UNITED STATES
SECURITIES AND EXCHANGE COMMISSION
Washington, D.C. 20549
FORM N-CSR
CERTIFIED SHAREHOLDER REPORT OF REGISTERED MANAGEMENT INVESTMENT
COMPANIES
Investment Company Act file number: 811-05742
Name of Fund: BlackRock Funds
BlackRock Emerging Markets Long/Short Equity Fund
BlackRock Global Long/Short Equity Fund
BlackRock Midcap Index Fund
BlackRock Min Vol EAFE Index
BlackRock Min Vol USA Index
BlackRock MSCI Asia ex Japan Index Fund
BlackRock MSCI World Index Fund
BlackRock Multifactor International Index
BlackRock Multifactor USA Index
BlackRock Small/Mid Cap Index Fund
BlackRock Total Stock Market Index Fund
BlackRock USA Momentum Factor Index Fund
BlackRock USA Quality Factor Index Fund
BlackRock USA Size Factor Index Fund
BlackRock USA Value Factor Index Fund
Fund Address: 100 Bellevue Parkway, Wilmington, DE 19809
Name and address of agent for service: John M. Perlowski, Chief Executive Officer, BlackRock Funds, 55 East 52nd Street, New York, NY 10055
Registrant’s telephone number, including area code: (800) 441-7762
Date of fiscal year end: 07/31/2017
Date of reporting period: 01/31/2017
Item 1 – Report to Stockholders
JANUARY 31, 2017
| | | | |
SEMI-ANNUAL REPORT (UNAUDITED) | | | |  |
BlackRock FundsSM
| Ø | BlackRock Emerging Markets Long/Short Equity Fund |
| Ø | BlackRock Global Long/Short Equity Fund |
|
| Not FDIC Insured • May Lose Value • No Bank Guarantee |
Dear Shareholder,
The 12 months ended January 31, 2017 was an exceptionally strong period for risk assets (such as stocks and high yield bonds), while higher-quality assets generated muted returns after struggling in the latter part of 2016. As the period began, worries about slowing growth in China and the instability of oil prices had global equity prices sliding. However, the broad market momentum shifted in the second half of 2016 as reflationary expectations in the United States helped drive a pick-up in global growth.
Markets were remarkably resilient during the period. Big surprises such as the United Kingdom’s vote to leave the European Union and the outcome of the U.S. presidential election brought spikes in equity market volatility, but they were ultimately short-lived. Instead, investors used the sell-offs to seize upon buying opportunities, allowing markets to quickly rebound. We believe this reinforces the case for taking the long view rather than reacting to short-term market noise.
The global reflationary theme — rising nominal growth, wages and inflation — was the dominant driver of asset returns during the period, outweighing significant political upheavals and uncertainty. This trend accelerated after the U.S. election and continued into the beginning of 2017, stoked by expectations for an extra boost to U.S. growth via fiscal policy.
Although economic momentum is gaining traction, the capacity for rapid global growth is restrained by structural factors including an aging population, low productivity growth and excess savings. A tempered economic growth trend and high valuations across most assets have set the stage for muted investment returns going forward.
Equity markets still have room to move, although the disparity between winners and losers is widening, making stock selection increasingly important. Fixed income investors are also facing challenges as bond markets recalibrate to accommodate rising rates and higher inflation expectations. And in a world where political risk and policy uncertainty abound, there is no lack of potential catalysts for higher volatility.
In this environment, investors need to think globally, extend their scope across a broad array of asset classes and be nimble as market conditions change. We encourage you to talk with your financial advisor and visit blackrock.com for further insight about investing in today’s markets.
Sincerely,

Rob Kapito
President, BlackRock Advisors, LLC

Rob Kapito
President, BlackRock Advisors, LLC
| | | | | | | | |
| Total Returns as of January 31, 2017 | |
| | | 6-month | | | 12-month | |
U.S. large cap equities
(S&P 500® Index) | | | 5.96 | % | | | 20.04 | % |
U.S. small cap equities
(Russell 2000® Index) | | | 12.43 | | | | 33.53 | |
International equities
(MSCI Europe, Australasia,
Far East Index) | | | 3.49 | | | | 12.03 | |
Emerging market equities
(MSCI Emerging Markets Index) | | | 4.92 | | | | 25.41 | |
3-month Treasury bills
(BofA Merrill Lynch 3-Month
U.S. Treasury Bill Index) | | | 0.20 | | | | 0.37 | |
U.S. Treasury securities
(BofA Merrill Lynch
10-Year U.S. Treasury
Index) | | | (7.87 | ) | | | (3.26 | ) |
U.S. investment grade bonds
(Bloomberg Barclays U.S.
Aggregate Bond Index) | | | (2.95 | ) | | | 1.45 | |
Tax-exempt municipal
bonds (S&P Municipal
Bond Index) | | | (2.94 | ) | | | 0.24 | |
U.S. high yield bonds
(Bloomberg Barclays U.S. Corporate High Yield 2% Issuer
Capped Index) | | | 6.09 | | | | 20.77 | |
| Past performance is no guarantee of future results. Index performance is shown for illustrative purposes only. You cannot invest directly in an index. | |
| | | | | | |
| | | | | | | |
| 2 | | THIS PAGE NOT PART OF YOUR FUND REPORT | | | | |

| | | | | | |
| | | | | | | |
| | BLACKROCK FUNDS | | JANUARY 31, 2017 | | 3 |
| | | | |
| Fund Summary as of January 31, 2017 | | BlackRock Emerging Markets Long/Short Equity Fund |
BlackRock Emerging Markets Long/Short Equity Fund’s (the “Fund”) investment objective is to seek total return over the long term.
|
| Portfolio Management Commentary |
How did the Fund perform?
| • | | For the six-month period ended January 31, 2017, the Fund’s Investor A and Investor C Shares underperformed its benchmark, the BofA Merrill Lynch 3-Month U.S. Treasury Bill Index, while the Fund’s Institutional Shares performed in line. |
What factors influenced performance?
| • | | As part of its investment strategy, the Fund uses derivatives, including total return swaps, to achieve exposure to a market or to manage market and/or equity risks. Through its use of total return swaps, the Fund’s performance is attributable to bottom-up security selection and top-down country and industry positioning, coupled with a long-short approach to controlling the Fund’s exposure to the market. |
| • | | For the six-month period, positive performance was mainly driven by the Fund’s net long equity market exposure, as emerging market equities finished the period with solid gains. The Fund’s investments in developed market companies that have significant emerging market exposure contributed to performance, after beginning to recover in the third quarter of 2016 and building momentum throughout the period. Stock selection strategies that focus on value- and quality-based stock selection saw strong performance in response to market perceptions of reduced deflationary risk, particularly following the surprising results of the U.S. presidential election. Positions driven by market sentiment also contributed to the Fund’s performance. |
| • | | The Fund’s exposure to emerging market countries detracted from performance during the period. Country selection within emerging markets was a key detractor, as an overweight position in Turkey and an underweight position in China both acted as constraints on performance |
| | | relative to the benchmark. From a sector perspective, the Fund’s exposures to the materials, telecommunications services, and utilities sectors weighed on performance. |
Describe recent portfolio activity.
| • | | The Fund increased its gross exposure during the period. However, net market exposure remained stable, and the Fund’s risk level remained within its target range. No other major changes in positioning occurred during the period. |
| • | | The Fund was fully invested throughout the period. The Fund’s cash exposure had no material impact on performance as it was principally in conjunction with the Fund taking long and short positions via the use of derivatives. |
Describe portfolio positioning at period end.
| • | | The Fund had an approximately 20% net long market exposure at the end of the period. Reflecting the divergent paths between conflicting high-level macroeconomic factors and the likelihood of heightened financial market volatility, the Fund continued to have well-balanced exposure to different groups of investment insights in both emerging market stocks and developed market stocks with exposure to emerging markets. |
| • | | In terms of the Fund’s country positioning, key country weightings continued to be driven by prospects for future outperformance. Overweight positions in Thailand and Turkey were based on potential for reforms, attractive relative valuations, and stable-to-improving fundamentals. |
The views expressed reflect the opinions of BlackRock as of the date of this report and are subject to change based on changes in market, economic or other conditions. These views are not intended to be a forecast of future events and are no guarantee of future results.
| | | | | | |
| | | | | | | |
| 4 | | BLACKROCK FUNDS | | JANUARY 31, 2017 | | |
| | |
| | | BlackRock Emerging Markets Long/Short Equity Fund |
|
| Total Return Based on a $10,000 Investment |
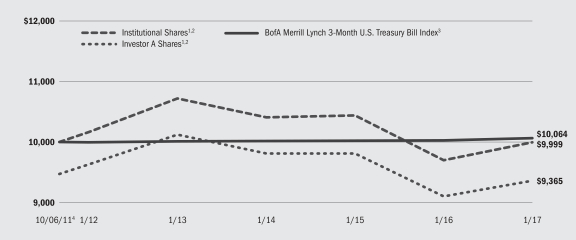
| | 1 | | Assuming maximum sales charges, if any, transaction costs and other operating expenses, including investment advisory fees. Institutional Shares do not have a sales charge. |
| | 2 | | Under normal conditions, the Fund invests at least 80% of its total assets in global equity instruments and related derivative instruments issued by, or tied economically to, companies in emerging markets. |
| | 3 | | An unmanaged index that tracks 3-month U.S. Treasury securities. |
| | 4 | | Commencement of operations. |
|
| Performance Summary for the Period Ended January 31, 2017 |
| | | | | | | | | | | | | | | | | | | | | | | | | | | | |
| | | | | | Average Annual Total Returns5 | |
| | | | | | 1 Year | | | 5 Years | | | Since Inception6 | |
| | | 6-Month
Total Returns | | | w/o sales
charge | | | w/sales
charge | | | w/o sales
charge | | | w/sales
charge | | | w/o sales
charge | | | w/sales
charge | |
Institutional | | | 0.21 | % | | | 3.06 | % | | | N/A | | | | (0.33 | )% | | | N/A | | | | 0.00 | % | | | N/A | |
Investor A | | | 0.10 | | | | 2.87 | | | | (2.53 | )% | | | (0.55 | ) | | | (1.62 | )% | | | (0.22 | ) | | | (1.23 | )% |
Investor C | | | (0.32 | ) | | | 2.08 | | | | 1.08 | | | | (1.31 | ) | | | (1.31 | ) | | | (0.99 | ) | | | (0.99 | ) |
BofA Merrill Lynch 3-Month U.S. Treasury Bill Index | | | 0.20 | | | | 0.37 | | | | N/A | | | | 0.13 | | | | N/A | | | | 0.12 | | | | N/A | |
| | 5 | | Assuming maximum sales charges, if any. Average annual total returns with and without sales charges reflect reductions for distribution and service fees. See “About Fund Performance” on page 8 for a detailed description of share classes, including any related sales charges and fees. |
| | 6 | | The Fund commenced operations on October 6, 2011. |
| | | | N/A — Not applicable as share class and index do not have a sales charge. |
| | | | Past performance is not indicative of future results. |
| | | | Performance results may include adjustments made for financial reporting purposes in accordance with U.S. generally accepted accounting principles. |
| | | | | | | | | | | | | | | | | | | | | | | | | | | | |
| | | Actual | | | Hypothetical8 | | | | |
| | | Beginning
Account Value
August 1, 2016 | | | Ending
Account Value
January 31, 2017 | | | Expenses Paid
During the Period7 | | | Beginning
Account Value
August 1, 2016 | | | Ending
Account Value
January 31, 2017 | | | Expenses Paid
During the Period7 | | | Annualized
Expense Ratio | |
Institutional | | $ | 1,000.00 | | | $ | 1,002.10 | | | $ | 8.83 | | | $ | 1,000.00 | | | $ | 1,016.38 | | | $ | 8.89 | | | | 1.75 | % |
Investor A | | $ | 1,000.00 | | | $ | 1,001.00 | | | $ | 10.09 | | | $ | 1,000.00 | | | $ | 1,015.12 | | | $ | 10.16 | | | | 2.00 | % |
Investor C | | $ | 1,000.00 | | | $ | 996.80 | | | $ | 13.84 | | | $ | 1,000.00 | | | $ | 1,011.34 | | | $ | 13.94 | | | | 2.75 | % |
| | 7 | | For each class of the Fund, expenses are equal to the annualized net expense ratio for the class, multiplied by the average account value over the period, multiplied by 184/365 (to reflect the one-half year period shown). |
| | 8 | | Hypothetical 5% annual return before expenses is calculated by prorating the number of days in the most recent fiscal half year divided by 365. |
| | | | See “Disclosure of Expenses” on page 8 for further information on how expenses were calculated. |
| | | | | | |
| | | | | | | |
| | BLACKROCK FUNDS | | JANUARY 31, 2017 | | 5 |
| | | | |
| Fund Summary as of January 31, 2017 | | BlackRock Global Long/Short Equity Fund |
BlackRock Global Long/Short Equity Fund’s (the “Fund”) investment objective is to seek total return over the long term.
|
| Portfolio Management Commentary |
How did the Fund perform?
| • | | For the six-month period ended January 31, 2017, the Fund outperformed its benchmark, the BofA Merrill Lynch 3-Month U.S. Treasury Bill Index. |
What factors influenced performance?
| • | | As part of its investment strategy, the Fund uses derivatives, including total return swaps and futures, to achieve exposure to a market or to manage market and/or equity risks. Through its use of derivatives, the Fund’s performance is attributable to stock selection and bet timing based on security analysis coupled with a long-short approach to controlling the Fund’s exposure to trends in global equity markets. |
| • | | The Fund’s strategies that focus on fundamental business performance were the primary contributor to performance for the period, as a change in market sentiment in September favored positions that benefited from reduced anxiety about deflationary macroeconomic pressure. In particular, stock selection strategies that capture relative valuations drove strong returns, with rising bond yields refocusing attention on balance sheet quality. Short positions in the U.S. retail and consumer durables industries were notably strong contributors to performance, and a negative view toward U.S. real estate investment trusts and other overbought yield-focused investments contributed as well. These positive trends continued through the end of the period, and the Fund’s value-based stock selection strategies benefited as lagging stocks caught up to early leaders during the stock market’s rally. The Fund’s short positions in overextended leading stocks were also rewarded, as many stocks showed signs of fatigue as the rally proceeded. |
| • | | The Fund’s strategies focusing on macroeconomic factors and thematic positioning detracted from performance. The market’s reaction to the |
| | | surprise result of the U.S. presidential election was contrary to investor expectations, and a short position in U.S. shares based on analysis of investor flows and a less favorable interest rate environment relative to other regions was a key detractor from performance. In addition, a strategy based on sensitivity to Chinese economic conditions underperformed. By January, however, the Fund’s adherence to strategies based on market sentiment began to align with the broader market rally. |
Describe recent portfolio activity.
| • | | Over the six-month period, the Fund maintained long positions in the United Kingdom and Japan, but it trimmed its overall short position to U.S. stocks. From a sector perspective, the Fund increased its long position in energy and reduced long exposure to consumer staples, while closing its short position in financials and increasing its short position in the materials sector. |
| • | | The Fund was fully invested throughout the period. The Fund’s cash exposure had no material impact on performance as it was principally in conjunction with the Fund taking long and short positions via the use of derivatives. |
Describe portfolio positioning at period end.
| • | | The Fund’s positioning at period-end reflected its attempt to benefit from the reflationary theme that evolved during the period. At the industry level, the Fund maintained long positions in the information technology, energy and health care sectors, while remaining short in the materials and telecommunication services sectors. From a geographical perspective, the Fund had long positions in the United Kingdom, Canada and Ireland, and short positions in the Netherlands, the United States and Sweden. |
The views expressed reflect the opinions of BlackRock as of the date of this report and are subject to change based on changes in market, economic or other conditions. These views are not intended to be a forecast of future events and are no guarantee of future results.
| | | | | | |
| | | | | | | |
| 6 | | BLACKROCK FUNDS | | JANUARY 31, 2017 | | |
| | |
| | | BlackRock Global Long/Short Equity Fund |
|
| Total Return Based on a $10,000 Investment |
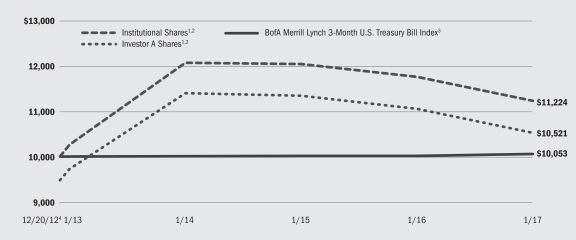
| | 1 | | Assuming maximum sales charges, if any, transaction costs and other operating expenses, including investment advisory fees. Institutional Shares do not have a sales charge. |
| | 2 | | Under normal conditions, the Fund invests at least 80% of its total assets in equity instruments and related derivative instruments issued by, or tied economically to, companies located in developed markets. |
| | 3 | | An unmanaged index that tracks 3-month U.S. Treasury securities. |
| | 4 | | Commencement of operations. |
|
| Performance Summary for the Period Ended January 31, 2017 |
| | | | | | | | | | | | | | | | | | | | |
| | | | | | Average Annual Total Returns5 | |
| | | | | | 1 Year | | | Since Inception6 | |
| | | 6-Month
Total Returns | | | w/o sales
charge | | | w/sales
charge | | | w/o sales
charge | | | w/sales
charge | |
Institutional | | | 2.94 | % | | | (4.48 | )% | | | N/A | | | | 2.85 | % | | | N/A | |
Investor A | | | 2.86 | | | | (4.77 | ) | | | (9.77 | )% | | | 2.58 | | | | 1.24 | % |
Investor C | | | 2.44 | | | | (5.49 | ) | | | (6.43 | ) | | | 1.82 | | | | 1.82 | |
Class K | | | 3.03 | | | | (4.38 | ) | | | N/A | | | | 2.93 | | | | N/A | |
BofA Merrill Lynch 3-Month U.S. Treasury Bill Index | | | 0.20 | | | | 0.37 | | | | N/A | | | | 0.13 | | | | N/A | |
| | 5 | | Assuming maximum sales charges, if any. Average annual total returns with and without sales charges reflect reductions for distribution and service fees. See “About Fund Performance” on page 8 for a detailed description of share classes, including any related sales charges and fees. |
| | 6 | | The Fund commenced operations on December 20, 2012. |
| | | | N/A — Not applicable as share class and index do not have a sales charge. |
| | | | Past performance is not indicative of future results. |
| | | | Performance results may include adjustments made for financial reporting purposes in accordance with U.S. generally accepted accounting principles. |
| | | | | | | | | | | | | | | | | | | | | | | | | | | | |
| | | Actual | | | Hypothetical8 | | | | |
| | | Beginning
Account Value
August 1, 2016 | | | Ending
Account Value
January 31, 2017 | | | Expenses Paid
During the Period7 | | | Beginning
Account Value
August 1, 2016 | | | Ending
Account Value
January 31, 2017 | | | Expenses Paid
During the Period7 | | | Annualized
Expense Ratio | |
Institutional | | $ | 1,000.00 | | | $ | 1,029.40 | | | $ | 8.95 | | | $ | 1,000.00 | | | $ | 1,016.38 | | | $ | 8.89 | | | | 1.75 | % |
Investor A | | $ | 1,000.00 | | | $ | 1,028.60 | | | $ | 10.23 | | | $ | 1,000.00 | | | $ | 1,015.12 | | | $ | 10.16 | | | | 2.00 | % |
Investor C | | $ | 1,000.00 | | | $ | 1,024.40 | | | $ | 14.03 | | | $ | 1,000.00 | | | $ | 1,011.34 | | | $ | 13.94 | | | | 2.75 | % |
Class K | | $ | 1,000.00 | | | $ | 1,030.30 | | | $ | 8.29 | | | $ | 1,000.00 | | | $ | 1,017.04 | | | $ | 8.24 | | | | 1.62 | % |
| | 7 | | For each class of the Fund, expenses are equal to the annualized net expense ratio for the class, multiplied by the average account value over the period, multiplied by 184/365 (to reflect the one-half year period shown). |
| | 8 | | Hypothetical 5% annual return before expenses is calculated by prorating the number of days in the most recent fiscal half year divided by 365. |
| | | | See “Disclosure of Expenses” on page 8 for further information on how expenses were calculated. |
| | | | | | |
| | | | | | | |
| | BLACKROCK FUNDS | | JANUARY 31, 2017 | | 7 |
| • | | Institutional and Class K Shares (Class K Shares available only in BlackRock Global Long/Short Equity Fund) are not subject to any sales charge. These shares bear no ongoing distribution or service fees and are available only to certain eligible investors. Prior to the Class K Shares inception date of March 28, 2016, Class K Shares performance results are those of Institutional Shares (which have no distribution or service fees) and were restated to reflect Class K Shares fees. |
| • | | Investor A Shares are subject to a maximum initial sales charge (front-end load) of 5.25% and a service fee of 0.25% per year (but no distribution fee). Certain redemptions of these shares may be subject to a contingent deferred sales charge (“CDSC”) where no initial sales charge was paid at the time of purchase. These shares are generally available through financial intermediaries. |
| • | | Investor C Shares are subject to a 1.00% CDSC if redeemed within one year of purchase. In addition, these shares are subject to a distribution fee of 0.75% per year and a service fee of 0.25% per year. These shares are generally available through financial intermediaries. |
Performance information reflects past performance and does not guarantee future results. Current performance may be lower or higher than
performance data quoted. Refer to www.blackrock.com/funds to obtain performance data current to the most recent month end. Performance results do not reflect the deduction of taxes that a shareholder would pay on fund distributions or the redemption of fund shares. Figures shown in each of the performance tables on the previous pages assume reinvestment of all distributions, if any, at net asset value (“NAV”) on the ex-dividend dates. Investment return and principal value of shares will fluctuate so that shares, when redeemed, may be worth more or less than their original cost. Distributions paid to each class of shares will vary because of the different levels of service, distribution and transfer agency fees applicable to each class, which are deducted from the income available to be paid to shareholders.
BlackRock Advisors, LLC (the “Manager”), the Funds’ investment adviser, has contractually agreed to waive and/or reimburse a portion of each Fund’s expenses. Without such waiver and/or reimbursement, each Fund’s performance would have been lower. The Manager is under no obligation to waive and/or reimburse or to continue waiving and/or reimbursing its fees after the applicable termination date of such agreement. See Note 6 of the Notes to Financial Statements for additional information on waivers and/or reimbursements.
Shareholders of each Fund may incur the following charges: (a) transactional expenses, such as sales charges; and (b) operating expenses, including investment advisory fees, service and distribution fees, including 12b-1 fees, acquired fund fees and expenses, and other Fund expenses. The expense examples shown on the previous pages (which are based on a hypothetical investment of $1,000 invested on August 1, 2016 and held through January 31, 2017 are intended to assist shareholders both in calculating expenses based on an investment in each Fund and in comparing these expenses with similar costs of investing in other mutual funds.
The expense examples provide information about actual account values and actual expenses. In order to estimate the expenses a shareholder paid during the period covered by this report, shareholders can divide their account value by $1,000 and then multiply the result by the number corresponding to their Fund and share class under the heading entitled “Expenses Paid During the Period.”
The expense examples also provide information about hypothetical account values and hypothetical expenses based on a Fund’s actual expense ratio and an assumed rate of return of 5% per year before expenses. In order to assist shareholders in comparing the ongoing expenses of investing in these Funds and other funds, compare the 5% hypothetical examples with the 5% hypothetical examples that appear in shareholder reports of other funds.
The expenses shown in the expense examples are intended to highlight shareholders’ ongoing costs only and do not reflect any transactional expenses, such as sales charges, if any. Therefore, the hypothetical examples are useful in comparing ongoing expenses only, and will not help shareholders determine the relative total expenses of owning different funds. If these transactional expenses were included, shareholder expenses would have been higher.
| | | | | | |
| | | | | | | |
| 8 | | BLACKROCK FUNDS | | JANUARY 31, 2017 | | |
| | |
| Derivative Financial Instruments | | |
The Funds may invest in various derivative financial instruments. These instruments are used to obtain exposure to a security, commodity, index, market, and/or other assets without owning or taking physical custody of securities, commodities and/or other referenced assets or to manage market, equity, credit, interest rate, foreign currency exchange rate, commodity and/or other risks. Derivative financial instruments may give rise to a form of economic leverage and involve risks, including the imperfect correlation between the value of a derivative financial instrument and the underlying asset, possible default of the counterparty to the
transaction or illiquidity of the instrument. The Funds’ successful use of a derivative financial instrument depends on the investment adviser’s ability to predict pertinent market movements accurately, which cannot be assured. The use of these instruments may result in losses greater than if they had not been used, may limit the amount of appreciation a Fund can realize on an investment and/or may result in lower distributions paid to shareholders. The Funds’ investments in these instruments are discussed in detail in the Notes to Financial Statements.
|
| Portfolio Information as of January 31, 2017 |
|
| BlackRock Emerging Markets Long/Short Equity Fund |
| | | | | | | | | | | | |
| | | Percent of Total Investments1 | |
| Geographic Allocation | | Long | | | Short | | | Total | |
China | | | 12 | % | | | 6 | % | | | 18 | % |
Taiwan | | | 10 | | | | 4 | | | | 14 | |
South Korea | | | 8 | | | | 5 | | | | 13 | |
Hong Kong | | | 3 | | | | 5 | | | | 8 | |
Brazil | | | 3 | | | | 3 | | | | 6 | |
Mexico | | | 3 | | | | 2 | | | | 5 | |
Thailand | | | 3 | | | | 2 | | | | 5 | |
United States | | | 3 | | | | 2 | | | | 5 | |
South Africa | | | 3 | | | | 1 | | | | 4 | |
Turkey | | | 3 | | | | — | | | | 3 | |
Russia | | | 2 | | | | 1 | | | | 3 | |
Malaysia | | | 2 | | | | — | | | | 2 | |
Japan | | | 1 | | | | 1 | | | | 2 | |
Indonesia | | | 2 | | | | — | | | | 2 | |
Other2 | | | 6 | | | | 4 | | | | 10 | |
| | | | | | | | | | | | |
Total | | | 64 | % | | | 36 | % | | | 100 | % |
| | | | | | | | | | | | |
|
| BlackRock Global Long/Short Equity Fund |
| | | | | | | | | | | | |
| | | Percent of Total Investments1 | |
| Geographic Allocation | | Long | | | Short | | | Total | |
United States | | | 25 | % | | | 25 | % | | | 50 | % |
Japan | | | 6 | | | | 7 | | | | 13 | |
United Kingdom | | | 4 | | | | 2 | | | | 6 | |
Canada | | | 3 | | | | 2 | | | | 5 | |
Switzerland | | | 2 | | | | 2 | | | | 4 | |
France | | | 2 | | | | 2 | | | | 4 | |
Germany | | | 2 | | | | 2 | | | | 4 | |
Australia | | | 1 | | | | 1 | | | | 2 | |
Sweden | | | 1 | | | | 1 | | | | 2 | |
Other2 | | | 6 | | | | 4 | | | | 10 | |
| | | | | | | | | | | | |
Total | | | 52 | % | | | 48 | % | | | 100 | % |
| | | | | | | | | | | | |
| | 1 | | Total investments include the gross notional values of long and short equity securities of the underlying derivative contracts utilized by the Fund and exclude short-term securities. |
| | 2 | | Includes holdings within countries representing 1% or less of long-term investments. Please refer to the Schedules of Investments for such countries. |
| | | | | | |
| | | | | | | |
| | BLACKROCK FUNDS | | JANUARY 31, 2017 | | 9 |
| | |
Schedule of Investments January 31, 2017 (Unaudited) | | BlackRock Emerging Markets Long/Short Equity Fund (Percentages shown are based on Net Assets) |
| | | | | | | | |
| Short-Term Securities | | Shares | | | Value | |
BlackRock Liquidity Funds, T-Fund,
Institutional Class, 0.40% (a)(b) | | | 148,882,956 | | | $ | 148,882,956 | |
Total Short-Term Securities
(Cost — $148,882,956*) — 96.3% | | | | 148,882,956 | |
Other Assets Less Liabilities — 3.7% | | | | 5,693,835 | |
| | | | | | | | |
Net Assets — 100.0% | | | | | | $ | 154,576,791 | |
| | | | | | | | |
| | |
| ADR | | American Depository Receipt |
| CHF | | Swiss Franc |
| CVR | | Contingent Value Right |
| EUR | | Euro |
| GBP | | British Pound |
| GDR | | Global Depository Receipt |
| HIBOR | | Hong Kong Interbank Offered Rate |
| | |
| JPY | | Japanese Yen |
| LIBOR | | London Interbank Offered Rate |
| MXN | | Mexican Peso |
| OTC | | Over-the-Counter |
| REIT | | Real Estate Investment Trust |
| S&P | | Standard & Poor’s |
| USD | | U.S. Dollar |
|
| Notes to Schedule of Investments |
| * | | Cost for federal income tax purposes. |
| (a) | | During the six months ended January 31, 2017, investments in issuers considered to be affiliates of the Fund for purposes of Section 2(a)(3) of the Investment Company Act of 1940, as amended, were as follows: |
| | | | | | | | | | | | | | | | | | | | | | | | | | | | |
| Affiliate | | Shares
Held at
July 31, 2016 | | | Net
Activity | | | Shares
Held at
January 31,
2017 | | | Value at
January 31,
2017 | | | Income | | | Net Realized
Gain1 | | | Change in
Unrealized
Appreciation
(Depreciation) | |
BlackRock Liquidity Funds, TempFund Institutional Class | | | 190,126,929 | | | | (190,126,929 | ) | | | — | | | | — | | | $ | 60,882 | | | | — | | | | — | |
BlackRock Liquidity Funds, T-Fund, Institutional Class | | | — | | | | 148,882,956 | | | | 148,882,956 | | | $ | 148,882,956 | | | | 183,041 | | | $ | 803 | | | | — | |
Total | | | | | | | | | | | | | | $ | 148,882,956 | | | $ | 243,923 | | | $ | 803 | | | | — | |
| | | | | |
1 Includes net capital gain distributions. | |
| (b) | | Represents the current yield as of report date. |
| | | | | | | | | | | | | | | | |
| Derivative Financial Instruments Outstanding as of Period End |
| | | | | | | | | | | | | | | | | | | | | | | | | | | | | | | | |
| OTC Total Return Swaps | |
| Reference Entity | | Fixed Amount1 | | | Counterparty | | | Effective
Date | | | Expiration
Date | | | Notional
Amount
(000) | | | Value | | | Premiums
Paid
(Received) | | | Unrealized
Depreciation | |
MSCI Emerging Markets Index | | $ | 32,000,079 | | | | Goldman Sachs International | | | | 5/23/16 | | | | 5/23/17 | | | $ | 93,747 | | | $ | (5,442,046 | ) | | | — | | | $ | (5,442,046 | ) |
MSCI Emerging Markets Index | | $ | 27,515,258 | | | | UBS AG | | | | 8/08/16 | | | | 2/08/17 | | | $ | 69,446 | | | | (208,038 | ) | | | — | | | | (208,038 | ) |
Total | | | | | | | | | | | | | | | | | | | | | | $ | (5,650,084 | ) | | | — | | | $ | (5,650,084 | ) |
| | | | | |
1 Fund pays the total return of the reference entity and receives the fixed amount. Net payment made at termination. | |
See Notes to Financial Statements.
| | | | | | |
| | | | | | | |
| 10 | | BLACKROCK FUNDS | | JANUARY 31, 2017 | | |
| | |
Schedule of Investments (continued) | | BlackRock Emerging Markets Long/Short Equity Fund |
| | | | | | | | | | | | | | | | |
| OTC Total Return Swaps1 | |
| Reference Entity | | Counterparty | | Expiration
Date | | Net Notional
Amount | | | Unrealized
Appreciation | | | Net Value of
Reference
Entities | |
Equity Securities Long/Short | | Goldman Sachs & Co. | | 1/05/17 - 8/29/18 | | $ | 30,545,796 | | | $ | 3,150,686 | 2 | | $ | 33,211,526 | |
| | Goldman Sachs & Co. | | 3/01/17 - 8/29/18 | | | (159,961 | ) | | | 192,857 | 3 | | | (1,042 | ) |
| | Morgan Stanley & Co, Inc. | | 10/11/17 - 8/28/19 | | | 26,583,454 | | | | 7,105,859 | 4 | | | 33,308,307 | |
| | Morgan Stanley & Co, Inc. | | 3/30/17 - 3/01/18 | | | (205,245 | ) | | | 233,622 | 5 | | | 14,692 | |
| | UBS AG | | 5/19/17 | | | (296,372 | ) | | | 244,814 | 6 | | | (47,728 | ) |
| | | UBS AG | | 5/19/17 | | | 27,390,105 | | | | 5,801,743 | 7 | | | 32,909,435 | |
Total | | | $ | 16,729,581 | | | $ | 99,395,190 | |
| | | | | |
1 The Fund receives or pays the total return on a portfolio of long and short positions underlying the total return swap. In addition, the Fund pays or receives a variable rate of interest, based on a specified benchmark, plus or minus a spread in a range of 19 — 1,807 basis points. The benchmark and spread are determined based upon the country and/or currency of the individual underlying positions. The following are the specified benchmarks used in determining the variable rate of interest: | |
Intercontinental Exchange LIBOR: | |
EUR 1 Week; EUR Overnight. | |
GBP 1 Week; GBP Overnight | |
JPY Spot Next | |
MXN Spot Next | |
USD 1 Week; USD Spot Next | |
Overnight Bank Funding Rate | |
Bank of Canada Overnight Repo Rate | |
Hong Kong Dollar HIBOR Fixings 2 Week | |
2 Amount includes $484,956 of net dividends and financing fees. | |
3 Amount includes $33,938 of net dividends and financing fees. | |
4 Amount includes $381,006 of net dividends and financing fees. | |
5 Amount includes $13,685 of net dividends and financing fees. | |
6 Amount includes $(3,830) of net dividends and financing fees. | |
7 Amount includes $282,413 of net dividends and financing fees. | |
See Notes to Financial Statements.
| | | | | | |
| | | | | | | |
| | BLACKROCK FUNDS | | JANUARY 31, 2017 | | 11 |
| | |
Schedule of Investments (continued) | | BlackRock Emerging Markets Long/Short Equity Fund |
| | | | | | | | |
| The following table represents the individual long and short positions and related values of equity securities underlying the total return swap with Goldman Sachs & Co. as of January 31, 2017, expiration dates 1/05/17 — 8/29/18: | |
| | | Shares | | | Value | |
| Reference Entity — Long | | | | | | |
Brazil | |
Braskem SA — ADR | | | 762 | | | $ | 15,766 | |
Braskem SA, Preference A Shares | | | 23,300 | | | | 240,609 | |
Cia de Saneamento Basico do Estado de Sao Paulo — ADR | | | 17,165 | | | | 170,963 | |
Engie Brasil Energia SA | | | 9,100 | | | | 103,386 | |
Fleury SA | | | 93,600 | | | | 1,128,154 | |
Hypermarcas SA | | | 93,700 | | | | 831,111 | |
Itau Unibanco Holding SA, Preference Shares | | | 6,610 | | | | 78,118 | |
Magazine Luiza SA | | | 900 | | | | 36,556 | |
Marfrig Global Foods SA | | | 21,800 | | | | 44,692 | |
Multiplus SA | | | 39,100 | | | | 441,490 | |
Tim Participacoes SA — ADR | | | 4,694 | | | | 66,326 | |
| | | | | | | | |
| | | | | | | | 3,157,171 | |
Chile | | | | | |
Empresa Nacional de Electricidad SA — ADR | | | 63,485 | | | | 1,230,339 | |
Enersis SA — ADR | | | 81,392 | | | | 734,970 | |
| | | | | | | | |
| | | | | | | | 1,965,309 | |
China | |
Bank of China Ltd., Class H | | | 1,714,000 | | | | 776,299 | |
China Biologic Products, Inc. | | | 6,784 | | | | 772,969 | |
China Cinda Asset Management Co. Ltd. | | | 1,085,000 | | | | 375,882 | |
China Communications Services Corp. Ltd., Class H | | | 826,000 | | | | 561,491 | |
China Construction Bank Corp., Class H | | | 1,163,000 | | | | 862,235 | |
China Lesso Group Holdings, Ltd. | | | 150,000 | | | | 102,278 | |
China Mobile Ltd. | | | 39,500 | | | | 444,479 | |
China Pacific Insurance Group Co. Ltd., Class H | | | 134,000 | | | | 475,969 | |
China Petroleum & Chemical Corp. — ADR | | | 7,126 | | | | 570,365 | |
China Petroleum & Chemical Corp. Class H | | | 464,000 | | | | 366,526 | |
China Railway Group Ltd., Class H | | | 958,000 | | | | 838,549 | |
China Telecom Corp. Ltd., Class H | | | 86,000 | | | | 40,604 | |
CNOOC Ltd. | | | 79,000 | | | | 98,652 | |
Datang International Power Generation Co. Ltd., Class H | | | 118,000 | | | | 30,597 | |
Dongfang Electric Corp. Ltd. | | | 73,800 | | | | 74,417 | |
Great Wall Motor Co. Ltd., Class H | | | 102,000 | | | | 102,202 | |
Guangzhou Automobile Group Co. Ltd., Class H | | | 298,000 | | | | 406,416 | |
Guangzhou Pharmaceutical Co. Ltd. | | | 78,000 | | | | 190,738 | |
Industrial and Commercial Bank of China Ltd., Class H | | | 704,000 | | | | 430,415 | |
Jiangsu Expressway Co. Ltd. Class H | | | 206,000 | | | | 257,996 | |
Longfor Properties Co. Ltd. | | | 243,500 | | | | 350,562 | |
Maanshan Iron & Steel | | | 52,000 | | | | 19,056 | |
Metallurgical Corp. of China, Ltd. | | | 85,000 | | | | 30,819 | |
People’s Insurance Co. Group of China Ltd., Class H | | | 1,586,000 | | | | 617,784 | |
Shanghai Pharmaceuticals Holding Co. Ltd., Class H | | | 39,100 | | | | 99,578 | |
Sinopec Shanghai Petrochemical Co. Ltd. — ADR | | | 210 | | | | 13,070 | |
Sinopec Shanghai Petrochemical Co. Ltd., Class H | | | 834,000 | | | | 516,423 | |
Sinopharm Group Co., Class H | | | 59,600 | | | | 272,367 | |
Sinotrans Ltd., Class H | | | 593,000 | | | | 247,256 | |
Sohu.com, Inc. | | | 10,461 | | | | 414,988 | |
Tencent Holdings, Ltd. | | | 89,000 | | | | 2,326,937 | |
Tianjin Capital Environmental Protection Group Co. Ltd. | | | 352,000 | | | | 189,207 | |
Tianneng Power International Ltd. | | | 210,000 | | | | 184,923 | |
Weichai Power Co. Ltd., Class H | | | 432,000 | | | | 765,507 | |
ZTE Corp., Class H | | | 492,800 | | | | 766,197 | |
| | | | | | | | |
| | | | | | | | 14,593,753 | |
| | | | | | | | |
| | | Shares | | | Value | |
| Reference Entity — Long (continued) | | | | | | |
Egypt | | | | | | | | |
Global Telecom Holding — GDR | | | 109,690 | | | $ | 198,539 | |
Hong Kong | | | | | | | | |
China Mobile, Ltd. | | | 32,133 | | | | 1,831,581 | |
China Overseas Land & Investment Ltd. | | | 4,000 | | | | 11,746 | |
China Resources Cement Holdings Ltd. | | | 226,000 | | | | 104,685 | |
China Resources Land Ltd. | | | 60,000 | | | | 148,413 | |
ENN Energy Holdings Ltd. | | | 10,000 | | | | 49,300 | |
Geely Automobile Holdings Ltd. | | | 195,000 | | | | 230,475 | |
Haier Electronics Group Co. Ltd. | | | 290,000 | | | | 510,111 | |
KWG Property Holding Ltd. | | | 202,500 | | | | 116,367 | |
Nine Dragons Paper Holdings Ltd. | | | 61,000 | | | | 70,207 | |
Shenzhen Investment Ltd. | | | 66,000 | | | | 26,837 | |
Shimao Property Holdings Ltd. | | | 44,000 | | | | 58,946 | |
Skyworth Digital Holdings Ltd. | | | 1,068,000 | | | | 704,456 | |
| | | | | | | | |
| | | | | | | | 3,863,124 | |
Indonesia | |
Bank Central Asia Tbk PT | | | 26,600 | | | | 30,488 | |
Gudang Garam Tbk PT | | | 58,100 | | | | 268,651 | |
Matahari Department Store Tbk PT | | | 1,528,300 | | | | 1,691,955 | |
Telekomunikasi Indonesia Persero Tbk PT | | | 994,800 | | | | 288,378 | |
Telekomunikasi Indonesia Persero Tbk PT — ADR | | | 53,841 | | | | 1,584,002 | |
Unilever Indonesia Tbk PT | | | 11,100 | | | | 34,228 | |
| | | | | | | | |
| | | | | | | | 3,897,702 | |
Malaysia | |
Astro Malaysia Holdings Bhd | | | 337,100 | | | | 207,001 | |
IOI Corp. Bhd | | | 565,500 | | | | 563,174 | |
MISC Bhd | | | 174,400 | | | | 288,221 | |
| | | | | | | | |
| | | | | | | | 1,058,396 | |
Mexico | |
Alfa SAB de C.V., Series A | | | 502,600 | | | | 652,186 | |
America Movil SAB de C.V., Series L | | | 487,800 | | | | 307,368 | |
Gruma SAB de C.V. Class B | | | 10,385 | | | | 139,723 | |
Grupo Aeroportuario del Centro Norte SAB de C.V. —ADR | | | 2,053 | | | | 70,233 | |
Grupo Bimbo SAB de C.V., Series A | | | 535,292 | | | | 1,186,686 | |
Industrias Penoles SAB de C.V. | | | 56,880 | | | | 1,345,088 | |
Kimberly-Clark de Mexico SAB de C.V. | | | 149,700 | | | | 268,912 | |
Wal-Mart de Mexico SAB de C.V. | | | 201,100 | | | | 355,844 | |
| | | | | | | | |
| | | | | | | | 4,326,040 | |
Netherlands | |
Yandex NV | | | 55,740 | | | | 1,289,823 | |
Peru | |
Compania de Minas Buenaventura SA — ADR | | | 668 | | | | 9,212 | |
Poland | |
KGHM Polska Miedz SA | | | 1,168 | | | | 36,226 | |
Polskie Gornictwo Naftowe i Gazownictwo SA | | | 298,081 | | | | 409,342 | |
| | | | | | | | |
| | | | | | | | 445,568 | |
Russia | |
Aeroflot — Russian Airlines OJSC | | | 53,900 | | | | 155,743 | |
AK Transneft OAO, Preference Shares | | | 32 | | | | 109,245 | |
Alrosa AO | | | 73,000 | | | | 128,603 | |
Lukoil PJSC — ADR | | | 2,280 | | | | 128,489 | |
Mobile Telesystems OJSC — ADR | | | 1,117 | | | | 11,695 | |
Sberbank of Russia — ADR | | | 55,232 | | | | 647,607 | |
Severstal OAO | | | 430 | | | | 6,851 | |
Severstal PAO — GDR | | | 288 | | | | 4,575 | |
Sistema JSFC — GDR | | | 6,521 | | | | 62,406 | |
Tatneft PAO — ADR | | | 66 | | | | 2,690 | |
Uralkali PJSC — GDR | | | 10,897 | | | | 154,837 | |
| | | | | | | | |
| | | | | | | | 1,412,741 | |
See Notes to Financial Statements.
| | | | | | |
| | | | | | | |
| 12 | | BLACKROCK FUNDS | | JANUARY 31, 2017 | | |
| | |
Schedule of Investments (continued) | | BlackRock Emerging Markets Long/Short Equity Fund |
| | | | | | | | |
| | | Shares | | | Value | |
| Reference Entity — Long (continued) | | | | | | |
South Africa | |
Clicks Group Ltd. | | | 65,883 | | | $ | 596,492 | |
Investec Ltd. | | | 21,043 | | | | 148,736 | |
Kumba Iron Ore Ltd. | | | 7,549 | | | | 116,432 | |
Life Healthcare Group Holdings Ltd. | | | 17,018 | | | | 42,434 | |
Mondi Ltd. | | | 20,450 | | | | 449,323 | |
Nedbank Group Ltd. | | | 3,137 | | | | 54,110 | |
Netcare Ltd. | | | 226,174 | | | | 543,991 | |
Pick n Pay Stores Ltd. | | | 44,281 | | | | 224,642 | |
Sappi Ltd. | | | 116,739 | | | | 750,609 | |
Spar Group Ltd. | | | 4,569 | | | | 64,593 | |
Standard Bank Group Ltd. | | | 4,497 | | | | 48,090 | |
Telkom SA SOC Ltd. | | | 28,657 | | | | 157,048 | |
Tsogo Sun Holdings, Ltd. | | | 24,795 | | | | 48,657 | |
Vodacom Group Ltd. | | | 11,027 | | | | 123,576 | |
| | | | | | | | |
| | | | | | | | 3,368,733 | |
South Korea | |
Byucksan Corp. | | | 8,988 | | | | 29,674 | |
CJ Corp. | | | 718 | | | | 112,740 | |
Daewoo International Corp. | | | 6,929 | | | | 152,040 | |
Hanjin Kal Corp. | | | 1 | | | | 13 | |
Hanwha Corp. | | | 4,224 | | | | 128,182 | |
Hyundai Development Co-Engineering & Construction | | | 5,143 | | | | 193,516 | |
Hyundai Engineering & Construction Co. Ltd. | | | 19,204 | | | | 687,426 | |
Kia Motors Corp. | | | 7,298 | | | | 228,739 | |
Korea Electric Power Corp. | | | 1,809 | | | | 66,251 | |
Korea Investment Holdings Co. Ltd. | | | 9,520 | | | | 381,818 | |
KT Corp. | | | 43,291 | | | | 1,095,600 | |
KT Corp. — ADR | | | 70,949 | | | | 1,055,012 | |
LG Electronics, Inc. | | | 11,692 | | | | 558,760 | |
LG International Corp. | | | 5,466 | | | | 152,099 | |
LG Uplus Corp. | | | 4,409 | | | | 43,307 | |
Lotte Chemical Corp. | | | 952 | | | | 308,503 | |
LS Corp. | | | 5,163 | | | | 279,091 | |
NAVER Corp. | | | 422 | | | | 275,656 | |
NongShim Co. Ltd. | | | 188 | | | | 51,445 | |
Poongsan Corp. | | | 4,316 | | | | 161,721 | |
POSCO | | | 451 | | | | 105,410 | |
Samsung Electronics Co. Ltd. | | | 433 | | | | 736,436 | |
Shinhan Financial Group Co. Ltd. | | | 3,556 | | | | 140,541 | |
SK Hynix, Inc. | | | 1,233 | | | | 56,945 | |
SK Innovation Co. Ltd. | | | 1,617 | | | | 219,055 | |
SK Networks Co. Ltd. | | | 7,118 | | | | 40,543 | |
| | | | | | | | |
| | | | | | | | 7,260,523 | |
Taiwan | |
AU Optronics Corp. | | | 124,000 | | | | 51,345 | |
Cathay Financial Holding Co. Ltd. | | | 105,000 | | | | 159,902 | |
Chen Full International Co. Ltd. | | | 49,000 | | | | 78,226 | |
Chimei Innolux Corp. | | | 345,000 | | | | 146,147 | |
China Life Insurance Co. Ltd. | | | 32,000 | | | | 31,318 | |
CTCI Corp. | | | 63,000 | | | | 98,080 | |
Elite Advanced Laser Corp. | | | 46,600 | | | | 185,451 | |
Everlight Electronics Co. Ltd. | | | 267,000 | | | | 417,695 | |
Feng TAY Enterprise Co. Ltd. | | | 216 | | | | 944 | |
First Financial Holding Co. Ltd. | | | 1,551,825 | | | | 865,990 | |
Formosa Chemicals & Fibre Corp. | | | 102,000 | | | | 316,193 | |
Formosa Petrochemical Corp. | | | 37,000 | | | | 126,391 | |
Fubon Financial Holding Co. Ltd. | | | 278,000 | | | | 451,820 | |
Hon Hai Precision Industry Co. Ltd. | | | 845,875 | | | | 2,268,449 | |
Hon Hai Precision Industry Co. Ltd. — GDR | | | 10,417 | | | | 54,793 | |
Inventec Co. Ltd. | | | 534,000 | | | | 401,620 | |
Lite-On Technology Corp. | | | 788,914 | | | | 1,191,613 | |
MediaTek, Inc. | | | 194,000 | | | | 1,328,142 | |
Novatek Microelectronics Corp. | | | 39,000 | | | | 138,135 | |
| | | | | | | | |
| | | Shares | | | Value | |
| Reference Entity — Long (continued) | | | | | | |
Taiwan (continued) | |
Pegatron Corp. | | | 191,000 | | | $ | 459,945 | |
Radiant Opto-Electronics Corp. | | | 181,000 | | | | 329,049 | |
Taiwan Semiconductor Manufacturing Co. Ltd. — ADR | | | 28,596 | | | | 883,902 | |
Taiwan Semiconductor Manufacturing Co. Ltd. | | | 125,000 | | | | 744,858 | |
Uni-President Enterprises Corp. | | | 253,000 | | | | 434,008 | |
WPG Holdings Ltd. | | | 21,000 | | | | 25,135 | |
| | | | | | | | |
| | | | | | | | 11,189,151 | |
Thailand | |
Charoen Pokphand Foods PCL | | | 883,900 | | | | 715,454 | |
Glow Energy PCL, Foreign Registered Shares | | | 4,500 | | | | 9,969 | |
PTT Exploration & Production PCL | | | 193,800 | | | | 539,404 | |
PTT Global Chemical PCL | | | 53,200 | | | | 102,366 | |
PTT PCL | | | 18,800 | | | | 215,711 | |
Thai Oil PCL | | | 236,100 | | | | 481,118 | |
Thanachart Capital PCL | | | 156,000 | | | | 210,452 | |
| | | | | | | | |
| | | | | | | | 2,274,474 | |
Turkey | |
Arcelik AS | | | 70,900 | | | | 430,042 | |
Eregli Demir ve Celik Fabrikalari TAS | | | 450,936 | | | | 694,849 | |
KOC Holding AS | | | 182,604 | | | | 735,584 | |
Turkiye Is Bankasi (Isabank), C Shares | | | 1,201,308 | | | | 1,898,874 | |
| | | | | | | | |
| | | | | | | | 3,759,349 | |
United Kingdom | |
Anglo American PLC | | | 13,764 | | | | 237,316 | |
United States | |
Genpact Ltd. | | | 23,670 | | | | 584,175 | |
| Total Reference Entity — Long | | | | | | | 64,891,099 | |
| | | | | | | | |
| | | | | | | | | |
| | |
| Reference Entity — Short | | | | | | |
Brazil | |
AMBEV SA — ADR | | | (250,199 | ) | | | (1,348,573 | ) |
BRF SA — ADR | | | (4,479 | ) | | | (63,288 | ) |
Cosan SA Industria e Comercio | | | (10,300 | ) | | | (131,630 | ) |
Embraer SA — ADR | | | (52,131 | ) | | | (1,191,715 | ) |
Klabin SA | | | (17,600 | ) | | | (90,706 | ) |
Petroleo Brasileiro SA — ADR | | | (22,221 | ) | | | (211,322 | ) |
Rumo Logistica Operadora Multimodal SA | | | (97,300 | ) | | | (231,586 | ) |
Suzano Papel e Celulose SA, Preference ‘A’ Shares | | | (1,200 | ) | | | (5,103 | ) |
WEG SA | | | (2,500 | ) | | | (12,622 | ) |
| | | | | | | | |
| | | | | | | | (3,286,545 | ) |
China | |
58.com, Inc. — ADR | | | (1,092 | ) | | | (31,865 | ) |
Agricultural Bank of China, Ltd. | | | (1,339,000 | ) | | | (559,329 | ) |
AviChina Industry & Technology Co. Ltd. | | | (1,060,000 | ) | | | (778,110 | ) |
CGN Power Co. Ltd. | | | (1,205,000 | ) | | | (339,788 | ) |
China Conch Venture Holdings, Ltd. | | | (65,500 | ) | | | (125,758 | ) |
China Longyuan Power Group Corp., Class H | | | (53,000 | ) | | | (43,291 | ) |
China Medical System Holdings Ltd. | | | (22,000 | ) | | | (35,850 | ) |
China National Building Material Co. Ltd. Class H | | | (232,000 | ) | | | (135,680 | ) |
China Oilfield Services, Ltd. | | | (10,000 | ) | | | (10,667 | ) |
China Shanshui Cement Group Ltd. | | | (2,165,000 | ) | | | (139,517 | ) |
Ctrip.com International, Ltd. — ADR | | | (13,210 | ) | | | (570,804 | ) |
Fosun International Ltd. | | | (193,500 | ) | | | (293,682 | ) |
Hollysys Automation Technologies Ltd. | | | (7,305 | ) | | | (123,455 | ) |
Huatai Securities Co. Ltd. | | | (46,600 | ) | | | (89,871 | ) |
New China Life Insurance Co. Ltd. | | | (79,300 | ) | | | (382,618 | ) |
New Oriental Education & Technology Group, Inc. — ADR | | | (21,975 | ) | | | (1,044,911 | ) |
See Notes to Financial Statements.
| | | | | | |
| | | | | | | |
| | BLACKROCK FUNDS | | JANUARY 31, 2017 | | 13 |
| | |
Schedule of Investments (continued) | | BlackRock Emerging Markets Long/Short Equity Fund |
| | | | | | | | |
| | | Shares | | | Value | |
| Reference Entity — Short (continued) | | | | | | |
China (continued) | |
Semiconductor Manufacturing International Corp. | | | (100 | ) | | $ | (137 | ) |
Shanghai Fosun Pharmaceutical Group Co. Ltd. | | | (5,000 | ) | | | (16,588 | ) |
SOHO China Ltd. | | | (738,000 | ) | | | (373,358 | ) |
Sunac China Holdings Ltd. | | | (740,000 | ) | | | (657,371 | ) |
TAL Education Group — ADR | | | (9,807 | ) | | | (794,269 | ) |
Zhuzhou CSR Times Electric Co. Ltd. | | | (4,000 | ) | | | (22,790 | ) |
Zoomlion Heavy Industry Science and Technology Co. Ltd., Class H | | | (791,200 | ) | | | (400,241 | ) |
| | | | | | | | |
| | | | | | | | (6,969,950 | ) |
Colombia | |
Bancolombia SA — ADR | | | (21,505 | ) | | | (814,179 | ) |
Hong Kong | |
Beijing Enterprises Water Group Ltd. | | | (484,000 | ) | | | (335,693 | ) |
China Everbright International Ltd. | | | (65,000 | ) | | | (78,832 | ) |
China Gas Holdings Ltd. | | | (136,000 | ) | | | (196,881 | ) |
China Mengniu Dairy Co. Ltd. | | | (35,000 | ) | | | (65,333 | ) |
China Merchants Holdings International Co. Ltd. | | | (71,932 | ) | | | (192,298 | ) |
China Resources Gas Group Ltd. | | | (16,000 | ) | | | (50,566 | ) |
China Unicom Hong Kong, Ltd. — ADR | | | (12,379 | ) | | | (148,177 | ) |
CITIC, Ltd. | | | (4,000 | ) | | | (5,930 | ) |
COSCO Pacific Ltd. | | | (42,000 | ) | | | (41,737 | ) |
Guangdong Investment Ltd. | | | (42,000 | ) | | | (52,118 | ) |
Hopewell Highway Infrastructure Ltd. | | | (786,000 | ) | | | (414,038 | ) |
Shenzhen International Holdings Ltd. | | | (20,000 | ) | | | (28,779 | ) |
Tongda Group Holdings Ltd. | | | (4,920,000 | ) | | | (1,374,818 | ) |
| | | | | | | | |
| | | | | | | | (2,985,200 | ) |
India | |
Reliance Industries, Ltd. — GDR | | | (3,989 | ) | | | (123,659 | ) |
Mexico | |
Grupo Aeroportuario del Sureste SAB de C.V. — ADR | | | (976 | ) | | | (141,393 | ) |
Grupo Carso SAB de C.V. | | | (172,237 | ) | | | (692,136 | ) |
Grupo Financiero Inbursa SAB de C.V. | | | (279,783 | ) | | | (414,707 | ) |
Grupo Mexico SAB de C.V. | | | (127,500 | ) | | | (382,375 | ) |
Grupo Televisa SAB | | | (5,200 | ) | | | (23,193 | ) |
Grupo Televisa SAB — ADR | | | (71,625 | ) | | | (1,604,400 | ) |
Infraestructura Energetica Nova SAB de C.V. | | | (302,352 | ) | | | (1,334,620 | ) |
Mexichem SAB de C.V. | | | (923,637 | ) | | | (2,188,896 | ) |
| | | | | | | | |
| | | | | | | | (6,781,720 | ) |
Peru | |
Hochschild Mining PLC | | | (68,613 | ) | | | (213,838 | ) |
Poland | |
Orange Polska SA | | | (38,485 | ) | | | (51,924 | ) |
Romania | |
New Europe Property Investments PLC | | | (10,336 | ) | | | (120,427 | ) |
Singapore | |
IGG, Inc. | | | (568,000 | ) | | | (423,252 | ) |
South Africa | |
Discovery Holdings Ltd. | | | (24,525 | ) | | | (209,308 | ) |
Impala Platinum Holdings Ltd. | | | (27,928 | ) | | | (111,299 | ) |
Sasol, Ltd. — ADR | | | (59,180 | ) | | | (1,767,115 | ) |
| | | | | | | | |
| | | | | | | | (2,087,722 | ) |
South Korea | |
Dongsuh Cos., Inc. | | | (1,925 | ) | | | (42,406 | ) |
KB Financial Group, Inc. — ADR | | | (10,706 | ) | | | (434,664 | ) |
Korea Aerospace Industries Ltd. | | | (859 | ) | | | (45,856 | ) |
Samsung Biologics Co. Ltd. | | | (6,452 | ) | | | (893,875 | ) |
Samsung Techwin Co. Ltd. | | | (2,389 | ) | | | (85,826 | ) |
Soulbrain Co. Ltd. | | | (423 | ) | | | (19,598 | ) |
| | | | | | | | |
| | | | | | | | (1,522,225 | ) |
| | | | | | | | |
| | | Shares | | | Value | |
| Reference Entity — Short (continued) | | | | | | |
Taiwan | |
Cheng Shin Rubber Industry Co. Ltd. | | | (216,000 | ) | | $ | (430,013 | ) |
China Development Financial Holding Corp. | | | (188,000 | ) | | | (48,053 | ) |
Delta Electronics Inc. | | | (165,000 | ) | | | (921,590 | ) |
E.Sun Financial Holding Co. Ltd. | | | (73,000 | ) | | | (43,121 | ) |
Mega Financial Holding Co. Ltd. | | | (378,000 | ) | | | (281,794 | ) |
Shin Kong Financial Holding Co. Ltd. | | | (42,000 | ) | | | (10,788 | ) |
Siliconware Precision Industries Co. | | | (57,000 | ) | | | (86,822 | ) |
SinoPac Financial Holdings Co. Ltd. | | | (1,425,000 | ) | | | (420,419 | ) |
Taiwan Cooperative Financial Holding Co. Ltd. | | | (1,555,000 | ) | | | (710,586 | ) |
United Microelectronics Corp. | | | (1,036,000 | ) | | | (376,202 | ) |
United Microelectronics Corp. — ADR | | | (54,933 | ) | | | (99,429 | ) |
| | | | | | | | |
| | | | | | | | (3,428,817 | ) |
Thailand | |
IRPC PCL | | | (565,100 | ) | | | (83,457 | ) |
Minor International PCL | | | (89,200 | ) | | | (88,034 | ) |
Siam Commercial Bank PCL | | | (503,000 | ) | | | (2,157,143 | ) |
TPI Polene PCL | | | (1,275,424 | ) | | | (85,683 | ) |
| | | | | | | | |
| | | | | | | | (2,414,317 | ) |
Turkey | |
Tofas Turk Otomobil Fabrikasi | | | (66,005 | ) | | | (455,798 | ) |
| Total Reference Entity — Short | | | | (31,679,573 | ) |
| Net Value of Reference Entity — Goldman Sachs & Co. | | | $ | 33,211,526 | |
| | | | | | | | |
| | | | | | | | | |
|
| The following table represents the individual long and short positions and related values of equity securities underlying the total return swap with Goldman Sachs & Co. as of January 31, 2017, expiration dates 3/01/17 — 8/29/18: | |
| Reference Entity — Long | |
Australia | |
Amcor Ltd. | | | 491 | | | | 5,329 | |
Boral Ltd. | | | 1,836 | | | | 8,114 | |
Mineral Resources Ltd. | | | 693 | | | | 6,471 | |
| | | | | | | | |
| | | | | | | | 19,914 | |
Austria | |
Andritz AG | | | 164 | | | | 8,864 | |
OMV AG | | | 143 | | | | 5,005 | |
Wienerberger AG | | | 1,452 | | | | 28,028 | |
| | | | | | | | |
| | | | | | | | 41,897 | |
Canada | |
Bank of Nova Scotia | | | 52 | | | | 3,107 | |
Celestica, Inc. | | | 2,181 | | | | 30,287 | |
Finning International, Inc. | | | 768 | | | | 15,546 | |
Gibson Energy, Inc. | | | 310 | | | | 4,515 | |
Husky Energy, Inc. | | | 589 | | | | 7,600 | |
Kinross Gold Corp. | | | 1,321 | | | | 5,147 | |
Pan American Silver Corp. | | | 1,231 | | | | 23,991 | |
Yamana Gold, Inc. | | | 2,261 | | | | 7,471 | |
| | | | | | | | |
| | | | | | | | 97,664 | |
Denmark | |
GN Store Nord A/S | | | 721 | | | | 16,104 | |
Finland | |
Nokian Renkaat OYJ | | | 611 | | | | 22,921 | |
UPM-Kymmene OYJ | | | 1,745 | | | | 39,576 | |
| | | | | | | | |
| | | | | | | | 62,497 | |
France | |
Arkema SA | | | 592 | | | | 58,467 | |
Cie Generale des Etablissements Michelin | | | 344 | | | | 36,957 | |
See Notes to Financial Statements.
| | | | | | |
| | | | | | | |
| 14 | | BLACKROCK FUNDS | | JANUARY 31, 2017 | | |
| | |
Schedule of Investments (continued) | | BlackRock Emerging Markets Long/Short Equity Fund |
| | | | | | | | |
| | | Shares | | | Value | |
| Reference Entity — Long (continued) | |
France (continued) | |
Danone SA | | | 481 | | | $ | 30,153 | |
Faurecia | | | 1,766 | | | | 76,732 | |
LVMH Moet Hennessy Louis Vuitton SE | | | 577 | | | | 116,279 | |
Peugeot SA | | | 193 | | | | 3,592 | |
Plastic Omnium SA | | | 393 | | | | 13,333 | |
Renault SA | | | 422 | | | | 37,998 | |
Safran SA | | | 46 | | | | 3,118 | |
SEB SA | | | 44 | | | | 5,533 | |
Sodexo SA | | | 852 | | | | 94,216 | |
Thales SA | | | 416 | | | | 39,027 | |
Valeo SA | | | 1,542 | | | | 94,247 | |
| | | | | | | | |
| | | | | | | | 609,652 | |
Germany | |
Deutsche Lufthansa AG, Registered Shares | | | 3,546 | | | | 47,370 | |
Duerr AG | | | 1,446 | | | | 125,443 | |
Evonik Industries AG | | | 142 | | | | 4,610 | |
Hannover Rueck SE | | | 704 | | | | 77,545 | |
Hochtief AG | | | 287 | | | | 40,912 | |
Lanxess AG | | | 1,036 | | | | 75,391 | |
Talanx AG | | | 72 | | | | 2,478 | |
Wacker Chemie AG | | | 252 | | | | 30,456 | |
| | | | | | | | |
| | | | | | | | 404,205 | |
Hong Kong | |
CLP Holdings Ltd. | | | 1,000 | | | | 9,761 | |
New World Development Co. Ltd. | | | 63,000 | | | | 72,689 | |
Sun Hung Kai Properties Ltd. | | | 1,000 | | | | 13,761 | |
Texwinca Holdings Ltd. | | | 50,000 | | | | 32,037 | |
| | | | | | | | |
| | | | | | | | 128,248 | |
Ireland | |
CRH PLC | | | 284 | | | | 9,851 | |
Japan | |
Amada Holdings Co. Ltd. | | | 1,400 | | | | 16,455 | |
Astellas Pharma, Inc. | | | 900 | | | | 12,080 | |
Bridgestone Corp. | | | 2,400 | | | | 88,022 | |
Citizen Holdings Co. Ltd. | | | 5,700 | | | | 35,396 | |
Daicel Corp. | | | 1,800 | | | | 19,904 | |
Daido Steel Co. Ltd. | | | 2,000 | | | | 9,082 | |
Dowa Holdings Co. Ltd. | | | 1,000 | | | | 8,487 | |
FANUC Corp. | | | 200 | | | | 39,265 | |
Hitachi Ltd. | | | 6,000 | | | | 34,353 | |
Ibiden Co. Ltd. | | | 200 | | | | 2,844 | |
IHI Corp. | | | 6,000 | | | | 16,157 | |
Inpex Corp. | | | 200 | | | | 1,963 | |
Japan Steel Works Ltd. | | | 1,000 | | | | 18,777 | |
JTEKT Corp. | | | 100 | | | | 1,642 | |
Kao Corp. | | | 1,400 | | | | 69,278 | |
Mazda Motor Corp. | | | 100 | | | | 1,472 | |
MISUMI Group, Inc. | | | 500 | | | | 9,342 | |
Mitsubishi Chemical Holdings Corp. | | | 15,100 | | | | 105,322 | |
Mitsui Chemicals, Inc. | | | 3,000 | | | | 14,108 | |
NSK Ltd. | | | 1,400 | | | | 16,995 | |
Panasonic Corp. | | | 100 | | | | 1,040 | |
Pigeon Corp. | | | 400 | | | | 10,867 | |
SMC Corp. | | | 200 | | | | 54,596 | |
Sumitomo Chemical Co. Ltd. | | | 9,000 | | | | 47,952 | |
Taiyo Yuden Co Ltd. | | | 2,600 | | | | 31,710 | |
Teijin Ltd. | | | 2,000 | | | | 42,214 | |
TonenGeneral Sekiyu KK | | | 7,000 | | | | 82,321 | |
| | | | | | | | |
| | | | | | | | 791,644 | |
Netherlands | |
Akzo Nobel NV | | | 254 | | | | 17,238 | |
ASM International NV | | | 979 | | | | 48,268 | |
| | | | | | | | |
| | | Shares | | | Value | |
| Reference Entity — Long (continued) | |
Netherlands (continued) | |
BE Semiconductor Industries NV | | | 423 | | | $ | 15,274 | |
Koninklijke DSM NV | | | 584 | | | | 37,230 | |
| | | | | | | | |
| | | | | | | | 118,010 | |
Norway | |
Subsea 7 SA | | | 68 | | | | 925 | |
Portugal | |
Jeronimo Martins SGPS SA | | | 377 | | | | 6,381 | |
Singapore | |
Hutchison Port Holdings Trust | | | 70,300 | | | | 29,901 | |
Venture Corp. Ltd. | | | 19,200 | | | | 138,894 | |
| | | | | | | | |
| | | | | | | | 168,795 | |
Spain | |
ACS Actividades de Construccion y Servicios SA | | | 7,072 | | | | 110,569 | |
Sweden | |
Atlas Copco AB, A Shares | | | 1,276 | | | | 40,923 | |
Electrolux AB, Class B | | | 2,541 | | | | 67,568 | |
Saab AB | | | 2,013 | | | | 82,207 | |
| | | | | | | | |
| | | | | | | | 190,698 | |
Switzerland | |
Coca-Cola HBC AG | | | 1,261 | | | | 28,824 | |
Georg Fischer AG, Registered Shares | | | 80 | | | | 65,931 | |
Glencore PLC | | | 5,778 | | | | 23,931 | |
IWG PLC | | | 49,377 | | | | 155,554 | |
Logitech International SA, Registered Shares | | | 186 | | | | 5,327 | |
Schindler Holding AG, Participation Certificates | | | 203 | | | | 38,695 | |
Straumann Holding AG, Registered Shares | | | 56 | | | | 22,600 | |
TE Connectivity Ltd. | | | 812 | | | | 60,372 | |
| | | | | | | | |
| | | | | | | | 401,234 | |
United Kingdom | |
Anglo American PLC | | | 752 | | | | 12,963 | |
British American Tobacco PLC | | | 2,284 | | | | 140,987 | |
Croda International PLC | | | 372 | | | | 15,708 | |
Dialog Semiconductor PLC | | | 511 | | | | 23,778 | |
Inchcape PLC | | | 14,775 | | | | 133,725 | |
Intertek Group PLC | | | 1,140 | | | | 48,800 | |
Rolls-Royce Holdings PLC | | | 8,905 | | | | 75,003 | |
Spirax-Sarco Engineering PLC | | | 897 | | | | 48,721 | |
TechnipFMC PLC | | | 314 | | | | 10,291 | |
UBM PLC | | | 312 | | | | 2,772 | |
| | | | | | | | |
| | | | | | | | 512,748 | |
United States | |
Amdocs Ltd. | | | 186 | | | | 10,920 | |
American Express Co. | | | 33 | | | | 2,521 | |
Amphenol Corp., Class A | | | 471 | | | | 31,788 | |
Analog Devices, Inc. | | | 508 | | | | 38,070 | |
Applied Materials, Inc. | | | 1,030 | | | | 35,277 | |
Archer-Daniels-Midland Co. | | | 434 | | | | 19,209 | |
Baxter International, Inc. | | | 192 | | | | 9,199 | |
Bristol-Myers Squibb Co. | | | 418 | | | | 20,549 | |
C.R. Bard, Inc. | | | 441 | | | | 104,663 | |
Cabot Corp. | | | 1,928 | | | | 106,753 | |
Celanese Corp., Series A | | | 248 | | | | 20,931 | |
Citrix Systems, Inc. | | | 1,193 | | | | 108,790 | |
Diamond Offshore Drilling, Inc. | | | 1,742 | | | | 28,534 | |
Dril-Quip, Inc. | | | 10 | | | | 622 | |
Eastman Chemical Co. | | | 1,337 | | | | 103,617 | |
Energen Corp. | | | 181 | | | | 9,754 | |
Estee Lauder Cos., Inc., Class A | | | 120 | | | | 9,745 | |
Expeditors International of Washington, Inc. | | | 1,952 | | | | 101,660 | |
Fluor Corp. | | | 755 | | | | 41,902 | |
Hasbro, Inc. | | | 212 | | | | 17,492 | |
See Notes to Financial Statements.
| | | | | | |
| | | | | | | |
| | BLACKROCK FUNDS | | JANUARY 31, 2017 | | 15 |
| | |
Schedule of Investments (continued) | | BlackRock Emerging Markets Long/Short Equity Fund |
| | | | | | | | |
| | | Shares | | | Value | |
| Reference Entity — Long (continued) | |
United States (continued) | |
Hawaiian Holdings, Inc. | | | 147 | | | $ | 7,490 | |
HP, Inc. | | | 8,599 | | | | 129,415 | |
Ingredion, Inc. | | | 689 | | | | 88,323 | |
Newmont Mining Corp. | | | 758 | | | | 27,500 | |
Occidental Petroleum Corp. | | | 1,926 | | | | 130,525 | |
Praxair, Inc. | | | 269 | | | | 31,860 | |
Teradata Corp. | | | 815 | | | | 23,928 | |
Texas Instruments, Inc. | | | 638 | | | | 48,195 | |
VeriSign, Inc. | | | 1,417 | | | | 113,658 | |
VMware, Inc., Class A | | | 80 | | | | 7,003 | |
Xerox Corp. | | | 2,163 | | | | 14,990 | |
Xilinx, Inc. | | | 1,001 | | | | 58,258 | |
| | | | | | | | |
| | | | | | | | 1,503,141 | |
| Total Reference Entity — Long | | | | 5,194,177 | |
| | | | | | | | |
| | | | | | | | | |
| | |
| Reference Entity — Short | | | | | | |
Australia | | | | | | | | |
ALS Ltd. | | | (4,431 | ) | | | (19,918 | ) |
Brambles Ltd. | | | (540 | ) | | | (4,268 | ) |
Iluka Resources Ltd. | | | (1,735 | ) | | | (9,957 | ) |
Incitec Pivot Ltd. | | | (27,071 | ) | | | (79,118 | ) |
| | | | | | | | |
| | | | | | | | (113,261 | ) |
Austria | | | | | | | | |
Ams AG | | | (152 | ) | | | (5,236 | ) |
Belgium | | | | | | | | |
Anheuser-Busch InBev NV | | | (2,907 | ) | | | (303,543 | ) |
Groupe Bruxelles Lambert SA | | | (250 | ) | | | (21,306 | ) |
| | | | | | | | |
| | | | | | | | (324,849 | ) |
Canada | | | | | | | | |
Centerra Gold, Inc. | | | (2,389 | ) | | | (11,805 | ) |
Parex Resources, Inc. | | | (2,597 | ) | | | (30,216 | ) |
| | | | | | | | |
| | | | | | | | (42,021 | ) |
Denmark | | | | | | | | |
NKT Holding A/S | | | (57 | ) | | | (4,407 | ) |
Finland | | | | | | | | |
Metsa Board OYJ | | | (17,523 | ) | | | (119,696 | ) |
Nokia OYJ | | | (32,514 | ) | | | (145,993 | ) |
| | | | | | | | |
| | | | | | | | (265,689 | ) |
France | | | | | | | | |
Accor SA | | | (406 | ) | | | (16,454 | ) |
Air Liquide SA | | | (752 | ) | | | (81,189 | ) |
Bollore SA | | | (25,331 | ) | | | (101,311 | ) |
Bollore SA — New | | | (39 | ) | | | (160 | ) |
Eutelsat Communications SA | | | (1,180 | ) | | | (20,127 | ) |
Ingenico Group SA | | | (961 | ) | | | (81,037 | ) |
JCDecaux SA | | | (254 | ) | | | (8,131 | ) |
Pernod Ricard SA | | | (601 | ) | | | (70,301 | ) |
Suez Environnement Co. | | | (2,610 | ) | | | (39,535 | ) |
| | | | | | | | |
| | | | | | | | (418,245 | ) |
Germany | | | | | | | | |
Axel Springer SE | | | (545 | ) | | | (28,727 | ) |
Bayerische Motoren Werke AG | | | (1,306 | ) | | | (111,045 | ) |
GEA Group AG | | | (240 | ) | | | (9,945 | ) |
HeidelbergCement AG | | | (300 | ) | | | (28,981 | ) |
Hella KGaA Hueck & Co. | | | (985 | ) | | | (40,260 | ) |
Krones AG | | | (26 | ) | | | (2,658 | ) |
Volkswagen AG | | | (205 | ) | | | (32,788 | ) |
| | | | | | | | |
| | | | | | | | (254,404 | ) |
| | | | | | | | |
| | | Shares | | | Value | |
| Reference Entity — Short (continued) | |
Hong Kong | | | | | | | | |
Cathay Pacific Airways Ltd. | | | (29,000 | ) | | $ | (39,277 | ) |
Esprit Holdings Ltd. | | | (5 | ) | | | (4 | ) |
Hong Kong & China Gas Co. Ltd. | | | (1,200 | ) | | | (2,260 | ) |
Jardine Matheson Holdings Ltd. | | | (600 | ) | | | (37,005 | ) |
Jardine Strategic Holdings Ltd. | | | (1,000 | ) | | | (38,111 | ) |
Shangri-La Asia Ltd. | | | (10,000 | ) | | | (11,123 | ) |
| | | | | | | | |
| | | | | | | | (127,780 | ) |
Ireland | | | | | | | | |
Adient PLC | | | (22 | ) | | | (1,397 | ) |
Kerry Group PLC | | | (61 | ) | | | (4,287 | ) |
| | | | | | | | |
| | | | | | | | (5,684 | ) |
Israel | | | | | | | | |
Frutarom Industries Ltd. | | | (630 | ) | | | (33,286 | ) |
Italy | | | | | | | | |
Finmeccanica SpA | | | (9,942 | ) | | | (128,087 | ) |
Parmalat SpA | | | (419 | ) | | | (1,352 | ) |
| | | | | | | | |
| | | | | | | | (129,439 | ) |
Japan | | | | | | | | |
Ajinomoto Co. Inc. | | | (400 | ) | | | (7,895 | ) |
Alps Electric Co. Ltd. | | | (600 | ) | | | (15,981 | ) |
Asahi Intecc Co. Ltd. | | | (100 | ) | | | (4,070 | ) |
Asics Corp. | | | (900 | ) | | | (17,532 | ) |
Brother Industries, Ltd. | | | (1,100 | ) | | | (20,304 | ) |
Calsonic Kansei Corp. | | | (2,000 | ) | | | (31,795 | ) |
Daifuku Co. Ltd. | | | (300 | ) | | | (6,632 | ) |
Daikin Industries Ltd. | | | (800 | ) | | | (79,410 | ) |
Hitachi Kokusai Electric, Inc. | | | (600 | ) | | | (13,475 | ) |
Isuzu Motors Ltd. | | | (300 | ) | | | (4,025 | ) |
JGC Corp. | | | (3,200 | ) | | | (55,550 | ) |
Kansai Paint Co. Ltd. | | | (3,500 | ) | | | (67,991 | ) |
Kirin Holdings Co. Ltd. | | | (800 | ) | | | (13,109 | ) |
Koito Manufacturing Co. Ltd. | | | (900 | ) | | | (47,741 | ) |
Konica Minolta, Inc. | | | (1,100 | ) | | | (11,395 | ) |
Kyocera Corp. | | | (2,000 | ) | | | (104,122 | ) |
Mitsubishi Motors Corp. | | | (200 | ) | | | (1,083 | ) |
Nihon Kohden Corp. | | | (200 | ) | | | (4,589 | ) |
Nippon Electric Glass Co. Ltd. | | | (1,000 | ) | | | (5,756 | ) |
Nippon Kayaku Co. Ltd. | | | (5,000 | ) | | | (65,348 | ) |
Nippon Paint Co. Ltd. | | | (1,000 | ) | | | (29,170 | ) |
Nippon Steel & Sumitomo Metal Corp. | | | (400 | ) | | | (9,663 | ) |
Pilot Corp. | | | (200 | ) | | | (8,115 | ) |
Rinnai Corp. | | | (100 | ) | | | (8,498 | ) |
Shiseido Co. Ltd. | | | (1,000 | ) | | | (27,949 | ) |
Stanley Electric Co. Ltd. | | | (500 | ) | | | (14,086 | ) |
Sumitomo Electric Industries Ltd. | | | (100 | ) | | | (1,455 | ) |
Tadano Ltd. | | | (300 | ) | | | (3,679 | ) |
TDK Corp. | | | (300 | ) | | | (21,563 | ) |
Terumo Corp. | | | (1,900 | ) | | | (70,288 | ) |
Tokuyama Corp. | | | (2,000 | ) | | | (8,951 | ) |
Trend Micro, Inc. | | | (1,200 | ) | | | (46,568 | ) |
Yokohama Rubber Co. Ltd. | | | (700 | ) | | | (12,311 | ) |
| | | | | | | | |
| | | | | | | | (840,099 | ) |
Netherlands | | | | | | | | |
Koninklijke Boskalis Westminster NV | | | (1,457 | ) | | | (53,906 | ) |
Royal Dutch Shell PLC, B Shares | | | (2,622 | ) | | | (74,057 | ) |
SBM Offshore NV | | | (2,984 | ) | | | (48,542 | ) |
TomTom NV | | | (8,420 | ) | | | (77,186 | ) |
| | | | | | | | |
| | | | | | | | (253,691 | ) |
Norway | | | | | | | | |
Yara International ASA | | | (3,811 | ) | | | (160,693 | ) |
See Notes to Financial Statements.
| | | | | | |
| | | | | | | |
| 16 | | BLACKROCK FUNDS | | JANUARY 31, 2017 | | |
| | |
Schedule of Investments (continued) | | BlackRock Emerging Markets Long/Short Equity Fund |
| | | | | | | | |
| | | Shares | | | Value | |
| Reference Entity — Short (continued) | |
Singapore | | | | | | | | |
UOL Group Ltd. | | | (100 | ) | | $ | (453 | ) |
Wing Tai Holdings Ltd. | | | (3,300 | ) | | | (4,069 | ) |
| | | | | | | | |
| | | | | | | | (4,522 | ) |
Spain | | | | | | | | |
Ferrovial SA | | | (2,194 | ) | | | (39,826 | ) |
Tecnicas Reunidas SA | | | (390 | ) | | | (15,486 | ) |
| | | | | | | | |
| | | | | | | | (55,312 | ) |
Sweden | | | | | | | | |
Alfa Laval AB | | | (2,858 | ) | | | (53,434 | ) |
Autoliv, Inc. | | | (15 | ) | | | (1,735 | ) |
Fingerprint Cards AB | | | (5,869 | ) | | | (35,721 | ) |
| | | | | | | | |
| | | | | | | | (90,890 | ) |
Switzerland | | | | | | | | |
Chocoladefabriken Lindt & Spruengli AG | | | (10 | ) | | | (55,504 | ) |
Cie Financiere Richemont SA | | | (873 | ) | | | (67,989 | ) |
OC Oerlikon Corp. AG | | | (968 | ) | | | (10,981 | ) |
Swatch Group AG | | | (388 | ) | | | (137,509 | ) |
U-Blox Holding AG | | | (43 | ) | | | (7,763 | ) |
| | | | | | | | |
| | | | | | | | (279,746 | ) |
United Kingdom | | | | | | | | |
Capita PLC | | | (3,272 | ) | | | (20,644 | ) |
John Wood Group PLC | | | (5,951 | ) | | | (62,955 | ) |
Kazakhmys PLC | | | (12,563 | ) | | | (74,544 | ) |
Marks & Spencer Group PLC | | | (3,360 | ) | | | (14,242 | ) |
Micro Focus International PLC | | | (4,736 | ) | | | (128,107 | ) |
Next PLC | | | (1,592 | ) | | | (76,815 | ) |
Rio Tinto PLC | | | (576 | ) | | | (25,518 | ) |
Rotork PLC | | | (4,656 | ) | | | (15,000 | ) |
Unilever PLC | | | (550 | ) | | | (22,278 | ) |
WS Atkins PLC | | | (621 | ) | | | (11,452 | ) |
| | | | | | | | |
| | | | | | | | (451,555 | ) |
United States | | | | | | | | |
ANSYS, Inc. | | | (871 | ) | | | (81,229 | ) |
Avnet, Inc. | | | (1,500 | ) | | | (69,660 | ) |
Ball Corp. | | | (106 | ) | | | (8,084 | ) |
Bio-Rad Laboratories, Inc. | | | (380 | ) | | | (72,230 | ) |
Cavium, Inc. | | | (45 | ) | | | (2,979 | ) |
CF Industries Holdings, Inc. | | | (2,886 | ) | | | (101,847 | ) |
Chemours Co. | | | (1,881 | ) | | | (49,696 | ) |
Coty, Inc., Class A | | | (254 | ) | | | (4,877 | ) |
Cypress Semiconductor Corp. | | | (8,192 | ) | | | (96,666 | ) |
Dentsply Sirona, Inc. | | | (200 | ) | | | (11,340 | ) |
Diebold, Inc. | | | (636 | ) | | | (17,299 | ) |
EI du Pont de Nemours & Co. | | | (376 | ) | | | (28,388 | ) |
Flowserve Corp. | | | (975 | ) | | | (47,931 | ) |
Freeport-McMoRan, Inc. | | | (285 | ) | | | (4,745 | ) |
Halliburton Co. | | | (337 | ) | | | (19,064 | ) |
Hecla Mining Co. | | | (2,238 | ) | | | (14,413 | ) |
Hess Corp. | | | (19 | ) | | | (1,029 | ) |
Illumina, Inc. | | | (186 | ) | | | (29,779 | ) |
Integrated Device Technology, Inc. | | | (2,508 | ) | | | (63,177 | ) |
John Bean Technologies Corp. | | | (999 | ) | | | (86,264 | ) |
Keysight Technologies, Inc. | | | (204 | ) | | | (7,562 | ) |
Lumentum Holdings, Inc. | | | (82 | ) | | | (3,112 | ) |
M/A-COM Technology Solutions Holdings, Inc. | | | (159 | ) | | | (7,560 | ) |
Newell Rubbermaid, Inc. | | | (1,260 | ) | | | (59,636 | ) |
PerkinElmer, Inc. | | | (1,244 | ) | | | (66,168 | ) |
Platform Specialty Products Corp. | | | (500 | ) | | | (6,070 | ) |
Procter & Gamble Co. | | | (1,334 | ) | | | (116,858 | ) |
Symantec Corp. | | | (2,012 | ) | | | (55,431 | ) |
Terex Corp. | | | (557 | ) | | | (17,713 | ) |
| | | | | | | | |
| | | Shares | | | Value | |
| Reference Entity — Short (continued) | |
United States (continued) | |
Total System Services, Inc. | | | (545 | ) | | $ | (27,621 | ) |
Verint Systems, Inc. | | | (45 | ) | | | (1,681 | ) |
VWR Corp. | | | (689 | ) | | | (17,852 | ) |
WABCO Holdings, Inc. | | | (280 | ) | | | (30,528 | ) |
Western Digital Corp. | | | (487 | ) | | | (38,828 | ) |
Zimmer Biomet Holdings, Inc. | | | (567 | ) | | | (67,093 | ) |
| | | | | | | | |
| | | | | | | | (1,334,410 | ) |
| Total Reference Entity — Short | | | | | | | (5,195,219 | ) |
| Net Value of Reference Entity — Goldman Sachs & Co. | | | | (1,042 | ) |
| |
| | | | | | | | | |
|
| The following table represents the individual long and short positions and related values of equity securities underlying the total return swap with Morgan Stanley & Co., Inc. as of January 31, 2017, expiration dates 10/11/17 — 8/28/19: | |
| Reference Entity — Long | | | | | | |
Brazil | | | | | | | | |
Banco Bradesco SA — ADR | | | 1,951 | | | | 20,154 | |
Braskem SA — ADR | | | 17,698 | | | | 366,172 | |
Braskem SA, Preference A Shares | | | 1,300 | | | | 13,424 | |
Cia Energetica de Minas Gerais, Preference Shares | | | 100 | | | | 290 | |
Cia Energetica de Sao Paulo, Preference ‘B’ Shares | | | 42,500 | | | | 234,680 | |
Companhia de Saneamento Basico do Estado de Sao Paulo | | | 44,100 | | | | 438,747 | |
CPFL Energia SA | | | 1,700 | | | | 13,665 | |
Fleury SA | | | 1,200 | | | | 14,463 | |
Itau Unibanco Holding SA, Preference Shares | | | 45,200 | | | | 534,178 | |
Itau Unibanco Holding SA, Preference Shares — ADR | | | 49,132 | | | | 580,249 | |
JBS SA | | | 61,000 | | | | 230,364 | |
Localiza Rent a Car SA | | | 5,800 | | | | 67,827 | |
M Dias Branco SA | | | 2,500 | | | | 98,315 | |
Marfrig Global Foods SA | | | 134,100 | | | | 274,915 | |
Smiles SA | | | 30,300 | | | | 500,016 | |
Tim Participacoes SA | | | 5,600 | | | | 15,906 | |
Tim Participacoes SA — ADR | | | 9,145 | | | | 129,219 | |
| | | | | | | | |
| | | | | | | | 3,532,584 | |
Chile | | | | | | | | |
Empresa Nacional de Electricidad SA | | | 1,080,612 | | | | 694,211 | |
Empresa Nacional de Electricidad SA — ADR | | | 18,368 | | | | 355,972 | |
| | | | | | | | |
| | | | | | | | 1,050,183 | |
China | | | | | | | | |
Air China Ltd., Class H | | | 100,000 | | | | 71,553 | |
Alibaba Group Holding Ltd. — ADR | | | 5,682 | | | | 575,643 | |
Anhui Conch Cement Co. Ltd., Class H | | | 33,000 | | | | 106,193 | |
Anhui Expressway Co. Ltd., Class H | | | 120,000 | | | | 89,091 | |
Bank of China Ltd., Class H | | | 120,000 | | | | 54,350 | |
China Biologic Products, Inc. | | | 3,688 | | | | 420,211 | |
China Communications Construction Co. Ltd., Class H | | | 418,000 | | | | 503,100 | |
China Communications Services Corp. Ltd., Class H | | | 2,012,000 | | | | 1,367,700 | |
China Lesso Group Holdings Ltd. | | | 277,000 | | | | 188,874 | |
China Pacific Insurance Group Co. Ltd., Class H | | | 93,000 | | | | 330,337 | |
China Petroleum & Chemical Corp. — ADR | | | 11,559 | | | | 925,182 | |
China Petroleum & Chemical Corp., Class H | | | 912,000 | | | | 720,413 | |
China Railway Construction Corp. Ltd., Class H | | | 328,000 | | | | 455,101 | |
China Railway Group Ltd., Class H | | | 822,000 | | | | 719,506 | |
China Vanke Co. Ltd., Class H | | | 23,600 | | | | 59,867 | |
CNOOC Ltd. | | | 35,000 | | | | 43,706 | |
Datang International Power Generation Co. Ltd., Class H | | | 1,020,000 | | | | 264,482 | |
Great Wall Motor Co. Ltd., Class H | | | 117,000 | | | | 117,232 | |
Guangzhou Automobile Group Co. Ltd., Class H | | | 124,000 | | | | 169,113 | |
See Notes to Financial Statements.
| | | | | | |
| | | | | | | |
| | BLACKROCK FUNDS | | JANUARY 31, 2017 | | 17 |
| | |
Schedule of Investments (continued) | | BlackRock Emerging Markets Long/Short Equity Fund |
| | | | | | | | |
| | | Shares | | | Value | |
| Reference Entity — Long (continued) | | | | | | |
| China (continued) | | | | | | |
Guangzhou Baiyunshan Pharmaceutical Holdings Co. Ltd., Class H | | | 78,000 | | | $ | 190,738 | |
Industrial & Commercial Bank of China Ltd., Class H | | | 1,008,000 | | | | 616,276 | |
Jiangxi Copper Co. Ltd., Class H | | | 131,000 | | | | 226,228 | |
Lenovo Group Ltd. | | | 1,004,000 | | | | 657,638 | |
Longfor Properties Co. Ltd. | | | 227,000 | | | | 326,807 | |
Lonking Holdings Ltd. | | | 549,000 | | | | 143,836 | |
Maanshan Iron & Steel | | | 288,000 | | | | 105,541 | |
Metallurgical Corp. of China Ltd. | | | 54,000 | | | | 19,579 | |
NetEase, Inc. — ADR | | | 11,019 | | | | 2,797,724 | |
People’s Insurance Co. Group of China Ltd., Class H | | | 744,000 | | | | 289,805 | |
Ping An Insurance Group Co. of China Ltd., Class H | | | 238,000 | | | | 1,220,886 | |
Shanghai Pharmaceuticals Holding Co. Ltd., Class H | | | 75,700 | | | | 192,790 | |
Sino-Ocean Land Holdings Ltd. | | | 353,000 | | | | 152,027 | |
Sinopec Shanghai Petrochemical Co. Ltd. — ADR | | | 571 | | | | 35,539 | |
Sinopec Shanghai Petrochemical Co. Ltd., Class H | | | 992,000 | | | | 614,259 | |
Sinopharm Group Co. Ltd., Class H | | | 173,600 | | | | 793,337 | |
Sinotrans Ltd., Class H | | | 341,000 | | | | 142,183 | |
Sohu.com, Inc. | | | 25,545 | | | | 1,013,370 | |
Tencent Holdings Ltd. | | | 18,600 | | | | 486,304 | |
Tianjin Capital Environmental Protection Group Co. Ltd. | | | 92,000 | | | | 49,452 | |
Tianneng Power International, Ltd. | | | 550,000 | | | | 484,321 | |
Weichai Power Co. Ltd., Class H | | | 661,000 | | | | 1,171,297 | |
Zhejiang Expressway Co. Ltd., Class H | | | 292,000 | | | | 293,296 | |
ZTE Corp., Class H | | | 117,400 | | | | 182,532 | |
| | | | | | | | |
| | | | | | | | 19,387,419 | |
Czech Republic | | | | | | | | |
Czech Republic AS | | | 20,796 | | | | 215,180 | |
Egypt | | | | | | | | |
Global Telecom Holding — GDR | | | 79,398 | | | | 143,710 | |
Hong Kong | | | | | | | | |
Belle International Holdings Ltd. | | | 335,000 | | | | 204,198 | |
China Mobile Ltd. — ADR | | | 14,896 | | | | 849,072 | |
China Overseas Land & Investment Ltd. | | | 98,000 | | | | 287,772 | |
China Power International Development Ltd. | | | 326,000 | | | | 117,483 | |
China Resources Cement Holdings Ltd. | | | 856,000 | | | | 396,507 | |
China Resources Land Ltd. | | | 314,000 | | | | 776,696 | |
Geely Automobile Holdings Ltd. | | | 155,000 | | | | 183,198 | |
Haier Electronics Group Co. Ltd. | | | 385,000 | | | | 677,217 | |
KWG Property Holding Ltd. | | | 858,000 | | | | 493,052 | |
Nine Dragons Paper Holdings Ltd. | | | 501,000 | | | | 576,618 | |
Shenzhen Investment Ltd. | | | 328,000 | | | | 133,369 | |
| | | | | | | | |
| | | | | | | | 4,695,182 | |
Hungary | | | | | | | | |
MOL Hungarian Oil & Gas PLC | | | 11,522 | | | | 811,965 | |
Richter Gedeon Nyrt | | | 57,659 | | | | 1,241,820 | |
| | | | | | | | |
| | | | | | | | 2,053,785 | |
Indonesia | | | | | | | | |
Adaro Energy Tbk PT | | | 579,700 | | | | 73,679 | |
Astra International Tbk PT | | | 90,400 | | | | 53,892 | |
Jasa Marga Persero Tbk PT | | | 152,800 | | | | 48,330 | |
Matahari Department Store Tbk PT | | | 118,400 | | | | 131,079 | |
Telekomunikasi Indonesia Persero Tbk PT | | | 740,500 | | | | 214,660 | |
United Tractors Tbk PT | | | 154,500 | | | | 252,852 | |
| | | | | | | | |
| | | | | | | | 774,492 | |
Malaysia | | | | | | | | |
Astro Malaysia Holdings Bhd | | | 242,400 | | | | 148,849 | |
IOI Corp. Bhd | | | 506,500 | | | | 504,416 | |
MISC Bhd | | | 215,900 | | | | 356,806 | |
Sime Darby Bhd | | | 909,800 | | | | 1,829,254 | |
Tenaga Nasional Bhd | | | 75,800 | | | | 229,113 | |
| | | | | | | | |
| | | | | | | | 3,068,438 | |
| | | | | | | | |
| | | Shares | | | Value | |
| Reference Entity — Long (continued) | | | | | | |
Mexico | | | | | | | | |
Alfa SAB de C.V., Series A | | | 140,573 | | | $ | 182,411 | |
America Movil SAB de C.V., Series L | | | 123,800 | | | | 78,008 | |
America Movil SAB de C.V., Series L — ADR | | | 9,560 | | | | 120,552 | |
Cemex SAB de C.V. | | | 379,274 | | | | 350,292 | |
Coca-Cola Femsa SAB de C.V., Series L | | | 3,500 | | | | 21,716 | |
El Puerto de Liverpool SAB de C.V., Series C1 | | | 26,540 | | | | 167,460 | |
Gruma SAB de C.V. | | | 87,338 | | | | 1,175,075 | |
Grupo Aeroportuario del Centro Norte SAB
de C.V. — ADR | | | 2,290 | | | | 78,341 | |
Grupo Bimbo SAB de C.V., Series A | | | 392,583 | | | | 870,315 | |
Industrias Penoles SAB de C.V. | | | 6,320 | | | | 149,454 | |
Kimberly-Clark de Mexico SAB de C.V., Class A | | | 393,835 | | | | 707,462 | |
Wal-Mart de Mexico SAB de C.V. | | | 719,300 | | | | 1,272,792 | |
| | | | | | | | |
| | | | | | | | 5,173,878 | |
Netherlands | | | | | | | | |
Yandex NV, Class A | | | 50,767 | | | | 1,174,748 | |
Philippines | | | | | | | | |
Robinsons Land Corp. | | | 105,500 | | | | 53,261 | |
Poland | | | | | | | | |
Polskie Gornictwo Naftowe i Gazownictwo SA | | | 119,894 | | | | 164,645 | |
Qatar | | | | | | | | |
Ooredoo QSC | | | 2,607 | | | | 75,178 | |
Russia | | | | | | | | |
Aeroflot — Russian Airlines OJSC | | | 40,050 | | | | 115,724 | |
Alrosa PJSC | | | 163,100 | | | | 287,330 | |
Lukoil PJSC | | | 1,915 | | | | 107,821 | |
Lukoil PJSC — ADR | | | 398 | | | | 22,429 | |
Magnitogorsk Iron & Steel Works OJSC | | | 503,000 | | | | 328,385 | |
Mail.ru Group Ltd. — GDR | | | 17,602 | | | | 319,476 | |
Mobile TeleSystems OJSC | | | 3,990 | | | | 18,401 | |
Mobile TeleSystems PJSC — ADR | | | 2,250 | | | | 23,558 | |
Severstal PAO — GDR | | | 4,596 | | | | 73,006 | |
Severstal PJSC | | | 910 | | | | 14,499 | |
Sistema PJSC FC — GDR | | | 28,976 | | | | 277,300 | |
Tatneft PAO — ADR | | | 3,537 | | | | 144,193 | |
Tatneft PJSC | | | 16,870 | | | | 114,575 | |
Uralkali PJSC — GDR | | | 1,989 | | | | 28,262 | |
| | | | | | | | |
| | | | | | | | 1,874,959 | |
South Africa | | | | | | | | |
Barloworld Ltd. | | | 58,295 | | | | 479,305 | |
Gold Fields Ltd. | | | 5,166 | | | | 17,864 | |
Gold Fields Ltd. — ADR | | | 40,031 | | | | 140,509 | |
Growthpoint Properties Ltd. | | | 10,331 | | | | 20,212 | |
Hyprop Investments, Ltd. | | | 22,055 | | | | 196,192 | |
Imperial Holdings Ltd. | | | 3,902 | | | | 48,446 | |
Investec Ltd. | | | 6,921 | | | | 48,919 | |
Mondi Ltd. | | | 43,906 | | | | 964,694 | |
Pick n Pay Stores Ltd. | | | 38,467 | | | | 195,147 | |
Redefine Properties Ltd. | | | 61,877 | | | | 51,260 | |
Sanlam Ltd. | | | 53,663 | | | | 259,238 | |
Sappi Ltd. | | | 148,093 | | | | 952,210 | |
Spar Group Ltd. | | | 4,888 | | | | 69,103 | |
Standard Bank Group Ltd. | | | 16,144 | | | | 172,639 | |
Tsogo Sun Holdings Ltd. | | | 45,835 | | | | 89,945 | |
Vodacom Group Ltd. | | | 25,446 | | | | 285,164 | |
| | | | | | | | |
| | | | | | | | 3,990,847 | |
South Korea | | | | | | | | |
Able C&C Co. Ltd. | | | 2,728 | | | | 43,791 | |
Byucksan Corp. | | | 16,246 | | | | 53,636 | |
E-Mart, Inc. | | | 1,915 | | | | 335,243 | |
Hyundai Development Co-Engineering & Construction | | | 10,760 | | | | 404,867 | |
See Notes to Financial Statements.
| | | | | | |
| | | | | | | |
| 18 | | BLACKROCK FUNDS | | JANUARY 31, 2017 | | |
| | |
Schedule of Investments (continued) | | BlackRock Emerging Markets Long/Short Equity Fund |
| | | | | | | | |
| | | Shares | | | Value | |
| Reference Entity — Long (continued) | | | | | | |
South Korea (continued) | | | | | | | | |
Hyundai Glovis Co. Ltd. | | | 1,673 | | | $ | 224,027 | |
Hyundai Mobis Co. Ltd. | | | 3,072 | | | | 639,087 | |
Industrial Bank of Korea | | | 11,807 | | | | 128,972 | |
Kia Motors Corp. | | | 40,893 | | | | 1,281,696 | |
KT Corp. | | | 46,860 | | | | 1,185,924 | |
KT Corp. — ADR | | | 14,642 | | | | 217,727 | |
LG Electronics, Inc. | | | 10,032 | | | | 479,429 | |
LG International Corp. | | | 24,848 | | | | 691,432 | |
LG Uplus Corp. | | | 1,064 | | | | 10,451 | |
Lotte Chemical Corp. | | | 180 | | | | 58,331 | |
NAVER Corp. | | | 1,641 | | | | 1,071,923 | |
Poongsan Corp. | | | 3,529 | | | | 132,232 | |
POSCO | | | 3,251 | | | | 759,840 | |
POSCO — ADR | | | 7,893 | | | | 456,847 | |
Posco Daewoo Corp. | | | 24,706 | | | | 542,113 | |
S&T Motiv Co. Ltd. | | | 4,669 | | | | 182,926 | |
Samsung Securities Co. Ltd. | | | 6,284 | | | | 175,457 | |
Samsung Securities Co. Ltd., Rights
(Expires 03/08/17) | | | 846 | | | | 4,441 | |
Shinhan Financial Group Co. Ltd. | | | 17,882 | | | | 706,737 | |
Shinhan Financial Group Co. Ltd. — ADR | | | 4,839 | | | | 191,334 | |
SK Hynix, Inc. | | | 4,850 | | | | 223,992 | |
SK Innovation Co. Ltd. | | | 86 | | | | 11,650 | |
SK Networks Co. Ltd. | | | 7,417 | | | | 42,246 | |
| | | | | | | | |
| | | | | | | | 10,256,351 | |
Taiwan | | | | | | | | |
AU Optronics Corp. — ADR | | | 27,375 | | | | 114,701 | |
Cathay Financial Holding Co. Ltd. | | | 704,000 | | | | 1,072,107 | |
China Life Insurance Co. Ltd. | | | 858,000 | | | | 839,705 | |
China Steel Corp. | | | 1,201,000 | | | | 972,407 | |
CTBC Financial Holding Co. Ltd. | | | 4,876,680 | | | | 2,777,823 | |
Elite Advanced Laser Corp. | | | 160 | | | | 637 | |
Everlight Electronics Co. Ltd. | | | 105,000 | | | | 164,262 | |
First Financial Holding Co. Ltd. | | | 677,000 | | | | 377,797 | |
Formosa Chemicals & Fibre Corp. | | | 725,000 | | | | 2,247,453 | |
Formosa Petrochemical Corp. | | | 260,000 | | | | 888,153 | |
Formosa Plastics Corp. | | | 116,000 | | | | 335,174 | |
Fubon Financial Holding Co. Ltd. | | | 955,000 | | | | 1,552,114 | |
Hon Hai Precision Industry Co. Ltd. | | | 152,000 | | | | 407,630 | |
Hon Hai Precision Industry Co. Ltd. — GDR | | | 11,715 | | | | 61,621 | |
Innolux Corp. | | | 2,073,000 | | | | 878,155 | |
Inventec Co. Ltd. | | | 18,000 | | | | 13,538 | |
Lite-On Technology Corp. | | | 161,803 | | | | 244,395 | |
Novatek Microelectronics Corp. | | | 112,000 | | | | 396,694 | |
Pegatron Corp. | | | 351,000 | | | | 845,240 | |
President Chain Store Corp. | | | 34,000 | | | | 254,322 | |
Quanta Computer, Inc. | | | 100,000 | | | | 203,884 | |
Sercomm Corp. | | | 133,000 | | | | 340,020 | |
Taiwan Semiconductor Manufacturing Co. Ltd. | | | 398,000 | | | | 2,371,627 | |
Taiwan Semiconductor Manufacturing Co.
Ltd. — ADR | | | 45,263 | | | | 1,399,079 | |
WPG Holdings Ltd. | | | 567,000 | | | | 678,642 | |
| | | | | | | | |
| | | | | | | | 19,437,180 | |
Thailand | | | | | | | | |
Glow Energy PCL, Foreign Registered Shares | | | 18,500 | | | | 40,983 | |
Indorama Ventures PCL | | | 21,200 | | | | 21,074 | |
PTT Exploration & Production PCL, Foreign Registered Shares | | | 245,200 | | | | 682,465 | |
PTT Global Chemical PCL, Foreign Registered Shares | | | 208,700 | | | | 401,574 | |
PTT PCL | | | 135,700 | | | | 1,557,024 | |
Siam Cement PCL, Foreign Registered Shares | | | 7,450 | | | | 107,108 | |
Thai Oil PCL — NVDR | | | 616,400 | | | | 1,256,083 | |
| | | | | | | | |
| | | | | | | | 4,066,311 | |
| | | | | | | | |
| | | Shares | | | Value | |
| Reference Entity — Long (continued) | | | | | | |
Turkey | | | | | | | | |
Arcelik AS | | | 18,143 | | | $ | 110,046 | |
Eregli Demir ve Celik Fabrikalari TAS | | | 946,475 | | | | 1,458,428 | |
KOC Holding AS | | | 401,272 | | | | 1,616,445 | |
TAV Havalimanlari Holding AS | | | 111,645 | | | | 459,496 | |
Turkiye Is Bankasi, Class C | | | 116,975 | | | | 184,899 | |
Turkiye Sise ve Cam Fabrikalari AS | | | 27,024 | | | | 28,965 | |
| | | | | | | | |
| | | | | | | | 3,858,279 | |
United Arab Emirates | | | | | | | | |
Aldar Properties PJSC | | | 257,380 | | | | 179,250 | |
United Kingdom | | | | | | | | |
Anglo American PLC | | | 7,980 | | | | 137,590 | |
United States | | | | | | | | |
Genpact Ltd. | | | 25,619 | | | | 632,277 | |
Yum China Holdings, Inc. | | | 35,945 | | | | 987,768 | |
| | | | | | | | |
| | | | | | | | 1,620,045 | |
| Total Reference Entity — Long | | | | | | | 86,983,495 | |
| | | | | | | | |
| | | | | | | | | |
| | |
| Reference Entity — Short | | | | | | |
Brazil | | | | | | | | |
BRF SA — ADR | | | (65,375 | ) | | | (923,749 | ) |
Cia Paranaense de Energia — ADR | | | (14,180 | ) | | | (144,778 | ) |
Cielo SA | | | (224,309 | ) | | | (1,885,673 | ) |
Embraer SA — ADR | | | (25,483 | ) | | | (582,541 | ) |
Fibria Celulose SA — ADR | | | (2,171 | ) | | | (20,017 | ) |
Gerdau SA — ADR | | | (9,106 | ) | | | (34,876 | ) |
Itausa — Investimentos Itau SA | | | (4,500 | ) | | | (13,252 | ) |
Klabin SA | | | (25,300 | ) | | | (130,390 | ) |
Petroleo Brasileiro SA — ADR | | | (84,799 | ) | | | (806,438 | ) |
Rumo Logistica Operadora Multimodal SA | | | (5,300 | ) | | | (12,615 | ) |
Suzano Papel e Celulose SA, Preference ‘A’ Shares | | | (100,200 | ) | | | (426,099 | ) |
WEG SA | | | (4,300 | ) | | | (21,711 | ) |
| | | | | | | | |
| | | | | | | | (5,002,139 | ) |
Chile | | | | | | | | |
Cia Cervecerias Unidas SA — ADR | | | (3,607 | ) | | | (81,482 | ) |
Sociedad Quimica y Minera de Chile SA — ADR | | | (17,264 | ) | | | (557,973 | ) |
| | | | | | | | |
| | | | | | | | (639,455 | ) |
China | | | | | | | | |
58.com, Inc. — ADR | | | (1,008 | ) | | | (29,414 | ) |
AAC Technologies Holdings, Inc. | | | (51,000 | ) | | | (523,754 | ) |
Agricultural Bank of China Ltd. | | | (266,000 | ) | | | (111,114 | ) |
AviChina Industry & Technology Co. Ltd., Class H | | | (268,000 | ) | | | (196,730 | ) |
CGN Power Co. Ltd. | | | (3,293,000 | ) | | | (928,566 | ) |
China Conch Venture Holdings Ltd. | | | (255,500 | ) | | | (490,551 | ) |
China Longyuan Power Group Corp., Class H | | | (430,000 | ) | | | (351,232 | ) |
China Medical System Holdings Ltd. | | | (223,000 | ) | | | (363,386 | ) |
China Molybdenum Co. Ltd., Class H | | | (1,545,000 | ) | | | (449,058 | ) |
China National Building Material Co. Ltd., Class H | | | (330,000 | ) | | | (192,993 | ) |
China Oilfield Services Ltd. | | | (244,000 | ) | | | (260,282 | ) |
China Shanshui Cement Group Ltd. | | | (1,350,000 | ) | | | (86,997 | ) |
Country Garden Holdings Co. Ltd. | | | (1,000,000 | ) | | | (573,413 | ) |
Fang Holdings Ltd. — ADR | | | (150,885 | ) | | | (574,872 | ) |
Fosun International Ltd. | | | (845,000 | ) | | | (1,282,485 | ) |
Huaneng Renewables Corp. Ltd. | | | (184,000 | ) | | | (57,102 | ) |
Li Ning Co. Ltd. | | | (107,000 | ) | | | (67,901 | ) |
New China Life Insurance Co. Ltd. | | | (5,300 | ) | | | (25,572 | ) |
Semiconductor Manufacturing International Corp. | | | (100 | ) | | | (137 | ) |
Shandong Weigao Group Medical Polymer Co. Ltd., Class H | | | (108,000 | ) | | | (70,650 | ) |
Shanghai Fosun Pharmaceutical Group Co. Ltd. | | | (16,500 | ) | | | (54,740 | ) |
Sichuan Expressway Co. Ltd. | | | (594,000 | ) | | | (226,258 | ) |
See Notes to Financial Statements.
| | | | | | |
| | | | | | | |
| | BLACKROCK FUNDS | | JANUARY 31, 2017 | | 19 |
| | |
Schedule of Investments (continued) | | BlackRock Emerging Markets Long/Short Equity Fund |
| | | | | | | | |
| | | Shares | | | Value | |
| Reference Entity — Short (continued) | | | | | | |
China (continued) | | | | | | | | |
SOHO China Ltd. | | | (1,318,500 | ) | | $ | (667,036 | ) |
Sunac China Holdings Ltd. | | | (79,000 | ) | | | (70,179 | ) |
TravelSky Technology Ltd. | | | (40,000 | ) | | | (89,848 | ) |
Zhuzhou CSR Times Electric Co. Ltd. | | | (165,000 | ) | | | (940,093 | ) |
Zoomlion Heavy Industry Science and Technology Co. Ltd., Class H | | | (31,600 | ) | | | (15,985 | ) |
| | | | | | | | |
| | | | | | | | (8,700,348 | ) |
Czech Republic | | | | | | | | |
CEZ | | | (33,914 | ) | | | (580,884 | ) |
Moneta Money Bank | | | (47,659 | ) | | | (157,572 | ) |
| | | | | | | | |
| | | | | | | | (738,456 | ) |
Hong Kong | | | | | | | | |
Alibaba Pictures Group Ltd. | | | (3,630,000 | ) | | | (609,852 | ) |
Beijing Enterprises Water Group Ltd. | | | (2,758,000 | ) | | | (1,912,896 | ) |
Brilliance China Automotive Holdings Ltd. | | | (1,056,000 | ) | | | (1,487,629 | ) |
China Everbright International Ltd. | | | (707,000 | ) | | | (857,453 | ) |
China Everbright Ltd. | | | (44,000 | ) | | | (84,006 | ) |
China Gas Holdings Ltd. | | | (410,000 | ) | | | (593,537 | ) |
China Mengniu Dairy Co. Ltd. | | | (575,000 | ) | | | (1,073,321 | ) |
China Merchants Holdings International Co. Ltd. | | | (890,081 | ) | | | (2,379,488 | ) |
China Resources Gas Group Ltd. | | | (14,000 | ) | | | (44,245 | ) |
China Traditional Chinese Medicine Co. Ltd. | | | (334,000 | ) | | | (157,391 | ) |
China Travel International Investment Hong Kong Ltd. | | | (182,000 | ) | | | (50,910 | ) |
China Unicom Hong Kong Ltd. | | | (214,000 | ) | | | (252,589 | ) |
CITIC Ltd. | | | (1,775,000 | ) | | | (2,631,434 | ) |
COSCO Pacific Ltd. | | | (1,265,043 | ) | | | (1,257,110 | ) |
Far East Horizon Ltd. | | | (341,000 | ) | | | (310,865 | ) |
Guangdong Investment Ltd. | | | (276,000 | ) | | | (342,489 | ) |
Hopewell Highway Infrastructure Ltd. | | | (17,500 | ) | | | (9,218 | ) |
Kunlun Energy Co. Ltd. | | | (1,010,000 | ) | | | (802,142 | ) |
Shenzhen International Holdings Ltd. | | | (89,719 | ) | | | (129,101 | ) |
Tongda Group Holdings Ltd. | | | (820,000 | ) | | | (229,136 | ) |
| | | | | | | | |
| | | | | | | | (15,214,812 | ) |
Mexico | | | | | | | | |
Grupo Aeroportuario del Sureste SAB de C.V. | | | (9,175 | ) | | | (132,929 | ) |
Grupo Financiero Inbursa SAB de C.V. | | | (93,000 | ) | | | (137,849 | ) |
Grupo Mexico SAB de C.V. | | | (198,600 | ) | | | (595,605 | ) |
Grupo Televisa SAB | | | (57,953 | ) | | | (258,480 | ) |
Grupo Televisa SAB — ADR | | | (25,350 | ) | | | (567,840 | ) |
Mexichem SAB de C.V. | | | (66,698 | ) | | | (158,065 | ) |
| | | | | | | | |
| | | | | | | | (1,850,768 | ) |
Peru | | | | | | | | |
Hochschild Mining PLC | | | (6,350 | ) | | | (19,790 | ) |
Poland | | | | | | | | |
Orange Polska SA | | | (158,374 | ) | | | (213,679 | ) |
Powszechna Kasa Oszczednosci Bank Polski SA | | | (9,412 | ) | | | (72,209 | ) |
Tauron Polska Energia SA | | | (137,656 | ) | | | (101,402 | ) |
| | | | | | | | |
| | | | | | | | (387,290 | ) |
Republic of Korea | | | | | | | | |
Kolon Industries, Inc. | | | (877 | ) | | | (56,050 | ) |
Russia | | | | | | | | |
Gazprom PAO — ADR | | | (7,907 | ) | | | (39,232 | ) |
South Africa | | | | | | | | |
Impala Platinum Holdings Ltd. | | | (1,579 | ) | | | (6,293 | ) |
Sasol, Ltd. — ADR | | | (18,981 | ) | | | (566,773 | ) |
Truworths International Ltd. | | | (2,832 | ) | | | (17,023 | ) |
| | | | | | | | |
| | | | | | | | (590,089 | ) |
| | | | | | | | |
| | | Shares | | | Value | |
| Reference Entity — Short (continued) | | | | | | |
South Korea | | | | | | | | |
Amorepacific Corp. | | | (1,006 | ) | | $ | (155,475 | ) |
BNK Financial Group, Inc. | | | (8,311 | ) | | | (60,998 | ) |
Cheil Industries, Inc. | | | (280 | ) | | | (30,381 | ) |
Dongsuh Cos., Inc. | | | (1,304 | ) | | | (28,726 | ) |
GS Holdings | | | (1,619 | ) | | | (71,289 | ) |
GS Retail Co. Ltd. | | | (1,146 | ) | | | (51,411 | ) |
Halla Holdings Corp. | | | (3,073 | ) | | | (159,719 | ) |
Halla Visteon Climate Control Corp. | | | (31,673 | ) | | | (248,020 | ) |
Hanssem Co. Ltd. | | | (270 | ) | | | (48,499 | ) |
Hyundai Motor Co. | | | (14,039 | ) | | | (1,690,130 | ) |
KB Financial Group, Inc. — ADR | | | (168 | ) | | | (6,821 | ) |
KB Insurance Co. Ltd. | | | (16,069 | ) | | | (340,536 | ) |
KCC Corp. | | | (3,387 | ) | | | (1,012,588 | ) |
KEPCO Plant Service & Engineering Co. Ltd. | | | (177 | ) | | | (8,330 | ) |
Korea Aerospace Industries Ltd. | | | (21,093 | ) | | | (1,126,009 | ) |
KT&G Corp. | | | (1,170 | ) | | | (101,350 | ) |
Kumho Petrochemical Co. Ltd. | | | (2,045 | ) | | | (144,944 | ) |
Lotte Chilsung Beverage Co. Ltd. | | | (55 | ) | | | (68,651 | ) |
NCSoft Corp. | | | (1,637 | ) | | | (428,586 | ) |
Samsung Electro-Mechanics Co. Ltd. | | | (44,889 | ) | | | (2,192,259 | ) |
Samsung Life Insurance Co. Ltd. | | | (6,534 | ) | | | (624,319 | ) |
Samsung SDI Co. Ltd. | | | (11,484 | ) | | | (1,141,243 | ) |
Samsung Techwin Co. Ltd. | | | (322 | ) | | | (11,568 | ) |
Shinsegae Co. Ltd. | | | (386 | ) | | | (58,451 | ) |
SK Holdings Co. Ltd. | | | (837 | ) | | | (155,953 | ) |
SK Materials Co. Ltd. | | | (1,328 | ) | | | (227,801 | ) |
Soulbrain Co. Ltd. | | | (5,016 | ) | | | (232,394 | ) |
| | | | | | | | |
| | | | | | | | (10,426,451 | ) |
Switzerland | | | | | | | | |
Luxoft Holding Inc. | | | (3,888 | ) | | | (228,809 | ) |
Taiwan | | | | | | | | |
Chang Hwa Commercial Bank | | | (2,252,655 | ) | | | (1,250,905 | ) |
China Development Financial Holding Corp. | | | (3,374,000 | ) | | | (862,402 | ) |
Chunghwa Telecom Co. Ltd. | | | (565,000 | ) | | | (1,842,860 | ) |
Delta Electronics, Inc. | | | (3,000 | ) | | | (16,756 | ) |
E.Sun Financial Holding Co. Ltd. | | | (1,540,000 | ) | | | (909,683 | ) |
Largan Precision Co. Ltd. | | | (2,000 | ) | | | (286,073 | ) |
Mega Financial Holding Co. Ltd. | | | (274,000 | ) | | | (204,263 | ) |
Ruentex Development Co. Ltd. | | | (295,000 | ) | | | (359,458 | ) |
Shin Kong Financial Holding Co. Ltd. | | | (1,244,000 | ) | | | (319,528 | ) |
Taiwan Business Bank | | | (1,332,000 | ) | | | (347,991 | ) |
Taiwan Cooperative Financial Holding Co. Ltd. | | | (158,000 | ) | | | (72,201 | ) |
Taiwan Mobile Co. Ltd. | | | (186,000 | ) | | | (621,266 | ) |
United Microelectronics Corp. | | | (3,868,000 | ) | | | (1,404,586 | ) |
Walsin Technology Corp. | | | (81,000 | ) | | | (100,275 | ) |
| | | | | | | | |
| | | | | | | | (8,598,247 | ) |
Thailand | | | | | | | | |
Advanced Info Service PCL | | | (28,300 | ) | | | (127,796 | ) |
BTS Group Holdings PCL | | | (852,100 | ) | | | (202,075 | ) |
IRPC PCL | | | (588,000 | ) | | | (86,839 | ) |
Minor International PCL | | | (698,900 | ) | | | (689,769 | ) |
True Corp. PCL | | | (412,700 | ) | | | (76,773 | ) |
| | | | | | | | |
| | | | | | | | (1,183,252 | ) |
| Total Reference Entity — Short | | | | (53,675,188 | ) |
| Net Value of Reference Entity — Morgan Stanley & Co., Inc. | | | | 33,308,307 | |
See Notes to Financial Statements.
| | | | | | |
| | | | | | | |
| 20 | | BLACKROCK FUNDS | | JANUARY 31, 2017 | | |
| | |
Schedule of Investments (continued) | | BlackRock Emerging Markets Long/Short Equity Fund |
| | | | | | | | |
| The following table represents the individual long and short positions and related values of equity securities underlying the total return swap with Morgan Stanley & Co., Inc. as of January 31, 2017, expiration dates 3/30/17 — 3/01/18: | |
| | | Shares | | | Value | |
| Reference Entity — Long | | | | | | |
Australia | | | | | | | | |
Amcor Ltd. | | | 2,036 | | | $ | 22,099 | |
Boral Ltd. | | | 4,689 | | | | 20,722 | |
Coca-Cola Amatil Ltd. | | | 424 | | | | 3,136 | |
Mineral Resources Ltd. | | | 1,244 | | | | 11,615 | |
Whitehaven Coal Ltd. | | | 363 | | | | 784 | |
| | | | | | | | |
| | | | | | | | 58,356 | |
Austria | | | | | | | | |
OMV AG | | | 907 | | | | 31,743 | |
Vienna Insurance Group AG | | | 614 | | | | 14,964 | |
Wienerberger AG | | | 2,340 | | | | 45,170 | |
| | | | | | | | |
| | | | | | | | 91,877 | |
Belgium | | | | | | | | |
NV Bekaert SA | | | 280 | | | | 12,152 | |
Bermuda | | | | | | | | |
Nabors Industries, Ltd. | | | 1,299 | | | | 21,109 | |
Canada | | | | | | | | |
Air Canada | | | 3,597 | | | | 36,958 | |
Bank of Nova Scotia | | | 2,237 | | | | 133,679 | |
Finning International, Inc. | | | 1,076 | | | | 21,780 | |
| | | | | | | | |
| | | | | | | | 192,417 | |
Denmark | | | | | | | | |
Carlsberg A/S, Class B | | | 499 | | | | 45,143 | |
GN Store Nord A/S | | | 1,624 | | | | 36,273 | |
| | | | | | | | |
| | | | | | | | 81,416 | |
Finland | | | | | | | | |
Nokian Renkaat OYJ | | | 597 | | | | 22,396 | |
UPM-Kymmene OYJ | | | 1,055 | | | | 23,927 | |
| | | | | | | | |
| | | | | | | | 46,323 | |
France | | | | | | | | |
Arkema SA | | | 260 | | | | 25,678 | |
Cie Generale des Etablissements Michelin | | | 688 | | | | 73,914 | |
Danone SA | | | 385 | | | | 24,135 | |
Faurecia | | | 1,851 | | | | 80,425 | |
Peugeot SA | | | 16,429 | | | | 305,754 | |
Plastic Omnium SA | | | 404 | | | | 13,706 | |
Renault SA | | | 1,931 | | | | 173,874 | |
Teleperformance | | | 189 | | | | 20,232 | |
Thales SA | | | 435 | | | | 40,810 | |
| | | | | | | | |
| | | | | | | | 758,528 | |
Germany | | | | | | | | |
Deutsche Lufthansa AG, Registered Shares | | | 2,659 | | | | 35,521 | |
Duerr AG | | | 931 | | | | 80,766 | |
Evonik Industries AG | | | 1,451 | | | | 47,102 | |
Hannover Rueck SE | | | 1,066 | | | | 117,419 | |
Hochtief AG | | | 788 | | | | 112,330 | |
Lanxess AG | | | 2,167 | | | | 157,695 | |
Software AG | | | 433 | | | | 15,620 | |
Talanx AG | | | 175 | | | | 6,024 | |
Wacker Chemie AG | | | 372 | | | | 44,959 | |
| | | | | | | | |
| | | | | | | | 617,436 | |
Hong Kong | | | | | | | | |
CLP Holdings Ltd. | | | 5,000 | | | | 48,803 | |
Hopewell Holdings Ltd. | | | 9,000 | | | | 32,135 | |
Li & Fung Ltd. | | | 72,000 | | | | 31,222 | |
New World Development Co. Ltd. | | | 77,000 | | | | 88,842 | |
Sun Hung Kai Properties Ltd. | | | 1,000 | | | | 13,761 | |
| | | | | | | | |
| | | Shares | | | Value | |
| Reference Entity — Long (continued) | | | | | | |
Hong Kong (continued) | | | | | | | | |
Texwinca Holdings Ltd. | | | 50,000 | | | $ | 32,037 | |
| | | | | | | | |
| | | | | | | | 246,800 | |
Ireland | | | | | | | | |
CRH PLC | | | 360 | | | | 12,487 | |
Italy | | | | | | | | |
Atlantia SpA | | | 384 | | | | 8,751 | |
Japan | | | | | | | | |
Amada Holdings Co. Ltd. | | | 600 | | | | 7,052 | |
Astellas Pharma, Inc. | | | 700 | | | | 9,395 | |
Bridgestone Corp. | | | 4,400 | | | | 161,374 | |
Citizen Holdings Co. Ltd. | | | 4,300 | | | | 26,702 | |
Daicel Corp. | | | 1,100 | | | | 12,164 | |
Dowa Holdings Co. Ltd. | | | 3,000 | | | | 25,462 | |
Hitachi Ltd. | | | 19,000 | | | | 108,784 | |
Inpex Corp. | | | 100 | | | | 981 | |
ITOCHU Corp. | | | 6,200 | | | | 85,411 | |
Jafco Co. Ltd. | | | 100 | | | | 3,373 | |
Japan Airlines Co. Ltd. | | | 100 | | | | 3,184 | |
Japan Steel Works Ltd. | | | 700 | | | | 13,144 | |
JTEKT Corp. | | | 300 | | | | 4,927 | |
Kao Corp. | | | 4,000 | | | | 197,939 | |
Mazda Motor Corp. | | | 900 | | | | 13,244 | |
MISUMI Group, Inc. | | | 2,100 | | | | 39,236 | |
Mitsubishi Chemical Holdings Corp. | | | 3,600 | | | | 25,110 | |
Mitsubishi Materials Corp. | | | 1,100 | | | | 37,537 | |
Mitsui Chemicals, Inc. | | | 1,000 | | | | 4,703 | |
NSK Ltd. | | | 4,700 | | | | 57,054 | |
Penta-Ocean Construction Co. Ltd. | | | 3,400 | | | | 16,600 | |
Pigeon Corp. | | | 100 | | | | 2,717 | |
SMC Corp. | | | 200 | | | | 54,596 | |
Sumitomo Corp. | | | 10,400 | | | | 130,372 | |
Taiyo Yuden Co. Ltd. | | | 1,700 | | | | 20,734 | |
Teijin Ltd. | | | 2,600 | | | | 54,878 | |
TS Tech Co. Ltd. | | | 200 | | | | 5,104 | |
| | | | | | | | |
| | | | | | | | 1,121,777 | |
Netherlands | | | | | | | | |
Akzo Nobel NV | | | 3,208 | | | | 217,712 | |
ASM International NV | | | 2,149 | | | | 105,954 | |
BE Semiconductor Industries NV | | | 652 | | | | 23,542 | |
Koninklijke DSM NV | | | 2,852 | | | | 181,816 | |
| | | | | | | | |
| | | | | | | | 529,024 | |
Norway | | | | | | | | |
Subsea 7 SA | | | 506 | | | | 6,885 | |
Singapore | | | | | | | | |
Venture Corp. Ltd. | | | 12,900 | | | | 93,320 | |
Spain | | | | | | | | |
ACS Actividades de Construccion y Servicios SA | | | 4,761 | | | | 75,728 | |
Indra Sistemas SA | | | 1,071 | | | | 11,798 | |
| | | | | | | | |
| | | | | | | | 87,526 | |
Sweden | | | | | | | | |
Atlas Copco AB, A Shares | | | 722 | | | | 23,156 | |
Electrolux AB, Class B | | | 388 | | | | 10,317 | |
Saab AB | | | 2,297 | | | | 93,805 | |
| | | | | | | | |
| | | | | | | | 127,278 | |
Switzerland | | | | | | | | |
Coca-Cola HBC AG | | | 4,246 | | | | 97,055 | |
Georg Fischer AG, Registered Shares | | | 100 | | | | 82,414 | |
Glencore PLC | | | 19,986 | | | | 82,776 | |
IWG PLC | | | 31,684 | | | | 99,815 | |
Logitech International SA, Registered Shares | | | 708 | | | | 20,277 | |
See Notes to Financial Statements.
| | | | | | |
| | | | | | | |
| | BLACKROCK FUNDS | | JANUARY 31, 2017 | | 21 |
| | |
Schedule of Investments (continued) | | BlackRock Emerging Markets Long/Short Equity Fund |
| | | | | | | | |
| | | Shares | | | Value | |
| Reference Entity — Long (continued) | | | | | | |
Switzerland (continued) | | | | | | | | |
Lonza Group AG, Registered Shares | | | 1,363 | | | $ | 250,409 | |
Schindler Holding AG, Participation Certificates | | | 187 | | | | 35,645 | |
Straumann Holding AG, Registered Shares | | | 30 | | | | 12,107 | |
TE Connectivity Ltd. | | | 1,634 | | | | 121,488 | |
| | | | | | | | |
| | | | | | | | 801,986 | |
United Kingdom | | | | | | | | |
Anglo American PLC | | | 941 | | | | 16,221 | |
British American Tobacco PLC | | | 1,526 | | | | 94,197 | |
Inchcape PLC | | | 7,667 | | | | 69,392 | |
Intertek Group PLC | | | 908 | | | | 38,868 | |
Spirax-Sarco Engineering PLC | | | 1,399 | | | | 75,987 | |
TechnipFMC PLC | | | 148 | | | | 4,851 | |
UBM PLC | | | 1,102 | | | | 9,792 | |
| | | | | | | | |
| | | | | | | | 309,308 | |
United States | | | | | | | | |
Accenture PLC, Class A | | | 555 | | | | 63,198 | |
Agilent Technologies, Inc. | | | 867 | | | | 42,457 | |
Amdocs Ltd. | | | 110 | | | | 6,458 | |
Amphenol Corp., Class A | | | 994 | | | | 67,085 | |
Analog Devices, Inc. | | | 703 | | | | 52,683 | |
Applied Materials, Inc. | | | 3,623 | | | | 124,088 | |
Archer-Daniels-Midland Co. | | | 2,638 | | | | 116,758 | |
Baker Hughes, Inc. | | | 417 | | | | 26,304 | |
Baxter International, Inc. | | | 2,456 | | | | 117,667 | |
C.R. Bard, Inc. | | | 309 | | | | 73,335 | |
Cabot Corp. | | | 1,620 | | | | 89,699 | |
CBS Corp., Class B | | | 370 | | | | 23,861 | |
Celanese Corp., Series A | | | 263 | | | | 22,197 | |
Citrix Systems, Inc. | | | 1,382 | | | | 126,025 | |
Corning, Inc. | | | 7,062 | | | | 187,072 | |
Diamond Offshore Drilling, Inc. | | | 454 | | | | 7,437 | |
Dril-Quip, Inc. | | | 269 | | | | 16,732 | |
Eastman Chemical Co. | | | 678 | | | | 52,545 | |
Energen Corp. | | | 507 | | | | 27,322 | |
Estee Lauder Cos., Inc., Class A | | | 792 | | | | 64,318 | |
Expeditors International of Washington, Inc. | | | 1,724 | | | | 89,786 | |
Fluor Corp. | | | 286 | | | | 15,873 | |
Hasbro, Inc. | | | 1,520 | | | | 125,415 | |
Hawaiian Holdings, Inc. | | | 82 | | | | 4,178 | |
HP, Inc. | | | 3,217 | | | | 48,416 | |
Ingersoll-Rand PLC | | | 833 | | | | 66,099 | |
Ingredion, Inc. | | | 362 | | | | 46,405 | |
International Paper Co. | | | 470 | | | | 26,602 | |
KLA-Tencor Corp. | | | 1,243 | | | | 105,792 | |
Lear Corp. | | | 92 | | | | 13,072 | |
Newmont Mining Corp. | | | 865 | | | | 31,382 | |
Occidental Petroleum Corp. | | | 1,285 | | | | 87,084 | |
PACCAR, Inc. | | | 52 | | | | 3,500 | |
Parker Hannifin Corp. | | | 377 | | | | 55,468 | |
Praxair, Inc. | | | 625 | | | | 74,025 | |
Teradata Corp. | | | 363 | | | | 10,658 | |
Texas Instruments, Inc. | | | 1,063 | | | | 80,299 | |
VeriSign, Inc. | | | 353 | | | | 28,314 | |
VMware, Inc., Class A | | | 286 | | | | 25,036 | |
Xerox Corp. | | | 32,664 | | | | 226,362 | |
| | | | | | | | |
| | | | | | | | 2,471,007 | |
| Total Reference Entity — Long | | | | | | | 7,695,763 | |
| | | | | | | | |
| | | | | | | | | |
| | |
| Reference Entity — Short | | | | | | |
Australia | | | | | | | | |
Iluka Resources Ltd. | | | (1,444 | ) | | | (8,287 | ) |
| | | | | | | | |
| | | Shares | | | Value | |
| Reference Entity — Short (continued) | | | | | | |
Australia (continued) | | | | | | | | |
Incitec Pivot Ltd. | | | (33,618 | ) | | $ | (98,253 | ) |
| | | | | | | | |
| | | | | | | | (106,540 | ) |
Austria | | | | | | | | |
Ams AG | | | (790 | ) | | | (27,215 | ) |
Canada | | | | | | | | |
Agrium, Inc. | | | (480 | ) | | | (49,437 | ) |
Brookfield Asset Management, Inc., Class A | | | (3,891 | ) | | | (134,559 | ) |
Centerra Gold, Inc. | | | (1,297 | ) | | | (6,409 | ) |
Methanex Corp. | | | (173 | ) | | | (8,650 | ) |
Potash Corp. of Saskatchewan, Inc. | | | (1,772 | ) | | | (32,968 | ) |
| | | | | | | | |
| | | | | | | | (232,023 | ) |
Denmark | | | | | | | | |
AP Moeller — Maersk A/S | | | (4 | ) | | | (6,404 | ) |
NKT Holding A/S | | | (35 | ) | | | (2,706 | ) |
| | | | | | | | |
| | | | | | | | (9,110 | ) |
France | | | | | | | | |
Accor SA | | | (773 | ) | | | (31,327 | ) |
Air Liquide SA | | | (1,163 | ) | | | (125,562 | ) |
Airbus Group SE | | | (2,495 | ) | | | (169,123 | ) |
Bollore SA | | | (11,822 | ) | | | (47,282 | ) |
Bollore SA — New | | | (64 | ) | | | (263 | ) |
Eutelsat Communications SA | | | (357 | ) | | | (6,089 | ) |
Ingenico Group SA | | | (426 | ) | | | (35,923 | ) |
JCDecaux SA | | | (3,451 | ) | | | (110,475 | ) |
Suez Environnement Co. | | | (9,184 | ) | | | (139,115 | ) |
| | | | | | | | |
| | | | | | | | (665,159 | ) |
Germany | | | | | | | | |
Axel Springer SE | | | (1,114 | ) | | | (58,719 | ) |
Bayerische Motoren Werke AG | | | (701 | ) | | | (52,662 | ) |
Fraport AG Frankfurt Airport Services Worldwide | | | (957 | ) | | | (57,272 | ) |
GEA Group AG | | | (1,605 | ) | | | (66,506 | ) |
HeidelbergCement AG | | | (1,887 | ) | | | (182,292 | ) |
Hella KGaA Hueck & Co. | | | (670 | ) | | | (27,385 | ) |
Krones AG | | | (466 | ) | | | (47,635 | ) |
Volkswagen AG | | | (524 | ) | | | (82,658 | ) |
| | | | | | | | |
| | | | | | | | (575,129 | ) |
Hong Kong | | | | | | | | |
Bank of East Asia Ltd. | | | (5,600 | ) | | | (23,853 | ) |
Cheung Kong Property Holdings Ltd. | | | (7,000 | ) | | | (46,010 | ) |
Hong Kong & China Gas Co. Ltd. | | | (130,200 | ) | | | (245,141 | ) |
Hong Kong Exchanges and Clearing Ltd. | | | (1,700 | ) | | | (41,118 | ) |
Jardine Strategic Holdings Ltd. | | | (100 | ) | | | (3,811 | ) |
Melco International Development Ltd. | | | (9,000 | ) | | | (13,577 | ) |
Shangri-La Asia Ltd. | | | (4,000 | ) | | | (4,449 | ) |
Shun Tak Holdings Ltd. | | | (20,000 | ) | | | (6,912 | ) |
Wharf Holdings Ltd. | | | (2,000 | ) | | | (14,997 | ) |
Wheelock & Co. Ltd. | | | (7,000 | ) | | | (42,545 | ) |
| | | | | | | | |
| | | | | | | | (442,413 | ) |
Ireland | | | | | | | | |
Adient PLC | | | (2,046 | ) | | | (129,901 | ) |
Israel | | | | | | | | |
Frutarom Industries Ltd. | | | (455 | ) | | | (24,040 | ) |
Italy | | | | | | | | |
Prada SpA | | | (1,600 | ) | | | (6,629 | ) |
Japan | | | | | | | | |
Ajinomoto Co., Inc. | | | (1,600 | ) | | | (31,580 | ) |
Alps Electric Co. Ltd. | | | (1,000 | ) | | | (26,636 | ) |
Ariake Japan Co. Ltd. | | | (100 | ) | | | (5,301 | ) |
Asahi Intecc Co. Ltd. | | | (800 | ) | | | (32,557 | ) |
See Notes to Financial Statements.
| | | | | | |
| | | | | | | |
| 22 | | BLACKROCK FUNDS | | JANUARY 31, 2017 | | |
| | |
Schedule of Investments (continued) | | BlackRock Emerging Markets Long/Short Equity Fund |
| | | | | | | | |
| | | Shares | | | Value | |
| Reference Entity — Short (continued) | | | | | | |
Japan (continued) | | | | | | | | |
Asics Corp. | | | (700 | ) | | $ | (13,636 | ) |
Brother Industries Ltd. | | | (200 | ) | | | (3,692 | ) |
Calsonic Kansei Corp. | | | (4,000 | ) | | | (63,590 | ) |
Daifuku Co. Ltd. | | | (700 | ) | | | (15,475 | ) |
Daikin Industries Ltd. | | | (700 | ) | | | (69,484 | ) |
Eisai Co. Ltd. | | | (100 | ) | | | (5,512 | ) |
Hino Motors Ltd. | | | (800 | ) | | | (8,440 | ) |
Hitachi Kokusai Electric, Inc. | | | (1,600 | ) | | | (35,933 | ) |
Isuzu Motors Ltd. | | | (2,200 | ) | | | (29,519 | ) |
JGC Corp. | | | (4,400 | ) | | | (76,381 | ) |
Kansai Paint Co. Ltd. | | | (6,200 | ) | | | (120,441 | ) |
Kirin Holdings Co. Ltd. | | | (1,300 | ) | | | (21,301 | ) |
Koito Manufacturing Co. Ltd. | | | (3,000 | ) | | | (159,137 | ) |
Kyocera Corp. | | | (300 | ) | | | (15,618 | ) |
Mitsubishi Motors Corp. | | | (11,100 | ) | | | (60,130 | ) |
Nihon Kohden Corp. | | | (400 | ) | | | (9,178 | ) |
Nippon Kayaku Co. Ltd. | | | (11,000 | ) | | | (143,765 | ) |
Nippon Paint Co. Ltd. | | | (1,100 | ) | | | (32,087 | ) |
Pilot Corp. | | | (100 | ) | | | (4,057 | ) |
Rinnai Corp. | | | (600 | ) | | | (50,989 | ) |
Shimano, Inc. | | | (200 | ) | | | (31,538 | ) |
Shiseido Co. Ltd. | | | (1,300 | ) | | | (36,334 | ) |
Stanley Electric Co. Ltd. | | | (1,200 | ) | | | (33,807 | ) |
Sumitomo Electric Industries Ltd. | | | (2,900 | ) | | | (42,197 | ) |
Tadano Ltd. | | | (600 | ) | | | (7,358 | ) |
TDK Corp. | | | (400 | ) | | | (28,751 | ) |
Terumo Corp. | | | (3,100 | ) | | | (114,681 | ) |
Tokuyama Corp. | | | (2,000 | ) | | | (8,951 | ) |
Topcon Corp. | | | (1,200 | ) | | | (18,394 | ) |
Toray Industries, Inc. | | | (5,000 | ) | | | (43,295 | ) |
Trend Micro, Inc. | | | (500 | ) | | | (19,403 | ) |
Unicharm Corp. | | | (1,700 | ) | | | (38,288 | ) |
Ushio, Inc. | | | (100 | ) | | | (1,269 | ) |
Yamaha Motor Co. Ltd. | | | (700 | ) | | | (14,560 | ) |
Yaskawa Electric Corp. | | | (700 | ) | | | (12,622 | ) |
Yokohama Rubber Co. Ltd. | | | (300 | ) | | | (5,276 | ) |
| | | | | | | | |
| | | | | | | | (1,491,163 | ) |
Netherlands | | | | | | | | |
Koninklijke Boskalis Westminster NV | | | (933 | ) | | | (34,519 | ) |
Royal Dutch Shell PLC, A Shares | | | (611 | ) | | | (16,571 | ) |
Royal Dutch Shell PLC, B Shares | | | (227 | ) | | | (6,411 | ) |
SBM Offshore NV | | | (36 | ) | | | (586 | ) |
TomTom NV | | | (3,136 | ) | | | (28,748 | ) |
| | | | | | | | |
| | | | | | | | (86,835 | ) |
Norway | | | | | | | | |
Norwegian Air Shuttle ASA | | | (581 | ) | | | (18,967 | ) |
Yara International ASA | | | (2,223 | ) | | | (93,734 | ) |
| | | | | | | | |
| | | | | | | | (112,701 | ) |
Singapore | | | | | | | | |
Broadcom Ltd. | | | (1,230 | ) | | | (245,385 | ) |
Keppel Corp. Ltd. | | | (2,300 | ) | | | (10,093 | ) |
UOL Group Ltd. | | | (1,000 | ) | | | (4,529 | ) |
Wing Tai Holdings Ltd. | | | (5,000 | ) | | | (6,165 | ) |
| | | | | | | | |
| | | | | | | | (266,172 | ) |
Spain | | | | | | | | |
Atlantica Yield PLC | | | (235 | ) | | | (5,029 | ) |
Ferrovial SA | | | (2,791 | ) | | | (50,663 | ) |
| | | | | | | | |
| | | | | | | | (55,692 | ) |
Sweden | | | | | | | | |
Alfa Laval AB | | | (3,910 | ) | | | (73,102 | ) |
Autoliv, Inc. | | | (108 | ) | | | (12,492 | ) |
| | | | | | | | |
| | | Shares | | | Value | |
| Reference Entity — Short (continued) | | | | | | |
Sweden (continued) | | | | | | | | |
Getinge AB, B Shares | | | (309 | ) | | $ | (4,992 | ) |
Hexagon AB, B Shares | | | (1,513 | ) | | | (59,849 | ) |
| | | | | | | | |
| | | | | | | | (150,435 | ) |
Switzerland | | | | | | | | |
Cie Financiere Richemont SA | | | (1,204 | ) | | | (93,767 | ) |
Dufry AG | | | (442 | ) | | | (63,098 | ) |
OC Oerlikon Corp. AG | | | (1,088 | ) | | | (12,343 | ) |
Swatch Group AG | | | (1,527 | ) | | | (106,692 | ) |
U-Blox Holding AG | | | (94 | ) | | | (16,970 | ) |
| | | | | | | | |
| | | | | | | | (292,870 | ) |
United Kingdom | | | | | | | | |
Capita PLC | | | (3,491 | ) | | | (22,025 | ) |
Halma PLC | | | (160 | ) | | | (1,864 | ) |
HSBC Holdings PLC | | | (15,184 | ) | | | (129,533 | ) |
John Wood Group PLC | | | (8,617 | ) | | | (91,159 | ) |
Marks & Spencer Group PLC | | | (402 | ) | | | (1,704 | ) |
Micro Focus International PLC | | | (2,981 | ) | | | (80,635 | ) |
Next PLC | | | (1,408 | ) | | | (67,937 | ) |
Rio Tinto PLC | | | (97 | ) | | | (4,297 | ) |
Rotork PLC | | | (6,693 | ) | | | (21,562 | ) |
RPC Group PLC | | | (2,285 | ) | | | (30,857 | ) |
WS Atkins PLC | | | (474 | ) | | | (8,742 | ) |
| | | | | | | | |
| | | | | | | | (460,315 | ) |
United States | | | | | | | | |
Advanced Micro Devices, Inc. | | | (3,459 | ) | | | (35,870 | ) |
AGCO Corp. | | | (97 | ) | | | (6,092 | ) |
ANSYS, Inc. | | | (221 | ) | | | (20,610 | ) |
Avnet, Inc. | | | (4,406 | ) | | | (204,615 | ) |
Axalta Coating Systems Ltd. | | | (1,876 | ) | | | (54,404 | ) |
Bio-Rad Laboratories, Inc. | | | (521 | ) | | | (99,032 | ) |
Cavium, Inc. | | | (2,476 | ) | | | (163,936 | ) |
CF Industries Holdings, Inc. | | | (1,234 | ) | | | (43,548 | ) |
Chemours Co. | | | (2,040 | ) | | | (53,897 | ) |
Cheniere Energy, Inc. | | | (746 | ) | | | (35,547 | ) |
Cooper Cos., Inc. | | | (115 | ) | | | (21,230 | ) |
Coty, Inc., Class A | | | (2,525 | ) | | | (48,480 | ) |
Cypress Semiconductor Corp. | | | (1,328 | ) | | | (15,670 | ) |
Dentsply Sirona, Inc. | | | (1,531 | ) | | | (86,808 | ) |
Diebold, Inc. | | | (4,865 | ) | | | (132,328 | ) |
Dow Chemical Co. | | | (1,320 | ) | | | (78,712 | ) |
EI du Pont de Nemours & Co. | | | (55 | ) | | | (4,152 | ) |
Flowserve Corp. | | | (2,339 | ) | | | (114,985 | ) |
Freeport-McMoRan, Inc. | | | (117 | ) | | | (1,948 | ) |
General Electric Co. | | | (6,568 | ) | | | (195,070 | ) |
Hecla Mining Co. | | | (1,109 | ) | | | (7,142 | ) |
Hess Corp. | | | (584 | ) | | | (31,641 | ) |
Illumina, Inc. | | | (635 | ) | | | (101,663 | ) |
Integrated Device Technology, Inc. | | | (1,616 | ) | | | (40,707 | ) |
John Bean Technologies Corp. | | | (649 | ) | | | (56,041 | ) |
Keysight Technologies, Inc. | | | (669 | ) | | | (24,800 | ) |
Lumentum Holdings, Inc. | | | (391 | ) | | | (14,838 | ) |
M/A-COM Technology Solutions Holdings, Inc. | | | (1,021 | ) | | | (48,549 | ) |
MKS Instruments, Inc. | | | (212 | ) | | | (13,971 | ) |
Newell Rubbermaid, Inc. | | | (3,075 | ) | | | (145,540 | ) |
PerkinElmer, Inc. | | | (341 | ) | | | (18,138 | ) |
Procter & Gamble Co. | | | (1,933 | ) | | | (169,331 | ) |
Quintiles Transnational Holdings, Inc. | | | (1,407 | ) | | | (110,435 | ) |
Salesforce.com, Inc. | | | (71 | ) | | | (5,616 | ) |
Symantec Corp. | | | (3,380 | ) | | | (93,119 | ) |
Terex Corp. | | | (525 | ) | | | (16,695 | ) |
Textron, Inc. | | | (298 | ) | | | (14,116 | ) |
Total System Services, Inc. | | | (125 | ) | | | (6,335 | ) |
Universal Display Corp. | | | (673 | ) | | | (44,418 | ) |
��
See Notes to Financial Statements.
| | | | | | |
| | | | | | | |
| | BLACKROCK FUNDS | | JANUARY 31, 2017 | | 23 |
| | |
Schedule of Investments (continued) | | BlackRock Emerging Markets Long/Short Equity Fund |
| | | | | | | | |
| | | Shares | | | Value | |
| Reference Entity — Short (continued) | | | | | | |
United States (continued) | | | | | | | | |
Verint Systems, Inc. | | | (310 | ) | | $ | (11,578 | ) |
WABCO Holdings, Inc. | | | (634 | ) | | | (69,125 | ) |
Western Digital Corp. | | | (269 | ) | | | (21,447 | ) |
Zebra Technologies Corp., Class A | | | (664 | ) | | | (55,557 | ) |
Zimmer Biomet Holdings, Inc. | | | (76 | ) | | | (8,993 | ) |
| | | | | | | | |
| | | | | | | | (2,546,729 | ) |
| Total Reference Entity — Short | | | | | | | (7,681,071 | ) |
| Net Value of Reference Entity — Morgan Stanley & Co., Inc. | | | | 14,692 | |
| | | | | | | | |
| | | | | | | | | |
|
| The following table represents the individual long and short positions and related values of equity securities underlying the total return swap with UBS AG as of January 31, 2017, expiration date 5/19/17: | |
| | |
| Reference Entity — Long | | | | | | |
Australia | | | | | | | | |
Amcor Ltd. | | | 256 | | | | 2,779 | |
Boral Ltd. | | | 21,785 | | | | 96,274 | |
Coca-Cola Amatil Ltd. | | | 6,874 | | | | 50,836 | |
Mineral Resources Ltd. | | | 1,433 | | | | 13,380 | |
Whitehaven Coal Ltd. | | | 4,854 | | | | 10,484 | |
| | | | | | | | |
| | | | | | | | 173,753 | |
Austria | | | | | | | | |
OMV AG | | | 2,016 | | | | 70,556 | |
Wienerberger AG | | | 424 | | | | 8,185 | |
| | | | | | | | |
| | | | | | | | 78,741 | |
Belgium | | | | | | | | |
NV Bekaert SA | | | 361 | | | | 15,667 | |
Bermuda | | | | | | | | |
Nabors Industries Ltd. | | | 1,599 | | | | 25,984 | |
Canada | | | | | | | | |
Bank of Nova Scotia | | | 2,609 | | | | 155,909 | |
Finning International, Inc. | | | 910 | | | | 18,420 | |
Husky Energy, Inc. | | | 143 | | | | 1,845 | |
West Fraser Timber Co. Ltd. | | | 679 | | | | 23,189 | |
Yamana Gold, Inc. | | | 8,601 | | | | 28,422 | |
| | | | | | | | |
| | | | | | | | 227,785 | |
Denmark | | | | | | | | |
GN Store Nord A/S | | | 1,469 | | | | 32,811 | |
Finland | | | | | | | | |
Nokian Renkaat OYJ | | | 2,071 | | | | 77,690 | |
UPM-Kymmene OYJ | | | 7,059 | | | | 160,098 | |
| | | | | | | | |
| | | | | | | | 237,788 | |
France | | | | | | | | |
Arkema SA | | | 1,092 | | | | 107,848 | |
Cie Generale des Etablissements Michelin | | | 1,703 | | | | 182,958 | |
Faurecia | | | 1,413 | | | | 61,394 | |
LVMH Moet Hennessy Louis Vuitton SE | | | 100 | | | | 20,152 | |
Plastic Omnium SA | | | 1,140 | | | | 38,676 | |
Renault SA | | | 736 | | | | 66,272 | |
Sodexo SA | | | 1,077 | | | | 119,097 | |
Thales SA | | | 1,461 | | | | 137,063 | |
Valeo SA | | | 3,462 | | | | 211,596 | |
| | | | | | | | |
| | | | | | | | 945,056 | |
Germany | | | | | | | | |
Covestro AG | | | 2,449 | | | | 184,296 | |
Deutsche Lufthansa AG, Registered Shares | | | 703 | | | | 9,391 | |
Duerr AG | | | 375 | | | | 32,532 | |
| | | | | | | | |
| | | Shares | | | Value | |
| Reference Entity — Long (continued) | | | | | | |
Germany (continued) | | | | | | | | |
Evonik Industries AG | | | 4,537 | | | $ | 147,279 | |
Hannover Rueck SE | | | 425 | | | | 46,814 | |
Hochtief AG | | | 977 | | | | 139,272 | |
Lanxess AG | | | 851 | | | | 61,928 | |
Software AG | | | 70 | | | | 2,525 | |
Talanx AG | | | 125 | | | | 4,303 | |
Wacker Chemie AG | | | 227 | | | | 27,435 | |
| | | | | | | | |
| | | | | | | | 655,775 | |
Hong Kong | | | | | | | | |
CLP Holdings Ltd. | | | 12,500 | | | | 122,007 | |
Hong Kong Exchanges & Clearing Ltd. | | | 4 | | | | 97 | |
Hopewell Holdings Ltd. | | | 8,500 | | | | 30,350 | |
Johnson Electric Holdings Ltd. | | | 500 | | | | 1,331 | |
New World Development Co. Ltd. | | | 13,000 | | | | 14,999 | |
Sun Hung Kai Properties Ltd. | | | 5,000 | | | | 68,805 | |
Texwinca Holdings Ltd. | | | 18,000 | | | | 11,533 | |
| | | | | | | | |
| | | | | | | | 249,122 | |
Ireland | | | | | | | | |
CRH PLC | | | 317 | | | | 10,995 | |
Italy | | | | | | | | |
Atlantia SpA | | | 2,193 | | | | 49,978 | |
Japan | | | | | | | | |
Amada Holdings Co. Ltd. | | | 1,000 | | | | 11,754 | |
Asahi Glass Co. Ltd. | | | 1,000 | | | | 7,430 | |
Astellas Pharma, Inc. | | | 8,000 | | | | 107,374 | |
Bridgestone Corp. | | | 1,500 | | | | 55,014 | |
Citizen Holdings Co. Ltd. | | | 2,000 | | | | 12,420 | |
Daicel Corp. | | | 1,900 | | | | 21,010 | |
Daido Steel Co. Ltd. | | | 1,000 | | | | 4,541 | |
DIC Corp. | | | 2,000 | | | | 61,934 | |
FANUC Corp. | | | 600 | | | | 117,796 | |
Hitachi Ltd. | | | 9,000 | | | | 51,529 | |
Inpex Corp. | | | 400 | | | | 3,925 | |
ITOCHU Corp. | | | 1,000 | | | | 13,776 | |
Japan Airlines Co. Ltd. | | | 400 | | | | 12,737 | |
Japan Steel Works Ltd. | | | 1,200 | | | | 22,532 | |
JTEKT Corp. | | | 1,000 | | | | 16,424 | |
Kao Corp. | | | 500 | | | | 24,742 | |
Komatsu Ltd. | | | 2,700 | | | | 63,932 | |
Lintec Corp. | | | 400 | | | | 8,952 | |
MISUMI Group, Inc. | | | 400 | | | | 7,473 | |
Mitsubishi Chemical Holdings Corp. | | | 23,400 | | | | 163,214 | |
Mitsubishi Materials Corp. | | | 700 | | | | 23,888 | |
Mitsui Chemicals, Inc. | | | 4,000 | | | | 18,810 | |
Mitsui Engineering & Shipbuilding Co. Ltd. | | | 1,000 | | | | 1,618 | |
NSK Ltd. | | | 100 | | | | 1,214 | |
Panasonic Corp. | | | 400 | | | | 4,162 | |
Penta-Ocean Construction Co. Ltd. | | | 5,200 | | | | 25,389 | |
Sumitomo Chemical Co. Ltd. | | | 7,000 | | | | 37,296 | |
Sumitomo Corp. | | | 2,000 | | | | 25,072 | |
Teijin Ltd. | | | 2,400 | | | | 50,656 | |
Tokai Rika Co. Ltd. | | | 300 | | | | 5,971 | |
TonenGeneral Sekiyu KK | | | 18,000 | | | | 211,682 | |
TS Tech Co. Ltd. | | | 300 | | | | 7,656 | |
Zeon Corp. | | | 1,000 | | | | 11,475 | |
| | | | | | | | |
| | | | | | | | 1,213,398 | |
Netherlands | | | | | | | | |
Akzo Nobel NV | | | 771 | | | | 52,324 | |
ASM International NV | | | 668 | | | | 32,935 | |
Koninklijke DSM NV | | | 1,445 | | | | 92,119 | |
| | | | | | | | |
| | | | | | | | 177,378 | |
See Notes to Financial Statements.
| | | | | | |
| | | | | | | |
| 24 | | BLACKROCK FUNDS | | JANUARY 31, 2017 | | |
| | |
Schedule of Investments (continued) | | BlackRock Emerging Markets Long/Short Equity Fund |
| | | | | | | | |
| | | Shares | | | Value | |
| Reference Entity — Long (continued) | | | | | | |
Norway | | | | | | | | |
Seadrill Ltd. | | | 919 | | | $ | 1,800 | |
Subsea 7 SA | | | 5,627 | | | | 76,570 | |
| | | | | | | | |
| | | | | | | | 78,370 | |
Portugal | | | | | | | | |
Jeronimo Martins SGPS SA | | | 610 | | | | 10,325 | |
Singapore | | | | | | | | |
Hutchison Port Holdings Trust | | | 25,700 | | | | 10,931 | |
Venture Corp. Ltd. | | | 9,300 | | | | 67,277 | |
| | | | | | | | |
| | | | | | | | 78,208 | |
Spain | | | | | | | | |
ACS Actividades de Construccion y Servicios SA | | | 7,160 | | | | 114,891 | |
Sweden | | | | | | | | |
Atlas Copco AB, A Shares | | | 4,524 | | | | 145,093 | |
Atlas Copco AB, B Shares | | | 95 | | | | 2,755 | |
Electrolux AB, Class B | | | 8,786 | | | | 233,629 | |
Saab AB | | | 745 | | | | 30,424 | |
Securitas AB, Class B | | | 856 | | | | 13,631 | |
| | | | | | | | |
| | | | | | | | 425,532 | |
Switzerland | | | | | | | | |
Coca-Cola HBC AG | | | 2,868 | | | | 65,557 | |
Georg Fischer AG, Registered Shares | | | 134 | | | | 110,434 | |
Glencore PLC | | | 9,283 | | | | 38,447 | |
IWG PLC | | | 8,800 | | | | 27,723 | |
Logitech International SA, Registered Shares | | | 1,370 | | | | 39,237 | |
Lonza Group AG, Registered Shares | | | 280 | | | | 51,441 | |
Schindler Holding AG, Participation Certificates | | | 283 | | | | 53,945 | |
Straumann Holding AG, Registered Shares | | | 539 | | | | 217,522 | |
TE Connectivity Ltd. | | | 1,067 | | | | 79,332 | |
| | | | | | | | |
| | | | | | | | 683,638 | |
United Kingdom | | | | | | | | |
Anglo American PLC | | | 519 | | | | 8,947 | |
British American Tobacco PLC | | | 1,051 | | | | 64,876 | |
Croda International PLC | | | 14 | | | | 591 | |
Inchcape PLC | | | 6,848 | | | | 61,980 | |
Intertek Group PLC | | | 4,833 | | | | 206,884 | |
Rolls-Royce Holdings PLC | | | 8,120 | | | | 68,392 | |
Spirax-Sarco Engineering PLC | | | 3,460 | | | | 187,930 | |
UBM PLC | | | 7,195 | | | | 63,933 | |
| | | | | | | | |
| | | | | | | | 663,533 | |
United States | | | | | | | | |
Agilent Technologies, Inc. | | | 2,003 | | | | 98,087 | |
Amphenol Corp., Class A | | | 533 | | | | 35,972 | |
Analog Devices, Inc. | | | 1,236 | | | | 92,626 | |
Applied Materials, Inc. | | | 4,354 | | | | 149,125 | |
Archer-Daniels-Midland Co. | | | 3,671 | | | | 162,478 | |
Baker Hughes, Inc. | | | 930 | | | | 58,664 | |
Baxter International, Inc. | | | 2,457 | | | | 117,715 | |
Boeing Co. | | | 123 | | | | 20,101 | |
Bristol-Myers Squibb Co. | | | 157 | | | | 7,718 | |
C.R. Bard, Inc. | | | 547 | | | | 129,820 | |
Cabot Corp. | | | 1,873 | | | | 103,708 | |
CBS Corp., Class B | | | 2,152 | | | | 138,782 | |
Celanese Corp., Series A | | | 456 | | | | 38,486 | |
Citrix Systems, Inc. | | | 653 | | | | 59,547 | |
Diamond Offshore Drilling, Inc. | | | 2,458 | | | | 40,262 | |
Dril-Quip, Inc. | | | 348 | | | | 21,646 | |
Eastman Chemical Co. | | | 563 | | | | 43,633 | |
Energen Corp. | | | 36 | | | | 1,940 | |
Expeditors International of Washington, Inc. | | | 279 | | | | 14,530 | |
F5 Networks, Inc. | | | 51 | | | | 6,836 | |
Fluor Corp. | | | 388 | | | | 21,534 | |
| | | | | | | | |
| | | Shares | | | Value | |
| Reference Entity — Long (continued) | | | | | | |
United States (continued) | | | | | | | | |
Hasbro, Inc. | | | 1,873 | | | $ | 154,541 | |
Hawaiian Holdings, Inc. | | | 140 | | | | 7,133 | |
Hormel Foods Corp. | | | 838 | | | | 30,419 | |
HP, Inc. | | | 8,222 | | | | 123,741 | |
Ingersoll-Rand PLC | | | 1,635 | | | | 129,737 | |
Ingredion, Inc. | | | 419 | | | | 53,712 | |
International Paper Co. | | | 77 | | | | 4,358 | |
Kellogg Co. | | | 806 | | | | 58,604 | |
Lear Corp. | | | 931 | | | | 132,286 | |
McCormick & Co., Inc. | | | 325 | | | | 31,054 | |
Newmont Mining Corp. | | | 194 | | | | 7,038 | |
Occidental Petroleum Corp. | | | 1,098 | | | | 74,411 | |
Penske Automotive Group, Inc. | | | 158 | | | | 8,589 | |
Praxair, Inc. | | | 1,053 | | | | 124,717 | |
Teradata Corp. | | | 578 | | | | 16,970 | |
Texas Instruments, Inc. | | | 2,225 | | | | 168,077 | |
VeriSign, Inc. | | | 904 | | | | 72,510 | |
VMware, Inc., Class A | | | 211 | | | | 18,471 | |
Xerox Corp. | | | 8,034 | | | | 55,676 | |
Xilinx, Inc. | | | 3,742 | | | | 217,784 | |
| | | | | | | | |
| | | | | | | | 2,853,038 | |
| Total Reference Entity — Long | | | | 9,001,766 | |
| | | | | | | | |
| | | | | | | | | |
| | |
| Reference Entity — Short | | | | | | |
Australia | | | | | | | | |
ALS Ltd. | | | (6,833 | ) | | | (30,715 | ) |
Brambles Ltd. | | | (653 | ) | | | (5,161 | ) |
Iluka Resources Ltd. | | | (1,143 | ) | | | (6,560 | ) |
Incitec Pivot Ltd. | | | (23,450 | ) | | | (68,535 | ) |
OceanaGold Corp. | | | (14,047 | ) | | | (48,793 | ) |
| | | | | | | | |
| | | | | | | | (159,764 | ) |
Canada | | | | | | | | |
Agrium, Inc. | | | (285 | ) | | | (29,353 | ) |
BlackBerry Ltd. | | | (3,436 | ) | | | (24,240 | ) |
Brookfield Asset Management, Inc., Class A | | | (1,418 | ) | | | (49,037 | ) |
Centerra Gold, Inc. | | | (563 | ) | | | (2,782 | ) |
Methanex Corp. | | | (643 | ) | | | (32,149 | ) |
Parex Resources, Inc. | | | (8,414 | ) | | | (97,897 | ) |
| | | | | | | | |
| | | | | | | | (235,458 | ) |
Denmark | | | | | | | | |
AP Moeller — Maersk A/S | | | (13 | ) | | | (20,814 | ) |
FLSmidth & Co. A/S | | | (83 | ) | | | (3,863 | ) |
NKT Holding A/S | | | (33 | ) | | | (2,551 | ) |
Novozymes A/S, B Shares | | | (1,938 | ) | | | (75,543 | ) |
| | | | | | | | |
| | | | | | | | (102,771 | ) |
France | | | | | | | | |
Accor SA | | | (256 | ) | | | (10,375 | ) |
Air Liquide SA | | | (832 | ) | | | (89,826 | ) |
Airbus Group SE | | | (1,835 | ) | | | (124,385 | ) |
Bollore SA | | | (38,035 | ) | | | (152,129 | ) |
Bureau Veritas SA | | | (14,461 | ) | | | (283,197 | ) |
Eutelsat Communications SA | | | (1,230 | ) | | | (20,980 | ) |
Ingenico Group SA | | | (650 | ) | | | (54,812 | ) |
JCDecaux SA | | | (1,572 | ) | | | (50,324 | ) |
Pernod Ricard SA | | | (324 | ) | | | (37,899 | ) |
Suez Environnement Co. | | | (5,067 | ) | | | (76,753 | ) |
| | | | | | | | |
| | | | | | | | (900,680 | ) |
Germany | | | | | | | | |
Axel Springer SE | | | (1,695 | ) | | | (89,344 | ) |
See Notes to Financial Statements.
| | | | | | |
| | | | | | | |
| | BLACKROCK FUNDS | | JANUARY 31, 2017 | | 25 |
| | |
Schedule of Investments (continued) | | BlackRock Emerging Markets Long/Short Equity Fund |
| | | | | | | | |
| | | Shares | | | Value | |
| Reference Entity — Short (continued) | | | | | | |
Germany (continued) | | | | | | | | |
Bayerische Motoren Werke AG | | | (755 | ) | | $ | (56,719 | ) |
Fraport AG Frankfurt Airport Services Worldwide | | | (3 | ) | | | (179 | ) |
GEA Group AG | | | (4,958 | ) | | | (205,445 | ) |
HeidelbergCement AG | | | (931 | ) | | | (89,938 | ) |
Hella KGaA Hueck & Co. | | | (1,159 | ) | | | (47,372 | ) |
K+S AG | | | (1,728 | ) | | | (43,897 | ) |
Rational AG | | | (6 | ) | | | (2,724 | ) |
Symrise AG | | | (4,071 | ) | | | (245,125 | ) |
Volkswagen AG | | | (1,389 | ) | | | (217,648 | ) |
| | | | | | | | |
| | | | | | | | (998,391 | ) |
Hong Kong | | | | | | | | |
Bank of East Asia Ltd. | | | (400 | ) | | | (1,704 | ) |
Cathay Pacific Airways Ltd. | | | (6,000 | ) | | | (8,126 | ) |
Hong Kong & China Gas Co. Ltd. | | | (100 | ) | | | (188 | ) |
Hong Kong Exchanges and Clearing Ltd. | | | (4 | ) | | | (97 | ) |
Jardine Strategic Holdings Ltd. | | | (800 | ) | | | (30,489 | ) |
Shun Tak Holdings Ltd. | | | (4,000 | ) | | | (1,382 | ) |
| | | | | | | | |
| | | | | | | | (41,986 | ) |
Ireland | | | | | | | | |
Adient PLC | | | (179 | ) | | | (11,365 | ) |
Italy | | | | | | | | |
Finmeccanica SpA | | | (10,859 | ) | | | (139,901 | ) |
Japan | | | | | | | | |
Ajinomoto Co., Inc. | | | (600 | ) | | | (11,843 | ) |
Alps Electric Co. Ltd. | | | (1,500 | ) | | | (39,954 | ) |
Asahi Intecc Co. Ltd. | | | (200 | ) | | | (8,139 | ) |
Asics Corp. | | | (700 | ) | | | (13,636 | ) |
Brother Industries Ltd. | | | (900 | ) | | | (16,612 | ) |
Calsonic Kansei Corp. | | | (2,000 | ) | | | (31,795 | ) |
Casio Computer Co. Ltd. | | | (800 | ) | | | (11,054 | ) |
Daifuku Co. Ltd. | | | (1,400 | ) | | | (30,949 | ) |
Daikin Industries Ltd. | | | (400 | ) | | | (39,705 | ) |
Eisai Co. Ltd. | | | (500 | ) | | | (27,560 | ) |
Hitachi Kokusai Electric, Inc. | | | (800 | ) | | | (17,967 | ) |
Isuzu Motors Ltd. | | | (5,100 | ) | | | (68,431 | ) |
JGC Corp. | | | (3,600 | ) | | | (62,494 | ) |
Kansai Paint Co. Ltd. | | | (100 | ) | | | (1,943 | ) |
Kawasaki Kisen Kaisha Ltd. | | | (3,000 | ) | | | (7,295 | ) |
Kirin Holdings Co. Ltd. | | | (6,200 | ) | | | (101,592 | ) |
Koito Manufacturing Co. Ltd. | | | (1,500 | ) | | | (79,568 | ) |
Konica Minolta, Inc. | | | (700 | ) | | | (7,251 | ) |
Kyocera Corp. | | | (400 | ) | | | (20,824 | ) |
Nippon Kayaku Co. Ltd. | | | (6,000 | ) | | | (78,417 | ) |
Nippon Paint Co. Ltd. | | | (1,000 | ) | | | (29,170 | ) |
Nippon Steel & Sumitomo Metal Corp. | | | (800 | ) | | | (19,326 | ) |
Nissan Chemical Industries Ltd. | | | (200 | ) | | | (7,141 | ) |
Omron Corp. | | | (700 | ) | | | (28,720 | ) |
Pilot Corp. | | | (100 | ) | | | (4,058 | ) |
Rinnai Corp. | | | (200 | ) | | | (16,996 | ) |
Shimano, Inc. | | | (200 | ) | | | (31,538 | ) |
Shiseido Co. Ltd. | | | (1,100 | ) | | | (30,744 | ) |
Stanley Electric Co. Ltd. | | | (500 | ) | | | (14,086 | ) |
Sumitomo Electric Industries Ltd. | | | (1,700 | ) | | | (24,736 | ) |
TDK Corp. | | | (600 | ) | | | (43,126 | ) |
Terumo Corp. | | | (2,700 | ) | | | (99,883 | ) |
Tokyo Ohka Kogyo Co. Ltd. | | | (100 | ) | | | (3,573 | ) |
Topcon Corp. | | | (100 | ) | | | (1,533 | ) |
Unicharm Corp. | | | (2,000 | ) | | | (45,044 | ) |
Yakult Honsha Co. Ltd. | | | (200 | ) | | | (10,278 | ) |
Yokohama Rubber Co. Ltd. | | | (1,000 | ) | | | (17,587 | ) |
| | | | | | | | |
| | | | | | | | (1,104,568 | ) |
| | | | | | | | |
| | | Shares | | | Value | |
| Reference Entity — Short (continued) | | | | | | |
Netherlands | | | | | | | | |
Koninklijke Boskalis Westminster NV | | | (5,324 | ) | | $ | (196,977 | ) |
Royal Dutch Shell PLC, A Shares | | | (5,577 | ) | | | (151,257 | ) |
Royal Dutch Shell PLC, B Shares | | | (2,930 | ) | | | (82,756 | ) |
SBM Offshore NV | | | (7,869 | ) | | | (128,008 | ) |
| | | | | | | | |
| | | | | | | | (558,998 | ) |
Norway | | | | | | | | |
DNO ASA | | | (11,708 | ) | | | (12,254 | ) |
Norwegian Air Shuttle ASA | | | (643 | ) | | | (20,991 | ) |
Yara International ASA | | | (664 | ) | | | (27,998 | ) |
| | | | | | | | |
| | | | | | | | (61,243 | ) |
Singapore | | | | | | | | |
UOL Group Ltd. | | | (1,300 | ) | | | (5,888 | ) |
Wing Tai Holdings Ltd. | | | (2,500 | ) | | | (3,083 | ) |
| | | | | | | | |
| | | | | | | | (8,971 | ) |
Spain | | | | | | | | |
Atlantica Yield PLC | | | (93 | ) | | | (1,990 | ) |
Ferrovial SA | | | (7,759 | ) | | | (140,844 | ) |
Tecnicas Reunidas SA | | | (450 | ) | | | (17,868 | ) |
Viscofan SA | | | (150 | ) | | | (7,628 | ) |
| | | | | | | | |
| | | | | | | | (168,330 | ) |
Sweden | | | | | | | | |
Alfa Laval AB | | | (10,134 | ) | | | (189,467 | ) |
Autoliv, Inc. | | | (2,385 | ) | | | (275,849 | ) |
Hexagon AB, B Shares | | | (449 | ) | | | (17,761 | ) |
| | | | | | | | |
| | | | | | | | (483,077 | ) |
Switzerland | | | | | | | | |
Chocoladefabriken Lindt & Spruengli AG | | | (22 | ) | | | (240,725 | ) |
Cie Financiere Richemont SA | | | (1,696 | ) | | | (132,084 | ) |
Dufry AG | | | (1,349 | ) | | | (192,579 | ) |
OC Oerlikon Corp. AG | | | (793 | ) | | | (8,996 | ) |
Sonova Holding AG | | | (133 | ) | | | (17,610 | ) |
Swatch Group AG | | | (603 | ) | | | (54,651 | ) |
U-Blox Holding AG | | | (8 | ) | | | (1,444 | ) |
| | | | | | | | |
| | | | | | | | (648,089 | ) |
United Kingdom | | | | | | | | |
Capita PLC | | | (3,537 | ) | | | (22,315 | ) |
HSBC Holdings PLC | | | (17,676 | ) | | | (150,792 | ) |
John Wood Group PLC | | | (3,124 | ) | | | (33,049 | ) |
Kazakhmys PLC | | | (1,222 | ) | | | (7,251 | ) |
Micro Focus International PLC | | | (3,537 | ) | | | (95,675 | ) |
Next PLC | | | (1,793 | ) | | | (86,514 | ) |
Rio Tinto PLC | | | (1,047 | ) | | | (46,385 | ) |
Rolls-Royce Holdings PLC | | | (56,693 | ) | | | (71 | ) |
RPC Group PLC | | | (848 | ) | | | (11,452 | ) |
WS Atkins PLC | | | (2,333 | ) | | | (43,025 | ) |
| | | | | | | | |
| | | | | | | | (496,529 | ) |
United States | | | | | | | | |
Advanced Micro Devices, Inc. | | | (1,638 | ) | | | (16,986 | ) |
ANSYS, Inc. | | | (300 | ) | | | (27,978 | ) |
Ashland Global Holdings, Inc. | | | (65 | ) | | | (7,737 | ) |
Avnet, Inc. | | | (248 | ) | | | (11,517 | ) |
Axalta Coating Systems Ltd. | | | (8,008 | ) | | | (232,232 | ) |
Ball Corp. | | | (3,842 | ) | | | (292,991 | ) |
Bio-Rad Laboratories, Inc. | | | (632 | ) | | | (120,131 | ) |
Cavium, Inc. | | | (1,684 | ) | | | (111,498 | ) |
CF Industries Holdings, Inc. | | | (1,932 | ) | | | (68,180 | ) |
Chemours Co. | | | (1,335 | ) | | | (35,271 | ) |
Cheniere Energy, Inc. | | | (260 | ) | | | (12,389 | ) |
Cigna Corp. | | | (238 | ) | | | (34,800 | ) |
Cirrus Logic, Inc. | | | (410 | ) | | | (24,731 | ) |
See Notes to Financial Statements.
| | | | | | |
| | | | | | | |
| 26 | | BLACKROCK FUNDS | | JANUARY 31, 2017 | | |
| | |
Schedule of Investments (continued) | | BlackRock Emerging Markets Long/Short Equity Fund |
| | | | | | | | |
| | | Shares | | | Value | |
| Reference Entity — Short (continued) | | | | | | |
United States (continued) | | | | | | | | |
Coty, Inc., Class A | | | (2,876 | ) | | $ | (55,219 | ) |
Cypress Semiconductor Corp. | | | (1,011 | ) | | | (11,930 | ) |
Dentsply Sirona, Inc. | | | (3,369 | ) | | | (191,022 | ) |
Diebold, Inc. | | | (961 | ) | | | (26,139 | ) |
EI du Pont de Nemours & Co. | | | (172 | ) | | | (12,986 | ) |
Exxon Mobil Corp. | | | (252 | ) | | | (21,140 | ) |
Facebook, Inc. | | | (63 | ) | | | (8,210 | ) |
Flowserve Corp. | | | (1,375 | ) | | | (67,595 | ) |
FMC Corp. | | | (440 | ) | | | (26,470 | ) |
General Electric Co. | | | (2,637 | ) | | | (78,319 | ) |
Goldman Sachs Group, Inc. | | | (336 | ) | | | (77,052 | ) |
Halliburton Co. | | | (185 | ) | | | (10,466 | ) |
Hecla Mining Co. | | | (2,320 | ) | | | (14,941 | ) |
Illumina, Inc. | | | (822 | ) | | | (131,602 | ) |
Integrated Device Technology, Inc. | | | (1,612 | ) | | | (40,606 | ) |
John Bean Technologies Corp. | | | (125 | ) | | | (10,794 | ) |
Keysight Technologies, Inc. | | | (1,024 | ) | | | (37,960 | ) |
Lumentum Holdings, Inc. | | | (698 | ) | | | (26,489 | ) |
M/A-COM Technology Solutions Holdings, Inc. | | | (20 | ) | | | (951 | ) |
Mattel, Inc. | | | (221 | ) | | | (5,792 | ) |
Microsemi Corp. | | | (1,716 | ) | | | (91,205 | ) |
Mondelez International, Inc. | | | (1,354 | ) | | | (59,955 | ) |
Newell Rubbermaid, Inc. | | | (1,814 | ) | | | (85,857 | ) |
PerkinElmer, Inc. | | | (1,252 | ) | | | (66,594 | ) |
PTC, Inc. | | | (30 | ) | | | (1,577 | ) |
Symantec Corp. | | | (4,618 | ) | | | (127,226 | ) |
Terex Corp. | | | (700 | ) | | | (22,260 | ) |
Textron, Inc. | | | (814 | ) | | | (38,559 | ) |
Total System Services, Inc. | | | (4,338 | ) | | | (219,850 | ) |
Trimble Navigation Ltd. | | | (1,329 | ) | | | (39,365 | ) |
Verint Systems, Inc. | | | (94 | ) | | | (3,511 | ) |
WABCO Holdings, Inc. | | | (707 | ) | | | (77,084 | ) |
Western Digital Corp. | | | (592 | ) | | | (47,200 | ) |
Zebra Technologies Corp., Class A | | | (195 | ) | | | (16,316 | ) |
Zimmer Biomet Holdings, Inc. | | | (1,527 | ) | | | (180,690 | ) |
| | | | | | | | |
| | | | | | | | (2,929,373 | ) |
| Total Reference Entity — Short | | | | | | | (9,049,494 | ) |
| Net Value of Reference Entity — UBS AG | | | | | | | (47,728 | ) |
| | | | | | | | |
| | | | | | | | | |
|
| The following table represents the individual long and short positions and related values of equity securities underlying the total return swap with UBS AG as of January 31, 2017, expiration date 5/19/17: | |
| | |
| Reference Entity — Long | | | | | | |
Brazil | | | | | | | | |
Banco Bradesco SA, Preference Shares | | | 26,900 | | | | 279,150 | |
Braskem SA — ADR | | | 1,188 | | | | 24,580 | |
Cia de Saneamento Basico do Estado de Sao
Paulo — ADR | | | 16,859 | | | | 167,916 | |
Cia Energetica de Sao Paulo, Preference ‘B’ Shares | | | 182 | | | | 1,005 | |
Companhia de Saneamento Basico do Estado de Sao Paulo | | | 5,200 | | | | 51,734 | |
Engie Brasil Energia SA | | | 38,400 | | | | 436,267 | |
Hypermarcas SA | | | 100,900 | | | | 894,975 | |
Itau Unibanco Holding SA, Preference Shares | | | 85,700 | | | | 1,012,811 | |
Itau Unibanco Holding SA, Preference Shares — ADR | | | 109,330 | | | | 1,291,187 | |
JBS SA | | | 64,800 | | | | 244,714 | |
Localiza Rent a Car SA | | | 53,200 | | | | 622,138 | |
M Dias Branco SA | | | 4,700 | | | | 184,832 | |
Magazine Luiza SA | | | 4,400 | | | | 178,717 | |
Marfrig Global Foods SA | | | 35,800 | | | | 73,393 | |
Qualicorp SA | | | 27,600 | | | | 180,520 | |
| | | | | | | | |
| | | Shares | | | Value | |
| Reference Entity — Long (continued) | | | | | | |
Brazil (continued) | | | | | | | | |
Smiles SA | | | 1,400 | | | $ | 23,103 | |
Tim Participacoes SA | | | 17,100 | | | | 48,569 | |
Tim Participacoes SA — ADR | | | 3,419 | | | | 48,310 | |
Ultrapar Participacoes SA | | | 2,500 | | | | 52,490 | |
| | | | | | | | |
| | | | | | | | 5,816,411 | |
Chile | | | | | | | | |
Empresa Nacional de Electricidad SA | | | 962,959 | | | | 618,628 | |
Empresa Nacional de Electricidad SA — ADR | | | 10,480 | | | | 203,102 | |
Enersis SA | | | 3,559,779 | | | | 637,174 | |
| | | | | | | | |
| | | | | | | | 1,458,904 | |
China | | | | | | | | |
Anhui Expressway Co. Ltd., Class H | | | 134,000 | | | | 99,485 | |
Bank of China Ltd., Class H | | | 500,000 | | | | 226,458 | |
China Biologic Products, Inc. | | | 768 | | | | 87,506 | |
China Cinda Asset Management Co. Ltd., Class H | | | 206,000 | | | | 71,366 | |
China Communications Services Corp. Ltd., Class H | | | 934,000 | | | | 634,906 | |
China Lesso Group Holdings Ltd. | | | 156,000 | | | | 106,369 | |
China Merchants Bank Co. Ltd., Class H | | | 94,000 | | | | 235,410 | |
China Pacific Insurance Group Co. Ltd., Class H | | | 55,600 | | | | 197,492 | |
China Petroleum & Chemical Corp. — ADR | | | 6,386 | | | | 511,135 | |
China Petroleum & Chemical Corp., Class H | | | 716,000 | | | | 565,587 | |
China Railway Construction Corp. Ltd., Class H | | | 166,500 | | | | 231,019 | |
China Railway Group Ltd., Class H | | | 272,000 | | | | 238,085 | |
China Shipping Development Co. Ltd. | | | 166,000 | | | | 91,750 | |
CNOOC Ltd. | | | 12,000 | | | | 14,985 | |
Datang International Power Generation Co. Ltd., Class H | | | 276,000 | | | | 71,566 | |
Dongfang Electric Corp. Ltd. | | | 14,600 | | | | 14,722 | |
Great Wall Motor Co. Ltd., Class H | | | 215,500 | | | | 215,927 | |
Guangzhou Automobile Group Co. Ltd., Class H | | | 10,000 | | | | 13,638 | |
Guangzhou Baiyunshan Pharmaceutical Holdings Co. Ltd., Class H | | | 146,000 | | | | 357,022 | |
Hengan International Group Co. Ltd. | | | 28,000 | | | | 229,243 | |
Industrial & Commercial Bank of China Ltd., Class H | | | 2,049,000 | | | | 1,252,727 | |
Jiangxi Copper Co. Ltd., Class H | | | 5,000 | | | | 8,635 | |
Lenovo Group Ltd. | | | 320,000 | | | | 209,606 | |
Longfor Properties Co. Ltd. | | | 317,000 | | | | 456,378 | |
Lonking Holdings Ltd. | | | 562,000 | | | | 147,242 | |
Maanshan Iron & Steel | | | 94,000 | | | | 34,447 | |
Metallurgical Corp. of China Ltd. | | | 1,905,000 | | | | 690,718 | |
People’s Insurance Co. Group of China Ltd., Class H | | | 233,000 | | | | 90,759 | |
Ping An Insurance Group Co. of China Ltd., Class H | | | 48,500 | | | | 248,794 | |
Shanghai Pharmaceuticals Holding Co. Ltd., Class H | | | 445,200 | | | | 1,133,818 | |
Sino-Ocean Land Holdings Ltd. | | | 199,000 | | | | 85,704 | |
Sinopec Shanghai Petrochemical Co. Ltd. — ADR | | | 203 | | | | 12,635 | |
Sinopec Shanghai Petrochemical Co. Ltd., Class H | | | 1,062,000 | | | | 657,603 | |
Sinopharm Group Co. Ltd., Class H | | | 232,000 | | | | 1,060,220 | |
Sinotrans Ltd., Class H | | | 73,000 | | | | 30,438 | |
Sohu.com, Inc. | | | 9,088 | | | | 360,521 | |
Tencent Holdings Ltd. | | | 13,400 | | | | 350,348 | |
Tianjin Capital Environmental Protection Group Co. Ltd. | | | 36,000 | | | | 19,351 | |
Tianneng Power International Ltd. | | | 286,000 | | | | 251,847 | |
Weichai Power Co. Ltd., Class H | | | 378,400 | | | | 670,528 | |
Zhejiang Expressway Co. Ltd., Class H | | | 78,000 | | | | 78,346 | |
ZTE Corp., Class H | | | 272,600 | | | | 423,834 | |
| | | | | | | | |
| | | | | | | | 12,488,170 | |
Egypt | | | | | | | | |
Global Telecom Holding — GDR | | | 69,653 | | | | 126,072 | |
Hong Kong | | | | | | | | |
China Mobile Ltd. — ADR | | | 472 | | | | 26,904 | |
China Power International Development Ltd. | | | 178,000 | | | | 64,147 | |
China Resources Cement Holdings Ltd. | | | 694,000 | | | | 321,468 | |
See Notes to Financial Statements.
| | | | | | |
| | | | | | | |
| | BLACKROCK FUNDS | | JANUARY 31, 2017 | | 27 |
| | |
Schedule of Investments (continued) | | BlackRock Emerging Markets Long/Short Equity Fund |
| | | | | | | | |
| | | Shares | | | Value | |
| Reference Entity — Long (continued) | | | | | | |
Hong Kong (continued) | | | | | | | | |
China Resources Land Ltd. | | | 78,000 | | | $ | 192,937 | |
Geely Automobile Holdings Ltd. | | | 555,000 | | | | 655,967 | |
Haier Electronics Group Co. Ltd. | | | 415,000 | | | | 729,987 | |
KWG Property Holding Ltd. | | | 106,000 | | | | 60,913 | |
Nine Dragons Paper Holdings Ltd. | | | 150,000 | | | | 172,640 | |
Shenzhen Investment Ltd. | | | 60,000 | | | | 24,397 | |
Shimao Property Holdings Ltd. | | | 84,500 | | | | 113,202 | |
Yuexiu Property Co. Ltd. | | | 1,082,000 | | | | 158,232 | |
| | | | | | | | |
| | | | | | | | 2,520,794 | |
Hungary | | | | | | | | |
MOL Hungarian Oil & Gas PLC | | | 9,180 | | | | 646,922 | |
Indonesia | | | | | | | | |
Adaro Energy Tbk PT | | | 260,700 | | | | 33,135 | |
Bank Central Asia Tbk PT | | | 245,000 | | | | 280,808 | |
Bank Rakyat Indonesia Persero Tbk PT | | | 135,000 | | | | 118,543 | |
Gudang Garam Tbk PT | | | 18,200 | | | | 84,156 | |
Matahari Department Store Tbk PT | | | 153,800 | | | | 170,269 | |
Telekomunikasi Indonesia Persero Tbk PT | | | 1,677,100 | | | | 486,165 | |
Telekomunikasi Indonesia Persero Tbk PT — ADR | | | 14,361 | | | | 422,501 | |
| | | | | | | | |
| | | | | | | | 1,595,577 | |
Malaysia | | | | | | | | |
Astro Malaysia Holdings Bhd | | | 260,600 | | | | 160,025 | |
Berjaya Sports Toto Bhd | | | 116,600 | | | | 77,128 | |
Genting Malaysia Bhd | | | 291,100 | | | | 331,079 | |
Kuala Lumpur Kepong Bhd | | | 10,100 | | | | 54,958 | |
MISC Bhd | | | 669,700 | | | | 1,106,775 | |
Sime Darby Bhd | | | 270,600 | | | | 544,071 | |
Tenaga Nasional Bhd | | | 121,900 | | | | 368,456 | |
Top Glove Corp. Bhd | | | 108,300 | | | | 127,139 | |
| | | | | | | | |
| | | | | | | | 2,769,631 | |
Mexico — 1.5% | | | | | | | | |
America Movil SAB de C.V., Series L — ADR | | | 40,070 | | | | 505,283 | |
Netherlands | | | | | | | | |
Yandex NV, Class A | | | 8,778 | | | | 203,123 | |
Philippines | | | | | | | | |
Ayala Corp. | | | 5,890 | | | | 94,748 | |
Globe Telecom, Inc. | | | 16,520 | | | | 570,971 | |
Metro Pacific Investments Corp. | | | 4,453,100 | | | | 610,636 | |
| | | | | | | | |
| | | | | | | | 1,276,355 | |
Poland | | | | | | | | |
Grupa Lotos SA | | | 21,173 | | | | 199,535 | |
KGHM Polska Miedz SA | | | 39,782 | | | | 1,233,876 | |
Polski Koncern Naftowy SA | | | 17,433 | | | | 353,781 | |
Polskie Gornictwo Naftowe i Gazownictwo SA | | | 25,509 | | | | 35,030 | |
| | | | | | | | |
| | | | | | | | 1,822,222 | |
Russia | | | | | | | | |
Aeroflot — Russian Airlines OJSC | | | 43,300 | | | | 125,115 | |
Alrosa PJSC | | | 237,800 | | | | 418,928 | |
Lukoil PJSC | | | 771 | | | | 43,410 | |
Lukoil PJSC — ADR | | | 22,907 | | | | 1,290,918 | |
Magnitogorsk Iron & Steel Works OJSC | | | 67,400 | | | | 44,002 | |
Rostelecom PJSC | | | 8,240 | | | | 11,484 | |
Severstal PAO — GDR | | | 18,562 | | | | 294,852 | |
Severstal PJSC | | | 3,790 | | | | 60,384 | |
Sistema PJSC FC — GDR | | | 5,984 | | | | 57,267 | |
Tatneft PAO — ADR | | | 5,363 | | | | 218,634 | |
Tatneft PJSC | | | 12,320 | | | | 83,673 | |
| | | | | | | | |
| | | | | | | | 2,648,667 | |
| | | | | | | | |
| | | Shares | | | Value | |
| Reference Entity — Long (continued) | | | | | | |
South Africa | | | | | | | | |
Anglo American Platinum Ltd. | | | 2,309 | | | $ | 60,450 | |
AVI Ltd. | | | 17,957 | | | | 122,094 | |
Barloworld Ltd. | | | 11,626 | | | | 95,590 | |
Capitec Bank Holdings Ltd. | | | 1,879 | | | | 98,195 | |
Clicks Group Ltd. | | | 16,432 | | | | 148,772 | |
Gold Fields Ltd. — ADR | | | 30,241 | | | | 106,146 | |
Growthpoint Properties Ltd. | | | 151,504 | | | | 296,416 | |
Mondi Ltd. | | | 9,089 | | | | 199,702 | |
Netcare Ltd. | | | 18,407 | | | | 44,272 | |
Pick n Pay Stores Ltd. | | | 37,237 | | | | 188,907 | |
Pioneer Foods Group Ltd. | | | 7,752 | | | | 95,435 | |
Redefine Properties Ltd. | | | 96,634 | | | | 80,053 | |
Sappi Ltd. | | | 69,617 | | | | 447,624 | |
Sibanye Gold Ltd. | | | 66,688 | | | | 150,778 | |
Spar Group Ltd. | | | 9,652 | | | | 136,453 | |
Standard Bank Group Ltd. | | | 20,391 | | | | 218,055 | |
Telkom SA SOC Ltd. | | | 16,497 | | | | 90,408 | |
Tiger Brands Ltd. | | | 2,616 | | | | 78,959 | |
Tsogo Sun Holdings Ltd. | | | 42,885 | | | | 84,156 | |
Vodacom Group Ltd. | | | 37,945 | | | | 425,236 | |
| | | | | | | | |
| | | | | | | | 3,167,701 | |
South Korea | | | | | | | | |
Hyundai Development Co-Engineering & Construction | | | 34,374 | | | | 1,293,394 | |
Hyundai Wia Corp. | | | 3,858 | | | | 214,731 | |
Kia Motors Corp. | | | 25,823 | | | | 809,362 | |
KT Corp. — ADR | | | 101,294 | | | | 1,506,242 | |
LG Electronics, Inc. | | | 3,746 | | | | 179,021 | |
LG Household & Health Care Ltd. | | | 521 | | | | 393,968 | |
LG International Corp. | | | 11,138 | | | | 309,931 | |
LG Uplus Corp. | | | 17,567 | | | | 172,550 | |
Lotte Chemical Corp. | | | 1,320 | | | | 427,757 | |
NAVER Corp. | | | 1,808 | | | | 1,181,010 | |
Poongsan Corp. | | | 30,239 | | | | 1,133,055 | |
POSCO | | | 312 | | | | 72,922 | |
POSCO — ADR | | | 8,205 | | | | 474,905 | |
Posco ICT Co. Ltd. | | | 1 | | | | 5 | |
S&T Motiv Co. Ltd. | | | 2,578 | | | | 101,003 | |
Samsung Electronics Co. Ltd. | | | 366 | | | | 622,484 | |
Shinhan Financial Group Co. Ltd. — ADR | | | 1,971 | | | | 77,933 | |
SK Hynix, Inc. | | | 26,729 | | | | 1,234,449 | |
SK Networks Co. Ltd. | | | 21,796 | | | | 124,146 | |
| | | | | | | | |
| | | | | | | | 10,328,868 | |
Taiwan | | | | | | | | |
AU Optronics Corp. | | | 422,000 | | | | 174,740 | |
China Life Insurance Co. Ltd. | | | 26,000 | | | | 25,446 | |
Elite Advanced Laser Corp. | | | 23,640 | | | | 94,079 | |
Formosa Chemicals & Fibre Corp. | | | 60,000 | | | | 185,996 | |
Formosa Petrochemical Corp. | | | 177,000 | | | | 604,627 | |
Foxconn Technology Co. Ltd. | | | 470,182 | | | | 1,327,019 | |
Fubon Financial Holding Co. Ltd. | | | 477,000 | | | | 775,244 | |
Hon Hai Precision Industry Co. Ltd. | | | 112,320 | | | | 301,217 | |
Hon Hai Precision Industry Co. Ltd. — GDR | | | 76,772 | | | | 403,821 | |
Lite-On Technology Corp. | | | 227,128 | | | | 343,065 | |
MediaTek, Inc. | | | 40,000 | | | | 273,844 | |
Novatek Microelectronics Corp. | | | 55,000 | | | | 194,805 | |
Pegatron Corp. | | | 70,000 | | | | 168,566 | |
Sitronix Technology Corp. | | | 336,000 | | | | 1,013,023 | |
Taiwan Semiconductor Manufacturing Co. Ltd. — ADR | | | 12,290 | | | | 379,884 | |
Uni-President Enterprises Corp. | | | 149,000 | | | | 255,602 | |
Yuanta Financial Holding Co. Ltd. | | | 166 | | | | 66 | |
| | | | | | | | |
| | | | | | | | 6,521,044 | |
See Notes to Financial Statements.
| | | | | | |
| | | | | | | |
| 28 | | BLACKROCK FUNDS | | JANUARY 31, 2017 | | |
| | |
Schedule of Investments (continued) | | BlackRock Emerging Markets Long/Short Equity Fund |
| | | | | | | | |
| | | Shares | | | Value | |
| Reference Entity — Long (continued) | | | | | | |
Thailand | | | | | | | | |
Bangkok Chain Hospital PCL | | | 712,200 | | | $ | 299,363 | |
CP ALL PCL | | | 302,800 | | | | 520,290 | |
Glow Energy PCL, Foreign Registered Shares | | | 266,700 | | | | 590,815 | |
Indorama Ventures PCL | | | 156,800 | | | | 155,865 | |
Kiatnakin Bank PCL | | | 235,400 | | | | 381,079 | |
PTT Exploration & Production PCL, Foreign Registered Shares | | | 341,300 | | | | 949,940 | |
PTT Global Chemical PCL, Foreign Registered Shares | | | 115,800 | | | | 222,819 | |
Thai Oil PCL — NVDR | | | 72,300 | | | | 147,331 | |
Thanachart Capital PCL | | | 251,900 | | | | 339,825 | |
| | | | | | | | |
| | | | | | | | 3,607,327 | |
Turkey | | | | | | | | |
Arcelik AS | | | 365,512 | | | | 2,217,002 | |
Eregli Demir ve Celik Fabrikalari TAS | | | 362,300 | | | | 558,270 | |
Haci Omer Sabanci Holding AS | | | 39,602 | | | | 104,859 | |
KOC Holding AS | | | 105,005 | | | | 422,992 | |
TAV Havalimanlari Holding AS | | | 58,702 | | | | 241,599 | |
Turkiye Is Bankasi, Class C | | | 457,894 | | | | 723,780 | |
Turkiye Sise ve Cam Fabrikalari AS | | | 17,298 | | | | 18,540 | |
Yapi ve Kredi Bankasi | | | 482,948 | | | | 490,648 | |
| | | | | | | | |
| | | | | | | | 4,777,690 | |
United Arab Emirates | | | | | | | | |
Aldar Properties PJSC | | | 273,141 | | | | 190,226 | |
Emaar Properties PJSC | | | 98,381 | | | | 198,815 | |
| | | | | | | | |
| | | | | | | | 389,041 | |
United Kingdom | | | | | | | | |
Anglo American PLC | | | 17,315 | | | | 298,542 | |
United States | | | | | | | | |
Genpact Ltd. | | | 43,676 | | | | 1,077,924 | |
| Total Reference Entity — Long | | | | 64,046,268 | |
| | | | | | | | |
| | | | | | | | | |
|
| Reference Entity — Short | |
Brazil | | | | | | | | |
BRF SA — ADR | | | (3,178 | ) | | | (44,905 | ) |
Cielo SA | | | (19,400 | ) | | | (163,088 | ) |
Embraer SA — ADR | | | (3,173 | ) | | | (72,535 | ) |
Fibria Celulose SA — ADR | | | (62,961 | ) | | | (580,500 | ) |
Gerdau SA — ADR | | | (67,667 | ) | | | (259,165 | ) |
Itausa — Investimentos Itau SA | | | (26,200 | ) | | | (77,159 | ) |
Klabin SA | | | (47,800 | ) | | | (246,349 | ) |
Rumo Logistica Operadora Multimodal SA | | | (64,600 | ) | | | (153,756 | ) |
WEG SA | | | (87,800 | ) | | | (443,305 | ) |
| | | | | | | | |
| | | | | | | | (2,040,762 | ) |
Chile | | | | | | | | |
Cia Cervecerias Unidas SA — ADR | | | (21,452 | ) | | | (484,601 | ) |
China | | | | | | | | |
58.com, Inc. — ADR | | | (55,750 | ) | | | (1,626,785 | ) |
CGN Power Co. Ltd. | | | (96,000 | ) | | | (27,070 | ) |
China Medical System Holdings Ltd. | | | (3,000 | ) | | | (4,889 | ) |
China National Building Material Co. Ltd., Class H | | | (764,000 | ) | | | (446,807 | ) |
China Oilfield Services Ltd. | | | (4,000 | ) | | | (4,267 | ) |
China Shanshui Cement Group Ltd. | | | (2,538,622 | ) | | | (163,594 | ) |
Ctrip.com International Ltd. — ADR | | | (44,930 | ) | | | (1,941,425 | ) |
Fosun International Ltd. | | | (496,972 | ) | | | (754,271 | ) |
Hollysys Automation Technologies Ltd. | | | (1,934 | ) | | | (32,685 | ) |
Huaneng Renewables Corp. Ltd. | | | (34,000 | ) | | | (10,552 | ) |
Semiconductor Manufacturing International Corp. | | | (100 | ) | | | (137 | ) |
Sichuan Expressway Co. Ltd. | | | (88,000 | ) | | | (33,520 | ) |
SOHO China Ltd. | | | (53,500 | ) | | | (27,066 | ) |
| | | | | | | | |
| | | Shares | | | Value | |
| Reference Entity — Short (continued) | | | | | | |
China (continued) | | | | | | | | |
Sunac China Holdings Ltd. | | | (57,000 | ) | | $ | (50,635 | ) |
TAL Education Group — ADR | | | (23,622 | ) | | | (1,913,146 | ) |
Zhuzhou CSR Times Electric Co. Ltd. | | | (12,000 | ) | | | (68,370 | ) |
| | | | | | | | |
| | | | | | | | (7,105,219 | ) |
Czech Republic | | | | | | | | |
CEZ | | | (751 | ) | | | (12,863 | ) |
Moneta Money Bank | | | (53,909 | ) | | | (178,236 | ) |
| | | | | | | | |
| | | | | | | | (191,099 | ) |
Hong Kong | | | | | | | | |
Alibaba Pictures Group Ltd. | | | (2,210,000 | ) | | | (371,287 | ) |
Beijing Enterprises Water Group Ltd. | | | (108,000 | ) | | | (74,907 | ) |
Brilliance China Automotive Holdings Ltd. | | | (2,000 | ) | | | (2,817 | ) |
China Everbright International Ltd. | | | (12,000 | ) | | | (14,554 | ) |
China Gas Holdings Ltd. | | | (18,000 | ) | | | (26,058 | ) |
China Mengniu Dairy Co. Ltd. | | | (45,000 | ) | | | (83,999 | ) |
China Merchants Holdings International Co. Ltd. | | | (16,552 | ) | | | (44,249 | ) |
China Traditional Chinese Medicine Co. Ltd. | | | (48,000 | ) | | | (22,619 | ) |
COSCO Pacific Ltd. | | | (83,813 | ) | | | (83,287 | ) |
Hopewell Highway Infrastructure Ltd. | | | (299,000 | ) | | | (157,503 | ) |
Shenzhen International Holdings Ltd. | | | (161,500 | ) | | | (232,390 | ) |
Tongda Group Holdings Ltd. | | | (420,000 | ) | | | (117,363 | ) |
| | | | | | | | |
| | | | | | | | (1,231,033 | ) |
India | | | | | | | | |
Reliance Industries Ltd. — GDR | | | (42 | ) | | | (1,302 | ) |
Mexico | | | | | | | | |
Grupo Aeroportuario del Sureste SAB de C.V. — ADR | | | (4,140 | ) | | | (599,762 | ) |
Grupo Financiero Inbursa SAB de C.V. | | | (7,200 | ) | | | (10,672 | ) |
| | | | | | | | |
| | | | | | | | (610,434 | ) |
Monaco | | | | | | | | |
GasLog Ltd. | | | (52,244 | ) | | | (872,475 | ) |
Peru | | | | | | | | |
Hochschild Mining PLC | | | (23,949 | ) | | | (74,639 | ) |
Poland | | | | | | | | |
Orange Polska SA | | | (9,537 | ) | | | (12,867 | ) |
Romania | | | | | | | | |
New Europe Property Investments PLC | | | (1,110 | ) | | | (12,933 | ) |
Russia | | | | | | | | |
Gazprom PAO — ADR | | | (394,590 | ) | | | (1,957,829 | ) |
MMC Norilsk Nickel PJSC — ADR | | | (44,736 | ) | | | (725,548 | ) |
| | | | | | | | |
| | | | | | | | (2,683,377 | ) |
Singapore | | | | | | | | |
IGG, Inc. | | | (127,000 | ) | | | (94,636 | ) |
South Africa | | | | | | | | |
Nampak Ltd. | | | (48,259 | ) | | | (67,311 | ) |
Sasol Ltd. — ADR | | | (2,611 | ) | | | (77,965 | ) |
Truworths International Ltd. | | | (21,589 | ) | | | (129,774 | ) |
Woolworths Holdings Ltd. | | | (40,459 | ) | | | (222,283 | ) |
| | | | | | | | |
| | | | | | | | (497,333 | ) |
South Korea | | | | | | | | |
Amorepacific Corp. | | | (115 | ) | | | (17,773 | ) |
Cheil Industries Inc. | | | (11,845 | ) | | | (1,285,214 | ) |
Coway Co. Ltd. | | | (5,816 | ) | | | (437,353 | ) |
GS Holdings | | | (9,275 | ) | | | (408,403 | ) |
Hyundai Motor Co. | | | (4,972 | ) | | | (598,570 | ) |
KCC Corp. | | | (66 | ) | | | (19,732 | ) |
KEPCO Plant Service & Engineering Co. Ltd. | | | (1,646 | ) | | | (77,466 | ) |
Korea Aerospace Industries Ltd. | | | (11,700 | ) | | | (624,582 | ) |
Kumho Petrochemical Co. Ltd. | | | (5,442 | ) | | | (385,713 | ) |
See Notes to Financial Statements.
| | | | | | |
| | | | | | | |
| | BLACKROCK FUNDS | | JANUARY 31, 2017 | | 29 |
| | |
Schedule of Investments (continued) | | BlackRock Emerging Markets Long/Short Equity Fund |
| | | | | | | | |
| | | Shares | | | Value | |
| Reference Entity — Short (continued) | | | | | | |
South Korea (continued) | | | | | | | | |
NCSoft Corp. | | | (7,452 | ) | | $ | (1,951,023 | ) |
Samsung Biologics Co. Ltd. | | | (612 | ) | | | (84,788 | ) |
Samsung Electro-Mechanics Co. Ltd. | | | (11,749 | ) | | | (573,790 | ) |
Samsung Life Insurance Co. Ltd. | | | (467 | ) | | | (44,622 | ) |
Samsung SDI Co. Ltd. | | | (16,504 | ) | | | (1,640,115 | ) |
Samsung Techwin Co. Ltd. | | | (695 | ) | | | (24,968 | ) |
SK Holdings Co. Ltd. | | | (186 | ) | | | (34,656 | ) |
| | | | | | | | |
| | | | | | | | (8,208,768 | ) |
Taiwan | | | | | | | | |
Chunghwa Telecom Co. Ltd. — ADR | | | (5,996 | ) | | | (189,234 | ) |
Delta Electronics, Inc. | | | (312,489 | ) | | | (1,745,373 | ) |
Far Eastern New Century Corp. | | | (447,640 | ) | | | (373,079 | ) |
Shin Kong Financial Holding Co. Ltd. | | | (1,512,000 | ) | | | (388,365 | ) |
United Microelectronics Corp. | | | (1,239,000 | ) | | | (449,918 | ) |
United Microelectronics Corp. — ADR | | | (3,521 | ) | | | (6,373 | ) |
| | | | | | | | |
| | | | | | | | (3,152,342 | ) |
| | | | | | | | |
| | | Shares | | | Value | |
| Reference Entity — Short (continued) | | | | | | |
Thailand | | | | | | | | |
Advanced Info Service PCL | | | (573,900 | ) | | $ | (2,591,596 | ) |
Bangkok Dusit Medical Services PCL | | | (613,600 | ) | | | (386,877 | ) |
IRPC PCL | | | (588,000 | ) | | | (86,839 | ) |
Minor International PCL | | | (604,200 | ) | | | (596,306 | ) |
Siam Commercial Bank PCL | | | (11,700 | ) | | | (50,176 | ) |
True Corp. PCL | | | (696,700 | ) | | | (129,605 | ) |
| | | | | | | | |
| | | | | | | | (3,841,399 | ) |
Turkey | | | | | | | | |
Tofas Turk Otomobil Fabrikasi | | | (3,130 | ) | | | (21,614 | ) |
| Total Reference Entity — Short | | | | (31,136,833 | ) |
| Net Value of Reference Entity — UBS AG | | | | 32,909,435 | |
| | |
| Derivative Financial Instruments Categorized by Risk Exposure |
As of period end, the fair values of derivative financial instruments in the Statements of Assets and Liabilities were as follows:
| | | | | | | | | | | | | | | | | | | | | | | | | | | | | | |
| | | | | Commodity
Contracts | | | Credit
Contracts | | | Equity
Contracts | | | Foreign
Currency
Exchange
Contracts | | | Interest
Rate
Contracts | | | Other
Contacts | | | Total | |
| Assets — Derivative Financial Instruments | | | | | | | | | | | | | | | | | | | | | |
Swap — OTC | | Unrealized appreciation on OTC swaps | | | — | | | | — | | | $ | 16,729,581 | | | | — | | | | — | | | | — | | | $ | 16,729,581 | |
| | | | | | | | | | | | | | | | | | | | | | | | | | | | | | | |
| Liabilities — Derivative Financial Instruments | | | | | | | | | | | | | | | | | | | | | |
Swap — OTC | | Unrealized depreciation on OTC swaps | | | — | | | | — | | | $ | 5,650,084 | | | | — | | | | — | | | | — | | | $ | 5,650,084 | |
For the six months ended January 31, 2017, the effect of derivative financial instruments in the Statements of Operations was as follows:
| | | | | | | | | | | | | | | | | | | | | | | | | | | | | | | | |
| | | Commodity
Contracts | | | Credit
Contracts | | | Equity
Contracts | | | Foreign
Currency
Exchange
Contracts | | | Interest
Rate
Contracts | | | Other
Contacts | | | Total | | | | |
| Net Realized Gain (Loss) From: | | | | | | | | | | | | | | | | | | | | | | | | | | | | | | | | |
Futures | | | — | | | | — | | | $ | 920,868 | | | | — | | | | — | | | | — | | | $ | 920,868 | | | | | |
Swaps | | | — | | | | — | | | | 4,167 | | | | — | | | | — | | | | — | | | | 4,167 | | | | | |
| | | | |
Total | | | — | | | | — | | | $ | 925,035 | | | | — | | | | — | | | | — | | | $ | 925,035 | | | | | |
| | | | |
| | | | | | | | | | | | | | | | | | | | | | | | | | | | | | | | |
| Net Change in Unrealized Appreciation (Depreciation) on: | | | | | | | | | | | | | | | | | | | | | | | | |
Swaps | | | — | | | | — | | | $ | 354,321 | | | | — | | | | — | | | | — | | | $ | 354,321 | | | | | |
| | | | |
| | |
| Average Quarterly Balances of Outstanding Derivative Financial Instruments |
| | | | |
| Futures contracts: | | | | |
Average notional value of contracts — short | | $ | 31,529,050 | 1 |
| Total return swaps: | | | | |
Average notional value | | $ | 143,443,446 | |
1 Actual amounts for the period are shown due to limited outstanding derivative financial instruments as of each quarter. | |
For more information about the Fund’s investment risks regarding derivative financial instruments, refer to the Notes to Financial Statements.
See Notes to Financial Statements.
| | | | | | |
| | | | | | | |
| 30 | | BLACKROCK FUNDS | | JANUARY 31, 2017 | | |
| | |
Schedule of Investments (concluded) | | BlackRock Emerging Markets Long/Short Equity Fund |
|
| Derivative Financial Instruments — Offsetting as of Period End |
The Fund’s derivative assets and liabilities (by type) were as follows:
| | | | | | | | |
| | | Assets | | | Liabilities | |
| Derivative Financial Instruments: | | | | | | | | |
Swaps — OTC1 | | $ | 16,729,581 | | | $ | 5,650,084 | |
Derivatives not subject to a Master Netting Agreement or similar agreement (“MNA”) | | | — | | | | — | |
| | | | |
Total derivative assets and liabilities subject to an MNA | | $ | 16,729,581 | | | $ | 5,650,084 | |
| | | | |
1 Includes unrealized appreciation (depreciation) on OTC swaps in the Statements of Assets and Liabilities and reported in the schedule of investments. | |
The following table presents the Fund’s derivative assets and liabilities by counterparty net of amounts available for offset under an MNA and net of the related collateral received by the Fund:
| | | | | | | | | | | | | | | | | | | | | | | | |
| Counterparty | | Derivative Assets
Subject to a MNA
by Counterparty | | | Derivatives Available
for Offset1 | | | Non-cash
Collateral
Received | | | Cash
Collateral
Received | | | Net Amount of
Derivative Assets2 | | | | |
Goldman Sachs & Co. | | $ | 3,343,543 | | | | — | | | | — | | | | — | | | $ | 3,343,543 | | | | | |
Morgan Stanley & Co, Inc. . | | | 7,339,481 | | | | — | | | | — | | | $ | (5,227,939 | ) | | | 2,111,542 | | | | | |
UBS AG | | | 6,046,557 | | | $ | (208,038 | ) | | | — | | | | (3,613,864 | ) | | | 2,224,655 | | | | | |
| | | | |
Total | | $ | 16,729,581 | | | $ | (208,038 | ) | | | — | | | $ | (8,841,803 | ) | | $ | 7,679,740 | | | | | |
| | | | |
| | | | | | | | | | | | | | | | | | | | | | | | |
| Counterparty | | Derivative Liabilities
Subject to a MNA
by Counterparty | | | Derivatives Available
for Offset1 | | | Non-cash
Collateral
Pledged | | | Cash
Collateral
Pledged | | | Net Amount of
Derivative Liabilities3 | | | | |
Goldman Sachs International | | $ | 5,442,046 | | | | — | | | | — | | | $ | (4,010,000 | ) | | $ | 1,432,046 | | | | | |
UBS AG | | | 208,038 | | | $ | (208,038 | ) | | | — | | | | — | | | | — | | | | | |
| | | | |
Total | | $ | 5,650,084 | | | $ | (208,038 | ) | | | — | | | $ | (4,010,000 | ) | | $ | 1,432,046 | | | | | |
| | | | |
1 The amount of derivatives available for offset is limited to the amount of derivative assets and/or liabilities that are subject to an MNA. | | | | | |
2 Net amount represents the net amount receivable from the counterparty in the event of default. | | | | | |
3 Net amount represents the net amount due to the counterparty in the event of default. | | | | | |
| | |
| Fair Value Hierarchy as of Period End | | |
Various inputs are used in determining the fair value of investments and derivative financial instruments. For information about the Fund’s policy regarding valuation of investments and derivative financial instruments, refer to the Notes to Financial Statements.
The following tables summarize the Fund’s investments and derivative financial instruments categorized in the disclosure hierarchy:
| | | | | | | | | | | | | | | | |
| | | Level 1 | | | Level 2 | | | Level 3 | | | Total | |
Assets: | | | | | | | | | | | | | | | | |
| Investments: | | | | | | | | | | | | | | | | |
Short-Term Securities | | $ | 148,882,956 | | | | — | | | | — | | | $ | 148,882,956 | |
| | | | | | | | | | | | | | | | |
| Derivative Financial Instruments 1 | | | | | | | | | | | | | | | | |
Assets: | | | | | | | | | | | | | | | | |
Equity contracts | | | — | | | $ | 16,729,581 | | | | — | | | $ | 16,729,581 | |
Liabilities: | | | | | | | | | | | | | | | | |
Equity contracts | | | — | | | | (5,650,084 | ) | | | — | | | | (5,650,084 | ) |
| | | | | | | | | | | | | | | | |
Total | | | — | | | $ | 11,079,497 | | | | — | | | $ | 11,079,497 | |
| | | | | | | | | | | | | | | | |
1 Derivative financial instruments are swaps. Swaps are valued at the unrealized appreciation (depreciation) on the instrument. | |
During the six months ended January 31, 2017, there were no transfers between levels.
See Notes to Financial Statements.
| | | | | | |
| | | | | | | |
| | BLACKROCK FUNDS | | JANUARY 31, 2017 | | 31 |
| | |
Schedule of Investments January 31, 2017 (Unaudited) | | BlackRock Global Long/Short Equity Fund (Percentages shown are based on Net Assets) |
| | | | | | | | |
| Preferred Securities | | Shares | | | Value | |
Preferred Stocks | | | | | | | | |
United States — 1.0% | | | | | | | | |
AliphCom (a)(b)(c) | | | | | | | | |
Series 6 (acquired 12/15/15, cost $0) | | | 8,264 | | | | — | |
Series 8 (acquired 3/10/15, cost $1,750,010) | | | 823,530 | | | | — | |
Illumio, Inc., Series C, 0.00% (acquired 3/10/15, cost $1,500,001) (a)(b) | | | 466,730 | | | $ | 1,493,544 | |
Palantir Technologies, Inc., Series I, 0.00% (acquired 6/05/14, cost $1,999,998) (a)(b) | | | 326,264 | | | | 2,688,415 | |
Uber Technologies, Inc., Series E, 0.00% (acquired 12/04/14, cost $1,499,957) (a)(b) | | | 45,020 | | | | 2,305,925 | |
Total Long-Term Investments
(Cost — $6,749,966) — 1.0% | | | | 6,487,884 | |
| | | | | | | | |
| Short-Term Securities | | Shares | | | Value | |
BlackRock Liquidity Funds, T-Fund, Institutional Class, 0.40% (d)(e) | | | 610,032,932 | | | $ | 610,032,932 | |
Total Short-Term Securities
(Cost — $610,032,932) — 97.8% | | | | 610,032,932 | |
| Total Investments (Cost — $616,782,898) — 98.8% | | | | 616,520,816 | |
Other assets less liabilities — 1.2% | | | | 7,787,752 | |
| | | | | | | | |
Net Assets — 100.0% | | | $ | 624,308,568 | |
| | | | | | | | |
|
| Notes to Schedule of Investments |
| (a) | | Non-income producing security. |
| (b) | | Restricted security as to resale, excluding 144A securities. As of report date, the Fund held restricted securities with a current value of $6,487,884, and an original cost of $6,749,966, which was 1.04% of its net assets. |
| (c) | | Issuer filed for bankruptcy and/or is in default. |
| (d) | | During the six months ended January 31, 2017, investments in issuers considered to be affiliates of the Fund for purposes of Section 2(a)(3) of the Investment Company Act of 1940, as amended, were as follows: |
| | | | | | | | | | | | | | | | | | | | | | | | | | | | |
| Affiliate | | Shares Held
at July 31,
2016 | | | Net
Activity | | | Shares Held
at January 31,
2017 | | | Value at
January 31,
2017 | | | Income | | | Net
Realized
Gain1 | | | Change in
Unrealized
Appreciation
(Depreciation) | |
BlackRock Liquidity Funds, TempFund, Institutional Class | | | 1,044,984,235 | | | | (1,044,984,235 | ) | | | — | | | | — | | | $ | 326,809 | | | | — | | | | — | |
BlackRock Liquidity Funds, T-Fund, Institutional Class | | | — | | | | 610,032,932 | | | | 610,032,932 | | | $ | 610,032,932 | | | | 831,740 | | | $ | 3,485 | | | | — | |
Total | | | | | | | | | | | | | | $ | 610,032,932 | | | $ | 1,158,549 | | | $ | 3,485 | | | | — | |
| | | | | |
1 Includes net capital gain distributions. | | | | | | | | | | | | | |
| (e) | | Represents the current yield as of report date. |
|
| Derivative Financial Instruments Outstanding as of Period End |
| | | | | | | | | | | | | | | | | | | | |
| Futures Contracts | |
Contracts
Long (Short) | | | Issue | | Expiration | | | Notional
Value | | | Unrealized
Appreciation
(Depreciation) | | | | |
| | (233 | ) | | AEX Index | | | February 2017 | | | $ | 23,889,697 | | | $ | 255,980 | | | | | |
| | 368 | | | CAC 40 Index | | | February 2017 | | | $ | 18,859,724 | | | | (402,015 | ) | | | | |
| | (24 | ) | | Hang Seng Index | | | February 2017 | | | $ | 3,608,553 | | | | (53,177 | ) | | | | |
| | 60 | | | IBEX 35 Index | | | February 2017 | | | $ | 6,050,488 | | | | (7,116 | ) | | | | |
| | (190 | ) | | SGX MSCI Singapore Index | | | February 2017 | | | $ | 4,546,600 | | | | 10,385 | | | | | |
| | (933 | ) | | OMX Stockholm 30 Index | | | February 2017 | | | $ | 16,402,245 | | | | (8,288 | ) | | | | |
| | (16 | ) | | Dax Index | | | March 2017 | | | $ | 4,993,766 | | | | 68,509 | | | | | |
| | 439 | | | FTSE100 Index | | | March 2017 | | | $ | 38,909,598 | | | | 709,066 | | | | | |
| | 165 | | | FTSE/MIB Index | | | March 2017 | | | $ | 16,540,878 | | | | (464,547 | ) | | | | |
| | 6 | | | S&P 500 E-Mini Index | | | March 2017 | | | $ | 682,350 | | | | — | | | | | |
| | 44 | | | S&P/TSX 60 Index | | | March 2017 | | | $ | 6,136,500 | | | | (10,593 | ) | | | | |
| | 55 | | | SPI 200 Index | | | March 2017 | | | $ | 5,792,756 | | | | (58,070 | ) | | | | |
| | 144 | | | TOPIX Index | | | March 2017 | | | $ | 19,347,091 | | | | (224,416 | ) | | | | |
| | Total | | | | | | | | | | | | | $ | (184,282 | ) | | | | |
| | | | | | | | | | | | | | | | |
See Notes to Financial Statements.
| | | | | | |
| | | | | | | |
| 32 | | BLACKROCK FUNDS | | JANUARY 31, 2017 | | |
| | |
Schedule of Investments (continued) | | BlackRock Global Long/Short Equity Fund |
| | | | | | | | | | | | | | | | | | | | | | | | | | | | | | | | | | | | | | |
| OTC Total Return Swaps | |
| Reference Entity | | Fixed Amount1 | | | Counterparty | | Effective
Date | | | Expiration
Date | | | Contract
Amount | | | Value | | | Premiums
Paid
(Received) | | | Unrealized
Appreciation
(Depreciation) | |
Swiss Market IX Future March 2017 | | | CHF | | | | 2,195,488 | | | Morgan Stanley & Co. International | | | 1/23/17 | | | | 3/17/17 | | | | CHF | | | | 27 | | | $ | 23,346 | | | | — | | | $ | 23,346 | |
Swiss Market IX Future March 2017 | | | CHF | | | | 330,199 | | | Morgan Stanley & Co. International | | | 1/25/17 | | | | 3/17/17 | | | | CHF | | | | 4 | | | | (1,535 | ) | | | — | | | | (1,535 | ) |
Swiss Market IX Future March 2017 | | | CHF | | | | 2,942,292 | | | Morgan Stanley & Co. International | | | 1/20/17 | | | | 3/17/17 | | | | CHF | | | | 36 | | | | 15,995 | | | | — | | | | 15,995 | |
Swiss Market IX Future March 2017 | | | CHF | | | | 8,292,667 | | | Morgan Stanley & Co. International | | | 1/19/17 | | | | 3/17/17 | | | | CHF | | | | 100 | | | | 6,506 | | | | — | | | | 6,506 | |
Swiss Market IX Future March 2017 | | | CHF | | | | 1,143,643 | | | Morgan Stanley & Co. International | | | 1/24/17 | | | | 3/17/17 | | | | CHF | | | | 14 | | | | 6,808 | | | | — | | | | 6,808 | |
Total | | | | | | | | | | | | | | | | | | | | | | | | | | | | $ | 51,120 | | | | — | | | $ | 51,120 | |
| | | | | | | | | | | | | | | | | | | | | | | | | | | | | | |
1 Fund pays the total return of the reference entity and receives the fixed amount. Net payment made at termination. | |
| | | | | | | | | | | | | | | | | | | | |
| OTC Total Return Swaps1 | |
| Reference Entity | | Counterparty | | | Expiration
Date | | | Net Notional
Amount | | | Unrealized
Appreciation | | | Net Value of
Reference
Entities | |
Equity Securities Long/Short | | | Bank of America N.A. | | | | 3/28/17 - 7/11/17 | | | $ | 14,584,841 | | | $ | 1,621,422 | 2 | | $ | 15,672,218 | |
| | | Bank of America N.A. | | | | 5/01/17 | | | | (1,846,653 | ) | | | 2,331,754 | 3 | | | 328,928 | |
| | | Deutsche Bank AG | | | | 3/01/17 - 3/23/17 | | | | 12,470,041 | | | | 1,365,262 | 4 | | | 13,985,353 | |
| | | Goldman Sachs & Co. | | | | 3/02/17 - 8/29/18 | | | | 8,473,500 | | | | 6,599,604 | 5 | | | 16,060,180 | |
| | | Goldman Sachs & Co. | | | | 6/14/17 - 8/29/18 | | | | 14,592 | | | | 243,058 | 6 | | | 236,377 | |
| | | | UBS AG | | | | 4/12/17 - 4/13/17 | | | | (2,490,743 | ) | | | 21,174,020 | 7 | | | 16,294,835 | |
Total | | | | | | | | | | | | | | $ | 33,335,120 | | | $ | 62,577,891 | |
| | | | | | | | | | | | | | | | |
| | 1 | | The Fund receives or pays the total return on a portfolio of long and short positions underlying the total return swap. In addition, the Fund pays or receives a variable rate of interest, based on a specified benchmark, plus or minus a spread in a range of 20—745 basis points. The benchmark and spread are determined based upon the country and/or currency of the individual underlying positions. The following are the specified benchmarks used in determining the variable rate of interest: |
Intercontinental Exchange LIBOR:
EUR 1 Week; EUR Overnight.
GBP 1 Week; GBP Overnight
JPY Spot Next; JPY 1 Week
USD 1 Week
Garbon Intercapital Federal Funds Rate Open
Hong Kong Dollar HIBOR Fixings 1 Week; 2 Week
Tokyo Interbank Offered Rate 1 Week
| | 2 | | Amount includes $534,045 of net dividends and financing fees. |
| | 3 | | Amount includes $156,173 of net dividends and financing fees. |
| | 4 | | Amount includes $(150,050) of net dividends and financing fees. |
| | 5 | | Amount includes $(987,076) of net dividends and financing fees. |
| | 6 | | Amount includes $21,273 of net dividends and financing fees. |
| | 7 | | Amount includes $2,388,442 of net dividends and financing fees. |
See Notes to Financial Statements.
| | | | | | |
| | | | | | | |
| | BLACKROCK FUNDS | | JANUARY 31, 2017 | | 33 |
| | |
Schedule of Investments (continued) | | BlackRock Global Long/Short Equity Fund |
| | | | | | | | |
| The following table represents the individual long and short positions and related values of equity securities underlying the total return swap with Bank of America N.A. as of January 31, 2017, expiration dates 3/28/17 — 7/11/17: | |
| | | Shares | | | Value | |
| Reference Entity — Long | | | | | | |
Australia | | | | | | | | |
Aristocrat Leisure Ltd. | | | 12,385 | | | $ | 143,626 | |
Mineral Resources Ltd. | | | 8,953 | | | | 83,596 | |
Regis Resources Ltd. | | | 116,393 | | | | 282,086 | |
WorleyParsons Ltd. | | | 2,673 | | | | 20,099 | |
| | | | | | | | |
| | | | | | | | 529,407 | |
Austria | | | | | | | | |
Wienerberger AG | | | 1,268 | | | | 24,477 | |
Belgium | | | | | | | | |
NV Bekaert SA | | | 5,479 | | | | 237,778 | |
Umicore SA | | | 603 | | | | 33,777 | |
| | | | | | | | |
| | | | | | | | 271,555 | |
Bermuda | | | | | | | | |
Nabors Industries Ltd. | | | 19,007 | | | | 308,864 | |
Canada | | | | | | | | |
B2Gold Corp. | | | 12,164 | | | | 36,924 | |
Canadian Natural Resources Ltd. | | | 14,143 | | | | 427,578 | |
Capital Power Corp. | | | 3,725 | | | | 70,650 | |
Crescent Point Energy Corp. | | | 1,284 | | | | 14,969 | |
Dollarama, Inc. | | | 194 | | | | 14,692 | |
Finning International, Inc. | | | 5,845 | | | | 118,315 | |
Inter Pipeline Ltd. | | | 3,606 | | | | 78,203 | |
Maple Leaf Foods, Inc. | | | 10,783 | | | | 247,191 | |
Quebecor, Inc., Class B | | | 3,098 | | | | 93,303 | |
Saputo, Inc. | | | 588 | | | | 21,649 | |
| | | | | | | | |
| | | | | | | | 1,123,474 | |
China | | | | | | | | |
FIH Mobile Ltd. | | | 303,000 | | | | 97,357 | |
Denmark | | | | | | | | |
GN Store Nord A/S | | | 6,752 | | | | 150,811 | |
Novo Nordisk A/S, Class B | | | 10,492 | | | | 379,178 | |
Tryg A/S | | | 22,960 | | | | 439,298 | |
| | | | | | | | |
| | | | | | | | 969,287 | |
Finland | | | | | | | | |
Valmet Corp. | | | 5,528 | | | | 87,401 | |
France | | | | | | | | |
Arkema SA | | | 931 | | | | 91,947 | |
Carrefour SA | | | 1,916 | | | | 46,872 | |
Faurecia | | | 6,789 | | | | 294,979 | |
Nexity SA | | | 1,134 | | | | 55,698 | |
Peugeot SA | | | 3,583 | | | | 66,682 | |
Plastic Omnium SA | | | 2,838 | | | | 96,283 | |
Remy Cointreau SA | | | 364 | | | | 33,093 | |
Sodexo SA | | | 2,067 | | | | 228,574 | |
Technicolor SA, Registered Shares | | | 4,410 | | | | 18,908 | |
Valeo SA | | | 1,685 | | | | 102,987 | |
| | | | | | | | |
| | | | | | | | 1,036,023 | |
Germany | | | | | | | | |
Covestro AG | | | 10,049 | | | | 756,224 | |
Hochtief AG | | | 566 | | | | 80,684 | |
Kloeckner & Co. SE | | | 14,161 | | | | 184,917 | |
Lanxess AG | | | 2,532 | | | | 184,257 | |
| | | | | | | | |
| | | | | | | | 1,206,082 | |
Hong Kong | | | | | | | | |
Kerry Properties Ltd. | | | 38,500 | | | | 108,949 | |
Texwinca Holdings Ltd. | | | 58,000 | | | | 37,163 | |
| | | | | | | | |
| | | | | | | | 146,112 | |
| | | | | | | | |
| | | Shares | | | Value | |
| Reference Entity — Long (continued) | | | | | | |
Ireland | | | | | | | | |
CRH PLC | | | 3,858 | | | $ | 133,817 | |
Glanbia PLC | | | 10,247 | | | | 173,115 | |
Smurfit Kappa Group PLC | | | 21,970 | | | | 578,685 | |
| | | | | | | | |
| | | | | | | | 885,617 | |
Israel | | | | | | | | |
Check Point Software Technologies Ltd. | | | 1,855 | | | | 183,218 | |
Italy | | | | | | | | |
Brembo SpA | | | 267 | | | | 17,107 | |
Mediobanca SpA | | | 8,066 | | | | 69,449 | |
Unipol Gruppo Finanziario SpA | | | 87,946 | | | | 325,239 | |
| | | | | | | | |
| | | | | | | | 411,795 | |
Japan | | | | | | | | |
Bank of Kyoto Ltd. | | | 36,000 | | | | 281,428 | |
Chiba Bank Ltd. | | | 40,000 | | | | 261,653 | |
Citizen Holdings Co. Ltd. | | | 3,200 | | | | 19,872 | |
Glory Ltd. | | | 600 | | | | 18,745 | |
Hokuhoku Financial Group, Inc. | | | 26,100 | | | | 447,143 | |
Ito En Ltd. | | | 2,300 | | | | 76,433 | |
Itochu Techno-Solutions Corp. | | | 14,200 | | | | 381,965 | |
Japan Petroleum Exploration Co. | | | 10,100 | | | | 226,879 | |
Komeri Co. Ltd. | | | 2,400 | | | | 56,513 | |
Mitsubishi Chemical Holdings Corp. | | | 239,300 | | | | 1,669,106 | |
Nichi-iko Pharmaceutical Co. Ltd. | | | 2,000 | | | | 29,200 | |
Nishimatsu Construction Co. Ltd. | | | 2,000 | | | | 10,001 | |
Nomura Real Estate Holdings, Inc. | | | 4,700 | | | | 80,841 | |
Ono Pharmaceutical Co. Ltd. | | | 900 | | | | 18,465 | |
Open House Co. Ltd. | | | 3,700 | | | | 86,604 | |
ORIX Corp. | | | 5,000 | | | | 75,436 | |
Park24 Co. Ltd. | | | 900 | | | | 24,841 | |
Penta-Ocean Construction Co. Ltd. | | | 26,400 | | | | 128,899 | |
Sankyo Co. Ltd. | | | 11,100 | | | | 370,615 | |
Showa Shell Sekiyu KK | | | 1,700 | | | | 16,664 | |
Sumitomo Mitsui Trust Holdings, Inc. | | | 17,400 | | | | 648,557 | |
Sumitomo Real Estate Sales Co. Ltd. | | | 2,200 | | | | 50,059 | |
Sumitomo Realty & Development Co. Ltd. | | | 3,000 | | | | 81,155 | |
TAG Immobilien AG | | | 5,086 | | | | 68,762 | |
TonenGeneral Sekiyu KK | | | 106,000 | | | | 1,246,571 | |
Toppan Forms Co. Ltd. | | | 8,900 | | | | 92,314 | |
Toppan Printing Co. Ltd. | | | 34,000 | | | | 333,742 | |
| | | | | | | | |
| | | | | | | | 6,802,463 | |
Netherlands | | | | | | | | |
BE Semiconductor Industries NV | | | 17,814 | | | | 643,226 | |
PostNL NV | | | 41,570 | | | | 182,450 | |
| | | | | | | | |
| | | | | | | | 825,676 | |
Norway | | | | | | | | |
Nordic American Tankers Ltd. | | | 1,973 | | | | 17,047 | |
Salmar ASA | | | 636 | | | | 18,001 | |
| | | | | | | | |
| | | | | | | | 35,048 | |
Portugal | | | | | | | | |
CTT — Correios de Portugal SA | | | 111,115 | | | | 619,860 | |
Jeronimo Martins SGPS SA | | | 82,173 | | | | 1,390,827 | |
NOS SGPS SA | | | 38,459 | | | | 216,544 | |
| | | | | | | | |
| | | | | | | | 2,227,231 | |
Singapore | | | | | | | | |
Venture Corp. Ltd. | | | 34,700 | | | | 251,022 | |
Sweden | | | | | | | | |
JM AB | | | 1,704 | | | | 51,384 | |
Saab AB | | | 2,855 | | | | 116,592 | |
| | | | | | | | |
| | | | | | | | 167,976 | |
See Notes to Financial Statements.
| | | | | | |
| | | | | | | |
| 34 | | BLACKROCK FUNDS | | JANUARY 31, 2017 | | |
| | |
Schedule of Investments (continued) | | BlackRock Global Long/Short Equity Fund |
| | | | | | | | |
| | | Shares | | | Value | |
| Reference Entity — Long (continued) | | | | | | |
Switzerland | | | | | | | | |
Georg Fischer AG, Registered Shares | | | 215 | | | $ | 177,189 | |
IWG PLC | | | 158,376 | | | | 498,937 | |
Straumann Holding AG, Registered Shares | | | 1,343 | | | | 541,990 | |
| | | | | | | | |
| | | | | | | | 1,218,116 | |
United Kingdom | | | | | | | | |
Acacia Mining PLC | | | 6,014 | | | | 32,613 | |
Auto Trader Group PLC | | | 8,447 | | | | 42,662 | |
Bunzl PLC | | | 10,915 | | | | 287,726 | |
Centrica PLC | | | 5,611 | | | | 15,885 | |
Croda International PLC | | | 2,338 | | | | 98,727 | |
Indivior PLC | | | 259,157 | | | | 967,798 | |
Intertek Group PLC | | | 3,300 | | | | 141,262 | |
Moneysupermarket.com Group PLC | | | 173,328 | | | | 719,824 | |
Serco Group PLC | | | 296,486 | | | | 538,484 | |
TechnipFMC PLC | | | 1,212 | | | | 39,722 | |
Thomas Cook Group PLC | | | 20,860 | | | | 22,925 | |
WH Smith PLC | | | 3,678 | | | | 75,616 | |
WM Morrison Supermarkets PLC | | | 10,026 | | | | 29,890 | |
| | | | | | | | |
| | | | | | | | 3,013,134 | |
United States | | | | | | | | |
Agilent Technologies, Inc. | | | 3,026 | | | | 148,183 | |
Amdocs Ltd. | | | 9,088 | | | | 533,556 | |
Applied Materials, Inc. | | | 2,846 | | | | 97,476 | |
Big Lots, Inc. | | | 37,536 | | | | 1,876,800 | |
Booz Allen Hamilton Holding Corp. | | | 13,838 | | | | 468,001 | |
Bruker Corp. | | | 1,957 | | | | 46,440 | |
C.R. Bard, Inc. | | | 8,300 | | | | 1,969,839 | |
Cabot Corp. | | | 20,535 | | | | 1,137,023 | |
Carter’s, Inc. | | | 670 | | | | 56,113 | |
CBS Corp., Class B | | | 35,890 | | | | 2,314,546 | |
CenterPoint Energy, Inc. | | | 80,758 | | | | 2,116,667 | |
Cheesecake Factory, Inc. | | | 1,766 | | | | 106,419 | |
Church & Dwight Co., Inc. | | | 4,775 | | | | 215,926 | |
Cinemark Holdings, Inc. | | | 9,805 | | | | 416,712 | |
CONSOL Energy, Inc. | | | 20,565 | | | | 348,371 | |
Darden Restaurants, Inc. | | | 7,623 | | | | 558,613 | |
DCT Industrial Trust, Inc. | | | 7,154 | | | | 319,712 | |
Diamond Offshore Drilling, Inc. | | | 30,141 | | | | 493,710 | |
Domino’s Pizza, Inc. | | | 7,857 | | | | 1,371,361 | |
Dr. Pepper Snapple Group, Inc. | | | 1,556 | | | | 141,907 | |
Dril-Quip, Inc. | | | 8,807 | | | | 547,795 | |
Duke Realty Corp. | | | 3,266 | | | | 79,462 | |
Eastman Chemical Co. | | | 622 | | | | 48,205 | |
Eaton Vance Corp. | | | 436 | | | | 18,281 | |
Energen Corp. | | | 4,166 | | | | 224,506 | |
Equity Lifestyle Properties, Inc. | | | 9,819 | | | | 726,017 | |
First American Financial Corp. | | | 10,042 | | | | 377,378 | |
Gartner, Inc. | | | 4,775 | | | | 474,444 | |
HP, Inc. | | | 27,550 | | | | 414,628 | |
Hyatt Hotels Corp., Class A | | | 5,253 | | | | 287,392 | |
IDEXX Laboratories, Inc. | | | 2,685 | | | | 328,456 | |
Ingredion, Inc. | | | 7,703 | | | | 987,448 | |
Interpublic Group of Cos., Inc. | | | 109,102 | | | | 2,567,170 | |
Kohl’s Corp. | | | 60,885 | | | | 2,425,050 | |
Landstar System, Inc. | | | 1,910 | | | | 161,586 | |
Legg Mason, Inc. | | | 32,218 | | | | 1,020,988 | |
ManpowerGroup, Inc. | | | 70 | | | | 6,682 | |
Masimo Corp. | | | 4,991 | | | | 367,238 | |
MasTec, Inc. | | | 4,594 | | | | 171,127 | |
NCR Corp. | | | 17,344 | | | | 746,139 | |
Newmont Mining Corp. | | | 536 | | | | 19,446 | |
Norfolk Southern Corp. | | | 2,092 | | | | 245,726 | |
Nutanix, Inc., Class A | | | 1,694 | | | | 51,277 | |
Oceaneering International, Inc. | | | 24,904 | | | | 693,576 | |
| | | | | | | | |
| | | Shares | | | Value | |
| Reference Entity — Long (continued) | | | | | | |
United States (continued) | | | | | | | | |
OGE Energy Corp. | | | 468 | | | $ | 15,697 | |
Oshkosh Corp. | | | 366 | | | | 25,485 | |
Papa John’s International, Inc. | | | 9,229 | | | | 786,495 | |
Pilgrim’s Pride Corp. | | | 21,156 | | | | 404,926 | |
Pitney Bowes, Inc. | | | 5,051 | | | | 80,412 | |
RPC, Inc. | | | 4,229 | | | | 91,008 | |
Target Corp. | | | 26,166 | | | | 1,687,184 | |
Tenneco, Inc. | | | 887 | | | | 59,828 | |
Teradata Corp. | | | 2,279 | | | | 66,911 | |
Texas Instruments, Inc. | | | 5,098 | | | | 385,103 | |
VeriSign, Inc. | | | 22,043 | | | | 1,768,069 | |
Weingarten Realty Investors | | | 23,586 | | | | 840,369 | |
WellCare Health Plans, Inc. | | | 8,744 | | | | 1,272,602 | |
Whiting Petroleum Corp. | | | 4,323 | | | | 47,942 | |
Williams-Sonoma, Inc. | | | 7,560 | | | | 364,468 | |
Xerox Corp. | | | 76,601 | | | | 530,845 | |
Zynga, Inc., Class A | | | 62,966 | | | | 158,674 | |
| | | | | | | | |
| | | | | | | | 36,313,410 | |
| Total Reference Entity — Long | | | | | | | 58,134,745 | |
| | | | | | | | |
| | | | | | | | | |
| | |
| Reference Entity — Short | | | | | | |
Australia | | | | | | | | |
Alumina Ltd. | | | (41,141 | ) | | | (60,619 | ) |
Domino’s Pizza Enterprises Ltd. | | | (543 | ) | | | (24,497 | ) |
Incitec Pivot Ltd. | | | (12,395 | ) | | | (36,226 | ) |
Independence Group NL | | | (6,108 | ) | | | (17,556 | ) |
Qube Holdings Ltd. | | | (379,922 | ) | | | (663,105 | ) |
Vocus Communications, Ltd. | | | (21,628 | ) | | | (66,326 | ) |
| | | | | | | | |
| | | | | | | | (868,329 | ) |
Finland | | | | | | | | |
Metsa Board OYJ | | | (3,383 | ) | | | (23,108 | ) |
France | | | | | | | | |
Airbus Group SE | | | (7,303 | ) | | | (495,034 | ) |
Italy | | | | | | | | |
Yoox SpA | | | (1,850 | ) | | | (46,407 | ) |
Japan | | | | | | | | |
Asics Corp. | | | (7,300 | ) | | | (142,202 | ) |
Daikin Industries Ltd. | | | (1,300 | ) | | | (129,041 | ) |
JGC Corp. | | | (81,800 | ) | | | (1,419,997 | ) |
Kansai Paint Co. Ltd. | | | (1,100 | ) | | | (21,369 | ) |
Koito Manufacturing Co. Ltd. | | | (2,100 | ) | | | (111,396 | ) |
Kyocera Corp. | | | (14,300 | ) | | | (744,469 | ) |
Nippon Kayaku Co. Ltd. | | | (10,000 | ) | | | (130,695 | ) |
Nippon Paint Co. Ltd. | | | (1,600 | ) | | | (46,671 | ) |
PanaHome Corp. | | | (7,000 | ) | | | (59,339 | ) |
Rinnai Corp. | | | (200 | ) | | | (16,997 | ) |
SBI Holdings, Inc. | | | (6,600 | ) | | | (91,105 | ) |
Shimano, Inc. | | | (800 | ) | | | (126,150 | ) |
Sugi Holdings Co. Ltd. | | | (600 | ) | | | (27,923 | ) |
TDK Corp. | | | (700 | ) | | | (50,314 | ) |
Terumo Corp. | | | (1,400 | ) | | | (51,791 | ) |
TOTO Ltd. | | | (2,300 | ) | | | (92,635 | ) |
| | | | | | | | |
| | | | | | | | (3,262,094 | ) |
Netherlands | | | | | | | | |
Altice NV, Class B | | | (11,328 | ) | | | (250,010 | ) |
GrandVision NV | | | (2,502 | ) | | | (59,663 | ) |
| | | | | | | | |
| | | | | | | | (309,673 | ) |
Norway | | | | | | | | |
Schibsted ASA | | | (5,229 | ) | | | (138,270 | ) |
Schibsted ASA, B Shares | | | (6,667 | ) | | | (165,999 | ) |
| | | | | | | | |
| | | | | | | | (304,269 | ) |
See Notes to Financial Statements.
| | | | | | |
| | | | | | | |
| | BLACKROCK FUNDS | | JANUARY 31, 2017 | | 35 |
| | |
Schedule of Investments (continued) | | BlackRock Global Long/Short Equity Fund |
| | | | | | | | |
| | | Shares | | | Value | |
| Reference Entity — Short (continued) | | | | | | |
Spain | | | | | | | | |
Telefonica SA | | | (1,435 | ) | | $ | (13,884 | ) |
Sweden | | | | | | | | |
Alfa Laval AB | | | (4,050 | ) | | | (75,719 | ) |
United Kingdom | | | | | | | | |
Antofagasta PLC | | | (75,482 | ) | | | (797,519 | ) |
J Sainsbury PLC | | | (233,234 | ) | | | (758,842 | ) |
| | | | | | | | |
| | | | | | | | (1,556,361 | ) |
United States | | | | | | | | |
Acuity Brands, Inc. | | | (113 | ) | | | (23,417 | ) |
Advance Auto Parts, Inc. | | | (3,426 | ) | | | (562,686 | ) |
Berkshire Hathaway, Inc., Class B | | | (13,121 | ) | | | (2,153,681 | ) |
Callon Petroleum Co. | | | (11,966 | ) | | | (182,841 | ) |
Cavium, Inc. | | | (2,218 | ) | | | (146,854 | ) |
CF Industries Holdings, Inc. | | | (28,207 | ) | | | (995,425 | ) |
Chemours Co. | | | (4,546 | ) | | | (120,105 | ) |
Chevron Corp. | | | (3,187 | ) | | | (354,873 | ) |
Chipotle Mexican Grill, Inc. | | | (1,594 | ) | | | (671,775 | ) |
Colony Starwood Homes | | | (1,031 | ) | | | (32,425 | ) |
DexCom, Inc. | | | (2,276 | ) | | | (180,145 | ) |
Diamondback Energy, Inc. | | | (196 | ) | | | (20,613 | ) |
Diebold, Inc. | | | (8,328 | ) | | | (226,522 | ) |
EPAM Systems, Inc. | | | (3,918 | ) | | | (252,163 | ) |
Exxon Mobil Corp. | | | (2,564 | ) | | | (215,094 | ) |
First Solar, Inc. | | | (2,311 | ) | | | (72,080 | ) |
Global Payments, Inc. | | | (4,962 | ) | | | (383,463 | ) |
Hilton Worldwide Holdings, Inc. | | | (7,588 | ) | | | (436,917 | ) |
Illumina, Inc. | | | (4,912 | ) | | | (786,411 | ) |
Interactive Brokers Group, Inc., Class A | | | (22,562 | ) | | | (842,465 | ) |
Liberty Ventures | | | (48,200 | ) | | | (2,103,930 | ) |
LKQ Corp. | | | (21,384 | ) | | | (682,363 | ) |
MGIC Investment Corp. | | | (157,731 | ) | | | (1,679,835 | ) |
Monster Beverage Corp. | | | (66,329 | ) | | | (2,825,615 | ) |
Netflix, Inc. | | | (148 | ) | | | (20,825 | ) |
Nevro Corp. | | | (74,592 | ) | | | (6,490,996 | ) |
New York Community Bancorp, Inc. | | | (57,855 | ) | | | (878,817 | ) |
NuVasive, Inc. | | | (12,296 | ) | | | (870,188 | ) |
Pandora Media, Inc. | | | (20,463 | ) | | | (266,019 | ) |
Physicians Realty Trust | | | (112,729 | ) | | | (2,091,123 | ) |
Post Holdings, Inc. | | | (200 | ) | | | (16,736 | ) |
Procter & Gamble Co. | | | (21,171 | ) | | | (1,854,580 | ) |
Radian Group, Inc. | | | (243,880 | ) | | | (4,487,392 | ) |
Scotts Miracle-Gro Co., Class A | | | (1,244 | ) | | | (114,411 | ) |
Snyder’s-Lance, Inc. | | | (14,189 | ) | | | (544,574 | ) |
Tyler Technologies, Inc. | | | (186 | ) | | | (27,160 | ) |
UniFirst Corp. | | | (5,517 | ) | | | (705,624 | ) |
United States Steel Corp. | | | (13,936 | ) | | | (455,847 | ) |
Walgreens Boots Alliance, Inc. | | | (5,051 | ) | | | (413,879 | ) |
Wells Fargo & Co. | | | (1,672 | ) | | | (94,184 | ) |
Western Digital Corp. | | | (1,126 | ) | | | (89,776 | ) |
Workday, Inc., Class A | | | (882 | ) | | | (73,285 | ) |
Zillow Group, Inc. | | | (1,711 | ) | | | (60,535 | ) |
| | | | | | | | |
| | | | | | | | (35,507,649 | ) |
| Total Reference Entity — Short | | | | | | | (42,462,527 | ) |
| Net Value of Reference Entity —Bank of America N.A. | | | | | | | 15,672,218 | |
| | | | | | | | |
| | | | | | | | | |
|
| The following table represents the individual long and short positions and related values of equity securities underlying the total return swap with Bank of America N.A. as of January 31, 2017, expiration date 5/01/17: | |
| Reference Entity — Long | | | | | | |
Argentina | | | | | | | | |
Adecoagro SA | | | 1,578 | | | | 18,258 | |
| | | | | | | | |
| | | Shares | | | Value | |
| Reference Entity — Long (continued) | | | | | | |
Belgium | | | | | | | | |
Euronav SA | | | 2,487 | | | $ | 19,523 | |
Bermuda | | | | | | | | |
Belmond Ltd., Class A | | | 7,129 | | | | 98,737 | |
Nabors Industries Ltd. | | | 15,507 | | | | 251,989 | |
Seadrill Ltd. | | | 35,011 | | | | 65,470 | |
Triton International Ltd. | | | 4,297 | | | | 104,589 | |
| | | | | | | | |
| | | | | | | | 520,785 | |
Canada | | | | | | | | |
Domtar Corp. | | | 7,576 | | | | 330,995 | |
First Majestic Silver Corp. | | | 3,950 | | | | 37,920 | |
Precision Drilling Corp. | | | 16,426 | | | | 92,643 | |
Shopify, Inc., Class A | | | 2,460 | | | | 125,017 | |
| | | | | | | | |
| | | | | | | | 586,575 | |
China | | | | | | | | |
Hollysys Automation Technologies Ltd. | | | 10,222 | | | | 172,752 | |
Yirendai Ltd. — ADR | | | 1,588 | | | | 33,554 | |
| | | | | | | | |
| | | | | | | | 206,306 | |
Germany | | | | | | | | |
Deutsche Bank AG | | | 7,142 | | | | 142,197 | |
Ireland | | | | | | | | |
Allegion PLC | | | 6,676 | | | | 438,413 | |
Israel | | | | | | | | |
Caesarstone Ltd. | | | 752 | | | | 22,823 | |
CyberArk Software Ltd. | | | 838 | | | | 44,464 | |
Orbotech Ltd. | | | 21,650 | | | | 755,368 | |
Taro Pharmaceutical Industries Ltd. | | | 648 | | | | 67,710 | |
Tower Semiconductor Ltd. | | | 31,799 | | | | 674,457 | |
Wix.com Ltd. | | | 7,631 | | | | 401,009 | |
| | | | | | | | |
| | | | | | | | 1,965,831 | |
Ivory Coast | | | | | | | | |
Fabrinet | | | 8,861 | | | | 373,314 | |
Netherlands | | | | | | | | |
Aegon NV | | | 64,234 | | | | 352,003 | |
QIAGEN NV | | | 3,288 | | | | 95,286 | |
| | | | | | | | |
| | | | | | | | 447,289 | |
Norway | | | | | | | | |
Nordic American Tankers Ltd. | | | 6,787 | | | | 58,640 | |
Panama | | | | | | | | |
Copa Holdings SA, Class A | | | 1,610 | | | | 156,959 | |
Switzerland | | | | | | | | |
UBS Group AG | | | 15,022 | | | | 242,005 | |
United Kingdom | | | | | | | | |
Atlassian Corp. PLC, Class A | | | 1,425 | | | | 39,373 | |
Coca-Cola European Partners PLC | | | 28,198 | | | | 973,677 | |
Delphi Automotive PLC | | | 6,216 | | | | 435,493 | |
Ferroglobe PLC | | | 13,781 | | | | 144,838 | |
Pentair PLC | | | 6,548 | | | | 383,909 | |
Travelport Worldwide Ltd. | | | 6,731 | | | | 96,657 | |
| | | | | | | | |
| | | | | | | | 2,073,947 | |
United States | | | | | | | | |
2U, Inc. | | | 2,281 | | | | 77,645 | |
A. Schulman, Inc. | | | 2,195 | | | | 75,728 | |
Accelerate Diagnostics, Inc. | | | 2,588 | | | | 54,219 | |
Accenture PLC, Class A | | | 458 | | | | 52,152 | |
ACCO Brands Corp. | | | 13,327 | | | | 169,919 | |
Activision Blizzard, Inc. | | | 34,136 | | | | 1,372,609 | |
Acxiom Corp. | | | 7,907 | | | | 206,373 | |
Advanced Energy Industries, Inc. | | | 28,567 | | | | 1,680,882 | |
Affiliated Managers Group, Inc. | | | 1,415 | | | | 215,589 | |
See Notes to Financial Statements.
| | | | | | |
| | | | | | | |
| 36 | | BLACKROCK FUNDS | | JANUARY 31, 2017 | | |
| | |
Schedule of Investments (continued) | | BlackRock Global Long/Short Equity Fund |
| | | | | | | | |
| | | Shares | | | Value | |
| Reference Entity — Long (continued) | | | | | | |
United States (continued) | | | | | | | | |
Alarm.com Holdings, Inc. | | | 1,067 | | | $ | 28,905 | |
Albemarle Corp. | | | 4,747 | | | | 439,762 | |
Alliant Energy Corp. | | | 17,456 | | | | 657,218 | |
Allison Transmission Holdings, Inc. | | | 24,927 | | | | 871,946 | |
Amdocs Ltd. | | | 42,651 | | | | 2,504,040 | |
American Campus Communities, Inc. | | | 1,850 | | | | 89,947 | |
American Eagle Outfitters, Inc. | | | 15,267 | | | | 230,684 | |
American Tower Corp. | | | 9,296 | | | | 962,136 | |
American Water Works Co., Inc. | | | 2,531 | | | | 185,877 | |
AMN Healthcare Services, Inc. | | | 2,127 | | | | 76,253 | |
Amphastar Pharmaceuticals, Inc. | | | 8,014 | | | | 126,221 | |
Amphenol Corp., Class A | | | 19,784 | | | | 1,335,222 | |
AmTrust Financial Services, Inc. | | | 3,399 | | | | 89,700 | |
Analog Devices, Inc. | | | 7,632 | | | | 571,942 | |
Analogic Corp. | | | 328 | | | | 25,469 | |
Andersons, Inc. | | | 3,367 | | | | 127,104 | |
Anixter International, Inc. | | | 6,466 | | | | 552,843 | |
AO Smith Corp. | | | 11,443 | | | | 557,846 | |
Aon PLC | | | 12,095 | | | | 1,363,106 | |
Applied Industrial Technologies, Inc. | | | 4,605 | | | | 278,372 | |
Applied Materials, Inc. | | | 34,816 | | | | 1,192,448 | |
Aptargroup, Inc. | | | 14,546 | | | | 1,061,422 | |
Aramark | | | 12,441 | | | | 421,003 | |
Archer-Daniels-Midland Co. | | | 21,477 | | | | 950,572 | |
Archrock, Inc. | | | 1,049 | | | | 15,315 | |
Armstrong World Industries, Inc. | | | 11,629 | | | | 464,579 | |
ARRIS International PLC | | | 1,028 | | | | 29,380 | |
Ascena Retail Group, Inc. | | | 9,273 | | | | 44,603 | |
Aspen Technology, Inc. | | | 745 | | | | 39,567 | |
Astec Industries, Inc. | | | 3,606 | | | | 252,348 | |
Atlas Air Worldwide Holdings, Inc. | | | 252 | | | | 13,293 | |
Atmos Energy Corp. | | | 28,891 | | | | 2,200,916 | |
AutoZone, Inc. | | | 826 | | | | 598,833 | |
Bank of the Ozarks, Inc. | | | 1,521 | | | | 83,457 | |
Bankrate, Inc. | | | 10,721 | | | | 116,859 | |
BankUnited, Inc. | | | 15,050 | | | | 574,910 | |
Barnes & Noble, Inc. | | | 9,437 | | | | 96,257 | |
Barracuda Networks, Inc. | | | 8,697 | | | | 204,293 | |
Beacon Roofing Supply, Inc. | | | 4,545 | | | | 198,935 | |
Belden, Inc. | | | 6,962 | | | | 532,384 | |
Bio-Techne Corp. | | | 5,571 | | | | 566,849 | |
Bloomin’ Brands, Inc. | | | 6,140 | | | | 105,055 | |
Booz Allen Hamilton Holding Corp. | | | 15,632 | | | | 528,674 | |
BorgWarner, Inc. | | | 1,655 | | | | 67,574 | |
Briggs & Stratton Corp. | | | 9,923 | | | | 214,932 | |
Bright Horizons Family Solutions, Inc. | | | 9,885 | | | | 700,451 | |
Bristol-Myers Squibb Co. | | | 4,007 | | | | 196,984 | |
Bruker Corp. | | | 19,932 | | | | 472,986 | |
Builders FirstSource, Inc. | | | 11,747 | | | | 126,398 | |
Bunge Ltd. | | | 5,019 | | | | 347,365 | |
BWX Technologies, Inc. | | | 5,732 | | | | 237,821 | |
Cabot Corp. | | | 3,120 | | | | 172,754 | |
Cadence Design Systems, Inc. | | | 11,674 | | | | 303,874 | |
CalAtlantic Group, Inc. | | | 539 | | | | 18,795 | |
Callaway Golf Co. | | | 61,095 | | | | 692,206 | |
Callon Petroleum Co. | | | 4,440 | | | | 67,843 | |
Camping World Holdings, Inc., Class A | | | 2,993 | | | | 94,220 | |
Cantel Medical Corp. | | | 4,969 | | | | 384,650 | |
Capella Education Co. | | | 1,782 | | | | 152,361 | |
Carlisle Cos., Inc. | | | 8,029 | | | | 876,044 | |
Carrizo Oil & Gas, Inc. | | | 849 | | | | 30,021 | |
Carter’s, Inc. | | | 530 | | | | 44,388 | |
CBRE Group, Inc., Class A | | | 5,112 | | | | 155,200 | |
CBS Corp., Class B | | | 10,741 | | | | 692,687 | |
Central Garden and Pet Co., Class A | | | 3,041 | | | | 93,602 | |
Charles River Laboratories International, Inc. | | | 690 | | | | 55,752 | |
| | | | | | | | |
| | | Shares | | | Value | |
| Reference Entity — Long (continued) | | | | | | |
United States (continued) | | | | | | | | |
Cheesecake Factory, Inc. | | | 1,130 | | | $ | 68,094 | |
Chico’s FAS, Inc. | | | 2,995 | | | | 40,403 | |
Choice Hotels International, Inc. | | | 6,273 | | | | 348,152 | |
Church & Dwight Co., Inc. | | | 61,585 | | | | 2,784,874 | |
Cimarex Energy Co. | | | 415 | | | | 56,112 | |
Cincinnati Financial Corp. | | | 16,109 | | | | 1,136,973 | |
Cinemark Holdings, Inc. | | | 7,556 | | | | 321,130 | |
Cirrus Logic, Inc. | | | 834 | | | | 50,307 | |
Cisco Systems, Inc. | | | 29,993 | | | | 921,385 | |
Citigroup, Inc. | | | 1,867 | | | | 104,235 | |
Citizens Financial Group, Inc. | | | 22,995 | | | | 831,729 | |
Citrix Systems, Inc. | | | 417 | | | | 38,026 | |
Cliffs Natural Resources, Inc. | | | 10,148 | | | | 88,998 | |
ClubCorp Holdings, Inc. | | | 7,383 | | | | 121,820 | |
CME Group, Inc. | | | 7,318 | | | | 886,063 | |
CMS Energy Corp. | | | 67,627 | | | | 2,880,910 | |
CNA Financial Corp. | | | 6,239 | | | | 259,854 | |
CNO Financial Group, Inc. | | | 4,097 | | | | 77,474 | |
Coca-Cola Co. | | | 40,748 | | | | 1,693,894 | |
Coeur Mining, Inc. | | | 7,809 | | | | 90,975 | |
Cognex Corp. | | | 816 | | | | 55,129 | |
Coherent, Inc. | | | 669 | | | | 105,521 | |
Colfax Corp. | | | 3,000 | | | | 117,000 | |
Columbia Sportswear Co. | | | 7,108 | | | | 386,462 | |
CommScope Holding Co., Inc. | | | 26,507 | | | | 1,002,495 | |
CONMED Corp. | | | 1,426 | | | | 63,585 | |
Consolidated Communications Holdings, Inc. | | | 2,274 | | | | 59,829 | |
Continental Building Products, Inc. | | | 1,804 | | | | 41,943 | |
Continental Resources, Inc. | | | 1,269 | | | | 61,623 | |
Cooper-Standard Holding, Inc. | | | 913 | | | | 96,121 | |
Corning, Inc. | | | 49,258 | | | | 1,304,844 | |
Crane Co. | | | 21,343 | | | | 1,537,550 | |
CSG Systems International, Inc. | | | 8,189 | | | | 396,348 | |
Curtiss-Wright Corp. | | | 2,485 | | | | 243,679 | |
Cynosure, Inc., Class A | | | 2,076 | | | | 110,858 | |
Dana, Inc. | | | 18,529 | | | | 373,174 | |
Danaher Corp. | | | 7,011 | | | | 588,363 | |
Darling Ingredients, Inc. | | | 1,405 | | | | 16,860 | |
Delek U.S. Holdings, Inc. | | | 10,563 | | | | 236,611 | |
Dentsply Sirona, Inc. | | | 11,891 | | | | 674,220 | |
Dermira, Inc. | | | 7,405 | | | | 218,003 | |
DigitalGlobe, Inc. | | | 2,287 | | | | 64,150 | |
Discovery Communications, Inc., Class A | | | 658 | | | | 18,654 | |
Dolby Laboratories, Inc., Class A | | | 1,342 | | | | 64,295 | |
Dr. Pepper Snapple Group, Inc. | | | 6,165 | | | | 562,248 | |
Dun & Bradstreet Corp. | | | 4,035 | | | | 494,772 | |
Dunkin’ Brands Group, Inc. | | | 12,390 | | | | 642,669 | |
E*Trade Financial Corp. | | | 6,999 | | | | 262,113 | |
E.I. du Pont de Nemours & Co. | | | 7,960 | | | | 600,980 | |
Eagle Bancorp, Inc. | | | 8,740 | | | | 535,325 | |
East West Bancorp, Inc. | | | 2,163 | | | | 111,265 | |
Eaton Corp. PLC | | | 13,839 | | | | 979,524 | |
Edison International | | | 10,853 | | | | 790,967 | |
Electronic Arts, Inc. | | | 9,980 | | | | 832,631 | |
Ellie Mae, Inc. | | | 728 | | | | 60,235 | |
EMCOR Group, Inc. | | | 5,103 | | | | 355,628 | |
Energen Corp. | | | 3,325 | | | | 179,184 | |
EnerSys | | | 15,018 | | | | 1,170,653 | |
EnPro Industries, Inc. | | | 342 | | | | 23,225 | |
Ensign Group, Inc. | | | 15,014 | | | | 305,385 | |
Envision Healthcare Corp. | | | 234 | | | | 15,912 | |
EQT Corp. | | | 6,888 | | | | 417,619 | |
Equifax, Inc. | | | 12,045 | | | | 1,412,638 | |
Estee Lauder Cos., Inc., Class A | | | 20,552 | | | | 1,669,028 | |
Ethan Allen Interiors, Inc. | | | 7,224 | | | | 210,218 | |
Etsy, Inc. | | | 4,633 | | | | 58,422 | |
See Notes to Financial Statements.
| | | | | | |
| | | | | | | |
| | BLACKROCK FUNDS | | JANUARY 31, 2017 | | 37 |
| | |
Schedule of Investments (continued) | | BlackRock Global Long/Short Equity Fund |
| | | | | | | | |
| | | Shares | | | Value | |
| Reference Entity — Long (continued) | | | | | | |
United States (continued) | | | | | | | | |
Euronet Worldwide, Inc. | | | 7,659 | | | $ | 547,772 | |
Eversource Energy | | | 924 | | | | 51,116 | |
Expeditors International of Washington, Inc. | | | 17,820 | | | | 928,066 | |
Express, Inc. | | | 22,235 | | | | 236,358 | |
Extended Stay America, Inc. | | | 3,575 | | | | 57,951 | |
Fastenal Co. | | | 16,273 | | | | 808,443 | |
FCB Financial Holdings, Inc., Class A | | | 14,415 | | | | 676,784 | |
Ferro Corp. | | | 14,794 | | | | 209,187 | |
Fidelity National Information Services, Inc. | | | 22,460 | | | | 1,783,773 | |
First American Financial Corp. | | | 26,915 | | | | 1,011,466 | |
First Horizon National Corp. | | | 25,796 | | | | 515,920 | |
First Industrial Realty Trust, Inc. | | | 24,492 | | | | 633,118 | |
Fitbit, Inc., Series A | | | 5,172 | | | | 31,084 | |
FleetCor Technologies, Inc. | | | 6,175 | | | | 910,751 | |
FLIR Systems, Inc. | | | 2,849 | | | | 100,655 | |
Flowserve Corp. | | | 2,152 | | | | 105,792 | |
Fluor Corp. | | | 6,824 | | | | 378,732 | |
Foot Locker, Inc. | | | 968 | | | | 66,347 | |
Fortinet, Inc. | | | 1,290 | | | | 42,905 | |
Fortive Corp. | | | 312 | | | | 17,257 | |
Fortune Brands Home & Security, Inc. | | | 1,561 | | | | 86,058 | |
Forum Energy Technologies, Inc. | | | 5,350 | | | | 116,095 | |
Forward Air Corp. | | | 4,764 | | | | 229,577 | |
Garmin Ltd. | | | 13,199 | | | | 637,380 | |
Gigamon, Inc. | | | 2,380 | | | | 78,897 | |
Gogo, Inc. | | | 14,903 | | | | 136,362 | |
Gramercy Property Trust | | | 3,833 | | | | 100,961 | |
Great Plains Energy, Inc. | | | 1,725 | | | | 47,524 | |
Great Western Bancorp, Inc. | | | 9,166 | | | | 391,847 | |
Greif, Inc., Class A | | | 310 | | | | 17,850 | |
Groupon, Inc. | | | 17,515 | | | | 60,427 | |
Halcon Resources Corp. | | | 5,048 | | | | 42,605 | |
Hanesbrands, Inc. | | | 16,547 | | | | 392,329 | |
Harris Corp. | | | 2,561 | | | | 263,040 | |
Hasbro, Inc. | | | 16,561 | | | | 1,366,448 | |
Healthcare Realty Trust, Inc. | | | 588 | | | | 17,763 | |
HealthSouth Corp. | | | 4,983 | | | | 193,440 | |
Helix Energy Solutions Group, Inc. | | | 8,165 | | | | 69,239 | |
Helmerich & Payne, Inc. | | | 7,549 | | | | 537,187 | |
Henry Schein, Inc. | | | 7,785 | | | | 1,244,510 | |
Hersha Hospitality Trust | | | 6,785 | | | | 135,632 | |
Hexcel Corp. | | | 4,735 | | | | 243,142 | |
Hibbett Sports, Inc. | | | 8,728 | | | | 288,024 | |
Hilltop Holdings, Inc. | | | 15,332 | | | | 419,790 | |
Hilton Grand Vacations, Inc. | | | 1,868 | | | | 54,788 | |
HollyFrontier Corp. | | | 1,281 | | | | 37,111 | |
Hologic, Inc. | | | 15,826 | | | | 641,428 | |
Home Depot, Inc. | | | 8,608 | | | | 1,184,289 | |
Hormel Foods Corp. | | | 29,183 | | | | 1,059,343 | |
Hospitality Properties Trust | | | 20,127 | | | | 626,554 | |
Host Hotels & Resorts, Inc. | | | 1,108 | | | | 20,022 | |
Howard Hughes Corp. | | | 584 | | | | 62,260 | |
Hub Group, Inc., Class A | | | 4,098 | | | | 181,746 | |
HubSpot, Inc. | | | 6,656 | | | | 341,453 | |
Hyatt Hotels Corp., Class A | | | 10,227 | | | | 559,519 | |
IDEXX Laboratories, Inc. | | | 5,511 | | | | 674,161 | |
II-VI, Inc. | | | 7,468 | | | | 272,582 | |
Imperva, Inc. | | | 3,708 | | | | 154,809 | |
Ingersoll-Rand PLC | | | 8,613 | | | | 683,442 | |
Ingredion, Inc. | | | 10,728 | | | | 1,375,222 | |
Innophos Holdings, Inc. | | | 167 | | | | 8,123 | |
Innospec, Inc. | | | 2,901 | | | | 206,986 | |
Inogen, Inc. | | | 1,496 | | | | 96,298 | |
Inphi Corp. | | | 413 | | | | 18,924 | |
Insight Enterprises, Inc. | | | 1,834 | | | | 68,096 | |
Integra LifeSciences Holdings Corp. | | | 549 | | | | 22,910 | |
| | | | | | | | |
| | | Shares | | | Value | |
| Reference Entity — Long (continued) | | | | | | |
United States (continued) | | | | | | | | |
Intercontinental Exchange, Inc. | | | 22,316 | | | $ | 1,302,362 | |
International Flavors & Fragrances, Inc. | | | 2,835 | | | | 332,290 | |
Interpublic Group of Cos., Inc. | | | 56,992 | | | | 1,341,022 | |
Intuit, Inc. | | | 2,467 | | | | 292,537 | |
Invesco Mortgage Capital, Inc. | | | 1,484 | | | | 21,622 | |
Itron, Inc. | | | 3,656 | | | | 225,575 | |
ITT, Inc. | | | 1,568 | | | | 64,084 | |
Jacobs Engineering Group, Inc. | | | 9,842 | | | | 576,249 | |
JC Penney Co., Inc. | | | 2,895 | | | | 19,252 | |
Jones Lang LaSalle, Inc. | | | 2,949 | | | | 303,835 | |
Kellogg Co. | | | 38,794 | | | | 2,820,712 | |
KeyCorp | | | 14,757 | | | | 265,183 | |
Kimco Realty Corp. | | | 6,175 | | | | 153,696 | |
Kite Realty Group Trust | | | 30,206 | | | | 725,548 | |
KLA-Tencor Corp. | | | 502 | | | | 42,725 | |
Knoll, Inc. | | | 18,415 | | | | 480,816 | |
Kohl’s Corp. | | | 8,438 | | | | 336,086 | |
Kraton Corp. | | | 1,410 | | | | 37,873 | |
L3 Technologies, Inc. | | | 4,211 | | | | 668,244 | |
Laredo Petroleum, Inc. | | | 3,827 | | | | 51,856 | |
LCI Industries | | | 2,114 | | | | 232,012 | |
LegacyTexas Financial Group, Inc. | | | 3,091 | | | | 127,720 | |
Liberty Expedia Holdings, Inc., Class A | | | 343 | | | | 15,095 | |
Liberty Property Trust | | | 23,209 | | | | 890,994 | |
LifePoint Health, Inc. | | | 412 | | | | 24,452 | |
Littelfuse, Inc. | | | 253 | | | | 39,901 | |
Louisiana-Pacific Corp. | | | 7,802 | | | | 149,252 | |
Lowe’s Cos., Inc. | | | 10,893 | | | | 796,060 | |
LPL Financial Holdings, Inc. | | | 2,869 | | | | 112,752 | |
Luxoft Holding, Inc. | | | 151 | | | | 8,886 | |
Lydall, Inc. | | | 1,326 | | | | 80,886 | |
Macerich Co. | | | 1,050 | | | | 72,125 | |
Madison Square Garden Co., Class A | | | 3,991 | | | | 701,099 | |
Magellan Health, Inc. | | | 1,359 | | | | 101,857 | |
Manitowoc Foodservice, Inc. | | | 1,826 | | | | 35,023 | |
ManpowerGroup, Inc. | | | 8,499 | | | | 811,315 | |
Mantech International Corp., Class A | | | 3,463 | | | | 134,849 | |
Marriott International, Inc., Class A | | | 435 | | | | 36,801 | |
Marsh & McLennan Cos., Inc. | | | 11,209 | | | | 762,436 | |
MasTec, Inc. | | | 16,720 | | | | 622,820 | |
MAXIMUS, Inc. | | | 6,895 | | | | 380,190 | |
McCormick & Co., Inc. | | | 1,761 | | | | 168,264 | |
McDermott International, Inc. | | | 26,001 | | | | 210,608 | |
Media General, Inc. CVR | | | 3,231 | | | | 436 | |
Medidata Solutions, Inc. | | | 1,812 | | | | 89,766 | |
Medpace Holdings, Inc. | | | 1,083 | | | | 37,786 | |
Meritage Homes Corp. | | | 444 | | | | 16,317 | |
Meritor, Inc. | | | 7,066 | | | | 101,962 | |
MetLife, Inc. | | | 434 | | | | 23,614 | |
MINDBODY, Inc., Class A | | | 659 | | | | 16,047 | |
Mobile Mini, Inc. | | | 16,741 | | | | 544,920 | |
Molson Coors Brewing Co., Class B | | | 9,981 | | | | 963,366 | |
Monolithic Power Systems, Inc. | | | 1,143 | | | | 99,715 | |
Morningstar, Inc. | | | 2,321 | | | | 176,744 | |
Mosaic Co. | | | 4,685 | | | | 146,968 | |
MRC Global, Inc. | | | 3,855 | | | | 79,220 | |
MSCI, Inc. | | | 5,874 | | | | 486,074 | |
Mueller Water Products, Inc., Series A | | | 33,888 | | | | 456,132 | |
Nasdaq, Inc. | | | 1,286 | | | | 90,714 | |
National Retail Properties, Inc. | | | 5,226 | | | | 227,854 | |
Natus Medical, Inc. | | | 7,296 | | | | 284,909 | |
Navistar International Corp. | | | 996 | | | | 27,161 | |
NCR Corp. | | | 5,817 | | | | 250,247 | |
New Senior Investment Group, Inc. | | | 19,367 | | | | 193,864 | |
Newmont Mining Corp. | | | 648 | | | | 23,509 | |
NextEra Energy, Inc. | | | 3,880 | | | | 480,034 | |
See Notes to Financial Statements.
| | | | | | |
| | | | | | | |
| 38 | | BLACKROCK FUNDS | | JANUARY 31, 2017 | | |
| | |
Schedule of Investments (continued) | | BlackRock Global Long/Short Equity Fund |
| | | | | | | | |
| | | Shares | | | Value | |
| Reference Entity — Long (continued) | | | | | | |
United States (continued) | | | | | | | | |
Nielsen Holdings PLC | | | 33,928 | | | $ | 1,387,994 | |
NiSource, Inc. | | | 58,490 | | | | 1,308,421 | |
Nordstrom, Inc. | | | 1,101 | | | | 48,686 | |
Norfolk Southern Corp. | | | 3,054 | | | | 358,723 | |
Northwest Bancshares, Inc. | | | 2,690 | | | | 45,918 | |
NorthWestern Corp. | | | 31,341 | | | | 1,789,885 | |
NOW, Inc. | | | 7,452 | | | | 158,430 | |
NRG Yield, Inc., Class C | | | 6,224 | | | | 105,497 | |
Nuance Communications, Inc. | | | 32,093 | | | | 508,995 | |
Nucor Corp. | | | 736 | | | | 42,754 | |
NVIDIA Corp. | | | 3,474 | | | | 379,291 | |
NxStage Medical, Inc. | | | 1,826 | | | | 49,119 | |
O’Reilly Automotive, Inc. | | | 4,836 | | | | 1,268,338 | |
Occidental Petroleum Corp. | | | 563 | | | | 38,155 | |
Oclaro, Inc. | | | 6,875 | | | | 67,444 | |
Oil States International, Inc. | | | 1,323 | | | | 52,259 | |
Old Dominion Freight Line, Inc. | | | 1,889 | | | | 166,761 | |
Omnicell, Inc. | | | 2,255 | | | | 80,955 | |
On Assignment, Inc. | | | 535 | | | | 24,225 | |
OSI Systems, Inc. | | | 5,554 | | | | 414,717 | |
Owens Corning | | | 5,377 | | | | 297,079 | |
Panera Bread Co., Class A | | | 1,185 | | | | 247,736 | |
Papa John’s International, Inc. | | | 338 | | | | 28,804 | |
Parsley Energy, Inc., Class A | | | 1,907 | | | | 67,165 | |
Paylocity Holding Corp. | | | 13,834 | | | | 426,917 | |
Penn National Gaming, Inc. | | | 5,570 | | | | 76,755 | |
Penske Automotive Group, Inc. | | | 3,728 | | | | 202,654 | |
PepsiCo, Inc. | | | 489 | | | | 50,748 | |
Performance Food Group Co. | | | 6,496 | | | | 143,886 | |
PerkinElmer, Inc. | | | 631 | | | | 33,563 | |
Philip Morris International, Inc. | | | 2,394 | | | | 230,135 | |
Pilgrim’s Pride Corp. | | | 5,106 | | | | 97,729 | |
Pinnacle Foods, Inc. | | | 5,362 | | | | 285,205 | |
Pioneer Natural Resources Co. | | | 543 | | | | 97,865 | |
Pitney Bowes, Inc. | | | 24,738 | | | | 393,829 | |
Planet Fitness, Inc., Class A | | | 4,631 | | | | 97,436 | |
Power Integrations, Inc. | | | 4,329 | | | | 307,359 | |
PRA Health Sciences, Inc. | | | 509 | | | | 29,822 | |
Praxair, Inc. | | | 19,598 | | | | 2,321,187 | |
Priceline Group, Inc. | | | 204 | | | | 321,327 | |
Proofpoint, Inc. | | | 1,033 | | | | 82,805 | |
Public Service Enterprise Group, Inc. | | | 2,788 | | | | 123,369 | |
Pure Storage, Inc., Class A | | | 17,888 | | | | 203,387 | |
Q2 Holdings, Inc. | | | 5,076 | | | | 161,163 | |
QTS Realty Trust, Inc., Class A | | | 6,020 | | | | 303,348 | |
Quad/Graphics, Inc. | | | 3,856 | | | | 100,989 | |
QUALCOMM, Inc. | | | 9,843 | | | | 525,911 | |
Ramco-Gershenson Properties Trust | | | 6,310 | | | | 102,601 | |
Range Resources Corp. | | | 2,319 | | | | 74,996 | |
Rayonier, Inc. | | | 2,984 | | | | 83,224 | |
Red Rock Resorts, Inc., Class A | | | 7,317 | | | | 171,803 | |
Redwood Trust, Inc. | | | 8,392 | | | | 130,076 | |
Regal Entertainment Group, Class A | | | 11,654 | | | | 264,080 | |
Regal-Beloit Corp. | | | 743 | | | | 53,942 | |
Regency Centers Corp. | | | 4,302 | | | | 299,978 | |
Reliance Steel & Aluminum Co. | | | 5,663 | | | | 451,058 | |
Rockwell Collins, Inc. | | | 4,475 | | | | 406,151 | |
Rogers Corp. | | | 1,991 | | | | 159,180 | |
Rollins, Inc. | | | 1,159 | | | | 40,866 | |
Roper Technologies, Inc. | | | 5,135 | | | | 985,150 | |
Ross Stores, Inc. | | | 3,763 | | | | 248,772 | |
RPC, Inc. | | | 4,185 | | | | 90,061 | |
Sabre Corp. | | | 1,864 | | | | 45,668 | |
Saia, Inc. | | | 4,677 | | | | 224,730 | |
SBA Communications Corp. | | | 812 | | | | 85,471 | |
Scorpio Tankers, Inc. | | | 11,996 | | | | 45,945 | |
| | | | | | | | |
| | | Shares | | | Value | |
| Reference Entity — Long (continued) | | | | | | |
United States (continued) | | | | | | | | |
Sears Holdings Corp. | | | 14,028 | | | $ | 97,915 | |
Select Comfort Corp. | | | 5,849 | | | | 118,033 | |
Sempra Energy | | | 318 | | | | 32,560 | |
Shutterstock, Inc. | | | 1,420 | | | | 76,396 | |
Sirius XM Holdings, Inc. | | | 59,390 | | | | 280,321 | |
Six Flags Entertainment Corp. | | | 2,416 | | | | 143,945 | |
Sotheby’s | | | 2,297 | | | | 91,214 | |
Spirit Aerosystems Holdings, Inc., Class A | | | 1,110 | | | | 66,656 | |
Spirit Airlines, Inc. | | | 2,487 | | | | 134,397 | |
Sprint Corp. | | | 25,142 | | | | 232,061 | |
STAG Industrial, Inc. | | | 37,786 | | | | 874,368 | |
STORE Capital Corp. | | | 2,135 | | | | 50,514 | |
Summit Hotel Properties, Inc. | | | 20,969 | | | | 331,939 | |
Swift Transportation Co. | | | 5,857 | | | | 133,715 | |
Synchronoss Technologies, Inc. | | | 8,963 | | | | 345,255 | |
Synopsys, Inc. | | | 17,613 | | | | 1,107,682 | |
T-Mobile U.S., Inc. | | | 3,735 | | | | 232,578 | |
Take-Two Interactive Software, Inc. | | | 7,034 | | | | 377,374 | |
Tallgrass Energy GP LP | | | 8,349 | | | | 225,173 | |
Targa Resources Corp. | | | 1,034 | | | | 59,579 | |
Target Corp. | | | 19,946 | | | | 1,286,118 | |
Taylor Morrison Home Corp., Class A | | | 17,646 | | | | 342,332 | |
TEGNA, Inc. | | | 1,508 | | | | 34,548 | |
Teladoc, Inc. | | | 1,097 | | | | 21,940 | |
Teledyne Technologies, Inc. | | | 4,785 | | | | 587,933 | |
Teleflex, Inc. | | | 378 | | | | 63,402 | |
Tenneco, Inc. | | | 6,149 | | | | 414,750 | |
Terex Corp. | | | 5,466 | | | | 173,819 | |
Tesoro Corp. | | | 3,226 | | | | 260,822 | |
Texas Instruments, Inc. | | | 6,386 | | | | 482,398 | |
Texas Roadhouse, Inc. | | | 7,476 | | | | 348,681 | |
TherapeuticsMD, Inc. | | | 22,494 | | | | 130,690 | |
Thermo Fisher Scientific, Inc. | | | 4,228 | | | | 644,305 | |
TiVo Corp. | | | 6,029 | | | | 113,948 | |
TJX Cos., Inc. | | | 15,230 | | | | 1,141,032 | |
Tractor Supply Co. | | | 4,143 | | | | 305,215 | |
TransUnion | | | 9,310 | | | | 293,544 | |
Triumph Group, Inc. | | | 6,773 | | | | 181,178 | |
Tronox Ltd., Class A | | | 7,626 | | | | 95,478 | |
TTM Technologies, Inc. | | | 4,118 | | | | 61,070 | |
Tupperware Brands Corp. | | | 3,493 | | | | 210,837 | |
Two Harbors Investment Corp. | | | 44,059 | | | | 386,397 | |
Tyson Foods, Inc., Class A | | | 11,673 | | | | 732,948 | |
U.S. Foods Holding Corp. | | | 3,826 | | | | 104,067 | |
U.S. Silica Holdings, Inc. | | | 1,079 | | | | 63,812 | |
Ubiquiti Networks, Inc. | | | 4,962 | | | | 309,629 | |
Unit Corp. | | | 2,064 | | | | 53,664 | |
United Community Banks, Inc. | | | 18,942 | | | | 532,838 | |
Universal Corp. | | | 3,476 | | | | 236,368 | |
Universal Health Services, Inc., Class B | | | 587 | | | | 66,114 | |
Unum Group | | | 5,285 | | | | 240,098 | |
Valero Energy Corp. | | | 3,297 | | | | 216,811 | |
Varex Imaging Corp. | | | 136 | | | | 3,910 | |
Ventas, Inc. | | | 15,357 | | | | 947,066 | |
VEREIT, Inc. | | | 54,711 | | | | 466,685 | |
VF Corp. | | | 20,500 | | | | 1,055,340 | |
ViaSat, Inc. | | | 9,248 | | | | 600,288 | |
Viavi Solutions, Inc. | | | 29,358 | | | | 262,754 | |
Vishay Intertechnology, Inc. | | | 13,895 | | | | 230,657 | |
Vonage Holdings Corp. | | | 30,728 | | | | 217,862 | |
Voya Financial, Inc. | | | 8,710 | | | | 350,316 | |
Vulcan Materials Co. | | | 1,612 | | | | 206,868 | |
VWR Corp. | | | 1,384 | | | | 35,859 | |
Waddell & Reed Financial, Inc., Class A | | | 7,466 | | | | 134,761 | |
Waste Management, Inc. | | | 14,404 | | | | 1,001,078 | |
Watsco, Inc. | | | 2,623 | | | | 400,637 | |
See Notes to Financial Statements.
| | | | | | |
| | | | | | | |
| | BLACKROCK FUNDS | | JANUARY 31, 2017 | | 39 |
| | |
Schedule of Investments (continued) | | BlackRock Global Long/Short Equity Fund |
| | | | | | | | |
| | | Shares | | | Value | |
| Reference Entity — Long (continued) | | | | | | |
United States (continued) | | | | | | | | |
Weingarten Realty Investors | | | 55,857 | | | $ | 1,990,185 | |
WellCare Health Plans, Inc. | | | 841 | | | | 122,399 | |
Welltower, Inc. | | | 7,376 | | | | 489,029 | |
Weyerhaeuser Co. | | | 3,836 | | | | 120,182 | |
Williams Cos., Inc. | | | 8,870 | | | | 255,811 | |
Windstream Holdings, Inc. | | | 31,524 | | | | 254,714 | |
Winnebago Industries, Inc. | | | 7,367 | | | | 231,324 | |
Wintrust Financial Corp. | | | 1,436 | | | | 102,818 | |
World Fuel Services Corp. | | | 515 | | | | 22,907 | |
WR Grace & Co. | | | 1,371 | | | | 95,065 | |
Wyndham Worldwide Corp. | | | 4,211 | | | | 332,922 | |
Xcel Energy, Inc. | | | 14,309 | | | | 591,248 | |
Xylem, Inc. | | | 43,250 | | | | 2,132,657 | |
Zayo Group Holdings, Inc. | | | 4,052 | | | | 129,502 | |
Zimmer Biomet Holdings, Inc. | | | 1,438 | | | | 170,159 | |
Zoetis, Inc. | | | 270 | | | | 14,834 | |
Zynga, Inc., Class A | | | 115,726 | | | | 291,630 | |
| | | | | | | | |
| | | | | | | | 157,702,348 | |
| Total Reference Entity — Long | | | | | | | 164,952,390 | |
| | | | | | | | |
| | | | | | | | | |
| | |
| Reference Entity — Short | | | | | | |
Australia | | | | | | | | |
InterOil Corp. | | | (2,137 | ) | | | (102,213 | ) |
Bermuda | | | | | | | | |
Axis Capital Holdings Ltd. | | | (9,549 | ) | | | (611,231 | ) |
Helen of Troy Ltd. | | | (3,672 | ) | | | (342,598 | ) |
Kosmos Energy Ltd. | | | (3,166 | ) | | | (20,706 | ) |
Marvell Technology Group Ltd. | | | (1,385 | ) | | | (20,595 | ) |
RenaissanceRe Holdings Ltd. | | | (2,522 | ) | | | (343,799 | ) |
| | | | | | | | |
| | | | | | | | (1,338,929 | ) |
Canada | | | | | | | | |
Lululemon Athletica, Inc. | | | (2,745 | ) | | | (185,315 | ) |
China | | | | | | | | |
Sohu.com, Inc. | | | (1,481 | ) | | | (58,751 | ) |
India | | | | | | | | |
MakeMyTrip, Ltd. | | | (1,437 | ) | | | (47,996 | ) |
Ireland | | | | | | | | |
Endo International PLC | | | (3,185 | ) | | | (38,984 | ) |
Jazz Pharmaceuticals PLC | | | (4,364 | ) | | | (532,059 | ) |
Medtronic PLC | | | (7,238 | ) | | | (550,233 | ) |
Perrigo Co. PLC | | | (465 | ) | | | (35,410 | ) |
| | | | | | | | |
| | | | | | | | (1,156,686 | ) |
Israel | | | | | | | | |
Mellanox Technologies, Ltd. | | | (1,140 | ) | | | (53,979 | ) |
Italy | | | | | | | | |
Rizzoli Corriere Della Sera Mediagroup SpA | | | (934 | ) | | | (806 | ) |
Mexico | | | | | | | | |
Southern Copper Corp. | | | (7,510 | ) | | | (288,084 | ) |
Netherlands | | | | | | | | |
ASML Holding NV | | | (1,531 | ) | | | (185,863 | ) |
Cimpress NV | | | (2,200 | ) | | | (185,658 | ) |
Koninklijke Philips NV | | | (27,968 | ) | | | (821,700 | ) |
| | | | | | | | |
| | | | | | | | (1,193,221 | ) |
Norway | | | | | | | | |
Ship Finance International Ltd. | | | (29,920 | ) | | | (448,800 | ) |
Russia | | | | | | | | |
Yandex NV | | | (9,972 | ) | | | (230,752 | ) |
| | | | | | | | |
| | | Shares | | | Value | |
| Reference Entity — Short (continued) | | | | | | |
Singapore | | | | | | | | |
Broadcom Ltd. | | | (4,565 | ) | | $ | (910,717 | ) |
Spain | | | | | | | | |
Atlantica Yield PLC | | | (966 | ) | | | (20,672 | ) |
Switzerland | | | | | | | | |
Transocean Ltd. | | | (24,093 | ) | | | (336,579 | ) |
Weatherford International PLC | | | (24,324 | ) | | | (126,728 | ) |
| | | | | | | | |
| | | | | | | | (463,307 | ) |
United Kingdom | | | | | | | | |
Ensco PLC, Class A | | | (51,467 | ) | | | (562,020 | ) |
Fiat Chrysler Automobiles NV | | | (8,759 | ) | | | (96,262 | ) |
Liberty Global PLC | | | (10,906 | ) | | | (397,851 | ) |
LivaNova PLC | | | (2,516 | ) | | | (121,032 | ) |
Noble Corp. PLC | | | (12,875 | ) | | | (86,906 | ) |
STERIS PLC | | | (3,928 | ) | | | (278,220 | ) |
| | | | | | | | |
| | | | | | | | (1,542,291 | ) |
United States | | | | | | | | |
3D Systems Corp. | | | (1,127 | ) | | | (18,584 | ) |
AAR Corp. | | | (434 | ) | | | (13,884 | ) |
Abbott Laboratories | | | (5,552 | ) | | | (231,907 | ) |
Actuant Corp. | | | (2,491 | ) | | | (65,140 | ) |
Acuity Brands, Inc. | | | (2,721 | ) | | | (563,873 | ) |
Adtran, Inc. | | | (2,483 | ) | | | (54,378 | ) |
Advanced Drainage Systems, Inc. | | | (7,964 | ) | | | (191,932 | ) |
Advisory Board Co. | | | (11,569 | ) | | | (526,390 | ) |
AES Corp. | | | (11,352 | ) | | | (129,867 | ) |
AGNC Investment Corp. REIT | | | (12,398 | ) | | | (231,471 | ) |
Agree Realty Corp. | | | (16,729 | ) | | | (784,590 | ) |
Air Methods Corp. | | | (1,691 | ) | | | (60,369 | ) |
AK Steel Holding Corp. | | | (6,073 | ) | | | (49,070 | ) |
Akorn, Inc. | | | (10,436 | ) | | | (199,328 | ) |
Alexander & Baldwin, Inc. | | | (7,740 | ) | | | (344,585 | ) |
Alexandria Real Estate Equities, Inc. | | | (1,607 | ) | | | (178,088 | ) |
Allegheny Technologies, Inc. | | | (6,363 | ) | | | (138,268 | ) |
Allegiant Travel Co. | | | (2,242 | ) | | | (385,624 | ) |
Allergan PLC | | | (1,246 | ) | | | (272,737 | ) |
ALLETE, Inc. | | | (1,476 | ) | | | (96,457 | ) |
Alliance Data Systems Corp. | | | (4,824 | ) | | | (1,101,705 | ) |
Alphabet, Inc., Class A Class A | | | (919 | ) | | | (753,755 | ) |
Altria Group, Inc. | | | (31,886 | ) | | | (2,269,645 | ) |
Ambarella, Inc. | | | (1,552 | ) | | | (76,995 | ) |
Amedisys, Inc. | | | (5,366 | ) | | | (245,870 | ) |
AMERCO, Inc. | | | (553 | ) | | | (208,299 | ) |
Ameren Corp. | | | (7,631 | ) | | | (401,772 | ) |
American Electric Power Co., Inc. | | | (408 | ) | | | (26,136 | ) |
American Express Co. | | | (4,006 | ) | | | (305,978 | ) |
American Financial Group, Inc. | | | (1,096 | ) | | | (94,442 | ) |
American Homes 4 Rent | | | (3,085 | ) | | | (68,734 | ) |
American States Water Co. | | | (18,852 | ) | | | (825,341 | ) |
American Woodmark Corp. | | | (417 | ) | | | (29,690 | ) |
AmerisourceBergen Corp. | | | (1,905 | ) | | | (166,268 | ) |
AMETEK, Inc. | | | (3,698 | ) | | | (188,968 | ) |
Annaly Capital Management, Inc. | | | (2,841 | ) | | | (29,035 | ) |
ANSYS, Inc. | | | (4,822 | ) | | | (449,700 | ) |
Antero Resources Corp. | | | (1,086 | ) | | | (26,509 | ) |
Apogee Enterprises, Inc. | | | (7,156 | ) | | | (408,464 | ) |
Apple Hospitality REIT, Inc. | | | (1,526 | ) | | | (30,551 | ) |
Apple, Inc. | | | (4,785 | ) | | | (580,660 | ) |
Arch Capital Group Ltd. | | | (3,296 | ) | | | (291,202 | ) |
Arch Coal, Inc. | | | (275 | ) | | | (19,797 | ) |
Arconic, Inc. | | | (7,842 | ) | | | (178,719 | ) |
Argan, Inc. | | | (3,320 | ) | | | (244,850 | ) |
Arista Networks, Inc. | | | (2,571 | ) | | | (241,674 | ) |
Arthur J Gallagher & Co. | | | (3,096 | ) | | | (166,658 | ) |
See Notes to Financial Statements.
| | | | | | |
| | | | | | | |
| 40 | | BLACKROCK FUNDS | | JANUARY 31, 2017 | | |
| | |
Schedule of Investments (continued) | | BlackRock Global Long/Short Equity Fund |
| | | | | | | | |
| | | Shares | | | Value | |
| Reference Entity — Short (continued) | | | | | | |
United States (continued) | | | | | | | | |
Artisan Partners Asset Management, Inc. | | | (8,202 | ) | | $ | (237,448 | ) |
Ashland Global Holdings, Inc. | | | (1,931 | ) | | | (229,847 | ) |
Assurant, Inc. | | | (9,339 | ) | | | (907,097 | ) |
AT&T, Inc. | | | (43,100 | ) | | | (1,817,096 | ) |
athenahealth, Inc. | | | (1,838 | ) | | | (231,570 | ) |
Atwood Oceanics, Inc. | | | (2,424 | ) | | | (29,476 | ) |
Automatic Data Processing, Inc. | | | (5,710 | ) | | | (576,653 | ) |
Avalonbay Communities, Inc. | | | (3,939 | ) | | | (682,668 | ) |
Avangrid, Inc. | | | (18,740 | ) | | | (727,112 | ) |
Avis Budget Group, Inc. | | | (3,965 | ) | | | (147,577 | ) |
Avista Corp. | | | (3,650 | ) | | | (141,036 | ) |
Avnet, Inc. | | | (22,624 | ) | | | (1,050,659 | ) |
AZZ, Inc. | | | (2,273 | ) | | | (135,357 | ) |
B&G Foods, Inc. | | | (5,088 | ) | | | (225,653 | ) |
Badger Meter, Inc. | | | (12,015 | ) | | | (463,178 | ) |
Balchem Corp. | | | (10,939 | ) | | | (932,440 | ) |
Ball Corp. | | | (7,098 | ) | | | (541,293 | ) |
BancorpSouth, Inc. | | | (20,996 | ) | | | (623,581 | ) |
Bed Bath & Beyond, Inc. | | | (37,794 | ) | | | (1,524,988 | ) |
Beneficial Bancorp, Inc. | | | (6,760 | ) | | | (120,666 | ) |
Berry Plastics Group, Inc. | | | (3,073 | ) | | | (156,815 | ) |
Blackbaud, Inc. | | | (9,418 | ) | | | (617,915 | ) |
Blackhawk Network Holdings, Inc. | | | (1,288 | ) | | | (45,982 | ) |
Blue Buffalo Pet Products, Inc. | | | (3,631 | ) | | | (88,052 | ) |
BNC Bancorp | | | (4,318 | ) | | | (152,209 | ) |
Bob Evans Farms, Inc. | | | (863 | ) | | | (48,699 | ) |
Boeing Co. | | | (1,954 | ) | | | (319,323 | ) |
Boston Beer Co., Inc. | | | (1,110 | ) | | | (170,607 | ) |
Boston Properties, Inc. | | | (127 | ) | | | (16,624 | ) |
Brandywine Realty Trust | | | (1,383 | ) | | | (22,266 | ) |
Brinker International, Inc. | | | (1,286 | ) | | | (57,227 | ) |
Brookdale Senior Living, Inc. | | | (13,825 | ) | | | (206,960 | ) |
Brown & Brown, Inc. | | | (6,741 | ) | | | (283,998 | ) |
Burlington Stores, Inc. | | | (1,157 | ) | | | (96,841 | ) |
Cable One, Inc. | | | (863 | ) | | | (545,744 | ) |
Cabot Microelectronics Corp. | | | (778 | ) | | | (52,523 | ) |
Caesars Entertainment Corp. | | | (3,618 | ) | | | (32,381 | ) |
Cal-Maine Foods, Inc. | | | (1,179 | ) | | | (49,164 | ) |
Caleres, Inc. | | | (492 | ) | | | (15,129 | ) |
California Water Service Group | | | (4,299 | ) | | | (148,315 | ) |
Calpine Corp. | | | (12,690 | ) | | | (149,742 | ) |
Camden Property Trust | | | (181 | ) | | | (15,126 | ) |
Capstead Mortgage Corp. | | | (16,089 | ) | | | (171,670 | ) |
Carnival Corp. | | | (13,425 | ) | | | (743,477 | ) |
Carpenter Technology Corp. | | | (1,394 | ) | | | (55,788 | ) |
Casey’s General Stores, Inc. | | | (3,090 | ) | | | (355,041 | ) |
Cavium, Inc. | | | (3,548 | ) | | | (234,913 | ) |
CBL & Associates Properties, Inc. | | | (3,848 | ) | | | (41,751 | ) |
CBOE Holdings, Inc. | | | (5,679 | ) | | | (452,162 | ) |
Centene Corp. | | | (849 | ) | | | (53,716 | ) |
Centennial Resource Development, Inc. | | | (1,319 | ) | | | (24,098 | ) |
Cerner Corp. | | | (5,473 | ) | | | (293,955 | ) |
CF Industries Holdings, Inc. | | | (11,592 | ) | | | (409,082 | ) |
CH Robinson Worldwide, Inc. | | | (19,040 | ) | | | (1,448,182 | ) |
Chemed Corp. | | | (244 | ) | | | (40,526 | ) |
Chemical Financial Corp. | | | (5,241 | ) | | | (259,063 | ) |
Chemours Co. | | | (5,769 | ) | | | (152,417 | ) |
Chesapeake Lodging Trust | | | (9,251 | ) | | | (236,826 | ) |
Chevron Corp. | | | (7,411 | ) | | | (825,215 | ) |
Chipotle Mexican Grill, Inc. | | | (347 | ) | | | (146,240 | ) |
Ciena Corp. | | | (3,751 | ) | | | (91,299 | ) |
Cintas Corp. | | | (7,366 | ) | | | (855,266 | ) |
CIRCOR International, Inc. | | | (1,186 | ) | | | (73,864 | ) |
Clean Harbors, Inc. | | | (6,218 | ) | | | (345,099 | ) |
Clearwater Paper Corp. | | | (2,895 | ) | | | (182,095 | ) |
Coca-Cola Bottling Co. Consolidated | | | (81 | ) | | | (13,676 | ) |
| | | | | | | | |
| | | Shares | | | Value | |
| Reference Entity — Short (continued) | | | | | | |
United States (continued) | | | | | | | | |
Colony Northstar, Inc. Class A | | | (21,660 | ) | | $ | (301,507 | ) |
Colony Starwood Homes | | | (29,446 | ) | | | (926,077 | ) |
Commerce Bancshares, Inc. | | | (5,166 | ) | | | (292,034 | ) |
Commercial Metals Co. | | | (7,247 | ) | | | (148,056 | ) |
Communications Sales & Leasing, Inc. | | | (2,661 | ) | | | (69,931 | ) |
Community Bank System, Inc. | | | (10,049 | ) | | | (586,460 | ) |
comScore, Inc. | | | (14,177 | ) | | | (475,638 | ) |
ConAgra Foods, Inc. | | | (12,906 | ) | | | (504,496 | ) |
Constellation Brands, Inc. | | | (8,782 | ) | | | (1,315,192 | ) |
Core-Mark Holding Co., Inc. | | | (5,859 | ) | | | (204,655 | ) |
CoreSite Realty Corp. | | | (1,617 | ) | | | (139,272 | ) |
Corporate Office Properties Trust | | | (20,404 | ) | | | (649,255 | ) |
CoStar Group, Inc. | | | (252 | ) | | | (50,929 | ) |
Costco Wholesale Corp. | | | (2,740 | ) | | | (449,223 | ) |
Cotiviti Holdings, Inc. | | | (1,344 | ) | | | (45,508 | ) |
Coty, Inc., Class A | | | (4,651 | ) | | | (89,299 | ) |
Cousins Properties, Inc. | | | (8,885 | ) | | | (75,522 | ) |
Covanta Holding Corp. | | | (2,088 | ) | | | (33,617 | ) |
CSRA, Inc. | | | (3,038 | ) | | | (94,239 | ) |
CSX Corp. | | | (10,486 | ) | | | (486,446 | ) |
Cubic Corp. | | | (5,990 | ) | | | (284,824 | ) |
CVB Financial Corp. | | | (14,040 | ) | | | (316,462 | ) |
Cypress Semiconductor Corp. | | | (16,451 | ) | | | (194,122 | ) |
Dean Foods Co. | | | (13,340 | ) | | | (264,932 | ) |
Deckers Outdoor Corp. | | | (4,899 | ) | | | (282,182 | ) |
Deere & Co. | | | (4,133 | ) | | | (442,438 | ) |
DexCom, Inc. | | | (4,466 | ) | | | (353,484 | ) |
Digital Realty Trust, Inc. | | | (626 | ) | | | (67,376 | ) |
Dollar General Corp. | | | (7,135 | ) | | | (526,706 | ) |
Dorman Products, Inc. | | | (4,916 | ) | | | (339,302 | ) |
Douglas Emmett, Inc. | | | (594 | ) | | | (22,477 | ) |
Dril-Quip, Inc. | | | (7,710 | ) | | | (479,562 | ) |
DTE Energy Co. | | | (4,950 | ) | | | (488,268 | ) |
DuPont Fabros Technology, Inc. | | | (10,067 | ) | | | (477,981 | ) |
Dynegy, Inc. | | | (2,701 | ) | | | (25,795 | ) |
Eagle Materials, Inc. | | | (1,500 | ) | | | (156,870 | ) |
EastGroup Properties, Inc. | | | (1,241 | ) | | | (87,826 | ) |
EchoStar Corp. | | | (7,445 | ) | | | (379,174 | ) |
El Paso Electric Co. | | | (10,122 | ) | | | (464,600 | ) |
Electronics For Imaging, Inc. | | | (1,343 | ) | | | (60,354 | ) |
Emerson Electric Co. | | | (12,341 | ) | | | (723,923 | ) |
Enbridge Energy Management LLC | | | (41 | ) | | | (772 | ) |
Endurance International Group Holdings, Inc. | | | (4,188 | ) | | | (32,248 | ) |
Envestnet, Inc. | | | (1,045 | ) | | | (39,501 | ) |
Equity LifeStyle Properties, Inc. | | | (439 | ) | | | (32,460 | ) |
EW Scripps Co. | | | (12,281 | ) | | | (239,234 | ) |
Exxon Mobil Corp. | | | (361 | ) | | | (30,284 | ) |
F5 Networks, Inc. | | | (2,139 | ) | | | (286,690 | ) |
FactSet Research Systems, Inc. | | | (3,724 | ) | | | (644,438 | ) |
FedEx Corp. | | | (3,854 | ) | | | (728,830 | ) |
Fiesta Restaurant Group, Inc. | | | (6,459 | ) | | | (169,872 | ) |
Finisar Corp. | | | (826 | ) | | | (24,425 | ) |
First Republic Bank | | | (263 | ) | | | (24,809 | ) |
First Solar, Inc. | | | (9,664 | ) | | | (301,420 | ) |
Five Below, Inc. | | | (12,146 | ) | | | (484,018 | ) |
Flex Ltd. | | | (3,344 | ) | | | (52,400 | ) |
Flowers Foods, Inc. | | | (30,832 | ) | | | (620,032 | ) |
Forest City Realty Trust, Inc. | | | (7,421 | ) | | | (168,011 | ) |
Franklin Electric Co., Inc. | | | (2,045 | ) | | | (82,516 | ) |
Freeport-McMoRan, Inc. | | | (13,514 | ) | | | (225,008 | ) |
Fresh Del Monte Produce, Inc. | | | (14,738 | ) | | | (843,751 | ) |
FTI Consulting, Inc. | | | (11,309 | ) | | | (476,561 | ) |
Fulton Financial Corp. | | | (9,660 | ) | | | (175,812 | ) |
G-III Apparel Group Ltd. | | | (4,938 | ) | | | (129,672 | ) |
GameStop Corp., Class A | | | (2,371 | ) | | | (58,066 | ) |
Gaming and Leisure Properties, Inc. | | | (12,704 | ) | | | (401,828 | ) |
See Notes to Financial Statements.
| | | | | | |
| | | | | | | |
| | BLACKROCK FUNDS | | JANUARY 31, 2017 | | 41 |
| | |
Schedule of Investments (continued) | | BlackRock Global Long/Short Equity Fund |
| | | | | | | | |
| | | Shares | | | Value | |
| Reference Entity — Short (continued) | | | | | | |
United States (continued) | | | | | | | | |
General Dynamics Corp. | | | (6,857 | ) | | $ | (1,241,666 | ) |
General Electric Co. | | | (74,559 | ) | | | (2,214,402 | ) |
General Mills, Inc. | | | (36,112 | ) | | | (2,256,278 | ) |
Genesco, Inc. | | | (3,613 | ) | | | (217,503 | ) |
Gentex Corp. | | | (53,783 | ) | | | (1,123,527 | ) |
Global Payments, Inc. | | | (8,077 | ) | | | (624,191 | ) |
Globus Medical, Inc. | | | (2,865 | ) | | | (75,521 | ) |
Graco, Inc. | | | (7,764 | ) | | | (695,577 | ) |
Green Dot Corp., Class A | | | (3,728 | ) | | | (99,910 | ) |
Greenbrier Cos., Inc. | | | (4,106 | ) | | | (179,637 | ) |
GrubHub, Inc. | | | (1,604 | ) | | | (66,646 | ) |
Guidewire Software, Inc. | | | (541 | ) | | | (28,311 | ) |
Gulfport Energy Corp. | | | (785 | ) | | | (16,406 | ) |
H&R Block, Inc. | | | (23,534 | ) | | | (505,040 | ) |
Hancock Holding Co. | | | (7,552 | ) | | | (346,259 | ) |
Hanover Insurance Group, Inc. | | | (835 | ) | | | (70,090 | ) |
Hawaiian Electric Industries, Inc. | | | (22,487 | ) | | | (752,865 | ) |
HB Fuller Co. | | | (7,733 | ) | | | (381,778 | ) |
HCA Holdings, Inc. | | | (8,870 | ) | | | (712,084 | ) |
Healthcare Services Group, Inc. | | | (3,323 | ) | | | (132,089 | ) |
HEICO Corp. | | | (1,950 | ) | | | (150,052 | ) |
Herman Miller, Inc. | | | (14,632 | ) | | | (456,518 | ) |
Hertz Global Holdings, Inc. | | | (9,039 | ) | | | (189,548 | ) |
Hewlett Packard Enterprise Co. | | | (6,533 | ) | | | (148,168 | ) |
Hillenbrand, Inc. | | | (23,631 | ) | | | (863,713 | ) |
Hope Bancorp, Inc. | | | (2,411 | ) | | | (50,414 | ) |
Horizon Pharma PLC | | | (1,060 | ) | | | (17,352 | ) |
HP, Inc. | | | (3,200 | ) | | | (48,160 | ) |
HSN, Inc. | | | (500 | ) | | | (17,625 | ) |
Hubbell, Inc. | | | (625 | ) | | | (76,300 | ) |
ICU Medical, Inc. | | | (1,008 | ) | | | (138,197 | ) |
IDACORP, Inc. | | | (6,254 | ) | | | (500,445 | ) |
Illumina, Inc. | | | (3,528 | ) | | | (564,833 | ) |
Impax Laboratories, Inc. | | | (11,968 | ) | | | (157,379 | ) |
Infinera Corp. | | | (17,381 | ) | | | (156,603 | ) |
Ingevity Corp. | | | (834 | ) | | | (46,362 | ) |
Insulet Corp. | | | (551 | ) | | | (22,922 | ) |
Intel Corp. | | | (16,629 | ) | | | (612,280 | ) |
Interactive Brokers Group, Inc., Class A | | | (4,087 | ) | | | (152,609 | ) |
International Bancshares Corp. | | | (6,110 | ) | | | (226,681 | ) |
International Business Machines Corp. | | | (2,585 | ) | | | (451,134 | ) |
Intuitive Surgical, Inc. | | | (300 | ) | | | (207,807 | ) |
InvenSense, Inc. | | | (15,715 | ) | | | (198,952 | ) |
IPG Photonics Corp. | | | (966 | ) | | | (111,080 | ) |
Iron Mountain, Inc. | | | (1,966 | ) | | | (70,383 | ) |
J&J Snack Foods Corp. | | | (5,733 | ) | | | (731,359 | ) |
Jabil Circuit, Inc. | | | (17,751 | ) | | | (425,669 | ) |
JetBlue Airways Corp. | | | (2,512 | ) | | | (49,260 | ) |
Johnson & Johnson | | | (233 | ) | | | (26,387 | ) |
Juniper Networks, Inc. | | | (3,653 | ) | | | (97,827 | ) |
Kaman Corp. | | | (23,669 | ) | | | (1,195,995 | ) |
Kate Spade & Co. | | | (9,963 | ) | | | (184,415 | ) |
KBR, Inc. | | | (10,101 | ) | | | (171,818 | ) |
KCG Holdings, Inc., Class A | | | (7,000 | ) | | | (97,790 | ) |
Kemper Corp. | | | (938 | ) | | | (40,522 | ) |
Kennametal, Inc. | | | (6,108 | ) | | | (218,300 | ) |
Kimberly-Clark Corp. | | | (1,151 | ) | | | (139,421 | ) |
Kinder Morgan, Inc. | | | (17,607 | ) | | | (393,340 | ) |
Kroger Co. | | | (29,725 | ) | | | (1,009,461 | ) |
L Brands, Inc. | | | (4,372 | ) | | | (263,238 | ) |
Lam Research Corp. | | | (2,623 | ) | | | (301,278 | ) |
Lamar Advertising Co. | | | (17,901 | ) | | | (1,351,884 | ) |
Lamb Weston Holdings, Inc. | | | (18,368 | ) | | | (686,228 | ) |
Lennar Corp. | | | (26,320 | ) | | | (1,175,188 | ) |
Liberty Broadband Corp. | | | (792 | ) | | | (66,275 | ) |
Liberty SiriusXM Group | | | (16,567 | ) | | | (600,388 | ) |
| | | | | | | | |
| | | Shares | | | Value | |
| Reference Entity — Short (continued) | | | | | | |
United States (continued) | | | | | | | | |
Liberty Ventures | | | (4,961 | ) | | $ | (216,548 | ) |
Life Storage, Inc. | | | (269 | ) | | | (21,910 | ) |
Lincoln Electric Holdings, Inc. | | | (6,462 | ) | | | (538,737 | ) |
Lindsay Corp. | | | (3,003 | ) | | | (226,246 | ) |
Lithia Motors, Inc., Class A | | | (3,174 | ) | | | (327,303 | ) |
LTC Properties, Inc. | | | (2,326 | ) | | | (108,554 | ) |
LyondellBasell Industries NV, Class A | | | (4,547 | ) | | | (424,099 | ) |
M&T Bank Corp. | | | (6,368 | ) | | | (1,035,246 | ) |
Mallinckrodt PLC | | | (592 | ) | | | (28,848 | ) |
Markel Corp. | | | (26 | ) | | | (24,050 | ) |
Masimo Corp. | | | (907 | ) | | | (66,737 | ) |
Masonite International Corp. | | | (2,550 | ) | | | (169,830 | ) |
Matson, Inc. | | | (3,096 | ) | | | (110,403 | ) |
Matthews International Corp., Class A | | | (953 | ) | | | (64,280 | ) |
Maxim Integrated Products, Inc. | | | (11,045 | ) | | | (491,282 | ) |
MaxLinear, Inc., Class A | | | (801 | ) | | | (20,490 | ) |
MB Financial, Inc. | | | (2,817 | ) | | | (125,441 | ) |
MBIA, Inc. | | | (4,556 | ) | | | (46,471 | ) |
Mednax, Inc. | | | (5,211 | ) | | | (356,172 | ) |
Mercury General Corp. | | | (8,211 | ) | | | (519,346 | ) |
Mercury Systems, Inc. | | | (547 | ) | | | (18,445 | ) |
Meredith Corp. | | | (360 | ) | | | (22,068 | ) |
Mettler-Toledo International, Inc. | | | (207 | ) | | | (88,312 | ) |
MGE Energy, Inc. | | | (26,529 | ) | | | (1,688,571 | ) |
MGIC Investment Corp. | | | (14,706 | ) | | | (156,619 | ) |
Michaels Cos., Inc. | | | (1,638 | ) | | | (32,219 | ) |
Micron Technology, Inc. | | | (5,313 | ) | | | (128,096 | ) |
Microsoft Corp. | | | (21,584 | ) | | | (1,395,406 | ) |
Middleby Corp. | | | (6,160 | ) | | | (826,549 | ) |
Monogram Residential Trust, Inc. | | | (43,328 | ) | | | (440,646 | ) |
Monro Muffler Brake, Inc. | | | (420 | ) | | | (25,158 | ) |
Monster Beverage Corp. | | | (4,774 | ) | | | (203,372 | ) |
Moog, Inc., Class A | | | (5,726 | ) | | | (377,172 | ) |
MSC Industrial Direct Co., Inc. | | | (6,568 | ) | | | (670,921 | ) |
Multi-Color Corp. | | | (7,817 | ) | | | (603,472 | ) |
Murphy USA, Inc. | | | (2,335 | ) | | | (148,739 | ) |
National Fuel Gas Co. | | | (4,982 | ) | | | (279,739 | ) |
National Health Investors, Inc. | | | (2,617 | ) | | | (193,632 | ) |
National Instruments Corp. | | | (18,883 | ) | | | (593,304 | ) |
Navient Corp. | | | (10,888 | ) | | | (163,756 | ) |
Neogen Corp. | | | (5,069 | ) | | | (334,757 | ) |
NetApp, Inc. | | | (5,324 | ) | | | (204,016 | ) |
Netscout Systems, Inc. | | | (4,424 | ) | | | (147,319 | ) |
Nevro Corp. | | | (434 | ) | | | (37,767 | ) |
New Jersey Resources Corp. | | | (36,865 | ) | | | (1,389,811 | ) |
New Residential Investment Corp. | | | (3,280 | ) | | | (49,692 | ) |
New York REIT, Inc. | | | (18,316 | ) | | | (182,244 | ) |
New York Times Co. | | | (42,303 | ) | | | (571,091 | ) |
NIC, Inc. | | | (7,035 | ) | | | (169,543 | ) |
NIKE, Inc., Class B | | | (42,484 | ) | | | (2,247,404 | ) |
Northwest Natural Gas Co. | | | (36,232 | ) | | | (2,134,065 | ) |
Norwegian Cruise Line Holdings Ltd. | | | (16,325 | ) | | | (767,275 | ) |
Nutrisystem, Inc. | | | (9,670 | ) | | | (319,594 | ) |
NuVasive, Inc. | | | (4,211 | ) | | | (298,012 | ) |
Oasis Petroleum, Inc. | | | (3,231 | ) | | | (45,686 | ) |
Old Republic International Corp. | | | (18,387 | ) | | | (382,450 | ) |
Ollie’s Bargain Outlet Holdings, Inc. | | | (8,332 | ) | | | (254,543 | ) |
ON Semiconductor Corp. | | | (25,664 | ) | | | (341,844 | ) |
OneMain Holdings, Inc. | | | (10,159 | ) | | | (227,358 | ) |
Oracle Corp. | | | (55,711 | ) | | | (2,234,568 | ) |
Orbital ATK, Inc. | | | (4,156 | ) | | | (361,364 | ) |
Ormat Technologies, Inc. | | | (13,517 | ) | | | (725,863 | ) |
Outfront Media, Inc. | | | (755 | ) | | | (20,710 | ) |
Pacira Pharmaceuticals, Inc. | | | (512 | ) | | | (19,686 | ) |
Palo Alto Networks, Inc. | | | (4,297 | ) | | | (634,065 | ) |
Pandora Media, Inc. | | | (11,456 | ) | | | (148,928 | ) |
See Notes to Financial Statements.
| | | | | | |
| | | | | | | |
| 42 | | BLACKROCK FUNDS | | JANUARY 31, 2017 | | |
| | |
Schedule of Investments (continued) | | BlackRock Global Long/Short Equity Fund |
| | | | | | | | |
| | | Shares | | | Value | |
| Reference Entity — Short (continued) | | | | | | |
United States (continued) | | | | | | | | |
Parexel International Corp. | | | (1,647 | ) | | $ | (116,756 | ) |
Paychex, Inc. | | | (23,752 | ) | | | (1,432,008 | ) |
PDC Energy, Inc. | | | (3,545 | ) | | | (262,117 | ) |
Pegasystems, Inc. | | | (3,399 | ) | | | (131,881 | ) |
Penumbra, Inc. | | | (1,829 | ) | | | (130,865 | ) |
Physicians Realty Trust | | | (3,399 | ) | | | (63,051 | ) |
Piedmont Office Realty Trust, Inc. | | | (33,502 | ) | | | (727,663 | ) |
Pinnacle West Capital Corp. | | | (592 | ) | | | (45,957 | ) |
Plantronics, Inc. | | | (3,742 | ) | | | (211,722 | ) |
Plexus Corp. | | | (4,228 | ) | | | (229,580 | ) |
PNM Resources, Inc. | | | (3,083 | ) | | | (106,055 | ) |
Polaris Industries, Inc. | | | (1,768 | ) | | | (148,636 | ) |
Popeyes Louisiana Kitchen, Inc. | | | (9,396 | ) | | | (593,733 | ) |
Portland General Electric Co. | | | (3,060 | ) | | | (133,447 | ) |
Post Holdings, Inc. | | | (1,341 | ) | | | (112,215 | ) |
Potlatch Corp. | | | (2,551 | ) | | | (105,101 | ) |
PRA Group, Inc. | | | (6,540 | ) | | | (260,292 | ) |
Premier, Inc., Class A | | | (1,620 | ) | | | (51,613 | ) |
PriceSmart, Inc. | | | (3,120 | ) | | | (264,264 | ) |
Procter & Gamble Co. | | | (26,028 | ) | | | (2,280,053 | ) |
Prosperity Bancshares, Inc. | | | (3,883 | ) | | | (282,022 | ) |
PVH Corp. | | | (2,346 | ) | | | (220,078 | ) |
Qorvo, Inc. | | | (2,729 | ) | | | (175,229 | ) |
Quality Care Properties, Inc. | | | (4,371 | ) | | | (80,689 | ) |
Quanta Services, Inc. | | | (36,498 | ) | | | (1,309,913 | ) |
Radian Group, Inc. | | | (1,812 | ) | | | (33,341 | ) |
Raytheon Co. | | | (2,499 | ) | | | (360,256 | ) |
RBC Bearings, Inc. | | | (6,699 | ) | | | (620,528 | ) |
Realogy Holdings Corp. | | | (8,335 | ) | | | (215,960 | ) |
RealPage, Inc. | | | (3,531 | ) | | | (108,049 | ) |
Red Hat, Inc. | | | (13,563 | ) | | | (1,029,160 | ) |
Republic Services, Inc. | | | (1,016 | ) | | | (58,298 | ) |
ResMed, Inc. | | | (4,991 | ) | | | (337,092 | ) |
Restoration Hardware | | | (8,723 | ) | | | (235,695 | ) |
RLI Corp. | | | (4,109 | ) | | | (244,157 | ) |
Robert Half International, Inc. | | | (1,998 | ) | | | (94,026 | ) |
Rowan Cos. PLC | | | (9,206 | ) | | | (164,972 | ) |
Royal Caribbean Cruises Ltd. | | | (5,053 | ) | | | (473,112 | ) |
RPM International, Inc. | | | (21,591 | ) | | | (1,128,346 | ) |
Sabra Health Care REIT, Inc. | | | (11,038 | ) | | | (280,365 | ) |
Sanmina Corp. | | | (1,745 | ) | | | (67,968 | ) |
Science Applications International Corp. | | | (7,874 | ) | | | (641,101 | ) |
Scotts Miracle-Gro Co., Class A | | | (3,020 | ) | | | (277,749 | ) |
SEACOR Holdings, Inc. | | | (8,306 | ) | | | (611,072 | ) |
Seagate Technology PLC | | | (3,336 | ) | | | (150,620 | ) |
SEI Investments Co. | | | (5,447 | ) | | | (264,234 | ) |
Select Medical Holdings Corp. | | | (26,448 | ) | | | (329,278 | ) |
Seritage Growth Properties | | | (1,083 | ) | | | (44,186 | ) |
Service Corp. International | | | (13,272 | ) | | | (386,613 | ) |
ServiceMaster Global Holdings, Inc. | | | (3,530 | ) | | | (130,539 | ) |
ServiceNow, Inc. | | | (7,584 | ) | | | (687,262 | ) |
Shenandoah Telecommunications Co. | | | (4,241 | ) | | | (115,567 | ) |
Sherwin-Williams Co. | | | (3,112 | ) | | | (945,457 | ) |
Signature Bank | | | (537 | ) | | | (84,588 | ) |
Simon Property Group, Inc. | | | (78 | ) | | | (14,334 | ) |
SiteOne Landscape Supply, Inc. | | | (6,046 | ) | | | (232,287 | ) |
Skechers U.S.A., Inc., Class A | | | (529 | ) | | | (13,288 | ) |
SL Green Realty Corp. | | | (1,363 | ) | | | (148,526 | ) |
SLM Corp. | | | (6,282 | ) | | | (74,630 | ) |
Snyder’s-Lance, Inc. | | | (23,003 | ) | | | (882,855 | ) |
Sonic Automotive, Inc., Class A | | | (7,109 | ) | | | (166,351 | ) |
Sonic Corp. | | | (1,846 | ) | | | (45,965 | ) |
Sonoco Products Co. | | | (563 | ) | | | (30,937 | ) |
Southern Co. | | | (17,747 | ) | | | (877,234 | ) |
Spirit Realty Capital, Inc. | | | (15,363 | ) | | | (161,619 | ) |
Sprouts Farmers Market, Inc. | | | (1,093 | ) | | | (20,406 | ) |
| | | | | | | | |
| | | Shares | | | Value | |
| Reference Entity — Short (continued) | | | | | | |
United States (continued) | | | | | | | | |
SPS Commerce, Inc. | | | (2,148 | ) | | $ | (148,212 | ) |
SPX FLOW, Inc. | | | (679 | ) | | | (23,690 | ) |
Standex International Corp. | | | (1,849 | ) | | | (161,233 | ) |
Starwood Property Trust, Inc. | | | (38,380 | ) | | | (854,339 | ) |
State Street Corp. | | | (1,807 | ) | | | (137,693 | ) |
Steelcase, Inc., Class A | | | (30,178 | ) | | | (506,990 | ) |
Stepan Co. | | | (1,121 | ) | | | (87,561 | ) |
Stericycle, Inc. | | | (2,908 | ) | | | (224,323 | ) |
Stifel Financial Corp. | | | (5,712 | ) | | | (287,485 | ) |
Stratasys, Ltd. | | | (2,985 | ) | | | (58,864 | ) |
Summit Materials, Inc., Class A | | | (5,144 | ) | | | (129,114 | ) |
Sykes Enterprises, Inc. | | | (10,427 | ) | | | (291,226 | ) |
Symantec Corp. | | | (4,265 | ) | | | (117,501 | ) |
Synaptics, Inc. | | | (2,783 | ) | | | (156,906 | ) |
Synovus Financial Corp. | | | (1,301 | ) | | | (54,226 | ) |
Taubman Centers, Inc. | | | (2,517 | ) | | | (178,304 | ) |
Tenet Healthcare Corp. | | | (3,079 | ) | | | (54,160 | ) |
Tennant Co. | | | (12,370 | ) | | | (856,623 | ) |
Tessera Holding Corp. | | | (2,588 | ) | | | (116,978 | ) |
Textron, Inc. | | | (5,631 | ) | | | (266,740 | ) |
Thor Industries, Inc. | | | (1,739 | ) | | | (179,986 | ) |
Time, Inc. | | | (5,713 | ) | | | (109,975 | ) |
Timken Co. | | | (2,161 | ) | | | (95,948 | ) |
Toll Brothers, Inc. | | | (20,800 | ) | | | (652,288 | ) |
Torchmark Corp. | | | (14,149 | ) | | | (1,040,517 | ) |
Trade Desk, Inc., Class A | | | (3,363 | ) | | | (99,747 | ) |
TreeHouse Foods, Inc. | | | (10,770 | ) | | | (817,228 | ) |
TRI Pointe Group, Inc. | | | (6,962 | ) | | | (85,424 | ) |
TripAdvisor, Inc. | | | (502 | ) | | | (26,556 | ) |
Trustmark Corp. | | | (9,549 | ) | | | (321,037 | ) |
Twenty-First Century Fox, Inc. | | | (18,239 | ) | | | (572,340 | ) |
UDR, Inc. | | | (3,777 | ) | | | (132,006 | ) |
Ulta Salon Cosmetics & Fragrance, Inc. | | | (2,130 | ) | | | (579,956 | ) |
UniFirst Corp. | | | (7,044 | ) | | | (900,928 | ) |
United Natural Foods, Inc. | | | (11,418 | ) | | | (521,803 | ) |
United Rentals, Inc. | | | (2,476 | ) | | | (313,239 | ) |
Universal Electronics, Inc. | | | (2,603 | ) | | | (154,878 | ) |
Urban Edge Properties | | | (13,130 | ) | | | (367,246 | ) |
US Bancorp | | | (2,502 | ) | | | (131,730 | ) |
US Ecology, Inc. | | | (3,240 | ) | | | (166,050 | ) |
USANA Health Sciences, Inc. | | | (7,935 | ) | | | (494,351 | ) |
USG Corp. | | | (1,122 | ) | | | (34,322 | ) |
Vector Group Ltd. | | | (13,954 | ) | | | (307,825 | ) |
Vectren Corp. | | | (13,979 | ) | | | (767,307 | ) |
Veeva Systems, Inc., Class A | | | (3,065 | ) | | | (129,741 | ) |
VeriFone Systems, Inc. | | | (32,731 | ) | | | (594,722 | ) |
Verint Systems, Inc. | | | (20,339 | ) | | | (759,662 | ) |
Verisk Analytics, Inc., Class A | | | (5,422 | ) | | | (448,074 | ) |
Verizon Communications, Inc. | | | (22,975 | ) | | | (1,126,005 | ) |
Versum Materials, Inc. | | | (1,844 | ) | | | (51,540 | ) |
Viacom, Inc., Class B | | | (5,167 | ) | | | (217,737 | ) |
Visteon Corp. | | | (5,841 | ) | | | (523,178 | ) |
Vornado Realty Trust | | | (148 | ) | | | (15,734 | ) |
Wabash National Corp. | | | (5,524 | ) | | | (97,499 | ) |
Walt Disney Co. | | | (5,147 | ) | | | (569,516 | ) |
Wayfair, Inc., Class A | | | (3,802 | ) | | | (158,011 | ) |
WD-40 Co. | | | (2,517 | ) | | | (264,663 | ) |
Wells Fargo & Co. | | | (3,381 | ) | | | (190,452 | ) |
Wendy’s Co. | | | (8,638 | ) | | | (116,872 | ) |
Western Digital Corp. | | | (2,616 | ) | | | (208,574 | ) |
Western Union Co. | | | (5,844 | ) | | | (114,426 | ) |
Westlake Chemical Corp. | | | (7,171 | ) | | | (443,957 | ) |
Whirlpool Corp. | | | (2,990 | ) | | | (522,921 | ) |
Williams-Sonoma, Inc. | | | (2,476 | ) | | | (119,368 | ) |
Wolverine World Wide, Inc. | | | (5,490 | ) | | | (128,960 | ) |
Workday, Inc., Class A | | | (12,464 | ) | | | (1,035,634 | ) |
See Notes to Financial Statements.
| | | | | | |
| | | | | | | |
| | BLACKROCK FUNDS | | JANUARY 31, 2017 | | 43 |
| | |
Schedule of Investments (continued) | | BlackRock Global Long/Short Equity Fund |
| | | | | | | | |
| | | Shares | | | Value | |
| Reference Entity — Short (continued) | | | | | | |
United States (continued) | | | | | | | | |
Worthington Industries, Inc. | | | (6,410 | ) | | $ | (306,334 | ) |
WP Carey, Inc. | | | (3,630 | ) | | | (224,842 | ) |
WPX Energy, Inc. | | | (3,036 | ) | | | (42,291 | ) |
WR Berkley Corp. | | | (22,163 | ) | | | (1,489,575 | ) |
WW Grainger, Inc. | | | (1,340 | ) | | | (338,444 | ) |
Wynn Resorts Ltd. | | | (383 | ) | | | (38,848 | ) |
Xenia Hotels & Resorts, Inc. | | | (36,182 | ) | | | (663,940 | ) |
Yelp, Inc. | | | (469 | ) | | | (19,595 | ) |
Zendesk, Inc. | | | (3,905 | ) | | | (93,447 | ) |
Zillow Group, Inc. | | | (2,552 | ) | | | (90,290 | ) |
| | | | | | | | |
| | | | | | | | (156,580,943 | ) |
| Total Reference Entity — Short | | | | | | | (164,623,462 | ) |
| Net Value of Reference Entity — Bank of America N.A. | | | | 328,928 | |
| | | | | | | | |
| | | | | | | | | |
|
| The following table represents the individual long and short positions and related values of equity securities underlying the total return swap with Deutsche Bank AG as of January 31, 2017, expiration dates 3/01/17 — 3/23/17: | |
| Reference Entity — Long | | | | | | |
France | | | | | | | | |
Peugeot SA | | | 146,641 | | | | 2,729,077 | |
Germany | | | | | | | | |
Solarworld AG | | | 10 | | | | 44 | |
Hong Kong | | | | | | | | |
Champion REIT | | | 94,000 | | | | 50,770 | |
HKT Trust & HKT Ltd. | | | 56,000 | | | | 78,227 | |
| | | | | | | | |
| | | | | | | | 128,997 | |
Italy | | | | | | | | |
Autogrill SpA | | | 205,618 | | | | 1,808,273 | |
Japan | | | | | | | | |
Glory Ltd. | | | 10,200 | | | | 318,668 | |
Penta-Ocean Construction Co. Ltd. | | | 17,400 | | | | 84,956 | |
| | | | | | | | |
| | | | | | | | 403,624 | |
Singapore | | | | | | | | |
Venture Corp. Ltd. | | | 190,300 | | | | 1,376,644 | |
Spain | | | | | | | | |
Mediaset Espana Comunicacion SA | | | 484,842 | | | | 5,934,238 | |
Sweden | | | | | | | | |
Intrum Justitia AB | | | 39,745 | | | | 1,338,053 | |
United Kingdom | | | | | | | | |
Qinetiq Group PLC | | | 465,113 | | | | 1,546,978 | |
| Total Reference Entity — Long | | | | | | | 15,265,928 | |
| | | | | | | | |
| | | | | | | | | |
| | |
| Reference Entity — Short | | | | | | |
Australia | | | | | | | | |
Qube Holdings Ltd. | | | (202,922 | ) | | | (354,174 | ) |
Hong Kong | | | | | | | | |
Esprit Holdings Ltd. | | | (1,186,906 | ) | | | (926,401 | ) |
| Total Reference Entity — Short | | | | | | | (1,280,575 | ) |
| Net Value of Reference Entity — Deutsche Bank AG | | | | 13,985,353 | |
| | | | | | | | |
| | | | | | | | |
| The following table represents the individual long and short positions and related values of equity securities underlying the total return swap with Goldman Sachs & Co. as of January 31, 2017, expiration dates 3/02/17 — 8/29/18: | |
| | | Shares | | | Value | |
| Reference Entity — Long | | | | | | |
Australia | | | | | | | | |
Aristocrat Leisure Ltd. | | | 8,391 | | | $ | 97,309 | |
Caltex Australia Ltd. | | | 62,663 | | | | 1,359,952 | |
CSR Ltd. | | | 165,588 | | | | 554,508 | |
Mineral Resources Ltd. | | | 9,718 | | | | 90,739 | |
Platinum Asset Management Ltd. | | | 2,141 | | | | 8,112 | |
Regis Resources Ltd. | | | 4,201 | | | | 10,181 | |
WorleyParsons Ltd. | | | 5,729 | | | | 43,077 | |
| | | | | | | | |
| | | | | | | | 2,163,878 | |
Austria | | | | | | | | |
Raiffeisen Bank International AG | | | 884 | | | | 19,688 | |
Vienna Insurance Group AG | | | 7,697 | | | | 187,586 | |
| | | | | | | | |
| | | | | | | | 207,274 | |
Belgium | | | | | | | | |
NV Bekaert SA | | | 4,633 | | | | 201,064 | |
Umicore SA | | | 570 | | | | 31,928 | |
| | | | | | | | |
| | | | | | | | 232,992 | |
Bermuda | | | | | | | | |
Nabors Industries Ltd. | | | 3,239 | | | | 52,634 | |
Canada | | | | | | | | |
Canadian Natural Resources Ltd. | | | 60,455 | | | | 1,827,704 | |
Capital Power Corp. | | | 11,030 | | | | 209,199 | |
Celestica, Inc. | | | 2,789 | | | | 38,730 | |
Crescent Point Energy Corp. | | | 12,920 | | | | 150,622 | |
HudBay Minerals, Inc. | | | 9,642 | | | | 75,506 | |
Inter Pipeline Ltd. | | | 28,512 | | | | 618,335 | |
Maple Leaf Foods, Inc. | | | 48,566 | | | | 1,113,332 | |
Quebecor, Inc., Class B | | | 3,865 | | | | 116,403 | |
Saputo, Inc. | | | 139,216 | | | | 5,125,716 | |
Vermilion Energy, Inc. | | | 3,466 | | | | 142,982 | |
| | | | | | | | |
| | | | | | | | 9,418,529 | |
China | | | | | | | | |
FIH Mobile Ltd. | | | 200,000 | | | | 64,262 | |
Denmark | | | | | | | | |
Carlsberg A/S, Class B | | | 684 | | | | 61,880 | |
GN Store Nord A/S | | | 15,243 | | | | 340,463 | |
Novo Nordisk A/S, Class B | | | 23,285 | | | | 841,514 | |
| | | | | | | | |
| | | | | | | | 1,243,857 | |
Finland | | | | | | | | |
Valmet Corp. | | | 12,346 | | | | 195,198 | |
France | | | | | | | | |
Arkema SA | | | 273 | | | | 26,962 | |
Cie Generale des Etablissements Michelin | | | 8,095 | | | | 869,665 | |
Danone SA | | | 11,120 | | | | 697,099 | |
Eurazeo | | | 301 | | | | 18,539 | |
Faurecia | | | 5,086 | | | | 220,984 | |
Ipsen SA | | | 2,676 | | | | 207,355 | |
Nexity SA | | | 1,623 | | | | 79,716 | |
Peugeot SA | | | 1,832 | | | | 34,095 | |
Plastic Omnium SA | | | 4,840 | | | | 164,204 | |
Sodexo SA | | | 670 | | | | 74,090 | |
Technicolor SA, Registered Shares | | | 16,018 | | | | 68,679 | |
| | | | | | | | |
| | | | | | | | 2,461,388 | |
Germany | | | | | | | | |
Covestro AG | | | 8,162 | | | | 614,221 | |
Deutsche Euroshop AG | | | 3,491 | | | | 145,116 | |
Duerr AG | | | 801 | | | | 69,488 | |
See Notes to Financial Statements.
| | | | | | |
| | | | | | | |
| 44 | | BLACKROCK FUNDS | | JANUARY 31, 2017 | | |
| | |
Schedule of Investments (continued) | | BlackRock Global Long/Short Equity Fund |
| | | | | | | | |
| | | Shares | | | Value | |
| Reference Entity — Long (continued) | | | | | | |
Germany (continued) | | | | | | | | |
Hochtief AG | | | 341 | | | $ | 48,610 | |
Kloeckner & Co. SE | | | 25,448 | | | | 332,305 | |
Lanxess AG | | | 4,027 | | | | 293,050 | |
Rheinmetall AG | | | 34,324 | | | | 2,634,069 | |
| | | | | | | | |
| | | | | | | | 4,136,859 | |
Hong Kong | | | | | | | | |
Hang Lung Properties Ltd. | | | 79,000 | | | | 194,425 | |
HKT Trust & HKT Ltd. | | | 250,000 | | | | 349,229 | |
Kerry Properties Ltd. | | | 102,000 | | | | 288,643 | |
Texwinca Holdings Ltd. | | | 84,000 | | | | 53,822 | |
WH Group Ltd. | | | 37,500 | | | | 28,483 | |
| | | | | | | | |
| | | | | | | | 914,602 | |
Ireland | | | | | | | | |
CRH PLC | | | 146,598 | | | | 5,084,849 | |
DCC PLC | | | 7,379 | | | | 595,214 | |
Glanbia PLC | | | 1,474 | | | | 24,902 | |
Greencore Group PLC | | | 92,534 | | | | 275,462 | |
ICON PLC | | | 1,796 | | | | 150,972 | |
Kerry Group PLC, Class A | | | 297 | | | | 20,872 | |
Smurfit Kappa Group PLC | | | 75,871 | | | | 1,998,426 | |
| | | | | | | | |
| | | | | | | | 8,150,697 | |
Israel | | | | | | | | |
Check Point Software Technologies Ltd. | | | 3,949 | | | | 390,043 | |
Italy | | | | | | | | |
Mediobanca SpA | | | 53,141 | | | | 457,546 | |
Unipol Gruppo Finanziario SpA | | | 39,996 | | | | 147,912 | |
| | | | | | | | |
| | | | | | | | 605,458 | |
Japan | | | | | | | | |
Alfresa Holdings Corp. | | | 3,000 | | | | 49,381 | |
Bank of Kyoto Ltd. | | | 47,000 | | | | 367,420 | |
Chiba Bank Ltd. | | | 176,000 | | | | 1,151,274 | |
COLOPL, Inc. | | | 3,000 | | | | 25,947 | |
Daiichi Sankyo Co. Ltd. | | | 16,800 | | | | 375,868 | |
Glory Ltd. | | | 3,100 | | | | 96,850 | |
Gunma Bank Ltd. | | | 98,900 | | | | 539,479 | |
Hokuhoku Financial Group, Inc. | | | 59,300 | | | | 1,015,924 | |
Hokuriku Electric Power Co. | | | 1,500 | | | | 15,113 | |
Ito En Ltd. | | | 700 | | | | 23,262 | |
Itochu Techno-Solutions Corp. | | | 10,300 | | | | 277,059 | |
Japan Petroleum Exploration Co. | | | 20,800 | | | | 467,237 | |
Japan Steel Works Ltd. | | | 1,300 | | | | 24,410 | |
JX Holdings, Inc. | | | 33,800 | | | | 159,400 | |
Kandenko Co. Ltd. | | | 19,000 | | | | 176,518 | |
Matsumotokiyoshi Holdings Co. Ltd. | | | 2,100 | | | | 104,404 | |
Mitsubishi Chemical Holdings Corp. | | | 175,400 | | | | 1,223,406 | |
Nagase & Co. Ltd. | | | 54,400 | | | | 745,520 | |
Nomura Real Estate Holdings, Inc. | | | 18,100 | | | | 311,325 | |
NTT Docomo, Inc. | | | 84,100 | | | | 2,010,836 | |
Ono Pharmaceutical Co. Ltd. | | | 2,100 | | | | 43,084 | |
Open House Co. Ltd. | | | 16,000 | | | | 374,504 | |
Park24 Co. Ltd. | | | 2,500 | | | | 69,002 | |
Penta-Ocean Construction Co. Ltd. | | | 124,600 | | | | 608,362 | |
Resona Holdings, Inc. | | | 340,900 | | | | 1,845,657 | |
Sankyo Co. Ltd. | | | 25,800 | | | | 861,429 | |
Sumitomo Forestry Co. Ltd. | | | 14,100 | | | | 193,959 | |
Sumitomo Mitsui Trust Holdings, Inc. | | | 21,600 | | | | 805,105 | |
Sumitomo Real Estate Sales Co. Ltd. | | | 5,700 | | | | 129,699 | |
TAG Immobilien AG | | | 28,796 | | | | 389,319 | |
Taiyo Yuden Co. Ltd. | | | 3,000 | | | | 36,589 | |
TonenGeneral Sekiyu KK | | | 173,000 | | | | 2,034,498 | |
Toppan Forms Co. Ltd. | | | 40,800 | | | | 423,194 | |
Toppan Printing Co. Ltd. | | | 61,000 | | | | 598,772 | |
| | | | | | | | |
| | | | | | | | 17,573,806 | |
| | | | | | | | |
| | | Shares | | | Value | |
| Reference Entity — Long (continued) | | | | | | |
Mexico | | | | | | | | |
Fresnillo PLC | | | 11,273 | | | $ | 206,932 | |
Netherlands | | | | | | | | |
BE Semiconductor Industries NV | | | 34,086 | | | | 1,230,774 | |
Koninklijke Vopak NV | | | 1,407 | | | | 60,438 | |
| | | | | | | | |
| | | | | | | | 1,291,212 | |
Norway | | | | | | | | |
Salmar ASA | | | 2,694 | | | | 76,249 | |
Subsea 7 SA | | | 45,521 | | | | 619,431 | |
| | | | | | | | |
| | | | | | | | 695,680 | |
Portugal | | | | | | | | |
CTT — Correios de Portugal SA | | | 71,381 | | | | 398,202 | |
Jeronimo Martins SGPS SA | | | 41,861 | | | | 708,522 | |
NOS SGPS SA | | | 88,191 | | | | 496,560 | |
| | | | | | | | |
| | | | | | | | 1,603,284 | |
Singapore | | | | | | | | |
Venture Corp. Ltd. | | | 103,900 | | | | 751,620 | |
Spain | | | | | | | | |
ACS Actividades de Construccion y Servicios SA | | | 1,382 | | | | 21,607 | |
Sweden | | | | | | | | |
JM AB | | | 21,073 | | | | 635,456 | |
Modern Times Group MTG AB, B Shares | | | 782 | | | | 24,103 | |
Saab AB | | | 11,657 | | | | 476,048 | |
| | | | | | | | |
| | | | | | | | 1,135,607 | |
Switzerland | | | | | | | | |
Coca-Cola HBC AG | | | 68,892 | | | | 1,574,739 | |
Georg Fischer AG, Registered Shares | | | 471 | | | | 388,168 | |
IWG PLC | | | 60,084 | | | | 189,285 | |
Logitech International SA, Registered Shares | | | 3,104 | | | | 88,898 | |
Lonza Group AG, Registered Shares | | | 617 | | | | 113,355 | |
Straumann Holding AG, Registered Shares | | | 7,971 | | | | 3,216,825 | |
| | | | | | | | |
| | | | | | | | 5,571,270 | |
United Kingdom | | | | | | | | |
Auto Trader Group PLC | | | 27,023 | | | | 136,483 | |
Barratt Developments PLC | | | 312,460 | | | | 1,884,306 | |
Bunzl PLC | | | 3,032 | | | | 79,925 | |
Dialog Semiconductor PLC | | | 3,776 | | | | 175,705 | |
DS Smith PLC | | | 49,414 | | | | 276,219 | |
Electrocomponents PLC | | | 26,807 | | | | 163,945 | |
Inchcape PLC | | | 10,630 | | | | 96,210 | |
Indivior PLC | | | 109,747 | | | | 409,840 | |
Intertek Group PLC | | | 4,281 | | | | 183,255 | |
Liberty Global PLC LiLAC, Class A | | | 2 | | | | 46 | |
Michael Page International PLC | | | 86,038 | | | | 468,641 | |
Moneysupermarket.com Group PLC | | | 69,190 | | | | 287,343 | |
Petrofac Ltd. | | | 8,203 | | | | 94,984 | |
Qinetiq Group PLC | | | 415 | | | | 1,380 | |
Rentokil Initial PLC | | | 8,245 | | | | 23,757 | |
Royal Mail PLC | | | 5,354 | | | | 27,805 | |
Serco Group PLC | | | 152,372 | | | | 276,742 | |
Spirax-Sarco Engineering PLC | | | 16,445 | | | | 893,211 | |
TechnipFMC PLC | | | 5,340 | | | | 175,011 | |
Thomas Cook Group PLC | | | 115,973 | | | | 127,453 | |
UBM PLC | | | 199,115 | | | | 1,769,289 | |
WH Smith PLC | | | 2,117 | | | | 43,523 | |
WM Morrison Supermarkets PLC | | | 531,242 | | | | 1,583,784 | |
| | | | | | | | |
| | | | | | | | 9,178,857 | |
United States | | | | | | | | |
Agilent Technologies, Inc. | | | 1,460 | | | | 71,496 | |
Amdocs Ltd. | | | 48,193 | | | | 2,829,411 | |
American Eagle Outfitters, Inc. | | | 127,752 | | | | 1,930,333 | |
See Notes to Financial Statements.
| | | | | | |
| | | | | | | |
| | BLACKROCK FUNDS | | JANUARY 31, 2017 | | 45 |
| | |
Schedule of Investments (continued) | | BlackRock Global Long/Short Equity Fund |
| | | | | | | | |
| | | Shares | | | Value | |
| Reference Entity — Long (continued) | | | | | | |
United States (continued) | | | | | | | | |
AmerisourceBergen Corp. | | | 5,647 | | | $ | 492,870 | |
Applied Materials, Inc. | | | 49,204 | | | | 1,685,237 | |
Archer-Daniels-Midland Co. | | | 170,857 | | | | 7,562,131 | |
Arconic, Inc. | | | 3 | | | | 68 | |
Baker Hughes, Inc. | | | 55,794 | | | | 3,519,486 | |
Baxter International, Inc. | | | 137,297 | | | | 6,577,899 | |
Best Buy Co., Inc. | | | 42,347 | | | | 1,885,288 | |
Big Lots, Inc. | | | 128,784 | | | | 6,439,200 | |
Blue Buffalo Pet Products, Inc. | | | 20,769 | | | | 503,648 | |
Booz Allen Hamilton Holding Corp. | | | 5,743 | | | | 194,228 | |
Bruker Corp. | | | 1,211 | | | | 28,737 | |
Burlington Stores, Inc. | | | 9,142 | | | | 765,185 | |
C.R. Bard, Inc. | | | 14,991 | | | | 3,557,814 | |
Cabot Corp. | | | 20,060 | | | | 1,110,722 | |
CenterPoint Energy, Inc. | | | 236,587 | | | | 6,200,945 | |
Cinemark Holdings, Inc. | | | 6,616 | | | | 281,180 | |
CommScope Holding Co., Inc. | | | 1,027 | | | | 38,841 | |
CONSOL Energy, Inc. | | | 40,656 | | | | 688,713 | |
Crimson Wine Group Ltd. | | | 1 | | | | 9 | |
Darden Restaurants, Inc. | | | 22,345 | | | | 1,637,442 | |
DCT Industrial Trust, Inc. | | | 37,759 | | | | 1,687,450 | |
Diamond Offshore Drilling, Inc. | | | 40,444 | | | | 662,473 | |
Dick’s Sporting Goods, Inc. | | | 71,293 | | | | 3,678,719 | |
Domino’s Pizza, Inc. | | | 46,489 | | | | 8,114,190 | |
Dr. Pepper Snapple Group, Inc. | | | 2,974 | | | | 271,229 | |
Dril-Quip, Inc. | | | 37,052 | | | | 2,304,634 | |
DST Systems, Inc. | | | 210 | | | | 24,182 | |
Duke Realty Corp. | | | 81,100 | | | | 1,973,163 | |
Energen Corp. | | | 8,440 | | | | 454,832 | |
Equity Lifestyle Properties, Inc. | | | 21,135 | | | | 1,562,722 | |
First American Financial Corp. | | | 76,811 | | | | 2,886,557 | |
Fitbit, Inc., Series A | | | 26,885 | | | | 161,579 | |
Flex Ltd. | | | 112,634 | | | | 1,764,975 | |
Gartner, Inc. | | | 3,169 | | | | 314,872 | |
Groupon, Inc. | | | 275,646 | | | | 950,979 | |
Hasbro, Inc. | | | 82,629 | | | | 6,817,719 | |
Helmerich & Payne, Inc. | | | 4,320 | | | | 307,411 | |
Hilton Grand Vacations, Inc. | | | 7 | | | | 205 | |
Hormel Foods Corp. | | | 85,740 | | | | 3,112,362 | |
HP, Inc. | | | 115,164 | | | | 1,733,218 | |
IDEXX Laboratories, Inc. | | | 35,413 | | | | 4,332,072 | |
Ingredion, Inc. | | | 12,548 | | | | 1,608,528 | |
Interpublic Group of Cos., Inc. | | | 187,969 | | | | 4,422,911 | |
Intuit, Inc. | | | 26,427 | | | | 3,133,714 | |
Kellogg Co. | | | 3,183 | | | | 231,436 | |
KLA-Tencor Corp. | | | 18,674 | | | | 1,589,344 | |
Kohl’s Corp. | | | 101,371 | | | | 4,037,607 | |
Landstar System, Inc. | | | 39,417 | | | | 3,334,678 | |
Laredo Petroleum, Inc. | | | 50,820 | | | | 688,611 | |
Lear Corp. | | | 21,092 | | | | 2,996,962 | |
Legg Mason, Inc. | | | 250,108 | | | | 7,925,923 | |
Macy’s, Inc. | | | 22,748 | | | | 671,976 | |
ManpowerGroup, Inc. | | | 33,021 | | | | 3,152,185 | |
Masimo Corp. | | | 39,298 | | | | 2,891,547 | |
MasTec, Inc. | | | 12,463 | | | | 464,247 | |
McCormick & Co., Inc. | | | 104,969 | | | | 10,029,788 | |
NCR Corp. | | | 25,916 | | | | 1,114,906 | |
NetApp, Inc. | | | 9,444 | | | | 361,894 | |
Newmont Mining Corp. | | | 2,723 | | | | 98,790 | |
Nordstrom, Inc. | | | 10,450 | | | | 462,099 | |
Norfolk Southern Corp. | | | 4,298 | | | | 504,843 | |
Nutanix, Inc., Class A | | | 4,426 | | | | 133,975 | |
Oceaneering International, Inc. | | | 6,053 | | | | 168,576 | |
OGE Energy Corp. | | | 580 | | | | 19,453 | |
Oshkosh Corp. | | | 1,369 | | | | 95,323 | |
Owens Corning | | | 918 | | | | 50,720 | |
| | | | | | | | |
| | | Shares | | | Value | |
| Reference Entity — Long (continued) | | | | | | |
United States (continued) | | | | | | | | |
Papa John’s International, Inc. | | | 14,619 | | | $ | 1,245,831 | |
Park Hotels & Resorts, Inc. | | | 6 | | | | 163 | |
Pilgrim’s Pride Corp. | | | 60,195 | | | | 1,152,132 | |
Range Resources Corp. | | | 9,922 | | | | 320,877 | |
Regal Entertainment Group, Class A | | | 7,607 | | | | 172,375 | |
Ross Stores, Inc. | | | 84,504 | | | | 5,586,559 | |
RPC, Inc. | | | 12,802 | | | | 275,499 | |
Sinclair Broadcast Group, Inc., Class A | | | 986 | | | | 33,278 | |
Target Corp. | | | 113,156 | | | | 7,296,299 | |
Tenneco, Inc. | | | 1,672 | | | | 112,776 | |
Teradata Corp. | | | 21,549 | | | | 632,679 | |
Texas Instruments, Inc. | | | 15,988 | | | | 1,207,734 | |
VeriSign, Inc. | | | 42,728 | | | | 3,427,213 | |
Weingarten Realty Investors | | | 287,432 | | | | 10,241,202 | |
WellCare Health Plans, Inc. | | | 23,442 | | | | 3,411,749 | |
Whiting Petroleum Corp. | | | 67,170 | | | | 744,915 | |
Williams-Sonoma, Inc. | | | 5,822 | | | | 280,679 | |
Xerox Corp. | | | 804,628 | | | | 5,576,072 | |
Xilinx, Inc. | | | 137,819 | | | | 8,021,066 | |
Zynga, Inc., Class A | | | 118,499 | | | | 298,617 | |
| | | | | | | | |
| | | | | | | | 191,344,177 | |
| Total Reference Entity — Long | | | | | | | 259,611,723 | |
| | | | | | | | |
| | | | | | | | | |
| | |
| Reference Entity — Short | | | | | | |
Australia | | | | | | | | |
Alumina Ltd. | | | (15,203 | ) | | | (22,401 | ) |
Domino’s Pizza Enterprises Ltd. | | | (4,151 | ) | | | (187,267 | ) |
Qube Holdings Ltd. | | | (97,557 | ) | | | (170,273 | ) |
| | | | | | | | |
| | | | | | | | (379,941 | ) |
Bermuda | | | | | | | | |
Signet Jewelers Ltd. | | | (1,004 | ) | | | (77,981 | ) |
Canada | | | | | | | | |
Alimentation Couche-Tard, Inc. | | | (2,858 | ) | | | (130,925 | ) |
Emera, Inc. | | | (16,640 | ) | | | (581,073 | ) |
| | | | | | | | |
| | | | | | | | (711,998 | ) |
Denmark | | | | | | | | |
DSV A/S | | | (24,499 | ) | | | (1,191,375 | ) |
Finland | | | | | | | | |
Metsa Board OYJ | | | (50,286 | ) | | | (343,492 | ) |
Nokia OYJ | | | (1,662,757 | ) | | | (7,466,052 | ) |
| | | | | | | | |
| | | | | | | | (7,809,544 | ) |
France | | | | | | | | |
Air Liquide SA | | | (736 | ) | | | (79,461 | ) |
Airbus Group SE | | | (388 | ) | | | (26,301 | ) |
Bollore SA | | | (34,905 | ) | | | (139,602 | ) |
| | | | | | | | |
| | | | | | | | (245,364 | ) |
Germany | | | | | | | | |
HeidelbergCement AG | | | (64 | ) | | | (6,183 | ) |
Hong Kong | | | | | | | | |
Cathay Pacific Airways Ltd. | | | (72,000 | ) | | | (97,516 | ) |
Ireland | | | | | | | | |
Adient PLC | | | (1,158 | ) | | | (73,521 | ) |
Israel | | | | | | | | |
Mobileye NV | | | (26,229 | ) | | | (1,126,798 | ) |
Italy | | | | | | | | |
Yoox SpA | | | (2,624 | ) | | | (65,822 | ) |
See Notes to Financial Statements.
| | | | | | |
| | | | | | | |
| 46 | | BLACKROCK FUNDS | | JANUARY 31, 2017 | | |
| | |
Schedule of Investments (continued) | | BlackRock Global Long/Short Equity Fund |
| | | | | | | | |
| | | Shares | | | Value | |
| Reference Entity — Short (continued) | | | | | | |
Japan | | | | | | | | |
Aeon Co. Ltd. | | | (7,900 | ) | | $ | (114,177 | ) |
Alps Electric Co. Ltd. | | | (4,500 | ) | | | (119,861 | ) |
Asics Corp. | | | (4,100 | ) | | | (79,867 | ) |
Bic Camera, Inc. | | | (147,100 | ) | | | (1,373,959 | ) |
Calsonic Kansei Corp. | | | (73,000 | ) | | | (1,160,523 | ) |
Daikin Industries Ltd. | | | (1,500 | ) | | | (148,894 | ) |
Dentsu, Inc. | | | (37,300 | ) | | | (1,723,972 | ) |
FamilyMart UNY Holdings Co. Ltd. | | | (15,100 | ) | | | (956,725 | ) |
JGC Corp. | | | (60,600 | ) | | | (1,051,978 | ) |
Koito Manufacturing Co. Ltd. | | | (13,000 | ) | | | (689,593 | ) |
Kyocera Corp. | | | (7,000 | ) | | | (364,425 | ) |
Nippon Kayaku Co. Ltd. | | | (27,000 | ) | | | (352,877 | ) |
Nippon Paint Co. Ltd. | | | (38,400 | ) | | | (1,120,111 | ) |
Oriental Land Co. Ltd. | | | (12,800 | ) | | | (701,431 | ) |
PanaHome Corp. | | | (3,000 | ) | | | (25,431 | ) |
Recruit Holdings Co. Ltd. | | | (34,500 | ) | | | (1,510,259 | ) |
Rinnai Corp. | | | (1,700 | ) | | | (144,470 | ) |
SBI Holdings, Inc. | | | (2,300 | ) | | | (31,749 | ) |
Shimano, Inc. | | | (2,200 | ) | | | (346,913 | ) |
Shiseido Co. Ltd. | | | (3,400 | ) | | | (95,027 | ) |
Sugi Holdings Co. Ltd. | | | (3,300 | ) | | | (153,577 | ) |
TDK Corp. | | | (800 | ) | | | (57,501 | ) |
Terumo Corp. | | | (7,100 | ) | | | (262,656 | ) |
TOTO Ltd. | | | (29,700 | ) | | | (1,196,203 | ) |
| | | | | | | | |
| | | | | | | | (13,782,179 | ) |
Jordan | | | | | | | | |
Hikma Pharmaceuticals PLC | | | (54,634 | ) | | | (1,258,393 | ) |
Netherlands | | | | | | | | |
GrandVision NV | | | (2,457 | ) | | | (58,590 | ) |
TomTom NV | | | (51,520 | ) | | | (472,286 | ) |
| | | | | | | | |
| | | | | | | | (530,876 | ) |
Norway | | | | | | | | |
Schibsted ASA | | | (34,334 | ) | | | (907,888 | ) |
Schibsted ASA, B Shares | | | (18,593 | ) | | | (462,940 | ) |
| | | | | | | | |
| | | | | | | | (1,370,828 | ) |
Sweden | | | | | | | | |
Alfa Laval AB | | | (42,385 | ) | | | (792,438 | ) |
Hennes & Mauritz AB, B Shares | | | (4,337 | ) | | | (124,090 | ) |
SSAB AB, A Shares | | | (33,550 | ) | | | (137,905 | ) |
| | | | | | | | |
| | | | | | | | (1,054,433 | ) |
Switzerland | | | | | | | | |
Cie Financiere Richemont SA | | | (10,179 | ) | | | (792,737 | ) |
Swatch Group AG | | | (1,259 | ) | | | (446,196 | ) |
Weatherford International PLC | | | (82,636 | ) | | | (430,534 | ) |
| | | | | | | | |
| | | | | | | | (1,669,467 | ) |
United Kingdom | | | | | | | | |
Antofagasta PLC | | | (20,628 | ) | | | (217,949 | ) |
Capital & Counties Properties PLC | | | (511,286 | ) | | | (1,754,082 | ) |
J Sainsbury PLC | | | (372,169 | ) | | | (1,210,876 | ) |
Next PLC | | | (1,687 | ) | | | (81,399 | ) |
Rio Tinto PLC | | | (30,001 | ) | | | (1,329,133 | ) |
Willis Towers Watson PLC | | | (404 | ) | | | (50,553 | ) |
| | | | | | | | |
| | | | | | | | (4,643,992 | ) |
United States | | | | | | | | |
Acuity Brands, Inc. | | | (2,365 | ) | | | (490,099 | ) |
Advance Auto Parts, Inc. | | | (18,746 | ) | | | (3,078,843 | ) |
AK Steel Holding Corp. | | | (15,042 | ) | | | (121,539 | ) |
Alcoa Corp. | | | (3,209 | ) | | | (116,968 | ) |
Allegiant Travel Co. | | | (8,488 | ) | | | (1,459,936 | ) |
Allergan PLC | | | (23,872 | ) | | | (5,225,342 | ) |
Alliance Data Systems Corp. | | | (28,723 | ) | | | (6,559,759 | ) |
| | | | | | | | |
| | | Shares | | | Value | |
| Reference Entity — Short (continued) | | | | | | |
United States (continued) | | | | | | | | |
Amazon.com, Inc. | | | (3,764 | ) | | $ | (3,099,579 | ) |
American Homes 4 Rent | | | (223,648 | ) | | | (4,982,877 | ) |
Arch Capital Group Ltd. | | | (16,419 | ) | | | (1,450,619 | ) |
Assurant, Inc. | | | (2,601 | ) | | | (252,635 | ) |
AT&T, Inc. | | | (229,070 | ) | | | (9,657,591 | ) |
Avalonbay Communities, Inc. | | | (14,794 | ) | | | (2,563,948 | ) |
Axalta Coating Systems Ltd. | | | (31,422 | ) | | | (911,238 | ) |
Ball Corp. | | | (127,879 | ) | | | (9,752,053 | ) |
Berkshire Hathaway, Inc., Class B | | | (40,777 | ) | | | (6,693,137 | ) |
Boston Beer Co., Inc. | | | (19,191 | ) | | | (2,949,657 | ) |
Callon Petroleum Co. | | | (16,567 | ) | | | (253,144 | ) |
CarMax, Inc. | | | (2,885 | ) | | | (192,458 | ) |
Cavium, Inc. | | | (5,633 | ) | | | (372,961 | ) |
CF Industries Holdings, Inc. | | | (121,566 | ) | | | (4,290,064 | ) |
Cheniere Energy, Inc. | | | (9,116 | ) | | | (434,377 | ) |
Chemours Co. | | | (16,357 | ) | | | (432,152 | ) |
Chevron Corp. | | | (39,027 | ) | | | (4,345,656 | ) |
Chipotle Mexican Grill, Inc. | | | (6,779 | ) | | | (2,856,942 | ) |
Credit Acceptance Corp. | | | (1,239 | ) | | | (254,342 | ) |
DexCom, Inc. | | | (10,978 | ) | | | (868,909 | ) |
Diebold, Inc. | | | (36,960 | ) | | | (1,005,312 | ) |
DISH Network Corp. | | | (108,992 | ) | | | (6,449,057 | ) |
Dollar Tree, Inc. | | | (37,425 | ) | | | (2,888,836 | ) |
EPAM Systems, Inc. | | | (19,255 | ) | | | (1,239,252 | ) |
Equinix, Inc. | | | (2,622 | ) | | | (1,009,418 | ) |
Exxon Mobil Corp. | | | (105,866 | ) | | | (8,881,099 | ) |
First Solar, Inc. | | | (1,847 | ) | | | (57,608 | ) |
Freeport-McMoRan, Inc. | | | (17,825 | ) | | | (296,786 | ) |
General Electric Co. | | | (56,376 | ) | | | (1,674,367 | ) |
Global Payments, Inc. | | | (8,697 | ) | | | (672,104 | ) |
Gramercy Property Trust REIT | | | (167,400 | ) | | | (4,409,316 | ) |
Hilton Worldwide Holdings, Inc. | | | (62,892 | ) | | | (3,621,321 | ) |
Illumina, Inc. | | | (8,498 | ) | | | (1,360,530 | ) |
Interactive Brokers Group, Inc., Class A | | | (72,801 | ) | | | (2,718,389 | ) |
Kraft Heinz Co. | | | (28,606 | ) | | | (2,554,230 | ) |
Liberty Broadband Corp. | | | (33,577 | ) | | | (2,865,461 | ) |
Liberty Ventures | | | (80,559 | ) | | | (3,516,400 | ) |
LKQ Corp. | | | (109,721 | ) | | | (3,501,197 | ) |
M&T Bank Corp. | | | (58,454 | ) | | | (9,502,867 | ) |
Medicines Co. | | | (112,570 | ) | | | (4,058,149 | ) |
Middleby Corp. | | | (718 | ) | | | (96,341 | ) |
Monster Beverage Corp. | | | (26,570 | ) | | | (1,131,882 | ) |
Netflix, Inc. | | | (33,124 | ) | | | (4,660,878 | ) |
New York Community Bancorp, Inc. | | | (126,696 | ) | | | (1,924,512 | ) |
Newell Rubbermaid, Inc. | | | (186,014 | ) | | | (8,804,043 | ) |
Norwegian Cruise Line Holdings Ltd. | | | (136,330 | ) | | | (6,407,510 | ) |
Oasis Petroleum, Inc. | | | (21,092 | ) | | | (298,241 | ) |
PacWest Bancorp | | | (7,676 | ) | | | (425,250 | ) |
Palo Alto Networks, Inc. | | | (3,587 | ) | | | (529,298 | ) |
Pandora Media, Inc. | | | (237,339 | ) | | | (3,085,407 | ) |
Physicians Realty Trust | | | (234,552 | ) | | | (4,350,940 | ) |
Platform Specialty Products Corp. | | | (1,924 | ) | | | (23,357 | ) |
Priceline Group, Inc. | | | (100 | ) | | | (157,513 | ) |
Procter & Gamble Co. | | | (87,608 | ) | | | (7,674,461 | ) |
Scotts Miracle-Gro Co., Class A | | | (2,624 | ) | | | (241,329 | ) |
ServiceNow, Inc. | | | (15,958 | ) | | | (1,446,114 | ) |
Snyder’s-Lance, Inc. | | | (57,189 | ) | | | (2,194,914 | ) |
Spirit Realty Capital, Inc. | | | (293,256 | ) | | | (3,085,053 | ) |
SS&C Technologies Holdings, Inc. | | | (12,447 | ) | | | (399,922 | ) |
Sun Communities, Inc. | | | (21,041 | ) | | | (1,657,189 | ) |
TreeHouse Foods, Inc. | | | (96,197 | ) | | | (7,299,428 | ) |
Under Armour, Inc., Class A | | | (1,080 | ) | | | (23,209 | ) |
Under Armour, Inc., Class C | | | (9,520 | ) | | | (182,974 | ) |
UniFirst Corp. | | | (2,903 | ) | | | (371,294 | ) |
United States Steel Corp. | | | (3,914 | ) | | | (128,027 | ) |
Vereit, Inc. | | | (494,408 | ) | | | (4,217,300 | ) |
See Notes to Financial Statements.
| | | | | | |
| | | | | | | |
| | BLACKROCK FUNDS | | JANUARY 31, 2017 | | 47 |
| | |
Schedule of Investments (continued) | | BlackRock Global Long/Short Equity Fund |
| | | | | | | | |
| | | Shares | | | Value | |
| Reference Entity — Short (continued) | | | | | | |
United States (continued) | | | | | | | | |
Walgreens Boots Alliance, Inc. | | | (1,010 | ) | | $ | (82,759 | ) |
Wayfair, Inc., Class A | | | (37,747 | ) | | | (1,568,765 | ) |
Wells Fargo & Co. | | | (19,078 | ) | | | (1,074,664 | ) |
Western Digital Corp. | | | (5,621 | ) | | | (448,162 | ) |
Workday, Inc., Class A | | | (20,533 | ) | | | (1,706,087 | ) |
XPO Logistics, Inc. | | | (4,452 | ) | | | (199,183 | ) |
Zayo Group Holdings, Inc. | | | (95,011 | ) | | | (3,036,552 | ) |
Zendesk, Inc. | | | (1,137 | ) | | | (27,208 | ) |
Zillow Group, Inc. | | | (71,991 | ) | | | (2,547,042 | ) |
| | | | | | | | |
| | | | | | | | (207,455,332 | ) |
| Total Reference Entity — Short | | | | | | | (243,551,543 | ) |
| Net Value of Reference Entity — Goldman Sachs & Co. | | | | 16,060,180 | |
| | | | | | | | |
| | | | | | | | | |
|
| The following table represents the individual long and short positions and related values of equity securities underlying the total return swap with Goldman Sachs & Co. as of January 31, 2017, expiration dates 6/14/17 — 8/29/18: | |
| Reference Entity — Long | | | | | | |
Canada | | | | | | | | |
Domtar Corp. | | | 521 | | | | 22,762 | |
Precision Drilling Corp. | | | 4,443 | | | | 25,059 | |
Shopify, Inc., Class A | | | 324 | | | | 16,466 | |
| | | | | | | | |
| | | | | | | | 64,287 | |
China | | | | | | | | |
Yirendai, Ltd. — ADR | | | 934 | | | | 19,735 | |
Israel | | | | | | | | |
Caesarstone Ltd. | | | 474 | | | | 14,386 | |
Orbotech, Ltd. | | | 570 | | | | 19,887 | |
Taro Pharmaceutical Industries Ltd. | | | 501 | | | | 52,350 | |
| | | | | | | | |
| | | | | | | | 86,623 | |
Luxembourg | | | | | | | | |
Globant SA | | | 701 | | | | 23,238 | |
Panama | | | | | | | | |
Copa Holdings SA, Class A | | | 236 | | | | 23,008 | |
United Kingdom | | | | | | | | |
Cardtronics PLC, Class A | | | 757 | | | | 41,317 | |
Liberty Global PLC LiLAC, Class A | | | 1 | | | | 23 | |
| | | | | | | | |
| | | | | | | | 41,340 | |
United States | | | | | | | | |
A. Schulman, Inc. | | | 541 | | | | 18,664 | |
Activision Blizzard, Inc. | | | 420 | | | | 16,888 | |
Advanced Energy Industries, Inc. | | | 752 | | | | 44,248 | |
American Eagle Outfitters, Inc. | | | 1,284 | | | | 19,401 | |
American Tower Corp. | | | 419 | | | | 43,366 | |
AMN Healthcare Services, Inc. | | | 200 | | | | 7,170 | |
Analog Devices, Inc. | | | 249 | | | | 18,660 | |
Andersons, Inc. | | | 1,803 | | | | 68,063 | |
Anixter International, Inc. | | | 74 | | | | 6,327 | |
Applied Industrial Technologies, Inc. | | | 233 | | | | 14,085 | |
Archrock, Inc. | | | 951 | | | | 13,885 | |
Belden, Inc. | | | 188 | | | | 14,376 | |
Bio-Techne Corp. | | | 155 | | | | 15,771 | |
BorgWarner, Inc. | | | 464 | | | | 18,945 | |
Bright Horizons Family Solutions, Inc. | | | 261 | | | | 18,494 | |
BWX Technologies, Inc. | | | 361 | | | | 14,978 | |
Callon Petroleum Co. | | | 1,025 | | | | 15,662 | |
Carlisle Cos., Inc. | | | 409 | | | | 44,626 | |
Cincinnati Financial Corp. | | | 181 | | | | 12,775 | |
Coherent, Inc. | | | 124 | | | | 19,559 | |
| | | | | | | | |
| | | Shares | | | Value | |
| Reference Entity — Long (continued) | | | | | | |
United States (continued) | | | | | | | | |
Columbia Sportswear Co. | | | 313 | | | $ | 17,018 | |
CVS Health Corp. | | | 8,828 | | | | 695,735 | |
Dana, Inc. | | | 2,165 | | | | 43,603 | |
Dermira, Inc. | | | 603 | | | | 17,752 | |
Discovery Communications, Inc., Class A | | | 634 | | | | 17,974 | |
Dun & Bradstreet Corp. | | | 125 | | | | 15,327 | |
Dunkin’ Brands Group, Inc. | | | 339 | | | | 17,584 | |
Education Realty Trust, Inc. | | | 428 | | | | 17,210 | |
Energen Corp. | | | 261 | | | | 14,065 | |
Ensign Group, Inc. | | | 1,000 | | | | 20,340 | |
EPR Properties | | | 374 | | | | 27,665 | |
EQT Corp. | | | 672 | | | | 40,743 | |
Estee Lauder Cos., Inc., Class A | | | 165 | | | | 13,400 | |
Fidelity National Information Services, Inc. | | | 297 | | | | 23,588 | |
First Industrial Realty Trust, Inc. | | | 766 | | | | 19,801 | |
Fitbit, Inc., Series A | | | 2,147 | | | | 12,903 | |
Generac Holdings, Inc. | | | 429 | | | | 17,272 | |
Gramercy Property Trust | | | 706 | | | | 18,596 | |
Halcon Resources Corp. | | | 4,036 | | | | 34,064 | |
HealthSouth Corp. | | | 434 | | | | 16,848 | |
Hexcel Corp. | | | 908 | | | | 46,626 | |
Hilltop Holdings, Inc. | | | 979 | | | | 26,805 | |
Hologic, Inc. | | | 1,966 | | | | 79,682 | |
Hope Bancorp, Inc. | | | 3,164 | | | | 66,159 | |
Howard Hughes Corp. | | | 207 | | | | 22,068 | |
IDEXX Laboratories, Inc. | | | 44 | | | | 5,383 | |
Insight Enterprises, Inc. | | | 1,741 | | | | 64,643 | |
Intercontinental Exchange, Inc. | | | 837 | | | | 48,847 | |
Interpublic Group of Cos., Inc. | | | 1,950 | | | | 45,883 | |
Itron, Inc. | | | 226 | | | | 13,944 | |
ITT, Inc. | | | 453 | | | | 18,514 | |
Jacobs Engineering Group, Inc. | | | 599 | | | | 35,071 | |
John Bean Technologies Corp. | | | 246 | | | | 21,242 | |
Kraton Corp. | | | 3,296 | | | | 88,531 | |
LCI Industries | | | 147 | | | | 16,133 | |
LifePoint Health, Inc. | | | 285 | | | | 16,915 | |
Lowe’s Cos., Inc. | | | 233 | | | | 17,028 | |
MACOM Technology Solutions Holdings, Inc. | | | 645 | | | | 30,670 | |
MarketAxess Holdings, Inc. | | | 91 | | | | 17,040 | |
Masco Corp. | | | 527 | | | | 17,365 | |
McDermott International, Inc. | | | 2,748 | | | | 22,259 | |
Meritage Homes Corp. | | | 986 | | | | 36,235 | |
Mobile Mini, Inc. | | | 964 | | | | 31,378 | |
Monolithic Power Systems, Inc. | | | 21 | | | | 1,832 | |
Mosaic Co. | | | 439 | | | | 13,771 | |
Natus Medical, Inc. | | | 370 | | | | 14,449 | |
Navistar International Corp. | | | 582 | | | | 15,871 | |
NiSource, Inc. | | | 2,503 | | | | 55,992 | |
Nordstrom, Inc. | | | 322 | | | | 14,239 | |
Old Dominion Freight Line, Inc. | | | 55 | | | | 4,855 | |
Patrick Industries, Inc. | | | 265 | | | | 21,664 | |
Performance Food Group Co. | | | 847 | | | | 18,761 | |
PerkinElmer, Inc. | | | 477 | | | | 25,372 | |
Power Integrations, Inc. | | | 1,435 | | | | 101,885 | |
PRA Health Sciences, Inc. | | | 242 | | | | 14,179 | |
Proto Labs, Inc. | | | 612 | | | | 32,130 | |
Red Rock Resorts, Inc., Class A | | | 1,249 | | | | 29,327 | |
Regal-Beloit Corp. | | | 208 | | | | 15,101 | |
Rockwell Collins, Inc. | | | 196 | | | | 17,789 | |
Saia, Inc. | | | 424 | | | | 20,373 | |
Shutterstock, Inc. | | | 308 | | | | 16,570 | |
Sirius XM Holdings, Inc. | | | 13,861 | | | | 65,424 | |
Sotheby’s | | | 441 | | | | 17,512 | |
Spirit Airlines, Inc. | | | 282 | | | | 15,239 | |
STAG Industrial, Inc. | | | 2,615 | | | | 60,511 | |
Summit Hotel Properties, Inc. | | | 3,614 | | | | 57,210 | |
See Notes to Financial Statements.
| | | | | | |
| | | | | | | |
| 48 | | BLACKROCK FUNDS | | JANUARY 31, 2017 | | |
| | |
Schedule of Investments (continued) | | BlackRock Global Long/Short Equity Fund |
| | | | | | | | |
| | | Shares | | | Value | |
| Reference Entity — Long (continued) | | | | | | |
United States (continued) | | | | | | | | |
Synchronoss Technologies, Inc. | | | 1,523 | | | $ | 58,666 | |
T-Mobile U.S., Inc. | | | 265 | | | | 16,502 | |
TEGNA, Inc. | | | 753 | | | | 17,251 | |
Tenneco, Inc. | | | 313 | | | | 21,112 | |
Terex Corp. | | | 686 | | | | 21,815 | |
TiVo Corp. | | | 1,188 | | | | 22,453 | |
TJX Cos., Inc. | | | 561 | | | | 42,030 | |
Triumph Group, Inc. | | | 1,884 | | | | 50,397 | |
Tronox Ltd., Class A | | | 1,240 | | | | 15,525 | |
Viavi Solutions, Inc. | | | 4,348 | | | | 38,915 | |
Visa, Inc., Class A | | | 9,255 | | | | 765,481 | |
Vishay Intertechnology, Inc. | | | 1,156 | | | | 19,190 | |
Watsco, Inc. | | | 5,677 | | | | 867,105 | |
Weingarten Realty Investors | | | 1,552 | | | | 55,298 | |
WellCare Health Plans, Inc. | | | 95 | | | | 13,826 | |
Welltower, Inc. | | | 232 | | | | 15,382 | |
Weyerhaeuser Co. | | | 583 | | | | 18,265 | |
Williams Cos., Inc. | | | 6,181 | | | | 178,260 | |
World Fuel Services Corp. | | | 397 | | | | 17,659 | |
Xylem, Inc. | | | 288 | | | | 14,201 | |
Zynga, Inc., Class A | | | 17,636 | | | | 44,443 | |
| | | | | | | | |
| | | | | | | | 5,299,684 | |
| Total Reference Entity — Long | | | | | | | 5,557,915 | |
| | | | | | | | |
| | | | | | | | | |
| | |
| Reference Entity — Short | | | | | | |
Bermuda | | | | | | | | |
Signet Jewelers Ltd. | | | (1,812 | ) | | | (140,738 | ) |
Canada | | | | | | | | |
Lululemon Athletica, Inc. | | | (4,893 | ) | | | (330,327 | ) |
Israel | | | | | | | | |
Mellanox Technologies Ltd. | | | (2,886 | ) | | | (136,652 | ) |
Netherlands | | | | | | | | |
Cimpress NV | | | (184 | ) | | | (15,528 | ) |
Wright Medical Group NV | | | (861 | ) | | | (21,680 | ) |
| | | | | | | | |
| | | | | | | | (37,208 | ) |
Norway | | | | | | | | |
Ship Finance International Ltd. | | | (5,449 | ) | | | (81,735 | ) |
Spain | | | | | | | | |
Atlantica Yield PLC | | | (7,291 | ) | | | (156,027 | ) |
Switzerland | | | | | | | | |
Logitech International SA | | | (509 | ) | | | (14,593 | ) |
United Kingdom | | | | | | | | |
CNH Industrial NV | | | (4,536 | ) | | | (40,643 | ) |
Noble Corp. PLC | | | (4,934 | ) | | | (33,304 | ) |
| | | | | | | | |
| | | | | | | | (73,947 | ) |
United States | | | | | | | | |
Allergan PLC | | | (261 | ) | | | (57,130 | ) |
athenahealth, Inc. | | | (1,260 | ) | | | (158,747 | ) |
Boston Beer Co., Inc. | | | (2,156 | ) | | | (331,377 | ) |
CarMax, Inc. | | | (10,413 | ) | | | (694,651 | ) |
Chipotle Mexican Grill, Inc. | | | (505 | ) | | | (212,827 | ) |
Colony Northstar, Inc. Class A | | | (7,844 | ) | | | (109,189 | ) |
GameStop Corp., Class A | | | (3,165 | ) | | | (77,511 | ) |
Government Properties Income Trust | | | (4,224 | ) | | | (81,354 | ) |
H&R Block, Inc. | | | (1,357 | ) | | | (29,121 | ) |
Hope Bancorp, Inc. | | | (3,164 | ) | | | (66,159 | ) |
Infinera Corp. | | | (754 | ) | | | (6,794 | ) |
Johnson & Johnson | | | (1,105 | ) | | | (125,141 | ) |
Knowles Corp. | | | (12,221 | ) | | | (220,223 | ) |
| | | | | | | | |
| | | Shares | | | Value | |
| Reference Entity — Short (continued) | | | | | | |
United States (continued) | | | | | | | | |
Liberty SiriusXM Group | | | (1,577 | ) | | $ | (57,151 | ) |
Lions Gate Entertainment Corp. | | | (713 | ) | | | (19,101 | ) |
MasterCard, Inc., Class A | | | (7,505 | ) | | | (798,007 | ) |
Paycom Software, Inc. | | | (1,017 | ) | | | (47,026 | ) |
Penumbra, Inc. | | | (190 | ) | | | (13,595 | ) |
Royal Caribbean Cruises Ltd. | | | (1,399 | ) | | | (130,988 | ) |
TerraForm Power, Inc. | | | (13,028 | ) | | | (154,642 | ) |
Tiffany & Co. | | | (9,355 | ) | | | (736,426 | ) |
Wayfair, Inc., Class A | | | (354 | ) | | | (14,712 | ) |
Wynn Resorts Ltd. | | | (2,055 | ) | | | (208,439 | ) |
| | | | | | | | |
| | | | | | | | (4,350,311 | ) |
| Total Reference Entity — Short | | | | | | | (5,321,538 | ) |
| Net Value of Reference Entity — Goldman Sachs & Co. | | | | 236,377 | |
| | | | | | | | |
| | | | | | | | | |
|
| The following table represents the individual long and short positions and related values of equity securities underlying the total return swap with UBS AG as of January 31, 2017, expiration dates 4/12/17 — 4/13/17: | |
| Reference Entity — Long | | | | | | |
Australia | | | | | | | | |
Aristocrat Leisure Ltd. | | | 141,829 | | | | 1,644,761 | |
Caltex Australia Ltd. | | | 289,188 | | | | 6,276,140 | |
CSR Ltd. | | | 888,885 | | | | 2,976,626 | |
JB Hi-Fi Ltd. | | | 95,619 | | | | 2,005,659 | |
Mineral Resources Ltd. | | | 29,955 | | | | 279,697 | |
Northern Star Resources Ltd. | | | 152,943 | | | | 444,937 | |
Platinum Asset Management Ltd. | | | 169,091 | | | | 640,652 | |
Qantas Airways Ltd. | | | 296,330 | | | | 765,964 | |
Regis Resources Ltd. | | | 365,195 | | | | 885,072 | |
WorleyParsons Ltd. | | | 333,463 | | | | 2,507,361 | |
| | | | | | | | |
| | | | | | | | 18,426,869 | |
Austria | | | | | | | | |
Andritz AG | | | 26,931 | | | | 1,455,616 | |
Raiffeisen Bank International AG | | | 15,654 | | | | 348,648 | |
Vienna Insurance Group AG | | | 133,271 | | | | 3,247,986 | |
Wienerberger AG | | | 3,967 | | | | 76,576 | |
| | | | | | | | |
| | | | | | | | 5,128,826 | |
Belgium | | | | | | | | |
NV Bekaert SA | | | 17,964 | | | | 779,605 | |
Umicore SA | | | 8,253 | | | | 462,287 | |
| | | | | | | | |
| | | | | | | | 1,241,892 | |
Canada | | | | | | | | |
B2Gold Corp. | | | 137,797 | | | | 418,289 | |
Bank of Nova Scotia | | | 3,003 | | | | 179,453 | |
Canadian Imperial Bank of Commerce | | | 127,740 | | | | 10,877,902 | |
Canadian Natural Resources Ltd. | | | 114,721 | | | | 3,468,299 | |
Capital Power Corp. | | | 21,548 | | | | 408,687 | |
Crescent Point Energy Corp. | | | 92,136 | | | | 1,074,123 | |
Dollarama, Inc. | | | 51,929 | | | | 3,932,836 | |
Domtar Corp. | | | 89,292 | | | | 3,904,488 | |
Enerplus Corp. | | | 303,172 | | | | 2,702,628 | |
Finning International, Inc. | | | 10,021 | | | | 202,846 | |
IGM Financial, Inc. | | | 856 | | | | 26,307 | |
Inter Pipeline Ltd. | | | 146,146 | | | | 3,169,445 | |
Kinross Gold Corp. | | | 176,147 | | | | 686,313 | |
Maple Leaf Foods, Inc. | | | 168,406 | | | | 3,860,558 | |
Pan American Silver Corp. | | | 22,783 | | | | 444,017 | |
Quebecor, Inc., Class B | | | 15,040 | | | | 452,963 | |
Saputo, Inc. | | | 78,678 | | | | 2,896,801 | |
Vermilion Energy, Inc. | | | 15,199 | | | | 626,999 | |
Yamana Gold, Inc. | | | 50,348 | | | | 166,376 | |
| | | | | | | | |
| | | | | | | | 39,499,330 | |
See Notes to Financial Statements.
| | | | | | |
| | | | | | | |
| | BLACKROCK FUNDS | | JANUARY 31, 2017 | | 49 |
| | |
Schedule of Investments (continued) | | BlackRock Global Long/Short Equity Fund |
| | | | | | | | |
| | | Shares | | | Value | |
| Reference Entity — Long (continued) | | | | | | |
China | | | | | | | | |
FIH Mobile Ltd. | | | 1,264,000 | | | $ | 406,134 | |
Denmark | | | | | | | | |
GN Store Nord A/S | | | 69,407 | | | | 1,550,255 | |
H Lundbeck A/S | | | 1,377 | | | | 59,141 | |
Novo Nordisk A/S, Class B | | | 5,002 | | | | 180,771 | |
Tryg A/S | | | 47,461 | | | | 908,080 | |
| | | | | | | | |
| | | | | | | | 2,698,247 | |
Finland | | | | | | | | |
Valmet Corp. | | | 47,491 | | | | 750,862 | |
France | | | | | | | | |
Arkema SA | | | 1,581 | | | | 156,142 | |
Cie Generale des Etablissements Michelin | | | 11,078 | | | | 1,190,136 | |
Danone SA | | | 3,020 | | | | 189,320 | |
Eurazeo | | | 1,258 | | | | 77,481 | |
Faurecia | | | 9,115 | | | | 396,042 | |
Ipsen SA | | | 21,811 | | | | 1,690,067 | |
Nexans SA | | | 25,868 | | | | 1,501,086 | |
Nexity SA | | | 763 | | | | 37,476 | |
Peugeot SA | | | 367,586 | | | | 6,840,997 | |
Plastic Omnium SA | | | 3,766 | | | | 127,767 | |
Sartorius Stedim Biotech | | | 281 | | | | 17,004 | |
Sodexo SA | | | 14,441 | | | | 1,596,919 | |
Technicolor SA, Registered Shares | | | 22,227 | | | | 95,300 | |
Thales SA | | | 44,485 | | | | 4,173,344 | |
Valeo SA | | | 15,541 | | | | 949,860 | |
Vivendi SA | | | 13,958 | | | | 255,935 | |
| | | | | | | | |
| | | | | | | | 19,294,876 | |
Germany | | | | | | | | |
Covestro AG | | | 13,627 | | | | 1,025,483 | |
Deutsche Euroshop AG | | | 6,741 | | | | 280,214 | |
Duerr AG | | | 1,439 | | | | 124,836 | |
Hochtief AG | | | 76,744 | | | | 10,939,923 | |
Kloeckner & Co. SE | | | 547,020 | | | | 7,143,089 | |
Lanxess AG | | | 32,933 | | | | 2,396,576 | |
| | | | | | | | |
| | | | | | | | 21,910,121 | |
Hong Kong | | | | | | | | |
Champion REIT | | | 1,077,000 | | | | 581,692 | |
Chow Tai Fook Jewellery Group Ltd. | | | 386,400 | | | | 328,519 | |
CLP Holdings Ltd. | | | 615,500 | | | | 6,007,637 | |
Hang Lung Properties Ltd. | | | 1,081,000 | | | | 2,660,421 | |
HKT Trust & HKT Ltd. | | | 404,000 | | | | 564,354 | |
Hutchison Telecommunications Hong Kong Holdings Ltd. | | | 588,000 | | | | 190,592 | |
Kerry Properties Ltd. | | | 927,500 | | | | 2,624,676 | |
Li & Fung Ltd. | | | 1,038,000 | | | | 450,112 | |
New World Development Co. Ltd. | | | 449,000 | | | | 518,054 | |
SJM Holdings Ltd. | | | 121,000 | | | | 96,142 | |
Sun Hung Kai Properties Ltd. | | | 319,000 | | | | 4,389,776 | |
Texwinca Holdings Ltd. | | | 768,000 | | | | 492,086 | |
WH Group Ltd. | | | 383,000 | | | | 290,905 | |
Yue Yuen Industrial Holdings Ltd. | | | 54,000 | | | | 197,657 | |
| | | | | | | | |
| | | | | | | | 19,392,623 | |
Ireland | | | | | | | | |
CRH PLC | | | 110,923 | | | | 3,847,438 | |
DCC PLC | | | 10,106 | | | | 815,183 | |
Glanbia PLC | | | 216,260 | | | | 3,653,534 | |
Greencore Group PLC | | | 182,671 | | | | 543,788 | |
Kerry Group PLC, Class A | | | 9,310 | | | | 654,264 | |
Smurfit Kappa Group PLC | | | 112,139 | | | | 2,953,718 | |
| | | | | | | | |
| | | | | | | | 12,467,925 | |
| | | | | | | | |
| | | Shares | | | Value | |
| Reference Entity — Long (continued) | | | | | | |
Italy | | | | | | | | |
A2A SpA | | | 701,417 | | | $ | 936,856 | |
Autogrill SpA | | | 195,648 | | | | 1,720,594 | |
Mediobanca SpA | | | 192,420 | | | | 1,656,742 | |
Unipol Gruppo Finanziario SpA | | | 39,511 | | | | 146,118 | |
| | | | | | | | |
| | | | | | | | 4,460,310 | |
Japan | | | | | | | | |
Alfresa Holdings Corp. | | | 30,100 | | | | 495,457 | |
Aoyama Trading Co. Ltd. | | | 7,100 | | | | 250,245 | |
Bank of Kyoto Ltd. | | | 173,000 | | | | 1,352,419 | |
Chiba Bank Ltd. | | | 490,000 | | | | 3,205,251 | |
Citizen Holdings Co. Ltd. | | | 3,900 | | | | 24,219 | |
COLOPL, Inc. | | | 99,700 | | | | 862,321 | |
Daiichi Sankyo Co. Ltd. | | | 88,300 | | | | 1,975,542 | |
Daito Trust Construction Co. Ltd. | | | 1,900 | | | | 265,618 | |
Glory Ltd. | | | 66,300 | | | | 2,071,342 | |
Gree, Inc. | | | 84,000 | | | | 453,095 | |
Gunma Bank Ltd. | | | 96,500 | | | | 526,387 | |
Hokuhoku Financial Group, Inc. | | | 248,200 | | | | 4,252,145 | |
Hokuriku Electric Power Co. | | | 34,200 | | | | 344,574 | |
IT Holdings Corp. | | | 8,200 | | | | 185,798 | |
Ito En Ltd. | | | 7,500 | | | | 249,237 | |
Itochu Techno-Solutions Corp. | | | 33,400 | | | | 898,425 | |
Japan Petroleum Exploration Co. | | | 35,100 | | | | 788,462 | |
Japan Steel Works Ltd. | | | 3,300 | | | | 61,963 | |
Kandenko Co. Ltd. | | | 7,000 | | | | 65,033 | |
Komeri Co. Ltd. | | | 2,300 | | | | 54,159 | |
Maeda Road Construction Co. Ltd. | | | 90,000 | | | | 1,555,720 | |
Matsumotokiyoshi Holdings Co. Ltd. | | | 26,400 | | | | 1,312,508 | |
Mitsubishi Chemical Holdings Corp. | | | 1,226,600 | | | | 8,555,475 | |
Nagase & Co. Ltd. | | | 93,600 | | | | 1,282,734 | |
Nichi-iko Pharmaceutical Co. Ltd. | | | 9,700 | | | | 141,618 | |
Nishimatsu Construction Co. Ltd. | | | 146,000 | | | | 730,075 | |
Nomura Real Estate Holdings, Inc. | | | 61,900 | | | | 1,064,698 | |
NTT Docomo, Inc. | | | 216,700 | | | | 5,181,310 | |
Ono Pharmaceutical Co. Ltd. | | | 11,900 | | | | 244,144 | |
Open House Co. Ltd. | | | 18,800 | | | | 440,042 | |
Park24 Co. Ltd. | | | 6,400 | | | | 176,645 | |
Penta-Ocean Construction Co. Ltd. | | | 259,800 | | | | 1,268,478 | |
Resona Holdings, Inc. | | | 1,022,700 | | | | 5,536,970 | |
Sankyo Co. Ltd. | | | 135,100 | | | | 4,510,814 | |
Sapporo Holdings Ltd. | | | 34,300 | | | | 892,091 | |
Seven & i Holdings Co. Ltd. | | | 1,900 | | | | 75,864 | |
Shikoku Electric Power Co. Ltd. | | | 81,500 | | | | 784,240 | |
SKY Perfect JSAT Holdings, Inc. | | | 43,000 | | | | 193,509 | |
Sumitomo Forestry Co. Ltd. | | | 91,400 | | | | 1,257,297 | |
Sumitomo Mitsui Trust Holdings, Inc. | | | 36,200 | | | | 1,349,297 | |
Sumitomo Real Estate Sales Co. Ltd. | | | 31,000 | | | | 705,382 | |
Sumitomo Realty & Development Co. Ltd. | | | 3,000 | | | | 81,155 | |
TAG Immobilien AG | | | 59,685 | | | | 806,935 | |
Taiyo Yuden Co Ltd. | | | 20,900 | | | | 254,903 | |
Teijin Ltd. | | | 64,100 | | | | 1,352,945 | |
Tokai Rika Co. Ltd. | | | 49,700 | | | | 989,149 | |
Tokyo Gas Co. Ltd. | | | 230,000 | | | | 1,020,708 | |
TonenGeneral Sekiyu KK | | | 649,000 | | | | 7,632,306 | |
Toppan Forms Co. Ltd. | | | 86,200 | | | | 894,101 | |
Toppan Printing Co. Ltd. | | | 397,000 | | | | 3,896,929 | |
Zeon Corp. | | | 86,000 | | | | 986,875 | |
| | | | | | | | |
| | | | | | | | 73,556,609 | |
Mexico | | | | | | | | |
Fresnillo PLC | | | 9,112 | | | | 167,264 | |
Netherlands | | | | | | | | |
ASM International NV | | | 4,741 | | | | 233,749 | |
BE Semiconductor Industries NV | | | 93,488 | | | | 3,375,656 | |
See Notes to Financial Statements.
| | | | | | |
| | | | | | | |
| 50 | | BLACKROCK FUNDS | | JANUARY 31, 2017 | | |
| | |
Schedule of Investments (continued) | | BlackRock Global Long/Short Equity Fund |
| | | | | | | | |
| | | Shares | | | Value | |
| Reference Entity — Long (continued) | | | | | | |
Netherlands (continued) | | | | | | | | |
PostNL NV | | | 108,544 | | | $ | 476,397 | |
| | | | | | | | |
| | | | | | | | 4,085,802 | |
New Zealand | | | | | | | | |
Contact Energy Ltd. | | | 210,685 | | | | 738,294 | |
Norway | | | | | | | | |
Salmar ASA | | | 31,301 | | | | 885,919 | |
Subsea 7 SA | | | 134,052 | | | | 1,824,125 | |
| | | | | | | | |
| | | | | | | | 2,710,044 | |
Portugal | | | | | | | | |
CTT — Correios de Portugal SA | | | 578,294 | | | | 3,226,040 | |
Jeronimo Martins SGPS SA | | | 137,584 | | | | 2,328,691 | |
NOS SGPS SA | | | 107,914 | | | | 607,610 | |
| | | | | | | | |
| | | | | | | | 6,162,341 | |
Singapore | | | | | | | | |
Venture Corp. Ltd. | | | 392,800 | | | | 2,841,543 | |
Spain | | | | | | | | |
ACS Actividades de Construccion y Servicios SA | | | 73,204 | | | | 1,144,525 | |
Mediaset Espana Comunicacion SA | | | 436,995 | | | | 5,348,614 | |
Melia Hotels International SA | | | 18,542 | | | | 238,448 | |
| | | | | | | | |
| | | | | | | | 6,731,587 | |
Sweden | | | | | | | | |
Axfood AB | | | 30,235 | | | | 497,145 | |
Electrolux AB, Class B | | | 55,190 | | | | 1,467,562 | |
Fabege AB | | | 130,472 | | | | 2,221,689 | |
Intrum Justitia AB | | | 33,842 | | | | 1,139,323 | |
JM AB | | | 70,422 | | | | 2,123,575 | |
Modern Times Group MTG AB, B Shares | | | 17,018 | | | | 524,530 | |
Saab AB | | | 72,416 | | | | 2,957,321 | |
| | | | | | | | |
| | | | | | | | 10,931,145 | |
Switzerland | | | | | | | | |
Coca-Cola HBC AG | | | 89,852 | | | | 2,053,845 | |
Georg Fischer AG, Registered Shares | | | 1,774 | | | | 1,462,016 | |
IWG PLC | | | 1,962,880 | | | | 6,183,727 | |
Logitech International SA, Registered Shares | | | 135,653 | | | | 3,885,086 | |
Lonza Group AG, Registered Shares | | | 58,409 | | | | 10,730,850 | |
Straumann Holding AG, Registered Shares | | | 5,607 | | | | 2,262,795 | |
| | | | | | | | |
| | | | | | | | 26,578,319 | |
United Kingdom | | | | | | | | |
Acacia Mining PLC | | | 9,032 | | | | 48,979 | |
Auto Trader Group PLC | | | 131,844 | | | | 665,894 | |
Barratt Developments PLC | | | 413,620 | | | | 2,494,356 | |
Bunzl PLC | | | 956 | | | | 25,201 | |
Compass Group PLC | | | 34,922 | | | | 621,508 | |
Croda International PLC | | | 1,245 | | | | 52,573 | |
Dialog Semiconductor PLC | | | 13,406 | | | | 623,808 | |
DS Smith PLC | | | 151,864 | | | | 848,905 | |
Electrocomponents PLC | | | 8,033 | | | | 49,128 | |
IG Group Holdings PLC | | | 47,602 | | | | 320,004 | |
Inchcape PLC | | | 549,351 | | | | 4,972,053 | |
Indivior PLC | | | 526,413 | | | | 1,965,841 | |
Intertek Group PLC | | | 15,060 | | | | 644,668 | |
Jupiter Fund Management PLC | | | 191,250 | | | | 969,672 | |
Michael Page International PLC | | | 40,428 | | | | 220,208 | |
Moneysupermarket.com Group PLC | | | 828,868 | | | | 3,442,254 | |
Pearson PLC | | | 81,945 | | | | 638,845 | |
Petrofac Ltd. | | | 72,581 | | | | 840,429 | |
Qinetiq Group PLC | | | 2,028,146 | | | | 6,745,666 | |
Rentokil Initial PLC | | | 7,432 | | | | 21,415 | |
Royal Mail PLC | | | 382,933 | | | | 1,988,707 | |
Saga PLC | | | 12,212 | | | | 28,375 | |
| | | | | | | | |
| | | Shares | | | Value | |
| Reference Entity — Long (continued) | | | | | | |
United Kingdom (continued) | | | | | | | | |
Serco Group PLC | | | 953,639 | | | $ | 1,732,021 | |
Spirax-Sarco Engineering PLC | | | 176,835 | | | | 9,604,804 | |
TechnipFMC PLC | | | 59,700 | | | | 1,956,585 | |
Thomas Cook Group PLC | | | 872,559 | | | | 958,930 | |
UBM PLC | | | 432,367 | | | | 3,841,910 | |
WM Morrison Supermarkets PLC | | | 1,204,116 | | | | 3,589,814 | |
Wolseley PLC | | | 355 | | | | 21,985 | |
| | | | | | | | |
| | | | | | | | 49,934,538 | |
| Total Reference Entity — Long | | | | | | | 330,115,501 | |
| | | | | | | | |
| | | | | | | | | |
| | |
| Reference Entity — Short | | | | | | |
Australia | | | | | | | | |
ALS Ltd. | | | (135,121 | ) | | | (607,389 | ) |
Alumina Ltd. | | | (348,602 | ) | | | (513,650 | ) |
APA Group | | | (8,644 | ) | | | (55,219 | ) |
Commonwealth Bank of Australia | | | (3,799 | ) | | | (235,386 | ) |
Domino’s Pizza Enterprises Ltd. | | | (33,681 | ) | | | (1,519,475 | ) |
Iluka Resources Ltd. | | | (3,441 | ) | | | (19,748 | ) |
Incitec Pivot Ltd. | | | (494,157 | ) | | | (1,444,232 | ) |
Independence Group NL | | | (14,076 | ) | | | (40,457 | ) |
Macquarie Atlas Roads Group | | | (5,106 | ) | | | (19,443 | ) |
Transurban Group | | | (862,051 | ) | | | (6,670,633 | ) |
Vocus Communications Ltd. | | | (506,013 | ) | | | (1,551,789 | ) |
| | | | | | | | |
| | | | | | | | (12,677,421 | ) |
Canada | | | | | | | | |
Alimentation Couche-Tard, Inc. | | | (4,388 | ) | | | (201,013 | ) |
Amaya, Inc. | | | (16,295 | ) | | | (223,528 | ) |
Bombardier, Inc. | | | (205,561 | ) | | | (393,350 | ) |
Corus Entertainment, Inc., B Shares | | | (74,756 | ) | | | (742,246 | ) |
Cott Corp. | | | (378,565 | ) | | | (4,017,662 | ) |
DH Corp. | | | (110,442 | ) | | | (1,952,946 | ) |
Element Financial Corp. | | | (718,317 | ) | | | (6,983,063 | ) |
Empire Co. Ltd. | | | (34,065 | ) | | | (425,403 | ) |
Fairfax Financial Holdings Ltd. | | | (8,653 | ) | | | (4,043,054 | ) |
Hydro One Ltd. | | | (490,147 | ) | | | (9,059,009 | ) |
New Flyer Industries, Inc. | | | (27,760 | ) | | | (889,600 | ) |
Pretium Resources, Inc. | | | (106,568 | ) | | | (1,148,191 | ) |
Stantec, Inc. | | | (38,764 | ) | | | (1,039,069 | ) |
Torex Gold Resources, Inc. | | | (15,165 | ) | | | (321,655 | ) |
| | | | | | | | |
| | | | | | | | (31,439,789 | ) |
Denmark | | | | | | | | |
AP Moeller — Maersk A/S | | | (157 | ) | | | (251,367 | ) |
DSV A/S | | | (24,681 | ) | | | (1,200,226 | ) |
William Demant Holding A/S | | | (13,680 | ) | | | (256,145 | ) |
| | | | | | | | |
| | | | | | | | (1,707,738 | ) |
France | | | | | | | | |
Aeroports de Paris | | | (77,796 | ) | | | (8,632,819 | ) |
Air Liquide SA | | | (87,839 | ) | | | (9,483,422 | ) |
Airbus Group SE | | | (130,301 | ) | | | (8,832,450 | ) |
Bollore SA | | | (727,531 | ) | | | (2,909,744 | ) |
| | | | | | | | |
| | | | | | | | (29,858,435 | ) |
Germany | | | | | | | | |
Bayerische Motoren Werke AG | | | (36,901 | ) | | | (2,772,175 | ) |
GEA Group AG | | | (227,364 | ) | | | (9,421,277 | ) |
HeidelbergCement AG | | | (84,247 | ) | | | (8,138,606 | ) |
Volkswagen AG | | | (34,390 | ) | | | (5,370,205 | ) |
| | | | | | | | |
| | | | | | | | (25,702,263 | ) |
Hong Kong | | | | | | | | |
Esprit Holdings Ltd. | | | (230,500 | ) | | | (179,909 | ) |
See Notes to Financial Statements.
| | | | | | |
| | | | | | | |
| | BLACKROCK FUNDS | | JANUARY 31, 2017 | | 51 |
| | |
Schedule of Investments (continued) | | BlackRock Global Long/Short Equity Fund |
| | | | | | | | |
| | | Shares | | | Value | |
| Reference Entity — Short (continued) | | | | | | |
Italy | | | | | | | | |
Finmeccanica SpA | | | (18,246 | ) | | $ | (235,070 | ) |
Yoox SpA | | | (169,263 | ) | | | (4,245,905 | ) |
| | | | | | | | |
| | | | | | | | (4,480,975 | ) |
Japan | | | | | | | | |
Acom Co. Ltd. | | | (727,000 | ) | | | (3,126,935 | ) |
Aeon Co. Ltd. | | | (130,800 | ) | | | (1,890,432 | ) |
Ain Holdings, Inc. | | | (400 | ) | | | (29,321 | ) |
Alps Electric Co. Ltd. | | | (74,500 | ) | | | (1,984,365 | ) |
Asics Corp. | | | (4,600 | ) | | | (89,607 | ) |
Bic Camera, Inc. | | | (2,100 | ) | | | (19,615 | ) |
Calsonic Kansei Corp. | | | (64,000 | ) | | | (1,017,445 | ) |
Chugai Pharmaceutical Co. Ltd. | | | (46,900 | ) | | | (1,378,326 | ) |
Daikin Industries Ltd. | | | (18,000 | ) | | | (1,786,724 | ) |
Dentsu, Inc. | | | (128,800 | ) | | | (5,953,017 | ) |
DMG Mori Seiki Co. Ltd. | | | (428,200 | ) | | | (5,851,305 | ) |
FamilyMart UNY Holdings Co. Ltd. | | | (139,500 | ) | | | (8,838,615 | ) |
Fast Retailing Co. Ltd. | | | (30,200 | ) | | | (9,498,356 | ) |
HIS Co. Ltd. | | | (700 | ) | | | (18,680 | ) |
Isuzu Motors Ltd. | | | (206,600 | ) | | | (2,772,139 | ) |
JGC Corp. | | | (309,300 | ) | | | (5,369,256 | ) |
Kansai Paint Co. Ltd. | | | (143,200 | ) | | | (2,781,790 | ) |
Kawasaki Kisen Kaisha Ltd. | | | (1,140,000 | ) | | | (2,771,980 | ) |
Koito Manufacturing Co. Ltd. | | | (72,500 | ) | | | (3,845,809 | ) |
Kyocera Corp. | | | (35,800 | ) | | | (1,863,775 | ) |
Kyudenko Corp. | | | (600 | ) | | | (16,282 | ) |
McDonald’s Holdings Co. Japan Ltd. | | | (55,600 | ) | | | (1,461,766 | ) |
Mitsubishi Motors Corp. | | | (73,900 | ) | | | (400,327 | ) |
Mitsubishi UFJ Financial Group, Inc. | | | (141,700 | ) | | | (907,379 | ) |
Mitsubishi UFJ Lease & Finance Co. Ltd. | | | (3,700 | ) | | | (19,723 | ) |
Nihon Kohden Corp. | | | (6,300 | ) | | | (144,560 | ) |
Nippon Kayaku Co. Ltd. | | | (231,000 | ) | | | (3,019,056 | ) |
Nippon Paint Co. Ltd. | | | (70,300 | ) | | | (2,050,620 | ) |
Nippon Steel & Sumitomo Metal Corp. | | | (30,300 | ) | | | (731,974 | ) |
Oriental Land Co. Ltd. | | | (95,000 | ) | | | (5,205,934 | ) |
Recruit Holdings Co. Ltd. | | | (187,500 | ) | | | (8,207,929 | ) |
Resorttrust, Inc. | | | (17,800 | ) | | | (327,944 | ) |
Rinnai Corp. | | | (500 | ) | | | (42,491 | ) |
SBI Holdings, Inc. | | | (23,200 | ) | | | (320,247 | ) |
Sharp Corp. | | | (33,000 | ) | | | (89,242 | ) |
Shimano, Inc. | | | (4,000 | ) | | | (630,751 | ) |
Sugi Holdings Co. Ltd. | | | (46,700 | ) | | | (2,173,346 | ) |
Sumitomo Electric Industries Ltd. | | | (9,300 | ) | | | (135,323 | ) |
TDK Corp. | | | (10,900 | ) | | | (783,452 | ) |
Terumo Corp. | | | (112,700 | ) | | | (4,169,208 | ) |
Topcon Corp. | | | (105,900 | ) | | | (1,623,269 | ) |
TOTO Ltd. | | | (136,700 | ) | | | (5,505,755 | ) |
Unicharm Corp. | | | (86,700 | ) | | | (1,952,663 | ) |
| | | | | | | | |
| | | | | | | | (100,806,733 | ) |
Jordan | | | | | | | | |
Hikma Pharmaceuticals PLC | | | (119,691 | ) | | | (2,756,860 | ) |
Luxembourg | | | | | | | | |
ArcelorMittal | | | (27,610 | ) | | | (215,290 | ) |
Tenaris SA | | | (277,210 | ) | | | (4,855,875 | ) |
| | | | | | | | |
| | | | | | | | (5,071,165 | ) |
Macau | | | | | | | | |
Wynn Macau Ltd. | | | (528,000 | ) | | | (960,234 | ) |
Netherlands | | | | | | | | |
Altice NV, Class A | | | (153,439 | ) | | | (3,368,578 | ) |
Altice NV, Class B | | | (60,801 | ) | | | (1,341,882 | ) |
GrandVision NV | | | (23,956 | ) | | | (571,259 | ) |
Koninklijke Boskalis Westminster NV | | | (596 | ) | | | (22,051 | ) |
| | | | | | | | |
| | | Shares | | | Value | |
| Reference Entity — Short (continued) | | | | | | |
Netherlands (continued) | | | | | | | | |
Royal Dutch Shell PLC, A Shares | | | (181,019 | ) | | $ | (4,909,534 | ) |
Royal Dutch Shell PLC, B Shares | | | (167,178 | ) | | | (4,721,843 | ) |
| | | | | | | | |
| | | | | | | | (14,935,147 | ) |
Norway | | | | | | | | |
Norwegian Air Shuttle ASA | | | (20,148 | ) | | | (657,725 | ) |
Schibsted ASA | | | (56,382 | ) | | | (1,490,899 | ) |
Schibsted ASA, B Shares | | | (50,970 | ) | | | (1,269,082 | ) |
| | | | | | | | |
| | | | | | | | (3,417,706 | ) |
Singapore | | | | | | | | |
Sembcorp Industries Ltd. | | | (2,688,300 | ) | | | (6,003,740 | ) |
Singapore Telecommunications Ltd. | | | (735,100 | ) | | | (2,021,078 | ) |
| | | | | | | | |
| | | | | | | | (8,024,818 | ) |
South Africa | | | | | | | | |
Mediclinic International PLC | | | (161,591 | ) | | | (1,598,759 | ) |
Spain | | | | | | | | |
Ferrovial SA | | | (230,934 | ) | | | (4,191,988 | ) |
Sweden | | | | | | | | |
Alfa Laval AB | | | (7,732 | ) | | | (144,559 | ) |
Fastighets AB Balder | | | (1,115 | ) | | | (22,821 | ) |
Hennes & Mauritz AB, B Shares | | | (337,586 | ) | | | (9,659,000 | ) |
| | | | | | | | |
| | | | | | | | (9,826,380 | ) |
Switzerland | | | | | | | | |
Chocoladefabriken Lindt & Spruengli AG | | | (1,123 | ) | | | (6,233,071 | ) |
Chocoladefabriken Lindt & Spruengli AG | | | (49 | ) | | | (3,178,073 | ) |
Cie Financiere Richemont SA | | | (112,551 | ) | | | (8,765,438 | ) |
Dufry AG | | | (28,850 | ) | | | (4,118,523 | ) |
Geberit AG | | | (361 | ) | | | (154,288 | ) |
Swatch Group AG | | | (42,113 | ) | | | (2,942,436 | ) |
| | | | | | | | |
| | | | | | | | (25,391,829 | ) |
United Kingdom | | | | | | | | |
Antofagasta PLC | | | (826,450 | ) | | | (8,732,007 | ) |
AstraZeneca PLC | | | (9,685 | ) | | | (513,973 | ) |
BBA Aviation PLC | | | (1,177,904 | ) | | | (4,154,372 | ) |
Berkeley Group Holdings PLC | | | (10,973 | ) | | | (387,561 | ) |
Capita PLC | | | (168,104 | ) | | | (1,060,592 | ) |
Capital & Counties Properties PLC | | | (65,868 | ) | | | (225,975 | ) |
Cobham PLC | | | (4,772,648 | ) | | | (8,166,876 | ) |
CYBG PLC | | | (86,853 | ) | | | (311,043 | ) |
Greene King PLC | | | (7,977 | ) | | | (68,543 | ) |
HSBC Holdings PLC | | | (704,518 | ) | | | (6,010,184 | ) |
Next PLC | | | (9,873 | ) | | | (476,381 | ) |
Rio Tinto PLC | | | (10,249 | ) | | | (454,061 | ) |
Rolls-Royce Holdings PLC | | | (1,489,022 | ) | | | (1,873 | ) |
Travis Perkins PLC | | | (12,490 | ) | | | (229,076 | ) |
| | | | | | | | |
| | | | | | | | (30,792,517 | ) |
| Total Reference Entity — Short | | | | | | | (313,820,666 | ) |
| Net Value of Reference Entity — UBS AG | | | | | | | 16,294,835 | |
See Notes to Financial Statements.
| | | | | | |
| | | | | | | |
| 52 | | BLACKROCK FUNDS | | JANUARY 31, 2017 | | |
| | |
Schedule of Investments (continued) | | BlackRock Global Long/Short Equity Fund |
| | | | |
| Transactions in Options Written for the Six Months Ended January 31, 2017 |
| | | | | | | | |
| | | Calls | |
| | | Contracts | | | Premiums
Received | |
Outstanding options, beginning of period | | | — | | | | — | |
Options written | | | 58,400 | | | $ | 933,232 | |
Options closed | | | (58,400 | ) | | | (933,232 | ) |
| | | | |
Outstanding options, end of period | | | — | | | | — | |
| | | | |
|
| Derivative Financial Instruments Categorized by Risk Exposure |
As of period end, the fair values of derivative financial instruments located in the Statements of Assets and Liabilities were as follows:
| | | | | | | | | | | | | | | | | | | | | | | | | | | | | | |
| Assets — Derivative Financial Instruments | | Commodity
Contracts | | | Credit
Contracts | | | Equity
Contracts | | | Foreign
Currency
Exchange
Contracts | | | Interest
Rate
Contracts | | | Other
Contacts | | | Total | |
Futures contracts | | Net unrealized appreciation1 | | | — | | | | — | | | $ | 1,043,940 | | | | — | | | | — | | | | — | | | $ | 1,043,940 | |
Swap — OTC | | Unrealized appreciation on OTC swaps | | | — | | | | — | | | | 33,387,775 | | | | — | | | | — | | | | — | | | | 33,387,775 | |
| | | | | | |
Total | | | | | — | | | | — | | | $ | 34,431,715 | | | | — | | | | — | | | | — | | | $ | 34,431,715 | |
| | | | | | |
| | | | | | | | | | | | | | | | | | | | | | | | | | | | | | |
| Liabilities — Derivative Financial Instruments | | | | | | | | | | | | | | | | | | | | | |
Futures contracts | | Net unrealized depreciation1 | | | — | | | | — | | | $ | 1,228,222 | | | | — | | | | — | | | | — | | | $ | 1,228,222 | |
Swap — OTC | | Unrealized depreciation on OTC swaps | | | — | | | | — | | | | 1,535 | | | | — | | | | — | | | | — | | | | 1,535 | |
| | | | | | |
Total | | | | | — | | | | — | | | $ | 1,229,757 | | | | — | | | | — | | | | — | | | $ | 1,229,757 | |
| | | | | | |
1 Includes cumulative appreciation (depreciation) on futures contracts, if any, as reported in the Schedule of Investments. Only current day’s variation margin is reported within the Statements of Assets and Liabilities. | |
For the six months ended January 31, 2017, the effect of derivative financial instruments in the Statements of Operation was as follows:
| | | | | | | | | | | | | | | | | | | | | | | | | | | | |
| Net Realized Gain (Loss) From: | | Commodity
Contracts | | | Credit
Contracts | | | Equity
Contracts | | | Foreign
Currency
Exchange
Contracts | | | Interest
Rate
Contracts | | | Other
Contacts | | | Total | |
Futures contracts | | | — | | | | — | | | $ | 4,655,996 | | | | — | | | | — | | | | — | | | $ | 4,655,996 | |
Options purchased1 | | | — | | | | — | | | | (1,683,278 | ) | | | — | | | | — | | | | — | | | | (1,683,278 | ) |
Options written | | | — | | | | — | | | | 735,840 | | | | — | | | | — | | | | — | | | | 735,840 | |
Swaps | | | — | | | | — | | | | 2,697,245 | | | | — | | | | — | | | | — | | | | 2,697,245 | |
| | | | |
Total | | | — | | | | — | | | $ | 6,405,803 | | | | — | | | | — | | | | — | | | $ | 6,405,803 | |
| | | | |
1 Options purchased are included in the net realized gain (loss) from investments. | | | | | | | | | | | | | |
| | | | | | | | | | | | | | | | | | | | | | | | | | | | |
| Net Change in Unrealized Appreciation (Depreciation) on: | | | | | | | | | | | | | | | | | | | |
Futures contracts | | | — | | | | — | | | $ | (1,020,586 | ) | | | — | | | | — | | | | — | | | $ | (1,020,586 | ) |
Swaps | | | — | | | | — | | | | 22,952,852 | | | | — | | | | — | | | | — | | | | 22,952,852 | |
| | | | |
Total | | | — | | | | — | | | $ | 21,932,266 | | | | — | | | | — | | | | — | | | $ | 21,932,266 | |
| | | | |
| | |
| Average Quarterly Balances of Outstanding Derivative Financial Instruments |
| | | | |
| Futures contracts: | | | | |
Average notional value of contracts — long | | $ | 129,115,633 | |
Average notional value of contracts — short | | $ | 65,916,233 | |
| Options: | | | | |
Average value of options contracts purchased | | $ | 764,748 | |
Average value of options contracts written | | $ | 916,880 | 1 |
| Total return swaps: | | | | |
Average notional value | | $ | 57,757,969 | |
1 Actual amounts for the period are shown due to limited outstanding derivative financial instruments as of each quarter. | |
See Notes to Financial Statements.
| | | | | | |
| | | | | | | |
| | BLACKROCK FUNDS | | JANUARY 31, 2017 | | 53 |
| | |
Schedule of Investments (continued) | | BlackRock Global Long/Short Equity Fund |
For more information about the Fund’s investment risks regarding derivative financial instruments, refer to the Notes to Financial Statements.
|
| Derivative Financial Instruments — Offsetting as of Period End |
The Fund’s derivative assets and liabilities (by type) were as follows:
| | | | | | | | |
| | | Assets | | | Liabilities | |
Derivative Financial Instruments: | | | | | | | | |
Futures contracts | | $ | 158,804 | | | $ | 662,005 | |
Swaps — OTC1 | | | 33,387,775 | | | | 1,535 | |
| | | | |
Total derivative assets and liabilities in the Statements of Assets and Liabilities | | $ | 33,546,579 | | | $ | 663,540 | |
| | | | |
Derivatives not subject to a Master Netting Agreement or similar agreement (“MNA”) | | | (158,804 | ) | | | (662,005 | ) |
| | | | |
Total derivative assets and liabilities subject to an MNA | | $ | 33,387,775 | | | $ | 1,535 | |
| | | | |
1 Includes unrealized appreciation (depreciation) on OTC swaps in the Statements of Assets and Liabilities and reported in the Schedule of Investments. | |
The following table presents the Fund’s derivative assets and liabilities by counterparty net of amounts available for offset under an MNA and net of the related collateral received and pledged by the Fund:
| | | | | | | | | | | | | | | | | | | | |
| Counterparty | | Derivative Assets
Subject to a MNA
by Counterparty | | | Derivatives Available
for Offset1 | | | Non-cash
Collateral
Received | | | Cash
Collateral
Received2 | | | Net Amount of
Derivative Assets3 | |
Bank of America N.A | | $ | 3,953,176 | | | | — | | | | — | | | $ | (3,430,000 | ) | | $ | 523,176 | |
Deutsche Bank AG | | | 1,365,262 | | | | — | | | | — | | | | (1,365,262 | ) | | | — | |
Goldman Sachs & Co | | | 6,842,662 | | | | — | | | | — | | | | (6,100,000 | ) | | | 742,662 | |
Morgan Stanley & Co. International | | | 52,655 | | | $ | (1,535 | ) | | | — | | | | — | | | | 51,120 | |
UBS AG | | | 21,174,020 | | | | — | | | | — | | | | (21,151,403 | ) | | | 22,617 | |
| | | | |
Total | | $ | 33,387,775 | | | $ | (1,535 | ) | | | — | | | $ | (32,046,665 | ) | | $ | 1,339,575 | |
| | | | |
| | | | | | | | | | | | | | | | | | | | |
| Counterparty | | Derivative Liabilities
Subject to a MNA
by Counterparty | | | Derivatives Available
for Offset1 | | | Non-cash
Collateral
Pledged | | | Cash
Collateral
Pledged | | | Net Amount of
Derivative Liabilities | |
Morgan Stanley & Co. International | | $ | 1,535 | | | $ | (1,535 | ) | | | — | | | | — | | | | — | |
1 The amount of derivatives available for offset is limited to the amount of assets and/or liabilities that are subject to an MNA. | |
2 Excess of collateral received from the individual counterparty is not shown for financial reporting purposes. | |
3 Net amount represents the net amount receivable from the counterparty in the event of default. | |
| | |
| Fair Value Hierarchy as of Period End | | |
Various inputs are used in determining the fair value of investments and derivative financial instruments. For information about the Fund’s policy regarding valuation of investments and derivative financial instruments, refer to the Notes to Financial Statements.
The following tables summarize the Fund’s investments and derivative financial instruments categorized in the disclosure hierarchy:
| | | | | | | | | | | | | | | | |
| | | Level 1 | | | Level 2 | | | Level 3 | | | Total | |
Assets: | | | | | | | | | | | | | | | | |
| Investments: | | | | | | | | | | | | | | | | |
Long-Term Investments:1 | | | | | | | | | | | | | | | | |
Preferred Securities | | | — | | | | — | | | $ | 6,487,884 | | | $ | 6,487,884 | |
Short-Term Securities | | $ | 610,032,932 | | | | — | | | | — | | | | 610,032,932 | |
| | | | | | | | | | | | | | | | |
Total | | $ | 610,032,932 | | | | — | | | $ | 6,487,884 | | | $ | 616,520,816 | |
| | | | | | | | | | | | | | | | |
| Derivative Financial Instruments 2 | | | | | | | | | | | | | | | | |
Assets: | | | | | | | | | | | | | | | | |
Equity contracts | | $ | 1,043,940 | | | $ | 33,387,775 | | | | — | | | $ | 34,431,715 | |
Liabilities: | | | | | | | | | | | | | | | | |
Equity contracts | | | (1,228,222 | ) | | | (1,535 | ) | | | — | | | | (1,229,757 | ) |
| | | | | | | | | | | | | | | | |
Total | | $ | (184,282 | ) | | $ | 33,386,240 | | | | — | | | $ | 33,201,958 | |
| | | | | | | | | | | | | | | | |
1 See above Schedule of Investments for values in each country. | |
2 �� Derivative financial instruments are futures contracts and swaps. Futures contracts and swaps are valued at the unrealized appreciation (depreciation) on the instrument. | |
During the six months ended January 31, 2017, there were no transfers between levels.
See Notes to Financial Statements.
| | | | | | |
| | | | | | | |
| 54 | | BLACKROCK FUNDS | | JANUARY 31, 2017 | | |
| | |
Schedule of Investments (concluded) | | BlackRock Global Long/Short Equity Fund |
A reconciliation of Level 3 investments is presented when the Fund had a significant amount of Level 3 investments at the beginning and/or end of the period in relation to net assets. The following table is a reconciliation of Level 3 investments for which significant unobservable inputs were used in determining fair value:
| | | | |
| | | Preferred
Securities | |
Assets: | | | | |
Opening balance, as of July 31, 2016 | | $ | 6,612,226 | |
Transfers into Level 3 | | | — | |
Transfers out of Level 31 | | | — | |
Accrued discounts/premiums | | | — | |
Net realized gain (loss) | | | (124,342 | ) |
Net change in unrealized appreciation (depreciation)1,2 | | | — | |
Purchases | | | — | |
Sales | | | — | |
| | | | |
Closing Balance, as of January 31, 2017 | | $ | 6,487,884 | |
| | | | |
Net change in unrealized appreciation (depreciation) on investments still held at January 31, 20172 | | $ | (124,342 | ) |
| | | | |
1 Included in the related net change in unrealized appreciation (depreciation) in the Statements of Operations. | |
2 Any difference between net change in unrealized appreciation (depreciation) and net change in unrealized appreciation (depreciation) on investments still held at January 31, 2017 is generally due to investments no longer held or categorized as Level 3 at period end. | |
The following table summarizes the valuation approaches used and unobservable inputs utilized by the BlackRock Global Valuation Methodologies Committee (the “Global Valuation Committee”) to determine the value of certain of the Fund’s Level 3 investments as of period end.
| | | | | | | | | | | | | | | | |
| | | Value | | | Valuation Approach | | Unobservable Inputs | | Range of
Unobservable Inputs
Utilized | | | Weighted Average of
Unobservable
Inputs | |
Assets: | | | | | | | | | | | | | | | | |
Preferred Stocks | | $ | 6,487,884 | | | Market | | Discount Rate1 Revenue Growth Rate2 Revenue Growth Rate2 Revenue Multiple2 Exit Scenario Probability2 Time to Exit1 | |
| 25.00%
72.00% 187% – 230.00% 11.25x – 37.50x 15.00% – 55.00% 1-2 years |
| |
| —
— 203.90% 15.03x 35.00% — |
|
1 Decrease in unobservable input may result in a significant increase to value, while an increase in unobservable input may result in a significant decrease to value. | |
2 Increase in unobservable input may result in a significant increase to value, while a decrease in unobservable input may result in a significant decrease to value. | |
See Notes to Financial Statements.
| | | | | | |
| | | | | | | |
| | BLACKROCK FUNDS | | JANUARY 31, 2017 | | 55 |
| | |
| Statements of Assets and Liabilities | | |
| | | | | | | | |
| January 31, 2017 (Unaudited) | | BlackRock
Emerging
Markets
Long/Short
Equity Fund | | | BlackRock
Global
Long/Short
Equity Fund | |
| | | | | | | | |
| Assets | | | | | | | | |
Investments at value — affiliated1 | | $ | 148,882,956 | | | $ | 610,032,932 | |
Investments at value — unaffiliated2 | | | — | | | | 6,487,884 | |
Foreign currency at value3 | | | — | | | | 4,977,273 | |
| Cash pledged: | | | | | | | | |
OTC derivatives | | | 4,010,000 | | | | — | |
Futures contracts | | | — | | | | 8,302,000 | |
| Receivables: | | | | | | | | |
Capital shares sold | | | 593,830 | | | | 2,057,320 | |
Dividends — affiliated | | | 50,289 | | | | 199,618 | |
Swaps | | | — | | | | 2,646 | |
Variation margin on futures contracts | | | — | | | | 158,804 | |
Unrealized appreciation on OTC swaps | | | 16,729,581 | | | | 33,387,775 | |
Deferred offering costs | | | — | | | | 34,417 | |
Prepaid expenses | | | 28,053 | | | | 74,226 | |
| | | | |
Total assets | | | 170,294,709 | | | | 665,714,895 | |
| | | | |
| | | | | | | | |
| Liabilities | | | | | | | | |
Bank overdraft | | | 257,586 | | | | 1,748,232 | |
Cash received as collateral for OTC derivatives | | | 8,841,803 | | | | 34,481,403 | |
| Payables: | | | | | | | | |
Capital shares redeemed | | | 456,716 | | | | 2,573,361 | |
Investment advisory fees | | | 190,861 | | | | 777,532 | |
Administration fees | | | 5,641 | | | | 23,055 | |
Officer’s and Trustees’ fees | | | 5,532 | | | | 17,357 | |
Service and distribution fees | | | 5,479 | | | | 48,043 | |
Variation margin on futures contracts | | | — | | | | 662,005 | |
Other accrued expenses | | | 304,216 | | | | 1,073,804 | |
Unrealized depreciation on OTC swaps | | | 5,650,084 | | | | 1,535 | |
| | | | |
Total liabilities | | | 15,717,918 | | | | 41,406,327 | |
| | | | |
Net Assets | | $ | 154,576,791 | | | $ | 624,308,568 | |
| | | | |
| | | | | | | | |
| Net Assets Consist of | | | | | | | | |
Paid-in capital | | $ | 167,880,210 | | | $ | 739,593,705 | |
Accumulated net investment loss | | | (3,258,008 | ) | | | (18,223,122 | ) |
Accumulated net realized loss | | | (21,124,908 | ) | | | (130,066,064 | ) |
Net unrealized appreciation (depreciation) | | | 11,079,497 | | | | 33,004,049 | |
| | | | |
Net Assets | | $ | 154,576,791 | | | $ | 624,308,568 | |
| | | | |
| | | | | | |
| See Notes to Financial Statements. | | | | |
| | | | | | | |
| 56 | | BLACKROCK FUNDS | | JANUARY 31, 2017 | | |
| | |
| Statements of Assets and Liabilities (concluded) | | |
| | | | | | | | |
| January 31, 2017 (Unaudited) | | BlackRock
Emerging
Markets
Long/Short
Equity Fund | | | BlackRock
Global
Long/Short
Equity Fund | |
| | | | | | | | |
| Net Asset Value | | | | | | | | |
| Institutional: | | | | | | | | |
Net assets | | $ | 143,564,421 | | | $ | 517,511,581 | |
| | | | |
Shares outstanding4 | | | 14,676,851 | | | | 47,630,658 | |
| | | | |
Net asset value | | $ | 9.78 | | | $ | 10.87 | |
| | | | |
| Investor A: | | | | | | | | |
Net assets | | $ | 6,222,493 | | | $ | 69,063,329 | |
| | | | |
Shares outstanding4 | | | 643,061 | | | | 6,402,927 | |
| | | | |
Net asset value | | $ | 9.68 | | | $ | 10.79 | |
| | | | |
| Investor C: | | | | |
Net assets | | $ | 4,789,877 | | | $ | 37,714,899 | |
| | | | |
Shares outstanding4 | | | 513,577 | | | | 3,589,021 | |
| | | | |
Net asset value | | $ | 9.33 | | | $ | 10.51 | |
| | | | |
| Class K: | | | | | | | | |
Net assets | | | — | | | $ | 18,759 | |
| | | | |
Shares outstanding4 | | | — | | | | 1,724 | |
| | | | |
Net asset value | | | — | | | $ | 10.88 | |
| | | | |
1 Investments at cost — affiliated | | $ | 148,882,956 | | | $ | 610,032,932 | |
2 Investments at cost — unaffiliated | | | — | | | $ | 6,749,966 | |
3 Foreign currency at cost | | | — | | | $ | 4,908,189 | |
4 Unlimited number of shares authorized, $0.001 par value. | | | | | | | | |
| | | | | | |
| See Notes to Financial Statements. | | | | |
| | | | | | | |
| | BLACKROCK FUNDS | | JANUARY 31, 2017 | | 57 |
| | | | | | | | |
| Six Months Ended January 31, 2017 (Unaudited) | | BlackRock
Emerging
Markets
Long/Short
Equity Fund | | | BlackRock
Global
Long/Short
Equity Fund | |
| | | | | | | | |
| Investment Income | | | | | | | | |
Dividends — affiliated | | $ | 243,923 | | | $ | 1,158,549 | |
| | | | |
| | | | | | | | |
| Expenses | | | | | | | | |
Investment advisory | | | 1,335,033 | | | | 6,255,792 | |
Transfer agent — class specific | | | 67,849 | | | | 600,597 | |
Professional | | | 58,480 | | | | 67,840 | |
Service and distribution — class specific | | | 38,847 | | | | 359,125 | |
Administration | | | 37,826 | | | | 173,121 | |
Accounting services | | | 36,364 | | | | 205,820 | |
Registration | | | 25,981 | | | | 96,739 | |
Administration — class specific | | | 17,800 | | | | 83,489 | |
Printing | | | 17,150 | | | | 32,683 | |
Officer and Trustees | | | 8,148 | | | | 22,125 | |
Custodian | | | 7,996 | | | | 39,070 | |
Offering | | | — | | | | 42,614 | |
Recoupment of past waived fees — class specific | | | 19,543 | | | | 2,985 | |
Miscellaneous | | | 41,685 | | | | 49,355 | |
| | | | |
Total expenses | | | 1,712,702 | | | | 8,031,355 | |
| Less: | | | | | | | | |
Fees waived by the Manager | | | (53,891 | ) | | | (253,202 | ) |
Administrator fees waived — class specific | | | (8,407 | ) | | | (59,466 | ) |
Transfer agent fees waived and/or reimbursed — class specific | | | (54,032 | ) | | | (85,017 | ) |
| | | | |
Total expenses after fees waived and/or reimbursed | | | 1,596,372 | | | | 7,633,670 | |
| | | | |
Net investment loss | | | (1,352,449 | ) | | | (6,475,121 | ) |
| | | | |
| | | | | | | | |
| Realized and Unrealized Gain (Loss) | | | | | | | | |
| Net realized gain (loss) from: | | | | | | | | |
Investments — unaffiliated | | | — | | | | (1,687,170 | ) |
Capital gain distributions from investment companies — affiliated | | | 803 | | | | 3,485 | |
Futures contracts | | | 920,868 | | | | 4,655,996 | |
Foreign currency transactions | | | — | | | | 40,969 | |
Options written | | | — | | | | 735,840 | |
Swaps | | | 4,167 | | | | 2,697,245 | |
| | | | |
| | | 925,838 | | | | 6,446,365 | |
| | | | |
| Net change in unrealized appreciation (depreciation) on: | | | | | | | | |
Investments — unaffiliated | | | — | | | | (120,134 | ) |
Futures contracts | | | — | | | | (1,020,586 | ) |
Foreign currency translations | | | — | | | | 66,598 | |
Swaps | | | 354,321 | | | | 22,952,852 | |
| | | | |
| | | 354,321 | | | | 21,878,730 | |
| | | | |
Net realized and unrealized gain | | | 1,280,159 | | | | 28,325,095 | |
| | | | |
Net Increase (Decrease) in Net Assets Resulting from Operations | | $ | (72,290 | ) | | $ | 21,849,974 | |
| | | | |
| | | | | | |
| See Notes to Financial Statements. | | | | |
| | | | | | | |
| 58 | | BLACKROCK FUNDS | | JANUARY 31, 2017 | | |
| | |
| Statements of Changes in Net Assets | | |
| | | | | | | | | | | | | | | | |
| | | BlackRock Emerging Markets
Long/Short Equity Fund | | | BlackRock Global
Long/Short Equity Fund | |
| Increase (Decrease) in Net Assets: | | Six Months Ended
January 31,
2017
(Unaudited) | | | Year Ended
July 31,
2016 | | | Six Months Ended
January 31,
2017
(Unaudited) | | | Year Ended
July 31,
2016 | |
| | | | | | | | | | | | | | | | |
| Operations | | | | | | | | | | | | | | | | |
Net investment loss | | $ | (1,352,449 | ) | | $ | (4,117,675 | ) | | $ | (6,475,121 | ) | | $ | (23,401,275 | ) |
Net realized gain (loss) | | | 925,838 | | | | (5,503,444 | ) | | | 6,446,365 | | | | (90,655,239 | ) |
Net change in unrealized appreciation (depreciation) | | | 354,321 | | | | 7,828,927 | | | | 21,878,730 | | | | (51,517,722 | ) |
| | | | | | | | |
Net increase (decrease) in net assets resulting from operations | | | (72,290 | ) | | | (1,792,192 | ) | | | 21,849,974 | | | | (165,574,236 | ) |
| | | | | | | | |
| | | | | | | | | | | | | | | | |
| Distributions to Shareholders1 | | | | | | | | | | | | | | | | |
| From net realized gain: | | | | | | | | | | | | | | | | |
Institutional | | | — | | | | (3,004,653 | ) | | | — | | | | (27,244,588 | ) |
Investor A | | | — | | | | (187,418 | ) | | | — | | | | (3,362,215 | ) |
Investor C | | | — | | | | (89,473 | ) | | | — | | | | (1,181,063 | ) |
| | | | | | | | |
Decrease in net assets resulting from distributions to shareholders | | | — | | | | (3,281,544 | ) | | | — | | | | (31,787,866 | ) |
| | | | | | | | |
| | | | | | | | | | | | | | | | |
| Capital Share Transactions | | | | | | | | | | | | | | | | |
Net decrease in net assets derived from capital share transactions | | | (41,573,212 | ) | | | (227,124,855 | ) | | | (459,332,914 | ) | | | (564,023,952 | ) |
Capital contributions — affiliated | | | 22,962 | 2 | | | — | | | | — | | | | — | |
| | | | | | | | |
| | | (41,550,250 | ) | | | (227,124,855 | ) | | | (459,332,914 | ) | | | (564,023,952 | ) |
| | | | | | | | |
| | | | | | | | | | | | | | | | |
| Net Assets | | | | | | | | | | | | | | | | |
Total decrease in net assets | | | (41,622,540 | ) | | | (232,198,591 | ) | | | (437,482,940 | ) | | | (761,386,054 | ) |
Beginning of period | | | 196,199,331 | | | | 428,397,922 | | | | 1,061,791,508 | | | | 1,823,177,562 | |
| | | | | | | | |
End of period | | $ | 154,576,791 | | | $ | 196,199,331 | | | $ | 624,308,568 | | | $ | 1,061,791,508 | |
| | | | | | | | |
Accumulated net investment loss, end of period | | $ | (3,258,008 | ) | | $ | (1,905,559 | ) | | $ | (18,223,122 | ) | | $ | (11,748,001 | ) |
| | | | | | | | |
| 1 | | Distributions for annual periods determined in accordance with federal income tax regulations. |
| 2 | | See Note 6 of the Notes to Financial Statements. |
| | | | | | |
| See Notes to Financial Statements. | | | | |
| | | | | | | |
| | BLACKROCK FUNDS | | JANUARY 31, 2017 | | 59 |
| | |
| Financial Highlights | | BlackRock Emerging Markets Long/Short Equity Fund |
| | | | | | | | | | | | | | | | | | | | | | | | | | | | |
| | | Institutional | |
| | | Six Months Ended
January 31,
2017
(Unaudited) | | | Year Ended July 31, | | | Period
October 6, 20111
to July 31,
2012 | | | | |
| | | | 2016 | | | 2015 | | | 2014 | | | 2013 | | | |
| | | | | | | | | | | | | | | | | | | | | | | | | | | | |
| Per Share Operating Performance | | | | | | | | | | | | | | | | | | | | |
Net asset value, beginning of period | | $ | 9.76 | | | $ | 9.84 | | | $ | 10.34 | | | $ | 10.73 | | | $ | 10.73 | | | $ | 10.00 | | | | | |
| | | | |
Net investment loss2 | | | (0.07 | ) | | | (0.14 | ) | | | (0.17 | ) | | | (0.18 | ) | | | (0.17 | ) | | | (0.14 | ) | | | | |
Net realized and unrealized gain (loss) | | | 0.09 | | | | 0.17 | | | | (0.33 | ) | | | (0.15 | ) | | | 0.21 | | | | 0.89 | | | | | |
| | | | |
Net increase (decrease) from investment operations | | | 0.02 | | | | 0.03 | | | | (0.50 | ) | | | (0.33 | ) | | | 0.04 | | | | 0.75 | | | | | |
| | | | |
| Distributions:3 | | | | | | | | | | | | | | | | | | | | | | | | | | | | |
From net investment income | | | — | | | | — | | | | — | | | | — | | | | — | | | | (0.02 | ) | | | | |
From net realized gain | | | — | | | | (0.11 | ) | | | — | | | | (0.06 | ) | | | (0.04 | ) | | | — | | | | | |
| | | | |
Total distributions | | | — | | | | (0.11 | ) | | | — | | | | (0.06 | ) | | | (0.04 | ) | | | (0.02 | ) | | | | |
| | | | |
Net asset value, end of period | | $ | 9.78 | | | $ | 9.76 | | | $ | 9.84 | | | $ | 10.34 | | | $ | 10.73 | | | $ | 10.73 | | | | | |
| | | | |
| | | | | | | | | | | | | | | | | | | | | | | | | | | | |
| Total Return4 | | | | | | | | | | | | | | | | | | | | |
Based on net asset value | | | 0.21% | 5 | | | 0.34% | | | | (4.84)% | | | | (3.09)% | | | | 0.33% | | | | 7.47% | 5 | | | | |
| | | | |
| | | | | | | | | | | | | | | | | | | | | | | | | | | | |
| Ratios to Average Net Assets | | | | | | | | | | | | | | | | | | | | |
Total expenses | | | 1.88% | 6,7 | | | 1.85% | 8 | | | 1.86% | 9 | | | 1.85% | 8 | | | 1.84% | 8 | | | 2.13% | 6,8,10 | | | | |
| | | | |
Total expenses excluding recoupment of past fees waived | | | 1.85% | 6,7 | | | 1.84% | 8 | | | 1.85% | 9 | | | 1.84% | 8 | | | 1.81% | 8 | | | 2.13% | 6,8 | | | | |
| | | | |
Total expenses after fees waived and/or reimbursed | | | 1.75% | 6,7 | | | 1.75% | 8 | | | 1.75% | 9 | | | 1.75% | 8 | | | 1.71% | 8 | | | 1.75% | 6,8 | | | | |
| | | | |
Net investment loss | | | (1.48)% | 6,7 | | | (1.49)% | 8 | | | (1.68)% | 9 | | | (1.72)% | 8 | | | (1.61)% | 8 | | | (1.61)% | 6,8 | | | | |
| | | | |
| | | | | | | | | | | | | | | | | | | | | | | | | | | | |
| Supplemental Data | | | | | | | | | | | | | | | | | | | | |
Net assets, end of period (000) | | $ | 143,564 | | | $ | 177,981 | | | $ | 400,181 | | | $ | 509,665 | | | $ | 433,886 | | | $ | 126,707 | | | | | |
| | | | |
| | 1 | | Commencement of operations. |
| | 2 | | Based on average shares outstanding. |
| | 3 | | Distributions for annual periods determined in accordance with federal income tax regulations. |
| | 4 | | Where applicable, assumes the reinvestment of distributions. |
| | 5 | | Aggregate total return. |
| | 7 | | Ratios do not include expenses incurred indirectly as a result of investments in underlying funds of approximately 0.17%. |
| | 8 | | Ratios do not include expenses incurred indirectly as a result of investments in underlying funds of approximately 0.18%. |
| | 9 | | Ratios do not include expenses incurred indirectly as a result of investments in underlying funds of approximately 0.16%. |
| | 10 | | Organization costs were not annualized in the calculation of the expense ratio. If these expenses were annualized, the total expense ratio would have been 2.15%. |
| | | | | | |
| See Notes to Financial Statements. | | | | |
| | | | | | | |
| 60 | | BLACKROCK FUNDS | | JANUARY 31, 2017 | | |
| | |
| Financial Highlights (continued) | | BlackRock Emerging Markets Long/Short Equity Fund |
| | | | | | | | | | | | | | | | | | | | | | | | | | | | |
| | | Investor A | |
| | | Six Months Ended
January 31,
2017
(Unaudited) | | | Year Ended July 31, | | | Period
October 6, 20111
to July 31,
2012 | | | | |
| | | | 2016 | | | 2015 | | | 2014 | | | 2013 | | | |
| | | | | | | | | | | | | | | | | | | | | | | | | | | | |
| Per Share Operating Performance | | | | | | | | | | | | | | | | | | | | | | | | | | | | |
Net asset value, beginning of period | | $ | 9.67 | | | $ | 9.78 | | | $ | 10.29 | | | $ | 10.69 | | | $ | 10.71 | | | $ | 10.00 | | | | | |
| | | | |
Net investment loss2 | | | (0.08 | ) | | | (0.17 | ) | | | (0.19 | ) | | | (0.20 | ) | | | (0.20 | ) | | | (0.16 | ) | | | | |
Net realized and unrealized gain (loss) | | | 0.09 | | | | 0.17 | | | | (0.32 | ) | | | (0.15 | ) | | | 0.21 | | | | 0.88 | | | | | |
| | | | |
Net increase (decrease) from investment operations | | | 0.01 | | | | — | | | | (0.51 | ) | | | (0.35 | ) | | | 0.01 | | | | 0.72 | | | | | |
| | | | |
| Distributions:3 | | | | | | | | | | | | | | | | | | | | | | | | | | | | |
From net investment income | | | — | | | | — | | | | — | | | | — | | | | — | | | | (0.01 | ) | | | | |
From net realized gain | | | — | | | | (0.11 | ) | | | — | | | | (0.05 | ) | | | (0.03 | ) | | | — | | | | | |
| | | | |
Total distributions | | | — | | | | (0.11 | ) | | | — | | | | (0.05 | ) | | | (0.03 | ) | | | (0.01 | ) | | | | |
| | | | |
Net asset value, end of period | | $ | 9.68 | | | $ | 9.67 | | | $ | 9.78 | | | $ | 10.29 | | | $ | 10.69 | | | $ | 10.71 | | | | | |
| | | | |
| | | | | | | | | | | | | | | | | | | | | | | | | | | | |
| Total Return4 | | | | | | | | | | | | | | | | | | | | | | | | | | | | |
Based on net asset value | | | 0.10% | 5 | | | 0.03% | | | | (4.96)% | | | | (3.27)% | | | | 0.12% | | | | 7.24% | 5 | | | | |
| | | | |
| | | | | | | | | | | | | | | | | | | | | | | | | | | | |
| Ratios to Average Net Assets | | | | | | | | | | | | | | | | | | | | | | | | | | | | |
Total expenses | | | 2.16% | 6,7 | | | 2.10% | 8 | | | 2.03% | 9 | | | 2.01% | 8 | | | 2.03% | 8 | | | 2.19% | 6,8,10 | | | | |
| | | | |
Total expenses excluding recoupment of past fees waived | | | 2.15% | 6,7 | | | 2.08% | 8 | | | 2.02% | 9 | | | 2.00% | 8 | | | 2.01% | 8 | | | 2.19% | 6,8 | | | | |
| | | | |
Total expenses after fees waived and/or reimbursed | | | 2.00% | 6,7 | | | 2.00% | 8 | | | 1.95% | 9 | | | 1.94% | 8 | | | 1.95% | 8 | | | 2.00% | 6,8 | | | | |
| | | | |
Net investment loss | | | (1.72)% | 6,7 | | | (1.74)% | 8 | | | (1.89)% | 9 | | | (1.91)% | 8 | | | (1.85)% | 8 | | | (1.85)% | 6,8 | | | | |
| | | | |
| | | | | | | | | | | | | | | | | | | | | | | | | | | | |
| Supplemental Data | | | | | | | | | | | | | | | | | | | | | | | | | | | | |
Net assets, end of period (000) | | $ | 6,222 | | | $ | 12,239 | | | $ | 19,036 | | | $ | 64,400 | | | $ | 166,701 | | | $ | 57,655 | | | | | |
| | | | |
| | 1 | | Commencement of operations. |
| | 2 | | Based on average shares outstanding. |
| | 3 | | Distributions for annual periods determined in accordance with federal income tax regulations. |
| | 4 | | Where applicable, excludes the effects of any sales charges and assumes the reinvestment of distributions. |
| | 5 | | Aggregate total return. |
| | 7 | | Ratios do not include expenses incurred indirectly as a result of investments in underlying funds of approximately 0.17%. |
| | 8 | | Ratios do not include expenses incurred indirectly as a result of investments in underlying funds of approximately 0.18%. |
| | 9 | | Ratios do not include expenses incurred indirectly as a result of investments in underlying funds of approximately 0.16%. |
| | 10 | | Organization costs were not annualized in the calculation of the expense ratio. If these expenses were annualized, the total expense ratio would have been 2.20%. |
| | | | | | |
| See Notes to Financial Statements. | | | | |
| | | | | | | |
| | BLACKROCK FUNDS | | JANUARY 31, 2017 | | 61 |
| | |
| Financial Highlights (concluded) | | BlackRock Emerging Markets Long/Short Equity Fund |
| | | | | | | | | | | | | | | | | | | | | | | | | | | | |
| | | Investor C | |
| | | Six Months Ended
January 31,
2017
(Unaudited) | | | Year Ended July 31, | | | Period
October 6, 20111
to July 31,
2012 | | | | |
| | | | 2016 | | | 2015 | | | 2014 | | | 2013 | | | | | |
| | | | | | | | | | | | | | | | | | | | | | | | | | | | |
| Per Share Operating Performance | | | | | | | | | | | | | | | | | | | | | | | | | | | | |
Net asset value, beginning of period | | $ | 9.36 | | | $ | 9.53 | | | $ | 10.11 | | | $ | 10.56 | | | $ | 10.65 | | | $ | 10.00 | | | | | |
| | | | |
Net investment loss2 | | | (0.12 | ) | | | (0.23 | ) | | | (0.27 | ) | | | (0.27 | ) | | | (0.28 | ) | | | (0.22 | ) | | | | |
Net realized and unrealized gain (loss) | | | 0.09 | | | | 0.17 | | | | (0.31 | ) | | | (0.15 | ) | | | 0.21 | | | | 0.87 | | | | | |
| | | | |
Net increase (decrease) from investment operations | | | (0.03 | ) | | | (0.06 | ) | | | (0.58 | ) | | | (0.42 | ) | | | (0.07 | ) | | | 0.65 | | | | | |
| | | | |
| Distributions from net realized gain3 | | | — | | | | (0.11 | ) | | | — | | | | (0.03 | ) | | | (0.02 | ) | | | (0.00 | )4 | | | | |
| | | | |
Net asset value, end of period | | $ | 9.33 | | | $ | 9.36 | | | $ | 9.53 | | | $ | 10.11 | | | $ | 10.56 | | | $ | 10.65 | | | | | |
| | | | |
| | | | | | | | | | | | | | | | | | | | | | | | | | | | |
| Total Return5 | | | | | | | | | | | | | | | | | | | | | | | | | | | | |
Based on net asset value | | | (0.32)% | 6 | | | (0.60)% | | | | (5.74)% | | | | (3.99)% | | | | (0.70)% | | | | 6.53% | 6 | | | | |
| | | | |
| | | | | | | | | | | | | | | | | | | | | | | | | | | | |
| Ratios to Average Net Assets | | | | | | | | | | | | | | | | | | | | | | | | | | | | |
Total expenses | | | 2.90% | 7,8 | | | 2.85% | 9 | | | 2.81% | 10 | | | 2.79% | 9 | | | 2.81% | 9 | | | 3.00% | 7,9,11 | | | | |
| | | | |
Total expenses excluding recoupment of past fees waived | | | 2.90% | 7,8 | | | 2.85% | 9 | | | 2.80% | 10 | | | 2.78% | 9 | | | 2.77% | 9 | | | 3.00% | 7,9 | | | | |
| | | | |
Total expenses after fees waived and/or reimbursed | | | 2.75% | 7,8 | | | 2.74% | 9 | | | 2.74% | 10 | | | 2.72% | 9 | | | 2.72% | 9 | | | 2.75% | 7,9 | | | | |
| | | | |
Net investment loss | | | (2.47)% | 7,8 | | | (2.48)% | 9 | | | (2.67)% | 10 | | | (2.68)% | 9 | | | (2.62)% | 9 | | | (2.61)% | 7,9 | | | | |
| | | | |
| | | | | | | | | | | | | | | | | | | | | | | | | | | | |
| Supplemental Data | | | | | | | | | | | | | | | | | | | | | | | | | | | | |
Net assets, end of period (000) | | $ | 4,790 | | | $ | 5,979 | | | $ | 9,181 | | | $ | 16,131 | | | $ | 20,636 | | | $ | 10,196 | | | | | |
| | | | |
| | 1 | | Commencement of operations. |
| | 2 | | Based on average shares outstanding. |
| | 3 | | Distributions for annual periods determined in accordance with federal income tax regulations. |
| | 4 | | Amount is greater than $(0.005) per share. |
| | 5 | | Where applicable, excludes the effects of any sales charges and assumes the reinvestment of distributions. |
| | 6 | | Aggregate total return. |
| | 8 | | Ratios do not include expenses incurred indirectly as a result of investments in underlying funds of approximately 0.17%. |
| | 9 | | Ratios do not include expenses incurred indirectly as a result of investments in underlying funds of approximately 0.18%. |
| | 10 | | Ratios do not include expenses incurred indirectly as a result of investments in underlying funds of approximately 0.16%. |
| | 11 | | Organization costs were not annualized in the calculation of the expense ratio. If these expenses were annualized, the total expense ratio would have been 3.00%. |
| | | | | | |
| See Notes to Financial Statements. | | | | |
| | | | | | | |
| 62 | | BLACKROCK FUNDS | | JANUARY 31, 2017 | | |
| | |
| Financial Highlights | | BlackRock Global Long/Short Equity Fund |
| | | | | | | | | | | | | | | | | | | | | | | | |
| | | Institutional | |
| | | Six Months Ended January 31,
2017
(Unaudited) | | | Year Ended July 31, | | | Period December 20, 20121
to July 31,
2013 | | | | |
| | | | 2016 | | | 2015 | | | 2014 | | | | | |
| | | | | | | | | | | | | | | | | | | | | | | | |
| Per Share Operating Performance | | | | | | | | | | | | | | | | | | | | | | | | |
Net asset value, beginning of period | | $ | 10.56 | | | $ | 11.92 | | | $ | 11.61 | | | $ | 11.29 | | | $ | 10.00 | | | | | |
| | | | |
Net investment loss2 | | | (0.08 | ) | | | (0.15 | ) | | | (0.18 | ) | | | (0.19 | ) | | | (0.11 | ) | | | | |
Net realized and unrealized gain (loss) | | | 0.39 | | | | (1.00 | ) | | | 0.50 | | | | 0.66 | | | | 1.40 | | | | | |
| | | | |
Net increase (decrease) from investment operations | | | 0.31 | | | | (1.15 | ) | | | 0.32 | | | | 0.47 | | | | 1.29 | | | | | |
| | | | |
| Distributions from net realized gain3 | | | — | | | | (0.21 | ) | | | (0.01 | ) | | | (0.15 | ) | | | — | | | | | |
| | | | |
Net asset value, end of period | | $ | 10.87 | | | $ | 10.56 | | | $ | 11.92 | | | $ | 11.61 | | | $ | 11.29 | | | | | |
| | | | |
| | | | | | | | | | | | | | | | | | | | | | | | |
| Total Return4 | | | | | | | | | | | | | | | | | | | | | | | | |
Based on net asset value | | | 2.94% | 5 | | | (9.77)% | | | | 2.78% | | | | 4.13% | | | | 12.90% | 5 | | | | |
| | | | |
| | | | | | | | | | | | | | | | | | | | | | | | |
| Ratios to Average Net Assets | | | | | | | | | | | | | | | | | | | | | | | | |
Total expenses | | | 1.84% | 6,7 | | | 1.68% | 8 | | | 1.67% | 9 | | | 1.71% | 8 | | | 2.67% | 6,8,10 | | | | |
| | | | |
Total expenses excluding recoupment of past fees waived | | | 1.84% | 6,7 | | | 1.68% | 8 | | | 1.67% | 9 | | | 1.69% | 8 | | | 2.67% | 6,8 | | | | |
| | | | |
Total expenses after fees waived and/or reimbursed | | | 1.75% | 6,7 | | | 1.62% | 8 | | | 1.60% | 9 | | | 1.64% | 8 | | | 1.75% | 6,8 | | | | |
| | | | |
Net investment loss | | | (1.47)% | 6,7 | | | (1.35)% | 8 | | | (1.53)% | 9 | | | (1.61)% | 8 | | | (1.67)% | 6,8 | | | | |
| | | | |
| | | | | | | | | | | | | | | | | | | | | | | | |
| Supplemental Data | | | | | | | | | | | | | | | | | | | | | | | | |
Net assets, end of period (000) | | $ | 517,512 | | | $ | 824,306 | | | $ | 1,496,484 | | | $ | 1,005,213 | | | $ | 65,630 | | | | | |
| | | | |
Portfolio turnover rate | | | — | | | | 34% | 11 | | | 17% | 11 | | | — | | | | — | | | | | |
| | | | |
| | 1 | | Commencement of operations. |
| | 2 | | Based on average shares outstanding. |
| | 3 | | Distributions for annual periods determined in accordance with federal income tax regulations. |
| | 4 | | Where applicable, assumes the reinvestment of distributions. |
| | 5 | | Aggregate total return. |
| | 7 | | Ratios do not include expenses incurred indirectly as a result of investments in underlying funds of approximately 0.17%. |
| | 8 | | Ratios do not include expenses incurred indirectly as a result of investments in underlying funds of approximately 0.18%. |
| | 9 | | Ratios do not include expenses incurred indirectly as a result of investments in underlying funds of approximately 0.16%. |
| | 10 | | Organization costs were not annualized in the calculation of the expense ratio. If these expenses were annualized, the total expense ratio would have been 2.94%. |
| | 11 | | Excludes investments underlying the total return swaps. |
| | | | | | |
| See Notes to Financial Statements. | | | | |
| | | | | | | |
| | BLACKROCK FUNDS | | JANUARY 31, 2017 | | 63 |
| | |
| Financial Highlights (continued) | | BlackRock Global Long/Short Equity Fund |
| | | | | | | | | | | | | | | | | | | | | | | | |
| | | Investor A | |
| | | Six Months Ended January 31,
2017
(Unaudited) | | | Year Ended July 31, | | | Period December 20, 20121
to July 31,
2013 | | | | |
| | | | 2016 | | | 2015 | | | 2014 | | | | | |
| | | | | | | | | | | | | | | | | | | | | | | | |
| Per Share Operating Performance | | | | | | | | | | | | | | | | | | | | | | | | |
Net asset value, beginning of period | | $ | 10.49 | | | $ | 11.84 | | | $ | 11.57 | | | $ | 11.28 | | | $ | 10.00 | | | | | |
| | | | |
Net investment loss2 | | | (0.09 | ) | | | (0.18 | ) | | | (0.21 | ) | | | (0.21 | ) | | | (0.14 | ) | | | | |
Net realized and unrealized gain (loss) | | | 0.39 | | | | (0.99 | ) | | | 0.49 | | | | 0.64 | | | | 1.42 | | | | | |
| | | | |
Net increase (decrease) from investment operations | | | 0.30 | | | | (1.17 | ) | | | 0.28 | | | | 0.43 | | | | 1.28 | | | | | |
| | | | |
Distributions from net realized gain3 | | | — | | | | (0.18 | ) | | | (0.01 | ) | | | (0.14 | ) | | | — | | | | | |
| | | | |
Net asset value, end of period | | $ | 10.79 | | | $ | 10.49 | | | $ | 11.84 | | | $ | 11.57 | | | $ | 11.28 | | | | | |
| | | | |
| | | | | | | | | | | | | | | | | | | | | | | | |
| Total Return4 | | | | | | | | | | | | | | | | | | | | | | | | |
Based on net asset value | | | 2.86% | 5 | | | (10.02)% | | | | 2.44% | | | | 3.82% | | | | 12.80% | 5 | | | | |
| | | | |
| | | | | | | | | | | | | | | | | | | | | | | | |
| Ratios to Average Net Assets | | | | | | | | | | | | | | | | | | | | | | | | |
Total expenses | | | 2.15% | 6,7 | | | 1.95% | 8 | | | 1.93% | 9 | | | 1.97% | 8 | | | 2.30% | 6,8,10 | | | | |
| | | | |
Total expenses excluding recoupment of past fees waived | | | 2.15% | 6,7 | | | 1.94% | 8 | | | 1.92% | 9 | | | 1.95% | 8 | | | 2.30% | 6,8 | | | | |
| | | | |
Total expenses after fees waived and/or reimbursed | | | 2.00% | 6,7 | | | 1.88% | 8 | | | 1.86% | 9 | | | 1.89% | 8 | | | 2.00% | 6,8 | | | | |
| | | | |
Net investment loss | | | (1.72)% | 6,7 | | | (1.61)% | 8 | | | (1.80)% | 9 | | | (1.86)% | 8 | | | (1.95)% | 6,8 | | | | |
| | | | |
| | | | | | | | | | | | | | | | | | | | | | | | |
| Supplemental Data | | | | | | | | | | | | | | | | | | | | | | | | |
Net assets, end of period (000) | | $ | 69,063 | | | $ | 122,464 | | | $ | 225,910 | | | $ | 294,439 | | | $ | 15,076 | | | | | |
| | | | |
Portfolio turnover rate | | | — | | | | 34% | 11 | | | 17% | 11 | | | — | | | | — | | | | | |
| | | | |
| | 1 | | Commencement of operations. |
| | 2 | | Based on average shares outstanding. |
| | 3 | | Distributions for annual periods determined in accordance with federal income tax regulations. |
| | 4 | | Where applicable, excludes the effects of any sales charges and assumes the reinvestment of distributions. |
| | 5 | | Aggregate total return. |
| | 7 | | Ratios do not include expenses incurred indirectly as a result of investments in underlying funds of approximately 0.17%. |
| | 8 | | Ratios do not include expenses incurred indirectly as a result of investments in underlying funds of approximately 0.18%. |
| | 9 | | Ratios do not include expenses incurred indirectly as a result of investments in underlying funds of approximately 0.16%. |
| | 10 | | Organization costs were not annualized in the calculation of the expense ratio. If these expenses were annualized, the total expense ratio would have been 2.57%. |
| | 11 | | Excludes investments underlying the total return swaps. |
| | | | | | |
| See Notes to Financial Statements. | | | | |
| | | | | | | |
| 64 | | BLACKROCK FUNDS | | JANUARY 31, 2017 | | |
| | |
| Financial Highlights (continued) | | BlackRock Global Long/Short Equity Fund |
| | | | | | | | | | | | | | | | | | | | | | | | |
| | | Investor C | |
| | | Six Months Ended January 31,
2017
(Unaudited) | | | Year Ended July 31, | | | Period December 20, 20121
to July 31,
2013 | | | | |
| | | | 2016 | | | 2015 | | | 2014 | | | | | |
| | | | | | | | | | | | | | | | | | | | | | | | |
| Per Share Operating Performance | | | | | | | | | | | | | | | | | | | | | | | | |
Net asset value, beginning of period | | $ | 10.26 | | | $ | 11.63 | | | $ | 11.45 | | | $ | 11.23 | | | $ | 10.00 | | | | | |
| | | | |
Net investment loss2 | | | (0.13 | ) | | | (0.26 | ) | | | (0.30 | ) | | | (0.30 | ) | | | (0.19 | ) | | | | |
Net realized and unrealized gain (loss) | | | 0.38 | | | | (0.97 | ) | | | 0.49 | | | | 0.65 | | | | 1.42 | | | | | |
| | | | |
Net increase (decrease) from investment operations | | | 0.25 | | | | (1.23 | ) | | | 0.19 | | | | 0.35 | | | | 1.23 | | | | | |
| | | | |
Distributions from net realized gain3 | | | — | | | | (0.14 | ) | | | (0.01 | ) | | | (0.13 | ) | | | — | | | | | |
| | | | |
Net asset value, end of period | | $ | 10.51 | | | $ | 10.26 | | | $ | 11.63 | | | $ | 11.45 | | | $ | 11.23 | | | | | |
| | | | |
| | | | | | | | | | | | | | | | | | | | | | | | |
| Total Return4 | | | | | | | | | | | | | | | | | | | | | | | | |
Based on net asset value | | | 2.44% | 5 | | | (10.66)% | | | | 1.69% | | | | 3.07% | | | | 12.30% | 5 | | | | |
| | | | |
| | | | | | | | | | | | | | | | | | | | | | | | |
| Ratios to Average Net Assets | | | | | | | | | | | | | | | | | | | | | | | | |
Total expenses | | | 2.85% | 6,7 | | | 2.71% | 8 | | | 2.70% | 9 | | | 2.72% | 8 | | | 3.09% | 6,8,10 | | | | |
| | | | |
Total expenses excluding recoupment of past fees waived | | | 2.85% | 6,7 | | | 2.71% | 8 | | | 2.69% | 9 | | | 2.70% | 8 | | | 3.09% | 6,8 | | | | |
| | | | |
Total expenses after fees waived and/or reimbursed | | | 2.75% | 6,7 | | | 2.64% | 8 | | | 2.63% | 9 | | | 2.64% | 8 | | | 2.75% | 6,8 | | | | |
| | | | |
Net investment loss | | | (2.47)% | 6,7 | | | (2.37)% | 8 | | | (2.57)% | 9 | | | (2.61)% | 8 | | | (2.70)% | 6,8 | | | | |
| | | | |
| | | | | | | | | | | | | | | | | | | | | | | | |
| Supplemental Data | | | | | | | | | | | | | | | | | | | | | | | | |
Net assets, end of period (000) | | $ | 37,715 | | | $ | 62,567 | | | $ | 100,783 | | | $ | 100,980 | | | $ | 2,592 | | | | | |
| | | | |
Portfolio turnover rate | | | — | | | | 34% | 11 | | | 17% | 11 | | | — | | | | — | | | | | |
| | | | |
| | 1 | | Commencement of operations. |
| | 2 | | Based on average shares outstanding. |
| | 3 | | Distributions for annual periods determined in accordance with federal income tax regulations. |
| | 4 | | Where applicable, excludes the effects of any sales charges and assumes the reinvestment of distributions. |
| | 5 | | Aggregate total return. |
| | 7 | | Ratios do not include expenses incurred indirectly as a result of investments in underlying funds of approximately 0.17%. |
| | 8 | | Ratios do not include expenses incurred indirectly as a result of investments in underlying funds of approximately 0.18%. |
| | 9 | | Ratios do not include expenses incurred indirectly as a result of investments in underlying funds of approximately 0.16%. |
| | 10 | | Organization costs were not annualized in the calculation of the expense ratio. If these expenses were annualized, the total expense ratio would have been 3.36%. |
| | 11 | | Excludes investments underlying the total return swaps. |
| | | | | | |
| See Notes to Financial Statements. | | | | |
| | | | | | | |
| | BLACKROCK FUNDS | | JANUARY 31, 2017 | | 65 |
| | |
| Financial Highlights (concluded) | | BlackRock Global Long/Short Equity Fund |
| | | | | | | | | | | | |
| | | Class K | |
| | | Six Months Ended January 31,
2017 (Unaudited) | | | Period March 28, 20161
to July 31, 2016 | | | | |
| | | | | | | | | | | | |
| Per Share Operating Performance | | | | | | | | | | | | |
Net asset value, beginning of period | | $ | 10.56 | | | $ | 11.02 | | | | | |
| | | | |
Net investment loss2 | | | (0.07 | ) | | | (0.04 | ) | | | | |
Net realized and unrealized gain (loss) | | | 0.39 | | | | (0.42 | ) | | | | |
| | | | |
Net increase (decrease) from investment operations | | | 0.32 | | | | (0.46 | ) | | | | |
| | | | |
Net asset value, end of period | | $ | 10.88 | | | $ | 10.56 | | | | | |
| | | | |
| | | | | | | | | | | | |
| Total Return3 | | | | | | | | | | | | |
Based on net asset value | | | 3.03% | 4 | | | (4.17)% | 4 | | | | |
| | | | |
| | | | | | | | | | | | |
| Ratios to Average Net Assets | | | | | | | | | | | | |
Total expenses | | | 1.68% | 5,6 | | | 1.63% | 5,7 | | | | |
| | | | |
Total expenses excluding recoupment of past fees waived | | | 1.68% | 5,6 | | | 1.63% | 5,7 | | | | |
| | | | |
Total expenses after fees waived and/or reimbursed | | | 1.62% | 5,6 | | | 1.56% | 5,7 | | | | |
| | | | |
Net investment loss | | | (1.34)% | 5,6 | | | (1.15)% | 5,7 | | | | |
| | | | |
| | | | | | | | | | | | |
| Supplemental Data | | | | | | | | | | | | |
Net assets, end of period (000) | | $ | 19 | | | $ | 52,455 | | | | | |
| | | | |
Portfolio turnover rate | | | — | | | | 34% | 8,9 | | | | |
| | | | |
| | 1 | | Commencement of operations. |
| | 2 | | Based on average shares outstanding. |
| | 3 | | Where applicable, assumes the reinvestment of distributions. |
| | 4 | | Aggregate total return. |
| | 6 | | Ratios do not include expenses incurred indirectly as a result of investments in underlying funds of approximately 0.17%. |
| | 7 | | Ratios do not include expenses incurred indirectly as a result of investments in underlying funds of approximately 0.18%. |
| | 8 | | Excludes investments underlying the total return swaps. |
| | 9 | | Portfolio turnover is representative of the Fund for the entire year. |
| | | | | | |
| See Notes to Financial Statements. | | | | |
| | | | | | | |
| 66 | | BLACKROCK FUNDS | | JANUARY 31, 2017 | | |
| | |
| Notes to Financial Statements (Unaudited) | | |
1. Organization:
BlackRock FundsSM (the “Trust”) is registered under the Investment Company Act of 1940, as amended (the “1940 Act”), as an open-end management investment company. The Trust is organized as a Massachusetts business trust. The following are referred to herein collectively as the “Funds”, or individually, a “Fund”:
| | | | | | |
| Fund Name | | Herein Referred To As | | Diversification
Classification | |
BlackRock Emerging Markets Long/Short Equity Fund | | Emerging Markets Long/Short Equity | | | Diversified | |
BlackRock Global Long/Short Equity Fund | | Global Long/Short Equity | | | Diversified | |
Each Fund offers multiple classes of shares. All classes of shares have identical voting, dividend, liquidation and other rights and are subject to the same terms and conditions, except that certain classes bear expenses related to the shareholder servicing and distribution of such shares. Institutional and Class K Shares are sold only to certain eligible investors. Investor A and Investor C Shares are generally available through financial intermediaries. Each class has exclusive voting rights with respect to matters relating to its shareholder servicing and distribution expenditures.
| | | | | | | | | | | | |
| Share Class | | Initial
Sales Charge | | | CDSC | | | Conversion Privilege | |
Institutional and Class K Shares | | | No | | | | No | | | | None | |
Investor A Shares | | | Yes | | | | No | 1 | | | None | |
Investor C Shares | | | No | | | | Yes | | | | None | |
| | 1 | | Investor A Shares may be subject to a contingent deferred sales charge (“CDSC”) for certain redemptions where no initial sales charge was paid at the time of purchase. |
The Funds, together with certain other registered investment companies advised by BlackRock Advisors, LLC (the “Manager”) or its affiliates, are included in a complex of open-end funds referred to as the Equity-Liquidity Complex.
2. Significant Accounting Policies:
The financial statements are prepared in conformity with accounting principles generally accepted in the United States of America (“U.S. GAAP”), which may require management to make estimates and assumptions that affect the reported amounts of assets and liabilities in the financial statements, disclosure of contingent assets and liabilities at the date of the financial statements and the reported amounts of increases and decreases in net assets from operations during the reporting period. Actual results could differ from those estimates. Each Fund is considered an investment company under U.S. GAAP and follows the accounting and reporting guidance applicable to investment companies. Below is a summary of significant accounting policies:
Foreign Currency: Each Fund’s books and records are maintained in U.S. dollars. Purchases and sales of investments are recorded at the rates of exchange prevailing on the respective dates of such transactions. Generally, when the U.S. dollar rises in value against a foreign currency, the investments denominated in that currency will lose value; the opposite effect occurs if the U.S. dollar falls in relative value.
Each Fund does not isolate the portion of the results of operations arising as a result of changes in the exchange rates from the changes in the market prices of investments held or sold for financial reporting purposes. Accordingly, the effects of changes in exchange rates on investments are not segregated in the Statements of Operations from the effects of changes in market prices of those investments, but are included as a component of net realized and unrealized gain (loss) from investments. Each Fund reports realized currency gains (losses) on foreign currency related transactions as components of net realized gain (loss) for financial reporting purposes, whereas such components are generally treated as ordinary income for federal income tax purposes.
Defensive Positions: Investment policies may vary for temporary defensive purposes during periods in which the investment adviser believes that conditions in the securities markets or other economic, financial or political conditions warrant. Under such conditions, a Fund may invest up to 100% of its total assets in U.S. Government securities, certificates of deposit, repurchase agreements that involve purchases of debt securities, bankers’ acceptances and other bank obligations, commercial paper, money market funds and/or other debt securities, or may hold its assets in cash. The investment adviser applies this defensive posture as applicable and is consistent with each Fund’s investment policies.
Segregation and Collateralization: In cases where a Fund enters into certain investments (e.g., futures contracts, options written and swaps) that would be treated as “senior securities” for 1940 Act purposes, a Fund may segregate or designate on its books and records cash or liquid assets having a market value at least equal to the amount of its future obligations under such investments. Doing so allows the investment to be excluded from treatment as a “senior security.” Furthermore, if required by an exchange or counterparty agreement, the Funds may be required to deliver/deposit cash and/or securities to/with an exchange, or broker-dealer or custodian as collateral for certain investments or obligations.
Investment Transactions and Investment Income: For financial reporting purposes, investment transactions are recorded on the dates the transactions are entered into (the trade dates). Realized gains and losses on investment transactions are determined on the identified cost basis. Dividend income is recorded on the ex-dividend date. Dividends from foreign securities where the ex-dividend date may have passed are subsequently recorded when the Funds are informed of the ex-dividend date. Under the applicable foreign tax laws, a withholding tax at various rates may be imposed on capital gains, dividends and interest. Income, expenses and realized and unrealized gains and losses are allocated daily to each class based on its relative net assets.
| | | | | | |
| | | | | | | |
| | BLACKROCK FUNDS | | JANUARY 31, 2017 | | 67 |
| | |
| Notes to Financial Statements (continued) | | |
Distributions: Distributions paid by the Funds are recorded on the ex-dividend date. Distributions of capital gains are recorded on the ex-dividend date and made at least annually. The character and timing of distributions are determined in accordance with federal income tax regulations, which may differ from U.S. GAAP.
Offering Costs: Offering costs are amortized over a 12-month period beginning with the commencement of operations.
Recent Accounting Standard: In November 2016, the Financial Accounting Standards Board issued Accounting Standards Update “Restricted Cash” which will require entities to include the total of cash, cash equivalents, restricted cash, and restricted cash equivalents in the beginning and ending cash balances in the Statements of Cash Flows. The guidance will be applied retrospectively and is effective for fiscal years beginning after December 15, 2017, and interim periods within those years. Management is evaluating the impact, if any, of this guidance on the Funds’ presentation in the Statements of Cash Flows.
Indemnifications: In the normal course of business, a Fund enters into contracts that contain a variety of representations that provide general indemnification. A Fund’s maximum exposure under these arrangements is unknown because it involves future potential claims against a Fund, which cannot be predicted with any certainty.
Other: Expenses directly related to a Fund or its classes are charged to that Fund or the applicable class. Other operating expenses shared by several funds, including other funds managed by the Manager, are prorated among those funds on the basis of relative net assets or other appropriate methods. Expenses directly related to the Funds and other shared expenses prorated to the Funds are allocated daily to each class based on their relative net assets or other appropriate methods.
Through May 31, 2016, the Funds had an arrangement with their custodian whereby credits were earned on uninvested cash balances, which could be used to reduce custody fees and/or overdraft charges. Credits previously earned may have been utilized until December 31, 2016. Under current arrangements effective June 1, 2016, the Funds no longer earn credits on uninvested cash, and may incur charges on uninvested cash balances and overdrafts, subject to certain conditions.
3. Investment Valuation and Fair Value Measurements:
Investment Valuation Policies: The Funds’ investments are valued at fair value (also referred to as “market value” within the financial statements) as of the close of trading on the New York Stock Exchange (“NYSE”) (generally 4:00 p.m., Eastern time). U.S. GAAP defines fair value as the price the Funds would receive to sell an asset or pay to transfer a liability in an orderly transaction between market participants at the measurement date. The Funds determine the fair values of their financial instruments using various independent dealers or pricing services under policies approved by the Board of Trustees of the Trust (the “Board”). The BlackRock Global Valuation Methodologies Committee (the “Global Valuation Committee”) is the committee formed by management to develop global pricing policies and procedures and to oversee the pricing function for all financial instruments.
Fair Value Inputs and Methodologies: The following methods and inputs are used to establish the fair value of each Fund’s assets and liabilities:
| • | | Equity investments traded on a recognized securities exchange are valued at the official closing price each day, if available. For equity investments traded on more than one exchange, the official closing price on the exchange where the stock is primarily traded is used. Equity investments traded on a recognized exchange for which there were no sales on that day may be valued at the last available bid (long positions) or ask (short positions) price. |
Generally, trading in foreign instruments is substantially completed each day at various times prior to the close of trading on the NYSE. Occasionally, events affecting the values of such instruments may occur between the foreign market close and the close of trading on the NYSE that may not be reflected in the computation of the Funds’ net assets. Each business day, the Funds use a pricing service to assist with the valuation of certain foreign exchange-traded equity securities and foreign exchange-traded and over-the-counter (“OTC”) options (the “Systematic Fair Value Price”). Using current market factors, the Systematic Fair Value Price is designed to value such foreign securities and foreign options at fair value as of the close of trading on the NYSE, which follows the close of the local markets.
| • | | Investments in open-end U.S. mutual funds are valued at net asset value (“NAV”) each business day. |
| • | | Futures contracts traded on exchanges are valued at their last sale price. |
| • | | Securities and other assets and liabilities denominated in foreign currencies are translated into U.S. dollars using exchange rates determined as of the close of trading on the NYSE. Forward foreign currency exchange contracts are valued at the mean between the bid and ask prices and are determined as of the close of trading on the NYSE. Interpolated values are derived when the settlement date of the contract is an interim date for which quotations are not available. |
| • | | Exchange-traded options are valued at the mean between the last bid and ask prices at the close of the options market in which the options trade. An exchange-traded option for which there is no mean price is valued at the last bid (long positions) or ask (short positions) price. If no bid or ask price is available, the prior day’s price will be used, unless it is determined that the prior day’s price no longer reflects the fair value of the option. OTC options and options on swaps (“swaptions”) are valued by an independent pricing service using a mathematical model, which incorporates a number of market data factors, such as the trades and prices of the underlying instruments. |
| • | | Swap agreements are valued utilizing quotes received daily by the Funds’ pricing service or through brokers, which are derived using daily swap curves and models that incorporate a number of market data factors, such as discounted cash flows, trades and values of the underlying reference instruments. |
| | | | | | |
| | | | | | | |
| 68 | | BLACKROCK FUNDS | | JANUARY 31, 2017 | | |
| | | | |
| Notes to Financial Statements (continued) | | |
If events (e.g., a company announcement, market volatility or a natural disaster) occur that are expected to materially affect the value of such investments, or in the event that the application of these methods of valuation results in a price for an investment that is deemed not to be representative of the market value of such investment, or if a price is not available, the investment will be valued by the Global Valuation Committee, or its delegate, in accordance with a policy approved by the Board as reflecting fair value (“Fair Valued Investments”). The fair valuation approaches that may be used by the Global Valuation Committee will include Market approach, Income approach and Cost approach. Valuation techniques such as discounted cash flow, use of market comparables and matrix pricing are types of valuation approaches and typically used in determining fair value. When determining the price for Fair Valued Investments, the Global Valuation Committee, or its delegate, seeks to determine the price that each Fund might reasonably expect to receive or pay from the current sale or purchase of that asset or liability in an arm’s-length transaction. Fair value determinations shall be based upon all available factors that the Global Valuation Committee, or its delegate, deems relevant and consistent with the principles of fair value measurement.
The Global Valuation Committee, or its delegate, employs various methods for calibrating valuation approaches for investments where an active market does not exist, including regular due diligence of each Fund’s pricing vendors, regular reviews of key inputs and assumptions, transactional back-testing or disposition analysis to compare unrealized gains and losses to realized gains and losses, reviews of missing or stale prices and large movements in market values and reviews of any market related activity. The pricing of all Fair Valued Investments is subsequently reported to the Board or a committee thereof on a quarterly basis. As a result of the inherent uncertainty in valuation of these investments, the fair values may differ from the values that would have been used had an active market existed.
For investments in equity or debt issued by privately-held companies or funds (“Private Company” or collectively, the “Private Companies”) and other Fair Valued Investments, the fair valuation approaches that are used by third party pricing services utilize one or a combination of, but not limited to, the following inputs.
Standard Inputs Generally Considered By Third Party Pricing Services
| | | | | | |
Market approach | | | (i) | | | recent market transactions, including subsequent rounds of financing, in the underlying investment or comparable issuers; |
| | | (ii) | | | recapitalizations and other transactions across the capital structure; and |
| | | | (iii | ) | | market multiples of comparable issuers. |
Income approach | | | (i) | | | future cash flows discounted to present and adjusted as appropriate for liquidity, credit, and/or market risks; |
| | | (ii) | | | quoted prices for similar investments or assets in active markets; and |
| | | | (iii) | | | other risk factors, such as interest rates, yield curves, volatilities, prepayment speeds, loss severities, credit risks, recovery rates, liquidation
amounts and/or default rates. |
Cost approach | | | (i) | | | audited or unaudited financial statements, investor communications and financial or operational metrics issued by the Private Company; |
| | | (ii) | | | changes in the valuation of relevant indices or publicly traded companies comparable to the Private Company; |
| | | (iii) | | | relevant news and other public sources; and |
| | | | (iv) | | | known secondary market transactions in the Private Company’s interests and merger or acquisition activity in companies comparable to the
Private Company. |
Investments in series of preferred stock issued by Private Companies are typically valued utilizing Market approach in determining the enterprise value of the company. Such investments often contain rights and preferences that differ from other series of preferred and common stock of the same issuer. Valuation techniques such as an option pricing model (“OPM”), a probability weighted expected return model (“PWERM”) or a hybrid of those techniques are used in allocating enterprise value of the company, as deemed appropriate under the circumstances. The use of OPM and PWERM techniques involve a determination of the exit scenarios of the investment in order to appropriately allocate the enterprise value of the company among the various parts of its capital structure.
The Private Companies are not subject to the public company disclosure, timing, and reporting standards as other investments held by a Fund. Typically, the most recently available information by a Private Company is as of a date that is earlier than the date a Fund is calculating its NAV. This factor may result in a difference between the value of the investment and the price a Fund could receive upon the sale of the investment.
Fair Value Hierarchy: Various inputs are used in determining the fair value of investments and derivative financial instruments. These inputs to valuation techniques are categorized into a fair value hierarchy consisting of three broad levels for financial statement purposes as follows:
| • | | Level 1 — unadjusted price quotations in active markets/exchanges for identical assets or liabilities that each Fund has the ability to access |
| • | | Level 2 — other observable inputs (including, but not limited to, quoted prices for similar assets or liabilities in markets that are active, quoted prices for identical or similar assets or liabilities in markets that are not active, inputs other than quoted prices that are observable for the assets or liabilities (such as interest rates, yield curves, volatilities, prepayment speeds, loss severities, credit risks and default rates) or other market–corroborated inputs) |
| • | | Level 3 — unobservable inputs based on the best information available in the circumstances, to the extent observable inputs are not available (including each Fund’s own assumptions used in determining the fair value of investments and derivative financial instruments) |
The hierarchy gives the highest priority to unadjusted quoted prices in active markets for identical assets or liabilities (Level 1 measurements) and the lowest priority to unobservable inputs (Level 3 measurements). Accordingly, the degree of judgment exercised in determining fair value is greatest for instruments categorized in Level 3. The inputs used to measure fair value may fall into different levels of the fair value hierarchy. In such cases, for disclosure purposes, the fair value hierarchy classification is determined based on the lowest level input that is significant to the fair value measurement in its
| | | | | | |
| | | | | | | |
| | BLACKROCK FUNDS | | JANUARY 31, 2017 | | 69 |
| | |
| Notes to Financial Statements (continued) | | |
entirety. Investments classified within Level 3 have significant unobservable inputs used by the Global Valuation Committee in determining the price for Fair Valued Investments. Level 3 investments include equity or debt issued by Private Companies. There may not be a secondary market, and/or there are a limited number of investors. Level 3 investments may also be adjusted to reflect illiquidity and/or non-transferability, with the amount of such discount estimated by the Global Valuation Committee in the absence of market information.
Changes in valuation techniques may result in transfers into or out of an assigned level within the hierarchy. In accordance with each Fund’s policy, transfers between different levels of the fair value hierarchy are deemed to have occurred as of the beginning of the reporting period. The categorization of a value determined for investments and derivative financial instruments is based on the pricing transparency of the investments and derivative financial instruments and is not necessarily an indication of the risks associated with investing in those securities.
4. Securities and Other Investments:
Preferred Stock: Preferred stock has a preference over common stock in liquidation (and generally in receiving dividends as well), but is subordinated to the liabilities of the issuer in all respects. As a general rule, the market value of preferred stock with a fixed dividend rate and no conversion element varies inversely with interest rates and perceived credit risk, while the market price of convertible preferred stock generally also reflects some element of conversion value. Because preferred stock is junior to debt securities and other obligations of the issuer, deterioration in the credit quality of the issuer will cause greater changes in the value of a preferred stock than in a more senior debt security with similar stated yield characteristics. Unlike interest payments on debt securities, preferred stock dividends are payable only if declared by the issuer’s board of directors. Preferred stock also may be subject to optional or mandatory redemption provisions.
5. Derivative Financial Instruments:
The Funds engage in various portfolio investment strategies using derivative contracts both to increase the returns of the Funds and/or to manage their exposure to certain risks such as credit risk, equity risk, interest rate risk, foreign currency exchange rate risk, commodity price risk or other risks (e.g., inflation risk). Derivative financial instruments categorized by risk exposure are included in the Schedules of Investments. These contracts may be transacted on an exchange or OTC.
Futures Contracts: Certain Funds invest in long and/or short positions in futures and options on futures contracts to gain exposure to, or manage exposure to, changes in interest rates (interest rate risk), changes in the value of equity securities (equity risk) or foreign currencies (foreign currency exchange rate risk).
Futures contracts are agreements between the Funds and a counterparty to buy or sell a specific quantity of an underlying instrument at a specified price and on a specified date. Depending on the terms of a contract, it is settled either through physical delivery of the underlying instrument on the settlement date or by payment of a cash amount on the settlement date. Upon entering into a futures contract, the Funds are required to deposit initial margin with the broker in the form of cash or securities in an amount that varies depending on a contract’s size and risk profile. The initial margin deposit must then be maintained at an established level over the life of the contract.
Securities deposited as initial margin are designated in the Schedules of Investments and cash deposited, if any, is shown as cash pledged for futures contracts in the Statements of Assets and Liabilities. Pursuant to the contract, the Funds agree to receive from or pay to the broker an amount of cash equal to the daily fluctuation in market value of the contract (“variation margin”). Variation margin is recorded as unrealized appreciation (depreciation) and, if any, shown as variation margin receivable (or payable) on futures contracts in the Statements of Assets and Liabilities. When the contract is closed, a realized gain or loss is recorded in the Statements of Operations equal to the difference between the value of the contract at the time it was opened and the value at the time it was closed. The use of futures contracts involves the risk of an imperfect correlation in the movements in the price of futures contracts and interest, foreign currency exchange rates or underlying assets.
Options: Certain Funds purchase and write call and put options to increase or decrease their exposure to the risks of underlying instruments, including equity risk, interest rate risk and/or commodity price risk and/or, in the case of options written, to generate gains from options premiums.
A call option gives the purchaser (holder) of the option the right (but not the obligation) to buy, and obligates the seller (writer) to sell (when the option is exercised) the underlying instrument at the exercise or strike price at any time or at a specified time during the option period. A put option gives the holder the right to sell and obligates the writer to buy the underlying instrument at the exercise or strike price at any time or at a specified time during the option period.
Premiums paid on options purchased and premiums received on options written, as well as the daily fluctuation in market value, are included in investments at value — unaffiliated and options written at value, respectively, in the Statements of Assets and Liabilities. When an instrument is purchased or sold through the exercise of an option, the premium is offset against the cost or proceeds of the underlying instrument. When an option expires, a realized gain or loss is recorded in the Statements of Operations to the extent of the premiums received or paid. When an option is closed or sold, a gain or loss is recorded in the Statements of Operations to the extent the cost of the closing transaction exceeds the premiums received or paid). When the Funds write a call option, such option is typically “covered,” meaning that they hold the underlying instrument subject to being called by the option counterparty. When the Funds write a put option, such option is covered by cash in an amount sufficient to cover the obligation.
| | | | | | |
| | | | | | | |
| 70 | | BLACKROCK FUNDS | | JANUARY 31, 2017 | | |
| | | | |
| Notes to Financial Statements (continued) | | |
In purchasing and writing options, the Fund bear the risk of an unfavorable change in the value of the underlying instrument or the risk that they may not be able to enter into a closing transaction due to an illiquid market. Exercise of a written option could result in the Funds purchasing or selling a security when it otherwise would not, or at a price different from the current market value.
Swaps: The Funds enter into swap contracts to manage exposure to issuers, markets and securities. Such contracts are agreements between the Funds and a counterparty to make periodic net payments on a specified notional amount or a net payment upon termination. Swap agreements are privately negotiated in the OTC market and may be entered into as a bilateral contract (“OTC swaps”) or centrally cleared (“centrally cleared swaps”).
For OTC swaps, any upfront premiums paid and any upfront fees received are shown as swap premiums paid and swap premiums received, respectively, in the Statements of Assets and Liabilities and amortized over the term of the contract. The daily fluctuation in market value is recorded as unrealized appreciation (depreciation) on OTC Swaps in the Statements of Assets and Liabilities. Payments received or paid are recorded in the Statements of Operations as realized gains or losses, respectively. When an OTC swap is terminated, a realized gain or loss is recorded in the Statements of Operations equal to the difference between the proceeds from (or cost of) the closing transaction and the Funds’ basis in the contract, if any. Generally, the basis of the contract is the premium received or paid.
| • | | Total return swaps — Certain Funds enter into total return swaps to obtain exposure to a security or market without owning such security or investing directly in such market or to exchange the risk/return of one market (e.g., fixed income) with another market (e.g., equity or commodity prices) (equity risk, commodity price risk and/or interest rate risk). |
Total return swaps are agreements in which there is an exchange of cash flows whereby one party commits to make payments based on the total return (distributions plus capital gains/losses) of an underlying instrument in exchange for fixed or floating rate interest payments. If the total return of the instrument or index underlying the transaction exceeds or falls short of the offsetting fixed or floating interest rate obligation, the Funds receive payment from or make a payment to the counterparty.
| • | | Total return swaps / Custom basket swaps — Certain Funds enter into total return swaps to obtain exposure to a portfolio of long and short securities without owning such securities. |
Under the terms of a contract, the swap is designed to function as a portfolio of direct investments in long and short equity positions. This means that each Fund has the ability to trade in and out of these long and short positions within the swap and will receive the economic benefits and risks equivalent to direct investment in these positions, subject to certain adjustments due to events related to the counterparty. Benefits and risks include capital appreciation (depreciation), corporate actions and dividends received and paid, all of which are reflected in the swap’s market value. The market value also includes interest charges and credits (“financing fees”) related to the notional values of the long and short positions and cash balances within the swap. These interest charges and credits are based on a specified benchmark rate plus or minus a specified spread determined based upon the country and/or currency of the positions in the portfolio.
Positions within the swap and financing fees are reset periodically. During a reset, any unrealized appreciation (depreciation) on positions and accrued financing fees become available for cash settlement between the Funds and the counterparty. The amounts that are available for cash settlement are recorded as realized gains or losses in the Statements of Operations. Cash settlement in and out of the swap may occur at a reset date or any other date, at the discretion of the Funds and the counterparty, over the life of the agreement. Certain swaps have no stated expiration and can be terminated by either party at any time.
Swap transactions involve, to varying degrees, elements of interest rate, credit and market risk in excess of the amounts recognized in the Statements of Assets and Liabilities. Such risks involve the possibility that there will be no liquid market for these agreements, that the counterparty to the agreements may default on its obligation to perform or disagree as to the meaning of the contractual terms in the agreements, and that there may be unfavorable changes in interest rates and/or market values associated with these transactions.
Master Netting Arrangements: In order to define their contractual rights and to secure rights that will help them mitigate their counterparty risk, the Funds may enter into an International Swaps and Derivatives Association, Inc. Master Agreement (“ISDA Master Agreement”) or similar agreement with their counterparties. An ISDA Master Agreement is a bilateral agreement between each Fund and a counterparty that governs certain OTC derivatives and typically contains, among other things, collateral posting terms and netting provisions in the event of a default and/or termination event. Under an ISDA Master Agreement, each Fund may, under certain circumstances, offset with the counterparty certain derivative financial instruments’ payables and/or receivables with collateral held and/or posted and create one single net payment. The provisions of the ISDA Master Agreement typically permit a single net payment in the event of default including the bankruptcy or insolvency of the counterparty. Bankruptcy or insolvency laws of a particular jurisdiction may restrict or prohibit the right of offset in bankruptcy, insolvency or other events. In addition, certain ISDA Master Agreements allow counterparties to terminate derivative contracts prior to maturity in the event the Funds’ net assets decline by a stated percentage or the Funds fail to meet the terms of their ISDA Master Agreements. The result would cause the Funds to accelerate payment of any net liability owed to the counterparty.
Collateral Requirements: For derivatives traded under an ISDA Master Agreement, the collateral requirements are typically calculated by netting the mark-to-market amount for each transaction under such agreement and comparing that amount to the value of any collateral currently pledged by the Fund and the counterparty.
| | | | | | |
| | | | | | | |
| | BLACKROCK FUNDS | | JANUARY 31, 2017 | | 71 |
| | |
| Notes to Financial Statements (continued) | | |
Cash collateral that has been pledged to cover obligations of the Funds and cash collateral received from the counterparty, if any, is reported separately on the Statements of Assets and Liabilities as cash pledged as collateral and cash received as collateral, respectively. Non-cash collateral pledged by the Funds, if any, is noted in the Schedules of Investments. Generally, the amount of collateral due from or to a counterparty is subject to a certain minimum transfer amount threshold before a transfer is required, which is determined at the close of business of the Funds. Any additional required collateral is delivered to/pledged by the Funds on the next business day. Typically, the counterparty is not permitted to sell, re-pledge or use cash and non-cash collateral it receives. A Fund generally agrees not to use non-cash collateral that it receives but may, absent default or certain other circumstances defined in the underlying ISDA Master Agreement, be permitted to use cash collateral received. In such cases, interest may be paid pursuant to the collateral arrangement with the counterparty. To the extent amounts due to the Funds from their counterparties are not fully collateralized, they bear the risk of loss from counterparty non-performance. Likewise, to the extent the Funds have delivered collateral to a counterparty and stand ready to perform under the terms of their agreement with such counterparty, they bear the risk of loss from a counterparty in the amount of the value of the collateral in the event the counterparty fails to return such collateral. Based on the terms of agreements, collateral may not be required for all derivative contracts.
For financial reporting purposes, the Funds do not offset derivative assets and derivative liabilities that are subject to netting arrangements, if any, in the Statements of Assets and Liabilities.
6. Investment Advisory Agreement and Other Transactions with Affiliates:
The PNC Financial Services Group, Inc. is the largest stockholder and an affiliate of BlackRock, Inc. (“BlackRock”) for 1940 Act purposes.
Investment Advisory: The Trust, on behalf of the Funds, entered into an Investment Advisory Agreement with the Manager, the Funds’ investment adviser, an indirect, wholly-owned subsidiary of BlackRock, to provide investment advisory services. The Manager is responsible for the management of each Fund’s portfolio and provides the personnel, facilities, equipment and certain other services necessary to the operations of each Fund.
For such services, each Fund pays the Manager a monthly fee at an annual rate equal to the following percentages of the average daily value of each Fund’s net assets as follows:
| | | | |
| Average Daily Net Assets | | Investment Advisory Fee | |
First $1 Billion | | | 1.50% | |
$1 Billion — $3 Billion | | | 1.41% | |
$3 Billion — $5 Billion | | | 1.35% | |
$5 Billion — $10 Billion | | | 1.31% | |
Greater than $10 Billion | | | 1.28% | |
With respect to Global Long/Short Equity, the Manager entered into a separate sub-advisory agreement with BlackRock International Limited (“BIL”), an affiliate of the Manager. The Manager pays BIL, for services it provides, a monthly fee that is a percentage of the investment advisory fees paid by the Fund to the Manager.
Service and Distribution Fees: The Trust, on behalf of the Funds, entered into a Distribution Agreement and a Distribution and Service Plan with BlackRock Investments, LLC (“BRIL”), an affiliate of the Manager. Pursuant to the Distribution and Service Plan and in accordance with Rule 12b-1 under the 1940 Act, each Fund pays BRIL ongoing service and distribution fees. The fees are accrued daily and paid monthly at annual rates based upon the average daily net assets of the relevant share class of each Fund as follows:
| | | | | | | | |
| | | Service Fees | | | Distribution Fees | |
Investor A | | | 0.25% | | | | — | |
Investor C | | | 0.25% | | | | 0.75% | |
BRIL and broker-dealers, pursuant to sub-agreements with BRIL, provide shareholder servicing and distribution services to the Funds. The ongoing service and/or distribution fee compensates BRIL and each broker-dealer for providing shareholder servicing and/or distribution related services to the shareholders.
For the six months ended January 31, 2017, the following table shows the class specific service and distribution fees borne directly by each share class of each Fund:
| | | | | | | | | | | | |
| Service and Distribution Fees | | Investor A | | | Investor C | | | Total | |
Emerging Markets Long/Short Equity | | $ | 11,681 | | | $ | 27,166 | | | $ | 38,847 | |
Global Long/Short Equity | | $ | 110,468 | | | $ | 248,657 | | | $ | 359,125 | |
| | | | | | |
| | | | | | | |
| 72 | | BLACKROCK FUNDS | | JANUARY 31, 2017 | | |
| | | | |
| Notes to Financial Statements (continued) | | |
Administration: The Trust, on behalf of the Funds, entered into an Administration Agreement with the Manager, an indirect, wholly-owned subsidiary of BlackRock, to provide administrative services. For these services, the Manager receives an administration fee computed daily and payable monthly, based on a percentage of the average daily net assets of each Fund. The administration fee, which is shown as administration in the Statements of Operations, is paid at the annual rates below.
| | | | |
| Average Daily Net Assets | | Administration Fee | |
First $500 Million | | | 0.0425 | % |
$500 Million — $1 Billion | | | 0.0400 | % |
$1 Billion — $2 Billion | | | 0.0375 | % |
$2 Billion — $4 Billion | | | 0.0350 | % |
$4 Billion — $13 Billion | | | 0.0325 | % |
Greater than $13 Billion | | | 0.0300 | % |
In addition, the Manager charges each of the share classes an administration fee, which is shown as administration — class specific in the Statements of Operations, at an annual rate of 0.02% of the average daily net assets of each respective class.
For the six months ended January 31, 2017, the following table shows the class specific administration fees borne directly by each share class of each Fund:
| | | | | | | | | | | | | | | | | | | | |
| Administration Fees | | Institutional | | | Investor A | | | Investor C | | | Class K | | | Total | |
Emerging Markets Long/Short Equity | | $ | 16,327 | | | $ | 930 | | | $ | 543 | | | | — | | | $ | 17,800 | |
Global Long/Short Equity | | $ | 67,057 | | | $ | 8,816 | | | $ | 4,951 | | | $ | 2,665 | | | $ | 83,489 | |
Transfer Agent: Pursuant to written agreements, certain financial intermediaries, some of which may be affiliates, provide the Funds with sub-accounting, recordkeeping, sub-transfer agency and other administrative services with respect to sub-accounts they service. For these services, these entities receive an asset-based fee or an annual fee per shareholder account, which will vary depending on share class and/or net assets. For the six months ended
January 31, 2017, the Funds paid the following amounts to affiliates of BlackRock in return for these services, which are included in transfer agent — class specific in the Statements of Operations:
| | | | | | | | | | | | |
| | | Institutional | | | Investor A | | | Total | |
Emerging Markets Long/Short Equity | | $ | 2 | | | | — | | | $ | 2 | |
Global Long/Short Equity | | $ | 4,331 | | | $ | 907 | | | $ | 5,238 | |
The Manager maintains a call center that is responsible for providing certain shareholder services to the Funds. Shareholder services include responding to inquiries and processing subscriptions and redemptions based upon instructions from shareholders. For the six months ended January 31, 2017, each Fund reimbursed the Manager the following amounts for costs incurred in running the call center, which are included in transfer agent — class specific in the Statements of Operations:
| | | | | | | | | | | | | | | | | | | | |
| | | Institutional | | | Investor A | | | Investor C | | | Class K | | | Total | |
Emerging Markets Long/Short Equity | | $ | 233 | | | $ | 184 | | | $ | 58 | | | | — | | | $ | 475 | |
Global Long/Short Equity | | $ | 1,953 | | | $ | 809 | | | $ | 617 | | | $ | 202 | | | $ | 3,581 | |
For the six months ended January 31, 2017, the following table shows the class specific transfer agent fees borne directly by each class of each Fund:
| | | | | | | | | | | | | | | | | | | | |
| | | Institutional | | | Investor A | | | Investor C | | | Class K | | | Total | |
Emerging Markets Long/Short Equity | | $ | 59,080 | | | $ | 5,654 | | | $ | 3,115 | | | | — | | | $ | 67,849 | |
Global Long/Short Equity | | $ | 474,133 | | | $ | 89,276 | | | $ | 36,757 | | | $ | 431 | | | $ | 600,597 | |
Other Fees: For the six months ended January 31, 2017, affiliates earned underwriting discounts, direct commissions and dealer concessions on sales of each Fund’s Investor A Shares as follows:
| | | | | | | | |
| | | Emerging Markets
Long/Short Equity | | | Global Long/Short
Equity | |
Investor A | | $ | 164 | | | $ | 315 | |
For the six months ended January 31, 2017, affiliates received CDSCs as follows:
| | | | | | | | |
| | | Emerging Markets
Long/Short Equity | | | Global Long/Short
Equity | |
Investor A | | | — | | | $ | 18,091 | |
Investor C | | $ | 45 | | | $ | 5,630 | |
| | | | | | |
| | | | | | | |
| | BLACKROCK FUNDS | | JANUARY 31, 2017 | | 73 |
| | |
| Notes to Financial Statements (continued) | | |
Expense Limitations, Waivers, Reimbursements and Recoupments: With respect to each Fund, the Manager contractually agreed to waive and/or reimburse fees or expenses in order to limit expenses, excluding interest expense, dividend expense, tax expense, acquired fund fees and expenses, and certain other fund expenses, which constitute extraordinary expenses not incurred in the ordinary course of each Fund’s business (“expense limitation”). The expense limitations as a percentage of average daily net assets are as follows:
| | | | | | | | |
| Share Class | | Emerging Markets
Long/Short Equity | | | Global Long/Short
Equity | |
Institutional | | | 1.75% | | | | 1.75% | |
Investor A | | | 2.00% | | | | 2.00% | |
Investor C | | | 2.75% | | | | 2.75% | |
Class K | | | — | | | | 1.70% | |
The Manager has agreed not to reduce or discontinue these contractual expense limitations prior to December 1, 2017 for each Fund unless approved by the Board, including a majority of the Independent Trustees who are not “interested persons” of the Funds, as defined in the 1940 Act (“Independent Trustees”) or by a vote of a majority of the outstanding voting securities of the Fund.
For the six months ended January 31, 2017, class specific expense waivers and/or reimbursements are as follows:
| | | | | | | | | | | | | | | | | | | | |
| Administration Fees Waived — Class Specific | | | | | | | | | | | | | | | |
| | | Institutional | | | Investor A | | | Investor C | | | Class K | | | Total | |
Emerging Markets Long/Short Equity | | $ | 7,271 | | | $ | 631 | | | $ | 505 | | | | — | | | $ | 8,407 | |
Global Long/Short Equity | | $ | 46,842 | | | $ | 8,580 | | | $ | 4,015 | | | $ | 29 | | | $ | 59,466 | |
| | | | | | | | | | | | | | | | | | | | |
| Transfer Agent Fees Waived and/or Reimbursed — Class Specific | | | | | | | | | | | | | | | |
| | | Institutional | | | Investor A | | | Investor C | | | Class K | | | Total | |
Emerging Markets Long/Short Equity | | $ | 48,291 | | | $ | 3,814 | | | $ | 1,927 | | | | — | | | $ | 54,032 | |
Global Long/Short Equity | | $ | 49,269 | | | $ | 29,863 | | | $ | 5,792 | | | $ | 93 | | | $ | 85,017 | |
These amounts waived and/or reimbursed are included in fees waived and/or reimbursed by the Manager, and shown as administration fees waived — class specific and transfer agent fees waived and/or reimbursed — class specific, respectively, in the Statements of Operations.
With respect to the Funds, the Manager voluntarily agreed to waive its investment advisory fees by the amount of investment advisory fees each Fund pays to the Manager indirectly through its investment in affiliated money market funds (the “affiliated money market fund waiver”). These amounts are included in fees waived by the Manager in the Statements of Operations. The amount of waivers of fees and expenses made pursuant to the expense limitation caps, as applicable, will be reduced by the amount of the affiliated money market fund waiver. For the six months ended January 31, 2017, the amounts waived were as follows:
| | | | |
Emerging Markets Long/Short Equity | | $ | 53,891 | |
Global Long/Short Equity | | $ | 253,202 | |
Effective September 1, 2016, the Manager voluntarily agreed to waive its investment advisory fee with respect to any portion of each Fund’s assets invested in affiliated equity and fixed-income mutual funds and exchange-traded funds that have a contractual management fee. Prior to September 1, 2016, the Manager did not waive such fees. Effective November 28, 2016, the waiver become contractual through November 30, 2017. The contractual agreement may be terminated upon 90 days’ notice by a majority of the non-interested trustees of the Trust or by a vote of a majority of the outstanding voting securities of the Funds.
With respect to the contractual expense caps, if during a Fund’s fiscal year the operating expenses of a share class, that at any time during the prior two fiscal years received a waiver and/or reimbursement from the Manager, are less than the expense cap for that share class, the Manager is entitled to be reimbursed by such share class up to the lesser of the following expenses:
| | (a) | The amount of fees waived and/or expenses reimbursed during those prior two fiscal years under the agreement. |
| | (b) | The amount by which the expense cap for that share class exceeds the operating expenses of the share class for the current fiscal year, provided that: |
| | • | | Each Fund, of which the share class is a part, has more than $50 million in assets for the fiscal year; and |
| | • | | The Manager or an affiliate continues to serve as a Fund’s investment adviser or administrator. |
In the event the expense cap for a share class is changed subsequent to a fiscal year in which the Manager becomes entitled to reimbursement for fees waived and/or reimbursed, the amount available to reimburse the Manager shall be calculated by reference to the expense cap for that share class in effect at the time the Manager became entitled to receive such reimbursement, rather than the subsequently changed expense cap for that share class.
| | | | | | |
| | | | | | | |
| 74 | | BLACKROCK FUNDS | | JANUARY 31, 2017 | | |
| | | | |
| Notes to Financial Statements (continued) | | |
For the six months ended January 31, 2017, the Manager recouped the following fund level and class specific waivers and/or reimbursements previously recorded by the Funds:
| | | | | | | | |
| | | Emerging Markets
Long/Short Equity | | | Global Long/Short
Equity | |
Fund Level | | | — | | | | — | |
Institutional | | $ | 19,343 | | | $ | 2,478 | |
Investor A | | $ | 141 | | | | — | |
Investor C | | $ | 59 | | | $ | 507 | |
On January 31, 2017, the Funds’ fund level and class specific waivers and/or reimbursements subject to possible future recoupment under the expense limitation agreement are as follows:
| | | | | | | | | | | | | | | | | | | | | | | | |
| | | Emerging Markets Long/Short Equity | | | Global Long/Short Equity | |
| Expiring July 31, | | 2017 | | | 2018 | | | 2019 | | | 2017 | | | 2018 | | | 2019 | |
Fund Level | | | — | | | | — | | | | — | | | | — | | | | — | | | | — | |
Institutional | | $ | 166,594 | | | $ | 87,987 | | | $ | 55,562 | | | | — | | | | — | | | $ | 96,111 | |
Investor A | | $ | 2,067 | | | $ | 4,571 | | | $ | 4,445 | | | | — | | | $ | 4,223 | | | $ | 38,443 | |
Investor C | | | — | | | $ | 3,152 | | | $ | 2,432 | | | | — | | | | — | | | $ | 9,807 | |
Class K | | | — | | | | — | | | | — | | | | — | | | | — | | | $ | 122 | |
| | | | |
Total | | $ | 168,661 | | | $ | 95,710 | | | $ | 62,439 | | | | — | | | $ | 4,223 | | | $ | 144,483 | |
| | | | |
Interfund Lending: In accordance with an exemptive order (the “Order”) from the U.S. Securities and Exchange Commission, each Fund may participate in a joint lending and borrowing facility for temporary purposes (the “Interfund Lending Program”), subject to compliance with the terms and conditions of the Order, and to the extent permitted by each Fund’s investment policies and restrictions. Each Fund is currently permitted to borrow and lend under the Interfund Lending Program.
A Fund may lend in aggregate up to 15% of its net assets, but may not lend more than 5% of its net assets, to any one borrowing fund through the Interfund Lending Program. A Fund may not borrow through the Interfund Lending Program or from any other source more than 33 1/3% of its total assets or any lower threshold provided for by the Funds’ investment restrictions. If a Fund’s total outstanding borrowings exceed 10% of its total assets, each of its outstanding interfund loans will be subject to collateralization of at least 102% of the outstanding principal value of the loan. All interfund loans are for temporary or emergency purposes and the interest rate to be charged will be the average of the highest current overnight repurchase agreement rate available to a lending fund and the bank loan rate, as calculated according to a formula established by the Board.
During the six months ended January 31, 2017, the Funds did not participate in the Interfund Lending Program.
Officers and Trustees: Certain officers and/or trustees of the Trust are officers and/or directors of BlackRock or its affiliates. The Funds reimburse the Manager for a portion of the compensation paid to the Trust’s Chief Compliance Officer, which is included in Officer and Trustees in the Statements of Operations.
Other Transactions: During the six months ended January 31, 2017, Emerging Markets Long/Short Equity Fund received a reimbursement of $22,962 from an affiliate, which is included in capital share transactions in the Statements of Changes in Net Assets, relating to an operating error.
7. Purchase and Sales:
For the six months ended January 31, 2017, purchases and sales of investments excluding short-term securities, were as follows:
| | | | |
| | | Global Long/Short
Equity | |
Purchases | | | — | |
Sales | | $ | 6,018 | |
8. Income Tax Information:
It is the Funds’ policy to comply with the requirements of the Internal Revenue Code of 1986, as amended, applicable to regulated investment companies, and to distribute substantially all of their taxable income to their shareholders. Therefore, no federal income tax provision is required.
Each Fund files U.S. federal and various state and local tax returns. No income tax returns are currently under examination. The statute of limitations on Emerging Market Long/Short Equity’s U.S. federal tax returns generally remains open for each of the four years ended July 31, 2016. The statute of limitations on Global Long/Short Equity’s U.S. federal tax returns remains open for each of the three years ended July 31, 2016 and the period ended July 31, 2013. The statutes of limitations on each Fund’s state and local tax returns may remain open for an additional year depending upon the jurisdiction.
Management has analyzed tax laws and regulations and their application to the Funds as of January 31, 2017, inclusive of the open tax return years, and does not believe that there are any uncertain tax positions that require recognition of a tax liability in the Funds��� financial statements.
| | | | | | |
| | | | | | | |
| | BLACKROCK FUNDS | | JANUARY 31, 2017 | | 75 |
| | |
| Notes to Financial Statements (continued) | | |
As of July 31, 2016, Emerging Markets Long/Short Equity Fund and Global Long/Short Equity Fund had capital loss carryforwards, with no expiration dates, available to offset future realized capital gains of $10,094,032 and $73,499,970, respectively.
As of January 31, 2017, gross unrealized appreciation and depreciation based on cost for federal income tax purposes were as follows:
| | | | |
| | | Global Long/
Short Equity | |
Tax cost | | $ | 616,782,898 | |
| | | | |
Gross unrealized appreciation | | $ | 1,494,384 | |
Gross unrealized depreciation | | | (1,756,466 | ) |
| | | | |
Net unrealized appreciation (depreciation) | | $ | (262,082 | ) |
| | | | |
9. Bank Borrowings:
The Trust, on behalf of the Funds, along with certain other funds managed by the Manager and its affiliates (“Participating Funds”), is a party to a 364-day, $2.1 billion credit agreement with a group of lenders. Under this agreement, the Funds may borrow to fund shareholder redemptions. Excluding commitments designated for certain individual funds, the Participating Funds, including the Funds, can borrow up to an aggregate commitment amount of $1.6 billion at any time outstanding, subject to asset coverage and other limitations as specified in the agreement. The credit agreement has the following terms: a fee of 0.12% per annum on unused commitment amounts and interest at a rate equal to the higher of (a) one-month LIBOR (but, in any event, not less than 0.00%) on the date the loan is made plus 0.80% per annum or (b) the Fed Funds rate (but, in any event, not less than 0.00%) in effect from time to time plus 0.80% per annum on amounts borrowed. The agreement expires in April 2017 unless extended or renewed. Participating Funds paid administration, legal and arrangement fees, which, if applicable, are included in miscellaneous expenses in the Statements of Operations. These fees were allocated among such funds based upon portions of the aggregate commitment available to them and relative net assets of Participating Funds. During the six months ended January 31, 2017, the Funds did not borrow under the credit agreement.
10. Principal Risks:
In the normal course of business, the Funds invest in securities and enter into transactions where risks exist due to fluctuations in the market (market risk) or failure of the issuer to meet all its obligations, including the ability to pay principal and interest when due (issuer credit risk). The value of securities held by the Funds may decline in response to certain events, including those directly involving the issuers of securities owned by the Funds. Investments in the securities of issuers domiciled in countries with emerging capital markets involve certain additional risks that do not generally apply to investments in securities of issuers in more developed capital markets, such as (i) low or nonexistent trading volume, resulting in a lack of liquidity and increased volatility in prices for such securities; (ii) uncertain national policies and social, political and economic instability, increasing the potential for expropriation of assets, confiscatory taxation, high rates of inflation or unfavorable diplomatic developments; and (iii) possible fluctuations in exchange rates, differing legal systems and the existence or possible imposition of exchange controls, custodial restrictions or other foreign or U.S. governmental laws or restrictions applicable to such investments. Changes arising from the general economy, the overall market and local, regional or global political and/or social instability, as well as currency, interest rate and price fluctuations, may also affect the securities’ value.
Valuation Risk: The market values of equities, such as common stocks and preferred securities or equity related investments, such as futures and options, may decline due to general market conditions which are not specifically related to a particular company. They may also decline due to factors which affect a particular industry or industries. A Fund may invest in illiquid investments and may experience difficulty in selling those investments in a timely manner at the price that it believes the investments are worth. Prices may fluctuate widely over short or extended periods in response to company, market or economic news. Markets also tend to move in cycles, with periods of rising and falling prices. This volatility may cause each Fund’s NAV to experience significant increases or decreases over short periods of time. If there is a general decline in the securities and other markets, the NAV of a Fund may lose value, regardless of the individual results of the securities and other instruments in which the Fund invests.
The price a Fund could receive upon the sale of any particular portfolio investment may differ from a Fund’s valuation of the investment, particularly for securities that trade in thin or volatile markets or that are valued using a fair valuation technique or a price provided by an independent pricing service. Changes to significant unobservable inputs and assumptions (i.e., publicly traded company multiples, growth rate, time to exit) due to the lack of observable inputs may significantly impact the resulting fair value and therefore a Fund’s results of operations. As a result, the price received upon the sale of an investment may be less than the value ascribed by a Fund, and a Fund could realize a greater than expected loss or lesser than expected gain upon the sale of the investment. A Fund’s ability to value its investments may also be impacted by technological issues and/or errors by pricing services or other third party service providers.
Counterparty Credit Risk: Similar to issuer credit risk, the Funds may be exposed to counterparty credit risk, or the risk that an entity may fail to or be unable to perform on its commitments related to unsettled or open transactions. The Funds manage counterparty credit risk by entering into transactions only with counterparties that the Manager believes have the financial resources to honor their obligations and by monitoring the financial stability of those counterparties. Financial assets, which potentially expose the Funds to market, issuer and counterparty credit risks, consist principally of financial instruments and receivables due from counterparties. The extent of the Funds’ exposure to market, issuer and counterparty credit risks with respect to these financial assets is approximately their value recorded in the Statements of Assets and Liabilities, less any collateral held by the Funds.
| | | | | | |
| | | | | | | |
| 76 | | BLACKROCK FUNDS | | JANUARY 31, 2017 | | |
| | | | |
| Notes to Financial Statements (continued) | | |
A derivative contract may suffer a mark-to-market loss if the value of the contract decreases due to an unfavorable change in the market rates or values of the underlying instrument. Losses can also occur if the counterparty does not perform under the contract.
A Fund’s risk of loss from counterparty credit risk on OTC derivatives is generally limited to the aggregate unrealized gain less the value of any collateral held by such Fund.
For OTC options purchased, each Fund bears the risk of loss in the amount of the premiums paid plus the positive change in market values net of any collateral held by the Funds should the counterparty fail to perform under the contracts. Options written by the Funds do not typically give rise to counterparty credit risk, as options written generally obligate the Funds, and not the counterparty, to perform. The Funds may be exposed to counterparty credit risk with respect to options written to the extent the Funds deposit collateral with its counterparty to a written option.
With exchange-traded options purchased and futures, there is less counterparty credit risk to the Funds since the exchange or clearinghouse, as counterparty to such instruments, guarantees against a possible default. The clearinghouse stands between the buyer and the seller of the contract; therefore, credit risk is limited to failure of the clearinghouse. While offset rights may exist under applicable law, a Fund does not have a contractual right of offset against a clearing broker or clearinghouse in the event of a default (including the bankruptcy or insolvency). Additionally, credit risk exists in exchange-traded futures with respect to initial and variation margin that is held in a clearing broker’s customer accounts. While clearing brokers are required to segregate customer margin from their own assets, in the event that a clearing broker becomes insolvent or goes into bankruptcy and at that time there is a shortfall in the aggregate amount of margin held by the clearing broker for all its clients, typically the shortfall would be allocated on a pro rata basis across all the clearing broker’s customers, potentially resulting in losses to the Funds.
Concentration Risk: Certain Funds invest a substantial amount of their assets in issuers located in a single country or a limited number of countries. When the Funds concentrate their investments in this manner, it assumes the risk that economic, political and social conditions in those countries may have a significant impact on their investment performance. Foreign issuers may not be subject to the same uniform accounting, auditing and financial reporting standards and practices as used in the United States. Foreign securities markets may also be less liquid, more volatile, and less subject to governmental supervision not typically associated with investing in U.S. securities. Investment percentages in specific countries are presented in the Schedules of Investments.
Certain Funds invest a significant portion of their assets in securities of issuers located in Europe or with significant exposure to European issuers or countries. The European financial markets have recently experienced volatility and adverse trends due to concerns about economic downturns in, or rising government debt levels of, several European countries. These events may spread to other countries in Europe and may affect the value and liquidity of certain of the Funds’ investments.
The United Kingdom voted on June 23, 2016 to withdraw from the European Union, which may introduce significant new uncertainties and instability in the financial markets across Europe.
Certain Funds invest a significant portion of their assets in securities of issuers located in Asia or with significant exposure to Asian issuers or countries. The Asian financial markets have recently experienced volatility and adverse trends due to concerns in several Asian countries regarding monetary policy, government intervention in the markets, rising government debt levels or economic downturns. These events may spread to other countries in Asia and may affect the value and liquidity of certain of the Funds’ investments.
11. Capital Share Transactions:
Transactions in capital shares for each class were as follows:
| | | | | | | | | | | | | | | | | | | | |
| | | Six Months Ended
January 31, 2017 | | | | | | Year Ended
July 31, 2016 | |
| Emerging Markets Long/Short Equity | | Shares | | | Amount | | | | | | Shares | | | Amount | |
| Institutional | | | | | | | | | | | | | | | | | | | | |
Shares sold | | | 2,874,695 | | | $ | 28,058,823 | | | | | | | | 5,109,943 | | | $ | 49,489,464 | |
Shares issued in reinvestment of distributions | | | — | | | | — | | | | | | | | 270,813 | | | | 2,570,013 | |
Shares redeemed | | | (6,426,340 | ) | | | (62,473,961 | ) | | | | | | | (27,809,335 | ) | | | (269,618,413 | ) |
| | | | | | | | | | | | |
Net decrease | | | (3,551,645 | ) | | $ | (34,415,138 | ) | | | | | | | (22,428,579 | ) | | $ | (217,558,936 | ) |
| | | | | | | | | | | | |
| | | | | | | | | | | | | | | | | | | | |
| Investor A | | | | | | | | | | | | | | | | | | | | |
Shares sold | | | 18,843 | | | $ | 181,460 | | | | | | | | 250,108 | | | $ | 2,396,073 | |
Shares issued in reinvestment of distributions | | | — | | | | — | | | | | | | | 19,138 | | | | 180,087 | |
Shares redeemed | | | (641,380 | ) | | | (6,151,475 | ) | | | | | | | (950,988 | ) | | | (9,115,067 | ) |
| | | | | | | | | | | | |
Net decrease | | | (622,537 | ) | | $ | (5,970,015 | ) | | | | | | | (681,742 | ) | | $ | (6,538,907 | ) |
| | | | | | | | | | | | |
| | | | | | |
| | | | | | | |
| | BLACKROCK FUNDS | | JANUARY 31, 2017 | | 77 |
| | |
| Notes to Financial Statements (concluded) | | |
| | | | | | | | | | | | | | | | | | | | |
| | | Six Months Ended
January 31, 2017 | | | | | | Year Ended
July 31, 2016 | |
| Emerging Markets Long/Short Equity (concluded) | | Shares | | | Amount | | | | | | Shares | | | Amount | |
| Investor C | | | | | | | | | | | | | | | | | | | | |
Shares sold | | | 2,514 | | | $ | 23,135 | | | | | | | | 43,762 | | | $ | 406,389 | |
Shares issued in reinvestment of distributions | | | — | | | | — | | | | | | | | 9,534 | | | | 87,244 | |
Shares redeemed | | | (127,907 | ) | | | (1,188,232 | ) | | | | | | | (377,482 | ) | | | (3,520,645 | ) |
| | | | | | | | | | | | |
Net decrease | | | (125,393 | ) | | $ | (1,165,097 | ) | | | | | | | (324,186 | ) | | $ | (3,027,012 | ) |
| | | | | | | | | | | | |
Total Net Decrease | | | (4,299,575 | ) | | $ | (41,550,250 | ) | | | | | | | (23,434,507 | ) | | $ | (227,124,855 | ) |
| | | | | | | | | | | | |
| | | | | | | | | | | | | | | | | | | | |
| Global Long/Short Equity | | | | | | | | | | | | | | | | | | | | |
| Institutional | | | | | | | | | | | | | | | | | | | | |
Shares sold | | | 7,880,033 | | | $ | 83,683,601 | | | | | | | | 55,910,136 | | | $ | 632,370,583 | |
Shares issued in reinvestment of distributions | | | — | | | | — | | | | | | | | 1,799,694 | | | | 20,750,471 | |
Shares redeemed | | | (38,341,680 | ) | | | (408,513,198 | ) | | | | | | | (105,181,745 | ) | | | (1,165,600,523 | ) |
| | | | | | | | | | | | |
Net decrease | | | (30,461,647 | ) | | $ | (324,829,597 | ) | | | | | | | (47,471,915 | ) | | $ | (512,479,469 | ) |
| | | | | | | | | | | | |
| | | | | | | | | | | | | | | | | | | | |
| Investor A | | | | | | | | | | | | | | | | | | | | |
Shares sold | | | 600,033 | | | $ | 6,364,185 | | | | | | | | 7,359,585 | | | $ | 83,095,922 | |
Shares issued in reinvestment of distributions | | | — | | | | — | | | | | | | | 289,164 | | | | 3,319,604 | |
Shares redeemed | | | (5,868,584 | ) | | | (61,986,892 | ) | | | | | | | (15,050,945 | ) | | | (165,087,237 | ) |
| | | | | | | | | | | | |
Net decrease | | | (5,268,551 | ) | | $ | (55,622,707 | ) | | | | | | | (7,402,196 | ) | | $ | (78,671,711 | ) |
| | | | | | | | | | | | |
| | | | | | | | | | | | | | | | | | | | |
| Investor C | | | | | | | | | | | | | | | | | | | | |
Shares sold | | | 145,333 | | | $ | 1,492,661 | | | | | | | | 1,890,714 | | | $ | 20,601,379 | |
Shares issued in reinvestment of distributions | | | — | | | | — | | | | | | | | 101,849 | | | | 1,148,859 | |
Shares redeemed | | | (2,654,082 | ) | | | (27,403,138 | ) | | | | | | | (4,561,193 | ) | | | (49,208,113 | ) |
| | | | | | | | | | | | |
Net decrease | | | (2,508,749 | ) | | $ | (25,910,477 | ) | | | | | | | (2,568,630 | ) | | $ | (27,457,875 | ) |
| | | | | | | | | | | | |
| | | | | | | | | | | | | | | | | | | | |
| Class K1 | | | | | | | | | | | | | | | | | | | | |
Shares sold | | | 1,032,910 | | | $ | 10,867,859 | | | | | | | | 6,977,422 | | | $ | 75,936,456 | |
Shares issued in reinvestment of distributions | | | — | | | | — | | | | | | | | — | | | | — | |
Shares redeemed | | | (5,997,998 | ) | | | (63,837,992 | ) | | | | | | | (2,010,610 | ) | | | (21,351,353 | ) |
| | | | | | | | | | | | |
Net increase (decrease) | | | (4,965,088 | ) | | $ | (52,970,133 | ) | | | | | | | 4,966,812 | | | $ | 54,585,103 | |
| | | | | | | | | | | | |
Total Net Decrease | | | (43,204,035 | ) | | $ | (459,332,914 | ) | | | | | | | (52,475,929 | ) | | $ | (564,023,952 | ) |
| | | | | | | | | | | | |
| | 1 | | Class K Shares commenced operations on March 28, 2016. |
12. Subsequent Events:
Management has evaluated the impact of all subsequent events on the Funds through the date the financial statements were issued and has determined that there were no subsequent events requiring adjustment or additional disclosure in the financial statements.
| | | | | | |
| | | | | | | |
| 78 | | BLACKROCK FUNDS | | JANUARY 31, 2017 | | |
Rodney D. Johnson, Chair of the Board and Trustee
Susan J. Carter, Trustee
Collette Chilton, Trustee
Neil A. Cotty, Trustee
Cynthia A. Montgomery, Trustee
Joseph P. Platt, Trustee
Robert C. Robb, Jr., Trustee
Mark Stalnecker, Trustee
Kenneth L. Urish, Trustee
Claire A. Walton, Trustee
Frederick W. Winter, Trustee
Barbara G. Novick, Trustee
John M. Perlowski, Trustee, President and Chief Executive Officer
Thomas Callahan, Vice President
Jennifer McGovern, Vice President
Neal J. Andrews, Chief Financial Officer
Jay M. Fife, Treasurer
Charles Park, Chief Compliance Officer
Fernanda Piedra, Anti-Money Laundering Compliance Officer
Benjamin Archibald, Secretary
Effective December 31, 2016, David O. Beim and Dr. Matina S. Horner resigned as Trustees of the Trust.
| | | | | | |
| | | | |
Investment Adviser and Administrator BlackRock Advisors, LLC Wilmington, DE 19809 | | Accounting Agent and Custodian State Street Bank and Trust Company Boston, MA 02110 | | Distributor BlackRock Investments, LLC New York, NY 10022 | | Legal Counsel Sidley Austin LLP New York, NY 10019 |
| | | |
Sub-Adviser BlackRock International Limited1 Edinburgh, EH3 8BL United Kingdom | | Transfer Agent BNY Mellon Investment Servicing (US) Inc. Wilmington, DE 19809 | | Independent Registered Public Accounting Firm PricewaterhouseCoopers LLP Philadelphia, PA 19103 | | Address of the Trust 100 Bellevue Parkway Wilmington, DE 19809 |
| | 1 | | For Global Long/Short Equity |
| | | | | | |
| | | | | | | |
| | BLACKROCK FUNDS | | JANUARY 31, 2017 | | 79 |
Householding
The Funds will mail only one copy of shareholder documents, including prospectuses, annual and semi-annual reports and proxy statements, to shareholders with multiple accounts at the same address. This practice is commonly called “householding” and is intended to reduce expenses and eliminate duplicate mailings of shareholder documents. Mailings of your shareholder documents may be householded indefinitely unless you instruct us otherwise. If you do not want the mailing of these documents to be combined with those for other members of your household, please call the Funds at (800) 441-7762.
Availability of Quarterly Schedule of Investments
The Funds file their complete schedule of portfolio holdings with the SEC for the first and third quarters of each fiscal year on Form N-Q. The Funds’ Forms N-Q are available on the SEC’s website at http://www.sec.gov and may also be reviewed and copied at the SEC’s Public Reference Room in Washington, DC. Information on the operation of the Public Reference Room or how to access documents on the SEC’s website without charge may be obtained by calling (800) SEC-0330. The Funds’ Forms N-Q may also be obtained upon request and without charge by calling (800) 441-7762.
Availability of Proxy Voting Policies and Procedures
A description of the policies and procedures that the Funds use to determine how to vote proxies relating to portfolio securities is available upon request and without charge (1) by calling (800) 441-7762; (2) at http://www.blackrock.com; and (3) on the SEC’s website at http://www.sec.gov.
Availability of Proxy Voting Record
Information about how the Funds voted proxies relating to securities held in the Funds’ portfolios during the most recent 12-month period ended June 30 is available upon request and without charge (1) at http://www.blackrock.com or by calling (800) 441-7762 and (2) on the SEC’s website at http://www.sec.gov.
BlackRock’s Mutual Fund Family
BlackRock offers a diverse lineup of open-end mutual funds crossing all investment styles and managed by experts in equity, fixed income and tax-exempt investing. Visit BlackRock online at http://www.blackrock.com for more information.
| | | | | | |
| | | | | | | |
| 80 | | BLACKROCK FUNDS | | JANUARY 31, 2017 | | |
| | |
| Additional Information (concluded) | | |
Account Information
Call us at (800) 441-7762 from 8:00 AM to 6:00 PM ET on any business day to get information about your account balances, recent transactions and share prices. You can also reach us on the Web at http://www.blackrock.com/funds.
Automatic Investment Plans
Investor Class shareholders who want to invest regularly can arrange to have $50 or more automatically deducted from their checking or savings account and invested in any of the BlackRock funds.
Systematic Withdrawal Plans
Investor Class shareholders can establish a systematic withdrawal plan and receive periodic payments of $50 or more from their BlackRock funds, as long as their account balance is at least $10,000.
Retirement Plans
Shareholders may make investments in conjunction with Traditional, Rollover, Roth, Coverdell, Simple IRAs, SEP IRAs and 403(b) Plans.
|
| BlackRock Privacy Principles |
BlackRock is committed to maintaining the privacy of its current and former fund investors and individual clients (collectively, “Clients”) and to safeguarding their non-public personal information. The following information is provided to help you understand what personal information BlackRock collects, how we protect that information and why in certain cases we share such information with select parties.
If you are located in a jurisdiction where specific laws, rules or regulations require BlackRock to provide you with additional or different privacy-related rights beyond what is set forth below, then BlackRock will comply with those specific laws, rules or regulations.
BlackRock obtains or verifies personal non-public information from and about you from different sources, including the following: (i) information we receive from you or, if applicable, your financial intermediary, on applications, forms or other documents; (ii) information about your transactions with us, our affiliates, or others; (iii) information we receive from a consumer reporting agency; and (iv) from visits to our websites.
BlackRock does not sell or disclose to non-affiliated third parties any non-public personal information about its Clients, except as permitted by law or as is necessary to respond to regulatory requests or to service Client accounts. These non-affiliated third parties are required to protect the confidentiality and security of this information and to use it only for its intended purpose.
We may share information with our affiliates to service your account or to provide you with information about other BlackRock products or services that may be of interest to you. In addition, BlackRock restricts access to non-public personal information about its Clients to those BlackRock employees with a legitimate business need for the information. BlackRock maintains physical, electronic and procedural safeguards that are designed to protect the non-public personal information of its Clients, including procedures relating to the proper storage and disposal of such information.
| | | | | | |
| | | | | | | |
| | BLACKROCK FUNDS | | JANUARY 31, 2017 | | 81 |
This report is intended for current holders. It is not authorized for use as an offer of sale or a solicitation of an offer to buy shares of a Fund unless preceded or accompanied by that Fund’s current prospectus. Past performance results shown in this report should not be considered a representation of future performance. Investment returns and principal value of shares will fluctuate so that shares, when redeemed, may be worth more or less than their original cost. Statements and other information herein are as dated and are subject to change.

| | |
| EMLSGLS-1/17-SAR | |  |
JANUARY 31, 2017
| | | | |
SEMI-ANNUAL REPORT (UNAUDITED) | | | |  |
BlackRock FundsSM
| Ø | BlackRock Midcap Index Fund |
| Ø | BlackRock MSCI Asia ex Japan Index Fund |
| Ø | BlackRock MSCI World Index Fund |
| Ø | BlackRock Small/Mid Cap Index Fund |
| Ø | BlackRock Total Stock Market Index Fund |
|
| Not FDIC Insured • May Lose Value • No Bank Guarantee |
Dear Shareholder,
The 12 months ended January 31, 2017 was an exceptionally strong period for risk assets (such as stocks and high yield bonds), while higher-quality assets generated muted returns after struggling in the latter part of 2016. As the period began, worries about slowing growth in China and the instability of oil prices had global equity prices sliding. However, the broad market momentum shifted in the second half of 2016 as reflationary expectations in the United States helped drive a pick-up in global growth.
Markets were remarkably resilient during the period. Big surprises such as the United Kingdom’s vote to leave the European Union and the outcome of the U.S. presidential election brought spikes in equity market volatility, but they were ultimately short-lived. Instead, investors used the sell-offs to seize upon buying opportunities, allowing markets to quickly rebound. We believe this reinforces the case for taking the long view rather than reacting to short-term market noise.
The global reflationary theme — rising nominal growth, wages and inflation — was the dominant driver of asset returns during the period, outweighing significant political upheavals and uncertainty. This trend accelerated after the U.S. election and continued into the beginning of 2017, stoked by expectations for an extra boost to U.S. growth via fiscal policy.
Although economic momentum is gaining traction, the capacity for rapid global growth is restrained by structural factors including an aging population, low productivity growth and excess savings. A tempered economic growth trend and high valuations across most assets have set the stage for muted investment returns going forward.
Equity markets still have room to move, although the disparity between winners and losers is widening, making stock selection increasingly important. Fixed income investors are also facing challenges as bond markets recalibrate to accommodate rising rates and higher inflation expectations. And in a world where political risk and policy uncertainty abound, there is no lack of potential catalysts for higher volatility.
In this environment, investors need to think globally, extend their scope across a broad array of asset classes and be nimble as market conditions change. We encourage you to talk with your financial advisor and visit blackrock.com for further insight about investing in today’s markets.
Sincerely,
Rob Kapito
President, BlackRock Advisors, LLC
Rob Kapito
President, BlackRock Advisors, LLC
| | | | | | | | |
| Total Returns as of January 31, 2017 | |
| | | 6-month | | | 12-month | |
U.S. large cap equities
(S&P 500® Index) | | | 5.96 | % | | | 20.04 | % |
U.S. small cap equities
(Russell 2000® Index) | | | 12.43 | | | | 33.53 | |
International equities
(MSCI Europe, Australasia,
Far East Index) | | | 3.49 | | | | 12.03 | |
Emerging market equities
(MSCI Emerging Markets Index) | | | 4.92 | | | | 25.41 | |
3-month Treasury bills
(BofA Merrill Lynch 3-Month
U.S. Treasury Bill Index) | | | 0.20 | | | | 0.37 | |
U.S. Treasury securities
(BofA Merrill Lynch
10-Year U.S. Treasury
Index) | | | (7.87 | ) | | | (3.26 | ) |
U.S. investment grade bonds
(Bloomberg Barclays U.S.
Aggregate Bond Index) | | | (2.95 | ) | | | 1.45 | |
Tax-exempt municipal
bonds (S&P Municipal
Bond Index) | | | (2.94 | ) | | | 0.24 | |
U.S. high yield bonds
(Bloomberg Barclays U.S. Corporate High Yield 2% Issuer
Capped Index) | | | 6.09 | | | | 20.77 | |
| Past performance is no guarantee of future results. Index performance is shown for illustrative purposes only. You cannot invest directly in an index. | |
| | | | | | |
| | | | | | | |
| 2 | | THIS PAGE NOT PART OF YOUR FUND REPORT | | | | |

| | | | | | |
| | | | | | | |
| | BLACKROCK FUNDS | | JANUARY 31, 2017 | | 3 |
| | | | |
| Fund Summary as of January 31, 2017 | | BlackRock Midcap Index Fund |
BlackRock Midcap Index Fund’s (the “Fund”) investment objective is to seek to track the investment results of an index composed of mid-capitalization U.S. equities.
On February 24, 2017, the Board of Trustees of BlackRock Funds approved a name change from “BlackRock Midcap Index Fund” to “iShares Mid-Cap Index Fund.” The change is expected to be effective during the second quarter of 2017.
|
| Portfolio Management Commentary |
How did the Fund perform?
| • | | For the six months ended January 31, 2017, the Fund’s Institutional Shares returned 5.67%, Investor A Shares returned 5.60% and Class K Shares returned 5.69%. The benchmark Russell MidCap® Index returned 5.65% for the same period. |
| • | | Returns for the Fund’s respective share classes differ from the benchmark index based on individual share-class expenses. |
Describe the market environment.
| • | | Most of the major U.S. equity indexes saw gains at the beginning of the period, largely driven by a dovish Federal Reserve (“Fed”) that kept rates unchanged and stronger-than-expected earnings releases versus analyst expectations. |
| • | | Investors’ focus on the September Fed meeting dominated market performance in the last month of the third quarter. While the Fed kept rates unchanged, several Fed officials expressed support of a rate hike later in the year. |
| • | | The U.S. presidential election and the Fed were front and center in 2016, especially in the fourth quarter. The fourth quarter started with a slight increase in volatility as investors prepared for a possible Fed rate |
| | increase, and weighed probable outcomes of the presidential election. While many people were shocked by the Trump win, markets did not experience the same type of volatility seen after the Brexit vote, with major U.S. indexes posting solid gains in November. |
| • | | The performance of U.S. equities post-election suggests market participants are optimistic about President Trump’s pro-growth policies including lower taxes, deregulation and infrastructure spending. |
Describe recent portfolio activity.
| • | | During the period, as changes were made to the composition of the Russell Midcap® Index, the Fund purchased and sold securities to maintain its objective of replicating the risks and return of the benchmark index. |
Describe portfolio positioning at period end.
| • | | The Fund remains positioned to match the risk characteristics of its benchmark index, irrespective of the market’s future direction. |
The views expressed reflect the opinions of BlackRock as of the date of this report and are subject to change based on changes in market, economic or other conditions. These views are not intended to be a forecast of future events and are no guarantee of future results.
| | | | | | |
| | | | | | | |
| 4 | | BLACKROCK FUNDS | | JANUARY 31, 2017 | | |
| | | | |
| | | BlackRock Midcap Index Fund |
|
| Total Return Based on a $10,000 Investment |
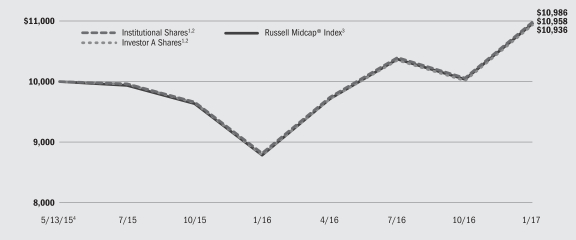
| | 1 | | Assuming transaction costs and other operating expenses, including investment advisory fees, if any. |
| | 2 | | The Fund generally invests at least 90% of its assets, plus the amount of any borrowing for investment purposes, in securities of the Russell Midcap® Index and in depositary receipts representing securities of the Russell Midcap® Index. |
| | 3 | | A float-adjusted capitalization-weighted index that measures the performance of the mid-cap segment of the U.S. equities universe. It is a subset of the Russell 1000® Index including approximately 800 of the smallest issuers based on a combination of their market cap and current index membership. |
| | 4 | | Commencement of operations. |
|
| Performance Summary for the Period Ended January 31, 2017 |
| | | | | | | | | | | | |
| | | | | | Average Annual Total Returns5 | |
| | | 6-Month
Total Returns | | | 1 Year | | | Since
Inception6 | |
Institutional | | | 5.67 | % | | | 24.59 | % | | | 5.61 | % |
Investor A | | | 5.60 | | | | 24.38 | | | | 5.34 | |
Class K | | | 5.69 | | | | 24.61 | | | | 5.69 | |
Russell Midcap® Index | | | 5.65 | | | | 24.72 | | | | 5.48 | |
| | 5 | | See “About Fund Performance” on page 16 for a detailed description of share classes, including any related fees. |
| | 6 | | The Fund commenced operations on May 13, 2015. |
| | | | Past performance is not indicative of future results. |
| | | | Performance results may include adjustments made for financial reporting purposes in accordance with U.S. generally accepted accounting principles. |
| | | | | | | | | | | | | | | | | | | | | | | | | | | | |
| | | Actual | | | Hypothetical8 | | | | |
| | | Beginning
Account Value
August 1, 2016 | | | Ending
Account Value
January 31, 2017 | | | Expenses Paid
During the Period7 | | | Beginning
Account Value
August 1, 2016 | | | Ending
Account Value
January 31, 2017 | | | Expenses Paid
During the Period7 | | | Annualized
Expense Ratio | |
Institutional | | $ | 1,000.00 | | | $ | 1,056.70 | | | $ | 0.57 | | | $ | 1,000.00 | | | $ | 1,024.65 | | | $ | 0.56 | | | | 0.11 | % |
Investor A | | $ | 1,000.00 | | | $ | 1,056.00 | | | $ | 1.66 | | | $ | 1,000.00 | | | $ | 1,023.59 | | | $ | 1.63 | | | | 0.32 | % |
Class K | | $ | 1,000.00 | | | $ | 1,056.90 | | | $ | 0.36 | | | $ | 1,000.00 | | | $ | 1,024.85 | | | $ | 0.36 | | | | 0.07 | % |
| | 7 | | For each class of the Fund, expenses are equal to the annualized net expense ratio for the class, multiplied by the average account value over the period, multiplied by 184/365 (to reflect the one-half year period shown). |
| | 8 | | Hypothetical 5% annual return before expenses is calculated by prorating the number of days in the most recent fiscal half year divided by 365. |
| | | | See “Disclosure of Expenses” on page 16 for further information on how expenses were calculated. |
| | | | | | |
| | | | | | | |
| | BLACKROCK FUNDS | | JANUARY 31, 2017 | | 5 |
| | | | |
| Fund Summary as of January 31, 2017 | | BlackRock MSCI Asia ex Japan Index Fund |
BlackRock MSCI Asia ex Japan Index Fund’s (the “Fund”) investment objective is to seek to track the investment results of an index composed of Asian equities, excluding Japan.
On February 24, 2017, the Board of Trustees of BlackRock Funds approved a name change from “BlackRock MSCI Asia ex Japan Index Fund” to “iShares MSCI Asia ex Japan Index Fund.” The change is expected to be effective during the second quarter of 2017.
|
| Portfolio Management Commentary |
How did the Fund perform?
| • | | For the six months ended January 31, 2017, the Fund’s Institutional and Class K Shares each returned 4.80%. The benchmark MSCI AC Asia ex Japan Index returned 4.52% for the same period. |
| • | | Returns for the Fund’s respective share classes differ from the benchmark index based on individual share-class expenses. |
Describe the market environment.
| • | | Global equity markets broadly rallied during the third quarter as the Fed kept rates unchanged, Japan announced additional fiscal and monetary stimulus, and the Bank of England cut rates. |
| • | | Markets had a strong start to the third quarter as expectations of a near-term Fed rate hike diminished, Japan announced another round of fiscal stimulus, and the earnings season had a strong start. |
| • | | Despite multiple terrorist attacks in France and Germany and a failed coup in Turkey, markets continued to rally in August on the back of a strong earnings season and monetary stimulus from the Bank of England. Positive performance sustained in September as the Fed kept rates unchanged, the Bank of Japan announced additional monetary stimulus, and OPEC decided to limit output. This was all despite inaction from the European Central Bank (“ECB”), the crisis in Syria, and concerns around Wells Fargo and Deutsche Bank. However, weak macro data out of China, a terrorist attack in Thailand, flooding in Louisiana, and a more hawkish tone from Fed officials hindered some performance early in the period. |
| • | | China implemented significant fiscal and monetary stimulus policies in the face of economic slowdown. Markets reacted positively to the stimulus and Moody’s upgraded its economic forecast on the back of the news. Outside the stimulus, the economic slowdown continued to be a drag on demand for raw materials, which contributed to underperformance and volatility in commodity-exporting countries. |
| • | | Developed markets rallied in the last quarter of the year as global investors embraced the results of the U.S. election and strong macro data, although a stronger U.S. dollar subdued gains for U.S. investors. Global equity market performance was mixed in October as Asia and Europe outperformed the United States (in local currency terms) on |
| | | improving economic data and supportive commentary from the Bank of England and ECB. |
| • | | Asian stocks continued to perform well in November as global investors absorbed the unexpected results of the U.S. election and the Bank of Japan’s first intervention after introducing target yield curve control in September. |
| • | | December brought a global equity rally as strong global economic data and continued optimism around President-elect Trump’s reflationary policies outweighed the effects of the ECB’s decision to reduce the pace of its asset purchases and diplomatic tensions between the United States and other major powers. |
| • | | The 2016 emerging market (“EM”) rally lost steam in the fourth quarter, with particularly poor performance in the month of November as speculation around the outcome of the U.S. presidential election pressured the asset class and EM currencies broadly. The unexpected Trump victory raised concerns for EM investors given the potential for a faster pace of U.S. rate hikes in 2017, leading to a stronger U.S. dollar, and the possible renegotiation of trade agreements that could be detrimental to EM companies. |
Describe recent portfolio activity.
| • | | During the period, as changes were made to the composition of the MSCI AC Asia Ex Japan Index, the Fund purchased and sold securities to maintain its objective of replicating the risks and return of the benchmark index. |
| • | | As part of its investment strategy, the Fund utilized derivatives in the form of financial futures contracts. The Fund invests in derivative instruments in order to gain market exposure quickly in the event of subscriptions, to maintain liquidity in the event of redemptions and to keep trading costs low. The Fund may seek to enhance returns using derivatives. During the period, the Fund’s use of financial futures contracts contributed positively to Fund performance. |
Describe portfolio positioning at period end.
| • | | The Fund remains positioned to match the risk characteristics of its benchmark index, irrespective of the market’s future direction. |
The views expressed reflect the opinions of BlackRock as of the date of this report and are subject to change based on changes in market, economic or other conditions. These views are not intended to be a forecast of future events and are no guarantee of future results.
| | | | | | |
| | | | | | | |
| 6 | | BLACKROCK FUNDS | | JANUARY 31, 2017 | | |
| | | | |
| | | BlackRock MSCI Asia ex Japan Index Fund |
|
| Total Return Based on a $10,000 Investment |
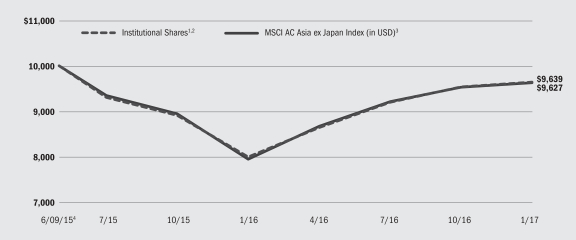
| | 1 | | Assuming transaction costs and other operating expenses, including investment advisory fees, if any. |
| | 2 | | The Fund generally invests at least 90% of its assets, plus the amount of any borrowing for investment purposes, in securities of the MSCI AC Asia ex Japan Index and in depositary receipts representing securities of the MSCI AC Asia ex Japan Index. |
| | 3 | | A free float-adjusted market capitalization index designed to measure equity market performance of the following 10 developed and emerging market countries or regions: China, Hong Kong, India, Indonesia, Malaysia, the Philippines, Singapore, South Korea, Taiwan and Thailand. |
| | 4 | | Commencement of operations. |
|
| Performance Summary for the Period Ended January 31, 2017 |
| | | | | | | | | | | | |
| | | | | | Average Annual Total Returns5 | |
| | | 6-Month Total Returns | | | 1 Year | | | Since
Inception6 | |
Institutional | | | 4.80 | % | | | 20.65 | % | | | (2.20 | )% |
Class K | | | 4.80 | | | | 20.66 | | | | (2.18 | ) |
MSCI AC Asia ex Japan Index (in USD) | | | 4.52 | | | | 21.24 | | | | (2.29 | ) |
| | 5 | | See “About Fund Performance” on page 16 for a detailed description of share classes, including any related fees. |
| | 6 | | The Fund commenced operations on June 9, 2015. |
| | | | Past performance is not indicative of future results. |
| | | | Performance results may include adjustments made for financial reporting purposes in accordance with U.S. generally accepted accounting principles. |
| | | | | | | | | | | | | | | | | | | | | | | | | | | | |
| | | Actual | | | Hypothetical8 | | | | |
| | | Beginning
Account Value
August 1, 2016 | | | Ending
Account Value
January 31, 2017 | | | Expenses Paid
During the Period7 | | | Beginning
Account Value
August 1, 2016 | | | Ending
Account Value
January 31, 2017 | | | Expenses Paid
During the Period7 | | | Annualized
Expense Ratio | |
Institutional | | $ | 1,000.00 | | | $ | 1,048.00 | | | $ | 2.32 | | | $ | 1,000.00 | | | $ | 1,022.94 | | | $ | 2.29 | | | | 0.45 | % |
Class K | | $ | 1,000.00 | | | $ | 1,048.00 | | | $ | 2.32 | | | $ | 1,000.00 | | | $ | 1,022.94 | | | $ | 2.29 | | | | 0.45 | % |
| | 7 | | For each class of the Fund, expenses are equal to the annualized net expense ratio for the class, multiplied by the average account value over the period, multiplied by 184/365 (to reflect the one-half year period shown). |
| | 8 | | Hypothetical 5% annual return before expenses is calculated by prorating the number of days in the most recent fiscal half year divided by 365. |
| | | | See “Disclosure of Expenses” on page 16 for further information on how expenses were calculated. |
| | | | | | |
| | | | | | | |
| | BLACKROCK FUNDS | | JANUARY 31, 2017 | | 7 |
| | |
| Fund Summary as of January 31, 2017 | | BlackRock MSCI World Index Fund |
BlackRock MSCI World Index Fund’s (the “Fund”) investment objective is to seek to track the investment results of an index composed of developed market equities.
On February 24, 2017, the Board of Trustees of BlackRock Funds approved a name change from “BlackRock MSCI World Index Fund” to “iShares MSCI World Index Fund.” The change is expected to be effective during the second quarter of 2017.
|
| Portfolio Management Commentary |
How did the Fund perform?
| • | | For the six months ended January 31, 2017, the Fund’s Institutional Shares returned 5.13%, and Class K Shares returned 5.24%. The benchmark MSCI World Index returned 4.95% for the same period. |
| • | | Returns for the Fund’s respective share classes differ from the benchmark index based on individual share-class expenses. |
Describe the market environment.
| • | | Markets had a strong start to the period as expectations of a near-term Fed rate hike diminished, Japan announced another round of fiscal stimulus, and the earnings season had a strong start. |
| • | | Despite multiple terrorist attacks in France and Germany and a failed coup in Turkey, markets continued to rally in August on the back of a strong earnings season and monetary stimulus from the Bank of England. |
| • | | Positive performance sustained in September as the Fed kept rates unchanged, the Bank of Japan announced additional monetary stimulus, and OPEC decided to limit output. This was all despite inaction from the European Central Bank (“ECB”), the crisis in Syria, and concerns around Wells Fargo and Deutsche Bank. However, weak macro data out of China, a terrorist attack in Thailand, flooding in Louisiana, and a more hawkish tone from Fed officials hindered some performance for the quarter. |
| • | | Developed markets rallied later in the period as global investors embraced the results of the U.S. election and strong macro data, although a stronger U.S. dollar subdued gains for U.S. investors. |
| • | | Global equity market performance was mixed in October as Asia and Europe outperformed the United States (in local currency terms) on improving economic data and supportive commentary from the Bank of England and ECB. Asian stocks continued to perform well in November as global investors absorbed the unexpected results of the U.S. election and the Bank of Japan’s first intervention after introducing target yield curve control in September. Europe lagged in anticipation of the Italian referendum, while energy stocks rallied as OPEC and Russia agreed on a production cut at the end of the month. |
| • | | Global equities rallied as strong global economic data and continued optimism around President Trump’s reflationary policies outweighed the effects of the ECB’s decision to reduce the pace of its asset purchases and diplomatic tensions between the United States and other major powers. |
Describe recent portfolio activity.
| • | | During the period, as changes were made to the composition of the MSCI World Index, the Fund purchased and sold securities to maintain its objective of replicating the risks and return of the benchmark index. |
Describe portfolio positioning at period end.
| • | | The Fund remains positioned to match the risk characteristics of its benchmark index, irrespective of the market’s future direction. |
The views expressed reflect the opinions of BlackRock as of the date of this report and are subject to change based on changes in market, economic or other conditions. These views are not intended to be a forecast of future events and are no guarantee of future results.
| | | | | | |
| | | | | | | |
| 8 | | BLACKROCK FUNDS | | JANUARY 31, 2017 | | |
| | |
| | | BlackRock MSCI World Index Fund |
|
| Total Return Based on a $10,000 Investment |
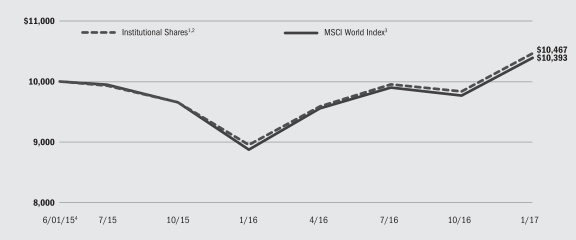
| | 1 | | Assuming transaction costs and other operating expenses, including investment advisory fees, if any. |
| | 2 | | The Fund generally invests at least 90% of its assets, plus the amount of any borrowing for investment purposes, in securities of the MSCI World Index and in depositary receipts representing securities of the MSCI World Index. |
| | 3 | | A free float-adjusted market capitalization weighted index that is designed to measure the equity market performance of developed markets. The MSCI World Index consists of the following 23 developed market country indexes: Australia, Austria, Belgium, Canada, Denmark, Finland, France, Germany, Hong Kong, Ireland, Israel, Italy, Japan, the Netherlands, New Zealand, Norway, Portugal, Singapore, Spain, Sweden, Switzerland, the United Kingdom, and the United States. |
| | 4 | | Commencement of operations. |
|
| Performance Summary for the Period Ended January 31, 2017 |
| | | | | | | | | | | | |
| | | | | | Average Annual Total Returns5 | |
| | | 6-Month
Total Returns | | | 1 Year | | | Since
Inception6 | |
Institutional | | | 5.13 | % | | | 16.85 | % | | | 2.77 | % |
Class K | | | 5.24 | | | | 17.12 | | | | 2.93 | |
MSCI World Index | | | 4.95 | | | | 17.11 | | | | 2.34 | |
| | 5 | | See “About Fund Performance” on page 16 for a detailed description of share classes, including any related fees. |
| | 6 | | The Fund commenced operations on June 1, 2015. |
| | | | Past performance is not indicative of future results. |
| | | | Performance results may include adjustments made for financial reporting purposes in accordance with U.S. generally accepted accounting principles. |
| | | | | | | | | | | | | | | | | | | | | | | | | | | | |
| | | Actual | | | Hypothetical8 | | | | |
| | | Beginning
Account Value
August 1, 2016 | | | Ending
Account Value
January 31, 2017 | | | Expenses Paid
During the Period7 | | | Beginning
Account Value
August 1, 2016 | | | Ending
Account Value
January 31, 2017 | | | Expenses Paid
During the Period7 | | | Annualized
Expense Ratio | |
Institutional | | $ | 1,000.00 | | | $ | 1,051.30 | | | $ | 0.93 | | | $ | 1,000.00 | | | $ | 1,024.30 | | | $ | 0.92 | | | | 0.18 | % |
Class K | | $ | 1,000.00 | | | $ | 1,052.40 | | | $ | 0.78 | | | $ | 1,000.00 | | | $ | 1,024.45 | | | $ | 0.71 | | | | 0.15 | % |
| | 7 | | For each class of the Fund, expenses are equal to the annualized net expense ratio for the class, multiplied by the average account value over the period, multiplied by 184/365 (to reflect the one-half year period shown). |
| | 8 | | Hypothetical 5% annual return before expenses is calculated by prorating the number of days in the most recent fiscal half year divided by 365. |
| | | | See “Disclosure of Expenses” on page 16 for further information on how expenses were calculated. |
| | | | | | |
| | | | | | | |
| | BLACKROCK FUNDS | | JANUARY 31, 2017 | | 9 |
| | | | |
| Fund Summary as of January 31, 2017 | | BlackRock Small/Mid Cap Index Fund |
BlackRock Small/Mid Cap Index Fund’s (the “Fund”) investment objective is to seek to track the performance of the small to mid-cap segment of the U.S. equity universe.
On February 24, 2017, the Board of Trustees of BlackRock Funds approved a name change from “BlackRock Small/Mid Cap Index Fund” to “iShares Small/Mid-Cap Index Fund.” The change is expected to be effective during the second quarter of 2017.
|
| Portfolio Management Commentary |
How did the Fund perform?
| • | | For the six months ended January 31, 2017, the Fund’s Institutional Shares returned 8.99%, Investor A Shares returned 8.90%, and Class K Shares returned 9.00%. The benchmark Russell 2500™ Index returned 8.97% for the same period. |
| • | | Returns for the Fund’s respective share classes differ from the benchmark index based on individual share-class expenses. |
Describe the market environment.
| • | | Most of the major U.S. equity indexes saw gains at the beginning of the period, largely driven by a dovish Fed that kept rates unchanged and stronger-than-expected earnings releases versus analyst expectations. |
| • | | Investors’ focus on the September Fed meeting dominated market performance in the last month of the third quarter. While the Fed kept rates unchanged, several Fed officials expressed support of a rate hike later in the year. |
| • | | The U.S. presidential election and the Fed were front and center in 2016, especially in the fourth quarter. The fourth quarter started with a slight increase in volatility as investors prepared for a possible Fed rate increase, and weighed probable outcomes of the presidential election. While many people were shocked by the Trump win, markets did not experience the same type of volatility seen after the Brexit vote, with major U.S. indexes posting solid gains in November. |
| • | | The performance of U.S. equities post-election suggests market participants are optimistic about President Trump’s pro-growth policies including lower taxes, deregulation and infrastructure spending. |
Describe recent portfolio activity.
| • | | During the period, as changes were made to the composition of the Russell 2500™ Index, the Fund purchased and sold securities to maintain its objective of replicating the risks and return of the benchmark index. |
Describe portfolio positioning at period end.
| • | | The Fund remains positioned to match the risk characteristics of its benchmark index, irrespective of the market’s future direction. |
The views expressed reflect the opinions of BlackRock as of the date of this report and are subject to change based on changes in market, economic or other conditions. These views are not intended to be a forecast of future events and are no guarantee of future results.
| | | | | | |
| | | | | | | |
| 10 | | BLACKROCK FUNDS | | JANUARY 31, 2017 | | |
| | |
| | | BlackRock Small/Mid Cap Index Fund |
|
| Total Return Based on a $10,000 Investment |
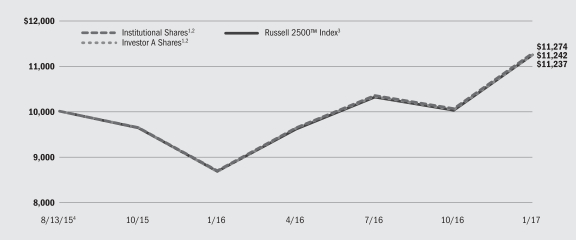
| | 1 | | Assuming transaction costs and other operating expenses, including investment advisory fees, if any. |
| | 2 | | The Fund generally invests at least 90% of its assets, plus the amount of any borrowing for investment purposes, in securities of the Russell 2500™ Index. |
| | 3 | | An index that measures the performance of the small to mid-cap segment of the U.S. equity universe, commonly referred to as “smid” cap. The Russell 2500™ Index is a subset of the Russell 3000® Index. It includes approximately 2500 of the smallest securities based on a combination of their market cap and current index membership. |
| | 4 | | Commencement of operations. |
| | | | |
| Performance Summary for the Period Ended January 31, 2017 | | |
| | | | | | | | | | | | |
| | | | | | Average Annual Total Returns5 | |
| | | 6 Month Total Returns | | | 1 Year | | | Since Inception6 | |
Institutional | | | 8.99 | % | | | 29.78 | % | | | 8.51 | % |
Investor A | | | 8.90 | | | | 29.67 | | | | 8.30 | |
Class K | | | 9.00 | | | | 29.81 | | | | 8.55 | |
Russell 2500™ Index | | | 8.97 | | | | 29.55 | | | | 8.29 | |
| | 5 | | See “About Fund Performance” on page 16 for a detailed description of share classes, including any related fees. |
| | 6 | | The Fund commenced operations on August 13, 2015. |
Past performance is not indicative of future results.
Performance results may include adjustments made for financial reporting purposes in accordance with U.S. generally accepted accounting principles.
| | | | | | | | | | | | | | | | | | | | | | | | | | | | |
| | | Actual | | | Hypothetical8 | | | | |
| | | Beginning
Account Value
August 1, 2016 | | | Ending
Account Value
January 31, 2017 | | | Expenses Paid
During the Period7 | | | Beginning
Account Value
August 1, 2016 | | | Ending
Account Value
January 31, 2017 | | | Expenses Paid
During the Period7 | | | Annualized
Expense Ratio | |
Institutional | | $ | 1,000.00 | | | $ | 1,089.90 | | | $ | 0.52 | | | $ | 1,000.00 | | | $ | 1,024.43 | | | $ | 0.50 | | | | 0.10 | % |
Investor A | | $ | 1,000.00 | | | $ | 1,089.00 | | | $ | 1.72 | | | $ | 1,000.00 | | | $ | 1,023.29 | | | $ | 1.66 | | | | 0.33 | % |
Class K | | $ | 1,000.00 | | | $ | 1,090.00 | | | $ | 0.36 | | | $ | 1,000.00 | | | $ | 1,024.58 | | | $ | 0.35 | | | | 0.07 | % |
| | 7 | | For each class of the Fund, expenses are equal to the annualized net expense ratio for the class, multiplied by the average account value over the period, multiplied by 184/365 (to reflect the one-half year period shown). |
| | 8 | | Hypothetical 5% annual return before expenses is calculated by prorating the number of days in the most recent fiscal half year divided by 365. |
| | | | See “Disclosure of Expenses” on page 16 for further information on how expenses were calculated. |
| | | | | | |
| | | | | | | |
| | BLACKROCK FUNDS | | JANUARY 31, 2017 | | 11 |
| | | | |
| Fund Summary as of January 31, 2017 | | BlackRock Total Stock Market Index Fund |
BlackRock Total Stock Market Index Fund’s (the “Fund”) investment objective is to seek to track the investment results of a broad-based index composed of U.S. equities.
On February 24, 2017, the Board of Trustees of BlackRock Funds approved a name change from “BlackRock Total Stock Market Index Fund” to “iShares Total U.S. Stock Market Index Fund.” The change is expected to be effective during the second quarter of 2017.
|
| Portfolio Management Commentary |
How did the Fund perform?
| • | | For the six months ended January 31, 2017, the Fund’s Institutional Shares returned 6.55%, Investor A Shares returned 6.37%, and Class K Shares returned 6.57%. The benchmark Russell 3000® Index returned 6.61% for the same period. |
| • | | Returns for the Fund’s respective share classes differ from the benchmark index based on individual share-class expenses. |
Describe the market environment.
| • | | Most of the major U.S. equity indexes saw gains at the beginning of the period, largely driven by a dovish Fed that kept rates unchanged and stronger-than-expected earnings releases versus analyst expectations. |
| • | | Investors’ focus on the September Fed meeting dominated market performance in the last month of the third quarter. While the Fed kept rates unchanged, several Fed officials expressed support of a rate hike later in the year. |
| • | | The U.S. presidential election and the Fed were front and center in 2016, especially in the fourth quarter. The fourth quarter started with a slight increase in volatility as investors prepared for a possible Fed rate increase, and weighed probable outcomes of the presidential election. While many people were shocked by the Trump win, markets did not experience the same type of volatility seen after the Brexit vote, with major U.S. indexes posting solid gains in November. |
| • | | The performance of U.S. equities post-election suggests market participants are optimistic about President Trump’s pro-growth policies including lower taxes, deregulation and infrastructure spending. |
Describe recent portfolio activity.
| • | | During the period, as changes were made to the composition of the Russell 3000® Index, the Fund purchased and sold securities to maintain its objective of replicating the risks and return of the benchmark index. |
| • | | At period end, the Fund accumulated cash leading into the rebalancing of the benchmark index to limit transactional costs. The Fund’s cash position had no material impact on performance. |
Describe portfolio positioning at period end.
| • | | The Fund remains positioned to match the risk characteristics of its benchmark index, irrespective of the market’s future direction. |
The views expressed reflect the opinions of BlackRock as of the date of this report and are subject to change based on changes in market, economic or other conditions. These views are not intended to be a forecast of future events and are no guarantee of future results.
| | | | | | |
| | | | | | | |
| 12 | | BLACKROCK FUNDS | | JANUARY 31, 2017 | | |
| | |
| | | BlackRock Total Stock Market Index Fund |
|
| Total Return Based on a $10,000 Investment |

| | 1 | | Assuming transaction costs and other operating expenses, including investment advisory fees, if any. |
| | 2 | | The Fund generally invests at least 90% of its assets, plus the amount of any borrowing for investment purposes, in securities of the Russell 3000® Index. |
| | 3 | | An index that measures the performance of the largest 3,000 U.S. companies representing approximately 98% of the investable U.S. equity market. |
| | 4 | | Commencement of operations. |
| | | | |
| Performance Summary for the Period Ended January 31, 2017 | | |
| | | | | | | | | | | | |
| | | | | | Average Annual
Total Returns5 | |
| | | 6 Month Total Returns | | | 1 Year | | | Since Inception6 | |
Institutional | | | 6.55 | % | | | 21.82 | % | | | 8.47 | % |
Investor A | | | 6.37 | | | | 21.52 | | | | 8.21 | |
Class K | | | 6.57 | | | | 21.86 | | | | 8.50 | |
Russell 3000® Index | | | 6.61 | | | | 21.73 | | | | 8.37 | |
| | 5 | | See “About Fund Performance” on page 16 for a detailed description of share classes, including any related fees. |
| | 6 | | The Fund commenced operations on August 13, 2015. |
Past performance is not indicative of future results.
Performance results may include adjustments made for financial reporting purposes in accordance with U.S. generally accepted accounting principles.
| | | | | | | | | | | | | | | | | | | | | | | | | | | | |
| | | Actual | | | Hypothetical8 | | | | |
| | | Beginning
Account Value
August 1, 2016 | | | Ending
Account Value
January 31, 2017 | | | Expenses Paid
During the Period7 | | | Beginning
Account Value
August 1, 2016 | | | Ending
Account Value
January 31, 2017 | | | Expenses Paid
During the Period7 | | | Annualized
Expense Ratio | |
Institutional | | $ | 1,000.00 | | | $ | 1,065.50 | | | $ | 0.31 | | | $ | 1,000.00 | | | $ | 1,024.90 | | | $ | 0.31 | | | | 0.06 | % |
Investor A | | $ | 1,000.00 | | | $ | 1,063.70 | | | $ | 1.46 | | | $ | 1,000.00 | | | $ | 1,023.79 | | | $ | 1.43 | | | | 0.28 | % |
Class K | | $ | 1,000.00 | | | $ | 1,065.70 | | | $ | 0.16 | | | $ | 1,000.00 | | | $ | 1,025.05 | | | $ | 0.15 | | | | 0.03 | % |
| | 7 | | For each class of the Fund, expenses are equal to the annualized net expense ratio for the class, multiplied by the average account value over the period, multiplied by 184/365 (to reflect the one-half year period shown). |
| | 8 | | Hypothetical 5% annual return before expenses is calculated by prorating the number of days in the most recent fiscal half year divided by 365. |
| | | | See “Disclosure of Expenses” on page 16 for further information on how expenses were calculated. |
| | | | | | |
| | | | | | | |
| | BLACKROCK FUNDS | | JANUARY 31, 2017 | | 13 |
| | | | |
| Portfolio Information as of January 31, 2017 | | |
|
| BlackRock Midcap Index Fund* |
| | | | |
| Sector Allocation | | Percent of Net Assets | |
Consumer Discretionary | | | 15 | % |
Information Technology | | | 15 | |
Industrials | | | 13 | |
Financials | | | 13 | |
Real Estate | | | 9 | |
Health Care | | | 9 | |
Energy | | | 6 | |
Utilities | | | 6 | |
Materials | | | 6 | |
Consumer Staples | | | 5 | |
Telecommunication Services | | | 1 | |
Short-Term Securities | | | 4 | |
Liabilities in Excess of Other Assets | | | (2 | ) |
For Fund compliance purposes, the Fund’s sector classifications refer to one or more of the sector sub-classifications used by one or more widely recognized market indexes or rating group indexes, and/or as defined by the investment adviser. These definitions may not apply for purposes of this report, which may combine such sector sub-classifications for reporting ease.
| | * | | Ten largest holdings have not been included as the Fund does not hold any position in excess of 1% of Net Assets. |
| | |
| BlackRock MSCI Asia ex Japan Index Fund |
| | | | |
| Ten Largest Holdings | | Percent of
Net Assets | |
Samsung Electronics Co. Ltd. | | | 5 | % |
Tencent Holdings Ltd. | | | 4 | |
Taiwan Semiconductor Manufacturing Co. Ltd. | | | 4 | |
Alibaba Group Holding Ltd. — ADR | | | 3 | |
AIA Group Ltd. | | | 2 | |
China Mobile Ltd. | | | 2 | |
China Construction Bank Corp., Class H | | | 2 | |
Baidu, Inc. — ADR | | | 1 | |
Industrial & Commercial Bank of China Ltd., Class H | | | 1 | |
Hon Hai Precision Industry Co. Ltd. | | | 1 | |
| | | | |
| Geographic Allocation | | Percent of
Net Assets | |
China | | | 26 | % |
South Korea | | | 17 | |
Hong Kong | | | 17 | |
Taiwan | | | 14 | |
India | | | 10 | |
Singapore | | | 5 | |
Indonesia | | | 3 | |
Malaysia | | | 3 | |
Thailand | | | 3 | |
Philippines | | | 1 | |
Other | | | — | 1 |
Short-Term Securities | | | 1 | |
Other Assets Less Liabilities | | | — | 2 |
| | 1 | | Other includes a 1% or less investment in each of the following countries: Republic of Korea, United States. |
| | 2 | | Represents less than 1% of Net Assets. |
|
| BlackRock MSCI World Index Fund |
| | | | |
| Ten Largest Holdings | | Percent of Net Assets | |
Apple, Inc. | | | 2 | % |
Microsoft Corp. | | | 1 | |
Exxon Mobil Corp. | | | 1 | |
Amazon.com, Inc. | | | 1 | |
Johnson & Johnson | | | 1 | |
JPMorgan Chase & Co. | | | 1 | |
Facebook, Inc. | | | 1 | |
Wells Fargo & Co. | | | 1 | |
General Electric Co. | | | 1 | |
AT&T, Inc. | | | 1 | |
| | | | |
| Geographic Allocation | | Percent of Net Assets1 | |
United States | | | 58 | % |
Japan | | | 9 | |
United Kingdom | | | 6 | |
Canada | | | 4 | |
France | | | 3 | |
Switzerland | | | 3 | |
Germany | | | 3 | |
Australia | | | 3 | |
Netherlands | | | 2 | |
Other | | | 7 | 1 |
Short-Term Securities | | | 3 | |
Liabilities in Excess of Other Assets | | | (1 | ) |
| | 1 | | Other includes a 1% or less investment in each of the following countries: Hong Kong, Spain, Sweden, Singapore, Ireland, Italy, Denmark, Belgium, Finland, Norway, Israel, Austria, New Zealand, Portugal, Argentina, Luxembourg, Bermuda, Mexico and United Arab Emirates. |
| | | | | | |
| | | | | | | |
| 14 | | BLACKROCK FUNDS | | JANUARY 31, 2017 | | |
| | |
| Portfolio Information (concluded) | | |
|
| BlackRock Small/Mid Cap Index Fund* |
| | | | |
| Sector Allocation | | Percent of Net Assets | |
Financials | | | 17 | % |
Industrials | | | 15 | |
Information Technology | | | 15 | |
Consumer Discretionary | | | 12 | |
Health Care | | | 11 | |
Real Estate | | | 10 | |
Materials | | | 6 | |
Short-Term Securities | | | 5 | |
Energy | | | 5 | |
Utilities | | | 4 | |
Consumer Staples | | | 3 | |
Telecommunication Services | | | 1 | |
Liabilities in Excess of Other Assets | | | (4 | ) |
For Fund compliance purposes, the Fund’s sector classifications refer to one or more of the sector sub-classifications used by one or more widely recognized market indexes or rating group indexes, and/or as defined by the investment adviser. These definitions may not apply for purposes of this report, which may combine such sector sub-classifications for reporting ease.
| | * | | Ten largest holdings have not been included as the Fund does not hold any position in excess of 1% of Net Assets. |
|
| BlackRock Total Stock Market Index Fund |
| | | | |
| Ten Largest Holdings | | Percent of
Net Assets | |
Apple, Inc. | | | 3 | % |
Microsoft Corp. | | | 2 | |
Exxon Mobil Corp. | | | 1 | |
Amazon.com, Inc. | | | 1 | |
Johnson & Johnson | | | 1 | |
Berkshire Hathaway, Inc. | | | 1 | |
JPMorgan Chase & Co. | | | 1 | |
Facebook, Inc. | | | 1 | |
General Electric Co. | | | 1 | |
AT&T, Inc. | | | 1 | |
| | | | |
| Sector Allocation | | Percent of
Net Assets | |
Information Technology | | | 20 | % |
Financials | | | 15 | |
Health Care | | | 13 | |
Consumer Discretionary | | | 12 | |
Industrials | | | 11 | |
Consumer Staples | | | 8 | |
Energy | | | 7 | |
Real Estate | | | 4 | |
Materials | | | 3 | |
Utilities | | | 3 | |
Telecommunication Services | | | 2 | |
Short-Term Securities | | | 9 | |
Liabilities in Excess of Other Assets | | | (7 | ) |
For Fund compliance purposes, the Fund’s sector classifications refer to one or more of the sector sub-classifications used by one or more widely recognized market indexes or rating group indexes, and/or as defined by the investment adviser. These definitions may not apply for purposes of this report, which may combine such sector sub-classifications for reporting ease.
| | | | | | |
| | | | | | | |
| | BLACKROCK FUNDS | | JANUARY 31, 2017 | | 15 |
| • | | Institutional and Class K Shares are not subject to any sales charge. These shares bear no ongoing distribution or service fees and are available only to certain eligible investors. Prior to November 30, 2015, Class K Shares of BlackRock MSCI Asia ex Japan Index Fund and BlackRock MSCI World Index Fund performance results are those of Institutional Shares of BlackRock MSCI Asia ex Japan Index Fund and BlackRock MSCI World Index Fund, respectively, restated to reflect Class K Share fees. |
| • | | Investor A Shares (available only in BlackRock Midcap Index Fund, BlackRock Small/Mid Cap Index Fund and BlackRock Total Stock Market Index Fund) are not subject to any sales charge and bear no ongoing distribution fee. These shares are subject to an ongoing service fee of 0.25% per year. These shares are generally available through financial intermediaries. Prior to November 30, 2015, Investor A Shares of BlackRock Midcap Index Fund performance results are those of Institutional Shares restated to reflect Investor A Share fees. |
Performance information reflects past performance and does not guarantee future results. Current performance may be lower or higher than the perform-
ance data quoted. Refer to www.blackrock.com to obtain performance data current to the most recent month end. Performance results do not reflect the deduction of taxes that a shareholder would pay on fund distributions or the redemption of fund shares. Figures shown in the performance tables on the previous pages assume reinvestment of all distributions, if any, at net asset value (“NAV”) on the ex-dividend date. Investment return and principal value of shares will fluctuate so that shares, when redeemed, may be worth more or less than their original cost. Distributions paid to each class of shares will vary because of the different levels of service, distribution and transfer agency fees applicable to each class, which are deducted from the income available to be paid to shareholders.
BlackRock Advisors, LLC (the “Manager”), each Fund’s investment adviser, has contractually agreed to waive and/or reimburse a portion of the Funds’ expenses. Without such waiver and/or reimbursement, the Funds’ performance would have been lower. The Manager is under no obligation to continue waiving and/or reimbursing its fees after the applicable termination date of such agreement. See Note 6 of the Notes to Financial Statements for additional information on waivers and/or reimbursements.
Shareholders of these Funds may incur the following charges: (a) transactional expenses; and (b) operating expenses, including investment advisory fees, service and distribution fees, including 12b-1 fees, and other fund expenses. The expense examples shown on the previous pages (which are based on a hypothetical investment of $1,000 invested on August 1, 2016 and held through January 31, 2017) are intended to assist shareholders both in calculating expenses based on an investment in each Fund and in comparing these expenses with similar costs of investing in other mutual funds.
The expense examples provide information about actual account values and actual expenses. In order to estimate the expenses a shareholder paid during the period covered by this report, shareholders can divide their account value by $1,000 and then multiply the result by the number corresponding to their Fund and share class under the heading entitled “Expenses Paid During the Period.”
The expense examples also provide information about hypothetical account values and hypothetical expenses based on a Fund’s actual expense ratio and an assumed rate of return of 5% per year before expenses. In order to assist shareholders in comparing the ongoing expenses of investing in these Funds and other funds, compare the 5% hypothetical examples with the 5% hypothetical examples that appear in shareholder reports of other funds.
The expenses shown in the expense examples are intended to highlight shareholders’ ongoing costs only and do not reflect any transactional expenses, such as sales charges, if any. Therefore, the hypothetical examples are useful in comparing ongoing expenses only, and will not help shareholders determine the relative total expenses of owning different funds. If these transactional expenses were included, shareholder expenses would have been higher.
|
| Derivative Financial Instruments |
The Funds may invest in various derivative financial instruments. These instruments are used to obtain exposure to a security, commodity, index, market, and/or other asset without owning or taking physical custody of securities, commodities and/or other referenced assets or to manage market, equity, credit, interest rate, foreign currency exchange rate, commodity and/or other risks. Derivative financial instruments may give rise to a form of economic leverage and involve risks, including the imperfect correlation between the value of a derivative financial instrument and the underlying asset, possible default of the counterparty to the
transaction or illiquidity of the instrument. The Funds’ successful use of a derivative financial instrument depends on the investment adviser’s ability to predict pertinent market movements accurately, which cannot be assured. The use of these instruments may result in losses greater than if they had not been used, may limit the amount of appreciation a Fund can realize on an investment and/or may result in lower distributions paid to shareholders. The Funds’ investments in these instruments, if any, are discussed in detail in the Notes to Financial Statements.
| | | | | | |
| | | | | | | |
| 16 | | BLACKROCK FUNDS | | JANUARY 31, 2017 | | |
| | |
Schedule of Investments January 31, 2017 (Unaudited) | | BlackRock Midcap Index Fund (Percentages shown are based on Net Assets) |
| | | | | | | | |
| Common Stocks | | Shares | | | Value | |
Aerospace & Defense — 1.5% | |
Arconic, Inc. | | | 182,698 | | | $ | 4,163,689 | |
B/E Aerospace, Inc. | | | 42,487 | | | | 2,611,676 | |
HEICO Corp. | | | 7,843 | | | | 603,519 | |
HEICO Corp., Class A | | | 16,353 | | | | 1,084,204 | |
Hexcel Corp. | | | 38,471 | | | | 1,975,486 | |
Huntington Ingalls Industries, Inc. | | | 19,396 | | | | 3,762,048 | |
L3 Technologies, Inc. | | | 31,942 | | | | 5,068,876 | |
Orbital ATK, Inc. | | | 24,295 | | | | 2,112,450 | |
Rockwell Collins, Inc. | | | 54,232 | | | | 4,922,096 | |
Spirit Aerosystems Holdings, Inc., Class A | | | 50,670 | | | | 3,042,734 | |
Textron, Inc. | | | 112,244 | | | | 5,316,998 | |
TransDigm Group, Inc. | | | 20,881 | | | | 4,518,648 | |
| | | | | | | | |
| | | | | | | | 39,182,424 | |
Air Freight & Logistics — 0.3% | |
C.H. Robinson Worldwide, Inc. | | | 59,255 | | | | 4,506,936 | |
Expeditors International of Washington, Inc. | | | 75,503 | | | | 3,932,196 | |
| | | | | | | | |
| | | | | | | | 8,439,132 | |
Airlines — 1.1% | |
Alaska Air Group, Inc. | | | 49,796 | | | | 4,671,861 | |
American Airlines Group, Inc. | | | 220,295 | | | | 9,748,054 | |
Copa Holdings SA, Class A | | | 13,121 | | | | 1,279,166 | |
JetBlue Airways Corp. (a) | | | 133,837 | | | | 2,624,544 | |
Spirit Airlines, Inc. (a) | | | 29,611 | | | | 1,600,178 | |
United Continental Holdings, Inc. (a) | | | 132,121 | | | | 9,310,567 | |
| | | | | | | | |
| | | | | | | | 29,234,370 | |
Auto Components — 1.7% | |
Adient PLC (a) | | | 38,276 | | | | 2,430,143 | |
Allison Transmission Holdings, Inc. | | | 58,719 | | | | 2,053,990 | |
BorgWarner, Inc. | | | 90,371 | | | | 3,689,848 | |
Delphi Automotive PLC | | | 113,678 | | | | 7,964,281 | |
Gentex Corp. | | | 117,511 | | | | 2,454,805 | |
Goodyear Tire & Rubber Co. | | | 110,885 | | | | 3,591,565 | |
Johnson Controls International PLC | | | 382,385 | | | | 16,817,292 | |
Lear Corp. | | | 30,807 | | | | 4,377,367 | |
Visteon Corp. (a) | | | 14,202 | | | | 1,272,073 | |
| | | | | | | | |
| | | | | | | | 44,651,364 | |
Automobiles — 0.2% | |
Harley-Davidson, Inc. | | | 75,445 | | | | 4,303,383 | |
Thor Industries, Inc. | | | 20,056 | | | | 2,075,796 | |
| | | | | | | | |
| | | | | | | | 6,379,179 | |
Banks — 4.1% | |
Associated Banc-Corp | | | 61,934 | | | | 1,566,930 | |
Bank of Hawaii Corp. | | | 17,594 | | | | 1,511,501 | |
BankUnited, Inc. | | | 41,147 | | | | 1,571,815 | |
BOK Financial Corp. | | | 10,867 | | | | 893,702 | |
CIT Group, Inc. | | | 83,069 | | | | 3,421,612 | |
Citizens Financial Group, Inc. | | | 220,817 | | | | 7,986,951 | |
Comerica, Inc. | | | 72,872 | | | | 4,921,046 | |
Commerce Bancshares, Inc. | | | 36,554 | | | | 2,066,398 | |
Cullen/Frost Bankers, Inc. | | | 22,135 | | | | 1,978,869 | |
East West Bancorp, Inc. | | | 59,479 | | | | 3,059,600 | |
Fifth Third Bancorp | | | 318,582 | | | | 8,314,990 | |
First Hawaiian, Inc. | | | 10,124 | | | | 333,991 | |
First Horizon National Corp. | | | 95,875 | | | | 1,917,500 | |
First Republic Bank | | | 60,813 | | | | 5,736,490 | |
Huntington Bancshares, Inc. | | | 447,455 | | | | 6,054,066 | |
| | | | | | | | |
| Common Stocks | | Shares | | | Value | |
Banks (continued) | |
KeyCorp | | | 449,605 | | | $ | 8,079,402 | |
M&T Bank Corp. | | | 62,379 | | | | 10,140,954 | |
PacWest Bancorp | | | 49,562 | | | | 2,745,735 | |
Popular, Inc. | | | 42,722 | | | | 1,898,138 | |
Regions Financial Corp. | | | 528,949 | | | | 7,622,155 | |
Signature Bank (a) | | | 21,991 | | | | 3,464,022 | |
SunTrust Banks, Inc. | | | 209,257 | | | | 11,889,983 | |
SVB Financial Group (a) | | | 21,545 | | | | 3,710,695 | |
Synovus Financial Corp. | | | 51,744 | | | | 2,156,690 | |
TCF Financial Corp. | | | 65,902 | | | | 1,143,400 | |
Western Alliance Bancorp (a) | | | 38,868 | | | | 1,919,302 | |
Zions Bancorporation | | | 83,563 | | | | 3,525,523 | |
| | | | | | | | |
| | | | | | | | 109,631,460 | |
Beverages — 0.7% | |
Brown-Forman Corp., Class A | | | 23,545 | | | | 1,101,435 | |
Brown-Forman Corp., Class B | | | 76,219 | | | | 3,475,586 | |
Dr. Pepper Snapple Group, Inc. | | | 77,199 | | | | 7,040,549 | |
Molson Coors Brewing Co., Class B | | | 71,673 | | | | 6,917,878 | |
| | | | | | | | |
| | | | | | | | 18,535,448 | |
Biotechnology — 1.2% | |
ACADIA Pharmaceuticals, Inc. (a) | | | 40,583 | | | | 1,403,766 | |
Agios Pharmaceuticals, Inc. (a) | | | 12,481 | | | | 537,058 | |
Alkermes PLC (a) | | | 62,575 | | | | 3,385,933 | |
Alnylam Pharmaceuticals, Inc. (a) | | | 31,108 | | | | 1,244,009 | |
AquaBounty Technologies, Inc. (a) | | | 358 | | | | 4,940 | |
BioMarin Pharmaceutical, Inc. (a) | | | 71,011 | | | | 6,222,694 | |
Incyte Corp. (a) | | | 67,751 | | | | 8,212,099 | |
Intercept Pharmaceuticals, Inc. (a) | | | 6,831 | | | | 749,702 | |
Intrexon Corp. (a) | | | 23,983 | | | | 507,480 | |
Ionis Pharmaceuticals, Inc. (a) | | | 50,033 | | | | 2,226,469 | |
Juno Therapeutics, Inc. (a) | | | 26,412 | | | | 563,632 | |
Neurocrine Biosciences, Inc. (a) | | | 35,742 | | | | 1,533,689 | |
OPKO Health, Inc. (a) | | | 135,003 | | | | 1,173,176 | |
Seattle Genetics, Inc. (a) | | | 39,975 | | | | 2,408,094 | |
United Therapeutics Corp. (a) | | | 18,314 | | | | 2,996,720 | |
| | | | | | | | |
| | | | | | | | 33,169,461 | |
Building Products — 0.8% | |
Allegion PLC | | | 39,891 | | | | 2,619,642 | |
AO Smith Corp. | | | 60,676 | | | | 2,957,955 | |
Armstrong World Industries, Inc. (a) | | | 19,141 | | | | 764,683 | |
Fortune Brands Home & Security, Inc. | | | 63,785 | | | | 3,516,467 | |
Lennox International, Inc. | | | 16,531 | | | | 2,592,226 | |
Masco Corp. | | | 138,144 | | | | 4,551,845 | |
Owens Corning | | | 47,649 | | | | 2,632,607 | |
USG Corp. (a) | | | 37,139 | | | | 1,136,082 | |
| | | | | | | | |
| | | | | | | | 20,771,507 | |
Capital Markets — 2.0% | |
Affiliated Managers Group, Inc. (a) | | | 22,461 | | | | 3,422,158 | |
Ameriprise Financial, Inc. | | | 65,458 | | | | 7,348,970 | |
Artisan Partners Asset Management, Inc., Class A | | | 14,824 | | | | 429,155 | |
Donnelley Financial Solutions, Inc. (a) | | | 10,375 | | | | 249,830 | |
E*Trade Financial Corp. (a) | | | 116,428 | | | | 4,360,229 | |
Eaton Vance Corp. | | | 45,819 | | | | 1,921,191 | |
Federated Investors, Inc., Class B | | | 34,623 | | | | 900,544 | |
Invesco Ltd. | | | 171,512 | | | | 4,960,127 | |
Lazard Ltd., Class A | | | 53,214 | | | | 2,260,531 | |
Legg Mason, Inc. | | | 42,149 | | | | 1,335,702 | |
| | | | | | | | | | |
| ADR | | American Depositary Receipts | | MSCI | | Morgan Stanley Capital International | | PCL | | Public Company Limited |
| CVA | | Certificaten Van Aandelen (Dutch Certificate) | | NVDR | | Non-voting Depository Receipts | | REIT | | Real Estate Investment Trust |
| GDR | | Global Depositary Receipt | | | | | | | | |
See Notes to Financial Statements.
| | | | | | |
| | | | | | | |
| | BLACKROCK FUNDS | | JANUARY 31, 2017 | | 17 |
| | |
Schedule of Investments (continued) | | BlackRock Midcap Index Fund |
| | | | | | | | |
| Common Stocks | | Shares | | | Value | |
Capital Markets (continued) | |
LPL Financial Holdings, Inc. | | | 35,051 | | | $ | 1,377,504 | |
Northern Trust Corp. | | | 86,329 | | | | 7,161,854 | |
Raymond James Financial, Inc. | | | 52,722 | | | | 3,950,459 | |
SEI Investments Co. | | | 53,157 | | | | 2,578,646 | |
T. Rowe Price Group, Inc. | | | 101,276 | | | | 6,830,053 | |
TD Ameritrade Holding Corp. | | | 103,649 | | | | 4,783,401 | |
| | | | | | | | |
| | | | | | | | 53,870,354 | |
Chemicals — 1.9% | |
Albemarle Corp. | | | 46,647 | | | | 4,321,378 | |
Ashland Global Holdings, Inc. | | | 25,802 | | | | 3,071,212 | |
Axalta Coating Systems Ltd. (a) | | | 68,890 | | | | 1,997,810 | |
Cabot Corp. | | | 25,446 | | | | 1,408,945 | |
Celanese Corp., Series A | | | 61,425 | | | | 5,184,270 | |
CF Industries Holdings, Inc. | | | 97,080 | | | | 3,425,953 | |
Eastman Chemical Co. | | | 61,558 | | | | 4,770,745 | |
FMC Corp. | | | 55,652 | | | | 3,348,024 | |
Huntsman Corp. | | | 82,444 | | | | 1,681,033 | |
International Flavors & Fragrances, Inc. | | | 33,196 | | | | 3,890,903 | |
Mosaic Co. | | | 145,693 | | | | 4,570,389 | |
NewMarket Corp. | | | 3,070 | | | | 1,323,692 | |
Platform Specialty Products Corp. (a) | | | 82,049 | | | | 996,075 | |
RPM International, Inc. | | | 54,180 | | | | 2,831,447 | |
Scotts Miracle-Gro Co., Class A | | | 18,781 | | | | 1,727,289 | |
Valspar Corp. | | | 32,671 | | | | 3,615,699 | |
Valvoline, Inc. | | | 13,812 | | | | 319,748 | |
Westlake Chemical Corp. | | | 16,060 | | | | 994,275 | |
WR Grace & Co. | | | 29,246 | | | | 2,027,918 | |
| | | | | | | | |
| | | | | | | | 51,506,805 | |
Commercial Services & Supplies — 1.0% | |
Cintas Corp. | | | 36,959 | | | | 4,291,310 | |
Clean Harbors, Inc. (a) | | | 21,876 | | | | 1,214,118 | |
Copart, Inc. (a) | | | 40,631 | | | | 2,305,403 | |
Covanta Holding Corp. | | | 49,793 | | | | 801,667 | |
Iron Mountain, Inc. | | | 108,989 | | | | 3,901,806 | |
KAR Auction Services, Inc. | | | 57,306 | | | | 2,610,288 | |
LSC Communications, Inc. | | | 10,375 | | | | 272,033 | |
Pitney Bowes, Inc. | | | 79,094 | | | | 1,259,176 | |
Republic Services, Inc. | | | 98,183 | | | | 5,633,741 | |
Rollins, Inc. | | | 39,940 | | | | 1,408,284 | |
RR Donnelley & Sons Co. | | | 31,840 | | | | 546,056 | |
Stericycle, Inc. (a) | | | 34,259 | | | | 2,642,739 | |
| | | | | | | | |
| | | | | | | | 26,886,621 | |
Communications Equipment — 1.2% | |
Arista Networks, Inc. (a) | | | 16,218 | | | | 1,524,492 | |
ARRIS International PLC (a) | | | 78,519 | | | | 2,244,073 | |
Brocade Communications Systems, Inc. | | | 166,337 | | | | 2,074,223 | |
CommScope Holding Co., Inc. (a) | | | 53,272 | | | | 2,014,747 | |
EchoStar Corp., Class A (a) | | | 18,462 | | | | 940,270 | |
F5 Networks, Inc. (a) | | | 27,975 | | | | 3,749,489 | |
Harris Corp. | | | 51,968 | | | | 5,337,633 | |
Juniper Networks, Inc. | | | 155,393 | | | | 4,161,425 | |
Motorola Solutions, Inc. | | | 72,789 | | | | 5,874,800 | |
Palo Alto Networks, Inc. (a) | | | 36,206 | | | | 5,342,557 | |
| | | | | | | | |
| | | | | | | | 33,263,709 | |
Construction & Engineering — 0.5% | |
AECOM (a) | | | 63,328 | | | | 2,338,703 | |
Chicago Bridge & Iron Co. NV | | | 43,373 | | | | 1,440,417 | |
Fluor Corp. | | | 57,933 | | | | 3,215,281 | |
Jacobs Engineering Group, Inc. (a) | | | 49,763 | | | | 2,913,624 | |
KBR, Inc. | | | 60,389 | | | | 1,027,217 | |
Quanta Services, Inc. (a) | | | 60,001 | | | | 2,153,436 | |
| | | | | | | | |
| | | | | | | | 13,088,678 | |
| | | | | | | | |
| Common Stocks | | Shares | | | Value | |
Construction Materials — 0.6% | | | | | |
Eagle Materials, Inc. | | | 19,468 | | | $ | 2,035,963 | |
Martin Marietta Materials, Inc. | | | 26,466 | | | | 6,076,594 | |
Vulcan Materials Co. | | | 55,154 | | | | 7,077,913 | |
| | | | | | | | |
| | | | | | | | 15,190,470 | |
Consumer Finance — 0.8% | |
Ally Financial, Inc. | | | 184,733 | | | | 3,901,561 | |
Credit Acceptance Corp. (a)(b) | | | 3,330 | | | | 683,582 | |
Navient Corp. | | | 125,321 | | | | 1,884,828 | |
OneMain Holdings, Inc. (a) | | | 21,667 | | | | 484,908 | |
Santander Consumer USA Holdings, Inc. (a) | | | 42,787 | | | | 565,644 | |
SLM Corp. (a) | | | 178,554 | | | | 2,121,222 | |
Synchrony Financial | | | 348,815 | | | | 12,494,553 | |
| | | | | | | | |
| | | | | | | | 22,136,298 | |
Containers & Packaging — 1.7% | |
Aptargroup, Inc. | | | 25,643 | | | | 1,871,170 | |
Avery Dennison Corp. | | | 37,429 | | | | 2,733,065 | |
Ball Corp. | | | 71,110 | | | | 5,422,848 | |
Bemis Co., Inc. | | | 39,018 | | | | 1,900,957 | |
Berry Plastics Group, Inc. (a) | | | 52,402 | | | | 2,674,074 | |
Crown Holdings, Inc. (a) | | | 55,847 | | | | 3,025,232 | |
Graphic Packaging Holding Co. | | | 131,968 | | | | 1,650,920 | |
International Paper Co. | | | 170,903 | | | | 9,673,110 | |
Owens-Illinois, Inc. (a) | | | 67,412 | | | | 1,274,087 | |
Packaging Corp. of America | | | 38,926 | | | | 3,588,199 | |
Sealed Air Corp. | | | 81,726 | | | | 3,963,711 | |
Silgan Holdings, Inc. | | | 16,475 | | | | 963,952 | |
Sonoco Products Co. | | | 41,152 | | | | 2,261,302 | |
WestRock Co. | | | 104,197 | | | | 5,559,952 | |
| | | | | | | | |
| | | | | | | | 46,562,579 | |
Distributors — 0.4% | |
Genuine Parts Co. | | | 60,783 | | | | 5,884,402 | |
LKQ Corp. (a) | | | 127,012 | | | | 4,052,953 | |
Pool Corp. | | | 16,745 | | | | 1,767,602 | |
| | | | | | | | |
| | | | | | | | 11,704,957 | |
Diversified Consumer Services — 0.3% | |
Graham Holdings Co., Class B | | | 1,818 | | | | 944,542 | |
H&R Block, Inc. | | | 86,289 | | | | 1,851,762 | |
Service Corp. International | | | 77,788 | | | | 2,265,964 | |
ServiceMaster Global Holdings, Inc. (a) | | | 56,350 | | | | 2,083,823 | |
| | | | | | | | |
| | | | | | | | 7,146,091 | |
Diversified Financial Services — 1.1% | |
CBOE Holdings, Inc. | | | 33,817 | | | | 2,692,510 | |
FactSet Research Systems, Inc. | | | 16,651 | | | | 2,881,456 | |
Interactive Brokers Group, Inc., Class A | | | 26,612 | | | | 993,692 | |
Leucadia National Corp. | | | 136,959 | | | | 3,266,472 | |
MarketAxess Holdings, Inc. | | | 15,278 | | | | 2,860,805 | |
Moody’s Corp. | | | 70,553 | | | | 7,314,229 | |
Morningstar, Inc. | | | 7,239 | | | | 551,250 | |
MSCI, Inc. | | | 37,871 | | | | 3,133,825 | |
Nasdaq, Inc. | | | 46,798 | | | | 3,301,131 | |
Voya Financial, Inc. | | | 85,385 | | | | 3,434,185 | |
| | | | | | | | |
| | | | | | | | 30,429,555 | |
Diversified Telecommunication Services — 0.8% | |
CenturyLink, Inc. | | | 224,183 | | | | 5,797,372 | |
Frontier Communications Corp. | | | 483,522 | | | | 1,687,492 | |
Level 3 Communications, Inc. (a) | | | 121,874 | | | | 7,246,628 | |
SBA Communications Corp. (a) | | | 51,786 | | | | 5,450,994 | |
Zayo Group Holdings, Inc. (a) | | | 67,932 | | | | 2,171,107 | |
| | | | | | | | |
| | | | | | | | 22,353,593 | |
Electric Utilities — 2.3% | |
Avangrid, Inc. | | | 22,396 | | | | 868,965 | |
See Notes to Financial Statements.
| | | | | | |
| | | | | | | |
| 18 | | BLACKROCK FUNDS | | JANUARY 31, 2017 | | |
| | |
Schedule of Investments (continued) | | BlackRock Midcap Index Fund |
| | | | | | | | |
| Common Stocks | | Shares | | | Value | |
Electric Utilities (continued) | |
Edison International | | | 131,991 | | | $ | 9,619,504 | |
Entergy Corp. | | | 74,652 | | | | 5,348,069 | |
Eversource Energy | | | 132,338 | | | | 7,320,938 | |
FirstEnergy Corp. | | | 177,268 | | | | 5,374,766 | |
Great Plains Energy, Inc. | | | 89,266 | | | | 2,459,278 | |
Hawaiian Electric Industries, Inc. | | | 44,650 | | | | 1,494,882 | |
OGE Energy Corp. | | | 82,830 | | | | 2,778,118 | |
Pinnacle West Capital Corp. | | | 46,241 | | | | 3,589,689 | |
PPL Corp. | | | 282,817 | | | | 9,853,344 | |
Westar Energy, Inc. | | | 59,040 | | | | 3,228,898 | |
Xcel Energy, Inc. | | | 212,034 | | | | 8,761,245 | |
| | | | | | | | |
| | | | | | | | 60,697,696 | |
Electrical Equipment — 0.8% | |
Acuity Brands, Inc. | | | 18,110 | | | | 3,752,935 | |
AMETEK, Inc. | | | 95,900 | | | | 4,900,490 | |
Hubbell, Inc. | | | 22,734 | | | | 2,775,367 | |
Regal-Beloit Corp. | | | 18,561 | | | | 1,347,528 | |
Rockwell Automation, Inc. | | | 54,139 | | | | 8,012,031 | |
| | | | | | | | |
| | | | | | | | 20,788,351 | |
Electronic Equipment, Instruments & Components — 1.3% | |
Amphenol Corp., Class A | | | 124,975 | | | | 8,434,563 | |
Arrow Electronics, Inc. (a) | | | 38,170 | | | | 2,806,258 | |
Avnet, Inc. | | | 53,276 | | | | 2,474,138 | |
CDW Corp. | | | 67,710 | | | | 3,487,742 | |
Cognex Corp. | | | 33,770 | | | | 2,281,501 | |
Dolby Laboratories, Inc., Class A | | | 21,342 | | | | 1,022,495 | |
Fitbit, Inc., Series A (a) | | | 50,416 | | | | 303,000 | |
FLIR Systems, Inc. | | | 56,849 | | | | 2,008,475 | |
IPG Photonics Corp. (a) | | | 14,674 | | | | 1,687,363 | |
Jabil Circuit, Inc. | | | 77,715 | | | | 1,863,606 | |
Keysight Technologies, Inc. (a) | | | 71,367 | | | | 2,645,575 | |
National Instruments Corp. | | | 43,141 | | | | 1,355,490 | |
Trimble, Inc. (a) | | | 105,474 | | | | 3,124,140 | |
Zebra Technologies Corp., Class A (a) | | | 21,539 | | | | 1,802,168 | |
| | | | | | | | |
| | | | | | | | 35,296,514 | |
Energy Equipment & Services — 1.3% | |
Baker Hughes, Inc. | | | 182,469 | | | | 11,510,144 | |
Diamond Offshore Drilling, Inc. (a) | | | 25,641 | | | | 420,000 | |
Dril-Quip, Inc. (a) | | | 15,891 | | | | 988,420 | |
Ensco PLC, Class A | | | 125,992 | | | | 1,375,833 | |
Frank’s International NV | | | 20,758 | | | | 245,775 | |
Helmerich & Payne, Inc. | | | 40,282 | | | | 2,866,467 | |
Nabors Industries Ltd. | | | 114,307 | | | | 1,857,489 | |
National Oilwell Varco, Inc. | | | 156,901 | | | | 5,932,427 | |
Noble Corp. PLC | | | 103,607 | | | | 699,347 | |
Oceaneering International, Inc. | | | 40,869 | | | | 1,138,202 | |
Patterson-UTI Energy, Inc. | | | 59,725 | | | | 1,674,689 | |
Rowan Cos. PLC, Class A (a) | | | 52,747 | | | | 945,226 | |
RPC, Inc. | | | 23,631 | | | | 508,539 | |
Superior Energy Services, Inc. (a) | | | 64,502 | | | | 1,139,750 | |
Transocean Ltd. (a) | | | 144,801 | | | | 2,022,870 | |
Weatherford International PLC (a) | | | 405,039 | | | | 2,110,253 | |
| | | | | | | | |
| | | | | | | | 35,435,431 | |
Equity Real Estate Investment Trusts (REITs) — 0.1% | |
Colony NorthStar, Inc., Class A | | | 227,235 | | | | 3,163,111 | |
Food & Staples Retailing — 0.4% | |
Casey’s General Stores, Inc. | | | 16,153 | | | | 1,855,980 | |
Rite Aid Corp. (a) | | | 429,427 | | | | 2,413,380 | |
Sprouts Farmers Market, Inc. (a) | | | 56,014 | | | | 1,045,781 | |
U.S. Foods Holding Corp. (a) | | | 18,145 | | | | 493,544 | |
Whole Foods Market, Inc. | | | 132,555 | | | | 4,005,812 | |
| | | | | | | | |
| | | | | | | | 9,814,497 | |
| | | | | | | | |
| Common Stocks | | Shares | | | Value | |
Food Products — 2.9% | | | | | |
Blue Buffalo Pet Products, Inc. (a) | | | 23,965 | | | $ | 581,151 | |
Bunge Ltd. | | | 57,948 | | | | 4,010,581 | |
Campbell Soup Co. | | | 77,633 | | | | 4,831,102 | |
Conagra Brands, Inc. | | | 182,152 | | | | 7,120,322 | |
Flowers Foods, Inc. | | | 70,979 | | | | 1,427,388 | |
Hain Celestial Group, Inc. (a) | | | 42,320 | | | | 1,674,179 | |
Hershey Co. | | | 58,424 | | | | 6,161,979 | |
Hormel Foods Corp. | | | 112,673 | | | | 4,090,030 | |
Ingredion, Inc. | | | 29,910 | | | | 3,834,163 | |
J.M. Smucker Co. | | | 48,285 | | | | 6,559,517 | |
Kellogg Co. | | | 103,465 | | | | 7,522,940 | |
Lamb Weston Holdings, Inc. | | | 60,682 | | | | 2,267,080 | |
McCormick & Co., Inc. | | | 48,155 | | | | 4,601,210 | |
Mead Johnson Nutrition Co. | | | 77,806 | | | | 5,482,211 | |
Pilgrim’s Pride Corp. | | | 25,439 | | | | 486,903 | |
Pinnacle Foods, Inc. | | | 48,121 | | | | 2,559,556 | |
Post Holdings, Inc. (a) | | | 26,724 | | | | 2,236,264 | |
TreeHouse Foods, Inc. (a) | | | 22,789 | | | | 1,729,229 | |
Tyson Foods, Inc., Class A | | | 121,508 | | | | 7,629,487 | |
WhiteWave Foods Co. (a) | | | 72,396 | | | | 3,986,124 | |
| | | | | | | | |
| | | | | | | | 78,791,416 | |
Gas Utilities — 0.3% | |
Atmos Energy Corp. | | | 42,319 | | | | 3,223,861 | |
National Fuel Gas Co. | | | 30,903 | | | | 1,735,204 | |
UGI Corp. | | | 71,819 | | | | 3,330,247 | |
| | | | | | | | |
| | | | | | | | 8,289,312 | |
Health Care Equipment & Supplies — 2.9% | |
ABIOMED, Inc. (a) | | | 16,506 | | | | 1,755,743 | |
Alere, Inc. (a) | | | 36,002 | | | | 1,332,074 | |
Align Technology, Inc. (a) | | | 30,332 | | | | 2,781,141 | |
C.R. Bard, Inc. | | | 30,623 | | | | 7,267,757 | |
Cooper Cos., Inc. | | | 19,817 | | | | 3,658,416 | |
Dentsply Sirona, Inc. | | | 95,642 | | | | 5,422,901 | |
DexCom, Inc. (a) | | | 34,182 | | | | 2,705,505 | |
Edwards Lifesciences Corp. (a) | | | 87,976 | | | | 8,466,810 | |
Hill-Rom Holdings, Inc. | | | 27,222 | | | | 1,602,559 | |
Hologic, Inc. (a) | | | 116,139 | | | | 4,707,114 | |
IDEXX Laboratories, Inc. (a) | | | 36,966 | | | | 4,522,051 | |
Intuitive Surgical, Inc. (a) | | | 15,744 | | | | 10,905,711 | |
ResMed, Inc. | | | 57,958 | | | | 3,914,483 | |
Teleflex, Inc. | | | 18,184 | | | | 3,050,002 | |
Varex Imaging Corp. (a) | | | 15,622 | | | | 449,133 | |
Varian Medical Systems, Inc. (a) | | | 39,724 | | | | 3,084,569 | |
West Pharmaceutical Services, Inc. | | | 29,636 | | | | 2,508,095 | |
Zimmer Biomet Holdings, Inc. | | | 76,930 | | | | 9,103,127 | |
| | | | | | | | |
| | | | | | | | 77,237,191 | |
Health Care Providers & Services — 2.0% | |
Acadia Healthcare Co., Inc. (a) | | | 30,318 | | | | 1,163,302 | |
AmerisourceBergen Corp. | | | 68,556 | | | | 5,983,568 | |
Brookdale Senior Living, Inc. (a) | | | 76,841 | | | | 1,150,310 | |
Centene Corp. (a) | | | 69,631 | | | | 4,405,553 | |
DaVita, Inc. (a) | | | 69,762 | | | | 4,447,327 | |
Envision Healthcare Corp. (a) | | | 48,328 | | | | 3,286,304 | |
Henry Schein, Inc. (a) | | | 34,068 | | | | 5,446,110 | |
Laboratory Corp. of America Holdings (a) | | | 42,599 | | | | 5,717,212 | |
LifePoint Health, Inc. (a) | | | 15,596 | | | | 925,622 | |
MEDNAX, Inc. (a) | | | 38,072 | | | | 2,602,221 | |
Patterson Cos., Inc. | | | 34,877 | | | | 1,451,232 | |
Premier, Inc., Class A (a) | | | 19,117 | | | | 609,068 | |
Quest Diagnostics, Inc. | | | 58,978 | | | | 5,421,258 | |
Tenet Healthcare Corp. (a) | | | 33,669 | | | | 592,238 | |
Universal Health Services, Inc., Class B | | | 35,641 | | | | 4,014,246 | |
VCA, Inc. (a) | | | 32,343 | | | | 2,930,276 | |
WellCare Health Plans, Inc. (a) | | | 18,640 | | | | 2,712,865 | |
| | | | | | | | |
| | | | | | | | 52,858,712 | |
See Notes to Financial Statements.
| | | | | | |
| | | | | | | |
| | BLACKROCK FUNDS | | JANUARY 31, 2017 | | 19 |
| | |
Schedule of Investments (continued) | | BlackRock Midcap Index Fund |
| | | | | | | | |
| Common Stocks | | Shares | | | Value | |
Health Care Technology — 0.4% | | | | | |
athenahealth, Inc. (a) | | | 16,172 | | | $ | 2,037,510 | |
Cerner Corp. (a) | | | 122,500 | | | | 6,579,475 | |
Inovalon Holdings, Inc., Class A (a) | | | 24,032 | | | | 277,570 | |
Veeva Systems, Inc., Class A (a) | | | 39,927 | | | | 1,690,110 | |
| | | | | | | | |
| | | | | | | | 10,584,665 | |
Hotels, Restaurants & Leisure — 2.5% | |
Aramark | | | 100,793 | | | | 3,410,835 | |
Brinker International, Inc. | | | 20,928 | | | | 931,296 | |
Chipotle Mexican Grill, Inc. (a) | | | 11,758 | | | | 4,955,291 | |
Choice Hotels International, Inc. | | | 13,611 | | | | 755,410 | |
Darden Restaurants, Inc. | | | 48,521 | | | | 3,555,619 | |
Domino’s Pizza, Inc. | | | 20,796 | | | | 3,629,734 | |
Dunkin’ Brands Group, Inc. | | | 38,051 | | | | 1,973,705 | |
Extended Stay America, Inc. | | | 29,343 | | | | 475,650 | |
Hilton Grand Vacations, Inc. (a) | | | 21,254 | | | | 623,380 | |
Hilton Worldwide Holdings, Inc. | | | 72,657 | | | | 4,183,590 | |
Hyatt Hotels Corp., Class A (a) | | | 13,679 | | | | 748,378 | |
International Game Technology PLC | | | 39,771 | | | | 1,050,352 | |
Marriott International, Inc., Class A | | | 134,045 | | | | 11,340,207 | |
MGM Resorts International (a) | | | 197,397 | | | | 5,685,034 | |
Norwegian Cruise Line Holdings Ltd. (a) | | | 66,238 | | | | 3,113,186 | |
Panera Bread Co., Class A (a) | | | 9,280 | | | | 1,940,077 | |
Royal Caribbean Cruises Ltd. | | | 70,190 | | | | 6,571,890 | |
Six Flags Entertainment Corp. | | | 29,773 | | | | 1,773,875 | |
Vail Resorts, Inc. | | | 16,011 | | | | 2,746,527 | |
Wendy’s Co. | | | 88,086 | | | | 1,191,804 | |
Wyndham Worldwide Corp. | | | 45,731 | | | | 3,615,493 | |
Wynn Resorts Ltd. | | | 33,508 | | | | 3,398,716 | |
| | | | | | | | |
| | | | | | | | 67,670,049 | |
Household Durables — 1.8% | |
CalAtlantic Group, Inc. | | | 31,462 | | | | 1,097,080 | |
D.R. Horton, Inc. | | | 140,573 | | | | 4,204,538 | |
Garmin Ltd. | | | 46,334 | | | | 2,237,469 | |
Harman International Industries, Inc. | | | 29,405 | | | | 3,268,660 | |
Leggett & Platt, Inc. | | | 55,036 | | | | 2,626,318 | |
Lennar Corp., Class A | | | 73,657 | | | | 3,288,785 | |
Lennar Corp., Class B | | | 6,095 | | | | 219,176 | |
Mohawk Industries, Inc. (a) | | | 25,683 | | | | 5,543,419 | |
Newell Brands, Inc. | | | 196,036 | | | | 9,278,384 | |
NVR, Inc. (a) | | | 1,454 | | | | 2,701,532 | |
PulteGroup, Inc. | | | 143,486 | | | | 3,086,384 | |
Tempur Sealy International, Inc. (a) | | | 22,151 | | | | 952,493 | |
Toll Brothers, Inc. (a) | | | 64,275 | | | | 2,015,664 | |
Tupperware Brands Corp. | | | 21,071 | | | | 1,271,846 | |
Whirlpool Corp. | | | 30,950 | | | | 5,412,845 | |
| | | | | | | | |
| | | | | | | | 47,204,593 | |
Household Products — 0.5% | |
Church & Dwight Co., Inc. | | | 106,885 | | | | 4,833,340 | |
Clorox Co. | | | 53,970 | | | | 6,476,400 | |
Energizer Holdings, Inc. | | | 25,702 | | | | 1,297,180 | |
Spectrum Brands Holdings, Inc. | | | 10,257 | | | | 1,368,181 | |
| | | | | | | | |
| | | | | | | | 13,975,101 | |
Independent Power and Renewable Electricity Producers — 0.3% | |
AES Corp. | | | 274,158 | | | | 3,136,367 | |
Calpine Corp. (a) | | | 149,140 | | | | 1,759,852 | |
NRG Energy, Inc. | | | 129,561 | | | | 2,142,939 | |
| | | | | | | | |
| | | | | | | | 7,039,158 | |
Industrial Conglomerates — 0.5% | |
BWX Technologies, Inc. | | | 38,762 | | | | 1,608,235 | |
Carlisle Cos., Inc. | | | 26,279 | | | | 2,867,302 | |
Roper Technologies, Inc. | | | 41,586 | | | | 7,978,274 | |
| | | | | | | | |
| | | | | | | | 12,453,811 | |
| | | | | | | | |
| Common Stocks | | Shares | | | Value | |
Insurance — 4.3% | | | | | |
Alleghany Corp. (a) | | | 5,676 | | | $ | 3,471,271 | |
Allied World Assurance Co. Holdings AG | | | 36,518 | | | | 1,940,201 | |
American Financial Group, Inc. | | | 29,502 | | | | 2,542,187 | |
American National Insurance Co. | | | 3,272 | | | | 381,482 | |
AmTrust Financial Services, Inc. | | | 37,389 | | | | 986,696 | |
Arch Capital Group Ltd. (a) | | | 48,431 | | | | 4,278,879 | |
Arthur J Gallagher & Co. | | | 73,295 | | | | 3,945,470 | |
Aspen Insurance Holdings Ltd. | | | 26,029 | | | | 1,468,036 | |
Assurant, Inc. | | | 24,200 | | | | 2,350,546 | |
Assured Guaranty Ltd. | | | 56,911 | | | | 2,214,407 | |
Axis Capital Holdings Ltd. | | | 39,592 | | | | 2,534,284 | |
Brown & Brown, Inc. | | | 48,656 | | | | 2,049,877 | |
Cincinnati Financial Corp. | | | 62,834 | | | | 4,434,824 | |
CNA Financial Corp. | | | 13,113 | | | | 546,156 | |
Endurance Specialty Holdings Ltd. | | | 26,266 | | | | 2,434,596 | |
Erie Indemnity Co., Class A | | | 9,786 | | | | 1,097,108 | |
Everest Re Group Ltd. | | | 15,450 | | | | 3,397,919 | |
First American Financial Corp. | | | 44,359 | | | | 1,667,011 | |
FNF Group | | | 109,753 | | | | 3,880,866 | |
Hanover Insurance Group, Inc. | | | 17,942 | | | | 1,506,051 | |
Hartford Financial Services Group, Inc. | | | 163,712 | | | | 7,974,412 | |
Lincoln National Corp. | | | 99,639 | | | | 6,726,629 | |
Loews Corp. | | | 116,814 | | | | 5,441,196 | |
Markel Corp. (a) | | | 5,739 | | | | 5,308,575 | |
Mercury General Corp. | | | 7,488 | | | | 473,616 | |
Old Republic International Corp. | | | 100,601 | | | | 2,092,501 | |
Principal Financial Group, Inc. | | | 111,648 | | | | 6,373,984 | |
ProAssurance Corp. | | | 20,924 | | | | 1,138,266 | |
Progressive Corp. | | | 243,759 | | | | 9,126,337 | |
Reinsurance Group of America, Inc. | | | 25,450 | | | | 3,193,212 | |
RenaissanceRe Holdings Ltd. | | | 15,515 | | | | 2,115,005 | |
Torchmark Corp. | | | 49,819 | | | | 3,663,689 | |
Unum Group | | | 99,460 | | | | 4,518,468 | |
Validus Holdings Ltd. | | | 32,680 | | | | 1,862,760 | |
W.R. Berkley Corp. | | | 41,111 | | | | 2,763,070 | |
White Mountains Insurance Group Ltd. | | | 1,816 | | | | 1,652,124 | |
XL Group Ltd. | | | 110,610 | | | | 4,155,618 | |
| | | | | | | | |
| | | | | | | | 115,707,329 | |
Internet & Direct Marketing Retail — 0.6% | |
Expedia, Inc. | | | 49,718 | | | | 6,045,212 | |
Groupon, Inc. (a) | | | 147,930 | | | | 510,359 | |
Liberty Expedia Holdings, Inc., Class A (a) | | | 22,615 | | | | 995,286 | |
Liberty Interactive Corp QVC Group, Series A (a) | | | 184,585 | | | | 3,540,340 | |
Liberty Ventures (a) | | | 33,222 | | | | 1,450,140 | |
TripAdvisor, Inc. (a) | | | 47,339 | | | | 2,504,233 | |
| | | | | | | | |
| | | | | | | | 15,045,570 | |
Internet Software & Services — 0.9% | |
Akamai Technologies, Inc. (a) | | | 71,738 | | | | 4,920,510 | |
CommerceHub, Inc., Series A (a) | | | 13,222 | | | | 194,231 | |
CommerceHub, Inc., Series C (a) | | | 11,894 | | | | 173,415 | |
CoStar Group, Inc. (a) | | | 13,281 | | | | 2,684,090 | |
GoDaddy, Inc., Class A (a) | | | 18,775 | | | | 670,831 | |
IAC/InterActiveCorp (a) | | | 29,195 | | | | 2,008,908 | |
Match Group, Inc. (a)(b) | | | 11,955 | | | | 207,658 | |
Nutanix, Inc., Class A (a)(b) | | | 5,953 | | | | 180,197 | |
Pandora Media, Inc. (a) | | | 91,652 | | | | 1,191,476 | |
Twilio, Inc. (a) | | | 7,777 | | | | 224,211 | |
Twitter, Inc. (a) | | | 263,362 | | | | 4,640,439 | |
VeriSign, Inc. (a) | | | 39,439 | | | | 3,163,402 | |
Yelp, Inc. (a) | | | 28,689 | | | | 1,198,626 | |
Zillow Group, Inc., Class A (a) | | | 20,938 | | | | 753,349 | |
Zillow Group, Inc., Class C (a) | | | 43,001 | | | | 1,521,375 | |
| | | | | | | | |
| | | | | | | | 23,732,718 | |
See Notes to Financial Statements.
| | | | | | |
| | | | | | | |
| 20 | | BLACKROCK FUNDS | | JANUARY 31, 2017 | | |
| | |
Schedule of Investments (continued) | | BlackRock Midcap Index Fund |
| | | | | | | | |
| Common Stocks | | Shares | | | Value | |
IT Services — 3.7% | | | | | |
Alliance Data Systems Corp. | | | 24,044 | | | $ | 5,491,169 | |
Amdocs Ltd. | | | 61,924 | | | | 3,635,558 | |
Black Knight Financial Services, Inc., Class A (a) | | | 9,785 | | | | 356,663 | |
Booz Allen Hamilton Holding Corp. | | | 47,225 | | | | 1,597,149 | |
Broadridge Financial Solutions, Inc. | | | 49,165 | | | | 3,270,947 | |
Computer Sciences Corp. | | �� | 57,763 | | | | 3,592,859 | |
Conduent, Inc. (a) | | | 83,957 | | | | 1,255,997 | |
CoreLogic, Inc. (a) | | | 36,927 | | | | 1,302,415 | |
CSRA, Inc. | | | 67,886 | | | | 2,105,824 | |
DST Systems, Inc. | | | 13,650 | | | | 1,571,798 | |
Euronet Worldwide, Inc. (a) | | | 20,725 | | | | 1,482,252 | |
Fidelity National Information Services, Inc. | | | 135,360 | | | | 10,750,291 | |
First Data Corp., Class A (a) | | | 129,676 | | | | 1,989,230 | |
Fiserv, Inc. (a) | | | 92,488 | | | | 9,935,986 | |
FleetCor Technologies, Inc. (a) | | | 38,167 | | | | 5,629,251 | |
Gartner, Inc. (a) | | | 33,334 | | | | 3,312,066 | |
Genpact Ltd. (a) | | | 62,621 | | | | 1,545,486 | |
Global Payments, Inc. | | | 64,017 | | | | 4,947,234 | |
Jack Henry & Associates, Inc. | | | 32,723 | | | | 2,937,871 | |
Leidos Holdings, Inc. | | | 55,376 | | | | 2,675,768 | |
Paychex, Inc. | | | 134,287 | | | | 8,096,163 | |
Sabre Corp. | | | 85,974 | | | | 2,106,363 | |
Square, Inc., Class A (a) | | | 21,063 | | | | 307,941 | |
Teradata Corp. (a) | | | 53,797 | | | | 1,579,480 | |
Total System Services, Inc. | | | 69,193 | | | | 3,506,701 | |
Vantiv, Inc., Class A (a) | | | 64,555 | | | | 4,017,903 | |
VeriFone Systems, Inc. (a) | | | 46,570 | | | | 846,177 | |
Western Union Co. | | | 205,321 | | | | 4,020,185 | |
WEX, Inc. (a) | | | 16,047 | | | | 1,834,654 | |
Xerox Corp. | | | 418,645 | | | | 2,901,210 | |
| | | | | | | | |
| | | | | | | | 98,602,591 | |
Leisure Products — 0.5% | |
Brunswick Corp. | | | 37,631 | | | | 2,252,592 | |
Hasbro, Inc. | | | 46,767 | | | | 3,858,745 | |
Mattel, Inc. | | | 141,911 | | | | 3,719,487 | |
Polaris Industries, Inc. | | | 25,043 | | | | 2,105,365 | |
Vista Outdoor, Inc. (a) | | | 24,358 | | | | 701,754 | |
| | | | | | | | |
| | | | | | | | 12,637,943 | |
Life Sciences Tools & Services — 1.6% | |
Agilent Technologies, Inc. | | | 135,100 | | | | 6,615,847 | |
Bio-Rad Laboratories, Inc., Class A (a) | | | 8,623 | | | | 1,639,060 | |
Bio-Techne Corp. | | | 15,247 | | | | 1,551,382 | |
Bruker Corp. | | | 44,091 | | | | 1,046,279 | |
Charles River Laboratories International, Inc. (a) | | | 19,641 | | | | 1,586,993 | |
Illumina, Inc. (a) | | | 60,914 | | | | 9,752,331 | |
Mettler-Toledo International, Inc. (a) | | | 10,935 | | | | 4,665,199 | |
Patheon NV (a) | | | 13,350 | | | | 383,012 | |
PerkinElmer, Inc. | | | 45,138 | | | | 2,400,890 | |
QIAGEN NV (a) | | | 91,227 | | | | 2,643,759 | |
Quintiles IMS Holdings, Inc. (a) | | | 58,346 | | | | 4,579,578 | |
VWR Corp. (a) | | | 31,308 | | | | 811,190 | |
Waters Corp. (a) | | | 31,971 | | | | 4,528,692 | |
| | | | | | | | |
| | | | | | | | 42,204,212 | |
Machinery — 3.8% | |
AGCO Corp. | | | 28,929 | | | | 1,816,741 | |
Colfax Corp. (a) | | | 40,858 | | | | 1,593,462 | |
Crane Co. | | | 20,225 | | | | 1,457,009 | |
Cummins, Inc. | | | 65,832 | | | | 9,677,962 | |
Donaldson Co., Inc. | | | 52,610 | | | | 2,222,773 | |
Dover Corp. | | | 63,801 | | | | 4,960,528 | |
Flowserve Corp. | | | 54,019 | | | | 2,655,574 | |
Graco, Inc. | | | 23,093 | | | | 2,068,902 | |
IDEX Corp. | | | 31,633 | | | | 2,852,031 | |
Ingersoll-Rand PLC | | | 107,316 | | | | 8,515,525 | |
| | | | | | | | |
| Common Stocks | | Shares | | | Value | |
Machinery (continued) | | | | | |
ITT, Inc. | | | 37,516 | | | $ | 1,533,279 | |
Lincoln Electric Holdings, Inc. | | | 25,407 | | | | 2,118,182 | |
Manitowoc Foodservice, Inc. (a) | | | 52,303 | | | | 1,003,172 | |
Middleby Corp. (a) | | | 23,404 | | | | 3,140,349 | |
Nordson Corp. | | | 23,727 | | | | 2,693,726 | |
Oshkosh Corp. | | | 30,297 | | | | 2,109,580 | |
PACCAR, Inc. | | | 142,623 | | | | 9,599,954 | |
Parker Hannifin Corp. | | | 55,673 | | | | 8,191,168 | |
Pentair PLC | | | 69,180 | | | | 4,056,023 | |
Snap-on, Inc. | | | 24,099 | | | | 4,374,691 | |
Stanley Black & Decker, Inc. | | | 62,318 | | | | 7,727,432 | |
Terex Corp. | | | 43,905 | | | | 1,396,179 | |
Timken Co. | | | 29,358 | | | | 1,303,495 | |
Toro Co. | | | 44,460 | | | | 2,620,028 | |
Trinity Industries, Inc. | | | 62,050 | | | | 1,708,857 | |
Valmont Industries, Inc. | | | 9,256 | | | | 1,332,864 | |
WABCO Holdings, Inc. (a) | | | 21,964 | | | | 2,394,735 | |
Wabtec Corp. | | | 36,043 | | | | 3,122,766 | |
Xylem, Inc. | | | 74,837 | | | | 3,690,212 | |
| | | | | | | | |
| | | | | | | | 101,937,199 | |
Marine — 0.1% | |
Kirby Corp. (a) | | | 21,946 | | | | 1,414,420 | |
Media — 2.0% | |
AMC Networks, Inc., Class A (a) | | | 24,684 | | | | 1,415,627 | |
Cable One, Inc. | | | 1,956 | | | | 1,236,935 | |
Cinemark Holdings, Inc. | | | 44,112 | | | | 1,874,760 | |
Clear Channel Outdoor Holdings, Inc., Class A | | | 14,126 | | | | 69,924 | |
Discovery Communications, Inc., Class A (a) | | | 61,949 | | | | 1,756,254 | |
Discovery Communications, Inc., Class C (a) | | | 92,932 | | | | 2,575,146 | |
Interpublic Group of Cos., Inc. | | | 167,175 | | | | 3,933,628 | |
John Wiley & Sons, Inc., Class A | | | 18,760 | | | | 1,033,676 | |
Liberty Broadband Corp., Class A (a) | | | 10,345 | | | | 865,670 | |
Liberty Broadband Corp., Class C (a) | | | 43,213 | | | | 3,687,797 | |
Liberty Media Corp. — Liberty SiriusXM, Class A (a) | | | 38,186 | | | | 1,383,861 | |
Liberty Media Corp. — Liberty SiriusXM, Class C (a) | | | 75,933 | | | | 2,725,235 | |
Lions Gate Entertainment Corp., Class A | | | 20,241 | | | | 582,334 | |
Lions Gate Entertainment Corp., Class B (a) | | | 43,013 | | | | 1,152,318 | |
Live Nation Entertainment, Inc. (a) | | | 54,537 | | | | 1,560,849 | |
Madison Square Garden Co., Class A (a) | | | 8,094 | | | | 1,421,873 | |
News Corp., Class A | | | 156,546 | | | | 1,923,950 | |
News Corp., Class B | | | 51,247 | | | | 648,275 | |
Omnicom Group, Inc. | | | 98,475 | | | | 8,434,384 | |
Regal Entertainment Group, Class A | | | 32,562 | | | | 737,855 | |
Scripps Networks Interactive, Inc., Class A | | | 34,307 | | | | 2,612,821 | |
Sirius XM Holdings, Inc. | | | 740,307 | | | | 3,494,249 | |
TEGNA, Inc. | | | 90,477 | | | | 2,072,828 | |
Tribune Media Co., Class A | | | 32,698 | | | | 943,010 | |
Viacom, Inc., Class A | | | 4,340 | | | | 196,385 | |
Viacom, Inc., Class B | | | 143,494 | | | | 6,046,837 | |
| | | | | | | | |
| | | | | | | | 54,386,481 | |
Metals & Mining — 1.5% | |
Alcoa Corp. | | | 60,811 | | | | 2,216,561 | |
Compass Minerals International, Inc. | | | 14,166 | | | | 1,184,278 | |
Freeport-McMoRan, Inc. (a) | | | 553,119 | | | | 9,209,431 | |
Newmont Mining Corp. | | | 221,115 | | | | 8,022,052 | |
Nucor Corp. | | | 132,503 | | | | 7,697,099 | |
Reliance Steel & Aluminum Co. | | | 28,851 | | | | 2,297,982 | |
Royal Gold, Inc. | | | 27,122 | | | | 1,957,395 | |
Southern Copper Corp. | | | 34,843 | | | | 1,336,578 | |
Steel Dynamics, Inc. | | | 97,668 | | | | 3,302,155 | |
Tahoe Resources, Inc. | | | 126,717 | | | | 1,158,193 | |
United States Steel Corp. | | | 63,991 | | | | 2,093,146 | |
| | | | | | | | |
| | | | | | | | 40,474,870 | |
See Notes to Financial Statements.
| | | | | | |
| | | | | | | |
| | BLACKROCK FUNDS | | JANUARY 31, 2017 | | 21 |
| | |
Schedule of Investments (continued) | | BlackRock Midcap Index Fund |
| | | | | | | | |
| Common Stocks | | Shares | | | Value | |
Multi-Utilities — 2.8% | | | | | |
Alliant Energy Corp. | | | 95,014 | | | $ | 3,577,277 | |
Ameren Corp. | | | 101,159 | | | | 5,326,021 | |
CenterPoint Energy, Inc. | | | 179,897 | | | | 4,715,100 | |
CMS Energy Corp. | | | 116,126 | | | | 4,946,968 | |
Consolidated Edison, Inc. | | | 127,222 | | | | 9,458,956 | |
DTE Energy Co. | | | 74,742 | | | | 7,372,551 | |
MDU Resources Group, Inc. | | | 80,651 | | | | 2,367,107 | |
NiSource, Inc. | | | 132,303 | | | | 2,959,618 | |
Public Service Enterprise Group, Inc. | | | 210,355 | | | | 9,308,209 | |
SCANA Corp. | | | 54,349 | | | | 3,733,776 | |
Sempra Energy | | | 104,163 | | | | 10,665,250 | |
Vectren Corp. | | | 34,427 | | | | 1,889,698 | |
WEC Energy Group, Inc. | | | 131,883 | | | | 7,787,691 | |
| | | | | | | | |
| | | | | | | | 74,108,222 | |
Multiline Retail — 1.1% | |
Burlington Stores, Inc. (a) | | | 29,238 | | | | 2,447,221 | |
Dillard’s, Inc., Class A | | | 7,129 | | | | 402,361 | |
Dollar General Corp. | | | 118,576 | | | | 8,753,280 | |
Dollar Tree, Inc. (a) | | | 94,411 | | | | 7,287,585 | |
JC Penney Co., Inc. (a) | | | 130,652 | | | | 868,836 | |
Kohl’s Corp. | | | 76,908 | | | | 3,063,246 | |
Macy’s, Inc. | | | 128,519 | | | | 3,796,451 | |
Nordstrom, Inc. | | | 51,219 | | | | 2,264,904 | |
| | | | | | | | |
| | | | | | | | 28,883,884 | |
Oil, Gas & Consumable Fuels — 4.8% | |
Antero Resources Corp. (a) | | | 75,298 | | | | 1,838,024 | |
Cabot Oil & Gas Corp. | | | 192,468 | | | | 4,134,213 | |
Cheniere Energy, Inc. (a) | | | 83,272 | | | | 3,967,911 | |
Chesapeake Energy Corp. (a) | | | 253,629 | | | | 1,635,907 | |
Cimarex Energy Co. | | | 39,109 | | | | 5,287,928 | |
Concho Resources, Inc. (a) | | | 58,856 | | | | 8,206,881 | |
CONSOL Energy, Inc. | | | 94,662 | | | | 1,603,574 | |
Continental Resources, Inc. (a) | | | 36,342 | | | | 1,764,767 | |
Devon Energy Corp. | | | 217,956 | | | | 9,925,716 | |
Diamondback Energy, Inc. (a) | | | 37,669 | | | | 3,961,649 | |
Energen Corp. (a) | | | 40,531 | | | | 2,184,216 | |
EQT Corp. | | | 71,938 | | | | 4,361,601 | |
Extraction Oil & Gas, Inc. (a) | | | 18,124 | | | | 324,782 | |
Gulfport Energy Corp. (a) | | | 66,349 | | | | 1,386,694 | |
Hess Corp. | | | 117,612 | | | | 6,372,218 | |
HollyFrontier Corp. | | | 67,430 | | | | 1,953,447 | |
Kosmos Energy Ltd. (a) | | | 62,538 | | | | 408,998 | |
Laredo Petroleum, Inc. (a) | | | 61,432 | | | | 832,404 | |
Marathon Oil Corp. | | | 353,647 | | | | 5,923,587 | |
Marathon Petroleum Corp. | | | 219,284 | | | | 10,536,596 | |
Murphy Oil Corp. | | | 68,138 | | | | 1,969,870 | |
Murphy USA, Inc. (a) | | | 15,689 | | | | 999,389 | |
Newfield Exploration Co. (a) | | | 82,958 | | | | 3,324,957 | |
Noble Energy, Inc. | | | 177,572 | | | | 7,060,263 | |
ONEOK, Inc. | | | 87,502 | | | | 4,822,235 | |
Parsley Energy, Inc., Class A (a) | | | 77,424 | | | | 2,726,873 | |
PBF Energy, Inc., Class A | | | 45,236 | | | | 1,049,023 | |
QEP Resources, Inc. (a) | | | 99,750 | | | | 1,739,640 | |
Range Resources Corp. | | | 85,804 | | | | 2,774,901 | |
Rice Energy, Inc. (a) | | | 45,491 | | | | 902,087 | |
SM Energy Co. | | | 40,304 | | | | 1,229,675 | |
Southwestern Energy Co. (a) | | | 204,380 | | | | 1,841,464 | |
Targa Resources Corp. | | | 68,744 | | | | 3,961,029 | |
Tesoro Corp. | | | 49,761 | | | | 4,023,177 | |
Whiting Petroleum Corp. (a) | | | 85,390 | | | | 946,975 | |
Williams Cos., Inc. | | | 312,053 | | | | 8,999,608 | |
World Fuel Services Corp. | | | 28,897 | | | | 1,285,339 | |
WPX Energy, Inc. (a) | | | 160,225 | | | | 2,231,934 | |
| | | | | | | | |
| | | | | | | | 128,499,552 | |
| | | | | | | | |
| Common Stocks | | Shares | | | Value | |
Paper & Forest Products — 0.0% | |
Domtar Corp. | | | 25,013 | | | $ | 1,092,818 | |
Personal Products — 0.3% | |
Coty, Inc., Class A | | | 190,035 | | | | 3,648,672 | |
Edgewell Personal Care Co. (a) | | | 24,531 | | | | 1,934,024 | |
Herbalife Ltd. (a) | | | 30,744 | | | | 1,727,813 | |
Nu Skin Enterprises, Inc., Class A | | | 23,201 | | | | 1,203,668 | |
| | | | | | | | |
| | | | | | | | 8,514,177 | |
Pharmaceuticals — 0.7% | |
Akorn, Inc. (a) | | | 33,794 | | | | 645,465 | |
Endo International PLC (a) | | | 87,043 | | | | 1,065,406 | |
Mallinckrodt PLC (a) | | | 45,567 | | | | 2,220,480 | |
Perrigo Co. PLC | | | 57,326 | | | | 4,365,375 | |
Zoetis, Inc. | | | 189,938 | | | | 10,435,194 | |
| | | | | | | | |
| | | | | | | | 18,731,920 | |
Professional Services — 0.9% | |
Dun & Bradstreet Corp. | | | 15,115 | | | | 1,853,401 | |
Equifax, Inc. | | | 49,378 | | | | 5,791,052 | |
ManpowerGroup, Inc. | | | 27,825 | | | | 2,656,174 | |
Nielsen Holdings PLC | | | 150,093 | | | | 6,140,305 | |
Robert Half International, Inc. | | | 53,005 | | | | 2,494,415 | |
TransUnion (a) | | | 21,828 | | | | 688,237 | |
Verisk Analytics, Inc. (a) | | | 63,948 | | | | 5,284,663 | |
| | | | | | | | |
| | | | | | | | 24,908,247 | |
Real Estate Investment Trusts (REITs) — 9.5% | |
AGNC Investment Corp. | | | 137,723 | | | | 2,571,288 | |
Alexandria Real Estate Equities, Inc. | | | 32,293 | | | | 3,578,710 | |
American Campus Communities, Inc. | | | 54,425 | | | | 2,646,144 | |
American Homes 4 Rent, Class A | | | 69,397 | | | | 1,546,165 | |
Annaly Capital Management, Inc. | | | 423,705 | | | | 4,330,265 | |
Apartment Investment & Management Co., Class A | | | 64,890 | | | | 2,859,702 | |
Apple Hospitality REIT, Inc. | | | 68,468 | | | | 1,370,729 | |
AvalonBay Communities, Inc. | | | 57,176 | | | | 9,909,173 | |
Boston Properties, Inc. | | | 63,787 | | | | 8,349,718 | |
Brandywine Realty Trust | | | 72,263 | | | | 1,163,434 | |
Brixmor Property Group, Inc. | | | 79,399 | | | | 1,915,898 | |
Camden Property Trust | | | 35,867 | | | | 2,997,405 | |
Care Capital Properties, Inc. | | | 35,677 | | | | 881,579 | |
Chimera Investment Corp. | | | 81,824 | | | | 1,442,557 | |
Columbia Property Trust, Inc. | | | 52,147 | | | | 1,160,271 | |
Communications Sales & Leasing, Inc. | | | 50,972 | | | | 1,339,544 | |
CoreCivic, Inc. | | | 46,897 | | | | 1,361,889 | |
Corporate Office Properties Trust | | | 39,531 | | | | 1,257,876 | |
CubeSmart | | | 73,837 | | | | 1,855,524 | |
CyrusOne, Inc. | | | 29,418 | | | | 1,416,771 | |
DCT Industrial Trust, Inc. | | | 37,605 | | | | 1,680,568 | |
DDR Corp. | | | 127,217 | | | | 1,931,154 | |
Digital Realty Trust, Inc. | | | 66,383 | | | | 7,144,802 | |
Douglas Emmett, Inc. | | | 58,061 | | | | 2,197,028 | |
Duke Realty Corp. | | | 144,534 | | | | 3,516,512 | |
Empire State Realty Trust, Inc., Class A | | | 51,118 | | | | 1,047,408 | |
EPR Properties | | | 26,289 | | | | 1,944,597 | |
Equinix, Inc. | | | 28,865 | | | | 11,112,448 | |
Equity Commonwealth (a) | | | 50,880 | | | | 1,569,139 | |
Equity Lifestyle Properties, Inc. | | | 31,796 | | | | 2,350,996 | |
Equity One, Inc. | | | 38,416 | | | | 1,198,195 | |
Essex Property Trust, Inc. | | | 27,187 | | | | 6,098,044 | |
Extra Space Storage, Inc. | | | 50,230 | | | | 3,619,072 | |
Federal Realty Investment Trust | | | 29,457 | | | | 4,136,647 | |
Forest City Realty Trust, Inc., Class A | | | 94,967 | | | | 2,150,053 | |
Gaming and Leisure Properties, Inc. | | | 77,710 | | | | 2,457,967 | |
GGP, Inc. | | | 233,786 | | | | 5,807,244 | |
HCP, Inc. | | | 194,550 | | | | 5,898,756 | |
Healthcare Trust of America, Inc., Class A | | | 56,035 | | | | 1,628,937 | |
Highwoods Properties, Inc. | | | 39,828 | | | | 2,047,558 | |
See Notes to Financial Statements.
| | | | | | |
| | | | | | | |
| 22 | | BLACKROCK FUNDS | | JANUARY 31, 2017 | | |
| | |
Schedule of Investments (continued) | | BlackRock Midcap Index Fund |
| | | | | | | | |
| Common Stocks | | Shares | | | Value | |
Real Estate Investment Trusts (REITs) (continued) | |
Hospitality Properties Trust | | | 62,358 | | | $ | 1,941,205 | |
Host Hotels & Resorts, Inc. | | | 306,841 | | | | 5,544,617 | |
Kilroy Realty Corp. | | | 39,960 | | | | 2,991,006 | |
Kimco Realty Corp. | | | 167,983 | | | | 4,181,097 | |
Lamar Advertising Co., Class A | | | 34,145 | | | | 2,578,630 | |
Liberty Property Trust | | | 60,823 | | | | 2,334,995 | |
Life Storage, Inc. | | | 19,003 | | | | 1,547,794 | |
Macerich Co. | | | 59,738 | | | | 4,103,403 | |
MFA Financial, Inc. | | | 155,123 | | | | 1,223,921 | |
Mid-America Apartment Communities, Inc. | | | 47,033 | | | | 4,465,783 | |
National Retail Properties, Inc. | | | 59,582 | | | | 2,597,775 | |
Omega Healthcare Investors, Inc. | | | 76,726 | | | | 2,460,603 | |
Outfront Media, Inc. | | | 57,282 | | | | 1,571,245 | |
Paramount Group, Inc. | | | 75,476 | | | | 1,259,694 | |
Park Hotels & Resorts, Inc. | | | 42,508 | | | | 1,153,667 | |
Piedmont Office Realty Trust, Inc., Class A | | | 60,514 | | | | 1,314,364 | |
Prologis, Inc. | | | 217,675 | | | | 10,633,424 | |
Quality Care Properties, Inc. (a) | | | 37,982 | | | | 701,148 | |
Rayonier, Inc. | | | 51,916 | | | | 1,447,937 | |
Realty Income Corp. | | | 107,509 | | | | 6,410,762 | |
Regency Centers Corp. | | | 42,935 | | | | 2,993,858 | |
Retail Properties of America, Inc., Class A | | | 98,667 | | | | 1,477,045 | |
Senior Housing Properties Trust | | | 93,782 | | | | 1,786,547 | |
SL Green Realty Corp. | | | 40,625 | | | | 4,426,906 | |
Spirit Realty Capital, Inc. | | | 199,085 | | | | 2,094,374 | |
Starwood Property Trust, Inc. | | | 104,365 | | | | 2,323,165 | |
STORE Capital Corp. | | | 62,834 | | | | 1,486,652 | |
Sun Communities, Inc. | | | 27,779 | | | | 2,187,874 | |
Tanger Factory Outlet Centers, Inc. | | | 38,930 | | | | 1,331,017 | |
Taubman Centers, Inc. | | | 24,208 | | | | 1,714,895 | |
Two Harbors Investment Corp. | | | 144,768 | | | | 1,269,615 | |
UDR, Inc. | | | 110,184 | | | | 3,850,931 | |
Ventas, Inc. | | | 140,898 | | | | 8,689,180 | |
VEREIT, Inc. | | | 402,262 | | | | 3,431,295 | |
Vornado Realty Trust | | | 71,503 | | | | 7,601,484 | |
Weingarten Realty Investors | | | 48,241 | | | | 1,718,827 | |
Welltower, Inc. | | | 148,892 | | | | 9,871,540 | |
Weyerhaeuser Co. | | | 308,691 | | | | 9,671,289 | |
WP Carey, Inc. | | | 43,042 | | | | 2,666,022 | |
| | | | | | | | |
| | | | | | | | 254,547,353 | |
Real Estate Management & Development — 0.3% | |
CBRE Group, Inc., Class A (a) | | | 125,001 | | | | 3,795,030 | |
Howard Hughes Corp. (a) | | | 15,023 | | | | 1,601,602 | |
Jones Lang LaSalle, Inc. | | | 18,732 | | | | 1,929,958 | |
Realogy Holdings Corp. | | | 59,327 | | | | 1,537,163 | |
| | | | | | | | |
| | | | | | | | 8,863,753 | |
Road & Rail — 0.7% | |
AMERCO, Inc. | | | 2,578 | | | | 971,055 | |
Avis Budget Group, Inc. (a) | | | 33,518 | | | | 1,247,540 | |
Genesee & Wyoming, Inc., Class A (a) | | | 25,204 | | | | 1,899,374 | |
Hertz Global Holdings, Inc. (a) | | | 29,668 | | | | 622,138 | |
JB Hunt Transport Services, Inc. | | | 36,886 | | | | 3,654,665 | |
Kansas City Southern | | | 44,841 | | | | 3,852,290 | |
Landstar System, Inc. | | | 17,837 | | | | 1,509,010 | |
Old Dominion Freight Line, Inc. (a) | | | 28,067 | | | | 2,477,755 | |
Ryder System, Inc. | | | 22,270 | | | | 1,728,152 | |
| | | | | | | | |
| | | | | | | | 17,961,979 | |
Semiconductors & Semiconductor Equipment — 3.8% | |
Analog Devices, Inc. | | | 127,846 | | | | 9,580,779 | |
Cree, Inc. (a) | | | 41,493 | | | | 1,144,377 | |
Cypress Semiconductor Corp. | | | 129,259 | | | | 1,525,256 | |
First Solar, Inc. (a) | | | 32,052 | | | | 999,702 | |
KLA-Tencor Corp. | | | 64,976 | | | | 5,530,107 | |
Lam Research Corp. | | | 66,497 | | | | 7,637,845 | |
| | | | | | | | |
| Common Stocks | | Shares | | | Value | |
Semiconductors & Semiconductor Equipment (continued) | |
Linear Technology Corp. | | | 99,197 | | | $ | 6,262,307 | |
Marvell Technology Group Ltd. | | | 167,575 | | | | 2,491,840 | |
Maxim Integrated Products, Inc. | | | 117,653 | | | | 5,233,206 | |
Microchip Technology, Inc. | | | 87,553 | | | | 5,896,695 | |
Micron Technology, Inc. (a) | | | 431,717 | | | | 10,408,697 | |
NVIDIA Corp. | | | 212,226 | | | | 23,170,835 | |
ON Semiconductor Corp. (a) | | | 171,377 | | | | 2,282,742 | |
Qorvo, Inc. (a) | | | 53,421 | | | | 3,430,162 | |
Skyworks Solutions, Inc. | | | 79,076 | | | | 7,254,432 | |
SunPower Corp. (a)(b) | | | 22,929 | | | | 152,249 | |
Teradyne, Inc. | | | 84,450 | | | | 2,396,691 | |
Xilinx, Inc. | | | 105,772 | | | | 6,155,930 | |
| | | | | | | | |
| | | | | | | | 101,553,852 | |
Software — 3.3% | |
Allscripts Healthcare Solutions, Inc. (a) | | | 74,989 | | | | 878,121 | |
ANSYS, Inc. (a) | | | 36,651 | | | | 3,418,072 | |
Atlassian Corp. PLC, Class A (a) | | | 10,565 | | | | 291,911 | |
Autodesk, Inc. (a) | | | 88,228 | | | | 7,176,465 | |
CA, Inc. | | | 121,479 | | | | 3,798,648 | |
Cadence Design Systems, Inc. (a) | | | 125,002 | | | | 3,253,802 | |
CDK Global, Inc. | | | 64,780 | | | | 4,051,989 | |
Citrix Systems, Inc. (a) | | | 64,671 | | | | 5,897,348 | |
Electronic Arts, Inc. (a) | | | 121,285 | | | | 10,118,808 | |
FireEye, Inc. (a) | | | 64,452 | | | | 873,325 | |
Fortinet, Inc. (a) | | | 60,234 | | | | 2,003,383 | |
Guidewire Software, Inc. (a) | | | 30,072 | | | | 1,573,668 | |
Manhattan Associates, Inc. (a) | | | 29,803 | | | | 1,527,702 | |
Nuance Communications, Inc. (a) | | | 92,808 | | | | 1,471,935 | |
PTC, Inc. (a) | | | 47,424 | | | | 2,493,080 | |
Red Hat, Inc. (a) | | | 75,425 | | | | 5,723,249 | |
ServiceNow, Inc. (a) | | | 65,671 | | | | 5,951,106 | |
Splunk, Inc. (a) | | | 54,501 | | | | 3,153,428 | |
SS&C Technologies Holdings, Inc. | | | 69,978 | | | | 2,248,393 | |
Symantec Corp. | | | 255,661 | | | | 7,043,461 | |
Synopsys, Inc. (a) | | | 63,028 | | | | 3,963,831 | |
Tableau Software, Inc., Class A (a) | | | 22,376 | | | | 1,070,468 | |
Tyler Technologies, Inc. (a) | | | 13,765 | | | | 2,009,965 | |
Ultimate Software Group, Inc. (a) | | | 11,433 | | | | 2,214,115 | |
Workday, Inc., Class A (a) | | | 48,523 | | | | 4,031,776 | |
Zynga, Inc., Class A (a) | | | 295,693 | | | | 745,146 | |
| | | | | | | | |
| | | | | | | | 86,983,195 | |
Specialty Retail — 3.4% | |
Advance Auto Parts, Inc. | | | 29,497 | | | | 4,844,587 | |
AutoNation, Inc. (a) | | | 27,096 | | | | 1,439,340 | |
AutoZone, Inc. (a) | | | 12,266 | | | | 8,892,605 | |
Bed Bath & Beyond, Inc. | | | 61,824 | | | | 2,494,598 | |
Best Buy Co., Inc. | | | 115,458 | | | | 5,140,190 | |
Cabela’s, Inc. (a) | | | 20,878 | | | | 1,166,871 | |
CarMax, Inc. (a) | | | 80,498 | | | | 5,370,022 | |
CST Brands, Inc. | | | 30,946 | | | | 1,490,978 | |
Dick’s Sporting Goods, Inc. | | | 36,355 | | | | 1,875,918 | |
Foot Locker, Inc. | | | 56,206 | | | | 3,852,359 | |
GameStop Corp., Class A | | | 42,927 | | | | 1,051,282 | |
Gap, Inc. | | | 92,461 | | | | 2,129,377 | |
L Brands, Inc. | | | 100,831 | | | | 6,071,035 | |
Michaels Cos., Inc. (a) | | | 39,664 | | | | 780,191 | |
O’Reilly Automotive, Inc. (a) | | | 39,387 | | | | 10,330,029 | |
Penske Automotive Group, Inc. | | | 16,429 | | | | 893,080 | |
Ross Stores, Inc. | | | 164,003 | | | | 10,842,238 | |
Sally Beauty Holdings, Inc. (a) | | | 60,718 | | | | 1,445,088 | |
Signet Jewelers Ltd. | | | 28,977 | | | | 2,250,644 | |
Staples, Inc. | | | 267,828 | | | | 2,464,018 | |
Tiffany & Co. | | | 45,562 | | | | 3,586,641 | |
Tractor Supply Co. | | | 55,517 | | | | 4,089,937 | |
Ulta Salon Cosmetics & Fragrance, Inc. (a) | | | 24,385 | | | | 6,639,548 | |
See Notes to Financial Statements.
| | | | | | |
| | | | | | | |
| | BLACKROCK FUNDS | | JANUARY 31, 2017 | | 23 |
| | |
Schedule of Investments (continued) | | BlackRock Midcap Index Fund |
| | | | | | | | |
| Common Stocks | | Shares | | | Value | |
Specialty Retail (continued) | |
Urban Outfitters, Inc. (a) | | | 37,833 | | | $ | 1,004,088 | |
Williams-Sonoma, Inc. | | | 36,710 | | | | 1,769,789 | |
| | | | | | | | |
| | | | | | | | 91,914,453 | |
Technology Hardware, Storage & Peripherals — 0.6% | |
NCR Corp. (a) | | | 51,369 | | | | 2,209,894 | |
NetApp, Inc. | | | 120,678 | | | | 4,624,381 | |
Western Digital Corp. | | | 117,607 | | | | 9,376,806 | |
| | | | | | | | |
| | | | | | | | 16,211,081 | |
Textiles, Apparel & Luxury Goods — 1.0% | |
Carter’s, Inc. | | | 20,796 | | | | 1,741,665 | |
Coach, Inc. | | | 115,988 | | | | 4,332,152 | |
Hanesbrands, Inc. | | | 156,962 | | | | 3,721,569 | |
Kate Spade & Co. (a) | | | 53,209 | | | | 984,899 | |
lululemon athletica, Inc. (a) | | | 40,396 | | | | 2,727,134 | |
Michael Kors Holdings Ltd. (a) | | | 67,353 | | | | 2,883,382 | |
PVH Corp. | | | 33,781 | | | | 3,168,996 | |
Ralph Lauren Corp. | | | 23,695 | | | | 2,095,349 | |
Skechers U.S.A., Inc., Class A (a) | | | 54,169 | | | | 1,360,725 | |
Under Armour, Inc., Class A (a)(b) | | | 76,339 | | | | 1,640,525 | |
Under Armour, Inc., Class C (a) | | | 76,761 | | | | 1,475,346 | |
| | | | | | | | |
| | | | | | | | 26,131,742 | |
Thrifts & Mortgage Finance — 0.2% | |
New York Community Bancorp, Inc. | | | 198,699 | | | | 3,018,238 | |
People’s United Financial, Inc. | | | 128,374 | | | | 2,407,013 | |
TFS Financial Corp. | | | 23,182 | | | | 405,453 | |
| | | | | | | | |
| | | | | | | | 5,830,704 | |
Trading Companies & Distributors — 1.0% | |
Air Lease Corp. | | | 40,018 | | | | 1,455,855 | |
Fastenal Co. | | | 119,783 | | | | 5,950,819 | |
HD Supply Holdings, Inc. (a) | | | 83,715 | | | | 3,541,145 | |
Herc Holdings, Inc. (a) | | | 9,584 | | | | 476,037 | |
MSC Industrial Direct Co., Inc., Class A | | | 18,314 | | | | 1,870,775 | |
United Rentals, Inc. (a) | | | 36,770 | | | | 4,651,773 | |
| | | | | | | | |
| Common Stocks | | Shares | | | Value | |
Trading Companies & Distributors (continued) | |
W.W. Grainger, Inc. | | | 23,066 | | | $ | 5,825,780 | |
Watsco, Inc. | | | 10,768 | | | | 1,644,704 | |
WESCO International, Inc. (a) | | | 19,873 | | | | 1,405,021 | |
| | | | | | | | |
| | | | | | | | 26,821,909 | |
Transportation Infrastructure — 0.1% | |
Macquarie Infrastructure Corp. | | | 31,464 | | | | 2,359,485 | |
Water Utilities — 0.3% | |
American Water Works Co., Inc. | | | 74,338 | | | | 5,459,383 | |
Aqua America, Inc. | | | 73,590 | | | | 2,237,872 | |
| | | | | | | | |
| | | | | | | | 7,697,255 | |
Wireless Telecommunication Services — 0.2% | |
Sprint Corp. (a) | | | 315,144 | | | | 2,908,779 | |
Telephone & Data Systems, Inc. | | | 40,016 | | | | 1,226,491 | |
United States Cellular Corp. (a) | | | 5,797 | | | | 258,488 | |
| | | | | | | | |
| | | | | | | | 4,393,758 | |
Total Long-Term Investments
(Cost — $2,324,399,424) — 98.2% | | | | 2,627,586,335 | |
| | | | | | | | |
| | | | | | | | | |
| | |
| Short-Term Securities | | | | | | |
BlackRock Liquidity Funds, T-Fund, Institutional Class, 0.40% (c)(d) | | | 106,972,620 | | | | 106,972,620 | |
SL Liquidity Series, LLC, Money Market
Series, 0.94% (c)(d)(e) | | | 1,310,830 | | | | 1,311,092 | |
Total Short-Term Securities
(Cost — $108,283,541) — 4.0% | | | | 108,283,712 | |
| Total Investments (Cost — $2,432,682,965) — 102.2% | | | | 2,735,870,047 | |
Liabilities in Excess of Other Assets — (2.2)% | | | | (58,680,607 | ) |
| | | | | | | | |
Net Assets — 100.0% | | | | | | $ | 2,677,189,440 | |
| | | | | | | | |
|
| Notes to Schedule of Investments |
| (a) | | Non-income producing security. |
| (b) | | Security, or a portion of security, is on loan. |
| (c) | | During the six months ended January 31, 2017, investments in issuers considered to be affiliates of the Fund for purposes of Section 2(a)(3) of the Investment Company Act of 1940, as amended, were as follows: |
| | | | | | | | | | | | | | | | | | | | | | | | | | | | |
| Affiliate | | Shares Held
at July 31,
2016 | | | Net
Activity | | | Shares Held
at January 31,
2017 | | | Value at
January 31,
2017 | | | Income | | | Net Realized
Gain1 | | | Change in
Unrealized
Appreciation | |
BlackRock Liquidity Funds, T-Fund, Institutional Class | | | — | | | | 106,972,620 | | | | 106,972,620 | | | $ | 106,972,620 | | | $ | 62,426 | | | $ | 353 | | | | — | |
BlackRock Premier Government Institutional Fund | | | 38,232,137 | | | | (38,232,137 | ) | | | — | | | | — | | | | 11,444 | | | | — | | | | — | |
SL Liquidity Series, LLC, Money Market Series | | | 4,519,466 | | | | (3,208,636 | ) | | | 1,310,830 | | | | 1,311,092 | | | | 136,976 | 2 | | | 920 | | | $ | 171 | |
Total | | | $ | 108,283,712 | | | $ | 210,846 | | | $ | 1,273 | | | $ | 171 | |
| | | | | | | | | | | | | | | | | |
1 Includes net capital gain distributions. | |
2 Represents securities lending income earned from the reinvestment of cash collateral from loaned securities, net of fees and collateral investment expenses, and other payments to and from borrowers of securities. | |
| (d) | | Current yield as of period end. |
| (e) | | Security was purchased with the cash collateral from loaned securities. |
See Notes to Financial Statements.
| | | | | | |
| | | | | | | |
| 24 | | BLACKROCK FUNDS | | JANUARY 31, 2017 | | |
| | |
Schedule of Investments (continued) | | BlackRock Midcap Index Fund |
For Fund compliance purposes, the Fund’s industry classifications refer to one or more of the industry sub-classifications used by one or more widely recognized market indexes or rating group indexes, and/or as defined by the investment adviser. These definitions may not apply for purposes of this report, which may combine such industry sub-classifications for reporting ease.
|
| Derivative Financial Instruments Outstanding as of Period End |
| | | | | | | | | | | | | | | | | | | | | | |
| Futures Contracts | | | | | | | |
Contracts
Long | | | Issue | | Expiration | | Notional Value | | | Unrealized
Appreciation
(Depreciation) | | | | | | | |
| | 107 | | | S&P 500 E-Mini Index | | March 2017 | | $ | 12,168,575 | | | $ | (6,319 | ) | | | | | | | | |
| | 189 | | | S&P MidCap 400 E-Mini Index | | March 2017 | | $ | 31,855,950 | | | | 10,791 | | | | | | | | | |
| | Total | | | $ | 4,472 | | | | | | | | | |
| | | | | | | | | | | | | | | | | | |
|
| Derivative Financial Instruments Outstanding as of Period End |
As of period end, the fair values of derivative financial instruments located in the Statements of Assets and Liabilities were as follows:
| | | | | | | | | | | | | | | | | | | | | | | | | | | | | | |
| Assets — Derivative Financial Instruments | | Commodity
Contracts | | | Credit
Contracts | | | Equity
Contracts | | | Foreign
Currency
Exchange
Contracts | | | Interest
Rate
Contracts | | | Other
Contracts | | | Total | |
Futures contracts | | Net unrealized appreciation | | | — | | | | — | | | $ | 10,791 | | | | — | | | | — | | | | — | | | $ | 10,791 | |
| | | | | | | |
| Liabilities — Derivative Financial Instruments | | | | | | | | | | | | | | | | | | | | | |
Futures contracts | | Net unrealized depreciation | | | — | | | | — | | | $ | 6,319 | | | | — | | | | — | | | | — | | | $ | 6,319 | |
| | | | | | | | | | | | | | | | | | | | | | | | | | | | | | |
For the six months ended January 31, 2017, the effect of derivative financial instruments in the Statements of Operations was as follows:
| |
| | | | | | | | | | | | | | | | | | | | | | | | | | | | | | |
| Net Realized Gain (Loss) from: | | | | | | | | | | | | | | | | | | | | | |
Futures contracts | | | — | | | | — | | | $ | 5,530,284 | | | | — | | | | — | | | | — | | | $ | 5,530,284 | |
| | | | | | | |
| Net Change in Unrealized Appreciation (Depreciation) on: | | | | | | | | | | | | | | | | | | | | | |
Futures contracts | | | — | | | | — | | | ($ | 2,520,492 | ) | | | — | | | | — | | | | — | | | ($ | 2,520,492 | ) |
| | |
| Average Quarterly Balances of Outstanding Derivative Financial Instruments |
| | | | |
| Futures contracts: | |
Average notional value of contracts — long | | $ | 37,542,490 | |
For more information about the Fund’s investment risks regarding derivative financial instruments, refer to the Notes to Financial Statements.
See Notes to Financial Statements.
| | | | | | |
| | | | | | | |
| | BLACKROCK FUNDS | | JANUARY 31, 2017 | | 25 |
| | |
Schedule of Investments (concluded) | | BlackRock Midcap Index Fund |
|
| Fair Value Hierarchy as of Period End |
Various inputs are used in determining the fair value of investments and derivative financial instruments. For information about the Fund’s policy regarding valuation of investments and derivative financial instruments, refer to the Notes to Financial Statements.
The following tables summarize the Fund’s investments and derivative financial instruments categorized in the disclosure hierarchy:
| | | | | | | | | | | | | | | | |
| | | Level 1 | | | Level 2 | | | Level 3 | | | Total | |
Assets: | | | | | | | | | | | | | | | | |
| Investments: | | | | | | | | | | | | | | | | |
Long-Term Investments | | | | | | | | | | | | | | | | |
Common Stocks:1 | | $ | 2,627,586,335 | | | | — | | | | — | | | $ | 2,627,586,335 | |
Short-Term Securities | | | 106,972,620 | | | | — | | | | — | | | | 106,972,620 | |
| | | | |
Subtotal | | $ | 2,734,558,955 | | | | — | | | | — | | | $ | 2,734,558,955 | |
| | | | |
Investments valued at NAV2 | | | | | | | | | | | | | | | 1,311,092 | |
| | | | | | | | | | | | | | | | |
Total | | | | | | | | | | | | | | $ | 2,735,870,047 | |
| | | | | | | | | | | | | | | | |
| | | | | | | | | | | | | | | | |
| Derivative Financial Instruments3 | |
Assets: | | | | | | | | | | | | | | | | |
Equity contracts | | $ | 10,791 | | | | — | | | | — | | | $ | 10,791 | |
Liabilities: | | | | | | | | | | | | | | | | |
Equity contracts | | | (6,319 | ) | | | — | | | | — | | | | (6,319 | ) |
| | | | |
Total | | $ | 4,472 | | | | — | | | | — | | | $ | 4,472 | |
| | | | |
1 See above Schedule of Investments for values in each sector. | |
2 As of January 31, 2017, certain of the Fund’s investments were fair valued using NAV per share as no quoted market value is available and therefore have been excluded from the fair value hierarchy. | |
3 Derivative financial instruments are futures contracts, which are valued at the unrealized appreciation (depreciation) on the instrument. | |
During the six months ended January 31, 2017, there were no transfers between levels.
See Notes to Financial Statements.
| | | | | | |
| | | | | | | |
| 26 | | BLACKROCK FUNDS | | JANUARY 31, 2017 | | |
| | |
Schedule of Investments January 31, 2017 (Unaudited) | | BlackRock MSCI Asia ex Japan Index Fund (Percentages shown are based on Net Assets) |
| | | | | | | | |
| Common Stocks | | Shares | | | Value | |
China — 25.9% | |
58.com, Inc. — ADR (a) | | | 1,541 | | | $ | 44,967 | |
AAC Technologies Holdings, Inc. | | | 12,000 | | | | 123,236 | |
Agricultural Bank of China Ltd., Class H | | | 386,000 | | | | 161,240 | |
Air China Ltd., Class H | | | 22,000 | | | | 15,742 | |
Alibaba Group Holding Ltd. — ADR (a) | | | 16,679 | | | | 1,689,750 | |
Aluminum Corp. of China Ltd., Class H (a) | | | 58,000 | | | | 29,958 | |
Anhui Conch Cement Co. Ltd., Class H | | | 17,500 | | | | 56,314 | |
ANTA Sports Products Ltd. | | | 13,000 | | | | 41,377 | |
AviChina Industry & Technology Co. Ltd., Class H | | | 23,000 | | | | 16,884 | |
Baidu, Inc. — ADR (a) | | | 4,091 | | | | 716,211 | |
Bank of China Ltd., Class H | | | 1,125,000 | | | | 509,531 | |
Bank of Communications Co. Ltd., Class H | | | 148,000 | | | | 108,860 | |
Beijing Capital International Airport Co. Ltd., Class H | | | 18,000 | | | | 17,414 | |
Byd Co. Ltd., Class H | | | 8,000 | | | | 44,255 | |
CGN Power Co. Ltd., Class H (b) | | | 119,000 | | | | 33,556 | |
China Cinda Asset Management Co. Ltd., Class H | | | 131,000 | | | | 45,383 | |
China CITIC Bank Corp. Ltd., Class H | | | 150,000 | | | | 98,656 | |
China Coal Energy Co. Ltd., Class H (a) | | | 30,000 | | | | 15,644 | |
China Communications Construction Co. Ltd., Class H | | | 54,000 | | | | 64,994 | |
China Communications Services Corp. Ltd., Class H | | | 30,000 | | | | 20,393 | |
China Conch Venture Holdings Ltd. | | | 17,000 | | | | 32,639 | |
China Construction Bank Corp., Class H | | | 1,228,000 | | | | 910,425 | |
China Everbright Bank Co. Ltd., Class H | | | 33,000 | | | | 15,884 | |
China Evergrande Group | | | 64,000 | | | | 44,580 | |
China Galaxy Securities Co. Ltd., Class H | | | 42,500 | | | | 39,454 | |
China Huarong Asset Management Co., Ltd., Class H (a)(b) | | | 82,983 | | | | 31,457 | |
China Huishan Dairy Holdings Co. Ltd. | | | 144,000 | | | | 53,768 | |
China Life Insurance Co. Ltd., Class H | | | 109,000 | | | | 300,250 | |
China Longyuan Power Group Corp. Ltd., Class H | | | 25,000 | | | | 20,420 | |
China Medical System Holdings Ltd. | | | 32,000 | | | | 52,145 | |
China Mengniu Dairy Co. Ltd. | | | 40,000 | | | | 74,666 | |
China Merchants Bank Co., Ltd., Class H | | | 60,500 | | | | 151,514 | |
China Minsheng Banking Corp. Ltd., Class H | | | 100,000 | | | | 110,052 | |
China National Building Material Co. Ltd., Class H | | | 40,000 | | | | 23,393 | |
China Oilfield Services Ltd., Class H | | | 34,000 | | | | 36,269 | |
China Pacific Insurance Group Co. Ltd., Class H | | | 36,000 | | | | 127,872 | |
China Petroleum & Chemical Corp. Class H | | | 380,000 | | | | 300,172 | |
China Railway Construction Corp. Ltd., Class H | | | 23,500 | | | | 32,606 | |
China Railway Group Ltd., Class H | | | 46,000 | | | | 40,264 | |
China Resources Gas Group Ltd. | | | 10,000 | | | | 31,604 | |
China Shenhua Energy Co. Ltd., Class H | | | 50,500 | | | | 106,722 | |
China Southern Airlines Co. Ltd., Class H | | | 26,000 | | | | 14,891 | |
China Telecom Corp. Ltd., Class H | | | 204,000 | | | | 96,316 | |
China Unicom Hong Kong Ltd. | | | 100,000 | | | | 118,032 | |
China Vanke Co. Ltd., Class H | | | 19,200 | | | | 48,706 | |
Chongqing Changan Automobile Co. Ltd., Class B | | | 13,000 | | | | 18,433 | |
Chongqing Rural Commercial Bank, Co. Ltd., Class H | | | 25,000 | | | | 15,223 | |
CITIC Securities Co. Ltd., Class H | | | 29,000 | | | | 59,013 | |
CNOOC Ltd. | | | 304,000 | | | | 379,621 | |
Country Garden Holdings Co. Ltd. | | | 112,000 | | | | 64,222 | |
CSPC Pharmaceutical Group Ltd. | | | 72,000 | | | | 81,033 | |
CSR Corp. Ltd., Class H | | | 58,000 | | | | 56,441 | |
Ctrip.com International Ltd. — ADR (a) | | | 5,963 | | | | 257,661 | |
Dongfeng Motor Group Co. Ltd., Class H | | | 38,000 | | | | 40,285 | |
Far East Horizon Ltd. | | | 28,000 | | | | 25,526 | |
Fosun International Ltd. | | | 43,000 | | | | 65,263 | |
Fuyao Glass Industry Group Co., Ltd. (b) | | | 6,800 | | | | 20,099 | |
GF Securities Co., Ltd., Class H | | | 18,000 | | | | 38,483 | |
Great Wall Motor Co. Ltd., Class H | | | 39,000 | | | | 39,077 | |
Guangzhou Automobile Group Co. Ltd., Class H | | | 24,000 | | | | 32,732 | |
Guangzhou R&F Properties Co. Ltd., Class H | | | 14,800 | | | | 18,982 | |
Haitian International Holdings Ltd. | | | 8,000 | | | | 16,274 | |
Haitong Securities Co. Ltd., Class H | | | 40,400 | | | | 72,483 | |
Hengan International Group Co. Ltd. | | | 14,000 | | | | 114,621 | |
HengTen Networks Group Ltd. (a) | | | 784,000 | | | | 22,196 | |
Huaneng Power International, Inc., Class H | | | 78,000 | | | | 50,599 | |
| | | | | | | | |
| Common Stocks | | Shares | | | Value | |
China (continued) | |
Huaneng Renewables Corp. Ltd., Class H | | | 48,000 | | | $ | 14,896 | |
Huatai Securities Co. Ltd., Class H (b) | | | 18,200 | | | | 35,100 | |
Industrial & Commercial Bank of China Ltd., Class H | | | 1,051,000 | | | | 642,565 | |
JD.com, Inc. — ADR (a) | | | 10,634 | | | | 302,006 | |
Jiangsu Expressway Co. Ltd., Class H | | | 22,000 | | | | 27,553 | |
Jiangxi Copper Co. Ltd., Class H | | | 14,000 | | | | 24,177 | |
Kingsoft Corp. Ltd. | | | 13,000 | | | | 27,217 | |
Lenovo Group Ltd. | | | 118,000 | | | | 77,292 | |
Longfor Properties Co. Ltd. | | | 23,000 | | | | 33,113 | |
NetEase, Inc. — ADR | | | 1,255 | | | | 318,645 | |
New China Life Insurance Co. Ltd., Class H | | | 11,700 | | | | 56,452 | |
New Oriental Education & Technology Group, Inc. — ADR (a) | | | 2,325 | | | | 110,554 | |
People’s Insurance Co. Group of China Ltd., Class H | | | 79,000 | | | | 30,772 | |
PetroChina Co. Ltd., Class H | | | 318,000 | | | | 252,629 | |
PICC Property & Casualty Co. Ltd., Class H | | | 62,000 | | | | 93,722 | |
Ping An Insurance Group Co. of China Ltd., Class H | | | 74,500 | | | | 382,168 | |
Qunar Cayman Islands Ltd. — ADR (a) | | | 1,310 | | | | 39,863 | |
Semiconductor Manufacturing International Corp. (a) | | | 43,300 | | | | 59,375 | |
Shandong Weigao Group Medical Polymer Co. Ltd., Class H | | | 28,000 | | | | 18,317 | |
Shanghai Electric Group Co. Ltd., Class H (a) | | | 32,000 | | | | 14,563 | |
Shanghai Fosun Pharmaceutical Group Co. Ltd., Class H | | | 8,000 | | | | 26,541 | |
Shanghai Lujiazui Finance & Trade Zone Development Co., Ltd., Class B | | | 20,680 | | | | 29,799 | |
Shanghai Pharmaceuticals Holding Co. Ltd., Class H | | | 10,500 | | | | 26,741 | |
Shenzhou International Group Holdings Ltd. | | | 11,000 | | | | 67,852 | |
SINA Corp. (a) | | | 980 | | | | 68,326 | |
Sino-Ocean Land Holdings Ltd. | | | 32,500 | | | | 13,997 | |
Sinopec Engineering Group Co. Ltd., Class H | | | 8,000 | | | | 6,497 | |
Sinopec Shanghai Petrochemical Co. Ltd., Class H | | | 50,000 | | | | 30,961 | |
Sinopharm Group Co. Ltd., Class H | | | 17,600 | | | | 80,430 | |
Sinotrans Ltd., Class H | | | 30,000 | | | | 12,509 | |
SOHO China Ltd. | | | 32,000 | | | | 16,189 | |
Sunac China Holdings Ltd. | | | 22,000 | | | | 19,543 | |
Sunny Optical Technology Group Co., Ltd. | | | 10,000 | | | | 58,595 | |
TAL Education Group — ADR (a) | | | 920 | | | | 74,511 | |
Tencent Holdings Ltd. | | | 84,500 | | | | 2,209,283 | |
Tingyi Cayman Islands Holding Corp. | | | 34,000 | | | | 38,649 | |
TravelSky Technology Ltd., Class H | | | 12,000 | | | | 26,955 | |
Tsingtao Brewery Co. Ltd., Class H | | | 6,000 | | | | 23,958 | |
Vipshop Holdings Ltd. — ADR (a) | | | 6,979 | | | | 79,002 | |
Want Want China Holdings Ltd. | | | 90,000 | | | | 64,211 | |
Weibo Corp. — ADR (a) | | | 662 | | | | 31,922 | |
Weichai Power Co. Ltd., Class H | | | 12,000 | | | | 21,264 | |
Yanzhou Coal Mining Co. Ltd., Class H | | | 22,000 | | | | 17,234 | |
YY, Inc. — ADR (a) | | | 825 | | | | 33,891 | |
Zhejiang Expressway Co. Ltd., Class H | | | 16,000 | | | | 16,071 | |
Zhuzhou CRRC Times Electric Co. Ltd. | | | 6,500 | | | | 37,034 | |
Zijin Mining Group Co. Ltd., Class H | | | 66,000 | | | | 22,583 | |
ZTE Corp., Class H | | | 11,000 | | | | 17,103 | |
| | | | | | | | |
| | | | | | | | 13,889,363 | |
Hong Kong — 16.6% | |
AIA Group Ltd. | | | 180,600 | | | | 1,118,158 | |
Alibaba Health Information Technology Ltd. (a) | | | 70,000 | | | | 32,446 | |
Alibaba Pictures Group Ltd. (a) | | | 300,000 | | | | 50,401 | |
ASM Pacific Technology Ltd. | | | 4,400 | | | | 53,496 | |
Bank of East Asia Ltd. | | | 15,200 | | | | 64,744 | |
Beijing Enterprises Holdings Ltd. | | | 6,000 | | | | 29,909 | |
Beijing Enterprises Water Group Ltd. (a) | | | 44,000 | | | | 30,518 | |
Belle International Holdings Ltd. | | | 142,000 | | | | 86,555 | |
BOC Hong Kong Holdings Ltd. | | | 57,000 | | | | 227,879 | |
Brilliance China Automotive Holdings Ltd. | | | 42,000 | | | | 59,167 | |
Cathay Pacific Airways Ltd. | | | 17,000 | | | | 23,025 | |
Cheung Kong Infrastructure Holdings Ltd. | | | 11,000 | | | | 88,459 | |
See Notes to Financial Statements.
| | | | | | |
| | | | | | | |
| | BLACKROCK FUNDS | | JANUARY 31, 2017 | | 27 |
| | |
Schedule of Investments (continued) | | BlackRock MSCI Asia ex Japan Index Fund |
| | | | | | | | |
| Common Stocks | | Shares | | | Value | |
Hong Kong (continued) | |
Cheung Kong Property Holdings Ltd. | | | 38,000 | | | $ | 249,769 | |
China Everbright International Ltd. | | | 38,000 | | | | 46,087 | |
China Everbright Ltd. | | | 10,000 | | | | 19,092 | |
China Gas Holdings Ltd. | | | 16,000 | | | | 23,162 | |
China Jinmao Holdings Group Ltd. | | | 22,000 | | | | 6,458 | |
China Merchants Port Holdings Co., Ltd. | | | 14,110 | | | | 37,721 | |
China Mobile Ltd. | | | 91,500 | | | | 1,029,615 | |
China Overseas Land & Investment Ltd. | | | 60,000 | | | | 176,187 | |
China Power International Development Ltd. | | | 42,000 | | | | 15,136 | |
China Resources Beer Holdings Co. Ltd. (a) | | | 32,000 | | | | 64,996 | |
China Resources Land Ltd. | | | 44,000 | | | | 108,836 | |
China Resources Power Holdings Co. Ltd. | | | 20,000 | | | | 34,350 | |
China State Construction International Holdings Ltd. | | | 22,000 | | | | 35,749 | |
China Taiping Insurance Holdings Co. Ltd. (a) | | | 22,200 | | | | 48,634 | |
CITIC Ltd. | | | 59,000 | | | | 87,467 | |
CK Hutchison Holdings Ltd. | | | 37,500 | | | | 449,444 | |
CLP Holdings Ltd. | | | 26,000 | | | | 253,775 | |
COSCO Pacific Ltd. | | | 18,000 | | | | 17,887 | |
ENN Energy Holdings Ltd. | | | 10,000 | | | | 49,299 | |
First Pacific Co. Ltd. | | | 34,000 | | | | 25,779 | |
Fullshare Holdings Ltd. | | | 107,500 | | | | 45,292 | |
Galaxy Entertainment Grup Ltd. | | | 36,000 | | | | 170,996 | |
GCL-Poly Energy Holdings Ltd. (a) | | | 196,000 | | | | 25,330 | |
Geely Automobile Holdings Ltd. | | | 80,000 | | | | 94,554 | |
GOME Electrical Appliances Holding Ltd. | | | 176,000 | | | | 21,904 | |
Guangdong Investment Ltd. | | | 34,000 | | | | 42,191 | |
Haier Electronics Group Co. Ltd. | | | 16,000 | | | | 28,144 | |
Hang Lung Group Ltd. | | | 12,000 | | | | 46,021 | |
Hang Lung Properties Ltd. | | | 22,000 | | | | 54,144 | |
Hang Seng Bank Ltd. | | | 12,000 | | | | 244,595 | |
Henderson Land Development Co. Ltd. | | | 18,500 | | | | 102,119 | |
HK Electric Investments & HK Electric Investments Ltd. (b)(c) | | | 61,500 | | | | 51,335 | |
HKT Trust & HKT Ltd. (c) | | | 52,000 | | | | 72,640 | |
Hong Kong & China Gas Co. Ltd. | | | 124,400 | | | | 234,220 | |
Hong Kong Exchanges & Clearing Ltd. | | | 17,100 | | | | 413,595 | |
Hongkong Land Holdings Ltd. | | | 20,900 | | | | 141,153 | |
Hysan Development Co. Ltd. | | | 9,000 | | | | 41,017 | |
Jardine Matheson Holdings Ltd. | | | 4,000 | | | | 246,700 | |
Kerry Properties Ltd. | | | 6,500 | | | | 18,394 | |
Kunlun Energy Co. Ltd. | | | 64,000 | | | | 50,829 | |
Li & Fung Ltd. | | | 64,000 | | | | 27,753 | |
Link REIT | | | 34,000 | | | | 232,342 | |
Melco Crown Entertainment Ltd. — ADR | | | 4,032 | | | | 67,899 | |
MGM China Holdings Ltd. | | | 13,200 | | | | 25,640 | |
MTR Corp. Ltd. | | | 26,000 | | | | 132,084 | |
New World Development Co. Ltd. | | | 89,000 | | | | 102,688 | |
Nine Dragons Paper Holdings Ltd. | | | 21,000 | | | | 24,170 | |
NWS Holdings Ltd. | | | 17,321 | | | | 31,125 | |
PCCW Ltd. | | | 94,000 | | | | 57,055 | |
Power Assets Holdings Ltd. | | | 19,000 | | | | 182,055 | |
Sands China Ltd. | | | 37,600 | | | | 165,439 | |
Shanghai Industrial Holdings Ltd. | | | 6,000 | | | | 16,148 | |
Shangri-La Asia Ltd. | | | 18,000 | | | | 20,021 | |
Shimao Property Holdings Ltd. | | | 15,000 | | | | 20,095 | |
Sino Biopharmaceutical Ltd. | | | 71,000 | | | | 55,726 | |
Sino Land Co. Ltd. | | | 40,000 | | | | 66,094 | |
SJM Holdings Ltd. | | | 21,000 | | | | 16,686 | |
Sun Art Retail Group Ltd. | | | 35,500 | | | | 35,780 | |
Sun Hung Kai Properties Ltd. | | | 21,000 | | | | 288,982 | |
Swire Pacific Ltd., Class A | | | 7,000 | | | | 71,315 | |
Swire Properties Ltd. | | | 16,400 | | | | 46,146 | |
Techtronic Industries Co. Ltd. | | | 21,500 | | | | 74,360 | |
WH Group Ltd. (b) | | | 118,500 | | | | 90,006 | |
Wharf Holdings Ltd. | | | 21,000 | | | | 157,464 | |
Wheelock & Co. Ltd. | | | 9,000 | | | | 54,701 | |
Wynn Macau Ltd. | | | 20,800 | | | | 37,827 | |
| | | | | | | | |
| Common Stocks | | Shares | | | Value | |
Hong Kong (continued) | |
Yue Yuen Industrial Holdings Ltd. | | | 10,500 | | | $ | 38,433 | |
| | | | | | | | |
| | | | | | | | 8,927,407 | |
India — 9.6% | |
Axis Bank Ltd. — GDR | | | 4,900 | | | | 169,614 | |
Dr. Reddy’s Laboratories Ltd. — ADR | | | 10,723 | | | | 484,680 | |
GAIL India Ltd. — GDR | | | 13,423 | | | | 555,041 | |
ICICI Bank Ltd. — ADR | | | 65,278 | | | | 505,904 | |
Infosys Ltd. — ADR | | | 33,146 | | | | 456,420 | |
Larsen & Toubro Ltd. — GDR | | | 24,923 | | | | 536,882 | |
Mahindra & Mahindra Ltd. — GDR | | | 26,850 | | | | 498,495 | |
Reliance Industries Ltd. — GDR (b) | | | 5,423 | | | | 168,113 | |
State Bank of India — GDR | | | 13,423 | | | | 522,608 | |
Tata Motors Ltd. — ADR | | | 7,423 | | | | 289,200 | |
Vedanta Ltd. — ADR | | | 33,850 | | | | 500,980 | |
Wipro Ltd. — ADR | | | 53,250 | | | | 491,497 | |
| | | | | | | | |
| | | | | | | | 5,179,434 | |
Indonesia — 2.9% | |
Adaro Energy Tbk PT | | | 207,900 | | | | 26,424 | |
AKR Corporindo Tbk PT | | | 20,000 | | | | 9,998 | |
Astra International Tbk PT | | | 284,300 | | | | 169,487 | |
Bank Central Asia Tbk PT | | | 186,400 | | | | 213,644 | |
Bank Danamon Indonesia Tbk PT | | | 47,200 | | | | 14,710 | |
Bank Mandiri Persero Tbk PT | | | 154,600 | | | | 126,274 | |
Bank Negara Indonesia Persero Tbk PT | | | 100,000 | | | | 42,726 | |
Bank Rakyat Indonesia Persero Tbk PT | | | 175,200 | | | | 153,842 | |
Bumi Serpong Damai Tbk PT | | | 110,900 | | | | 15,212 | |
Charoen Pokphand Indonesia Tbk PT | | | 89,300 | | | | 20,754 | |
Gudang Garam Tbk PT | | | 5,600 | | | | 25,894 | |
Hanjaya Mandala Sampoerna Tbk PT | | | 122,600 | | | | 35,318 | |
Indocement Tunggal Prakarsa Tbk PT | | | 18,900 | | | | 21,275 | |
Indofood CBP Sukses Makmur Tbk PT | | | 65,200 | | | | 41,025 | |
Indofood Sukses Makmur Tbk PT | | | 51,400 | | | | 30,507 | |
Jasa Marga Persero Tbk PT | | | 31,699 | | | | 10,026 | |
Kalbe Farma Tbk PT | | | 293,700 | | | | 31,922 | |
Lippo Karawaci Tbk PT | | | 216,500 | | | | 11,922 | |
Matahari Department Store Tbk PT | | | 36,900 | | | | 40,851 | |
Media Nusantara Citra Tbk PT | | | 50,200 | | | | 6,376 | |
Pakuwon Jati Tbk PT | | | 124,800 | | | | 5,239 | |
Perusahaan Gas Negara Persero Tbk PT | | | 128,100 | | | | 27,665 | |
Semen Indonesia Persero Tbk PT | | | 36,400 | | | | 24,618 | |
Summarecon Agung Tbk PT | | | 127,500 | | | | 12,519 | |
Surya Citra Media Tbk PT | | | 101,300 | | | | 21,411 | |
Telekomunikasi Indonesia Persero Tbk PT | | | 755,300 | | | | 218,950 | |
Tower Bersama Infrastructure Tbk PT | | | 27,800 | | | | 10,306 | |
Unilever Indonesia Tbk PT | | | 32,700 | | | | 100,834 | |
United Tractors Tbk PT | | | 28,900 | | | | 47,297 | |
Waskita Karya Persero Tbk PT | | | 126,100 | | | | 24,190 | |
XL Axiata Tbk PT (a) | | | 24,200 | | | | 5,276 | |
| | | | | | | | |
| | | | | | | | 1,546,492 | |
Malaysia — 2.9% | |
AirAsia Bhd | | | 14,700 | | | | 8,463 | |
Alliance Financial Group Bhd | | | 7,000 | | | | 5,942 | |
AMMB Holdings Bhd | | | 20,000 | | | | 20,680 | |
Astro Malaysia Holdings Bhd | | | 33,600 | | | | 20,633 | |
Axiata Group Bhd | | | 33,600 | | | | 35,905 | |
British American Tobacco Malaysia Bhd | | | 3,200 | | | | 33,477 | |
CIMB Group Holdings Bhd | | | 36,800 | | | | 41,309 | |
Dialog Group Bhd | | | 43,300 | | | | 14,955 | |
DiGi.Com Bhd | | | 53,400 | | | | 59,795 | |
Felda Global Ventures Holdings Bhd | | | 17,800 | | | | 7,428 | |
Gamuda Bhd | | | 27,500 | | | | 29,875 | |
Genting Bhd | | | 23,500 | | | | 43,528 | |
Genting Malaysia Bhd | | | 22,100 | | | | 25,135 | |
Genting Plantations Bhd | | | 12,800 | | | | 31,527 | |
See Notes to Financial Statements.
| | | | | | |
| | | | | | | |
| 28 | | BLACKROCK FUNDS | | JANUARY 31, 2017 | | |
| | |
Schedule of Investments (continued) | | BlackRock MSCI Asia ex Japan Index Fund |
| | | | | | | | |
| Common Stocks | | Shares | | | Value | |
Malaysia (continued) | |
HAP Seng Consolidated Bhd | | | 9,800 | | | $ | 19,244 | |
Hartalega Holdings Bhd | | | 13,900 | | | | 14,812 | |
Hong Leong Bank Bhd | | | 6,300 | | | | 18,752 | |
IHH Healthcare Bhd | | | 59,700 | | | | 84,910 | |
IJM Corp. Bhd | | | 28,500 | | | | 21,302 | |
IOI Corp. Bhd | | | 39,300 | | | | 39,138 | |
Kuala Lumpur Kepong Bhd | | | 9,900 | | | | 53,870 | |
Lafarge Malayan Cement Bhd | | | 2,900 | | | | 4,520 | |
Malayan Banking Bhd | | | 59,100 | | | | 109,680 | |
Malaysia Airports Holdings Bhd | | | 9,600 | | | | 13,394 | |
Maxis Bhd | | | 26,300 | | | | 36,524 | |
MISC Bhd | | | 12,900 | | | | 21,319 | |
Petronas Chemicals Group Bhd | | | 37,800 | | | | 60,845 | |
Petronas Dagangan Bhd | | | 10,200 | | | | 54,188 | |
Petronas Gas Bhd | | | 10,100 | | | | 47,671 | |
PPB Group Bhd | | | 12,400 | | | | 45,518 | |
Public Bank Bhd | | | 41,700 | | | | 189,225 | |
Sapurakencana Petroleum Bhd (a) | | | 42,900 | | | | 16,667 | |
Sime Darby Bhd | | | 34,700 | | | | 69,768 | |
Telekom Malaysia Bhd | | | 29,000 | | | | 38,955 | |
Tenaga Nasional Bhd | | | 52,700 | | | | 159,291 | |
UMW Holdings Bhd | | | 2,800 | | | | 3,572 | |
Westports Holdings Bhd | | | 24,500 | | | | 23,079 | |
YTL Corp. Bhd | | | 48,400 | | | | 16,622 | |
| | | | | | | | |
| | | | | | | | 1,541,518 | |
Philippines — 1.4% | |
Aboitiz Equity Ventures, Inc. | | | 17,120 | | | | 25,587 | |
Aboitiz Power Corp. | | | 34,700 | | | | 29,404 | |
Alliance Global Group, Inc. | | | 20,000 | | | | 5,043 | |
Ayala Corp. | | | 4,690 | | | | 75,444 | |
Ayala Land, Inc. | | | 113,300 | | | | 80,985 | |
Bank of the Philippine Islands | | | 17,190 | | | | 30,960 | |
BDO Unibank, Inc. | | | 26,530 | | | | 60,117 | |
DMCI Holdings, Inc. | | | 25,500 | | | | 6,625 | |
Energy Development Corp. | | | 42,800 | | | | 4,696 | |
Globe Telecom, Inc. | | | 430 | | | | 14,862 | |
GT Capital Holdings, Inc. | | | 1,090 | | | | 28,582 | |
International Container Terminal Services, Inc. | | | 3,340 | | | | 5,195 | |
JG Summit Holdings, Inc. | | | 29,710 | | | | 44,362 | |
Jollibee Foods Corp. | | | 10,700 | | | | 44,199 | |
Megaworld Corp. | | | 173,000 | | | | 12,770 | |
Metro Pacific Investments Corp. | | | 151,800 | | | | 20,816 | |
Metropolitan Bank & Trust Co. | | | 15,450 | | | | 25,309 | |
PLDT, Inc. | | | 1,290 | | | | 38,132 | |
Robinsons Land Corp. | | | 19,100 | | | | 9,643 | |
Security Bank Corp. | | | 4,800 | | | | 20,578 | |
SM Investments Corp. | | | 4,985 | | | | 69,144 | |
SM Prime Holdings, Inc. | | | 116,400 | | | | 69,508 | |
Universal Robina Corp. | | | 15,390 | | | | 50,430 | |
| | | | | | | | |
| | | | | | | | 772,391 | |
Republic of Korea — 0.1% | |
Lotte Chilsung Beverage Co. Ltd. | | | 22 | | | | 27,460 | |
Singapore — 4.6% | |
Ascendas Real Estate Investment Trust | | | 43,991 | | | | 76,811 | |
CapitaLand Commercial Trust Ltd. | | | 51,600 | | | | 55,902 | |
CapitaLand Ltd. | | | 43,800 | | | | 102,218 | |
CapitaLand Mall Trust | | | 50,300 | | | | 69,118 | |
City Developments Ltd. | | | 6,000 | | | | 39,384 | |
ComfortDelGro Corp. Ltd. | | | 31,400 | | | | 53,731 | |
DBS Group Holdings Ltd. | | | 25,900 | | | | 350,167 | |
Genting Singapore PLC | | | 82,900 | | | | 57,179 | |
Global Logistic Properties Ltd. | | | 42,200 | | | | 77,774 | |
Golden Agri-Resources Ltd. | | | 100,900 | | | | 30,350 | |
Hutchison Port Holdings Trust | | | 74,700 | | | | 31,772 | |
Jardine Cycle & Carriage Ltd. | | | 1,544 | | | | 45,275 | |
| | | | | | | | |
| Common Stocks | | Shares | | | Value | |
Singapore (continued) | |
Keppel Corp. Ltd. | | | 20,800 | | | $ | 91,272 | |
Oversea-Chinese Banking Corp. Ltd. | | | 45,500 | | | | 303,467 | |
SATS Ltd. | | | 11,000 | | | | 41,211 | |
SembCorp Industries Ltd. | | | 10,300 | | | | 23,003 | |
Singapore Airlines Ltd. | | | 8,000 | | | | 56,344 | |
Singapore Exchange Ltd. | | | 10,900 | | | | 57,334 | |
Singapore Technologies Engineering Ltd. | | | 21,200 | | | | 49,683 | |
Singapore Telecommunications Ltd. | | | 125,100 | | | | 343,949 | |
StarHub Ltd. | | | 20,500 | | | | 43,162 | |
Suntec Real Estate Investment Trust | | | 35,000 | | | | 43,015 | |
United Overseas Bank Ltd. | | | 18,241 | | | | 271,279 | |
UOL Group Ltd. | | | 5,900 | | | | 26,722 | |
Wilmar International Ltd. | | | 33,800 | | | | 93,018 | |
Yangzijiang Shipbuilding Holdings Ltd. | | | 24,500 | | | | 14,011 | |
| | | | | | | | |
| | | | | | | | 2,447,151 | |
South Korea — 17.1% | |
Amorepacific Corp. | | | 707 | | | | 175,446 | |
Amorepacific Group | | | 553 | | | | 64,525 | |
BGF Retail Co., Ltd. | | | 334 | | | | 26,427 | |
BNK Financial Group, Inc. | | | 2,214 | | | | 16,249 | |
Celltrion, Inc. (a) | | | 1,339 | | | | 115,713 | |
Cheil Worldwide, Inc. | | | 1,559 | | | | 24,878 | |
CJ CheilJedang Corp. | | | 160 | | | | 48,868 | |
CJ Corp. | | | 156 | | | | 24,495 | |
CJ E&M Corp. | | | 407 | | | | 30,631 | |
CJ Korea Express Co., Ltd. (a) | | | 98 | | | | 13,746 | |
Coway Co., Ltd. | | | 749 | | | | 56,323 | |
Daelim Industrial Co., Ltd. | | | 302 | | | | 21,873 | |
Daewoo Engineering & Construction Co., Ltd. (a) | | | 1,719 | | | | 7,678 | |
Daewoo Securities Co., Ltd. | | | 4,547 | | | | 34,499 | |
DGB Financial Group, Inc. | | | 2,050 | | | | 17,411 | |
Dongbu Insurance Co., Ltd. | | | 742 | | | | 37,806 | |
Dongsuh Cos., Inc. | | | 1,249 | | | | 27,514 | |
Doosan Heavy Industries & Construction Co., Ltd. | | | 883 | | | | 20,919 | |
E-Mart, Inc. | | | 346 | | | | 60,571 | |
GS Engineering & Construction Corp. (a) | | | 640 | | | | 15,253 | |
GS Holdings Corp. | | | 1,081 | | | | 47,599 | |
GSretail Co. Ltd. | | | 452 | | | | 20,277 | |
Hana Financial Group, Inc. | | | 4,045 | | | | 119,937 | |
Hankook Tire Co., Ltd. | | | 1,008 | | | | 49,190 | |
Hanmi Pharm Co., Ltd. | | | 90 | | | | 22,353 | |
Hanmi Science Co., Ltd. | | | 179 | | | | 8,914 | |
Hanon Systems | | | 2,643 | | | | 20,696 | |
Hanssem Co., Ltd. | | | 147 | | | | 26,405 | |
Hanwha Chemical Corp. | | | 1,535 | | | | 34,482 | |
Hanwha Corp. | | | 544 | | | | 16,508 | |
Hanwha Life Insurance Co., Ltd. | | | 3,268 | | | | 18,127 | |
Hotel Shilla Co., Ltd. | | | 642 | | | | 23,978 | |
Hyosung Corp. | | | 266 | | | | 31,009 | |
Hyundai Department Store Co., Ltd. | | | 217 | | | | 17,952 | |
Hyundai Development Co-Engineering & Construction | | | 721 | | | | 27,129 | |
Hyundai Engineering & Construction Co., Ltd. | | | 771 | | | | 27,599 | |
Hyundai Glovis Co., Ltd. | | | 251 | | | | 33,611 | |
Hyundai Heavy Industries Co., Ltd. (a) | | | 571 | | | | 65,118 | |
Hyundai Marine & Fire Insurance Co., Ltd. | | | 934 | | | | 24,207 | |
Hyundai Mobis Co. Ltd. | | | 987 | | | | 205,332 | |
Hyundai Motor Co. | | | 2,286 | | | | 275,208 | |
Hyundai Motor Co., Preference Shares | | | 226 | | | | 18,125 | |
Hyundai Motor Co., Second Preference Shares | | | 394 | | | | 32,601 | |
Hyundai Steel Co. | | | 925 | | | | 46,387 | |
Hyundai Wia Corp. | | | 219 | | | | 12,189 | |
Industrial Bank of Korea | | | 3,523 | | | | 38,483 | |
Kakao Corp. | | | 617 | | | | 41,309 | |
Kangwon Land, Inc. | | | 1,547 | | | | 43,531 | |
KB Financial Group, Inc. | | | 5,820 | | | | 235,508 | |
KCC Corp. | | | 69 | | | | 20,628 | |
See Notes to Financial Statements.
| | | | | | |
| | | | | | | |
| | BLACKROCK FUNDS | | JANUARY 31, 2017 | | 29 |
| | |
Schedule of Investments (continued) | | BlackRock MSCI Asia ex Japan Index Fund |
| | | | | | | | |
| Common Stocks | | Shares | | | Value | |
South Korea (continued) | |
KEPCO Plant Service & Engineering Co., Ltd. | | | 482 | | | $ | 22,684 | |
Kia Motors Corp. | | | 4,194 | | | | 131,451 | |
Korea Aerospace Industries Ltd. | | | 903 | | | | 48,205 | |
Korea Electric Power Corp. | | | 3,471 | | | | 127,119 | |
Korea Gas Corp. | | | 526 | | | | 21,006 | |
Korea Investment Holdings Co., Ltd. | | | 513 | | | | 20,575 | |
Korea Zinc Co., Ltd. | | | 112 | | | | 47,365 | |
Korean Air Lines Co., Ltd. (a) | | | 788 | | | | 17,911 | |
KT Corp. | | | 267 | | | | 6,757 | |
KT&G Corp. | | | 1,830 | | | | 158,522 | |
Kumho Petrochemical Co., Ltd. | | | 258 | | | | 18,286 | |
LG Chem Ltd. | | | 741 | | | | 167,093 | |
LG Chem Ltd., Preference Shares | | | 47 | | | | 6,922 | |
LG Corp. | | | 1,573 | | | | 80,257 | |
LG Display Co., Ltd. | | | 2,985 | | | | 78,749 | |
LG Electronics, Inc. | | | 1,816 | | | | 86,787 | |
LG Household & Health Care Ltd. | | | 193 | | | | 136,931 | |
LG Innotek Co., Ltd. | | | 294 | | | | 25,103 | |
LG Uplus Corp. | | | 3,934 | | | | 38,641 | |
Lotte Chemical Corp. | | | 226 | | | | 73,237 | |
Lotte Confectionery Co., Ltd. | | | 102 | | | | 17,928 | |
Lotte Shopping Co., Ltd. | | | 118 | | | | 22,961 | |
NAVER Corp. | | | 397 | | | | 259,326 | |
NCSoft Corp. | | | 259 | | | | 67,809 | |
NH Investment & Securities Co., Ltd. | | | 2,142 | | | | 21,085 | |
OCI Co., Ltd. (a) | | | 289 | | | | 21,375 | |
Orion Corp. | | | 72 | | | | 40,229 | |
Ottogi Corp. | | | 22 | | | | 12,305 | |
POSCO | | | 1,085 | | | | 253,592 | |
Posco Daewoo Corp. | | | 310 | | | | 6,802 | |
S-1 Corp. | | | 496 | | | | 35,990 | |
S-Oil Corp. | | | 787 | | | | 54,967 | |
Samsung Biologics Co. Ltd. (a) | | | 226 | | | | 31,311 | |
Samsung C&T Corp. | | | 1,188 | | | | 128,901 | |
Samsung Card Co., Ltd. | | | 532 | | | | 17,982 | |
Samsung Electro-Mechanics Co., Ltd. | | | 789 | | | | 38,533 | |
Samsung Electronics Co. Ltd. | | | 1,485 | | | | 2,525,651 | |
Samsung Electronics Co. Ltd., Preference Shares | | | 255 | | | | 344,632 | |
Samsung Fire & Marine Insurance Co., Ltd. | | | 543 | | | | 125,805 | |
Samsung Heavy Industries Co. Ltd. (a) | | | 2,239 | | | | 20,054 | |
Samsung Life Insurance Co., Ltd. | | | 1,191 | | | | 113,799 | |
Samsung SDI Co. Ltd. | | | 804 | | | | 79,899 | |
Samsung SDS Co., Ltd. | | | 473 | | | | 51,277 | |
Samsung Securities Co., Ltd. | | | 889 | | | | 24,822 | |
Samsung Techwin Co., Ltd. | | | 465 | | | | 16,705 | |
Shinhan Financial Group Co. Ltd. | | | 5,769 | | | | 228,004 | |
Shinsegae Co., Ltd. | | | 94 | | | | 14,234 | |
SK Holdings Co., Ltd. | | | 639 | | | | 119,061 | |
SK Hynix, Inc. | | | 8,621 | | | | 398,151 | |
SK Innovation Co., Ltd. | | | 1,045 | | | | 141,566 | |
SK Networks Co., Ltd. | | | 1,641 | | | | 9,347 | |
SK Telecom Co. Ltd. | | | 394 | | | | 75,532 | |
Woori Bank | | | 4,140 | | | | 46,736 | |
Yuhan Corp. | | | 159 | | | | 25,762 | |
| | | | | | | | |
| | | | | | | | 9,150,951 | |
Taiwan — 14.1% | |
Acer, Inc. | | | 39,000 | | | | 18,010 | |
Advanced Semiconductor Engineering, Inc. | | | 93,000 | | | | 102,485 | |
Advantech Co. Ltd. | | | 5,000 | | | | 42,415 | |
Asia Cement Corp. | | | 24,000 | | | | 20,574 | |
Asia Pacific Telecom Co., Ltd. (a) | | | 41,000 | | | | 13,294 | |
Asustek Computer, Inc. | | | 10,000 | | | | 87,399 | |
AU Optronics Corp. | | | 121,000 | | | | 50,103 | |
Casetek Holdings Ltd. | | | 4,000 | | | | 12,302 | |
Catcher Technology Co. Ltd. | | | 11,000 | | | | 89,713 | |
Cathay Financial Holding Co. Ltd. | | | 129,000 | | | | 196,451 | |
| | | | | | | | |
| Common Stocks | | Shares | | | Value | |
Taiwan (continued) | |
Chailease Holding Co. Ltd. | | | 20,200 | | | $ | 36,136 | |
Chang Hwa Commercial Bank Ltd. | | | 66,220 | | | | 36,772 | |
Cheng Shin Rubber Industry Co. Ltd. | | | 28,000 | | | | 55,742 | |
Chicony Electronics Co. Ltd. | | | 11,030 | | | | 26,021 | |
China Airlines Ltd. | | | 51,000 | | | | 15,320 | |
China Development Financial Holding Corp. | | | 123,000 | | | | 31,439 | |
China Life Insurance Co. Ltd. | | | 58,160 | | | | 56,920 | |
China Steel Corp. | | | 173,000 | | | | 140,072 | |
Chunghwa Telecom Co. Ltd. | | | 62,000 | | | | 202,225 | |
Compal Electronics, Inc. | | | 54,000 | | | | 32,581 | |
CTBC Financial Holding Co. Ltd. | | | 265,966 | | | | 151,498 | |
Delta Electronics, Inc. | | | 29,000 | | | | 161,976 | |
E.Sun Financial Holding Co. Ltd. | | | 106,259 | | | | 62,768 | |
Eclat Textile Co. Ltd. | | | 3,000 | | | | 31,337 | |
Eva Airways Corp. | | | 33,550 | | | | 16,203 | |
Evergreen Marine Corp. Taiwan Ltd. (a) | | | 42,150 | | | | 17,433 | |
Far Eastern New Century Corp. | | | 32,320 | | | | 26,937 | |
Far EasTone Telecommunications Co. Ltd. | | | 31,000 | | | | 73,655 | |
Feng TAY Enterprise Co. Ltd. | | | 5,307 | | | | 23,198 | |
First Financial Holding Co. Ltd. | | | 141,189 | | | | 78,790 | |
Formosa Chemicals & Fibre Corp. | | | 44,000 | | | | 136,397 | |
Formosa Petrochemical Corp. | | | 21,000 | | | | 71,735 | |
Formosa Plastics Corp. | | | 55,000 | | | | 158,918 | |
Formosa Taffeta Co. Ltd. | | | 4,000 | | | | 3,852 | |
Foxconn Technology Co. Ltd. | | | 16,090 | | | | 45,412 | |
Fubon Financial Holding Co. Ltd. | | | 106,000 | | | | 172,276 | |
Giant Manufacturing Co. Ltd. | | | 4,000 | | | | 26,289 | |
Highwealth Construction Corp. | | | 10,900 | | | | 16,211 | |
Hiwin Technologies Corp. | | | 4,050 | | | | 20,878 | |
Hon Hai Precision Industry Co. Ltd. | | | 225,800 | | | | 605,545 | |
Hotai Motor Co. Ltd. | | | 4,000 | | | | 45,967 | |
HTC Corp. (a) | | | 10,000 | | | | 25,484 | |
Hua Nan Financial Holdings Co. Ltd. | | | 82,963 | | | | 43,632 | |
Innolux Corp. | | | 100,000 | | | | 42,362 | |
Inventec Co. Ltd. | | | 30,000 | | | | 22,563 | |
Largan Precision Co. Ltd. | | | 1,450 | | | | 207,403 | |
Lite-On Technology Corp. | | | 26,110 | | | | 39,438 | |
MediaTek, Inc. | | | 23,000 | | | | 157,460 | |
Mega Financial Holding Co. Ltd. | | | 147,000 | | | | 109,587 | |
Merida Industry Co. Ltd. | | | 4,000 | | | | 20,838 | |
Micro-Star International Co., Ltd. | | | 9,000 | | | | 21,836 | |
Nan Ya Plastics Corp. | | | 66,000 | | | | 155,468 | |
Nanya Technology Corp. | | | 10,000 | | | | 15,406 | |
Nien Made Enterprise Co., Ltd. | | | 4,000 | | | | 37,551 | |
Novatek Microelectronics Corp. | | | 8,000 | | | | 28,335 | |
OBI Pharma, Inc. (a) | | | 2,000 | | | | 18,527 | |
Pegatron Corp. | | | 25,000 | | | | 60,202 | |
Phison Electronics Corp. | | | 5,000 | | | | 39,580 | |
Pou Chen Corp. | | | 21,000 | | | | 26,608 | |
Powertech Technology, Inc. | | | 10,000 | | | | 27,409 | |
President Chain Store Corp. | | | 11,000 | | | | 82,281 | |
Quanta Computer, Inc. | | | 38,000 | | | | 77,476 | |
Realtek Semiconductor Corp. | | | 7,000 | | | | 24,429 | |
Ruentex Development Co. Ltd. (a) | | | 13,536 | | | | 16,494 | |
Ruentex Industries Ltd. | | | 10,000 | | | | 18,555 | |
Shin Kong Financial Holding Co. Ltd. (a) | | | 99,755 | | | | 25,623 | |
Siliconware Precision Industries Co. | | | 38,302 | | | | 58,341 | |
SinoPac Financial Holdings Co. Ltd. | | | 110,727 | | | | 32,668 | |
Standard Foods Corp. | | | 14,663 | | | | 36,039 | |
Synnex Technology International Corp. | | | 24,350 | | | | 25,412 | |
TaiMed Biologics, Inc. (a) | | | 3,000 | | | | 15,391 | |
Taishin Financial Holding Co. Ltd. | | | 116,026 | | | | 43,814 | |
Taiwan Business Bank | | | 71,419 | | | | 18,659 | |
Taiwan Cement Corp. | | | 46,000 | | | | 52,167 | |
Taiwan Cooperative Financial Holding Co. Ltd. | | | 92,322 | | | | 42,188 | |
Taiwan Fertilizer Co. Ltd. | | | 13,000 | | | | 16,911 | |
Taiwan Mobile Co. Ltd. | | | 29,000 | | | | 96,864 | |
See Notes to Financial Statements.
| | | | | | |
| | | | | | | |
| 30 | | BLACKROCK FUNDS | | JANUARY 31, 2017 | | |
| | |
Schedule of Investments (continued) | | BlackRock MSCI Asia ex Japan Index Fund |
| | | | | | | | |
| Common Stocks | | Shares | | | Value | |
Taiwan (continued) | |
Taiwan Semiconductor Manufacturing Co. Ltd. | | | 366,000 | | | $ | 2,180,943 | |
Teco Electric and Machinery Co. Ltd. | | | 21,000 | | | | 18,982 | |
Transcend Information, Inc. | | | 6,000 | | | | 16,366 | |
Uni-President Enterprises Corp. | | | 82,840 | | | | 142,108 | |
United Microelectronics Corp. | | | 136,000 | | | | 49,386 | |
Vanguard International Semiconductor Corp. | | | 11,000 | | | | 19,880 | |
Wistron Corp. | | | 35,553 | | | | 30,358 | |
WPG Holdings Ltd. | | | 28,000 | | | | 33,513 | |
Yuanta Financial Holding Co. Ltd. | | | 140,865 | | | | 55,933 | |
Yulon Motor Co. Ltd. | | | 6,000 | | | | 5,282 | |
Zhen Ding Technology Holding Ltd. | | | 11,000 | | | | 23,103 | |
| | | | | | | | |
| | | | | | | | 7,572,104 | |
Thailand — 2.7% | |
Advanced Info Service PCL — NVDR | | | 19,200 | | | | 86,722 | |
Airports of Thailand PCL — NVDR | | | 7,900 | | | | 93,036 | |
Bangkok Bank PCL — NVDR | | | 1,400 | | | | 6,941 | |
Bangkok Bank PCL, Foreign Registered Shares | | | 4,400 | | | | 22,686 | |
Bangkok Dusit Medical Services PCL — NVDR | | | 66,100 | | | | 41,646 | |
Bangkok Expressway & Metro PCL | | | 48,100 | | | | 9,649 | |
Banpu PCL — NVDR | | | 20,100 | | | | 11,085 | |
BEC World PCL — NVDR | | | 21,400 | | | | 10,758 | |
Berli Jucker PCL — NVDR | | | 16,000 | | | | 22,739 | |
BTS Group Holdings PCL — NVDR | | | 34,900 | | | | 8,279 | |
Bumrungrad Hospital PCL — NVDR | | | 5,500 | | | | 27,947 | |
Central Pattana PCL — NVDR | | | 11,500 | | | | 18,458 | |
Charoen Pokphand Foods PCL — NVDR | | | 24,400 | | | | 19,755 | |
CP ALL PCL — NVDR | | | 79,900 | | | | 137,226 | |
Delta Electronics Thailand PCL — NVDR | | | 6,000 | | | | 14,603 | |
Electricity Generating PCL | | | 3,000 | | | | 17,196 | |
Glow Energy PCL — NVDR | | | 3,300 | | | | 7,309 | |
Home Product Center PCL — NVDR | | | 41,900 | | | | 11,836 | |
Indorama Ventures PCL — NVDR | | | 21,000 | | | | 20,875 | |
IRPC PCL — NVDR | | | 125,600 | | | | 18,555 | |
Kasikornbank PCL — NVDR | | | 12,000 | | | | 64,299 | |
Kasikornbank PCL, Foreign Registered Shares | | | 20,100 | | | | 107,121 | |
KCE Electronics PCL | | | 3,900 | | | | 12,082 | |
Krung Thai Bank PCL — NVDR | | | 42,800 | | | | 23,104 | |
Minor International PCL — NVDR | | | 10,500 | | | | 10,370 | |
| | | | | | | | |
| Common Stocks | | Shares | | | Value | |
Thailand (continued) | |
PTT Exploration & Production PCL — NVDR | | | 24,500 | | | $ | 68,211 | |
PTT Global Chemical PCL — NVDR | | | 14,300 | | | | 27,523 | |
PTT PCL — NVDR | | | 15,900 | | | | 182,499 | |
Robinson Department Store PCL | | | 2,000 | | | | 3,292 | |
Siam Cement PCL — NVDR | | | 3,000 | | | | 43,124 | |
Siam Cement PCL, Foreign Registered Shares | | | 5,600 | | | | 80,511 | |
Siam Commercial Bank PCL — NVDR | | | 26,600 | | | | 114,124 | |
Thai Oil PCL — NVDR | | | 13,300 | | | | 27,108 | |
Thai Union Group PCL — NVDR | | | 39,800 | | | | 23,512 | |
TMB Bank PCL — NVDR | | | 256,800 | | | | 17,074 | |
True Corp. PCL — NVDR | | | 81,773 | | | | 15,217 | |
| | | | | | | | |
| | | | | | | | 1,426,472 | |
United States — 0.3% | |
Yum China Holdings, Inc. (a) | | | 6,845 | | | | 188,101 | |
| Total Common Stocks — 98.2% | | | | | | | 52,668,844 | |
| | | | | | | | |
| | | | | | | | | |
|
| Rights | |
Republic of Korea — 0.0% | |
Korean Air Lines Co., Ltd. (a) | | | 187 | | | | 893 | |
Samsung Securities Co., Ltd. (a) | | | 119 | | | | 625 | |
| Total Rights — 0.0% | | | | | | | 1,518 | |
Total Long-Term Investments
(Cost — $53,662,381) — 98.2% | | | | | | | 52,670,362 | |
| | | | | | | | |
| | | | | | | | | |
| | |
| Short-Term Securities | | | | | | |
BlackRock Liquidity Funds, T-Fund, Institutional Class, 0.40% (d)(e) | | | 702,741 | | | | 702,741 | |
Total Short-Term Securities (Cost — $702,741) — 1.3% | | | | | | | 702,741 | |
| Total Investments (Cost — $54,365,122) — 99.5% | | | | | | | 53,373,103 | |
Other Assets Less Liabilities — 0.5% | | | | | | | 257,693 | |
| | | | | | | | |
Net Assets — 100.0% | | | | | | $ | 53,630,796 | |
| | | | | | | | |
|
| Notes to Schedule of Investments |
| (a) | | Non-income producing security. |
| (b) | | Security exempt from registration pursuant to Rule 144A under the Securities Act of 1933, as amended. These securities may be resold in transactions exempt from registration to qualified institutional investors. |
| (c) | | A security contractually bound to one or more other securities to form a single saleable unit which cannot be sold separately. |
| (d) | | During the six months ended January 31, 2017, investments in issuers considered to be affiliates of the Fund for purposes of Section 2(a)(3) of the Investment Company Act of 1940, as amended, were as follows: |
| | | | | | | | | | | | | | | | | | | | | | | | | | | | |
| Affiliate | | Shares Held
at July 31,
2016 | | | Net
Activity | | | Shares Held
at January 31,
2017 | | | Value at
January 31,
2017 | | | Income | | | Net
Realized
Gain1 | | | Change in
Unrealized
Appreciation | |
BlackRock Liquidity Funds, T-Fund, Institutional Class | | | — | | | | 702,741 | | | | 702,741 | | | $ | 702,741 | | | $ | 1,482 | | | $ | 2 | | | | — | |
BlackRock Premier Government Institutional Fund | | | 15,860 | | | | (15,860 | ) | | | — | | | | — | | | | 15 | | | | — | | | | — | |
SL Liquidity Series, LLC, Money Market Series | | | 3,553 | | | | (3,553 | ) | | | — | | | | — | | | | 101 | 2 | | | — | | | | — | |
Total | | | $ | 702,741 | | | $ | 1,598 | | | $ | 2 | | | | — | |
| | | | | | | | | | | | | | | | | | | | | | | | | | | | |
1 Includes net capital gain distributions. | |
2 Represents securities lending income earned from the reinvestment of cash collateral from loaned securities, net of fees and collateral investment expenses, and other payments to and from borrowers of securities. | |
| (e) | | Current yield as of period end. |
See Notes to Financial Statements.
| | | | | | |
| | | | | | | |
| | BLACKROCK FUNDS | | JANUARY 31, 2017 | | 31 |
| | |
Schedule of Investments (concluded) | | BlackRock MSCI Asia ex Japan Index Fund |
|
| Derivative Financial Instruments Outstanding as of Period End |
| | | | | | | | | | | | | | |
| Futures Contracts | |
Contracts
Long | | | Issue | | Expiration | | Notional Value | | | Unrealized
Appreciation | |
| | 18 | | | MSCI Emerging Markets Mini Index | | March 2017 | | $ | 823,590 | | | $ | 10,364 | |
|
| Derivative Financial Instruments Outstanding as of Period End |
As of period end, the fair values of derivative financial instruments located in the Statements of Assets and Liabilities were as follows:
| | | | | | | | | | | | | | | | | | | | | | | | | | | | | | | | |
| Assets — Derivative Financial Instruments | | | | | Commodity
Contracts | | | Credit
Contracts | | | Equity
Contracts | | | Foreign
Currency
Exchange
Contracts | | | Interest Rate
Contracts | | | Other
Contracts | | | Total | |
Futures contracts | | | Net unrealized appreciation | | | | — | | | | — | | | $ | 10,364 | | | | — | | | | — | | | | — | | | $ | 10,364 | |
| | | | | | | | | | | | | | | | | | | | | | | | | | | | | | | | |
| For the six months ended January 31, 2017, the effect of derivative financial instruments in the Statements of Operations was as follows: | |
| | | | | | | | | | | | | | | | | | | | | | | | | | | | | | | | |
Net Realized Gain (Loss) from: | | | | | | | | | | | | | | | | | | | | | | | | | | | | | | | | |
Futures contracts | | | | — | | | | — | | | $ | 181,886 | | | | — | | | | — | | | | — | | | $ | 181,886 | |
Net Change in Unrealized Appreciation (Depreciation) on: | | | | | | | | | | | | | | | | | | | | | | | | | | | | | | | | |
Futures contracts | | | | — | | | | — | | | $ | 8,069 | | | | — | | | | — | | | | — | | | $ | 8,069 | |
| | |
| Average Quarterly Balances of Outstanding Derivative Financial Instruments |
| | | | |
| Futures contracts: | |
Average notional value of contracts — long | | $ | 592,495 | |
| | | | |
For more information about the Fund’s investment risks regarding derivative financial instruments, refer to the Notes to Financial Statements.
|
| Fair Value Hierarchy as of Period End |
Various inputs are used in determining the fair value of investments and derivative financial instruments. For information about the Fund’s policy regarding valuation of investments and derivative financial instruments, refer to the Notes to Financial Statements.
The following tables summarize the Fund’s investments and derivative financial instruments categorized in the disclosure hierarchy:
| | | | | | | | | | | | | | | | |
| | | Level 1 | | | Level 2 | | | Level 3 | | | Total | |
Assets: | |
| Investments: | |
| Common Stocks: | |
China | | $ | 3,767,309 | | | $ | 10,122,054 | | | | — | | | $ | 13,889,363 | |
Hong Kong | | | 142,112 | | | | 8,785,295 | | | | — | | | | 8,927,407 | |
India | | | 3,451,835 | | | | 1,727,599 | | | | — | | | | 5,179,434 | |
Indonesia | | | 20,304 | | | | 1,526,188 | | | | — | | | | 1,546,492 | |
Malaysia | | | 579,541 | | | | 961,977 | | | | — | | | | 1,541,518 | |
Philippines | | | 14,862 | | | | 757,529 | | | | — | | | | 772,391 | |
Republic of Korea | | | — | | | | 27,460 | | | | — | | | | 27,460 | |
Singapore | | | 41,211 | | | | 2,405,940 | | | | — | | | | 2,447,151 | |
South Korea | | | 128,407 | | | | 9,022,544 | | | | — | | | | 9,150,951 | |
Taiwan | | | 16,366 | | | | 7,555,738 | | | | — | | | | 7,572,104 | |
Thailand | | | 10,758 | | | | 1,415,714 | | | | — | | | | 1,426,472 | |
United States | | | 188,101 | | | | — | | | | — | | | | 188,101 | |
Rights | | | — | | | | 1,518 | | | | — | | | | 1,518 | |
Short-Term Securities | | | 702,741 | | | | — | | | | — | | | | 702,741 | |
| | | | | | | | | | | | | | | | |
Total | | $ | 9,063,547 | | | $ | 44,309,556 | | | | — | | | $ | 53,373,103 | |
| | | | | | | | | | | | | | | | |
| | | | | | | | | | | | | | | | |
| Derivative Financial Instruments1 | |
Assets: | |
Equity contracts | | $ | 10,364 | | | | — | | | | — | | | $ | 10,364 | |
1 Derivative financial instruments are futures contracts, which are valued at the unrealized appreciation (depreciation) on the instrument. | |
During the six months ended January 31, 2017, there were no transfers between levels.
See Notes to Financial Statements.
| | | | | | |
| | | | | | | |
| 32 | | BLACKROCK FUNDS | | JANUARY 31, 2017 | | |
| | |
Schedule of Investments January 31, 2017 (Unaudited) | | BlackRock MSCI World Index Fund (Percentages shown are based on Net Assets) |
| | | | | | | | |
| Common Stocks | | Shares | | | Value | |
Argentina — 0.0% | |
MercadoLibre, Inc. | | | 430 | | | $ | 79,718 | |
Australia — 2.7% | |
AGL Energy Ltd. | | | 8,754 | | | | 150,110 | |
Alumina Ltd. | | | 41,516 | | | | 61,172 | |
Amcor Ltd. | | | 13,996 | | | | 151,913 | |
AMP Ltd. | | | 38,003 | | | | 144,243 | |
APA Group (a) | | | 16,874 | | | | 107,793 | |
Aristocrat Leisure Ltd. | | | 6,025 | | | | 69,871 | |
ASX Ltd. | | | 2,220 | | | | 84,025 | |
Aurizon Holdings Ltd. | | | 28,230 | | | | 107,249 | |
AusNet Services | | | 18,104 | | | | 21,715 | |
Australia & New Zealand Banking Group Ltd. | | | 36,509 | | | | 811,171 | |
Bank of Queensland Ltd. | | | 6,911 | | | | 62,790 | |
Bendigo & Adelaide Bank Ltd. | | | 7,799 | | | | 74,273 | |
BHP Billiton Ltd. | | | 41,158 | | | | 835,023 | |
Boral Ltd. | | | 14,795 | | | | 65,383 | |
Brambles Ltd. | | | 19,513 | | | | 154,211 | |
Caltex Australia Ltd. | | | 4,121 | | | | 89,437 | |
Challenger Ltd. | | | 4,979 | | | | 41,661 | |
CIMIC Group Ltd. | | | 1,069 | | | | 27,825 | |
Coca-Cola Amatil Ltd. | | | 8,032 | | | | 59,399 | |
Cochlear Ltd. | | | 995 | | | | 94,519 | |
Commonwealth Bank of Australia | | | 21,599 | | | | 1,338,276 | |
Computershare Ltd. | | | 7,242 | | | | 70,827 | |
Crown Resorts Ltd. | �� | | 7,473 | | | | 64,646 | |
CSL Ltd. | | | 5,494 | | | | 468,364 | |
Dexus Property Group | | | 11,769 | | | | 80,173 | |
Domino’s Pizza Enterprises Ltd. | | | 517 | | | | 23,324 | |
DUET Group (a) | | | 27,920 | | | | 59,336 | |
Flight Centre Travel Group Ltd. | | | 482 | | | | 10,959 | |
Fortescue Metals Group Ltd. | | | 21,688 | | | | 109,748 | |
Goodman Group | | | 19,389 | | | | 101,818 | |
GPT Group | | | 18,738 | | | | 66,542 | |
Harvey Norman Holdings Ltd. | | | 5,760 | | | | 21,847 | |
Healthscope Ltd. | | | 18,926 | | | | 31,430 | |
Incitec Pivot Ltd. | | | 20,268 | | | | 59,236 | |
Insurance Australia Group Ltd. | | | 32,134 | | | | 140,632 | |
Lend Lease Group (a) | | | 5,084 | | | | 54,364 | |
Macquarie Group Ltd. | | | 4,073 | | | | 261,550 | |
Medibank Pvt Ltd. | | | 26,335 | | | | 53,969 | |
Mirvac Group | | | 53,906 | | | | 83,036 | |
National Australia Bank Ltd. | | | 33,795 | | | | 777,154 | |
Newcrest Mining Ltd. | | | 8,944 | | | | 146,674 | |
Oil Search Ltd. | | | 14,597 | | | | 76,234 | |
Orica Ltd. | | | 3,615 | | | | 51,460 | |
Origin Energy Ltd. | | | 22,413 | | | | 120,184 | |
Qantas Airways Ltd. | | | 4,693 | | | | 12,131 | |
QBE Insurance Group Ltd. | | | 16,931 | | | | 160,628 | |
Ramsay Health Care Ltd. | | | 1,442 | | | | 73,088 | |
REA Group Ltd. | | | 1,287 | | | | 51,380 | |
Rio Tinto Ltd. | | | 5,501 | | | | 279,063 | |
Santos Ltd. | | | 27,671 | | | | 84,183 | |
Scentre Group | | | 61,972 | | | | 206,795 | |
Seek Ltd. | | | 4,929 | | | | 54,025 | |
Sonic Healthcare Ltd. | | | 4,595 | | | | 72,469 | |
South32 Ltd. | | | 64,231 | | | | 134,434 | |
Stockland | | | 31,102 | | | | 102,634 | |
Suncorp Group Ltd. | | | 15,512 | | | | 153,366 | |
Sydney Airport (a) | | | 13,012 | | | | 57,743 | |
Tabcorp Holdings Ltd. | | | 6,721 | | | | 24,157 | |
Tatts Group Ltd. | | | 20,780 | | | | 68,412 | |
Telstra Corp. Ltd. | | | 49,855 | | | | 189,152 | |
TPG Telecom Ltd. | | | 2,446 | | | | 12,016 | |
Transurban Group (a) | | | 22,354 | | | | 172,977 | |
Treasury Wine Estates Ltd. | | | 9,623 | | | | 84,894 | |
Vicinity Centres | | | 41,144 | | | | 89,276 | |
| | | | | | | | |
| Common Stocks | | Shares | | | Value | |
Australia (continued) | |
Vocus Group Ltd. | | | 3,819 | | | $ | 11,712 | |
Wesfarmers Ltd. | | | 14,928 | | | | 456,038 | |
Westfield Corp. | | | 25,016 | | | | 166,766 | |
Westpac Banking Corp. | | | 42,979 | | | | 1,034,654 | |
Woodside Petroleum Ltd. | | | 10,381 | | | | 248,901 | |
Woolworths Ltd. | | | 16,219 | | | | 302,685 | |
| | | | | | | | |
| | | | | | | | 11,789,145 | |
Austria — 0.1% | |
Andritz AG | | | 961 | | | | 51,942 | |
Erste Group Bank AG (b) | | | 2,816 | | | | 85,835 | |
OMV AG | | | 2,521 | | | | 88,230 | |
Raiffeisen Bank International AG (b) | | | 2,054 | | | | 45,747 | |
Voestalpine AG | | | 1,750 | | | | 74,206 | |
| | | | | | | | |
| | | | | | | | 345,960 | |
Belgium — 0.4% | |
Ageas | | | 1,997 | | | | 85,506 | |
Anheuser-Busch InBev SA | | | 9,631 | | | | 1,005,650 | |
Colruyt SA | | | 810 | | | | 39,642 | |
Groupe Bruxelles Lambert SA | | | 977 | | | | 83,263 | |
KBC Group NV | | | 2,832 | | | | 183,930 | |
Proximus | | | 1,452 | | | | 41,701 | |
Solvay SA | | | 939 | | | | 110,098 | |
Telenet Group Holding NV (b) | | | 1,112 | | | | 59,670 | |
UCB SA | | | 1,818 | | | | 125,569 | |
Umicore SA | | | 891 | | | | 49,909 | |
| | | | | | | | |
| | | | | | | | 1,784,938 | |
Bermuda — 0.0% | |
Marvell Technology Group Ltd. | | | 4,833 | | | | 71,867 | |
Canada — 3.7% | |
Agnico Eagle Mines Ltd. | | | 3,088 | | | | 147,298 | |
Agrium, Inc. | | | 1,617 | | | | 166,540 | |
Alimentation Couche Tard, Inc., Class B | | | 5,319 | | | | 243,662 | |
AltaGas Ltd. | | | 1,443 | | | | 34,322 | |
ARC Resources Ltd. | | | 3,536 | | | | 55,027 | |
Atco Ltd. Class I | | | 804 | | | | 28,311 | |
Bank of Montreal | | | 8,473 | | | | 640,920 | |
Bank of Nova Scotia | | | 15,021 | | | | 897,624 | |
Barrick Gold Corp. | | | 13,880 | | | | 255,787 | |
BCE, Inc. | | | 1,717 | | | | 77,402 | |
BlackBerry Ltd. (b) | | | 7,929 | | | | 55,937 | |
Bombardier, Inc., Class B (b) | | | 21,867 | | | | 41,843 | |
Brookfield Asset Management, Inc., Class A | | | 10,408 | | | | 359,931 | |
CAE, Inc. | | | 5,090 | | | | 72,287 | |
Cameco Corp. | | | 6,528 | | | | 83,127 | |
Canadian Imperial Bank of Commerce | | | 4,881 | | | | 415,649 | |
Canadian National Railway Co. | | | 9,878 | | | | 686,545 | |
Canadian Natural Resources Ltd. | | | 13,898 | | | | 420,171 | |
Canadian Pacific Railway Ltd. | | | 1,852 | | | | 280,109 | |
Canadian Tire Corp. Ltd., Class A | | | 946 | | | | 100,609 | |
Canadian Utilities Ltd., Class A | | | 958 | | | | 27,269 | |
CCL Industries, Inc., Class B | | | 278 | | | | 57,213 | |
Cenovus Energy, Inc. | | | 9,399 | | | | 128,281 | |
CGI Group, Inc., Class A (b) | | | 3,036 | | | | 145,985 | |
CI Financial Corp. | | | 2,827 | | | | 59,093 | |
Constellation Software, Inc. | | | 195 | | | | 88,075 | |
Crescent Point Energy Corp. | | | 7,219 | | | | 84,159 | |
Dollarama, Inc. | | | 1,421 | | | | 107,619 | |
Eldorado Gold Corp. (b) | | | 8,726 | | | | 30,847 | |
Element Fleet Management Corp. | | | 5,211 | | | | 50,658 | |
Emera, Inc. | | | 1,068 | | | | 37,295 | |
Empire Co. Ltd., Class A | | | 1,259 | | | | 15,722 | |
Enbridge, Inc. | | | 11,497 | | | | 489,478 | |
Encana Corp. | | | 13,206 | | | | 168,570 | |
Fairfax Financial Holdings Ltd. | | | 276 | | | | 128,959 | |
See Notes to Financial Statements.
| | | | | | |
| | | | | | | |
| | BLACKROCK FUNDS | | JANUARY 31, 2017 | | 33 |
| | |
Schedule of Investments (continued) | | BlackRock MSCI World Index Fund |
| | | | | | | | |
| Common Stocks | | Shares | | | Value | |
Canada (continued) | |
Finning International, Inc. | | | 1,457 | | | $ | 29,493 | |
First Capital Realty, Inc. | | | 1,017 | | | | 16,178 | |
First Quantum Minerals Ltd. | | | 8,989 | | | | 113,360 | |
Fortis, Inc. | | | 5,378 | | | | 172,923 | |
Franco-Nevada Corp. | | | 2,020 | | | | 131,391 | |
George Weston Ltd. | | | 565 | | | | 48,187 | |
Gildan Activewear, Inc. | | | 3,360 | | | | 87,896 | |
Goldcorp, Inc. | | | 11,706 | | | | 189,275 | |
Great-West Lifeco, Inc. | | | 4,569 | | | | 125,211 | |
H&R Real Estate Investment Trust | | | 1,261 | | | | 21,862 | |
Husky Energy, Inc. (b) | | | 4,896 | | | | 63,173 | |
Hydro One, Ltd. (c) | | | 1,427 | | | | 26,374 | |
IGM Financial, Inc. | | | 882 | | | | 27,106 | |
Imperial Oil Ltd. | | | 4,200 | | | | 138,080 | |
Industrial Alliance Insurance & Financial Services, Inc. | | | 1,683 | | | | 70,812 | |
Intact Financial Corp. | | | 1,902 | | | | 138,873 | |
Inter Pipeline Ltd. | | | 5,492 | | | | 119,104 | |
Jean Coutu Group PJC, Inc., Class A | | | 1,007 | | | | 15,826 | |
Keyera Corp. | | | 2,885 | | | | 84,693 | |
Kinross Gold Corp. (b) | | | 11,493 | | | | 44,780 | |
Linamar Corp. | | | 414 | | | | 18,202 | |
Loblaw Cos. Ltd. | | | 2,805 | | | | 147,423 | |
Magna International, Inc. | | | 4,753 | | | | 205,607 | |
Manulife Financial Corp. | | | 24,342 | | | | 466,730 | |
Methanex Corp. | | | 1,478 | | | | 73,897 | |
Metro, Inc. | | | 2,406 | | | | 73,091 | |
National Bank of Canada | | | 4,132 | | | | 178,363 | |
Onex Corp. | | | 873 | | | | 61,092 | |
Open Text Corp. | | | 3,208 | | | | 109,805 | |
Pembina Pipeline Corp. | | | 5,792 | | | | 179,691 | |
Peyto Exploration & Development Corp. | | | 2,379 | | | | 51,776 | |
Potash Corp. of Saskatchewan, Inc. | | | 10,313 | | | | 191,875 | |
Power Corp. of Canada | | | 4,214 | | | | 98,869 | |
Power Financial Corp. | | | 2,724 | | | | 70,777 | |
PrairieSky Royalty Ltd. | | | 3,587 | | | | 84,076 | |
Restaurant Brands International, Inc. | | | 3,030 | | | | 148,630 | |
RioCan Real Estate Investment Trust | | | 1,373 | | | | 27,444 | |
Rogers Communications, Inc., Class B | | | 4,096 | | | | 177,690 | |
Royal Bank of Canada | | | 18,731 | | | | 1,346,761 | |
Saputo, Inc. | | | 3,711 | | | | 136,633 | |
Seven Generations Energy Ltd. (b) | | | 2,327 | | | | 46,513 | |
Shaw Communications, Inc., Class B | | | 5,704 | | | | 123,044 | |
Silver Wheaton Corp. | | | 6,151 | | | | 135,996 | |
Smart Real Estate Investment Trust | | | 626 | | | | 15,404 | |
SNC-Lavalin Group, Inc. | | | 1,379 | | | | 59,431 | |
Sun Life Financial, Inc. | | | 7,853 | | | | 309,956 | |
Suncor Energy, Inc. | | | 21,365 | | | | 662,664 | |
Teck Resources Ltd., Class B | | | 6,863 | | | | 168,193 | |
TELUS Corp. | | | 2,185 | | | | 72,942 | |
Thomson Reuters Corp. | | | 4,610 | | | | 206,648 | |
Toronto-Dominion Bank | | | 23,570 | | | | 1,221,021 | |
Tourmaline Oil Corp. (b) | | | 3,253 | | | | 76,047 | |
TransCanada Corp. | | | 11,086 | | | | 523,012 | |
Turquoise Hill Resources Ltd. (b) | | | 11,569 | | | | 41,875 | |
Valeant Pharmaceuticals International, Inc. (b) | | | 3,056 | | | | 42,179 | |
Veresen, Inc. | | | 5,822 | | | | 59,193 | |
Vermilion Energy, Inc. | | | 1,807 | | | | 74,544 | |
Waste Connections, Inc. | | | 396 | | | | 31,759 | |
Waste Connections, Inc. | | | 2,085 | | | | 167,425 | |
West Fraser Timber Co. Ltd. | | | 709 | | | | 24,214 | |
Yamana Gold, Inc. | | | 9,349 | | | | 30,894 | |
| | | | | | | | |
| | | | | | | | 16,288,307 | |
Denmark — 0.6% | |
A.P. Moeller — Maersk A/S, Class A | | | 45 | | | | 72,048 | |
A.P. Moeller — Maersk A/S, Class B | | | 85 | | | | 142,471 | |
Carlsberg A/S, Class B | | | 1,431 | | | | 129,459 | |
| | | | | | | | |
| Common Stocks | | Shares | | | Value | |
Denmark (continued) | |
Chr Hansen Holding A/S | | | 1,404 | | | $ | 85,706 | |
Coloplast A/S, Class B | | | 1,705 | | | | 122,257 | |
Danske Bank A/S | | | 9,358 | | | | 312,131 | |
DONG Energy A/S (b)(c) | | | 1,033 | | | | 39,171 | |
DSV A/S | | | 2,240 | | | | 108,930 | |
Genmab A/S (b) | | | 528 | | | | 102,253 | |
ISS A/S | | | 2,883 | | | | 102,659 | |
Novo Nordisk A/S, Class B | | | 24,144 | | | | 872,558 | |
Novozymes A/S, Class B | | | 3,192 | | | | 124,424 | |
Pandora A/S | | | 1,252 | | | | 164,073 | |
TDC A/S (b) | | | 9,490 | | | | 50,004 | |
Tryg A/S | | | 1,039 | | | | 19,879 | |
Vestas Wind Systems A/S | | | 2,606 | | | | 182,756 | |
William Demant Holding A/S (b) | | | 1,130 | | | | 21,158 | |
| | | | | | | | |
| | | | | | | | 2,651,937 | |
Finland — 0.3% | |
Elisa OYJ | | | 2,308 | | | | 77,774 | |
Fortum OYJ | | | 5,806 | | | | 92,633 | |
Kone OYJ, Class B | | | 4,010 | | | | 181,296 | |
Metso OYJ | | | 1,005 | | | | 30,897 | |
Neste Oil OYJ | | | 1,226 | | | | 42,656 | |
Nokia OYJ | | | 71,473 | | | | 320,936 | |
Nokian Renkaat OYJ | | | 1,183 | | | | 44,378 | |
Orion OYJ, Class B | | | 1,454 | | | | 67,682 | |
Sampo OYJ, Class A | | | 5,734 | | | | 265,533 | |
Stora Enso OYJ, Class R | | | 8,882 | | | | 100,795 | |
UPM-Kymmene OYJ | | | 6,947 | | | | 157,557 | |
Wartsila OYJ | | | 1,746 | | | | 87,683 | |
| | | | | | | | |
| | | | | | | | 1,469,820 | |
France — 3.5% | |
Accor SA | | | 2,478 | | | | 100,423 | |
Aeroports de Paris | | | 190 | | | | 21,084 | |
Air Liquide SA | | | 4,885 | | | | 527,403 | |
Airbus SE | | | 7,093 | | | | 480,799 | |
Alstom SA (b) | | | 2,603 | | | | 73,859 | |
ArcelorMittal (b) | | | 22,213 | | | | 173,207 | |
Arkema SA | | | 715 | | | | 70,615 | |
AtoS SE | | | 1,039 | | | | 110,544 | |
AXA SA | | | 25,175 | | | | 618,732 | |
BNP Paribas SA | | | 13,268 | | | | 848,778 | |
Bollore SA | | | 7,514 | | | | 30,052 | |
Bouygues SA | | | 2,591 | | | | 94,146 | |
Bureau Veritas SA | | | 2,974 | | | | 58,242 | |
Cap Gemini SA | | | 2,046 | | | | 166,582 | |
Carrefour SA | | | 7,762 | | | | 189,884 | |
Casino Guichard-Perrachon SA | | | 496 | | | | 26,745 | |
Christian Dior SE | | | 746 | | | | 160,140 | |
Cie Generale des Etablissements Michelin | | | 2,208 | | | | 237,211 | |
CNP Assurances | | | 1,387 | | | | 26,066 | |
Compagnie de Saint-Gobain | | | 6,401 | | | | 314,517 | |
Credit Agricole SA | | | 13,354 | | | | 177,230 | |
Danone SA | | | 7,693 | | | | 482,264 | |
Dassault Aviation SA | | | 33 | | | | 38,035 | |
Dassault Systemes SA | | | 1,593 | | | | 123,319 | |
Edenred | | | 1,805 | | | | 39,354 | |
Eiffage SA | | | 1,030 | | | | 74,047 | |
Electricite de France SA | | | 1,940 | | | | 19,125 | |
Engie SA | | | 21,803 | | | | 261,037 | |
Essilor International SA | | | 2,793 | | | | 327,664 | |
Eurazeo | | | 537 | | | | 33,074 | |
Eutelsat Communications SA | | | 1,683 | | | | 28,706 | |
Fonciere Des Regions | | | 385 | | | | 32,092 | |
Gecina SA | | | 544 | | | | 70,150 | |
Groupe Eurotunnel SE, Registered Shares | | | 7,842 | | | | 72,948 | |
Hermes International | | | 365 | | | | 158,624 | |
See Notes to Financial Statements.
| | | | | | |
| | | | | | | |
| 34 | | BLACKROCK FUNDS | | JANUARY 31, 2017 | | |
| | |
Schedule of Investments (continued) | | BlackRock MSCI World Index Fund |
| | | | | | | | |
| Common Stocks | | Shares | | | Value | |
France (continued) | |
ICADE | | | 255 | | | $ | 18,078 | |
Iliad SA | | | 426 | | | | 91,101 | |
Imerys SA | | | 272 | | | | 21,843 | |
Ingenico Group SA | | | 950 | | | | 80,110 | |
JCDecaux SA | | | 576 | | | | 18,439 | |
Kering | | | 902 | | | | 214,713 | |
Klepierre | | | 3,250 | | | | 123,413 | |
L’Oreal SA | | | 3,289 | | | | 597,996 | |
Lagardere SCA | | | 1,249 | | | | 31,336 | |
Legrand SA | | | 3,202 | | | | 185,976 | |
LVMH Moet Hennessy Louis Vuitton SE | | | 3,506 | | | | 706,540 | |
Natixis SA | | | 14,230 | | | | 84,321 | |
Orange SA | | | 24,278 | | | | 376,902 | |
Pernod Ricard SA | | | 2,594 | | | | 303,430 | |
Peugeot SA (b) | | | 4,915 | | | | 91,471 | |
Publicis Groupe SA | | | 2,156 | | | | 148,115 | |
Remy Cointreau SA | | | 190 | | | | 17,274 | |
Renault SA | | | 2,424 | | | | 218,266 | |
Rexel SA | | | 5,012 | | | | 87,414 | |
Safran SA | | | 3,796 | | | | 257,318 | |
Sanofi | | | 14,764 | | | | 1,186,678 | |
Schneider Electric SE | | | 7,242 | | | | 518,194 | |
SCOR SE | | | 2,534 | | | | 85,760 | |
SEB SA | | | 259 | | | | 32,571 | |
SES SA | | | 3,592 | | | | 69,846 | |
SFR Group SA (b) | | | 1,035 | | | | 30,073 | |
Societe BIC SA | | | 528 | | | | 69,037 | |
Societe Generale SA | | | 10,036 | | | | 490,635 | |
Sodexo SA | | | 1,221 | | | | 135,021 | |
Suez | | | 4,073 | | | | 61,696 | |
Thales SA | | | 1,573 | | | | 147,570 | |
TOTAL SA | | | 28,244 | | | | 1,429,010 | |
Unibail-Rodamco SE | | | 1,172 | | | | 270,089 | |
Valeo SA | | | 2,837 | | | | 173,396 | |
Veolia Environnement SA | | | 6,594 | | | | 112,318 | |
Vinci SA | | | 6,607 | | | | 463,128 | |
Vivendi SA | | | 12,539 | | | | 229,916 | |
Wendel SA | | | 198 | | | | 23,433 | |
Zodiac Aerospace | | | 3,050 | | | | 92,702 | |
| | | | | | | | |
| | | | | | | | 15,561,827 | |
Germany — 3.3% | |
adidas AG | | | 2,439 | | | | 384,886 | |
Allianz SE, Registered Shares | | | 5,644 | | | | 959,278 | |
Axel Springer AG | | | 398 | | | | 20,979 | |
BASF SE | | | 11,798 | | | | 1,138,905 | |
Bayer AG, Registered Shares | | | 10,666 | | | | 1,184,770 | |
Bayerische Motoren Werke AG | | | 4,227 | | | | 385,968 | |
Bayerische Motoren Werke AG, Preference Shares | | | 763 | | | | 57,320 | |
Beiersdorf AG | | | 1,473 | | | | 130,683 | |
Brenntag AG | | | 2,242 | | | | 130,433 | |
Commerzbank AG | | | 16,186 | | | | 140,780 | |
Continental AG | | | 1,340 | | | | 262,323 | |
Covestro AG (c) | | | 640 | | | | 48,162 | |
Daimler AG, Registered Shares | | | 11,937 | | | | 897,744 | |
Deutsche Bank AG, Registered Shares (b) | | | 17,841 | | | | 356,302 | |
Deutsche Boerse AG (b) | | | 2,326 | | | | 214,628 | |
Deutsche Lufthansa AG, Registered Shares | | | 1,873 | | | | 25,021 | |
Deutsche Post AG, Registered Shares | | | 12,571 | | | | 421,946 | |
Deutsche Telekom AG, Registered Shares | | | 42,002 | | | | 735,329 | |
Deutsche Wohnen AG, Bearer Shares | | | 4,506 | | | | 146,974 | |
E.ON SE | | | 22,965 | | | | 176,901 | |
Evonik Industries AG | | | 1,551 | | | | 50,348 | |
Fraport AG Frankfurt Airport Services Worldwide | | | 362 | | | | 21,664 | |
Fresenius Medical Care AG & Co. KGaA | | | 2,917 | | | | 238,099 | |
Fresenius SE & Co. KGaA | | | 5,172 | | | | 409,336 | |
Fuchs Petrolub SE, Preference Shares | | | 501 | | | | 22,943 | |
| | | | | | | | |
| Common Stocks | | Shares | | | Value | |
Germany (continued) | |
GEA Group AG | | | 2,824 | | | $ | 117,018 | |
Hannover Rueck SE | | | 1,031 | | | | 113,564 | |
HeidelbergCement AG | | | 1,683 | | | | 162,585 | |
Henkel AG & Co. KGaA | | | 1,133 | | | | 119,557 | |
Henkel AG & Co. KGaA Preference Shares | | | 2,201 | | | | 268,683 | |
Hochtief AG | | | 204 | | | | 29,080 | |
HUGO BOSS AG | | | 657 | | | | 42,211 | |
Infineon Technologies AG | | | 15,009 | | | | 276,185 | |
Innogy SE (b)(c) | | | 1,392 | | | | 47,612 | |
K+S AG, Registered Shares | | | 2,113 | | | | 53,677 | |
Lanxess AG | | | 972 | | | | 70,734 | |
Linde AG | | | 2,451 | | | | 398,592 | |
MAN SE | | | 649 | | | | 67,283 | |
Merck KGaA | | | 1,516 | | | | 167,263 | |
Metro AG | | | 2,730 | | | | 93,423 | |
Muenchener Rueckversicherungs AG, Registered Shares | | | 2,186 | | | | 411,637 | |
OSRAM Licht AG | | | 1,512 | | | | 87,773 | |
Porsche Automobil Holding SE, Preference Shares | | | 1,935 | | | | 116,396 | |
ProSiebenSat.1 Media AG, Registered Shares | | | 3,110 | | | | 132,304 | |
RWE AG (b) | | | 5,181 | | | | 68,985 | |
SAP SE | | | 12,558 | | | | 1,148,431 | |
Schaeffler AG | | | 2,023 | | | | 32,805 | |
Siemens AG, Registered Shares | | | 9,717 | | | | 1,256,975 | |
Symrise AG | | | 1,653 | | | | 99,531 | |
Telefonica Deutschland Holding AG | | | 13,818 | | | | 57,803 | |
ThyssenKrupp AG | | | 5,275 | | | | 133,631 | |
TUI AG | | | 7,224 | | | | 105,873 | |
United Internet AG, Registered Shares | | | 1,622 | | | | 67,973 | |
Volkswagen AG | | | 323 | | | | 51,743 | |
Vonovia SE | | | 5,314 | | | | 174,102 | |
Zalando SE (b)(c) | | | 1,629 | | | | 64,425 | |
| | | | | | | | |
| | | | | | | | 14,599,576 | |
Hong Kong — 1.2% | |
AIA Group Ltd. | | | 149,400 | | | | 924,988 | |
ASM Pacific Technology Ltd. | | | 2,400 | | | | 29,180 | |
Bank of East Asia Ltd. | | | 13,000 | | | | 55,373 | |
BOC Hong Kong Holdings Ltd. | | | 44,000 | | | | 175,907 | |
Cathay Pacific Airways Ltd. | | | 12,000 | | | | 16,253 | |
Cheung Kong Infrastructure Holdings Ltd. | | | 11,000 | | | | 88,459 | |
Cheung Kong Property Holdings Ltd. | | | 33,500 | | | | 220,191 | |
CK Hutchison Holdings Ltd. | | | 33,000 | | | | 395,511 | |
CLP Holdings Ltd. | | | 19,500 | | | | 190,331 | |
First Pacific Co. Ltd. | | | 22,000 | | | | 16,681 | |
Galaxy Entertainment Group Ltd. | | | 32,000 | | | | 151,996 | |
Hang Lung Group, Ltd. | | | 10,000 | | | | 38,351 | |
Hang Lung Properties Ltd. | | | 26,000 | | | | 63,988 | |
Hang Seng Bank Ltd. | | | 8,800 | | | | 179,370 | |
Henderson Land Development Co. Ltd. | | | 13,310 | | | | 73,470 | |
HK Electric Investments & HK Electric Investments Ltd. (a)(c) | | | 23,500 | | | | 19,616 | |
HKT Trust & HKT Ltd. (a) | | | 27,000 | | | | 37,717 | |
Hong Kong & China Gas Co. Ltd. | | | 89,940 | | | | 169,339 | |
Hong Kong Exchanges & Clearing Ltd. | | | 13,914 | | | | 336,536 | |
Hongkong Land Holdings Ltd. | | | 16,700 | | | | 112,787 | |
Hysan Development Co. Ltd. | | | 15,000 | | | | 68,362 | |
Jardine Matheson Holdings Ltd. | | | 3,100 | | | | 191,193 | |
Kerry Properties Ltd. | | | 2,500 | | | | 7,075 | |
Li & Fung Ltd. | | | 130,000 | | | | 56,372 | |
Link REIT | | | 30,000 | | | | 205,007 | |
Melco Crown Entertainment Ltd. — ADR | | | 2,297 | | | | 38,681 | |
MGM China Holdings Ltd. | | | 14,000 | | | | 27,194 | |
MTR Corp. Ltd. | | | 22,000 | | | | 111,763 | |
New World Development Co. Ltd. | | | 60,000 | | | | 69,228 | |
NWS Holdings Ltd. | | | 11,295 | | | | 20,297 | |
PCCW Ltd. | | | 102,000 | | | | 61,910 | |
Power Assets Holdings Ltd. | | | 17,000 | | | | 162,892 | |
See Notes to Financial Statements.
| | | | | | |
| | | | | | | |
| | BLACKROCK FUNDS | | JANUARY 31, 2017 | | 35 |
| | |
Schedule of Investments (continued) | | BlackRock MSCI World Index Fund |
| | | | | | | | |
| Common Stocks | | Shares | | | Value | |
Hong Kong (continued) | |
Sands China Ltd. | | | 29,200 | | | $ | 128,479 | |
Shangri-La Asia Ltd. | | | 16,000 | | | | 17,797 | |
Sino Land Co. Ltd. | | | 34,000 | | | | 56,180 | |
SJM Holdings Ltd. | | | 17,000 | | | | 13,507 | |
Sun Hung Kai Properties Ltd. | | | 17,000 | | | | 233,938 | |
Swire Pacific Ltd., Class A | | | 5,500 | | | | 56,033 | |
Swire Properties Ltd. | | | 18,000 | | | | 50,648 | |
Techtronic Industries Co. Ltd. | | | 12,500 | | | | 43,232 | |
WH Group Ltd. (c) | | | 81,500 | | | | 61,903 | |
Wharf Holdings Ltd. | | | 19,000 | | | | 142,467 | |
Wheelock & Co. Ltd. | | | 11,000 | | | | 66,857 | |
Wynn Macau Ltd. | | | 14,800 | | | | 26,916 | |
Yue Yuen Industrial Holdings Ltd. | | | 6,500 | | | | 23,792 | |
| | | | | | | | |
| | | | | | | | 5,237,767 | |
Ireland — 0.6% | |
Bank of Ireland (b) | | | 378,850 | | | | 101,781 | |
CRH PLC | | | 10,646 | | | | 369,263 | |
DCC PLC | | | 1,063 | | | | 85,745 | |
Experian PLC | | | 11,240 | | | | 217,070 | |
James Hardie Industries PLC | | | 7,199 | | | | 113,070 | |
Kerry Group PLC, Class A | | | 2,141 | | | | 150,460 | |
Medtronic PLC | | | 17,623 | | | | 1,339,700 | |
Paddy Power Betfair PLC | | | 876 | | | | 91,538 | |
Seagate Technology PLC | | | 3,334 | | | | 150,530 | |
Weatherford International PLC (b) | | | 9,576 | | | | 49,891 | |
XL Group Ltd. | | | 2,930 | | | | 110,080 | |
| | | | | | | | |
| | | | | | | | 2,779,128 | |
Israel — 0.2% | |
Azrieli Group Ltd. | | | 353 | | | | 16,113 | |
Bank Hapoalim BM | | | 15,396 | | | | 93,025 | |
Bank Leumi Le-Israel BM (b) | | | 17,440 | | | | 72,134 | |
Bezeq The Israeli Telecommunication Corp. Ltd. | | | 18,930 | | | | 33,069 | |
Check Point Software Technologies Ltd. (b) | | | 1,757 | | | | 173,539 | |
Elbit Systems Ltd. | | | 343 | | | | 37,799 | |
Frutarom Industries, Ltd. | | | 666 | | | | 35,188 | |
Israel Chemicals Ltd. | | | 13,160 | | | | 60,483 | |
Mizrahi Tefahot Bank Ltd. | | | 422 | | | | 6,500 | |
Mobileye NV (b) | | | 1,856 | | | | 79,734 | |
NICE Ltd. | | | 770 | | | | 53,883 | |
Taro Pharmaceutical Industries Ltd. (b) | | | 234 | | | | 24,450 | |
Teva Pharmaceutical Industries Ltd. — ADR | | | 11,917 | | | | 398,385 | |
| | | | | | | | |
| | | | | | | | 1,084,302 | |
Italy — 0.6% | |
Assicurazioni Generali SpA | | | 15,535 | | | | 247,893 | |
Atlantia SpA | | | 5,722 | | | | 130,403 | |
Enel SpA | | | 92,076 | | | | 384,936 | |
Eni SpA | | | 30,726 | | | | 472,437 | |
Ferrari NV | | | 1,208 | | | | 75,303 | |
Intesa Sanpaolo SpA | | | 176,588 | | | | 413,789 | |
Luxottica Group SpA | | | 1,746 | | | | 93,748 | |
Mediobanca SpA | | | 4,831 | | | | 41,595 | |
Poste Italiane SpA (c) | | | 7,200 | | | | 45,308 | |
Prysmian SpA | | | 2,468 | | | | 64,200 | |
Saipem SpA (b) | | | 75,921 | | | | 38,984 | |
Snam SpA | | | 34,139 | | | | 129,937 | |
Telecom Italia SpA (b) | | | 143,547 | | | | 123,438 | |
Telecom Italia SpA, Non-Convertible Savings Shares (b) | | | 97,247 | | | | 69,434 | |
Tenaris SA | | | 6,566 | | | | 115,016 | |
Terna — Rete Elettrica Nazionale SpA | | | 24,823 | | | | 108,869 | |
UniCredit SpA | | | 6,732 | | | | 183,764 | |
UnipolSai SpA | | | 9,911 | | | | 20,670 | |
| | | | | | | | |
| | | | | | | | 2,759,724 | |
| | | | | | | | |
| Common Stocks | | Shares | | | Value | |
Japan — 8.7% | |
ABC-Mart, Inc. | | | 300 | | | $ | 17,466 | |
Acom Co. Ltd. (b) | | | 2,100 | | | | 9,032 | |
Aeon Co. Ltd. | | | 6,800 | | | | 98,279 | |
AEON Financial Service Co. Ltd. | | | 600 | | | | 10,742 | |
Aeon Mall Co. Ltd. | | | 1,000 | | | | 14,493 | |
Air Water, Inc. | | | 1,000 | | | | 18,516 | |
Aisin Seiki Co. Ltd. | | | 2,000 | | | | 91,489 | |
Ajinomoto Co., Inc. | | | 7,200 | | | | 142,110 | |
Alfresa Holdings Corp. | | | 1,600 | | | | 26,337 | |
Alps Electric Co. Ltd. | | | 2,200 | | | | 58,599 | |
Amada Holdings Co. Ltd. | | | 3,300 | | | | 38,787 | |
ANA Holdings, Inc. | | | 16,000 | | | | 47,525 | |
Aozora Bank Ltd. | | | 12,000 | | | | 43,704 | |
Asahi Glass Co. Ltd. | | | 15,000 | | | | 111,444 | |
Asahi Group Holdings Ltd. | | | 4,500 | | | | 158,353 | |
Asahi Kasei Corp. | | | 18,000 | | | | 167,878 | |
Asics Corp. | | | 1,900 | | | | 37,012 | |
Astellas Pharma, Inc. | | | 27,600 | | | | 370,441 | |
Bandai Namco Holdings, Inc. | | | 2,100 | | | | 57,836 | |
Bank of Kyoto Ltd. | | | 3,000 | | | | 23,452 | |
Benesse Holdings, Inc. | | | 500 | | | | 14,553 | |
Bridgestone Corp. | | | 7,900 | | | | 289,740 | |
Brother Industries Ltd. | | | 2,700 | | | | 49,836 | |
Calbee, Inc. | | | 800 | | | | 26,042 | |
Canon, Inc. | | | 14,100 | | | | 417,168 | |
Casio Computer Co. Ltd. | | | 2,800 | | | | 38,688 | |
Central Japan Railway Co. | | | 1,900 | | | | 307,014 | |
Chiba Bank Ltd. | | | 11,000 | | | | 71,955 | |
Chubu Electric Power Co., Inc. | | | 8,100 | | | | 108,139 | |
Chugai Pharmaceutical Co. Ltd. | | | 2,300 | | | | 67,594 | |
Chugoku Bank Ltd. | | | 1,800 | | | | 26,478 | |
Chugoku Electric Power Co., Inc. | | | 2,400 | | | | 27,024 | |
Concordia Financial Group Ltd. | | | 12,600 | | | | 66,458 | |
Credit Saison Co. Ltd. | | | 900 | | | | 16,398 | |
CYBERDYNE, Inc. (b) | | | 1,300 | | | | 18,349 | |
Dai Nippon Printing Co. Ltd. | | | 5,000 | | | | 50,868 | |
Dai-ichi Life Insurance Co. Ltd. | | | 12,600 | | | | 228,424 | |
Daicel Corp. | | | 2,100 | | | | 23,222 | |
Daiichi Sankyo Co. Ltd. | | | 7,000 | | | | 156,611 | |
Daikin Industries Ltd. | | | 3,000 | | | | 297,787 | |
Daito Trust Construction Co. Ltd. | | | 1,000 | | | | 139,799 | |
Daiwa House Industry Co. Ltd. | | | 8,100 | | | | 219,365 | |
Daiwa House REIT Investment Corp. | | | 18 | | | | 45,325 | |
Daiwa Securities Group, Inc. | | | 21,000 | | | | 133,902 | |
DeNA Co. Ltd. | | | 1,200 | | | | 26,813 | |
Denso Corp. | | | 5,700 | | | | 246,836 | |
Dentsu, Inc. | | | 3,000 | | | | 138,657 | |
Don Quijote Holdings Co. Ltd. | | | 1,400 | | | | 50,813 | |
East Japan Railway Co. | | | 4,000 | | | | 362,228 | |
Eisai Co. Ltd. | | | 3,600 | | | | 198,434 | |
Electric Power Development Co. Ltd. | | | 1,700 | | | | 39,513 | |
FamilyMart UNY Holdings Co. Ltd. | | | 800 | | | | 50,687 | |
FANUC Corp. | | | 2,400 | | | | 471,184 | |
Fast Retailing Co. Ltd. | | | 800 | | | | 251,612 | |
Fuji Electric Co. Ltd. | | | 4,000 | | | | 23,698 | |
Fuji Heavy Industries Ltd. | | | 7,900 | | | | 316,127 | |
FUJIFILM Holdings Corp. | | | 5,800 | | | | 224,606 | |
Fujitsu Ltd. | | | 27,000 | | | | 156,923 | |
Fukuoka Financial Group, Inc. | | | 14,000 | | | | 61,800 | |
Hachijuni Bank Ltd. | | | 3,000 | | | | 17,658 | |
Hakuhodo DY Holdings, Inc. | | | 1,600 | | | | 19,685 | |
Hamamatsu Photonics KK | | | 2,000 | | | | 57,759 | |
Hankyu Hanshin Holdings, Inc. | | | 2,400 | | | | 81,432 | |
Hikari Tsushin, Inc. | | | 300 | | | | 27,415 | |
Hino Motors Ltd. | | | 2,000 | | | | 21,101 | |
Hirose Electric Co. Ltd. | | | 300 | | | | 39,054 | |
Hiroshima Bank Ltd. | | | 4,000 | | | | 18,689 | |
See Notes to Financial Statements.
| | | | | | |
| | | | | | | |
| 36 | | BLACKROCK FUNDS | | JANUARY 31, 2017 | | |
| | |
Schedule of Investments (continued) | | BlackRock MSCI World Index Fund |
| | | | | | | | |
| Common Stocks | | Shares | | | Value | |
Japan (continued) | |
Hisamitsu Pharmaceutical Co., Inc. | | | 500 | | | $ | 26,100 | |
Hitachi Chemical Co. Ltd. | | | 1,000 | | | | 28,391 | |
Hitachi Construction Machinery Co. Ltd. | | | 1,100 | | | | 25,297 | |
Hitachi High-Technologies Corp. | | | 700 | | | | 29,984 | |
Hitachi Ltd. | | | 62,000 | | | | 354,978 | |
Hitachi Metals Ltd. | | | 1,700 | | | | 23,567 | |
Hokuriku Electric Power Co. | | | 1,600 | | | | 16,120 | |
Honda Motor Co. Ltd. | | | 21,200 | | | | 630,889 | |
Hoshizaki Corp. | | | 600 | | | | 48,895 | |
Hoya Corp. | | | 4,600 | | | | 200,500 | |
Hulic Co. Ltd. | | | 2,100 | | | | 20,477 | |
Idemitsu Kosan Co. Ltd. | | | 1,100 | | | | 34,014 | |
IHI Corp. (b) | | | 23,000 | | | | 61,935 | |
Iida Group Holdings Co. Ltd. | | | 1,300 | | | | 24,330 | |
Inpex Corp. | | | 14,100 | | | | 138,366 | |
Isetan Mitsukoshi Holdings Ltd. | | | 3,400 | | | | 39,771 | |
Isuzu Motors Ltd. | | | 8,100 | | | | 108,685 | |
ITOCHU Corp. | | | 19,700 | | | | 271,385 | |
J. Front Retailing Co. Ltd. | | | 3,900 | | | | 56,284 | |
Japan Airlines Co. Ltd. | | | 1,400 | | | | 44,580 | |
Japan Airport Terminal Co. Ltd. | | | 600 | | | | 21,452 | |
Japan Exchange Group, Inc. | | | 7,600 | | | | 112,963 | |
Japan Post Bank Co. Ltd. | | | 7,300 | | | | 88,675 | |
Japan Post Holdings Co. Ltd. | | | 7,100 | | | | 89,153 | |
Japan Prime Realty Investment Corp. | | | 15 | | | | 60,195 | |
Japan Real Estate Investment Corp. | | | 16 | | | | 90,919 | |
Japan Retail Fund Investment Corp. | | | 28 | | | | 59,866 | |
Japan Tobacco, Inc. | | | 14,200 | | | | 458,029 | |
JFE Holdings, Inc. | | | 6,300 | | | | 110,276 | |
JGC Corp. | | | 1,600 | | | | 27,775 | |
JSR Corp. | | | 2,000 | | | | 34,279 | |
JTEKT Corp. | | | 3,600 | | | | 59,125 | |
JX Holdings, Inc. | | | 31,000 | | | | 146,195 | |
Kajima Corp. | | | 9,000 | | | | 62,728 | |
Kakaku.com, Inc. | | | 1,500 | | | | 27,154 | |
Kamigumi Co. Ltd. | | | 2,000 | | | | 19,441 | |
Kaneka Corp. | | | 3,000 | | | | 25,849 | |
Kansai Electric Power Co., Inc. (b) | | | 9,500 | | | | 101,519 | |
Kansai Paint Co. Ltd. | | | 3,100 | | | | 60,220 | |
Kao Corp. | | | 6,200 | | | | 306,805 | |
Kawasaki Heavy Industries Ltd. | | | 17,000 | | | | 53,196 | |
KDDI Corp. | | | 23,500 | | | | 631,407 | |
Keihan Holdings Co. Ltd. | | | 4,000 | | | | 26,644 | |
Keikyu Corp. | | | 7,000 | | | | 82,089 | |
Keio Corp. | | | 5,000 | | | | 41,098 | |
Keisei Electric Railway Co. Ltd. | | | 1,500 | | | | 35,514 | |
Keyence Corp. | | | 1,200 | | | | 466,040 | |
Kikkoman Corp. | | | 3,000 | | | | 94,444 | |
Kintetsu Group Holdings Co. Ltd. | | | 22,000 | | | | 84,574 | |
Kirin Holdings Co. Ltd. | | | 9,400 | | | | 154,026 | |
Kobe Steel Ltd. (b) | | | 2,200 | | | | 21,399 | |
Koito Manufacturing Co. Ltd. | | | 1,100 | | | | 58,350 | |
Komatsu Ltd. | | | 12,500 | | | | 295,983 | |
Konami Holdings Corp. | | | 1,700 | | | | 67,982 | |
Konica Minolta, Inc. | | | 5,500 | | | | 56,975 | |
Kose Corp. | | | 200 | | | | 17,032 | |
Kubota Corp. | | | 14,700 | | | | 233,690 | |
Kuraray Co. Ltd. | | | 4,000 | | | | 63,400 | |
Kurita Water Industries Ltd. | | | 800 | | | | 18,977 | |
Kyocera Corp. | | | 4,500 | | | | 234,273 | |
Kyowa Hakko Kirin Co. Ltd. | | | 4,700 | | | | 63,645 | |
Kyushu Electric Power Co. Inc. | | | 7,100 | | | | 79,250 | |
Kyushu Financial Group, Inc. | | | 6,400 | | | | 44,097 | |
Lawson, Inc. | | | 1,100 | | | | 80,292 | |
LINE Corp. (b) | | | 1,000 | | | | 32,026 | |
Lion Corp. | | | 3,000 | | | | 52,180 | |
LIXIL Group Corp. | | | 3,500 | | | | 81,720 | |
| | | | | | | | |
| Common Stocks | | Shares | | | Value | |
Japan (continued) | |
M3, Inc. | | | 1,900 | | | $ | 51,047 | |
Mabuchi Motor Co. Ltd. | | | 400 | | | | 20,562 | |
Makita Corp. | | | 1,200 | | | | 83,348 | |
Marubeni Corp. | | | 22,900 | | | | 139,334 | |
Marui Group Co. Ltd. | | | 1,400 | | | | 20,018 | |
Maruichi Steel Tube Ltd. | | | 500 | | | | 16,766 | |
Mazda Motor Corp. | | | 8,100 | | | | 119,201 | |
McDonald’s Holdings Co. Japan Ltd. | | | 700 | | | | 18,404 | |
Mebuki Financial Group, Inc. | | | 15,610 | | | | 59,947 | |
Medipal Holdings Corp. | | | 3,800 | | | | 61,588 | |
Meiji Holdings Co. Ltd. | | | 1,400 | | | | 108,439 | |
Minebea Co. Ltd. | | | 4,100 | | | | 40,758 | |
Miraca Holdings, Inc. | | | 400 | | | | 18,230 | |
MISUMI Group, Inc. | | | 3,000 | | | | 56,051 | |
Mitsubishi Chemical Holdings Corp. | | | 20,600 | | | | 143,684 | |
Mitsubishi Corp. | | | 19,500 | | | | 440,507 | |
Mitsubishi Electric Corp. | | | 24,400 | | | | 371,335 | |
Mitsubishi Estate Co. Ltd. | | | 17,000 | | | | 323,577 | |
Mitsubishi Gas Chemical Co., Inc. | | | 2,000 | | | | 38,361 | |
Mitsubishi Heavy Industries Ltd. | | | 47,000 | | | | 211,132 | |
Mitsubishi Logistics Corp. | | | 2,000 | | | | 28,450 | |
Mitsubishi Materials Corp. | | | 2,100 | | | | 71,663 | |
Mitsubishi Motors Corp. | | | 7,000 | | | | 37,920 | |
Mitsubishi Tanabe Pharma Corp. | | | 2,700 | | | | 54,154 | |
Mitsubishi UFJ Financial Group, Inc. | | | 163,900 | | | | 1,049,537 | |
Mitsubishi UFJ Lease & Finance Co. Ltd. | | | 6,700 | | | | 35,714 | |
Mitsui & Co. Ltd. | | | 20,700 | | | | 303,791 | |
Mitsui Chemicals, Inc. | | | 10,000 | | | | 47,026 | |
Mitsui Fudosan Co. Ltd. | | | 12,000 | | | | 277,046 | |
Mitsui OSK Lines Ltd. | | | 16,000 | | | | 50,846 | |
Mixi, Inc. | | | 700 | | | | 30,370 | |
Mizuho Financial Group, Inc. | | | 318,600 | | | | 591,190 | |
MS&AD Insurance Group Holdings, Inc. | | | 7,100 | | | | 237,520 | |
Murata Manufacturing Co. Ltd. | | | 2,600 | | | | 350,179 | |
Nabtesco Corp. | | | 900 | | | | 23,473 | |
Nagoya Railroad Co. Ltd. | | | 11,000 | | | | 54,150 | |
NEC Corp. | | | 39,000 | | | | 90,012 | |
Nexon Co. Ltd. | | | 1,100 | | | | 16,748 | |
NGK Insulators Ltd. | | | 3,900 | | | | 76,470 | |
NGK Spark Plug Co. Ltd. | | | 3,000 | | | | 67,570 | |
NH Foods Ltd. | | | 2,000 | | | | 54,432 | |
Nidec Corp. | | | 3,200 | | | | 300,459 | |
Nikon Corp. | | | 4,800 | | | | 77,468 | |
Nintendo Co. Ltd. | | | 1,600 | | | | 327,491 | |
Nippon Building Fund, Inc. | | | 14 | | | | 80,401 | |
Nippon Electric Glass Co. Ltd. | | | 4,000 | | | | 23,026 | |
Nippon Express Co. Ltd. | | | 12,000 | | | | 63,481 | |
Nippon Paint Holdings Co. Ltd. | | | 1,700 | | | | 49,588 | |
Nippon Prologis REIT, Inc. | | | 30 | | | | 62,689 | |
Nippon Steel & Sumitomo Metal Corp. | | | 9,500 | | | | 229,497 | |
Nippon Telegraph & Telephone Corp. | | | 8,500 | | | | 375,464 | |
Nippon Yusen KK | | | 31,000 | | | | 65,555 | |
Nissan Chemical Industries Ltd. | | | 1,300 | | | | 46,418 | |
Nissan Motor Co. Ltd. | | | 32,800 | | | | 324,496 | |
Nisshin Seifun Group, Inc. | | | 1,500 | | | | 22,819 | |
Nissin Foods Holdings Co. Ltd. | | | 400 | | | | 21,109 | |
Nitori Holdings Co. Ltd. | | | 1,200 | | | | 134,486 | |
Nitto Denko Corp. | | | 2,300 | | | | 181,991 | |
NOK Corp. | | | 900 | | | | 18,290 | |
Nomura Holdings, Inc. | | | 49,800 | | | | 308,703 | |
Nomura Real Estate Holdings, Inc. | | | 1,000 | | | | 17,200 | |
Nomura Real Estate Master Fund, Inc. | | | 52 | | | | 81,019 | |
Nomura Research Institute Ltd. | | | 2,390 | | | | 81,662 | |
NSK Ltd. | | | 4,400 | | | | 53,413 | |
NTT Data Corp. | | | 1,400 | | | | 70,556 | |
NTT Docomo, Inc. | | | 17,400 | | | | 416,035 | |
Obayashi Corp. | | | 9,200 | | | | 87,641 | |
See Notes to Financial Statements.
| | | | | | |
| | | | | | | |
| | BLACKROCK FUNDS | | JANUARY 31, 2017 | | 37 |
| | |
Schedule of Investments (continued) | | BlackRock MSCI World Index Fund |
| | | | | | | | |
| Common Stocks | | Shares | | | Value | |
Japan (continued) | |
Obic Co. Ltd. | | | 1,100 | | | $ | 52,798 | |
Odakyu Electric Railway Co. Ltd. | | | 4,600 | | | | 91,100 | |
Oji Holdings Corp. | | | 14,000 | | | | 61,966 | |
Olympus Corp. | | | 3,700 | | | | 127,999 | |
Omron Corp. | | | 2,900 | | | | 118,984 | |
Ono Pharmaceutical Co. Ltd. | | | 5,000 | | | | 102,581 | |
Oracle Corp. Japan | | | 400 | | | | 22,412 | |
Oriental Land Co. Ltd. | | | 2,500 | | | | 136,998 | |
ORIX Corp. | | | 18,200 | | | | 274,588 | |
Osaka Gas Co. Ltd. | | | 21,000 | | | | 78,717 | |
Otsuka Corp. | | | 400 | | | | 20,586 | |
Otsuka Holdings Co. Ltd. | | | 5,200 | | | | 239,554 | |
Panasonic Corp. | | | 29,900 | | | | 311,107 | |
Park24 Co. Ltd. | | | 700 | | | | 19,320 | |
Pola Orbis Holdings, Inc. | | | 100 | | | | 9,500 | |
Rakuten, Inc. | | | 11,900 | | | | 118,788 | |
Recruit Holdings Co. Ltd. | | | 4,300 | | | | 188,235 | |
Resona Holdings, Inc. | | | 30,500 | | | | 165,129 | |
Ricoh Co. Ltd. | | | 9,400 | | | | 83,862 | |
Rinnai Corp. | | | 600 | | | | 50,989 | |
Rohm Co. Ltd. | | | 1,300 | | | | 83,130 | |
Ryohin Keikaku Co. Ltd. | | | 500 | | | | 93,729 | |
Sankyo Co. Ltd. | | | 500 | | | | 16,694 | |
Santen Pharmaceutical Co. Ltd. | | | 5,100 | | | | 64,086 | |
SBI Holdings, Inc. | | | 1,700 | | | | 23,466 | |
Secom Co. Ltd. | | | 2,500 | | | | 180,794 | |
Sega Sammy Holdings, Inc. | | | 1,900 | | | | 29,834 | |
Seibu Holdings, Inc. | | | 1,600 | | | | 26,960 | |
Seiko Epson Corp. | | | 3,200 | | | | 65,923 | |
Sekisui Chemical Co. Ltd. | | | 6,200 | | | | 101,169 | |
Sekisui House Ltd. | | | 8,400 | | | | 135,881 | |
Seven & i Holdings Co. Ltd. | | | 10,100 | | | | 403,276 | |
Seven Bank Ltd. | | | 2,700 | | | | 7,735 | |
Sharp Corp. (b) | | | 17,000 | | | | 45,973 | |
Shimadzu Corp. | | | 2,000 | | | | 33,752 | |
Shimamura Co. Ltd. | | | 300 | | | | 39,320 | |
Shimano, Inc. | | | 1,000 | | | | 157,688 | |
Shimizu Corp. | | | 5,000 | | | | 45,957 | |
Shin-Etsu Chemical Co. Ltd. | | | 4,800 | | | | 414,099 | |
Shinsei Bank Ltd. | | | 21,000 | | | | 36,119 | |
Shionogi & Co. Ltd. | | | 3,500 | | | | 168,568 | |
Shiseido Co. Ltd. | | | 5,000 | | | | 139,745 | |
Shizuoka Bank Ltd. | | | 6,000 | | | | 52,210 | |
Showa Shell Sekiyu KK | | | 1,400 | | | | 13,724 | |
SMC Corp. | | | 700 | | | | 191,085 | |
Softbank Group Corp. | | | 12,200 | | | | 939,885 | |
Sohgo Security Services Co. Ltd. | | | 500 | | | | 18,813 | |
Sompo Holdings, Inc. | | | 4,500 | | | | 162,944 | |
Sony Corp. | | | 16,000 | | | | 484,444 | |
Sony Financial Holdings, Inc. | | | 3,200 | | | | 53,594 | |
Stanley Electric Co. Ltd. | | | 2,600 | | | | 73,248 | |
Start Today Co. Ltd. | | | 1,800 | | | | 33,904 | |
Sumitomo Chemical Co. Ltd. | | | 17,000 | | | | 90,576 | |
Sumitomo Corp. | | | 13,700 | | | | 171,740 | |
Sumitomo Dainippon Pharma Co. Ltd. | | | 1,500 | | | | 25,445 | |
Sumitomo Electric Industries Ltd. | | | 9,900 | | | | 144,053 | |
Sumitomo Heavy Industries Ltd. | | | 11,000 | | | | 75,629 | |
Sumitomo Metal Mining Co. Ltd. | | | 5,000 | | | | 67,741 | |
Sumitomo Mitsui Financial Group, Inc. | | | 16,600 | | | | 651,251 | |
Sumitomo Mitsui Trust Holdings, Inc. | | | 4,100 | | | | 152,821 | |
Sumitomo Realty & Development Co. Ltd. | | | 5,000 | | | | 135,258 | |
Sumitomo Rubber Industries Ltd. | | | 1,400 | | | | 21,866 | |
Sundrug Co. Ltd. | | | 400 | | | | 27,584 | |
Suntory Beverage & Food Ltd. | | | 1,300 | | | | 55,312 | |
Suruga Bank Ltd. | | | 3,000 | | | | 68,346 | |
Suzuken Co. Ltd. | | | 900 | | | | 29,713 | |
Suzuki Motor Corp. | | | 4,800 | | | | 185,246 | |
| | | | | | | | |
| Common Stocks | | Shares | | | Value | |
Japan (continued) | |
Sysmex Corp. | | | 2,400 | | | $ | 144,192 | |
T&D Holdings, Inc. | | | 6,200 | | | | 91,850 | |
Taiheiyo Cement Corp. | | | 12,000 | | | | 41,931 | |
Taisei Corp. | | | 14,000 | | | | 99,450 | |
Taisho Pharmaceutical Holdings Co. Ltd. | | | 300 | | | | 25,358 | |
Taiyo Nippon Sanso Corp. | | | 1,800 | | | | 21,258 | |
Takashimaya Co. Ltd. | | | 5,000 | | | | 43,060 | |
Takeda Pharmaceutical Co. Ltd. | | | 8,700 | | | | 364,405 | |
TDK Corp. | | | 1,700 | | | | 122,190 | |
Teijin Ltd. | | | 2,000 | | | | 42,214 | |
Terumo Corp. | | | 4,300 | | | | 159,074 | |
THK Co. Ltd. | | | 1,000 | | | | 24,641 | |
Tobu Railway Co. Ltd. | | | 17,000 | | | | 86,279 | |
Toho Co. Ltd. | | | 1,400 | | | | 40,375 | |
Toho Gas Co. Ltd. | | | 9,000 | | | | 67,327 | |
Tohoku Electric Power Co., Inc. | | | 7,300 | | | | 89,115 | |
Tokio Marine Holdings, Inc. | | | 8,300 | | | | 346,060 | |
Tokyo Electric Power Co. Holdings, Inc. (b) | | | 15,100 | | | | 57,835 | |
Tokyo Electron Ltd. | | | 2,100 | | | | 217,528 | |
Tokyo Gas Co. Ltd. | | | 26,000 | | | | 115,384 | |
Tokyo Tatemono Co. Ltd. | | | 1,600 | | | | 21,189 | |
Tokyu Corp. | | | 14,000 | | | | 103,108 | |
Tokyu Fudosan Holdings Corp. | | | 3,700 | | | | 21,630 | |
TonenGeneral Sekiyu KK | | | 3,000 | | | | 35,280 | |
Toppan Printing Co. Ltd. | | | 6,000 | | | | 58,896 | |
Toray Industries, Inc. | | | 19,000 | | | | 164,520 | |
Toshiba Corp. (b) | | | 49,000 | | | | 105,074 | |
Toto Ltd. | | | 1,400 | | | | 56,387 | |
Toyo Seikan Kaisha Ltd. | | | 1,400 | | | | 25,821 | |
Toyo Suisan Kaisha Ltd. | | | 1,300 | | | | 46,386 | |
Toyoda Gosei Co. Ltd. | | | 700 | | | | 16,862 | |
Toyota Industries Corp. | | | 2,400 | | | | 115,824 | |
Toyota Motor Corp. | | | 33,900 | | | | 1,971,382 | |
Toyota Tsusho Corp. | | | 2,000 | | | | 55,012 | |
Trend Micro, Inc. | | | 1,400 | | | | 54,329 | |
Tsuruha Holdings, Inc. | | | 300 | | | | 28,200 | |
Unicharm Corp. | | | 5,700 | | | | 128,376 | |
United Urban Investment Corp. | | | 36 | | | | 57,420 | |
USS Co. Ltd. | | | 3,300 | | | | 57,919 | |
West Japan Railway Co. | | | 1,800 | | | | 117,275 | |
Yahoo! Japan Corp. | | | 22,700 | | | | 95,268 | |
Yakult Honsha Co. Ltd. | | | 1,500 | | | | 77,086 | |
Yamada Denki Co. Ltd. | | | 5,400 | | | | 29,751 | |
Yamaguchi Financial Group, Inc. | | | 2,000 | | | | 21,790 | |
Yamaha Corp. | | | 1,800 | | | | 54,982 | |
Yamaha Motor Co. Ltd. | | | 2,900 | | | | 60,318 | |
Yamato Holdings Co. Ltd. | | | 3,600 | | | | 72,552 | |
Yamazaki Baking Co. Ltd. | | | 1,000 | | | | 20,111 | |
Yaskawa Electric Corp. | | | 2,500 | | | | 45,080 | |
Yokogawa Electric Corp. | | | 1,600 | | | | 25,568 | |
Yokohama Rubber Co. Ltd. | | | 1,000 | | | | 17,587 | |
| | | | | | | | |
| | | | | | | | 38,491,986 | |
Luxembourg — 0.0% | |
Eurofins Scientific SE | | | 118 | | | | 52,978 | |
RTL Group SA (b) | | | 260 | | | | 19,863 | |
| | | | | | | | |
| | | | | | | | 72,841 | |
Mexico — 0.0% | |
Fresnillo PLC | | | 1,783 | | | | 32,730 | |
Netherlands — 1.8% | |
ABN AMRO Group NV (c) | | | 2,857 | | | | 67,204 | |
Aegon NV | | | 26,877 | | | | 146,090 | |
AerCap Holdings NV (b) | | | 2,198 | | | | 97,305 | |
Akzo Nobel NV | | | 3,125 | | | | 212,079 | |
Altice NV Class A (b) | | | 5,606 | | | | 123,073 | |
Altice NV Class B (b) | | | 2,261 | | | | 49,900 | |
See Notes to Financial Statements.
| | | | | | |
| | | | | | | |
| 38 | | BLACKROCK FUNDS | | JANUARY 31, 2017 | | |
| | |
Schedule of Investments (continued) | | BlackRock MSCI World Index Fund |
| | | | | | | | |
| Common Stocks | | Shares | | | Value | |
Netherlands (continued) | |
ASML Holding NV | | | 4,687 | | | $ | 569,113 | |
CNH Industrial NV | | | 14,413 | | | | 128,041 | |
Core Laboratories NV | | | 474 | | | | 55,377 | |
EXOR NV | | | 1,768 | | | | 80,671 | |
Gemalto NV | | | 766 | | | | 44,516 | |
Heineken Holding NV | | | 991 | | | | 69,616 | |
Heineken NV | | | 3,000 | | | | 224,367 | |
ING Groep NV | | | 47,864 | | | | 687,612 | |
Koninklijke Ahold Delhaize NV | | | 16,895 | | | | 359,927 | |
Koninklijke Boskalis Westminster NV | | | 1,674 | | | | 61,935 | |
Koninklijke DSM NV | | | 2,182 | | | | 139,103 | |
Koninklijke KPN NV | | | 39,299 | | | | 113,219 | |
Koninklijke Philips NV | | | 11,534 | | | | 338,436 | |
Koninklijke Vopak NV | | | 563 | | | | 24,184 | |
NN Group NV | | | 3,933 | | | | 139,290 | |
NXP Semiconductor NV (b) | | | 3,675 | | | | 359,599 | |
QIAGEN NV (b) | | | 1,965 | | | | 57,194 | |
Randstad Holding NV | | | 1,821 | | | | 105,945 | |
Royal Dutch Shell PLC, Class A | | | 55,731 | | | | 1,511,517 | |
Royal Dutch Shell PLC, Class B | | | 47,366 | | | | 1,337,824 | |
Sensata Technologies Holding NV (b) | | | 2,422 | | | | 101,603 | |
Unilever NV CVA | | | 20,255 | | | | 821,579 | |
Wolters Kluwer NV | | | 4,338 | | | | 165,893 | |
| | | | | | | | |
| | | | | | | | 8,192,212 | |
New Zealand — 0.1% | |
Auckland International Airport Ltd. | | | 12,237 | | | | 61,380 | |
Contact Energy Ltd. | | | 17,654 | | | | 61,864 | |
Fletcher Building Ltd. | | | 8,290 | | | | 63,870 | |
Mercury NZ Ltd. | | | 7,580 | | | | 17,081 | |
Meridian Energy Ltd. | | | 9,623 | | | | 18,592 | |
Ryman Healthcare Ltd. | | | 3,091 | | | | 19,757 | |
Spark New Zealand Ltd. | | | 20,014 | | | | 51,570 | |
| | | | | | | | |
| | | | | | | | 294,114 | |
Norway — 0.3% | |
DNB ASA | | | 11,351 | | | | 189,363 | |
Gjensidige Forsikring ASA | | | 3,186 | | | | 54,828 | |
Marine Harvest ASA (b) | | | 5,247 | | | | 92,640 | |
Norsk Hydro ASA | | | 20,249 | | | | 115,507 | |
Orkla ASA | | | 12,309 | | | | 114,841 | |
Schibsted ASA, Class A | | | 1,912 | | | | 50,559 | |
Schibsted ASA, Class B | | | 808 | | | | 20,118 | |
Statoil ASA | | | 13,548 | | | | 252,632 | |
Telenor ASA | | | 8,552 | | | | 135,570 | |
Yara International ASA | | | 1,796 | | | | 75,729 | |
| | | | | | | | |
| | | | | | | | 1,101,787 | |
Portugal — 0.0% | |
EDP — Energias de Portugal SA | | | 17,442 | | | | 50,723 | |
Galp Energia SGPS SA | | | 4,087 | | | | 60,219 | |
Jeronimo Martins SGPS SA | | | 4,509 | | | | 76,318 | |
| | | | | | | | |
| | | | | | | | 187,260 | |
Singapore — 0.7% | |
Ascendas Real Estate Investment Trust | | | 27,497 | | | | 48,011 | |
Broadcom Ltd. | | | 5,072 | | | | 1,011,864 | |
CapitaLand Commercial Trust Ltd. | | | 18,700 | | | | 20,259 | |
CapitaLand Ltd. | | | 41,800 | | | | 97,550 | |
CapitaLand Mall Trust | | | 33,000 | | | | 45,346 | |
City Developments Ltd. | | | 7,000 | | | | 45,948 | |
ComfortDelGro Corp. Ltd. | | | 43,100 | | | | 73,752 | |
DBS Group Holdings Ltd. | | | 19,400 | | | | 262,287 | |
Genting Singapore PLC | | | 105,700 | | | | 72,905 | |
Global Logistic Properties Ltd. | | | 48,300 | | | | 89,016 | |
Golden Agri-Resources Ltd. | | | 65,200 | | | | 19,612 | |
Hutchison Port Holdings Trust | | | 104,400 | | | | 44,404 | |
Jardine Cycle & Carriage Ltd. | | | 900 | | | | 26,391 | |
| | | | | | | | |
| Common Stocks | | Shares | | | Value | |
Singapore (continued) | |
Keppel Corp. Ltd. | | | 21,400 | | | $ | 93,905 | |
Oversea-Chinese Banking Corp. Ltd. | | | 42,000 | | | | 280,124 | |
SATS, Ltd. | | | 10,800 | | | | 40,461 | |
SembCorp Industries Ltd. | | | 9,300 | | | | 20,770 | |
Singapore Airlines Ltd. | | | 5,600 | | | | 39,441 | |
Singapore Exchange Ltd. | | | 4,400 | | | | 23,144 | |
Singapore Press Holdings Ltd. | | | 5,600 | | | | 13,732 | |
Singapore Technologies Engineering Ltd. | | | 25,100 | | | | 58,823 | |
Singapore Telecommunications Ltd. | | | 109,800 | | | | 301,883 | |
StarHub Ltd. | | | 6,700 | | | | 14,107 | |
Suntec Real Estate Investment Trust | | | 35,000 | | | | 43,015 | |
United Overseas Bank Ltd. | | | 15,676 | | | | 233,133 | |
UOL Group Ltd. | | | 4,200 | | | | 19,022 | |
Wilmar International Ltd. | | | 20,300 | | | | 55,866 | |
Yangzijiang Shipbuilding Holdings Ltd. | | | 31,000 | | | | 17,728 | |
| | | | | | | | |
| | | | | | | | 3,112,499 | |
Spain — 1.1% | |
Abertis Infraestructuras SA | | | 8,462 | | | | 121,258 | |
ACS Actividades de Construccion y Servicios SA | | | 2,693 | | | | 82,999 | |
Aena SA (c) | | | 972 | | | | 141,355 | |
Amadeus IT Group SA | | | 5,101 | | | | 235,976 | |
Banco Bilbao Vizcaya Argentaria SA | | | 80,328 | | | | 546,278 | |
Banco de Sabadell SA | | | 85,952 | | | | 129,763 | |
Banco Popular Espanol SA | | | 35,333 | | | | 36,587 | |
Banco Santander SA | | | 187,901 | | | | 1,049,777 | |
Bankia SA | | | 77,644 | | | | 82,082 | |
Bankinter SA | | | 6,680 | | | | 53,768 | |
CaixaBank SA | | | 42,273 | | | | 154,951 | |
Distribuidora Internacional de Alimentacion SA | | | 7,093 | | | | 37,542 | |
Enagas SA | | | 716 | | | | 17,584 | |
Endesa SA | | | 3,615 | | | | 74,550 | |
Ferrovial SA | | | 7,139 | | | | 129,589 | |
Gas Natural SDG SA | | | 3,368 | | | | 64,969 | |
Grifols SA | | | 4,695 | | | | 100,793 | |
Iberdrola SA | | | 68,554 | | | | 432,996 | |
Iberdrola SA (b) | | | 1,354 | | | | 8,525 | |
Industria de Diseno Textil SA | | | 13,940 | | | | 461,073 | |
International Consolidated Airlines Group SA | | | 14,232 | | | | 85,565 | |
Mapfre SA | | | 14,471 | | | | 43,877 | |
Red Electrica Corp. SA | | | 2,654 | | | | 47,459 | |
Repsol SA | | | 16,238 | | | | 240,675 | |
Telefonica SA | | | 57,350 | | | | 554,867 | |
Zardoya Otis SA | | | 1,808 | | | | 15,261 | |
| | | | | | | | |
| | | | | | | | 4,950,119 | |
Sweden — 1.1% | |
Alfa Laval AB | | | 3,766 | | | | 70,410 | |
Assa Abloy AB, Class B | | | 13,294 | | | | 251,555 | |
Atlas Copco AB, A Shares | | | 8,126 | | | | 260,615 | |
Atlas Copco AB, B Shares | | | 4,390 | | | | 127,316 | |
Autoliv, Inc. | | | 1,163 | | | | 134,513 | |
Boliden AB | | | 2,858 | | | | 83,375 | |
Electrolux AB, Class B | | | 3,781 | | | | 100,541 | |
Getinge AB, Class B | | | 2,556 | | | | 41,292 | |
Hennes & Mauritz AB, Class B | | | 11,411 | | | | 326,491 | |
Hexagon AB, Class B | | | 3,736 | | | | 147,784 | |
Husqvarna AB, Class B | | | 3,673 | | | | 30,763 | |
ICA Gruppen AB | | | 579 | | | | 18,921 | |
Industrivarden AB, Class C | | | 1,356 | | | | 26,275 | |
Investor AB, Class B | | | 5,292 | | | | 211,237 | |
Kinnevik AB | | | 3,667 | | | | 94,141 | |
L E Lundbergforetagen AB, -B Shares | | | 593 | | | | 38,155 | |
Lundin Petroleum AB (b) | | | 1,782 | | | | 38,456 | |
Millicom International Cellular SA | | | 776 | | | | 38,429 | |
Nordea Bank AB | | | 39,588 | | | | 477,917 | |
Sandvik AB | | | 12,772 | | | | 172,404 | |
See Notes to Financial Statements.
| | | | | | |
| | | | | | | |
| | BLACKROCK FUNDS | | JANUARY 31, 2017 | | 39 |
| | |
Schedule of Investments (continued) | | BlackRock MSCI World Index Fund |
| | | | | | | | |
| Common Stocks | | Shares | | | Value | |
Sweden (continued) | |
Securitas AB, Class B | | | 4,304 | | | $ | 68,534 | |
Skandinaviska Enskilda Banken AB, Class A | | | 18,019 | | | | 202,404 | |
Skanska AB, Class B | | | 4,598 | | | | 112,422 | |
SKF AB, Class B | | | 6,315 | | | | 127,069 | |
Svenska Cellulosa AB, B Shares | | | 8,461 | | | | 254,605 | |
Svenska Handelsbanken AB, Class A | | | 18,891 | | | | 282,018 | |
Swedbank AB, Class A | | | 11,382 | | | | 287,794 | |
Swedish Match AB | | | 2,064 | | | | 67,197 | |
Tele2 AB, Class B | | | 7,257 | | | | 63,983 | |
Telefonaktiebolaget LM Ericsson, Class B | | | 40,738 | | | | 241,101 | |
TeliaSonera AB | | | 34,113 | | | | 138,377 | |
Volvo AB, Class B | | | 18,158 | | | | 232,382 | |
| | | | | | | | |
| | | | | | | | 4,768,476 | |
Switzerland — 3.4% | |
ABB Ltd., Registered Shares (b) | | | 24,299 | | | | 579,065 | |
Actelion Ltd., Registered Shares (b) | | | 1,209 | | | | 315,661 | |
Adecco SA, Registered Shares | | | 2,208 | | | | 157,993 | |
Aryzta AG (b) | | | 1,310 | | | | 36,084 | |
Baloise Holding AG, Registered Shares | | | 609 | | | | 78,417 | |
Barry Callebaut AG, Registered Shares (b) | | | 20 | | | | 24,748 | |
Cie Financiere Richemont SA, Registered Shares | | | 6,588 | | | | 513,071 | |
Coca-Cola HBC AG (b) | | | 3,025 | | | | 69,146 | |
Credit Suisse Group AG, Registered Shares (b) | | | 25,612 | | | | 390,970 | |
Dufry AG (b) | | | 728 | | | | 103,927 | |
EMS-Chemie Holding AG, Registered Shares | | | 102 | | | | 52,653 | |
Galenica AG | | | 35 | | | | 38,374 | |
Geberit AG, Registered Shares | | | 420 | | | | 179,504 | |
Givaudan SA, Registered Shares | | | 103 | | | | 185,692 | |
Glencore PLC (b) | | | 153,879 | | | | 637,318 | |
Julius Baer Group Ltd. (b) | | | 3,134 | | | | 147,332 | |
Kuehne & Nagel International AG, Registered Shares | | | 691 | | | | 94,548 | |
LafargeHolcim Ltd. (b) | | | 5,761 | | | | 310,194 | |
Lindt & Spruengli AG | | | 16 | | | | 88,806 | |
Lindt & Spruengli AG, Registered Shares | | | 1 | | | | 64,859 | |
Lonza Group AG, Registered Shares (b) | | | 752 | | | | 138,157 | |
Nestle SA, Registered Shares | | | 39,357 | | | | 2,883,471 | |
Novartis AG, Registered Shares | | | 28,239 | | | | 2,084,816 | |
Pargesa Holding SA, Bearer Shares | | | 334 | | | | 22,249 | |
Partners Group Holding AG | | | 214 | | | | 108,149 | |
Roche Holding AG | | | 8,885 | | | | 2,105,285 | |
Schindler Holding AG, Participation Certificates | | | 437 | | | | 83,300 | |
Schindler Holding AG, Registered Shares | | | 380 | | | | 71,583 | |
SGS SA, Registered Shares | | | 69 | | | | 146,403 | |
Sika AG, Bearer Shares | | | 31 | | | | 162,913 | |
Sonova Holding AG, Registered Shares | | | 512 | | | | 67,791 | |
STMicroelectronics NV | | | 8,975 | | | | 118,453 | |
Swatch Group AG, Bearer Shares | | | 437 | | | | 154,875 | |
Swatch Group AG, Registered Shares | | | 1,000 | | | | 69,870 | |
Swiss Life Holding AG, Registered Shares (b) | | | 464 | | | | 140,864 | |
Swiss Prime Site AG, Registered Shares (b) | | | 626 | | | | 52,148 | |
Swiss Re AG | | | 4,125 | | | | 385,475 | |
Swisscom AG, Registered Shares | | | 329 | | | | 145,137 | |
Syngenta AG, Registered Shares | | | 1,209 | | | | 513,841 | |
TE Connectivity Ltd. | | | 4,421 | | | | 328,701 | |
UBS Group AG, Registered Shares | | | 44,512 | | | | 723,379 | |
Zurich Insurance Group AG (b) | | | 1,830 | | | | 526,992 | |
| | | | | | | | |
| | | | | | | | 15,102,214 | |
United Arab Emirates — 0.0% | |
Mediclinic International PLC | | | 3,047 | | | | 30,147 | |
United Kingdom — 6.0% | |
3i Group PLC | | | 11,859 | | | | 104,760 | |
Aberdeen Asset Management PLC | | | 10,586 | | | | 35,034 | |
Admiral Group PLC | | | 1,803 | | | | 40,395 | |
Anglo American PLC (b) | | | 18,216 | | | | 314,013 | |
Antofagasta PLC | | | 4,892 | | | | 51,687 | |
| | | | | | | | |
| Common Stocks | | Shares | | | Value | |
United Kingdom (continued) | |
Ashtead Group PLC | | | 7,345 | | | $ | 148,915 | |
Associated British Foods PLC | | | 4,683 | | | | 141,123 | |
AstraZeneca PLC | | | 16,188 | | | | 859,081 | |
Auto Trader Group PLC (c) | | | 17,858 | | | | 90,194 | |
Aviva PLC | | | 54,111 | | | | 325,796 | |
Babcock International Group PLC | | | 3,103 | | | | 34,947 | |
BAE Systems PLC | | | 43,693 | | | | 320,912 | |
Barclays PLC | | | 209,805 | | | | 582,276 | |
Barratt Developments PLC | | | 14,586 | | | | 87,962 | |
Berkeley Group Holdings PLC | | | 1,444 | | | | 51,001 | |
BHP Billiton PLC | | | 26,512 | | | | 483,520 | |
BP PLC | | | 235,442 | | | | 1,406,185 | |
British American Tobacco PLC | | | 23,577 | | | | 1,455,358 | |
British Land Co. PLC | | | 7,180 | | | | 52,774 | |
BT Group PLC | | | 107,504 | | | | 412,279 | |
Bunzl PLC | | | 4,094 | | | | 107,920 | |
Burberry Group PLC | | | 5,493 | | | | 113,592 | |
Capita PLC | | | 5,414 | | | | 34,158 | |
Carnival PLC | | | 2,248 | | | | 120,265 | |
Centrica PLC | | | 63,441 | | | | 179,603 | |
Cobham PLC | | | 15,416 | | | | 26,380 | |
Coca-Cola European Partners PLC | | | 2,243 | | | | 77,454 | |
Compass Group PLC | | | 20,080 | | | | 357,364 | |
Croda International PLC | | | 1,507 | | | | 63,636 | |
Delphi Automotive PLC | | | 3,579 | | | | 250,745 | |
Diageo PLC | | | 31,326 | | | | 870,169 | |
Direct Line Insurance Group PLC | | | 14,001 | | | | 62,722 | |
Dixons Carphone PLC | | | 16,826 | | | | 67,118 | |
easyJet PLC | | | 1,336 | | | | 16,016 | |
Fiat Chrysler Automobiles NV (b) | | | 12,922 | | | | 141,489 | |
G4S PLC | | | 25,652 | | | | 82,642 | |
GKN PLC | | | 23,837 | | | | 103,352 | |
GlaxoSmithKline PLC | | | 62,056 | | | | 1,199,230 | |
Hammerson PLC | | | 8,380 | | | | 57,758 | |
Hargreaves Lansdown PLC | | | 3,139 | | | | 53,625 | |
Hikma Pharmaceuticals PLC | | | 1,324 | | | | 30,496 | |
HSBC Holdings PLC | | | 251,559 | | | | 2,146,029 | |
IHS Markit, Ltd. (b) | | | 5,158 | | | | 203,483 | |
IMI PLC | | | 4,912 | | | | 72,276 | |
Imperial Brands PLC | | | 12,486 | | | | 578,447 | |
Inmarsat PLC | | | 3,662 | | | | 28,057 | |
InterContinental Hotels Group PLC | | | 2,218 | | | | 102,997 | |
Intertek Group PLC | | | 2,293 | | | | 98,156 | |
Intu Properties PLC | | | 16,499 | | | | 56,274 | |
Investec PLC | | | 7,068 | | | | 50,148 | |
ITV PLC | | | 40,042 | | | | 102,749 | |
J. Sainsbury PLC | | | 22,766 | | | | 74,071 | |
Johnson Matthey PLC | | | 2,989 | | | | 122,603 | |
Kingfisher PLC | | | 21,365 | | | | 90,647 | |
Land Securities Group PLC | | | 8,038 | | | | 100,737 | |
Legal & General Group PLC | | | 74,489 | | | | 220,912 | |
Liberty Global PLC, Class A (b) | | | 2,659 | | | | 97,000 | |
Liberty Global PLC, Class C (b) | | | 8,163 | | | | 286,766 | |
Liberty Global PLC LiLAC, Class C (b) | | | 729 | | | | 16,271 | |
Lloyds Banking Group PLC | | | 834,344 | | | | 684,329 | |
London Stock Exchange Group PLC | | | 4,227 | | | | 169,233 | |
Marks & Spencer Group PLC | | | 20,912 | | | | 88,638 | |
Meggitt PLC | | | 7,666 | | | | 40,430 | |
Merlin Entertainments PLC (c) | | | 7,685 | | | | 46,203 | |
Mondi PLC | | | 3,822 | | | | 84,474 | |
National Grid PLC | | | 48,098 | | | | 563,381 | |
Next PLC | | | 1,735 | | | | 83,715 | |
Old Mutual PLC | | | 60,857 | | | | 159,806 | |
Pearson PLC | | | 12,164 | | | | 94,831 | |
Pentair PLC | | | 2,188 | | | | 128,282 | |
Persimmon PLC | | | 4,587 | | | | 111,723 | |
Petrofac Ltd. | | | 2,236 | | | | 25,891 | |
See Notes to Financial Statements.
| | | | | | |
| | | | | | | |
| 40 | | BLACKROCK FUNDS | | JANUARY 31, 2017 | | |
| | |
Schedule of Investments (continued) | | BlackRock MSCI World Index Fund |
| | | | | | | | |
| Common Stocks | | Shares | | | Value | |
United Kingdom (continued) | |
Provident Financial PLC | | | 2,321 | | | $ | 79,925 | |
Prudential PLC | | | 32,670 | | | | 633,103 | |
Randgold Resources Ltd. | | | 1,437 | | | | 122,319 | |
Reckitt Benckiser Group PLC | | | 7,964 | | | | 683,355 | |
RELX NV | | | 11,621 | | | | 196,287 | |
RELX PLC | | | 14,548 | | | | 261,138 | |
Rio Tinto PLC | | | 15,680 | | | | 694,670 | |
Rolls-Royce Holdings PLC (b) | | | 22,138 | | | | 186,460 | |
Royal Bank of Scotland Group PLC (b) | | | 45,280 | | | | 126,850 | |
Royal Mail PLC | | | 10,324 | | | | 53,616 | |
RSA Insurance Group PLC | | | 11,778 | | | | 85,278 | |
Sage Group PLC | | | 16,060 | | | | 124,210 | |
Schroders PLC | | | 1,572 | | | | 58,303 | |
Segro PLC | | | 8,485 | | | | 49,289 | |
Severn Trent PLC | | | 2,385 | | | | 68,362 | |
Shire PLC | | | 11,419 | | | | 635,761 | |
Sky PLC | | | 12,338 | | | | 155,886 | |
Smith & Nephew PLC | | | 10,883 | | | | 162,806 | |
Smiths Group PLC | | | 5,578 | | | | 105,725 | |
SSE PLC | | | 12,563 | | | | 236,167 | |
St. James’s Place PLC | | | 5,787 | | | | 78,290 | |
Standard Chartered PLC (b) | | | 43,739 | | | | 428,307 | |
Standard Life PLC | | | 23,358 | | | | 102,052 | |
Tate & Lyle PLC | | | 5,376 | | | | 45,440 | |
Taylor Wimpey PLC | | | 47,099 | | | | 99,436 | |
TechnipFMC PLC (b) | | | 5,034 | | | | 167,012 | |
Tesco PLC (b) | | | 104,108 | | | | 255,748 | |
Travis Perkins PLC | | | 4,478 | | | | 82,130 | |
Unilever PLC | | | 16,016 | | | | 648,741 | |
United Utilities Group PLC | | | 8,099 | | | | 93,791 | |
Vodafone Group PLC | | | 331,012 | | | | 810,824 | |
Weir Group PLC | | | 2,371 | | | | 60,064 | |
Whitbread PLC | | | 2,840 | | | | 140,586 | |
William Hill PLC | | | 10,334 | | | | 33,708 | |
Willis Towers Watson PLC | | | 1,517 | | | | 189,822 | |
WM Morrison Supermarkets PLC | | | 27,049 | | | | 80,641 | |
Wolseley PLC | | | 3,057 | | | | 189,321 | |
Worldpay Group PLC (c) | | | 26,755 | | | | 96,521 | |
WPP PLC | | | 16,575 | | | | 385,768 | |
| | | | | | | | |
| | | | | | | | 26,450,217 | |
United States — 57.7% | |
3M Co. | | | 7,665 | | | | 1,339,995 | |
Abbott Laboratories | | | 21,727 | | | | 907,537 | |
AbbVie, Inc. | | | 20,893 | | | | 1,276,771 | |
Accenture PLC, Class A | | | 8,028 | | | | 914,148 | |
Activision Blizzard, Inc. | | | 7,631 | | | | 306,843 | |
Acuity Brands, Inc. | | | 604 | | | | 125,167 | |
Adobe Systems, Inc. (b) | | | 6,157 | | | | 698,081 | |
Advance Auto Parts, Inc. | | | 909 | | | | 149,294 | |
AES Corp. | | | 7,348 | | | | 84,061 | |
Aetna, Inc. | | | 4,144 | | | | 491,520 | |
Affiliated Managers Group, Inc. (b) | | | 692 | | | | 105,433 | |
Aflac, Inc. | | | 5,506 | | | | 385,365 | |
AGCO Corp. | | | 1,150 | | | | 72,220 | |
Agilent Technologies, Inc. | | | 3,911 | | | | 191,522 | |
AGNC Investment Corp. | | | 4,633 | | | | 86,498 | |
Air Products & Chemicals, Inc. | | | 2,506 | | | | 350,239 | |
Akamai Technologies, Inc. (b) | | | 2,262 | | | | 155,151 | |
Albemarle Corp. | | | 1,550 | | | | 143,592 | |
Alexandria Real Estate Equities, Inc. | | | 885 | | | | 98,076 | |
Alexion Pharmaceuticals, Inc. (b) | | | 2,725 | | | | 356,103 | |
Align Technology, Inc. (b) | | | 779 | | | | 71,427 | |
Alkermes PLC (b) | | | 2,207 | | | | 119,421 | |
Alleghany Corp. (b) | | | 130 | | | | 79,504 | |
Allergan PLC (b) | | | 4,961 | | | | 1,085,913 | |
Alliance Data Systems Corp. | | | 701 | | | | 160,094 | |
| | | | | | | | |
| Common Stocks | | Shares | | | Value | |
United States (continued) | |
Alliant Energy Corp. | | | 3,275 | | | $ | 123,304 | |
Allstate Corp. | | | 4,557 | | | | 342,732 | |
Ally Financial, Inc. | | | 6,617 | | | | 139,751 | |
Alphabet, Inc., Class A (b) | | | 3,729 | | | | 3,058,489 | |
Alphabet, Inc., Class C (b) | | | 3,911 | | | | 3,116,246 | |
Altria Group, Inc. | | | 24,916 | | | | 1,773,521 | |
Amazon.com, Inc. (b) | | | 5,096 | | | | 4,196,454 | |
AMERCO, Inc. | | | 58 | | | | 21,847 | |
Ameren Corp. | | | 3,033 | | | | 159,687 | |
American Airlines Group, Inc. | | | 1,624 | | | | 71,862 | |
American Electric Power Co., Inc. | | | 6,522 | | | | 417,799 | |
American Express Co. | | | 10,117 | | | | 772,736 | |
American International Group, Inc. | | | 13,394 | | | | 860,698 | |
American Tower Corp. | | | 5,555 | | | | 574,942 | |
American Water Works Co., Inc. | | | 2,350 | | | | 172,584 | |
Ameriprise Financial, Inc. | | | 1,938 | | | | 217,579 | |
AmerisourceBergen Corp. | | | 2,234 | | | | 194,984 | |
AMETEK, Inc. | | | 2,931 | | | | 149,774 | |
Amgen, Inc. | | | 9,464 | | | | 1,482,820 | |
Amphenol Corp., Class A | | | 4,002 | | | | 270,095 | |
Anadarko Petroleum Corp. | | | 6,738 | | | | 468,493 | |
Analog Devices, Inc. | | | 3,854 | | | | 288,819 | |
Annaly Capital Management, Inc. | | | 12,024 | | | | 122,885 | |
ANSYS, Inc. (b) | | | 1,057 | | | | 98,576 | |
Antero Resources Corp. (b) | | | 1,468 | | | | 35,834 | |
Anthem, Inc. | | | 3,328 | | | | 512,978 | |
AO Smith Corp. | | | 1,964 | | | | 95,745 | |
Aon PLC | | | 3,463 | | | | 390,280 | |
Apache Corp. | | | 4,993 | | | | 298,681 | |
Apple, Inc. | | | 68,143 | | | | 8,269,153 | |
Applied Materials, Inc. | | | 14,036 | | | | 480,733 | |
Aramark | | | 2,312 | | | | 78,238 | |
Arch Capital Group Ltd. (b) | | | 1,637 | | | | 144,629 | |
Archer-Daniels-Midland Co. | | | 7,467 | | | | 330,489 | |
Arconic, Inc. | | | 5,906 | | | | 134,598 | |
Arrow Electronics, Inc. (b) | | | 1,441 | | | | 105,942 | |
Arthur J Gallagher & Co. | | | 2,488 | | | | 133,929 | |
Ashland Global Holdings, Inc. | | | 875 | | | | 104,151 | |
Assurant, Inc. | | | 913 | | | | 88,680 | |
AT&T, Inc. | | | 77,799 | | | | 3,280,006 | |
Atmos Energy Corp. | | | 1,082 | | | | 82,427 | |
Autodesk, Inc. (b) | | | 2,379 | | | | 193,508 | |
Automatic Data Processing, Inc. | | | 5,985 | | | | 604,425 | |
AutoNation, Inc. (b) | | | 571 | | | | 30,332 | |
AutoZone, Inc. (b) | | | 389 | | | | 282,017 | |
AvalonBay Communities, Inc. | | | 1,695 | | | | 293,760 | |
Avery Dennison Corp. | | | 1,090 | | | | 79,592 | |
Avnet, Inc. | | | 1,174 | | | | 54,521 | |
Axalta Coating Systems Ltd. (b) | | | 3,047 | | | | 88,363 | |
Axis Capital Holdings Ltd. | | | 1,335 | | | | 85,453 | |
B/E Aerospace, Inc. | | | 1,136 | | | | 69,830 | |
Baker Hughes, Inc. | | | 5,400 | | | | 340,632 | |
Ball Corp. | | | 2,115 | | | | 161,290 | |
Bank of America Corp. | | | 129,051 | | | | 2,921,715 | |
Bank of New York Mellon Corp. | | | 13,769 | | | | 615,887 | |
Baxter International, Inc. | | | 5,605 | | | | 268,536 | |
BB&T Corp. | | | 9,930 | | | | 458,667 | |
Becton Dickinson & Co. | | | 2,595 | | | | 460,068 | |
Bed Bath & Beyond, Inc. | | | 2,508 | | | | 101,198 | |
Berkshire Hathaway, Inc., Class B (b) | | | 15,407 | | | | 2,528,905 | |
Best Buy Co., Inc. | | | 3,322 | | | | 147,895 | |
Biogen, Inc. (b) | | | 2,800 | | | | 776,272 | |
BioMarin Pharmaceutical, Inc. (b) | | | 2,283 | | | | 200,059 | |
BlackRock, Inc. (d) | | | 1,542 | | | | 576,677 | |
Boeing Co. | | | 7,378 | | | | 1,205,713 | |
BorgWarner, Inc. | | | 2,847 | | | | 116,243 | |
Boston Properties, Inc. | | | 1,932 | | | | 252,899 | |
See Notes to Financial Statements.
| | | | | | |
| | | | | | | |
| | BLACKROCK FUNDS | | JANUARY 31, 2017 | | 41 |
| | |
Schedule of Investments (continued) | | BlackRock MSCI World Index Fund |
| | | | | | | | |
| Common Stocks | | Shares | | | Value | |
United States (continued) | |
Boston Scientific Corp. (b) | | | 17,204 | | | $ | 413,928 | |
Bristol-Myers Squibb Co. | | | 20,911 | | | | 1,027,985 | |
Brixmor Property Group, Inc. | | | 4,579 | | | | 110,491 | |
Broadridge Financial Solutions, Inc. | | | 1,406 | | | | 93,541 | |
Brown-Forman Corp., Class B | | | 3,170 | | | | 144,552 | |
Bunge Ltd. | | | 1,712 | | | | 118,488 | |
C.H. Robinson Worldwide, Inc. | | | 1,957 | | | | 148,849 | |
C.R. Bard, Inc. | | | 995 | | | | 236,143 | |
CA, Inc. | | | 3,370 | | | | 105,380 | |
Cabot Oil & Gas Corp. | | | 5,728 | | | | 123,037 | |
Cadence Design Systems, Inc. (b) | | | 3,742 | | | | 97,404 | |
Calpine Corp. (b) | | | 3,625 | | | | 42,775 | |
Camden Property Trust | | | 916 | | | | 76,550 | |
Campbell Soup Co. | | | 2,442 | | | | 151,966 | |
Capital One Financial Corp. | | | 6,350 | | | | 554,926 | |
Cardinal Health, Inc. | | | 4,077 | | | | 305,612 | |
CarMax, Inc. (b) | | | 2,543 | | | | 169,644 | |
Carnival Corp. | | | 4,517 | | | | 250,151 | |
Caterpillar, Inc. | | | 7,221 | | | | 690,761 | |
CBRE Group, Inc., Class A (b) | | | 4,159 | | | | 126,267 | |
CBS Corp., Class B | | | 5,217 | | | | 336,444 | |
CDK Global, Inc. | | | 1,768 | | | | 110,588 | |
CDW Corp. | | | 1,577 | | | | 81,231 | |
Celanese Corp., Series A | | | 1,988 | | | | 167,787 | |
Celgene Corp. (b) | | | 9,911 | | | | 1,151,163 | |
Centene Corp. (b) | | | 1,765 | | | | 111,672 | |
CenterPoint Energy, Inc. | | | 5,470 | | | | 143,369 | |
CenturyLink, Inc. | | | 7,860 | | | | 203,260 | |
Cerner Corp. (b) | | | 3,630 | | | | 194,967 | |
CF Industries Holdings, Inc. | | | 2,464 | | | | 86,955 | |
Charles Schwab Corp. | | | 15,201 | | | | 626,889 | |
Charter Communications, Inc., Class A (b) | | | 2,774 | | | | 898,637 | |
Cheniere Energy, Inc. (b) | | | 3,018 | | | | 143,808 | |
Chevron Corp. | | | 23,857 | | | | 2,656,477 | |
Chipotle Mexican Grill, Inc. (b) | | | 353 | | | | 148,768 | |
Chubb Ltd. | | | 5,739 | | | | 754,621 | |
Church & Dwight Co., Inc. | | | 3,222 | | | | 145,699 | |
Cigna Corp. | | | 3,128 | | | | 457,376 | |
Cimarex Energy Co. | | | 1,209 | | | | 163,469 | |
Cincinnati Financial Corp. | | | 1,864 | | | | 131,561 | |
Cintas Corp. | | | 1,042 | | | | 120,987 | |
Cisco Systems, Inc. | | | 63,615 | | | | 1,954,253 | |
CIT Group, Inc. | | | 2,080 | | | | 85,675 | |
Citigroup, Inc. | | | 36,742 | | | | 2,051,306 | |
Citizens Financial Group, Inc. | | | 6,418 | | | | 232,139 | |
Citrix Systems, Inc. (b) | | | 1,855 | | | | 169,157 | |
Clorox Co. | | | 1,513 | | | | 181,560 | |
CME Group, Inc. | | | 4,372 | | | | 529,362 | |
CMS Energy Corp. | | | 3,553 | | | | 151,358 | |
Coach, Inc. | | | 3,667 | | | | 136,962 | |
Coca-Cola Co. | | | 51,852 | | | | 2,155,488 | |
Cognizant Technology Solutions Corp., Class A (b) | | | 7,870 | | | | 413,883 | |
Colgate-Palmolive Co. | | | 10,980 | | | | 709,088 | |
Colony NorthStar, Inc., Class A | | | 6,355 | | | | 88,462 | |
Comcast Corp., Class A | | | 30,381 | | | | 2,291,335 | |
Comerica, Inc. | | | 2,377 | | | | 160,519 | |
Computer Sciences Corp. | | | 1,518 | | | | 94,420 | |
Conagra Brands, Inc. | | | 5,035 | | | | 196,818 | |
Concho Resources, Inc. (b) | | | 1,639 | | | | 228,542 | |
ConocoPhillips | | | 15,342 | | | | 748,076 | |
Consolidated Edison, Inc. | | | 3,911 | | | | 290,783 | |
Constellation Brands, Inc., Class A | | | 2,364 | | | | 354,033 | |
Continental Resources, Inc. (b) | | | 829 | | | | 40,256 | |
Cooper Cos., Inc. | | | 727 | | | | 134,211 | |
Corning, Inc. | | | 13,221 | | | | 350,224 | |
CoStar Group, Inc. (b) | | | 352 | | | | 71,139 | |
Costco Wholesale Corp. | | | 5,457 | | | | 894,675 | |
| | | | | | | | |
| Common Stocks | | Shares | | | Value | |
United States (continued) | |
Coty, Inc., Class A | | | 7,115 | | | $ | 136,608 | |
Crown Castle International Corp. | | | 4,157 | | | | 365,109 | |
Crown Holdings, Inc. (b) | | | 1,436 | | | | 77,788 | |
CSX Corp. | | | 12,044 | | | | 558,721 | |
Cummins, Inc. | | | 2,076 | | | | 305,193 | |
CVS Health Corp. | | | 13,308 | | | | 1,048,803 | |
D.R. Horton, Inc. | | | 4,644 | | | | 138,902 | |
Danaher Corp. | | | 8,064 | | | | 676,731 | |
Darden Restaurants, Inc. | | | 1,799 | | | | 131,831 | |
DaVita, Inc. (b) | | | 2,146 | | | | 136,807 | |
Deere & Co. | | | 3,218 | | | | 344,487 | |
Dell Technologies, Inc., Class V (b) | | | 2,759 | | | | 173,789 | |
Delta Air Lines, Inc. | | | 2,380 | | | | 112,431 | |
Dentsply Sirona, Inc. | | | 2,897 | | | | 164,260 | |
Devon Energy Corp. | | | 6,367 | | | | 289,953 | |
DexCom, Inc. (b) | | | 907 | | | | 71,789 | |
Diamondback Energy, Inc. (b) | | | 1,237 | | | | 130,095 | |
Dick’s Sporting Goods, Inc. | | | 987 | | | | 50,929 | |
Digital Realty Trust, Inc. | | | 2,029 | | | | 218,381 | |
Discover Financial Services | | | 5,280 | | | | 365,798 | |
Discovery Communications, Inc., Class A (b) | | | 1,706 | | | | 48,365 | |
Discovery Communications, Inc., Class C (b) | | | 2,192 | | | | 60,740 | |
DISH Network Corp., Class A (b) | | | 2,701 | | | | 159,818 | |
Dollar General Corp. | | | 3,763 | | | | 277,785 | |
Dollar Tree, Inc. (b) | | | 2,715 | | | | 209,571 | |
Dominion Resources, Inc. | | | 8,040 | | | | 613,291 | |
Domino’s Pizza, Inc. | | | 622 | | | | 108,564 | |
Dover Corp. | | | 2,042 | | | | 158,765 | |
Dow Chemical Co. | | | 14,267 | | | | 850,741 | |
Dr. Pepper Snapple Group, Inc. | | | 2,515 | | | | 229,368 | |
DTE Energy Co. | | | 2,400 | | | | 236,736 | |
Duke Energy Corp. | | | 8,610 | | | | 676,229 | |
Duke Realty Corp. | | | 4,907 | | | | 119,387 | |
Dun & Bradstreet Corp. | | | 306 | | | | 37,522 | |
E*Trade Financial Corp. (b) | | | 2,940 | | | | 110,103 | |
E.I. du Pont de Nemours & Co. | | | 11,135 | | | | 840,692 | |
Eastman Chemical Co. | | | 1,973 | | | | 152,907 | |
Eaton Corp. PLC | | | 5,467 | | | | 386,954 | |
Eaton Vance Corp. | | | 1,566 | | | | 65,662 | |
eBay, Inc. (b) | | | 13,944 | | | | 443,838 | |
Ecolab, Inc. | | | 3,447 | | | | 414,088 | |
Edgewell Personal Care Co. (b) | | | 1,008 | | | | 79,471 | |
Edison International | | | 4,100 | | | | 298,808 | |
Edwards Lifesciences Corp. (b) | | | 2,648 | | | | 254,844 | |
Electronic Arts, Inc. (b) | | | 3,682 | | | | 307,189 | |
Eli Lilly & Co. | | | 12,696 | | | | 977,973 | |
Emerson Electric Co. | | | 8,086 | | | | 474,325 | |
Endo International PLC (b) | | | 1,958 | | | | 23,966 | |
Entergy Corp. | | | 2,207 | | | | 158,109 | |
Envision Healthcare Corp. (b) | | | 1,295 | | | | 88,060 | |
EOG Resources, Inc. | | | 7,417 | | | | 753,419 | |
EQT Corp. | | | 1,948 | | | | 118,107 | |
Equifax, Inc. | | | 1,434 | | | | 168,180 | |
Equinix, Inc. | | | 887 | | | | 341,477 | |
Equity Residential | | | 4,450 | | | | 270,426 | |
Essex Property Trust, Inc. | | | 899 | | | | 201,646 | |
Estee Lauder Cos., Inc., Class A | �� | | 2,921 | | | | 237,214 | |
Everest Re Group Ltd. | | | 310 | | | | 68,178 | |
Eversource Energy | | | 4,395 | | | | 243,131 | |
Exelon Corp. | | | 11,221 | | | | 402,609 | |
Expedia, Inc. | | | 1,723 | | | | 209,500 | |
Expeditors International of Washington, Inc. | | | 2,100 | | | | 109,368 | |
Express Scripts Holding Co. (b) | | | 8,218 | | | | 566,056 | |
Extra Space Storage, Inc. | | | 1,622 | | | | 116,865 | |
Exxon Mobil Corp. | | | 52,439 | | | | 4,399,108 | |
F5 Networks, Inc. (b) | | | 842 | | | | 112,853 | |
Facebook, Inc., Class A (b) | | | 29,376 | | | | 3,828,280 | |
See Notes to Financial Statements.
| | | | | | |
| | | | | | | |
| 42 | | BLACKROCK FUNDS | | JANUARY 31, 2017 | | |
| | |
Schedule of Investments (continued) | | BlackRock MSCI World Index Fund |
| | | | | | | | |
| Common Stocks | | Shares | | | Value | |
United States (continued) | |
Fastenal Co. | | | 3,355 | | | $ | 166,676 | |
Federal Realty Investment Trust | | | 922 | | | | 129,476 | |
FedEx Corp. | | | 3,254 | | | | 615,364 | |
Fidelity National Information Services, Inc. | | | 4,030 | | | | 320,063 | |
Fifth Third Bancorp | | | 10,266 | | | | 267,943 | |
First Data Corp., Class A (b) | | | 3,322 | | | | 50,959 | |
First Republic Bank | | | 1,832 | | | | 172,813 | |
FirstEnergy Corp. | | | 4,699 | | | | 142,474 | |
Fiserv, Inc. (b) | | | 2,595 | | | | 278,781 | |
FleetCor Technologies, Inc. (b) | | | 1,043 | | | | 153,832 | |
Flex Ltd. (b) | | | 7,136 | | | | 111,821 | |
FLIR Systems, Inc. | | | 1,512 | | | | 53,419 | |
Flowserve Corp. | | | 1,663 | | | | 81,753 | |
Fluor Corp. | | | 1,605 | | | | 89,078 | |
FMC Corp. | | | 1,878 | | | | 112,980 | |
FNF Group | | | 3,365 | | | | 118,986 | |
Foot Locker, Inc. | | | 1,987 | | | | 136,189 | |
Ford Motor Co. | | | 48,035 | | | | 593,713 | |
Fortinet, Inc. (b) | | | 2,400 | | | | 79,824 | |
Fortive Corp. | | | 3,604 | | | | 199,337 | |
Fortune Brands Home & Security, Inc. | | | 2,314 | | | | 127,571 | |
Franklin Resources, Inc. | | | 4,426 | | | | 175,889 | |
Freeport-McMoRan, Inc. (b) | | | 16,711 | | | | 278,238 | |
Frontier Communications Corp. | | | 15,469 | | | | 53,987 | |
Gap, Inc. | | | 2,622 | | | | 60,385 | |
Garmin Ltd. | | | 1,553 | | | | 74,994 | |
Gartner, Inc. (b) | | | 1,257 | | | | 124,896 | |
General Dynamics Corp. | | | 3,299 | | | | 597,383 | |
General Electric Co. | | | 113,325 | | | | 3,365,752 | |
General Mills, Inc. | | | 7,496 | | | | 468,350 | |
General Motors Co. | | | 18,259 | | | | 668,462 | |
Genuine Parts Co. | | | 1,775 | | | | 171,838 | |
GGP, Inc. | | | 6,633 | | | | 164,764 | |
Gilead Sciences, Inc. | | | 16,538 | | | | 1,198,178 | |
Global Payments, Inc. | | | 1,843 | | | | 142,427 | |
Goldman Sachs Group, Inc. | | | 4,538 | | | | 1,040,654 | |
Goodyear Tire & Rubber Co. | | | 4,171 | | | | 135,099 | |
H&R Block, Inc. | | | 3,364 | | | | 72,191 | |
Halliburton Co. | | | 10,660 | | | | 603,036 | |
Hanesbrands, Inc. | | | 5,612 | | | | 133,061 | |
Harley-Davidson, Inc. | | | 2,333 | | | | 133,074 | |
Harman International Industries, Inc. | | | 871 | | | | 96,820 | |
Harris Corp. | | | 1,586 | | | | 162,898 | |
Hartford Financial Services Group, Inc. | | | 5,280 | | | | 257,189 | |
Hasbro, Inc. | | | 1,352 | | | | 111,554 | |
HCA Holdings, Inc. (b) | | | 3,852 | | | | 309,239 | |
HCP, Inc. | | | 6,588 | | | | 199,748 | |
Helmerich & Payne, Inc. | | | 1,233 | | | | 87,740 | |
Henry Schein, Inc. (b) | | | 956 | | | | 152,826 | |
Hershey Co. | | | 1,700 | | | | 179,299 | |
Hess Corp. | | | 3,395 | | | | 183,941 | |
Hewlett Packard Enterprise Co. | | | 20,439 | | | | 463,557 | |
Hilton Worldwide Holdings, Inc. | | | 2,788 | | | | 160,533 | |
HollyFrontier Corp. | | | 1,631 | | | | 47,250 | |
Hologic, Inc. (b) | | | 3,454 | | | | 139,991 | |
Home Depot, Inc. | | | 15,625 | | | | 2,149,687 | |
Honeywell International, Inc. | | | 8,987 | | | | 1,063,342 | |
Hormel Foods Corp. | | | 3,876 | | | | 140,699 | |
Host Hotels & Resorts, Inc. | | | 9,072 | | | | 163,931 | |
HP, Inc. | | | 21,948 | | | | 330,317 | |
Humana, Inc. | | | 2,015 | | | | 399,977 | |
Huntington Bancshares, Inc. | | | 12,395 | | | | 167,704 | |
Huntington Ingalls Industries, Inc. | | | 506 | | | | 98,144 | |
IDEXX Laboratories, Inc. (b) | | | 1,275 | | | | 155,971 | |
Illinois Tool Works, Inc. | | | 4,004 | | | | 509,309 | |
Illumina, Inc. (b) | | | 1,985 | | | | 317,798 | |
Incyte Corp. (b) | | | 2,194 | | | | 265,935 | |
| | | | | | | | |
| Common Stocks | | Shares | | | Value | |
United States (continued) | |
Ingersoll-Rand PLC | | | 3,353 | | | $ | 266,061 | |
Ingredion, Inc. | | | 1,084 | | | | 138,958 | |
Intel Corp. | | | 59,715 | | | | 2,198,706 | |
Intercontinental Exchange, Inc. | | | 7,795 | | | | 454,916 | |
International Business Machines Corp. | | | 11,483 | | | | 2,004,013 | |
International Flavors & Fragrances, Inc. | | | 1,157 | | | | 135,612 | |
International Paper Co. | | | 5,110 | | | | 289,226 | |
Interpublic Group of Cos., Inc. | | | 4,333 | | | | 101,955 | |
Intuit, Inc. | | | 3,268 | | | | 387,519 | |
Intuitive Surgical, Inc. (b) | | | 460 | | | | 318,637 | |
Invesco Ltd. | | | 4,996 | | | | 144,484 | |
Iron Mountain, Inc. | | | 3,192 | | | | 114,274 | |
J.M. Smucker Co. | | | 1,352 | | | | 183,669 | |
Jacobs Engineering Group, Inc. (b) | | | 1,221 | | | | 71,490 | |
Jazz Pharmaceuticals PLC (b) | | | 936 | | | | 114,117 | |
JB Hunt Transport Services, Inc. | | | 943 | | | | 93,432 | |
Johnson & Johnson | | | 34,598 | | | | 3,918,223 | |
Johnson Controls International PLC | | | 11,915 | | | | 524,022 | |
Jones Lang LaSalle, Inc. | | | 420 | | | | 43,273 | |
JPMorgan Chase & Co. | | | 45,678 | | | | 3,865,729 | |
Juniper Networks, Inc. | | | 4,983 | | | | 133,445 | |
Kansas City Southern | | | 1,505 | | | | 129,295 | |
Kellogg Co. | | | 3,378 | | | | 245,614 | |
KeyCorp | | | 14,527 | | | | 261,050 | |
Kimberly-Clark Corp. | | | 4,403 | | | | 533,335 | |
Kimco Realty Corp. | | | 5,186 | | | | 129,080 | |
Kinder Morgan, Inc. | | | 23,624 | | | | 527,760 | |
KLA-Tencor Corp. | | | 1,969 | | | | 167,582 | |
Kohl’s Corp. | | | 2,230 | | | | 88,821 | |
Kraft Heinz Co. | | | 7,850 | | | | 700,926 | |
Kroger Co. | | | 10,855 | | | | 368,636 | |
L Brands, Inc. | | | 3,461 | | | | 208,387 | |
L3 Technologies, Inc. | | | 907 | | | | 143,932 | |
Laboratory Corp. of America Holdings (b) | | | 1,165 | | | | 156,355 | |
Lam Research Corp. | | | 2,164 | | | | 248,557 | |
Las Vegas Sands Corp. | | | 5,410 | | | | 284,458 | |
Lear Corp. | | | 1,058 | | | | 150,331 | |
Leggett & Platt, Inc. | | | 2,066 | | | | 98,590 | |
Lennar Corp., Class A | | | 2,674 | | | | 119,394 | |
Leucadia National Corp. | | | 3,998 | | | | 95,352 | |
Level 3 Communications, Inc. (b) | | | 3,522 | | | | 209,418 | |
Liberty Broadband Corp., Class C (b) | | | 1,594 | | | | 136,032 | |
Liberty Interactive Corp QVC Group, Series A (b) | | | 5,487 | | | | 105,241 | |
Liberty Media Corp. — Liberty SiriusXM, Class A (b) | | | 618 | | | | 22,396 | |
Liberty Media Corp. — Liberty SiriusXM, Class C (b) | | | 2,089 | | | | 74,974 | |
Liberty Property Trust | | | 1,416 | | | | 54,360 | |
Lincoln National Corp. | | | 3,023 | | | | 204,083 | |
Linear Technology Corp. | | | 2,840 | | | | 179,289 | |
LKQ Corp. (b) | | | 3,691 | | | | 117,780 | |
Lockheed Martin Corp. | | | 3,337 | | | | 838,688 | |
Loews Corp. | | | 3,495 | | | | 162,797 | |
Lowe’s Cos., Inc. | | | 11,308 | | | | 826,389 | |
lululemon athletica, Inc. (b) | | | 1,148 | | | | 77,501 | |
LyondellBasell Industries NV, Class A | | | 4,408 | | | | 411,134 | |
M&T Bank Corp. | | | 1,884 | | | | 306,282 | |
Macerich Co. | | | 1,670 | | | | 114,712 | |
Macquarie Infrastructure Corp. | | | 837 | | | | 62,767 | |
Macy’s, Inc. | | | 3,959 | | | | 116,949 | |
Mallinckrodt PLC (b) | | | 1,032 | | | | 50,289 | |
ManpowerGroup, Inc. | | | 986 | | | | 94,124 | |
Marathon Oil Corp. | | | 10,622 | | | | 177,918 | |
Marathon Petroleum Corp. | | | 6,542 | | | | 314,343 | |
Markel Corp. (b) | | | 169 | | | | 156,325 | |
Marriott International, Inc., Class A | | | 4,127 | | | | 349,144 | |
Marsh & McLennan Cos., Inc. | | | 6,741 | | | | 458,523 | |
Martin Marietta Materials, Inc. | | | 715 | | | | 164,164 | |
Masco Corp. | | | 4,087 | | | | 134,667 | |
See Notes to Financial Statements.
| | | | | | |
| | | | | | | |
| | BLACKROCK FUNDS | | JANUARY 31, 2017 | | 43 |
| | |
Schedule of Investments (continued) | | BlackRock MSCI World Index Fund |
| | | | | | | | |
| Common Stocks | | Shares | | | Value | |
United States (continued) | |
Mastercard, Inc., Class A | | | 12,382 | | | $ | 1,316,578 | |
Mattel, Inc. | | | 4,750 | | | | 124,498 | |
Maxim Integrated Products, Inc. | | | 3,812 | | | | 169,558 | |
McCormick & Co., Inc. | | | 1,239 | | | | 118,386 | |
McDonald’s Corp. | | | 10,792 | | | | 1,322,775 | |
McKesson Corp. | | | 2,887 | | | | 401,726 | |
Mead Johnson Nutrition Co. | | | 2,254 | | | | 158,817 | |
MEDNAX, Inc. (b) | | | 1,308 | | | | 89,402 | |
Merck & Co., Inc. | | | 34,969 | | | | 2,167,728 | |
MetLife, Inc. | | | 11,930 | | | | 649,111 | |
Mettler-Toledo International, Inc. (b) | | | 316 | | | | 134,815 | |
MGM Resorts International (b) | | | 5,788 | | | | 166,694 | |
Michael Kors Holdings Ltd. (b) | | | 1,849 | | | | 79,156 | |
Microchip Technology, Inc. | | | 2,596 | | | | 174,841 | |
Micron Technology, Inc. (b) | | | 13,390 | | | | 322,833 | |
Microsoft Corp. | | | 93,618 | | | | 6,052,404 | |
Mid-America Apartment Communities, Inc. | | | 1,227 | | | | 116,504 | |
Middleby Corp. (b) | | | 622 | | | | 83,460 | |
Mohawk Industries, Inc. (b) | | | 773 | | | | 166,844 | |
Molson Coors Brewing Co., Class B | | | 2,414 | | | | 232,999 | |
Mondelez International, Inc., Class A | | | 19,379 | | | | 858,102 | |
Monsanto Co. | | | 5,405 | | | | 585,416 | |
Monster Beverage Corp. (b) | | | 5,576 | | | | 237,538 | |
Moody’s Corp. | | | 2,288 | | | | 237,197 | |
Morgan Stanley | | | 18,028 | | | | 766,010 | |
Mosaic Co. | | | 4,595 | | | | 144,145 | |
Motorola Solutions, Inc. | | | 2,014 | | | | 162,550 | |
MSCI, Inc. | | | 1,142 | | | | 94,501 | |
Murphy Oil Corp. | | | 1,578 | | | | 45,620 | |
Mylan NV (b) | | | 5,301 | | | | 201,703 | |
Nasdaq, Inc. | | | 1,658 | | | | 116,955 | |
National Oilwell Varco, Inc. | | | 5,368 | | | | 202,964 | |
National Retail Properties, Inc. | | | 1,590 | | | | 69,324 | |
Navient Corp. | | | 4,485 | | | | 67,454 | |
NetApp, Inc. | | | 3,058 | | | | 117,183 | |
Netflix, Inc. (b) | | | 5,463 | | | | 768,699 | |
New York Community Bancorp, Inc. | | | 4,928 | | | | 74,856 | |
Newell Brands, Inc. | | | 5,575 | | | | 263,865 | |
Newfield Exploration Co. (b) | | | 2,649 | | | | 106,172 | |
Newmont Mining Corp. | | | 6,732 | | | | 244,237 | |
News Corp., Class A | | | 4,384 | | | | 53,879 | |
NextEra Energy, Inc. | | | 5,744 | | | | 710,648 | |
Nielsen Holdings PLC | | | 4,548 | | | | 186,059 | |
NIKE, Inc., Class B | | | 17,233 | | | | 911,626 | |
NiSource, Inc. | | | 3,916 | | | | 87,601 | |
Noble Energy, Inc. | | | 4,949 | | | | 196,772 | |
Nordstrom, Inc. | | | 1,424 | | | | 62,969 | |
Norfolk Southern Corp. | | | 3,615 | | | | 424,618 | |
Northern Trust Corp. | | | 2,935 | | | | 243,488 | |
Northrop Grumman Corp. | | | 2,130 | | | | 487,940 | |
Norwegian Cruise Line Holdings Ltd. (b) | | | 1,670 | | | | 78,490 | |
Nuance Communications, Inc. (b) | | | 2,784 | | | | 44,154 | |
Nucor Corp. | | | 4,345 | | | | 252,401 | |
NVIDIA Corp. | | | 6,620 | | | | 722,772 | |
O’Reilly Automotive, Inc. (b) | | | 1,178 | | | | 308,954 | |
Occidental Petroleum Corp. | | | 9,636 | | | | 653,032 | |
OGE Energy Corp. | | | 2,238 | | | | 75,063 | |
Omnicom Group, Inc. | | | 3,147 | | | | 269,541 | |
ONEOK, Inc. | | | 2,715 | | | | 149,624 | |
Oracle Corp. | | | 39,103 | | | | 1,568,421 | |
PACCAR, Inc. | | | 4,505 | | | | 303,232 | |
Packaging Corp. of America | | | 1,375 | | | | 126,748 | |
Palo Alto Networks, Inc. (b) | | | 1,154 | | | | 170,284 | |
Parker Hannifin Corp. | | | 1,801 | | | | 264,981 | |
Parsley Energy, Inc., Class A (b) | | | 2,786 | | | | 98,123 | |
Patterson Cos., Inc. | | | 561 | | | | 23,343 | |
Paychex, Inc. | | | 4,463 | | | | 269,074 | |
| | | | | | | | |
| Common Stocks | | Shares | | | Value | |
United States (continued) | |
PayPal Holdings, Inc. (b) | | | 13,687 | | | $ | 544,469 | |
People’s United Financial, Inc. | | | 4,316 | | | | 80,925 | |
PepsiCo, Inc. | | | 18,241 | | | | 1,893,051 | |
Perrigo Co. PLC | | | 1,796 | | | | 136,765 | |
Pfizer, Inc. | | | 76,707 | | | | 2,433,913 | |
PG&E Corp. | | | 6,567 | | | | 406,432 | |
Philip Morris International, Inc. | | | 19,688 | | | | 1,892,607 | |
Phillips 66 | | | 6,217 | | | | 507,432 | |
Pinnacle West Capital Corp. | | | 1,627 | | | | 126,304 | |
Pioneer Natural Resources Co. | | | 2,192 | | | | 395,064 | |
Plains GP Holdings LP, Class A Class A | | | 1,061 | | | | 34,429 | |
PNC Financial Services Group, Inc. (d) | | | 6,214 | | | | 748,538 | |
Polaris Industries, Inc. | | | 544 | | | | 45,734 | |
PPG Industries, Inc. | | | 3,233 | | | | 323,332 | |
PPL Corp. | | | 9,156 | | | | 318,995 | |
Praxair, Inc. | | | 3,676 | | | | 435,385 | |
Priceline Group, Inc. (b) | | | 639 | | | | 1,006,508 | |
Principal Financial Group, Inc. | | | 3,318 | | | | 189,425 | |
Procter & Gamble Co. | | | 32,335 | | | | 2,832,546 | |
Progressive Corp. | | | 7,583 | | | | 283,908 | |
Prologis, Inc. | | | 6,892 | | | | 336,674 | |
Prudential Financial, Inc. | | | 5,389 | | | | 566,438 | |
Public Service Enterprise Group, Inc. | | | 6,826 | | | | 302,050 | |
Public Storage | | | 1,860 | | | | 399,900 | |
PulteGroup, Inc. | | | 4,809 | | | | 103,442 | |
PVH Corp. | | | 833 | | | | 78,144 | |
Qorvo, Inc. (b) | | | 1,959 | | | | 125,787 | |
QUALCOMM, Inc. | | | 18,846 | | | | 1,006,942 | |
Quest Diagnostics, Inc. | | | 1,831 | | | | 168,306 | |
Quintiles IMS Holdings, Inc. (b) | | | 1,819 | | | | 142,773 | |
Ralph Lauren Corp. | | | 629 | | | | 55,622 | |
Range Resources Corp. | | | 1,772 | | | | 57,306 | |
Raymond James Financial, Inc. | | | 1,608 | | | | 120,487 | |
Raytheon Co. | | | 3,887 | | | | 560,350 | |
Realty Income Corp. | | | 3,321 | | | | 198,031 | |
Red Hat, Inc. (b) | | | 2,076 | | | | 157,527 | |
Regency Centers Corp. | | | 1,584 | | | | 110,452 | |
Regeneron Pharmaceuticals, Inc. (b) | | | 1,002 | | | | 360,009 | |
Regions Financial Corp. | | | 15,227 | | | | 219,421 | |
Reinsurance Group of America, Inc. | | | 692 | | | | 86,825 | |
RenaissanceRe Holdings Ltd. | | | 254 | | | | 34,625 | |
Republic Services, Inc. | | | 3,241 | | | | 185,969 | |
ResMed, Inc. | | | 2,031 | | | | 137,174 | |
Reynolds American, Inc. | | | 10,929 | | | | 657,161 | |
Rite Aid Corp. (b) | | | 14,956 | | | | 84,053 | |
Robert Half International, Inc. | | | 1,759 | | | | 82,779 | |
Rockwell Automation, Inc. | | | 1,509 | | | | 223,317 | |
Rockwell Collins, Inc. | | | 1,670 | | | | 151,569 | |
Roper Technologies, Inc. | | | 1,373 | | | | 263,410 | |
Ross Stores, Inc. | | | 4,746 | | | | 313,758 | |
Royal Caribbean Cruises Ltd. | | | 1,993 | | | | 186,605 | |
S&P Global, Inc. | | | 3,299 | | | | 396,474 | |
Sabre Corp. | | | 3,111 | | | | 76,220 | |
salesforce.com, Inc. (b) | | | 8,412 | | | | 665,389 | |
SBA Communications Corp. (b) | | | 1,432 | | | | 150,732 | |
SCANA Corp. | | | 1,810 | | | | 124,347 | |
Schlumberger Ltd. | | | 17,418 | | | | 1,458,061 | |
Scripps Networks Interactive, Inc., Class A | | | 831 | | | | 63,289 | |
Sealed Air Corp. | | | 2,830 | | | | 137,255 | |
Seattle Genetics, Inc. (b) | | | 1,071 | | | | 64,517 | |
SEI Investments Co. | | | 1,947 | | | | 94,449 | |
Sempra Energy | | | 2,927 | | | | 299,696 | |
ServiceNow, Inc. (b) | | | 1,876 | | | | 170,003 | |
Sherwin-Williams Co. | | | 960 | | | | 291,658 | |
Signature Bank (b) | | | 810 | | | | 127,591 | |
Signet Jewelers Ltd. | | | 717 | | | | 55,689 | |
Simon Property Group, Inc. | | | 4,020 | | | | 738,755 | |
See Notes to Financial Statements.
| | | | | | |
| | | | | | | |
| 44 | | BLACKROCK FUNDS | | JANUARY 31, 2017 | | |
| | |
Schedule of Investments (continued) | | BlackRock MSCI World Index Fund |
| | | | | | | | |
| Common Stocks | | Shares | | | Value | |
United States (continued) | |
Sirius XM Holdings, Inc. | | | 23,361 | | | $ | 110,264 | |
Skyworks Solutions, Inc. | | | 2,595 | | | | 238,065 | |
SL Green Realty Corp. | | | 1,279 | | | | 139,373 | |
Snap-on, Inc. | | | 823 | | | | 149,399 | |
Southern Co. | | | 12,492 | | | | 617,480 | |
Southwest Airlines Co. | | | 2,052 | | | | 107,340 | |
Southwestern Energy Co. (b) | | | 7,733 | | | | 69,674 | |
Spectra Energy Corp. | | | 8,481 | | | | 353,234 | |
Spectrum Brands Holdings, Inc. | | | 295 | | | | 39,350 | |
Splunk, Inc. (b) | | | 1,318 | | | | 76,259 | |
Sprint Corp. (b) | | | 11,215 | | | | 103,514 | |
Stanley Black & Decker, Inc. | | | 1,811 | | | | 224,564 | |
Staples, Inc. | | | 8,395 | | | | 77,234 | |
Starbucks Corp. | | | 18,448 | | | | 1,018,699 | |
State Street Corp. | | | 4,889 | | | | 372,542 | |
Stericycle, Inc. (b) | | | 872 | | | | 67,266 | |
Stryker Corp. | | | 4,211 | | | | 520,185 | |
SunTrust Banks, Inc. | | | 6,439 | | | | 365,864 | |
Symantec Corp. | | | 7,880 | | | | 217,094 | |
Synchrony Financial | | | 10,187 | | | | 364,898 | |
Synopsys, Inc. (b) | | | 2,252 | | | | 141,628 | |
Sysco Corp. | | | 6,429 | | | | 337,265 | |
T-Mobile U.S., Inc. (b) | | | 4,000 | | | | 249,080 | |
T. Rowe Price Group, Inc. | | | 3,308 | | | | 223,092 | |
Targa Resources Corp. | | | 1,801 | | | | 103,774 | |
Target Corp. | | | 6,667 | | | | 429,888 | |
TD Ameritrade Holding Corp. | | | 3,576 | | | | 165,032 | |
TEGNA, Inc. | | | 3,484 | | | | 79,818 | |
Teleflex, Inc. | | | 476 | | | | 79,839 | |
Tesla Motors, Inc. (b) | | | 1,617 | | | | 407,371 | |
Tesoro Corp. | | | 1,429 | | | | 115,535 | |
Texas Instruments, Inc. | | | 12,518 | | | | 945,610 | |
Textron, Inc. | | | 3,545 | | | | 167,927 | |
Thermo Fisher Scientific, Inc. | | | 5,101 | | | | 777,341 | |
Tiffany & Co. | | | 1,819 | | | | 143,192 | |
Time Warner, Inc. | | | 9,627 | | | | 932,375 | |
TJX Cos., Inc. | | | 8,604 | | | | 644,612 | |
Toll Brothers, Inc. (b) | | | 1,581 | | | | 49,580 | |
Torchmark Corp. | | | 1,376 | | | | 101,191 | |
Total System Services, Inc. | | | 2,429 | | | | 123,102 | |
Tractor Supply Co. | | | 1,715 | | | | 126,344 | |
TransDigm Group, Inc. | | | 612 | | | | 132,437 | |
Travelers Cos., Inc. | | | 3,805 | | | | 448,153 | |
Trimble, Inc. (b) | | | 3,448 | | | | 102,130 | |
TripAdvisor, Inc. (b) | | | 1,178 | | | | 62,316 | |
Twenty-First Century Fox, Inc., Class A | | | 13,154 | | | | 412,773 | |
Twenty-First Century Fox, Inc., Class B | | | 5,274 | | | | 163,547 | |
Twitter, Inc. (b) | | | 7,107 | | | | 125,225 | |
Tyson Foods, Inc., Class A | | | 4,107 | | | | 257,879 | |
UDR, Inc. | | | 2,869 | | | | 100,272 | |
UGI Corp. | | | 2,559 | | | | 118,661 | |
Ulta Salon Cosmetics & Fragrance, Inc. (b) | | | 693 | | | | 188,690 | |
Under Armour, Inc., Class A (b) | | | 1,730 | | | | 37,178 | |
Under Armour, Inc., Class C (b) | | | 2,939 | | | | 56,488 | |
Union Pacific Corp. | | | 10,364 | | | | 1,104,595 | |
United Continental Holdings, Inc. (b) | | | 777 | | | | 54,755 | |
United Parcel Service, Inc., Class B | | | 8,707 | | | | 950,195 | |
United Rentals, Inc. (b) | | | 940 | | | | 118,919 | |
United Technologies Corp. | | | 10,174 | | | | 1,115,783 | |
United Therapeutics Corp. (b) | | | 622 | | | | 101,778 | |
UnitedHealth Group, Inc. | | | 12,044 | | | | 1,952,332 | |
Universal Health Services, Inc., Class B | | | 1,222 | | | | 137,634 | |
Unum Group | | | 2,960 | | | | 134,473 | |
US Bancorp | | | 21,378 | | | | 1,125,552 | |
Valero Energy Corp. | | | 5,598 | | | | 368,124 | |
Valspar Corp. | | | 901 | | | | 99,714 | |
Vantiv, Inc., Class A (b) | | | 2,205 | | | | 137,239 | |
| | | | | | | | |
| Common Stocks | | Shares | | | Value | |
United States (continued) | |
Varex Imaging Corp. (b) | | | 448 | | | $ | 12,892 | |
Varian Medical Systems, Inc. (b) | | | 1,121 | | | | 87,046 | |
Ventas, Inc. | | | 4,401 | | | | 271,410 | |
VEREIT, Inc. | | | 14,625 | | | | 124,751 | |
VeriSign, Inc. (b) | | | 998 | | | | 80,050 | |
Verisk Analytics, Inc. (b) | | | 1,865 | | | | 154,124 | |
Verizon Communications, Inc. | | | 51,550 | | | | 2,526,465 | |
Vertex Pharmaceuticals, Inc. (b) | | | 3,318 | | | | 284,917 | |
VF Corp. | | | 3,848 | | | | 198,095 | |
Viacom, Inc., Class B | | | 4,670 | | | | 196,794 | |
Visa, Inc., Class A | | | 23,856 | | | | 1,973,130 | |
VMware, Inc., Class A (b)(e) | | | 835 | | | | 73,096 | |
Vornado Realty Trust | | | 2,257 | | | | 239,942 | |
Voya Financial, Inc. | | | 2,712 | | | | 109,077 | |
Vulcan Materials Co. | | | 1,812 | | | | 232,534 | |
W.R. Berkley Corp. | | | 1,461 | | | | 98,194 | |
W.W. Grainger, Inc. | | | 701 | | | | 177,052 | |
WABCO Holdings, Inc. (b) | | | 486 | | | | 52,989 | |
Wabtec Corp. | | | 1,113 | | | | 96,430 | |
Wal-Mart Stores, Inc. | | | 19,559 | | | | 1,305,368 | |
Walgreens Boots Alliance, Inc. | | | 11,732 | | | | 961,320 | |
Walt Disney Co. | | | 19,307 | | | | 2,136,320 | |
Waste Management, Inc. | | | 5,403 | | | | 375,508 | |
Waters Corp. (b) | | | 1,067 | | | | 151,141 | |
WEC Energy Group, Inc. | | | 4,371 | | | | 258,108 | |
Wells Fargo & Co. | | | 60,616 | | | | 3,414,499 | |
Welltower, Inc. | | | 4,601 | | | | 305,046 | |
Westar Energy, Inc. | | | 1,907 | | | | 104,294 | |
Western Digital Corp. | | | 3,860 | | | | 307,758 | |
Western Union Co. | | | 6,607 | | | | 129,365 | |
WestRock Co. | | | 3,025 | | | | 161,414 | |
Weyerhaeuser Co. | | | 9,416 | | | | 295,003 | |
Whirlpool Corp. | | | 941 | | | | 164,571 | |
WhiteWave Foods Co. (b) | | | 2,507 | | | | 138,035 | |
Whole Foods Market, Inc. | | | 3,906 | | | | 118,039 | |
Williams Cos., Inc. | | | 9,857 | | | | 284,276 | |
Workday, Inc., Class A (b) | | | 1,625 | | | | 135,021 | |
WR Grace & Co. | | | 1,097 | | | | 76,066 | |
Wyndham Worldwide Corp. | | | 1,454 | | | | 114,953 | |
Wynn Resorts Ltd. | | | 850 | | | | 86,216 | |
Xcel Energy, Inc. | | | 6,749 | | | | 278,869 | |
Xerox Corp. | | | 11,333 | | | | 78,538 | |
Xilinx, Inc. | | | 2,994 | | | | 174,251 | |
Xylem, Inc. | | | 2,502 | | | | 123,374 | |
Yahoo!, Inc. (b) | | | 11,347 | | | | 500,062 | |
Yum! Brands, Inc. | | | 4,760 | | | | 311,923 | |
Zayo Group Holdings, Inc. (b) | | | 1,705 | | | | 54,492 | |
Zillow Group, Inc., Class C (b) | | | 880 | | | | 31,134 | |
Zimmer Biomet Holdings, Inc. | | | 2,536 | | | | 300,085 | |
Zoetis, Inc. | | | 5,905 | | | | 324,421 | |
| | | | | | | | |
| | | | | | | | 255,994,255 | |
| Total Common Stocks — 98.1% | | | | | | | 435,284,873 | |
| | | | | | | | |
Preferred Stock — 0.1% | |
Germany — 0.1% | |
Volkswagen AG, Preference Shares, 0.00% | | | 2,256 | | | | 352,288 | |
| | | | | | | | |
Rights — 0.0% | |
Spain — 0.0% | |
ACS Actividades de Construccion y Servicios SA (b) | | | 2,693 | | | | 1,209 | |
Total Long-Term Investments
(Cost — $394,223,689) — 98.2% | | | | | | | 435,638,370 | |
See Notes to Financial Statements.
| | | | | | |
| | | | | | | |
| | BLACKROCK FUNDS | | JANUARY 31, 2017 | | 45 |
| | |
Schedule of Investments (continued) | | BlackRock MSCI World Index Fund |
| | | | | | | | |
| Short-Term Securities | | Shares | | | Value | |
BlackRock Liquidity Funds, T-Fund, Institutional Class, 0.40% (d)(f) | | | 11,917,267 | | | $ | 11,917,267 | |
SL Liquidity Series, LLC, Money Market Series, 0.94% (d)(f)(g) | | | 73,346 | | | | 73,360 | |
Total Short-Term Securities
(Cost — $11,990,619) — 2.7% | | | | 11,990,627 | |
| Total Investments (Cost — $406,214,308) — 100.9% | | | | 447,628,997 | |
Liabilities in Excess of Other Assets — (0.9)% | | | | | | | (3,872,082 | ) |
| | | | | | | | |
Net Assets — 100.0% | | | | | | $ | 443,756,915 | |
| | | | | | | | |
|
| Notes to Schedule of Investments |
| (a) | | A security contractually bound to one or more other securities to form a single saleable unit which cannot be sold separately. |
| (b) | | Non-income producing security. |
| (c) | | Security exempt from registration pursuant to Rule 144A under the Securities Act of 1933, as amended. These securities may be resold in transactions exempt from registration to qualified institutional investors. |
| (d) | | During the six months ended January 31, 2017, investments in issuers considered to be affiliates of the Fund for purposes of Section 2(a)(3) of the Investment Company Act of 1940, as amended, were as follows: |
| | | | | | | | | | | | | | | | | | | | | | | | | | | | | | | | |
| Affiliate | | Shares Held
at July 31,
2016 | | | Shares Purchased | | | Shares Sold | | | Shares Held
at January 31,
2017 | | | Value at
January 31,
2017 | | | Income | | | Net Realized
Gain1 | | | Change in
Unrealized
Appreciation | |
BlackRock, Inc. | | | 1,168 | | | | 374 | | | | — | | | | 1,542 | | | $ | 576,677 | | | $ | 5,627 | | | | — | | | $ | 86,115 | |
BlackRock Liquidity Funds, T-Fund, Institutional Class | | | — | | | | 11,917,267 | 2 | | | — | | | | 11,917,267 | | | | 11,917,267 | | | | 8,331 | | | $ | 39 | | | | — | |
BlackRock Premier Government Institutional Fund | | | 1,751,171 | | | | — | | | | (1,751,171 | )3 | | | — | | | | — | | | | 2,317 | | | | — | | | | — | |
PNC Financial Services Group, Inc. | | | 4,505 | | | | 1,709 | | | | — | | | | 6,214 | | | | 748,538 | | | | 5,945 | | | | — | | | | 114,664 | |
SL Liquidity Series, LLC, Money Market Series | | | 10,972 | | | | 62,374 | 2 | | | — | | | | 73,346 | | | | 73,360 | | | | 5,886 | 4 | | | 4 | | | | 8 | |
Total | | | | | | | $ | 13,315,842 | | | $ | 28,106 | | | $ | 43 | | | $ | 200,787 | |
| | | | | | | | | | | | | | | | | | | | | |
1 Includes net capital gain distributions. | |
2 Represents net shares purchased. | |
3 Represents net shares sold. | |
4 Represents securities lending income earned from the reinvestment of cash collateral from loaned securities, net of fees and collateral investment expenses, and other payments to and from borrowers of securities. | |
| (e) | | Security, or a portion of security, is on loan. |
| (f) | | Current yield as of period end. |
| (g) | | Security was purchased with the cash collateral from loaned securities. |
|
| Derivative Financial Instruments Outstanding as of Period End |
| | | | | | | | | | | | | | | | | | |
| Futures Contracts | |
Contracts
Long | | | Issue | | Expiration | | Notional
Value | | | Unrealized
Appreciation
(Depreciation) | | | | |
| | 25 | | | Euro Stoxx 50 Index | | March 2017 | | $ | 872,775 | | | $ | (8,843 | ) | | | | |
| | 8 | | | FTSE 100 Index | | March 2017 | | $ | 709,059 | | | | (1,259 | ) | | | | |
| | 6 | | | Nikkei 225 Index | | March 2017 | | $ | 504,561 | | | | (6,441 | ) | | | | |
| | 37 | | | S&P 500 E-Mini Index | | March 2017 | | $ | 4,207,825 | | | | 6,876 | | | | | |
| | Total | | | $ | (9,667 | ) | | | | |
| | | | | | | | | | | | | | |
See Notes to Financial Statements.
| | | | | | |
| | | | | | | |
| 46 | | BLACKROCK FUNDS | | JANUARY 31, 2017 | | |
| | |
Schedule of Investments (continued) | | BlackRock MSCI World Index Fund |
|
| Derivative Financial Instruments Outstanding as of Period End |
As of period end, the fair values of derivative financial instruments located in the Statements of Assets and Liabilities were as follows:
| | | | | | | | | | | | | | | | | | | | | | | | | | | | | | | | |
| Assets — Derivative Financial Instruments | | | Commodity
Contracts | | | Credit
Contracts | | | Equity
Contracts | | | Foreign
Currency
Exchange
Contracts | | | Interest
Rate
Contracts | | | Other
Contracts | | | Total | |
Futures contracts | | | Net unrealized appreciation | | | | — | | | | — | | | $ | 6,876 | | | | — | | | | — | | | | — | | | $ | 6,876 | |
| | | | | | | | | | | | | | | | | | | | | | | | | | | | | | | | |
Liabilities — Derivative Financial Instruments | | | | | | | | | | | | | | | | | | | | | | | | | | | | | |
Futures contracts | | | Net unrealized depreciation | | | | — | | | | — | | | $ | 16,543 | | | | — | | | | — | | | | — | | | $ | 16,543 | |
| | | | | | | | | | | | | | | | | | | | | | | | | | | | | | | | |
| For the six month ended January 31, 2017, the effect of derivative financial instruments in the Statements of Operations were as follows: | |
| | | | | | | | | | | | | | | | | | | | | | | | | | | | | | | | |
Net Realized Gain (Loss) from: | | | | | | | | | | | | | | | | | | | | | | | | | | | | | | | | |
Futures contracts | | | | — | | | | — | | | $ | 551,279 | | | | — | | | | — | | | | — | | | $ | 551,279 | |
Net Change in Unrealized Appreciation (Depreciation) on: | | | | | | | | | | | | | | | | | | | | | | | | | | | | | |
Futures contracts | | | | — | | | | — | | | $ | (35,236 | ) | | | — | | | | — | | | | — | | | $ | (35,236 | ) |
|
| Average Quarterly Balances of Outstanding Derivative Financial Instruments |
| | | | |
| Futures contracts: | |
Average notional value of contracts — long | | $ | 7,681,709 | |
For more information about the Fund’s investment risks regarding derivative financial instruments, refer to the Notes to Financial Statements.
|
| Fair Value Hierarchy as of Period End |
Various inputs are used in determining the fair value of investments and derivative financial instruments. For information about the Fund’s policy regarding valuation of investments and derivative financial instruments, refer to the Notes to Financial Statements.
The following tables summarize the Fund’s investments and derivative financial instruments categorized in the disclosure hierarchy:
| | | | | | | | | | | | | | | | |
| | | Level 1 | | | Level 2 | | | Level 3 | | | Total | |
Assets: | |
| Investments: | |
| Common Stocks: | | | | | | | | | | | | | | | | |
Argentina | | $ | 79,718 | | | | — | | | | — | | | $ | 79,718 | |
Australia | | | — | | | $ | 11,789,145 | | | | — | | | | 11,789,145 | |
Austria | | | — | | | | 345,960 | | | | — | | | | 345,960 | |
Belgium | | | — | | | | 1,784,938 | | | | — | | | | 1,784,938 | |
Bermuda | | | 71,867 | | | | — | | | | — | | | | 71,867 | |
Canada | | | 16,288,307 | | | | — | | | | — | | | | 16,288,307 | |
Denmark | | | — | | | | 2,651,937 | | | | — | | | | 2,651,937 | |
Finland | | | — | | | | 1,469,820 | | | | — | | | | 1,469,820 | |
France | | | — | | | | 15,561,827 | | | | — | | | | 15,561,827 | |
Germany | | | 47,612 | | | | 14,551,964 | | | | — | | | | 14,599,576 | |
Hong Kong | | | 62,473 | | | | 5,175,294 | | | | — | | | | 5,237,767 | |
Ireland | | | 1,892,199 | | | | 886,929 | | | | — | | | | 2,779,128 | |
Israel | | | 676,108 | | | | 408,194 | | | | — | | | | 1,084,302 | |
Italy | | | — | | | | 2,759,724 | | | | — | | | | 2,759,724 | |
Japan | | | — | | | | 38,491,986 | | | | — | | | | 38,491,986 | |
Luxembourg | | | — | | | | 72,841 | | | | — | | | | 72,841 | |
Mexico | | | — | | | | 32,730 | | | | — | | | | 32,730 | |
Netherlands | | | 613,884 | | | | 7,578,328 | | | | — | | | | 8,192,212 | |
New Zealand | | | — | | | | 294,114 | | | | — | | | | 294,114 | |
Norway | | | — | | | | 1,101,787 | | | | — | | | | 1,101,787 | |
Portugal | | | — | | | | 187,260 | | | | — | | | | 187,260 | |
Singapore | | | 1,052,325 | | | | 2,060,174 | | | | — | | | | 3,112,499 | |
Spain | | | — | | | | 4,950,119 | | | | — | | | | 4,950,119 | |
Sweden | | | 134,513 | | | | 4,633,963 | | | | — | | | | 4,768,476 | |
Switzerland | | | 328,701 | | | | 14,773,513 | | | | — | | | | 15,102,214 | |
United Arab Emirates | | | — | | | | 30,147 | | | | — | | | | 30,147 | |
United Kingdom | | | 1,339,381 | | | | 25,110,836 | | | | — | | | | 26,450,217 | |
United States | | | 255,994,255 | | | | — | | | | — | | | | 255,994,255 | |
See Notes to Financial Statements.
| | | | | | |
| | | | | | | |
| | BLACKROCK FUNDS | | JANUARY 31, 2017 | | 47 |
| | |
Schedule of Investments (concluded) | | BlackRock MSCI World Index Fund |
| | | | | | | | | | | | | | | | |
| | | Level 1 | | | Level 2 | | | Level 3 | | | Total | |
Preferred Stock | | | — | | | $ | 352,288 | | | | — | | | $ | 352,288 | |
Rights | | $ | 1,209 | | | | — | | | | — | | | | 1,209 | |
Short-Term Investment Fund | | | 11,917,267 | | | | — | | | | — | | | | 11,917,267 | |
| | | | |
Subtotal | | $ | 290,499,819 | | | $ | 157,055,818 | | | | — | | | $ | 447,555,637 | |
| | | | |
Investments valued at NAV1 | | | | | | | | | | | | | | | 73,360 | |
| | | | | | | | | | | | | | | | |
Total | | | | | | | | | | | | | | $ | 447,628,997 | |
| | | | | | | | | | | | | | | | |
| | | | | | | | | | | | | | | | |
| | | Level 1 | | | Level 2 | | | Level 3 | | | Total | |
| Derivative Financial Instruments 2 | |
Assets: | |
Equity contracts | | $ | 6,876 | | | | — | | | | — | | | $ | 6,876 | |
Liabilities: | |
Equity contracts | | | (16,543 | ) | | | — | | | | — | | | | (16,543 | ) |
| | | | |
Total | | $ | (9,667 | ) | | | — | | | | — | | | $ | (9,667 | ) |
| | | | |
1 As of January 31, 2017, certain of the Fund’s investments were fair valued using NAV per share as no quoted market value is available and therefore have been excluded from the fair value hierarchy. | |
2 Derivative financial instruments are futures contracts, which are valued at the unrealized appreciation (depreciation) on the instrument. | |
During the six months ended January 31, 2017, there were no transfers between levels.
See Notes to Financial Statements.
| | | | | | |
| | | | | | | |
| 48 | | BLACKROCK FUNDS | | JANUARY 31, 2017 | | |
| | |
Schedule of Investments January 31, 2017 (Unaudited) | | BlackRock Small/Mid Cap Index Fund (Percentages shown are based on Net Assets) |
| | | | | | | | |
| Common Stocks | | Shares | | | Value | |
Aerospace & Defense — 1.5% | |
AAR Corp. | | | 585 | | | $ | 18,714 | |
Aerojet Rocketdyne Holdings, Inc. (a) | | | 1,061 | | | | 19,215 | |
Aerovironment, Inc. (a) | | | 354 | | | | 9,271 | |
Astronics Corp. (a) | | | 323 | | | | 10,598 | |
B/E Aerospace, Inc. | | | 1,758 | | | | 108,064 | |
Cubic Corp. | | | 445 | | | | 21,160 | |
Curtiss-Wright Corp. | | | 754 | | | | 73,937 | |
DigitalGlobe, Inc. (a) | | | 1,109 | | | | 31,107 | |
Ducommun, Inc. (a) | | | 176 | | | | 5,215 | |
Engility Holdings, Inc. (a) | | | 313 | | | | 9,180 | |
Esterline Technologies Corp. (a) | | | 503 | | | | 43,082 | |
HEICO Corp. | | | 348 | | | | 26,778 | |
HEICO Corp., Class A | | | 653 | | | | 43,294 | |
Hexcel Corp. | | | 1,593 | | | | 81,800 | |
Huntington Ingalls Industries, Inc. | | | 798 | | | | 154,780 | |
KEYW Holding Corp. (a) | | | 505 | | | | 5,055 | |
KLX, Inc. (a) | | | 919 | | | | 45,022 | |
Kratos Defense & Security Solutions, Inc. (a) | | | 970 | | | | 7,993 | |
Moog, Inc., Class A (a) | | | 548 | | | | 36,097 | |
National Presto Industries, Inc. | | | 79 | | | | 8,406 | |
Orbital ATK, Inc. | | | 1,002 | | | | 87,124 | |
Sparton Corp. (a) | | | 111 | | | | 2,406 | |
Spirit Aerosystems Holdings, Inc., Class A | | | 2,094 | | | | 125,745 | |
Taser International, Inc. (a) | | | 912 | | | | 22,782 | |
Teledyne Technologies, Inc. (a) | | | 585 | | | | 71,879 | |
Triumph Group, Inc. | | | 857 | | | | 22,925 | |
Vectrus, Inc. (a) | | | 194 | | | | 4,373 | |
| | | | | | | | |
| | | | | | | | 1,096,002 | |
Air Freight & Logistics — 0.3% | |
Air Transport Services Group, Inc. (a) | | | 787 | | | | 12,694 | |
Atlas Air Worldwide Holdings, Inc. (a) | | | 426 | | | | 22,472 | |
Echo Global Logistics, Inc. (a) | | | 486 | | | | 11,543 | |
Forward Air Corp. | | | 540 | | | | 26,023 | |
Hub Group, Inc., Class A (a) | | | 603 | | | | 26,743 | |
Park-Ohio Holdings Corp. | | | 159 | | | | 7,131 | |
Radiant Logistics, Inc. (a) | | | 682 | | | | 2,503 | |
XPO Logistics, Inc. (a) | | | 1,675 | | | | 74,939 | |
| | | | | | | | |
| | | | | | | | 184,048 | |
Airlines — 0.7% | |
Alaska Air Group, Inc. | | | 2,060 | | | | 193,269 | |
Allegiant Travel Co. | | | 223 | | | | 38,356 | |
Copa Holdings SA, Class A | | | 534 | | | | 52,060 | |
Hawaiian Holdings, Inc. (a) | | | 916 | | | | 46,670 | |
JetBlue Airways Corp. (a) | | | 5,546 | | | | 108,757 | |
SkyWest, Inc. | | | 875 | | | | 30,975 | |
Spirit Airlines, Inc. (a) | | | 1,222 | | | | 66,037 | |
| | | | | | | | |
| | | | | | | | 536,124 | |
Auto Components — 1.3% | |
Allison Transmission Holdings, Inc. | | | 2,431 | | | | 85,036 | |
American Axle & Manufacturing Holdings, Inc. (a) | | | 1,335 | | | | 27,234 | |
Cooper Tire & Rubber Co. | | | 942 | | | | 34,147 | |
Cooper-Standard Holding, Inc. (a) | | | 263 | | | | 27,689 | |
Dana, Inc. | | | 2,555 | | | | 51,458 | |
Dorman Products, Inc. (a) | | | 447 | | | | 30,852 | |
Fox Factory Holding Corp. (a) | | | 365 | | | | 9,454 | |
Gentex Corp. | | | 4,865 | | | | 101,630 | |
Gentherm, Inc. (a) | | | 635 | | | | 22,479 | |
Goodyear Tire & Rubber Co. | | | 4,594 | | | | 148,800 | |
Horizon Global Corp. (a) | | | 262 | | | | 5,127 | |
LCI Industries | | | 401 | | | | 44,010 | |
Lear Corp. | | | 1,271 | | | | 180,596 | |
Metaldyne Performance Group, Inc. | | | 264 | | | | 6,230 | |
Modine Manufacturing Co. (a) | | | 767 | | | | 10,431 | |
Motorcar Parts of America, Inc. (a) | | | 320 | | | | 8,394 | |
Spartan Motors, Inc. | | | 534 | | | | 4,219 | |
| | | | | | | | |
| Common Stocks | | Shares | | | Value | |
Auto Components (continued) | |
Standard Motor Products, Inc. | | | 375 | | | $ | 18,701 | |
Stoneridge, Inc. (a) | | | 407 | | | | 6,679 | |
Strattec Security Corp. | | | 68 | | | | 2,094 | |
Superior Industries International, Inc. | | | 410 | | | | 9,451 | |
Tenneco, Inc. (a) | | | 973 | | | | 65,629 | |
Tower International, Inc. | | | 357 | | | | 9,353 | |
Visteon Corp. (a) | | | 583 | | | | 52,219 | |
Workhorse Group, Inc. (a) | | | 173 | | | | 561 | |
| | | | | | | | |
| | | | | | | | 962,473 | |
Automobiles — 0.1% | |
Thor Industries, Inc. | | | 827 | | | | 85,595 | |
Winnebago Industries, Inc. | | | 436 | | | | 13,690 | |
| | | | | | | | |
| | | | | | | | 99,285 | |
Banks — 7.4% | |
1st Source Corp. | | | 261 | | | | 11,774 | |
Access National Corp. | | | 120 | | | | 3,202 | |
ACNB Corp. | | | 97 | | | | 2,910 | |
Allegiance Bancshares, Inc. (a) | | | 181 | | | | 5,873 | |
American National Bankshares, Inc. | | | 112 | | | | 3,976 | |
Ameris Bancorp | | | 631 | | | | 28,458 | |
Ames National Corp. | | | 115 | | | | 3,715 | |
Arrow Financial Corp. | | | 172 | | | | 6,072 | |
Associated Banc-Corp | | | 2,615 | | | | 66,159 | |
Atlantic Capital Bancshares, Inc. (a) | | | 293 | | | | 5,596 | |
Bancfirst Corp. | | | 129 | | | | 12,171 | |
Banco Latinoamericano de Comercio Exterior SA | | | 500 | | | | 13,600 | |
Bancorp, Inc. (a) | | | 718 | | | | 4,301 | |
BancorpSouth, Inc. | | | 1,526 | | | | 45,322 | |
Bank of Hawaii Corp. | | | 735 | | | | 63,144 | |
Bank of Marin Bancorp | | | 98 | | | | 6,586 | |
The Bank of NT Butterfield & Son, Ltd. | | | 200 | | | | 6,578 | |
Bank of the Ozarks, Inc. | | | 1,525 | | | | 83,677 | |
BankUnited, Inc. | | | 1,735 | | | | 66,277 | |
Bankwell Financial Group, Inc. | | | 100 | | | | 2,931 | |
Banner Corp. | | | 561 | | | | 31,483 | |
Bar Harbor Bankshares | | | 146 | | | | 6,326 | |
Blue Hills Bancorp, Inc. | | | 452 | | | | 8,588 | |
BNC Bancorp | | | 776 | | | | 27,354 | |
BOK Financial Corp. | | | 463 | | | | 38,077 | |
Boston Private Financial Holdings, Inc. | | | 1,448 | | | | 23,892 | |
Bridge Bancorp, Inc. | | | 334 | | | | 12,074 | |
Bryn Mawr Bank Corp. | | | 269 | | | | 10,773 | |
C&F Financial Corp. | | | 55 | | | | 2,384 | |
Camden National Corp. | | | 252 | | | | 10,453 | |
Capital Bank Financial Corp., Class A | | | 438 | | | | 17,257 | |
Capital City Bank Group, Inc. | | | 169 | | | | 3,497 | |
Cardinal Financial Corp. | | | 522 | | | | 16,370 | |
Carolina Financial Corp. | | | 183 | | | | 5,481 | |
Cascade Bancorp (a) | | | 459 | | | | 3,658 | |
Cathay General Bancorp | | | 1,285 | | | | 46,825 | |
Centerstate Banks, Inc. | | | 854 | | | | 20,829 | |
Central Pacific Financial Corp. | | | 546 | | | | 17,106 | |
Central Valley Community Bancorp | | | 117 | | | | 2,367 | |
Century Bancorp, Inc., Class A | | | 53 | | | | 3,196 | |
Chemical Financial Corp. | | | 1,150 | | | | 56,844 | |
Chemung Financial Corp. | | | 55 | | | | 1,880 | |
Citizens & Northern Corp. | | | 150 | | | | 3,564 | |
City Holding Co. | | | 262 | | | | 17,054 | |
CNB Financial Corp. | | | 227 | | | | 5,325 | |
CoBiz Financial, Inc. | | | 679 | | | | 11,896 | |
Codorus Valley Bancorp, Inc. | | | 129 | | | | 3,311 | |
Columbia Banking System, Inc. | | | 1,004 | | | | 39,919 | |
Commerce Bancshares, Inc. | | | 1,524 | | | | 86,152 | |
Community Bank System, Inc. | | | 741 | | | | 43,245 | |
Community Trust Bancorp, Inc. | | | 243 | | | | 11,239 | |
See Notes to Financial Statements.
| | | | | | |
| | | | | | | |
| | BLACKROCK FUNDS | | JANUARY 31, 2017 | | 49 |
| | |
Schedule of Investments (continued) | | BlackRock Small/Mid Cap Index Fund |
| | | | | | | | |
| Common Stocks | | Shares | | | Value | |
Banks (continued) | |
ConnectOne Bancorp, Inc. | | | 543 | | | $ | 13,412 | |
County Bancorp, Inc. | | | 96 | | | | 2,621 | |
CU Bancorp (a) | | | 270 | | | | 9,788 | |
Cullen/Frost Bankers, Inc. | | | 921 | | | | 82,337 | |
Customers Bancorp, Inc. (a) | | | 405 | | | | 13,956 | |
CVB Financial Corp. | | | 1,761 | | | | 39,693 | |
Eagle Bancorp, Inc. (a) | | | 527 | | | | 32,279 | |
East West Bancorp, Inc. | | | 2,484 | | | | 127,777 | |
Enterprise Bancorp, Inc. | | | 157 | | | | 5,277 | |
Enterprise Financial Services Corp. | | | 309 | | | | 12,870 | |
Equity Bancshares, Inc., Class A (a) | | | 139 | | | | 4,540 | |
Farmers Capital Bank Corp. | | | 99 | | | | 3,678 | |
Farmers National Banc Corp. | | | 430 | | | | 5,418 | |
FB Financial Corp. (a) | | | 117 | | | | 2,979 | |
FCB Financial Holdings, Inc., Class A (a) | | | 551 | | | | 25,869 | |
Fidelity Southern Corp. | | | 391 | | | | 9,091 | |
Financial Institutions, Inc. | | | 211 | | | | 6,952 | |
First Bancorp, Inc. | | | 202 | | | | 5,454 | |
First Bancorp, North Carolina | | | 366 | | | | 10,713 | |
First BanCorp, Puerto Rico (a) | | | 1,993 | | | | 13,393 | |
First Busey Corp. | | | 557 | | | | 16,292 | |
First Business Financial Services, Inc. | | | 134 | | | | 3,247 | |
First Citizens BancShares, Inc., Class A | | | 130 | | | | 47,676 | |
First Commonwealth Financial Corp. | | | 1,565 | | | | 22,098 | |
First Community Bancshares, Inc. | | | 233 | | | | 6,780 | |
First Community Financial Partners, Inc. (a) | | | 224 | | | | 2,666 | |
First Connecticut Bancorp, Inc. | | | 308 | | | | 6,976 | |
First Financial Bancorp | | | 1,070 | | | | 29,479 | |
First Financial Bankshares, Inc. | | | 1,098 | | | | 46,830 | |
First Financial Corp. | | | 166 | | | | 8,026 | |
First Financial Northwest, Inc. | | | 162 | | | | 3,362 | |
First Foundation, Inc. (a) | | | 420 | | | | 6,090 | |
First Hawaiian, Inc. | | | 398 | | | | 13,130 | |
First Horizon National Corp. | | | 4,006 | | | | 80,120 | |
First Internet Bancorp | | | 97 | | | | 3,022 | |
First Interstate Bancsystem, Inc., Class A | | | 321 | | | | 13,209 | |
First Merchants Corp. | | | 719 | | | | 27,559 | |
First Mid-Illinois Bancshares, Inc. | | | 114 | | | | 3,592 | |
First Midwest Bancorp, Inc. | | | 1,402 | | | | 34,041 | |
First NBC Bank Holding Co. (a) | | | 221 | | | | 884 | |
First Northwest Bancorp (a) | | | 195 | | | | 2,888 | |
First of Long Island Corp. | | | 352 | | | | 9,539 | |
FNB Corp. | | | 3,670 | | | | 54,830 | |
Franklin Financial Network, Inc. (a) | | | 178 | | | | 6,862 | |
Fulton Financial Corp. | | | 2,962 | | | | 53,908 | |
German American Bancorp, Inc. | | | 231 | | | | 11,086 | |
Glacier Bancorp, Inc. | | | 1,316 | | | | 46,757 | |
Great Southern Bancorp, Inc. | | | 202 | | | | 10,110 | |
Great Western Bancorp, Inc. | | | 1,021 | | | | 43,648 | |
Green Bancorp, Inc. (a) | | | 410 | | | | 7,032 | |
Guaranty Bancorp | | | 301 | | | | 7,284 | |
Hancock Holding Co. | | | 1,117 | | | | 51,214 | |
Hanmi Financial Corp. | | | 560 | | | | 18,564 | |
HarborOne Bancorp, Inc. (a) | | | 248 | | | | 4,618 | |
Heartland Financial USA, Inc. | | | 394 | | | | 18,439 | |
Heritage Commerce Corp. | | | 528 | | | | 7,413 | |
Heritage Financial Corp. | | | 473 | | | | 12,062 | |
Heritage Oaks Bancorp | | | 336 | | | | 4,549 | |
Home BancShares, Inc. | | | 2,060 | | | | 55,496 | |
HomeTrust Bancshares, Inc. (a) | | | 314 | | | | 7,772 | |
Hope Bancorp, Inc. | | | 2,218 | | | | 46,378 | |
Horizon Bancorp | | | 356 | | | | 9,124 | |
Huntington Bancshares, Inc. | | | 18,580 | | | | 251,387 | |
Iberiabank Corp. | | | 761 | | | | 62,516 | |
Independent Bank Corp. | | | 769 | | | | 34,757 | |
Independent Bank Group, Inc. | | | 186 | | | | 11,560 | |
International Bancshares Corp. | | | 950 | | | | 35,245 | |
| | | | | | | | |
| Common Stocks | | Shares | | | Value | |
Banks (continued) | |
Investors Bancorp, Inc. | | | 5,118 | | | $ | 73,443 | |
Lakeland Bancorp, Inc. | | | 630 | | | | 11,687 | |
Lakeland Financial Corp. | | | 426 | | | | 18,923 | |
LCNB Corp. | | | 146 | | | | 3,285 | |
LegacyTexas Financial Group, Inc. | | | 800 | | | | 33,056 | |
Live Oak Bancshares, Inc. | | | 506 | | | | 10,348 | |
Macatawa Bank Corp. | | | 372 | | | | 3,802 | |
MainSource Financial Group, Inc. | | | 370 | | | | 12,158 | |
MB Financial, Inc. | | | 1,292 | | | | 57,533 | |
MBT Financial Corp. | | | 283 | | | | 3,056 | |
Mercantile Bank Corp. | | | 258 | | | | 8,333 | |
Merchants Bancshares, Inc. | | | 111 | | | | 5,661 | |
Middleburg Financial Corp. | | | 77 | | | | 2,644 | |
Midland States Bancorp, Inc. | | | 58 | | | | 1,964 | |
MidWestOne Financial Group, Inc. | | | 170 | | | | 6,003 | |
MutualFirst Financial, Inc. | | | 99 | | | | 3,094 | |
National Bank Holdings Corp., Class A | | | 396 | | | | 12,870 | |
National Bankshares, Inc. | | | 95 | | | | 4,137 | |
National Commerce Corp. (a) | | | 161 | | | | 6,038 | |
NBT Bancorp, Inc. | | | 738 | | | | 30,066 | |
Nicolet Bankshares, Inc. (a) | | | 111 | | | | 5,380 | |
Northrim BanCorp, Inc. | | | 108 | | | | 3,051 | |
OFG Bancorp | | | 686 | | | | 9,090 | |
Old Line Bancshares, Inc. | | | 140 | | | | 3,753 | |
Old National Bancorp | | | 2,310 | | | | 41,002 | |
Old Second Bancorp, Inc. | | | 550 | | | | 5,940 | |
Opus Bank | | | 326 | | | | 6,634 | |
Orrstown Financial Services, Inc. | | | 126 | | | | 2,766 | |
Pacific Continental Corp. | | | 317 | | | | 7,862 | |
Pacific Mercantile Bancorp (a) | | | 227 | | | | 1,623 | |
Pacific Premier Bancorp, Inc. (a) | | | 508 | | | | 19,990 | |
PacWest Bancorp | | | 2,057 | | | | 113,958 | |
Park National Corp. | | | 234 | | | | 25,925 | |
Park Sterling Corp. | | | 872 | | | | 10,202 | |
Peapack Gladstone Financial Corp. | | | 271 | | | | 8,186 | |
Penns Woods Bancorp, Inc. | | | 67 | | | | 3,095 | |
People’s Utah Bancorp | | | 248 | | | | 6,262 | |
Peoples Bancorp, Inc. | | | 266 | | | | 8,259 | |
Peoples Financial Services Corp. | | | 135 | | | | 5,805 | |
Pinnacle Financial Partners, Inc. | | | 742 | | | | 49,603 | |
Popular, Inc. | | | 1,784 | | | | 79,263 | |
Preferred Bank | | | 216 | | | | 11,969 | |
Premier Financial Bancorp, Inc. | | | 145 | | | | 2,656 | |
PrivateBancorp, Inc. | | | 1,345 | | | | 73,518 | |
Prosperity Bancshares, Inc. | | | 1,152 | | | | 83,670 | |
QCR Holdings, Inc. | | | 209 | | | | 8,768 | |
Renasant Corp. | | | 750 | | | | 29,850 | |
Republic Bancorp, Inc., Class A | | | 157 | | | | 5,440 | |
Republic First Bancorp, Inc. (a) | | | 784 | | | | 5,919 | |
S&T Bancorp, Inc. | | | 602 | | | | 22,647 | |
Sandy Spring Bancorp, Inc. | | | 421 | | | | 17,248 | |
Seacoast Banking Corp. of Florida (a) | | | 467 | | | | 10,171 | |
ServisFirst Bancshares, Inc. | | | 789 | | | | 31,592 | |
Shore Bancshares, Inc. | | | 212 | | | | 3,411 | |
Sierra Bancorp | | | 226 | | | | 6,048 | |
Signature Bank (a) | | | 914 | | | | 143,973 | |
Simmons First National Corp., Class A | | | 513 | | | | 30,857 | |
South State Corp. | | | 452 | | | | 40,409 | |
Southern First Bancshares, Inc. (a) | | | 94 | | | | 3,328 | |
Southern National Bancorp of Virginia, Inc. | | | 179 | | | | 2,869 | |
Southside Bancshares, Inc. | | | 449 | | | | 15,338 | |
Southwest Bancorp, Inc. | | | 303 | | | | 8,393 | |
State Bank Financial Corp. | | | 560 | | | | 14,806 | |
Sterling Bancorp | | | 2,186 | | | | 52,136 | |
Stock Yards Bancorp, Inc. | | | 373 | | | | 16,710 | |
Stonegate Bank | | | 221 | | | | 10,058 | |
Suffolk Bancorp | | | 196 | | | | 8,118 | |
See Notes to Financial Statements.
| | | | | | |
| | | | | | | |
| 50 | | BLACKROCK FUNDS | | JANUARY 31, 2017 | | |
| | |
Schedule of Investments (continued) | | BlackRock Small/Mid Cap Index Fund |
| | | | | | | | |
| Common Stocks | | Shares | | | Value | |
Banks (continued) | |
Summit Financial Group, Inc. | | | 128 | | | $ | 3,347 | |
Sun Bancorp, Inc. | | | 145 | | | | 3,625 | |
SVB Financial Group (a) | | | 893 | | | | 153,801 | |
Synovus Financial Corp. | | | 2,163 | | | | 90,154 | |
TCF Financial Corp. | | | 2,743 | | | | 47,591 | |
Texas Capital Bancshares, Inc. (a) | | | 862 | | | | 71,115 | |
Tompkins Financial Corp. | | | 258 | | | | 23,362 | |
TowneBank | | | 966 | | | | 31,105 | |
Trico Bancshares | | | 320 | | | | 11,798 | |
Tristate Capital Holdings, Inc. (a) | | | 329 | | | | 7,304 | |
Triumph Bancorp, Inc. (a) | | | 252 | | | | 6,817 | |
Trustmark Corp. | | | 1,169 | | | | 39,302 | |
UMB Financial Corp. | | | 766 | | | | 59,089 | |
Umpqua Holdings Corp. | | | 3,777 | | | | 69,157 | |
Union Bankshares Corp. | | | 761 | | | | 27,974 | |
Union Bankshares, Inc. (b) | | | 61 | | | | 2,532 | |
United Bankshares, Inc. | | | 1,200 | | | | 53,760 | |
United Community Banks, Inc. | | | 1,223 | | | | 34,403 | |
Univest Corp. of Pennsylvania | | | 396 | | | | 11,147 | |
Valley National Bancorp | | | 4,277 | | | | 51,794 | |
Veritex Holdings, Inc. (a) | | | 220 | | | | 5,975 | |
Washington Trust Bancorp, Inc. | | | 241 | | | | 13,135 | |
WashingtonFirst Bankshares, Inc. | | | 124 | | | | 3,453 | |
Webster Financial Corp. | | | 1,575 | | | | 82,719 | |
WesBanco, Inc. | | | 704 | | | | 29,216 | |
West BanCorp., Inc. | | | 253 | | | | 5,768 | |
Westamerica BanCorp | | | 466 | | | | 26,446 | |
Western Alliance Bancorp (a) | | | 1,615 | | | | 79,749 | |
Wintrust Financial Corp. | | | 878 | | | | 62,865 | |
Xenith Bankshares, Inc. (a) | | | 139 | | | | 3,620 | |
Yadkin Financial Corp. | | | 905 | | | | 28,960 | |
Zions Bancorporation | | | 3,480 | | | | 146,821 | |
| | | | | | | | |
| | | | | | | | 5,392,511 | |
Beverages — 0.1% | |
Boston Beer Co., Inc., Class A (a) | | | 156 | | | | 23,977 | |
Coca-Cola Bottling Co. Consolidated | | | 78 | | | | 13,170 | |
Craft Brew Alliance, Inc. (a) | | | 194 | | | | 2,949 | |
MGP Ingredients, Inc. | | | 201 | | | | 8,521 | |
National Beverage Corp. | | | 201 | | | | 10,088 | |
Primo Water Corp. (a) | | | 383 | | | | 4,948 | |
| | | | | | | | |
| | | | | | | | 63,653 | |
Biotechnology — 3.2% | |
ACADIA Pharmaceuticals, Inc. (a) | | | 1,661 | | | | 57,454 | |
Acceleron Pharma, Inc. (a) | | | 464 | | | | 11,266 | |
Achillion Pharmaceuticals, Inc. (a) | | | 2,147 | | | | 8,953 | |
Acorda Therapeutics, Inc. (a) | | | 730 | | | | 14,965 | |
Adamas Pharmaceuticals, Inc. (a) | | | 291 | | | | 4,618 | |
Aduro Biotech, Inc. (a) | | | 556 | | | | 6,589 | |
Advaxis, Inc. (a) | | | 609 | | | | 5,457 | |
Adverum Biotechnologies, Inc. (a) | | | 597 | | | | 1,731 | |
Aevi Genomic Medicine, Inc. (a) | | | 486 | | | | 2,313 | |
Agenus, Inc. (a) | | | 1,059 | | | | 4,236 | |
Agios Pharmaceuticals, Inc. (a) | | | 553 | | | | 23,796 | |
Aimmune Therapeutics, Inc. (a) | | | 480 | | | | 8,774 | |
Akebia Therapeutics, Inc. (a) | | | 582 | | | | 5,837 | |
Alder Biopharmaceuticals, Inc. (a) | | | 764 | | | | 15,700 | |
Alkermes PLC (a) | | | 2,594 | | | | 140,361 | |
Alnylam Pharmaceuticals, Inc. (a) | | | 1,296 | | | | 51,827 | |
AMAG Pharmaceuticals, Inc. (a) | | | 571 | | | | 13,761 | |
Amicus Therapeutics, Inc. (a) | | | 2,406 | | | | 13,233 | |
Anavex Life Sciences Corp. (a)(b) | | | 651 | | | | 2,930 | |
Anthera Pharmaceuticals, Inc. (a) | | | 419 | | | | 227 | |
Applied Genetic Technologies Corp. (a) | | | 277 | | | | 2,008 | |
Aptevo Therapeutics, Inc. (a) | | | 858 | | | | 1,707 | |
AquaBounty Technologies, Inc. (a) | | | 13 | | | | 179 | |
| | | | | | | | |
| Common Stocks | | Shares | | | Value | |
Biotechnology (continued) | |
Ardelyx, Inc. (a) | | | 451 | | | $ | 5,412 | |
Arena Pharmaceuticals, Inc. (a) | | | 3,876 | | | | 5,969 | |
Argos Therapeutics, Inc. (a) | | | 349 | | | | 1,588 | |
Ariad Pharmaceuticals, Inc. (a) | | | 3,162 | | | | 75,319 | |
Array BioPharma, Inc. (a) | | | 2,896 | | | | 31,480 | |
Arrowhead Pharmaceuticals, Inc. (a) | | | 997 | | | | 1,934 | |
Asterias Biotherapeutics, Inc. (a) | | | 387 | | | | 1,645 | |
Atara Biotherapeutics, Inc. (a) | | | 441 | | | | 5,931 | |
Athersys, Inc. (a) | | | 519 | | | | 566 | |
Audentes Therapeutics, Inc. (a) | | | 102 | | | | 1,665 | |
Avexis, Inc. (a) | | | 108 | | | | 6,024 | |
Axovant Sciences Ltd. (a) | | | 393 | | | | 4,814 | |
Bellicum Pharmaceuticals, Inc. (a) | | | 304 | | | | 4,068 | |
BioCryst Pharmaceuticals, Inc. (a) | | | 1,120 | | | | 7,056 | |
Biospecifics Technologies Corp. (a) | | | 100 | | | | 5,129 | |
BioTime, Inc. (a) | | | 1,256 | | | | 3,931 | |
Bluebird Bio, Inc. (a) | | | 716 | | | | 53,342 | |
Blueprint Medicines Corp. (a) | | | 427 | | | | 14,552 | |
Cara Therapeutics, Inc. (a) | | | 404 | | | | 6,189 | |
Celldex Therapeutics, Inc. (a) | | | 1,599 | | | | 5,213 | |
Cellular Biomedicine Group, Inc. (a) | | | 207 | | | | 2,567 | |
ChemoCentryx, Inc. (a) | | | 243 | | | | 1,767 | |
Chimerix, Inc. (a) | | | 1,140 | | | | 6,202 | |
Cidara Therapeutics, Inc. (a) | | | 173 | | | | 1,713 | |
Clovis Oncology, Inc. (a) | | | 633 | | | | 41,018 | |
Coherus Biosciences, Inc. (a) | | | 485 | | | | 13,531 | |
Concert Pharmaceuticals, Inc. (a) | | | 325 | | | | 2,876 | |
Curis, Inc. (a) | | | 1,794 | | | | 5,149 | |
Cytokinetics, Inc. (a) | | | 492 | | | | 5,141 | |
CytomX Therapeutics, Inc. (a) | | | 382 | | | | 4,439 | |
Dynavax Technologies Corp. (a) | | | 509 | | | | 2,087 | |
Eagle Pharmaceuticals, Inc. (a) | | | 149 | | | | 10,312 | |
Edge Therapeutics, Inc. (a) | | | 292 | | | | 2,812 | |
Editas Medicine, Inc. (a)(b) | | | 149 | | | | 2,596 | |
Emergent Biosolutions, Inc. (a) | | | 542 | | | | 16,406 | |
Enanta Pharmaceuticals, Inc. (a) | | | 286 | | | | 9,474 | |
Epizyme, Inc. (a) | | | 685 | | | | 7,193 | |
Esperion Therapeutics, Inc. (a) | | | 284 | | | | 3,442 | |
Exact Sciences Corp. (a) | | | 1,828 | | | | 34,641 | |
Exelixis, Inc. (a) | | | 3,928 | | | | 71,175 | |
FibroGen, Inc. (a) | | | 858 | | | | 19,434 | |
Five Prime Therapeutics, Inc. (a) | | | 482 | | | | 22,080 | |
Flexion Therapeutics, Inc. (a) | | | 478 | | | | 9,273 | |
Fortress Biotech, Inc. (a) | | | 699 | | | | 1,713 | |
Foundation Medicine, Inc. (a) | | | 230 | | | | 4,497 | |
Genomic Health, Inc. (a) | | | 348 | | | | 9,563 | |
Geron Corp. (a) | | | 2,223 | | | | 4,624 | |
Global Blood Therapeutics, Inc. (a) | | | 297 | | | | 4,797 | |
GlycoMimetics, Inc. (a) | | | 274 | | | | 1,559 | |
Halozyme Therapeutics, Inc. (a) | | | 1,784 | | | | 20,605 | |
Heron Therapeutics, Inc. (a) | | | 731 | | | | 9,503 | |
Idera Pharmaceuticals, Inc. (a) | | | 1,739 | | | | 2,435 | |
Ignyta, Inc. (a) | | | 468 | | | | 2,293 | |
Immune Design Corp. (a) | | | 227 | | | | 1,283 | |
ImmunoGen, Inc. (a) | | | 1,104 | | | | 2,583 | |
Immunomedics, Inc. (a) | | | 1,512 | | | | 6,804 | |
Infinity Pharmaceuticals, Inc. (a) | | | 1,559 | | | | 3,227 | |
Innoviva, Inc. (a) | | | 1,326 | | | | 14,056 | |
Inotek Pharmaceuticals Corp. (a) | | | 120 | | | | 192 | |
Inovio Pharmaceuticals, Inc. (a) | | | 969 | | | | 6,395 | |
Insmed, Inc. (a) | | | 1,089 | | | | 16,085 | |
Insys Therapeutics, Inc. (a)(b) | | | 386 | | | | 3,953 | |
Intellia Therapeutics, Inc. (a) | | | 151 | | | | 1,951 | |
Intercept Pharmaceuticals, Inc. (a) | | | 307 | | | | 33,693 | |
Intrexon Corp. (a) | | | 921 | | | | 19,488 | |
Invitae Corp., cost $28,390,380) (Acquired 10/08/14, cost (a) | | | 399 | | | | 3,340 | |
See Notes to Financial Statements.
| | | | | | |
| | | | | | | |
| | BLACKROCK FUNDS | | JANUARY 31, 2017 | | 51 |
| | |
Schedule of Investments (continued) | | BlackRock Small/Mid Cap Index Fund |
| | | | | | | | |
| Common Stocks | | Shares | | | Value | |
Biotechnology (continued) | |
Ionis Pharmaceuticals, Inc. (a) | | | 2,087 | | | $ | 92,871 | |
Ironwood Pharmaceuticals, Inc. (a) | | | 2,228 | | | | 32,039 | |
Juno Therapeutics, Inc. (a) | | | 1,036 | | | | 22,108 | |
Karyopharm Therapeutics, Inc. (a) | | | 378 | | | | 3,912 | |
Keryx Biopharmaceuticals, Inc. (a) | | | 1,146 | | | | 5,719 | |
Kite Pharma, Inc. (a)(b) | | | 679 | | | | 34,609 | |
La Jolla Pharmaceutical Co. (a) | | | 238 | | | | 4,629 | |
Lexicon Pharmaceuticals, Inc. (a) | | | 756 | | | | 10,833 | |
Ligand Pharmaceuticals, Inc. (a) | | | 325 | | | | 34,453 | |
Lion Biotechnologies, Inc. (a) | | | 919 | | | | 6,663 | |
Loxo Oncology, Inc. (a) | | | 285 | | | | 11,181 | |
MacroGenics, Inc. (a) | | | 575 | | | | 10,620 | |
MannKind Corp. (a) | | | 4,524 | | | | 3,185 | |
MediciNova, Inc. (a) | | | 452 | | | | 2,513 | |
Merrimack Pharmaceuticals, Inc. (a) | | | 1,787 | | | | 5,558 | |
MiMedx Group, Inc. (a) | | | 1,688 | | | | 13,639 | |
Minerva Neurosciences, Inc. (a) | | | 292 | | | | 3,095 | |
Mirati Therapeutics, Inc. (a) | | | 323 | | | | 1,647 | |
Momenta Pharmaceuticals, Inc. (a) | | | 1,070 | | | | 20,223 | |
Myovant Sciences, Ltd. (a) | | | 157 | | | | 1,749 | |
Myriad Genetics, Inc. (a) | | | 1,209 | | | | 19,562 | |
NantKwest, Inc. (a) | | | 249 | | | | 1,335 | |
Natera, Inc. (a) | | | 444 | | | | 3,978 | |
Neurocrine Biosciences, Inc. (a) | | | 1,494 | | | | 64,108 | |
NewLink Genetics Corp. (a) | | | 343 | | | | 4,174 | |
Novavax, Inc. (a) | | | 3,817 | | | | 5,000 | |
OncoMed Pharmaceuticals, Inc. (a) | | | 349 | | | | 2,883 | |
Ophthotech Corp. (a) | | | 446 | | | | 2,123 | |
OPKO Health, Inc. (a) | | | 5,557 | | | | 48,290 | |
Organovo Holdings, Inc. (a) | | | 1,510 | | | | 5,572 | |
Osiris Therapeutics, Inc. (a) | | | 295 | | | | 1,658 | |
Otonomy, Inc. (a) | | | 347 | | | | 5,084 | |
OvaScience, Inc. (a) | | | 285 | | | | 450 | |
PDL BioPharma, Inc. | | | 3,504 | | | | 7,709 | |
Pfenex, Inc. (a) | | | 315 | | | | 2,514 | |
PharmAthene, Inc. (a) | | | 916 | | | | 2,840 | |
Portola Pharmaceuticals, Inc. (a) | | | 807 | | | | 21,991 | |
Progenics Pharmaceuticals, Inc. (a) | | | 1,097 | | | | 9,785 | |
Protagonist Therapeutics, Inc. (a) | | | 83 | | | | 1,497 | |
Proteostasis Therapeutics, Inc. (a) | | | 84 | | | | 1,239 | |
Prothena Corp. PLC (a) | | | 653 | | | | 31,971 | |
PTC Therapeutics, Inc. (a) | | | 617 | | | | 8,083 | |
Puma Biotechnology, Inc. (a) | | | 464 | | | | 15,034 | |
Ra Pharmaceuticals, Inc. (a) | | | 111 | | | | 1,769 | |
Radius Health, Inc. (a) | | | 556 | | | | 24,197 | |
REGENXBIO, Inc. (a) | | | 304 | | | | 5,624 | |
Regulus Therapeutics, Inc. (a) | | | 261 | | | | 313 | |
Repligen Corp. (a) | | | 558 | | | | 16,762 | |
Retrophin, Inc. (a) | | | 613 | | | | 12,027 | |
Rigel Pharmaceuticals, Inc. (a) | | | 1,631 | | | | 3,392 | |
Sage Therapeutics, Inc. (a) | | | 528 | | | | 25,333 | |
Sangamo Therapeutics, Inc. (a) | | | 1,111 | | | | 3,889 | |
Sarepta Therapeutics, Inc. (a) | | | 872 | | | | 27,084 | |
Seattle Genetics, Inc. (a) | | | 1,666 | | | | 100,360 | |
Selecta Biosciences, Inc. (a) | | | 73 | | | | 1,022 | |
Seres Therapeutics, Inc. (a) | | | 232 | | | | 2,294 | |
Sorrento Therapeutics, Inc. (a) | | | 262 | | | | 1,415 | |
Spark Therapeutics, Inc. (a) | | | 315 | | | | 19,864 | |
Spectrum Pharmaceuticals, Inc. (a) | | | 1,300 | | | | 6,058 | |
Stemline Therapeutics, Inc. (a) | | | 387 | | | | 3,947 | |
Synergy Pharmaceuticals, Inc. (a) | | | 2,962 | | | | 20,941 | |
Synthetic Biologics, Inc. (a) | | | 521 | | | | 442 | |
Syros Pharmaceuticals, Inc. (a) | | | 132 | | | | 1,432 | |
T2 Biosystems, Inc. (a) | | | 101 | | | | 545 | |
TESARO, Inc. (a) | | | 497 | | | | 80,931 | |
Tetraphase Pharmaceuticals, Inc. (a) | | | 462 | | | | 1,769 | |
TG Therapeutics, Inc. (a) | | | 642 | | | | 3,082 | |
| | | | | | | | |
| Common Stocks | | Shares | | | Value | |
Biotechnology (continued) | |
Trevena, Inc. (a) | | | 1,128 | | | $ | 7,873 | |
Trovagene, Inc. (a) | | | 194 | | | | 388 | |
Ultragenyx Pharmaceutical, Inc. (a) | | | 619 | | | | 46,431 | |
United Therapeutics Corp. (a) | | | 764 | | | | 125,013 | |
Vanda Pharmaceuticals, Inc. (a) | | | 659 | | | | 9,325 | |
Versartis, Inc. (a) | | | 557 | | | | 7,965 | |
Vital Therapies, Inc. (a) | | | 481 | | | | 2,381 | |
Voyager Therapeutics, Inc. (a) | | | 211 | | | | 2,515 | |
XBiotech, Inc. (a)(b) | | | 339 | | | | 3,865 | |
Xencor, Inc. (a) | | | 602 | | | | 14,346 | |
Zafgen, Inc. (a) | | | 217 | | | | 914 | |
ZIOPHARM Oncology, Inc. (a)(b) | | | 2,150 | | | | 12,728 | |
| | | | | | | | |
| | | | | | | | 2,296,078 | |
Building Products — 1.5% | |
AAON, Inc. | | | 666 | | | | 22,611 | |
Advanced Drainage Systems, Inc. | | | 585 | | | | 14,099 | |
Allegion PLC | | | 1,660 | | | | 109,012 | |
Ameresco, Inc., Class A (a) | | | 314 | | | | 1,633 | |
American Woodmark Corp. (a) | | | 245 | | | | 17,444 | |
AO Smith Corp. | | | 2,509 | | | | 122,314 | |
Apogee Enterprises, Inc. | | | 530 | | | | 30,252 | |
Armstrong Flooring, Inc. (a) | | | 412 | | | | 8,664 | |
Armstrong World Industries, Inc. (a) | | | 804 | | | | 32,120 | |
Builders FirstSource, Inc. (a) | | | 1,357 | | | | 14,601 | |
Caesarstone Ltd. (a) | | | 395 | | | | 11,988 | |
Continental Building Products, Inc. (a) | | | 573 | | | | 13,322 | |
CSW Industrials, Inc. (a) | | | 228 | | | | 8,333 | |
Fortune Brands Home & Security, Inc. | | | 2,634 | | | | 145,212 | |
Gibraltar Industries, Inc. (a) | | | 577 | | | | 25,330 | |
Griffon Corp. | | | 493 | | | | 12,547 | |
Insteel Industries, Inc. | | | 295 | | | | 10,927 | |
Lennox International, Inc. | | | 684 | | | | 107,258 | |
Masonite International Corp. (a) | | | 520 | | | | 34,632 | |
NCI Building Systems, Inc. (a) | | | 491 | | | | 7,856 | |
Owens Corning | | | 1,980 | | | | 109,395 | |
Patrick Industries, Inc. (a) | | | 266 | | | | 21,746 | |
PGT Innovations, Inc. (a) | | | 816 | | | | 9,384 | |
Ply Gem Holdings, Inc. (a) | | | 365 | | | | 5,895 | |
Quanex Building Products Corp. | | | 561 | | | | 11,080 | |
Simpson Manufacturing Co., Inc. | | | 709 | | | | 30,856 | |
Trex Co., Inc. (a) | | | 510 | | | | 34,542 | |
Universal Forest Products, Inc. | | | 348 | | | | 35,395 | |
USG Corp. (a) | | | 1,516 | | | | 46,375 | |
| | | | | | | | |
| | | | | | | | 1,054,823 | |
Capital Markets — 1.8% | |
Artisan Partners Asset Management, Inc., Class A | | | 698 | | | | 20,207 | |
Associated Capital Group, Inc., Class A | | | 106 | | | | 3,731 | |
B. Riley Financial, Inc. | | | 120 | | | | 2,262 | |
BGC Partners, Inc., Class A | | | 3,840 | | | | 42,509 | |
Calamos Asset Management, Inc., Class A | | | 339 | | | | 2,854 | |
Cohen & Steers, Inc. | | | 373 | | | | 13,014 | |
Cowen Group, Inc., Class A (a) | | | 475 | | | | 7,125 | |
Diamond Hill Investment Group, Inc. | | | 56 | | | | 11,323 | |
Donnelley Financial Solutions, Inc. (a) | | | 451 | | | | 10,860 | |
E*Trade Financial Corp. (a) | | | 4,837 | | | | 181,146 | |
Eaton Vance Corp. | | | 1,933 | | | | 81,051 | |
Evercore Partners, Inc., Class A | | | 681 | | | | 52,744 | |
FBR & Co. | | | 154 | | | | 2,202 | |
Federated Investors, Inc., Class B | | | 809 | | | | 21,042 | |
Financial Engines, Inc. | | | 942 | | | | 36,314 | |
Gain Capital Holdings, Inc. | | | 728 | | | | 5,467 | |
GAMCO Investors, Inc., Class A | | | 110 | | | | 3,212 | |
Greenhill & Co., Inc. | | | 481 | | | | 14,214 | |
Hannon Armstrong Sustainable Infrastructure Capital, Inc. | | | 777 | | | | 14,204 | |
Hennessy Advisors, Inc. | | | 79 | | | | 2,197 | |
See Notes to Financial Statements.
| | | | | | |
| | | | | | | |
| 52 | | BLACKROCK FUNDS | | JANUARY 31, 2017 | | |
| | |
Schedule of Investments (continued) | | BlackRock Small/Mid Cap Index Fund |
| | | | | | | | |
| Common Stocks | | Shares | | | Value | |
Capital Markets (continued) | |
HFF, Inc., Class A | | | 649 | | | $ | 19,262 | |
Houlihan Lokey, Inc. | | | 234 | | | | 7,277 | |
INTL. FCStone, Inc. (a) | | | 271 | | | | 9,995 | |
Investment Technology Group, Inc. | | | 288 | | | | 5,795 | |
Janus Capital Group, Inc. | | | 2,564 | | | | 32,050 | |
KCG Holdings, Inc., Class A (a) | | | 920 | | | | 12,852 | |
Ladenburg Thalmann Financial Services, Inc. (a) | | | 1,649 | | | | 3,793 | |
Lazard Ltd., Class A | | | 2,225 | | | | 94,518 | |
Legg Mason, Inc. | | | 1,738 | | | | 55,077 | |
LPL Financial Holdings, Inc. | | | 1,504 | | | | 59,107 | |
Manning & Napier, Inc. | | | 336 | | | | 2,335 | |
Marcus & Millichap, Inc. (a) | | | 286 | | | | 7,370 | |
Moelis & Co., Class A | | | 432 | | | | 14,731 | |
OM Asset Management PLC | | | 741 | | | | 10,448 | |
Oppenheimer Holdings, Inc., Class A | | | 167 | | | | 2,856 | |
Piper Jaffray Cos. (a) | | | 268 | | | | 18,894 | |
PJT Partners, Inc., Class A | | | 306 | | | | 9,716 | |
Pzena Investment Management, Inc., Class A | | | 361 | | | | 3,606 | |
Raymond James Financial, Inc. | | | 2,192 | | | | 164,247 | |
Safeguard Scientifics, Inc. (a) | | | 347 | | | | 4,181 | |
SEI Investments Co. | | | 2,228 | | | | 108,080 | |
Silvercrest Asset Management Group, Inc., Class A | | | 132 | | | | 1,835 | |
Stifel Financial Corp. (a) | | | 1,115 | | | | 56,118 | |
Virtu Financial, Inc., Class A | | | 459 | | | | 8,055 | |
Virtus Investment Partners, Inc. | | | 88 | | | | 9,592 | |
Waddell & Reed Financial, Inc., Class A | | | 1,435 | | | | 25,902 | |
Walter Investment Management Corp. (a) | | | 209 | | | | 794 | |
Westwood Holdings Group, Inc. | | | 148 | | | | 8,276 | |
Wins Finance Holdings, Inc. (a) | | | 28 | | | | 6,781 | |
WisdomTree Investments, Inc. | | | 1,886 | | | | 19,426 | |
| | | | | | | | |
| | | | | | | | 1,310,647 | |
Chemicals — 2.7% | |
A. Schulman, Inc. | | | 459 | | | | 15,835 | |
AgroFresh Solutions, Inc. (a) | | | 256 | | | | 673 | |
Albemarle Corp. | | | 1,930 | | | | 178,795 | |
American Vanguard Corp. | | | 507 | | | | 8,720 | |
Ashland Global Holdings, Inc. | | | 1,070 | | | | 127,362 | |
Axalta Coating Systems Ltd. (a) | | | 2,837 | | | | 82,273 | |
Balchem Corp. | | | 536 | | | | 45,689 | |
Cabot Corp. | | | 1,063 | | | | 58,858 | |
Calgon Carbon Corp. | | | 817 | | | | 12,949 | |
Chase Corp. | | | 110 | | | | 9,680 | |
Chemours Co. | | | 3,138 | | | | 82,906 | |
Chemtura Corp. (a) | | | 1,104 | | | | 36,542 | |
Codexis, Inc. (a) | | | 588 | | | | 2,793 | |
Ferro Corp. (a) | | | 1,455 | | | | 20,574 | |
Flotek Industries, Inc. (a) | | | 1,015 | | | | 10,729 | |
FutureFuel Corp. | | | 472 | | | | 6,131 | |
GCP Applied Technologies, Inc. (a) | | | 1,263 | | | | 34,038 | |
Hawkins, Inc. | | | 160 | | | | 8,584 | |
HB Fuller Co. | | | 858 | | | | 42,359 | |
Huntsman Corp. | | | 3,432 | | | | 69,978 | |
Ingevity Corp. (a) | | | 728 | | | | 40,469 | |
Innophos Holdings, Inc. | | | 343 | | | | 16,683 | |
Innospec, Inc. | | | 410 | | | | 29,253 | |
KMG Chemicals, Inc. | | | 141 | | | | 5,197 | |
Koppers Holdings, Inc. (a) | | | 333 | | | | 13,470 | |
Kraton Corp. (a) | | | 496 | | | | 13,323 | |
Kronos Worldwide, Inc. | | | 310 | | | | 4,098 | |
Landec Corp. (a) | | | 488 | | | | 6,149 | |
LSB Industries, Inc. (a) | | | 395 | | | | 3,361 | |
Minerals Technologies, Inc. | | | 591 | | | | 47,369 | |
NewMarket Corp. | | | 127 | | | | 54,759 | |
Olin Corp. | | | 2,831 | | | | 74,200 | |
OMNOVA Solutions, Inc. (a) | | | 686 | | | | 6,243 | |
Platform Specialty Products Corp. (a) | | | 3,436 | | | | 41,713 | |
| | | | | | | | |
| Common Stocks | | Shares | | | Value | |
Chemicals (continued) | |
PolyOne Corp. | | | 1,442 | | | $ | 49,187 | |
Quaker Chemical Corp. | | | 222 | | | | 28,527 | |
Rayonier Advanced Materials, Inc. | | | 738 | | | | 10,015 | |
RPM International, Inc. | | | 2,246 | | | | 117,376 | |
Scotts Miracle-Gro Co., Class A | | | 776 | | | | 71,369 | |
Sensient Technologies Corp. | | | 769 | | | | 59,021 | |
Stepan Co. | | | 344 | | | | 26,870 | |
TerraVia Holdings, Inc. (a) | | | 2,111 | | | | 2,048 | |
Trecora Resources (a) | | | 399 | | | | 4,948 | |
Tredegar Corp. | | | 423 | | | | 9,412 | |
Trinseo SA | | | 473 | | | | 30,627 | |
Tronox Ltd., Class A | | | 1,092 | | | | 13,672 | |
Valhi, Inc. | | | 605 | | | | 1,882 | |
Valspar Corp. | | | 1,351 | | | | 149,515 | |
Valvoline, Inc. | | | 613 | | | | 14,191 | |
Westlake Chemical Corp. | | | 656 | | | | 40,613 | |
WR Grace & Co. | | | 1,220 | | | | 84,595 | |
| | | | | | | | |
| | | | | | | | 1,925,623 | |
Commercial Services & Supplies — 1.8% | |
ABM Industries, Inc. | | | 951 | | | | 38,411 | |
ACCO Brands Corp. (a) | | | 1,841 | | | | 23,473 | |
Advanced Disposal Services, Inc. (a) | | | 424 | | | | 9,417 | |
Aqua Metals, Inc. (a) | | | 180 | | | | 2,009 | |
ARC Document Solutions, Inc. (a) | | | 659 | | | | 3,104 | |
Brink’s Co. | | | 801 | | | | 35,645 | |
Casella Waste Systems, Inc., Class A (a) | | | 674 | | | | 7,791 | |
Ceco Environmental Corp. | | | 445 | | | | 5,838 | |
Clean Harbors, Inc. (a) | | | 917 | | | | 50,894 | |
Copart, Inc. (a) | | | 1,676 | | | | 95,096 | |
Covanta Holding Corp. | | | 2,035 | | | | 32,764 | |
Deluxe Corp. | | | 846 | | | | 61,631 | |
Encore Capital Group, Inc. (a) | | | 223 | | | | 6,902 | |
Ennis, Inc. | | | 438 | | | | 7,402 | |
Essendant, Inc. | | | 598 | | | | 12,492 | |
G&K Services, Inc., Class A | | | 332 | | | | 31,892 | |
Healthcare Services Group, Inc. | | | 1,196 | | | | 47,541 | |
Heritage-Crystal Clean, Inc. (a) | | | 194 | | | | 2,900 | |
Herman Miller, Inc. | | | 1,029 | | | | 32,105 | |
HNI Corp. | | | 774 | | | | 39,017 | |
InnerWorkings, Inc. (a) | | | 585 | | | | 5,622 | |
Interface, Inc. | | | 1,127 | | | | 20,511 | |
Iron Mountain, Inc. | | | 4,521 | | | | 161,852 | |
KAR Auction Services, Inc. | | | 2,384 | | | | 108,591 | |
Kimball International, Inc., Class B | | | 601 | | | | 10,055 | |
Knoll, Inc. | | | 833 | | | | 21,750 | |
LSC Communications, Inc. | | | 452 | | | | 11,851 | |
McGrath RentCorp | | | 375 | | | | 14,355 | |
Mobile Mini, Inc. | | | 766 | | | | 24,933 | |
MSA Safety, Inc. | | | 532 | | | | 37,958 | |
Multi-Color Corp. | | | 228 | | | | 17,602 | |
Pitney Bowes, Inc. | | | 3,241 | | | | 51,597 | |
Quad/Graphics, Inc. | | | 478 | | | | 12,519 | |
Rollins, Inc. | | | 1,619 | | | | 57,086 | |
RR Donnelley & Sons Co. | | | 1,175 | | | | 20,151 | |
Steelcase, Inc., Class A | | | 1,488 | | | | 24,998 | |
Sykes Enterprises, Inc. (a) | | | 637 | | | | 17,791 | |
Team, Inc. (a) | | | 517 | | | | 17,371 | |
Tetra Tech, Inc. | | | 974 | | | | 42,564 | |
TRC Cos., Inc. (a) | | | 311 | | | | 2,892 | |
U.S. Ecology, Inc. | | | 386 | | | | 19,783 | |
UniFirst Corp. | | | 257 | | | | 32,870 | |
Viad Corp. | | | 330 | | | | 14,471 | |
VSE Corp. | | | 141 | | | | 5,257 | |
West Corp. | | | 790 | | | | 19,173 | |
| | | | | | | | |
| | | | | | | | 1,319,927 | |
See Notes to Financial Statements.
| | | | | | |
| | | | | | | |
| | BLACKROCK FUNDS | | JANUARY 31, 2017 | | 53 |
| | |
Schedule of Investments (continued) | | BlackRock Small/Mid Cap Index Fund |
| | | | | | | | |
| Common Stocks | | Shares | | | Value | |
Communications Equipment — 1.3% | |
ADTRAN, Inc. | | | 866 | | | $ | 18,965 | |
Aerohive Networks, Inc. (a) | | | 464 | | | | 2,659 | |
Applied Optoelectronics, Inc. (a) | | | 293 | | | | 9,013 | |
Arista Networks, Inc. (a) | | | 671 | | | | 63,074 | |
ARRIS International PLC (a) | | | 3,250 | | | | 92,885 | |
Bel Fuse, Inc., Class B | | | 122 | | | | 3,880 | |
Black Box Corp. | | | 212 | | | | 2,830 | |
Brocade Communications Systems, Inc. | | | 6,905 | | | | 86,105 | |
CalAmp Corp. (a) | | | 628 | | | | 9,433 | |
Calix, Inc. (a) | | | 575 | | | | 4,140 | |
Ciena Corp. (a) | | | 2,361 | | | | 57,467 | |
Clearfield, Inc. (a) | | | 168 | | | | 2,890 | |
CommScope Holding Co., Inc. (a) | | | 2,212 | | | | 83,658 | |
Comtech Telecommunications Corp. | | | 441 | | | | 4,732 | |
Digi International, Inc. (a) | | | 432 | | | | 5,638 | |
EchoStar Corp., Class A (a) | | | 790 | | | | 40,235 | |
Emcore Corp. | | | 178 | | | | 1,602 | |
Extreme Networks, Inc. (a) | | | 1,760 | | | | 9,733 | |
Finisar Corp. (a) | | | 1,864 | | | | 55,118 | |
Harmonic, Inc. (a) | | | 1,418 | | | | 7,515 | |
Infinera Corp. (a) | | | 2,443 | | | | 22,011 | |
InterDigital, Inc. | | | 604 | | | | 56,414 | |
Ixia (a) | | | 1,125 | | | | 21,881 | |
KVH Industries, Inc. (a) | | | 273 | | | | 2,839 | |
Loral Space & Communications, Inc. (a) | | | 219 | | | | 8,924 | |
Lumentum Holdings, Inc. (a) | | | 864 | | | | 32,789 | |
NETGEAR, Inc. (a) | | | 555 | | | | 31,580 | |
Numerex Corp., Class A (a) | | | 184 | | | | 1,082 | |
Oclaro, Inc. (a) | | | 1,969 | | | | 19,316 | |
Plantronics, Inc. | | | 573 | | | | 32,420 | |
Quantenna Communications, Inc. (a) | | | 108 | | | | 2,031 | |
ShoreTel, Inc. (a) | | | 1,204 | | | | 8,368 | |
Silicom, Ltd. | | | 82 | | | | 3,002 | |
Sonus Networks, Inc. (a) | | | 690 | | | | 4,402 | |
Ubiquiti Networks, Inc. (a) | | | 468 | | | | 29,203 | |
ViaSat, Inc. (a) | | | 876 | | | | 56,861 | |
Viavi Solutions, Inc. (a) | | | 4,036 | | | | 36,122 | |
| | | | | | | | |
| | | | | | | | 930,817 | |
Construction & Engineering — 1.0% | |
AECOM (a) | | | 2,632 | | | | 97,200 | |
Aegion Corp. (a) | | | 563 | | | | 13,095 | |
Argan, Inc. | | | 238 | | | | 17,552 | |
Chicago Bridge & Iron Co. NV | | | 1,808 | | | | 60,044 | |
Comfort Systems USA, Inc. | | | 646 | | | | 21,867 | |
Dycom Industries, Inc. (a) | | | 525 | | | | 42,346 | |
EMCOR Group, Inc. | | | 1,040 | | | | 72,478 | |
Granite Construction, Inc. | | | 678 | | | | 38,056 | |
Great Lakes Dredge & Dock Corp. (a) | | | 921 | | | | 4,789 | |
HC2 Holdings, Inc. (a) | | | 600 | | | | 3,990 | |
IES Holdings, Inc. (a) | | | 357 | | | | 6,961 | |
Jacobs Engineering Group, Inc. (a) | | | 2,063 | | | | 120,789 | |
KBR, Inc. | | | 2,486 | | | | 42,287 | |
Layne Christensen Co. (a) | | | 293 | | | | 3,056 | |
MasTec, Inc. (a) | | | 1,129 | | | | 42,055 | |
MYR Group, Inc. (a) | | | 248 | | | | 9,541 | |
NV5 Global Inc. (a) | | | 98 | | | | 3,994 | |
Orion Group Holdings, Inc. (a) | | | 365 | | | | 3,833 | |
Primoris Services Corp. | | | 644 | | | | 15,984 | |
Quanta Services, Inc. (a) | | | 2,481 | | | | 89,043 | |
Tutor Perini Corp. (a) | | | 667 | | | | 19,877 | |
| | | | | | | | |
| | | | | | | | 728,837 | |
Construction Materials — 0.3% | |
Eagle Materials, Inc. | | | 804 | | | | 84,082 | |
Forterra, Inc. (a) | | | 288 | | | | 5,541 | |
Headwaters, Inc. (a) | | | 1,254 | | | | 29,055 | |
| | | | | | | | |
| Common Stocks | | Shares | | | Value | |
Construction Materials (continued) | |
Summit Materials, Inc., Class A (a) | | | 1,841 | | | $ | 46,209 | |
United States Lime & Minerals, Inc. | | | 18 | | | | 1,368 | |
US Concrete, Inc. (a) | | | 257 | | | | 16,834 | |
| | | | | | | | |
| | | | | | | | 183,089 | |
Consumer Discretionary — 0.1% | |
Acushnet Holdings Corp. (a) | | | 338 | | | | 6,270 | |
American Outdoor Brands Corp. (a) | | | 961 | | | | 20,469 | |
At Home Group, Inc. (a) | | | 88 | | | | 1,341 | |
Camping World Holdings, Inc., Class A | | | 183 | | | | 5,761 | |
SP Plus Corp. (a) | | | 252 | | | | 6,981 | |
| | | | | | | | |
| | | | | | | | 40,822 | |
Consumer Finance — 0.5% | |
Credit Acceptance Corp. (a)(b) | | | 146 | | | | 29,971 | |
Enova International, Inc. (a) | | | 410 | | | | 5,781 | |
Ezcorp, Inc., Class A (a) | | | 913 | | | | 9,039 | |
Green Dot Corp., Class A (a) | | | 705 | | | | 18,894 | |
Navient Corp. | | | 5,238 | | | | 78,779 | |
Nelnet, Inc., Class A | | | 373 | | | | 18,288 | |
OneMain Holdings, Inc. (a) | | | 949 | | | | 21,239 | |
PRA Group, Inc. (a) | | | 831 | | | | 33,074 | |
Regional Management Corp. (a) | | | 188 | | | | 4,702 | |
Santander Consumer USA Holdings, Inc. (a) | | | 1,924 | | | | 25,435 | |
SLM Corp. (a) | | | 7,386 | | | | 87,746 | |
World Acceptance Corp. (a) | | | 92 | | | | 4,514 | |
| | | | | | | | |
| | | | | | | | 337,462 | |
Containers & Packaging — 1.5% | |
Aptargroup, Inc. | | | 1,069 | | | | 78,005 | |
Avery Dennison Corp. | | | 1,535 | | | | 112,086 | |
Bemis Co., Inc. | | | 1,628 | | | | 79,316 | |
Berry Plastics Group, Inc. (a) | | | 2,175 | | | | 110,990 | |
Crown Holdings, Inc. (a) | | | 2,321 | | | | 125,729 | |
Graphic Packaging Holding Co. | | | 5,495 | | | | 68,742 | |
Greif, Inc., Class A | | | 447 | | | | 25,738 | |
Greif, Inc., Class B | | | 89 | | | | 6,337 | |
Multi Packaging Solutions International Ltd. (a) | | | 356 | | | | 6,344 | |
Myers Industries, Inc. | | | 322 | | | | 4,444 | |
Owens-Illinois, Inc. (a) | | | 2,800 | | | | 52,920 | |
Packaging Corp. of America | | | 1,610 | | | | 148,410 | |
Sealed Air Corp. | | | 3,394 | | | | 164,609 | |
Silgan Holdings, Inc. | | | 643 | | | | 37,622 | |
Sonoco Products Co. | | | 1,711 | | | | 94,019 | |
UFP Technologies, Inc. (a) | | | 109 | | | | 2,719 | |
| | | | | | | | |
| | | | | | | | 1,118,030 | |
Distributors — 0.1% | |
Core-Mark Holding Co., Inc. | | | 790 | | | | 27,595 | |
Pool Corp. | | | 698 | | | | 73,681 | |
Weyco Group, Inc. | | | 103 | | | | 2,902 | |
| | | | | | | | |
| | | | | | | | 104,178 | |
Diversified Consumer Services — 1.0% | |
2U, Inc. (a) | | | 639 | | | | 21,752 | |
American Public Education, Inc. (a) | | | 289 | | | | 7,023 | |
Apollo Education Group, Inc. (a) | | | 1,396 | | | | 13,946 | |
Ascent Capital Group, Inc., Class A (a) | | | 270 | | | | 4,182 | |
Bridgepoint Education, Inc. (a) | | | 291 | | | | 3,096 | |
Bright Horizons Family Solutions, Inc. (a) | | | 762 | | | | 53,995 | |
Capella Education Co. | | | 181 | | | | 15,476 | |
Career Education Corp. (a) | | | 1,107 | | | | 10,815 | |
Carriage Services, Inc. | | | 256 | | | | 6,643 | |
Collectors Universe, Inc. | | | 114 | | | | 2,356 | |
DeVry Education Group, Inc. | | | 1,108 | | | | 37,118 | |
Graham Holdings Co., Class B | | | 75 | | | | 38,966 | |
Grand Canyon Education, Inc. (a) | | | 766 | | | | 45,179 | |
H&R Block, Inc. | | | 3,615 | | | | 77,578 | |
See Notes to Financial Statements.
| | | | | | |
| | | | | | | |
| 54 | | BLACKROCK FUNDS | | JANUARY 31, 2017 | | |
| | |
Schedule of Investments (continued) | | BlackRock Small/Mid Cap Index Fund |
| | | | | | | | |
| Common Stocks | | Shares | | | Value | |
Diversified Consumer Services (continued) | |
Hillenbrand, Inc. | | | 1,008 | | | $ | 36,842 | |
Houghton Mifflin Harcourt Co. (a) | | | 2,144 | | | | 24,227 | |
K12, Inc. (a) | | | 580 | | | | 11,559 | |
Liberty Tax, Inc. | | | 144 | | | | 1,930 | |
LifeLock, Inc. (a) | | | 1,464 | | | | 35,078 | |
Matthews International Corp., Class A | | | 548 | | | | 36,963 | |
Regis Corp. (a) | | | 657 | | | | 9,146 | |
Service Corp. International | | | 3,216 | | | | 93,682 | |
ServiceMaster Global Holdings, Inc. (a) | | | 2,342 | | | | 86,607 | |
Sotheby’s (a) | | | 855 | | | | 33,952 | |
Strayer Education, Inc. (a) | | | 171 | | | | 13,851 | |
Weight Watchers International, Inc. (a)(b) | | | 434 | | | | 5,403 | |
| | | | | | | | |
| | | | | | | | 727,365 | |
Diversified Financial Services — 0.8% | |
CBOE Holdings, Inc. | | | 1,415 | | | | 112,662 | |
FactSet Research Systems, Inc. | | | 692 | | | | 119,751 | |
FNFV Group (a) | | | 1,216 | | | | 15,808 | |
MarketAxess Holdings, Inc. | | | 636 | | | | 119,091 | |
Marlin Business Services Corp. | | | 144 | | | | 3,305 | |
Morningstar, Inc. | | | 319 | | | | 24,292 | |
MSCI, Inc. | | | 1,574 | | | | 130,248 | |
NewStar Financial, Inc. (a) | | | 287 | | | | 2,549 | |
On Deck Capital, Inc. (a) | | | 712 | | | | 3,581 | |
PHH Corp. (a) | | | 885 | | | | 12,903 | |
PICO Holdings, Inc. (a) | | | 400 | | | | 5,700 | |
Tiptree, Inc., Class A | | | 771 | | | | 5,050 | |
| | | | | | | | |
| | | | | | | | 554,940 | |
Diversified Telecommunication Services — 0.5% | |
8x8, Inc. (a) | | | 1,529 | | | | 24,235 | |
ATN International, Inc. | | | 168 | | | | 13,489 | |
Cincinnati Bell, Inc. (a) | | | 766 | | | | 17,580 | |
Cogent Communications Holdings, Inc. | | | 708 | | | | 29,594 | |
Consolidated Communications Holdings, Inc. | | | 870 | | | | 22,890 | |
Fairpoint Communications, Inc. (a) | | | 336 | | | | 6,216 | |
Frontier Communications Corp. | | | 20,203 | | | | 70,508 | |
General Communication, Inc., Class A (a) | | | 416 | | | | 8,370 | |
Globalstar, Inc. (a)(b) | | | 6,987 | | | | 11,039 | |
Hawaiian Telcom Holdco, Inc. (a) | | | 118 | | | | 2,930 | |
IDT Corp., Class B | | | 279 | | | | 5,357 | |
Inteliquent, Inc. | | | 535 | | | | 12,251 | |
Intelsat SA (a) | | | 436 | | | | 1,574 | |
Iridium Communications, Inc. (a) | | | 1,357 | | | | 13,706 | |
Lumos Networks Corp. (a) | | | 326 | | | | 5,043 | |
ORBCOMM, Inc. (a) | | | 1,099 | | | | 8,979 | |
pdvWireless, Inc. (a) | | | 163 | | | | 3,472 | |
Straight Path Communications, Inc., Class B (a) | | | 152 | | | | 5,326 | |
Vonage Holdings Corp. (a) | | | 3,332 | | | | 23,624 | |
Windstream Holdings, Inc. (b) | | | 1,596 | | | | 12,896 | |
Zayo Group Holdings, Inc. (a) | | | 2,814 | | | | 89,935 | |
| | | | | | | | |
| | | | | | | | 389,014 | |
Electric Utilities — 1.2% | |
ALLETE, Inc. | | | 864 | | | | 56,463 | |
El Paso Electric Co. | | | 694 | | | | 31,855 | |
Great Plains Energy, Inc. | | | 3,710 | | | | 102,211 | |
Hawaiian Electric Industries, Inc. | | | 1,838 | | | | 61,536 | |
IDACORP, Inc. | | | 867 | | | | 69,377 | |
MGE Energy, Inc. | | | 588 | | | | 37,426 | |
OGE Energy Corp. | | | 3,441 | | | | 115,411 | |
Otter Tail Corp. | | | 654 | | | | 24,754 | |
Pinnacle West Capital Corp. | | | 1,905 | | | | 147,885 | |
PNM Resources, Inc. | | | 1,361 | | | | 46,818 | |
Portland General Electric Co. | | | 1,542 | | | | 67,247 | |
Spark Energy, Inc., Class A | | | 108 | | | | 2,792 | |
Unitil Corp. | | | 221 | | | | 10,115 | |
Westar Energy, Inc. | | | 2,431 | | | | 132,951 | |
| | | | | | | | |
| | | | | | | | 906,841 | |
| | | | | | | | |
| Common Stocks | | Shares | | | Value | |
Electrical Equipment — 0.7% | |
Allied Motion Technologies, Inc. | | | 123 | | | $ | 2,711 | |
American Superconductor Corp. (a) | | | 219 | | | | 1,531 | |
Atkore International Group, Inc. (a) | | | 206 | | | | 5,504 | |
AZZ, Inc. | | | 470 | | | | 27,989 | |
Babcock & Wilcox Enterprises, Inc. (a) | | | 755 | | | | 12,563 | |
Brady Corp., Class A | | | 792 | | | | 28,789 | |
Encore Wire Corp. | | | 327 | | | | 13,816 | |
Energous Corp. (a)(b) | | | 272 | | | | 3,933 | |
EnerSys | | | 743 | | | | 57,917 | |
Franklin Electric Co., Inc. | | | 796 | | | | 32,119 | |
FuelCell Energy, Inc. (a) | | | 171 | | | | 257 | |
Generac Holdings, Inc. (a) | | | 1,125 | | | | 45,292 | |
General Cable Corp. | | | 786 | | | | 15,956 | |
Hubbell, Inc. | | | 944 | | | | 115,244 | |
II-VI, Inc. (a) | | | 1,018 | | | | 37,157 | |
LSI Industries, Inc. | | | 336 | | | | 3,199 | |
Plug Power, Inc. (a)(b) | | | 2,769 | | | | 2,935 | |
Powell Industries, Inc. | | | 131 | | | | 5,041 | |
Power Solutions International, Inc. (a) | | | 126 | | | | 932 | |
Preformed Line Products Co. | | | 33 | | | | 1,802 | |
Regal-Beloit Corp. | | | 764 | | | | 55,466 | |
Sunrun, Inc. (a) | | | 990 | | | | 5,237 | |
Thermon Group Holdings, Inc. (a) | | | 542 | | | | 11,252 | |
TPI Composites, Inc. (a) | | | 62 | | | | 1,203 | |
Vicor Corp. (a) | | | 227 | | | | 3,473 | |
| | | | | | | | |
| | | | | | | | 491,318 | |
Electronic Equipment, Instruments & Components — 2.8% | |
Agilysys, Inc. (a) | | | 267 | | | | 2,598 | |
Anixter International, Inc. (a) | | | 497 | | | | 42,494 | |
Arrow Electronics, Inc. (a) | | | 1,569 | | | | 115,353 | |
Avnet, Inc. | | | 2,216 | | | | 102,911 | |
AVX Corp. | | | 766 | | | | 12,409 | |
Badger Meter, Inc. | | | 494 | | | | 19,044 | |
Belden, Inc. | | | 731 | | | | 55,900 | |
Benchmark Electronics, Inc. (a) | | | 930 | | | | 28,458 | |
CDW Corp. | | | 2,802 | | | | 144,331 | |
Cognex Corp. | | | 1,399 | | | | 94,517 | |
Coherent, Inc. (a) | | | 412 | | | | 64,985 | |
Control4 Corp. (a) | | | 391 | | | | 4,215 | |
CTS Corp. | | | 514 | | | | 11,051 | |
Daktronics, Inc. | | | 691 | | | | 7,021 | |
Dolby Laboratories, Inc., Class A | | | 872 | | | | 41,778 | |
Electro Scientific Industries, Inc. (a) | | | 512 | | | | 3,364 | |
Fabrinet (a) | | | 626 | | | | 26,373 | |
FARO Technologies, Inc. (a) | | | 282 | | | | 10,462 | |
Fitbit, Inc., Series A (a) | | | 2,109 | | | | 12,675 | |
FLIR Systems, Inc. | | | 2,349 | | | | 82,990 | |
Insight Enterprises, Inc. (a) | | | 680 | | | | 25,248 | |
InvenSense, Inc. (a) | | | 1,352 | | | | 17,116 | |
IPG Photonics Corp. (a) | | | 611 | | | | 70,259 | |
Itron, Inc. (a) | | | 571 | | | | 35,231 | |
Jabil Circuit, Inc. | | | 3,248 | | | | 77,887 | |
Keysight Technologies, Inc. (a) | | | 2,962 | | | | 109,801 | |
Kimball Electronics, Inc. (a) | | | 434 | | | | 7,421 | |
Knowles Corp. (a) | | | 1,516 | | | | 27,318 | |
Littelfuse, Inc. | | | 376 | | | | 59,299 | |
Maxwell Technologies, Inc. (a) | | | 557 | | | | 2,651 | |
Mercury Systems, Inc. (a) | | | 682 | | | | 22,997 | |
Mesa Laboratories, Inc. | | | 46 | | | | 5,480 | |
Methode Electronics, Inc. | | | 667 | | | | 28,047 | |
MTS Systems Corp. | | | 269 | | | | 15,629 | |
National Instruments Corp. | | | 1,791 | | | | 56,273 | |
Novanta, Inc. (a) | | | 520 | | | | 11,622 | |
OSI Systems, Inc. (a) | | | 305 | | | | 22,774 | |
Park Electrochemical Corp. | | | 264 | | | | 4,839 | |
PC Connection, Inc. | | | 173 | | | | 4,719 | |
See Notes to Financial Statements.
| | | | | | |
| | | | | | | |
| | BLACKROCK FUNDS | | JANUARY 31, 2017 | | 55 |
| | |
Schedule of Investments (continued) | | BlackRock Small/Mid Cap Index Fund |
| | | | | | | | |
| Common Stocks | | Shares | | | Value | |
Electronic Equipment, Instruments & Components (continued) | |
Plexus Corp. (a) | | | 576 | | | $ | 31,277 | |
Radisys Corp. (a) | | | 655 | | | | 2,889 | |
Rogers Corp. (a) | | | 312 | | | | 24,944 | |
Sanmina Corp. (a) | | | 1,259 | | | | 49,038 | |
ScanSource, Inc. (a) | | | 443 | | | | 17,521 | |
SYNNEX Corp. | | | 505 | | | | 60,691 | |
Tech Data Corp. (a) | | | 596 | | | | 50,994 | |
Trimble, Inc. (a) | | | 4,340 | | | | 128,551 | |
TTM Technologies, Inc. (a) | | | 1,287 | | | | 19,086 | |
Universal Display Corp. (a) | | | 711 | | | | 46,926 | |
Vishay Intertechnology, Inc. | | | 2,341 | | | | 38,861 | |
Vishay Precision Group, Inc. (a) | | | 176 | | | | 2,930 | |
Zebra Technologies Corp., Class A (a) | | | 895 | | | | 74,885 | |
| | | | | | | | |
| | | | | | | | 2,036,133 | |
Energy Equipment & Services — 1.3% | |
Archrock, Inc. | | | 1,241 | | | | 18,119 | |
Atwood Oceanics, Inc. (a) | | | 1,340 | | | | 16,294 | |
Bristow Group, Inc. | | | 592 | | | | 10,455 | |
CARBO Ceramics, Inc. (a) | | | 429 | | | | 6,092 | |
Dawson Geophysical Co. (a) | | | 464 | | | | 3,675 | |
Diamond Offshore Drilling, Inc. (a) | | | 1,154 | | | | 18,903 | |
Dril-Quip, Inc. (a) | | | 655 | | | | 40,741 | |
Ensco PLC, Class A | | | 5,181 | | | | 56,576 | |
Era Group, Inc. (a) | | | 360 | | | | 5,638 | |
Exterran Corp. (a) | | | 519 | | | | 16,099 | |
Fairmount Santrol Holdings, Inc. (a) | | | 1,508 | | | | 18,880 | |
Forum Energy Technologies, Inc. (a) | | | 1,040 | | | | 22,568 | |
Frank’s International NV | | | 649 | | | | 7,684 | |
Geospace Technologies Corp. (a) | | | 247 | | | | 5,765 | |
Helix Energy Solutions Group, Inc. (a) | | | 2,395 | | | | 20,310 | |
Hornbeck Offshore Services, Inc. (a) | | | 657 | | | | 4,763 | |
Independence Contract Drilling, Inc. (a) | | | 549 | | | | 3,481 | |
Mammoth Energy Services, Inc. (a) | | | 97 | | | | 1,746 | |
Matrix Service Co. (a) | | | 466 | | | | 10,438 | |
McDermott International, Inc. (a) | | | 4,302 | | | | 34,846 | |
Nabors Industries Ltd. | | | 4,743 | | | | 77,074 | |
Natural Gas Services Group, Inc. (a) | | | 203 | | | | 5,826 | |
Newpark Resources, Inc. (a) | | | 1,424 | | | | 10,751 | |
Noble Corp. PLC | | | 4,232 | | | | 28,566 | |
Oceaneering International, Inc. | | | 1,698 | | | | 47,289 | |
Oil States International, Inc. (a) | | | 883 | | | | 34,878 | |
Parker Drilling Co. (a) | | | 1,886 | | | | 4,809 | |
Patterson-UTI Energy, Inc. | | | 2,475 | | | | 69,399 | |
PHI, Inc. (a) | | | 199 | | | | 3,154 | |
Pioneer Energy Services Corp. (a) | | | 1,368 | | | | 8,618 | |
RigNet, Inc. (a) | | | 232 | | | | 4,582 | |
Rowan Cos. PLC, Class A (a) | | | 2,164 | | | | 38,779 | |
RPC, Inc. | | | 1,012 | | | | 21,778 | |
SEACOR Holdings, Inc. (a) | | | 277 | | | | 20,379 | |
Seadrill Ltd. (a)(b) | | | 6,732 | | | | 12,589 | |
Smart Sand, Inc. (a) | | | 180 | | | | 3,132 | |
Superior Energy Services, Inc. (a) | | | 2,573 | | | | 45,465 | |
Tesco Corp. (a) | | | 748 | | | | 6,433 | |
TETRA Technologies, Inc. (a) | | | 1,986 | | | | 9,851 | |
Tidewater, Inc. | | | 564 | | | | 1,241 | |
Transocean Ltd. (a) | | | 5,980 | | | | 83,541 | |
Unit Corp. (a) | | | 892 | | | | 23,192 | |
Weatherford International PLC (a) | | | 16,862 | | | | 87,851 | |
Willbros Group, Inc. (a) | | | 832 | | | | 2,521 | |
| | | | | | | | |
| | | | | | | | 974,771 | |
Equity Real Estate Investment Trusts (REITs) — 0.3% | |
Colony NorthStar, Inc., Class A | | | 9,476 | | | | 131,906 | |
Gramercy Property Trust | | | 2,467 | | | | 64,981 | |
MedEquities Realty Trust, Inc. | | | 332 | | | | 3,619 | |
| | | | | | | | |
| | | | | | | | 200,506 | |
| | | | | | | | |
| Common Stocks | | Shares | | | Value | |
Food & Staples Retailing — 0.6% | |
Andersons, Inc. | | | 469 | | | $ | 17,705 | |
Casey’s General Stores, Inc. | | | 668 | | | | 76,753 | |
Chefs’ Warehouse, Inc. (a) | | | 303 | | | | 5,060 | |
Diplomat Pharmacy, Inc. (a) | | | 794 | | | | 10,910 | |
Ingles Markets, Inc., Class A | | | 228 | | | | 10,317 | |
Natural Grocers by Vitamin Cottage, Inc. (a) | | | 158 | | | | 1,997 | |
Performance Food Group Co. (a) | | | 614 | | | | 13,600 | |
PriceSmart, Inc. | | | 347 | | | | 29,391 | |
Rite Aid Corp. (a) | | | 17,773 | | | | 99,884 | |
Smart & Final Stores, Inc. (a) | | | 332 | | | | 4,764 | |
SpartanNash Co. | | | 640 | | | | 24,230 | |
Sprouts Farmers Market, Inc. (a) | | | 2,280 | | | | 42,568 | |
Supervalu, Inc. (a) | | | 4,769 | | | | 18,694 | |
U.S. Foods Holding Corp. (a) | | | 794 | | | | 21,597 | |
United Natural Foods, Inc. (a) | | | 875 | | | | 39,988 | |
Village Super Market, Inc., Class A | | | 88 | | | | 2,666 | |
Weis Markets, Inc. | | | 167 | | | | 9,926 | |
| | | | | | | | |
| | | | | | | | 430,050 | |
Food Products — 1.6% | |
AdvancePierre Foods Holdings, Inc. | | | 376 | | | | 10,419 | |
Alico, Inc. | | | 65 | | | | 1,752 | |
Amplify Snack Brands, Inc. (a)(b) | | | 443 | | | | 4,266 | |
B&G Foods, Inc. | | | 1,151 | | | | 51,047 | |
Blue Buffalo Pet Products, Inc. (a) | | | 1,070 | | | | 25,947 | |
Cal-Maine Foods, Inc. (b) | | | 545 | | | | 22,726 | |
Calavo Growers, Inc. | | | 249 | | | | 13,770 | |
Darling Ingredients, Inc. (a) | | | 2,904 | | | | 34,848 | |
Dean Foods Co. | | | 1,581 | | | | 31,399 | |
Farmer Bros Co. (a) | | | 144 | | | | 5,011 | |
Flowers Foods, Inc. | | | 3,001 | | | | 60,350 | |
Fresh Del Monte Produce, Inc. | | | 554 | | | | 31,716 | |
Freshpet, Inc. (a) | | | 351 | | | | 3,914 | |
Hain Celestial Group, Inc. (a) | | | 1,762 | | | | 69,705 | |
Ingredion, Inc. | | | 1,237 | | | | 158,571 | |
Inventure Foods, Inc. (a) | | | 329 | | | | 1,971 | |
J&J Snack Foods Corp. | | | 256 | | | | 32,658 | |
John B Sanfilippo & Son, Inc. | | | 146 | | | | 9,605 | |
Lancaster Colony Corp. | | | 318 | | | | 41,674 | |
Limoneira Co. | | | 174 | | | | 2,958 | |
Omega Protein Corp. (a) | | | 383 | | | | 9,556 | |
Pilgrim’s Pride Corp. | | | 1,077 | | | | 20,614 | |
Pinnacle Foods, Inc. | | | 1,996 | | | | 106,167 | |
Post Holdings, Inc. (a) | | | 1,107 | | | | 92,634 | |
Sanderson Farms, Inc. | | | 354 | | | | 32,214 | |
Seneca Foods Corp., Class A (a) | | | 92 | | | | 3,298 | |
Snyders-Lance, Inc. | | | 1,375 | | | | 52,772 | |
Tootsie Roll Industries, Inc. | | | 285 | | | | 10,673 | |
TreeHouse Foods, Inc. (a) | | | 950 | | | | 72,086 | |
WhiteWave Foods Co. (a) | | | 2,993 | | | | 164,795 | |
| | | | | | | | |
| | | | | | | | 1,179,116 | |
Gas Utilities — 1.0% | |
Atmos Energy Corp. | | | 1,736 | | | | 132,249 | |
Chesapeake Utilities Corp. | | | 276 | | | | 18,050 | |
Delta Natural Gas Co., Inc. | | | 116 | | | | 3,053 | |
National Fuel Gas Co. | | | 1,303 | | | | 73,163 | |
New Jersey Resources Corp. | | | 1,496 | | | | 56,399 | |
Northwest Natural Gas Co. | | | 470 | | | | 27,683 | |
ONE Gas, Inc. | | | 898 | | | | 58,029 | |
South Jersey Industries, Inc. | | | 1,364 | | | | 45,012 | |
Southwest Gas Corp. | | | 815 | | | | 65,665 | |
Spire, Inc. | | | 760 | | | | 49,400 | |
UGI Corp. | | | 2,961 | | | | 137,302 | |
WGL Holdings, Inc. | | | 866 | | | | 70,960 | |
| | | | | | | | |
| | | | | | | | 736,965 | |
See Notes to Financial Statements.
| | | | | | |
| | | | | | | |
| 56 | | BLACKROCK FUNDS | | JANUARY 31, 2017 | | |
| | |
Schedule of Investments (continued) | | BlackRock Small/Mid Cap Index Fund |
| | | | | | | | |
| Common Stocks | | Shares | | | Value | |
Health Care Equipment & Supplies — 3.2% | |
Abaxis, Inc. | | | 356 | | | $ | 18,140 | |
ABIOMED, Inc. (a) | | | 687 | | | | 73,076 | |
Accuray, Inc. (a) | | | 1,208 | | | | 6,946 | |
Alere, Inc. (a) | | | 1,498 | | | | 55,426 | |
Align Technology, Inc. (a) | | | 1,242 | | | | 113,879 | |
Analogic Corp. | | | 203 | | | | 15,763 | |
AngioDynamics, Inc. (a) | | | 405 | | | | 6,518 | |
Anika Therapeutics, Inc. (a) | | | 240 | | | | 12,130 | |
AtriCure, Inc. (a) | | | 525 | | | | 8,542 | |
Atrion Corp. | | | 22 | | | | 10,749 | |
Avinger, Inc. (a) | | | 446 | | | | 1,160 | |
AxoGen, Inc. (a) | | | 372 | | | | 4,055 | |
Cantel Medical Corp. | | | 610 | | | | 47,220 | |
Cardiovascular Systems, Inc. (a) | | | 527 | | | | 13,017 | |
Cerus Corp. (a) | | | 1,868 | | | | 7,958 | |
ConforMIS, Inc. (a) | | | 592 | | | | 4,914 | |
CONMED Corp. | | | 488 | | | | 21,760 | |
Cooper Cos., Inc. | | | 818 | | | | 151,011 | |
CryoLife, Inc. (a) | | | 537 | | | | 10,203 | |
Cutera, Inc. (a) | | | 187 | | | | 3,459 | |
Cynosure, Inc., Class A (a) | | | 419 | | | | 22,375 | |
DexCom, Inc. (a) | | | 1,419 | | | | 112,314 | |
Endologix, Inc. (a) | | | 1,433 | | | | 9,830 | |
Entellus Medical, Inc. (a) | | | 145 | | | | 2,481 | |
Exactech, Inc. (a) | | | 186 | | | | 4,585 | |
GenMark Diagnostics, Inc. (a) | | | 791 | | | | 9,595 | |
Glaukos Corp. (a) | | | 291 | | | | 11,995 | |
Globus Medical, Inc., Class A (a) | | | 1,268 | | | | 33,424 | |
Haemonetics Corp. (a) | | | 876 | | | | 34,917 | |
Halyard Health, Inc. (a) | | | 855 | | | | 32,892 | |
Hill-Rom Holdings, Inc. | | | 1,121 | | | | 65,993 | |
Hologic, Inc. (a) | | | 4,816 | | | | 195,192 | |
ICU Medical, Inc. (a) | | | 252 | | | | 34,549 | |
IDEXX Laboratories, Inc. (a) | | | 1,530 | | | | 187,165 | |
Inogen, Inc. (a) | | | 264 | | | | 16,994 | |
Insulet Corp. (a) | | | 995 | | | | 41,392 | |
Integra LifeSciences Holdings Corp. (a) | | | 1,030 | | | | 42,982 | |
Invacare Corp. | | | 513 | | | | 5,899 | |
InVivo Therapeutics Holdings Corp. (a) | | | 626 | | | | 2,973 | |
iRhythm Technologies, Inc. (a) | | | 108 | | | | 3,524 | |
IRIDEX Corp. (a) | | | 90 | | | | 1,256 | |
K2M Group Holdings, Inc. (a) | | | 453 | | | | 9,205 | |
LeMaitre Vascular, Inc. | | | 210 | | | | 4,769 | |
Masimo Corp. (a) | | | 697 | | | | 51,285 | |
Meridian Bioscience, Inc. | | | 641 | | | | 8,397 | |
Merit Medical Systems, Inc. (a) | | | 700 | | | | 17,780 | |
Natus Medical, Inc. (a) | | | 574 | | | | 22,415 | |
Neogen Corp. (a) | | | 622 | | | | 41,077 | |
Nevro Corp. (a) | | | 410 | | | | 35,678 | |
Novocure Ltd. (a) | | | 686 | | | | 4,356 | |
NuVasive, Inc. (a) | | | 847 | | | | 59,942 | |
NxStage Medical, Inc. (a) | | | 1,177 | | | | 31,661 | |
Ocular Therapeutix, Inc. (a) | | | 196 | | | | 1,286 | |
OraSure Technologies, Inc. (a) | | | 989 | | | | 8,723 | |
Orthofix International NV (a) | | | 300 | | | | 10,782 | |
Oxford Immunotec Global PLC (a) | | | 367 | | | | 4,958 | |
Quidel Corp. (a) | | | 480 | | | | 9,110 | |
ResMed, Inc. | | | 2,400 | | | | 162,096 | |
Rockwell Medical, Inc. (a)(b) | | | 691 | | | | 4,015 | |
RTI Surgical, Inc. (a) | | | 1,125 | | | | 3,656 | |
Senseonics Holdings, Inc. (a) | | | 343 | | | | 954 | |
Spectranetics Corp. (a) | | | 758 | | | | 19,594 | |
STAAR Surgical Co. (a) | | | 576 | | | | 5,702 | |
SurModics, Inc. (a) | | | 218 | | | | 5,276 | |
Tactile Systems Technology, Inc. (a) | | | 109 | | | | 1,680 | |
Tandem Diabetes Care, Inc. (a) | | | 128 | | | | 301 | |
Teleflex, Inc. | | | 753 | | | | 126,301 | |
| | | | | | | | |
| Common Stocks | | Shares | | | Value | |
Health Care Equipment & Supplies (continued) | |
TransEnterix, Inc. (a) | | | 752 | | | $ | 1,105 | |
Utah Medical Products, Inc. | | | 49 | | | | 3,048 | |
Vascular Solutions, Inc. (a) | | | 273 | | | | 15,274 | |
Veracyte, Inc. (a) | | | 229 | | | | 1,690 | |
West Pharmaceutical Services, Inc. | | | 1,236 | | | | 104,603 | |
Wright Medical Group NV (a) | | | 1,765 | | | | 44,443 | |
Zeltiq Aesthetics, Inc. (a) | | | 637 | | | | 28,245 | |
| | | | | | | | |
| | | | | | | | 2,307,660 | |
Health Care Providers & Services — 2.0% | |
AAC Holdings, Inc. (a) | | | 267 | | | | 2,123 | |
Acadia Healthcare Co., Inc. (a) | | | 1,275 | | | | 48,922 | |
Addus HomeCare Corp. (a) | | | 105 | | | | 3,586 | |
Adeptus Health, Inc., Class A (a) | | | 332 | | | | 2,380 | |
Air Methods Corp. (a) | | | 584 | | | | 20,849 | |
Almost Family, Inc. (a) | | | 189 | | | | 8,930 | |
Amedisys, Inc. (a) | | | 483 | | | | 22,131 | |
American Renal Associates Holdings, Inc. (a) | | | 137 | | | | 2,633 | |
AMN Healthcare Services, Inc. (a) | | | 819 | | | | 29,361 | |
BioScrip, Inc. (a) | | | 1,492 | | | | 2,044 | |
BioTelemetry, Inc. (a) | | | 469 | | | | 10,810 | |
Brookdale Senior Living, Inc. (a) | | | 3,183 | | | | 47,649 | |
Capital Senior Living Corp. (a) | | | 425 | | | | 7,085 | |
Chemed Corp. | | | 274 | | | | 45,509 | |
Civitas Solutions, Inc. (a) | | | 275 | | | | 5,032 | |
Community Health Systems, Inc. (a) | | | 1,957 | | | | 12,525 | |
Corvel Corp. (a) | | | 187 | | | | 7,171 | |
Cross Country Healthcare, Inc. (a) | | | 500 | | | | 7,235 | |
Ensign Group, Inc. | | | 776 | | | | 15,784 | |
Envision Healthcare Corp. (a) | | | 1,999 | | | | 135,932 | |
Genesis Healthcare, Inc. (a) | | | 519 | | | | 2,133 | |
HealthEquity, Inc. (a) | | | 771 | | | | 35,659 | |
HealthSouth Corp. | | | 1,519 | | | | 58,968 | |
HMS Holdings Corp. (a) | | | 1,516 | | | | 27,531 | |
Integer Holdings Corp. (a) | | | 510 | | | | 16,524 | |
Kindred Healthcare, Inc. | | | 1,506 | | | | 10,015 | |
Landauer, Inc. | | | 173 | | | | 8,884 | |
LHC Group, Inc. (a) | | | 253 | | | | 12,683 | |
LifePoint Health, Inc. (a) | | | 643 | | | | 38,162 | |
Magellan Health, Inc. (a) | | | 403 | | | | 30,205 | |
MEDNAX, Inc. (a) | | | 1,573 | | | | 107,515 | |
Molina Healthcare, Inc. (a) | | | 739 | | | | 41,916 | |
National Healthcare Corp. | | | 188 | | | | 14,072 | |
National Research Corp. | | | 114 | | | | 1,989 | |
Nobilis Health Corp. (a) | | | 1,073 | | | | 2,307 | |
Owens & Minor, Inc. | | | 1,079 | | | | 38,715 | |
Patterson Cos., Inc. | | | 1,458 | | | | 60,667 | |
Penumbra, Inc. (a) | | | 460 | | | | 32,913 | |
PharMerica Corp. (a) | | | 514 | | | | 12,747 | |
Premier, Inc., Class A (a) | | | 801 | | | | 25,520 | |
Providence Service Corp. (a) | | | 233 | | | | 9,005 | |
Quorum Health Corp. (a) | | | 580 | | | | 5,098 | |
RadNet, Inc. (a) | | | 664 | | | | 3,851 | |
Select Medical Holdings Corp. (a) | | | 1,851 | | | | 23,045 | |
Surgery Partners, Inc. (a) | | | 331 | | | | 6,123 | |
Surgical Care Affiliates, Inc. (a) | | | 464 | | | | 26,216 | |
Team Health Holdings, Inc. (a) | | | 1,162 | | | | 50,500 | |
Teladoc, Inc. (a) | | | 357 | | | | 7,140 | |
Tenet Healthcare Corp. (a) | | | 1,418 | | | | 24,943 | |
Tivity Health, Inc. (a) | | | 535 | | | | 13,723 | |
Triple-S Management Corp., Class B (a) | | | 443 | | | | 8,466 | |
U.S. Physical Therapy, Inc. | | | 200 | | | | 14,030 | |
Universal American Corp. (a) | | | 745 | | | | 7,405 | |
VCA, Inc. (a) | | | 1,342 | | | | 121,585 | |
WellCare Health Plans, Inc. (a) | | | 787 | | | | 114,540 | |
| | | | | | | | |
| | | | | | | | 1,452,486 | |
See Notes to Financial Statements.
| | | | | | |
| | | | | | | |
| | BLACKROCK FUNDS | | JANUARY 31, 2017 | | 57 |
| | |
Schedule of Investments (continued) | | BlackRock Small/Mid Cap Index Fund |
| | | | | | | | |
| Common Stocks | | Shares | | | Value | |
Health Care Technology — 0.4% | |
athenahealth, Inc. (a) | | | 675 | | | $ | 85,043 | |
Castlight Health, Inc., Class B (a) | | | 628 | | | | 1,947 | |
Computer Programs & Systems, Inc. | | | 161 | | | | 3,639 | |
Cotiviti Holdings, Inc. (a) | | | 243 | | | | 8,228 | |
Evolent Health, Inc., Class A (a) | | | 243 | | | | 4,423 | |
HealthStream, Inc. (a) | | | 432 | | | | 9,919 | |
Inovalon Holdings, Inc., Class A (a) | | | 1,050 | | | | 12,127 | |
Medidata Solutions, Inc. (a) | | | 944 | | | | 46,766 | |
NantHealth, Inc. (a) | | | 95 | | | | 773 | |
Omnicell, Inc. (a) | | | 622 | | | | 22,330 | |
Quality Systems, Inc. (a) | | | 858 | | | | 12,878 | |
Tabula Rasa HealthCare, Inc. (a) | | | 93 | | | | 1,308 | |
Veeva Systems, Inc., Class A (a) | | | 1,654 | | | | 70,014 | |
Vocera Communications, Inc. (a) | | | 391 | | | | 8,113 | |
| | | | | | | | |
| | | | | | | | 287,508 | |
Hotels, Restaurants & Leisure — 2.6% | |
Aramark | | | 4,180 | | | | 141,451 | |
Belmond Ltd., Class A (a) | | | 1,458 | | | | 20,193 | |
Biglari Holdings, Inc. (a) | | | 17 | | | | 7,534 | |
BJ’s Restaurants, Inc. (a) | | | 381 | | | | 13,545 | |
Bloomin’ Brands, Inc. | | | 1,805 | | | | 30,884 | |
Bob Evans Farms, Inc. | | | 352 | | | | 19,863 | |
Bojangles’, Inc. (a) | | | 156 | | | | 3,089 | |
Boyd Gaming Corp. (a) | | | 1,335 | | | | 27,127 | |
Brinker International, Inc. | | | 859 | | | | 38,225 | |
Buffalo Wild Wings, Inc. (a) | | | 311 | | | | 46,961 | |
Caesars Acquisition Co., Class A (a) | | | 810 | | | | 12,150 | |
Caesars Entertainment Corp. (a) | | | 848 | | | | 7,590 | |
Carrols Restaurant Group, Inc. (a) | | | 577 | | | | 8,280 | |
Century Casinos, Inc. (a) | | | 411 | | | | 2,898 | |
Cheesecake Factory, Inc. | | | 784 | | | | 47,244 | |
Choice Hotels International, Inc. | | | 580 | | | | 32,190 | |
Churchill Downs, Inc. | | | 232 | | | | 33,257 | |
Chuy’s Holdings, Inc. (a) | | | 293 | | | | 8,614 | |
ClubCorp Holdings, Inc. | | | 1,047 | | | | 17,275 | |
Cracker Barrel Old Country Store, Inc. | | | 324 | | | | 51,211 | |
Dave & Buster’s Entertainment, Inc. (a) | | | 655 | | | | 35,671 | |
Del Frisco’s Restaurant Group, Inc. (a) | | | 424 | | | | 7,420 | |
Del Taco Restaurants, Inc. (a) | | | 380 | | | | 5,183 | |
Denny’s Corp. (a) | | | 1,224 | | | | 14,896 | |
DineEquity, Inc. | | | 320 | | | | 21,946 | |
Domino’s Pizza, Inc. | | | 862 | | | | 150,453 | |
Dunkin’ Brands Group, Inc. | | | 1,585 | | | | 82,214 | |
El Pollo Loco Holdings, Inc. (a) | | | 369 | | | | 4,594 | |
Eldorado Resorts, Inc. (a) | | | 459 | | | | 7,114 | |
Empire Resorts, Inc. (a) | | | 81 | | | | 1,839 | |
Extended Stay America, Inc. | | | 1,337 | | | | 21,673 | |
Fiesta Restaurant Group, Inc. (a) | | | 430 | | | | 11,309 | |
Fogo De Chao, Inc. (a) | | | 126 | | | | 1,739 | |
Golden Entertainment, Inc. | | | 211 | | | | 2,325 | |
Habit Restaurants, Inc., Class A (a) | | | 315 | | | | 4,568 | |
Hyatt Hotels Corp., Class A (a) | | | 582 | | | | 31,841 | |
ILG, Inc. | | | 2,016 | | | | 38,203 | |
International Game Technology PLC | | | 1,611 | | | | 42,547 | |
International Speedway Corp., Class A | | | 382 | | | | 14,000 | |
Intrawest Resorts Holdings, Inc. (a) | | | 274 | | | | 5,647 | |
Isle of Capri Casinos, Inc. (a) | | | 453 | | | | 10,786 | |
J Alexander’s Holdings, Inc. (a) | | | 266 | | | | 2,660 | |
Jack in the Box, Inc. | | | 563 | | | | 60,759 | |
Jamba, Inc. (a) | | | 88 | | | | 801 | |
Kona Grill, Inc. (a) | | | 137 | | | | 1,254 | |
La Quinta Holdings, Inc. (a) | | | 1,389 | | | | 19,627 | |
Lindblad Expeditions Holdings, Inc. (a) | | | 281 | | | | 2,526 | |
Luby’s, Inc. (a) | | | 415 | | | | 1,523 | |
Marcus Corp. | | | 265 | | | | 7,857 | |
Marriott Vacations Worldwide Corp. | | | 389 | | | | 33,641 | |
| | | | | | | | |
| Common Stocks | | Shares | | | Value | |
Hotels, Restaurants & Leisure (continued) | |
Monarch Casino & Resort, Inc. (a) | | | 126 | | | $ | 2,994 | |
Nathan’s Famous, Inc. (a) | | | 50 | | | | 3,125 | |
Panera Bread Co., Class A (a) | | | 384 | | | | 80,279 | |
Papa John’s International, Inc. | | | 473 | | | | 40,309 | |
Penn National Gaming, Inc. (a) | | | 1,228 | | | | 16,922 | |
Pinnacle Entertainment, Inc. (a) | | | 903 | | | | 13,906 | |
Planet Fitness, Inc., Class A | | | 482 | | | | 10,141 | |
Popeyes Louisiana Kitchen, Inc. (a) | | | 340 | | | | 21,485 | |
Potbelly Corp. (a) | | | 395 | | | | 5,135 | |
Red Lion Hotels Corp. (a) | | | 209 | | | | 1,672 | |
Red Robin Gourmet Burgers, Inc. (a) | | | 212 | | | | 10,081 | |
Red Rock Resorts, Inc., Class A | | | 548 | | | | 12,867 | |
Ruby Tuesday, Inc. (a) | | | 1,089 | | | | 2,134 | |
Ruth’s Hospitality Group, Inc. | | | 534 | | | | 9,158 | |
Ryman Hospitality Properties, Inc. | | | 754 | | | | 46,130 | |
Scientific Games Corp., Class A (a) | | | 862 | | | | 14,654 | |
SeaWorld Entertainment, Inc. | | | 1,172 | | | | 21,225 | |
Shake Shack, Inc., Class A (a) | | | 283 | | | | 9,993 | |
Six Flags Entertainment Corp. | | | 1,223 | | | | 72,866 | |
Sonic Corp. | | | 747 | | | | 18,600 | |
Speedway Motorsports, Inc. | | | 164 | | | | 3,524 | |
Texas Roadhouse, Inc. | | | 1,124 | | | | 52,423 | |
Vail Resorts, Inc. | | | 668 | | | | 114,589 | |
Wendy’s Co. | | | 3,654 | | | | 49,439 | |
Wingstop, Inc. | | | 291 | | | | 8,285 | |
Zoe’s Kitchen, Inc. (a) | | | 355 | | | | 7,750 | |
| | | | | | | | |
| | | | | | | | 1,865,883 | |
Household Durables — 1.7% | |
Bassett Furniture Industries, Inc. | | | 149 | | | | 4,202 | |
Beazer Homes USA, Inc. (a) | | | 594 | | | | 8,470 | |
CalAtlantic Group, Inc. | | | 1,294 | | | | 45,122 | |
Cavco Industries, Inc. (a) | | | 137 | | | | 13,460 | |
Century Communities, Inc. (a) | | | 226 | | | | 5,141 | |
CSS Industries, Inc. | | | 123 | | | | 3,028 | |
Ethan Allen Interiors, Inc. | | | 397 | | | | 11,553 | |
Flexsteel Industries, Inc. | | | 103 | | | | 5,239 | |
GoPro, Inc., Class A (a)(b) | | | 1,662 | | | | 17,866 | |
Green Brick Partners, Inc. (a) | | | 347 | | | | 3,331 | |
Harman International Industries, Inc. | | | 1,216 | | | | 135,171 | |
Helen of Troy Ltd. (a) | | | 481 | | | | 44,877 | |
Hooker Furniture Corp. | | | 175 | | | | 5,810 | |
Hovnanian Enterprises, Inc., Class A (a) | | | 1,763 | | | | 4,178 | |
Installed Building Products, Inc. (a) | | | 326 | | | | 13,333 | |
iRobot Corp. (a) | | | 480 | | | | 29,069 | |
KB Home | | | 1,466 | | | | 24,013 | |
La-Z-Boy, Inc. | | | 846 | | | | 24,196 | |
Leggett & Platt, Inc. | | | 2,282 | | | | 108,897 | |
Lennar Corp., Class A | | | 3,122 | | | | 139,397 | |
Lennar Corp., Class B | | | 169 | | | | 6,077 | |
LGI Homes, Inc. (a) | | | 276 | | | | 8,573 | |
Libbey, Inc. | | | 551 | | | | 9,428 | |
Lifetime Brands, Inc. | | | 182 | | | | 2,721 | |
M/I Homes, Inc. (a) | | | 406 | | | | 10,207 | |
MDC Holdings, Inc. | | | 739 | | | | 19,983 | |
Meritage Homes Corp. (a) | | | 667 | | | | 24,512 | |
NACCO Industries, Inc., Class A | | | 62 | | | | 4,573 | |
New Home Co., Inc. (a) | | | 238 | | | | 2,485 | |
NVR, Inc. (a) | | | 60 | | | | 111,480 | |
PulteGroup, Inc. | | | 5,956 | | | | 128,114 | |
Taylor Morrison Home Corp., Class A (a) | | | 529 | | | | 10,263 | |
Tempur Sealy International, Inc. (a) | | | 923 | | | | 39,689 | |
Toll Brothers, Inc. (a) | | | 2,676 | | | | 83,919 | |
TopBuild Corp. (a) | | | 722 | | | | 26,793 | |
TRI Pointe Group, Inc. (a) | | | 2,690 | | | | 33,006 | |
Tupperware Brands Corp. | | | 854 | | | | 51,547 | |
UCP, Inc., Class A (a) | | | 159 | | | | 1,805 | |
See Notes to Financial Statements.
| | | | | | |
| | | | | | | |
| 58 | | BLACKROCK FUNDS | | JANUARY 31, 2017 | | |
| | |
Schedule of Investments (continued) | | BlackRock Small/Mid Cap Index Fund |
| | | | | | | | |
| Common Stocks | | Shares | | | Value | |
Household Durables (continued) | |
Universal Electronics, Inc. (a) | | | 225 | | | $ | 13,387 | |
WCI Communities, Inc. (a) | | | 402 | | | | 9,407 | |
William Lyon Homes, Class A (a) | | | 365 | | | | 6,442 | |
ZAGG, Inc. (a) | | | 434 | | | | 2,908 | |
| | | | | | | | |
| | | | | | | | 1,253,672 | |
Household Products — 0.3% | |
Central Garden & Pet Co. (a) | | | 170 | | | | 5,584 | |
Central Garden and Pet Co., Class A (a) | | | 549 | | | | 16,898 | |
Energizer Holdings, Inc. | | | 1,052 | | | | 53,094 | |
HRG Group, Inc. (a) | | | 2,052 | | | | 34,535 | |
Oil-Dri Corp. of America | | | 78 | | | | 2,625 | |
Orchids Paper Products Co. | | | 173 | | | | 4,725 | |
Spectrum Brands Holdings, Inc. | | | 425 | | | | 56,691 | |
WD-40 Co. | | | 245 | | | | 25,762 | |
| | | | | | | | |
| | | | | | | | 199,914 | |
Independent Power and Renewable Electricity Producers — 0.4% | |
Atlantic Power Corp. (a) | | | 2,207 | | | | 5,186 | |
Atlantica Yield PLC | | | 1,045 | | | | 22,363 | |
Calpine Corp. (a) | | | 6,251 | | | | 73,762 | |
Dynegy, Inc. (a) | | | 1,910 | | | | 18,240 | |
Genie Energy Ltd., Class B (a) | | | 286 | | | | 1,650 | |
NRG Energy, Inc. | | | 5,444 | | | | 90,044 | |
NRG Yield, Inc., Class A | | | 633 | | | | 10,286 | |
NRG Yield, Inc., Class C | | | 1,007 | | | | 17,069 | |
Ormat Technologies, Inc. | | | 670 | | | | 35,979 | |
Pattern Energy Group, Inc. | | | 1,150 | | | | 22,701 | |
TerraForm Global, Inc., Class A (a) | | | 1,300 | | | | 5,720 | |
TerraForm Power, Inc., Class A (a) | | | 1,556 | | | | 18,470 | |
Vivint Solar, Inc. (a)(b) | | | 597 | | | | 1,821 | |
| | | | | | | | |
| | | | | | | | 323,291 | |
Industrial Conglomerates — 0.3% | |
BWX Technologies, Inc. | | | 1,606 | | | | 66,633 | |
Carlisle Cos., Inc. | | | 1,076 | | | | 117,402 | |
Raven Industries, Inc. | | | 577 | | | | 14,454 | |
Seaboard Corp. (a) | | | 4 | | | | 15,400 | |
Standex International Corp. | | | 223 | | | | 19,446 | |
| | | | | | | | |
| | | | | | | | 233,335 | |
Insurance — 4.3% | |
Alleghany Corp. (a) | | | 160 | | | | 97,851 | |
Allied World Assurance Co. Holdings AG | | | 1,569 | | | | 83,361 | |
Ambac Financial Group, Inc. (a) | | | 64 | | | | 1,339 | |
American Equity Investment Life Holding Co. | | | 183 | | | | 4,319 | |
American Financial Group, Inc. | | | 1,273 | | | | 109,694 | |
American National Insurance Co. | | | 206 | | | | 24,017 | |
AMERISAFE, Inc. | | | 335 | | | | 21,122 | |
AmTrust Financial Services, Inc. | | | 1,713 | | | | 45,206 | |
Arch Capital Group Ltd. (a) | | | 2,048 | | | | 180,941 | |
Argo Group International Holdings Ltd. | | | 510 | | | | 32,614 | |
Arthur J Gallagher & Co. | | | 3,033 | | | | 163,266 | |
Aspen Insurance Holdings Ltd. | | | 1,151 | | | | 64,916 | |
Assurant, Inc. | | | 1,036 | | | | 100,627 | |
Assured Guaranty Ltd. | | | 2,425 | | | | 94,357 | |
Atlas Financial Holdings, Inc. (a) | | | 266 | | | | 4,522 | |
Axis Capital Holdings Ltd. | | | 1,686 | | | | 107,921 | |
Baldwin & Lyons, Inc., Class B | | | 339 | | | | 8,136 | |
Blue Capital Reinsurance Holdings Ltd. | | | 310 | | | | 5,905 | |
Brown & Brown, Inc. | | | 2,016 | | | | 84,934 | |
Citizens, Inc. (a) | | | 884 | | | | 8,186 | |
CNO Financial Group, Inc. | | | 2,585 | | | | 48,882 | |
Crawford & Co., Class B | | | 130 | | | | 1,576 | |
Donegal Group, Inc., Class A | | | 476 | | | | 7,840 | |
eHealth, Inc. (a) | | | 293 | | | | 3,592 | |
EMC Insurance Group, Inc. | | | 308 | | | | 8,978 | |
Employers Holdings, Inc. | | | 640 | | | | 23,328 | |
| | | | | | | | |
| Common Stocks | | Shares | | | Value | |
Insurance (continued) | |
Endurance Specialty Holdings Ltd. | | | 1,056 | | | $ | 97,881 | |
Enstar Group Ltd. (a) | | | 234 | | | | 45,314 | |
Erie Indemnity Co., Class A | | | 417 | | | | 46,750 | |
Everest Re Group Ltd. | | | 420 | | | | 92,371 | |
FBL Financial Group, Inc., Class A | | | 247 | | | | 17,241 | |
Federated National Holding Co. | | | 382 | | | | 7,006 | |
Fidelity & Guaranty Life | | | 360 | | | | 8,622 | |
First American Financial Corp. | | | 1,762 | | | | 66,216 | |
Genworth Financial, Inc., Class A (a) | | | 6,227 | | | | 20,923 | |
Global Indemnity, Ltd. (a) | | | 248 | | | | 9,798 | |
Greenlight Capital Re Ltd., Class A (a) | | | 829 | | | | 18,735 | |
Hallmark Financial Services, Inc. (a) | | | 565 | | | | 6,181 | |
Hanover Insurance Group, Inc. | | | 818 | | | | 68,663 | |
HCI Group, Inc. | | | 88 | | | | 3,640 | |
Heritage Insurance Holdings, Inc. | | | 530 | | | | 7,515 | |
Hilltop Holdings, Inc. | | | 1,302 | | | | 35,649 | |
Horace Mann Educators Corp. | | | 882 | | | | 36,471 | |
Independence Holding Co. | | | 313 | | | | 6,229 | |
Infinity Property & Casualty Corp. | | | 257 | | | | 22,320 | |
Investors Title Co. | | | 45 | | | | 5,468 | |
James River Group Holdings Ltd. | | | 364 | | | | 14,433 | |
Kemper Corp. | | | 824 | | | | 35,597 | |
Kinsale Capital Group, Inc. | | | 168 | | | | 4,931 | |
Maiden Holdings Ltd. | | | 1,008 | | | | 17,892 | |
MBIA, Inc. (a) | | | 2,471 | | | | 25,204 | |
Mercury General Corp. | | | 409 | | | | 25,869 | |
National General Holdings Corp. | | | 976 | | | | 23,902 | |
National Western Life Group, Inc., Class A | | | 51 | | | | 14,951 | |
Navigators Group, Inc. | | | 418 | | | | 23,471 | |
Old Republic International Corp. | | | 3,995 | | | | 83,096 | |
OneBeacon Insurance Group Ltd., Class A | | | 669 | | | | 10,858 | |
Patriot National, Inc. (a) | | | 142 | | | | 608 | |
Primerica, Inc. | | | 768 | | | | 57,946 | |
ProAssurance Corp. | | | 868 | | | | 47,219 | |
Reinsurance Group of America, Inc. | | | 1,057 | | | | 132,622 | |
RenaissanceRe Holdings Ltd. | | | 212 | | | | 28,900 | |
RLI Corp. | | | 740 | | | | 43,971 | |
Safety Insurance Group, Inc. | | | 207 | | | | 14,842 | |
Selective Insurance Group, Inc. | | | 280 | | | | 11,676 | |
State Auto Financial Corp. | | | 444 | | | | 11,215 | |
State National Cos., Inc. | | | 725 | | | | 9,976 | |
Stewart Information Services Corp. | | | 453 | | | | 19,787 | |
Third Point Reinsurance Ltd. (a) | | | 1,418 | | | | 16,236 | |
Torchmark Corp. | | | 2,091 | | | | 153,772 | |
Trupanion, Inc. (a)(b) | | | 278 | | | | 4,445 | |
United Fire Group, Inc. | | | 312 | | | | 14,726 | |
United Insurance Holdings Corp. | | | 183 | | | | 2,502 | |
Universal Insurance Holdings, Inc. | | | 625 | | | | 16,344 | |
Validus Holdings Ltd. | | | 1,430 | | | | 81,510 | |
W.R. Berkley Corp. | | | 1,767 | | | | 118,760 | |
White Mountains Insurance Group Ltd. | | | 82 | | | | 74,600 | |
WMIH Corp. (a) | | | 3,618 | | | | 5,608 | |
| | | | | | | | |
| | | | | | | | 3,107,892 | |
Internet & Direct Marketing Retail — 0.4% | |
1-800-Flowers.com, Inc., Class A (a) | | | 465 | | | | 4,185 | |
Blue Nile, Inc. | | | 196 | | | | 7,979 | |
Duluth Holdings, Inc., Class B (a) | | | 178 | | | | 4,026 | |
Etsy, Inc. (a) | | | 1,827 | | | | 23,039 | |
FTD Cos., Inc. (a) | | | 281 | | | | 6,457 | |
Groupon, Inc. (a) | | | 6,462 | | | | 22,294 | |
HSN, Inc. | | | 560 | | | | 19,740 | |
Lands’ End, Inc. (a)(b) | | | 218 | | | | 3,346 | |
Liberty Expedia Holdings, Inc., Class A (a) | | | 920 | | | | 40,489 | |
Liberty TripAdvisor Holdings, Inc., Series A (a) | | | 1,275 | | | | 22,886 | |
Liberty Ventures (a) | | | 1,372 | | | | 59,888 | |
Nutrisystem, Inc. | | | 465 | | | | 15,368 | |
See Notes to Financial Statements.
| | | | | | |
| | | | | | | |
| | BLACKROCK FUNDS | | JANUARY 31, 2017 | | 59 |
| | |
Schedule of Investments (continued) | | BlackRock Small/Mid Cap Index Fund |
| | | | | | | | |
| Common Stocks | | Shares | | | Value | |
Internet & Direct Marketing Retail (continued) | |
Overstock.com, Inc. (a) | | | 189 | | | $ | 3,138 | |
PetMed Express, Inc. | | | 283 | | | | 5,997 | |
RetailMeNot, Inc. (a) | | | 624 | | | | 5,647 | |
Shutterfly, Inc. (a) | | | 614 | | | | 31,517 | |
Wayfair, Inc., Class A (a)(b) | | | 554 | | | | 23,024 | |
| | | | | | | | |
| | | | | | | | 299,020 | |
Internet Software & Services — 1.7% | |
Alarm.com Holdings, Inc. (a) | | | 163 | | | | 4,416 | |
Amber Road, Inc. (a) | | | 274 | | | | 2,425 | |
Angie’s List, Inc. (a) | | | 595 | | | | 3,731 | |
Appfolio, Inc., Class A (a) | | | 90 | | | | 2,039 | |
Apptio Inc., Class A (a) | | | 104 | | | | 1,439 | |
Autobytel, Inc. (a) | | | 57 | | | | 784 | |
Bankrate, Inc. (a) | | | 847 | | | | 9,232 | |
Bazaarvoice, Inc. (a) | | | 1,189 | | | | 5,588 | |
Benefitfocus, Inc. (a) | | | 203 | | | | 6,141 | |
Blucora, Inc. (a) | | | 720 | | | | 10,872 | |
Box, Inc., Class A (a) | | | 825 | | | | 14,083 | |
Brightcove, Inc. (a) | | | 506 | | | | 3,643 | |
Carbonite, Inc. (a) | | | 295 | | | | 5,089 | |
Care.com, Inc. (a) | | | 110 | | | | 928 | |
ChannelAdvisor Corp. (a) | | | 381 | | | | 5,277 | |
Chegg, Inc. (a) | | | 1,372 | | | | 9,865 | |
Cimpress NV (a) | | | 433 | | | | 36,541 | |
CommerceHub, Inc., Series A (a) | | | 217 | | | | 3,188 | |
CommerceHub, Inc., Series C (a) | | | 445 | | | | 6,488 | |
ComScore, Inc. (a) | | | 825 | | | | 27,679 | |
Cornerstone OnDemand, Inc. (a) | | | 862 | | | | 35,075 | |
CoStar Group, Inc. (a) | | | 552 | | | | 111,559 | |
Coupa Software, Inc. (a) | | | 132 | | | | 3,431 | |
DHI Group, Inc. (a) | | | 783 | | | | 4,463 | |
EarthLink Holdings Corp. | | | 1,792 | | | | 11,487 | |
Endurance International Group Holdings, Inc. (a) | | | 1,088 | | | | 8,378 | |
Envestnet, Inc. (a) | | | 746 | | | | 28,199 | |
Five9, Inc. (a) | | | 574 | | | | 8,874 | |
Global Eagle Entertainment, Inc. (a) | | | 657 | | | | 4,047 | |
GoDaddy, Inc., Class A (a) | | | 821 | | | | 29,334 | |
Gogo, Inc. (a)(b) | | | 1,003 | | | | 9,177 | |
GrubHub, Inc. (a) | | | 1,378 | | | | 57,256 | |
GTT Communications, Inc. (a) | | | 432 | | | | 12,204 | |
Hortonworks, Inc. (a) | | | 642 | | | | 6,227 | |
IAC/InterActiveCorp (a) | | | 1,211 | | | | 83,329 | |
Instructure, Inc. (a) | | | 197 | | | | 4,295 | |
j2 Global, Inc. | | | 803 | | | | 67,299 | |
LendingClub Corp. (a) | | | 5,798 | | | | 35,774 | |
Limelight Networks, Inc. (a) | | | 832 | | | | 1,822 | |
Liquidity Services, Inc. (a) | | | 470 | | | | 4,583 | |
LivePerson, Inc. (a) | | | 978 | | | | 7,139 | |
LogMeIn, Inc. | | | 890 | | | | 96,209 | |
Marchex, Inc., Class B (a) | | | 675 | | | | 1,829 | |
Match Group, Inc. (a)(b) | | | 552 | | | | 9,588 | |
MeetMe, Inc. (a) | | | 817 | | | | 4,020 | |
MINDBODY, Inc., Class A (a) | | | 224 | | | | 5,454 | |
New Relic, Inc. (a) | | | 377 | | | | 13,647 | |
NIC, Inc. | | | 1,093 | | | | 26,341 | |
Nutanix, Inc., Class A (a)(b) | | | 282 | | | | 8,536 | |
Pandora Media, Inc. (a) | | | 3,868 | | | | 50,284 | |
Perficient, Inc. (a) | | | 604 | | | | 10,709 | |
Q2 Holdings, Inc. (a) | | | 422 | | | | 13,398 | |
QuinStreet, Inc. (a) | | | 483 | | | | 1,691 | |
Quotient Technology, Inc. (a) | | | 1,075 | | | | 11,449 | |
RealNetworks, Inc. (a) | | | 359 | | | | 1,921 | |
Reis, Inc. | | | 139 | | | | 2,780 | |
Rightside Group Ltd. (a) | | | 146 | | | | 1,232 | |
Shutterstock, Inc. (a) | | | 310 | | | | 16,678 | |
SPS Commerce, Inc. (a) | | | 293 | | | | 20,217 | |
| | | | | | | | |
| Common Stocks | | Shares | | | Value | |
Internet Software & Services (continued) | |
Stamps.com, Inc. (a) | | | 277 | | | $ | 33,669 | |
TechTarget, Inc. (a) | | | 128 | | | | 1,128 | |
The Trade Desk, Inc., Class A (a) | | | 83 | | | | 2,462 | |
TrueCar, Inc. (a) | | | 910 | | | | 11,966 | |
Twilio, Inc. (a) | | | 355 | | | | 10,235 | |
Web.com Group, Inc. (a) | | | 697 | | | | 13,208 | |
WebMD Health Corp. (a) | | | 643 | | | | 32,079 | |
Xactly Corp. (a) | | | 368 | | | | 4,471 | |
XO Group, Inc. (a) | | | 459 | | | | 8,643 | |
Yelp, Inc. (a) | | | 1,174 | | | | 49,050 | |
Zillow Group, Inc., Class A (a) | | | 897 | | | | 32,274 | |
Zillow Group, Inc., Class C (a) | | | 1,764 | | | | 62,410 | |
| | | | | | | | |
| | | | | | | | 1,250,978 | |
IT Services — 2.5% | |
Acxiom Corp. (a) | | | 1,340 | | | | 34,974 | |
ALJ Regional Holdings, Inc. (a) | | | 284 | | | | 1,133 | |
Black Knight Financial Services, Inc., Class A (a) | | | 390 | | | | 14,216 | |
Blackhawk Network Holdings, Inc. (a) | | | 966 | | | | 34,486 | |
Booz Allen Hamilton Holding Corp. | | | 1,972 | | | | 66,693 | |
Broadridge Financial Solutions, Inc. | | | 2,035 | | | | 135,389 | |
CACI International, Inc., Class A (a) | | | 415 | | | | 50,962 | |
Cardtronics PLC, Class A (a) | | | 775 | | | | 42,299 | |
Cass Information Systems, Inc. | | | 179 | | | | 11,773 | |
Convergys Corp. | | | 1,542 | | | | 38,272 | |
CoreLogic, Inc. (a) | | | 1,547 | | | | 54,563 | |
CSG Systems International, Inc. | | | 588 | | | | 28,459 | |
CSRA, Inc. | | | 2,836 | | | | 87,973 | |
DST Systems, Inc. | | | 574 | | | | 66,096 | |
EPAM Systems, Inc. (a) | | | 839 | | | | 53,998 | |
Euronet Worldwide, Inc. (a) | | | 866 | | | | 61,936 | |
EVERTEC, Inc. | | | 1,150 | | | | 19,608 | |
ExlService Holdings, Inc. (a) | | | 594 | | | | 27,294 | |
Forrester Research, Inc. | | | 157 | | | | 6,406 | |
Gartner, Inc. (a) | | | 1,381 | | | | 137,216 | |
Genpact Ltd. (a) | | | 2,615 | | | | 64,538 | |
Hackett Group, Inc. | | | 419 | | | | 6,809 | |
Information Services Group, Inc. (a) | | | 536 | | | | 1,769 | |
Jack Henry & Associates, Inc. | | | 1,360 | | | | 122,101 | |
Leidos Holdings, Inc. | | | 2,288 | | | | 110,556 | |
Lionbridge Technologies, Inc. (a) | | | 868 | | | | 4,965 | |
Mantech International Corp., Class A | | | 398 | | | | 15,498 | |
MAXIMUS, Inc. | | | 1,117 | | | | 61,591 | |
MoneyGram International, Inc. (a) | | | 477 | | | | 6,058 | |
NCI, Inc., Class A | | | 134 | | | | 1,702 | |
PFSweb, Inc. (a) | | | 317 | | | | 2,381 | |
Planet Payment, Inc. (a) | | | 708 | | | | 2,988 | |
Sabre Corp. | | | 3,585 | | | | 87,832 | |
Science Applications International Corp. | | | 732 | | | | 59,599 | |
ServiceSource International, Inc. (a) | | | 847 | | | | 4,489 | |
Square, Inc., Class A (a) | | | 900 | | | | 13,158 | |
Syntel, Inc. | | | 579 | | | | 12,194 | |
TeleTech Holdings, Inc. | | | 298 | | | | 8,821 | |
Teradata Corp. (a) | | | 2,248 | | | | 66,001 | |
Travelport Worldwide Ltd. | | | 2,102 | | | | 30,185 | |
Unisys Corp. (a) | | | 845 | | | | 10,858 | |
VeriFone Systems, Inc. (a) | | | 1,905 | | | | 34,614 | |
Virtusa Corp. (a) | | | 452 | | | | 11,517 | |
WEX, Inc. (a) | | | 668 | | | | 76,372 | |
| | | | | | | | |
| | | | | | | | 1,790,342 | |
Leisure Products — 0.4% | |
Arctic Cat, Inc. (a) | | | 222 | | | | 4,174 | |
Brunswick Corp. | | | 1,563 | | | | 93,561 | |
Callaway Golf Co. | | | 1,657 | | | | 18,774 | |
Escalade, Inc. | | | 129 | | | | 1,703 | |
JAKKS Pacific, Inc. (a) | | | 105 | | | | 535 | |
See Notes to Financial Statements.
| | | | | | |
| | | | | | | |
| 60 | | BLACKROCK FUNDS | | JANUARY 31, 2017 | | |
| | |
Schedule of Investments (continued) | | BlackRock Small/Mid Cap Index Fund |
| | | | | | | | |
| Common Stocks | | Shares | | | Value | |
Leisure Products (continued) | |
Johnson Outdoors, Inc., Class A | | | 75 | | | $ | 2,586 | |
Malibu Boats, Inc. (a) | | | 259 | | | | 4,807 | |
Marine Products Corp. | | | 150 | | | | 1,711 | |
MCBC Holdings, Inc. | | | 133 | | | | 1,855 | |
Nautilus, Inc. (a) | | | 534 | | | | 9,265 | |
Polaris Industries, Inc. | | | 1,038 | | | | 87,265 | |
Sturm Ruger & Co., Inc. | | | 332 | | | | 17,513 | |
Vista Outdoor, Inc. (a) | | | 1,055 | | | | 30,395 | |
| | | | | | | | |
| | | | | | | | 274,144 | |
Life Sciences Tools & Services — 1.3% | |
Accelerate Diagnostics, Inc. (a) | | | 414 | | | | 8,673 | |
Albany Molecular Research, Inc. (a) | | | 395 | | | | 7,268 | |
Bio-Rad Laboratories, Inc., Class A (a) | | | 361 | | | | 68,619 | |
Bio-Techne Corp. | | | 640 | | | | 65,120 | |
Bruker Corp. | | | 1,861 | | | | 44,162 | |
Cambrex Corp. (a) | | | 591 | | | | 30,998 | |
Charles River Laboratories International, Inc. (a) | | | 812 | | | | 65,610 | |
ChromaDex Corp. (a) | | | 675 | | | | 1,876 | |
Enzo Biochem, Inc. (a) | | | 698 | | | | 4,663 | |
Fluidigm Corp. (a) | | | 200 | | | | 1,266 | |
INC Research Holdings, Inc., Class A (a) | | | 720 | | | | 38,160 | |
Luminex Corp. (a) | | | 656 | | | | 13,264 | |
Medpace Holdings, Inc. (a) | | | 132 | | | | 4,605 | |
NanoString Technologies, Inc. (a) | | | 247 | | | | 4,456 | |
NeoGenomics, Inc. (a) | | | 780 | | | | 6,287 | |
Pacific Biosciences of California, Inc. (a) | | | 1,505 | | | | 7,254 | |
PAREXEL International Corp. (a) | | | 910 | | | | 64,510 | |
Patheon NV (a) | | | 546 | | | | 15,665 | |
PerkinElmer, Inc. | | | 1,874 | | | | 99,678 | |
PRA Health Sciences, Inc. (a) | | | 422 | | | | 24,725 | |
QIAGEN NV (a) | | | 3,802 | | | | 110,182 | |
Quintiles IMS Holdings, Inc. (a) | | | 2,427 | | | | 190,495 | |
VWR Corp. (a) | | | 1,417 | | | | 36,714 | |
| | | | | | | | |
| | | | | | | | 914,250 | |
Machinery — 4.3% | |
Actuant Corp., Class A | | | 1,011 | | | | 26,438 | |
AGCO Corp. | | | 1,201 | | | | 75,423 | |
Alamo Group, Inc. | | | 155 | | | | 11,723 | |
Albany International Corp., Class A | | | 497 | | | | 23,583 | |
Altra Industrial Motion Corp. | | | 401 | | | | 14,957 | |
American Railcar Industries, Inc. | | | 143 | | | | 6,369 | |
Ampco-Pittsburgh Corp. | | | 119 | | | | 1,791 | |
Astec Industries, Inc. | | | 332 | | | | 23,233 | |
Barnes Group, Inc. | | | 856 | | | | 41,199 | |
Blue Bird Corp. (a) | | | 107 | | | | 1,803 | |
Briggs & Stratton Corp. | | | 687 | | | | 14,880 | |
Chart Industries, Inc. (a) | | | 536 | | | | 20,791 | |
CIRCOR International, Inc. | | | 293 | | | | 18,248 | |
CLARCOR, Inc. | | | 817 | | | | 67,656 | |
Colfax Corp. (a) | | | 1,699 | | | | 66,261 | |
Columbus McKinnon Corp. | | | 332 | | | | 9,127 | |
Crane Co. | | | 840 | | | | 60,514 | |
DMC Global, Inc. | | | 204 | | | | 3,254 | |
Donaldson Co., Inc. | | | 2,183 | | | | 92,232 | |
Douglas Dynamics, Inc. | | | 361 | | | | 12,202 | |
Energy Recovery, Inc. (a) | | | 658 | | | | 6,738 | |
EnPro Industries, Inc. | | | 386 | | | | 26,213 | |
ESCO Technologies, Inc. | | | 420 | | | | 24,444 | |
ExOne Co. (a) | | | 461 | | | | 4,541 | |
Federal Signal Corp. | | | 988 | | | | 15,354 | |
Flowserve Corp. | | | 2,242 | | | | 110,217 | |
FreightCar America, Inc. | | | 204 | | | | 2,948 | |
Gencor Industries, Inc. (a) | | | 109 | | | | 1,706 | |
Global Brass & Copper Holdings, Inc. | | | 341 | | | | 11,304 | |
Gorman-Rupp Co. | | | 275 | | | | 8,927 | |
| | | | | | | | |
| Common Stocks | | Shares | | | Value | |
Machinery (continued) | |
Graco, Inc. | | | 952 | | | $ | 85,290 | |
Graham Corp. | | | 141 | | | | 3,133 | |
Greenbrier Cos., Inc. | | | 474 | | | | 20,737 | |
Hardinge, Inc. | | | 149 | | | | 1,579 | |
Harsco Corp. (a) | | | 1,414 | | | | 18,877 | |
Hurco Cos., Inc. | | | 97 | | | | 2,968 | |
Hyster-Yale Materials Handling, Inc. | | | 160 | | | | 9,843 | |
IDEX Corp. | | | 1,307 | | | | 117,839 | |
ITT, Inc. | | | 1,574 | | | | 64,329 | |
John Bean Technologies Corp. | | | 495 | | | | 42,743 | |
Joy Global, Inc. | | | 1,713 | | | | 48,170 | |
Kadant, Inc. | | | 177 | | | | 10,903 | |
Kennametal, Inc. | | | 1,361 | | | | 48,642 | |
Lincoln Electric Holdings, Inc. | | | 1,056 | | | | 88,039 | |
Lindsay Corp. | | | 184 | | | | 13,863 | |
Lydall, Inc. (a) | | | 294 | | | | 17,934 | |
Manitowoc Co., Inc. (a) | | | 3,340 | | | | 22,812 | |
Manitowoc Foodservice, Inc. (a) | | | 1,898 | | | | 36,404 | |
Meritor, Inc. (a) | | | 1,448 | | | | 20,895 | |
Middleby Corp. (a) | | | 975 | | | | 130,825 | |
Milacron Holdings Corp. (a) | | | 266 | | | | 4,400 | |
Miller Industries, Inc. | | | 135 | | | | 3,578 | |
Mueller Industries, Inc. | | | 964 | | | | 38,811 | |
Mueller Water Products, Inc., Series A | | | 2,665 | | | | 35,871 | |
Navistar International Corp. (a) | | | 859 | | | | 23,425 | |
NN, Inc. | | | 474 | | | | 9,172 | |
Nordson Corp. | | | 981 | | | | 111,373 | |
Omega Flex, Inc. | | | 34 | | | | 1,613 | |
Oshkosh Corp. | | | 1,253 | | | | 87,246 | |
Proto Labs, Inc. (a) | | | 431 | | | | 22,627 | |
RBC Bearings, Inc. (a) | | | 386 | | | | 35,755 | |
Rexnord Corp. (a) | | | 1,504 | | | | 33,223 | |
Snap-on, Inc. | | | 995 | | | | 180,622 | |
SPX Corp. (a) | | | 820 | | | | 20,459 | |
SPX FLOW, Inc. (a) | | | 606 | | | | 21,143 | |
Sun Hydraulics Corp. | | | 371 | | | | 14,536 | |
Supreme Industries, Inc., Class A | | | 240 | | | | 4,406 | |
Tennant Co. | | | 305 | | | | 21,121 | |
Terex Corp. | | | 1,830 | | | | 58,194 | |
Timken Co. | | | 1,209 | | | | 53,680 | |
Titan International, Inc. | | | 766 | | | | 10,180 | |
Toro Co. | | | 1,838 | | | | 108,313 | |
TriMas Corp. (a) | | | 722 | | | | 15,379 | |
Trinity Industries, Inc. | | | 2,584 | | | | 71,163 | |
Valmont Industries, Inc. | | | 380 | | | | 54,720 | |
Wabash National Corp. | | | 1,143 | | | | 20,174 | |
WABCO Holdings, Inc. (a) | | | 908 | | | | 98,999 | |
Wabtec Corp. | | | 1,474 | | | | 127,707 | |
Watts Water Technologies, Inc., Class A | | | 475 | | | | 31,350 | |
Woodward, Inc. | | | 894 | | | | 62,258 | |
Xylem, Inc. | | | 3,080 | | | | 151,875 | |
| | | | | | | | |
| | | | | | | | 3,143,274 | |
Marine — 0.1% | |
Costamare, Inc. | | | 423 | | | | 2,246 | |
Kirby Corp. (a) | | | 912 | | | | 58,778 | |
Matson, Inc. | | | 761 | | | | 27,137 | |
Scorpio Bulkers, Inc. (a) | | | 851 | | | | 6,085 | |
| | | | | | | | |
| | | | | | | | 94,246 | |
Media — 1.7% | |
AMC Entertainment Holdings, Inc., Class A | | | 476 | | | | 16,065 | |
AMC Networks, Inc., Class A (a) | | | 1,045 | | | | 59,931 | |
Cable One, Inc. | | | 80 | | | | 50,590 | |
Central European Media Enterprises Ltd., Class A (a) | | | 1,186 | | | | 3,084 | |
Cinemark Holdings, Inc. | | | 1,809 | | | | 76,882 | |
Clear Channel Outdoor Holdings, Inc., Class A | | | 637 | | | | 3,153 | |
See Notes to Financial Statements.
| | | | | | |
| | | | | | | |
| | BLACKROCK FUNDS | | JANUARY 31, 2017 | | 61 |
| | |
Schedule of Investments (continued) | | BlackRock Small/Mid Cap Index Fund |
| | | | | | | | |
| Common Stocks | | Shares | | | Value | |
Media (continued) | |
Daily Journal Corp. (a) | | | 20 | | | $ | 4,328 | |
Entercom Communications Corp., Class A | | | 388 | | | | 5,510 | |
Entravision Communications Corp., Class A | | | 979 | | | | 5,287 | |
Eros International PLC (a) | | | 486 | | | | 5,783 | |
EW Scripps Co., Class A (a) | | | 1,050 | | | | 20,454 | |
Gannett Co., Inc. | | | 2,113 | | | | 20,327 | |
Global Sources Ltd. (a) | | | 197 | | | | 1,812 | |
Gray Television, Inc. (a) | | | 1,095 | | | | 12,976 | |
IMAX Corp. (a) | | | 1,010 | | | | 32,926 | |
Interpublic Group of Cos., Inc. | | | 6,935 | | | | 163,181 | |
John Wiley & Sons, Inc., Class A | | | 775 | | | | 42,702 | |
Liberty Braves Group, Class A (a) | | | 150 | | | | 2,993 | |
Liberty Braves Group, Class C (a) | | | 512 | | | | 10,230 | |
Liberty Media Corp. — Liberty Formula One, Class A (a) | | | 387 | | | | 11,215 | |
Liberty Media Corp. — Liberty Formula One, Class C (a) | | | 767 | | | | 22,044 | |
Lions Gate Entertainment Corp., Class A | | | 1,125 | | | | 32,366 | |
Lions Gate Entertainment Corp., Class B (a) | | | 1,767 | | | | 47,338 | |
Live Nation Entertainment, Inc. (a) | | | 2,245 | | | | 64,252 | |
Madison Square Garden Co., Class A (a) | | | 318 | | | | 55,863 | |
MDC Partners, Inc., Class A | | | 746 | | | | 4,774 | |
Meredith Corp. | | | 616 | | | | 37,761 | |
MSG Networks, Inc., Class A (a) | | | 1,014 | | | | 23,525 | |
National CineMedia, Inc. | | | 1,018 | | | | 14,924 | |
New Media Investment Group, Inc. | | | 842 | | | | 12,832 | |
New York Times Co., Class A | | | 2,352 | | | | 31,752 | |
Nexstar Broadcasting Group, Inc., Class A | | | 757 | | | | 49,508 | |
Radio One, Inc., Class D (a) | | | 587 | | | | 1,761 | |
Reading International, Inc., Class A (a) | | | 226 | | | | 3,695 | |
Regal Entertainment Group, Class A | | | 1,395 | | | | 31,611 | |
Saga Communications, Inc., Class A | | | 61 | | | | 3,068 | |
Scholastic Corp. | | | 484 | | | | 22,158 | |
Sinclair Broadcast Group, Inc., Class A | | | 1,158 | | | | 39,082 | |
TEGNA, Inc. | | | 3,774 | | | | 86,462 | |
Time, Inc. | | | 1,855 | | | | 35,709 | |
TiVo Corp. (a) | | | 2,019 | | | | 38,159 | |
Townsquare Media, Inc. (a) | | | 141 | | | | 1,506 | |
Tribune Media Co., Class A | | | 1,355 | | | | 39,078 | |
TRONC, Inc. (a) | | | 405 | | | | 5,370 | |
World Wrestling Entertainment, Inc., Class A | | | 608 | | | | 11,905 | |
| | | | | | | | |
| | | | | | | | 1,265,932 | |
Metals & Mining — 1.4% | |
AK Steel Holding Corp. (a) | | | 5,416 | | | | 43,761 | |
Allegheny Technologies, Inc. | | | 1,863 | | | | 40,483 | |
Carpenter Technology Corp. | | | 817 | | | | 32,696 | |
Century Aluminum Co. (a) | | | 873 | | | | 13,444 | |
Cliffs Natural Resources, Inc. (a) | | | 3,795 | | | | 33,282 | |
Coeur Mining, Inc. (a) | | | 3,096 | | | | 36,068 | |
Commercial Metals Co. | | | 1,966 | | | | 40,165 | |
Compass Minerals International, Inc. | | | 576 | | | | 48,154 | |
Ferroglobe PLC | | | 1,945 | | | | 11,015 | |
Gold Resource Corp. | | | 914 | | | | 4,917 | |
Handy & Harman Ltd. (a) | | | 75 | | | | 2,115 | |
Haynes International, Inc. | | | 218 | | | | 8,962 | |
Hecla Mining Co. | | | 6,496 | | | | 41,834 | |
Kaiser Aluminum Corp. | | | 304 | | | | 23,852 | |
Materion Corp. | | | 319 | | | | 12,537 | |
Olympic Steel, Inc. | | | 112 | | | | 2,520 | |
Real Industry, Inc. (a) | | | 473 | | | | 2,554 | |
Reliance Steel & Aluminum Co. | | | 1,197 | | | | 95,341 | |
Royal Gold, Inc. | | | 1,123 | | | | 81,047 | |
Ryerson Holding Corp. (a) | | | 207 | | | | 2,194 | |
Schnitzer Steel Industries, Inc., Class A | | | 433 | | | | 10,240 | |
Steel Dynamics, Inc. | | | 4,038 | | | | 136,525 | |
Stillwater Mining Co. (a) | | | 2,112 | | | | 35,904 | |
SunCoke Energy, Inc. (a) | | | 1,068 | | | | 9,420 | |
Tahoe Resources, Inc. | | | 5,154 | | | | 47,108 | |
| | | | | | | | |
| Common Stocks | | Shares | | | Value | |
Metals & Mining (continued) | |
TimkenSteel Corp. (a) | | | 668 | | | $ | 11,263 | |
U.S. Silica Holdings, Inc. | | | 1,271 | | | | 75,167 | |
United States Steel Corp. | | | 2,649 | | | | 86,649 | |
Worthington Industries, Inc. | | | 770 | | | | 36,798 | |
| | | | | | | | |
| | | | | | | | 1,026,015 | |
Multi-Utilities — 0.6% | |
Alliant Energy Corp. | | | 3,909 | | | | 147,174 | |
Avista Corp. | | | 1,077 | | | | 41,615 | |
Black Hills Corp. | | | 898 | | | | 56,170 | |
MDU Resources Group, Inc. | | | 3,342 | | | | 98,088 | |
NorthWestern Corp. | | | 829 | | | | 47,344 | |
Vectren Corp. | | | 1,437 | | | | 78,877 | |
| | | | | | | | |
| | | | | | | | 469,268 | |
Multiline Retail — 0.3% | |
Big Lots, Inc. | | | 769 | | | | 38,450 | |
Burlington Stores, Inc. (a) | | | 1,213 | | | | 101,528 | |
Dillard’s, Inc., Class A | | | 312 | | | | 17,609 | |
FirstCash, Inc. | | | 831 | | | | 35,484 | |
Fred’s, Inc., Class A | | | 485 | | | | 7,066 | |
JC Penney Co., Inc. (a) | | | 5,250 | | | | 34,912 | |
Ollie’s Bargain Outlet Holdings, Inc. (a) | | | 330 | | | | 10,082 | |
Sears Holdings Corp. (a)(b) | | | 172 | | | | 1,201 | |
Tuesday Morning Corp. (a) | | | 754 | | | | 3,242 | |
| | | | | | | | |
| | | | | | | | 249,574 | |
Oil & Gas Exploration & Production — 0.1% | |
Carrizo Oil & Gas, Inc. (a) | | | 1,073 | | | | 37,941 | |
Oil, Gas & Consumable Fuels — 3.2% | |
Abraxas Petroleum Corp. (a) | | | 2,886 | | | | 7,128 | |
Adams Resources & Energy, Inc. | | | 43 | | | | 1,666 | |
Alon USA Energy, Inc. | | | 498 | | | | 5,607 | |
Ardmore Shipping Corp. | | | 703 | | | | 5,167 | |
Bill Barrett Corp. (a) | | | 1,169 | | | | 7,657 | |
California Resources Corp. (a) | | | 552 | | | | 11,824 | |
Callon Petroleum Co. (a) | | | 3,243 | | | | 49,553 | |
Chesapeake Energy Corp. (a) | | | 10,626 | | | | 68,538 | |
Clayton Williams Energy, Inc. (a) | | | 105 | | | | 15,272 | |
Clean Energy Fuels Corp. (a) | | | 1,286 | | | | 3,331 | |
Cobalt International Energy, Inc. (a) | | | 6,815 | | | | 6,684 | |
CONSOL Energy, Inc. | | | 3,962 | | | | 67,116 | |
Contango Oil & Gas Co. (a) | | | 408 | | | | 3,305 | |
CVR Energy, Inc. | | | 244 | | | | 5,419 | |
Delek U.S. Holdings, Inc. | | | 1,071 | | | | 23,990 | |
Denbury Resources, Inc. (a) | | | 6,260 | | | | 20,971 | |
DHT Holdings, Inc. | | | 1,466 | | | | 6,876 | |
Diamondback Energy, Inc. (a) | | | 1,569 | | | | 165,012 | |
Dorian LPG Ltd. (a) | | | 487 | | | | 5,508 | |
Eclipse Resources Corp. (a) | | | 1,131 | | | | 2,782 | |
Energen Corp. (a) | | | 1,702 | | | | 91,721 | |
EP Energy Corp., Class A (a) | | | 661 | | | | 3,464 | |
Evolution Petroleum Corp. | | | 605 | | | | 5,264 | |
EXCO Resources, Inc. (a) | | | 2,654 | | | | 1,776 | |
Frontline Ltd. | | | 1,263 | | | | 8,765 | |
GasLog Ltd. | | | 855 | | | | 14,278 | |
Gener8 Maritime, Inc. (a) | | | 694 | | | | 3,505 | |
Golar LNG Ltd. | | | 1,634 | | | | 42,255 | |
Green Plains, Inc. | | | 586 | | | | 13,185 | |
Gulfport Energy Corp. (a) | | | 2,794 | | | | 58,395 | |
HollyFrontier Corp. | | | 2,812 | | | | 81,464 | |
International Seaways, Inc. (a) | | | 244 | | | | 4,241 | |
Isramco, Inc. (a) | | | 23 | | | | 2,880 | |
Jones Energy, Inc., Class A (a) | | | 1,146 | | | | 5,100 | |
Kosmos Energy Ltd. (a) | | | 2,960 | | | | 19,358 | |
Laredo Petroleum, Inc. (a) | | | 2,550 | | | | 34,552 | |
Matador Resources Co. (a) | | | 1,573 | | | | 41,417 | |
See Notes to Financial Statements.
| | | | | | |
| | | | | | | |
| 62 | | BLACKROCK FUNDS | | JANUARY 31, 2017 | | |
| | |
Schedule of Investments (continued) | | BlackRock Small/Mid Cap Index Fund |
| | | | | | | | |
| Common Stocks | | Shares | | | Value | |
Oil, Gas & Consumable Fuels (continued) | |
Murphy Oil Corp. | | | 2,860 | | | $ | 82,683 | |
Murphy USA, Inc. (a) | | | 644 | | | | 41,023 | |
Navios Maritime Acquisition Corp. | | | 1,649 | | | | 3,067 | |
Newfield Exploration Co. (a) | | | 3,461 | | | | 138,717 | |
Nordic American Tankers Ltd. | | | 1,626 | | | | 14,049 | |
Northern Oil and Gas, Inc. (a) | | | 1,126 | | | | 4,054 | |
Oasis Petroleum, Inc. (a) | | | 4,048 | | | | 57,239 | |
Overseas Shipholding Group, Inc., Class A | | | 473 | | | | 2,322 | |
Pacific Ethanol, Inc. (a) | | | 404 | | | | 2,868 | |
Panhandle Oil and Gas, Inc., Class A | | | 321 | | | | 7,062 | |
Par Pacific Holdings, Inc. (a) | | | 536 | | | | 7,788 | |
Parsley Energy, Inc., Class A (a) | | | 3,229 | | | | 113,725 | |
PBF Energy, Inc., Class A | | | 1,902 | | | | 44,107 | |
PDC Energy, Inc. (a) | | | 983 | | | | 72,683 | |
QEP Resources, Inc. (a) | | | 4,201 | | | | 73,265 | |
Renewable Energy Group, Inc. (a) | | | 549 | | | | 4,776 | |
REX American Resources Corp. (a) | | | 100 | | | | 8,303 | |
Rice Energy, Inc. (a) | | | 1,170 | | | | 23,201 | |
Ring Energy, Inc. (a) | | | 785 | | | | 10,362 | |
RSP Permian, Inc. (a) | | | 1,717 | | | | 73,076 | |
Sanchez Energy Corp. (a) | | | 514 | | | | 6,816 | |
Scorpio Tankers, Inc. | | | 2,752 | | | | 10,540 | |
SemGroup Corp., Class A | | | 1,137 | | | | 45,139 | |
Ship Finance International Ltd. | | | 981 | | | | 14,715 | |
SM Energy Co. | | | 1,700 | | | | 51,867 | |
Southwestern Energy Co. (a) | | | 8,535 | | | | 76,900 | |
Synergy Resources Corp. (a) | | | 3,332 | | | | 28,689 | |
Targa Resources Corp. | | | 2,845 | | | | 163,929 | |
Teekay Corp. | | | 953 | | | | 9,578 | |
Teekay Tankers Ltd., Class A | | | 2,075 | | | | 5,084 | |
W&T Offshore, Inc. (a) | | | 1,101 | | | | 3,193 | |
Western Refining, Inc. | | | 1,410 | | | | 49,364 | |
Westmoreland Coal Co. (a) | | | 280 | | | | 5,082 | |
Whiting Petroleum Corp. (a) | | | 3,502 | | | | 38,837 | |
World Fuel Services Corp. | | | 1,200 | | | | 53,376 | |
WPX Energy, Inc. (a) | | | 6,679 | | | | 93,038 | |
| | | | | | | | |
| | | | | | | | 2,355,543 | |
Paper & Forest Products — 0.3% | |
Boise Cascade Co. (a) | | | 644 | | | | 15,971 | |
Clearwater Paper Corp. (a) | | | 275 | | | | 17,298 | |
Deltic Timber Corp. | | | 174 | | | | 13,219 | |
Domtar Corp. | | | 1,093 | | | | 47,753 | |
KapStone Paper and Packaging Corp. | | | 1,509 | | | | 36,186 | |
Louisiana-Pacific Corp. (a) | | | 2,477 | | | | 47,385 | |
Neenah Paper, Inc. | | | 295 | | | | 24,234 | |
PH Glatfelter Co. | | | 701 | | | | 17,111 | |
Schweitzer-Mauduit International, Inc. | | | 528 | | | | 23,406 | |
| | | | | | | | |
| | | | | | | | 242,563 | |
Personal Products — 0.6% | |
Avon Products, Inc. (a) | | | 7,521 | | | | 44,148 | |
Coty, Inc., Class A | | | 7,871 | | | | 151,123 | |
Edgewell Personal Care Co. (a) | | | 1,014 | | | | 79,944 | |
elf Beauty, Inc. (a) | | | 144 | | | | 3,594 | |
Herbalife Ltd. (a) | | | 1,292 | | | | 72,610 | |
Inter Parfums, Inc. | | | 290 | | | | 9,889 | |
Lifevantage Corp. (a) | | | 93 | | | | 671 | |
Medifast, Inc. | | | 186 | | | | 7,844 | |
Natural Health Trends Corp. | | | 87 | | | | 2,182 | |
Nature’s Sunshine Products, Inc. | | | 97 | | | | 1,237 | |
Nu Skin Enterprises, Inc., Class A | | | 945 | | | | 49,027 | |
Nutraceutical International Corp. | | | 110 | | | | 3,685 | |
Revlon, Inc., Class A (a) | | | 218 | | | | 7,292 | |
Synutra International, Inc. (a) | | | 335 | | | | 1,943 | |
USANA Health Sciences, Inc. (a) | | | 180 | | | | 11,214 | |
| | | | | | | | |
| | | | | | | | 446,403 | |
| | | | | | | | |
| Common Stocks | | Shares | | | Value | |
Pharmaceuticals — 0.8% | |
AcelRx Pharmaceuticals, Inc. (a) | | | 373 | | | $ | 988 | |
Aclaris Therapeutics, Inc. (a) | | | 171 | | | | 4,537 | |
Aerie Pharmaceuticals, Inc. (a) | | | 511 | | | | 22,433 | |
Agile Therapeutics, Inc. (a) | | | 252 | | | | 580 | |
Akorn, Inc. (a) | | | 1,561 | | | | 29,815 | |
Amphastar Pharmaceuticals, Inc. (a) | | | 609 | | | | 9,592 | |
ANI Pharmaceuticals, Inc. (a) | | | 144 | | | | 8,705 | |
Aratana Therapeutics, Inc. (a) | | | 598 | | | | 4,778 | |
Axsome Therapeutics, Inc. (a) | | | 257 | | | | 1,259 | |
Bio-Path Holdings, Inc. (a) | | | 1,942 | | | | 1,845 | |
Catalent, Inc. (a) | | | 1,715 | | | | 45,893 | |
Cempra, Inc. (a) | | | 759 | | | | 2,391 | |
Clearside Biomedical, Inc. (a) | | | 89 | | | | 663 | |
Collegium Pharmaceutical, Inc. (a) | | | 307 | | | | 5,164 | |
Corcept Therapeutics, Inc. (a) | | | 1,342 | | | | 9,542 | |
Depomed, Inc. (a) | | | 998 | | | | 18,054 | |
Dermira, Inc. (a) | | | 405 | | | | 11,923 | |
Durect Corp. (a) | | | 2,155 | | | | 2,284 | |
Egalet Corp. (a) | | | 661 | | | | 3,232 | |
Endo International PLC (a) | | | 3,590 | | | | 43,942 | |
Endocyte, Inc. (a) | | | 262 | | | | 579 | |
Flex Pharma, Inc. (a) | | | 116 | | | | 506 | |
Heska Corp. (a) | | | 113 | | | | 8,997 | |
Horizon Pharma PLC (a) | | | 2,785 | | | | 45,590 | |
Impax Laboratories, Inc. (a) | | | 1,202 | | | | 15,806 | |
Intersect ENT, Inc. (a) | | | 474 | | | | 6,399 | |
Intra-Cellular Therapies, Inc. (a) | | | 616 | | | | 8,895 | |
Lannett Co., Inc. (a) | | | 506 | | | | 10,196 | |
Lipocine, Inc. (a)(b) | | | 114 | | | | 413 | |
Medicines Co. (a) | | | 1,154 | | | | 41,602 | |
MyoKardia, Inc. (a) | | | 236 | | | | 2,643 | |
Nektar Therapeutics (a) | | | 2,614 | | | | 31,656 | |
Neos Therapeutics, Inc. (a) | | | 95 | | | | 556 | |
Novan, Inc. (a) | | | 69 | | | | 280 | |
Omeros Corp. (a)(b) | | | 706 | | | | 6,841 | |
Pacira Pharmaceuticals, Inc. (a) | | | 639 | | | | 24,570 | |
Paratek Pharmaceuticals, Inc. (a) | | | 312 | | | | 4,711 | |
Phibro Animal Health Corp., Class A | | | 431 | | | | 11,508 | |
Prestige Brands Holdings, Inc. (a) | | | 911 | | | | 48,064 | |
Reata Pharmaceuticals, Inc. (a) | | | 126 | | | | 3,137 | |
Revance Therapeutics, Inc. (a) | | | 298 | | | | 5,960 | |
Sciclone Pharmaceuticals, Inc. (a) | | | 890 | | | | 9,033 | |
Sucampo Pharmaceuticals, Inc., Class A (a) | | | 340 | | | | 3,791 | |
Supernus Pharmaceuticals, Inc. (a) | | | 826 | | | | 22,343 | |
Teligent, Inc. (a) | | | 615 | | | | 4,305 | |
TherapeuticsMD, Inc. (a)(b) | | | 2,442 | | | | 14,188 | |
Theravance Biopharma, Inc. (a) | | | 651 | | | | 19,504 | |
Titan Pharmaceuticals, Inc. (a) | | | 221 | | | | 961 | |
WaVe Life Sciences Ltd. (a) | | | 120 | | | | 3,450 | |
Zogenix, Inc. (a) | | | 364 | | | | 2,930 | |
| | | | | | | | |
| | | | | | | | 587,034 | |
Producer Durables: Miscellaneous — 0.0% | |
Actua Corp. (a) | | | 628 | | | | 8,980 | |
PROS Holdings, Inc. (a) | | | 447 | | | | 10,004 | |
| | | | | | | | |
| | | | | | | | 18,984 | |
Professional Services — 1.1% | |
Acacia Research Corp. (a) | | | 169 | | | | 989 | |
Advisory Board Co. (a) | | | 711 | | | | 32,350 | |
Barrett Business Services, Inc. | | | 131 | | | | 7,874 | |
CBIZ, Inc. (a) | | | 926 | | | | 12,131 | |
CEB, Inc. | | | 572 | | | | 43,729 | |
CRA International, Inc. | | | 114 | | | | 3,788 | |
Dun & Bradstreet Corp. | | | 633 | | | | 77,618 | |
Exponent, Inc. | | | 466 | | | | 27,051 | |
Franklin Covey Co. (a) | | | 153 | | | | 2,678 | |
See Notes to Financial Statements.
| | | | | | |
| | | | | | | |
| | BLACKROCK FUNDS | | JANUARY 31, 2017 | | 63 |
| | |
Schedule of Investments (continued) | | BlackRock Small/Mid Cap Index Fund |
| | | | | | | | |
| Common Stocks | | Shares | | | Value | |
Professional Services (continued) | |
FTI Consulting, Inc. (a) | | | 745 | | | $ | 31,394 | |
GP Strategies Corp. (a) | | | 175 | | | | 4,498 | |
Heidrick & Struggles International, Inc. | | | 284 | | | | 6,347 | |
Hill International, Inc. (a) | | | 674 | | | | 3,640 | |
Huron Consulting Group, Inc. (a) | | | 356 | | | | 16,127 | |
ICF International, Inc. (a) | | | 297 | | | | 15,444 | |
Insperity, Inc. | | | 276 | | | | 19,734 | |
Kelly Services, Inc., Class A | | | 477 | | | | 10,680 | |
Kforce, Inc. | | | 420 | | | | 9,660 | |
Korn/Ferry International | | | 991 | | | | 28,789 | |
ManpowerGroup, Inc. | | | 1,155 | | | | 110,256 | |
Mistras Group, Inc. (a) | | | 268 | | | | 6,185 | |
Navigant Consulting, Inc. (a) | | | 847 | | | | 20,921 | |
On Assignment, Inc. (a) | | | 874 | | | | 39,575 | |
Paylocity Holding Corp. (a) | | | 363 | | | | 11,202 | |
Resources Connection, Inc. | | | 602 | | | | 10,053 | |
Robert Half International, Inc. | | | 2,200 | | | | 103,532 | |
RPX Corp. (a) | | | 915 | | | | 9,937 | |
TransUnion (a) | | | 939 | | | | 29,607 | |
TriNet Group, Inc. (a) | | | 758 | | | | 19,276 | |
TrueBlue, Inc. (a) | | | 690 | | | | 17,078 | |
WageWorks, Inc. (a) | | | 624 | | | | 45,022 | |
| | | | | | | | |
| | | | | | | | 777,165 | |
Real Estate Investment Trusts (REITs) — 9.6% | |
Acadia Realty Trust | | | 1,340 | | | | 42,666 | |
AG Mortgage Investment Trust, Inc. | | | 405 | | | | 7,096 | |
AGNC Investment Corp. | | | 5,774 | | | | 107,801 | |
Agree Realty Corp. | | | 439 | | | | 20,589 | |
Alexander’s, Inc. | | | 40 | | | | 16,912 | |
Alexandria Real Estate Equities, Inc. | | | 1,335 | | | | 147,945 | |
American Assets Trust, Inc. | | | 703 | | | | 30,180 | |
American Campus Communities, Inc. | | | 2,270 | | | | 110,367 | |
American Homes 4 Rent, Class A | | | 2,897 | | | | 64,545 | |
Anworth Mortgage Asset Corp. | | | 1,381 | | | | 7,085 | |
Apartment Investment & Management Co., Class A | | | 2,729 | | | | 120,267 | |
Apollo Commercial Real Estate Finance, Inc. | | | 1,471 | | | | 25,610 | |
Apple Hospitality REIT, Inc. | | | 2,917 | | | | 58,398 | |
Ares Commercial Real Estate Corp. | | | 395 | | | | 5,325 | |
Armada Hoffler Properties, Inc. | | | 602 | | | | 8,296 | |
ARMOUR Residential REIT, Inc. | | | 646 | | | | 13,579 | |
Ashford Hospitality Prime, Inc. | | | 370 | | | | 4,973 | |
Ashford Hospitality Trust, Inc. | | | 1,377 | | | | 10,465 | |
Bluerock Residential Growth REIT, Inc. | | | 501 | | | | 6,553 | |
Brandywine Realty Trust | | | 3,033 | | | | 48,831 | |
Brixmor Property Group, Inc. | | | 3,369 | | | | 81,294 | |
Camden Property Trust | | | 1,479 | | | | 123,600 | |
Capstead Mortgage Corp. | | | 1,468 | | | | 15,664 | |
Care Capital Properties, Inc. | | | 1,508 | | | | 37,263 | |
Catchmark Timber Trust, Inc., Class A | | | 801 | | | | 8,242 | |
CBL & Associates Properties, Inc. | | | 3,068 | | | | 33,288 | |
Cedar Realty Trust, Inc. | | | 1,172 | | | | 7,044 | |
Chatham Lodging Trust | | | 552 | | | | 11,117 | |
Chesapeake Lodging Trust | | | 1,069 | | | | 27,366 | |
Chimera Investment Corp. | | | 3,375 | | | | 59,501 | |
City Office REIT, Inc. | | | 381 | | | | 4,797 | |
Colony Starwood Homes | | | 1,133 | | | | 35,633 | |
Columbia Property Trust, Inc. | | | 2,197 | | | | 48,883 | |
Communications Sales & Leasing, Inc. | | | 2,084 | | | | 54,767 | |
Community Healthcare Trust, Inc. | | | 217 | | | | 4,681 | |
CoreCivic, Inc. | | | 1,931 | | | | 56,076 | |
CorEnergy Infrastructure Trust, Inc. | | | 230 | | | | 8,257 | |
Coresite Realty Corp. | | | 578 | | | | 49,783 | |
Corporate Office Properties Trust | | | 1,656 | | | | 52,694 | |
Cousins Properties, Inc. | | | 5,870 | | | | 49,895 | |
CubeSmart | | | 3,113 | | | | 78,230 | |
CyrusOne, Inc. | | | 1,232 | | | | 59,333 | |
| | | | | | | | |
| Common Stocks | | Shares | | | Value | |
Real Estate Investment Trusts (REITs) (continued) | |
CYS Investments, Inc. | | | 2,915 | | | $ | 22,067 | |
DCT Industrial Trust, Inc. | | | 1,593 | | | | 71,191 | |
DDR Corp. | | | 5,296 | | | | 80,393 | |
DiamondRock Hospitality Co. | | | 3,507 | | | | 39,524 | |
Douglas Emmett, Inc. | | | 2,454 | | | | 92,859 | |
Duke Realty Corp. | | | 6,014 | | | | 146,321 | |
DuPont Fabros Technology, Inc. | | | 1,314 | | | | 62,389 | |
Dynex Capital, Inc. | | | 687 | | | | 4,589 | |
Easterly Government Properties, Inc. | | | 458 | | | | 9,023 | |
EastGroup Properties, Inc. | | | 300 | | | | 21,231 | |
Education Realty Trust, Inc. | | | 1,270 | | | | 51,067 | |
Empire State Realty Trust, Inc., Class A | | | 2,141 | | | | 43,869 | |
EPR Properties | | | 1,099 | | | | 81,293 | |
Equity Commonwealth (a) | | | 2,123 | | | | 65,473 | |
Equity Lifestyle Properties, Inc. | | | 1,333 | | | | 98,562 | |
Equity One, Inc. | | | 1,627 | | | | 50,746 | |
Farmland Partners, Inc. | | | 230 | | | | 2,613 | |
FelCor Lodging Trust, Inc. | | | 2,461 | | | | 18,950 | |
First Industrial Realty Trust, Inc. | | | 2,031 | | | | 52,501 | |
First Potomac Realty Trust | | | 1,126 | | | | 11,530 | |
Forest City Realty Trust, Inc., Class A | | | 3,987 | | | | 90,266 | |
Four Corners Property Trust, Inc. | | | 1,055 | | | | 23,010 | |
Franklin Street Properties Corp. | | | 1,883 | | | | 24,008 | |
Gaming and Leisure Properties, Inc. | | | 3,295 | | | | 104,221 | |
Geo Group, Inc. | | | 1,284 | | | | 53,312 | |
Getty Realty Corp. | | | 457 | | | | 11,786 | |
Gladstone Commercial Corp. | | | 414 | | | | 8,131 | |
Global Net Lease, Inc. | | | 3,530 | | | | 27,357 | |
Great Ajax Corp. | | | 220 | | | | 2,862 | |
Healthcare Realty Trust, Inc. | | | 1,993 | | | | 60,209 | |
Healthcare Trust of America, Inc., Class A | | | 2,388 | | | | 69,419 | |
Hersha Hospitality Trust | | | 734 | | | | 14,673 | |
Highwoods Properties, Inc. | | | 1,680 | | | | 86,369 | |
Hospitality Properties Trust | | | 1,984 | | | | 61,762 | |
Hudson Pacific Properties, Inc. | | | 1,973 | | | | 69,864 | |
Independence Realty Trust, Inc. | | | 1,144 | | | | 10,559 | |
InfraREIT, Inc. | | | 694 | | | | 11,437 | |
Invesco Mortgage Capital, Inc. | | | 2,060 | | | | 30,014 | |
Investors Real Estate Trust | | | 2,021 | | | | 13,015 | |
iStar, Inc. (a) | | | 1,185 | | | | 13,296 | |
Kilroy Realty Corp. | | | 1,668 | | | | 124,850 | |
Kite Realty Group Trust | | | 1,357 | | | | 32,595 | |
Lamar Advertising Co., Class A | | | 1,430 | | | | 107,994 | |
LaSalle Hotel Properties | | | 1,845 | | | | 55,664 | |
Lexington Realty Trust | | | 4,026 | | | | 43,159 | |
Liberty Property Trust | | | 2,555 | | | | 98,086 | |
Life Storage, Inc. | | | 805 | | | | 65,567 | |
LTC Properties, Inc. | | | 677 | | | | 31,596 | |
Mack-Cali Realty Corp. | | | 1,585 | | | | 44,412 | |
Medical Properties Trust, Inc. | | | 5,169 | | | | 65,905 | |
MFA Financial, Inc. | | | 6,481 | | | | 51,135 | |
Mid-America Apartment Communities, Inc. | | | 1,951 | | | | 185,247 | |
Monmouth Real Estate Investment Corp. | | | 1,216 | | | | 17,754 | |
Monogram Residential Trust, Inc. | | | 3,298 | | | | 33,541 | |
MTGE Investment Corp. | | | 664 | | | | 10,558 | |
National Health Investors, Inc. | | | 650 | | | | 48,093 | |
National Retail Properties, Inc. | | | 2,485 | | | | 108,346 | |
National Storage Affiliates Trust | | | 688 | | | | 15,308 | |
New Residential Investment Corp. | | | 4,187 | | | | 63,433 | |
New Senior Investment Group, Inc. | | | 1,408 | | | | 14,094 | |
New York Mortgage Trust, Inc. | | | 1,603 | | | | 10,275 | |
NexPoint Residential Trust, Inc. | | | 284 | | | | 6,563 | |
NorthStar Realty Europe Corp. | | | 1,014 | | | | 12,178 | |
Omega Healthcare Investors, Inc. | | | 3,215 | | | | 103,105 | |
One Liberty Properties, Inc. | | | 219 | | | | 5,072 | |
Orchid Island Capital, Inc. | | | 442 | | | | 5,229 | |
Outfront Media, Inc. | | | 2,422 | | | | 66,435 | |
See Notes to Financial Statements.
| | | | | | |
| | | | | | | |
| 64 | | BLACKROCK FUNDS | | JANUARY 31, 2017 | | |
| | |
Schedule of Investments (continued) | | BlackRock Small/Mid Cap Index Fund |
| | | | | | | | |
| Common Stocks | | Shares | | | Value | |
Real Estate Investment Trusts (REITs) (continued) | |
Owens Realty Mortgage, Inc. | | | 163 | | | $ | 2,761 | |
Paramount Group, Inc. | | | 3,215 | | | | 53,658 | |
Parkway, Inc. (a) | | | 717 | | | | 15,265 | |
Pebblebrook Hotel Trust | | | 1,323 | | | | 39,571 | |
Pennsylvania Real Estate Investment Trust | | | 1,110 | | | | 19,880 | |
PennyMac Mortgage Investment Trust (c) | | | 983 | | | | 16,662 | |
Physicians Realty Trust | | | 2,355 | | | | 43,685 | |
Piedmont Office Realty Trust, Inc., Class A | | | 2,546 | | | | 55,299 | |
Potlatch Corp. | | | 688 | | | | 28,346 | |
Preferred Apartment Communities, Inc., Class A | | | 485 | | | | 6,567 | |
PS Business Parks, Inc. | | | 345 | | | | 38,654 | |
QTS Realty Trust, Inc., Class A | | | 820 | | | | 41,320 | |
RAIT Financial Trust | | | 701 | | | | 2,425 | |
Ramco-Gershenson Properties Trust | | | 1,439 | | | | 23,398 | |
Rayonier, Inc. | | | 2,177 | | | | 60,716 | |
Redwood Trust, Inc. | | | 1,428 | | | | 22,134 | |
Regency Centers Corp. | | | 1,793 | | | | 125,026 | |
Resource Capital Corp. | | | 497 | | | | 4,085 | |
Retail Opportunity Investments Corp. | | | 1,552 | | | | 32,902 | |
Retail Properties of America, Inc., Class A | | | 4,205 | | | | 62,949 | |
Rexford Industrial Realty, Inc. | | | 1,077 | | | | 24,459 | |
RLJ Lodging Trust | | | 2,125 | | | | 49,321 | |
Sabra Health Care REIT, Inc. | | | 1,143 | | | | 29,032 | |
Saul Centers, Inc. | | | 177 | | | | 11,238 | |
Select Income REIT | | | 1,135 | | | | 28,386 | |
Senior Housing Properties Trust | | | 3,420 | | | | 65,151 | |
Seritage Growth Properties, Class A (b) | | | 378 | | | | 15,422 | |
Silver Bay Realty Trust Corp. | | | 585 | | | | 9,857 | |
Spirit Realty Capital, Inc. | | | 8,360 | | | | 87,947 | |
STAG Industrial, Inc. | | | 1,349 | | | | 31,216 | |
Starwood Property Trust, Inc. | | | 4,342 | | | | 96,653 | |
STORE Capital Corp. | | | 2,621 | | | | 62,013 | |
Summit Hotel Properties, Inc. | | | 1,420 | | | | 22,479 | |
Sun Communities, Inc. | | | 1,168 | | | | 91,992 | |
Sunstone Hotel Investors, Inc. | | | 3,820 | | | | 56,230 | |
Tanger Factory Outlet Centers, Inc. | | | 1,642 | | | | 56,140 | |
Taubman Centers, Inc. | | | 1,045 | | | | 74,028 | |
Terreno Realty Corp. | | | 756 | | | | 20,556 | |
Tier REIT, Inc. | | | 787 | | | | 14,331 | |
Two Harbors Investment Corp. | | | 6,207 | | | | 54,435 | |
UMH Properties, Inc. | | | 433 | | | | 6,343 | |
Universal Health Realty Income Trust | | | 12 | | | | 745 | |
Urban Edge Properties | | | 1,473 | | | | 41,200 | |
Urstadt Biddle Properties, Inc., Class A | | | 194 | | | | 4,355 | |
Washington Prime Group, Inc. | | | 3,467 | | | | 33,457 | |
Washington Real Estate Investment Trust | | | 1,308 | | | | 41,137 | |
Weingarten Realty Investors | | | 2,031 | | | | 72,364 | |
Western Asset Mortgage Capital Corp. | | | 590 | | | | 5,953 | |
Whitestone REIT | | | 550 | | | | 7,650 | |
WP Carey, Inc. | | | 1,806 | | | | 111,864 | |
Xenia Hotels & Resorts, Inc. | | | 1,720 | | | | 31,562 | |
| | | | | | | | |
| | | | | | | | 6,955,665 | |
Real Estate Management & Development — 0.5% | |
Alexander & Baldwin, Inc. | | | 800 | | | | 35,616 | |
Altisource Portfolio Solutions SA (a) | | | 175 | | | | 4,987 | |
Altisource Residential Corp. | | | 957 | | | | 11,618 | |
AV Homes, Inc. (a) | | | 191 | | | | 3,371 | |
CareTrust REIT, Inc. | | | 994 | | | | 15,069 | |
Consolidated-Tomoka Land Co. | | | 60 | | | | 3,300 | |
Forestar Group, Inc. (a) | | | 523 | | | | 6,825 | |
FRP Holdings, Inc. (a) | | | 88 | | | | 3,432 | |
Global Medical REIT, Inc. | | | 162 | | | | 1,434 | |
Howard Hughes Corp. (a) | | | 618 | | | | 65,885 | |
Jones Lang LaSalle, Inc. | | | 793 | | | | 81,703 | |
Kennedy-Wilson Holdings, Inc. | | | 1,431 | | | | 29,264 | |
RE/MAX Holdings, Inc., Class A | | | 282 | | | | 15,806 | |
| | | | | | | | |
| Common Stocks | | Shares | | | Value | |
Real Estate Management & Development (continued) | |
Realogy Holdings Corp. | | | 2,549 | | | $ | 66,044 | |
RMR Group, Inc., Class A | | | 112 | | | | 5,354 | |
St. Joe Co. (a) | | | 729 | | | | 12,284 | |
Stratus Properties, Inc. (a) | | | 102 | | | | 3,121 | |
Tejon Ranch Co. (a) | | | 228 | | | | 5,388 | |
Trinity Place Holdings, Inc. (a) | | | 309 | | | | 2,494 | |
| | | | | | | | |
| | | | | | | | 372,995 | |
Road & Rail — 0.8% | |
AMERCO, Inc. | | | 107 | | | | 40,304 | |
ArcBest Corp. | | | 406 | | | | 12,830 | |
Avis Budget Group, Inc. (a) | | | 1,353 | | | | 50,359 | |
Celadon Group, Inc. | | | 464 | | | | 3,526 | |
Covenant Transportation Group, Inc., Class A (a) | | | 166 | | | | 3,574 | |
Genesee & Wyoming, Inc., Class A (a) | | | 1,042 | | | | 78,525 | |
Heartland Express, Inc. | | | 726 | | | | 14,956 | |
Hertz Global Holdings, Inc. (a) | | | 1,261 | | | | 26,443 | |
Knight Transportation, Inc. | | | 1,130 | | | | 37,742 | |
Landstar System, Inc. | | | 727 | | | | 61,504 | |
Marten Transport Ltd. | | | 375 | | | | 8,569 | |
Old Dominion Freight Line, Inc. (a) | | | 1,155 | | | | 101,963 | |
Roadrunner Transportation Systems, Inc. (a) | | | 540 | | | | 4,277 | |
Ryder System, Inc. | | | 927 | | | | 71,935 | |
Saia, Inc. (a) | | | 450 | | | | 21,623 | |
Swift Transportation Co. (a) | | | 1,294 | | | | 29,542 | |
Universal Logistics Holdings, Inc. | | | 113 | | | | 1,633 | |
USA Truck, Inc. (a) | | | 61 | | | | 515 | |
Werner Enterprises, Inc. | | | 795 | | | | 22,339 | |
YRC Worldwide, Inc. (a) | | | 587 | | | | 8,764 | |
| | | | | | | | |
| | | | | | | | 600,923 | |
Semiconductors & Semiconductor Equipment — 2.3% | |
Acacia Communications, Inc. (a) | | | 81 | | | | 4,712 | |
Advanced Energy Industries, Inc. (a) | | | 673 | | | | 39,599 | |
Advanced Micro Devices, Inc. (a) | | | 12,868 | | | | 133,441 | |
Alpha & Omega Semiconductor Ltd. (a) | | | 336 | | | | 6,838 | |
Ambarella, Inc. (a) | | | 555 | | | | 27,534 | |
Amkor Technology, Inc. (a) | | | 1,794 | | | | 16,881 | |
Axcelis Technologies, Inc. (a) | | | 428 | | | | 6,506 | |
Brooks Automation, Inc. | | | 1,187 | | | | 20,677 | |
Cabot Microelectronics Corp. | | | 429 | | | | 28,962 | |
Cavium, Inc. (a) | | | 1,109 | | | | 73,427 | |
CEVA, Inc. (a) | | | 334 | | | | 11,807 | |
Cirrus Logic, Inc. (a) | | | 1,072 | | | | 64,663 | |
Cohu, Inc. | | | 419 | | | | 5,531 | |
Cree, Inc. (a) | | | 1,713 | | | | 47,244 | |
Cypress Semiconductor Corp. | | | 5,381 | | | | 63,496 | |
Diodes, Inc. (a) | | | 613 | | | | 15,258 | |
DSP Group, Inc. (a) | | | 294 | | | | 3,190 | |
Entegris, Inc. (a) | | | 2,420 | | | | 45,375 | |
Exar Corp. (a) | | | 588 | | | | 6,027 | |
First Solar, Inc. (a) | | | 1,316 | | | | 41,046 | |
FormFactor, Inc. (a) | | | 1,127 | | | | 14,031 | |
GigPeak, Inc. (a) | | | 634 | | | | 1,636 | |
Impinj, Inc. (a) | | | 94 | | | | 3,310 | |
Inphi Corp. (a) | | | 694 | | | | 31,799 | |
Integrated Device Technology, Inc. (a) | | | 2,336 | | | | 58,844 | |
Intersil Corp., Class A | | | 2,287 | | | | 51,297 | |
IXYS Corp. | | | 425 | | | | 5,142 | |
Kopin Corp. (a) | | | 1,064 | | | | 3,394 | |
Lattice Semiconductor Corp. (a) | | | 1,946 | | | | 13,992 | |
MACOM Technology Solutions Holdings, Inc. (a) | | | 547 | | | | 26,016 | |
Marvell Technology Group Ltd. | | | 6,920 | | | | 102,900 | |
MaxLinear, Inc., Class A (a) | | | 970 | | | | 24,813 | |
Microsemi Corp. (a) | | | 1,944 | | | | 103,324 | |
MKS Instruments, Inc. | | | 908 | | | | 59,837 | |
Monolithic Power Systems, Inc. | | | 662 | | | | 57,753 | |
See Notes to Financial Statements.
| | | | | | |
| | | | | | | |
| | BLACKROCK FUNDS | | JANUARY 31, 2017 | | 65 |
| | |
Schedule of Investments (continued) | | BlackRock Small/Mid Cap Index Fund |
| | | | | | | | |
| Common Stocks | | Shares | | | Value | |
Semiconductors & Semiconductor Equipment (continued) | |
Nanometrics, Inc. (a) | | | 398 | | | $ | 10,233 | |
NeoPhotonics Corp. (a) | | | 445 | | | | 4,873 | |
NVE Corp. | | | 82 | | | | 6,362 | |
ON Semiconductor Corp. (a) | | | 7,121 | | | | 94,852 | |
PDF Solutions, Inc. (a) | | | 451 | | | | 10,152 | |
Photronics, Inc. (a) | | | 1,079 | | | | 12,408 | |
Power Integrations, Inc. | | | 468 | | | | 33,228 | |
Rambus, Inc. (a) | | | 1,970 | | | | 25,571 | |
Rudolph Technologies, Inc. (a) | | | 498 | | | | 11,429 | |
Semtech Corp. (a) | | | 1,109 | | | | 36,541 | |
Sigma Designs, Inc. (a) | | | 534 | | | | 3,257 | |
Silicon Laboratories, Inc. (a) | | | 704 | | | | 45,901 | |
SunPower Corp. (a) | | | 836 | | | | 5,551 | |
Teradyne, Inc. | | | 3,502 | | | | 99,387 | |
Tessera Holding Corp. | | | 841 | | | | 38,013 | |
Ultra Clean Holdings, Inc. (a) | | | 546 | | | | 6,841 | |
Ultratech, Inc. (a) | | | 373 | | | | 9,668 | |
Veeco Instruments, Inc. (a) | | | 700 | | | | 18,025 | |
Xcerra Corp. (a) | | | 954 | | | | 7,231 | |
| | | | | | | | |
| | | | | | | | 1,699,825 | |
Software — 3.5% | |
A10 Networks, Inc. (a) | | | 650 | | | | 5,180 | |
ACI Worldwide, Inc. (a) | | | 1,970 | | | | 38,218 | |
Allscripts Healthcare Solutions, Inc. (a) | | | 3,341 | | | | 39,123 | |
American Software, Inc., Class A | | | 327 | | | | 3,430 | |
ANSYS, Inc. (a) | | | 1,517 | | | | 141,475 | |
Aspen Technology, Inc. (a) | | | 1,336 | | | | 70,955 | |
Atlassian Corp. PLC, Class A (a) | | | 448 | | | | 12,378 | |
Barracuda Networks, Inc. (a) | | | 399 | | | | 9,373 | |
Blackbaud, Inc. | | | 815 | | | | 53,472 | |
Blackline, Inc. (a) | | | 155 | | | | 4,213 | |
Bottomline Technologies, Inc. (a) | | | 650 | | | | 16,718 | |
BroadSoft, Inc. (a) | | | 517 | | | | 21,714 | |
Cadence Design Systems, Inc. (a) | | | 5,161 | | | | 134,341 | |
Callidus Software, Inc. (a) | | | 1,075 | | | | 19,834 | |
CommVault Systems, Inc. (a) | | | 665 | | | | 32,651 | |
Digimarc Corp. (a) | | | 155 | | | | 4,092 | |
Ebix, Inc. | | | 442 | | | | 24,531 | |
Ellie Mae, Inc. (a) | | | 554 | | | | 45,838 | |
EnerNOC, Inc. (a) | | | 468 | | | | 2,668 | |
ePlus, Inc. (a) | | | 102 | | | | 11,429 | |
Everbridge, Inc. (a) | | | 132 | | | | 2,438 | |
Exa Corp. (a) | | | 206 | | | | 3,193 | |
Fair Isaac Corp. | | | 532 | | | | 65,596 | |
FireEye, Inc. (a) | | | 2,658 | | | | 36,016 | |
Fortinet, Inc. (a) | | | 2,506 | | | | 83,350 | |
Gigamon, Inc. (a) | | | 570 | | | | 18,895 | |
Globant SA (a) | | | 417 | | | | 13,824 | |
Glu Mobile, Inc. (a) | | | 1,837 | | | | 4,225 | |
Guidance Software, Inc. (a) | | | 393 | | | | 2,853 | |
Guidewire Software, Inc. (a) | | | 1,260 | | | | 65,936 | |
HubSpot, Inc. (a) | | | 501 | | | | 25,701 | |
Imperva, Inc. (a) | | | 505 | | | | 21,084 | |
Jive Software, Inc. (a) | | | 1,151 | | | | 4,374 | |
Manhattan Associates, Inc. (a) | | | 1,251 | | | | 64,126 | |
Mentor Graphics Corp. | | | 1,835 | | | | 67,730 | |
MicroStrategy, Inc., Class A (a) | | | 163 | | | | 32,812 | |
Mitek Systems, Inc. (a) | | | 515 | | | | 3,399 | |
MobileIron, Inc. (a) | | | 750 | | | | 3,263 | |
Model N, Inc. (a) | | | 344 | | | | 3,027 | |
Monotype Imaging Holdings, Inc. | | | 660 | | | | 14,454 | |
Netscout Systems, Inc. (a) | | | 1,532 | | | | 51,016 | |
Nuance Communications, Inc. (a) | | | 3,814 | | | | 60,490 | |
Park City Group, Inc. (a) | | | 160 | | | | 2,024 | |
Paycom Software, Inc. (a) | | | 756 | | | | 34,957 | |
Pegasystems, Inc. | | | 659 | | | | 25,569 | |
| | | | | | | | |
| Common Stocks | | Shares | | | Value | |
Software (continued) | |
Progress Software Corp. | | | 823 | | | $ | 23,060 | |
Proofpoint, Inc. (a) | | | 701 | | | | 56,192 | |
PTC, Inc. (a) | | | 1,968 | | | | 103,458 | |
QAD, Inc., Class A | | | 124 | | | | 3,584 | |
Qualys, Inc. (a) | | | 442 | | | | 15,868 | |
Rapid7, Inc. (a) | | | 353 | | | | 4,402 | |
RealPage, Inc. (a) | | | 942 | | | | 28,825 | |
Rosetta Stone, Inc. (a) | | | 347 | | | | 3,054 | |
Rubicon Project, Inc. (a) | | | 550 | | | | 4,658 | |
Sapiens International Corp. NV | | | 381 | | | | 5,090 | |
SecureWorks Corp., Class A (a) | | | 142 | | | | 1,468 | |
Silver Spring Networks, Inc. (a) | | | 660 | | | | 8,435 | |
Splunk, Inc. (a) | | | 2,262 | | | | 130,879 | |
SS&C Technologies Holdings, Inc. | | | 2,913 | | | | 93,595 | |
Synchronoss Technologies, Inc. (a) | | | 742 | | | | 28,582 | |
Synopsys, Inc. (a) | | | 2,606 | | | | 163,891 | |
Tableau Software, Inc., Class A (a) | | | 950 | | | | 45,448 | |
Take-Two Interactive Software, Inc. (a) | | | 1,425 | | | | 76,451 | |
Tangoe, Inc. (a) | | | 377 | | | | 2,745 | |
TeleNav, Inc. (a) | | | 508 | | | | 4,521 | |
Tyler Technologies, Inc. (a) | | | 571 | | | | 83,377 | |
Ultimate Software Group, Inc. (a) | | | 474 | | | | 91,795 | |
Varonis Systems, Inc. (a) | | | 172 | | | | 5,143 | |
VASCO Data Security International, Inc. (a) | | | 544 | | | | 8,269 | |
Verint Systems, Inc. (a) | | | 1,072 | | | | 40,039 | |
VirnetX Holding Corp. (a) | | | 876 | | | | 2,278 | |
Workiva, Inc. (a) | | | 333 | | | | 4,196 | |
Zendesk, Inc. (a) | | | 1,431 | | | | 34,244 | |
Zix Corp. (a) | | | 922 | | | | 4,398 | |
Zynga, Inc., Class A (a) | | | 12,920 | | | | 32,558 | |
| | | | | | | | |
| | | | | | | | 2,512,488 | |
Specialty Retail — 2.2% | |
Aaron’s, Inc. | | | 1,138 | | | | 35,210 | |
Abercrombie & Fitch Co., Class A | | | 1,142 | | | | 13,259 | |
America’s Car-Mart, Inc. (a) | | | 110 | | | | 4,614 | |
American Eagle Outfitters, Inc. | | | 2,880 | | | | 43,517 | |
Asbury Automotive Group, Inc. (a) | | | 350 | | | | 22,960 | |
Ascena Retail Group, Inc. (a) | | | 2,795 | | | | 13,444 | |
AutoNation, Inc. (a) | | | 1,131 | | | | 60,079 | |
Barnes & Noble Education, Inc. (a) | | | 611 | | | | 6,140 | |
Barnes & Noble, Inc. | | | 1,055 | | | | 10,761 | |
Big 5 Sporting Goods Corp. | | | 288 | | | | 4,435 | |
BMC Stock Holdings, Inc. (a) | | | 886 | | | | 16,568 | |
Boot Barn Holdings, Inc. (a) | | | 421 | | | | 4,568 | |
Buckle, Inc. | | | 522 | | | | 11,040 | |
Build-A-Bear Workshop, Inc., Class A (a) | | | 212 | | | | 2,544 | |
Cabela’s, Inc. (a) | | | 879 | | | | 49,127 | |
Caleres, Inc. | | | 747 | | | | 22,970 | |
Cato Corp., Class A | | | 418 | | | | 10,613 | |
Chico’s FAS, Inc. | | | 2,258 | | | | 30,460 | |
Children’s Place, Inc. | | | 322 | | | | 31,234 | |
Citi Trends, Inc. | | | 225 | | | | 3,611 | |
Conn’s, Inc. (a) | | | 363 | | | | 3,830 | |
Container Store Group, Inc. (a) | | | 305 | | | | 1,485 | |
CST Brands, Inc. | | | 1,296 | | | | 62,441 | |
Destination XL Group, Inc. (a) | | | 666 | | | | 2,364 | |
Dick’s Sporting Goods, Inc. | | | 1,510 | | | | 77,916 | |
DSW, Inc., Class A | | | 1,173 | | | | 24,821 | |
Express, Inc. (a) | | | 1,251 | | | | 13,298 | |
Finish Line, Inc., Class A | | | 690 | | | | 11,868 | |
Five Below, Inc. (a) | | | 936 | | | | 37,300 | |
Foot Locker, Inc. | | | 2,328 | | | | 159,561 | |
Francesca’s Holdings Corp. (a) | | | 640 | | | | 11,162 | |
GameStop Corp., Class A | | | 1,770 | | | | 43,347 | |
Genesco, Inc. (a) | | | 359 | | | | 21,612 | |
GNC Holdings, Inc., Class A | | | 1,167 | | | | 10,351 | |
See Notes to Financial Statements.
| | | | | | |
| | | | | | | |
| 66 | | BLACKROCK FUNDS | | JANUARY 31, 2017 | | |
| | |
Schedule of Investments (continued) | | BlackRock Small/Mid Cap Index Fund |
| | | | | | | | |
| Common Stocks | | Shares | | | Value | |
Specialty Retail (continued) | |
Group 1 Automotive, Inc. | | | 362 | | | $ | 29,246 | |
Guess?, Inc. | | | 1,036 | | | | 13,230 | |
Haverty Furniture Cos., Inc. | | | 339 | | | | 7,390 | |
Hibbett Sports, Inc. (a) | | | 374 | | | | 12,342 | |
Kirkland’s, Inc. (a) | | | 239 | | | | 3,317 | |
Lithia Motors, Inc., Class A | | | 413 | | | | 42,589 | |
Lumber Liquidators Holdings, Inc. (a) | | | 501 | | | | 7,846 | |
MarineMax, Inc. (a) | | | 451 | | | | 9,674 | |
Michaels Cos., Inc. (a) | | | 1,637 | | | | 32,200 | |
Monro Muffler Brake, Inc. | | | 568 | | | | 34,023 | |
Office Depot, Inc. | | | 9,584 | | | | 42,649 | |
Party City Holdco, Inc. (a) | | | 395 | | | | 5,708 | |
Penske Automotive Group, Inc. | | | 675 | | | | 36,693 | |
Pier 1 Imports, Inc. | | | 1,345 | | | | 9,778 | |
Rent-A-Center, Inc. | | | 727 | | | | 6,514 | |
RH (a)(b) | | | 696 | | | | 18,806 | |
Sally Beauty Holdings, Inc. (a) | | | 2,545 | | | | 60,571 | |
Sears Hometown and Outlet Stores, Inc. (a) | | | 269 | | | | 982 | |
Select Comfort Corp. (a) | | | 745 | | | | 15,034 | |
Shoe Carnival, Inc. | | | 195 | | | | 4,986 | |
Sonic Automotive, Inc., Class A | | | 480 | | | | 11,232 | |
Sportsman’s Warehouse Holdings, Inc. (a) | | | 468 | | | | 3,482 | |
Stage Stores, Inc. | | | 294 | | | | 823 | |
Staples, Inc. | | | 11,127 | | | | 102,368 | |
Stein Mart, Inc. | | | 575 | | | | 2,104 | |
Systemax, Inc. | | | 197 | | | | 1,671 | |
Tailored Brands, Inc. | | | 869 | | | | 18,466 | |
Tile Shop Holdings, Inc. (a) | | | 548 | | | | 10,467 | |
Tilly’s, Inc., Class A (a) | | | 187 | | | | 2,506 | |
Urban Outfitters, Inc. (a) | | | 1,555 | | | | 41,270 | |
Vitamin Shoppe, Inc. (a) | | | 424 | | | | 9,180 | |
West Marine, Inc. (a) | | | 309 | | | | 2,864 | |
Williams-Sonoma, Inc. | | | 1,527 | | | | 73,617 | |
Winmark Corp. | | | 45 | | | | 4,984 | |
Zumiez, Inc. (a) | | | 257 | | | | 5,153 | |
| | | | | | | | |
| | | | | | | | 1,562,275 | |
Technology Hardware, Storage & Peripherals — 0.4% | |
3D Systems Corp. (a) | | | 1,832 | | | | 30,210 | |
Avid Technology, Inc. (a) | | | 628 | | | | 3,360 | |
CPI Card Group, Inc. | | | 229 | | | | 1,042 | |
Cray, Inc. (a) | | | 656 | | | | 11,250 | |
Diebold Nixdorf, Inc. | | | 1,211 | | | | 32,939 | |
Eastman Kodak Co. (a) | | | 270 | | | | 3,618 | |
Electronics for Imaging, Inc. (a) | | | 807 | | | | 36,266 | |
Immersion Corp. (a) | | | 421 | | | | 4,332 | |
NCR Corp. (a) | | | 2,131 | | | | 91,676 | |
Nimble Storage, Inc. (a) | | | 1,061 | | | | 9,093 | |
Pure Storage, Inc., Class A (a) | | | 1,130 | | | | 12,848 | |
Stratasys Ltd. (a) | | | 801 | | | | 15,796 | |
Super Micro Computer, Inc. (a) | | | 679 | | | | 17,959 | |
Synaptics, Inc. (a) | | | 618 | | | | 34,843 | |
USA Technologies, Inc. (a) | | | 508 | | | | 2,134 | |
| | | | | | | | |
| | | | | | | | 307,366 | |
Textiles, Apparel & Luxury Goods — 0.7% | |
Carter’s, Inc. | | | 867 | | | | 72,611 | |
Columbia Sportswear Co. | | | 483 | | | | 26,261 | |
Crocs, Inc. (a) | | | 1,319 | | | | 9,629 | |
Culp, Inc. | | | 147 | | | | 4,733 | |
Deckers Outdoor Corp. (a) | | | 564 | | | | 32,486 | |
Delta Apparel, Inc. (a) | | | 133 | | | | 2,492 | |
Fossil Group, Inc. (a) | | | 748 | | | | 19,126 | |
G-III Apparel Group Ltd. (a) | | | 762 | | | | 20,010 | |
Iconix Brand Group, Inc. (a) | | | 796 | | | | 8,191 | |
Kate Spade & Co. (a) | | | 2,205 | | | | 40,815 | |
lululemon athletica, Inc. (a) | | | 1,673 | | | | 112,944 | |
| | | | | | | | |
| Common Stocks | | Shares | | | Value | |
Textiles, Apparel & Luxury Goods (continued) | |
Movado Group, Inc. | | | 283 | | | $ | 7,683 | |
Oxford Industries, Inc. | | | 248 | | | | 13,645 | |
Perry Ellis International, Inc. (a) | | | 234 | | | | 5,520 | |
Sequential Brands Group, Inc. (a) | | | 637 | | | | 2,949 | |
Skechers U.S.A., Inc., Class A (a) | | | 2,272 | | | | 57,073 | |
Steven Madden Ltd. (a) | | | 1,050 | | | | 36,960 | |
Superior Uniform Group, Inc. | | | 125 | | | | 2,128 | |
Unifi, Inc. (a) | | | 229 | | | | 6,158 | |
Vera Bradley, Inc. (a) | | | 263 | | | | 3,014 | |
Vince Holding Corp. (a) | | | 233 | | | | 711 | |
Wolverine World Wide, Inc. | | | 1,700 | | | | 39,933 | |
| | | | | | | | |
| | | | | | | | 525,072 | |
Thrifts & Mortgage Finance — 1.3% | |
Astoria Financial Corp. | | | 1,646 | | | | 31,126 | |
Banc of California, Inc. | | | 837 | | | | 13,225 | |
Bank Mutual Corp. | | | 813 | | | | 7,764 | |
BankFinancial Corp. | | | 225 | | | | 3,031 | |
Bear State Financial, Inc. | | | 299 | | | | 3,011 | |
Beneficial Bancorp, Inc. | | | 1,235 | | | | 22,045 | |
Berkshire Hills Bancorp, Inc. | | | 554 | | | | 19,612 | |
BofI Holding, Inc. (a) | | | 1,045 | | | | 30,827 | |
Brookline Bancorp, Inc. | | | 1,145 | | | | 18,034 | |
BSB Bancorp, Inc. (a) | | | 121 | | | | 3,358 | |
Capitol Federal Financial, Inc. | | | 2,225 | | | | 34,376 | |
Charter Financial Corp. | | | 214 | | | | 3,676 | |
Clifton Bancorp, Inc. | | | 298 | | | | 4,625 | |
Dime Community Bancshares, Inc. | | | 540 | | | | 11,556 | |
ESSA Bancorp, Inc. | | | 159 | | | | 2,517 | |
Essent Group Ltd. (a) | | | 1,429 | | | | 49,400 | |
EverBank Financial Corp. | | | 1,795 | | | | 34,877 | |
Federal Agricultural Mortgage Corp., Class C | | | 170 | | | | 9,462 | |
First Defiance Financial Corp. | | | 157 | | | | 7,608 | |
Flagstar Bancorp, Inc. (a) | | | 384 | | | | 9,896 | |
Flushing Financial Corp. | | | 460 | | | | 12,512 | |
Hingham Institution for Savings | | | 20 | | | | 3,868 | |
Home Bancorp, Inc. | | | 91 | | | | 3,237 | |
HomeStreet, Inc. (a) | | | 399 | | | | 10,454 | |
Impac Mortgage Holdings, Inc. (a) | | | 184 | | | | 2,543 | |
Kearny Financial Corp. | | | 1,449 | | | | 22,097 | |
Ladder Capital Corp. | | | 871 | | | | 11,811 | |
LendingTree, Inc. (a) | | | 111 | | | | 12,421 | |
Meridian Bancorp, Inc. | | | 786 | | | | 14,816 | |
Meta Financial Group, Inc. | | | 157 | | | | 13,792 | |
MGIC Investment Corp. (a) | | | 6,053 | | | | 64,464 | |
Nationstar Mortgage Holdings, Inc. (a) | | | 525 | | | | 9,523 | |
NMI Holdings, Inc., Class A (a) | | | 1,022 | | | | 11,038 | |
Northfield Bancorp, Inc. | | | 679 | | | | 12,256 | |
Northwest Bancshares, Inc. | | | 1,757 | | | | 29,992 | |
OceanFirst Financial Corp. | | | 446 | | | | 12,671 | |
Ocwen Financial Corp. (a) | | | 1,677 | | | | 8,838 | |
Oritani Financial Corp. | | | 640 | | | | 11,104 | |
People’s United Financial, Inc. | | | 5,372 | | | | 100,725 | |
Provident Financial Holdings, Inc. | | | 127 | | | | 2,353 | |
Provident Financial Services, Inc. | | | 1,122 | | | | 29,699 | |
Radian Group, Inc. | | | 3,819 | | | | 70,270 | |
SI Financial Group, Inc. | | | 203 | | | | 3,055 | |
Southern Missouri Bancorp, Inc. | | | 97 | | | | 3,265 | |
Territorial Bancorp, Inc. | | | 106 | | | | 3,357 | |
TFS Financial Corp. | | | 937 | | | | 16,388 | |
TrustCo Bank Corp. NY | | | 1,487 | | | | 12,491 | |
United Community Financial Corp. | | | 726 | | | | 6,178 | |
United Financial Bancorp, Inc. | | | 839 | | | | 15,144 | |
Walker & Dunlop, Inc. (a) | | | 464 | | | | 14,574 | |
Washington Federal, Inc. | | | 1,575 | | | | 51,739 | |
Waterstone Financial, Inc. | | | 437 | | | | 7,910 | |
Western New England Bancorp, Inc. | | | 317 | | | | 3,075 | |
WSFS Financial Corp. | | | 531 | | | | 24,054 | |
| | | | | | | | |
| | | | | | | | 951,740 | |
See Notes to Financial Statements.
| | | | | | |
| | | | | | | |
| | BLACKROCK FUNDS | | JANUARY 31, 2017 | | 67 |
| | |
Schedule of Investments (continued) | | BlackRock Small/Mid Cap Index Fund |
| | | | | | | | |
| Common Stocks | | Shares | | | Value | |
Tobacco — 0.1% | |
Alliance One International, Inc. (a) | | | 176 | | | $ | 2,931 | |
Turning Point Brands, Inc. (a) | | | 122 | | | | 1,620 | |
Universal Corp. | | | 379 | | | | 25,772 | |
Vector Group Ltd. | | | 1,573 | | | | 34,700 | |
| | | | | | | | |
| | | | | | | | 65,023 | |
Trading Companies & Distributors — 1.4% | |
Aceto Corp. | | | 491 | | | | 9,373 | |
Air Lease Corp. | | | 1,675 | | | | 60,937 | |
Aircastle Ltd. | | | 857 | | | | 19,111 | |
Applied Industrial Technologies, Inc. | | | 623 | | | | 37,660 | |
Beacon Roofing Supply, Inc. (a) | | | 1,023 | | | | 44,777 | |
CAI International, Inc. (a) | | | 303 | | | | 4,890 | |
DXP Enterprises, Inc. (a) | | | 276 | | | | 10,438 | |
GATX Corp. | | | 693 | | | | 40,069 | |
GMS, Inc. (a) | | | 117 | | | | 3,491 | |
H&E Equipment Services, Inc. | | | 527 | | | | 13,628 | |
HD Supply Holdings, Inc. (a) | | | 3,476 | | | | 147,035 | |
Herc Holdings, Inc. (a) | | | 430 | | | | 21,358 | |
Kaman Corp. | | | 505 | | | | 25,518 | |
Lawson Products, Inc. (a) | | | 117 | | | | 3,025 | |
MRC Global, Inc. (a) | | | 1,624 | | | | 33,373 | |
MSC Industrial Direct Co., Inc., Class A | | | 760 | | | | 77,634 | |
Neff Corp., Class A (a) | | | 140 | | | | 2,198 | |
NOW, Inc. (a) | | | 1,851 | | | | 39,352 | |
Rush Enterprises, Inc., Class A (a) | | | 515 | | | | 16,866 | |
Rush Enterprises, Inc., Class B (a) | | | 112 | | | | 3,444 | |
SiteOne Landscape Supply, Inc. (a) | | | 198 | | | | 7,607 | |
Textainer Group Holdings Ltd. | | | 414 | | | | 5,962 | |
Titan Machinery, Inc. (a) | | | 258 | | | | 3,563 | |
Triton International, Ltd. | | | 691 | | | | 16,819 | |
United Rentals, Inc. (a) | | | 1,523 | | | | 192,675 | |
Univar, Inc. (a) | | | 749 | | | | 22,335 | |
Veritiv Corp. (a) | | | 152 | | | | 8,520 | |
Watsco, Inc. | | | 446 | | | | 68,122 | |
WESCO International, Inc. (a) | | | 843 | | | | 59,600 | |
Willis Lease Finance Corp. (a) | | | 56 | | | | 1,427 | |
| | | | | | | | |
| | | | | | | | 1,000,807 | |
Transportation Infrastructure — 0.2% | |
Macquarie Infrastructure Corp. | | | 1,301 | | | | 97,562 | |
Wesco Aircraft Holdings, Inc. (a) | | | 910 | | | | 13,787 | |
| | | | | | | | |
| | | | | | | | 111,349 | |
| | | | | | | | |
| Common Stocks | | Shares | | | Value | |
Water Utilities — 0.3% | |
American States Water Co. | | | 671 | | | $ | 29,376 | |
Aqua America, Inc. | | | 3,054 | | | | 92,872 | |
AquaVenture Holdings, Ltd. (a) | | | 106 | | | | 2,044 | |
Artesian Resources Corp., Class A | | | 106 | | | | 3,289 | |
California Water Service Group | | | 863 | | | | 29,773 | |
Connecticut Water Service, Inc. | | | 163 | | | | 8,809 | |
Consolidated Water Co. Ltd. | | | 249 | | | | 2,565 | |
Middlesex Water Co. | | | 252 | | | | 9,528 | |
SJW Corp. | | | 265 | | | | 13,276 | |
York Water Co. | | | 232 | | | | 8,306 | |
| | | | | | | | |
| | | | | | | | 199,838 | |
Wireless Telecommunication Services — 0.2% | |
Boingo Wireless, Inc. (a) | | | 629 | | | | 7,359 | |
NII Holdings, Inc. (a) | | | 1,367 | | | | 3,862 | |
RingCentral, Inc., Class��A (a) | | | 1,017 | | | | 23,747 | |
Shenandoah Telecommunications Co. | | | 866 | | | | 23,599 | |
Spok Holdings, Inc. | | | 348 | | | | 7,151 | |
Telephone & Data Systems, Inc. | | | 1,663 | | | | 50,971 | |
United States Cellular Corp. (a) | | | 243 | | | | 10,835 | |
| | | | | | | | |
| | | | | | | | 127,524 | |
| Total Common Stocks — 98.5% | | | | | | | 71,578,655 | |
| | | | | | | | |
Rights — 0.0% | |
Biotechnology — 0.0% | |
Dyax Corp. (a) | | | 502 | | | | 1,150 | |
Total Long-Term Investments
(Cost — $66,335,754) — 98.5% | | | | | | | 71,579,805 | |
| | | | | | | | |
| | | | | | | | | |
|
| Short-Term Securities | |
BlackRock Liquidity Funds, T-Fund, Institutional Class, 0.40% (c)(d) | | | 3,704,020 | | | | 3,704,020 | |
SL Liquidity Series, LLC, Money Market Series, 0.94% (c)(d)(e) | | | 283,228 | | | | 283,285 | |
Total Short-Term Securities
(Cost — $3,987,267) — 5.5% | | | | 3,987,305 | |
| Total Investments (Cost — $70,323,021) — 104.0% | | | | | | | 75,567,110 | |
Liabilities in Excess of Other Assets — (4.0)% | | | | | | | (2,874,137 | ) |
| | | | | | | | |
Net Assets — 100.0% | | | | | | $ | 72,692,973 | |
| | | | | | | | |
|
| Notes to Schedule of Investments |
| (a) | | Non-income producing security. |
| (b) | | Security, or a portion of security, is on loan. |
| (c) | | During the six months ended January 31, 2017, investments in issuers considered to be affiliates of the Fund for purposes of Section 2(a)(3) of the Investment Company Act of 1940, as amended, were as follows: |
| | | | | | | | | | | | | | | | | | | | | | | | | | | | | | | | |
| Affiliate | | Shares Held
at July 31,
2016 | | | Shares
Purchased | | | Shares
Sold | | | Shares Held
at January 31,
2017 | | | Value at
January 31,
2017 | | | Income | | | Net
Realized
Gain1 | | | Change in
Unrealized
Appreciation | |
BlackRock Liquidity Funds, T-Fund, Institutional Class | | | — | | | $ | 3,704,020 | 2 | | | — | | | | 3,704,020 | | | $ | 3,704,020 | | | $ | 2,217 | | | $ | 11 | | | | — | |
BlackRock Premier Government Institutional Fund | | $ | 2,735,369 | | | | — | | | | (2,735,369 | )3 | | | — | | | | — | | | | 980 | | | | — | | | | — | |
PennyMac Mortgage Investment Trust | | | 521 | | | | 462 | | | | — | | | | 983 | | | | 16,662 | | | | 775 | | | | — | | | $ | 724 | |
SL Liquidity Series, LLC, Money Market Series | | | 136,471 | | | | 146,757 | | | | — | | | $ | 283,228 | | | | 283,285 | | | | 10,300 | 4 | | | 10 | | | | 38 | |
Total | | | | | | | $ | 4,003,967 | | | $ | 14,272 | | | $ | 21 | | | $ | 762 | |
| | | | | | | | | | | | | | | | | | | | | |
1 Includes net capital gain distributions. | |
2 Represents net shares purchased. | |
3 Represents net shares sold. | |
4 Represents securities lending income earned from the reinvestment of cash collateral from loaned securities, net of fees and collateral investment expenses, and other payments to and from borrowers of securities. | |
See Notes to Financial Statements.
| | | | | | |
| | | | | | | |
| 68 | | BLACKROCK FUNDS | | JANUARY 31, 2017 | | |
| | |
Schedule of Investments (continued) | | BlackRock Small/Mid Cap Index Fund |
| (d) | | Current yield as of period end. |
| (e) | | Security was purchased with the cash collateral from loaned securities. |
For Fund compliance purposes, the Fund’s industry classifications refer to one or more of the industry sub-classifications used by one or more widely recognized market indexes or rating group indexes, and/or as defined by the investment adviser. These definitions may not apply for purposes of this report, which may combine such industry sub-classifications for reporting ease.
|
| Derivative Financial Instruments Outstanding as of Period End |
| | | | | | | | | | | | | | | | |
| Futures Contracts | |
Contracts
Long | | | Issue | | Expiration | | | Notional
Value | | | Unrealized
Appreciation
(Depreciation) | |
| | 9 | | | Russell 2000 Mini Index | | | March 2017 | | | $ | 611,775 | | | $ | (1,865 | ) |
| | 2 | | | S&P MidCap 400 E-Mini Index | | | March 2017 | | | $ | 337,100 | | | | 2,284 | |
| | Total | | | | | | | | | | | | | $ | 419 | |
| | | | | | | | | | | | | | | | |
|
| Derivative Financial Instruments Outstanding as of Period End |
As of period end, the fair values of derivative financial instruments located in the Statements of Assets and Liabilities were as follows:
| | | | | | | | | | | | | | | | | | | | | | | | | | | | | | | | |
| Assets — Derivative Financial Instruments | | | Commodity
Contracts | | | Credit
Contracts | | | Equity
Contracts | | | Foreign
Currency
Exchange
Contracts | | | Interest
Rate
Contracts | | | Other
Contracts | | | Total | |
Futures contracts | | | Net unrealized appreciation | | | | — | | | | — | | | $ | 2,284 | | | | — | | | | — | | | | — | | | $ | 2,284 | |
| | | | | | | | | | | | | | | | | | | | | | | | | | | | | | | | |
Liabilities — Derivative Financial Instruments | | | | | | | | | | | | | | | | | | | | | | | | | | | | | |
Futures contracts | | | Net unrealized depreciation | | | | — | | | | — | | | $ | 1,865 | | | | — | | | | — | | | | — | | | $ | 1,865 | |
| | | | | | | | | | | | | | | | | | | | | | | | | | | | | | | | |
| For the six months ended January 31, 2017, the effect of derivative financial instruments in the Statements of Operations was as follows: | |
| | | | | | | | | | | | | | | | | | | | | | | | | | | | | | | | |
Net Realized Gain (Loss) from: | | | | | | | | | | | | | | | | | | | | | | | | | | | | | | | | |
Futures contracts | | | | | | | — | | | | — | | | $ | 194,522 | | | | — | | | | | | | | — | | | $ | 194,522 | |
Net Change in Unrealized Appreciation (Depreciation) on: | | | | | | | | | | | | | | | | | | | | | | | | | | | | | |
Futures contracts | | | | | | | — | | | | — | | | $ | (2,629 | ) | | | — | | | | — | | | | — | | | $ | (2,629 | ) |
| | |
| Average Quarterly Balances of Outstanding Derivative Financial Instruments | | |
| | | | |
Futures contracts: | |
Average notional value of contracts — long | | $ | 938,318 | |
For more information about the Fund’s investment risks regarding derivative financial instruments, refer to the Notes to Financial Statements.
|
| Fair Value Hierarchy as of Period End |
Various inputs are used in determining the fair value of investments and derivative financial instruments. For information about the Fund’s policy regarding valuation of investments and derivative financial instruments, refer to the Notes to Financial Statements.
The following tables summarize the Fund’s investments and derivative financial instruments categorized in the disclosure hierarchy:
| | | | | | | | | | | | | | | | |
| | | Level 1 | | | Level 2 | | | Level 3 | | | Total | |
Assets: | |
| Investments: | |
Long-Term Investments1: | |
Common Stocks | | $ | 71,578,655 | | | | — | | | | — | | | $ | 71,578,655 | |
Rights | | | — | | | | — | | | $ | 1,150 | | | | 1,150 | |
Short-Term Securities | | | 3,704,020 | | | | — | | | | — | | | | 3,704,020 | |
| | | | | | | | | | | | | | | | |
Subtotal | | $ | 75,282,675 | | | | — | | | $ | 1,150 | | | $ | 75,283,825 | |
| | | | | | | | | | | | | | | | |
Investments valued at NAV2 | | | | | | | | | | | | | | | 283,285 | |
| | | | | | | | | | | | | | | | |
Total | | | | | | | | | | | | | | $ | 75,567,110 | |
| | | | | | | | | | | | | | | | |
See Notes to Financial Statements.
| | | | | | |
| | | | | | | |
| | BLACKROCK FUNDS | | JANUARY 31, 2017 | | 69 |
| | |
Schedule of Investments (concluded) | | BlackRock Small/Mid Cap Index Fund |
| | | | | | | | | | | | | | | | |
| | | Level 1 | | | Level 2 | | | Level 3 | | | Total | |
| Derivative Financial Instruments 3 | |
Assets: | |
Equity contracts | | $ | 2,284 | | | | — | | | | — | | | $ | 2,284 | |
Liabilities: | |
Equity contracts | | | (1,865 | ) | | | — | | | | — | | | | (1,865 | ) |
| | | | | | | | | | | | | | | | |
Total | | $ | 419 | | | | — | | | | — | | | $ | 419 | |
| | | | | | | | | | | | | | | | |
1 See above Schedule of Investments for values in each sector. | |
2 As of January 31, 2017, certain of the Fund’s investments were fair valued using NAV per share as no quoted market value is available and therefore have been excluded from the fair value hierarchy. | |
3 Derivative financial instruments are futures contracts, which are valued at the unrealized appreciation (depreciation) on the instrument. | |
During the six months ended January 31, 2017, there were no transfers between levels.
See Notes to Financial Statements.
| | | | | | |
| | | | | | | |
| 70 | | BLACKROCK FUNDS | | JANUARY 31, 2017 | | |
| | |
Schedule of Investments January 31, 2017 (Unaudited) | | BlackRock Total Stock Market Index Fund (Percentages shown are based on Net Assets) |
| | | | | | | | |
| Common Stocks | | Shares | | | Value | |
Aerospace & Defense — 2.0% | |
AAR Corp. | | | 576 | | | $ | 18,426 | |
Aerojet Rocketdyne Holdings, Inc. (a) | | | 1,016 | | | | 18,400 | |
Aerovironment, Inc. (a) | | | 274 | | | | 7,176 | |
Arconic, Inc. | | | 9,777 | | | | 222,818 | |
Astronics Corp. (a) | | | 299 | | | | 9,810 | |
B/E Aerospace, Inc. | | | 2,279 | | | | 140,090 | |
Boeing Co. | | | 13,654 | | | | 2,231,337 | |
Cubic Corp. | | | 548 | | | | 26,057 | |
Curtiss-Wright Corp. | | | 963 | | | | 94,432 | |
DigitalGlobe, Inc. (a) | | | 1,557 | | | | 43,674 | |
Ducommun, Inc. (a) | | | 229 | | | | 6,785 | |
Engility Holdings, Inc. (a) | | | 406 | | | | 11,908 | |
Esterline Technologies Corp. (a) | | | 696 | | | | 59,612 | |
General Dynamics Corp. | | | 5,526 | | | | 1,000,648 | |
HEICO Corp. | | | 382 | | | | 29,395 | |
HEICO Corp., Class A | | | 1,542 | | | | 102,235 | |
Hexcel Corp. | | | 2,007 | | | | 103,059 | |
Huntington Ingalls Industries, Inc. | | | 999 | | | | 193,766 | |
KEYW Holding Corp. (a) | | | 934 | | | | 9,349 | |
KLX, Inc. (a) | | | 1,279 | | | | 62,658 | |
Kratos Defense & Security Solutions, Inc. (a) | | | 883 | | | | 7,276 | |
L3 Technologies, Inc. | | | 1,914 | | | | 303,733 | |
Lockheed Martin Corp. | | | 5,802 | | | | 1,458,217 | |
Moog, Inc., Class A (a) | | | 1,056 | | | | 69,559 | |
National Presto Industries, Inc. | | | 82 | | | | 8,725 | |
Northrop Grumman Corp. | | | 3,756 | | | | 860,425 | |
Orbital ATK, Inc. | | | 1,348 | | | | 117,209 | |
Raytheon Co. | | | 6,719 | | | | 968,611 | |
Rockwell Collins, Inc. | | | 2,879 | | | | 261,298 | |
Sparton Corp. (a) | | | 231 | | | | 5,008 | |
Spirit Aerosystems Holdings, Inc., Class A | | | 2,664 | | | | 159,973 | |
Taser International, Inc. (a) | | | 1,444 | | | | 36,071 | |
Teledyne Technologies, Inc. (a) | | | 688 | | | | 84,535 | |
Textron, Inc. | | | 6,038 | | | | 286,020 | |
TransDigm Group, Inc. | | | 1,107 | | | | 239,555 | |
Triumph Group, Inc. | | | 1,299 | | | | 34,748 | |
United Technologies Corp. | | | 17,732 | | | | 1,944,668 | |
Vectrus, Inc. (a) | | | 359 | | | | 8,092 | |
| | | | | | | | |
| | | | | | | | 11,245,358 | |
Air Freight & Logistics — 0.6% | |
Air Transport Services Group, Inc. (a) | | | 816 | | | | 13,162 | |
Atlas Air Worldwide Holdings, Inc. (a) | | | 475 | | | | 25,056 | |
C.H. Robinson Worldwide, Inc. | | | 3,114 | | | | 236,851 | |
Echo Global Logistics, Inc. (a) | | | 550 | | | | 13,063 | |
Expeditors International of Washington, Inc. | | | 3,924 | | | | 204,362 | |
FedEx Corp. | | | 5,682 | | | | 1,074,523 | |
Forward Air Corp. | | | 560 | | | | 26,986 | |
Hub Group, Inc., Class A (a) | | | 632 | | | | 28,029 | |
Park-Ohio Holdings Corp. | | | 132 | | | | 5,920 | |
Radiant Logistics, Inc. (a) | | | 1,065 | | | | 3,909 | |
United Parcel Service, Inc., Class B | | | 15,836 | | | | 1,728,183 | |
XPO Logistics, Inc. (a) | | | 2,256 | | | | 100,933 | |
| | | | | | | | |
| | | | | | | | 3,460,977 | |
Airlines — 0.6% | |
Alaska Air Group, Inc. | | | 2,678 | | | | 251,250 | |
Allegiant Travel Co. | | | 307 | | | | 52,804 | |
American Airlines Group, Inc. | | | 12,046 | | | | 533,035 | |
Copa Holdings SA, Class A | | | 806 | | | | 78,577 | |
Delta Air Lines, Inc. | | | 17,521 | | | | 827,692 | |
Hawaiian Holdings, Inc. (a) | | | 1,184 | | | | 60,325 | |
JetBlue Airways Corp. (a) | | | 7,418 | | | | 145,467 | |
SkyWest, Inc. | | | 966 | | | | 34,196 | |
Southwest Airlines Co. | | | 14,520 | | | | 759,541 | |
Spirit Airlines, Inc. (a) | | | 1,641 | | | | 88,680 | |
United Continental Holdings, Inc. (a) | | | 7,170 | | | | 505,270 | |
| | | | | | | | |
| | | | | | | | 3,336,837 | |
| | | | | | | | |
| Common Stocks | | Shares | | | Value | |
Auto Components — 0.5% | |
Adient PLC (a) | | | 2,281 | | | $ | 144,821 | |
Allison Transmission Holdings, Inc. | | | 3,103 | | | | 108,543 | |
American Axle & Manufacturing Holdings, Inc. (a) | | | 1,972 | | | | 40,229 | |
BorgWarner, Inc. | | | 4,943 | | | | 201,823 | |
Cooper Tire & Rubber Co. | | | 1,248 | | | | 45,240 | |
Cooper-Standard Holding, Inc. (a) | | | 383 | | | | 40,322 | |
Dana, Inc. | | | 3,424 | | | | 68,959 | |
Delphi Automotive PLC | | | 6,171 | | | | 432,340 | |
Dorman Products, Inc. (a) | | | 620 | | | | 42,792 | |
Fox Factory Holding Corp. (a) | | | 691 | | | | 17,897 | |
Gentex Corp. | | | 6,260 | | | | 130,771 | |
Gentherm, Inc. (a) | | | 724 | | | | 25,630 | |
Goodyear Tire & Rubber Co. | | | 6,066 | | | | 196,478 | |
Horizon Global Corp. (a) | | | 519 | | | | 10,157 | |
Johnson Controls International PLC | | | 20,805 | | | | 915,004 | |
LCI Industries | | | 539 | | | | 59,155 | |
Lear Corp. | | | 1,684 | | | | 239,280 | |
Metaldyne Performance Group, Inc. | | | 260 | | | | 6,136 | |
Modine Manufacturing Co. (a) | | | 686 | | | | 9,330 | |
Motorcar Parts of America, Inc. (a) | | | 249 | | | | 6,531 | |
Spartan Motors, Inc. | | | 620 | | | | 4,898 | |
Standard Motor Products, Inc. | | | 386 | | | | 19,250 | |
Stoneridge, Inc. (a) | | | 452 | | | | 7,417 | |
Strattec Security Corp. | | | 195 | | | | 6,006 | |
Superior Industries International, Inc. | | | 483 | | | | 11,133 | |
Tenneco, Inc. (a) | | | 1,503 | | | | 101,377 | |
Tower International, Inc. | | | 322 | | | | 8,436 | |
Visteon Corp. (a) | | | 826 | | | | 73,985 | |
| | | | | | | | |
| | | | | | | | 2,973,940 | |
Automobiles — 0.6% | |
Ford Motor Co. | | | 88,306 | | | | 1,091,462 | |
General Motors Co. | | | 31,797 | | | | 1,164,088 | |
Harley-Davidson, Inc. | | | 4,062 | | | | 231,696 | |
Tesla Motors, Inc. (a) | | | 2,848 | | | | 717,497 | |
Thor Industries, Inc. | | | 1,051 | | | | 108,779 | |
Winnebago Industries, Inc. | | | 515 | | | | 16,171 | |
| | | | | | | | |
| | | | | | | | 3,329,693 | |
Banks — 6.6% | |
1st Source Corp. | | | 180 | | | | 8,120 | |
ACNB Corp. | | | 387 | | | | 11,610 | |
Allegiance Bancshares, Inc. (a) | | | 408 | | | | 13,240 | |
American National Bankshares, Inc. | | | 234 | | | | 8,307 | |
Ameris Bancorp | | | 882 | | | | 39,778 | |
Ames National Corp. | | | 233 | | | | 7,526 | |
Arrow Financial Corp. | | | 430 | | | | 15,179 | |
Associated Banc-Corp | | | 3,670 | | | | 92,851 | |
Bancfirst Corp. | | | 95 | | | | 8,963 | |
Banco Latinoamericano de Comercio Exterior SA | | | 516 | | | | 14,035 | |
BancorpSouth, Inc. | | | 2,073 | | | | 61,568 | |
Bank of America Corp. | | | 235,130 | | | | 5,323,343 | |
Bank of Hawaii Corp. | | | 882 | | | | 75,773 | |
Bank of the Ozarks, Inc. | | | 1,875 | | | | 102,881 | |
BankUnited, Inc. | | | 2,121 | | | | 81,022 | |
Banner Corp. | | | 592 | | | | 33,223 | |
Bar Harbor Bankshares | | | 1,443 | | | | 62,525 | |
BB&T Corp. | | | 18,323 | | | | 846,339 | |
Blue Hills Bancorp, Inc. | | | 840 | | | | 15,960 | |
BNC Bancorp | | | 1,442 | | | | 50,831 | |
BOK Financial Corp. | | | 589 | | | | 48,439 | |
Boston Private Financial Holdings, Inc. | | | 4,725 | | | | 77,963 | |
Bridge Bancorp, Inc. | | | 369 | | | | 13,339 | |
Bryn Mawr Bank Corp. | | | 476 | | | | 19,064 | |
Camden National Corp. | | | 528 | | | | 21,901 | |
Capital Bank Financial Corp., Class A | | | 303 | | | | 11,938 | |
Cardinal Financial Corp. | | | 474 | | | | 14,865 | |
See Notes to Financial Statements.
| | | | | | |
| | | | | | | |
| | BLACKROCK FUNDS | | JANUARY 31, 2017 | | 71 |
| | |
Schedule of Investments (continued) | | BlackRock Total Stock Market Index Fund |
| | | | | | | | |
| Common Stocks | | Shares | | | Value | |
Banks (continued) | |
Carolina Financial Corp. | | | 506 | | | $ | 15,155 | |
Cathay General Bancorp | | | 2,019 | | | | 73,572 | |
Centerstate Banks, Inc. | | | 3,196 | | | | 77,950 | |
Central Pacific Financial Corp. | | | 427 | | | | 13,378 | |
Chemical Financial Corp. | | | 1,425 | | | | 70,438 | |
CIT Group, Inc. | | | 4,529 | | | | 186,550 | |
Citigroup, Inc. | | | 63,756 | | | | 3,559,498 | |
Citizens & Northern Corp. | | | 322 | | | | 7,651 | |
Citizens Financial Group, Inc. | | | 11,677 | | | | 422,357 | |
City Holding Co. | | | 249 | | | | 16,207 | |
CoBiz Financial, Inc. | | | 792 | | | | 13,876 | |
Codorus Valley Bancorp, Inc. | | | 295 | | | | 7,573 | |
Columbia Banking System, Inc. | | | 991 | | | | 39,402 | |
Comerica, Inc. | | | 3,790 | | | | 255,939 | |
Commerce Bancshares, Inc. | | | 1,992 | | | | 112,608 | |
Community Bank System, Inc. | | | 1,056 | | | | 61,628 | |
Community Trust Bancorp, Inc. | | | 312 | | | | 14,430 | |
ConnectOne Bancorp, Inc. | | | 619 | | | | 15,289 | |
CU Bancorp (a) | | | 561 | | | | 20,336 | |
Cullen/Frost Bankers, Inc. | | | 1,116 | | | | 99,770 | |
Customers Bancorp, Inc. (a) | | | 320 | | | | 11,027 | |
CVB Financial Corp. | | | 3,868 | | | | 87,185 | |
Eagle Bancorp, Inc. (a) | | | 521 | | | | 31,911 | |
East West Bancorp, Inc. | | | 3,363 | | | | 172,993 | |
Enterprise Financial Services Corp. | | | 346 | | | | 14,411 | |
Farmers Capital Bank Corp. | | | 262 | | | | 9,733 | |
FCB Financial Holdings, Inc., Class A (a) | | | 513 | | | | 24,085 | |
Fidelity Southern Corp. | | | 744 | | | | 17,298 | |
Fifth Third Bancorp | | | 16,772 | | | | 437,749 | |
Financial Institutions, Inc. | | | 439 | | | | 14,465 | |
First Bancorp, Inc. | | | 314 | | | | 8,478 | |
First Bancorp, North Carolina | | | 584 | | | | 17,094 | |
First BanCorp, Puerto Rico (a) | | | 1,903 | | | | 12,788 | |
First Busey Corp. | | | 408 | | | | 11,934 | |
First Business Financial Services, Inc. | | | 443 | | | | 10,734 | |
First Citizens BancShares, Inc., Class A | | | 164 | | | | 60,145 | |
First Commonwealth Financial Corp. | | | 1,105 | | | | 15,603 | |
First Community Bancshares, Inc. | | | 576 | | | | 16,762 | |
First Community Financial Partners, Inc. (a) | | | 703 | | | | 8,366 | |
First Financial Bancorp | | | 1,627 | | | | 44,824 | |
First Financial Bankshares, Inc. | | | 1,943 | | | | 82,869 | |
First Financial Corp. | | | 269 | | | | 13,006 | |
First Foundation, Inc. (a) | | | 1,126 | | | | 16,327 | |
First Hawaiian, Inc. | | | 374 | | | | 12,338 | |
First Horizon National Corp. | | | 5,041 | | | | 100,820 | |
First Interstate Bancsystem, Inc., Class A | | | 383 | | | | 15,760 | |
First Merchants Corp. | | | 616 | | | | 23,611 | |
First Midwest Bancorp, Inc. | | | 3,356 | | | | 81,484 | |
First NBC Bank Holding Co. (a) | | | 204 | | | | 816 | |
First of Long Island Corp. | | | 640 | | | | 17,344 | |
First Republic Bank | | | 3,188 | | | | 300,724 | |
FNB Corp. | | | 5,076 | | | | 75,835 | |
Franklin Financial Network, Inc. (a) | | | 413 | | | | 15,921 | |
Fulton Financial Corp. | | | 2,904 | | | | 52,853 | |
German American Bancorp, Inc. | | | 417 | | | | 20,012 | |
Glacier Bancorp, Inc. | | | 2,406 | | | | 85,485 | |
Great Southern Bancorp, Inc. | | | 266 | | | | 13,313 | |
Great Western Bancorp, Inc. | | | 1,678 | | | | 71,735 | |
Hancock Holding Co. | | | 816 | | | | 37,414 | |
Hanmi Financial Corp. | | | 471 | | | | 15,614 | |
Heartland Financial USA, Inc. | | | 347 | | | | 16,240 | |
Heritage Commerce Corp. | | | 1,357 | | | | 19,052 | |
Heritage Financial Corp. | | | 731 | | | | 18,641 | |
Home BancShares, Inc. | | | 2,685 | | | | 72,334 | |
HomeTrust Bancshares, Inc. (a) | | | 642 | | | | 15,890 | |
Hope Bancorp, Inc. | | | 3,638 | | | | 76,071 | |
Horizon Bancorp | | | 598 | | | | 15,327 | |
| | | | | | | | |
| Common Stocks | | Shares | | | Value | |
Banks (continued) | |
Huntington Bancshares, Inc. | | | 22,957 | | | $ | 310,608 | |
Iberiabank Corp. | | | 1,353 | | | | 111,149 | |
Independent Bank Corp. | | | 1,342 | | | | 46,252 | |
Independent Bank Group, Inc. | | | 156 | | | | 9,695 | |
International Bancshares Corp. | | | 909 | | | | 33,724 | |
Investors Bancorp, Inc. | | | 6,086 | | | | 87,334 | |
JPMorgan Chase & Co. | | | 83,335 | | | | 7,052,641 | |
KeyCorp | | | 23,724 | | | | 426,320 | |
Lakeland Bancorp, Inc. | | | 1,021 | | | | 18,940 | |
Lakeland Financial Corp. | | | 316 | | | | 14,037 | |
LCNB Corp. | | | 345 | | | | 7,763 | |
LegacyTexas Financial Group, Inc. | | | 863 | | | | 35,659 | |
M&T Bank Corp. | | | 3,310 | | | | 538,107 | |
Macatawa Bank Corp. | | | 816 | | | | 8,340 | |
MainSource Financial Group, Inc. | | | 511 | | | | 16,791 | |
MB Financial, Inc. | | | 1,595 | | | | 71,025 | |
MBT Financial Corp. | | | 784 | | | | 8,467 | |
Mercantile Bank Corp. | | | 497 | | | | 16,053 | |
Merchants Bancshares, Inc. | | | 158 | | | | 8,058 | |
Middleburg Financial Corp. | | | 417 | | | | 14,320 | |
MutualFirst Financial, Inc. | | | 253 | | | | 7,906 | |
National Bank Holdings Corp., Class A | | | 665 | | | | 21,613 | |
National Bankshares, Inc. | | | 185 | | | | 8,057 | |
NBT Bancorp, Inc. | | | 716 | | | | 29,170 | |
Nicolet Bankshares, Inc. (a) | | | 324 | | | | 15,704 | |
OFG Bancorp | | | 1,049 | | | | 13,899 | |
Old Line Bancshares, Inc. | | | 322 | | | | 8,633 | |
Old National Bancorp | | | 2,410 | | | | 42,778 | |
Opus Bank | | | 316 | | | | 6,431 | |
Orrstown Financial Services, Inc. | | | 348 | | | | 7,639 | |
Pacific Continental Corp. | | | 915 | | | | 22,692 | |
Pacific Premier Bancorp, Inc. (a) | | | 500 | | | | 19,675 | |
PacWest Bancorp | | | 2,573 | | | | 142,544 | |
Park National Corp. | | | 310 | | | | 34,345 | |
Park Sterling Corp. | | | 2,049 | | | | 23,973 | |
Peapack Gladstone Financial Corp. | | | 523 | | | | 15,797 | |
Penns Woods Bancorp, Inc. | | | 162 | | | | 7,484 | |
Peoples Bancorp, Inc. | | | 664 | | | | 20,617 | |
Peoples Financial Services Corp. | | | 169 | | | | 7,267 | |
Pinnacle Financial Partners, Inc. | | | 1,031 | | | | 68,922 | |
PNC Financial Services Group, Inc. (b) | | | 11,332 | | | | 1,365,053 | |
Popular, Inc. | | | 2,812 | | | | 124,937 | |
Preferred Bank | | | 405 | | | | 22,441 | |
Premier Financial Bancorp, Inc. | | | 400 | | | | 7,328 | |
PrivateBancorp, Inc. | | | 1,663 | | | | 90,900 | |
Prosperity Bancshares, Inc. | | | 1,572 | | | | 114,174 | |
QCR Holdings, Inc. | | | 413 | | | | 17,325 | |
Regions Financial Corp. | | | 27,992 | | | | 403,365 | |
Renasant Corp. | | | 687 | | | | 27,343 | |
Republic First Bancorp, Inc. (a) | | | 1,213 | | | | 9,158 | |
S&T Bancorp, Inc. | | | 563 | | | | 21,180 | |
Sandy Spring Bancorp, Inc. | | | 402 | | | | 16,470 | |
Seacoast Banking Corp. of Florida (a) | | | 515 | | | | 11,217 | |
ServisFirst Bancshares, Inc. | | | 1,364 | | | | 54,615 | |
Signature Bank (a) | | | 1,190 | | | | 187,449 | |
Simmons First National Corp., Class A | | | 548 | | | | 32,962 | |
South State Corp. | | | 686 | | | | 61,328 | |
Southside Bancshares, Inc. | | | 1,883 | | | | 64,323 | |
Southwest Bancorp, Inc. | | | 219 | | | | 6,066 | |
State Bank Financial Corp. | | | 612 | | | | 16,181 | |
Sterling Bancorp | | | 3,268 | | | | 77,942 | |
Stock Yards Bancorp, Inc. | | | 496 | | | | 22,221 | |
Stonegate Bank | | | 463 | | | | 21,071 | |
Suffolk Bancorp | | | 407 | | | | 16,858 | |
Summit Financial Group, Inc. | | | 488 | | | | 12,761 | |
SunTrust Banks, Inc. | | | 11,116 | | | | 631,611 | |
SVB Financial Group (a) | | | 1,131 | | | | 194,792 | |
See Notes to Financial Statements.
| | | | | | |
| | | | | | | |
| 72 | | BLACKROCK FUNDS | | JANUARY 31, 2017 | | |
| | |
Schedule of Investments (continued) | | BlackRock Total Stock Market Index Fund |
| | | | | | | | |
| Common Stocks | | Shares | | | Value | |
Banks (continued) | |
Synovus Financial Corp. | | | 2,536 | | | $ | 105,700 | |
TCF Financial Corp. | | | 4,103 | | | | 71,187 | |
Texas Capital Bancshares, Inc. (a) | | | 1,429 | | | | 117,893 | |
Tompkins Financial Corp. | | | 237 | | | | 21,460 | |
TowneBank | | | 886 | | | | 28,529 | |
Trico Bancshares | | | 439 | | | | 16,186 | |
Tristate Capital Holdings, Inc. (a) | | | 771 | | | | 17,116 | |
Triumph Bancorp, Inc. (a) | | | 569 | | | | 15,391 | |
Trustmark Corp. | | | 1,081 | | | | 36,343 | |
UMB Financial Corp. | | | 908 | | | | 70,043 | |
Umpqua Holdings Corp. | | | 4,658 | | | | 85,288 | |
Union Bankshares Corp. | | | 1,170 | | | | 43,009 | |
Union Bankshares, Inc. (c) | | | 330 | | | | 13,695 | |
United Bankshares, Inc. | | | 1,511 | | | | 67,693 | |
United Community Banks, Inc. | | | 1,961 | | | | 55,163 | |
Univest Corp. of Pennsylvania | | | 396 | | | | 11,147 | |
US Bancorp | | | 37,097 | | | | 1,953,157 | |
Valley National Bancorp | | | 6,763 | | | | 81,900 | |
Washington Trust Bancorp, Inc. | | | 276 | | | | 15,042 | |
WashingtonFirst Bankshares, Inc. | | | 301 | | | | 8,383 | |
Webster Financial Corp. | | | 1,967 | | | | 103,307 | |
Wells Fargo & Co. | | | 104,646 | | | | 5,894,709 | |
WesBanco, Inc. | | | 1,029 | | | | 42,704 | |
Westamerica BanCorp | | | 648 | | | | 36,774 | |
Western Alliance Bancorp (a) | | | 1,950 | | | | 96,291 | |
Wintrust Financial Corp. | | | 1,095 | | | | 78,402 | |
Yadkin Financial Corp. | | | 842 | | | | 26,944 | |
Zions Bancorporation | | | 4,494 | | | | 189,602 | |
| | | | | | | | |
| | | | | | | | 36,773,169 | |
Beverages — 1.6% | |
Boston Beer Co., Inc., Class A (a) | | | 166 | | | | 25,514 | |
Brown-Forman Corp., Class A | | | 1,148 | | | | 53,703 | |
Brown-Forman Corp., Class B | | | 4,214 | | | | 192,158 | |
Coca-Cola Bottling Co. Consolidated | | | 89 | | | | 15,027 | |
Coca-Cola Co. | | | 89,451 | | | | 3,718,478 | |
Constellation Brands, Inc., Class A | | | 3,752 | | | | 561,899 | |
Craft Brew Alliance, Inc. (a) | | | 284 | | | | 4,317 | |
Dr. Pepper Snapple Group, Inc. | | | 4,143 | | | | 377,842 | |
MGP Ingredients, Inc. | | | 219 | | | | 9,283 | |
Molson Coors Brewing Co., Class B | | | 3,878 | | | | 374,305 | |
Monster Beverage Corp. (a) | | | 9,576 | | | | 407,938 | |
National Beverage Corp. | | | 227 | | | | 11,393 | |
PepsiCo, Inc. | | | 33,128 | | | | 3,438,024 | |
Primo Water Corp. (a) | | | 879 | | | | 11,357 | |
| | | | | | | | |
| | | | | | | | 9,201,238 | |
Biotechnology — 2.9% | |
AbbVie, Inc. | | | 37,228 | | | | 2,275,003 | |
ACADIA Pharmaceuticals, Inc. (a) | | | 2,668 | | | | 92,286 | |
Acceleron Pharma, Inc. (a) | | | 555 | | | | 13,475 | |
Achillion Pharmaceuticals, Inc. (a) | | | 2,422 | | | | 10,100 | |
Acorda Therapeutics, Inc. (a) | | | 1,558 | | | | 31,939 | |
Adamas Pharmaceuticals, Inc. (a) | | | 202 | | | | 3,206 | |
Aduro Biotech, Inc. (a) | | | 478 | | | | 5,664 | |
Advaxis, Inc. (a) | | | 420 | | | | 3,763 | |
Aevi Genomic Medicine, Inc. (a) | | | 709 | | | | 3,375 | |
Agenus, Inc. (a) | | | 860 | | | | 3,440 | |
Agios Pharmaceuticals, Inc. (a) | | | 616 | | | | 26,506 | |
Aimmune Therapeutics, Inc. (a) | | | 432 | | | | 7,897 | |
Akebia Therapeutics, Inc. (a) | | | 437 | | | | 4,383 | |
Alder Biopharmaceuticals, Inc. (a) | | | 843 | | | | 17,324 | |
Alexion Pharmaceuticals, Inc. (a) | | | 5,017 | | | | 655,622 | |
Alkermes PLC (a) | | | 3,521 | | | | 190,521 | |
Alnylam Pharmaceuticals, Inc. (a) | | | 2,085 | | | | 83,379 | |
AMAG Pharmaceuticals, Inc. (a) | | | 692 | | | | 16,677 | |
Amgen, Inc. | | | 17,267 | | | | 2,705,394 | |
| | | | | | | | |
| Common Stocks | | Shares | | | Value | |
Biotechnology (continued) | |
Amicus Therapeutics, Inc. (a) | | | 2,618 | | | $ | 14,399 | |
Anavex Life Sciences Corp. (a)(c) | | | 580 | | | | 2,610 | |
Applied Genetic Technologies Corp. (a) | | | 171 | | | | 1,240 | |
Aptevo Therapeutics, Inc. (a) | | | 323 | | | | 643 | |
AquaBounty Technologies, Inc. (a) | | | 16 | | | | 221 | |
Ardelyx, Inc. (a) | | | 547 | | | | 6,564 | |
Arena Pharmaceuticals, Inc. (a) | | | 3,789 | | | | 5,835 | |
Ariad Pharmaceuticals, Inc. (a) | | | 4,169 | | | | 99,306 | |
Array BioPharma, Inc. (a) | | | 3,222 | | | | 35,023 | |
Arrowhead Pharmaceuticals, Inc. (a) | | | 681 | | | | 1,321 | |
Atara Biotherapeutics, Inc. (a) | | | 449 | | | | 6,039 | |
Athersys, Inc. (a) | | | 1,234 | | | | 1,345 | |
Avexis, Inc. (a) | | | 61 | | | | 3,403 | |
Axovant Sciences Ltd. (a) | | | 290 | | | | 3,553 | |
Bellicum Pharmaceuticals, Inc. (a) | | | 229 | | | | 3,064 | |
BioCryst Pharmaceuticals, Inc. (a) | | | 2,094 | | | | 13,192 | |
Biogen, Inc. (a) | | | 5,034 | | | | 1,395,626 | |
BioMarin Pharmaceutical, Inc. (a) | | | 3,835 | | | | 336,061 | |
Biospecifics Technologies Corp. (a) | | | 73 | | | | 3,744 | |
BioTime, Inc. (a) | | | 1,303 | | | | 4,078 | |
Bluebird Bio, Inc. (a) | | | 1,050 | | | | 78,225 | |
Blueprint Medicines Corp. (a) | | | 404 | | | | 13,768 | |
Cara Therapeutics, Inc. (a) | | | 462 | | | | 7,078 | |
Celgene Corp. (a) | | | 17,658 | | | | 2,050,977 | |
Celldex Therapeutics, Inc. (a) | | | 2,655 | | | | 8,655 | |
Cellular Biomedicine Group, Inc. (a) | | | 281 | | | | 3,484 | |
ChemoCentryx, Inc. (a) | | | 482 | | | | 3,504 | |
Chimerix, Inc. (a) | | | 931 | | | | 5,065 | |
Clovis Oncology, Inc. (a) | | | 806 | | | | 52,229 | |
Coherus Biosciences, Inc. (a) | | | 566 | | | | 15,791 | |
Concert Pharmaceuticals, Inc. (a) | | | 219 | | | | 1,938 | |
Curis, Inc. (a) | | | 1,975 | | | | 5,668 | |
Cytokinetics, Inc. (a) | | | 407 | | | | 4,253 | |
CytomX Therapeutics, Inc. (a) | | | 253 | | | | 2,940 | |
Dynavax Technologies Corp. (a) | | | 478 | | | | 1,960 | |
Eagle Pharmaceuticals, Inc. (a) | | | 156 | | | | 10,797 | |
Edge Therapeutics, Inc. (a) | | | 255 | | | | 2,456 | |
Editas Medicine, Inc. (a)(c) | | | 30 | | | | 523 | |
Emergent Biosolutions, Inc. (a) | | | 869 | | | | 26,305 | |
Enanta Pharmaceuticals, Inc. (a) | | | 421 | | | | 13,946 | |
Epizyme, Inc. (a) | | | 581 | | | | 6,100 | |
Esperion Therapeutics, Inc. (a) | | | 354 | | | | 4,290 | |
Exact Sciences Corp. (a) | | | 2,903 | | | | 55,012 | |
Exelixis, Inc. (a) | | | 5,307 | | | | 96,163 | |
FibroGen, Inc. (a) | | | 1,025 | | | | 23,216 | |
Five Prime Therapeutics, Inc. (a) | | | 764 | | | | 34,999 | |
Flexion Therapeutics, Inc. (a) | | | 493 | | | | 9,564 | |
Foundation Medicine, Inc. (a) | | | 293 | | | | 5,728 | |
Genomic Health, Inc. (a) | | | 261 | | | | 7,172 | |
Geron Corp. (a) | | | 2,354 | | | | 4,896 | |
Gilead Sciences, Inc. | | | 30,410 | | | | 2,203,204 | |
Global Blood Therapeutics, Inc. (a) | | | 145 | | | | 2,342 | |
Halozyme Therapeutics, Inc. (a) | | | 3,170 | | | | 36,613 | |
Heron Therapeutics, Inc. (a) | | | 376 | | | | 4,888 | |
Idera Pharmaceuticals, Inc. (a) | | | 2,309 | | | | 3,233 | |
Ignyta, Inc. (a) | | | 481 | | | | 2,357 | |
ImmunoGen, Inc. (a) | | | 2,093 | | | | 4,898 | |
Immunomedics, Inc. (a) | | | 1,402 | | | | 6,309 | |
Incyte Corp. (a) | | | 3,758 | | | | 455,507 | |
Innoviva, Inc. (a) | | | 2,582 | | | | 27,369 | |
Inotek Pharmaceuticals Corp. (a) | | | 326 | | | | 522 | |
Inovio Pharmaceuticals, Inc. (a) | | | 806 | | | | 5,320 | |
Insmed, Inc. (a) | | | 1,242 | | | | 18,344 | |
Insys Therapeutics, Inc. (a)(c) | | | 259 | | | | 2,652 | |
Intercept Pharmaceuticals, Inc. (a) | | | 320 | | | | 35,120 | |
Intrexon Corp. (a) | | | 1,092 | | | | 23,107 | |
See Notes to Financial Statements.
| | | | | | |
| | | | | | | |
| | BLACKROCK FUNDS | | JANUARY 31, 2017 | | 73 |
| | |
Schedule of Investments (continued) | | BlackRock Total Stock Market Index Fund |
| | | | | | | | |
| Common Stocks | | Shares | | | Value | |
Biotechnology (continued) | |
Invitae Corp., cost $28,390,380) (Acquired 10/08/14, cost (a) | | | 635 | | | $ | 5,315 | |
Ionis Pharmaceuticals, Inc. (a) | | | 2,778 | | | | 123,621 | |
Ironwood Pharmaceuticals, Inc. (a) | | | 3,329 | | | | 47,871 | |
Juno Therapeutics, Inc. (a) | | | 1,860 | | | | 39,692 | |
Karyopharm Therapeutics, Inc. (a) | | | 521 | | | | 5,392 | |
Keryx Biopharmaceuticals, Inc. (a) | | | 1,317 | | | | 6,572 | |
Kite Pharma, Inc. (a)(c) | | | 1,099 | | | | 56,016 | |
La Jolla Pharmaceutical Co. (a) | | | 192 | | | | 3,734 | |
Lexicon Pharmaceuticals, Inc. (a) | | | 862 | | | | 12,352 | |
Ligand Pharmaceuticals, Inc. (a) | | | 551 | | | | 58,412 | |
Lion Biotechnologies, Inc. (a) | | | 1,066 | | | | 7,728 | |
Loxo Oncology, Inc. (a) | | | 149 | | | | 5,845 | |
MacroGenics, Inc. (a) | | | 529 | | | | 9,771 | |
MannKind Corp. (a) | | | 2,524 | | | | 1,777 | |
MediciNova, Inc. (a) | | | 353 | | | | 1,963 | |
Merrimack Pharmaceuticals, Inc. (a) | | | 2,034 | | | | 6,326 | |
MiMedx Group, Inc. (a) | | | 1,930 | | | | 15,594 | |
Minerva Neurosciences, Inc. (a) | | | 223 | | | | 2,364 | |
Momenta Pharmaceuticals, Inc. (a) | | | 1,073 | | | | 20,280 | |
Myriad Genetics, Inc. (a) | | | 1,797 | | | | 29,075 | |
Natera, Inc. (a) | | | 274 | | | | 2,455 | |
Neurocrine Biosciences, Inc. (a) | | | 2,159 | | | | 92,643 | |
NewLink Genetics Corp. (a) | | | 181 | | | | 2,203 | |
Novavax, Inc. (a) | | | 5,716 | | | | 7,488 | |
OncoMed Pharmaceuticals, Inc. (a) | | | 75 | | | | 620 | |
Ophthotech Corp. (a) | | | 521 | | | | 2,480 | |
OPKO Health, Inc. (a) | | | 7,590 | | | | 65,957 | |
Organovo Holdings, Inc. (a) | | | 1,130 | | | | 4,170 | |
Otonomy, Inc. (a) | | | 261 | | | | 3,824 | |
OvaScience, Inc. (a) | | | 115 | | | | 182 | |
PDL BioPharma, Inc. | | | 4,251 | | | | 9,352 | |
Pfenex, Inc. (a) | | | 404 | | | | 3,224 | |
Portola Pharmaceuticals, Inc. (a) | | | 1,510 | | | | 41,147 | |
Progenics Pharmaceuticals, Inc. (a) | | | 1,204 | | | | 10,740 | |
Protagonist Therapeutics, Inc. (a) | | | 153 | | | | 2,760 | |
Prothena Corp. PLC (a) | | | 661 | | | | 32,363 | |
PTC Therapeutics, Inc. (a) | | | 727 | | | | 9,524 | |
Puma Biotechnology, Inc. (a) | | | 555 | | | | 17,982 | |
Radius Health, Inc. (a) | | | 623 | | | | 27,113 | |
Regeneron Pharmaceuticals, Inc. (a) | | | 1,797 | | | | 645,644 | |
REGENXBIO, Inc. (a) | | | 258 | | | | 4,773 | |
Regulus Therapeutics, Inc. (a) | | | 434 | | | | 521 | |
Repligen Corp. (a) | | | 657 | | | | 19,736 | |
Retrophin, Inc. (a) | | | 615 | | | | 12,066 | |
Rigel Pharmaceuticals, Inc. (a) | | | 1,849 | | | | 3,846 | |
Sage Therapeutics, Inc. (a) | | | 816 | | | | 39,152 | |
Sangamo Therapeutics, Inc. (a) | | | 1,093 | | | | 3,826 | |
Sarepta Therapeutics, Inc. (a) | | | 974 | | | | 30,252 | |
Seattle Genetics, Inc. (a) | | | 2,268 | | | | 136,624 | |
Seres Therapeutics, Inc. (a) | | | 199 | | | | 1,968 | |
Sorrento Therapeutics, Inc. (a) | | | 164 | | | | 886 | |
Spark Therapeutics, Inc. (a) | | | 361 | | | | 22,765 | |
Spectrum Pharmaceuticals, Inc. (a) | | | 1,047 | | | | 4,879 | |
Stemline Therapeutics, Inc. (a) | | | 346 | | | | 3,529 | |
Synergy Pharmaceuticals, Inc. (a) | | | 3,590 | | | | 25,381 | |
Synthetic Biologics, Inc. (a) | | | 1,301 | | | | 1,103 | |
TESARO, Inc. (a) | | | 681 | | | | 110,894 | |
Tetraphase Pharmaceuticals, Inc. (a) | | | 851 | | | | 3,259 | |
TG Therapeutics, Inc. (a) | | | 479 | | | | 2,299 | |
Trevena, Inc. (a) | | | 537 | | | | 3,748 | |
Ultragenyx Pharmaceutical, Inc. (a) | | | 938 | | | | 70,359 | |
United Therapeutics Corp. (a) | | | 1,031 | | | | 168,703 | |
Vanda Pharmaceuticals, Inc. (a) | | | 666 | | | | 9,424 | |
Versartis, Inc. (a) | | | 676 | | | | 9,667 | |
Vertex Pharmaceuticals, Inc. (a) | | | 5,710 | | | | 490,318 | |
XBiotech, Inc. (a)(c) | | | 186 | | | | 2,120 | |
| | | | | | | | |
| Common Stocks | | Shares | | | Value | |
Biotechnology (continued) | |
Xencor, Inc. (a) | | | 1,364 | | | $ | 32,504 | |
ZIOPHARM Oncology, Inc. (a)(c) | | | 2,000 | | | | 11,840 | |
| | | | | | | | |
| | | | | | | | 16,143,721 | |
Building Products — 0.3% | |
AAON, Inc. | | | 790 | | | | 26,820 | |
Advanced Drainage Systems, Inc. | | | 647 | | | | 15,593 | |
Allegion PLC | | | 2,215 | | | | 145,459 | |
American Woodmark Corp. (a) | | | 274 | | | | 19,509 | |
AO Smith Corp. | | | 3,326 | | | | 162,142 | |
Apogee Enterprises, Inc. | | | 558 | | | | 31,851 | |
Armstrong Flooring, Inc. (a) | | | 377 | | | | 7,928 | |
Armstrong World Industries, Inc. (a) | | | 1,159 | | | | 46,302 | |
Builders FirstSource, Inc. (a) | | | 1,712 | | | | 18,421 | |
Caesarstone Ltd. (a) | | | 516 | | | | 15,661 | |
Continental Building Products, Inc. (a) | | | 596 | | | | 13,857 | |
CSW Industrials, Inc. (a) | | | 435 | | | | 15,899 | |
Fortune Brands Home & Security, Inc. | | | 3,478 | | | | 191,742 | |
Gibraltar Industries, Inc. (a) | | | 600 | | | | 26,340 | |
Griffon Corp. | | | 454 | | | | 11,554 | |
Insteel Industries, Inc. | | | 261 | | | | 9,667 | |
Lennox International, Inc. | | | 894 | | | | 140,188 | |
Masco Corp. | | | 7,504 | | | | 247,257 | |
Masonite International Corp. (a) | | | 1,175 | | | | 78,255 | |
NCI Building Systems, Inc. (a) | | | 625 | | | | 10,000 | |
Owens Corning | | | 2,609 | | | | 144,147 | |
Patrick Industries, Inc. (a) | | | 267 | | | | 21,827 | |
PGT Innovations, Inc. (a) | | | 761 | | | | 8,752 | |
Ply Gem Holdings, Inc. (a) | | | 364 | | | | 5,879 | |
Quanex Building Products Corp. | | | 446 | | | | 8,809 | |
Simpson Manufacturing Co., Inc. | | | 1,080 | | | | 47,002 | |
Trex Co., Inc. (a) | | | 730 | | | | 49,443 | |
Universal Forest Products, Inc. | | | 485 | | | | 49,329 | |
USG Corp. (a) | | | 2,327 | | | | 71,183 | |
| | | | | | | | |
| | | | | | | | 1,640,816 | |
Capital Markets — 2.2% | |
Affiliated Managers Group, Inc. (a) | | | 1,193 | | | | 181,766 | |
Ameriprise Financial, Inc. | | | 3,572 | | | | 401,028 | |
Artisan Partners Asset Management, Inc., Class A | | | 738 | | | | 21,365 | |
Associated Capital Group, Inc., Class A | | | 152 | | | | 5,350 | |
B. Riley Financial, Inc. | | | 227 | | | | 4,279 | |
Bank of New York Mellon Corp. | | | 23,793 | | | | 1,064,261 | |
BGC Partners, Inc., Class A | | | 5,772 | | | | 63,896 | |
BlackRock, Inc. (b) | | | 2,852 | | | | 1,066,591 | |
Charles Schwab Corp. | | | 26,728 | | | | 1,102,263 | |
CME Group, Inc. | | | 7,716 | | | | 934,253 | |
Cohen & Steers, Inc. | | | 390 | | | | 13,607 | |
Cowen Group, Inc., Class A (a) | | | 773 | | | | 11,595 | |
Diamond Hill Investment Group, Inc. | | | 56 | | | | 11,323 | |
Donnelley Financial Solutions, Inc. (a) | | | 406 | | | | 9,776 | |
E*Trade Financial Corp. (a) | | | 6,375 | | | | 238,744 | |
Eaton Vance Corp. | | | 2,759 | | | | 115,685 | |
Evercore Partners, Inc., Class A | | | 930 | | | | 72,029 | |
Federated Investors, Inc., Class B | | | 1,311 | | | | 34,099 | |
Financial Engines, Inc. | | | 1,437 | | | | 55,396 | |
Franklin Resources, Inc. | | | 8,259 | | | | 328,213 | |
Gain Capital Holdings, Inc. | | | 726 | | | | 5,452 | |
Goldman Sachs Group, Inc. | | | 8,822 | | | | 2,023,061 | |
Greenhill & Co., Inc. | | | 453 | | | | 13,386 | |
Hannon Armstrong Sustainable Infrastructure Capital, Inc. | | | 739 | | | | 13,509 | |
HFF, Inc., Class A | | | 701 | | | | 20,806 | |
Houlihan Lokey, Inc. | | | 453 | | | | 14,088 | |
INTL. FCStone, Inc. (a) | | | 199 | | | | 7,339 | |
Invesco Ltd. | | | 9,422 | | | | 272,484 | |
Janus Capital Group, Inc. | | | 3,891 | | | | 48,638 | |
See Notes to Financial Statements.
| | | | | | |
| | | | | | | |
| 74 | | BLACKROCK FUNDS | | JANUARY 31, 2017 | | |
| | |
Schedule of Investments (continued) | | BlackRock Total Stock Market Index Fund |
| | | | | | | | |
| Common Stocks | | Shares | | | Value | |
Capital Markets (continued) | |
KCG Holdings, Inc., Class A (a) | | | 920 | | | $ | 12,852 | |
Ladenburg Thalmann Financial Services, Inc. (a) | | | 380 | | | | 874 | |
Lazard Ltd., Class A | | | 3,007 | | | | 127,737 | |
Legg Mason, Inc. | | | 2,813 | | | | 89,144 | |
LPL Financial Holdings, Inc. | | | 2,333 | | | | 91,687 | |
Marcus & Millichap, Inc. (a) | | | 477 | | | | 12,292 | |
Moelis & Co., Class A | | | 295 | | | | 10,060 | |
Morgan Stanley | | | 32,687 | | | | 1,388,871 | |
Northern Trust Corp. | | | 4,633 | | | | 384,354 | |
OM Asset Management PLC | | | 855 | | | | 12,056 | |
Oppenheimer Holdings, Inc., Class A | | | 269 | | | | 4,600 | |
Piper Jaffray Cos. (a) | | | 266 | | | | 18,753 | |
PJT Partners, Inc., Class A | | | 381 | | | | 12,097 | |
Raymond James Financial, Inc. | | | 2,874 | | | | 215,349 | |
Safeguard Scientifics, Inc. (a) | | | 589 | | | | 7,097 | |
SEI Investments Co. | | | 2,908 | | | | 141,067 | |
State Street Corp. | | | 8,997 | | | | 685,571 | |
Stifel Financial Corp. (a) | | | 1,834 | | | | 92,305 | |
T. Rowe Price Group, Inc. | | | 5,541 | | | | 373,685 | |
TD Ameritrade Holding Corp. | | | 5,695 | | | | 262,824 | |
Virtu Financial, Inc., Class A | | | 804 | | | | 14,110 | |
Virtus Investment Partners, Inc. | | | 98 | | | | 10,682 | |
Waddell & Reed Financial, Inc., Class A | | | 2,763 | | | | 49,872 | |
Westwood Holdings Group, Inc. | | | 168 | | | | 9,395 | |
WisdomTree Investments, Inc. | | | 2,265 | | | | 23,330 | |
| | | | | | | | |
| | | | | | | | 12,204,946 | |
Chemicals — 2.2% | |
A. Schulman, Inc. | | | 547 | | | | 18,872 | |
AdvanSix, Inc. (a) | | | 1,613 | | | | 41,438 | |
Air Products & Chemicals, Inc. | | | 4,443 | | | | 620,954 | |
Albemarle Corp. | | | 2,536 | | | | 234,935 | |
American Vanguard Corp. | | | 632 | | | | 10,870 | |
Ashland Global Holdings, Inc. | | | 1,362 | | | | 162,119 | |
Axalta Coating Systems Ltd. (a) | | | 4,856 | | | | 140,824 | |
Balchem Corp. | | | 746 | | | | 63,589 | |
Cabot Corp. | | | 1,678 | | | | 92,911 | |
Calgon Carbon Corp. | | | 890 | | | | 14,107 | |
Celanese Corp., Series A | | | 3,302 | | | | 278,689 | |
CF Industries Holdings, Inc. | | | 5,349 | | | | 188,766 | |
Chase Corp. | | | 109 | | | | 9,592 | |
Chemours Co. | | | 4,126 | | | | 109,009 | |
Chemtura Corp. (a) | | | 1,580 | | | | 52,298 | |
Codexis, Inc. (a) | | | 807 | | | | 3,833 | |
Dow Chemical Co. | | | 25,642 | | | | 1,529,032 | |
E.I. du Pont de Nemours & Co. | | | 20,025 | | | | 1,511,888 | |
Eastman Chemical Co. | | | 3,349 | | | | 259,548 | |
Ecolab, Inc. | | | 5,862 | | | | 704,202 | |
Ferro Corp. (a) | | | 1,490 | | | | 21,069 | |
Flotek Industries, Inc. (a) | | | 1,115 | | | | 11,786 | |
FMC Corp. | | | 2,958 | | | | 177,953 | |
GCP Applied Technologies, Inc. (a) | | | 1,898 | | | | 51,151 | |
Hawkins, Inc. | | | 210 | | | | 11,267 | |
HB Fuller Co. | | | 1,285 | | | | 63,440 | |
Huntsman Corp. | | | 4,632 | | | | 94,446 | |
Ingevity Corp. (a) | | | 1,059 | | | | 58,870 | |
Innophos Holdings, Inc. | | | 357 | | | | 17,364 | |
Innospec, Inc. | | | 470 | | | | 33,535 | |
International Flavors & Fragrances, Inc. | | | 1,797 | | | | 210,626 | |
KMG Chemicals, Inc. | | | 107 | | | | 3,944 | |
Koppers Holdings, Inc. (a) | | | 1,213 | | | | 49,066 | |
Kraton Corp. (a) | | | 594 | | | | 15,955 | |
Landec Corp. (a) | | | 899 | | | | 11,327 | |
LSB Industries, Inc. (a) | | | 74 | | | | 630 | |
LyondellBasell Industries NV, Class A | | | 7,883 | | | | 735,247 | |
Minerals Technologies, Inc. | | | 798 | | | | 63,960 | |
Monsanto Co. | | | 9,991 | | | | 1,082,125 | |
| | | | | | | | |
| Common Stocks | | Shares | | | Value | |
Chemicals (continued) | |
Mosaic Co. | | | 8,024 | | | $ | 251,713 | |
NewMarket Corp. | | | 165 | | | | 71,143 | |
Olin Corp. | | | 3,854 | | | | 101,013 | |
OMNOVA Solutions, Inc. (a) | | | 1,355 | | | | 12,331 | |
Platform Specialty Products Corp. (a) | | | 4,855 | | | | 58,940 | |
PolyOne Corp. | | | 2,489 | | | | 84,900 | |
PPG Industries, Inc. | | | 6,035 | | | | 603,560 | |
Praxair, Inc. | | | 6,507 | | | | 770,689 | |
Quaker Chemical Corp. | | | 362 | | | | 46,517 | |
Rayonier Advanced Materials, Inc. | | | 841 | | | | 11,412 | |
RPM International, Inc. | | | 3,020 | | | | 157,825 | |
Scotts Miracle-Gro Co., Class A | | | 1,001 | | | | 92,062 | |
Sensient Technologies Corp. | | | 1,195 | | | | 91,716 | |
Sherwin-Williams Co. | | | 1,824 | | | | 554,149 | |
Stepan Co. | | | 356 | | | | 27,807 | |
TerraVia Holdings, Inc. (a) | | | 1,012 | | | | 982 | |
Trecora Resources (a) | | | 733 | | | | 9,089 | |
Tredegar Corp. | | | 681 | | | | 15,152 | |
Trinseo SA | | | 561 | | | | 36,325 | |
Tronox Ltd., Class A | | | 1,229 | | | | 15,387 | |
Valspar Corp. | | | 1,756 | | | | 194,337 | |
Westlake Chemical Corp. | | | 854 | | | | 52,871 | |
WR Grace & Co. | | | 1,645 | | | | 114,064 | |
| | | | | | | | |
| | | | | | | | 12,135,221 | |
Commercial Services & Supplies — 0.6% | |
ABM Industries, Inc. | | | 1,274 | | | | 51,457 | |
ACCO Brands Corp. (a) | | | 2,042 | | | | 26,036 | |
Aqua Metals, Inc. (a) | | | 1,057 | | | | 11,796 | |
ARC Document Solutions, Inc. (a) | | | 941 | | | | 4,432 | |
Brink’s Co. | | | 1,070 | | | | 47,615 | |
Casella Waste Systems, Inc., Class A (a) | | | 782 | | | | 9,040 | |
Ceco Environmental Corp. | | | 925 | | | | 12,136 | |
Cintas Corp. | | | 1,904 | | | | 221,073 | |
Clean Harbors, Inc. (a) | | | 1,173 | | | | 65,101 | |
Copart, Inc. (a) | | | 2,102 | | | | 119,267 | |
Covanta Holding Corp. | | | 3,235 | | | | 52,083 | |
Deluxe Corp. | | | 1,071 | | | | 78,022 | |
Encore Capital Group, Inc. (a) | | | 330 | | | | 10,214 | |
Ennis, Inc. | | | 495 | | | | 8,366 | |
Essendant, Inc. | | | 636 | | | | 13,286 | |
G&K Services, Inc., Class A | | | 453 | | | | 43,515 | |
Healthcare Services Group, Inc. | | | 1,716 | | | | 68,211 | |
Heritage-Crystal Clean, Inc. (a) | | | 397 | | | | 5,935 | |
Herman Miller, Inc. | | | 1,453 | | | | 45,334 | |
HNI Corp. | | | 1,046 | | | | 52,729 | |
InnerWorkings, Inc. (a) | | | 577 | | | | 5,545 | |
Interface, Inc. | | | 1,200 | | | | 21,840 | |
Iron Mountain, Inc. | | | 5,730 | | | | 205,134 | |
KAR Auction Services, Inc. | | | 3,005 | | | | 136,878 | |
Kimball International, Inc., Class B | | | 1,050 | | | | 17,567 | |
Knoll, Inc. | | | 939 | | | | 24,517 | |
LSC Communications, Inc. | | | 406 | | | | 10,645 | |
McGrath RentCorp | | | 1,491 | | | | 57,075 | |
Mobile Mini, Inc. | | | 1,241 | | | | 40,395 | |
MSA Safety, Inc. | | | 774 | | | | 55,225 | |
Multi-Color Corp. | | | 716 | | | | 55,275 | |
Pitney Bowes, Inc. | | | 4,306 | | | | 68,552 | |
Quad/Graphics, Inc. | | | 390 | | | | 10,214 | |
Republic Services, Inc. | | | 4,870 | | | | 279,441 | |
Rollins, Inc. | | | 2,129 | | | | 75,069 | |
RR Donnelley & Sons Co. | | | 1,032 | | | | 17,699 | |
Steelcase, Inc., Class A | | | 2,295 | | | | 38,556 | |
Stericycle, Inc. (a) | | | 1,902 | | | | 146,720 | |
Sykes Enterprises, Inc. (a) | | | 779 | | | | 21,757 | |
Team, Inc. (a) | | | 528 | | | | 17,741 | |
Tetra Tech, Inc. | | | 1,295 | | | | 56,591 | |
See Notes to Financial Statements.
| | | | | | |
| | | | | | | |
| | BLACKROCK FUNDS | | JANUARY 31, 2017 | | 75 |
| | |
Schedule of Investments (continued) | | BlackRock Total Stock Market Index Fund |
| | | | | | | | |
| Common Stocks | | Shares | | | Value | |
Commercial Services & Supplies (continued) | |
TRC Cos., Inc. (a) | | | 473 | | | $ | 4,399 | |
U.S. Ecology, Inc. | | | 462 | | | | 23,678 | |
UniFirst Corp. | | | 464 | | | | 59,346 | |
Viad Corp. | | | 392 | | | | 17,189 | |
VSE Corp. | | | 300 | | | | 11,184 | |
Waste Management, Inc. | | | 9,800 | | | | 681,100 | |
West Corp. | | | 787 | | | | 19,100 | |
| | | | | | | | |
| | | | | | | | 3,124,080 | |
Communications Equipment — 1.1% | |
ADTRAN, Inc. | | | 877 | | | | 19,206 | |
Applied Optoelectronics, Inc. (a) | | | 273 | | | | 8,397 | |
Arista Networks, Inc. (a) | | | 862 | | | | 81,028 | |
ARRIS International PLC (a) | | | 4,421 | | | | 126,352 | |
Bel Fuse, Inc., Class B | | | 206 | | | | 6,551 | |
Black Box Corp. | | | 669 | | | | 8,931 | |
Brocade Communications Systems, Inc. | | | 9,056 | | | | 112,928 | |
CalAmp Corp. (a) | | | 488 | | | | 7,330 | |
Calix, Inc. (a) | | | 1,374 | | | | 9,893 | |
Ciena Corp. (a) | | | 3,484 | | | | 84,801 | |
Cisco Systems, Inc. | | | 115,129 | | | | 3,536,763 | |
Clearfield, Inc. (a) | | | 214 | | | | 3,681 | |
CommScope Holding Co., Inc. (a) | | | 2,790 | | | | 105,518 | |
Comtech Telecommunications Corp. | | | 769 | | | | 8,251 | |
Digi International, Inc. (a) | | | 916 | | | | 11,954 | |
EchoStar Corp., Class A (a) | | | 1,063 | | | | 54,139 | |
Extreme Networks, Inc. (a) | | | 2,054 | | | | 11,359 | |
F5 Networks, Inc. (a) | | | 1,490 | | | | 199,705 | |
Finisar Corp. (a) | | | 2,523 | | | | 74,605 | |
Harmonic, Inc. (a) | | | 2,232 | | | | 11,830 | |
Harris Corp. | | | 2,815 | | | | 289,129 | |
Infinera Corp. (a) | | | 4,027 | | | | 36,283 | |
InterDigital, Inc. | | | 833 | | | | 77,802 | |
Ixia (a) | | | 1,123 | | | | 21,842 | |
Juniper Networks, Inc. | | | 8,498 | | | | 227,576 | |
KVH Industries, Inc. (a) | | | 368 | | | | 3,827 | |
Loral Space & Communications, Inc. (a) | | | 204 | | | | 8,313 | |
Lumentum Holdings, Inc. (a) | | | 1,209 | | | | 45,881 | |
Motorola Solutions, Inc. | | | 3,927 | | | | 316,948 | |
NETGEAR, Inc. (a) | | | 814 | | | | 46,317 | |
Oclaro, Inc. (a) | | | 2,007 | | | | 19,689 | |
Palo Alto Networks, Inc. (a) | | | 2,000 | | | | 295,120 | |
Plantronics, Inc. | | | 930 | | | | 52,619 | |
ShoreTel, Inc. (a) | | | 1,555 | | | | 10,807 | |
Silicom, Ltd. | | | 179 | | | | 6,553 | |
Sonus Networks, Inc. (a) | | | 1,319 | | | | 8,415 | |
Ubiquiti Networks, Inc. (a) | | | 493 | | | | 30,763 | |
ViaSat, Inc. (a) | | | 1,226 | | | | 79,580 | |
Viavi Solutions, Inc. (a) | | | 6,068 | | | | 54,309 | |
| | | | | | | | |
| | | | | | | | 6,114,995 | |
Construction & Engineering — 0.2% | |
AECOM (a) | | | 3,399 | | | | 125,525 | |
Aegion Corp. (a) | | | 2,164 | | | | 50,335 | |
Argan, Inc. | | | 230 | | | | 16,963 | |
Chicago Bridge & Iron Co. NV | | | 2,644 | | | | 87,807 | |
Comfort Systems USA, Inc. | | | 787 | | | | 26,640 | |
Dycom Industries, Inc. (a) | | | 696 | | | | 56,139 | |
EMCOR Group, Inc. | | | 1,403 | | | | 97,775 | |
Fluor Corp. | | | 3,184 | | | | 176,712 | |
Granite Construction, Inc. | | | 918 | | | | 51,527 | |
Great Lakes Dredge & Dock Corp. (a) | | | 1,265 | | | | 6,578 | |
IES Holdings, Inc. (a) | | | 192 | | | | 3,744 | |
Jacobs Engineering Group, Inc. (a) | | | 2,695 | | | | 157,792 | |
KBR, Inc. | | | 3,434 | | | | 58,412 | |
Layne Christensen Co. (a) | | | 427 | | | | 4,454 | |
MasTec, Inc. (a) | | | 1,468 | | | | 54,683 | |
MYR Group, Inc. (a) | | | 480 | | | | 18,466 | |
| | | | | | | | |
| Common Stocks | | Shares | | | Value | |
Construction & Engineering (continued) | |
NV5 Global Inc. (a) | | | 93 | | | $ | 3,790 | |
Orion Group Holdings, Inc. (a) | | | 507 | | | | 5,324 | |
Primoris Services Corp. | | | 732 | | | | 18,168 | |
Quanta Services, Inc. (a) | | | 3,211 | | | | 115,243 | |
Tutor Perini Corp. (a) | | | 738 | | | | 21,992 | |
| | | | | | | | |
| | | | | | | | 1,158,069 | |
Construction Materials — 0.2% | |
Eagle Materials, Inc. | | | 1,025 | | | | 107,194 | |
Headwaters, Inc. (a) | | | 1,754 | | | | 40,640 | |
Martin Marietta Materials, Inc. | | | 1,410 | | | | 323,736 | |
Summit Materials, Inc., Class A (a) | | | 1,903 | | | | 47,765 | |
US Concrete, Inc. (a) | | | 263 | | | | 17,227 | |
Vulcan Materials Co. | | | 2,917 | | | | 374,339 | |
| | | | | | | | |
| | | | | | | | 910,901 | |
Consumer Discretionary — 0.0% | |
American Outdoor Brands Corp. (a) | | | 1,541 | | | | 32,823 | |
SP Plus Corp. (a) | | | 321 | | | | 8,892 | |
| | | | | | | | |
| | | | | | | | 41,715 | |
Consumer Finance — 0.8% | |
Ally Financial, Inc. | | | 10,199 | | | | 215,403 | |
American Express Co. | | | 18,323 | | | | 1,399,511 | |
Capital One Financial Corp. | | | 10,818 | | | | 945,385 | |
Credit Acceptance Corp. (a)(c) | | | 264 | | | | 54,194 | |
Discover Financial Services | | | 9,302 | | | | 644,443 | |
Enova International, Inc. (a) | | | 433 | | | | 6,105 | |
Ezcorp, Inc., Class A (a) | | | 876 | | | | 8,672 | |
Green Dot Corp., Class A (a) | | | 809 | | | | 21,681 | |
Navient Corp. | | | 6,422 | | | | 96,587 | |
Nelnet, Inc., Class A | | | 380 | | | | 18,632 | |
OneMain Holdings, Inc. (a) | | | 1,024 | | | | 22,917 | |
PRA Group, Inc. (a) | | | 1,617 | | | | 64,357 | |
Regional Management Corp. (a) | | | 217 | | | | 5,427 | |
Santander Consumer USA Holdings, Inc. (a) | | | 2,774 | | | | 36,672 | |
SLM Corp. (a) | | | 12,060 | | | | 143,273 | |
Synchrony Financial | | | 18,987 | | | | 680,114 | |
World Acceptance Corp. (a) | | | 213 | | | | 10,452 | |
| | | | | | | | |
| | | | | | | | 4,373,825 | |
Containers & Packaging — 0.5% | |
Aptargroup, Inc. | | | 1,305 | | | | 95,226 | |
Avery Dennison Corp. | | | 1,917 | | | | 139,979 | |
Ball Corp. | | | 3,827 | | | | 291,847 | |
Bemis Co., Inc. | | | 2,239 | | | | 109,084 | |
Berry Plastics Group, Inc. (a) | | | 2,767 | | | | 141,200 | |
Crown Holdings, Inc. (a) | | | 3,127 | | | | 169,390 | |
Graphic Packaging Holding Co. | | | 7,110 | | | | 88,946 | |
Greif, Inc., Class A | | | 953 | | | | 54,874 | |
International Paper Co. | | | 9,210 | | | | 521,286 | |
Multi Packaging Solutions International Ltd. (a) | | | 375 | | | | 6,683 | |
Myers Industries, Inc. | | | 350 | | | | 4,830 | |
Owens-Illinois, Inc. (a) | | | 4,255 | | | | 80,420 | |
Packaging Corp. of America | | | 2,123 | | | | 195,698 | |
Sealed Air Corp. | | | 4,419 | | | | 214,321 | |
Silgan Holdings, Inc. | | | 735 | | | | 43,005 | |
Sonoco Products Co. | | | 2,231 | | | | 122,593 | |
UFP Technologies, Inc. (a) | | | 191 | | | | 4,765 | |
WestRock Co. | | | 5,624 | | | | 300,097 | |
| | | | | | | | |
| | | | | | | | 2,584,244 | |
Distributors — 0.1% | |
Core-Mark Holding Co., Inc. | | | 1,195 | | | | 41,741 | |
Genuine Parts Co. | | | 3,241 | | | | 313,761 | |
LKQ Corp. (a) | | | 6,849 | | | | 218,552 | |
Pool Corp. | | | 895 | | | | 94,476 | |
| | | | | | | | |
| | | | | | | | 668,530 | |
See Notes to Financial Statements.
| | | | | | |
| | | | | | | |
| 76 | | BLACKROCK FUNDS | | JANUARY 31, 2017 | | |
| | |
Schedule of Investments (continued) | | BlackRock Total Stock Market Index Fund |
| | | | | | | | |
| Common Stocks | | Shares | | | Value | |
Diversified Consumer Services — 0.2% | |
2U, Inc. (a) | | | 688 | | | $ | 23,420 | |
American Public Education, Inc. (a) | | | 306 | | | | 7,436 | |
Apollo Education Group, Inc. (a) | | | 1,545 | | | | 15,435 | |
Ascent Capital Group, Inc., Class A (a) | | | 65 | | | | 1,007 | |
Bright Horizons Family Solutions, Inc. (a) | | | 1,113 | | | | 78,867 | |
Capella Education Co. | | | 507 | | | | 43,349 | |
Career Education Corp. (a) | | | 1,520 | | | | 14,850 | |
Carriage Services, Inc. | | | 331 | | | | 8,589 | |
Collectors Universe, Inc. | | | 191 | | | | 3,948 | |
DeVry Education Group, Inc. | | | 1,501 | | | | 50,284 | |
Graham Holdings Co., Class B | | | 93 | | | | 48,318 | |
Grand Canyon Education, Inc. (a) | | | 1,000 | | | | 58,980 | |
H&R Block, Inc. | | | 4,843 | | | | 103,931 | |
Hillenbrand, Inc. | | | 1,417 | | | | 51,791 | |
Houghton Mifflin Harcourt Co. (a) | | | 3,459 | | | | 39,087 | |
K12, Inc. (a) | | | 695 | | | | 13,851 | |
LifeLock, Inc. (a) | | | 2,041 | | | | 48,902 | |
Matthews International Corp., Class A | | | 706 | | | | 47,620 | |
Regis Corp. (a) | | | 590 | | | | 8,213 | |
Service Corp. International | | | 4,141 | | | | 120,627 | |
ServiceMaster Global Holdings, Inc. (a) | | | 2,988 | | | | 110,496 | |
Sotheby’s (a) | | | 1,241 | | | | 49,280 | |
Strayer Education, Inc. (a) | | | 164 | | | | 13,284 | |
Weight Watchers International, Inc. (a)(c) | | | 256 | | | | 3,187 | |
| | | | | | | | |
| | | | | | | | 964,752 | |
Diversified Financial Services — 1.8% | |
Berkshire Hathaway, Inc., Class B (a) | | | 43,251 | | | | 7,099,219 | |
CBOE Holdings, Inc. | | | 1,847 | | | | 147,058 | |
FactSet Research Systems, Inc. | | | 916 | | | | 158,514 | |
FNFV Group (a) | | | 2,019 | | | | 26,247 | |
Interactive Brokers Group, Inc., Class A | | | 1,812 | | | | 67,660 | |
Intercontinental Exchange, Inc. | | | 13,485 | | | | 786,985 | |
Leucadia National Corp. | | | 7,432 | | | | 177,253 | |
MarketAxess Holdings, Inc. | | | 814 | | | | 152,421 | |
Marlin Business Services Corp. | | | 218 | | | | 5,003 | |
Moody’s Corp. | | | 3,841 | | | | 398,196 | |
Morningstar, Inc. | | | 330 | | | | 25,130 | |
MSCI, Inc. | | | 2,056 | | | | 170,134 | |
Nasdaq, Inc. | | | 2,464 | | | | 173,811 | |
On Deck Capital, Inc. (a) | | | 454 | | | | 2,284 | |
PHH Corp. (a) | | | 1,066 | | | | 15,542 | |
PICO Holdings, Inc. (a) | | | 421 | | | | 5,999 | |
S&P Global, Inc. | | | 6,011 | | | | 722,402 | |
Voya Financial, Inc. | | | 4,530 | | | | 182,197 | |
| | | | | | | | |
| | | | | | | | 10,316,055 | |
Diversified Telecommunication Services — 2.2% | |
8x8, Inc. (a) | | | 3,052 | | | | 48,374 | |
AT&T, Inc. | | | 140,936 | | | | 5,941,862 | |
ATN International, Inc. | | | 207 | | | | 16,620 | |
CenturyLink, Inc. | | | 11,623 | | | | 300,571 | |
Cincinnati Bell, Inc. (a) | | | 747 | | | | 17,144 | |
Cogent Communications Holdings, Inc. | | | 1,020 | | | | 42,636 | |
Consolidated Communications Holdings, Inc. | | | 1,206 | | | | 31,730 | |
Fairpoint Communications, Inc. (a) | | | 393 | | | | 7,271 | |
Frontier Communications Corp. | | | 26,001 | | | | 90,744 | |
General Communication, Inc., Class A (a) | | | 528 | | | | 10,623 | |
Globalstar, Inc. (a)(c) | | | 4,973 | | | | 7,857 | |
Hawaiian Telcom Holdco, Inc. (a) | | | 433 | | | | 10,751 | |
IDT Corp., Class B | | | 292 | | | | 5,606 | |
Inteliquent, Inc. | | | 621 | | | | 14,221 | |
Iridium Communications, Inc. (a) | | | 1,532 | | | | 15,473 | |
Level 3 Communications, Inc. (a) | | | 6,531 | | | | 388,333 | |
Lumos Networks Corp. (a) | | | 416 | | | | 6,436 | |
ORBCOMM, Inc. (a) | | | 751 | | | | 6,136 | |
pdvWireless, Inc. (a) | | | 207 | | | | 4,409 | |
| | | | | | | | |
| Common Stocks | | Shares | | | Value | |
Diversified Telecommunication Services (continued) | |
SBA Communications Corp. (a) | | | 2,823 | | | $ | 297,149 | |
Straight Path Communications, Inc., Class B (a) | | | 159 | | | | 5,571 | |
Verizon Communications, Inc. | | | 93,368 | | | | 4,575,966 | |
Vonage Holdings Corp. (a) | | | 5,249 | | | | 37,216 | |
Windstream Holdings, Inc. (c) | | | 1,642 | | | | 13,267 | |
Zayo Group Holdings, Inc. (a) | | | 3,643 | | | | 116,430 | |
| | | | | | | | |
| | | | | | | | 12,012,396 | |
Electric Utilities — 1.6% | |
ALLETE, Inc. | | | 1,629 | | | | 106,455 | |
American Electric Power Co., Inc. | | | 11,200 | | | | 717,472 | |
Avangrid, Inc. | | | 1,026 | | | | 39,809 | |
Duke Energy Corp. | | | 15,841 | | | | 1,244,152 | |
Edison International | | | 7,043 | | | | 513,294 | |
El Paso Electric Co. | | | 757 | | | | 34,746 | |
Entergy Corp. | | | 3,989 | | | | 285,772 | |
Eversource Energy | | | 7,083 | | | | 391,832 | |
Exelon Corp. | | | 20,198 | | | | 724,704 | |
FirstEnergy Corp. | | | 9,808 | | | | 297,379 | |
Great Plains Energy, Inc. | | | 4,900 | | | | 134,995 | |
Hawaiian Electric Industries, Inc. | | | 3,349 | | | | 112,124 | |
IDACORP, Inc. | | | 1,438 | | | | 115,069 | |
MGE Energy, Inc. | | | 789 | | | | 50,220 | |
NextEra Energy, Inc. | | | 10,548 | | | | 1,304,998 | |
OGE Energy Corp. | | | 4,356 | | | | 146,100 | |
Otter Tail Corp. | | | 899 | | | | 34,027 | |
Pinnacle West Capital Corp. | | | 2,365 | | | | 183,595 | |
PNM Resources, Inc. | | | 1,430 | | | | 49,192 | |
Portland General Electric Co. | | | 2,619 | | | | 114,215 | |
PPL Corp. | | | 15,342 | | | | 534,515 | |
Southern Co. | | | 21,583 | | | | 1,066,848 | |
Spark Energy, Inc., Class A | | | 146 | | | | 3,774 | |
Unitil Corp. | | | 397 | | | | 18,171 | |
Westar Energy, Inc. | | | 3,085 | | | | 168,719 | |
Xcel Energy, Inc. | | | 11,335 | | | | 468,362 | |
| | | | | | | | |
| | | | | | | | 8,860,539 | |
Electrical Equipment — 0.6% | |
Acuity Brands, Inc. | | | 990 | | | | 205,158 | |
Allied Motion Technologies, Inc. | | | 178 | | | | 3,923 | |
AMETEK, Inc. | | | 5,109 | | | | 261,070 | |
AZZ, Inc. | | | 702 | | | | 41,804 | |
Babcock & Wilcox Enterprises, Inc. (a) | | | 834 | | | | 13,878 | |
Brady Corp., Class A | | | 832 | | | | 30,243 | |
Eaton Corp. PLC | | | 10,343 | | | | 732,078 | |
Emerson Electric Co. | | | 14,539 | | | | 852,858 | |
Encore Wire Corp. | | | 372 | | | | 15,717 | |
Energous Corp. (a)(c) | | | 545 | | | | 7,881 | |
EnerSys | | | 1,136 | | | | 88,551 | |
Franklin Electric Co., Inc. | | | 1,139 | | | | 45,959 | |
Generac Holdings, Inc. (a) | | | 1,440 | | | | 57,974 | |
General Cable Corp. | | | 903 | | | | 18,331 | |
Hubbell, Inc. | | | 1,114 | | | | 135,997 | |
II-VI, Inc. (a) | | | 1,436 | | | | 52,414 | |
LSI Industries, Inc. | | | 297 | | | | 2,827 | |
Plug Power, Inc. (a)(c) | | | 1,890 | | | | 2,003 | |
Powell Industries, Inc. | | | 173 | | | | 6,657 | |
Preformed Line Products Co. | | | 83 | | | | 4,532 | |
Regal-Beloit Corp. | | | 1,187 | | | | 86,176 | |
Rockwell Automation, Inc. | | | 2,892 | | | | 427,987 | |
Sunrun, Inc. (a) | | | 588 | | | | 3,111 | |
Thermon Group Holdings, Inc. (a) | | | 457 | | | | 9,487 | |
| | | | | | | | |
| | | | | | | | 3,106,616 | |
Electronic Equipment, Instruments & Components — 0.7% | |
Amphenol Corp., Class A | | | 6,675 | | | | 450,496 | |
Anixter International, Inc. (a) | | | 670 | | | | 57,285 | |
See Notes to Financial Statements.
| | | | | | |
| | | | | | | |
| | BLACKROCK FUNDS | | JANUARY 31, 2017 | | 77 |
| | |
Schedule of Investments (continued) | | BlackRock Total Stock Market Index Fund |
| | | | | | | | |
| Common Stocks | | Shares | | | Value | |
Electronic Equipment, Instruments & Components (continued) | |
Arrow Electronics, Inc. (a) | | | 2,022 | | | $ | 148,657 | |
Avnet, Inc. | | | 2,960 | | | | 137,462 | |
AVX Corp. | | | 510 | | | | 8,262 | |
Badger Meter, Inc. | | | 507 | | | | 19,545 | |
Belden, Inc. | | | 1,078 | | | | 82,435 | |
Benchmark Electronics, Inc. (a) | | | 2,189 | | | | 66,983 | |
CDW Corp. | | | 3,700 | | | | 190,587 | |
Cognex Corp. | | | 1,844 | | | | 124,581 | |
Coherent, Inc. (a) | | | 571 | | | | 90,064 | |
Control4 Corp. (a) | | | 363 | | | | 3,913 | |
Corning, Inc. | | | 21,271 | | | | 563,469 | |
CTS Corp. | | | 459 | | | | 9,869 | |
Daktronics, Inc. | | | 624 | | | | 6,340 | |
Dolby Laboratories, Inc., Class A | | | 1,174 | | | | 56,246 | |
Electro Scientific Industries, Inc. (a) | | | 703 | | | | 4,619 | |
Fabrinet (a) | | | 1,162 | | | | 48,955 | |
FARO Technologies, Inc. (a) | | | 224 | | | | 8,310 | |
Fitbit, Inc., Series A (a) | | | 2,526 | | | | 15,181 | |
FLIR Systems, Inc. | | | 2,839 | | | | 100,302 | |
Insight Enterprises, Inc. (a) | | | 683 | | | | 25,360 | |
InvenSense, Inc. (a) | | | 1,536 | | | | 19,446 | |
IPG Photonics Corp. (a) | | | 815 | | | | 93,717 | |
Itron, Inc. (a) | | | 986 | | | | 60,836 | |
Jabil Circuit, Inc. | | | 4,200 | | | | 100,716 | |
Keysight Technologies, Inc. (a) | | | 3,773 | | | | 139,865 | |
Kimball Electronics, Inc. (a) | | | 871 | | | | 14,894 | |
Knowles Corp. (a) | | | 1,663 | | | | 29,967 | |
Littelfuse, Inc. | | | 526 | | | | 82,956 | |
Maxwell Technologies, Inc. (a) | | | 878 | | | | 4,179 | |
Mercury Systems, Inc. (a) | | | 711 | | | | 23,975 | |
Mesa Laboratories, Inc. | | | 63 | | | | 7,506 | |
Methode Electronics, Inc. | | | 948 | | | | 39,863 | |
MTS Systems Corp. | | | 301 | | | | 17,488 | |
National Instruments Corp. | | | 2,646 | | | | 83,137 | |
Novanta, Inc. (a) | | | 537 | | | | 12,002 | |
OSI Systems, Inc. (a) | | | 325 | | | | 24,268 | |
Park Electrochemical Corp. | | | 658 | | | | 12,061 | |
Plexus Corp. (a) | | | 864 | | | | 46,915 | |
Radisys Corp. (a) | | | 1,745 | | | | 7,695 | |
Rogers Corp. (a) | | | 597 | | | | 47,730 | |
Sanmina Corp. (a) | | | 1,905 | | | | 74,200 | |
ScanSource, Inc. (a) | | | 458 | | | | 18,114 | |
SYNNEX Corp. | | | 663 | | | | 79,679 | |
Tech Data Corp. (a) | | | 766 | | | | 65,539 | |
Trimble, Inc. (a) | | | 5,756 | | | | 170,493 | |
TTM Technologies, Inc. (a) | | | 2,582 | | | | 38,291 | |
Universal Display Corp. (a) | | | 998 | | | | 65,868 | |
Vishay Intertechnology, Inc. | | | 3,295 | | | | 54,697 | |
Vishay Precision Group, Inc. (a) | | | 235 | | | | 3,913 | |
Zebra Technologies Corp., Class A (a) | | | 1,207 | | | | 100,990 | |
| | | | | | | | |
| | | | | | | | 3,759,921 | |
Energy Equipment & Services — 1.1% | |
Archrock, Inc. | | | 1,293 | | | | 18,878 | |
Atwood Oceanics, Inc. (a) | | | 1,144 | | | | 13,911 | |
Baker Hughes, Inc. | | | 9,903 | | | | 624,681 | |
Bristow Group, Inc. | | | 553 | | | | 9,766 | |
CARBO Ceramics, Inc. (a) | | | 1,879 | | | | 26,682 | |
Dawson Geophysical Co. (a) | | | 321 | | | | 2,542 | |
Diamond Offshore Drilling, Inc. (a) | | | 1,152 | | | | 18,870 | |
Dril-Quip, Inc. (a) | | | 906 | | | | 56,353 | |
Ensco PLC, Class A | | | 7,902 | | | | 86,290 | |
Era Group, Inc. (a) | | | 614 | | | | 9,615 | |
Exterran Corp. (a) | | | 755 | | | | 23,420 | |
Fairmount Santrol Holdings, Inc. (a) | | | 2,774 | | | | 34,731 | |
Forum Energy Technologies, Inc. (a) | | | 1,055 | | | | 22,894 | |
Frank’s International NV | | | 468 | | | | 5,541 | |
| | | | | | | | |
| Common Stocks | | Shares | | | Value | |
Energy Equipment & Services (continued) | |
Geospace Technologies Corp. (a) | | | 309 | | | $ | 7,212 | |
Halliburton Co. | | | 19,477 | | | | 1,101,814 | |
Helix Energy Solutions Group, Inc. (a) | | | 2,186 | | | | 18,537 | |
Helmerich & Payne, Inc. | | | 2,193 | | | | 156,054 | |
Hornbeck Offshore Services, Inc. (a) | | | 88 | | | | 638 | |
Matrix Service Co. (a) | | | 641 | | | | 14,358 | |
McDermott International, Inc. (a) | | | 4,928 | | | | 39,917 | |
Nabors Industries Ltd. | | | 7,211 | | | | 117,179 | |
National Oilwell Varco, Inc. | | | 8,487 | | | | 320,894 | |
Natural Gas Services Group, Inc. (a) | | | 149 | | | | 4,276 | |
Newpark Resources, Inc. (a) | | | 1,377 | | | | 10,396 | |
Noble Corp. PLC | | | 6,973 | | | | 47,068 | |
Oceaneering International, Inc. | | | 2,768 | | | | 77,089 | |
Oil States International, Inc. (a) | | | 1,277 | | | | 50,442 | |
Parker Drilling Co. (a) | | | 1,353 | | | | 3,450 | |
Patterson-UTI Energy, Inc. | | | 3,011 | | | | 84,428 | |
PHI, Inc. (a) | | | 118 | | | | 1,870 | |
Pioneer Energy Services Corp. (a) | | | 3,963 | | | | 24,967 | |
RigNet, Inc. (a) | | | 264 | | | | 5,214 | |
Rowan Cos. PLC, Class A (a) | | | 3,264 | | | | 58,491 | |
RPC, Inc. | | | 1,370 | | | | 29,482 | |
Schlumberger Ltd. | | | 31,806 | | | | 2,662,480 | |
SEACOR Holdings, Inc. (a) | | | 311 | | | | 22,880 | |
Seadrill Ltd. (a)(c) | | | 7,260 | | | | 13,576 | |
Superior Energy Services, Inc. (a) | | | 4,664 | | | | 82,413 | |
Tesco Corp. (a) | | | 1,478 | | | | 12,711 | |
TETRA Technologies, Inc. (a) | | | 1,785 | | | | 8,854 | |
Transocean Ltd. (a) | | | 8,132 | | | | 113,604 | |
Unit Corp. (a) | | | 973 | | | | 25,298 | |
Weatherford International PLC (a) | | | 23,537 | | | | 122,628 | |
| | | | | | | | |
| | | | | | | | 6,192,394 | |
Food & Staples Retailing — 1.7% | |
Andersons, Inc. | | | 506 | | | | 19,101 | |
Casey’s General Stores, Inc. | | | 852 | | | | 97,895 | |
Chefs’ Warehouse, Inc. (a) | | | 397 | | | | 6,630 | |
Costco Wholesale Corp. | | | 9,957 | | | | 1,632,450 | |
CVS Health Corp. | | | 24,547 | | | | 1,934,549 | |
Diplomat Pharmacy, Inc. (a) | | | 690 | | | | 9,481 | |
Ingles Markets, Inc., Class A | | | 278 | | | | 12,579 | |
Kroger Co. | | | 21,651 | | | | 735,268 | |
Natural Grocers by Vitamin Cottage, Inc. (a) | | | 357 | | | | 4,512 | |
Performance Food Group Co. (a) | | | 681 | | | | 15,084 | |
PriceSmart, Inc. | | | 389 | | | | 32,948 | |
Rite Aid Corp. (a) | | | 23,919 | | | | 134,425 | |
Smart & Final Stores, Inc. (a) | | | 347 | | | | 4,979 | |
SpartanNash Co. | | | 667 | | | | 25,253 | |
Sprouts Farmers Market, Inc. (a) | | | 3,238 | | | | 60,453 | |
Supervalu, Inc. (a) | | | 4,842 | | | | 18,981 | |
Sysco Corp. | | | 11,922 | | | | 625,428 | |
U.S. Foods Holding Corp. (a) | | | 779 | | | | 21,189 | |
United Natural Foods, Inc. (a) | | | 1,207 | | | | 55,160 | |
Village Super Market, Inc., Class A | | | 168 | | | | 5,089 | |
Wal-Mart Stores, Inc. | | | 34,613 | | | | 2,310,072 | |
Walgreens Boots Alliance, Inc. | | | 19,655 | | | | 1,610,531 | |
Weis Markets, Inc. | | | 138 | | | | 8,203 | |
Whole Foods Market, Inc. | | | 7,231 | | | | 218,521 | |
| | | | | | | | |
| | | | | | | | 9,598,781 | |
Food Products — 1.6% | |
AdvancePierre Foods Holdings, Inc. | | | 402 | | | | 11,139 | |
Amplify Snack Brands, Inc. (a)(c) | | | 258 | | | | 2,485 | |
Archer-Daniels-Midland Co. | | | 12,980 | | | | 574,495 | |
B&G Foods, Inc. | | | 1,561 | | | | 69,230 | |
Blue Buffalo Pet Products, Inc. (a) | | | 1,104 | | | | 26,772 | |
Bunge Ltd. | | | 3,380 | | | | 233,930 | |
Cal-Maine Foods, Inc. (c) | | | 578 | | | | 24,103 | |
See Notes to Financial Statements.
| | | | | | |
| | | | | | | |
| 78 | | BLACKROCK FUNDS | | JANUARY 31, 2017 | | |
| | |
Schedule of Investments (continued) | | BlackRock Total Stock Market Index Fund |
| | | | | | | | |
| Common Stocks | | Shares | | | Value | |
Food Products (continued) | |
Calavo Growers, Inc. | | | 294 | | | $ | 16,258 | |
Campbell Soup Co. | | | 4,169 | | | | 259,437 | |
Conagra Brands, Inc. | | | 9,834 | | | | 384,411 | |
Darling Ingredients, Inc. (a) | | | 4,145 | | | | 49,740 | |
Dean Foods Co. | | | 2,435 | | | | 48,359 | |
Farmer Bros Co. (a) | | | 293 | | | | 10,196 | |
Flowers Foods, Inc. | | | 4,297 | | | | 86,413 | |
Fresh Del Monte Produce, Inc. | | | 1,062 | | | | 60,800 | |
Freshpet, Inc. (a) | | | 494 | | | | 5,508 | |
General Mills, Inc. | | | 13,557 | | | | 847,041 | |
Hain Celestial Group, Inc. (a) | | | 2,408 | | | | 95,260 | |
Hershey Co. | | | 3,158 | | | | 333,074 | |
Hormel Foods Corp. | | | 6,124 | | | | 222,301 | |
Ingredion, Inc. | | | 1,560 | | | | 199,976 | |
Inventure Foods, Inc. (a) | | | 551 | | | | 3,300 | |
J&J Snack Foods Corp. | | | 400 | | | | 51,028 | |
J.M. Smucker Co. | | | 2,592 | | | | 352,123 | |
John B Sanfilippo & Son, Inc. | | | 174 | | | | 11,447 | |
Kellogg Co. | | | 5,643 | | | | 410,303 | |
Kraft Heinz Co. | | | 13,682 | | | | 1,221,666 | |
Lamb Weston Holdings, Inc. | | | 3,302 | | | | 123,363 | |
Lancaster Colony Corp. | | | 420 | | | | 55,041 | |
Limoneira Co. | | | 296 | | | | 5,032 | |
McCormick & Co., Inc. | | | 2,557 | | | | 244,321 | |
Mead Johnson Nutrition Co. | | | 4,287 | | | | 302,062 | |
Mondelez International, Inc., Class A | | | 34,208 | | | | 1,514,730 | |
Omega Protein Corp. (a) | | | 425 | | | | 10,604 | |
Pilgrim’s Pride Corp. | | | 1,080 | | | | 20,671 | |
Pinnacle Foods, Inc. | | | 2,487 | | | | 132,284 | |
Post Holdings, Inc. (a) | | | 1,468 | | | | 122,842 | |
Sanderson Farms, Inc. | | | 495 | | | | 45,045 | |
Seneca Foods Corp., Class A (a) | | | 168 | | | | 6,023 | |
Snyders-Lance, Inc. | | | 1,855 | | | | 71,195 | |
Tootsie Roll Industries, Inc. | | | 246 | | | | 9,213 | |
TreeHouse Foods, Inc. (a) | | | 1,170 | | | | 88,780 | |
Tyson Foods, Inc., Class A | | | 6,572 | | | | 412,656 | |
WhiteWave Foods Co. (a) | | | 3,933 | | | | 216,551 | |
| | | | | | | | |
| | | | | | | | 8,991,208 | |
Gas Utilities — 0.2% | |
Atmos Energy Corp. | | | 2,168 | | | | 165,158 | |
Chesapeake Utilities Corp. | | | 423 | | | | 27,664 | |
National Fuel Gas Co. | | | 1,655 | | | | 92,929 | |
New Jersey Resources Corp. | | | 2,331 | | | | 87,879 | |
Northwest Natural Gas Co. | | | 1,112 | | | | 65,497 | |
ONE Gas, Inc. | | | 1,081 | | | | 69,854 | |
South Jersey Industries, Inc. | | | 2,044 | | | | 67,452 | |
Southwest Gas Corp. | | | 1,295 | | | | 104,338 | |
Spire, Inc. | | | 1,112 | | | | 72,280 | |
UGI Corp. | | | 3,754 | | | | 174,073 | |
WGL Holdings, Inc. | | | 1,230 | | | | 100,786 | |
| | | | | | | | |
| | | | | | | | 1,027,910 | |
Health Care Equipment & Supplies — 2.3% | |
Abaxis, Inc. | | | 413 | | | | 21,044 | |
Abbott Laboratories | | | 39,182 | | | | 1,636,632 | |
ABIOMED, Inc. (a) | | | 919 | | | | 97,754 | |
Accuray, Inc. (a) | | | 2,245 | | | | 12,909 | |
Alere, Inc. (a) | | | 2,151 | | | | 79,587 | |
Align Technology, Inc. (a) | | | 1,602 | | | | 146,887 | |
Analogic Corp. | | | 235 | | | | 18,248 | |
AngioDynamics, Inc. (a) | | | 820 | | | | 13,198 | |
Anika Therapeutics, Inc. (a) | | | 299 | | | | 15,111 | |
AtriCure, Inc. (a) | | | 723 | | | | 11,763 | |
Atrion Corp. | | | 20 | | | | 9,772 | |
AxoGen, Inc. (a) | | | 532 | | | | 5,799 | |
Baxter International, Inc. | | | 10,454 | | | | 500,851 | |
| | | | | | | | |
| Common Stocks | | Shares | | | Value | |
Health Care Equipment & Supplies (continued) | |
Becton Dickinson & Co. | | | 4,778 | | | $ | 847,092 | |
Boston Scientific Corp. (a) | | | 30,765 | | | | 740,206 | |
C.R. Bard, Inc. | | | 1,651 | | | | 391,832 | |
Cantel Medical Corp. | | | 828 | | | | 64,095 | |
Cardiovascular Systems, Inc. (a) | | | 623 | | | | 15,388 | |
Cerus Corp. (a) | | | 1,475 | | | | 6,284 | |
ConforMIS, Inc. (a) | | | 375 | | | | 3,113 | |
CONMED Corp. | | | 528 | | | | 23,544 | |
Cooper Cos., Inc. | | | 1,055 | | | | 194,764 | |
CryoLife, Inc. (a) | | | 601 | | | | 11,419 | |
Cutera, Inc. (a) | | | 240 | | | | 4,440 | |
Cynosure, Inc., Class A (a) | | | 485 | | | | 25,899 | |
Dentsply Sirona, Inc. | | | 5,176 | | | | 293,479 | |
DexCom, Inc. (a) | | | 1,962 | | | | 155,292 | |
Edwards Lifesciences Corp. (a) | | | 4,819 | | | | 463,781 | |
Endologix, Inc. (a) | | | 1,592 | | | | 10,921 | |
Exactech, Inc. (a) | | | 193 | | | | 4,757 | |
GenMark Diagnostics, Inc. (a) | | | 801 | | | | 9,716 | |
Glaukos Corp. (a) | | | 323 | | | | 13,314 | |
Globus Medical, Inc., Class A (a) | | | 1,950 | | | | 51,402 | |
Haemonetics Corp. (a) | | | 1,356 | | | | 54,050 | |
Halyard Health, Inc. (a) | | | 1,343 | | | | 51,665 | |
Hill-Rom Holdings, Inc. | | | 1,527 | | | | 89,895 | |
Hologic, Inc. (a) | | | 6,384 | | | | 258,744 | |
ICU Medical, Inc. (a) | | | 362 | | | | 49,630 | |
IDEXX Laboratories, Inc. (a) | | | 1,999 | | | | 244,538 | |
Inogen, Inc. (a) | | | 305 | | | | 19,633 | |
Insulet Corp. (a) | | | 1,480 | | | | 61,568 | |
Integra LifeSciences Holdings Corp. (a) | | | 1,456 | | | | 60,759 | |
Intuitive Surgical, Inc. (a) | | | 858 | | | | 594,328 | |
Invacare Corp. | | | 859 | | | | 9,879 | |
InVivo Therapeutics Holdings Corp. (a) | | | 784 | | | | 3,724 | |
K2M Group Holdings, Inc. (a) | | | 494 | | | | 10,038 | |
LeMaitre Vascular, Inc. | | | 180 | | | | 4,088 | |
Masimo Corp. (a) | | | 936 | | | | 68,871 | |
Medtronic PLC | | | 32,184 | | | | 2,446,628 | |
Meridian Bioscience, Inc. | | | 886 | | | | 11,607 | |
Merit Medical Systems, Inc. (a) | | | 800 | | | | 20,320 | |
Natus Medical, Inc. (a) | | | 623 | | | | 24,328 | |
Neogen Corp. (a) | | | 901 | | | | 59,502 | |
Nevro Corp. (a) | | | 602 | | | | 52,386 | |
Novocure Ltd. (a) | | | 1,006 | | | | 6,388 | |
NuVasive, Inc. (a) | | | 1,351 | | | | 95,610 | |
NxStage Medical, Inc. (a) | | | 1,886 | | | | 50,733 | |
Ocular Therapeutix, Inc. (a) | | | 390 | | | | 2,558 | |
OraSure Technologies, Inc. (a) | | | 891 | | | | 7,859 | |
Orthofix International NV (a) | | | 352 | | | | 12,651 | |
Oxford Immunotec Global PLC (a) | | | 422 | | | | 5,701 | |
Quidel Corp. (a) | | | 467 | | | | 8,864 | |
ResMed, Inc. | | | 3,158 | | | | 213,291 | |
Rockwell Medical, Inc. (a)(c) | | | 732 | | | | 4,253 | |
RTI Surgical, Inc. (a) | | | 1,373 | | | | 4,462 | |
Spectranetics Corp. (a) | | | 819 | | | | 21,171 | |
STAAR Surgical Co. (a) | | | 712 | | | | 7,049 | |
Stryker Corp. | | | 7,669 | | | | 947,352 | |
SurModics, Inc. (a) | | | 407 | | | | 9,849 | |
Teleflex, Inc. | | | 1,014 | | | | 170,078 | |
Utah Medical Products, Inc. | | | 90 | | | | 5,598 | |
Varex Imaging Corp. (a) | | | 870 | | | | 25,024 | |
Varian Medical Systems, Inc. (a) | | | 2,176 | | | | 168,966 | |
Vascular Solutions, Inc. (a) | | | 317 | | | | 17,736 | |
West Pharmaceutical Services, Inc. | | | 1,569 | | | | 132,784 | |
Wright Medical Group NV (a) | | | 3,158 | | | | 79,518 | |
Zeltiq Aesthetics, Inc. (a) | | | 924 | | | | 40,970 | |
Zimmer Biomet Holdings, Inc. | | | 4,208 | | | | 497,933 | |
| | | | | | | | |
| | | | | | | | 12,632,872 | |
See Notes to Financial Statements.
| | | | | | |
| | | | | | | |
| | BLACKROCK FUNDS | | JANUARY 31, 2017 | | 79 |
| | |
Schedule of Investments (continued) | | BlackRock Total Stock Market Index Fund |
| | | | | | | | |
| Common Stocks | | Shares | | | Value | |
Health Care Providers & Services — 2.4% | |
Acadia Healthcare Co., Inc. (a) | | | 1,710 | | | $ | 65,613 | |
Addus HomeCare Corp. (a) | | | 156 | | | | 5,327 | |
Adeptus Health, Inc., Class A (a) | | | 127 | | | | 911 | |
Aetna, Inc. | | | 7,755 | | | | 919,821 | |
Air Methods Corp. (a) | | | 995 | | | | 35,521 | |
Almost Family, Inc. (a) | | | 340 | | | | 16,065 | |
Amedisys, Inc. (a) | | | 535 | | | | 24,514 | |
AmerisourceBergen Corp. | | | 3,742 | | | | 326,602 | |
AMN Healthcare Services, Inc. (a) | | | 1,123 | | | | 40,260 | |
Anthem, Inc. | | | 6,010 | | | | 926,381 | |
BioTelemetry, Inc. (a) | | | 528 | | | | 12,170 | |
Brookdale Senior Living, Inc. (a) | | | 4,520 | | | | 67,664 | |
Capital Senior Living Corp. (a) | | | 492 | | | | 8,202 | |
Cardinal Health, Inc. | | | 7,417 | | | | 555,978 | |
Centene Corp. (a) | | | 3,782 | | | | 239,287 | |
Chemed Corp. | | | 377 | | | | 62,616 | |
Cigna Corp. | | | 5,764 | | | | 842,812 | |
Civitas Solutions, Inc. (a) | | | 124 | | | | 2,269 | |
Community Health Systems, Inc. (a) | | | 2,135 | | | | 13,664 | |
Corvel Corp. (a) | | | 227 | | | | 8,705 | |
Cross Country Healthcare, Inc. (a) | | | 730 | | | | 10,563 | |
DaVita, Inc. (a) | | | 3,759 | | | | 239,636 | |
Ensign Group, Inc. | | | 699 | | | | 14,218 | |
Envision Healthcare Corp. (a) | | | 2,630 | | | | 178,840 | |
Express Scripts Holding Co. (a) | | | 14,432 | | | | 994,076 | |
Genesis Healthcare, Inc. (a) | | | 1,147 | | | | 4,714 | |
HCA Holdings, Inc. (a) | | | 6,922 | | | | 555,698 | |
HealthEquity, Inc. (a) | | | 849 | | | | 39,266 | |
HealthSouth Corp. | | | 2,739 | | | | 106,328 | |
Henry Schein, Inc. (a) | | | 1,818 | | | | 290,625 | |
HMS Holdings Corp. (a) | | | 1,582 | | | | 28,729 | |
Humana, Inc. | | | 3,389 | | | | 672,716 | |
Integer Holdings Corp. (a) | | | 576 | | | | 18,662 | |
Kindred Healthcare, Inc. | | | 1,627 | | | | 10,820 | |
Laboratory Corp. of America Holdings (a) | | | 2,361 | | | | 316,870 | |
Landauer, Inc. | | | 189 | | | | 9,705 | |
LHC Group, Inc. (a) | | | 270 | | | | 13,535 | |
LifePoint Health, Inc. (a) | | | 1,198 | | | | 71,101 | |
Magellan Health, Inc. (a) | | | 689 | | | | 51,641 | |
McKesson Corp. | | | 5,134 | | | | 714,396 | |
MEDNAX, Inc. (a) | | | 1,967 | | | | 134,444 | |
Molina Healthcare, Inc. (a) | | | 1,032 | | | | 58,535 | |
National Healthcare Corp. | | | 195 | | | | 14,596 | |
Nobilis Health Corp. (a) | | | 1,564 | | | | 3,363 | |
Owens & Minor, Inc. | | | 1,771 | | | | 63,543 | |
Patterson Cos., Inc. | | | 2,273 | | | | 94,580 | |
Penumbra, Inc. (a) | | | 669 | | | | 47,867 | |
PharMerica Corp. (a) | | | 536 | | | | 13,293 | |
Premier, Inc., Class A (a) | | | 1,479 | | | | 47,121 | |
Providence Service Corp. (a) | | | 166 | | | | 6,416 | |
Quest Diagnostics, Inc. | | | 3,102 | | | | 285,136 | |
Quorum Health Corp. (a) | | | 712 | | | | 6,258 | |
RadNet, Inc. (a) | | | 791 | | | | 4,588 | |
Select Medical Holdings Corp. (a) | | | 2,053 | | | | 25,560 | |
Surgery Partners, Inc. (a) | | | 153 | | | | 2,831 | |
Surgical Care Affiliates, Inc. (a) | | | 500 | | | | 28,250 | |
Team Health Holdings, Inc. (a) | | | 1,410 | | | | 61,279 | |
Teladoc, Inc. (a) | | | 206 | | | | 4,120 | |
Tenet Healthcare Corp. (a) | | | 2,167 | | | | 38,118 | |
Tivity Health, Inc. (a) | | | 640 | | | | 16,416 | |
Triple-S Management Corp., Class B (a) | | | 307 | | | | 5,867 | |
U.S. Physical Therapy, Inc. | | | 224 | | | | 15,714 | |
UnitedHealth Group, Inc. | | | 21,412 | | | | 3,470,885 | |
Universal American Corp. (a) | | | 1,250 | | | | 12,425 | |
Universal Health Services, Inc., Class B | | | 1,932 | | | | 217,601 | |
VCA, Inc. (a) | | | 1,733 | | | | 157,010 | |
WellCare Health Plans, Inc. (a) | | | 1,030 | | | | 149,906 | |
| | | | | | | | |
| | | | | | | | 13,502,243 | |
| | | | | | | | |
| Common Stocks | | Shares | | | Value | |
Health Care Technology — 0.1% | |
athenahealth, Inc. (a) | | | 939 | | | $ | 118,305 | |
Castlight Health, Inc., Class B (a) | | | 894 | | | | 2,771 | |
Cerner Corp. (a) | | | 6,679 | | | | 358,729 | |
Computer Programs & Systems, Inc. | | | 171 | | | | 3,865 | |
Cotiviti Holdings, Inc. (a) | | | 325 | | | | 11,004 | |
Evolent Health, Inc., Class A (a) | | | 139 | | | | 2,530 | |
HealthStream, Inc. (a) | | | 385 | | | | 8,840 | |
Inovalon Holdings, Inc., Class A (a) | | | 906 | | | | 10,464 | |
Medidata Solutions, Inc. (a) | | | 1,317 | | | | 65,244 | |
Omnicell, Inc. (a) | | | 643 | | | | 23,084 | |
Quality Systems, Inc. (a) | | | 929 | | | | 13,944 | |
Veeva Systems, Inc., Class A (a) | | | 2,251 | | | | 95,285 | |
Vocera Communications, Inc. (a) | | | 531 | | | | 11,018 | |
| | | | | | | | |
| | | | | | | | 725,083 | |
Hotels, Restaurants & Leisure — 1.9% | |
Aramark | | | 5,511 | | | | 186,492 | |
Belmond Ltd., Class A (a) | | | 1,504 | | | | 20,830 | |
Biglari Holdings, Inc. (a) | | | 20 | | | | 8,864 | |
BJ’s Restaurants, Inc. (a) | | | 523 | | | | 18,593 | |
Bloomin’ Brands, Inc. | | | 2,096 | | | | 35,863 | |
Bob Evans Farms, Inc. | | | 387 | | | | 21,838 | |
Boyd Gaming Corp. (a) | | | 1,494 | | | | 30,358 | |
Brinker International, Inc. | | | 1,020 | | | | 45,390 | |
Buffalo Wild Wings, Inc. (a) | | | 294 | | | | 44,394 | |
Caesars Acquisition Co., Class A (a) | | | 944 | | | | 14,160 | |
Caesars Entertainment Corp. (a) | | | 1,014 | | | | 9,075 | |
Carnival Corp. | | | 9,041 | | | | 500,691 | |
Carrols Restaurant Group, Inc. (a) | | | 896 | | | | 12,858 | |
Cheesecake Factory, Inc. | | | 1,100 | | | | 66,286 | |
Chipotle Mexican Grill, Inc. (a) | | | 649 | | | | 273,515 | |
Choice Hotels International, Inc. | | | 809 | | | | 44,899 | |
Churchill Downs, Inc. | | | 346 | | | | 49,599 | |
Chuy’s Holdings, Inc. (a) | | | 256 | | | | 7,526 | |
ClubCorp Holdings, Inc. | | | 1,347 | | | | 22,226 | |
Cracker Barrel Old Country Store, Inc. | | | 444 | | | | 70,179 | |
Darden Restaurants, Inc. | | | 2,604 | | | | 190,821 | |
Dave & Buster’s Entertainment, Inc. (a) | | | 911 | | | | 49,613 | |
Del Frisco’s Restaurant Group, Inc. (a) | | | 854 | | | | 14,945 | |
Del Taco Restaurants, Inc. (a) | | | 678 | | | | 9,248 | |
Denny’s Corp. (a) | | | 1,350 | | | | 16,430 | |
DineEquity, Inc. | | | 333 | | | | 22,837 | |
Domino’s Pizza, Inc. | | | 1,122 | | | | 195,834 | |
Dunkin’ Brands Group, Inc. | | | 2,053 | | | | 106,489 | |
El Pollo Loco Holdings, Inc. (a) | | | 399 | | | | 4,968 | |
Eldorado Resorts, Inc. (a) | | | 405 | | | | 6,278 | |
Extended Stay America, Inc. | | | 1,447 | | | | 23,456 | |
Fiesta Restaurant Group, Inc. (a) | | | 480 | | | | 12,624 | |
Golden Entertainment, Inc. | | | 302 | | | | 3,328 | |
Habit Restaurants, Inc., Class A (a) | | | 422 | | | | 6,119 | |
Hilton Grand Vacations, Inc. (a) | | | 1,042 | | | | 30,562 | |
Hilton Worldwide Holdings, Inc. | | | 4,064 | | | | 234,005 | |
Hyatt Hotels Corp., Class A (a) | | | 964 | | | | 52,740 | |
ILG, Inc. | | | 2,894 | | | | 54,841 | |
International Game Technology PLC | | | 2,458 | | | | 64,916 | |
International Speedway Corp., Class A | | | 397 | | | | 14,550 | |
Intrawest Resorts Holdings, Inc. (a) | | | 223 | | | | 4,596 | |
Isle of Capri Casinos, Inc. (a) | | | 670 | | | | 15,953 | |
Jack in the Box, Inc. | | | 727 | | | | 78,458 | |
La Quinta Holdings, Inc. (a) | | | 1,573 | | | | 22,226 | |
Las Vegas Sands Corp. | | | 8,370 | | | | 440,095 | |
Marcus Corp. | | | 514 | | | | 15,240 | |
Marriott International, Inc., Class A | | | 7,369 | | | | 623,417 | |
Marriott Vacations Worldwide Corp. | | | 580 | | | | 50,158 | |
McDonald’s Corp. | | | 19,122 | | | | 2,343,784 | |
MGM Resorts International (a) | | | 10,820 | | | | 311,616 | |
Monarch Casino & Resort, Inc. (a) | | | 228 | | | | 5,417 | |
See Notes to Financial Statements.
| | | | | | |
| | | | | | | |
| 80 | | BLACKROCK FUNDS | | JANUARY 31, 2017 | | |
| | |
Schedule of Investments (continued) | | BlackRock Total Stock Market Index Fund |
| | | | | | | | |
| Common Stocks | | Shares | | | Value | |
Hotels, Restaurants & Leisure (continued) | |
Nathan’s Famous, Inc. (a) | | | 78 | | | $ | 4,875 | |
Norwegian Cruise Line Holdings Ltd. (a) | | | 3,804 | | | | 178,788 | |
Panera Bread Co., Class A (a) | | | 523 | | | | 109,338 | |
Papa John’s International, Inc. | | | 627 | | | | 53,433 | |
Penn National Gaming, Inc. (a) | | | 1,613 | | | | 22,227 | |
Pinnacle Entertainment, Inc. (a) | | | 1,064 | | | | 16,386 | |
Planet Fitness, Inc., Class A | | | 452 | | | | 9,510 | |
Popeyes Louisiana Kitchen, Inc. (a) | | | 397 | | | | 25,086 | |
Potbelly Corp. (a) | | | 715 | | | | 9,295 | |
Red Robin Gourmet Burgers, Inc. (a) | | | 269 | | | | 12,791 | |
Red Rock Resorts, Inc., Class A | | | 727 | | | | 17,070 | |
Royal Caribbean Cruises Ltd. | | | 3,735 | | | | 349,708 | |
Ruby Tuesday, Inc. (a) | | | 1,314 | | | | 2,575 | |
Ruth’s Hospitality Group, Inc. | | | 527 | | | | 9,038 | |
Ryman Hospitality Properties, Inc. | | | 1,083 | | | | 66,258 | |
Scientific Games Corp., Class A (a) | | | 1,050 | | | | 17,850 | |
SeaWorld Entertainment, Inc. | | | 1,271 | | | | 23,018 | |
Shake Shack, Inc., Class A (a) | | | 304 | | | | 10,734 | |
Six Flags Entertainment Corp. | | | 1,572 | | | | 93,660 | |
Sonic Corp. | | | 1,583 | | | | 39,417 | |
Starbucks Corp. | | | 32,766 | | | | 1,809,339 | |
Texas Roadhouse, Inc. | | | 1,686 | | | | 78,635 | |
Vail Resorts, Inc. | | | 878 | | | | 150,612 | |
Wendy’s Co. | | | 4,960 | | | | 67,109 | |
Wingstop, Inc. | | | 315 | | | | 8,968 | |
Wyndham Worldwide Corp. | | | 2,539 | | | | 200,733 | |
Wynn Resorts Ltd. | | | 1,768 | | | | 179,328 | |
Yum China Holdings, Inc. (a) | | | 7,884 | | | | 216,652 | |
Yum! Brands, Inc. | | | 7,900 | | | | 517,687 | |
Zoe’s Kitchen, Inc. (a) | | | 407 | | | | 8,885 | |
| | | | | | | | |
| | | | | | | | 10,818,205 | |
Household Durables — 0.6% | |
Bassett Furniture Industries, Inc. | | | 182 | | | | 5,132 | |
Beazer Homes USA, Inc. (a) | | | 349 | | | | 4,977 | |
CalAtlantic Group, Inc. | | | 2,025 | | | | 70,612 | |
Cavco Industries, Inc. (a) | | | 160 | | | | 15,720 | |
Century Communities, Inc. (a) | | | 541 | | | | 12,308 | |
CSS Industries, Inc. | | | 356 | | | | 8,765 | |
D.R. Horton, Inc. | | | 7,624 | | | | 228,034 | |
Ethan Allen Interiors, Inc. | | | 482 | | | | 14,026 | |
Flexsteel Industries, Inc. | | | 220 | | | | 11,189 | |
Garmin Ltd. | | | 2,594 | | | | 125,264 | |
GoPro, Inc., Class A (a)(c) | | | 1,770 | | | | 19,028 | |
Green Brick Partners, Inc. (a) | | | 414 | | | | 3,974 | |
Harman International Industries, Inc. | | | 1,609 | | | | 178,856 | |
Helen of Troy Ltd. (a) | | | 880 | | | | 82,104 | |
Hooker Furniture Corp. | | | 333 | | | | 11,056 | |
Hovnanian Enterprises, Inc., Class A (a) | | | 2,660 | | | | 6,304 | |
Installed Building Products, Inc. (a) | | | 348 | | | | 14,233 | |
iRobot Corp. (a) | | | 675 | | | | 40,878 | |
KB Home | | | 2,137 | | | | 35,004 | |
La-Z-Boy, Inc. | | | 896 | | | | 25,626 | |
Leggett & Platt, Inc. | | | 2,745 | | | | 130,991 | |
Lennar Corp., Class A | | | 4,143 | | | | 184,985 | |
Lennar Corp., Class B | | | 259 | | | | 9,314 | |
LGI Homes, Inc. (a) | | | 223 | | | | 6,926 | |
Libbey, Inc. | | | 628 | | | | 10,745 | |
Lifetime Brands, Inc. | | | 222 | | | | 3,319 | |
M/I Homes, Inc. (a) | | | 425 | | | | 10,685 | |
MDC Holdings, Inc. | | | 713 | | | | 19,280 | |
Meritage Homes Corp. (a) | | | 1,018 | | | | 37,411 | |
Mohawk Industries, Inc. (a) | | | 1,328 | | | | 286,636 | |
NACCO Industries, Inc., Class A | | | 95 | | | | 7,006 | |
New Home Co., Inc. (a) | | | 329 | | | | 3,435 | |
Newell Brands, Inc. | | | 10,601 | | | | 501,745 | |
NVR, Inc. (a) | | | 78 | | | | 144,924 | |
| | | | | | | | |
| Common Stocks | | Shares | | | Value | |
Household Durables (continued) | |
PulteGroup, Inc. | | | 7,569 | | | $ | 162,809 | |
Taylor Morrison Home Corp., Class A (a) | | | 547 | | | | 10,612 | |
Tempur Sealy International, Inc. (a) | | | 1,277 | | | | 54,911 | |
Toll Brothers, Inc. (a) | | | 3,440 | | | | 107,878 | |
TopBuild Corp. (a) | | | 712 | | | | 26,422 | |
TRI Pointe Group, Inc. (a) | | | 3,712 | | | | 45,546 | |
Tupperware Brands Corp. | | | 1,230 | | | | 74,243 | |
Universal Electronics, Inc. (a) | | | 483 | | | | 28,738 | |
WCI Communities, Inc. (a) | | | 617 | | | | 14,438 | |
Whirlpool Corp. | | | 1,647 | | | | 288,044 | |
William Lyon Homes, Class A (a) | | | 595 | | | | 10,502 | |
ZAGG, Inc. (a) | | | 555 | | | | 3,719 | |
| | | | | | | | |
| | | | | | | | 3,098,354 | |
Household Products — 1.5% | |
Central Garden & Pet Co. (a) | | | 682 | | | | 22,404 | |
Central Garden and Pet Co., Class A (a) | | | 912 | | | | 28,071 | |
Church & Dwight Co., Inc. | | | 5,783 | | | | 261,507 | |
Clorox Co. | | | 2,865 | | | | 343,800 | |
Colgate-Palmolive Co. | | | 19,818 | | | | 1,279,846 | |
Energizer Holdings, Inc. | | | 1,436 | | | | 72,475 | |
HRG Group, Inc. (a) | | | 2,266 | | | | 38,137 | |
Kimberly-Clark Corp. | | | 8,175 | | | | 990,238 | |
Oil-Dri Corp. of America | | | 141 | | | | 4,744 | |
Orchids Paper Products Co. | | | 354 | | | | 9,668 | |
Procter & Gamble Co. | | | 58,563 | | | | 5,130,119 | |
Spectrum Brands Holdings, Inc. | | | 579 | | | | 77,233 | |
WD-40 Co. | | | 268 | | | | 28,180 | |
| | | | | | | | |
| | | | | | | | 8,286,422 | |
Independent Power and Renewable Electricity Producers — 0.1% | |
AES Corp. | | | 14,901 | | | | 170,468 | |
Atlantic Power Corp. (a) | | | 4,381 | | | | 10,295 | |
Atlantica Yield PLC | | | 1,316 | | | | 28,163 | |
Calpine Corp. (a) | | | 8,469 | | | | 99,934 | |
Dynegy, Inc. (a) | | | 3,577 | | | | 34,160 | |
NRG Energy, Inc. | | | 8,441 | | | | 139,614 | |
NRG Yield, Inc., Class A | | | 765 | | | | 12,431 | |
NRG Yield, Inc., Class C | | | 989 | | | | 16,764 | |
Ormat Technologies, Inc. | | | 964 | | | | 51,767 | |
Pattern Energy Group, Inc. | | | 1,245 | | | | 24,576 | |
TerraForm Global, Inc., Class A (a) | | | 891 | | | | 3,920 | |
TerraForm Power, Inc., Class A (a) | | | 1,562 | | | | 18,541 | |
| | | | | | | | |
| | | | | | | | 610,633 | |
Industrial Conglomerates — 2.2% | |
3M Co. | | | 13,462 | | | | 2,353,427 | |
BWX Technologies, Inc. | | | 2,153 | | | | 89,328 | |
Carlisle Cos., Inc. | | | 1,383 | | | | 150,899 | |
Danaher Corp. | | | 13,821 | | | | 1,159,858 | |
General Electric Co. | | | 210,805 | | | | 6,260,908 | |
Honeywell International, Inc. | | | 17,396 | | | | 2,058,295 | |
Raven Industries, Inc. | | | 668 | | | | 16,733 | |
Roper Technologies, Inc. | | | 2,236 | | | | 428,977 | |
Seaboard Corp. (a) | | | 4 | | | | 15,400 | |
Standex International Corp. | | | 278 | | | | 24,242 | |
| | | | | | | | |
| | | | | | | | 12,558,067 | |
Insurance — 2.8% | |
Aflac, Inc. | | | 9,227 | | | | 645,798 | |
Alleghany Corp. (a) | | | 228 | | | | 139,438 | |
Allied World Assurance Co. Holdings AG | | | 2,169 | | | | 115,239 | |
Allstate Corp. | | | 8,430 | | | | 634,020 | |
American Equity Investment Life Holding Co. | | | 1,135 | | | | 26,786 | |
American Financial Group, Inc. | | | 1,591 | | | | 137,096 | |
American International Group, Inc. | | | 23,393 | | | | 1,503,234 | |
American National Insurance Co. | | | 143 | | | | 16,672 | |
AMERISAFE, Inc. | | | 355 | | | | 22,383 | |
See Notes to Financial Statements.
| | | | | | |
| | | | | | | |
| | BLACKROCK FUNDS | | JANUARY 31, 2017 | | 81 |
| | |
Schedule of Investments (continued) | | BlackRock Total Stock Market Index Fund |
| | | | | | | | |
| Common Stocks | | Shares | | | Value | |
Insurance (continued) | |
AmTrust Financial Services, Inc. | | | 2,434 | | | $ | 64,233 | |
Aon PLC | | | 5,929 | | | | 668,198 | |
Arch Capital Group Ltd. (a) | | | 3,002 | | | | 265,227 | |
Argo Group International Holdings Ltd. | | | 725 | | | | 46,364 | |
Arthur J Gallagher & Co. | | | 3,923 | | | | 211,175 | |
Aspen Insurance Holdings Ltd. | | | 2,318 | | | | 130,735 | |
Assurant, Inc. | | | 1,296 | | | | 125,880 | |
Assured Guaranty Ltd. | | | 3,178 | | | | 123,656 | |
Axis Capital Holdings Ltd. | | | 2,100 | | | | 134,421 | |
Baldwin & Lyons, Inc., Class B | | | 404 | | | | 9,696 | |
Brown & Brown, Inc. | | | 2,515 | | | | 105,957 | |
Chubb Ltd. | | | 10,620 | | | | 1,396,424 | |
Cincinnati Financial Corp. | | | 3,353 | | | | 236,655 | |
Citizens, Inc. (a) | | | 1,392 | | | | 12,890 | |
CNA Financial Corp. | | | 602 | | | | 25,073 | |
CNO Financial Group, Inc. | | | 2,178 | | | | 41,186 | |
Crawford & Co., Class B | | | 288 | | | | 3,491 | |
eHealth, Inc. (a) | | | 206 | | | | 2,526 | |
EMC Insurance Group, Inc. | | | 502 | | | | 14,633 | |
Employers Holdings, Inc. | | | 1,780 | | | | 64,881 | |
Endurance Specialty Holdings Ltd. | | | 1,429 | | | | 132,454 | |
Enstar Group Ltd. (a) | | | 410 | | | | 79,397 | |
Erie Indemnity Co., Class A | | | 538 | | | | 60,315 | |
Everest Re Group Ltd. | | | 513 | | | | 112,824 | |
FBL Financial Group, Inc., Class A | | | 849 | | | | 59,260 | |
Federated National Holding Co. | | | 170 | | | | 3,118 | |
First American Financial Corp. | | | 2,427 | | | | 91,207 | |
FNF Group | | | 5,982 | | | | 211,524 | |
Genworth Financial, Inc., Class A (a) | | | 4,655 | | | | 15,641 | |
Greenlight Capital Re Ltd., Class A (a) | | | 575 | | | | 12,995 | |
Hanover Insurance Group, Inc. | | | 1,020 | | | | 85,619 | |
Hartford Financial Services Group, Inc. | | | 8,824 | | | | 429,817 | |
Heritage Insurance Holdings, Inc. | | | 585 | | | | 8,295 | |
Hilltop Holdings, Inc. | | | 1,395 | | | | 38,195 | |
Horace Mann Educators Corp. | | | 1,675 | | | | 69,261 | |
Independence Holding Co. | | | 268 | | | | 5,333 | |
Infinity Property & Casualty Corp. | | | 337 | | | | 29,268 | |
Investors Title Co. | | | 51 | | | | 6,198 | |
James River Group Holdings Ltd. | | | 302 | | | | 11,974 | |
Kemper Corp. | | | 1,892 | | | | 81,734 | |
Lincoln National Corp. | | | 5,437 | | | | 367,052 | |
Loews Corp. | | | 6,045 | | | | 281,576 | |
Maiden Holdings Ltd. | | | 1,108 | | | | 19,667 | |
Markel Corp. (a) | | | 310 | | | | 286,750 | |
Marsh & McLennan Cos., Inc. | | | 11,825 | | | | 804,337 | |
MBIA, Inc. (a) | | | 2,769 | | | | 28,244 | |
MetLife, Inc. | | | 21,390 | | | | 1,163,830 | |
National General Holdings Corp. | | | 1,074 | | | | 26,302 | |
National Western Life Group, Inc., Class A | | | 54 | | | | 15,830 | |
Navigators Group, Inc. | | | 534 | | | | 29,984 | |
Old Republic International Corp. | | | 5,173 | | | | 107,598 | |
OneBeacon Insurance Group Ltd., Class A | | | 795 | | | | 12,903 | |
Primerica, Inc. | | | 675 | | | | 50,929 | |
Principal Financial Group, Inc. | | | 6,046 | | | | 345,166 | |
ProAssurance Corp. | | | 1,196 | | | | 65,062 | |
Progressive Corp. | | | 13,236 | | | | 495,556 | |
Prudential Financial, Inc. | | | 10,123 | | | | 1,064,029 | |
Reinsurance Group of America, Inc. | | | 1,167 | | | | 146,423 | |
RenaissanceRe Holdings Ltd. | | | 433 | | | | 59,027 | |
RLI Corp. | | | 1,127 | | | | 66,966 | |
Safety Insurance Group, Inc. | | | 141 | | | | 10,110 | |
Selective Insurance Group, Inc. | | | 533 | | | | 22,226 | |
State Auto Financial Corp. | | | 446 | | | | 11,266 | |
State National Cos., Inc. | | | 765 | | | | 10,526 | |
Third Point Reinsurance Ltd. (a) | | | 1,141 | | | | 13,064 | |
Torchmark Corp. | | | 2,598 | | | | 191,057 | |
Travelers Cos., Inc. | | | 6,657 | | | | 784,061 | |
| | | | | | | | |
| Common Stocks | | Shares | | | Value | |
Insurance (continued) | |
Trupanion, Inc. (a)(c) | | | 727 | | | $ | 11,625 | |
United Fire Group, Inc. | | | 405 | | | | 19,116 | |
United Insurance Holdings Corp. | | | 218 | | | | 2,980 | |
Universal Insurance Holdings, Inc. | | | 610 | | | | 15,952 | |
Unum Group | | | 5,418 | | | | 246,140 | |
Validus Holdings Ltd. | | | 2,276 | | | | 129,732 | |
W.R. Berkley Corp. | | | 2,236 | | | | 150,282 | |
White Mountains Insurance Group Ltd. | | | 157 | | | | 142,832 | |
WMIH Corp. (a) | | | 1,915 | | | | 2,968 | |
XL Group Ltd. | | | 5,908 | | | | 221,964 | |
| | | | | | | | |
| | | | | | | | 15,891,528 | |
Internet & Direct Marketing Retail — 2.1% | |
Amazon.com, Inc. (a) | | | 8,895 | | | | 7,324,855 | |
Blue Nile, Inc. | | | 293 | | | | 11,928 | |
Duluth Holdings, Inc., Class B (a) | | | 128 | | | | 2,895 | |
Etsy, Inc. (a) | | | 2,101 | | | | 26,494 | |
Expedia, Inc. | | | 2,701 | | | | 328,415 | |
FTD Cos., Inc. (a) | | | 264 | | | | 6,067 | |
Groupon, Inc. (a) | | | 6,943 | | | | 23,953 | |
HSN, Inc. | | | 590 | | | | 20,798 | |
Lands’ End, Inc. (a)(c) | | | 215 | | | | 3,300 | |
Liberty Expedia Holdings, Inc., Class A (a) | | | 1,515 | | | | 66,675 | |
Liberty Interactive Corp QVC Group, Series A (a) | | | 9,810 | | | | 188,156 | |
Liberty TripAdvisor Holdings, Inc., Series A (a) | | | 2,127 | | | | 38,180 | |
Liberty Ventures, Series A (a) | | | 1,821 | | | | 79,487 | |
Netflix, Inc. (a) | | | 9,306 | | | | 1,309,447 | |
Nutrisystem, Inc. | | | 565 | | | | 18,673 | |
Overstock.com, Inc. (a) | | | 145 | | | | 2,407 | |
PetMed Express, Inc. | | | 418 | | | | 8,857 | |
Priceline Group, Inc. (a) | | | 1,131 | | | | 1,781,472 | |
RetailMeNot, Inc. (a) | | | 820 | | | | 7,421 | |
Shutterfly, Inc. (a) | | | 886 | | | | 45,478 | |
TripAdvisor, Inc. (a) | | | 2,640 | | | | 139,656 | |
Wayfair, Inc., Class A (a)(c) | | | 600 | | | | 24,936 | |
| | | | | | | | |
| | | | | | | | 11,459,550 | |
Internet Software & Services — 3.9% | |
Akamai Technologies, Inc. (a) | | | 3,892 | | | | 266,952 | |
Alarm.com Holdings, Inc. (a) | | | 128 | | | | 3,468 | |
Alphabet, Inc., Class A (a) | | | 6,684 | | | | 5,482,150 | |
Alphabet, Inc., Class C (a) | | | 6,808 | | | | 5,424,546 | |
Amber Road, Inc. (a) | | | 336 | | | | 2,974 | |
Angie’s List, Inc. (a) | | | 439 | | | | 2,753 | |
Appfolio, Inc., Class A (a) | | | 182 | | | | 4,122 | |
Bankrate, Inc. (a) | | | 823 | | | | 8,971 | |
Bazaarvoice, Inc. (a) | | | 881 | | | | 4,141 | |
Benefitfocus, Inc. (a) | | | 285 | | | | 8,621 | |
Blucora, Inc. (a) | | | 670 | | | | 10,117 | |
Box, Inc., Class A (a) | | | 928 | | | | 15,841 | |
Brightcove, Inc. (a) | | | 354 | | | | 2,549 | |
Carbonite, Inc. (a) | | | 278 | | | | 4,795 | |
ChannelAdvisor Corp. (a) | | | 283 | | | | 3,920 | |
Chegg, Inc. (a) | | | 1,883 | | | | 13,539 | |
Cimpress NV (a) | | | 901 | | | | 76,035 | |
CommerceHub, Inc., Series A (a) | | | 157 | | | | 2,306 | |
CommerceHub, Inc., Series C (a) | | | 952 | | | | 13,880 | |
ComScore, Inc. (a) | | | 1,519 | | | | 50,962 | |
Cornerstone OnDemand, Inc. (a) | | | 1,249 | | | | 50,822 | |
CoStar Group, Inc. (a) | | | 729 | | | | 147,331 | |
DHI Group, Inc. (a) | | | 1,464 | | | | 8,345 | |
EarthLink Holdings Corp. | | | 6,505 | | | | 41,697 | |
eBay, Inc. (a) | | | 24,303 | | | | 773,564 | |
Endurance International Group Holdings, Inc. (a) | | | 771 | | | | 5,937 | |
Envestnet, Inc. (a) | | | 1,166 | | | | 44,075 | |
Facebook, Inc., Class A (a) | | | 51,299 | | | | 6,685,286 | |
Five9, Inc. (a) | | | 715 | | | | 11,054 | |
See Notes to Financial Statements.
| | | | | | |
| | | | | | | |
| 82 | | BLACKROCK FUNDS | | JANUARY 31, 2017 | | |
| | |
Schedule of Investments (continued) | | BlackRock Total Stock Market Index Fund |
| | | | | | | | |
| Common Stocks | | Shares | | | Value | |
Internet Software & Services (continued) | |
Global Eagle Entertainment, Inc. (a) | | | 478 | | | $ | 2,944 | |
GoDaddy, Inc., Class A (a) | | | 1,141 | | | | 40,768 | |
Gogo, Inc. (a)(c) | | | 740 | | | | 6,771 | |
GrubHub, Inc. (a) | | | 1,874 | | | | 77,865 | |
GTT Communications, Inc. (a) | | | 498 | | | | 14,068 | |
Hortonworks, Inc. (a) | | | 362 | | | | 3,511 | |
IAC/InterActiveCorp (a) | | | 1,631 | | | | 112,229 | |
j2 Global, Inc. | | | 992 | | | | 83,140 | |
LendingClub Corp. (a) | | | 8,300 | | | | 51,211 | |
Liquidity Services, Inc. (a) | | | 954 | | | | 9,301 | |
LivePerson, Inc. (a) | | | 1,406 | | | | 10,264 | |
LogMeIn, Inc. | | | 601 | | | | 64,968 | |
Match Group, Inc. (a)(c) | | | 532 | | | | 9,241 | |
MeetMe, Inc. (a) | | | 514 | | | | 2,529 | |
MINDBODY, Inc., Class A (a) | | | 188 | | | | 4,578 | |
New Relic, Inc. (a) | | | 420 | | | | 15,204 | |
NIC, Inc. | | | 1,913 | | | | 46,103 | |
Pandora Media, Inc. (a) | | | 5,453 | | | | 70,889 | |
Perficient, Inc. (a) | | | 685 | | | | 12,145 | |
Q2 Holdings, Inc. (a) | | | 486 | | | | 15,430 | |
Quotient Technology, Inc. (a) | | | 984 | | | | 10,480 | |
Reis, Inc. | | | 224 | | | | 4,480 | |
Shutterstock, Inc. (a) | | | 357 | | | | 19,207 | |
SPS Commerce, Inc. (a) | | | 314 | | | | 21,666 | |
Stamps.com, Inc. (a) | | | 381 | | | | 46,311 | |
TrueCar, Inc. (a) | | | 1,020 | | | | 13,413 | |
Twilio, Inc. (a) | | | 835 | | | | 24,073 | |
Twitter, Inc. (a) | | | 14,554 | | | | 256,441 | |
VeriSign, Inc. (a) | | | 2,184 | | | | 175,179 | |
Web.com Group, Inc. (a) | | | 796 | | | | 15,084 | |
WebMD Health Corp. (a) | | | 937 | | | | 46,747 | |
Xactly Corp. (a) | | | 252 | | | | 3,062 | |
XO Group, Inc. (a) | | | 558 | | | | 10,507 | |
Yahoo!, Inc. (a) | | | 19,787 | | | | 872,013 | |
Yelp, Inc. (a) | | | 1,611 | | | | 67,308 | |
Zillow Group, Inc., Class A (a) | | | 926 | | | | 33,317 | |
Zillow Group, Inc., Class C (a) | | | 2,853 | | | | 100,939 | |
| | | | | | | | |
| | | | | | | | 21,544,139 | |
IT Services — 3.6% | |
Accenture PLC, Class A | | | 14,281 | | | | 1,626,177 | |
Acxiom Corp. (a) | | | 1,980 | | | | 51,678 | |
Alliance Data Systems Corp. | | | 1,312 | | | | 299,635 | |
Amdocs Ltd. | | | 3,834 | | | | 225,094 | |
Automatic Data Processing, Inc. | | | 10,388 | | | | 1,049,084 | |
Black Knight Financial Services, Inc., Class A (a) | | | 469 | | | | 17,095 | |
Blackhawk Network Holdings, Inc. (a) | | | 1,410 | | | | 50,337 | |
Booz Allen Hamilton Holding Corp. | | | 2,512 | | | | 84,956 | |
Broadridge Financial Solutions, Inc. | | | 2,585 | | | | 171,980 | |
CACI International, Inc., Class A (a) | | | 543 | | | | 66,680 | |
Cardtronics PLC, Class A (a) | | | 1,364 | | | | 74,447 | |
Cass Information Systems, Inc. | | | 213 | | | | 14,009 | |
Cognizant Technology Solutions Corp., Class A (a) | | | 13,781 | | | | 724,743 | |
Computer Sciences Corp. | | | 3,094 | | | | 192,447 | |
Conduent, Inc. (a) | | | 4,709 | | | | 70,447 | |
Convergys Corp. | | | 2,145 | | | | 53,239 | |
CoreLogic, Inc. (a) | | | 2,180 | | | | 76,889 | |
CSG Systems International, Inc. | | | 603 | | | | 29,185 | |
CSRA, Inc. | | | 3,751 | | | | 116,356 | |
DST Systems, Inc. | | | 830 | | | | 95,575 | |
EPAM Systems, Inc. (a) | | | 1,260 | | | | 81,094 | |
Euronet Worldwide, Inc. (a) | | | 1,174 | | | | 83,965 | |
EVERTEC, Inc. | | | 1,188 | | | | 20,255 | |
ExlService Holdings, Inc. (a) | | | 612 | | | | 28,121 | |
Fidelity National Information Services, Inc. | | | 7,313 | | | | 580,798 | |
First Data Corp., Class A (a) | | | 7,147 | | | | 109,635 | |
Fiserv, Inc. (a) | | | 4,952 | | | | 531,993 | |
| | | | | | | | |
| Common Stocks | | Shares | | | Value | |
IT Services (continued) | |
FleetCor Technologies, Inc. (a) | | | 2,078 | | | $ | 306,484 | |
Forrester Research, Inc. | | | 194 | | | | 7,915 | |
Gartner, Inc. (a) | | | 1,804 | | | | 179,245 | |
Genpact Ltd. (a) | | | 4,887 | | | | 120,611 | |
Global Payments, Inc. | | | 3,477 | | | | 268,703 | |
Hackett Group, Inc. | | | 467 | | | | 7,589 | |
International Business Machines Corp. | | | 20,116 | | | | 3,510,644 | |
Jack Henry & Associates, Inc. | | | 1,754 | | | | 157,474 | |
Leidos Holdings, Inc. | | | 3,061 | | | | 147,908 | |
Lionbridge Technologies, Inc. (a) | | | 1,118 | | | | 6,395 | |
Mantech International Corp., Class A | | | 444 | | | | 17,289 | |
Mastercard, Inc., Class A | | | 22,096 | | | | 2,349,468 | |
MAXIMUS, Inc. | | | 1,709 | | | | 94,234 | |
MoneyGram International, Inc. (a) | | | 577 | | | | 7,328 | |
Paychex, Inc. | | | 7,237 | | | | 436,319 | |
PayPal Holdings, Inc. (a) | | | 25,869 | | | | 1,029,069 | |
Planet Payment, Inc. (a) | | | 1,065 | | | | 4,494 | |
Sabre Corp. | | | 4,617 | | | | 113,117 | |
Science Applications International Corp. | | | 967 | | | | 78,733 | |
ServiceSource International, Inc. (a) | | | 904 | | | | 4,791 | |
Square, Inc., Class A (a) | | | 845 | | | | 12,354 | |
Syntel, Inc. | | | 464 | | | | 9,772 | |
TeleTech Holdings, Inc. | | | 224 | | | | 6,630 | |
Teradata Corp. (a) | | | 3,312 | | | | 97,240 | |
Total System Services, Inc. | | | 3,749 | | | | 189,999 | |
Travelport Worldwide Ltd. | | | 2,199 | | | | 31,578 | |
Unisys Corp. (a) | | | 1,375 | | | | 17,669 | |
Vantiv, Inc., Class A (a) | | | 3,451 | | | | 214,790 | |
VeriFone Systems, Inc. (a) | | | 2,765 | | | | 50,240 | |
Virtusa Corp. (a) | | | 504 | | | | 12,842 | |
Visa, Inc., Class A | | | 43,679 | | | | 3,612,690 | |
Western Union Co. | | | 11,224 | | | | 219,766 | |
WEX, Inc. (a) | | | 888 | | | | 101,525 | |
Xerox Corp. | | | 22,978 | | | | 159,238 | |
| | | | | | | | |
| | | | | | | | 20,110,057 | |
Leisure Products — 0.1% | |
Brunswick Corp. | | | 1,984 | | | | 118,762 | |
Callaway Golf Co. | | | 1,951 | | | | 22,105 | |
Hasbro, Inc. | | | 2,508 | | | | 206,935 | |
Malibu Boats, Inc. (a) | | | 690 | | | | 12,806 | |
Mattel, Inc. | | | 7,841 | | | | 205,513 | |
Nautilus, Inc. (a) | | | 627 | | | | 10,879 | |
Polaris Industries, Inc. | | | 1,387 | | | | 116,605 | |
Sturm Ruger & Co., Inc. | | | 340 | | | | 17,935 | |
Vista Outdoor, Inc. (a) | | | 1,584 | | | | 45,635 | |
| | | | | | | | |
| | | | | | | | 757,175 | |
Life Sciences Tools & Services — 0.7% | |
Accelerate Diagnostics, Inc. (a) | | | 394 | | | | 8,254 | |
Agilent Technologies, Inc. | | | 7,332 | | | | 359,048 | |
Albany Molecular Research, Inc. (a) | | | 557 | | | | 10,249 | |
Bio-Rad Laboratories, Inc., Class A (a) | | | 507 | | | | 96,370 | |
Bio-Techne Corp. | | | 848 | | | | 86,284 | |
Bruker Corp. | | | 2,538 | | | | 60,227 | |
Cambrex Corp. (a) | | | 804 | | | | 42,170 | |
Charles River Laboratories International, Inc. (a) | | | 1,189 | | | | 96,071 | |
Enzo Biochem, Inc. (a) | | | 451 | | | | 3,013 | |
Fluidigm Corp. (a) | | | 250 | | | | 1,582 | |
Illumina, Inc. (a) | | | 3,338 | | | | 534,414 | |
INC Research Holdings, Inc., Class A (a) | | | 975 | | | | 51,675 | |
Luminex Corp. (a) | | | 759 | | | | 15,347 | |
Medpace Holdings, Inc. (a) | | | 111 | | | | 3,873 | |
Mettler-Toledo International, Inc. (a) | | | 568 | | | | 242,326 | |
NanoString Technologies, Inc. (a) | | | 178 | | | | 3,211 | |
NeoGenomics, Inc. (a) | | | 792 | | | | 6,383 | |
Pacific Biosciences of California, Inc. (a) | | | 1,535 | | | | 7,399 | |
See Notes to Financial Statements.
| | | | | | |
| | | | | | | |
| | BLACKROCK FUNDS | | JANUARY 31, 2017 | | 83 |
| | |
Schedule of Investments (continued) | | BlackRock Total Stock Market Index Fund |
| | | | | | | | |
| Common Stocks | | Shares | | | Value | |
Life Sciences Tools & Services (continued) | |
PAREXEL International Corp. (a) | | | 1,298 | | | $ | 92,015 | |
Patheon NV (a) | | | 701 | | | | 20,112 | |
PerkinElmer, Inc. | | | 2,407 | | | | 128,028 | |
PRA Health Sciences, Inc. (a) | | | 440 | | | | 25,780 | |
QIAGEN NV (a) | | | 4,834 | | | | 140,089 | |
Quintiles IMS Holdings, Inc. (a) | | | 3,129 | | | | 245,595 | |
Thermo Fisher Scientific, Inc. | | | 8,953 | | | | 1,364,348 | |
VWR Corp. (a) | | | 1,855 | | | | 48,063 | |
Waters Corp. (a) | | | 1,715 | | | | 242,930 | |
| | | | | | | | |
| | | | | | | | 3,934,856 | |
Machinery — 1.8% | |
Actuant Corp., Class A | | | 1,827 | | | | 47,776 | |
AGCO Corp. | | | 1,720 | | | | 108,016 | |
Alamo Group, Inc. | | | 115 | | | | 8,697 | |
Albany International Corp., Class A | | | 564 | | | | 26,762 | |
Altra Industrial Motion Corp. | | | 1,768 | | | | 65,946 | |
American Railcar Industries, Inc. | | | 85 | | | | 3,786 | |
Astec Industries, Inc. | | | 906 | | | | 63,402 | |
Barnes Group, Inc. | | | 1,133 | | | | 54,531 | |
Briggs & Stratton Corp. | | | 751 | | | | 16,267 | |
Caterpillar, Inc. | | | 12,664 | | | | 1,211,438 | |
Chart Industries, Inc. (a) | | | 575 | | | | 22,304 | |
CIRCOR International, Inc. | | | 306 | | | | 19,058 | |
CLARCOR, Inc. | | | 1,172 | | | | 97,053 | |
Colfax Corp. (a) | | | 2,125 | | | | 82,875 | |
Columbus McKinnon Corp. | | | 232 | | | | 6,378 | |
Crane Co. | | | 1,160 | | | | 83,566 | |
Cummins, Inc. | | | 3,512 | | | | 516,299 | |
Deere & Co. | | | 7,043 | | | | 753,953 | |
DMC Global, Inc. | | | 301 | | | | 4,801 | |
Donaldson Co., Inc. | | | 2,952 | | | | 124,722 | |
Douglas Dynamics, Inc. | | | 346 | | | | 11,695 | |
Dover Corp. | | | 3,329 | | | | 258,830 | |
Energy Recovery, Inc. (a) | | | 703 | | | | 7,199 | |
EnPro Industries, Inc. | | | 405 | | | | 27,504 | |
ESCO Technologies, Inc. | | | 437 | | | | 25,433 | |
Federal Signal Corp. | | | 1,085 | | | | 16,861 | |
Flowserve Corp. | | | 2,957 | | | | 145,366 | |
Fortive Corp. | | | 6,771 | | | | 374,504 | |
FreightCar America, Inc. | | | 360 | | | | 5,202 | |
Global Brass & Copper Holdings, Inc. | | | 409 | | | | 13,558 | |
Gorman-Rupp Co. | | | 250 | | | | 8,115 | |
Graco, Inc. | | | 1,256 | | | | 112,525 | |
Graham Corp. | | | 286 | | | | 6,355 | |
Greenbrier Cos., Inc. | | | 523 | | | | 22,881 | |
Harsco Corp. (a) | | | 1,484 | | | | 19,811 | |
Hurco Cos., Inc. | | | 172 | | | | 5,263 | |
Hyster-Yale Materials Handling, Inc. | | | 114 | | | | 7,013 | |
IDEX Corp. | | | 1,659 | | | | 149,575 | |
Illinois Tool Works, Inc. | | | 6,603 | | | | 839,902 | |
Ingersoll-Rand PLC | | | 5,556 | | | | 440,869 | |
ITT, Inc. | | | 2,022 | | | | 82,639 | |
John Bean Technologies Corp. | | | 793 | | | | 68,476 | |
Joy Global, Inc. | | | 2,206 | | | | 62,033 | |
Kadant, Inc. | | | 188 | | | | 11,581 | |
Kennametal, Inc. | | | 2,293 | | | | 81,952 | |
Lincoln Electric Holdings, Inc. | | | 1,320 | | | | 110,048 | |
Lindsay Corp. | | | 471 | | | | 35,485 | |
Lydall, Inc. (a) | | | 301 | | | | 18,361 | |
Manitowoc Co., Inc. (a) | | | 2,432 | | | | 16,611 | |
Manitowoc Foodservice, Inc. (a) | | | 3,379 | | | | 64,809 | |
Meritor, Inc. (a) | | | 2,833 | | | | 40,880 | |
Middleby Corp. (a) | | | 1,306 | | | | 175,239 | |
Miller Industries, Inc. | | | 363 | | | | 9,620 | |
Mueller Industries, Inc. | | | 1,332 | | | | 53,626 | |
Mueller Water Products, Inc., Series A | | | 3,670 | | | | 49,398 | |
| | | | | | | | |
| Common Stocks | | Shares | | | Value | |
Machinery (continued) | |
Navistar International Corp. (a) | | | 961 | | | $ | 26,206 | |
NN, Inc. | | | 453 | | | | 8,766 | |
Nordson Corp. | | | 1,290 | | | | 146,454 | |
Oshkosh Corp. | | | 1,669 | | | | 116,212 | |
PACCAR, Inc. | | | 7,680 | | | | 516,941 | |
Parker Hannifin Corp. | | | 2,927 | | | | 430,650 | |
Pentair PLC | | | 3,754 | | | | 220,097 | |
Proto Labs, Inc. (a) | | | 639 | | | | 33,548 | |
RBC Bearings, Inc. (a) | | | 547 | | | | 50,669 | |
Rexnord Corp. (a) | | | 2,129 | | | | 47,030 | |
Snap-on, Inc. | | | 1,242 | | | | 225,460 | |
SPX Corp. (a) | | | 673 | | | | 16,791 | |
SPX FLOW, Inc. (a) | | | 551 | | | | 19,224 | |
Stanley Black & Decker, Inc. | | | 3,279 | | | | 406,596 | |
Sun Hydraulics Corp. | | | 425 | | | | 16,652 | |
Supreme Industries, Inc., Class A | | | 283 | | | | 5,196 | |
Tennant Co. | | | 341 | | | | 23,614 | |
Terex Corp. | | | 2,288 | | | | 72,758 | |
Timken Co. | | | 1,581 | | | | 70,196 | |
Titan International, Inc. | | | 1,283 | | | | 17,051 | |
Toro Co. | | | 2,413 | | | | 142,198 | |
TriMas Corp. (a) | | | 825 | | | | 17,573 | |
Trinity Industries, Inc. | | | 3,493 | | | | 96,197 | |
Valmont Industries, Inc. | | | 589 | | | | 84,816 | |
Wabash National Corp. | | | 1,138 | | | | 20,086 | |
WABCO Holdings, Inc. (a) | | | 1,225 | | | | 133,562 | |
Wabtec Corp. | | | 1,986 | | | | 172,067 | |
Watts Water Technologies, Inc., Class A | | | 811 | | | | 53,526 | |
Woodward, Inc. | | | 1,245 | | | | 86,702 | |
Xylem, Inc. | | | 3,887 | | | | 191,668 | |
| | | | | | | | |
| | | | | | | | 10,165,355 | |
Marine — 0.0% | |
Kirby Corp. (a) | | | 1,237 | | | | 79,725 | |
Matson, Inc. | | | 1,263 | | | | 45,038 | |
Scorpio Bulkers, Inc. (a) | | | 1,346 | | | | 9,624 | |
| | | | | | | | |
| | | | | | | | 134,387 | |
Media — 3.1% | |
AMC Entertainment Holdings, Inc., Class A | | | 969 | | | | 32,704 | |
AMC Networks, Inc., Class A (a) | | | 1,411 | | | | 80,921 | |
Cable One, Inc. | | | 103 | | | | 65,135 | |
CBS Corp., Class B | | | 8,615 | | | | 555,581 | |
Charter Communications, Inc., Class A (a) | | | 4,585 | | | | 1,485,311 | |
Cinemark Holdings, Inc. | | | 2,217 | | | | 94,222 | |
Clear Channel Outdoor Holdings, Inc., Class A | | | 713 | | | | 3,529 | |
Comcast Corp., Class A | | | 55,099 | | | | 4,155,567 | |
Daily Journal Corp. (a) | | | 28 | | | | 6,059 | |
Discovery Communications, Inc., Class A (a) | | | 3,688 | | | | 104,555 | |
Discovery Communications, Inc., Class C (a) | | | 4,600 | | | | 127,466 | |
DISH Network Corp., Class A (a) | | | 4,967 | | | | 293,897 | |
Entercom Communications Corp., Class A | | | 339 | | | | 4,814 | |
Entravision Communications Corp., Class A | | | 1,689 | | | | 9,121 | |
Eros International PLC (a) | | | 591 | | | | 7,033 | |
EW Scripps Co., Class A (a) | | | 1,830 | | | | 35,648 | |
Gannett Co., Inc. | | | 3,516 | | | | 33,824 | |
Gray Television, Inc. (a) | | | 1,183 | | | | 14,019 | |
IMAX Corp. (a) | | | 2,096 | | | | 68,330 | |
Interpublic Group of Cos., Inc. | | | 8,964 | | | | 210,923 | |
John Wiley & Sons, Inc., Class A | | | 1,333 | | | | 73,448 | |
Liberty Braves Group, Class A (a) | | | 996 | | | | 19,870 | |
Liberty Braves Group, Class C (a) | | | 944 | | | | 18,861 | |
Liberty Broadband Corp., Class A (a) | | | 518 | | | | 43,346 | |
Liberty Broadband Corp., Class C (a) | | | 2,613 | | | | 222,993 | |
Liberty Media Corp. — Liberty Formula One, Class A (a) | | | 581 | | | | 16,837 | |
Liberty Media Corp. — Liberty Formula One, Class C (a) | | | 951 | | | | 27,332 | |
Liberty Media Corp. — Liberty SiriusXM, Class A (a) | | | 3,154 | | | | 114,301 | |
See Notes to Financial Statements.
| | | | | | |
| | | | | | | |
| 84 | | BLACKROCK FUNDS | | JANUARY 31, 2017 | | |
| | |
Schedule of Investments (continued) | | BlackRock Total Stock Market Index Fund |
| | | | | | | | |
| Common Stocks | | Shares | | | Value | |
Media (continued) | |
Liberty Media Corp. — Liberty SiriusXM, Class C (a) | | | 2,993 | | | $ | 107,419 | |
Lions Gate Entertainment Corp., Class A | | | 1,567 | | | | 45,083 | |
Lions Gate Entertainment Corp., Class B (a) | | | 2,917 | | | | 78,146 | |
Live Nation Entertainment, Inc. (a) | | | 2,817 | | | | 80,623 | |
Madison Square Garden Co., Class A (a) | | | 370 | | | | 64,998 | |
MDC Partners, Inc., Class A | | | 524 | | | | 3,354 | |
Meredith Corp. | | | 677 | | | | 41,500 | |
MSG Networks, Inc., Class A (a) | | | 1,652 | | | | 38,326 | |
National CineMedia, Inc. | | | 1,170 | | | | 17,152 | |
New Media Investment Group, Inc. | | | 543 | | | | 8,275 | |
New York Times Co., Class A | | | 2,155 | | | | 29,092 | |
News Corp., Class A | | | 8,027 | | | | 98,652 | |
News Corp., Class B | | | 5,383 | | | | 68,095 | |
Nexstar Broadcasting Group, Inc., Class A | | | 1,082 | | | | 70,763 | |
Omnicom Group, Inc. | | | 5,306 | | | | 454,459 | |
Reading International, Inc., Class A (a) | | | 655 | | | | 10,709 | |
Regal Entertainment Group, Class A | | | 1,839 | | | | 41,672 | |
Scholastic Corp. | | | 411 | | | | 18,816 | |
Scripps Networks Interactive, Inc., Class A | | | 1,786 | | | | 136,022 | |
Sinclair Broadcast Group, Inc., Class A | | | 1,713 | | | | 57,814 | |
Sirius XM Holdings, Inc. | | | 38,989 | | | | 184,028 | |
TEGNA, Inc. | | | 4,936 | | | | 113,084 | |
Thomson Reuters Corp. | | | 7,393 | | | | 331,502 | |
Time Warner, Inc. | | | 17,872 | | | | 1,730,903 | |
Time, Inc. | | | 3,045 | | | | 58,616 | |
TiVo Corp. (a) | | | 3,425 | | | | 64,732 | |
Tribune Media Co., Class A | | | 2,318 | | | | 66,851 | |
TRONC, Inc. (a) | | | 502 | | | | 6,657 | |
Twenty-First Century Fox, Inc., Class A | | | 23,038 | | | | 722,932 | |
Twenty-First Century Fox, Inc., Class B | | | 12,944 | | | | 401,393 | |
Viacom, Inc., Class A | | | 144 | | | | 6,516 | |
Viacom, Inc., Class B | | | 7,798 | | | | 328,608 | |
Walt Disney Co. | | | 37,087 | | | | 4,103,677 | |
World Wrestling Entertainment, Inc., Class A | | | 1,688 | | | | 33,051 | |
| | | | | | | | |
| | | | | | | | 17,549,167 | |
Metals & Mining — 0.5% | |
AK Steel Holding Corp. (a) | | | 7,016 | | | | 56,689 | |
Alcoa Corp. | | | 3,830 | | | | 139,603 | |
Allegheny Technologies, Inc. | | | 2,737 | | | | 59,475 | |
Carpenter Technology Corp. | | | 1,214 | | | | 48,584 | |
Century Aluminum Co. (a) | | | 998 | | | | 15,369 | |
Cliffs Natural Resources, Inc. (a) | | | 5,416 | | | | 47,498 | |
Coeur Mining, Inc. (a) | | | 5,267 | | | | 61,361 | |
Commercial Metals Co. | | | 2,682 | | | | 54,793 | |
Compass Minerals International, Inc. | | | 816 | | | | 68,218 | |
Ferroglobe PLC | | | 2,093 | | | | 13,127 | |
Freeport-McMoRan, Inc. (a) | | | 30,315 | | | | 504,745 | |
Haynes International, Inc. | | | 363 | | | | 14,923 | |
Hecla Mining Co. | | | 10,046 | | | | 64,696 | |
Kaiser Aluminum Corp. | | | 329 | | | | 25,813 | |
Materion Corp. | | | 360 | | | | 14,148 | |
Newmont Mining Corp. | | | 11,877 | | | | 430,898 | |
Nucor Corp. | | | 7,178 | | | | 416,970 | |
Olympic Steel, Inc. | | | 97 | | | | 2,183 | |
Reliance Steel & Aluminum Co. | | | 1,578 | | | | 125,688 | |
Royal Gold, Inc. | | | 1,461 | | | | 105,440 | |
Ryerson Holding Corp. (a) | | | 148 | | | | 1,569 | |
Schnitzer Steel Industries, Inc., Class A | | | 603 | | | | 14,261 | |
Southern Copper Corp. | | | 1,843 | | | | 70,697 | |
Steel Dynamics, Inc. | | | 5,366 | | | | 181,424 | |
Stillwater Mining Co. (a) | | | 2,990 | | | | 50,830 | |
SunCoke Energy, Inc. (a) | | | 1,134 | | | | 10,002 | |
Tahoe Resources, Inc. | | | 7,290 | | | | 66,631 | |
TimkenSteel Corp. (a) | | | 882 | | | | 14,871 | |
U.S. Silica Holdings, Inc. | | | 1,671 | | | | 98,823 | |
United States Steel Corp. | | | 3,417 | | | | 111,770 | |
| | | | | | | | |
| Common Stocks | | Shares | | | Value | |
Metals & Mining (continued) | |
Worthington Industries, Inc. | | | 1,046 | | | $ | 49,988 | |
| | | | | | | | |
| | | | | | | | 2,941,087 | |
Multi-Utilities — 1.1% | |
Alliant Energy Corp. | | | 4,791 | | | | 180,381 | |
Ameren Corp. | | | 5,380 | | | | 283,257 | |
Avista Corp. | | | 1,407 | | | | 54,366 | |
Black Hills Corp. | | | 1,695 | | | | 106,022 | |
CenterPoint Energy, Inc. | | | 9,633 | | | | 252,481 | |
CMS Energy Corp. | | | 5,921 | | | | 252,235 | |
Consolidated Edison, Inc. | | | 6,778 | | | | 503,944 | |
Dominion Resources, Inc. | | | 14,109 | | | | 1,076,235 | |
DTE Energy Co. | | | 3,917 | | | | 386,373 | |
MDU Resources Group, Inc. | | | 4,307 | | | | 126,410 | |
NiSource, Inc. | | | 5,769 | | | | 129,053 | |
NorthWestern Corp. | | | 1,369 | | | | 78,184 | |
PG&E Corp. | | | 11,284 | | | | 698,367 | |
Public Service Enterprise Group, Inc. | | | 11,301 | | | | 500,069 | |
SCANA Corp. | | | 2,770 | | | | 190,299 | |
Sempra Energy | | | 5,562 | | | | 569,493 | |
Vectren Corp. | | | 1,938 | | | | 106,377 | |
WEC Energy Group, Inc. | | | 7,060 | | | | 416,893 | |
| | | | | | | | |
| | | | | | | | 5,910,439 | |
Multiline Retail — 0.5% | |
Big Lots, Inc. | | | 1,076 | | | | 53,800 | |
Burlington Stores, Inc. (a) | | | 1,525 | | | | 127,643 | |
Dillard’s, Inc., Class A | | | 348 | | | | 19,641 | |
Dollar General Corp. | | | 6,436 | | | | 475,106 | |
Dollar Tree, Inc. (a) | | | 5,148 | | | | 397,374 | |
FirstCash, Inc. | | | 1,230 | | | | 52,521 | |
Fred’s, Inc., Class A | | | 569 | | | | 8,290 | |
JC Penney Co., Inc. (a) | | | 7,840 | | | | 52,136 | |
Kohl’s Corp. | | | 4,324 | | | | 172,225 | |
Macy’s, Inc. | | | 6,986 | | | | 206,366 | |
Nordstrom, Inc. | | | 2,859 | | | | 126,425 | |
Ollie’s Bargain Outlet Holdings, Inc. (a) | | | 360 | | | | 10,998 | |
Sears Holdings Corp. (a) | | | 57 | | | | 398 | |
Target Corp. | | | 13,438 | | | | 866,482 | |
Tuesday Morning Corp. (a) | | | 1,836 | | | | 7,895 | |
| | | | | | | | |
| | | | | | | | 2,577,300 | |
Oil & Gas Exploration & Production — 0.0% | |
Carrizo Oil & Gas, Inc. (a) | | | 1,606 | | | | 56,788 | |
Oil, Gas & Consumable Fuels — 5.3% | |
Abraxas Petroleum Corp. (a) | | | 2,071 | | | | 5,115 | |
Alon USA Energy, Inc. | | | 547 | | | | 6,159 | |
Anadarko Petroleum Corp. | | | 12,780 | | | | 888,593 | |
Antero Resources Corp. (a) | | | 4,037 | | | | 98,543 | |
Apache Corp. | | | 8,692 | | | | 519,956 | |
Ardmore Shipping Corp. | | | 591 | | | | 4,344 | |
Bill Barrett Corp. (a) | | | 1,200 | | | | 7,860 | |
Cabot Oil & Gas Corp. | | | 10,360 | | | | 222,533 | |
California Resources Corp. (a) | | | 958 | | | | 20,520 | |
Callon Petroleum Co. (a) | | | 3,375 | | | | 51,570 | |
Cheniere Energy, Inc. (a) | | | 4,580 | | | | 218,237 | |
Chesapeake Energy Corp. (a) | | | 14,109 | | | | 91,003 | |
Chevron Corp. | | | 43,005 | | | | 4,788,607 | |
Cimarex Energy Co. | | | 2,101 | | | | 284,076 | |
Clayton Williams Energy, Inc. (a) | | | 166 | | | | 24,145 | |
Clean Energy Fuels Corp. (a) | | | 2,177 | | | | 5,638 | |
Cobalt International Energy, Inc. (a) | | | 8,356 | | | | 8,196 | |
Concho Resources, Inc. (a) | | | 3,202 | | | | 446,487 | |
ConocoPhillips | | | 28,371 | | | | 1,383,370 | |
CONSOL Energy, Inc. | | | 5,288 | | | | 89,579 | |
Contango Oil & Gas Co. (a) | | | 215 | | | | 1,742 | |
Continental Resources, Inc. (a) | | | 1,941 | | | | 94,255 | |
See Notes to Financial Statements.
| | | | | | |
| | | | | | | |
| | BLACKROCK FUNDS | | JANUARY 31, 2017 | | 85 |
| | |
Schedule of Investments (continued) | | BlackRock Total Stock Market Index Fund |
| | | | | | | | |
| Common Stocks | | Shares | | | Value | |
Oil, Gas & Consumable Fuels (continued) | |
Delek U.S. Holdings, Inc. | | | 1,146 | | | $ | 25,670 | |
Denbury Resources, Inc. (a) | | | 9,975 | | | | 33,416 | |
Devon Energy Corp. | | | 11,980 | | | | 545,569 | |
DHT Holdings, Inc. | | | 1,316 | | | | 6,172 | |
Diamondback Energy, Inc. (a) | | | 1,742 | | | | 183,206 | |
Dorian LPG Ltd. (a) | | | 197 | | | | 2,228 | |
Eclipse Resources Corp. (a) | | | 580 | | | | 1,427 | |
Energen Corp. (a) | | | 2,209 | | | | 119,043 | |
EOG Resources, Inc. | | | 12,545 | | | | 1,274,321 | |
EP Energy Corp., Class A (a) | | | 381 | | | | 1,996 | |
EQT Corp. | | | 3,893 | | | | 236,033 | |
EXCO Resources, Inc. (a) | | | 695 | | | | 465 | |
Exxon Mobil Corp. | | | 95,470 | | | | 8,008,978 | |
Frontline Ltd. | | | 788 | | | | 5,469 | |
GasLog Ltd. | | | 733 | | | | 12,241 | |
Gener8 Maritime, Inc. (a) | | | 963 | | | | 4,863 | |
Golar LNG Ltd. | | | 3,482 | | | | 90,045 | |
Green Plains, Inc. | | | 670 | | | | 15,075 | |
Gulfport Energy Corp. (a) | | | 2,981 | | | | 62,303 | |
Hess Corp. | | | 6,458 | | | | 349,894 | |
HollyFrontier Corp. | | | 3,660 | | | | 106,030 | |
International Seaways, Inc. (a) | | | 85 | | | | 1,477 | |
Jones Energy, Inc., Class A (a) | | | 1,008 | | | | 4,486 | |
Kinder Morgan, Inc. | | | 43,912 | | | | 980,994 | |
Kosmos Energy Ltd. (a) | | | 2,757 | | | | 18,031 | |
Laredo Petroleum, Inc. (a) | | | 3,468 | | | | 46,991 | |
Marathon Oil Corp. | | | 19,378 | | | | 324,582 | |
Marathon Petroleum Corp. | | | 11,961 | | | | 574,726 | |
Matador Resources Co. (a) | | | 2,078 | | | | 54,714 | |
Murphy Oil Corp. | | | 3,680 | | | | 106,389 | |
Murphy USA, Inc. (a) | | | 872 | | | | 55,546 | |
Navios Maritime Acquisition Corp. | | | 2,872 | | | | 5,342 | |
Newfield Exploration Co. (a) | | | 4,421 | | | | 177,194 | |
Noble Energy, Inc. | | | 9,719 | | | | 386,428 | |
Nordic American Tankers Ltd. | | | 1,483 | | | | 12,813 | |
Northern Oil and Gas, Inc. (a) | | | 1,813 | | | | 6,527 | |
Oasis Petroleum, Inc. (a) | | | 5,445 | | | | 76,992 | |
Occidental Petroleum Corp. | | | 17,497 | | | | 1,185,772 | |
ONEOK, Inc. | | | 4,710 | | | | 259,568 | |
Overseas Shipholding Group, Inc., Class A | | | 256 | | | | 1,257 | |
Pacific Ethanol, Inc. (a) | | | 558 | | | | 3,962 | |
Panhandle Oil and Gas, Inc., Class A | | | 196 | | | | 4,312 | |
Par Pacific Holdings, Inc. (a) | | | 783 | | | | 11,377 | |
Parsley Energy, Inc., Class A (a) | | | 3,746 | | | | 131,934 | |
PBF Energy, Inc., Class A | | | 2,439 | | | | 56,560 | |
PDC Energy, Inc. (a) | | | 1,282 | | | | 94,791 | |
Phillips 66 | | | 10,228 | | | | 834,809 | |
Pioneer Natural Resources Co. | | | 3,699 | | | | 666,671 | |
QEP Resources, Inc. (a) | | | 5,121 | | | | 89,310 | |
Range Resources Corp. | | | 4,813 | | | | 155,652 | |
Renewable Energy Group, Inc. (a) | | | 713 | | | | 6,203 | |
REX American Resources Corp. (a) | | | 107 | | | | 8,884 | |
Rice Energy, Inc. (a) | | | 1,755 | | | | 34,802 | |
Ring Energy, Inc. (a) | | | 2,128 | | | | 28,090 | |
RSP Permian, Inc. (a) | | | 2,357 | | | | 100,314 | |
Scorpio Tankers, Inc. | | | 3,157 | | | | 12,091 | |
SemGroup Corp., Class A | | | 1,583 | | | | 62,845 | |
Ship Finance International Ltd. | | | 1,106 | | | | 16,590 | |
SM Energy Co. | | | 2,297 | | | | 70,082 | |
Southwestern Energy Co. (a) | | | 11,212 | | | | 101,020 | |
Spectra Energy Corp. | | | 15,844 | | | | 659,903 | |
Synergy Resources Corp. (a) | | | 4,863 | | | | 41,870 | |
Targa Resources Corp. | | | 3,778 | | | | 217,688 | |
Teekay Corp. | | | 710 | | | | 7,136 | |
Teekay Tankers Ltd., Class A | | | 1,294 | | | | 3,170 | |
Tesoro Corp. | | | 2,675 | | | | 216,274 | |
Valero Energy Corp. | | | 10,670 | | | | 701,659 | |
| | | | | | | | |
| Common Stocks | | Shares | | | Value | |
Oil, Gas & Consumable Fuels (continued) | |
Western Refining, Inc. | | | 1,873 | | | $ | 65,574 | |
Westmoreland Coal Co. (a) | | | 343 | | | | 6,226 | |
Whiting Petroleum Corp. (a) | | | 5,856 | | | | 64,943 | |
Williams Cos., Inc. | | | 15,717 | | | | 453,278 | |
World Fuel Services Corp. | | | 1,648 | | | | 73,303 | |
WPX Energy, Inc. (a) | | | 7,799 | | | | 108,640 | |
| | | | | | | | |
| | | | | | | | 29,734,764 | |
Paper & Forest Products — 0.1% | |
Boise Cascade Co. (a) | | | 1,353 | | | | 33,554 | |
Clearwater Paper Corp. (a) | | | 332 | | | | 20,883 | |
Deltic Timber Corp. | | | 167 | | | | 12,687 | |
Domtar Corp. | | | 1,535 | | | | 67,064 | |
KapStone Paper and Packaging Corp. | | | 2,191 | | | | 52,540 | |
Louisiana-Pacific Corp. (a) | | | 3,377 | | | | 64,602 | |
Neenah Paper, Inc. | | | 304 | | | | 24,974 | |
PH Glatfelter Co. | | | 807 | | | | 19,699 | |
Schweitzer-Mauduit International, Inc. | | | 571 | | | | 25,312 | �� |
| | | | | | | | |
| | | | | | | | 321,315 | |
Personal Products — 0.2% | |
Avon Products, Inc. (a) | | | 10,458 | | | | 61,388 | |
Coty, Inc., Class A | | | 10,496 | | | | 201,523 | |
Edgewell Personal Care Co. (a) | | | 1,356 | | | | 106,907 | |
Estee Lauder Cos., Inc., Class A | | | 4,883 | | | | 396,548 | |
Herbalife Ltd. (a) | | | 1,729 | | | | 97,170 | |
Inter Parfums, Inc. | | | 236 | | | | 8,048 | |
Lifevantage Corp. (a) | | | 178 | | | | 1,285 | |
Medifast, Inc. | | | 293 | | | | 12,356 | |
Natural Health Trends Corp. | | | 98 | | | | 2,458 | |
Nature’s Sunshine Products, Inc. | | | 255 | | | | 3,251 | |
Nu Skin Enterprises, Inc., Class A | | | 1,295 | | | | 67,185 | |
Nutraceutical International Corp. | | | 166 | | | | 5,561 | |
Revlon, Inc., Class A (a) | | | 260 | | | | 8,697 | |
Synutra International, Inc. (a) | | | 737 | | | | 4,275 | |
USANA Health Sciences, Inc. (a) | | | 195 | | | | 12,148 | |
| | | | | | | | |
| | | | | | | | 988,800 | |
Pharmaceuticals — 4.1% | |
Aclaris Therapeutics, Inc. (a) | | | 156 | | | | 4,139 | |
Aerie Pharmaceuticals, Inc. (a) | | | 1,137 | | | | 49,914 | |
Akorn, Inc. (a) | | | 2,135 | | | | 40,778 | |
Allergan PLC (a) | | | 7,666 | | | | 1,678,011 | |
Amphastar Pharmaceuticals, Inc. (a) | | | 686 | | | | 10,804 | |
ANI Pharmaceuticals, Inc. (a) | | | 175 | | | | 10,579 | |
Aratana Therapeutics, Inc. (a) | | | 403 | | | | 3,220 | |
Bio-Path Holdings, Inc. (a) | | | 1,124 | | | | 1,068 | |
Bristol-Myers Squibb Co. | | | 38,222 | | | | 1,878,993 | |
Catalent, Inc. (a) | | | 2,277 | | | | 60,933 | |
Cempra, Inc. (a) | | | 856 | | | | 2,696 | |
Collegium Pharmaceutical, Inc. (a) | | | 181 | | | | 3,044 | |
Corcept Therapeutics, Inc. (a) | | | 1,196 | | | | 8,504 | |
Depomed, Inc. (a) | | | 1,111 | | | | 20,098 | |
Dermira, Inc. (a) | | | 392 | | | | 11,540 | |
Durect Corp. (a) | | | 2,947 | | | | 3,124 | |
Eli Lilly & Co. | | | 22,314 | | | | 1,718,847 | |
Endo International PLC (a) | | | 5,144 | | | | 62,963 | |
Heska Corp. (a) | | | 84 | | | | 6,688 | |
Horizon Pharma PLC (a) | | | 4,324 | | | | 70,784 | |
Impax Laboratories, Inc. (a) | | | 1,996 | | | | 26,247 | |
Intersect ENT, Inc. (a) | | | 286 | | | | 3,861 | |
Intra-Cellular Therapies, Inc. (a) | | | 732 | | | | 10,570 | |
Johnson & Johnson | | | 62,920 | | | | 7,125,690 | |
Lannett Co., Inc. (a) | | | 445 | | | | 8,967 | |
Mallinckrodt PLC (a) | | | 2,493 | | | | 121,484 | |
Medicines Co. (a) | | | 1,727 | | | | 62,258 | |
Merck & Co., Inc. | | | 63,340 | | | | 3,926,447 | |
See Notes to Financial Statements.
| | | | | | |
| | | | | | | |
| 86 | | BLACKROCK FUNDS | | JANUARY 31, 2017 | | |
| | |
Schedule of Investments (continued) | | BlackRock Total Stock Market Index Fund |
| | | | | | | | |
| Common Stocks | | Shares | | | Value | |
Pharmaceuticals (continued) | |
Mylan NV (a) | | | 10,390 | | | $ | 395,339 | |
MyoKardia, Inc. (a) | | | 234 | | | | 2,621 | |
Nektar Therapeutics (a) | | | 3,821 | | | | 46,272 | |
Omeros Corp. (a)(c) | | | 872 | | | | 8,450 | |
Pacira Pharmaceuticals, Inc. (a) | | | 686 | | | | 26,377 | |
Paratek Pharmaceuticals, Inc. (a) | | | 182 | | | | 2,748 | |
Perrigo Co. PLC | | | 3,199 | | | | 243,604 | |
Pfizer, Inc. | | | 137,531 | | | | 4,363,859 | |
Phibro Animal Health Corp., Class A | | | 430 | | | | 11,481 | |
Prestige Brands Holdings, Inc. (a) | | | 1,262 | | | | 66,583 | |
Reata Pharmaceuticals, Inc. (a) | | | 143 | | | | 3,561 | |
Revance Therapeutics, Inc. (a) | | | 232 | | | | 4,640 | |
Sciclone Pharmaceuticals, Inc. (a) | | | 3,392 | | | | 34,429 | |
Sucampo Pharmaceuticals, Inc., Class A (a) | | | 534 | | | | 5,954 | |
Supernus Pharmaceuticals, Inc. (a) | | | 895 | | | | 24,210 | |
Teligent, Inc. (a) | | | 475 | | | | 3,325 | |
TherapeuticsMD, Inc. (a)(c) | | | 2,459 | | | | 14,287 | |
Theravance Biopharma, Inc. (a) | | | 733 | | | | 21,961 | |
WaVe Life Sciences Ltd. (a) | | | 106 | | | | 3,047 | |
Zoetis, Inc. | | | 10,373 | | | | 569,893 | |
Zogenix, Inc. (a) | | | 502 | | | | 4,041 | |
| | | | | | | | |
| | | | | | | | 22,788,933 | |
Producer Durables: Miscellaneous — 0.0% | |
Actua Corp. (a) | | | 1,097 | | | | 15,687 | |
PROS Holdings, Inc. (a) | | | 583 | | | | 13,048 | |
| | | | | | | | |
| | | | | | | | 28,735 | |
Professional Services — 0.3% | |
Advisory Board Co. (a) | | | 1,152 | | | | 52,416 | |
Barrett Business Services, Inc. | | | 146 | | | | 8,776 | |
CBIZ, Inc. (a) | | | 770 | | | | 10,087 | |
CEB, Inc. | | | 843 | | | | 64,447 | |
CRA International, Inc. | | | 196 | | | | 6,513 | |
Dun & Bradstreet Corp. | | | 841 | | | | 103,123 | |
Equifax, Inc. | | | 2,634 | | | | 308,916 | |
Exponent, Inc. | | | 478 | | | | 27,748 | |
Franklin Covey Co. (a) | | | 195 | | | | 3,413 | |
FTI Consulting, Inc. (a) | | | 801 | | | | 33,754 | |
GP Strategies Corp. (a) | | | 414 | | | | 10,640 | |
Heidrick & Struggles International, Inc. | | | 563 | | | | 12,583 | |
Hill International, Inc. (a) | | | 947 | | | | 5,114 | |
Huron Consulting Group, Inc. (a) | | | 409 | | | | 18,528 | |
ICF International, Inc. (a) | | | 336 | | | | 17,472 | |
Insperity, Inc. | | | 297 | | | | 21,235 | |
Kelly Services, Inc., Class A | | | 388 | | | | 8,687 | |
Kforce, Inc. | | | 363 | | | | 8,349 | |
Korn/Ferry International | | | 1,529 | | | | 44,417 | |
ManpowerGroup, Inc. | | | 1,448 | | | | 138,226 | |
Mistras Group, Inc. (a) | | | 335 | | | | 7,732 | |
Navigant Consulting, Inc. (a) | | | 883 | | | | 21,810 | |
Nielsen Holdings PLC | | | 8,181 | | | | 334,685 | |
On Assignment, Inc. (a) | | | 1,216 | | | | 55,060 | |
Paylocity Holding Corp. (a) | | | 416 | | | | 12,838 | |
Resources Connection, Inc. | | | 605 | | | | 10,103 | |
Robert Half International, Inc. | | | 2,878 | | | | 135,439 | |
RPX Corp. (a) | | | 744 | | | | 8,080 | |
TransUnion (a) | | | 994 | | | | 31,341 | |
TriNet Group, Inc. (a) | | | 1,193 | | | | 30,338 | |
TrueBlue, Inc. (a) | | | 763 | | | | 18,884 | |
Verisk Analytics, Inc. (a) | | | 3,442 | | | | 284,447 | |
WageWorks, Inc. (a) | | | 871 | | | | 62,843 | |
| | | | | | | | |
| | | | | | | | 1,918,044 | |
Real Estate Investment Trusts (REITs) — 3.9% | |
Acadia Realty Trust | | | 3,194 | | | | 101,697 | |
AG Mortgage Investment Trust, Inc. | | | 900 | | | | 15,768 | |
| | | | | | | | |
| Common Stocks | | Shares | | | Value | |
Real Estate Investment Trusts (REITs) (continued) | |
AGNC Investment Corp. | | | 7,338 | | | $ | 137,000 | |
Agree Realty Corp. | | | 415 | | | | 19,464 | |
Alexander’s, Inc. | | | 37 | | | | 15,644 | |
Alexandria Real Estate Equities, Inc. | | | 1,705 | | | | 188,948 | |
American Assets Trust, Inc. | | | 696 | | | | 29,879 | |
American Campus Communities, Inc. | | | 2,798 | | | | 136,039 | |
American Homes 4 Rent, Class A | | | 4,478 | | | | 99,770 | |
American Tower Corp. | | | 9,623 | | | | 995,980 | |
Annaly Capital Management, Inc. | | | 20,992 | | | | 214,538 | |
Anworth Mortgage Asset Corp. | | | 2,687 | | | | 13,784 | |
Apartment Investment & Management Co., Class A | | | 3,487 | | | | 153,672 | |
Apollo Commercial Real Estate Finance, Inc. | | | 1,345 | | | | 23,416 | |
Apple Hospitality REIT, Inc. | | | 4,029 | | | | 80,661 | |
Ares Commercial Real Estate Corp. | | | 1,122 | | | | 15,125 | |
Armada Hoffler Properties, Inc. | | | 1,336 | | | | 18,410 | |
ARMOUR Residential REIT, Inc. | | | 558 | | | | 11,729 | |
Ashford Hospitality Prime, Inc. | | | 837 | | | | 11,249 | |
Ashford Hospitality Trust, Inc. | | | 1,493 | | | | 11,347 | |
AvalonBay Communities, Inc. | | | 3,060 | | | | 530,329 | |
Bluerock Residential Growth REIT, Inc. | | | 999 | | | | 13,067 | |
Boston Properties, Inc. | | | 3,382 | | | | 442,704 | |
Brandywine Realty Trust | | | 4,323 | | | | 69,600 | |
Brixmor Property Group, Inc. | | | 4,055 | | | | 97,847 | |
Camden Property Trust | | | 1,831 | | | | 153,017 | |
Capstead Mortgage Corp. | | | 1,502 | | | | 16,026 | |
Care Capital Properties, Inc. | | | 2,730 | | | | 67,458 | |
Catchmark Timber Trust, Inc., Class A | | | 712 | | | | 7,326 | |
CBL & Associates Properties, Inc. | | | 4,513 | | | | 48,966 | |
Cedar Realty Trust, Inc. | | | 1,848 | | | | 11,106 | |
Chatham Lodging Trust | | | 600 | | | | 12,084 | |
Chesapeake Lodging Trust | | | 1,132 | | | | 28,979 | |
Chimera Investment Corp. | | | 4,196 | | | | 73,975 | |
City Office REIT, Inc. | | | 814 | | | | 10,248 | |
Colony NorthStar, Inc., Class A | | | 12,972 | | | | 180,570 | |
Colony Starwood Homes | | | 1,218 | | | | 38,306 | |
Columbia Property Trust, Inc. | | | 3,723 | | | | 82,837 | |
Communications Sales & Leasing, Inc. | | | 2,872 | | | | 75,476 | |
Community Healthcare Trust, Inc. | | | 647 | | | | 13,956 | |
CoreCivic, Inc. | | | 2,660 | | | | 77,246 | |
CorEnergy Infrastructure Trust, Inc. | | | 292 | | | | 10,483 | |
Coresite Realty Corp. | | | 803 | | | | 69,162 | |
Corporate Office Properties Trust | | | 2,168 | | | | 68,986 | |
Cousins Properties, Inc. | | | 7,863 | | | | 66,836 | |
Crown Castle International Corp. | | | 8,164 | | | | 717,044 | |
CubeSmart | | | 4,257 | | | | 106,978 | |
CyrusOne, Inc. | | | 2,068 | | | | 99,595 | |
CYS Investments, Inc. | | | 2,553 | | | | 19,326 | |
DCT Industrial Trust, Inc. | | | 2,264 | | | | 101,178 | |
DDR Corp. | | | 6,612 | | | | 100,370 | |
DiamondRock Hospitality Co. | | | 5,063 | | | | 57,060 | |
Digital Realty Trust, Inc. | | | 3,495 | | | | 376,167 | |
Douglas Emmett, Inc. | | | 3,172 | | | | 120,028 | |
Duke Realty Corp. | | | 7,613 | | | | 185,224 | |
DuPont Fabros Technology, Inc. | | | 2,003 | | | | 95,102 | |
Dynex Capital, Inc. | | | 2,085 | | | | 13,928 | |
Easterly Government Properties, Inc. | | | 1,197 | | | | 23,581 | |
EastGroup Properties, Inc. | | | 449 | | | | 31,776 | |
Education Realty Trust, Inc. | | | 1,845 | | | | 74,187 | |
Empire State Realty Trust, Inc., Class A | | | 3,002 | | | | 61,511 | |
EPR Properties | | | 1,347 | | | | 99,638 | |
Equinix, Inc. | | | 1,553 | | | | 597,874 | |
Equity Commonwealth (a) | | | 2,980 | | | | 91,903 | |
Equity Lifestyle Properties, Inc. | | | 1,757 | | | | 129,913 | |
Equity One, Inc. | | | 2,462 | | | | 76,790 | |
Equity Residential | | | 7,899 | | | | 480,022 | |
Essex Property Trust, Inc. | | | 1,430 | | | | 320,749 | |
Extra Space Storage, Inc. | | | 2,658 | | | | 191,509 | |
See Notes to Financial Statements.
| | | | | | |
| | | | | | | |
| | BLACKROCK FUNDS | | JANUARY 31, 2017 | | 87 |
| | |
Schedule of Investments (continued) | | BlackRock Total Stock Market Index Fund |
| | | | | | | | |
| Common Stocks | | Shares | | | Value | |
Real Estate Investment Trusts (REITs) (continued) | |
Federal Realty Investment Trust | | | 1,588 | | | $ | 223,003 | |
FelCor Lodging Trust, Inc. | | | 2,548 | | | | 19,620 | |
First Industrial Realty Trust, Inc. | | | 3,831 | | | | 99,031 | |
First Potomac Realty Trust | | | 1,256 | | | | 12,861 | |
Forest City Realty Trust, Inc., Class A | | | 5,381 | | | | 121,826 | |
Four Corners Property Trust, Inc. | | | 3,935 | | | | 85,822 | |
Franklin Street Properties Corp. | | | 1,777 | | | | 22,657 | |
Gaming and Leisure Properties, Inc. | | | 4,213 | | | | 133,257 | |
Geo Group, Inc. | | | 1,713 | | | | 71,124 | |
Getty Realty Corp. | | | 583 | | | | 15,036 | |
GGP, Inc. | | | 14,217 | | | | 353,150 | |
Gladstone Commercial Corp. | | | 957 | | | | 18,795 | |
Global Net Lease, Inc. | | | 3,004 | | | | 23,281 | |
Gramercy Property Trust | | | 3,429 | | | | 90,320 | |
Great Ajax Corp. | | | 321 | | | | 4,176 | |
HCP, Inc. | | | 10,473 | | | | 317,541 | |
Healthcare Realty Trust, Inc. | | | 3,457 | | | | 104,436 | |
Healthcare Trust of America, Inc., Class A | | | 3,425 | | | | 99,565 | |
Hersha Hospitality Trust | | | 628 | | | | 12,554 | |
Highwoods Properties, Inc. | | | 2,064 | | | | 106,110 | |
Hospitality Properties Trust | | | 2,359 | | | | 73,436 | |
Host Hotels & Resorts, Inc. | | | 16,400 | | | | 296,348 | |
Hudson Pacific Properties, Inc. | | | 2,810 | | | | 99,502 | |
Independence Realty Trust, Inc. | | | 1,495 | | | | 13,799 | |
InfraREIT, Inc. | | | 504 | | | | 8,306 | |
Invesco Mortgage Capital, Inc. | | | 2,091 | | | | 30,466 | |
Investors Real Estate Trust | | | 1,698 | | | | 10,935 | |
iStar, Inc. (a) | | | 1,081 | | | | 12,129 | |
Kilroy Realty Corp. | | | 1,920 | | | | 143,712 | |
Kimco Realty Corp. | | | 8,842 | | | | 220,077 | |
Kite Realty Group Trust | | | 1,544 | | | | 37,087 | |
Lamar Advertising Co., Class A | | | 1,870 | | | | 141,222 | |
LaSalle Hotel Properties | | | 2,776 | | | | 83,752 | |
Lexington Realty Trust | | | 9,410 | | | | 100,875 | |
Liberty Property Trust | | | 3,162 | | | | 121,389 | |
Life Storage, Inc. | | | 998 | | | | 81,287 | |
LTC Properties, Inc. | | | 683 | | | | 31,876 | |
Macerich Co. | | | 3,088 | | | | 212,115 | |
Mack-Cali Realty Corp. | | | 1,583 | | | | 44,356 | |
Medical Properties Trust, Inc. | | | 6,800 | | | | 86,700 | |
MFA Financial, Inc. | | | 9,862 | | | | 77,811 | |
Mid-America Apartment Communities, Inc. | | | 2,467 | | | | 234,242 | |
Monmouth Real Estate Investment Corp. | | | 995 | | | | 14,527 | |
Monogram Residential Trust, Inc. | | | 2,751 | | | | 27,978 | |
MTGE Investment Corp. | | | 730 | | | | 11,607 | |
National Health Investors, Inc. | | | 1,189 | | | | 87,974 | |
National Retail Properties, Inc. | | | 3,198 | | | | 139,433 | |
National Storage Affiliates Trust | | | 447 | | | | 9,946 | |
New Residential Investment Corp. | | | 5,321 | | | | 80,613 | |
New Senior Investment Group, Inc. | | | 1,250 | | | | 12,513 | |
New York Mortgage Trust, Inc. | | | 2,062 | | | | 13,217 | |
NexPoint Residential Trust, Inc. | | | 679 | | | | 15,692 | |
NorthStar Realty Europe Corp. | | | 1,409 | | | | 16,922 | |
Omega Healthcare Investors, Inc. | | | 4,037 | | | | 129,467 | |
One Liberty Properties, Inc. | | | 642 | | | | 14,869 | |
Orchid Island Capital, Inc. | | | 389 | | | | 4,602 | |
Outfront Media, Inc. | | | 3,711 | | | | 101,793 | |
Owens Realty Mortgage, Inc. | | | 267 | | | | 4,523 | |
Paramount Group, Inc. | | | 4,520 | | | | 75,439 | |
Park Hotels & Resorts, Inc. | | | 2,084 | | | | 56,560 | |
Parkway, Inc. (a) | | | 681 | | | | 14,498 | |
Pebblebrook Hotel Trust | | | 2,003 | | | | 59,910 | |
Pennsylvania Real Estate Investment Trust | | | 1,280 | | | | 22,925 | |
PennyMac Mortgage Investment Trust (b) | | | 1,256 | | | | 21,289 | |
Physicians Realty Trust | | | 3,799 | | | | 70,471 | |
Piedmont Office Realty Trust, Inc., Class A | | | 3,332 | | | | 72,371 | |
Potlatch Corp. | | | 1,400 | | | | 57,680 | |
| | | | | | | | |
| Common Stocks | | Shares | | | Value | |
Real Estate Investment Trusts (REITs) (continued) | |
Preferred Apartment Communities, Inc., Class A | | | 1,032 | | | $ | 13,973 | |
Prologis, Inc. | | | 11,702 | | | | 571,643 | |
PS Business Parks, Inc. | | | 655 | | | | 73,386 | |
Public Storage | | | 3,348 | | | | 719,820 | |
QTS Realty Trust, Inc., Class A | | | 1,286 | | | | 64,802 | |
Quality Care Properties, Inc. (a) | | | 1,624 | | | | 29,979 | |
RAIT Financial Trust | | | 337 | | | | 1,166 | |
Ramco-Gershenson Properties Trust | | | 1,515 | | | | 24,634 | |
Rayonier, Inc. | | | 3,685 | | | | 102,775 | |
Realty Income Corp. | | | 5,709 | | | | 340,428 | |
Redwood Trust, Inc. | | | 1,521 | | | | 23,576 | |
Regency Centers Corp. | | | 2,243 | | | | 156,404 | |
Resource Capital Corp. | | | 848 | | | | 6,971 | |
Retail Opportunity Investments Corp. | | | 1,925 | | | | 40,810 | |
Retail Properties of America, Inc., Class A | | | 6,809 | | | | 101,931 | |
Rexford Industrial Realty, Inc. | | | 1,160 | | | | 26,344 | |
RLJ Lodging Trust | | | 3,692 | | | | 85,691 | |
Sabra Health Care REIT, Inc. | | | 1,182 | | | | 30,023 | |
Saul Centers, Inc. | | | 143 | | | | 9,079 | |
Select Income REIT | | | 1,201 | | | | 30,037 | |
Senior Housing Properties Trust | | | 3,367 | | | | 64,141 | |
Seritage Growth Properties, Class A (c) | | | 466 | | | | 19,013 | |
Silver Bay Realty Trust Corp. | | | 932 | | | | 15,704 | |
Simon Property Group, Inc. | | | 7,035 | | | | 1,292,822 | |
SL Green Realty Corp. | | | 2,152 | | | | 234,503 | |
Spirit Realty Capital, Inc. | | | 10,847 | | | | 114,110 | |
STAG Industrial, Inc. | | | 3,704 | | | | 85,711 | |
Starwood Property Trust, Inc. | | | 6,166 | | | | 137,255 | |
STORE Capital Corp. | | | 3,412 | | | | 80,728 | |
Summit Hotel Properties, Inc. | | | 1,562 | | | | 24,726 | |
Sun Communities, Inc. | | | 1,484 | | | | 116,880 | |
Sunstone Hotel Investors, Inc. | | | 5,845 | | | | 86,038 | |
Tanger Factory Outlet Centers, Inc. | | | 2,740 | | | | 93,681 | |
Taubman Centers, Inc. | | | 1,450 | | | | 102,718 | |
Terreno Realty Corp. | | | 829 | | | | 22,541 | |
Tier REIT, Inc. | | | 1,188 | | | | 21,633 | |
Two Harbors Investment Corp. | | | 9,328 | | | | 81,807 | |
UDR, Inc. | | | 5,808 | | | | 202,990 | |
UMH Properties, Inc. | | | 764 | | | | 11,193 | |
Urban Edge Properties | | | 2,029 | | | | 56,751 | |
Ventas, Inc. | | | 7,470 | | | | 460,675 | |
VEREIT, Inc. | | | 22,826 | | | | 194,706 | |
Vornado Realty Trust | | | 3,780 | | | | 401,852 | |
Washington Prime Group, Inc. | | | 7,572 | | | | 73,070 | |
Washington Real Estate Investment Trust | | | 1,321 | | | | 41,545 | |
Weingarten Realty Investors | | | 2,586 | | | | 92,139 | |
Welltower, Inc. | | | 8,027 | | | | 532,190 | |
Western Asset Mortgage Capital Corp. | | | 1,131 | | | | 11,412 | |
Weyerhaeuser Co. | | | 16,930 | | | | 530,417 | |
Whitestone REIT | | | 415 | | | | 5,773 | |
WP Carey, Inc. | | | 2,284 | | | | 141,471 | |
Xenia Hotels & Resorts, Inc. | | | 1,904 | | | | 34,938 | |
| | | | | | | | |
| | | | | | | | 21,803,174 | |
Real Estate Management & Development — 0.1% | |
Alexander & Baldwin, Inc. | | | 1,174 | | | | 52,266 | |
Altisource Portfolio Solutions SA (a) | | | 294 | | | | 8,379 | |
Altisource Residential Corp. | | | 1,032 | | | | 12,528 | |
AV Homes, Inc. (a) | | | 236 | | | | 4,165 | |
CareTrust REIT, Inc. | | | 892 | | | | 13,523 | |
CBRE Group, Inc., Class A (a) | | | 6,863 | | | | 208,361 | |
Consolidated-Tomoka Land Co. | | | 88 | | | | 4,840 | |
Forestar Group, Inc. (a) | | | 840 | | | | 10,962 | |
Howard Hughes Corp. (a) | | | 867 | | | | 92,431 | |
Jones Lang LaSalle, Inc. | | | 1,042 | | | | 107,357 | |
Kennedy-Wilson Holdings, Inc. | | | 2,259 | | | | 46,197 | |
RE/MAX Holdings, Inc., Class A | | | 321 | | | | 17,992 | |
See Notes to Financial Statements.
| | | | | | |
| | | | | | | |
| 88 | | BLACKROCK FUNDS | | JANUARY 31, 2017 | | |
| | |
Schedule of Investments (continued) | | BlackRock Total Stock Market Index Fund |
| | | | | | | | |
| Common Stocks | | Shares | | | Value | |
Real Estate Management & Development (continued) | |
Realogy Holdings Corp. | | | 3,502 | | | $ | 90,737 | |
RMR Group, Inc., Class A | | | 188 | | | | 8,986 | |
Stratus Properties, Inc. (a) | | | 132 | | | | 4,039 | |
Tejon Ranch Co. (a) | | | 423 | | | | 9,996 | |
Trinity Place Holdings, Inc. (a) | | | 384 | | | | 3,099 | |
| | | | | | | | |
| | | | | | | | 695,858 | |
Road & Rail — 0.9% | |
AMERCO, Inc. | | | 144 | | | | 54,240 | |
ArcBest Corp. | | | 693 | | | | 21,899 | |
Avis Budget Group, Inc. (a) | | | 1,821 | | | | 67,778 | |
Celadon Group, Inc. | | | 608 | | | | 4,621 | |
Covenant Transportation Group, Inc., Class A (a) | | | 245 | | | | 5,275 | |
CSX Corp. | | | 21,710 | | | | 1,007,127 | |
Genesee & Wyoming, Inc., Class A (a) | | | 1,273 | | | | 95,933 | |
Heartland Express, Inc. | | | 815 | | | | 16,789 | |
Hertz Global Holdings, Inc. (a) | | | 1,958 | | | | 41,059 | |
JB Hunt Transport Services, Inc. | | | 2,003 | | | | 198,457 | |
Kansas City Southern | | | 2,425 | | | | 208,332 | |
Knight Transportation, Inc. | | | 1,626 | | | | 54,308 | |
Landstar System, Inc. | | | 1,038 | | | | 87,815 | |
Marten Transport Ltd. | | | 535 | | | | 12,225 | |
Norfolk Southern Corp. | | | 6,697 | | | | 786,630 | |
Old Dominion Freight Line, Inc. (a) | | | 1,545 | | | | 136,393 | |
PAM Transportation Services, Inc. (a) | | | 369 | | | | 8,601 | |
Roadrunner Transportation Systems, Inc. (a) | | | 671 | | | | 5,314 | |
Ryder System, Inc. | | | 1,214 | | | | 94,206 | |
Saia, Inc. (a) | | | 428 | | | | 20,565 | |
Swift Transportation Co. (a) | | | 1,809 | | | | 41,299 | |
Union Pacific Corp. | | | 19,279 | | | | 2,054,756 | |
USA Truck, Inc. (a) | | | 50 | | | | 423 | |
Werner Enterprises, Inc. | | | 852 | | | | 23,941 | |
YRC Worldwide, Inc. (a) | | | 617 | | | | 9,212 | |
| | | | | | | | |
| | | | | | | | 5,057,198 | |
Semiconductors & Semiconductor Equipment — 3.1% | |
Acacia Communications, Inc. (a) | | | 109 | | | | 6,341 | |
Advanced Energy Industries, Inc. (a) | | | 892 | | | | 52,485 | |
Advanced Micro Devices, Inc. (a) | | | 17,341 | | | | 179,826 | |
Alpha & Omega Semiconductor Ltd. (a) | | | 229 | | | | 4,660 | |
Ambarella, Inc. (a) | | | 925 | | | | 45,889 | |
Amkor Technology, Inc. (a) | | | 1,942 | | | | 18,274 | |
Analog Devices, Inc. | | | 6,891 | | | | 516,412 | |
Applied Materials, Inc. | | | 24,701 | | | | 846,009 | |
Axcelis Technologies, Inc. (a) | | | 1,025 | | | | 15,580 | |
Broadcom Ltd. | | | 8,597 | | | | 1,715,101 | |
Brooks Automation, Inc. | | | 1,220 | | | | 21,252 | |
Cabot Microelectronics Corp. | | | 485 | | | | 32,742 | |
Cavium, Inc. (a) | | | 1,592 | | | | 105,406 | |
CEVA, Inc. (a) | | | 291 | | | | 10,287 | |
Cirrus Logic, Inc. (a) | | | 1,428 | | | | 86,137 | |
Cohu, Inc. | | | 889 | | | | 11,735 | |
Cree, Inc. (a) | | | 2,386 | | | | 65,806 | |
Cypress Semiconductor Corp. | | | 8,170 | | | | 96,406 | |
Diodes, Inc. (a) | | | 663 | | | | 16,502 | |
DSP Group, Inc. (a) | | | 1,130 | | | | 12,261 | |
Entegris, Inc. (a) | | | 3,287 | | | | 61,631 | |
Exar Corp. (a) | | | 1,287 | | | | 13,192 | |
First Solar, Inc. (a) | | | 1,598 | | | | 49,842 | |
FormFactor, Inc. (a) | | | 1,041 | | | | 12,960 | |
Inphi Corp. (a) | | | 1,003 | | | | 45,957 | |
Integrated Device Technology, Inc. (a) | | | 3,433 | | | | 86,477 | |
Intel Corp. | | | 108,063 | | | | 3,978,880 | |
Intersil Corp., Class A | | | 3,003 | | | | 67,357 | |
IXYS Corp. | | | 979 | | | | 11,846 | |
KLA-Tencor Corp. | | | 3,476 | | | | 295,842 | |
Kopin Corp. (a) | | | 1,560 | | | | 4,976 | |
| | | | | | | | |
| Common Stocks | | Shares | | | Value | |
Semiconductors & Semiconductor Equipment (continued) | |
Lam Research Corp. | | | 3,555 | | | $ | 408,327 | |
Lattice Semiconductor Corp. (a) | | | 2,141 | | | | 15,394 | |
Linear Technology Corp. | | | 5,289 | | | | 333,895 | |
MACOM Technology Solutions Holdings, Inc. (a) | | | 593 | | | | 28,175 | |
Marvell Technology Group Ltd. | | | 10,034 | | | | 149,206 | |
Maxim Integrated Products, Inc. | | | 6,325 | | | | 281,336 | |
MaxLinear, Inc., Class A (a) | | | 1,037 | | | | 26,526 | |
Microchip Technology, Inc. | | | 4,662 | | | | 313,986 | |
Micron Technology, Inc. (a) | | | 23,512 | | | | 566,874 | |
Microsemi Corp. (a) | | | 2,452 | | | | 130,324 | |
MKS Instruments, Inc. | | | 1,416 | | | | 93,314 | |
Monolithic Power Systems, Inc. | | | 1,049 | | | | 91,515 | |
Nanometrics, Inc. (a) | | | 423 | | | | 10,875 | |
NeoPhotonics Corp. (a) | | | 339 | | | | 3,712 | |
NVE Corp. | | | 172 | | | | 13,345 | |
NVIDIA Corp. | | | 11,599 | | | | 1,266,379 | |
ON Semiconductor Corp. (a) | | | 9,213 | | | | 122,717 | |
PDF Solutions, Inc. (a) | | | 466 | | | | 10,490 | |
Photronics, Inc. (a) | | | 1,151 | | | | 13,237 | |
Power Integrations, Inc. | | | 702 | | | | 49,842 | |
Qorvo, Inc. (a) | | | 2,816 | | | | 180,815 | |
QUALCOMM, Inc. | | | 33,584 | | | | 1,794,393 | |
Rambus, Inc. (a) | | | 3,047 | | | | 39,550 | |
Rudolph Technologies, Inc. (a) | | | 558 | | | | 12,806 | |
Semtech Corp. (a) | | | 1,579 | | | | 52,028 | |
Sigma Designs, Inc. (a) | | | 755 | | | | 4,606 | |
Silicon Laboratories, Inc. (a) | | | 970 | | | | 63,244 | |
Skyworks Solutions, Inc. | | | 4,261 | | | | 390,904 | |
SunPower Corp. (a)(c) | | | 1,191 | | | | 7,908 | |
Teradyne, Inc. | | | 4,660 | | | | 132,251 | |
Tessera Holding Corp. | | | 1,193 | | | | 53,924 | |
Texas Instruments, Inc. | | | 22,899 | | | | 1,729,790 | |
Ultra Clean Holdings, Inc. (a) | | | 650 | | | | 8,145 | |
Ultratech, Inc. (a) | | | 368 | | | | 9,539 | |
Veeco Instruments, Inc. (a) | | | 722 | | | | 18,592 | |
Versum Materials, Inc. (a) | | | 2,250 | | | | 62,888 | |
Xcerra Corp. (a) | | | 1,092 | | | | 8,277 | |
Xilinx, Inc. | | | 5,663 | | | | 329,587 | |
| | | | | | | | |
| | | | | | | | 17,316,787 | |
Software — 4.3% | |
A10 Networks, Inc. (a) | | | 1,111 | | | | 8,855 | |
ACI Worldwide, Inc. (a) | | | 2,912 | | | | 56,493 | |
Activision Blizzard, Inc. | | | 12,722 | | | | 511,552 | |
Adobe Systems, Inc. (a) | | | 11,128 | | | | 1,261,693 | |
Allscripts Healthcare Solutions, Inc. (a) | | | 4,856 | | | | 56,864 | |
ANSYS, Inc. (a) | | | 1,916 | | | | 178,686 | |
Aspen Technology, Inc. (a) | | | 1,712 | | | | 90,924 | |
Atlassian Corp. PLC, Class A (a) | | | 484 | | | | 13,373 | |
Autodesk, Inc. (a) | | | 4,841 | | | | 393,767 | |
Barracuda Networks, Inc. (a) | | | 420 | | | | 9,866 | |
Blackbaud, Inc. | | | 1,112 | | | | 72,958 | |
Bottomline Technologies, Inc. (a) | | | 761 | | | | 19,573 | |
BroadSoft, Inc. (a) | | | 548 | | | | 23,016 | |
CA, Inc. | | | 6,396 | | | | 200,003 | |
Cadence Design Systems, Inc. (a) | | | 6,668 | | | | 173,568 | |
Callidus Software, Inc. (a) | | | 1,174 | | | | 21,660 | |
CDK Global, Inc. | | | 3,530 | | | | 220,801 | |
Citrix Systems, Inc. (a) | | | 3,495 | | | | 318,709 | |
CommVault Systems, Inc. (a) | | | 1,238 | | | | 60,786 | |
Dell Technologies, Inc., Class V (a) | | | 4,934 | | | | 310,793 | |
Digimarc Corp. (a) | | | 290 | | | | 7,656 | |
Ebix, Inc. | | | 642 | | | | 35,631 | |
Electronic Arts, Inc. (a) | | | 6,578 | | | | 548,803 | |
Ellie Mae, Inc. (a) | | | 747 | | | | 61,807 | |
EnerNOC, Inc. (a) | | | 649 | | | | 3,699 | |
ePlus, Inc. (a) | | | 149 | | | | 16,695 | |
See Notes to Financial Statements.
| | | | | | |
| | | | | | | |
| | BLACKROCK FUNDS | | JANUARY 31, 2017 | | 89 |
| | |
Schedule of Investments (continued) | | BlackRock Total Stock Market Index Fund |
| | | | | | | | |
| Common Stocks | | Shares | | | Value | |
Software (continued) | |
Exa Corp. (a) | | | 324 | | | $ | 5,022 | |
Fair Isaac Corp. | | | 664 | | | | 81,871 | |
FireEye, Inc. (a) | | | 4,309 | | | | 58,387 | |
Fortinet, Inc. (a) | | | 3,482 | | | | 115,811 | |
Gigamon, Inc. (a) | | | 553 | | | | 18,332 | |
Globant SA (a) | | | 447 | | | | 14,818 | |
Glu Mobile, Inc. (a) | | | 377 | | | | 867 | |
Guidewire Software, Inc. (a) | | | 1,840 | | | | 96,287 | |
HubSpot, Inc. (a) | | | 783 | | | | 40,168 | |
Imperva, Inc. (a) | | | 869 | | | | 36,281 | |
Intuit, Inc. | | | 5,519 | | | | 654,443 | |
Manhattan Associates, Inc. (a) | | | 1,637 | | | | 83,913 | |
Mentor Graphics Corp. | | | 2,374 | | | | 87,624 | |
Microsoft Corp. | | | 173,311 | | | | 11,204,556 | |
MicroStrategy, Inc., Class A (a) | | | 249 | | | | 50,124 | |
Mitek Systems, Inc. (a) | | | 331 | | | | 2,185 | |
MobileIron, Inc. (a) | | | 923 | | | | 4,015 | |
Monotype Imaging Holdings, Inc. | | | 756 | | | | 16,556 | |
Netscout Systems, Inc. (a) | | | 2,124 | | | | 70,729 | |
Nuance Communications, Inc. (a) | | | 5,457 | | | | 86,548 | |
Oracle Corp. | | | 67,694 | | | | 2,715,206 | |
Park City Group, Inc. (a) | | | 251 | | | | 3,175 | |
Paycom Software, Inc. (a) | | | 1,058 | | | | 48,922 | |
Pegasystems, Inc. | | | 698 | | | | 27,082 | |
Progress Software Corp. | | | 922 | | | | 25,834 | |
Proofpoint, Inc. (a) | | | 1,060 | | | | 84,970 | |
PTC, Inc. (a) | | | 2,650 | | | | 139,311 | |
Qualys, Inc. (a) | | | 554 | | | | 19,889 | |
Rapid7, Inc. (a) | | | 592 | | | | 7,382 | |
RealPage, Inc. (a) | | | 1,015 | | | | 31,059 | |
Red Hat, Inc. (a) | | | 4,136 | | | | 313,840 | |
Rubicon Project, Inc. (a) | | | 334 | | | | 2,829 | |
salesforce.com, Inc. (a) | | | 14,662 | | | | 1,159,764 | |
Sapiens International Corp. NV | | | 864 | | | | 11,543 | |
ServiceNow, Inc. (a) | | | 3,620 | | | | 328,044 | |
Silver Spring Networks, Inc. (a) | | | 531 | | | | 6,786 | |
Splunk, Inc. (a) | | | 2,970 | | | | 171,844 | |
SS&C Technologies Holdings, Inc. | | | 3,780 | | | | 121,451 | |
Symantec Corp. | | | 13,949 | | | | 384,295 | |
Synchronoss Technologies, Inc. (a) | | | 1,052 | | | | 40,523 | |
Synopsys, Inc. (a) | | | 3,366 | | | | 211,688 | |
Tableau Software, Inc., Class A (a) | | | 1,412 | | | | 67,550 | |
Take-Two Interactive Software, Inc. (a) | | | 1,912 | | | | 102,579 | |
Tangoe, Inc. (a) | | | 115 | | | | 837 | |
TeleNav, Inc. (a) | | | 760 | | | | 6,764 | |
Tyler Technologies, Inc. (a) | | | 761 | | | | 111,121 | |
Ultimate Software Group, Inc. (a) | | | 625 | | | | 121,038 | |
VASCO Data Security International, Inc. (a) | | | 429 | | | | 6,521 | |
Verint Systems, Inc. (a) | | | 1,559 | | | | 58,229 | |
VMware, Inc., Class A (a)(c) | | | 1,843 | | | | 161,336 | |
Workday, Inc., Class A (a) | | | 2,618 | | | | 217,530 | |
Workiva, Inc. (a) | | | 612 | | | | 7,711 | |
Zendesk, Inc. (a) | | | 2,142 | | | | 51,258 | |
Zix Corp. (a) | | | 998 | | | | 4,760 | |
Zynga, Inc., Class A (a) | | | 19,153 | | | | 48,266 | |
| | | | | | | | |
| | | | | | | | 24,227,705 | |
Specialty Retail — 2.3% | |
Aaron’s, Inc. | | | 1,567 | | | | 48,483 | |
Abercrombie & Fitch Co., Class A | | | 2,579 | | | | 29,942 | |
Advance Auto Parts, Inc. | | | 1,590 | | | | 261,141 | |
America’s Car-Mart, Inc. (a) | | | 281 | | | | 11,788 | |
American Eagle Outfitters, Inc. | | | 4,172 | | | | 63,039 | |
Asbury Automotive Group, Inc. (a) | | | 377 | | | | 24,731 | |
Ascena Retail Group, Inc. (a) | | | 4,289 | | | | 20,630 | |
AutoNation, Inc. (a) | | | 1,518 | | | | 80,636 | |
AutoZone, Inc. (a) | | | 659 | | | | 477,762 | |
| | | | | | | | |
| Common Stocks | | Shares | | | Value | |
Specialty Retail (continued) | |
Barnes & Noble Education, Inc. (a) | | | 774 | | | $ | 7,779 | |
Barnes & Noble, Inc. | | | 1,024 | | | | 10,445 | |
Bed Bath & Beyond, Inc. | | | 3,253 | | | | 131,258 | |
Best Buy Co., Inc. | | | 6,244 | | | | 277,983 | |
Big 5 Sporting Goods Corp. | | | 293 | | | | 4,512 | |
BMC Stock Holdings, Inc. (a) | | | 1,098 | | | | 20,533 | |
Boot Barn Holdings, Inc. (a) | | | 235 | | | | 2,550 | |
Buckle, Inc. | | | 543 | | | | 11,484 | |
Build-A-Bear Workshop, Inc., Class A (a) | | | 292 | | | | 3,504 | |
Cabela’s, Inc. (a) | | | 1,126 | | | | 62,932 | |
Caleres, Inc. | | | 786 | | | | 24,169 | |
CarMax, Inc. (a) | | | 4,370 | | | | 291,523 | |
Cato Corp., Class A | | | 507 | | | | 12,873 | |
Chico’s FAS, Inc. | | | 3,622 | | | | 48,861 | |
Children’s Place, Inc. | | | 492 | | | | 47,724 | |
Citi Trends, Inc. | | | 277 | | | | 4,446 | |
Conn’s, Inc. (a) | | | 389 | | | | 4,104 | |
CST Brands, Inc. | | | 1,700 | | | | 81,906 | |
Dick’s Sporting Goods, Inc. | | | 1,914 | | | | 98,762 | |
DSW, Inc., Class A | | | 2,120 | | | | 44,859 | |
Express, Inc. (a) | | | 2,627 | | | | 27,925 | |
Finish Line, Inc., Class A | | | 792 | | | | 13,622 | |
Five Below, Inc. (a) | | | 1,336 | | | | 53,240 | |
Foot Locker, Inc. | | | 3,044 | | | | 208,636 | |
Francesca’s Holdings Corp. (a) | | | 821 | | | | 14,318 | |
GameStop Corp., Class A | | | 2,382 | | | | 58,335 | |
Gap, Inc. | | | 5,086 | | | | 117,130 | |
Genesco, Inc. (a) | | | 391 | | | | 23,538 | |
GNC Holdings, Inc., Class A | | | 1,064 | | | | 9,438 | |
Group 1 Automotive, Inc. | | | 539 | | | | 43,546 | |
Guess?, Inc. | | | 1,146 | | | | 14,634 | |
Haverty Furniture Cos., Inc. | | | 502 | | | | 10,944 | |
Hibbett Sports, Inc. (a) | | | 427 | | | | 14,091 | |
Home Depot, Inc. | | | 28,462 | | | | 3,915,802 | |
Kirkland’s, Inc. (a) | | | 341 | | | | 4,733 | |
L Brands, Inc. | | | 5,570 | | | | 335,370 | |
Lithia Motors, Inc., Class A | | | 589 | | | | 60,738 | |
Lowe’s Cos., Inc. | | | 20,440 | | | | 1,493,755 | |
Lumber Liquidators Holdings, Inc. (a) | | | 647 | | | | 10,132 | |
MarineMax, Inc. (a) | | | 1,644 | | | | 35,264 | |
Michaels Cos., Inc. (a) | | | 2,246 | | | | 44,179 | |
Monro Muffler Brake, Inc. | | | 803 | | | | 48,100 | |
O’Reilly Automotive, Inc. (a) | | | 2,127 | | | | 557,848 | |
Office Depot, Inc. | | | 16,469 | | | | 73,287 | |
Party City Holdco, Inc. (a) | | | 508 | | | | 7,341 | |
Penske Automotive Group, Inc. | | | 919 | | | | 49,957 | |
Pier 1 Imports, Inc. | | | 1,225 | | | | 8,906 | |
Rent-A-Center, Inc. | | | 723 | | | | 6,478 | |
RH (a)(c) | | | 1,173 | | | | 31,694 | |
Ross Stores, Inc. | | | 8,966 | | | | 592,742 | |
Sally Beauty Holdings, Inc. (a) | | | 3,488 | | | | 83,014 | |
Select Comfort Corp. (a) | | | 898 | | | | 18,122 | |
Shoe Carnival, Inc. | | | 372 | | | | 9,512 | |
Signet Jewelers Ltd. | | | 1,609 | | | | 124,971 | |
Sonic Automotive, Inc., Class A | | | 412 | | | | 9,641 | |
Sportsman’s Warehouse Holdings, Inc. (a) | | | 414 | | | | 3,080 | |
Staples, Inc. | | | 14,549 | | | | 133,851 | |
Tailored Brands, Inc. | | | 944 | | | | 20,060 | |
Tiffany & Co. | | | 2,489 | | | | 195,934 | |
Tile Shop Holdings, Inc. (a) | | | 579 | | | | 11,059 | |
TJX Cos., Inc. | | | 15,154 | | | | 1,135,338 | |
Tractor Supply Co. | | | 3,013 | | | | 221,968 | |
Ulta Salon Cosmetics & Fragrance, Inc. (a) | | | 1,310 | | | | 356,687 | |
Urban Outfitters, Inc. (a) | | | 2,003 | | | | 53,160 | |
Vitamin Shoppe, Inc. (a) | | | 484 | | | | 10,479 | |
West Marine, Inc. (a) | | | 309 | | | | 2,864 | |
Williams-Sonoma, Inc. | | | 2,071 | | | | 99,843 | |
See Notes to Financial Statements.
| | | | | | |
| | | | | | | |
| 90 | | BLACKROCK FUNDS | | JANUARY 31, 2017 | | |
| | |
Schedule of Investments (continued) | | BlackRock Total Stock Market Index Fund |
| | | | | | | | |
| Common Stocks | | Shares | | | Value | |
Specialty Retail (continued) | |
Winmark Corp. | | | 34 | | | $ | 3,765 | |
Zumiez, Inc. (a) | | | 536 | | | | 10,747 | |
| | | | | | | | |
| | | | | | | | 12,600,177 | |
Technology Hardware, Storage & Peripherals — 3.2% | |
3D Systems Corp. (a) | | | 2,820 | | | | 46,502 | |
Apple, Inc. | | | 125,283 | | | | 15,203,092 | |
Avid Technology, Inc. (a) | | | 592 | | | | 3,167 | |
Cray, Inc. (a) | | | 772 | | | | 13,240 | |
Diebold Nixdorf, Inc. | | | 1,775 | | | | 48,280 | |
Eastman Kodak Co. (a) | | | 340 | | | | 4,556 | |
Electronics for Imaging, Inc. (a) | | | 1,193 | | | | 53,613 | |
Hewlett Packard Enterprise Co. | | | 39,123 | | | | 887,310 | |
HP, Inc. | | | 39,268 | | | | 590,983 | |
Immersion Corp. (a) | | | 1,186 | | | | 12,204 | |
NCR Corp. (a) | | | 2,758 | | | | 118,649 | |
NetApp, Inc. | | | 6,491 | | | | 248,735 | |
Nimble Storage, Inc. (a) | | | 1,259 | | | | 10,790 | |
Pure Storage, Inc., Class A (a) | | | 1,036 | | | | 11,779 | |
Stratasys Ltd. (a) | | | 1,943 | | | | 38,316 | |
Super Micro Computer, Inc. (a) | | | 825 | | | | 21,821 | |
Synaptics, Inc. (a) | | | 891 | | | | 50,235 | |
USA Technologies, Inc. (a) | | | 901 | | | | 3,784 | |
Western Digital Corp. | | | 6,394 | | | | 509,794 | |
| | | | | | | | |
| | | | | | | | 17,876,850 | |
Textiles, Apparel & Luxury Goods — 0.7% | |
Carter’s, Inc. | | | 1,135 | | | | 95,056 | |
Coach, Inc. | | | 6,270 | | | | 234,184 | |
Columbia Sportswear Co. | | | 520 | | | | 28,272 | |
Crocs, Inc. (a) | | | 930 | | | | 6,789 | |
Culp, Inc. | | | 170 | | | | 5,474 | |
Deckers Outdoor Corp. (a) | | | 826 | | | | 47,578 | |
Fossil Group, Inc. (a) | | | 815 | | | | 20,839 | |
G-III Apparel Group Ltd. (a) | | | 811 | | | | 21,297 | |
Hanesbrands, Inc. | | | 8,568 | | | | 203,147 | |
Iconix Brand Group, Inc. (a) | | | 1,306 | | | | 13,439 | |
Kate Spade & Co. (a) | | | 3,103 | | | | 57,436 | |
lululemon athletica, Inc. (a) | | | 2,166 | | | | 146,227 | |
Michael Kors Holdings Ltd. (a) | | | 3,563 | | | | 152,532 | |
Movado Group, Inc. | | | 450 | | | | 12,217 | |
NIKE, Inc., Class B | | | 30,334 | | | | 1,604,669 | |
Oxford Industries, Inc. | | | 289 | | | | 15,901 | |
Perry Ellis International, Inc. (a) | | | 255 | | | | 6,015 | |
PVH Corp. | | | 1,844 | | | | 172,986 | |
Ralph Lauren Corp. | | | 1,372 | | | | 121,326 | |
Sequential Brands Group, Inc. (a) | | | 363 | | | | 1,681 | |
Skechers U.S.A., Inc., Class A (a) | | | 2,842 | | | | 71,391 | |
Steven Madden Ltd. (a) | | | 1,543 | | | | 54,314 | |
Under Armour, Inc., Class A (a)(c) | | | 4,165 | | | | 89,506 | |
Under Armour, Inc., Class C (a) | | | 4,022 | | | | 77,303 | |
Unifi, Inc. (a) | | | 322 | | | | 8,659 | |
Vera Bradley, Inc. (a) | | | 696 | | | | 7,976 | |
VF Corp. | | | 7,694 | | | | 396,087 | |
Wolverine World Wide, Inc. | | | 2,373 | | | | 55,742 | |
| | | | | | | | |
| | | | | | | | 3,728,043 | |
Thrifts & Mortgage Finance — 0.3% | |
Astoria Financial Corp. | | | 2,728 | | | | 51,587 | |
Banc of California, Inc. | | | 902 | | | | 14,252 | |
BankFinancial Corp. | | | 603 | | | | 8,122 | |
Beneficial Bancorp, Inc. | | | 1,762 | | | | 31,452 | |
Berkshire Hills Bancorp, Inc. | | | 2,063 | | | | 73,030 | |
BofI Holding, Inc. (a) | | | 1,490 | | | | 43,955 | |
Brookline Bancorp, Inc. | | | 1,313 | | | | 20,680 | |
Capitol Federal Financial, Inc. | | | 2,270 | | | | 35,072 | |
Charter Financial Corp. | | | 722 | | | | 12,404 | |
| | | | | | | | |
| Common Stocks | | Shares | | | Value | |
Thrifts & Mortgage Finance (continued) | |
Dime Community Bancshares, Inc. | | | 548 | | | $ | 11,727 | |
Essent Group Ltd. (a) | | | 3,104 | | | | 107,305 | |
EverBank Financial Corp. | | | 2,410 | | | | 46,826 | |
Federal Agricultural Mortgage Corp., Class C | | | 139 | | | | 7,737 | |
First Defiance Financial Corp. | | | 305 | | | | 14,780 | |
Flagstar Bancorp, Inc. (a) | | | 446 | | | | 11,493 | |
Flushing Financial Corp. | | | 429 | | | | 11,669 | |
Greene County Bancorp, Inc. | | | 392 | | | | 8,624 | |
Hingham Institution for Savings | | | 79 | | | | 15,278 | |
HomeStreet, Inc. (a) | | | 371 | | | | 9,720 | |
Impac Mortgage Holdings, Inc. (a) | | | 232 | | | | 3,206 | |
Kearny Financial Corp. | | | 2,282 | | | | 34,801 | |
Ladder Capital Corp. | | | 570 | | | | 7,729 | |
LendingTree, Inc. (a) | | | 124 | | | | 13,876 | |
Meridian Bancorp, Inc. | | | 1,376 | | | | 25,938 | |
Meta Financial Group, Inc. | | | 159 | | | | 13,968 | |
MGIC Investment Corp. (a) | | | 9,142 | | | | 97,362 | |
Nationstar Mortgage Holdings, Inc. (a) | | | 547 | | | | 9,923 | |
New York Community Bancorp, Inc. | | | 10,194 | | | | 154,847 | |
NMI Holdings, Inc., Class A (a) | | | 743 | | | | 8,024 | |
Northfield Bancorp, Inc. | | | 1,190 | | | | 21,480 | |
Northwest Bancshares, Inc. | | | 2,104 | | | | 35,915 | |
OceanFirst Financial Corp. | | | 487 | | | | 13,836 | |
Ocwen Financial Corp. (a) | | | 1,730 | | | | 9,117 | |
Oritani Financial Corp. | | | 1,043 | | | | 18,096 | |
People’s United Financial, Inc. | | | 6,187 | | | | 116,006 | |
Provident Bancorp, Inc. (a) | | | 433 | | | | 8,530 | |
Provident Financial Services, Inc. | | | 1,941 | | | | 51,378 | |
Radian Group, Inc. | | | 5,168 | | | | 95,091 | |
Territorial Bancorp, Inc. | | | 536 | | | | 16,975 | |
TFS Financial Corp. | | | 1,417 | | | | 24,783 | |
TrustCo Bank Corp. NY | | | 1,531 | | | | 12,860 | |
United Community Financial Corp. | | | 695 | | | | 5,915 | |
United Financial Bancorp, Inc. | | | 771 | | | | 13,917 | |
Walker & Dunlop, Inc. (a) | | | 523 | | | | 16,428 | |
Washington Federal, Inc. | | | 2,051 | | | | 67,375 | |
Waterstone Financial, Inc. | | | 804 | | | | 14,552 | |
WSFS Financial Corp. | | | 534 | | | | 24,190 | |
| | | | | | | | |
| | | | | | | | 1,471,831 | |
Tobacco — 1.4% | |
Alliance One International, Inc. (a) | | | 257 | | | | 4,279 | |
Altria Group, Inc. | | | 44,605 | | | | 3,174,984 | |
Philip Morris International, Inc. | | | 35,462 | | | | 3,408,962 | |
Reynolds American, Inc. | | | 18,777 | | | | 1,129,061 | |
Turning Point Brands, Inc. (a) | | | 273 | | | | 3,625 | |
Universal Corp. | | | 669 | | | | 45,492 | |
Vector Group Ltd. | | | 2,264 | | | | 49,944 | |
| | | | | | | | |
| | | | | | | | 7,816,347 | |
Trading Companies & Distributors — 0.4% | |
Aceto Corp. | | | 578 | | | | 11,034 | |
Air Lease Corp. | | | 2,558 | | | | 93,060 | |
Aircastle Ltd. | | | 781 | | | | 17,416 | |
Applied Industrial Technologies, Inc. | | | 871 | | | | 52,652 | |
Beacon Roofing Supply, Inc. (a) | | | 1,964 | | | | 85,964 | |
CAI International, Inc. (a) | | | 191 | | | | 3,083 | |
DXP Enterprises, Inc. (a) | | | 333 | | | | 12,594 | |
Fastenal Co. | | | 6,497 | | | | 322,771 | |
GATX Corp. | | | 972 | | | | 56,201 | |
H&E Equipment Services, Inc. | | | 611 | | | | 15,800 | |
HD Supply Holdings, Inc. (a) | | | 4,446 | | | | 188,066 | |
Herc Holdings, Inc. (a) | | | 427 | | | | 21,209 | |
Kaman Corp. | | | 435 | | | | 21,981 | |
Lawson Products, Inc. (a) | | | 478 | | | | 12,356 | |
MRC Global, Inc. (a) | | | 2,394 | | | | 49,197 | |
MSC Industrial Direct Co., Inc., Class A | | | 939 | | | | 95,919 | |
See Notes to Financial Statements.
| | | | | | |
| | | | | | | |
| | BLACKROCK FUNDS | | JANUARY 31, 2017 | | 91 |
| | |
Schedule of Investments (continued) | | BlackRock Total Stock Market Index Fund |
| | | | | | | | |
| Common Stocks | | Shares | | | Value | |
Trading Companies & Distributors (continued) | |
NOW, Inc. (a) | | | 2,824 | | | $ | 60,038 | |
Rush Enterprises, Inc., Class A (a) | | | 415 | | | | 13,591 | |
Rush Enterprises, Inc., Class B (a) | | | 266 | | | | 8,180 | |
SiteOne Landscape Supply, Inc. (a) | | | 207 | | | | 7,953 | |
Textainer Group Holdings Ltd. | | | 1,756 | | | | 25,286 | |
Titan Machinery, Inc. (a) | | | 378 | | | | 5,220 | |
Triton International, Ltd. | | | 728 | | | | 17,720 | |
United Rentals, Inc. (a) | | | 2,004 | | | | 253,526 | |
Univar, Inc. (a) | | | 820 | | | | 24,452 | |
Veritiv Corp. (a) | | | 176 | | | | 9,865 | |
W.W. Grainger, Inc. | | | 1,231 | | | | 310,914 | |
Watsco, Inc. | | | 588 | | | | 89,811 | |
WESCO International, Inc. (a) | | | 1,340 | | | | 94,738 | |
| | | | | | | | |
| | | | | | | | 1,980,597 | |
Transportation Infrastructure — 0.0% | |
Macquarie Infrastructure Corp. | | | 1,661 | | | | 124,558 | |
Wesco Aircraft Holdings, Inc. (a) | | | 1,006 | | | | 15,241 | |
| | | | | | | | |
| | | | | | | | 139,799 | |
Water Utilities — 0.1% | |
American States Water Co. | | | 671 | | | | 29,376 | |
American Water Works Co., Inc. | | | 3,710 | | | | 272,462 | |
Aqua America, Inc. | | | 4,238 | | | | 128,878 | |
Artesian Resources Corp., Class A | | | 169 | | | | 5,244 | |
California Water Service Group | | | 1,529 | | | | 52,751 | |
Connecticut Water Service, Inc. | | | 261 | | | | 14,104 | |
Middlesex Water Co. | | | 276 | | | | 10,436 | |
SJW Corp. | | | 313 | | | | 15,681 | |
York Water Co. | | | 487 | | | | 17,435 | |
| | | | | | | | |
| | | | | | | | 546,367 | |
Wireless Telecommunication Services — 0.1% | |
Boingo Wireless, Inc. (a) | | | 1,078 | | | | 12,613 | |
NII Holdings, Inc. (a) | | | 714 | | | | 2,017 | |
RingCentral, Inc., Class A (a) | | | 1,099 | | | | 25,662 | |
| | | | | | | | |
| Common Stocks | | Shares | | | Value | |
Wireless Telecommunication Services (continued) | |
Shenandoah Telecommunications Co. | | | 866 | | | $ | 23,599 | |
Spok Holdings, Inc. | | | 353 | | | | 7,254 | |
Sprint Corp. (a) | | | 16,730 | | | | 154,418 | |
T-Mobile U.S., Inc. (a) | | | 6,571 | | | | 409,176 | |
Telephone & Data Systems, Inc. | | | 2,328 | | | | 71,353 | |
United States Cellular Corp. (a) | | | 194 | | | | 8,650 | |
| | | | | | | | |
| | | | | | | | 714,742 | |
| Total Common Stocks — 97.4% | | | | | | | 543,272,620 | |
| | | | | | | | |
| | | | | | | | | |
| | |
| Rights | | | | | | |
Biotechnology — 0.0% | |
Dyax Corp. (a) | | | 119 | | | | 272 | |
| Total Rights — 0.0% | | | | | | | 272 | |
Total Long-Term Investments
(Cost — $509,427,150) — 97.4% | | | | 543,272,892 | |
| | | | | | | | |
| | | | | | | | | |
|
| Short-Term Securities | |
BlackRock Liquidity Funds, T-Fund, Institutional Class, 0.40% (b)(d) | | | 50,173,788 | | | | 50,173,788 | |
SL Liquidity Series, LLC, Money Market Series, 0.94% (b)(d)(e) | | | 448,997 | | | | 449,087 | |
Total Short-Term Securities
(Cost — $50,622,812) — 9.1% | | | | 50,622,875 | |
| Total Investments (Cost — $560,049,962) — 106.5% | | | | 593,895,767 | |
Liabilities in Excess of Other Assets — (6.5)% | | | | (36,504,271 | ) |
| | | | | | | | |
Net Assets — 100.0% | | | $ | 557,391,496 | |
| | | | | | | | |
|
| Notes to Schedule of Investments |
| (a) | | Non-income producing security. |
| (b) | | During the six months ended January 31, 2017, investments in issuers considered to be affiliates of the Fund for purposes of Section 2(a)(3) of the Investment Company Act of 1940, as amended, were as follows: |
| | | | | | | | | | | | | | | | | | | | | | | | | | | | | | | | |
| Affiliate | | Shares Held
at July 31,
2016 | | | Shares
Purchased | | | Shares
Sold | | | Shares Held
at January 31,
2017 | | | Value at
January 31,
2017 | | | Income | | | Net
Realized
Gain1 | | | Change in
Unrealized
Appreciation | |
BlackRock, Inc. | | | 1,619 | | | | 1,233 | | | | — | | | | 2,852 | | | $ | 1,066,591 | | | $ | 8,771 | | | | — | | | $ | 6,879 | |
BlackRock Liquidity Funds, T-Fund, Institutional Class | | | — | | | | 50,173,788 | 2 | | | — | | | | 50,173,788 | | | | 50,173,788 | | | | 18,497 | | | $ | 258 | | | | — | |
BlackRock Premier Government Institutional Fund | | | 20,471,120 | | | | — | | | | (20,471,120 | )3 | | | — | | | | — | | | | 5,327 | | | | — | | | | — | |
PennyMac Mortgage Investment Trust | | | 716 | | | | 540 | | | | — | | | | 1,256 | | | | 21,289 | | | | 927 | | | | — | | | | 858 | |
PNC Financial Services Group, Inc. | | | 6,410 | | | | 4,922 | | | | — | | | | 11,332 | | | | 1,365,053 | | | | 9,592 | | | | — | | | | 289,914 | |
SL Liquidity Series, LLC, Money Market Series | | | 431,687 | | | | 17,310 | | | | — | | | | 448,997 | | | | 449,087 | | | | 22,078 | 4 | | | 43 | | | | 64 | |
Total | | | | | | | | | | | | | | | | | | $ | 53,075,808 | | | $ | 65,192 | | | $ | 301 | | | $ | 297,715 | |
| | | | | | | | | | | | | | | | | | | | |
1 Includes net capital gain distributions. | |
2 Represents net shares purchased. | |
3 Represents net shares sold. | |
4 Represents securities lending income earned from the reinvestment of cash collateral from loaned securities, net of fees and collateral investment expenses, and other payments to and from borrowers of securities. | |
See Notes to Financial Statements.
| | | | | | |
| | | | | | | |
| 92 | | BLACKROCK FUNDS | | JANUARY 31, 2017 | | |
| | |
Schedule of Investments (continued) | | BlackRock Total Stock Market Index Fund |
| (c) | | Security, or a portion of security, is on loan. |
| (d) | | Current yield as of period end. |
| (e) | | Security was purchased with the cash collateral from loaned securities. |
For Fund compliance purposes, the Fund’s industry classifications refer to one or more of the industry sub-classifications used by one or more widely recognized market indexes or rating group indexes, and/or as defined by the investment adviser. These definitions may not apply for purposes of this report, which may combine such industry sub-classifications for reporting ease.
|
| Derivative Financial Instruments Outstanding as of Period End |
| | | | | | | | | | | | | | | | | | | | | | |
| Futures Contracts | | | | | | | |
Contracts
Long | | | Issue | | Expiration | | Notional Value | | | Unrealized
Depreciation | | | | | | | |
| | 22 | | | Russell 2000 Mini Index | | March 2017 | | $ | 1,495,450 | | | $ | (7,218 | ) | | | | | | | | |
| | 84 | | | S&P 500 E-Mini Index | | March 2017 | | $ | 9,552,900 | | | | (38,540 | ) | | | | | | | | |
| | Total | | | $ | (45,758 | ) | | | | | | | | |
| | | | | | | | | | | | | | | | | | |
|
| Derivative Financial Instruments Outstanding as of Period End |
As of period end, the fair values of derivative financial instruments located in the Statements of Assets and Liabilities were as follows:
| | | | | | | | | | | | | | | | | | | | | | | | | | | | | | | | |
| Liabilities — Derivative Financial Instruments | | | Commodity
Contracts | | | Credit
Contracts | | | Equity
Contracts | | | Foreign
Currency
Exchange
Contracts | | | Interest
Rate
Contracts | | | Other
Contracts | | | Total | |
Futures contracts | | | Net unrealized depreciation | | | | — | | | | — | | | $ | 45,758 | | | | — | | | | — | | | | — | | | $ | 45,758 | |
| | | | | | | | | | | | | | | | | | | | | | | | | | | | | | | | |
For the six month ended January 31, 2017, the effect of derivative financial instruments in the Statements of Operations were as follows: | |
| | | | | | | | | | | | | | | | | | | | | | | | | | | | | | | | |
Net Realized Gain (Loss) from: | | | | | | | | | | | | | | | | | | | | | | | | | | | | | | | | |
Futures contracts | | | | — | | | | — | | | $ | 582,260 | | | | — | | | | — | | | | — | | | $ | 582,260 | |
Net Change in Unrealized Appreciation (Depreciation) on: | | | | | | | | | | | | | | | | | | | | | | | | | | | | | |
Futures contracts | | | | — | | | | — | | | $ | (67,776 | ) | | | — | | | | — | | | | — | | | $ | (67,776 | ) |
|
| Average Quarterly Balances of Outstanding Derivative Financial Instruments |
| | | | |
| Futures contracts: | |
Average notional value of contracts — long | | $ | 7,782,593 | |
| | | | |
For more information about the Fund’s investment risks regarding derivative financial instruments, refer to the Notes to Financial Statements.
See Notes to Financial Statements.
| | | | | | |
| | | | | | | |
| | BLACKROCK FUNDS | | JANUARY 31, 2017 | | 93 |
| | |
Schedule of Investments (concluded) | | BlackRock Total Stock Market Index Fund |
|
| Fair Value Hierarchy as of Period End |
Various inputs are used in determining the fair value of investments and derivative financial instruments. For information about the Fund’s policy regarding valuation of investments and derivative financial instruments, refer to the Notes to Financial Statements.
The following tables summarize the Fund’s investments and derivative financial instruments categorized in the disclosure hierarchy:
| | | | | | | | | | | | | | | | |
| | | Level 1 | | | Level 2 | | | Level 3 | | | Total | |
Assets: | | | | | | | | | | | | | | | | |
| Investments: | | | | | | | | | | | | | | | | |
Long-Term Investments1: | | | | | | | | | | | | | | | | |
Common Stocks | | $ | 543,272,620 | | | | — | | | | — | | | $ | 543,272,620 | |
Rights | | | — | | | | — | | | $ | 272 | | | | 272 | |
Short-Term Securities | | | 50,173,788 | | | | — | | | | — | | | | 50,173,788 | |
| | | | | | | | | | | | | | | | |
Subtotal | | $ | 593,446,408 | | | | — | | | $ | 272 | | | $ | 593,446,680 | |
| | | | | | | | | | | | | | | | |
Investments valued at NAV2 | | | | | | | | | | | | | | | 449,087 | |
| | | | | | | | | | | | | | | | |
Total | | | | | | | | | | | | | | $ | 593,895,767 | |
| | | | | | | | | | | | | | | | |
| | | | | | | | | | | | | | | | |
| Derivative Financial Instruments3 | |
Liabilities: | |
Equity contracts | | $ | (45,758 | ) | | | — | | | | — | | | $ | (45,758 | ) |
1 See above Schedule of Investments for values in each sector. | |
2 As of January 31, 2017, certain of the Fund’s investments were fair valued using NAV per share as no quoted market value is available and therefore have been excluded from the fair value hierarchy. | |
3 Derivative financial instruments are futures contracts, which are valued at the unrealized appreciation (depreciation) on the instrument. | |
During the six months ended January 31, 2017, there were no transfers between levels.
See Notes to Financial Statements.
| | | | | | |
| | | | | | | |
| 94 | | BLACKROCK FUNDS | | JANUARY 31, 2017 | | |
| | |
| Statements of Assets and Liabilities | | |
| | | | | | | | | | | | | | | | | | | | |
| January 31, 2017 (Unaudited) | | BlackRock
Midcap Index
Fund
| | | BlackRock MSCI
Asia ex Japan
Index Fund
| | | BlackRock
MSCI World
Index Fund
| | | BlackRock
Small/Mid Cap
Index Fund
| | | BlackRock Total
Stock Market
Index Fund
| |
| | | | | | | | | | | | | | | | | | | | |
| Assets | |
Investments at value — unaffiliated1,2 | | $ | 2,627,586,335 | | | $ | 52,670,362 | | | $ | 434,313,155 | | | $ | 71,563,143 | | | $ | 540,819,959 | |
Investments at value — affiliated3 | | | 108,283,712 | | | | 702,741 | | | | 13,315,842 | | | | 4,003,967 | | | | 53,075,808 | |
Cash pledged for futures contracts | | | 5,178,650 | | | | 36,000 | | | | 779,980 | | | | 175,000 | | | | 344,000 | |
Foreign currency at value4 | | | — | | | | 111,230 | | | | 3,947,851 | | | | — | | | | — | |
| Receivables: | | | | | | | | | | | | | | | | | | | | |
Capital shares sold | | | 12,292,516 | | | | 133,040 | | | | 3,355,588 | | | | 153,444 | | | | 3,223,210 | |
Dividends — unaffiliated | | | 1,486,604 | | | | 116,645 | | | | 407,588 | | | | 33,590 | | | | 399,298 | |
Variation margin on futures contracts | | | 208,333 | | | | 1,005 | | | | — | | | | 18,586 | | | | 17,839 | |
Dividends — affiliated | | | 26,078 | | | | 268 | | | | 6,542 | | | | 918 | | | | 14,353 | |
Securities lending income — affiliated | | | 22,626 | | | | — | | | | 467 | | | | 2,466 | | | | 3,266 | |
Investments sold | | | — | | | | — | | | | 11,906 | | | | 33,762 | | | | 229,509 | |
Prepaid expenses | | | 44,442 | | | | 15,674 | | | | 22,219 | | | | 23,495 | | | | 24,472 | |
| | | | |
Total assets | | | 2,755,129,296 | | | | 53,786,965 | | | | 456,161,138 | | | | 76,008,371 | | | | 598,151,714 | |
| | | | |
| | | | | | | | | | | | | | | | | | | | |
| Liabilities | |
Cash collateral on securities loaned at value | | | 1,310,001 | | | | — | | | | 73,349 | | | | 283,237 | | | | 448,980 | |
Bank overdraft | | | 47 | | | | — | | | | 39 | | | | 11,107 | | | | 11,595 | |
| Payables: | | | | | | | | | | | | | | | | | | | | |
Investments purchased | | | 68,614,432 | | | | 68,130 | | | | 10,478,323 | | | | 2,959,108 | | | | 39,941,875 | |
Capital shares redeemed | | | 6,948,171 | | | | 10,224 | | | | 1,547,469 | | | | 13,059 | | | | 307,266 | |
Investment advisory fees | | | 144,135 | | | | 7,065 | | | | 23,683 | | | | 9,129 | | | | 19,331 | |
Officer’s and Trustees’ fees | | | 12,022 | | | | 3,483 | | | | 3,365 | | | | 3,410 | | | | 1,620 | |
Service fees | | | 3,288 | | | | — | | | | — | | | | 3,295 | | | | 7,566 | |
Variation margin on futures contracts | | | — | | | | — | | | | 44,185 | | | | — | | | | — | |
Other accrued expenses | | | 907,760 | | | | 67,267 | | | | 233,810 | | | | 33,053 | | | | 21,985 | |
| | | | |
Total liabilities | | | 77,939,856 | | | | 156,169 | | | | 12,404,223 | | | | 3,315,398 | | | | 40,760,218 | |
| | | | |
Net Assets | | $ | 2,677,189,440 | | | $ | 53,630,796 | | | $ | 443,756,915 | | | $ | 72,692,973 | | | $ | 557,391,496 | |
| | | | |
| | | | | | | | | | | | | | | | | | | | |
| Net Assets Consist of | |
Paid-in capital | | $ | 2,375,596,238 | | | $ | 54,770,660 | | | $ | 403,592,212 | | | $ | 67,306,922 | | | $ | 523,053,388 | |
Undistributed net investment income (loss) | | | 363,116 | | | | (30,722 | ) | | | 83,916 | | | | (19,033 | ) | | | 413,139 | |
Undistributed net realized gain (accumulated net realized loss) | | | (1,961,468 | ) | | | (132,025 | ) | | | (1,368,538 | ) | | | 160,576 | | | | 124,922 | |
Net unrealized appreciation (depreciation) | | | 303,191,554 | | | | (977,117 | ) | | | 41,449,325 | | | | 5,244,508 | | | | 33,800,047 | |
| | | | |
Net Assets | | $ | 2,677,189,440 | | | $ | 53,630,796 | | | $ | 443,756,915 | | | $ | 72,692,973 | | | $ | 557,391,496 | |
| | | | |
1 Investments at cost — unaffiliated | | $ | 2,324,399,424 | | | $ | 53,662,381 | | | $ | 393,127,079 | | | $ | 66,319,895 | | | $ | 507,262,714 | |
2 Securities loaned at value | | $ | 1,207,277 | | | | — | | | $ | 72,308 | | | $ | 269,188 | | | $ | 419,474 | |
3 Investments at cost — affiliated | | $ | 108,283,541 | | | $ | 702,741 | | | $ | 13,087,229 | | | $ | 4,003,126 | | | $ | 52,787,248 | |
4 Foreign currency at cost | | | — | | | $ | 111,004 | | | $ | 3,924,641 | | | | — | | | | — | |
| | | | | | | | | | | | | | | | | | | | |
| | | | | | |
| See Notes to Financial Statements. | | | | |
| | | | | | | |
| | BLACKROCK FUNDS | | JANUARY 31, 2017 | | 95 |
| | |
| Statements of Assets and Liabilities (concluded) | | |
| | | | | | | | | | | | | | | | | | | | |
| January 31, 2017 (Unaudited) | | BlackRock
Midcap Index
Fund
| | | BlackRock MSCI
Asia ex Japan
Index Fund
| | | BlackRock
MSCI World
Index Fund
| | | BlackRock
Small/Mid Cap
Index Fund
| | | BlackRock Total
Stock Market
Index Fund
| |
| | | | | | | | | | | | | | | | | | | | |
| Net Assets Value | |
| Institutional: | |
Net assets | | $ | 289,986,338 | | | $ | 14,180,675 | | | $ | 7,878,167 | | | $ | 577,913 | | | $ | 17,704,788 | |
| | | | |
Shares outstanding | | | 27,207,811 | | | | 1,516,543 | | | | 777,409 | | | | 52,382 | | | | 1,607,933 | |
| | | | |
Net asset value | | $ | 10.66 | | | $ | 9.35 | | | $ | 10.13 | | | $ | 11.03 | | | $ | 11.01 | |
| | | | |
Shares authorized | | | Unlimited | | | | Unlimited | | | | Unlimited | | | | Unlimited | | | | Unlimited | |
| | | | |
Par value | | $ | 0.001 | | | $ | 0.001 | | | $ | 0.001 | | | $ | 0.001 | | | $ | 0.001 | |
| | | | |
| Investor A: | |
Net assets | | $ | 15,454,347 | | | | — | | | | — | | | $ | 16,326,175 | | | $ | 40,409,195 | |
| | | | |
Shares outstanding | | | 1,452,758 | | | | — | | | | — | | | | 1,481,678 | | | | 3,673,187 | |
| | | | |
Net asset value | | $ | 10.64 | | | | — | | | | — | | | $ | 11.02 | | | $ | 11.00 | |
| | | | |
Shares authorized | | | Unlimited | | | | — | | | | — | | | | Unlimited | | | | Unlimited | |
| | | | |
Par value | | $ | 0.001 | | | | — | | | | — | | | $ | 0.001 | | | $ | 0.001 | |
| | | | |
| Class K: | |
Net assets | | $ | 2,371,748,755 | | | $ | 39,450,121 | | | $ | 435,878,748 | | | $ | 55,788,885 | | | $ | 499,277,513 | |
| | | | |
Shares outstanding | | | 222,290,732 | | | | 4,217,865 | | | | 42,954,727 | | | | 5,056,957 | | | | 45,345,936 | |
| | | | |
Net asset value | | $ | 10.67 | | | $ | 9.35 | | | $ | 10.15 | | | $ | 11.03 | | | $ | 11.01 | |
| | | | |
Shares authorized | | | Unlimited | | | | Unlimited | | | | Unlimited | | | | Unlimited | | | | Unlimited | |
| | | | |
Par value | | $ | 0.001 | | | $ | 0.001 | | | $ | 0.001 | | | $ | 0.001 | | | $ | 0.001 | |
| | | | |
| | | | | | |
| See Notes to Financial Statements. | | | | |
| | | | | | | |
| 96 | | BLACKROCK FUNDS | | JANUARY 31, 2017 | | |
| | | | | | | | | | | | | | | | | | | | |
| Six Months Ended January 31, 2017 (Unaudited) | | BlackRock
Midcap Index
Fund
| | | BlackRock MSCI
Asia ex Japan
Index Fund
| | | BlackRock
MSCI World
Index Fund
| | | BlackRock
Small/Mid Cap
Index Fund
| | | BlackRock Total
Stock Market
Index Fund
| |
| | | | | | | | | | | | | | | | | | | | |
| Investment Income | |
Dividends — unaffiliated | | $ | 24,476,462 | | | $ | 284,239 | | | $ | 3,743,519 | | | $ | 409,251 | | | $ | 3,845,456 | |
Securities lending — affiliated — net | | | 136,976 | | | | 101 | | | | 5,886 | | | | 10,300 | | | | 22,078 | |
Dividends — affiliated | | | 73,870 | | | | 1,497 | | | | 22,220 | | | | 3,972 | | | | 43,114 | |
Foreign taxes withheld | | | (4,587 | ) | | | (42,247 | ) | | | (95,983 | ) | | | (172 | ) | | | (768 | ) |
| | | | | | | | | | | | | | | | | | | | |
Total Investment Income | | | 24,682,721 | | | | 243,590 | | | | 3,675,642 | | | | 423,351 | | | | 3,909,880 | |
| | | | | | | | | | | | | | | | | | | | |
| | | | | | | | | | | | | | | | | | | | |
| Expenses | |
Transfer agent — class specific | | | 698,523 | | | | 44 | | | | 160,867 | | | | 738 | | | | 1,308 | |
Registration | | | 339,765 | | | | 15,222 | | | | 38,601 | | | | 23,324 | | | | 42,141 | |
Investment advisory | | | 245,269 | | | | 46,602 | | | | 90,409 | | | | 7,332 | | | | 19,624 | |
Recoupment of past waived fees | | | 91,305 | | | | — | | | | 6,074 | | | | — | | | | — | |
Custodian | | | 51,957 | | | | 6,303 | | | | 50,880 | | | | 8,600 | | | | 8,788 | |
Officer and Trustees | | | 40,834 | | | | 5,346 | | | | 9,941 | | | | 5,546 | | | | 9,554 | |
Offering | | | 40,175 | | | | 29,929 | | | | 49,604 | | | | 3,516 | | | | 3,822 | |
Professional | | | 34,181 | | | | 32,985 | | | | 32,190 | | | | 23,326 | | | | 23,326 | |
Printing | | | 18,479 | | | | 3,677 | | | | 4,359 | | | | 5,071 | | | | 6,049 | |
Service and distribution — class specific | | | 15,297 | | | | — | | | | — | | | | 14,461 | | | | 28,383 | |
Recoupment of past waived fees — class specific | | | 12,593 | | | | — | | | | 282 | | | | 1 | | | | 32 | |
Miscellaneous | | | 20,686 | | | | 4,765 | | | | 6,179 | | | | 4,846 | | | | 5,873 | |
| | | | | | | | | | | | | | | | | | | | |
Total expenses | | | 1,609,064 | | | | 144,873 | | | | 449,386 | | | | 96,761 | | | | 148,900 | |
| Less: | |
Fees waived by the Manager | | | (113,074 | ) | | | (33,923 | ) | | | (38,598 | ) | | | (8,943 | ) | | | (18,290 | ) |
Other expenses reimbursed by the Manager | | | (11,915 | ) | | | (26,974 | ) | | | (5,070 | ) | | | (54,794 | ) | | | (42,259 | ) |
Transfer agent fees waived and/or reimbursed — class specific | | | (591,161 | ) | | | (44 | ) | | | (142,339 | ) | | | (448 | ) | | | (427 | ) |
| | | | | | | | | | | | | | | | | | | | |
Total expenses after fees waived and/or reimbursed | | | 892,914 | | | | 83,932 | | | | 263,379 | | | | 32,576 | | | | 87,924 | |
| | | | | | | | | | | | | | | | | | | | |
Net investment income | | | 23,789,807 | | | | 159,658 | | | | 3,412,263 | | | | 390,775 | | | | 3,821,956 | |
| | | | | | | | | | | | | | | | | | | | |
| | | | | | | | | | | | | | | | | | | | |
| Realized and Unrealized Gain (Loss) | |
| Net realized gain (loss) from: | |
Investments — unaffiliated | | | 3,368,074 | | | | (34,519 | ) | | | 120,972 | | | | 33,232 | | | | (186,172 | ) |
Investments — affiliated | | | 920 | | | | — | | | | 4 | | | | 10 | | | | 43 | |
Futures contracts | | | 5,530,284 | | | | 181,886 | | | | 551,279 | | | | 194,522 | | | | 582,260 | |
Foreign currency transactions | | | — | | | | (10,254 | ) | �� | | (113,720 | ) | | | — | | | | — | |
Capital gain distributions from investment companies — affiliated | | | 353 | | | | 2 | | | | 39 | | | | 11 | | | | 258 | |
| | | | | | | | | | | | | | | | | | | | |
| | | 8,899,631 | | | | 137,115 | | | | 558,574 | | | | 227,775 | | | | 396,389 | |
| | | | | | | | | | | | | | | | | | | | |
| Net change in unrealized appreciation (depreciation) on: | |
Investments — unaffiliated | | | 108,866,168 | | | | 193,998 | | | | 15,881,595 | | | | 3,730,375 | | | | 21,423,852 | |
Investments — affiliated | | | 171 | | | | — | | | | 200,787 | | | | 762 | | | | 297,715 | |
Futures contracts | | | (2,520,492 | ) | | | 8,069 | | | | (35,236 | ) | | | (2,629 | ) | | | (67,776 | ) |
Foreign currency translations | | | — | | | | 4,107 | | | | 41,976 | | | | — | | | | — | |
| | | | | | | | | | | | | | | | | | | | |
| | | 106,345,847 | | | | 206,174 | | | | 16,089,122 | | | | 3,728,508 | | | | 21,653,791 | |
| | | | | | | | | | | | | | | | | | | | |
Net realized and unrealized gain | | | 115,245,478 | | | | 343,289 | | | | 16,647,696 | | | | 3,956,283 | | | | 22,050,180 | |
| | | | | | | | | | | | | | | | | | | | |
Net Increase in Net Assets Resulting from Operations | | $ | 139,035,285 | | | $ | 502,947 | | | $ | 20,059,959 | | | $ | 4,347,058 | | | $ | 25,872,136 | |
| | | | | | | | | | | | | | | | | | | | |
| | | | | | |
| See Notes to Financial Statements. | | | | |
| | | | | | | |
| | BLACKROCK FUNDS | | JANUARY 31, 2017 | | 97 |
| | |
| Statements of Changes in Net Assets | | |
| | | | | | | | | | | | | | | | | | | | |
| | | BlackRock Midcap
Index Fund | | | | | | BlackRock MSCI Asia
ex Japan Index Fund | |
| Increase (Decrease) in Net Assets: | | Six Months Ended January 31,
2017
(Unaudited) | | | Year Ended July 31,
2016 | | | | | | Six Months Ended
January 31,
2017
(Unaudited) | | | Year Ended July 31,
2016 | |
| | | | | | | | | | | | | | | | | | | | |
| Operations | | | | | | | | | | | | | | | | | | | | |
Net investment income | | $ | 23,789,807 | | | $ | 30,039,411 | | | | | | | $ | 159,658 | | | $ | 308,396 | |
Net realized gain (loss) | | | 8,899,631 | | | | (502,673 | ) | | | | | | | 137,115 | | | | (258,218 | ) |
Net change in unrealized appreciation (depreciation) | | | 106,345,847 | | | | 196,879,884 | | | | | | | | 206,174 | | | | (51,456 | ) |
| | | | | | | | | | | | |
Net increase (decrease) in net assets resulting from operations | | | 139,035,285 | | | | 226,416,622 | | | | | | | | 502,947 | | | | (1,278 | ) |
| | | | | | | | | | | | |
| | | | | | | | | | | | | | | | | | | | |
| Distributions to Shareholders1 | | | | | | | | | | | | | | | | | | | | |
| From net investment income: | | | | | | | | | | | | | |
Institutional | | | (2,391,758 | ) | | | (11,088,076 | ) | | | | | | | (73,902 | ) | | | (285,599 | ) |
Investor A | | | (123,330 | ) | | | (26,107 | ) | | | | | | | — | | | | — | |
Class K | | | (22,285,206 | ) | | | (17,674,276 | ) | | | | | | | (180,106 | ) | | | (27,517 | ) |
| From net realized gain: | | | | | | | | | | | | | |
Institutional | | | (868,058 | ) | | | (2,280,751 | ) | | | | | | | — | | | | (13,319 | ) |
Investor A | | | (45,796 | ) | | | (112 | ) | | | | | | | — | | | | — | |
Class K | | | (7,124,451 | ) | | | (54,402 | ) | | | | | | | — | | | | (87 | ) |
| | | | | | | | | | | | |
Decrease in net assets resulting from distributions to shareholders | | | (32,838,599 | ) | | | (31,123,724 | ) | | | | | | | (254,008 | ) | | | (326,522 | ) |
| | | | | | | | | | | | |
| | | | | | | | | | | | | | | | | | | | |
| Capital Share Transactions | | | | | | | | | | | | | | | | | | | | |
Net increase in net assets derived from capital share transactions | | | 198,890,061 | | | | 2,173,779,816 | | | | | | | | 37,207,320 | | | | 2,540,689 | |
| | | | | | | | | | | | |
| | | | | | | | | | | | | | | | | | | | |
| Net Assets | | | | | | | | | | | | | | | | | | | | |
Total increase in net assets | | | 305,086,747 | | | | 2,369,072,714 | | | | | | | | 37,456,259 | | | | 2,212,889 | |
Beginning of period | | | 2,372,102,693 | | | | 3,029,979 | | | | | | | | 16,174,537 | | | | 13,961,648 | |
| | | | | | | | | | | | |
End of period | | $ | 2,677,189,440 | | | $ | 2,372,102,693 | | | | | | | $ | 53,630,796 | | | $ | 16,174,537 | |
| | | | | | | | | | | | |
Undistributed net investment income, end of period | | $ | 363,116 | | | $ | 1,373,603 | | | | | | | $ | (30,722 | ) | | $ | 63,628 | |
| | | | | | | | | | | | |
1 Distributions for annual periods determined in accordance with federal income tax regulations. | | | | | | | | | |
| | | | | | |
| See Notes to Financial Statements. | | | | |
| | | | | | | |
| 98 | | BLACKROCK FUNDS | | JANUARY 31, 2017 | | |
| | |
| Statements of Changes in Net Assets | | |
| | | | | | | | | | | | | | | | | | | | |
| | | BlackRock MSCI World
Index Fund | | | | | | BlackRock Small/Mid Cap
Index Fund | |
| Increase (Decrease) in Net Assets: | | Six Months Ended
January 31,
2017
(Unaudited) | | | Year Ended July 31,
2016 | | | | | | Six Months Ended
January 31,
2017
(Unaudited) | | | Period August 13, 20151 to July 31,
2016 | |
| | | | | | | | | | | | | | | | | | | | |
| Operations | | | | | | | | | | | | | | | | | | | | |
Net investment income | | $ | 3,412,263 | | | $ | 3,988,948 | | | | | | | $ | 390,775 | | | $ | 226,566 | |
Net realized gain (loss) | | | 558,574 | | | | (1,193,151 | ) | | | | | | | 227,775 | | | | 29,422 | |
Net change in unrealized appreciation (depreciation) | | | 16,089,122 | | | | 25,488,495 | | | | | | | | 3,728,508 | | | | 1,516,000 | |
| | | | | | | | | | | | |
Net increase in net assets resulting from operations | | | 20,059,959 | | | | 28,284,292 | | | | | | | | 4,347,058 | | | | 1,771,988 | |
| | | | | | | | | | | | |
| | | | | | | | | | | | | | | | | | | | |
| Distributions to Shareholders2 | | | | | | | | | | | | | | | | | | | | |
| From net investment income: | | | | | | | | | | | | | |
Institutional | | | (27,471 | ) | | | (376,176 | ) | | | | | | | (2,033 | ) | | | (325 | ) |
Investor A | | | — | | | | — | | | | | | | | (88,441 | ) | | | (9,972 | ) |
Class K | | | (3,547,566 | ) | | | (3,304,090 | ) | | | | | | | (339,530 | ) | | | (196,073 | ) |
| From net realized gain: | | | | | | | | | | | | | |
Institutional | | | (5,166 | ) | | | (152,889 | ) | | | | | | | (483 | ) | | | (10 | ) |
Investor A | | | — | | | | — | | | | | | | | (18,557 | ) | | | (14 | ) |
Class K | | | (695,764 | ) | | | (269 | ) | | | | | | | (70,921 | ) | | | (6,636 | ) |
| | | | | | | | | | | | |
Decrease in net assets resulting from distributions to shareholders | | | (4,275,967 | ) | | | (3,833,424 | ) | | | | | | | (519,965 | ) | | | (213,030 | ) |
| | | | | | | | | | | | |
| | | | | | | | | | | | | | | | | | | | |
| Capital Share Transactions | | | | | | | | | | | | | | | | | | | | |
Net increase in net assets derived from capital share transactions | | | 101,945,958 | | | | 286,677,627 | | | | | | | | 35,964,843 | | | | 31,342,079 | |
| | | | | | | | | | | | |
| | | | | | | | | | | | | | | | | | | | |
| Net Assets | | | | | | | | | | | | | | | | | | | | |
Total increase in net assets | | | 117,729,950 | | | | 311,128,495 | | | | | | | | 39,791,936 | | | | 32,901,037 | |
Beginning of period | | | 326,026,965 | | | | 14,898,470 | | | | | | | | 32,901,037 | | | | — | |
| | | | | | | | | | | | |
End of period | | $ | 443,756,915 | | | $ | 326,026,965 | | | | | | | $ | 72,692,973 | | | $ | 32,901,037 | |
| | | | | | | | | | | | |
Undistributed net investment income, end of period | | $ | 83,916 | | | $ | 246,690 | | | | | | | $ | (19,033 | ) | | $ | 20,196 | |
| | | | | | | | | | | | |
1 Commencement of operations. | | | | | | | | | | | | | | | | |
2 Distributions for annual periods determined in accordance with federal income tax regulations. | | | | | | | | | | | | | |
| | | | | | |
| See Notes to Financial Statements. | | | | |
| | | | | | | |
| | BLACKROCK FUNDS | | JANUARY 31, 2017 | | 99 |
| | |
| Statements of Changes in Net Assets | | |
| | | | | | | | |
| | | BlackRock Total Stock Market
Index Fund | |
| Increase (Decrease) in Net Assets: | | Six Months Ended
January 31,
2017
(Unaudited) | | | Period August 13, 20151 to July 31,
2016 | |
| | | | | | | | |
| Operations | |
Net investment income | | $ | 3,821,956 | | | $ | 977,539 | |
Net realized gain | | | 396,389 | | | | 274,040 | |
Net change in unrealized appreciation (depreciation) | | | 21,653,791 | | | | 12,146,256 | |
| | | | |
Net increase in net assets resulting from operations | | | 25,872,136 | | | | 13,397,835 | |
| | | | |
| | | | | | | | |
| Distributions to Shareholders2 | |
From net investment income: | |
Institutional | | | (29,347 | ) | | | (18,472 | ) |
Investor A | | | (186,439 | ) | | | (13,246 | ) |
Class K | | | (3,484,272 | ) | | | (654,580 | ) |
| From net realized gain: | |
Institutional | | | (4,494 | ) | | | (44 | ) |
Investor A | | | (29,567 | ) | | | (1 | ) |
Class K | | | (511,066 | ) | | | (335 | ) |
| | | | |
Decrease in net assets resulting from distributions to shareholders | | | (4,245,185 | ) | | | (686,678 | ) |
| | | | |
| | | | | | | | |
| Capital Share Transactions | |
Net increase in net assets derived from capital share transactions | | | 234,083,767 | | | | 288,969,621 | |
| | | | |
| | | | | | | | |
| Net Assets | |
Total increase in net assets | | | 255,710,718 | | | | 301,680,778 | |
Beginning of period | | | 301,680,778 | | | | — | |
| | | | |
End of period | | $ | 557,391,496 | | | $ | 301,680,778 | |
| | | | |
Undistributed net investment income, end of period | | $ | 413,139 | | | $ | 291,241 | |
| | | | |
1 Commencement of operations. | | | | |
2 Distributions for annual periods determined in accordance with federal income tax regulations. | | | | |
| | | | | | |
| See Notes to Financial Statements. | | | | |
| | | | | | | |
| 100 | | BLACKROCK FUNDS | | JANUARY 31, 2017 | | |
| | |
| Financial Highlights | | BlackRock Midcap Index Fund |
| | | | | | | | | | | | | | | | | | | | | | | | | | | | |
| | | Institutional | | | | | | Investor A | |
| | | Six Months Ended
January 31,
2017
(Unaudited) | | | Year Ended
July 31,
2016 | | | Period
May 13, 20151
to July 31,
2015 | | | | | | Six Months Ended
January 31,
2017
(Unaudited) | | | Period
November 30, 20151
to July 31,
2016 | | | | |
| | | | | | | | | | | | | | | | | | | | | | | | | | | | |
| Per Share Operating Performance | | | | | | | | | | | | | | | | | | | | | | | | | | | | |
Net asset value, beginning of period | | $ | 10.22 | | | $ | 9.94 | | | $ | 10.00 | | | | | | | $ | 10.20 | | | $ | 9.66 | | | | | |
| | | | | | | | |
Net investment income2 | | | 0.10 | | | | 0.18 | | | | 0.03 | | | | | | | | 0.09 | | | | 0.07 | | | | | |
Net realized and unrealized gain (loss) | | | 0.47 | | | | 0.24 | | | | (0.07 | ) | | | | | | | 0.47 | | | | 0.60 | | | | | |
| | | | | | | | |
Net increase (decrease) from investment operations | | | 0.57 | | | | 0.42 | | | | (0.04 | ) | | | | | | | 0.56 | | | | 0.67 | | | | | |
| | | | | | | | |
| Distributions:3 | | | | | | | | | | | | | | | | | | | | | | | | | | | | |
From net investment income | | | (0.10 | ) | | | (0.13 | ) | | | (0.02 | ) | | | | | | | (0.09 | ) | | | (0.12 | ) | | | | |
From net realized gain | | | (0.03 | ) | | | (0.01 | ) | | | — | | | | | | | | (0.03 | ) | | | (0.01 | ) | | | | |
| | | | | | | | |
Total distributions | | | (0.13 | ) | | | (0.14 | ) | | | (0.02 | ) | | | | | | | (0.12 | ) | | | (0.13 | ) | | | | |
| | | | | | | | |
Net asset value, end of period | | $ | 10.66 | | | $ | 10.22 | | | $ | 9.94 | | | | | | | $ | 10.64 | | | $ | 10.20 | | | | | |
| | | | | | | | |
| | | | | | | | | | | | | | | | | | | | | | | | | | | | |
| Total Return4 | | | | | | | | | | | | | | | | | | | | | | | | | | | | |
Based on net asset value | | | 5.67% | 5 | | | 4.35% | | | | (0.37)% | 5 | | | | | | | 5.60% | 5 | | | 7.07% | 5 | | | | |
| | | | | | | | |
| | | | | | | | | | | | | | | | | | | | | | | | | | | | |
| Ratios to Average Net Assets | | | | | | | | | | | | | | | | | | | | | | | | | | | | |
Total expenses | | | 0.37% | 6,8 | | | 0.13% | 7 | | | 9.27% | 6,8 | | | | | | | 0.33% | 6,8 | | | 0.34% | 6,7,8 | | | | |
| | | | | | | | |
Total expenses excluding recoupment of past fees waived | | | 0.36% | 6,8 | | | 0.13% | 7 | | | 9.27% | 6,8 | | | | | | | 0.33% | 6,8 | | | 0.34% | 6,7,8 | | | | |
| | | | | | | | |
Total expenses after fees waived and/or reimbursed and/or paid indirectly | | | 0.11% | 6 | | | 0.06% | 7 | | | 0.12% | 6 | | | | | | | 0.32% | 6 | | | 0.33% | 6,7 | | | | |
| | | | | | | | |
Net investment income | | | 1.87% | 6 | | | 1.87% | 7 | | | 1.38% | 6 | | | | | | | 1.67% | 6 | | | 1.06% | 6,7 | | | | |
| | | | | | | | |
| | | | | | | | | | | | | | | | | | | | | | | | | | | | |
| Supplemental Data | | | | | | | | | | | | | | | | | | | | | | | | | | | | |
Net assets, end of period (000) | | $ | 289,986 | | | $ | 191,337 | | | $ | 2,985 | | | | | | | $ | 15,454 | | | $ | 6,669 | | | | | |
| | | | | | | | |
Portfolio turnover rate | | | 2% | | | | 24% | | | | 8% | | | | | | | | 2% | | | | 24% | | | | | |
| | | | | | | | |
| | 1 | | Commencement of operations. |
| | 2 | | Based on average shares outstanding. |
| | 3 | | Distributions for annual periods determined in accordance with federal income tax regulations. |
| | 4 | | Where applicable, assumes the reinvestment of distributions. |
| | 5 | | Aggregate total return. |
| | 7 | | Excludes 0.01% of expenses incurred indirectly as a result of investments in underlying funds. |
| | 8 | | Offering costs were not annualized in the calculation of the expense ratios. If these expenses were annualized for Institutional Shares, the total expenses would have been 0.37% for the six months ended January 31, 2017 and 13.78% for the period ended July 31, 2015. If these expenses were annualized for Investor A Shares, the total expenses would have been 0.34% for the six months ended January 31, 2017 and the period ended July 31, 2016. |
| | | | | | |
| See Notes to Financial Statements. | | | | |
| | | | | | | |
| | BLACKROCK FUNDS | | JANUARY 31, 2017 | | 101 |
| | |
| Financial Highlights (concluded) | | BlackRock Midcap Index Fund |
| | | | | | | | | | | | | | | | |
| | | Class K | |
| | | Six Months Ended
January 31,
2017
(Unaudited) | | | Year Ended
July 31, 2016 | | | Period May 13, 20151 to July 31, 2015 | | | | |
| | | | | | | | | | | | | | | | |
| Per Share Operating Performance | | | | | | | | | | | | | | | | |
Net asset value, beginning of period | | $ | 10.23 | | | $ | 9.94 | | | $ | 10.00 | | | | | |
| | | | |
Net investment income2 | | | 0.10 | | | | 0.17 | | | | 0.03 | | | | | |
Net realized and unrealized gain (loss) | | | 0.47 | | | | 0.26 | | | | (0.07 | ) | | | | |
| | | | |
Net increase (decrease) from investment operations | | | 0.57 | | | | 0.43 | | | | (0.04 | ) | | | | |
| | | | |
| Distributions:3 | | | | | | | | | | | | | | | | |
From net investment income | | | (0.10 | ) | | | (0.13 | ) | | | (0.02 | ) | | | | |
From net realized gain | | | (0.03 | ) | | | (0.01 | ) | | | — | | | | | |
| | | | |
Total distributions | | | (0.13 | ) | | | (0.14 | ) | | | (0.02 | ) | | | | |
| | | | |
Net asset value, end of period | | $ | 10.67 | | | $ | 10.23 | | | $ | 9.94 | | | | | |
| | | | |
| | | | | | | | | | | | | | | | |
| Total Return4 | | | | | | | | | | | | | | | | |
Based on net asset value | | | 5.69% | 5 | | | 4.46% | | | | (0.37)% | 5 | | | | |
| | | | |
| | | | | | | | | | | | | | | | |
| Ratios to Average Net Assets | | | | | | | | | | | | | | | | |
Total expenses | | | 0.10% | 6,8 | | | 0.09% | 7 | | | 9.42% | 6,9 | | | | |
| | | | |
Total expenses excluding recoupment of past fees waived | | | 0.09% | 6,8 | | | 0.09% | 7 | | | 9.42% | 6,9 | | | | |
| | | | |
Total expenses after fees waived and/or reimbursed and/or paid indirectly | | | 0.07% | 6 | | | 0.07% | 7 | | | 0.08% | 6 | | | | |
| | | | |
Net investment income | | | 1.95% | 6 | | | 1.78% | 7 | | | 1.21% | 6 | | | | |
| | | | |
| | | | | | | | | | | | | | | | |
| Supplemental Data | | | | | | | | | | | | | | | | |
Net assets, end of period (000) | | $ | 2,371,749 | | | $ | 2,174,096 | | | $ | 45 | | | | | |
| | | | |
Portfolio turnover rate | | | 2% | | | | 24% | | | | 8% | | | | | |
| | | | |
| | 1 | | Commencement of operations. |
| | 2 | | Based on average shares outstanding. |
| | 3 | | Distributions for annual periods determined in accordance with federal income tax regulations. |
| | 4 | | Where applicable, assumes the reinvestment of distributions. |
| | 5 | | Aggregate total return. |
| | 7 | | Excludes 0.01% of expenses incurred indirectly as a result of investments in underlying funds. |
| | 8 | | Offering costs were not annualized in the calculation of the expense ratio. If these expenses were annualized, the total expenses would have been 0.11% for the six months ended January 31, 2017. |
| | 9 | | Organization costs were not annualized in the calculation of the expense ratio. If these expenses were annualized, the total expenses would have been 12.82% for the period ended July 31, 2015. |
| | | | | | |
| See Notes to Financial Statements. | | | | |
| | | | | | | |
| 102 | | BLACKROCK FUNDS | | JANUARY 31, 2017 | | |
| | |
| Financial Highlights | | BlackRock MSCI Asia ex Japan Index Fund |
| | | | | | | | | | | | | | | | | | | | | | | | | | | | |
| | | Institutional | | | | | | Class K | |
| | | Six Months Ended
January 31,
2017
(Unaudited) | | | Year Ended
July 31, | | | Period
June 9, 20151
to July 31, | | | | | | Six Months Ended
January 31,
2017
(Unaudited) | | | Period
November 30, 20151
to July 31, | | | | |
| | | | 2016 | | | 2015 | | | | | | | 2016 | | | | |
| | | | | | | | | | | | | | | | | | | | | | | | | | | | |
| Per Share Operating Performance | | | | | | | | | | | | | | | | | |
Net asset value, beginning of period | | $ | 8.97 | | | $ | 9.27 | | | $ | 10.00 | | | | | | | $ | 8.97 | | | $ | 8.58 | | | | | |
| | | | | | | | |
Net investment income2 | | | 0.05 | | | | 0.18 | | | | 0.08 | | | | | | | | 0.03 | | | | 0.16 | | | | | |
Net realized and unrealized gain (loss) | | | 0.38 | | | | (0.29 | ) | | | (0.77 | ) | | | | | | | 0.40 | | | | 0.38 | | | | | |
| | | | | | | | |
Net increase (decrease) from investment operations | | | 0.43 | | | | (0.11 | ) | | | (0.69 | ) | | | | | | | 0.43 | | | | 0.54 | | | | | |
| | | | | | | | |
| Distributions:3 | | | | | | | | | | | | | | | | | | | | | | | | | | | | |
From net investment income | | | (0.05 | ) | | | (0.18 | ) | | | (0.04 | ) | | | | | | | (0.05 | ) | | | (0.14 | ) | | | | |
From net realized gain | | | — | | | | (0.01 | ) | | | — | | | | | | | | — | | | | (0.01 | ) | | | | |
| | | | | | | | |
Total distributions | | | (0.05 | ) | | | (0.19 | ) | | | (0.04 | ) | | | | | | | (0.05 | ) | | | (0.15 | ) | | | | |
| | | | | | | | |
Net asset value, end of period | | $ | 9.35 | | | $ | 8.97 | | | $ | 9.27 | | | | | | | $ | 9.35 | | | $ | 8.97 | | | | | |
| | | | | | | | |
| | | | | | | | | | | | | | | | | | | | | | | | | | | | |
| Total Return4 | | | | | | | | | | | | | | | | | |
Based on net asset value | | | 4.80% | 5 | | | (1.14)% | | | | (6.96)% | 5 | | | | | | | 4.80% | 5 | | | 6.37% | 5 | | | | |
| | | | | | | | |
| | | | | | | | | | | | | | | | | | | | | | | | | | | | |
| Ratios to Average Net Assets | | | | | | | | | | | | | | | | | |
Total expenses | | | 0.83% | 6,7,8 | | | 1.61% | | | | 3.80% | 6,9 | | | | | | | 0.62% | 6,7,8 | | | 1.39% | 6,8 | | | | |
| | | | | | | | |
Total expenses after fees waived and/or reimbursed and/or paid indirectly | | | 0.45% | 6,7 | | | 0.47% | | | | 0.50% | 6 | | | | | | | 0.45% | 6,7 | | | 0.45% | 6 | | | | |
| | | | | | | | |
Net investment income | | | 1.15% | 6,7 | | | 2.09% | | | | 5.69% | 6 | | | | | | | 0.68% | 6,7 | | | 2.81% | 6 | | | | |
| | | | | | | | |
| | | | | | | | | | | | | | | | | | | | | | | | | | | | |
| Supplemental Data | | | | | | | | | | | | | | | | | |
Net assets, end of period (000) | | $ | 14,181 | | | $ | 13,505 | | | $ | 13,962 | | | | | | | $ | 39,450 | | | $ | 2,669 | | | | | |
| | | | | | | | |
Portfolio turnover rate | | | 1% | | | | 11% | | | | 0% | | | | | | | | 1% | | | | 11% | | | | | |
| | | | | | | | |
| | 1 | | Commencement of operations. |
| | 2 | | Based on average shares outstanding. |
| | 3 | | Distributions for annual periods determined in accordance with federal income tax regulations. |
| | 4 | | Where applicable, assumes the reinvestment of distributions. |
| | 5 | | Aggregate total return. |
| | 7 | | Excludes 0.01% of expenses incurred indirectly as a result of investments in underlying funds. |
| | 8 | | Offering costs were not annualized in the calculation of the expense ratios. If these expenses were annualized for Institutional Shares, the total expenses would have been 0.95% for the six months ended January 31, 2017. If these expenses were annualized for Class K Shares, the total expenses would have been 0.67% for the six months ended January 31, 2017 and 1.67% for the period ended July 31, 2016. |
| | 9 | | Organization costs were not annualized in the calculation of the expense ratios. If these expenses were annualized for Institutional Shares, the total expenses would have been 4.82% for the period ended July 31, 2015. |
| | | | | | |
| See Notes to Financial Statements. | | | | |
| | | | | | | |
| | BLACKROCK FUNDS | | JANUARY 31, 2017 | | 103 |
| | |
| Financial Highlights | | BlackRock MSCI World Index Fund |
| | | | | | | | | | | | | | | | | | | | | | | | | | | | |
| | | Institutional | | | | | | Class K | |
| | | Six Months Ended
January 31,
2017
(Unaudited) | | | Year Ended
July 31,
2016 | | | Period
June 1, 20151
to July 31,
2015 | | | | | | Six Months Ended January 31,
2017
(Unaudited) | | | Period November 30, 20151 to July 31, 2016 | | | | |
| | | | | | | | | | | | | | | | | | | | | | | | | | | | |
| Per Share Operating Performance | | | | | | | | | | | | | | | | | | | | | | | | | | | | |
Net asset value, beginning of period | | $ | 9.75 | | | $ | 9.92 | | | $ | 10.00 | | | | | | | $ | 9.76 | | | $ | 9.60 | | | | | |
| | | | | | | | |
Net investment income2 | | | 0.09 | | | | 0.16 | | | | 0.02 | | | | | | | | 0.09 | | | | 0.17 | | | | | |
Net realized and unrealized gain (loss) | | | 0.41 | | | | (0.14 | ) | | | (0.09 | ) | | | | | | | 0.42 | | | | 0.17 | | | | | |
| | | | | | | | |
Net increase (decrease) from investment operations | | | 0.50 | | | | 0.02 | | | | (0.07 | ) | | | | | | | 0.51 | | | | 0.34 | | | | | |
| | | | | | | | |
| Distributions:3 | | | | | | | | | | | | | | | | | | | | | | | | | | | | |
From net investment income | | | (0.10 | ) | | | (0.16 | ) | | | (0.01 | ) | | | | | | | (0.10 | ) | | | (0.15 | ) | | | | |
From net realized gain | | | (0.02 | ) | | | (0.03 | ) | | | — | | | | | | | | (0.02 | ) | | | (0.03 | ) | | | | |
| | | | | | | | |
Total distributions | | | (0.12 | ) | | | (0.19 | ) | | | (0.01 | ) | | | | | | | (0.12 | ) | | | (0.18 | ) | | | | |
| | | | | | | | |
Net asset value, end of period | | $ | 10.13 | | | $ | 9.75 | | | $ | 9.92 | | | | | | | $ | 10.15 | | | $ | 9.76 | | | | | |
| | | | | | | | |
| | | | | | | | | | | | | | | | | | | | | | | | | | | | |
| Total Return4 | | | | | | | | | | | | | | | | | | | | | | | | | | | | |
Based on net asset value | | | 5.13% | 5 | | | 0.23% | | | | (0.66)% | 5 | | | | | | | 5.24% | 5 | | | 3.52% | 5 | | | | |
| | | | | | | | |
| | | | | | | | | | | | | | | | | | | | | | | | | | | | |
| Ratios to Average Net Assets | | | | | | | | | | | | | | | | | | | | | | | | | | | | |
Total expenses | | | 1.82% | 6,8,9 | | | 0.41% | 7 | | | 2.93% | 6,10 | | | | | | | 0.22% | 6,8 | | | 0.28% | 6,7,8,9 | | | | |
| | | | | | | | |
Total expenses after fees waived and/or reimbursed and/or paid indirectly | | | 0.18% | 6 | | | 0.16% | 7 | | | 0.20% | 6 | | | | | | | 0.15% | 6 | | | 0.14% | 6,7 | | | | |
| | | | | | | | |
Net investment income7 | | | 1.83% | 6 | | | 1.75% | 7 | | | 1.32% | 6 | | | | | | | 1.89% | 6 | | | 2.69% | 6,7 | | | | |
| | | | | | | | |
| | | | | | | | | | | | | | | | | | | | | | | | | | | | |
| Supplemental Data | | | | | | | | | | | | | | | | | | | | | | | | | | | | |
Net assets, end of period (000) | | $ | 7,878 | | | $ | 2,765 | | | $ | 14,898 | | | | | | | $ | 435,879 | | | $ | 323,262 | | | | | |
| | | | | | | | |
Portfolio turnover rate | | | 6% | | | | 10% | | | | 1% | | | | | | | | 6% | | | | 10% | | | | | |
| | | | | | | | |
| | 1 | | Commencement of operations. |
| | 2 | | Based on average shares outstanding. |
| | 3 | | Distributions for annual periods determined in accordance with federal income tax regulations. |
| | 4 | | Where applicable, assumes the reinvestment of distributions. |
| | 5 | | Aggregate total return. |
| | 7 | | Excludes 0.01% of expenses incurred indirectly as a result of investments in underlying funds. |
| | 8 | | Offering costs were not annualized in the calculation of the expense ratios. If these expenses were annualized for Institutional Shares, the total expenses would have been 1.83% for the six months ended January 31, 2017. If these expenses were annualized for Class K Shares, the total expenses would have been 0.24% for the six months ended January 31, 2017 and 0.29% for the period ended July 31, 2016. |
| | 9 | | Includes recoupment of past waived and/or reimbursed fees with no financial impact to the expense ratios. |
| | 10 | | Organization costs were not annualized in the calculation of the expense ratios. If these expenses were annualized for Institutional Shares, the total expenses would have been 3.84% for the period ended July 31, 2015. |
| | | | | | |
| See Notes to Financial Statements. | | | | |
| | | | | | | |
| 104 | | BLACKROCK FUNDS | | JANUARY 31, 2017 | | |
| | |
| Financial Highlights | | BlackRock Small/Mid Cap Index Fund |
| | | | | | | | | | | | | | | | | | | | | | | | |
| | | Institutional | | | | | | Investor A | |
| | | Six Months Ended
January 31,
2017
(Unaudited) | | | Period
August 13, 20151
to July 31,
2016 | | | | | | Six Months Ended January 31,
2017
(Unaudited) | | | Period August 13, 20151
to July 31, 2016 | | | | |
| | | | | | | | | | | | | | | | | | | | | | | | |
| Per Share Operating Performance | | | | | | | | | | | | | | | | | |
Net asset value, beginning of period | | $ | 10.22 | | | $ | 10.00 | | | | | | | $ | 10.21 | | | $ | 10.00 | | | | | |
| | | | | | | | |
Net investment income2 | | | 0.09 | | | | 0.14 | | | | | | | | 0.08 | | | | 0.08 | | | | | |
Net realized and unrealized gain | | | 0.83 | | | | 0.19 | | | | | | | | 0.83 | | | | 0.23 | | | | | |
| | | | | | | | |
Net increase from investment operations | | | 0.92 | | | | 0.33 | | | | | | | | 0.91 | | | | 0.31 | | | | | |
| | | | | | | | |
| Distributions:3 | | | | | | | | | | | | | | | | | | | | | | | | |
From net investment income | | | (0.09 | ) | | | (0.11 | ) | | | | | | | (0.08 | ) | | | (0.10 | ) | | | | |
From net realized gain | | | (0.02 | ) | | | (0.00 | )4 | | | | | | | (0.02 | ) | | | (0.00 | )4 | | | | |
| | | | | | | | |
Total distributions | | | (0.11 | ) | | | (0.11 | ) | | | | | | | (0.10 | ) | | | (0.10 | ) | | | | |
| | | | | | | | |
Net asset value, end of period | | $ | 11.03 | | | $ | 10.22 | | | | | | | $ | 11.02 | | | $ | 10.21 | | | | | |
| | | | | | | | |
| | | | | | | | | | | | | | | | | | | | | | | | |
| Total Return5,6 | | | | | | | | | | | | | | | | | |
Based on net asset value | | | 8.99% | | | | 3.44% | | | | | | | | 8.90% | | | | 3.24% | | | | | |
| | | | | | | | |
| | | | | | | | | | | | | | | | | | | | | | | | |
| Ratios to Average Net Assets | | | | | | | | | | | | | | | | | |
Total expenses | | | 0.34% | 7,8,9 | | | 1.60% | 7,8,10 | | | | | | | 0.58% | 7,8,9 | | | 1.17% | 7,8,10 | | | | |
| | | | | | | | |
Total expenses after fees waived and/or reimbursed and/or paid indirectly | | | 0.10% | 7,8 | | | 0.12% | 7,8 | | | | | | | 0.33% | 7,8 | | | 0.35% | 7,8 | | | | |
| | | | | | | | |
Net investment income | | | 1.65% | 7,8 | | | 1.50% | 7,8 | | | | | | | 1.42% | 7,8 | | | 0.79% | 7,8 | | | | |
| | | | | | | | |
| | | | | | | | | | | | | | | | | | | | | | | | |
| Supplemental Data | | | | | | | | | | | | | | | | | |
Net assets, end of period (000) | | $ | 578 | | | $ | 78 | | | | | | | $ | 16,326 | | | $ | 5,713 | | | | | |
| | | | | | | | |
Portfolio turnover rate | | | 2% | | | | 17% | | | | | | | | 2% | | | | 17% | | | | | |
| | | | | | | | |
| | 1 | | Commencement of operations. |
| | 2 | | Based on average shares outstanding. |
| | 3 | | Distributions for annual periods determined in accordance with federal income tax regulations. |
| | 4 | | Amount is greater than $(0.005) per share. |
| | 5 | | Where applicable, assumes the reinvestment of distributions. |
| | 6 | | Aggregate total return. |
| | 8 | | Excludes 0.01% of expenses incurred indirectly as a result of investments in underlying funds. |
| | 9 | | Offering costs were not annualized in the calculation of the expense ratio. If these expenses were annualized for Institutional Shares, the total expenses would have been 0.34% for the six months ended January 31, 2017. If these expenses were annualized for Investor A Shares, the total expenses would have been 0.59% for the six months ended January 31, 2017. |
| | 10 | | Audit, offering and organization costs were not annualized in the calculation of the expense ratio. If these expenses were annualized for Institutional Shares, the total expenses would have been 1.63% for the period ended July 31, 2016. If these expenses were annualized for Investor A Shares, the total expenses would have been 1.18% for the period ended July 31, 2016. |
| | | | | | |
| See Notes to Financial Statements. | | | | |
| | | | | | | |
| | BLACKROCK FUNDS | | JANUARY 31, 2017 | | 105 |
| | |
| Financial Highlights (concluded) | | BlackRock Small/Mid Cap Index Fund |
| | | | | | | | | | | | |
| | | Class K | |
| | | Six Months Ended January 31, 2017
(Unaudited) | | | Period August 13, 20151
to July 31, 2016 | | | | |
| | | | | | | | | | | | |
| Per Share Operating Performance | | | | | | | | | | | | |
Net asset value, beginning of period | | $ | 10.22 | | | $ | 10.00 | | | | | |
| | | | |
Net investment income2 | | | 0.09 | | | | 0.14 | | | | | |
Net realized and unrealized gain | | | 0.82 | | | | 0.19 | | | | | |
| | | | |
Net increase (decrease) from investment operations | | | 0.91 | | | | 0.33 | | | | | |
| | | | |
| Distributions:3 | | | | | | | | | | | | |
From net investment income | | | (0.09 | ) | | | (0.11 | ) | | | | |
From net realized gain | | | (0.01 | ) | | | (0.00 | )4 | | | | |
| | | | |
Total distributions | | | (0.10 | ) | | | (0.11 | ) | | | | |
| | | | |
Net asset value, end of period | | $ | 11.03 | | | $ | 10.22 | | | | | |
| | | | |
| | | | | | | | | | | | |
| Total Return5,6 | | | | | | | | | | | | |
Based on net asset value | | | 9.00% | | | | 3.48% | | | | | |
| | | | |
| | | | | | | | | | | | |
| Ratios to Average Net Assets | | | | | | | | | | | | |
Total expenses | | | 0.33% | 7,8,9 | | | 1.34% | 7,8,10 | | | | |
| | | | |
Total expenses after fees waived and/or reimbursed and/or paid indirectly | | | 0.07% | 7,8 | | | 0.08% | 7,8 | | | | |
| | | | |
Net investment income | | | 1.66% | 7,8 | | | 1.57% | 7,8 | | | | |
| | | | |
| | | | | | | | | | | | |
| Supplemental Data | | | | | | | | | | | | |
Net assets, end of period (000) | | $ | 55,789 | | | $ | 27,109 | | | | | |
| | | | |
Portfolio turnover rate | | | 2% | | | | 17% | | | | | |
| | | | |
| | 1 | | Commencement of operations. |
| | 2 | | Based on average shares outstanding. |
| | 3 | | Distributions for annual periods determined in accordance with federal income tax regulations. |
| | 4 | | Amount is greater than $(0.005) per share. |
| | 5 | | Where applicable, assumes the reinvestment of distributions. |
| | 6 | | Aggregate total return. |
| | 8 | | Excludes 0.01% of expenses incurred indirectly as a result of investments in underlying funds. |
| | 9 | | Offering costs were not annualized in the calculation of the expense ratio. If these expenses were annualized, the total expenses would have been 0.34% for the six months ended January 31, 2017. |
| | 10 | | Audit, offering and organization costs were not annualized in the calculation of the expense ratio. If these expenses were annualized, the total expenses would have been 1.37% for the period ended July 31, 2016. |
| | | | | | |
| See Notes to Financial Statements. | | | | |
| | | | | | | |
| 106 | | BLACKROCK FUNDS | | JANUARY 31, 2017 | | |
| | |
| Financial Highlights | | BlackRock Total Stock Market Index Fund |
| | | | | | | | | | | | | | | | | | | | | | | | |
| | | Institutional | | | | | | Investor A | |
| | | Six Months Ended January 31, 2017
(Unaudited) | | | Period August 13, 20151
to July 31, 2016 | | | | | | Six Months Ended January 31,
2017
(Unaudited) | | | Period
August 13, 20151
to July 31,
2016 | | | | |
| | | | | | | | | | | | | | | | | | | | | | | | |
| Per Share Operating Performance | | | | | | | | | | | | | | | | | | | | | | | | |
Net asset value, beginning of period | | $ | 10.44 | | | $ | 10.00 | | | | | | | $ | 10.44 | | | $ | 10.00 | | | | | |
| | | | | | | | |
Net investment income2 | | | 0.09 | | | | 0.18 | | | | | | | | 0.09 | | | | 0.10 | | | | | |
Net realized and unrealized gain | | | 0.59 | | | | 0.39 | | | | | | | | 0.57 | | | | 0.45 | | | | | |
| | | | | | | | |
Net increase (decrease) from investment operations | | | 0.68 | | | | 0.57 | | | | | | | | 0.66 | | | | 0.55 | | | | | |
| | | | | | | | |
| Distributions:3 | | | | | | | | | | | | | | | | | | | | | | | | |
From net investment income | | | (0.10 | ) | | | (0.13 | ) | | | | | | | (0.09 | ) | | | (0.11 | ) | | | | |
From net realized gain | | | (0.01 | ) | | | (0.00 | )4 | | | | | | | (0.01 | ) | | | (0.00 | )4 | | | | |
| | | | | | | | |
Total distributions | | | (0.11 | ) | | | (0.13 | ) | | | | | | | (0.10 | ) | | | (0.11 | ) | | | | |
| | | | | | | | |
Net asset value, end of period | | $ | 11.01 | | | $ | 10.44 | | | | | | | $ | 11.00 | | | $ | 10.44 | | | | | |
| | | | | | | | |
| | | | | | | | | | | | | | | | | | | | | | | | |
| Total Return5,6 | | | | | | | | | | | | | | | | | | | | | | | | |
Based on net asset value | | | 6.55% | | | | 5.75% | | | | | | | | 6.37% | | | | 5.57% | | | | | |
| | | | | | | | |
| | | | | | | | | | | | | | | | | | | | | | | | |
| Ratios to Average Net Assets | | | | | | | | | | | | | | | | | | | | | | | | |
Total expenses | | | 0.08% | 7,8,9 | | | 0.77% | 7,8,10 | | | | | | | 0.31% | 7,8,9 | | | 0.44% | 7,8,10 | | | | |
| | | | | | | | |
Total expenses after fees waived and/or reimbursed and/or paid indirectly | | | 0.06% | 7,8 | | | 0.06% | 7,8 | | | | | | | 0.28% | 7,8 | | | 0.29% | 7,8 | | | | |
| | | | | | | | |
Net investment income | | | 1.72% | 7,8 | | | 1.96% | 7,8 | | | | | | | 1.61% | 7,8 | | | 1.06% | 7,8 | | | | |
| | | | | | | | |
| | | | | | | | | | | | | | | | | | | | | | | | |
| Supplemental Data | | | | | | | | | | | | | | | | | | | | | | | | |
Net assets, end of period (000) | | $ | 17,705 | | | $ | 2,428 | | | | | | | $ | 40,409 | | | $ | 8,873 | | | | | |
| | | | | | | | |
Portfolio turnover rate | | | 4% | | | | 4% | | | | | | | | 4% | | | | 4% | | | | | |
| | | | | | | | |
| | 1 | | Commencement of operations. |
| | 2 | | Based on average shares outstanding. |
| | 3 | | Distributions for annual periods determined in accordance with federal income tax regulations. |
| | 4 | | Amount is greater than $(0.005) per share. |
| | 5 | | Where applicable, assumes the reinvestment of distributions. |
| | 6 | | Aggregate total return. |
| | 8 | | Excludes 0.01% of expenses incurred indirectly as a result of investments in underlying funds. |
| | 9 | | Offering costs were not annualized in the calculation of the expense ratio. If these expenses were annualized for Institutional Shares, the total expenses would have been 0.08% for the six months ended January 31, 2017. If these expenses were annualized for Investor A Shares, the total expenses would have been 0.31% for the six months ended January 31, 2017. |
| | 10 | | Audit, offering and organization costs were not annualized in the calculation of the expense ratio. If these expenses were annualized for Institutional Shares, the total expenses would have been 0.79% for the period ended July 31, 2016. If these expenses were annualized for Investor A Shares, the total expenses would have been 0.44% for the period ended July 31, 2016. |
| | | | | | |
| See Notes to Financial Statements. | | | | |
| | | | | | | |
| | BLACKROCK FUNDS | | JANUARY 31, 2017 | | 107 |
| | |
| Financial Highlights (concluded) | | BlackRock Total Stock Market Index Fund |
| | | | | | | | | | | | |
| | | Class K | |
| | | Six Months Ended January 31, 2017
(Unaudited) | | | Period August 13, 20151
to July 31, 2016 | | | | |
| | | | | | | | | | | | |
| Per Share Operating Performance | | | | | |
Net asset value, beginning of period | | $ | 10.44 | | | $ | 10.00 | | | | | |
| | | | |
Net investment income2 | | | 0.11 | | | | 0.17 | | | | | |
Net realized and unrealized gain | | | 0.57 | | | | 0.40 | | | | | |
| | | | |
Net increase (decrease) from investment operations | | | 0.68 | | | | 0.57 | | | | | |
| | | | |
| Distributions:3 | | | | | | | | | | | | |
From net investment income | | | (0.10 | ) | | | (0.13 | ) | | | | |
From net realized gain | | | (0.01 | ) | | | (0.00 | )4 | | | | |
| | | | |
Total distributions | | | (0.11 | ) | | | (0.13 | ) | | | | |
| | | | |
Net asset value, end of period | | $ | 11.01 | | | $ | 10.44 | | | | | |
| | | | |
| | | | | | | | | | | | |
| Total Return5,6 | | | | | |
Based on net asset value | | | 6.57% | | | | 5.78% | | | | | |
| | | | |
| | | | | | | | | | | | |
| Ratios to Average Net Assets | | | | | |
Total expenses | | | 0.06% | 7,8,9 | | | 0.37% | 7,8,10 | | | | |
| | | | |
Total expenses after fees waived and/or reimbursed and/or paid indirectly | | | 0.03% | 7,8 | | | 0.03% | 7,8 | | | | |
| | | | |
Net investment income | | | 1.97% | 7,8 | | | 1.71% | 7,8 | | | | |
| | | | |
| | | | | | | | | | | | |
| Supplemental Data | | | | | |
Net assets, end of period (000) | | $ | 499,278 | | | $ | 290,381 | | | | | |
| | | | |
Portfolio turnover rate | | | 4% | | | | 4% | | | | | |
| | | | |
| | 1 | | Commencement of operations. |
| | 2 | | Based on average shares outstanding. |
| | 3 | | Distributions for annual periods determined in accordance with federal income tax regulations. |
| | 4 | | Amount is greater than $(0.005) per share. |
| | 5 | | Where applicable, assumes the reinvestment of distributions. |
| | 6 | | Aggregate total return. |
| | 8 | | Excludes 0.01% of expenses incurred indirectly as a result of investments in underlying funds. |
| | 9 | | Offering costs were not annualized in the calculation of the expense ratio. If these expenses were annualized, the total expenses would have been 0.06% for the six months ended January 31, 2017. |
| | 10 | | Audit, offering and organization costs were not annualized in the calculation of the expense ratio. If these expenses were annualized, the total expenses would have been 0.38% for the period ended July 31, 2016. |
| | | | | | |
| See Notes to Financial Statements. | | | | |
| | | | | | | |
| 108 | | BLACKROCK FUNDS | | JANUARY 31, 2017 | | |
| | | | |
| Notes to Financial Statements (Unaudited) | | |
1. Organization:
BlackRock FundsSM (the “Trust”) is registered under the Investment Company Act of 1940, as amended (the “1940 Act”), as an open-end management investment company. The Trust is organized as a Massachusetts business trust. Each Fund is a series of the Trust. The following are referred to herein collectively as the “Funds” or individually, a “Fund”:
| | | | | | | | |
| Fund Name | | Herein
Referred To As | | | Diversification
Classification | |
BlackRock Midcap Index Fund | | | Midcap Index | | | | Diversified | |
BlackRock MSCI Asia ex Japan Index Fund | | | Asia ex Japan Index | | | | Diversified | |
BlackRock MSCI World Index Fund | | | World Index | | | | Diversified | |
BlackRock Small/Mid Cap Index Fund | | | Small/Mid Cap Index | | | | Diversified | |
BlackRock Total Stock Market Index Fund | | | Total Stock Market Index | | | | Diversified | |
Each Fund offers multiple classes of shares. All classes of shares have identical voting, dividend, liquidation and other rights and are subject to the same terms and conditions, except that certain classes bear expenses related to the shareholder servicing and distribution of such shares. Institutional and Class K shares are sold without a sales charge and only to certain eligible investors. Investor A Shares are sold without a sales charge and are generally available through financial intermediaries. Each class has exclusive voting rights with respect to matters relating to its shareholder servicing and distribution expenditures.
| | | | | | | | | | | | |
| Share Class | | Initial Sales Charge | | | CDSC | | | Conversion Privilege | |
Institutional Shares | | | No | | | | No | | | | None | |
Investor A Shares | | | No | | | | No | | | | None | |
Class K Shares | | | No | | | | No | | | | None | |
The Funds, together with certain other registered investment companies advised by BlackRock Advisors, LLC (the “Manager”) or its affiliates, are included in a complex of open-end funds referred to as the Equity-Liquidity Complex.
2. Significant Accounting Policies:
The financial statements are prepared in conformity with accounting principles generally accepted in the United States of America (“U.S. GAAP”), which may require management to make estimates and assumptions that affect the reported amounts of assets and liabilities in the financial statements, disclosure of contingent assets and liabilities at the date of the financial statements and the reported amounts of increases and decreases in net assets from operations during the reporting period. Actual results could differ from those estimates. Each Fund is considered an investment company under U.S. GAAP and follows the accounting and reporting guidance applicable to investment companies. Below is a summary of significant accounting policies:
Foreign Currency: Each Fund’s books and records are maintained in U.S. dollars. Purchases and sales of investments are recorded at the rates of exchange prevailing on the respective dates of such transactions. Generally, when the U.S. dollar rises in value against a foreign currency, the investments denominated in that currency will lose value; the opposite effect occurs if the U.S. dollar falls in relative value.
Each Fund does not isolate the portion of the results of operations arising as a result of changes in the exchange rates from the changes in the market prices of investments held or sold for financial reporting purposes. Accordingly, the effects of changes in exchange rates on investments are not segregated in the Statements of Operations from the effects of changes in market prices of those investments, but are included as a component of net realized and unrealized gain (loss) from investments. Each Fund reports realized currency gains (losses) on foreign currency related transactions as components of net realized gain (loss) for financial reporting purposes, whereas such components are generally treated as ordinary income for federal income tax purposes.
Segregation and Collateralization: In cases where a Fund enters into certain investments (e.g., futures contracts) that would be treated as “senior securities” for 1940 Act purposes, a Fund may segregate or designate on its books and records cash or liquid assets having a market value at least equal to the amount of its future obligations under such investments. Doing so allows the investment to be excluded from treatment as a “senior security.” Furthermore, if required by an exchange or counterparty agreement, the Funds may be required to deliver/deposit cash and/or securities to/with an exchange, or broker-dealer or custodian as collateral for certain investments or obligations.
Investment Transactions and Investment Income: For financial reporting purposes, investment transactions are recorded on the dates the transactions are entered into (the trade dates). Realized gains and losses on investment transactions are determined on the identified cost basis. Dividend income is recorded on the ex-dividend date. Dividends from foreign securities where the ex-dividend date may have passed are subsequently recorded when the Funds are informed of the ex-dividend date. Under the applicable foreign tax laws, a withholding tax at various rates may be imposed on capital gains, dividends and interest. Upon notification from issuers, some of the dividend income received from a real estate investment trust may be redesignated as a reduction of cost of the related investment and/or realized gain. Income, expenses and realized and unrealized gains and losses are allocated daily to each class based on its relative net assets.
Distributions: Distributions paid by the Funds are recorded on the ex-dividend date. The character and timing of distributions are determined in accordance with federal income tax regulations, which may differ from U.S. GAAP.
| | | | | | |
| | | | | | | |
| | BLACKROCK FUNDS | | JANUARY 31, 2017 | | 109 |
| | |
| Notes to Financial Statements (continued) | | |
Organization and Offering Costs: Upon commencement of operations, organization costs associated with the establishment of the Funds were expensed by the Funds and reimbursed by the Manager. The Manager reimbursed the Funds $127,046, which is shown as expenses reimbursed by the Manager in the Statements of Operations. Offering costs are amortized over a 12-month period beginning with the commencement of operations.
Recent Accounting Standard: In April 2015, the Financial Accounting Standards Board issued “Disclosures for Investments in Certain Entities that Calculate Net Asset Value (“NAV”) per Share” which eliminates the requirement to categorize investments within the fair value hierarchy when fair value is based on the NAV per share and no quoted market value is available. As of January 31, 2017, certain investments of the Fund were valued using NAV per share or its equivalent as no quoted market value is available and therefore have been excluded from the fair value hierarchy.
In November 2016, the Financial Accounting Standards Board issued Accounting Standards Update “Restricted Cash” which will require entities to include the total of cash, cash equivalents, restricted cash, and restricted cash equivalents in the beginning and ending cash balances in the Statements of Cash Flows. The guidance will be applied retrospectively and is effective for fiscal years beginning after December 15, 2017, and interim periods within those years. Management is evaluating the impact, if any, of this guidance on the Funds’ presentation in the Statements of Cash Flows.
Indemnifications: In the normal course of business, a Fund enters into contracts that contain a variety of representations that provide general indemnification. A Fund’s maximum exposure under these arrangements is unknown because it involves future potential claims against a Fund, which cannot be predicted with any certainty.
Other: Expenses directly related to a Fund or its classes are charged to that Fund or the applicable class. Other operating expenses shared by several funds, including other funds managed by the Manager, are prorated among those funds on the basis of relative net assets or other appropriate methods. Expenses directly related to the Funds and other shared expenses prorated to the Funds are allocated daily to each class based on its relative net assets or other appropriate methods.
Through May 31, 2016, the Funds had an arrangement with their custodian whereby credits were earned on uninvested cash balances, which could be used to reduce custody fees and/or overdraft charges. Credits previously earned may have been utilized until December 31, 2016. Under current arrangements effective June 1, 2016, the Funds no longer earn credits on uninvested cash, and may incur charges on uninvested cash balances and overdrafts, subject to certain conditions.
3. Investment Valuation and Fair Value Measurements:
Investment Valuation Policies: The Funds’ investments are valued at fair value (also referred to as “market value” within the financial statements) as of the close of trading on the New York Stock Exchange (“NYSE”) (generally 4:00 p.m., Eastern time). U.S. GAAP defines fair value as the price the Funds would receive to sell an asset or pay to transfer a liability in an orderly transaction between market participants at the measurement date. The Funds determine the fair values of their financial instruments using various independent dealers or pricing services under policies approved by the Board of Trustees of the Trust (the “Board”). The BlackRock Global Valuation Methodologies Committee (the “Global Valuation Committee”) is the committee formed by management to develop global pricing policies and procedures and to oversee the pricing function for all financial instruments.
Fair Value Inputs and Methodologies: The following methods and inputs are used to establish the fair value of each Fund’s assets and liabilities:
| • | | Equity investments traded on a recognized securities exchange are valued at the official closing price each day, if available. For equity investments traded on more than one exchange, the official closing price on the exchange where the stock is primarily traded is used. Equity investments traded on a recognized exchange for which there were no sales on that day may be valued at the last available bid (long positions) or ask (short positions) price. Generally, trading in foreign instruments is substantially completed each day at various times prior to the close of trading on the NYSE. Occasionally, events affecting the values of such instruments may occur between the foreign market close and the close of trading on the NYSE that may not be reflected in the computation of the Funds’ net assets. Each business day, the Funds use a pricing service to assist with the valuation of certain foreign exchange-traded equity securities and foreign exchange-traded and over-the-counter (“OTC”) options (the “Systematic Fair Value Price”). Using current market factors, the Systematic Fair Value Price is designed to value such foreign securities and foreign options at fair value as of the close of trading on the NYSE, which follows the close of the local markets. |
| • | | Investments in open-end U.S. mutual funds are valued at NAV each business day. |
| • | | The Funds value their investment in SL Liquidity Series, LLC, Money Market Series (the “Money Market Series”) at fair value, which is ordinarily based upon their pro rata ownership in the underlying fund’s net assets. The Money Market Series seeks current income consistent with maintaining liquidity and preserving capital. Although the Money Market Series is not registered under the 1940 Act, its investments may follow the parameters of investments by a money market fund that is subject to Rule 2a-7 under the 1940 Act. |
| • | | Futures contracts traded on exchanges are valued at their last sale price. |
| | | | | | |
| | | | | | | |
| 110 | | BLACKROCK FUNDS | | JANUARY 31, 2017 | | |
| | | | |
| Notes to Financial Statements (continued) | | |
| • | | Securities and other assets and liabilities denominated in foreign currencies are translated into U.S. dollars using exchange rates determined as of the close of trading on the NYSE. Forward foreign currency exchange contracts are valued at the mean between the bid and ask prices and are determined as of the close of trading on the NYSE. Interpolated values are derived when the settlement date of the contract is an interim date for which quotations are not available. |
If events (e.g., a company announcement, market volatility or a natural disaster) occur that are expected to materially affect the value of such investments, or in the event that the application of these methods of valuation results in a price for an investment that is deemed not to be representative of the market value of such investment, or if a price is not available, the investment will be valued by the Global Valuation Committee, or its delegate, in accordance with a policy approved by the Board as reflecting fair value (“Fair Valued Investments”). The fair valuation approaches that may be used by the Global Valuation Committee will include Market approach, Income approach and Cost approach. Valuation techniques such as discounted cash flow, use of market comparables and matrix pricing are types of valuation approaches and typically used in determining fair value. When determining the price for Fair Valued Investments, the Global Valuation Committee, or its delegate, seeks to determine the price that each Fund might reasonably expect to receive or pay from the current sale or purchase of that asset or liability in an arm’s-length transaction. Fair value determinations shall be based upon all available factors that the Global Valuation Committee, or its delegate, deems relevant and consistent with the principles of fair value measurement.
The Global Valuation Committee, or its delegate, employs various methods for calibrating valuation approaches for investments where an active market does not exist, including regular due diligence of each Fund’s pricing vendors, regular reviews of key inputs and assumptions, transactional back-testing or disposition analysis to compare unrealized gains and losses to realized gains and losses, reviews of missing or stale prices and large movements in market values and reviews of any market related activity. The pricing of all Fair Valued Investments is subsequently reported to the Board or a committee thereof on a quarterly basis. As a result of the inherent uncertainty in valuation of these investments, the fair values may differ from the values that would have been used had an active market existed.
Fair Value Hierarchy: Various inputs are used in determining the fair value of investments and derivative financial instruments. These inputs to valuation techniques are categorized into a fair value hierarchy consisting of three broad levels for financial statement purposes as follows:
| • | | Level 1 — unadjusted price quotations in active markets/exchanges for identical assets or liabilities that each Fund has the ability to access |
| • | | Level 2 — other observable inputs (including, but not limited to, quoted prices for similar assets or liabilities in markets that are active, quoted prices for identical or similar assets or liabilities in markets that are not active, inputs other than quoted prices that are observable for the assets or liabilities (such as interest rates, yield curves, volatilities, prepayment speeds, loss severities, credit risks and default rates) or other market–corroborated inputs) |
| • | | Level 3 — unobservable inputs based on the best information available in the circumstances, to the extent observable inputs are not available (including each Fund’s own assumptions used in determining the fair value of investments and derivative financial instruments) |
The hierarchy gives the highest priority to unadjusted quoted prices in active markets for identical assets or liabilities (Level 1 measurements) and the lowest priority to unobservable inputs (Level 3 measurements). Accordingly, the degree of judgment exercised in determining fair value is greatest for instruments categorized in Level 3. The inputs used to measure fair value may fall into different levels of the fair value hierarchy. In such cases, for disclosure purposes, the fair value hierarchy classification is determined based on the lowest level input that is significant to the fair value measurement in its entirety. Investments classified within Level 3 have significant unobservable inputs used by the Global Valuation Committee in determining the price for Fair Valued Investments. Level 3 investments include equity or debt issued by privately held companies or funds. There may not be a secondary market, and/or there are a limited number of investors. Level 3 investments may also be adjusted to reflect illiquidity and/or non-transferability, with the amount of such discount estimated by the Global Valuation Committee in the absence of market information.
Changes in valuation techniques may result in transfers into or out of an assigned level within the hierarchy. In accordance with each Fund’s policy, transfers between different levels of the fair value hierarchy are deemed to have occurred as of the beginning of the reporting period. The categorization of a value determined for investments and derivative financial instruments is based on the pricing transparency of the investments and derivative financial instruments and is not necessarily an indication of the risks associated with investing in those securities.
4. Securities and Other Investments:
Securities Lending: The Funds may lend their securities to approved borrowers, such as brokers, dealers and other financial institutions. The borrower pledges and maintains with the Funds collateral consisting of cash, an irrevocable letter of credit issued by a bank, or securities issued or guaranteed by the U.S. Government. The initial collateral received by each Fund is required to have a value of at least 102% of the current value of the loaned securities for securities traded on U.S. exchanges and a value of at least 105% for all other securities. The collateral is maintained thereafter at a value equal to at least 100% of the current market value of the securities on loan. The market value of the loaned securities is determined at the close of each business day of the Fund and any additional required collateral is delivered to the Fund, or excess collateral returned by the Fund, on the next business day. During the term of the loan, the Funds are entitled to all distributions made on or in respect of the loaned securities, but does not receive interest income on securities received as collateral. Loans of securities are terminable at any time and the borrower, after notice, is required to return borrowed securities within the standard time period for settlement of securities transactions.
| | | | | | |
| | | | | | | |
| | BLACKROCK FUNDS | | JANUARY 31, 2017 | | 111 |
| | | | |
| Notes to Financial Statements (continued) | | |
The market value of any securities on loan, all of which were classified as common stocks in the Funds’ Schedules of Investments, and the value of any related collateral are shown separately in the Statements of Assets and Liabilities as a component of investments at value-unaffiliated, and collateral on securities loaned at value, respectively. As of period end, any securities on loan were collateralized by cash and/or U.S. Government obligations. Cash collateral invested by the securities lending agent, BlackRock Investment Management, LLC (“BIM”) if any, is disclosed in the Schedules of Investments.
Securities lending transactions are entered into by the Funds under Master Securities Lending Agreements (each, an “MSLA”), which provide the right, in the event of default (including bankruptcy or insolvency), for the non-defaulting party to liquidate the collateral and calculate a net exposure to the defaulting party or request additional collateral. In the event that a borrower defaults, the Funds, as lender, would offset the market value of the collateral received against the market value of the securities loaned. When the value of the collateral is greater than that of the market value of the securities loaned, the lender is left with a net amount payable to the defaulting party. However, bankruptcy or insolvency laws of a particular jurisdiction may impose restrictions on or prohibitions against such a right of offset in the event of an MSLA counterparty’s bankruptcy or insolvency. Under the MSLA, absent an event of default, the borrower can resell or re-pledge the loaned securities, and a Fund can reinvest cash collateral received in connection with loaned securities. Upon an event of default, the parties’ obligations to return the securities or collateral to the other party are extinguished, and the parties can resell or re-pledge the loaned securities or the collateral received in connection with the loaned securities in order to satisfy the defaulting party’s net payment obligation for all transactions under the MSLA. The defaulting party remains liable for any deficiency.
As of period end, the following table is a summary of the Funds’ securities lending agreements by counterparty which are subject to offset under an MSLA:
| | | | | | | | | | | | |
| Midcap Index | |
| Counterparty | | Securities
Loaned at
Value | | | Cash
Collateral
Received1 | | | Net
Amount2 | |
Citigroup Global Markets, Inc. | | $ | 65,928 | | | $ | (65,013 | ) | | $ | 915 | |
Credit Suisse Securities (USA) LLC | | | 795,577 | | | | (795,577 | ) | | | — | |
Deutsche Bank Securities, Inc. | | | 180,666 | | | | (180,666 | ) | | | — | |
Merrill Lynch, Pierce, Fenner & Smith, Inc. | | | 165,106 | | | | (165,106 | ) | | | — | |
| | | | |
Total | | $ | 1,207,277 | | | $ | (1,206,362 | ) | | $ | 915 | |
| | | | |
| | | | | | | | | | | | |
| World Index | |
| Counterparty | | Securities
Loaned at
Value | | | Cash
Collateral
Received1 | | | Net
Amount | |
Citigroup Global Markets, Inc. | | $ | 72,308 | | | $ | (72,308 | ) | | | — | |
| | | |
| | | | | | | | | | | | |
| Small/Mid Cap Index | |
| Counterparty | | Securities
Loaned at
Value | | | Cash
Collateral
Received1 | | | Net
Amount | |
BNP Paribas S.A. | | $ | 13,159 | | | $ | (13,159 | ) | | | — | |
Citigroup Global Markets, Inc. | | | 78,211 | | | | (78,211 | ) | | | — | |
Credit Suisse Securities (USA) LLC | | | 52,388 | | | | (52,388 | ) | | | — | |
Deutsche Bank Securities, Inc. | | | 37,014 | | | | (37,014 | ) | | | — | |
JPMorgan Securities LLC | | | 36,212 | | | | (36,212 | ) | | | — | |
Merrill Lynch, Pierce, Fenner & Smith, Inc. | | | 52,204 | | | | (52,204 | ) | | | — | |
| | | | |
Total | | $ | 269,188 | | | $ | (269,188 | ) | | | — | |
| | | | |
| | | | | | | | | | | | |
| Total Stock Market Index | |
| Counterparty | | Securities
Loaned at
Value | | | Cash
Collateral
Received1 | | | Net
Amount | |
BNP Paribas Prime S.A. | | $ | 9,848 | | | $ | (9,848 | ) | | | — | |
Citigroup Global Markets, Inc. | | | 188,302 | | | | (188,302 | ) | | | — | |
Credit Suisse Securities (USA) LLC | | | 53,180 | | | | (53,180 | ) | | | — | |
Deutsche Bank Securities, Inc. | | | 91,949 | | | | (91,949 | ) | | | — | |
JPMorgan Securities LLC | | | 44,274 | | | | (44,274 | ) | | | — | |
Merrill Lynch, Pierce, Fenner & Smith, Inc. | | | 31,921 | | | | (31,921 | ) | | | — | |
| | | | |
Total | | $ | 419,474 | | | $ | (419,474 | ) | | | — | |
| | | | |
| | 1 | | Cash collateral received in excess of the value of securities loaned from the individual counterparty is not shown for financial reporting purposes in the tables above. Collateral has been received in connection with securities lending agreements as follows: |
| | | | | | |
| Midcap Index | | World Index | | Small/Mid Cap Index | | Total Stock Market Index |
$1,310,001 | | $73,349 | | $283,237 | | $448,980 |
| | 2 | | The market value of the loaned securities is determined as of January 31, 2017. Additional collateral is delivered to the Fund on the next business day in accordance with the MSLA. The net amount would be subject to the borrower default indemnity in the event of default by the counterparty. |
| | | | | | |
| | | | | | | |
| 112 | | BLACKROCK FUNDS | | JANUARY 31, 2017 | | |
| | | | |
| Notes to Financial Statements (continued) | | |
The risks of securities lending include the risk that the borrower may not provide additional collateral when required or may not return the securities when due. To mitigate these risks, the Funds benefit from a borrower default indemnity provided by BIM. BIM’s indemnity allows for full replacement of the securities loaned if the collateral received does not cover the value on the securities loaned in the event of borrower default. Each Fund could suffer a loss if the value of an investment purchased with cash collateral falls below the market value of loaned securities or if the value of an investment purchased with cash collateral falls below the value of the original cash collateral received.
5. Derivative Financial Instruments:
The Funds engage in various portfolio investment strategies using derivative contracts both to increase the returns of the Funds and/or to manage their exposure to certain risks such as credit risk, equity risk, interest rate risk, foreign currency exchange rate risk, commodity price risk or other risks (e.g., inflation risk). Derivative financial instruments categorized by risk exposure are included in the Schedules of Investments. These contracts may be transacted on an exchange or OTC.
Futures Contracts: Certain Funds invest in long and/or short positions in futures and options on futures contracts to gain exposure to, or manage exposure to, changes in interest rates (interest rate risk), changes in the value of equity securities (equity risk) or foreign currencies (foreign currency exchange rate risk).
Futures contracts are agreements between the Funds and a counterparty to buy or sell a specific quantity of an underlying instrument at a specified price and on a specified date. Depending on the terms of a contract, it is settled either through physical delivery of the underlying instrument on the settlement date or by payment of a cash amount on the settlement date. Upon entering into a futures contract, the Funds are required to deposit initial margin with the broker in the form of cash or securities in an amount that varies depending on a contract’s size and risk profile. The initial margin deposit must then be maintained at an established level over the life of the contract.
Securities deposited as initial margin are designated in the Schedules of Investments and cash deposited, if any, is shown as cash pledged for futures contracts in the Statements of Assets and Liabilities. Pursuant to the contract, the Funds agree to receive from or pay to the broker an amount of cash equal to the daily fluctuation in market value of the contract (“variation margin”). Variation margin is recorded as unrealized appreciation (depreciation) and, if any, shown as variation margin receivable (or payable) on futures contracts in the Statements of Assets and Liabilities. When the contract is closed, a realized gain or loss is recorded in the Statements of Operations equal to the difference between the value of the contract at the time it was opened and the value at the time it was closed. The use of futures contracts involves the risk of an imperfect correlation in the movements in the price of futures contracts and interest, foreign currency exchange rates or underlying assets.
6. Investment Advisory Agreement and Other Transactions with Affiliates:
The PNC Financial Services Group, Inc. is the largest stockholder and an affiliate of BlackRock, Inc. (“BlackRock”) for 1940 Act purposes.
Investment Advisory: The Trust, on behalf of the Funds, entered into an Investment Advisory Agreement with the Manager, the Funds’ investment adviser, an indirect, wholly-owned subsidiary of BlackRock, to provide investment advisory and administration services. The Manager is responsible for the management of each Fund’s portfolio and provides the personnel, facilities, equipment and certain other services necessary to the operations of each Fund.
For such services, each Fund pays the Manager a monthly fee, which is determined by calculating a percentage of each Fund’s average daily net assets, based on the following annual rates:
| | | | |
| Average Daily Net Assets | | Investment Advisory Fees | |
Midcap Index | | | 0.02% | |
Asia ex Japan Index | | | 0.25% | |
World Index | | | 0.05% | |
Small/Mid Cap Index | | | 0.03% | |
Total Stock Market Index | | | 0.01% | |
Service and Distribution Fees: The Trust, on behalf of the Funds, entered into a Distribution Agreement and a Distribution and Service Plan with BlackRock Investments, LLC (“BRIL”), an affiliate of the Manager. Pursuant to the Distribution and Service Plan and in accordance with Rule 12b-1 under the 1940 Act, each Fund pays BRIL ongoing service fees. The fees are accrued daily and paid monthly at annual rates based upon the average daily net assets of the relevant share class of each Fund as follows:
| | | | | | | | | | | | |
| | | Institutional | | | Investor A | | | Class K | |
Midcap Index | | | — | | | | 0.25% | | | | — | |
Small/Mid Cap Index | | | — | | | | 0.25% | | | | — | |
Total Stock Market Index | | | — | | | | 0.25% | | | | — | |
BRIL and broker-dealers, pursuant to sub-agreements with BRIL, provide shareholder servicing services to the Funds. The ongoing service fee compensates BRIL and each broker-dealer for providing shareholder servicing related services to the shareholders.
| | | | | | |
| | | | | | | |
| | BLACKROCK FUNDS | | JANUARY 31, 2017 | | 113 |
| | | | |
| Notes to Financial Statements (continued) | | |
For the six months ended January 31, 2017, the following table shows the class specific service and distribution fees borne directly by each share class of each Fund:
| | | | | | | | | | | | | | | | |
| | | Institutional | | | Investor A | | | Class K | | | Total | |
Midcap Index | | | — | | | $ | 15,297 | | | | — | | | $ | 15,297 | |
Small/Mid Cap Index | | | — | | | $ | 14,461 | | | | — | | | $ | 14,461 | |
Total Stock Market Index | | | — | | | $ | 28,383 | | | | — | | | $ | 28,383 | |
Transfer Agent: Pursuant to written agreements, certain financial intermediaries, some of which may be affiliates, provide the Funds with sub-accounting, recordkeeping, sub-transfer agency and other administrative services with respect to sub-accounts they service. For these services, these entities receive an asset-based fee or an annual fee per shareholder account, which will vary depending on share class and/or net assets. For the six months ended January 31, 2017, the Funds paid the following amounts to affiliates of BlackRock in return for these services, which are included in transfer agent— class specific in the Statement of Operations:
| | | | | | | | | | | | | | | | |
| | | Institutional | | | Investor A | | | Class K | | | Total | |
Midcap Index | | $ | 4 | | | | — | | | | — | | | $ | 4 | |
The Manager maintains a call center that is responsible for providing certain shareholder services to the Funds. Shareholder services include responding to inquiries and processing subscriptions and redemptions based upon instructions from shareholders. For the six months ended January 31, 2017, each Fund reimbursed the Manager the following amounts for costs incurred in running the call center, which are included in transfer agent — class specific in the Statements of Operations:
| | | | | | | | | | | | | | | | |
| | | Institutional | | | Investor A | | | Class K | | | Total | |
Midcap Index | | $ | 88 | | | | — | | | $ | 2,811 | | | $ | 2,899 | |
Asia ex Japan Index | | | — | | | | — | | | | — | | | | — | |
World Index | | | — | | | | — | | | $ | 3,021 | | | $ | 3,021 | |
Small/Mid Cap Index | | $ | 4 | | | $ | 25 | | | $ | 34 | | | $ | 63 | |
Total Stock Market Index | | $ | 7 | | | $ | 14 | | | $ | 31 | | | $ | 52 | |
For the six months ended January 31, 2017, the following table shows the class specific transfer agent fees borne directly by each class of each Fund:
| | | | | | | | | | | | | | | | |
| | | Institutional | | | Investor A | | | Class K | | | Total | |
Midcap Index | | $ | 332,705 | | | $ | 897 | | | $ | 364,921 | | | $ | 698,523 | |
Asia ex Japan Index | | | — | | | | — | | | $ | 44 | | | $ | 44 | |
World Index | | $ | 24,490 | | | | — | | | $ | 136,377 | | | $ | 160,867 | |
Small/Mid Cap Index | | $ | 90 | | | $ | 227 | | | $ | 421 | | | $ | 738 | |
Total Stock Market Index | | $ | 555 | | | $ | 323 | | | $ | 430 | | | $ | 1,308 | |
Expense Limitations, Waivers, Reimbursements, and Recoupments: With respect to each Fund, the Manager contractually agreed to waive and/or reimburse fees or expenses in order to limit expenses, excluding interest expense, dividend expense, tax expense, acquired fund fees and expenses, and certain other fund expenses, which constitute extraordinary expenses not incurred in the ordinary course of each Fund’s business (“expense limitation”). The current expense limitations as a percentage of average daily net assets are as follows:
| | | | | | | | | | | | |
| | | Institutional | | | Investor A | | | Class K | |
Midcap Index | | | 0.12% | | | | 0.37% | | | | 0.07% | |
Asia ex Japan Index | | | 0.50% | | | | N/A | | | | 0.45% | |
World Index | | | 0.20% | | | | N/A | | | | 0.15% | |
Small/Mid Cap Index | | | 0.12% | | | | 0.37% | | | | 0.07% | |
Total Stock Market Index | | | 0.08% | | | | 0.33% | | | | 0.03% | |
Prior to October 5, 2016, the expense limitations as a percentage of average daily net assets for Midcap Index and Small/Mid Cap Index were as follows:
| | | | | | | | | | | | |
| | | Institutional | | | Investor A | | | Class K | |
Midcap Index | | | 0.13% | | | | 0.38% | | | | 0.08% | |
Small/Mid Cap Index | | | 0.13% | | | | 0.38% | | | | 0.08% | |
| | | | | | |
| | | | | | | |
| 114 | | BLACKROCK FUNDS | | JANUARY 31, 2017 | | |
| | | | |
| Notes to Financial Statements (continued) | | |
These amounts waived and/or reimbursed are included in fees waived by the Manager, and shown as other expenses reimbursed by the Manager, transfer agent fees waived and/or reimbursed, respectively, in the Statements of Operations. For the six-months ended January 31, 2017, the amounts included in fees waived by the Manager were as follows:
| | | | | | | | |
| | | Fees Waived by the Manager | | | Other Expenses Reimbursed by the Manager | |
Midcap Index | | $ | 97,180 | | | $ | 11,915 | |
Asia ex Japan Index | | | 33,526 | | | | 26,974 | |
World Index | | | 36,227 | | | | 5,070 | |
Small/Mid Cap Index | | | 8,224 | | | | 54,794 | |
Total Stock Market Index | | | 13,158 | | | | 42,259 | |
For the six months ended January 31, 2017, the amounts shown as transfer agent fees waived and/or reimbursed-class specific were as follows:
| | | | | | | | | | | | | | | | |
| | | Institutional | | | Investor A | | | Class K | | | Total | |
Midcap Index | | $ | 275,854 | | | $ | 7 | | | $ | 315,300 | | | $ | 591,161 | |
Asia ex Japan Index | | | — | | | | — | | | $ | 44 | | | $ | 44 | |
World Index | | $ | 24,127 | | | | — | | | $ | 118,212 | | | $ | 142,339 | |
Small/Mid Cap Index | | $ | 28 | | | | — | | | $ | 420 | | | $ | 448 | |
Total Stock Market Index | | $ | 1 | | | | — | | | $ | 426 | | | $ | 427 | |
The Manager has agreed not to reduce or discontinue these contractual expense limitations prior to December 1, 2017, unless approved by the Board, including a majority of the independent trustees who are not “interested persons” of the Funds, as defined in the 1940 Act (“Independent Trustees”) or by a vote of a majority of the outstanding voting securities of the Funds.
With respect to the Funds, the Manager voluntarily agreed to waive its investment advisory fees by the amount of investment advisory fees each Fund pays to the Manager indirectly through its investment in affiliated money market funds (the “affiliated money market fund waiver”). These amounts are included in fees waived by the Manager in the Statements of Operations. The amount of waivers and/or reimbursements of fees and expenses limitation caps, as applicable, will be reduced by the amount of the affiliated money market fund waiver. For the six months ended January 31, 2017, the amounts waived were as follows:
| | | | |
| | | Amount Waived | |
Midcap Index | | $ | 15,894 | |
Asia ex Japan Index | | $ | 397 | |
World Index | | $ | 2,351 | |
Small/Mid Cap Index | | $ | 719 | |
Total Stock Market Index | | $ | 5,132 | |
Effective September 1, 2016, the Manager voluntarily agreed to waive its investment advisory fee with respect to any portion of the Funds’ assets invested in affiliated equity or fixed-income mutual funds or affiliated exchange-traded funds that have a contractual management fee. Prior to September 1, 2016, the Manager did not waive such fees. Effective November 28, 2016, the waiver became contractual through November 30, 2017. This contractual agreement may be terminated upon 90 days’ notice by a majority of the non-interested trustees of the Trust or by a vote of a majority of the outstanding voting securities of the Funds. For the six months ended January 31, 2017, the amount waived on World Index was $20.
With respect to the contractual expense caps, if during a Fund’s fiscal year the operating expenses of a share class, that at any time during the prior two fiscal years received a waiver and/or reimbursement from the Manager, are less than the expense cap for that share class, the Manager is entitled to be reimbursed by such share class up to the lesser of the following expenses:
| | (a) | The amount of fees waived and/or expenses reimbursed during those prior two fiscal years under the agreement. |
| | (b) | The amount by which the expense cap for that share class exceeds the operating expenses of the share class for the current fiscal year, provided that: |
| | • | | Each Fund, of which the share class is a part, has more than $50 million in assets for the fiscal year; and |
| | • | | The Manager or an affiliate continues to serve as a Fund’s investment adviser or administrator. |
In the event the expense cap for a share class is changed subsequent to a fiscal year in which the Manager becomes entitled to reimbursement for fees waived and/or reimbursed, the amount available to reimburse the Manager shall be calculated by reference to the expense cap for that share class in effect at the time the Manager became entitled to receive such reimbursement, rather than the subsequently changed expense cap for that share class.
| | | | | | |
| | | | | | | |
| | BLACKROCK FUNDS | | JANUARY 31, 2017 | | 115 |
| | | | |
| Notes to Financial Statements (continued) | | |
For the six months ended January 31, 2017, the Manager recouped the following fund level and class specific waivers and/or reimbursements previously recorded by the Funds:
| | | | | | | | | | | | | | | | |
| | | Midcap Index | | | World Index | | | Small/Mid Cap
Index | | | Total Stock
Market Index | |
Fund Level | | $ | 91,305 | | | $ | 6,074 | | | | — | | | | — | |
Institutional | | $ | 2,326 | | | $ | 282 | | | $ | 1 | | | $ | 1 | |
Class A | | | — | | | | — | | | | — | | | $ | 31 | |
Class K | | $ | 10,267 | | | | — | | | | — | | | | — | |
On January 31, 2017, the Fund level and class specific waivers and/or reimbursements subject to possible future recoupment under the expense limitation agreement are as follows:
| | | | | | | | | | | | |
| | | Expiring July 31, | |
| | | 2017 | | | 2018 | | | 2019 | |
| Midcap Index | | | | | | | | | | | | |
Fund level | | | — | | | $ | 15,841 | | | $ | 109,095 | |
Institutional | | | — | | | $ | 344,216 | | | $ | 275,854 | |
Investor A | | | — | | | | — | | | $ | 8 | |
Class K | | | — | | | $ | 150,466 | | | $ | 315,300 | |
| Asia ex Japan Index | | | | | | | | | | | | |
Fund level | | $ | 79,538 | | | $ | 162,934 | | | $ | 60,500 | |
Institutional | | $ | 217 | | | $ | 488 | | | | — | |
Class K | | | — | | | $ | 23 | | | $ | 44 | |
| World Index | | | | | | | | | | | | |
Fund level | | $ | 64,849 | | | $ | 216,191 | | | $ | 41,298 | |
Institutional | | | — | | | $ | 10,637 | | | $ | 24,127 | |
Class K | | | — | | | $ | 36,922 | | | $ | 118,212 | |
| Small/Mid Cap Index | | | | | | | | | | | | |
Fund level | | | — | | | $ | 205,994 | | | $ | 63,018 | |
Institutional | | | — | | | $ | 61 | | | $ | 27 | |
Investor A | | | — | | | $ | 56 | | | | — | |
Class K | | | — | | | $ | 1,052 | | | $ | 421 | |
| Total Stock Market Index | | | | | | | | | | | | |
Fund level | | | — | | | $ | 208,860 | | | $ | 55,417 | |
Institutional | | | — | | | | — | | | $ | 1 | |
Investor A | | | — | | | | — | | | | — | |
Class K | | | — | | | $ | 1,037 | | | $ | 426 | |
Securities Lending: The U.S. Securities and Exchange Commission has issued an exemptive order which permits BIM, an affiliate of the Manager, to serve as securities lending agent for the Funds, subject to applicable conditions. As securities lending agent, BIM bears all operational costs directly related to securities lending. The Funds are responsible for expenses in connection with the investment of cash collateral received for securities on loan (the “collateral investment expenses”). The cash collateral is invested in a private investment company managed by the Manager or its affiliates. However, BIM has agreed to cap the collateral investment expenses of the private investment company to an annual rate of 0.04%. The investment adviser to the private investment company will not charge any advisory fees with respect to shares purchased by the Funds.
Securities lending income is equal to the total of income earned from the reinvestment of cash collateral, net of fees and other payments to and from borrowers of securities, and less the collateral investment expenses. Each Fund retains a portion of securities lending income and remits a remaining portion to BIM as compensation for its services as securities lending agent. Pursuant to a securities lending agreement, BIM may lend securities only when the difference between the borrower rebate rate and the risk free rate exceeds a certain level (such securities, the “specials only securities”).
Pursuant to such agreement, each Fund retains 80% of securities lending income. In addition, commencing the business day following the date that the aggregate securities lending income earned across certain funds in the Equity-Liquidity Complex in a calendar year exceeds a specified threshold, each Fund, pursuant to the securities lending agreement, will retain for the remainder of the calendar year securities lending income in an amount equal to 85% of securities lending income.
The share of securities lending income earned by each Fund is shown as securities lending — affiliated — net in the Statements of Operations. For the six months ended January 31, 2017, each Fund paid BIM the following amounts for securities lending agent services:
| | | | |
Midcap Index | | $ | 34,244 | |
Asia ex Japan Index | | $ | 25 | |
World Index | | $ | 1,471 | |
Small/Mid Cap Index | | $ | 2,575 | |
Total Stock Market Index | | $ | 5,520 | |
Interfund Lending: In accordance with an exemptive order (the “Order”) from the U.S. Securities and Exchange Commission, each Fund may participate in a joint lending and borrowing facility for temporary purposes (the “Interfund Lending Program”), subject to compliance with the terms and conditions of the
| | | | | | |
| | | | | | | |
| 116 | | BLACKROCK FUNDS | | JANUARY 31, 2017 | | |
| | | | |
| Notes to Financial Statements (continued) | | |
Order, and to the extent permitted by each Fund’s investment policies and restrictions. Each Fund is currently permitted to borrow and lend under the Interfund Lending Program.
A Fund may lend in aggregate up to 15% of its net assets, but may not lend more than 5% of its net assets to any one borrowing fund through the Interfund Lending Program. A Fund may not borrow through the Interfund Lending Program or from any other source more than 33 1/3% of its total assets (or any lower threshold provided for by the Fund’s investment restrictions). If a Fund’s total outstanding borrowings exceed 10% of its total assets, each of its outstanding interfund loans will be subject to collateralization of at least 102% of the outstanding principal value of the loan. All interfund loans are for temporary or emergency purposes and the interest rate to be charged will be the average of the highest current overnight repurchase agreement rate available to a lending fund and the bank loan rate, as calculated according to a formula established by the Board.
During the period ended January 31, 2017, the Funds did not participate in the Interfund Lending Program.
Officers and Trustees: Certain officers and/or trustees of the Trust are officers and/or directors of BlackRock or its affiliates. The Funds reimburse the Manager for a portion of the compensation paid to the Trust’s Chief Compliance Officer, which is included in Officer and Trustees in the Statements of Operations.
Other Transactions: The Funds may purchase securities from, or sell securities to, an affiliated fund provided the affiliation is due solely to having a common investment adviser, common officers, or common trustees. For the six months ended January 31, 2017, the purchase and sale transactions and any net realized gains (losses) with affiliated funds in compliance with Rule 17a-7 under the 1940 Act were as follows:
| | | | | | | | | | | | |
| | | Purchases | | | Sales | | | Net Realized Gain | |
Midcap Index | | $ | 35,802,298 | | | $ | 2,523,983 | | | $ | 184,223 | |
7. Purchases and Sales:
For the period ended January 31, 2017, purchases and sales of investments excluding short-term securities were as follows:
| | | | | | | | | | | | | | | | | | | | |
| | | Midcap Index | | | Asia ex Japan Index | | | World Index | | | Small/Mid Cap Index | | | Total Stock
Market Index | |
Purchases | | $ | 245,394,003 | | | $ | 36,864,282 | | | $ | 120,093,972 | | | $ | 36,973,681 | | | $ | 243,982,421 | |
Sales | | $ | 53,608,266 | | | $ | 327,697 | | | $ | 21,434,881 | | | $ | 1,195,636 | | | $ | 15,934,102 | |
8. Income Tax Information:
It is the Funds’ policy to comply with the requirements of the Internal Revenue Code of 1986, as amended, applicable to regulated investment companies, and to distribute substantially all of their taxable income to their shareholders. Therefore, no federal income tax provision is required.
Each Fund files U.S. federal and various state and local tax returns. No income tax returns are currently under examination. The statute of limitations on Midcap Index’s, World Index’s and Asia ex Japan Index’s U.S. federal tax returns generally remains open for the period ended July 31, 2016 and the period ended July 31, 2015. The statute of limitations on Small/Mid Cap Index’s and Total Stock Market Index’s U.S. federal tax returns generally remains open for the period ended July 31, 2016. The statutes of limitations on each Fund’s state and local tax returns may remain open for an additional year depending upon the jurisdiction.
Management has analyzed tax laws and regulations and their application to the Funds as of January 31, 2017, inclusive of the open tax return years, and does not believe that there are any uncertain tax positions that require recognition of a tax liability in the Funds’ financial statements.
As of January 31, 2017, gross unrealized appreciation and depreciation based on cost for federal income tax purposes were as follows:
| | | | | | | | | | | | | | | | | | | | |
| | | Midcap Index | | | Asia ex Japan Index | | | World Index | | | Small/Mid Cap Index | | | Total Stock
Market Index | |
Tax cost | | $ | 2,440,937,030 | | | $ | 54,444,831 | | | $ | 407,822,898 | | | $ | 70,378,700 | | | $ | 560,299,988 | |
| | | | |
Gross unrealized appreciation | | $ | 383,497,858 | | | $ | 2,107,770 | | | $ | 48,860,952 | | | $ | 6,919,760 | | | $ | 42,325,758 | |
Gross unrealized depreciation | | | (88,564,841 | ) | | | (3,179,498 | ) | | | (9,054,853 | ) | | | (1,731,350 | ) | | | (8,729,979 | ) |
| | | | |
Net unrealized appreciation (depreciation) | | $ | 294,933,017 | | | $ | (1,071,728 | ) | | $ | 39,806,099 | | | $ | 5,188,410 | | | $ | 33,595,779 | |
| | | | |
9. Bank Borrowings:
The Trust, on behalf of the Funds, along with certain other funds managed by the Manager and its affiliates (“Participating Funds”), is a party to a 364-day, $2.1 billion credit agreement with a group of lenders. Under this agreement, the Funds may borrow to fund shareholder redemptions. Excluding commitments designated for certain individual funds, the Participating Funds, including the Funds, can borrow up to an aggregate commitment amount of $1.6 billion at any time outstanding, subject to asset coverage and other limitations as specified in the agreement. The credit agreement has the following terms: a fee of 0.12% per annum on unused commitment amounts and interest at a rate equal to the higher of (a) one-month LIBOR (but, in any event,
| | | | | | |
| | | | | | | |
| | BLACKROCK FUNDS | | JANUARY 31, 2017 | | 117 |
| | | | |
| Notes to Financial Statements (continued) | | |
not less than 0.00%) on the date the loan is made plus 0.80% per annum or (b) the Fed Funds rate (but, in any event, not less than 0.00%) in effect from time to time plus 0.80% per annum on amounts borrowed. The agreement expires in April 2017 unless extended or renewed. Participating Funds paid administration, legal and arrangement fees, which, if applicable, are included in miscellaneous expenses in the Statements of Operations. These fees were allocated among such funds based upon portions of the aggregate commitment available to them and relative net assets of Participating Funds. During the six months ended January 31, 2017, the Funds did not borrow under the credit agreement.
10. Principal Risks:
In the normal course of business, the Funds invest in securities and enter into transactions where risks exist due to fluctuations in the market (market risk) or failure of the issuer to meet all its obligations, including the ability to pay principal and interest when due (issuer credit risk). The value of securities held by the Funds may decline in response to certain events, including those directly involving the issuers of securities owned by the Funds. Changes arising from the general economy, the overall market and local, regional or global political and/or social instability, as well as currency, interest rate and price fluctuations, may also affect the securities’ value.
On October 11, 2016, BlackRock implemented certain changes required by amendments to Rule 2a-7 under the 1940 Act, which governs the operations of U.S. money market funds. The Funds may be exposed to additional risks when reinvesting cash collateral in money market funds that do not seek to maintain a stable NAV per share of $1.00 and which may be subject to redemption gates or liquidity fees under certain circumstances.
Valuation Risk: The market values of equities, such as common stocks and preferred securities or equity related investments, such as futures and options, may decline due to general market conditions which are not specifically related to a particular company. They may also decline due to factors which affect a particular industry or industries. A Fund may invest in illiquid investments and may experience difficulty in selling those investments in a timely manner at the price that it believes the investments are worth. Prices may fluctuate widely over short or extended periods in response to company, market or economic news. Markets also tend to move in cycles, with periods of rising and falling prices. This volatility may cause each Fund’s NAV to experience significant increases or decreases over short periods of time. If there is a general decline in the securities and other markets, the NAV of a Fund may lose value, regardless of the individual results of the securities and other instruments in which a Fund invests.
Counterparty Credit Risk: Similar to issuer credit risk, the Funds may be exposed to counterparty credit risk, or the risk that an entity may fail to or be unable to perform on its commitments related to unsettled or open transactions. The Funds manage counterparty credit risk by entering into transactions only with counterparties that the Manager believes have the financial resources to honor their obligations and by monitoring the financial stability of those counterparties. Financial assets, which potentially expose the Funds to market, issuer and counterparty credit risks, consist principally of financial instruments and receivables due from counterparties. The extent of the Funds’ exposure to market, issuer and counterparty credit risks with respect to these financial assets is approximately their value recorded in the Statements of Assets and Liabilities, less any collateral held by the Funds.
A derivative contract may suffer a mark-to-market loss if the value of the contract decreases due to an unfavorable change in the market rates or values of the underlying instrument. Losses can also occur if the counterparty does not perform under the contract.
With exchange-traded futures, there is less counterparty credit risk to the Funds since the exchange or clearinghouse, as counterparty to such instruments, guarantees against a possible default. The clearinghouse stands between the buyer and the seller of the contract; therefore, credit risk is limited to failure of the clearinghouse. While offset rights may exist under applicable law, a Fund does not have a contractual right of offset against a clearing broker or clearinghouse in the event of a default (including the bankruptcy or insolvency). Additionally, credit risk exists in exchange-traded futures with respect to initial and variation margin that is held in a clearing broker’s customer accounts. While clearing brokers are required to segregate customer margin from their own assets, in the event that a clearing broker becomes insolvent or goes into bankruptcy and at that time there is a shortfall in the aggregate amount of margin held by the clearing broker for all its clients, typically the shortfall would be allocated on a pro rata basis across all the clearing broker’s customers, potentially resulting in losses to the Funds.
Concentration Risk: Certain Funds invest a substantial amount of their assets in issuers located in a single country or a limited number of countries. When the Funds concentrate their investments in this manner, it assumes the risk that economic, political and social conditions in those countries may have a significant impact on their investment performance. Foreign issuers may not be subject to the same uniform accounting, auditing and financial reporting standards and practices as used in the United States. Foreign securities markets may also be less liquid, more volatile and less subject to governmental supervision not typically associated with investing in U.S. securities. Investment percentages in specific countries are presented in the Schedules of Investments.
Asia ex Japan Index invests a significant portion of its assets in securities of issuers located in Asia or with significant exposure to Asian issuers or countries. The Asian financial markets have recently experienced volatility and adverse trends due to concerns in several Asian countries regarding monetary policy, government intervention in the markets, rising government debt levels or economic downturns. These events may spread to other countries in Asia and may affect the value and liquidity of certain of the Fund’s investments.
| | | | | | |
| | | | | | | |
| 118 | | BLACKROCK FUNDS | | JANUARY 31, 2017 | | |
| | | | |
| Notes to Financial Statements (continued) | | |
As of period end, the Funds’ investments had the following industry classifications:
| | | | |
| Asia ex Japan Index | | | |
| Industry | | Percent of
Net Assets | |
Banks | | | 15% | |
Internet Software & Services | | | 7 | |
Semiconductors & Semiconductor Equipment | | | 7 | |
Technology, Hardware, Storage & Peripherals | | | 6 | |
Real Estate Management & Development | | | 6 | |
Insurance | | | 5 | |
Other1 | | | 54 | |
| | 1 | | All other industries held were less than 5% of net assets. |
| | | | |
| World Index | | | |
| Industry | | Percent of
Net Assets | |
Banks | | | 9% | |
Oil, Gas & Consumable Fuels | | | 6 | |
Pharmaceuticals | | | 6 | |
Other1 | | | 79 | |
| | 1 | | All other industries held were less than 5% of net assets. |
11. Capital Share Transactions:
Transactions in capital shares for each class were as follows:
| | | | | | | | | | | | | | | | | | | | |
| | | Six Months Ended
January 31, 2017 | | | | | | Year Ended
July 31, 2016 | |
| Midcap Index | | Shares | | | Amount | | | | | | Shares | | | Amount | |
| Institutional | | | | | | | | | | | | | | | | | | | | |
Shares sold | | | 8,827,982 | | | $ | 91,099,287 | | | | | | | | 237,113,373 | | | $ | 2,216,966,753 | |
Shares issued in reinvestment of distributions | | | 314,708 | | | | 3,259,248 | | | | | | | | 1,444,234 | | | | 13,368,058 | |
Shares redeemed | | | (651,532 | ) | | | (6,743,761 | ) | | | | | | | (220,141,149 | ) | | | (1,862,314,020 | ) |
| | | | | | | | | | | | |
Net increase | | | 8,491,158 | | | $ | 87,614,774 | | | | | | | | 18,416,458 | | | $ | 368,020,791 | |
| | | | | | | | | | | | |
| | | | | | | | | | | | | | | | | | | | |
| | | | | | | | | | | | Period November 30, 20151 to July 31, 2016 | |
| Investor A | | | | | | | | | | | | | |
Shares sold | | | 954,822 | | | $ | 9,725,724 | | | | | | | | 657,707 | | | $ | 6,354,693 | |
Shares issued in reinvestment of distributions | | | 16,248 | | | | 167,658 | | | | | | | | 2,552 | | | | 25,404 | |
Shares redeemed | | | (171,841 | ) | | | (1,782,426 | ) | | | | | | | (6,730 | ) | | | (65,778 | ) |
| | | | | | | | | | | | |
Net increase | | | 799,229 | | | $ | 8,110,956 | | | | | | | | 653,529 | | | $ | 6,314,319 | |
| | | | | | | | | | | | |
| | | | | | | | | | | | | | | | | | | | |
| | | | | | | | | | | | Year Ended
July 31, 2016 | |
| Class K | | | | | | | | | | | | | |
Shares sold | | | 35,084,483 | | | $ | 362,584,859 | | | | | | | | 246,629,571 | | | $ | 2,114,282,753 | |
Shares issued in reinvestment of distributions | | | 2,632,346 | | | | 27,178,380 | | | | | | | | 1,712,978 | | | | 16,791,258 | |
Shares redeemed | | | (27,888,239 | ) | | | (286,598,908 | ) | | | | | | | (35,884,959 | ) | | | (331,629,305 | ) |
| | | | | | | | | | | | |
Net increase | | | 9,828,590 | | | $ | 103,164,331 | | | | | | | | 212,457,590 | | | $ | 1,799,444,706 | |
| | | | | | | | | | | | |
Total Net Increase | | | 19,118,977 | | | $ | 198,890,061 | | | | | | | | 231,527,577 | | | $ | 2,173,779,816 | |
| | | | | | | | | | | | |
| | | | | | | | | | | | | | | | | | | | |
| | | | | | | | | | | | Year Ended
July 31, 2016 | |
| Asia ex Japan Index | | | | | | | | | | | Shares | | | Amount | |
| Institutional | | | | | | | | | | | | | | | |
Shares sold | | | 11,008 | | | $ | 98,275 | | | | | | | | 285,722 | | | $ | 2,440,000 | |
Shares issued in reinvestment of distributions | | | 8 | | | | 72 | | | | | | | | — | | | | — | |
Shares redeemed | | | — | | | | (1 | ) | | | | | | | (285,722 | ) | | | (2,180,061 | ) |
| | | | | | | | | | | | |
Net increase (decrease) | | | 11,016 | | | $ | 98,346 | | | | | | | | — | | | $ | 259,939 | |
| | | | | | | | | | �� | | |
| | | | | | |
| | | | | | | |
| | BLACKROCK FUNDS | | JANUARY 31, 2017 | | 119 |
| | | | |
| Notes to Financial Statements (continued) | | |
| | | | | | | | | | | | | | | | | | | | |
| | | Six Months Ended
January 31, 2017 | | | | | | Period
November 30, 20151
to July 31, 2016 | |
| Asia ex Japan Index (concluded) | | Shares | | | Amount | | | | | | Shares | | | Amount | |
| Class K | | | | | | | | | | | | | | | | | | | | |
Shares sold | | | 3,954,270 | | | $ | 37,428,729 | | | | | | | | 297,378 | | | $ | 2,280,061 | |
Shares issued in reinvestment of distributions | | | 18,189 | | | | 165,519 | | | | | | | | 84 | | | | 689 | |
Shares redeemed | | | (52,056 | ) | | | (485,274 | ) | | | | | | | — | | | | — | |
| | | | | | | | | | | | |
Net increase | | | 3,920,403 | | | $ | 37,108,974 | | | | | | | | 297,462 | | | $ | 2,280,750 | |
| | | | | | | | | | | | |
Total Net Increase | | | 3,931,419 | | | $ | 37,207,320 | | | | | | | | 297,462 | | | $ | 2,540,689 | |
| | | | | | | | | | | | |
| | | | | | | | | | | | | | | | | | | | |
| | | | | | | | | Year Ended
July 31, 2016 | |
| World Index | | | | | | | | | | | Shares | | | Amount | |
| Institutional | | | | | | | | | | | | | | | | | | | | |
Shares sold | | | 493,365 | | | $ | 5,019,010 | | | | | | | | 21,208,634 | | | $ | 188,624,722 | |
Shares issued in reinvestment of distributions | | | 522 | | | | 5,174 | | | | | | | | 137 | | | | 1,271 | |
Shares redeemed | | | (54 | ) | | | (534 | ) | | | | | | | (22,427,291 | ) | | | (196,625,224 | ) |
| | | | | | | | | | | | |
Net increase (decrease) | | | 493,833 | | | $ | 5,023,650 | | | | | | | | (1,218,520 | ) | | $ | (7,999,231 | ) |
| | | | | | | | | | | | |
| | | | | | | | | | | | | | | | | | | | |
| | | | | | | | | Period
November 30, 20151
to July 31, 2016 | |
| Class K | | | | | | | | | | | | | |
Shares sold | | | 15,093,175 | | | $ | 148,764,785 | | | | | | | | 38,543,171 | | | $ | 344,238,428 | |
Shares issued in reinvestment of distributions | | | 83,304 | | | | 815,906 | | | | | | | | 32,837 | | | | 315,857 | |
Shares redeemed | | | (5,336,343 | ) | | | (52,658,383 | ) | | | | | | | (5,461,417 | ) | | | (49,877,427 | ) |
| | | | | | | | | | | | |
Net increase | | | 9,840,136 | | | $ | 96,922,308 | | | | | | | | 33,114,591 | | | $ | 294,676,858 | |
| | | | | | | | | | | | |
Total Net Increase | | | 10,333,969 | | | $ | 101,945,958 | | | | | | | | 31,896,071 | | | $ | 286,677,627 | |
| | | | | | | | | | | | |
| | | | | | | | | | | | | | | | | | | | |
| | | | | | | | | Period
August 13, 20151
to July 31, 2016 | |
| Small/Mid Cap Index | | | | | | | | | | | Shares | | | Amount | |
| Institutional | | | | | | | | | | | | | | | | | | | | |
Shares sold | | | 204,344 | | | $ | 2,161,581 | | | | | | | | 7,655 | | | $ | 75,034 | |
Shares issued in reinvestment of distributions | | | 213 | | | | 2,306 | | | | | | | | — | | | | — | |
Shares redeemed | | | (159,840 | ) | | | (1,764,662 | ) | | | | | | | 10 | | | | 105 | |
| | | | | | | | | | | | |
Net increase | | | 44,717 | | | $ | 399,225 | | | | | | | | 7,665 | | | $ | 75,139 | |
| | | | | | | | | | | | |
| | | | | | | | | | | | | | | | | | | | |
| Investor A | | | | | | | | | | | | | | | | | | | | |
Shares sold | | | 947,166 | | | $ | 9,961,761 | | | | | | | | 563,013 | | | $ | 5,585,233 | |
Shares issued in reinvestment of distributions | | | 10,028 | | | | 106,805 | | | | | | | | (4,647 | ) | | | (45,447 | ) |
Shares redeemed | | | (34,852 | ) | | | (366,192 | ) | | | | | | | 970 | | | | 9,775 | |
| | | | | | | | | | | | |
Net increase | | | 922,342 | | | $ | 9,702,374 | | | | | | | | 559,336 | | | $ | 5,549,561 | |
| | | | | | | | | | | | |
| | | | | | | | | | | | | | | | | | | | |
| Class K | | | | | | | | | | | | | | | | | | | | |
Shares sold | | | 2,515,766 | | | $ | 27,061,280 | | | | | | | | 2,695,868 | | | $ | 26,115,996 | |
Shares issued in reinvestment of distributions | | | 28,345 | | | | 304,860 | | | | | | | | (52,699 | ) | | | (482,819 | ) |
Shares redeemed | | | (138,983 | ) | | | (1,502,896 | ) | | | | | | | 8,660 | | | | 84,202 | |
| | | | | | | | | | | | |
Net increase | | | 2,405,128 | | | $ | 25,863,244 | | | | | | | | 2,651,829 | | | $ | 25,717,379 | |
| | | | | | | | | | | | |
Total Net Increase | | | 3,372,187 | | | $ | 35,964,843 | | | | | | | | 3,218,830 | | | $ | 31,342,079 | |
| | | | | | | | | | | | |
| | | | | | |
| | | | | | | |
| 120 | | BLACKROCK FUNDS | | JANUARY 31, 2017 | | |
| | | | |
| Notes to Financial Statements (concluded) | | |
| | | | | | | | | | | | | | | | | | | | |
| | | Six Months Ended
January 31, 2017 | | | | | | Period
August 13, 20151
to July 31, 2016 | |
| Total Stock Market Index | | Shares | | | Amount | | | | | | Shares | | | Amount | |
| Institutional | | | | | | | | | | | | | | | | | | | | |
Shares sold | | | 1,397,637 | | | $ | 15,334,046 | | | | | | | | 287,334 | | | $ | 2,764,841 | |
Shares issued in reinvestment of distributions | | | 3,142 | | | | 33,618 | | | | | | | | 1,847 | | | | 18,263 | |
Shares redeemed | | | (25,379 | ) | | | (268,520 | ) | | | | | | | (56,648 | ) | | | (539,744 | ) |
| | | | | | | | | | | | |
Net increase | | | 1,375,400 | | | $ | 15,099,144 | | | | | | | | 232,533 | | | $ | 2,243,360 | |
| | | | | | | | | | | | |
| | | | | | | | | | | | | | | | | | | | |
| Investor A | | | | | | | | | | | | | | | | | | | | |
Shares sold | | | 2,967,658 | | | $ | 31,817,517 | | | | | | | | 857,708 | | | $ | 8,734,653 | |
Shares issued in reinvestment of distributions | | | 20,084 | | | | 214,341 | | | | | | | | 1,219 | | | | 12,649 | |
Shares redeemed | | | (164,698 | ) | | | (1,750,766 | ) | | | | | | | (8,784 | ) | | | (89,530 | ) |
| | | | | | | | | | | | |
Net increase | | | 2,823,044 | | | $ | 30,281,092 | | | | | | | | 850,143 | | | $ | 8,657,772 | |
| | | | | | | | | | | | |
| | | | | | | | | | | | | | | | | | | | |
| Class K | | | | | | | | | | | | | | | | | | | | |
Shares sold | | | 20,406,142 | | | $ | 219,045,099 | | | | | | | | 28,212,416 | | | $ | 282,128,652 | |
Shares issued in reinvestment of distributions | | | 373,842 | | | | 3,995,339 | | | | | | | | 50,987 | | | | 526,701 | |
Shares redeemed | | | (3,242,721 | ) | | | (34,336,907 | ) | | | | | | | (454,730 | ) | | | (4,586,864 | ) |
| | | | | | | | | | | | |
Net increase | | | 17,537,263 | | | $ | 188,703,531 | | | | | | | | 27,808,673 | | | $ | 278,068,489 | |
| | | | | | | | | | | | |
Total Net Increase | | | 21,735,707 | | | $ | 234,083,767 | | | | | | | | 28,891,349 | | | $ | 288,969,621 | |
| | | | | | | | | | | | |
| | 1 | | Commencement of operations |
At January 31, 2017, shares owned by BlackRock HoldCo 2, Inc., an affiliate of the Funds, were as follows:
| | | | | | | | | | | | |
| | | Institutional | | | Investor A | | | Class K | |
Midcap Index | | | — | | | | 10,414 | | | | — | |
Asia ex Japan Index | | | 1,505,527 | | | | — | | | | 11,739 | |
World Index | | | 12,595 | | | | — | | | | — | |
Small/Mid Cap Index | | | 2,000 | | | | 2,000 | | | | 996,000 | |
Total Stock Market Index | | | — | | | | — | | | | — | |
12. Subsequent Events:
Management’s evaluation of the impact of all subsequent events on the Funds’ financial statements was completed through the date the financial statements were issued and the following items were noted:
On February 24, 2017, the Board approved name changes for each Fund. The change is expected to be effective during the second quarter of 2017.
| | |
| Current Fund Name | | New Fund Name |
| BlackRock Midcap Index Fund | | iShares Russell Mid-Cap Index Fund |
| BlackRock MSCI Asia ex Japan Index Fund | | iShares MSCI Asia ex Japan Index Fund |
| BlackRock MSCI World Index Fund | | iShares MSCI Developed World Index Fund |
| BlackRock Small/Mid Cap Index Fund | | iShares Russell Small/Mid-Cap Index Fund |
| BlackRock Total Stock Market Index Fund | | iShares Total U.S. Stock Market Index Fund |
| | | | | | |
| | | | | | | |
| | BLACKROCK FUNDS | | JANUARY 31, 2017 | | 121 |
Rodney D. Johnson, Chair of the Board and Trustee
Susan J. Carter, Trustee
Collette Chilton, Trustee
Neil A. Cotty, Trustee
Cynthia A. Montgomery, Trustee
Joseph P. Platt, Trustee
Robert C. Robb, Jr., Trustee
Mark Stalnecker, Trustee
Kenneth L. Urish, Trustee
Claire A. Walton, Trustee
Frederick W. Winter, Trustee
Barbara G. Novick, Trustee
John M. Perlowski, Trustee, President and Chief Executive Officer
Thomas Callahan, Vice President
Jennifer McGovern, Vice President
Neal J. Andrews, Chief Financial Officer
Jay M. Fife, Treasurer
Charles Park, Chief Compliance Officer
Fernanda Piedra, Anti-Money Laundering Compliance Officer
Benjamin Archibald, Secretary
Effective December 31, 2016, David O. Beim and Dr. Matina S. Horner resigned as Trustees of the Trust.
| | | | | | |
| | | | |
Investment Adviser BlackRock Advisors, LLC Wilmington, DE 19809 | | Accounting Agent and Custodian State Street Bank and Trust Company Boston, MA 02110 | | Distributor BlackRock Investments, LLC New York, NY 10022 | | Legal Counsel Sidley Austin LLP New York, NY 10019 |
| | | |
| | Transfer Agent BNY Mellon Investment Servicing (US) Inc. Wilmington, DE 19809 | | Independent Registered Public Accounting Firm PricewaterhouseCoopers LLP Philadelphia, PA 19103 | | Address of the Trust 100 Bellevue Parkway Wilmington, DE 19809 |
Householding
The Funds will mail only one copy of shareholder documents, including prospectuses, annual and semi-annual reports and proxy statements, to shareholders with multiple accounts at the same address. This practice is commonly called “householding” and is intended to reduce expenses and eliminate duplicate mailings of shareholder documents. Mailings of your shareholder documents may be householded indefinitely unless you instruct us otherwise. If you do not want the mailing of these documents to be combined with those for other members of your household, please call the Funds at (800) 441-7762.
Availability of Quarterly Schedule of Investments
The Funds file their complete schedule of portfolio holdings with the SEC for the first and third quarters of each fiscal year on Form N-Q. The Funds’ Forms N-Q are available on the SEC’s website at http://www.sec.gov and may also be reviewed and copied at the SEC’s Public Reference Room in Washington, D.C. Information on the operation of the Public Reference Room or how to access documents on the SEC’s website without charge may be obtained by calling (800) SEC-0330. The Funds’ Forms N-Q may also be obtained upon request and without charge by calling (800) 441-7762.
| | | | | | |
| | | | | | | |
| 122 | | BLACKROCK FUNDS | | JANUARY 31, 2017 | | |
| | | | |
| Additional Information (concluded) | | |
|
| General Information (concluded) |
Availability of Proxy Voting Policies and Procedures
A description of the policies and procedures that the Funds use to determine how to vote proxies relating to portfolio securities is available upon request and without charge, (1) by calling (800) 441-7762; (2) at http://www.blackrock.com; and (3) on the SEC’s website at http://www.sec.gov.
Availability of Proxy Voting Record
Information about how the Funds voted proxies relating to securities held in the Funds’ portfolio during the most recent 12-month period ended June 30 is available upon request and without charge (1) at http://www.blackrock.com or by calling (800) 441-7762 and (2) on the SEC’s website at http://www.sec.gov.
BlackRock’s Mutual Fund Family
BlackRock offers a diverse lineup of open-end mutual funds crossing all investment styles and managed by experts in equity, fixed income and tax-exempt investing. Visit http://www.blackrock.com for more information.
Account Information
Call us at (800) 441-7762 from 8:00 AM to 6:00 PM ET on any business day to get information about your account balances, recent transactions and share prices. You can also reach us on the Web at http://www.blackrock.com.
Automatic Investment Plans
Investor Class shareholders who want to invest regularly can arrange to have $50 or more automatically deducted from their checking or savings account and invested in any of the BlackRock funds.
Systematic Withdrawal Plans
Investor Class shareholders can establish a systematic withdrawal plan and receive periodic payments of $50 or more from their BlackRock funds, as long as their account balance is at least $10,000.
Retirement Plans
Shareholders may make investments in conjunction with Traditional, Rollover, Roth, Coverdell, Simple IRAs, SEP IRAs and 403(b) Plans.
|
| BlackRock Privacy Principles |
BlackRock is committed to maintaining the privacy of its current and former fund investors and individual clients (collectively, “Clients”) and to safeguarding their non-public personal information. The following information is provided to help you understand what personal information BlackRock collects, how we protect that information and why in certain cases we share such information with select parties.
If you are located in a jurisdiction where specific laws, rules or regulations require BlackRock to provide you with additional or different privacy-related rights beyond what is set forth below, then BlackRock will comply with those specific laws, rules or regulations.
BlackRock obtains or verifies personal non-public information from and about you from different sources, including the following: (i) information we receive from you or, if applicable, your financial intermediary, on applications, forms or other documents; (ii) information about your transactions with us, our affiliates, or others; (iii) information we receive from a consumer reporting agency; and (iv) from visits to our websites.
BlackRock does not sell or disclose to non-affiliated third parties any non-public personal information about its Clients, except as permitted by law or as is necessary to respond to regulatory requests or to service Client accounts. These non-affiliated third parties are required to protect the confidentiality and security of this information and to use it only for its intended purpose.
We may share information with our affiliates to service your account or to provide you with information about other BlackRock products or services that may be of interest to you. In addition, BlackRock restricts access to non-public personal information about its Clients to those BlackRock employees with a legitimate business need for the information. BlackRock maintains physical, electronic and procedural safeguards that are designed to protect the non-public personal information of its Clients, including procedures relating to the proper storage and disposal of such information.
| | | | | | |
| | | | | | | |
| | BLACKROCK FUNDS | | JANUARY 31, 2017 | | 123 |
This report is intended for current holders. It is not authorized for use as an offer of sale or a solicitation of an offer to buy shares of a Fund unless preceded or accompanied by the Fund’s current prospectus. Past performance results shown in this report should not be considered a representation of future performance. Investment returns and principal value of shares will fluctuate so that shares, when redeemed, may be worth more or less than their original cost. Statements and other information herein are as dated and are subject to change.

| | |
| Index5-1/17-SAR | |  |
JANUARY 31, 2017
| | | | |
SEMI-ANNUAL REPORT (UNAUDITED) | | | |  |
BlackRock FundsSM
| Ø | BlackRock Min Vol EAFE Index Fund |
| Ø | BlackRock Min Vol USA Index Fund |
| Ø | BlackRock Multifactor International Index Fund |
| Ø | BlackRock Multifactor USA Index Fund |
|
| Not FDIC Insured • May Lose Value • No Bank Guarantee |
Dear Shareholder,
The 12 months ended January 31, 2017 was an exceptionally strong period for risk assets (such as stocks and high yield bonds), while higher-quality assets generated muted returns after struggling in the latter part of 2016. As the period began, worries about slowing growth in China and the instability of oil prices had global equity prices sliding. However, the broad market momentum shifted in the second half of 2016 as reflationary expectations in the United States helped drive a pick-up in global growth.
Markets were remarkably resilient during the period. Big surprises such as the United Kingdom’s vote to leave the European Union and the outcome of the U.S. presidential election brought spikes in equity market volatility, but they were ultimately short-lived. Instead, investors used the sell-offs to seize upon buying opportunities, allowing markets to quickly rebound. We believe this reinforces the case for taking the long view rather than reacting to short-term market noise.
The global reflationary theme — rising nominal growth, wages and inflation — was the dominant driver of asset returns during the period, outweighing significant political upheavals and uncertainty. This trend accelerated after the U.S. election and continued into the beginning of 2017, stoked by expectations for an extra boost to U.S. growth via fiscal policy.
Although economic momentum is gaining traction, the capacity for rapid global growth is restrained by structural factors including an aging population, low productivity growth and excess savings. A tempered economic growth trend and high valuations across most assets have set the stage for muted investment returns going forward.
Equity markets still have room to move, although the disparity between winners and losers is widening, making stock selection increasingly important. Fixed income investors are also facing challenges as bond markets recalibrate to accommodate rising rates and higher inflation expectations. And in a world where political risk and policy uncertainty abound, there is no lack of potential catalysts for higher volatility.
In this environment, investors need to think globally, extend their scope across a broad array of asset classes and be nimble as market conditions change. We encourage you to talk with your financial advisor and visit blackrock.com for further insight about investing in today’s markets.
Sincerely,
Rob Kapito
President, BlackRock Advisors, LLC
Rob Kapito
President, BlackRock Advisors, LLC
| | | | | | | | |
| Total Returns as of January 31, 2017 | |
| | | 6-month | | | 12-month | |
U.S. large cap equities
(S&P 500® Index) | | | 5.96 | % | | | 20.04 | % |
U.S. small cap equities
(Russell 2000® Index) | | | 12.43 | | | | 33.53 | |
International equities
(MSCI Europe, Australasia,
Far East Index) | | | 3.49 | | | | 12.03 | |
Emerging market equities
(MSCI Emerging Markets Index) | | | 4.92 | | | | 25.41 | |
3-month Treasury bills
(BofA Merrill Lynch 3-Month
U.S. Treasury Bill Index) | | | 0.20 | | | | 0.37 | |
U.S. Treasury securities
(BofA Merrill Lynch
10-Year U.S. Treasury
Index) | | | (7.87 | ) | | | (3.26 | ) |
U.S. investment grade bonds
(Bloomberg Barclays U.S.
Aggregate Bond Index) | | | (2.95 | ) | | | 1.45 | |
Tax-exempt municipal
bonds (S&P Municipal
Bond Index) | | | (2.94 | ) | | | 0.24 | |
U.S. high yield bonds
(Bloomberg Barclays U.S. Corporate High Yield 2% Issuer
Capped Index) | | | 6.09 | | | | 20.77 | |
| Past performance is no guarantee of future results. Index performance is shown for illustrative purposes only. You cannot invest directly in an index. | |
| | | | | | |
| | | | | | | |
| 2 | | THIS PAGE NOT PART OF YOUR FUND REPORT | | | | |

| | | | | | |
| | | | | | | |
| | BLACKROCK FUNDS | | JANUARY 31, 2017 | | 3 |
| | | | |
| Fund Summary as of January 31, 2017 | | BlackRock Min Vol EAFE Index Fund |
BlackRock Min Vol EAFE Index Fund’s (the “Fund”) investment objective is to seek to track the investment results of an index composed of developed markets equities that, in the aggregate, have lower volatility characteristics relative to the broader developed equity markets, excluding the United States and Canada.
On February 24, 2017, the Board of Trustees of BlackRock Funds approved a name change from “BlackRock Min Vol EAFE Index Fund” to “iShares Edge MSCI Min Vol EAFE Index Fund.” The change is expected to be effective during the second quarter of 2017.
|
| Portfolio Management Commentary |
How did the Fund perform?
| • | | For the six-month period ended January 31, 2017, the Fund’s Institutional Shares returned (4.91)% and Class K Shares returned (4.89)%. The benchmark MSCI EAFE Minimum Volatility (USD) Index returned (4.63)% for the same period. |
| • | | Returns for the Fund’s respective share classes differ from the benchmark index based on individual share-class expenses. |
Describe the market environment.
| • | | Markets had a strong start to the period as expectations of a near-term Fed rate hike diminished, Japan announced another round of fiscal stimulus, and the earnings season had a strong start. |
| • | | Despite multiple terrorist attacks in France and Germany and a failed coup in Turkey, markets continued to rally in August on the back of a strong earnings season and monetary stimulus from the Bank of England. |
| • | | Positive performance sustained in September as the Fed kept rates unchanged, the Bank of Japan announced additional monetary stimulus, and OPEC decided to limit output. This was all despite inaction from the European Central Bank (“ECB”), the crisis in Syria, and concerns around Wells Fargo and Deutsche Bank. However, weak macro data out of China, a terrorist attack in Thailand, flooding in Louisiana, and a more hawkish tone from Fed officials hindered some performance for the quarter. |
| • | | Developed markets rallied later in the period as global investors embraced the results of the U.S. election and strong macro data, although a stronger U.S. dollar subdued gains for U.S. investors. |
| • | | Global equity market performance was mixed in October as Asia and Europe outperformed the United States (in local currency terms) on improving economic data and supportive commentary from the Bank of England and ECB. Asian stocks continued to perform well in November as global investors absorbed the unexpected results of the U.S. election and the Bank of Japan’s first intervention after introducing target yield curve control in September. Europe lagged in anticipation of the Italian referendum, while energy stocks rallied as OPEC and Russia agreed on a production cut at the end of the month. |
| • | | Global equities rallied as strong global economic data and continued optimism around President Trump’s reflationary policies outweighed the effects of the ECB’s decision to reduce the pace of its asset purchases and diplomatic tensions between the United States and other major powers. |
Describe recent portfolio activity.
| • | | During the period, as changes were made to the composition of the MSCI EAFE Minimum Volatility (USD) Index, the Fund purchased and sold securities to maintain its objective of replicating the risks and return of the benchmark index. |
Describe portfolio positioning at period end.
| • | | The Fund remains positioned to match the risk characteristics of its benchmark index, irrespective of the market’s future direction. |
The views expressed reflect the opinions of BlackRock as of the date of this report and are subject to change based on changes in market, economic or other conditions. These views are not intended to be a forecast of future events and are no guarantee of future results.
| | | | | | |
| | | | | | | |
| 4 | | BLACKROCK FUNDS | | JANUARY 31, 2017 | | |
| | |
| | | BlackRock Min Vol EAFE Index Fund |
|
| Total Return Based on a $10,000 Investment |
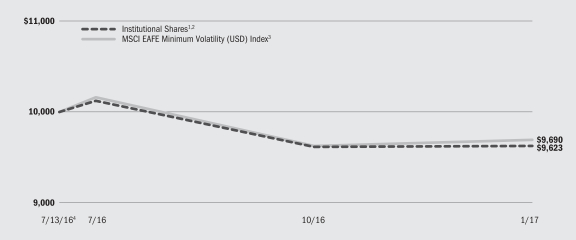
| | 1 | | Assuming transaction costs and other operating expenses, including investment advisory fees, if any. |
| | 2 | | The Fund generally invests at least 80% of its assets, plus the amount of any borrowing for investment purposes, in securities of the MSCI EAFE Minimum Volatility (USD) Index. |
| | 3 | | An index that aims to reflect the performance characteristics of a minimum variance strategy applied to the large- and mid-cap equity universe across developed markets around the world excluding the United States and Canada. The index is calculated by optimizing the MSCI EAFE Index, its parent index, in USD for the lowest absolute risk (within a given set of constraints). |
| | 4 | | Commencement of operations. |
|
| Performance Summary for the Period Ended January 31, 2017 |
| | | | | | | | |
| | | | | | Aggregate Total Returns5 | |
| | | 6-Month Total Returns | | | Since Inception6 | |
Institutional | | | (4.91 | )% | | | (3.77 | )% |
Class K | | | (4.89 | ) | | | (3.75 | ) |
MSCI EAFE Minimum Volatility (USD) Index | | | (4.63 | ) | | | (3.10 | ) |
| | 5 | | See “About Fund Performance” on page 14 for a detailed description of share classes, including any related fees. |
| | 6 | | The Fund commenced operations on July 13, 2016. |
| | | | Past performance is not indicative of future results. |
| | | | Performance results may include adjustments made for financial reporting purposes in accordance with U.S. generally accepted accounting principles. |
| | | | | | | | | | | | | | | | | | | | | | | | | | | | |
| | | Actual | | | Hypothetical2 | | | | |
| | | Beginning Account Value August 1, 2016 | | | Ending Account Value January 31, 2017 | | | Expenses Paid
During the Period1 | | | Beginning Account Value August 1, 2016 | | | Ending Account Value January 31, 2017 | | | Expenses Paid
During the Period1 | | | Annualized
Expense Ratio | |
Institutional | | $ | 1,000.00 | | | $ | 950.90 | | | $ | 1.13 | | | $ | 1,000.00 | | | $ | 1,024.05 | | | $ | 1.17 | | | | 0.23 | % |
Class K | | $ | 1,000.00 | | | $ | 951.10 | | | $ | 0.89 | | | $ | 1,000.00 | | | $ | 1,024.30 | | | $ | 0.92 | | | | 0.18 | % |
| | 1 | | For each class of the Fund, expenses are equal to the annualized expense ratio for the class, multiplied by the average account value over the period, multiplied by 184/365 (to reflect the one-half year period shown). |
| | 2 | | Hypothetical 5% return before expenses is calculated by prorating the number of days in the most recent fiscal half year divided by 365. |
| | | | See “Disclosure of Expenses” on page 14 for further information on how expenses were calculated. |
| | | | | | |
| | | | | | | |
| | BLACKROCK FUNDS | | JANUARY 31, 2017 | | 5 |
| | | | |
| | | BlackRock Min Vol EAFE Index Fund |
|
| Portfolio Information as of January 31, 2017 |
| | | | |
| Ten Largest Holdings | | Percent of
Net Assets | |
Nestle SA, Registered Shares | | | 1 | % |
Novartis AG, Registered Shares | | | 1 | |
Roche Holding AG | | | 1 | |
Danske Bank A/S | | | 1 | |
Swiss Re AG | | | 1 | |
CLP Holdings Ltd. | | | 1 | |
Hang Seng Bank Ltd. | | | 1 | |
Nippon Telegraph & Telephone Corp. | | | 1 | |
Reckitt Benckiser Group PLC | | | 1 | |
Otsuka Holdings Co. Ltd. | | | 1 | |
| | | | |
| Geographic Allocation | | Percent of
Net Assets | |
Japan | | | 29 | % |
United Kingdom | | | 15 | |
Switzerland | | | 13 | |
Hong Kong | | | 8 | |
France | | | 5 | |
Denmark | | | 5 | |
Australia | | | 4 | |
Germany | | | 4 | |
Singapore | | | 4 | |
Israel | | | 2 | |
Belgium | | | 2 | |
Sweden | | | 2 | |
Finland | | | 1 | |
Ireland | | | 1 | |
New Zealand | | | 1 | 1 |
Other | | | 2 | |
Other Assets Less Liabilities | | | 2 | |
Short-Term Securities | | | — | 2 |
| | 1 | | Other includes a less than 1% investment in each of the following countries: Italy, Luxembourg, Netherlands, Norway, Mexico and Spain. |
| | 2 | | Represents less than 1%. |
| | | | | | |
| | | | | | | |
| 6 | | BLACKROCK FUNDS | | JANUARY 31, 2017 | | |
| | | | |
| Fund Summary as of January 31, 2017 | | BlackRock Min Vol USA Index Fund |
BlackRock Min Vol USA Index Fund’s (the “Fund”) investment objective is to seek to track the investment results of an index composed of U.S. equities that, in the aggregate, have lower volatility characteristics relative to the broader U.S. equity market.
On February 24, 2017, the Board of Trustees of BlackRock Funds approved a name change from “BlackRock Min Vol USA Index Fund” to “iShares Edge MSCI Min Vol USA Index Fund.” The change is expected to be effective during the second quarter of 2017.
|
| Portfolio Management Commentary |
How did the Fund perform?
| • | | For the six-month period ended January 31, 2017, the Fund’s Institutional Shares returned (1.25)% and Class K Shares returned (1.23)%. The benchmark MSCI USA Minimum Volatility (USD) Index returned (1.15)% for the same period. |
| • | | Returns for the Fund’s respective share classes differ from the benchmark index based on individual share-class expenses. |
Describe the market environment.
| • | | Most of the major U.S. equity indexes saw gains at the beginning of the period, largely driven by a dovish Fed that kept rates unchanged and stronger-than-expected earnings releases versus analyst expectations. |
| • | | Investors’ focus on the September Fed meeting dominated market performance in the last month of the third quarter. While the Fed kept rates unchanged, several Fed officials expressed support of a rate hike later in the year. |
| • | | The U.S. presidential election and the Fed were front and center in 2016, especially in the fourth quarter. The fourth quarter started with a slight |
| | | increase in volatility as investors prepared for a possible Fed rate increase, and weighed probable outcomes of the presidential election. While many people were shocked by the Trump win, markets did not experience the same type of volatility seen after the Brexit vote, with major U.S. indexes posting solid gains in November. |
| • | | The performance of U.S. equities post-election suggests market participants are optimistic about President Trump’s pro-growth policies including lower taxes, deregulation and infrastructure spending. |
Describe recent portfolio activity.
| • | | During the period, as changes were made to the composition of the MSCI USA Minimum Volatility (USD) Index, the Fund purchased and sold securities to maintain its objective of replicating the risks and return of the benchmark index. |
Describe portfolio positioning at period end.
| • | | The Fund remains positioned to match the risk characteristics of its benchmark index, irrespective of the market’s future direction. |
The views expressed reflect the opinions of BlackRock as of the date of this report and are subject to change based on changes in market, economic or other conditions. These views are not intended to be a forecast of future events and are no guarantee of future results.
| | | | |
| Ten Largest Holdings | | Percent of
Net Assets | |
AT&T, Inc. | | | 2 | % |
Automatic Data Processing, Inc. | | | 2 | |
PepsiCo, Inc. | | | 1 | |
Becton Dickinson & Co. | | | 1 | |
Johnson & Johnson | | | 1 | |
Verizon Communications, Inc. | | | 1 | |
McDonald’s Corp. | | | 1 | |
Procter & Gamble Co. | | | 1 | |
Stryker Corp. | | | 1 | |
Visa, Inc. | | | 1 | |
| | | | |
| Sector Allocation | | Percent of
Net Assets | |
Health Care | | | 19 | % |
Information Technology | | | 16 | |
Consumer Staples | | | 14 | |
Financials | | | 10 | |
Utilities | | | 8 | |
Real Estate | | | 8 | |
Industrials | | | 8 | |
Consumer Discretionary | | | 8 | |
Telecommunication Services | | | 3 | |
Energy | | | 2 | |
Materials | | | 2 | |
Short-Term Securities | | | 2 | |
For Fund compliance purposes, the Fund’s industry classifications refer to one or more of the industry sub-classifications used by one or more widely recognized market indexes, and/or as defined by the investment adviser. These definitions may not apply for purposes of this report, which may combine such sector sub-classifications for reporting ease.
| | | | | | |
| | | | | | | |
| | BLACKROCK FUNDS | | JANUARY 31, 2017 | | 7 |
| | | | |
| | | BlackRock Min Vol USA Index Fund |
|
| Total Return Based on a $10,000 Investment |
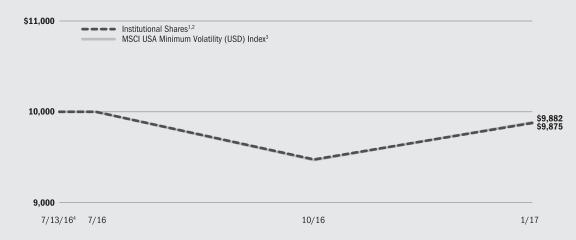
| | 1 | | Assuming transaction costs and other operating expenses, including investment advisory fees, if any. |
| | 2 | | The Fund generally invests at least 80% of its assets, plus the amount of any borrowing for investment purposes, in securities of the MSCI USA Minimum Volatility (USD) Index. |
| | 3 | | An index that aims to reflect the performance characteristics of a minimum variance strategy applied to the large- and mid-capitalization U.S. equity universe. The index is calculated by optimizing the MSCI USA Index, its parent index, in USD for the lowest absolute risk (within a given set of constraints). |
| | 4 | | Commencement of operations. |
|
| Performance Summary for the Period Ended January 31, 2017 |
| | | | | | | | |
| | | | | | Aggregate Total Returns5 | |
| | | 6-Month Total Returns | | | Since Inception6 | |
Institutional | | | (1.25 | )% | | | (1.25 | )% |
Class K | | | (1.23 | ) | | | (1.23 | ) |
MSCI USA Minimum Volatility (USD) Index | | | (1.15 | ) | | | (1.18 | ) |
| | 5 | | See “About Fund Performance” on page 14 for a detailed description of share classes, including any related fees. |
| | 6 | | The Fund commenced operations on July 13, 2016. |
| | | | Past performance is not indicative of future results. |
| | | | Performance results may include adjustments made for financial reporting purposes in accordance with U.S. generally accepted accounting principles. |
| | | | | | | | | | | | | | | | | | | | | | | | | | | | |
| | | Actual | | | Hypothetical2 | | | | |
| | | Beginning Account Value August 1, 2016 | | | Ending Account Value January 31, 2017 | | | Expenses Paid
During the Period1 | | | Beginning Account Value August 1, 2016 | | | Ending Account Value January 31, 2017 | | | Expenses Paid
During the Period1 | | | Annualized
Expense Ratio | |
Institutional | | $ | 1,000.00 | | | $ | 987.50 | | | $ | 0.85 | | | $ | 1,000.00 | | | $ | 1,024.35 | | | $ | 0.87 | | | | 0.18 | % |
Class K | | $ | 1,000.00 | | | $ | 987.70 | | | $ | 0.65 | | | $ | 1,000.00 | | | $ | 1,024.55 | | | $ | 0.66 | | | | 0.13 | % |
| | 1 | | For each class of the Fund, expenses are equal to the annualized expense ratio for the class, multiplied by the average account value over the period, multiplied by 184/365 (to reflect the one-half year period shown). |
| | 2 | | Hypothetical 5% return before expenses is calculated by prorating the number of days in the most recent fiscal half year divided by 365. |
| | | | See “Disclosure of Expenses” on page 14 for further information on how expenses were calculated. |
| | | | | | |
| | | | | | | |
| 8 | | BLACKROCK FUNDS | | JANUARY 31, 2017 | | |
| | | | |
| Fund Summary as of January 31, 2017 | | BlackRock Multifactor International Index Fund |
BlackRock Multifactor International Index Fund’s (the “Fund”) investment objective is to seek to track the investment results of an index composed of global developed market large- and mid-capitalization stocks, excluding the United States, that have favorable exposure to target style factors subject to constraints.
On February 24, 2017, the Board of Trustees of BlackRock Funds approved a name change from “BlackRock Multifactor International Index Fund” to “iShares Edge MSCI Multifactor Intl Index Fund.” The change is expected to be effective during the second quarter of 2017.
|
| Portfolio Management Commentary |
How did the Fund perform?
| • | | For the six-month period ended January 31, 2017, the Fund’s Institutional Shares returned 3.77% and Class K Shares returned 3.79%. The benchmark MSCI World ex USA Diversified Multiple-Factor Index returned 3.66% for the same period. |
| • | | Returns for the Fund’s respective share classes differ from the benchmark index based on individual share-class expenses. |
Describe the market environment.
| • | | Markets had a strong start to the period as expectations of a near-term Fed rate hike diminished, Japan announced another round of fiscal stimulus, and the earnings season had a strong start. |
| • | | Despite multiple terrorist attacks in France and Germany and a failed coup in Turkey, markets continued to rally in August on the back of a strong earnings season and monetary stimulus from the Bank of England. |
| • | | Positive performance sustained in September as the Fed kept rates unchanged, the Bank of Japan announced additional monetary stimulus, and OPEC decided to limit output. This was all despite inaction from the European Central Bank (“ECB”), the crisis in Syria, and concerns around Wells Fargo and Deutsche Bank. However, weak macro data out of China, a terrorist attack in Thailand, flooding in Louisiana, and a more hawkish tone from Fed officials hindered some performance for the quarter. |
| • | | Developed markets rallied later in the period as global investors embraced the results of the U.S. election and strong macro data, although a stronger U.S. dollar subdued gains for U.S. investors. |
| • | | Global equity market performance was mixed in October as Asia and Europe outperformed the United States (in local currency terms) on improving economic data and supportive commentary from the Bank of England and ECB. Asian stocks continued to perform well in November as global investors absorbed the unexpected results of the U.S. election and the Bank of Japan’s first intervention after introducing target yield curve control in September. Europe lagged in anticipation of the Italian referendum, while energy stocks rallied as OPEC and Russia agreed on a production cut at the end of the month. |
| • | | Global equities rallied as strong global economic data and continued optimism around President Trump’s reflationary policies outweighed the effects of the ECB’s decision to reduce the pace of its asset purchases and diplomatic tensions between the United States and other major powers. |
Describe recent portfolio activity.
| • | | During the period, as changes were made to the composition of the MSCI World ex USA Diversified Multiple-Factor Index, the Fund purchased and sold securities to maintain its objective of replicating the risks and return of the benchmark index. |
Describe portfolio positioning at period end.
| • | | The Fund remains positioned to match the risk characteristics of its benchmark index, irrespective of the market’s future direction. |
The views expressed reflect the opinions of BlackRock as of the date of this report and are subject to change based on changes in market, economic or other conditions. These views are not intended to be a forecast of future events and are no guarantee of future results.
| | | | | | |
| | | | | | | |
| | BLACKROCK FUNDS | | JANUARY 31, 2017 | | 9 |
| | | | |
| | | BlackRock Multifactor International Index Fund |
|
| Total Return Based on a $10,000 Investment |
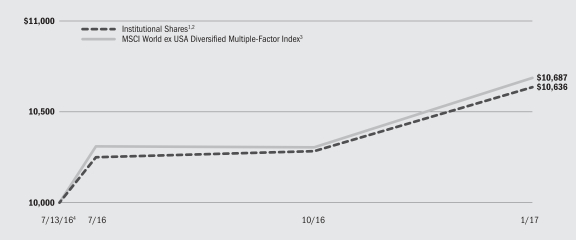
| | 1 | | Assuming transaction costs and other operating expenses, including investment advisory fees, if any. |
| | 2 | | The Fund generally invests at least 80% of its assets, plus the amount of any borrowing for investment purposes, in securities of the MSCI World ex USA Diversified Multiple-Factor Index. |
| | 3 | | An index that is based on the MSCI World ex USA Index, its parent index, which includes large- and mid-capitalization stocks across 22 of 23 developed markets, excluding the United States. The index aims to maximize exposure to four factors — value, momentum, quality and low size — while maintaining a risk profile similar to that of the underlying parent index. |
| | 4 | | Commencement of operations. |
|
| Performance Summary for the Period Ended January 31, 2017 |
| | | | | | | | |
| | | | | | Aggregate Total Returns5 | |
| | | 6-Month Total Returns | | | Since Inception6 | |
Institutional | | | 3.77 | % | | | 6.36 | % |
Class K | | | 3.79 | | | | 6.38 | |
MSCI World ex USA Diversified Multiple-Factor Index | | | 3.66 | | | | 6.87 | |
| | 5 | | See “About Fund Performance” on page 14 for a detailed description of share classes, including any related fees. |
| | 6 | | The Fund commenced operations on July 13, 2016. |
| | | | Past performance is not indicative of future results. |
| | | | Performance results may include adjustments made for financial reporting purposes in accordance with U.S. generally accepted accounting principles. |
| | | | | | | | | | | | | | | | | | | | | | | | | | | | |
| | | Actual | | | Hypothetical2 | | | | |
| | | Beginning Account Value August 1, 2016 | | | Ending Account Value January 31, 2017 | | | Expenses Paid
During the Period1 | | | Beginning Account Value August 1, 2016 | | | Ending Account Value January 31, 2017 | | | Expenses Paid
During the Period1 | | | Annualized
Expense Ratio | |
Institutional | | $ | 1,000.00 | | | $ | 1,037.70 | | | $ | 2.31 | | | $ | 1,000.00 | | | $ | 1,022.94 | | | $ | 2.29 | | | | 0.45 | % |
Class K | | $ | 1,000.00 | | | $ | 1,037.90 | | | $ | 2.05 | | | $ | 1,000.00 | | | $ | 1,023.19 | | | $ | 2.04 | | | | 0.40 | % |
| | 1 | | For each class of the Fund, expenses are equal to the annualized expense ratio for the class, multiplied by the average account value over the period, multiplied by 184/365 (to reflect the one-half year period shown). |
| | 2 | | Hypothetical 5% return before expenses is calculated by prorating the number of days in the most recent fiscal half year divided by 365. |
| | | | See “Disclosure of Expenses” on page 14 for further information on how expenses were calculated. |
| | | | | | |
| | | | | | | |
| 10 | | BLACKROCK FUNDS | | JANUARY 31, 2017 | | |
| | |
| | | BlackRock Multifactor International Index Fund |
|
| Portfolio Information as of January 31, 2017 |
| | | | |
| Ten Largest Holdings | | Percent of
Net Assets | |
Nippon Telegraph & Telephone Corp. | | | 2 | % |
adidas AG | | | 2 | |
Swiss Re AG | | | 2 | |
Koninklijke Ahold Delhaize NV | | | 2 | |
Actelion Ltd., Registered Shares | | | 2 | |
Fuji Heavy Industries Ltd. | | | 2 | |
BAE Systems PLC | | | 2 | |
ITOCHU Corp. | | | 1 | |
Infineon Technologies AG | | | 1 | |
Cie Generale des Etablissements Michelin | | | 1 | |
| | | | |
| Geographic Allocation | | Percent of
Net Assets | |
Japan | | | 22 | % |
United Kingdom | | | 18 | |
Switzerland | | | 12 | |
France | | | 9 | |
Germany | | | 8 | |
Australia | | | 6 | |
Canada | | | 5 | |
Netherlands | | | 4 | |
Hong Kong | | | 3 | |
Finland | | | 2 | |
Sweden | | | 2 | |
Denmark | | | 2 | |
Spain | | | 1 | |
Belgium | | | 1 | |
Israel | | | 1 | |
Singapore | | | 1 | |
Ireland | | | 1 | |
Other | | | — | 1 |
Other Assets Less Liabilities | | | 2 | |
Short-Term Securities | | | — | 2 |
| | 1 | | Other includes a less than 1% investment in each of the following countries: Luxembourg and Italy. |
| | 2 | | Represents less than 1%. |
| | | | | | |
| | | | | | | |
| | BLACKROCK FUNDS | | JANUARY 31, 2017 | | 11 |
| | | | |
| Fund Summary as of January 31, 2017 | | BlackRock Multifactor USA Index Fund |
BlackRock Multifactor USA Index Fund’s (the “Fund”) investment objective is to seek to track the investment results of an index composed of U.S. large- and mid-capitalization stocks that have favorable exposure to target style factors subject to constraints.
On February 24, 2017, the Board of Trustees of BlackRock Funds approved a name change from “BlackRock Multifactor USA Index Fund” to “iShares Edge MSCI Multifactor Intl Index Fund.” The change is expected to be effective during the second quarter of 2017.
|
| Portfolio Management Commentary |
How did the Fund perform?
| • | | For the six-month period ended January 31, 2017, the Fund’s Institutional Shares returned 9.47% and Class K Shares returned 9.50%. The benchmark MSCI USA Diversified Multiple-Factor Index returned 9.84% for the same period. |
| • | | Returns for the Fund’s respective share classes differ from the benchmark index based on individual share-class expenses. |
Describe the market environment.
| • | | Most of the major U.S. equity indexes saw gains at the beginning of the period, largely driven by a dovish Fed that kept rates unchanged and stronger-than-expected earnings releases versus analyst expectations. |
| • | | Investors’ focus on the September Fed meeting dominated market performance in the last month of the third quarter. While the Fed kept rates unchanged, several Fed officials expressed support of a rate hike later in the year. |
| • | | The U.S. presidential election and the Fed were front and center in 2016, especially in the fourth quarter. The fourth quarter started with a slight increase in volatility as investors prepared for a possible Fed rate increase, and weighed probable outcomes of the presidential election. While many people were shocked by the Trump win, markets did not experience the same type of volatility seen after the Brexit vote, with major U.S. indexes posting solid gains in November. |
| • | | The performance of U.S. equities post-election suggests market participants are optimistic about President Trump’s pro-growth policies including lower taxes, deregulation and infrastructure spending. |
Describe recent portfolio activity.
| • | | During the period, as changes were made to the composition of the MSCI USA Diversified Multiple-Factor Index, the Fund purchased and sold securities to maintain its objective of replicating the risks and return of the benchmark index. |
Describe portfolio positioning at period end.
| • | | The Fund remains positioned to match the risk characteristics of its benchmark index, irrespective of the market’s future direction. |
The views expressed reflect the opinions of BlackRock as of the date of this report and are subject to change based on changes in market, economic or other conditions. These views are not intended to be a forecast of future events and are no guarantee of future results.
| | | | |
| Ten Largest Holdings | | Percent of
Net Assets | |
AT&T, Inc. | | | 3 | % |
NVIDIA Corp. | | | 2 | |
General Motors Co. | | | 2 | |
Accenture PLC | | | 2 | |
Kimberly-Clark Corp. | | | 2 | |
Gilead Sciences, Inc. | | | 2 | |
Aetna, Inc. | | | 2 | |
Anthem, Inc. | | | 2 | |
Hewlett Packard Enterprise Co. | | | 2 | |
Phillips 66 | | | 2 | |
| | | | |
| Sector Allocation | | Percent of
Net Assets | |
Information Technology | | | 19 | % |
Health Care | | | 14 | |
Financials | | | 12 | |
Consumer Discretionary | | | 8 | |
Consumer Staples | | | 8 | |
Utilities | | | 8 | |
Industrials | | | 7 | |
Real Estate | | | 7 | |
Materials | | | 6 | |
Energy | | | 5 | |
Telecommunication Services | | | 4 | |
Short-Term Securities | | | 2 | |
For Fund compliance purposes, the Fund’s industry classifications refer to one or more of the industry sub-classifications used by one or more widely recognized market indexes, and/or as defined by the investment adviser. These definitions may not apply for purposes of this report, which may combine such sector sub-classifications for reporting ease.
| | | | | | |
| | | | | | | |
| 12 | | BLACKROCK FUNDS | | JANUARY 31, 2017 | | |
| | |
| | | BlackRock Multifactor USA Index Fund |
|
| Total Return Based on a $10,000 Investment |

| | 1 | | Assuming transaction costs and other operating expenses, including investment advisory fees, if any. |
| | 2 | | The Fund generally invests at least 80% of its assets, plus the amount of any borrowing for investment purposes, in securities of the MSCI USA Diversified Multiple-Factor Index. |
| | 3 | | An index that is based on a traditional market cap weighted parent index, the MSCI USA Index, which includes U.S. large- and mid-capitalization stocks. The index aims to maximize exposure to four factors — value, momentum, quality and low size — while maintaining a risk profile similar to that of the underlying parent index. |
| | 4 | | Commencement of operations. |
|
| Performance Summary for the Period Ended January 31, 2017 |
| | | | | | | | |
| | | | | | Aggregate Total Returns5 | |
| | | 6-Month Total Returns | | | Since Inception6 | |
Institutional | | | 9.47 | % | | | 10.79 | % |
Class K | | | 9.50 | | | | 10.81 | |
MSCI USA Diversified Multiple-Factor Index | | | 9.84 | | | | 11.12 | |
| | 5 | | See “About Fund Performance” on page 14 for a detailed description of share classes, including any related fees. |
| | 6 | | The Fund commenced operations on July 13, 2016. |
| | | | Past performance is not indicative of future results. |
| | | | Performance results may include adjustments made for financial reporting purposes in accordance with U.S. generally accepted accounting principles. |
| | | | | | | | | | | | | | | | | | | | | | | | | | | | |
| | | Actual | | | Hypothetical2 | | | | |
| | | Beginning Account Value August 1, 2016 | | | Ending Account Value January 31, 2017 | | | Expenses Paid
During the Period1 | | | Beginning Account Value August 1, 2016 | | | Ending Account Value January 31, 2017 | | | Expenses Paid
During the Period1 | | | Annualized
Expense Ratio | |
Institutional | | $ | 1,000.00 | | | $ | 1,094.70 | | | $ | 1.85 | | | $ | 1,000.00 | | | $ | 1,023.44 | | | $ | 1.79 | | | | 0.35 | % |
Class K | | $ | 1,000.00 | | | $ | 1,095.00 | | | $ | 1.58 | | | $ | 1,000.00 | | | $ | 1,023.69 | | | $ | 1.53 | | | | 0.30 | % |
| | 1 | | For each class of the Fund, expenses are equal to the annualized expense ratio for the class, multiplied by the average account value over the period, multiplied by 184/365 (to reflect the one-half year period shown). |
| | 2 | | Hypothetical 5% return before expenses is calculated by prorating the number of days in the most recent fiscal half year divided by 365. |
| | | | See “Disclosure of Expenses” on page 14 for further information on how expenses were calculated. |
| | | | | | |
| | | | | | | |
| | BLACKROCK FUNDS | | JANUARY 31, 2017 | | 13 |
| • | | Institutional and Class K Shares are not subject to any sales charge. These shares bear no ongoing distribution or service fees and are available only to certain eligible investors. |
Performance information reflects past performance and does not guarantee future results. Current performance may be lower or higher than performance data quoted. Refer to www.blackrock.com/funds to obtain the performance data current to the most recent month end. Performance results do not reflect the deduction of taxes that a shareholder would pay on fund distributions or the redemption of fund shares. Figures shown in the performance tables on the previous pages assume reinvestment of all distributions, if any, at net asset value (“NAV”) on the ex-dividend date. Investment return and principal value of shares will fluctuate so that
shares, when redeemed, may be worth more or less than their original cost. Distributions paid to each class of shares will vary because of the different levels of service, distribution and transfer agency fees applicable to each class, which are deducted from the income available to be paid to shareholders.
BlackRock Advisors, LLC (the “Manager”), the Funds’ investment adviser, has contractually agreed to waive and/or reimburse a portion of each Fund’s expenses. Without such waiver and/or reimbursement, each Fund’s performance would have been lower. The Manager is under no obligation to continue waiving and/or reimbursing its fees after the applicable termination date of such agreement. See Note 5 of the Notes to Financial Statements for additional information on waivers and/or reimbursements.
Shareholders of the Funds may incur the following charges: (a) transactional expenses, such as sales charges; and (b) operating expenses, including investment advisory fees, service and distribution fees, including 12b-1 fees, acquired fund fees and expenses and other fund expenses. The expense examples shown on previous pages, which are based on a hypothetical investment of $1,000 invested on August 1, 2016 and held through January 31, 2017, are intended to assist shareholders both in calculating expenses based on an investment in each Fund and in comparing these expenses with similar costs of investing in other mutual funds.
The expense examples provide information about actual account values and actual expenses. In order to estimate the expenses a shareholder paid during the period covered by this report, shareholders can divide their account value by $1,000 and then multiply the result by the number corresponding to their Fund and share class under the heading entitled “Expenses Paid During the Period.”
The expense examples also provide information about hypothetical account values and hypothetical expenses based on a Fund’s actual expense ratio and an assumed rate of return of 5% per year before expenses. In order to assist shareholders in comparing the ongoing expenses of investing in the Funds and other funds, compare the 5% hypothetical examples with the 5% hypothetical examples that appear in shareholder reports of other funds.
The expenses shown in the expense examples are intended to highlight shareholders’ ongoing costs only and do not reflect any transactional expenses, such as sales charges, if any. Therefore, the hypothetical examples are useful in comparing ongoing expenses only, and will not help shareholders determine the relative total expenses of owning different funds. If these transactional expenses were included, shareholder expenses would have been higher.
|
| Derivative Financial Instruments |
The Funds may invest in various derivative financial instruments. These instruments are used to obtain exposure to a security, commodity, index, market, and/or other asset without owning or taking physical custody of securities, commodities and/or other referenced assets or to manage market, equity, credit, interest rate, foreign currency exchange rate, commodity and/or other risks. Derivative financial instruments may give rise to a form of economic leverage and involve risks, including the imperfect correlation between the value of a derivative financial instrument and the underlying asset, possible default of the counterparty to the
transaction or illiquidity of the instrument. The Funds’ successful use of a derivative financial instrument depends on the investment adviser’s ability to predict pertinent market movements accurately, which cannot be assured. The use of these instruments may result in losses greater than if they had not been used, may limit the amount of appreciation a Fund can realize on an investment and/or may result in lower distributions paid to shareholders. The Funds’ investments in these instruments, if any, are discussed in detail in the Notes to Financial Statements.
| | | | | | |
| | | | | | | |
| 14 | | BLACKROCK FUNDS | | JANUARY 31, 2017 | | |
| | |
Schedule of Investments January 31, 2017 (Unaudited) | | BlackRock Min Vol EAFE Index Fund (Percentages shown are based on Net Assets) |
| | | | | | | | |
| Common Stocks | | Shares | | | Value | |
Australia — 4.2% | |
AGL Energy Ltd. | | | 27,724 | | | $ | 475,400 | |
Commonwealth Bank of Australia | | | 2,351 | | | | 145,668 | |
CSL Ltd. | | | 1,629 | | | | 138,872 | |
Newcrest Mining Ltd. | | | 8,563 | | | | 140,426 | |
Scentre Group | | | 52,724 | | | | 175,935 | |
Sonic Healthcare Ltd. | | | 22,266 | | | | 351,164 | |
Stockland | | | 23,151 | | | | 76,397 | |
Telstra Corp. Ltd. | | | 265,674 | | | | 1,007,978 | |
Transurban Group (a) | | | 35,546 | | | | 275,058 | |
Vicinity Centres | | | 77,863 | | | | 168,951 | |
Wesfarmers Ltd. | | | 20,581 | | | | 628,733 | |
Westfield Corp. | | | 32,105 | | | | 214,024 | |
| | | | | | | | |
| | | | | 3,798,606 | |
Belgium — 2.0% | |
Ageas | | | 2,459 | | | | 105,288 | |
Colruyt SA | | | 9,143 | | | | 447,469 | |
Groupe Bruxelles Lambert SA | | | 2,822 | | | | 240,498 | |
KBC Group NV | | | 866 | | | | 56,244 | |
Proximus | | | 19,762 | | | | 567,558 | |
UCB SA | | | 5,229 | | | | 361,168 | |
| | | | | | | | |
| | | | | 1,778,225 | |
Denmark — 4.6% | |
Chr Hansen Holding A/S | | | 6,807 | | | | 415,526 | |
Coloplast A/S, Class B | | | 5,097 | | | | 365,482 | |
Danske Bank A/S | | | 38,442 | | | | 1,282,213 | |
DONG Energy A/S (b)(c) | | | 12,023 | | | | 455,908 | |
DSV A/S | | | 9,264 | | | | 450,504 | |
ISS A/S | | | 11,487 | | | | 409,033 | |
TDC A/S (b) | | | 38,495 | | | | 202,834 | |
Tryg A/S | | | 13,911 | | | | 266,162 | |
William Demant Holding A/S (b) | | | 17,122 | | | | 320,593 | |
| | | | | | | | |
| | | | | 4,168,255 | |
Finland — 1.3% | |
Elisa OYJ | | | 8,574 | | | | 288,923 | |
Neste Oil OYJ | | | 3,946 | | | | 137,294 | |
Orion OYJ, Class B | | | 4,890 | | | | 227,623 | |
Sampo OYJ, Class A | | | 11,948 | | | | 553,294 | |
| | | | | | | | |
| | | | | 1,207,134 | |
France — 4.8% | |
Aeroports de Paris | | | 3,849 | | | | 427,113 | |
Air Liquide SA | | | 1,988 | | | | 214,632 | |
AtoS SE | | | 1,014 | | | | 107,884 | |
Danone SA | | | 4,915 | | | | 308,115 | |
Dassault Systemes SA | | | 4,857 | | | | 375,995 | |
Essilor International SA | | | 1,195 | | | | 140,193 | |
Hermes International | | | 388 | | | | 168,620 | |
Iliad SA | | | 685 | | | | 146,488 | |
L’Oreal SA | | | 2,764 | | | | 502,542 | |
Sanofi | | | 4,990 | | | | 401,079 | |
SCOR SE | | | 7,222 | | | | 244,421 | |
SEB SA | | | 1,008 | | | | 126,762 | |
SES SA | | | 8,030 | | | | 156,141 | |
Sodexo SA | | | 3,213 | | | | 355,301 | |
Thales SA | | | 4,834 | | | | 453,500 | |
Vivendi SA | | | 7,863 | | | | 144,176 | |
| | | | | | | | |
| | | | | 4,272,962 | |
| | | | | | | | |
| Common Stocks | | Shares | | | Value | |
Germany — 4.0% | |
adidas AG | | | 288 | | | $ | 45,448 | |
Beiersdorf AG | | | 4,451 | | | | 394,887 | |
Fresenius Medical Care AG & Co. KGaA | | | 6,715 | | | | 548,110 | |
Fresenius SE & Co. KGaA | | | 2,505 | | | | 198,257 | |
Henkel AG & Co. KGaA | | | 4,021 | | | | 424,305 | |
MAN SE | | | 5,040 | | | | 522,507 | |
Merck KGaA | | | 2,219 | | | | 244,826 | |
Muenchener Rueckversicherungs AG, Registered Shares | | | 2,640 | | | | 497,128 | |
SAP SE | | | 2,956 | | | | 270,327 | |
Symrise AG | | | 720 | | | | 43,353 | |
TUI AG | | | 27,747 | | | | 406,651 | |
| | | | | | | | |
| | | | | 3,595,799 | |
Hong Kong — 8.2% | |
Cheung Kong Infrastructure Holdings Ltd. | | | 90,000 | | | | 723,753 | |
CLP Holdings Ltd. | | | 126,500 | | | | 1,234,714 | |
Hang Seng Bank Ltd. | | | 60,300 | | | | 1,229,093 | |
HK Electric Investments & HK Electric Investments Ltd. (a)(c) | | | 379,000 | | | | 316,355 | |
HKT Trust & HKT Ltd. (a) | | | 377,000 | | | | 526,637 | |
Hong Kong & China Gas Co. Ltd. | | | 316,000 | | | | 594,965 | |
Link REIT | | | 39,500 | | | | 269,926 | |
MTR Corp. Ltd. | | | 189,500 | | | | 962,689 | |
PCCW Ltd. | | | 422,000 | | | | 256,139 | |
Power Assets Holdings Ltd. | | | 93,000 | | | | 891,113 | |
Yue Yuen Industrial Holdings Ltd. | | | 93,500 | | | | 342,239 | |
| | | | | | | | |
| | | | | 7,347,623 | |
Ireland — 1.2% | |
Kerry Group PLC, Class A | | | 8,285 | | | | 582,232 | |
Paddy Power Betfair PLC | | | 807 | | | | 84,328 | |
Ryanair Holdings PLC — ADR (b) | | | 4,415 | | | | 369,359 | |
| | | | | | | | |
| | | | | 1,035,919 | |
Israel — 2.1% | |
Azrieli Group Ltd. | | | 4,684 | | | | 213,801 | |
Bank Hapoalim BM | | | 121,251 | | | | 732,619 | |
Bank Leumi Le-Israel BM (b) | | | 115,528 | | | | 477,837 | |
Bezeq The Israeli Telecommunication Corp. Ltd. | | | 95,643 | | | | 167,082 | |
Mizrahi Tefahot Bank Ltd. | | | 19,902 | | | | 306,547 | |
| | | | | | | | |
| | | | | 1,897,886 | |
Italy — 0.5% | |
Snam SpA | | | 112,153 | | | | 426,867 | |
Japan — 29.0% | |
ABC-Mart, Inc. | | | 3,500 | | | | 203,767 | |
Ajinomoto Co., Inc. | | | 11,500 | | | | 226,982 | |
ANA Holdings, Inc. | | | 157,000 | | | | 466,336 | |
Aozora Bank Ltd. | | | 22,000 | | | | 80,123 | |
Asahi Group Holdings Ltd. | | | 3,000 | | | | 105,569 | |
Astellas Pharma, Inc. | | | 46,100 | | | | 618,744 | |
Benesse Holdings, Inc. | | | 9,500 | | | | 276,504 | |
Bridgestone Corp. | | | 4,600 | | | | 168,709 | |
Canon, Inc. | | | 32,100 | | | | 949,723 | |
Chugai Pharmaceutical Co. Ltd. | | | 2,900 | | | | 85,227 | |
Daiichi Sankyo Co. Ltd. | | | 16,400 | | | | 366,918 | |
Daito Trust Construction Co. Ltd. | | | 600 | | | | 83,880 | |
Daiwa House REIT Investment Corp. | | | 50 | | | | 125,904 | |
East Japan Railway Co. | | | 5,500 | | | | 498,064 | |
Eisai Co. Ltd. | | | 3,600 | | | | 198,434 | |
FamilyMart UNY Holdings Co. Ltd. | | | 6,800 | | | | 430,843 | |
| | |
| ADR | | American Depositary Receipts |
| REIT | | Real Estate Investment Trust |
See Notes to Financial Statements.
| | | | | | |
| | | | | | | |
| | BLACKROCK FUNDS | | JANUARY 31, 2017 | | 15 |
| | |
Schedule of Investments (continued) | | BlackRock Min Vol EAFE Index Fund |
| | | | | | | | |
| Common Stocks | | Shares | | | Value | |
Japan (continued) | |
Hankyu Hanshin Holdings, Inc. | | | 1,700 | | | $ | 57,681 | |
Japan Airlines Co. Ltd. | | | 17,100 | | | | 544,518 | |
Japan Prime Realty Investment Corp. | | | 102 | | | | 409,327 | |
Japan Real Estate Investment Corp. | | | 57 | | | | 323,897 | |
Japan Retail Fund Investment Corp. | | | 242 | | | | 517,416 | |
Kajima Corp. | | | 51,000 | | | | 355,461 | |
Kao Corp. | | | 6,400 | | | | 316,702 | |
KDDI Corp. | | | 12,700 | | | | 341,228 | |
Keikyu Corp. | | | 49,000 | | | | 574,620 | |
Keyence Corp. | | | 200 | | | | 77,673 | |
Kirin Holdings Co. Ltd. | | | 13,900 | | | | 227,762 | |
Kyowa Hakko Kirin Co. Ltd. | | | 2,600 | | | | 35,208 | |
Lawson, Inc. | | | 9,300 | | | | 678,834 | |
LINE Corp. (b) | | | 4,100 | | | | 131,306 | |
McDonald’s Holdings Co. Japan Ltd. | | | 9,500 | | | | 249,762 | |
Meiji Holdings Co. Ltd. | | | 4,300 | | | | 333,063 | |
Miraca Holdings, Inc. | | | 4,600 | | | | 209,648 | |
Mitsubishi Tanabe Pharma Corp. | | | 32,100 | | | | 643,834 | |
Mizuho Financial Group, Inc. | | | 259,400 | | | | 481,339 | |
Nagoya Railroad Co. Ltd. | | | 57,000 | | | | 280,594 | |
NH Foods Ltd. | | | 14,600 | | | | 397,350 | |
Nippon Building Fund, Inc. | | | 39 | | | | 223,975 | |
Nippon Prologis REIT, Inc. | | | 212 | | | | 443,002 | |
Nippon Telegraph & Telephone Corp. | | | 27,800 | | | | 1,227,990 | |
Nissin Foods Holdings Co. Ltd. | | | 7,900 | | | | 416,908 | |
Nitori Holdings Co. Ltd. | | | 2,500 | | | | 280,179 | |
Nomura Real Estate Master Fund, Inc. | | | 450 | | | | 701,129 | |
Nomura Research Institute Ltd. | | | 5,860 | | | | 200,227 | |
NTT Data Corp. | | | 2,500 | | | | 125,993 | |
NTT Docomo, Inc. | | | 32,000 | | | | 765,122 | |
Obayashi Corp. | | | 22,600 | | | | 215,292 | |
Oracle Corp. Japan | | | 5,200 | | | | 291,360 | |
Oriental Land Co. Ltd. | | | 3,600 | | | | 197,278 | |
Osaka Gas Co. Ltd. | | | 60,000 | | | | 224,905 | |
Otsuka Corp. | | | 3,300 | | | | 169,831 | |
Otsuka Holdings Co. Ltd. | | | 24,200 | | | | 1,114,845 | |
Park24 Co. Ltd. | | | 7,400 | | | | 204,245 | |
Recruit Holdings Co. Ltd. | | | 20,600 | | | | 901,778 | |
Sankyo Co. Ltd. | | | 6,400 | | | | 213,688 | |
Santen Pharmaceutical Co. Ltd. | | | 10,500 | | | | 131,942 | |
Secom Co. Ltd. | | | 5,400 | | | | 390,515 | |
Seven & i Holdings Co. Ltd. | | | 1,025 | | | | 40,927 | |
Shimamura Co. Ltd. | | | 1,000 | | | | 131,068 | |
Shionogi & Co. Ltd. | | | 3,600 | | | | 173,384 | |
Suntory Beverage & Food Ltd. | | | 15,300 | | | | 650,978 | |
Taisei Corp. | | | 23,000 | | | | 163,382 | |
Taisho Pharmaceutical Holdings Co. Ltd. | | | 4,300 | | | | 363,460 | |
Takeda Pharmaceutical Co. Ltd. | | | 16,200 | | | | 678,547 | |
Terumo Corp. | | | 7,100 | | | | 262,656 | |
Tobu Railway Co. Ltd. | | | 37,000 | | | | 187,783 | |
Toho Gas Co. Ltd. | | | 7,000 | | | | 52,365 | |
Tokyo Gas Co. Ltd. | | | 11,000 | | | | 48,816 | |
TonenGeneral Sekiyu KK | | | 10,000 | | | | 117,601 | |
Toray Industries, Inc. | | | 51,000 | | | | 441,605 | |
Toyo Suisan Kaisha Ltd. | | | 12,700 | | | | 453,154 | |
Toyota Motor Corp. | | | 3,100 | | | | 180,274 | |
Tsuruha Holdings, Inc. | | | 1,000 | | | | 94,002 | |
United Urban Investment Corp. | | | 349 | | | | 556,658 | |
USS Co. Ltd. | | | 2,600 | | | | 45,633 | |
West Japan Railway Co. | | | 3,600 | | | | 234,550 | |
Yamada Denki Co. Ltd. | | | 43,900 | | | | 241,863 | |
Yamaguchi Financial Group, Inc. | | | 14,000 | | | | 152,532 | |
Yamato Holdings Co. Ltd. | | | 14,600 | | | | 294,239 | |
| | | | | | | | |
| | | | | 26,078,631 | |
Luxembourg — 0.5% | |
RTL Group SA (b) | | | 5,534 | | | | 422,783 | |
| | | | | | | | |
| Common Stocks | | Shares | | | Value | |
Mexico — 0.1% | |
Fresnillo PLC | | | 3,322 | | | $ | 60,980 | |
Netherlands — 0.2% | |
Koninklijke Ahold Delhaize NV | | | 2,875 | | | | 61,248 | |
NN Group NV | | | 4,261 | | | | 150,907 | |
| | | | | | | | |
| | | | | 212,155 | |
New Zealand — 0.6% | |
Auckland International Airport Ltd. | | | 9,136 | | | | 45,825 | |
Contact Energy Ltd. | | | 36,969 | | | | 129,549 | |
Mercury NZ Ltd. | | | 22,216 | | | | 50,064 | |
Meridian Energy Ltd. | | | 50,291 | | | | 97,166 | |
Ryman Healthcare Ltd. | | | 18,946 | | | | 121,099 | |
Spark New Zealand Ltd. | | | 28,947 | | | | 74,587 | |
| | | | | | | | |
| | | | | | | | 518,290 | |
Norway — 0.2% | |
Gjensidige Forsikring ASA | | | 8,599 | | | | 147,979 | |
Singapore — 3.8% | |
DBS Group Holdings Ltd. | | | 60,900 | | | | 823,366 | |
Oversea-Chinese Banking Corp. Ltd. | | | 114,100 | | | | 761,002 | |
SATS, Ltd. | | | 19,400 | | | | 72,680 | |
Singapore Airlines Ltd. | | | 80,900 | | | | 569,781 | |
Singapore Press Holdings Ltd. | | | 1,900 | | | | 4,659 | |
Singapore Telecommunications Ltd. | | | 259,200 | | | | 712,643 | |
StarHub Ltd. | | | 68,300 | | | | 143,802 | |
United Overseas Bank Ltd. | | | 23,550 | | | | 350,235 | |
| | | | | | | | |
| | | | | | | | 3,438,168 | |
Spain — 0.0% | |
Endesa SA | | | 1,937 | | | | 39,946 | |
Sweden — 1.6% | |
Hennes & Mauritz AB, Class B | | | 4,390 | | | | 125,607 | |
ICA Gruppen AB | | | 4,540 | | | | 148,361 | |
L E Lundbergforetagen AB, B Shares | | | 4,105 | | | | 264,126 | |
Skandinaviska Enskilda Banken AB, Class A | | | 5,835 | | | | 65,544 | |
Svenska Handelsbanken AB, Class A | | | 11,502 | | | | 171,710 | |
Swedbank AB, Class A | | | 5,804 | | | | 146,754 | |
Swedish Match AB | | | 5,003 | | | | 162,881 | |
TeliaSonera AB | | | 93,108 | | | | 377,687 | |
| | | | | | | | |
| | | | | | | | 1,462,670 | |
Switzerland — 13.5% | |
Baloise Holding AG, Registered Shares | | | 3,226 | | | | 415,389 | |
Barry Callebaut AG, Registered Shares (b) | | | 154 | | | | 190,556 | |
Givaudan SA, Registered Shares | | | 225 | | | | 405,639 | |
Kuehne & Nagel International AG, Registered Shares | | | 6,378 | | | | 872,689 | |
Lindt & Spruengli AG | | | 82 | | | | 455,131 | |
Lindt & Spruengli AG, Registered Shares | | | 5 | | | | 324,293 | |
Nestle SA, Registered Shares | | | 18,341 | | | | 1,343,744 | |
Novartis AG, Registered Shares | | | 17,633 | | | | 1,301,801 | |
Partners Group Holding AG | | | 735 | | | | 371,445 | |
Roche Holding AG | | | 5,473 | | | | 1,296,818 | |
Schindler Holding AG, Registered Shares | | | 382 | | | | 71,960 | |
Sonova Holding AG, Registered Shares | | | 6,034 | | | | 798,933 | |
Swiss Life Holding AG, Registered Shares (b) | | | 1,472 | | | | 446,881 | |
Swiss Prime Site AG, Registered Shares (b) | | | 7,826 | | | | 651,931 | |
Swiss Re AG | | | 13,689 | | | | 1,279,218 | |
Swisscom AG, Registered Shares | | | 2,228 | | | | 982,873 | |
Syngenta AG, Registered Shares | | | 704 | | | | 299,209 | |
Zurich Insurance Group AG (b) | | | 2,165 | | | | 623,463 | |
| | | | | | | | |
| | | | | 12,131,973 | |
United Kingdom — 15.2% | |
Admiral Group PLC | | | 5,755 | | | | 128,936 | |
AstraZeneca PLC | | | 13,287 | | | | 705,128 | |
British American Tobacco PLC | | | 8,980 | | | | 554,316 | |
BT Group PLC | | | 56,315 | | | | 215,969 | |
See Notes to Financial Statements.
| | | | | | |
| | | | | | | |
| 16 | | BLACKROCK FUNDS | | JANUARY 31, 2017 | | |
| | |
Schedule of Investments (continued) | | BlackRock Min Vol EAFE Index Fund |
| | | | | | | | |
| Common Stocks | | Shares | | | Value | |
United Kingdom (continued) | |
Compass Group PLC | | | 58,459 | | | $ | 1,040,397 | |
Diageo PLC | | | 24,893 | | | | 691,474 | |
Direct Line Insurance Group PLC | | | 86,885 | | | | 389,228 | |
GlaxoSmithKline PLC | | | 47,740 | | | | 922,574 | |
HSBC Holdings PLC | | | 124,943 | | | | 1,065,878 | |
Imperial Brands PLC | | | 11,105 | | | | 514,468 | |
Kingfisher PLC | | | 127,131 | | | | 539,390 | |
Merlin Entertainments PLC (c) | | | 20,908 | | | | 125,702 | |
National Grid PLC | | | 86,996 | | | | 1,019,000 | |
Randgold Resources Ltd. | | | 7,305 | | | | 621,810 | |
Reckitt Benckiser Group PLC | | | 13,546 | | | | 1,162,322 | |
RELX PLC | | | 41,512 | | | | 745,144 | |
Royal Mail PLC | | | 110,010 | | | | 571,321 | |
Severn Trent PLC | | | 1,648 | | | | 47,237 | |
Smith & Nephew PLC | | | 28,402 | | | | 424,884 | |
SSE PLC | | | 37,339 | | | | 701,921 | |
Tate & Lyle PLC | | | 36,635 | | | | 309,652 | |
Unilever PLC | | | 16,949 | | | | 686,533 | |
| | | | | | | | |
| Common Stocks | | Shares | | | Value | |
United Kingdom (continued) | |
United Utilities Group PLC | | | 4,116 | | | $ | 47,666 | |
Vodafone Group PLC | | | 181,957 | | | | 445,709 | |
| | | | | | | | |
| | | | | 13,676,659 | |
Total Long-Term Investments
(Cost — $87,923,657) — 97.6% | | | | 87,719,510 | |
| | | | | | | | |
| | | | | | | | | |
| | |
| Short-Term Securities | | | | | | |
BlackRock Liquidity Funds, T-Fund, Institutional Class, 0.40% (d)(e) | | | 335,074 | | | | 335,074 | |
Total Short-Term Securities
(Cost — $335,074) — 0.4% | | | | | | | 335,074 | |
| Total Investments (Cost — $88,258,731) — 98.0% | | | | | | | 88,054,584 | |
Other Assets Less Liabilities — 2.0% | | | | 1,813,451 | |
| | | | | | | | |
Net Assets — 100.0% | | | $ | 89,868,035 | |
| | | | | | | | |
|
| Notes to Schedule of Investments |
| (a) | | A security contractually bound to one or more other securities to form a single saleable unit which cannot be sold separately. |
| (b) | | Non-income producing security. |
| (c) | | Security exempt from registration pursuant to Rule 144A under the Securities Act of 1933, as amended. These securities may be resold in transactions exempt from registration to qualified institutional investors. |
| (d) | | Current yield as of period end. |
| (e) | | During the six months ended January 31, 2017, investments in issuers considered to be affiliates of the Fund for purposes of Section 2(a)(3) of the Investment Company Act of 1940, as amended, were as follows: |
| | | | | | | | | | | | | | | | | | | | | | | | |
| Affiliate | | Shares Held
at July 31,
2016 | | | Net
Activity | | | Shares Held
at January 31,
2017 | | | Value at
January 31,
2017 | | | Income | | | Net Realized
Gain (Loss) | | Change in
Unrealized
Appreciation
(Depreciation) |
BlackRock Liquidity Funds, T-Fund, Institutional Class | | | — | | | | 335,074 | | | | 335,074 | | | $ | 335,074 | | | $ | 284 | | | — | | — |
BlackRock Premier Government Institutional Fund | | | — | | | | — | | | | — | | | | — | | | | 3 | | | — | | — |
| | | | | | | | | | | | | | | | | | $ | 287 | | | — | | — |
| | | | | | | | | | | | | | | | | | | |
|
| Derivative Financial Instruments Outstanding as of Period End |
| | | | | | | | | | | | | | | | | | |
| Futures Contracts | | | | | | | |
Contracts
Long | | | Issue | | Expiration | | Notional
Value | | | Unrealized
Depreciation | | | | |
| | 9 | | | FTSE 100 Index | | March 2017 | | $ | 797,691 | | | $ | (8,600 | ) | | | | |
| | 7 | | | Nikkei 225 Index | | March 2017 | | $ | 588,655 | | | | (1,573 | ) | | | | |
| | 5 | | | SPI 200 Index | | March 2017 | | $ | 526,614 | | | | (6,725 | ) | | | | |
| | Total | | | $ | (16,898 | ) | | | | |
| | | | | | | | | | | | | | |
|
| Derivative Financial Instruments Categorized by Risk Exposure |
As of period end, the fair values of derivative financial instruments located in the Statements of Assets and Liabilities were as follows:
| | | | | | | | | | | | | | | | | | | | | | |
| Liabilities — Derivative Financial Instruments | | | Commodity
Contracts | | Credit
Contracts | | Equity
Contracts | | | Foreign
Currency
Exchange
Contracts | | Interest
Rate
Contracts | | Other
Contracts | | Total | |
Futures contracts | | | Net unrealized depreciation | 1 | | — | | — | | $ | 16,898 | | | — | | — | | — | | $ | 16,898 | |
1 Includes cumulative appreciation (depreciation) on futures contracts, if any, as reported in the Schedule of Investments. Only current day’s variation margin is reported within the Statements of Assets and Liabilities. | |
See Notes to Financial Statements.
| | | | | | |
| | | | | | | |
| | BLACKROCK FUNDS | | JANUARY 31, 2017 | | 17 |
| | |
Schedule of Investments (concluded) | | BlackRock Min Vol EAFE Index Fund |
For the six months ended January 31, 2017, the effect of derivative financial instruments in the Statements of Operations was as follows:
| | | | | | | | | | | | | | | | | | | | | | |
| Net Realized Gain (Loss) from: | | Commodity
Contracts | | Credit
Contracts | | Equity
Contracts | | | Foreign
Currency
Exchange
Contracts | | Interest
Rate
Contracts | | Other
Contracts | | Total | | | | |
Futures contracts | | — | | — | | $ | (27,140 | ) | | — | | | | — | | $ | (27,140 | ) | | | | |
Net Change in Unrealized Appreciation (Depreciation) on: | | | | | | | | | | | | | | | | | | | | | | |
Futures contracts | | — | | — | | $ | (18,833 | ) | | — | | — | | — | | $ | (18,833 | ) | | | | |
| | | | |
| Average Quarterly Balances of Outstanding Derivative Financial Instruments |
| | | | |
| Futures contracts: | | | | |
Average notional value of contracts — long | | $ | 998,885 | |
For more information about the Fund’s investment risks regarding derivative financial instruments, refer to the Notes to Financial Statements.
|
| Fair Value Hierarchy as of Period End |
Various inputs are used in determining the fair value of investments and derivative financial instruments. For information about the Fund’s policy regarding valuation of investments and derivative financial instruments, refer to the Notes to Financial Statements.
The following tables summarize the Fund’s investments and derivative financial instruments categorized in the disclosure hierarchy:
| | | | | | | | | | | | | | |
| | | Level 1 | | | Level 2 | | | Level 3 | | Total | |
Assets: | |
| Investments: | |
Common Stocks: | |
Australia | | | — | | | $ | 3,798,606 | | | — | | $ | 3,798,606 | |
Belgium | | | — | | | | 1,778,225 | | | — | | | 1,778,225 | |
Denmark | | | — | | | | 4,168,255 | | | — | | | 4,168,255 | |
Finland | | | — | | | | 1,207,134 | | | — | | | 1,207,134 | |
France | | | — | | | | 4,272,962 | | | — | | | 4,272,962 | |
Germany | | | — | | | | 3,595,799 | | | — | | | 3,595,799 | |
Hong Kong | | $ | 342,239 | | | | 7,005,384 | | | — | | | 7,347,623 | |
Ireland | | | 1,035,919 | | | | — | | | — | | | 1,035,919 | |
Israel | | | — | | | | 1,897,886 | | | — | | | 1,897,886 | |
Italy | | | — | | | | 426,867 | | | — | | | 426,867 | |
Japan | | | — | | | | 26,078,631 | | | — | | | 26,078,631 | |
Luxembourg | | | — | | | | 422,783 | | | — | | | 422,783 | |
Mexico | | | — | | | | 60,980 | | | — | | | 60,980 | |
Netherlands | | | — | | | | 212,155 | | | — | | | 212,155 | |
New Zealand | | | — | | | | 518,290 | | | — | | | 518,290 | |
Norway | | | — | | | | 147,979 | | | — | | | 147,979 | |
Singapore | | | 72,680 | | | | 3,365,488 | | | — | | | 3,438,168 | |
Spain | | | — | | | | 39,946 | | | — | | | 39,946 | |
Sweden | | | — | | | | 1,462,670 | | | — | | | 1,462,670 | |
Switzerland | | | — | | | | 12,131,973 | | | — | | | 12,131,973 | |
United Kingdom | | | — | | | | 13,676,659 | | | — | | | 13,676,659 | |
Short-Term Securities | | | 335,074 | | | | — | | | — | | | 335,074 | |
| | | | |
Total | | $ | 1,785,912 | | | $ | 86,268,672 | | | — | | $ | 88,054,584 | |
| | | | |
| | | | | | | | | | | | | | |
| Derivative Financial Instruments1 | |
Liabilities: | |
Equity contracts | | $ | (16,898 | ) | | | — | | | — | | $ | (16,898 | ) |
1 Derivative financial instruments are futures contracts which are valued at the unrealized appreciation (depreciation) on the instrument. | |
During the six months ended January 31, 2017, there were no transfers between levels.
See Notes to Financial Statements.
| | | | | | |
| | | | | | | |
| 18 | | BLACKROCK FUNDS | | JANUARY 31, 2017 | | |
| | |
Schedule of Investments January 31, 2017 (Unaudited) | | BlackRock Min Vol USA Index Fund (Percentages shown are based on Net Assets) |
| | | | | | | | |
| Common Stocks | | Shares | | | Value | |
Aerospace & Defense — 1.7% | |
General Dynamics Corp. | | | 178 | | | $ | 32,232 | |
Lockheed Martin Corp. | | | 157 | | | | 39,459 | |
Northrop Grumman Corp. | | | 146 | | | | 33,446 | |
Raytheon Co. | | | 418 | | | | 60,259 | |
| | | | | | | | |
| | | | | 165,396 | |
Air Freight & Logistics — 2.1% | |
C.H. Robinson Worldwide, Inc. | | | 523 | | | | 39,779 | |
Expeditors International of Washington, Inc. | | | 862 | | | | 44,893 | |
United Parcel Service, Inc., Class B | | | 1,151 | | | | 125,609 | |
| | | | | | | | |
| | | | | 210,281 | |
Banks — 0.4% | |
US Bancorp | | | 506 | | | | 26,641 | |
Wells Fargo & Co. | | | 181 | | | | 10,196 | |
| | | | | | | | |
| | | | | 36,837 | |
Beverages — 3.5% | |
Coca-Cola Co. | | | 2,588 | | | | 107,583 | |
Constellation Brands, Inc., Class A | | | 239 | | | | 35,793 | |
Dr. Pepper Snapple Group, Inc. | | | 713 | | | | 65,025 | |
PepsiCo, Inc. | | | 1,327 | | | | 137,716 | |
| | | | | | | | |
| | | | | 346,117 | |
Capital Markets — 0.3% | |
CME Group, Inc. | | | 250 | | | | 30,270 | |
Chemicals — 1.2% | |
E.I. du Pont de Nemours & Co. | | | 210 | | | | 15,855 | |
Ecolab, Inc. | | | 262 | | | | 31,474 | |
Monsanto Co. | | | 198 | | | | 21,445 | |
Praxair, Inc. | | | 247 | | | | 29,255 | |
Sherwin-Williams Co. | | | 43 | | | | 13,064 | |
Valspar Corp. | | | 68 | | | | 7,525 | |
| | | | | | | | |
| | | | | 118,618 | |
Commercial Services & Supplies — 3.1% | |
Cintas Corp. | | | 505 | | | | 58,635 | |
Republic Services, Inc. | | | 1,981 | | | | 113,670 | |
Waste Connections, Inc. | | | 136 | | | | 10,921 | |
Waste Management, Inc. | | | 1,680 | | | | 116,760 | |
| | | | | | | | |
| | | | | 299,986 | |
Communications Equipment — 1.2% | |
Cisco Systems, Inc. | | | 2,281 | | | | 70,073 | |
Motorola Solutions, Inc. | | | 568 | | | | 45,843 | |
| | | | | | | | |
| | | | | 115,916 | |
Distributors — 0.1% | |
Genuine Parts Co. | | | 148 | | | | 14,328 | |
Diversified Financial Services — 1.2% | |
Berkshire Hathaway, Inc., Class B (a) | | | 727 | | | | 119,330 | |
Diversified Telecommunication Services — 3.3% | |
AT&T, Inc. | | | 3,708 | | | | 156,329 | |
SBA Communications Corp. (a) | | | 145 | | | | 15,263 | |
Verizon Communications, Inc. | | | 2,756 | | | | 135,072 | |
Zayo Group Holdings, Inc. (a) | | | 488 | | | | 15,596 | |
| | | | | | | | |
| | | | | 322,260 | |
Electric Utilities — 4.7% | |
American Electric Power Co., Inc. | | | 276 | | | | 17,680 | |
Duke Energy Corp. | | | 1,548 | | | | 121,580 | |
Eversource Energy | | | 321 | | | | 17,758 | |
NextEra Energy, Inc. | | | 521 | | | | 64,458 | |
Southern Co. | | | 2,452 | | | | 121,202 | |
Westar Energy, Inc. | | | 562 | | | | 30,736 | |
Xcel Energy, Inc. | | �� | 2,171 | | | | 89,706 | |
| | | | | | | | |
| | | | | 463,120 | |
| | | | | | | | |
| Common Stocks | | Shares | | | Value | |
Electronic Equipment, Instruments & Components — 0.1% | |
Amphenol Corp., Class A | | | 210 | | | $ | 14,173 | |
Energy Equipment & Services — 0.2% | |
Schlumberger Ltd. | | | 260 | | | | 21,765 | |
Food & Staples Retailing — 1.2% | |
Costco Wholesale Corp. | | | 204 | | | | 33,446 | |
CVS Health Corp. | | | 147 | | | | 11,585 | |
Sysco Corp. | | | 558 | | | | 29,272 | |
Wal-Mart Stores, Inc. | | | 697 | | | | 46,518 | |
| | | | | | | | |
| | | | | 120,821 | |
Food Products — 3.7% | |
Campbell Soup Co. | | | 900 | | | | 56,007 | |
Conagra Brands, Inc. | | | 467 | | | | 18,255 | |
General Mills, Inc. | | | 1,826 | | | | 114,089 | |
Hershey Co. | | | 102 | | | | 10,758 | |
Hormel Foods Corp. | | | 521 | | | | 18,912 | |
J.M. Smucker Co. | | | 51 | | | | 6,928 | |
Kellogg Co. | | | 989 | | | | 71,910 | |
McCormick & Co., Inc. | | | 633 | | | | 60,483 | |
| | | | | | | | |
| | | | | 357,342 | |
Health Care Equipment & Supplies — 8.4% | |
Abbott Laboratories | | | 1,295 | | | | 54,092 | |
Baxter International, Inc. | | | 1,121 | | | | 53,707 | |
Becton Dickinson & Co. | | | 772 | | | | 136,868 | |
Boston Scientific Corp. (a) | | | 1,586 | | | | 38,159 | |
C.R. Bard, Inc. | | | 423 | | | | 100,391 | |
Cooper Cos., Inc. | | | 138 | | | | 25,476 | |
Hologic, Inc. (a) | | | 425 | | | | 17,225 | |
Intuitive Surgical, Inc. (a) | | | 144 | | | | 99,748 | |
Medtronic PLC | | | 1,146 | | | | 87,119 | |
ResMed, Inc. | | | 234 | | | | 15,804 | |
Stryker Corp. | | | 1,026 | | | | 126,741 | |
Varex Imaging Corp. (a) | | | 1 | | | | 17 | |
Varian Medical Systems, Inc. (a) | | | 689 | | | | 53,501 | |
Zimmer Biomet Holdings, Inc. | | | 128 | | | | 15,146 | |
| | | | | | | | |
| | | | | 823,994 | |
Health Care Providers & Services — 4.3% | |
Aetna, Inc. | | | 478 | | | | 56,696 | |
Anthem, Inc. | | | 175 | | | | 26,975 | |
Cigna Corp. | | | 280 | | | | 40,942 | |
Express Scripts Holding Co. (a) | | | 196 | | | | 13,500 | |
Henry Schein, Inc. (a) | | | 234 | | | | 37,407 | |
Humana, Inc. | | | 164 | | | | 32,554 | |
Laboratory Corp. of America Holdings (a) | | | 343 | | | | 46,034 | |
Patterson Cos., Inc. | | | 353 | | | | 14,688 | |
Quest Diagnostics, Inc. | | | 265 | | | | 24,359 | |
UnitedHealth Group, Inc. | | | 745 | | | | 120,764 | |
Universal Health Services, Inc., Class B | | | 101 | | | | 11,376 | |
| | | | | | | | |
| | | | | 425,295 | |
Hotels, Restaurants & Leisure — 2.3% | |
Aramark | | | 663 | | | | 22,436 | |
Chipotle Mexican Grill, Inc. (a) | | | 12 | | | | 5,057 | |
Darden Restaurants, Inc. | | | 305 | | | | 22,351 | |
McDonald’s Corp. | | | 1,083 | | | | 132,743 | |
Starbucks Corp. | | | 822 | | | | 45,391 | |
| | | | | | | | |
| | | | | 227,978 | |
Household Products — 4.1% | |
Church & Dwight Co., Inc. | | | 1,446 | | | | 65,388 | |
Clorox Co. | | | 617 | | | | 74,040 | |
Colgate-Palmolive Co. | | | 1,123 | | | | 72,523 | |
Kimberly-Clark Corp. | | | 490 | | | | 59,354 | |
Procter & Gamble Co. | | | 1,466 | | | | 128,422 | |
| | | | | | | | |
| | | | | 399,727 | |
See Notes to Financial Statements.
| | | | | | |
| | | | | | | |
| | BLACKROCK FUNDS | | JANUARY 31, 2017 | | 19 |
| | |
Schedule of Investments (continued) | | BlackRock Min Vol USA Index Fund |
| | | | | | | | |
| Common Stocks | | Shares | | | Value | |
Industrial Conglomerates — 1.3% | |
3M Co. | | | 314 | | | $ | 54,894 | |
Danaher Corp. | | | 860 | | | | 72,171 | |
| | | | | | | | |
| | | | | 127,065 | |
Insurance — 6.9% | |
Alleghany Corp. (a) | | | 37 | | | | 22,628 | |
Allstate Corp. | | | 742 | | | | 55,806 | |
Aon PLC | | | 213 | | | | 24,005 | |
Arch Capital Group Ltd. (a) | | | 1,134 | | | | 100,189 | |
Axis Capital Holdings Ltd. | | | 852 | | | | 54,536 | |
Chubb Ltd. | | | 764 | | | | 100,458 | |
Cincinnati Financial Corp. | | | 246 | | | | 17,363 | |
Everest Re Group Ltd. | | | 294 | | | | 64,659 | |
FNF Group | | | 400 | | | | 14,144 | |
Markel Corp. (a) | | | 69 | | | | 63,825 | |
Marsh & McLennan Cos., Inc. | | | 834 | | | | 56,729 | |
Progressive Corp. | | | 142 | | | | 5,316 | |
Travelers Cos., Inc. | | | 424 | | | | 49,939 | |
W.R. Berkley Corp. | | | 608 | | | | 40,864 | |
| | | | | | | | |
| | | | | 670,461 | |
Internet Software & Services — 1.5% | |
Alphabet, Inc., Class A (a) | | | 56 | | | | 45,931 | |
eBay, Inc. (a) | | | 1,063 | | | | 33,835 | |
Facebook, Inc., Class A (a) | | | 487 | | | | 63,466 | |
| | | | | | | | |
| | | | | 143,232 | |
IT Services — 9.4% | |
Accenture PLC, Class A | | | 943 | | | | 107,379 | |
Automatic Data Processing, Inc. | | | 1,476 | | | | 149,061 | |
Broadridge Financial Solutions, Inc. | | | 754 | | | | 50,164 | |
Fidelity National Information Services, Inc. | | | 742 | | | | 58,930 | |
Fiserv, Inc. (a) | | | 933 | | | | 100,232 | |
Gartner, Inc. (a) | | | 528 | | | | 52,462 | |
International Business Machines Corp. | | | 463 | | | | 80,803 | |
Mastercard, Inc., Class A | | | 609 | | | | 64,755 | |
Paychex, Inc. | | | 1,979 | | | | 119,314 | |
Vantiv, Inc., Class A (a) | | | 182 | | | | 11,328 | |
Visa, Inc., Class A | | | 1,522 | | | | 125,884 | |
| | | | | | | | |
| | | | | 920,312 | |
Life Sciences Tools & Services — 0.7% | |
Quintiles IMS Holdings, Inc. (a) | | | 95 | | | | 7,457 | |
Thermo Fisher Scientific, Inc. | | | 237 | | | | 36,116 | |
Waters Corp. (a) | | | 148 | | | | 20,964 | |
| | | | | | | | |
| | | | | 64,537 | |
Media — 1.6% | |
Charter Communications, Inc., Class A (a) | | | 175 | | | | 56,691 | |
Comcast Corp., Class A | | | 842 | | | | 63,504 | |
Omnicom Group, Inc. | | | 170 | | | | 14,560 | |
Walt Disney Co. | | | 181 | | | | 20,028 | |
| | | | | | | | |
| | | | | 154,783 | |
Metals & Mining — 0.8% | |
Newmont Mining Corp. | | | 2,225 | | | | 80,723 | |
Multi-Utilities — 3.2% | |
Consolidated Edison, Inc. | | | 1,602 | | | | 119,109 | |
Dominion Resources, Inc. | | | 995 | | | | 75,899 | |
PG&E Corp. | | | 959 | | | | 59,352 | |
WEC Energy Group, Inc. | | | 930 | | | | 54,916 | |
| | | | | | | | |
| | | | | 309,276 | |
Multiline Retail — 0.4% | |
Target Corp. | | | 658 | | | | 42,428 | |
| | | | | | | | |
| Common Stocks | | Shares | | | Value | |
Oil, Gas & Consumable Fuels — 1.8% | |
Chevron Corp. | | | 156 | | | $ | 17,370 | |
Exxon Mobil Corp. | | | 1,457 | | | | 122,228 | |
Occidental Petroleum Corp. | | | 571 | | | | 38,697 | |
| | | | | | | | |
| | | | | 178,295 | |
Pharmaceuticals — 4.5% | |
Allergan PLC (a) | | | 27 | | | | 5,910 | |
Eli Lilly & Co. | | | 1,097 | | | | 84,502 | |
Johnson & Johnson | | | 1,207 | | | | 136,693 | |
Merck & Co., Inc. | | | 1,561 | | | | 96,766 | |
Pfizer, Inc. | | | 3,534 | | | | 112,134 | |
| | | | | | | | |
| | | | | 436,005 | |
Professional Services — 0.3% | |
Equifax, Inc. | | | 64 | | | | 7,506 | |
Verisk Analytics, Inc. (a) | | | 252 | | | | 20,825 | |
| | | | | | | | |
| | | | | 28,331 | |
Real Estate Investment Trusts (REITs) — 9.5% | |
AGNC Investment Corp. | | | 3,110 | | | | 58,064 | |
American Tower Corp. | | | 110 | | | | 11,385 | |
Annaly Capital Management, Inc. | | | 9,354 | | | | 95,598 | |
AvalonBay Communities, Inc. | | | 664 | | | | 115,078 | |
Boston Properties, Inc. | | | 54 | | | | 7,069 | |
Camden Property Trust | | | 82 | | | | 6,853 | |
Crown Castle International Corp. | | | 856 | | | | 75,182 | |
Digital Realty Trust, Inc. | | | 219 | | | | 23,571 | |
Equity Residential | | | 908 | | | | 55,179 | |
Essex Property Trust, Inc. | | | 155 | | | | 34,767 | |
Extra Space Storage, Inc. | | | 95 | | | | 6,845 | |
Federal Realty Investment Trust | | | 373 | | | | 52,380 | |
Macerich Co. | | | 470 | | | | 32,284 | |
National Retail Properties, Inc. | | | 112 | | | | 4,883 | |
Public Storage | | | 414 | | | | 89,010 | |
Realty Income Corp. | | | 1,056 | | | | 62,969 | |
Regency Centers Corp. | | | 340 | | | | 23,708 | |
Simon Property Group, Inc. | | | 352 | | | | 64,687 | |
UDR, Inc. | | | 1,396 | | | | 48,790 | |
Ventas, Inc. | | | 401 | | | | 24,730 | |
Welltower, Inc. | | | 560 | | | | 37,128 | |
| | | | | | | | |
| | | | | 930,160 | |
Semiconductors & Semiconductor Equipment — 0.5% | |
Intel Corp. | | | 1,041 | | | | 38,330 | |
Linear Technology Corp. | | | 158 | | | | 9,974 | |
| | | | | | | | |
| | | | | 48,304 | |
Software — 3.3% | |
Adobe Systems, Inc. (a) | | | 435 | | | | 49,320 | |
ANSYS, Inc. (a) | | | 518 | | | | 48,309 | |
Cadence Design Systems, Inc. (a) | | | 882 | | | | 22,959 | |
Intuit, Inc. | | | 92 | | | | 10,909 | |
Microsoft Corp. | | | 955 | | | | 61,741 | |
Oracle Corp. | | | 1,047 | | | | 41,995 | |
Synopsys, Inc. (a) | | | 1,315 | | | | 82,700 | |
VMware, Inc., Class A (a) | | | 82 | | | | 7,178 | |
| | | | | | | | |
| | | | | 325,111 | |
Specialty Retail — 3.2% | |
AutoZone, Inc. (a) | | | 112 | | | | 81,198 | |
Foot Locker, Inc. | | | 101 | | | | 6,923 | |
Home Depot, Inc. | | | 499 | | | | 68,652 | |
Lowe’s Cos., Inc. | | | 360 | | | | 26,309 | |
O’Reilly Automotive, Inc. (a) | | | 65 | | | | 17,048 | |
Ross Stores, Inc. | | | 267 | | | | 17,651 | |
TJX Cos., Inc. | | | 1,210 | | | | 90,653 | |
| | | | | | | | |
| | | | | 308,434 | |
See Notes to Financial Statements.
| | | | | | |
| | | | | | | |
| 20 | | BLACKROCK FUNDS | | JANUARY 31, 2017 | | |
| | |
Schedule of Investments (continued) | | BlackRock Min Vol USA Index Fund |
| | | | | | | | |
| Common Stocks | | Shares | | | Value | |
Technology Hardware, Storage & Peripherals — 0.1% | |
Apple, Inc. | | | 42 | | | $ | 5,097 | |
Tobacco — 1.6% | |
Altria Group, Inc. | | | 1,428 | | | | 101,645 | |
Philip Morris International, Inc. | | | 403 | | | | 38,740 | |
Reynolds American, Inc. | | | 237 | | | | 14,251 | |
| | | | | | | | |
| | | | | 154,636 | |
Water Utilities — 0.2% | |
American Water Works Co., Inc. | | | 324 | | | | 23,795 | |
Total Long-Term Investments
(Cost — $9,713,056) — 97.9% | | | | 9,584,539 | |
| | | | | | | | |
| Short-Term Securities | | Shares | | | Value | |
BlackRock Liquidity Funds, T-Fund, Institutional Class, 0.40% (b)(c) | | | 161,472 | | | $ | 161,472 | |
Total Short-Term Securities
(Cost — $161,472) — 1.6% | | | | 161,472 | |
| Total Investments (Cost — $9,874,528) — 99.5% | | | | 9,746,011 | |
Other Assets Less Liabilities — 0.5% | | | | 44,764 | |
| | | | | | | | |
Net Assets — 100.0% | | | $ | 9,790,775 | |
| | | | | | | | |
|
| Notes to Schedule of Investments |
| (a) | | Non-income producing security. |
| (b) | | During the period ended January 31, 2017, investments in issuers considered to be affiliates of the Fund for purposes of Section 2(a)(3) of the Investment Company Act of 1940, as amended, were as follows: |
| | | | | | | | | | | | | | | | | | | | | | | | | | |
| Affiliate | | Shares Held
at July 31, 2016 | | | Net
Activity | | | Shares Held
at January 31,
2017 | | | Value at
January 31,
2017 | | | Income | | | Net
Realized
Gain1 | | | Change in
Unrealized
Appreciation
(Depreciation) |
BlackRock Liquidity Funds, T-Fund, Institutional Class | | | — | | | | 161,472 | | | | 161,472 | | | $ | 161,472 | | | $ | 118 | | | $ | 1 | | | — |
BlackRock Premier Government Institutional Fund | | | 111,089 | | | | (111,089 | ) | | | — | | | | — | | | | 74 | | | | — | | | — |
Total | | | $ | 161,472 | | | $ | 192 | | | $ | 1 | | | — |
| | | | | | | | | | | | | | | |
1 Includes net capital gain distributions. |
| (c) | | Current yield as of period end. |
| • | | For Fund compliance purposes, the sector classifications refer to one or more of the sector sub-classifications used by one or more widely recognized market indexes or rating group indexes, and/or as defined by the investment adviser. These definitions may not apply for purposes of this report, which may combine such sector sub-classifications for reporting ease. |
|
| Derivative Financial Instruments Outstanding as of Period End |
| | | | | | | | | | | | | | |
| Futures Contracts | | | | |
Contracts
Long | | | Issue | | Expiration | | Notional
Value | | | Unrealized
Appreciation | |
| | 1 | | | S&P 500 E-Mini Index | | March 2017 | | $ | 113,725 | | | $ | 2,150 | |
|
| Derivative Financial Instruments Categorized by Risk Exposure |
As of period end, the fair values of derivative financial instruments located in the Statements of Assets and Liabilities were as follows:
| | | | | | | | | | | | | | | | | | | | |
| Assets — Derivative Financial Instruments | | Commodity
Contracts | | Credit
Contracts | | Equity
Contracts | | | Foreign
Currency
Exchange
Contracts | | Interest
Rate
Contracts | | Other
Contracts | | Total | |
Futures contracts | | Net unrealized appreciation1 | | — | | — | | $ | 2,150 | | | — | | — | | — | | $ | 2,150 | |
1 Includes cumulative appreciation (depreciation) on futures contracts, if any, as reported in the Schedule of Investments. Only current day’s variation margin is reported within the Statements of Assets and Liabilities. | |
See Notes to Financial Statements.
| | | | | | |
| | | | | | | |
| | BLACKROCK FUNDS | | JANUARY 31, 2017 | | 21 |
| | |
Schedule of Investments (concluded) | | BlackRock Min Vol USA Index Fund |
For the six months ended January 31, 2017, the effect of derivative financial instruments in the Statements of Operations was as follows:
| | | | | | | | | | | | | | | | | | | | | | | | | | | | | | |
| Net Realized Gain (Loss) from: | | Commodity
Contracts | | Credit
Contracts | | | Equity
Contracts | | | Foreign
Currency
Exchange
Contracts | | | Interest
Rate
Contracts | | | Other
Contracts | | | Total | | | | |
Futures contracts | | — | | | — | | | $ | 3,898 | | | | — | | | | | | | | — | | | $ | 3,898 | | | | | |
Net Change in Unrealized Appreciation (Depreciation) on: | | | | | | | | | | | | | | | | | | | | | | | | | | | | |
Futures contracts | | — | | | — | | | $ | 1,018 | | | | — | | | | — | | | | — | | | $ | 1,018 | | | | | |
| | | | |
| Average Quarterly Balances of Outstanding Derivative Financial Instruments |
| | | | |
| Futures contracts: | | | | |
Average notional value of contracts — long | | $ | 56,863 | |
For more information about the Fund’s investment risks regarding derivative financial instruments, refer to the Notes to Financial Statements.
|
| Fair Value Hierarchy as of Period End |
Various inputs are used in determining the fair value of investments and derivative financial instruments. For information about the Fund’s policy regarding valuation of investments and derivative financial instruments, refer to the Notes to Financial Statements.
The following tables summarize the Fund’s investments and derivative financial instruments categorized in the disclosure hierarchy:
| | | | | | | | | | | | | | | | |
| | | Level 1 | | | Level 2 | | | Level 3 | | | Total | |
Assets: | | | | | | | | | | | | | | | | |
| Investments: | | | | | | | | | | | | | | | | |
Common Stocks1 | | $ | 9,584,539 | | | | — | | | | — | | | $ | 9,584,539 | |
Short-Term Securities | | | 161,472 | | | | — | | | | — | | | | 161,472 | |
| | | | |
Total | | $ | 9,746,011 | | | | — | | | | — | | | $ | 9,746,011 | |
| | | | |
| | | | | | | | | | | | | | | | |
| Derivative Financial Instruments2 | | | | | | | | | | | | | | | | |
Assets: | | | | | | | | | | | | | | | | |
Equity contracts | | $ | 2,150 | | | | — | | | | — | | | $ | 2,150 | |
1 See above Schedule of Investments for values in each sector. | |
2 Derivative financial instruments are futures contracts which are valued at the unrealized appreciation (depreciation) on the instrument. | |
During the six months ended January 31, 2017, there were no transfers between levels.
See Notes to Financial Statements.
| | | | | | |
| | | | | | | |
| 22 | | BLACKROCK FUNDS | | JANUARY 31, 2017 | | |
| | |
Schedule of Investments January 31, 2017 (Unaudited) | | BlackRock Multifactor International Index Fund (Percentages shown are based on Net Assets) |
| | | | | | | | |
| Common Stocks | | Shares | | | Value | |
Australia — 5.9% | |
Aristocrat Leisure Ltd. | | | 4,070 | | | $ | 47,199 | |
Bendigo & Adelaide Bank Ltd. | | | 3,485 | | | | 33,189 | |
Cochlear Ltd. | | | 438 | | | | 41,608 | |
Dexus Property Group | | | 6,928 | | | | 47,195 | |
Domino’s Pizza Enterprises Ltd. | | | 469 | | | | 21,158 | |
Flight Centre Travel Group Ltd. | | | 425 | | | | 9,663 | |
Fortescue Metals Group Ltd. | | | 11,700 | | | | 59,205 | |
Goodman Group | | | 13,445 | | | | 70,604 | |
GPT Group | | | 13,735 | | | | 48,776 | |
Harvey Norman Holdings Ltd. | | | 4,248 | | | | 16,112 | |
Lend Lease Group (a) | | | 4,221 | | | | 45,136 | |
Mirvac Group | | | 27,843 | | | | 42,889 | |
Qantas Airways Ltd. | | | 3,941 | | | | 10,187 | |
REA Group Ltd. | | | 403 | | | | 16,089 | |
Vocus Group Ltd. | | | 3,846 | | | | 11,795 | |
Westfield Corp. | | | 14,836 | | | | 98,902 | |
| | | | | | | | |
| | | | | 619,707 | |
Belgium — 1.3% | |
Ageas | | | 1,540 | | | | 65,939 | |
Colruyt SA | | | 515 | | | | 25,205 | |
Umicore SA | | | 728 | | | | 40,778 | |
| | | | | | | | |
| | | | | 131,922 | |
Canada — 5.5% | |
CAE, Inc. | | | 2,020 | | | | 28,687 | |
Cameco Corp. | | | 3,026 | | | | 38,533 | |
CCL Industries, Inc., Class B | | | 213 | | | | 43,836 | |
Constellation Software, Inc. | | | 146 | | | | 65,943 | |
Industrial Alliance Insurance & Financial Services, Inc. | | | 784 | | | | 32,987 | |
Keyera Corp. | | | 1,396 | | | | 40,982 | |
Linamar Corp. | | | 374 | | | | 16,443 | |
Magna International, Inc. | | | 2,884 | | | | 124,757 | |
Metro, Inc. | | | 1,821 | | | | 55,319 | |
Teck Resources Ltd., Class B | | | 4,261 | | | | 104,425 | |
Veresen, Inc. | | | 2,346 | | | | 23,852 | |
| | | | | | | | |
| | | | | 575,764 | |
Denmark — 1.6% | |
Coloplast A/S, Class B | | | 927 | | | | 66,471 | |
DSV A/S | | | 1,472 | | | | 71,582 | |
Tryg A/S | | | 880 | | | | 16,837 | |
William Demant Holding A/S (b) | | | 936 | | | | 17,526 | |
| | | | | | | | |
| | | | | 172,416 | |
Finland — 2.4% | |
Elisa OYJ | | | 1,088 | | | | 36,663 | |
Kone OYJ, Class B | | | 224 | | | | 10,127 | |
Neste Oil OYJ | | | 980 | | | | 34,097 | |
Orion OYJ, Class B | | | 783 | | | | 36,448 | |
Stora Enso OYJ, Class R | | | 4,211 | | | | 47,787 | |
UPM-Kymmene OYJ | | | 4,080 | | | | 92,534 | |
| | | | | | | | |
| | | | | 257,656 | |
France — 9.0% | |
Arkema SA | | | 510 | | | | 50,369 | |
AtoS SE | | | 673 | | | | 71,603 | |
AXA SA | | | 5,968 | | | | 146,677 | |
Cap Gemini SA | | | 399 | | | | 32,486 | |
Cie Generale des Etablissements Michelin | | | 1,370 | | | | 147,182 | |
CNP Assurances | | | 1,312 | | | | 24,656 | |
Electricite de France SA | | | 1,967 | | | | 19,391 | |
Renault SA | | | 1,470 | | | | 132,364 | |
Rexel SA | | | 2,272 | | | | 39,626 | |
SCOR SE | | | 1,248 | | | | 42,237 | |
SEB SA | | | 170 | | | | 21,379 | |
Societe BIC SA | | | 220 | | | | 28,765 | |
| | | | | | | | |
| Common Stocks | | Shares | | | Value | |
France (continued) | |
Thales SA | | | 807 | | | $ | 75,709 | |
Valeo SA | | | 1,800 | | | | 110,015 | |
| | | | | | | | |
| | | | | 942,459 | |
Germany — 8.1% | |
adidas AG | | | 1,415 | | | | 223,294 | |
Covestro AG (c) | | | 542 | | | | 40,788 | |
Deutsche Lufthansa AG, Registered Shares | | | 1,776 | | | | 23,725 | |
Evonik Industries AG | | | 603 | | | | 19,574 | |
Fuchs Petrolub SE, Preference Shares | | | 532 | | | | 24,362 | |
GEA Group AG | | | 1,374 | | | | 56,934 | |
Hannover Rueck SE | | | 461 | | | | 50,779 | |
HeidelbergCement AG | | | 1,078 | | | | 104,139 | |
Infineon Technologies AG | | | 8,253 | | | | 151,866 | |
Innogy SE (b)(c) | | | 1,044 | | | | 35,709 | |
K+S AG, Registered Shares | | | 1,461 | | | | 37,114 | |
Metro AG | | | 1,363 | | | | 46,643 | |
OSRAM Licht AG | | | 681 | | | | 39,533 | |
| | | | | | | | |
| | | | | 854,460 | |
Hong Kong — 2.8% | |
HK Electric Investments & HK Electric Investments Ltd. (a)(c) | | | 20,500 | | | | 17,112 | |
Hysan Development Co. Ltd. | | | 5,000 | | | | 22,787 | |
Kerry Properties Ltd. | | | 5,000 | | | | 14,149 | |
NWS Holdings Ltd. | | | 12,321 | | | | 22,140 | |
Sino Land Co. Ltd. | | | 24,000 | | | | 39,656 | |
WH Group Ltd. (c) | | | 61,500 | | | | 46,712 | |
Wharf Holdings Ltd. | | | 10,000 | | | | 74,983 | |
Wheelock & Co. Ltd. | | | 6,000 | | | | 36,468 | |
Yue Yuen Industrial Holdings Ltd. | | | 5,500 | | | | 20,132 | |
| | | | | | | | |
| | | | | 294,139 | |
Ireland — 0.5% | |
DCC PLC | | | 677 | | | | 54,609 | |
Israel — 1.2% | |
Bank Hapoalim BM | | | 8,105 | | | | 48,972 | |
Bank Leumi Le-Israel BM (b) | | | 10,683 | | | | 44,186 | |
Mizrahi Tefahot Bank Ltd. | | | 1,064 | | | | 16,389 | |
Taro Pharmaceutical Industries Ltd. (b) | | | 115 | | | | 12,016 | |
| | | | | | | | |
| | | | | 121,563 | |
Italy — 0.1% | |
UnipolSai SpA | | | 4,275 | | | | 8,916 | |
Japan — 22.0% | |
Aeon Mall Co. Ltd. | | | 900 | | | | 13,044 | |
Air Water, Inc. | | | 1,000 | | | | 18,516 | |
Alfresa Holdings Corp. | | | 1,400 | | | | 23,045 | |
Amada Holdings Co. Ltd. | | | 2,600 | | | | 30,560 | |
Bank of Kyoto Ltd. | | | 2,000 | | | | 15,635 | |
Brother Industries Ltd. | | | 1,800 | | | | 33,224 | |
Chiba Bank Ltd. | | | 5,000 | | | | 32,707 | |
Chugoku Bank Ltd. | | | 1,200 | | | | 17,652 | |
Concordia Financial Group Ltd. | | | 8,800 | | | | 46,415 | |
Daicel Corp. | | | 2,200 | | | | 24,328 | |
Daito Trust Construction Co. Ltd. | | | 500 | | | | 69,900 | |
Daiwa House Industry Co. Ltd. | | | 4,300 | | | | 116,453 | |
DeNA Co. Ltd. | | | 800 | | | | 17,875 | |
Fuji Heavy Industries Ltd. | | | 4,500 | | | | 180,072 | |
Fukuoka Financial Group, Inc. | | | 6,000 | | | | 26,486 | |
Hachijuni Bank Ltd. | | | 3,100 | | | | 18,246 | |
Hiroshima Bank Ltd. | | | 4,000 | | | | 18,689 | |
Hitachi Chemical Co. Ltd. | | | 800 | | | | 22,713 | |
Hitachi High-Technologies Corp. | | | 500 | | | | 21,417 | |
Hitachi Metals Ltd. | | | 1,600 | | | | 22,181 | |
Idemitsu Kosan Co. Ltd. | | | 700 | | | | 21,645 | |
Iida Group Holdings Co. Ltd. | | | 1,100 | | | | 20,587 | |
See Notes to Financial Statements.
| | | | | | |
| | | | | | | |
| | BLACKROCK FUNDS | | JANUARY 31, 2017 | | 23 |
| | |
Schedule of Investments (continued) | | BlackRock Multifactor International Index Fund |
| | | | | | | | |
| Common Stocks | | Shares | | | Value | |
Japan (continued) | |
ITOCHU Corp. | | | 11,400 | | | $ | 157,045 | |
Japan Airlines Co. Ltd. | | | 900 | | | | 28,659 | |
JSR Corp. | | | 1,500 | | | | 25,709 | |
Kakaku.com, Inc. | | | 1,100 | | | | 19,913 | |
Kamigumi Co. Ltd. | | | 2,000 | | | | 19,441 | |
Kaneka Corp. | | | 2,000 | | | | 17,232 | |
Koito Manufacturing Co. Ltd. | | | 900 | | | | 47,741 | |
Konami Holdings Corp. | | | 700 | | | | 27,992 | |
Kuraray Co. Ltd. | | | 2,700 | | | | 42,795 | |
Kyushu Financial Group, Inc. | | | 2,700 | | | | 18,603 | |
Lion Corp. | | | 2,000 | | | | 34,786 | |
Maruichi Steel Tube Ltd. | | | 400 | | | | 13,413 | |
Mebuki Financial Group, Inc. | | | 7,100 | | | | 27,266 | |
Medipal Holdings Corp. | | | 1,000 | | | | 16,207 | |
Miraca Holdings, Inc. | | | 400 | | | | 18,230 | |
Mitsubishi Chemical Holdings Corp. | | | 10,400 | | | | 72,539 | |
Mitsubishi Gas Chemical Co., Inc. | | | 1,500 | | | | 28,771 | |
Mixi, Inc. | | | 400 | | | | 17,354 | |
Nippon Electric Glass Co. Ltd. | | | 3,000 | | | | 17,270 | |
Nippon Telegraph & Telephone Corp. | | | 5,100 | | | | 225,279 | |
Nisshin Seifun Group, Inc. | | | 1,500 | | | | 22,819 | |
NOK Corp. | | | 700 | | | | 14,226 | |
Oji Holdings Corp. | | | 5,000 | | | | 22,131 | |
Oracle Corp. Japan | | | 300 | | | | 16,809 | |
Osaka Gas Co. Ltd. | | | 14,000 | | | | 52,478 | |
Park24 Co. Ltd. | | | 800 | | | | 22,081 | |
Pola Orbis Holdings, Inc. | | | 200 | | | | 19,001 | |
Stanley Electric Co. Ltd. | | | 1,200 | | | | 33,807 | |
Start Today Co. Ltd. | | | 1,500 | | | | 28,253 | |
Sumitomo Dainippon Pharma Co. Ltd. | | | 1,200 | | | | 20,356 | |
Sumitomo Heavy Industries Ltd. | | | 4,000 | | | | 27,502 | |
Sumitomo Rubber Industries Ltd. | | | 1,300 | | | | 20,305 | |
Sundrug Co. Ltd. | | | 300 | | | | 20,688 | |
Suruga Bank Ltd. | | | 1,300 | | | | 29,617 | |
Suzuken Co. Ltd. | | | 600 | | | | 19,809 | |
Taiheiyo Cement Corp. | | | 9,000 | | | | 31,449 | |
Teijin Ltd. | | | 1,400 | | | | 29,549 | |
Toho Gas Co. Ltd. | | | 3,000 | | | | 22,442 | |
Toppan Printing Co. Ltd. | | | 4,000 | | | | 39,264 | |
Toyo Suisan Kaisha Ltd. | | | 700 | | | | 24,977 | |
Toyoda Gosei Co. Ltd. | | | 500 | | | | 12,044 | |
Tsuruha Holdings, Inc. | | | 300 | | | | 28,200 | |
Yamada Denki Co. Ltd. | | | 4,800 | | | | 26,445 | |
Yamaguchi Financial Group, Inc. | | | 2,000 | | | | 21,790 | |
Yokogawa Electric Corp. | | | 1,700 | | | | 27,166 | |
| | | | | | | | |
| | | | | 2,320,843 | |
Luxembourg — 0.2% | |
RTL Group SA (b) | | | 291 | | | | 22,232 | |
Netherlands — 3.8% | |
Aegon NV | | | 13,838 | | | | 75,216 | |
Koninklijke Ahold Delhaize NV | | | 9,764 | | | | 208,010 | |
Koninklijke Boskalis Westminster NV | | | 293 | | | | 10,840 | |
Koninklijke Vopak NV | | | 538 | | | | 23,110 | |
NN Group NV | | | 2,252 | | | | 79,757 | |
| | | | | | | | |
| | | | | 396,933 | |
Singapore — 0.9% | |
Golden Agri-Resources Ltd. | | | 54,000 | | | | 16,243 | |
SATS, Ltd. | | | 5,100 | | | | 19,107 | |
Singapore Exchange Ltd. | | | 6,100 | | | | 32,086 | |
UOL Group Ltd. | | | 3,700 | | | | 16,757 | |
Yangzijiang Shipbuilding Holdings Ltd. | | | 14,700 | | | | 8,407 | |
| | | | | | | | |
| | | | | 92,600 | |
| | | | | | | | |
| Common Stocks | | Shares | | | Value | |
Spain — 1.5% | |
Mapfre SA | | | 8,100 | | | $ | 24,560 | |
Repsol SA | | | 8,478 | | | | 125,658 | |
Zardoya Otis SA | | | 1,329 | | | | 11,218 | |
| | | | | | | | |
| | | | | 161,436 | |
Sweden — 1.7% | |
Boliden AB | | | 2,087 | | | | 60,883 | |
L E Lundbergforetagen AB, -B Shares | | | 286 | | | | 18,402 | |
Securitas AB, Class B | | | 2,394 | | | | 38,120 | |
Skanska AB, Class B | | | 2,555 | | | | 62,470 | |
| | | | | | | | |
| | | | | 179,875 | |
Switzerland — 11.9% | |
Actelion Ltd., Registered Shares (b) | | | 729 | | | | 190,337 | |
Aryzta AG (b) | | | 667 | | | | 18,373 | |
Baloise Holding AG, Registered Shares | | | 382 | | | | 49,187 | |
Coca-Cola HBC AG (b) | | | 1,360 | | | | 31,087 | |
EMS-Chemie Holding AG, Registered Shares | | | 63 | | | | 32,521 | |
Geberit AG, Registered Shares | | | 269 | | | | 114,968 | |
Kuehne & Nagel International AG, Registered Shares | | | 413 | | | | 56,510 | |
Lonza Group AG, Registered Shares (b) | | | 405 | | | | 74,406 | |
Pargesa Holding SA, Bearer Shares | | | 261 | | | | 17,386 | |
Partners Group Holding AG | | | 133 | | | | 67,214 | |
Schindler Holding AG, Participation Certificates | | | 295 | | | | 56,232 | |
Schindler Holding AG, Registered Shares | | | 157 | | | | 29,575 | |
SGS SA, Registered Shares | | | 42 | | | | 89,115 | |
Sika AG, Bearer Shares | | | 17 | | | | 89,339 | |
Swiss Life Holding AG, Registered Shares (b) | | | 246 | | | | 74,682 | |
Swiss Prime Site AG, Registered Shares (b) | | | 532 | | | | 44,317 | |
Swiss Re AG | | | 2,356 | | | | 220,165 | |
| | | | | | | | |
| | | | | 1,255,414 | |
United Kingdom — 17.8% | |
3i Group PLC | | | 7,433 | | | | 65,661 | |
Aberdeen Asset Management PLC | | | 6,933 | | | | 22,944 | |
Admiral Group PLC | | | 1,615 | | | | 36,183 | |
Ashtead Group PLC | | | 3,767 | | | | 76,373 | |
Babcock International Group PLC | | | 1,900 | | | | 21,398 | |
BAE Systems PLC | | | 23,158 | | | | 170,088 | |
Barratt Developments PLC | | | 7,661 | | | | 46,200 | |
Berkeley Group Holdings PLC | | | 993 | | | | 35,072 | |
Bunzl PLC | | | 2,562 | | | | 67,536 | |
Croda International PLC | | | 1,004 | | | | 42,396 | |
Direct Line Insurance Group PLC | | | 10,510 | | | | 47,083 | |
Dixons Carphone PLC | | | 7,481 | | | | 29,841 | |
GKN PLC | | | 13,101 | | | | 56,803 | |
Hargreaves Lansdown PLC | | | 1,994 | | | | 34,065 | |
IMI PLC | | | 2,079 | | | | 30,591 | |
Investec PLC | | | 2,658 | | | | 18,859 | |
ITV PLC | | | 27,735 | | | | 71,169 | |
J. Sainsbury PLC | | | 10,293 | | | | 33,489 | |
Johnson Matthey PLC | | | 1,454 | | | | 59,640 | |
Meggitt PLC | | | 5,925 | | | | 31,248 | |
Mondi PLC | | | 2,807 | �� | | | 62,041 | |
Old Mutual PLC | | | 37,046 | | | | 97,280 | |
Persimmon PLC | | | 2,351 | | | | 57,262 | |
Petrofac Ltd. | | | 1,980 | | | | 22,927 | |
Provident Financial PLC | | | 1,126 | | | | 38,774 | |
Randgold Resources Ltd. | | | 462 | | | | 39,326 | |
RELX PLC | | | 8,005 | | | | 143,690 | |
Sage Group PLC | | | 8,250 | | | | 63,807 | |
Smith & Nephew PLC | | | 6,735 | | | | 100,753 | |
Smiths Group PLC | | | 3,020 | | | | 57,241 | |
Tate & Lyle PLC | | | 3,565 | | | | 30,133 | |
Taylor Wimpey PLC | | | 24,911 | | | | 52,592 | |
Travis Perkins PLC | | | 1,899 | | | | 34,829 | |
William Hill PLC | | | 6,761 | | | | 22,054 | |
See Notes to Financial Statements.
| | | | | | |
| | | | | | | |
| 24 | | BLACKROCK FUNDS | | JANUARY 31, 2017 | | |
| | |
Schedule of Investments (continued) | | BlackRock Multifactor International Index Fund |
| | | | | | | | |
| Common Stocks | | Shares | | | Value | |
United Kingdom (continued) | |
WM Morrison Supermarkets PLC | | | 16,956 | | | $ | 50,551 | |
Wolseley PLC | | | 119 | | | | 7,370 | |
| | | | | | | | |
| | | | | 1,877,269 | |
Total Long-Term Investments
(Cost — $9,683,536) — 98.2% | | | | 10,340,213 | |
| | | | | | | | |
| | | | | | | | | |
| | |
| Short-Term Securities | | | | | | |
BlackRock Liquidity Funds, T-Fund, Institutional Class, 0.40% (d)(e) | | | 22,854 | | | | 22,854 | |
Total Short-Term Securities (Cost — $22,854) — 0.2% | | | | 22,854 | |
| Total Investments (Cost — $9,706,390) — 98.4% | | | | 10,363,067 | |
Other Assets Less Liabilities — 1.6% | | | | 166,980 | |
| | | | | | | | |
Net Assets — 100.0% | | | $ | 10,530,047 | |
| | | | | | | | |
|
| Notes to Schedule of Investments |
| (a) | | A security contractually bound to one or more other securities to form a single saleable unit which cannot be sold separately. |
| (b) | | Non-income producing security. |
| (c) | | Security exempt from registration pursuant to Rule 144A under the Securities Act of 1933, as amended. These securities may be resold in transactions exempt from registration to qualified institutional investors. |
| (d) | | During the six months ended January 31, 2017, investments in issuers considered to be affiliates of the Fund for purposes of Section 2(a)(3) of the Investment Company Act of 1940, as amended, were as follows: |
| | | | | | | | | | | | | | | | | | | | | | | | |
| Affiliate | | Shares Held
at July 31,
2016 | | | Net
Activity | | | Shares Held
at January 31,
2017 | | | Value at
January 31,
2017 | | | Income | | | Net Realized
Gain (Loss) | | Change in
Unrealized
Appreciation
(Depreciation) |
BlackRock Liquidity Funds, T-Fund, Institutional Class | | | — | | | | 22,854 | | | | 22,854 | | | $ | 22,854 | | | $ | 20 | | | — | | — |
BlackRock Premier Government Institutional Fund | | | 5,173 | | | | (5,173 | ) | | | — | | | | — | | | | 2 | | | — | | — |
Total | | | $ | 22,854 | | | $ | 22 | | | — | | — |
| | | | | | | | | | | | | | | |
| (e) | | Current yield as of period end. |
|
| Derivative Financial Instruments Outstanding as of Period End |
Futures Contracts
| | | | | | | | | | | | | | |
Contracts
Long | | | Issue | | Expiration | | Notional
Value | | | Unrealized
Depreciation | |
| | 4 | | | Euro Stoxx 50 Index | | March 2017 | | $ | 139,644 | | | $ | (1,604 | ) |
|
| Derivative Financial Instruments Categorized by Risk Exposure |
As of period end, the fair values of derivative financial instruments located in the Statements of Assets and Liabilities were as follows:
| | | | | | | | | | | | | | | | | | | | |
| Liabilities — Derivative Financial Instruments | | Commodity
Contracts | | Credit
Contracts | | Equity
Contracts | | | Foreign
Currency
Exchange
Contracts | | Interest
Rate
Contracts | | Other
Contracts | | Total | |
Futures contracts | | Net unrealized depreciation1 | | — | | — | | $ | 1,604 | | | — | | — | | — | | $ | 1,604 | |
1 Includes cumulative appreciation (depreciation) on futures contracts, if any, as reported in the Schedule of Investments. Only current day’s variation margin is reported within the Statements of Assets and Liabilities. | |
See Notes to Financial Statements.
| | | | | | |
| | | | | | | |
| | BLACKROCK FUNDS | | JANUARY 31, 2017 | | 25 |
| | |
Schedule of Investments (concluded) | | BlackRock Multifactor International Index Fund |
For the six months ended January 31, 2017, the effect of derivative financial instruments in the Statements of Operations was as follows:
| | | | | | | | | | | | | | | | | | |
| Net Realized Gain (Loss) from: | | Commodity
Contracts | | Credit
Contracts | | Equity
Contracts | | | Foreign
Currency
Exchange
Contracts | | Interest
Rate
Contracts | | Other
Contracts | | Total | |
Futures contracts | | — | | — | | $ | 8,985 | | | — | | | | — | | $ | 8,985 | |
Net Change in Unrealized Appreciation (Depreciation) on: | | | | | | | | | | | | | | | | | | |
Futures contracts | | — | | — | | $ | (4,362 | ) | | — | | — | | — | | $ | (4,362 | ) |
|
| Average Quarterly Balances of Outstanding Derivative Financial Instruments |
| | | | |
| Futures contracts: | |
Average notional value of contracts — long | | $ | 128,985 | |
For more information about the Fund’s investment risks regarding derivative financial instruments, refer to the Notes to Financial Statements.
|
| Fair Value Hierarchy as of Period End |
Various inputs are used in determining the fair value of investments and derivative financial instruments. For information about the Fund’s policy regarding valuation of investments and derivative financial instruments, refer to the Notes to Financial Statements.
The following tables summarize the Fund’s investments and derivative financial instruments categorized in the disclosure hierarchy:
| | | | | | | | | | | | | | |
| | | Level 1 | | | Level 2 | | | Level 3 | | Total | |
Assets: | |
| Investments: | |
Common Stocks: | |
Australia | | | — | | | $ | 619,707 | | | — | | $ | 619,707 | |
Belgium | | | — | | | | 131,922 | | | — | | | 131,922 | |
Canada | | $ | 575,764 | | | | — | | | — | | | 575,764 | |
Denmark | | | — | | | | 172,416 | | | — | | | 172,416 | |
Finland | | | — | | | | 257,656 | | | — | | | 257,656 | |
France | | | — | | | | 942,459 | | | — | | | 942,459 | |
Germany | | | 35,709 | | | | 818,751 | | | — | | | 854,460 | |
Hong Kong | | | 20,132 | | | | 274,007 | | | — | | | 294,139 | |
Ireland | | | — | | | | 54,609 | | | — | | | 54,609 | |
Israel | | | 12,016 | | | | 109,547 | | | — | | | 121,563 | |
Italy | | | — | | | | 8,916 | | | — | | | 8,916 | |
Japan | | | — | | | | 2,320,843 | | | — | | | 2,320,843 | |
Luxembourg | | | — | | | | 22,232 | | | — | | | 22,232 | |
Netherlands | | | — | | | | 396,933 | | | — | | | 396,933 | |
Singapore | | | 19,107 | | | | 73,493 | | | — | | | 92,600 | |
Spain | | | — | | | | 161,436 | | | — | | | 161,436 | |
Sweden | | | — | | | | 179,875 | | | — | | | 179,875 | |
Switzerland | | | — | | | | 1,255,414 | | | — | | | 1,255,414 | |
United Kingdom | | | — | | | | 1,877,269 | | | — | | | 1,877,269 | |
Short-Term Securities | | | 22,854 | | | | — | | | — | | | 22,854 | |
| | | | |
Total | | $ | 685,582 | | | $ | 9,677,485 | | | — | | $ | 10,363,067 | |
| | | | |
| | | | | | | | | | | | | | |
| Derivative Financial Instruments1 | |
Liabilities: | |
Equity contracts | | $ | (1,604 | ) | | | — | | | — | | $ | (1,604 | ) |
1 Derivative financial instruments are futures contracts, which are valued at the unrealized appreciation (depreciation) on the instrument. | |
During the six months ended January 31, 2017, there were no transfers between levels.
See Notes to Financial Statements.
| | | | | | |
| | | | | | | |
| 26 | | BLACKROCK FUNDS | | JANUARY 31, 2017 | | |
| | |
Schedule of Investments January 31, 2017 (Unaudited) | | BlackRock Multifactor USA Index Fund (Percentages shown are based on Net Assets) |
| | | | | | | | |
| Common Stocks | | Shares | | | Value | |
Aerospace & Defense — 3.3% | |
Autoliv, Inc. | | | 458 | | | $ | 52,972 | |
Core Laboratories NV | | | 229 | | | | 26,754 | |
Huntington Ingalls Industries, Inc. | | | 243 | | | | 47,132 | |
L3 Technologies, Inc. | | | 401 | | | | 63,635 | |
Northrop Grumman Corp. | | | 738 | | | | 169,061 | |
| | | | | | | | |
| | | | | 359,554 | |
Airlines — 0.9% | |
American Airlines Group, Inc. | | | 688 | | | | 30,444 | |
Southwest Airlines Co. | | | 805 | | | | 42,110 | |
United Continental Holdings, Inc. (a) | | | 419 | | | | 29,527 | |
| | | | | | | | |
| | | | | 102,081 | |
Auto Components — 0.9% | |
Goodyear Tire & Rubber Co. | | | 1,336 | | | | 43,273 | |
Lear Corp. | | | 372 | | | | 52,858 | |
| | | | | | | | |
| | | | | 96,131 | |
Automobiles — 2.3% | |
General Motors Co. | | | 6,951 | | | | 254,476 | |
Banks — 0.9% | |
Citizens Financial Group, Inc. | | | 2,683 | | | | 97,044 | |
Beverages — 0.8% | |
Dr. Pepper Snapple Group, Inc. | | | 943 | | | | 86,002 | |
Biotechnology — 2.2% | |
Gilead Sciences, Inc. | | | 2,901 | | | | 210,177 | |
United Therapeutics Corp. (a) | | | 223 | | | | 36,490 | |
| | | | | | | | |
| | | | | 246,667 | |
Building Products — 0.3% | |
AO Smith Corp. | | | 760 | | | | 37,050 | |
Capital Markets — 0.7% | |
Eaton Vance Corp. | | | 585 | | | | 24,529 | |
Raymond James Financial, Inc. | | | 642 | | | | 48,105 | |
| | | | | | | | |
| | | | | 72,634 | |
Chemicals — 3.1% | |
Celanese Corp., Series A | | | 747 | | | | 63,047 | |
Eastman Chemical Co. | | | 752 | | | | 58,280 | |
International Flavors & Fragrances, Inc. | | | 414 | | | | 48,525 | |
LyondellBasell Industries NV, Class A | | | 1,839 | | | | 171,523 | |
| | | | | | | | |
| | | | | 341,375 | |
Communications Equipment — 0.6% | |
Harris Corp. | | | 646 | | | | 66,351 | |
Construction & Engineering — 0.7% | |
Fluor Corp. | | | 718 | | | | 39,849 | |
Jacobs Engineering Group, Inc. (a) | | | 625 | | | | 36,594 | |
| | | | | | | | |
| | | | | 76,443 | |
Containers & Packaging — 1.3% | |
Avery Dennison Corp. | | | 455 | | | | 33,224 | |
Packaging Corp. of America | | | 490 | | | | 45,168 | |
WestRock Co. | | | 1,307 | | | | 69,742 | |
| | | | | | | | |
| | | | | 148,134 | |
Distributors — 0.7% | |
Genuine Parts Co. | | | 757 | | | | 73,285 | |
Diversified Telecommunication Services — 4.0% | |
AT&T, Inc. | | | 8,666 | | | | 365,358 | |
CenturyLink, Inc. | | | 2,837 | | | | 73,365 | |
| | | | | | | | |
| | | | | 438,723 | |
Electric Utilities — 4.0% | |
Edison International | | | 1,607 | | | | 117,118 | |
Entergy Corp. | | | 930 | | | | 66,625 | |
Exelon Corp. | | | 4,796 | | | | 172,080 | |
| | | | | | | | |
| Common Stocks | | Shares | | | Value | |
Electric Utilities (continued) | |
OGE Energy Corp. | | | 1,038 | | | $ | 34,815 | |
Pinnacle West Capital Corp. | | | 560 | | | | 43,473 | |
| | | | | | | | |
| | | | | 434,111 | |
Electrical Equipment — 0.9% | |
Rockwell Automation, Inc. | | | 661 | | | | 97,821 | |
Electronic Equipment, Instruments & Components — 3.8% | |
Arrow Electronics, Inc. (a) | | | 474 | | | | 34,849 | |
Avnet, Inc. | | | 648 | | | | 30,093 | |
Corning, Inc. | | | 5,388 | | | | 142,728 | |
Flex Ltd. (a) | | | 2,839 | | | | 44,487 | |
FLIR Systems, Inc. | | | 694 | | | | 24,519 | |
TE Connectivity Ltd. | | | 1,848 | | | | 137,399 | |
| | | | | | | | |
| | | | | 414,075 | |
Energy Equipment & Services — 0.4% | |
Helmerich & Payne, Inc. | | | 562 | | | | 39,992 | |
Food Products — 5.1% | |
Archer-Daniels-Midland Co. | | | 3,023 | | | | 133,798 | |
Bunge Ltd. | | | 725 | | | | 50,177 | |
Campbell Soup Co. | | | 1,024 | | | | 63,724 | |
Hormel Foods Corp. | | | 1,476 | | | | 53,579 | |
Ingredion, Inc. | | | 375 | | | | 48,071 | |
J.M. Smucker Co. | | | 605 | | | | 82,189 | |
McCormick & Co., Inc. | | | 320 | | | | 30,576 | |
Tyson Foods, Inc., Class A | | | 1,546 | | | | 97,073 | |
| | | | | | | | |
| | | | | 559,187 | |
Gas Utilities — 0.8% | |
Atmos Energy Corp. | | | 540 | | | | 41,137 | |
UGI Corp. | | | 900 | | | | 41,733 | |
| | | | | | | | |
| | | | | 82,870 | |
Health Care Equipment & Supplies — 2.4% | |
Align Technology, Inc. (a) | | | 374 | | | | 34,292 | |
Edwards Lifesciences Corp. (a) | | | 1,106 | | | | 106,441 | |
ResMed, Inc. | | | 722 | | | | 48,764 | |
Teleflex, Inc. | | | 229 | | | | 38,410 | |
Varex Imaging Corp. (a) | | | 1 | | | | 23 | |
Varian Medical Systems, Inc. (a) | | | 487 | | | | 37,816 | |
| | | | | | | | |
| | | | | 265,746 | |
Health Care Providers & Services — 8.0% | |
Aetna, Inc. | | | 1,768 | | | | 209,703 | |
Anthem, Inc. | | | 1,326 | | | | 204,390 | |
Cardinal Health, Inc. | | | 1,643 | | | | 123,159 | |
Cigna Corp. | | | 1,293 | | | | 189,062 | |
MEDNAX, Inc. (a) | | | 477 | | | | 32,603 | |
Quest Diagnostics, Inc. | | | 716 | | | | 65,815 | |
Universal Health Services, Inc., Class B | | | 453 | | | | 51,021 | |
| | | | | | | | |
| | | | | 875,753 | |
Household Products — 2.1% | |
Kimberly-Clark Corp. | | | 1,869 | | | | 226,392 | |
Insurance — 10.1% | |
Aflac, Inc. | | | 2,087 | | | | 146,069 | |
Alleghany Corp. (a) | | | 44 | | | | 26,909 | |
Arch Capital Group Ltd. (a) | | | 637 | | | | 56,279 | |
Assurant, Inc. | | | 321 | | | | 31,179 | |
Axis Capital Holdings Ltd. | | | 471 | | | | 30,149 | |
Cincinnati Financial Corp. | | | 790 | | | | 55,758 | |
FNF Group | | | 1,260 | | | | 44,554 | |
Lincoln National Corp. | | | 1,209 | | | | 81,619 | |
Loews Corp. | | | 1,459 | | | | 67,960 | |
Markel Corp. (a) | | | 70 | | | | 64,750 | |
MetLife, Inc. | | | 3,536 | | | | 192,394 | |
Principal Financial Group, Inc. | | | 1,467 | | | | 83,751 | |
See Notes to Financial Statements.
| | | | | | |
| | | | | | | |
| | BLACKROCK FUNDS | | JANUARY 31, 2017 | | 27 |
| | |
Schedule of Investments (continued) | | BlackRock Multifactor USA Index Fund |
| | | | | | | | |
| Common Stocks | | Shares | | | Value | |
Insurance (continued) | |
Reinsurance Group of America, Inc. | | | 333 | | | $ | 41,781 | |
Torchmark Corp. | | | 585 | | | | 43,021 | |
Unum Group | | | 1,218 | | | | 55,334 | |
W.R. Berkley Corp. | | | 495 | | | | 33,269 | |
XL Group Ltd. | | | 1,433 | | | | 53,838 | |
| | | | | | | | |
| | | | | 1,108,614 | |
Internet Software & Services — 0.3% | |
MercadoLibre, Inc. | | | 207 | | | | 38,376 | |
IT Services — 4.9% | |
Accenture PLC, Class A | | | 2,058 | | | | 234,344 | |
Broadridge Financial Solutions, Inc. | | | 604 | | | | 40,184 | |
Computer Sciences Corp. | | | 730 | | | | 45,406 | |
Paychex, Inc. | | | 1,634 | | | | 98,514 | |
Total System Services, Inc. | | | 835 | | | | 42,318 | |
Western Union Co. | | | 2,535 | | | | 49,635 | |
Xerox Corp. | | | 4,390 | | | | 30,423 | |
| | | | | | | | |
| | | | | 540,824 | |
Life Sciences Tools & Services — 1.8% | |
Agilent Technologies, Inc. | | | 1,661 | | | | 81,339 | |
Mettler-Toledo International, Inc. (a) | | | 137 | | | | 58,448 | |
Waters Corp. (a) | | | 413 | | | | 58,502 | |
| | | | | | | | |
| | | | | 198,289 | |
Machinery — 1.2% | |
AGCO Corp. | | | 346 | | | | 21,729 | |
Cummins, Inc. | | | 717 | | | | 105,406 | |
| | | | | | | | |
| | | | | 127,135 | |
Media — 1.2% | |
News Corp., Class A | | | 1,978 | | | | 24,310 | |
Omnicom Group, Inc. | | | 1,199 | | | | 102,694 | |
| | | | | | | | |
| | | | | 127,004 | |
Metals & Mining — 1.8% | |
Newmont Mining Corp. | | | 2,757 | | | | 100,024 | |
Nucor Corp. | | | 1,603 | | | | 93,118 | |
| | | | | | | | |
| | | | | 193,142 | |
Multi-Utilities — 3.1% | |
Ameren Corp. | | | 1,229 | | | | 64,707 | |
Consolidated Edison, Inc. | | | 1,527 | | | | 113,532 | |
Public Service Enterprise Group, Inc. | | | 2,629 | | | | 116,333 | |
SCANA Corp. | | | 687 | | | | 47,197 | |
| | | | | | | | |
| | | | | 341,769 | |
Oil, Gas & Consumable Fuels — 4.0% | |
Marathon Petroleum Corp. | | | 707 | | | | 33,971 | |
Phillips 66 | | | 2,385 | | | | 194,664 | |
Tesoro Corp. | | | 609 | | | | 49,238 | |
Valero Energy Corp. | | | 2,367 | | | | 155,654 | |
| | | | | | | | |
| | | | | 433,527 | |
Professional Services — 0.3% | |
ManpowerGroup, Inc. | | | 356 | | | | 33,984 | |
Real Estate Investment Trusts (REITs) — 6.5% | |
HCP, Inc. | | | 2,430 | | | | 73,678 | |
Liberty Property Trust | | | 763 | | | | 29,292 | |
Mid-America Apartment Communities, Inc. | | | 590 | | | | 56,020 | |
National Retail Properties, Inc. | | | 765 | | | | 33,354 | |
Public Storage | | | 766 | | | | 164,690 | |
Realty Income Corp. | | | 1,344 | | | | 80,143 | |
Ventas, Inc. | | | 1,826 | | | | 112,609 | |
VEREIT, Inc. | | | 5,016 | | | | 42,786 | |
Weyerhaeuser Co. | | | 3,891 | | | | 121,905 | |
| | | | | | | | |
| | | | | 714,477 | |
| | | | | | | | |
| Common Stocks | | Shares | | | Value | |
Real Estate Management & Development — 0.2% | |
Jones Lang LaSalle, Inc. | | | 234 | | | $ | 24,109 | |
Road & Rail — 0.1% | |
AMERCO, Inc. | | | 35 | | | | 13,183 | |
Semiconductors & Semiconductor Equipment — 3.2% | |
Marvell Technology Group Ltd. | | | 2,199 | | | | 32,699 | |
NVIDIA Corp. | | | 2,478 | | | | 270,548 | |
Qorvo, Inc. (a) | | | 665 | | | | 42,700 | |
| | | | | | | | |
| | | | | 345,947 | |
Software — 2.3% | |
CA, Inc. | | | 1,633 | | | | 51,064 | |
CDK Global, Inc. | | | 663 | | | | 41,471 | |
Intuit, Inc. | | | 710 | | | | 84,192 | |
Microsoft Corp. | | | 443 | | | | 28,640 | |
Synopsys, Inc. (a) | | | 786 | | | | 49,431 | |
| | | | | | | | |
| | | | | 254,798 | |
Specialty Retail — 2.7% | |
Best Buy Co., Inc. | | | 1,474 | | | | 65,623 | |
Dick’s Sporting Goods, Inc. | | | 458 | | | | 23,633 | |
Foot Locker, Inc. | | | 686 | | | | 47,018 | |
Ross Stores, Inc. | | | 2,026 | | | | 133,939 | |
Staples, Inc. | | | 3,282 | | | | 30,194 | |
| | | | | | | | |
| | | | | 300,407 | |
Technology Hardware, Storage & Peripherals — 3.9% | |
Apple, Inc. | | | 934 | | | | 113,341 | |
Hewlett Packard Enterprise Co. | | | 8,635 | | | | 195,842 | |
NetApp, Inc. | | | 1,457 | | | | 55,832 | |
Seagate Technology PLC | | | 1,507 | | | | 68,041 | |
| | | | | | | | |
| | | | | 433,056 | |
Wireless Telecommunication Services — 0.3% | |
Sprint Corp. (a) | | | 4,135 | | | | 38,166 | |
Total Long-Term Investments (Cost — $9,922,869) — 98.1% | | | | 10,758,704 | |
| | | | | | | | |
| | |
| | |
| Short-Term Securities | | | | | | |
BlackRock Liquidity Funds, T-Fund, Institutional Class, 0.40% (b)(c) | | | 164,145 | | | | 164,145 | |
Total Short-Term Securities
(Cost — $164,145) — 1.5% | | | | 164,145 | |
| Total Investments (Cost — $10,087,014) — 99.6% | | | | 10,922,849 | |
Other Assets Less Liabilities — 0.4% | | | | 49,086 | |
| | | | | | | | |
Net Assets — 100.0% | | | $ | 10,971,935 | |
| | | | | | | | |
See Notes to Financial Statements.
| | | | | | |
| | | | | | | |
| 28 | | BLACKROCK FUNDS | | JANUARY 31, 2017 | | |
| | |
Schedule of Investments (continued) | | BlackRock Multifactor USA Index Fund |
|
| Notes to Schedule of Investments |
| (a) | | Non-income producing security. |
| (b) | | During the six months ended January 31, 2017, investments in issuers considered to be affiliates of the Fund for purposes of Section 2(a)(3) of the Investment Company Act of 1940, as amended, were as follows: |
| | | | | | | | | | | | | | | | | | | | | | | | | | |
| Affiliate | | Shares Held
at July 31, 2016 | | | Net
Activity | | | Shares Held
at January 31,
2017 | | | Value at
January 31,
2017 | | | Income | | | Net
Realized
Gain1 | | | Change in
Unrealized
Appreciation
(Depreciation) |
BlackRock Liquidity Funds, T-Fund, Institutional Class | | | — | | | | 164,145 | | | | 164,145 | | | $ | 164,145 | | | $ | 113 | | | $ | 1 | | | — |
BlackRock Premier Government Institutional Fund | | | 105,026 | | | | (105,026 | ) | | | — | | | | — | | | | 39 | | | | — | | | — |
Total | | | $ | 164,145 | | | $ | 152 | | | $ | 1 | | | — |
| | | | | | | | | | | | | | | |
1 Includes net capital gain distributions. |
| (c) | | Current yield as of period end. |
| • | | For Fund compliance purposes, the sector classifications refer to one or more of the sector sub-classifications used by one or more widely recognized market indexes or rating group indexes, and/or as defined by the investment adviser. These definitions may not apply for purposes of this report, which may combine such sector sub-classifications for reporting ease. |
|
| Derivative Financial Instruments Outstanding as of Period End |
| | | | | | | | | | | | | | |
| Futures Contracts | | | | |
Contracts
Long | | | Issue | | Expiration | | Notional
Value | | | Unrealized
Appreciation | |
| | 1 | | | S&P 500 E-Mini Index | | March 2017 | | $ | 113,725 | | | $ | 2,150 | |
|
| Derivative Financial Instruments Categorized by Risk Exposure |
As of period end, the fair values of derivative financial instruments located in the Statements of Assets and Liabilities were as follows:
| | | | | | | | | | | | | | | | | | | | |
| Assets — Derivative Financial Instruments | | Commodity
Contracts | | Credit
Contracts | | Equity
Contracts | | | Foreign
Currency
Exchange
Contracts | | Interest
Rate
Contracts | | Other
Contracts | | Total | |
Futures contracts | | Net unrealized appreciation1 | | — | | — | | $ | 2,150 | | | — | | — | | — | | $ | 2,150 | |
1 Includes cumulative appreciation (depreciation) on futures contracts, if any, as reported in the Schedule of Investments. Only current day’s variation margin is reported within the Statements of Assets and Liabilities. | |
For the six months ended January 31, 2017, the effect of derivative financial instruments in the Statements of Operations was as follows:
| | | | | | | | | | | | | | | | | | |
| Net Realized Gain (Loss) from: | | Commodity
Contracts | | Credit
Contracts | | Equity
Contracts | | | Foreign
Currency
Exchange
Contracts | | Interest
Rate
Contracts | | Other
Contracts | | Total | |
Futures contracts | | — | | — | | $ | 6,201 | | | — | | | | — | | $ | 6,201 | |
Net Change in Unrealized Appreciation (Depreciation) on: | | | | | | | | | | | | | | | | | | |
Futures contracts | | — | | — | | $ | 1,018 | | | — | | — | | — | | $ | 1,018 | |
| | | | |
| Average Quarterly Balances of Outstanding Derivative Financial Instruments |
| | | | |
| Futures contracts: | | | | |
Average notional value of contracts — long | | $ | 56,863 | |
For more information about the Fund’s investment risks regarding derivative financial instruments, refer to the Notes to Financial Statements.
See Notes to Financial Statements.
| | | | | | |
| | | | | | | |
| | BLACKROCK FUNDS | | JANUARY 31, 2017 | | 29 |
| | |
Schedule of Investments (concluded) | | BlackRock Multifactor USA Index Fund |
|
| Fair Value Hierarchy as of Period End |
Various inputs are used in determining the fair value of investments and derivative financial instruments. For information about the Fund’s policy regarding valuation of investments and derivative financial instruments, refer to the Notes to Financial Statements.
The following tables summarize the Fund’s investments and derivative financial instruments categorized in the disclosure hierarchy:
| | | | | | | | | | | | | | | | |
| | | Level 1 | | | Level 2 | | | Level 3 | | | Total | |
Assets: | | | | | | | | | | | | | | | | |
| Investments: | | | | | | | | | | | | | | | | |
Common Stocks1 | | $ | 10,758,704 | | | | — | | | | — | | | $ | 10,758,704 | |
Short-Term Securities | | | 164,145 | | | | — | | | | — | | | | 164,145 | |
| | | | |
Total | | $ | 10,922,849 | | | | — | | | | — | | | $ | 10,922,849 | |
| | | | |
| | | | | | | | | | | | | | | | |
| Derivative Financial Instruments2 | | | | | | | | | | | | | | | | |
Assets: | | | | | | | | | | | | | | | | |
Equity contracts | | $ | 2,150 | | | | — | | | | — | | | $ | 2,150 | |
1 See above Schedule of Investments for values in each sector. | |
2 Derivative financial instruments are futures contracts, which are valued at the unrealized appreciation (depreciation) on the instrument. | |
During the six months ended January 31, 2017, there were no transfers between levels.
See Notes to Financial Statements.
| | | | | | |
| | | | | | | |
| 30 | | BLACKROCK FUNDS | | JANUARY 31, 2017 | | |
| | |
| Statements of Assets and Liabilities | | |
| | | | | | | | | | | | | | | | |
| January 31, 2017 (Unaudited) | | BlackRock
Min Vol EAFE
Index Fund | | | BlackRock
Min Vol USA
Index Fund | | | BlackRock
Multifactor
International
Index Fund | | | BlackRock
Multifactor USA
Index Fund | |
| | | | | | | | | | | | | | | | |
| Assets | |
Investments at value — unaffiliated1 | | $ | 87,719,510 | | | $ | 9,584,539 | | | $ | 10,340,213 | | | $ | 10,758,704 | |
Investments at value — affiliated2 | | | 335,074 | | | | 161,472 | | | | 22,854 | | | | 164,145 | |
Cash | | | — | | | | — | | | | — | | | | 10 | |
Cash pledged for futures contracts | | | 87,241 | | | | 6,000 | | | | 9,530 | | | | 6,000 | |
Foreign currency at value3 | | | 2,561,803 | | | | — | | | | 146,978 | | | | — | |
| Receivables: | |
Investments sold | | | 4,307,901 | | | | 7,498 | | | | 71 | | | | 5,289 | |
Capital shares sold | | | 60,614 | | | | — | | | | — | | | | — | |
Dividends — unaffiliated | | | 35,417 | | | | 9,881 | | | | 6,144 | | | | 8,414 | |
From the Manager | | | 31,879 | | | | 33,585 | | | | 34,494 | | | | 28,588 | |
Dividends — affiliated | | | 272 | | | | 43 | | | | 4 | | | | 47 | |
Deferred offering costs | | | 46,764 | | | | 46,764 | | | | 46,764 | | | | 46,764 | |
Prepaid expenses | | | 7,632 | | | | 7,632 | | | | 7,635 | | | | 7,634 | |
| | | | |
Total assets | | | 95,194,107 | | | | 9,857,414 | | | | 10,614,687 | | | | 11,025,595 | |
| | | | |
| | | | | | | | | | | | | | | | |
| Liabilities | |
| Payables: | |
Investments purchased | | | 5,232,217 | | | | — | | | | — | | | | — | |
Variation margin on futures contracts | | | 15,017 | | | | 75 | | | | 791 | | | | 75 | |
Offering costs | | | 8,601 | | | | 15,501 | | | | 12,387 | | | | 11,351 | |
Officer’s and Trustees’ fees | | | 4,054 | | | | 4,054 | | | | 4,046 | | | | 4,045 | |
Other accrued expenses | | | 66,183 | | | | 47,009 | | | | 67,416 | | | | 38,189 | |
| | | | |
Total liabilities | | | 5,326,072 | | | | 66,639 | | | | 84,640 | | | | 53,660 | |
| | | | |
Net Assets | | $ | 89,868,035 | | | $ | 9,790,775 | | | $ | 10,530,047 | | | $ | 10,971,935 | |
| | | | |
| | | | | | | | | | | | | | | | |
| Net Assets Consist of | |
Paid-in capital | | $ | 90,195,263 | | | $ | 10,038,009 | | | $ | 9,999,816 | | | $ | 10,003,358 | |
Undistributed (distributions in excess of) net investment income | | | 9,355 | | | | 5,470 | | | | (14,048 | ) | | | (1,448 | ) |
Accumulated net realized gain (loss) | | | (133,001 | ) | | | (126,337 | ) | | | (113,753 | ) | | | 132,040 | |
Net unrealized appreciation (depreciation) | | | (203,582 | ) | | | (126,367 | ) | | | 658,032 | | | | 837,985 | |
| | | | |
Net Assets | | $ | 89,868,035 | | | $ | 9,790,775 | | | $ | 10,530,047 | | | $ | 10,971,935 | |
| | | | |
1 Investments at cost — unaffiliated | | $ | 87,923,657 | | | $ | 9,713,056 | | | $ | 9,683,536 | | | $ | 9,922,869 | |
2 Investments at cost — affiliated | | $ | 335,074 | | | $ | 161,472 | | | $ | 22,854 | | | $ | 164,145 | |
3 Foreign currency at cost | | $ | 2,541,670 | | | | — | | | $ | 144,304 | | | | — | |
| | | | | | | | | | | | | | | | |
| Net Asset Value | |
| Institutional: | |
Net assets | | $ | 95,202 | | | $ | 126,290 | | | $ | 105,299 | | | $ | 113,461 | |
| | | | |
Shares outstanding | | | 10,000 | | | | 12,942 | | | | 10,000 | | | | 10,345 | |
| | | | |
Net asset value | | $ | 9.52 | | | $ | 9.76 | | | $ | 10.53 | | | $ | 10.97 | |
| | | | |
Shares authorized | | | Unlimited | | | | Unlimited | | | | Unlimited | | | | Unlimited | |
| | | | |
Par value | | $ | 0.001 | | | $ | 0.001 | | | $ | 0.001 | | | $ | 0.001 | |
| | | | |
| Class K: | |
Net assets | | $ | 89,772,833 | | | $ | 9,664,485 | | | $ | 10,424,748 | | | $ | 10,858,474 | |
| | | | |
Shares outstanding | | | 9,430,682 | | | | 990,713 | | | | 990,000 | | | | 990,000 | |
| | | | |
Net asset value | | $ | 9.52 | | | $ | 9.76 | | | $ | 10.53 | | | $ | 10.97 | |
| | | | |
Shares authorized | | | Unlimited | | | | Unlimited | | | | Unlimited | | | | Unlimited | |
| | | | |
Par value | | $ | 0.001 | | | $ | 0.001 | | | $ | 0.001 | | | $ | 0.001 | |
| | | | |
| | | | | | |
| See Notes to Financial Statements. | | | | |
| | | | | | | |
| | BLACKROCK FUNDS | | JANUARY 31, 2017 | | 31 |
| | | | | | | | | | | | | | | | |
| Six Months Ended January 31, 2017 (Unaudited) | | BlackRock
Min Vol EAFE
Index Fund | | | BlackRock
Min Vol USA
Index Fund | | | BlackRock
Multifactor
International
Index Fund | | | BlackRock
Multifactor USA
Index Fund | |
| | | | | | | | | | | | | | | | |
| Investment Income | | | | |
Dividends — unaffiliated | | $ | 132,143 | | | $ | 119,309 | | | $ | 102,905 | | | $ | 117,362 | |
Dividends — affiliated | | | 287 | | | | 192 | | | | 22 | | | | 152 | |
Foreign taxes withheld | | | (7,630 | ) | | | — | | | | (8,552 | ) | | | (19 | ) |
| | | | |
Total Investment Income | | | 124,800 | | | | 119,501 | | | | 94,375 | | | | 117,495 | |
| | | | |
| | | | | | | | | | | | | | | | |
| Expenses | | | | |
Offering | | | 52,788 | | | | 52,788 | | | | 52,788 | | | | 52,788 | |
Custodian | | | 30,495 | | | | 13,879 | | | | 31,059 | | | | 7,271 | |
Professional | | | 27,033 | | | | 26,373 | | | | 27,033 | | | | 26,373 | |
Registration | | | 7,931 | | | | 7,931 | | | | 7,931 | | | | 7,931 | |
Investment advisory | | | 6,808 | | | | 1,956 | | | | 15,539 | | | | 11,004 | |
Printing | | | 6,177 | | | | 6,177 | | | | 6,177 | | | | 6,177 | |
Officer and Trustees | | | 5,522 | | | | 5,522 | | | | 5,522 | | | | 5,522 | |
Transfer agent — class specific | | | 358 | | | | 358 | | | | 358 | | | | 358 | |
Miscellaneous | | | 2,536 | | | | 2,533 | | | | 2,538 | | | | 2,535 | |
| | | | |
Total expenses | | | 139,648 | | | | 117,517 | | | | 148,945 | | | | 119,959 | |
| Less: | | | | | | | | | | | | | | | | |
Fees waived by the Manager | | | (6,808 | ) | | | (1,956 | ) | | | (15,539 | ) | | | (11,004 | ) |
Other expenses reimbursed by the Manager | | | (117,133 | ) | | | (108,818 | ) | | | (112,296 | ) | | | (92,847 | ) |
Transfer agent fees waived and/or reimbursed — class specific | | | (334 | ) | | | (327 | ) | | | (333 | ) | | | (332 | ) |
| | | | |
Total expenses after fees waived and/or reimbursed | | | 15,373 | | | | 6,416 | | | | 20,777 | | | | 15,776 | |
| | | | |
Net investment income | | | 109,427 | | | | 113,085 | | | | 73,598 | | | | 101,719 | |
| | | | |
| | | | | | | | | | | | | | | | |
| Realized and Unrealized Gain (Loss) | | | | |
| Net realized gain (loss) from: | | | | |
Investments — unaffiliated | | | (120,073 | ) | | | (127,578 | ) | | | (104,015 | ) | | | 126,970 | |
Futures contracts | | | (27,140 | ) | | | 3,898 | | | | 8,985 | | | | 6,201 | |
Foreign currency transactions | | | 14,607 | | | | — | | | | (9,921 | ) | | | — | |
Capital gain distributions from investment companies — affiliated | | | — | | | | 1 | | | | — | | | | 1 | |
| | | | |
| | | (132,606 | ) | | | (123,679 | ) | | | (104,951 | ) | | | 133,172 | |
| | | | |
| Net change in unrealized appreciation (depreciation) on: | |
Investments — unaffiliated | | | (318,358 | ) | | | (121,273 | ) | | | 414,205 | | | | 722,299 | |
Futures contracts | | | (18,833 | ) | | | 1,018 | | | | (4,362 | ) | | | 1,018 | |
Foreign currency translations | | | 16,059 | | | | — | | | | 957 | | | | — | |
| | | | |
| | | (321,132 | ) | | | (120,255 | ) | | | 410,800 | | | | 723,317 | |
| | | | |
Net realized and unrealized gain (loss) | | | (453,738 | ) | | | (243,934 | ) | | | 305,849 | | | | 856,489 | |
| | | | |
Net Increase (Decrease) in Net Assets Resulting from Operations | | $ | (344,311 | ) | | $ | (130,849 | ) | | $ | 379,447 | | | $ | 958,208 | |
| | | | |
| | | | | | |
| See Notes to Financial Statements. | | | | |
| | | | | | | |
| 32 | | BLACKROCK FUNDS | | JANUARY 31, 2017 | | |
| | |
| Statements of Changes in Net Assets | | |
| | | | | | | | | | | | | | | | | | | | | | | | | | | | |
| | | BlackRock Min Vol EAFE Index Fund | | | | | | BlackRock Min Vol USA Index Fund | |
| Increase (Decrease) in Net Assets: | | Six Months Ended
January 31,
2017
(Unaudited) | | | Period from July 13, 20161 to July 31,
2016 | | | | | | Six Months Ended
January 31,
2017
(Unaudited) | | | Period from July 13, 20161 to July 31,
2016 | |
| | | | | | | | | | | | | | | | | | | | | | | | | | | | |
| Operations | | | | | | | | | | | | | | | | | |
Net investment income | | $ | 109,427 | | | | | | | $ | 3,678 | | | | | | | $ | 113,085 | | | | | | | $ | 4,318 | |
Net realized gain (loss) | | | (132,606 | ) | | | | | | | 65 | | | | | | | | (123,679 | ) | | | | | | | (29 | ) |
Net change in unrealized appreciation (depreciation) | | | (321,132 | ) | | | | | | | 117,550 | | | | | | | | (120,255 | ) | | | | | | | (6,112 | ) |
| | | | | | | | | | | | |
Net increase (decrease) in net assets resulting from operations | | | (344,311 | ) | | | | | | | 121,293 | | | | | | | | (130,849 | ) | | | | | | | (1,823 | ) |
| | | | | | | | | | | | |
| | | | | | | | | | | | | | | | | | | | | | | | | | | | |
| Distributions to Shareholders2 | | | | | | | | | | | | | | | | | | | | | | | | | | | | |
| From net investment income: | | | | | | | | | | | | | | | | | |
Institutional | | | (1,015 | ) | | | | | | | — | | | | | | | | (1,414 | ) | | | | | | | — | |
Class K | | | (102,735 | ) | | | | | | | — | | | | | | | | (110,587 | ) | | | | | | | — | |
| From net realized gain: | | | | | | | | | | | | | | | | | | | | | | | | | | | | |
Institutional | | | (5 | ) | | | | | | | — | | | | | | | | (34 | ) | | | | | | | — | |
Class K | | | (538 | ) | | | | | | | — | | | | | | | | (2,595 | ) | | | | | | | — | |
| | | | | | | | | | | | |
Decrease in net assets resulting from distributions to shareholders | | | (104,293 | ) | | | | | | | — | | | | | | | | (114,630 | ) | | | | | | | — | |
| | | | | | | | | | | | |
| | | | | | | | | | | | | | | | | | | | | | | | | | | | |
| Capital Share Transactions | | | | | | | | | | | | | | | | | | | | | | | | | | | | |
Net increase in net assets derived from capital share transactions | | | 80,195,346 | | | | | | | | 10,000,000 | | | | | | | | 9,776 | | | | | | | | 10,028,301 | |
| | | | | | | | | | | | |
| | | | | | | | | | | | | | | | | | | | | | | | | | | | |
| Net Assets | | | | | | | | | | | | | | | | | | | | | | | | | | | | |
Total increase (decrease) in net assets | | | 79,746,742 | | | | | | | | 10,121,293 | | | | | | | | (235,703 | ) | | | | | | | 10,026,478 | |
Beginning of period | | | 10,121,293 | | | | | | | | — | | | | | | | | 10,026,478 | | | | | | | | — | |
| | | | | | | | | | | | |
End of period | | $ | 89,868,035 | | | | | | | $ | 10,121,293 | | | | | | | $ | 9,790,775 | | | | | | | $ | 10,026,478 | |
| | | | | | | | | | | | |
Undistributed net investment income, end of period | | $ | 9,355 | | | | | | | $ | 3,678 | | | | | | | $ | 5,470 | | | | | | | $ | 4,386 | |
| | | | | | | | | | | | |
1 Commencement of operations. | | | | | | | | | | | | | | | | | | | | | | | | | | | | |
2 Distributions for annual periods determined in accordance with federal income tax regulations. | | | | | | | | | | | | | | | | | | | | | | | | | |
| | | | | | |
| See Notes to Financial Statements. | | | | |
| | | | | | | |
| | BLACKROCK FUNDS | | JANUARY 31, 2017 | | 33 |
| | |
| Statements of Changes in Net Assets | | |
| | | | | | | | | | | | | | | | | | | | | | | | | | | | |
| | | BlackRock Multifactor
International Index Fund | | | | | | BlackRock Multifactor USA Index Fund | |
| Increase (Decrease) in Net Assets: | | Six Months Ended
January 31,
2017
(Unaudited) | | | Period from July 13, 20161 to July 31,
2016 | | | | | | Six Months Ended
January 31,
2017
(Unaudited) | | | Period from July 13, 20161 to July 31,
2016 | |
| | | | | | | | | | | | | | | | | | | | | | | | | | | | |
| Operations | | | | | | | | | | | | | | | | | |
Net investment income | | $ | 73,598 | | | | | | | $ | 7,156 | | | | | | | $ | 101,719 | | | | | | | $ | 1,670 | |
Net realized loss | | | (104,951 | ) | | | | | | | (4 | ) | | | | | | | 133,172 | | | | | | | | 75 | |
Net change in unrealized appreciation (depreciation) | | | 410,800 | | | | | | | | 247,232 | | | | | | | | 723,317 | | | | | | | | 114,668 | |
| | | | | | | | | | | | |
Net increase in net assets resulting from operations | | | 379,447 | | | | | | | | 254,384 | | | | | | | | 958,208 | | | | | | | | 116,413 | |
| | | | | | | | | | | | |
| | | | | | | | | | | | | | | | | | | | | | | | | | | | |
| Distributions to Shareholders2 | | | | | | | | | | | | | | | | | | | | | | | | | | | | |
| From net investment income: | | | | | | | | | | | | | | | | | |
Institutional | | | (927 | ) | | | | | | | — | | | | | | | | (1,048 | ) | | | | | | | — | |
Class K | | | (94,075 | ) | | | | | | | — | | | | | | | | (103,953 | ) | | | | | | | — | |
| From net realized gain: | | | | | | | | | | | | | | | | | | | | | | | | | | | | |
Institutional | | | (88 | ) | | | | | | | — | | | | | | | | (12 | ) | | | | | | | — | |
Class K | | | (8,694 | ) | | | | | | | — | | | | | | | | (1,195 | ) | | | | | | | — | |
| | | | | | | | | | | | |
Decrease in net assets resulting from distributions to shareholders | | | (103,784 | ) | | | | | | | — | | | | | | | | (106,208 | ) | | | | | | | — | |
| | | | | | | | | | | | |
| | | | | | | | | | | | | | | | | | | | | | | | | | | | |
| Capital Share Transactions | | | | | | | | | | | | | | | | | | | | | | | | | | | | |
Net increase in net assets derived from capital share transactions | | | — | | | | | | | | 10,000,000 | | | | | | | | 3,522 | | | | | | | | 10,000,000 | |
| | | | | | | | | | | | |
| | | | | | | | | | | | | | | | | | | | | | | | | | | | |
| Net Assets | | | | | | | | | | | | | | | | | | | | | | | | | | | | |
Total increase in net assets | | | 275,663 | | | | | | | | 10,254,384 | | | | | | | | 855,522 | | | | | | | | 10,116,413 | |
Beginning of period | | | 10,254,384 | | | | | | | | — | | | | | | | | 10,116,413 | | | | | | | | — | |
| | | | | | | | | | | | |
End of period | | $ | 10,530,047 | | | | | | | $ | 10,254,384 | | | | | | | $ | 10,971,935 | | | | | | | $ | 10,116,413 | |
| | | | | | | | | | | | |
Undistributed (distributions in excess of) net investment income, end of period | | $ | (14,048 | ) | | | | | | $ | 7,356 | | | | | | | $ | (1,448 | ) | | | | | | $ | 1,834 | |
| | | | | | | | | | | | |
1 Commencement of operations. | | | | | | | | | | | | | | | | | | | | | | | | | | | | |
2 Distributions for annual periods determined in accordance with federal income tax regulations. | | | | | | | | | | | | | | | | | | | | | | | | | |
| | | | | | |
| See Notes to Financial Statements. | | | | |
| | | | | | | |
| 34 | | BLACKROCK FUNDS | | JANUARY 31, 2017 | | |
| | |
| Financial Highlights | | BlackRock Min Vol EAFE Index Fund |
| | | | | | | | | | | | |
| | | Institutional | |
| | | Six Months Ended
January 31,
2017
(Unaudited) | | | Period
July 13, 20161
to July 31,
2016 | | | | |
| | | | | | | | | | | | |
| Per Share Operating Performance | | | | | |
Net asset value, beginning of period | | $ | 10.12 | | | $ | 10.00 | | | | | |
| | | | |
Net investment income2 | | | 0.09 | | | | 0.00 | 3 | | | | |
Net realized and unrealized gain (loss) | | | (0.59 | ) | | | 0.12 | | | | | |
| | | | |
Net increase (decrease) from investment operations | | | (0.50 | ) | | | 0.12 | | | | | |
| | | | |
| Distributions:4 | | | | | | | | | | | | |
From net investment income | | | (0.10 | ) | | | — | | | | | |
From net realized gain | | | (0.00 | )5 | | | — | | | | | |
| | | | |
Total distributions | | | (0.10 | ) | | | — | | | | | |
| | | | |
Net asset value, end of period | | $ | 9.52 | | | $ | 10.12 | | | | | |
| | | | |
| | | | | | | | | | | | |
| Total Return6,7 | | | | | |
Based on net asset value | | | (4.91)% | | | | 1.20% | | | | | |
| | | | |
| | | | | | | | | | | | |
| Ratios to Average Net Assets | | | | | |
Total expenses8 | | | 2.17% | 9,10 | | | 3.97% | 11 | | | | |
| | | | |
Total expenses after fees waived and/or reimbursed8 | | | 0.23% | 9 | | | 0.23% | | | | | |
| | | | |
Net investment income8 | | | 1.89% | 9 | | | 0.70% | | | | | |
| | | | |
| | | | | | | | | | | | |
| Supplemental Data | | | | | |
Net assets, end of period (000) | | $ | 95 | | | $ | 101 | | | | | |
| | | | |
Portfolio turnover rate | | | 47% | | | | — | | | | | |
| | | | |
| | 1 | | Commencement of operations. |
| | 2 | | Based on average shares outstanding. |
| | 3 | | Amount is less than $0.005 per share. |
| | 4 | | Distributions for annual periods determined in accordance with federal income tax regulations. |
| | 5 | | Amount is greater than $(0.005) per share. |
| | 6 | | Where applicable, assumes the reinvestment of distributions. |
| | 7 | | Aggregate total return. |
| | 9 | | Does not include expenses incurred indirectly as a result of investments in underlying funds of approximately 0.02%. |
| | 10 | | Offering costs were not annualized in the calculation of the expense ratios. If these expenses were annualized, the total expenses would have been 2.66%. |
| | 11 | | Audit, offering and organization costs were not annualized in the calculation of the expense ratios. If these expenses were annualized, the total expenses would have been 13.44%. |
| | | | | | |
| See Notes to Financial Statements. | | | | |
| | | | | | | |
| | BLACKROCK FUNDS | | JANUARY 31, 2017 | | 35 |
| | |
| Financial Highlights (concluded) | | BlackRock Min Vol EAFE Index Fund |
| | | | | | | | | | | | |
| | | Class K | |
| | | Six Months Ended
January 31,
2017
(Unaudited) | | | Period
July 13, 20161
to July 31,
2016 | | | | |
| | | | | | | | | | | | |
| Per Share Operating Performance | | | | | |
Net asset value, beginning of period | | $ | 10.12 | | | $ | 10.00 | | | | | |
| | | | |
Net investment income2 | | | 0.07 | | | | 0.00 | 3 | | | | |
Net realized and unrealized gain (loss) | | | (0.57 | ) | | | 0.12 | | | | | |
| | | | |
Net increase (decrease) from investment operations | | | (0.50 | ) | | | 0.12 | | | | | |
| | | | |
| Distributions:4 | | | | | | | | | | | | |
From net investment income | | | (0.10 | ) | | | — | | | | | |
From net realized gain | | | (0.00 | )5 | | | — | | | | | |
| | | | |
Total distributions | | | (0.10 | ) | | | — | | | | | |
| | | | |
Net asset value, end of period | | $ | 9.52 | | | $ | 10.12 | | | | | |
| | | | |
| | | | | | | | | | | | |
| Total Return6,7 | | | | | |
Based on net asset value | | | (4.89)% | | | | 1.20% | | | | | |
| | | | |
| | | | | | | | | | | | |
| Ratios to Average Net Assets | | | | | |
Total expenses8 | | | 1.33% | 9,10 | | | 3.90% | 11 | | | | |
| | | | |
Total expenses after fees waived and/or reimbursed8 | | | 0.18% | 9 | | | 0.18% | | | | | |
| | | | |
Net investment income8 | | | 1.28% | 9 | | | 0.75% | | | | | |
| | | | |
| | | | | | | | | | | | |
| Supplemental Data | | | | | |
Net assets, end of period (000) | | $ | 89,773 | | | $ | 10,020 | | | | | |
| | | | |
Portfolio turnover rate | | | 47% | | | | — | | | | | |
| | | | |
| | 1 | | Commencement of operations. |
| | 2 | | Based on average shares outstanding. |
| | 3 | | Amount is less than $0.005 per share. |
| | 4 | | Distributions for annual periods determined in accordance with federal income tax regulations. |
| | 5 | | Amount is greater than $(0.005) per share. |
| | 6 | | Where applicable, assumes the reinvestment of distributions. |
| | 7 | | Aggregate total return. |
| | 9 | | Does not include expenses incurred indirectly as a result of investments in underlying funds of approximately 0.02%. |
| | 10 | | Offering costs were not annualized in the calculation of the expense ratios. If these expenses were annualized, the total expenses would have been 1.64%. |
| | 11 | | Audit, offering and organization costs were not annualized in the calculation of the expense ratios. If these expenses were annualized, the total expenses would have been 13.37%. |
| | | | | | |
| See Notes to Financial Statements. | | | | |
| | | | | | | |
| 36 | | BLACKROCK FUNDS | | JANUARY 31, 2017 | | |
| | |
| Financial Highlights | | BlackRock Min Vol USA Index Fund |
| | | | | | | | | | | | |
| | | Institutional | |
| | | Six Months Ended
January 31,
2017
(Unaudited) | | | Period
July 13, 20161
to July 31,
2016 | | | | |
| | | | | | | | | | | | |
| Per Share Operating Performance | | | | | |
Net asset value, beginning of period | | $ | 10.00 | | | $ | 10.00 | | | | | |
| | | | |
Net investment income2 | | | 0.12 | | | | 0.00 | 3 | | | | |
Net realized and unrealized (loss) | | | (0.25 | ) | | | (0.00 | )4 | | | | |
| | | | |
Net increase (decrease) from investment operations | | | (0.13 | ) | | | — | | | | | |
| | | | |
| Distributions:4 | | | | | | | | | | | | |
From net investment income | | | (0.11 | ) | | | — | | | | | |
From net realized gain | | | (0.00 | )5 | | | — | | | | | |
| | | | |
Total distributions | | | (0.11 | ) | | | — | | | | | |
| | | | |
Net asset value, end of period | | $ | 9.76 | | | $ | 10.00 | | | | | |
| | | | |
| | | | | | | | | | | | |
| Total Return6,7 | | | | | |
Based on net asset value | | | (1.25)% | | | | 0.00% | | | | | |
| | | | |
| | | | | | | | | | | | |
| Ratios to Average Net Assets | | | | | |
Total expenses8 | | | 1.89% | 9 | | | 2.81% | 10,11 | | | | |
| | | | |
Total expenses after fees waived and/or reimbursed8 | | | 0.18% | | | | 0.18% | 10 | | | | |
| | | | |
Net investment income8 | | | 2.38% | | | | 0.85% | 10 | | | | |
| | | | |
| | | | | | | | | | | | |
| Supplemental Data | | | | | |
Net assets, end of period (000) | | $ | 126 | | | $ | 128 | | | | | |
| | | | |
Portfolio turnover rate | | | 11% | | | | 1% | | | | | |
| | | | |
| | 1 | | Commencement of operations. |
| | 2 | | Based on average shares outstanding. |
| | 3 | | Amount is less than $0.005 per share. |
| | 4 | | Distributions for annual periods determined in accordance with federal income tax regulations. |
| | 5 | | Amount is greater than $(0.005) per share. |
| | 6 | | Where applicable, assumes the reinvestment of distributions. |
| | 7 | | Aggregate total return. |
| | 9 | | Offering costs were not annualized in the calculation of the expense ratios. If these expenses were annualized, the total expenses would have been 2.42%. |
| | 10 | | Does not include expenses incurred indirectly as a result of investments in underlying funds of approximately 0.02%. |
| | 11 | | Audit, offering and organization costs were not annualized in the calculation of the expense ratios. If these expenses were annualized, the total expenses would have been 11.78%. |
| | | | | | |
| See Notes to Financial Statements. | | | | |
| | | | | | | |
| | BLACKROCK FUNDS | | JANUARY 31, 2017 | | 37 |
| | |
| Financial Highlights (concluded) | | BlackRock Min Vol USA Index Fund |
| | | | | | | | | | | | |
| | | Class K | |
| | | Six Months Ended
January 31,
2017
(Unaudited) | | | Period
July 13, 20161
to July 31,
2016 | | | | |
| | | | | | | | | | | | |
| Per Share Operating Performance | | | | | |
Net asset value, beginning of period | | $ | 10.00 | | | $ | 10.00 | | | | | |
| | | | |
Net investment income2 | | | 0.11 | | | | 0.00 | 3 | | | | |
Net realized and unrealized (loss) | | | (0.24 | ) | | | (0.00 | )4 | | | | |
| | | | |
Net increase (decrease) from investment operations | | | (0.13 | ) | | | — | | | | | |
| | | | |
| Distributions:4 | | | | | | | | | | | | |
From net investment income | | | (0.11 | ) | | | — | | | | | |
From net realized gain | | | (0.00 | )5 | | | — | | | | | |
| | | | |
Total distributions | | | (0.11 | ) | | | — | | | | | |
| | | | |
Net asset value, end of period | | $ | 9.76 | | | $ | 10.00 | | | | | |
| | | | |
| | | | | | | | | | | | |
| Total Return6,7 | | | | | |
Based on net asset value | | | (1.23)% | | | | 0.00% | | | | | |
| | | | |
| | | | | | | | | | | | |
| Ratios to Average Net Assets | | | | | |
Total expenses8 | | | 1.87% | 9 | | | 2.75% | 10,11 | | | | |
| | | | |
Total expenses after fees waived and/or reimbursed8 | | | 0.13% | | | | 0.13% | 10 | | | | |
| | | | |
Net investment income8 | | | 2.31% | | | | 0.87% | 10 | | | | |
| | | | |
| | | | | | | | | | | | |
| Supplemental Data | | | | | |
Net assets, end of period (000) | | $ | 9,664 | | | $ | 9,898 | | | | | |
| | | | |
Portfolio turnover rate | | | 11% | | | | 1% | | | | | |
| | | | |
| | 1 | | Commencement of operations. |
| | 2 | | Based on average shares outstanding. |
| | 3 | | Amount is less than $0.005 per share. |
| | 4 | | Distributions for annual periods determined in accordance with federal income tax regulations. |
| | 5 | | Amount is greater than $(0.005) per share. |
| | 6 | | Where applicable, assumes the reinvestment of distributions. |
| | 7 | | Aggregate total return. |
| | 9 | | Offering costs were not annualized in the calculation of the expense ratios. If these expenses were annualized, the total expenses would have been 2.40%. |
| | 10 | | Does not include expenses incurred indirectly as a result of investments in underlying funds of approximately 0.02%. |
| | 11 | | Audit, offering and organization costs were not annualized in the calculation of the expense ratios. If these expenses were annualized, the total expenses would have been 11.99%. |
| | | | | | |
| See Notes to Financial Statements. | | | | |
| | | | | | | |
| 38 | | BLACKROCK FUNDS | | JANUARY 31, 2017 | | |
| | |
| Financial Highlights | | BlackRock Multifactor International Index Fund |
| | | | | | | | | | | | |
| | | Institutional | |
| | | Six Months Ended
January 31,
2017
(Unaudited) | | | Period
July 13, 20161
to July 31,
2016 | | | | |
| | | | | | | | | | | | |
| Per Share Operating Performance | | | | | |
Net asset value, beginning of period | | $ | 10.25 | | | $ | 10.00 | | | | | |
| | | | |
Net investment income2 | | | 0.07 | | | | 0.01 | | | | | |
Net realized and unrealized gain | | | 0.31 | | | | 0.24 | | | | | |
| | | | |
Net increase from investment operations | | | 0.38 | | | | 0.25 | | | | | |
| | | | |
| Distributions:3 | | | | | | | | | | | | |
From net investment income | | | (0.09 | ) | | | — | | | | | |
From net realized gain | | | (0.01 | ) | | | — | | | | | |
| | | | |
Total distributions | | | (0.10 | ) | | | — | | | | | |
| | | | |
Net asset value, end of period | | $ | 10.53 | | | $ | 10.25 | | | | | |
| | | | |
| | | | | | | | | | | | |
| Total Return4,5 | | | | | |
Based on net asset value | | | 3.77% | | | | 2.50% | | | | | |
| | | | |
| | | | | | | | | | | | |
| Ratios to Average Net Assets | | | | | |
Total expenses6 | | | 2.43% | 7 | | | 4.20% | 8 | | | | |
| | | | |
Total expenses after fees waived and/or reimbursed6 | | | 0.45% | | | | 0.45% | | | | | |
| | | | |
Net investment income6 | | | 1.37% | | | | 1.39% | | | | | |
| | | | |
| | | | | | | | | | | | |
| Supplemental Data | | | | | |
Net assets, end of period (000) | | $ | 105 | | | $ | 103 | | | | | |
| | | | |
Portfolio turnover rate | | | 21% | | | | — | | | | | |
| | | | |
| | 1 | | Commencement of operations. |
| | 2 | | Based on average shares outstanding. |
| | 3 | | Distributions for annual periods determined in accordance with federal income tax regulations. |
| | 4 | | Where applicable, assumes the reinvestment of distributions. |
| | 5 | | Aggregate total return. |
| | 7 | | Offering costs were not annualized in the calculation of the expense ratios. If these expenses were annualized, the total expenses would have been 2.94%. |
| | 8 | | Audit, offering and organization costs were not annualized in the calculation of the expense ratios. If these expenses were annualized, the total expenses would have been 13.62%. |
| | | | | | |
| See Notes to Financial Statements. | | | | |
| | | | | | | |
| | BLACKROCK FUNDS | | JANUARY 31, 2017 | | 39 |
| | |
| Financial Highlights (concluded) | | BlackRock Multifactor International Index Fund |
| | | | | | | | | | | | |
| | | Class K | |
| | | Six Months Ended
January 31,
2017
(Unaudited) | | | Period
July 13, 20161
to July 31,
2016 | | | | |
| | | | | | | | | | | | |
| Per Share Operating Performance | | | | | |
Net asset value, beginning of period | | $ | 10.25 | | | $ | 10.00 | | | | | |
| | | | |
Net investment income2 | | | 0.07 | | | | 0.01 | | | | | |
Net realized and unrealized gain | | | 0.32 | | | | 0.24 | | | | | |
| | | | |
Net increase from investment operations | | | 0.39 | | | | 0.25 | | | | | |
| | | | |
| Distributions:3 | | | | | | | | | | | | |
From net investment income | | | (0.10 | ) | | | — | | | | | |
From net realized gain | | | (0.01 | ) | | | — | | | | | |
| | | | |
Total distributions | | | (0.11 | ) | | | — | | | | | |
| | | | |
Net asset value, end of period | | $ | 10.53 | | | $ | 10.25 | | | | | |
| | | | |
| | | | | | | | | | | | |
| Total Return4,5 | | | | | |
Based on net asset value | | | 3.79% | | | | 2.50% | | | | | |
| | | | |
| | | | | | | | | | | | |
| Ratios to Average Net Assets | | | | | |
Total expenses6 | | | 2.37% | 7 | | | 4.13% | 8 | | | | |
| | | | |
Total expenses after fees waived and/or reimbursed6 | | | 0.40% | | | | 0.40% | | | | | |
| | | | |
Net investment income6 | | | 1.42% | | | | 1.44% | | | | | |
| | | | |
| | | | | | | | | | | | |
| Supplemental Data | | | | | |
Net assets, end of period (000) | | $ | 10,425 | | | $ | 10,152 | | | | | |
| | | | |
Portfolio turnover rate | | | 21% | | | | — | | | | | |
| | | | |
| | 1 | | Commencement of operations. |
| | 2 | | Based on average shares outstanding. |
| | 3 | | Distributions for annual periods determined in accordance with federal income tax regulations. |
| | 4 | | Where applicable, assumes the reinvestment of distributions. |
| | 5 | | Aggregate total return. |
| | 7 | | Offering costs were not annualized in the calculation of the expense ratios. If these expenses were annualized, the total expenses would have been 2.87%. |
| | 8 | | Audit, offering and organization costs were not annualized in the calculation of the expense ratios. If these expenses were annualized, the total expenses would have been 13.55%. |
| | | | | | |
| See Notes to Financial Statements. | | | | |
| | | | | | | |
| 40 | | BLACKROCK FUNDS | | JANUARY 31, 2017 | | |
| | |
| Financial Highlights | | BlackRock Multifactor USA Index Fund |
| | | | | | | | | | | | |
| | | Institutional | |
| | | Six Months Ended
January 31,
2017
(Unaudited) | | | Period
July 13, 20161
to July 31,
2016 | | | | |
| | | | | | | | | | | | |
| Per Share Operating Performance | | | | | |
Net asset value, beginning of period | | $ | 10.12 | | | $ | 10.00 | | | | | |
| | | | |
Net investment income2 | | | 0.10 | | | | 0.00 | 3 | | | | |
Net realized and unrealized gain | | | 0.85 | | | | 0.12 | | | | | |
| | | | |
Net increase from investment operations | | | 0.95 | | | | 0.12 | | | | | |
| | | | |
| Distributions:4 | | | | | | | | | | | | |
From net investment income | | | (0.10 | ) | | | — | | | | | |
From net realized gain | | | (0.00 | )5 | | | — | | | | | |
| | | | |
Total distributions | | | (0.10 | ) | | | — | | | | | |
| | | | |
Net asset value, end of period | | $ | 10.97 | | | $ | 10.12 | | | | | |
| | | | |
| | | | | | | | | | | | |
| Total Return6,7 | | | | | |
Based on net asset value | | | 9.47% | | | | 1.20% | | | | | |
| | | | |
| | | | | | | | | | | | |
| Ratios to Average Net Assets | | | | | |
Total expenses8 | | | 1.85% | 9 | | | 2.54% | 10,11 | | | | |
| | | | |
Total expenses after fees waived and/or reimbursed8 | | | 0.35% | | | | 0.35% | 10 | | | | |
| | | | |
Net investment income8 | | | 1.89% | | | | 0.29% | 10 | | | | |
| | | | |
| | | | | | | | | | | | |
| Supplemental Data | | | | | |
Net assets, end of period (000) | | $ | 113 | | | $ | 101 | | | | | |
| | | | |
Portfolio turnover rate | | | 21% | | | | — | 12 | | | | |
| | | | |
| | 1 | | Commencement of operations. |
| | 2 | | Based on average shares outstanding. |
| | 3 | | Amount is less than $0.005 per share. |
| | 4 | | Distributions for annual periods determined in accordance with federal income tax regulations. |
| | 5 | | Amount is greater than $(0.005) per share. |
| | 6 | | Where applicable, assumes the reinvestment of distributions. |
| | 7 | | Aggregate total return. |
| | 9 | | Offering costs were not annualized in the calculation of the expense ratios. If these expenses were annualized, the total expenses would have been 2.35%. |
| | 10 | | Does not include expenses incurred indirectly as a result of investments in underlying funds of approximately 0.02%. |
| | 11 | | Audit, offering and organization costs were not annualized in the calculation of the expense ratios. If these expenses were annualized, the total expenses would have been 11.73%. |
| | 12 | | Amount is less than 0.50% |
| | | | | | |
| See Notes to Financial Statements. | | | | |
| | | | | | | |
| | BLACKROCK FUNDS | | JANUARY 31, 2017 | | 41 |
| | |
| Financial Highlights (concluded) | | BlackRock Multifactor USA Index Fund |
| | | | | | | | | | | | |
| | | Class K | |
| | | Six Months Ended
January 31,
2017
(Unaudited) | | | Period
July 13, 20161
to July 31,
2016 | | | | |
| | | | | | | | | | | | |
| Per Share Operating Performance | | | | | |
Net asset value, beginning of period | | $ | 10.12 | | | $ | 10.00 | | | | | |
| | | | |
Net investment income2 | | | 0.10 | | | | 0.00 | 3 | | | | |
Net realized and unrealized gain | | | 0.86 | | | | 0.12 | | | | | |
| | | | |
Net increase from investment operations | | | 0.96 | | | | 0.12 | | | | | |
| | | | |
| Distributions:4 | | | | | | | | | | | | |
From net investment income | | | (0.11 | ) | | | — | | | | | |
From net realized gain | | | (0.00 | )5 | | | — | | | | | |
| | | | |
Total distributions | | | (0.11 | ) | | | — | | | | | |
| | | | |
Net asset value, end of period | | $ | 10.97 | | | $ | 10.12 | | | | | |
| | | | |
| | | | | | | | | | | | |
| Total Return6,7 | | | | | |
Based on net asset value | | | 9.50% | | | | 1.20% | | | | | |
| | | | |
| | | | | | | | | | | | |
| Ratios to Average Net Assets | | | | | |
Total expenses8 | | | 1.79% | 9 | | | 2.47% | 10,11 | | | | |
| | | | |
Total expenses after fees waived and/or reimbursed8 | | | 0.30% | | | | 0.30% | 10 | | | | |
| | | | |
Net investment income8 | | | 1.94% | | | | 0.34% | 10 | | | | |
| | | | |
| | | | | | | | | | | | |
| Supplemental Data | | | | | |
Net assets, end of period (000) | | $ | 10,858 | | | $ | 10,015 | | | | | |
| | | | |
Portfolio turnover rate | | | 21% | | | | — | 12 | | | | |
| | | | |
| | 1 | | Commencement of operations. |
| | 2 | | Based on average shares outstanding. |
| | 3 | | Amount is less than $0.005 per share. |
| | 4 | | Distribution for annual periods determined in accordance with federal income tax regulations. |
| | 5 | | Amount is greater than $(0.005) per share. |
| | 6 | | Where applicable, assumes the reinvestment of distributions. |
| | 7 | | Aggregate total return. |
| | 9 | | Offering costs were not annualized in the calculation of the expense ratios. If these expenses were annualized, the total expenses would have been 2.29%. |
| | 10 | | Does not include expenses incurred indirectly as a result of investments in underlying funds of approximately 0.02%. |
| | 11 | | Audit, offering and organization costs were not annualized in the calculation of the expense ratios. If these expenses were annualized, the total expenses would have been 11.67%. |
| | 12 | | Amount is less than 0.50% |
| | | | | | |
| See Notes to Financial Statements. | | | | |
| | | | | | | |
| 42 | | BLACKROCK FUNDS | | JANUARY 31, 2017 | | |
| | | | |
| Notes to Financial Statements (Unaudited) | | |
1. Organization:
BlackRock FundsSM (the “Trust”) is registered under the Investment Company Act of 1940, as amended (the “1940 Act”), as an open-end management investment company. The Trust is organized as a Massachusetts business trust. The following are referred to herein collectively as the “Funds” or individually, a “Fund”:
| | | | | | |
| Fund Name | | Herein Referred To As | | Diversification
Classification | |
BlackRock Min Vol EAFE Index Fund | | Min Vol EAFE | | | Diversified | |
BlackRock Min Vol USA Index Fund | | Min Vol USA | | | Diversified | |
BlackRock Multifactor International Index Fund | | MF International | | | Non-diversified | |
BlackRock Multifactor USA Index Fund | | MF USA | | | Non-diversified | |
Each Fund offers multiple classes of shares. All classes of shares have identical voting, dividend, liquidation and other rights and are subject to the same terms and conditions. Institutional and Class K shares are sold without a sales charge and only to certain eligible investors.
| | | | | | | | | | |
| Share Class | | Initial Sales Charge | | CDSC | | | Conversion Privilege | |
Institutional Shares | | No | | | No | | | | None | |
Class K Shares | | No | | | No | | | | None | |
The Funds, together with certain other registered investment companies advised by BlackRock Advisors, LLC (the “Manager”) or its affiliates, are included in a complex of open-end funds referred to as the Equity-Liquidity Complex.
2. Significant Accounting Policies:
The financial statements are prepared in conformity with accounting principles generally accepted in the United States of America (“U.S. GAAP”), which may require management to make estimates and assumptions that affect the reported amounts of assets and liabilities in the financial statements, disclosure of contingent assets and liabilities at the date of the financial statements and the reported amounts of increases and decreases in net assets from operations during the reporting period. Actual results could differ from those estimates. Each Fund is considered an investment company under U.S. GAAP and follows the accounting and reporting guidance applicable to investment companies. Below is a summary of significant accounting policies:
Foreign Currency: Each Fund’s books and records are maintained in U.S. dollars. Purchases and sales of investments are recorded at the rates of exchange prevailing on the respective dates of such transactions. Generally, when the U.S. dollar rises in value against a foreign currency, the investments denominated in that currency will lose value; the opposite effect occurs if the U.S. dollar falls in relative value.
Each Fund does not isolate the portion of the results of operations arising as a result of changes in the exchange rates from the changes in the market prices of investments held or sold for financial reporting purposes. Accordingly, the effects of changes in exchange rates on investments are not segregated in the Statements of Operations from the effects of changes in market prices of those investments, but are included as a component of net realized and unrealized gain (loss) from investments. Each Fund reports realized currency gains (losses) on foreign currency related transactions as components of net realized gain (loss) for financial reporting purposes, whereas such components are generally treated as ordinary income for federal income tax purposes.
Segregation and Collateralization: In cases where a Fund enters into certain investments (e.g., futures contracts) that would be treated as “senior securities” for 1940 Act purposes, a Fund may segregate or designate on its books and records cash or liquid assets having a market value at least equal to the amount of its future obligations under such investments. Doing so allows the investment to be excluded from treatment as a “senior security.” Furthermore, if required by an exchange or counterparty agreement, the Funds may be required to deliver/deposit cash and/or securities to/with an exchange, or broker-dealer or custodian as collateral for certain investments or obligations.
Investment Transactions and Investment Income: For financial reporting purposes, investment transactions are recorded on the dates the transactions are entered into (the trade dates). Realized gains and losses on investment transactions are determined on the identified cost basis. Dividend income is recorded on the ex-dividend date. Dividends from foreign securities where the ex-dividend date may have passed are subsequently recorded when the Funds are informed of the ex-dividend date. Under the applicable foreign tax laws, a withholding tax at various rates may be imposed on capital gains, dividends and interest. Upon notification from issuers, some of the dividend income received from a real estate investment trust may be redesignated as a reduction of cost of the related investment and/or realized gain. Income, expenses and realized and unrealized gains and losses are allocated daily to each class based on its relative net assets.
Distributions: Distributions paid by the Funds are recorded on the ex-dividend date. The character and timing of distributions are determined in accordance with federal income tax regulations, which may differ from U.S. GAAP.
Offering Costs: Offering costs are amortized over a 12-month period beginning with the commencement of operations.
Recent Accounting Standard: In November 2016, the Financial Accounting Standards Board issued Accounting Standards Update “Restricted Cash” which will require entities to include the total of cash, cash equivalents, restricted cash, and restricted cash equivalents in the beginning and ending cash
| | | | | | |
| | | | | | | |
| | BLACKROCK FUNDS | | JANUARY 31, 2017 | | 43 |
| | |
| Notes to Financial Statements (continued) | | |
balances in the Statements of Cash Flows. The guidance will be applied retrospectively and is effective for fiscal years beginning after December 15, 2017, and interim periods within those years. Management is evaluating the impact, if any, of this guidance on the Funds’ presentation in the Statements of Cash Flows.
Indemnifications: In the normal course of business, a Fund enters into contracts that contain a variety of representations that provide general indemnification. A Fund’s maximum exposure under these arrangements is unknown because it involves future potential claims against a Fund, which cannot be predicted with any certainty.
Other: Expenses directly related to a Fund or its classes are charged to that Fund or the applicable class. Other operating expenses shared by several funds, including other funds managed by the Manager, are prorated among those funds on the basis of relative net assets or other appropriate methods. Expenses directly related to the Funds and other shared expenses prorated to the Funds are allocated daily to each class based on its relative net assets or other appropriate methods.
The Funds may incur charges on uninvested cash balances and overdrafts, subject to certain conditions.
3. Investment Valuation and Fair Value Measurements:
Investment Valuation Policies: The Funds’ investments are valued at fair value (also referred to as “market value” within the financial statements) as of the close of trading on the New York Stock Exchange (“NYSE”) (generally 4:00 p.m., Eastern time) (or if the reporting date falls on a day the NYSE is closed, investments are valued at fair value as of the period end). U.S. GAAP defines fair value as the price the Funds would receive to sell an asset or pay to transfer a liability in an orderly transaction between market participants at the measurement date. The Funds determine the fair values of their financial instruments using various independent dealers or pricing services under policies approved by the Board of Trustees of the Trust (the “Board”). The BlackRock Global Valuation Methodologies Committee (the “Global Valuation Committee”) is the committee formed by management to develop global pricing policies and procedures and to oversee the pricing function for all financial instruments.
Fair Value Inputs and Methodologies: The following methods and inputs are used to establish the fair value of each Fund’s assets and liabilities:
| • | | Equity investments traded on a recognized securities exchange are valued at the official closing price each day, if available. For equity investments traded on more than one exchange, the official closing price on the exchange where the stock is primarily traded is used. Equity investments traded on a recognized exchange for which there were no sales on that day may be valued at the last available bid (long positions) or ask (short positions) price. Generally, trading in foreign instruments is substantially completed each day at various times prior to the close of trading on the NYSE. Occasionally, events affecting the values of such instruments may occur between the foreign market close and the close of trading on the NYSE that may not be reflected in the computation of the Funds’ net assets. Each business day, the Funds use a pricing service to assist with the valuation of certain foreign exchange-traded equity securities and foreign exchange-traded and over-the-counter (“OTC”) options (the “Systematic Fair Value Price”). Using current market factors, the Systematic Fair Value Price is designed to value such foreign securities and foreign options at fair value as of the close of trading on the NYSE, which follows the close of the local markets. |
| • | | Investments in open-end U.S. mutual funds are valued at net asset value (“NAV”) each business day. |
| • | | Futures contracts traded on exchanges are valued at their last sale price. |
| • | | Securities and other assets and liabilities denominated in foreign currencies are translated into U.S. dollars using exchange rates determined as of the close of trading on the NYSE. Forward foreign currency exchange contracts are valued at the mean between the bid and ask prices and are determined as of the close of trading on the NYSE. Interpolated values are derived when the settlement date of the contract is an interim date for which quotations are not available |
If events (e.g., a company announcement, market volatility or a natural disaster) occur that are expected to materially affect the value of such investments, or in the event that the application of these methods of valuation results in a price for an investment that is deemed not to be representative of the market value of such investment, or if a price is not available, the investment will be valued by the Global Valuation Committee, or its delegate, in accordance with a policy approved by the Board as reflecting fair value (“Fair Valued Investments”). The fair valuation approaches that may be used by the Global Valuation Committee will include Market approach, Income approach and Cost approach. Valuation techniques such as discounted cash flow, use of market comparables and matrix pricing are types of valuation approaches and typically used in determining fair value. When determining the price for Fair Valued Investments, the Global Valuation Committee, or its delegate, seeks to determine the price that a Fund might reasonably expect to receive or pay from the current sale or purchase of that asset or liability in an arm’s-length transaction. Fair value determinations shall be based upon all available factors that the Global Valuation Committee, or its delegate, deems relevant and consistent with the principles of fair value measurement. The pricing of all Fair Valued Investments is subsequently reported to the Board or a committee thereof on a quarterly basis.
| | | | | | |
| | | | | | | |
| 44 | | BLACKROCK FUNDS | | JANUARY 31, 2017 | | |
| | | | |
| Notes to Financial Statements (continued) | | |
Fair Value Hierarchy: Various inputs are used in determining the fair value of investments and derivative financial instruments. These inputs to valuation techniques are categorized into a fair value hierarchy consisting of three broad levels for financial statement purposes as follows:
| • | | Level 1 — unadjusted price quotations in active markets/exchanges for identical assets or liabilities that each Fund has the ability to access |
| • | | Level 2 — other observable inputs (including, but not limited to, quoted prices for similar assets or liabilities in markets that are active, quoted prices for identical or similar assets or liabilities in markets that are not active, inputs other than quoted prices that are observable for the assets or liabilities (such as interest rates, yield curves, volatilities, prepayment speeds, loss severities, credit risks and default rates) or other market–corroborated inputs) |
| • | | Level 3 – unobservable inputs based on the best information available in the circumstances, to the extent observable inputs are not available (including each Fund’s own assumptions used in determining the fair value of investments and derivative financial instruments) |
The hierarchy gives the highest priority to unadjusted quoted prices in active markets for identical assets or liabilities (Level 1 measurements) and the lowest priority to unobservable inputs (Level 3 measurements). Accordingly, the degree of judgment exercised in determining fair value is greatest for instruments categorized in Level 3. The inputs used to measure fair value may fall into different levels of the fair value hierarchy. In such cases, for disclosure purposes, the fair value hierarchy classification is determined based on the lowest level input that is significant to the fair value measurement in its entirety. Investments classified within Level 3 have significant unobservable inputs used by the Global Valuation Committee in determining the price for Fair Valued Investments. Level 3 investments include equity or debt issued by private companies. There may not be a secondary market, and/or there are a limited number of investors. Level 3 investments may also be adjusted to reflect illiquidity and/or non-transferability, with the amount of such discount estimated by the Global Valuation Committee in the absence of market information.
Changes in valuation techniques may result in transfers into or out of an assigned level within the hierarchy. In accordance with each Fund’s policy, transfers between different levels of the fair value hierarchy are deemed to have occurred as of the beginning of the reporting period. The categorization of a value determined for investments and derivative financial instruments is based on the pricing transparency of the investments and derivative financial instruments and is not necessarily an indication of the risks associated with investing in those securities.
4. Derivative Financial Instruments:
The Funds engage in various portfolio investment strategies using derivative contracts both to increase the returns of the Funds and/or to manage their exposure to certain risks such as credit risk, equity risk, interest rate risk, foreign currency exchange rate risk, commodity price risk or other risks (e.g., inflation risk). Derivative financial instruments categorized by risk exposure are included in the Schedules of Investments. These contracts may be transacted on an exchange or OTC.
Futures Contracts: Certain Funds invest in long and/or short positions in futures and options on futures contracts to gain exposure to, or manage exposure to changes in interest rates (interest rate risk), changes in the value of equity securities (equity risk) or foreign currencies (foreign currency exchange rate risk).
Futures contracts are agreements between the Funds and a counterparty to buy or sell a specific quantity of an underlying instrument at a specified price and on a specified date. Depending on the terms of a contract, it is settled either through physical delivery of the underlying instrument on the settlement date or by payment of a cash amount on the settlement date. Upon entering into a futures contract, the Funds are required to deposit initial margin with the broker in the form of cash or securities in an amount that varies depending on a contract’s size and risk profile. The initial margin deposit must then be maintained at an established level over the life of the contract.
Securities deposited as initial margin are designated in the Schedules of Investments and cash deposited, if any, is shown as cash pledged for futures contracts in the Statements of Assets and Liabilities. Pursuant to the contract, the Funds agree to receive from or pay to the broker an amount of cash equal to the daily fluctuation in market value of the contract (“variation margin”). Variation margin is recorded as unrealized appreciation (depreciation) and, if any, shown as variation margin receivable (or payable) on futures contracts in the Statements of Assets and Liabilities. When the contract is closed, a realized gain or loss is recorded in the Statements of Operations equal to the difference between the value of the contract at the time it was opened and the value at the time it was closed. The use of futures contracts involves the risk of an imperfect correlation in the movements in the price of futures contracts and interest, foreign currency exchange rates or underlying assets.
5. Investment Advisory Agreement and Other Transactions with Affiliates:
The PNC Financial Services Group, Inc. is the largest stockholder and an affiliate of BlackRock, Inc. (“BlackRock”) for 1940 Act purposes.
Investment Advisory: The Trust, on behalf of the Funds, entered into an Investment Advisory Agreement with the Manager, the Funds’ investment adviser, an indirect, wholly owned subsidiary of BlackRock, to provide investment advisory and administration services. The Manager is responsible for the management of each Fund’s portfolio and provides the personnel, facilities, equipment and certain other services necessary to the operations of each Fund.
| | | | | | |
| | | | | | | |
| | BLACKROCK FUNDS | | JANUARY 31, 2017 | | 45 |
| | |
| Notes to Financial Statements (continued) | | |
For such services, each Fund pays the Manager a monthly fee, which is determined by calculating a percentage of each Fund’s average daily net assets, based on the following annual rates:
| | | | |
| Average Daily Net Assets | | Investment Advisory Fees | |
Min Vol EAFE | | | 0.08% | |
Min Vol USA | | | 0.04% | |
MF International | | | 0.30% | |
MF USA | | | 0.21% | |
Service and Distribution Fees: The Trust, on behalf of the Funds, entered into a Distribution Agreement and a Distribution and Service Plan with BlackRock Investments, LLC (“BRIL”), an affiliate of the Manager.
BRIL and broker-dealers, pursuant to sub-agreements with BRIL, provide shareholder servicing and distribution services to the Funds.
Transfer Agent: Pursuant to written agreements, certain financial intermediaries, some of which may be affiliates, provide the Funds with sub-accounting, recordkeeping, sub-transfer agency and other administrative services with respect to sub-accounts they service. For these services, these entities receive an asset-based fee or an annual fee per shareholder account, which will vary depending on share class and/or net assets.
For the six months ended January 31, 2017, the following table shows the class specific transfer agent fees borne directly by each class of each Fund:
| | | | | | | | | | | | |
| | | Institutional | | | Class K | | | Total | |
Min Vol EAFE | | $ | 26 | | | $ | 322 | | | $ | 358 | |
Min Vol USA | | $ | 26 | | | $ | 322 | | | $ | 358 | |
MF International | | $ | 26 | | | $ | 322 | | | $ | 358 | |
MF USA | | $ | 26 | | | $ | 322 | | | $ | 358 | |
Expense Limitations, Waivers, Reimbursements and Recoupments: With respect to each Fund, the Manager contractually agreed to waive and/or reimburse fees or expenses in order to limit expenses, excluding interest expense, dividend expense, tax expense, acquired fund fees and expenses, and certain other fund expenses, which constitute extraordinary expenses not incurred in the ordinary course of each Fund’s business (“expense limitation”). The expense limitations as a percentage of average daily net assets are as follows:
| | | | | | | | |
| | | Institutional | | | Class K | |
Min Vol EAFE | | | 0.23% | | | | 0.18% | |
Min Vol USA | | | 0.18% | | | | 0.13% | |
MF International | | | 0.45% | | | | 0.40% | |
MF USA | | | 0.35% | | | | 0.30% | |
The Manager has agreed not to reduce or discontinue this contractual expense limitation prior to November 30, 2017, unless approved by the Board, including a majority of the Independent Trustees who are not “interested persons” of the Funds, as defined in the 1940 Act (“Independent Trustees”) or by a vote of a majority of the outstanding voting securities of the Funds.
These amounts waived and/or reimbursed are included in fees waived by the Manager, and shown as other expenses reimbursed by the Manager, and transfer agent fees waived and/or reimbursed — class specific, respectively, in the Statements of Operations. For the six-months ended January 31, 2017, the amounts included in fees waived by the Manager and shown as other expenses reimbursed by the Manager were as follows:
| | | | | | | | |
| | | Fees Waived
by the
Manager | | | Other Expenses
Reimbursed by
the Manager | |
Min Vol EAFE | | $ | 6,687 | | | $ | 117,133 | |
Min Vol USA | | $ | 1,910 | | | $ | 108,818 | |
MF International | | $ | 15,535 | | | $ | 112,296 | |
MF USA | | $ | 10,971 | | | $ | 92,847 | |
For the period ended January 31, 2017, class specific expense waivers and/or reimbursements were as follows:
Transfer Agent Fees Waived and/or Reimbursed
| | | | | | | | | | | | |
| | | Institutional | | | Class K | | | Total | |
Min Vol EAFE | | $ | 12 | | | $ | 322 | | | $ | 334 | |
Min Vol USA | | $ | 5 | | | $ | 322 | | | $ | 327 | |
MF International | | $ | 11 | | | $ | 322 | | | $ | 333 | |
MF USA | | $ | 10 | | | $ | 322 | | | $ | 332 | |
| | | | | | |
| | | | | | | |
| 46 | | BLACKROCK FUNDS | | JANUARY 31, 2017 | | |
| | | | |
| Notes to Financial Statements (continued) | | |
With respect to the Funds, the Manager voluntarily agreed to waive its investment advisory fees by the amount of investment advisory fees each Fund pays to the Manager indirectly through its investment in affiliated money market funds (the “affiliated money market fund waiver”). These amounts are included in fees waived by the Manager in the Statements of Operations. The amount of waivers and/or reimbursements of fees and expenses made pursuant to the expense limitation caps, as applicable, will be reduced by the amount of the affiliated money market fund waiver. These amounts are included in fees waived by the Manager in the Statements of Operations. For the six months ended January 31, 2017, the amounts waived were as follows:
| | | | |
| | | Amount Waived | |
Min Vol EAFE | | $ | 50 | |
Min Vol USA | | $ | 46 | |
MF International | | $ | 4 | |
MF USA | | $ | 33 | |
Effective September 1, 2016, the Manager voluntarily agreed to waive its investment advisory fee with respect to any portion of a Fund’s assets invested in affiliated equity or fixed-income mutual funds or affiliated exchange-traded funds that have a contractual management fee. Prior to September 1, 2016, the Manager did not waive such fees. Effective November 28, 2016, the waiver became contractual through November 30, 2017. This contractual agreement may be terminated upon 90 days’ notice by a majority of Independent Trustees or by a vote of a majority of the Independent Trustees or by a vote of a majority of the outstanding voting securities of the Funds. This amount is included in fees waived by the Manager in the Statements of Operations. For the six months ended January 31, 2017, the amount included in fees waived the Manager for Min Vol EAFE was $71.
With respect to the contractual expense caps, if during a Fund’s fiscal year the operating expenses of a share class, that at any time during the prior two fiscal years received a waiver and/or reimbursement from the Manager, are less than the expense cap for that share class, the Manager is entitled to be reimbursed by such share class up to the lesser of the following expenses:
| | (a) | The amount of fees waived and/or expenses reimbursed during those prior two fiscal years under the agreement. |
| | (b) | The amount by which the expense cap for that share class exceeds the operating expenses of the share class for the current fiscal year, provided that: |
| | • | | Each Fund, of which the share class is a part, has more than $50 million in assets for the fiscal year; and |
| | • | | The Manager or an affiliate continues to serve as the Fund’s investment adviser or administrator. |
In the event the expense cap for a share class is changed subsequent to a fiscal year in which the Manager becomes entitled to reimbursement for fees waived and/or reimbursed, the amount available to reimburse the Manager shall be calculated by reference to the expense cap for that share class in effect at the time the Manager became entitled to receive such reimbursement, rather than the subsequently changed expense cap for that share class.
On January 31, 2017, the fund level and class specific waivers and/or reimbursements subject to possible future recoupment under the expense limitation agreement are as follows:
| | | | | | | | | | | | | | | | | | | | | | | | | | | | | | | | | | | | |
| | | Expiring 2018 | | | | | | Expiring 2019 | |
| | | Min Vol EAFE | | | Min Vol USA | | | MF International | | | MF USA | | | | | | Min Vol EAFE | | | Min Vol USA | | | MF International | | | MF USA | |
Fund Level | | $ | 54,983 | | | $ | 48,547 | | | $ | 55,142 | | | $ | 46,403 | | | | | | | $ | 123,820 | | | $ | 110,728 | | | $ | 127,831 | | | $ | 103,818 | |
Institutional | | $ | 1 | | | $ | 1 | | | $ | 1 | | | $ | 1 | | | | | | | $ | 12 | | | $ | 5 | | | $ | 11 | | | $ | 10 | |
Class K | | $ | 49 | | | $ | 48 | | | $ | 49 | | | $ | 49 | | | | | | | $ | 322 | | | $ | 322 | | | $ | 322 | | | $ | 322 | |
Interfund Lending: In accordance with an exemptive order (the “Order”) from the U.S. Securities and Exchange Commission, each Fund may participate in a joint lending and borrowing facility for temporary purposes (the “Interfund Lending Program”), subject to compliance with the terms and conditions of the Order, and to the extent permitted by each Fund’s investment policies and restrictions. Each Fund is currently permitted to borrow and lend under the Interfund Lending Program.
A Fund may lend in aggregate up to 15% of its net assets, but may not lend more than 5% of its net assets to any one borrowing fund through the Interfund Lending Program. A Fund may not borrow through the Interfund Lending Program or from any other source more than 33 1/3% of its total assets (or any lower threshold provided for by the Fund’s investment restrictions). If a Fund’s total outstanding borrowings exceed 10% of its total assets, each of its outstanding interfund loans will be subject to collateralization of at least 102% of the outstanding principal value of the loan. All interfund loans are for temporary or emergency purposes and the interest rate to be charged will be the average of the highest current overnight repurchase agreement rate available to a lending fund and the bank loan rate, as calculated according to a formula establishted by the Board.
During the period ended January 31, 2017, the Funds did not participate in the Interfund Lending Program.
Officers and Trustees: Certain officers and/or trustees of the Trust are officers and/or directors of BlackRock or its affiliates. The Funds reimburse the Manager for a portion of the compensation paid to the Trust’s Chief Compliance Officer, which is included in Officer and Trustees in the Statements of Operations.
| | | | | | |
| | | | | | | |
| | BLACKROCK FUNDS | | JANUARY 31, 2017 | | 47 |
| | |
| Notes to Financial Statements (continued) | | |
6. Purchases and Sales:
For the period ended January 31, 2017, purchases and sales of investments excluding short-term securities were as follows:
| | | | | | | | | | | | | | | | |
| | | Min Vol EAFE | | | Min Vol USA | | | MF International | | | MF USA | |
Purchases | | $ | 87,918,010 | | | $ | 1,035,654 | | | $ | 2,072,712 | | | $ | 2,133,347 | |
Sales | | $ | 9,655,270 | | | $ | 1,105,263 | | | $ | 2,077,917 | | | $ | 2,228,512 | |
7. Income Tax Information:
It is the Funds’ policy to comply with the requirements of the Internal Revenue Code of 1986, as amended, applicable to regulated investment companies, and to distribute substantially all of their taxable income to their shareholders. Therefore, no federal income tax provision is required.
Each Fund files U.S. federal and various state and local tax returns. No income tax returns are currently under examination. The statute of limitations on each Fund’s U.S. federal tax returns generally remains open for the period ended July 31, 2016.
Management has analyzed tax laws and regulations and their application to the Funds as of January 31, 2017, inclusive of the open tax return years, and does not believe that there are any uncertain tax positions that require recognition of a tax liability in the Funds’ financial statements.
As of January 31, 2017, gross unrealized appreciation and depreciation based on cost for federal income tax purposes were as follows:
| | | | | | | | | | | | | | | | |
| | | Min Vol EAFE | | | Min Vol USA | | | MF International | | | MF USA | |
Tax cost | | $ | 88,267,860 | | | $ | 9,874,528 | | | $ | 9,716,694 | | | $ | 10,087,014 | |
| | | | |
Gross unrealized appreciation | | $ | 1,004,357 | | | $ | 307,501 | | | $ | 968,759 | | | $ | 1,031,469 | |
Gross unrealized depreciation | | | (1,217,633 | ) | | | (436,018 | ) | | | (322,386 | ) | | | (195,634 | ) |
| | | | |
Net unrealized appreciation (depreciation) | | $ | (213,276 | ) | | $ | (128,517 | ) | | $ | 646,373 | | | $ | 835,835 | |
| | | | |
8. Bank Borrowings:
The Trust, on behalf of the Funds, along with certain other funds managed by the Manager and its affiliates (“Participating Funds”), is a party to a 364-day, $2.1 billion credit agreement with a group of lenders. Under this agreement, the Funds may borrow to fund shareholder redemptions. Excluding commitments designated for certain individual funds, the Participating Funds, including the Funds, can borrow up to an aggregate commitment amount of $1.6 billion at any time outstanding, subject to asset coverage and other limitations as specified in the agreement. The credit agreement has the following terms: a fee of 0.12% per annum on unused commitment amounts and interest at a rate equal to the higher of (a) one-month LIBOR (but, in any event, not less than 0.00%) on the date the loan is made plus 0.80% per annum or (b) the Fed Funds rate (but, in any event, not less than 0.00%) in effect from time to time plus 0.80% per annum on amounts borrowed. The agreement expires in April 2017 unless extended or renewed. Participating Funds paid administration, legal and arrangement fees, which, if applicable, are included in miscellaneous expenses in the Statements of Operations. These fees were allocated among such funds based upon portions of the aggregate commitment available to them and relative net assets of Participating Funds. During the six months ended January 31, 2017, the Funds did not borrow under the credit agreement.
9. Principal Risks:
In the normal course of business, the Funds invest in securities and enter into transactions where risks exist due to fluctuations in the market (market risk) or failure of the issuer to meet all its obligations, including the ability to pay principal and interest when due (issuer credit risk). The value of securities held by the Funds may decline in response to certain events, including those directly involving the issuers of securities owned by the Funds. Changes arising from the general economy, the overall market and local, regional or global political and/or social instability, as well as currency, interest rate and price fluctuations, may also affect the securities’ value.
Valuation Risk: The market values of equities, such as common stocks and preferred securities or equity related investments, such as futures and options, may decline due to general market conditions which are not specifically related to a particular company. They may also decline due to factors which affect a particular industry or industries. The Funds may invest in illiquid investments and may experience difficulty in selling those investments in a timely manner at the price that they believe the investments are worth. Prices may fluctuate widely over short or extended periods in response to company, market or economic news. Markets also tend to move in cycles, with periods of rising and falling prices. This volatility may cause a Fund’s NAV to experience significant increases or decreases over short periods of time. If there is a general decline in the securities and other markets, the NAV of a Fund may lose value, regardless of the individual results of the securities and other instruments in which a Fund invests.
Counterparty Credit Risk: Similar to issuer credit risk, the Funds may be exposed to counterparty credit risk, or the risk that an entity may fail to or be unable to perform on its commitments related to unsettled or open transactions. The Funds manage counterparty credit risk by entering into transactions only with counterparties that the Manager believes have the financial resources to honor their obligations and by monitoring the financial stability of those counterparties. Financial assets, which potentially expose the Funds to market, issuer and counterparty credit risks, consist principally of financial instruments and
| | | | | | |
| | | | | | | |
| 48 | | BLACKROCK FUNDS | | JANUARY 31, 2017 | | |
| | | | |
| Notes to Financial Statements (continued) | | |
receivables due from counterparties. The extent of the Funds’ exposure to market, issuer and counterparty credit risks with respect to these financial assets is approximately their value recorded in the Statements of Assets and Liabilities, less any collateral held by the Funds.
A derivative contract may suffer a mark-to-market loss if the value of the contract decreases due to an unfavorable change in the market rates or values of the underlying instrument. Losses can also occur if the counterparty does not perform under the contract.
With exchange-traded futures, there is less counterparty credit risk to the Funds since the exchange or clearinghouse, as counterparty to such instruments, guarantees against a possible default. The clearinghouse stands between the buyer and the seller of the contract; therefore, credit risk is limited to failure of the clearinghouse. While offset rights may exist under applicable law, a Fund does not have a contractual right of offset against a clearing broker or clearinghouse in the event of a default (including the bankruptcy or insolvency). Additionally, credit risk exists in exchange-traded futures with respect to initial and variation margin that is held in a clearing broker’s customer accounts. While clearing brokers are required to segregate customer margin from their own assets, in the event that a clearing broker becomes insolvent or goes into bankruptcy and at that time there is a shortfall in the aggregate amount of margin held by the clearing broker for all its clients, typically the shortfall would be allocated on a pro rata basis across all the clearing broker’s customers, potentially resulting in losses to the Funds.
Concentration Risk: Certain Funds invest a substantial amount of their assets in issuers located in a single country or a limited number of countries. When the Funds concentrate their investments in this manner, it assumes the risk that economic, political and social conditions in those countries may have a significant impact on their investment performance. Foreign issuers may not be subject to the same uniform accounting, auditing and financial reporting standards and practices as used in the United States. Foreign securities markets may also be less liquid, more volatile and less subject to governmental supervision not typically associated with investing in U.S. securities. Investment percentages in specific countries are presented in the Schedules of Investments.
Certain Funds invest a significant portion of their assets in securities of issuers located in Asia or with significant exposure to Asian issuers or countries. The Asian financial markets have recently experienced volatility and adverse trends due to concerns in several Asian countries regarding monetary policy, government intervention in the markets, rising government debt levels or economic downturns. These events may spread to other countries in Asia and may affect the value and liquidity of certain of the Funds’ investments.
Certain Funds invest a significant portion of their assets in securities of issuers located in Europe or with significant exposure to European issuers or countries. The European financial markets have recently experienced volatility and adverse trends due to concerns about economic downturns in, or rising government debt levels of, several European countries. These events may spread to other countries in Europe and may affect the value and liquidity of certain of the Funds’ investments.
The United Kingdom voted on June 23, 2016 to withdraw from the European Union, which may introduce significant new uncertainties and instability in the financial markets across Europe.
10. Capital Share Transactions:
Transactions in capital shares for each class were as follows:
| | | | | | | | | | | | | | | | | | | | |
| | | Six Months Ended
January 31, 2017 | | | | | | Period
July 13, 20161
to July 31, 2016 | |
| Min Vol EAFE | | Shares | | | Amount | | | | | | Shares | | | Amount | |
| Institutional | | | | | | | | | | | | | | | | | | | | |
Shares sold | | | — | | | | — | | | | | | | | 10,000 | | | $ | 100,000 | |
Shares issued in reinvestment of distributions | | | — | | | | — | | | | | | | | — | | | | — | |
Shares redeemed | | | — | | | | — | | | | | | | | — | | | | — | |
| | | | | | | | | | | | |
Net increase | | | — | | | | — | | | | | | | | 10,000 | | | $ | 100,000 | |
| | | | | | | | | | | | |
| | | | | | | | | | | | | | | | | | | | |
| Class K | | | | | | | | | | | | | | | | | | | | |
Shares sold | | | 8,463,828 | | | $ | 80,413,720 | | | | | | | | 990,000 | | | $ | 9,900,000 | |
Shares issued in reinvestment of distributions | | | — | | | | — | | | | | | | | — | | | | — | |
Shares redeemed | | | (23,146 | ) | | | (218,374 | ) | | | | | | | — | | | | — | |
| | | | | | | | | | | | |
Net increase | | | 8,440,682 | | | $ | 80,195,346 | | | | | | | | 990,000 | | | $ | 9,900,000 | |
| | | | | | | | | | | | |
Total Net Increase | | | 8,440,682 | | | $ | 80,195,346 | | | | | | | | 1,000,000 | | | $ | 10,000,000 | |
| | | | | | | | | | | | |
| | | | | | |
| | | | | | | |
| | BLACKROCK FUNDS | | JANUARY 31, 2017 | | 49 |
| | |
| Notes to Financial Statements (continued) | | |
| | | | | | | | | | | | | | | | | | | | |
| | | Six Months Ended
January 31, 2017 | | | | | | Period
July 13, 20161
to July 31, 2016 | |
| Min Vol USA | | Shares | | | Amount | | | | | | Shares | | | Amount | |
| Institutional | | | | | | | | | | | | | | | | | | | | |
Shares sold | | | 25,057 | | | $ | 249,307 | | | | | | | | 12,830 | | | $ | 128,301 | |
Shares issued in reinvestment of distributions | | | 34 | | | | 327 | | | | | | | | — | | | | — | |
Shares redeemed | | | (24,979 | ) | | | (246,792 | ) | | | | | | | — | | | | — | |
| | | | | | | | | | | | |
Net increase | | | 112 | | | $ | 2,842 | | | | | | | | 12,830 | | | $ | 128,301 | |
| | | | | | | | | | | | |
| | | | | | | | | | | | | | | | | | | | |
| Class K | | | | | | | | | | | | | | | | | | | | |
Shares sold | | | 713 | | | $ | 6,934 | | | | | | | | 990,000 | | | $ | 9,900,000 | |
Shares issued in reinvestment of distributions | | | — | | | | — | | | | | | | | — | | | | — | |
| | | | | | | | | | | | |
Net increase | | | 713 | | | $ | 6,934 | | | | | | | | 990,000 | | | $ | 9,900,000 | |
| | | | | | | | | | | | |
Total Net Increase | | | 825 | | | $ | 9,776 | | | | | | | | 1,002,830 | | | $ | 10,028,301 | |
| | | | | | | | | | | | |
| | | |
| | | Six Months Ended
January 31, 2017 | | | | | | Period
July 13, 20161
to July 31, 2016 | |
| MF International | | Shares | | | Amount | | | | | | Shares | | | Amount | |
| Institutional | | | | | | | | | | | | | | | | | | | | |
Shares sold | | | — | | | | — | | | | | | | | 10,000 | | | $ | 100,000 | |
Shares issued in reinvestment of distributions | | | — | | | | — | | | | | | | | — | | | | — | |
Shares redeemed | | | — | | | | — | | | | | | | | — | | | | — | |
| | | | | | | | | | | | |
Net increase | | | — | | | | — | | | | | | | | 10,000 | | | $ | 100,000 | |
| | | | | | | | | | | | |
| | | | | | | | | | | | | | | | | | | | |
| Class K | | | | | | | | | | | | | | | | | | | | |
Shares sold | | | — | | | | — | | | | | | | | 990,000 | | | $ | 9,900,000 | |
Shares issued in reinvestment of distributions | | | — | | | | — | | | | | | | | — | | | | — | |
| | | | | | | | | | | | |
Net increase | | | — | | | | — | | | | | | | | 990,000 | | | $ | 9,900,000 | |
| | | | | | | | | | | | |
Total Net Increase | | | — | | | | — | | | | | | | | 1,000,000 | | | $ | 10,000,000 | |
| | | | | | | | | | | | |
| | | |
| | | Six Months Ended
January 31, 2017 | | | | | | Period
July 13, 20161
to July 31, 2016 | |
| MF USA | | Shares | | | Amount | | | | | | Shares | | | Amount | |
| Institutional | | | | | | | | | | | | | | | | | | | | |
Shares sold | | | 343 | | | $ | 3,500 | | | | | | | | 10,000 | | | $ | 100,000 | |
Shares issued in reinvestment of distributions | | | 2 | | | | 22 | | | | | | | | — | | | | — | |
Shares redeemed | | | — | | | | — | | | | | | | | — | | | | — | |
| | | | | | | | | | | | |
Net increase | | | 345 | | | $ | 3,522 | | | | | | | | 10,000 | | | $ | 100,000 | |
| | | | | | | | | | | | |
| | | | | | | | | | | | | | | | | | | | |
| Class K | | | | | | | | | | | | | | | | | | | | |
Shares sold | | | — | | | | — | | | | | | | | 990,000 | | | $ | 9,900,000 | |
Shares issued in reinvestment of distributions | | | — | | | | — | | | | | | | | — | | | | — | |
| | | | | | | | | | | | |
Net increase | | | — | | | | — | | | | | | | | 990,000 | | | $ | 9,900,000 | |
| | | | | | | | | | | | |
Total Net Increase | | | 345 | | | $ | 3,522 | | | | | | | | 1,000,000 | | | $ | 10,000,000 | |
| | | | | | | | | | | | |
| | 1 | | Commencement of operations. |
At January 31, 2017, shares owned by BlackRock HoldCo 2, Inc., an affiliate of the Funds, were as follows:
| | | | | | | | |
| | | Institutional | | | Class K | |
Min Vol EAFE | | | 10,000 | | | | 990,000 | |
Min Vol USA | | | 10,000 | | | | 990,000 | |
MF International | | | 10,000 | | | | 990,000 | |
MF USA | | | 10,000 | | | | 990,000 | |
| | | | | | |
| | | | | | | |
| 50 | | BLACKROCK FUNDS | | JANUARY 31, 2017 | | |
| | | | |
| Notes to Financial Statements (concluded) | | |
11. Subsequent Events:
Management’s evaluation of the impact of all subsequent events on the Funds’ financial statements was completed through the date the financial statements were issued and the following items were noted:
On February 24, 2017, the Board of Trustees of BlackRock Funds approved a name change from “BlackRock Min Vol EAFE Index Fund,” “BlackRock Min Vol USA Index Fund,” “BlackRock Multifactor International Index Fund” and “BlackRock Multifactor USA Index Fund” to “iShares Edge MSCI Min Vol EAFE Index Fund,” “iShares Edge MSCI Min Vol USA Index Fund,” “iShares Edge MSCI Multifactor Intl Index Fund” and “iShares Edge MSCI Multifactor Intl Index Fund,” respectively. The change is expected to be effective during the second quarter of 2017.
| | | | | | |
| | | | | | | |
| | BLACKROCK FUNDS | | JANUARY 31, 2017 | | 51 |
Rodney D. Johnson, Chair of the Board and Trustee
Susan J. Carter, Trustee
Collette Chilton, Trustee
Neil A. Cotty, Trustee
Cynthia A. Montgomery, Trustee
Joseph P. Platt, Trustee
Robert C. Robb, Jr., Trustee
Mark Stalnecker, Trustee
Kenneth L. Urish, Trustee
Claire A. Walton, Trustee
Frederick W. Winter, Trustee
Barbara G. Novick, Trustee
John M. Perlowski, Trustee, President and Chief Executive Officer
Thomas Callahan, Vice President
Jennifer McGovern, Vice President
Neal J. Andrews, Chief Financial Officer
Jay M. Fife, Treasurer
Charles Park, Chief Compliance Officer
Fernanda Piedra, Anti-Money Laundering Compliance Officer
Benjamin Archibald, Secretary
Effective December 31, 2016, David O. Beim and Dr. Matina S. Horner resigned as Trustees of the Trust.
| | | | | | |
| | | | |
Investment Adviser and Administrator BlackRock Advisors, LLC Wilmington, DE 19809 | | Accounting Agent and Custodian State Street Bank and Trust Company Boston, MA 02110 Transfer Agent BNY Mellon Investment Servicing (US) Inc. Wilmington, DE 19809 | | Distributor BlackRock Investments, LLC New York, NY 10022 Independent Registered Public Accounting Firm PricewaterhouseCoopers LLP Philadelphia, PA 19103 | | Legal Counsel Sidley Austin LLP New York, NY 10019 Address of the Trust 100 Bellevue Parkway Wilmington, DE 19809 |
| | | | | | |
| | | | | | | |
| 52 | | BLACKROCK FUNDS | | JANUARY 31, 2017 | | |
Householding
The Funds will mail only one copy of shareholder documents, including prospectuses, annual and semi-annual reports and proxy statements, to shareholders with multiple accounts at the same address. This practice is commonly called “householding” and is intended to reduce expenses and eliminate duplicate mailings of shareholder documents. Mailings of your shareholder documents may be householded indefinitely unless you instruct us otherwise. If you do not want the mailing of these documents to be combined with those for other members of your household, please call the Funds at (800) 537-4942.
Availability of Quarterly Schedule of Investments
The Funds file their complete schedule of portfolio holdings with the SEC for the first and third quarters of each fiscal year on Form N-Q. The Funds’ Forms N-Q are available on the SEC’s website at http://www.sec.gov and may also be reviewed and copied at the SEC’s Public Reference Room in Washington, D.C. Information on the operation of the Public Reference Room or how to access documents on the SEC’s website without charge may be obtained by calling (800) SEC-0330. The Funds’ Forms N-Q may also be obtained upon request and without charge by calling (800) 537-4942.
Availability of Proxy Voting Policies and Procedures
A description of the policies and procedures that the Funds use to determine how to vote proxies relating to portfolio securities is available upon request and without charge, (1) by calling (800) 537-4942; (2) at http://www.blackrock.com; and (3) on the SEC’s website at http://www.sec.gov.
Availability of Proxy Voting Record
Information about how the Funds voted proxies relating to securities held in the Funds’ portfolios during the most recent 12-month period ended June 30 is available upon request and without charge (1) at http://www.blackrock.com or by calling (800) 537-4942 and (2) on the SEC’s website at http://www.sec.gov.
BlackRock’s Mutual Fund Family
BlackRock offers a diverse lineup of open-end mutual funds crossing all investment styles and managed by experts in equity, fixed income and tax-exempt investing. Visit http://www.blackrock.com for more information.
| | | | | | |
| | | | | | | |
| | BLACKROCK FUNDS | | JANUARY 31, 2017 | | 53 |
| | | | |
| Additional Information (concluded) | | |
Account Information
Call us at (800) 537-4942 from 8:00 AM to 6:00 PM ET on any business day to get information about your account balances, recent transactions and share prices. You can also reach us on the Web at http://www.blackrock.com/funds.
Automatic Investment Plans
Investor Class shareholders who want to invest regularly can arrange to have $50 or more automatically deducted from their checking or savings account and invested in any of the BlackRock funds.
Systematic Withdrawal Plans
Investor Class shareholders can establish a systematic withdrawal plan and receive periodic payments of $50 or more from their BlackRock funds, as long as their account balance is at least $10,000.
Retirement Plans
Shareholders may make investments in conjunction with Traditional, Rollover, Roth, Coverdell, Simple IRAs, SEP IRAs and 403(b) Plans.
|
| BlackRock Privacy Principles |
BlackRock is committed to maintaining the privacy of its current and former fund investors and individual clients (collectively, “Clients”) and to safeguarding their non-public personal information. The following information is provided to help you understand what personal information BlackRock collects, how we protect that information and why in certain cases we share such information with select parties.
If you are located in a jurisdiction where specific laws, rules or regulations require BlackRock to provide you with additional or different privacy-related rights beyond what is set forth below, then BlackRock will comply with those specific laws, rules or regulations.
BlackRock obtains or verifies personal non-public information from and about you from different sources, including the following: (i) information we receive from you or, if applicable, your financial intermediary, on applications, forms or other documents; (ii) information about your transactions with us, our affiliates, or others; (iii) information we receive from a consumer reporting agency; and (iv) from visits to our websites.
BlackRock does not sell or disclose to non-affiliated third parties any non-public personal information about its Clients, except as permitted by law or as is necessary to respond to regulatory requests or to service Client accounts. These non-affiliated third parties are required to protect the confidentiality and security of this information and to use it only for its intended purpose.
We may share information with our affiliates to service your account or to provide you with information about other BlackRock products or services that may be of interest to you. In addition, BlackRock restricts access to non-public personal information about its Clients to those BlackRock employees with a legitimate business need for the information. BlackRock maintains physical, electronic and procedural safeguards that are designed to protect the non-public personal information of its Clients, including procedures relating to the proper storage and disposal of such information.
| | | | | | |
| | | | | | | |
| 54 | | BLACKROCK FUNDS | | JANUARY 31, 2017 | | |
This report is intended for current holders. It is not authorized for use as an offer of sale or a solicitation of an offer to buy shares of a Fund unless preceded or accompanied by the Funds’ current prospectus. Past performance results shown in this report should not be considered a representation of future performance. Investment returns and principal value of shares will fluctuate so that shares, when redeemed, may be worth more or less than their original cost. Statements and other information herein are as dated and are subject to change.

| | |
| MFMV-1/17-SAR | |  |
JANUARY 31, 2017
| | | | |
SEMI-ANNUAL REPORT (UNAUDITED) | | | |  |
BlackRock FundsSM
| Ø | BlackRock USA Momentum Factor Index Fund |
| Ø | BlackRock USA Quality Factor Index Fund |
| Ø | BlackRock USA Size Factor Index Fund |
| Ø | BlackRock USA Value Factor Index Fund |
|
| Not FDIC Insured • May Lose Value • No Bank Guarantee |
Dear Shareholder,
The 12 months ended January 31, 2017 was an exceptionally strong period for risk assets (such as stocks and high yield bonds), while higher-quality assets generated muted returns after struggling in the latter part of 2016. As the period began, worries about slowing growth in China and the instability of oil prices had global equity prices sliding. However, the broad market momentum shifted in the second half of 2016 as reflationary expectations in the United States helped drive a pick-up in global growth.
Markets were remarkably resilient during the period. Big surprises such as the United Kingdom’s vote to leave the European Union and the outcome of the U.S. presidential election brought spikes in equity market volatility, but they were ultimately short-lived. Instead, investors used the sell-offs to seize upon buying opportunities, allowing markets to quickly rebound. We believe this reinforces the case for taking the long view rather than reacting to short-term market noise.
The global reflationary theme — rising nominal growth, wages and inflation — was the dominant driver of asset returns during the period, outweighing significant political upheavals and uncertainty. This trend accelerated after the U.S. election and continued into the beginning of 2017, stoked by expectations for an extra boost to U.S. growth via fiscal policy.
Although economic momentum is gaining traction, the capacity for rapid global growth is restrained by structural factors including an aging population, low productivity growth and excess savings. A tempered economic growth trend and high valuations across most assets have set the stage for muted investment returns going forward.
Equity markets still have room to move, although the disparity between winners and losers is widening, making stock selection increasingly important. Fixed income investors are also facing challenges as bond markets recalibrate to accommodate rising rates and higher inflation expectations. And in a world where political risk and policy uncertainty abound, there is no lack of potential catalysts for higher volatility.
In this environment, investors need to think globally, extend their scope across a broad array of asset classes and be nimble as market conditions change. We encourage you to talk with your financial advisor and visit blackrock.com for further insight about investing in today’s markets.
Sincerely,
Rob Kapito
President, BlackRock Advisors, LLC
Rob Kapito
President, BlackRock Advisors, LLC
| | | | | | | | |
| Total Returns as of January 31, 2017 | |
| | | 6-month | | | 12-month | |
U.S. large cap equities
(S&P 500® Index) | | | 5.96 | % | | | 20.04 | % |
U.S. small cap equities
(Russell 2000® Index) | | | 12.43 | | | | 33.53 | |
International equities
(MSCI Europe, Australasia,
Far East Index) | | | 3.49 | | | | 12.03 | |
Emerging market equities
(MSCI Emerging Markets Index) | | | 4.92 | | | | 25.41 | |
3-month Treasury bills
(BofA Merrill Lynch 3-Month
U.S. Treasury Bill Index) | | | 0.20 | | | | 0.37 | |
U.S. Treasury securities
(BofA Merrill Lynch
10-Year U.S. Treasury
Index) | | | (7.87 | ) | | | (3.26 | ) |
U.S. investment grade bonds
(Bloomberg Barclays U.S.
Aggregate Bond Index) | | | (2.95 | ) | | | 1.45 | |
Tax-exempt municipal
bonds (S&P Municipal
Bond Index) | | | (2.94 | ) | | | 0.24 | |
U.S. high yield bonds
(Bloomberg Barclays U.S. Corporate High Yield 2% Issuer
Capped Index) | | | 6.09 | | | | 20.77 | |
| Past performance is no guarantee of future results. Index performance is shown for illustrative purposes only. You cannot invest directly in an index. | |
| | | | | | |
| | | | | | | |
| 2 | | THIS PAGE NOT PART OF YOUR FUND REPORT | | | | |

| | | | | | |
| | | | | | | |
| | BLACKROCK FUNDS | | JANUARY 31, 2017 | | 3 |
| | | | |
| Fund Summary as of January 31, 2017 | | BlackRock USA Momentum Factor Index Fund |
BlackRock USA Momentum Factor Index Fund’s (the “Fund”) investment objective is to seek to track the investment results of an index that measures the performance of U.S. large- and mid-capitalization stocks exhibiting relatively higher momentum characteristics.
On February 24, 2017, the Board of Trustees of BlackRock Funds approved a name change from “BlackRock USA Momentum Factor Index Fund” to “iShares Edge MSCI USA Momentum Factor Index Fund.” The change is expected to be effective during the second quarter of 2017.
| | | | |
| Ten Largest Holdings | | Percent of
Net Assets | |
Facebook, Inc., Class A | | | 5 | % |
Amazon.com, Inc. | | | 5 | |
Procter & Gamble Co. | | | 5 | |
Microsoft Corp. | | | 5 | |
Johnson & Johnson | | | 5 | |
UnitedHealth Group, Inc. | | | 4 | |
NVIDIA Corp. | | | 3 | |
Alphabet, Inc. | | | 3 | |
Texas Instruments, Inc. | | | 2 | |
QUALCOMM, Inc. | | | 2 | |
| | | | |
| Sector Allocation | | Percent of
Net Assets | |
Information Technology | | | 39 | % |
Health Care | | | 14 | |
Consumer Staples | | | 10 | |
Consumer Discretionary | | | 9 | |
Industrials | | | 8 | |
Utilities | | | 7 | |
Real Estate | | | 4 | |
Financials | | | 4 | |
Energy | | | 2 | |
Materials | | | 2 | |
Telecommunication Services | | | 1 | |
For Fund compliance purposes, the Fund’s industry classifications refer to one or more of the industry sub-classifications used by one or more widely recognized market indexes, and/or as defined by the investment adviser. These definitions may not apply for purposes of this report, which may combine such sector sub-classifications for reporting ease.
| | | | | | | | | | | | | | | | | | | | | | | | | | | | |
| | | Actual | | | Hypothetical3 | | | | |
| | | Beginning Account Value December 20, 20161 | | | Ending Account Value January 31, 2017 | | | Expenses Paid
During the Period2 | | | Beginning Account Value December 20, 20161 | | | Ending Account Value January 31, 2017 | | | Expenses Paid
During the Period2 | | | Annualized
Expense Ratio | |
Institutional | | $ | 1,000.00 | | | $ | 1,020.40 | | | $ | 0.23 | | | $ | 1,000.00 | | | $ | 1,005.52 | | | $ | 0.23 | | | | 0.20 | % |
Class K | | $ | 1,000.00 | | | $ | 1,020.40 | | | $ | 0.17 | | | $ | 1,000.00 | | | $ | 1,005.58 | | | $ | 0.17 | | | | 0.15 | % |
| | 1 | | Commencement of operations. |
| | 2 | | For each class of the Fund, expenses are equal to the annualized expense ratio for the class, multiplied by the average account value over the period, multiplied by 43/365 (to reflect the period from December 20, 2016, the commencement of operations, to January 31, 2017). |
| | 3 | | Hypothetical 5% return before expenses is calculated by prorating the number of days in the most recent fiscal half year divided by 365. |
| | | | See “Disclosure of Expenses” on page 8 for further information on how expenses were calculated. |
The views expressed reflect the opinions of BlackRock as of the date of this report and are subject to change based on changes in market, economic or other conditions. These views are not intended to be a forecast of future events and are no guarantee of future results.
| | | | | | |
| | | | | | | |
| 4 | | BLACKROCK FUNDS | | JANUARY 31, 2017 | | |
| | | | |
| Fund Summary as of January 31, 2017 | | BlackRock USA Quality Factor Index Fund |
BlackRock USA Quality Factor Index Fund’s (the “Fund”) investment objective is to seek to track the investment results of an index that measures the performance of U.S. large- and mid-capitalization stocks as identified through three fundamental variables: return on equity, earnings variability and debt-to-equity.
On February 24, 2017, the Board of Trustees of BlackRock Funds approved a name change from “BlackRock USA Quality Factor Index Fund” to “iShares Edge MSCI USA Quality Factor Index Fund.” The change is expected to be effective during the second quarter of 2017.
| | | | |
| Ten Largest Holdings | | Percent of
Net Assets | |
Apple, Inc. | | | 5 | % |
Microsoft Corp. | | | 5 | |
Johnson & Johnson | | | 5 | |
International Business Machines Corp. | | | 3 | |
Home Depot, Inc. | | | 3 | |
Walt Disney Co. | | | 3 | |
Intel Corp. | | | 3 | |
Mastercard, Inc. | | | 3 | |
Visa, Inc. | | | 3 | |
PepsiCo, Inc. | | | 3 | |
| | | | |
| Sector Allocation | | Percent of
Net Assets | |
Information Technology | | | 37 | % |
Consumer Discretionary | | | 22 | |
Industrials | | | 16 | |
Health Care | | | 12 | |
Consumer Staples | | | 8 | |
Materials | | | 2 | |
Financials | | | 2 | |
Real Estate | | | 1 | |
For Fund compliance purposes, the Fund’s industry classifications refer to one or more of the industry sub-classifications used by one or more widely recognized market indexes, and/or as defined by the investment adviser. These definitions may not apply for purposes of this report, which may combine such sector sub-classifications for reporting ease.
| | | | | | | | | | | | | | | | | | | | | | | | | | | | |
| | | Actual | | | Hypothetical3 | | | | |
| | | Beginning Account Value December 20, 20161 | | | Ending Account Value January 31, 2017 | | | Expenses Paid
During the Period2 | | | Beginning Account Value December 20, 20161 | | | Ending Account Value January 31, 2017 | | | Expenses Paid
During the Period2 | | | Annualized
Expense Ratio | |
Institutional | | $ | 1,000.00 | | | $ | 1,001.10 | | | $ | 0.23 | | | $ | 1,000.00 | | | $ | 1,005.52 | | | $ | 0.23 | | | | 0.20 | % |
Class K | | $ | 1,000.00 | | | $ | 1,001.10 | | | $ | 0.17 | | | $ | 1,000.00 | | | $ | 1,005.58 | | | $ | 0.17 | | | | 0.15 | % |
| | 1 | | Commencement of operations. |
| | 2 | | For each class of the Fund, expenses are equal to the annualized expense ratio for the class, multiplied by the average account value over the period, multiplied by 43/365 (to reflect the period from December 20, 2016, the commencement of operations, to January 31, 2017). |
| | 3 | | Hypothetical 5% return before expenses is calculated by prorating the number of days in the most recent fiscal half year divided by 365. |
| | | | See “Disclosure of Expenses” on page 8 for further information on how expenses were calculated. |
The views expressed reflect the opinions of BlackRock as of the date of this report and are subject to change based on changes in market, economic or other conditions. These views are not intended to be a forecast of future events and are no guarantee of future results.
| | | | | | |
| | | | | | | |
| | BLACKROCK FUNDS | | JANUARY 31, 2017 | | 5 |
| | | | |
| Fund Summary as of January 31, 2017 | | BlackRock USA Size Factor Index Fund |
BlackRock USA Size Factor Index Fund’s (the “Fund”) investment objective is to seek to seek to track the investment results of an index composed of U.S. large- and mid-capitalization stocks with relatively smaller average market capitalization.
On February 24, 2017, the Board of Trustees of BlackRock Funds approved a name change from “BlackRock USA Size Factor Index Fund” to “iShares Edge MSCI USA Size Factor Index Fund.” The change is expected to be effective during the second quarter of 2017.
| | | | |
| Ten Largest Holdings* | | Percent of
Net Assets | |
Arch Capital Group Ltd. | | | 1 | % |
Mid-America Apartment Communities, Inc. | | | 1 | |
Clorox Co. | | | 1 | |
| | * | | Fund does not hold any other positions in excess of 1% of Net Assets. |
| | | | |
| Sector Allocation | | Percent of
Net Assets | |
Financials | | | 17 | % |
Consumer Discretionary | | | 13 | |
Industrials | | | 13 | |
Information Technology | | | 11 | |
Health Care | | | 11 | |
Consumer Staples | | | 10 | |
Real Estate | | | 8 | |
Utilities | | | 8 | |
Materials | | | 5 | |
Energy | | | 3 | |
Telecommunication Services | | | 1 | |
For Fund compliance purposes, the Fund’s industry classifications refer to one or more of the industry sub-classifications used by one or more widely recognized market indexes, and/or as defined by the investment adviser. These definitions may not apply for purposes of this report, which may combine such sector sub-classifications for reporting ease.
| | | | | | | | | | | | | | | | | | | | | | | | | | | | |
| | | Actual | | | Hypothetical3 | | | | |
| | | Beginning Account Value December 20, 20161 | | | Ending Account Value January 31, 2017 | | | Expenses Paid
During the Period2 | | | Beginning Account Value December 20, 20161 | | | Ending Account Value January 31, 2017 | | | Expenses Paid
During the Period1 | | | Annualized
Expense Ratio | |
Institutional | | $ | 1,000.00 | | | $ | 1,007.90 | | | $ | 0.23 | | | $ | 1,000.00 | | | $ | 1,005.52 | | | $ | 0.23 | | | | 0.20 | % |
Class K | | $ | 1,000.00 | | | $ | 1,007.90 | | | $ | 0.17 | | | $ | 1,000.00 | | | $ | 1,005.58 | | | $ | 0.17 | | | | 0.15 | % |
| | 1 | | Commencement of operations. |
| | 2 | | For each class of the Fund, expenses are equal to the annualized expense ratio for the class, multiplied by the average account value over the period, multiplied by 43/365 (to reflect the period from December 20, 2016, the commencement of operations, to January 31, 2017). |
| | 3 | | Hypothetical 5% return before expenses is calculated by prorating the number of days in the most recent fiscal half year divided by 365. |
| | | | See “Disclosure of Expenses” on page 8 for further information on how expenses were calculated. |
The views expressed reflect the opinions of BlackRock as of the date of this report and are subject to change based on changes in market, economic or other conditions. These views are not intended to be a forecast of future events and are no guarantee of future results.
| | | | | | |
| | | | | | | |
| 6 | | BLACKROCK FUNDS | | JANUARY 31, 2017 | | |
| | | | |
| Fund Summary as of January 31, 2017 | | BlackRock USA Value Factor Index Fund |
BlackRock USA Value Factor Index Fund’s (the “Fund”) investment objective is to seek to seek to track the investment results of an index that measures the performance of U.S. large- and mid-capitalization stocks with value characteristics and relatively lower valuations.
On February 24, 2017, the Board of Trustees of BlackRock Funds approved a name change from “BlackRock USA Value Factor Index Fund” to “iShares Edge MSCI USA Value Factor Index Fund.” The change is expected to be effective during the second quarter of 2017.
| | | | |
| Ten Largest Holdings | | Percent of
Net Assets | |
Apple, Inc. | | | 8 | % |
Intel Corp. | | | 4 | |
Chevron Corp. | | | 4 | |
General Motors Co. | | | 3 | |
Cosco Systems, Inc. | | | 3 | |
Pfizer, Inc. | | | 3 | |
Wal-Mart Stores, Inc. | | | 3 | |
Bank of America Corp. | | | 3 | |
Gilead Sciences, Inc. | | | 3 | |
AT&T, Inc. | | | 3 | |
| | | | |
| Sector Allocation | | Percent of
Net Assets | |
Information Technology | | | 22 | % |
Financials | | | 14 | |
Health Care | | | 14 | |
Consumer Discretionary | | | 12 | |
Industrials | | | 10 | |
Consumer Staples | | | 9 | |
Energy | | | 7 | |
Utilities | | | 3 | |
Materials | | | 3 | |
Real Estate | | | 3 | |
Telecommunication Services | | | 3 | |
For Fund compliance purposes, the Fund’s industry classifications refer to one or more of the industry sub-classifications used by one or more widely recognized market indexes, and/or as defined by the investment adviser. These definitions may not apply for purposes of this report, which may combine such sector sub-classifications for reporting ease.
| | | | | | | | | | | | | | | | | | | | | | | | | | | | |
| | | Actual | | | Hypothetical3 | | | | |
| | | Beginning Account Value December 20, 20161 | | | Ending Account Value January 31, 2017 | | | Expenses Paid
During the Period2 | | | Beginning Account Value December 20, 20161 | | | Ending Account Value January 31, 2017 | | | Expenses Paid
During the Period2 | | | Annualized
Expense Ratio | |
Institutional | | $ | 1,000.00 | | | $ | 995.30 | | | $ | 0.23 | | | $ | 1,000.00 | | | $ | 1,005.52 | | | $ | 0.23 | | | | 0.20 | % |
Class K | | $ | 1,000.00 | | | $ | 995.40 | | | $ | 0.17 | | | $ | 1,000.00 | | | $ | 1,005.58 | | | $ | 0.17 | | | | 0.15 | % |
| | 1 | | Commencement of operations. |
| | 2 | | For each class of the Fund, expenses are equal to the annualized expense ratio for the class, multiplied by the average account value over the period, multiplied by 43/365 (to reflect the period from December 20, 2016, the commencement of operations, to January 31, 2017). |
| | 3 | | Hypothetical 5% return before expenses is calculated by prorating the number of days in the most recent fiscal half year divided by 365. |
| | | | See “Disclosure of Expenses” on page 8 for further information on how expenses were calculated. |
The views expressed reflect the opinions of BlackRock as of the date of this report and are subject to change based on changes in market, economic or other conditions. These views are not intended to be a forecast of future events and are no guarantee of future results.
| | | | | | |
| | | | | | | |
| | BLACKROCK FUNDS | | JANUARY 31, 2017 | | 7 |
| • | | Institutional and Class K Shares are not subject to any sales charge. These shares bear no ongoing distribution or service fees and are available only to certain eligible investors. |
Performance information reflects past performance and does not guarantee future results. Current performance may be lower or higher than the performance data quoted. Refer to www.blackrock.com/funds to obtain performance data current to the most recent month end. Performance results do not reflect the deduction of taxes that a shareholder would pay on fund distributions or the redemption of fund shares. Investment return and principal value of shares will fluctuate so that shares, when redeemed, may be worth more or less than their original cost.
Distributions paid to each class of shares will vary because of the different levels of service, distribution and transfer agency fees applicable to each class, which are deducted from the income available to be paid to shareholders.
BlackRock Fund Advisors (the “Manager”), the Funds’ investment adviser, has contractually agreed to waive and/or reimburse a portion of each Fund’s expenses. Without such waiver and/or reimbursement, each Fund’s performance would have been lower. The Manager is under no obligation to continue waiving and/or reimbursing its fees after the applicable termination date of such agreement. See Note 4 of the Notes to Financial Statements for additional information on waivers and/or reimbursements.
Shareholders of the Funds may incur the following charges: (a) transactional expenses, such as sales charges; and (b) operating expenses, including investment advisory fees, service and distribution fees, including 12b-1 fees, acquired fund fees and expenses and other fund expenses. The expense examples shown on previous pages, which are based on a hypothetical investment of $1,000 invested on December 20, 2016 (commencement of operations) and held through January 31, 2017, are intended to assist shareholders both in calculating expenses based on an investment in each Fund and in comparing these expenses with similar costs of investing in other mutual funds.
The expense examples provide information about actual account values and actual expenses. In order to estimate the expenses a shareholder paid during the period covered by this report, shareholders can divide their account value by $1,000 and then multiply the result by the number corresponding to their Fund and share class under the heading entitled “Expenses Paid During the Period.”
The expense examples also provide information about hypothetical account values and hypothetical expenses based on a Fund’s actual expense ratio and an assumed rate of return of 5% per year before expenses. In order to assist shareholders in comparing the ongoing expenses of investing in the Funds and other funds, compare the 5% hypothetical examples with the 5% hypothetical examples that appear in shareholder reports of other funds.
The expenses shown in the expense examples are intended to highlight shareholders’ ongoing costs only and do not reflect any transactional expenses, such as sales charges, if any. Therefore, the hypothetical examples are useful in comparing ongoing expenses only, and will not help shareholders determine the relative total expenses of owning different funds. If these transactional expenses were included, shareholder expenses would have been higher.
| | | | | | |
| | | | | | | |
| 8 | | BLACKROCK FUNDS | | JANUARY 31, 2017 | | |
| | |
Schedule of Investments January 31, 2017 (Unaudited) | | BlackRock USA Momentum Factor Index Fund (Percentages shown are based on Net Assets) |
| | | | | | | | |
| Common Stocks | | Shares | | | Value | |
Aerospace & Defense — 4.4% | |
B/E Aerospace, Inc. | | | 273 | | | $ | 16,781 | |
Huntington Ingalls Industries, Inc. | | | 130 | | | | 25,215 | |
Lockheed Martin Corp. | | | 544 | | | | 136,723 | |
Northrop Grumman Corp. | | | 498 | | | | 114,082 | |
Raytheon Co. | | | 693 | | | | 99,903 | |
TransDigm Group, Inc. | | | 255 | | | | 55,182 | |
| | | | | | | | |
| | | | | 447,886 | |
Banks — 0.5% | |
Fifth Third Bancorp | | | 2,037 | | | | 53,166 | |
Beverages — 1.0% | |
Constellation Brands, Inc., Class A | | | 425 | | | | 63,648 | |
Molson Coors Brewing Co., Class B | | | 396 | | | | 38,222 | |
| | | | | | | | |
| | | | | 101,870 | |
Biotechnology — 0.1% | |
Seattle Genetics, Inc. (a) | | | 256 | | | | 15,421 | |
Building Products — 0.2% | |
AO Smith Corp. | | | 369 | | | | 17,989 | |
Chemicals — 0.4% | |
Albemarle Corp. | | | 413 | | | | 38,260 | |
Commercial Services & Supplies — 2.3% | |
Cintas Corp. | | | 266 | | | | 30,885 | |
Republic Services, Inc. | | | 854 | | | | 49,003 | |
Waste Connections, Inc. | | | 609 | | | | 48,903 | |
Waste Management, Inc. | | | 1,487 | | | | 103,346 | |
| | | | | | | | |
| | | | | 232,137 | |
Communications Equipment — 0.3% | |
F5 Networks, Inc. (a) | | | 219 | | | | 29,353 | |
Construction & Engineering — 0.2% | |
Jacobs Engineering Group, Inc. (a) | | | 310 | | | | 18,150 | |
Construction Materials — 0.6% | |
Martin Marietta Materials, Inc. | | | 116 | | | | 26,634 | |
Vulcan Materials Co. | | | 250 | | | | 32,082 | |
| | | | | | | | |
| | | | | 58,716 | |
Containers & Packaging — 0.2% | |
Packaging Corp. of America | | | 279 | | | | 25,718 | |
Diversified Financial Services — 1.1% | |
MSCI, Inc. | | | 193 | | | | 15,971 | |
S&P Global, Inc. | | | 812 | | | | 97,586 | |
| | | | | | | | |
| | | | | 113,557 | |
Diversified Telecommunication Services — 0.1% | |
Zayo Group Holdings, Inc. (a) | | | 405 | | | | 12,944 | |
Electric Utilities — 4.2% | |
Edison International | | | 761 | | | | 55,462 | |
NextEra Energy, Inc. | | | 1,402 | | | | 173,455 | |
Pinnacle West Capital Corp. | | | 273 | | | | 21,193 | |
Southern Co. | | | 2,004 | | | | 99,058 | |
Westar Energy, Inc. | | | 583 | | | | 31,884 | |
Xcel Energy, Inc. | | | 1,133 | | | | 46,816 | |
| | | | | | | | |
| | | | | 427,868 | |
Electronic Equipment, Instruments & Components — 1.7% | |
Amphenol Corp., Class A | | | 987 | | | | 66,613 | |
Corning, Inc. | | | 3,105 | | | | 82,251 | |
Flex Ltd. (a) | | | 1,753 | | | | 27,470 | |
| | | | | | | | |
| | | | | 176,334 | |
| | | | | | | | |
| Common Stocks | | Shares | | | Value | |
Food & Staples Retailing — 0.6% | |
Sysco Corp. | | | 1,154 | | | $ | 60,539 | |
Food Products — 1.6% | |
Conagra Brands, Inc. | | | 972 | | | | 37,995 | |
Ingredion, Inc. | | | 267 | | | | 34,227 | |
Tyson Foods, Inc., Class A | | | 982 | | | | 61,660 | |
WhiteWave Foods Co. (a) | | | 629 | | | | 34,633 | |
| | | | | | | | |
| | | | | 168,515 | |
Gas Utilities — 0.4% | |
Atmos Energy Corp. | | | 229 | | | | 17,445 | |
UGI Corp. | | | 587 | | | | 27,219 | |
| | | | | | | | |
| | | | | 44,664 | |
Health Care Equipment & Supplies — 3.9% | |
Align Technology, Inc. (a) | | | 188 | | | | 17,238 | |
Baxter International, Inc. | | | 1,389 | | | | 66,547 | |
Becton Dickinson & Co. | | | 469 | | | | 83,149 | |
IDEXX Laboratories, Inc. (a) | | | 367 | | | | 44,895 | |
Intuitive Surgical, Inc. (a) | | | 94 | | | | 65,113 | |
Stryker Corp. | | | 840 | | | | 103,765 | |
Varian Medical Systems, Inc. (a) | | | 260 | | | | 20,189 | |
| | | | | | | | |
| | | | | 400,896 | |
Health Care Providers & Services — 3.6% | |
UnitedHealth Group, Inc. | | | 2,286 | | | | 370,561 | |
Hotels, Restaurants & Leisure — 1.0% | |
Domino’s Pizza, Inc. | | | 249 | | | | 43,460 | |
Las Vegas Sands Corp. | | | 1,126 | | | | 59,205 | |
| | | | | | | | |
| | | | | 102,665 | |
Household Durables — 0.1% | |
Garmin Ltd. | | | 304 | | | | 14,680 | |
Household Products — 5.5% | |
Church & Dwight Co., Inc. | | | 562 | | | | 25,414 | |
Procter & Gamble Co. | | | 5,958 | | | | 521,921 | |
Spectrum Brands Holdings, Inc. | | | 114 | | | | 15,206 | |
| | | | | | | | |
| | | | | 562,541 | |
Industrial Conglomerates — 1.0% | |
Danaher Corp. | | | 1,199 | | | | 100,620 | |
Insurance — 2.1% | |
Aon PLC | | | 657 | | | | 74,044 | |
Cincinnati Financial Corp. | | | 405 | | | | 28,585 | |
Loews Corp. | | | 763 | | | | 35,541 | |
Principal Financial Group, Inc. | | | 848 | | | | 48,412 | |
Reinsurance Group of America, Inc. | | | 200 | | | | 25,094 | |
| | | | | | | | |
| | | | | 211,676 | |
Internet & Direct Marketing Retail — 5.1% | |
Amazon.com, Inc. (a) | | | 638 | | | | 525,380 | |
Internet Software & Services — 11.1% | |
Akamai Technologies, Inc. (a) | | | 470 | | | | 32,237 | |
Alphabet, Inc., Class A (a) | | | 318 | | | | 260,821 | |
Alphabet, Inc., Class C (a) | | | 315 | | | | 250,989 | |
Facebook, Inc., Class A (a) | | | 4,151 | | | | 540,958 | |
MercadoLibre, Inc. | | | 147 | | | | 27,252 | |
Zillow Group, Inc., Class C (a) | | | 423 | | | | 14,966 | |
| | | | | | | | |
| | | | | 1,127,223 | |
IT Services — 0.6% | |
Computer Sciences Corp. | | | 695 | | | | 43,229 | |
Vantiv, Inc., Class A (a) | | | 321 | | | | 19,979 | |
| | | | | | | | |
| | | | | 63,208 | |
| | | | | | | | | | |
| REIT | | Real Estate Investment Trust | | | | | | | | |
See Notes to Financial Statements.
| | | | | | |
| | | | | | | |
| | BLACKROCK FUNDS | | JANUARY 31, 2017 | | 9 |
| | |
Schedule of Investments (continued) | | BlackRock USA Momentum Factor Index Fund |
| | | | | | | | |
| Common Stocks | | Shares | | | Value | |
Life Sciences Tools & Services — 0.4% | |
Mettler-Toledo International, Inc. (a) | | | 86 | | | $ | 36,690 | |
Machinery — 1.4% | |
Illinois Tool Works, Inc. | | | 870 | | | | 110,664 | |
Xylem, Inc. | | | 573 | | | | 28,255 | |
| | | | | | | | |
| | | | | 138,919 | |
Media — 1.9% | |
Charter Communications, Inc., Class A (a) | | | 525 | | | | 170,073 | |
Liberty Broadband Corp., Class C (a) | | | 317 | | | | 27,053 | |
| | | | | | | | |
| | | | | 197,126 | |
Metals & Mining — 0.6% | |
Newmont Mining Corp. | | | 1,597 | | | | 57,939 | |
Multi-Utilities — 2.2% | |
Alliant Energy Corp. | | | 656 | | | | 24,699 | |
Ameren Corp. | | | 459 | | | | 24,166 | |
CenterPoint Energy, Inc. | | | 982 | | | | 25,738 | |
CMS Energy Corp. | | | 592 | | | | 25,219 | |
DTE Energy Co. | | | 452 | | | | 44,585 | |
NiSource, Inc. | | | 677 | | | | 15,145 | |
SCANA Corp. | | | 373 | | | | 25,625 | |
WEC Energy Group, Inc. | | | 619 | | | | 36,552 | |
| | | | | | | | |
| | | | | 221,729 | |
Oil, Gas & Consumable Fuels — 1.9% | |
Continental Resources, Inc. (a) | | | 222 | | | | 10,780 | |
ONEOK, Inc. | | | 604 | | | | 33,286 | |
Parsley Energy, Inc., Class A (a) | | | 807 | | | | 28,423 | |
Spectra Energy Corp. | | | 2,943 | | | | 122,576 | |
| | | | | | | | |
| | | | | 195,065 | |
Pharmaceuticals — 4.7% | |
Johnson & Johnson | | | 4,235 | | | | 479,614 | |
Professional Services — 0.3% | |
Equifax, Inc. | | | 247 | | | | 28,968 | |
Real Estate Investment Trusts (REITs) — 4.2% | |
Alexandria Real Estate Equities, Inc. | | | 249 | | | | 27,594 | |
American Tower Corp. | | | 1,081 | | | | 111,883 | |
Digital Realty Trust, Inc. | | | 416 | | | | 44,774 | |
Duke Realty Corp. | | | 1,232 | | | | 29,975 | |
Equinix, Inc. | | | 164 | | | | 63,137 | |
Liberty Property Trust | | | 418 | | | | 16,047 | |
Prologis, Inc. | | | 1,596 | | | | 77,965 | |
Ventas, Inc. | | | 911 | | | | 56,181 | |
| | | | | | | | |
| | | | | 427,556 | |
Semiconductors & Semiconductor Equipment — 14.2% | |
Applied Materials, Inc. | | | 5,388 | | | | 184,539 | |
Broadcom Ltd. | | | 1,012 | | | | 201,894 | |
Lam Research Corp. | | | 506 | | | | 58,119 | |
Linear Technology Corp. | | | 962 | | | | 60,731 | |
Marvell Technology Group Ltd. | | | 1,775 | | | | 26,394 | |
| | | | | | | | |
| Common Stocks | | Shares | | | Value | |
Semiconductors & Semiconductor Equipment (continued) | |
Microchip Technology, Inc. | | | 676 | | | $ | 45,529 | |
Micron Technology, Inc. (a) | | | 2,827 | | | | 68,159 | |
NVIDIA Corp. | | | 2,671 | | | | 291,620 | |
QUALCOMM, Inc. | | | 4,749 | | | | 253,739 | |
Texas Instruments, Inc. | | | 3,365 | | | | 254,192 | |
| | | | | | | | |
| | | | | 1,444,916 | |
Software — 9.0% | |
Activision Blizzard, Inc. | | | 1,685 | | | | 67,754 | |
Adobe Systems, Inc. (a) | | | 1,252 | | | | 141,952 | |
Autodesk, Inc. (a) | | | 524 | | | | 42,622 | |
Microsoft Corp. | | | 8,049 | | | | 520,368 | |
Symantec Corp. | | | 3,081 | | | | 84,882 | |
Synopsys, Inc. (a) | | | 580 | | | | 36,476 | |
VMware, Inc., Class A (a) | | | 275 | | | | 24,073 | |
| | | | | | | | |
| | | | | 918,127 | |
Specialty Retail — 0.6% | |
Dick’s Sporting Goods, Inc. | | | 251 | | | | 12,951 | |
Ulta Salon Cosmetics & Fragrance, Inc. (a) | | | 163 | | | | 44,382 | |
| | | | | | | | |
| | | | | 57,333 | |
Technology Hardware, Storage & Peripherals — 2.2% | |
Hewlett Packard Enterprise Co. | | | 7,077 | | | | 160,506 | |
NetApp, Inc. | | | 780 | | | | 29,890 | |
Seagate Technology PLC | | | 744 | | | | 33,592 | |
| | | | | | | | |
| | | | | 223,988 | |
Tobacco — 1.1% | |
Reynolds American, Inc. | | | 1,895 | | | | 113,946 | |
Water Utilities — 0.4% | |
American Water Works Co., Inc. | | | 497 | | | | 36,500 | |
Wireless Telecommunication Services — 0.8% | |
Sprint Corp. (a) | | | 2,565 | | | | 23,675 | |
T-Mobile U.S., Inc. (a) | | | 910 | | | | 56,666 | |
| | | | | | | | |
| | | | | 80,341 | |
Total Long-Term Investments
(Cost — $9,988,678) — 99.8% | | | | 10,181,294 | |
| | | | | | | | |
| | | | | | | | | |
|
| Short-Term Securities | |
BlackRock Liquidity Funds, T-Fund, Institutional Class,
0.40% (b)(c) | | | 8,869 | | | | 8,869 | |
Total Short-Term Securities (Cost — $8,869) — 0.1% | | | | 8,869 | |
| Total Investments (Cost — $9,997,547) — 99.9% | | | | 10,190,163 | |
Other Assets Less Liabilities — 0.1% | | | | 8,548 | |
| | | | | | | | |
Net Assets — 100.0% | | | $ | 10,198,711 | |
| | | | | | | | |
| | |
| Notes to Schedule of Investments | | |
| (a) | | Non-income producing security. |
| (b) | | During the period ended January 31, 2017, investments in issuers considered to be an affiliate of the Fund for purposes of Section 2(a)(3) of the Investment Company Act of 1940, as amended, were as follows: |
| | | | | | | | | | | | | | | | | | | | |
| Affiliate | | Net
Activity | | | Shares Held
at January 31,
2017 | | | Value at
January 31,
2017 | | | Income | | | Net Realized
Gain (Loss) | | Change in
Unrealized
Appreciation
(Depreciation) |
BlackRock Liquidity Funds, T-Fund, Institutional Class | | | 8,869 | 1 | | | 8,869 | | | $ | 8,869 | | | $ | 7 | | | — | | — |
1 Represents net shares purchased for the period December 20, 2016, the commencement of operations, to January 31, 2017. |
See Notes to Financial Statements.
| | | | | | |
| | | | | | | |
| 10 | | BLACKROCK FUNDS | | JANUARY 31, 2017 | | |
| | |
Schedule of Investments (concluded) | | BlackRock USA Momentum Factor Index Fund |
| (c) | | Current yield as of period end. |
| • | | For Fund compliance purposes, the Fund’s sector classifications refer to one or more of the sector sub-classifications used by one or more widely recognized market indexes or rating group indexes, and/or as defined by the investment adviser. These definitions may not apply for purposes of this report, which may combine such sector subclassifications for reporting ease. |
| | |
| Fair Value Hierarchy as of Period End | | |
Various inputs are used in determining the fair value of investments. For information about the Fund’s policy regarding valuation of investments, refer to the Notes to Financial Statements.
The following table summarizes the Fund’s investments categorized in the disclosure hierarchy:
| | | | | | | | | | | | |
| | | Level 1 | | | Level 2 | | Level 3 | | Total | |
Assets: | |
| Investments: | |
Common Stocks1 | | $ | 10,181,294 | | | — | | — | | $ | 10,181,294 | |
Short-Term Securities | | | 8,869 | | | — | | — | | | 8,869 | |
| | | | |
Total | | $ | 10,190,163 | | | — | | — | | $ | 10,190,163 | |
| | | | |
1 See above Schedule of Investments for values in each sector. | |
See Notes to Financial Statements.
| | | | | | |
| | | | | | | |
| | BLACKROCK FUNDS | | JANUARY 31, 2017 | | 11 |
| | |
Schedule of Investments January 31, 2017 (Unaudited) | | BlackRock USA Quality Factor Index Fund (Percentages shown are based on Net Assets) |
| | | | | | | | |
| Common Stocks | | Shares | | | Value | |
Aerospace & Defense — 5.3% | |
Boeing Co. | | | 1,443 | | | $ | 235,815 | |
Core Laboratories NV | | | 136 | | | | 15,889 | |
General Dynamics Corp. | | | 493 | | | | 89,273 | |
Huntington Ingalls Industries, Inc. | | | 82 | | | | 15,905 | |
Northrop Grumman Corp. | | | 329 | | | | 75,367 | |
Raytheon Co. | | | 521 | | | | 75,107 | |
Rockwell Collins, Inc. | | | 250 | | | | 22,690 | |
| | | | | | | | |
| | | | | 530,046 | |
Air Freight & Logistics — 0.4% | |
C.H. Robinson Worldwide, Inc. | | | 301 | | | | 22,894 | |
Expeditors International of Washington, Inc. | | | 361 | | | | 18,801 | |
| | | | | | | | |
| | | | | 41,695 | |
Airlines — 0.2% | |
Southwest Airlines Co. | | | 303 | | | | 15,850 | |
Auto Components — 0.4% | |
Delphi Automotive PLC | | | 575 | | | | 40,284 | |
Beverages — 3.4% | |
Brown-Forman Corp., Class B | | | 503 | | | | 22,937 | |
Dr. Pepper Snapple Group, Inc. | | | 351 | | | | 32,011 | |
Monster Beverage Corp. (a) | | | 705 | | | | 30,033 | |
PepsiCo, Inc. | | | 2,509 | | | | 260,384 | |
| | | | | | | | |
| | | | | 345,365 | |
Biotechnology — 3.5% | |
Biogen, Inc. (a) | | | 438 | | | | 121,431 | |
Gilead Sciences, Inc. | | | 2,856 | | | | 206,917 | |
United Therapeutics Corp. (a) | | | 111 | | | | 18,163 | |
| | | | | | | | |
| | | | | 346,511 | |
Building Products — 0.1% | |
AO Smith Corp. | | | 277 | | | | 13,504 | |
Capital Markets — 1.0% | |
Eaton Vance Corp. | | | 209 | | | | 8,763 | |
Franklin Resources, Inc. | | | 630 | | | | 25,036 | |
SEI Investments Co. | | | 272 | | | | 13,195 | |
T. Rowe Price Group, Inc. | | | 484 | | | | 32,641 | |
TD Ameritrade Holding Corp. | | | 456 | | | | 21,045 | |
| | | | | | | | |
| | | | | 100,680 | |
Chemicals — 2.0% | |
International Flavors & Fragrances, Inc. | | | 143 | | | | 16,761 | |
LyondellBasell Industries NV, Class A | | | 905 | | | | 84,409 | |
PPG Industries, Inc. | | | 473 | | | | 47,305 | |
Sherwin-Williams Co. | | | 175 | | | | 53,167 | |
| | | | | | | | |
| | | | | 201,642 | |
Commercial Services & Supplies — 0.2% | |
Cintas Corp. | | | 149 | | | | 17,300 | |
Communications Equipment — 0.2% | |
F5 Networks, Inc. (a) | | | 133 | | | | 17,826 | |
Containers & Packaging — 0.1% | |
Avery Dennison Corp. | | | 159 | | | | 11,610 | |
Distributors — 0.3% | |
Genuine Parts Co. | | | 282 | | | | 27,300 | |
Diversified Financial Services — 0.1% | |
MSCI, Inc. | | | 174 | | | | 14,399 | |
Electrical Equipment — 1.2% | |
Acuity Brands, Inc. | | | 77 | | | | 15,957 | |
Emerson Electric Co. | | | 1,082 | | | | 63,470 | |
Rockwell Automation, Inc. | | | 268 | | | | 39,661 | |
| | | | | | | | |
| | | | | 119,088 | |
Electronic Equipment, Instruments & Components — 0.8% | |
Amphenol Corp., Class A | | | 525 | | | | 35,432 | |
| | | | | | | | |
| Common Stocks | | Shares | | | Value | |
Electronic Equipment, Instruments & Components (continued) | |
TE Connectivity Ltd. | | | 667 | | | $ | 49,592 | |
| | | | | | | | |
| | | | | 85,024 | |
Food & Staples Retailing — 1.4% | |
Costco Wholesale Corp. | | | 769 | | | | 126,078 | |
Whole Foods Market, Inc. | | | 555 | | | | 16,772 | |
| | | | | | | | |
| | | | | 142,850 | |
Food Products — 1.6% | |
Campbell Soup Co. | | | 376 | | | | 23,398 | |
General Mills, Inc. | | | 1,081 | | | | 67,541 | |
Hershey Co. | | | 316 | | | | 33,329 | |
Hormel Foods Corp. | | | 547 | | | | 19,856 | |
McCormick & Co., Inc. | | | 207 | | | | 19,779 | |
| | | | | | | | |
| | | | | 163,903 | |
Health Care Equipment & Supplies — 0.8% | |
Align Technology, Inc. (a) | | | 132 | | | | 12,103 | |
Edwards Lifesciences Corp. (a) | | | 401 | | | | 38,592 | |
ResMed, Inc. | | | 242 | | | | 16,345 | |
Varex Imaging Corp. (a) | | | — | | | | 12 | |
Varian Medical Systems, Inc. (a) | | | 176 | | | | 13,666 | |
| | | | | | | | |
| | | | | 80,718 | |
Health Care Providers & Services — 0.8% | |
Henry Schein, Inc. (a) | | | 146 | | | | 23,339 | |
McKesson Corp. | | | 398 | | | | 55,382 | |
| | | | | | | | |
| | | | | 78,721 | |
Hotels, Restaurants & Leisure — 4.2% | |
Chipotle Mexican Grill, Inc. (a) | | | 51 | | | | 21,494 | |
McDonald’s Corp. | | | 1,609 | | | | 197,215 | |
Starbucks Corp. | | | 3,609 | | | | 199,289 | |
| | | | | | | | |
| | | | | 417,998 | |
Household Durables — 0.1% | |
Leggett & Platt, Inc. | | | 253 | | | | 12,073 | |
Household Products — 1.6% | |
Church & Dwight Co., Inc. | | | 467 | | | | 21,118 | |
Kimberly-Clark Corp. | | | 1,129 | | | | 136,756 | |
| | | | | | | | |
| | | | | 157,874 | |
Industrial Conglomerates — 3.8% | |
3M Co. | | | 1,299 | | | | 227,091 | |
Honeywell International, Inc. | | | 1,310 | | | | 154,999 | |
| | | | | | | | |
| | | | | 382,090 | |
Insurance — 0.6% | |
Marsh & McLennan Cos., Inc. | | | 950 | | | | 64,619 | |
Internet & Direct Marketing Retail — 1.5% | |
Priceline Group, Inc. (a) | | | 94 | | | | 148,062 | |
Internet Software & Services — 5.2% | |
Alphabet, Inc., Class A (a) | | | 307 | | | | 251,798 | |
Alphabet, Inc., Class C (a) | | | 322 | | | | 256,566 | |
MercadoLibre, Inc. | | | 86 | | | | 15,944 | |
| | | | | | | | |
| | | | | 524,308 | |
IT Services — 13.1% | |
Accenture PLC, Class A | | | 1,685 | | | | 191,871 | |
Automatic Data Processing, Inc. | | | 958 | | | | 96,748 | |
Broadridge Financial Solutions, Inc. | | | 218 | | | | 14,504 | |
Fiserv, Inc. (a) | | | 386 | | | | 41,468 | |
International Business Machines Corp. | | | 1,874 | | | | 327,051 | |
Mastercard, Inc., Class A | | | 2,701 | | | | 287,197 | |
Paychex, Inc. | | | 770 | | | | 46,423 | |
Visa, Inc., Class A | | | 3,409 | | | | 281,958 | |
Western Union Co. | | | 1,082 | | | | 21,186 | |
| | | | | | | | |
| | | | | 1,308,406 | |
See Notes to Financial Statements.
| | | | | | |
| | | | | | | |
| 12 | | BLACKROCK FUNDS | | JANUARY 31, 2017 | | |
| | |
Schedule of Investments (continued) | | BlackRock USA Quality Factor Index Fund |
| | | | | | | | |
| Common Stocks | | Shares | | | Value | |
Leisure Products — 0.3% | |
Hasbro, Inc. | | | 201 | | | $ | 16,584 | |
Polaris Industries, Inc. | | | 137 | | | | 11,518 | |
| | | | | | | | |
| | | | | 28,102 | |
Life Sciences Tools & Services — 0.5% | |
Mettler-Toledo International, Inc. (a) | | | 70 | | | | 29,864 | |
Waters Corp. (a) | | | 140 | | | | 19,831 | |
| | | | | | | | |
| | | | | 49,695 | |
Machinery — 2.0% | |
Cummins, Inc. | | | 290 | | | | 42,633 | |
Fortive Corp. | | | 744 | | | | 41,150 | |
Illinois Tool Works, Inc. | | | 599 | | | | 76,193 | |
Snap-on, Inc. | | | 105 | | | | 19,061 | |
WABCO Holdings, Inc. (a) | | | 93 | | | | 10,140 | |
Wabtec Corp. | | | 163 | | | | 14,122 | |
| | | | | | | | |
| | | | | 203,299 | |
Media — 4.0% | |
CBS Corp., Class B | | | 751 | | | | 48,432 | |
Omnicom Group, Inc. | | | 479 | | | | 41,027 | |
Walt Disney Co. | | | 2,808 | | | | 310,705 | |
| | | | | | | | |
| | | | | 400,164 | |
Multiline Retail — 0.4% | |
Dollar General Corp. | | | 508 | | | | 37,501 | |
Personal Products — 0.4% | |
Estee Lauder Cos., Inc., Class A | | | 450 | | | | 36,544 | |
Pharmaceuticals — 6.2% | |
Bristol-Myers Squibb Co. | | | 2,941 | | | | 144,580 | |
Johnson & Johnson | | | 4,194 | | | | 474,970 | |
| | | | | | | | |
| | | | | 619,550 | |
Professional Services — 0.4% | |
Equifax, Inc. | | | 206 | | | | 24,160 | |
Robert Half International, Inc. | | | 293 | | | | 13,788 | |
| | | | | | | | |
| | | | | 37,948 | |
Real Estate Investment Trusts (REITs) — 0.6% | |
Public Storage | | | 287 | | | | 61,705 | |
Real Estate Management & Development — 0.1% | |
Jones Lang LaSalle, Inc. | | | 78 | | | | 8,036 | |
Road & Rail — 1.7% | |
JB Hunt Transport Services, Inc. | | | 177 | | | | 17,537 | |
Union Pacific Corp. | | | 1,429 | | | | 152,303 | |
| | | | | | | | |
| | | | | 169,840 | |
Semiconductors & Semiconductor Equipment — 6.7% | |
Intel Corp. | | | 8,082 | | | | 297,579 | |
Linear Technology Corp. | | | 501 | | | | 31,628 | |
QUALCOMM, Inc. | | | 2,471 | | | | 132,026 | |
Skyworks Solutions, Inc. | | | 375 | | | | 34,402 | |
Texas Instruments, Inc. | | | 2,023 | | | | 152,817 | |
Xilinx, Inc. | | | 438 | | | | 25,492 | |
| | | | | | | | |
| | | | | 673,944 | |
| | | | | | | | |
| Common Stocks | | Shares | | | Value | |
Software — 6.1% | |
CDK Global, Inc. | | | 240 | | | $ | 15,012 | |
Intuit, Inc. | | | 630 | | | | 74,705 | |
Microsoft Corp. | | | 8,050 | | | | 520,433 | |
| | | | | | | | |
| | | | | 610,150 | |
Specialty Retail — 8.2% | |
Advance Auto Parts, Inc. | | | 123 | | | | 20,202 | |
Bed Bath & Beyond, Inc. | | | 304 | | | | 12,266 | |
Dick’s Sporting Goods, Inc. | | | 162 | | | | 8,359 | |
Foot Locker, Inc. | | | 257 | | | | 17,615 | |
Gap, Inc. | | | 436 | | | | 10,041 | |
Home Depot, Inc. | | | 2,351 | | | | 323,451 | |
Lowe’s Cos., Inc. | | | 1,655 | | | | 120,947 | |
O’Reilly Automotive, Inc. (a) | | | 249 | | | | 65,305 | |
Ross Stores, Inc. | | | 949 | | | | 62,738 | |
TJX Cos., Inc. | | | 1,681 | | | | 125,941 | |
Tractor Supply Co. | | | 279 | | | | 20,554 | |
Ulta Salon Cosmetics & Fragrance, Inc. (a) | | | 121 | | | | 32,946 | |
| | | | | | | | |
| | | | | 820,365 | |
Technology Hardware, Storage & Peripherals — 5.4% | |
Apple, Inc. | | | 4,414 | | | | 535,639 | |
Textiles, Apparel & Luxury Goods — 2.3% | |
Hanesbrands, Inc. | | | 695 | | | | 16,478 | |
lululemon athletica, Inc. (a) | | | 211 | | | | 14,245 | |
Michael Kors Holdings Ltd. (a) | | | 389 | | | | 16,653 | |
NIKE, Inc., Class B | | | 2,897 | | | | 153,251 | |
VF Corp. | | | 662 | | | | 34,080 | |
| | | | | | | | |
| | | | | 234,707 | |
Trading Companies & Distributors — 0.6% | |
Fastenal Co. | | | 589 | | | | 29,262 | |
W.W. Grainger, Inc. | | | 111 | | | | 28,035 | |
| | | | | | | | |
| | | | | 57,297 | |
Total Long-Term Investments
(Cost — $9,992,156) — 99.8% | | | | 9,994,232 | |
| | | | | | | | |
| | | | | | | | | |
|
| Short-Term Securities | |
BlackRock Liquidity Funds, T-Fund, Institutional Class, 0.40% (b)(c) | | | 6,389 | | | | 6,389 | |
Total Short-Term Securities (Cost — 6,389) — 0.1% | | | | 6,389 | |
| Total Investments (Cost — $9,998,545) — 99.9% | | | | 10,000,621 | |
Other Assets Less Liabilities — 0.1% | | | | 6,259 | |
| | | | | | | | |
Net Assets — 100.0% | | | $ | 10,006,880 | |
| | | | | | | | |
See Notes to Financial Statements.
| | | | | | |
| | | | | | | |
| | BLACKROCK FUNDS | | JANUARY 31, 2017 | | 13 |
| | |
Schedule of Investments (concluded) | | BlackRock USA Quality Factor Index Fund |
| | |
| Notes to Schedule of Investments | | |
| (a) | | Non-income producing security. |
| (b) | | During the period ended January 31, 2017, investments in issuers considered to be an affiliate of the Fund for purposes of Section 2(a)(3) of the Investment Company Act of 1940, as amended, were as follows: |
| | | | | | | | | | | | | | | | | | | | | | | | |
| Affiliate | | Net
Activity | | | Shares Held
at January 31,
2017 | | | Value at
January 31,
2017 | | | Income | | | Net Realized
Gain (Loss) | | | Change in
Unrealized
Appreciation
(Depreciation) | |
BlackRock Liquidity Funds, T-Fund, Institutional Class | | | 6,389 | 1 | | $ | 6,389 | | | $ | 6,389 | | | $ | 3 | | | | — | | | | — | |
1 Represents net shares purchased for the period December 20, 2016, the commencement of operations, to January 31, 2017. | | | | | | | | | |
| (c) | | Current yield as of period end. |
| • | | For Fund compliance purposes, the Fund’s sector classifications refer to one or more of the sector sub-classifications used by one or more widely recognized market indexes or rating group indexes, and/or as defined by the investment adviser. These definitions may not apply for purposes of this report, which may combine such sector subclassifications for reporting ease. |
| | |
| Fair Value Hierarchy as of Period End | | |
Various inputs are used in determining the fair value of investments. For information about the Fund’s policy regarding valuation of investments, refer to the Notes to Financial Statements.
The following table summarizes the Fund’s investments categorized in the disclosure hierarchy:
| | | | | | | | | | | | |
| | | Level 1 | | | Level 2 | | Level 3 | | Total | |
Assets: | |
| Investments: | |
Common Stocks1 | | $ | 9,994,232 | | | — | | — | | $ | 9,994,232 | |
Short-Term Securities | | | 6,389 | | | — | | — | | | 6,389 | |
| | | | |
Total | | $ | 10,000,621 | | | — | | — | | $ | 10,000,621 | |
| | | | |
1 See above Schedule of Investments for values in each sector. | |
See Notes to Financial Statements.
| | | | | | |
| | | | | | | |
| 14 | | BLACKROCK FUNDS | | JANUARY 31, 2017 | | |
| | |
Schedule of Investments January 31, 2017 (Unaudited) | | BlackRock USA Size Factor Index Fund (Percentages shown are based on Net Assets) |
| | | | | | | | |
| Common Stocks | | Shares | | | Value | |
Aerospace & Defense — 2.5% | |
Arconic, Inc. | | | 246 | | | $ | 5,606 | |
Autoliv, Inc. | | | 148 | | | | 17,118 | |
B/E Aerospace, Inc. | | | 158 | | | | 9,712 | |
Boeing Co. | | | 99 | | | | 16,178 | |
Core Laboratories NV | | | 82 | | | | 9,580 | |
General Dynamics Corp. | | | 135 | | | | 24,446 | |
Huntington Ingalls Industries, Inc. | | | 60 | | | | 11,638 | |
L3 Technologies, Inc. | | | 113 | | | | 17,932 | |
Lockheed Martin Corp. | | | 97 | | | | 24,379 | |
Northrop Grumman Corp. | | | 93 | | | | 21,304 | |
Raytheon Co. | | | 149 | | | | 21,480 | |
Rockwell Collins, Inc. | | | 243 | | | | 22,055 | |
Textron, Inc. | | | 195 | | | | 9,237 | |
TransDigm Group, Inc. | | | 84 | | | | 18,178 | |
United Technologies Corp. | | | 183 | | | | 20,070 | |
| | | | | | | | |
| | | | | 248,913 | |
Air Freight & Logistics — 0.9% | |
C.H. Robinson Worldwide, Inc. | | | 243 | | | | 18,482 | |
Expeditors International of Washington, Inc. | | | 479 | | | | 24,946 | |
FedEx Corp. | | | 89 | | | | 16,831 | |
United Parcel Service, Inc., Class B | | | 282 | | | | 30,775 | |
| | | | | | | | |
| | | | | 91,034 | |
Airlines — 0.2% | |
American Airlines Group, Inc. | | | 85 | | | | 3,761 | |
Delta Air Lines, Inc. | | | 162 | | | | 7,653 | |
Southwest Airlines Co. | | | 156 | | | | 8,160 | |
United Continental Holdings, Inc. (a) | | | 76 | | | | 5,356 | |
| | | | | | | | |
| | | | | 24,930 | |
Auto Components — 0.6% | |
BorgWarner, Inc. | | | 241 | | | | 9,840 | |
Delphi Automotive PLC | | | 152 | | | | 10,649 | |
Goodyear Tire & Rubber Co. | | | 230 | | | | 7,450 | |
Johnson Controls International PLC | | | 372 | | | | 16,360 | |
Lear Corp. | | | 110 | | | | 15,630 | |
| | | | | | | | |
| | | | | 59,929 | |
Automobiles — 0.4% | |
Ford Motor Co. | | | 1,178 | | | | 14,560 | |
General Motors Co. | | | 358 | | | | 13,106 | |
Harley-Davidson, Inc. | | | 137 | | | | 7,814 | |
Tesla Motors, Inc. (a) | | | 21 | | | | 5,291 | |
| | | | | | | | |
| | | | | 40,771 | |
Banks — 2.8% | |
Bank of America Corp. | | | 479 | | | | 10,845 | |
BB&T Corp. | | | 448 | | | | 20,693 | |
CIT Group, Inc. | | | 292 | | | | 12,027 | |
Citigroup, Inc. | | | 209 | | | | 11,668 | |
Citizens Financial Group, Inc. | | | 347 | | | | 12,551 | |
Comerica, Inc. | | | 167 | | | | 11,278 | |
Fifth Third Bancorp | | | 448 | | | | 11,693 | |
First Republic Bank | | | 181 | | | | 17,074 | |
Huntington Bancshares, Inc. | | | 1,011 | | | | 13,679 | |
JPMorgan Chase & Co. | | | 211 | | | | 17,857 | |
KeyCorp | | | 689 | | | | 12,381 | |
M&T Bank Corp. | | | 144 | | | | 23,410 | |
PNC Financial Services Group, Inc. | | | 179 | | | | 21,562 | |
Regions Financial Corp. | | | 698 | | | | 10,058 | |
Signature Bank (a) | | | 72 | | | | 11,341 | |
SunTrust Banks, Inc. | | | 291 | | | | 16,535 | |
U.S. Bancorp | | | 523 | | | | 27,536 | |
Wells Fargo & Co. | | | 375 | | | | 21,124 | |
| | | | | | | | |
| | | | | 283,312 | |
| | | | | | | | |
| Common Stocks | | Shares | | | Value | |
Beverages — 1.7% | |
Brown-Forman Corp., Class B | | | 523 | | | $ | 23,849 | |
Coca-Cola Co. | | | 817 | | | | 33,963 | |
Constellation Brands, Inc., Class A | | | 110 | | | | 16,473 | |
Dr. Pepper Snapple Group, Inc. | | | 333 | | | | 30,369 | |
Molson Coors Brewing Co., Class B | | | 138 | | | | 13,320 | |
Monster Beverage Corp. (a) | | | 135 | | | | 5,751 | |
PepsiCo, Inc. | | | 429 | | | | 44,522 | |
| | | | | | | | |
| | | | | 168,247 | |
Biotechnology — 0.8% | |
AbbVie, Inc. | | | 145 | | | | 8,861 | |
Alexion Pharmaceuticals, Inc. (a) | | | 44 | | | | 5,750 | |
Alkermes PLC (a) | | | 58 | | | | 3,138 | |
Amgen, Inc. | | | 84 | | | | 13,161 | |
Biogen, Inc. (a) | | | 20 | | | | 5,545 | |
BioMarin Pharmaceutical, Inc. (a) | | | 49 | | | | 4,294 | |
Celgene Corp. (a) | | | 64 | | | | 7,434 | |
Gilead Sciences, Inc. | | | 136 | | | | 9,853 | |
Incyte Corp. (a) | | | 30 | | | | 3,636 | |
Regeneron Pharmaceuticals, Inc. (a) | | | 15 | | | | 5,389 | |
Seattle Genetics, Inc. (a) | | | 42 | | | | 2,530 | |
United Therapeutics Corp. (a) | | | 38 | | | | 6,218 | |
Vertex Pharmaceuticals, Inc. (a) | | | 32 | | | | 2,748 | |
| | | | | | | | |
| | | | | 78,557 | |
Building Products — 0.4% | |
AO Smith Corp. | | | 307 | | | | 14,966 | |
Fortune Brands Home & Security, Inc. | | | 238 | | | | 13,121 | |
Masco Corp. | | | 386 | | | | 12,719 | |
| | | | | | | | |
| | | | | 40,806 | |
Capital Markets — 2.1% | |
Affiliated Managers Group, Inc. (a) | | | 68 | | | | 10,361 | |
Ameriprise Financial, Inc. | | | 83 | | | | 9,318 | |
Bank of New York Mellon Corp. | | | 357 | | | | 15,969 | |
BlackRock, Inc. | | | 44 | | | | 16,455 | |
Charles Schwab Corp. | | | 206 | | | | 8,495 | |
E*Trade Financial Corp. (a) | | | 201 | | | | 7,527 | |
Eaton Vance Corp. | | | 275 | | | | 11,531 | |
Franklin Resources, Inc. | | | 328 | | | | 13,035 | |
Goldman Sachs Group, Inc. | | | 71 | | | | 16,282 | |
Invesco Ltd. | | | 375 | | | | 10,845 | |
Morgan Stanley | | | 230 | | | | 9,773 | |
Northern Trust Corp. | | | 197 | | | | 16,343 | |
Raymond James Financial, Inc. | | | 166 | | | | 12,438 | |
SEI Investments Co. | | | 285 | | | | 13,825 | |
State Street Corp. | | | 161 | | | | 12,268 | |
T. Rowe Price Group, Inc. | | | 279 | | | | 18,816 | |
TD Ameritrade Holding Corp. | | | 238 | | | | 10,984 | |
| | | | | | | | |
| | | | | 214,265 | |
Chemicals — 3.2% | |
Air Products & Chemicals, Inc. | | | 130 | | | | 18,169 | |
Albemarle Corp. | | | 98 | | | | 9,079 | |
Ashland Global Holdings, Inc. | | | 216 | | | | 25,710 | |
Axalta Coating Systems Ltd. (a) | | | 370 | | | | 10,730 | |
Celanese Corp., Series A | | | 142 | | | | 11,985 | |
CF Industries Holdings, Inc. | | | 149 | | | | 5,258 | |
Dow Chemical Co. | | | 248 | | | | 14,788 | |
E.I. du Pont de Nemours & Co. | | | 174 | | | | 13,137 | |
Eastman Chemical Co. | | | 170 | | | | 13,175 | |
Ecolab, Inc. | | | 220 | | | | 26,429 | |
FMC Corp. | | | 190 | | | | 11,430 | |
International Flavors & Fragrances, Inc. | | | 186 | | | | 21,801 | |
LyondellBasell Industries NV, Class A | | | 106 | | | | 9,887 | |
Monsanto Co. | | | 185 | | | | 20,037 | |
Mosaic Co. | | | 282 | | | | 8,846 | |
PPG Industries, Inc. | | | 199 | | | | 19,902 | |
See Notes to Financial Statements.
| | | | | | |
| | | | | | | |
| | BLACKROCK FUNDS | | JANUARY 31, 2017 | | 15 |
| | |
Schedule of Investments (continued) | | BlackRock USA Size Factor Index Fund |
| | | | | | | | |
| Common Stocks | | Shares | | | Value | |
Chemicals (continued) | |
Praxair, Inc. | | | 242 | | | $ | 28,663 | |
Sherwin-Williams Co. | | | 72 | | | | 21,874 | |
Valspar Corp. | | | 167 | | | | 18,482 | |
WR Grace & Co. | | | 237 | | | | 16,434 | |
| | | | | | | | |
| | | | | 325,816 | |
Commercial Services & Supplies — 1.5% | |
Cintas Corp. | | | 223 | | | | 25,893 | |
Iron Mountain, Inc. | | | 315 | | | | 11,277 | |
Republic Services, Inc. | | | 749 | | | | 42,978 | |
Stericycle, Inc. (a) | | | 149 | | | | 11,494 | |
Waste Connections, Inc. | | | 344 | | | | 27,623 | |
Waste Management, Inc. | | | 507 | | | | 35,236 | |
| | | | | | | | |
| | | | | 154,501 | |
Communications Equipment — 0.7% | |
Cisco Systems, Inc. | | | 488 | | | | 14,991 | |
F5 Networks, Inc. (a) | | | 75 | | | | 10,052 | |
Harris Corp. | | | 150 | | | | 15,407 | |
Juniper Networks, Inc. | | | 345 | | | | 9,239 | |
Motorola Solutions, Inc. | | | 222 | | | | 17,918 | |
Palo Alto Networks, Inc. (a) | | | 29 | | | | 4,279 | |
| | | | | | | | |
| | | | | 71,886 | |
Construction & Engineering — 0.2% | |
Fluor Corp. | | | 196 | | | | 10,878 | |
Jacobs Engineering Group, Inc. (a) | | | 163 | | | | 9,544 | |
| | | | | | | | |
| | | | | 20,422 | |
Construction Materials — 0.2% | |
Martin Marietta Materials, Inc. | | | 34 | | | | 7,806 | |
Vulcan Materials Co. | | | 103 | | | | 13,218 | |
| | | | | | | | |
| | | | | 21,024 | |
Consumer Finance — 0.8% | |
Ally Financial, Inc. | | | 613 | | | | 12,947 | |
American Express Co. | | | 231 | | | | 17,644 | |
Capital One Financial Corp. | | | 175 | | | | 15,293 | |
Discover Financial Services | | | 251 | | | | 17,389 | |
Navient Corp. | | | 338 | | | | 5,084 | |
Synchrony Financial | | | 343 | | | | 12,286 | |
| | | | | | | | |
| | | | | 80,643 | |
Containers & Packaging — 0.9% | |
Avery Dennison Corp. | | | 269 | | | | 19,642 | |
Ball Corp. | | | 253 | | | | 19,294 | |
Crown Holdings, Inc. (a) | | | 340 | | | | 18,418 | |
Packaging Corp. of America | | | 124 | | | | 11,430 | |
Sealed Air Corp. | | | 287 | | | | 13,920 | |
WestRock Co. | | | 176 | | | | 9,391 | |
| | | | | | | | |
| | | | | 92,095 | |
Distributors — 0.3% | |
Genuine Parts Co. | | | 220 | | | | 21,298 | |
LKQ Corp. (a) | | | 350 | | | | 11,169 | |
| | | | | | | | |
| | | | | 32,467 | |
Diversified Consumer Services — 0.1% | |
H&R Block, Inc. | | | 401 | | | | 8,605 | |
Diversified Financial Services — 1.7% | |
Berkshire Hathaway, Inc., Class B (a) | | | 260 | | | | 42,677 | |
CME Group, Inc. | | | 152 | | | | 18,404 | |
Intercontinental Exchange, Inc. | | | 318 | | | | 18,559 | |
Leucadia National Corp. | | | 612 | | | | 14,596 | |
Moody’s Corp. | | | 145 | | | | 15,032 | |
MSCI, Inc. | | | 220 | | | | 18,205 | |
Nasdaq, Inc. | | | 295 | | | | 20,809 | |
S&P Global, Inc. | | | 133 | | | | 15,984 | |
| | | | | | | | |
| Common Stocks | | Shares | | | Value | |
Diversified Financial Services (continued) | |
Voya Financial, Inc. | | | 283 | | | $ | 11,382 | |
| | | | | | | | |
| | | | | 175,648 | |
Diversified Telecommunication Services — 1.2% | |
AT&T, Inc. | | | 884 | | | | 37,269 | |
CenturyLink, Inc. | | | 409 | | | | 10,577 | |
Frontier Communications Corp. | | | 1,214 | | | | 4,237 | |
Level 3 Communications, Inc. (a) | | | 169 | | | | 10,049 | |
SBA Communications Corp. (a) | | | 154 | | | | 16,210 | |
Verizon Communications, Inc. | | | 646 | | | | 31,660 | |
Zayo Group Holdings, Inc. (a) | | | 184 | | | | 5,881 | |
| | | | | | | | |
| | | | | 115,883 | |
Electric Utilities — 3.8% | |
American Electric Power Co., Inc. | | | 453 | | | | 29,019 | |
Duke Energy Corp. | | | 406 | | | | 31,887 | |
Edison International | | | 397 | | | | 28,933 | |
Entergy Corp. | | | 365 | | | | 26,149 | |
Eversource Energy | | | 527 | | | | 29,154 | |
Exelon Corp. | | | 446 | | | | 16,002 | |
FirstEnergy Corp. | | | 510 | | | | 15,463 | |
NextEra Energy, Inc. | | | 248 | | | | 30,683 | |
OGE Energy Corp. | | | 615 | | | | 20,627 | |
Pinnacle West Capital Corp. | | | 369 | | | | 28,645 | |
PPL Corp. | | | 697 | | | | 24,284 | |
Southern Co. | | | 747 | | | | 36,924 | |
Westar Energy, Inc. | | | 453 | | | | 24,775 | |
Xcel Energy, Inc. | | | 854 | | | | 35,287 | |
| | | | | | | | |
| | | | | 377,832 | |
Electrical Equipment — 0.8% | |
Acuity Brands, Inc. | | | 30 | | | | 6,217 | |
AMETEK, Inc. | | | 395 | | | | 20,184 | |
Eaton Corp. PLC | | | 159 | | | | 11,254 | |
Emerson Electric Co. | | | 250 | | | | 14,665 | |
Rockwell Automation, Inc. | | | 104 | | | | 15,391 | |
Sensata Technologies Holding NV (a) | | | 403 | | | | 16,906 | |
| | | | | | | | |
| | | | | 84,617 | |
Electronic Equipment, Instruments & Components — 1.3% | |
Amphenol Corp., Class A | | | 325 | | | | 21,934 | |
Arrow Electronics, Inc. (a) | | | 186 | | | | 13,675 | |
Avnet, Inc. | | | 340 | | | | 15,790 | |
CDW Corp. | | | 248 | | | | 12,774 | |
Corning, Inc. | | | 602 | | | | 15,947 | |
Flex Ltd. (a) | | | 1,127 | | | | 17,660 | |
FLIR Systems, Inc. | | | 293 | | | | 10,352 | |
TE Connectivity Ltd. | | | 253 | | | | 18,811 | |
Trimble, Inc. (a) | | | 207 | | | | 6,131 | |
| | | | | | | | |
| | | | | 133,074 | |
Energy Equipment & Services — 0.6% | |
Baker Hughes, Inc. | | | 117 | | | | 7,380 | |
Halliburton Co. | | | 155 | | | | 8,768 | |
Helmerich & Payne, Inc. | | | 64 | | | | 4,554 | |
National Oilwell Varco, Inc. | | | 161 | | | | 6,088 | |
Schlumberger Ltd. | | | 163 | | | | 13,645 | |
TechnipFMC PLC (a) | | | 401 | | | | 13,482 | |
Weatherford International PLC (a) | | | 392 | | | | 2,042 | |
| | | | | | | | |
| | | | | 55,959 | |
Equity Real Estate Investment Trusts (REITs) — 0.4% | |
Colony NorthStar, Inc., Class A | | | 2,514 | | | | 34,995 | |
Food & Staples Retailing — 1.5% | |
Costco Wholesale Corp. | | | 200 | | | | 32,790 | |
CVS Health Corp. | | | 337 | | | | 26,559 | |
Kroger Co. | | | 496 | | | | 16,844 | |
Rite Aid Corp. (a) | | | 548 | | | | 3,080 | |
See Notes to Financial Statements.
| | | | | | |
| | | | | | | |
| 16 | | BLACKROCK FUNDS | | JANUARY 31, 2017 | | |
| | |
Schedule of Investments (continued) | | BlackRock USA Size Factor Index Fund |
| | | | | | | | |
| Common Stocks | | Shares | | | Value | |
Food & Staples Retailing (continued) | |
Sysco Corp. | | | 477 | | | $ | 25,024 | |
Wal-Mart Stores, Inc. | | | 360 | | | | 24,026 | |
Walgreens Boots Alliance, Inc. | | | 163 | | | | 13,356 | |
Whole Foods Market, Inc. | | | 249 | | | | 7,525 | |
| | | | | | | | |
| | | | | 149,204 | |
Food Products — 3.1% | |
Archer-Daniels-Midland Co. | | | 267 | | | | 11,817 | |
Bunge Ltd. | | | 238 | | | | 16,472 | |
Campbell Soup Co. | | | 410 | | | | 25,514 | |
Conagra Brands, Inc. | | | 506 | | | | 19,780 | |
General Mills, Inc. | | | 541 | | | | 33,802 | |
Hershey Co. | | | 216 | | | | 22,782 | |
Hormel Foods Corp. | | | 541 | | | | 19,638 | |
Ingredion, Inc. | | | 155 | | | | 19,870 | |
J.M. Smucker Co. | | | 176 | | | | 23,910 | |
Kellogg Co. | | | 461 | | | | 33,519 | |
Kraft Heinz Co. | | | 87 | | | | 7,768 | |
McCormick & Co., Inc. | | | 278 | | | | 26,563 | |
Mead Johnson Nutrition Co. | | | 256 | | | | 18,038 | |
Mondelez International, Inc., Class A | | | 379 | | | | 16,782 | |
Tyson Foods, Inc., Class A | | | 170 | | | | 10,674 | |
WhiteWave Foods Co. (a) | | | 173 | | | | 9,525 | |
| | | | | | | | |
| | | | | 316,454 | |
Gas Utilities — 0.6% | |
Atmos Energy Corp. | | | 392 | | | | 29,863 | |
UGI Corp. | | | 563 | | | | 26,106 | |
| | | | | | | | |
| | | | | 55,969 | |
Health Care Equipment & Supplies — 3.5% | |
Abbott Laboratories | | | 622 | | | | 25,981 | |
Align Technology, Inc. (a) | | | 84 | | | | 7,702 | |
Baxter International, Inc. | | | 530 | | | | 25,392 | |
Becton Dickinson & Co. | | | 156 | | | | 27,657 | |
Boston Scientific Corp. (a) | | | 593 | | | | 14,268 | |
C.R. Bard, Inc. | | | 115 | | | | 27,293 | |
Cooper Cos., Inc. | | | 98 | | | | 18,092 | |
Dentsply Sirona, Inc. | | | 320 | | | | 18,144 | |
DexCom, Inc. (a) | | | 59 | | | | 4,670 | |
Edwards Lifesciences Corp. (a) | | | 94 | | | | 9,047 | |
Hologic, Inc. (a) | | | 398 | | | | 16,131 | |
IDEXX Laboratories, Inc. (a) | | | 91 | | | | 11,132 | |
Intuitive Surgical, Inc. (a) | | | 16 | | | | 11,083 | |
Medtronic PLC | | | 296 | | | | 22,502 | |
ResMed, Inc. | | | 231 | | | | 15,602 | |
Stryker Corp. | | | 240 | | | | 29,647 | |
Teleflex, Inc. | | | 149 | | | | 24,992 | |
Varex Imaging Corp. (a) | | | 1 | | | | 17 | |
Varian Medical Systems, Inc. (a) | | | 314 | | | | 24,382 | |
Zimmer Biomet Holdings, Inc. | | | 156 | | | | 18,459 | |
| | | | | | | | |
| | | | | 352,193 | |
Health Care Providers & Services — 3.2% | |
Aetna, Inc. | | | 115 | | | | 13,640 | |
AmerisourceBergen Corp. | | | 200 | | | | 17,456 | |
Anthem, Inc. | | | 116 | | | | 17,880 | |
Cardinal Health, Inc. | | | 270 | | | | 20,239 | |
Centene Corp. (a) | | | 116 | | | | 7,339 | |
Cigna Corp. | | | 90 | | | | 13,160 | |
DaVita, Inc. (a) | | | 353 | | | | 22,504 | |
Envision Healthcare Corp. (a) | | | 196 | | | | 13,328 | |
Express Scripts Holding Co. (a) | | | 235 | | | | 16,187 | |
HCA Holdings, Inc. (a) | | | 171 | | | | 13,728 | |
Henry Schein, Inc. (a) | | | 182 | | | | 29,095 | |
Humana, Inc. | | | 45 | | | | 8,933 | |
Laboratory Corp. of America Holdings (a) | | | 160 | | | | 21,474 | |
McKesson Corp. | | | 79 | | | | 10,993 | |
| | | | | | | | |
| Common Stocks | | Shares | | | Value | |
Health Care Providers & Services (continued) | |
MEDNAX, Inc. (a) | | | 266 | | | $ | 18,181 | |
Patterson Cos., Inc. | | | 504 | | | | 20,971 | |
Quest Diagnostics, Inc. | | | 237 | | | | 21,785 | |
UnitedHealth Group, Inc. | | | 144 | | | | 23,342 | |
Universal Health Services, Inc., Class B | | | 110 | | | | 12,389 | |
| | | | | | | | |
| | | | | 322,624 | |
Health Care Technology — 0.1% | |
Cerner Corp. (a) | | | 253 | | | | 13,589 | |
Hotels, Restaurants & Leisure — 2.1% | |
Aramark | | | 212 | | | | 7,174 | |
Carnival Corp. | | | 283 | | | | 15,673 | |
Chipotle Mexican Grill, Inc. (a) | | | 19 | | | | 8,007 | |
Darden Restaurants, Inc. | | | 271 | | | | 19,859 | |
Domino’s Pizza, Inc. | | | 80 | | | | 13,963 | |
Hilton Worldwide Holdings, Inc. | | | 89 | | | | 5,124 | |
Las Vegas Sands Corp. | | | 121 | | | | 6,362 | |
Marriott International, Inc., Class A | | | 193 | | | | 16,328 | |
McDonald’s Corp. | | | 275 | | | | 33,707 | |
MGM Resorts International (a) | | | 254 | | | | 7,315 | |
Norwegian Cruise Line Holdings Ltd. (a) | | | 220 | | | | 10,340 | |
Royal Caribbean Cruises Ltd. | | | 85 | | | | 7,959 | |
Starbucks Corp. | | | 353 | | | | 19,493 | |
Wyndham Worldwide Corp. | | | 227 | | | | 17,947 | |
Wynn Resorts Ltd. | | | 43 | | | | 4,361 | |
Yum! Brands, Inc. | | | 250 | | | | 16,382 | |
| | | | | | | | |
| | | | | 209,994 | |
Household Durables — 1.3% | |
D.R. Horton, Inc. | | | 334 | | | | 9,990 | |
Garmin Ltd. | | | 186 | | | | 8,982 | |
Harman International Industries, Inc. | | | 42 | | | | 4,669 | |
Leggett & Platt, Inc. | | | 471 | | | | 22,476 | |
Lennar Corp., Class A | | | 271 | | | | 12,100 | |
Mohawk Industries, Inc. (a) | | | 93 | | | | 20,073 | |
Newell Brands, Inc. | | | 383 | | | | 18,128 | |
PulteGroup, Inc. | | | 608 | | | | 13,078 | |
Toll Brothers, Inc. (a) | | | 425 | | | | 13,328 | |
Whirlpool Corp. | | | 61 | | | | 10,668 | |
| | | | | | | | |
| | | | | 133,492 | |
Household Products — 2.3% | |
Church & Dwight Co., Inc. | | | 883 | | | | 39,929 | |
Clorox Co. | | | 383 | | | | 45,960 | |
Colgate-Palmolive Co. | | | 668 | | | | 43,140 | |
Kimberly-Clark Corp. | | | 307 | | | | 37,187 | |
Procter & Gamble Co. | | | 499 | | | | 43,712 | |
Spectrum Brands Holdings, Inc. | | | 159 | | | | 21,209 | |
| | | | | | | | |
| | | | | 231,137 | |
Independent Power and Renewable Electricity Producers — 0.2% | |
AES Corp. | | | 872 | | | | 9,975 | |
Calpine Corp. (a) | | | 556 | | | | 6,561 | |
| | | | | | | | |
| | | | | 16,536 | |
Industrial Conglomerates — 1.3% | |
3M Co. | | | 161 | | | | 28,146 | |
Danaher Corp. | | | 384 | | | | 32,225 | |
General Electric Co. | | | 582 | | | | 17,285 | |
Honeywell International, Inc. | | | 206 | | | | 24,374 | |
Roper Technologies, Inc. | | | 129 | | | | 24,749 | |
| | | | | | | | |
| | | | | 126,779 | |
Insurance — 8.2% | |
Aflac, Inc. | | | 420 | | | | 29,396 | |
Alleghany Corp. (a) | | | 17 | | | | 10,397 | |
Allstate Corp. | | | 561 | | | | 42,193 | |
American International Group, Inc. | | | 367 | | | | 23,583 | |
See Notes to Financial Statements.
| | | | | | |
| | | | | | | |
| | BLACKROCK FUNDS | | JANUARY 31, 2017 | | 17 |
| | |
Schedule of Investments (continued) | | BlackRock USA Size Factor Index Fund |
| | | | | | | | |
| Common Stocks | | Shares | | | Value | |
Insurance (continued) | |
Aon PLC | | | 236 | | | $ | 26,597 | |
Arch Capital Group Ltd. (a) | | | 563 | | | | 49,741 | |
Arthur J. Gallagher & Co. | | | 654 | | | | 35,205 | |
Assurant, Inc. | | | 245 | | | | 23,797 | |
Axis Capital Holdings Ltd. | | | 678 | | | | 43,399 | |
Chubb Ltd. | | | 343 | | | | 45,101 | |
Cincinnati Financial Corp. | | | 504 | | | | 35,572 | |
FNF Group | | | 713 | | | | 25,212 | |
Hartford Financial Services Group, Inc. | | | 502 | | | | 24,452 | |
Lincoln National Corp. | | | 152 | | | | 10,261 | |
Loews Corp. | | | 771 | | | | 35,913 | |
Markel Corp. (a) | | | 46 | | | | 42,550 | |
Marsh & McLennan Cos., Inc. | | | 508 | | | | 34,554 | |
MetLife, Inc. | | | 177 | | | | 9,631 | |
Principal Financial Group, Inc. | | | 246 | | | | 14,044 | |
Progressive Corp. | | | 1,007 | | | | 37,702 | |
Prudential Financial, Inc. | | | 132 | | | | 13,874 | |
Reinsurance Group of America, Inc. | | | 240 | | | | 30,113 | |
Torchmark Corp. | | | 463 | | | | 34,049 | |
Travelers Cos., Inc. | | | 338 | | | | 39,810 | |
Unum Group | | | 292 | | | | 13,266 | |
W.R. Berkley Corp. | | | 627 | | | | 42,141 | |
Willis Towers Watson PLC | | | 203 | | | | 25,401 | |
XL Group Ltd. | | | 752 | | | | 28,253 | |
| | | | | | | | |
| | | | | 826,207 | |
Internet & Direct Marketing Retail — 0.4% | |
Amazon.com, Inc. (a) | | | 10 | | | | 8,235 | |
Expedia, Inc. | | | 64 | | | | 7,781 | |
Liberty Interactive Corp. QVC Group, Series A (a) | | | 499 | | | | 9,571 | |
Netflix, Inc. (a) | | | 21 | | | | 2,955 | |
Priceline Group, Inc. (a) | | | 6 | | | | 9,451 | |
TripAdvisor, Inc. (a) | | | 69 | | | | 3,650 | |
| | | | | | | | |
| | | | | 41,643 | |
Internet Software & Services — 1.0% | |
Akamai Technologies, Inc. (a) | | | 100 | | | | 6,859 | |
Alphabet, Inc., Class A (a) | | | 16 | | | | 13,123 | |
Alphabet, Inc., Class C (a) | | | 8 | | | | 6,374 | |
CoStar Group, Inc. (a) | | | 46 | | | | 9,297 | |
eBay, Inc. (a) | | | 391 | | | | 12,446 | |
Facebook, Inc., Class A (a) | | | 87 | | | | 11,338 | |
MercadoLibre, Inc. | | | 34 | | | | 6,303 | |
Twitter, Inc. (a) | | | 104 | | | | 1,832 | |
VeriSign, Inc. (a) | | | 161 | | | | 12,914 | |
Yahoo!, Inc. (a) | | | 202 | | | | 8,902 | |
Zillow Group, Inc., Class C (a) | | | 206 | | | | 7,288 | |
| | | | | | | | |
| | | | | 96,676 | |
IT Services — 3.6% | |
Accenture PLC, Class A | | | 170 | | | | 19,358 | |
Alliance Data Systems Corp. | | | 45 | | | | 10,277 | |
Automatic Data Processing, Inc. | | | 283 | | | | 28,580 | |
Broadridge Financial Solutions, Inc. | | | 347 | | | | 23,086 | |
Cognizant Technology Solutions Corp., Class A (a) | | | 208 | | | | 10,939 | |
Computer Sciences Corp. | | | 105 | | | | 6,531 | |
Fidelity National Information Services, Inc. | | | 299 | | | | 23,747 | |
First Data Corp., Class A (a) | | | 341 | | | | 5,231 | |
Fiserv, Inc. (a) | | | 244 | | | | 26,213 | |
FleetCor Technologies, Inc. (a) | | | 65 | | | | 9,587 | |
Gartner, Inc. (a) | | | 143 | | | | 14,208 | |
Global Payments, Inc. | | | 221 | | | | 17,079 | |
International Business Machines Corp. | | | 128 | | | | 22,339 | |
Mastercard, Inc., Class A | | | 188 | | | | 19,990 | |
Paychex, Inc. | | | 459 | | | | 27,673 | |
PayPal Holdings, Inc. (a) | | | 146 | | | | 5,808 | |
Sabre Corp. | | | 240 | | | | 5,880 | |
| | | | | | | | |
| Common Stocks | | Shares | | | Value | |
IT Services (continued) | |
Total System Services, Inc. | | | 339 | | | $ | 17,180 | |
Vantiv, Inc., Class A (a) | | | 292 | | | | 18,174 | |
Visa, Inc., Class A | | | 282 | | | | 23,324 | |
Western Union Co. | | | 788 | | | | 15,429 | |
Xerox Corp. | | | 1,212 | | | | 8,399 | |
| | | | | | | | |
| | | | | 359,032 | |
Leisure Products — 0.3% | |
Hasbro, Inc. | | | 187 | | | | 15,429 | |
Mattel, Inc. | | | 265 | | | | 6,946 | |
Polaris Industries, Inc. | | | 93 | | | | 7,818 | |
| | | | | | | | |
| | | | | 30,193 | |
Life Sciences Tools & Services — 1.1% | |
Agilent Technologies, Inc. | | | 382 | | | | 18,707 | |
Illumina, Inc. (a) | | | 32 | | | | 5,123 | |
Mettler-Toledo International, Inc. (a) | | | 55 | | | | 23,465 | |
Quintiles IMS Holdings, Inc. (a) | | | 211 | | | | 16,561 | |
Thermo Fisher Scientific, Inc. | | | 149 | | | | 22,706 | |
Waters Corp. (a) | | | 141 | | | | 19,973 | |
| | | | | | | | |
| | | | | 106,535 | |
Machinery — 2.6% | |
AGCO Corp. | | | 234 | | | | 14,695 | |
Caterpillar, Inc. | | | 126 | | | | 12,053 | |
Cummins, Inc. | | | 95 | | | | 13,966 | |
Deere & Co. | | | 185 | | | | 19,804 | |
Dover Corp. | | | 181 | | | | 14,073 | |
Flowserve Corp. | | | 174 | | | | 8,554 | |
Fortive Corp. | | | 129 | | | | 7,135 | |
Illinois Tool Works, Inc. | | | 179 | | | | 22,769 | |
Ingersoll-Rand PLC | | | 193 | | | | 15,315 | |
Middleby Corp. (a) | | | 65 | | | | 8,722 | |
PACCAR, Inc. | | | 233 | | | | 15,683 | |
Parker Hannifin Corp. | | | 91 | | | | 13,389 | |
Pentair PLC | | | 167 | | | | 9,791 | |
Snap-on, Inc. | | | 109 | | | | 19,787 | |
Stanley Black & Decker, Inc. | | | 196 | | | | 24,304 | |
WABCO Holdings, Inc. (a) | | | 106 | | | | 11,557 | |
Wabtec Corp. | | | 131 | | | | 11,350 | |
Xylem, Inc. | | | 295 | | | | 14,546 | |
| | | | | | | | |
| | | | | 257,493 | |
Media — 3.6% | |
CBS Corp., Class B | | | 223 | | | | 14,381 | |
Charter Communications, Inc., Class A (a) | | | 61 | | | | 19,761 | |
Comcast Corp., Class A | | | 284 | | | | 21,419 | |
Discovery Communications, Inc., Class A (a) | | | 268 | | | | 7,598 | |
Discovery Communications, Inc., Class C (a) | | | 475 | | | | 13,162 | |
DISH Network Corp., Class A (a) | | | 183 | | | | 10,828 | |
IHS Markit Ltd. (a) | | | 547 | | | | 21,579 | |
Interpublic Group of Cos., Inc. | | | 822 | | | | 19,342 | |
Liberty Broadband Corp., Class C (a) | | | 146 | | | | 12,459 | |
Liberty Global PLC, Class A (a) | | | 362 | | | | 13,206 | |
Liberty Global PLC, Class C (a) | | | 423 | | | | 14,860 | |
Liberty Global PLC LiLAC, Class C (a) | | | 265 | | | | 5,915 | |
Liberty Media Corp. — Liberty SiriusXM, Class A (a) | | | 513 | | | | 18,591 | |
Liberty Media Corp. — Liberty SiriusXM, Class C (a) | | | 266 | | | | 9,547 | |
News Corp., Class A | | | 937 | | | | 11,516 | |
Omnicom Group, Inc. | | | 333 | | | | 28,521 | |
Scripps Networks Interactive, Inc., Class A | | | 173 | | | | 13,176 | |
Sirius XM Holdings, Inc. | | | 5,135 | | | | 24,237 | |
TEGNA, Inc. | | | 348 | | | | 7,973 | |
Time Warner, Inc. | | | 114 | | | | 11,041 | |
Twenty-First Century Fox, Inc., Class A | | | 482 | | | | 15,125 | |
Twenty-First Century Fox, Inc., Class B | | | 777 | | | | 24,095 | |
Viacom, Inc., Class B | | | 148 | | | | 6,237 | |
Walt Disney Co. | | | 197 | | | | 21,798 | |
| | | | | | | | |
| | | | | 366,367 | |
See Notes to Financial Statements.
| | | | | | |
| | | | | | | |
| 18 | | BLACKROCK FUNDS | | JANUARY 31, 2017 | | |
| | |
Schedule of Investments (continued) | | BlackRock USA Size Factor Index Fund |
| | | | | | | | |
| Common Stocks | | Shares | | | Value | |
Metals & Mining — 0.2% | |
Freeport-McMoRan, Inc. (a) | | | 89 | | | $ | 1,482 | |
Newmont Mining Corp. | | | 122 | | | | 4,426 | |
Nucor Corp. | | | 176 | | | | 10,224 | |
| | | | | | | | |
| | | | | 16,132 | |
Multi-Utilities — 3.3% | |
Alliant Energy Corp. | | | 695 | | | | 26,167 | |
Ameren Corp. | | | 471 | | | | 24,798 | |
CenterPoint Energy, Inc. | | | 975 | | | | 25,555 | |
CMS Energy Corp. | | | 639 | | | | 27,221 | |
Consolidated Edison, Inc. | | | 416 | | | | 30,930 | |
Dominion Resources, Inc. | | | 365 | | | | 27,842 | |
DTE Energy Co. | | | 307 | | | | 30,282 | |
NiSource, Inc. | | | 831 | | | | 18,589 | |
PG&E Corp. | | | 398 | | | | 24,632 | |
Public Service Enterprise Group, Inc. | | | 479 | | | | 21,196 | |
SCANA Corp. | | | 365 | | | | 25,076 | |
Sempra Energy | | | 251 | | | | 25,700 | |
WEC Energy Group, Inc. | | | 467 | | | | 27,576 | |
| | | | | | | | |
| | | | | 335,564 | |
Multiline Retail — 0.6% | |
Dollar General Corp. | | | 151 | | | | 11,147 | |
Dollar Tree, Inc. (a) | | | 156 | | | | 12,042 | |
Kohl’s Corp. | | | 127 | | | | 5,058 | |
Macy’s, Inc. | | | 199 | | | | 5,878 | |
Nordstrom, Inc. | | | 137 | | | | 6,058 | |
Target Corp. | | | 243 | | | | 15,669 | |
| | | | | | | | |
| | | | | 55,852 | |
Oil, Gas & Consumable Fuels — 2.5% | |
Anadarko Petroleum Corp. | | | 70 | | | | 4,867 | |
Antero Resources Corp. (a) | | | 238 | | | | 5,810 | |
Apache Corp. | | | 79 | | | | 4,726 | |
Cabot Oil & Gas Corp. | | | 350 | | | | 7,518 | |
Cheniere Energy, Inc. (a) | | | 108 | | | | 5,146 | |
Chevron Corp. | | | 149 | | | | 16,591 | |
Cimarex Energy Co. | | | 61 | | | | 8,248 | |
Concho Resources, Inc. (a) | | | 51 | | | | 7,111 | |
ConocoPhillips | | | 156 | | | | 7,606 | |
Continental Resources, Inc. (a) | | | 53 | | | | 2,574 | |
Devon Energy Corp. | | | 81 | | | | 3,689 | |
Diamondback Energy, Inc. (a) | | | 66 | | | | 6,941 | |
EOG Resources, Inc. | | | 103 | | | | 10,463 | |
EQT Corp. | | | 164 | | | | 9,943 | |
Exxon Mobil Corp. | | | 275 | | | | 23,070 | |
Hess Corp. | | | 110 | | | | 5,960 | |
HollyFrontier Corp. | | | 228 | | | | 6,605 | |
Kinder Morgan, Inc. | | | 245 | | | | 5,473 | |
Marathon Oil Corp. | | | 155 | | | | 2,596 | |
Marathon Petroleum Corp. | | | 123 | | | | 5,910 | |
Murphy Oil Corp. | | | 102 | | | | 2,949 | |
Newfield Exploration Co. (a) | | | 91 | | | | 3,647 | |
Noble Energy, Inc. | | | 160 | | | | 6,362 | |
Occidental Petroleum Corp. | | | 218 | | | | 14,774 | |
ONEOK, Inc. | | | 89 | | | | 4,905 | |
Parsley Energy, Inc., Class A (a) | | | 109 | | | | 3,839 | |
Phillips 66 | | | 135 | | | | 11,019 | |
Pioneer Natural Resources Co. | | | 47 | | | | 8,471 | |
Plains GP Holdings LP, Class A | | | 79 | | | | 2,563 | |
Range Resources Corp. | | | 100 | | | | 3,234 | |
Southwestern Energy Co. (a) | | | 216 | | | | 1,946 | |
Spectra Energy Corp. | | | 274 | | | | 11,412 | |
Targa Resources Corp. | | | 45 | | | | 2,593 | |
Tesoro Corp. | | | 91 | | | | 7,357 | |
Valero Energy Corp. | | | 137 | | | | 9,009 | |
Williams Cos., Inc. | | | 108 | | | | 3,115 | |
| | | | | | | | |
| | | | | 248,042 | |
| | | | | | | | |
| Common Stocks | | Shares | | | Value | |
Paper & Forest Products — 0.2% | |
International Paper Co. | | | 361 | | | $ | 20,433 | |
Personal Products — 0.4% | |
Coty, Inc., Class A | | | 338 | | | | 6,490 | |
Edgewell Personal Care Co. (a) | | | 185 | | | | 14,585 | |
Estee Lauder Cos., Inc., Class A | | | 280 | | | | 22,739 | |
| | | | | | | | |
| | | | | 43,814 | |
Pharmaceuticals — 1.7% | |
Allergan PLC (a) | | | 44 | | | | 9,631 | |
Bristol-Myers Squibb Co. | | | 219 | | | | 10,766 | |
Eli Lilly & Co. | | | 234 | | | | 18,025 | |
Endo International PLC (a) | | | 100 | | | | 1,224 | |
Jazz Pharmaceuticals PLC (a) | | | 71 | | | | 8,656 | |
Johnson & Johnson | | | 348 | | | | 39,411 | |
Mallinckrodt PLC (a) | | | 57 | | | | 2,778 | |
Merck & Co., Inc. | | | 365 | | | | 22,626 | |
Mylan NV (a) | | | 143 | | | | 5,441 | |
Perrigo Co. PLC | | | 83 | | | | 6,321 | |
Pfizer, Inc. | | | 690 | | | | 21,894 | |
Zoetis, Inc. | | | 410 | | | | 22,525 | |
| | | | | | | | |
| | | | | 169,298 | |
Professional Services — 1.0% | |
Dun & Bradstreet Corp. | | | 121 | | | | 14,837 | |
Equifax, Inc. | | | 200 | | | | 23,456 | |
ManpowerGroup, Inc. | | | 134 | | | | 12,792 | |
Nielsen Holdings PLC | | | 386 | | | | 15,791 | |
Robert Half International, Inc. | | | 255 | | | | 12,000 | |
Verisk Analytics, Inc. (a) | | | 280 | | | | 23,139 | |
| | | | | | | | |
| | | | | 102,015 | |
Real Estate Investment Trusts (REITs) — 8.3% | |
AGNC Investment Corp. | | | 1,856 | | | | 34,651 | |
Alexandria Real Estate Equities, Inc. | | | 219 | | | | 24,270 | |
American Tower Corp. | | | 225 | | | | 23,287 | |
Annaly Capital Management, Inc. | | | 3,293 | | | | 33,654 | |
AvalonBay Communities, Inc. | | | 175 | | | | 30,329 | |
Boston Properties, Inc. | | | 216 | | | | 28,274 | |
Brixmor Property Group, Inc. | | | 853 | | | | 20,583 | |
Camden Property Trust | | | 321 | | | | 26,826 | |
Crown Castle International Corp. | | | 292 | | | | 25,646 | |
Digital Realty Trust, Inc. | | | 222 | | | | 23,894 | |
Duke Realty Corp. | | | 878 | | | | 21,362 | |
Equinix, Inc. | | | 54 | | | | 20,789 | |
Equity Residential | | | 447 | | | | 27,164 | |
Essex Property Trust, Inc. | | | 116 | | | | 26,019 | |
Extra Space Storage, Inc. | | | 241 | | | | 17,364 | |
Federal Realty Investment Trust | | | 247 | | | | 34,686 | |
GGP, Inc. | | | 731 | | | | 18,158 | |
HCP, Inc. | | | 349 | | | | 10,582 | |
Host Hotels & Resorts, Inc. | | | 756 | | | | 13,661 | |
Kimco Realty Corp. | | | 847 | | | | 21,082 | |
Liberty Property Trust | | | 538 | | | | 20,654 | |
Macerich Co. | | | 243 | | | | 16,692 | |
Mid-America Apartment Communities, Inc. | | | 517 | | | | 49,089 | |
National Retail Properties, Inc. | | | 492 | | | | 21,451 | |
Prologis, Inc. | | | 421 | | | | 20,566 | |
Public Storage | | | 116 | | | | 24,940 | |
Realty Income Corp. | | | 312 | | | | 18,605 | |
Regency Centers Corp. | | | 404 | | | | 28,171 | |
Simon Property Group, Inc. | | | 155 | | | | 28,484 | |
SL Green Realty Corp. | | | 170 | | | | 18,525 | |
UDR, Inc. | | | 728 | | | | 25,444 | |
Ventas, Inc. | | | 259 | | | | 15,972 | |
VEREIT, Inc. | | | 1,029 | | | | 8,777 | |
Vornado Realty Trust | | | 235 | | | | 24,983 | |
Welltower, Inc. | | | 242 | | | | 16,045 | |
See Notes to Financial Statements.
| | | | | | |
| | | | | | | |
| | BLACKROCK FUNDS | | JANUARY 31, 2017 | | 19 |
| | |
Schedule of Investments (continued) | | BlackRock USA Size Factor Index Fund |
| | | | | | | | |
| Common Stocks | | Shares | | | Value | |
Real Estate Investment Trusts (REITs) (continued) | |
Weyerhaeuser Co. | | | 421 | | | $ | 13,190 | |
| | | | | | | | |
| | | | | 833,869 | |
Real Estate Management & Development — 0.2% | |
CBRE Group, Inc., Class A (a) | | | 384 | | | | 11,658 | |
Jones Lang LaSalle, Inc. | | | 90 | | | | 9,273 | |
| | | | | | | | |
| | | | | 20,931 | |
Road & Rail — 0.8% | |
AMERCO, Inc. | | | 42 | | | | 15,820 | |
CSX Corp. | | | 311 | | | | 14,427 | |
JB Hunt Transport Services, Inc. | | | 192 | | | | 19,024 | |
Kansas City Southern | | | 101 | | | | 8,677 | |
Norfolk Southern Corp. | | | 109 | | | | 12,803 | |
Union Pacific Corp. | | | 129 | | | | 13,749 | |
| | | | | | | | |
| | | | | 84,500 | |
Semiconductors & Semiconductor Equipment — 1.7% | |
Analog Devices, Inc. | | | 191 | | | | 14,314 | |
Applied Materials, Inc. | | | 279 | | | | 9,556 | |
Broadcom Ltd. | | | 37 | | | | 7,381 | |
Intel Corp. | | | 372 | | | | 13,697 | |
KLA-Tencor Corp. | | | 133 | | | | 11,320 | |
Lam Research Corp. | | | 106 | | | | 12,175 | |
Linear Technology Corp. | | | 206 | | | | 13,005 | |
Marvell Technology Group Ltd. | | | 659 | | | | 9,799 | |
Maxim Integrated Products, Inc. | | | 255 | | | | 11,342 | |
Microchip Technology, Inc. | | | 196 | | | | 13,201 | |
Micron Technology, Inc. (a) | | | 183 | | | | 4,412 | |
NVIDIA Corp. | | | 53 | | | | 5,787 | |
Qorvo, Inc. (a) | | | 49 | | | | 3,146 | |
QUALCOMM, Inc. | | | 157 | | | | 8,388 | |
Skyworks Solutions, Inc. | | | 65 | | | | 5,963 | |
Texas Instruments, Inc. | | | 200 | | | | 15,108 | |
Xilinx, Inc. | | | 213 | | | | 12,397 | |
| | | | | | | | |
| | | | | 170,991 | |
Software — 2.7% | |
Activision Blizzard, Inc. | | | 240 | | | | 9,650 | |
Adobe Systems, Inc. (a) | | | 135 | | | | 15,306 | |
ANSYS, Inc. (a) | | | 226 | | | | 21,077 | |
Autodesk, Inc. (a) | | | 95 | | | | 7,727 | |
CA, Inc. | | | 638 | | | | 19,950 | |
Cadence Design Systems, Inc. (a) | | | 707 | | | | 18,403 | |
CDK Global, Inc. | | | 119 | | | | 7,444 | |
Citrix Systems, Inc. (a) | | | 158 | | | | 14,408 | |
Dell Technologies, Inc., Class V (a) | | | 120 | | | | 7,559 | |
Electronic Arts, Inc. (a) | | | 98 | | | | 8,176 | |
Fortinet, Inc. (a) | | | 213 | | | | 7,084 | |
Intuit, Inc. | | | 161 | | | | 19,091 | |
Microsoft Corp. | | | 223 | | | | 14,417 | |
Nuance Communications, Inc. (a) | | | 373 | | | | 5,916 | |
Oracle Corp. | | | 439 | | | | 17,608 | |
Red Hat, Inc. (a) | | | 130 | | | | 9,864 | |
salesforce.com, Inc. (a) | | | 118 | | | | 9,334 | |
ServiceNow, Inc. (a) | | | 62 | | | | 5,619 | |
Splunk, Inc. (a) | | | 45 | | | | 2,604 | |
Symantec Corp. | | | 485 | | | | 13,362 | |
Synopsys, Inc. (a) | | | 422 | | | | 26,540 | |
VMware, Inc., Class A (a) | | | 122 | | | | 10,680 | |
Workday, Inc., Class A (a) | | | 53 | | | | 4,404 | |
| | | | | | | | |
| | | | | 276,223 | |
Specialty Retail — 2.5% | |
Advance Auto Parts, Inc. | | | 74 | | | | 12,154 | |
AutoNation, Inc. (a) | | | 255 | | | | 13,546 | |
AutoZone, Inc. (a) | | | 40 | | | | 28,999 | |
Bed Bath & Beyond, Inc. | | | 326 | | | | 13,154 | |
| | | | | | | | |
| Common Stocks | | Shares | | | Value | |
Specialty Retail (continued) | |
Best Buy Co., Inc. | | | 105 | | | $ | 4,675 | |
CarMax, Inc. (a) | | | 140 | | | | 9,339 | |
Dick’s Sporting Goods, Inc. | | | 192 | | | | 9,907 | |
Foot Locker, Inc. | | | 180 | | | | 12,337 | |
Gap, Inc. | | | 245 | | | | 5,642 | |
Home Depot, Inc. | | | 188 | | | | 25,865 | |
L Brands, Inc. | | | 161 | | | | 9,694 | |
Lowe’s Cos., Inc. | | | 287 | | | | 20,974 | |
O’Reilly Automotive, Inc. (a) | | | 59 | | | | 15,474 | |
Ross Stores, Inc. | | | 217 | | | | 14,346 | |
Signet Jewelers Ltd. | | | 85 | | | | 6,602 | |
Staples, Inc. | | | 589 | | | | 5,419 | |
Tiffany & Co. | | | 142 | | | | 11,178 | |
TJX Cos., Inc. | | | 257 | | | | 19,254 | |
Tractor Supply Co. | | | 124 | | | | 9,135 | |
Ulta Salon Cosmetics & Fragrance, Inc. (a) | | | 31 | | | | 8,441 | |
| | | | | | | | |
| | | | | 256,135 | |
Technology Hardware, Storage & Peripherals — 0.5% | |
Apple, Inc. | | | 94 | | | | 11,407 | |
Hewlett Packard Enterprise Co. | | | 272 | | | | 6,169 | |
HP, Inc. | | | 560 | | | | 8,428 | |
NetApp, Inc. | | | 206 | | | | 7,894 | |
Seagate Technology PLC | | | 96 | | | | 4,334 | |
Western Digital Corp. | | | 86 | | | | 6,857 | |
| | | | | | | | |
| | | | | 45,089 | |
Textiles, Apparel & Luxury Goods — 0.8% | |
Coach, Inc. | | | 276 | | | | 10,308 | |
Hanesbrands, Inc. | | | 391 | | | | 9,271 | |
lululemon athletica, Inc. (a) | | | 90 | | | | 6,076 | |
Michael Kors Holdings Ltd. (a) | | | 105 | | | | 4,495 | |
NIKE, Inc., Class B | | | 330 | | | | 17,457 | |
PVH Corp. | | | 88 | | | | 8,255 | |
Ralph Lauren Corp. | | | 69 | | | | 6,102 | |
Under Armour, Inc., Class A (a) | | | 183 | | | | 3,933 | |
Under Armour, Inc., Class C (a) | | | 250 | | | | 4,805 | |
VF Corp. | | | 267 | | | | 13,745 | |
| | | | | | | | |
| | | | | 84,447 | |
Thrifts & Mortgage Finance — 0.5% | |
New York Community Bancorp, Inc. | | | 1,433 | | | | 21,767 | |
People’s United Financial, Inc. | | | 1,398 | | | | 26,213 | |
| | | | | | | | |
| | | | | 47,980 | |
Tobacco — 0.8% | |
Altria Group, Inc. | | | 445 | | | | 31,675 | |
Philip Morris International, Inc. | | | 310 | | | | 29,800 | |
Reynolds American, Inc. | | | 328 | | | | 19,723 | |
| | | | | | | | |
| | | | | 81,198 | |
Trading Companies & Distributors — 0.4% | |
Fastenal Co. | | | 343 | | | | 17,040 | |
United Rentals, Inc. (a) | | | 42 | | | | 5,314 | |
W.W. Grainger, Inc. | | | 86 | | | | 21,721 | |
| | | | | | | | |
| | | | | 44,075 | |
Transportation Infrastructure — 0.2% | |
Macquarie Infrastructure Corp. | | | 223 | | | | 16,723 | |
Water Utilities — 0.3% | |
American Water Works Co., Inc. | | | 445 | | | | 32,681 | |
Wireless Telecommunication Services — 0.1% | |
Sprint Corp. (a) | | | 298 | | | | 2,750 | |
T-Mobile U.S., Inc. (a) | | | 184 | | | | 11,458 | |
| | | | | | | | |
| | | | | 14,208 | |
Total Long-Term Investments
(Cost — $9,989,148) — 99.8% | | | | 10,048,548 | |
See Notes to Financial Statements.
| | | | | | |
| | | | | | | |
| 20 | | BLACKROCK FUNDS | | JANUARY 31, 2017 | | |
| | |
Schedule of Investments (concluded) | | BlackRock USA Size Factor Index Fund |
| | | | | | | | |
| Short-Term Securities | | Shares | | | Value | |
BlackRock Liquidity Funds, T-Fund, Institutional Class, 0.40% (b)(c) | | | 9,619 | | | $ | 9,619 | |
Total Short-Term Securities (Cost — 9,619) — 0.1% | | | | 9,619 | |
| Total Investments (Cost — $9,998,767) — 99.9% | | | | 10,058,167 | |
Other Assets Less Liabilities — 0.1% | | | | 9,135 | |
| | | | | | | | |
Net Assets — 100.0% | | | $ | 10,067,302 | |
| | | | | | | | |
| | |
| Notes to Schedule of Investments | | |
| (a) | | Non-income producing security. |
| (b) | | During the period ended January 31, 2017, investments in issuers considered to be an affiliate of the Fund for purposes of Section 2(a)(3) of the Investment Company Act of 1940, as amended, were as follows: |
| | | | | | | | | | | | | | | | | | | | | | | | |
| Affiliate | | Net
Activity | | | Shares Held
at January 31,
2017 | | | Value at
January 31,
2017 | | | Income | | | Net Realized
Gain (Loss) | | | Change in
Unrealized
Appreciation
(Depreciation) | |
BlackRock Liquidity Funds, T-Fund, Institutional Class | | | 9,619 | 1 | | $ | 9,619 | | | $ | 9,619 | | | $ | 8 | | | | — | | | | — | |
1 Represents net shares purchased for the period December 20, 2016, the commencement of operations, to January 31, 2017. | | | | | | | | | |
| (c) | | Current yield as of period end. |
| • | | For Fund compliance purposes, the Fund’s sector classifications refer to one or more of the sector sub-classifications used by one or more widely recognized market indexes or rating group indexes, and/or as defined by the investment adviser. These definitions may not apply for purposes of this report, which may combine such sector subclassifications for reporting ease. |
| | |
| Fair Value Hierarchy as of Period End | | |
Various inputs are used in determining the fair value of investments. For information about the Fund’s policy regarding valuation of investments, refer to the Notes to Financial Statements.
The following table summarizes the Fund’s investments categorized in the disclosure hierarchy:
| | | | | | | | | | | | |
| | | Level 1 | | | Level 2 | | Level 3 | | Total | |
Assets: | |
| Investments: | |
Common Stocks1 | | $ | 10,048,548 | | | — | | — | | $ | 10,048,548 | |
Short-Term Securities | | | 9,619 | | | — | | — | | | 9,619 | |
| | | | |
Total | | $ | 10,058,167 | | | — | | — | | $ | 10,058,167 | |
| | | | |
1 See above Schedule of Investments for values in each sector. | |
See Notes to Financial Statements.
| | | | | | |
| | | | | | | |
| | BLACKROCK FUNDS | | JANUARY 31, 2017 | | 21 |
| | |
Schedule of Investments January 31, 2017 (Unaudited) | | BlackRock USA Value Factor Index Fund (Percentages shown are based on Net Assets) |
| | | | | | | | |
| Common Stocks | | Shares | | | Value | |
Aerospace & Defense — 1.2% | |
Arconic, Inc. | | | 1,215 | | | $ | 27,690 | |
L3 Technologies, Inc. | | | 590 | | | | 93,627 | |
| | | | | | | | |
| | | | | 121,317 | |
Airlines — 3.3% | |
American Airlines Group, Inc. | | | 1,446 | | | | 63,985 | |
Delta Air Lines, Inc. | | | 2,449 | | | | 115,691 | |
Southwest Airlines Co. | | | 1,528 | | | | 79,930 | |
United Continental Holdings, Inc. (a) | | | 1,035 | | | | 72,936 | |
| | | | | | | | |
| | | | | 332,542 | |
Auto Components — 0.9% | |
BorgWarner, Inc. | | | 391 | | | | 15,965 | |
Goodyear Tire & Rubber Co. | | | 1,075 | | | | 34,819 | |
Lear Corp. | | | 255 | | | | 36,233 | |
| | | | | | | | |
| | | | | 87,017 | |
Automobiles — 5.7% | |
Ford Motor Co. | | | 18,804 | | | | 232,417 | |
General Motors Co. | | | 9,221 | | | | 337,581 | |
| | | | | | | | |
| | | | | 569,998 | |
Banks — 8.6% | |
Bank of America Corp. | | | 13,024 | | | | 294,863 | |
CIT Group, Inc. | | | 255 | | | | 10,503 | |
Citigroup, Inc. | | | 4,019 | | | | 224,381 | |
Citizens Financial Group, Inc. | | | 601 | | | | 21,738 | |
JPMorgan Chase & Co. | | | 2,887 | | | | 244,327 | |
KeyCorp | | | 820 | | | | 14,735 | |
Regions Financial Corp. | | | 1,349 | | | | 19,439 | |
SunTrust Banks, Inc. | | | 403 | | | | 22,899 | |
| | | | | | | | |
| | | | | 852,885 | |
Biotechnology — 2.9% | |
Gilead Sciences, Inc. | | | 3,842 | | | | 278,353 | |
United Therapeutics Corp. (a) | | | 73 | | | | 11,945 | |
| | | | | | | | |
| | | | | 290,298 | |
Capital Markets — 1.4% | |
Goldman Sachs Group, Inc. | | | 349 | | | | 80,032 | |
Morgan Stanley | | | 1,379 | | | | 58,594 | |
| | | | | | | | |
| | | | | 138,626 | |
Chemicals — 2.0% | |
Celanese Corp., Series A | | | 172 | | | | 14,517 | |
CF Industries Holdings, Inc. | | | 336 | | | | 11,857 | |
Dow Chemical Co. | | | 860 | | | | 51,282 | |
Eastman Chemical Co. | | | 250 | | | | 19,375 | |
LyondellBasell Industries NV, Class A | | | 758 | | | | 70,699 | |
Mosaic Co. | | | 845 | | | | 26,507 | |
| | | | | | | | |
| | | | | 194,237 | |
Commercial Services & Supplies — 0.3% | |
Iron Mountain, Inc. | | | 949 | | | | 33,974 | |
Communications Equipment — 3.6% | |
Cisco Systems, Inc. | | | 10,978 | | | | 337,244 | |
Juniper Networks, Inc. | | | 660 | | | | 17,675 | |
| | | | | | | | |
| | | | | 354,919 | |
Construction & Engineering — 1.0% | |
Fluor Corp. | | | 601 | | | | 33,356 | |
Jacobs Engineering Group, Inc. (a) | | | 1,206 | | | | 70,611 | |
| | | | | | | | |
| | | | | 103,967 | |
Consumer Finance — 0.7% | |
Ally Financial, Inc. | | | 728 | | | | 15,375 | |
Capital One Financial Corp. | | | 609 | | | | 53,221 | |
Navient Corp. | | | 379 | | | | 5,700 | |
| | | | | | | | |
| | | | | 74,296 | |
| | | | | | | | |
| Common Stocks | | Shares | | | Value | |
Containers & Packaging — 0.2% | |
WestRock Co. | | | 441 | | | $ | 23,532 | |
Diversified Financial Services — 0.1% | |
Voya Financial, Inc. | | | 350 | | | | 14,077 | |
Diversified Telecommunication Services — 2.7% | |
AT&T, Inc. | | | 5,863 | | | | 247,184 | |
CenturyLink, Inc. | | | 816 | | | | 21,102 | |
| | | | | | | | |
| | | | | 268,286 | |
Electric Utilities — 2.4% | |
Entergy Corp. | | | 648 | | | | 46,423 | |
Exelon Corp. | | | 4,146 | | | | 148,758 | |
FirstEnergy Corp. | | | 1,384 | | | | 41,963 | |
| | | | | | | | |
| | | | | 237,144 | |
Electronic Equipment, Instruments & Components — 1.4% | |
Arrow Electronics, Inc. (a) | | | 273 | | | | 20,071 | |
Avnet, Inc. | | | 340 | | | | 15,790 | |
Corning, Inc. | | | 3,033 | | | | 80,344 | |
Flex Ltd. (a) | | | 1,384 | | | | 21,687 | |
| | | | | | | | |
| | | | | 137,892 | |
Energy Equipment & Services — 0.4% | |
Helmerich & Payne, Inc. | | | 223 | | | | 15,869 | |
National Oilwell Varco, Inc. | | | 636 | | | | 24,047 | |
| | | | | | | | |
| | | | | 39,916 | |
Food & Staples Retailing — 5.4% | |
CVS Health Corp. | | | 1,209 | | | | 95,281 | |
Kroger Co. | | | 2,838 | | | | 96,379 | |
Wal-Mart Stores, Inc. | | | 4,756 | | | | 317,415 | |
Whole Foods Market, Inc. | | | 785 | | | | 23,723 | |
| | | | | | | | |
| | | | | 532,798 | |
Food Products — 3.4% | |
Archer-Daniels-Midland Co. | | | 3,586 | | | | 158,716 | |
Bunge Ltd. | | | 750 | | | | 51,908 | |
Ingredion, Inc. | | | 102 | | | | 13,075 | |
J.M. Smucker Co. | | | 246 | | | | 33,419 | |
Tyson Foods, Inc., Class A | | | 1,279 | | | | 80,309 | |
| | | | | | | | |
| | | | | 337,427 | |
Health Care Providers & Services — 5.2% | |
Aetna, Inc. | | | 742 | | | | 88,009 | |
AmerisourceBergen Corp. | | | 371 | | | | 32,381 | |
Anthem, Inc. | | | 688 | | | | 106,048 | |
Cardinal Health, Inc. | | | 593 | | | | 44,451 | |
Centene Corp. (a) | | | 354 | | | | 22,397 | |
Cigna Corp. | | | 436 | | | | 63,752 | |
Express Scripts Holding Co. (a) | | | 1,203 | | | | 82,863 | |
McKesson Corp. | | | 271 | | | | 37,710 | |
Quest Diagnostics, Inc. | | | 226 | | | | 20,774 | |
Universal Health Services, Inc., Class B | | | 131 | | | | 14,754 | |
| | | | | | | | |
| | | | | 513,139 | |
Hotels, Restaurants & Leisure — 0.7% | |
Carnival Corp. | | | 1,220 | | | | 67,564 | |
Household Durables — 0.6% | |
Toll Brothers, Inc. (a) | | | 366 | | | | 11,478 | |
Whirlpool Corp. | | | 253 | | | | 44,247 | |
| | | | | | | | |
| | | | | 55,725 | |
Independent Power and Renewable Electricity Producers — 0.1% | |
AES Corp. | | | 1,205 | | | | 13,785 | |
Insurance — 3.3% | |
Aflac, Inc. | | | 291 | | | | 20,367 | |
American International Group, Inc. | | | 1,245 | | | | 80,004 | |
Assurant, Inc. | | | 43 | | | | 4,177 | |
See Notes to Financial Statements.
| | | | | | |
| | | | | | | |
| 22 | | BLACKROCK FUNDS | | JANUARY 31, 2017 | | |
| | |
Schedule of Investments (continued) | | BlackRock USA Value Factor Index Fund |
| | | | | | | | |
| Common Stocks | | Shares | | | Value | |
Insurance (continued) | |
Axis Capital Holdings Ltd. | | | 72 | | | $ | 4,609 | |
Hartford Financial Services Group, Inc. | | | 356 | | | | 17,341 | |
Lincoln National Corp. | | | 363 | | | | 24,506 | |
Loews Corp. | | | 268 | | | | 12,483 | |
MetLife, Inc. | | | 1,411 | | | | 76,772 | |
Prudential Financial, Inc. | | | 636 | | | | 66,850 | |
Unum Group | | | 266 | | | | 12,084 | |
XL Group Ltd. | | | 296 | | | | 11,121 | |
| | | | | | | | |
| | | | | 330,314 | |
IT Services — 0.2% | |
Xerox Corp. | | | 2,883 | | | | 19,979 | |
Machinery — 1.4% | |
AGCO Corp. | | | 810 | | | | 50,868 | |
Cummins, Inc. | | | 631 | | | | 92,763 | |
| | | | | | | | |
| | | | | 143,631 | |
Media — 0.7% | |
Liberty Global PLC LiLAC, Class C (a) | | | 127 | | | | 2,835 | |
News Corp., Class A | | | 2,234 | | | | 27,456 | |
TEGNA, Inc. | | | 538 | | | | 12,326 | |
Viacom, Inc., Class B | | | 632 | | | | 26,632 | |
| | | | | | | | |
| | | | | 69,249 | |
Metals & Mining — 0.6% | |
Newmont Mining Corp. | | | 914 | | | | 33,160 | |
Nucor Corp. | | | 407 | | | | 23,643 | |
| | | | | | | | |
| | | | | 56,803 | |
Multi-Utilities — 0.6% | |
Public Service Enterprise Group, Inc. | | | 1,441 | | | | 63,764 | |
Multiline Retail — 1.8% | |
Kohl’s Corp. | | | 831 | | | | 33,099 | |
Macy’s, Inc. | | | 1,065 | | | | 31,460 | |
Nordstrom, Inc. | | | 300 | | | | 13,266 | |
Target Corp. | | | 1,504 | | | | 96,978 | |
| | | | | | | | |
| | | | | 174,803 | |
Oil, Gas & Consumable Fuels — 6.6% | |
Chevron Corp. | | | 3,156 | | | | 351,421 | |
Devon Energy Corp. | | | 760 | | | | 34,611 | |
HollyFrontier Corp. | | | 405 | | | | 11,733 | |
Marathon Oil Corp. | | | 1,799 | | | | 30,133 | |
Marathon Petroleum Corp. | | | 821 | | | | 39,449 | |
Murphy Oil Corp. | | | 401 | | | | 11,593 | |
Phillips 66 | | | 715 | | | | 58,358 | |
Plains GP Holdings LP, Class A | | | 112 | | | | 3,634 | |
Southwestern Energy Co. (a) | | | 889 | | | | 8,010 | |
Tesoro Corp. | | | 195 | | | | 15,766 | |
Valero Energy Corp. | | | 1,370 | | | | 90,091 | |
| | | | | | | | |
| | | | | 654,799 | |
Paper & Forest Products — 0.3% | |
International Paper Co. | | | 573 | | | | 32,432 | |
Pharmaceuticals — 5.5% | |
Allergan PLC (a) | | | 596 | | | | 130,458 | |
Endo International PLC (a) | | | 693 | | | | 8,482 | |
Mallinckrodt PLC (a) | | | 324 | | | | 15,789 | |
Mylan NV (a) | | | 1,124 | | | | 42,768 | |
Perrigo Co. PLC | | | 230 | | | | 17,515 | |
Pfizer, Inc. | | | 10,419 | | | | 330,595 | |
| | | | | | | | |
| | | | | 545,607 | |
Professional Services — 0.1% | |
ManpowerGroup, Inc. | | | 92 | | | | 8,782 | |
Real Estate Investment Trusts (REITs) — 2.6% | |
AGNC Investment Corp. | | | 395 | | | | 7,375 | |
| | | | | | | | |
| Common Stocks | | Shares | | | Value | |
Real Estate Investment Trusts (REITs) (continued) | |
Annaly Capital Management, Inc. | | | 1,165 | | | $ | 11,906 | |
Host Hotels & Resorts, Inc. | | | 4,974 | | | | 89,880 | |
Liberty Property Trust | | | 508 | | | | 19,502 | |
VEREIT, Inc. | | | 4,375 | | | | 37,319 | |
Weyerhaeuser Co. | | | 3,083 | | | | 96,590 | |
| | | | | | | | |
| | | | | 262,572 | |
Real Estate Management & Development — 0.2% | |
Jones Lang LaSalle, Inc. | | | 153 | | | | 15,764 | |
Road & Rail — 2.1% | |
AMERCO, Inc. | | | 10 | | | | 3,767 | |
Norfolk Southern Corp. | | | 1,721 | | | | 202,148 | |
| | | | | | | | |
| | | | | 205,915 | |
Semiconductors & Semiconductor Equipment — 4.9% | |
Intel Corp. | | | 9,841 | | | | 362,346 | |
Lam Research Corp. | | | 160 | | | | 18,378 | |
Marvell Technology Group Ltd. | | | 1,023 | | | | 15,212 | |
Micron Technology, Inc. (a) | | | 3,246 | | | | 78,261 | |
Qorvo, Inc. (a) | | | 268 | | | | 17,208 | |
| | | | | | | | |
| | | | | 491,405 | |
Software — 0.5% | |
CA, Inc. | | | 615 | | | | 19,231 | |
Nuance Communications, Inc. (a) | | | 283 | | | | 4,488 | |
Symantec Corp. | | | 1,079 | | | | 29,727 | |
| | | | | | | | |
| | | | | 53,446 | |
Specialty Retail — 1.7% | |
Bed Bath & Beyond, Inc. | | | 566 | | | | 22,838 | |
Best Buy Co., Inc. | | | 1,449 | | | | 64,509 | |
Dick’s Sporting Goods, Inc. | | | 220 | | | | 11,352 | |
Foot Locker, Inc. | | | 330 | | | | 22,618 | |
Gap, Inc. | | | 870 | | | | 20,036 | |
Staples, Inc. | | | 3,483 | | | | 32,044 | |
| | | | | | | | |
| | | | | 173,397 | |
Technology Hardware, Storage & Peripherals — 11.1% | |
Apple, Inc. | | | 6,879 | | | | 834,766 | |
Hewlett Packard Enterprise Co. | | | 3,510 | | | | 79,607 | |
HP, Inc. | | | 4,334 | | | | 65,227 | |
NetApp, Inc. | | | 870 | | | | 33,338 | |
Seagate Technology PLC | | | 832 | | | | 37,565 | |
Western Digital Corp. | | | 656 | | | | 52,303 | |
| | | | | | | | |
| | | | | 1,102,806 | |
Textiles, Apparel & Luxury Goods — 0.3% | |
Michael Kors Holdings Ltd. (a) | | | 196 | | | | 8,391 | |
PVH Corp. | | | 197 | | | | 18,480 | |
| | | | | | | | |
| | | | | 26,871 | |
Trading Companies & Distributors — 1.0% | |
United Rentals, Inc. (a) | | | 754 | | | | 95,389 | |
Total Long-Term Investments
(Cost — $9,985,696) — 99.7% | | | | 9,923,089 | |
| | | | | | | | |
| | | | | | | | | |
|
| Short-Term Securities | |
BlackRock Liquidity Funds, T-Fund, Institutional Class, 0.40% (b)(c) | | | 18,887 | | | | 18,887 | |
Total Short-Term Securities (Cost — 18,887) — 0.2% | | | | 18,887 | |
| Total Investments (Cost — $10,004,583) — 99.9% | | | | 9,941,976 | |
Other Assets Less Liabilities — 0.1% | | | | 6,688 | |
| | | | | | | | |
Net Assets — 100.0% | | | $ | 9,948,664 | |
| | | | | | | | |
See Notes to Financial Statements.
| | | | | | |
| | | | | | | |
| | BLACKROCK FUNDS | | JANUARY 31, 2017 | | 23 |
| | |
Schedule of Investments (concluded) | | BlackRock USA Value Factor Index Fund |
| | |
| Notes to Schedule of Investments | | |
| (a) | | Non-income producing security. |
| (b) | | During the period ended January 31, 2017, investments in issuers considered to be an affiliate of the Fund for purposes of Section 2(a)(3) of the Investment Company Act of 1940, as amended, were as follows: |
| | | | | | | | | | | | | | | | | | | | | | |
| Affiliate | | Net
Activity | | | Shares Held
at January 31,
2017 | | | Value at
January 31,
2017 | | | Income | | | Net Realized
Gain (Loss) | | Change in
Unrealized
Appreciation
(Depreciation) | |
BlackRock Liquidity Funds, T-Fund, Institutional Class | | | 18,887 | 1 | | | 18,887 | | | $ | 18,887 | | | $ | 4 | | | — | | | — | |
1 Represents net shares purchased for the period December 20, 2016, the commencement of operations, to January 31, 2017. | | | | |
| (c) | | Current yield as of period end. |
| • | | For Fund compliance purposes, the Fund’s sector classifications refer to one or more of the sector sub-classifications used by one or more widely recognized market indexes or rating group indexes, and/or as defined by the investment adviser. These definitions may not apply for purposes of this report, which may combine such sector subclassifications for reporting ease. |
| | |
| Fair Value Hierarchy as of Period End | | |
Various inputs are used in determining the fair value of investments. For information about the Fund’s policy regarding valuation of investments, refer to the Notes to Financial Statements.
The following table summarizes the Fund’s investments categorized in the disclosure hierarchy:
| | | | | | | | | | | | |
| | | Level 1 | | | Level 2 | | Level 3 | | Total | |
Assets: | |
| Investments: | |
Common Stocks1 | | $ | 9,923,089 | | | — | | — | | $ | 9,923,089 | |
Short-Term Securities | | | 18,887 | | | — | | — | | | 18,887 | |
| | | | |
Total | | $ | 9,941,976 | | | — | | — | | $ | 9,941,976 | |
| | | | |
1 See above Schedule of Investments for values in each sector. | |
See Notes to Financial Statements.
| | | | | | |
| | | | | | | |
| 24 | | BLACKROCK FUNDS | | JANUARY 31, 2017 | | |
| | |
| Statements of Assets and Liabilities | | |
| | | | | | | | | | | | | | | | |
| January 31, 2017 (Unaudited) | | BlackRock
USA
Momentum
Factor Index
Fund | | | BlackRock
USA Quality
Factor Index
Fund | | | BlackRock
USA Size
Factor Index
Fund | | | BlackRock
USA Value
Factor Index
Fund | |
| | | | | | | | | | | | | | | | |
| Assets | |
Investments at value — unaffiliated1 | | $ | 10,181,294 | | | $ | 9,994,232 | | | $ | 10,048,548 | | | $ | 9,923,089 | |
Investments at value — affiliated2 | | | 8,869 | | | | 6,389 | | | | 9,619 | | | | 18,887 | |
| Receivables: | |
Investment adviser | | | 17,847 | | | | 17,859 | | | | 19,956 | | | | 17,995 | |
Dividends — unaffiliated | | | 7,399 | | | | 6,027 | | | | 7,402 | | | | 8,353 | |
Investments sold | | | 2,835 | | | | 1,909 | | | | 3,409 | | | | — | |
Dividends — affiliated | | | 5 | | | | 2 | | | | 6 | | | | 4 | |
Deferred offering costs | | | 62,742 | | | | 62,742 | | | | 62,742 | | | | 62,742 | |
| | | | |
Total assets | | | 10,280,991 | | | | 10,089,160 | | | | 10,151,682 | | | | 10,031,070 | |
| | | | |
| | | | | | | | | | | | | | | | |
| Liabilities | |
| Payables: | |
Offering costs | | | 70,900 | | | | 70,900 | | | | 70,900 | | | | 70,900 | |
Officer’s and Trustees’ fees | | | 1,083 | | | | 1,083 | | | | 1,083 | | | | 1,083 | |
Other accrued expenses | | | 10,297 | | | | 10,297 | | | | 12,397 | | | | 10,423 | |
| | | | |
Total liabilities | | | 82,280 | | | | 82,280 | | | | 84,380 | | | | 82,406 | |
| | | | |
Net Assets | | $ | 10,198,711 | | | $ | 10,006,880 | | | $ | 10,067,302 | | | $ | 9,948,664 | |
| | | | |
| | | | | | | | | | | | | | | | |
| Net Assets Consist of | |
Paid-in capital | | $ | 10,000,000 | | | $ | 10,000,000 | | | $ | 10,000,000 | | | $ | 10,000,000 | |
Undistributed net investment income | | | 5,973 | | | | 4,694 | | | | 7,909 | | | | 11,680 | |
Accumulated net realized gain (loss) | | | 122 | | | | 110 | | | | (7 | ) | | | (409 | ) |
Net unrealized appreciation (depreciation) | | | 192,616 | | | | 2,076 | | | | 59,400 | | | | (62,607 | ) |
| | | | |
Net Assets | | $ | 10,198,711 | | | $ | 10,006,880 | | | $ | 10,067,302 | | | $ | 9,948,664 | |
| | | | |
1 Investments at cost — unaffiliated | | $ | 9,988,678 | | | $ | 9,992,156 | | | $ | 9,989,148 | | | $ | 9,985,696 | |
2 Investments at cost — affiliated | | $ | 8,869 | | | $ | 6,389 | | | $ | 9,619 | | | $ | 18,887 | |
| | | | | | | | | | | | | | | | |
| Net Assets | |
| Institutional: | |
Net assets | | $ | 101,983 | | | $ | 100,065 | | | $ | 100,669 | | | $ | 99,482 | |
| | | | |
Shares outstanding | | | 10,000 | | | | 10,000 | | | | 10,000 | | | | 10,000 | |
| | | | |
Net asset value | | $ | 10.20 | | | $ | 10.01 | | | $ | 10.07 | | | $ | 9.95 | |
| | | | |
Shares authorized | | | Unlimited | | | | Unlimited | | | | Unlimited | | | | Unlimited | |
| | | | |
Par value | | $ | 0.001 | | | $ | 0.001 | | | $ | 0.001 | | | $ | 0.001 | |
| | | | |
| Class K: | |
Net assets | | $ | 10,096,728 | | | $ | 9,906,815 | | | $ | 9,966,633 | | | $ | 9,849,182 | |
| | | | |
Shares outstanding | | | 990,000 | | | | 990,000 | | | | 990,000 | | | | 990,000 | |
| | | | |
Net asset value | | $ | 10.20 | | | $ | 10.01 | | | $ | 10.07 | | | $ | 9.95 | |
| | | | |
Shares authorized | | | Unlimited | | | | Unlimited | | | | Unlimited | | | | Unlimited | |
| | | | |
Par value | | $ | 0.001 | | | $ | 0.001 | | | $ | 0.001 | | | $ | 0.001 | |
| | | | |
| | | | | | |
| See Notes to Financial Statements. | | | | |
| | | | | | | |
| | BLACKROCK FUNDS | | JANUARY 31, 2017 | | 25 |
| | | | | | | | | | | | | | | | |
| Period December 20, 20161 to January 31, 2017 (Unaudited) | | BlackRock
USA
Momentum
Factor Index
Fund | | | BlackRock
USA Quality
Factor Index
Fund | | | BlackRock
USA Size
Factor Index
Fund | | | BlackRock
USA Value
Factor Index
Fund | |
| | | | | | | | | | | | | | | | |
| Investment Income | |
Dividends — unaffiliated | | $ | 11,818 | | | $ | 7,433 | | | $ | 18,140 | | | $ | 17,022 | |
Dividends — affiliated | | | 7 | | | | 3 | | | | 8 | | | | 4 | |
Foreign taxes withheld | | | — | | | | (11 | ) | | | (7 | ) | | | — | |
| | | | |
Total Investment Income | | | 11,825 | | | | 7,425 | | | | 18,141 | | | | 17,026 | |
| | | | |
| | | | | | | | | | | | | | | | |
| Expenses | |
Organization and offering | | | 18,159 | | | | 18,159 | | | | 18,159 | | | | 18,159 | |
Professional | | | 6,888 | | | | 6,888 | | | | 6,888 | | | | 6,888 | |
Printing | | | 1,470 | | | | 1,470 | | | | 1,470 | | | | 1,470 | |
Officer and Trustees | | | 1,134 | | | | 1,134 | | | | 1,134 | | | | 1,134 | |
Custodian | | | 1,050 | | | | 1,050 | | | | 3,150 | | | | 1,176 | |
Investment advisory | | | 926 | | | | 919 | | | | 921 | | | | 915 | |
Registration | | | 210 | | | | 210 | | | | 210 | | | | 210 | |
Transfer agent — class specific | | | 122 | | | | 122 | | | | 122 | | | | 122 | |
Miscellaneous | | | 670 | | | | 671 | | | | 668 | | | | 670 | |
| | | | |
Total expenses | | | 30,629 | | | | 30,623 | | | | 32,722 | | | | 30,744 | |
| Less: | | | | | | | | | | | | | | | | |
Fees waived by the Manager | | | (926 | ) | | | (919 | ) | | | (921 | ) | | | (915 | ) |
Other expenses reimbursed by the Manager | | | (27,846 | ) | | | (27,859 | ) | | | (29,955 | ) | | | (27,994 | ) |
Transfer agent fees waived and/or reimbursed — class specific | | | (115 | ) | | | (115 | ) | | | (115 | ) | | | (115 | ) |
| | | | |
Total expenses after fees waived and/or reimbursed | | | 1,742 | | | | 1,730 | | | | 1,731 | | | | 1,720 | |
| | | | |
Net investment income | | | 10,083 | | | | 5,695 | | | | 16,410 | | | | 15,306 | |
| | | | |
| | | | | | | | | | | | | | | | |
| Realized and Unrealized Gain (Loss) | |
Net realized gain from (loss) investments — unaffiliated | | | 122 | | | | 110 | | | | (7 | ) | | | (409 | ) |
Net change in unrealized appreciation (depreciation) on investments — unaffiliated | | | 192,616 | | | | 2,076 | | | | 59,400 | | | | (62,607 | ) |
| | | | |
Net realized and unrealized gain (loss) | | | 192,738 | | | | 2,186 | | | | 59,393 | | | | (63,016 | ) |
| | | | |
Net Increase (Decrease) in Net Assets Resulting from Operations | | $ | 202,821 | | | $ | 7,881 | | | $ | 75,803 | | | $ | (47,710 | ) |
| | | | |
1 Commencement of operations. | |
| | | | | | |
| See Notes to Financial Statements. | | | | |
| | | | | | | |
| 26 | | BLACKROCK FUNDS | | JANUARY 31, 2017 | | |
| | |
| Statement of Changes in Net Assets | | |
| | | | | | | | | | | | | | | | | | | | |
| | | BlackRock USA
Momentum Factor
Index Fund | | | | | | | | | BlackRock USA
Quality Factor
Index Fund | | | | |
| Increase (Decrease) in Net Assets: | | Period December 20, 20161 to January 31,
2017
(Unaudited) | | | | | | | | | Period December 20, 20161 to January 31,
2017
(Unaudited) | | | | |
| | | | | | | | | | | | | | | | | | | | |
| Operations | | | | | | | | | | | | | | | | | |
Net investment income | | $ | 10,083 | | | | | | | | | | | $ | 5,695 | | | | | |
Net realized gain | | | 122 | | | | | | | | | | | | 110 | | | | | |
Net change in unrealized appreciation (depreciation) | | | 192,616 | | | | | | | | | | | | 2,076 | | | | | |
| | | | | | | | | | | | |
Net increase in net assets resulting from operations | | | 202,821 | | | | | | | | | | | | 7,881 | | | | | |
| | | | | | | | | | | | |
| | | | | | | | | | | | | | | | | | | | |
| Distributions to Shareholders2 | | | | | | | | | | | | | | | | | |
| From net investment income: | | | | | | | | | | | | | | | | | |
Institutional | | | (40 | ) | | | | | | | | | | | (9 | ) | | | | |
Class K | | | (4,070 | ) | | | | | | | | | | | (992 | ) | | | | |
| | | | | | | | | | | | |
Decrease in net assets resulting from distributions to shareholders | | | (4,110 | ) | | | | | | | | | | | (1,001 | ) | | | | |
| | | | | | | | | | | | |
| | | | | | | | | | | | | | | | | | | | |
| Capital Share Transactions | | | | | | | | | | | | | | | | | |
Net increase in net assets derived from capital share transactions | | | 10,000,000 | | | | | | | | | | | | 10,000,000 | | | | | |
| | | | | | | | | | | | |
| | | | | | | | | | | | | | | | | | | | |
| Net Assets | | | | | | | | | | | | | | | | | |
Total increase in net assets | | | 10,198,711 | | | | | | | | | | | | 10,006,880 | | | | | |
Beginning of period | | | — | | | | | | | | | | | | — | | | | | |
| | | | | | | | | | | | |
End of period | | $ | 10,198,711 | | | | | | | | | | | $ | 10,006,880 | | | | | |
| | | | | | | | | | | | |
Undistributed net investment income, end of period | | $ | 5,973 | | | | | | | | | | | $ | 4,694 | | | | | |
| | | | | | | | | | | | |
1 Commencement of operations. | | | | | | | | | | | | | | | | | |
2 Distributions for annual periods determined in accordance with federal income tax regulations. | | | | | | | | | | | | | | | | | |
| | | | | | |
| See Notes to Financial Statements. | | | | |
| | | | | | | |
| | BLACKROCK FUNDS | | JANUARY 31, 2017 | | 27 |
| | |
| Statement of Changes in Net Assets | | |
| | | | | | | | | | | | | | | | | | | | |
| | | BlackRock USA
Size Factor
Index Fund | | | | | | | | | BlackRock USA
Value Factor
Index Fund | | | | |
| Increase (Decrease) in Net Assets: | | Period December 20, 20161 to January 31,
2017
(Unaudited) | | | | | | | | | Period December 20, 20161 to January 31,
2017 (Unaudited) | | | | |
| | | | | | | | | | | | | | | | | | | | |
| Operations | | | | | | | | | | | | | |
Net investment income | | $ | 16,410 | | | | | | | | | | | $ | 15,306 | | | | | |
Net realized loss | | | (7 | ) | | | | | | | | | | | (409 | ) | | | | |
Net change in unrealized appreciation (depreciation) | | | 59,400 | | | | | | | | | | | | (62,607 | ) | | | | |
| | | | | | | | | | | | |
Net increase (decrease) in net assets resulting from operations | | | 75,803 | | | | | | | | | | | | (47,710 | ) | | | | |
| | | | | | | | | | | | |
| | | | | | | | | | | | | | | | | | | | |
| Distributions to Shareholders2 | | | | | | | | | | | | | |
| From net investment income: | | | | | | | | | | | | | |
Institutional | | | (84 | ) | | | | | | | | | | | (35 | ) | | | | |
Class K | | | (8,417 | ) | | | | | | | | | | | (3,591 | ) | | | | |
| | | | | | | | | | | | |
Decrease in net assets resulting from distributions to shareholders | | | (8,501 | ) | | | | | | | | | | | (3,626 | ) | | | | |
| | | | | | | | | | | | |
| | | | | | | | | | | | | | | | | | | | |
| Capital Share Transactions | | | | | | | | | | | | | |
Net increase in net assets derived from capital share transactions | | | 10,000,000 | | | | | | | | | | | | 10,000,000 | | | | | |
| | | | | | | | | | | | |
| | | | | | | | | | | | | | | | | | | | |
| Net Assets | | | | | | | | | | | | | |
Total increase in net assets | | | 10,067,302 | | | | | | | | | | | | 9,948,664 | | | | | |
Beginning of period | | | — | | | | | | | | | | | | — | | | | | |
| | | | | | | | | | | | |
End of period | | $ | 10,067,302 | | | | | | | | | | | $ | 9,948,664 | | | | | |
| | | | | | | | | | | | |
Undistributed net investment income, end of period | | $ | 7,909 | | | | | | | | | | | $ | 11,680 | | | | | |
| | | | | | | | | | | | |
1 Commencement of operations. | | | | | | | | | | | | | |
2 Distributions for annual periods determined in accordance with federal income tax regulations. | | | | | | | | | | | | | |
| | | | | | |
| See Notes to Financial Statements. | | | | |
| | | | | | | |
| 28 | | BLACKROCK FUNDS | | JANUARY 31, 2017 | | |
| | |
| Financial Highlights | | BlackRock USA Momentum Factor Index Fund |
| | | | | | | | |
| | | Period
December 20, 20161
to January 31,
2017
(Unaudited) | |
| | | Institutional | | | Class K | |
| | | | | | | | |
| Per Share Operating Performance | |
Net asset value, beginning of period | | $ | 10.00 | | | $ | 10.00 | |
| | | | |
Net investment income2 | | | 0.01 | | | | 0.01 | |
Net realized and unrealized gain | | | 0.19 | | | | 0.19 | |
| | | | |
Net increase from investment operations | | | 0.20 | | | | 0.20 | |
| | | | |
Distributions from net investment income3 | | | (0.00 | )4 | | | (0.00 | )4 |
| | | | |
Net asset value, end of period | | $ | 10.20 | | | $ | 10.20 | |
| | | | |
| | | | | | | | |
| Total Return5,6 | |
Based on net asset value | | | 2.04% | | | | 2.04% | |
| | | | |
| | | | | | | | |
| Ratios to Average Net Assets | |
Total expenses7,8 | | | 0.82% | | | | 0.76% | |
| | | | |
Total expenses after fees waived and/or reimbursed7 | | | 0.20% | | | | 0.15% | |
| | | | |
Net investment income7 | | | 0.82% | | | | 0.87% | |
| | | | |
| | | | | | | | |
| Supplemental Data | |
Net assets, end of period (000) | | $ | 102 | | | $ | 10,097 | |
| | | | |
Portfolio turnover rate | | | 0% | 9 | | | 0% | 9 |
| | | | |
| | 1 | | Commencement of operations. |
| | 2 | | Based on average shares outstanding. |
| | 3 | | Distributions for annual periods determined in accordance with federal income tax regulations. |
| | 4 | | Amount is greater than $(0.005) per share. |
| | 5 | | Where applicable, assumes the reinvestment of distributions. |
| | 6 | | Aggregate total return. |
| | 8 | | Audit, offering and organization costs were not annualized in the calculation of the expense ratios. If these expenses were annualized, the total expenses for Institutional and Class K Shares would have been 2.70% and 2.65%, respectively. |
| | 9 | | Amount is less than 0.50%. |
| | | | | | |
| See Notes to Financial Statements. | | | | |
| | | | | | | |
| | BLACKROCK FUNDS | | JANUARY 31, 2017 | | 29 |
| | |
| Financial Highlights | | BlackRock USA Quality Factor Index Fund |
| | | | | | | | |
| | | Period
December 20, 20161
to January 31,
2017
(Unaudited) | |
| | | Institutional | | | Class K | |
| | | | | | | | |
| Per Share Operating Performance | |
Net asset value, beginning of period | | $ | 10.00 | | | $ | 10.00 | |
| | | | |
Net investment income2 | | | 0.01 | | | | 0.01 | |
Net realized and unrealized gain | | | 0.00 | 3 | | | 0.00 | 3 |
| | | | |
Net increase from investment operations | | | 0.01 | | | | 0.01 | |
| | | | |
Distributions from net investment income4 | | | (0.00 | )5 | | | (0.00 | )5 |
| | | | |
Net asset value, end of period | | $ | 10.01 | | | $ | 10.01 | |
| | | | |
| | | | | | | | |
| Total Return6,7 | |
Based on net asset value | | | 0.11% | | | | 0.11% | |
| | | | |
| | | | | | | | |
| Ratios to Average Net Assets | |
Total expenses8,9 | | | 0.83% | | | | 0.77% | |
| | | | |
Total expenses after fees waived and/or reimbursed8 | | | 0.20% | | | | 0.15% | |
| | | | |
Net investment income8 | | | 0.44% | | | | 0.50% | |
| | | | |
| | | | | | | | |
| Supplemental Data | |
Net assets, end of period (000) | | $ | 100 | | | $ | 9,907 | |
| | | | |
Portfolio turnover rate | | | 0% | 10 | | | 0% | 10 |
| | | | |
| | 1 | | Commencement of operations. |
| | 2 | | Based on average shares outstanding. |
| | 3 | | Amount is less than $0.005 per share. |
| | 4 | | Distributions for annual periods determined in accordance with federal income tax regulations. |
| | 5 | | Amount is greater than $(0.005) per share. |
| | 6 | | Where applicable, assumes the reinvestment of distributions. |
| | 7 | | Aggregate total return. |
| | 9 | | Audit, offering and organization costs were not annualized in the calculation of the expense ratios. If these expenses were annualized, the total expenses for Institutional and Class K Shares would have been 2.72% and 2.67%, respectively. |
| | 10 | | Amount is less than 0.50%. |
| | | | | | |
| See Notes to Financial Statements. | | | | |
| | | | | | | |
| 30 | | BLACKROCK FUNDS | | JANUARY 31, 2017 | | |
| | |
| Financial Highlights | | BlackRock USA Size Factor Index Fund |
| | | | | | | | |
| | | Period
December 20, 20161
to January 31,
2017
(Unaudited) | |
| | | Institutional | | | Class K | |
| | | | | | | | |
| Per Share Operating Performance | |
Net asset value, beginning of period | | $ | 10.00 | | | $ | 10.00 | |
| | | | |
Net investment income2 | | | 0.02 | | | | 0.02 | |
Net realized and unrealized gain | | | 0.06 | | | | 0.06 | |
| | | | |
Net increase from investment operations | | | 0.08 | | | | 0.08 | |
| | | | |
Distributions from net investment income3 | | | (0.01 | ) | | | (0.01 | ) |
| | | | |
Net asset value, end of period | | $ | 10.07 | | | $ | 10.07 | |
| | | | |
| | | | | | | | |
| Total Return4,5 | |
Based on net asset value | | | 0.79% | | | | 0.79% | |
| | | | |
| | | | | | | | |
| Ratios to Average Net Assets | |
Total expenses6.7 | | | 1.00% | | | | 0.95% | |
| | | | |
Total expenses after fees waived and/or reimbursed6 | | | 0.20% | | | | 0.15% | |
| | | | |
Net investment income6 | | | 1.38% | | | | 1.43% | |
| | | | |
| | | | | | | | |
| Supplemental Data | |
Net assets, end of period (000) | | $ | 101 | | | $ | 9,967 | |
| | | | |
Portfolio turnover rate | | | 1% | | | | 1% | |
| | | | |
| | 1 | | Commencement of operations. |
| | 2 | | Based on average shares outstanding. |
| | 3 | | Distributions for annual periods determined in accordance with federal income tax regulations. |
| | 4 | | Where applicable, assumes the reinvestment of distributions. |
| | 5 | | Aggregate total return. |
| | 7 | | Audit, offering and organization costs were not annualized in the calculation of the expense ratios. If these expenses were annualized, the total expenses for Institutional and Class K Shares would have been 2.90% and 2.85%, respectively. |
| | | | | | |
| See Notes to Financial Statements. | | | | |
| | | | | | | |
| | BLACKROCK FUNDS | | JANUARY 31, 2017 | | 31 |
| | |
| Financial Highlights | | BlackRock USA Value Factor Index Fund |
| | | | | | | | |
| | | Period
December 20, 20161
to January 31,
2017
(Unaudited) | |
| | | Institutional | | | Class K | |
| | | | | | | | |
| Per Share Operating Performance | |
Net asset value, beginning of period | | $ | 10.00 | | | $ | 10.00 | |
| | | | |
Net investment income2 | | | 0.02 | | | | 0.02 | |
Net realized and unrealized loss | | | (0.07 | ) | | | (0.07 | ) |
| | | | |
Net decrease from investment operations | | | (0.05 | ) | | | (0.05 | ) |
| | | | |
Distributions from net investment income3 | | | (0.00 | )4 | | | (0.00 | )4 |
| | | | |
Net asset value, end of period | | $ | 9.95 | | | $ | 9.95 | |
| | | | |
| | | | | | | | |
| Total Return5,6 | |
Based on net asset value | | | (0.47)% | | | | (0.46)% | |
| | | | |
| | | | | | | | |
| Ratios to Average Net Assets | |
Total expenses7.8 | | | 0.84% | | | | 0.78% | |
| | | | |
Total expenses after fees waived and/or reimbursed7 | | | 0.20% | | | | 0.15% | |
| | | | |
Net investment income7 | | | 1.28% | | | | 1.34% | |
| | | | |
| | | | | | | | |
| Supplemental Data | |
Net assets, end of period (000) | | $ | 99 | | | $ | 9,849 | |
| | | | |
Portfolio turnover rate | | | 0% | 9 | | | 0% | 9 |
| | | | |
| | 1 | | Commencement of operations. |
| | 2 | | Based on average shares outstanding. |
| | 3 | | Distributions for annual periods determined in accordance with federal income tax regulations. |
| | 4 | | Amount is greater than $(0.005) per share. |
| | 5 | | Where applicable, assumes the reinvestment of distributions. |
| | 6 | | Aggregate total return. |
| | 8 | | Audit, offering and organization costs were not annualized in the calculation of the expense ratios. If these expenses were annualized, the total expenses for Institutional and Class K Shares would have been 2.75% and 2.69%, respectively. |
| | 9 | | Amount is less than 0.50%. |
| | | | | | |
| See Notes to Financial Statements. | | | | |
| | | | | | | |
| 32 | | BLACKROCK FUNDS | | JANUARY 31, 2017 | | |
| | | | |
| Notes to Financial Statements (Unaudited) | | |
1. Organization:
BlackRock FundsSM (the “Trust”) is registered under the Investment Company Act of 1940, as amended (the “1940 Act”), as an open-end management investment company. The Trust is organized as a Massachusetts business trust. The following are referred to herein collectively as the “Funds” or individually, a “Fund”:
| | | | |
| Fund Name | | Herein
Referred To As | | Diversification
Classification |
BlackRock USA Momentum Factor Index Fund | | Momentum Factor Index Fund | | Diversified |
BlackRock USA Quality Factor Index Fund | | Quality Factor Index Fund | | Non-diversified |
BlackRock USA Size Factor Index Fund | | Size Factor Index Fund | | Diversified |
BlackRock USA Value Factor Index Fund | | Value Factor Index Fund | | Diversified |
Each Fund offers multiple classes of shares. All classes of shares have identical voting, dividend, liquidation and other rights and are subject to the same terms and conditions. Institutional and Class K shares are sold without a sales charge and only to certain eligible investors.
| | | | | | | | | | | | |
| Share Class | | Initial Sales Charge | | | CDSC | | | Conversion Privilege | |
Institutional Shares | | | No | | | | No | | | | None | |
Class K Shares | | | No | | | | No | | | | None | |
The Funds, together with certain other registered investment companies advised by BlackRock Fund Advisors (the “Manager”) or its affiliates, are included in a complex of open-end funds referred to as the Equity-Liquidity Complex.
2. Significant Accounting Policies:
The financial statements are prepared in conformity with accounting principles generally accepted in the United States of America (“U.S. GAAP”), which may require management to make estimates and assumptions that affect the reported amounts of assets and liabilities in the financial statements, disclosure of contingent assets and liabilities at the date of the financial statements and the reported amounts of increases and decreases in net assets from operations during the reporting period. Actual results could differ from those estimates. Each Fund is considered an investment company under U.S. GAAP and follows the accounting and reporting guidance applicable to investment companies. Below is a summary of significant accounting policies:
Investment Transactions and Investment Income: For financial reporting purposes, investment transactions are recorded on the dates the transactions are entered into (the trade dates). Realized gains and losses on investment transactions are determined on the identified cost basis. Dividend income is recorded on the ex-dividend date. Upon notification from issuers, some of the dividend income received from a real estate investment trust may be redesignated as a reduction of cost of the related investment and/or realized gain. Income, expenses and realized and unrealized gains and losses are allocated daily to each class based on its relative net assets.
Distributions: Distributions paid by the Funds are recorded on the ex-dividend date. The character and timing of distributions are determined in accordance with federal income tax regulations, which may differ from U.S. GAAP.
Organization and Offering Costs: Upon commencement of operations, organization costs associated with the establishment of the Funds were expensed by the Funds and reimbursed by the Manager. The Manager reimbursed the Funds $10,000, which is included in expenses reimbursed by the Manager in the Statements of Operations. Offering costs are amortized over a 12-month period beginning with the commencement of operations.
Recent Accounting Standard: In November 2016, the Financial Accounting Standards Board issued Accounting Standards Update “Restricted Cash” which will require entities to include the total of cash, cash equivalents, restricted cash, and restricted cash equivalents in the beginning and ending cash balances in the Statements of Cash Flows. The guidance will be applied retrospectively and is effective for fiscal years beginning after December 15, 2017, and interim periods within those years. Management is evaluating the impact, if any, of this guidance on the Funds’ presentation in the Statements of Cash Flows.
Indemnifications: In the normal course of business, a Fund enters into contracts that contain a variety of representations that provide general indemnification. A Fund’s maximum exposure under these arrangements is unknown because it involves future potential claims against a Fund, which cannot be predicted with any certainty.
Other: Expenses directly related to a Fund or its classes are charged to the Fund or the applicable class. Other operating expenses shared by several funds, including other funds managed by the Manager, are prorated among those funds on the basis of relative net assets or other appropriate methods. Expenses directly related to the Funds and other shared expenses prorated to the Funds are allocated daily to each class based on their relative net assets or other appropriate methods.
The Funds may incur charges on uninvested cash balances and overdrafts, subject to certain conditions.
3. Investment Valuation and Fair Value Measurements:
Investment Valuation Policies: The Funds’ investments are valued at fair value (also referred to as “market value” within the financial statements) as of the close of trading on the New York Stock Exchange (“NYSE”). U.S. GAAP defines fair value as the price the Funds would receive to sell an asset or pay to
| | | | | | |
| | | | | | | |
| | BLACKROCK FUNDS | | JANUARY 31, 2017 | | 33 |
| | |
| Notes to Financial Statements (continued) | | |
transfer a liability in an orderly transaction between market participants at the measurement date. The Funds determine the fair values of their financial instruments using various independent dealers or pricing services under policies approved by the Board of Trustees of the Trust (the “Board”). The BlackRock Global Valuation Methodologies Committee (the “Global Valuation Committee”) is the committee formed by management to develop global pricing policies and procedures and to oversee the pricing function for all financial instruments.
Fair Value Inputs and Methodologies: The following methods and inputs are used to establish the fair value of each Fund’s assets and liabilities:
| • | | Equity investments traded on a recognized securities exchange are valued at the official closing price each day, if available. For equity investments traded on more than one exchange, the official closing price on the exchange where the stock is primarily traded is used. Equity investments traded on a recognized exchange for which there were no sales on that day may be valued at the last available bid (long positions) or ask (short positions) price. |
| • | | Investments in open-end U.S. mutual funds are valued at net asset value (“NAV”) each business day. |
If events (e.g., a company announcement, market volatility or a natural disaster) occur that are expected to materially affect the value of such investments, or in the event that the application of these methods of valuation results in a price for an investment that is deemed not to be representative of the market value of such investment, or if a price is not available, the investment will be valued by the Global Valuation Committee, or its delegate, in accordance with a policy approved by the Board as reflecting fair value (“Fair Valued Investments”). The fair valuation approaches that may be used by the Global Valuation Committee will include Market approach, Income approach and Cost approach. Valuation techniques such as discounted cash flow, use of market comparables and matrix pricing are types of valuation approaches and typically used in determining fair value. When determining the price for Fair Valued Investments, the Global Valuation Committee, or its delegate, seeks to determine the price that each Fund might reasonably expect to receive or pay from the current sale or purchase of that asset or liability in an arm’s-length transaction. Fair value determinations shall be based upon all available factors that the Global Valuation Committee, or its delegate, deems relevant and consistent with the principles of fair value measurement. The pricing of all Fair Valued Investments is subsequently reported to the Board or a committee thereof on a quarterly basis.
Fair Value Hierarchy: Various inputs are used in determining the fair value of investments. These inputs to valuation techniques are categorized into a fair value hierarchy consisting of three broad levels for financial statement purposes as follows:
| • | | Level 1 — unadjusted price quotations in active markets/exchanges for identical assets or liabilities that each Fund has the ability to access |
| • | | Level 2 — other observable inputs (including, but not limited to, quoted prices for similar assets or liabilities in markets that are active, quoted prices for identical or similar assets or liabilities in markets that are not active, inputs other than quoted prices that are observable for the assets or liabilities (such as interest rates, yield curves, volatilities, prepayment speeds, loss severities, credit risks and default rates) or other market–corroborated inputs) |
| • | | Level 3 — unobservable inputs based on the best information available in the circumstances, to the extent observable inputs are not available (including each Fund’s own assumptions used in determining the fair value of investments) |
The hierarchy gives the highest priority to unadjusted quoted prices in active markets for identical assets or liabilities (Level 1 measurements) and the lowest priority to unobservable inputs (Level 3 measurements). Accordingly, the degree of judgment exercised in determining fair value is greatest for instruments categorized in Level 3. The inputs used to measure fair value may fall into different levels of the fair value hierarchy. In such cases, for disclosure purposes, the fair value hierarchy classification is determined based on the lowest level input that is significant to the fair value measurement in its entirety. Investments classified within Level 3 have significant unobservable inputs used by the Global Valuation Committee in determining the price for Fair Valued Investments. Level 3 investments include equity or debt issued by Private Companies. There may not be a secondary market, and/or there are a limited number of investors. Level 3 investments may also be adjusted to reflect illiquidity and/or non-transferability, with the amount of such discount estimated by the Global Valuation Committee in the absence of market information.
Changes in valuation techniques may result in transfers into or out of an assigned level within the hierarchy. In accordance with each Fund’s policy, transfers between different levels of the fair value hierarchy are deemed to have occurred as of the beginning of the reporting period. The categorization of a value determined for investments is based on the pricing transparency of the investments and is not necessarily an indication of the risks associated with investing in those securities.
4. Investment Advisory Agreement and Other Transactions with Affiliates:
The PNC Financial Services Group, Inc. is the largest stockholder and an affiliate of BlackRock, Inc. (“BlackRock”) for 1940 Act purposes.
Investment Advisory: The Trust, on behalf of the Funds, entered into an Investment Advisory Agreement with the Manager, the Funds’ investment adviser, an indirect, wholly-owned subsidiary of BlackRock, to provide investment advisory and administration services. The Manager is responsible for the management of each Fund’s portfolio and provides the personnel, facilities, equipment and certain other services necessary to the operations of each Fund.
For such services, each Fund pays the Manager a monthly fee at an annual rate equal to 0.08%, respectively, of the average daily value of each Fund’s net assets.
| | | | | | |
| | | | | | | |
| 34 | | BLACKROCK FUNDS | | JANUARY 31, 2017 | | |
| | | | |
| Notes to Financial Statements (continued) | | |
Service and Distribution Fees: The Trust, on behalf of the Funds, entered into a Distribution Agreement and a Distribution and Service Plan with BlackRock Investments, LLC (“BRIL”), an affiliate of the Manager.
BRIL and broker-dealers, pursuant to sub-agreements with BRIL, provide shareholder servicing and distribution services to the Funds.
Transfer Agent: Pursuant to written agreements, certain financial intermediaries, some of which may be affiliates, provide the Funds with sub-accounting, recordkeeping, sub-transfer agency and other administrative services with respect to sub-accounts they service. For these services, these entities receive an asset-based fee or an annual fee per shareholder account, which will vary depending on share class and/or net assets.
For the six months ended January 31, 2017, the following table shows the class specific transfer agent fees borne directly by each class of each Fund:
| | | | | | | | | | | | |
| | | Institutional | | | Class K | | | Total | |
Momentum Factor Index Fund | | $ | 8 | | | $ | 114 | | | $ | 122 | |
Quality Factor Index Fund | | $ | 8 | | | $ | 114 | | | $ | 122 | |
Size Factor Index Fund | | $ | 8 | | | $ | 114 | | | $ | 122 | |
Value Factor Index Fund | | $ | 8 | | | $ | 114 | | | $ | 122 | |
Expense Limitations, Waivers, Reimbursements and Recoupments: With respect to each Fund, the Manager contractually agreed to waive and/or reimburse fees or expenses in order to limit expenses, excluding interest expense, dividend expense, tax expense, acquired fund fees and expenses, and certain other fund expenses, which constitute extraordinary expenses not incurred in the ordinary course of each Fund’s business (“expense limitation”). The expense limitations as a percentage of average daily net assets are as follows:
| | | | | | | | |
| | | Institutional | | | Class K | |
Momentum Factor Index Fund | | | 0.20% | | | | 0.15% | |
Quality Factor Index Fund | | | 0.20% | | | | 0.15% | |
Size Factor Index Fund | | | 0.20% | | | | 0.15% | |
Value Factor Index Fund | | | 0.20% | | | | 0.15% | |
The Manager has agreed not to reduce or discontinue these contractual expense limitations prior to November 30, 2027, unless approved by the Board, including a majority of the Independent Trustees who are not “interested persons” of the Trust, as defined in the 1940 Act (“Independent Trustees”) or by a vote of a majority of the outstanding voting securities of the Funds.
These amounts waived and/or reimbursed are included in fees waived by the Manager and other expenses reimbursed by the Manager, and shown as transfer agent fees waived and/or reimbursed — class specific, respectively, in the Statements of Operations. For the period ended January 31, 2017, the amounts included in fees waived by the Manager and shown as other expenses reimbursed by the Manager were as follows:
| | | | | | | | |
| | | Fees Waived by the Manager | | | Other Expenses Reimbursed by the Manager | |
Momentum Factor Index Fund | | $ | 925 | | | $ | 17,846 | |
Quality Factor Index Fund | | $ | 919 | | | $ | 17,859 | |
Size Factor Index Fund | | $ | 920 | | | $ | 19,955 | |
Value Factor Index Fund | | $ | 914 | | | $ | 17,994 | |
For the period ended January 31, 2017, class specific expense waivers and/or reimbursements were as follows:
Transfer agent fees waived and/or reimbursed
| | | | | | | | | | | | |
| | | Institutional | | | Class K | | | Total | |
Momentum Factor Index Fund | | $ | 2 | | | $ | 113 | | | $ | 115 | |
Quality Factor Index Fund | | $ | 2 | | | $ | 113 | | | $ | 115 | |
Size Factor Index Fund | | $ | 2 | | | $ | 113 | | | $ | 115 | |
Value Factor Index Fund | | $ | 2 | | | $ | 113 | | | $ | 115 | |
With respect to the Funds, the Manager voluntarily agreed to waive its investment advisory fees by the amount of investment advisory fees each Fund pays to the Manager indirectly through its investment in affiliated money market funds (the “affiliated money market fund waiver”). These amounts are included in fees waived by the Manager in the Statements of Operations. The amount of waivers and/or reimbursements of fees and expenses made pursuant to the expense limitation caps, as applicable, will be reduced by the amount of the affiliated money market fund waiver included in fees waived by the Manager in the Statements of Operations. For the period ended January 31, 2017, the amounts waived were as follows.
| | | | |
| | | Amount Waived | |
Momentum Factor Index Fund | | $ | 1 | |
Quality Factor Index Fund | | | — | |
Size Factor Index Fund | | $ | 1 | |
Value Factor Index Fund | | $ | 1 | |
| | | | | | |
| | | | | | | |
| | BLACKROCK FUNDS | | JANUARY 31, 2017 | | 35 |
| | |
| Notes to Financial Statements (continued) | | |
The Manager has contractually agreed to waive its investment advisory fee with respect to any portion of the Fund’s assets invested in affiliated equity or fixed-income mutual funds or affiliated exchange-traded funds that have a contractual management fee, through November 30, 2018. The contractual agreement may be terminated upon 90 days’ notice by a majority of the non-interested trustees of the Trust or by a vote of a majority of the outstanding voting securities of the Funds.
With respect to the contractual expense caps, if during a Fund’s fiscal year the operating expenses of a share class, that at any time during the prior two fiscal years received a waiver and/or reimbursement from the Manager, are less than the expense cap for that share class, the Manager is entitled to be reimbursed by such share class up to the lesser of the following expenses:
| | (a) | The amount of fees waived and/or expenses reimbursed during those prior two fiscal years under the agreement. |
| | (b) | The amount by which the expense cap for that share class exceeds the operating expenses of the share class for the current fiscal year, provided that: |
| | • | | Each Fund, of which the share class is a part, has more than $50 million in assets for the fiscal year; and |
| | • | | The Manager or an affiliate continues to serve as a Fund’s investment adviser or administrator. |
In the event the expense cap for a share class is changed subsequent to a fiscal year in which the Manager becomes entitled to reimbursement for fees waived and/or reimbursed, the amount available to reimburse the Manager shall be calculated by reference to the expense cap for that share class in effect at the time the Manager became entitled to receive such reimbursement, rather than the subsequently changed expense cap for that share class.
On January 31, 2017, the fund level and class specific waivers and/or reimbursements subject to possible future recoupment under the expense limitation agreement are as follows:
| | | | | | | | | | | | | | | | |
| | | Momentum Factor
Index Fund | | | Quality Factor
Index Fund | | | Size Factor
Index Fund | | | Value Factor
Index Fund | |
Fund Level | | $ | 18,771 | | | $ | 18,778 | | | $ | 20,875 | | | $ | 18,908 | |
Institutional | | $ | 2 | | | $ | 2 | | | $ | 2 | | | $ | 2 | |
Class K | | $ | 113 | | | $ | 113 | | | $ | 113 | | | $ | 113 | |
Interfund Lending: In accordance with an exemptive order (the “Order”) from the U.S. Securities and Exchange Commission, each Fund may participate in a joint lending and borrowing facility for temporary purposes (the “Interfund Lending Program”), subject to compliance with the terms and conditions of the Order, and to the extent permitted by each Fund’s investment policies and restrictions. Each Fund is currently permitted to borrow and lend under the Interfund Lending Program.
A Fund may lend in aggregate up to 15% of its net assets, but may not lend more than 5% of its net assets to any one borrowing fund through the Interfund Lending Program. A Fund may not borrow through the Interfund Lending Program or from any other source more than 33 1/3% of its total assets (or any lower threshold provided for by the Fund’s investment restrictions). If a Fund’s total outstanding borrowings exceed 10% of its total assets, each of its outstanding interfund loans will be subject to collateralization of at least 102% of the outstanding principal value of the loan. All interfund loans are for temporary or emergency purposes and the interest rate to be charged will be the average of the highest current overnight repurchase agreement rate available to a lending fund and the bank loan rate, as calculated according to a formula established by the Board.
During the period ended January 31, 2017, the Funds did not participate in the Interfund Lending Program.
Officers and Trustees: Certain officers and/or trustees of the Trust are officers and/or directors of BlackRock or its affiliates. The Funds reimburse the Manager for a portion of the compensation paid to the Trusts’ Chief Compliance Officer, which is included in Officer and Trustees in the Statements of Operations.
5. Purchases and Sales:
For the six months ended January 31, 2017, purchases and sales of investments excluding short-term securities, were as follows:
| | | | | | | | | | | | | | | | |
| | | Momentum Factor
Index Fund | | | Quality Factor
Index Fund | | | Size Factor
Index Fund | | | Value Factor
Index Fund | |
Purchases | | $ | 10,006,032 | | | $ | 9,993,955 | | | $ | 10,060,467 | | | $ | 9,997,761 | |
Sales | | $ | 17,476 | | | $ | 1,909 | | | $ | 64,066 | | | $ | 11,656 | |
6. Income Tax Information:
It is the Funds’ policy to comply with the requirements of the Internal Revenue Code of 1986, as amended, applicable to regulated investment companies, and to distribute substantially all of their taxable income to their shareholders. Therefore, no federal income tax provision is required.
Each Fund files U.S. federal and various state and local tax returns. No income tax returns are currently under examination.
| | | | | | |
| | | | | | | |
| 36 | | BLACKROCK FUNDS | | JANUARY 31, 2017 | | |
| | | | |
| Notes to Financial Statements (continued) | | |
Management has analyzed tax laws and regulations and their application to the Funds as of January 31, 2017, inclusive of the open tax return years, and does not believe that there are any uncertain tax positions that require recognition of a tax liability in the Funds’ financial statements.
As of January 31, 2017, gross unrealized appreciation and depreciation based on cost for federal income tax purposes were as follows:
| | | | | | | | | | | | | | | | | | | | | | | | |
| | | Momentum Factor
Index Fund | | | Quality Factor
Index Fund | | | Size Factor
Index Fund | | | Value Factor
Index Fund | |
Tax cost | | | | | | $ | 9,997,547 | | | | | | | $ | 9,998,545 | | | $ | 9,998,767 | | | $ | 10,004,583 | |
| | | | | | | | | | | | | | | | | | | | | | | | |
Gross unrealized appreciation | | | | | | | 337,421 | | | | | | | | 176,197 | | | | 225,729 | | | | 200,348 | |
Gross unrealized depreciation | | | | | | | (144,805 | ) | | | | | | | (174,121 | ) | | | (166,329 | ) | | | (262,955 | ) |
| | | | | | | | | | | | | | | | | | | | | | | | |
Net unrealized appreciation (depreciation) | | | | | | $ | 192,616 | | | | | | | $ | 2,076 | | | $ | 59,400 | | | $ | (62,607 | ) |
| | | | | | | | | | | | | | | | | | | | | | | | |
7. Bank Borrowings:
The Trust, on behalf of the Funds, along with certain other funds managed by the Manager and its affiliates (“Participating Funds”), is a party to a 364-day, $2.1 billion credit agreement with a group of lenders. Under this agreement, the Funds may borrow to fund shareholder redemptions. Excluding commitments designated for certain individual funds, the Participating Funds, including the Funds, can borrow up to an aggregate commitment amount of $1.6 billion at any time outstanding, subject to asset coverage and other limitations as specified in the agreement. The credit agreement has the following terms: a fee of 0.12% per annum on unused commitment amounts and interest at a rate equal to the higher of (a) one-month LIBOR (but, in any event, not less than 0.00%) on the date the loan is made plus 0.80% per annum or (b) the Fed Funds rate (but, in any event, not less than 0.00%) in effect from time to time plus 0.80% per annum on amounts borrowed. The agreement expires in April 2017 unless extended or renewed. Participating Funds paid administration, legal and arrangement fees, which, if applicable, are included in miscellaneous expenses in the Statements of Operations. These fees were allocated among such funds based upon portions of the aggregate commitment available to them and relative net assets of Participating Funds. During the period ended January 31, 2017, the Funds did not borrow under the credit agreement.
8. Principal Risks:
In the normal course of business, the Funds invest in securities and enter into transactions where risks exist due to fluctuations in the market (market risk) or failure of the issuer to meet all its obligations, including the ability to pay principal and interest when due (issuer credit risk). The value of securities held by the Funds may decline in response to certain events, including those directly involving the issuers of securities owned by the Funds. Changes arising from the general economy, the overall market and local, regional or global political and/or social instability, as well as currency, interest rate and price fluctuations, may also affect the securities’ value.
Valuation Risk: The market values of equities, such as common stocks and preferred securities or equity related investments, such as futures and options, may decline due to general market conditions which are not specifically related to a particular company. They may also decline due to factors which affect a particular industry or industries. A Fund may invest in illiquid investments and may experience difficulty in selling those investments in a timely manner at the price that they believe the investments are worth. Prices may fluctuate widely over short or extended periods in response to company, market or economic news. Markets also tend to move in cycles, with periods of rising and falling prices. This volatility may cause each Fund’s NAV to experience significant increases or decreases over short periods of time. If there is a general decline in the securities and other markets, the NAV of a Fund may lose value, regardless of the individual results of the securities and other instruments in which the Fund invests.
Counterparty Credit Risk: Similar to issuer credit risk, the Funds may be exposed to counterparty credit risk, or the risk that an entity may fail to or be unable to perform on its commitments related to unsettled or open transactions. The Funds manage counterparty credit risk by entering into transactions only with counterparties that the Manager believes have the financial resources to honor their obligations and by monitoring the financial stability of those counterparties. Financial assets, which potentially expose the Funds to market, issuer and counterparty credit risks, consist principally of financial instruments and receivables due from counterparties. The extent of the Funds’ exposure to market, issuer and counterparty credit risks with respect to these financial assets is approximately their value recorded in the Statements of Assets and Liabilities, less any collateral held by the Funds.
Concentration Risk: As of period end, Momentum Factor Index Fund and Quality Factor Index Fund invested a significant portion of their assets in securities in the Information Technology sector. Changes in economic conditions affecting such sector would have a greater impact on the Funds and could affect the value, income and/or liquidity of positions in such securities.
| | | | | | |
| | | | | | | |
| | BLACKROCK FUNDS | | JANUARY 31, 2017 | | 37 |
| | |
| Notes to Financial Statements (continued) | | |
9. Capital Share Transactions:
Transactions in capital shares for each class were as follows:
| | | | | | | | |
| | | Period
December 20, 20161
to January 31, 2017 | |
| Momentum Factor Index Fund | | Shares | | | Amount | |
| Institutional | | | | | | | | |
Shares sold | | | 10,000 | | | $ | 100,000 | |
Shares issued in reinvestment of distributions | | | — | | | | — | |
Shares redeemed | | | — | | | | — | |
| | | | |
Net increase | | | 10,000 | | | $ | 100,000 | |
| | | | |
| | | | | | | | |
| Class K | | | | | | | | |
Shares sold | | | 990,000 | | | $ | 9,900,000 | |
Shares issued in reinvestment of distributions | | | — | | | | — | |
Shares redeemed | | | — | | | | — | |
| | | | |
Net increase | | | 990,000 | | | $ | 9,900,000 | |
| | | | |
Total Increase | | | 1,000,000 | | | $ | 10,000,000 | |
| | | | |
| |
| | | Period
December 20, 20161
to January 31, 2017 | |
| Quality Factor Index Fund | | Shares | | | Amount | |
| Institutional | | | | | | | | |
Shares sold | | | 10,000 | | | $ | 100,000 | |
Shares issued in reinvestment of distributions | | | — | | | | — | |
Shares redeemed | | | — | | | | — | |
| | | | |
Net increase | | | 10,000 | | | $ | 100,000 | |
| | | | |
| | | | | | | | |
| Class K | | | | | | | | |
Shares sold | | | 990,000 | | | $ | 9,900,000 | |
Shares issued in reinvestment of distributions | | | — | | | | — | |
Shares redeemed | | | — | | | | — | |
| | | | |
Net increase | | | 990,000 | | | $ | 9,900,000 | |
| | | | |
Total Increase | | | 1,000,000 | | | $ | 10,000,000 | |
| | | | |
| |
| | | Period
December 20, 20161
to January 31, 2017 | |
| Size Factor Index Fund | | Shares | | | Amount | |
| Institutional | | | | | | | | |
Shares sold | | | 10,000 | | | $ | 100,000 | |
Shares issued in reinvestment of distributions | | | — | | | | — | |
Shares redeemed | | | — | | | | — | |
| | | | |
Net increase | | | 10,000 | | | $ | 100,000 | |
| | | | |
| | | | | | | | |
| Class K | | | | | | | | |
Shares sold | | | 990,000 | | | $ | 9,900,000 | |
Shares issued in reinvestment of distributions | | | — | | | | — | |
Shares redeemed | | | — | | | | — | |
| | | | |
Net increase | | | 990,000 | | | $ | 9,900,000 | |
| | | | |
Total Increase | | | 1,000,000 | | | $ | 10,000,000 | |
| | | | |
| | | | | | |
| | | | | | | |
| 38 | | BLACKROCK FUNDS | | JANUARY 31, 2017 | | |
| | | | |
| Notes to Financial Statements (concluded) | | |
| | | | | | | | |
| . | | Period
December 20, 20161
to January 31, 2017 | |
| Value Factor Index Fund | | Shares | | | Amount | |
| Institutional | | | | | | | | |
Shares sold | | | 10,000 | | | $ | 100,000 | |
Shares issued in reinvestment of distributions | | | — | | | | — | |
Shares redeemed | | | — | | | | — | |
| | | | |
Net increase | | | 10,000 | | | $ | 100,000 | |
| | | | |
| | | | | | | | |
| Class K | | | | | | | | |
Shares sold | | | 990,000 | | | $ | 9,900,000 | |
Shares issued in reinvestment of distributions | | | — | | | | — | |
Shares redeemed | | | — | | | | — | |
| | | | |
Net increase | | | 990,000 | | | $ | 9,900,000 | |
| | | | |
Total Increase | | | 1,000,000 | | | $ | 10,000,000 | |
| | | | |
| | 1 | | Commencement of operations. |
At January 31, 2017, shares owned by BlackRock HoldCo 2, Inc., an affiliate of the Funds, were as follows:
| | | | | | | | |
| | | Institutional | | | Class K | |
Momentum Factor Index Fund | | | 10,000 | | | | 990,000 | |
Quality Factor Index Fund | | | 10,000 | | | | 990,000 | |
Size Factor Index Fund | | | 10,000 | | | | 990,000 | |
Value Factor Index Fund | | | 10,000 | | | | 990,000 | |
10. Subsequent Events:
Management’s evaluation of the impact of all subsequent events on the Funds’ financial statements was completed through the date the financial statements were issued and the following items were noted:
On February 24, 2017, the Board of Trustees of BlackRock Funds approved a name change from “BlackRock USA Momentum Factor Index Fund,” “BlackRock USA Quality Factor Index Fund,” “BlackRock USA Size Factor Index Fund” and “BlackRock USA Value Factor Index Fund” to “iShares Edge MSCI USA Momentum Factor Index Fund,” “iShares Edge MSCI USA Quality Factor Index Fund,” “iShares Edge MSCI USA Size Factor Index Fund” and “iShares Edge MSCI USA Value Factor Index Fund,” respectively. The change is expected to be effective during the second quarter of 2017.
| | | | | | |
| | | | | | | |
| | BLACKROCK FUNDS | | JANUARY 31, 2017 | | 39 |
| | |
| Disclosure of Investment Advisory Agreement | | |
The Board of Trustees (the “Board,” and the members of which are referred to as “Board Members”) of BlackRock FundsSM (the “Trust”) met in person on September 21-23, 2016 (the “September Meeting”) to consider the approval of the Trust’s proposed investment advisory agreement (the “BAL Agreement”) with BlackRock Advisors, LLC (“BAL”), the Trust’s investment advisor, on behalf of BlackRock USA Momentum Factor Index Fund (“Momentum Factor Index Fund”), BlackRock USA Quality Factor Index Fund (“Quality Factor Index Fund”), BlackRock USA Size Factor Index Fund (“Size Factor Index Fund”) and BlackRock USA Value Factor Index Fund (“Value Factor Index Fund”), each a portfolio of the Trust. Momentum Factor Index Fund, Quality Factor Index Fund, Size Factor Index Fund and Value Factor Index Fund are referred to herein individually as a “Fund” or collectively as the “Funds.” The BAL Agreement was the same agreement that had been previously approved by the Board with respect to certain other portfolios of the Trust.
The Board also met in person on November 16-18, 2016 (the “November Meeting,” and together with the September Meeting, the “Meetings”) to consider the approval of the Trust’s proposed investment advisory agreement (the “BFA Agreement”) with BlackRock Fund Advisors (“BFA”) on behalf of each of the Funds, which would replace the BAL Agreement prior to the commencement of operations of the Funds. The Board was informed that the BFA Agreement was substantially the same as the BAL Agreement. The materials reviewed and the factors considered by the Board at the November Meeting in connection with the approval of the BFA Agreement were substantially the same as the materials reviewed and the factors the Board considered at the September meeting with respect to consideration of the approval of the BAL Agreement.
BAL and BFA are referred to herein as “BlackRock.” The BAL Agreement and the BFA Agreement are referred to herein individually as an “Agreement” or collectively as the “Agreements.” Each of the Funds commenced operations in December 2016.
Activities and Composition of the Board
On the date of each of the Meetings, the Board consisted of fifteen individuals, thirteen of whom were not “interested persons” of the Trust as defined in the Investment Company Act of 1940, as amended (the “1940 Act”) (the “Independent Board Members”). The Board Members are responsible for the oversight of the operations of the Funds and perform the various duties imposed on the directors of investment companies by the 1940 Act. The Independent Board Members have retained independent legal counsel to assist them in connection with their duties. The Chair of the Board is an Independent Board Member. The Board has established five standing committees: an Audit Committee, a Governance and Nominating Committee, a Compliance Committee, a Performance Oversight and Contract Committee and an Executive Committee, each of which is chaired by an Independent Board Member and composed of Independent Board Members (except for the Executive Committee, which also has one interested Board Member).
The Agreements
Pursuant to the 1940 Act, the Board is required to consider the initial approval of each of the Agreements. In connection with this process, the Board assessed, among other things, the nature, extent and quality of the services to be provided to the Funds by BlackRock, BlackRock’s personnel and affiliates, including (as applicable): investment management; administrative and shareholder services; the oversight of fund service providers; marketing; risk oversight; compliance; and ability to meet applicable legal and regulatory requirements.
Board Considerations in Approving the Agreements
The Approval Process: At the September Meeting, the Board reviewed materials relating to its consideration of the BAL Agreement. The Board considered all factors it believed relevant with respect to the Trust and the Funds, including, among other factors: (a) the nature, extent and quality of the services to be provided by BlackRock; (b) the investment performance of BlackRock portfolio management; (c) the advisory fee and the cost of the services and profits to be realized by BlackRock and its affiliates from their relationship with the Funds; (d) the sharing of potential economies of scale; (e) fall out benefits to BlackRock and its affiliates from their relationship with the Funds; (f) possible alternatives to the proposed BAL Agreement; (g) the policies and practices of BlackRock with respect to portfolio transactions for the Funds; (h) BlackRock’s portfolio compliance systems and capabilities; and (i) other factors deemed relevant by the Board Members.
In considering approval of the BAL Agreement, the Board met with the relevant investment advisory personnel from BlackRock and considered all information it deemed reasonably necessary to evaluate the terms of the BAL Agreement. The Board received materials in advance of the September Meeting relating to its consideration of the BAL Agreement, including, with respect to each Fund, fees and estimated expense ratios of each class of the Fund, and for a representative class of the Fund, as compared with the fees and expense ratios of a peer group of funds as determined by Broadridge Financial Solutions, Inc. (“Broadridge”)1. The Board also received (a) information regarding BlackRock’s economic outlook for each Fund and its general investment outlook for the markets; (b) information regarding fees paid to service providers that are affiliates of BlackRock; and (c) information outlining the legal duties of the Board under the 1940 Act with respect to the consideration and approval of the BAL Agreement. The Board also noted information received at prior Board meetings concerning compliance records and regulatory matters relating to BlackRock.
The Board also considered other matters it deemed important to the approval process, such as payments made to BlackRock or its affiliates relating to the distribution of Fund shares, securities lending and cash management, services related to the valuation and pricing of Fund portfolio holdings, direct and indirect benefits to BlackRock and its affiliates from their relationship with the Funds and advice from independent legal counsel with respect to the review
| 1 | | Funds are ranked by Broadridge in quartiles, ranging from first to fourth, where first is the most desirable quartile position and fourth is the least desirable. |
| | | | | | |
| | | | | | | |
| 40 | | BLACKROCK FUNDS | | JANUARY 31, 2017 | | |
| | |
| Disclosure of Investment Advisory Agreement (continued) |
process and materials submitted for the Board’s review. The Board noted the willingness of BlackRock personnel to engage in open, candid discussions with the Board. The Board did not identify any particular information as determinative, and each Board Member may have attributed different weights to the various items considered.
A. Nature, Extent and Quality of the Services: At the September Meeting, the Board, including the Independent Board Members, reviewed the nature, extent and quality of services to be provided by BlackRock, including the investment advisory services to be provided to the Funds. The Board received information concerning the investment philosophy and investment process to be used by BlackRock in managing the Funds, as well as a description of the capabilities, personnel and services of BlackRock. In connection with this review, the Board considered BlackRock’s in-house research capabilities as well as other resources available to its personnel. The Board considered the scope of the services provided by BlackRock to the Funds under the Agreement relative to services typically provided by third parties to other funds. The Board noted that the standard of care applicable under the BAL Agreement was comparable to that found generally in investment company advisory agreements. The Board concluded that the scope of BlackRock’s services to be provided to the Funds was consistent with each Fund’s operational requirements, including, in addition to seeking to meet its investment objective(s), compliance with investment restrictions, tax and reporting requirements and related shareholder services.
The Board, including the Independent Board Members, also considered the quality of the administrative and other non-investment advisory services to be provided by BlackRock and its affiliates to the Funds. The Board evaluated the procedures of BlackRock designed to fulfill its fiduciary duty to the Funds with respect to possible conflicts of interest, including BlackRock’s code of ethics (regulating the personal trading of BlackRock’s officers and employees), the procedures by which BlackRock allocates trades among its various investment advisory clients, the integrity of the systems in place to ensure compliance with the foregoing and the record of BlackRock in these matters. The Board also noted information received at prior Board meetings concerning standards of BlackRock with respect to the execution of portfolio transactions.
The Board considered, among other factors, with respect to BlackRock: the number, education and experience of investment personnel generally and each Fund’s portfolio management team; BlackRock’s research capabilities; investments by portfolio managers in the funds they manage; portfolio trading capabilities; use of technology; commitment to compliance; credit analysis capabilities; risk analysis and oversight capabilities; and the approach to training and retaining portfolio managers and other research, advisory and management personnel. The Board reviewed BlackRock’s compensation structure with respect to each Fund’s portfolio management team and BlackRock’s ability to attract and retain high-quality talent and create performance incentives. The Board also considered the business reputation of BlackRock and its financial resources and concluded that BlackRock would be able to meet any reasonably foreseeable obligation under the BAL Agreement.
In addition to investment advisory services, the Board considered the quality of the administrative and other non-investment advisory services to be provided to the Funds. The Board noted that BlackRock and its affiliates will provide the Funds with certain administrative, shareholder and other services (in addition to any such services provided to the Funds by third parties) and officers and other personnel as are necessary for the operations of the Funds. In particular, BlackRock and its affiliates will provide the Funds with administrative services, including, among others: (i) preparing disclosure documents, such as the prospectus, the summary prospectus, the statement of additional information and periodic shareholder reports; (ii) oversight of daily accounting and pricing; (iii) preparing periodic filings with regulators; (iv) overseeing and coordinating the activities of other service providers; (v) organizing Board meetings and preparing the materials for such Board meetings; (vi) providing legal and compliance support; (vii) furnishing analytical and other support to assist the Board in its consideration of strategic issues such as the merger, consolidation or repurposing of certain open-end funds; and (viii) performing other administrative functions necessary for the operation of the Funds, such as tax reporting, fulfilling regulatory filing requirements and call center services. The Board reviewed the structure and duties of BlackRock’s fund administration, shareholder services, and legal & compliance departments and considered BlackRock’s policies and procedures for assuring compliance with applicable laws and regulations.
B. The Investment Performance of the Funds and BlackRock: With respect to the September Meeting, the Board, including the Independent Board Members, previously received and considered information about BlackRock’s investment performance for other funds. The Board, however, did not consider the performance history of the Funds because each Fund was newly organized and had not yet commenced operations as of the date of the Meeting.
C. Consideration of the Advisory Fees and the Cost of the Services and Profits to be Realized by BlackRock and its Affiliates from their Relationship with the Funds: At the September Meeting, in connection with the initial approval of the BAL Agreement, the Board, including the Independent Board Members, reviewed each Fund’s contractual management fee rate compared with the other funds in the Fund’s Broadridge category. The contractual management fee rate represents a combination of the advisory fee and any administrative fees, before taking into account any reimbursements or fee waivers. The Board also compared each Fund’s estimated total expense ratio, as well as its estimated actual management fee rate, to those of other funds in its Broadridge category. The total expense ratio represents a fund’s total net operating expenses, including any 12b-1 or non 12b-1 service fees. The total expense ratio gives effect to any expense reimbursements or fee waivers that benefit a fund, and the actual management fee rate gives effect to any management fee reimbursements or waivers that benefit a fund. Additionally, the Board noted information received at prior Board meetings concerning the services provided and the fees charged by BlackRock and its affiliates to other types of clients with similar investment mandates, as applicable, including institutional accounts and sub-advised mutual funds (including mutual funds sponsored by third parties).
| | | | | | |
| | | | | | | |
| | BLACKROCK FUNDS | | JANUARY 31, 2017 | | 41 |
| | | | |
| Disclosure of Investment Advisory Agreement (concluded) |
The Board noted that with respect to each of Momentum Factor Index Fund, Quality Factor Index Fund and Size Factor Index Fund, the Fund’s contractual management fee rate and estimated actual management fee rate each ranked in the first quartile, and that the estimated total expense ratio ranked in the second quartile, relative to the Fund’s Expense Peers.
The Board noted that Value Factor Index Fund’s contractual management fee rate ranked in the first quartile, and that the estimated actual management fee rate and the estimated total expense ratio each ranked in the second quartile, relative to the Fund’s Expense Peers.
The Board also noted that, with respect to each Fund, BlackRock has contractually agreed to a cap on the Fund’s total net operating expenses as a percentage of the Fund’s average daily net assets on a class-by-class basis.
Following consideration of this information, as pertinent, the Board, including the independent Board Members, concluded that, with respect to each Fund, the fees to be paid pursuant to the BAL Agreement were fair and reasonable in light of the services provided.
As each Fund had not commenced operations as of the date of the September Meeting, BlackRock was not able to provide the Board with specific information concerning the expected profits to be realized by BlackRock and its affiliates from their relationships with the Funds. BlackRock, however, will provide the Board with such information at future meetings.
D. Economies of Scale: The Board, including the Independent Board Members, considered the extent to which economies of scale might be realized as the assets of the Funds increase. The Board also noted the existence of expense caps.
E. Other Factors Deemed Relevant by the Board Members: At the September Meeting, the Board, including a majority of the Independent Board Members, also took into account other ancillary or “fall-out” benefits that BlackRock or its affiliates may derive from their respective relationships with the Funds, both tangible and intangible, such as BlackRock’s ability to leverage its investment professionals who manage other portfolios and risk management personnel, an increase in BlackRock’s profile in the investment advisory community, and the engagement of BlackRock’s affiliates as service providers to the Funds, including for administrative, distribution, securities lending and cash management services. The Board also considered BlackRock’s overall operations and its efforts to expand the scale of, and improve the quality of, its operations. The Board also noted that BlackRock may use and benefit from third party research obtained by soft dollars generated by certain registered fund transactions to assist in managing all or a number of its other client accounts. The Board further noted that it had considered the investment by BlackRock’s funds in affiliated ETFs without any offset against the management fees payable by the funds to BlackRock.
The Board, including the Independent Board Members, concluded that these ancillary benefits that BlackRock and its affiliates could receive with regard to providing investment advisory and other services to the Funds were consistent with those generally available to other mutual fund sponsors.
Conclusion
At the September Meeting, the Board, including a majority of the Independent Board Members, approved the BAL Agreement between BAL and the Trust, on behalf of each Fund, for a two-year term beginning on the effective date of the BAL Agreement. At the November Meeting, the Board, including a majority of the Independent Board Members, approved the BFA Agreement between BFA and the Trust, on behalf of each Fund, for a two-year term beginning on the effective date of the BFA Agreement, which replaced the BAL Agreement prior to commencement of operations of the Funds.
Based upon its evaluation of all of the aforementioned factors in their totality, the Board, including a majority of the Independent Board Members, was satisfied that the terms of each respective Agreement were fair and reasonable and in the best interest of each Fund and its shareholders. In arriving at a decision to approve each respective Agreement, the Board did not identify any single factor or group of factors as all-important or controlling, but considered all factors together, and different Board Members may have attributed different weights to the various factors considered. The Independent Board Members were also assisted by the advice of independent legal counsel in making these determinations.
| | | | | | |
| | | | | | | |
| 42 | | BLACKROCK FUNDS | | JANUARY 31, 2017 | | |
Rodney D. Johnson, Chair of the Board and Trustee
Susan J. Carter, Trustee
Collette Chilton, Trustee
Neil A. Cotty, Trustee
Cynthia A. Montgomery, Trustee
Joseph P. Platt, Trustee
Robert C. Robb, Jr., Trustee
Mark Stalnecker, Trustee
Kenneth L. Urish, Trustee
Claire A. Walton, Trustee
Frederick W. Winter, Trustee
Barbara G. Novick, Trustee
John M. Perlowski, Trustee, President and Chief Executive Officer
Thomas Callahan, Vice President
Jennifer McGovern, Vice President
Neal J. Andrews, Chief Financial Officer
Jay M. Fife, Treasurer
Charles Park, Chief Compliance Officer
Fernanda Piedra, Anti-Money Laundering Compliance Officer
Benjamin Archibald, Secretary
Effective December 31, 2016, David O. Beim and Dr. Matina S. Horner resigned as Trustees of the Trust.
| | | | | | |
| | | | |
Investment Adviser BlackRock Fund Advisors San Francisco, CA 94105 | | Accounting Agent and Custodian State Street Bank and Trust Company Boston, MA 02110 Transfer Agent BNY Mellon Investment Servicing (US) Inc. Wilmington, DE 19809 | | Distributor BlackRock Investments, LLC New York, NY 10022 Independent Registered Public Accounting Firm PricewaterhouseCoopers LLP Philadelphia, PA 19103 | | Legal Counsel Sidley Austin LLP New York, NY 10019 Address of the Trust 100 Bellevue Parkway Wilmington, DE 19809 |
| | | | | | |
| | | | | | | |
| | BLACKROCK FUNDS | | JANUARY 31, 2017 | | 43 |
Householding
The Funds will mail only one copy of shareholder documents, including prospectuses, annual and semi-annual reports and proxy statements, to shareholders with multiple accounts at the same address. This practice is commonly called “householding” and is intended to reduce expenses and eliminate duplicate mailings of shareholder documents. Mailings of your shareholder documents may be householded indefinitely unless you instruct us otherwise. If you do not want the mailing of these documents to be combined with those for other members of your household, please call the Funds at (800) 537-4942.
Availability of Quarterly Schedule of Investments
The Funds file their complete schedule of portfolio holdings with the SEC for the first and third quarters of each fiscal year on Form N-Q. The Funds’ Forms N-Q are available on the SEC’s website at http://www.sec.gov and may also be reviewed and copied at the SEC’s Public Reference Room in Washington, D.C. Information on the operation of the Public Reference Room or how to access documents on the SEC’s website without charge may be obtained by calling (800) SEC-0330. The Funds’ Forms N-Q may also be obtained upon request and without charge by calling (800) 537-4942.
Availability of Proxy Voting Policies and Procedures
A description of the policies and procedures that the Funds use to determine how to vote proxies relating to portfolio securities is available upon request and without charge, (1) by calling (800) 537-4942; (2) at http://www.blackrock.com; and (3) on the SEC’s website at http://www.sec.gov.
Availability of Proxy Voting Record
Information about how the Funds voted proxies relating to securities held in the Funds’ portfolios during the most recent 12-month period ended June 30 is available upon request and without charge (1) at http://www.blackrock.com or by calling (800) 537-4942 and (2) on the SEC’s website at http://www.sec.gov.
BlackRock’s Mutual Fund Family
BlackRock offers a diverse lineup of open-end mutual funds crossing all investment styles and managed by experts in equity, fixed income and tax-exempt investing. Visit http://www.blackrock.com for more information.
| | | | | | |
| | | | | | | |
| 44 | | BLACKROCK FUNDS | | JANUARY 31, 2017 | | |
| | |
| Additional Information (concluded) | | |
Account Information
Call us at (800) 537-4942 from 8:00 AM to 6:00 PM ET on any business day to get information about your account balances, recent transactions and share prices. You can also reach us on the Web at http://www.blackrock.com/funds.
Automatic Investment Plans
Investor Class shareholders who want to invest regularly can arrange to have $50 or more automatically deducted from their checking or savings account and invested in any of the BlackRock funds.
Systematic Withdrawal Plans
Investor Class shareholders can establish a systematic withdrawal plan and receive periodic payments of $50 or more from their BlackRock funds, as long as their account balance is at least $10,000.
Retirement Plans
Shareholders may make investments in conjunction with Traditional, Rollover, Roth, Coverdell, Simple IRAs, SEP IRAs and 403(b) Plans.
|
| BlackRock Privacy Principles |
BlackRock is committed to maintaining the privacy of its current and former fund investors and individual clients (collectively, “Clients”) and to safeguarding their non-public personal information. The following information is provided to help you understand what personal information BlackRock collects, how we protect that information and why in certain cases we share such information with select parties.
If you are located in a jurisdiction where specific laws, rules or regulations require BlackRock to provide you with additional or different privacy-related rights beyond what is set forth below, then BlackRock will comply with those specific laws, rules or regulations.
BlackRock obtains or verifies personal non-public information from and about you from different sources, including the following: (i) information we receive from you or, if applicable, your financial intermediary, on applications, forms or other documents; (ii) information about your transactions with us, our affiliates, or others; (iii) information we receive from a consumer reporting agency; and (iv) from visits to our websites.
BlackRock does not sell or disclose to non-affiliated third parties any non-public personal information about its Clients, except as permitted by law or as is necessary to respond to regulatory requests or to service Client accounts. These non-affiliated third parties are required to protect the confidentiality and security of this information and to use it only for its intended purpose.
We may share information with our affiliates to service your account or to provide you with information about other BlackRock products or services that may be of interest to you. In addition, BlackRock restricts access to non-public personal information about its Clients to those BlackRock employees with a legitimate business need for the information. BlackRock maintains physical, electronic and procedural safeguards that are designed to protect the non-public personal information of its Clients, including procedures relating to the proper storage and disposal of such information.
| | | | | | |
| | | | | | | |
| | BLACKROCK FUNDS | | JANUARY 31, 2017 | | 45 |
This report is intended for current holders. It is not authorized for use as an offer of sale or a solicitation of an offer to buy shares of a Fund unless preceded or accompanied by the Funds’ current prospectus. Past performance results shown in this report should not be considered a representation of future performance. Investment returns and principal value of shares will fluctuate so that shares, when redeemed, may be worth more or less than their original cost. Statements and other information herein are as dated and are subject to change.

| | |
FACTOR-1/17-SAR | |  |
| Item 2 – | Code of Ethics – Not Applicable to this semi-annual report |
| Item 3 – | Audit Committee Financial Expert – Not Applicable to this semi-annual report |
| Item 4 – | Principal Accountant Fees and Services – Not Applicable to this semi-annual report |
| Item 5 – | Audit Committee of Listed Registrants – Not Applicable |
| | (a) The registrant’s Schedule of Investments is included as part of the Report to Stockholders filed under Item 1 of this Form. |
| | (b) Not Applicable due to no such divestments during the semi-annual period covered since the previous Form N-CSR filing. |
| Item 7 – | Disclosure of Proxy Voting Policies and Procedures for Closed-End Management Investment Companies – Not Applicable |
| Item 8 – | Portfolio Managers of Closed-End Management Investment Companies – Not Applicable |
| Item 9 – | Purchases of Equity Securities by Closed-End Management Investment Company and Affiliated Purchasers – Not Applicable |
| Item 10 – | Submission of Matters to a Vote of Security Holders –There have been no material changes to these procedures. |
| Item 11 – | Controls and Procedures |
(a) – The registrant’s principal executive and principal financial officers, or persons performing similar functions, have concluded that the registrant’s disclosure controls and procedures (as defined in Rule 30a-3(c) under the Investment Company Act of 1940, as amended (the “1940 Act”)) are effective as of a date within 90 days of the filing of this report based on the evaluation of these controls and procedures required by Rule 30a-3(b) under the 1940 Act and Rule 15d-15(b) under the Securities Exchange Act of 1934, as amended.
(b) – There were no changes in the registrant’s internal control over financial reporting (as defined in Rule 30a-3(d) under the 1940 Act) that occurred during the second fiscal quarter of the period covered by this report that have materially affected, or are reasonably likely to materially affect, the registrant’s internal control over financial reporting.
| Item 12 – | Exhibits attached hereto |
(a)(1) – Code of Ethics – Not Applicable to this semi-annual report
(a)(2) – Certifications – Attached hereto
(a)(3) – Not Applicable
(b) – Certifications – Attached hereto
2
Pursuant to the requirements of the Securities Exchange Act of 1934 and the Investment Company Act of 1940, the registrant has duly caused this report to be signed on its behalf by the undersigned, thereunto duly authorized.
BlackRock Funds
| | |
| |
| By: | | /s/ John M. Perlowski |
| | John M. Perlowski |
Chief Executive Officer (principal executive officer) of
BlackRock Funds
Date: April 5, 2017
Pursuant to the requirements of the Securities Exchange Act of 1934 and the Investment Company Act of 1940, this report has been signed below by the following persons on behalf of the registrant and in the capacities and on the dates indicated.
| | |
| By: | | /s/ John M. Perlowski |
| | John M. Perlowski |
Chief Executive Officer (principal executive officer) of
BlackRock Funds
Date: April 5, 2017
| | |
| |
| By: | | /s/ Neal J. Andrews |
| | Neal J. Andrews |
Chief Financial Officer (principal financial officer) of
BlackRock Funds
Date: April 5, 2017
3