UNITED STATES
SECURITIES AND EXCHANGE COMMISSION
Washington, D.C. 20549
FORM N-CSR
CERTIFIED SHAREHOLDER REPORT OF REGISTERED MANAGEMENT INVESTMENT
COMPANIES
Investment Company Act file number: 811-05742
| | |
| Name of Fund: | | BlackRock Funds |
| | BlackRock Alternative Capital Strategies Fund |
| | BlackRock Emerging Markets Equity Strategies Fund |
| | iShares Short-Term TIPS Bond Index Fund (Formerly BlackRock Short-Term Inflation-Protected Securities Index Fund) |
| |
| Fund Address: | | 100 Bellevue Parkway, Wilmington, DE 19809 |
Name and address of agent for service: John M. Perlowski, Chief Executive Officer, BlackRock Funds, 55 East 52nd Street, New York, NY 10055
Registrant’s telephone number, including area code: (800) 441-7762
Date of fiscal year end: 12/31/2017
Date of reporting period: 06/30/2017
| Item 1 – | Report to Stockholders |
JUNE 30, 2017
| | | | |
SEMI-ANNUAL REPORT (UNAUDITED) | | | |  |
BlackRock FundsSM
| Ø | BlackRock Alternative Capital Strategies Fund |
| Ø | BlackRock Emerging Markets Equity Strategies Fund |
| Ø | iShares Short-Term TIPS Bond Index Fund |
|
| Not FDIC Insured • May Lose Value • No Bank Guarantee |
Dear Shareholder,
In the 12 months ended June 30, 2017, risk assets, such as stocks and high-yield bonds, delivered strong performance. These markets showed great resilience during a period with big surprises, including the aftermath of the U.K.’s vote to leave the European Union and the outcome of the U.S. presidential election, which brought only brief spikes in equity market volatility. However, interest rates rose, which worked against high-quality assets with more interest rate sensitivity. Aside from the shortest-term Treasury bills, most U.S. Treasuries posted negative returns, as rising energy prices, modest wage increases and steady job growth led to expectations of higher inflation and anticipation of interest rate increases by the U.S. Federal Reserve (the “Fed”).
The global reflationary theme — rising nominal growth, wages and inflation — was the dominant driver of asset returns during the period, outweighing significant political upheavals and economic uncertainty. Reflationary expectations accelerated after the U.S. election in November 2016 and continued into the beginning of 2017, stoked by expectations that the new administration’s policies would provide an extra boost to U.S. growth.
The Fed has responded to these positive developments by increasing interest rates three times in the last six months, setting expectations for additional interest rate increases and moving toward normalizing monetary policy. For its part, the European Central Bank also began to signal its intent to wind down asset purchases and begin the long move toward policy normalization, contingent upon further improvement in economic growth.
In recent months, growing skepticism about the near-term likelihood of significant U.S. tax reform and infrastructure spending has tempered enthusiasm around the reflation trade. Similarly, renewed concern about oversupply has weighed on energy prices. Nonetheless, financial markets — and to an extent the Fed — have adopted a “wait-and-see” approach to the economic data and potential fiscal stimulus. Although uncertainty has persisted, benign credit conditions, modest inflation and the outlook for economic growth have kept markets relatively tranquil.
In the fifth edition of our Global Investor Pulse Survey, we heard from 28,000 individuals across 18 countries, including more than 4,000 respondents from the United States. While retirement remains the single most important issue for American investors, only a third of respondents feel confident that they will have enough retirement income, and nearly 40% of respondents have yet to begin saving for retirement. We encourage you to talk with your financial advisor and visit blackrock.com for further insight about investing in today’s markets.
Sincerely,

Rob Kapito
President, BlackRock Advisors, LLC

Rob Kapito
President, BlackRock Advisors, LLC
| | | | | | | | |
| Total Returns as of June 30, 2017 | |
| | | 6-month | | | 12-month | |
U.S. large cap equities
(S&P 500® Index) | | | 9.34 | % | | | 17.90 | % |
U.S. small cap equities
(Russell 2000® Index) | | | 4.99 | | | | 24.60 | |
International equities
(MSCI Europe, Australasia,
Far East Index) | | | 13.81 | | | | 20.27 | |
Emerging market equities
(MSCI Emerging Markets Index) | | | 18.43 | | | | 23.75 | |
3-month Treasury bills
(BofA Merrill Lynch 3-Month
U.S. Treasury Bill Index) | | | 0.31 | | | | 0.49 | |
U.S. Treasury securities
(BofA Merrill Lynch
10-Year U.S. Treasury
Index) | | | 2.08 | | | | (5.58 | ) |
U.S. investment grade bonds
(Bloomberg Barclays U.S.
Aggregate Bond Index) | | | 2.27 | | | | (0.31 | ) |
Tax-exempt municipal
bonds (S&P Municipal
Bond Index) | | | 3.26 | | | | (0.28 | ) |
U.S. high yield bonds
(Bloomberg Barclays U.S. Corporate High Yield 2% Issuer
Capped Index) | | | 4.92 | | | | 12.69 | |
| Past performance is no guarantee of future results. Index performance is shown for illustrative purposes only. You cannot invest directly in an index. | |
| | | | | | |
| | | | | | | |
| 2 | | THIS PAGE NOT PART OF YOUR FUND REPORT | | | | |

| | | | | | |
| | | | | | | |
| | BLACKROCK FUNDS | | JUNE 30, 2017 | | 3 |
| | | | |
| Fund Summary as of June 30, 2017 | | BlackRock Alternative Capital Strategies Fund |
BlackRock Alternative Capital Strategies Fund’s (the “Fund”) investment objective is to seek total return comprised of current income and capital appreciation.
| | |
| Portfolio Management Commentary | | |
How did the Fund perform?
| • | | For the six-month period ended June 30, 2017, the Fund outperformed both of its benchmarks, the Bloomberg Barclays U.S. Aggregate Bond Index and the BofA Merrill Lynch 3-Month U.S. Treasury Bill Index. |
Fund Strategies:
| • | | Core allocation across fixed-income and equity markets to balance interest rate and credit exposures. Strategies in the core portfolio may include mortgages, duration and curve, investment grade corporates, emerging markets, securitized credit, dividend equities and high yield. |
| • | | Long/short alpha strategies seek equity securities and equity derivatives, primarily total return swaps, within a global opportunity set. These strategies seek to identify opportunities through a systematic approach by evaluating predicted returns relative to risk for each security. These strategies seek to provide an uncorrelated source of defensive returns. |
| • | | Long/short macro strategies seek to capture returns through tactical trades to fixed income and equity markets. These strategies seek to tactically allocate and time directional exposures across several asset classes, such as credit default swaps, U.S. Treasuries, U.K. Gilts and index futures. |
What factors influenced performance?
| • | | The active core strategy group was the leading contributor to Fund performance for the period. Subdued interest rate volatility supported the strategy’s tilt toward carry (income), particularly in high yield corporates. The rate environment also supported the strategy’s allocation to agency mortgage-backed securities, which outperformed on strong domestic bank demand. Long positioning in duration (interest rate sensitivity) was additive on softening inflation data in April and May. In the long/short alpha strategy group, sentiment-driven short equity positions within energy and |
| | | valuation-driven security selection within retailers contributed positively. Finally, macro strategies also added to performance over the period. |
| • | | There were no material detractors for the six-month period as each of the Fund’s strategy groups contributed positively. |
| • | | The Fund held derivatives during the period as a part of its investment strategy. Derivatives are used by the investment adviser management team as a means to manage risk and/or take outright views on interest rates, credit risk and/or foreign exchange positions in the Fund. Stand-alone performance impact from derivatives used to manage risk can be taken out of context, and may not necessarily portray the total performance impact of the affected position. The use of U.S. Treasury futures, currency forwards, mortgage TBA (to-be-announced) derivatives, options and swaps had a positive impact on performance for the period. |
Describe recent portfolio activity.
| • | | During the period, the Fund applied its investment approach which combines an active core portfolio with two long/short strategies. The Fund seeks to provide the benefits of “core” fixed income diversification and stability, while adding the potential for higher returns through the application of long/short alpha (equities) and macro long/short (asset allocation) strategies. |
Describe portfolio positioning at period end.
| • | | At the end of the period, the Fund had approximately 46% of its assets allocated to corporate credit. The next most significant allocations were to agency mortgage-backed securities and securitized credit. The Fund was slightly overweight in duration (and corresponding interest rate sensitivity). Within corporate credit, the Fund was overweight in industrials and underweight in utilities. |
The views expressed reflect the opinions of BlackRock as of the date of this report and are subject to change based on changes in market, economic or other conditions. These views are not intended to be a forecast of future events and are no guarantee of future results.
| | | | | | |
| | | | | | | |
| 4 | | BLACKROCK FUNDS | | JUNE 30, 2017 | | |
| | |
| | | BlackRock Alternative Capital Strategies Fund |
| | |
| Total Return Based on a $10,000 Investment | | |
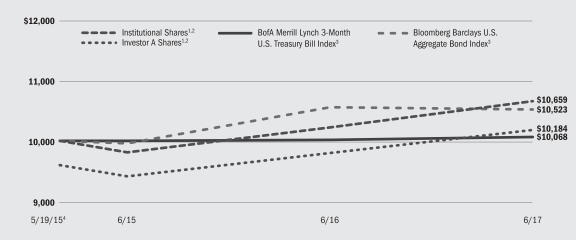
| | 1 | | Assuming maximum sales charges, if any, transaction costs and other operating expenses, including investment advisory fees. Institutional Shares do not have a sales charge. |
| | 2 | | The Fund invests in a range of global asset classes, with a focus on fixed and floating rate debt securities and equity securities. |
| | 3 | | BofA Merrill Lynch 3-Month U.S. Treasury Bill Index is an unmanaged index that tracks 3-month U.S. Treasury securities. Bloomberg Barclays U.S. Aggregate Bond Index is a widely recognized unmanaged market-weighted index, comprised of investment-grade corporate bonds rated BBB or better, mortgages and U.S. Treasury and U.S. Government agency issues with at least one year to maturity. |
| | 4 | | Commencement of operations. |
| | | | | | | | | | | | | | | | | | | | |
| Performance Summary for the Period Ended June 30, 2017 | | | | | | | | | | | | | |
| | | | | | Average Annual Total Returns5 | |
| | | | | | 1 Year | | | Since Inception6 | |
| | | 6-Month
Total Returns | | | w/o sales
charge | | | w/sales
charge | | | w/o sales
charge | | | w/sales
charge | |
Institutional | | | 4.33 | % | | | 4.22 | % | | | N/A | | | | 3.06 | % | | | N/A | |
Investor A | | | 4.26 | | | | 3.89 | | | | (0.26 | )% | | | 2.83 | | | | 0.86 | % |
Investor C | | | 3.86 | | | | 3.20 | | | | 2.20 | | | | 2.01 | | | | 2.01 | |
BofA Merrill Lynch 3-Month U.S. Treasury Bill Index | | | 0.31 | | | | 0.49 | | | | N/A | | | | 0.32 | | | | N/A | |
Bloomberg Barclays U.S. Aggregate Bond Index | | | 2.27 | | | | (0.31 | ) | | | N/A | | | | 2.44 | | | | N/A | |
| | 5 | | Assuming maximum sales charges, if any. Average annual total returns with and without sales charges reflect reductions for distribution and service fees. See “About Fund Performance” on page 13 for a detailed description of share classes, including any related sales charges and fees. |
| | 6 | | The Fund commenced operations on May 19, 2015. |
| | | | N/A — Not applicable as share class and index do not have a sales charge. |
| | | | Past performance is not indicative of future results. |
| | | | Performance results may include adjustments made for financial reporting purposes in accordance with U.S. generally accepted accounting principles. |
| | | | | | | | | | | | | | | | | | | | | | | | | | | | |
| | | Actual | | | Hypothetical8 | | | | |
| | | Beginning
Account Value
January 1, 2017 | | | Ending
Account Value
June 30, 2017 | | | Expenses Paid
During the Period7 | | | Beginning
Account Value
January 1, 2017 | | | Ending
Account Value
June 30, 2017 | | | Expenses Paid
During the Period7 | | | Annualized
Expense Ratio | |
Institutional | | $ | 1,000.00 | | | $ | 1,043.30 | | | $ | 4.81 | | | $ | 1,000.00 | | | $ | 1,020.08 | | | $ | 4.76 | | | | 0.95 | % |
Investor A | | $ | 1,000.00 | | | $ | 1,042.60 | | | $ | 6.08 | | | $ | 1,000.00 | | | $ | 1,018.84 | | | $ | 6.01 | | | | 1.20 | % |
Investor C | | $ | 1,000.00 | | | $ | 1,038.60 | | | $ | 9.86 | | | $ | 1,000.00 | | | $ | 1,015.12 | | | $ | 9.74 | | | | 1.95 | % |
| | 7 | | For each class of the Fund, expenses are equal to the annualized net expense ratio for the class, multiplied by the average account value over the period, multiplied by 181/365. |
| | 8 | | Hypothetical 5% annual return before expenses is calculated by prorating the number of days in the most recent fiscal half year divided by 365. |
See “Disclosure of Expenses” on Page 13 for further information on how expenses were calculated.
| | | | | | |
| | | | | | | |
| | BLACKROCK FUNDS | | JUNE 30, 2017 | | 5 |
| | | | |
| | | BlackRock Alternative Capital Strategies Fund |
| | |
| Portfolio Information as of June 30, 2017 | | |
| | | | |
| Portfolio Composition | | Percent of Total Investments1 | |
Corporate Bonds | | | 38 | % |
U.S. Government Sponsored Agency Securities | | | 35 | |
Asset-Backed Securities | | | 18 | |
Common Stocks | | | 9 | |
Non-Agency Mortgage-Backed Securities | | | 1 | |
Short-Term Securities | | | 1 | |
TBA Sale Commitments | | | (2 | ) |
Total | | | 100 | % |
| | 1 | | Does not include underlying investment in total return swaps. |
| | | | | | | | | | | | |
| | | Percentage of Total Investments2 | |
| Industry | | Long | | | Short | | | Total | |
Oil, Gas & Consumable Fuels Total | | | 4 | % | | | 4 | % | | | 8 | % |
Hotels, Restaurants & Leisure | | | 4 | | | | 1 | | | | 5 | |
Real Estate Investment Trusts (REITs) Total | | | 1 | | | | 3 | | | | 4 | |
Media Total | | | 3 | | | | 1 | | | | 4 | |
Health Care Providers & Services | | | 3 | | | | 1 | | | | 4 | |
Diversified Financial Services | | | 3 | | | | 1 | | | | 4 | |
Aerospace & Defense | | | 3 | | | | 1 | | | | 4 | |
Food Products | | | 2 | | | | 1 | | | | 3 | |
Insurance | | | 2 | | | | 1 | | | | 3 | |
Electric Utilities | | | 3 | | | | — | | | | 3 | |
Metals & Mining | | | 3 | | | | — | | | | 3 | |
Health Care Equipment & Supplies | | | 2 | | | | 1 | | | | 3 | |
Chemicals | | | 1 | | | | 1 | | | | 2 | |
Pharmaceuticals | | | 1 | | | | 1 | | | | 2 | |
Multi-Utilities | | | 1 | | | | 1 | | | | 2 | |
Banks | | | 2 | | | | — | | | | 2 | |
Semiconductors & Semiconductor Equipment | | | 1 | | | | 1 | | | | 2 | |
Consumer Finance | | | 1 | | | | 1 | | | | 2 | |
Household Durables | | | 1 | | | | 1 | | | | 2 | |
Other3 | | | 26 | | | | 12 | | | | 38 | |
Total | | | 67 | % | | | 33 | % | | | 100 | % |
| | 2 | | Total investments include the gross notional values of long and short positions of the underlying derivative contracts utilized by the Fund and exclude short-term securities and TBA sale commitments. |
| | 3 | | Consists of Asset-Backed Securities (6%), Non-Agency Mortgaged-Backed Securities (3%) and U.S. Government Sponsored Agency Obligations (17%) with the remainder consisting of other industries held that were each 2% of total investments (0% long and 12% short). |
| | | | | | |
| | | | | | | |
| 6 | | BLACKROCK FUNDS | | JUNE 30, 2017 | | |
| | | | |
| Fund Summary as of June 30, 2017 | | BlackRock Emerging Markets Equity Strategies Fund |
BlackRock Emerging Markets Equity Strategies Fund’s (the “Fund”) investment objective is to seek total return.
| | |
| Portfolio Management Commentary | | |
How did the Fund perform?
| • | | For the six-month period ended June 30, 2017, the Fund outperformed its benchmark, the MSCI Emerging Markets Index. |
What factors influenced performance?
| • | | The Fund’s positioning with respect to South Africa was the primary positive contributor to relative performance. An underweight to the country and a short financial position there benefited the Fund as the political situation remained volatile. Exposure to the Turkish stock market also contributed positively after central bank action to defend the currency and positive macroeconomic surprises led to a market recovery. |
| • | | The leading individual contributor to the Fund’s performance was Turkish Airlines, Inc., which benefited from encouraging industry trends, signs of operational improvement and upward earnings revisions. Also contributing to performance were South African media and entertainment company Naspers Ltd. and Taiwanese electronic connector manufacturer Bizlink Holding, Inc. |
| • | | The Fund’s exposure in South Korea was the largest detractor from relative performance during the period. An underweight position in consumer stocks and an overweight position in cyclical value stocks kept the Fund from fully participating in the Korean stock market’s rally in the second quarter of 2017. Furthermore, an underweight to information technology (“IT”) led to the Fund’s not fully capturing strong performance from hardware stocks. In China, underweight exposure to internet names hurt performance, with the Fund’s lack of a position in China’s Tencent Holdings Ltd. among the largest individual detractors for the period. An |
| | | overweight to energy stocks also detracted from performance as oil prices softened during the period. |
| • | | As part of its investment strategy, the Fund uses derivatives to achieve exposure to a market or to manage market and/or equity risks. As of the end of the period, the Fund had approximately 48% of assets invested in futures contracts for difference for its synthetic long and synthetic short positions, which directly contributed to performance. |
| • | | The Fund was fully invested throughout the period. The Fund’s cash exposure had no material impact on performance as it was principally a function of trading down physical positions over the period. |
Describe recent portfolio activity.
| • | | The Fund’s most notable activity during the period was its reduction in exposure to Brazil, including the exit of positions in diversified bank Itau Unibanco Holding S.A. and stock exchange operator B3 S.A., formerly known as BM&F Bovespa. The Fund added exposure to the energy and financials sectors in Russia, taking advantage of a market correction by initiating positions in PAO Novatek and Rosneft Oil Co. and adding to its position in VTB Bank. |
Describe portfolio positioning at period end.
| • | | Relative to the MSCI Emerging Markets Index, the Fund ended the period overweight in Russia and Greece, while being underweight in Taiwan and the Philippines. In terms of sectors, the Fund was most overweight in industrials and most underweight in IT. |
The views expressed reflect the opinions of BlackRock as of the date of this report and are subject to change based on changes in market, economic or other conditions. These views are not intended to be a forecast of future events and are no guarantee of future results.
| | | | | | |
| | | | | | | |
| | BLACKROCK FUNDS | | JUNE 30, 2017 | | 7 |
| | |
| | | BlackRock Emerging Markets Equity Strategies Fund |
| | |
| Total Return Based on a $10,000 Investment | | |
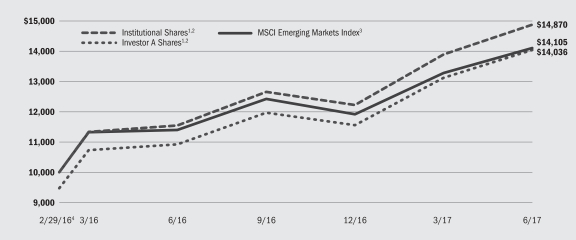
| | 1 | | Assuming maximum sales charges, if any, transaction costs and other operating expenses, including investment advisory fees. Institutional Shares do not have a sales charge. |
| | 2 | | Under normal conditions, the Fund invests at least 80% of its net assets, plus any borrowings for investment purposes, in equity instruments and related derivative instruments issued by companies in, or tied economically to, emerging markets. |
| | 3 | | MSCI Emerging Markets Index is a free float-adjusted market capitalization index that is designed to measure equity market performance of emerging markets. The MSCI Emerging Markets Index consists of the following 23 emerging market country indexes: Brazil, Chile, China, Colombia, Czech Republic, Egypt, Greece, Hungary, India, Indonesia, South Korea, Malaysia, Mexico, Peru, the Philippines, Poland, Qatar, Russia, South Africa, Taiwan, Thailand, Turkey and the United Arab Emirates. |
| | 4 | | Commencement of operations. |
| | | | | | | | | | | | | | | | | | | | |
| Performance Summary for the Period Ended June 30, 2017 | | | | | | | | | | | | | |
| | | | | | Average Annual Total Returns5 | |
| | | | | | 1 Year | | | Since Inception6 | |
| | | 6-Month
Total Returns | | | w/o sales
charge | | | w/sales
charge | | | w/o sales
charge | | | w/sales
charge | |
Institutional | | | 21.68 | % | | | 28.86 | % | | | N/A | | | | 34.63 | % | | | N/A | |
Investor A | | | 21.48 | | | | 28.48 | | | | 21.74 | % | | | 34.25 | | | | 28.93 | % |
Investor C | | | 21.00 | | | | 27.52 | | | | 26.52 | | | | 33.24 | | | | 33.24 | |
Class K | | | 21.68 | | | | 28.88 | | | | N/A | | | | 34.65 | | | | N/A | |
MSCI Emerging Markets Index | | | 18.43 | | | | 23.75 | | | | N/A | | | | 29.43 | | | | N/A | |
| | 5 | | Assuming maximum sales charges, if any. Average annual total returns with and without sales charges reflect reductions for distribution and service fees. See “About Fund Performance” on page 13 for a detailed description of share classes, including any related sales charges and fees. |
| | 6 | | The Fund commenced operations on February 29, 2016. |
| | | | N/A — Not applicable as share class and index do not have a sales charge. |
| | | | Past performance is not indicative of future results. |
| | | | Performance results may include adjustments made for financial reporting purposes in accordance with U.S. generally accepted accounting principles. |
| | | | | | | | | | | | | | | | | | | | | | | | | | | | |
| | | Actual | | | Hypothetical8 | | | | |
| | | Beginning
Account Value
January 1, 2017 | | | Ending
Account Value
June 30, 2017 | | | Expenses Paid
During the Period7 | | | Beginning
Account Value
January 1, 2017 | | | Ending
Account Value
June 30, 2017 | | | Expenses Paid
During the Period7 | | | Annualized
Expense Ratio | |
Institutional | | $ | 1,000.00 | | | $ | 1,216.80 | | | $ | 6.98 | | | $ | 1,000.00 | | | $ | 1,018.50 | | | $ | 1,009.25 | | | | 1.27 | % |
Investor A | | $ | 1,000.00 | | | $ | 1,214.80 | | | $ | 8.51 | | | $ | 1,000.00 | | | $ | 1,017.11 | | | $ | 1,008.55 | | | | 1.55 | % |
Investor C | | $ | 1,000.00 | | | $ | 1,210.00 | | | $ | 12.60 | | | $ | 1,000.00 | | | $ | 1,013.39 | | | $ | 1,006.69 | | | | 2.30 | % |
Class K | | $ | 1,000.00 | | | $ | 1,216.80 | | | $ | 6.87 | | | $ | 1,000.00 | | | $ | 1,018.60 | | | $ | 1,009.30 | | | | 1.25 | % |
| | 7 | | For each class of the Fund, expenses are equal to the annualized net expense ratio for the class, multiplied by the average account value over the period, multiplied by 181/365. |
| | 8 | | Hypothetical 5% annual return before expenses is calculated by prorating the number of days in the most recent fiscal half year divided by 365. |
See “Disclosure of Expenses” on Page 13 for further information on how expenses were calculated.
| | | | | | |
| | | | | | | |
| 8 | | BLACKROCK FUNDS | | JUNE 30, 2017 | | |
| | |
| | | BlackRock Emerging Markets Equity Strategies Fund |
| | |
| Portfolio Information as of June 30, 2017 | | |
| | | | | | | | | | | | |
| | | Percent of Total Investments1 | |
| Geographical Allocation | | Long | | | Short | | | Total | |
China | | | 16 | % | | | 2 | % | | | 18 | % |
South Korea | | | 13 | | | | — | | | | 13 | |
Russia | | | 9 | | | | — | | | | 9 | |
Taiwan | | | 7 | | | | — | | | | 7 | |
India | | | 6 | | | | — | | | | 6 | |
Mexico | | | 6 | | | | — | | | | 6 | |
Turkey | | | 2 | | | | 2 | | | | 4 | |
Hong Kong | | | 4 | | | | — | | | | 4 | |
United Arab Emirates | | | 3 | | | | — | | | | 3 | |
Brazil | | | 2 | | | | 1 | | | | 3 | |
United Kingdom | | | 1 | | | | 2 | | | | 3 | |
Indonesia | | | 3 | | | | — | | | | 3 | |
Hungary | | | 2 | | | | 1 | | | | 3 | |
Columbia | | | 3 | | | | — | | | | 3 | |
Thailand | | | 1 | | | | 1 | | | | 2 | |
South Africa | | | 2 | | | | — | | | | 2 | |
Czech Republic | | | 2 | | | | — | | | | 2 | |
Philippines | | | — | | | | 2 | | | | 2 | |
Other | | | 5 | | | | 2 | | | | 7 | |
Total | | | 87 | % | | | 13 | % | | | 100 | % |
| | 1 | | Total investments include the gross notional values of long and short positions of the underlying derivative contracts utilized by the Fund and exclude short-term securities. |
| | | | | | | | | | | | |
| | | Percentage of Total investments1 | |
| Industry | | Long | | | Short | | | Total | |
Banks | | | 18 | % | | | 3 | % | | | 21 | % |
Oil, Gas & Consumable Fuels Total | | | 14 | | | | 2 | | | | 16 | |
Airlines | | | 8 | | | | 1 | | | | 9 | |
Insurance | | | 5 | | | | 4 | | | | 9 | |
Metals & Mining | | | 5 | | | | 1 | | | | 6 | |
Automobiles | | | 5 | | | | — | | | | 5 | |
Independent Power and Renewable Electricity Producers | | | 5 | | | | — | | | | 5 | |
Semiconductors & Semiconductor Equipment | | | 5 | | | | — | | | | 5 | |
Electronic Equipment, Instruments & Components | | | 4 | | | | — | | | | 4 | |
Pharmaceuticals | | | 4 | | | | — | | | | 4 | |
Wireless Telecommunication Services | | | 2 | | | | 1 | | | | 3 | |
Construction Materials | | | 3 | | | | — | | | | 3 | |
Real Estate Management & Development | | | 1 | | | | 1 | | | | 2 | |
Other2 | | | 8 | | | | — | | | | 8 | |
Total | | | 87 | % | | | 13 | % | | | 100 | % |
| | 2 | | Consists of other industries held that were each 2% of total investments (8% long). |
| | | | | | |
| | | | | | | |
| | BLACKROCK FUNDS | | JUNE 30, 2017 | | 9 |
| | | | |
| Fund Summary as of June 30, 2017 | | iShares Short-Term TIPS Bond Index Fund |
iShares Short-Term TIPS Bond Index Fund’s (the “Fund”) investment objective is to seek to track the investment results of an index composed of U.S. 0-5 Year Treasury Inflation-Protected Securities. On February 24, 2017, the Board approved a proposal to change the name of BlackRock Short-Term Inflation-Protected Securities Index Fund to iShares Short-Term TIPS Bond Index Fund, which was effective on June 19, 2017.
| | |
| Portfolio Management Commentary | | |
How did the Fund perform?
| • | | For the six-month period ended June 30, 2017, the Fund’s Institutional, Investor A and Class K Shares returned 0.26%, 0.26% and 0.26%, respectively. For the same period, the Fund’s benchmark, the Bloomberg Barclays U.S. Treasury Inflation-Protected Securities (TIPS) 0-5 Years Index (Series L) (the “Underlying Index”), returned 0.19%. |
Describe the market environment.
| • | | The period opened with most signs pointing to a strengthening in inflation. January consumer price index (“CPI”) data surprised to the upside, with core CPI up 2.3% year over year, and headline CPI at 2.5%, with strength in both core goods and services. The U.S. economy beat expectations, adding 227,000 jobs in January, the most in four months. However, wage growth disappointed, with average hourly earnings increasing only 0.1% versus the prior month, and the jobless rate posted its second consecutive increase, at 4.8%. Fed Chair Janet Yellen’s semi-annual monetary policy testimony had a hawkish tilt, on balance. Oil prices reached their highest levels since mid-2015, supported by comments that OPEC intends to fully comply with planned supply cuts. |
| • | | In March, as expected, the Fed announced a 25 basis point (0.25%) increase in short interest rates, and commented that their 2% inflation goal is “not a ceiling”. U.S. inflation data continued to press higher, with headline CPI of 2.7%, supported by energy prices coming off of lows, and core CPI remaining firm at 2.2%. Personal consumption expenditure inflation (“PCE”) was also strong, with headline PCE coming in at 2.1% year over year, the first reading above the Fed’s target since April 2012. Core PCE, which excludes food and energy prices and is the Fed’s |
| | | preferred measure, came in at 1.8%. Non-farm payroll numbers surprised to the upside, while the unemployment rate remained unchanged and wage data continued to edge higher. However, measures of U.S. inflation expectations trended lower later in the month, as sentiment around the outlook for pro-growth measures waned following the Trump administration’s failure to push a new healthcare bill through the legislature. |
| • | | Inflation expectations softened in the second quarter of 2017. May’s core CPI reading came in weaker than expected at 1.7% year-on-year, with headline at 1.9%. Fed Chair Yellen acknowledged the weak data, but stressed that the committee members believed this effect to be transitory. Breakeven rates, which reflect the difference between nominal and inflation-protected Treasury yields, declined over the quarter, giving back most of the gains TIPS had seen since the U.S. presidential election in November of 2016. |
Describe recent portfolio activity.
| • | | During the period, the Fund maintained its objective of seeking to provide investment results that correspond to the total return performance of the Underlying Index by selecting securities in accordance with their relative proportion within the Index. Other factors considered in security selection included transaction costs and maturity. |
Describe portfolio positioning at period end.
| • | | The Fund remains positioned to attempt to match the risk and return characteristics of the Underlying Index, irrespective of the future direction of inflation expectations. |
The views expressed reflect the opinions of BlackRock as of the date of this report and are subject to change based on changes in market, economic or other conditions. These views are not intended to be a forecast of future events and are no guarantee of future results.
| | | | | | |
| | | | | | | |
| 10 | | BLACKROCK FUNDS | | JUNE 30, 2017 | | |
| | |
| | | iShares Short-Term TIPS Bond Index Fund |
| | |
| Total Return Based on a $10,000 Investment | | |
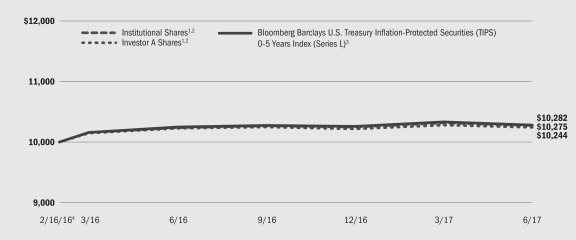
| | 1 | | Assuming transaction costs and other operating expenses, including investment advisory fees, if any. |
| | 2 | | The Fund generally invests at least 90% of its assets, plus the amount of any borrowing for investment purposes, in securities of the Underlying Index. From time to time when conditions warrant, however, the Fund may invest at least 80% of its assets in securities of the Underlying Index. The Fund may invest a portion of the remainder of its assets in securities not included in the Underlying Index, but which BlackRock Advisors, LLC believes will help the Fund track the Underlying Index. |
| | 3 | | Bloomberg Barclays U.S. Treasury Inflation-Protected Securities (TIPS) 0-5 Years Index (Series L) measures the performance of the inflation-protected public obligations of the U.S. Treasury that have a remaining maturity of less than five years. |
| | 4 | | Commencement of operations. |
| | | | | | | | | | | | |
| Performance Summary for the Period Ended June 30, 2017 | | | | |
| | | | | | Average Annual Total Returns5 | |
| | | | | | 1 Year | | | Since Inception6 | |
| | | 6-Month
Total Returns | | | w/o sales
charge | | | w/o sales
charge | |
Institutional | | | 0.26 | % | | | 0.32 | % | | | 2.00 | % |
Investor A | | | 0.26 | | | | 0.11 | | | | 1.78 | |
Class K | | | 0.26 | | | | 0.34 | | | | 2.03 | |
Bloomberg Barclays U.S. Treasury Inflation-Protected Securities (TIPS) 0-5 Years Index (Series L) | | | 0.19 | | | | 0.32 | | | | 2.04 | |
| | 5 | | Average annual total returns reflect reductions for distribution and service fees. See “About Fund Performance” on page 13 for a detailed description of share classes, including any related fees. |
| | 6 | | The Fund commenced operations on February 16, 2016. |
| | | | Past performance is not indicative of future results. |
| | | | Performance results may include adjustments made for financial reporting purposes in accordance with U.S. generally accepted accounting principles. |
| | | | | | | | | | | | | | | | | | | | | | | | | | | | |
| | | Actual | | | Hypothetical8 | | | | |
| | | Beginning
Account Value
January 1, 2017 | | | Ending
Account Value
June 30, 2017 | | | Expenses Paid
During the Period7 | | | Beginning
Account Value
January 1, 2017 | | | Ending
Account Value
June 30, 2017 | | | Expenses Paid
During the Period7 | | | Annualized
Expense Ratio | |
Institutional | | $ | 1,000.00 | | | $ | 1,002.60 | | | $ | 0.35 | | | $ | 1,000.00 | | | $ | 1,024.45 | | | $ | 0.35 | | | | 0.07 | % |
Investor A | | $ | 1,000.00 | | | $ | 1,002.60 | | | $ | 1.79 | | | $ | 1,000.00 | | | $ | 1,023.01 | | | $ | 1.81 | | | | 0.36 | % |
Class K | | $ | 1,000.00 | | | $ | 1,002.60 | | | $ | 0.30 | | | $ | 1,000.00 | | | $ | 1,024.50 | | | $ | 0.30 | | | | 0.06 | % |
| | 7 | | For each class of the Fund, expenses are equal to the annualized net expense ratio for the class, multiplied by the average account value over the period, multiplied by 181/365. |
| | 8 | | Hypothetical 5% annual return before expenses is calculated by prorating the number of days in the most recent fiscal half year divided by 365. |
See “Disclosure of Expenses” on Page 13 for further information on how expenses were calculated.
| | | | | | |
| | | | | | | |
| | BLACKROCK FUNDS | | JUNE 30, 2017 | | 11 |
| | | | |
| | | iShares Short-Term TIPS Bond Index Fund |
| | |
| Portfolio Information as of June 30, 2017 | | |
| | | | |
| Allocation by Maturity | | Percent of Total Investments1 | |
0-1 Year | | | 20 | % |
1-2 Years | | | 16 | |
2-3 Years | | | 19 | |
3-4 Years | | | 24 | |
4-5 Years | | | 21 | |
Total | | | 100 | % |
| | 1 | | Excludes short-term securities. |
| | | | |
| Five Largest Fund Holdings | | Percent of Total Investments1 | |
U.S. Treasury Inflation Protected Securities, 0.13%, 4/15/18 | | | 13 | % |
U.S. Treasury Inflation Protected Securities, 0.13%, 4/15/20 | | | 12 | |
U.S. Treasury Inflation Protected Securities, 0.13%, 4/15/19 | | | 11 | |
U.S. Treasury Inflation Protected Securities, 0.13%, 4/15/21 | | | 11 | |
U.S. Treasury Inflation Protected Securities, 0.13%, 1/15/22 | | | 11 | |
Total | | | 58 | % |
| | | | | | |
| | | | | | | |
| 12 | | BLACKROCK FUNDS | | JUNE 30, 2017 | | |
| • | | Institutional Shares are not subject to any sales charge. These shares bear no ongoing distribution or service fees and are available only to certain eligible investors. |
| • | | Investor A Shares are subject to a maximum initial sales charge (front-end load) of 4.00% for BlackRock Alternative Capital Strategies Fund and 5.25% for BlackRock Emerging Markets Equity Strategies Fund, as well as a service fee of 0.25% per year (but no distribution fee). With respect to BlackRock Alternative Capital Strategies Fund and BlackRock Emerging Markets Equity Strategies Fund, certain redemptions of these shares may be subject to a contingent deferred sales charge (“CDSC”) where no initial sales charge was paid at the time of purchase. For iShares Short-Term TIPS Bond Index Fund, Investor A Shares are not subject to any sales charge and bear no ongoing distribution fee. These shares are subject to an ongoing service fee of 0.25% per year. These shares are generally available through financial intermediaries. |
| • | | Investor C Shares (available only in BlackRock Alternative Capital Strategies Fund and BlackRock Emerging Markets Equity Strategies Fund) are subject to a 1.00% CDSC if redeemed within one year of purchase. In addition, these shares are subject to a distribution fee of 0.75% per year and a service fee of 0.25% per year. These shares are generally available through financial intermediaries. |
| • | | Class K Shares (available only in BlackRock Emerging Markets Equity Strategies Fund and iShares Short-Term TIPS Bond Index Fund) are not |
| | | subject to any sales charge. These shares bear no ongoing distribution or service fees and are available only to certain eligible investors. |
Performance information reflects past performance and does not guarantee future results. Current performance may be lower or higher than the performance data quoted. Refer to www.blackrock.com to obtain performance data current to the most recent month end. Performance results do not reflect the deduction of taxes that a shareholder would pay on fund distributions or the redemption of fund shares. Figures shown in the performance table on the previous pages assume reinvestment of all distributions, if any, at net asset value (“NAV”) on the ex-dividend/payable date. Investment return and principal value of shares will fluctuate so that shares, when redeemed, may be worth more or less than their original cost. Distributions paid to each class of shares will vary because of the different levels of service, distribution and transfer agency fees applicable to each class, which are deducted from the income available to be paid to shareholders.
BlackRock Advisors, LLC (the “Manager”), each Fund’s investment adviser, has contractually agreed to waive and/or reimburse a portion of the Funds’ expenses. Without such waiver and/or reimbursement, the Funds’ performance would have been lower. The Manager is under no obligation to continue waiving and/or reimbursing its fees after the applicable termination date of such agreement. See Note 6 of the Notes to Financial Statements for additional information on waivers and/or reimbursements.
Shareholders of the Funds may incur the following charges: (a) transactional expenses, such as sales charges; and (b) operating expenses, including investment advisory fees, service and distribution fees, including 12b-1 fees, acquired fund fees and expenses, and other fund expenses. The expense examples on the previous pages (which are based on a hypothetical investment of $1,000 invested on January 1, 2017 and held through June 30, 2017) are intended to assist shareholders both in calculating expenses based on an investment in each Fund and in comparing these expenses with similar costs of investing in other mutual funds.
The expense examples provide information about actual account values and actual expenses. In order to estimate the expenses a shareholder paid during the period covered by this report, shareholders can divide their account value by $1,000 and then multiply the result by the number corresponding to their Fund and share class under the heading entitled “Expenses Paid During the Period.”
The expense examples also provide information about hypothetical account values and hypothetical expenses based on a Fund’s actual expense ratio and an assumed rate of return of 5% per year before expenses. In order to assist shareholders in comparing the ongoing expenses of investing in these Funds and other funds, compare the 5% hypothetical examples with the 5% hypothetical examples that appear in shareholder reports of other funds.
The expenses shown in the expense examples are intended to highlight shareholders’ ongoing costs only and do not reflect any transactional expenses, such as sales charges, if any. Therefore, the hypothetical examples are useful in comparing ongoing expenses only, and will not help shareholders determine the relative total expenses of owning different funds. If these transactional expenses were included, shareholder expenses would have been higher.
| | | | | | |
| | | | | | | |
| | BLACKROCK FUNDS | | JUNE 30, 2017 | | 13 |
| | | | |
| Derivative Financial Instruments | | |
The Funds may invest in various derivative financial instruments. These instruments are used to obtain exposure to a security, commodity, index, market, and/or other asset without owning or taking physical custody of securities, commodities and/or other referenced assets or to manage market, equity, credit, interest rate, foreign currency exchange rate, commodity and/or other risks. Derivative financial instruments may give rise to a form of economic leverage and involve risk, including the imperfect correlation between the value of a derivative financial instrument and the underlying asset, possible default of the counter-
party to the transaction or illiquidity of the instrument. The Funds’ successful use of a derivative financial instrument depends on the investment adviser’s ability to predict pertinent market movements accurately, which cannot be assured. The use of these instruments may result in losses greater than if they had not been used, may limit the amount of appreciation a Fund can realize on an investment and/or may result in lower distributions paid to shareholders. The Funds’ investments in these instruments, if any, are discussed in detail in the Notes to Financial Statements.
| | | | | | |
| | | | | | | |
| 14 | | BLACKROCK FUNDS | | JUNE 30, 2017 | | |
| | |
Schedule of Investments June 30, 2017 (Unaudited) | | BlackRock Alternative Capital Strategies Fund (Percentages shown are based on Net Assets) |
| | | | | | | | |
| Common Stocks | | Shares | | | Value | |
| Aerospace & Defense — 0.3% | | | | | | |
Lockheed Martin Corp. | | | 214 | | | $ | 59,408 | |
Raytheon Co. | | | 214 | | | | 34,557 | |
| | | | | | | | |
| | | | | | | | 93,965 | |
| Air Freight & Logistics — 0.1% | | | | | | |
C.H. Robinson Worldwide, Inc. | | | 454 | | | | 31,181 | |
| Beverages — 0.4% | | | | | | |
Dr. Pepper Snapple Group, Inc. | | | 621 | | | | 56,579 | |
PepsiCo, Inc. | | | 524 | | | | 60,517 | |
| | | | | | | | |
| | | | | | | | 117,096 | |
| Commercial Services & Supplies — 0.4% | | | | | | |
Republic Services, Inc. | | | 634 | | | | 40,405 | |
Waste Management, Inc. | | | 778 | | | | 57,066 | |
| | | | | | | | |
| | | | | | | | 97,471 | |
| Communications Equipment — 0.2% | | | | | | |
Cisco Systems, Inc. | | | 1,323 | | | | 41,410 | |
| Containers & Packaging — 0.0% | | | | | | |
Bemis Co., Inc. | | | 297 | | | | 13,736 | |
| Distributors — 0.2% | | | | | | |
Genuine Parts Co. | | | 506 | | | | 46,937 | |
| Electric Utilities — 1.6% | | | | | | |
American Electric Power Co., Inc. | | | 641 | | | | 44,530 | |
Duke Energy Corp. | | | 671 | | | | 56,089 | |
Edison International | | | 289 | | | | 22,597 | |
Eversource Energy | | | 350 | | | | 21,248 | |
NextEra Energy, Inc. | | | 435 | | | | 60,957 | |
Pinnacle West Capital Corp. | | | 724 | | | | 61,656 | |
Portland General Electric Co. | | | 1,350 | | | | 61,681 | |
Westar Energy, Inc. | | | 1,026 | | | | 54,399 | |
Xcel Energy, Inc. | | | 1,302 | | | | 59,736 | |
| | | | | | | | |
| | | | | | | | 442,893 | |
| Food & Staples Retailing — 0.5% | | | | | | |
CVS Health Corp. | | | 184 | | | | 14,805 | |
Sysco Corp. | | | 1,040 | | | | 52,343 | |
Wal-Mart Stores, Inc. | | | 803 | | | | 60,771 | |
| | | | | | | | |
| | | | | | | | 127,919 | |
| Food Products — 0.8% | | | | | | |
Campbell Soup Co. | | | 565 | | | | 29,465 | |
Conagra Brands, Inc. | | | 1,214 | | | | 43,413 | |
General Mills, Inc. | | | 824 | | | | 45,650 | |
J.M. Smucker Co. | | | 441 | | | | 52,183 | |
Kellogg Co. | | | 816 | | | | 56,679 | |
| | | | | | | | |
| | | | | | | | 227,390 | |
| Health Care Equipment & Supplies — 0.2% | | | | | | |
Medtronic PLC | | | 669 | | | | 59,374 | |
| Health Care Providers & Services — 0.3% | | | | | | |
Cardinal Health, Inc. | | | 349 | | | | 27,194 | |
Owens & Minor, Inc. | | | 1,613 | | | | 51,922 | |
| | | | | | | | |
| | | | | | | | 79,116 | |
| Hotels, Restaurants & Leisure — 0.5% | | | | | | |
Cracker Barrel Old Country Store, Inc. | | | 240 | | | | 40,140 | |
| | | | | | | | |
| Common Stocks | | Shares | | | Value | |
| Hotels, Restaurants & Leisure (continued) | | | | | | |
Darden Restaurants, Inc. | | | 312 | | | $ | 28,217 | |
Six Flags Entertainment Corp. | | | 989 | | | | 58,955 | |
| | | | | | | | |
| | | | | | | | 127,312 | |
| Household Products — 0.8% | | | | | | |
Clorox Co. | | | 470 | | | | 62,623 | |
Colgate-Palmolive Co. | | | 662 | | | | 49,074 | |
Kimberly-Clark Corp. | | | 484 | | | | 62,489 | |
Procter & Gamble Co. | | | 674 | | | | 58,739 | |
| | | | | | | | |
| | | | | | | | 232,925 | |
| Industrial Conglomerates — 0.2% | | | | | | |
3M Co. | | | 300 | | | | 62,457 | |
| Insurance — 0.1% | | | | | | |
Validus Holdings Ltd. | | | 269 | | | | 13,980 | |
| IT Services — 0.4% | | | | | | |
Automatic Data Processing, Inc. | | | 183 | | | | 18,750 | |
International Business Machines Corp. | | | 203 | | | | 31,227 | |
Paychex, Inc. | | | 973 | | | | 55,403 | |
| | | | | | | | |
| | | | | | | | 105,380 | |
| Media — 0.2% | | | | | | |
Omnicom Group, Inc. | | | 632 | | | | 52,393 | |
Regal Entertainment Group, Class A | | | 682 | | | | 13,953 | |
| | | | | | | | |
| | | | | | | | 66,346 | |
| Multi-Utilities — 1.4% | | | | | | |
Alliant Energy Corp. | | | 673 | | | | 27,034 | |
Ameren Corp. | | | 533 | | | | 29,139 | |
CMS Energy Corp. | | | 1,028 | | | | 47,545 | |
Consolidated Edison, Inc. | | | 780 | | | | 63,040 | |
Dominion Resources, Inc. | | | 779 | | | | 59,695 | |
DTE Energy Co. | | | 564 | | | | 59,666 | |
NorthWestern Corp. | | | 398 | | | | 24,286 | |
PG&E Corp. | | | 403 | | | | 26,747 | |
WEC Energy Group, Inc. | | | 937 | | | | 57,513 | |
| | | | | | | | |
| | | | | | | | 394,665 | |
| Multiline Retail — 0.1% | | | | | | |
Target Corp. | | | 390 | | | | 20,393 | |
| Oil, Gas & Consumable Fuels — 0.2% | | | | | | |
Magellan Midstream Partners LP | | | 797 | | | | 56,802 | |
| Pharmaceuticals — 1.1% | |
Bristol-Myers Squibb Co. | | | 1,058 | | | | 58,952 | |
Eli Lilly & Co. | | | 788 | | | | 64,852 | |
Johnson & Johnson | | | 483 | | | | 63,896 | |
Merck & Co., Inc. | | | 895 | | | | 57,360 | |
Pfizer, Inc. | | | 1,762 | | | | 59,186 | |
| | | | | | | | |
| | | | | | | | 304,246 | |
| Real Estate Investment Trusts (REITs) — 0.2% | |
Public Storage | | | 275 | | | | 57,346 | |
| Total Common Stocks — 10.2% | | | | | | | 2,820,340 | |
| | | | | | | | |
| | |
| ADR | | American Depositary Receipts |
| AUD | | Australian Dollar |
| CAD | | Canadian Dollar |
| GBP | | British Pound |
| GDR | | Global Depositary Receipt |
| | |
| HIBOR | | Honk Kong Interbank Offered Rate |
| LIBOR | | London Interbank Offered Rate |
| OTC | | Over-the-Counter |
| USD | | U.S. Dollar |
| WIBOR | | Warsaw Interbank Offered Rate |
See Notes to Financial Statements.
| | | | | | |
| | | | | | | |
| | BLACKROCK FUNDS | | JUNE 30, 2017 | | 15 |
| | |
Schedule of Investments (continued) | | BlackRock Alternative Capital Strategies Fund |
| | | | | | | | |
| Asset-Backed Securities | | Par
(000) | | | Value | |
Academic Loan Funding Trust, Series 2012-1A, Class A1, 2.02%, 12/27/22 (a)(b) | | $ | 20 | | | $ | 19,784 | |
AmeriCredit Automobile Receivables Trust, Class D: | | | | | | | | |
Series 2013-1, 2.09%, 2/08/19 | | | 88 | | | | 88,083 | |
Series 2014-4, 3.07%, 11/09/20 | | | 100 | | | | 101,188 | |
AVANT Loans Funding Trust (b): | | | | | | | | |
Series 2016-B, Class A, 3.92%, 8/15/19 | | | 7 | | | | 7,268 | |
Series 2016-B, Class B, 7.80%, 9/15/20 | | | 150 | | | | 153,732 | |
Series 2016-C, Class A, 2.96%, 9/16/19 | | | 11 | | | | 11,179 | |
Bayview Opportunity Master Fund IIIa Trust, Series 2016-RN3, Class A1, 3.60%, 9/29/31 (b) | | | 54 | | | | 54,270 | |
Bayview Opportunity Master Fund IVb Trust, Series 2016-RN4, Class A1, 3.47%, 10/28/31 (b) | | | 59 | | | | 59,203 | |
Drive Auto Receivables Trust: | | | | | | | | |
Series 2015-BA, Class C, 2.76%, 7/15/21 (b) | | | 77 | | | | 77,791 | |
Series 2016-BA, Class B, 2.56%, 6/15/20 (b) | | | 100 | | | | 100,328 | |
Series 2016-BA, Class C, 2.61%, 8/16/21 (b) | | | 200 | | | | 200,291 | |
Series 2016-BA, Class C, 3.19%, 7/15/22 (b) | | | 250 | | | | 252,716 | |
Series 2016-CA, Class B, 2.37%, 11/16/20 (b) | | | 100 | | | | 100,093 | |
Series 2016-CA, Class C, 3.02%, 11/15/21 (b) | | | 100 | | | | 100,438 | |
Series 2017-1, Class B, 2.36%, 3/15/21 | | | 110 | | | | 109,948 | |
Series 2017-1, Class C, 2.84%, 4/15/22 | | | 150 | | | | 150,386 | |
Series 2017-1, Class D, 3.84%, 3/15/23 | | | 150 | | | | 150,617 | |
Series 2017-AA, Class C, 2.98%, 1/18/22 (b) | | | 90 | | | | 90,654 | |
Exeter Automobile Receivables Trust (b): | | | | | | | | |
Series 2015-1A, Class C, 4.10%, 12/15/20 | | | 40 | | | | 40,848 | |
Series 2017-2A, Class A, 2.11%, 6/15/21 | | | 93 | | | | 92,978 | |
Marlette Funding Trust, Series 2017-2A, Class A, 2.39%, 7/15/24 (b)(c) | | | 100 | | | | 99,970 | |
National Collegiate Student Loan Trust (a): | | | | | | | | |
Series 2004-2, Class A4, 1.53%, 11/27/28 | | | 15 | | | | 15,403 | |
Series 2005-1, Class A4, 1.46%, 11/27/28 | | | 6 | | | | 5,991 | |
Series 2006-1, Class A4, 1.47%, 3/27/28 | | | 82 | | | | 81,664 | |
Series 2006-2, Class A3, 1.43%, 11/25/27 | | | 71 | | | | 70,447 | |
OneMain Direct Auto Receivables Trust, Series 2016-1A, Class A, 2.04%, 1/15/21 (b) | | | 72 | | | | 72,086 | |
OneMain Financial Issuance Trust, Class A (b): | | | | | | | | |
Series 2015-1A, 3.19%, 3/18/26 | | | 100 | | | | 100,997 | |
Series 2015-2A, 2.57%, 7/18/25 | | | 88 | | | | 87,843 | |
Series 2016-2A, 4.10%, 3/20/28 | | | 150 | | | | 153,015 | |
Park Place Securities, Inc. Asset-Backed Pass-Through Certificates, Series 2004-WHQ2, Class M2, 2.16%, 2/25/35 (a) | | | 21 | | | | 21,093 | |
Residential Asset Mortgage Trust, Series 2005-EFC4, 1.66%, 9/25/35 (a) | | | 48 | | | | 47,855 | |
Santander Drive Auto Receivables Trust: | | | | | | | | |
Series 2013-3, Class C, 1.81%, 4/15/19 | | | 16 | | | | 15,760 | |
Series 2013-3, Class D, 2.42%, 4/15/19 | | | 100 | | | | 100,343 | |
Series 2013-4, Class C, 3.25%, 1/15/20 | | | 23 | | | | 22,755 | |
Series 2014-1, Class C, 2.36%, 4/15/20 | | | 46 | | | | 46,083 | |
Series 2014-1, Class D, 2.91%, 4/15/20 | | | 100 | | | | 100,938 | |
Series 2014-3, Class D, 2.65%, 8/17/20 | | | 100 | | | | 100,648 | |
Series 2014-4, Class D, 3.10%, 11/16/20 | | | 100 | | | | 101,494 | |
Series 2014-5, Class C, 2.46%, 6/15/20 | | | 100 | | | | 100,439 | |
Series 2015-1, Class D, 3.24%, 4/15/21 | | | 150 | | | | 152,068 | |
Series 2015-2, Class D, 3.02%, 4/15/21 | | | 150 | | | | 151,886 | |
Series 2016-1, Class C, 3.09%, 4/15/22 | | | 110 | | | | 111,534 | |
Series 2017-1, Class B, 2.10%, 6/15/21 | | | 100 | | | | 99,922 | |
Series 2017-2, Class B, 2.21%, 10/15/21 | | | 120 | | | | 119,988 | |
Series 2017-2, Class C, 2.79%, 8/15/22 | | | 120 | | | | 119,849 | |
SLM Private Education Loan Trust, Series 2011-B, Class A2, 3.74%, 2/15/29 (b) | | | 104 | | | | 105,613 | |
SoFi Consumer Loan Program LLC, Class A (b): | | | | | | | | |
Series 2016-2A, 3.09%, 10/27/25 | | | 65 | | | | 65,749 | |
Series 2016-3, 3.05%, 12/26/25 | | | 73 | | | | 73,517 | |
Series 2017-3, 2.77%, 5/25/26 | | | 97 | | | | 97,517 | |
| | | | | | | | |
| Asset-Backed Securities | | Par
(000) | | | Value | |
SoFi Consumer Loan Program Trust, Series 2015-1, Class A, 3.28%, 9/15/23 (b) | | $ | 79 | | | $ | 79,106 | |
Springleaf Funding Trust, Series 2015-AA, Class A, 3.16%, 11/15/24 (b) | | | 100 | | | | 100,904 | |
SPS Servicer Advance Receivables Trust, Series 2016-T1, Class AT1, 2.53%, 11/16/48 (b) | | | 100 | | | | 99,128 | |
Sunset Mortgage Loan Co. LLC, Series 2016-NPL1, Class A, 3.84%, 7/16/47 (b)(c) | | | 70 | | | | 69,812 | |
US Residential Opportunity Fund III Trust, Class A (b): | | | | | | | | |
Series 2016-2III, 3.47%, 8/27/36 | | | 127 | | | | 126,045 | |
Series 2016-3III, 3.60%, 10/27/36 | | | 139 | | | | 138,825 | |
VOLT LI LLC, Series 2016-NP11, Class A1, 3.50%, 10/25/46 (b) | | | 81 | | | | 81,379 | |
VOLT LIV LLC, Series 2017-NPL1, Class A1, 3.50%, 2/25/47 (b) | | | 140 | | | | 140,570 | |
VOLT LIX LLC, Series 2017-NPL6, Class A1, 3.25%, 5/25/47 (b) | | | 146 | | | | 146,012 | |
VOLT LV LLC, Series 2017-NPL2, Class A1, 3.50%, 3/25/47 (b) | | | 94 | | | | 93,748 | |
VOLT LVII LLC, Series 2017-NPL4, Class A1, 3.38%, 4/25/47 (b) | | | 130 | | | | 130,198 | |
VOLT LVIII LLC, Series 2017-NPL5, Class A1, 3.38%, 5/28/47 (b) | | | 121 | | | | 120,827 | |
VOLT XXV LLC, Series 2015-NPL8, Class A1, 3.50%, 6/26/45 (b) | | | 57 | | | | 57,255 | |
| Total Asset-Backed Securities — 20.9% | | | | | | | 5,788,071 | |
| | | | | | | | |
| | | | | | | | | |
| Corporate Bonds | | | | | | | | |
| Aerospace & Defense — 0.6% | | | | | | |
L3 Technologies, Inc.: | | | | | | | | |
5.20%, 10/15/19 | | | 50 | | | | 53,376 | |
3.95%, 5/28/24 | | | 18 | | | | 18,508 | |
3.85%, 12/15/26 | | | 40 | | | | 41,234 | |
Lockheed Martin Corp., 3.55%, 1/15/26 | | | 50 | | | | 51,810 | |
| | | | | | | | |
| | | | | | | | 164,928 | |
| Air Freight & Logistics — 0.0% | | | | | | |
XPO Logistics, Inc., 6.50%, 6/15/22 (b) | | | 10 | | | | 10,500 | |
| Airlines — 0.4% | | | | | | |
American Airlines Group, Inc., 4.63%, 3/01/20 (b) | | | 10 | | | | 10,343 | |
United Continental Holdings, Inc., 5.00%, 2/01/24 | | | 100 | | | | 101,375 | |
| | | | | | | | |
| | | | | | | | 111,718 | |
| Auto Components — 1.0% | | | | | | |
Allison Transmission, Inc., 5.00%, 10/01/24 (b) | | | 50 | | | | 51,250 | |
Ford Motor Credit Co. LLC, 2.16%, 1/09/20 (a) | | | 200 | | | | 201,414 | |
General Motors Co., 4.00%, 4/01/25 | | | 50 | | | | 50,187 | |
| | | | | | | | |
| | | | | | | | 302,851 | |
| Auto Parts — 0.1% | | | | | | |
TPC Group, Inc., 8.75%, 12/15/20 (b) | | | 25 | | | | 22,500 | |
| Auto Services — 0.3% | | | | | | |
AutoZone, Inc., 2.50%, 4/15/21 | | | 75 | | | | 74,804 | |
| Banks — 4.0% | | | | | | |
Bank of Montreal, 1.50%, 7/18/19 | | | 50 | | | | 49,530 | |
Bank of New York Mellon Corp., 2.60%, 8/17/20 | | | 40 | | | | 40,591 | |
Bank of Nova Scotia, 2.45%, 3/22/21 | | | 50 | | | | 50,218 | |
Capital One Financial Corp., 2.50%, 5/12/20 | | | 35 | | | | 35,152 | |
CIT Group, Inc., 3.88%, 2/19/19 | | | 35 | | | | 35,875 | |
Credit Suisse, New York, 5.40%, 1/14/20 | | | 75 | | | | 80,539 | |
HSBC Holdings PLC, 4.00%, 3/30/22 | | | 50 | | | | 52,735 | |
HSBC USA, Inc.: | | | | | | | | |
2.75%, 8/07/20 | | | 100 | | | | 101,635 | |
3.50%, 6/23/24 | | | 100 | | | | 103,022 | |
See Notes to Financial Statements.
| | | | | | |
| | | | | | | |
| 16 | | BLACKROCK FUNDS | | JUNE 30, 2017 | | |
| | |
Schedule of Investments (continued) | | BlackRock Alternative Capital Strategies Fund |
| | | | | | | | |
Corporate Bonds | | Par
(000) | | | Value | |
| Banks (continued) | | | | | | |
Sumitomo Mitsui Banking Corp., Series 2, 1.70%, 1/11/19 (a) | | $ | 250 | | | $ | 250,711 | |
Wells Fargo & Co.: | | | | | | | | |
3.00%, 1/22/21 | | | 50 | | | | 51,059 | |
2.10%, 7/26/21 | | | 100 | | | | 98,659 | |
Westpac Banking Corp.: | | | | | | | | |
1.65%, 5/13/19 | | | 55 | | | | 54,706 | |
1.60%, 8/19/19 | | | 100 | | | | 99,223 | |
| | | | | | | | |
| | | | | | | | 1,103,655 | |
| Beverages — 0.3% | | | | | | |
Anheuser-Busch InBev Worldwide, Inc., 7.75%, 1/15/19 | | | 50 | | | | 54,361 | |
BWAY Holding Co., 5.50%, 4/15/24 (b) | | | 25 | | | | 25,531 | |
| | | | | | | | |
| | | | | | | | 79,892 | |
| Building Materials — 0.3% | | | | | | |
Eagle Materials, Inc., 4.50%, 8/01/26 | | | 50 | | | | 51,125 | |
Summit Materials LLC, 6.13%, 7/15/23 | | | 10 | | | | 10,475 | |
Vulcan Materials Co., 7.50%, 6/15/21 | | | 15 | | | | 17,702 | |
| | | | | | | | |
| | | | | | | | 79,302 | |
| Building Products — 0.2% | | | | | | |
Building Materials Corp. of America, 5.38%, 11/15/24 (b) | | | 35 | | | | 36,882 | |
Louisiana-Pacific Corp., 4.88%, 9/15/24 | | | 25 | | | | 25,531 | |
| | | | | | | | |
| | | | | | | | 62,413 | |
| Capital Markets — 3.3% | | | | | | |
Goldman Sachs Group, Inc.: | | | | | | | | |
5.95%, 1/18/18 | | | 50 | | | | 51,117 | |
2.55%, 10/23/19 | | | 50 | | | | 50,546 | |
2.04%, 12/13/19 (a) | | | 100 | | | | 100,590 | |
5.25%, 7/27/21 | | | 50 | | | | 54,803 | |
3.75%, 5/22/25 | | | 75 | | | | 76,799 | |
3.75%, 2/25/26 | | | 75 | | | | 76,369 | |
3.50%, 11/16/26 | | | 35 | | | | 34,814 | |
Jefferies Group LLC, 4.85%, 1/15/27 | | | 50 | | | | 52,264 | |
Morgan Stanley: | | | | | | | | |
2.20%, 12/07/18 | | | 40 | | | | 40,199 | |
2.65%, 1/27/20 | | | 50 | | | | 50,527 | |
2.63%, 11/17/21 | | | 50 | | | | 49,926 | |
2.75%, 5/19/22 | | | 50 | | | | 49,989 | |
4.88%, 11/01/22 | | | 25 | | | | 27,144 | |
3.70%, 10/23/24 | | | 25 | | | | 25,657 | |
3.88%, 1/27/26 | | | 50 | | | | 51,474 | |
3.13%, 7/27/26 | | | 90 | | | | 87,502 | |
National Financial Partners Corp., 9.00%, 7/15/21 (b) | | | 35 | | | | 36,726 | |
| | | | | | | | |
| | | | | | | | 916,446 | |
| Chemicals — 0.8% | | | | | | |
Ashland, Inc., 4.75%, 8/15/22 | | | 35 | | | | 36,619 | |
Dow Chemical Co., 8.55%, 5/15/19 | | | 50 | | | | 56,002 | |
Monsanto Co., 2.20%, 7/15/22 | | | 50 | | | | 48,275 | |
Olin Corp., 5.13%, 9/15/27 | | | 50 | | | | 51,500 | |
PolyOne Corp., 5.25%, 3/15/23 | | | 35 | | | | 36,750 | |
| | | | | | | | |
| | | | | | | | 229,146 | |
| Commercial Services & Supplies — 0.3% | | | | | | |
Park Aerospace Holdings Ltd., 5.50%, 2/15/24 (b) | | | 85 | | | | 88,782 | |
| Communications Equipment — 1.1% | | | | | | |
Gogo Intermediate Holdings LLC/Gogo Finance Co., Inc., 12.50%, 7/01/22 (b) | | | 100 | | | | 113,875 | |
Juniper Networks, Inc., 3.30%, 6/15/20 | | | 50 | | | | 51,204 | |
Motorola Solutions, Inc., 4.00%, 9/01/24 | | | 54 | | | | 54,289 | |
Plantronics, Inc., 5.50%, 5/31/23 (b) | | | 50 | | | | 52,312 | |
| | | | | | | | |
Corporate Bonds | | Par
(000) | | | Value | |
| Communications Equipment (continued) | | | | | | |
Zayo Group LLC/Zayo Capital, Inc., 6.38%, 5/15/25 | | $ | 30 | | | $ | 32,381 | |
| | | | | | | | |
| | | | | | | | 304,061 | |
| Construction & Engineering — 0.2% | | | | | | |
AECOM, Series WI, 5.13%, 3/15/27 | | | 50 | | | | 50,188 | |
| Construction Materials — 0.1% | | | | | | |
American Tire Distributors, Inc., 10.25%, 3/01/22 (b) | | | 30 | | | | 31,050 | |
| Consumer Discretionary — 0.1% | | | | | | |
The ServiceMaster Co. LLC, 5.13%, 11/15/24 (b) | | | 25 | | | | 25,875 | |
| Consumer Finance — 1.2% | | | | | | |
Ally Financial, Inc., 5.13%, 9/30/24 | | | 25 | | | | 26,373 | |
American Express Co., 8.13%, 5/20/19 | | | 50 | | | | 55,560 | |
Everi Payments, Inc., 10.00%, 1/15/22 | | | 20 | | | | 21,900 | |
MasterCard, Inc., 2.95%, 11/21/26 | | | 80 | | | | 80,227 | |
Navient Corp.: | | | | | | | | |
5.00%, 10/26/20 | | | 15 | | | | 15,563 | |
6.63%, 7/26/21 | | | 25 | | | | 26,906 | |
6.13%, 3/25/24 | | | 50 | | | | 51,500 | |
Synchrony Financial, 2.60%, 1/15/19 | | | 25 | | | | 25,133 | |
Visa, Inc., 3.15%, 12/14/25 | | | 40 | | | | 40,611 | |
| | | | | | | | |
| | | | | | | | 343,773 | |
| Containers & Packaging — 0.2% | | | | | | |
Ball Corp., 4.00%, 11/15/23 | | | 15 | | | | 15,338 | |
Clearwater Paper Corp., 5.38%, 2/01/25 (b) | | | 35 | | | | 34,737 | |
| | | | | | | | |
| | | | | | | | 50,075 | |
| Diversified Financial Services — 5.4% | | | | | | |
Aircastle Ltd., 5.13%, 3/15/21 | | | 35 | | | | 37,463 | |
Bank of America Corp.: | | | | | | | | |
7.63%, 6/01/19 | | | 50 | | | | 55,134 | |
5.00%, 5/13/21 | | | 50 | | | | 54,556 | |
2.88%, 4/24/23 (a) | | | 50 | | | | 50,092 | |
3.82%, 1/20/28 (a) | | | 50 | | | | 50,868 | |
Citigroup, Inc.: | | | | | | | | |
2.05%, 12/07/18 | | | 50 | | | | 50,074 | |
2.05%, 6/07/19 | | | 50 | | | | 50,032 | |
2.45%, 1/10/20 | | | 35 | | | | 35,210 | |
4.50%, 1/14/22 | | | 50 | | | | 53,765 | |
2.75%, 4/25/22 | | | 100 | | | | 99,842 | |
CME Group, Inc., 3.00%, 9/15/22 | | | 25 | | | | 25,595 | |
FS Investment Corp., 4.75%, 5/15/22 | | | 25 | | | | 25,670 | |
General Motors Financial Co., Inc.: | | | | | | | | |
2.40%, 5/09/19 | | | 35 | | | | 35,094 | |
3.50%, 7/10/19 | | | 35 | | | | 35,814 | |
2.09%, 4/13/20 (a) | | | 100 | | | | 100,511 | |
4.20%, 3/01/21 | | | 50 | | | | 52,443 | |
3.45%, 4/10/22 | | | 50 | | | | 50,820 | |
Intercontinental Exchange, Inc., 3.75%, 12/01/25 | | | 25 | | | | 26,152 | |
JPMorgan Chase & Co.: | | | | | | | | |
6.30%, 4/23/19 | | | 50 | | | | 53,814 | |
2.55%, 3/01/21 | | | 50 | | | | 50,246 | |
4.63%, 5/10/21 | | | 50 | | | | 53,901 | |
2.40%, 6/07/21 | | | 50 | | | | 49,905 | |
2.97%, 1/15/23 | | | 100 | | | | 101,190 | |
3.88%, 9/10/24 | | | 25 | | | | 25,794 | |
3.13%, 1/23/25 | | | 50 | | | | 49,707 | |
3.22%, 3/01/25 (a) | | | 50 | | | | 50,094 | |
3.30%, 4/01/26 | | | 50 | | | | 49,650 | |
Nationstar Mortgage LLC/Nationstar Capital Corp., 6.50%, 6/01/22 | | | 50 | | | | 51,375 | |
Sally Holdings LLC/Sally Capital, Inc., 5.63%, 12/01/25 | | | 25 | | | | 25,594 | |
WMG Acquisition Corp., 5.00%, 8/01/23 (b) | | | 25 | | | | 25,625 | |
| | | | | | | | |
| | | | | | | | 1,476,030 | |
See Notes to Financial Statements.
| | | | | | |
| | | | | | | |
| | BLACKROCK FUNDS | | JUNE 30, 2017 | | 17 |
| | |
Schedule of Investments (continued) | | BlackRock Alternative Capital Strategies Fund |
| | | | | | | | |
| Corporate Bonds | | Par
(000) | | | Value | |
| Diversified Telecommunication Services — 1.4% | | | | | | |
AT&T, Inc.: | | | | | | | | |
5.88%, 10/01/19 | | $ | 50 | | | $ | 54,111 | |
2.80%, 2/17/21 | | | 50 | | | | 50,530 | |
3.20%, 3/01/22 | | | 40 | | | | 40,488 | |
3.00%, 6/30/22 | | | 50 | | | | 50,026 | |
3.40%, 5/15/25 | | | 50 | | | | 49,155 | |
CC Holdings GS V LLC/Crown Castle GS III Corp., 3.85%, 4/15/23 | | | 25 | | | | 26,282 | |
CenturyLink, Inc., Series S, 6.45%, 6/15/21 | | | 50 | | | | 54,000 | |
Verizon Communications, Inc., 4.50%, 9/15/20 | | | 50 | | | | 53,412 | |
| | | | | | | | |
| | | | | | | | 378,004 | |
| Electric Utilities — 1.3% | |
Berkshire Hathaway Energy Co., 2.40%, 2/01/20 | | | 50 | | | | 50,435 | |
Dominion Resources, Inc., Series B, 2.75%, 1/15/22 | | | 50 | | | | 50,272 | |
Duke Energy Corp., 3.05%, 8/15/22 | | | 50 | | | | 51,044 | |
Exelon Generation Co. LLC, 4.00%, 10/01/20 | | | 25 | | | | 26,084 | |
Progress Energy, Inc., 4.88%, 12/01/19 | | | 50 | | | | 52,951 | |
PSEG Power LLC, 3.00%, 6/15/21 | | | 100 | | | | 101,537 | |
Talen Energy Supply LLC: | | | | | | | | |
4.63%, 7/15/19 (b) | | | 7 | | | | 6,825 | |
6.50%, 6/01/25 | | | 15 | | | | 10,575 | |
| | | | | | | | |
| | | | | | | | 349,723 | |
| Electronic Equipment, Instruments & Components — 0.2% | |
Fortive Corp., 1.80%, 6/15/19 | | | 30 | | | | 29,785 | |
Tech Data Corp., 3.70%, 2/15/22 | | | 30 | | | | 30,612 | |
| | | | | | | | |
| | | | | | | | 60,397 | |
| Energy Equipment & Services — 0.3% | |
Transocean, Inc.: | | | | | | | | |
5.80%, 10/15/22 | | | 25 | | | | 23,187 | |
9.00%, 7/15/23 (b) | | | 50 | | | | 51,875 | |
| | | | | | | | |
| | | | | | | | 75,062 | |
| Food & Staples Retailing — 0.5% | |
Lamb Weston Holdings, Inc., 4.88%, 11/01/26 (b) | | | 100 | | | | 103,625 | |
Sysco Corp., 2.60%, 10/01/20 | | | 25 | | | | 25,310 | |
| | | | | | | | |
| | | | | | | | 128,935 | |
| Food Products — 0.6% | |
JBS USA LLC/JBS USA Finance, Inc., 5.88%, 7/15/24 (b) | | | 35 | | | | 32,813 | |
Kraft Heinz Foods Co., 2.00%, 7/02/18 | | | 100 | | | | 100,253 | |
Post Holdings, Inc., 5.50%, 3/01/25 (b) | | | 45 | | | | 46,406 | |
| | | | | | | | |
| | | | | | | | 179,472 | |
| Gas Utilities — 0.2% | |
Suburban Propane Partners LP/Suburban Energy Finance Corp., 5.50%, 6/01/24 | | | 50 | | | | 49,750 | |
| Health Care Equipment & Supplies — 1.9% | |
Abbott Laboratories: | | | | | | | | |
2.35%, 11/22/19 | | | 65 | | | | 65,489 | |
2.90%, 11/30/21 | | | 50 | | | | 50,558 | |
3.40%, 11/30/23 | | | 100 | | | | 102,368 | |
Becton Dickinson & Co., 2.89%, 6/06/22 | | | 30 | | | | 30,094 | |
Boston Scientific Corp.: | | | | | | | | |
2.85%, 5/15/20 | | | 50 | | | | 50,693 | |
3.38%, 5/15/22 | | | 50 | | | | 51,471 | |
DJO Finco, Inc./DJO Finance LLC/DJO Finance Corp., 8.13%, 6/15/21 (b) | | | 50 | | | | 46,500 | |
Hill-Rom Holdings, Inc., 5.00%, 2/15/25 (b) | | | 50 | | | | 51,000 | |
Stryker Corp., 4.38%, 1/15/20 | | | 50 | | | | 52,813 | |
Teleflex, Inc., 4.88%, 6/01/26 | | | 25 | | | | 25,563 | |
| | | | | | | | |
| | | | | | | | 526,549 | |
| | | | | | | | |
| Corporate Bonds | | Par
(000) | | | Value | |
| Health Care Providers & Services — 0.6% | |
Centene Corp., 5.63%, 2/15/21 | | $ | 30 | | | $ | 31,275 | |
CHS/Community Health Systems, Inc., 6.25%, 3/31/23 | | | 40 | | | | 41,294 | |
HCA, Inc.: | | | | | | | | |
3.75%, 3/15/19 | | | 35 | | | | 35,700 | |
5.00%, 3/15/24 | | | 50 | | | | 52,937 | |
| | | | | | | | |
| | | | | | | | 161,206 | |
| Hotels, Restaurants & Leisure — 2.1% | |
Burger King / New Red Finance, Inc., 4.63%, 1/15/22 (b) | | | 35 | | | | 35,875 | |
Darden Restaurants, Inc., 3.85%, 5/01/27 | | | 35 | | | | 35,561 | |
GLP Capital LP/GLP Financing II, Inc., 4.88%, 11/01/20 | | | 35 | | | | 37,319 | |
International Game Technology PLC, 6.50%, 2/15/25 (b) | | | 200 | | | | 219,500 | |
McDonald’s Corp.: | | | | | | | | |
2.20%, 5/26/20 | | | 50 | | | | 50,326 | |
2.63%, 1/15/22 | | | 100 | | | | 100,598 | |
3.38%, 5/26/25 | | | 50 | | | | 51,139 | |
Scientific Games International, Inc., 10.00%, 12/01/22 | | | 15 | | | | 16,444 | |
Wyndham Worldwide Corp., 2.50%, 3/01/18 | | | 50 | | | | 50,219 | |
| | | | | | | | |
| | | | | | | | 596,981 | |
| Household Durables — 0.1% | |
RSI Home Products, Inc., 6.50%, 3/15/23 (b) | | | 15 | | | | 15,788 | |
Shea Homes LP/Shea Homes Funding Corp., 6.13%, 4/01/25 (b) | | | 25 | | | | 25,812 | |
| | | | | | | | |
| | | | | | | | 41,600 | |
| Household Products — 0.1% | |
Newell Rubbermaid, Inc., 2.15%, 10/15/18 | | | 25 | | | | 25,063 | |
| Independent Power and Renewable Electricity Producers — 0.4% | |
AES Corp.: | | | | | | | | |
7.38%, 7/01/21 | | | 65 | | | | 74,425 | |
5.50%, 3/15/24 | | | 50 | | | | 52,062 | |
| | | | | | | | |
| | | | | | | | 126,487 | |
| Insurance — 1.1% | |
Aflac, Inc., 4.00%, 2/15/22 | | | 50 | | | | 53,412 | |
Allstate Corp., 3.28%, 12/15/26 | | | 25 | | | | 25,373 | |
CNO Financial Group, Inc., 4.50%, 5/30/20 | | | 10 | | | | 10,375 | |
HUB International Ltd., 7.88%, 10/01/21 (b) | | | 25 | | | | 26,063 | |
Marsh & McLennan Cos., Inc., 2.35%, 9/10/19 | | | 50 | | | | 50,327 | |
Radian Group, Inc., 5.25%, 6/15/20 | | | 75 | | | | 79,688 | |
Trinity Acquisition PLC, 3.50%, 9/15/21 | | | 50 | | | | 51,201 | |
| | | | | | | | |
| | | | | | | | 296,439 | |
| Internet Software & Services — 0.6% | |
eBay, Inc., 2.75%, 1/30/23 | | | 50 | | | | 49,557 | |
Expedia, Inc., 4.50%, 8/15/24 | | | 25 | | | | 26,309 | |
Priceline Group, Inc., 3.60%, 6/01/26 | | | 50 | | | | 50,613 | |
VeriSign, Inc., 4.63%, 5/01/23 | | | 35 | | | | 35,875 | |
| | | | | | | | |
| | | | | | | | 162,354 | |
| IT Services — 0.1% | |
Verisk Analytics, Inc., 4.00%, 6/15/25 | | | 25 | | | | 25,832 | |
| Machinery — 0.1% | |
Stanley Black & Decker, Inc., 1.62%, 11/17/18 | | | 40 | | | | 39,902 | |
| Media — 2.2% | |
Charter Communications Operating LLC/Charter Communications Operating Capital: | | | | | | | | |
3.58%, 7/23/20 | | | 50 | | | | 51,669 | |
4.91%, 7/23/25 | | | 100 | | | | 108,032 | |
3.75%, 2/15/28 (b)(d) | | | 50 | | | | 49,262 | |
See Notes to Financial Statements.
| | | | | | |
| | | | | | | |
| 18 | | BLACKROCK FUNDS | | JUNE 30, 2017 | | |
| | |
Schedule of Investments (continued) | | BlackRock Alternative Capital Strategies Fund |
| | | | | | | | |
| Corporate Bonds | | Par
(000) | | | Value | |
| Media (continued) | |
CSC Holdings LLC, 5.25%, 6/01/24 | | $ | 50 | | | $ | 51,005 | |
DISH DBS Corp.: | | | | | | | | |
5.88%, 11/15/24 | | | 25 | | | | 26,674 | |
7.75%, 7/01/26 | | | 100 | | | | 118,500 | |
Hughes Satellite Systems Corp.: | | | | | | | | |
5.25%, 8/01/26 | | | 35 | | | | 36,575 | |
6.63%, 8/01/26 | | | 55 | | | | 59,125 | |
Sirius XM Radio, Inc. (b): | | | | | | | | |
5.38%, 4/15/25 | | | 35 | | | | 36,181 | |
5.38%, 7/15/26 | | | 50 | | | | 51,750 | |
Time Warner Cable, Inc., 4.00%, 9/01/21 | | | 20 | | | | 20,906 | |
Univision Communications, Inc., 5.13%, 2/15/25 (b) | | | 15 | | | | 14,869 | |
| | | | | | | | |
| | | | | | | | 624,548 | |
| Metals & Mining — 0.8% | |
Aleris International, Inc., 7.88%, 11/01/20 | | | 13 | | | | 12,253 | |
Freeport-McMoRan, Inc.: | | | | | | | | |
3.55%, 3/01/22 | | | 50 | | | | 46,859 | |
3.88%, 3/15/23 | | | 50 | | | | 46,500 | |
Kinross Gold Corp., 5.95%, 3/15/24 | | | 50 | | | | 55,234 | |
Teck Resources Ltd., 6.25%, 7/15/41 | | | 25 | | | | 25,937 | |
United States Steel Corp., 8.38%, 7/01/21 (b) | | | 25 | | | | 27,500 | |
| | | | | | | | |
| | | | | | | | 214,283 | |
| Multi-Utilities — 0.3% | |
AmeriGas Partners LP/AmeriGas Finance Corp.: | | | | | | | | |
5.63%, 5/20/24 | | | 45 | | | | 46,350 | |
5.50%, 5/20/25 | | | 50 | | | | 51,000 | |
| | | | | | | | |
| | | | | | | | 97,350 | |
| Oil, Gas & Consumable Fuels — 1.9% | |
Buckeye Partners LP, 3.95%, 12/01/26 | | | 25 | | | | 24,746 | |
Kinder Morgan, Inc., 3.05%, 12/01/19 | | | 25 | | | | 25,434 | |
Marathon Petroleum Corp., 2.70%, 12/14/18 | | | 50 | | | | 50,382 | |
ONEOK, Inc., 7.50%, 9/01/23 | | | 50 | | | | 59,625 | |
Rowan Cos., Inc., 7.38%, 6/15/25 | | | 50 | | | | 46,625 | |
Sabine Pass Liquefaction LLC, 5.63%, 3/01/25 | | | 50 | | | | 55,153 | |
Tesoro Corp., 5.13%, 12/15/26 (b) | | | 50 | | | | 54,411 | |
TransCanada PipeLines Ltd.: | | | | | | | | |
3.13%, 1/15/19 | | | 30 | | | | 30,529 | |
3.80%, 10/01/20 | | | 50 | | | | 52,480 | |
Williams Partners LP: | | | | | | | | |
4.30%, 3/04/24 | | | 50 | | | | 52,009 | |
3.75%, 6/15/27 | | | 50 | | | | 49,491 | |
WPX Energy, Inc., 7.50%, 8/01/20 | | | 15 | | | | 15,750 | |
| | | | | | | | |
| | | | | | | | 516,635 | |
| Personal Products — 0.2% | | | | | | |
Avon International Operations, Inc., 7.88%, 8/15/22 (b) | | | 50 | | | | 51,875 | |
| Pharmaceuticals — 0.8% | | | | | | |
AbbVie, Inc., 2.30%, 5/14/21 | | | 25 | | | | 24,938 | |
Johnson & Johnson, 2.95%, 3/03/27 | | | 75 | | | | 75,897 | |
Laboratory Corp. of America Holdings, 2.50%, 11/01/18 | | | 50 | | | | 50,397 | |
Shire Acquisitions Investments Ireland DAC, 1.90%, 9/23/19 | | | 50 | | | | 49,768 | |
Valeant Pharmaceuticals International, Inc., 5.38%, 3/15/20 (b) | | | 15 | | | | 14,494 | |
| | | | | | | | |
| | | | | | | | 215,494 | |
| Producer Durables: Miscellaneous — 0.1% | | | | | | |
CA, Inc., 3.60%, 8/15/22 | | | 25 | | | | 25,281 | |
| Real Estate Investment Trusts (REITs) — 0.5% | | | | | | |
American Tower Corp., 3.50%, 1/31/23 | | | 25 | | | | 25,640 | |
Digital Realty Trust, Inc., 3.40%, 10/01/20 | | | 50 | | | | 51,281 | |
Hospitality Properties Trust, 4.50%, 6/15/23 | | | 50 | | | | 52,400 | |
| | | | | | | | |
| | | | | | | | 129,321 | |
| | | | | | | | |
| Corporate Bonds | | Par
(000) | | | Value | |
| Real Estate Management & Development — 0.1% | | | | | | |
Howard Hughes Corp., 5.38%, 3/15/25 (b) | | $ | 25 | | | $ | 25,563 | |
| Road & Rail — 0.1% | | | | | | |
OPE KAG Finance Sub, Inc., 7.88%, 7/31/23 (b) | | | 15 | | | | 15,750 | |
| Semiconductors & Semiconductor Equipment — 1.8% | | | | |
Analog Devices, Inc., 2.50%, 12/05/21 | | | 25 | | | | 25,023 | |
Applied Materials, Inc., 3.30%, 4/01/27 | | | 30 | | | | 30,488 | |
Broadcom Corp./Broadcom Cayman Finance Ltd. (b): | | | | | | | | |
2.38%, 1/15/20 | | | 75 | | | | 75,109 | |
3.00%, 1/15/22 | | | 75 | | | | 75,670 | |
3.63%, 1/15/24 | | | 40 | | | | 40,920 | |
Intel Corp.: | | | | | | | | |
2.35%, 5/11/22 | | | 100 | | | | 100,233 | |
2.88%, 5/11/24 | | | 100 | | | | 100,379 | |
NVIDIA Corp., 3.20%, 9/16/26 | | | 50 | | | | 49,576 | |
| | | | | | | | |
| | | | | | | | 497,398 | |
| Software — 0.4% | | | | | | |
BMC Software Finance, Inc., 8.13%, 7/15/21 (b) | | | 15 | | | | 15,530 | |
CDW LLC/CDW Finance Corp., 5.50%, 12/01/24 | | | 50 | | | | 54,078 | |
Infor US, Inc., 6.50%, 5/15/22 | | | 30 | | | | 31,050 | |
| | | | | | | | |
| | | | | | | | 100,658 | |
| Technology Hardware, Storage & Peripherals — 1.2% | |
Apple, Inc., 3.35%, 2/09/27 | | | 65 | | | | 66,452 | |
DXC Technology Co., 4.75%, 4/15/27 (b) | | | 50 | | | | 52,134 | |
Hewlett Packard Enterprise Co.: | | | | | | | | |
2.85%, 10/05/18 | | | 75 | | | | 75,642 | |
4.90%, 10/15/25 | | | 50 | | | | 52,420 | |
Seagate HDD Cayman, 4.25%, 3/01/22 (b) | | | 40 | | | | 40,659 | |
Western Digital Corp., 10.50%, 4/01/24 | | | 45 | | | | 53,085 | |
| | | | | | | | |
| | | | | | | | 340,392 | |
| Thrifts & Mortgage Finance — 0.1% | | | | | | |
Quicken Loans, Inc., 5.75%, 5/01/25 (b) | | | 15 | | | | 15,488 | |
| Tobacco — 0.9% | | | | | | |
Alliance One International, Inc., 9.88%, 7/15/21 | | | 25 | | | | 21,750 | |
Altria Group, Inc., 4.00%, 1/31/24 | | | 50 | | | | 53,345 | |
Philip Morris International, Inc.: | | | | | | | | |
2.63%, 2/18/22 | | | 70 | | | | 70,476 | |
3.25%, 11/10/24 | | | 25 | | | | 25,451 | |
Reynolds American, Inc., 2.30%, 6/12/18 | | | 50 | | | | 50,218 | |
Vector Group Ltd., 6.13%, 2/01/25 (b) | | | 35 | | | | 36,356 | |
| | | | | | | | |
| | | | | | | | 257,596 | |
| Wireless Telecommunication Services — 1.2% | | | | | | |
American Tower Corp.: | | | | | | | | |
3.30%, 2/15/21 | | | 50 | | | | 51,306 | |
3.55%, 7/15/27 | | | 80 | | | | 79,327 | |
Communications Sales & Leasing, Inc./CSL Capital LLC, 6.00%, 4/15/23 (b) | | | 15 | | | | 15,609 | |
DuPont Fabros Technology LP, 5.63%, 6/15/23 | | | 15 | | | | 16,013 | |
Sprint Communications, Inc., 6.00%, 11/15/22 | | | 25 | | | | 26,500 | |
Sprint Corp., 7.88%, 9/15/23 | | | 25 | | | | 28,750 | |
T-Mobile USA, Inc.: | | | | | | | | |
6.63%, 4/01/23 | | | 50 | | | | 52,910 | |
6.38%, 3/01/25 | | | 50 | | | | 54,062 | |
| | | | | | | | |
| | | | | | | | 324,477 | |
| Total Corporate Bonds — 44.1% | | | | 12,203,854 | |
| | | | | | | | |
| | | | | | | | | |
| | |
| Non-Agency Mortgage-Backed Securities | | | | | | |
| Commercial Mortgage-Backed Securities — 0.5% | | | | | | |
Bear Stearns Commercial Mortgage Securities Trust, Series 2007-PW18, Class AMA, 6.09%, 6/11/50 (a) | | | 100 | | | | 101,213 | |
See Notes to Financial Statements.
| | | | | | |
| | | | | | | |
| | BLACKROCK FUNDS | | JUNE 30, 2017 | | 19 |
| | |
Schedule of Investments (continued) | | BlackRock Alternative Capital Strategies Fund |
| | | | | | | | |
| Non-Agency Mortgage-Backed Securities | | Par
(000) | | | Value | |
| Commercial Mortgage-Backed Securities (continued) | |
Commercial Mortgage Trust, Series 2008-LS1, Class A4B, 6.16%, 12/10/49 (a) | | $ | 36 | | | $ | 36,075 | |
| Total Non-Agency Mortgage-Backed Securities — 0.5% | | | | 137,288 | |
| | | | | | | | |
| | | | | | | | | |
| | |
| U.S. Government Sponsored Agency Securities | | | | | | |
| Collateralized Mortgage Obligations — 5.7% | | | | | | |
Fannie Mae Connecticut Avenue Securities (a): | | | | | | | | |
Series 2014-C02, Class 2M1, 2.17%, 5/25/24 | | | 15 | | | | 15,160 | |
Series 2014-C03, Class 2M1., 2.42%, 7/25/24 | | | 18 | | | | 17,612 | |
Series 2017-C01, Class 1M1, 2.52%, 7/25/29 | | | 97 | | | | 98,458 | |
Series 2016-C05, Class 2M1, 2.57%, 1/25/29 | | | 79 | | | | 80,138 | |
Series 2016-C04, Class 1M1, 2.67%, 1/25/29 | | | 142 | | | | 143,810 | |
Series 2015-C03, Class 2M1, 2.72%, 7/25/25 | | | 7 | | | | 6,855 | |
Series 2015-C04, Class 2M1, 2.92%, 4/25/28 | | | 20 | | | | 20,469 | |
Series 2016-C03, Class 2M1, 3.42%, 10/25/28 | | | 75 | | | | 76,026 | |
Series 2014-C02, Class 2M2, 3.82%, 5/25/24 | | | 100 | | | | 104,517 | |
Series 2014-C03, Class 2M2, 4.12%, 7/25/24 | | | 100 | | | | 105,669 | |
Series 2015-C02, Class 2M2, 5.22%, 5/25/25 | | | 182 | | | | 196,023 | |
Series 2015-C01, Class 1M2, 5.52%, 2/25/25 | | | 86 | | | | 93,734 | |
Series 2015-C03, Class 1M2, 6.22%, 11/25/24 - 7/25/25 | | | 208 | | | | 233,485 | |
Series 2015-C04, Class 1M2, 6.92%, 4/25/28 | | | 100 | | | | 113,945 | |
Freddie Mac Structured Agency Credit Risk Debt Notes, Series 2015-DN1, Class M3, 5.37%, 1/25/25 (a) | | | 250 | | | | 271,187 | |
| | | | | | | | |
| | | | | | | | 1,577,088 | |
| Mortgage-Backed Securities — 35.2% | | | | | | |
Fannie Mae Mortgage-Backed Securities: | | | | | | | | |
3.00%, 7/01/47 (e) | | | 271 | | | | 270,884 | |
3.50%, 11/01/45 - 5/01/47 | | | 1,264 | | | | 1,299,205 | |
4.00%, 7/01/32 - 7/01/47 (e) | | | 1,083 | | | | 1,137,669 | |
4.50%, 7/01/32 - 7/01/47 (e) | | | 1,617 | | | | 1,732,351 | |
5.00%, 2/01/41 - 7/01/47 (e) | | | 949 | | | | 1,036,786 | |
5.50%, 7/01/47 (e) | | | 400 | | | | 443,125 | |
Freddie Mac Mortgage-Backed Securities (e): | | | | | | | | |
3.00%, 7/01/47 | | | 360 | | | | 359,213 | |
3.50%, 7/01/32 - 7/01/47 | | | 668 | | | | 689,830 | |
4.00%, 7/01/32 - 7/01/47 | | | 512 | | | | 538,089 | |
4.50%, 5/01/42 - 7/01/47 | | | 61 | | | | 65,980 | |
| | | | | | | | |
| U.S. Government Sponsored Agency Securities | | Par
(000) | | | Value | |
| Mortgage-Backed Securities (continued) | | | | | | |
Ginnie Mae Mortgage-Backed Securities (e): | | | | | | | | |
3.50%, 7/20/46 - 7/01/47 | | $ | 910 | | | $ | 943,190 | |
4.00%, 11/20/46 - 7/01/47 | | | 583 | | | | 613,135 | |
4.50%, 7/01/47 | | | 401 | | | | 426,952 | |
5.00%, 7/01/47 | | | 175 | | | | 187,633 | |
| | | | | | | | |
| | | | | | | | 9,744,042 | |
| Total U.S. Government Sponsored Agency Securities — 40.9% | | | | 11,321,130 | |
Total Long-Term Investments
(Cost — $31,854,752) — 116.6% | | | | | | | 32,270,683 | |
| | | | | | | | |
| | | | | | | | | |
| | |
| Short-Term Securities | | Shares | | | | |
BlackRock Liquidity Funds, T-Fund, Institutional Class, 0.84% (f)(g) | | | 389,982 | | | | 389,982 | |
Total Short-Term Securities
(Cost — $389,982) — 1.4% | | | | | | | 389,982 | |
Total Investments Before TBA Sale Commitments
(Cost — $32,244,734) — 118.0% | | | | 32,660,665 | |
| | | | | | | | |
| | | | | | | | | |
| TBA Sale Commitments (e) | | Par
(000) | | | | |
| Mortgage-Backed Securities — (1.8%) | | | | | | |
Fannie Mae Mortgage-Backed Securities,
3.50%, 7/01/32 – 7/01/47: | | $ | 259 | | | | (268,557 | ) |
Freddie Mac Mortgage-Backed Securities, 4.50%, 7/01/32 | | | 25 | | | | (25,524 | ) |
Ginnie Mae Mortgage-Backed Securities, 3.00%, 7/20/47 | | | 210 | | | | (212,116 | ) |
Total TBA Sale Commitments
(Proceeds — $509,668) — 1.8% | | | | | | | (506,197 | ) |
Total Investments, Net of TBA Sale Commitments
(Cost — $31,735,066) — 116.2% | | | | | | | 32,154,468 | |
Liabilities in Excess of Other Assets — (16.2)% | | | | | | | (4,482,652 | ) |
| | | | | | | | |
Net Assets — 100.0% | | | | | | $ | 27,671,816 | |
| | | | | | | | |
|
| Notes to Schedule of Investments |
| (a) | | Variable rate security. Rate as of period end. |
| (b) | | Security exempt from registration pursuant to Rule 144A under the Securities Act of 1933, as amended. These securities may be resold in transactions exempt from registration to qualified institutional investors. |
| (c) | | Security is valued using significant unobservable inputs and is classified as Level 3 in the fair value hierarchy. |
| (d) | | When-issued security. |
| (e) | | Represents or includes a TBA transaction. As of period end, unsettled TBA transactions were as follows: |
| | | | | | | | |
| Counterparty | | Value | | | Unrealized
Appreciation
(Depreciation) | |
Bank of America Corp. | | $ | 1,702,309 | | | $ | (8,567 | ) |
Barclays Capital, Inc. | | $ | 75,089 | | | $ | (282 | ) |
Citigroup Global Markets, Inc. | | $ | 283,100 | | | $ | (787 | ) |
Credit Suisse Securities (USA) LLC | | $ | 1,389,090 | | | $ | (6,334 | ) |
Goldman Sachs & Co. | | $ | 169,554 | | | $ | (835 | ) |
J.P. Morgan Securities LLC | | $ | 216,994 | | | $ | (498 | ) |
Mizuho Securities USA, Inc. | | $ | 72,904 | | | $ | (268 | ) |
Morgan Stanley & Co. LLC | | $ | 332,845 | | | $ | (1,519 | ) |
Nomura Securities International, Inc. | | $ | 626,719 | | | $ | (2,794 | ) |
RBC Capital Markets | | $ | (179,489 | ) | | $ | 2,146 | |
See Notes to Financial Statements.
| | | | | | |
| | | | | | | |
| 20 | | BLACKROCK FUNDS | | JUNE 30, 2017 | | |
| | |
Schedule of Investments (continued) | | BlackRock Alternative Capital Strategies Fund |
| (f) | | Current yield as of period end. |
| (g) | | During the six months ended June 30, 2017, investments in issuers considered to be an affiliate of the Fund for purposes of Section 2(a)(3) of the Investment Company Act of 1940, as amended, were as follows: |
| | | | | | | | | | | | | | | | | | | | | | | | | | | | | | | | |
| Affiliate | | Shares Held
at December 31,
2016 | | | Net
Activity | | | Shares Held
at June 30,
2017 | | | Value
Held at
June 30,
2017 | | | Income | | | Realized Gain (Loss) | | | Change in
Unrealized
Appreciation
(Depreciation) | | | | |
BlackRock Liquidity Funds, T-Fund, Institutional Class | | | 406,999 | | | | (17,017 | ) | | | 389,982 | | | $ | 389,982 | | | $ | 967 | | | | — | | | | — | | | | | |
For Fund compliance purposes, the Fund’s industry classifications refer to one or more of the industry sub-classifications used by one or more widely recognized market indexes or rating group indexes, and/or as defined by the investment adviser. These definitions may not apply for purposes of this report, which may combine such industry sub-classifications for reporting ease.
|
| Derivative Financial Instruments Outstanding as of Period End |
| | | | | | | | | | | | | | | | | | |
| Futures Contracts | | | | | | | |
Contracts
Long (Short) | | | Issue | | Expiration | | Notional
Value | | | Unrealized
Appreciation
(Depreciation) | | | | |
| | (12 | ) | | 2-Year U.S. Treasury Note | | September 2017 | | $ | 2,593,312 | | | $ | 2,750 | | | | | |
| | 5 | | | 5-Year U.S. Treasury Note | | September 2017 | | $ | 589,180 | | | | (1,173 | ) | | | | |
| | 11 | | | 10-Year Australian Treasury Bonds | | September 2017 | | $ | 1,092,839 | | | | (16,889 | ) | | | | |
| | (14 | ) | | 10-Year Canadian Bond | | September 2017 | | $ | 1,517,350 | | | | 41,140 | | | | | |
| | 21 | | | 10-Year U.S. Treasury Note | | September 2017 | | $ | 2,636,156 | | | | (16,591 | ) | | | | |
| | (6 | ) | | 10-Year U.S. Ultra Long Treasury Note | | September 2017 | | $ | 808,875 | | | | 1,092 | | | | | |
| | (2 | ) | | Euro Bund | | September 2017 | | $ | 369,760 | | | | 2,854 | | | | | |
| | 1 | | | Euro OAT | | September 2017 | | $ | 169,586 | | | | (1,634 | ) | | | | |
| | 1 | | | German Euro BTP | | September 2017 | | $ | 154,350 | | | | (2,034 | ) | | | | |
| | 2 | | | Long U.S. Treasury Bond | | September 2017 | | $ | 307,375 | | | | 2,122 | | | | | |
| | (2 | ) | | UK Long Gilt Bond | | September 2017 | | $ | 327,097 | | | | 2,186 | | | | | |
| | 2 | | | Ultra Long U.S. Treasury Bond | | September 2017 | | $ | 331,750 | | | | 5,950 | | | | | |
| | Total | | | | | | | | | | | $ | 19,773 | | | | | |
| | | | | | | | | | | | | | |
| | | | | | | | | | | | | | | | | | | | | | |
| Forward Foreign Currency Exchange Contracts | | | | | | |
Currency
Purchased | | | Currency
Sold | | | Counterparty | | Settlement
Date | | | Unrealized
Appreciation
(Depreciation) | |
| AUD | | | 70,000 | | | | USD | | | | 53,104 | | | Goldman Sachs International | | | 9/21/17 | | | $ | 645 | |
| | | | | | | | | | | | | | | | | | | | | | |
| USD | | | 19,311 | | | | GBP | | | | 15,000 | | | Goldman Sachs International | | | 7/05/17 | | | | (226 | ) |
| USD | | | 7,676 | | | | AUD | | | | 10,000 | | | Barclays Bank PLC | | | 9/21/17 | | | | (3 | ) |
| USD | | | 15,335 | | | | AUD | | | | 20,000 | | | Deutsche Bank AG | | | 9/21/17 | | | | (22 | ) |
| USD | | | 7,573 | | | | CAD | | | | 10,000 | | | UBS AG | | | 9/21/17 | | | | (147 | ) |
| | | | | | | | | | | | | | | | | | | | | (398 | ) |
| | | | | | | | | | | | | | | | | | | | | | |
Net Unrealized Appreciation | | | | | | $ | 247 | |
| | | | | | | | | | | | | | | | | | | | | | |
| | | | | | | | | | | | | | | | | | | | | | | | | | | | |
| Centrally Cleared Credit Default Swaps — Sell Protection | | | | | | | | | | | | | |
| Issuer / Index | | Receive
Fixed Rate | | | Expiration
Date | | | Credit
Rating1 | | | Notional
Amount
(000)2 | | | Unrealized
Depreciation | | | | |
Dow Jones CDX North America High Yield Index, Series 28, Version 1 | | | 5.00 | % | | | 6/20/22 | | | | B+ | | | | USD | | | | 877 | | | $ | (2,688 | ) | | | | |
| | | | | | | | | | | | | | | | | | | | | | | | | | | | |
1 Using Standard & Poor’s rating of the issuer or the underlying securities of the index, as applicable. | |
2 The maximum potential amount the Fund may pay should a negative credit event take place as defined under the terms of the agreement. | |
See Notes to Financial Statements.
| | | | | | |
| | | | | | | |
| | BLACKROCK FUNDS | | JUNE 30, 2017 | | 21 |
| | |
Schedule of Investments (continued) | | BlackRock Alternative Capital Strategies Fund |
| | | | | | | | | | | | | | | | | | |
| OTC Total Return Swaps1 | | | | | | | |
| Reference Entity | | Counterparty | | Expiration Date | | | Net Notional
Amount | | | Unrealized
Appreciation
(Depreciation) | | | Net Value of
Reference
Entities | |
Equity Securities Long/Short: | | Morgan Stanley & Co. International PLC | | | 5/28/19 | | | $ | 275,199 | | | $ | 16,509 | 2 | | $ | 294,593 | |
| | Bank of America N.A. | | | 1/19/18 | | | | (124,342 | ) | | | 389,909 | 3 | | | 286,301 | |
| | Morgan Stanley & Co. International PLC | | | 2/07/19 | | | | 60,319 | | | | 49,979 | 4 | | | 107,396 | |
| | | Bank of America N.A. | | | 1/19/18 | | | | (186,350 | ) | | | 282,750 | 5 | | | 89,149 | |
Total | | | | | | | | $ | 24,826 | | | $ | 739,147 | | | $ | 777,439 | |
| | | | | | | | | | |
1 The Fund receives or pays the total return on a portfolio of long and short positions underlying the total return swap. In addition, the Fund pays or receives a variable rate of interest, based on a specified benchmark, plus or minus a spread in a range of 20 – 1,293 basis points. The benchmark and spread are determined based upon the country and/or currency of the individual underlying positions. The following are the specified benchmarks used in determining the variable rate of interest: | | | | | |
Garban Intercapital Federal Funds Rate Open | | | | | |
2 Amount includes $(2,885) of net dividends and financing fees. | | | | | |
3 Amount includes $(20,734) of net dividends and financing fees. | | | | | |
4 Amount includes $2,902 of net dividends and financing fees. | | | | | |
5 Amount includes $7,251 of net dividends and financing fees. | | | | | |
See Notes to Financial Statements.
| | | | | | |
| | | | | | | |
| 22 | | BLACKROCK FUNDS | | JUNE 30, 2017 | | |
| | |
Schedule of Investments (continued) | | BlackRock Alternative Capital Strategies Fund |
| | | | | | | | |
| The following table represents the individual long and short positions and related values of the equity securities underlying the total return swap with Morgan Stanley & Co. International PLC as of June 30, 2017, expiration date 5/28/19: | |
| | | Shares | | | Value | |
| Reference Entity — Long | | | | | | |
| Aerospace & Defense | | | | | | |
Arconic, Inc. | | | 2,575 | | | $ | 58,324 | |
General Dynamics Corp. | | | 52 | | | | 10,301 | |
Raytheon Co. | | | 597 | | | | 96,403 | |
| | | | | | | | |
| | | | | | | | 165,028 | |
| Air Freight & Logistics | | | | | | |
United Parcel Service, Inc., Class B | | | 828 | | | | 91,569 | |
| Airlines | | | | | | |
JetBlue Airways Corp. | | | 1,043 | | | | 23,812 | |
| Biotechnology | | | | | | |
Amgen, Inc. | | | 20 | | | | 3,445 | |
| Commercial Services & Supplies | | | | | | |
Republic Services, Inc. | | | 507 | | | | 32,311 | |
| Communications Equipment | | | | | | |
Cisco Systems, Inc. | | | 2,856 | | | | 89,393 | |
Motorola Solutions, Inc. | | | 3 | | | | 260 | |
| | | | | | | | |
| | | | | | | | 89,653 | |
| Construction Materials | | | | | | |
Vulcan Materials Co. | | | 93 | | | | 11,781 | |
| Consumer Finance | | | | | | |
American Express Co. | | | 237 | | | | 19,965 | |
OneMain Holdings, Inc. | | | 1,044 | | | | 25,672 | |
| | | | | | | | |
| | | | | | | | 45,637 | |
| Electric Utilities | | | | | | |
American Electric Power Co., Inc. | | | 86 | | | | 5,975 | |
Duke Energy Corp. | | | 853 | | | | 71,302 | |
Exelon Corp. | | | 275 | | | | 9,919 | |
| | | | | | | | |
| | | | | | | | 87,196 | |
| Energy Equipment & Services | | | | | | |
Baker Hughes, Inc. | �� | | 75 | | | | 4,088 | |
Halliburton Co. | | | 837 | | | | 35,749 | |
| | | | | | | | |
| | | | | | | | 39,837 | |
| Food & Staples Retailing | | | | | | |
CVS Health Corp. | | | 1,218 | | | | 98,000 | |
Wal-Mart Stores, Inc. | | | 87 | | | | 6,584 | |
| | | | | | | | |
| | | | | | | | 104,584 | |
| Food Products | | | | | | |
Campbell Soup Co. | | | 130 | | | | 6,780 | |
General Mills, Inc. | | | 673 | | | | 37,284 | |
| | | | | | | | |
| | | | | | | | 44,064 | |
| Health Care Providers & Services | | | | | | |
HCA Holdings, Inc. | | | 522 | | | | 45,518 | |
| Hotels, Restaurants & Leisure | | | | | | |
Marriott International, Inc., Class A | | | 36 | | | | 3,611 | |
Royal Caribbean Cruises Ltd. | | | 36 | | | | 35,172 | |
| | | | | | | | |
| | | | | | | | 38,783 | |
| Household Durables | | | | | | |
CalAtlantic Group, Inc. | | | 781 | | | | 27,608 | |
| Household Products | | | | | | |
Clorox Co. | | | 64 | | | | 8,527 | |
Colgate-Palmolive Co. | | | 971 | | | | 71,980 | |
Kimberly-Clark Corp. | | | 288 | | | | 37,184 | |
| | | | | | | | |
| | | | | | | | 117,691 | |
| | | | | | | | |
| | | Shares | | | Value | |
| Reference Entity — Long (continued) | | | | | | |
| Independent Power and Renewable Electricity Producers | |
AES Corp. | | | 8,022 | | | $ | 89,125 | |
NRG Energy, Inc. | | | 361 | | | | 6,216 | |
| | | | | | | | |
| | | | | | | | 95,341 | |
| Insurance | | | | | | |
Hartford Financial Services Group, Inc. | | | 64 | | | | 3,365 | |
Loews Corp. | | | 736 | | | | 34,452 | |
Prudential Financial, Inc. | | | 31 | | | | 3,352 | |
XL Group Ltd. | | | 153 | | | | 6,701 | |
| | | | | | | | |
| | | | | | | | 47,870 | |
| IT Services | | | | | | |
International Business Machines Corp. | | | 27 | | | | 4,153 | |
| Leisure Products | | | | | | |
Hasbro, Inc. | | | 11 | | | | 1,227 | |
| Machinery | | | | | | |
Cummins, Inc. | | | 31 | | | | 5,029 | |
Deere & Co. | | | 54 | | | | 6,674 | |
Meritor, Inc. | | | 1,218 | | | | 20,231 | |
| | | | | | | | |
| | | | | | | | 31,934 | |
| Media | | | | | | |
TEGNA, Inc. | | | 5,021 | | | | 72,353 | |
Twenty-First Century Fox, Inc., Class A | | | 130 | | | | 3,684 | |
| | | | | | | | |
| | | | | | | | 76,037 | |
| Metals & Mining | | | | | | |
Barrick Gold Corp. | | | 3,994 | | | | 63,545 | |
Newmont Mining Corp. | | | 1,377 | | | | 44,601 | |
Teck Resources Ltd., Class B | | | 344 | | | | 5,961 | |
| | | | | | | | |
| | | | | | | | 114,107 | |
| Multiline Retail | | | | | | |
Macy’s, Inc. | | | 1,687 | | | | 39,206 | |
| Oil, Gas & Consumable Fuels | | | | | | |
Apache Corp. | | | 276 | | | | 13,229 | |
ConocoPhillips | | | 69 | | | | 3,033 | |
Devon Energy Corp. | | | 2,510 | | | | 80,245 | |
Exxon Mobil Corp. | | | 42 | | | | 3,391 | |
Murphy Oil Corp. | | | 1,683 | | | | 43,135 | |
Valero Energy Corp. | | | 88 | | | | 5,936 | |
| | | | | | | | |
| | | | | | | | 148,969 | |
| Pharmaceuticals | | | | | | |
Bristol-Myers Squibb Co. | | | 34 | | | | 1,895 | |
Pfizer, Inc. | | | 1,009 | | | | 33,892 | |
| | | | | | | | |
| | | | | | | | 35,787 | |
| Real Estate Investment Trusts (REITs) | | | | | | |
Kimco Realty Corp. | | | 235 | | | | 4,312 | |
| Road & Rail | | | | | | |
CSX Corp. | | | 252 | | | | 13,749 | |
Norfolk Southern Corp. | | | 413 | | | | 50,262 | |
Ryder System, Inc. | | | 385 | | | | 27,712 | |
Union Pacific Corp. | | | 137 | | | | 14,921 | |
| | | | | | | | |
| | | | | | | | 106,644 | |
| Specialty Retail | | | | | | |
Home Depot, Inc. | | | 622 | | | | 95,415 | |
| Technology Hardware, Storage & Peripherals | | | | | | |
HP, Inc. | | | 176 | | | | 3,076 | |
| Trading Companies & Distributors | | | | | | |
HD Supply Holdings, Inc. | | | 536 | | | | 16,418 | |
| Total Reference Entity — Long | | | | | | | 1,789,013 | |
See Notes to Financial Statements.
| | | | | | |
| | | | | | | |
| | BLACKROCK FUNDS | | JUNE 30, 2017 | | 23 |
| | |
Schedule of Investments (continued) | | BlackRock Alternative Capital Strategies Fund |
| | | | | | | | |
| | | Shares | | | Value | |
| Reference Entity — Short | | | | | | |
| Aerospace & Defense | | | | | | |
TransDigm Group, Inc. | | | (348 | ) | | $ | (93,567 | ) |
| Beverages | | | | | | |
Molson Coors Brewing Co. | | | (477 | ) | | | (41,184 | ) |
| Electric Utilities | | | | | | |
Southern Co. | | | (1,929 | ) | | | (92,360 | ) |
| Energy Equipment & Services | | | | | | |
Transocean Ltd. | | | (10,064 | ) | | | (82,827 | ) |
| Food Products | | | | | | |
Archer-Daniels-Midland Co. | | | (1,941 | ) | | | (80,318 | ) |
| Food Products | | | | | | |
Kellogg Co. | | | (1,210 | ) | | | (84,047 | ) |
| Health Care Equipment & Supplies | | | | | | |
Abbott Laboratories | | | (778 | ) | | | (37,819 | ) |
| Household Durables | | | | | | |
Lennar Corp. | | | (688 | ) | | | (36,684 | ) |
Mohawk Industries, Inc. | | | (249 | ) | | | (60,181 | ) |
| | | | | | | | |
| | | | | | | | (96,865 | ) |
| Internet & Direct Marketing Retail | | | | | | |
Expedia, Inc. | | | (490 | ) | | | (72,985 | ) |
| IT Services | | | | | | |
Western Union Co. | | | (4,636 | ) | | | (88,316 | ) |
| Machinery | | | | | | |
Stanley Black & Decker, Inc. | | | (671 | ) | | | (94,430 | ) |
| Media | | | | | | |
Comcast Corp., Class A | | | (1,813 | ) | | | (70,562 | ) |
| Multi-Utilities | | | | | | |
Dominion Resources, Inc. | | | (1,204 | ) | | | (92,263 | ) |
Sempra Energy | | | (124 | ) | | | (13,981 | ) |
| | | | | | | | |
| | | | | | | | (106,244 | ) |
| Multiline Retail | | | | | | |
Dillard’s, Inc., Class A Class A | | | (463 | ) | | | (26,710 | ) |
JC Penney Co., Inc. | | | (1,629 | ) | | | (7,575 | ) |
| | | | | | | | |
| | | | | | | | (34,285 | ) |
| Oil, Gas & Consumable Fuels | | | | | | |
Chesapeake Energy Corp. | | | (19,062 | ) | | | (94,738 | ) |
| Real Estate Investment Trusts (REITs) | | | | | | |
HCP, Inc. | | | (2,599 | ) | | | (83,064 | ) |
Simon Property Group, Inc. | | | (70 | ) | | | (11,323 | ) |
| | | | | | | | |
| | | | | | | | (94,387 | ) |
| Road & Rail | | | | | | |
Canadian National Railway Co. | | | (408 | ) | | | (33,068 | ) |
| Semiconductors & Semiconductor Equipment | | | | | | |
Intel Corp. | | | (1,554 | ) | | | (52,432 | ) |
| Specialty Retail | | | | | | |
Gap, Inc. | | | (2,824 | ) | | | (62,100 | ) |
| Textiles, Apparel & Luxury Goods | | | | | | |
VF Corp. | | | (752 | ) | | | (43,315 | ) |
| Wireless Telecommunication Services | | | | | | |
Rogers Communications, Inc. | | | (817 | ) | | | (38,571 | ) |
| Total Reference Entity — Short | | | | | | | (1,494,420 | ) |
| Net Value of Reference Entity — Morgan Stanley & Co. International PLC | | | $ | 294,593 | |
| | | | | | | | |
| The following table represents the individual long and short positions and related values of the equity securities underlying the total return swap with Bank of America N.A., as of June 30, 2017, expiration date 1/19/18: | |
| | | Shares | | | Value | |
| Reference Entity — Long | | | | | | |
| Aerospace & Defense | | | | | | |
Arconic, Inc. | | | 1,596 | | | $ | 36,149 | |
Boeing Co. | | | 488 | | | | 96,502 | |
General Dynamics Corp. | | | 394 | | | | 78,051 | |
Lockheed Martin Corp. | | | 350 | | | | 97,164 | |
Northrop Grumman Corp. | | | 386 | | | | 99,090 | |
| | | | | | | | |
| | | | | | | | 406,956 | |
| Air Freight & Logistics | | | | | | |
United Parcel Service, Inc., Class B | | | 55 | | | | 6,082 | |
| Airlines | | | | | | |
JetBlue Airways Corp. | | | 3,169 | | | | 72,348 | |
Southwest Airlines Co. | | | 1,603 | | | | 99,611 | |
| | | | | | | | |
| | | | | | | | 171,959 | |
| Auto Components | | | | | | |
BorgWarner, Inc. | | | 383 | | | | 16,224 | |
| Biotechnology | | | | | | |
Amgen, Inc. | | | 559 | | | | 96,277 | |
| Chemicals | | | | | | |
Eastman Chemical Co. | | | 1,154 | | | | 96,924 | |
Sherwin-Williams Co. | | | 276 | | | | 96,865 | |
| | | | | | | | |
| | | | | | | | 193,789 | |
| Commercial Services & Supplies | | | | | | |
Republic Services, Inc. | | | 1,020 | | | | 65,005 | |
Waste Management, Inc. | | | 1,336 | | | | 97,995 | |
| | | | | | | | |
| | | | | | | | 163,000 | |
| Communications Equipment | | | | | | |
Motorola Solutions, Inc. | | | 1,129 | | | | 97,929 | |
| Construction Materials | | | | | | |
Vulcan Materials Co. | | | 518 | | | | 65,620 | |
| Consumer Finance | | | | | | |
American Express Co. | | | 945 | | | | 79,607 | |
Navient Corp. | | | 6,057 | | | | 100,849 | |
OneMain Holdings, Inc. | | | 2,993 | | | | 73,598 | |
| | | | | | | | |
| | | | | | | | 254,054 | |
| Containers & Packaging | | | | | | |
Packaging Corp. of America | | | 877 | | | | 97,689 | |
WestRock Co. | | | 1,723 | | | | 97,625 | |
| | | | | | | | |
| | | | | | | | 195,314 | |
| Diversified Telecommunication Services | | | | | | |
Frontier Communications Corp. | | | 16,265 | | | | 18,867 | |
| Electric Utilities | | | | | | |
American Electric Power Co., Inc. | | | 1,214 | | | | 84,337 | |
Exelon Corp. | | | 1,900 | | | | 68,533 | |
FirstEnergy Corp. | | | 2,340 | | | | 68,234 | |
| | | | | | | | |
| | | | | | | | 221,104 | |
| Energy Equipment & Services | | | | | | |
Baker Hughes, Inc. | | | 1,626 | | | | 88,633 | |
Halliburton Co. | | | 1,157 | | | | 49,416 | |
| | | | | | | | |
| | | | | | | | 138,049 | |
| Food & Staples Retailing | | | | | | |
Costco Wholesale Corp. | | | 458 | | | | 73,248 | |
Wal-Mart Stores, Inc. | | | 1,153 | | | | 87,259 | |
| | | | | | | | |
| | | | | | | | 160,507 | |
See Notes to Financial Statements.
| | | | | | |
| | | | | | | |
| 24 | | BLACKROCK FUNDS | | JUNE 30, 2017 | | |
| | |
Schedule of Investments (continued) | | BlackRock Alternative Capital Strategies Fund |
| | | | | | | | |
| | | Shares | | | Value | |
| Reference Entity — Long (continued) | | | | | | |
| Food Products | | | | | | |
Campbell Soup Co. | | | 1,634 | | | $ | 85,213 | |
General Mills, Inc. | | | 884 | | | | 48,974 | |
Hershey Co. | | | 858 | | | | 92,123 | |
| | | | | | | | |
| | | | | | | | 226,310 | |
| Health Care Equipment & Supplies | | | | | | |
Baxter International, Inc. | | | 1,630 | | | | 98,680 | |
Boston Scientific Corp. | | | 2,030 | | | | 56,272 | |
| | | | | | | | |
| | | | | | | | 154,952 | |
| Health Care Providers & Services | | | | | | |
Cigna Corp. | | | 580 | | | | 97,086 | |
HCA Holdings, Inc. | | | 406 | | | | 35,403 | |
Humana, Inc. | | | 409 | | | | 98,414 | |
Quest Diagnostics, Inc. | | | 874 | | | | 97,154 | |
UnitedHealth Group, Inc. | | | 331 | | | | 61,374 | |
Universal Health Services, Inc., Class B | | | 712 | | | | 86,921 | |
| | | | | | | | |
| | | | | | | | 476,352 | |
| Hotels, Restaurants & Leisure | | | | | | |
Carnival Corp. | | | 1,502 | | | | 98,486 | |
Darden Restaurants, Inc. | | | 1,063 | | | | 96,138 | |
Marriott International, Inc., Class A | | | 895 | | | | 89,778 | |
McDonald’s Corp. | | | 639 | | | | 97,869 | |
Royal Caribbean Cruises Ltd. | | | 341 | | | | 37,247 | |
Yum! Brands, Inc. | | | 1,318 | | | | 97,216 | |
| | | | | | | | |
| | | | | | | | 516,734 | |
| Household Durables | | | | | | |
Toll Brothers, Inc. | | | 2,509 | | | | 99,131 | |
| Household Products | | | | | | |
Clorox Co. | | | 384 | | | | 51,164 | |
Colgate-Palmolive Co. | | | 253 | | | | 18,755 | |
Kimberly-Clark Corp. | | | 448 | | | | 57,841 | |
Procter & Gamble Co. | | | 1,058 | | | | 92,205 | |
| | | | | | | | |
| | | | | | | | 219,965 | |
| Independent Power and Renewable Electricity Producers | | | | |
AES Corp. | | | 338 | | | | 3,755 | |
NRG Energy, Inc. | | | 5,206 | | | | 89,648 | |
| | | | | | | | |
| | | | | | | | 93,403 | |
| Insurance | | | | | | |
Allstate Corp. | | | 1,121 | | | | 99,141 | |
Hartford Financial Services Group, Inc. | | | 1,806 | | | | 94,942 | |
Lincoln National Corp. | | | 1,469 | | | | 99,275 | |
Loews Corp. | | | 1,331 | | | | 62,304 | |
Marsh & McLennan Cos., Inc. | | | 1,221 | | | | 95,189 | |
Prudential Financial, Inc. | | | 862 | | | | 93,217 | |
XL Group Ltd. | | | 798 | | | | 34,952 | |
| | | | | | | | |
| | | | | | | | 579,020 | |
| IT Services | | | | | | |
First Data Corp., Class A | | | 5,256 | | | | 95,659 | |
International Business Machines Corp. | | | 575 | | | | 88,452 | |
| | | | | | | | |
| | | | | | | | 184,111 | |
| Leisure Products | | | | | | |
Hasbro, Inc. | | | 828 | | | | 92,330 | |
| Machinery | | | | | | |
Cummins, Inc. | | | 556 | | | | 90,194 | |
Deere & Co. | | | 720 | | | | 88,985 | |
Meritor, Inc. | | | 1,306 | | | | 21,693 | |
| | | | | | | | |
| | | | | | | | 200,872 | |
| Media | | | | | | |
Omnicom Group, Inc. | | | 1,134 | | | | 94,009 | |
| | | | | | | | |
| | | Shares | | | Value | |
| Reference Entity — Long (continued) | | | | | | |
| Media (continued) | | | | | | |
TEGNA, Inc. | | | 1,335 | | | $ | 19,237 | |
Twenty-First Century Fox, Inc., Class A | | | 3,345 | | | | 94,797 | |
Viacom, Inc., Class B | | | 2,647 | | | | 88,860 | |
Walt Disney Co. | | | 890 | | | | 94,563 | |
| | | | | | | | |
| | | | | | | | 391,466 | |
| Metals & Mining | | | | | | |
Barrick Gold Corp. | | | 1,972 | | | | 31,375 | |
Newmont Mining Corp. | | | 1,518 | | | | 49,168 | |
Nucor Corp. | | | 1,670 | | | | 96,643 | |
Teck Resources Ltd., Class B | | | 5,401 | | | | 93,599 | |
| | | | | | | | |
| | | | | | | | 270,785 | |
| Multi-Utilities | | | | | | |
CenterPoint Energy, Inc. | | | 3,442 | | | | 94,242 | |
| Multiline Retail | | | | | | |
Macy’s, Inc. | | | 2,542 | | | | 59,076 | |
Target Corp. | | | 1,847 | | | | 96,580 | |
| | | | | | | | |
| | | | | | | | 155,656 | |
| Oil, Gas & Consumable Fuels | | | | | | |
Apache Corp. | | | 655 | | | | 31,394 | |
ConocoPhillips | | | 2,010 | | | | 88,360 | |
Devon Energy Corp. | | | 527 | | | | 16,848 | |
Exxon Mobil Corp. | | | 1,109 | | | | 89,530 | |
Kinder Morgan, Inc. | | | 4,603 | | | | 88,193 | |
Marathon Oil Corp. | | | 2,272 | | | | 26,923 | |
Murphy Oil Corp. | | | 2,144 | | | | 54,951 | |
Valero Energy Corp. | | | 1,313 | | | | 88,575 | |
Williams Cos., Inc. | | | 3,146 | | | | 95,261 | |
| | | | | | | | |
| | | | | | | | 580,035 | |
| Pharmaceuticals | | | | | | |
Bristol-Myers Squibb Co. | | | 1,694 | | | | 94,390 | |
Johnson & Johnson | | | 721 | | | | 95,381 | |
Pfizer, Inc. | | | 1,179 | | | | 39,602 | |
| | | | | | | | |
| | | | | | | | 229,373 | |
| Real Estate Investment Trusts (REITs) | | | | | | |
Kimco Realty Corp. | | | 2,920 | | | | 53,582 | |
| Road & Rail | | | | | | |
CSX Corp. | | | 1,519 | | | | 82,877 | |
Norfolk Southern Corp. | | | 384 | | | | 46,733 | |
Ryder System, Inc. | | | 1,006 | | | | 72,412 | |
Union Pacific Corp. | | | 605 | | | | 65,890 | |
| | | | | | | | |
| | | | | | | | 267,912 | |
| Specialty Retail | | | | | | |
Lowe’s Cos., Inc. | | | 1,199 | | | | 92,958 | |
| Technology Hardware, Storage & Peripherals | | | | | | |
HP, Inc. | | | 5,083 | | | | 88,851 | |
Xerox Corp. | | | 1,481 | | | | 42,549 | |
| | | | | | | | |
| | | | | | | | 131,400 | |
| Trading Companies & Distributors | | | | | | |
HD Supply Holdings, Inc. | | | 2,425 | | | | 74,278 | |
| Total Reference Entity — Long | | | | | | | 7,390,598 | |
| | | | | | | | |
| | | | | | | | | |
| | |
| Reference Entity — Short | | | | | | |
| Aerospace & Defense | | | | | | |
Textron, Inc. | | | (2,009 | ) | | | (94,624 | ) |
United Technologies Corp. | | | (407 | ) | | | (49,699 | ) |
| | | | | | | | |
| | | | | | | | (144,323 | ) |
See Notes to Financial Statements.
| | | | | | |
| | | | | | | |
| | BLACKROCK FUNDS | | JUNE 30, 2017 | | 25 |
| | |
Schedule of Investments (continued) | | BlackRock Alternative Capital Strategies Fund |
| | | | | | | | |
| | | Shares | | | Value | |
| Reference Entity — Short (continued) | | | | | | |
| Air Freight & Logistics | | | | | | |
FedEx Corp. | | | (462 | ) | | $ | (100,406 | ) |
| Auto Components | | | | | | |
American Axle & Manufacturing Holdings, Inc. | | | (6,120 | ) | | | (95,472 | ) |
Johnson Controls International PLC | | | (2,294 | ) | | | (99,468 | ) |
| | | | | | | | |
| | | | | | | | (194,940 | ) |
| Automobiles | | | | | | |
Ford Motor Co. | | | (3,176 | ) | | | (35,539 | ) |
General Motors Co. | | | (2,790 | ) | | | (97,455 | ) |
| | | | | | | | |
| | | | | | | | (132,994 | ) |
| Beverages | | | | | | |
Coca-Cola Co. | | | (2,124 | ) | | | (95,261 | ) |
Constellation Brands, Inc. | | | (514 | ) | | | (99,577 | ) |
Molson Coors Brewing Co. | | | (586 | ) | | | (50,595 | ) |
PepsiCo, Inc. | | | (850 | ) | | | (98,167 | ) |
| | | | | | | | |
| | | | | | | | (343,600 | ) |
| Chemicals | | | | | | |
Agrium, Inc. | | | (208 | ) | | | (18,822 | ) |
Air Products & Chemicals, Inc. | | | (639 | ) | | | (91,416 | ) |
Potash Corp. of Saskatchewan, Inc. | | | (2,884 | ) | | | (47,009 | ) |
PPG Industries, Inc. | | | (892 | ) | | | (98,084 | ) |
RPM International, Inc. | | | (1,573 | ) | | | (85,807 | ) |
| | | | | | | | |
| | | | | | | | (341,138 | ) |
| Consumer Finance | | | | | | |
Ally Financial, Inc. | | | (4,642 | ) | | | (97,018 | ) |
Capital One Financial Corp. | | | (1,123 | ) | | | (92,782 | ) |
| | | | | | | | |
| | | | | | | | (189,800 | ) |
| Containers & Packaging | | | | | | |
International Paper Co. | | | (331 | ) | | | (18,738 | ) |
| Diversified Financial Services | | | | | | |
Berkshire Hathaway, Inc., Class B | | | (571 | ) | | | (96,710 | ) |
Welltower, Inc. | | | (1,287 | ) | | | (96,332 | ) |
| | | | | | | | |
| | | | | | | | (193,042 | ) |
| Diversified Telecommunication Services | | | | | | |
AT&T, Inc. | | | (2,328 | ) | | | (87,835 | ) |
| Electric Utilities | | | | | | |
Entergy Corp. | | | (1,215 | ) | | | (93,276 | ) |
| Electrical Equipment | | | | | | |
Eaton Corp. PLC | | | (565 | ) | | | (43,974 | ) |
| Electronic Equipment, Instruments & Components | | | | | | |
Arrow Electronics, Inc. | | | (1,242 | ) | | | (97,398 | ) |
Avnet, Inc. | | | (2,547 | ) | | | (99,027 | ) |
| | | | | | | | |
| | | | | | | | (196,425 | ) |
| Energy Equipment & Services | | | | | | |
Nabors Industries, Ltd. | | | (12,184 | ) | | | (99,178 | ) |
| Equity Real Estate Investment Trusts (REITs) | | | | | | |
Uniti Group, Inc. | | | (3,749 | ) | | | (94,250 | ) |
| Food & Staples Retailing | | | | | | |
Kroger Co. | | | (1,726 | ) | | | (40,250 | ) |
| Food Products | | | | | | |
Archer-Daniels-Midland Co. | | | (296 | ) | | | (12,248 | ) |
Kellogg Co. | | | (117 | ) | | | (8,127 | ) |
Kraft Heinz Co. | | | (1,064 | ) | | | (91,121 | ) |
Mondelez International, Inc. | | | (2,136 | ) | | | (92,254 | ) |
Tyson Foods, Inc., Class A Class A | | | (476 | ) | | | (29,812 | ) |
| | | | | | | | |
| | | | | | | | (233,562 | ) |
| | | | | | | | |
| | | Shares | | | Value | |
| Reference Entity — Short (continued) | | | | | | |
| Health Care Equipment & Supplies | | | | | | |
Abbott Laboratories | | | (1,253 | ) | | $ | (60,908 | ) |
Medtronic PLC | | | (1,101 | ) | | | (97,714 | ) |
| | | | | | | | |
| | | | | | | | (158,622 | ) |
| Health Care Providers & Services | | | | | | |
Aetna, Inc. | | | (478 | ) | | | (72,575 | ) |
AmerisourceBergen Corp. | | | (1,023 | ) | | | (96,704 | ) |
Cardinal Health, Inc. | | | (1,249 | ) | | | (97,322 | ) |
McKesson Corp. | | | (479 | ) | | | (78,815 | ) |
| | | | | | | | |
| | | | | | | | (345,416 | ) |
| Hotels, Restaurants & Leisure | | | | | | |
MGM Resorts International | | | (2,650 | ) | | | (82,919 | ) |
| Household Durables | | | | | | |
DR Horton, Inc. | | | (1,722 | ) | | | (59,530 | ) |
Lennar Corp. | | | (1,048 | ) | | | (55,879 | ) |
Mohawk Industries, Inc. | | | (147 | ) | | | (35,528 | ) |
Newell Rubbermaid, Inc. | | | (1,792 | ) | | | (96,087 | ) |
PulteGroup, Inc. | | | (4,000 | ) | | | (98,120 | ) |
Whirlpool Corp. | | | (372 | ) | | | (71,283 | ) |
| | | | | | | | |
| | | | | | | | (416,427 | ) |
| Industrial Conglomerates | | | | | | |
Danaher Corp. | | | (1,142 | ) | | | (96,373 | ) |
| Insurance | | | | | | |
MetLife, Inc. | | | (946 | ) | | | (51,973 | ) |
The Travelers Cos., Inc. | | | (379 | ) | | | (47,955 | ) |
| | | | | | | | |
| | | | | | | | (99,928 | ) |
| Internet & Direct Marketing Retail | | | | | | |
Expedia, Inc. | | | (152 | ) | | | (22,640 | ) |
| Leisure Products | | | | | | |
Brunswick Corp. | | | (294 | ) | | | (18,443 | ) |
Mattel, Inc. | | | (4,468 | ) | | | (96,196 | ) |
| | | | | | | | |
| | | | | | | | (114,639 | ) |
| Machinery | | | | | | |
Caterpillar, Inc. | | | (879 | ) | | | (94,458 | ) |
Dover Corp. | | | (1,192 | ) | | | (95,622 | ) |
| | | | | | | | |
| | | | | | | | (190,080 | ) |
| Media | | | | | | |
Comcast Corp., Class A | | | (526 | ) | | | (20,472 | ) |
DISH Network Corp. | | | (1,523 | ) | | | (95,583 | ) |
| | | | | | | | |
| | | | | | | | (116,055 | ) |
| Metals & Mining | | | | | | |
Freeport-McMoRan, Inc. | | | (8,008 | ) | | | (96,176 | ) |
United States Steel Corp. | | | (4,408 | ) | | | (97,593 | ) |
| | | | | | | | |
| | | | | | | | (193,769 | ) |
| Multi-Utilities | | | | | | |
CMS Energy Corp. | | | (1,801 | ) | | | (83,296 | ) |
Sempra Energy | | | (711 | ) | | | (80,166 | ) |
| | | | | | | | |
| | | | | | | | (163,462 | ) |
| Multiline Retail | | | | | | |
JC Penney Co., Inc. | | | (1,959 | ) | | | (9,109 | ) |
Kohl’s Corp. | | | (728 | ) | | | (28,152 | ) |
Nordstrom, Inc. | | | (2,100 | ) | | | (100,443 | ) |
| | | | | | | | |
| | | | | | | | (137,704 | ) |
| Oil, Gas & Consumable Fuels | | | | | | |
Canadian Natural Resources, Ltd. | | | (3,359 | ) | | | (96,874 | ) |
Chevron Corp. | | | (576 | ) | | | (60,094 | ) |
Enbridge, Inc. | | | (2,432 | ) | | | (96,818 | ) |
Encana Corp. | | | (3,672 | ) | | | (32,314 | ) |
See Notes to Financial Statements.
| | | | | | |
| | | | | | | |
| 26 | | BLACKROCK FUNDS | | JUNE 30, 2017 | | |
| | |
Schedule of Investments (continued) | | BlackRock Alternative Capital Strategies Fund |
| | | | | | | | |
| | | Shares | | | Value | |
| Reference Entity — Short (continued) | | | | | | |
| Oil, Gas & Consumable Fuels (continued) | | | | | | |
Hess Corp. | | | (2,242 | ) | | $ | (98,356 | ) |
Newfield Exploration Co. | | | (597 | ) | | | (16,991 | ) |
Occidental Petroleum Corp. | | | (1,339 | ) | | | (80,166 | ) |
Pioneer Natural Resources Co. | | | (521 | ) | | | (83,141 | ) |
Tesoro Corp. | | | (1,007 | ) | | | (94,255 | ) |
Weatherford International PLC | | | (18,760 | ) | | | (72,601 | ) |
| | | | | | | | |
| | | | | | | | (731,610 | ) |
| Pharmaceuticals | | | | | | |
Eli Lilly & Co. | | | (577 | ) | | | (47,487 | ) |
| Real Estate Investment Trusts (REITs) | | | | | | |
Avalonbay Communities, Inc. | | | (475 | ) | | | (91,281 | ) |
Boston Properties, Inc. | | | (756 | ) | | | (93,003 | ) |
DDR Corp. | | | (2,485 | ) | | | (22,539 | ) |
HCP, Inc. | | | (358 | ) | | | (11,442 | ) |
Host Hotels & Resorts, Inc. | | | (5,180 | ) | | | (94,639 | ) |
Simon Property Group, Inc. | | | (541 | ) | | | (87,512 | ) |
Vornado Realty Trust | | | (646 | ) | | | (60,659 | ) |
Weyerhaeuser Co. | | | (2,807 | ) | | | (94,034 | ) |
| | | | | | | | |
| | | | | | | | (555,109 | ) |
| Road & Rail | | | | | | |
Avis Budget Group, Inc. | | | (3,724 | ) | | | (101,554 | ) |
| Semiconductors & Semiconductor Equipment | | | | | | |
Advanced Micro Devices, Inc. | | | (7,339 | ) | | | (91,591 | ) |
Intel Corp. | | | (1,075 | ) | | | (36,270 | ) |
Texas Instruments, Inc. | | | (1,140 | ) | | | (87,700 | ) |
| | | | | | | | |
| | | | | | | | (215,561 | ) |
| Software | | | | | | |
Oracle Corp. | | | (1,826 | ) | | | (91,556 | ) |
| Specialty Retail | | | | | | |
Best Buy Co., Inc. | | | (1,698 | ) | | | (97,346 | ) |
Gap, Inc. | | | (1,136 | ) | | | (24,981 | ) |
L Brands, Inc. | | | (1,856 | ) | | | (100,020 | ) |
TJX Cos., Inc. | | | (340 | ) | | | (24,538 | ) |
| | | | | | | | |
| | | | | | | | (246,885 | ) |
| Textiles, Apparel & Luxury Goods | | | | | | |
VF Corp. | | | (1,009 | ) | | | (58,118 | ) |
| Tobacco | | | | | | |
Altria Group, Inc. | | | (1,204 | ) | | | (89,662 | ) |
Philip Morris International, Inc. | | | (821 | ) | | | (96,426 | ) |
| | | | | | | | |
| | | | | | | | (186,088 | ) |
| Trading Companies & Distributors | | | | | | |
United Rentals, Inc. | | | (370 | ) | | | (41,703 | ) |
| Wireless Telecommunication Services | | | | | | |
Rogers Communications, Inc. | | | (1,142 | ) | | | (53,914 | ) |
Sprint Corp. | | | (10,834 | ) | | | (88,947 | ) |
| | | | | | | | |
| | | | | | | | (142,861 | ) |
| Total Reference Entity — Short | | | | | | | (7,104,297 | ) |
| Net Value of Reference Entity — Bank of America N.A. | | | | | | $ | 286,301 | |
| | | | | | | | |
| | | | | | | | | |
|
| The following table represents the individual long and short positions and related values of the equity securities underlying the total return swap with Morgan Stanley & Co. International PLC as of June 30, 2017, expiration date 2/07/19: | |
| Reference Entity — Long | |
| Aerospace & Defense | |
Boeing Co. | | | 106 | | | | 20,962 | |
| | | | | | | | |
| | | Shares | | | Value | |
| Reference Entity — Long (continued) | |
| Aerospace & Defense (continued) | |
Huntington Ingalls Industries, Inc. | | | 59 | | | $ | 10,983 | |
| | | | | | | | |
| | | | | | | | 31,945 | |
| Air Freight & Logistics | |
United Parcel Service, Inc., Class B | | | 25 | | | | 2,765 | |
| Automobiles | |
Ford Motor Co. | | | 594 | | | | 6,647 | |
General Motors Co. | | | 407 | | | | 14,216 | |
| | | | | | | | |
| | | | | | | | 20,863 | |
| Biotechnology | |
Amgen, Inc. | | | 129 | | | | 22,218 | |
| Building Products | |
Owens Corning | | | 84 | | | | 5,621 | |
| Chemicals | |
Chemours Co. | | | 243 | | | | 9,215 | |
Mosaic Co. | | | 633 | | | | 14,451 | |
| | | | | | | | |
| | | | | | | | 23,666 | |
| Commercial Services & Supplies | |
RR Donnelley & Sons Co. | | | 569 | | | | 7,135 | |
Waste Management, Inc. | | | 179 | | | | 13,130 | |
| | | | | | | | |
| | | | | | | | 20,265 | |
| Communications Equipment | |
Juniper Networks, Inc. | | | 428 | | | | 11,933 | |
Motorola Solutions, Inc. | | | 177 | | | | 15,353 | |
| | | | | | | | |
| | | | | | | | 27,286 | |
| Consumer Finance | |
American Express Co. | | | 87 | | | | 7,329 | |
Capital One Financial Corp. | | | 71 | | | | 5,866 | |
| | | | | | | | |
| | | | | | | | 13,195 | |
| Containers & Packaging | |
Graphic Packaging Holding Co. | | | 701 | | | | 9,660 | |
| Diversified Consumer Services | |
H&R Block, Inc. | | | 318 | | | | 9,829 | |
| Diversified Financial Services | |
Berkshire Hathaway, Inc., Class B | | | 33 | | | | 5,589 | |
| Electric Utilities | |
Entergy Corp. | | | 206 | | | | 15,815 | |
FirstEnergy Corp. | | | 446 | | | | 13,005 | |
PPL Corp. | | | 713 | | | | 27,565 | |
| | | | | | | | |
| | | | | | | | 56,385 | |
| Electrical Equipment | |
Eaton Corp. PLC | | | 36 | | | | 2,802 | |
| Electronic Equipment, Instruments & Components | |
Flex Ltd. | | | 996 | | | | 16,245 | |
| Energy Equipment & Services | |
Diamond Offshore Drilling, Inc. | | | 963 | | | | 10,429 | |
| Food & Staples Retailing | |
Sysco Corp. | | | 127 | | | | 6,392 | |
Wal-Mart Stores, Inc. | | | 64 | | | | 4,843 | |
| | | | | | | | |
| | | | | | | | 11,235 | |
| Food Products | |
Bunge Ltd. | | | 45 | | | | 3,357 | |
Kellogg Co. | | | 117 | | | | 8,127 | |
| | | | | | | | |
| | | | | | | | 11,484 | |
| Health Care Equipment & Supplies | |
Baxter International, Inc. | | | 48 | | | | 2,906 | |
See Notes to Financial Statements.
| | | | | | |
| | | | | | | |
| | BLACKROCK FUNDS | | JUNE 30, 2017 | | 27 |
| | |
Schedule of Investments (continued) | | BlackRock Alternative Capital Strategies Fund |
| | | | | | | | |
| | | Shares | | | Value | |
| Reference Entity — Long (continued) | |
| Health Care Providers & Services | |
Cigna Corp. | | | 190 | | | $ | 31,804 | |
DaVita, Inc. | | | 225 | | | | 14,571 | |
HCA Holdings, Inc. | | | 216 | | | | 18,835 | |
Humana, Inc. | | | 82 | | | | 19,731 | |
Quest Diagnostics, Inc. | | | 312 | | | | 34,682 | |
| | | | | | | | |
| | | | | | | | 119,623 | |
| Hotels, Restaurants & Leisure | |
Royal Caribbean Cruises Ltd. | | | 147 | | | | 16,057 | |
| Household Durables | |
Tupperware Brands Corp. | | | 87 | | | | 6,110 | |
| Household Products | |
Colgate-Palmolive Co. | | | 446 | | | | 33,062 | |
Kimberly-Clark Corp. | | | 284 | | | | 36,667 | |
Procter & Gamble Co. | | | 31 | | | | 2,702 | |
| | | | | | | | |
| | | | | | | | 72,431 | |
| Independent Power and Renewable Electricity Producers | |
AES Corp. | | | 1,153 | | | | 12,810 | |
| Industrial Conglomerates | |
Honeywell International, Inc. | | | 20 | | | | 2,666 | |
| Insurance | |
Assured Guaranty Ltd. | | | 228 | | | | 9,517 | |
Hartford Financial Services Group, Inc. | | | 110 | | | | 5,782 | |
| | | | | | | | |
| | | | | | | | 15,299 | |
| Internet Software & Services | |
VeriSign, Inc. | | | 99 | | | | 9,203 | |
| IT Services | |
Mastercard, Inc., Class A | | | 133 | | | | 16,153 | |
| Machinery | |
Trinity Industries, Inc. | | | 198 | | | | 5,550 | |
| Media | |
AMC Networks, Inc., Class A | | | 188 | | | | 10,041 | |
Viacom, Inc., Class B | | | 231 | | | | 7,755 | |
Walt Disney Co. | | | 157 | | | | 16,681 | |
| | | | | | | | |
| | | | | | | | 34,477 | |
| Metals & Mining | |
Barrick Gold Corp. | | | 691 | | | | 10,994 | |
Cliffs Natural Resources, Inc. | | | 839 | | | | 5,806 | |
Goldcorp, Inc. | | | 196 | | | | 2,530 | |
Newmont Mining Corp. | | | 530 | | | | 17,167 | |
Nucor Corp. | | | 148 | | | | 8,565 | |
Steel Dynamics, Inc. | | | 590 | | | | 21,128 | |
Teck Resources Ltd., Class B | | | 702 | | | | 12,165 | |
| | | | | | | | |
| | | | | | | | 78,355 | |
| Multi-Utilities | |
Consolidated Edison, Inc. | | | 102 | | | | 8,244 | |
| Multiline Retail | |
Kohl’s Corp. | | | 160 | | | | 6,187 | |
Macy’s, Inc. | | | 69 | | | | 1,604 | |
Target Corp. | | | 321 | | | | 16,785 | |
| | | | | | | | |
| | | | | | | | 24,576 | |
| Oil, Gas & Consumable Fuels | |
Chevron Corp. | | | 113 | | | | 11,789 | |
Exxon Mobil Corp. | | | 147 | | | | 11,867 | |
Occidental Petroleum Corp. | | | 326 | | | | 19,518 | |
Valero Energy Corp. | | | 192 | | | | 12,952 | |
| | | | | | | | |
| | | | | | | | 56,126 | |
| | | | | | | | |
| | | Shares | | | Value | |
| Reference Entity — Long (continued) | |
| Pharmaceuticals | |
Bristol-Myers Squibb Co. | | | 48 | | | $ | 2,674 | |
Merck & Co., Inc. | | | 88 | | | | 5,640 | |
| | | | | | | | |
| | | | | | | | 8,314 | |
| Real Estate Investment Trusts (REITs) | |
CoreCivic, Inc. | | | 124 | | | | 3,420 | |
Lamar Advertising Co., Class A | | | 38 | | | | 2,796 | |
| | | | | | | | |
| | | | | | | | 6,216 | |
| Road & Rail | |
CSX Corp. | | | 82 | | | | 4,474 | |
Norfolk Southern Corp. | | | 172 | | | | 20,932 | |
| | | | | | | | |
| | | | | | | | 25,406 | |
| Semiconductors & Semiconductor Equipment | |
Intel Corp. | | | 623 | | | | 21,020 | |
KLA-Tencor Corp. | | | 73 | | | | 6,680 | |
NVIDIA Corp. | | | 88 | | | | 12,721 | |
| | | | | | | | |
| | | | | | | | 40,421 | |
| Specialty Retail | |
Home Depot, Inc. | | | 36 | | | | 5,522 | |
| Technology Hardware, Storage & Peripherals | |
HP, Inc. | | | 147 | | | | 2,570 | |
NetApp, Inc. | | | 646 | | | | 25,872 | |
Xerox Corp. | | | 116 | | | | 3,333 | |
| | | | | | | | |
| | | | | | | | 31,775 | |
| Trading Companies & Distributors | |
United Rentals, Inc. | | | 73 | | | | 8,228 | |
| Total Reference Entity — Long | | | | 907,950 | |
| | | | | | | | |
| | | | | | | | | |
| | |
| Reference Entity — Short | | | | | | |
| Aerospace & Defense | |
TransDigm Group, Inc. | | | (7 | ) | | | (1,882 | ) |
| Air Freight & Logistics | |
XPO Logistics, Inc. | | | (736 | ) | | | (47,568 | ) |
| Auto Components | |
Delphi Automotive PLC | | | (289 | ) | | | (25,331 | ) |
| Chemicals | |
Ecolab, Inc. | | | (105 | ) | | | (13,939 | ) |
Methanex Corp. | | | (1,031 | ) | | | (45,415 | ) |
PolyOne Corp. | | | (31 | ) | | | (1,201 | ) |
| | | | | | | | |
| | | | | | | | (60,555 | ) |
| Containers & Packaging | |
Ball Corp. | | | (343 | ) | | | (14,478 | ) |
| Diversified Telecommunication Services | |
AT&T, Inc. | | | (30 | ) | | | (1,132 | ) |
| Food Products | |
Post Holdings, Inc. | | | (48 | ) | | | (3,727 | ) |
| Health Care Providers & Services | |
Aetna, Inc. | | | (79 | ) | | | (11,995 | ) |
| Household Durables | |
DR Horton, Inc. | | | (41 | ) | | | (1,418 | ) |
Tempur Sealy International, Inc. | | | (62 | ) | | | (3,310 | ) |
| | | | | | | | |
| | | | | | | | (4,728 | ) |
| Household Products | |
Spectrum Brands Holdings, Inc. | | | (587 | ) | | | (73,398 | ) |
See Notes to Financial Statements.
| | | | | | |
| | | | | | | |
| 28 | | BLACKROCK FUNDS | | JUNE 30, 2017 | | |
| | |
Schedule of Investments (continued) | | BlackRock Alternative Capital Strategies Fund |
| | | | | | | | |
| | | Shares | | | Value | |
| Reference Entity — Short (continued) | | | | | | |
| Industrial Conglomerates | |
3M Co. | | | (13 | ) | | $ | (2,706 | ) |
| Insurance | |
Aon PLC | | | (111 | ) | | | (14,757 | ) |
| Internet & Direct Marketing Retail | |
Expedia, Inc. | | | (104 | ) | | | (15,491 | ) |
| IT Services | |
Visa, Inc., Class A | | | (143 | ) | | | (13,411 | ) |
| Media | |
Live Nation Entertainment, Inc. | | | (187 | ) | | | (6,517 | ) |
Omnicom Group, Inc. | | | (1 | ) | | | (83 | ) |
| | | | | | | | |
| | | | | | | | (6,600 | ) |
| Metals & Mining | |
Freeport-McMoRan, Inc. | | | (738 | ) | | | (8,863 | ) |
| Multi-Utilities | |
Dominion Resources, Inc. | | | (176 | ) | | | (13,487 | ) |
DTE Energy Co. | | | (103 | ) | | | (10,896 | ) |
SCANA Corp. | | | (246 | ) | | | (16,485 | ) |
| | | | | | | | |
| | | | | | | | (40,868 | ) |
| Oil, Gas & Consumable Fuels | |
Chesapeake Energy Corp. | | | (14,970 | ) | | | (74,401 | ) |
Continental Resources, Inc. | | | (577 | ) | | | (18,654 | ) |
Encana Corp. | | | (262 | ) | | | (2,306 | ) |
RSP Permian, Inc. | | | (354 | ) | | | (11,424 | ) |
Suncor Energy, Inc. | | | (36 | ) | | | (1,051 | ) |
Weatherford International PLC | | | (15,767 | ) | | | (61,018 | ) |
| | | | | | | | |
| | | | | | | | (168,854 | ) |
| Pharmaceuticals | |
Mylan NV | | | (130 | ) | | | (5,047 | ) |
Zoetis, Inc. | | | (193 | ) | | | (12,039 | ) |
| | | | | | | | |
| | | | | | | | (17,086 | ) |
| Professional Services | |
Verisk Analytics, Inc., Class A | | | (174 | ) | | | (14,680 | ) |
| Real Estate Investment Trusts (REITs) | |
Host Hotels & Resorts, Inc. | | | (338 | ) | | | (6,175 | ) |
Medical Properties Trust, Inc. | | | (507 | ) | | | (6,525 | ) |
Omega Healthcare Investors, Inc. | | | (1,444 | ) | | | (47,681 | ) |
Prologis, Inc. | | | (334 | ) | | | (19,586 | ) |
Simon Property Group, Inc. | | | (38 | ) | | | (6,147 | ) |
| | | | | | | | |
| | | | | | | | (86,114 | ) |
| Road & Rail | |
Hertz Global Holdings, Inc. | | | (237 | ) | | | (2,726 | ) |
| Semiconductors & Semiconductor Equipment | |
Advanced Micro Devices, Inc. | | | (6,406 | ) | | | (79,947 | ) |
| Specialty Retail | |
AutoZone, Inc. | | | (34 | ) | | | (19,396 | ) |
O’Reilly Automotive, Inc. | | | (37 | ) | | | (8,093 | ) |
Signet Jewelers Ltd. | | | (237 | ) | | | (14,988 | ) |
| | | | | | | | |
| | | | | | | | (42,477 | ) |
| Textiles, Apparel & Luxury Goods | |
Under Armour, Inc., Class A | | | (1,445 | ) | | | (31,443 | ) |
| Wireless Telecommunication Services | |
Sprint Corp. | | | (1,186 | ) | | | (9,737 | ) |
| Total Reference Entity — Short | | | | (800,554 | ) |
| Net Value of Reference Entity — Morgan Stanley & Co. International PLC | | | $ | 107,396 | |
| | | | | | | | |
| The following table represents the individual long and short positions and related values of the equity securities underlying the total return swap with Bank of America N.A., as of June 30, 2017, expiration date 1/19/18: | |
| | | Shares | | | Value | |
| Reference Entity — Long | |
| Aerospace & Defense | |
Boeing Co. | | | 321 | | | $ | 63,478 | |
Huntington Ingalls Industries, Inc. | | | 269 | | | | 50,077 | |
Northrop Grumman Corp. | | | 230 | | | | 59,043 | |
| | | | | | | | |
| | | | | | | | 172,598 | |
| Air Freight & Logistics | |
United Parcel Service, Inc., Class B | | | 741 | | | | 81,947 | |
| Airlines | |
Southwest Airlines Co. | | | 1,330 | | | | 82,646 | |
United Continental Holdings, Inc. | | | 215 | | | | 16,179 | |
| | | | | | | | |
| | | | | | | | 98,825 | |
| Auto Components | |
Lear Corp. | | | 343 | | | | 48,733 | |
| Automobiles | |
Ford Motor Co. | | | 3,967 | | | | 44,391 | |
General Motors Co. | | | 449 | | | | 15,683 | |
| | | | | | | | |
| | | | | | | | 60,074 | |
| Biotechnology | |
Amgen, Inc. | | | 368 | | | | 63,380 | |
Biogen, Inc. | | | 138 | | | | 37,448 | |
Gilead Sciences, Inc. | | | 1,182 | | | | 83,662 | |
| | | | | | | | |
| | | | | | | | 184,490 | |
| Building Products | |
Masco Corp. | | | 1,996 | | | | 76,267 | |
Owens Corning | | | 970 | | | | 64,913 | |
| | | | | | | | |
| | | | | | | | 141,180 | |
| Chemicals | |
Celanese Corp., Series A | | | 183 | | | | 17,374 | |
Chemours Co. | | | 1,035 | | | | 39,247 | |
Eastman Chemical Co. | | | 564 | | | | 47,370 | |
LyondellBasell Industries NV, Class A | | | 914 | | | | 77,133 | |
Mosaic Co. | | | 1,020 | | | | 23,287 | |
| | | | | | | | |
| | | | | | | | 204,411 | |
| Commercial Services & Supplies | |
Republic Services, Inc. | | | 1,301 | | | | 82,913 | |
RR Donnelley & Sons Co. | | | 963 | | | | 12,076 | |
Waste Management, Inc. | | | 927 | | | | 67,995 | |
| | | | | | | | |
| | | | | | | | 162,984 | |
| Communications Equipment | |
Juniper Networks, Inc. | | | 1,185 | | | | 33,038 | |
| Consumer Finance | |
American Express Co. | | | 613 | | | | 51,639 | |
Capital One Financial Corp. | | | 860 | | | | 71,053 | |
| | | | | | | | |
| | | | | | | | 122,692 | |
| Containers & Packaging | | | | | | |
Graphic Packaging Holding Co. | | | 1,331 | | | | 18,341 | |
| Diversified Consumer Services | | | | | | |
H&R Block, Inc. | | | 2,458 | | | | 75,977 | |
| Diversified Financial Services | | | | | | |
Berkshire Hathaway, Inc., Class B | | | 302 | | | | 51,150 | |
MSCI, Inc. | | | 187 | | | | 19,259 | |
Voya Financial, Inc. | | | 1,281 | | | | 47,256 | |
| | | | | | | | |
| | | | | | | | 117,665 | |
See Notes to Financial Statements.
| | | | | | |
| | | | | | | |
| | BLACKROCK FUNDS | | JUNE 30, 2017 | | 29 |
| | |
Schedule of Investments (continued) | | BlackRock Alternative Capital Strategies Fund |
| | | | | | | | |
| | | Shares | | | Value | |
| Reference Entity — Long (continued) | |
| Diversified Telecommunication Services | | | | | | |
Verizon Communications, Inc. | | | 349 | | | $ | 15,586 | |
| Electric Utilities | | | | | | |
Entergy Corp. | | | 810 | | | | 62,184 | |
Exelon Corp. | | | 886 | | | | 31,958 | |
FirstEnergy Corp. | | | 1,158 | | | | 33,767 | |
PPL Corp. | | | 485 | | | | 18,750 | |
| | | | | | | | |
| | | | | | | | 146,659 | |
| Electrical Equipment | | | | | | |
Eaton Corp. PLC | | | 973 | | | | 75,729 | |
| Electronic Equipment, Instruments & Components | | | | | | |
Flex Ltd. | | | 1,493 | | | | 24,351 | |
| Energy Equipment & Services | | | | | | |
Diamond Offshore Drilling, Inc. | | | 636 | | | | 6,888 | |
Noble Corp. PLC | | | 5,210 | | | | 18,860 | |
Transocean Ltd. | | | 3,327 | | | | 27,381 | |
| | | | | | | | |
| | | | | | | | 53,129 | |
| Food & Staples Retailing | | | | | | |
Costco Wholesale Corp. | | | 223 | | | | 35,665 | |
Sysco Corp. | | | 1,491 | | | | 75,042 | |
Wal-Mart Stores, Inc. | | | 1,009 | | | | 76,361 | |
| | | | | | | | |
| | | | | | | | 187,068 | |
| Food Products | | | | | | |
Bunge Ltd. | | | 179 | | | | 13,353 | |
Campbell Soup Co. | | | 1,553 | | | | 80,989 | |
General Mills, Inc. | | | 981 | | | | 54,347 | |
Hershey Co. | | | 743 | | | | 79,776 | |
Kellogg Co. | | | 182 | | | | 12,642 | |
| | | | | | | | |
| | | | | | | | 241,107 | |
| Health Care Equipment & Supplies | | | | | | |
Baxter International, Inc. | | | 315 | | | | 19,070 | |
| Health Care Providers & Services | | | | | | |
Cigna Corp. | | | 301 | | | | 50,384 | |
DaVita, Inc. | | | 42 | | | | 2,720 | |
HCA Holdings, Inc. | | | 728 | | | | 63,482 | |
Humana, Inc. | | | 236 | | | | 56,786 | |
McKesson Corp. | | | 118 | | | | 19,416 | |
Quest Diagnostics, Inc. | | | 424 | | | | 47,132 | |
| | | | | | | | |
| | | | | | | | 239,920 | |
| Hotels, Restaurants & Leisure | | | | | | |
McDonald’s Corp. | | | 546 | | | | 83,625 | |
Royal Caribbean Cruises Ltd. | | | 579 | | | | 63,244 | |
Yum! Brands, Inc. | | | 1,152 | | | | 84,972 | |
| | | | | | | | |
| | | | | | | | 231,841 | |
| Household Durables | | | | | | |
Toll Brothers, Inc. | | | 535 | | | | 21,138 | |
Tupperware Brands Corp. | | | 692 | | | | 48,599 | |
| | | | | | | | |
| | | | | | | | 69,737 | |
| Household Products | | | | | | |
Clorox Co. | | | 281 | | | | 37,440 | |
Colgate-Palmolive Co. | | | 655 | | | | 48,555 | |
Kimberly-Clark Corp. | | | 333 | | | | 42,994 | |
Procter & Gamble Co. | | | 157 | | | | 13,683 | |
| | | | | | | | |
| | | | | | | | 142,672 | |
| Independent Power and Renewable Electricity Producers | |
AES Corp. | | | 4,352 | | | | 48,351 | |
NRG Energy, Inc. | | | 4,139 | | | | 71,273 | |
| | | | | | | | |
| | | | | | | | 119,624 | |
| | | | | | | | |
| | | Shares | | | Value | |
| Reference Entity — Long (continued) | |
| Industrial Conglomerates | | | | | | |
Honeywell International, Inc. | | | 101 | | | $ | 13,462 | |
| Insurance | | | | | | |
Assured Guaranty Ltd. | | | 469 | | | | 19,576 | |
Hartford Financial Services Group, Inc. | | | 960 | | | | 50,467 | |
Lincoln National Corp. | | | 1,225 | | | | 82,786 | |
Prudential Financial, Inc. | | | 760 | | | | 82,186 | |
| | | | | | | | |
| | | | | | | | 235,015 | |
| Internet & Direct Marketing Retail | | | | | | |
Amazon.com, Inc. | | | 41 | | | | 39,688 | |
| Internet Software & Services | | | | | | |
eBay, Inc. | | | 1,847 | | | | 64,497 | |
VeriSign, Inc. | | | 730 | | | | 67,861 | |
| | | | | | | | |
| | | | | | | | 132,358 | |
| Machinery | | | | | | |
Deere & Co. | | | 676 | | | | 83,547 | |
Trinity Industries, Inc. | | | 398 | | | | 11,156 | |
| | | | | | | | |
| | | | | | | | 94,703 | |
| Media | | | | | | |
AMC Networks, Inc., Class A | | | 359 | | | | 19,174 | |
Viacom, Inc., Class B | | | 1,041 | | | | 34,947 | |
Walt Disney Co. | | | 609 | | | | 64,706 | |
| | | | | | | | |
| | | | | | | | 118,827 | |
| Metals & Mining | | | | | | |
Barrick Gold Corp. | | | 4,245 | | | | 67,538 | |
Cliffs Natural Resources, Inc. | | | 2,890 | | | | 19,999 | |
Goldcorp, Inc. | | | 4,644 | | | | 59,954 | |
Kinross Gold Corp. | | | 10,923 | | | | 44,457 | |
Newmont Mining Corp. | | | 1,973 | | | | 63,905 | |
Nucor Corp. | | | 1,305 | | | | 75,520 | |
Steel Dynamics, Inc. | | | 1,491 | | | | 53,393 | |
Teck Resources Ltd., Class B | | | 3,000 | | | | 51,990 | |
| | | | | | | | |
| | | | | | | | 436,756 | |
| Multi-Utilities | | | | | | |
Consolidated Edison, Inc. | | | 261 | | | | 21,094 | |
| Multiline Retail | | | | | | |
Kohl’s Corp. | | | 2,047 | | | | 79,158 | |
Macy’s, Inc. | | | 1,838 | | | | 42,715 | |
Nordstrom, Inc. | | | 1,297 | | | | 62,036 | |
Target Corp. | | | 1,277 | | | | 66,774 | |
| | | | | | | | |
| | | | | | | | 250,683 | |
| Oil, Gas & Consumable Fuels | | | | | | |
Apache Corp. | | | 1,718 | | | | 82,344 | |
Chevron Corp. | | | 635 | | | | 66,250 | |
EOG Resources, Inc. | | | 176 | | | | 15,932 | |
Exxon Mobil Corp. | | | 502 | | | | 40,526 | |
Kinder Morgan, Inc. | | | 3,008 | | | | 57,633 | |
Marathon Petroleum Corp. | | | 1,350 | | | | 70,645 | |
Murphy Oil Corp. | | | 2,089 | | | | 53,541 | |
Occidental Petroleum Corp. | | | 253 | | | | 15,147 | |
ONEOK, Inc. | | | 1,646 | | | | 85,855 | |
Valero Energy Corp. | | | 282 | | | | 19,024 | |
Williams Cos., Inc. | | | 2,734 | | | | 82,786 | |
| | | | | | | | |
| | | | | | | | 589,683 | |
| Pharmaceuticals | | | | | | |
Bristol-Myers Squibb Co. | | | 523 | | | | 29,141 | |
Merck & Co., Inc. | | | 1,163 | | | | 74,537 | |
| | | | | | | | |
| | | | | | | | 103,678 | |
See Notes to Financial Statements.
| | | | | | |
| | | | | | | |
| 30 | | BLACKROCK FUNDS | | JUNE 30, 2017 | | |
| | |
Schedule of Investments (continued) | | BlackRock Alternative Capital Strategies Fund |
| | | | | | | | |
| | | Shares | | | Value | |
| Reference Entity — Long (continued) | |
| Real Estate Investment Trusts (REITs) | | | | | | |
Boston Properties, Inc. | | | 120 | | | $ | 14,762 | |
Brixmor Property Group, Inc. | | | 858 | | | | 15,341 | |
CoreCivic, Inc. | | | 839 | | | | 23,140 | |
Gaming and Leisure Properties, Inc. | | | 755 | | | | 28,441 | |
Kimco Realty Corp. | | | 1,134 | | | | 20,809 | |
Lamar Advertising Co., Class A | | | 994 | | | | 73,128 | |
VEREIT, Inc. | | | 1,829 | | | | 14,888 | |
| | | | | | | | |
| | | | | | | | 190,509 | |
| Road & Rail | | | | | | |
CSX Corp. | | | 1,449 | | | | 79,058 | |
Norfolk Southern Corp. | | | 503 | | | | 61,215 | |
| | | | | | | | |
| | | | | | | | 140,273 | |
| Semiconductors & Semiconductor Equipment | | | | | | |
Applied Materials, Inc. | | | 1,620 | | | | 66,922 | |
Intel Corp. | | | 711 | | | | 23,989 | |
KLA-Tencor Corp. | | | 783 | | | | 71,652 | |
NVIDIA Corp. | | | 6 | | | | 868 | |
| | | | | | | | |
| | | | | | | | 163,431 | |
| Software | | | | | | |
Microsoft Corp. | | | 982 | | | | 67,689 | |
| Specialty Retail | | | | | | |
Home Depot, Inc. | | | 484 | | | | 74,246 | |
| Technology Hardware, Storage & Peripherals | | | | | | |
Apple, Inc. | | | 347 | | | | 49,975 | |
HP, Inc. | | | 2,751 | | | | 48,087 | |
NetApp, Inc. | | | 1,296 | | | | 51,905 | |
Seagate Technology PLC | | | 365 | | | | 14,144 | |
Xerox Corp. | | | 953 | | | | 27,380 | |
| | | | | | | | |
| | | | | | | | 191,491 | |
| Trading Companies & Distributors | | | | | | |
United Rentals, Inc. | | | 696 | | | | 78,446 | |
| Total Reference Entity — Long | | | | | | | 6,031,480 | |
| | | | | | | | |
| | | | | | | | | |
| | |
| Reference Entity — Short | | | | | | |
| Aerospace & Defense | | | | | | |
L3 Technologies, Inc. | | | (92 | ) | | | (15,371 | ) |
Raytheon Co. | | | (154 | ) | | | (24,868 | ) |
TransDigm Group, Inc. | | | (306 | ) | | | (82,274 | ) |
Triumph Group, Inc. | | | (1,583 | ) | | | (50,023 | ) |
United Technologies Corp. | | | (663 | ) | | | (80,959 | ) |
| | | | | | | | |
| | | | | | | | (253,495 | ) |
| Air Freight & Logistics | | | | | | |
FedEx Corp. | | | (399 | ) | | | (86,715 | ) |
XPO Logistics, Inc. | | | (601 | ) | | | (38,842 | ) |
| | | | | | | | |
| | | | | | | | (125,557 | ) |
| Auto Components | | | | | | |
BorgWarner, Inc. | | | (564 | ) | | | (23,891 | ) |
Delphi Automotive PLC | | | (428 | ) | | | (37,514 | ) |
| | | | | | | | |
| | | | | | | | (61,405 | ) |
| Beverages | | | | | | |
Constellation Brands, Inc. | | | (437 | ) | | | (84,660 | ) |
PepsiCo, Inc. | | | (140 | ) | | | (16,169 | ) |
| | | | | | | | |
| | | | | | | | (100,829 | ) |
| Chemicals | | | | | | |
Ashland Global Holdings, Inc. | | | (284 | ) | | | (18,718 | ) |
Ecolab, Inc. | | | (64 | ) | | | (8,496 | ) |
| | | | | | | | |
| | | Shares | | | Value | |
| Reference Entity — Short (continued) | | | | | | |
| Chemicals (continued) | | | | | | |
EI du Pont de Nemours & Co. | | | (344 | ) | | $ | (27,764 | ) |
Methanex Corp. | | | (437 | ) | | | (19,250 | ) |
PolyOne Corp. | | | (763 | ) | | | (29,559 | ) |
| | | | | | | | |
| | | | | | | | (103,787 | ) |
| Construction & Engineering | | | | | | |
MasTec, Inc. | | | (804 | ) | | | (36,301 | ) |
| Construction Materials | | | | | | |
Vulcan Materials Co. | | | (340 | ) | | | (43,071 | ) |
| Containers & Packaging | | | | | | |
Ball Corp. | | | (1,688 | ) | | | (71,251 | ) |
Crown Holdings, Inc. | | | (1,390 | ) | | | (82,927 | ) |
| | | | | | | | |
| | | | | | | | (154,178 | ) |
| Diversified Telecommunication Services | | | | | | |
AT&T, Inc. | | | (2,054 | ) | | | (77,497 | ) |
| Electric Utilities | | | | | | |
NextEra Energy, Inc. | | | (115 | ) | | | (16,115 | ) |
| Electronic Equipment, Instruments & Components | | | | | | |
Avnet, Inc. | | | (1,265 | ) | | | (49,183 | ) |
Keysight Technologies, Inc. | | | (423 | ) | | | (16,468 | ) |
| | | | | | | | |
| | | | | | | | (65,651 | ) |
| Energy Equipment & Services | | | | | | |
Halliburton Co. | | | (541 | ) | | | (23,106 | ) |
National Oilwell Varco, Inc. | | | (424 | ) | | | (13,967 | ) |
Schlumberger Ltd. | | | (528 | ) | | | (34,763 | ) |
| | | | | | | | |
| | | | | | | | (71,836 | ) |
| Food Products | | | | | | |
ConAgra Foods, Inc. | | | (373 | ) | | | (13,339 | ) |
Kraft Heinz Co. | | | (942 | ) | | | (80,673 | ) |
Mondelez International, Inc. | | | (515 | ) | | | (22,243 | ) |
Post Holdings, Inc. | | | (836 | ) | | | (64,915 | ) |
| | | | | | | | |
| | | | | | | | (181,170 | ) |
| Gas Utilities | | | | | | |
National Fuel Gas Co. | | | (426 | ) | | | (23,788 | ) |
| Health Care Equipment & Supplies | | | | | | |
Abbott Laboratories | | | (918 | ) | | | (44,624 | ) |
Becton Dickinson and Co. | | | (412 | ) | | | (80,386 | ) |
Boston Scientific Corp. | | | (2,514 | ) | | | (69,688 | ) |
Stryker Corp. | | | (435 | ) | | | (60,369 | ) |
Zimmer Biomet Holdings, Inc. | | | (678 | ) | | | (87,055 | ) |
| | | | | | | | |
| | | | | | | | (342,122 | ) |
| Health Care Providers & Services | | | | | | |
Aetna, Inc. | | | (482 | ) | | | (73,182 | ) |
AmerisourceBergen Corp. | | | (437 | ) | | | (41,310 | ) |
Centene Corp. | | | (506 | ) | | | (40,419 | ) |
Mednax, Inc. | | | (1,096 | ) | | | (66,166 | ) |
| | | | | | | | |
| | | | | | | | (221,077 | ) |
| Hotels, Restaurants & Leisure | | | | | | |
Marriott International, Inc., Class A | | | (136 | ) | | | (13,642 | ) |
MGM Resorts International | | | (2,255 | ) | | | (70,559 | ) |
Wyndham Worldwide Corp. | | | (631 | ) | | | (63,359 | ) |
| | | | | | | | |
| | | | | | | | (147,560 | ) |
| Household Durables | | | | | | |
DR Horton, Inc. | | | (797 | ) | | | (27,552 | ) |
KB Home | | | (673 | ) | | | (16,132 | ) |
Lennar Corp. | | | (340 | ) | | | (18,129 | ) |
Newell Rubbermaid, Inc. | | | (1,555 | ) | | | (83,379 | ) |
Tempur Sealy International, Inc. | | | (914 | ) | | | (48,798 | ) |
| | | | | | | | |
| | | | | | | | (193,990 | ) |
See Notes to Financial Statements.
| | | | | | |
| | | | | | | |
| | BLACKROCK FUNDS | | JUNE 30, 2017 | | 31 |
| | |
Schedule of Investments (continued) | | BlackRock Alternative Capital Strategies Fund |
| | | | | | | | |
| | | Shares | | | Value | |
| Reference Entity — Short (continued) | | | | | | |
| Household Products | | | | | | |
Spectrum Brands Holdings, Inc. | | | (21 | ) | | $ | (2,626 | ) |
| Industrial Conglomerates | | | | | | |
3M Co. | | | (320 | ) | | | (66,621 | ) |
General Electric Co. | | | (1,330 | ) | | | (35,923 | ) |
Roper Industries, Inc. | | | (63 | ) | | | (14,587 | ) |
| | | | | | | | |
| | | | | | | | (117,131 | ) |
| Insurance | | | | | | |
Loews Corp. | | | (1,172 | ) | | | (54,861 | ) |
Marsh & McLennan Cos., Inc. | | | (906 | ) | | | (70,632 | ) |
Willis Towers Watson PLC | | | (568 | ) | | | (82,621 | ) |
| | | | | | | | |
| | | | | | | | (208,114 | ) |
| Internet & Direct Marketing Retail | | | | | | |
Expedia, Inc. | | | (446 | ) | | | (66,432 | ) |
Netflix, Inc. | | | (267 | ) | | | (39,892 | ) |
Priceline Group, Inc. | | | (42 | ) | | | (78,562 | ) |
| | | | | | | | |
| | | | | | | | (184,886 | ) |
| Internet Software & Services | | | | | | |
Equinix, Inc. | | | (187 | ) | | | (80,253 | ) |
| IT Services | | | | | | |
Fidelity National Information Services, Inc. | | | (936 | ) | | | (79,934 | ) |
International Business Machines Corp. | | | (106 | ) | | | (16,306 | )�� |
Total System Services, Inc. | | | (406 | ) | | | (23,650 | ) |
| | | | | | | | |
| | | | | | | | (119,890 | ) |
| Life Sciences Tools & Services | | | | | | |
Thermo Fisher Scientific, Inc. | | | (285 | ) | | | (49,724 | ) |
| Media | | | | | | |
AMC Entertainment Holdings, Inc., Class A | | | (653 | ) | | | (14,856 | ) |
CBS Corp., Class B | | | (240 | ) | | | (15,307 | ) |
Comcast Corp., Class A | | | (1,951 | ) | | | (75,933 | ) |
DISH Network Corp. | | | (1,293 | ) | | | (81,149 | ) |
Live Nation Entertainment, Inc. | | | (973 | ) | | | (33,909 | ) |
Omnicom Group, Inc. | | | (190 | ) | | | (15,751 | ) |
| | | | | | | | |
| | | | | | | | (236,905 | ) |
| Metals & Mining | | | | | | |
Freeport-McMoRan, Inc. | | | (5,309 | ) | | | (63,761 | ) |
Southern Copper Corp. | | | (2,241 | ) | | | (77,606 | ) |
| | | | | | | | |
| | | | | | | | (141,367 | ) |
| Multi-Utilities | | | | | | |
Dominion Resources, Inc. | | | (35 | ) | | | (2,682 | ) |
DTE Energy Co. | | | (76 | ) | | | (8,040 | ) |
Public Service Enterprise Group, Inc. | | | (1,660 | ) | | | (71,397 | ) |
SCANA Corp. | | | (407 | ) | | | (27,273 | ) |
Sempra Energy | | | (698 | ) | | | (78,699 | ) |
| | | | | | | | |
| | | | | | | | (188,091 | ) |
| Multiline Retail | | | | | | |
Dollar General Corp. | | | (1,008 | ) | | | (72,667 | ) |
| Oil, Gas & Consumable Fuels | | | | | | |
Canadian Natural Resources, Ltd. | | | (1,803 | ) | | | (51,999 | ) |
Chesapeake Energy Corp. | | | (1,097 | ) | | | (5,452 | ) |
Cimarex Energy Co. | | | (166 | ) | | | (15,606 | ) |
Concho Resources, Inc. | | | (428 | ) | | | (52,015 | ) |
ConocoPhillips | | | (296 | ) | | | (13,012 | ) |
Continental Resources, Inc. | | | (95 | ) | | | (3,071 | ) |
Diamondback Energy, Inc. | | | (440 | ) | | | (39,076 | ) |
Enbridge, Inc. | | | (1,451 | ) | | | (57,764 | ) |
Encana Corp. | | | (5,163 | ) | | | (45,434 | ) |
EQT Corp. | | | (757 | ) | | | (44,353 | ) |
Hess Corp. | | | (1,961 | ) | | | (86,029 | ) |
HollyFrontier Corp. | | | (1,930 | ) | | | (53,017 | ) |
| | | | | | | | |
| | | Shares | | | Value | |
| Reference Entity — Short (continued) | | | | | | |
| Oil, Gas & Consumable Fuels (continued) | | | | | | |
Newfield Exploration Co. | | | (538 | ) | | $ | (15,312 | ) |
Noble Energy, Inc. | | | (495 | ) | | | (14,009 | ) |
Parsley Energy, Inc., Class A | | | (3,071 | ) | | | (85,220 | ) |
Phillips 66 | | | (206 | ) | | | (17,034 | ) |
Pioneer Natural Resources Co. | | | (101 | ) | | | (16,118 | ) |
RSP Permian, Inc. | | | (1,031 | ) | | | (33,270 | ) |
Southwestern Energy Co. | | | (2,480 | ) | | | (15,078 | ) |
Suncor Energy, Inc. | | | (451 | ) | | | (13,169 | ) |
Tesoro Corp. | | | (735 | ) | | | (68,796 | ) |
Weatherford International PLC | | | (5,155 | ) | | | (19,950 | ) |
| | | | | | | | |
| | | | | | | | (764,784 | ) |
| Pharmaceuticals | | | | | | |
Allergan PLC | | | (342 | ) | | | (83,137 | ) |
Endo International PLC | | | (1,911 | ) | | | (21,346 | ) |
Mylan NV | | | (916 | ) | | | (35,559 | ) |
Perrigo Co. PLC | | | (513 | ) | | | (38,742 | ) |
Zoetis, Inc. | | | (48 | ) | | | (2,994 | ) |
| | | | | | | | |
| | | | | | | | (181,778 | ) |
| Professional Services | | | | | | |
Verisk Analytics, Inc., Class A | | | (822 | ) | | | (69,352 | ) |
| Real Estate Investment Trusts (REITs) | | | | | | |
American Tower Corp. | | | (523 | ) | | | (69,204 | ) |
Avalonbay Communities, Inc. | | | (413 | ) | | | (79,366 | ) |
Crown Castle International Corp. | | | (532 | ) | | | (53,296 | ) |
Equity Residential | | | (1,151 | ) | | | (75,770 | ) |
HCP, Inc. | | | (469 | ) | | | (14,989 | ) |
Host Hotels & Resorts, Inc. | | | (1,112 | ) | | | (20,316 | ) |
Medical Properties Trust, Inc. | | | (5,213 | ) | | | (67,091 | ) |
Omega Healthcare Investors, Inc. | | | (461 | ) | | | (15,222 | ) |
Prologis, Inc. | | | (231 | ) | | | (13,546 | ) |
Simon Property Group, Inc. | | | (484 | ) | | | (78,292 | ) |
| | | | | | | | |
| | | | | | | | (487,092 | ) |
| Real Estate Management & Development | | | | | | |
CBRE Group, Inc. | | | (1,977 | ) | | | (71,963 | ) |
| Road & Rail | | | | | | |
Avis Budget Group, Inc. | | | (1,282 | ) | | | (34,960 | ) |
Hertz Global Holdings, Inc. | | | (3,550 | ) | | | (40,825 | ) |
| | | | | | | | |
| | | | | | | | (75,785 | ) |
| Semiconductors & Semiconductor Equipment | | | | | | |
Micron Technology, Inc. | | | (520 | ) | | | (15,527 | ) |
QUALCOMM, Inc. | | | (328 | ) | | | (18,112 | ) |
| | | | | | | | |
| | | | | | | | (33,639 | ) |
| Software | | | | | | |
Autodesk, Inc. | | | (399 | ) | | | (40,227 | ) |
Oracle Corp. | | | (1,638 | ) | | | (82,129 | ) |
Symantec Corp. | | | (1,198 | ) | | | (33,844 | ) |
| | | | | | | | |
| | | | | | | | (156,200 | ) |
| Specialty Retail | | | | | | |
AutoZone, Inc. | | | (105 | ) | | | (59,898 | ) |
O’Reilly Automotive, Inc. | | | (332 | ) | | | (72,622 | ) |
Signet Jewelers Ltd. | | | (905 | ) | | | (57,232 | ) |
| | | | | | | | |
| | | | | | | | (189,752 | ) |
| Textiles, Apparel & Luxury Goods | | | | | | |
Coach, Inc. | | | (905 | ) | | | (42,843 | ) |
Under Armour, Inc., Class A | | | (1,168 | ) | | | (25,415 | ) |
| | | | | | | | |
| | | | | | | | (68,258 | ) |
| Tobacco | | | | | | |
Altria Group, Inc. | | | (1,103 | ) | | | (82,140 | ) |
See Notes to Financial Statements.
| | | | | | |
| | | | | | | |
| 32 | | BLACKROCK FUNDS | | JUNE 30, 2017 | | |
| | |
Schedule of Investments (continued) | | BlackRock Alternative Capital Strategies Fund |
| | | | | | | | |
| | | Shares | | | Value | |
| Reference Entity — Short (continued) | | | | | | |
| Tobacco (continued) | | | | | | |
Philip Morris International, Inc. | | | (284 | ) | | $ | (33,356 | ) |
| | | | | | | | |
| | | | | | | | (115,496 | ) |
| Wireless Telecommunication Services | | | | | | |
Sprint Corp. | | | (3,371 | ) | | | (27,676 | ) |
T-Mobile US, Inc. | | | (1,311 | ) | | | (79,473 | ) |
| | | | | | | | |
| | | | | | | | (107,149 | ) |
| Total Reference Entity — Short | | | | | | | (5,942,331 | ) |
| Net Value of Reference Entity — Bank of America N.A. | | | | | | $ | 89,149 | |
|
| Transactions in Options Written for the Period Ended June 30, 2017 |
| | | | | | | | | | | | |
| | | Puts | |
| | | Contracts | | | Premiums
Received | |
Outstanding options, beginning of period | | | | | | | — | | | | — | |
Options written | | | | | | | 10,000 | | | $ | 3,200 | |
Options expired | | | | | | | (10,000 | ) | | | (3,200 | ) |
| | | | | | | | | | | | |
Outstanding options, end of period | | | | | | | — | | | | — | |
| | | | | | | | | | | | |
|
| Derivative Financial Instruments Categorized by Risk Exposure |
As of period end, the fair values of derivative financial instruments located in the Statements of Assets and Liabilities were as follows:
| | | | | | | | | | | | | | | | | | | | | | | | | | | | | | | | | | |
| Assets — Derivative Financial Instruments | | Commodity
Contracts | | | Credit
Contracts | | | Equity
Contracts | | | Foreign
Currency
Exchange
Contracts | | | Interest
Rate
Contracts | | | Other
Contracts | | | Total | | | | |
Futures contracts | | Net unrealized appreciation1 | | | — | | | | — | | | | — | | | | — | | | $ | 58,094 | | | | — | | | $ | 58,094 | | | | | |
Forward foreign currency exchange contracts | | Unrealized appreciation on forward foreign currency exchange contracts | | | — | | | | — | | | | — | | | $ | 645 | | | | — | | | | — | | | | 645 | | | | | |
Swaps — OTC | | Unrealized appreciation on OTC swaps | | | — | | | | — | | | $ | 739,147 | | | | — | | | | — | | | | — | | | | 739,147 | | | | | |
| | | | | | |
| | | | | — | | | | — | | | $ | 739,147 | | | $ | 645 | | | $ | 58,094 | | | | — | | | $ | 797,886 | | | | | |
| | | | | | |
| | | | | | | | | | | | | | | | | | | | | | | | | | | | | | | | | | |
| Liabilities — Derivative Financial Instruments | | | | | | | | | | | | | | | | | | | | | | | | |
Futures contracts | | Net unrealized depreciation1 | | | — | | | | — | | | | — | | | | — | | | $ | 38,321 | | | | — | | | $ | 38,321 | | | | | |
Forward foreign currency exchange contracts | | Unrealized depreciation on forward foreign currency exchange contracts | | | — | | | | — | | | | — | | | $ | 398 | | | | — | | | | — | | | | 398 | | | | | |
Swaps — centrally cleared | | Net unrealized depreciation1 | | | — | | | $ | 2,688 | | | | — | | | | | | | | — | | | | — | | | | 2,688 | | | | | |
| | | | | | |
Total | | | | | — | | | $ | 2,688 | | | | — | | | $ | 398 | | | $ | 38,321 | | | | — | | | $ | 41,407 | | | | | |
| | | | | | |
1 Includes cumulative appreciation (depreciation) on futures contracts and centrally cleared swaps, if any, as reported in the Schedule of Investments. Only current day’s variation margin is reported within the Statements of Assets and Liabilities. | |
For the period ended June 30, 2017, the effect of derivative financial instruments in the Statements of Operations was as follows:
| | | | | | | | | | | | | | | | | | | | | | | | | | | | | | | | |
| Net Realized Gain (Loss) from: | | Commodity
Contracts | | | Credit
Contracts | | | Equity
Contracts | | | Foreign
Currency
Exchange
Contracts | | | Interest
Rate
Contracts | | | Other
Contracts | | | Total | |
Futures contracts | | | | | | | — | | | | — | | | | — | | | | — | | | $ | (13,951 | ) | | | — | | | $ | (13,951 | ) |
Forward foreign currency exchange contracts | | | | | | | — | | | | — | | | | — | | | $ | (3,191 | ) | | | — | | | | — | | | | (3,191 | ) |
Options purchased1 | | | | | | | — | | | | — | | | $ | (12,400 | ) | | | — | | | | — | | | | — | | | | (12,400 | ) |
Options written | | | | | | | — | | | | — | | | | 3,200 | | | | — | | | | — | | | | — | | | | 3,200 | |
Swaps | | | | | | | — | | | $ | (19,640 | ) | | | 161,329 | | | | — | | | | (1,108 | ) | | | — | | | | 140,581 | |
| | | | | | | | | | | | | | | | | | | | | | | | | | | | | | | | |
Total | | | | | | | — | | | $ | (19,640 | ) | | $ | 152,129 | | | $ | (3,191 | ) | | $ | (15,059 | ) | | | — | | | $ | 114,239 | |
| | | | | | | | | | | | | | | | | | | | | | | | | | | | | | | | |
1 Options purchased are included in the net realized gain (loss) from investments. | |
See Notes to Financial Statements.
| | | | | | |
| | | | | | | |
| | BLACKROCK FUNDS | | JUNE 30, 2017 | | 33 |
| | |
Schedule of Investments (continued) | | BlackRock Alternative Capital Strategies Fund |
| | | | | | | | | | | | | | | | | | | | | | | | | | | | | | | | |
| Net Change in Unrealized Appreciation (Depreciation) on: | | Commodity
Contracts | | | Credit
Contracts | | | Equity
Contracts | | | Foreign
Currency
Exchange
Contracts | | | Interest
Rate
Contracts | | | Other
Contracts | | | Total | |
Futures contracts | | | | | | | — | | | | — | | | | — | | | | — | | | $ | 46,011 | | | | — | | | $ | 46,011 | |
Forward foreign currency exchange contracts | | | | | | | — | | | | — | | | | — | | | $ | 1,114 | | | | — | | | | — | | | | 1,114 | |
Swaps | | | | | | | — | | | $ | (271 | ) | | $ | 284,000 | | | | — | | | | 1,993 | | | | — | | | | 285,722 | |
| | | | | | | | | | | | | | | | | | | | | | | | | | | | | | | | |
Total | | | | | | | — | | | $ | (271 | ) | | $ | 284,000 | | | $ | 1,114 | | | $ | 48,004 | | | | — | | | $ | 332,847 | |
| | | | | | | | | | | | | | | | | | | | | | | | | | | | | | | | |
| | |
| Average Quarterly Balances of Outstanding Derivative Financial Instruments | | |
| | | | |
| Futures contracts: | | | | |
Average notional value of contracts — long | | $ | 4,506,332 | |
Average notional value of contracts — short | | $ | 4,982,738 | |
| Forward foreign currency exchange contracts: | | | | |
Average amounts purchased — in USD | | $ | 55,167 | |
Average amounts sold — in USD | | $ | 47,571 | |
| Options: | | | | |
Average value of options contracts purchased | | $ | 1,125 | |
Average value of options contracts written | | $ | 250 | |
| Credit default swaps: | | | | |
Average notional value — buy protection | | $ | 310,000 | |
Average notional value — sell protection | | $ | 438,500 | |
| Interest rate swaps: | | | | |
Average notional value — pays fixed rate | | $ | 301,875 | 1 |
Average notional value — receives fixed rate | | $ | 656,250 | 1 |
| Total return swaps: | | | | |
Average notional value | | $ | (40,619 | ) |
1 Actual amounts for the period are shown due to limited outstanding derivative financial instruments as of each quarter. | | | | |
For information about the Fund’s investment risks regarding derivative financial instruments, refer to the Notes to Financial Statements.
| | |
| Derivative Financial Instruments — Offsetting as of Period End |
The Fund’s derivative assets and liabilities (by type) were as follows:
| | | | | | | | |
| | | Assets | | | Liabilities | |
Derivative Financial Instruments: | | | | | | | | |
Futures contracts | | $ | 10,693 | | | $ | 16,178 | |
Swaps — centrally cleared | | | 2,369 | | | | — | |
Swaps — OTC1 | | | 739,147 | | | | — | |
Forward foreign currency exchange contracts | | | 645 | | | | 398 | |
| | | | | | | | |
Total derivative assets and liabilities in the Statements of Assets and Liabilities | | $ | 752,854 | | | $ | 16,576 | |
| | | | | | | | |
Derivatives not subject to a Master Netting Agreement or similar agreement (“MNA”) | | | (13,062 | ) | | | (16,178 | ) |
| | | | | | | | |
Total derivative assets and liabilities subject to an MNA | | $ | 739,792 | | | $ | 398 | |
| | | | | | | | |
1 Includes unrealized appreciation (depreciation) on OTC swaps and swap premiums paid/received in the Statements of Assets and Liabilities. | |
The following table presents the Fund’s derivative assets and liabilities by counterparty net of amounts available for offset under an MNA and net of the related collateral received and pledged by the Fund:
| | | | | | | | | | | | | | | | | | | | | | | | |
| Counterparty | | Derivative Assets
Subject to an MNA
by Counterparty | | | Derivatives
Available
for Offset1 | | | Non-cash
Collateral
Received | | | Cash
Collateral
Received2 | | | Net Amount of
Derivative
Assets3 | | | | |
Bank of America N.A. | | $ | 672,659 | | | | — | | | | — | | | | — | | | $ | 672,659 | | | | | |
Goldman Sachs International | | | 645 | | | $ | (226 | ) | | | — | | | | — | | | | 419 | | | | | |
Morgan Stanley & Co. International PLC | | | 66,488 | | | | — | | | | — | | | $ | (66,488 | ) | | | — | | | | | |
| | | | |
Total | | $ | 739,792 | | | $ | (226 | ) | | | — | | | $ | (66,488 | ) | | $ | 673,078 | | | | | |
| | | | |
| | | | | | | | | | | | | | | | | | | | | | | | |
See Notes to Financial Statements.
| | | | | | |
| | | | | | | |
| 34 | | BLACKROCK FUNDS | | JUNE 30, 2017 | | |
| | |
Schedule of Investments (concluded) | | BlackRock Alternative Capital Strategies Fund |
| | | | | | | | | | | | | | | | | | | | | | | | |
| Counterparty | | Derivative Liabilities
Subject to an MNA
by Counterparty | | | Derivatives
Available
for Offset1 | | | Non-cash
Collateral
Pledged | | | Cash
Collateral
Pledged | | | Net Amount of
Derivative
Liabilities4 | | | | |
Barclays Bank PLC | | $ | 3 | | | | — | | | | — | | | | — | | | $ | 3 | | | | | |
Deutsche Bank AG | | | 22 | | | | — | | | | — | | | | — | | | | 22 | | | | | |
Goldman Sachs International | | | 226 | | | $ | (226 | ) | | | — | | | | — | | | | — | | | | | |
UBS AG | | | 147 | | | | — | | | | — | | | | — | | | | 147 | | | | | |
| | | | |
Total | | $ | 398 | | | $ | (226 | ) | | | — | | | | — | | | $ | 172 | | | | | |
| | | | |
1 The amount of derivatives available for offset is limited to the amount of derivative assets and/or liabilities that are subject to an MNA. | |
2 Excess of collateral received from the individual counterparty is not shown for financial reporting purposes. | |
3 Net amount represents the net amount receivable from the counterparty in the event of default. | |
4 Net amount represents the net amount payable due to the counterparty in the event of default. | |
|
| Fair Value Hierarchy as of Period End |
Various inputs are used in determining the fair value of investments and derivative financial instruments. For information about the Fund’s policy regarding valuation of investments and derivative financial instruments, refer to the Notes to Financial Statements.
The following tables summarize the Fund’s investments and derivative financial instruments categorized in the disclosure hierarchy:
| | | | | | | | | | | | | | | | |
| | | Level 1 | | | Level 2 | | | Level 3 | | | Total | |
Assets: | | | | | | | | | | | | | | | | |
| Investments: | | | | | | | | | | | | | | | | |
Long-Term Investments: | | | | | | | | | | | | | | | | |
Common Stocks | | $ | 2,820,340 | | | | — | | | | — | | | $ | 2,820,340 | |
Asset-Backed Securities | | | — | | | $ | 5,618,289 | | | $ | 169,782 | | | | 5,788,071 | |
Corporate Bonds | | | — | | | | 12,203,854 | | | | — | | | | 12,203,854 | |
Non-Agency Mortgage-Backed Securities | | | — | | | | 137,288 | | | | — | | | | 137,288 | |
U.S. Government Sponsored Agency Securities | | | — | | | | 11,321,130 | | | | — | | | | 11,321,130 | |
Short-Term Securities | | | 389,982 | | | | — | | | | — | | | | 389,982 | |
Liabilities: | | | | | | | | | | | | | | | | |
| Investments: | | | | | | | | | | | | | | | | |
TBA Sale Commitments | | | — | | | | (506,197 | ) | | | — | | | | (506,197 | ) |
| | | | |
Total | | $ | 3,210,322 | | | $ | 28,774,364 | | | $ | 169,782 | | | $ | 32,154,468 | |
| | | | |
| | | | | | | | | | | | | | | | |
| Derivative Financial Instruments1 | | | | | | | | | | | | | | | | |
Assets: | | | | | | | | | | | | | | | | |
Equity contracts | | | — | | | $ | 739,147 | | | | — | | | $ | 739,147 | |
Forward foreign currency contracts | | | — | | | | 645 | | | | — | | | | 645 | |
Interest rate contracts | | $ | 58,094 | | | | — | | | | — | | | | 58,094 | |
Liabilities: | | | | | | | | | | | | | | | | |
Credit contracts | | | — | | | | (2,688 | ) | | | — | | | | (2,688 | ) |
Forward foreign currency contracts | | | — | | | | (398 | ) | | | — | | | | (398 | ) |
Interest rate contracts | | | (38,321 | ) | | | — | | | | — | | | | (38,321 | ) |
| | | | |
Total | | $ | 19,773 | | | $ | 736,706 | | | | — | | | $ | 756,479 | |
| | | | |
1 Derivative financial instruments are swaps, futures contracts and forward foreign currency exchange contracts. Swaps, futures contracts and forward foreign currency exchange contracts are valued at the unrealized appreciation (depreciation) on the instrument. | |
During the six months ended June 30, 2017, there were no transfers between levels.
See Notes to Financial Statements.
| | | | | | |
| | | | | | | |
| | BLACKROCK FUNDS | | JUNE 30, 2017 | | 35 |
| | |
Schedule of Investments June 30, 2017 (Unaudited) | | BlackRock Emerging Markets Equity Strategies Fund (Percentages shown are based on Net Assets) |
| | | | | | | | |
| Common Stocks | | Shares | | | Value | |
| Austria — 2.2% | | | | | | |
Erste Group Bank AG (a) | | | 20,956 | | | $ | 802,714 | |
| Brazil — 2.3% | | | | | | |
BB Seguridade Participacoes SA | | | 95,034 | | | | 821,855 | |
| Canada — 1.4% | | | | | | |
Eldorado Gold Corp. | | | 185,502 | | | | 492,078 | |
| China — 14.2% | | | | | | |
China Pacific Insurance Group Co. Ltd., Class H | | | 151,600 | | | | 619,844 | |
China Petroleum & Chemical Corp. — ADR | | | 3,837 | | | | 301,588 | |
China Petroleum & Chemical Corp., Class H | | | 682,000 | | | | 534,007 | |
Huaneng Power International, Inc. — ADR | | | 29,293 | | | | 814,053 | |
Industrial & Commercial Bank of China Ltd., Class H | | | 2,054,000 | | | | 1,386,208 | |
Semiconductor Manufacturing International Corp. (a) | | | 606,000 | | | | 701,956 | |
ZTO Express Cayman, Inc. — ADR (a) | | | 51,148 | | | | 714,026 | |
| | | | | | | | |
| | | | | | | | 5,071,682 | |
| Colombia — 3.1% | | | | | | |
Ecopetrol SA — ADR | | | 122,475 | | | | 1,113,298 | |
| Czech Republic — 2.7% | | | | | | |
Moneta Money Bank (b) | | | 284,159 | | | | 951,398 | |
| Greece — 1.3% | | | | | | |
Alpha Bank AE (a) | | | 94,086 | | | | 231,902 | |
National Bank of Greece SA (a) | | | 566,941 | | | | 215,745 | |
| | | | | | | | |
| | | | | | | | 447,647 | |
| Hong Kong — 4.1% | | | | | | |
China Resources Power Holdings Co. Ltd. | | | 470,000 | | | | 922,596 | |
Skyworth Digital Holdings Ltd. | | | 898,000 | | | | 557,557 | |
| | | | | | | | |
| | | | | | | | 1,480,153 | |
| Hungary — 1.9% | | | | | | |
Richter Gedeon Nyrt | | | 26,156 | | | | 683,808 | |
| India — 5.4% | | | | | | |
Mahindra & Mahindra Ltd. — GDR | | | 52,791 | | | | 1,129,165 | |
Reliance Industries Ltd. — GDR (a)(b) | | | 18,908 | | | | 801,699 | |
| | | | | | | | |
| | | | | | | | 1,930,864 | |
| Indonesia — 3.4% | | | | | | |
Astra International Tbk PT | | | 1,243,100 | | | | 832,873 | |
Semen Indonesia Persero Tbk PT | | | 508,000 | | | | 380,981 | |
| | | | | | | | |
| | | | | | | | 1,213,854 | |
| Mexico — 6.5% | | | | | | |
America Movil SAB de CV, Series L — ADR | | | 46,016 | | | | 732,575 | |
Controladora Vuela Cia de Aviacion SAB de CV — ADR (a) | | | 56,709 | | | | 825,116 | |
Grupo Mexico SAB de CV, Series B | | | 268,839 | | | | 756,504 | |
| | | | | | | | |
| | | | | | | | 2,314,195 | |
| Russia — 9.8% | | | | | | |
Gazprom PJSC — ADR | | | 135,234 | | | | 536,764 | |
Novatek PJSC — GDR | | | 13,810 | | | | 1,540,239 | |
Rosneft PJSC — GDR | | | 140,980 | | | | 767,067 | |
VTB Bank PJSC | | | 54,292,425 | | | | 58,765 | |
VTB Bank PJSC — GDR | | | 280,515 | | | | 590,453 | |
| | | | | | | | |
| | | | | | | | 3,493,288 | |
| | | | | | | | |
| Common Stocks | | Shares | | | Value | |
| South Africa — 0.3% | | | | | | |
AngloGold Ashanti Ltd. — ADR | | | 12,078 | | | $ | 117,398 | |
| South Korea — 9.5% | | | | | | |
GSretail Co. Ltd. | | | 6,884 | | | | 310,402 | |
Hyundai Robotics Co. Ltd. (a) | | | 2,083 | | | | 703,649 | |
Hyundai Wia Corp. | | | 6,361 | | | | 387,968 | |
Pan Ocean Co. Ltd. (a) | | | 140,500 | | | | 648,539 | |
Shinhan Financial Group Co. Ltd. | | | 13,650 | | | | 588,931 | |
Shinhan Financial Group Co. Ltd. — ADR | | | 17,446 | | | | 758,727 | |
| | | | | | | | |
| | | | | | | | 3,398,216 | |
| Taiwan — 8.4% | | | | | | |
Bizlink Holding, Inc. | | | 89,000 | | | | 628,392 | |
Elite Material Co. Ltd. | | | 102,000 | | | | 494,312 | |
MediaTek, Inc. | | | 61,000 | | | | 521,862 | |
Quanta Computer, Inc. | | | 230,000 | | | | 544,069 | |
Sino Biopharmaceutical Ltd. | | | 935,000 | | | | 826,748 | |
| | | | | | | | |
| | | | | | | | 3,015,383 | |
| Thailand — 1.8% | | | | | | |
Land & Houses PCL | | | 2,122,700 | | | | 624,642 | |
Land & Houses PCL, Foreign Registered Shares | | | 77,300 | | | | 23,194 | |
| | | | | | | | |
| | | | | | | | 647,836 | |
| Turkey — 1.2% | | | | | | |
Turk Hava Yollari (a) | | | 181,469 | | | | 415,133 | |
| United Arab Emirates — 3.8% | | | | | | |
Air Arabia PJSC | | | 2,412,925 | | | | 668,492 | |
Arabtec Holding Co. (a) | | | 900,023 | | | | 699,386 | |
| | | | | | | | |
| | | | | | | | 1,367,878 | |
| Total Common Stocks — 83.3% | | | | | | | 29,778,678 | |
| | | | | | | | |
| | | | | | | | | |
| | |
| Warrants | | | | | | |
| China — 1.1% | | | | | | |
Weifu High-Technology Group Co. Ltd. (Issued/exercisable 1/14/16, 1 share for 1 warrant, Expires 12/29/17, Strike Price $0.00) (a) | | | 102,379 | | | | 391,123 | |
Total Long-Term Investments
(Cost — $29,155,949) — 84.4% | | | | | | | 30,169,801 | |
| | | | | | | | |
| | | | | | | | | |
| | |
| Short-Term Securities | | | | | | |
BlackRock Liquidity Funds, T-Fund, Institutional Class, 0.84% (c)(d) | | | 11,684,360 | | | | 11,684,360 | |
Total Short-Term Securities
(Cost — $11,684,360) — 32.7% | | | | | | | 11,684,360 | |
Total Investments
(Cost — $40,840,309) — 117.1% | | | | | | | 41,854,161 | |
Liabilities in Excess of Other Assets — (17.1)% | | | | | | | (6,097,019 | ) |
| | | | | | | | |
Net Assets — 100.0% | | | | | | $ | 35,757,142 | |
| | | | | | | | |
|
| Notes to Schedule of Investments |
| (a) | | Non-income producing security. |
| (b) | | Security exempt from registration pursuant to Rule 144A under the Securities Act of 1933, as amended. These securities may be resold in transactions exempt from registration to qualified institutional investors. |
See Notes to Financial Statements.
| | | | | | |
| | | | | | | |
| 36 | | BLACKROCK FUNDS | | JUNE 30, 2017 | | |
| | |
Schedule of Investments (continued) | | BlackRock Emerging Markets Equity Strategies Fund |
| (c) | | During the six months ended June 30, 2017, investments in issuers considered to be an affiliate of the Fund for purposes of Section 2(a)(3) of the Investment Company Act of 1940, as amended, were as follows: |
| | | | | | | | | | | | | | | | | | | | | | | | | | | | |
| Affiliate | | Shares Held
at December 31, 2016 | | | Net
Activity1 | | | Shares Held
at June 30, 2017 | | | Value at
June 30, 2017 | | | Income | | | Realized Gain (Loss) | | | Change in
Unrealized
Appreciation
(Depreciation) | |
BlackRock Liquidity Funds, T-Fund, Institutional Class | | | 32,905 | | | | 11,651,455 | | | | 11,684,360 | | | $ | 11,684,360 | | | $ | 4,063 | | | | — | | | | — | |
1 Represents net shares purchased. | |
| (d) | | Current yield as of period end. |
| | | | | | | | | | | | | | | | | | |
| OTC Total Return Swaps1 | |
| Reference Entity | | Counterparty | | Expiration
Date | | | Net Notional
Amount | | | Unrealized
Appreciation
(Depreciation) | | | Net Value of
Reference
Entities | |
Equity Securities Long/Short: | | Credit Suisse International | | | 7/10/17 | | | $ | 2,260,020 | | | $ | (367,468 | )2 | | $ | 2,092,491 | |
| | Deutsche Bank AG | | | 7/17/17 | | | | (904,269 | ) | | | (17,196 | )3 | | | (919,219 | ) |
| | | HSBC Bank PLC | | | 7/10/17 | | | | (124,487 | ) | | | 3,701 | 4 | | | (213,152 | ) |
Total | | | | | | | | $ | 1,231,264 | | | $ | (380,963 | ) | | $ | 960,120 | |
| | | | | | | | | | |
1 The Fund receives or pays the total return on a portfolio of long and short positions underlying the total return swap. In addition, the Fund pays or receives a variable rate of interest, based on a specified benchmark, plus or minus a spread in a range of 25 — 475 basis points. The benchmark and spread are determined based upon the country and/or currency of the individual underlying positions. The following are the specified benchmarks used in determining the variable rate of interest: | |
USD 1 Month LIBOR | |
USD 1 Day LIBOR | |
EUR 1 Month LIBOR | |
GBP 1 Month LIBOR | |
HKD 1 Month HIBOR | |
PLN 1 Month WIBOR | |
2 Amount includes $ (199,939) of net dividends and financing fees. | |
3 Amount includes $ (2,246) of net dividends and financing fees. | |
4 Amount includes $ 92,366 of net dividends and financing fees. | |
See Notes to Financial Statements.
| | | | | | |
| | | | | | | |
| | BLACKROCK FUNDS | | JUNE 30, 2017 | | 37 |
| | |
Schedule of Investments (continued) | | BlackRock Emerging Markets Equity Strategies Fund |
| | | | | | | | |
| The following table represents the individual long and short positions and related values of the equity securities underlying the total return swap with Credit Suisse International as of June 30, 2017, expiration date 7/10/17: | |
| | | Shares | | | Value | |
| Reference Entity — Long | | | | | | |
| Brazil | | | | | | |
MRV Engenharia e Participacoes SA | | | 32,483 | | | $ | 132,564 | |
| Greece | | | | | | |
Alpha Bank AE | | | 18,626 | | | | 45,909 | |
| India | | | | | | |
Axis Bank Ltd. | | | 15,316 | | | | 610,054 | |
| Malaysia | | | | | | |
Malayan Banking BHD | | | 245,200 | | | | 550,009 | |
| South Africa | | | | | | |
AngloGold Ashanti Ltd. | | | 43,086 | | | | 420,691 | |
Naspers Ltd. | | | 2,501 | | | | 492,529 | |
| | | | | | | | |
| | | | | | | | 913,220 | |
| South Korea | | | | | | |
SK Holdings Co. Ltd. | | | 3,332 | | | | 809,909 | |
| United Kingdom | | | | | | |
Centamin PLC | | | 246,232 | | | | 497,356 | |
| Total Reference Entity — Long | | | | | | | 3,559,021 | |
| | | | | | | | |
| | | | | | | | | |
| | |
| Reference Entity — Short | | | | | | |
| Brazil | | | | | | |
VALE SA | | | (45,643 | ) | | | (399,376 | ) |
| China | | | | | | |
AIA Group Ltd. | | | (118,000 | ) | | | (863,330 | ) |
| Philippines | | | | | | |
BDO Unibank, Inc. | | | (82,911 | ) | | | (203,824 | ) |
| Total Reference Entity — Short | | | | | | | (1,466,530 | ) |
| Net Value of Reference Entity — Credit Suisse International | | | $ | 2,092,491 | |
| | | | | | | | |
| | | | | | | | | |
|
| The following table represents the individual long and short positions and related values of the equity securities underlying the total return swap with Deutsche Bank AG as of June 30, 2017, expiration date 7/17/17: | |
| Reference Entity — Long | | | | | | |
| China | | | | | | |
Huadian Power International Corp. Ltd., Class H | | | 1,218,000 | | | | 544,372 | |
| Total Reference Entity — Long | | | | | | | 544,372 | |
| | | | | | | | |
| | | | | | | | | |
| | |
| Reference Entity — Short | | | | | | |
| Philippines | | | | | | |
Ayala Land Inc. | | | (109,100 | ) | | | (85,952 | ) |
BDO Unibank, Inc. | | | (44,780 | ) | | | (110,084 | ) |
| | | | | | | | |
| | | | | | | | (196,036 | ) |
| | | | | | | | |
| | | Shares | | | Value | |
| Reference Entity — Short (continued) | | | | | | |
| Poland | | | | | | |
Polski Koncern Naftowy Orlen SA | | | (27,606 | ) | | $ | (833,862 | ) |
| Thailand | | | | | | |
Airports of Thailand PCL | | | (311,800 | ) | | | (433,693 | ) |
| Total Reference Entity — Short | | | | | | | (1,463,591 | ) |
| Net Value of Reference Entity — Deutsche Bank AG | | | | | | $ | (919,219 | ) |
| | | | | | | | |
| | | | | | | | | |
|
| The following table represents the individual long and short positions and related values of the equity securities underlying the total return swap with HSBC Bank PLC as of June 30, 2017, expiration date 7/10/17: | |
| Reference Entity — Long | | | | | | |
| China | | | | | | |
Bank of China Ltd. | | | 1,237,000 | | | | 606,583 | |
| Russia | | | | | | |
Gazprom PAO | | | 125,389 | | | | 496,625 | |
| South Korea | | | | | | |
ING Life Insurance Ltd. | | | 22,525 | | | | 669,362 | |
Korea Aerospace Industries Ltd. | | | 8,790 | | | | 437,906 | |
Shinhan Financial Group Co. Ltd. | | | 1,208 | | | | 52,119 | |
| | | | | | | | |
| | | | | | | | 1,159,387 | |
| Turkey | | | | | | |
Turk Hava Yollari AO | | | 116,484 | | | | 266,472 | |
| Total Reference Entity — Long | | | | | | | 2,529,067 | |
| | | | | | | | |
| | | | | | | | | |
| Reference Entity — Short | | | | | | | | |
| Hungary | | | | | | |
OTP Bank PLC | | | (14,449 | ) | | | (483,600 | ) |
| Philippines | | | | | | |
Ayala Land Inc. | | | (366,900 | ) | | | (289,055 | ) |
BDO Unibank, Inc. | | | (97,960 | ) | | | (240,818 | ) |
| | | | | | | | |
| | | | | | | | (529,873 | ) |
| Turkey | | | | | | |
Akbank TAS | | | (167,870 | ) | | | (467,588 | ) |
Turk Telekomunikasyon AS | | | (278,827 | ) | | | (494,319 | ) |
| | | | | | | | |
| | | | | | | | (961,907 | ) |
| United Kingdom | | | | | | |
Prudential PLC | | | (33,408 | ) | | | (766,839 | ) |
| Total Reference Entity — Short | | | | | | | (2,742,219 | ) |
| Net Value of Reference Entity — HSBC Bank PLC | | | | | | $ | (213,152 | ) |
See Notes to Financial Statements.
| | | | | | |
| | | | | | | |
| 38 | | BLACKROCK FUNDS | | JUNE 30, 2017 | | |
| | |
Schedule of Investments (continued) | | BlackRock Emerging Markets Equity Strategies Fund |
|
| Derivative Financial Instruments Categorized by Risk Exposure |
As of period end, the fair values of derivative financial instruments located in the Statements of Assets and Liabilities were as follows:
| | | | | | | | | | | | | | | | | | | | | | | | | | | | | | |
| Assets — Derivative Financial Instruments | | Commodity
Contracts | | | Credit
Contracts | | | Equity
Contracts | | | Foreign
Currency
Exchange
Contracts | | | Interest
Rate
Contracts | | | Other
Contracts | | | Total | |
Swaps — OTC | | Unrealized appreciation on OTC swaps | | | — | | | | — | | | $ | 3,701 | | | | — | | | | — | | | | — | | | $ | 3,701 | |
| Liabilities — Derivative Financial Instruments | | | | | | | | | | | | | | | | | | | | | |
Swaps — OTC | | Unrealized depreciation on OTC swaps | | | — | | | | — | | | $ | 384,664 | | | | — | | | | — | | | | — | | | $ | 384,664 | |
For the period ended June 30, 2017, the effect of derivative financial instruments in the Statements of Operations was as follows:
| | | | | | | | | | | | | | | | | | | | | | | | | | | | | | | | |
| Net Realized Gain (Loss) from: | | | | | Commodity
Contracts | | | Credit
Contracts | | | Equity
Contracts | | | Foreign
Currency
Exchange
Contracts | | | Interest
Rate
Contracts | | | Other
Contracts | | | Total | |
Forward foreign currency exchange contracts | | | | | | | — | | | | — | | | | — | | | $ | 12,006 | | | | — | | | | — | | | $ | 12,006 | |
Swaps | | | | | | | — | | | | — | | | $ | 126,789 | | | | — | | | | — | | | | — | | | | 126,789 | |
Options purchased1 | | | | | | | — | | | | — | | | | (37,461 | ) | | | — | | | | — | | | | — | | | | (37,461 | ) |
| | | | | | | | | | | | | | | | | | | | | | | | | | | | | | | | |
Total | | | | | | | — | | | | — | | | $ | 89,328 | | | $ | 12,006 | | | | — | | | | — | | | $ | 101,334 | |
| | | | | | | | | | | | | | | | | | | | | | | | | | | | | | | | |
1 Options purchased are included in the net realized gain (loss) from investments. | |
| | | | | | | | | | | | | | | | | | | | | | | | | | | | | | | | |
| Net Change in Unrealized Appreciation (Depreciation) on: | |
Forward foreign currency exchange contracts | | | | | | | — | | | | — | | | | — | | | $ | 6,142 | | | | — | | | | — | | | $ | 6,142 | |
Swaps | | | | | | | — | | | | — | | | $ | (375,615 | ) | | | — | | | | — | | | | — | | | | (375,615 | ) |
| | | | | | | | | | | | | | | | | | | | | | | | | | | | | | | | |
Total | | | | | | | — | | | | — | | | $ | (375,615 | ) | | $ | 6,142 | | | | — | | | | — | | | $ | (369,473 | ) |
| | | | | | | | | | | | | | | | | | | | | | | | | | | | | | | | |
|
| Average Quarterly Balances of Outstanding Derivative Financial Instruments |
| | | | |
| Forward foreign currency exchange contracts: | | | | |
Average amounts purchased — in USD | | $ | 170,086 | |
Average amounts sold — in USD | | $ | 162,500 | |
| Options: | | | | |
Average market value of option contracts purchased | | $ | 24,390 | 1 |
| Total return swaps: | | | | |
Average notional value | | $ | 432,941 | |
1 Actual amounts for the period are shown due to limited outstanding derivative financial instruments as of each quarter. | |
For information about the Fund’s investment risks regarding derivative financial instruments, refer to the Notes to Financial Statements.
|
| Derivative Financial Instruments — Offsetting as of Period End |
The Fund’s derivative assets and liabilities (by type) were as follows:
| | | | | | | | |
| | | Assets | | | Liabilities | |
Derivative Financial Instruments: | | | | | | | | |
Swaps — OTC1 | | $ | 3,701 | | | $ | 384,664 | |
| | | | | | | | |
Total derivative assets and liabilities in the Statements of Assets and Liabilities | | $ | 3,701 | | | $ | 384,664 | |
| | | | | | | | |
Derivatives not subject to a Master Netting Agreement or similar agreement (“MNA”) | | | — | | | | — | |
| | | | | | | | |
Total derivative assets and liabilities subject to an MNA | | $ | 3,701 | | | $ | 384,664 | |
| | | | | | | | |
1 Includes unrealized appreciation (depreciation) on OTC swaps and swap premiums paid/received in the Statements of Assets and Liabilities. | |
See Notes to Financial Statements.
| | | | | | |
| | | | | | | |
| | BLACKROCK FUNDS | | JUNE 30, 2017 | | 39 |
| | |
Schedule of Investments (concluded) | | BlackRock Emerging Markets Equity Strategies Fund |
The following table presents the Fund’s derivative assets and liabilities by counterparty net of amounts available for offset under an MNA and net of the related collateral received and pledged by the Fund:
| | | | | | | | | | | | | | | | | | | | | | | | |
| Counterparty | | Derivative Assets
Subject to an MNA
by Counterparty | | | Derivatives
Available
for Offset | | | Non-cash
Collateral
Received | | | Cash
Collateral
Received | | | Net Amount of
Derivative
Assets1 | | | | |
HSBC Bank PLC | | $ | 3,701 | | | | — | | | | — | | | | — | | | $ | 3,701 | | | | | |
| | | | | | | | | | | | | | | | | | | | | | | | |
| Counterparty | | Derivative Liabilities
Subject to an MNA
by Counterparty | | | Derivatives
Available
for Offset | | | Non-cash
Collateral
Pledged | | | Cash
Collateral
Pledged | | | Net Amount of
Derivative
Liabilities2 | | | | |
Credit Suisse International | | $ | 367,468 | | | | — | | | | — | | | | — | | | $ | 367,468 | | | | | |
Deutsche Bank AG | | | 17,196 | | | | — | | | | — | | | | — | | | | 17,196 | | | | | |
| | | | |
Total | | $ | 384,664 | | | | — | | | | — | | | | — | | | $ | 384,664 | | | | | |
| | | | |
1 Net amount represents the net amount receivable from the counterparty in the event of default. | |
2 Net amount represents the net amount payable due to the counterparty in the event of default. | |
|
| Fair Value Hierarchy as of Period End |
Various inputs are used in determining the fair value of investments and derivative financial instruments. For information about the Fund’s policy regarding valuation of investments and derivative financial instruments, refer to the Notes to Financial Statements.
The following tables summarize the Fund’s investments and derivative financial instruments categorized in the disclosure hierarchy:
| | | | | | | | | | | | | | | | |
| | | Level 1 | | | Level 2 | | | Level 3 | | | Total | |
Assets: | | | | | | | | | | | | | | | | |
| Investments: | | | | | | | | | | | | | | | | |
Common Stocks: | | | | | | | | | | | | | | | | |
Austria | | | — | | | $ | 802,714 | | | | — | | | $ | 802,714 | |
Brazil | | $ | 821,855 | | | | — | | | | — | | | | 821,855 | |
Canada | | | 492,078 | | | | — | | | | — | | | | 492,078 | |
China | | | 1,829,667 | | | | 3,242,015 | | | | — | | | | 5,071,682 | |
Colombia | | | 1,113,298 | | | | — | | | | — | | | | 1,113,298 | |
Czech Republic | | | — | | | | 951,398 | | | | — | | | | 951,398 | |
Greece | | | — | | | | 447,647 | | | | — | | | | 447,647 | |
Hong Kong | | | — | | | | 1,480,153 | | | | — | | | | 1,480,153 | |
Hungary | | | — | | | | 683,808 | | | | — | | | | 683,808 | |
India | | | 801,699 | | | | 1,129,165 | | | | — | | | | 1,930,864 | |
Indonesia | | | — | | | | 1,213,854 | | | | — | | | | 1,213,854 | |
Mexico | | | 2,314,195 | | | | — | | | | — | | | | 2,314,195 | |
Russia | | | 187,952 | | | | 3,305,336 | | | | — | | | | 3,493,288 | |
South Africa | | | 117,398 | | | | — | | | | — | | | | 117,398 | |
South Korea | | | 1,462,376 | | | | 1,935,840 | | | | — | | | | 3,398,216 | |
Taiwan | | | — | | | | 3,015,383 | | | | — | | | | 3,015,383 | |
Thailand | | | — | | | | 647,836 | | | | — | | | | 647,836 | |
Turkey | | | — | | | | 415,133 | | | | — | | | | 415,133 | |
United Arab Emirates | | | — | | | | 1,367,878 | | | | — | | | | 1,367,878 | |
Warrants | | | — | | | | 391,123 | | | | — | | | | 391,123 | |
Short-Term Securities | | | 11,684,360 | | | | — | | | | — | | | | 11,684,360 | |
| | | | | | | | | | | | | | | | |
Total | | $ | 20,824,878 | | | $ | 21,029,283 | | | | — | | | $ | 41,854,161 | |
| | | | | | | | | | | | | | | | |
| | | | | | | | | | | | | | | | |
Derivative Financial Insturments1 | | | | | | | | | | | | | | | | |
Assets: | | | | | | | | | | | | | | | | |
Equity contracts | | | — | | | $ | 3,701 | | | | — | | | $ | 3,701 | |
Liabilities: | | | | | | | | | | | | | | | | |
Equity contracts | | | — | | | | (384,664 | ) | | | — | | | | (384,664 | ) |
| | | | | | | | | | | | | | | | |
Total | | | — | | | $ | (380,963 | ) | | | — | | | $ | (380,963 | ) |
| | | | | | | | | | | | | | | | |
1 Derivative financial instruments are swaps, which are valued at the unrealized appreciation (depreciation) on the instrument. | |
During the six months ended June 30, 2017, there were no transfers between levels.
See Notes to Financial Statements.
| | | | | | |
| | | | | | | |
| 40 | | BLACKROCK FUNDS | | JUNE 30, 2017 | | |
| | |
Schedule of Investments June 30, 2017 (Unaudited) | | iShares Short-Term TIPS Bond Index Fund (Percentages shown are based on Net Assets) |
| | | | | | | | |
| U.S. Treasury Obligations | | Par
(000) | | | Value | |
U.S. Treasury Inflation Protected Securities: | | | | | | | | |
2.63%, 7/15/17 | | $ | 115 | | | $ | 115,475 | |
1.63%, 1/15/18 | | | 167 | | | | 167,549 | |
0.13%, 4/15/18 | | | 569 | | | | 567,261 | |
1.38%, 7/15/18 | | | 49 | | | | 49,303 | |
2.13%, 1/15/19 | | | 130 | | | | 134,048 | |
0.13%, 4/15/19 | | | 494 | | | | 493,732 | |
1.88%, 7/15/19 | | | 101 | | | | 104,921 | |
1.38%, 1/15/20 | | | 192 | | | | 199,240 | |
0.13%, 4/15/20 | | | 515 | | | | 515,688 | |
1.25%, 7/15/20 | | | 250 | | | | 260,667 | |
1.13%, 1/15/21 | | | 289 | | | | 300,174 | |
0.13%, 4/15/21 | | | 479 | | | | 478,719 | |
0.63%, 7/15/21 | | | 376 | | | | 385,834 | |
0.13%, 1/15/22 | | | 454 | | | | 453,732 | |
0.13%, 4/15/22 | | | 80 | | | | 80,055 | |
Total Long-Term Investments
(Cost — $4,355,120) — 98.6% | | | | 4,306,398 | |
| | | | | | | | |
| Short-Term Securities | | Shares | | | Value | |
BlackRock Liquidity Funds, T-Fund, Institutional Class, 0.84% (a)(b) | | | 83,214 | | | $ | 83,214 | |
Total Short-Term Securities
(Cost — $83,214) — 1.9% | | | | | | | 83,214 | |
Total Investments (Cost — $4,438,334) — 100.5% | | | | | | | 4,389,612 | |
Liabilities in Excess of Other Assets — (0.5)% | | | | | | | (24,004 | ) |
| | | | | | | | |
Net Assets — 100.0% | | | | | | $ | 4,365,608 | |
| | | | | | | | |
| | |
| Notes to Schedule of Investments | | |
| (a) | | During the six months ended June 30, 2017, investments in issuers considered to be an affiliate of the Fund for purposes of Section 2(a)(3) of the Investment Company Act of 1940, as amended, were as follows: |
| | | | | | | | | | | | | | | | | | | | | | | | |
| Affiliate | | Shares Held
at December 31,
2016 | | | Net
Activity1 | | | Shares Held
at June 30, 2017 | | | Value at
June 30, 2017 | | | Income | | | Change in
Unrealized
Appreciation
(Depreciation) | |
BlackRock Liquidity Funds, T-Fund, Institutional Class | | | 13,890 | | | | 69,324 | | | | 83,214 | | | $ | 83,214 | | | $ | 219 | | | | — | |
1 Represents net shares purchased. | |
| (b) | | Current yield as of period end. |
| | |
| Fair Value Hierarchy as of Period End | | |
Various inputs are used in determining the fair value of investments. For information about the Fund’s policy regarding valuation of investments, refer to the Notes to Financial Statements.
The following table summarizes the Fund’s investments categorized in the disclosure hierarchy:
| | | | | | | | | | | | | | | | |
| | | Level 1 | | | Level 2 | | | Level 3 | | | Total | |
Assets: | | | | | | | | | | | | | | | | |
| Investments: | | | | | | | | | | | | | | | | |
U.S. Treasury Obligations | | | — | | | $ | 4,306,398 | | | | — | | | $ | 4,306,398 | |
Short-Term Securities | | $ | 83,214 | | | | — | | | | — | | | | 83,214 | |
| | | | |
Total | | $ | 83,214 | | | $ | 4,306,398 | | | | — | | | $ | 4,389,612 | |
| | | | |
During the six months ended June 30, 2017, there were no transfers between levels.
See Notes to Financial Statements.
| | | | | | |
| | | | | | | |
| | BLACKROCK FUNDS | | JUNE 30, 2017 | | 41 |
| | |
| Statements of Assets and Liabilities | | |
| | | | | | | | | | | | |
| June 30, 2017 (Unaudited) | | BlackRock
Alternative
Capital
Strategies
Fund | | | BlackRock
Emerging
Markets Equity
Strategies
Fund | | | iShares
Short-Term
TIPS Bond
Index
Fund | |
| | | | | | | | | | | | |
| Assets | |
Investments at value — unaffiliated1 | | $ | 32,270,683 | | | $ | 30,169,801 | | | $ | 4,306,398 | |
Investments at value — affiliated2 | | | 389,982 | | | | 11,684,360 | | | | 83,214 | |
Foreign currency at value3 | | | 49,237 | | | | 37,666 | | | | — | |
| Cash pledged: | |
Centrally cleared swaps | | | 45,000 | | | | — | | | | — | |
Futures contracts | | | 102,683 | | | | — | | | | — | |
| Receivables: | |
Investments sold | | | 78,430 | | | | 425,484 | | | | — | |
TBA sale commitments | | | 509,668 | | | | — | | | | — | |
Dividends — unaffiliated | | | 4,752 | | | | 57,498 | | | | — | |
Dividends — affiliated | | | 241 | | | | 2,279 | | | | | |
Capital shares sold | | | 50 | | | | — | | | | — | |
Interest — unaffiliated | | | 161,479 | | | | — | | | | 11,222 | |
From the Manager | | | 15,007 | | | | 11,204 | | | | 30,606 | |
Swaps | | | — | | | | 271,015 | | | | — | |
Variation margin on futures contracts | | | 10,693 | | | | — | | | | — | |
Variation margin on centrally cleared swaps | | | 2,369 | | | | — | | | | — | |
| Unrealized appreciation on: | |
Forward foreign currency exchange contracts | | | 645 | | | | — | | | | — | |
OTC swaps | | | 739,147 | | | | 3,701 | | | | — | |
Prepaid expenses | | | 32,005 | | | | 35,868 | | | | 29,786 | |
| | | | |
Total assets | | | 34,412,071 | | | | 42,698,876 | | | | 4,461,226 | |
| | | | |
| | | | | | | | | | | | |
| Liabilities | |
Bank overdraft | | | 6,340 | | | | — | | | | — | |
TBA sale commitments at value4 | | | 506,197 | | | | — | | | | — | |
Cash received as collateral for OTC derivatives | | | 510,000 | | | | — | | | | — | |
| Payables: | |
Investments purchased | | | 5,533,169 | | | | 6,152,725 | | | | 37,883 | |
Capital shares redeemed | | | — | | | | — | | | | 8,423 | |
Investment advisory fees | | | — | | | | 3,862 | | | | — | |
Administration fees | | | — | | | | 1,147 | | | | — | |
Service and distribution fees | | | 453 | | | | 83 | | | | 31 | |
Officer’s and Trustees’ fees | | | 1,380 | | | | 1,265 | | | | 1,145 | |
Swaps | | | — | | | | 275,392 | | | | — | |
Income dividends | | | — | | | | — | | | | 2,525 | |
Variation margin on futures contracts | | | 16,178 | | | | — | | | | — | |
Accounting fees | | | 69,638 | | | | 37,623 | | | | — | |
Professional fees | | | 54,921 | | | | 38,967 | | | | 18,866 | |
Printing fees | | | 27,543 | | | | 23,036 | | | | 23,891 | |
Custodian fees | | | 5,971 | | | | 11,501 | | | | 426 | |
Other accrued expenses | | | 8,067 | | | | 11,469 | | | | 2,428 | |
| Unrealized depreciation on: | |
Forward foreign currency exchange contracts | | | 398 | | | | — | | | | — | |
OTC swaps | | | — | | | | 384,664 | | | | — | |
| | | | |
Total liabilities | | | 6,740,255 | | | | 6,941,734 | | | | 95,618 | |
| | | | |
Net Assets | | $ | 27,671,816 | | | $ | 35,757,142 | | | $ | 4,365,608 | |
| | | | |
| | | | | | | | | | | | |
| Net Assets Consist of | |
Paid-in capital | | $ | 27,655,624 | | | $ | 33,726,575 | | | $ | 4,414,189 | |
Undistributed net investment income | | | 67,867 | | | | 122,115 | | | | 10,024 | |
Accumulated net realized gain (loss) | | | (1,228,211 | ) | | | 1,275,714 | | | | (9,883 | ) |
Net unrealized appreciation (depreciation) | | | 1,176,536 | | | | 632,738 | | | | (48,722 | ) |
| | | | |
Net Assets | | $ | 27,671,816 | | | $ | 35,757,142 | | | $ | 4,365,608 | |
| | | | |
1 Investments at cost — unaffiliated | | $ | 31,854,752 | | | $ | 29,155,949 | | | $ | 4,355,120 | |
2 Investments at cost — affiliated | | $ | 389,982 | | | $ | 11,684,360 | | | $ | 83,214 | |
3 Foreign currency at cost | | $ | 48,586 | | | $ | 37,671 | | | | — | |
4 Proceeds from TBA sale commitments | | $ | 509,668 | | | | — | | | | — | |
| | | | | | |
| See Notes to Financial Statements. | | | | |
| | | | | | | |
| 42 | | BLACKROCK FUNDS | | JUNE 30, 2017 | | |
| | |
| Statements of Assets and Liabilities (concluded) | | |
| | | | | | | | | | | | |
| June 30, 2017 (Unaudited) | | BlackRock
Alternative
Capital
Strategies
Fund | | | BlackRock
Emerging
Markets Equity
Strategies
Fund | | | iShares
Short-Term
TIPS Bond
Index
Fund | |
| | | | | | | | | | | | |
| Net Asset Value | |
| Institutional: | |
Net assets | | $ | 25,708,165 | | | $ | 28,354,551 | | | $ | 3,155,887 | |
| | | | |
Shares outstanding5 | | | 2,579,143 | | | | 2,276,288 | | | | 316,093 | |
| | | | |
Net asset value | | $ | 9.97 | | | $ | 12.46 | | | $ | 9.98 | |
| | | | |
| Investor A: | |
Net assets | | $ | 1,886,061 | | | $ | 74,502 | | | $ | 153,130 | |
| | | | |
Shares outstanding5 | | | 189,398 | | | | 5,989 | | | | 15,350 | |
| | | | |
Net asset value | | $ | 9.96 | | | $ | 12.44 | | | $ | 9.98 | |
| | | | |
| Investor C: | |
Net assets | | $ | 77,590 | | | $ | 82,537 | | | | — | |
| | | | |
Shares outstanding5 | | | 7,823 | | | | 6,662 | | | | — | |
| | | | |
Net asset value | | $ | 9.92 | | | $ | 12.39 | | | | — | |
| | | | |
| Class K: | |
Net assets | | | — | | | $ | 7,245,552 | | | $ | 1,056,591 | |
| | | | |
Shares outstanding5 | | | — | | | | 581,623 | | | | 105,876 | |
| | | | |
Net asset value | | | — | | | $ | 12.46 | | | $ | 9.98 | |
| | | | |
5 Unlimited number of shares authorized, $0.001 par value. | |
| | | | | | |
| See Notes to Financial Statements. | | | | |
| | | | | | | |
| | BLACKROCK FUNDS | | JUNE 30, 2017 | | 43 |
| | | | | | | | | | | | |
| Six Months Ended June 30, 2017 (Unaudited) | | BlackRock
Alternative
Capital
Strategies
Fund | | | BlackRock
Emerging
Markets Equity
Strategies
Fund | | | iShares
Short-Term
TIPS Bond
Index
Fund | |
| | | | | | | | | | | | |
| Investment Income | | | | |
Interest — unaffiliated | | $ | 385,976 | | | | — | | | $ | 84,932 | 1 |
Dividends — unaffiliated | | | 36,042 | | | $ | 204,794 | | | | — | |
Dividends — affiliated | | | 967 | | | | 4,063 | | | | 219 | |
Foreign taxes withheld | | | (94 | ) | | | (17,419 | ) | | | — | |
| | | | |
Total investment income | | | 422,891 | | | | 191,438 | | | | 85,151 | |
| | | | |
| | | | | | | | | | | | |
| Expenses | |
Investment advisory | | | 108,316 | | | | 62,597 | | | | 320 | |
Service and distribution — class specific | | | 3,001 | | | | 450 | | | | 108 | |
Transfer agent — class specific | | | 3,699 | | | | 183 | | | | 103 | |
Professional | | | 57,883 | | | | 52,073 | | | | 22,527 | |
Custodian | | | 7,054 | | | | 12,339 | | | | 360 | |
Printing | | | 28,835 | | | | 15,079 | | | | 5,890 | |
Administration | | | 5,754 | | | | 2,660 | | | | — | |
Administration — class specific | | | 2,708 | | | | 1,252 | | | | — | |
Accounting services | | | 38,387 | | | | 12,531 | | | | — | |
Registration | | | 21,678 | | | | 26,768 | | | | 21,348 | |
Offering | | | — | | | | 16,082 | | | | 18,620 | |
Officer and Trustees | | | 4,250 | | | | 4,031 | | | | 3,948 | |
Miscellaneous | | | 9,446 | | | | 257 | | | | 5,199 | |
| | | | |
Total expenses | | | 291,011 | | | | 206,302 | | | | 78,423 | |
| Less: | |
Fees waived and/or reimbursed by the Manager | | | (147,197 | ) | | | (124,318 | ) | | | (76,236 | ) |
Administration fees waived | | | (5,723 | ) | | | (1,795 | ) | | | — | |
Administration fees waived — class specific | | | (2,706 | ) | | | (688 | ) | | | — | |
Transfer agent fees waived — class specific | | | (3,699 | ) | | | (97 | ) | | | (41 | ) |
| | | | |
Total expenses after fees waived and/or reimbursed | | | 131,686 | | | | 79,404 | | | | 2,146 | |
| | | | |
Net investment income | | | 291,205 | | | | 112,034 | | | | 83,005 | |
| | | | |
| | | | | | | | | | | | |
| Realized and Unrealized Gain (Loss) | |
| Net realized gain (loss) from: | |
Investments — unaffiliated | | | 67,775 | | | | 1,059,974 | | | | (9,921 | ) |
Futures contracts | | | (13,951 | ) | | | — | | | | — | |
Foreign currency transactions | | | 2,132 | | | | (16,957 | ) | | | — | |
Forward foreign currency exchange contracts | | | (3,191 | ) | | | 12,006 | | | | — | |
Options written | | | 3,200 | | | | — | | | | — | |
Swaps | | | 140,581 | | | | 126,789 | | | | — | |
| | | | |
| | | 196,546 | | | | 1,181,812 | | | | (9,921 | ) |
| | | | |
| Net change in unrealized appreciation (depreciation) on: | |
Investments — unaffiliated | | | 329,320 | | | | 975,164 | | | | (54,018 | ) |
Futures contracts | | | 46,011 | | | | — | | | | — | |
Foreign currency translations | | | 1,328 | | | | (245 | ) | | | — | |
Forward foreign currency exchange contracts | | | 1,114 | | | | 6,142 | | | | — | |
Swaps | | | 285,722 | | | | (375,615 | ) | | | — | |
| | | | |
| | | 663,495 | | | | 605,446 | | | | (54,018 | ) |
| | | | |
Net realized and unrealized gain (loss) | | | 860,041 | | | | 1,787,258 | | | | (63,939 | ) |
| | | | |
Net Increase in Net Assets Resulting from Operations | | $ | 1,151,246 | | | $ | 1,899,292 | | | $ | 19,066 | |
| | | | |
1 Includes net inflationary and deflationary adjustments. See Note 4 of the Notes to Financial Statements. | |
| | | | | | |
| See Notes to Financial Statements. | | | | |
| | | | | | | |
| 44 | | BLACKROCK FUNDS | | JUNE 30, 2017 | | |
| | |
| Statements of Changes in Net Assets | | |
| | | | | | | | |
| | | BlackRock Alternative Capital
Strategies Fund | |
| Increase (Decrease) in Net Assets: | | Six Months Ended
June 30,
2017
(Unaudited) | | | Year Ended
December 31,
2016 | |
| | | | | | | | |
| Operations | |
Net investment income | | $ | 291,205 | | | $ | 449,230 | |
Net realized gain | | | 196,546 | | | | 39,728 | |
Net change in unrealized appreciation (depreciation) | | | 663,495 | | | | 983,699 | |
| | | | |
Net increase in net assets resulting from operations | | | 1,151,246 | | | | 1,472,657 | |
| | | | |
| | | | | | | | |
| Distributions to Shareholders1 | | | | | | | | |
| From net investment income: | | | | | | | | |
Institutional | | | (141,277 | ) | | | (429,469 | ) |
Investor A | | | (8,170 | ) | | | (27,201 | ) |
Investor C | | | (554 | ) | | | (1,336 | ) |
From net realized gain: | |
Institutional | | | — | | | | (843,780 | ) |
Investor A | | | — | | | | (78,549 | ) |
Investor C | | | — | | | | (7,130 | ) |
| | | | |
Decrease in net assets resulting from distributions to shareholders | | | (150,001 | ) | | | (1,387,465 | ) |
| | | | |
| | | | | | | | |
| Capital Share Transactions | | | | | | | | |
Net increase (decrease) in net assets derived from capital share transactions | | | (1,549,084 | ) | | | 3,908,724 | |
| | | | |
| | | | | | | | |
| Net Assets | |
Total increase (decrease) in net assets | | | (547,839 | ) | | | 3,993,916 | |
Beginning of period | | | 28,219,655 | | | | 24,225,739 | |
| | | | |
End of period | | $ | 27,671,816 | | | $ | 28,219,655 | |
| | | | |
Undistributed (distributions in excess of) net investment income, end of period | | $ | 67,867 | | | $ | (73,337 | ) |
| | | | |
1 Distributions for annual periods determined in accordance with U.S. federal income tax regulations. | |
| | | | | | |
| See Notes to Financial Statements. | | | | |
| | | | | | | |
| | BLACKROCK FUNDS | | JUNE 30, 2017 | | 45 |
| | |
| Statements of Changes in Net Assets (continued) | | |
| | | | | | | | |
| | | BlackRock Emerging Markets
Equity Strategies Fund | |
| Increase (Decrease) in Net Assets: | | Six Months Ended
June 30,
2017
(Unaudited) | | | Period
February 29, 20161
to December 31,
2016 | |
| | | | | | | | |
| Operations | |
Net investment income | | $ | 112,034 | | | $ | 123,344 | |
Net realized gain | | | 1,181,812 | | | | 1,005,582 | |
Net change in unrealized appreciation (depreciation) | | | 605,446 | | | | 27,292 | |
| | | | |
Net increase in net assets resulting from operations | | | 1,899,292 | | | | 1,156,218 | |
| | | | |
| | | | | | | | |
| Distributions to Shareholders2 | | | | | | | | |
| From net investment income: | | | | | | | | |
Institutional | | | — | | | | (14,131 | ) |
Investor A | | | — | | | | (2,177 | ) |
Investor C | | | — | | | | (1,802 | ) |
Class K | | | — | | | | (224,741 | ) |
From net realized gain: | |
Institutional | | | — | | | | (46,903 | ) |
Investor A | | | — | | | | (7,667 | ) |
Investor C | | | — | | | | (7,654 | ) |
Class K | | | — | | | | (742,455 | ) |
| | | | |
Decrease in net assets resulting from distributions to shareholders | | | — | | | | (1,047,530 | ) |
| | | | |
| | | | | | | | |
| Capital Share Transactions | | | | | | | | |
Net increase in net assets derived from capital share transactions | | | 27,404,904 | | | | 6,344,258 | |
| | | | |
| | | | | | | | |
| Net Assets | |
Total increase in net assets | | | 29,304,196 | | | | 6,452,946 | |
Beginning of period | | | 6,452,946 | | | | — | |
| | | | |
End of period | | $ | 35,757,142 | | | $ | 6,452,946 | |
| | | | |
Undistributed net investment income, end of period | | $ | 122,115 | | | $ | 10,081 | |
| | | | |
1 Commencement of operations. | |
2 Distributions for annual periods determined in accordance with U.S. federal income tax regulations. | |
| | | | | | |
| See Notes to Financial Statements. | | | | |
| | | | | | | |
| 46 | | BLACKROCK FUNDS | | JUNE 30, 2017 | | |
| | |
| Statements of Changes in Net Assets (concluded) | | |
| | | | | | | | |
| | | iShares Short-Term TIPS
Bond Index Fund | |
| Increase (Decrease) in Net Assets: | | Six Months Ended June 30, 2017
(Unaudited) | | | Period February 16, 20161
to December 31,
2016 | |
| | | | | | | | |
| Operations | |
Net investment income | | $ | 83,005 | | | $ | 19,743 | |
Net realized gain (loss) | | | (9,921 | ) | | | 1,219 | |
Net change in unrealized appreciation (depreciation) | | | (54,018 | ) | | | 5,296 | |
| | | | |
Net increase in net assets resulting from operations | | | 19,066 | | | | 26,258 | |
| | | | |
| | | | | | | | |
| Distributions to Shareholders2 | |
| From net investment income: | |
Institutional | | | (19,324 | ) | | | (872 | ) |
Investor A | | | (775 | ) | | | (1,804 | ) |
Class K | | | (52,958 | ) | | | (17,412 | ) |
From net realized gain: | | | | | | | | |
Institutional | | | — | | | | (389 | ) |
Investor A | | | — | | | | (51 | ) |
Class K | | | — | | | | (741 | ) |
| | | | |
Decrease in net assets resulting from distributions to shareholders | | | (73,057 | ) | | | (21,269 | ) |
| | | | |
| | | | | | | | |
| Capital Share Transactions | |
Net increase in net assets derived from capital share transactions | | | 2,976,955 | | | | 1,437,655 | |
| | | | |
| | | | | | | | |
| Net Assets | |
Total increase in net assets | | | 2,922,964 | | | | 1,442,644 | |
Beginning of period | | | 1,442,644 | | | | — | |
| | | | |
End of period | | $ | 4,365,608 | | | $ | 1,442,644 | |
| | | | |
Undistributed net investment income, end of period | | $ | 10,024 | | | $ | 76 | |
| | | | |
| | 1 | | Commencement of operations. |
| | 2 | | Distributions for annual periods determined in accordance with U.S. federal income tax regulations. |
| | | | | | |
| See Notes to Financial Statements. | | | | |
| | | | | | | |
| | BLACKROCK FUNDS | | JUNE 30, 2017 | | 47 |
| | |
| Financial Highlights | | BlackRock Alternative Capital Strategies Fund |
| | | | | | | | | | | | | | | | |
| | | Institutional | |
| | | Six Months Ended
June 30,
2017
(Unaudited) | | | Year Ended
December 31,
2016 | | | Period
May 19, 20151
to December 31,
2015 | | | | |
| | | | | | | | | | | | | | | | |
| Per Share Operating Performance | | | | | | | | | | | | | | | | |
Net asset value, beginning of period | | $ | 9.61 | | | $ | 9.53 | | | $ | 10.00 | | | | | |
| | | | |
Net investment income2 | | | 0.11 | | | | 0.16 | | | | 0.11 | | | | | |
Net realized and unrealized gain (loss) | | | 0.30 | | | | 0.40 | | | | (0.46 | ) | | | | |
| | | | |
Net increase (decrease) from investment operations | | | 0.41 | | | | 0.56 | | | | (0.35 | ) | | | | |
| | | | |
| Distributions:3 | | | | | | | | | | | | | | | | |
From net investment income | | | (0.05 | ) | | | (0.16 | ) | | | (0.12 | ) | | | | |
From net realized gain | | | — | | | | (0.32 | ) | | | — | | | | | |
| | | | |
Total distributions | | | (0.05 | ) | | | (0.48 | ) | | | (0.12 | ) | | | | |
| | | | |
Net asset value, end of period | | $ | 9.97 | | | $ | 9.61 | | | $ | 9.53 | | | | | |
| | | | |
| | | | | | | | | | | | | | | | |
| Total Return4 | | | | | | | | | | | | | | | | |
Based on net asset value | | | 4.33% | 5 | | | 5.91% | | | | (3.53)% | 5 | | | | |
| | | | |
| | | | | | | | | | | | | | | | |
| Ratios to Average Net Assets | | | | | | | | | | | | | | | | |
Total expenses | | | 2.11% | 6 | | | 2.24% | 7 | | | 2.05% | 6,8,9 | | | | |
| | | | |
Total expenses after fees waived and/or reimbursed | | | 0.95% | 6 | | | 1.19% | 7 | | | 1.20% | 6,8 | | | | |
| | | | |
Total expenses after fees waived and/or reimbursed and excluding excise tax | | | 0.95% | 6 | | | 1.18% | 7 | | | 1.20% | 6,8 | | | | |
| | | | |
Net investment income | | | 2.17% | 6 | | | 1.64% | 7 | | | 1.79% | 6,8 | | | | |
| | | | |
| | | | | | | | | | | | | | | | |
| Supplemental Data | | | | | | | | | | | | | | | | |
Net assets, end of period (000) | | $ | 25,708 | | | $ | 25,588 | | | $ | 23,844 | | | | | |
| | | | |
Portfolio turnover rate10,11 | | | 224% | | | | 722% | | | | 440% | | | | | |
| | | | |
| | 1 | | Commencement of operations. |
| | 2 | | Based on average shares outstanding. |
| | 3 | | Distributions for annual periods determined in accordance with U.S. federal income tax regulations. |
| | 4 | | Where applicable, assumes the reinvestment of distributions. |
| | 5 | | Aggregate total return. |
| | 7 | | Does not include expenses incurred indirectly as a result of investments in underlying funds of approximately 0.02%. |
| | 8 | | Does not include expenses incurred indirectly as a result of investments in underlying funds of approximately 0.03%. |
| | 9 | | Audit, offering and organization costs were not annualized in the calculation of expense ratios. If these expenses were annualized, the total expenses would have been 2.44%. |
| | 10 | | Excludes investments underlying the total return swaps. |
| | 11 | | Includes mortgage dollar rolls (“MDRs”). Additional information regarding portfolio turnover rate is as follows: |
| | | | | | | | | | | | | | | | |
| | | Six Months Ended
June 30,
2017 (Unaudited) | | | Year Ended
December 31,
2016 | | | Period May 19, 20151 to December 31,
2015 | | | | |
Portfolio turnover rate10,11 | | | 143% | | | | 488% | | | | 437% | | | | | |
| | | | |
| | | | | | |
| See Notes to Financial Statements. | | | | |
| | | | | | | |
| 48 | | BLACKROCK FUNDS | | JUNE 30, 2017 | | |
| | |
| Financial Highlights (continued) | | BlackRock Alternative Capital Strategies Fund |
| | | | | | | | | | | | | | | | |
| | | Investor A | |
| | | Six Months Ended
June 30,
2017
(Unaudited) | | | Year Ended
December 31,
2016 | | | Period
May 19, 20151
to December 31,
2015 | | | | |
| | | | | | | | | | | | | | | | |
| Per Share Operating Performance | | | | | | | | | | | | | | | | |
Net asset value, beginning of period | | $ | 9.60 | | | $ | 9.53 | | | $ | 10.00 | | | | | |
| | | | |
Net investment income2 | | | 0.09 | | | | 0.14 | | | | 0.11 | | | | | |
Net realized and unrealized gain (loss) | | | 0.32 | | | | 0.39 | | | | (0.48 | ) | | | | |
| | | | |
Net increase (decrease) from investment operations | | | 0.41 | | | | 0.53 | | | | (0.37 | ) | | | | |
| | | | |
| Distributions:3 | | | | | | | | | | | | | | | | |
From net investment income | | | (0.05 | ) | | | (0.14 | ) | | | (0.10 | ) | | | | |
From net realized gain | | | — | | | | (0.32 | ) | | | — | | | | | |
| | | | |
Total distributions | | | (0.05 | ) | | | (0.46 | ) | | | (0.10 | ) | | | | |
| | | | |
Net asset value, end of period | | $ | 9.96 | | | $ | 9.60 | | | $ | 9.53 | | | | | |
| | | | |
| | | | | | | | | | | | | | | | |
| Total Return4 | | | | | | | | | | | | | | | | |
Based on net asset value | | | 4.26% | 5 | | | 5.61% | | | | (3.66)% | 5 | | | | |
| | | | |
| | | | | | | | | | | | | | | | |
| Ratios to Average Net Assets | | | | | | | | | | | | | | | | |
Total expenses | | | 2.64% | 6 | | | 2.75% | 7 | | | 2.42% | 6,8,9 | | | | |
| | | | |
Total expenses after fees waived and/or reimbursed | | | 1.20% | 6 | | | 1.42% | 7 | | | 1.45% | 6,8 | | | | |
| | | | |
Total expenses after fees waived and/or reimbursed and excluding excise tax | | | 1.20% | 6 | | | 1.42% | 7 | | | 1.45% | 6,8 | | | | |
| | | | |
Net investment income | | | 1.92% | 6 | | | 1.46% | 7 | | | 1.76% | 6,8 | | | | |
| | | | |
| | | | | | | | | | | | | | | | |
| Supplemental Data | | | | | | | | | | | | | | | | |
Net assets, end of period (000) | | $ | 1,886 | | | $ | 2,439 | | | $ | 311 | | | | | |
| | | | |
Portfolio turnover rate10,11 | | | 224% | | | | 722% | | | | 440% | | | | | |
| | | | |
| | 1 | | Commencement of operations. |
| | 2 | | Based on average shares outstanding. |
| | 3 | | Distributions for annual periods determined in accordance with U.S. federal income tax regulations. |
| | 4 | | Where applicable, excludes the effects of any sales charges and assumes the reinvestment of distributions. |
| | 5 | | Aggregate total return. |
| | 7 | | Does not include expenses incurred indirectly as a result of investments in underlying funds of approximately 0.02%. |
| | 8 | | Does not include expenses incurred indirectly as a result of investments in underlying funds of approximately 0.03%. |
| | 9 | | Audit, offering and organization costs were not annualized in the calculation of expense ratios. If these expenses were annualized, the total expenses would have been 2.81%. |
| | 10 | | Excludes investments underlying the total return swaps. |
| | 11 | | Includes mortgage dollar rolls (“MDRs”). Additional information regarding portfolio turnover rate is as follows: |
| | | | | | | | | | | | | | | | |
| | | Six Months Ended
June 30,
2017 (Unaudited) | | | Year Ended
December 31,
2016 | | | Period May 19, 20151 to December 31,
2015 | | | | |
Portfolio turnover rate10,11 | | | 143% | | | | 488% | | | | 437% | | | | | |
| | | | |
| | | | | | |
| See Notes to Financial Statements. | | | | |
| | | | | | | |
| | BLACKROCK FUNDS | | JUNE 30, 2017 | | 49 |
| | |
| Financial Highlights (concluded) | | BlackRock Alternative Capital Strategies Fund |
| | | | | | | | | | | | | | | | |
| | | Investor C | |
| | | Six Months Ended
June 30,
2017
(Unaudited) | | | Year Ended
December 31,
2016 | | | Period
May 19, 20151
to December 31,
2015 | | | | |
| | | | | | | | | | | | | | | | |
| Per Share Operating Performance | | | | | | | | | | | | | | | | |
Net asset value, beginning of period | | $ | 9.58 | | | $ | 9.51 | | | $ | 10.00 | | | | | |
| | | | |
Net investment income2 | | | 0.05 | | | | 0.06 | | | | 0.05 | | | | | |
Net realized and unrealized gain (loss) | | | 0.32 | | | | 0.40 | | | | (0.47 | ) | | | | |
| | | | |
Net increase (decrease) from investment operations | | | 0.37 | | | | 0.46 | | | | (0.42 | ) | | | | |
| | | | |
| Distributions:3 | | | | | | | | | | | | | | | | |
From net investment income | | | (0.03 | ) | | | (0.07 | ) | | | (0.07 | ) | | | | |
From net realized gain | | | — | | | | (0.32 | ) | | | — | | | | | |
| | | | |
Total distributions | | | (0.03 | ) | | | (0.39 | ) | | | (0.07 | ) | | | | |
| | | | |
Net asset value, end of period | | $ | 9.92 | | | $ | 9.58 | | | $ | 9.51 | | | | | |
| | | | |
| | | | | | | | | | | | | | | | |
| Total Return4 | | | | | | | | | | | | | | | | |
Based on net asset value | | | 3.86% | 5 | | | 4.82% | | | | (4.19)% | 5 | | | | |
| | | | |
| | | | | | | | | | | | | | | | |
| Ratios to Average Net Assets | | | | | | | | | | | | | | | | |
Total expenses | | | 3.28% | 6 | | | 3.43% | 7 | | | 3.31% | 6,8,9 | | | | |
| | | | |
Total expenses after fees waived and/or reimbursed | | | 1.95% | 6 | | | 2.19% | 7 | | | 2.20% | 6,8 | | | | |
| | | | |
Total expenses after fees waived and/or reimbursed and excluding excise tax | | | 1.95% | 6 | | | 2.18% | 7 | | | 2.20% | 6,8 | | | | |
| | | | |
Net investment income | | | 1.17% | 6 | | | 0.64% | 7 | | | 0.89% | 6,8 | | | | |
| | | | |
| | | | | | | | | | | | | | | | |
| Supplemental Data | | | | | | | | | | | | | | | | |
Net assets, end of period (000) | | $ | 78 | | | $ | 193 | | | $ | 71 | | | | | |
| | | | |
Portfolio turnover rate10,11 | | | 224% | | | | 722% | | | | 440% | | | | | |
| | | | |
| | 1 | | Commencement of operations. |
| | 2 | | Based on average shares outstanding. |
| | 3 | | Distributions for annual periods determined in accordance with U.S. federal income tax regulations. |
| | 4 | | Where applicable, excludes the effects of any sales charges and assumes the reinvestment of distributions. |
| | 5 | | Aggregate total return. |
| | 7 | | Does not include expenses incurred indirectly as a result of investments in underlying funds of approximately 0.02%. |
| | 8 | | Does not include expenses incurred indirectly as a result of investments in underlying funds of approximately 0.03%. |
| | 9 | | Audit, offering and organization costs were not annualized in the calculation of expense ratios. If these expenses were annualized, the total expenses would have been 3.70%. |
| | 10 | | Excludes investments underlying the total return swaps. |
| | 11 | | Includes mortgage dollar rolls (“MDRs”). Additional information regarding portfolio turnover rate is as follows: |
| | | | | | | | | | | | | | | | |
| | | Six Months Ended
June 30,
2017 (Unaudited) | | | Year Ended
December 31,
2016 | | | Period May 19, 20151 to December 31,
2015 | | | | |
Portfolio turnover rate10,11 | | | 143% | | | | 488% | | | | 437% | | | | | |
| | | | |
| | | | | | |
| See Notes to Financial Statements. | | | | |
| | | | | | | |
| 50 | | BLACKROCK FUNDS | | JUNE 30, 2017 | | |
| | |
| Financial Highlights | | BlackRock Emerging Markets Equity Strategies Fund |
| | | | | | | | | | | | |
| | | Institutional | |
| | | Six Months Ended
June 30,
2017
(Unaudited) | | | Period
February 29, 20161
to December 31,
2016 | | | | |
| | | | | | | | | | | | |
| Per Share Operating Performance | | | | | | | | | | | | |
Net asset value, beginning of period | | $ | 10.24 | | | $ | 10.00 | | | | | |
| | | | |
Net investment income2 | | | 0.11 | | | | 0.23 | | | | | |
Net realized and unrealized gain | | | 2.11 | | | | 2.00 | | | | | |
| | | | |
Net increase from investment operations | | | 2.22 | | | | 2.23 | | | | | |
| | | | |
| Distributions:3 | | | | | | | | | | | | |
From net investment income | | | — | | | | (0.46 | ) | | | | |
From net realized gain | | | — | | | | (1.53 | ) | | | | |
| | | | |
Total distributions | | | — | | | | (1.99 | ) | | | | |
| | | | |
Net asset value, end of period | | $ | 12.46 | | | $ | 10.24 | | | | | |
| | | | |
| | | | | | | | | | | | |
| Total Return4 | | | | | | | | | | | | |
Based on net asset value | | | 21.68% | 5 | | | 22.20% | 5 | | | | |
| | | | |
| | | | | | | | | | | | |
| Ratios to Average Net Assets | | | | | | | | | | | | |
Total expenses | | | 2.40% | 6,7,8 | | | 6.31% | 6,9,10 | | | | |
| | | | |
Total expenses after fees waived and/or reimbursed | | | 1.27% | 6,7 | | | 1.28% | 6,9 | | | | |
| | | | |
Net investment income | | | 1.79% | 6,7 | | | 2.37% | 6,9 | | | | |
| | | | |
| | | | | | | | | | | | |
| Supplemental Data | | | | | | | | | | | | |
Net assets, end of period (000) | | $ | 28,355 | | | $ | 375 | | | | | |
| | | | |
Portfolio turnover rate11 | | | 78% | | | | 161% | | | | | |
| | | | |
| | 1 | | Commencement of operations. |
| | 2 | | Based on average shares outstanding. |
| | 3 | | Distributions for annual periods determined in accordance with U.S. federal income tax regulations. |
| | 4 | | Where applicable, assumes the reinvestment of distributions. |
| | 5 | | Aggregate total return. |
| | 7 | | Does not include expenses incurred indirectly as a result of investments in underlying funds of approximately 0.02%. |
| | 8 | | Offering costs were not annualized in the calculation of the expense ratios. If these expenses were annualized, the total expenses would have been 2.44%. |
| | 9 | | Does not include expenses incurred indirectly as a result of investments in underlying funds of approximately 0.01%. |
| | 10 | | Audit, offering and organization costs were not annualized in the calculation of the expense ratios. If these expenses were annualized, the total expenses would have been 6.93%. |
| | 11 | | Excludes investments underlying the total return swaps. |
| | | | | | |
| See Notes to Financial Statements. | | | | |
| | | | | | | |
| | BLACKROCK FUNDS | | JUNE 30, 2017 | | 51 |
| | |
| Financial Highlights (continued) | | BlackRock Emerging Markets Equity Strategies Fund |
| | | | | | | | | | | | |
| | | Investor A | |
| | | Six Months Ended
June 30,
2017
(Unaudited) | | | Period
February 29, 20161
to December 31,
2016 | | | | |
| | | | | | | | | | | | |
| Per Share Operating Performance | | | | | | | | | | | | |
Net asset value, beginning of period | | $ | 10.24 | | | $ | 10.00 | | | | | |
| | | | |
Net investment income2 | | | 0.09 | | | | 0.21 | | | | | |
Net realized and unrealized gain | | | 2.11 | | | | 2.00 | | | | | |
| | | | |
Net increase from investment operations | | | 2.20 | | | | 2.21 | | | | | |
| | | | |
| Distributions:3 | | | | | | | | | | | | |
From net investment income | | | — | | | | (0.44 | ) | | | | |
From net realized gain | | | — | | | | (1.53 | ) | | | | |
| | | | |
Total distributions | | | — | | | | (1.97 | ) | | | | |
| | | | |
Net asset value, end of period | | $ | 12.44 | | | $ | 10.24 | | | | | |
| | | | |
| | | | | | | | | | | | |
| Total Return4 | | | | | | | | | | | | |
Based on net asset value | | | 21.48% | 5 | | | 21.94% | 5 | | | | |
| | | | |
| | | | | | | | | | | | |
| Ratios to Average Net Assets | | | | | | | | | | | | |
Total expenses | | | 4.17% | 6,7,8 | | | 6.82% | 6,9,10 | | | | |
| | | | |
Total expenses after fees waived and/or reimbursed | | | 1.55% | 6,7 | | | 1.54% | 6,9 | | | | |
| | | | |
Net investment income | | | 1.51% | 6,7 | | | 2.14% | 6,9 | | | | |
| | | | |
| | | | | | | | | | | | |
| Supplemental Data | | | | | | | | | | | | |
Net assets, end of period (000) | | $ | 75 | | | $ | 61 | | | | | |
| | | | |
Portfolio turnover rate11 | | | 78% | | | | 161% | | | | | |
| | | | |
| | 1 | | Commencement of operations. |
| | 2 | | Based on average shares outstanding. |
| | 3 | | Distributions for annual periods determined in accordance with U.S. federal income tax regulations. |
| | 4 | | Where applicable, excludes the effects of any sales charges and assumes the reinvestment of distributions. |
| | 5 | | Aggregate total return. |
| | 7 | | Does not include expenses incurred indirectly as a result of investments in underlying funds of approximately 0.02%. |
| | 8 | | Offering costs were not annualized in the calculation of the expense ratios. If these expenses were annualized, the total expenses would have been 4.40%. |
| | 9 | | Does not include expenses incurred indirectly as a result of investments in underlying funds of approximately 0.01%. |
| | 10 | | Audit, offering and organization costs were not annualized in the calculation of the expense ratios. If these expenses were annualized, the total expenses would have been 7.48%. |
| | 11 | | Excludes investments underlying the total return swaps. |
| | | | | | |
| See Notes to Financial Statements. | | | | |
| | | | | | | |
| 52 | | BLACKROCK FUNDS | | JUNE 30, 2017 | | |
| | |
| Financial Highlights (continued) | | BlackRock Emerging Markets Equity Strategies Fund |
| | | | | | | | | | | | |
| | | Investor C | |
| | | Six Months Ended
June 30,
2017
(Unaudited) | | | Period
February 29, 20161
to December 31,
2016 | | | | |
| | | | | | | | | | | | |
| Per Share Operating Performance | | | | | | | | | | | | |
Net asset value, beginning of period | | $ | 10.24 | | | $ | 10.00 | | | | | |
| | | | |
Net investment income2 | | | 0.04 | | | | 0.13 | | | | | |
Net realized and unrealized gain | | | 2.11 | | | | 2.00 | | | | | |
| | | | |
Net increase from investment operations | | | 2.15 | | | | 2.13 | | | | | |
| | | | |
| Distributions:3 | | | | | | | | | | | | |
From net investment income | | | — | | | | (0.36 | ) | | | | |
From net realized gain | | | — | | | | (1.53 | ) | | | | |
| | | | |
Total distributions | | | — | | | | (1.89 | ) | | | | |
| | | | |
Net asset value, end of period | | $ | 12.39 | | | $ | 10.24 | | | | | |
| | | | |
| | | | | | | | | | | | |
| Total Return4 | | | | | | | | | | | | |
Based on net asset value | | | 21.00% | 5 | | | 21.20% | 5 | | | | |
| | | | |
| | | | | | | | | | | | |
| Ratios to Average Net Assets | | | | | | | | | | | | |
Total expenses | | | 4.77% | 6,7,8 | | | 7.53% | 6,9,10 | | | | |
| | | | |
Total expenses after fees waived and/or reimbursed | | | 2.30% | 6,7 | | | 2.30% | 6,9 | | | | |
| | | | |
Net investment income | | | 0.76% | 6,7 | | | 1.38% | 6,9 | | | | |
| | | | |
| | | | | | | | | | | | |
| Supplemental Data | | | | | | | | | | | | |
Net assets, end of period (000) | | $ | 83 | | | $ | 61 | | | | | |
| | | | |
Portfolio turnover rate11 | | | 78% | | | | 161% | | | | | |
| | | | |
| | 1 | | Commencement of operations. |
| | 2 | | Based on average shares outstanding. |
| | 3 | | Distributions for annual periods determined in accordance with U.S. federal income tax regulations. |
| | 4 | | Where applicable, excludes the effects of any sales charges and assumes the reinvestment of distributions. |
| | 5 | | Aggregate total return. |
| | 7 | | Does not include expenses incurred indirectly as a result of investments in underlying funds of approximately 0.02%. |
| | 8 | | Offering costs were not annualized in the calculation of the expense ratios. If these expenses were annualized, the total expenses would have been 5.00%. |
| | 9 | | Does not include expenses incurred indirectly as a result of investments in underlying funds of approximately 0.01%. |
| | 10 | | Audit, offering and organization costs were not annualized in the calculation of the expense ratios. If these expenses were annualized, the total expenses would have been 8.20%. |
| | 11 | | Excludes investments underlying the total return swaps. |
| | | | | | |
| See Notes to Financial Statements. | | | | |
| | | | | | | |
| | BLACKROCK FUNDS | | JUNE 30, 2017 | | 53 |
| | |
| Financial Highlights (concluded) | | BlackRock Emerging Markets Equity Strategies Fund |
| | | | | | | | | | | | |
| | | Class K | |
| | | Six Months Ended
June 30,
2017
(Unaudited) | | | Period
February 29, 20161
to December 31,
2016 | | | | |
| | | | | | | | | | | | |
| Per Share Operating Performance | | | | | | | | | | | | |
Net asset value, beginning of period | | $ | 10.24 | | | $ | 10.00 | | | | | |
| | | | |
Net investment income2 | | | 0.10 | | | | 0.24 | | | | | |
Net realized and unrealized gain | | | 2.12 | | | | 1.99 | | | | | |
| | | | |
Net increase from investment operations | | | 2.22 | | | | 2.23 | | | | | |
| | | | |
| Distributions:3 | | | | | | | | | | | | |
From net investment income | | | — | | | | (0.46 | ) | | | | |
From net realized gain | | | — | | | | (1.53 | ) | | | | |
| | | | |
Total distributions | | | — | | | | (1.99 | ) | | | | |
| | | | |
Net asset value, end of period | | $ | 12.46 | | | $ | 10.24 | | | | | |
| | | | |
| | | | | | | | | | | | |
| Total Return4 | | | | | | | | | | | | |
Based on net asset value | | | 21.68% | 5 | | | 22.23% | 5 | | | | |
| | | | |
| | | | | | | | | | | | |
| Ratios to Average Net Assets | | | | | | | | | | | | |
Total expenses | | | 3.76% | 6,7,8 | | | 6.48% | 6,9,10 | | | | |
| | | | |
Total expenses after fees waived and/or reimbursed | | | 1.25% | 6,7 | | | 1.25% | 6,9 | | | | |
| | | | |
Net investment income | | | 1.81% | 6,7 | | | 2.43% | 6,9 | | | | |
| | | | |
| | | | | | | | | | | | |
| Supplemental Data | | | | | | | | | | | | |
Net assets, end of period (000) | | $ | 7,246 | | | $ | 5,956 | | | | | |
| | | | |
Portfolio turnover rate11 | | | 78% | | | | 161% | | | | | |
| | | | |
| | 1 | | Commencement of operations. |
| | 2 | | Based on average shares outstanding. |
| | 3 | | Distributions for annual periods determined in accordance with U.S. federal income tax regulations. |
| | 4 | | Where applicable, assumes the reinvestment of distributions. |
| | 5 | | Aggregate total return. |
| | 7 | | Does not include expenses incurred indirectly as a result of investments in underlying funds of approximately 0.02%. |
| | 8 | | Offering costs were not annualized in the calculation of the expense ratios. If these expenses were annualized, the total expenses would have been 3.99%. |
| | 9 | | Does not include expenses incurred indirectly as a result of investments in underlying funds of approximately 0.01%. |
| | 10 | | Audit, offering and organization costs were not annualized in the calculation of the expense ratios. If these expenses were annualized, the total expenses would have been 7.14%. |
| | 11 | | Excludes investments underlying the total return swaps. |
| | | | | | |
| See Notes to Financial Statements. | | | | |
| | | | | | | |
| 54 | | BLACKROCK FUNDS | | JUNE 30, 2017 | | |
| | |
| Financial Highlights | | iShares Short-Term TIPS Bond Index Fund |
| | | | | | | | | | | | |
| | | Institutional | |
| | | Six Months Ended June 30, 2017 (Unaudited) | | | Period
February 16, 20161
to December 31,
2016 | | | | |
| | | | | | | | | | | | |
| Per Share Operating Performance | | | | | | | | | | | | |
Net asset value, beginning of period | | $ | 10.05 | | | $ | 10.00 | | | | | |
| | | | |
Net investment income2 | | | 0.11 | | | | 0.17 | | | | | |
Net realized and unrealized gain (loss) | | | (0.08 | ) | | | 0.08 | | | | | |
| | | | |
Net increase from investment operations | | | 0.03 | | | | 0.25 | | | | | |
| | | | |
| Distributions:3 | | | | | | | | | | | | |
From net investment income | | | (0.10 | ) | | | (0.19 | ) | | | | |
From net realized gain | | | — | | | | (0.01 | ) | | | | |
| | | | |
Total distributions | | | (0.10 | ) | | | (0.20 | ) | | | | |
| | | | |
Net asset value, end of period | | $ | 9.98 | | | $ | 10.05 | | | | | |
| | | | |
| | | | | | | | | | | | |
| Total Return4 | | | | | | | | | | | | |
Based on net asset value | | | 0.26% | 5 | | | 2.49% | 5 | | | | |
| | | | |
| | | | | | | | | | | | |
| Ratios to Average Net Assets | | | | | | | | | | | | |
Total expenses | | | 3.14% | 6,7 | | | 18.22% | 6,8 | | | | |
| | | | |
Total expenses after fees waived and/or reimbursed | | | 0.07% | 6 | | | 0.09% | 6 | | | | |
| | | | |
Net investment income | | | 2.21% | 6 | | | 1.91% | 6 | | | | |
| | | | |
| | | | | | | | | | | | |
| Supplemental Data | | | | | | | | | | | | |
Net assets, end of period (000) | | $ | 3,156 | | | $ | 476 | | | | | |
| | | | |
Portfolio turnover rate | | | 181% | | | | 10% | | | | | |
| | | | |
| | 1 | | Commencement of operations. |
| | 2 | | Based on average shares outstanding. |
| | 3 | | Distributions for annual periods determined in accordance with U.S. federal income tax regulations. |
| | 4 | | Where applicable, assumes the reinvestment of distributions. |
| | 5 | | Aggregate total return. |
| | 7 | | Offering costs were not annualized in the calculation of the expense ratios. If these expenses were annualized, the total expenses would have been 3.38%. |
| | 8 | | Audit, offering and organization costs were not annualized in the calculation of the expense ratios. If these expenses were annualized, the total expenses would have been 19.98%. |
| | | | | | |
| See Notes to Financial Statements. | | | | |
| | | | | | | |
| | BLACKROCK FUNDS | | JUNE 30, 2017 | | 55 |
| | |
| Financial Highlights (continued) | | iShares Short-Term TIPS Bond Index Fund |
| | | | | | | | | | | | |
| | | Investor A | |
| | | Six Months Ended
June 30,
2017
(Unaudited) | | | Period
February 16, 20161
to December 31,
2016 | | | | |
| | | | | | | | | | | | |
| Per Share Operating Performance | | | | | | | | | | | | |
Net asset value, beginning of period | | $ | 10.04 | | | $ | 10.00 | | | | | |
| | | | |
Net investment income2 | | | 0.08 | | | | 0.16 | | | | | |
Net realized and unrealized gain (loss) | | | (0.05 | ) | | | 0.06 | | | | | |
| | | | |
Net increase from investment operations | | | 0.03 | | | | 0.22 | | | | | |
| | | | |
| Distributions:3 | | | | | | | | | | | | |
From net investment income | | | (0.09 | ) | | | (0.17 | ) | | | | |
From net realized gain | | | — | | | | (0.01 | ) | | | | |
| | | | |
Total distributions | | | (0.09 | ) | | | (0.18 | ) | | | | |
| | | | |
Net asset value, end of period | | $ | 9.98 | | | $ | 10.04 | | | | | |
| | | | |
| | | | | | | | | | | | |
| Total Return4 | | | | | | | | | | | | |
Based on net asset value | | | 0.26% | 5 | | | 2.18% | 5 | | | | |
| | | | |
| | | | | | | | | | | | |
| Ratios to Average Net Assets | | | | | | | | | | | | |
Total expenses | | | 4.11% | 6,7 | | | 20.84% | 6,8 | | | | |
| | | | |
Total expenses after fees waived and/or reimbursed | | | 0.36% | 6 | | | 0.36% | 6 | | | | |
| | | | |
Net investment income | | | 1.59% | 6 | | | 1.81% | 6 | | | | |
| | | | |
| | | | | | | | | | | | |
| Supplemental Data | | | | | | | | | | | | |
Net assets, end of period (000) | | $ | 153 | | | $ | 62 | | | | | |
| | | | |
Portfolio turnover rate | | | 181% | | | | 10% | | | | | |
| | | | |
| | 1 | | Commencement of operations. |
| | 2 | | Based on average shares outstanding. |
| | 3 | | Distributions for annual periods determined in accordance with U.S. federal income tax regulations. |
| | 4 | | Where applicable, assumes the reinvestment of distributions. |
| | 5 | | Aggregate total return. |
| | 7 | | Offering costs were not annualized in the calculation of the expense ratios. If these expenses were annualized, the total expenses would have been 4.76%. |
| | 8 | | Audit, offering and organization costs were not annualized in the calculation of the expense ratios. If these expenses were annualized, the total expenses would have been 22.90%. |
| | | | | | |
| See Notes to Financial Statements. | | | | |
| | | | | | | |
| 56 | | BLACKROCK FUNDS | | JUNE 30, 2017 | | |
| | |
| Financial Highlights (concluded) | | iShares Short-Term TIPS Bond Index Fund |
| | | | | | | | | | | | |
| | | Class K | |
| | | Six Months Ended
June 30,
2017
(Unaudited) | | | Period
February 16, 20161
to December 31,
2016 | | | | |
| | | | | | | | | | | | |
| Per Share Operating Performance | | | | | | | | | | | | |
Net asset value, beginning of period | | $ | 10.05 | | | $ | 10.00 | | | | | |
| | | | |
Net investment income2 | | | 0.12 | | | | 0.19 | | | | | |
Net realized and unrealized gain (loss) | | | (0.09 | ) | | | 0.06 | | | | | |
| | | | |
Net increase from investment operations | | | 0.03 | | | | 0.25 | | | | | |
| | | | |
| Distributions:3 | | | | | | | | | | | | |
From net investment income | | | (0.10 | ) | | | (0.19 | ) | | | | |
From net realized gain | | | — | | | | (0.01 | ) | | | | |
| | | | |
Total distributions | | | (0.10 | ) | | | (0.20 | ) | | | | |
| | | | |
Net asset value, end of period | | $ | 9.98 | | | $ | 10.05 | | | | | |
| | | | |
| | | | | | | | | | | | |
| Total Return4 | | | | | | | | | | | | |
Based on net asset value | | | 0.26% | 5 | | | 2.52% | 5 | | | | |
| | | | |
| | | | | | | | | | | | |
| Ratios to Average Net Assets | | | | | | | | | | | | |
Total expenses | | | 1.75% | 6,7 | | | 20.61% | 6,8 | | | | |
| | | | |
Total expenses after fees waived and/or reimbursed | | | 0.06% | 6 | | | 0.06% | 6 | | | | |
| | | | |
Net investment income | | | 2.34% | 6 | | | 2.17% | 6 | | | | |
| | | | |
| | | | | | | | | | | | |
| Supplemental Data | | | | | | | | | | | | |
Net assets, end of period (000) | | $ | 1,057 | | | $ | 904 | | | | | |
| | | | |
Portfolio turnover rate | | | 181% | | | | 10% | | | | | |
| | | | |
| | 1 | | Commencement of operations. |
| | 2 | | Based on average shares outstanding. |
| | 3 | | Distributions for annual periods determined in accordance with U.S. federal income tax regulations. |
| | 4 | | Where applicable, assumes the reinvestment of distributions. |
| | 5 | | Aggregate total return. |
| | 7 | | Offering costs were not annualized in the calculation of the expense ratios. If these expenses were annualized, the total expenses would have been 2.05%. |
| | 8 | | Audit, offering and organization costs were not annualized in the calculation of the expense ratios. If these expenses were annualized, the total expenses would have been 22.68%. |
| | | | | | |
| See Notes to Financial Statements. | | | | |
| | | | | | | |
| | BLACKROCK FUNDS | | JUNE 30, 2017 | | 57 |
| | | | |
| Notes to Financial Statements (Unaudited) | | |
1. Organization:
BlackRock FundsSM (the “Trust”) is registered under the Investment Company Act of 1940, as amended (the “1940 Act”), as an open-end management investment company. The Trust is organized as a Massachusetts trust. The following are each a series of the Trust and referred to herein collectively as the “Funds”, or individually, a “Fund”:
| | | | |
| Fund Name | | Herein Referred to As | | Diversification Classification |
BlackRock Alternative Capital Strategies Fund | | Alternative Capital Strategies | | Diversified |
BlackRock Emerging Markets Equity Strategies Fund | | Emerging Markets Equity Strategies | | Diversified |
iShares Short-Term TIPS Bond Index Fund (formerly known as BlackRock Short-Term Inflation-Protected Securities Index Fund) | | Short-Term TIPS Bond Index | | Diversified |
Each Fund offers multiple classes of shares. All classes of shares have identical voting, dividend, liquidation and other rights and are subject to the same terms and conditions, except that certain classes bear expenses related to the shareholder servicing and distribution of such shares. Institutional and Class K Shares are sold only to certain eligible investors. Investor A and Investor C Shares are generally available through financial intermediaries. Each class has exclusive voting rights with respect to matters relating to its shareholder servicing and distribution expenditures.
| | | | | | |
| Share Class | | Initial Sales Charge | | CDSC | | Conversion Privilege |
Institutional and Class K Shares | | No | | No | | None |
Investor A Shares | | Yes2 | | No1 | | None |
Investor C Shares | | No2 | | Yes2 | | None2 |
| | 1 | | Investor A Shares may be subject to a contingent deferred sales charge (“CDSC”) for certain redemptions where no initial sales charge was paid at the time of purchase. |
| | 2 | | Not applicable for Short-Term TIPS Bond Index. |
On February 24, 2017, the Board approved a proposal to change the name of BlackRock Short-Term Inflation-Protected Securities Index Fund to iShares Short-Term TIPS Bond Index Fund, which was effective on June 19, 2017.
The Funds, together with certain other registered investment companies advised by BlackRock Advisors, LLC (the “Manager”) or its affiliates, are included in a complex of open-end funds referred to as the Equity-Liquidity Complex.
2. Significant Accounting Policies:
The financial statements are prepared in conformity with accounting principles generally accepted in the United States of America (“U.S. GAAP”), which may require management to make estimates and assumptions that affect the reported amounts of assets and liabilities in the financial statements, disclosure of contingent assets and liabilities at the date of the financial statements and the reported amounts of increases and decreases in net assets from operations during the reporting period. Actual results could differ from those estimates. Each Fund is considered an investment company under U.S. GAAP and follows the accounting and reporting guidance applicable to investment companies. Below is a summary of significant accounting policies:
Investment Transactions and Income Recognition: For financial reporting purposes, investment transactions are recorded on the dates the transactions are entered into (the “trade dates”). Realized gains and losses on investment transactions are determined on the identified cost basis. Dividend income is recorded on the ex-dividend date. Dividends from foreign securities where the ex-dividend date may have passed are subsequently recorded when the Funds are informed of the ex-dividend date. Under the applicable foreign tax laws, a withholding tax at various rates may be imposed on capital gains, dividends and interest. Upon notification from issuers, some of the dividend income received from a real estate investment trust may be redesignated as a reduction of cost of the related investment and/or realized gain. Interest income, including amortization and accretion of premiums and discounts on debt securities, is recognized on an accrual basis. Income, expenses and realized and unrealized gains and losses are allocated daily to each class based on its relative net assets.
Foreign Currency Translation: Each Fund’s books and records are maintained in U.S. dollars. Securities and other assets and liabilities denominated in foreign currencies are translated into U.S. dollars using exchange rates determined as of the close of trading on the New York Stock Exchange (“NYSE”). Purchases and sales of investments are recorded at the rates of exchange prevailing on the respective dates of such transactions. Generally, when the U.S. dollar rises in value against a foreign currency, the investments denominated in that currency will lose value; the opposite effect occurs if the U.S. dollar falls in relative value.
Each Fund does not isolate the portion of the results of operations arising as a result of changes in the exchange rates from the changes in the market prices of investments held or sold for financial reporting purposes. Accordingly, the effects of changes in exchange rates on investments are not segregated in the Statements of Operations from the effects of changes in market prices of those investments, but are included as a component of net realized and unrealized gain (loss) from investments. Each Fund reports realized currency gains (losses) on foreign currency related transactions as components of net realized gain (loss) for financial reporting purposes, whereas such components are generally treated as ordinary income for U.S. federal income tax purposes.
| | | | | | |
| | | | | | | |
| 58 | | BLACKROCK FUNDS | | JUNE 30, 2017 | | |
| | |
| Notes to Financial Statements (continued) | | |
Segregation and Collateralization: In cases where a Fund enters into certain investments (e.g., dollar rolls, TBA sale commitments, futures contracts, forward foreign currency exchange contracts, options written and swaps) that would be treated as “senior securities” for 1940 Act purposes, a Fund may segregate or designate on its books and records cash or liquid assets having a market value at least equal to the amount of its future obligations under such investments. Doing so allows the investment to be excluded from treatment as a “senior security.” Furthermore, if required by an exchange or counterparty agreement, the Funds may be required to deliver/deposit cash and/or securities to/with an exchange, or broker-dealer or custodian as collateral for certain investments or obligations.
Distributions: Distributions paid by the Funds are recorded on the ex-dividend date. For Alternative Capital Strategies, distributions from net investment income are declared quarterly and paid quarterly. Emerging Markets Equity Strategies will distribute net investment income, if any, at least annually. For Short-Term TIPS Bond Index, distributions from net investment income are declared daily and paid monthly. Distributions of capital gains are recorded on the ex-dividend date and made at least annually. The character and timing of distributions are determined in accordance with U.S. federal income tax regulations, which may differ from U.S. GAAP.
Organization and Offering Costs: Upon commencement of operations, organization costs associated with the establishment of the Funds were expensed by the Funds and reimbursed by the Manager. Offering costs are amortized over a 12-month period beginning with the commencement of operations.
Recent Accounting Standards: In March 2017, the Financial Accounting Standards Board issued Accounting Standards Update “Premium Amortization of Purchased Callable Debt Securities” which amends the amortization period for certain purchased callable debt securities. Under the new guidance, the premium amortization of purchased callable debt securities that have explicit, non-contingent call features and are callable at fixed prices will be amortized to the earliest call date. The guidance will be applied on a modified retrospective basis and is effective for fiscal years, and their interim periods, beginning after December 15, 2018. Management is currently evaluating the impact of this guidance to the Funds.
SEC Reporting Modernization: The U.S. Securities and Exchange Commission (“SEC”) adopted new rules and forms and amended other rules to enhance the reporting and disclosure of information by registered investment companies. As part of these changes, the SEC amended Regulation S-X to standardize and enhance disclosures in investment company financial statements. The compliance date for implementing the new or amended rules is August 1, 2017.
Indemnifications: In the normal course of business, a Fund enters into contracts that contain a variety of representations that provide general indemnification. A Fund’s maximum exposure under these arrangements is unknown because it involves future potential claims against a Fund, which cannot be predicted with any certainty.
Other: Expenses directly related to a Fund or its classes are charged to that Fund or the applicable class. Other operating expenses shared by several funds, including other funds managed by the Manager, are prorated among those funds on the basis of relative net assets or other appropriate methods. Expenses directly related to the Funds and other shared expenses prorated to the Funds are allocated daily to each class based on their relative net assets or other appropriate methods.
Through May 31, 2016, the Funds had an arrangement with their custodian whereby credits were earned on uninvested cash balances, which could be used to reduce custody fees and/or overdraft charges. Credits previously earned have been utilized until December 31, 2016. Under current arrangements effective June 1, 2016, the Funds no longer earn credits on uninvested cash, and may incur charges on uninvested cash balances and overdrafts, subject to certain conditions.
3. Investment Valuation and Fair Value Measurements:
Investment Valuation Policies: The Funds’ investments are valued at fair value (also referred to as “market value” within the financial statements) as of the close of trading on the NYSE (generally 4:00 p.m., Eastern time). U.S. GAAP defines fair value as the price the Funds would receive to sell an asset or pay to transfer a liability in an orderly transaction between market participants at the measurement date. The Funds determine the fair values of their financial instruments using various independent dealers or pricing services under policies approved by the Board of Trustees of each Fund (the “Board”). The BlackRock Global Valuation Methodologies Committee (the “Global Valuation Committee”) is the committee formed by management to develop global pricing policies and procedures and to oversee the pricing function for all financial instruments.
Fair Value Inputs and Methodologies: The following methods and inputs are used to establish the fair value of each Fund’s assets and liabilities:
| • | | Equity investments traded on a recognized securities exchange are valued at the official closing price each day, if available. For equity investments traded on more than one exchange, the official closing price on the exchange where the stock is primarily traded is used. Equity investments traded on a recognized exchange for which there were no sales on that day may be valued at the last available bid (long positions) or ask (short positions) price. |
| • | | Fixed-income securities for which market quotations are readily available are generally valued using the last available bid prices or current market quotations provided by independent dealers or third party pricing services. Floating rate loan interests are valued at the mean of the bid prices from one or more independent brokers or dealers as obtained from a third party pricing service. Pricing services generally value fixed-income securities |
| | | | | | |
| | | | | | | |
| | BLACKROCK FUNDS | | JUNE 30, 2017 | | 59 |
| | |
| Notes to Financial Statements (continued) | | |
| | assuming orderly transactions of an institutional round lot size, but a fund may hold or transact in such securities in smaller, odd lot sizes. Odd lots often trade at lower prices than institutional round lots. The pricing services may use matrix pricing or valuation models that utilize certain inputs and assumptions to derive values, including transaction data (e.g., recent representative bids and offers), credit quality information, perceived market movements, news, and other relevant information. Certain fixed-income securities, including asset-backed and mortgage related securities may be valued based on valuation models that consider the estimated cash flows of each tranche of the entity, establish a benchmark yield and develop an estimated tranche specific spread to the benchmark yield based on the unique attributes of the tranche. The amortized cost method of valuation may be used with respect to debt obligations with sixty days or less remaining to maturity unless the Manager determines such method does not represent fair value. |
Generally, trading in foreign instruments is substantially completed each day at various times prior to the close of trading on the NYSE. Occasionally, events affecting the values of such instruments may occur between the foreign market close and the close of trading on the NYSE that may not be reflected in the computation of the Funds’ net assets. Each business day, the Funds use a pricing service to assist with the valuation of certain foreign exchange-traded equity securities and foreign exchange-traded over-the-counter (“OTC”) options (the “Systematic Fair Value Price”). Using current market factors, the Systematic Fair Value Price is designed to value such foreign securities and foreign options at fair value as of the close of trading on the NYSE, which follows the close of the local markets.
| • | | Investments in open-end U.S. mutual funds are valued at net asset value (“NAV”) each business day. |
| • | | Futures contracts traded on exchanges are valued at their last sale price. |
| • | | Forward foreign currency exchange contracts are valued at the mean between the bid and ask prices and are determined as of the close of trading on the NYSE. Interpolated values are derived when the settlement date of the contract is an interim date for which quotations are not available. |
| • | | Exchange-traded options are valued at the mean between the last bid and ask prices at the close of the options market in which the options trade. An exchange-traded option for which there is no mean price is valued at the last bid (long positions) or ask (short positions) price. If no bid or ask price is available, the prior day’s price will be used, unless it is determined that the prior day’s price no longer reflects the fair value of the option. OTC options are valued by an independent pricing service using a mathematical model, which incorporates a number of market data factors, such as the trades and prices of the underlying instruments. |
| • | | Swap agreements are valued utilizing quotes received daily by the Funds’ pricing service or through brokers, which are derived using daily swap curves and models that incorporate a number of market data factors, such as discounted cash flows, trades and values of the underlying reference instruments. |
| • | | To-be-announced (“TBA”) commitments are valued on the basis of last available bid prices or current market quotations provided by pricing services. |
If events (e.g., a company announcement, market volatility or a natural disaster) occur that are expected to materially affect the value of such investments, or in the event that the application of these methods of valuation results in a price for an investment that is deemed not to be representative of the market value of such investment, or if a price is not available, the investment will be valued by the Global Valuation Committee, or its delegate, in accordance with a policy approved by the Board as reflecting fair value (“Fair Valued Investments”). The fair valuation approaches that may be used by the Global Valuation Committee will include Market approach, Income approach and Cost approach. Valuation techniques such as discounted cash flow, use of market comparables and matrix pricing are types of valuation approaches and typically used in determining fair value. When determining the price for Fair Valued Investments, the Global Valuation Committee, or its delegate, seeks to determine the price that each Fund might reasonably expect to receive or pay from the current sale or purchase of that asset or liability in an arm’s-length transaction. Fair value determinations shall be based upon all available factors that the Global Valuation Committee, or its delegate, deems relevant and consistent with the principles of fair value measurement.
The Global Valuation Committee, or its delegate, employs various methods for calibrating valuation approaches for investments where an active market does not exist, including regular due diligence of each Fund’s pricing vendors, regular reviews of key inputs and assumptions, transactional back-testing or disposition analysis to compare unrealized gains and losses to realized gains and losses, reviews of missing or stale prices and large movements in market values and reviews of any market related activity. The pricing of all Fair Valued Investments is subsequently reported to the Board or a committee thereof on a quarterly basis. As a result of the inherent uncertainty in valuation of these investments, the fair values may differ from the values that would have been used had an active market existed.
For investments in equity or debt issued by privately-held companies or funds (“Private Company” or collectively, the “Private Companies”) and other Fair Valued Investments, the fair valuation approaches that are used by third party pricing services utilize one or a combination of, but not limited to, the following inputs.
| | |
| | | Standard Inputs Generally Considered By Third Party Pricing Services |
Market approach | | (i) recent market transactions, including subsequent rounds of financing, in the underlying investment or comparable issuers; (ii) recapitalizations and other transactions across the capital structure; and (iii) market multiples of comparable issuers. |
| | | | | | |
| | | | | | | |
| 60 | | BLACKROCK FUNDS | | JUNE 30, 2017 | | |
| | |
| Notes to Financial Statements (continued) | | |
| | |
| | | Standard Inputs Generally Considered By Third Party Pricing Services |
Income approach | | (i) future cash flows discounted to present and adjusted as appropriate for liquidity, credit, and/or market risks; (ii) quoted prices for similar investments or assets in active markets; and (iii) other risk factors, such as interest rates, yield curves, volatilities, prepayment speeds, loss severities, credit risks, recovery rates, liquidation amounts and/or default rates. |
Cost approach | | (i) audited or unaudited financial statements, investor communications and financial or operational metrics issued by the Private Company; (ii) changes in the valuation of relevant indices or publicly traded companies comparable to the Private Company; (iii) relevant news and other public sources; and (iv) known secondary market transactions in the Private Company’s interests and merger or acquisition activity in companies comparable to the Private Company. |
Investments in series of preferred stock issued by Private Companies are typically valued utilizing Market approach in determining the enterprise value of the company. Such investments often contain rights and preferences that differ from other series of preferred and common stock of the same issuer. Valuation techniques such as an option pricing model (“OPM”), a probability weighted expected return model (“PWERM”) or a hybrid of those techniques are used in allocating enterprise value of the company, as deemed appropriate under the circumstances. The use of OPM and PWERM techniques involve a determination of the exit scenarios of the investment in order to appropriately allocate the enterprise value of the company among the various parts of its capital structure.
The Private Companies are not subject to the public company disclosure, timing, and reporting standards as other investments held by a Fund. Typically, the most recently available information by a Private Company is as of a date that is earlier than the date a Fund is calculating its NAV. This factor may result in a difference between the value of the investment and the price a Fund could receive upon the sale of the investment.
Fair Value Hierarchy: Various inputs are used in determining the fair value of investments and derivative financial instruments. These inputs to valuation techniques are categorized into a fair value hierarchy consisting of three broad levels for financial statement purposes as follows:
| • | | Level 1 — Unadjusted price quotations in active markets/exchanges for identical assets or liabilities that each Fund has the ability to access |
| • | | Level 2 — Other observable inputs (including, but not limited to, quoted prices for similar assets or liabilities in markets that are active, quoted prices for identical or similar assets or liabilities in markets that are not active, inputs other than quoted prices that are observable for the assets or liabilities (such as interest rates, yield curves, volatilities, prepayment speeds, loss severities, credit risks and default rates) or other market–corroborated inputs) |
| • | | Level 3 — Unobservable inputs based on the best information available in the circumstances, to the extent observable inputs are not available (including each Fund’s own assumptions used in determining the fair value of investments and derivative financial instruments) |
The hierarchy gives the highest priority to unadjusted quoted prices in active markets for identical assets or liabilities (Level 1 measurements) and the lowest priority to unobservable inputs (Level 3 measurements). Accordingly, the degree of judgment exercised in determining fair value is greatest for instruments categorized in Level 3. The inputs used to measure fair value may fall into different levels of the fair value hierarchy. In such cases, for disclosure purposes, the fair value hierarchy classification is determined based on the lowest level input that is significant to the fair value measurement in its entirety. Investments classified within Level 3 have significant unobservable inputs used by the Global Valuation Committee in determining the price for Fair Valued Investments. Level 3 investments include equity or debt issued by Private Companies. There may not be a secondary market, and/or there are a limited number of investors. Level 3 investments may also be adjusted to reflect illiquidity and/or non-transferability, with the amount of such discount estimated by the Global Valuation Committee in the absence of market information.
Changes in valuation techniques may result in transfers into or out of an assigned level within the hierarchy. In accordance with each Fund’s policy, transfers between different levels of the fair value hierarchy are deemed to have occurred as of the beginning of the reporting period. The categorization of a value determined for investments and derivative financial instruments is based on the pricing transparency of the investments and derivative financial instruments and is not necessarily an indication of the risks associated with investing in those securities.
4. Securities and Other Investments:
Asset-Backed and Mortgage-Backed Securities: Asset-backed securities are generally issued as pass-through certificates or as debt instruments. Asset-backed securities issued as pass-through certificates represent undivided fractional ownership interests in an underlying pool of assets. Asset-backed securities issued as debt instruments, which are also known as collateralized obligations, are typically issued as the debt of a special purpose entity organized solely for the purpose of owning such assets and issuing such debt. Asset-backed securities are often backed by a pool of assets representing the obligations of a number of different parties. The yield characteristics of certain asset-backed securities may differ from traditional debt securities. One such major difference is that all or a principal part of the obligations may be prepaid at any time because the underlying assets (i.e., loans) may be prepaid at any time. As a result, a decrease in interest rates in the market may result in increases in the level of prepayments as borrowers, particularly mortgagors, refinance and repay their loans. An increased prepayment rate with respect to an asset-backed security will have the effect of shortening the
| | | | | | |
| | | | | | | |
| | BLACKROCK FUNDS | | JUNE 30, 2017 | | 61 |
| | |
| Notes to Financial Statements (continued) | | |
maturity of the security. In addition, a fund may subsequently have to reinvest the proceeds at lower interest rates. If a fund has purchased such an asset-backed security at a premium, a faster than anticipated prepayment rate could result in a loss of principal to the extent of the premium paid.
For mortgage pass-through securities (the “Mortgage Assets”) there are a number of important differences among the agencies and instrumentalities of the U.S. Government that issue mortgage-related securities and among the securities that they issue. For example, mortgage-related securities guaranteed by Ginnie Mae are guaranteed as to the timely payment of principal and interest by Ginnie Mae and such guarantee is backed by the full faith and credit of the United States. However, mortgage-related securities issued by Freddie Mac and Fannie Mae, including Freddie Mac and Fannie Mae guaranteed mortgage pass-through certificates, which are solely the obligations of Freddie Mac and Fannie Mae, are not backed by or entitled to the full faith and credit of the United States, but are supported by the right of the issuer to borrow from the U.S. Treasury.
Non-agency mortgage-backed securities are securities issued by non-governmental issuers and have no direct or indirect government guarantees of payment and are subject to various risks. Non-agency mortgage loans are obligations of the borrowers thereunder only and are not typically insured or guaranteed by any other person or entity. The ability of a borrower to repay a loan is dependent upon the income or assets of the borrower. A number of factors, including a general economic downturn, acts of God, terrorism, social unrest and civil disturbances, may impair a borrower’s ability to repay its loans.
Inflation-Indexed Bonds: Inflation-indexed bonds (other than municipal inflation-indexed and certain corporate inflation-indexed bonds) are fixed-income securities whose principal value is periodically adjusted according to the rate of inflation. If the index measuring inflation rises or falls, the principal value of inflation-indexed bonds (other than municipal inflation-indexed and certain corporate inflation-indexed bonds) will be adjusted upward or downward, and consequently the interest payable on these securities (calculated with respect to a larger or smaller principal amount) will be increased or reduced, respectively. Any upward or downward adjustment in the principal amount of an inflation-indexed bond will be included as interest income in the Statements of Operations, even though investors do not receive their principal until maturity. Repayment of the original bond principal upon maturity (as adjusted for inflation) is guaranteed in the case of U.S. Treasury inflation-indexed bonds. For bonds that do not provide a similar guarantee, the adjusted principal value of the bond repaid at maturity may be less than the original principal. With regard to municipal inflation-indexed bonds and certain corporate inflation-indexed bonds, the inflation adjustment is typically reflected in the semi-annual coupon payment. As a result, the principal value of municipal inflation-indexed bonds and such corporate inflation-indexed bonds does not adjust according to the rate of inflation.
Multiple Class Pass-Through Securities: Multiple class pass-through securities, including collateralized mortgage obligations (“CMOs”) and commercial mortgage-backed securities, may be issued by Ginnie Mae, U.S. Government agencies or instrumentalities or by trusts formed by private originators of, or investors in, mortgage loans. In general, CMOs are debt obligations of a legal entity that are collateralized by a pool of residential or commercial mortgage loans or Mortgage Assets. The payments on these are used to make payments on the CMOs or multiple pass-through securities. Multiple class pass-through securities represent direct ownership interests in the Mortgage Assets. Classes of CMOs include interest only (“IOs”), principal only (“POs”), planned amortization classes and targeted amortization classes. IOs and POs are stripped mortgage-backed securities representing interests in a pool of mortgages, the cash flow from which has been separated into interest and principal components. IOs receive the interest portion of the cash flow while POs receive the principal portion. IOs and POs can be extremely volatile in response to changes in interest rates. As interest rates rise and fall, the value of IOs tends to move in the same direction as interest rates. POs perform best when prepayments on the underlying mortgages rise since this increases the rate at which the principal is returned and the yield to maturity on the PO. When payments on mortgages underlying a PO are slower than anticipated, the life of the PO is lengthened and the yield to maturity is reduced. If the underlying Mortgage Assets experience greater than anticipated prepayments of principal, a Fund’s initial investment in the IOs may not fully recoup.
Warrants: Warrants entitle a Fund to purchase a specified number of shares of common stock and are non-income producing. The purchase price and number of shares are subject to adjustment under certain conditions until the expiration date of the warrants, if any. If the price of the underlying stock does not rise above the strike price before the warrant expires, the warrant generally expires without any value and a Fund will lose any amount it paid for the warrant. Thus, investments in warrants may involve more risk than investments in common stock. Warrants may trade in the same markets as their underlying stock; however, the price of the warrant does not necessarily move with the price of the underlying stock.
TBA Commitments: TBA commitments are forward agreements for the purchase or sale of mortgage-backed securities for a fixed price, with payment and delivery on an agreed upon future settlement date. The specific securities to be delivered are not identified at the trade date. However, delivered securities must meet specified terms, including issuer, rate and mortgage terms. When entering into TBA commitments, a fund may take possession of or deliver the underlying mortgage-backed securities but can extend the settlement or roll the transaction. TBA commitments involve a risk of loss if the value of the security to be purchased or sold declines or increases, respectively, prior to settlement date.
In order to better define contractual rights and to secure rights that will help a Fund mitigate their counterparty risk, TBA commitments may be entered into by a Fund under Master Securities Forward Transaction Agreements (each, an “MSFTA”). An MSFTA typically contains, among other things, collateral posting terms and netting provisions in the event of default and/or termination event. The collateral requirements are typically calculated by netting the mark-to-market amount for each transaction under such agreement and comparing that amount to the value of the collateral currently pledged by a Fund and the counterparty. Cash collateral that has been pledged to cover the obligations of a Fund and cash collateral received from the counterparty, if any, is
| | | | | | |
| | | | | | | |
| 62 | | BLACKROCK FUNDS | | JUNE 30, 2017 | | |
| | |
| Notes to Financial Statements (continued) | | |
reported separately on the Statements of Assets and Liabilities as cash pledged as collateral for TBA commitments or cash received as collateral for TBA commitments, respectively. Non-cash collateral pledged by a Fund, if any, is noted in the Schedules of Investments. Typically, a Fund is permitted to sell, re-pledge or use the collateral it receives; however, the counterparty is not permitted to do so. To the extent amounts due to a Fund is not fully collateralized, contractually or otherwise, a Fund bears the risk of loss from counterparty non-performance.
Mortgage Dollar Roll Transactions: Certain Funds may sell TBA mortgage-backed securities and simultaneously contract to repurchase substantially similar (i.e., same type, coupon and maturity) securities on a specific future date at an agreed upon price. During the period between the sale and repurchase, a Fund is not entitled to receive interest and principal payments on the securities sold. Mortgage dollar roll transactions are treated as purchases and sales and realize gains and losses on these transactions. Mortgage dollar rolls involve the risk that the market value of the securities that a Fund is required to purchase may decline below the agreed upon repurchase price of those securities.
5. Derivative Financial Instruments:
The Funds engage in various portfolio investment strategies using derivative contracts both to increase the returns of the Funds and/or to manage their exposure to certain risks such as credit risk, equity risk, interest rate risk, foreign currency exchange rate risk, commodity price risk or other risks (e.g., inflation risk). Derivative financial instruments categorized by risk exposure are included in the Schedules of Investments. These contracts may be transacted on an exchange or OTC.
Futures Contracts: Futures contracts are purchased or sold to gain exposure to, or manage exposure to, changes in interest rates (interest rate risk), changes in the value of equity securities (equity risk) or foreign currencies (foreign currency exchange rate risk).
Futures contracts are agreements between the Funds and a counterparty to buy or sell a specific quantity of an underlying instrument at a specified price and on a specified date. Depending on the terms of a contract, it is settled either through physical delivery of the underlying instrument on the settlement date or by payment of a cash amount on the settlement date. Upon entering into a futures contract, the Funds are required to deposit initial margin with the broker in the form of cash or securities in an amount that varies depending on a contract’s size and risk profile. The initial margin deposit must then be maintained at an established level over the life of the contract.
Securities deposited as initial margin are designated in the Schedules of Investments and cash deposited, if any, is shown as cash pledged for futures contracts in the Statements of Assets and Liabilities. Pursuant to the contract, the Funds agree to receive from or pay to the broker an amount of cash equal to the daily fluctuation in market value of the contract (“variation margin”). Variation margin is recorded as unrealized appreciation (depreciation) and, if any, shown as variation margin receivable (or payable) on futures contracts in the Statements of Assets and Liabilities. When the contract is closed, a realized gain or loss is recorded in the Statements of Operations equal to the difference between the value of the contract at the time it was opened and the value at the time it was closed. The use of futures contracts involves the risk of an imperfect correlation in the movements in the price of futures contracts and interest, foreign currency exchange rates or underlying assets.
Forward Foreign Currency Exchange Contracts: Forward foreign currency exchange contracts are entered into to gain or reduce exposure to foreign currencies (foreign currency exchange rate risk).
A forward foreign currency exchange contract is an agreement between two parties to buy and sell a currency at a set exchange rate on a specified date. These contracts help to manage the overall exposure to the currencies in which some of the investments held by the Funds are denominated and in some cases, may be used to obtain exposure to a particular market.
The contract is marked-to-market daily and the change in market value is recorded as unrealized appreciation (depreciation) in the Statements of Assets and Liabilities. When a contract is closed, a realized gain or loss is recorded in the Statements of Operations equal to the difference between the value at the time it was opened and the value at the time it was closed. Non-deliverable forward foreign currency exchange contracts are settled with the counterparty in cash without the delivery of foreign currency. The use of forward foreign currency exchange contracts involves the risk that the value of a forward foreign currency exchange contract changes unfavorably due to movements in the value of the referenced foreign currencies.
Options: Certain Funds purchase and write call and put options to increase or decrease their exposure to the risks of underlying instruments, including equity risk, interest rate risk and/or commodity price risk and/or, in the case of options written, to generate gains from options premiums.
A call option gives the purchaser (holder) of the option the right (but not the obligation) to buy, and obligates the seller (writer) to sell (when the option is exercised) the underlying instrument at the exercise or strike price at any time or at a specified time during the option period. A put option gives the holder the right to sell and obligates the writer to buy the underlying instrument at the exercise or strike price at any time or at a specified time during the option period.
Premiums paid on options purchased and premiums received on options written, as well as the daily fluctuation in market value, are included in investments at value – unaffiliated and options written at value, respectively, in the Statements of Assets and Liabilities. When an instrument is purchased or sold through the exercise of an option, the premium is offset against the cost or proceeds of the underlying instrument. When an option expires, a realized gain or loss is recorded in the Statements of Operations to the extent of the premiums received or paid. When an option is closed or sold, a gain or loss is
| | | | | | |
| | | | | | | |
| | BLACKROCK FUNDS | | JUNE 30, 2017 | | 63 |
| | |
| Notes to Financial Statements (continued) | | |
recorded in the Statements of Operations to the extent the cost of the closing transaction exceeds the premiums received or paid. When the Funds write a call option, such option is typically “covered,” meaning that they hold the underlying instrument subject to being called by the option counterparty. When the Funds write a put option, such option is covered by cash in an amount sufficient to cover the obligation.
In purchasing and writing options, the Funds bear the risk of an unfavorable change in the value of the underlying instrument or the risk that they may not be able to enter into a closing transaction due to an illiquid market. Exercise of a written option could result in the Funds purchasing or selling a security when it otherwise would not, or at a price different from the current market value.
Swaps: Swap contracts are entered into to manage exposure to issuers, markets and securities. Such contracts are agreements between the Funds and a counterparty to make periodic net payments on a specified notional amount or a net payment upon termination. Swap agreements are privately negotiated in the OTC market and may be entered into as a bilateral contract (“OTC swaps”) or centrally cleared (“centrally cleared swaps”).
For OTC swaps, any upfront premiums paid and any upfront fees received are shown as swap premiums paid and swap premiums received, respectively, in the Statements of Assets and Liabilities and amortized over the term of the contract. The daily fluctuation in market value is recorded as unrealized appreciation (depreciation) on OTC Swaps in the Statements of Assets and Liabilities. Payments received or paid are recorded in the Statements of Operations as realized gains or losses, respectively. When an OTC swap is terminated, a realized gain or loss is recorded in the Statements of Operations equal to the difference between the proceeds from (or cost of) the closing transaction and the Funds’ basis in the contract, if any. Generally, the basis of the contract is the premium received or paid.
In a centrally cleared swap, immediately following execution of the swap contract, the swap contract is novated to a central counterparty (the “CCP”) and the Funds’ counterparty on the swap agreement becomes the CCP. The Funds are required to interface with the CCP through the broker. Upon entering into a centrally cleared swap, the Funds are required to deposit initial margin with the broker in the form of cash or securities in an amount that varies depending on the size and risk profile of the particular swap. Securities deposited as initial margin are designated in the Schedules of Investments and cash deposited is shown as cash pledged for centrally cleared swaps in the Statements of Assets and Liabilities. Pursuant to the contract, the Funds agree to receive from or pay to the broker an amount of cash equal to the daily fluctuation in market value of the contract (“variation margin”). Variation margin is recorded as unrealized appreciation (depreciation) and shown as variation margin receivable (or payable) on centrally cleared swaps in the Statements of Assets and Liabilities. Payments received from (paid to) the counterparty, including at termination, are recorded as realized gains (losses) in the Statements of Operations.
| • | | Credit default swaps — Credit default swaps are entered into to manage exposure to the market or certain sectors of the market, to reduce risk exposure to defaults of corporate and/or sovereign issuers or to create exposure to corporate and/or sovereign issuers to which a fund is not otherwise exposed (credit risk). |
The Funds may either buy or sell (write) credit default swaps on single-name issuers (corporate or sovereign), a combination or basket of single-name issuers or traded indexes. Credit default swaps are agreements in which the protection buyer pays fixed periodic payments to the seller in consideration for a promise from the protection seller to make a specific payment should a negative credit event take place with respect to the referenced entity (e.g., bankruptcy, failure to pay, obligation acceleration, repudiation, moratorium or restructuring). As a buyer, if an underlying credit event occurs, the Funds will either (i) receive from the seller an amount equal to the notional amount of the swap and deliver the referenced security or underlying securities comprising the index, or (ii) receive a net settlement of cash equal to the notional amount of the swap less the recovery value of the security or underlying securities comprising the index. As a seller (writer), if an underlying credit event occurs, the Funds will either pay the buyer an amount equal to the notional amount of the swap and take delivery of the referenced security or underlying securities comprising the index or pay a net settlement of cash equal to the notional amount of the swap less the recovery value of the security or underlying securities comprising the index.
| • | | Total return swaps — Total return swaps are entered into to obtain exposure to a portfolio of long and short securities without owning such securities. |
Under the terms of a contract, the swap is designed to function as a portfolio of direct investments in long and short equity positions. This means that each Fund has the ability to trade in and out of these long and short positions within the swap and will receive the economic benefits and risks equivalent to direct investment in these positions, subject to certain adjustments due to events related to the counterparty. Benefits and risks include capital appreciation (depreciation), corporate actions and dividends received and paid, all of which are reflected in the swap’s market value. The market value also includes interest charges and credits (“financing fees”) related to the notional values of the long and short positions and cash balances within the swap. These interest charges and credits are based on a specified benchmark rate plus or minus a specified spread determined based upon the country and/or currency of the positions in the portfolio.
Positions within the swap and financing fees are reset periodically. During a reset, any unrealized appreciation (depreciation) on positions and accrued financing fees become available for cash settlement between the Funds and the counterparty. The amounts that are available for cash settlement are recorded as realized gains or losses in the Statements of Operations. Cash settlement in and out of the swap may occur at a reset date or any other date, at the discretion of the Funds and the counterparty, over the life of the agreement. Certain swaps have no stated expiration and can be terminated by either party at any time.
| | | | | | |
| | | | | | | |
| 64 | | BLACKROCK FUNDS | | JUNE 30, 2017 | | |
| | |
| Notes to Financial Statements (continued) | | |
| • | | Interest rate swaps — Interest rate swaps are entered into to gain or reduce exposure to interest rates or to manage duration, the yield curve or interest rate (interest rate risk). |
Interest rate swaps are agreements in which one party pays a stream of interest payments, either fixed or floating, in exchange for another party’s stream of interest payments, either fixed or floating, on the same notional amount for a specified period of time. In more complex interest rate swaps, the notional principal amount may decline (or amortize) over time.
Swap transactions involve, to varying degrees, elements of interest rate, credit and market risk in excess of the amounts recognized in the Statements of Assets and Liabilities. Such risks involve the possibility that there will be no liquid market for these agreements, that the counterparty to the agreements may default on its obligation to perform or disagree as to the meaning of the contractual terms in the agreements, and that there may be unfavorable changes in interest rates and/or market values associated with these transactions.
Master Netting Arrangements: In order to define their contractual rights and to secure rights that will help them mitigate their counterparty risk, the Funds may enter into an International Swaps and Derivatives Association, Inc. Master Agreement (“ISDA Master Agreement”) or similar agreement with their counterparties. An ISDA Master Agreement is a bilateral agreement between each Fund and a counterparty that governs certain OTC derivatives and typically contains, among other things, collateral posting terms and netting provisions in the event of a default and/or termination event. Under an ISDA Master Agreement, each Fund may, under certain circumstances, offset with the counterparty certain derivative financial instruments’ payables and/or receivables with collateral held and/or posted and create one single net payment. The provisions of the ISDA Master Agreement typically permit a single net payment in the event of default including the bankruptcy or insolvency of the counterparty. Bankruptcy or insolvency laws of a particular jurisdiction may restrict or prohibit the right of offset in bankruptcy, insolvency or other events. In addition, certain ISDA Master Agreements allow counterparties to terminate derivative contracts prior to maturity in the event the Funds’ net assets decline by a stated percentage or the Funds fail to meet the terms of their ISDA Master Agreements. The result would cause the Funds to accelerate payment of any net liability owed to the counterparty.
Collateral Requirements: For derivatives traded under an ISDA Master Agreement, the collateral requirements are typically calculated by netting the mark-to-market amount for each transaction under such agreement and comparing that amount to the value of any collateral currently pledged by the Fund and the counterparty.
Cash collateral that has been pledged to cover obligations of the Funds and cash collateral received from the counterparty, if any, is reported separately on the Statements of Assets and Liabilities as cash pledged as collateral and cash received as collateral, respectively. Non-cash collateral pledged by the Funds, if any, is noted in the Schedules of Investments. Generally, the amount of collateral due from or to a counterparty is subject to a certain minimum transfer amount threshold before a transfer is required, which is determined at the close of business of the Funds. Any additional required collateral is delivered to/pledged by the Funds on the next business day. Typically, the counterparty is not permitted to sell, re-pledge or use cash and non-cash collateral it receives. A Fund generally agrees not to use non-cash collateral that it receives but may, absent default or certain other circumstances defined in the underlying ISDA Master Agreement, be permitted to use cash collateral received. In such cases, interest may be paid pursuant to the collateral arrangement with the counterparty. To the extent amounts due to the Funds from their counterparties are not fully collateralized, they bear the risk of loss from counterparty non-performance. Likewise, to the extent the Funds have delivered collateral to a counterparty and stand ready to perform under the terms of their agreement with such counterparty, they bear the risk of loss from a counterparty in the amount of the value of the collateral in the event the counterparty fails to return such collateral. Based on the terms of agreements, collateral may not be required for all derivative contracts.
For financial reporting purposes, the Funds do not offset derivative assets and derivative liabilities that are subject to netting arrangements, if any, in the Statements of Assets and Liabilities.
6. Investment Advisory Agreement and Other Transactions with Affiliates:
The PNC Financial Services Group, Inc. is the largest stockholder and an affiliate of BlackRock, Inc. (“BlackRock”) for 1940 Act purposes.
Investment Advisory: The Trust, on behalf of the Funds, entered into an Investment Advisory Agreement with the Manager, the Funds’ investment adviser, an indirect, wholly-owned subsidiary of BlackRock, to provide investment advisory services. The Manager is responsible for the management of each Fund’s portfolio and provides the personnel, facilities, equipment and certain other services necessary to the operations of each Fund.
For such services, each Fund pays the Manager a monthly fee at an annual rate equal to the following percentages of the average daily value of each Fund’s net assets as follows:
| | | | | | | | |
| Average Daily Net Assets | | Alternative Capital
Strategies | | | Emerging Markets Equity Strategies | |
First $1 Billion | | | 0.80% | | | | 1.00% | |
$1 Billion — $3 Billion | | | 0.75% | | | | 0.94% | |
$3 Billion — $5 Billion | | | 0.72% | | | | 0.90% | |
$5 Billion — $10 Billion | | | 0.70% | | | | 0.87% | |
Greater than $10 Billion | | | 0.68% | | | | 0.85% | |
| | | | | | |
| | | | | | | |
| | BLACKROCK FUNDS | | JUNE 30, 2017 | | 65 |
| | |
| Notes to Financial Statements (continued) | | |
Short-Term TIPS Bond Index pays the Manager a monthly fee at an annual rate of 0.01% of the Fund’s average daily net assets.
With respect to Alternative Capital Strategies and Emerging Markets Equity Strategies, the Manager entered into separate sub-advisory agreements with BlackRock International Limited (“BIL”), an affiliate of the Manager. With respect to Emerging Markets Equity Strategies, the Manager entered into a separate sub-advisory agreement with BlackRock Asset Management North Asia Limited (“BAMNAL”), an affiliate of the Manager. With respect to Short-Term TIPS Bond Index, the Manager entered into a separate sub-advisory agreement with BlackRock Fund Advisors (“BFA”), an affiliate of the Manager. The Manager pays BIL, BFA and BAMNAL, for services they provide, a monthly fee that is a percentage of the investment advisory fees paid by each Fund to the Manager.
Service and Distribution Fees: The Trust, on behalf of the Funds, entered into a Distribution Agreement and a Distribution and Service Plan with BlackRock Investments, LLC (“BRIL”), an affiliate of the Manager. Pursuant to the Distribution and Service Plan and in accordance with Rule 12b-1 under the 1940 Act, each Fund pays BRIL ongoing service and distribution fees. The fees are accrued daily and paid monthly at annual rates based upon the average daily net assets of the relevant share class of each Fund as follows:
| | | | | | | | |
| | | Service Fees | | | Distribution Fees | |
Investor A | | | 0.25% | | | | — | |
Investor C1 | | | 0.25% | | | | 0.75% | |
| | 1 | | Alternative Capital Strategies and Emerging Markets Equity Strategies only. |
BRIL and broker-dealers, pursuant to sub-agreements with BRIL, provide shareholder servicing and distribution services to the Funds. The ongoing service and/or distribution fee compensates BRIL and each broker-dealer for providing shareholder servicing and/or distribution related services to the shareholders.
For the six months ended June 30, 2017, the following table shows the class specific service and distribution fees borne directly by each share class of each Fund:
| | | | | | | | | | | | |
| Service and Distribution Fees | |
| | | Investor A | | | Investor C | | | Total | |
Alternative Capital Strategies | | $ | 2,147 | | | $ | 854 | | | $ | 3,001 | |
Emerging Markets Equity Strategies | | $ | 87 | | | $ | 363 | | | $ | 450 | |
Short-Term TIPS Bond Index | | $ | 108 | | | | N/A | | | $ | 108 | |
Administration: The Trust, on behalf of Alternative Capital Strategies and Emerging Markets Equity Strategies, entered into an Administration Agreement with the Manager, an indirect, wholly-owned subsidiary of BlackRock, to provide administrative services. For these services, the Manager receives an administration fee computed daily and payable monthly, based on a percentage of the average daily net assets of each Fund. The administration fee, which is shown as administration in the Statements of Operations, is paid at the annual rates below.
| | | | |
| Average Daily Net Assets | | Administration Fee | |
First $500 Million | | | 0.0425% | |
$500 Million — $1 Billion | | | 0.0400% | |
$1 Billion — $2 Billion | | | 0.0375% | |
$2 Billion — $4 Billion | | | 0.0350% | |
$4 Billion — $13 Billion | | | 0.0325% | |
Greater than $13 Billion | | | 0.0300% | |
In addition, for Alternative Capital Strategies and Emerging Markets Equity Strategies, the Manager charges each of the share classes an administration fee, which is shown as administration – class specific in the Statements of Operations, at an annual rate of 0.02% of the average daily net assets of each respective class.
For the six months ended June 30, 2017, the following table shows the class specific administration fees borne directly by each share class of each Fund:
| | | | | | | | | | | | | | | | | | | | |
| Administration Fees | |
| | | Institutional | | | Investor A | | | Investor C | | | Class K | | | Total | |
Alternative Capital Strategies | | $ | 2,519 | | | $ | 172 | | | $ | 17 | | | | N/A | | | $ | 2,708 | |
Emerging Markets Equity Strategies | | $ | 567 | | | $ | 7 | | | $ | 7 | | | $ | 671 | | | $ | 1,252 | |
The Manager may have, at its discretion, voluntarily waived all or any portion of its administration fees for a Fund or a share class, which are shown as administration fees waived and administration fees waived – class specific in the Statements of Operations.
Transfer Agent: Pursuant to written agreements, certain financial intermediaries, some of which may be affiliates, provide the Funds with sub-accounting, recordkeeping, sub-transfer agency and other administrative services with respect to sub-accounts they service. For these services, these entities receive an asset-based fee or an annual fee per shareholder account, which will vary depending on share class and/or net assets.
| | | | | | |
| | | | | | | |
| 66 | | BLACKROCK FUNDS | | JUNE 30, 2017 | | |
| | |
| Notes to Financial Statements (continued) | | |
The Manager maintains a call center that is responsible for providing certain shareholder services to the Funds. Shareholder services include responding to inquiries and processing subscriptions and redemptions based upon instructions from shareholders. For the six months ended June 30, 2017, each Fund reimbursed the Manager the following amounts for costs incurred in running the call center, which are included in transfer agent — class specific in the Statements of Operations:
| | | | | | | | | | | | | | | | | | | | |
| | | Institutional | | | Investor A | | | Investor C | | | Class K | | | Total | |
Alternative Capital Strategies | | $ | 81 | | | $ | 14 | | | $ | 8 | | | | N/A | | | $ | 103 | |
Emerging Markets Equity Strategies | | $ | 44 | | | $ | 44 | | | $ | 24 | | | $ | 26 | | | $ | 138 | |
Short-Term TIPS Bond Index | | | — | | | $ | 4 | | | | N/A | | | $ | 5 | | | $ | 9 | |
For the six months ended June 30, 2017, the following table shows the class specific transfer agent fees borne directly by each class of each Fund:
| | | | | | | | | | | | | | | | | | | | |
| | | Institutional | | | Investor A | | | Investor C | | | Class K | | | Total | |
Alternative Capital Strategies | | $ | 1,236 | | | $ | 2,311 | | | $ | 152 | | | | N/A | | | $ | 3,699 | |
Emerging Markets Equity Strategies | | $ | 56 | | | $ | 55 | | | $ | 30 | | | $ | 42 | | | $ | 183 | |
Short-Term TIPS Bond Index | | $ | 42 | | | $ | 45 | | | | N/A | | | $ | 16 | | | $ | 103 | |
Other Fees: For the six months ended June 30, 2017, affiliates earned underwriting discounts, direct commissions and dealer concessions of $24 on sales of Alternative Capital Strategies’ Investor A Shares.
Expense Limitations, Waivers and Recoupments: With respect to each Fund, the Manager contractually agreed to waive and/or reimburse fees or expenses in order to limit expenses, excluding interest expense, dividend expense, tax expense, acquired fund fees and expenses, and certain other fund expenses, which constitute extraordinary expenses not incurred in the ordinary course of each Fund’s business (“expense limitations”). The expense limitations as a percentage of average daily net assets are as follows:
| | | | | | | | | | | | | | | | |
| | | Institutional | | | Investor A | | | Investor C | | | Class K | |
Alternative Capital Strategies | | | 0.95% | | | | 1.20% | | | | 1.95% | | | | N/A | |
Emerging Markets Equity Strategies | | | 1.30% | | | | 1.55% | | | | 2.30% | | | | 1.25% | |
Short-Term TIPS Bond Index | | | 0.11% | | | | 0.36% | | | | N/A | | | | 0.06% | |
The Manager has agreed not to reduce or discontinue these contractual expense limitations through April 30, 2018, unless approved by the Board, including a majority of the independent trustees who are not “interested persons” of the Funds, as defined in the 1940 Act (“Independent Trustees”) or by a vote of a majority of the outstanding voting securities of a Fund.
These amounts waived and/or reimbursed are included in fees waived and/or reimbursed by the Manager, and shown as administration fees waived, administration fees waived — class specific and transfer agent fees waived — class specific, respectively, in the Statements of Operations. For the six months ended June 30, 2017, the amounts included in fees waived and/or reimbursed by the Manager are as follows:
| | | | |
Alternative Capital Strategies | | $ | 147,086 | |
Emerging Markets Equity Strategies | | $ | 123,924 | |
Short-Term TIPS Bond Index | | $ | 76,210 | |
For the six months ended June 30, 2017, class specific expense waivers were as follows:
| | | | | | | | | | | | | | | | | | | | |
| Administration Fees Waived — Class Specific | |
| | | Institutional | | | Investor A | | | Investor C | | | Class K | | | Total | |
Alternative Capital Strategies | | $ | 2,518 | | | $ | 171 | | | $ | 17 | | | | N/A | | | $ | 2,706 | |
Emerging Markets Equity Strategies | | $ | 3 | | | $ | 7 | | | $ | 7 | | | $ | 671 | | | $ | 688 | |
| | | | | | | | | | | | | | | | | | | | |
| Transfer Agent Fees Waived and/or Reimbursed — Class Specific | |
| | | Institutional | | | Investor A | | | Investor C | | | Class K | | | Total | |
Alternative Capital Strategies | | $ | 1,236 | | | $ | 2,311 | | | $ | 152 | | | | N/A | | | $ | 3,699 | |
Emerging Markets Equity Strategies | | $ | 5 | | | $ | 38 | | | $ | 13 | | | $ | 41 | | | $ | 97 | |
Short-Term TIPS Bond Index | | | — | | | $ | 25 | | | | N/A | | | $ | 16 | | | $ | 41 | |
With respect to each Fund, the Manager voluntarily agreed to waive its investment advisory fees by the amount of investment advisory fees each Fund pays to the Manager indirectly through its investment in affiliated money market funds (the “affiliated money market fund waiver”). These amounts are included in fees waived and/or reimbursed by the Manager in the Statements of Operations. The amount of waivers and/or reimbursements of fees and expenses made pursuant to the expense limitation caps, as applicable, will be reduced by the amount of the affiliated money market fund waiver. For the six months ended June 30, 2017, the amounts waived were as follows:
| | | | |
Alternative Capital Strategies | | $ | 111 | |
Emerging Markets Equity Strategies | | $ | 394 | |
Short-Term TIPS Bond Index | | $ | 26 | |
| | | | | | |
| | | | | | | |
| | BLACKROCK FUNDS | | JUNE 30, 2017 | | 67 |
| | |
| Notes to Financial Statements (continued) | | |
The Manager has contractually agreed to waive its investment advisory fee with respect to any portion of each Fund’s assets invested in affiliated equity and fixed-income mutual funds and affiliated exchange-traded funds that have a contractual management fee through April 30, 2018. The contractual agreement may be terminated upon 90 days’ notice by a majority of the independent Trustees of each Fund or by a vote of a majority of the outstanding voting securities of a Fund.
With respect to the contractual expense caps, if during a Fund’s fiscal year the operating expenses of a share class, that at any time during the prior two fiscal years received a waiver and/or reimbursement from the Manager, are less than the expense cap for that share class, the Manager is entitled to be reimbursed by such share class up to the lesser of the following expenses:
| | (a) | The amount of fees waived and/or expenses reimbursed during those prior two fiscal years under the agreement. |
| | (b) | The amount by which the expense cap for that share class exceeds the operating expenses of the share class for the current fiscal year, provided that: |
| | • | | Each Fund, of which the share class is a part, has more than $50 million in assets for the fiscal year; and |
| | • | | The Manager or an affiliate continues to serve as a Fund’s investment adviser or administrator. |
In the event the expense cap for a share class is changed subsequent to a fiscal year in which the Manager becomes entitled to reimbursement for fees waived and/or reimbursed, the amount available to reimburse the Manager shall be calculated by reference to the expense cap for that share class in effect at the time the Manager became entitled to receive such reimbursement, rather than the subsequently changed expense cap for that share class.
On June 30, 2017, the Funds’ fund level and class specific waivers and/or reimbursements subject to possible future recoupment under the expense limitation agreement are as follows:
| | | | | | | | | | | | | | | | | | | | | | | | | | | | | | | | |
| | | Expiring December 31, 2017 | | | Expiring December 31, 2018 | | | Expiring December 31, 2019 | | | | |
| | | Alternative
Capital Strategies | | | Alternative
Capital Strategies | | | Emerging
Markets Equity
Strategies | | | Short-Term
TIPS Bond
Index | | | Alternative Capital Strategies | | | Emerging
Markets Equity
Strategies | | | Short-Term TIPS Bond Index | | | | |
Fund Level | | $ | 172,276 | | | $ | 284,567 | | | $ | 293,219 | | | $ | 188,653 | | | $ | 152,809 | | | $ | 125,719 | | | $ | 76,210 | | | | | |
Institutional | | $ | 3,216 | | | $ | 6,195 | | | $ | 16 | | | $ | 26 | | | $ | 3,754 | | | $ | 8 | | | | — | | | | | |
Investor A | | $ | 75 | | | $ | 2,797 | | | $ | 40 | | | $ | 27 | | | $ | 2,482 | | | $ | 45 | | | $ | 25 | | | | | |
Investor C | | $ | 94 | | | $ | 331 | | | $ | 16 | | | | N/A | | | $ | 169 | | | $ | 20 | | | | N/A | | | | | |
Class K | | | N/A | | | | N/A | | | $ | 1,379 | | | $ | 55 | | | | N/A | | | $ | 712 | | | $ | 16 | | | | | |
| | | | |
Total | | $ | 175,661 | | | $ | 293,890 | | | $ | 294,670 | | | $ | 188,761 | | | $ | 159,214 | | | $ | 126,504 | | | $ | 76,251 | | | | | |
| | | | |
Interfund Lending: In accordance with an exemptive order (the “Order”) from the U.S. Securities and Exchange Commission, each Fund may participate in a joint lending and borrowing facility for temporary purposes (the “Interfund Lending Program”), subject to compliance with the terms and conditions of the Order, and to the extent permitted by each Fund’s investment policies and restrictions. Each Fund is currently permitted to borrow and lend under the Interfund Lending Program.
A lending BlackRock fund may lend in aggregate up to 15% of its net assets, but may not lend more than 5% of its net assets to any one borrowing fund through the Interfund Lending Program. A borrowing BlackRock fund may not borrow through the Interfund Lending Program or from any other source more than 33 1/3% of its total assets (or any lower threshold provided for by the fund’s investment restrictions). If a borrowing BlackRock fund’s total outstanding borrowings exceed 10% of its total assets, each of its outstanding interfund loans will be subject to collateralization of at least 102% of the outstanding principal value of the loan. All interfund loans are for temporary or emergency purposes and the interest rate to be charged will be the average of the highest current overnight repurchase agreement rate available to a lending fund and the bank loan rate, as calculated according to a formula established by the Board.
During the period ended June 30, 2017, the Funds did not participate in the Interfund Lending Program.
Officers and Trustees: Certain officers and/or trustees of the Trust are officers and/or trustees of BlackRock or its affiliates. The Funds reimburse the Manager for a portion of the compensation paid to the Trusts’ Chief Compliance Officer, which is included in Officer and Trustees in the Statements of Operations.
| | | | | | |
| | | | | | | |
| 68 | | BLACKROCK FUNDS | | JUNE 30, 2017 | | |
| | |
| Notes to Financial Statements (continued) | | |
7. Purchase and Sales:
For the six months ended June 30, 2017, purchases and sales of investments, including paydowns, mortgage dollar rolls and excluding short-term securities, were as follows:
| | | | | | | | | | | | | | | | |
| Purchases | | | | |
| | | Alternative Capital
Strategies | | | Emerging Markets
Equity Strategies | | | Short-Term TIPS
Bond Index | | | | |
Non-U.S. Government Securities | | $ | 70,464,806 | | | $ | 31,194,267 | | | | — | | | | | |
U.S. Government Securities | | | — | | | | — | | | $ | 11,702,664 | | | | | |
| | | | |
Total Purchases | | $ | 70,464,806 | | | $ | 31,194,267 | | | $ | 11,702,664 | | | | | |
| | | | |
| | | | | | | | | | | | | | | | |
| Sales | | | | |
| | | Alternative Capital
Strategies | | | Emerging Markets
Equity Strategies | | | Short-Term TIPS
Bond Index | | | | |
Non-U.S. Government Securities | | $ | 71,773,865 | | | $ | 9,635,390 | | | | — | | | | | |
U.S. Government Securities | | | — | | | | — | | | $ | 8,916,279 | | | | | |
| | | | |
Total Sales | | $ | 71,773,865 | | | $ | 9,635,390 | | | $ | 8,916,279 | | | | | |
| | | | |
For the six months ended June 30, 2017, purchases and sales related to mortgage dollar rolls for Alternative Capital Strategies were $25,417,503 and $25,445,083, respectively.
8. Income Tax Information:
It is each Fund’s policy to comply with the requirements of the Internal Revenue Code of 1986, as amended, applicable to regulated investment companies, and to distribute substantially all of their taxable income to their shareholders. Therefore, no U.S. federal income tax provision is required.
Each Fund files U.S. federal and various state and local tax returns. No income tax returns are currently under examination. The statute of limitations on Alternative Capital Strategies’ U.S. federal tax returns generally remains open for the year ended December 31, 2016 and the period ended December 31, 2015. The statute of limitations on Emerging Markets Equity Strategies’ and Short-Term TIPS Bond Index’s U.S. federal tax returns generally remains open for the period ended December 31, 2016. The statutes of limitations on each Fund’s state and local tax returns may remain open for an additional year depending upon the jurisdiction.
Management has analyzed tax laws and regulations and their application to the Funds as of June 30, 2017, inclusive of the open tax return years, and does not believe that there are any uncertain tax positions that require recognition of a tax liability in the Funds’ financial statements.
As of June 30, 2017, gross unrealized appreciation and depreciation based on cost for federal income tax purposes were as follows:
| | | | | | | | | | | | |
| | | Alternative Capital
Strategies | | | Emerging Markets
Equity Strategies | | | Short-Term TIPS
Bond Index | |
Tax cost | | $ | 32,351,636 | | | $ | 40,846,340 | | | $ | 4,438,378 | |
| | | | |
Gross unrealized appreciation | | $ | 567,164 | | | $ | 1,379,526 | | | | — | |
Gross unrealized depreciation | | | (258,135 | ) | | | (371,705 | ) | | $ | (48,766 | ) |
| | | | |
Net unrealized appreciation (depreciation) | | $ | 309,029 | | | $ | 1,007,821 | | | $ | (48,766 | ) |
| | | | |
9. Bank Borrowings:
The Trust, on behalf of the Funds, along with certain other funds managed by the Manager and its affiliates (“Participating Funds”), is a party to a 364-day, $2.1 billion credit agreement with a group of lenders. Under this agreement, the Funds may borrow to fund shareholder redemptions. Excluding commitments designated for certain individual funds, the Participating Funds, including the Funds, can borrow up to an aggregate commitment amount of $1.6 billion at any time outstanding, subject to asset coverage and other limitations as specified in the agreement. The credit agreement has the following terms: a fee of 0.12% per annum on unused commitment amounts and interest at a rate equal to the higher of (a) one-month LIBOR (but, in any event, not less than 0.00%) on the date the loan is made plus 0.80% per annum or (b) the Fed Funds rate (but, in any event, not less than 0.00%) in effect from time to time plus 0.80% per annum on amounts borrowed. The agreement expires in April 2018 unless extended or renewed. Participating Funds paid administration, legal and arrangement fees, which, if applicable, are included in miscellaneous expenses in the Statements of Operations. These fees were allocated among such funds based upon portions of the aggregate commitment available to them and relative net assets of Participating Funds. During the six months ended June 30, 2017, the Funds did not borrow under the credit agreement.
| | | | | | |
| | | | | | | |
| | BLACKROCK FUNDS | | JUNE 30, 2017 | | 69 |
| | |
| Notes to Financial Statements (continued) | | |
10. Principal Risks:
In the normal course of business, the Funds invest in securities and enter into transactions where risks exist due to fluctuations in the market (market risk) or failure of the issuer to meet all its obligations, including the ability to pay principal and interest when due (issuer credit risk). The value of securities held by the Funds may decline in response to certain events, including those directly involving the issuers of securities owned by the Funds. Investments in the securities of issuers domiciled in countries with emerging capital markets involve certain additional risks that do not generally apply to investments in securities of issuers in more developed capital markets, such as (i) low or nonexistent trading volume, resulting in a lack of liquidity and increased volatility in prices for such securities; (ii) uncertain national policies and social, political and economic instability, increasing the potential for expropriation of assets, confiscatory taxation, high rates of inflation or unfavorable diplomatic developments; and (iii) possible fluctuations in exchange rates, differing legal systems and the existence or possible imposition of exchange controls, custodial restrictions or other foreign or U.S. governmental laws or restrictions applicable to such investments. Changes arising from the general economy, the overall market and local, regional or global political and/or social instability, as well as currency, interest rate and price fluctuations, may also affect the securities’ value.
Alternative Capital Strategies and Short-Term TIPS Bond Index may be exposed to prepayment risk, which is the risk that borrowers may exercise their option to prepay principal earlier than scheduled during periods of declining interest rates, which would force each Fund to reinvest in lower yielding securities. Each Fund may also be exposed to reinvestment risk, which is the risk that income from each Fund’s portfolio will decline if each Fund invests the proceeds from matured, traded or called fixed-income securities at market interest rates that are below each Fund portfolio’s current earnings rate.
Valuation Risk: The market values of equities, such as common stocks and preferred securities or equity related investments, such as futures and options, may decline due to general market conditions which are not specifically related to a particular company. They may also decline due to factors which affect a particular industry or industries. A Fund may invest in illiquid investments and may experience difficulty in selling those investments in a timely manner at the price that it believes the investments are worth. Prices may fluctuate widely over short or extended periods in response to company, market or economic news. Markets also tend to move in cycles, with periods of rising and falling prices. This volatility may cause each Fund’s NAV to experience significant increases or decreases over short periods of time. If there is a general decline in the securities and other markets, the NAV of a Fund may lose value, regardless of the individual results of the securities and other instruments in which a Fund invests.
The price a Fund could receive upon the sale of any particular portfolio investment may differ from a Fund’s valuation of the investment, particularly for securities that trade in thin or volatile markets or that are valued using a fair valuation technique or a price provided by an independent pricing service. Changes to significant unobservable inputs and assumptions (i.e., publicly traded company multiples, growth rate, time to exit) due to the lack of observable inputs may significantly impact the resulting fair value and therefore a Fund’s results of operations. As a result, the price received upon the sale of an investment may be less than the value ascribed by a Fund, and a Fund could realize a greater than expected loss or lesser than expected gain upon the sale of the investment. A Fund’s ability to value its investments may also be impacted by technological issues and/or errors by pricing services or other third party service providers.
Counterparty Credit Risk: Similar to issuer credit risk, the Funds may be exposed to counterparty credit risk, or the risk that an entity may fail to or be unable to perform on its commitments related to unsettled or open transactions. The Funds manage counterparty credit risk by entering into transactions only with counterparties that the Manager believes have the financial resources to honor their obligations and by monitoring the financial stability of those counterparties. Financial assets, which potentially expose the Funds to market, issuer and counterparty credit risks, consist principally of financial instruments and receivables due from counterparties. The extent of the Funds’ exposure to market, issuer and counterparty credit risks with respect to these financial assets is approximately their value recorded in the Statements of Assets and Liabilities, less any collateral held by the Funds.
A derivative contract may suffer a mark-to-market loss if the value of the contract decreases due to an unfavorable change in the market rates or values of the underlying instrument. Losses can also occur if the counterparty does not perform under the contract.
A Fund’s risk of loss from counterparty credit risk on OTC derivatives is generally limited to the aggregate unrealized gain less the value of any collateral held by such Fund.
For OTC options purchased, each Fund bears the risk of loss in the amount of the premiums paid plus the positive change in market values net of any collateral held by the Funds should the counterparty fail to perform under the contracts. Options written by the Funds do not typically give rise to counterparty credit risk, as options written generally obligate the Funds, and not the counterparty, to perform. The Funds may be exposed to counterparty credit risk with respect to options written to the extent the Funds deposit collateral with its counterparty to a written option.
With exchange-traded options purchased, futures and centrally cleared swaps, there is less counterparty credit risk to the Funds since the exchange or clearinghouse, as counterparty to such instruments, guarantees against a possible default. The clearinghouse stands between the buyer and the seller of the contract; therefore, credit risk is limited to failure of the clearinghouse. While offset rights may exist under applicable law, a Fund does not have a contractual right of offset against a clearing broker or clearinghouse in the event of a default (including the bankruptcy or insolvency). Additionally, credit risk exists in exchange-traded futures and centrally cleared swaps with respect to initial and variation margin that is held in a clearing broker’s customer accounts. While clearing brokers are required to segregate customer margin from their own assets, in the event that a clearing broker becomes insolvent or
| | | | | | |
| | | | | | | |
| 70 | | BLACKROCK FUNDS | | JUNE 30, 2017 | | |
| | |
| Notes to Financial Statements (continued) | | |
goes into bankruptcy and at that time there is a shortfall in the aggregate amount of margin held by the clearing broker for all its clients, typically the shortfall would be allocated on a pro rata basis across all the clearing broker’s customers, potentially resulting in losses to the Funds.
Concentration Risk: Certain Funds invest a significant portion of their assets in fixed-income securities and/or use derivatives tied to the fixed-income markets. Changes in market interest rates or economic conditions may affect the value and/or liquidity of such investments. Interest rate risk is the risk that prices of bonds and other fixed-income securities will increase as interest rates fall and decrease as interest rates rise. The Funds may be subject to a greater risk of rising interest rates due to the current period of historically low rates.
Certain Funds invest a significant portion of their assets in securities of issuers located in Asia or with significant exposure to Asian issuers or countries. The Asian financial markets have recently experienced volatility and adverse trends due to concerns in several Asian countries regarding monetary policy, government intervention in the markets, rising government debt levels or economic downturns. These events may spread to other countries in Asia and may affect the value and liquidity of certain of the Funds’ investments.
Certain Funds invest a significant portion of their assets in securities backed by commercial or residential mortgage loans or in issuers that hold mortgage and other asset-backed securities. Investment percentages in these securities are presented in the Schedules of Investments. Changes in economic conditions, including delinquencies and/or defaults on assets underlying these securities, can affect the value, income and/or liquidity of such positions.
11. Capital Share Transactions:
Transactions in capital shares for each class were as follows:
| | | | | | | | | | | | | | | | | | | | |
| | | Six Months Ended
June 30, 2017 | | | | | | Year Ended
December 31, 2016 | |
| Alternative Capital Strategies | | Shares | | | Amount | | | | | | Shares | | | Amount | |
| Institutional | | | | | | | | | | | | | | | | | | | | |
Shares sold | | | 14,623 | | | $ | 144,630 | | | | | | | | 159,903 | | | $ | 1,577,379 | |
Shares issued in reinvestment of distributions | | | 413 | | | | 4,060 | | | | | | | | 7,512 | | | | 72,525 | |
Shares redeemed | | | (99,069 | ) | | | (960,589 | ) | | | | | | | (6,677 | ) | | | (65,914 | ) |
| | | | | | | | | | | | |
Net increase (decrease) | | | (84,033 | ) | | $ | (811,899 | ) | | | | | | | 160,738 | | | $ | 1,583,990 | |
| | | | | | | | | | | | |
| | | | | | | | | | | | | | | | | | | | |
| Investor A | | | | | | | | | | | | | | | | | | | | |
Shares sold | | | 28,309 | | | $ | 280,190 | | | | | | | | 230,236 | | | $ | 2,291,638 | |
Shares issued in reinvestment of distributions | | | 822 | | | | 8,073 | | | | | | | | 10,886 | | | | 104,825 | |
Shares redeemed | | | (93,694 | ) | | | (903,927 | ) | | | | | | | (19,763 | ) | | | (195,603 | ) |
| | | | | | | | | | | | |
Net increase (decrease) | | | (64,563 | ) | | $ | (615,664 | ) | | | | | | | 221,359 | | | $ | 2,200,860 | |
| | | | | | | | | | | | |
| | | | | | | | | | | | | | | | | | | | |
| Investor C | | | | | | | | | | | | | | | | | | | | |
Shares sold | | | — | | | | — | | | | | | | | 38,684 | | | $ | 379,908 | |
Shares issued in reinvestment of distributions | | | 50 | | | $ | 494 | | | | | | | | 803 | | | | 7,692 | |
Shares redeemed | | | (12,314 | ) | | | (122,015 | ) | | | | | | | (26,829 | ) | | | (263,726 | ) |
| | | | | | | | | | | | |
Net increase (decrease) | | | (12,264 | ) | | $ | (121,521 | ) | | | | | | | 12,658 | | | $ | 123,874 | |
| | | | | | | | | | | | |
Total Net Increase (Decrease) | | | (160,860 | ) | | $ | (1,549,084 | ) | | | | | | | 394,755 | | | $ | 3,908,724 | |
| | | | | | | | | | | | |
| | | |
| | | Six Months Ended
June 30, 2017 | | | | | | Period
February 29, 20161
to December 31, 2016 | |
| Emerging Markets Equity Strategies | | Shares | | | Amount | | | | | | Shares | | | Amount | |
| Institutional | | | | | | | | | | | | | | | | | | | | |
Shares sold | | | 2,255,546 | | | $ | 27,596,550 | | | | | | | | 31,634 | | | $ | 356,604 | |
Shares issued in reinvestment of distributions | | | — | | | | — | | | | | | | | 4,958 | | | | 51,074 | |
Shares redeemed | | | (15,850 | ) | | | (200,027 | ) | | | | | | | — | | | | — | |
| | | | | | | | | | | | |
Net increase | | | 2,239,696 | | | $ | 27,396,523 | | | | | | | | 36,592 | | | $ | 407,678 | |
| | | | | | | | | | | | |
| | | | | | | | | | | | | | | | | | | | |
| Investor A | | | | | | | | | | | | | | | | | | | | |
Shares sold | | | — | | | | — | | | | | | | | 5,989 | | | $ | 59,928 | |
Shares issued in reinvestment of distributions | | | — | | | | — | | | | | | | | — | | | | — | |
Shares redeemed | | | — | | | | — | | | | | | | | — | | | | — | |
| | | | | | | | | | | | |
Net increase | | | — | | | | — | | | | | | | | 5,989 | | | $ | 59,928 | |
| | | | | | | | | | | | |
| | | | | | | | | | | | | | | | | | | | |
| | | | | | |
| | | | | | | |
| | BLACKROCK FUNDS | | JUNE 30, 2017 | | 71 |
| | |
| Notes to Financial Statements (concluded) | | |
| | | | | | | | | | | | | | | | | | | | |
| | | |
| | | Six Months Ended
June 30, 2017 | | | | | | Period
February 29, 20161
to December 31, 2016 | |
| Emerging Markets Equity Strategies (concluded) | | Shares | | | Amount | | | | | | Shares | | | Amount | |
| Investor C | | | | | | | | | | | | | | | | | | | | |
Shares sold | | | 717 | | | $ | 8,381 | | | | | | | | 5,945 | | | $ | 59,457 | |
Shares issued in reinvestment of distributions | | | — | | | | — | | | | | | | | — | | | | — | |
Shares redeemed | | | — | | | | — | | | | | | | | — | | | | — | |
| | | | | | | | | | | | |
Net increase | | | 717 | | | $ | 8,381 | | | | | | | | 5,945 | | | $ | 59,457 | |
| | | | | | | | | | | | |
| | | | | | | | | | | | | | | | | | | | |
| Class K | | | | | | | | | | | | | | | | | | | | |
Shares sold | | | — | | | | — | | | | | | | | 581,623 | | | $ | 5,817,195 | |
Shares issued in reinvestment of distributions | | | — | | | | — | | | | | | | | — | | | | — | |
Shares redeemed | | | — | | | | — | | | | | | | | — | | | | — | |
| | | | | | | | | | | | |
Net increase | | | — | | | | — | | | | | | | | 581,623 | | | $ | 5,817,195 | |
| | | | | | | | | | | | |
Total Net Increase | | | 2,240,413 | | | $ | 27,404,904 | | | | | | | | 630,149 | | | $ | 6,344,258 | |
| | | | | | | | | | | | |
| | | Six Months Ended
June 30, 2017 | | | | | | Period
February 16, 20161
to December 31, 2016 | |
| Short-Term TIPS Bond Index | | Shares | | | Amount | | | | | | Shares | | | Amount | |
| Institutional | | | | | | | | | | | | | | | | | | | | |
Shares sold | | | 303,166 | | | $ | 3,060,599 | | | | | | | | 47,385 | | | $ | 475,566 | |
Shares issued in reinvestment of distributions | | | 1,879 | | | | 18,840 | | | | | | | | 120 | | | | 1,205 | |
Shares redeemed | | | (36,357 | ) | | | (364,252 | ) | | | | | | | (100 | ) | | | (1,006 | ) |
| | | | | | | | | | | | |
Net increase | | | 268,688 | | | $ | 2,715,187 | | | | | | | | 47,405 | | | $ | 475,765 | |
| | | | | | | | | | | | |
| | | | | | | | | | | | | | | | | | | | |
| Investor A | | | | | | | | | | | | | | | | | | | | |
Shares sold | | | 9,197 | | | $ | 92,218 | | | | | | | | 6,571 | | | $ | 65,807 | |
Shares issued in reinvestment of distributions | | | 35 | | | | 345 | | | | | | | | 4 | | | | 35 | |
Shares redeemed | | | (63 | ) | | | (628 | ) | | | | | | | (394 | ) | | | (3,952 | ) |
| | | | | | | | | | | | |
Net increase | | | 9,169 | | | $ | 91,935 | | | | | | | | 6,181 | | | $ | 61,890 | |
| | | | | | | | | | | | |
| | | | | | | | | | | | | | | | | | | | |
| Class K | | | | | | | | | | | | | | | | | | | | |
Shares sold | | | 1,027,511 | | | $ | 10,367,071 | | | | | | | | 90,000 | | | $ | 900,000 | |
Shares issued in reinvestment of distributions | | | 3,875 | | | | 39,018 | | | | | | | | — | | | | — | |
Shares redeemed | | | (1,015,510 | ) | | | (10,236,256 | ) | | | | | | | — | | | | — | |
| | | | | | | | | | | | |
Net increase | | | 15,876 | | | $ | 169,833 | | | | | | | | 90,000 | | | $ | 900,000 | |
| | | | | | | | | | | | |
Total Net Increase | | | 293,733 | | | $ | 2,976,955 | | | | | | | | 143,586 | | | $ | 1,437,655 | |
| | | | | | | | | | | | |
1 Commencement of operations. | |
As of June 30, 2017, shares the Funds owned by BlackRock HoldCo 2, Inc., an affiliate of the Funds, were as follows:
| | | | | | | | | | | | | | | | |
| | | Institutional | | | Investor A | | | Investor C | | | Class K | |
Alternative Capital Strategies | | | 2,497,309 | | | | 2,001 | | | | 2,000 | | | | N/A | |
Emerging Markets Equity Strategies | | | 5,995 | | | | 5,982 | | | | 5,945 | | | | 581,623 | |
Short-Term TIPS Bond Index | | | 5,000 | | | | 5,000 | | | | N/A | | | | 90,000 | |
12. Subsequent Events:
Management has evaluated the impact of all subsequent events on the Funds through the date the financial statements were issued and has determined that there were no subsequent events requiring adjustment or additional disclosure in the financial statements.
| | | | | | |
| | | | | | | |
| 72 | | BLACKROCK FUNDS | | JUNE 30, 2017 | | |
| | | | |
| Disclosure of Investment Advisory Agreement and Sub-Advisory Agreements |
The Board of Trustees (the “Board,” the members of which are referred to as “Board Members”) of BlackRock FundsSM (the “Trust”) met in person on April 20, 2017 (the “April Meeting”) and May 24-25, 2017 (the “May Meeting”) to consider the approval of the Trust’s investment advisory agreement (the “Advisory Agreement”) between the Trust, on behalf of BlackRock Alternative Capital Strategies Fund (“Alternative Capital Strategies Fund”), BlackRock Emerging Markets Equity Strategies Fund (“Emerging Markets Equity Strategies Fund”) and iShares Short-Term TIPS Bond Index Fund (“TIPS Bond Index Fund”) (each, a “Fund” and collectively, the “Funds”), each a series of the Trust, and BlackRock Advisors, LLC (the “Manager”), the Trust’s investment advisor. The Board also considered the approval of (i) the sub-advisory agreement (the “Alternative Capital Strategies Fund Sub-Advisory Agreement”) between the Manager and BlackRock International Limited (the “Sub-Advisor”) with respect to Alternative Capital Strategies Fund and (ii) the sub-advisory agreement between the Manager and the Sub-Advisor with respect to Emerging Markets Equity Strategies Fund (the “Emerging Markets Equity Strategies Fund Sub-Advisory Agreement’’). The Manager and the Sub-Advisor are referred to herein as “BlackRock.” The Advisory Agreement, the Alternative Capital Strategies Fund Sub-Advisory Agreement and the Emerging Markets Equity Strategies Fund are referred to herein as the “Agreements.”
Activities and Composition of the Board
On the date of the May Meeting, the Board consisted of thirteen individuals, eleven of whom were not “interested persons” of the Trust as defined in the Investment Company Act of 1940, as amended (the “1940 Act”) (the “Independent Board Members”). The Board Members are responsible for the oversight of the operations of the Funds and perform the various duties imposed on the directors of investment companies by the 1940 Act. The Independent Board Members have retained independent legal counsel to assist them in connection with their duties. The Chair of the Board is an Independent Board Member. The Board has established five standing committees: an Audit Committee, a Governance and Nominating Committee, a Compliance Committee, a Performance Oversight and Contract Committee and an Executive Committee, each of which is chaired by an Independent Board Member and composed of Independent Board Members (except for the Executive Committee, which also has one interested Board Member).
The Agreements
Pursuant to the 1940 Act, the Board is required to consider the continuation of the Agreements on an annual basis. The Board has four quarterly meetings per year, each extending over two days, a fifth one-day meeting to consider specific information surrounding the consideration of renewing the Agreements and additional in-person and telephonic meetings as needed. In connection with this year-long deliberative process, the Board assessed, among other things, the nature, extent and quality of the services provided to the Funds by BlackRock, BlackRock’s personnel and affiliates, including (as applicable): investment management; administrative and shareholder services; the oversight of fund service providers; marketing; risk oversight; compliance; and ability to meet applicable legal and regulatory requirements.
The Board, acting directly and through its committees, considers at each of its meetings, and from time to time as appropriate, factors that are relevant to its annual consideration of the renewal of the Agreements, including the services and support provided by BlackRock to the Funds and their shareholders. BlackRock also furnished additional information to the Board in response to specific questions from the Board. This additional information is discussed further below in the section titled “Board Considerations in Approving the Agreements.” Among the matters the Board considered were: (a) investment performance for one-year, three-year, five-year, ten-year, and/or since inception periods, as applicable, against peer funds, applicable benchmark, and performance metrics, as applicable, as well as senior management’s and portfolio managers’ analysis of the reasons for any over-performance or underperformance relative to its peers, benchmarks, and other performance metrics, as applicable; (b) fees, including advisory, administration, if applicable, and other amounts paid to BlackRock and its affiliates by the Funds for services; (c) the Funds’ operating expenses and how BlackRock allocates expenses to the Funds; (d) the resources devoted to, risk oversight of, and compliance reports relating to, implementation of each Fund’s investment objective(s), policies and restrictions, and meeting regulatory requirements; (e) the Trust’s adherence to its compliance policies and procedures; (f) the nature, cost and character of non-investment management services provided by BlackRock and its affiliates; (g) BlackRock’s and other service providers’ internal controls and risk and compliance oversight mechanisms; (h) BlackRock’s implementation of the proxy voting policies approved by the Board; (i) the use of brokerage commissions and execution quality of portfolio transactions; (j) BlackRock’s implementation of the Trust’s valuation and liquidity procedures; (k) an analysis of management fees for products with similar investment mandates across the open-end fund, exchange-traded fund (“ETF”), closed-end fund, sub-advised mutual fund, separately managed account, collective investment trust, and institutional separate account product channels, as applicable, and the similarities and differences between these products and the services provided as compared to the Funds; (l) BlackRock’s compensation methodology for its investment professionals and the incentives and accountability it creates, along with investment professionals’ investments in the fund(s) they manage; and (m) periodic updates on BlackRock’s business.
Board Considerations in Approving the Agreements
The Approval Process: Prior to the April Meeting, the Board requested and received materials specifically relating to the Agreements. The Board is continuously engaged in a process with its independent legal counsel and BlackRock to review the nature and scope of the information provided to better assist its deliberations. The materials provided in connection with the April Meeting included (a) information independently compiled and prepared by Broadridge Financial Solutions, Inc. (“Broadridge”) on the fees and expenses of each Fund as compared with a peer group of funds as determined by Broadridge (“Expense Peers”) and the investment performance of each Fund as compared with a peer group of funds as determined by Broadridge1, and in
| 1 | | Funds are ranked by Broadridge in quartiles, ranging from first to fourth, where first is the most desirable quartile position and fourth is the least desirable. |
| | | | | | |
| | | | | | | |
| | BLACKROCK FUNDS | | JUNE 30, 2017 | | 73 |
| | |
| Disclosure of Investment Advisory Agreement and Sub-Advisory Agreements (continued) |
the case of Alternative Capital Strategies Fund, certain performance metrics, as well as, in the case of TIPS Bond Index Fund, performance of the Fund as compared with its benchmark; (b) information on the profits realized by BlackRock and its affiliates pursuant to the Agreements and a discussion of fall-out benefits to BlackRock and its affiliates; (c) a general analysis provided by BlackRock concerning investment management fees charged to other clients, such as institutional clients, sub-advised mutual funds, ETFs, closed-end funds, and separately managed accounts, under similar investment mandates, as well as the performance of such other clients, as applicable; (d) review of non-management fees; (e) the existence, impact and sharing of potential economies of scale; (f) a summary of aggregate amounts paid by each Fund to BlackRock; and (g) sales and redemption data regarding each Fund’s shares.
At the April Meeting, the Board reviewed materials relating to its consideration of the Agreements. As a result of the discussions that occurred during the April Meeting, and as a culmination of the Board’s year-long deliberative process, the Board presented BlackRock with questions and requests for additional information. BlackRock responded to these requests with additional written information in advance of the May Meeting.
At the May Meeting, the Board, including the Independent Board Members, approved the continuation of (i) the Advisory Agreement between the Manager and the Trust with respect to each Fund, (ii) the Alternative Capital Strategies Fund Sub-Advisory Agreement between the Manager and the Sub-Advisor with respect to Alternative Capital Strategies Fund and (iii) the Emerging Markets Equity Strategies Fund Sub-Advisory Agreement between the Manager and the Sub-Advisor with respect to Emerging Markets Equity Strategies Fund, each for a one-year term ending June 30, 2018. In approving the continuation of the Agreements, the Board considered: (a) the nature, extent and quality of the services provided by BlackRock; (b) the investment performance of each Fund; (c) the advisory fee and the cost of the services and profits to be realized by BlackRock and its affiliates from their relationship with the Funds; (d) each Fund’s costs to investors compared to the costs of Expense Peers and performance compared to the relevant performance metrics as previously discussed; (e) the sharing of potential economies of scale; (f) fall-out benefits to BlackRock and its affiliates as a result of its relationship with the Funds; and (g) other factors deemed relevant by the Board Members.
The Board also considered other matters it deemed important to the approval process, such as other payments made to BlackRock or its affiliates, securities lending and cash management, services related to the valuation and pricing of the portfolio holdings of each Fund and advice from independent legal counsel with respect to the review process and materials submitted for the Board’s review. The Board noted the willingness of BlackRock personnel to engage in open, candid discussions with the Board. The Board did not identify any particular information as determinative, and each Board Member may have attributed different weights to the various items considered.
A. Nature, Extent and Quality of the Services Provided by BlackRock: The Board, including the Independent Board Members, reviewed the nature, extent and quality of services provided by BlackRock, including the investment advisory services and the resulting performance of each Fund. Throughout the year, the Board compared each Fund’s performance to the performance of a comparable group of mutual funds, relevant benchmark, and performance metrics, as applicable. The Board met with BlackRock’s senior management personnel responsible for investment activities, including the senior investment officers. The Board also reviewed the materials provided by each Fund’s portfolio management team discussing the relevant Fund’s performance and investment objective(s), strategies and outlook.
The Board considered, among other factors, with respect to BlackRock: the number, education and experience of investment personnel generally and each Fund’s portfolio management team; BlackRock’s research capabilities; investments by portfolio managers in the funds they manage; portfolio trading capabilities; use of technology; commitment to compliance; credit analysis capabilities; risk analysis and oversight capabilities; and the approach to training and retaining portfolio managers and other research, advisory and management personnel. The Board engaged in a review of BlackRock’s compensation structure with respect to each Fund’s portfolio management team and BlackRock’s ability to attract and retain high-quality talent and create performance incentives.
In addition to investment advisory services, the Board considered the quality of the administrative and other non-investment advisory services provided to the Funds. BlackRock and its affiliates provide the Funds with certain administrative, shareholder and other services (in addition to any such services provided to the Funds by third parties) and officers and other personnel as are necessary for the operations of the Funds. In particular, BlackRock and its affiliates provide the Funds with administrative services including, among others: (i) preparing disclosure documents, such as the prospectus, the summary prospectus (as applicable), the statement of additional information and periodic shareholder reports; (ii) oversight of daily accounting and pricing; (iii) preparing periodic filings with regulators; (iv) overseeing and coordinating the activities of other service providers; (v) organizing Board meetings and preparing the materials for such Board meetings; (vi) providing legal and compliance support; (vii) furnishing analytical and other support to assist the Board in its consideration of strategic issues such as the merger, consolidation or repurposing of certain open-end funds; and (viii) performing other administrative functions necessary for the operation of the Funds, such as tax reporting, fulfilling regulatory filing requirements and call center services. The Board reviewed the structure and duties of BlackRock’s fund administration, shareholder services, and legal & compliance departments and considered BlackRock’s policies and procedures for assuring compliance with applicable laws and regulations.
B. The Investment Performance of the Funds and BlackRock: The Board, including the Independent Board Members, also reviewed and considered the performance history of each Fund. In preparation for the April Meeting, the Board was provided with reports independently prepared by Broadridge, which included a comprehensive analysis of each Fund’s performance. The Board also reviewed a narrative and statistical analysis of the Broadridge data that
| | | | | | |
| | | | | | | |
| 74 | | BLACKROCK FUNDS | | JUNE 30, 2017 | | |
| | | | |
| Disclosure of Investment Advisory Agreement and Sub-Advisory Agreements (continued) |
was prepared by BlackRock. In connection with its review, the Board received and reviewed information regarding the investment performance of each Fund as compared to other funds in its applicable Broadridge category and, in the case of Alternative Capital Strategies Fund, certain performance metrics, as well as, in the case of TIPS Bond Index Fund, performance of the Fund as compared with its benchmark. With respect to BlackRock Alternative Capital Strategies Fund, which pursues an alternative investment strategy, the Board has been engaged in an iterative process with BlackRock to identify the most appropriate performance benchmarks and metrics by which the Board should measure the Fund’s performance. The Board was provided with a description of the methodology used by Broadridge to select peer funds and periodically meets with Broadridge representatives to review its methodology. The Board was provided with information on the composition of the Broadridge performance universes and expense universes. The Board and its Performance Oversight and Contract Committee regularly review, and meet with Fund management to discuss, the performance of each Fund throughout the year.
In evaluating performance, the Board recognized that the performance data reflects a snapshot of a period as of a particular date and that selecting a different performance period could produce significantly different results. Further, the Board recognized that it is possible that long-term performance can be adversely affected by even one period of significant underperformance so that a single investment decision or theme has the ability to affect long-term performance disproportionately.
The Board noted that for each of the one-year and since-inception periods reported, Alternative Capital Strategies Fund ranked in the first quartile against its Broadridge Performance Universe. In light of the Fund’s outcome oriented objective, BlackRock believes that other performance metrics may be more appropriate than the Broadridge Performance Universe, and the Board was provided with a comparison of Fund performance relative to certain of these other metrics. Under these other metrics, the Fund underperformed its total return target for the one-year and since-inception periods. The total return target is designed to be based on a three- to five-year time horizon, but in this case is being viewed over a shorter time horizon. The overall risk of the Fund, as measured by the standard deviation of returns, was below its target range for the one-year period and it was within its target range for the since-inception period.
The Board noted that for the since-inception period reported, Emerging Markets Equity Strategies Fund ranked in the first quartile against its Broadridge Performance Universe.
The Board noted that for the since-inception period reported, TIPS Bond Index Fund’s net performance underperformed its benchmark. BlackRock believes that net performance relative to the benchmark is an appropriate performance metric for the Fund.
C. Consideration of the Advisory/Management Fees and the Cost of the Services and Profits to be Realized by BlackRock and its Affiliates from their Relationship with the Funds: The Board, including the Independent Board Members, reviewed each Fund’s contractual management fee rate compared with the other funds in its Broadridge category. The contractual management fee rate represents a combination of the advisory fee and any administrative fees, before taking into account any reimbursements or fee waivers. The Board also compared each Fund’s total expense ratio, as well as its actual management fee rate, to those of other funds in its Broadridge category. The total expense ratio represents a fund’s total net operating expenses, including any 12b-1 or non 12b-1 service fees. The total expense ratio gives effect to any expense reimbursements or fee waivers that benefit a fund, and the actual management fee rate gives effect to any management fee reimbursements or waivers that benefit a fund. The Board considered the services provided and the fees charged by BlackRock and its affiliates to other types of clients with similar investment mandates, as applicable, including institutional accounts and sub-advised mutual funds (including mutual funds sponsored by third parties).
The Board received and reviewed statements relating to BlackRock’s financial condition. The Board reviewed BlackRock’s profitability methodology and was also provided with a profitability analysis that detailed the revenues earned and the expenses incurred by BlackRock for services provided to the Funds. The Board reviewed BlackRock’s profitability with respect to each Fund and other funds the Board currently oversees for the year ended December 31, 2016 compared to available aggregate profitability data provided for the prior two years. The Board reviewed BlackRock’s profitability with respect to certain other U.S. fund complexes managed by the Manager and/or its affiliates. The Board reviewed BlackRock’s assumptions and methodology of allocating expenses in the profitability analysis, noting the inherent limitations in allocating costs among various advisory products. The Board recognized that profitability may be affected by numerous factors including, among other things, fee waivers and expense reimbursements by the Manager, the types of funds managed, precision of expense allocations and business mix. As a result, calculating and comparing profitability at individual fund levels is difficult.
The Board noted that, in general, individual fund or product line profitability of other advisors is not publicly available. The Board reviewed BlackRock’s overall operating margin, in general, compared to that of certain other publicly-traded asset management firms. The Board considered the differences between BlackRock and these other firms, including the contribution of technology at BlackRock, BlackRock’s expense management, and the relative product mix.
In addition, the Board considered the cost of the services provided to the Funds by BlackRock, and BlackRock’s and its affiliates’ profits relating to the management and distribution of the Funds and the other funds advised by BlackRock and its affiliates. As part of its analysis, the Board reviewed BlackRock’s methodology in allocating its costs of managing the Funds, to each Fund. The Board may receive and review information from independent third parties as part of its annual evaluation. The Board considered whether BlackRock has the financial resources necessary to attract and retain high quality investment management personnel to perform its obligations under the Agreements and to continue to provide the high quality of services that is expected by the Board. The Board further considered factors including but not limited to BlackRock’s commitment of time, assumption of risk, and liability profile in
| | | | | | |
| | | | | | | |
| | BLACKROCK FUNDS | | JUNE 30, 2017 | | 75 |
| | |
| Disclosure of Investment Advisory Agreement and Sub-Advisory Agreements (concluded) |
servicing the Funds in contrast to what is required of BlackRock with respect to other products with similar investment mandates across the open-end fund, ETF, closed-end fund, sub-advised mutual fund, separately managed account, collective investment trust, and institutional separate account product channels, as applicable.
The Board noted that Alternative Capital Strategies Fund’s contractual management fee rate ranked in the first quartile, and that the actual management fee rate and total expense ratio each ranked in the first quartile, relative to the Fund’s Expense Peers. The Board also noted that the Fund has an advisory fee arrangement that includes breakpoints that adjust the fee rate downward as the size of the Fund increases above certain contractually specified levels. Additionally, the Board noted that BlackRock proposed, and the Board agreed to, a contractual adjustment to reduce specified levels within the breakpoint schedule. This adjustment was implemented on December 1, 2016. The Board also noted that BlackRock has contractually agreed to a cap on the Fund’s total expenses as a percentage of the Fund’s average daily net assets on a class-by-class basis. Additionally, the Board noted that BlackRock proposed, and the Board agreed to, a lower contractual expense cap on a class-by-class basis. This contractual expense cap reduction was implemented on December 1, 2016.
The Board noted that TIPS Bond Index Fund’s contractual management fee rate ranked in the first quartile, and that the actual management fee rate and total expense ratio ranked in the first and third quartiles, respectively, relative to the Fund’s Expense Peers. The Board further noted that BlackRock has contractually agreed to a cap on the Fund’s total expenses as a percentage of the Fund’s average daily net assets on a class-by-class basis.
The Board noted that Emerging Markets Equity Strategies Fund’s contractual management fee rate ranked in the second quartile, and that the actual management fee rate and total expense ratio ranked in the first and third quartiles, respectively, relative to the Fund’s Expense Peers. The Board also noted that the Fund has an advisory fee arrangement that includes breakpoints that adjust the fee rate downward as the size of the Fund increases above certain contractually specified levels. The Board further noted that BlackRock has contractually agreed to a cap on the Fund’s total expenses as a percentage of the Fund’s average daily net assets on a class-by-class basis.
D. Economies of Scale: The Board, including the Independent Board Members, considered the extent to which economies of scale might be realized as the assets of the Funds increase, as well as the existence of expense caps, as applicable. The Board also considered the extent to which the Funds benefit from such economies in a variety of ways and whether there should be changes in the advisory fee rate or breakpoint structure in order to enable the Funds to more fully participate in these economies of scale. The Board considered each Fund’s asset levels and whether the current fee schedule was appropriate. In their consideration, the Board Members took into account the existence of any expense caps and further considered the continuation and/or implementation, as applicable, of such caps.
E. Other Factors Deemed Relevant by the Board Members: The Board, including the Independent Board Members, also took into account other ancillary or “fall-out” benefits that BlackRock or its affiliates may derive from their respective relationships with the Funds, both tangible and intangible, such as BlackRock’s ability to leverage its investment professionals who manage other portfolios and risk management personnel, an increase in BlackRock’s profile in the investment advisory community, and the engagement of BlackRock’s affiliates as service providers to the Funds, including for administrative, distribution, securities lending and cash management services. The Board also considered BlackRock’s overall operations and its efforts to expand the scale of, and improve the quality of, its operations. The Board also noted that BlackRock may use and benefit from third party research obtained by soft dollars generated by certain registered fund transactions to assist in managing all or a number of its other client accounts.
In connection with its consideration of the Agreements, the Board also received information regarding BlackRock’s brokerage and soft dollar practices. The Board received reports from BlackRock which included information on brokerage commissions and trade execution practices throughout the year.
The Board noted the competitive nature of the open-end fund marketplace, and that shareholders are able to redeem their Fund shares if they believe that the pertinent Fund’s fees and expenses are too high or if they are dissatisfied with the performance of the Fund.
Conclusion
The Board, including the Independent Board Members, approved the continuation of (i) the Advisory Agreement between the Manager and the Trust on behalf of each Fund, (ii) the Alternative Capital Strategies Fund Sub-Advisory Agreement between the Manager and the Sub-Advisor with respect to Alternative Capital Strategies Fund and (iii) the Emerging Markets Equity Strategies Fund Sub-Advisory Agreement between the Manager and the Sub-Advisor with respect to Emerging Markets Equity Strategies Fund, each for a one-year term ending June 30, 2018. Based upon its evaluation of all of the aforementioned factors in their totality, as well as other information, the Board, including the Independent Board Members, was satisfied that the terms of the Agreements were fair and reasonable and in the best interest of each Fund, as applicable, and its shareholders. In arriving at its decision to approve the Agreements, the Board did not identify any single factor or group of factors as all-important or controlling, but considered all factors together, and different Board Members may have attributed different weights to the various factors considered. The Independent Board Members were also assisted by the advice of independent legal counsel in making this determination. The contractual fee arrangements for the Funds reflect the results of several years of review by the Board Members and predecessor Board Members, and discussions between such Board Members (and predecessor Board Members) and BlackRock. As a result, the Board Members’ conclusions may be based in part on their consideration of these arrangements in prior years.
| | | | | | |
| | | | | | | |
| 76 | | BLACKROCK FUNDS | | JUNE 30, 2017 | | |
| | |
| Disclosure of Sub-Advisory Agreement | | |
The Board of Directors (the “Board,” the members of which are referred to as “Board Members”) of BlackRock Funds (the “Trust”) met in person on February 23-24, 2017 (the “February 2017 Meeting”) to consider the initial approval of the proposed sub-advisory agreement (the “BAMNAL Sub-Advisory Agreement”) between BlackRock Advisors, LLC (the “Manager”), the Trust’s investment advisor, and BlackRock Asset Management North Asia Limited (the “Sub-Advisor” or “BAMNAL”) with respect to BlackRock Emerging Markets Equity Strategies Fund (the “Fund”). The BAMNAL Sub-Advisory Agreement was substantially the same as sub-advisory agreements that had previously been approved by the Board with respect to certain other portfolios of the Trust.
On the date of the February 2017 Meeting, the Board consisted of thirteen individuals, eleven of whom were not “interested persons” of the Trust as defined in the Investment Company Act of 1940, as amended (the “1940 Act”) (the “Independent Board Members”). Pursuant to the 1940 Act, the Board is required to consider the initial approval of the Sub-Advisory Agreement.
The Board previously met in person on February 17-19, 2016 (the “February 2016 Meeting”) to consider the approval of (i) the Trust’s proposed investment advisory agreement (the “Advisory Agreement”) between the Trust, on behalf of the Fund, and the Manager and (ii) the proposed sub-advisory agreement between the Manager and BlackRock International Limited (“BIL”) with respect to the Fund (the “BIL Sub-Advisory Agreement”). At the February 2016 Meeting, the Board, including the Independent Board Members, approved the Advisory Agreement and the BIL Sub-Advisory Agreement, each for a two-year term beginning on the effective date of the respective Agreement. A discussion of the basis for the Board’s approval of the Advisory Agreement and the BIL Sub-Advisory Agreement at the February 2016 Meeting is included in the semi-annual shareholder report of the Fund for the period ended June 30, 2016.
At the February 2017 Meeting, the Board reviewed materials relating to its consideration of the BAMNAL Sub-Advisory Agreement. The factors considered by the Board at the February 2017 Meeting in connection with approval of the proposed BAMNAL Sub-Advisory Agreement were substantially the same as the factors considered at the February 2016 Meeting with respect to approval of the Advisory Agreement and the BIL Sub-Advisory Agreement.
Following discussion, all the Board Members present at the February 2017 Meeting, including all the Independent Board Members present at the February 2017 Meeting, approved the BAMNAL Sub-Advisory Agreement between the Manager and the Sub-Advisor with respect to the Fund for a two-year term beginning on the effective date of the BAMNAL Sub-Advisory Agreement. Based upon its evaluation of all of the aforementioned factors in their totality, the Board, including a majority of the Independent Board Members, was satisfied that the terms of the BAMNAL Sub-Advisory Agreement were fair and reasonable and in the best interest of the Fund and its shareholders. In arriving at its decision to approve the BAMNAL Sub-Advisory Agreement, the Board did not identify any single factor or group of factors as all-important or controlling, but considered all factors together, and different Board Members may have attributed different weights to the various factors considered. The Independent Board Members were also assisted by the advice of independent legal counsel in making this determination.
| | | | | | |
| | | | | | | |
| | BLACKROCK FUNDS | | JUNE 30, 2017 | | 77 |
| | | | |
| Disclosure of Sub-Advisory Agreement | | |
The Board of Directors (the “Board,” the members of which are referred to as “Board Members”) of BlackRock Funds (the “Trust”) met in person on November 16-18, 2016 (the “November 2016 Meeting”) to consider the initial approval of the proposed sub-advisory agreement (the “Sub-Advisory Agreement”) between BlackRock Advisors, LLC (the “Manager”), the Trust’s investment advisor, and BlackRock Fund Advisors (the “Sub-Advisor” with respect to iShares Short-Term TIPS Bond Index Fund (the “Fund”). The Sub-Advisory Agreement was substantially the same as sub-advisory agreements that had previously been approved by the Board with respect to certain other portfolios of the Trust.
On the date of the November 2016 Meeting, the Board consisted of fifteen individuals, thirteen of whom were not “interested persons” of the Trust as defined in the Investment Company Act of 1940, as amended (the “1940 Act”) (the “Independent Board Members”). Pursuant to the 1940 Act, the Board is required to consider the initial approval of the Sub-Advisory Agreement.
The Board previously met in person on November 18-20, 2015 (the “November 2015 Meeting”) to consider the approval of the proposed investment advisory agreement (the “Advisory Agreement”) between the Trust, on behalf of the Fund, and the Manager. At the November 2015 Meeting, the Board, including the Independent Board Members, approved the Advisory Agreement for a two-year term beginning on the effective date of the Agreement. A discussion of the basis for the Board’s approval of the Advisory Agreement at the November 2015 Meeting is included in the semi-annual shareholder report of the Fund for the period ended June 30, 2016.
At the November 2016 Meeting, the Board reviewed materials relating to its consideration of the Sub-Advisory Agreement. The factors considered by the Board at the November 2016 Meeting in connection with approval of the proposed Sub-Advisory Agreement were substantially the same as the factors considered at the November 2015 Meeting with respect to approval of the Advisory Agreement.
Following discussion, all the Board Members present at the November 2016 Meeting, including all the Independent Board Members present at the November 2016 Meeting, approved the Sub-Advisory Agreement between the Manager and the Sub-Advisor with respect to the Fund for a two-year term beginning on the effective date of the Sub-Advisory Agreement. Based upon its evaluation of all of the aforementioned factors in their totality, the Board, including a majority of the Independent Board Members, was satisfied that the terms of the Sub-Advisory Agreement were fair and reasonable and in the best interest of the Fund and its shareholders. In arriving at its decision to approve the Sub-Advisory Agreement, the Board did not identify any single factor or group of factors as all-important or controlling, but considered all factors together, and different Board Members may have attributed different weights to the various factors considered. The Independent Board Members were also assisted by the advice of independent legal counsel in making this determination.
| | | | | | |
| | | | | | | |
| 78 | | BLACKROCK FUNDS | | JUNE 30, 2017 | | |
Rodney D. Johnson, Chair of the Board and Trustee
Susan J. Carter, Trustee
Collette Chilton, Trustee
Neil A. Cotty, Trustee
Cynthia A. Montgomery, Trustee
Joseph P. Platt, Trustee
Robert C. Robb, Jr., Trustee
Mark Stalnecker, Trustee
Kenneth L. Urish, Trustee
Claire A. Walton, Trustee
Frederick W. Winter, Trustee
Barbara G. Novick, Trustee
John M. Perlowski, Trustee, President and Chief Executive Officer
Thomas Callahan, Vice President
Jennifer McGovern, Vice President
Neal J. Andrews, Chief Financial Officer
Jay M. Fife, Treasurer
Charles Park, Chief Compliance Officer
Fernanda Piedra, Anti-Money Laundering Compliance Officer
Benjamin Archibald, Secretary
| | | | | | |
| | | | |
Investment Adviser and Administrator BlackRock Advisors, LLC Wilmington, DE 19809 Sub-Adviser BlackRock International Limited1 Edinburgh, EH3 8BL United Kingdom BlackRock Asset Management North Asia Limited2 Hong Kong BlackRock Fund Advisors3 San Francisco, CA 94105 | | Accounting Agent and Custodian State Street Bank and Trust Company Boston, MA 02111 Distributor BlackRock Investments, LLC New York, NY 10022 | | Transfer Agent BNY Mellon Investment Servicing (US) Inc. Wilmington, DE 19809 Independent Registered Public Accounting Firm Deloitte & Touche LLP Boston, MA 02116 | | Legal Counsel Sidley Austin LLP New York, NY 10019 Address of the Funds 100 Bellevue Parkway Wilmington, DE 19809 |
| | 1 | | For BlackRock Alternative Capital Strategies Fund and BlackRock Emerging Markets Equity Strategies Fund. |
| | 2 | | For BlackRock Emerging Markets Equity Strategies Fund. |
| | 3 | | For iShares Short-Term TIPS Bond Index Fund |
| | | | | | |
| | | | | | | |
| | BLACKROCK FUNDS | | JUNE 30, 2017 | | 79 |
Householding
The Funds will mail only one copy of shareholder documents, including prospectuses, annual and semi-annual reports and proxy statements, to shareholders with multiple accounts at the same address. This practice is commonly called “householding” and is intended to reduce expenses and eliminate duplicate mailings of shareholder documents. Mailings of your shareholder documents may be householded indefinitely unless you instruct us otherwise. If you do not want the mailing of these documents to be combined with those for other members of your household, please call the Funds at (800) 441-7762.
Availability of Quarterly Schedule of Investments
The Funds file their complete schedules of portfolio holdings with the SEC for the first and third quarters of each fiscal year on Form N-Q. The Funds’ Forms N-Q are available on the SEC’s website at http://www.sec.gov and may also be reviewed and copied at the SEC’s Public Reference Room in Washington, D.C. Information on the operation of the Public Reference Room or how to access documents on the SEC’s website without charge may be obtained by calling (800) SEC-0330. The Funds’ Forms N-Q may also be obtained upon request and without charge by calling (800) 441-7762.
Availability of Proxy Voting Policies and Procedures
A description of the policies and procedures that the Funds use to determine how to vote proxies relating to portfolio securities is available upon request and without charge (1) by calling (800) 441-7762; (2) at http://www.blackrock.com; and (3) on the SEC’s website at http://www.sec.gov.
Availability of Proxy Voting Record
Information about how the Funds voted proxies relating to securities held in the Funds’ portfolios during the most recent 12-month period ended June 30 is available upon request and without charge (1) at http://www.blackrock.com or by calling (800) 441-7762 and (2) on the SEC’s website at http://www.sec.gov.
BlackRock’s Mutual Fund Family
BlackRock offers a diverse lineup of open-end mutual funds crossing all investment styles and managed by experts in equity, fixed income and tax-exempt investing. Visit http://www.blackrock.com for more information.
Account Information
Call us at (800) 441-7762 from 8:00 AM to 6:00 PM ET on any business day to get information about your account balances, recent transactions and share prices. You can also reach us on the Web at http://www.blackrock.com.
Automatic Investment Plans
Investor Class shareholders who want to invest regularly can arrange to have $50 or more automatically deducted from their checking or savings account and invested in any of the BlackRock funds.
Systematic Withdrawal Plans
Investor Class shareholders can establish a systematic withdrawal plan and receive periodic payments of $50 or more from their BlackRock funds, as long as their account balance is at least $10,000.
Retirement Plans
Shareholders may make investments in conjunction with Traditional, Rollover, Roth, Coverdell, Simple IRAs, SEP IRAs and 403(b) Plans.
| | | | | | |
| | | | | | | |
| 80 | | BLACKROCK FUNDS | | JUNE 30, 2017 | | |
| | | | |
| Additional Information (concluded) | | |
| | |
| BlackRock Privacy Principles | | |
BlackRock is committed to maintaining the privacy of its current and former fund investors and individual clients (collectively, “Clients”) and to safeguarding their non-public personal information. The following information is provided to help you understand what personal information BlackRock collects, how we protect that information and why in certain cases we share such information with select parties.
If you are located in a jurisdiction where specific laws, rules or regulations require BlackRock to provide you with additional or different privacy-related rights beyond what is set forth below, then BlackRock will comply with those specific laws, rules or regulations.
BlackRock obtains or verifies personal non-public information from and about you from different sources, including the following: (i) information we receive from you or, if applicable, your financial intermediary, on applications, forms or other documents; (ii) information about your transactions with us, our affiliates, or others; (iii) information we receive from a consumer reporting agency; and (iv) from visits to our websites.
BlackRock does not sell or disclose to non-affiliated third parties any non-public personal information about its Clients, except as permitted by law or as is necessary to respond to regulatory requests or to service Client accounts. These non-affiliated third parties are required to protect the confidentiality and security of this information and to use it only for its intended purpose.
We may share information with our affiliates to service your account or to provide you with information about other BlackRock products or services that may be of interest to you. In addition, BlackRock restricts access to non-public personal information about its Clients to those BlackRock employees with a legitimate business need for the information. BlackRock maintains physical, electronic and procedural safeguards that are designed to protect the non-public personal information of its Clients, including procedures relating to the proper storage and disposal of such information.
| | | | | | |
| | | | | | | |
| | BLACKROCK FUNDS | | JUNE 30, 2017 | | 81 |
The report is intended for current holders. This report is not authorized for use as an offer of sale or a solicitation of an offer to buy shares of a Fund unless preceded or accompanied by the Fund’s current prospectus. Past performance results shown in this report should not be considered a representation of future performance. Investment returns and principal value of shares will fluctuate so that shares, when redeemed, may be worth more or less than their original cost. Statements and other information herein are as dated and are subject to change.

| | |
| STRAT-6/17-SAR | |  |
| Item 2 – | Code of Ethics – Not Applicable to this semi-annual report |
| Item 3 – | Audit Committee Financial Expert – Not Applicable to this semi-annual report |
| Item 4 – | Principal Accountant Fees and Services – Not Applicable to this semi-annual report |
| Item 5 – | Audit Committee of Listed Registrants – Not Applicable |
| | (a) The registrant’s Schedule of Investments is included as part of the Report to Stockholders filed under Item 1 of this Form. |
| | (b) Not Applicable due to no such divestments during the semi-annual period covered since the previous Form N-CSR filing. |
| Item 7 – | Disclosure of Proxy Voting Policies and Procedures for Closed-End Management Investment Companies – Not Applicable |
| Item 8 – | Portfolio Managers of Closed-End Management Investment Companies – Not Applicable |
| Item 9 – | Purchases of Equity Securities by Closed-End Management Investment Company and Affiliated Purchasers – Not Applicable |
| Item 10 – | Submission of Matters to a Vote of Security Holders –There have been no material changes to these procedures. |
| Item 11 – | Controls and Procedures |
| | (a) – The registrant’s principal executive and principal financial officers, or persons performing similar functions, have concluded that the registrant’s disclosure controls and procedures (as defined in Rule 30a-3(c) under the Investment Company Act of 1940, as amended (the “1940 Act”)) are effective as of a date within 90 days of the filing of this report based on the evaluation of these controls and procedures required by Rule 30a-3(b) under the 1940 Act and Rule 15d-15(b) under the Securities Exchange Act of 1934, as amended. |
| | (b) – There were no changes in the registrant’s internal control over financial reporting (as defined in Rule 30a-3(d) under the 1940 Act) that occurred during the second fiscal quarter of the period covered by this report that have materially affected, or are reasonably likely to materially affect, the registrant’s internal control over financial reporting. |
| Item 12 – | Exhibits attached hereto |
| | (a)(1) – Code of Ethics – Not Applicable to this semi-annual report |
| | (a)(2) – Certifications – Attached hereto |
| | (b) – Certifications – Attached hereto |
2
Pursuant to the requirements of the Securities Exchange Act of 1934 and the Investment Company Act of 1940, the registrant has duly caused this report to be signed on its behalf by the undersigned, thereunto duly authorized.
| | | | |
| BlackRock Funds | | |
| | |
| By: | | /s/ John M. Perlowski | | |
| | John M. Perlowski | | |
| | Chief Executive Officer (principal executive officer) of |
| | BlackRock Funds | | |
| |
| Date: September 5, 2017 | | |
Pursuant to the requirements of the Securities Exchange Act of 1934 and the Investment Company Act of 1940, this report has been signed below by the following persons on behalf of the registrant and in the capacities and on the dates indicated.
| | | | |
| By: | | /s/ John M. Perlowski | | |
| | John M. Perlowski | | |
| | Chief Executive Officer (principal executive officer) of |
| | BlackRock Funds | | |
| |
| Date: September 5, 2017 | | |
| | |
| By: | | /s/ Neal J. Andrews | | |
| | Neal J. Andrews | | |
| | Chief Financial Officer (principal financial officer) of |
| | BlackRock Funds | | |
| |
| Date: September 5, 2017 | | |
3