UNITED STATES
SECURITIES AND EXCHANGE COMMISSION
Washington, D.C. 20549
FORM N-CSR
CERTIFIED SHAREHOLDER REPORT OF REGISTERED MANAGEMENT INVESTMENT
COMPANIES
Investment Company Act file number: 811-05742
Name of Fund: BlackRock Funds
BlackRock Developed Real Estate Index Fund
Fund Address: 100 Bellevue Parkway, Wilmington, DE 19809
Name and address of agent for service: John M. Perlowski, Chief Executive Officer, BlackRock Funds, 55 East 52nd Street, New York, NY 10055
Registrant’s telephone number, including area code: (800) 441-7762
Date of fiscal year end: 01/31/2018
Date of reporting period: 07/31/2017
Item 1 – Report to Stockholders
JULY 31, 2017
| | | | |
SEMI-ANNUAL REPORT (UNAUDITED) | | | |  |
iShares Developed Real Estate Index Fund | of BlackRock FundsSM
|
| Not FDIC Insured • May Lose Value • No Bank Guarantee |
Dear Shareholder,
In the 12 months ended July 31, 2017, risk assets, such as stocks and high-yield bonds, continued to deliver strong performance. These markets showed great resilience during a period with big surprises, including the aftermath of the U.K.’s vote to leave the European Union and the outcome of the U.S. presidential election, which brought only brief spikes in equity market volatility. These expressions of isolationism and discontent were countered by the closely watched and less surprising elections in France, the Netherlands and Australia.
Interest rates rose, which worked against high-quality assets with more interest rate sensitivity. Aside from the shortest-term Treasury bills, most U.S. Treasuries posted negative returns, as rising energy prices, modest wage increases and steady job growth led to expectations of higher inflation and anticipation of interest rate increases by the U.S. Federal Reserve (the “Fed”).
The global reflationary theme — rising nominal growth, wages and inflation — was the dominant driver of asset returns during the period, outweighing significant political upheavals and economic uncertainty. Reflationary expectations accelerated after the U.S. election in November 2016 and continued into the beginning of 2017, stoked by expectations that the new administration’s policies would provide an extra boost to U.S. growth.
The Fed has responded to these positive developments by increasing interest rates three times in the last six months, setting expectations for additional interest rate increases and moving toward normalizing monetary policy. Divergent global monetary policy continued in earnest, as the European Central Bank and the Bank of Japan reiterated their commitments to economic stimulus despite nascent signs of sustained economic growth in both countries.
In recent months, growing skepticism about the near-term likelihood of significant U.S. tax reform and infrastructure spending has tempered enthusiasm around the reflation trade. Similarly, renewed concern about oversupply has weighed on energy prices. Nonetheless, financial markets — and to an extent the Fed — have adopted a “wait-and-see” approach to the economic data and potential fiscal stimulus. Although uncertainty has persisted, benign credit conditions, modest inflation and the positive outlook for economic growth have kept markets relatively tranquil.
Although economic momentum is gaining traction, the capacity for rapid global growth is restrained by structural factors, including an aging population, low productivity growth and excess savings, as well as cyclical factors, such as the Fed moving toward the normalization of monetary policy and the length of the current expansion. Tempered economic growth and high valuations across most assets have set the stage for muted returns going forward. At current valuation levels, potential equity gains will likely be closely tied to the pace of earnings growth, which has remained solid thus far in 2017.
In this environment, investors need to think globally, extend their scope across a broad array of asset classes, and be nimble as market conditions change. We encourage you to talk with your financial advisor and visit blackrock.com for further insight about investing in today’s markets.
Sincerely,

Rob Kapito
President, BlackRock Advisors, LLC

Rob Kapito
President, BlackRock Advisors, LLC
| | | | | | | | |
| Total Returns as of July 31, 2017 | |
| | | 6-month | | | 12-month | |
U.S. large cap equities
(S&P 500® Index) | | | 9.51 | % | | | 16.04 | % |
U.S. small cap equities
(Russell 2000® Index) | | | 5.35 | | | | 18.45 | |
International equities
(MSCI Europe, Australasia,
Far East Index) | | | 13.79 | | | | 17.77 | |
Emerging market equities
(MSCI Emerging Markets Index) | | | 18.98 | | | | 24.84 | |
3-month Treasury bills
(BofA Merrill Lynch 3-Month
U.S. Treasury Bill Index) | | | 0.35 | | | | 0.54 | |
U.S. Treasury securities
(BofA Merrill Lynch
10-Year U.S. Treasury
Index) | | | 2.33 | | | | (5.73 | ) |
U.S. investment grade bonds
(Bloomberg Barclays U.S.
Aggregate Bond Index) | | | 2.51 | | | | (0.51 | ) |
Tax-exempt municipal bonds (S&P Municipal Bond Index) | | | 3.40 | | | | 0.36 | |
U.S. high yield bonds
(Bloomberg Barclays U.S. Corporate High Yield 2% Issuer
Capped Index) | | | 4.57 | | | | 10.94 | |
| Past performance is no guarantee of future results. Index performance is shown for illustrative purposes only. You cannot invest directly in an index. | |
| | | | | | |
| | | | | | | |
| 2 | | THIS PAGE NOT PART OF YOUR FUND REPORT | | | | |

| | | | | | |
| | | | | | | |
| | iSHARES DEVELOPED REAL ESTATE INDEX FUND | | JULY 31, 2017 | | 3 |
| | |
| Fund Summary as of July 31, 2017 | | |
iShares Developed Real Estate Index Fund’s (the “Fund”) investment objective is to seek to track the investment results of an index composed of real estate equities in developed markets.
On February 24, 2017, the Fund’s Board approved a proposal to change the name of BlackRock Developed Real Estate Index Fund to iShares Developed Real Estate Index Fund, which was effective on June 19, 2017.
|
| Portfolio Management Commentary |
How did the Fund perform?
| • | | For the six-month period ended July 31, 2017, the Fund’s Institutional Shares and Investor A Shares returned 6.62% and 6.41%, respectively, while Class K Shares returned 6.64%. The benchmark FTSE EPRA/NAREIT Developed Index returned 6.17% for the same period. |
| • | | Returns for the Fund’s respective share classes differ from the benchmark index based on individual share class expenses. |
Describe the market environment.
| • | | Japanese equities posted solid gains early in the period with success that was attributed to Japanese companies having a higher exposure to global growth, which has been trending upward over the past few quarters. |
| • | | In the case of Europe, economic data has been improving, particularly in large export-driven economies like Germany. Political anxiety over elections in the Netherlands and France in the first half of the year, as well as fears over the European Central Bank tapering its asset purchase program too soon, have weighed on investor sentiment to some extent. |
| • | | In the United Kingdom, Prime Minster Theresa May triggered Article 50 at the end of March, marking the start of the two-year period in which the U.K. must leave the European Union. While the initial impact of Brexit |
| | | appeared to be inconsequential, recent economic data has shown the first signs of stress. |
| • | | The Japanese yen was relatively volatile throughout the second quarter of 2017, as the Bank of Japan made no changes to their policy, but revised upward their assessment of economic prospects. |
| • | | Investor interest accelerated in European equities, leading to solid, broad-based returns across the region. The defeat of anti-European Union populists in France and the Netherlands diminished political risk for the region overall. French President Emmanuel Macron’s victory was positively felt across the continent and unsurprisingly had the largest impact within France. |
Describe recent portfolio activity.
| • | | During the period, as changes were made to the composition of the FTSE EPRA/NAREIT Developed Index, the Fund purchased and sold securities to maintain its objective of replicating the risks and return of the benchmark index. |
Describe portfolio positioning at period end.
| • | | The Fund remains positioned to match the risk characteristics of its benchmark index, irrespective of the market’s future direction. |
The views expressed reflect the opinions of BlackRock as of the date of this report and are subject to change based on changes in market, economic or other conditions. These views are not intended to be a forecast of future events and are no guarantee of future results.
| | | | | | |
| | | | | | | |
| 4 | | iSHARES DEVELOPED REAL ESTATE INDEX FUND | | JULY 31, 2017 | | |
|
| Total Return Based on a $10,000 Investment |
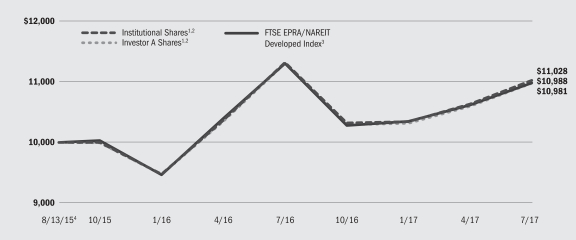
| | 1 | | Assuming transaction costs and other operating expenses, including investment advisory fees, if any. |
| | 2 | | The Fund generally invests at least 90% of its assets, plus the amount of any borrowing for investment purposes, in securities of the FTSE EPRA/NAREIT Developed Index and in depositary receipts representing securities of the FTSE EPRA/NAREIT Developed Index. |
| | 3 | | A global market capitalization weighted index composed of listed real estate securities from developed market countries in North America, Europe and Asia. |
| | 4 | | Commencement of operations. |
|
| Performance Summary for the Period Ended July 31, 2017 |
| | | | | | | | | | | | |
| | | | | | Average Annual Total Returns5 | |
| | | 6-Month Total Returns | | | 1-Year | | | Since
Inception6 | |
Institutional | | | 6.62 | % | | | (2.60 | )% | | | 5.10 | % |
Investor A | | | 6.41 | | | | (2.88 | ) | | | 4.87 | |
Class K | | | 6.64 | | | | (2.65 | ) | | | 5.14 | |
FTSE EPRA/NAREIT Developed Index | | | 6.17 | | | | (2.84 | ) | | | 4.91 | |
| | 5 | | See “About Fund Performance” on page 7 for a detailed description of share classes, including any related fees. |
| | 6 | | The Fund commenced operations on August 13, 2015. |
| | | | Past performance is not indicative of future results. |
| | | | Performance results may include adjustments made for financial reporting purposes in accordance with U.S. generally accepted accounting principles. |
| | | | | | | | | | | | | | | | | | | | | | | | | | | | |
| | | Actual | | | Hypothetical8 | | | | |
| | | Beginning
Account Value
February 1, 2017 | | | Ending
Account Value
July 31, 2017 | | | Expenses Paid
During the Period7 | | | Beginning
Account Value
February 1, 2017 | | | Ending
Account Value
July 31, 2017 | | | Expenses Paid
During the Period7 | | | Annualized
Expense Ratio | |
Institutional | | $ | 1,000.00 | | | $ | 1,066.20 | | | $ | 1.13 | | | $ | 1,000.00 | | | $ | 1,023.70 | | | $ | 1.10 | | | | 0.22 | % |
Investor A | | $ | 1,000.00 | | | $ | 1,064.10 | | | $ | 2.51 | | | $ | 1,000.00 | | | $ | 1,022.36 | | | $ | 2.46 | | | | 0.49 | % |
Class K | | $ | 1,000.00 | | | $ | 1,066.40 | | | $ | 0.92 | | | $ | 1,000.00 | | | $ | 1,023.90 | | | $ | 0.90 | | | | 0.18 | % |
| | 7 | | For each class of the Fund, expenses are equal to the annualized expense ratio for the class, multiplied by the average account value over the period, multiplied by 181/365 (to reflect the one-half year period shown). |
| | 8 | | Hypothetical 5% return before expenses is calculated by prorating the number of days in the most recent fiscal half year divided by 365. |
| | | | See “Disclosure of Expenses” on page 7 for further information on how expenses were calculated. |
| | | | | | |
| | | | | | | |
| | iSHARES DEVELOPED REAL ESTATE INDEX FUND | | JULY 31, 2017 | | 5 |
|
| Portfolio Composition as of July 31, 2017 |
| | | | |
| Ten Largest Holdings | | Percent of
Net Assets | |
Simon Property Group, Inc. | | | 3 | % |
Prologis, Inc. | | | 2 | |
Public Storage | | | 2 | |
Welltower, Inc. | | | 2 | |
AvalonBay Communities, Inc. | | | 2 | |
Unibail-Rodamco SE | | | 2 | |
Equity Residential | | | 2 | |
Ventas, Inc. | | | 2 | |
Cheung Kong Property Holdings Ltd. | | | 2 | |
Sun Hung Kai Properties Ltd. | | | 2 | |
| | | | |
| Geographic Allocation | | Percent of
Net Assets | |
United States | | | 54 | % |
Japan | | | 11 | |
Hong Kong | | | 7 | |
Australia | | | 6 | |
United Kingdom | | | 5 | |
Germany | | | 3 | |
France | | | 3 | |
Canada | | | 3 | |
Singapore | | | 3 | |
Switzerland | | | 1 | |
Spain | | | 1 | |
Belgium | | | 1 | |
Other1 | | | 2 | |
| | 1 | | Other includes a 1% or less investment in each of the following countries: Austria, Finland, Guernsey, Ireland, Israel, Italy, Jersey, Luxembourg, the Netherlands, New Zealand and Norway. |
| | | | | | |
| | | | | | | |
| 6 | | iSHARES DEVELOPED REAL ESTATE INDEX FUND | | JULY 31, 2017 | | |
| • | | Institutional and Class K Shares are not subject to any sales charge. These shares bear no ongoing distribution or service fees and are available only to certain eligible investors. |
| • | | Investor A Shares are not subject to any sales charge and bear no ongoing distribution fee. These shares are subject to an ongoing service fee of 0.25% per year. These shares are generally available through financial intermediaries. |
Performance information reflects past performance and does not guarantee future results. Current performance may be lower or higher than the performance data quoted. Refer to www.blackrock.com to obtain performance data current to the most recent month end. Performance results do not reflect the deduction of taxes that a shareholder would pay on Fund distributions or the redemption of Fund shares. Figures shown in the performance tables on the previous page
assume reinvestment of all distributions, if any, at net asset value (“NAV”) on the ex-dividend date. Investment return and principal value of shares will fluctuate so that shares, when redeemed, may be worth more or less than their original cost. Distributions paid to each class of shares will vary because of the different levels of service, distribution and transfer agency fees applicable to each class, which are deducted from the income available to be paid to shareholders.
BlackRock Advisors, LLC (the “Manager”), the Fund’s investment adviser, has contractually agreed to waive and/or reimburse a portion of the Fund’s expenses. Without such waiver and/or reimbursement, the Fund’s performance would have been lower. The Manager is under no obligation to continue waiving and/or reimbursing its fees after the applicable termination date of such agreement. See Note 6 of the Notes to Financial Statements for additional information on waivers and/or reimbursements.
Shareholders of the Fund may incur the following charges: (a) transactional expenses, and (b) operating expenses, including investment advisory fees, service and distribution fees, including 12b-1 fees, acquired fund fees and expenses, and other fund expenses. The expense example shown on the previous page (which is based on a hypothetical investment of $1,000 invested on February 1, 2017 and held through July 31, 2017) is intended to assist shareholders both in calculating expenses based on an investment in the Fund and in comparing these expenses with similar costs of investing in other mutual funds.
The expense example provides information about actual account values and actual expenses. In order to estimate the expenses a shareholder paid during the period covered by this report, shareholders can divide their account value by $1,000 and then multiply the result by the number corresponding to their Fund and share class under the heading entitled “Expenses Paid During the Period.”
The expense example also provides information about hypothetical account values and hypothetical expenses based on the Fund’s actual expense ratio and an assumed rate of return of 5% per year before expenses. In order to assist shareholders in comparing the ongoing expenses of investing in the Fund and other funds, compare the 5% hypothetical examples with the 5% hypothetical examples that appear in shareholder reports of other funds.
The expenses shown in the expense example are intended to highlight shareholders’ ongoing costs only and do not reflect any transactional expenses, such as sales charges, if any. Therefore, the hypothetical example is useful in comparing ongoing expenses only, and will not help shareholders determine the relative total expenses of owning different funds. If these transactional expenses were included, shareholder expenses would have been higher.
|
| Derivative Financial Instruments |
The Fund may invest in various derivative financial instruments. These instruments are used to obtain exposure to a security, commodity, index, market, and/or other asset without owning or taking physical custody of securities, commodities and/or other referenced assets or to manage market, equity, credit, interest rate, foreign currency exchange rate, commodity and/or other risks. Derivative financial instruments may give rise to a form of economic leverage and involve risks, including the imperfect correlation between the value of a derivative financial instrument and the underlying asset, possible default of the
counterparty to the transaction or illiquidity of the instrument. The Fund’s successful use of a derivative financial instrument depends on the investment adviser’s ability to predict pertinent market movements accurately, which cannot be assured. The use of these instruments may result in losses greater than if they had not been used, may limit the amount of appreciation the Fund can realize on an investment and/or may result in lower distributions paid to shareholders. The Fund’s investments in these instruments, if any, are discussed in detail in the Notes to Financial Statements.
| | | | | | |
| | | | | | | |
| | iSHARES DEVELOPED REAL ESTATE INDEX FUND | | JULY 31, 2017 | | 7 |
| | |
Schedule of Investments July 31, 2017 (Unaudited) | | (Percentages shown are based on Net Assets) |
| | | | | | | | |
| Common Stocks | | Shares | | | Value | |
| Hotels, Restaurants & Leisure — 0.1% | | | | | | |
Pandox AB | | | 58,657 | | | $ | 1,055,782 | |
| Real Estate Investment Trusts (REITs) — 79.0% | | | | | | |
Acadia Realty Trust | | | 73,015 | | | | 2,171,466 | |
Activia Properties, Inc. | | | 521 | | | | 2,341,653 | |
Advance Residence Investment Corp. | | | 1,102 | | | | 2,693,536 | |
Aedifica SA | | | 15,901 | | | | 1,456,194 | |
AEON REIT Investment Corp. | | | 1,214 | | | | 1,331,832 | |
Agree Realty Corp. | | | 22,483 | | | | 1,105,489 | |
Alexander’s, Inc. | | | 1,933 | | | | 840,836 | |
Alexandria Real Estate Equities, Inc. | | | 80,007 | | | | 9,700,849 | |
Allied Properties Real Estate Investment Trust | | | 75,281 | | | | 2,303,565 | |
Alstria Office REIT-AG | | | 117,608 | | | | 1,725,916 | |
American Assets Trust, Inc. | | | 36,106 | | | | 1,466,265 | |
American Campus Communities, Inc. | | | 118,809 | | | | 5,695,703 | |
American Homes 4 Rent, Class A | | | 201,887 | | | | 4,645,420 | |
ANF Immobilier | | | 5,172 | | | | 134,768 | |
Apartment Investment & Management Co., Class A | | | 138,755 | | | | 6,320,290 | |
Apple Hospitality REIT, Inc. | | | 187,901 | | | | 3,468,652 | |
Aritis REIT | | | 133,780 | | | | 1,402,450 | |
Ascendas Real Estate Investment Trust | | | 2,113,070 | | | | 4,206,716 | |
Ashford Hospitality Trust, Inc. | | | 78,080 | | | | 491,123 | |
Assura PLC | | | 1,519,756 | | | | 1,285,312 | |
AvalonBay Communities, Inc. | | | 121,967 | | | | 23,460,352 | |
Axiare Patrimonio SOCIMI SA | | | 54,829 | | | | 1,023,901 | |
Befimmo SA | | | 16,388 | | | | 1,017,148 | |
Beni Stabili SpA SIIQ | | | 865,200 | | | | 691,351 | |
Big Yellow Group PLC | | | 130,935 | | | | 1,338,857 | |
Boardwalk REIT | | | 33,397 | | | | 1,280,698 | |
Boston Properties, Inc. | | | 136,418 | | | | 16,494,300 | |
Brandywine Realty Trust | | | 153,266 | | | | 2,576,401 | |
British Land Co. PLC | | | 908,045 | | | | 7,316,946 | |
Brixmor Property Group, Inc. | | | 268,290 | | | | 5,255,801 | |
BWP Trust | | | 413,362 | | | | 959,372 | |
Camden Property Trust | | | 76,386 | | | | 6,851,824 | |
Canadian Apartment Properties REIT | | | 118,182 | | | | 3,072,211 | |
Canadian REIT | | | 67,119 | | | | 2,428,505 | |
Capital & Regional PLC | | | 449,893 | | | | 336,862 | |
CapitaLand Commercial Trust Ltd. | | | 1,648,000 | | | | 2,090,667 | |
CapitaLand Mall Trust | | | 1,994,299 | | | | 2,956,394 | |
Care Capital Properties, Inc. | | | 70,268 | | | | 1,701,891 | |
CBL & Associates Properties, Inc. | | | 146,527 | | | | 1,287,972 | |
CDL Hospitality Trusts | | | 897,500 | | | | 1,059,661 | |
Cedar Realty Trust, Inc. | | | 76,547 | | | | 396,513 | |
Champion REIT | | | 1,726,999 | | | | 1,343,677 | |
Charter Hall Retail REIT | | | 295,890 | | | | 970,869 | |
Chartwell Retirement Residences | | | 168,254 | | | | 2,066,147 | |
Chatham Lodging Trust | | | 35,193 | | | | 727,791 | |
Chesapeake Lodging Trust | | | 51,420 | | | | 1,297,327 | |
Cofinimmo SA | | | 17,822 | | | | 2,263,465 | |
Columbia Property Trust, Inc. | | | 108,544 | | | | 2,360,832 | |
Cominar Real Estate Investment Trust | | | 171,262 | | | | 1,804,999 | |
Corporate Office Properties Trust | | | 88,904 | | | | 2,959,614 | |
Cousins Properties, Inc. | | | 372,651 | | | | 3,424,663 | |
Crombie Real Estate Investment Trust | | | 75,386 | | | | 817,500 | |
Cromwell Property Group | | | 1,298,533 | | | | 955,886 | |
CubeSmart | | | 159,512 | | | | 3,933,566 | |
Custodian Reit PLC | | | 261,362 | | | | 394,846 | |
Daiwa House REIT Investment Corp. | | | 1,349 | | | | 3,343,488 | |
Daiwa Office Investment Corp. | | | 244 | | | | 1,201,743 | |
DCT Industrial Trust, Inc. | | | 82,015 | | | | 4,620,725 | |
DDR Corp. | | | 276,778 | | | | 2,820,368 | |
Derwent London PLC | | | 87,773 | | | | 3,297,858 | |
| | | | | | | | |
| Common Stocks | | Shares | | | Value | |
| Real Estate Investment Trusts (REITs) (continued) | | | | | | |
Dexus | | | 903,514 | | | $ | 6,784,552 | |
DiamondRock Hospitality Co. | | | 181,108 | | | | 2,115,341 | |
Digital Realty Trust, Inc. | | | 141,384 | | | | 16,307,231 | |
Douglas Emmett, Inc. | | | 129,179 | | | | 4,942,389 | |
Dream Global Real Estate Investment Trust | | | 115,227 | | | | 949,173 | |
Dream Office Real Estate Investment Trust | | | 88,626 | | | | 1,415,315 | |
Duke Realty Corp. | | | 316,421 | | | | 9,046,476 | |
DuPont Fabros Technology, Inc. | | | 69,161 | | | | 4,310,805 | |
EastGroup Properties, Inc. | | | 29,609 | | | | 2,581,313 | |
Education Realty Trust, Inc. | | | 65,802 | | | | 2,470,865 | |
Empire State Realty Trust, Inc., Class A | | | 114,195 | | | | 2,385,534 | |
Empiric Student Property PLC | | | 494,453 | | | | 715,989 | |
EPR Properties | | | 56,068 | | | | 4,058,202 | |
Equity Commonwealth (a) | | | 107,326 | | | | 3,389,355 | |
Equity Lifestyle Properties, Inc. | | | 72,151 | | | | 6,298,782 | |
Equity Residential | | | 315,801 | | | | 21,493,416 | |
Essex Property Trust, Inc. | | | 57,870 | | | | 15,144,579 | |
Eurocommercial Properties NV CVA | | | 43,101 | | | | 1,744,221 | |
Extra Space Storage, Inc. | | | 108,396 | | | | 8,617,482 | |
F&C UK Real Estate Investment Ltd. | | | 195,662 | | | | 273,001 | |
Federal Realty Investment Trust | | | 64,088 | | | | 8,499,991 | |
FelCor Lodging Trust, Inc. | | | 123,923 | | | | 914,552 | |
First Industrial Realty Trust, Inc. | | | 103,673 | | | | 3,164,100 | |
First Potomac Realty Trust | | | 55,389 | | | | 616,480 | |
Fonciere Des Regions | | | 34,346 | | | | 3,315,258 | |
Forest City Realty Trust, Inc., Class A | | | 215,904 | | | | 5,263,740 | |
Fortune Real Estate Investment Trust | | | 1,156,000 | | | | 1,444,046 | |
Four Corners Property Trust, Inc. | | | 54,766 | | | | 1,389,961 | |
Franklin Street Properties Corp. | | | 98,002 | | | | 1,035,881 | |
Frontier Real Estate Investment Corp. | | | 397 | | | | 1,697,905 | |
Fukuoka REIT Corp. | | | 551 | | | | 849,653 | |
Gaming and Leisure Properties, Inc. | | | 174,434 | | | | 6,618,026 | |
GCP Student Living PLC | | | 272,497 | | | | 510,538 | |
Gecina SA | | | 35,499 | | | | 5,367,161 | |
Getty Realty Corp. | | | 25,845 | | | | 671,453 | |
GGP, Inc. | | | 545,644 | | | | 12,337,011 | |
Global Net Lease, Inc. | | | 64,287 | | | | 1,414,336 | |
GLP J-REIT | | | 2,212 | | | | 2,408,479 | |
Goodman Group | | | 1,565,119 | | | | 9,974,093 | |
Government Properties Income Trust | | | 39,873 | | | | 706,948 | |
GPT Group | | | 1,600,638 | | | | 6,136,956 | |
Gramercy Property Trust | | | 134,770 | | | | 4,072,749 | |
Granite Real Estate Investment Trust | | | 41,176 | | | | 1,657,609 | |
Great Portland Estates PLC | | | 285,994 | | | | 2,272,734 | |
Green REIT PLC | | | 554,658 | | | | 967,835 | |
H&R Real Estate Investment Trust | | | 251,205 | | | | 4,251,394 | |
Hamborner REIT AG | | | 65,651 | | | | 703,955 | |
Hammerson PLC | | | 695,731 | | | | 5,272,639 | |
Hansteen Holdings PLC | | | 610,225 | | | | 1,022,517 | |
HCP, Inc. | | | 415,761 | | | | 13,158,836 | |
Healthcare Realty Trust, Inc. | | | 103,049 | | | | 3,431,532 | |
Healthcare Trust of America, Inc., Class A | | | 168,416 | | | | 5,151,845 | |
Hersha Hospitality Trust | | | 38,847 | | | | 728,770 | |
Hibernia REIT PLC | | | 590,884 | | | | 981,383 | |
Highwoods Properties, Inc. | | | 89,608 | | | | 4,616,604 | |
Hospitality Properties Trust | | | 67,776 | | | | 1,969,571 | |
Host Hotels & Resorts, Inc. | | | 646,451 | | | | 12,062,776 | |
Hudson Pacific Properties, Inc. | | | 139,295 | | | | 4,557,732 | |
Hulic Reit, Inc. | | | 807 | | | | 1,271,494 | |
ICADE | | | 30,822 | | | | 2,646,386 | |
Immobiliare Grande Distribuzione SIIQ SpA | | | 299,393 | | | | 292,398 | |
Industrial & Infrastructure Fund Investment Corp. | | | 319 | | | | 1,443,702 | |
| | | | | | |
| See Notes to Financial Statements. | | | | |
| | | | | | | |
| 8 | | iSHARES DEVELOPED REAL ESTATE INDEX FUND | | JULY 31, 2017 | | |
| | |
Schedule of Investments (continued) | | |
| | | | | | | | |
| Common Stocks | | Shares | | | Value | |
| Real Estate Investment Trusts (REITs) (continued) | | | | | | |
Intervest Offices & Warehouses NV | | | 14,659 | | | $ | 395,569 | |
Intu Properties PLC | | | 792,017 | | | | 2,670,075 | |
Investa Office Fund | | | 501,631 | | | | 1,822,567 | |
Investors Real Estate Trust | | | 109,109 | | | | 678,658 | |
Invincible Investment Corp. | | | 2,748 | | | | 1,230,826 | |
Invitation Homes, Inc. | | | 79,864 | | | | 1,702,722 | |
Irish Residential Properties REIT PLC | | | 331,767 | | | | 526,280 | |
Japan Excellent, Inc. | | | 1,051 | | | | 1,227,891 | |
Japan Hotel REIT Investment Corp. | | | 3,429 | | | | 2,478,804 | |
Japan Logistics Fund, Inc. | | | 733 | | | | 1,489,181 | |
Japan Prime Realty Investment Corp. | | | 749 | | | | 2,816,096 | |
Japan Real Estate Investment Corp. | | | 1,090 | | | | 5,724,613 | |
Japan Rental Housing Investments, Inc. | | | 1,314 | | | | 978,542 | |
Japan Retail Fund Investment Corp. | | | 2,376 | | | | 4,538,306 | |
JBG SMITH Properties (a) | | | 77,063 | | | | 2,734,231 | |
Kenedix Office Investment Corp. | | | 324 | | | | 1,831,253 | |
Kenedix Retail REIT Corp. | | | 467 | | | | 1,024,670 | |
Keppel REIT (b) | | | 1,690,900 | | | | 1,447,400 | |
Killam Apartment Real Estate Investment Trust | | | 64,411 | | | | 633,390 | |
Kilroy Realty Corp. | | | 85,562 | | | | 5,938,858 | |
Kimco Realty Corp. | | | 365,861 | | | | 7,383,075 | |
Kite Realty Group Trust | | | 68,103 | | | | 1,398,155 | |
Kiwi Property Group Ltd. | | | 1,185,165 | | | | 1,219,679 | |
Klepierre | | | 181,768 | | | | 7,397,509 | |
Land Securities Group PLC | | | 674,559 | | | | 9,096,779 | |
Lar Espana Real Estate Socimi SA | | | 73,296 | | | | 733,981 | |
LaSalle Hotel Properties | | | 101,069 | | | | 2,985,578 | |
Leasinvest Real Estate SCA | | | 1,273 | | | | 153,862 | |
Lexington Realty Trust | | | 208,181 | | | | 2,119,283 | |
Liberty Property Trust | | | 130,754 | | | | 5,494,283 | |
Life Storage, Inc. | | | 41,247 | | | | 3,012,681 | |
Link REIT | | | 1,962,999 | | | | 15,936,889 | |
LondonMetric Property PLC | | | 568,796 | | | | 1,263,041 | |
LTC Properties, Inc. | | | 36,108 | | | | 1,864,617 | |
Macerich Co. | | | 121,447 | | | | 6,969,843 | |
Mack-Cali Realty Corp. | | | 81,140 | | | | 2,129,114 | |
Mapletree Commercial Trust | | | 1,675,710 | | | | 1,984,662 | |
Mapletree Industrial Trust | | | 1,101,200 | | | | 1,507,125 | |
Mapletree Logistics Trust | | | 1,223,100 | | | | 1,082,594 | |
Medical Properties Trust, Inc. | | | 324,512 | | | | 4,212,166 | |
MedicX Fund Ltd. | | | 417,817 | | | | 501,654 | |
Mercialys SA | | | 37,000 | | | | 748,991 | |
Merlin Properties Socimi SA | | | 297,522 | | | | 4,003,959 | |
Mid-America Apartment Communities, Inc. | | | 100,618 | | | | 10,416,982 | |
Mirvac Group | | | 3,268,627 | | | | 5,677,463 | |
Monmouth Real Estate Investment Corp. | | | 63,794 | | | | 983,066 | |
Monogram Residential Trust, Inc. | | | 143,994 | | | | 1,722,168 | |
Mori Hills REIT Investment Corp. | | | 1,271 | | | | 1,601,360 | |
Mori Trust Sogo REIT, Inc. | | | 886 | | | | 1,469,099 | |
National Health Investors, Inc. | | | 35,710 | | | | 2,758,597 | |
National Retail Properties, Inc. | | | 132,223 | | | | 5,286,276 | |
National Storage Affiliates Trust | | | 40,225 | | | | 923,566 | |
New Senior Investment Group, Inc. | | | 76,032 | | | | 789,972 | |
NewRiver REIT PLC | | | 219,553 | | | | 1,022,564 | |
Nippon Accommodations Fund, Inc. | | | 390 | | | | 1,620,210 | |
Nippon Building Fund, Inc. | | | 1,124 | | | | 6,066,307 | |
Nippon Prologis REIT, Inc. | | | 1,446 | | | | 3,049,252 | |
Nomura Real Estate Master Fund, Inc. | | | 3,536 | | | | 5,013,169 | |
Northview Apartment Real Estate Investment Trust | | | 43,013 | | | | 720,707 | |
NSI NV | | | 14,436 | | | | 564,329 | |
Omega Healthcare Investors, Inc. | | | 172,725 | | | | 5,456,383 | |
Orix JREIT, Inc. | | | 2,239 | | | | 3,399,347 | |
Paramount Group, Inc. | | | 173,409 | | | | 2,838,705 | |
Park Hotels & Resorts, Inc. | | | 115,650 | | | | 3,114,454 | |
Parkway, Inc. | | | 37,705 | | | | 867,592 | |
Pebblebrook Hotel Trust | | | 62,395 | | | | 2,100,840 | |
Pennsylvania Real Estate Investment Trust | | | 61,529 | | | | 731,580 | |
| | | | | | | | |
| Common Stocks | | Shares | | | Value | |
| Real Estate Investment Trusts (REITs) (continued) | | | | | | |
Physicians Realty Trust | | | 154,654 | | | $ | 2,879,657 | |
Picton Property Income Ltd. | | | 485,806 | | | | 551,236 | |
Piedmont Office Realty Trust, Inc., Class A | | | 133,647 | | | | 2,807,923 | |
Premier Investment Corp. | | | 1,090 | | | | 1,112,205 | |
Primary Health Properties PLC | | | 528,817 | | | | 807,613 | |
Prologis, Inc. | | | 467,012 | | | | 28,399,000 | |
PS Business Parks, Inc. | | | 17,523 | | | | 2,356,143 | |
Public Storage | | | 131,089 | | | | 26,947,966 | |
Pure Industrial Real Estate Trust | | | 241,354 | | | | 1,233,146 | |
QTS Realty Trust, Inc., Class A | | | 42,417 | | | | 2,268,037 | |
Quality Care Properties, Inc. (a) | | | 85,113 | | | | 1,431,601 | |
Ramco-Gershenson Properties Trust | | | 70,218 | | | | 989,372 | |
Realty Income Corp. | | | 241,869 | | | | 13,801,045 | |
Redefine International PLC | | | 1,059,273 | | | | 534,372 | |
Regency Centers Corp. | | | 132,784 | | | | 8,792,956 | |
Regional REIT Ltd. (c) | | | 187,742 | | | | 254,519 | |
Retail Estates NV | | | 4,841 | | | | 437,521 | |
Retail Opportunity Investments Corp. | | | 96,766 | | | | 1,962,414 | |
Retail Properties of America, Inc., Class A | | | 211,152 | | | | 2,793,541 | |
Rexford Industrial Realty, Inc. | | | 58,222 | | | | 1,660,491 | |
RioCan Real Estate Investment Trust | | | 286,200 | | | | 5,530,024 | |
RLJ Lodging Trust | | | 108,330 | | | | 2,292,263 | |
Ryman Hospitality Properties, Inc. | | | 38,895 | | | | 2,434,438 | |
Sabra Health Care REIT, Inc. | | | 57,740 | | | | 1,339,568 | |
Safestore Holdings PLC | | | 187,536 | | | | 1,045,166 | |
Saul Centers, Inc. | | | 10,918 | | | | 645,909 | |
Scentre Group | | | 4,541,101 | | | | 15,016,178 | |
Schroder Real Estate Investment Trust Ltd. | | | 391,425 | | | | 320,197 | |
Segro PLC | | | 874,506 | | | | 6,086,293 | |
Sekisui House REIT, Inc. | | | 744 | | | | 920,510 | |
Sekisui House SI Residential Investment Corp. | | | 933 | | | | 969,856 | |
Select Income REIT | | | 59,337 | | | | 1,392,639 | |
Senior Housing Properties Trust | | | 172,646 | | | | 3,357,965 | |
Seritage Growth Properties, Class A (b) | | | 22,450 | | | | 1,049,986 | |
Shaftesbury PLC | | | 198,848 | | | | 2,579,849 | |
Shopping Centres Australasia Property Group | | | 660,930 | | | | 1,148,091 | |
Simon Property Group, Inc. | | | 275,506 | | | | 43,667,701 | |
SL Green Realty Corp. | | | 88,224 | | | | 9,110,892 | |
Smart Real Estate Investment Trust | | | 101,486 | | | | 2,552,718 | |
Spirit Realty Capital, Inc. | | | 430,857 | | | | 3,416,696 | |
STAG Industrial, Inc. | | | 81,872 | | | | 2,234,287 | |
Standard Life Investment Property Income Trust Ltd. | | | 316,917 | | | | 384,604 | |
Starwood Waypoint Homes | | | 99,634 | | | | 3,483,239 | |
Stockland | | | 2,146,667 | | | | 7,217,628 | |
STORE Capital Corp. | | | 151,127 | | | | 3,534,861 | |
Summit Hotel Properties, Inc. | | | 93,432 | | | | 1,675,236 | |
Sun Communities, Inc. | | | 66,849 | | | | 5,950,229 | |
Sunstone Hotel Investors, Inc. | | | 196,990 | | | | 3,206,997 | |
Suntec Real Estate Investment Trust | | | 2,165,099 | | | | 3,035,321 | |
Tanger Factory Outlet Centers, Inc. | | | 84,303 | | | | 2,228,128 | |
Target Healthcare REIT Ltd. | | | 281,882 | | | | 447,228 | |
Taubman Centers, Inc. | | | 52,612 | | | | 2,992,044 | |
Terreno Realty Corp. | | | 44,897 | | | | 1,554,334 | |
Tier REIT, Inc. | | | 42,232 | | | | 780,447 | |
Tokyu REIT, Inc. | | | 801 | | | | 975,048 | |
Tritax Big Box REIT PLC | | | 1,226,101 | | | | 2,423,342 | |
UDR, Inc. | | | 236,049 | | | | 9,227,155 | |
Unibail-Rodamco SE | | | 87,977 | | | | 22,003,434 | |
United Urban Investment Corp. | | | 2,548 | | | | 3,799,639 | |
Universal Health Realty Income Trust | | | 11,334 | | | | 878,158 | |
Urban Edge Properties | | | 86,203 | | | | 2,166,281 | |
Urstadt Biddle Properties, Inc., Class A | | | 22,710 | | | | 475,547 | |
Vastned Retail NV | | | 16,054 | | | | 733,583 | |
Ventas, Inc. | | | 314,143 | | | | 21,157,531 | |
VEREIT, Inc. | | | 866,551 | | | | 7,201,039 | |
Vicinity Centres | | | 2,910,334 | | | | 6,405,182 | |
Vornado Realty Trust | | | 152,433 | | | | 12,095,559 | |
| | | | | | |
| See Notes to Financial Statements. | | | | |
| | | | | | | |
| | iSHARES DEVELOPED REAL ESTATE INDEX FUND | | JULY 31, 2017 | | 9 |
| | |
Schedule of Investments (continued) | | |
| | | | | | | | |
| Common Stocks | | Shares | | | Value | |
| Real Estate Investment Trusts (REITs) (continued) | | | | | | |
Warehouses De Pauw CVA | | | 14,485 | | | $ | 1,608,250 | |
Washington Prime Group, Inc. | | | 164,230 | | | | 1,481,355 | |
Washington Real Estate Investment Trust | | | 69,217 | | | | 2,313,924 | |
Weingarten Realty Investors | | | 106,785 | | | | 3,466,241 | |
Welltower, Inc. | | | 324,748 | | | | 23,833,256 | |
Wereldhave Belgium NV | | | 1,980 | | | | 234,228 | |
Wereldhave NV | | | 37,282 | | | | 1,804,976 | |
Westfield Corp. | | | 1,695,247 | | | | 10,422,929 | |
Workspace Group PLC | | | 105,484 | | | | 1,273,457 | |
WP Carey, Inc. | | | 93,784 | | | | 6,425,142 | |
Xenia Hotels & Resorts, Inc. | | | 91,590 | | | | 1,861,109 | |
| | | | | | | | |
| | | | | | | | 1,024,078,161 | |
| Real Estate Management & Development — 19.7% | | | | |
ADLER Real Estate AG (a) | | | 27,146 | | | | 425,474 | |
ADO Properties SA (c) | | | 25,114 | | | | 1,133,663 | |
Aeon Mall Co. Ltd. | | | 104,600 | | | | 1,992,218 | |
Allreal Holding AG (a) | | | 12,416 | | | | 2,257,585 | |
Azrieli Group Ltd. | | | 26,074 | | | | 1,424,778 | |
BUWOG AG (a) | | | 95,663 | | | | 2,812,462 | |
CA Immobilien Anlagen AG | | | 61,635 | | | | 1,590,605 | |
Capital & Counties Properties PLC | | | 641,008 | | | | 2,436,693 | |
CapitaLand Ltd. | | | 2,229,999 | | | | 6,066,350 | |
CareTrust REIT, Inc. | | | 67,099 | | | | 1,223,886 | |
Castellum AB | | | 240,510 | | | | 3,738,390 | |
Cheung Kong Property Holdings Ltd. | | | 2,418,999 | | | | 19,562,022 | |
City Developments Ltd. | | | 419,400 | | | | 3,481,296 | |
Citycon OYJ | | | 328,149 | | | | 893,017 | |
D Carnegie & Co. AB (a) | | | 30,042 | | | | 435,348 | |
Daejan Holdings PLC | | | 4,380 | | | | 376,789 | |
Deutsche Euroshop AG | | | 46,003 | | | | 1,915,786 | |
Deutsche Wohnen AG, Bearer Shares | | | 315,293 | | | | 12,494,575 | |
DIC Asset AG | | | 36,036 | | | | 388,619 | |
Dios Fastigheter AB | | | 79,878 | | | | 466,972 | |
Entra ASA (c) | | | 95,909 | | | | 1,274,664 | |
F&C Commercial Property Trust Ltd. | | | 452,638 | | | | 888,052 | |
Fabege AB | | | 115,665 | | | | 2,284,539 | |
Fastighets AB Balder, B Shares (a) | | | 85,005 | | | | 2,162,795 | |
First Capital Realty, Inc. | | | 133,756 | | | | 2,188,588 | |
Grainger PLC | | | 365,511 | | | | 1,268,239 | |
Grand City Properties SA | | | 89,103 | | | | 1,847,431 | |
Hang Lung Properties Ltd. | | | 1,802,999 | | | | 4,484,218 | |
Helical PLC | | | 87,691 | | | | 399,163 | |
Hemfosa Fastigheter AB | | | 133,300 | | | | 1,635,246 | |
Henderson Land Development Co. Ltd. | | | 951,440 | | | | 5,499,072 | |
Hispania Activos Inmobiliarios SOCIMI SA | | | 76,763 | | | | 1,384,890 | |
Hongkong Land Holdings Ltd. | | | 1,034,199 | | | | 7,771,483 | |
Hufvudstaden AB, A Shares | | | 96,000 | | | | 1,671,017 | |
Hulic Co. Ltd. | | | 317,800 | | | | 3,355,527 | |
Hysan Development Co. Ltd. | | | 539,000 | | | | 2,606,465 | |
Inmobiliaria Colonial SA | | | 235,987 | | | | 2,201,157 | |
Kennedy Wilson Europe Real Estate PLC | | | 85,248 | | | | 1,285,604 | |
Klovern AB, B Shares | | | 522,089 | | | | 666,949 | |
Kungsleden AB | | | 168,896 | | | | 1,110,901 | |
| | | | | | | | |
| Common Stocks | | Shares | | | Value | |
| Real Estate Management & Development (continued) | | | | |
LEG Immobilien AG | | | 56,141 | | | $ | 5,398,260 | |
Mitsubishi Estate Co. Ltd. | | | 1,047,999 | | | | 19,055,736 | |
Mitsui Fudosan Co. Ltd. | | | 838,700 | | | | 19,248,359 | |
Mobimo Holding AG (a) | | | 5,511 | | | | 1,573,024 | |
New World Development Co. Ltd. | | | 4,815,028 | | | | 6,502,439 | |
Nomura Real Estate Holdings, Inc. | | | 104,600 | | | | 2,073,294 | |
Norwegian Property ASA | | | 134,059 | | | | 169,644 | |
NTT Urban Development Corp. | | | 94,600 | | | | 967,894 | |
Phoenix Spree Deutschland Ltd. | | | 75,160 | | | | 288,326 | |
PSP Swiss Property AG, Registered Shares | | | 34,477 | | | | 3,137,039 | |
Sino Land Co. Ltd. | | | 2,623,404 | | | | 4,326,704 | |
Sumitomo Realty & Development Co. Ltd. | | | 385,000 | | | | 11,654,850 | |
Sun Hung Kai Properties Ltd. | | | 1,260,499 | | | | 19,502,777 | |
Swire Properties Ltd. | | | 943,000 | | | | 3,257,576 | |
Swiss Prime Site AG, Registered Shares (a) | | | 62,714 | | | | 5,658,821 | |
TAG Immobilien AG | | | 128,560 | | | | 2,109,526 | |
Technopolis OYJ | | | 121,100 | | | | 524,704 | |
TLG Immobilien AG | | | 58,056 | | | | 1,259,156 | |
Tokyo Tatemono Co. Ltd. | | | 185,100 | | | | 2,518,589 | |
UK Commercial Property Trust Ltd. | | | 582,589 | | | | 697,182 | |
UNITE Group PLC | | | 224,635 | | | | 1,989,183 | |
UOL Group Ltd. | | | 412,000 | | | | 2,397,194 | |
Vonovia SE | | | 416,498 | | | | 16,878,517 | |
Wallenstam AB, B Shares | | | 171,942 | | | | 1,750,534 | |
WCM Beteiligungs & Grundbesitz AG | | | 81,913 | | | | 309,330 | |
Wharf Holdings Ltd. | | | 1,075,999 | | | | 9,145,614 | |
Wihlborgs Fastigheter AB | | | 58,301 | | | | 1,418,141 | |
| | | | | | | | |
| | | | | | | | 254,914,941 | |
| Total Common Stocks — 98.8% | | | | | | | 1,280,048,884 | |
| | | | | | | | |
| | | | | | | | | |
| | |
| Rights — 0.0% | | | | | | |
| Wireless Telecommunication Services — 0.0% | | | | | | |
Gecina SA (a) | | | 34,982 | | | | 103,967 | |
Total Long-Term Investments
(Cost — $1,221,853,865) — 98.8% | | | | | | | 1,280,152,851 | |
| | | | | | | | |
| | | | | | | | | |
| | |
| Short-Term Securities | | | | | | |
BlackRock Cash Funds: Institutional, SL Agency Shares, 1.31% (d)(e)(f) | | | 1,724,939 | | | | 1,725,456 | |
BlackRock Cash Funds: Treasury, SL Agency Shares, 0.99%, 12/31/50 (d)(e) | | | 12,209,954 | | | | 12,209,954 | |
Total Short-Term Securities
(Cost — $13,935,410) — 1.1% | | | | | | | 13,935,410 | |
Total Investments (Cost — $1,235,789,275) — 99.9% | | | | 1,294,088,261 | |
Other Assets Less Liabilities — 0.1% | | | | | | | 1,690,788 | |
| | | | | | | | |
Net Assets — 100.0% | | | | | | $ | 1,295,779,049 | |
| | | | | | | | |
|
| Notes to Schedule of Investments |
| (a) | | Non-income producing security. |
| (b) | | Security, or a portion of the security, is on loan. |
| (c) | | Security exempt from registration pursuant to Rule 144A under the Securities Act of 1933, as amended. These securities may be resold in transactions exempt from registration to qualified institutional investors. |
| | | | | | |
| See Notes to Financial Statements. | | | | |
| | | | | | | |
| 10 | | iSHARES DEVELOPED REAL ESTATE INDEX FUND | | JULY 31, 2017 | | |
| | |
Schedule of Investments (continued) | | |
| (d) | | During the six months ended July 31, 2017, investments in issuers considered to be affiliates of the Fund for purposes of Section 2(a)(3) of the Investment Company Act of 1940, as amended, were as follows: |
| | | | | | | | | | | | | | | | | | | | | | | | | | | | | | | | |
| Affiliate | | Shares Held
at January 31,
2017 | | | Shares
Purchased | | | Shares
Sold | | | Shares Held
at July 31,
2017 | | | Value at
July 31,
2017 | | | Income | | | Net Realized
Gain (Loss) | | | Change in
Unrealized
Appreciation
(Depreciation) | |
BlackRock Cash Funds: Institutional, SL Agency Shares | | | — | | | | 1,724,939 | 1 | | | — | | | | 1,724,939 | | | $ | 1,725,456 | | | $ | 2,751 | 3 | | $ | (7,682 | ) | | | — | |
BlackRock Cash Funds: Treasury, SL Agency Shares | | | — | | | | 12,209,954 | 1 | | | — | | | | 12,209,954 | | | | 12,209,954 | | | | 7,093 | | | | — | | | | — | |
BlackRock Liquidity Funds, T-Fund, Institutional Class | | | 14,418,646 | | | | — | | | | (14,418,646 | )2 | | | — | | | | — | | | | 42,871 | | | | — | | | | — | |
SL Liquidity Series, LLC, Money Market Series | | | — | | | | — | | | | — | | | | — | | | | — | | | | 6,330 | 3 | | | 19 | | | | — | |
iShares International Developed Real Estate ETF | | | — | | | | 425,000 | | | | (425,000 | ) | | | — | | | | — | | | | — | | | | (7,701 | ) | | | — | |
Total | | | | | | | | | | | | | | | | | | $ | 13,935,410 | | | $ | 59,045 | | | $ | (15,364 | ) | | | — | |
| | | | | | | | | | | | | | | | | | | | |
1 Represents net shares purchased. | | | | | | | | | | | | | | | | | |
2 Represents net shares sold. | | | | | | | | | | | | | | | | | |
3 Represents securities lending income earned from the reinvestment of cash collateral from loaned securities, net of fees and collateral investment expenses, and other payments to and from borrowers of securities. | |
| (e) | | Current yield as of period end. |
| (f) | | Security was purchased with cash collateral from loaned securities. |
|
| Derivative Financial Instruments Outstanding as of Period End |
| | | | | | | | | | | | | | |
| Futures Contracts | | | | | | | | | | | |
| Description | | Number of Contracts | | | Expiration Date | | Notional
Amount
(000) | | | Value/
Unrealized
Appreciation
(Depreciation) | |
Long Contracts | | | | | | | | | | | | | | |
Dow Jones U.S. Real Estate Index | | | 349 | | | September 2017 | | $ | 11,151 | | | $ | 134,827 | |
Nikkei 225 Index | | | 19 | | | September 2017 | | $ | 1,719 | | | | (8,605 | ) |
SPI 200 Index | | | 14 | | | September 2017 | | $ | 1,585 | | | | (4,770 | ) |
Total | | | | | | | | | | | | $ | 121,452 | |
|
| Derivative Financial Instruments Categorized by Risk Exposure |
As of period end, the fair values of derivative financial instruments located in the Statement of Assets and Liabilities were as follows:
| | | | | | | | | | | | | | | | | | | | | | | | | | | | | | |
| Assets — Derivative Financial Instruments | | Commodity Contracts | | | Credit Contracts | | | Equity Contracts | | | Foreign Currency Exchange Contracts | | | Interest Rate Contracts | | | Other Contracts | | | Total | |
Futures contracts | | Net unrealized appreciation1 | | | — | | | | — | | | $ | 134,827 | | | | — | | | | — | | | | — | | | $ | 134,827 | |
| Liabilities — Derivative Financial Instruments | | | | | | | | | | | | | | | | | | | | | |
Futures contracts | | Net unrealized depreciation1 | | | — | | | | — | | | $ | 13,375 | | | | — | | | | — | | | | — | | | $ | 13,375 | |
1 Includes cumulative appreciation (depreciation) on futures contracts, if any, as reported in the Schedule of Investments. Only current day’s variation margin is reported within the Statement of Assets and Liabilities. | |
| | | | | | | | | | | | | | | | | | | | | | | | | | | | | | |
For the six months ended July 31, 2017, the effect of derivative financial instruments in the Statement of Operations was as follows: | |
| | | | | | | | | | | | | | | | | | | | | | | | | | | | | | |
| Net Realized Gain (Loss) from: | | | | | | | | | | | | | | | | | | | | | | | |
Futures contracts | | | — | | | | — | | | $ | 572,680 | | | | — | | | | — | | | | — | | | $ | 572,680 | |
| | | | | | |
| Net Change in Unrealized Appreciation (Depreciation) on: | | | | | | | | | | | | | | | | | | | |
Futures contracts | | | — | | | | — | | | $ | 311,895 | | | | — | | | | — | | | | — | | | $ | 311,895 | |
|
| Average Quarterly Balances of Outstanding Derivative Financial Instruments |
| | | | |
| Futures contracts: | | | | |
Average notional value of contracts — long | | $ | 15,586,098 | |
For more information about the Fund’s investment risks regarding derivative financial instruments, refer to the Notes to Financial Statements.
| | | | | | |
| See Notes to Financial Statements. | | | | |
| | | | | | | |
| | iSHARES DEVELOPED REAL ESTATE INDEX FUND | | JULY 31, 2017 | | 11 |
| | |
Schedule of Investments (concluded) | | |
|
| Fair Value Hierarchy as of Period End |
Various inputs are used in determining the fair value of investments and derivative financial instruments. For information about the Fund’s policy regarding valuation of investments and derivative financial instruments, refer to the Notes to Financial Statements.
The following tables summarize the Fund’s investments and derivative financial instruments categorized in the disclosure hierarchy:
| | | | | | | | | | | | | | | | |
| | | Level 1 | | | Level 2 | | | Level 3 | | | Total | |
Assets: | | | | | | | | | | | | | | | | |
| Investments: | | | | | | | | | | | | | | | | |
Common Stocks: | | | | | | | | | �� | | | | | | | |
Hotels, Restaurants & Leisure | | $ | 1,055,782 | | | | — | | | | — | | | $ | 1,055,782 | |
Real Estate Investment Trusts (REITs) | | | 791,573,746 | | | $ | 232,504,415 | | | | — | | | | 1,024,078,161 | |
Real Estate Management & Development | | | 23,023,350 | | | | 231,891,591 | | | | — | | | | 254,914,941 | |
Rights | | | 103,967 | | | | — | | | | — | | | | 103,967 | |
Short-Term Securities | | | 13,935,410 | | | | — | | | | — | | | | 13,935,410 | |
| | | | |
Total | | $ | 829,692,255 | | | $ | 464,396,006 | | | | — | | | $ | 1,294,088,261 | |
| | | | |
| | | | | | | | | | | | | | | | |
| Derivative Financial Instruments1 | | | | | | | | | | | | | | | | |
Assets: | | | | | | | | | | | | | | | | |
Equity contracts | | $ | 134,827 | | | | — | | | | — | | | $ | 134,827 | |
Liabilities: | | | | | | | | | | | | | | | | |
Equity contracts | | | (13,375 | ) | | | — | | | | — | | | | (13,375 | ) |
| | | | |
Total | | $ | 121,452 | | | | — | | | | — | | | $ | 121,452 | |
| | | | |
1 Derivative financial instruments are futures contracts which are valued at the unrealized appreciation (depreciation) on the instrument. | |
| | During | | the six months ended July 31, 2017, there were no transfers between levels. |
| | | | | | |
| See Notes to Financial Statements. | | | | |
| | | | | | | |
| 12 | | iSHARES DEVELOPED REAL ESTATE INDEX FUND | | JULY 31, 2017 | | |
| | |
| Statement of Assets and Liabilities | | |
| | | | |
| July 31, 2017 (Unaudited) | |
| | | | |
| Assets | |
Investments at value — unaffiliated (including securities loaned at value of $1,666,095) (cost — $1,221,853,865) | | $ | 1,280,152,851 | |
Investments at value — affiliated (cost — $13,935,410) | | | 13,935,410 | |
Cash pledged for futures contracts | | | 569,000 | |
Foreign currency at value (cost — $5,341,042) | | | 5,406,469 | |
| Receivables: | |
Dividends — unaffiliated | | | 2,426,981 | |
Capital shares sold | | | 1,184,575 | |
Variation margin on futures contracts | | | 17,804 | |
Dividends — affiliated | | | 9,551 | |
Securities lending income — affiliated | | | 2,474 | |
Prepaid expenses | | | 39,954 | |
| | | | |
Total assets | | | 1,303,745,069 | |
| | | | |
| | | | |
| Liabilities | |
Cash collateral on securities loaned at value | | | 1,725,456 | |
| Payables: | |
Investments purchased | | | 5,304,754 | |
Capital shares redeemed | | | 500,000 | |
Investment advisory fees | | | 247,003 | |
Administration fees | | | 168,024 | |
Variation margin on futures contracts | | | 1,256 | |
Other accrued expenses | | | 19,527 | |
| | | | |
Total liabilities | | | 7,966,020 | |
| | | | |
Net Assets | | $ | 1,295,779,049 | |
| | | | |
| | | | |
| Net Assets Consist of | |
Paid-in capital | | $ | 1,231,007,747 | |
Undistributed net investment income | | | 5,548,636 | |
Accumulated net realized gain | | | 690,996 | |
Net unrealized appreciation (depreciation) | | | 58,531,670 | |
| | | | |
Net Assets | | $ | 1,295,779,049 | |
| | | | |
| | | | |
| Net Assets Value | |
Institutional — Based on net assets of $8,303,055 and 792,188 shares outstanding, unlimited shares authorized, $0.001 par value | | $ | 10.48 | |
| | | | |
Investor A — Based on net assets of $2,919,171 and 279,305 shares outstanding, unlimited shares authorized, $0.001 par value | | $ | 10.45 | |
| | | | |
Class K — Based on net assets of $1,284,556,823 and 122,813,184 shares outstanding, unlimited shares authorized, $0.001 par value | | $ | 10.46 | |
| | | | |
| | | | | | |
| See Notes to Financial Statements. | | | | |
| | | | | | | |
| | iSHARES DEVELOPED REAL ESTATE INDEX FUND | | JULY 31, 2017 | | 13 |
| | | | |
| Six Months Ended July 31, 2017 (Unaudited) | | | |
| | | | |
| Investment Income | |
Dividends — unaffiliated | | $ | 23,975,991 | |
Dividends — affiliated | | | 49,964 | |
Securities lending income — affiliated — net | | | 9,081 | |
Foreign taxes withheld | | | (1,206,252 | ) |
| | | | |
Total investment income | | | 22,828,784 | |
| | | | |
| | | | |
| Expenses | |
Investment advisory | | | 666,419 | |
Recoupment of past waived fees — class specific | | | 168,405 | |
Service and distribution — class specific | | | 3,052 | |
Registration | | | 67,359 | |
Professional | | | 43,486 | |
Custodian | | | 32,181 | |
Printing | | | 17,821 | |
Officer and Trustees | | | 13,809 | |
Transfer agent — class specific | | | 1,300 | |
Miscellaneous | | | 7,891 | |
| | | | |
Total expenses | | | 1,021,723 | |
| Less: | |
Fees waived by the Manager | | | (5,651 | ) |
Transfer agent fees waived and/or reimbursed — class specific | | | (131 | ) |
| | | | |
Total expenses after fees waived and/or reimbursed | | | 1,015,941 | |
| | | | |
Net investment income | | | 21,812,843 | |
| | | | |
| | | | |
| Realized and Unrealized Gain (Loss) | |
| Net realized gain (loss) from: | |
Investments — unaffiliated | | | (273,072 | ) |
Investments — affiliated | | | (15,364 | ) |
Futures contracts | | | 572,680 | |
Foreign currency transactions | | | 376,702 | |
| | | | |
| | | 660,946 | |
| | | | |
| Net change in unrealized appreciation (depreciation) on: | | | | |
Investments — unaffiliated | | | 49,892,950 | |
Futures contracts | | | 311,895 | |
Foreign currency translations | | | 31,242 | |
| | | | |
| | | 50,236,087 | |
| | | | |
Net realized and unrealized gain | | | 50,897,033 | |
| | | | |
Net Increase in Net Assets Resulting from Operations | | $ | 72,709,876 | |
| | | | |
| | | | | | |
| See Notes to Financial Statements. | | | | |
| | | | | | | |
| 14 | | iSHARES DEVELOPED REAL ESTATE INDEX FUND | | JULY 31, 2017 | | |
| | |
| Statement of Changes in Net Assets | | |
| | | | | | | | |
| Increase (Decrease) in Net Assets: | | Six Months Ended July 31,
2017 (Unaudited) | | | Year Ended January 31,
2017 | |
| | | | | | | | |
| Operations | |
Net investment income | | $ | 21,812,843 | | | $ | 3,379,509 | |
Net realized gain | | | 660,946 | | | | 1,305,623 | |
Net change in unrealized appreciation (depreciation) | | | 50,236,087 | | | | 8,597,144 | |
| | | | |
Net increase in net assets resulting from operations | | | 72,709,876 | | | | 13,282,276 | |
| | | | |
| | | | | | | | |
| Distributions to Shareholders1 | |
From net investment income: | |
Institutional | | | (63,375 | ) | | | (3,486 | ) |
Investor A | | | (33,508 | ) | | | (10,679 | ) |
Class K | | | (16,503,146 | ) | | | (3,281,700 | ) |
From net realized gain: | |
Institutional | | | (3,142 | ) | | | (9 | ) |
Investor A | | | (1,317 | ) | | | (185 | ) |
Class K | | | (577,174 | ) | | | (197,111 | ) |
| | | | |
Decrease in net assets resulting from distributions to shareholders | | | (17,181,662 | ) | | | (3,493,170 | ) |
| | | | |
| | | | | | | | |
| Capital Share Transactions | |
Net increase in net assets derived from capital share transactions | | | 327,311,259 | | | | 898,156,605 | |
| | | | |
| | | | | | | | |
| Net Assets | |
Total increase in net assets | | | 382,839,473 | | | | 907,945,711 | |
Beginning of period | | | 912,939,576 | | | | 4,993,865 | |
| | | | |
End of period | | $ | 1,295,779,049 | | | $ | 912,939,576 | |
| | | | |
Undistributed net investment income, end of period | | $ | 5,548,636 | | | $ | 335,822 | |
| | | | |
| | 1 | | Distributions for annual periods determined in accordance with U.S. federal income tax regulations. |
| | | | | | |
| See Notes to Financial Statements. | | | | |
| | | | | | | |
| | iSHARES DEVELOPED REAL ESTATE INDEX FUND | | JULY 31, 2017 | | 15 |
| | | | | | | | | | | | | | | | |
| | | Institutional | |
| | | Six Months Ended July 31,
2017 (Unaudited) | | | Year Ended
January 31,
2017 | | | Period
August 13, 20151
to January 31, 2016 | | | | |
| | | | | | | | | | | | | | | | |
| Per Share Operating Performance | | | | | |
Net asset value, beginning of period | | $ | 9.97 | | | $ | 9.35 | | | $ | 10.00 | | | | | |
| | | | |
Net investment income2 | | | 0.20 | | | | 0.29 | | | | 0.12 | | | | | |
Net realized and unrealized gain (loss) | | | 0.45 | | | | 0.56 | | | | (0.64 | ) | | | | |
| | | | |
Net increase (decrease) from investment operations | | | 0.65 | | | | 0.85 | | | | (0.52 | ) | | | | |
| | | | |
| Distributions:3 | | | | | | | | | | | | | | | | |
From net investment income | | | (0.14 | ) | | | (0.23 | ) | | | (0.13 | ) | | | | |
From net realized gain | | | (0.00 | )4 | | | (0.00 | )4 | | | — | | | | | |
| | | | |
Total distributions | | | (0.14 | ) | | | (0.23 | ) | | | (0.13 | ) | | | | |
| | | | |
Net asset value, end of period | | $ | 10.48 | | | $ | 9.97 | | | $ | 9.35 | | | | | |
| | | | |
| | | | | | | | | | | | | | | | |
| Total Return5 | | | | | |
Based on net asset value | | | 6.62% | 6 | | | 9.09% | | | | (5.19)% | 6 | | | | |
| | | | |
| | | | | | | | | | | | | | | | |
| Ratios to Average Net Assets | | | | | |
Total expenses | | | 0.22% | 7 | | | 3.91% | 8 | | | 2.89% | 7,9 | | | | |
| | | | |
Total expenses after fees waived and/or reimbursed | | | 0.22% | 7 | | | 0.29% | 8 | | | 0.29% | 7 | | | | |
| | | | |
Net investment income | | | 3.84% | 7 | | | 2.94% | 8 | | | 2.66% | 7 | | | | |
| | | | |
| | | | | | | | | | | | | | | | |
| Supplemental Data | | | | | |
Net assets, end of period (000) | | $ | 8,303 | | | $ | 307 | | | $ | 326 | | | | | |
| | | | |
Portfolio turnover rate | | | 3% | | | | 11% | | | | 8% | | | | | |
| | | | |
| | 1 | | Commencement of operations. |
| | 2 | | Based on average shares outstanding. |
| | 3 | | Distributions for annual periods determined in accordance with U.S. federal income tax regulations. |
| | 4 | | Amount is greater than $(0.005) per share. |
| | 5 | | Where applicable, assumes the reinvestment of distributions. |
| | 6 | | Aggregate total return. |
| | 8 | | Ratios do not include expenses incurred indirectly as a result of investments in underlying funds of approximately 0.02% for the year ended January 31, 2017. |
| | 9 | | Audit, offering and organization costs were not annualized in the calculation of the expense ratios. If these expenses were annualized, the total expenses would have been 4.85%. |
| | | | | | |
| See Notes to Financial Statements. | | | | |
| | | | | | | |
| 16 | | iSHARES DEVELOPED REAL ESTATE INDEX FUND | | JULY 31, 2017 | | |
| | |
| Financial Highlights (continued) | | |
| | | | | | | | | | | | | | | | |
| | | Investor A | |
| | | Six Months Ended
July 31,
2017
(Unaudited) | | | Year Ended
January 31,
2017 | | | Period
August 13, 20151
to January 31,
2016 | | | | |
| | | | | | | | | | | | | | | | |
| Per Share Operating Performance | | | | | |
Net asset value, beginning of period | | $ | 9.95 | | | $ | 9.35 | | | $ | 10.00 | | | | | |
| | | | |
Net investment income2 | | | 0.18 | | | | 0.23 | | | | 0.09 | | | | | |
Net realized and unrealized gain (loss) | | | 0.45 | | | | 0.61 | | | | (0.61 | ) | | | | |
| | | | |
Net increase (decrease) from investment operations | | | 0.63 | | | | 0.84 | | | | (0.52 | ) | | | | |
| | | | |
| Distributions:3 | | | | | | | | | | | | | | | | |
From net investment income | | | (0.13 | ) | | | (0.24 | ) | | | (0.13 | ) | | | | |
From net realized gain | | | (0.00 | )4 | | | (0.00 | )4 | | | — | | | | | |
| | | | |
Total distributions | | | (0.13) | | | | (0.24 | ) | | | (0.13 | ) | | | | |
| | | | |
Net asset value, end of period | | $ | 10.45 | | | $ | 9.95 | | | $ | 9.35 | | | | | |
| | | | |
| | | | | | | | | | | | | | | | |
| Total Return5 | | | | | |
Based on net asset value | | | 6.41% | 6 | | | 8.93% | | | | (5.26)% | 6 | | | | |
| | | | |
| | | | | | | | | | | | | | | | |
| Ratios to Average Net Assets | | | | | |
Total expenses | | | 0.50% | 7 | | | 2.27% | 8 | | | 3.65% | 7,9 | | | | |
| | | | |
Total expenses after fees waived and/or reimbursed | | | 0.49% | 7 | | | 0.49% | 8 | | | 0.49% | 7 | | | | |
| | | | |
Net investment income | | | 3.63% | 7 | | | 2.24% | 8 | | | 2.00% | 7 | | | | |
| | | | |
| | | | | | | | | | | | | | | | |
| Supplemental Data | | | | | |
Net assets, end of period (000) | | $ | 2,919 | | | $ | 1,539 | | | $ | 28 | | | | | |
| | | | |
Portfolio turnover rate | | | 3% | | | | 11% | | | | 8% | | | | | |
| | | | |
| | 1 | | Commencement of operations. |
| | 2 | | Based on average shares outstanding. |
| | 3 | | Distributions for annual periods determined in accordance with U.S. federal income tax regulations. |
| | 4 | | Amount is greater than $(0.005) per share. |
| | 5 | | Where applicable, assumes the reinvestment of distributions. |
| | 6 | | Aggregate total return. |
| | 8 | | Ratios do not include expenses incurred indirectly as a result of investments in underlying funds of approximately 0.02% for the year ended January 31, 2017. |
| | 9 | | Audit, offering and organization costs were not annualized in the calculation of the expense ratios. If these expenses were annualized, the total expenses would have been 5.79%. |
| | | | | | |
| See Notes to Financial Statements. | | | | |
| | | | | | | |
| | iSHARES DEVELOPED REAL ESTATE INDEX FUND | | JULY 31, 2017 | | 17 |
| | |
| Financial Highlights (concluded) | | |
| | | | | | | | | | | | | | | | |
| | | Class K | |
| | | Six Months Ended
July 31,
2017
(Unaudited) | | | Year Ended
January 31,
2017 | | | Period
August 13, 20151
to January 31,
2016 | | | | |
| | | | | | | | | | | | | | | | |
| Per Share Operating Performance | | | | | | | | | | | | | | | | |
Net asset value, beginning of period | | $ | 9.95 | | | $ | 9.35 | | | $ | 10.00 | | | | | |
| | | | |
Net investment income2 | | | 0.20 | | | | 0.26 | | | | 0.10 | | | | | |
Net realized and unrealized gain (loss) | | | 0.45 | | | | 0.60 | | | | (0.61 | ) | | | | |
| | | | |
Net increase (decrease) from investment operations | | | 0.65 | | | | 0.86 | | | | (0.51 | ) | | | | |
| | | | |
| Distributions:3 | | | | | | | | | | | | | | | | |
From net investment income | | | (0.14 | ) | | | (0.26 | ) | | | (0.14 | ) | | | | |
From net realized gain | | | (0.00 | )4 | | | (0.00 | )4 | | | — | | | | | |
| | | | |
Total distributions | | | (0.14 | ) | | | (0.26 | ) | | | (0.14 | ) | | | | |
| | | | |
Net asset value, end of period | | $ | 10.46 | | | $ | 9.95 | | | $ | 9.35 | | | | | |
| | | | |
| | | | | | | | | | | | | | | | |
| Total Return5 | | | | | | | | | | | | | | | | |
Based on net asset value | | | 6.64% | 6 | | | 9.12% | | | | (5.17)% | 6 | | | | |
| | | | |
| | | | | | | | | | | | | | | | |
| Ratios to Average Net Assets | | | | | | | | | | | | | |
Total expenses | | | 0.18% | 7 | | | 0.32% | 8 | | | 3.21% | 7,9 | | | | |
| | | | |
Total expenses after fees waived and/or reimbursed | | | 0.18% | 7 | | | 0.19% | 8 | | | 0.24% | 7 | | | | |
| | | | |
Net investment income | | | 3.93% | 7 | | | 2.65% | 8 | | | 2.27% | 7 | | | | |
| | | | |
| | | | | | | | | | | | | | | | |
| Supplemental Data | | | | | | | | | | | | | | | | |
Net assets, end of period (000) | | $ | 1,284,557 | | | $ | 911,094 | | | $ | 4,640 | | | | | |
| | | | |
Portfolio turnover rate | | | 3% | | | | 11% | | | | 8% | | | | | |
| | | | |
| | 1 | | Commencement of operations. |
| | 2 | | Based on average shares outstanding. |
| | 3 | | Distributions for annual periods determined in accordance with U.S. federal income tax regulations. |
| | 4 | | Amount is greater than $(0.005) per share. |
| | 5 | | Where applicable, assumes the reinvestment of distributions. |
| | 6 | | Aggregate total return. |
| | 8 | | Ratios do not include expenses incurred indirectly as a result of investments in underlying funds of approximately 0.02% for the year ended January 31, 2017. |
| | 9 | | Audit, offering and organization costs were not annualized in the calculation of the expense ratios. If these expenses were annualized, the total expenses would have been 5.40%. |
| | | | | | |
| See Notes to Financial Statements. | | | | |
| | | | | | | |
| 18 | | iSHARES DEVELOPED REAL ESTATE INDEX FUND | | JULY 31, 2017 | | |
| | | | |
| Notes to Financial Statements (Unaudited) | | |
1. Organization:
BlackRock FundsSM (the “Trust”) is registered under the Investment Company Act of 1940, as amended (the “1940 Act”), as an open-end management investment company. The Trust is organized as a Massachusetts business trust. iShares Developed Real Estate Index Fund (the “Fund”) is a series of the Trust. The Fund is classified as diversified.
The Fund offers multiple classes of shares. All classes of shares have identical voting, dividend, liquidation and other rights and are subject to the same terms and conditions. Institutional and Class K Shares are sold without a sales charge and only to certain eligible investors. Investor A Shares are generally sold with an initial sales charge and are generally available through financial intermediaries. Each class has exclusive voting rights with respect to matters relating to its shareholder servicing and distribution expenditures.
| | | | | | |
| Share Name | | Initial Sales Charge | | CDSC | | Conversion Privilege |
Institutional, Investor A and Class K Shares | | No | | No | | None |
On February 24, 2017, the Board of Trustees of BlackRock Funds approved a name, effective June 19, 2017, change from “BlackRock Developed Real Estate Index Fund” to “iShares Developed Real Estate Index Fund.”
The Fund, together with certain other registered investment companies advised by BlackRock Advisors, LLC (the “Manager”) or its affiliates, is included in a complex of open-end funds referred to as the Equity-Liquidity Complex.
2. Significant Accounting Policies:
The financial statements are prepared in conformity with accounting principles generally accepted in the United States of America (“U.S. GAAP”), which may require management to make estimates and assumptions that affect the reported amounts of assets and liabilities in the financial statements, disclosure of contingent assets and liabilities at the date of the financial statements and the reported amounts of increases and decreases in net assets from operations during the reporting period. Actual results could differ from those estimates. The Fund is considered an investment company under U.S. GAAP and follows the accounting and reporting guidance applicable to investment companies. Below is a summary of significant accounting policies:
Investment Transactions and Income Recognition: For financial reporting purposes, investment transactions are recorded on the dates the transactions are entered into (the “trade dates”). Realized gains and losses on investment transactions are determined on the identified cost basis. Dividend income is recorded on the ex-dividend date. Dividends from foreign securities where the ex-dividend date may have passed are subsequently recorded when the Fund are informed of the ex-dividend date. Under the applicable foreign tax laws, a withholding tax at various rates may be imposed on capital gains, dividends and interest. Upon notification from issuers, some of the dividend income received from a real estate investment trust may be redesignated as a reduction of cost of the related investment and/or realized gain. Income, expenses and realized and unrealized gains and losses are allocated daily to each class based on its relative net assets.
Foreign Currency Translation: The Fund’s books and records are maintained in U.S. dollars. Securities and other assets and liabilities denominated in foreign currencies are translated into U.S. dollars using exchange rates determined as of the close of trading on the New York Stock Exchange (“NYSE”). Purchases and sales of investments are recorded at the rates of exchange prevailing on the respective dates of such transactions. Generally, when the U.S. dollar rises in value against a foreign currency, the investments denominated in that currency will lose value; the opposite effect occurs if the U.S. dollar falls in relative value.
The Fund does not isolate the portion of the results of operations arising as a result of changes in the exchange rates from the changes in the market prices of investments held or sold for financial reporting purposes. Accordingly, the effects of changes in exchange rates on investments are not segregated in the Statement of Operations from the effects of changes in market prices of those investments, but are included as a component of net realized and unrealized gain (loss) from investments. The Fund reports realized currency gains (losses) on foreign currency related transactions as components of net realized gain (loss) for financial reporting purposes, whereas such components are generally treated as ordinary income for U.S. federal income tax purposes.
Segregation and Collateralization: In cases where the Fund enters into certain investments (e.g., futures contracts) that would be treated as “senior securities” for 1940 Act purposes, the Fund may segregate or designate on its books and records cash or liquid assets having a market value at least equal to the amount of its future obligations under such investments. Doing so allows the investment to be excluded from treatment as a “senior security.” Furthermore, if required by an exchange or counterparty agreement, the Fund may be required to deliver/deposit cash and/or securities to/with an exchange, or broker-dealer or custodian as collateral for certain investments or obligations.
Distributions: Distributions paid by the Fund are recorded on the ex-dividend date. The character and timing of distributions are determined in accordance with U.S. federal income tax regulations, which may differ from U.S. GAAP.
SEC Reporting Modernization: The U.S. Securities and Exchange Commission (“SEC”) adopted new rules and forms and amended other rules to enhance the reporting and disclosure of information by registered investment companies. As part of these changes, the SEC amended Regulation S-X to standardize and enhance disclosures in investment company financial statements. The compliance date for implementing the new or amended rules is August 1, 2017.
| | | | | | |
| | | | | | | |
| | iSHARES DEVELOPED REAL ESTATE INDEX FUND | | JULY 31, 2017 | | 19 |
| | |
| Notes to Financial Statements (continued) | | |
Indemnifications: In the normal course of business, the Fund enters into contracts that contain a variety of representations that provide general indemnification. The Fund’s maximum exposure under these arrangements is unknown because it involves future potential claims against the Fund, which cannot be predicted with any certainty.
Other: Expenses directly related to the Fund or its classes are charged to the Fund or the applicable class. Other operating expenses shared by several funds, including other funds managed by the Manager, are prorated among those funds on the basis of relative net assets or other appropriate methods. Expenses directly related to the Fund and other shared expenses prorated to the Fund are allocated daily to each class based on its relative net assets or other appropriate methods.
Through May 31, 2016, the Fund had an arrangement with its custodian whereby credits were earned on uninvested cash balances, which could be used to reduce custody fees and/or overdraft charges. Credits previously earned have been utilized until December 31, 2016. Under current arrangements effective June 1, 2016, the Fund no longer earns credits on uninvested cash, and may incur charges on uninvested cash balances and overdrafts, subject to certain conditions.
3. Investment Valuation and Fair Value Measurements:
Investment Valuation Policies The Fund’s investments are valued at fair value (also referred to as “market value” within the financial statements) as of the close of trading on the NYSE (generally 4:00 p.m., Eastern time). U.S. GAAP defines fair value as the price the Trust would receive to sell an asset or pay to transfer a liability in an orderly transaction between market participants at the measurement date. The Trust determines the fair values of its financial instruments using various independent dealers or pricing services under policies approved by the Board of Trustees of the Trust (the “Board”). The BlackRock Global Valuation Methodologies Committee (the “Global Valuation Committee”) is the committee formed by management to develop global pricing policies and procedures and to oversee the pricing function for all financial instruments.
Fair Value Inputs and Methodologies: The following methods and inputs are used to establish the fair value of the Fund’s assets and liabilities:
| • | | Equity investments traded on a recognized securities exchange are valued at the official closing price each day, if available. For equity investments traded on more than one exchange, the official closing price on the exchange where the stock is primarily traded is used. Equity investments traded on a recognized exchange for which there were no sales on that day may be valued at the last available bid (long positions) or ask (short positions) price. |
Generally, trading in foreign instruments is substantially completed each day at various times prior to the close of trading on the NYSE. Occasionally, events affecting the values of such instruments may occur between the foreign market close and the close of trading on the NYSE that may not be reflected in the computation of the Fund’s net assets. Each business day, the Fund uses a pricing service to assist with the valuation of certain foreign exchange-traded equity securities and foreign exchange-traded and over-the-counter (“OTC”) options (the “Systematic Fair Value Price”). Using current market factors, the Systematic Fair Value Price is designed to value such foreign securities and foreign options at fair value as of the close of trading on the NYSE, which follows the close of the local markets.
| • | | Investments in open-end U.S. mutual funds are valued at net asset value (“NAV”) each business day. |
| • | | Futures contracts traded on exchanges are valued at their last sale price. |
If events (e.g., a company announcement, market volatility or a natural disaster) occur that are expected to materially affect the value of such investments, or in the event that the application of these methods of valuation results in a price for an investment that is deemed not to be representative of the market value of such investment, or if a price is not available, the investment will be valued by the Global Valuation Committee, or its delegate, in accordance with a policy approved by the Board as reflecting fair value (“Fair Valued Investments”). The fair valuation approaches that may be used by the Global Valuation Committee include Market approach, Income approach and Cost approach. Valuation techniques such as discounted cash flow, use of market comparables and matrix pricing are types of valuation approaches and are typically used in determining fair value. When determining the price for Fair Valued Investments, the Global Valuation Committee, or its delegate, seeks to determine the price that the Fund might reasonably expect to receive or pay from the current sale or purchase of that asset or liability in an arm’s-length transaction. Fair value determinations shall be based upon all available factors that the Global Valuation Committee, or its delegate, deems relevant and consistent with the principles of fair value measurement. The pricing of all Fair Valued Investments is subsequently reported to the Board or a committee thereof on a quarterly basis.
Fair Value Hierarchy: Various inputs are used in determining the fair value of investments and derivative financial instruments. These inputs to valuation techniques are categorized into a fair value hierarchy consisting of three broad levels for financial statement purposes as follows:
| • | | Level 1 — Unadjusted price quotations in active markets/exchanges for identical assets or liabilities that the Trust has the ability to access |
| • | | Level 2 — Other observable inputs (including, but not limited to, quoted prices for similar assets or liabilities in markets that are active, quoted prices for identical or similar assets or liabilities in markets that are not active, inputs other than quoted prices that are observable for the assets or liabilities (such as interest rates, yield curves, volatilities, prepayment speeds, loss severities, credit risks and default rates) or other market–corroborated inputs) |
| | | | | | |
| | | | | | | |
| 20 | | iSHARES DEVELOPED REAL ESTATE INDEX FUND | | JULY 31, 2017 | | |
| | | | |
| Notes to Financial Statements (continued) | | |
| • | | Level 3 — Unobservable inputs based on the best information available in the circumstances, to the extent observable inputs are not available (including the Trust’s own assumptions used in determining the fair value of investments and derivative financial instruments) |
The hierarchy gives the highest priority to unadjusted quoted prices in active markets for identical assets or liabilities (Level 1 measurements) and the lowest priority to unobservable inputs (Level 3 measurements). Accordingly, the degree of judgment exercised in determining fair value is greatest for instruments categorized in Level 3. The inputs used to measure fair value may fall into different levels of the fair value hierarchy. In such cases, for disclosure purposes, the fair value hierarchy classification is determined based on the lowest level input that is significant to the fair value measurement in its entirety. Investments classified within Level 3 have significant unobservable inputs used by the Global Valuation Committee in determining the price for Fair Valued Investments. Level 3 investments include equity or debt issued by privately-held companies or funds. There may not be a secondary market, and/or there are a limited number of investors. Level 3 investments may also be adjusted to reflect illiquidity and/or non-transferability, with the amount of such discount estimated by the Global Valuation Committee in the absence of market information.
Changes in valuation techniques may result in transfers into or out of an assigned level within the hierarchy. In accordance with the Trust’s policy, transfers between different levels of the fair value hierarchy are deemed to have occurred as of the beginning of the reporting period. The categorization of a value determined for investments and derivative financial instruments is based on the pricing transparency of the investments and derivative financial instruments and is not necessarily an indication of the risks associated with investing in those securities.
4. Securities and Other Investments:
Securities Lending: The Fund may lend its securities to approved borrowers, such as brokers, dealers and other financial institutions. The borrower pledges and maintains with the Fund collateral consisting of cash, an irrevocable letter of credit issued by a bank, or securities issued or guaranteed by the U.S. Government. The initial collateral received by the Fund is required to have a value of at least 102% of the current value of the loaned securities for securities traded on U.S. exchanges and a value of at least 105% for all other securities. The collateral is maintained thereafter at a value equal to at least 100% of the current market value of the securities on loan. The market value of the loaned securities is determined at the close of each business day of the Fund and any additional required collateral is delivered to the Fund, or excess collateral returned by the Fund, on the next business day. During the term of the loan, the Fund is entitled to all distributions made on or in respect of the loaned securities but does not receive interest income on securities received as collateral. Loans of securities are terminable at any time and the borrower, after notice, is required to return borrowed securities within the standard time period for settlement of securities transactions.
The market value of any securities on loan, all of which were classified as common stocks in the Fund’s Schedule of Investments, and the value of any related collateral are shown separately in the Statement of Assets and Liabilities as a component of investments at value-unaffiliated, and collateral on securities loaned at value, respectively. As of period end, any securities on loan were collateralized by cash and/or U.S. Government obligations. Cash collateral invested by the securities lending agent, BlackRock Institutional Trust Company, N.A. (“BTC”), if any, is disclosed in the Schedule of Investments.
Securities lending transactions are entered into by the Fund under Master Securities Lending Agreements (each, an “MSLA”), which provide the right, in the event of default (including bankruptcy or insolvency), for the non-defaulting party to liquidate the collateral and calculate a net exposure to the defaulting party or request additional collateral. In the event that a borrower defaults, the Fund, as lender, would offset the market value of the collateral received against the market value of the securities loaned. When the value of the collateral is greater than that of the market value of the securities loaned, the lender is left with a net amount payable to the defaulting party. However, bankruptcy or insolvency laws of a particular jurisdiction may impose restrictions on or prohibitions against such a right of offset in the event of an MSLA counterparty’s bankruptcy or insolvency. Under the MSLA, absent an event of default, the borrower can resell or re-pledge the loaned securities, and the Fund can reinvest cash collateral received in connection with loaned securities. Upon an event of default, the parties’ obligations to return the securities or collateral to the other party are extinguished, and the parties can resell or re-pledge the loaned securities or the collateral received in connection with the loaned securities in order to satisfy the defaulting party’s net payment obligation for all transactions under the MSLA. The defaulting party remains liable for any deficiency.
As of period end, the following table is a summary of the Fund’s securities lending agreements by counterparty which are subject to offset under an MSLA:
| | | | | | | | | | | | |
| | | Securities
Loaned at
Value | | | Cash
Collateral
Received1 | | | Net
Amount | |
Morgan Stanley | | $ | 1,666,095 | | | $ | (1,666,095 | ) | | | — | |
| | 1 | | Cash collateral with a value of $1,725,456, respectively, has been received in connection with securities lending agreements. Collateral received in excess of the value of securities loaned from the individual counterparty is not shown for financial reporting purposes in the table above. |
The risks of securities lending include the risk that the borrower may not provide additional collateral when required or may not return the securities when due. To mitigate these risks, the Fund benefits from a borrower default indemnity provided by BTC. BTC’s indemnity allows for full replacement of the securities loaned if the collateral received does not cover the value on the securities loaned in the event of borrower default. The Fund could incur a loss if the value of an investment purchased with cash collateral falls below the market value of loaned securities or if the value of an investment purchased with cash collateral falls below the value of the original cash collateral received.
| | | | | | |
| | | | | | | |
| | iSHARES DEVELOPED REAL ESTATE INDEX FUND | | JULY 31, 2017 | | 21 |
| | |
| Notes to Financial Statements (continued) | | |
5. Derivative Financial Instruments:
The Fund engages in various portfolio investment strategies using derivative contracts both to increase the returns of the Fund and/or to manage its exposure to certain risks such as credit risk, equity risk, interest rate risk, foreign currency exchange rate risk, commodity price risk or other risks (e.g., inflation risk). Derivative financial instruments categorized by risk exposure are included in the Schedule of Investments. These contracts may be transacted on an exchange or OTC.
Futures Contracts: Futures contracts are purchased or sold to gain exposure to, or manage exposure to, changes in interest rates (interest rate risk), changes in the value of equity securities (equity risk) or foreign currencies (foreign currency exchange rate risk).
Futures contracts are agreements between the Fund and a counterparty to buy or sell a specific quantity of an underlying instrument at a specified price and on a specified date. Depending on the terms of a contract, it is settled either through physical delivery of the underlying instrument on the settlement date or by payment of a cash amount on the settlement date. Upon entering into a futures contract, the Fund is required to deposit initial margin with the broker in the form of cash or securities in an amount that varies depending on a contract’s size and risk profile. The initial margin deposit must then be maintained at an established level over the life of the contract.
Securities deposited as initial margin are designated in the Schedule of Investments and cash deposited, if any, is shown as cash pledged for futures contracts in the Statement of Assets and Liabilities. Pursuant to the contract, the Fund agrees to receive from or pay to the broker an amount of cash equal to the daily fluctuation in market value of the contract (“variation margin”). Variation margin is recorded as unrealized appreciation (depreciation) and, if any, shown as variation margin receivable (or payable) on futures contracts in the Statement of Assets and Liabilities. When the contract is closed, a realized gain or loss is recorded in the Statement of Operations equal to the difference between the value of the contract at the time it was opened and the value at the time it was closed. The use of futures contracts involves the risk of an imperfect correlation in the movements in the price of futures contracts and interest, foreign currency exchange rates or underlying assets.
6. Investment Advisory Agreement and Other Transactions with Affiliates:
The PNC Financial Services Group, Inc. is the largest stockholder and an affiliate of BlackRock, Inc. (“BlackRock”) for 1940 Act purposes.
Investment Advisory: The Trust, on behalf of the Fund, entered into an Investment Advisory Agreement with the Manager, the Fund’s investment adviser, an indirect, wholly-owned subsidiary of BlackRock, to provide investment advisory services. The Manager is responsible for the management of the Fund’s portfolio and provides the personnel, facilities, equipment and certain other services necessary to the operations of the Fund.
For such services, the Fund pays the Manager a monthly fee at an annual rate equal to 0.12% of the average daily value of the Fund’s net assets.
With respect to the Fund, the Manager entered into a sub-advisory agreement with BlackRock Fund Advisors (“BFA”), an affiliate of the Manager. The Manager pays BFA, for services it provides, a monthly fee that is a percentage of the investment advisory fees paid by the Fund to the Manager.
Service and Distribution Fees: The Trust, on behalf of the Fund, entered into a Distribution Agreement and a Distribution and Service Plan with BlackRock Investments, LLC (“BRIL”), an affiliate of the Manager. Pursuant to the Distribution and Service Plan and in accordance with Rule 12b-1 under the 1940 Act, the Fund pays BRIL ongoing service and distribution fees. The fees are accrued daily and paid monthly at annual rates based upon the average daily net assets of the relevant share class of the Fund as follows:
| | | | | | | | | | | | |
| | | Institutional | | | Investor A | | | Class K | |
Service Fee | | | — | | | | 0.25% | | | | — | |
BRIL and broker-dealers, pursuant to sub-agreements with BRIL, provide shareholder servicing [and distribution services] to the Fund. The ongoing service and/or distribution fee compensates BRIL and each broker-dealer for providing shareholder servicing and/or distribution related services to shareholders.
For the six months ended July 31, 2017, the amount of $3,052 is the class specific service and distribution fees borne directly by Investor A of the Fund.
Transfer Agent: Pursuant to written agreements, certain financial intermediaries, some of which may be affiliates, provide the Fund with sub-accounting, recordkeeping, sub-transfer agency and other administrative services with respect to sub-accounts they service. For these services, these entities receive an asset-based fee or an annual fee per shareholder account, which will vary depending on share class and/or net assets. For the six months ended July 31, 2017, the Fund paid the following amounts to affiliates of BlackRock in return for these services, which are included in transfer agent — class specific in the Statement of Operations:
| | | | | | |
| Institutional | | Investor A | | Class K | | Total |
| $251 | | $854 | | $195 | | $1,300 |
| | | | | | |
| | | | | | | |
| 22 | | iSHARES DEVELOPED REAL ESTATE INDEX FUND | | JULY 31, 2017 | | |
| | | | |
| Notes to Financial Statements (continued) | | |
The Manager maintains a call center that is responsible for providing certain shareholder services to the Fund. Shareholder services include responding to inquiries and processing subscriptions and redemptions based upon instructions from shareholders. For the six months ended July 31, 2017, the Fund reimbursed the Manager the following amounts for costs incurred in running the call center, which are included in transfer agent — class specific in the Statement of Operations:
| | | | | | |
| Institutional | | Investor A | | Class K | | Total |
| $10 | | $31 | | $13 | | $54 |
Expense Limitations, Waivers, Reimbursements and Recoupments: With respect to the Fund, the Manager voluntarily agreed to waive its investment advisory fees by the amount of investment advisory fees the Fund pays to the Manager indirectly through its investment in affiliated money market funds (the “affiliated money market fund waiver”). The amount of waivers and/or reimbursements of fees and expenses made pursuant to the expense limitation caps, as applicable, will be reduced by the amount of the affiliated money market fund waiver. This amount is included in fees waived by the Manager in the Statement of Operations. For the six months ended July 31, 2017, the amounts waived were as $5,575.
The Manager voluntarily agreed to waive its investment advisory fee with respect to any portion of the Fund’s assets invested in affiliated equity and fixed-income mutual funds and affiliated exchange-traded funds that have a contractual management fee. Effective May 31, 2017, the waiver became contractual through May 31, 2018. The contractual agreement may be terminated upon 90 days’ notice by a majority of the Independent Trustees of the Fund or by a vote of a majority of the outstanding voting securities of the Fund. This amount is included in fees waived by the Manager in the Statement of Operations. For six months ended July 31, 2017, the Fund waived $76 in investment advisory fees pursuant to these arrangements.
With respect to the Fund, the Manager contractually agreed to waive and/or reimburse fees or expenses in order to limit expenses, excluding interest expense, dividend expense, tax expense, acquired fund fees and expenses, and certain other fund expenses, which constitute extraordinary expenses not incurred in the ordinary course of the Fund’s business (“expense limitation”). The expense limitation as a percentage of average daily net assets is as follows:
| | | | |
Institutional | | | 0.29% | |
Investor A | | | 0.49% | |
Class K | | | 0.24% | |
The Manager has agreed not to reduce or discontinue this contractual expense limitation prior to June 1, 2018, unless approved by the Board, including a majority of the independent trustees who are not “interested persons” of the Fund, as defined in the 1940 Act (“Independent Trustees”) or by a vote of a majority of the outstanding voting securities of the Fund.
These amounts waived and/or reimbursed are shown as transfer agent fees waived and/or reimbursed, respectively, in the Statement of Operations. Investor A waived and/or reimbursed an amount of $131.
With respect to the contractual expense caps, if during the Fund’s fiscal year the operating expenses of a share class, that at any time during the prior two fiscal years received a waiver and/or reimbursement from the Manager, are less than the expense cap for that share class, the Manager is entitled to be reimbursed by such share class up to the lesser of the following expenses:
| | (a) | The amount of fees waived and/or expenses reimbursed during those prior two fiscal years under the agreement. |
| | (b) | The amount by which the expense cap for that share class exceeds the operating expenses of the share class for the current fiscal year, provided that: |
| | • | | The Fund, of which the share class is a part, has more than $50 million in assets for the fiscal year; and |
| | • | | The Manager or an affiliate continues to serve as the Fund’s investment adviser or administrator. |
In the event the expense cap for a share class is changed subsequent to a fiscal year in which the Manager becomes entitled to reimbursement for fees waived and/or reimbursed, the amount available to reimburse the Manager shall be calculated by reference to the expense cap for that share class in effect at the time the Manager became entitled to receive such reimbursement, rather than the subsequently changed expense cap for that share class.
For the six months ended July 31, 2017, the Manager recouped the following fund level and class specific waivers and/or reimbursements previously recorded by the Fund.
| | | | | | | | |
| Fund Level | | Institutional | | Class K | | Total | |
| 168,024 | | $374 | | $7 | | $ | 168,405 | |
| | | | | | |
| | | | | | | |
| | iSHARES DEVELOPED REAL ESTATE INDEX FUND | | JULY 31, 2017 | | 23 |
| | |
| Notes to Financial Statements (continued) | | |
On July 31, 2017, the fund level and class specific waivers and/or reimbursements subject to possible future recoupment under the expense limitation agreement are as follows:
| | | | | | | | | | | | |
| | | Expiring January 31, | |
| | | 2018 | | | 2019 | | | 2020 | |
Fund Level | | | — | | | $ | 152,759 | | | | — | |
Institutional | | | — | | | | 1 | | | | — | |
Investor A | | $ | 34 | | | | 216 | | | $ | 131 | |
Class K | | | — | | | | — | | | | — | |
Securities Lending: The SEC has issued an exemptive order which permits BTC, an affiliate of the Manager, to serve as securities lending agent for the Fund, subject to applicable conditions. As securities lending agent, BTC bears all operational costs directly related to securities lending. The Fund is responsible for expenses in connection with the investment of cash collateral received for securities on loan (the “collateral investment fees”). The cash collateral is invested in a money market fund managed by the Manager or its affiliates. However, BTC has agreed to reduce the amount of securities lending income it receives in order to effectively limit the collateral investment fees the Fund bears to and annual rate of 0.04%. The money market fund in which the cash collateral has been invested may, under certain circumstances, impose a liquidity fee of up to 2% on the value redeemed or temporarily restrict redemptions for up to 10 business days during a 90 day period, in the event that the money market fund’s weekly liquid assets fall below certain thresholds.
Pursuant to a securities lending agreement, the Fund retains 71.5% of securities lending income, and this amount retained can never be less than 65% of the total of securities lending income plus the collateral investment fees. In addition, commencing the business day following the date that the aggregate securities lending income earned across certain funds in the Equity-Liquidity Complex in a calendar year exceeds a specified threshold, the Fund, pursuant to the securities lending agreement, will retain for the remainder of the calendar year securities lending income in an amount equal to 75% of securities lending income, and this amount retained can never be less than 65% of the total of securities lending income plus the collateral investment fees.
Prior to June 12, 2017, BlackRock Investment Management, LLC (“BIM”) was the Fund’s securities lending agent.
The share of securities lending income earned by the Fund is shown as securities lending income — affiliated — net in the Statement of Operations. For the six months ended July 31, 2017, the Fund paid BIM and BTC the following amounts for securities lending agent services:
| | | | | | | | |
| | | BIM | | | BTC | |
Amounts | | $ | 6,330 | | | $ | 2,750 | |
Officers and Trustees: Certain officers and/or trustees of the Trust are officers and/or trustees of BlackRock or its affiliates. The Fund reimburses the Manager for a portion of the compensation paid to the Trust’s Chief Compliance Officer, which is included in Officer and Trustees in the Statement of Operations.
Other Transactions: The Fund may purchase securities from, or sell securities to, an affiliated fund provided the affiliation is due solely to having a common investment adviser, common officers, or common directors. For the six months ended July 31, 2017, the purchase and sale transactions and any net realized gains (losses) with an affiliated fund in compliance with Rule 17a-7 under the 1940 Act were as follows:
| | | | |
| Purchases | | Sales | | Net Realized Loss |
| $760,667 | | $236,258 | | $(8,809) |
7. Purchases and Sales:
For the six months ended July 31, 2017, purchases and sales of investments and excluding short-term securities, were $377,151,335 and $33,831,898, respectively.
| | | | | | |
| | | | | | | |
| 24 | | iSHARES DEVELOPED REAL ESTATE INDEX FUND | | JULY 31, 2017 | | |
| | | | |
| Notes to Financial Statements (continued) | | |
8. Income Tax Information:
It is the Fund’s policy to comply with the requirements of the Internal Revenue Code of 1986, as amended, applicable to regulated investment companies, and to distribute substantially all of its taxable income to its shareholders. Therefore, no U.S. federal income tax provision is required.
The Fund files U.S. federal and various state and local tax returns. No income tax returns are currently under examination. The statute of limitations on the Fund’s U.S. federal tax returns generally remains open for the period ended January 31, 2016 and for the year ended January 31, 2017. The statutes of limitations on the Fund’s state and local tax returns may remain open for an additional year depending upon the jurisdiction.
Management has analyzed tax laws and regulations and their application to the Fund as of July 31, 2017, inclusive of the open tax return years, and does not believe that there are any uncertain tax positions that require recognition of a tax liability in the Fund’s financial statements.
As of July 31, 2017, gross unrealized appreciation and depreciation based on cost for U.S. federal income tax purposes were as follows:
| | | | |
Tax cost | | $ | 1,239,715,076 | |
| | | | |
Gross unrealized appreciation | | $ | 88,798,231 | |
Gross unrealized depreciation | | | (34,425,046 | ) |
| | | | |
Net unrealized appreciation | | $ | 54,373,185 | |
9. Bank Borrowings:
The Trust, on behalf of the Fund, along with certain other funds managed by the Manager and its affiliates (“Participating Funds”), is a party to a 364-day, $2.1 billion credit agreement with a group of lenders. Under this agreement, the Fund may borrow to fund shareholder redemptions. Excluding commitments designated for certain individual funds, the Participating Funds, including the Fund, can borrow up to an aggregate commitment amount of $1.6 billion at any time outstanding, subject to asset coverage and other limitations as specified in the agreement. The credit agreement has the following terms: a fee of 0.12% per annum on unused commitment amounts and interest at a rate equal to the higher of (a) one-month LIBOR (but, in any event, not less than 0.00%) on the date the loan is made plus 0.80% per annum or (b) the Fed Funds rate (but, in any event, not less than 0.00%) in effect from time to time plus 0.80% per annum on amounts borrowed. The agreement expires in April 2018 unless extended or renewed. Participating Funds paid administration, legal and arrangement fees, which, if applicable, are included in miscellaneous expenses in the Statement of Operations. These fees were allocated among such funds based upon portions of the aggregate commitment available to them and relative net assets of Participating Funds. During the six months ended July 31, 2017, the Fund did not borrow under the credit agreement.
10. Principal Risks:
In the normal course of business, the Fund invests in securities and enters into transactions where risks exist due to fluctuations in the market (market risk) or failure of the issuer to meet all its obligations, including the ability to pay principal and interest when due (issuer credit risk). The value of securities may also be affected by one or all of the following: (i) general economy; (ii) overall market as well as local, regional or global political and/or social instability; (iii) regulation, taxation or international tax treaties between various countries; and (iv) currency, interest rate and price fluctuations.
On October 11, 2016, BlackRock implemented certain changes required by amendments to Rule 2a-7 under the 1940 Act, which governs the operations of U.S. money market funds. The Fund may be exposed to additional risks when reinvesting cash collateral in money market funds that do not seek to maintain a stable NAV per share of $1.00 and which may be subject to redemption gates or liquidity fees under certain circumstances.
Valuation Risk: The market values of equities, such as common stocks and preferred securities or equity related investments, such as futures and options, may decline due to general market conditions which are not specifically related to a particular company. They may also decline due to factors which affect a particular industry or industries. The Fund may invest in illiquid investments and may experience difficulty in selling those investments in a timely manner at the price that it believes the investments are worth. Prices may fluctuate widely over short or extended periods in response to company, market or economic news. Markets also tend to move in cycles, with periods of rising and falling prices. This volatility may cause the Fund’s NAV to experience significant increases or decreases over short periods of time. If there is a general decline in the securities and other markets, the NAV of the Fund may lose value, regardless of the individual results of the securities and other instruments in which the Fund invests.
Counterparty Credit Risk: Similar to issuer credit risk, the Fund may be exposed to counterparty credit risk, or the risk that an entity may fail to or be unable to perform on its commitments related to unsettled or open transactions. The Fund manages counterparty credit risk by entering into transactions only with counterparties that the Manager believes have the financial resources to honor their obligations and by monitoring the financial stability of those counterparties. Financial assets, which potentially expose the Fund to market, issuer and counterparty credit risks, consist principally of financial instruments and receivables due from counterparties. The extent of the Fund’s exposure to market, issuer and counterparty credit risks with respect to these financial assets is approximately their value recorded in the Statement of Assets and Liabilities, less any collateral held by the Fund.
A derivative contract may suffer a mark-to-market loss if the value of the contract decreases due to an unfavorable change in the market rates or values of the underlying instrument. Losses can also occur if the counterparty does not perform under the contract.
| | | | | | |
| | | | | | | |
| | iSHARES DEVELOPED REAL ESTATE INDEX FUND | | JULY 31, 2017 | | 25 |
| | |
| Notes to Financial Statements (continued) | | |
With exchange-traded futures, there is less counterparty credit risk to the Fund since the exchange or clearinghouse, as counterparty to such instruments, guarantees against a possible default. The clearinghouse stands between the buyer and the seller of the contract; therefore, credit risk is limited to failure of the clearinghouse. While offset rights may exist under applicable law, the Fund does not have a contractual right of offset against a clearing broker or clearinghouse in the event of a default (including the bankruptcy or insolvency). Additionally, credit risk exists in exchange-traded futures with respect to initial and variation margin that is held in a clearing broker’s customer accounts. While clearing brokers are required to segregate customer margin from their own assets, in the event that a clearing broker becomes insolvent or goes into bankruptcy and at that time there is a shortfall in the aggregate amount of margin held by the clearing broker for all its clients, typically the shortfall would be allocated on a pro rata basis across all the clearing broker’s customers, potentially resulting in losses to the Fund.
Concentration Risk: As of period end, the Fund invested a significant portion of its assets in securities in the real estate investment trusts (REITs) sector. Changes in economic conditions affecting such sector would have a greater impact on the Fund and could affect the value, income and/or liquidity of positions in such securities.
11. Capital Share Transactions:
Transactions in capital shares for each class were as follows:
| | | | | | | | | | | | | | | | | | | | |
| | | Six Months ended
July 31, 2017 | | | | | | Year ended
January 31, 2017 | |
| | | Shares | | | Amount | | | | | | Shares | | | Amount | |
| Institutional | | | | | | | | | | | | | | | | | | | | |
Shares sold | | | 772,033 | | | $ | 8,030,914 | | | | | | | | 38,290 | | | $ | 381,116 | |
Shares issued to shareholders in reinvestment of distributions | | | 6,376 | | | | 66,222 | | | | | | | | 296 | | | | 3,028 | |
Shares redeemed | | | (16,958 | ) | | | (171,446 | ) | | | | | | | (42,657 | ) | | | (450,668 | ) |
| | | | | | | | | | | | | | | | | | | | |
Net increase (decrease) | | | 761,451 | | | $ | 7,925,690 | | | | | | | | (4,071 | ) | | $ | (66,524 | ) |
| | | | | | | | | | | | | | | | | | | | |
| | | | | | | | | | | | | | | | | | | | |
| Investor A | | | | | | | | | | | | | | | | | | | | |
Shares sold | | | 133,373 | | | $ | 1,350,700 | | | | | | | | 159,675 | | | $ | 1,633,212 | |
Shares issued to shareholders in reinvestment of distributions | | | 3,342 | | | | 34,554 | | | | | | | | 1,020 | | | | 10,385 | |
Shares redeemed | | | (12,134 | ) | | | (124,548 | ) | | | | | | | (9,000 | ) | | | (91,015 | ) |
| | | | | | | | | | | | | | | | | | | | |
Net increase | | | 124,581 | | | $ | 1,260,706 | | | | | | | | 151,695 | | | $ | 1,552,582 | |
| | | | | | | | | | | | | | | | | | | | |
| | | | | | | | | | | | | | | | | | | | |
| Class K | | | | | | | | | | | | | | | | | | | | |
Shares sold | | | 30,320,421 | | | $ | 308,540,237 | | | | | | | | 91,100,576 | | | $ | 897,077,509 | |
Shares issued to shareholders in reinvestment of distributions | | | 1,643,678 | | | | 17,006,690 | | | | | | | | 345,629 | | | | 3,350,870 | |
Shares redeemed | | | (714,870 | ) | | | (7,422,064 | ) | | | | | | | (378,250 | ) | | | (3,757,832 | ) |
| | | | | | | | | | | | | | | | | | | | |
Net increase | | | 31,249,229 | | | $ | 318,124,863 | | | | | | | | 91,067,955 | | | $ | 896,670,547 | |
| | | | | | | | | | | | | | | | | | | | |
Total Net Increase | | | 32,135,261 | | | $ | 327,311,259 | | | | | | | | 91,215,579 | | | $ | 898,156,605 | |
| | | | | | | | | | | | | | | | | | | | |
12. Subsequent Events:
Management has evaluated the impact of all subsequent events on the Fund through the date the financial statements were issued and has determined that there were no subsequent events requiring adjustment or additional disclosure in the financial statements.
| | | | | | |
| | | | | | | |
| 26 | | iSHARES DEVELOPED REAL ESTATE INDEX FUND | | JULY 31, 2017 | | |
| | |
| Disclosure of Investment Advisory Agreement | | |
The Board of Trustees (the “Board,” the members of which are referred to as “Board Members”) of BlackRock Funds (the “Trust”) met in person on April 20, 2017 (the “April Meeting”) and May 24-25, 2017 (the “May Meeting”) to consider the approval of the investment advisory agreement (the “Agreement”) between the Trust, on behalf of iShares Developed Real Estate Index Fund (the “Fund”), a series of the Trust, and BlackRock Advisors, LLC (the “Manager” or “BlackRock”), the Trust’s investment advisor.
Activities and Composition of the Board
On the date of the May Meeting, the Board consisted of thirteen individuals, eleven of whom were not “interested persons” of the Trust as defined in the Investment Company Act of 1940, as amended (the “1940 Act”) (the “Independent Board Members”). The Board Members are responsible for the oversight of the operations of the Trust and perform the various duties imposed on the directors of investment companies by the 1940 Act. The Independent Board Members have retained independent legal counsel to assist them in connection with their duties. The Chair of the Board is an Independent Board Member. The Board has established five standing committees: an Audit Committee, a Governance and Nominating Committee, a Compliance Committee, a Performance Oversight and Contract Committee and an Executive Committee, each of which is chaired by an Independent Board Member and composed of Independent Board Members (except for the Executive Committee, which also has one interested Board Member).
The Agreement
Pursuant to the 1940 Act, the Board is required to consider the continuation of the Agreement on an annual basis. The Board has four quarterly meetings per year, each extending over two days, a fifth one-day meeting to consider specific information surrounding the consideration of renewing the Agreement and additional in-person and telephonic meetings as needed. In connection with this year-long deliberative process, the Board assessed, among other things, the nature, extent and quality of the services provided to the Fund by BlackRock, BlackRock’s personnel and affiliates, including (as applicable): investment management; administrative and shareholder services; the oversight of fund service providers; marketing; risk oversight; compliance; and ability to meet applicable legal and regulatory requirements.
The Board, acting directly and through its committees, considers at each of its meetings, and from time to time as appropriate, factors that are relevant to its annual consideration of the renewal of the Agreement, including the services and support provided by BlackRock to the Fund and its shareholders. BlackRock also furnished additional information to the Board in response to specific questions from the Board. This additional information is discussed further below in the section titled “Board Considerations in Approving the Agreement.” Among the matters the Board considered were: (a) investment performance for one-year, three-year, five-year, ten-year, and/or since inception periods, as applicable, against peer funds, applicable benchmark, and performance metrics, as applicable, as well as senior management’s and portfolio managers’ analysis of the reasons for any over-performance or underperformance relative to its peers, benchmarks, and other performance metrics, as applicable; (b) fees, including advisory, administration, if applicable, and other amounts paid to BlackRock and its affiliates by the Fund for services; (c) Fund operating expenses and how BlackRock allocates expenses to the Fund; (d) the resources devoted to, risk oversight of, and compliance reports relating to, implementation of the Fund’s investment objective(s), policies and restrictions, and meeting regulatory requirements; (e) the Trust’s adherence to its compliance policies and procedures; (f) the nature, cost and character of non-investment management services provided by BlackRock and its affiliates; (g) BlackRock’s and other service providers’ internal controls and risk and compliance oversight mechanisms; (h) BlackRock’s implementation of the proxy voting policies approved by the Board; (i) the use of brokerage commissions and execution quality of portfolio transactions; (j) BlackRock’s implementation of the Trust’s valuation and liquidity procedures; (k) an analysis of management fees for products with similar investment mandates across the open-end fund, exchange-traded fund (“ETF”), closed-end fund, sub-advised mutual fund, separately managed account, collective investment trust, and institutional separate account product channels, as applicable, and the similarities and differences between these products and the services provided as compared to the Fund; (l) BlackRock’s compensation methodology for its investment professionals and the incentives and accountability it creates, along with investment professionals’ investments in the fund(s) they manage; and (m) periodic updates on BlackRock’s business.
Board Considerations in Approving the Agreement
The Approval Process: Prior to the April Meeting, the Board requested and received materials specifically relating to the Agreement. The Board is continuously engaged in a process with its independent legal counsel and BlackRock to review the nature and scope of the information provided to better assist its deliberations. The materials provided in connection with the April Meeting included (a) information independently compiled and prepared by Broadridge Financial Solutions, Inc. (“Broadridge”) on Fund fees and expenses as compared with a peer group of funds as determined by Broadridge (“Expense Peers”) and the investment performance of the Fund as compared with a peer group of funds as determined by Broadridge1, as well as the performance of the Fund as compared with its benchmark; (b) information on the profits realized by BlackRock and its affiliates pursuant to the Agreement and a discussion of fall-out benefits to BlackRock and its affiliates; (c) a general analysis provided by BlackRock concerning investment management fees charged to other clients, such as institutional clients, sub-advised mutual funds, ETFs, closed-end funds, and separately managed accounts under similar investment mandates, as well as the performance of such other clients, as applicable; (d) review of non-management fees; (e) the existence, impact and sharing of potential economies of scale; (f) a summary of aggregate amounts paid by the Fund to BlackRock; and (g) sales and redemption data regarding the Fund’s shares.
| 1 | | Funds are ranked by Broadridge in quartiles, ranging from first to fourth, where first is the most desirable quartile position and fourth is the least desirable. |
| | | | | | |
| | | | | | | |
| | iSHARES DEVELOPED REAL ESTATE INDEX FUND | | JULY 31, 2017 | | 27 |
| | | | |
| Disclosure of Investment Advisory Agreement (continued) |
At the April Meeting, the Board reviewed materials relating to its consideration of the Agreement. As a result of the discussions that occurred during the April Meeting, and as a culmination of the Board’s year-long deliberative process, the Board presented BlackRock with questions and requests for additional information. BlackRock responded to these requests with additional written information in advance of the May Meeting.
At the May Meeting, the Board, including the Independent Board Members, approved the continuation of the Agreement between the Manager and the Trust with respect to the Fund for a one-year term ending June 30, 2018. In approving the continuation of the Agreement, the Board considered: (a) the nature, extent and quality of the services provided by BlackRock; (b) the investment performance of the Fund; (c) the advisory fee and the cost of the services and profits to be realized by BlackRock and its affiliates from their relationship with the Fund; (d) the Fund’s costs to investors compared to the costs of Expense Peers and performance compared to the relevant performance metrics as previously discussed; (e) the sharing of potential economies of scale; (f) fall-out benefits to BlackRock and its affiliates as a result of its relationship with the Fund; and (g) other factors deemed relevant by the Board Members.
The Board also considered other matters it deemed important to the approval process, such as other payments made to BlackRock or its affiliates, securities lending and cash management, services related to the valuation and pricing of Fund portfolio holdings, and advice from independent legal counsel with respect to the review process and materials submitted for the Board’s review. The Board noted the willingness of BlackRock personnel to engage in open, candid discussions with the Board. The Board did not identify any particular information as determinative, and each Board Member may have attributed different weights to the various items considered.
A. Nature, Extent and Quality of the Services Provided by BlackRock: The Board, including the Independent Board Members, reviewed the nature, extent and quality of services provided by BlackRock, including the investment advisory services and the resulting performance of the Fund. Throughout the year, the Board compared Fund performance to the performance of a comparable group of mutual funds, relevant benchmark, and performance metrics, as applicable. The Board met with BlackRock’s senior management personnel responsible for investment activities, including the senior investment officers. The Board also reviewed the materials provided by the Fund’s portfolio management team discussing the Fund’s performance and the Fund’s investment objective(s), strategies and outlook.
The Board considered, among other factors, with respect to BlackRock: the number, education and experience of investment personnel generally and the Fund’s portfolio management team; BlackRock’s research capabilities; investments by portfolio managers in the funds they manage; portfolio trading capabilities; use of technology; commitment to compliance; credit analysis capabilities; risk analysis and oversight capabilities; and the approach to training and retaining portfolio managers and other research, advisory and management personnel. The Board engaged in a review of BlackRock’s compensation structure with respect to the Fund’s portfolio management team and BlackRock’s ability to attract and retain high-quality talent and create performance incentives.
In addition to investment advisory services, the Board considered the quality of the administrative and other non-investment advisory services provided to the Fund. BlackRock and its affiliates provide the Fund with certain administrative, shareholder and other services (in addition to any such services provided to the Fund by third parties) and officers and other personnel as are necessary for the operations of the Fund. In particular, BlackRock and its affiliates provide the Fund with administrative services including, among others: (i) preparing disclosure documents, such as the prospectus, the summary prospectus (as applicable), the statement of additional information and periodic shareholder reports; (ii) oversight of daily accounting and pricing; (iii) preparing periodic filings with regulators; (iv) overseeing and coordinating the activities of other service providers; (v) organizing Board meetings and preparing the materials for such Board meetings; (vi) providing legal and compliance support; (vii) furnishing analytical and other support to assist the Board in its consideration of strategic issues such as the merger, consolidation or repurposing of certain open-end funds; and (viii) performing other administrative functions necessary for the operation of the Fund, such as tax reporting, fulfilling regulatory filing requirements and call center services. The Board reviewed the structure and duties of BlackRock’s fund administration, shareholder services, and legal & compliance departments and considered BlackRock’s policies and procedures for assuring compliance with applicable laws and regulations.
B. The Investment Performance of the Fund and BlackRock: The Board, including the Independent Board Members, also reviewed and considered the performance history of the Fund. In preparation for the April Meeting, the Board was provided with reports independently prepared by Broadridge, which included a comprehensive analysis of the Fund’s performance. The Board also reviewed a narrative and statistical analysis of the Broadridge data that was prepared by BlackRock. In connection with its review, the Board received and reviewed information regarding the investment performance of the Fund as compared to other funds in its applicable Broadridge category and the performance of the Fund as compared with its benchmark. The Board was provided with a description of the methodology used by Broadridge to select peer funds and periodically meets with Broadridge representatives to review its methodology. The Board was provided with information on the composition of the Broadridge performance universes and expense universes. The Board and its Performance Oversight and Contract Committee regularly review, and meet with Fund management to discuss, the performance of the Fund throughout the year.
In evaluating performance, the Board recognized that the performance data reflects a snapshot of a period as of a particular date and that selecting a different performance period could produce significantly different results. Further, the Board recognized that it is possible that long-term performance can be adversely affected by even one period of significant underperformance so that a single investment decision or theme has the ability to affect long-term performance disproportionately.
| | | | | | |
| | | | | | | |
| 28 | | iSHARES DEVELOPED REAL ESTATE INDEX FUND | | JULY 31, 2017 | | |
| | |
| Disclosure of Investment Advisory Agreement (continued) |
The Board noted that for the one-year period reported, the Fund’s net performance was out of the tolerance range of its benchmark. BlackRock believes that net performance relative to the benchmark is an appropriate performance metric for the Fund. The Board and BlackRock reviewed the Fund’s out of tolerance performance over the one-year period ended December 31, 2016. The Board was informed that, among other things, the Fund outperformed its benchmark and exceeded its upper tolerance, which was primarily driven by positive performance stemming from U.S. tax advantages. The Fund is a U.S. fund that does not get taxed on U.S. dividends, while the Fund’s benchmark taxes dividends from all countries.
C. Consideration of the Advisory/Management Fees and the Cost of the Services and Profits to be Realized by BlackRock and its Affiliates from their Relationship with the Fund: The Board, including the Independent Board Members, reviewed the Fund’s contractual management fee rate compared with the other funds in its Broadridge category. The contractual management fee rate represents a combination of the advisory fee and any administrative fees, before taking into account any reimbursements or fee waivers. The Board also compared the Fund’s total expense ratio, as well as its actual management fee rate, to those of other funds in its Broadridge category. The total expense ratio represents a fund’s total net operating expenses, including any 12b-1 or non 12b-1 service fees. The total expense ratio gives effect to any expense reimbursements or fee waivers that benefit a fund, and the actual management fee rate gives effect to any management fee reimbursements or waivers that benefit a fund. The Board considered the services provided and the fees charged by BlackRock and its affiliates to other types of clients with similar investment mandates, as applicable, including institutional accounts and sub-advised mutual funds (including mutual funds sponsored by third parties).
The Board received and reviewed statements relating to BlackRock’s financial condition. The Board reviewed BlackRock’s profitability methodology and was also provided with a profitability analysis that detailed the revenues earned and the expenses incurred by BlackRock for services provided to the Fund. The Board reviewed BlackRock’s profitability with respect to the Fund and other funds the Board currently oversees for the year ended December 31, 2016 compared to available aggregate profitability data provided for the prior two years. The Board reviewed BlackRock’s profitability with respect to certain other U.S. fund complexes managed by the Manager and/or its affiliates. The Board reviewed BlackRock’s assumptions and methodology of allocating expenses in the profitability analysis, noting the inherent limitations in allocating costs among various advisory products. The Board recognized that profitability may be affected by numerous factors including, among other things, fee waivers and expense reimbursements by the Manager, the types of funds managed, precision of expense allocations and business mix. As a result, calculating and comparing profitability at individual fund levels is difficult.
The Board noted that, in general, individual fund or product line profitability of other advisors is not publicly available. The Board reviewed BlackRock’s overall operating margin, in general, compared to that of certain other publicly-traded asset management firms. The Board considered the differences between BlackRock and these other firms, including the contribution of technology at BlackRock, BlackRock’s expense management, and the relative product mix.
In addition, the Board considered the cost of the services provided to the Fund by BlackRock, and BlackRock’s and its affiliates’ profits relating to the management and distribution of the Fund and the other funds advised by BlackRock and its affiliates. As part of its analysis, the Board reviewed BlackRock’s methodology in allocating its costs of managing the Fund, to the Fund. The Board may receive and review information from independent third parties as part of its annual evaluation. The Board considered whether BlackRock has the financial resources necessary to attract and retain high quality investment management personnel to perform its obligations under the Agreement and to continue to provide the high quality of services that is expected by the Board. The Board further considered factors including but not limited to BlackRock’s commitment of time, assumption of risk, and liability profile in servicing the Fund in contrast to what is required of BlackRock with respect to other products with similar investment mandates across the open-end fund, ETF, closed-end fund, sub-advised mutual fund, separately managed account, collective investment trust, and institutional separate account product channels, as applicable.
The Board noted that the Fund’s contractual management fee rate ranked third out of four funds, and that the actual management fee rate and total expense ratio ranked first out of four funds and third out of four funds, respectively, relative to the Fund’s Expense Peers. The Board also noted that BlackRock has contractually agreed to a cap on the Fund’s total expenses as a percentage of the Fund’s average daily net assets on a class-by-class basis.
D. Economies of Scale: The Board, including the Independent Board Members, considered the extent to which economies of scale might be realized as the assets of the Fund increase, as well as the existence of expense caps, as applicable. The Board also considered the extent to which the Fund benefits from such economies in a variety of ways and whether there should be changes in the advisory fee rate or breakpoint structure in order to enable the Fund to more fully participate in these economies of scale. The Board considered the Fund’s asset levels and whether the current fee schedule was appropriate. In their consideration, the Board Members took into account the existence of any expense caps and further considered the continuation and/or implementation, as applicable, of such caps.
E. Other Factors Deemed Relevant by the Board Members: The Board, including the Independent Board Members, also took into account other ancillary or “fall-out” benefits that BlackRock or its affiliates may derive from their respective relationships with the Fund, both tangible and intangible, such as BlackRock’s ability to leverage its investment professionals who manage other portfolios and risk management personnel, an increase in BlackRock’s profile in the investment advisory community, and the engagement of BlackRock’s affiliates as service providers to the Fund, including for administrative, distribution, securities lending and cash management services. The Board also considered BlackRock’s overall operations and its efforts to expand the scale
| | | | | | |
| | | | | | | |
| | iSHARES DEVELOPED REAL ESTATE INDEX FUND | | JULY 31, 2017 | | 29 |
| | | | |
| Disclosure of Investment Advisory Agreement (concluded) |
of, and improve the quality of, its operations. The Board also noted that BlackRock may use and benefit from third party research obtained by soft dollars generated by certain registered fund transactions to assist in managing all or a number of its other client accounts.
In connection with its consideration of the Agreement, the Board also received information regarding BlackRock’s brokerage and soft dollar practices. The Board received reports from BlackRock which included information on brokerage commissions and trade execution practices throughout the year.
The Board noted the competitive nature of the open-end fund marketplace, and that shareholders are able to redeem their Fund shares if they believe that the Fund’s fees and expenses are too high or if they are dissatisfied with the performance of the Fund.
Conclusion
The Board, including the Independent Board Members, approved the continuation of the Agreement between the Manager and the Trust with respect to the Fund for a one-year term ending June 30, 2018. Based upon its evaluation of all of the aforementioned factors in their totality, as well as other information, the Board, including the Independent Board Members, was satisfied that the terms of the Agreement were fair and reasonable and in the best interest of the Fund and its shareholders. In arriving at its decision to approve the Agreement, the Board did not identify any single factor or group of factors as all-important or controlling, but considered all factors together, and different Board Members may have attributed different weights to the various factors considered. The Independent Board Members were also assisted by the advice of independent legal counsel in making this determination. The contractual fee arrangements for the Fund reflect the results of several years of review by the Board Members and predecessor Board Members, and discussions between such Board Members (and predecessor Board Members) and BlackRock. As a result, the Board Members’ conclusions may be based in part on their consideration of these arrangements in prior years.
| | | | | | |
| | | | | | | |
| 30 | | iSHARES DEVELOPED REAL ESTATE INDEX FUND | | JULY 31, 2017 | | |
| | |
| Disclosure of Sub-Advisory Agreement |
The Board of Trustees (the “Board,” the members of which are referred to as “Board Members”) of BlackRock Funds (the “Trust”) met in person on May 24-25, 2017 (the “Meeting”) to consider the initial approval of the proposed sub-advisory agreement (the “Sub-Advisory Agreement”) between BlackRock Advisors, LLC (the “Manager”), the Trust’s investment advisor, and BlackRock Fund Advisors (the “Sub-Advisor”) with respect to iShares Developed Real Estate Index Fund (the “Fund”), a series of the Trust. The Sub-Advisory Agreement was substantially the same as sub-advisory agreements that had previously been approved by the Board with respect to certain other portfolios of the Trust.
On the date of the Meeting, the Board consisted of thirteen individuals, eleven of whom were not “interested persons” of the Trust or the Fund as defined in the Investment Company Act of 1940, as amended (the “1940 Act”) (the “Independent Board Members”). Pursuant to the 1940 Act, the Board is required to consider the initial approval of the Sub-Advisory Agreement.
At the Meeting, the Board reviewed materials relating to its consideration of the Sub-Advisory Agreement. The Trust’s investment advisory agreement (the “Advisory Agreement”) with the Manager on behalf of the Fund was most recently approved by the Board at the same Meeting. A discussion of the basis for the Board’s approval of the Advisory Agreement at the Meeting is included in this shareholder report. The factors considered by the Board at the Meeting in connection with approval of the proposed Sub-Advisory Agreement were substantially the same as the factors considered at the Meeting with respect to approval of the Advisory Agreement.
Following discussion, all the Board Members present at the Meeting, including the Independent Board Members present at the Meeting, approved the Sub-Advisory Agreement between the Manager and the Sub-Advisor with respect to the Fund for a two-year term beginning on the effective date of the Sub-Advisory Agreement. Based upon its evaluation of all of the aforementioned factors in their totality, the Board, including a majority of the Independent Board Members, was satisfied that the terms of the Sub-Advisory Agreement were fair and reasonable and in the best interest of the Fund and its shareholders. In arriving at its decision to approve the Sub-Advisory Agreement, the Board did not identify any single factor or group of factors as all-important or controlling, but considered all factors together, and different Board Members may have attributed different weights to the various factors considered. The Independent Board Members were also assisted by the advice of independent legal counsel in making this determination.
| | | | | | |
| | | | | | | |
| | iSHARES DEVELOPED REAL ESTATE INDEX FUND | | JULY 31, 2017 | | 31 |
Rodney D. Johnson, Chair of the Board and Trustee
Susan J. Carter, Trustee
Collette Chilton, Trustee
Neil A. Cotty, Trustee
Cynthia A. Montgomery, Trustee
Joseph P. Platt, Trustee
Robert C. Robb, Jr., Trustee
Mark Stalnecker, Trustee
Kenneth L. Urish, Trustee
Claire A. Walton, Trustee
Frederick W. Winter, Trustee
Barbara G. Novick, Trustee
John M. Perlowski, Trustee, President and Chief Executive Officer
Thomas Callahan, Vice President
Jennifer McGovern, Vice President
Neal J. Andrews, Chief Financial Officer
Jay M. Fife, Treasurer
Charles Park, Chief Compliance Officer
Fernanda Piedra, Anti-Money Laundering Compliance Officer
Benjamin Archibald, Secretary
| | | | | | |
| | | | |
Investment Adviser BlackRock Advisors, LLC Wilmington, DE 19809 | | Accounting Agent and Custodian State Street Bank and Trust Company Boston, MA 02111 | | Distributor BlackRock Investments, LLC New York, NY 10022 | | Legal Counsel Sidley Austin LLP New York, NY 10019 |
| | | |
Sub-Adviser BlackRock Fund Advisors San Francisco, California 94105 | | Transfer Agent BNY Mellon Investment Servicing (US) Inc. Wilmington, DE 19809 | | Independent Registered Public Accounting Firm Deloitte & Touche LLP Boston, MA 02116 | | Address of the Trust 100 Bellevue Parkway Wilmington, DE 19809 |
| | | | | | |
| | | | | | | |
| 32 | | iSHARES DEVELOPED REAL ESTATE INDEX FUND | | JULY 31, 2017 | | |
Householding
The Fund will mail only one copy of shareholder documents, including prospectuses, annual and semi-annual reports and proxy statements, to shareholders with multiple accounts at the same address. This practice is commonly called “householding” and is intended to reduce expenses and eliminate duplicate mailings of shareholder documents. Mailings of your shareholder documents may be householded indefinitely unless you instruct us otherwise. If you do not want the mailing of these documents to be combined with those for other members of your household, please call the Fund at (800) 441-7762.
Availability of Quarterly Schedule of Investments
The Fund files its complete schedule of portfolio holdings with the SEC for the first and third quarters of each fiscal year on Form N-Q. The Fund’s Forms N-Q are available on the SEC’s website at http://www.sec.gov and may also be reviewed and copied at the SEC’s Public Reference Room in Washington, D.C. Information on the operation of the Public Reference Room or how to access documents on the SEC’s website without charge may be obtained by calling (800) SEC-0330. The Fund’s Forms N-Q may also be obtained upon request and without charge by calling (800) 441-7762.
Availability of Proxy Voting Policies and Procedures
A description of the policies and procedures that the Fund uses to determine how to vote proxies relating to portfolio securities is available upon request and without charge, (1) by calling (800) 441-7762; (2) at http://www.blackrock.com; and (3) on the SEC’s website at http://www.sec.gov.
Availability of Proxy Voting Record
Information about how the Fund voted proxies relating to securities held in the Fund’s portfolio during the most recent 12-month period ended June 30 is available upon request and without charge (1) at http://www.blackrock.com or by calling (800) 441-7762 and (2) on the SEC’s website at http://www.sec.gov.
BlackRock’s Mutual Fund Family
BlackRock offers a diverse lineup of open-end mutual funds crossing all investment styles and managed by experts in equity, fixed income and tax-exempt investing. Visit http://www.blackrock.com for more information.
Account Information
Call us at (800) 441-7762 from 8:00 AM to 6:00 PM ET on any business day to get information about your account balances, recent transactions and share prices. You can also reach us on the Web at http://www.blackrock.com.
Automatic Investment Plans
Investor Class shareholders who want to invest regularly can arrange to have $50 or more automatically deducted from their checking or savings account and invested in any of the BlackRock funds.
Systematic Withdrawal Plans
Investor Class shareholders can establish a systematic withdrawal plan and receive periodic payments of $50 or more from their BlackRock funds, as long as their account balance is at least $10,000.
Retirement Plans
Shareholders may make investments in conjunction with Traditional, Rollover, Roth, Coverdell, Simple IRAs, SEP IRAs and 403(b) Plans.
| | | | | | |
| | | | | | | |
| | iSHARES DEVELOPED REAL ESTATE INDEX FUND | | JULY 31, 2017 | | 33 |
| | | | |
| Additional Information (concluded) | | |
|
| BlackRock Privacy Principles |
BlackRock is committed to maintaining the privacy of its current and former fund investors and individual clients (collectively, “Clients”) and to safeguarding their non-public personal information. The following information is provided to help you understand what personal information BlackRock collects, how we protect that information and why in certain cases we share such information with select parties.
If you are located in a jurisdiction where specific laws, rules or regulations require BlackRock to provide you with additional or different privacy-related rights beyond what is set forth below, then BlackRock will comply with those specific laws, rules or regulations.
BlackRock obtains or verifies personal non-public information from and about you from different sources, including the following: (i) information we receive from you or, if applicable, your financial intermediary, on applications, forms or other documents; (ii) information about your transactions with us, our affiliates, or others; (iii) information we receive from a consumer reporting agency; and (iv) from visits to our websites.
BlackRock does not sell or disclose to non-affiliated third parties any non-public personal information about its Clients, except as permitted by law or as is necessary to respond to regulatory requests or to service Client accounts. These non-affiliated third parties are required to protect the confidentiality and security of this information and to use it only for its intended purpose.
We may share information with our affiliates to service your account or to provide you with information about other BlackRock products or services that may be of interest to you. In addition, BlackRock restricts access to non-public personal information about its Clients to those BlackRock employees with a legitimate business need for the information. BlackRock maintains physical, electronic and procedural safeguards that are designed to protect the non-public personal information of its Clients, including procedures relating to the proper storage and disposal of such information.
|
| Change in Independent Registered Public Accounting Firms |
On February 24, 2017, iShares Developed Real Estate Index Fund, a series of BlackRock FundsSM, dismissed PricewaterhouseCoopers LLP (“PwC”) as the Fund’s independent registered public accounting firm effective upon the issuance of their report on the Fund’s financial statements as of and for the year ended January 31, 2017. The Audit Committee of the Trust’s Board of Trustees participated in, and approved, the decision to change the independent registered public accounting firm. PwC’s reports on the Fund’s financial statements for the fiscal periods ended January 31, 2017 and January 31, 2016 contained no adverse opinion or disclaimer of opinion nor were they qualified or modified as to uncertainty, audit scope or accounting principle. During the Fund’s fiscal periods ended January 31, 2017 and January 31, 2016 and the subsequent interim period through February 24, 2017, (i) there were no disagreements with PwC on any matter of accounting principles or practices, financial statement disclosure or auditing scope or procedure, which disagreements, if not resolved to the satisfaction of PwC, would have caused them to make reference to the subject matter of the disagreements in connection with their reports on the Fund’s financial statements for such periods, and (ii) there were no “reportable events” of the kind described in Item 304(a)(1)(v) of Regulation S-K under the Securities Exchange Act of 1934, as amended.
The Audit Committee of the Trust’s Board of Trustees approved the engagement of Deloitte & Touche LLP (“D&T”) as the Fund’s independent registered public accounting firm for the fiscal year ending January 31, 2018. The selection of D&T does not reflect any disagreements with or dissatisfaction by the Fund or the Board of Trustees with the performance of the Fund’s prior independent registered public accounting firm, PwC. During the Fund’s fiscal periods ended January 31, 2017 and January 31, 2016 and the subsequent interim period through February 24, 2017, neither the Fund, nor anyone on its behalf, consulted with D&T on items which: (i) concerned the application of accounting principles to a specified transaction, either completed or proposed, or the type of audit opinion that might be rendered on the Fund’s financial statements; or (ii) concerned the subject of a disagreement (as defined in paragraph (a)(1)(iv) of Item 304 of Regulation S-K) or reportable events (as described in paragraph (a)(1)(v) of said Item 304).
| | | | | | |
| | | | | | | |
| 34 | | iSHARES DEVELOPED REAL ESTATE INDEX FUND | | JULY 31, 2017 | | |
The report is intended for current holders. It is not authorized for use as an offer of sale or a solicitation of an offer to buy shares of the Fund unless preceded or accompanied by the Fund’s current prospectus. Past performance results shown in this report should not be considered a representation of future performance. Investment returns and principal value of shares will fluctuate so that shares, when redeemed, may be worth more or less than their original cost. Statements and other information herein are as dated and are subject to change.

| | |
| DREI-7/17-SAR | |  |
| Item 2 – | Code of Ethics – During the period covered by this report, the code of ethics was amended to clarify an inconsistency in to whom persons covered by the code should report suspected violations of the code. The amendment clarifies that such reporting should be made to BlackRock’s General Counsel, and retains the alternative option of anonymous reporting following “whistleblower” policies. Other non-material changes were also made in connection with this amendment. The registrant undertakes to provide a copy of the code of ethics to any person upon request, without charge, by calling 1-800-441-7762. |
| Item 3 – | Audit Committee Financial Expert – Not Applicable to this semi-annual report |
| Item 4 – | Principal Accountant Fees and Services – Not Applicable to this semi-annual report |
| Item 5 – | Audit Committee of Listed Registrants – Not Applicable |
(a) The registrant’s Schedule of Investments is included as part of the Report to Stockholders filed under Item 1 of this Form.
(b) Not Applicable due to no such divestments during the semi-annual period covered since the previous Form N-CSR filing.
| Item 7 – | Disclosure of Proxy Voting Policies and Procedures for Closed-End Management Investment Companies – Not Applicable |
| Item 8 – | Portfolio Managers of Closed-End Management Investment Companies – Not Applicable |
| Item 9 – | Purchases of Equity Securities by Closed-End Management Investment Company and Affiliated Purchasers – Not Applicable |
| Item 10 – | Submission of Matters to a Vote of Security Holders –There have been no material changes to these procedures. |
| Item 11 – | Controls and Procedures |
(a) – The registrant’s principal executive and principal financial officers, or persons performing similar functions, have concluded that the registrant’s disclosure controls and procedures (as defined in Rule 30a-3(c) under the Investment Company Act of 1940, as amended (the “1940 Act”)) are effective as of a date within 90 days of the filing of this report based on the evaluation of these controls and procedures required by Rule 30a-3(b) under the 1940 Act and Rule 15d-15(b) under the Securities Exchange Act of 1934, as amended.
(b) – There were no changes in the registrant’s internal control over financial reporting (as defined in Rule 30a-3(d) under the 1940 Act) that occurred during the second fiscal quarter of the period covered by this report that have materially affected, or are reasonably likely to materially affect, the registrant’s internal control over financial reporting.
| Item 12 – | Exhibits attached hereto |
(a)(1) – Code of Ethics – Not Applicable to this semi-annual report
(a)(2) – Certifications – Attached hereto
(a)(3) – Not Applicable
2
(b) – Certifications – Attached hereto
3
Pursuant to the requirements of the Securities Exchange Act of 1934 and the Investment Company Act of 1940, the registrant has duly caused this report to be signed on its behalf by the undersigned, thereunto duly authorized.
BlackRock Funds
| | | | |
By: | | /s/ John M. Perlowski | | |
| | John M. Perlowski | | |
| | Chief Executive Officer (principal executive officer) of |
| | BlackRock Funds |
| |
Date: | | October 4, 2017 |
Pursuant to the requirements of the Securities Exchange Act of 1934 and the Investment Company Act of 1940, this report has been signed below by the following persons on behalf of the registrant and in the capacities and on the dates indicated.
| | | | |
By: | | /s/ John M. Perlowski | | |
| | John M. Perlowski | | |
| | Chief Executive Officer (principal executive officer) of |
| | BlackRock Funds |
| |
Date: | | October 4, 2017 |
| | |
| By: | | /s/ Neal J. Andrews | | |
| | Neal J. Andrews | | |
| | Chief Financial Officer (principal financial officer) of |
| | BlackRock Funds |
| |
Date: | | October 4, 2017 |
4