UNITED STATES
SECURITIES AND EXCHANGE COMMISSION
Washington, D.C. 20549
FORMN-CSR
CERTIFIED SHAREHOLDER REPORT OF REGISTERED MANAGEMENT
INVESTMENT COMPANIES
Investment Company Act file number: 811-05742
Name of Fund: BlackRock Funds
BlackRock Advantage Emerging Markets Fund
BlackRock Global Long/Short Equity Fund
Fund Address: 100 Bellevue Parkway, Wilmington, DE 19809
Name and address of agent for service: John M. Perlowski, Chief Executive Officer, BlackRock Funds, 55 East 52ndStreet, New York, NY 10055
Registrant’s telephone number, including area code: (800) 441-7762
Date of fiscal year end: 04/30/2020
Date of reporting period: 04/30/2020
Item 1 – Report to Stockholders
 | APRIL 30, 2020 |
2020 Annual Report | ||
BlackRock FundsSM
| · | BlackRock Advantage Emerging Markets Fund |
| · | BlackRock Global Long/Short Equity Fund |
Beginning on January 1, 2021, as permitted by regulations adopted by the Securities and Exchange Commission, paper copies of each Fund’s shareholder reports will no longer be sent by mail, unless you specifically request paper copies of the reports from BlackRock or from your financial intermediary, such as a broker-dealer or bank. Instead, the reports will be made available on a website, and you will be notified by mail each time a report is posted and provided with a website link to access the report.
You may elect to receive all future reports in paper free of charge. If you hold accounts directly with BlackRock, you can call(800) 441-7762 to inform BlackRock that you wish to continue receiving paper copies of your shareholder reports. If you hold accounts through a financial intermediary, you can follow the instructions included with this disclosure, if applicable, or contact your financial intermediary to request that you continue to receive paper copies of your shareholder reports. Please note that not all financial intermediaries may offer this service. Your election to receive reports in paper will apply to all funds advised by BlackRock Advisors, LLC, BlackRock Fund Advisors or their affiliates, or all funds held with your financial intermediary, as applicable.
If you already elected to receive shareholder reports electronically, you will not be affected by this change and you need not take any action. You may elect to receive electronic delivery of shareholder reports and other communications by: (i) accessing the BlackRock website at blackrock.com/edelivery and logging into your accounts, if you hold accounts directly with BlackRock, or (ii) contacting your financial intermediary, if you hold accounts through a financial intermediary. Please note that not all financial intermediaries may offer this service.
| Not FDIC Insured • May Lose Value • No Bank Guarantee |
Dear Shareholder,
The last 12 months have been a time of sudden change in global financial markets, as a long period of growth and positive returns was interrupted in early 2020 by the emergence and spread of the coronavirus. For much of the reporting period, U.S. equities and bonds both delivered impressive returns, despite fears and doubts about the economy that were ultimately laid to rest with unprecedented monetary stimulus and a sluggish yet resolute performance from the U.S. economy. But as the threat from the coronavirus became more apparent throughout February and March 2020, leading countries around the world took economically disruptive countermeasures, causing equity prices to fall sharply. While markets have since recovered some of these losses as countries around the world begin reopening, there is still significant uncertainty surrounding the long-term impact of the pandemic on the global economy.
Returns for most securities were robust for the first three quarters of the reporting period, as investors began to realize that the U.S. economy was maintaining the modest yet steady growth that had characterized this economic cycle. However, once stay-at-home orders and closures of non-essential businesses became widespread, many workers were laid off and unemployment claims spiked. With large portions of the global economy on hold, all types of international equities ended the reporting period with negative performance, while in the U.S. only large-capitalization stocks delivered a slightly positive return.
The performance of different types of fixed-income securities diverged substantially due to a reduced investor appetite for risk. Treasuries benefited from the risk-off environment, and posted healthy returns, as the 10-year yield (which is inversely related to bond prices) fell to an all-time low. Investment-grade corporate bonds also delivered a positive return, while high-yield corporates were down due to credit concerns.
The U.S. Federal Reserve (the “Fed”) reduced interest rates three times in 2019, to support slowing economic growth. After the coronavirus outbreak, the Fed instituted two emergency rate cuts, pushing short-term interest rates close to zero. To stabilize credit markets, the Fed also announced a new bond-buying program, as did several other central banks around the world, including the European Central Bank and the Bank of Japan.
Looking ahead, while coronavirus-related disruption is certain to hurt worldwide economic growth, the global expansion is likely to continue once the impact of the outbreak subsides. Nonetheless, there are promising signs that a strong coordinated monetary and fiscal response is underway, both in the United States and abroad. With measures being taken to contain the virus and provide support to impacted businesses and individuals, we anticipate a sharp increase in economic activity as life returns to normal.
Overall, we favor a neutral stance toward risk, given the uncertainty surrounding the economic impact of coronavirus countermeasures. Among equities, we see an advantage in U.S. stocks compared to other developed markets, given the diversity of the U.S. economy and the impressive scope of monetary and fiscal stimulus. In bonds, the swift action taken by the world’s central banks means there are attractive opportunities in credit, and we expect credit spreads to narrow as markets stabilize. Both U.S. Treasuries and sustainable investments can help provide portfolio resilience, and the disruption created by the coronavirus appears to be accelerating the shift toward sustainable investments.
In this environment, investors need to think globally, extend their scope across a broad array of asset classes, and be nimble as market conditions change. We encourage you to talk with your financial advisor and visitblackrock.com for further insight about investing in today’s markets.
Sincerely,

Rob Kapito
President, BlackRock Advisors, LLC

Rob Kapito
President, BlackRock Advisors, LLC
| Total Returns as of April 30, 2020 | ||||
| 6-month | 12-month | |||
U.S. large cap equities | (3.16)% | 0.86% | ||
U.S. small cap equities | (15.47) | (16.39) | ||
International equities | (14.21) | (11.34) | ||
Emerging market equities | (10.50) | (12.00) | ||
3-month Treasury bills | 0.85 | 2.07 | ||
U.S. Treasury securities | 10.73 | 19.78 | ||
U.S. investment grade bonds | 4.86 | 10.84 | ||
Tax-exempt municipal bonds | (1.26) | 2.21 | ||
U.S. high yield bonds | (6.60) | (4.08) | ||
| Past performance is no guarantee of future results. Index performance is shown for illustrative purposes only. You cannot invest directly in an index. | ||||
| 2 | THIS PAGEISNOT PARTOF YOUR FUND REPORT |
| Page | ||||
| 2 | ||||
Annual Report: | ||||
| 4 | ||||
| 9 | ||||
| 9 | ||||
| 10 | ||||
| 10 | ||||
Financial Statements: | ||||
| 11 | ||||
| 79 | ||||
| 81 | ||||
| 82 | ||||
| 83 | ||||
| 91 | ||||
| 105 | ||||
| 106 | ||||
| 107 | ||||
| 108 | ||||
| 112 | ||||
| 113 | ||||

| 3 |
| Fund Summary as of April 30, 2020 | BlackRock Advantage Emerging Markets Fund |
Investment Objective
BlackRock Advantage Emerging Markets Fund’s (the “Fund”) investment objective is to seek long-term capital appreciation.
On November 13, 2019, the Board of Trustees of BlackRock FundsSM (the “Board”) approved a change in the fiscal year-end of the Fund, effective as of April 30, 2020, from July 31 to April 30.
Portfolio Management Commentary
How did the Fund perform?
For the abbreviated annual period from August 1, 2019 to April 30, 2020, the Fund’s Institutional, Investor A, Investor C and Class K Shares returned (11.78)%, (12.05)%, (12.57)% and (11.87)%, respectively, underperforming its benchmark, the MSCI Emerging Markets Index, which returned (9.58)%.
What factors influenced performance?
Overall, the Fund struggled against the highly changeable market backdrop during the period. Trade concerns that caused a broad market decline early in the period gave way to a risk-on rally amid excitement for a trade deal between the United States and China. Entering 2020, the resolution of trade issues initially supported stocks before the global spread of the coronavirus led to a steep market decline. Investor concerns mounted amid broadly enforced economic shutdowns, as expectations of growth and employment fell sharply. The selloff in the first quarter of 2020 led to one of the worst quarterly returns on record for equities globally. Volatility climbed to levels last observed during the global financial crisis in 2008 and 2009. Within emerging markets, equities began their descent in January, as China shut down its economy. As the coronavirus spread to other countries around the world, China outperformed the rest of the asset class.
Given the prevalence of headline risk, a major theme that emerged during the period was a lack of investor focus on underlying company financials. This theme resulted in losses across fundamental stock selection insights focusing on value and quality and was a key detractor from the Fund’s relative performance. Specifically, contrarian insights detracted, as more traditional value measures such as an insight that compares companies across sales struggled due to growth concerns. This headwind was particularly acute across Asian emerging market stocks in January and February, coinciding with the regional shutdowns necessary to curb the spread of the coronavirus. The shutdowns prompted a sharp adjustment of economic expectations, which had an impact on cyclical sectors of the market such as industrials and materials. Traditional quality measures similarly declined as balance sheet and cash flow measures came under pressure. Given the evolving market backdrop during the period, sentiment insights looking toward informed market participants saw equally significant challenges. As economic uncertainty from the coronavirus put pressure on guidance expectations, insights from text analyses from sell-side analysts broadly detracted from performance. However, text analyses of company executive conference calls helped offset losses, with notable strength in South African materials stocks. The Fund’s regional China A model was slightly down for the period, as the combination of trade concerns and coronavirus-related uncertainty weighed on the model’s performance.
On the positive side, macro thematic measures performed better and were able to provide ballast for the portfolio. This was highlighted by strength from a country timing model that motivated underweight positions to Brazil and Thailand, which added to performance. The underweight to Brazil in particular proved beneficial, as oil prices fell sharply during the period, impacting the country’s resource-heavy economy. The signal also prompted an underweight position in Chile, adding to performance as stocks in the country struggled against considerable political uncertainty early in the period.
Elsewhere, industry timing models were similarly additive, having motivated underweight positions to consumer discretionary stocks in India and communication services stocks in China. Finally, within macro-thematic insights, style timing also provided positive returns as it decreased the Fund’s sensitivity to generic momentum styles ahead of the sizable factor rotation in September. Further supporting performance, economic, social and governance (“ESG”)-related fundamental insights produced differentiated returns compared to more traditional measures. Collectively, these insights were able to provide some defensive quality properties amid the market’s volatility and helped insulate the portfolio from broader fundamental stock selection weakness. A recently added ESG insight that looks toward investor positioning in ESG-related holdings was a top performer, as it was able to capture the broader market trend to the space.
The Fund was fully invested throughout the period. The investment adviser kept a higher average cash balance over the period, which was hedged by MSCI Emerging Markets Index futures to manage client flows. The Fund’s cash exposure had no material impact on Fund performance.
Describe recent portfolio activity.
Over the course of the period, the portfolio maintained a balanced allocation of risk across all major return drivers. There were, however, several new signals added within the stock selection model. These included an insight that expands upon earlier research for machine-learned signal combination by using our full library of researched insights to create bespoke portfolios of individual securities. This also expanded into creating bespoke macro-thematic models using the same approach. In addition, a new sentiment measure looked to capture investor positioning in ESG-related holdings. This continued to build out the Fund’s positioning based on investor flows toward ESG and away from generic quant exposures. Finally, given the dynamic nature of the current environment, the Fund instituted enhanced signal constructs to best identify emerging trends such as domestically focused firms.
Describe portfolio positioning at period end.
Relative to the benchmark, the Fund ended the period overweight to stocks in India and Russia, with a focus on information technology (“IT”) and energy stocks, respectively. In India, the potential for policy accommodation prompted the overweight position, while in Russia, attractive valuations provided the motivation for the Fund’s positioning. Also, the Fund moved to a slight overweight position in China on expectations of policy accommodation and reform, expressed through financial stocks in the local China A market and communication services companies in the China H market. This was funded by underweights to Qatar and Brazil, predominantly in financials and consumer discretionary stocks, respectively. The Fund also maintained an underweight in South Korea, predominantly in industrials and IT stocks, motivated by declining fundamentals and export competitiveness.
The views expressed reflect the opinions of BlackRock as of the date of this report and are subject to change based on changes in market, economic or other conditions. These views are not intended to be a forecast of future events and are no guarantee of future results.
| 4 | 2020 BLACKROCK ANNUAL REPORTTO SHAREHOLDERS |
| Fund Summary as of April 30, 2020 (continued) | BlackRock Advantage Emerging Markets Fund |
TOTAL RETURN BASED ON A $10,000 INVESTMENT
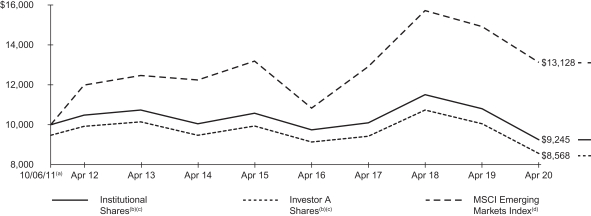
| (a) | Commencement of operations. |
| (b) | Assuming maximum sales charges, if any, transaction costs and other operating expenses, including investment advisory fees. Institutional Shares do not have a sales charge. |
| (c) | Under normal circumstances, the Fund seeks to invest at least 80% of its net assets plus the amount of any borrowings for investment purposes in equity securities issued by, or tied economically to, companies in emerging markets and derivatives that have similar economic characteristics to such securities. The Fund’s total returns prior to June 12, 2017 are the returns of the Fund when it followed different investment strategies under the name BlackRock Emerging Markets Long/Short Equity Fund. |
| (d) | A free float-adjusted market capitalization index that is designed to measure equity market performance of emerging markets and consists of the following 26 emerging market country indices: Argentina, Brazil, Chile, China, Colombia, Czech Republic, Egypt, Greece, Hungary, India, Indonesia, South Korea, Malaysia, Mexico, Pakistan, Peru, the Philippines, Poland, Qatar, Russia, Saudi Arabia, South Africa, Taiwan, Thailand, Turkey and the United Arab Emirates. |
Performance Summary for the Period Ended April 30, 2020
| Average Annual Total Returns (a)(b) | ||||||||||||||||||||||||||||||||||||||||
| 1 Year | 5 Years | Since Inception (c) | ||||||||||||||||||||||||||||||||||||||
| 6-Month Total Returns | w/o sales charge | w/sales charge | w/o sales charge | w/sales charge | w/o sales charge | w/sales charge | ||||||||||||||||||||||||||||||||||
Institutional | (12.89 | )% | (14.45 | )% | N/A | (2.66 | )% | N/A | (0.91 | )% | N/A | |||||||||||||||||||||||||||||
Investor A | (13.17 | ) | (14.76 | ) | (19.24 | )% | (2.94 | ) | (3.98 | )% | (1.17 | ) | (1.79 | )% | ||||||||||||||||||||||||||
Investor C | (13.48 | ) | (15.41 | ) | (16.25 | ) | (3.66 | ) | (3.66 | ) | (1.92 | ) | (1.92 | ) | ||||||||||||||||||||||||||
Class K | (12.97 | ) | (14.45 | ) | N/A | (2.66 | ) | N/A | (0.91 | ) | N/A | |||||||||||||||||||||||||||||
MSCI Emerging Markets Index | (10.50 | ) | (12.00 | ) | N/A | (0.10 | ) | N/A | 3.23 | N/A | ||||||||||||||||||||||||||||||
| (a) | Assuming maximum sales charges, if any. Average annual total returns with and without sales charges reflect reductions for distribution and service fees. See “About Fund Performance” on page 9 for a detailed description of share classes, including any related sales charges and fees, and how performance was calculated for certain share classes. |
| (b) | Under normal circumstances, the Fund seeks to invest at least 80% of its net assets plus the amount of any borrowings for investment purposes in equity securities issued by, or tied economically to, companies in emerging markets and derivatives that have similar economic characteristics to such securities. The Fund’s total returns prior to June 12, 2017 are the returns of the Fund when it followed different investment strategies under the name BlackRock Emerging Markets Long/Short Equity Fund. |
| (c) | The Fund commenced operations on October 6, 2011. |
| N/A | — Not applicable as share class and index do not have a sales charge. |
| Past | performance is not indicative of future results. |
| Performance | results may include adjustments made for financial reporting purposes in accordance with U.S. generally accepted accounting principles. |
Expense Example
| Actual | Hypothetical (a)(b) | |||||||||||||||||||||||||||||||
| Beginning Account Value (11/01/19) | Ending Account Value (04/30/20) | Expenses Paid During the Period (a) | Beginning Account Value (11/01/19) | Ending Account Value (04/30/20) | Expenses Paid During the Period (a) | Annualized Expense Ratio | ||||||||||||||||||||||||||
Institutional | $ | 1,000.00 | $ | 871.10 | $ | 3.68 | $ | 1,000.00 | $ | 1,020.93 | $ | 3.97 | 0.79 | % | ||||||||||||||||||
Investor A | 1,000.00 | 868.30 | 5.16 | 1,000.00 | 1,019.34 | 5.57 | 1.11 | |||||||||||||||||||||||||
Investor C | 1,000.00 | 865.20 | 8.81 | 1,000.00 | 1,015.41 | 9.52 | 1.90 | |||||||||||||||||||||||||
Class K | 1,000.00 | 870.30 | 3.77 | 1,000.00 | 1,020.84 | 4.07 | 0.81 | |||||||||||||||||||||||||
| (a) | For each class of the Fund, expenses are equal to the annualized net expense ratio for the class, multiplied by the average account value over the period, multiplied by 182/366 (to reflect the six-month period shown). |
| (b) | Hypothetical 5% annual return before expenses is calculated by prorating the number of days in the most recent six-months divided by 366. |
| See | “Disclosure of Expenses” on page 9 for further information on how expenses were calculated. |
| FUND SUMMARY | 5 |
| Fund Summary as of April 30, 2020 | BlackRock Global Long/Short Equity Fund |
Investment Objective
BlackRock Global Long/Short Equity Fund’s (the “Fund”) investment objective is to seek total return over the long term.
On November 13, 2019, the Board approved a change in the fiscal year-end of the Fund, effective as of April 30, 2020, from July 31 to April 30.
Portfolio Management Commentary
How did the Fund perform?
For the abbreviated annual period from August 1, 2019 to April 30, 2020, the Fund’s Institutional, Investor A, Investor C and Class K Shares returned (3.80)%, (3.94)%, (4.51)% and (3.77)%, respectively, underperforming its benchmark, the ICE BofAML 3-Month U.S. Treasury Bill Index, which returned 1.43%.
What factors influenced performance?
Overall, the Fund struggled against the highly changeable market backdrop during the period. Trade concerns that caused a broad market decline early in the period gave way to a risk-on rally amid anticipation of a trade agreement between the United States and China. Favorable negotiations and the resulting phase-one trade deal supported stocks through mid-February. However, exuberance quickly faded with the global spread of coronavirus, leading to a steep market decline. Investor concerns mounted amid broadly enforced economic shutdowns, as expectations of growth and employment fell sharply. The selloff in the first quarter of 2020 led to one of the worst quarterly returns on record for equities. Volatility climbed to levels last observed during the global financial crisis in 2008 and 2009. In response, policymakers stepped in with fiscal and monetary stimulus packages aimed at supporting markets. The Bank of Japan, for example, invested in a record level of equity exchange traded funds to help bolster Japanese equity markets.
Weakness in the Fund’s sentiment stock selection measures was the most significant detractor from relative performance during the period. Specifically, measures seeking to capture informed investor positioning and text analyses of executives and analysts proved wrong-footed, as investors questioned prior guidance. Performance challenges were most acute during August 2019 and in the first quarter of 2020. The Fund’s positioning entering the period had reflected a defensive posture that was suited to perform well in a continued “slow-flation” market environment. However, a more reflationary tone emerged that moved against the Fund’s positioning. Preferred long positions in communication services and short positions in riskier European cyclical stocks detracted from performance. The Fund’s defensive stance also struggled into December once improving trade dynamics triggered a broad market rally.
Many of these positions began to recover early in 2020 until February’s market volatility prompted another round of declines. Among macro-thematic signals, a style-timing model struggled in March through a preference for dividend yield. Positioning within real estate securities drove losses for this insight, as the Fund demonstrated a preference for higher-yielding stocks. This came under significant pressure as investors weighed the impact of mass economic closures on their business models. Hedging-related short positions in Japanese retail industry stocks, especially automakers, detracted from Fund performance, as the Bank of Japan’s ETF purchases helped Japanese equities outperform other regions. Finally, beta-timing models had motivated the Fund to take a slight net long position entering 2020, which had an adverse impact on performance as markets dropped.
Despite the underperformance relative to the benchmark, the Fund performed well compared to broader equity markets. The strongest contributors to performance were macro-thematic and fundamental quality insights. Notably, macro-thematic insights were able to generate gains through industry positioning. Industry timing insights performed well during the period, as the Fund’s sector positioning largely reflected its pro-growth posture.
Specifically, the Fund maintained preferred long positions among pharmaceutical and software companies, driven by trends across inventories, supply chains, and business invoicing. Additionally, a continued negative stance toward energy provided gains. Helping to provide ballast for the portfolio, fundamental stock selection insights contributed to relative performance, giving much-needed defense during the market decline. Notably, quality measures like profitability and operational sustainability insights were some of the best performers. Similarly, less traditional quality measures, such as environmental, social and governance (“ESG”)-related insights, also remained strong. Specifically, a recently added insight that identifies investor flows into ESG-related positions was one of the top performing signals after successfully capturing an evolving investor preference for sustainable investing. Finally, signals that were driven by more timely data were able to capture the rapid market evolution correctly and provide gains. These included insights that approximate sales from online browsing activity and mobile app users. Importantly, these insights provided gains toward the end of the period by successfully positioning the portfolio in April during earnings season.
The Fund was fully invested throughout the period. The Fund’s cash exposure had no material impact on performance, as cash was principally held in conjunction with the Fund taking long and short positions via the use of total return swap contracts. These derivative positions had a negative impact on performance.
Describe recent portfolio activity.
Over the course of the period, the portfolio maintained a balanced allocation of risk across all major return drivers. There were, however, several new signals added within the stock selection group of insights. These included a new insight that expands upon earlier research for machine-learned signal combination. The new signal uses the full library of the investment adviser’s researched insights, and through machine learning, it creates bespoke portfolios of those insights at a security level. Additionally, a new insight was added that looks to capture investor positioning to ESG-related holdings based on investor flows toward ESG and away from generic quantitative exposures. Finally, given the dynamic nature of the current market environment, the Fund instituted enhanced signal constructs to identify emerging trends such as “work from home.”
| 6 | 2020 BLACKROCK ANNUAL REPORTTO SHAREHOLDERS |
| Fund Summary as of April 30, 2020 (continued) | BlackRock Global Long/Short Equity Fund |
Describe portfolio positioning at period end.
The Fund’s market timing models adjusted to reflect the unprecedented rapid collapse in global macro data, as the Fund retained a neutral equity market exposure. Broadly, top-down macro signals that look toward market regimes continue to emphasize defense. In response, the Fund continued to prefer large cap and growth stocks, with short positions in volatility, value and leverage. Industry positioning continued to demonstrate the preference for growth over value and is reflected in long positions across information technology and health care stocks, along with short positions in financials and consumer discretionary stocks. More strategically, the Fund continued to emphasize the diverging outlook between generic quantitative factors and ESG measures by preferring the latter over the former. Geographically, the Fund was long stocks in Australia, the United States and France, and short in Japan, Canada and Sweden.
The views expressed reflect the opinions of BlackRock as of the date of this report and are subject to change based on changes in market, economic or other conditions. These views are not intended to be a forecast of future events and are no guarantee of future results.
| FUND SUMMARY | 7 |
| Fund Summary as of April 30, 2020 (continued) | BlackRock Global Long/Short Equity Fund |
TOTAL RETURN BASED ON A $10,000 INVESTMENT
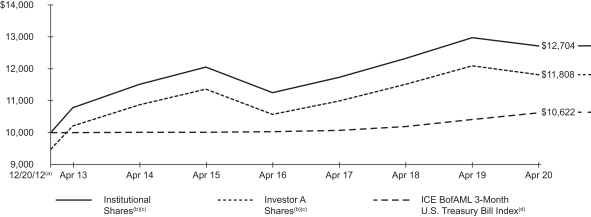
| (a) | Commencement of operations. |
| (b) | Assuming maximum sales charges, if any, transaction costs and other operating expenses, including investment advisory fees. Institutional Shares do not have a sales charge. |
| (c) | Under normal conditions, the Fund invests at least 80% of its total assets in equity instruments and related derivative instruments issued by, or tied economically to, companies located in developed markets. |
| (d) | An unmanaged index that tracks 3-month U.S. Treasury securities. Effective January 1, 2020, the Fund’s benchmark was renamed from ICE BofAML 3-Month U.S. Treasury Bill Index to ICE BofA 3-Month U.S. Treasury Bill Index. |
Performance Summary for the Period Ended April 30, 2020
| Average Annual Total Returns (a) | ||||||||||||||||||||||||||||||||||||||||
| 1 Year | 5 Years | Since Inception (b) | ||||||||||||||||||||||||||||||||||||||
| 6-Month Total Returns | w/o sales charge | w/sales charge | w/o sales charge | w/sales charge | w/o sales charge | w/sales charge | ||||||||||||||||||||||||||||||||||
Institutional | (0.18 | )% | (2.03 | )% | N/A | 1.06 | % | N/A | 3.31 | % | N/A | |||||||||||||||||||||||||||||
Investor A | (0.27 | ) | (2.30 | ) | (7.43 | )% | 0.78 | (0.30 | )% | 3.04 | 2.28 | % | ||||||||||||||||||||||||||||
Investor C | (0.70 | ) | (2.97 | ) | (3.88 | ) | 0.03 | 0.03 | 2.27 | 2.27 | ||||||||||||||||||||||||||||||
Class K | (0.15 | ) | (1.99 | ) | N/A | 1.10 | N/A | 3.34 | N/A | |||||||||||||||||||||||||||||||
ICE BofAML 3-Month U.S. Treasury Bill Index | 0.85 | 2.07 | N/A | 1.19 | N/A | 0.82 | N/A | |||||||||||||||||||||||||||||||||
| (a) | Assuming maximum sales charges, if any. Average annual total returns with and without sales charges reflect reductions for distribution and service fees. See “About Fund Performance” on page 9 for a detailed description of share classes, including any related sales charges and fees, and how performance was calculated for certain share classes. |
| (b) | The Fund commenced operations on December 20, 2012. |
N/A — Not applicable as share class and index do not have a sales charge.
Past performance is not indicative of future results.
Performance results may include adjustments made for financial reporting purposes in accordance with U.S. generally accepted accounting principles.
Expense Example
| Actual | Hypothetical (b) | |||||||||||||||||||||||||||||||
| Beginning Account Value (11/01/19) | Ending Account Value (04/30/20) | Expenses Paid During the Period (a) | Beginning Account Value (11/01/19) | Ending Account Value (04/30/20) | Expenses Paid During the Period (a) | Annualized Expense Ratio | ||||||||||||||||||||||||||
Institutional | $ | 1,000.00 | $ | 998.20 | $ | 7.80 | $ | 1,000.00 | $ | 1,017.06 | $ | 7.87 | 1.57 | % | ||||||||||||||||||
Investor A | 1,000.00 | 997.30 | 9.04 | 1,000.00 | 1,015.81 | 9.12 | 1.82 | |||||||||||||||||||||||||
Investor C | 1,000.00 | 993.00 | 12.74 | 1,000.00 | 1,012.08 | 12.86 | 2.57 | |||||||||||||||||||||||||
Class K | 1,000.00 | 998.50 | 7.55 | 1,000.00 | 1,017.30 | 7.62 | 1.52 | |||||||||||||||||||||||||
| (a) | For each class of the Fund, expenses are equal to the annualized net expense ratio for the class, multiplied by the average account value over the period, multiplied by 182/366 (to reflect the six-month period shown). |
| (b) | Hypothetical 5% annual return before expenses is calculated by prorating the number of days in the most recent six-months divided by 366. |
See “Disclosure of Expenses” on page 9 for further information on how expenses were calculated.
| 8 | 2020 BLACKROCK ANNUAL REPORTTO SHAREHOLDERS |
Institutional and Class K Shares are not subject to any sales charge. These shares bear no ongoing distribution or service fees and are available only to certain eligible investors. Class K Shares performance of BlackRock Global Long/Short Equity Fund shown prior to the Class K Shares inception date of March 28, 2016 is that of Institutional Shares. Class K Shares performance of BlackRock Advantage Emerging Markets Fund shown prior to the Class K Shares inception date of January 25, 2018 is that of Institutional Shares. The performance of each Fund’s Class K Shares would be substantially similar to Institutional Shares because Class K Shares and Institutional Shares invest in the same portfolio of securities and performance would only differ to the extent that Class K Shares and Institutional Shares have different expenses. The actual returns of Class K Shares would have been higher than those of the Institutional Shares because Class K Shares have lower expenses than the Institutional Shares.
Investor A Shares are subject to a maximum initial sales charge (front-end load) of 5.25% and a service fee of 0.25% per year (but no distribution fee). Certain redemptions of these shares may be subject to a contingent deferred sales charge (“CDSC”) where no initial sales charge was paid at the time of purchase. These shares are generally available through financial intermediaries.
Investor C Shares are subject to a 1.00% CDSC if redeemed within one year of purchase. In addition, these shares are subject to a distribution fee of 0.75% per year and a service fee of 0.25% per year. These shares are generally available through financial intermediaries. These shares automatically convert to Investor A Shares after approximately ten years.
Performance information reflects past performance and does not guarantee future results. Current performance may be lower or higher than the performance data quoted. Refer toblackrock.com to obtain performance data current to the most recent month-end. Performance results do not reflect the deduction of taxes that a shareholder would pay on Fund distributions or the redemption of Fund shares. Figures shown in the performance tables on the previous pages assume reinvestment of all distributions, if any, at net asset value (“NAV”) on the ex-dividend date or payable date, as applicable. Investment return and principal value of shares will fluctuate so that shares, when redeemed, may be worth more or less than their original cost. Distributions paid to each class of shares will vary because of the different levels of service, distribution and transfer agency fees applicable to each class, which are deducted from the income available to be paid to shareholders.
BlackRock Advisors, LLC (the “Manager”), each Fund’s investment adviser, has contractually agreed to waive and/or reimburse a portion of each Fund’s expenses. Without such waiver and/or reimbursement, each Fund’s performance would have been lower. With respect to each Fund’s contractual waivers, the Manager is under no obligation to continue waiving and/or reimbursing its fees after the applicable termination date of such agreement. See Note 6 of the Notes to Financial Statements for additional information on waivers and/or reimbursements.
Shareholders of each Fund may incur the following charges: (a) transactional expenses, such as sales charges; and (b) operating expenses, including investment advisory fees, administration fees, service and distribution fees, including 12b-1 fees, acquired fund fees and expenses, and other fund expenses. The expense examples shown on the previous pages (which are based on a hypothetical investment of $1,000 invested on November 1, 2019 and held through April 30, 2020) are intended to assist shareholders both in calculating expenses based on an investment in each Fund and in comparing these expenses with similar costs of investing in other mutual funds.
The expense examples provide information about actual account values and actual expenses. In order to estimate the expenses a shareholder paid during the period covered by this report, shareholders can divide their account value by $1,000 and then multiply the result by the number corresponding to their Fund and share class under the heading entitled “Expenses Paid During the Period.”
The expense examples also provide information about hypothetical account values and hypothetical expenses based on a Fund’s actual expense ratio and an assumed rate of return of 5% per year before expenses. In order to assist shareholders in comparing the ongoing expenses of investing in these Funds and other funds, compare the 5% hypothetical examples with the 5% hypothetical examples that appear in shareholder reports of other funds.
The expenses shown in the expense examples are intended to highlight shareholders’ ongoing costs only and do not reflect transactional expenses, such as sales charges, if any. Therefore, the hypothetical examples are useful in comparing ongoing expenses only, and will not help shareholders determine the relative total expenses of owning different funds. If these transactional expenses were included, shareholder expenses would have been higher.
| ABOUT FUND PERFORMANCE / DISCLOSUREOF EXPENSES | 9 |
Derivative Financial Instruments
The Funds may invest in various derivative financial instruments. These instruments are used to obtain exposure to a security, commodity, index, market, and/or other assets without owning or taking physical custody of securities, commodities and/or other referenced assets or to manage market, equity, credit, interest rate, foreign currency exchange rate, commodity and/or other risks. Derivative financial instruments may give rise to a form of economic leverage and involve risks, including the imperfect correlation between the value of a derivative financial instrument and the underlying asset, possible default of the counterparty to the transaction or illiquidity of the instrument. The Funds’ successful use of a derivative financial instrument depends on the investment adviser’s ability to predict pertinent market movements accurately, which cannot be assured. The use of these instruments may result in losses greater than if they had not been used, may limit the amount of appreciation a Fund can realize on an investment and/or may result in lower distributions paid to shareholders. The Funds’ investments in these instruments, if any, are discussed in detail in the Notes to Financial Statements.
Portfolio Information as of April 30, 2020
BlackRock Advantage Emerging Markets Fund
GEOGRAPHIC ALLOCATION
| Country/Geographic Region | Percent of Net Assets | |||
China | 36 | % | ||
Taiwan | 12 | |||
South Korea | 9 | |||
India | 9 | |||
South Africa | 4 | |||
Russia | 4 | |||
Brazil | 4 | |||
Mexico | 2 | |||
Saudi Arabia | 2 | |||
Thailand | 2 | |||
Malaysia | 1 | |||
Indonesia | 1 | |||
Turkey | 1 | |||
Poland | 1 | |||
Others(a) | 2 | |||
Short-Term Securities | 10 | |||
| (a) | Other includes less than 1% of investments in each of the following countries: Argentina, Chile, Colombia, Greece, Hong Kong, Hungary, Luxembourg, Peru, Philippines and United Arab Emirates. |
BlackRock Global Long/Short Equity Fund
GEOGRAPHIC ALLOCATION
| Percent of Total Investments (b) | ||||||||||||
| Country/Geographic Region | Long | Short | Total | |||||||||
United States | 25 | % | 23 | % | 48 | % | ||||||
Japan | 10 | 10 | 20 | |||||||||
United Kingdom | 3 | 3 | 6 | |||||||||
Germany | 2 | 2 | 4 | |||||||||
Canada | 2 | 2 | 4 | |||||||||
Australia | 2 | 1 | 3 | |||||||||
France | 1 | 1 | 2 | |||||||||
Switzerland | 1 | 2 | 3 | |||||||||
Sweden | 1 | 1 | 2 | |||||||||
Netherlands | 1 | — | (c) | 1 | ||||||||
Denmark | 1 | 1 | 2 | |||||||||
Ireland(c) | — | — | — | |||||||||
Finland | — | (c) | 1 | 1 | ||||||||
Italy(c) | — | — | — | |||||||||
Norway(c) | — | — | — | |||||||||
Others(d) | 1 | 3 | 4 | |||||||||
| 50 | % | 50 | % | 100 | % | |||||||
|
|
|
|
|
| |||||||
| (b) | Total investments include the gross notional values of long and short equity securities of the underlying derivative contracts utilized by the Fund and exclude short-term securities. |
| (c) | Represents less than 1% of total investments. Please refer to the Schedule of Investments for such countries. |
| (d) | Includes holdings within countries representing less than 1% of total investments. Please refer to the Schedules of Investments for such countries. |
| 10 | 2020 BLACKROCK ANNUAL REPORTTO SHAREHOLDERS |
April 30, 2020 | BlackRock Advantage Emerging Markets Fund (Percentages shown are based on Net Assets) |
| Security | Shares | Value | ||||||
Common Stocks — 87.9% |
| |||||||
Argentina — 0.0% |
| |||||||
YPF SA, ADR | 10,771 | $ | 41,361 | |||||
|
| |||||||
| Brazil — 2.3% | ||||||||
AMBEV SA | 87,700 | 182,886 | ||||||
AMBEV SA, ADR | 52,468 | 112,806 | ||||||
B3 SA — Brasil Bolsa Balcao | 27,119 | 191,602 | ||||||
BRF SA(a) | 8,576 | 30,579 | ||||||
Cosan Ltd., Class A(a) | 2,123 | 28,321 | ||||||
Cosan SA | 2,113 | 23,446 | ||||||
CPFL Energia SA | 27,287 | 145,721 | ||||||
Duratex SA | 13,705 | 24,547 | ||||||
Hapvida Participacoes e Investimentos SA(b) | 3,795 | 36,597 | ||||||
Hypera SA | 6,459 | 34,540 | ||||||
Iochpe-Maxion SA | 17,351 | 40,554 | ||||||
Klabin SA | 46,982 | 153,874 | ||||||
Lojas Renner SA | 9,172 | 64,752 | ||||||
M Dias Branco SA | 4,536 | 26,693 | ||||||
Natura & Co. Holding SA | 11,638 | 76,019 | ||||||
Notre Dame Intermedica Participacoes SA | 7,700 | 77,610 | ||||||
Raia Drogasil SA | 10,955 | 211,086 | ||||||
Rumo SA(a) | 8,801 | 32,029 | ||||||
Tim Participacoes SA | 22,080 | 51,811 | ||||||
Totvs SA | 4,892 | 53,212 | ||||||
Ultrapar Participacoes SA | 28,985 | 77,288 | ||||||
Vale SA | 54,247 | 447,511 | ||||||
WEG SA | 27,802 | 204,199 | ||||||
|
| |||||||
| 2,327,683 | ||||||||
| Chile — 0.2% | ||||||||
Aguas Andinas SA, Class A | 81,479 | 27,326 | ||||||
Empresa Nacional de Telecomunicaciones SA (ENTEL)(a) | 5,477 | 33,128 | ||||||
Enersis SA | 290,053 | 47,595 | ||||||
SACI Falabella | 49,453 | 135,050 | ||||||
|
| |||||||
| 243,099 | ||||||||
| China — 35.5% | ||||||||
3SBio, Inc.(a)(b) | 73,500 | 74,516 | ||||||
58.com, Inc. — ADR(a) | 504 | 26,183 | ||||||
A-Living Services Co. Ltd., Class H(b) | 6,750 | 37,313 | ||||||
AAC Technologies Holdings, Inc.(a) | 8,000 | 37,837 | ||||||
Agricultural Bank of China Ltd., Class H | 494,000 | 205,495 | ||||||
Alibaba Group Holding Ltd.(a) | 5,600 | 142,124 | ||||||
Alibaba Group Holding Ltd. — ADR(a) | 30,685 | 6,218,929 | ||||||
Alibaba Health Information Technology Ltd.(a) | 62,000 | 148,304 | ||||||
Anhui Conch Cement Co. Ltd., Class A | 22,029 | 184,034 | ||||||
Anhui Conch Cement Co. Ltd., Class H | 24,000 | 189,249 | ||||||
Anta Sports Products Ltd. | 20,000 | 170,321 | ||||||
Autohome, Inc. — ADR | 506 | 41,568 | ||||||
BAIC Motor Corp. Ltd., Class H(b) | 322,500 | 141,091 | ||||||
Baidu, Inc. — ADR(a) | 4,702 | 474,573 | ||||||
Bank of Beijing Co. Ltd., Class A | 193,400 | 135,358 | ||||||
Bank of China Ltd., Class H | 1,965,000 | 748,081 | ||||||
Bank of Communications Co. Ltd., Class H | 72,000 | 45,627 | ||||||
Bank of Jiangsu Co. Ltd., Class A | 79,399 | 67,438 | ||||||
Baoshan Iron & Steel Co. Ltd., Class A | 253,530 | 173,155 | ||||||
BBMG Corp., Class H | 167,000 | 42,221 | ||||||
Beijing Enterprises Holdings Ltd. | 37,000 | 131,076 | ||||||
Betta Pharmaceuticals Co. Ltd., Class A | 2,100 | 27,565 | ||||||
Bosideng International Holdings Ltd. | 200,000 | 54,223 | ||||||
Changchun High & New Technology Industry Group, Inc., Class A | 469 | 38,894 | ||||||
China CITIC Bank Corp. Ltd., Class H | 142,000 | 69,372 | ||||||
China Communications Services Corp. Ltd., Class H | 160,000 | 114,050 | ||||||
China Construction Bank Corp., Class A | 63,000 | 56,969 | ||||||
| Security | Shares | Value | ||||||
| China (continued) | ||||||||
China Construction Bank Corp., Class H | 1,863,000 | $ | 1,495,361 | |||||
China Everbright Bank Co. Ltd., Class A | 312,600 | 163,880 | ||||||
China Everbright Bank Co., Ltd., Class H | 63,000 | 26,734 | ||||||
China Galaxy Securities Co. Ltd., Class H | 53,500 | 27,167 | ||||||
China International Capital Corp. Ltd.(a)(b) | 24,000 | 36,857 | ||||||
China Lesso Group Holdings, Ltd. | 18,000 | 25,793 | ||||||
China Life Insurance Co. Ltd., Class H | 235,000 | 501,184 | ||||||
China Medical System Holdings, Ltd. | 32,000 | 37,669 | ||||||
China Mengniu Dairy Co. Ltd.(a) | 78,000 | 276,206 | ||||||
China Merchants Bank Co. Ltd., Class A | 13,900 | 68,207 | ||||||
China Merchants Bank Co. Ltd., Class H | 72,500 | 343,092 | ||||||
China Merchants Securities Co. Ltd., Class A(a) | 14,000 | 36,042 | ||||||
China Minsheng Banking Corp. Ltd., Class A | 316,697 | 262,173 | ||||||
China Mobile Ltd. | 105,000 | 844,101 | ||||||
China Molybdenum Co. Ltd., Class H | 81,000 | 24,438 | ||||||
China National Building Material Co. Ltd., Class H | 56,000 | 69,952 | ||||||
China National Medicines Corp. Ltd., Class A | 6,099 | 26,671 | ||||||
China Oilfield Services Ltd., Class H | 48,000 | 37,388 | ||||||
China Overseas Land & Investment Ltd. | 36,000 | 132,982 | ||||||
China Pacific Insurance Group Co. Ltd., Class A | 26,450 | 113,456 | ||||||
China Pacific Insurance Group Co. Ltd., Class H | 60,000 | 198,506 | ||||||
China Petroleum & Chemical Corp., Class H | 60,000 | 29,905 | ||||||
China Railway Construction Corp. Ltd., Class A | 25,000 | 27,450 | ||||||
China Railway Group Ltd., Class A | 222,194 | 182,257 | ||||||
China Railway Group Ltd., Class H | 284,000 | 169,811 | ||||||
China Resources Beer Holdings Co. Ltd. | 34,000 | 160,134 | ||||||
China Resources Cement Holdings Ltd. | 80,000 | 108,856 | ||||||
China Resources Land Ltd. | 54,000 | 223,139 | ||||||
China Resources Pharmaceutical Group Ltd.(b) | 61,500 | 38,624 | ||||||
China Telecom Corp. Ltd., Class H | 1,182,000 | 408,263 | ||||||
China Tower Corp. Ltd., Class H(b) | 292,000 | 64,983 | ||||||
China Unicom Hong Kong Ltd. | 94,000 | 60,793 | ||||||
China Vanke Co. Ltd., Class H | 15,400 | 51,755 | ||||||
Chongqing Rural Commercial Bank Co. Ltd., Class H | 123,000 | 53,659 | ||||||
CITIC Securities Co. Ltd., Class H | 25,000 | 47,887 | ||||||
CNOOC Ltd. | 244,000 | 269,772 | ||||||
Country Garden Holdings Co. Ltd. | 53,000 | 68,655 | ||||||
Country Garden Services Holdings Co. Ltd. | 53,000 | 244,869 | ||||||
CSPC Pharmaceutical Group Ltd. | 94,000 | 186,093 | ||||||
CSR Corp. Ltd., Class H | 92,000 | 48,701 | ||||||
East Money Information Co. Ltd., Class A | 18,399 | 46,654 | ||||||
ENN Energy Holdings Ltd. | 22,800 | 257,012 | ||||||
First Capital Securities Co. Ltd., Class A | 38,600 | 37,367 | ||||||
Foshan Haitian Flavouring & Food Co. Ltd., Class A | 3,746 | 64,435 | ||||||
G-bits Network Technology Xiamen Co. Ltd., Class A | 1,699 | 90,244 | ||||||
GCL System Integration Technology Co. Ltd.(a) | 64,600 | 22,878 | ||||||
GDS Holdings Ltd. — ADR(a) | 711 | 40,755 | ||||||
Geely Automobile Holdings Ltd. | 47,000 | 73,110 | ||||||
Genscript Biotech Corp.(a) | 16,000 | 28,534 | ||||||
GF Securities Co. Ltd., Class H | 40,800 | 44,273 | ||||||
Gigadevice Semiconductor Beijing, Inc., Class A | 2,200 | 85,175 | ||||||
Glodon Co. Ltd., Class A | 20,200 | 147,829 | ||||||
GoerTek, Inc., Class A | 16,917 | 45,437 | ||||||
Guangshen Railway Co. Ltd., Class A | 94,700 | 31,552 | ||||||
Guotai Junan Securities Co. Ltd., Class A | 13,200 | 31,132 | ||||||
Guotai Junan Securities Co. Ltd., Class H(b) | 25,800 | 36,722 | ||||||
Haier Electronics Group Co. Ltd. | 18,000 | 49,574 | ||||||
Haitong Securities Co. Ltd., Class H(a) | 41,600 | 37,661 | ||||||
Hansoh Pharmaceutical Group Co. Ltd.(a)(b) | 10,000 | 38,613 | ||||||
Henan Shuanghui Investment & Development Co. Ltd., Class A | 21,898 | 124,057 | ||||||
Hengan International Group Co. Ltd. | 9,000 | 80,037 | ||||||
Huadong Medicine Co. Ltd., Class A | 17,240 | 48,044 | ||||||
Huatai Securities Co. Ltd., Class A | 49,000 | 123,631 | ||||||
| SCHEDULES OF INVESTMENTS | 11 |
Schedule of Investments (continued) April 30, 2020 | BlackRock Advantage Emerging Markets Fund (Percentages shown are based on Net Assets) |
| Security | Shares | Value | ||||||
| China (continued) | ||||||||
Huatai Securities Co. Ltd., Class H(b) | 71,000 | $ | 117,745 | |||||
Hunan Valin Steel Co. Ltd., Class A | 64,995 | 36,309 | ||||||
Hytera Communications Corp. Ltd., Class A | 30,300 | 27,869 | ||||||
Industrial & Commercial Bank of China Ltd., Class H | 1,201,000 | 805,281 | ||||||
Industrial Bank Co. Ltd., Class A | 72,700 | 169,204 | ||||||
Inner Mongolia Yili Industrial Group Co. Ltd., Class A | 26,100 | 106,625 | ||||||
Innovent Biologics, Inc.(a)(b) | 17,000 | 83,721 | ||||||
JD.com, Inc. — ADR(a) | 13,739 | 592,151 | ||||||
Jiangsu Expressway Co. Ltd., Class H | 82,000 | 97,881 | ||||||
Jiangsu Hengrui Medicine Co. Ltd., Class A | 14,156 | 183,434 | ||||||
Jiangsu Yanghe Brewery Joint-Stock Co., Ltd., Class A | 3,592 | 49,595 | ||||||
JonjeeHi-Tech Industrial and Commercial Holding Co. Ltd., Class A | 6,000 | 39,611 | ||||||
JOYY, Inc., ADR(a) | 892 | 54,376 | ||||||
Kingdee International Software Group Co., Ltd.(a) | 64,000 | 91,531 | ||||||
Kingsoft Corp. Ltd. | 14,000 | 48,079 | ||||||
Kunlun Energy Co. Ltd. | 390,000 | 254,083 | ||||||
Kweichow Moutai Co. Ltd., Class A | 1,100 | 195,243 | ||||||
Legend Holdings Corp., Class H(b) | 19,000 | 22,234 | ||||||
Lenovo Group Ltd. | 300,000 | 162,059 | ||||||
Lens Technology Co. Ltd., Class A | 11,699 | 29,351 | ||||||
Li Ning Co. Ltd. | 24,500 | 77,358 | ||||||
Longfor Properties Co. Ltd.(b) | 20,000 | 101,681 | ||||||
Luckin Coffee, Inc., ADR(a) | 1,261 | 5,536 | ||||||
Luxshare Precision Industry Co. Ltd., Class A | 10,811 | 71,027 | ||||||
Luye Pharma Group Ltd.(b) | 78,000 | 37,875 | ||||||
Meituan Dianping, Class B(a) | 23,400 | 313,305 | ||||||
Muyuan Foodstuff Co. Ltd., Class A | 4,482 | 79,937 | ||||||
NetEase, Inc. — ADR | 1,387 | 478,460 | ||||||
New China Life Insurance Co. Ltd., Class A | 19,500 | 122,327 | ||||||
New China Life Insurance Co. Ltd., Class H | 19,000 | 65,830 | ||||||
New Hope Liuhe Co. Ltd., Class A | 12,100 | 55,695 | ||||||
New Oriental Education & Technology Group, Inc. — ADR(a) | 2,585 | 330,001 | ||||||
PetroChina Co. Ltd., Class H | 712,000 | 255,744 | ||||||
PICC Property & Casualty Co. Ltd., Class H | 178,000 | 170,336 | ||||||
Pinduoduo, Inc., ADR(a) | 4,005 | 189,997 | ||||||
Ping An Healthcare and Technology Co. Ltd.(a)(b) | 5,500 | 75,768 | ||||||
Ping An Insurance Group Co. of China Ltd., Class H | 99,500 | 1,012,538 | ||||||
Poly Developments and Holdings Group Co. Ltd., Class A | 45,400 | 102,682 | ||||||
Poly Property Development Co. Ltd., Class H | 5,200 | 55,291 | ||||||
Postal Savings Bank of China Co. Ltd., Class H(b) | 39,000 | 23,305 | ||||||
Q Technology Group Co. Ltd. | 7,000 | 8,375 | ||||||
RiseSun Real Estate Development Co. Ltd., Class A | 1 | 1 | ||||||
Sangfor Technologies, Inc., Class A | 3,400 | 91,348 | ||||||
Shandong Weigao Group Medical Polymer Co. Ltd., Class H | 28,000 | 42,536 | ||||||
Shanghai Baosight Software Co. Ltd., Class A | 5,768 | 40,834 | ||||||
Shanghai Fosun Pharmaceutical Group Co., Ltd. | 9,500 | 35,891 | ||||||
Shanghai Pharmaceuticals Holding Co. Ltd., Class H | 89,900 | 158,242 | ||||||
Shanxi Xinghuacun Fen Wine Factory Co. Ltd., Class A, Class A | 3,500 | 52,472 | ||||||
Shennan Circuits Co. Ltd., Class A | 1,300 | 41,706 | ||||||
Shenzhen Kangtai Biological Products Co. Ltd., Class A(a) | 2,600 | 48,485 | ||||||
Shenzhen MindrayBio-Medical Electronics Co. Ltd., Class A | 1,100 | 39,267 | ||||||
Shenzhou International Group Holdings Ltd. | 5,100 | 58,862 | ||||||
Shimao Property Holdings Ltd. | 7,000 | 28,454 | ||||||
Sichuan Kelun Pharmaceutical Co. Ltd., Class A | 12,700 | 34,467 | ||||||
Silergy Corp. | 1,000 | 39,728 | ||||||
Sinopec Engineering Group Co. Ltd., Class H | 65,000 | 31,164 | ||||||
Sinopec Shanghai Petrochemical Co. Ltd., Class H | 118,000 | 32,037 | ||||||
Sinopharm Group Co. Ltd., Class H | 88,400 | 238,358 | ||||||
Sunac China Holdings Ltd. | 30,000 | 134,198 | ||||||
Sunny Optical Technology Group Co. Ltd. | 20,300 | 282,688 | ||||||
TAL Education Group — ADR(a) | 6,856 | 371,527 | ||||||
Tencent Holdings Ltd. | 120,200 | 6,318,846 | ||||||
| Security | Shares | Value | ||||||
| China (continued) | ||||||||
Tingyi Cayman Islands Holding Corp. | 122,000 | $ | 216,562 | |||||
Trip.com Group Ltd., ADR(a) | 5,262 | 135,549 | ||||||
Tsingtao Brewery Co. Ltd., Class H | 4,000 | 24,300 | ||||||
Uni-President China Holdings Ltd. | 32,000 | 32,126 | ||||||
Venustech Group, Inc., Class A | 8,800 | 50,376 | ||||||
Vipshop Holdings Ltd. — ADR(a) | 4,054 | 64,580 | ||||||
Want Want China Holdings Ltd. | 228,000 | 162,505 | ||||||
Weihai Guangwei Composites Co. Ltd., Class A | 7,199 | 54,949 | ||||||
Will Semiconductor Ltd., Class A | 1,200 | 32,452 | ||||||
Wuhu Sanqi Interactive Entertainment Network Technology Group Co. Ltd., Class A | 21,422 | 108,326 | ||||||
WuXi AppTec Co. Ltd., Class A | 3,300 | 46,483 | ||||||
WuXi AppTec Co. Ltd., Class H(b) | 2,700 | 38,066 | ||||||
Wuxi Biologics Cayman, Inc.(a)(b) | 13,500 | 210,147 | ||||||
Xiaomi Corp., Class B(a)(b) | 123,200 | 161,588 | ||||||
Yealink Network Technology Corp. Ltd., Class A | 3,907 | 49,437 | ||||||
Yihai International Holding, Ltd.(a) | 5,000 | 39,844 | ||||||
Yum China Holdings, Inc.(a) | 3,789 | 183,615 | ||||||
Yunnan Baiyao Group Co. Ltd., Class A | 5,499 | 69,810 | ||||||
Yunnan Energy New Material Co. Ltd. | 5,400 | 40,793 | ||||||
Zai Lab Ltd., ADR(a) | 634 | 39,765 | ||||||
Zhejiang Expressway Co. Ltd., Class H | 60,000 | 45,378 | ||||||
Zhuzhou CSR Times Electric Co. Ltd., Class H | 8,400 | 25,697 | ||||||
Zijin Mining Group Co. Ltd., Class A | 61,800 | 33,680 | ||||||
Zijin Mining Group Co. Ltd., Class H | 164,000 | 66,956 | ||||||
Zoomlion Heavy Industry Science and Technology Co. Ltd., Class A(a) | 204,098 | 183,178 | ||||||
Zoomlion Heavy Industry Science and Technology Co. Ltd., Class H(a) | 159,000 | 128,724 | ||||||
ZTO Express Cayman, Inc., — ADR | 5,819 | 173,173 | ||||||
|
| |||||||
| 35,912,377 | ||||||||
| Colombia — 0.1% | ||||||||
Bancolombia SA — ADR | 3,304 | 86,234 | ||||||
|
| |||||||
| Greece — 0.1% | ||||||||
Hellenic Telecommunications Organization SA | 4,341 | 57,351 | ||||||
OPAP SA | 3,965 | 35,516 | ||||||
|
| |||||||
| 92,867 | ||||||||
| Hong Kong — 0.3% | ||||||||
Nine Dragons Paper Holdings Ltd. | 142,000 | 135,854 | ||||||
Sino Biopharmaceutical Ltd. | 105,000 | 153,048 | ||||||
|
| |||||||
| 288,902 | ||||||||
| Hungary — 0.3% | ||||||||
MOL Hungarian Oil & Gas PLC(a) | 15,380 | 97,368 | ||||||
OTP Bank PLC(a) | 2,193 | 64,948 | ||||||
Richter Gedeon Nyrt | 5,465 | 116,780 | ||||||
|
| |||||||
| 279,096 | ||||||||
| India — 8.9% | ||||||||
Ambuja Cements Ltd. | 22,111 | 50,073 | ||||||
APL Apollo Tubes Ltd. | 1,555 | 29,479 | ||||||
Asian Paints Ltd. | 11,901 | 277,687 | ||||||
Aurobindo Pharma Ltd. | 4,489 | 36,716 | ||||||
Axis Bank Ltd. | 25,227 | 147,388 | ||||||
Bajaj Finance Ltd. | 1,843 | 56,351 | ||||||
Berger Paints India Ltd. | 4,212 | 28,324 | ||||||
Bharti Airtel Ltd.(a) | 41,937 | 285,596 | ||||||
Biocon Ltd. | 8,589 | 40,082 | ||||||
Cipla Ltd. | 8,448 | 65,748 | ||||||
Dabur India Ltd. | 37,755 | 244,248 | ||||||
Divi’s Laboratories Ltd. | 1,356 | 41,812 | ||||||
Dr. Reddy’s Laboratories Ltd. | 4,459 | 230,964 | ||||||
GAIL India Ltd. | 53,789 | 68,061 | ||||||
Glenmark Pharmaceuticals Ltd. | 27,607 | 122,027 | ||||||
| 12 | 2020 BLACKROCK ANNUAL REPORTTO SHAREHOLDERS |
Schedule of Investments (continued) April 30, 2020 | BlackRock Advantage Emerging Markets Fund (Percentages shown are based on Net Assets) |
| Security | Shares | Value | ||||||
| India (continued) | ||||||||
Godrej Consumer Products Ltd. | 16,809 | $ | 120,627 | |||||
HCL Technologies Ltd. | 40,113 | 287,686 | ||||||
HDFC Asset Management Co. Ltd.(b) | 1,134 | 37,960 | ||||||
HDFC Bank Ltd. — ADR | 4,682 | 202,965 | ||||||
Hemisphere Properties India Ltd.(a) | 11,589 | 23,761 | ||||||
Hindalco Industries Ltd. | 126,974 | 215,367 | ||||||
Hindustan Unilever Ltd. | 20,177 | 584,236 | ||||||
Housing Development Finance Corp. Ltd. | 32,089 | 811,685 | ||||||
ICICI Bank Ltd. | 81,623 | 409,489 | ||||||
Infosys Ltd. | 59,568 | 556,790 | ||||||
Infosys Ltd. — ADR | 12,431 | 114,738 | ||||||
ITC Ltd. | 105,195 | 253,435 | ||||||
JSW Steel Ltd. | 21,187 | 50,040 | ||||||
Just Dial Ltd.(a) | 14,579 | 78,218 | ||||||
Kotak Mahindra Bank Ltd. | 7,130 | 128,045 | ||||||
Lupin Ltd. | 3,778 | 41,663 | ||||||
Marico Ltd. | 10,349 | 39,311 | ||||||
Mindtree Ltd. | 12,058 | 145,976 | ||||||
Mphasis Ltd. | 11,204 | 108,876 | ||||||
Nestle India Ltd. | 1,348 | 319,747 | ||||||
Oil & Natural Gas Corp. Ltd. | 58,586 | 61,996 | ||||||
Persistent Systems Ltd. | 6,238 | 39,181 | ||||||
Petronet LNG Ltd. | 47,758 | 153,859 | ||||||
PI Industries Ltd. | 2,076 | 43,533 | ||||||
Pidilite Industries Ltd. | 4,058 | 81,809 | ||||||
Reliance Industries Ltd. | 49,551 | 963,421 | ||||||
Sanofi India Ltd. | 234 | 24,017 | ||||||
Siemens Ltd. | 3,314 | 49,994 | ||||||
State Bank of India(a) | 26,035 | 65,154 | ||||||
Sun Pharmaceutical Industries Ltd. | 14,299 | 87,209 | ||||||
Tata Chemicals Ltd. | 35,347 | 132,126 | ||||||
Tata Consultancy Services Ltd. | 23,313 | 617,150 | ||||||
Tech Mahindra Ltd. | 35,482 | 255,189 | ||||||
Titan Co. Ltd. | 2,727 | 34,874 | ||||||
UPL Ltd. | 11,058 | 61,191 | ||||||
Wipro Ltd. | 15,845 | 40,228 | ||||||
|
| |||||||
| 8,966,102 | ||||||||
| Indonesia — 0.9% | ||||||||
Bank Central Asia Tbk PT | 234,100 | 405,506 | ||||||
Bank Mandiri Persero Tbk PT | 229,800 | 68,310 | ||||||
Bank Negara Indonesia Persero Tbk PT | 294,600 | 80,395 | ||||||
Bank Rakyat Indonesia Persero Tbk PT | 474,700 | 86,342 | ||||||
Gudang Garam Tbk PT | 30,700 | 93,322 | ||||||
Kalbe Farma Tbk PT | 280,700 | 27,117 | ||||||
Telekomunikasi Indonesia Persero Tbk PT | 823,000 | 189,250 | ||||||
|
| |||||||
| 950,242 | ||||||||
| Luxembourg — 0.0% | ||||||||
Reinet Investments SCA | 2,560 | 40,953 | ||||||
|
| |||||||
| Malaysia — 1.4% | ||||||||
CIMB Group Holdings Bhd | 298,200 | 238,435 | ||||||
Hartalega Holdings Bhd | 130,700 | 230,889 | ||||||
IHH Healthcare Bhd | 73,500 | 89,437 | ||||||
Malayan Banking Bhd | 65,800 | 115,483 | ||||||
Malaysia Airports Holdings Bhd | 24,900 | 30,273 | ||||||
Maxis Bhd | 129,200 | 164,159 | ||||||
Nestle Malaysia Bhd | 1,100 | 35,801 | ||||||
Petronas Gas Bhd | 14,100 | 50,365 | ||||||
Public Bank Bhd | 62,100 | 236,015 | ||||||
QL Resources BHD | 9,700 | 18,340 | ||||||
RHB Capital Bhd | 9,000 | 9,904 | ||||||
Telekom Malaysia Bhd | 152,500 | 142,336 | ||||||
Top Glove Corp. Bhd | 32,000 | 53,931 | ||||||
|
| |||||||
| 1,415,368 | ||||||||
| Security | Shares | Value | ||||||
| Mexico — 2.4% | ||||||||
America Movil SAB de CV, Series L | 568,735 | $ | 344,531 | |||||
Arca Continental SAB de CV | 86,811 | 334,371 | ||||||
Coca-Cola Femsa SAB de CV | 6,900 | 27,799 | ||||||
Fomento Economico Mexicano SAB de CV | 77,668 | 501,985 | ||||||
Grupo Aeroportuario del Centro Norte SAB de CV | 38,908 | 141,742 | ||||||
Grupo Aeroportuario del Pacifico SAB de CV, Series B | 10,155 | 63,456 | ||||||
Grupo Bimbo SAB de CV, Series A | 5,878 | 8,680 | ||||||
Grupo Financiero Banorte SAB de CV, Series O | 110,381 | 301,863 | ||||||
Grupo Mexico SAB de CV, Series B | 17,103 | 36,475 | ||||||
Kimberly-Clark de Mexico SAB de CV, Series A | 128,281 | 181,183 | ||||||
Wal-Mart de Mexico SAB de CV | 198,140 | 476,585 | ||||||
|
| |||||||
| 2,418,670 | ||||||||
| Peru — 0.2% | ||||||||
Credicorp Ltd. | 856 | 127,561 | ||||||
Hochschild Mining PLC(a) | 60,787 | 106,051 | ||||||
|
| |||||||
| 233,612 | ||||||||
| Philippines — 0.3% | ||||||||
Ayala Land, Inc. | 65,540 | 40,918 | ||||||
Bank of the Philippine Islands | 19,770 | 22,707 | ||||||
BDO Unibank, Inc. | 59,220 | 116,525 | ||||||
Manila Electric Co. | 14,170 | 70,751 | ||||||
Metro Pacific Investments Corp. | 506,000 | 25,511 | ||||||
Metropolitan Bank & Trust | 33,600 | 25,698 | ||||||
|
| |||||||
| 302,110 | ||||||||
| Poland — 0.7% | ||||||||
Bank Polska Kasa Opieki SA(a) | 13,628 | 172,868 | ||||||
KGHM Polska Miedz SA(a) | 4,648 | 87,425 | ||||||
Polski Koncern Naftowy ORLEN SA | 12,610 | 191,411 | ||||||
Polskie Gornictwo Naftowe i Gazownictwo SA | 50,354 | 45,325 | ||||||
Powszechna Kasa Oszczednosci Bank Polski SA | 22,760 | 121,806 | ||||||
Santander Bank Polska SA(a) | 902 | 35,855 | ||||||
|
| |||||||
| 654,690 | ||||||||
| Russia — 3.8% | ||||||||
Alrosa AO | 60,970 | 50,498 | ||||||
Federal Grid Co. Unified Energy System JSC | 9,493,999 | 23,398 | ||||||
Gazprom PJSC — ADR | 89,619 | 453,827 | ||||||
Inter Rao UES PJSC | 2,496,939 | 167,272 | ||||||
LUKOIL PJSC | 8,338 | 538,031 | ||||||
LUKOIL PJSC — ADR | 10,793 | 704,111 | ||||||
Magnitogorsk Iron & Steel Works PJSC | 385,903 | 207,591 | ||||||
MMC Norilsk Nickel PJSC | 1,455 | 395,301 | ||||||
MMC Norilsk Nickel PJSC, ADR | 4,942 | 137,080 | ||||||
Mobile Telesystems OJSC — ADR | 11,735 | 100,569 | ||||||
Novatek OAO | 8,796 | 122,343 | ||||||
Novatek PJSC — GDR | 1,688 | 236,712 | ||||||
PhosAgro PJSC — GDR | 9,037 | 108,932 | ||||||
Severstal PJSC | 24,983 | 296,701 | ||||||
Surgutneftegas OAO | 206,070 | 102,329 | ||||||
Tatneft PJSC(a) | 27,200 | 200,235 | ||||||
|
| |||||||
| 3,844,930 | ||||||||
| Saudi Arabia — 2.3% | ||||||||
Advanced Petrochemical Co. | 2,447 | 28,952 | ||||||
Al Rajhi Bank | 44,647 | 678,672 | ||||||
Alinma Bank(a) | 32,796 | 138,660 | ||||||
Almarai Co. JSC | 5,756 | 75,051 | ||||||
Arab National Bank | 12,342 | 66,747 | ||||||
BankAl-Jazira | 35,251 | 111,891 | ||||||
Bank AlBilad | 9,228 | 55,620 | ||||||
Banque Saudi Fransi | 5,260 | 43,230 | ||||||
Etihad Etisalat Co.(a) | 9,514 | 70,274 | ||||||
National Commercial Bank | 31,488 | 310,766 | ||||||
Rabigh Refining & Petrochemical Co.(a) | 7,314 | 26,561 | ||||||
| SCHEDULES OF INVESTMENTS | 13 |
Schedule of Investments (continued) April 30, 2020 | BlackRock Advantage Emerging Markets Fund (Percentages shown are based on Net Assets) |
| Security | Shares | Value | ||||||
| Saudi Arabia (continued) | ||||||||
Riyad Bank | 16,632 | $ | 75,190 | |||||
Samba Financial Group | 16,993 | 104,955 | ||||||
Saudi Basic Industries Corp. | 6,819 | 135,322 | ||||||
Saudi British Bank | 9,048 | 59,102 | ||||||
Saudi Cement Co. | 3,806 | 53,168 | ||||||
Saudi Industrial Investment Group | 9,202 | 45,414 | ||||||
Saudi Kayan Petrochemical Co.(a) | 19,741 | 45,328 | ||||||
Saudi Telecom Co. | 2,944 | 70,899 | ||||||
Yanbu National Petrochemical Co. | 7,732 | 92,130 | ||||||
|
| |||||||
| 2,287,932 | ||||||||
| South Africa — 4.1% | ||||||||
Absa Group, Ltd. | 35,693 | 176,150 | ||||||
Anglo American Platinum Ltd. | 2,739 | 143,743 | ||||||
AngloGold Ashanti Ltd. | 6,119 | 149,366 | ||||||
Aspen Pharmacare Holdings Ltd.(a) | 4,608 | 28,743 | ||||||
Barloworld Ltd. | 30,420 | 111,605 | ||||||
Capitec Bank Holdings, Ltd.(a) | 790 | 38,512 | ||||||
Clicks Group, Ltd.(a) | 13,174 | 163,976 | ||||||
FirstRand Ltd. | 169,438 | 369,799 | ||||||
The Foschini Group Ltd. | 26,002 | 102,019 | ||||||
Gold Fields Ltd. | 15,041 | 111,959 | ||||||
Gold Fields Ltd., ADR | 13,082 | 96,022 | ||||||
Impala Platinum Holdings Ltd. | 5,625 | 33,549 | ||||||
Life Healthcare Group Holdings Ltd. | 23,736 | 22,871 | ||||||
MTN Group Ltd. | 44,822 | 117,786 | ||||||
MultiChoice Group Ltd.(a) | 20,151 | 94,446 | ||||||
Naspers Ltd., Class N | 9,058 | 1,409,863 | ||||||
Nedbank Group Ltd. | 22,207 | 129,100 | ||||||
Netcare Ltd. | 150,381 | 125,754 | ||||||
Northam Platinum Ltd.(a) | 2,463 | 12,208 | ||||||
Old Mutual Ltd. | 121,324 | 88,069 | ||||||
Pick n Pay Stores Ltd. | 7,249 | 22,683 | ||||||
Shoprite Holdings Ltd. | 4,618 | 26,691 | ||||||
Spar Group Ltd. | 12,451 | 118,680 | ||||||
Standard Bank Group Ltd. | 64,273 | 354,142 | ||||||
Vodacom Group Ltd. | 9,437 | 62,735 | ||||||
|
| |||||||
| 4,110,471 | ||||||||
| South Korea — 9.3% | ||||||||
Celltrion Healthcare Co. Ltd.(a) | 900 | 62,379 | ||||||
Celltrion, Inc.(a) | 1,976 | 341,524 | ||||||
Cheil Worldwide, Inc. | 7,003 | 102,208 | ||||||
Dongbu Insurance Co., Ltd. | 1,152 | 42,077 | ||||||
Doosan Bobcat, Inc. | 2,820 | 54,582 | ||||||
Doosan Infracore Co. Ltd.(a) | 15,871 | 55,839 | ||||||
GS Holdings Corp. | 1,545 | 48,614 | ||||||
Hana Financial Group, Inc. | 1,310 | 29,905 | ||||||
Hanwha Chemical Corp. | 3,079 | 36,849 | ||||||
HLB, Inc.(a) | 650 | 50,966 | ||||||
Hyundai Mobis Co. Ltd. | 1,377 | 194,681 | ||||||
Hyundai Motor Co. | 2,762 | 213,482 | ||||||
Kakao Corp. | 370 | 55,914 | ||||||
KB Financial Group, Inc. | 6,626 | 189,579 | ||||||
KCC Corp. | 202 | 27,493 | ||||||
Korea Zinc Co., Ltd. | 278 | 88,358 | ||||||
KT Corp. — ADR | 23,903 | 234,488 | ||||||
Kumho Petrochemical Co. Ltd. | 1,590 | 100,269 | ||||||
LG Chem Ltd. | 723 | 224,646 | ||||||
LG Electronics, Inc. | 6,596 | 296,853 | ||||||
LG Household & Health Care Ltd. | 187 | 212,057 | ||||||
LG Innotek Co., Ltd. | 279 | 30,228 | ||||||
NAVER Corp. | 3,595 | 582,859 | ||||||
NCSoft Corp. | 398 | 210,880 | ||||||
POSCO | 4,026 | 608,350 | ||||||
| Security | Shares | Value | ||||||
| South Korea (continued) | ||||||||
Posco International Corp. | 3,700 | $ | 43,006 | |||||
Samsung Biologics Co. Ltd.(a)(b) | 284 | 135,662 | ||||||
Samsung Electronics Co. Ltd. | 100,122 | 4,116,769 | ||||||
Samsung Life Insurance Co. Ltd. | 670 | 27,172 | ||||||
Samsung SDI Co. Ltd. | 319 | 75,359 | ||||||
Samsung SDS Co. Ltd. | 100 | 13,340 | ||||||
Shinhan Financial Group Co. Ltd. | 15,034 | 381,150 | ||||||
SK Holdings Co. Ltd. | 276 | 41,197 | ||||||
SK Hynix, Inc. | 6,440 | 443,185 | ||||||
Woori Financial Group, Inc. | 9,825 | 68,043 | ||||||
Yuhan Corp. | 505 | 19,620 | ||||||
|
| |||||||
| 9,459,583 | ||||||||
| Taiwan — 12.0% | ||||||||
Acer, Inc. | 131,000 | 72,528 | ||||||
Asia Cement Corp. | 44,000 | 64,640 | ||||||
ASPEED Technology, Inc. | 2,000 | 79,088 | ||||||
Asustek Computer, Inc. | 22,000 | 148,712 | ||||||
Bizlink Holding, Inc. | 4,000 | 26,063 | ||||||
Catcher Technology Co., Ltd. | 19,000 | 143,915 | ||||||
Cathay Financial Holding Co. Ltd. | 292,298 | 390,019 | ||||||
Chailease Holding Co. Ltd. | 80,552 | 306,046 | ||||||
Chicony Electronics Co., Ltd. | 38,000 | 107,039 | ||||||
China Life Insurance Co. Ltd. | 66,000 | 45,066 | ||||||
Chipbond Technology Corp. | 81,000 | 152,483 | ||||||
Chunghwa Telecom Co. Ltd. | 41,000 | 150,692 | ||||||
CTBC Financial Holding Co. Ltd. | 701,000 | 467,141 | ||||||
Delta Electronics, Inc. | 33,000 | 153,919 | ||||||
E.Sun Financial Holding Co. Ltd. | 115,000 | 104,488 | ||||||
Far EasTone Telecommunications Co. Ltd. | 34,000 | 75,727 | ||||||
Faraday Technology Corp. | 26,000 | 37,379 | ||||||
Formosa Plastics Corp. | 17,000 | 49,899 | ||||||
Foxconn Technology Co., Ltd. | 21,000 | 40,322 | ||||||
Fubon Financial Holding Co. Ltd. | 286,000 | 404,398 | ||||||
General Interface Solution Holding Ltd. | 16,000 | 50,827 | ||||||
Hon Hai Precision Industry Co. Ltd. | 204,000 | 524,273 | ||||||
King Slide Works Co., Ltd. | 3,000 | 31,199 | ||||||
Kinsus Interconnect Technology Corp. | 24,000 | 41,983 | ||||||
Largan Precision Co. Ltd. | 2,000 | 272,627 | ||||||
Makalot Industrial Co. Ltd. | 7,000 | 29,805 | ||||||
MediaTek, Inc. | 35,000 | 483,295 | ||||||
Novatek Microelectronics Corp. | 10,000 | 62,190 | ||||||
President Chain Store Corp. | 14,000 | 144,770 | ||||||
Quanta Computer, Inc. | 36,000 | 77,784 | ||||||
Radiant Opto-Electronics Corp. | 6,000 | 19,692 | ||||||
Realtek Semiconductor Corp. | 21,000 | 179,830 | ||||||
Sercomm Corp. | 60,000 | 149,930 | ||||||
Simplo Technology Co. Ltd. | 7,000 | 72,699 | ||||||
SinoPac Financial Holdings Co. Ltd. | 93,000 | 37,852 | ||||||
Sitronix Technology Corp. | 9,000 | 43,758 | ||||||
Standard Foods Corp. | 12,000 | 27,046 | ||||||
Synnex Technology International Corp. | 38,000 | 50,715 | ||||||
Taiwan Mobile Co. Ltd. | 146,000 | 526,054 | ||||||
Taiwan Semiconductor Manufacturing Co. Ltd. | 487,000 | 4,912,757 | ||||||
Taiwan Semiconductor Manufacturing Co., Ltd. — ADR | 4,529 | 240,626 | ||||||
Tong Hsing Electronic Industries, Ltd. | 7,000 | 28,409 | ||||||
TPK Holding Co. Ltd.(a) | 73,000 | 102,121 | ||||||
TXC Corp. | 26,000 | 56,040 | ||||||
Uni-President Enterprises Corp. | 260,000 | 605,380 | ||||||
United Microelectronics Corp. | 121,000 | 62,601 | ||||||
Vanguard International Semiconductor Corp. | 22,000 | 51,040 | ||||||
Wistron Corp. | 69,000 | 64,704 | ||||||
WPG Holdings Ltd. | 21,000 | 27,356 | ||||||
Yuanta Financial Holding Co., Ltd. | 268,000 | 152,754 | ||||||
|
| |||||||
| 12,149,681 | ||||||||
| 14 | 2020 BLACKROCK ANNUAL REPORTTO SHAREHOLDERS |
Schedule of Investments (continued) April 30, 2020 | BlackRock Advantage Emerging Markets Fund (Percentages shown are based on Net Assets) |
| Security | Shares | Value | ||||||
| Thailand — 1.6% | ||||||||
Advanced Info Service PCL — NVDR | 40,000 | $ | 243,636 | |||||
Bangkok Dusit Medical Services PCL — NVDR | 162,400 | 103,187 | ||||||
Bumrungrad Hospital PCL — NVDR | 4,400 | 15,839 | ||||||
Central Pattana PCL — NVDR | 27,200 | 40,273 | ||||||
CP ALL PCL — NVDR | 195,000 | 426,255 | ||||||
Home Product Center PCL — NVDR | 867,000 | 361,975 | ||||||
Kiatnakin Bank PCL | 20,100 | 25,904 | ||||||
PTT Global Chemical PCL — NVDR | 71,400 | 82,190 | ||||||
PTT PCL — NVDR | 113,500 | 123,926 | ||||||
Siam Cement PCL — NVDR | 8,000 | 84,979 | ||||||
Siam Commercial Bank PCL — NVDR | 35,400 | 73,936 | ||||||
|
| |||||||
| 1,582,100 | ||||||||
| Turkey — 0.8% | ||||||||
Akbank TAS(a) | 60,850 | 51,369 | ||||||
BIM Birlesik Magazalar AS | 16,169 | 128,387 | ||||||
KOC Holding AS | 36,484 | 80,055 | ||||||
Koza Altin Isletmeleri AS(a) | 3,416 | 34,817 | ||||||
Tekfen Holding AS | 44,723 | 91,180 | ||||||
Tupras Turkiye Petrol Rafinerileri AS(a) | 1,954 | 25,375 | ||||||
Turk Telekomunikasyon AS | 38,411 | 40,557 | ||||||
Turkcell Iletisim Hizmetleri AS | 199,847 | 398,129 | ||||||
|
| |||||||
| 849,869 | ||||||||
| United Arab Emirates — 0.4% | ||||||||
Abu Dhabi Commercial Bank PJSC | 25,948 | 31,185 | ||||||
Aldar Properties PJSC | 221,657 | 108,200 | ||||||
DP World PLC | 3,073 | 49,072 | ||||||
Dubai Islamic Bank PJSC | 8,609 | 8,588 | ||||||
Emaar Properties PJSC(a) | 47,249 | 34,651 | ||||||
Emirates Telecommunications Group Co. PJSC | 21,150 | 88,879 | ||||||
First Abu Dhabi Bank PJSC | 25,880 | 80,702 | ||||||
|
| |||||||
| 401,277 | ||||||||
|
| |||||||
Total Common Stocks — 87.9% |
| 88,939,209 | ||||||
|
| |||||||
Preferred Securities — 1.4% |
| |||||||
Preferred Stocks — 1.4% |
| |||||||
| Brazil — 1.4% | ||||||||
Banco Bradesco SA, Preference Shares | 169,344 | 596,358 | ||||||
Cia de Transmissao de Energia Eletrica Paulista | 15,555 | 55,579 | ||||||
| Security | Shares | Value | ||||||
| Brazil (continued) | ||||||||
Cia Energetica de Minas Gerais, Preference Shares | 13,700 | $ | 23,984 | |||||
Itau Unibanco Holding SA, Preference Shares | 93,660 | 392,180 | ||||||
Lojas Americanas SA, Preference Shares | 8,783 | 40,185 | ||||||
Petroleo Brasileiro SA, Preference Shares(a) | 76,333 | 253,372 | ||||||
Telefonica Brasil SA, Preference Shares | 6,193 | 51,989 | ||||||
|
| |||||||
| 1,413,647 | ||||||||
| South Korea — 0.0% | ||||||||
LG Electronics, Inc., Preference Shares | 2,131 | 37,046 | ||||||
|
| |||||||
Total Preferred Stocks — 1.4% |
| 1,450,693 | ||||||
|
| |||||||
Total Preferred Securities — 1.4% |
| 1,450,693 | ||||||
|
| |||||||
Rights — 0.0% |
| |||||||
| South Korea — 0.0% | ||||||||
HLB, Inc. (Expires 06/05/20)(a) | 64 | 909 | ||||||
|
| |||||||
Total Rights — 0.0% |
| 909 | ||||||
|
| |||||||
Total Long-Term Investments — 89.3% |
| 90,390,811 | ||||||
|
| |||||||
Short-Term Securities — 10.5% |
| |||||||
BlackRock Liquidity Funds,T-Fund, Institutional Class, | ||||||||
0.12%(c)(d) | 10,615,413 | 10,615,413 | ||||||
|
| |||||||
Total Short-Term Securities — 10.5% |
| 10,615,413 | ||||||
|
| |||||||
Total Investments — 99.8% |
| 101,006,224 | ||||||
Other Assets Less Liabilities — 0.2% |
| 234,566 | ||||||
|
| |||||||
Net Assets — 100.0% |
| $ | 101,240,790 | |||||
|
| |||||||
| (a) | Non-income producing security. |
| (b) | Security exempt from registration pursuant to Rule 144A under the Securities Act of 1933, as amended. These securities may be resold in transactions exempt from registration to qualified institutional investors. |
| (c) | Annualized7-day yield as of period end. |
| (d) | Investments in issuers considered to be an affiliate/affiliates of the Fund during the period ended April 30, 2020 for purposes of Section 2(a)(3) of the Investment Company Act of 1940, as amended, were as follows: |
| Affiliated Issuer | Shares Held at 07/31/19 | Shares Purchased | Shares Sold | Shares Held at 04/30/20 | Value at 04/30/20 | Income | Net Realized Gain (Loss)(a) | Change in Unrealized Appreciation (Depreciation) | ||||||||||||||||||||||||
BlackRock Liquidity Funds,T-Fund, Institutional Class | 4,510,382 | 6,105,031 | (b) | — | 10,615,413 | $ | 10,615,413 | $ | 59,205 | $ | 13 | $ | — | |||||||||||||||||||
SL Liquidity Series, LLC, Money Market Series(c) | 745,051 | — | (745,051 | )(b) | — | — | 184 | (d) | (160 | ) | — | |||||||||||||||||||||
|
|
|
|
|
|
|
| |||||||||||||||||||||||||
| $ | 10,615,413 | $ | 59,389 | $ | (147 | ) | $ | — | ||||||||||||||||||||||||
|
|
|
|
|
|
|
| |||||||||||||||||||||||||
| (a) | Includes net capital gain distributions, if applicable. |
| (b) | Represents net shares purchased (sold). |
| (c) | As of period end, the entity is no longer held by the Fund. |
| (d) | All or a portion represents securities lending income earned from the reinvestment of cash collateral from loaned securities, net of fees and collateral investment expenses, and other payments to and from borrowers of securities. |
| SCHEDULES OF INVESTMENTS | 15 |
Schedule of Investments (continued) April 30, 2020 | BlackRock Advantage Emerging Markets Fund |
Derivative Financial Instruments Outstanding as of Period End
Futures Contracts
| Description | Number of Contracts | Expiration Date | Notional Amount (000) | Value / Unrealized Appreciation (Depreciation) | ||||||||||||
Long Contracts |
| |||||||||||||||
MSCI Emerging Markets Index | 253 | 06/19/20 | $ | 11,460 | $ | 725,953 | ||||||||||
|
|
|
| |||||||||||||
OTC Total Return Swaps (a)
| Reference Entity | Counterparty | Termination Date | Net Notional | Unrealized Appreciation | Net Value of Reference Entity | Gross Notional Amount Net Asset Percentage | ||||||||||||||||
Equity Securities Long | Morgan Stanley & Co., Inc. | 02/22/23 | USD | 164,673 | $ | 10,948 | (b) | $ | 125,637 | 0.2 | % | |||||||||||
| UBS AG | 06/12/23 - 06/14/23 | USD | 346,479 | (98,419 | )(c) | 235,525 | 0.3 | |||||||||||||||
|
|
|
| |||||||||||||||||||
| $ | (87,471 | ) | $ | 361,162 | ||||||||||||||||||
|
|
|
| |||||||||||||||||||
| (a) | The Fund receives the total return on a portfolio of long positions underlying the total return swap. In addition, the Fund pays a variable rate of interest, based on a specified benchmark, plus or minus a spread in a range of90-200 basis points. The benchmark and spread are determined based upon the country and/or currency of the individual underlying positions. The following are the specified benchmarks used in determining the variable rate of interest: |
USD — 1D Overnight Bank Funding Rate (OBFR01)
USD — 1D Overnight Fed Funds Effective Rate (FEDL01)
| (b) | Amount includes $49,984 of net dividends and financing fees. |
| (c) | Amount includes $12,535 of net dividends and financing fees. |
| 16 | 2020 BLACKROCK ANNUAL REPORTTO SHAREHOLDERS |
Schedule of Investments (continued) April 30, 2020 | BlackRock Advantage Emerging Markets Fund
|
The following table represents the individual long positions and related values of the equity securities underlying the total return swap with Morgan Stanley & Co, Inc. as of April 30, 2020 termination date 02/22/23:
| Shares | Value | % of Basket Value | ||||||||||
Reference Entity — Long |
| |||||||||||
| United Arab Emirates | ||||||||||||
Aldar Properties PJSC | 257,380 | $ | 125,637 | 100.0 | % | |||||||
|
|
|
| |||||||||
Total Reference Entity — Long |
| 125,637 | ||||||||||
|
| |||||||||||
Net Value of Reference Entity — Morgan Stanley & Co, Inc. |
| $ | 125,637 | |||||||||
|
| |||||||||||
The following table represents the individual long positions and related values of the equity securities underlying the total return swap with UBS AG as of April 30, 2020 termination dates 06/12/23 — 06/14/23:
| Shares | Value | % of Basket Value | ||||||||||
Reference Entity — Long |
| |||||||||||
| United Arab Emirates | ||||||||||||
Aldar Properties PJSC | 273,141 | $ | 133,331 | 56.6 | % | |||||||
Dubai Islamic Bank PJSC | 30,118 | 30,045 | 12.8 | |||||||||
Emaar Properties PJSC | 98,381 | 72,149 | 30.6 | |||||||||
|
|
|
| |||||||||
Total Reference Entity — Long |
| 235,525 | ||||||||||
|
| |||||||||||
Net Value of Reference Entity — UBS AG |
| $ | 235,525 | |||||||||
|
| |||||||||||
Balances Reported in the Statements of Assets and Liabilities for OTC Swaps
| Swap Premiums Paid | Swap Premiums Received | Unrealized Appreciation | Unrealized Depreciation | |||||||||||||
OTC Swaps | $ | — | $ | — | $ | 10,948 | $ | (98,419 | ) | |||||||
Derivative Financial Instruments Categorized by Risk Exposure
As of period end, the fair values of derivative financial instruments located in the Statements of Assets and Liabilities were as follows:
| Commodity Contracts | Credit Contracts | Equity Contracts | Foreign Currency Exchange Contracts | Interest Rate Contracts | Other Contracts | Total | ||||||||||||||||||||||
Assets — Derivative Financial Instruments |
| |||||||||||||||||||||||||||
Futures contracts | ||||||||||||||||||||||||||||
Unrealized appreciation on futures contracts(a) | $ | — | $ | — | $ | 725,953 | $ | — | $ | — | $ | — | $ | 725,953 | ||||||||||||||
Swaps — OTC |
| |||||||||||||||||||||||||||
Unrealized appreciation on OTC swaps; Swap premiums paid | — | — | 10,948 | — | — | — | 10,948 | |||||||||||||||||||||
|
|
|
|
|
|
|
|
|
|
|
|
|
| |||||||||||||||
| $ | — | $ | — | $ | 736,901 | $ | — | $ | — | $ | — | $ | 736,901 | |||||||||||||||
|
|
|
|
|
|
|
|
|
|
|
|
|
| |||||||||||||||
Liabilities — Derivative Financial Instruments |
| |||||||||||||||||||||||||||
Swaps — OTC |
| |||||||||||||||||||||||||||
Unrealized depreciation on OTC swaps; Swap premiums received | $ | — | $ | — | $ | 98,419 | $ | — | $ | — | $ | — | $ | 98,419 | ||||||||||||||
|
|
|
|
|
|
|
|
|
|
|
|
|
| |||||||||||||||
| (a) | Net cumulative unrealized appreciation (depreciation) on futures contracts and centrally cleared swaps, if any, are reported in the Schedule of Investments. In the Statements of Assets and Liabilities, only current day’s variation margin is reported in receivables or payables and the net cumulative unrealized appreciation (depreciation) is included in accumulated earnings (loss). |
For the period ended April 30, 2020, the effect of derivative financial instruments in the Statements of Operations was as follows:
| Commodity Contracts | Credit Contracts | Equity Contracts | Foreign Currency Exchange Contracts | Interest Rate Contracts | Other Contracts | Total | ||||||||||||||||||||||
Net Realized Gain (Loss) from: | ||||||||||||||||||||||||||||
Futures contracts | $ | — | $ | — | $ | (1,202,885 | ) | $ | — | $ | — | $ | — | $ | (1,202,885 | ) | ||||||||||||
Swaps | — | — | (302 | ) | — | — | — | (302 | ) | |||||||||||||||||||
|
|
|
|
|
|
|
|
|
|
|
|
|
| |||||||||||||||
| $ | — | $ | — | $ | (1,203,187 | ) | $ | — | $ | — | $ | — | $ | (1,203,187 | ) | |||||||||||||
|
|
|
|
|
|
|
|
|
|
|
|
|
| |||||||||||||||
| Net Change in Unrealized Appreciation (Depreciation) on: | ||||||||||||||||||||||||||||
Futures contracts | $ | — | $ | — | $ | 912,550 | $ | — | $ | — | $ | — | $ | 912,550 | ||||||||||||||
Swaps | — | — | (150,980 | ) | — | — | — | (150,980 | ) | |||||||||||||||||||
|
|
|
|
|
|
|
|
|
|
|
|
|
| |||||||||||||||
| $ | — | $ | — | $ | 761,570 | $ | — | $ | — | $ | — | $ | 761,570 | |||||||||||||||
|
|
|
|
|
|
|
|
|
|
|
|
|
| |||||||||||||||
| SCHEDULES OF INVESTMENTS | 17 |
Schedule of Investments (continued) April 30, 2020 | BlackRock Advantage Emerging Markets Fund |
Average Quarterly Balances of Outstanding Derivative Financial Instruments
Futures contracts: | ||||
Average notional value of contracts — long | $ | 7,653,425 | ||
Total return swaps: | ||||
Average notional amount | 511,868 |
For more information about the Fund’s investment risks regarding derivative financial instruments, refer to the Notes to Financial Statements.
Derivative Financial Instruments — Offsetting as of Period End
The Fund’s derivative assets and liabilities (by type) were as follows:
| Assets | Liabilities | |||||||
Derivative Financial Instruments: | ||||||||
Futures contracts | $ | — | $ | 245,413 | ||||
Swaps – OTC(a) | 10,948 | 98,419 | ||||||
|
|
|
| |||||
Total derivative assets and liabilities in the Statements of Assets and Liabilities | $ | 10,948 | $ | 343,832 | ||||
Derivatives not subject to a Master Netting Agreement or similar agreement (“MNA”) | — | (245,413 | ) | |||||
|
|
|
| |||||
Total derivative assets and liabilities subject to an MNA | $ | 10,948 | $ | 98,419 | ||||
|
|
|
| |||||
| (a) | Includes unrealized appreciation (depreciation) on OTC swaps in the Statements of Assets and Liabilities. |
The following table presents the Fund’s derivative assets (and liabilities) by counterparty net of amounts available for offset under an MNA and net of the related collateral received (and pledged) by the Fund:
| Counterparty | Derivative Assets Subject to an MNA by Counterparty | Derivatives Available for Offset | Non-cash Collateral Received | Cash Collateral Received | Net Amount of Derivative Assets (a) | |||||||||||||||
Morgan Stanley & Co., Inc. | $ | 10,948 | $ | — | $ | — | $ | — | $ | 10,948 | ||||||||||
|
|
|
|
|
|
|
|
|
| |||||||||||
| Counterparty | Derivative Liabilities Subject to an MNA by Counterparty | Derivatives Available for Offset | Non-cash Collateral Pledged | Cash Collateral Pledged | Net Amount of Derivative Liabilities (b) | |||||||||||||||
UBS AG | $ | 98,419 | $ | — | $ | — | $ | — | $ | 98,419 | ||||||||||
|
|
|
|
|
|
|
|
|
| |||||||||||
| (a) | Net amount represents the net amount receivable from the counterparty in the event of default. |
| (b) | Net amount represents the net amount payable due to counterparty in the event of default. |
| 18 | 2020 BLACKROCK ANNUAL REPORTTO SHAREHOLDERS |
Schedule of Investments (continued) April 30, 2020 | BlackRock Advantage Emerging Markets Fund |
Fair Value Hierarchy as of Period End
Various inputs are used in determining the fair value of investments and derivative financial instruments. For information about the Fund’s policy regarding valuation of investments and derivative financial instruments, refer to the Notes to Financial Statements.
The following tables summarize the Fund’s investments and derivative financial instruments categorized in the disclosure hierarchy:
| Level 1 | Level 2 | Level 3 | Total | |||||||||||||
Assets: | ||||||||||||||||
Investments: | ||||||||||||||||
Common Stocks: | ||||||||||||||||
Argentina | $ | 41,361 | $ | — | $ | — | $ | 41,361 | ||||||||
Brazil | 2,327,683 | — | — | 2,327,683 | ||||||||||||
Chile | 243,099 | — | — | 243,099 | ||||||||||||
China | 9,415,202 | 26,497,175 | — | 35,912,377 | ||||||||||||
Colombia | 86,234 | — | — | 86,234 | ||||||||||||
Greece | — | 92,867 | — | 92,867 | ||||||||||||
Hong Kong | — | 288,902 | — | 288,902 | ||||||||||||
Hungary | — | 279,096 | — | 279,096 | ||||||||||||
India | 317,703 | 8,648,399 | — | 8,966,102 | ||||||||||||
Indonesia | — | 950,242 | — | 950,242 | ||||||||||||
Luxembourg | — | 40,953 | — | 40,953 | ||||||||||||
Malaysia | — | 1,415,368 | — | 1,415,368 | ||||||||||||
Mexico | 2,418,670 | — | — | 2,418,670 | ||||||||||||
Peru | 127,561 | 106,051 | — | 233,612 | ||||||||||||
Philippines | — | 302,110 | — | 302,110 | ||||||||||||
Poland | — | 654,690 | — | 654,690 | ||||||||||||
Russia | 100,569 | 3,744,361 | — | 3,844,930 | ||||||||||||
Saudi Arabia | — | 2,287,932 | — | 2,287,932 | ||||||||||||
South Africa | 874,874 | 3,235,597 | — | 4,110,471 | ||||||||||||
South Korea | 234,488 | 9,225,095 | — | 9,459,583 | ||||||||||||
Taiwan | 240,626 | 11,909,055 | — | 12,149,681 | ||||||||||||
Thailand | — | 1,582,100 | — | 1,582,100 | ||||||||||||
Turkey | 131,737 | 718,132 | — | 849,869 | ||||||||||||
United Arab Emirates | — | 401,277 | — | 401,277 | ||||||||||||
Preferred Securities(a) | 1,413,647 | 37,046 | — | 1,450,693 | ||||||||||||
Rights(a) | 909 | — | — | 909 | ||||||||||||
Short-Term Securities | 10,615,413 | — | — | 10,615,413 | ||||||||||||
|
|
|
|
|
|
|
| |||||||||
| $ | 28,589,776 | $ | 72,416,448 | $ | — | $ | 101,006,224 | |||||||||
|
|
|
|
|
|
|
| |||||||||
Derivative Financial Instruments(b) | ||||||||||||||||
Assets: | ||||||||||||||||
Equity contracts | $ | 725,953 | $ | 10,948 | $ | — | $ | 736,901 | ||||||||
Liabilities: | ||||||||||||||||
Equity contracts | — | (98,419 | ) | — | (98,419 | ) | ||||||||||
|
|
|
|
|
|
|
| |||||||||
| $ | 725,953 | $ | (87,471 | ) | $ | — | $ | 638,482 | ||||||||
|
|
|
|
|
|
|
| |||||||||
| (a) | See above Schedule of Investments for values in each country |
| (b) | Derivative financial instruments are swaps and futures contracts. Swaps and futures contracts are valued at the unrealized appreciation (depreciation) on the instrument. |
See notes to financial statements.
| SCHEDULES OF INVESTMENTS | 19 |
Schedule of Investments April 30, 2020 | BlackRock Global Long/Short Equity Fund (Percentages shown are based on Net Assets) |
| Security |
Shares | Value | ||||||
Preferred Securities — 0.7% |
| |||||||
| Preferred Stocks — 0.7%(a)(b) | ||||||||
| United States — 0.7% | ||||||||
AliphCom, Series 6, (Acquired 12/15/15, cost $—)(c)(d) | 8,264 | $ | — | |||||
AliphCom, Series 8, (Acquired 03/10/15, cost $1,750,010)(c)(d) | 823,530 | 8 | ||||||
Illumio Inc., Series C (Acquired 3/10/15, cost $1,500,001) | 466,730 | 1,922,928 | ||||||
Palantir Technologies, Inc., Series I (Acquired 3/27/14, cost $1,999,998) | 326,264 | 1,748,775 | ||||||
|
| |||||||
Total Preferred Securities — 0.7% |
| 3,671,711 | ||||||
|
| |||||||
| Par (000) | ||||||||
| U.S. Treasury Obligations — 7.2% | ||||||||
U.S. Treasury Notes(e): | ||||||||
(3 mo. Treasury money market yield + 0.22%), 0.35%, 07/31/21 | $ | 20,000 | 20,039,218 | |||||
(3 mo. Treasury money market yield + 0.30%), 0.43%, 10/31/21 | 13,000 | 13,045,938 | ||||||
(3 mo. Treasury money market yield + 0.15%), 0.28%, 01/31/22 | 4,925 | 4,930,699 | ||||||
|
| |||||||
Total U.S. Treasury Obligations — 7.2% |
| 38,015,855 | ||||||
|
| |||||||
Total Long-Term Investments — 7.9% |
| 41,687,566 | ||||||
|
| |||||||
| Shares | ||||||||
| Short-Term Securities — 76.5% | ||||||||
| Money Market Fund — 2.7% | ||||||||
BlackRock Liquidity Funds,T-Fund, | 14,238,130 | 14,238,130 | ||||||
|
| |||||||
Total Money Market Fund — 2.7% |
| 14,238,130 | ||||||
| Par (000) | ||||||||
| U.S. Treasury Obligations — 73.8% | ||||||||
U.S. Treasury Bills: | ||||||||
0.66%, 05/05/20(f) | $ | 215 | 214,999 | |||||
1.57%, 05/07/20(f) | 3,985 | 3,984,963 | ||||||
0.08%-0.20%, 05/12/20(f) | 122,790 | 122,787,561 | ||||||
| Security | Par (000) | Value | ||||||
| U.S. Treasury Obligations (continued) | ||||||||
1.58%, 05/14/20(f) | $ | 28,000 | $ | 27,999,191 | ||||
1.50%-3.50%, 05/15/20 | 1,615 | 1,616,400 | ||||||
0.10%, 05/19/20(f) | 640 | 639,974 | ||||||
0.10%, 05/21/20(f) | 4,000 | 3,999,811 | ||||||
0.08%-0.09%, 05/26/20(f) | 58,000 | 57,996,980 | ||||||
0.06%-0.10%, 06/02/20(f) | 32,360 | 32,357,627 | ||||||
1.17%, 06/04/20(f) | 12,000 | 11,998,952 | ||||||
0.12%, 06/23/20(f) | 5,000 | 4,999,356 | ||||||
0.00%-0.19%, 06/25/20(f) | 17,500 | 17,498,162 | ||||||
0.13%, 07/23/20(f) | 13,000 | 12,997,452 | ||||||
0.12%-0.13%, 07/30/20(f) | 2,665 | 2,664,367 | ||||||
2.63%, 07/31/20 | 23,905 | 24,055,823 | ||||||
0.83%, 09/03/20(f) | 1,785 | 1,784,287 | ||||||
1.38%-2.75%, 09/30/20 | 1,665 | 1,674,566 | ||||||
0.29%, 10/15/20(f) | 2,240 | 2,238,831 | ||||||
2.50%, 12/31/20 | 12,610 | 12,809,002 | ||||||
0.17%, 01/28/21(f) | 5,000 | 4,994,428 | ||||||
U.S. Treasury Notes: | ||||||||
1.38%, 09/15/20 | 4,390 | 4,410,578 | ||||||
(3 mo. Treasury money market yield + 0.05%), 0.17%, 10/31/20(g) | 6,000 | 6,001,067 | ||||||
(3 mo. Treasury money market yield + 0.12%), 0.24%, 01/31/21(e) | 6,575 | 6,579,894 | ||||||
(3 mo. Treasury money market yield + 0.14%), 0.26%, 04/30/21(e) | 22,795 | 22,817,800 | ||||||
|
| |||||||
Total U.S. Treasury Obligations — 73.8% |
| 389,122,071 | ||||||
|
| |||||||
Total Short-Term Securities — 76.5% |
| 403,360,201 | ||||||
|
| |||||||
Options Purchased — 0.1% |
| 505,835 | ||||||
|
| |||||||
Total Investments Before Options Written — 84.5% |
| 445,553,602 | ||||||
|
| |||||||
Options Written — (0.1)% |
| (361,470 | ) | |||||
|
| |||||||
Total Investments, Net of Options Written — 84.4% |
| 445,192,132 | ||||||
Other Assets Less Liabilities — 15.6% |
| 82,202,331 | ||||||
|
| |||||||
Net Assets — 100.0% |
| $ | 527,394,463 | |||||
|
| |||||||
| (a) | Security is valued using significant unobservable inputs and is classified as Level 3 in the fair value hierarchy. |
| (b) | Restricted security as to resale, excluding 144A securities. As period end the Fund held restricted securities with a current value of $3,671,711, representing 0.7% of its net assets as of period end, and an original cost of $5,250,009. |
| (c) | Non-income producing security. |
| (d) | Issuer filed for bankruptcy and/or is in default. |
| (e) | Annualized7-day yield as of period end. |
| (f) | Rates shown are discount rates or a range of discount rates as of period end. |
| (g) | Variable rate security. Rate shown is the rate in effect as of period end. |
| (h) | Investments in issuers considered to be an affiliate/affiliates of the Fund during the period ended April 30, 2020 for purposes of Section 2(a)(3) of the Investment Company Act of 1940, as amended, were as follows: |
| Affiliated Issuer | Shares Held at 07/31/19 | Shares Purchased | Shares Sold | Shares Held at 04/30/20 | Value at 04/30/20 | Income | Net Realized Gain (Loss) (a) | Change in Unrealized Appreciation (Depreciation) | ||||||||||||||||||||||||
BlackRock Liquidity Funds,T-Fund, Institutional Class | 19,215,348 | — | (4,977,218 | )(b) | 14,238,130 | $ | 14,238,130 | $ | 253,609 | $ | 53 | $ | — | |||||||||||||||||||
|
|
|
|
|
|
|
| |||||||||||||||||||||||||
| (a) | Includes net capital gain distributions, if applicable. |
| (b) | Represents net shares purchased (sold). |
| 20 | 2020 BLACKROCK ANNUAL REPORTTO SHAREHOLDERS |
Schedule of Investments (continued) April 30, 2020 | BlackRock Global Long/Short Equity Fund |
Derivative Financial Instruments Outstanding as of Period End
Futures Contracts
| Description | Number of Contracts | Expiration Date | Notional Amount (000) | Value / Unrealized Appreciation (Depreciation) | ||||||||||||
Long Contracts | ||||||||||||||||
Amsterdam Index | 111 | 05/15/20 | $ | 12,444 | $ | 134,167 | ||||||||||
CAC 40 Index | 82 | 05/15/20 | 4,085 | 84,574 | ||||||||||||
IBEX 35 Index | 168 | 05/15/20 | 12,734 | (129,549 | ) | |||||||||||
Hang Seng Index | 16 | 05/28/20 | 2,528 | 35,257 | ||||||||||||
SPI 200 Index | 247 | 06/18/20 | 22,293 | 2,559,256 | ||||||||||||
FTSE/MIB Index | 4 | 06/19/20 | 385 | 15,320 | ||||||||||||
|
| |||||||||||||||
| 2,699,025 | ||||||||||||||||
|
| |||||||||||||||
Short Contracts | ||||||||||||||||
OMXS 30 Index | 1,009 | 05/15/20 | 16,321 | (592,813 | ) | |||||||||||
MSCI Sing Index | 146 | 05/28/20 | 3,087 | (138,599 | ) | |||||||||||
Topix Index | 37 | 06/11/20 | 5,013 | (154,223 | ) | |||||||||||
S&P/TSX 60 Index | 125 | 06/18/20 | 15,952 | (1,917,523 | ) | |||||||||||
DAX Index | 6 | 06/19/20 | 1,784 | (8,947 | ) | |||||||||||
FTSE 100 Index | 25 | 06/19/20 | 1,853 | (43,291 | ) | |||||||||||
S&P 500E-Mini Index | 34 | 06/19/20 | 4,934 | 34,624 | ||||||||||||
|
| |||||||||||||||
| (2,820,772 | ) | |||||||||||||||
|
| |||||||||||||||
| $ | (121,747 | ) | ||||||||||||||
|
| |||||||||||||||
Exchange-Traded Options Purchased
| Description | Number of Contracts | Expiration Date | Exercise Price | Notional Amount (000) | Value | |||||||||||||||||||
| Put | ||||||||||||||||||||||||
NASDAQ 100 Index | 12,300 | 05/15/20 | USD | 7,775.00 | USD | 110,706 | $ | 319,185 | ||||||||||||||||
S&P 500 Index | 17,300 | 05/15/20 | USD | 2,410.00 | USD | 50,385 | 77,850 | |||||||||||||||||
S&P 500 Index | 8,500 | 05/15/20 | USD | 2,600.00 | USD | 24,756 | 108,800 | |||||||||||||||||
|
| |||||||||||||||||||||||
| $ | 505,835 | |||||||||||||||||||||||
|
| |||||||||||||||||||||||
Exchange-Traded Options Written
| Description | Number of Contracts | Expiration Date | Exercise Price | Notional Amount (000) | Value | |||||||||||||||||||
| Put | ||||||||||||||||||||||||
NASDAQ 100 Index | 12,300 | 05/15/20 | USD | 7,625.00 | USD | 110,706 | $ | (238,005 | ) | |||||||||||||||
S&P 500 Index | 17,300 | 05/15/20 | USD | 2,360.00 | USD | 50,385 | (61,415 | ) | ||||||||||||||||
S&P 500 Index | 8,500 | 05/15/20 | USD | 2,500.00 | USD | 24,756 | (62,050 | ) | ||||||||||||||||
|
| |||||||||||||||||||||||
| $ | (361,470 | ) | ||||||||||||||||||||||
|
| |||||||||||||||||||||||
OTC Total Return Swaps
| Reference Entity | Fixed Amount Paid/(Received) by the Fund (a) | Counterparty | Termination Date | Notional Amount (000) | Value | Upfront Premiums | Unrealized Appreciation (Depreciation) | |||||||||||||||||||||||||||||
Swiss Market Future June 2020 | CHF | (192,262 | ) | Morgan Stanley & Co. International PLC | 06/19/20 | CHF | 199 | $ | (205 | ) | $ | — | $ | (205 | ) | |||||||||||||||||||||
Swiss Market Future June 2020 | CHF | (2,643,518 | ) | Morgan Stanley & Co. International PLC | 06/19/20 | CHF | 2,739 | (52,756 | ) | — | (52,756 | ) | ||||||||||||||||||||||||
Swiss Market Future June 2020 | CHF | (668,159 | ) | Morgan Stanley & Co. International PLC | 06/19/20 | CHF | 692 | (5,647 | ) | — | (5,647 | ) | ||||||||||||||||||||||||
Swiss Market Future June 2020 | CHF | (983,345 | ) | Morgan Stanley & Co. International PLC | 06/19/20 | CHF | 1,019 | 21,803 | — | 21,803 | ||||||||||||||||||||||||||
|
|
|
|
|
| |||||||||||||||||||||||||||||||
| $ | (36,805 | ) | $ | — | $ | (36,805 | ) | |||||||||||||||||||||||||||||
|
|
|
|
|
| |||||||||||||||||||||||||||||||
| (a) | At termination, the fixed amount paid (received) will be exchanged for the total return of the reference entity. |
| SCHEDULES OF INVESTMENTS | 21 |
Schedule of Investments (continued) April 30, 2020 | BlackRock Global Long/Short Equity Fund |
OTC Total Return Swaps (a)
| Reference Entity | Counterparty | Termination Date | Net Notional | Unrealized Appreciation (Depreciation) | Net Value of Reference Entity | Gross Notional Amount Net Asset Percentage | ||||||||||||||||||||
Equity Securities Long/Short | Bank of America, N.A. | 02/15/23 | USD | (738,204 | ) | $ | 1,219,346 | (b) | $ | (182,756 | ) | 51.7 | % | |||||||||||||
| Bank of America, N.A. | 02/15/23 | USD | (976,838 | ) | 375,546 | (c) | 145,581 | 27.6 | ||||||||||||||||||
| Deutsche Bank A.G. | 02/17/23 | USD | 47 | (1,116 | )(d) | 1 | 0.0 | |||||||||||||||||||
| Goldman Sachs & Co. | 06/24/20 - 03/01/23 | USD | (4,486,280 | ) | 10,637,311 | (e) | 2,715,459 | 108.8 | ||||||||||||||||||
| Goldman Sachs & Co. | 11/04/20 - 02/28/23 | USD | (4,173,121 | ) | 2,403,441 | (f) | (1,191,323 | ) | 32.4 | |||||||||||||||||
| UBS AG | 06/10/20 - 06/19/20 | USD | (4,203,534 | ) | 2,724,416 | (g) | 275,164 | 31.4 | ||||||||||||||||||
|
|
|
| |||||||||||||||||||||||
| $ | 17,358,944 | $ | 1,762,126 | |||||||||||||||||||||||
|
|
|
| |||||||||||||||||||||||
| (a) | The Fund receives or pays the total return on a portfolio of long and short positions underlying the total return swap. In addition, the Fund pays or receives a variable rate of interest, based on a specified benchmark, plus or minus a spread in a range of 0-6,190 basis points. The benchmark and spread are determined based upon the country and/or currency of the individual underlying positions. The following are the specified benchmarks used in determining the variable rate of interest: |
AUD — 1D Overnight Reserve Bank of Australia Rate (AONIA)
AUD — 1M Australian Bank Bill Rate (BBSW)
Bank of Canada Overnight Rate Target (CABROVER)
CAD — 1D Overnight Bank of Canada Repo Rate (CORRA)
CHF — 1D Overnight Swiss Franc LIBOR Rate BBA (CHFONLIB)
CHF — 1W Swiss Franc LIBOR Rate BBA (SF0001W)
DKK — 1W Copenhagen Interbank Swap Rate (CIBOR)
DKK — Danish Tom/Next Reference Rate (DETNT/N)
EUR — 1D Effective Overnight Index Average (EONIA)
EUR — 1M Euro Interbank Offer Rate (EURIBOR)
EUR — 1W Euro Interbank Offer Rate (EURIBOR)
GBP — 1D Overnight Sterling LIBOR Rate BBA (GBPONLIB)
GBP — 1D Sterling Overnight Index Average (SONIA)
GBP — 1W Sterling LIBOR Rate BBA (GBP1WLIB)
HKD — 1D Overnight Index Swap Rate (HKDONOIS)
HKD — 1M Hong Kong Interbank Offer Rate (HIBOR)
HKD — 1W Hong Kong Interbank Offer Rate (HIBOR)
HKD — 2W Hong Kong Interbank Offer Rate (HIBOR)
ILS — 1D Overnight Tel Aviv Interbank Offer Rate (TELBOR)
ILS — 1M Tel Aviv Interbank Offer Rate (TELBOR)
JPY — 1D Japanese Yen Spot Next BBA LIBOR (JY000S/N)
JPY — 1D Overnight Tokyo Average Rate (TONAT)
JPY — 1M Japanese Yen LIBOR Rate BBA (JY0001M)
JPY — 1W Japanese Yen LIBOR Rate BBA (JY0001W)
NOK — 1W Norway Interbank Offer Rate (NIBOR)
NOK — Norwegian Overnight Weighted Average (NOWA)
NZD — 1D New Zealand Official Overnight Deposit Rate (NZOCO)
NZD — 1M New Zealand Bank Bill Rate (BBR)
SEK — 1D Overnight Stockholm Interbank Offer Rate (STIBOR)
SEK — 1W Stockholm Interbank Offer Rate (STIBOR)
SEK — TN Stockholm Interbank Offer Rate (STIBOR)
SGD — 1D Overnight Singapore Assoc of Banks Rate (SIBOR)
SGD — 1D Singapore Assoc of Banks Swap Offer Rate (SOR)
SGD — 1M Singapore Assoc of Banks Swap Offer Rate (SOR)
USD — 1D Overnight Bank Funding Rate (OBFR01)
USD — 1D Overnight Fed Funds Effective Rate (FEDL01)
USD — 1M US Dollar LIBOR BBA
USD — 1W US Dollar LIBOR BBA
| (b) | Amount includes $663,898 of net dividends and financing fees. |
| (c) | Amount includes $(746,873) of net dividends and financing fees. |
| (d) | Amount includes $(1,070) of net dividends and financing fees. |
| (e) | Amount includes $3,435,572 of net dividends and financing fees. |
| (f) | Amount includes $(578,357) of net dividends and financing fees. |
| (g) | Amount includes $(1,754,282) of net dividends and financing fees. |
| 22 | 2020 BLACKROCK ANNUAL REPORTTO SHAREHOLDERS |
Schedule of Investments (continued) April 30, 2020 | BlackRock Global Long/Short Equity Fund |
The following table represents the individual long and short positions and related values of the equity securities underlying the total return swap with Bank of America, N.A. as of April 30, 2020, termination date 02/15/23:
| Shares | Value | % of Basket Value | ||||||||||
Reference Entity — Long | ||||||||||||
| Argentina | ||||||||||||
MercadoLibre, Inc. | 3,412 | $ | 1,990,936 | (1,089.4 | )% | |||||||
|
|
|
| |||||||||
| Australia | ||||||||||||
Alumina Ltd. | 48,787 | 54,117 | (29.6 | ) | ||||||||
Aristocrat Leisure Ltd. | 45,162 | 740,647 | (405.3 | ) | ||||||||
Brambles Ltd. | 24,234 | 173,214 | (94.8 | ) | ||||||||
Downer EDI Ltd. | 35,655 | 95,916 | (52.5 | ) | ||||||||
Harvey Norman Holdings Ltd. | 7,427 | 13,326 | (7.3 | ) | ||||||||
IGO Ltd. | 78,789 | 239,020 | (130.8 | ) | ||||||||
Mineral Resources Ltd. | 9,198 | 99,135 | (54.2 | ) | ||||||||
National Australia Bank Ltd. | 42,382 | 464,400 | (254.1 | ) | ||||||||
Newcrest Mining Ltd. | 9,213 | 183,644 | (100.5 | ) | ||||||||
Oil Search Ltd. | 189,534 | 371,963 | (203.5 | ) | ||||||||
Perpetual Ltd. | 1,034 | 20,099 | (11.0 | ) | ||||||||
Rio Tinto Ltd. | 240 | 13,527 | (7.4 | ) | ||||||||
SEEK Ltd. | 27,400 | 305,901 | (167.4 | ) | ||||||||
South32 Ltd. | 248,459 | 312,475 | (171.0 | ) | ||||||||
Spark Infrastructure Group | 124,146 | 152,476 | (83.4 | ) | ||||||||
St Barbara Ltd. | 33,577 | 55,266 | (30.2 | ) | ||||||||
Star Entertainment Group Ltd. | 31,505 | 61,764 | (33.8 | ) | ||||||||
WiseTech Global Ltd. | 16,023 | 190,804 | (104.4 | ) | ||||||||
Woodside Petroleum Ltd. | 21,106 | 302,222 | (165.4 | ) | ||||||||
Worley Ltd. | 8,175 | 47,384 | (25.9 | ) | ||||||||
|
|
|
| |||||||||
| 3,897,300 | ||||||||||||
| Austria | ||||||||||||
ams AG | 48,323 | 634,329 | (347.1 | ) | ||||||||
|
|
|
| |||||||||
| Canada | ||||||||||||
Bank of Nova Scotia | 11,593 | 464,736 | (254.3 | ) | ||||||||
Boralex, Inc. | 735 | 14,231 | (7.8 | ) | ||||||||
CAE, Inc. | 13,758 | 227,332 | (124.4 | ) | ||||||||
Canadian Apartment Properties REIT | 5,489 | 188,888 | (103.4 | ) | ||||||||
CCL Industries, Inc., Class B | 9,823 | 307,050 | (168.0 | ) | ||||||||
Innergex Renewable Energy, Inc. | 4,304 | 57,760 | (31.6 | ) | ||||||||
Lightspeed POS, Inc. | 1,240 | 23,491 | (12.8 | ) | ||||||||
Methanex Corp. | 3,658 | 58,157 | (31.8 | ) | ||||||||
Onex Corp. | 5,133 | 236,599 | (129.5 | ) | ||||||||
Parkland Fuel Corp. | 890 | 21,055 | (11.5 | ) | ||||||||
Quebecor, Inc., Class B | 4,036 | 87,885 | (48.1 | ) | ||||||||
Teck Resources Ltd., Class B | 5,176 | 45,626 | (25.0 | ) | ||||||||
TELUS Corp. | 156,988 | 2,565,808 | (1,403.9 | ) | ||||||||
West Fraser Timber Co. Ltd. | 986 | 27,442 | (15.0 | ) | ||||||||
|
|
|
| |||||||||
| 4,326,060 | ||||||||||||
| Denmark | ||||||||||||
Chr Hansen Holding A/S | 7,527 | 649,005 | (355.1 | ) | ||||||||
Demant A/S | 21,424 | 512,201 | (280.3 | ) | ||||||||
Novozymes A/S, Class B | 922 | 45,171 | (24.7 | ) | ||||||||
SimCorp A/S | 2,917 | 269,440 | (147.4 | ) | ||||||||
|
|
|
| |||||||||
| 1,475,817 | ||||||||||||
| Finland | ||||||||||||
Huhtamaki OYJ | 6,656 | 248,429 | (135.9 | ) | ||||||||
Orion OYJ, Class B | 4,311 | 219,078 | (119.9 | ) | ||||||||
Wartsila OYJ Abp | 20,971 | 153,932 | (84.2 | ) | ||||||||
|
|
|
| |||||||||
| 621,439 | ||||||||||||
| Shares | Value | % of Basket Value | ||||||||||
| France | ||||||||||||
Alten SA | 2,213 | $ | 159,330 | (87.2 | ) % | |||||||
AXA SA | 23,250 | 413,303 | (226.1 | ) | ||||||||
Cie Plastic Omnium SA | 6,934 | 131,301 | (71.8 | ) | ||||||||
CNP Assurances | 19,684 | 203,074 | (111.1 | ) | ||||||||
Danone SA | 10,052 | 700,595 | (383.3 | ) | ||||||||
Edenred | 3,855 | 155,291 | (85.0 | ) | ||||||||
Engie SA | 14,683 | 159,359 | (87.2 | ) | ||||||||
Gaztransport Et Technigaz SA | 1,111 | 80,544 | (44.1 | ) | ||||||||
Kering SA | 715 | 360,582 | (197.3 | ) | ||||||||
Korian SA | 707 | 23,746 | (13.0 | ) | ||||||||
Orpea | 1,511 | 168,073 | (92.0 | ) | ||||||||
Remy Cointreau SA | 5,403 | 602,685 | (329.8 | ) | ||||||||
Rexel SA | 46,128 | 430,825 | (235.7 | ) | ||||||||
Rubis SCA | 837 | 37,570 | (20.6 | ) | ||||||||
Societe Generale SA | 1,046 | 16,411 | (9.0 | ) | ||||||||
Teleperformance | 3,053 | 683,899 | (374.2 | ) | ||||||||
|
|
|
| |||||||||
| 4,326,588 | ||||||||||||
| Germany | ||||||||||||
adidas AG | 3,620 | 829,891 | (454.1 | ) | ||||||||
Carl Zeiss Meditec AG, Bearer Shares | 1,389 | 136,916 | (74.9 | ) | ||||||||
Deutsche Post AG, Registered Shares | 42,834 | 1,272,477 | (696.3 | ) | ||||||||
Evonik Industries AG | 17,639 | 433,927 | (237.4 | ) | ||||||||
Evotec SE | 2,302 | 56,803 | (31.1 | ) | ||||||||
MTU Aero Engines AG | 11,485 | 1,563,975 | (855.8 | ) | ||||||||
Rational AG | 2,222 | 1,072,282 | (586.7 | ) | ||||||||
Rheinmetall AG | 7,851 | 531,349 | (290.7 | ) | ||||||||
Sartorius AG, Preference Shares | 1,492 | 419,164 | (229.4 | ) | ||||||||
Symrise AG | 291 | 29,440 | (16.1 | ) | ||||||||
Zalando SE | 3,932 | 192,722 | (105.5 | ) | ||||||||
|
|
|
| |||||||||
| 6,538,946 | ||||||||||||
| Hong Kong | ||||||||||||
Hang Lung Properties Ltd. | 25,000 | 53,480 | (29.3 | ) | ||||||||
Hysan Development Co. Ltd. | 29,000 | 96,749 | (52.9 | ) | ||||||||
NWS Holdings Ltd. | 43,000 | 44,813 | (24.5 | ) | ||||||||
Swire Properties Ltd. | 121,400 | 340,499 | (186.3 | ) | ||||||||
|
|
|
| |||||||||
| 535,541 | ||||||||||||
| Ireland | ||||||||||||
AIB Group PLC | 147,300 | 203,836 | (111.5 | ) | ||||||||
Bank of Ireland Group PLC | 178,546 | 366,394 | (200.5 | ) | ||||||||
Kerry Group PLC, Class A | 1,340 | 153,746 | (84.1 | ) | ||||||||
Kingspan Group PLC | 11,419 | 581,878 | (318.4 | ) | ||||||||
|
|
|
| |||||||||
| 1,305,854 | ||||||||||||
| Israel | ||||||||||||
Amot Investments Ltd. | 6,611 | 37,131 | (20.3 | ) | ||||||||
Shapir Engineering and Industry Ltd. | 1,974 | 13,839 | (7.6 | ) | ||||||||
|
|
|
| |||||||||
| 50,970 | ||||||||||||
| Italy | ||||||||||||
Amplifon SpA | 2,861 | 65,492 | (35.8 | ) | ||||||||
Davide Campari-Milano SpA | 10,900 | 84,719 | (46.4 | ) | ||||||||
Ferrari NV | 2,806 | 438,565 | (240.0 | ) | ||||||||
Interpump Group SpA | 554 | 16,165 | (8.8 | ) | ||||||||
Terna Rete Elettrica Nazionale SpA | 4,381 | 27,433 | (15.0 | ) | ||||||||
|
|
|
| |||||||||
| 632,374 | ||||||||||||
| Japan | ||||||||||||
ABC-Mart, Inc. | 2,300 | 116,883 | (64.0 | ) | ||||||||
Advantest Corp. | 4,700 | 228,051 | (124.8 | ) | ||||||||
AEON Financial Service Co. Ltd. | 7,500 | 77,994 | (42.7 | ) | ||||||||
Aeon Mall Co. Ltd. | 2,800 | 35,198 | (19.3 | ) | ||||||||
AGC, Inc. | 2,600 | 64,116 | (35.1 | ) | ||||||||
| SCHEDULES OF INVESTMENTS | 23 |
Schedule of Investments (continued) April 30, 2020 | BlackRock Global Long/Short Equity Fund |
| Shares | Value | % of Basket Value | ||||||||||
| Japan (continued) | ||||||||||||
Alfresa Holdings Corp. | 8,900 | $ | 177,478 | (97.1 | ) % | |||||||
Alps Alpine Co. Ltd. | 2,800 | 28,880 | (15.8 | ) | ||||||||
Asahi Group Holdings Ltd. | 12,200 | 419,501 | (229.5 | ) | ||||||||
Asahi Kasei Corp. | 49,400 | 350,467 | (191.8 | ) | ||||||||
Benesse Holdings, Inc. | 3,100 | 88,280 | (48.3 | ) | ||||||||
Central Japan Railway Co. | 1,600 | 251,767 | (137.8 | ) | ||||||||
COMSYS Holdings Corp. | 1,400 | 38,497 | (21.1 | ) | ||||||||
Daiichi Sankyo Co. Ltd. | 2,100 | 144,357 | (79.0 | ) | ||||||||
Daiichikosho Co., Ltd. | 1,900 | 57,027 | (31.2 | ) | ||||||||
Daikin Industries Ltd. | 400 | 51,332 | (28.1 | ) | ||||||||
Daito Trust Construction Co. Ltd. | 2,300 | 218,696 | (119.7 | ) | ||||||||
Daiwa House Industry Co. Ltd. | 2,200 | 55,749 | (30.5 | ) | ||||||||
DeNA Co. Ltd. | 13,200 | 162,493 | (88.9 | ) | ||||||||
Dentsu Group Inc. | 14,700 | 306,993 | (168.0 | ) | ||||||||
DIC Corp. | 4,300 | 99,857 | (54.6 | ) | ||||||||
Dip Corp. | 13,100 | 279,585 | (153.0 | ) | ||||||||
East Japan Railway Co. | 13,400 | 978,468 | (535.4 | ) | ||||||||
Electric Power Development Co. Ltd. | 31,700 | 634,448 | (347.2 | ) | ||||||||
FamilyMart Co. Ltd. | 3,200 | 54,264 | (29.7 | ) | ||||||||
Fuji Media Holdings, Inc. | 27,800 | 276,152 | (151.1 | ) | ||||||||
Fuji Seal International, Inc. | 3,200 | 55,549 | (30.4 | ) | ||||||||
Fukuoka Financial Group, Inc. | 1,100 | 15,715 | (8.6 | ) | ||||||||
H2O Retailing Corp. | 28,600 | 224,315 | (122.7 | ) | ||||||||
House Foods Group, Inc. | 1,900 | 59,840 | (32.7 | ) | ||||||||
Isuzu Motors Ltd. | 57,700 | 438,494 | (239.9 | ) | ||||||||
Izumi Co. Ltd. | 29,500 | 863,538 | (472.5 | ) | ||||||||
Japan Retail Fund Investment Corp. | 33 | 35,977 | (19.7 | ) | ||||||||
Japan Tobacco, Inc. | 2,800 | 52,145 | (28.5 | ) | ||||||||
JCR Pharmaceuticals Co. Ltd. | 1,100 | 105,363 | (57.6 | ) | ||||||||
JFE Holdings, Inc. | 87,000 | 577,335 | (315.9 | ) | ||||||||
JGC Holdings Corp. | 8,200 | 79,186 | (43.3 | ) | ||||||||
Kajima Corp. | 5,800 | 60,266 | (33.0 | ) | ||||||||
Kao Corp. | 1,500 | 115,674 | (63.3 | ) | ||||||||
KDDI Corp. | 4,800 | 139,028 | (76.1 | ) | ||||||||
Konica Minolta, Inc. | 113,500 | 439,202 | (240.3 | ) | ||||||||
Kyocera Corp. | 300 | 16,029 | (8.8 | ) | ||||||||
Lintec Corp. | 14,200 | 304,724 | (166.7 | ) | ||||||||
Marubeni Corp. | 101,200 | 487,363 | (266.7 | ) | ||||||||
Maruha Nichiro Corp. | 14,700 | 307,629 | (168.3 | ) | ||||||||
Mazda Motor Corp. | 17,700 | 100,064 | (54.8 | ) | ||||||||
Mitsubishi Materials Corp. | 700 | 14,338 | (7.8 | ) | ||||||||
Mitsui Chemicals, Inc. | 1,800 | 35,339 | (19.3 | ) | ||||||||
Nexon Co. Ltd. | 9,800 | 158,231 | (86.6 | ) | ||||||||
Nidec Corp. | 3,500 | 203,749 | (111.5 | ) | ||||||||
Nihon M&A Center, Inc. | 3,200 | 104,392 | (57.1 | ) | ||||||||
Nikon Corp. | 96,900 | 901,346 | (493.2 | ) | ||||||||
Nippon Electric Glass Co. Ltd. | 86,900 | 1,265,936 | (692.7 | ) | ||||||||
Nippon Shinyaku Co. Ltd. | 400 | 28,089 | (15.4 | ) | ||||||||
Nippon Shokubai Co. Ltd. | 3,200 | 151,124 | (82.7 | ) | ||||||||
Nippon Suisan Kaisha Ltd. | 37,700 | 167,745 | (91.8 | ) | ||||||||
Nippon Television Holdings, Inc. | 1,000 | 11,170 | (6.1 | ) | ||||||||
Nitori Holdings Co. Ltd. | 1,100 | 168,603 | (92.3 | ) | ||||||||
Recruit Holdings Co. Ltd. | 20,200 | 589,258 | (322.4 | ) | ||||||||
Relo Group, Inc. | 700 | 15,164 | (8.3 | ) | ||||||||
Rohm Co. Ltd. | 2,400 | 151,737 | (83.0 | ) | ||||||||
Ryohin Keikaku Co. Ltd. | 31,800 | 378,468 | (207.1 | ) | ||||||||
Sankyu, Inc. | 1,200 | 46,113 | (25.2 | ) | ||||||||
Sanwa Holdings Corp. | 17,700 | 137,347 | (75.2 | ) | ||||||||
Seiko Epson Corp. | 19,400 | 220,298 | (120.5 | ) | ||||||||
Sekisui House Ltd. | 900 | 15,439 | (8.4 | ) | ||||||||
Seria Co. Ltd. | 2,300 | 74,751 | (40.9 | ) | ||||||||
Shionogi & Co. Ltd. | 4,700 | 259,569 | (142.0 | ) | ||||||||
| Shares | Value | % of Basket Value | ||||||||||
| Japan (continued) | ||||||||||||
SKY Perfect JSAT Holdings, Inc. | 32,200 | $ | 121,051 | (66.2 | ) % | |||||||
Sumitomo Bakelite Co. Ltd. | 700 | 18,080 | (9.9 | ) | ||||||||
Sumitomo Chemical Co. Ltd. | 132,600 | 406,711 | (222.5 | ) | ||||||||
Sumitomo Dainippon Pharma Co. Ltd. | 3,400 | 47,460 | (26.0 | ) | ||||||||
Sumitomo Mitsui Financial Group, Inc. | 20,300 | 533,834 | (292.1 | ) | ||||||||
Sundrug Co. Ltd. | 1,200 | 41,086 | (22.5 | ) | ||||||||
Sysmex Corp. | 700 | 48,361 | (26.5 | ) | ||||||||
Taisei Corp. | 2,700 | 84,165 | (46.1 | ) | ||||||||
Taisho Pharmaceutical Holdings Co. Ltd. | 3,100 | 193,676 | (106.0 | ) | ||||||||
Takara Holdings, Inc. | 9,300 | 68,441 | (37.4 | ) | ||||||||
Takeda Pharmaceutical Co. Ltd. | 9,600 | 346,190 | (189.4 | ) | ||||||||
Topcon Corp. | 19,500 | 160,111 | (87.6 | ) | ||||||||
Toray Industries, Inc. | 35,000 | 160,465 | (87.8 | ) | ||||||||
TOTO Ltd. | 2,000 | 69,614 | (38.1 | ) | ||||||||
Toyo Seikan Group Holdings Ltd. | 10,300 | 104,492 | (57.2 | ) | ||||||||
Ube Industries Ltd. | 87,900 | 1,474,030 | (806.6 | ) | ||||||||
Ulvac, Inc. | 2,500 | 68,907 | (37.7 | ) | ||||||||
Yamaha Corp. | 7,100 | 286,593 | (156.8 | ) | ||||||||
Yamaha Motor Co. Ltd. | 8,700 | 111,932 | (61.2 | ) | ||||||||
Yamato Kogyo Co. Ltd. | 700 | 13,737 | (7.5 | ) | ||||||||
Yokogawa Electric Corp. | 10,400 | 141,756 | (77.6 | ) | ||||||||
Zenkoku Hosho Co. Ltd. | 2,100 | 61,190 | (33.5 | ) | ||||||||
|
|
|
| |||||||||
| 19,334,057 | ||||||||||||
| Luxembourg | ||||||||||||
SES SA | 10,931 | 72,822 | (39.9 | ) | ||||||||
|
|
|
| |||||||||
| Macau | ||||||||||||
Sands China Ltd. | 17,200 | 69,634 | (38.1 | ) | ||||||||
|
|
|
| |||||||||
| Netherlands | ||||||||||||
Akzo Nobel NV | 1,128 | 85,539 | (46.8 | ) | ||||||||
Boskalis Westminster | 1,922 | 33,384 | (18.3 | ) | ||||||||
Euronext NV | 4,476 | 375,778 | (205.6 | ) | ||||||||
ING Groep NV | 57,457 | 321,919 | (176.1 | ) | ||||||||
Koninklijke Philips NV | 17,430 | 759,817 | (415.8 | ) | ||||||||
|
|
|
| |||||||||
| 1,576,437 | ||||||||||||
| New Zealand | ||||||||||||
Fisher & Paykel Healthcare Corp. Ltd. | 1,223 | 20,432 | (11.2 | ) | ||||||||
|
|
|
| |||||||||
| Norway | ||||||||||||
Aker BP ASA | 30,717 | 504,296 | (275.9 | ) | ||||||||
Leroy Seafood Group ASA | 35,496 | 188,509 | (103.2 | ) | ||||||||
Norsk Hydro ASA | 5,555 | 14,092 | (7.7 | ) | ||||||||
Schibsted ASA, Class A | 6,700 | 142,141 | (77.8 | ) | ||||||||
|
|
|
| |||||||||
| 849,038 | ||||||||||||
| Singapore | ||||||||||||
City Developments Ltd. | 53,700 | 300,169 | (164.3 | ) | ||||||||
Wilmar International Ltd. | 80,800 | 203,477 | (111.3 | ) | ||||||||
|
|
|
| |||||||||
| 503,646 | ||||||||||||
| Spain | ||||||||||||
Merlin Properties Socimi SA | 15,692 | 145,623 | (79.7 | ) | ||||||||
|
|
|
| |||||||||
| Sweden | ||||||||||||
Assa Abloy AB, Class B | 4,489 | 80,362 | (44.0 | ) | ||||||||
BillerudKorsnas AB | 2,984 | 37,619 | (20.6 | ) | ||||||||
Elekta AB, B Shares, Class B | 39,307 | 357,120 | (195.4 | ) | ||||||||
Fabege AB | 58,151 | 688,852 | (376.9 | ) | ||||||||
Hufvudstaden AB, A Shares | 125,470 | 1,607,714 | (879.7 | ) | ||||||||
Indutrade AB | 2,272 | 73,043 | (40.0 | ) | ||||||||
Investment AB Latour, -B Shares | 11,042 | 165,087 | (90.3 | ) | ||||||||
L E Lundbergforetagen AB, B Shares | 2,440 | 102,448 | (56.1 | ) | ||||||||
|
|
|
| |||||||||
| 3,112,245 | ||||||||||||
| 24 | 2020 BLACKROCK ANNUAL REPORTTO SHAREHOLDERS |
Schedule of Investments (continued) April 30, 2020 | BlackRock Global Long/Short Equity Fund |
| Shares | Value | % of Basket Value | ||||||||||
| Switzerland | ||||||||||||
Coca-Cola HBC AG | 38,720 | $ | 981,115 | (536.9 | ) % | |||||||
Geberit AG, Registered Shares | 642 | 287,104 | (157.1 | ) | ||||||||
Givaudan SA, Registered Shares | 109 | 365,508 | (200.0 | ) | ||||||||
Landis+Gyr Group AG | 899 | 60,710 | (33.2 | ) | ||||||||
PSP Swiss Property AG, Registered Shares | 8,236 | 956,755 | (523.5 | ) | ||||||||
Sika AG, Registered Shares | 2,676 | 442,635 | (242.2 | ) | ||||||||
Swiss Prime Site AG, Registered Shares | 1,517 | 144,428 | (79.0 | ) | ||||||||
Vifor Pharma AG | 1,969 | 295,397 | (161.6 | ) | ||||||||
|
|
|
| |||||||||
| 3,533,652 | ||||||||||||
| United Kingdom | ||||||||||||
Ashmore Group PLC | 19,049 | 90,822 | (49.7 | ) | ||||||||
Bellway PLC | 27,951 | 935,278 | (511.8 | ) | ||||||||
Centrica PLC | 362,602 | 182,222 | (99.7 | ) | ||||||||
Coca-Cola European Partners PLC | 12,977 | 514,408 | (281.5 | ) | ||||||||
Croda International PLC | 8,106 | 497,057 | (272.0 | ) | ||||||||
Dialog Semiconductor PLC | 6,809 | 213,836 | (117.0 | ) | ||||||||
Dunelm Group PLC | 6,816 | 78,751 | (43.1 | ) | ||||||||
Fevertree Drinks PLC | 4,092 | 89,313 | (48.9 | ) | ||||||||
Great Portland Estates PLC | 4,493 | 38,268 | (20.9 | ) | ||||||||
Hiscox Ltd. | 30,928 | 272,080 | (148.9 | ) | ||||||||
HomeServe PLC | 46,694 | 654,073 | (357.9 | ) | ||||||||
Howden Joinery Group PLC | 102,618 | 676,684 | (370.3 | ) | ||||||||
Informa PLC | 92,049 | 508,465 | (278.2 | ) | ||||||||
Janus Henderson Group PLC | 1,863 | 33,348 | (18.2 | ) | ||||||||
John Wood Group PLC | 43,573 | 110,331 | (60.4 | ) | ||||||||
Meggitt PLC | 9,354 | 32,755 | (17.9 | ) | ||||||||
Melrose Industries PLC | 290,809 | 363,483 | (198.9 | ) | ||||||||
Redrow PLC | 18,740 | 108,885 | (59.6 | ) | ||||||||
Renishaw PLC | 331 | 14,650 | (8.0 | ) | ||||||||
Schroders PLC | 1,580 | 52,771 | (28.9 | ) | ||||||||
Taylor Wimpey PLC | 59,996 | 110,803 | (60.6 | ) | ||||||||
Travis Perkins PLC | 22,624 | 295,412 | (161.6 | ) | ||||||||
Vistry Group PLC | 9,789 | 99,413 | (54.4 | ) | ||||||||
Vodafone Group PLC | 514,937 | 726,408 | (397.5 | ) | ||||||||
WPP PLC | 23,372 | 181,346 | (99.2 | ) | ||||||||
|
|
|
| |||||||||
| 6,880,862 | ||||||||||||
| United States | ||||||||||||
10X Genomics, Inc., Class A | 7,470 | 596,629 | (326.5 | ) | ||||||||
Acuity Brands, Inc. | 4,596 | 397,968 | (217.8 | ) | ||||||||
Aerojet Rocketdyne Holdings, Inc. | 5,271 | 216,849 | (118.7 | ) | ||||||||
Air Products & Chemicals, Inc. | 174 | 39,251 | (21.5 | ) | ||||||||
Alexandria Real Estate Equities, Inc. | 1,252 | 196,677 | (107.6 | ) | ||||||||
Altria Group, Inc. | 40,507 | 1,589,900 | (870.0 | ) | ||||||||
Amedisys, Inc. | 1,346 | 247,879 | (135.6 | ) | ||||||||
Americold Realty Trust | 3,156 | 96,542 | (52.8 | ) | ||||||||
ANSYS, Inc. | 271 | 70,956 | (38.8 | ) | ||||||||
Aptiv PLC | 2,279 | 158,504 | (86.7 | ) | ||||||||
Arch Capital Group Ltd. | 18,944 | 455,224 | (249.1 | ) | ||||||||
Avalara, Inc. | 140 | 12,512 | (6.8 | ) | ||||||||
Avangrid, Inc. | 10,699 | 460,057 | (251.7 | ) | ||||||||
Axalta Coating Systems Ltd. | 73,296 | 1,446,863 | (791.7 | ) | ||||||||
Axis Capital Holdings Ltd. | 11,052 | 404,503 | (221.3 | ) | ||||||||
Axon Enterprise, Inc. | 12,711 | 924,217 | (505.7 | ) | ||||||||
Ball Corp. | 8,887 | 582,898 | (319.0 | ) | ||||||||
Best Buy Co., Inc. | 4,265 | 327,253 | (179.1 | ) | ||||||||
Boeing Co. | 842 | 118,739 | (65.0 | ) | ||||||||
Boston Scientific Corp. | 7,818 | 293,019 | (160.3 | ) | ||||||||
Brink’s Co. | 628 | 32,103 | (17.6 | ) | ||||||||
Broadridge Financial Solutions, Inc. | 648 | 75,168 | (41.1 | ) | ||||||||
Bruker Corp. | 5,215 | 205,054 | (112.2 | ) | ||||||||
BWX Technologies, Inc. | 12,475 | 661,923 | (362.2 | ) | ||||||||
| Shares | Value | % of Basket Value | ||||||||||
| United States (continued) | ||||||||||||
Cabot Microelectronics Corp. | 1,495 | $ | 183,197 | (100.2 | ) % | |||||||
Cargurus, Inc. | 17,748 | 406,074 | (222.2 | ) | ||||||||
Carlisle Cos., Inc. | 775 | 93,744 | (51.3 | ) | ||||||||
Charles Schwab Corp. | 2,555 | 96,375 | (52.7 | ) | ||||||||
Chegg, Inc. | 11,533 | 493,036 | (269.8 | ) | ||||||||
Cirrus Logic, Inc. | 9,879 | 746,852 | (408.7 | ) | ||||||||
Coca-Cola Co. | 24,522 | 1,125,315 | (615.8 | ) | ||||||||
Copart, Inc. | 3,848 | 308,263 | (168.7 | ) | ||||||||
CoreSite Realty Corp. | 607 | 73,562 | (40.3 | ) | ||||||||
CoStar Group, Inc. | 576 | 373,398 | (204.3 | ) | ||||||||
Crane Co. | 2,799 | 152,406 | (83.4 | ) | ||||||||
CSX Corp. | 4,671 | 309,360 | (169.3 | ) | ||||||||
CyberArk Software Ltd. | 12,577 | 1,242,104 | (679.7 | ) | ||||||||
CyrusOne, Inc. | 9,587 | 672,528 | (368.0 | ) | ||||||||
Deckers Outdoor Corp. | 302 | 44,925 | (24.6 | ) | ||||||||
Dell Technologies, Inc., Class C | 3,498 | 149,330 | (81.7 | ) | ||||||||
DENTSPLY SIRONA, Inc. | 4,577 | 194,248 | (106.3 | ) | ||||||||
Dolby Laboratories, Inc., Class A | 1,426 | 85,603 | (46.8 | ) | ||||||||
Dollar General Corp. | 1,627 | 285,213 | (156.1 | ) | ||||||||
Domino’s Pizza, Inc. | 167 | 60,442 | (33.1 | ) | ||||||||
Dynatrace, Inc. | 12,055 | 359,842 | (196.9 | ) | ||||||||
eBay, Inc. | 6,373 | 253,837 | (138.9 | ) | ||||||||
eHealth, Inc. | 4,645 | 495,621 | (271.2 | ) | ||||||||
EPAM Systems, Inc. | 3,829 | 845,788 | (462.8 | ) | ||||||||
Essent Group Ltd. | 22,232 | 607,378 | (332.3 | ) | ||||||||
Etsy, Inc. | 10,056 | 652,333 | (356.9 | ) | ||||||||
Exponent, Inc. | 2,997 | 210,779 | (115.3 | ) | ||||||||
FactSet Research Systems, Inc. | 809 | 222,475 | (121.7 | ) | ||||||||
FedEx Corp. | 461 | 58,441 | (32.0 | ) | ||||||||
Fortune Brands Home & Security, Inc. | 14,868 | 716,638 | (392.1 | ) | ||||||||
Franklin Resources, Inc. | 28,630 | 539,389 | (295.1 | ) | ||||||||
frontdoor, Inc. | 4,673 | 180,892 | (99.0 | ) | ||||||||
Garmin Ltd. | 8,829 | 716,562 | (392.1 | ) | ||||||||
General Electric Co. | 192,941 | 1,311,999 | (717.9 | ) | ||||||||
Globus Medical, Inc., Class A | 6,694 | 317,697 | (173.8 | ) | ||||||||
Grand Canyon Education, Inc. | 441 | 37,935 | (20.8 | ) | ||||||||
GrubHub, Inc. | 12,271 | 586,431 | (320.9 | ) | ||||||||
Guardant Health, Inc. | 1,404 | 108,052 | (59.1 | ) | ||||||||
Guidewire Software, Inc. | 417 | 37,880 | (20.7 | ) | ||||||||
H&R Block, Inc. | 34,287 | 570,879 | (312.4 | ) | ||||||||
HD Supply Holdings, Inc. | 19,500 | 578,760 | (316.7 | ) | ||||||||
Healthcare Trust of America, Inc., Class A | 14,010 | 345,066 | (188.8 | ) | ||||||||
HealthEquity, Inc. | 17,050 | 959,403 | (525.0 | ) | ||||||||
HEICO Corp. | 1,513 | 132,539 | (72.5 | ) | ||||||||
Helen of Troy Ltd. | 2,417 | 397,065 | (217.3 | ) | ||||||||
Home Depot, Inc. | 13,911 | 3,058,055 | (1,673.3 | ) | ||||||||
Honeywell International, Inc. | 12,349 | 1,752,323 | (958.8 | ) | ||||||||
HubSpot, Inc. | 2,145 | 361,711 | (197.9 | ) | ||||||||
IAA, Inc. | 8,774 | 338,676 | (185.3 | ) | ||||||||
IDACORP, Inc. | 5,882 | 539,850 | (295.4 | ) | ||||||||
IDEXX Laboratories, Inc. | 1,221 | 338,950 | (185.5 | ) | ||||||||
Intercontinental Exchange, Inc. | 5,960 | 533,122 | (291.7 | ) | ||||||||
International Flavors & Fragrances, Inc. | 1,764 | 231,137 | (126.5 | ) | ||||||||
Intuitive Surgical, Inc. | 50 | 25,544 | (14.0 | ) | ||||||||
Invesco Ltd. | 60,281 | 519,622 | (284.3 | ) | ||||||||
ITT, Inc. | 13,675 | 720,946 | (394.5 | ) | ||||||||
JB Hunt Transport Services, Inc. | 195 | 19,718 | (10.8 | ) | ||||||||
Johnson Controls International PLC | 8,034 | 233,870 | (128.0 | ) | ||||||||
Keurig Dr Pepper, Inc. | 13,795 | 365,016 | (199.7 | ) | ||||||||
Keysight Technologies, Inc. | 9,298 | 899,767 | (492.3 | ) | ||||||||
L3Harris Technologies, Inc. | 8,388 | 1,624,756 | (889.0 | ) | ||||||||
Levi Strauss & Co., Class A | 3,310 | 42,666 | (23.3 | ) | ||||||||
| SCHEDULES OF INVESTMENTS | 25 |
Schedule of Investments (continued) April 30, 2020 | BlackRock Global Long/Short Equity Fund |
| Shares | Value | % of Basket Value | ||||||||||
| United States (continued) | ||||||||||||
Littelfuse, Inc. | 861 | $ | 125,052 | (68.4 | ) % | |||||||
LivaNova PLC | 7,249 | 385,067 | (210.7 | ) | ||||||||
Livongo Health, Inc. | 5,962 | 238,540 | (130.5 | ) | ||||||||
Lowe’s Cos., Inc. | 30,360 | 3,180,210 | (1,740.1 | ) | ||||||||
LPL Financial Holdings, Inc. | 3,636 | 218,960 | (119.8 | ) | ||||||||
MarketAxess Holdings, Inc. | 1,878 | 854,509 | (467.6 | ) | ||||||||
Marsh & McLennan Cos., Inc. | 7,083 | 689,388 | (377.2 | ) | ||||||||
Marvell Technology Group Ltd. | 27,128 | 725,403 | (396.9 | ) | ||||||||
Masimo Corp. | 1,292 | 276,372 | (151.2 | ) | ||||||||
Mattel, Inc. | 9,678 | 84,392 | (46.2 | ) | ||||||||
Maxim Integrated Products, Inc. | 2,214 | 121,726 | (66.6 | ) | ||||||||
Mercury Systems, Inc. | 2,485 | 221,563 | (121.2 | ) | ||||||||
MGIC Investment Corp. | 65,912 | 481,817 | (263.6 | ) | ||||||||
Middleby Corp. | 6,246 | 347,465 | (190.1 | ) | ||||||||
Monolithic Power Systems, Inc. | 14 | 2,799 | (1.5 | ) | ||||||||
Mosaic Co. | 19,148 | 220,393 | (120.6 | ) | ||||||||
MSA Safety, Inc. | 165 | 18,567 | (10.2 | ) | ||||||||
MyoKardia, Inc. | 3,780 | 237,460 | (129.9 | ) | ||||||||
National Instruments Corp. | 282 | 10,834 | (5.9 | ) | ||||||||
NeoGenomics, Inc. | 1,267 | 34,640 | (19.0 | ) | ||||||||
Nevro Corp. | 4,783 | 562,672 | (307.9 | ) | ||||||||
New Relic, Inc. | 4,542 | 243,860 | (133.4 | ) | ||||||||
New York Times Co., Class A | 2,973 | 96,682 | (52.9 | ) | ||||||||
Nexstar Media Group, Inc., Class A | 2,485 | 174,049 | (95.2 | ) | ||||||||
Nielsen Holdings PLC | 16,389 | 241,410 | (132.1 | ) | ||||||||
NIKE, Inc., Class B | 1,242 | 108,278 | (59.3 | ) | ||||||||
Northrop Grumman Corp. | 323 | 106,806 | (58.4 | ) | ||||||||
Nutanix, Inc., Class A | 8,066 | 165,272 | (90.4 | ) | ||||||||
Otis Worldwide Corp. | 8,460 | 430,699 | (235.7 | ) | ||||||||
Owens Corning | 3,722 | 161,386 | (88.3 | ) | ||||||||
Pinnacle Financial Partners, Inc. | 1,759 | 70,800 | (38.7 | ) | ||||||||
PPL Corp. | 24,423 | 620,833 | (339.7 | ) | ||||||||
PRA Health Sciences, Inc. | 1,084 | 104,606 | (57.2 | ) | ||||||||
Premier, Inc., Class A | 1,986 | 65,856 | (36.0 | ) | ||||||||
Public Service Enterprise Group, Inc. | 5,463 | 277,029 | (151.6 | ) | ||||||||
QTS Realty Trust, Inc., Class A | 4,308 | 269,379 | (147.4 | ) | ||||||||
Reata Pharmaceuticals, Inc., Class A | 1,767 | 279,469 | (152.9 | ) | ||||||||
Reliance Steel & Aluminum Co. | 3,084 | 276,265 | (151.2 | ) | ||||||||
Repligen Corp. | 1,372 | 159,358 | (87.2 | ) | ||||||||
RingCentral, Inc., Class A | 3,413 | 779,973 | (426.8 | ) | ||||||||
Robert Half International, Inc. | 10,571 | 499,691 | (273.4 | ) | ||||||||
Rockwell Automation, Inc. | 1,721 | 326,095 | (178.4 | ) | ||||||||
Roper Technologies, Inc. | 5,754 | 1,962,287 | (1,073.7 | ) | ||||||||
Service Corp. International | 7,486 | 275,036 | (150.5 | ) | ||||||||
ServiceNow, Inc. | 2,632 | 925,253 | (506.3 | ) | ||||||||
Sherwin-Williams Co. | 63 | 33,791 | (18.5 | ) | ||||||||
Silicon Laboratories, Inc. | 7,446 | 723,900 | (396.1 | ) | ||||||||
Skyworks Solutions, Inc. | 1,495 | 155,301 | (85.0 | ) | ||||||||
Smartsheet, Inc., Class A | 5,195 | 273,880 | (149.9 | ) | ||||||||
SolarEdge Technologies, Inc. | 1,955 | 218,158 | (119.4 | ) | ||||||||
Splunk, Inc., | 1,031 | 144,711 | (79.2 | ) | ||||||||
Sterling Bancorp | 44,193 | 544,900 | (298.2 | ) | ||||||||
STORE Capital Corp. | 10,320 | 207,122 | (113.3 | ) | ||||||||
Synovus Financial Corp. | 13,933 | 292,732 | (160.2 | ) | ||||||||
T. Rowe Price Group, Inc. | 12,043 | 1,392,532 | (762.0 | ) | ||||||||
Target Corp. | 6,319 | 693,447 | (379.4 | ) | ||||||||
TEGNA, Inc. | 1,718 | 18,417 | (10.1 | ) | ||||||||
Texas Instruments, Inc. | 1,244 | 144,391 | (79.0 | ) | ||||||||
TJX Cos., Inc. | 7,352 | 360,616 | (197.3 | ) | ||||||||
Toro Co. | 2,061 | 131,512 | (72.0 | ) | ||||||||
Tractor Supply Co. | 8,530 | 865,198 | (473.4 | ) | ||||||||
Trane Technologies PLC | 15,268 | 1,334,729 | (730.3 | ) | ||||||||
| Shares | Value | % of Basket Value | ||||||||||
| United States (continued) | ||||||||||||
TransDigm Group, Inc. | 532 | $ | 193,159 | (105.7 | ) % | |||||||
TriNet Group, Inc. | 463 | 22,673 | (12.4 | ) | ||||||||
Twilio, Inc., Class A | 3,294 | 369,916 | (202.4 | ) | ||||||||
Twitter, Inc. | 46,101 | 1,322,177 | (723.5 | ) | ||||||||
Ubiquiti, Inc. | 118 | 19,120 | (10.5 | ) | ||||||||
UGI Corp. | 22,258 | 671,746 | (367.6 | ) | ||||||||
Union Pacific Corp. | 2,986 | 477,133 | (261.1 | ) | ||||||||
United Parcel Service, Inc., Class B | 8,979 | 849,952 | (465.1 | ) | ||||||||
Universal Display Corp. | 582 | 87,370 | (47.8 | ) | ||||||||
Varian Medical Systems, Inc. | 11,017 | 1,260,124 | (689.5 | ) | ||||||||
Veeva Systems, Inc., Class A | 1,555 | 296,694 | (162.3 | ) | ||||||||
Virtu Financial, Inc., Class A | 6,577 | 153,704 | (84.1 | ) | ||||||||
VMware, Inc., Class A | 3,181 | 418,365 | (228.9 | ) | ||||||||
Vulcan Materials Co. | 6,476 | 731,594 | (400.3 | ) | ||||||||
W.W. Grainger, Inc. | 2,312 | 637,141 | (348.6 | ) | ||||||||
Wells Fargo & Co. | 6,376 | 185,223 | (101.4 | ) | ||||||||
Westlake Chemical Corp. | 9,905 | 430,372 | (235.5 | ) | ||||||||
Whirlpool Corp. | 501 | 55,982 | (30.6 | ) | ||||||||
Wingstop, Inc. | 2,439 | 286,021 | (156.5 | ) | ||||||||
Woodward, Inc. | 4,311 | 261,074 | (142.9 | ) | ||||||||
Workday, Inc., Class A | 209 | 32,165 | (17.6 | ) | ||||||||
Xilinx, Inc. | 6,505 | 568,537 | (311.1 | ) | ||||||||
XPO Logistics, Inc. | 1,078 | 71,946 | (39.4 | ) | ||||||||
Xylem, Inc. | 13,777 | 990,566 | (542.0 | ) | ||||||||
Yum! Brands, Inc. | 1,152 | 99,567 | (54.5 | ) | ||||||||
Zendesk, Inc. | 15,001 | 1,153,277 | (631.1 | ) | ||||||||
Zions Bancorp. NA | 34,356 | 1,085,993 | (594.2 | ) | ||||||||
Zoetis, Inc. | 652 | 84,310 | (46.1 | ) | ||||||||
|
|
|
| |||||||||
| 77,565,512 | ||||||||||||
| Zambia | ||||||||||||
First Quantum Minerals Ltd. | 6,627 | 40,468 | (22.1 | ) | ||||||||
|
|
|
| |||||||||
Total Reference Entity — Long |
| 140,040,582 | ||||||||||
|
| |||||||||||
Reference Entity — Short | ||||||||||||
Australia | ||||||||||||
AMP Ltd. | (71,368 | ) | (65,848 | ) | 36.0 | |||||||
Bank of Queensland, Ltd. | (57,208 | ) | (192,896 | ) | 105.6 | |||||||
Boral Ltd. | (17,605 | ) | (34,215 | ) | 18.7 | |||||||
Magellan Financial Group, Ltd. | (3,854 | ) | (126,244 | ) | 69.1 | |||||||
Orora Ltd. | (55,485 | ) | (92,208 | ) | 50.5 | |||||||
Qube Holdings Ltd. | (74,906 | ) | (155,933 | ) | 85.3 | |||||||
Seven Group Holdings Ltd. | (168,788 | ) | (1,659,773 | ) | 908.2 | |||||||
St Barbara Ltd. | (33,559 | ) | (55,236 | ) | 30.2 | |||||||
Suncorp Group Ltd. | (14,812 | ) | (88,055 | ) | 48.2 | |||||||
|
|
|
| |||||||||
| (2,470,408 | ) | |||||||||||
| Bermuda | ||||||||||||
RenaissanceRe Holdings Ltd. | (4,392 | ) | (641,276 | ) | 350.9 | |||||||
|
|
|
| |||||||||
| Canada | ||||||||||||
Alimentation Couche-Tard, Inc., Class B | (12,828 | ) | (357,944 | ) | 195.9 | |||||||
AltaGas Ltd. | (3,805 | ) | (45,487 | ) | 24.9 | |||||||
Bombardier, Inc., Class B | (68,476 | ) | (24,105 | ) | 13.2 | |||||||
Canadian Utilities, Ltd. | (1,322 | ) | (32,253 | ) | 17.6 | |||||||
Constellation Software, Inc. | (736 | ) | (707,754 | ) | 387.3 | |||||||
Eldorado Gold Corp. | (19,131 | ) | (182,383 | ) | 99.8 | |||||||
Kinaxis, Inc. | (619 | ) | (62,222 | ) | 34.0 | |||||||
Maple Leaf Foods, Inc. | (22,709 | ) | (419,773 | ) | 229.7 | |||||||
Norbord, Inc. | (17,711 | ) | (287,305 | ) | 157.2 | |||||||
Northland Power, Inc. | (1,459 | ) | (31,309 | ) | 17.1 | |||||||
Novagold Resources, Inc. | (67,877 | ) | (761,693 | ) | 416.8 | |||||||
| 26 | 2020 BLACKROCK ANNUAL REPORTTO SHAREHOLDERS |
Schedule of Investments (continued) April 30, 2020 | BlackRock Global Long/Short Equity Fund |
| Shares | Value | % of Basket Value | ||||||||||
| Canada (continued) | ||||||||||||
Pembina Pipeline Corp. | (9,418 | ) | $ | (215,972 | ) | 118.2 | % | |||||
Premium Brands Holdings Corp. | (6,218 | ) | (374,970 | ) | 205.2 | |||||||
Restaurant Brands International, Inc. | (21,965 | ) | (1,071,463 | ) | 586.3 | |||||||
Ritchie Bros Auctioneers, Inc. | (27,453 | ) | (1,181,586 | ) | 646.5 | |||||||
Saputo, Inc. | (9,440 | ) | (237,365 | ) | 129.9 | |||||||
Shopify, Inc., Class A | (970 | ) | (615,178 | ) | 336.6 | |||||||
SmartCentres Real Estate Investment Trust | (36,599 | ) | (560,574 | ) | 306.7 | |||||||
Stantec, Inc. | (21,072 | ) | (621,132 | ) | 339.9 | |||||||
Stars Group, Inc. | (19,598 | ) | (546,708 | ) | 299.1 | |||||||
TC Energy Corp. | (24,756 | ) | (1,139,315 | ) | 623.4 | |||||||
Thomson Reuters Corp. | (33,706 | ) | (2,374,760 | ) | 1,299.4 | |||||||
|
|
|
| |||||||||
| (11,851,251 | ) | |||||||||||
| China | ||||||||||||
Budweiser Brewing Co. APAC Ltd. | (6,700 | ) | (18,207 | ) | 10.0 | |||||||
|
|
|
| |||||||||
| Denmark | ||||||||||||
Carlsberg A/S | (891 | ) | (112,402 | ) | 61.5 | |||||||
Danske Bank A/S | (45,695 | ) | (542,540 | ) | 296.9 | |||||||
ISS A/S | (6,080 | ) | (90,393 | ) | 49.5 | |||||||
Rockwool International A/S, -B Shares | (124 | ) | (26,060 | ) | 14.2 | |||||||
|
|
|
| |||||||||
| (771,395 | ) | |||||||||||
| Finland | ||||||||||||
Fortum OYJ | (2,937 | ) | (48,666 | ) | 26.7 | |||||||
Konecranes OYJ | (22,238 | ) | (482,658 | ) | 264.1 | |||||||
Metsa Board OYJ | (32,665 | ) | (227,524 | ) | 124.5 | |||||||
Nordea Bank Abp | (172,081 | ) | (1,103,717 | ) | 603.9 | |||||||
Stora Enso OYJ, -R Shares | (31,586 | ) | (371,595 | ) | 203.3 | |||||||
|
|
|
| |||||||||
| (2,234,160 | ) | |||||||||||
| France | ||||||||||||
Bollore SA | (226,489 | ) | (600,246 | ) | 328.4 | |||||||
Dassault Aviation SA | (147 | ) | (119,718 | ) | 65.5 | |||||||
Eurazeo SE | (5,699 | ) | (272,943 | ) | 149.4 | |||||||
Faurecia SE | (2,235 | ) | (80,083 | ) | 43.8 | |||||||
La Francaise des Jeux SAEM | (776 | ) | (22,199 | ) | 12.2 | |||||||
|
|
|
| |||||||||
| (1,095,189 | ) | |||||||||||
| Germany | ||||||||||||
Bayer AG, Registered Shares | (739 | ) | (48,703 | ) | 26.7 | |||||||
Daimler AG | (28,428 | ) | (972,322 | ) | 532.0 | |||||||
Deutsche Bank AG | (154,710 | ) | (1,145,817 | ) | 627.0 | |||||||
Fuchs Petrolub SE | (12,653 | ) | (490,627 | ) | 268.5 | |||||||
Hapag-Lloyd AG | (4,967 | ) | (711,565 | ) | 389.4 | |||||||
HeidelbergCement AG | (15,872 | ) | (752,509 | ) | 411.8 | |||||||
LANXESS AG | (3,395 | ) | (167,052 | ) | 91.4 | |||||||
ProSiebenSat.1 Media SE | (5,385 | ) | (53,816 | ) | 29.4 | |||||||
Schaeffler AG | (15,133 | ) | (102,185 | ) | 55.9 | |||||||
Siltronic AG | (778 | ) | (66,605 | ) | 36.4 | |||||||
Talanx AG | (2,754 | ) | (97,802 | ) | 53.5 | |||||||
TeamViewer AG | (10,669 | ) | (462,988 | ) | 253.3 | |||||||
TUI AG | (199,471 | ) | (794,632 | ) | 434.8 | |||||||
Volkswagen AG | (179 | ) | (26,464 | ) | 14.5 | |||||||
Volkswagen AG | (8,616 | ) | (1,198,754 | ) | 655.9 | |||||||
|
|
|
| |||||||||
| (7,091,841 | ) | |||||||||||
| Hong Kong | ||||||||||||
Bank of East Asia Ltd. | (8,200 | ) | (17,371 | ) | 9.5 | |||||||
BOC Hong Kong Holdings Ltd. | (35,000 | ) | (107,420 | ) | 58.8 | |||||||
Cafe de Coral Holdings Ltd. | (20,000 | ) | (41,259 | ) | 22.6 | |||||||
Champion REIT | (102,000 | ) | (60,469 | ) | 33.1 | |||||||
CK Asset Holdings Ltd. | (27,500 | ) | (173,766 | ) | 95.1 | |||||||
Hang Seng Bank Ltd. | (4,600 | ) | (80,454 | ) | 44.0 | |||||||
Hong Kong & China Gas Co. Ltd. | (637,000 | ) | (1,141,631 | ) | 624.7 | |||||||
Johnson Electric Holdings, Ltd. | (119,500 | ) | (200,653 | ) | 109.8 | |||||||
| Shares | Value | % of Basket Value | ||||||||||
| Hong Kong (continued) | ||||||||||||
Li & Fung Ltd. | (984,000 | ) | $ | (147,739 | ) | 80.8 | % | |||||
Melco International Development Ltd. | (157,000 | ) | (293,482 | ) | 160.6 | |||||||
Shangri-La Asia Ltd. | (576,000 | ) | (475,645 | ) | 260.2 | |||||||
Shun Tak Holdings Ltd. | (1,382,000 | ) | (483,346 | ) | 264.5 | |||||||
SJM Holdings Ltd. | (74,000 | ) | (73,063 | ) | 40.0 | |||||||
Swire Pacific, Ltd. | (8,500 | ) | (55,277 | ) | 30.2 | |||||||
Techtronic Industries Co. Ltd. | (105,000 | ) | (796,163 | ) | 435.6 | |||||||
VTech Holdings Ltd. | (39,700 | ) | (299,338 | ) | 163.8 | |||||||
WH Group, Ltd. | (298,000 | ) | (284,218 | ) | 155.5 | |||||||
Wheelock & Co. Ltd. | (9,000 | ) | (65,961 | ) | 36.1 | |||||||
|
|
|
| |||||||||
| (4,797,255 | ) | |||||||||||
| Israel | ||||||||||||
First International Bank Of Israel Ltd. | (5,474 | ) | (135,029 | ) | 73.9 | |||||||
Gazit-Globe Ltd. | (13,848 | ) | (102,529 | ) | 56.1 | |||||||
Israel Corp. Ltd. | (3,510 | ) | (452,900 | ) | 247.8 | |||||||
Mizrahi Tefahot Bank Ltd. | (7,142 | ) | (146,276 | ) | 80.1 | |||||||
Oil Refineries Ltd. | (229,717 | ) | (63,484 | ) | 34.7 | |||||||
Teva Pharmaceutical Industries, Ltd., ADR | (10,162 | ) | (109,140 | ) | 59.7 | |||||||
|
|
|
| |||||||||
| (1,009,358 | ) | |||||||||||
| Italy | ||||||||||||
Prada SpA | (573,000 | ) | (1,860,341 | ) | 1,017.9 | |||||||
|
|
|
| |||||||||
| Japan | ||||||||||||
Acom Co. Ltd. | (3,300 | ) | (13,333 | ) | 7.3 | |||||||
Advance Residence Investment Corp. | (27 | ) | (82,843 | ) | 45.3 | |||||||
Aozora Bank, Ltd. | (800 | ) | (14,237 | ) | 7.8 | |||||||
ASKUL Corp. | (500 | ) | (14,276 | ) | 7.8 | |||||||
Bank of Kyoto Ltd. | (32,700 | ) | (1,119,267 | ) | 612.4 | |||||||
Brother Industries Ltd. | (3,600 | ) | (61,015 | ) | 33.4 | |||||||
Canon Marketing Japan, Inc. | (6,300 | ) | (121,254 | ) | 66.3 | |||||||
Chugoku Bank Ltd. | (97,100 | ) | (894,098 | ) | 489.2 | |||||||
Daiwa House REIT Investment Corp. | (28 | ) | (67,749 | ) | 37.1 | |||||||
FP Corp. | (400 | ) | (30,174 | ) | 16.5 | |||||||
Freee KK | (14,400 | ) | (508,959 | ) | 278.5 | |||||||
FUJIFILM Holdings Corp. | (15,100 | ) | (719,251 | ) | 393.6 | |||||||
GMO Payment Gateway, Inc. | (3,500 | ) | (312,023 | ) | 170.7 | |||||||
Gunma Bank Ltd. | (10,800 | ) | (34,578 | ) | 18.9 | |||||||
Hachijuni Bank Ltd. | (76,200 | ) | (272,099 | ) | 148.9 | |||||||
Hamamatsu Photonics KK | (15,900 | ) | (694,977 | ) | 380.3 | |||||||
Hitachi Construction Machinery Co., Ltd. | (15,100 | ) | (354,280 | ) | 193.9 | |||||||
Ibiden Co. Ltd. | (11,900 | ) | (304,164 | ) | 166.4 | |||||||
Ichigo, Inc. | (40,300 | ) | (103,200 | ) | 56.5 | |||||||
Invincible Investment Corp. | (360 | ) | (92,110 | ) | 50.4 | |||||||
Ito En Ltd. | (3,600 | ) | (199,987 | ) | 109.4 | |||||||
ITOCHU Corp. | (6,800 | ) | (133,315 | ) | 72.9 | |||||||
Itochu Techno-Solutions Corp. | (3,800 | ) | (116,107 | ) | 63.5 | |||||||
Iyo Bank Ltd. | (75,200 | ) | (402,864 | ) | 220.4 | |||||||
Japan Airport Terminal Co. Ltd. | (2,800 | ) | (113,546 | ) | 62.1 | |||||||
Japan Exchange Group, Inc. | (10,500 | ) | (195,304 | ) | 106.9 | |||||||
Justsystems Corp. | (2,900 | ) | (177,341 | ) | 97.0 | |||||||
Kagome Co., Ltd. | (1,600 | ) | (40,860 | ) | 22.4 | |||||||
Kaken Pharmaceutical Co. Ltd. | (400 | ) | (22,017 | ) | 12.0 | |||||||
Kansai Mirai Financial Group, Inc. | (42,100 | ) | (141,546 | ) | 77.4 | |||||||
Kawasaki Kisen Kaisha Ltd. | (1,200 | ) | (11,806 | ) | 6.5 | |||||||
Keihan Holdings Co. Ltd. | (8,500 | ) | (382,038 | ) | 209.0 | |||||||
Keikyu Corp. | (20,400 | ) | (335,287 | ) | 183.5 | |||||||
Kinden Corp. | (6,300 | ) | (101,374 | ) | 55.5 | |||||||
Kintetsu Group Holdings Co. Ltd. | (5,700 | ) | (272,292 | ) | 149.0 | |||||||
Koei Tecmo Holdings Co. Ltd. | (36,400 | ) | (957,538 | ) | 523.9 | |||||||
Komatsu, Ltd. | (7,300 | ) | (138,123 | ) | 75.6 | |||||||
Kyushu Financial Group, Inc. | (20,500 | ) | (86,483 | ) | 47.3 | |||||||
Lion Corp. | (1,300 | ) | (27,329 | ) | 15.0 | |||||||
| SCHEDULES OF INVESTMENTS | 27 |
Schedule of Investments (continued) April 30, 2020 | BlackRock Global Long/Short Equity Fund |
| Shares | Value | % of Basket Value | ||||||||||
| Japan (continued) | ||||||||||||
Makita Corp. | (1,700 | ) | $ | (55,356 | ) | 30.3 | % | |||||
Maruichi Steel Tube Ltd. | (1,900 | ) | (42,721 | ) | 23.4 | |||||||
McDonald’s Holdings Co. Japan Ltd. | (400 | ) | (19,680 | ) | 10.8 | |||||||
Minebea Mitsumi, Inc. | (27,900 | ) | (453,631 | ) | 248.2 | |||||||
Mitsubishi Corp. | (63,300 | ) | (1,342,466 | ) | 734.6 | |||||||
Mitsubishi Heavy Industries, Ltd. | (35,400 | ) | (907,784 | ) | 496.7 | |||||||
Mitsubishi Logistics Corp. | (6,100 | ) | (134,683 | ) | 73.7 | |||||||
Mitsubishi UFJ Financial Group, Inc. | (67,100 | ) | (271,084 | ) | 148.3 | |||||||
Mitsui OSK Lines Ltd. | (47,000 | ) | (815,199 | ) | 446.1 | |||||||
Nabtesco Corp. | (8,800 | ) | (251,815 | ) | 137.8 | |||||||
Nagoya Railroad Co. Ltd. | (3,100 | ) | (88,710 | ) | 48.5 | |||||||
NEC Corp. | (50,200 | ) | (1,926,414 | ) | 1,054.1 | |||||||
NGK Insulators Ltd. | (19,200 | ) | (251,190 | ) | 137.4 | |||||||
Nippo Corp. | (2,700 | ) | (60,719 | ) | 33.2 | |||||||
Nippon Accommodations Fund, Inc. | (4 | ) | (23,757 | ) | 13.0 | |||||||
Nishi-Nippon Financial Holdings, Inc. | (4,000 | ) | (23,344 | ) | 12.8 | |||||||
Noevir Holdings Co. Ltd. | (400 | ) | (18,738 | ) | 10.3 | |||||||
NOF Corp. | (6,500 | ) | (215,389 | ) | 117.9 | |||||||
NTT DOCOMO, Inc. | (22,000 | ) | (648,367 | ) | 354.8 | |||||||
Oji Holdings Corp. | (12,200 | ) | (61,945 | ) | 33.9 | |||||||
Orient Corp. | (38,500 | ) | (44,036 | ) | 24.1 | |||||||
Oriental Land Co. Ltd. | (2,100 | ) | (265,535 | ) | 145.3 | |||||||
Panasonic Corp. | (1,800 | ) | (13,721 | ) | 7.5 | |||||||
Rinnai Corp. | (300 | ) | (22,724 | ) | 12.4 | |||||||
Sega Sammy Holdings, Inc. | (7,000 | ) | (84,790 | ) | 46.4 | |||||||
Shiga Bank Ltd. | (23,100 | ) | (544,079 | ) | 297.7 | |||||||
Shimano, Inc. | (400 | ) | (58,942 | ) | 32.3 | |||||||
Shinsei Bank Ltd. | (12,700 | ) | (153,199 | ) | 83.8 | |||||||
Shizuoka Bank Ltd. | (4,600 | ) | (27,928 | ) | 15.3 | |||||||
SMC Corp. | (1,700 | ) | (768,438 | ) | 420.5 | |||||||
Sony Financial Holdings, Inc. | (13,800 | ) | (261,602 | ) | 143.1 | |||||||
Square Enix Holdings Co. Ltd. | (6,900 | ) | (282,804 | ) | 154.7 | |||||||
Sumitomo Forestry Co., Ltd. | (1,100 | ) | (13,589 | ) | 7.4 | |||||||
Suzuki Motor Corp. | (8,900 | ) | (284,046 | ) | 155.4 | |||||||
Tadano Ltd. | (1,900 | ) | (14,642 | ) | 8.0 | |||||||
Taiyo Nippon Sanso Corp. | (2,400 | ) | (37,226 | ) | 20.4 | |||||||
Tobu Railway Co. Ltd. | (10,100 | ) | (342,592 | ) | 187.5 | |||||||
Toho Gas Co. Ltd. | (6,200 | ) | (304,635 | ) | 166.7 | |||||||
Tokai Carbon Co. Ltd. | (26,303 | ) | (217,517 | ) | 119.0 | |||||||
Tokuyama Corp. | (5,000 | ) | (105,500 | ) | 57.7 | |||||||
Tokyo Electric Power Co. Holdings, Inc. | (19,000 | ) | (63,960 | ) | 35.0 | |||||||
Tokyo Tatemono Co. Ltd. | (7,600 | ) | (85,474 | ) | 46.8 | |||||||
Toppan Printing Co., Ltd. | (11,900 | ) | (176,776 | ) | 96.7 | |||||||
Toyo Suisan Kaisha Ltd. | (2,600 | ) | (125,026 | ) | 68.4 | |||||||
Toyo Tire Corp. | (3,100 | ) | (36,299 | ) | 19.9 | |||||||
Yamada Denki Co. Ltd. | (8,000 | ) | (37,937 | ) | 20.8 | |||||||
Yamazaki Baking Co., Ltd. | (24,400 | ) | (431,491 | ) | 236.1 | |||||||
Zeon Corp. | (2,000 | ) | (17,524 | ) | 9.6 | |||||||
|
|
|
| |||||||||
| (22,104,068 | ) | |||||||||||
| Luxembourg | ||||||||||||
APERAM SA | (3,088 | ) | (80,013 | ) | 43.8 | |||||||
|
|
|
| |||||||||
| Netherlands | ||||||||||||
Aalberts NV | (1,983 | ) | (55,841 | ) | 30.6 | |||||||
Flow Traders | (1,412 | ) | (47,039 | ) | 25.7 | |||||||
Koninklijke Ahold Delhaize NV | (2,116 | ) | (51,377 | ) | 28.1 | |||||||
|
|
|
| |||||||||
| (154,257 | ) | |||||||||||
| New Zealand | ||||||||||||
SKYCITY Entertainment Group Ltd. | (62,848 | ) | (101,431 | ) | 55.5 | |||||||
|
|
|
| |||||||||
| Norway | ||||||||||||
Orkla ASA | (3,712 | ) | (33,602 | ) | 18.4 | |||||||
|
|
|
| |||||||||
| Shares | Value | % of Basket Value | ||||||||||
| Singapore | ||||||||||||
Genting Singapore Ltd. | (1,013,400 | ) | $ | (562,303 | ) | 307.7 | % | |||||
Jardine Cycle & Carriage Ltd. | (16,200 | ) | (230,330 | ) | 126.0 | |||||||
Mapletree Industrial Trust | (148,800 | ) | (267,149 | ) | 146.2 | |||||||
SembCorp Industries Ltd. | (300,500 | ) | (344,255 | ) | 188.4 | |||||||
|
|
|
| |||||||||
| (1,404,037 | ) | |||||||||||
| Sweden | ||||||||||||
Autoliv, Inc. | (588 | ) | (35,292 | ) | 19.3 | |||||||
Electrolux Professional AB | (51,792 | ) | (119,238 | ) | 65.2 | |||||||
Fastighets AB Balder | (7,896 | ) | (312,028 | ) | 170.7 | |||||||
Loomis AB | (763 | ) | (18,606 | ) | 10.2 | |||||||
Nibe Industrier AB, -B Shares | (15,987 | ) | (298,266 | ) | 163.2 | |||||||
Samhallsbyggnadsbolaget i Norden AB | (202,358 | ) | (391,878 | ) | 214.4 | |||||||
Securitas AB, -B Shares | (1,307 | ) | (15,464 | ) | 8.5 | |||||||
SKF AB, -B Shares | (14,632 | ) | (230,946 | ) | 126.4 | |||||||
Svenska Cellulosa AB SCA, Class B | (6,136 | ) | (65,083 | ) | 35.6 | |||||||
Svenska Handelsbanken AB, -A Shares | (14,242 | ) | (131,826 | ) | 72.1 | |||||||
Telefonaktiebolaget LM Ericsson, -B Shares | (63,379 | ) | (541,457 | ) | 296.3 | |||||||
Telia Co. AB | (60,595 | ) | (210,686 | ) | 115.3 | |||||||
Volvo AB, -B Shares | (58,827 | ) | (753,842 | ) | 412.5 | |||||||
|
|
|
| |||||||||
| (3,124,612 | ) | |||||||||||
| Switzerland | ||||||||||||
Banque Cantonale Vaudoise | (20 | ) | (17,659 | ) | 9.7 | |||||||
Cembra Money Bank AG | (2,057 | ) | (195,555 | ) | 107.0 | |||||||
EMS-Chemie Holding AG | (1,117 | ) | (722,333 | ) | 395.2 | |||||||
Flughafen Zurich AG | (1,777 | ) | (219,756 | ) | 120.2 | |||||||
Georg Fischer AG, Registered Shares | (960 | ) | (716,447 | ) | 392.0 | |||||||
LafargeHolcim Ltd. | (19,951 | ) | (828,624 | ) | 453.4 | |||||||
Lonza Group AG, Registered Shares | (562 | ) | (245,406 | ) | 134.3 | |||||||
Roche Holding AG | (482 | ) | (166,915 | ) | 91.3 | |||||||
Swatch Group AG, Registered Shares | (7,839 | ) | (304,760 | ) | 166.8 | |||||||
UBS Group AG | (14,101 | ) | (151,053 | ) | 82.7 | |||||||
|
|
|
| |||||||||
| (3,568,508 | ) | |||||||||||
| United Kingdom | ||||||||||||
Admiral Group PLC | (7,619 | ) | (222,327 | ) | 121.7 | |||||||
Ashtead Group PLC | (28,655 | ) | (782,718 | ) | 428.3 | |||||||
Avast PLC | (11,048 | ) | (63,758 | ) | 34.9 | |||||||
B&M European Value Retail SA | (31,012 | ) | (129,990 | ) | 71.1 | |||||||
Barclays PLC | (254,197 | ) | (339,429 | ) | 185.7 | |||||||
Berkeley Group Holdings PLC | (1,393 | ) | (73,123 | ) | 40.0 | |||||||
CK Hutchison Holdings, Ltd. | (224,000 | ) | (1,660,326 | ) | 908.5 | |||||||
CRH PLC | (8,147 | ) | (247,169 | ) | 135.2 | |||||||
Domino’s Pizza Group PLC | (52,100 | ) | (225,769 | ) | 123.5 | |||||||
DS Smith PLC | (99,493 | ) | (390,107 | ) | 213.5 | |||||||
GVC Holdings PLC | (8,419 | ) | (79,952 | ) | 43.8 | |||||||
Halma PLC | (2,362 | ) | (62,098 | ) | 34.0 | |||||||
HSBC Holdings PLC | (109,512 | ) | (562,887 | ) | 308.0 | |||||||
Inchcape PLC | (58,217 | ) | (366,714 | ) | 200.7 | |||||||
InterContinental Hotels Group PLC | (5,388 | ) | (245,438 | ) | 134.3 | |||||||
Legal & General Group PLC | (85,381 | ) | (220,021 | ) | 120.4 | |||||||
Pets at Home Group PLC | (34,998 | ) | (112,056 | ) | 61.3 | |||||||
Quilter PLC | (18,609 | ) | (28,780 | ) | 15.7 | |||||||
Signature Aviation PLC | (154,949 | ) | (380,541 | ) | 208.2 | |||||||
Victrex PLC | (25,758 | ) | (645,391 | ) | 353.1 | |||||||
Weir Group PLC | (49,164 | ) | (587,542 | ) | 321.5 | |||||||
|
|
|
| |||||||||
| (7,426,136 | ) | |||||||||||
| United States | ||||||||||||
1Life Healthcare, Inc. | (14,084 | ) | (347,452 | ) | 190.1 | |||||||
Advance Auto Parts, Inc. | (4,357 | ) | (526,805 | ) | 288.3 | |||||||
Affiliated Managers Group, Inc. | (2,168 | ) | (151,673 | ) | 83.0 | |||||||
Aflac, Inc. | (5,394 | ) | (200,873 | ) | 109.9 | |||||||
| 28 | 2020 BLACKROCK ANNUAL REPORTTO SHAREHOLDERS |
Schedule of Investments (continued) April 30, 2020 | BlackRock Global Long/Short Equity Fund |
| Shares | Value | % of Basket Value | ||||||||||
| United States (continued) | ||||||||||||
Air Lease Corp. | (14,881 | ) | $ | (389,138 | ) | 212.9 | % | |||||
Alleghany Corp. | (813 | ) | (433,906 | ) | 237.4 | |||||||
Alliance Data Systems Corp. | (9,906 | ) | (495,993 | ) | 271.4 | |||||||
Allstate Corp. | (13,206 | ) | (1,343,314 | ) | 735.0 | |||||||
American Campus Communities, Inc. | (5,735 | ) | (202,388 | ) | 110.7 | |||||||
Apartment Investment & Management Co., Class A | (12,338 | ) | (464,772 | ) | 254.3 | |||||||
Archer-Daniels-Midland Co. | (48,515 | ) | (1,801,847 | ) | 985.9 | |||||||
Assurant, Inc. | (6,672 | ) | (708,833 | ) | 387.9 | |||||||
AutoNation, Inc. | (31,874 | ) | (1,186,988 | ) | 649.5 | |||||||
Bank OZK | (7,559 | ) | (170,985 | ) | 93.6 | |||||||
Berkshire Hathaway, Inc., Class B | (2,262 | ) | (423,808 | ) | 231.9 | |||||||
Black Knight, Inc. | (3,899 | ) | (275,152 | ) | 150.6 | |||||||
Brunswick Corp. | (9,927 | ) | (473,716 | ) | 259.2 | |||||||
CarMax, Inc. | (8,556 | ) | (630,149 | ) | 344.8 | |||||||
Caterpillar, Inc. | (13 | ) | (1,513 | ) | 0.8 | |||||||
CenturyLink, Inc. | (25,895 | ) | (275,005 | ) | 150.5 | |||||||
Ceridian HCM Holding, Inc. | (6,093 | ) | (359,304 | ) | 196.6 | |||||||
CF Industries Holdings, Inc. | (26,889 | ) | (739,448 | ) | 404.6 | |||||||
Change Healthcare, Inc. | (27,396 | ) | (318,889 | ) | 174.5 | |||||||
Charter Communications, Inc., Class A | (562 | ) | (278,319 | ) | 152.3 | |||||||
Cheniere Energy, Inc. | (5,717 | ) | (266,927 | ) | 146.1 | |||||||
Chevron Corp. | (8,360 | ) | (769,120 | ) | 420.8 | |||||||
Chewy, Inc., Class A | (6,915 | ) | (299,005 | ) | 163.6 | |||||||
Choice Hotels International, Inc. | (7,852 | ) | (589,293 | ) | 322.4 | |||||||
Churchill Downs, Inc. | (3,009 | ) | (301,562 | ) | 165.0 | |||||||
Cincinnati Financial Corp. | (6,690 | ) | (440,202 | ) | 240.9 | |||||||
Cintas Corp. | (4,067 | ) | (902,183 | ) | 493.7 | |||||||
Clorox Co. | (3,145 | ) | (586,354 | ) | 320.8 | |||||||
Colfax Corp. | (1,589 | ) | (40,980 | ) | 22.4 | |||||||
Commerce Bancshares, Inc. | (2,751 | ) | (168,334 | ) | 92.1 | |||||||
Concho Resources, Inc. | (940 | ) | (53,317 | ) | 29.2 | |||||||
Cooper Cos., Inc. | (134 | ) | (38,418 | ) | 21.0 | |||||||
CoreLogic, Inc. | (5,582 | ) | (214,460 | ) | 117.3 | |||||||
Corning, Inc. | (10,482 | ) | (230,709 | ) | 126.2 | |||||||
Cousins Properties, Inc. | (14,016 | ) | (422,863 | ) | 231.4 | |||||||
Credit Acceptance Corp. | (529 | ) | (164,821 | ) | 90.2 | |||||||
Crowdstrike Holdings, Inc., Class A | (467 | ) | (31,597 | ) | 17.3 | |||||||
Darling International, Inc. | (28,935 | ) | (595,772 | ) | 326.0 | |||||||
DaVita, Inc. | (233 | ) | (18,409 | ) | 10.1 | |||||||
Diamondback Energy, Inc. | (1,528 | ) | (66,529 | ) | 36.4 | |||||||
Discovery Communications, Inc. | (47,567 | ) | (1,066,452 | ) | 583.5 | |||||||
Dominion Energy, Inc. | (3,413 | ) | (263,245 | ) | 144.0 | |||||||
Dover Corp. | (960 | ) | (89,904 | ) | 49.2 | |||||||
DXC Technology Co. | (7,457 | ) | (135,195 | ) | 74.0 | |||||||
Eaton Vance Corp. | (1,072 | ) | (39,342 | ) | 21.5 | |||||||
Element Solutions, Inc. | (24,165 | ) | (247,691 | ) | 135.5 | |||||||
Eli Lilly & Co. | (1,481 | ) | (229,022 | ) | 125.3 | |||||||
Envista Holdings Corp. | (4,358 | ) | (84,850 | ) | 46.4 | |||||||
Essex Property Trust, Inc. | (1,758 | ) | (429,128 | ) | 234.8 | |||||||
Everest Re Group Ltd. | (770 | ) | (133,310 | ) | 72.9 | |||||||
Eversource Energy | (1,372 | ) | (110,720 | ) | 60.6 | |||||||
Expedia Group, Inc. | (17,034 | ) | (1,209,073 | ) | 661.6 | |||||||
Fifth Third Bancorp | (29,690 | ) | (554,906 | ) | 303.6 | |||||||
FireEye, Inc. | (19,935 | ) | (229,452 | ) | 125.6 | |||||||
First Citizens BancShares, Inc., Class A | (1,200 | ) | (458,400 | ) | 250.8 | |||||||
FirstCash, Inc. | (2,363 | ) | (169,758 | ) | 92.9 | |||||||
FleetCor Technologies, Inc. | (833 | ) | (200,961 | ) | 110.0 | |||||||
Flex Ltd. | (24,112 | ) | (235,333 | ) | 128.8 | |||||||
Flowers Foods, Inc. | (4,433 | ) | (98,767 | ) | 54.0 | |||||||
Gap, Inc. | (8,705 | ) | (70,685 | ) | 38.7 | |||||||
Genuine Parts Co. | (1,502 | ) | (119,079 | ) | 65.2 | |||||||
Global Payments, Inc. | (528 | ) | (87,659 | ) | 48.0 | |||||||
| Shares | Value | % of Basket Value | ||||||||||
| United States (continued) | ||||||||||||
GoDaddy, Inc., Class A | (5,831 | ) | $ | (404,846 | ) | 221.5 | % | |||||
Goldman Sachs Group, Inc. | (7,092 | ) | (1,300,815 | ) | 711.8 | |||||||
Graphic Packaging Holding Co. | (14,948 | ) | (199,556 | ) | 109.2 | |||||||
Hain Celestial Group, Inc. | (19,758 | ) | (510,547 | ) | 279.4 | |||||||
Hanesbrands, Inc. | (47,954 | ) | (476,663 | ) | 260.8 | |||||||
Healthcare Realty Trust, Inc. | (5,473 | ) | (160,851 | ) | 88.0 | |||||||
Highwoods Properties, Inc. | (1,077 | ) | (41,798 | ) | 22.9 | |||||||
Host Hotels & Resorts, Inc. | (90 | ) | (1,108 | ) | 0.6 | |||||||
Huntington Bancshares, Inc. | (13,783 | ) | (127,355 | ) | 69.7 | |||||||
ICU Medical, Inc. | (2,501 | ) | (548,494 | ) | 300.1 | |||||||
International Business Machines Corp. | (5,508 | ) | (691,584 | ) | 378.4 | |||||||
Jabil, Inc. | (53,469 | ) | (1,520,658 | ) | 832.1 | |||||||
Jefferies Financial Group, Inc. | (5,892 | ) | (80,838 | ) | 44.2 | |||||||
Kemper Corp. | (1,845 | ) | (124,021 | ) | 67.9 | |||||||
Kimberly-Clark Corp. | (1,386 | ) | (191,933 | ) | 105.0 | |||||||
Kinder Morgan, Inc. | (1,312 | ) | (19,982 | ) | 10.9 | |||||||
Kirby Corp. | (2,722 | ) | (145,409 | ) | 79.6 | |||||||
Lamar Advertising Co. | (2,235 | ) | (128,848 | ) | 70.5 | |||||||
Leidos Holdings, Inc. | (2,255 | ) | (222,817 | ) | 121.9 | |||||||
Lennar Corp., Class A | (15,769 | ) | (789,554 | ) | 432.0 | |||||||
Liberty Media Corp-Liberty SiriusXM | (11,506 | ) | (392,009 | ) | 214.5 | |||||||
Liberty SiriusXM Group | (2,558 | ) | (86,230 | ) | 47.2 | |||||||
LKQ Corp. | (9,140 | ) | (239,011 | ) | 130.8 | |||||||
Loews Corp. | (43,335 | ) | (1,501,991 | ) | 821.9 | |||||||
ManpowerGroup, Inc. | (1,549 | ) | (114,998 | ) | 62.9 | |||||||
Marriott International, Inc., Class A | (909 | ) | (82,664 | ) | 45.2 | |||||||
Marriott Vacations Worldwide Corp. | (7,676 | ) | (637,108 | ) | 348.6 | |||||||
Medpace Holdings, Inc. | (4,133 | ) | (330,061 | ) | 180.6 | |||||||
MetLife, Inc. | (68,813 | ) | (2,482,773 | ) | 1,358.5 | |||||||
MGM Resorts International | (20,495 | ) | (344,931 | ) | 188.7 | |||||||
MongoDB, Inc. | (531 | ) | (86,091 | ) | 47.1 | |||||||
Murphy USA, Inc. | (8,798 | ) | (939,626 | ) | 514.1 | |||||||
National Fuel Gas Co. | (1,348 | ) | (55,268 | ) | 30.2 | |||||||
National Retail Properties, Inc. | (12,321 | ) | (402,157 | ) | 220.1 | |||||||
New Jersey Resources Corp. | (4,056 | ) | (137,012 | ) | 75.0 | |||||||
New York Community Bancorp, Inc. | (52,678 | ) | (572,083 | ) | 313.0 | |||||||
Nordstrom, Inc. | (29,682 | ) | (557,428 | ) | 305.0 | |||||||
NRG Energy, Inc. | (9,059 | ) | (303,748 | ) | 166.2 | |||||||
Nucor Corp. | (8,406 | ) | (346,243 | ) | 189.5 | |||||||
NVR, Inc. | (53 | ) | (164,300 | ) | 89.9 | |||||||
Old Republic International Corp. | (6,383 | ) | (101,809 | ) | 55.7 | |||||||
Ollie’s Bargain Outlet Holdings, Inc. | (281 | ) | (19,083 | ) | 10.4 | |||||||
Omega Healthcare Investors, Inc. | (18,412 | ) | (536,710 | ) | 293.7 | |||||||
Oracle Corp. | (12,078 | ) | (639,772 | ) | 350.1 | |||||||
Oshkosh Corp. | (65 | ) | (4,389 | ) | 2.4 | |||||||
PACCAR, Inc. | (4,109 | ) | (284,466 | ) | 155.7 | |||||||
Parsley Energy, Inc., Class A | (11,966 | ) | (113,079 | ) | 61.9 | |||||||
Peloton Interactive, Inc., Class A | (12,179 | ) | (383,639 | ) | 209.9 | |||||||
People’s United Financial, Inc. | (59,752 | ) | (758,253 | ) | 414.9 | |||||||
Philip Morris International, Inc. | (8,998 | ) | (671,251 | ) | 367.3 | |||||||
Physicians Realty Trust | (4,457 | ) | (68,727 | ) | 37.6 | |||||||
Polaris Industries, Inc. | (15,306 | ) | (1,085,655 | ) | 594.0 | |||||||
Primerica, Inc. | (390 | ) | (40,525 | ) | 22.2 | |||||||
PTC, Inc. | (928 | ) | (64,264 | ) | 35.2 | |||||||
Public Storage | (459 | ) | (85,122 | ) | 46.6 | |||||||
Quaker Chemical Corp. | (843 | ) | (128,237 | ) | 70.2 | |||||||
Raymond James Financial, Inc. | (5,704 | ) | (376,008 | ) | 205.7 | |||||||
Restoration Hardware | (14,205 | ) | (2,042,395 | ) | 1,117.6 | |||||||
Rexnord Corp. | (4,706 | ) | (128,333 | ) | 70.2 | |||||||
Royal Caribbean Cruises Ltd. | (320 | ) | (14,966 | ) | 8.2 | |||||||
RPM International, Inc. | (3,015 | ) | (200,226 | ) | 109.6 | |||||||
Sanderson Farms, Inc. | (571 | ) | (77,736 | ) | 42.5 | |||||||
| SCHEDULES OF INVESTMENTS | 29 |
Schedule of Investments (continued) April 30, 2020 | BlackRock Global Long/Short Equity Fund |
| Shares | Value | % of Basket Value | ||||||||||
| United States (continued) | ||||||||||||
Santander Consumer USA Holdings, Inc. | (36,674 | ) | $ | (571,748 | ) | 312.8 | % | |||||
Scotts Miracle-Gro Co., Class A | (677 | ) | (83,968 | ) | 45.9 | |||||||
SL Green Realty Corp. | (19,137 | ) | (1,015,218 | ) | 555.5 | |||||||
SLM Corp. | (125,261 | ) | (1,044,677 | ) | 571.6 | |||||||
Snap, Inc., Class A | (37,470 | ) | (659,847 | ) | 361.1 | |||||||
Southern Co. | (3,283 | ) | (186,245 | ) | 101.9 | |||||||
Spirit Realty Capital, Inc. | (18,430 | ) | (566,907 | ) | 310.2 | |||||||
SS&C Technologies Holdings, Inc. | (19,216 | ) | (1,059,955 | ) | 580.0 | |||||||
STAG Industrial, Inc. | (3,701 | ) | (97,151 | ) | 53.2 | |||||||
Stericycle, Inc. | (2,088 | ) | (101,894 | ) | 55.8 | |||||||
Stifel Financial Corp. | (6,158 | ) | (272,676 | ) | 149.2 | |||||||
Switch, Inc. | (7,103 | ) | (121,959 | ) | 66.7 | |||||||
Synchrony Financial | (3,689 | ) | (73,005 | ) | 39.9 | |||||||
Sysco Corp. | (2,009 | ) | (113,046 | ) | 61.9 | |||||||
T-Mobile U.S., Inc. | (14,182 | ) | (1,245,180 | ) | 681.3 | |||||||
Teradyne, Inc. | (12,323 | ) | (770,680 | ) | 421.7 | |||||||
Textron, Inc. | (15,687 | ) | (413,509 | ) | 226.3 | |||||||
Thor Industries, Inc. | (1,578 | ) | (104,464 | ) | 57.2 | |||||||
Timken Co. | (5,003 | ) | (188,013 | ) | 102.9 | |||||||
TopBuild Corp. | (2,030 | ) | (189,176 | ) | 103.5 | |||||||
Travelers Cos., Inc. | (7,764 | ) | (785,794 | ) | 430.0 | |||||||
TripAdvisor, Inc. | (3,247 | ) | (64,843 | ) | 35.5 | |||||||
Tyler Technologies, Inc. | (2,020 | ) | (647,794 | ) | 354.5 | |||||||
Under Armour, Inc., Class A | (1,651 | ) | (17,203 | ) | 9.4 | |||||||
Under Armour, Inc., Class C | (2,536 | ) | (23,509 | ) | 12.9 | |||||||
Universal Health Services, Inc., Class B | (14,332 | ) | (1,514,749 | ) | 828.8 | |||||||
Unum Group | (3,992 | ) | (69,660 | ) | 38.1 | |||||||
VEREIT, Inc. | (28,881 | ) | (158,268 | ) | 86.6 | |||||||
VeriSign, Inc. | (279 | ) | (58,448 | ) | 32.0 | |||||||
ViaSat, Inc. | (1,591 | ) | (67,458 | ) | 36.9 | |||||||
Viavi Solutions, Inc. | (35,485 | ) | (428,659 | ) | 234.6 | |||||||
Vistra Energy Corp. | (1,156 | ) | (22,588 | ) | 12.4 | |||||||
Vornado Realty Trust | (62 | ) | (2,717 | ) | 1.5 | |||||||
Voya Financial, Inc. | (17,139 | ) | (774,169 | ) | 423.6 | |||||||
Watsco, Inc. | (4,986 | ) | (802,696 | ) | 439.2 | |||||||
Western Alliance Bancorp | (352 | ) | (12,630 | ) | 6.9 | |||||||
Western Union Co. | (1,784 | ) | (34,021 | ) | 18.6 | |||||||
Whirlpool Corp. | (11,751 | ) | (1,313,057 | ) | 718.5 | |||||||
Williams Cos., Inc. | (56,628 | ) | (1,096,884 | ) | 600.2 | |||||||
WP Carey, Inc. | (1,081 | ) | (71,108 | ) | 38.9 | |||||||
Wynn Resorts Ltd. | (1,904 | ) | (162,849 | ) | 89.1 | |||||||
Zimmer Biomet Holdings, Inc. | (7,451 | ) | (891,885 | ) | 488.0 | |||||||
Zoom Video Communications, Inc., Class A | (3,675 | ) | (496,750 | ) | 271.8 | |||||||
Zynga, Inc., Class A | (4,884 | ) | (36,825 | ) | 20.1 | |||||||
|
|
|
| |||||||||
| (68,385,993 | ) | |||||||||||
|
| |||||||||||
Total Reference Entity — Short |
| (140,223,338 | ) | |||||||||
|
| |||||||||||
Net Value of Reference Entity — Bank of America, N.A. |
| $ | (182,756 | ) | ||||||||
|
| |||||||||||
The following table represents the individual long and short positions and related values of the equity securities underlying the total return swap with Bank of America, N.A. as of April 30, 2020 termination date 02/15/23:
| Shares | Value | % of Basket Value | ||||||||||
Reference Entity — Long | ||||||||||||
| Australia | ||||||||||||
ALS Ltd. | 12,610 | $ | 55,066 | 37.8 | % | |||||||
Ansell Ltd. | 455 | 8,391 | 5.8 | |||||||||
Austal Ltd. | 8,545 | 18,544 | 12.7 | |||||||||
BWP Trust | 10,396 | 23,914 | 16.4 | |||||||||
Centuria Office REIT | 68,719 | 86,593 | 59.5 | |||||||||
Charter Hall Retail REIT | 12,594 | 25,916 | 17.8 | |||||||||
Downer EDI Ltd. | 19,742 | 53,108 | 36.5 | |||||||||
Growthpoint Properties Australia Ltd. | 20,849 | 41,828 | 28.7 | |||||||||
IGO Ltd. | 7,107 | 21,560 | 14.8 | |||||||||
Inghams Group Ltd. | 43,560 | 98,689 | 67.8 | |||||||||
InvoCare Ltd. | 1,156 | 7,731 | 5.3 | |||||||||
IOOF Holdings Ltd. | 46,421 | 129,596 | 89.0 | |||||||||
JB Hi-Fi Ltd. | 7,489 | 169,307 | 116.3 | |||||||||
Jumbo Interactive Ltd. | 6,562 | 51,542 | 35.4 | |||||||||
Kogan.com Ltd. | 6,238 | 32,184 | 22.1 | |||||||||
Megaport Ltd. | 2,057 | 15,829 | 10.9 | |||||||||
Metcash Ltd. | 11,857 | 19,125 | 13.1 | |||||||||
Mineral Resources Ltd. | 12,172 | 131,188 | 90.1 | |||||||||
Nanosonics Ltd. | 21,070 | 93,897 | 64.5 | |||||||||
Netwealth Group Ltd. | 3,391 | 16,613 | 11.4 | |||||||||
NEXTDC Ltd. | 5,698 | 32,517 | 22.3 | |||||||||
OZ Minerals Ltd. | 9,970 | 57,469 | 39.5 | |||||||||
Perpetual Ltd. | 2,910 | 56,566 | 38.9 | |||||||||
Pro Medicus Ltd. | 1,645 | 27,688 | 19.0 | |||||||||
Sandfire Resources NL | 53,304 | 154,703 | 106.3 | |||||||||
Saracen Mineral Holdings Ltd. | 15,554 | 42,658 | 29.3 | |||||||||
Service Stream Ltd. | 84,116 | 107,026 | 73.5 | |||||||||
SmartGroup Corp. Ltd. | 18,470 | 64,561 | 44.4 | |||||||||
Steadfast Group Ltd. | 21,785 | 43,019 | 29.6 | |||||||||
Tassal Group Ltd. | 10,140 | 24,734 | 17.0 | |||||||||
Technology One Ltd. | 333 | 2,043 | 1.4 | |||||||||
Viva Energy REIT | 13,596 | 21,244 | 14.6 | |||||||||
|
|
|
| |||||||||
| 1,734,849 | ||||||||||||
| Austria | ||||||||||||
Lenzing AG | 1,088 | 62,186 | 42.7 | |||||||||
Oesterreichische Post AG | 5,976 | 225,209 | 154.7 | |||||||||
S&T AG | 5,128 | 112,940 | 77.6 | |||||||||
Telekom Austria AG | 7,953 | 55,952 | 38.4 | |||||||||
UNIQA Insurance Group AG | 7,902 | 53,275 | 36.6 | |||||||||
Wienerberger AG | 865 | 16,201 | 11.1 | |||||||||
|
|
|
| |||||||||
| 525,763 | ||||||||||||
| Belgium | ||||||||||||
Befimmo SA | 1,075 | 47,985 | 33.0 | |||||||||
Orange Belgium SA | 1,146 | 19,063 | 13.1 | |||||||||
Sofina SA | 349 | 82,195 | 56.4 | |||||||||
Warehouses De Pauw CVA | 1,735 | 47,597 | 32.7 | |||||||||
|
|
|
| |||||||||
| 196,840 | ||||||||||||
| Canada | ||||||||||||
Aecon Group, Inc. | 8,545 | 93,863 | 64.5 | |||||||||
AGF Management Ltd., Class B | 7,526 | 23,249 | 16.0 | |||||||||
Alaris Royalty Corp. | 7,606 | 55,408 | 38.1 | |||||||||
Allied Properties Real Estate Investment Trust | 5,964 | 190,923 | 131.1 | |||||||||
Altius Minerals Corp. | 7,282 | 44,991 | 30.9 | |||||||||
ARC Resources Ltd. | 11,506 | 48,522 | 33.3 | |||||||||
Aritzia, Inc. | 1,440 | 17,142 | 11.8 | |||||||||
| 30 | 2020 BLACKROCK ANNUAL REPORTTO SHAREHOLDERS |
Schedule of Investments (continued) April 30, 2020 | BlackRock Global Long/Short Equity Fund |
| Shares | Value | % of Basket Value | ||||||||||
| Canada (continued) | ||||||||||||
ATS Automation Tooling Systems, Inc. | 6,622 | $ | 98,239 | 67.5 | % | |||||||
B2Gold Corp. | 3,075 | 15,552 | 10.7 | |||||||||
Birchcliff Energy, Ltd. | 12,273 | 13,490 | 9.3 | |||||||||
Boardwalk REIT | 9,335 | 178,324 | 122.5 | |||||||||
Boralex, Inc. | 1,867 | 36,148 | 24.8 | |||||||||
Canadian Western Bank | 2,715 | 42,970 | 29.5 | |||||||||
Computer Modelling Group Ltd. | 5,487 | 18,448 | 12.7 | |||||||||
CT Real Estate Investment Trust | 5,339 | 49,671 | 34.1 | |||||||||
Dream Office Real Estate Investment Trust | 1,736 | 27,089 | 18.6 | |||||||||
Enerflex Ltd. | 855 | 3,225 | 2.2 | |||||||||
Equitable Group, Inc. | 1,886 | 92,136 | 63.3 | |||||||||
Fiera Capital Corp. | 22,890 | 148,001 | 101.7 | |||||||||
Fortuna Silver Mines, Inc. | 6,735 | 20,225 | 13.9 | |||||||||
Freehold Royalties Ltd. | 22,057 | 59,106 | 40.6 | |||||||||
IAMGOLD Corp. | 14,329 | 50,133 | 34.4 | |||||||||
Intertape Polymer Group, Inc. | 8,470 | 83,121 | 57.1 | |||||||||
Knight Therapeutics, Inc. | 12,290 | 67,015 | 46.0 | |||||||||
Laurentian Bank of Canada | 4,577 | 102,230 | 70.2 | |||||||||
Lightspeed POS, Inc. | 3,447 | 65,302 | 44.9 | |||||||||
Magellan Aerospace Corp. | 1,999 | 9,206 | 6.3 | |||||||||
Major Drilling Group International, Inc. | 36,109 | 92,092 | 63.3 | |||||||||
Minto Apartment Real Estate Investment Trust | 3,813 | 56,512 | 38.8 | |||||||||
Morguard North American Residential Real Estate Investment Trust | 8,618 | 91,631 | 62.9 | |||||||||
Morguard Real Estate Investment Trust | 37,633 | 156,539 | 107.5 | |||||||||
Morneau Shepell, Inc. | 1,761 | 42,572 | 29.2 | |||||||||
MTY Food Group, Inc. | 2,524 | 43,609 | 30.0 | |||||||||
North West Co., Inc. | 1,970 | 37,222 | 25.6 | |||||||||
NorthWest Healthcare Properties Real Estate Investment Trust | 17,175 | 120,427 | 82.7 | |||||||||
Pan American Silver Corp. | 1,224 | 26,029 | 17.9 | |||||||||
Parex Resources, Inc. | 14,840 | 162,692 | 111.8 | |||||||||
Pason Systems, Inc. | 10,878 | 59,159 | 40.6 | |||||||||
Real Matters, Inc. | 1,428 | 16,373 | 11.2 | |||||||||
Recipe Un Ltd. Corp. | 2,182 | 20,771 | 14.3 | |||||||||
Sandstorm Gold Ltd. | 7,442 | 57,795 | 39.7 | |||||||||
Seabridge Gold, Inc. | 3,724 | 52,143 | 35.8 | |||||||||
Secure Energy Services, Inc. | 8,865 | 7,961 | 5.5 | |||||||||
Seven Generations Energy Ltd., Class A | 3,959 | 8,191 | 5.6 | |||||||||
Sierra Wireless, Inc. | 1,674 | 15,706 | 10.8 | |||||||||
Silvercorp Metals, Inc. | 4,248 | 15,931 | 10.9 | |||||||||
Sleep Country Canada Holdings, Inc. | 1,539 | 14,561 | 10.0 | |||||||||
SSR Mining, Inc. | 2,610 | 45,733 | 31.4 | |||||||||
Timbercreek Financial Corp. | 12,920 | 73,049 | 50.2 | |||||||||
TMX Group Ltd. | 742 | 64,282 | 44.2 | |||||||||
TORC Oil & Gas, Ltd. | 2,809 | 2,260 | 1.5 | |||||||||
Tourmaline Oil Corp. | 7,673 | 76,071 | 52.3 | |||||||||
Tricon Capital Group, Inc. | 9,281 | 53,941 | 37.0 | |||||||||
Whitecap Resources, Inc. | 50,034 | 65,780 | 45.2 | |||||||||
|
|
|
| |||||||||
| 3,132,761 | ||||||||||||
| Chile | ||||||||||||
Liberty Latin America Ltd., Class C | 4,667 | 48,257 | 33.1 | |||||||||
|
|
|
| |||||||||
| China | ||||||||||||
Ausnutria Dairy Corp. Ltd. | 48,000 | 88,523 | 60.8 | |||||||||
|
|
|
| |||||||||
| Denmark | ||||||||||||
Alm Brand A/S | 8,661 | 67,871 | 46.6 | |||||||||
GN Store Nord A/S | 2,861 | 130,565 | 89.7 | |||||||||
Royal Unibrew A/S | 922 | 71,332 | 49.0 | |||||||||
SimCorp A/S | 459 | 42,467 | 29.2 | |||||||||
|
|
|
| |||||||||
| 312,235 | ||||||||||||
| Shares | Value | % of Basket Value | ||||||||||
| Finland | ||||||||||||
Aktia Bank OYJ | 17,538 | $ | 147,919 | 101.6 | % | |||||||
Cargotec OYJ, -B Shares | 6,928 | 151,160 | 103.8 | |||||||||
Citycon OYJ | 10,399 | 68,688 | 47.2 | |||||||||
Huhtamaki OYJ | 529 | 19,744 | 13.6 | |||||||||
Kemira OYJ | 5,512 | 66,383 | 45.6 | |||||||||
Kesko OYJ, Class B | 1,416 | 23,043 | 15.8 | |||||||||
YIT OYJ | 37,746 | 206,907 | 142.1 | |||||||||
|
|
|
| |||||||||
| 683,844 | ||||||||||||
| France | ||||||||||||
Albioma SA | 618 | 20,468 | 14.1 | |||||||||
Alten SA | 1,114 | 80,206 | 55.1 | |||||||||
Carmila SA | 3,547 | 45,571 | 31.3 | |||||||||
Cie des Alpes | 5,083 | 95,183 | 65.4 | |||||||||
Cie Plastic Omnium SA | 6,477 | 122,647 | 84.2 | |||||||||
Coface SA | 15,638 | 91,977 | 63.2 | |||||||||
Europcar Mobility Group | 24,768 | 46,169 | 31.7 | |||||||||
Gaztransport Et Technigaz SA | 510 | 36,998 | 25.4 | |||||||||
GL Events | 3,863 | 46,271 | 31.8 | |||||||||
IPSOS | 5,247 | 101,033 | 69.4 | |||||||||
Maisons du Monde SA | 3,317 | 29,841 | 20.5 | |||||||||
Mercialys SA | 4,207 | 32,740 | 22.5 | |||||||||
Mersen SA | 1,216 | 26,832 | 18.4 | |||||||||
Metropole Television SA | 5,777 | 64,303 | 44.2 | |||||||||
Rubis SCA | 1,457 | 65,399 | 44.9 | |||||||||
SMCP SA | 2,990 | 14,089 | 9.7 | |||||||||
|
|
|
| |||||||||
| 919,727 | ||||||||||||
| Germany | ||||||||||||
ADO Properties SA | 714 | 20,003 | 13.7 | |||||||||
Cewe Stiftung & Co. KGAA | 1,549 | 161,217 | 110.7 | |||||||||
CompuGroup Medical SE | 1,209 | 91,882 | 63.1 | |||||||||
Draegerwerk AG & Co. KGaA | 372 | 31,131 | 21.4 | |||||||||
Duerr AG | 1,293 | 30,172 | 20.7 | |||||||||
Encavis AG | 10,146 | 124,454 | 85.5 | |||||||||
Gerresheimer AG | 539 | 42,866 | 29.4 | |||||||||
Grand City Properties SA | 936 | 19,574 | 13.4 | |||||||||
Hamborner REIT AG | 11,095 | 99,968 | 68.7 | |||||||||
HelloFresh SE | 562 | 20,032 | 13.8 | |||||||||
Hypoport SE | 100 | 35,254 | 24.2 | |||||||||
Indus Holding AG | 1,010 | 31,087 | 21.4 | |||||||||
LEG Immobilien AG | 716 | 82,200 | 56.5 | |||||||||
MLP SE | 23,549 | 121,337 | 83.3 | |||||||||
Nemetschek SE | 1,563 | 98,336 | 67.6 | |||||||||
New Work SE | 506 | 120,261 | 82.6 | |||||||||
Norma Group SE | 1,766 | 44,229 | 30.4 | |||||||||
Rheinmetall AG | 1,276 | 86,359 | 59.3 | |||||||||
Stroeer SE & Co. KGaA | 312 | 19,747 | 13.6 | |||||||||
Wuestenrot & Wuerttembergische AG | 618 | 10,892 | 7.5 | |||||||||
|
|
|
| |||||||||
| 1,291,001 | ||||||||||||
| Hong Kong | ||||||||||||
Dah Sing Financial Holdings, Ltd. | 42,400 | 139,867 | 96.0 | |||||||||
Hang Lung Group Ltd. | 20,000 | 45,681 | 31.4 | |||||||||
VTech Holdings Ltd. | 3,300 | 24,882 | 17.1 | |||||||||
|
|
|
| |||||||||
| 210,430 | ||||||||||||
| India | ||||||||||||
Rhi Magnesita NV | 756 | 23,222 | 16.0 | |||||||||
|
|
|
| |||||||||
| Ireland | ||||||||||||
Glanbia PLC | 2,361 | 25,126 | 17.3 | |||||||||
Hibernia REIT PLC | 16,057 | 20,887 | 14.3 | |||||||||
UDG Healthcare PLC | 4,495 | 35,476 | 24.4 | |||||||||
|
|
|
| |||||||||
| 81,489 | ||||||||||||
| SCHEDULES OF INVESTMENTS | 31 |
Schedule of Investments (continued) April 30, 2020 | BlackRock Global Long/Short Equity Fund |
| Shares | Value | % of Basket Value | ||||||||||
| Israel | ||||||||||||
AFI Properties Ltd. | 2,025 | $ | 61,623 | 42.3 | % | |||||||
Amot Investments Ltd. | 4,290 | 24,095 | 16.6 | |||||||||
Bayside Land Corp. | 33 | 19,662 | 13.5 | |||||||||
Elco Ltd. | 1,480 | 53,051 | 36.4 | |||||||||
Electra Ltd. | 230 | 105,498 | 72.5 | |||||||||
Energix-Renewable Energies Ltd. | 15,171 | 52,894 | 36.3 | |||||||||
FIBI Holdings Ltd. | 179 | 5,295 | 3.6 | |||||||||
Hilan Ltd. | 818 | 32,249 | 22.2 | |||||||||
Melisron Ltd. | 1,180 | 47,496 | 32.6 | |||||||||
Mivne Real Estate KD Ltd. | 25,250 | 54,238 | 37.3 | |||||||||
Plus500 Ltd. | 2,501 | 39,391 | 27.1 | |||||||||
Property & Building Corp. Ltd. | 675 | 49,832 | 34.2 | |||||||||
Radware Ltd. | 5,258 | 124,562 | 85.6 | |||||||||
Reit 1 Ltd. | 31,174 | 155,189 | 106.6 | |||||||||
Shapir Engineering and Industry Ltd. | 23,349 | 163,690 | 112.4 | |||||||||
Strauss Group Ltd. | 1,598 | 45,168 | 31.0 | |||||||||
|
|
|
| |||||||||
| 1,033,933 | ||||||||||||
| Italy | ||||||||||||
ACEA SpA | 4,821 | 80,581 | 55.3 | |||||||||
Anima Holding SpA | 5,642 | 19,974 | 13.7 | |||||||||
Banca Farmafactoring SpA | 5,058 | 26,118 | 17.9 | |||||||||
Credito Emiliano SpA | 13,958 | 61,869 | 42.5 | |||||||||
Interpump Group SpA | 2,153 | 62,821 | 43.1 | |||||||||
Italgas SpA | 67 | 375 | 0.3 | |||||||||
MARR SpA | 2,108 | 27,772 | 19.1 | |||||||||
Piaggio & C SpA | 20,680 | 47,412 | 32.6 | |||||||||
RAI Way SpA | 3,509 | 18,917 | 13.0 | |||||||||
Reply SpA | 2,322 | 162,549 | 111.7 | |||||||||
|
|
|
| |||||||||
| 508,388 | ||||||||||||
| Japan | ||||||||||||
A/S One Corp. | 400 | 35,733 | 24.5 | |||||||||
ADEKA Corp. | 11,100 | 139,384 | 95.7 | |||||||||
Ai Holdings Corp. | 7,300 | 90,180 | 61.9 | |||||||||
Ain Holdings, Inc. | 400 | 22,438 | 15.4 | |||||||||
Aisan Industry Co. Ltd. | 3,100 | 16,439 | 11.3 | |||||||||
Amano Corp. | 9,500 | 195,047 | 134.0 | |||||||||
Anritsu Corp. | 3,800 | 77,351 | 53.1 | |||||||||
AOKI Holdings, Inc. | 27,400 | 166,468 | 114.3 | |||||||||
Arcland Sakamoto Co. Ltd. | 11,800 | 112,521 | 77.3 | |||||||||
Arcland Service Holdings Co. Ltd. | 12,500 | 193,952 | 133.2 | |||||||||
Arcs Co. Ltd. | 17,900 | 335,857 | 230.7 | |||||||||
Ateam, Inc. | 8,900 | 58,360 | 40.1 | |||||||||
Atom Corp. | 4,400 | 34,391 | 23.6 | |||||||||
Autobacs Seven Co. Ltd. | 1,600 | 18,684 | 12.8 | |||||||||
Avex, Inc. | 7,700 | 58,282 | 40.0 | |||||||||
Azbil Corp. | 3,300 | 86,787 | 59.6 | |||||||||
Bando Chemical Industries Ltd. | 4,800 | 28,584 | 19.6 | |||||||||
Bank of Saga Ltd. | 2,200 | 22,778 | 15.6 | |||||||||
Belluna Co. Ltd. | 23,900 | 111,650 | 76.7 | |||||||||
BeNEXT Group, Inc. | 8,900 | 55,602 | 38.2 | |||||||||
Bengo4.com, Inc. | 500 | 31,625 | 21.7 | |||||||||
Bunka Shutter Co. Ltd. | 31,100 | 227,048 | 156.0 | |||||||||
Chiyoda Integre Co. Ltd. | 4,000 | 65,117 | 44.7 | |||||||||
CI Takiron Corp. | 10,600 | 57,627 | 39.6 | |||||||||
CMIC Holdings Co. Ltd. | 1,600 | 23,036 | 15.8 | |||||||||
COLOPL, Inc. | 2,200 | 17,976 | 12.4 | |||||||||
COMSYS Holdings Corp. | 4,300 | 118,240 | 81.2 | |||||||||
CONEXIO Corp. | 7,300 | 98,183 | 67.4 | |||||||||
Cosmos Pharmaceutical Corp. | 100 | 26,769 | 18.4 | |||||||||
Daiichi Jitsugyo Co. Ltd. | 900 | 30,429 | 20.9 | |||||||||
Daiichikosho Co., Ltd. | 1,600 | 48,023 | 33.0 | |||||||||
| Shares | Value | % of Basket Value | ||||||||||
| Japan (continued) | ||||||||||||
Daio Paper Corp. | 9,000 | $ | 122,804 | 84.4 | % | |||||||
Daiseki Co. Ltd. | 1,900 | 41,976 | 28.8 | |||||||||
DCM Holdings Co. Ltd. | 49,900 | 487,579 | 334.9 | |||||||||
DeNA Co. Ltd. | 2,100 | 25,851 | 17.8 | |||||||||
Dip Corp. | 4,800 | 102,443 | 70.4 | |||||||||
Doshisha Co. Ltd. | 20,500 | 252,219 | 173.3 | |||||||||
Doutor Nichires Holdings Co. Ltd. | 18,800 | 284,516 | 195.4 | |||||||||
DTS Corp. | 5,800 | 111,162 | 76.4 | |||||||||
Eagle Industry Co. Ltd. | 6,600 | 41,516 | 28.5 | |||||||||
EDION Corp. | 16,700 | 145,161 | 99.7 | |||||||||
en-japan, Inc. | 4,100 | 90,377 | 62.1 | |||||||||
EPS Holdings, Inc. | 11,500 | 119,602 | 82.2 | |||||||||
ESPEC Corp. | 2,200 | 35,189 | 24.2 | |||||||||
FP Corp. | 300 | 22,630 | 15.5 | |||||||||
Fuji Co. Ltd/Ehime | 4,200 | 67,079 | 46.1 | |||||||||
Fuji Soft, Inc. | 900 | 31,681 | 21.8 | |||||||||
Fujicco Co. Ltd. | 4,100 | 73,698 | 50.6 | |||||||||
Fujimori Kogyo Co. Ltd. | 800 | 23,537 | 16.2 | |||||||||
Fujitsu General Ltd. | 2,400 | 39,735 | 27.3 | |||||||||
Fukuoka REIT Corp. | 72 | 72,415 | 49.7 | |||||||||
FULLCAST Holdings Co. Ltd. | 4,300 | 54,457 | 37.4 | |||||||||
Funai Soken Holdings, Inc. | 1,600 | 34,094 | 23.4 | |||||||||
Furukawa Electric Co. Ltd. | 5,500 | 103,524 | 71.1 | |||||||||
Future Corp. | 500 | 6,616 | 4.5 | |||||||||
Fuyo General Lease Co. Ltd. | 1,500 | 74,999 | 51.5 | |||||||||
G-Tekt Corp. | 11,000 | 112,516 | 77.3 | |||||||||
Giken Ltd. | 2,500 | 91,308 | 62.7 | |||||||||
Glory Ltd. | 5,700 | 128,103 | 88.0 | |||||||||
GMO internet, Inc. | 2,400 | 52,239 | 35.9 | |||||||||
Goldcrest Co. Ltd. | 5,700 | 85,985 | 59.1 | |||||||||
Gree, Inc. | 35,300 | 138,775 | 95.3 | |||||||||
GungHo Online Entertainment, Inc. | 11,400 | 176,786 | 121.4 | |||||||||
Gunma Bank Ltd. | 7,700 | 24,653 | 16.9 | |||||||||
Hamakyorex Co. Ltd. | 2,500 | 68,337 | 46.9 | |||||||||
Hanwa Co. Ltd. | 4,200 | 66,721 | 45.8 | |||||||||
Hazama Ando Corp. | 6,800 | 42,349 | 29.1 | |||||||||
Heiwa Corp. | 1,700 | 28,625 | 19.7 | |||||||||
Heiwado Co. Ltd. | 9,300 | 158,497 | 108.9 | |||||||||
Hiday Hidaka Corp. | 14,100 | 217,501 | 149.4 | |||||||||
Hiroshima Bank Ltd. | 62,600 | 260,096 | 178.7 | |||||||||
Hogy Medical Co. Ltd. | 800 | 25,015 | 17.2 | |||||||||
Hokuetsu Corp. | 68,500 | 270,510 | 185.8 | |||||||||
Horiba Ltd. | 1,200 | 63,496 | 43.6 | |||||||||
Ichiyoshi Securities Co. Ltd. | 8,100 | 33,914 | 23.3 | |||||||||
Internet Initiative Japan, Inc. | 600 | 20,509 | 14.1 | |||||||||
Itochu Enex Co. Ltd. | 5,000 | 37,124 | 25.5 | |||||||||
Itoham Yonekyu Holdings, Inc. | 4,400 | 25,527 | 17.5 | |||||||||
Iwatani Corp. | 7,000 | 239,135 | 164.3 | |||||||||
Izumi Co. Ltd. | 11,700 | 342,488 | 235.3 | |||||||||
JAC Recruitment Co. Ltd. | 11,300 | 118,360 | 81.3 | |||||||||
JCR Pharmaceuticals Co. Ltd. | 200 | 19,157 | 13.2 | |||||||||
JSP Corp. | 3,700 | 47,759 | 32.8 | |||||||||
Kanamoto Co. Ltd. | 2,800 | 54,296 | 37.3 | |||||||||
Kandenko Co. Ltd. | 18,200 | 152,298 | 104.6 | |||||||||
Kinden Corp. | 1,900 | 30,930 | 21.2 | |||||||||
Kisoji Co. Ltd. | 900 | 19,732 | 13.6 | |||||||||
Kitanotatsujin Corp. | 11,000 | 52,255 | 35.9 | |||||||||
Koa Corp. | 2,400 | 19,870 | 13.7 | |||||||||
Kobe Bussan Co. Ltd. | 400 | 19,324 | 13.3 | |||||||||
Kohnan Shoji Co. Ltd. | 3,500 | 81,234 | 55.8 | |||||||||
Kokuyo Co. Ltd. | 2,400 | 29,342 | 20.2 | |||||||||
KOMEDA Holdings Co. Ltd. | 3,300 | 50,141 | 34.4 | |||||||||
| 32 | 2020 BLACKROCK ANNUAL REPORTTO SHAREHOLDERS |
Schedule of Investments (continued) April 30, 2020 | BlackRock Global Long/Short Equity Fund |
| Shares | Value | % of Basket Value | ||||||||||
| Japan (continued) | ||||||||||||
Konoike Transport Co. Ltd. | 12,800 | $ | 137,984 | 94.8 | % | |||||||
Kotobuki Spirits Co. Ltd. | 600 | 23,435 | 16.1 | |||||||||
Kumagai Gumi Co., Ltd. | 3,900 | 85,450 | 58.7 | |||||||||
Kureha Corp. | 500 | 20,166 | 13.9 | |||||||||
Kyudenko Corp. | 900 | 25,233 | 17.3 | |||||||||
Mars Group Holdings Corp. | 1,500 | 23,418 | 16.1 | |||||||||
Maruha Nichiro Corp. | 5,400 | 113,006 | 77.6 | |||||||||
Marvelous, Inc. | 11,900 | 59,316 | 40.7 | |||||||||
Matsuda Sangyo Co. Ltd. | 1,500 | 18,349 | 12.6 | |||||||||
Matsumotokiyoshi Holdings Co. Ltd. | 4,400 | 151,442 | 104.0 | |||||||||
MCUBS MidCity Investment Corp. | 60 | 41,644 | 28.6 | |||||||||
Media Do Holdings Co. Ltd. | 600 | 22,998 | 15.8 | |||||||||
Meiko Network Japan Co. Ltd. | 8,400 | 61,031 | 41.9 | |||||||||
Meitec Corp. | 5,900 | 260,510 | 178.9 | |||||||||
METAWATER Co., Ltd. | 5,500 | 218,726 | 150.2 | |||||||||
Milbon Co. Ltd. | 900 | 39,502 | 27.1 | |||||||||
Mirait Holdings Corp. | 3,500 | 45,212 | 31.1 | |||||||||
Miroku Jyoho Service Co. Ltd. | 1,700 | 42,866 | 29.4 | |||||||||
Mitsubishi Pencil Co. Ltd. | 2,200 | 27,535 | 18.9 | |||||||||
Mizuno Corp. | 5,400 | 93,681 | 64.4 | |||||||||
Modec, Inc. | 1,400 | 19,837 | 13.6 | |||||||||
Morinaga Milk Industry Co. Ltd. | 800 | 31,006 | 21.3 | |||||||||
MOS Food Services, Inc. | 6,300 | 158,631 | 109.0 | |||||||||
Nagase & Co. Ltd. | 14,100 | 169,604 | 116.5 | |||||||||
Nankai Electric Railway Co. Ltd. | 700 | 15,627 | 10.7 | |||||||||
Nanto Bank Ltd. | 3,100 | 65,014 | 44.7 | |||||||||
Nichicon Corp. | 2,800 | 18,453 | 12.7 | |||||||||
Nichiha Corp. | 8,400 | 153,442 | 105.4 | |||||||||
Nichirei Corp. | 1,100 | 27,517 | 18.9 | |||||||||
Nifco, Inc. | 2,400 | 46,341 | 31.8 | |||||||||
Nihon Kohden Corp. | 1,200 | 42,924 | 29.5 | |||||||||
Nihon M&A Center, Inc. | 1,600 | 52,196 | 35.9 | |||||||||
Nihon Trim Co. Ltd. | 5,200 | 146,622 | 100.7 | |||||||||
Nikkon Holdings Co. Ltd. | 16,900 | 328,155 | 225.4 | |||||||||
Nippon Ceramic Co. Ltd. | 1,100 | 20,349 | 14.0 | |||||||||
Nippon Densetsu Kogyo Co. Ltd. | 1,100 | 21,440 | 14.7 | |||||||||
Nippon Light Metal Holdings Co. Ltd. | 185,100 | 291,517 | 200.2 | |||||||||
Nippon Seiki Co. Ltd. | 2,500 | 26,901 | 18.5 | |||||||||
Nippon Shokubai Co. Ltd. | 800 | 37,781 | 26.0 | |||||||||
Nippon Suisan Kaisha Ltd. | 13,800 | 61,403 | 42.2 | |||||||||
Nishimatsu Construction Co. Ltd. | 6,100 | 115,508 | 79.3 | |||||||||
Nishimatsuya Chain Co. Ltd. | 2,900 | 22,942 | 15.8 | |||||||||
Nishio Rent All Co. Ltd. | 7,000 | 144,137 | 99.0 | |||||||||
Nissin Electric Co., Ltd. | 9,700 | 90,109 | 61.9 | |||||||||
Noevir Holdings Co. Ltd. | 1,400 | 65,582 | 45.1 | |||||||||
Nomura Co. Ltd. | 24,800 | 187,868 | 129.0 | |||||||||
Noritake Co. Ltd/Nagoya Japan | 600 | 19,650 | 13.5 | |||||||||
Noritz Corp. | 7,700 | 85,659 | 58.8 | |||||||||
NS Solutions Corp. | 2,100 | 53,045 | 36.4 | |||||||||
Obara Group, Inc. | 2,400 | 62,182 | 42.7 | |||||||||
Ohsho Food Service Corp. | 1,300 | 69,161 | 47.5 | |||||||||
Oiles Corp. | 2,000 | 25,869 | 17.8 | |||||||||
Oisix ra daichi, Inc. | 2,100 | 33,158 | 22.8 | |||||||||
Okabe Co. Ltd. | 21,800 | 153,010 | 105.1 | |||||||||
Okamura Corp. | 14,900 | 107,684 | 74.0 | |||||||||
Oki Electric Industry Co. Ltd. | 13,600 | 130,819 | 89.9 | |||||||||
Okumura Corp. | 1,900 | 40,540 | 27.8 | |||||||||
Okuwa Co. Ltd. | 1,200 | 16,324 | 11.2 | |||||||||
One REIT, Inc. | 10 | 21,847 | 15.0 | |||||||||
Open Door, Inc. | 4,500 | 39,897 | 27.4 | |||||||||
Optim Corp. | 800 | 15,848 | 10.9 | |||||||||
Outsourcing, Inc. | 5,100 | 24,109 | 16.6 | |||||||||
| Shares | Value | % of Basket Value | ||||||||||
| Japan (continued) | ||||||||||||
PIA Corp. | 2,300 | $ | 62,605 | 43.0 | % | |||||||
Press Kogyo Co. Ltd. | 10,300 | 25,386 | 17.4 | |||||||||
Prestige International, Inc. | 19,500 | 152,317 | 104.6 | |||||||||
Raksul, Inc. | 1,400 | 31,891 | 21.9 | |||||||||
Relia, Inc. | 10,400 | 109,628 | 75.3 | |||||||||
Relo Group, Inc. | 2,900 | 62,821 | 43.2 | |||||||||
Riken Corp. | 2,200 | 58,687 | 40.3 | |||||||||
Ringer Hut Co. Ltd. | 5,500 | 110,155 | 75.7 | |||||||||
Rock Field Co. Ltd. | 4,600 | 55,694 | 38.3 | |||||||||
Roland DG Corp. | 1,700 | 20,866 | 14.3 | |||||||||
Ryobi Ltd. | 2,100 | 24,743 | 17.0 | |||||||||
Sac’s Bar Holdings, Inc. | 1,800 | 9,235 | 6.3 | |||||||||
Sangetsu Corp. | 7,500 | 111,623 | 76.7 | |||||||||
Sanki Engineering Co. Ltd. | 20,900 | 235,664 | 161.9 | |||||||||
Sankyu, Inc. | 6,100 | 234,410 | 161.0 | |||||||||
Sanshin Electronics Co. Ltd. | 2,300 | 32,036 | 22.0 | |||||||||
Sanwa Holdings Corp. | 34,300 | 266,158 | 182.8 | |||||||||
Sanyo Chemical Industries Ltd. | 1,700 | 66,971 | 46.0 | |||||||||
Sawai Pharmaceutical Co. Ltd. | 1,600 | 87,367 | 60.0 | |||||||||
SCSK Corp. | 300 | 13,581 | 9.3 | |||||||||
Sekisui Plastics Co. Ltd. | 1,400 | 7,833 | 5.4 | |||||||||
Senko Group Holdings Co. Ltd. | 15,700 | 127,953 | 87.9 | |||||||||
Seria Co. Ltd. | 3,600 | 117,001 | 80.4 | |||||||||
SFP Holdings Co. Ltd. | 1,500 | 18,663 | 12.8 | |||||||||
Shikoku Bank Ltd. | 1,100 | 8,538 | 5.9 | |||||||||
Shikoku Electric Power Co., Inc. | 3,800 | 29,372 | 20.2 | |||||||||
Shimachu Co. Ltd. | 1,000 | 24,974 | 17.2 | |||||||||
Shindengen Electric Manufacturing Co. Ltd. | 1,700 | 39,197 | 26.9 | |||||||||
Ship Healthcare Holdings, Inc. | 2,600 | 117,590 | 80.8 | |||||||||
Shoei Co. Ltd. | 2,400 | 45,656 | 31.4 | |||||||||
Sinko Industries Ltd. | 4,900 | 63,639 | 43.7 | |||||||||
Sintokogio Ltd. | 14,900 | 103,000 | 70.8 | |||||||||
SKY Perfect JSAT Holdings, Inc. | 29,200 | 109,773 | 75.4 | |||||||||
SMS Co. Ltd. | 3,600 | 78,467 | 53.9 | |||||||||
Sojitz Corp. | 79,700 | 184,453 | 126.7 | |||||||||
St Marc Holdings Co. Ltd. | 13,100 | 218,736 | 150.3 | |||||||||
Star Asia Investment Corp. | 312 | 246,962 | 169.6 | |||||||||
Star Micronics Co. Ltd. | 10,300 | 113,712 | 78.1 | |||||||||
Starts Corp., Inc. | 12,700 | 245,684 | 168.8 | |||||||||
Studio Alice Co. Ltd. | 600 | 8,078 | 5.6 | |||||||||
Sumitomo Bakelite Co. Ltd. | 3,300 | 85,234 | 58.6 | |||||||||
Sumitomo Mitsui Construction Co., Ltd. | 20,100 | 82,940 | 57.0 | |||||||||
Taiho Kogyo Co. Ltd. | 700 | 3,368 | 2.3 | |||||||||
Takamatsu Construction Group Co. Ltd. | 2,900 | 59,538 | 40.9 | |||||||||
Takara Holdings, Inc. | 2,500 | 18,398 | 12.6 | |||||||||
Takasago International Corp. | 800 | 16,960 | 11.7 | |||||||||
Takasago Thermal Engineering Co. Ltd. | 5,800 | 91,426 | 62.8 | |||||||||
Takashimaya Co. Ltd. | 5,800 | 52,416 | 36.0 | |||||||||
Takuma Co. Ltd. | 7,500 | 81,087 | 55.7 | |||||||||
Tanseisha Co. Ltd. | 31,300 | 200,741 | 137.9 | |||||||||
TechMatrix Corp. | 800 | 19,988 | 13.7 | |||||||||
TechnoPro Holdings, Inc. | 700 | 39,876 | 27.4 | |||||||||
Tenma Corp. | 1,400 | 20,196 | 13.9 | |||||||||
Toagosei Co. Ltd. | 22,900 | 209,520 | 143.9 | |||||||||
Toenec Corp. | 700 | 21,221 | 14.6 | |||||||||
Toho Holdings Co., Ltd. | 8,900 | 184,319 | 126.6 | |||||||||
Tokyu Construction Co. Ltd. | 3,700 | 19,128 | 13.1 | |||||||||
Topcon Corp. | 7,900 | 64,866 | 44.6 | |||||||||
Topre Corp. | 3,600 | 41,644 | 28.6 | |||||||||
Topy Industries Ltd. | 6,400 | 74,833 | 51.4 | |||||||||
Tosei Corp. | 5,900 | 57,259 | 39.3 | |||||||||
Towa Pharmaceutical Co. Ltd. | 8,600 | 177,308 | 121.8 | |||||||||
| SCHEDULES OF INVESTMENTS | 33 |
Schedule of Investments (continued) April 30, 2020 | BlackRock Global Long/Short Equity Fund |
| Shares | Value | % of Basket Value | ||||||||||
| Japan (continued) | ||||||||||||
TPR Co. Ltd. | 4,900 | $ | 57,200 | 39.3 | % | |||||||
Transcosmos, Inc. | 2,600 | 51,879 | 35.6 | |||||||||
TSI Holdings Co. Ltd. | 13,400 | 51,878 | 35.6 | |||||||||
Tsubaki Nakashima Co. Ltd. | 2,800 | 19,650 | 13.5 | |||||||||
Ube Industries Ltd. | 25,000 | 419,235 | 288.0 | |||||||||
Ushio, Inc. | 3,400 | 35,852 | 24.6 | |||||||||
UT Group Co., Ltd. | 6,300 | 88,550 | 60.8 | |||||||||
YAMABIKO Corp. | 1,900 | 14,643 | 10.1 | |||||||||
Yamaguchi Financial Group, Inc. | 63,300 | 341,143 | 234.3 | |||||||||
Yamato Kogyo Co. Ltd. | 14,000 | 274,746 | 188.7 | |||||||||
Yamazen Corp. | 10,800 | 90,823 | 62.4 | |||||||||
Yaoko Co. Ltd. | 1,000 | 61,984 | 42.6 | |||||||||
Yellow Hat Ltd. | 1,800 | 25,010 | 17.2 | |||||||||
Yokohama Reito Co. Ltd. | 19,700 | 166,296 | 114.2 | |||||||||
Yondoshi Holdings, Inc. | 8,300 | 134,526 | 92.4 | |||||||||
Yoshinoya Holdings Co. Ltd. | 2,600 | 53,731 | 36.9 | |||||||||
Yuasa Trading Co. Ltd. | 4,300 | 115,714 | 79.5 | |||||||||
Yumeshin Holdings Co. Ltd. | 15,800 | 87,347 | 60.0 | |||||||||
Yurtec Corp. | 9,200 | 51,677 | 35.5 | |||||||||
Yushin Precision Equipment Co. Ltd. | 4,000 | 24,677 | 17.0 | |||||||||
Zenkoku Hosho Co. Ltd. | 1,300 | 37,879 | 26.0 | |||||||||
ZIGExN Co. Ltd. | 7,900 | 23,027 | 15.8 | |||||||||
|
|
|
| |||||||||
| 20,776,392 | ||||||||||||
| Luxembourg | ||||||||||||
Stabilus SA | 814 | 34,770 | 23.9 | |||||||||
|
|
|
| |||||||||
| Malta | ||||||||||||
Kindred Group PLC | 5,234 | 24,785 | 17.0 | |||||||||
|
|
|
| |||||||||
| Netherlands | ||||||||||||
Argenx SE | 259 | 38,733 | 26.6 | |||||||||
ASR Nederland NV | 1,421 | 38,229 | 26.3 | |||||||||
BE Semiconductor Industries NV | 2,257 | 92,898 | 63.8 | |||||||||
Corbion NV | 5,227 | 187,019 | 128.5 | |||||||||
Core Laboratories NV | 1,655 | 32,455 | 22.3 | |||||||||
Eurocommercial Properties NV | 1,580 | 17,604 | 12.1 | |||||||||
Euronext NV | 4,217 | 354,034 | 243.2 | |||||||||
Flow Traders | 809 | 26,988 | 18.5 | |||||||||
Fugro NV | 14,704 | 55,080 | 37.8 | |||||||||
IMCD NV | 3,248 | 286,812 | 197.0 | |||||||||
Shop Apotheke Europe NV | 680 | 50,225 | 34.5 | |||||||||
Vastned Retail NV | 626 | 11,546 | 7.9 | |||||||||
|
|
|
| |||||||||
| 1,191,623 | ||||||||||||
| Norway | ||||||||||||
Austevoll Seafood ASA | 6,561 | 51,109 | 35.1 | |||||||||
Entra ASA | 15,926 | 200,522 | 137.7 | |||||||||
Grieg Seafood ASA | 2,416 | 23,694 | 16.3 | |||||||||
Leroy Seafood Group ASA | 8,056 | 42,783 | 29.4 | |||||||||
Ocean Yield ASA | 56,766 | 147,189 | 101.1 | |||||||||
Salmar ASA | 1,224 | 47,703 | 32.8 | |||||||||
Sbanken ASA | 11,194 | 59,614 | 40.9 | |||||||||
SpareBank 1 SMN | 6,290 | �� | 45,702 | 31.4 | ||||||||
SpareBank 1 SR-Bank ASA | 4,005 | 25,433 | 17.5 | |||||||||
Storebrand ASA | 7,601 | 38,156 | 26.2 | |||||||||
Veidekke ASA | 4,069 | 36,126 | 24.8 | |||||||||
|
|
|
| |||||||||
| 718,031 | ||||||||||||
| Portugal | ||||||||||||
NOS SGPS SA | 76,642 | 287,071 | 197.2 | |||||||||
REN-Redes Energeticas Nacionais SGPS SA | 75,733 | 205,134 | 140.9 | |||||||||
|
|
|
| |||||||||
| 492,205 | ||||||||||||
| Singapore | ||||||||||||
Parkway Life Real Estate Investment Trust | 7,000 | 16,381 | 11.3 | |||||||||
|
|
|
| |||||||||
| Shares | Value | % of Basket Value | ||||||||||
| South Africa | ||||||||||||
Investec PLC | 41,420 | $ | 85,009 | 58.4 | % | |||||||
|
|
|
| |||||||||
| Spain | ||||||||||||
Acciona SA | 682 | 67,596 | 46.4 | |||||||||
Applus Services SA | 4,384 | 28,762 | 19.8 | |||||||||
Ebro Foods SA | 2,573 | 54,701 | 37.6 | |||||||||
Euskaltel SA | 6,440 | 51,377 | 35.3 | |||||||||
Faes Farma SA | 17,839 | 78,001 | 53.6 | |||||||||
Zardoya Otis SA | 9,842 | 68,496 | 47.0 | |||||||||
|
|
|
| |||||||||
| 348,933 | ||||||||||||
| Sweden | ||||||||||||
AF Poyry AB | 5,555 | 100,924 | 69.3 | |||||||||
Axfood AB | 5,576 | 118,617 | 81.5 | |||||||||
Bravida Holding AB | 2,246 | 18,134 | 12.5 | |||||||||
Bufab AB | 2,901 | 23,386 | 16.1 | |||||||||
Castellum AB | 12,227 | 214,459 | 147.3 | |||||||||
Dustin Group AB | 10,850 | 55,377 | 38.0 | |||||||||
Elekta AB, B Shares, Class B | 6,104 | 55,457 | 38.1 | |||||||||
Evolution Gaming Group AB | 1,484 | 67,962 | 46.7 | |||||||||
Fabege AB | 9,704 | 114,953 | 79.0 | |||||||||
Hufvudstaden AB, A Shares | 6,636 | 85,031 | 58.4 | |||||||||
Indutrade AB | 2,785 | 89,535 | 61.5 | |||||||||
Kungsleden AB | 16,177 | 123,195 | 84.6 | |||||||||
Lindab International AB | 4,270 | 39,126 | 26.9 | |||||||||
Mycronic AB | 3,085 | 51,534 | 35.4 | |||||||||
Peab AB | 9,240 | 70,390 | 48.3 | |||||||||
Recipharm AB, -B Shares | 1,703 | 20,234 | 13.9 | |||||||||
Resurs Holding AB | 24,845 | 91,418 | 62.8 | |||||||||
Scandi Standard AB | 16,344 | 106,850 | 73.4 | |||||||||
Stillfront Group AB | 969 | 57,574 | 39.5 | |||||||||
Sweco AB, -B Shares | 1,089 | 37,205 | 25.6 | |||||||||
Swedish Orphan Biovitrum AB | 4,560 | 87,366 | 60.0 | |||||||||
Thule Group AB | 1,359 | 25,341 | 17.4 | |||||||||
|
|
|
| |||||||||
| 1,654,068 | ||||||||||||
| Switzerland | ||||||||||||
ALSO Holding AG | 257 | 52,871 | 36.3 | |||||||||
Arbonia AG | 10,583 | 89,736 | 61.6 | |||||||||
BKW AG | 702 | 56,943 | 39.1 | |||||||||
Emmi AG | 166 | 152,480 | 104.7 | |||||||||
Helvetia Holding AG | 198 | 18,049 | 12.4 | |||||||||
Implenia AG | 1,238 | 50,637 | 34.8 | |||||||||
Inficon Holding AG | 70 | 47,317 | 32.5 | |||||||||
Landis+Gyr Group AG | 3,582 | 241,892 | 166.1 | |||||||||
LEM Holding SA | 16 | 20,692 | 14.2 | |||||||||
Logitech International SA, Registered Shares | 3,736 | 179,938 | 123.6 | |||||||||
Mediclinic International PLC | 6,771 | 22,015 | 15.1 | |||||||||
OC Oerlikon Corp. AG, Registered Shares | 3,018 | 22,665 | 15.6 | |||||||||
Orior AG | 246 | 20,434 | 14.0 | |||||||||
PSP Swiss Property AG, Registered Shares | 224 | 26,022 | 17.9 | |||||||||
Sensirion Holding AG | 1,732 | 61,685 | 42.4 | |||||||||
SFS Group AG | 789 | 62,435 | 42.9 | |||||||||
Siegfried Holding AG | 48 | 21,930 | 15.1 | |||||||||
Tecan Group AG | 421 | 135,538 | 93.1 | |||||||||
Valiant Holding AG | 2,131 | 205,842 | 141.4 | |||||||||
VAT Group AG | 524 | 86,482 | 59.4 | |||||||||
Ypsomed Holding AG | 144 | 18,887 | 13.0 | |||||||||
Zur Rose Group AG | 813 | 133,746 | 91.9 | |||||||||
|
|
|
| |||||||||
| 1,728,236 | ||||||||||||
| Ukraine | ||||||||||||
Ferrexpo PLC | 11,165 | 19,068 | 13.1 | |||||||||
|
|
|
| |||||||||
| 34 | 2020 BLACKROCK ANNUAL REPORTTO SHAREHOLDERS |
Schedule of Investments (continued) April 30, 2020 | BlackRock Global Long/Short Equity Fund |
| Shares | Value | % of Basket Value | ||||||||||
| United Kingdom | ||||||||||||
888 Holdings PLC | 9,257 | $ | 16,810 | 11.5 | % | |||||||
Abcam PLC | 2,012 | 32,183 | 22.1 | |||||||||
AG Barr PLC | 4,852 | 30,140 | 20.7 | |||||||||
Anglo Pacific Group PLC | 9,688 | 19,343 | 13.3 | |||||||||
Arrow Global Group PLC | 14,479 | 18,385 | 12.6 | |||||||||
Ascential PLC | 9,048 | 28,735 | 19.7 | |||||||||
Ashmore Group PLC | 27,558 | 131,392 | 90.3 | |||||||||
Bellway PLC | 4,009 | 134,146 | 92.1 | |||||||||
Big Yellow Group PLC | 7,462 | 100,442 | 69.0 | |||||||||
Brewin Dolphin Holdings PLC | 28,348 | 97,674 | 67.1 | |||||||||
Computacenter PLC | 2,194 | 40,098 | 27.5 | |||||||||
Craneware PLC | 732 | 17,702 | 12.2 | |||||||||
Cranswick PLC | 2,593 | 121,284 | 83.3 | |||||||||
Crest Nicholson Holdings PLC | 44,215 | 142,469 | 97.9 | |||||||||
Daily Mail & General Trust PLC | 6,540 | 58,080 | 39.9 | |||||||||
Derwent London PLC | 3,831 | 149,693 | 102.8 | |||||||||
Dialog Semiconductor PLC | 2,763 | 86,772 | 59.6 | |||||||||
Dignity PLC | 4,798 | 14,653 | 10.1 | |||||||||
Diploma PLC | 11,681 | 253,182 | 173.9 | |||||||||
Drax Group PLC | 16,658 | 43,671 | 30.0 | |||||||||
Dunelm Group PLC | 2,872 | 33,182 | 22.8 | |||||||||
EMIS Group PLC | 1,447 | 19,100 | 13.1 | |||||||||
Fevertree Drinks PLC | 4,589 | 100,161 | 68.8 | |||||||||
Games Workshop Group PLC | 1,586 | 120,036 | 82.5 | |||||||||
Gamesys Group PLC | 4,123 | 45,554 | 31.3 | |||||||||
Grainger PLC | 8,091 | 27,183 | 18.7 | |||||||||
Great Portland Estates PLC | 8,340 | 71,034 | 48.8 | |||||||||
HomeServe PLC | 9,526 | 133,437 | 91.7 | |||||||||
Hotel Chocolat Group PLC | 9,007 | 38,514 | 26.5 | |||||||||
Howden Joinery Group PLC | 153 | 1,009 | 0.7 | |||||||||
IG Group Holdings PLC | 3,743 | 35,477 | 24.4 | |||||||||
John Wood Group PLC | 39,809 | 100,800 | 69.2 | |||||||||
Jupiter Fund Management PLC | 19,280 | 53,000 | 36.4 | |||||||||
Kainos Group PLC | 4,468 | 39,306 | 27.0 | |||||||||
Lancashire Holdings Ltd. | 2,819 | 21,729 | 14.9 | |||||||||
LondonMetric Property PLC | 50,048 | 122,278 | 84.0 | |||||||||
Marshalls PLC | 4,159 | 33,310 | 22.9 | |||||||||
Moneysupermarket.com Group PLC | 9,092 | 36,370 | 25.0 | |||||||||
Morgan Advanced Materials PLC | 5,191 | 14,319 | 9.8 | |||||||||
Morgan Sindall Group PLC | 8,964 | 144,440 | 99.2 | |||||||||
Pennon Group PLC | 3,473 | 47,823 | 32.8 | |||||||||
Phoenix Group Holdings PLC | 5,491 | 41,667 | 28.6 | |||||||||
Playtech PLC | 9,861 | 28,930 | 19.9 | |||||||||
Polypipe Group PLC | 11,752 | 73,721 | 50.6 | |||||||||
Provident Financial PLC | 8,690 | 21,191 | 14.6 | |||||||||
Renishaw PLC | 1,154 | 51,076 | 35.1 | |||||||||
Safestore Holdings PLC | 7,116 | 64,371 | 44.2 | |||||||||
Shaftesbury PLC | 6,415 | 48,478 | 33.3 | |||||||||
Spirent Communications PLC | 14,186 | 42,912 | 29.5 | |||||||||
Telecom Plus PLC | 4,064 | 67,770 | 46.6 | |||||||||
TORM PLC | 2,375 | 20,300 | 13.9 | |||||||||
Travis Perkins PLC | 1,508 | 19,691 | 13.5 | |||||||||
Watkin Jones PLC | 56,592 | 122,761 | 84.3 | |||||||||
Workspace Group PLC | 6,782 | 66,799 | 45.9 | |||||||||
|
|
|
| |||||||||
| 3,444,583 | ||||||||||||
| United States | ||||||||||||
1-800-Flowers.com, Inc., Class A | 4,439 | 85,184 | 58.5 | |||||||||
2U, Inc. | 2,060 | 48,925 | 33.6 | |||||||||
3D Systems Corp. | 3,049 | 25,886 | 17.8 | |||||||||
8x8, Inc. | 6,799 | 115,311 | 79.2 | |||||||||
Acadia Realty Trust | 2,359 | 29,228 | 20.1 | |||||||||
Accelerate Diagnostics, Inc. | 10,658 | 116,279 | 79.9 | |||||||||
| Shares | Value | % of Basket Value | ||||||||||
| United States (continued) | ||||||||||||
Acceleron Pharma, Inc. | 320 | $ | 28,970 | 19.9 | % | |||||||
Addus HomeCare Corp. | 314 | 25,440 | 17.5 | |||||||||
Advanced Energy Industries, Inc. | 620 | 34,472 | 23.7 | |||||||||
AeroVironment, Inc. | 600 | 36,156 | 24.8 | |||||||||
Agree Realty Corp. | 1,110 | 72,272 | 49.6 | |||||||||
ALLETE, Inc. | 2,644 | 152,189 | 104.5 | |||||||||
Allogene Therapeutics, Inc. | 709 | 20,490 | 14.1 | |||||||||
Allscripts Healthcare Solutions, Inc. | 29,555 | 192,108 | 132.0 | |||||||||
Altair Engineering, Inc., Class A | 1,216 | 40,116 | 27.6 | |||||||||
Altra Industrial Motion Corp. | 3,003 | 83,814 | 57.6 | |||||||||
Amalgamated Bank, Class A | 3,615 | 38,681 | 26.6 | |||||||||
Ambarella, Inc. | 2,572 | 135,236 | 92.9 | |||||||||
AMC Networks, Inc., Class A | 4,353 | 103,819 | 71.3 | |||||||||
Ameresco, Inc., Class A | 1,969 | 35,560 | 24.4 | |||||||||
American Campus Communities, Inc. | 3,104 | 109,540 | 75.2 | |||||||||
American Homes 4 Rent, Class A | 7,937 | 191,599 | 131.6 | |||||||||
American Software, Inc., Class A | 1,520 | 25,050 | 17.2 | |||||||||
American States Water Co. | 519 | 41,193 | 28.3 | |||||||||
American Woodmark Corp. | 312 | 16,040 | 11.0 | |||||||||
Apartment Investment & Management Co., Class A | 2,680 | 100,956 | 69.3 | |||||||||
Appfolio, Inc., Class A | 2,263 | 248,613 | 170.8 | |||||||||
AptarGroup, Inc. | 340 | 36,407 | 25.0 | |||||||||
Archrock, Inc. | 17,983 | 86,498 | 59.4 | |||||||||
Ares Management Corp., Class A | 1,549 | 51,969 | 35.7 | |||||||||
Armada Hoffler Properties, Inc. | 2,490 | 23,929 | 16.4 | |||||||||
ASGN, Inc. | 952 | 44,220 | 30.4 | |||||||||
Ashland Global Holdings, Inc. | 648 | 39,975 | 27.5 | |||||||||
Associated Banc-Corp | 15,491 | 219,043 | 150.5 | |||||||||
Assured Guaranty Ltd. | 688 | 20,454 | 14.1 | |||||||||
Astronics Corp. | 2,234 | 20,061 | 13.8 | |||||||||
Atrion Corp. | 60 | 37,910 | 26.0 | |||||||||
Axon Enterprise, Inc. | 1,346 | 97,868 | 67.2 | |||||||||
Axonics Modulation Technologies, Inc. | 590 | 19,004 | 13.1 | |||||||||
Axos Financial, Inc. | 821 | 18,924 | 13.0 | |||||||||
AZZ, Inc. | 7,614 | 239,003 | 164.2 | |||||||||
Badger Meter, Inc. | 1,897 | 111,980 | 76.9 | |||||||||
Balchem Corp. | 433 | 38,641 | 26.5 | |||||||||
Banc of California, Inc. | 2,904 | 30,260 | 20.8 | |||||||||
BancFirst Corp. | 6,032 | 232,292 | 159.6 | |||||||||
Bancorp, Inc. | 3,744 | 26,096 | 17.9 | |||||||||
BankUnited, Inc. | 6,992 | 138,512 | 95.1 | |||||||||
Bar Harbor Bankshares | 1,159 | 21,302 | 14.6 | |||||||||
Bed Bath & Beyond, Inc. | 6,897 | 42,692 | 29.3 | |||||||||
Benchmark Electronics, Inc. | 2,255 | 46,588 | 32.0 | |||||||||
Benefitfocus, Inc. | 5,304 | 57,442 | 39.5 | |||||||||
Berry Global Group, Inc. | 1,492 | 59,367 | 40.8 | |||||||||
Big Lots, Inc. | 2,968 | 69,600 | 47.8 | |||||||||
Bio-Techne Corp. | 293 | 65,925 | 45.3 | |||||||||
BioTelemetry, Inc. | 1,660 | 77,539 | 53.3 | |||||||||
Blackbaud, Inc. | 1,142 | 63,107 | 43.3 | |||||||||
Blackline, Inc. | 2,689 | 163,330 | 112.2 | |||||||||
Blue Bird Corp. | 4,879 | 59,865 | 41.1 | |||||||||
BMC Stock Holdings, Inc. | 746 | 15,853 | 10.9 | |||||||||
Box, Inc., Class A | 9,078 | 146,519 | 100.6 | |||||||||
Brandywine Realty Trust | 5,589 | 62,373 | 42.8 | |||||||||
Bridge Bancorp, Inc. | 275 | 5,690 | 3.9 | |||||||||
BRP, Inc. | 1,209 | 36,184 | 24.9 | |||||||||
Burford Capital Ltd. | 11,278 | 70,846 | 48.7 | |||||||||
Cabot Microelectronics Corp. | 182 | 22,302 | 15.3 | |||||||||
CalAmp Corp. | 4,958 | 33,318 | 22.9 | |||||||||
Camping World Holdings, Inc., Class A | 5,529 | 49,042 | 33.7 | |||||||||
Cara Therapeutics, Inc. | 1,404 | 20,807 | 14.3 | |||||||||
| SCHEDULES OF INVESTMENTS | 35 |
Schedule of Investments (continued) April 30, 2020 | BlackRock Global Long/Short Equity Fund |
| Shares | Value | % of Basket Value | ||||||||||
| United States (continued) | ||||||||||||
Carriage Services, Inc. | 190 | $ | 2,854 | 2.0 | % | |||||||
Catalent, Inc. | 618 | 42,735 | 29.4 | |||||||||
CBTX, Inc. | 179 | 3,233 | 2.2 | |||||||||
Central Garden & Pet Co., Class A | 1,145 | 34,819 | 23.9 | |||||||||
Cerus Corp. | 4,155 | 25,553 | 17.6 | |||||||||
Cheesecake Factory, Inc. | 2,220 | 49,484 | 34.0 | |||||||||
Chegg, Inc. | 3,247 | 138,809 | 95.4 | |||||||||
Chemours Co. | 5,692 | 66,767 | 45.9 | |||||||||
Chuy’s Holdings, Inc. | 2,310 | 38,716 | 26.6 | |||||||||
Cirrus Logic, Inc. | 2,052 | 155,131 | 106.6 | |||||||||
CIT Group, Inc. | 3,609 | 68,499 | 47.1 | |||||||||
Clean Energy Fuels Corp. | 8,349 | 17,992 | 12.4 | |||||||||
Clearway Energy, Inc., Class A | 1,129 | 21,112 | 14.5 | |||||||||
Clearway Energy, Inc., Class C | 4,675 | 93,640 | 64.3 | |||||||||
CNO Financial Group, Inc. | 2,205 | 31,002 | 21.3 | |||||||||
Codexis, Inc. | 1,769 | 20,538 | 14.1 | |||||||||
Cohen & Steers, Inc. | 1,034 | 59,703 | 41.0 | |||||||||
Collegium Pharmaceutical, Inc. | 1,619 | 33,481 | 23.0 | |||||||||
Columbia Property Trust, Inc. | 4,864 | 69,507 | 47.7 | |||||||||
Commerce Bancshares, Inc. | 173 | 10,586 | 7.3 | |||||||||
CommScope Holding Co., Inc. | 1,935 | 21,304 | 14.6 | |||||||||
Community Healthcare Trust, Inc. | 578 | 21,502 | 14.8 | |||||||||
Conduent, Inc. | 12,477 | 31,442 | 21.6 | |||||||||
ConnectOne Bancorp, Inc. | 2,963 | 44,267 | 30.4 | |||||||||
CoreSite Realty Corp. | 740 | 89,681 | 61.6 | |||||||||
Cornerstone OnDemand, Inc. | 4,135 | 138,771 | 95.3 | |||||||||
CorVel Corp. | 975 | 51,373 | 35.3 | |||||||||
Cousins Properties, Inc. | 1,384 | 41,755 | 28.7 | |||||||||
Covetrus, Inc. | 2,100 | 24,969 | 17.2 | |||||||||
Cowen, Inc., Class A | 8,892 | 97,367 | 66.9 | |||||||||
Crocs, Inc. | 6,004 | 145,597 | 100.0 | |||||||||
CryoLife, Inc. | 558 | 12,460 | 8.6 | |||||||||
Cubic Corp. | 4,485 | 171,372 | 117.7 | |||||||||
Curtiss-Wright Corp. | 2,883 | 298,823 | 205.3 | |||||||||
Dana, Inc. | 2,968 | 34,132 | 23.4 | |||||||||
Deckers Outdoor Corp. | 572 | 85,091 | 58.5 | |||||||||
Del Taco Restaurants, Inc. | 691 | 4,063 | 2.8 | |||||||||
Denny’s Corp. | 2,793 | 31,477 | 21.6 | |||||||||
Designer Brands, Inc., Class A | 6,467 | 41,065 | 28.2 | |||||||||
Dicerna Pharmaceuticals, Inc. | 776 | 15,287 | 10.5 | |||||||||
Dine Brands Global, Inc. | 2,335 | 103,651 | 71.2 | |||||||||
Dolby Laboratories, Inc., Class A | 7,614 | 457,068 | 314.0 | |||||||||
Domo, Inc., Class B | 4,275 | 83,149 | 57.1 | |||||||||
Douglas Dynamics, Inc. | 2,245 | 82,975 | 57.0 | |||||||||
eHealth, Inc. | 360 | 38,412 | 26.4 | |||||||||
Emergent Biosolutions, Inc. | 863 | 63,819 | 43.8 | |||||||||
Endo International PLC | 11,558 | 53,167 | 36.5 | |||||||||
Ennis, Inc. | 959 | 17,847 | 12.3 | |||||||||
Enterprise Financial Services Corp. | 2,278 | 70,026 | 48.1 | |||||||||
ESCO Technologies, Inc. | 1,706 | 130,168 | 89.4 | |||||||||
Esperion Therapeutics, Inc. | 614 | 24,314 | 16.7 | |||||||||
Essent Group Ltd. | 1,649 | 45,051 | 30.9 | |||||||||
Etsy, Inc. | 3,155 | 204,665 | 140.6 | |||||||||
Eventbrite, Inc., Class A | 3,501 | 31,929 | 21.9 | |||||||||
Everbridge, Inc. | 369 | 41,099 | 28.2 | |||||||||
Evolent Health, Inc., Class A | 6,853 | 49,410 | 33.9 | |||||||||
Exponent, Inc. | 3,055 | 214,858 | 147.6 | |||||||||
Fair Isaac Corp. | 427 | 150,705 | 103.5 | |||||||||
Fate Therapeutics, Inc. | 1,572 | 43,041 | 29.6 | |||||||||
FB Financial Corp. | 3,612 | 80,692 | 55.4 | |||||||||
FBL Financial Group, Inc., Class A | 1,550 | 60,574 | 41.6 | |||||||||
First Busey Corp. | 300 | 5,526 | 3.8 | |||||||||
| Shares | Value | % of Basket Value | ||||||||||
| United States (continued) | ||||||||||||
First Defiance Financial Corp. | 9,502 | $ | 165,145 | 113.4 | % | |||||||
First Foundation, Inc. | 4,359 | 59,980 | 41.2 | |||||||||
First Hawaiian, Inc. | 1,360 | 23,922 | 16.4 | |||||||||
First Horizon National Corp. | 15,510 | 140,831 | 96.7 | |||||||||
First Mid Bancshares, Inc. | 3,710 | 99,057 | 68.0 | |||||||||
Fitbit, Inc., Series A | 9,911 | 66,305 | 45.5 | |||||||||
Flushing Financial Corp. | 4,892 | 61,101 | 42.0 | |||||||||
FNB Corp. | 23,839 | 192,858 | 132.5 | |||||||||
Forrester Research, Inc. | 3,237 | 101,318 | 69.6 | |||||||||
Franklin Electric Co., Inc. | 586 | 29,769 | 20.4 | |||||||||
Freshpet, Inc. | 508 | 38,308 | 26.3 | |||||||||
frontdoor, Inc. | 487 | 18,852 | 13.0 | |||||||||
G-III Apparel Group Ltd. | 2,602 | 29,481 | 20.3 | |||||||||
GameStop Corp., Class A | 3,759 | 21,539 | 14.8 | |||||||||
Generac Holdings, Inc. | 1,129 | 110,010 | 75.6 | |||||||||
Gentherm, Inc. | 3,328 | 124,600 | 85.6 | |||||||||
Gladstone Commercial Corp. | 11,635 | 183,833 | 126.3 | |||||||||
Global Medical REIT, Inc. | 2,064 | 21,507 | 14.8 | |||||||||
Globus Medical, Inc., Class A | 837 | 39,724 | 27.3 | |||||||||
GoPro, Inc., Class A | 25,260 | 88,915 | 61.1 | |||||||||
Granite Construction, Inc. | 4,715 | 77,515 | 53.2 | |||||||||
Green Brick Partners, Inc. | 3,147 | 28,040 | 19.3 | |||||||||
Greif, Inc., Class A | 692 | 23,452 | 16.1 | |||||||||
H&R Block, Inc. | 16,896 | 281,318 | 193.2 | |||||||||
Haemonetics Corp. | 282 | 32,086 | 22.0 | |||||||||
Hancock Whitney Corp. | 2,268 | 47,424 | 32.6 | |||||||||
Hanover Insurance Group, Inc. | 739 | 74,181 | 51.0 | |||||||||
Hawaiian Electric Industries, Inc. | 3,995 | 157,683 | 108.3 | |||||||||
HB Fuller Co. | 2,275 | 83,697 | 57.5 | |||||||||
HCI Group, Inc. | 2,081 | 86,674 | 59.5 | |||||||||
Healthcare Trust of America, Inc., Class A | 6,699 | 164,996 | 113.3 | |||||||||
Heartland Express, Inc. | 10,950 | 214,510 | 147.3 | |||||||||
Helen of Troy Ltd. | 1,130 | 185,636 | 127.5 | |||||||||
Heritage Commerce Corp. | 6,316 | 56,086 | 38.5 | |||||||||
Herman Miller, Inc. | 3,426 | 77,222 | 53.0 | |||||||||
Heska Corp. | 82 | 5,806 | 4.0 | |||||||||
Hillenbrand, Inc. | 11,620 | 243,439 | 167.2 | |||||||||
HMS Holdings Corp. | 1,473 | 42,238 | 29.0 | |||||||||
Hooker Furniture Corp. | 3,652 | 54,743 | 37.6 | |||||||||
Horizon Bancorp | 12,938 | 147,234 | 101.1 | |||||||||
Horizon Therapeutics PLC | 1,561 | 56,258 | 38.6 | |||||||||
Hub Group, Inc., Class A | 859 | 41,326 | 28.4 | |||||||||
Hubbell, Inc. | 2,378 | 295,895 | 203.3 | |||||||||
HubSpot, Inc. | 719 | 121,245 | 83.3 | |||||||||
Huron Consulting Group, Inc. | 1,306 | 73,188 | 50.3 | |||||||||
ICF International, Inc. | 1,173 | 86,262 | 59.3 | |||||||||
IDACORP, Inc. | 1,566 | 143,727 | 98.7 | |||||||||
Independence Realty Trust, Inc. | 2,781 | 28,005 | 19.2 | |||||||||
Independent Bank Corp. | 11,565 | 169,890 | 116.7 | |||||||||
Independent Bank Group, Inc. | 1,734 | 52,558 | 36.1 | |||||||||
Ingevity Corp. | 229 | 11,890 | 8.2 | |||||||||
Inogen, Inc. | 469 | 23,450 | 16.1 | |||||||||
Inphi Corp. | 666 | 64,296 | 44.2 | |||||||||
Insight Enterprises, Inc. | 4,374 | 237,464 | 163.1 | |||||||||
Insperity, Inc. | 6,700 | 319,657 | 219.6 | |||||||||
Inspire Medical Systems, Inc. | 283 | 20,280 | 13.9 | |||||||||
Interactive Brokers Group, Inc., Class A | 2,578 | 105,698 | 72.6 | |||||||||
InterDigital, Inc. | 2,585 | 149,335 | 102.6 | |||||||||
INTL. FCStone, Inc. | 1,534 | 61,299 | 42.1 | |||||||||
Invitae Corp. | 6,212 | 102,809 | 70.6 | |||||||||
ITT, Inc. | 3,846 | 202,761 | 139.3 | |||||||||
J&J Snack Foods Corp. | 265 | 33,663 | 23.1 | |||||||||
| 36 | 2020 BLACKROCK ANNUAL REPORTTO SHAREHOLDERS |
Schedule of Investments (continued) April 30, 2020 | BlackRock Global Long/Short Equity Fund |
| Shares | Value | % of Basket Value | ||||||||||
| United States (continued) | ||||||||||||
j2 Global, Inc. | 1,625 | $ | 131,040 | 90.0 | % | |||||||
Jabil, Inc. | 921 | 26,193 | 18.0 | |||||||||
Jack in the Box, Inc. | 386 | 23,276 | 16.0 | |||||||||
John Bean Technologies Corp. | 568 | 43,588 | 29.9 | |||||||||
Johnson Outdoors, Inc., Class A | 1,075 | 73,487 | 50.5 | |||||||||
Kelly Services, Inc., Class A | 1,810 | 27,965 | 19.2 | |||||||||
Kforce, Inc. | 2,655 | 79,517 | 54.6 | |||||||||
Kimball International, Inc., Class B | 6,389 | 78,393 | 53.8 | |||||||||
Knowles Corp. | 1,100 | 17,105 | 11.8 | |||||||||
Kraton Corp. | 2,045 | 31,922 | 21.9 | |||||||||
Kratos Defense & Security Solutions, Inc. | 1,249 | 18,760 | 12.9 | |||||||||
La-Z-Boy, Inc. | 3,023 | 70,889 | 48.7 | |||||||||
Lakeland Bancorp, Inc. | 12,637 | 141,408 | 97.1 | |||||||||
Lancaster Colony Corp. | 1,137 | 153,074 | 105.1 | |||||||||
LeMaitre Vascular, Inc. | 490 | 13,960 | 9.6 | |||||||||
Levi Strauss & Co., Class A | 3,007 | 38,760 | 26.6 | |||||||||
LGI Homes, Inc. | 390 | 23,626 | 16.2 | |||||||||
LHC Group, Inc. | 368 | 47,836 | 32.9 | |||||||||
Limelight Networks, Inc. | 10,698 | 54,239 | 37.3 | |||||||||
Littelfuse, Inc. | 55 | 7,988 | 5.5 | |||||||||
LivePerson, Inc. | 5,422 | 129,803 | 89.2 | |||||||||
Lumentum Holdings, Inc. | 497 | 40,212 | 27.6 | |||||||||
Magellan Health, Inc. | 842 | 51,135 | 35.1 | |||||||||
ManTech International Corp., Class A | 268 | 19,982 | 13.7 | |||||||||
Masimo Corp. | 1,325 | 283,431 | 194.7 | |||||||||
Materion Corp. | 1,678 | 86,820 | 59.6 | |||||||||
Matrix Service Co. | 2,761 | 28,825 | 19.8 | |||||||||
MaxLinear, Inc. | 6,597 | 108,785 | 74.7 | |||||||||
MDC Holdings, Inc. | 4,865 | 142,301 | 97.7 | |||||||||
MEDIA GEN, Inc. CVR | 3,231 | — | 0.0 | |||||||||
MEDNAX, Inc. | 3,095 | 44,939 | 30.9 | |||||||||
Mercantile Bank Corp. | 7,252 | 171,147 | 117.6 | |||||||||
Mercury Systems, Inc. | 521 | 46,452 | 31.9 | |||||||||
MFA Financial, Inc. | 798 | 1,397 | 1.0 | |||||||||
MGIC Investment Corp. | 4,814 | 35,190 | 24.2 | |||||||||
Midland States Bancorp, Inc. | 9,653 | 156,572 | 107.6 | |||||||||
MidWestOne Financial Group, Inc. | 2,558 | 53,385 | 36.7 | |||||||||
MobileIron, Inc. | 8,272 | 42,104 | 28.9 | |||||||||
Model N, Inc. | 4,223 | 121,876 | 83.7 | |||||||||
Modine Manufacturing Co. | 15,494 | 71,737 | 49.3 | |||||||||
Moog, Inc., Class A | 1,514 | 74,913 | 51.5 | |||||||||
Morningstar, Inc. | 2,160 | 336,874 | 231.4 | |||||||||
MSA Safety, Inc. | 536 | 60,316 | 41.4 | |||||||||
MSC Industrial Direct Co., Inc., Class A | 196 | 11,689 | 8.0 | |||||||||
Myers Industries, Inc. | 2,434 | 30,084 | 20.7 | |||||||||
MyoKardia, Inc. | 482 | 30,279 | 20.8 | |||||||||
MYR Group, Inc. | 3,290 | 98,700 | 67.8 | |||||||||
Myriad Genetics, Inc. | 1,663 | 25,710 | 17.7 | |||||||||
NanoString Technologies, Inc. | 1,146 | 36,397 | 25.0 | |||||||||
National General Holdings Corp. | 11,047 | 210,224 | 144.4 | |||||||||
National Research Corp., Class A | 3,016 | 155,595 | 106.9 | |||||||||
Navient Corp. | 3,447 | 26,266 | 18.0 | |||||||||
Neenah, Inc. | 1,353 | 66,108 | 45.4 | |||||||||
Nelnet, Inc., Class A | 1,811 | 87,200 | 59.9 | |||||||||
NetScout Systems, Inc. | 877 | 23,223 | 16.0 | |||||||||
Nevro Corp. | 310 | 36,468 | 25.1 | |||||||||
New Relic, Inc. | 2,415 | 129,661 | 89.1 | |||||||||
Nexstar Media Group, Inc., Class A | 1,205 | 84,398 | 58.0 | |||||||||
Nicolet Bankshares, Inc. | 1,568 | 86,271 | 59.3 | |||||||||
NOW, Inc. | 8,568 | 52,865 | 36.3 | |||||||||
Nu Skin Enterprises, Inc., Class A | 1,349 | 39,404 | 27.1 | |||||||||
Nutanix, Inc., Class A | 4,934 | 101,098 | 69.4 | |||||||||
| Shares | Value | % of Basket Value | ||||||||||
| United States (continued) | ||||||||||||
NV5 Global, Inc. | 582 | $ | 27,209 | 18.7 | % | |||||||
Oceaneering International, Inc. | 405 | 2,082 | 1.4 | |||||||||
OceanFirst Financial Corp. | 14,899 | 251,048 | 172.4 | |||||||||
Omnicell, Inc. | 397 | 28,941 | 19.9 | |||||||||
Onto Innovation, Inc. | 1,543 | 50,086 | 34.4 | |||||||||
Ormat Technologies, Inc. | 296 | 18,473 | 12.7 | |||||||||
Orthofix Medical, Inc. | 1,433 | 50,800 | 34.9 | |||||||||
Oshkosh Corp. | 1,502 | 101,430 | 69.7 | |||||||||
Outfront Media, Inc. | 1,516 | 23,786 | 16.3 | |||||||||
Oxford Industries, Inc. | 3,412 | 143,031 | 98.3 | |||||||||
Pacific Biosciences of California, Inc. | 20,665 | 68,298 | 46.9 | |||||||||
PacWest Bancorp | 1,312 | 26,555 | 18.2 | |||||||||
Parsley Energy, Inc., Class A | 4,225 | 39,926 | 27.4 | |||||||||
Parsons Corp. | 549 | 20,533 | 14.1 | |||||||||
Paylocity Holding Corp. | 3,356 | 384,363 | 264.0 | |||||||||
Paysign, Inc. | 3,650 | 31,390 | 21.6 | |||||||||
Peapack Gladstone Financial Corp. | 1,597 | 30,135 | 20.7 | |||||||||
Pegasystems, Inc. | 648 | 54,186 | 37.2 | |||||||||
Penumbra, Inc. | 408 | 72,347 | 49.7 | |||||||||
Perficient, Inc. | 2,249 | 78,333 | 53.8 | |||||||||
Physicians Realty Trust | 2,235 | 34,464 | 23.7 | |||||||||
Pinnacle Financial Partners, Inc. | 10,367 | 417,272 | 286.6 | |||||||||
PJT Partners, Inc., Class A | 520 | 25,293 | 17.4 | |||||||||
Plantronics, Inc. | 1,739 | 24,555 | 16.9 | |||||||||
Plug Power, Inc. | 12,181 | 50,977 | 35.0 | |||||||||
Post Holdings, Inc. | 2,938 | 269,855 | 185.4 | |||||||||
Power Integrations, Inc. | 1,056 | 108,082 | 74.2 | |||||||||
PRA Group, Inc. | 2,644 | 73,345 | 50.4 | |||||||||
Progress Software Corp. | 1,468 | 60,056 | 41.3 | |||||||||
Proofpoint, Inc. | 1,078 | 131,225 | 90.1 | |||||||||
PROS Holdings, Inc. | 640 | 22,010 | 15.1 | |||||||||
Pure Storage, Inc., Class A | 4,477 | 64,469 | 44.3 | |||||||||
Q2 Holdings, Inc. | 1,007 | 80,278 | 55.1 | |||||||||
QCR Holdings, Inc. | 7,552 | 232,451 | 159.7 | |||||||||
QTS Realty Trust, Inc., Class A | 4,716 | 294,891 | 202.6 | |||||||||
Qualys, Inc. | 782 | 82,454 | 56.6 | |||||||||
Quotient Technology, Inc. | 27,162 | 195,023 | 134.0 | |||||||||
RadNet, Inc. | 6,841 | 96,595 | 66.4 | |||||||||
Rambus, Inc. | 1,608 | 20,148 | 13.8 | |||||||||
Rapid7, Inc. | 4,043 | 184,159 | 126.5 | |||||||||
Raven Industries, Inc. | 14,257 | 317,503 | 218.1 | |||||||||
Rayonier, Inc. | 1,708 | 41,043 | 28.2 | |||||||||
RE/MAX Holdings, Inc., Class A | 1,611 | 42,353 | 29.1 | |||||||||
Realogy Holdings Corp. | 11,656 | 50,587 | 34.7 | |||||||||
RealReal, Inc. | 2,050 | 24,067 | 16.5 | |||||||||
Reata Pharmaceuticals, Inc., Class A | 337 | 53,300 | 36.6 | |||||||||
Red Robin Gourmet Burgers, Inc. | 1,115 | 16,312 | 11.2 | |||||||||
Reliance Steel & Aluminum Co. | 3,555 | 318,457 | 218.8 | |||||||||
Reliance Worldwide Corp., Ltd. | 14,594 | 25,675 | 17.6 | |||||||||
Repay Holdings Corp. | 2,782 | 49,714 | 34.2 | |||||||||
Repligen Corp. | 832 | 96,637 | 66.4 | |||||||||
Republic Bancorp, Inc., Class A | 2,561 | 85,358 | 58.6 | |||||||||
Rite Aid Corp. | 4,329 | 62,035 | 42.6 | |||||||||
Rubicon Project, Inc. | 3,629 | 26,020 | 17.9 | |||||||||
Sage Therapeutics, Inc. | 1,023 | 39,877 | 27.4 | |||||||||
SailPoint Technologies Holding, Inc. | 7,044 | 130,948 | 90.0 | |||||||||
ScanSource, Inc. | 854 | 22,136 | 15.2 | |||||||||
Schneider National, Inc., Class B | 1,855 | 40,643 | 27.9 | |||||||||
Scholastic Corp. | 908 | 26,396 | 18.1 | |||||||||
Scientific Games Corp., Class A | 8,527 | 107,525 | 73.9 | |||||||||
Seritage Growth Properties, Class A | 6,454 | 68,283 | 46.9 | |||||||||
Service Corp. International | 928 | 34,095 | 23.4 | |||||||||
| SCHEDULES OF INVESTMENTS | 37 |
Schedule of Investments (continued) April 30, 2020 | BlackRock Global Long/Short Equity Fund |
| Shares | Value | % of Basket Value | ||||||||||
| United States (continued) | ||||||||||||
Shutterstock, Inc. | 3,916 | $ | 148,808 | 102.2 | % | |||||||
Sims Ltd. | 5,034 | 22,630 | 15.5 | |||||||||
Simulations Plus, Inc. | 1,160 | 44,138 | 30.3 | |||||||||
Solaris Oilfield Infrastructure, Inc., Class A | 3,475 | 23,769 | 16.3 | |||||||||
SpartanNash Co. | 4,042 | 69,320 | 47.6 | |||||||||
Sprouts Farmers Market, Inc. | 3,821 | 79,400 | 54.5 | |||||||||
Stamps.com, Inc. | 166 | 26,273 | 18.0 | |||||||||
Steelcase, Inc., Class A | 8,914 | 97,608 | 67.0 | |||||||||
Sterling Bancorp | 2,576 | 31,762 | 21.8 | |||||||||
Strategic Education, Inc. | 176 | 28,037 | 19.3 | |||||||||
Summit Materials, Inc., Class A | 1,726 | 26,080 | 17.9 | |||||||||
Sunrun, Inc. | 3,527 | 49,484 | 34.0 | |||||||||
Supernus Pharmaceuticals, Inc. | 6,299 | 147,397 | 101.2 | |||||||||
SVMK, Inc. | 2,897 | 45,483 | 31.2 | |||||||||
SYNNEX Corp. | 1,047 | 91,675 | 63.0 | |||||||||
Systemax, Inc. | 1,181 | 23,455 | 16.1 | |||||||||
Tabula Rasa HealthCare, Inc. | 407 | 25,779 | 17.7 | |||||||||
Tactile Systems Technology, Inc. | 858 | 44,290 | 30.4 | |||||||||
Taylor Morrison Home Corp., Class A | 2,767 | 40,260 | 27.7 | |||||||||
TCF Financial Corp. | 878 | 26,068 | 17.9 | |||||||||
TechTarget, Inc. | 3,518 | 82,040 | 56.4 | |||||||||
Teladoc Health, Inc. | 417 | 68,634 | 47.1 | |||||||||
Tennant Co. | 1,561 | 92,364 | 63.4 | |||||||||
Terex Corp. | 1,648 | 25,033 | 17.2 | |||||||||
Tetra Tech, Inc. | 886 | 66,698 | 45.8 | |||||||||
Texas Roadhouse, Inc. | 2,587 | 121,822 | 83.7 | |||||||||
Tivity Health, Inc. | 5,518 | 49,496 | 34.0 | |||||||||
Toro Co. | 2,513 | 160,355 | 110.1 | |||||||||
TPI Composites, Inc. | 1,761 | 30,870 | 21.2 | |||||||||
Tradeweb Markets, Inc., Class A | 511 | 26,654 | 18.3 | |||||||||
TriState Capital Holdings, Inc. | 8,603 | 122,335 | 84.0 | |||||||||
Tronox Holdings PLC, Class A | 3,006 | 20,501 | 14.1 | |||||||||
TTM Technologies, Inc. | 5,164 | 59,851 | 41.1 | |||||||||
U.S. Physical Therapy, Inc. | 1,977 | 149,264 | 102.5 | |||||||||
Ultragenyx Pharmaceutical, Inc. | 247 | 14,926 | 10.3 | |||||||||
United Fire Group, Inc. | 730 | 20,878 | 14.3 | |||||||||
Uniti Group, Inc. | 3,557 | 25,112 | 17.3 | |||||||||
Unitil Corp. | 1,310 | 65,906 | 45.3 | |||||||||
Univest Financial Corp. | 5,269 | 93,261 | 64.1 | |||||||||
Upwork, Inc. | 1,500 | 12,495 | 8.6 | |||||||||
US Concrete, Inc. | 1,949 | 37,382 | 25.7 | |||||||||
USANA Health Sciences, Inc. | 1,025 | 91,451 | 62.8 | |||||||||
Valmont Industries, Inc. | 748 | 87,696 | 60.2 | |||||||||
Varonis Systems, Inc. | 1,129 | 75,699 | 52.0 | |||||||||
Vectrus, Inc. | 1,563 | 81,292 | 55.8 | |||||||||
Veracyte, Inc. | 3,308 | 89,217 | 61.3 | |||||||||
ViaSat, Inc. | 1,288 | 54,611 | 37.5 | |||||||||
Vicor Corp. | 1,560 | 82,945 | 57.0 | |||||||||
Virtus Investment Partners, Inc. | 1,103 | 89,641 | 61.6 | |||||||||
Virtusa Corp. | 2,344 | 77,352 | 53.1 | |||||||||
Visteon Corp. | 648 | 39,074 | 26.8 | |||||||||
Vivint Solar, Inc. | 14,059 | 89,134 | 61.2 | |||||||||
Vocera Communications, Inc. | 2,824 | 53,543 | 36.8 | |||||||||
Wabash National Corp. | 4,229 | 34,678 | 23.8 | |||||||||
Watts Water Technologies, Inc., Class A | 2,506 | 206,494 | 141.8 | |||||||||
Webster Financial Corp. | 2,420 | 68,365 | 47.0 | |||||||||
Weis Markets, Inc. | 1,554 | 77,747 | 53.4 | |||||||||
Welbilt, Inc. | 11,156 | 54,999 | 37.8 | |||||||||
Werner Enterprises, Inc. | 1,678 | 67,321 | 46.2 | |||||||||
WesBanco, Inc. | 2,737 | 67,549 | 46.4 | |||||||||
Wintrust Financial Corp. | 108 | 4,525 | 3.1 | |||||||||
WisdomTree Investments, Inc. | 4,679 | 15,160 | 10.4 | |||||||||
| Shares | Value | % of Basket Value | ||||||||||
| United States (continued) | ||||||||||||
Woodward, Inc. | 1,284 | $ | 77,759 | 53.4 | % | |||||||
Workiva, Inc. | 2,014 | 77,237 | 53.1 | |||||||||
WW International, Inc. | 5,197 | 132,575 | 91.1 | |||||||||
Yext, Inc. | 4,420 | 56,576 | 38.9 | |||||||||
Zendesk, Inc. | 4,660 | 358,261 | 246.1 | |||||||||
Zscaler, Inc. | 1,084 | 72,715 | 49.9 | |||||||||
Zuora, Inc., Class A | 3,414 | 36,086 | 24.8 | |||||||||
Zynga, Inc., Class A | 28,375 | 213,948 | 147.0 | |||||||||
|
|
|
| |||||||||
| 30,579,583 | ||||||||||||
|
| |||||||||||
Total Reference Entity — Long |
| 71,904,929 | ||||||||||
|
| |||||||||||
Reference Entity — Short | ||||||||||||
| Australia | ||||||||||||
Abacus Property Group | (23,187 | ) | (38,228 | ) | (26.3 | ) | ||||||
Adelaide Brighton, Ltd. | (76,797 | ) | (135,276 | ) | (92.9 | ) | ||||||
Altium Ltd. | (804 | ) | (17,892 | ) | (12.3 | ) | ||||||
ARB Corp. Ltd. | (5,599 | ) | (54,984 | ) | (37.8 | ) | ||||||
Bank of Queensland, Ltd. | (122,817 | ) | (414,118 | ) | (284.5 | ) | ||||||
Bingo Industries Ltd. | (16,589 | ) | (25,124 | ) | (17.3 | ) | ||||||
Bravura Solutions Ltd. | (47,652 | ) | (148,801 | ) | (102.2 | ) | ||||||
Breville Group Ltd. | (3,100 | ) | (35,080 | ) | (24.1 | ) | ||||||
Brickworks Ltd. | (10,222 | ) | (90,215 | ) | (62.0 | ) | ||||||
carsales.com, Ltd. | (13,574 | ) | (124,172 | ) | (85.3 | ) | ||||||
Charter Hall Group | (29,525 | ) | (145,899 | ) | (100.2 | ) | ||||||
Cleanaway Waste Management, Ltd. | (12,757 | ) | (15,392 | ) | (10.6 | ) | ||||||
Collins Foods Ltd. | (9,368 | ) | (44,550 | ) | (30.6 | ) | ||||||
Elders Ltd. | (6,493 | ) | (36,405 | ) | (25.0 | ) | ||||||
EML Payments Ltd. | (35,379 | ) | (63,894 | ) | (43.9 | ) | ||||||
G8 Education, Ltd. | (15,990 | ) | (8,238 | ) | (5.7 | ) | ||||||
G8 Education, Ltd. | (35,178 | ) | (19,727 | ) | (13.5 | ) | ||||||
GrainCorp Ltd. | (14,834 | ) | (34,065 | ) | (23.4 | ) | ||||||
Healius Ltd. | (19,199 | ) | (32,111 | ) | (22.0 | ) | ||||||
Iluka Resources Ltd. | (32,887 | ) | (163,121 | ) | (112.0 | ) | ||||||
Link Administration Holdings Ltd. | (10,001 | ) | (24,403 | ) | (16.8 | ) | ||||||
nib holdings Ltd. | (20,831 | ) | (66,570 | ) | (45.7 | ) | ||||||
Orora Ltd. | (19,407 | ) | (32,252 | ) | (22.1 | ) | ||||||
Premier Investments Ltd. | (10,807 | ) | (108,309 | ) | (74.4 | ) | ||||||
Qube Holdings Ltd. | (137,620 | ) | (286,485 | ) | (196.8 | ) | ||||||
Seven Group Holdings Ltd. | (31,691 | ) | (311,633 | ) | (214.1 | ) | ||||||
St Barbara Ltd. | (27,020 | ) | (45,604 | ) | (31.3 | ) | ||||||
Star Entertainment Grp Ltd. (The) | (37,194 | ) | (72,917 | ) | (50.1 | ) | ||||||
Super Retail Group Ltd. | (5,133 | ) | (20,941 | ) | (14.4 | ) | ||||||
Village Roadshow Ltd. | (3,511 | ) | (5,103 | ) | (3.5 | ) | ||||||
Webjet Ltd. | (15,828 | ) | (31,034 | ) | (21.3 | ) | ||||||
Western Areas Ltd. | (46,032 | ) | (64,887 | ) | (44.6 | ) | ||||||
Westgold Resources Ltd. | (30,197 | ) | (39,671 | ) | (27.2 | ) | ||||||
|
|
|
| |||||||||
| (2,757,101 | ) | |||||||||||
| Austria | ||||||||||||
Agrana Beteiligungs AG | (2,594 | ) | (47,725 | ) | (32.8 | ) | ||||||
AT&S Austria Technologie & Systemtechnik AG | (4,951 | ) | (85,336 | ) | (58.6 | ) | ||||||
DO & Co. AG | (46 | ) | (2,295 | ) | (1.6 | ) | ||||||
FACC AG | (7,615 | ) | (60,996 | ) | (41.9 | ) | ||||||
Kapsch TrafficCom AG | (2,615 | ) | (51,009 | ) | (35.0 | ) | ||||||
Schoeller-Bleckmann Oilfield Equipment AG | (2,947 | ) | (87,073 | ) | (59.8 | ) | ||||||
Semperit AG Holding | (770 | ) | (9,580 | ) | (6.6 | ) | ||||||
|
|
|
| |||||||||
| (344,014 | ) | |||||||||||
| Belgium | ||||||||||||
Aedifica SA | (190 | ) | (18,415 | ) | (12.7 | ) | ||||||
AGFA-Gevaert NV | (30,937 | ) | (122,551 | ) | (84.2 | ) | ||||||
| 38 | 2020 BLACKROCK ANNUAL REPORTTO SHAREHOLDERS |
Schedule of Investments (continued) April 30, 2020 | BlackRock Global Long/Short Equity Fund |
| Shares | Value | % of Basket Value | ||||||||||
| Belgium (continued) | ||||||||||||
Bekaert SA | (2,008 | ) | $ | (42,451 | ) | (29.2 | ) % | |||||
Cie d’Entreprises CFE | (875 | ) | (67,910 | ) | (46.6 | ) | ||||||
D’ieteren SA | (1,228 | ) | (61,540 | ) | (42.3 | ) | ||||||
Econocom Group SA | (7,521 | ) | (14,476 | ) | (9.9 | ) | ||||||
Elia System Operator SA | (334 | ) | (38,404 | ) | (26.4 | ) | ||||||
Ion Beam Applications | (4,410 | ) | (36,584 | ) | (25.1 | ) | ||||||
Mithra Pharmaceuticals SA | (2,999 | ) | (74,854 | ) | (51.4 | ) | ||||||
Van de Velde NV | (398 | ) | (10,075 | ) | (6.9 | ) | ||||||
|
|
|
| |||||||||
| (487,260 | ) | |||||||||||
| Canada | ||||||||||||
Altus Group Ltd. | (5,784 | ) | (174,648 | ) | (120.0 | ) | ||||||
Badger Daylighting, Ltd. | (5,130 | ) | (111,486 | ) | (76.6 | ) | ||||||
Canfor Corp. | (13,776 | ) | (96,000 | ) | (65.9 | ) | ||||||
Capital Power Corp. | (10,637 | ) | (205,870 | ) | (141.4 | ) | ||||||
Cascades, Inc. | (2,492 | ) | (24,939 | ) | (17.1 | ) | ||||||
Centerra Gold, Inc. | (9,248 | ) | (73,947 | ) | (50.8 | ) | ||||||
Cineplex, Inc. | (3,447 | ) | (41,207 | ) | (28.3 | ) | ||||||
Cogeco Communications, Inc. | (464 | ) | (34,305 | ) | (23.6 | ) | ||||||
Colliers International Group, Inc. | (342 | ) | (18,769 | ) | (12.9 | ) | ||||||
Descartes Systems Group, Inc. | (8,450 | ) | (355,192 | ) | (244.0 | ) | ||||||
DREAM Un Ltd. Corp., Class A | (44,168 | ) | (278,281 | ) | (191.2 | ) | ||||||
Eldorado Gold Corp. | (5,885 | ) | (56,104 | ) | (38.5 | ) | ||||||
Enghouse Systems Ltd. | (7,189 | ) | (269,339 | ) | (185.0 | ) | ||||||
Equinox Gold Corp. | (5,748 | ) | (48,026 | ) | (33.0 | ) | ||||||
Finning International, Inc. | (6,010 | ) | (76,293 | ) | (52.4 | ) | ||||||
goeasy Ltd. | (679 | ) | (21,688 | ) | (14.9 | ) | ||||||
Great Canadian Gaming Corp. | (4,436 | ) | (86,397 | ) | (59.3 | ) | ||||||
Interfor Corp. | (10,399 | ) | (61,335 | ) | (42.1 | ) | ||||||
InterRent Real Estate Investment Trust | (2,632 | ) | (27,474 | ) | (18.9 | ) | ||||||
Kinaxis, Inc. | (2,232 | ) | (224,363 | ) | (154.1 | ) | ||||||
Linamar Corp. | (1,162 | ) | (27,916 | ) | (19.2 | ) | ||||||
MAG Silver Corp. | (3,448 | ) | (39,213 | ) | (26.9 | ) | ||||||
Mercer International, Inc. | (9,078 | ) | (91,506 | ) | (62.9 | ) | ||||||
Norbord, Inc. | (9,909 | ) | (160,742 | ) | (110.4 | ) | ||||||
Northland Power, Inc. | (5,976 | ) | (128,240 | ) | (88.1 | ) | ||||||
Northview Apartment Real Estate Investment Trust | (5,007 | ) | (126,618 | ) | (87.0 | ) | ||||||
Novagold Resources, Inc. | (14,543 | ) | (163,197 | ) | (112.1 | ) | ||||||
Osisko Gold Royalties Ltd. | (2,000 | ) | (18,262 | ) | (12.5 | ) | ||||||
Park Lawn Corp. | (14,137 | ) | (221,610 | ) | (152.2 | ) | ||||||
Premium Brands Holdings Corp. | (9,090 | ) | (548,162 | ) | (376.5 | ) | ||||||
Pretium Resources, Inc. | (2,096 | ) | (16,007 | ) | (11.0 | ) | ||||||
Richelieu Hardware Ltd. | (9,454 | ) | (179,578 | ) | (123.4 | ) | ||||||
SEMAFO, Inc. | (11,685 | ) | (29,381 | ) | (20.2 | ) | ||||||
Stantec, Inc. | (6,091 | ) | (179,542 | ) | (123.3 | ) | ||||||
Stella-Jones, Inc. | (14,020 | ) | (349,505 | ) | (240.1 | ) | ||||||
Superior Plus Corp. | (11,300 | ) | (80,207 | ) | (55.1 | ) | ||||||
TFI International, Inc. | (671 | ) | (18,607 | ) | (12.8 | ) | ||||||
Torex Gold Resources, Inc. | (2,988 | ) | (42,525 | ) | (29.2 | ) | ||||||
Toromont Industries Ltd. | (3,242 | ) | (152,324 | ) | (104.6 | ) | ||||||
TransAlta Corp. | (11,439 | ) | (67,305 | ) | (46.2 | ) | ||||||
Transat AT, Inc. | (11,632 | ) | (84,402 | ) | (58.0 | ) | ||||||
Transcontinental, Inc., Class A | (2,673 | ) | (24,215 | ) | (16.6 | ) | ||||||
Uni-Select, Inc. | (900 | ) | (2,754 | ) | (1.9 | ) | ||||||
Uranium Participation Corp. | (21,737 | ) | (76,519 | ) | (52.6 | ) | ||||||
Winpak Ltd. | (2,348 | ) | (78,185 | ) | (53.7 | ) | ||||||
WPT Industrial Real Estate Investment Trust | (14,177 | ) | (162,610 | ) | (111.7 | ) | ||||||
|
|
|
| |||||||||
| (5,354,795 | ) | |||||||||||
| China | ||||||||||||
Health & Happiness H&H International Holdings Ltd. | (8,000 | ) | (30,594 | ) | (21.0 | ) | ||||||
Minth Group Ltd. | (10,000 | ) | (24,046 | ) | (16.5 | ) | ||||||
|
|
|
| |||||||||
| (54,640 | ) | |||||||||||
| Shares | Value | % of Basket Value | ||||||||||
| Denmark | ||||||||||||
ALK-Abello A/S | (144 | ) | $ | (36,631 | ) | (25.2 | ) % | |||||
Dfds A/S | (6,461 | ) | (164,016 | ) | (112.7 | ) | ||||||
FLSmidth & Co. A/S | (1,853 | ) | (48,769 | ) | (33.5 | ) | ||||||
Netcompany Group A/S | (1,712 | ) | (88,446 | ) | (60.7 | ) | ||||||
Nilfisk Holding A/S | (6,319 | ) | (89,503 | ) | (61.5 | ) | ||||||
NNIT A/S | (5,490 | ) | (93,986 | ) | (64.6 | ) | ||||||
Ringkjoebing Landbobank A/S | (697 | ) | (43,753 | ) | (30.0 | ) | ||||||
Rockwool International A/S, -B Shares | (619 | ) | (130,089 | ) | (89.4 | ) | ||||||
Sydbank A/S | (2,935 | ) | (48,496 | ) | (33.3 | ) | ||||||
Topdanmark A/S | (9,659 | ) | (389,908 | ) | (267.8 | ) | ||||||
|
|
|
| |||||||||
| (1,133,597 | ) | |||||||||||
| Faeroe Islands | ||||||||||||
Bakkafrost P/F | (925 | ) | (45,731 | ) | (31.4 | ) | ||||||
|
|
|
| |||||||||
| Finland | ||||||||||||
Adapteo OYJ | (2,487 | ) | (17,834 | ) | (12.2 | ) | ||||||
F-Secure OYJ | (25,068 | ) | (75,474 | ) | (51.8 | ) | ||||||
Konecranes OYJ | (1,174 | ) | (25,481 | ) | (17.5 | ) | ||||||
Metsa Board OYJ | (16,656 | ) | (116,015 | ) | (79.7 | ) | ||||||
Sanoma OYJ | (8,051 | ) | (72,692 | ) | (49.9 | ) | ||||||
TietoEVRY OYJ | (1,198 | ) | (29,191 | ) | (20.1 | ) | ||||||
Uponor OYJ | (2,385 | ) | (26,743 | ) | (18.4 | ) | ||||||
|
|
|
| |||||||||
| (363,430 | ) | |||||||||||
| France | ||||||||||||
Adevinta ASA | (1,072 | ) | (8,904 | ) | (6.1 | ) | ||||||
Beneteau SA | (19,722 | ) | (124,879 | ) | (85.8 | ) | ||||||
Bonduelle SCA | (4,278 | ) | (93,585 | ) | (64.3 | ) | ||||||
Chargeurs SA | (2,125 | ) | (40,321 | ) | (27.7 | ) | ||||||
Derichebourg SA | (66,752 | ) | (187,306 | ) | (128.7 | ) | ||||||
FFP | (218 | ) | (14,785 | ) | (10.1 | ) | ||||||
Guerbet | (129 | ) | (4,069 | ) | (2.8 | ) | ||||||
Jacquet Metal Service SA | (993 | ) | (10,120 | ) | (6.9 | ) | ||||||
Nexans SA | (1,037 | ) | (36,936 | ) | (25.4 | ) | ||||||
Oeneo SA | (13,322 | ) | (157,757 | ) | (108.4 | ) | ||||||
Trigano SA | (778 | ) | (57,253 | ) | (39.3 | ) | ||||||
|
|
|
| |||||||||
| (735,915 | ) | |||||||||||
| Germany | ||||||||||||
Aareal Bank AG | (7,357 | ) | (119,838 | ) | (82.3 | ) | ||||||
ADLER Real Estate AG | — | — | 0.0 | |||||||||
Amadeus Fire AG | (218 | ) | (22,449 | ) | (15.4 | ) | ||||||
AURELIUS Equity Opportunities SE & Co. KGaA | (8,318 | ) | (145,604 | ) | (100.0 | ) | ||||||
Aurubis AG | (424 | ) | (21,981 | ) | (15.1 | ) | ||||||
Bechtle AG | (262 | ) | (37,890 | ) | (26.0 | ) | ||||||
Bertrandt AG | (1,162 | ) | (44,759 | ) | (30.7 | ) | ||||||
Borussia Dortmund GmbH & Co. KGaA | (8,626 | ) | (60,809 | ) | (41.8 | ) | ||||||
CropEnergies AG | (6,240 | ) | (49,258 | ) | (33.8 | ) | ||||||
Dermapharm Holding SE | (529 | ) | (25,086 | ) | (17.2 | ) | ||||||
Deutz AG | (11,093 | ) | (42,639 | ) | (29.3 | ) | ||||||
Elmos Semiconductor AG | (1,133 | ) | (22,568 | ) | (15.5 | ) | ||||||
ElringKlinger AG | (5,655 | ) | (30,830 | ) | (21.2 | ) | ||||||
Flatex AG | (5,625 | ) | (176,273 | ) | (121.1 | ) | ||||||
H&R GmbH & Co. KGaA | (10 | ) | (45 | ) | 0.0 | |||||||
HUGO BOSS AG | (3,071 | ) | (85,264 | ) | (58.6 | ) | ||||||
Jenoptik AG | (2,766 | ) | (56,965 | ) | (39.1 | ) | ||||||
JOST Werke AG | (4,107 | ) | (111,391 | ) | (76.5 | ) | ||||||
Jungheinrich AG | (11,210 | ) | (202,435 | ) | (139.1 | ) | ||||||
KWS Saat SE & Co. KGaA | (4,647 | ) | (267,352 | ) | (183.6 | ) | ||||||
Pfeiffer Vacuum Technology AG | (524 | ) | (86,342 | ) | (59.3 | ) | ||||||
RHOEN-KLINIKUM AG | (3,794 | ) | (75,523 | ) | (51.9 | ) | ||||||
SGL Carbon SE | (39,578 | ) | (122,571 | ) | (84.2 | ) | ||||||
Siltronic AG | (84 | ) | (7,191 | ) | (4.9 | ) | ||||||
| SCHEDULES OF INVESTMENTS | 39 |
Schedule of Investments (continued) April 30, 2020 | BlackRock Global Long/Short Equity Fund |
| Shares | Value | % of Basket Value | ||||||||||
| Germany (continued) | ||||||||||||
VERBIO Vereinigte BioEnergie AG | (6,088 | ) | $ | (55,278 | ) | (38.0 | ) % | |||||
Vossloh AG | (5,503 | ) | (207,819 | ) | (142.8 | ) | ||||||
Wacker Chemie AG | (967 | ) | (56,384 | ) | (38.7 | ) | ||||||
Wacker Neuson SE | (3,561 | ) | (44,212 | ) | (30.4 | ) | ||||||
Washtec AG | (1,076 | ) | (42,454 | ) | (29.2 | ) | ||||||
|
|
|
| |||||||||
| (2,221,210 | ) | |||||||||||
| Hong Kong | ||||||||||||
HKBN Ltd. | (27,500 | ) | (47,358 | ) | (32.5 | ) | ||||||
Johnson Electric Holdings, Ltd. | (120,000 | ) | (201,493 | ) | (138.4 | ) | ||||||
Mandarin Oriental International Ltd. | (66,085 | ) | (92,519 | ) | (63.6 | ) | ||||||
Melco International Development Ltd. | (270,000 | ) | (504,715 | ) | (346.7 | ) | ||||||
|
|
|
| |||||||||
| (846,085 | ) | |||||||||||
| Ireland | ||||||||||||
Greencore Group PLC | (47,565 | ) | (108,937 | ) | (74.8 | ) | ||||||
Keywords Studios PLC | (1,058 | ) | (21,195 | ) | (14.6 | ) | ||||||
Origin Enterprises PLC | (31,474 | ) | (91,902 | ) | (63.1 | ) | ||||||
|
|
|
| |||||||||
| (222,034 | ) | |||||||||||
| Israel | ||||||||||||
Airport City Ltd. | (7,673 | ) | (116,413 | ) | (80.0 | ) | ||||||
Cellcom Israel Ltd. | (16,565 | ) | (60,997 | ) | (41.9 | ) | ||||||
Clal Insurance Enterprises Holdings Ltd. | (13,751 | ) | (136,642 | ) | (93.9 | ) | ||||||
Delek Group Ltd. | (728 | ) | (33,147 | ) | (22.8 | ) | ||||||
Fattal Holdings 1998 Ltd. | (432 | ) | (29,595 | ) | (20.3 | ) | ||||||
Gazit-Globe Ltd. | (1,561 | ) | (11,557 | ) | (7.9 | ) | ||||||
Gilat Satellite Networks Ltd. | (15,347 | ) | (132,031 | ) | (90.7 | ) | ||||||
Hadera Paper Ltd. | (1,434 | ) | (66,373 | ) | (45.6 | ) | ||||||
Isracard Ltd. | (48,261 | ) | (126,532 | ) | (86.9 | ) | ||||||
Israel Corp. Ltd. | (233 | ) | (30,064 | ) | (20.6 | ) | ||||||
Menora Mivtachim Holdings Ltd. | (6,466 | ) | (86,307 | ) | (59.3 | ) | ||||||
Partner Communications Co. Ltd. | (26,797 | ) | (116,846 | ) | (80.3 | ) | ||||||
Phoenix Holdings Ltd. | (33,138 | ) | (174,268 | ) | (119.7 | ) | ||||||
Shikun & Binui Ltd. | (24,693 | ) | (102,490 | ) | (70.4 | ) | ||||||
Summit Real Estate Holdings Ltd. | (1,375 | ) | (17,177 | ) | (11.8 | ) | ||||||
|
|
|
| |||||||||
| (1,240,439 | ) | |||||||||||
| Italy | ||||||||||||
Arnoldo Mondadori Editore SpA | (47,012 | ) | (63,965 | ) | (43.9 | ) | ||||||
Banca Popolare di Sondrio SCPA | (109,021 | ) | (173,079 | ) | (118.9 | ) | ||||||
Brunello Cucinelli SpA | (2,240 | ) | (72,234 | ) | (49.6 | ) | ||||||
Danieli & C Officine Meccaniche SpA | (1,689 | ) | (21,468 | ) | (14.8 | ) | ||||||
Danieli & C Officine Meccaniche SpA | (20,576 | ) | (152,817 | ) | (105.0 | ) | ||||||
De’ Longhi SpA | (2,780 | ) | (50,246 | ) | (34.5 | ) | ||||||
doValue SpA | (7,466 | ) | (55,144 | ) | (37.9 | ) | ||||||
Falck Renewables SpA | (6,081 | ) | (29,888 | ) | (20.5 | ) | ||||||
Freni Brembo SpA | (10,025 | ) | (85,045 | ) | (58.4 | ) | ||||||
Gruppo MutuiOnline SpA | (475 | ) | (8,627 | ) | (5.9 | ) | ||||||
Illimity Bank SpA | (14,119 | ) | (94,646 | ) | (65.0 | ) | ||||||
Italmobiliare SpA | (2,332 | ) | (69,789 | ) | (47.9 | ) | ||||||
La Doria SpA | (6,746 | ) | (71,609 | ) | (49.2 | ) | ||||||
SAES Getters SpA | (2,201 | ) | (53,283 | ) | (36.6 | ) | ||||||
Societa Cattolica di Assicurazioni | (11,529 | ) | (63,874 | ) | (43.9 | ) | ||||||
Tamburi Investment Partners SpA | (22,135 | ) | (143,176 | ) | (98.4 | ) | ||||||
Tod’s SpA | (4,427 | ) | (135,560 | ) | (93.1 | ) | ||||||
|
|
|
| |||||||||
| (1,344,450 | ) | |||||||||||
| Japan | ||||||||||||
ARTERIA Networks Corp. | (2,100 | ) | (41,624 | ) | (28.6 | ) | ||||||
ASKUL Corp. | (1,600 | ) | (45,682 | ) | (31.4 | ) | ||||||
Bank of Nagoya Ltd. | (4,700 | ) | (98,633 | ) | (67.7 | ) | ||||||
Bic Camera, Inc. | (37,400 | ) | (346,240 | ) | (237.8 | ) | ||||||
Change, Inc. | (1,800 | ) | (69,734 | ) | (47.9 | ) | ||||||
Chiyoda Corp. | (34,900 | ) | (78,595 | ) | (54.0 | ) | ||||||
| Shares | Value | % of Basket Value | ||||||||||
| Japan (continued) | ||||||||||||
Descente Ltd. | (7,200 | ) | $ | (95,866 | ) | (65.8 | ) % | |||||
eRex Co. Ltd. | (6,900 | ) | (96,125 | ) | (66.0 | ) | ||||||
euglena Co. Ltd. | (4,000 | ) | (22,770 | ) | (15.6 | ) | ||||||
Ferrotec Holdings Corp. | (7,500 | ) | (45,050 | ) | (30.9 | ) | ||||||
Fukuda Corp. | (1,300 | ) | (50,026 | ) | (34.4 | ) | ||||||
Fuso Chemical Co. Ltd. | (2,900 | ) | (85,888 | ) | (59.0 | ) | ||||||
Gunosy, Inc. | (3,700 | ) | (29,640 | ) | (20.4 | ) | ||||||
Harmonic Drive Systems, Inc. | (2,600 | ) | (120,117 | ) | (82.5 | ) | ||||||
Heiwa Real Estate REIT, Inc. | (232 | ) | (204,622 | ) | (140.6 | ) | ||||||
Hirata Corp. | (1,800 | ) | (86,349 | ) | (59.3 | ) | ||||||
Ichibanya Co. Ltd. | (500 | ) | (20,769 | ) | (14.3 | ) | ||||||
IDOM, Inc. | (27,600 | ) | (110,484 | ) | (75.9 | ) | ||||||
Information Services International-Dentsu Ltd. | (2,800 | ) | (118,809 | ) | (81.6 | ) | ||||||
IR Japan Holdings Ltd. | (900 | ) | (53,859 | ) | (37.0 | ) | ||||||
Japan Best Rescue System Co. Ltd. | (6,700 | ) | (47,370 | ) | (32.5 | ) | ||||||
Japan Elevator Service Holdings Co. Ltd. | (1,200 | ) | (30,519 | ) | (21.0 | ) | ||||||
Japan Lifeline Co. Ltd. | (8,000 | ) | (94,081 | ) | (64.6 | ) | ||||||
JINS Holdings, Inc. | (400 | ) | (21,099 | ) | (14.5 | ) | ||||||
Kanto Denka Kogyo Co. Ltd. | (22,400 | ) | (178,075 | ) | (122.3 | ) | ||||||
Kappa Create Co. Ltd. | (8,800 | ) | (108,184 | ) | (74.3 | ) | ||||||
Kawasaki Kisen Kaisha Ltd. | (23,300 | ) | (229,230 | ) | (157.5 | ) | ||||||
Keiyo Co. Ltd. | (4,100 | ) | (21,895 | ) | (15.0 | ) | ||||||
Kenko Mayonnaise Co. Ltd. | (2,500 | ) | (45,947 | ) | (31.6 | ) | ||||||
KLab, Inc. | (7,300 | ) | (49,403 | ) | (33.9 | ) | ||||||
LEC, Inc. | (1,900 | ) | (20,969 | ) | (14.4 | ) | ||||||
MCJ Co. Ltd. | (10,200 | ) | (67,667 | ) | (46.5 | ) | ||||||
Megachips Corp. | (2,300 | ) | (34,581 | ) | (23.8 | ) | ||||||
Mirai Corp. | (115 | ) | (38,723 | ) | (26.6 | ) | ||||||
Mitsubishi Estate Logistics REIT Investment Corp. | (7 | ) | (22,796 | ) | (15.7 | ) | ||||||
Mitsui High-Tec, Inc. | (1,200 | ) | (13,445 | ) | (9.2 | ) | ||||||
Money Forward, Inc. | (900 | ) | (41,900 | ) | (28.8 | ) | ||||||
Nextage Co. Ltd. | (1,200 | ) | (8,094 | ) | (5.6 | ) | ||||||
Nippon Sharyo Ltd. | (2,200 | ) | (56,285 | ) | (38.7 | ) | ||||||
Nishi-Nippon Railroad Co. Ltd. | (4,700 | ) | (115,043 | ) | (79.0 | ) | ||||||
Nissan Shatai Co. Ltd. | (31,200 | ) | (249,769 | ) | (171.6 | ) | ||||||
Nissei ASB Machine Co. Ltd. | (600 | ) | (16,147 | ) | (11.1 | ) | ||||||
Onward Holdings Co. Ltd. | (20,400 | ) | (63,825 | ) | (43.8 | ) | ||||||
Optorun Co. Ltd. | (1,500 | ) | (40,742 | ) | (28.0 | ) | ||||||
PKSHA Technology, Inc. | (1,200 | ) | (26,871 | ) | (18.5 | ) | ||||||
Rokko Butter Co. Ltd. | (5,800 | ) | (76,857 | ) | (52.8 | ) | ||||||
Rorze Corp. | (2,100 | ) | (86,403 | ) | (59.3 | ) | ||||||
RS Technologies Co. Ltd. | (2,400 | ) | (57,815 | ) | (39.7 | ) | ||||||
Sanken Electric Co., Ltd. | (3,500 | ) | (72,946 | ) | (50.1 | ) | ||||||
Sansan, Inc. | (500 | ) | (24,534 | ) | (16.9 | ) | ||||||
Stella Chemifa Corp. | (3,300 | ) | (71,965 | ) | (49.4 | ) | ||||||
Taiyo Yuden Co. Ltd. | (5,400 | ) | (150,567 | ) | (103.4 | ) | ||||||
Takara Leben Real Estate Investment Corp. | (52 | ) | (40,271 | ) | (27.7 | ) | ||||||
Tanaka Chemical Corp. | (1,700 | ) | (8,513 | ) | (5.8 | ) | ||||||
Tokai Carbon Co. Ltd. | (38,637 | ) | (319,515 | ) | (219.5 | ) | ||||||
Toyobo Co., Ltd. | (3,500 | ) | (40,771 | ) | (28.0 | ) | ||||||
Tri Chemical Laboratories, Inc. | (900 | ) | (79,966 | ) | (54.9 | ) | ||||||
Yokowo Co. Ltd. | (5,200 | ) | (117,349 | ) | (80.6 | ) | ||||||
|
|
|
| |||||||||
| (4,611,014 | ) | |||||||||||
| Jordan | ||||||||||||
Hikma Pharmaceuticals PLC | (3,577 | ) | (106,538 | ) | (73.2 | ) | ||||||
|
|
|
| |||||||||
| Kazakhstan | ||||||||||||
KAZ Minerals PLC | (13,482 | ) | (70,122 | ) | (48.2 | ) | ||||||
|
|
|
| |||||||||
| Luxembourg | ||||||||||||
APERAM SA | (7,373 | ) | (191,041 | ) | (131.2 | ) | ||||||
|
|
|
| |||||||||
| 40 | 2020 BLACKROCK ANNUAL REPORTTO SHAREHOLDERS |
Schedule of Investments (continued) April 30, 2020 | BlackRock Global Long/Short Equity Fund |
| Shares | Value | % of Basket Value | ||||||||||
| Monaco | ||||||||||||
Endeavour Mining Corp. | (3,519 | ) | $ | (63,354 | ) | (43.5 | ) % | |||||
|
|
|
| |||||||||
| Netherlands | ||||||||||||
Aalberts NV | (3,633 | ) | (102,304 | ) | (70.3 | ) | ||||||
Accell Group NV | (4,515 | ) | (84,374 | ) | (57.9 | ) | ||||||
AMG Advanced Metallurgical Group NV | (1,554 | ) | (26,147 | ) | (18.0 | ) | ||||||
Basic-Fit NV | (1,144 | ) | (23,239 | ) | (16.0 | ) | ||||||
ForFarmers NV | (7,813 | ) | (52,056 | ) | (35.8 | ) | ||||||
Intertrust NV | (3,048 | ) | (48,032 | ) | (33.0 | ) | ||||||
NIBC Holding NV | (11,666 | ) | (87,999 | ) | (60.4 | ) | ||||||
OCI NV | (4,380 | ) | (52,890 | ) | (36.3 | ) | ||||||
SIF Holding NV | (8,479 | ) | (90,819 | ) | (62.4 | ) | ||||||
TKH Group NV | (869 | ) | (30,488 | ) | (20.9 | ) | ||||||
|
|
|
| |||||||||
| (598,348 | ) | |||||||||||
| New Zealand | ||||||||||||
Contact Energy Ltd. | (14,564 | ) | (55,544 | ) | (38.2 | ) | ||||||
Genesis Energy Ltd. | (11,903 | ) | (20,518 | ) | (14.1 | ) | ||||||
Infratil Ltd. | (43,179 | ) | (120,901 | ) | (83.0 | ) | ||||||
Summerset Group Holdings Ltd. | (23,354 | ) | (86,132 | ) | (59.2 | ) | ||||||
Synlait Milk Ltd. | (3,251 | ) | (13,575 | ) | (9.3 | ) | ||||||
|
|
|
| |||||||||
| (296,670 | ) | |||||||||||
| Norway | ||||||||||||
Atea ASA | (4,741 | ) | (41,504 | ) | (28.5 | ) | ||||||
Axactor SE | (18,955 | ) | (12,336 | ) | (8.5 | ) | ||||||
Golden Ocean Group Ltd. | (8,487 | ) | (30,368 | ) | (20.8 | ) | ||||||
Sparebank 1 Oestlandet | (5,464 | ) | (44,491 | ) | (30.6 | ) | ||||||
Stolt-Nielsen Ltd. | (19,714 | ) | (167,960 | ) | (115.4 | ) | ||||||
TGS Nopec Geophysical Co. ASA | (7,034 | ) | (107,721 | ) | (74.0 | ) | ||||||
|
|
|
| |||||||||
| (404,380 | ) | |||||||||||
| Peru | ||||||||||||
Hochschild Mining PLC | (20,084 | ) | (35,039 | ) | (24.1 | ) | ||||||
|
|
|
| |||||||||
| Portugal | ||||||||||||
Altri SGPS SA | (70,982 | ) | (374,628 | ) | (257.3 | ) | ||||||
Corticeira Amorim SGPS SA | (22,350 | ) | (235,490 | ) | (161.8 | ) | ||||||
CTT-Correios de Portugal SA | (17,435 | ) | (41,078 | ) | (28.2 | ) | ||||||
Mota-Engil SGPS SA | (57,228 | ) | (72,072 | ) | (49.5 | ) | ||||||
Navigator Co. SA | (19,953 | ) | (51,843 | ) | (35.6 | ) | ||||||
Semapa-Sociedade de Investimento e Gestao | (3,155 | ) | (31,117 | ) | (21.4 | ) | ||||||
|
|
|
| |||||||||
| (806,228 | ) | |||||||||||
| Puerto Rico | ||||||||||||
EVERTEC, Inc. | (3,312 | ) | (83,926 | ) | (57.6 | ) | ||||||
First BanCorp | (3,984 | ) | (23,227 | ) | (16.0 | ) | ||||||
Popular, Inc. | (1,179 | ) | (45,497 | ) | (31.2 | ) | ||||||
|
|
|
| |||||||||
| (152,650 | ) | |||||||||||
| Singapore | ||||||||||||
Kulicke & Soffa Industries, Inc. | (194 | ) | (4,650 | ) | (3.2 | ) | ||||||
Mapletree Industrial Trust | (18,900 | ) | (33,932 | ) | (23.3 | ) | ||||||
Wing Tai Holdings Ltd. | (163,700 | ) | (200,134 | ) | (137.5 | ) | ||||||
|
|
|
| |||||||||
| (238,716 | ) | |||||||||||
| Spain | ||||||||||||
Aedas Homes SA | (15,968 | ) | (244,273 | ) | (167.8 | ) | ||||||
Almirall SA | (3,123 | ) | (40,275 | ) | (27.7 | ) | ||||||
Befesa SA | (6,974 | ) | (220,321 | ) | (151.3 | ) | ||||||
Construcciones y Auxiliar de Ferrocarriles SA | (1,932 | ) | (66,145 | ) | (45.4 | ) | ||||||
Metrovacesa SA | (27,151 | ) | (149,626 | ) | (102.8 | ) | ||||||
Neinor Homes SA | (8,725 | ) | (76,446 | ) | (52.5 | ) | ||||||
|
|
|
| |||||||||
| (797,086 | ) | |||||||||||
| Shares | Value | % of Basket Value | ||||||||||
| Sweden | ||||||||||||
Arjo AB, -B Shares | (19,263 | ) | $ | (95,139 | ) | (65.3 | ) % | |||||
Beijer Ref AB | (2,375 | ) | (48,800 | ) | (33.5 | ) | ||||||
Betsson AB | (8,569 | ) | (48,288 | ) | (33.2 | ) | ||||||
Bilia AB, -A Shares | (15,877 | ) | (107,675 | ) | (74.0 | ) | ||||||
Bonava AB, -B Shares | (10,709 | ) | (51,904 | ) | (35.7 | ) | ||||||
Boozt AB | (12,685 | ) | (78,578 | ) | (54.0 | ) | ||||||
Camurus AB | (6,320 | ) | (76,965 | ) | (52.9 | ) | ||||||
Cellavision AB | (3,638 | ) | (104,834 | ) | (72.0 | ) | ||||||
Climeon AB | (8,302 | ) | (46,294 | ) | (31.8 | ) | ||||||
Cloetta AB, -B Shares | (8,041 | ) | (18,611 | ) | (12.8 | ) | ||||||
Collector AB | — | — | 0.0 | |||||||||
Electrolux Professional AB | (61,802 | ) | (142,283 | ) | (97.7 | ) | ||||||
Fastighets AB Balder | (3,611 | ) | (142,697 | ) | (98.0 | ) | ||||||
Fingerprint Cards AB | (14,605 | ) | (22,958 | ) | (15.8 | ) | ||||||
Fortnox AB | (849 | ) | (19,494 | ) | (13.4 | ) | ||||||
Granges AB | (5,004 | ) | (36,564 | ) | (25.1 | ) | ||||||
Hexpol AB | (11,226 | ) | (80,650 | ) | (55.4 | ) | ||||||
JM AB | (2,651 | ) | (49,129 | ) | (33.7 | ) | ||||||
Loomis AB | (6,962 | ) | (169,774 | ) | (116.6 | ) | ||||||
Mekonomen AB | (3,412 | ) | (17,670 | ) | (12.1 | ) | ||||||
Modern Times Group MTG AB, -B Shares | (4,051 | ) | (40,755 | ) | (28.0 | ) | ||||||
Nibe Industrier AB, -B Shares | (16,680 | ) | (311,195 | ) | (213.8 | ) | ||||||
Nordic Entertainment Group AB | (314 | ) | (7,442 | ) | (5.1 | ) | ||||||
Ratos AB, -B Shares | (9,138 | ) | (21,631 | ) | (14.9 | ) | ||||||
RaySearch Laboratories AB | (5,567 | ) | (42,322 | ) | (29.1 | ) | ||||||
SSAB AB, -A Shares | (63,335 | ) | (152,138 | ) | (104.5 | ) | ||||||
SSAB AB, -B Shares | (71,007 | ) | (164,112 | ) | (112.7 | ) | ||||||
Trelleborg AB, -B Shares | (37,069 | ) | (472,033 | ) | (324.2 | ) | ||||||
Troax Group AB | (4,067 | ) | (46,585 | ) | (32.0 | ) | ||||||
Xvivo Perfusion AB | (2,895 | ) | (40,903 | ) | (28.1 | ) | ||||||
|
|
|
| |||||||||
| (2,657,423 | ) | |||||||||||
| Switzerland | ||||||||||||
Ascom Holding AG | (10,695 | ) | (81,112 | ) | (55.7 | ) | ||||||
Autoneum Holding AG | (1,208 | ) | (106,439 | ) | (73.1 | ) | ||||||
Bachem Holding AG | (161 | ) | (38,033 | ) | (26.1 | ) | ||||||
Banque Cantonale Vaudoise | (62 | ) | (54,744 | ) | (37.6 | ) | ||||||
Bossard Holding AG | (1,746 | ) | (217,766 | ) | (149.6 | ) | ||||||
Bucher Industries AG | (1,092 | ) | (307,982 | ) | (211.6 | ) | ||||||
Burckhardt Compression Holding AG | (1,090 | ) | (221,172 | ) | (151.9 | ) | ||||||
Cembra Money Bank AG | (1,016 | ) | (96,589 | ) | (66.3 | ) | ||||||
Coltene Holding AG | (2,368 | ) | (158,179 | ) | (108.7 | ) | ||||||
Comet Holding AG | (210 | ) | (28,146 | ) | (19.3 | ) | ||||||
Conzzeta AG | (117 | ) | (100,275 | ) | (68.9 | ) | ||||||
Daetwyler Holding AG | (363 | ) | (62,211 | ) | (42.7 | ) | ||||||
dormakaba Holding AG | (206 | ) | (102,802 | ) | (70.6 | ) | ||||||
EFG International AG | (14,223 | ) | (88,314 | ) | (60.7 | ) | ||||||
Flughafen Zurich AG | (4,054 | ) | (501,345 | ) | (344.4 | ) | ||||||
Garrett Motion, Inc. | (22,019 | ) | (120,004 | ) | (82.4 | ) | ||||||
Georg Fischer AG, Registered Shares | (99 | ) | (73,884 | ) | (50.7 | ) | ||||||
Gurit Holding AG | (132 | ) | (188,242 | ) | (129.3 | ) | ||||||
Huber + Suhner AG | (1,395 | ) | (89,084 | ) | (61.2 | ) | ||||||
Komax Holding AG | (504 | ) | (73,103 | ) | (50.2 | ) | ||||||
Medartis Holding AG | (973 | ) | (39,162 | ) | (26.9 | ) | ||||||
Mobilezone Holding AG | (19,097 | ) | (169,113 | ) | (116.2 | ) | ||||||
Rieter Holding AG | (474 | ) | (46,233 | ) | (31.8 | ) | ||||||
Swissquote Group Holding SA | (2,718 | ) | (175,991 | ) | (120.9 | ) | ||||||
|
|
|
| |||||||||
| (3,139,925 | ) | |||||||||||
| United Arab Emirates | ||||||||||||
Network International Holdings PLC | (4,517 | ) | (23,559 | ) | (16.2 | ) | ||||||
|
|
|
| |||||||||
| SCHEDULES OF INVESTMENTS | 41 |
Schedule of Investments (continued) April 30, 2020 | BlackRock Global Long/Short Equity Fund |
| Shares | Value | % of Basket Value | ||||||||||
| United Kingdom | ||||||||||||
B&M European Value Retail SA | (73,529 | ) | $ | (307,494 | ) | (211.2 | ) % | |||||
Balfour Beatty PLC | (18,478 | ) | (60,140 | ) | (41.3 | ) | ||||||
Beazley PLC | (9,710 | ) | (48,012 | ) | (33.0 | ) | ||||||
Bodycote PLC | (18,911 | ) | (138,351 | ) | (95.0 | ) | ||||||
Cairn Energy PLC | (30,653 | ) | (43,188 | ) | (29.7 | ) | ||||||
CVS Group PLC | (4,100 | ) | (47,250 | ) | (32.5 | ) | ||||||
De La Rue PLC | (64,696 | ) | (54,432 | ) | (37.4 | ) | ||||||
Domino’s Pizza Group PLC | (8,094 | ) | (35,074 | ) | (24.1 | ) | ||||||
DS Smith PLC | (22,614 | ) | (88,668 | ) | (60.9 | ) | ||||||
Electrocomponents PLC | (2,459 | ) | (17,862 | ) | (12.3 | ) | ||||||
Equiniti Group PLC | (56,079 | ) | (120,902 | ) | (83.1 | ) | ||||||
Essentra PLC | (45,554 | ) | (159,889 | ) | (109.8 | ) | ||||||
GB Group PLC | (2,213 | ) | (18,755 | ) | (12.9 | ) | ||||||
Greggs PLC | (1,491 | ) | (34,403 | ) | (23.6 | ) | ||||||
Hill & Smith Holdings PLC | (3,684 | ) | (53,407 | ) | (36.7 | ) | ||||||
IG Design Group PLC | (5,551 | ) | (36,685 | ) | (25.2 | ) | ||||||
Intermediate Capital Group PLC | (1,673 | ) | (23,668 | ) | (16.3 | ) | ||||||
LXI REIT PLC | (20,561 | ) | (27,381 | ) | (18.8 | ) | ||||||
National Express Group PLC | (10,595 | ) | (36,459 | ) | (25.0 | ) | ||||||
NCC Group PLC | (40,050 | ) | (82,737 | ) | (56.8 | ) | ||||||
Numis Corp. PLC | (8,218 | ) | (27,484 | ) | (18.9 | ) | ||||||
Pagegroup PLC | (4,723 | ) | (22,367 | ) | (15.4 | ) | ||||||
Paragon Banking Group PLC | (6,005 | ) | (25,141 | ) | (17.3 | ) | ||||||
Quilter PLC | (37,596 | ) | (58,362 | ) | (40.1 | ) | ||||||
Restaurant Group PLC | (23,371 | ) | (15,898 | ) | (10.9 | ) | ||||||
Restore PLC | (14,333 | ) | (69,842 | ) | (48.0 | ) | ||||||
Rightmove PLC | (22,077 | ) | (138,035 | ) | (94.8 | ) | ||||||
Rotork PLC | (27,944 | ) | (87,113 | ) | (59.8 | ) | ||||||
RWS Holdings PLC | (19,504 | ) | (131,734 | ) | (90.5 | ) | ||||||
Savills PLC | (14,926 | ) | (181,707 | ) | (124.8 | ) | ||||||
Serica Energy PLC | (14,600 | ) | (17,339 | ) | (11.9 | ) | ||||||
Signature Aviation PLC | (49,543 | ) | (121,673 | ) | (83.6 | ) | ||||||
Spectris PLC | (4,112 | ) | (138,659 | ) | (95.3 | ) | ||||||
Stagecoach Group PLC | (68,619 | ) | (64,339 | ) | (44.2 | ) | ||||||
Ted Baker PLC | (3,898 | ) | (7,487 | ) | (5.1 | ) | ||||||
TP ICAP PLC | (932 | ) | (3,979 | ) | (2.7 | ) | ||||||
Tritax Big Box REIT PLC | (20,052 | ) | (30,435 | ) | (20.9 | ) | ||||||
Vesuvius PLC | (35,455 | ) | (178,980 | ) | (122.9 | ) | ||||||
Victrex PLC | (3,575 | ) | (89,575 | ) | (61.5 | ) | ||||||
|
|
|
| |||||||||
| (2,844,906 | ) | |||||||||||
| United States | ||||||||||||
A10 Networks, Inc. | (7,479 | ) | (51,082 | ) | (35.1 | ) | ||||||
ABM Industries, Inc. | (2,944 | ) | (101,539 | ) | (69.7 | ) | ||||||
ACI Worldwide, Inc. | (8,522 | ) | (233,503 | ) | (160.4 | ) | ||||||
Acushnet Holdings Corp. | (3,625 | ) | (99,325 | ) | (68.2 | ) | ||||||
Adtran, Inc. | (5,658 | ) | (58,164 | ) | (40.0 | ) | ||||||
Aegion Corp. | (2,315 | ) | (37,156 | ) | (25.5 | ) | ||||||
Affiliated Managers Group, Inc. | (3,078 | ) | (215,337 | ) | (147.9 | ) | ||||||
AGCO Corp. | (806 | ) | (42,589 | ) | (29.3 | ) | ||||||
Air Lease Corp. | (8,945 | ) | (233,912 | ) | (160.7 | ) | ||||||
Air Transport Services Group, Inc. | (3,975 | ) | (80,454 | ) | (55.3 | ) | ||||||
Alacer Gold Corp. | (5,198 | ) | (26,663 | ) | (18.3 | ) | ||||||
Alexander’s, Inc. | (949 | ) | (299,182 | ) | (205.5 | ) | ||||||
Allison Transmission Holdings, Inc. | (2,940 | ) | (106,840 | ) | (73.4 | ) | ||||||
Alteryx, Inc., Class A | (253 | ) | (28,635 | ) | (19.7 | ) | ||||||
Ambac Financial Group, Inc. | (9,700 | ) | (166,840 | ) | (114.6 | ) | ||||||
American Assets Trust, Inc. | (3,978 | ) | (112,657 | ) | (77.4 | ) | ||||||
American Eagle Outfitters, Inc. | (7,838 | ) | (62,312 | ) | (42.8 | ) | ||||||
American Vanguard Corp. | (5,738 | ) | (72,127 | ) | (49.5 | ) | ||||||
Ameris Bancorp | (3,961 | ) | (100,728 | ) | (69.2 | ) | ||||||
AMERISAFE, Inc. | (746 | ) | (47,498 | ) | (32.6 | ) | ||||||
Amneal Pharmaceuticals, Inc. | (7,862 | ) | (28,539 | ) | (19.6 | ) | ||||||
| Shares | Value | % of Basket Value | ||||||||||
| United States (continued) | ||||||||||||
Anaplan, Inc. | (2,308 | ) | $ | (94,305 | ) | (64.8 | ) % | |||||
Andersons, Inc. | (2,139 | ) | (36,299 | ) | (24.9 | ) | ||||||
ANI Pharmaceuticals, Inc. | (417 | ) | (16,684 | ) | (11.5 | ) | ||||||
Anterix, Inc. | (1,122 | ) | (58,905 | ) | (40.5 | ) | ||||||
Apollo Medical Holdings, Inc. | (1,445 | ) | (22,455 | ) | (15.4 | ) | ||||||
Applied Industrial Technologies, Inc. | (1,800 | ) | (94,302 | ) | (64.8 | ) | ||||||
Arcosa, Inc. | (2,394 | ) | (89,224 | ) | (61.3 | ) | ||||||
Armstrong World Industries, Inc. | (2,095 | ) | (161,483 | ) | (110.9 | ) | ||||||
Arrow Financial Corp. | (4,067 | ) | (115,909 | ) | (79.6 | ) | ||||||
Asbury Automotive Group, Inc. | (1,856 | ) | (125,280 | ) | (86.1 | ) | ||||||
Assetmark Financial Holdings, Inc. | (5,624 | ) | (134,920 | ) | (92.7 | ) | ||||||
Astec Industries, Inc. | (3,688 | ) | (147,926 | ) | (101.6 | ) | ||||||
Atlantic Union Bankshares Corp. | (3,042 | ) | (72,613 | ) | (49.9 | ) | ||||||
Atlas Air Worldwide Holdings, Inc. | (3,383 | ) | (111,132 | ) | (76.3 | ) | ||||||
AutoNation, Inc. | (6,487 | ) | (241,576 | ) | (165.9 | ) | ||||||
Avanos Medical, Inc. | (2,537 | ) | (78,774 | ) | (54.1 | ) | ||||||
Axcelis Technologies, Inc. | (1,249 | ) | (29,177 | ) | (20.0 | ) | ||||||
Axis Capital Holdings Ltd. | (2,690 | ) | (98,454 | ) | (67.6 | ) | ||||||
B&G Foods, Inc. | (1,300 | ) | (25,246 | ) | (17.3 | ) | ||||||
BancorpSouth Bank | (995 | ) | (21,781 | ) | (15.0 | ) | ||||||
Bank of Marin Bancorp | (528 | ) | (17,403 | ) | (12.0 | ) | ||||||
Banner Corp. | (1,531 | ) | (58,836 | ) | (40.4 | ) | ||||||
Barnes Group, Inc. | (4,864 | ) | (186,680 | ) | (128.2 | ) | ||||||
BGC Partners, Inc., Class A | (25,149 | ) | (77,836 | ) | (53.5 | ) | ||||||
BioDelivery Sciences International, Inc. | (8,294 | ) | (37,821 | ) | (26.0 | ) | ||||||
Bloomin’ Brands, Inc. | (3,142 | ) | (37,861 | ) | (26.0 | ) | ||||||
BMC Stock Holdings, Inc. | (16,301 | ) | (346,396 | ) | (237.9 | ) | ||||||
Bonanza Creek Energy, Inc. | (1,500 | ) | (26,190 | ) | (18.0 | ) | ||||||
Boston Omaha Corp., Class A | (1,091 | ) | (17,707 | ) | (12.2 | ) | ||||||
Boyd Gaming Corp. | (3,125 | ) | (52,156 | ) | (35.8 | ) | ||||||
Bright Horizons Family Solutions, Inc. | (412 | ) | (47,977 | ) | (33.0 | ) | ||||||
BrightSphere Investment Group PLC | (2,472 | ) | (18,318 | ) | (12.6 | ) | ||||||
BrightView Holdings, Inc. | (3,214 | ) | (41,203 | ) | (28.3 | ) | ||||||
Brink’s Co. | (1,114 | ) | (56,948 | ) | (39.1 | ) | ||||||
Brixmor Property Group, Inc. | (4,923 | ) | (56,368 | ) | (38.7 | ) | ||||||
Brookdale Senior Living, Inc. | (5,697 | ) | (20,566 | ) | (14.1 | ) | ||||||
Brooks Automation, Inc. | (1,683 | ) | (64,779 | ) | (44.5 | ) | ||||||
Brunswick Corp. | (2,830 | ) | (135,048 | ) | (92.8 | ) | ||||||
Bryn Mawr Bank Corp. | (4,045 | ) | (117,770 | ) | (80.9 | ) | ||||||
Buckle, Inc. | (7,403 | ) | (113,340 | ) | (77.9 | ) | ||||||
Builders FirstSource, Inc. | (3,819 | ) | (70,079 | ) | (48.1 | ) | ||||||
Cabot Corp. | (2,299 | ) | (77,913 | ) | (53.5 | ) | ||||||
Cactus, Inc. | (1,491 | ) | (26,510 | ) | (18.2 | ) | ||||||
Cal-Maine Foods, Inc. | (7,308 | ) | (303,355 | ) | (208.4 | ) | ||||||
Cannae Holdings, Inc. | (1,376 | ) | (43,413 | ) | (29.8 | ) | ||||||
Cardlytics, Inc. | (782 | ) | (35,151 | ) | (24.1 | ) | ||||||
Carvana Co. | (245 | ) | (19,627 | ) | (13.5 | ) | ||||||
Casella Waste Systems, Inc. | (3,942 | ) | (182,830 | ) | (125.6 | ) | ||||||
Cass Information Systems, Inc. | (4,442 | ) | (178,169 | ) | (122.4 | ) | ||||||
CatchMark Timber Trust, Inc. | (2,968 | ) | (23,328 | ) | (16.0 | ) | ||||||
Cato Corp., Class A | (2,777 | ) | (31,269 | ) | (21.5 | ) | ||||||
Cavco Industries, Inc. | (302 | ) | (46,713 | ) | (32.1 | ) | ||||||
CBIZ, Inc. | (1,994 | ) | (47,357 | ) | (32.5 | ) | ||||||
CenterState Bank Corp. | (4,673 | ) | (81,263 | ) | (55.8 | ) | ||||||
Central Garden & Pet Co., Class A | (418 | ) | (12,711 | ) | (8.7 | ) | ||||||
Century Aluminum Co. | (4,719 | ) | (20,528 | ) | (14.1 | ) | ||||||
Century Bancorp, Inc., Class A | (346 | ) | (25,843 | ) | (17.8 | ) | ||||||
Ceridian HCM Holding, Inc. | (826 | ) | (48,709 | ) | (33.5 | ) | ||||||
Change Healthcare, Inc. | (7,101 | ) | (82,656 | ) | (56.8 | ) | ||||||
Chart Industries, Inc. | (951 | ) | (33,970 | ) | (23.3 | ) | ||||||
Chase Corp. | (442 | ) | (41,663 | ) | (28.6 | ) | ||||||
Choice Hotels International, Inc. | (2,814 | ) | (211,191 | ) | (145.1 | ) | ||||||
| 42 | 2020 BLACKROCK ANNUAL REPORTTO SHAREHOLDERS |
Schedule of Investments (continued) April 30, 2020 | BlackRock Global Long/Short Equity Fund |
| Shares | Value | % of Basket Value | ||||||||||
| United States (continued) | ||||||||||||
Cimarex Energy Co. | (5,228 | ) | $ | (132,896 | ) | (91.3 | ) % | |||||
Cinemark Holdings, Inc. | (2,998 | ) | (42,811 | ) | (29.4 | ) | ||||||
City Holding Co. | (4,771 | ) | (322,472 | ) | (221.5 | ) | ||||||
Clean Harbors, Inc. | (2,043 | ) | (109,157 | ) | (75.0 | ) | ||||||
Clearwater Paper Corp. | (2,066 | ) | (49,460 | ) | (34.0 | ) | ||||||
Cleveland-Cliffs, Inc. | (8,049 | ) | (35,255 | ) | (24.2 | ) | ||||||
CNX Resources Corp. | (3,142 | ) | (33,305 | ) | (22.9 | ) | ||||||
Coca-Cola Bottling Co. Consolidated | (572 | ) | (134,689 | ) | (92.5 | ) | ||||||
Cogent Communications Group, Inc. | (271 | ) | (22,718 | ) | (15.6 | ) | ||||||
Columbia Banking System, Inc. | (1,021 | ) | (27,557 | ) | (18.9 | ) | ||||||
Columbia Financial, Inc. | (14,877 | ) | (210,584 | ) | (144.7 | ) | ||||||
Commerce Bancshares, Inc. | (2,840 | ) | (173,780 | ) | (119.4 | ) | ||||||
Commercial Metals Co. | (11,244 | ) | (179,229 | ) | (123.1 | ) | ||||||
Community Health Systems, Inc. | (12,859 | ) | (38,963 | ) | (26.8 | ) | ||||||
CommVault Systems, Inc. | (78 | ) | (3,330 | ) | (2.3 | ) | ||||||
Compass Minerals International, Inc. | (1,729 | ) | (84,998 | ) | (58.4 | ) | ||||||
CONMED Corp. | (1,615 | ) | (119,365 | ) | (82.0 | ) | ||||||
Consolidated Communications Holdings, Inc. | (8,920 | ) | (55,928 | ) | (38.4 | ) | ||||||
Core-Mark Holding Co., Inc. | (1,330 | ) | (38,224 | ) | (26.3 | ) | ||||||
CoreCivic, Inc. | (7,290 | ) | (95,645 | ) | (65.7 | ) | ||||||
Covanta Holding Corp. | (3,302 | ) | (25,690 | ) | (17.6 | ) | ||||||
Cracker Barrel Old Country Store, Inc. | (2,434 | ) | (237,072 | ) | (162.8 | ) | ||||||
Crane Co. | (2,590 | ) | (141,025 | ) | (96.9 | ) | ||||||
Cree, Inc. | (2,666 | ) | (114,985 | ) | (79.0 | ) | ||||||
CryoPort, Inc. | (3,759 | ) | (70,820 | ) | (48.6 | ) | ||||||
CubeSmart | (5,559 | ) | (140,087 | ) | (96.2 | ) | ||||||
CVB Financial Corp. | (9,200 | ) | (191,222 | ) | (131.4 | ) | ||||||
Darling International, Inc. | (4,815 | ) | (99,141 | ) | (68.1 | ) | ||||||
Digital Turbine, Inc. | (10,693 | ) | (62,661 | ) | (43.0 | ) | ||||||
Diodes, Inc. | (3,111 | ) | (158,319 | ) | (108.8 | ) | ||||||
Dril-Quip, Inc. | (2,432 | ) | (80,572 | ) | (55.3 | ) | ||||||
Eagle Bancorp, Inc. | (3,532 | ) | (123,903 | ) | (85.1 | ) | ||||||
Eagle Materials, Inc. | (1,516 | ) | (92,491 | ) | (63.5 | ) | ||||||
Easterly Government Properties, Inc. | (6,714 | ) | (180,674 | ) | (124.1 | ) | ||||||
EastGroup Properties, Inc. | (1,404 | ) | (148,824 | ) | (102.2 | ) | ||||||
EchoStar Corp. | (1,101 | ) | (34,737 | ) | (23.9 | ) | ||||||
Element Solutions, Inc. | (21,312 | ) | (218,448 | ) | (150.1 | ) | ||||||
Empire State Realty Trust, Inc. | (5,350 | ) | (44,726 | ) | (30.7 | ) | ||||||
Encompass Health Corp. | (2,734 | ) | (181,127 | ) | (124.4 | ) | ||||||
Encore Wire Corp. | (1,554 | ) | (71,142 | ) | (48.9 | ) | ||||||
Energizer Holdings, Inc. | (1,161 | ) | (45,233 | ) | (31.1 | ) | ||||||
Enerpac Tool Group Corp. | (2,841 | ) | (48,467 | ) | (33.3 | ) | ||||||
Enova International, Inc. | (1,937 | ) | (31,069 | ) | (21.3 | ) | ||||||
Entegris, Inc. | (2,551 | ) | (138,341 | ) | (95.0 | ) | ||||||
Envista Holdings Corp. | (3,409 | ) | (66,373 | ) | (45.6 | ) | ||||||
Equity Bancshares, Inc., Class A | (3,409 | ) | (63,885 | ) | (43.9 | ) | ||||||
Equity Commonwealth | (6,420 | ) | (217,959 | ) | (149.7 | ) | ||||||
Essential Properties Realty Trust, Inc. | (3,664 | ) | (53,824 | ) | (37.0 | ) | ||||||
Ethan Allen Interiors, Inc. | (5,226 | ) | (59,106 | ) | (40.6 | ) | ||||||
Euronet Worldwide, Inc. | (333 | ) | (30,556 | ) | (21.0 | ) | ||||||
FireEye, Inc. | (5,779 | ) | (66,516 | ) | (45.7 | ) | ||||||
First Citizens BancShares, Inc., Class A | (1,255 | ) | (479,410 | ) | (329.3 | ) | ||||||
First Financial Corp. | (4,582 | ) | (162,753 | ) | (111.8 | ) | ||||||
First Interstate BancSystem, Inc., Class A | (11,306 | ) | (382,143 | ) | (262.5 | ) | ||||||
First Merchants Corp. | (3,974 | ) | (112,504 | ) | (77.3 | ) | ||||||
FirstCash, Inc. | (1,570 | ) | (112,789 | ) | (77.5 | ) | ||||||
Flagstar Bancorp, Inc. | (3,016 | ) | (78,145 | ) | (53.7 | ) | ||||||
Floor & Decor Holdings, Inc., Class A | (2,236 | ) | (94,806 | ) | (65.1 | ) | ||||||
Flowers Foods, Inc. | (5,360 | ) | (119,421 | ) | (82.0 | ) | ||||||
Forestar Group, Inc. | (20,656 | ) | (272,453 | ) | (187.1 | ) | ||||||
Forward Air Corp. | (357 | ) | (18,421 | ) | (12.7 | ) | ||||||
Fresh Del Monte Produce, Inc. | (2,409 | ) | (68,681 | ) | (47.2 | ) | ||||||
| Shares | Value | % of Basket Value | ||||||||||
| United States (continued) | ||||||||||||
FutureFuel Corp. | (1,496 | ) | $ | (15,528 | ) | (10.7 | ) % | |||||
GCP Applied Technologies, Inc. | (7,510 | ) | (128,571 | ) | (88.3 | ) | ||||||
GEO Group, Inc. | (4,596 | ) | (58,277 | ) | (40.0 | ) | ||||||
German American Bancorp, Inc. | (1,952 | ) | (58,033 | ) | (39.9 | ) | ||||||
Getty Realty Corp. | (2,923 | ) | (79,389 | ) | (54.5 | ) | ||||||
Gibraltar Industries, Inc. | (1,915 | ) | (88,664 | ) | (60.9 | ) | ||||||
Golden Entertainment, Inc. | (6,194 | ) | (58,471 | ) | (40.2 | ) | ||||||
Gorman-Rupp Co. | (1,883 | ) | (55,548 | ) | (38.2 | ) | ||||||
GrafTech International Ltd. | (5,252 | ) | (42,646 | ) | (29.3 | ) | ||||||
Graham Holdings Co., Class B | (208 | ) | (81,122 | ) | (55.7 | ) | ||||||
Graphic Packaging Holding Co. | (6,417 | ) | (85,667 | ) | (58.8 | ) | ||||||
Gray Television, Inc. | (1,684 | ) | (19,551 | ) | (13.4 | ) | ||||||
Group 1 Automotive, Inc. | (1,188 | ) | (67,229 | ) | (46.2 | ) | ||||||
Guess?, Inc. | (2,782 | ) | (26,012 | ) | (17.9 | ) | ||||||
Gulfport Energy Corp. | (11,354 | ) | (29,009 | ) | (19.9 | ) | ||||||
H&E Equipment Services, Inc. | (4,321 | ) | (70,259 | ) | (48.3 | ) | ||||||
Hain Celestial Group, Inc. | (6,757 | ) | (174,601 | ) | (119.9 | ) | ||||||
Hamilton Lane, Inc., Class A | (906 | ) | (58,754 | ) | (40.4 | ) | ||||||
Haynes International, Inc. | (2,019 | ) | (44,620 | ) | (30.7 | ) | ||||||
Healthcare Realty Trust, Inc. | (5,324 | ) | (156,472 | ) | (107.5 | ) | ||||||
Healthcare Services Group, Inc. | (2,084 | ) | (53,121 | ) | (36.5 | ) | ||||||
Heartland Financial USA, Inc. | (3,811 | ) | (129,460 | ) | (88.9 | ) | ||||||
Hecla Mining Co. | (29,897 | ) | (78,629 | ) | (54.0 | ) | ||||||
Helios Technologies, Inc. | (2,429 | ) | (86,400 | ) | (59.3 | ) | ||||||
Helmerich & Payne, Inc. | (7,168 | ) | (141,711 | ) | (97.3 | ) | ||||||
Hibbett Sports, Inc. | (4,664 | ) | (71,966 | ) | (49.4 | ) | ||||||
Hilltop Holdings, Inc. | (2,338 | ) | (45,123 | ) | (31.0 | ) | ||||||
HNI Corp. | (1,859 | ) | (45,248 | ) | (31.1 | ) | ||||||
HomeTrust Bancshares, Inc. | (1,186 | ) | (18,229 | ) | (12.5 | ) | ||||||
Hope Bancorp, Inc. | (3,927 | ) | (39,074 | ) | (26.8 | ) | ||||||
Houlihan Lokey, Inc. | (839 | ) | (49,820 | ) | (34.2 | ) | ||||||
Huntsman Corp. | (2,877 | ) | (48,362 | ) | (33.2 | ) | ||||||
ICU Medical, Inc. | (721 | ) | (158,123 | ) | (108.6 | ) | ||||||
Independent Bank Corp. | (4,594 | ) | (334,857 | ) | (230.0 | ) | ||||||
Innospec, Inc. | (3,832 | ) | (277,897 | ) | (190.9 | ) | ||||||
Innoviva, Inc. | (2,120 | ) | (30,062 | ) | (20.7 | ) | ||||||
Installed Building Products, Inc. | (894 | ) | (44,083 | ) | (30.3 | ) | ||||||
Insteel Industries, Inc. | (3,085 | ) | (54,203 | ) | (37.2 | ) | ||||||
Integer Holdings Corp. | (419 | ) | (31,199 | ) | (21.4 | ) | ||||||
Integra LifeSciences Holdings Corp. | (276 | ) | (14,090 | ) | (9.7 | ) | ||||||
Inter Parfums, Inc. | (1,415 | ) | (63,236 | ) | (43.4 | ) | ||||||
Interface, Inc. | (7,159 | ) | (66,149 | ) | (45.4 | ) | ||||||
International Bancshares Corp. | (3,503 | ) | (101,552 | ) | (69.8 | ) | ||||||
Investors Bancorp, Inc. | (15,437 | ) | (143,718 | ) | (98.7 | ) | ||||||
iRhythm Technologies, Inc. | (472 | ) | (49,862 | ) | (34.3 | ) | ||||||
Itron, Inc. | (1,577 | ) | (110,106 | ) | (75.6 | ) | ||||||
John B Sanfilippo & Son, Inc. | (2,620 | ) | (215,181 | ) | (147.8 | ) | ||||||
K12, Inc. | (1,500 | ) | (34,065 | ) | (23.4 | ) | ||||||
Kadant, Inc. | (575 | ) | (48,352 | ) | (33.2 | ) | ||||||
Kaiser Aluminum Corp. | (458 | ) | (33,081 | ) | (22.7 | ) | ||||||
KB Home | (879 | ) | (23,065 | ) | (15.8 | ) | ||||||
KBR, Inc. | (2,744 | ) | (55,593 | ) | (38.2 | ) | ||||||
Kearny Financial Corp. | (12,293 | ) | (114,325 | ) | (78.5 | ) | ||||||
Kemper Corp. | (223 | ) | (14,990 | ) | (10.3 | ) | ||||||
Kennametal, Inc. | (9,835 | ) | (251,874 | ) | (173.0 | ) | ||||||
Kimball Electronics, Inc. | (3,430 | ) | (46,374 | ) | (31.9 | ) | ||||||
Kirby Corp. | (1,734 | ) | (92,630 | ) | (63.6 | ) | ||||||
Kite Realty Group Trust | (17,946 | ) | (183,588 | ) | (126.1 | ) | ||||||
Kontoor Brands, Inc. | (959 | ) | (18,614 | ) | (12.8 | ) | ||||||
Korn Ferry | (2,227 | ) | (64,204 | ) | (44.1 | ) | ||||||
Lakeland Financial Corp. | (415 | ) | (17,567 | ) | (12.1 | ) | ||||||
Lamar Advertising Co. | (957 | ) | (55,171 | ) | (37.9 | ) | ||||||
| SCHEDULES OF INVESTMENTS | 43 |
Schedule of Investments (continued) April 30, 2020 | BlackRock Global Long/Short Equity Fund |
| Shares | Value | % of Basket Value | ||||||||||
| United States (continued) | ||||||||||||
Lattice Semiconductor Corp. | (3,097 | ) | $ | (69,713 | ) | (47.9 | ) % | |||||
LCI Industries | (831 | ) | (72,064 | ) | (49.5 | ) | ||||||
LendingClub Corp. | (1,825 | ) | (13,998 | ) | (9.6 | ) | ||||||
Lexington Realty Trust | (3,343 | ) | (34,934 | ) | (24.0 | ) | ||||||
Liberty Media Corp-Liberty Braves | (8,400 | ) | (168,756 | ) | (115.9 | ) | ||||||
Life Storage, Inc. | (757 | ) | (66,306 | ) | (45.5 | ) | ||||||
Lincoln Electric Holdings, Inc. | (1,594 | ) | (128,333 | ) | (88.2 | ) | ||||||
Lindsay Corp. | (526 | ) | (47,340 | ) | (32.5 | ) | ||||||
Lithia Motors, Inc., Class A | (265 | ) | (29,298 | ) | (20.1 | ) | ||||||
Livent Corp. | (3,263 | ) | (20,231 | ) | (13.9 | ) | ||||||
Louisiana-Pacific Corp. | (4,803 | ) | (96,060 | ) | (66.0 | ) | ||||||
LTC Properties, Inc. | (2,447 | ) | (87,113 | ) | (59.8 | ) | ||||||
Lumber Liquidators Holdings, Inc. | (2,029 | ) | (14,304 | ) | (9.8 | ) | ||||||
M/A-COM Technology Solutions Holdings, Inc. | (2,648 | ) | (81,188 | ) | (55.8 | ) | ||||||
Macquarie Infrastructure Corp. | (1,324 | ) | (36,529 | ) | (25.1 | ) | ||||||
Madison Square Garden Co., Class A | (499 | ) | (85,489 | ) | (58.7 | ) | ||||||
Madison Square Garden Entertainment Corp. | (1,026 | ) | (84,850 | ) | (58.3 | ) | ||||||
Malibu Boats, Inc. | (1,637 | ) | (56,280 | ) | (38.7 | ) | ||||||
Manitowoc Co., Inc. | (2,398 | ) | (22,110 | ) | (15.2 | ) | ||||||
Marcus Corp. | (8,183 | ) | (118,981 | ) | (81.7 | ) | ||||||
MarineMax, Inc. | (3,341 | ) | (48,144 | ) | (33.1 | ) | ||||||
Marriott Vacations Worldwide Corp. | (1,418 | ) | (117,694 | ) | (80.8 | ) | ||||||
Masonite International Corp. | (1,025 | ) | (60,557 | ) | (41.6 | ) | ||||||
Matador Resources Co. | (4,506 | ) | (31,722 | ) | (21.8 | ) | ||||||
Matson, Inc. | (3,334 | ) | (100,820 | ) | (69.3 | ) | ||||||
MAXIMUS, Inc. | (5,372 | ) | (361,643 | ) | (248.4 | ) | ||||||
MDU Resources Group, Inc. | (7,647 | ) | (171,752 | ) | (118.0 | ) | ||||||
Medpace Holdings, Inc. | (666 | ) | (53,187 | ) | (36.5 | ) | ||||||
Mercury General Corp. | (1,390 | ) | (56,934 | ) | (39.1 | ) | ||||||
Meredith Corp. | (2,063 | ) | (30,594 | ) | (21.0 | ) | ||||||
Meritor, Inc. | (1,933 | ) | (39,626 | ) | (27.2 | ) | ||||||
Mesa Laboratories, Inc. | (194 | ) | (46,172 | ) | (31.7 | ) | ||||||
Methode Electronics, Inc. | (2,663 | ) | (79,943 | ) | (54.9 | ) | ||||||
MFA Financial, Inc. | (798 | ) | (1,396 | ) | (1.0 | ) | ||||||
MGE Energy, Inc. | (602 | ) | (38,925 | ) | (26.7 | ) | ||||||
MGM Growth Properties LLC, Class A | (1,405 | ) | (35,364 | ) | (24.3 | ) | ||||||
MGP Ingredients, Inc. | (697 | ) | (26,298 | ) | (18.1 | ) | ||||||
Middlesex Water Co. | (1,074 | ) | (64,762 | ) | (44.5 | ) | ||||||
MKS Instruments, Inc. | (574 | ) | (57,532 | ) | (39.5 | ) | ||||||
Monarch Casino & Resort, Inc. | (2,451 | ) | (81,716 | ) | (56.1 | ) | ||||||
Monro, Inc. | (1,481 | ) | (82,181 | ) | (56.5 | ) | ||||||
Mr Cooper Group, Inc. | (8,707 | ) | (83,413 | ) | (57.3 | ) | ||||||
MSC Industrial Direct Co., Inc., Class A | (196 | ) | (11,689 | ) | (8.0 | ) | ||||||
Mueller Industries, Inc. | (19,624 | ) | (508,262 | ) | (349.1 | ) | ||||||
Mueller Water Products, Inc., Class A | (2,400 | ) | (22,776 | ) | (15.6 | ) | ||||||
Murphy Oil Corp. | (8,179 | ) | (97,003 | ) | (66.6 | ) | ||||||
Murphy USA, Inc. | (520 | ) | (55,536 | ) | (38.1 | ) | ||||||
National Fuel Gas Co. | (1,326 | ) | (54,366 | ) | (37.3 | ) | ||||||
National Storage Affiliates Trust | (3,749 | ) | (106,772 | ) | (73.3 | ) | ||||||
National Western Life Group, Inc., Class A | (439 | ) | (84,608 | ) | (58.1 | ) | ||||||
NBT Bancorp, Inc. | (3,036 | ) | (100,583 | ) | (69.1 | ) | ||||||
New Jersey Resources Corp. | (2,591 | ) | (87,524 | ) | (60.1 | ) | ||||||
New York Community Bancorp, Inc. | (5,016 | ) | (54,474 | ) | (37.4 | ) | ||||||
Newmark Group, Inc., Class A | (4,598 | ) | (17,840 | ) | (12.3 | ) | ||||||
NewMarket Corp. | (159 | ) | (65,419 | ) | (44.9 | ) | ||||||
nLight, Inc. | (1,145 | ) | (18,045 | ) | (12.4 | ) | ||||||
Northern Oil and Gas, Inc. | (23,999 | ) | (20,092 | ) | (13.8 | ) | ||||||
NorthWestern Corp. | (302 | ) | (17,422 | ) | (12.0 | ) | ||||||
NVE Corp. | (1,641 | ) | (93,160 | ) | (64.0 | ) | ||||||
Odonate Therapeutics, Inc. | (2,628 | ) | (73,978 | ) | (50.8 | ) | ||||||
Old Republic International Corp. | (17,318 | ) | (276,222 | ) | (189.7 | ) | ||||||
Ollie’s Bargain Outlet Holdings, Inc. | (768 | ) | (52,155 | ) | (35.8 | ) | ||||||
| Shares | Value | % of Basket Value | ||||||||||
| United States (continued) | ||||||||||||
ONE Gas, Inc. | (1,134 | ) | $ | (90,391 | ) | (62.1 | ) % | |||||
OneMain Holdings, Inc. | (5,800 | ) | (140,418 | ) | (96.5 | ) | ||||||
OSI Systems, Inc. | (330 | ) | (23,885 | ) | (16.4 | ) | ||||||
Otter Tail Corp. | (2,255 | ) | (100,077 | ) | (68.7 | ) | ||||||
Owens & Minor, Inc. | (2,337 | ) | (16,546 | ) | (11.4 | ) | ||||||
Pacific Premier Bancorp, Inc. | (2,127 | ) | (45,411 | ) | (31.2 | ) | ||||||
Park Aerospace Corp. | (5,302 | ) | (70,570 | ) | (48.5 | ) | ||||||
Park National Corp. | (1,585 | ) | (126,768 | ) | (87.1 | ) | ||||||
Patterson Cos., Inc. | (2,496 | ) | (45,627 | ) | (31.3 | ) | ||||||
Patterson-UTI Energy, Inc. | (10,184 | ) | (37,579 | ) | (25.8 | ) | ||||||
PDC Energy, Inc. | (7,617 | ) | (98,945 | ) | (68.0 | ) | ||||||
Penn National Gaming, Inc. | (1,721 | ) | (30,668 | ) | (21.1 | ) | ||||||
Pennant Group, Inc. | (936 | ) | (18,523 | ) | (12.7 | ) | ||||||
Penske Automotive Group, Inc. | (6,424 | ) | (231,136 | ) | (158.8 | ) | ||||||
Peoples Bancorp, Inc. | (1,640 | ) | (39,868 | ) | (27.4 | ) | ||||||
PetMed Express, Inc. | (759 | ) | (30,034 | ) | (20.6 | ) | ||||||
PH Glatfelter Co. | (8,487 | ) | (123,910 | ) | (85.1 | ) | ||||||
Phibro Animal Health Corp. | (1,571 | ) | (41,961 | ) | (28.8 | ) | ||||||
Photronics, Inc. | (1,669 | ) | (19,945 | ) | (13.7 | ) | ||||||
Piedmont Office Realty Trust, Inc., Class A | (2,105 | ) | (36,522 | ) | (25.1 | ) | ||||||
Piper Sandler Cos. | (1,837 | ) | (99,033 | ) | (68.0 | ) | ||||||
Planet Fitness, Inc., Class A | (1,037 | ) | (62,562 | ) | (43.0 | ) | ||||||
PNM Resources, Inc. | (835 | ) | (33,809 | ) | (23.2 | ) | ||||||
Portland General Electric Co. | (2,670 | ) | (124,929 | ) | (85.8 | ) | ||||||
PotlatchDeltic Corp. | (4,793 | ) | (168,282 | ) | (115.6 | ) | ||||||
Powell Industries, Inc. | (1,196 | ) | (30,343 | ) | (20.8 | ) | ||||||
Preferred Apartment Communities, Inc. | (5,615 | ) | (41,607 | ) | (28.6 | ) | ||||||
Prestige Consumer Healthcare, Inc. | (2,863 | ) | (116,495 | ) | (80.0 | ) | ||||||
PriceSmart, Inc. | (253 | ) | (16,076 | ) | (11.0 | ) | ||||||
Primo Water Corp. | (11,565 | ) | (118,396 | ) | (81.3 | ) | ||||||
Primoris Services Corp. | (1,167 | ) | (18,217 | ) | (12.5 | ) | ||||||
ProAssurance Corp. | (1,239 | ) | (26,502 | ) | (18.2 | ) | ||||||
Prosperity Bancshares, Inc. | (4,733 | ) | (283,649 | ) | (194.8 | ) | ||||||
Providence Service Corp. | (687 | ) | (39,853 | ) | (27.4 | ) | ||||||
PS Business Parks, Inc. | (1,460 | ) | (188,471 | ) | (129.5 | ) | ||||||
Quad/Graphics, Inc. | (18,027 | ) | (67,060 | ) | (46.1 | ) | ||||||
Quaker Chemical Corp. | (435 | ) | (66,172 | ) | (45.5 | ) | ||||||
Quanex Building Products Corp. | (4,347 | ) | (54,207 | ) | (37.2 | ) | ||||||
R1 RCM, Inc. | (2,087 | ) | (21,538 | ) | (14.8 | ) | ||||||
Radian Group, Inc. | (4,259 | ) | (63,800 | ) | (43.8 | ) | ||||||
Range Resources Corp. | (5,935 | ) | (34,601 | ) | (23.8 | ) | ||||||
RBC Bearings, Inc. | (1,015 | ) | (128,580 | ) | (88.3 | ) | ||||||
RealPage, Inc. | (2,443 | ) | (157,549 | ) | (108.2 | ) | ||||||
Regal-Beloit Corp. | (781 | ) | (55,459 | ) | (38.1 | ) | ||||||
Regis Corp. | (7,030 | ) | (87,313 | ) | (60.0 | ) | ||||||
Renasant Corp. | (5,459 | ) | (143,190 | ) | (98.4 | ) | ||||||
Renewable Energy Group, Inc. | (3,266 | ) | (81,029 | ) | (55.7 | ) | ||||||
Rent-A-Center, Inc. | (5,194 | ) | (103,387 | ) | (71.0 | ) | ||||||
Resideo Technologies, Inc. | (6,208 | ) | (31,847 | ) | (21.9 | ) | ||||||
Restoration Hardware | (1,605 | ) | (230,767 | ) | (158.5 | ) | ||||||
Retail Opportunity Investments Corp. | (3,676 | ) | (35,676 | ) | (24.5 | ) | ||||||
REX American Resources Corp. | (2,439 | ) | (145,072 | ) | (99.7 | ) | ||||||
Rexford Industrial Realty, Inc. | (7,842 | ) | (319,326 | ) | (219.3 | ) | ||||||
Rexnord Corp. | (1,498 | ) | (40,850 | ) | (28.1 | ) | ||||||
Rogers Corp. | (287 | ) | (31,868 | ) | (21.9 | ) | ||||||
RPC, Inc. | (5,241 | ) | (17,872 | ) | (12.3 | ) | ||||||
Ryman Hospitality Properties, Inc. | (1,454 | ) | (51,384 | ) | (35.3 | ) | ||||||
Safehold, Inc. | (2,059 | ) | (118,928 | ) | (81.7 | ) | ||||||
Safety Insurance Group, Inc. | (1,368 | ) | (115,076 | ) | (79.0 | ) | ||||||
Sally Beauty Holdings, Inc. | (5,465 | ) | (53,065 | ) | (36.5 | ) | ||||||
Sanderson Farms, Inc. | (1,360 | ) | (185,150 | ) | (127.2 | ) | ||||||
Sanmina Corp. | (3,156 | ) | (87,516 | ) | (60.1 | ) | ||||||
| 44 | 2020 BLACKROCK ANNUAL REPORTTO SHAREHOLDERS |
Schedule of Investments (continued) April 30, 2020 | BlackRock Global Long/Short Equity Fund |
| Shares | Value | % of Basket Value | ||||||||||
| United States (continued) | ||||||||||||
Saul Centers, Inc. | (2,785 | ) | $ | (90,847 | ) | (62.4 | ) % | |||||
Schweitzer-Mauduit International, Inc. | (2,352 | ) | (75,781 | ) | (52.1 | ) | ||||||
Selective Insurance Group, Inc. | (5,719 | ) | (286,693 | ) | (196.9 | ) | ||||||
Service Properties Trust | (2,916 | ) | (20,208 | ) | (13.9 | ) | ||||||
ServiceMaster Global Holdings, Inc. | (754 | ) | (25,674 | ) | (17.6 | ) | ||||||
ServisFirst Bancshares, Inc. | (877 | ) | (31,151 | ) | (21.4 | ) | ||||||
Shutterstock, Inc. | (540 | ) | (20,520 | ) | (14.1 | ) | ||||||
SIGA Technologies, Inc. | (6,721 | ) | (39,721 | ) | (27.3 | ) | ||||||
Signet Jewelers Ltd. | (3,246 | ) | (32,655 | ) | (22.4 | ) | ||||||
Simmons First National Corp., Class A | (2,178 | ) | (40,729 | ) | (28.0 | ) | ||||||
Simpson Manufacturing Co., Inc. | (454 | ) | (32,733 | ) | (22.5 | ) | ||||||
SITE Centers Corp. | (6,107 | ) | (37,008 | ) | (25.4 | ) | ||||||
Skyline Champion Corp. | (7,914 | ) | (155,985 | ) | (107.1 | ) | ||||||
South Jersey Industries, Inc. | (3,500 | ) | (100,065 | ) | (68.7 | ) | ||||||
South State Corp. | (1,926 | ) | (111,400 | ) | (76.5 | ) | ||||||
Spartan Motors, Inc. | (1,288 | ) | (18,148 | ) | (12.5 | ) | ||||||
SPIRE, Inc. | (2,581 | ) | (188,310 | ) | (129.4 | ) | ||||||
Spirit Realty Capital, Inc. | (8,655 | ) | (266,228 | ) | (182.9 | ) | ||||||
SPX Corp. | (3,181 | ) | (121,292 | ) | (83.3 | ) | ||||||
SPX FLOW, Inc. | (2,153 | ) | (70,123 | ) | (48.2 | ) | ||||||
STAAR Surgical Co. | (1,425 | ) | (54,606 | ) | (37.5 | ) | ||||||
STAG Industrial, Inc. | (9,431 | ) | (247,564 | ) | (170.1 | ) | ||||||
State Auto Financial Corp. | (1,711 | ) | (42,929 | ) | (29.5 | ) | ||||||
Stericycle, Inc. | (2,820 | ) | (137,616 | ) | (94.5 | ) | ||||||
Stewart Information Services Corp. | (7,337 | ) | (233,757 | ) | (160.6 | ) | ||||||
Stifel Financial Corp. | (1,245 | ) | (55,129 | ) | (37.9 | ) | ||||||
SunCoke Energy, Inc. | (2,918 | ) | (9,192 | ) | (6.3 | ) | ||||||
SunPower Corp. | (3,032 | ) | (22,285 | ) | (15.3 | ) | ||||||
Sykes Enterprises, Inc. | (5,599 | ) | (160,299 | ) | (110.1 | ) | ||||||
TCF Financial Corp. | (878 | ) | (26,068 | ) | (17.9 | ) | ||||||
Team, Inc. | (5,670 | ) | (34,984 | ) | (24.0 | ) | ||||||
TEGNA, Inc. | (6,142 | ) | (65,842 | ) | (45.2 | ) | ||||||
Tejon Ranch Co. | (8,165 | ) | (111,860 | ) | (76.8 | ) | ||||||
Tempur Sealy International, Inc. | (2,313 | ) | (124,324 | ) | (85.4 | ) | ||||||
TerraForm Power, Inc. | (9,005 | ) | (155,967 | ) | (107.1 | ) | ||||||
TFS Financial Corp. | (4,812 | ) | (65,684 | ) | (45.1 | ) | ||||||
Thermon Group Holdings, Inc. | (4,047 | ) | (61,838 | ) | (42.5 | ) | ||||||
Thor Industries, Inc. | (2,836 | ) | (187,743 | ) | (129.0 | ) | ||||||
TI Fluid Systems PLC | (32,235 | ) | (64,798 | ) | (44.5 | ) | ||||||
Timken Co. | (4,092 | ) | (153,777 | ) | (105.6 | ) | ||||||
Toll Brothers, Inc. | (917 | ) | (22,026 | ) | (15.1 | ) | ||||||
Tompkins Financial Corp. | (2,637 | ) | (178,024 | ) | (122.3 | ) | ||||||
Tootsie Roll Industries, Inc. | (1,683 | ) | (59,124 | ) | (40.6 | ) | ||||||
TopBuild Corp. | (227 | ) | (21,154 | ) | (14.5 | ) | ||||||
Towne Bank | (3,205 | ) | (64,741 | ) | (44.5 | ) | ||||||
TRI Pointe Group, Inc. | (1,707 | ) | (19,596 | ) | (13.5 | ) | ||||||
TriCo Bancshares | (3,903 | ) | (117,558 | ) | (80.8 | ) | ||||||
Trinity Industries, Inc. | (8,337 | ) | (160,821 | ) | (110.5 | ) | ||||||
Tucows, Inc., Class A | (1,565 | ) | (82,804 | ) | (56.9 | ) | ||||||
Twin River Worldwide Holdings, Inc. | (2,161 | ) | (34,101 | ) | (23.4 | ) | ||||||
UFP Industries, Inc. | (3,875 | ) | (159,340 | ) | (109.5 | ) | ||||||
Ultra Clean Holdings, Inc. | (2,573 | ) | (47,317 | ) | (32.5 | ) | ||||||
Umpqua Holdings Corp. | (2,781 | ) | (34,832 | ) | (23.9 | ) | ||||||
Unisys Corp. | (2,938 | ) | (36,989 | ) | (25.4 | ) | ||||||
United Community Banks, Inc. | (1,279 | ) | (27,044 | ) | (18.6 | ) | ||||||
United States Lime & Minerals, Inc. | (822 | ) | (65,842 | ) | (45.2 | ) | ||||||
United States Steel Corp. | (11,793 | ) | (90,570 | ) | (62.2 | ) | ||||||
Univar Solutions, Inc. | (1,463 | ) | (21,243 | ) | (14.6 | ) | ||||||
Universal Corp. | (1,237 | ) | (59,834 | ) | (41.1 | ) | ||||||
Universal Electronics, Inc. | (1,905 | ) | (78,638 | ) | (54.0 | ) | ||||||
Universal Health Realty Income Trust | (1,426 | ) | (152,525 | ) | (104.8 | ) | ||||||
Universal Logistics Holdings, Inc. | (4,495 | ) | (62,615 | ) | (43.0 | ) | ||||||
| Shares | Value | % of Basket Value | ||||||||||
| United States (continued) | ||||||||||||
Upland Software, Inc. | (2,346 | ) | $ | (74,204 | ) | (51.0 | ) % | |||||
Urban Edge Properties | (4,889 | ) | (56,223 | ) | (38.6 | ) | ||||||
Urban Outfitters, Inc. | (5,833 | ) | (101,144 | ) | (69.5 | ) | ||||||
Urstadt Biddle Properties, Inc., Class A | (3,241 | ) | (47,351 | ) | (32.5 | ) | ||||||
US Ecology, Inc. | (1,065 | ) | (34,911 | ) | (24.0 | ) | ||||||
Verint Systems, Inc. | (2,694 | ) | (115,142 | ) | (79.1 | ) | ||||||
Verra Mobility Corp. | (21,219 | ) | (190,122 | ) | (130.6 | ) | ||||||
Verso Corp., Class A | (3,929 | ) | (54,574 | ) | (37.5 | ) | ||||||
Viavi Solutions, Inc. | (44,280 | ) | (534,902 | ) | (367.4 | ) | ||||||
Victory Capital Holdings, Inc. | (2,831 | ) | (42,720 | ) | (29.3 | ) | ||||||
ViewRay, Inc. | (6,526 | ) | (13,574 | ) | (9.3 | ) | ||||||
Vishay Intertechnology, Inc. | (3,307 | ) | (54,863 | ) | (37.7 | ) | ||||||
Vishay Precision Group, Inc. | (2,201 | ) | (50,887 | ) | (35.0 | ) | ||||||
Waddell & Reed Financial, Inc., Class A | (11,780 | ) | (171,399 | ) | (117.7 | ) | ||||||
Walker & Dunlop, Inc. | (2,166 | ) | (83,239 | ) | (57.2 | ) | ||||||
Watsco, Inc. | (1,618 | ) | (260,482 | ) | (178.9 | ) | ||||||
Weingarten Realty Investors | (4,008 | ) | (72,906 | ) | (50.1 | ) | ||||||
Westamerica BanCorp. | (3,436 | ) | (216,468 | ) | (148.7 | ) | ||||||
Westwood Holdings Group, Inc. | (3,528 | ) | (81,250 | ) | (55.8 | ) | ||||||
Willdan Group, Inc. | (1,450 | ) | (36,772 | ) | (25.3 | ) | ||||||
Winnebago Industries, Inc. | (2,873 | ) | (127,475 | ) | (87.6 | ) | ||||||
Wolverine World Wide, Inc. | (2,829 | ) | (57,966 | ) | (39.8 | ) | ||||||
World Acceptance Corp. | (1,073 | ) | (72,803 | ) | (50.0 | ) | ||||||
World Fuel Services Corp. | (711 | ) | (17,775 | ) | (12.2 | ) | ||||||
World Wrestling Entertainment, Inc., Class A | (2,146 | ) | (95,433 | ) | (65.6 | ) | ||||||
Worthington Industries, Inc. | (720 | ) | (19,037 | ) | (13.1 | ) | ||||||
Wyndham Hotels & Resorts, Inc. | (1,635 | ) | (61,656 | ) | (42.4 | ) | ||||||
Yelp, Inc. | (1,547 | ) | (34,575 | ) | (23.8 | ) | ||||||
YETI Holdings, Inc. | (772 | ) | (21,315 | ) | (14.6 | ) | ||||||
York Water Co. | (3,559 | ) | (143,499 | ) | (98.6 | ) | ||||||
|
|
|
| |||||||||
| (37,571,648) | ||||||||||||
|
| |||||||||||
Total Reference Entity — Short |
| (71,759,348 | ) | |||||||||
|
| |||||||||||
Net Value of Reference Entity — Bank of America, N.A. |
| $ | 145,581 | |||||||||
|
| |||||||||||
The following table represents the individual long and short positions and related values of the equity securities underlying the total return swap with Deutsche Bank A.G. as of April 30, 2020 termination date 02/17/23:
| Shares | Value | % of Basket Value | ||||||||||
Reference Entity — Long | ||||||||||||
| Germany | ||||||||||||
Solarworld AG | 10 | $ | 1 | 100.0 | % | |||||||
|
|
|
| |||||||||
Total Reference Entity — Long |
| 1 | ||||||||||
|
| |||||||||||
Net Value of Reference Entity — Deutsche Bank A.G. |
| $ | 1 | |||||||||
|
| |||||||||||
| SCHEDULES OF INVESTMENTS | 45 |
Schedule of Investments (continued) April 30, 2020 | BlackRock Global Long/Short Equity Fund |
The following table represents the individual long and short positions and related values of the equity securities underlying the total return swap with Goldman Sachs & Co. as of April 30, 2020, termination dates 06/24/20 – 03/01/23:
| Shares | Value | % of Basket Value | ||||||||||
Reference Entity — Long | ||||||||||||
| Argentina | ||||||||||||
MercadoLibre, Inc. | 1,364 | $ | 795,908 | 29.3 | % | |||||||
|
|
|
| |||||||||
| Australia | ||||||||||||
Alumina Ltd. | 370,539 | 411,021 | 15.1 | |||||||||
Aristocrat Leisure Ltd. | 56,278 | 922,947 | 34.0 | |||||||||
Atlas Arteria Ltd. | 10,054 | 40,571 | 1.5 | |||||||||
Australia & New Zealand Banking Group Ltd. | 158,741 | 1,724,318 | 63.5 | |||||||||
BHP Group Ltd. | 41,229 | 841,661 | 31.0 | |||||||||
BlueScope Steel Ltd. | 7,610 | 49,669 | 1.8 | |||||||||
Caltex Australia Ltd. | 1,481 | 23,844 | 0.9 | |||||||||
Downer EDI Ltd. | 11,039 | 29,696 | 1.1 | |||||||||
IGO Ltd. | 23,989 | 72,775 | 2.7 | |||||||||
Mineral Resources Ltd. | 3,199 | 34,478 | 1.3 | |||||||||
National Australia Bank Ltd. | 11,128 | 121,935 | 4.5 | |||||||||
Newcrest Mining Ltd. | 1,186 | 23,641 | 0.9 | |||||||||
Oil Search Ltd. | 244,773 | 480,371 | 17.7 | |||||||||
OZ Minerals Ltd. | 3,435 | 19,800 | 0.7 | |||||||||
Rio Tinto Ltd. | 29,452 | 1,659,948 | 61.1 | |||||||||
SEEK Ltd. | 13,880 | 154,960 | 5.7 | |||||||||
South32 Ltd. | 38,942 | 48,976 | 1.8 | |||||||||
Spark Infrastructure Group | 57,974 | 71,203 | 2.6 | |||||||||
WiseTech Global Ltd. | 3,596 | 42,822 | 1.6 | |||||||||
Worley Ltd. | 28,796 | 166,909 | 6.1 | |||||||||
|
|
|
| |||||||||
| 6,941,545 | ||||||||||||
| Austria | ||||||||||||
ams AG | 33,892 | 444,895 | 16.4 | |||||||||
|
|
|
| |||||||||
| Canada | ||||||||||||
Bank of Nova Scotia | 8,899 | 356,740 | 13.1 | |||||||||
Boralex, Inc. | 3,103 | 60,078 | 2.2 | |||||||||
CAE, Inc. | 46,131 | 762,249 | 28.1 | |||||||||
Canadian Apartment Properties REIT | 22,640 | 779,091 | 28.7 | |||||||||
CCL Industries, Inc., Class B | 4,435 | 138,631 | 5.1 | |||||||||
CI Financial Corp. | 1,319 | 14,015 | 0.5 | |||||||||
Great-West Lifeco, Inc. | 3,571 | 58,800 | 2.1 | |||||||||
Innergex Renewable Energy, Inc. | 4,791 | 64,295 | 2.4 | |||||||||
Lightspeed POS, Inc. | 4,110 | 77,863 | 2.9 | |||||||||
Methanex Corp. | 11,782 | 187,317 | 6.9 | |||||||||
Onex Corp. | 1,844 | 84,997 | 3.1 | |||||||||
Parex Resources, Inc. | 1,456 | 15,962 | 0.6 | |||||||||
Parkland Fuel Corp. | 3,073 | 72,699 | 2.7 | |||||||||
Quebecor, Inc., Class B | 2,470 | 53,785 | 2.0 | |||||||||
SSR Mining, Inc. | 18,907 | 331,292 | 12.2 | |||||||||
Suncor Energy, Inc. | 6,907 | 123,159 | 4.5 | |||||||||
Teck Resources Ltd., Class B | 43,034 | 379,344 | 14.0 | |||||||||
TELUS Corp. | 26,740 | 437,038 | 16.1 | |||||||||
TFI International, Inc. | 3,710 | 102,882 | 3.8 | |||||||||
|
|
|
| |||||||||
| 4,100,237 | ||||||||||||
| Chile | ||||||||||||
Liberty Latin America Ltd., Class A | 2 | 21 | 0.0 | |||||||||
|
|
|
| |||||||||
| Denmark | ||||||||||||
Chr Hansen Holding A/S | 4,565 | 393,611 | 14.5 | |||||||||
Demant A/S | 17,642 | 421,782 | 15.5 | |||||||||
GN Store Nord A/S | 7,409 | 338,120 | 12.5 | |||||||||
Novozymes A/S, Class B | 14,295 | 701,264 | 25.8 | |||||||||
| Shares | Value | % of Basket Value | ||||||||||
| Denmark (continued) | ||||||||||||
Royal Unibrew A/S | 1,818 | $ | 140,652 | 5.2 | % | |||||||
SimCorp A/S | 2,121 | 195,914 | 7.2 | |||||||||
|
|
|
| |||||||||
| 2,191,343 | ||||||||||||
| Finland | ||||||||||||
Elisa OYJ | 2,860 | 173,797 | 6.4 | |||||||||
Huhtamaki OYJ | 3,427 | 127,910 | 4.7 | |||||||||
Kesko OYJ, Class B | 34,117 | 555,906 | 20.5 | |||||||||
Orion OYJ, Class B | 4,665 | 237,067 | 8.7 | |||||||||
Wartsila OYJ Abp | 42,119 | 309,163 | 11.4 | |||||||||
|
|
|
| |||||||||
| 1,403,843 | ||||||||||||
| France | ||||||||||||
Airbus SE | 54,008 | 3,419,705 | 125.9 | |||||||||
ALD SA | 1,974 | 19,230 | 0.7 | |||||||||
AXA SA | 29,756 | 528,957 | 19.5 | |||||||||
Cie Plastic Omnium SA | 2,759 | 52,244 | 1.9 | |||||||||
CNP Assurances | 41,645 | 429,639 | 15.8 | |||||||||
Danone SA | 1,242 | 86,564 | 3.2 | |||||||||
Dassault Systemes SE | 307 | 44,930 | 1.7 | |||||||||
Gaztransport Et Technigaz SA | 1,910 | 138,469 | 5.1 | |||||||||
Ipsen SA | 1,425 | 106,109 | 3.9 | |||||||||
Korian SA | 1,495 | 50,213 | 1.8 | |||||||||
Legrand SA | 4,912 | 329,313 | 12.1 | |||||||||
LVMH Moet Hennessy Louis Vuitton SE | 1,011 | 390,481 | 14.4 | |||||||||
Pernod Ricard SA | 1,070 | 162,587 | 6.0 | |||||||||
Rexel SA | 5,100 | 47,633 | 1.8 | |||||||||
Schneider Electric SE | 16,640 | 1,537,741 | 56.6 | |||||||||
Societe BIC SA | 301 | 15,068 | 0.6 | |||||||||
Societe Generale SA | 73,465 | 1,152,594 | 42.4 | |||||||||
Teleperformance | 3,708 | 830,625 | 30.6 | |||||||||
Thales SA | 7,301 | 553,175 | 20.4 | |||||||||
Unibail-Rodamco-Westfield | 6,735 | 398,789 | 14.7 | |||||||||
|
|
|
| |||||||||
| 10,294,066 | ||||||||||||
| Germany | ||||||||||||
BASF SE | 12,428 | 636,021 | 23.4 | |||||||||
Carl Zeiss Meditec AG, Bearer Shares | 792 | 78,069 | 2.9 | |||||||||
Deutsche Boerse AG | 3,990 | 618,603 | 22.8 | |||||||||
Deutsche Post AG, Registered Shares | 70,639 | 2,098,486 | 77.3 | |||||||||
Evotec SE | 4,019 | 99,171 | 3.6 | |||||||||
Grand City Properties SA | 23,861 | 498,979 | 18.4 | |||||||||
Hochtief AG | 9,055 | 708,565 | 26.1 | |||||||||
Infineon Technologies AG | 84,468 | 1,570,338 | 57.8 | |||||||||
Merck KGaA | 6,889 | 799,526 | 29.4 | |||||||||
MTU Aero Engines AG | 3,300 | 449,379 | 16.5 | |||||||||
Rational AG | 1,261 | 608,527 | 22.4 | |||||||||
Rheinmetall AG | 4,210 | 284,929 | 10.5 | |||||||||
SAP SE | 9,709 | 1,156,412 | 42.6 | |||||||||
Sartorius AG, Preference Shares | 1,404 | 394,441 | 14.6 | |||||||||
Stroeer SE & Co. KGaA | 242 | 15,316 | 0.6 | |||||||||
Zalando SE | 14,991 | 734,764 | 27.1 | |||||||||
|
|
|
| |||||||||
| 10,751,526 | ||||||||||||
| Hong Kong | ||||||||||||
Hysan Development Co. Ltd. | 27,000 | 90,076 | 3.3 | |||||||||
NWS Holdings Ltd. | 89,000 | 92,753 | 3.4 | |||||||||
Swire Properties Ltd. | 81,600 | 228,869 | 8.5 | |||||||||
Wharf Real Estate Investment Co. Ltd. | 39,000 | 165,105 | 6.1 | |||||||||
|
|
|
| |||||||||
| 576,803 | ||||||||||||
| Ireland | ||||||||||||
AIB Group PLC | 447,308 | 618,993 | 22.9 | |||||||||
Bank of Ireland Group PLC | 37,596 | 77,151 | 2.8 | |||||||||
| 46 | 2020 BLACKROCK ANNUAL REPORTTO SHAREHOLDERS |
Schedule of Investments (continued) April 30, 2020 | BlackRock Global Long/Short Equity Fund |
| Shares | Value | % of Basket Value | ||||||||||
| Ireland (continued) | ||||||||||||
Kerry Group PLC, Class A | 1,461 | $ | 167,628 | 6.2 | % | |||||||
Kingspan Group PLC | 22,664 | 1,154,890 | 42.5 | |||||||||
|
|
|
| |||||||||
| 2,018,662 | ||||||||||||
| Israel | ||||||||||||
Azrieli Group Ltd. | 322 | 19,067 | 0.7 | |||||||||
|
|
|
| |||||||||
| Italy | ||||||||||||
Amplifon SpA | 5,093 | 116,585 | 4.3 | |||||||||
Ferrari NV | 914 | 142,854 | 5.3 | |||||||||
Terna Rete Elettrica Nazionale SpA | 10,221 | 64,003 | 2.3 | |||||||||
|
|
|
| |||||||||
| 323,442 | ||||||||||||
| Japan | ||||||||||||
ABC-Mart, Inc. | 1,000 | 50,819 | 1.9 | |||||||||
Advantest Corp. | 2,000 | 97,043 | 3.6 | |||||||||
AEON Financial Service Co. Ltd. | 2,200 | 22,878 | 0.8 | |||||||||
Aeon Mall Co. Ltd. | 3,500 | 43,997 | 1.6 | |||||||||
AGC, Inc. | 1,400 | 34,524 | 1.3 | |||||||||
Alfresa Holdings Corp. | 15,600 | 311,085 | 11.5 | |||||||||
Alps Alpine Co. Ltd. | 22,400 | 231,041 | 8.5 | |||||||||
Asahi Group Holdings Ltd. | 6,900 | 237,259 | 8.7 | |||||||||
Asahi Intecc Co. Ltd. | 900 | 23,842 | 0.9 | |||||||||
Asahi Kasei Corp. | 51,900 | 368,203 | 13.6 | |||||||||
Astellas Pharma, Inc. | 16,800 | 277,858 | 10.2 | |||||||||
Benesse Holdings, Inc. | 19,200 | 546,766 | 20.1 | |||||||||
Bridgestone Corp. | 900 | 28,015 | 1.0 | |||||||||
Central Japan Railway Co. | 10,100 | 1,589,280 | 58.5 | |||||||||
Chugai Pharmaceutical Co. Ltd. | 2,900 | 345,685 | 12.7 | |||||||||
COMSYS Holdings Corp. | 1,600 | 43,996 | 1.6 | |||||||||
Daiichikosho Co., Ltd. | 7,900 | 237,112 | 8.7 | |||||||||
Daikin Industries Ltd. | 700 | 89,832 | 3.3 | |||||||||
Daito Trust Construction Co. Ltd. | 2,800 | 266,239 | 9.8 | |||||||||
DeNA Co. Ltd. | 6,900 | 84,940 | 3.1 | |||||||||
Dentsu Group Inc. | 20,900 | 436,473 | 16.1 | |||||||||
DIC Corp. | 13,500 | 313,504 | 11.6 | |||||||||
Dip Corp. | 10,300 | 219,826 | 8.1 | |||||||||
East Japan Railway Co. | 21,200 | 1,548,023 | 57.0 | |||||||||
Electric Power Development Co. Ltd. | 22,200 | 444,313 | 16.4 | |||||||||
FamilyMart Co. Ltd. | 2,300 | 39,003 | 1.4 | |||||||||
Fast Retailing Co. Ltd. | 800 | 379,397 | 14.0 | |||||||||
Fuji Media Holdings, Inc. | 68,100 | 676,474 | 24.9 | |||||||||
Fuji Seal International, Inc. | 4,300 | 74,643 | 2.8 | |||||||||
H2O Retailing Corp. | 27,800 | 218,040 | 8.0 | |||||||||
Hitachi Transport System Ltd. | 700 | 16,990 | 0.6 | |||||||||
Hoshizaki Corp. | 900 | 68,586 | 2.5 | |||||||||
House Foods Group, Inc. | 1,700 | 53,541 | 2.0 | |||||||||
Isuzu Motors Ltd. | 18,600 | 141,352 | 5.2 | |||||||||
Izumi Co. Ltd. | 23,600 | 690,830 | 25.4 | |||||||||
Japan Retail Fund Investment Corp. | 376 | 409,925 | 15.1 | |||||||||
Japan Tobacco, Inc. | 22,800 | 424,606 | 15.6 | |||||||||
JCR Pharmaceuticals Co. Ltd. | 500 | 47,892 | 1.8 | |||||||||
JFE Holdings, Inc. | 46,300 | 307,248 | 11.3 | |||||||||
JGC Holdings Corp. | 11,000 | 106,225 | 3.9 | |||||||||
JXTG Holdings, Inc. | 529,200 | 1,876,205 | 69.1 | |||||||||
Kajima Corp. | 5,600 | 58,188 | 2.2 | |||||||||
Kaneka Corp. | 6,600 | 170,711 | 6.3 | |||||||||
Kao Corp. | 600 | 46,270 | 1.7 | |||||||||
KDDI Corp. | 29,700 | 860,239 | 31.7 | |||||||||
Konica Minolta, Inc. | 101,800 | 393,927 | 14.5 | |||||||||
Kyocera Corp. | 5,300 | 283,181 | 10.4 | |||||||||
Lintec Corp. | 23,400 | 502,151 | 18.5 | |||||||||
Mabuchi Motor Co. Ltd. | 700 | 21,676 | 0.8 | |||||||||
Marubeni Corp. | 21,600 | 104,022 | 3.8 | |||||||||
| Shares | Value | % of Basket Value | ||||||||||
| Japan (continued) | ||||||||||||
Maruha Nichiro Corp. | 17,000 | $ | 355,761 | 13.1 | % | |||||||
Marui Group Co. Ltd. | 2,100 | 34,375 | 1.3 | |||||||||
Mazda Motor Corp. | 14,100 | 79,712 | 2.9 | |||||||||
Miraca Holdings, Inc. | 800 | 20,032 | 0.7 | |||||||||
Mitsui Chemicals, Inc. | 2,900 | 56,936 | 2.1 | |||||||||
Nexon Co. Ltd. | 14,000 | 226,044 | 8.3 | |||||||||
Nikon Corp. | 53,600 | 498,577 | 18.4 | |||||||||
Nippon Electric Glass Co. Ltd. | 60,400 | 879,891 | 32.4 | |||||||||
Nippon Paper Industries Co. Ltd. | 1,100 | 15,708 | 0.6 | |||||||||
Nippon Shinyaku Co. Ltd. | 900 | 63,201 | 2.3 | |||||||||
Nippon Shokubai Co. Ltd. | 5,800 | 273,912 | 10.1 | |||||||||
Nippon Steel Corp. | 14,500 | 121,998 | 4.5 | |||||||||
Nippon Television Holdings, Inc. | 12,700 | 141,863 | 5.2 | |||||||||
Nitori Holdings Co. Ltd. | 2,900 | 444,500 | 16.4 | |||||||||
Recruit Holdings Co. Ltd. | 8,800 | 256,706 | 9.5 | |||||||||
Rohm Co. Ltd. | 1,000 | 63,224 | 2.3 | |||||||||
Ryohin Keikaku Co. Ltd. | 31,300 | 372,517 | 13.7 | |||||||||
Sanwa Holdings Corp. | 36,600 | 284,005 | 10.5 | |||||||||
Seiko Epson Corp. | 11,900 | 135,131 | 5.0 | |||||||||
Sekisui House Ltd. | 37,500 | 643,302 | 23.7 | |||||||||
Seria Co. Ltd. | 11,200 | 364,004 | 13.4 | |||||||||
Seven Bank Ltd. | 49,200 | 133,372 | 4.9 | |||||||||
Shionogi & Co. Ltd. | 3,800 | 209,865 | 7.7 | |||||||||
SKY Perfect JSAT Holdings, Inc. | 5,700 | 21,428 | 0.8 | |||||||||
SMS Co. Ltd. | 3,200 | 69,748 | 2.6 | |||||||||
Sumitomo Chemical Co. Ltd. | 105,600 | 323,896 | 11.9 | |||||||||
Sysmex Corp. | 5,800 | 400,706 | 14.8 | |||||||||
Taisei Corp. | 500 | 15,586 | 0.6 | |||||||||
Taisho Pharmaceutical Holdings Co. Ltd. | 3,900 | 243,657 | 9.0 | |||||||||
Takara Holdings, Inc. | 4,900 | 36,060 | 1.3 | |||||||||
Takeda Pharmaceutical Co. Ltd. | 3,700 | 133,427 | 4.9 | |||||||||
Terumo Corp. | 4,800 | 159,276 | 5.9 | |||||||||
Toho Co. Ltd. | 2,100 | 68,770 | 2.5 | |||||||||
Tokyo Electron Ltd. | 1,100 | 234,279 | 8.6 | |||||||||
Topcon Corp. | 47,500 | 390,015 | 14.4 | |||||||||
Toray Industries, Inc. | 67,100 | 307,634 | 11.3 | |||||||||
TOTO Ltd. | 2,000 | 69,614 | 2.6 | |||||||||
Ube Industries Ltd. | 194,200 | 3,256,616 | 119.9 | |||||||||
Ulvac, Inc. | 2,500 | 68,907 | 2.5 | |||||||||
Yamaha Corp. | 5,000 | 201,826 | 7.4 | |||||||||
Yamaha Motor Co. Ltd. | 14,900 | 191,700 | 7.1 | |||||||||
Yamato Kogyo Co. Ltd. | 6,300 | 123,636 | 4.6 | |||||||||
Yokogawa Electric Corp. | 6,500 | 88,597 | 3.3 | |||||||||
Zenkoku Hosho Co. Ltd. | 5,500 | 160,259 | 5.9 | |||||||||
|
|
|
| |||||||||
| 28,104,148 | ||||||||||||
| Netherlands | ||||||||||||
Akzo Nobel NV | 12,855 | 975,564 | 35.9 | |||||||||
ASML Holding NV | 2,362 | 689,905 | 25.4 | |||||||||
BE Semiconductor Industries NV | 1,242 | 51,121 | 1.9 | |||||||||
Euronext NV | 11,052 | 927,860 | 34.2 | |||||||||
ING Groep NV | 9,259 | 51,876 | 1.9 | |||||||||
Just Eat Takeaway | 2,183 | 224,393 | 8.3 | |||||||||
|
|
|
| |||||||||
| 2,920,719 | ||||||||||||
| New Zealand | ||||||||||||
Fisher & Paykel Healthcare Corp. Ltd. | 1,336 | 22,320 | 0.8 | |||||||||
|
|
|
| |||||||||
| Norway | ||||||||||||
Aker BP ASA | 7,495 | 123,049 | 4.5 | |||||||||
Leroy Seafood Group ASA | 3,829 | 20,335 | 0.8 | |||||||||
Norsk Hydro ASA | 96,523 | 244,865 | 9.0 | |||||||||
Schibsted ASA, Class A | 4,918 | 104,336 | 3.8 | |||||||||
TGS Nopec Geophysical Co. ASA | 1,025 | 15,697 | 0.6 | |||||||||
|
|
|
| |||||||||
| 508,282 | ||||||||||||
| SCHEDULES OF INVESTMENTS | 47 |
Schedule of Investments (continued) April 30, 2020 | BlackRock Global Long/Short Equity Fund |
| Shares | Value | % of Basket Value | ||||||||||
| Portugal | ||||||||||||
Galp Energia SGPS SA | 9,678 | $ | 111,695 | 4.1 | % | |||||||
|
|
|
| |||||||||
| Singapore | ||||||||||||
City Developments Ltd. | 28,800 | 160,985 | 5.9 | |||||||||
ComfortDelGro Corp. Ltd. | 266,800 | 311,042 | 11.5 | |||||||||
Wilmar International Ltd. | 276,500 | 696,304 | 25.6 | |||||||||
|
|
|
| |||||||||
| 1,168,331 | ||||||||||||
| Spain | ||||||||||||
Industria de Diseno Textil SA | 37,736 | 966,509 | 35.6 | |||||||||
Merlin Properties Socimi SA | 2,774 | 25,743 | 1.0 | |||||||||
|
|
|
| |||||||||
| 992,252 | ||||||||||||
| Sweden | ||||||||||||
Assa Abloy AB, Class B | 60,857 | 1,089,458 | 40.1 | |||||||||
Castellum AB | 107,508 | 1,885,670 | 69.4 | |||||||||
Elekta AB, B Shares, Class B | 25,982 | 236,057 | 8.7 | |||||||||
Fabege AB | 41,917 | 496,545 | 18.3 | |||||||||
Hufvudstaden AB, A Shares | 47,280 | 605,824 | 22.3 | |||||||||
Indutrade AB | 9,570 | 307,665 | 11.3 | |||||||||
Investment AB Latour, -B Shares | 9,019 | 134,842 | 5.0 | |||||||||
L E Lundbergforetagen AB, B Shares | 1,421 | 59,663 | 2.2 | |||||||||
Swedish Match AB | 2,665 | 164,687 | 6.1 | |||||||||
|
|
|
| |||||||||
| 4,980,411 | ||||||||||||
| Switzerland | ||||||||||||
Belimo Holding AG | 3 | 19,973 | 0.7 | |||||||||
Cie Financiere Richemont SA, Registered Shares | 297 | 16,868 | 0.6 | |||||||||
Coca-Cola HBC AG | 22,734 | 576,050 | 21.2 | |||||||||
Galenica AG | 474 | 33,943 | 1.3 | |||||||||
Geberit AG, Registered Shares | 3,662 | 1,637,657 | 60.3 | |||||||||
Givaudan SA, Registered Shares | 762 | 2,555,202 | 94.1 | |||||||||
Kuehne + Nagel International AG, Registered Shares | 135 | 19,308 | 0.7 | |||||||||
Landis+Gyr Group AG | 1,060 | 71,600 | 2.7 | |||||||||
Nestle SA, Registered Shares | 12,352 | 1,308,200 | 48.2 | |||||||||
PSP Swiss Property AG, Registered Shares | 10,002 | 1,161,906 | 42.8 | |||||||||
Sika AG, Registered Shares | 376 | 62,194 | 2.3 | |||||||||
Sunrise Communications Group AG | 2,892 | 231,654 | 8.5 | |||||||||
Vifor Pharma AG | 2,666 | 399,964 | 14.7 | |||||||||
|
|
|
| |||||||||
| 8,094,519 | ||||||||||||
| United Kingdom | ||||||||||||
Ashmore Group PLC | 30,828 | 146,983 | 5.4 | |||||||||
ASOS PLC | 1,400 | 42,213 | 1.6 | |||||||||
Barratt Developments PLC | 91,708 | 597,877 | 22.0 | |||||||||
Bellway PLC | 896 | 29,981 | 1.1 | |||||||||
boohoo Group PLC | 60,710 | 246,690 | 9.1 | |||||||||
Burberry Group PLC | 24,169 | 419,659 | 15.5 | |||||||||
Coca-Cola European Partners PLC | 10,076 | 399,413 | 14.7 | |||||||||
Croda International PLC | 22,631 | 1,387,726 | 51.1 | |||||||||
Dunelm Group PLC | 4,554 | 52,616 | 1.9 | |||||||||
Experian PLC | 97,308 | 2,922,195 | 107.6 | |||||||||
Fevertree Drinks PLC | 7,112 | 155,228 | 5.7 | |||||||||
Games Workshop Group PLC | 1,006 | 76,139 | 2.8 | |||||||||
Great Portland Estates PLC | 8,231 | 70,106 | 2.6 | |||||||||
Hiscox Ltd. | 3,762 | 33,095 | 1.2 | |||||||||
HomeServe PLC | 25,633 | 359,058 | 13.2 | |||||||||
Howden Joinery Group PLC | 84,535 | 557,441 | 20.5 | |||||||||
Informa PLC | 148,249 | 818,906 | 30.2 | |||||||||
Johnson Matthey PLC | 2,133 | 53,529 | 2.0 | |||||||||
Jupiter Fund Management PLC | 5,295 | 14,556 | 0.5 | |||||||||
Marks & Spencer Group PLC | 66,564 | 77,552 | 2.9 | |||||||||
Meggitt PLC | 104,213 | 364,918 | 13.4 | |||||||||
Melrose Industries PLC | 190,448 | 238,041 | 8.8 | |||||||||
| Shares | Value | % of Basket Value | ||||||||||
| United Kingdom (continued) | ||||||||||||
Moneysupermarket.com Group PLC | 170,304 | $ | 678,539 | 25.0 | % | |||||||
Redrow PLC | 35,940 | 208,823 | 7.7 | |||||||||
Rotork PLC | 37,014 | 115,388 | 4.2 | |||||||||
Schroders PLC | 3,397 | 113,458 | 4.2 | |||||||||
Smiths Group PLC | 32,046 | 498,969 | 18.4 | |||||||||
Subsea 7 SA | 173,417 | 951,910 | 35.1 | |||||||||
Taylor Wimpey PLC | 447,123 | 825,765 | 30.4 | |||||||||
Travis Perkins PLC | 12,680 | 165,569 | 6.1 | |||||||||
Vistry Group PLC | 12,263 | 124,538 | 4.6 | |||||||||
Vodafone Group PLC | 195,130 | 275,265 | 10.1 | |||||||||
WH Smith PLC | 6,938 | 109,492 | 4.0 | |||||||||
WPP PLC | 21,017 | 163,073 | 6.0 | |||||||||
|
|
|
| |||||||||
| 13,294,711 | ||||||||||||
| United States | ||||||||||||
10X Genomics, Inc., Class A | 5,022 | 401,107 | 14.8 | |||||||||
3M Co. | 4,235 | 643,381 | 23.7 | |||||||||
Acuity Brands, Inc. | 902 | 78,104 | 2.9 | |||||||||
Adobe, Inc. | 1,637 | 578,909 | 21.3 | |||||||||
Aerojet Rocketdyne Holdings, Inc. | 9,270 | 381,368 | 14.0 | |||||||||
Air Products & Chemicals, Inc. | 4,152 | 936,608 | 34.5 | |||||||||
Alexandria Real Estate Equities, Inc. | 3,599 | 565,367 | 20.8 | |||||||||
Alphabet, Inc., Class A | 1,819 | 2,449,647 | 90.2 | |||||||||
Altria Group, Inc. | 54,961 | 2,157,219 | 79.4 | |||||||||
Amazon.com, Inc. | 2,129 | 5,267,146 | 194.0 | |||||||||
Amedisys, Inc. | 2,124 | 391,156 | 14.4 | |||||||||
Americold Realty Trust | 30,322 | 927,550 | 34.2 | |||||||||
AMETEK, Inc. | 289 | 24,238 | 0.9 | |||||||||
ANSYS, Inc. | 1,688 | 441,969 | 16.3 | |||||||||
AO Smith Corp. | 9,527 | 403,754 | 14.9 | |||||||||
Apple, Inc. | 6,093 | 1,790,123 | 65.9 | |||||||||
Aptiv PLC | 393 | 27,333 | 1.0 | |||||||||
Arch Capital Group Ltd. | 33,378 | 802,073 | 29.5 | |||||||||
Aspen Technology, Inc. | 1,233 | 126,074 | 4.6 | |||||||||
Autodesk, Inc. | 1,719 | 321,676 | 11.8 | |||||||||
Avalara, Inc. | 2,536 | 226,642 | 8.3 | |||||||||
Avangrid, Inc. | 36,646 | 1,575,778 | 58.0 | |||||||||
Avnet, Inc. | 8,515 | 255,620 | 9.4 | |||||||||
Axalta Coating Systems Ltd. | 72,018 | 1,421,635 | 52.4 | |||||||||
Axis Capital Holdings Ltd. | 5,522 | 202,105 | 7.4 | |||||||||
Axon Enterprise, Inc. | 6,253 | 454,656 | 16.7 | |||||||||
Baker Hughes Co. | 1,655 | 23,087 | 0.9 | |||||||||
Ball Corp. | 4,387 | 287,743 | 10.6 | |||||||||
Best Buy Co., Inc. | 6,557 | 503,119 | 18.5 | |||||||||
Bio-Techne Corp. | 588 | 132,300 | 4.9 | |||||||||
Boeing Co. | 8,723 | 1,230,117 | 45.3 | |||||||||
Booz Allen Hamilton Holding Corp. | 5,813 | 426,907 | 15.7 | |||||||||
Boston Scientific Corp. | 19,265 | 722,052 | 26.6 | |||||||||
Brink’s Co. | 710 | 36,295 | 1.3 | |||||||||
Broadridge Financial Solutions, Inc. | 2,681 | 310,996 | 11.5 | |||||||||
Bruker Corp. | 14,782 | 581,228 | 21.4 | |||||||||
BWX Technologies, Inc. | 10,020 | 531,661 | 19.6 | |||||||||
Cabot Microelectronics Corp. | 531 | 65,069 | 2.4 | |||||||||
Cadence Design Systems, Inc. | 4,237 | 343,748 | 12.7 | |||||||||
Camden Property Trust | 5,431 | 478,308 | 17.6 | |||||||||
Cargurus, Inc. | 24,334 | 556,762 | 20.5 | |||||||||
Carrier Global Corp. | 61,106 | 1,082,187 | 39.9 | |||||||||
Cboe Global Markets, Inc. | 6,832 | 678,964 | 25.0 | |||||||||
Centene Corp. | 2,513 | 167,316 | 6.2 | |||||||||
Charles Schwab Corp. | 6,083 | 229,451 | 8.4 | |||||||||
Chegg, Inc. | 4,097 | 175,147 | 6.4 | |||||||||
Cirrus Logic, Inc. | 9,198 | 695,369 | 25.6 | |||||||||
Coca-Cola Co. | 22,420 | 1,028,854 | 37.9 | |||||||||
| 48 | 2020 BLACKROCK ANNUAL REPORTTO SHAREHOLDERS |
Schedule of Investments (continued) April 30, 2020 | BlackRock Global Long/Short Equity Fund |
| Shares | Value | % of Basket Value | ||||||||||
| United States (continued) | ||||||||||||
Copart, Inc. | 21,137 | $ | 1,693,285 | 62.4 | % | |||||||
CoreSite Realty Corp. | 281 | 34,054 | 1.3 | |||||||||
CoStar Group, Inc. | 1,807 | 1,171,406 | 43.1 | |||||||||
Costco Wholesale Corp. | 8,308 | 2,517,324 | 92.7 | |||||||||
Crane Co. | 4,359 | 237,348 | 8.7 | |||||||||
Crimson Wine Group Ltd. | 1 | 6 | 0.0 | |||||||||
CVS Health Corp. | 16,153 | 994,217 | 36.6 | |||||||||
CyberArk Software Ltd. | 7,550 | 745,638 | 27.5 | |||||||||
CyrusOne, Inc. | 1,488 | 104,383 | 3.8 | |||||||||
Deckers Outdoor Corp. | 818 | 121,686 | 4.5 | |||||||||
Dell Technologies, Inc., Class C | 3,977 | 169,778 | 6.3 | |||||||||
DENTSPLY SIRONA, Inc. | 2,108 | 89,464 | 3.3 | |||||||||
DexCom, Inc. | 1,068 | 357,994 | 13.2 | |||||||||
Discover Financial Services | 5,920 | 254,382 | 9.4 | |||||||||
Dolby Laboratories, Inc., Class A | 1,973 | 118,439 | 4.4 | |||||||||
Dollar General Corp. | 8,819 | 1,545,971 | 56.9 | |||||||||
Domino’s Pizza, Inc. | 5,145 | 1,862,130 | 68.6 | |||||||||
Dropbox, Inc., Class A | 16,972 | 356,751 | 13.1 | |||||||||
eBay, Inc. | 28,861 | 1,149,534 | 42.3 | |||||||||
Edwards Lifesciences Corp. | 10,559 | 2,296,583 | 84.6 | |||||||||
eHealth, Inc. | 2,546 | 271,658 | 10.0 | |||||||||
EPAM Systems, Inc. | 6,005 | 1,326,444 | 48.9 | |||||||||
Essent Group Ltd. | 29,391 | 802,962 | 29.6 | |||||||||
Etsy, Inc. | 10,744 | 696,963 | 25.7 | |||||||||
Exponent, Inc. | 2,092 | 147,130 | 5.4 | |||||||||
Facebook, Inc., Class A | 19,294 | 3,949,675 | 145.5 | |||||||||
FactSet Research Systems, Inc. | 8,767 | 2,410,925 | 88.8 | |||||||||
FedEx Corp. | 1,707 | 216,396 | 8.0 | |||||||||
Fidelity National Financial, Inc. | 56,082 | 1,517,018 | 55.9 | |||||||||
Five9, Inc. | 3,477 | 322,214 | 11.9 | |||||||||
FLIR Systems, Inc. | 14,835 | 643,839 | 23.7 | |||||||||
Flowserve Corp. | 14,510 | 408,747 | 15.1 | |||||||||
Fortinet, Inc. | 9,079 | 978,171 | 36.0 | |||||||||
Fortune Brands Home & Security, Inc. | 2,131 | 102,714 | 3.8 | |||||||||
Franklin Resources, Inc. | 9,113 | 171,689 | 6.3 | |||||||||
frontdoor, Inc. | 14,040 | 543,488 | 20.0 | |||||||||
Garmin Ltd. | 605 | 49,102 | 1.8 | |||||||||
General Dynamics Corp. | 18,766 | 2,451,215 | 90.3 | |||||||||
General Electric Co. | 50,912 | 346,202 | 12.7 | |||||||||
Gentex Corp. | 33,998 | 824,112 | 30.3 | |||||||||
Globus Medical, Inc., Class A | 2,171 | 103,036 | 3.8 | |||||||||
GrubHub, Inc. | 28,848 | 1,378,646 | 50.8 | |||||||||
Guardant Health, Inc. | 2,356 | 181,318 | 6.7 | |||||||||
Guidewire Software, Inc. | 3,621 | 328,932 | 12.1 | |||||||||
H&R Block, Inc. | 84,214 | 1,402,163 | 51.6 | |||||||||
HD Supply Holdings, Inc. | 26,191 | 777,349 | 28.6 | |||||||||
HealthEquity, Inc. | 21,844 | 1,229,162 | 45.3 | |||||||||
HEICO Corp. | 883 | 77,351 | 2.8 | |||||||||
Helen of Troy Ltd. | 3,728 | 612,436 | 22.6 | |||||||||
Hologic, Inc. | 5,484 | 274,748 | 10.1 | |||||||||
Home Depot, Inc. | 22,680 | 4,985,744 | 183.6 | |||||||||
Honeywell International, Inc. | 6,548 | 929,161 | 34.2 | |||||||||
Howard Hughes Corp. | 796 | 43,111 | 1.6 | |||||||||
HubSpot, Inc. | 2,620 | 441,811 | 16.3 | |||||||||
IAA, Inc. | 6,946 | 268,116 | 9.9 | |||||||||
IDACORP, Inc. | 3,384 | 310,584 | 11.4 | |||||||||
IDEXX Laboratories, Inc. | 97 | 26,927 | 1.0 | |||||||||
Inphi Corp. | 7,115 | 686,882 | 25.3 | |||||||||
Intercontinental Exchange, Inc. | 40,078 | 3,584,977 | 132.0 | |||||||||
International Flavors & Fragrances, Inc. | 4,127 | 540,761 | 19.9 | |||||||||
Interpublic Group of Cos., Inc. | 9,103 | 154,569 | 5.7 | |||||||||
Invesco Ltd. | 43,220 | 372,556 | 13.7 | |||||||||
| Shares | Value | % of Basket Value | ||||||||||
| United States (continued) | ||||||||||||
IPG Photonics Corp. | 2,109 | $ | 272,757 | 10.0 | % | |||||||
ITT, Inc. | 10,726 | 565,475 | 20.8 | |||||||||
JB Hunt Transport Services, Inc. | 185 | 18,707 | 0.7 | |||||||||
Johnson Controls International PLC | 26,425 | 769,232 | 28.3 | |||||||||
JPMorgan Chase & Co. | 13,717 | 1,313,540 | 48.4 | |||||||||
Kansas City Southern | 3,066 | 400,266 | 14.7 | |||||||||
Keurig Dr Pepper, Inc. | 49,740 | 1,316,120 | 48.5 | |||||||||
Keysight Technologies, Inc. | 6,036 | 584,104 | 21.5 | |||||||||
L3Harris Technologies, Inc. | 4,807 | 931,116 | 34.3 | |||||||||
Littelfuse, Inc. | 2,263 | 328,678 | 12.1 | |||||||||
LivaNova PLC | 5,934 | 315,214 | 11.6 | |||||||||
Livongo Health, Inc. | 12,265 | 490,723 | 18.1 | |||||||||
Lowe’s Cos., Inc. | 5,744 | 601,684 | 22.2 | |||||||||
LPL Financial Holdings, Inc. | 1,605 | 96,653 | 3.6 | |||||||||
MarketAxess Holdings, Inc. | 213 | 96,917 | 3.6 | |||||||||
Marsh & McLennan Cos., Inc. | 34,011 | 3,310,291 | 121.9 | |||||||||
Marvell Technology Group Ltd. | 4,951 | 132,390 | 4.9 | |||||||||
Masimo Corp. | 520 | 111,233 | 4.1 | |||||||||
Mastercard, Inc., Class A | 3,456 | 950,296 | 35.0 | |||||||||
Mattel, Inc. | 19,677 | 171,583 | 6.3 | |||||||||
Maxim Integrated Products, Inc. | 35,224 | 1,936,616 | 71.3 | |||||||||
McCormick & Co., Inc. | 1,740 | 272,902 | 10.1 | |||||||||
Medtronic PLC | 10,023 | 978,546 | 36.0 | |||||||||
Mercury Systems, Inc. | 6,265 | 558,587 | 20.6 | |||||||||
MGIC Investment Corp. | 103,380 | 755,708 | 27.8 | |||||||||
Microsoft Corp. | 11,526 | 2,065,574 | 76.1 | |||||||||
Monolithic Power Systems, Inc. | 2,441 | 487,980 | 18.0 | |||||||||
Mosaic Co. | 30,426 | 350,203 | 12.9 | |||||||||
MSA Safety, Inc. | 13,256 | 1,491,698 | 54.9 | |||||||||
MSC Industrial Direct Co., Inc., Class A | 5,863 | 349,669 | 12.9 | |||||||||
National Instruments Corp. | 4,227 | 162,401 | 6.0 | |||||||||
NeoGenomics, Inc. | 5,743 | 157,014 | 5.8 | |||||||||
New Relic, Inc. | 14,656 | 786,881 | 29.0 | |||||||||
New York Times Co., Class A | 19,519 | 634,758 | 23.4 | |||||||||
Nexstar Media Group, Inc., Class A | 17,721 | 1,241,179 | 45.7 | |||||||||
Nielsen Holdings PLC | 11,048 | 162,737 | 6.0 | |||||||||
NIKE, Inc., Class B | 5,744 | 500,762 | 18.4 | |||||||||
Northrop Grumman Corp. | 4,229 | 1,398,403 | 51.5 | |||||||||
Nutanix, Inc., Class A | 2,669 | 54,688 | 2.0 | |||||||||
NVIDIA Corp. | 4,570 | 1,335,720 | 49.2 | |||||||||
Otis Worldwide Corp. | 27,656 | 1,407,967 | 51.9 | |||||||||
Owens Corning | 8,631 | 374,240 | 13.8 | |||||||||
PacWest Bancorp | 73,198 | 1,481,528 | 54.6 | |||||||||
Paylocity Holding Corp. | 16,488 | 1,888,371 | 69.5 | |||||||||
PayPal Holdings, Inc. | 53,783 | 6,615,309 | 243.6 | |||||||||
PerkinElmer, Inc. | 3,929 | 355,692 | 13.1 | |||||||||
PPD, Inc. | 35,213 | 841,591 | 31.0 | |||||||||
PPL Corp. | 10,877 | 276,493 | 10.2 | |||||||||
PRA Health Sciences, Inc. | 6,498 | 627,057 | 23.1 | |||||||||
Premier, Inc., Class A | 1,899 | 62,971 | 2.3 | |||||||||
Prudential Financial, Inc. | 19,695 | 1,228,377 | 45.2 | |||||||||
Public Service Enterprise Group, Inc. | 957 | 48,529 | 1.8 | |||||||||
Q2 Holdings, Inc. | 1,474 | 117,507 | 4.3 | |||||||||
QTS Realty Trust, Inc., Class A | 11,685 | 730,663 | 26.9 | |||||||||
Reata Pharmaceuticals, Inc., Class A | 354 | 55,989 | 2.1 | |||||||||
Reliance Steel & Aluminum Co. | 7,244 | 648,918 | 23.9 | |||||||||
Repligen Corp. | 493 | 57,262 | 2.1 | |||||||||
RingCentral, Inc., Class A | 2,652 | 606,062 | 22.3 | |||||||||
Robert Half International, Inc. | 8,571 | 405,151 | 14.9 | |||||||||
Rockwell Automation, Inc. | 6,134 | 1,162,270 | 42.8 | |||||||||
Roper Technologies, Inc. | 6,000 | 2,046,180 | 75.4 | |||||||||
salesforce.com, Inc. | 9,556 | 1,547,594 | 57.0 | |||||||||
| SCHEDULES OF INVESTMENTS | 49 |
Schedule of Investments (continued) April 30, 2020 | BlackRock Global Long/Short Equity Fund |
| Shares | Value | % of Basket Value | ||||||||||
| United States (continued) | ||||||||||||
Schlumberger Ltd. | 15,897 | $ | 267,388 | 9.8 | % | |||||||
Service Corp. International | 1,052 | 38,650 | 1.4 | |||||||||
ServiceNow, Inc. | 3,571 | 1,255,349 | 46.2 | |||||||||
Sherwin-Williams Co. | 8,279 | 4,440,607 | 163.5 | |||||||||
Silicon Laboratories, Inc. | 8,091 | 786,607 | 29.0 | |||||||||
Sirius XM Holdings, Inc. | 701,772 | 4,147,473 | 152.7 | |||||||||
Smartsheet, Inc., Class A | 3,657 | 192,797 | 7.1 | |||||||||
SolarEdge Technologies, Inc. | 5,730 | 639,411 | 23.5 | |||||||||
Spirit AeroSystems Holdings, Inc., Class A | 1,280 | 28,365 | 1.0 | |||||||||
Splunk, Inc., | 3,635 | 510,209 | 18.8 | |||||||||
Sterling Bancorp | 18,327 | 225,972 | 8.3 | |||||||||
STORE Capital Corp. | 41,699 | 836,899 | 30.8 | |||||||||
Synovus Financial Corp. | 82,542 | 1,734,207 | 63.9 | |||||||||
T. Rowe Price Group, Inc. | 7,626 | 881,794 | 32.5 | |||||||||
Target Corp. | 8,819 | 967,797 | 35.6 | |||||||||
Telephone & Data Systems, Inc. | 38,535 | 756,057 | 27.8 | |||||||||
Tetra Tech, Inc. | 15 | 1,129 | 0.0 | |||||||||
Texas Instruments, Inc. | 21,514 | 2,497,130 | 92.0 | |||||||||
TJX Cos., Inc. | 15,415 | 756,106 | 27.8 | |||||||||
Toro Co. | 1,123 | 71,659 | 2.6 | |||||||||
Tractor Supply Co. | 5,701 | 578,252 | 21.3 | |||||||||
Trane Technologies PLC | 15,125 | 1,322,228 | 48.7 | |||||||||
TransDigm Group, Inc. | 741 | 269,042 | 9.9 | |||||||||
TransUnion | 35,184 | 2,772,147 | 102.1 | |||||||||
Twilio, Inc., Class A | 9,126 | 1,024,850 | 37.7 | |||||||||
Twitter, Inc. | 103,599 | 2,971,219 | 109.4 | |||||||||
Uber Technologies, Inc. | 4,239 | 128,315 | 4.7 | |||||||||
UGI Corp. | 16,719 | 504,579 | 18.6 | |||||||||
Union Pacific Corp. | 17,743 | 2,835,154 | 104.4 | |||||||||
United Parcel Service, Inc., Class B | 15,070 | 1,426,526 | 52.5 | |||||||||
Universal Display Corp. | 160 | 24,019 | 0.9 | |||||||||
Varian Medical Systems, Inc. | 22,845 | 2,613,011 | 96.2 | |||||||||
Veeva Systems, Inc., Class A | 1,065 | 203,202 | 7.5 | |||||||||
Verisk Analytics, Inc. | 1,217 | 185,994 | 6.8 | |||||||||
Virtu Financial, Inc., Class A | 2,711 | 63,356 | 2.3 | |||||||||
Visa, Inc., Class A | 9,165 | 1,637,969 | 60.3 | |||||||||
VMware, Inc., Class A | 8,582 | 1,128,705 | 41.6 | |||||||||
Vulcan Materials Co. | 5,996 | 677,368 | 24.9 | |||||||||
W.W. Grainger, Inc. | 2,069 | 570,175 | 21.0 | |||||||||
Webster Financial Corp. | 43,416 | 1,226,502 | 45.2 | |||||||||
Wells Fargo & Co. | 33,255 | 966,058 | 35.6 | |||||||||
Westlake Chemical Corp. | 3,768 | 163,720 | 6.0 | |||||||||
Wingstop, Inc. | 878 | 102,963 | 3.8 | |||||||||
Woodward, Inc. | 3,877 | 234,791 | 8.6 | |||||||||
Workday, Inc., Class A | 22,100 | 3,401,190 | 125.3 | |||||||||
Xylem, Inc. | 38,668 | 2,780,229 | 102.4 | |||||||||
Yum! Brands, Inc. | 14,411 | 1,245,543 | 45.9 | |||||||||
Zendesk, Inc. | 53,503 | 4,113,311 | 151.5 | |||||||||
Zoetis, Inc. | 7,410 | 958,187 | 35.3 | |||||||||
|
|
|
| |||||||||
| 194,058,232 | ||||||||||||
|
| |||||||||||
Total Reference Entity — Long |
| 294,116,978 | ||||||||||
|
| |||||||||||
Reference Entity — Short | ||||||||||||
| Australia | ||||||||||||
Afterpay Ltd. | (25,375 | ) | (504,598 | ) | (18.6 | ) | ||||||
AMP Ltd. | (81,077 | ) | (74,806 | ) | (2.8 | ) | ||||||
AusNet Services | (232,320 | ) | (283,343 | ) | (10.4 | ) | ||||||
Boral Ltd. | (36,756 | ) | (71,435 | ) | (2.6 | ) | ||||||
Coles Group Ltd. | (13,251 | ) | (132,879 | ) | (4.9 | ) | ||||||
Computershare, Ltd. | (16,407 | ) | (129,085 | ) | (4.7 | ) | ||||||
Iluka Resources Ltd. | (12,053 | ) | (59,783 | ) | (2.2 | ) | ||||||
Magellan Financial Group, Ltd. | (2,260 | ) | (74,030 | ) | (2.7 | ) | ||||||
| Shares | Value | % of Basket Value | ||||||||||
| Australia (continued) | ||||||||||||
Orora Ltd. | (274,257 | ) | $ | (455,777 | ) | (16.8 | ) % | |||||
Qube Holdings Ltd. | (199,923 | ) | (416,181 | ) | (15.3 | ) | ||||||
Ramsay Health Care, Ltd. | (4,721 | ) | (191,727 | ) | (7.1 | ) | ||||||
Scentre Group | (12,446 | ) | (18,697 | ) | (0.7 | ) | ||||||
Seven Group Holdings Ltd. | (13,561 | ) | (133,352 | ) | (4.9 | ) | ||||||
Tabcorp Holdings, Ltd. | (46,688 | ) | (97,339 | ) | (3.6 | ) | ||||||
TPG Telecom Ltd. | (46,468 | ) | (221,732 | ) | (8.2 | ) | ||||||
Vicinity Centres | (75,185 | ) | (71,977 | ) | (2.6 | ) | ||||||
|
|
|
| |||||||||
| (2,936,741 | ) | |||||||||||
| Belgium | ||||||||||||
Euronav NV | (10,932 | ) | (122,101 | ) | (4.5 | ) | ||||||
Proximus SADP | (25,292 | ) | (539,818 | ) | (19.9 | ) | ||||||
|
|
|
| |||||||||
| (661,919 | ) | |||||||||||
| Bermuda | ||||||||||||
RenaissanceRe Holdings Ltd. | (13,969 | ) | (2,039,614 | ) | (75.1 | ) | ||||||
|
|
|
| |||||||||
| Canada | ||||||||||||
Bombardier, Inc., Class B | (376,577 | ) | (132,564 | ) | (4.9 | ) | ||||||
Canadian Utilities, Ltd. | (14,667 | ) | (357,837 | ) | (13.2 | ) | ||||||
Centerra Gold, Inc. | (2,353 | ) | (18,814 | ) | (0.7 | ) | ||||||
Fairfax Financial Holdings Ltd. | (731 | ) | (198,207 | ) | (7.3 | ) | ||||||
Fortis, Inc. | (7,732 | ) | (299,626 | ) | (11.0 | ) | ||||||
GFL Environmental, Inc. | (16,184 | ) | (279,983 | ) | (10.3 | ) | ||||||
Northland Power, Inc. | (1,869 | ) | (40,107 | ) | (1.5 | ) | ||||||
Osisko Gold Royalties Ltd. | (5 | ) | (46 | ) | 0.0 | |||||||
Restaurant Brands International, Inc. | (24,817 | ) | (1,210,585 | ) | (44.6 | ) | ||||||
Saputo, Inc. | (10,289 | ) | (258,713 | ) | (9.5 | ) | ||||||
Stars Group, Inc. | (16,648 | ) | (464,415 | ) | (17.1 | ) | ||||||
Thomson Reuters Corp. | (1,426 | ) | (100,469 | ) | (3.7 | ) | ||||||
|
|
|
| |||||||||
| (3,361,366 | ) | |||||||||||
| China | ||||||||||||
Budweiser Brewing Co. APAC Ltd. | (74,900 | ) | (203,535 | ) | (7.5 | ) | ||||||
Minth Group Ltd. | (106,000 | ) | (254,890 | ) | (9.4 | ) | ||||||
|
|
|
| |||||||||
| (458,425 | ) | |||||||||||
| Denmark | ||||||||||||
Ambu A/S, Class B | (12,471 | ) | (390,620 | ) | (14.4 | ) | ||||||
AP Moeller — Maersk A/S | (1,030 | ) | (954,394 | ) | (35.1 | ) | ||||||
AP Moeller — Maersk A/S | (946 | ) | (941,509 | ) | (34.7 | ) | ||||||
Danske Bank A/S | (172,454 | ) | (2,047,558 | ) | (75.4 | ) | ||||||
ISS A/S | (14,169 | ) | (210,655 | ) | (7.8 | ) | ||||||
Jyske Bank A/S, Registered Shares | (1,403 | ) | (37,871 | ) | (1.4 | ) | ||||||
Rockwool International A/S, -B Shares | (917 | ) | (192,716 | ) | (7.1 | ) | ||||||
|
|
|
| |||||||||
| (4,775,323 | ) | |||||||||||
| Finland | ||||||||||||
Fortum OYJ | (22,608 | ) | (374,618 | ) | (13.9 | ) | ||||||
Konecranes OYJ | (14,610 | ) | (317,098 | ) | (11.7 | ) | ||||||
Metsa Board OYJ | (8,557 | ) | (59,603 | ) | (2.2 | ) | ||||||
Nordea Bank Abp | (415,939 | ) | (2,667,806 | ) | (98.2 | ) | ||||||
Outokumpu OYJ | (57,201 | ) | (154,014 | ) | (5.7 | ) | ||||||
Stora Enso OYJ, -R Shares | (23,669 | ) | (278,455 | ) | (10.2 | ) | ||||||
|
|
|
| |||||||||
| (3,851,594 | ) | |||||||||||
| France | ||||||||||||
Bollore SA | (300,879 | ) | (797,396 | ) | (29.3 | ) | ||||||
Dassault Aviation SA | (333 | ) | (271,197 | ) | (10.0 | ) | ||||||
Faurecia SE | (2,277 | ) | (81,588 | ) | (3.0 | ) | ||||||
Iliad SA | (835 | ) | (124,349 | ) | (4.6 | ) | ||||||
La Francaise des Jeux SAEM | (2,003 | ) | (57,300 | ) | (2.1 | ) | ||||||
|
|
|
| |||||||||
| (1,331,830 | ) | |||||||||||
| 50 | 2020 BLACKROCK ANNUAL REPORTTO SHAREHOLDERS |
Schedule of Investments (continued) April 30, 2020 | BlackRock Global Long/Short Equity Fund |
| Shares | Value | % of Basket Value | ||||||||||
| Germany | ||||||||||||
Bayer AG, Registered Shares | (21,472 | ) | $ | (1,412,200 | ) | (52.0 | ) % | |||||
Bechtle AG | (850 | ) | (122,925 | ) | (4.5 | ) | ||||||
Daimler AG | (26,228 | ) | (897,076 | ) | (33.0 | ) | ||||||
Deutsche Bank AG | (13,711 | ) | (101,547 | ) | (3.7 | ) | ||||||
Deutsche Telekom AG | (95,769 | ) | (1,400,106 | ) | (51.6 | ) | ||||||
Fuchs Petrolub SE | (22,046 | ) | (854,846 | ) | (31.5 | ) | ||||||
Hannover Rueck SE | (736 | ) | (117,352 | ) | (4.3 | ) | ||||||
Hapag-Lloyd AG | (2,723 | ) | (390,093 | ) | (14.4 | ) | ||||||
HeidelbergCement AG | (28,214 | ) | (1,337,657 | ) | (49.3 | ) | ||||||
ProSiebenSat.1 Media SE | (18,142 | ) | (181,305 | ) | (6.7 | ) | ||||||
Schaeffler AG | (32,083 | ) | (216,638 | ) | (8.0 | ) | ||||||
Siltronic AG | (4,193 | ) | (358,962 | ) | (13.2 | ) | ||||||
Suedzucker AG | (47,710 | ) | (631,235 | ) | (23.2 | ) | ||||||
Talanx AG | (8,991 | ) | (319,296 | ) | (11.8 | ) | ||||||
TeamViewer AG | (15,576 | ) | (675,931 | ) | (24.9 | ) | ||||||
TUI AG | (18,996 | ) | (75,674 | ) | (2.8 | ) | ||||||
Volkswagen AG | (10,881 | ) | (1,608,688 | ) | (59.2 | ) | ||||||
|
|
|
| |||||||||
| (10,701,531 | ) | |||||||||||
| Hong Kong | ||||||||||||
ASM Pacific Technology Ltd. | (2,700 | ) | (27,283 | ) | (1.0 | ) | ||||||
Shangri-La Asia Ltd. | (26,000 | ) | (21,470 | ) | (0.8 | ) | ||||||
SJM Holdings Ltd. | (1,917,000 | ) | (1,892,735 | ) | (69.7 | ) | ||||||
|
|
|
| |||||||||
| (1,941,488 | ) | |||||||||||
| Israel | ||||||||||||
First International Bank Of Israel Ltd. | (1,809 | ) | (44,623 | ) | (1.7 | ) | ||||||
Gazit-Globe Ltd. | (1,870 | ) | (13,845 | ) | (0.5 | ) | ||||||
ICL Ltd. | (111,591 | ) | (389,344 | ) | (14.3 | ) | ||||||
Israel Corp. Ltd. | (700 | ) | (90,322 | ) | (3.3 | ) | ||||||
Shufersal Ltd. | (4,130 | ) | (26,506 | ) | (1.0 | ) | ||||||
Teva Pharmaceutical Industries Ltd. | (50,346 | ) | (544,587 | ) | (20.1 | ) | ||||||
Teva Pharmaceutical Industries, Ltd., ADR | (47,324 | ) | (508,260 | ) | (18.7 | ) | ||||||
Wix.com Ltd. | (1,181 | ) | (154,487 | ) | (5.7 | ) | ||||||
|
|
|
| |||||||||
| (1,771,974 | ) | |||||||||||
| Italy | ||||||||||||
Prada SpA | (5,800 | ) | (18,831 | ) | (0.7 | ) | ||||||
|
|
|
| |||||||||
| Japan | ||||||||||||
Acom Co. Ltd. | (3,200 | ) | (12,929 | ) | (0.5 | ) | ||||||
Bandai Namco Holdings, Inc. | (12,000 | ) | (599,597 | ) | (22.1 | ) | ||||||
Bank of Kyoto Ltd. | (42,800 | ) | (1,464,973 | ) | (53.9 | ) | ||||||
Brother Industries Ltd. | (3,300 | ) | (55,930 | ) | (2.1 | ) | ||||||
The Chiba Bank Ltd. | (3,400 | ) | (15,776 | ) | (0.6 | ) | ||||||
Chugoku Bank Ltd. | (80,800 | ) | (744,008 | ) | (27.4 | ) | ||||||
DMG Mori Co., Ltd. | (62,700 | ) | (641,087 | ) | (23.6 | ) | ||||||
Dowa Holdings Co. Ltd. | (35,100 | ) | (970,798 | ) | (35.7 | ) | ||||||
FUJIFILM Holdings Corp. | (13,700 | ) | (652,566 | ) | (24.0 | ) | ||||||
Fujitsu Ltd. | (6,200 | ) | (602,320 | ) | (22.2 | ) | ||||||
Gunma Bank Ltd. | (5,600 | ) | (17,929 | ) | (0.7 | ) | ||||||
Hachijuni Bank Ltd. | (172,700 | ) | (616,686 | ) | (22.7 | ) | ||||||
Hamamatsu Photonics KK | (8,400 | ) | (367,157 | ) | (13.5 | ) | ||||||
Hitachi Chemical Co. Ltd. | (1,064 | ) | (45,642 | ) | (1.7 | ) | ||||||
Hitachi Construction Machinery Co., Ltd. | (26,600 | ) | (624,095 | ) | (23.0 | ) | ||||||
Hitachi Metals Ltd. | (50,900 | ) | (490,459 | ) | (18.1 | ) | ||||||
Ibiden Co. Ltd. | (20,200 | ) | (516,312 | ) | (19.0 | ) | ||||||
Ichigo, Inc. | (45,400 | ) | (116,260 | ) | (4.3 | ) | ||||||
Invincible Investment Corp. | (821 | ) | (210,063 | ) | (7.7 | ) | ||||||
Ito En Ltd. | (8,100 | ) | (449,970 | ) | (16.6 | ) | ||||||
ITOCHU Corp. | (19,800 | ) | (388,181 | ) | (14.3 | ) | ||||||
Itochu Techno-Solutions Corp. | (4,700 | ) | (143,606 | ) | (5.3 | ) | ||||||
Iyo Bank Ltd. | (76,400 | ) | (409,293 | ) | (15.1 | ) | ||||||
Japan Airport Terminal Co. Ltd. | (7,100 | ) | (287,921 | ) | (10.6 | ) | ||||||
| Shares | Value | % of Basket Value | ||||||||||
| Japan (continued) | ||||||||||||
Japan Aviation Electronics Industry, Ltd. | (1,600 | ) | $ | (20,756 | ) | (0.8 | ) % | |||||
Japan Exchange Group, Inc. | (1,600 | ) | (29,761 | ) | (1.1 | ) | ||||||
Japan Post Bank Co. Ltd. | (2,000 | ) | (18,618 | ) | (0.7 | ) | ||||||
Japan Real Estate Investment Corp. | (120 | ) | (648,151 | ) | (23.9 | ) | ||||||
JSR Corp. | (3,900 | ) | (73,363 | ) | (2.7 | ) | ||||||
Justsystems Corp. | (4,800 | ) | (293,530 | ) | (10.8 | ) | ||||||
Kansai Mirai Financial Group, Inc. | (48,500 | ) | (163,064 | ) | (6.0 | ) | ||||||
Kawasaki Heavy Industries Ltd. | (1,700 | ) | (25,687 | ) | (0.9 | ) | ||||||
Keihan Holdings Co. Ltd. | (18,000 | ) | (809,023 | ) | (29.8 | ) | ||||||
Keihin Corp. | (8,100 | ) | (193,212 | ) | (7.1 | ) | ||||||
Keikyu Corp. | (4,300 | ) | (70,673 | ) | (2.6 | ) | ||||||
Keio Corp. | (16,600 | ) | (939,021 | ) | (34.6 | ) | ||||||
Keisei Electric Railway Co. Ltd. | (15,500 | ) | (467,547 | ) | (17.2 | ) | ||||||
Kikkoman Corp. | (4,100 | ) | (188,395 | ) | (6.9 | ) | ||||||
Kinden Corp. | (2,300 | ) | (37,009 | ) | (1.4 | ) | ||||||
Kintetsu Group Holdings Co. Ltd. | (3,900 | ) | (186,305 | ) | (6.9 | ) | ||||||
Kobe Steel, Ltd. | (7,500 | ) | (25,084 | ) | (0.9 | ) | ||||||
Koei Tecmo Holdings Co. Ltd. | (34,300 | ) | (902,295 | ) | (33.2 | ) | ||||||
Kurita Water Industries Ltd. | (600 | ) | (16,739 | ) | (0.6 | ) | ||||||
Kyushu Financial Group, Inc. | (17,800 | ) | (75,092 | ) | (2.8 | ) | ||||||
Makita Corp. | (12,000 | ) | (390,749 | ) | (14.4 | ) | ||||||
Mani, Inc. | (800 | ) | (17,818 | ) | (0.6 | ) | ||||||
Minebea Mitsumi, Inc. | (99,800 | ) | (1,622,667 | ) | (59.8 | ) | ||||||
Mitsubishi Corp. | (45,800 | ) | (971,326 | ) | (35.8 | ) | ||||||
Mitsubishi Estate Co. Ltd. | (13,700 | ) | (221,640 | ) | (8.2 | ) | ||||||
Mitsubishi Heavy Industries, Ltd. | (40,200 | ) | (1,030,874 | ) | (38.0 | ) | ||||||
Mitsubishi Logistics Corp. | (30,900 | ) | (682,246 | ) | (25.1 | ) | ||||||
Mitsubishi UFJ Financial Group, Inc. | (150,100 | ) | (606,404 | ) | (22.3 | ) | ||||||
Mitsui & Co., Ltd. | (35,300 | ) | (492,729 | ) | (18.1 | ) | ||||||
Mitsui OSK Lines Ltd. | (14,700 | ) | (254,967 | ) | (9.4 | ) | ||||||
Mizuho Financial Group, Inc. | (195,000 | ) | (227,062 | ) | (8.4 | ) | ||||||
Nabtesco Corp. | (1,900 | ) | (54,369 | ) | (2.0 | ) | ||||||
Nagoya Railroad Co. Ltd. | (18,500 | ) | (529,399 | ) | (19.5 | ) | ||||||
NGK Insulators Ltd. | (40,700 | ) | (532,471 | ) | (19.6 | ) | ||||||
Nippo Corp. | (4,400 | ) | (98,950 | ) | (3.6 | ) | ||||||
Nippon Yusen KK | (15,900 | ) | (209,300 | ) | (7.7 | ) | ||||||
NOF Corp. | (6,300 | ) | (208,761 | ) | (7.7 | ) | ||||||
Nomura Holdings, Inc. | (95,300 | ) | (395,458 | ) | (14.6 | ) | ||||||
NTN Corp. | (12,200 | ) | (23,400 | ) | (0.9 | ) | ||||||
NTT Data Corp. | (2,100 | ) | (21,429 | ) | (0.8 | ) | ||||||
Oji Holdings Corp. | (6,800 | ) | (34,527 | ) | (1.3 | ) | ||||||
Olympus Corp. | (9,400 | ) | (149,149 | ) | (5.5 | ) | ||||||
Orient Corp. | (171,000 | ) | (195,589 | ) | (7.2 | ) | ||||||
Oriental Land Co. Ltd. | (5,900 | ) | (746,027 | ) | (27.5 | ) | ||||||
Panasonic Corp. | (5,300 | ) | (40,402 | ) | (1.5 | ) | ||||||
Pigeon Corp. | (4,900 | ) | (174,488 | ) | (6.4 | ) | ||||||
Sega Sammy Holdings, Inc. | (17,600 | ) | (213,186 | ) | (7.8 | ) | ||||||
Sharp Corp. | (103,900 | ) | (1,143,739 | ) | (42.1 | ) | ||||||
Shiga Bank Ltd. | (15,400 | ) | (362,720 | ) | (13.4 | ) | ||||||
Shimano, Inc. | (500 | ) | (73,678 | ) | (2.7 | ) | ||||||
Shinsei Bank Ltd. | (21,400 | ) | (258,147 | ) | (9.5 | ) | ||||||
Shizuoka Bank Ltd. | (22,000 | ) | (133,567 | ) | (4.9 | ) | ||||||
Shochiku Co. Ltd. | (12,200 | ) | (1,330,019 | ) | (49.0 | ) | ||||||
Showa Corp. | (16,400 | ) | (344,611 | ) | (12.7 | ) | ||||||
Skylark Holdings Co. Ltd. | (8,300 | ) | (122,686 | ) | (4.5 | ) | ||||||
SMC Corp. | (700 | ) | (316,416 | ) | (11.6 | ) | ||||||
SoftBank Group Corp. | (1,500 | ) | (64,758 | ) | (2.4 | ) | ||||||
Sony Corp. | (5,400 | ) | (348,812 | ) | (12.8 | ) | ||||||
Sony Financial Holdings, Inc. | (35,000 | ) | (663,483 | ) | (24.4 | ) | ||||||
Square Enix Holdings Co. Ltd. | (10,700 | ) | (438,551 | ) | (16.1 | ) | ||||||
Sumco Corp. | (26,600 | ) | (378,707 | ) | (13.9 | ) | ||||||
Sumitomo Forestry Co., Ltd. | (2,100 | ) | (25,944 | ) | (0.9 | ) | ||||||
| SCHEDULES OF INVESTMENTS | 51 |
Schedule of Investments (continued) April 30, 2020 | BlackRock Global Long/Short Equity Fund |
| Shares | Value | % of Basket Value | ||||||||||
| Japan (continued) | ||||||||||||
Sumitomo Heavy Industries Ltd. | (3,500 | ) | $ | (73,760 | ) | (2.7 | ) % | |||||
Sumitomo Rubber Industries, Ltd. | (1,700 | ) | (16,501 | ) | (0.6 | ) | ||||||
Sushiro Global Holdings Ltd. | (11,300 | ) | (174,284 | ) | (6.4 | ) | ||||||
Suzuki Motor Corp. | (1,500 | ) | (47,873 | ) | (1.8 | ) | ||||||
Taiyo Nippon Sanso Corp. | (5,200 | ) | (80,656 | ) | (3.0 | ) | ||||||
Tobu Railway Co. Ltd. | (7,000 | ) | (237,440 | ) | (8.7 | ) | ||||||
Toho Gas Co. Ltd. | (10,700 | ) | (525,741 | ) | (19.4 | ) | ||||||
Tokai Carbon Co. Ltd. | (45,600 | ) | (377,096 | ) | (13.9 | ) | ||||||
Tokuyama Corp. | (1,500 | ) | (31,650 | ) | (1.2 | ) | ||||||
Tokyo Broadcasting System Holdings, Inc. | (900 | ) | (14,123 | ) | (0.5 | ) | ||||||
Tokyo Electric Power Co. Holdings, Inc. | (49,700 | ) | (167,306 | ) | (6.2 | ) | ||||||
Toyo Suisan Kaisha Ltd. | (9,000 | ) | (432,781 | ) | (15.9 | ) | ||||||
Toyo Tire Corp. | (6,200 | ) | (72,597 | ) | (2.7 | ) | ||||||
Yamazaki Baking Co., Ltd. | (12,500 | ) | (221,051 | ) | (8.1 | ) | ||||||
Zensho Holdings Co. Ltd. | (2,700 | ) | (53,148 | ) | (2.0 | ) | ||||||
|
|
|
| |||||||||
| (34,304,115 | ) | |||||||||||
| Jordan | ||||||||||||
Hikma Pharmaceuticals PLC | (24,440 | ) | (727,922 | ) | (26.8 | ) | ||||||
|
|
|
| |||||||||
| Kazakhstan | ||||||||||||
KAZ Minerals PLC | (6,711 | ) | (34,905 | ) | (1.3 | ) | ||||||
|
|
|
| |||||||||
| Luxembourg | ||||||||||||
APERAM SA | (24,104 | ) | (624,555 | ) | (23.0 | ) | ||||||
Millicom International Cellular SA | (814 | ) | (21,152 | ) | (0.8 | ) | ||||||
|
|
|
| |||||||||
| (645,707 | ) | |||||||||||
| Netherlands | ||||||||||||
Aalberts NV | (2,019 | ) | (56,855 | ) | (2.1 | ) | ||||||
Adyen NV | (472 | ) | (466,138 | ) | (17.2 | ) | ||||||
Koninklijke Ahold Delhaize NV | (33,375 | ) | (810,356 | ) | (29.8 | ) | ||||||
OCI NV | (64,381 | ) | (777,427 | ) | (28.6 | ) | ||||||
SBM Offshore NV | (13,929 | ) | (176,551 | ) | (6.5 | ) | ||||||
|
|
|
| |||||||||
| (2,287,327 | ) | |||||||||||
| Norway | ||||||||||||
Equinor ASA | (16,776 | ) | (232,294 | ) | (8.6 | ) | ||||||
Frontline Ltd. | (23,289 | ) | (218,411 | ) | (8.0 | ) | ||||||
Gjensidige Forsikring ASA | (64,317 | ) | (1,134,862 | ) | (41.8 | ) | ||||||
Yara International ASA | (816 | ) | (27,821 | ) | (1.0 | ) | ||||||
|
|
|
| |||||||||
| (1,613,388 | ) | |||||||||||
| Portugal | ||||||||||||
Banco Comercial Portugues SA | (6,839,637 | ) | (765,239 | ) | (28.2 | ) | ||||||
|
|
|
| |||||||||
| Singapore | ||||||||||||
Genting Singapore Ltd. | (1,801,600 | ) | (999,650 | ) | (36.8 | ) | ||||||
Jardine Cycle & Carriage Ltd. | (19,700 | ) | (280,093 | ) | (10.3 | ) | ||||||
Mapletree Industrial Trust | (22,300 | ) | (40,036 | ) | (1.5 | ) | ||||||
Mapletree Logistics Trust | (454,400 | ) | (575,601 | ) | (21.2 | ) | ||||||
SembCorp Industries Ltd. | (90,700 | ) | (103,906 | ) | (3.8 | ) | ||||||
Suntec Real Estate Investment Trust | (914,900 | ) | (903,666 | ) | (33.3 | ) | ||||||
|
|
|
| |||||||||
| (2,902,952 | ) | |||||||||||
| Sweden | ||||||||||||
Autoliv, Inc. | (2,561 | ) | �� | (153,711 | ) | (5.7 | ) | |||||
Electrolux Professional AB | (28,833 | ) | (66,381 | ) | (2.4 | ) | ||||||
EQT AB | (8,402 | ) | (116,101 | ) | (4.3 | ) | ||||||
Fastighets AB Balder | (408 | ) | (16,123 | ) | (0.6 | ) | ||||||
Hennes & Mauritz AB, - B Shares | (24,986 | ) | (341,548 | ) | (12.6 | ) | ||||||
Husqvarna AB, B Shares | (183,123 | ) | (1,101,904 | ) | (40.6 | ) | ||||||
JM AB | (27,674 | ) | (512,864 | ) | (18.9 | ) | ||||||
Loomis AB | (4,023 | ) | (98,104 | ) | (3.6 | ) | ||||||
Lundin Energy AB | (1,633 | ) | (42,467 | ) | (1.6 | ) | ||||||
Nibe Industrier AB, -B Shares | (28,259 | ) | (527,222 | ) | (19.4 | ) | ||||||
| Shares | Value | % of Basket Value | ||||||||||
| Sweden (continued) | ||||||||||||
Samhallsbyggnadsbolaget i Norden AB | (35,262 | ) | $ | (68,287 | ) | (2.5 | ) % | |||||
Securitas AB, -B Shares | (40,469 | ) | (478,837 | ) | (17.6 | ) | ||||||
SKF AB, -B Shares | (46,464 | ) | (733,370 | ) | (27.0 | ) | ||||||
Svenska Cellulosa AB SCA, Class B | (113,959 | ) | (1,208,730 | ) | (44.5 | ) | ||||||
Telefonaktiebolaget LM Ericsson, -B Shares | (222,564 | ) | (1,901,399 | ) | (70.0 | ) | ||||||
Telia Co. AB | (3,880 | ) | (13,491 | ) | (0.5 | ) | ||||||
Volvo AB, -B Shares | (54,747 | ) | (701,559 | ) | (25.8 | ) | ||||||
|
|
|
| |||||||||
| (8,082,098 | ) | |||||||||||
| Switzerland | ||||||||||||
ABB Ltd. | (53,648 | ) | (1,018,361 | ) | (37.5 | ) | ||||||
Banque Cantonale Vaudoise | (200 | ) | (176,594 | ) | (6.5 | ) | ||||||
EMS-Chemie Holding AG | (486 | ) | (314,283 | ) | (11.6 | ) | ||||||
Flughafen Zurich AG | (884 | ) | (109,321 | ) | (4.0 | ) | ||||||
Georg Fischer AG, Registered Shares | (609 | ) | (454,496 | ) | (16.7 | ) | ||||||
LafargeHolcim Ltd. | (64,189 | ) | (2,665,959 | ) | (98.2 | ) | ||||||
Lonza Group AG, Registered Shares | (2,724 | ) | (1,189,477 | ) | (43.8 | ) | ||||||
Swatch Group AG | (2,390 | ) | (479,581 | ) | (17.7 | ) | ||||||
Swatch Group AG, Registered Shares | (12,301 | ) | (478,231 | ) | (17.6 | ) | ||||||
TE Connectivity Ltd. | (3,787 | ) | (278,193 | ) | (10.3 | ) | ||||||
UBS Group AG | (29,730 | ) | (318,334 | ) | (11.7 | ) | ||||||
Zurich Insurance Group AG | (9,492 | ) | (3,009,480 | ) | (110.8 | ) | ||||||
|
|
|
| |||||||||
| (10,492,310 | ) | |||||||||||
| United Kingdom | ||||||||||||
Admiral Group PLC | (10,990 | ) | (320,694 | ) | (11.8 | ) | ||||||
Ashtead Group PLC | (92,609 | ) | (2,529,636 | ) | (93.2 | ) | ||||||
Auto Trader Group PLC | (5,349 | ) | (30,903 | ) | (1.1 | ) | ||||||
Avast PLC | (28,367 | ) | (163,707 | ) | (6.0 | ) | ||||||
B&M European Value Retail SA | (533,527 | ) | (2,231,181 | ) | (82.2 | ) | ||||||
British American Tobacco PLC | (20,649 | ) | (795,900 | ) | (29.3 | ) | ||||||
BT Group PLC | (15,035 | ) | (21,914 | ) | (0.8 | ) | ||||||
Cineworld Group PLC | (279,309 | ) | (230,273 | ) | (8.5 | ) | ||||||
CRH PLC | (29,880 | ) | (906,517 | ) | (33.4 | ) | ||||||
Domino’s Pizza Group PLC | (67,562 | ) | (292,772 | ) | (10.8 | ) | ||||||
GVC Holdings PLC | (10,376 | ) | (98,487 | ) | (3.6 | ) | ||||||
Halma PLC | (104,107 | ) | (2,737,012 | ) | (100.8 | ) | ||||||
HSBC Holdings PLC | (82,468 | ) | (425,861 | ) | (15.7 | ) | ||||||
Inchcape PLC | (72,030 | ) | (453,723 | ) | (16.7 | ) | ||||||
InterContinental Hotels Group PLC | (8,453 | ) | (384,128 | ) | (14.1 | ) | ||||||
Legal & General Group PLC | (55,193 | ) | (142,229 | ) | (5.2 | ) | ||||||
National Grid PLC | (14,553 | ) | (170,543 | ) | (6.3 | ) | ||||||
Pentair PLC | (17,235 | ) | (596,159 | ) | (22.0 | ) | ||||||
Pets at Home Group PLC | (52,971 | ) | (169,602 | ) | (6.2 | ) | ||||||
Prudential PLC | (47,998 | ) | (677,127 | ) | (24.9 | ) | ||||||
Quilter PLC | (296,368 | ) | (458,349 | ) | (16.9 | ) | ||||||
Signature Aviation PLC | (150,311 | ) | (369,151 | ) | (13.6 | ) | ||||||
St. James’s Place PLC | (38,533 | ) | (410,306 | ) | (15.1 | ) | ||||||
Tesco PLC | (483,028 | ) | (1,428,708 | ) | (52.6 | ) | ||||||
Victrex PLC | (17,733 | ) | (444,317 | ) | (16.4 | ) | ||||||
Weir Group PLC | (44,109 | ) | (527,131 | ) | (19.4 | ) | ||||||
|
|
|
| |||||||||
| (17,016,330 | ) | |||||||||||
| United States | ||||||||||||
Advance Auto Parts, Inc. | (10,083 | ) | (1,219,136 | ) | (44.9 | ) | ||||||
AECOM | (10,387 | ) | (376,633 | ) | (13.9 | ) | ||||||
Aflac, Inc. | (1,502 | ) | (55,934 | ) | (2.1 | ) | ||||||
Air Lease Corp. | (81,606 | ) | (2,133,997 | ) | (78.6 | ) | ||||||
Albemarle Corp. | (1,093 | ) | (67,143 | ) | (2.5 | ) | ||||||
Alleghany Corp. | (140 | ) | (74,719 | ) | (2.8 | ) | ||||||
Alliance Data Systems Corp. | (9,951 | ) | (498,247 | ) | (18.4 | ) | ||||||
Allison Transmission Holdings, Inc. | (17,400 | ) | (632,316 | ) | (23.3 | ) | ||||||
Allstate Corp. | (36,058 | ) | (3,667,820 | ) | (135.1 | ) | ||||||
American Campus Communities, Inc. | (2,592 | ) | (91,472 | ) | (3.4 | ) | ||||||
| 52 | 2020 BLACKROCK ANNUAL REPORTTO SHAREHOLDERS |
Schedule of Investments (continued) April 30, 2020 | BlackRock Global Long/Short Equity Fund |
| Shares | Value | % of Basket Value | ||||||||||
| United States (continued) | ||||||||||||
Ameriprise Financial, Inc. | (6,326 | ) | $ | (727,110 | ) | (26.8 | ) % | |||||
AmerisourceBergen Corp. | (5,341 | ) | (478,874 | ) | (17.6 | ) | ||||||
Analog Devices, Inc. | (9,524 | ) | (1,043,830 | ) | (38.4 | ) | ||||||
Apartment Investment & Management Co., Class A | �� | (14,791 | ) | (557,177 | ) | (20.5 | ) | |||||
Appian Corp. | (8,242 | ) | (376,412 | ) | (13.9 | ) | ||||||
Archer-Daniels-Midland Co. | (112,099 | ) | (4,163,357 | ) | (153.3 | ) | ||||||
Assurant, Inc. | (28,967 | ) | (3,077,454 | ) | (113.3 | ) | ||||||
Athene Holding Ltd., Class A | (6,442 | ) | (173,934 | ) | (6.4 | ) | ||||||
AutoNation, Inc. | (25,525 | ) | (950,551 | ) | (35.0 | ) | ||||||
AutoZone, Inc. | (468 | ) | (477,510 | ) | (17.6 | ) | ||||||
Avalonbay Communities, Inc. | (2,915 | ) | (474,999 | ) | (17.5 | ) | ||||||
Bank OZK | (4,265 | ) | (96,474 | ) | (3.6 | ) | ||||||
Berkshire Hathaway, Inc., Class B | (9,784 | ) | (1,833,130 | ) | (67.5 | ) | ||||||
Bill.com Holdings, Inc. | (8,380 | ) | (493,498 | ) | (18.2 | ) | ||||||
Black Knight, Inc. | (10,637 | ) | (750,653 | ) | (27.6 | ) | ||||||
Brixmor Property Group, Inc. | (25,336 | ) | (290,097 | ) | (10.7 | ) | ||||||
Brunswick Corp. | (54,441 | ) | (2,597,925 | ) | (95.7 | ) | ||||||
CACI International, Inc., Class A | (6,989 | ) | (1,748,228 | ) | (64.4 | ) | ||||||
Capri Holdings Ltd. | (22,852 | ) | (348,493 | ) | (12.8 | ) | ||||||
CarMax, Inc. | (12,095 | ) | (890,797 | ) | (32.8 | ) | ||||||
Carnival Corp. | (76,961 | ) | (1,223,680 | ) | (45.1 | ) | ||||||
Carnival PLC | (88,363 | ) | (1,217,662 | ) | (44.8 | ) | ||||||
Carvana Co. | (7,160 | ) | (573,588 | ) | (21.1 | ) | ||||||
Caterpillar, Inc. | (18,365 | ) | (2,137,319 | ) | (78.7 | ) | ||||||
Celanese Corp. | (242 | ) | (20,103 | ) | (0.7 | ) | ||||||
CenturyLink, Inc. | (70,958 | ) | (753,574 | ) | (27.8 | ) | ||||||
CF Industries Holdings, Inc. | (47,762 | ) | (1,313,455 | ) | (48.4 | ) | ||||||
Change Healthcare, Inc. | (10,769 | ) | (125,351 | ) | (4.6 | ) | ||||||
Cheniere Energy, Inc. | (5,225 | ) | (243,955 | ) | (9.0 | ) | ||||||
Chevron Corp. | (12,826 | ) | (1,179,992 | ) | (43.5 | ) | ||||||
Chewy, Inc., Class A | (19,180 | ) | (829,343 | ) | (30.5 | ) | ||||||
Choice Hotels International, Inc. | (12,177 | ) | (913,884 | ) | (33.7 | ) | ||||||
Churchill Downs, Inc. | (11,139 | ) | (1,116,351 | ) | (41.1 | ) | ||||||
Cincinnati Financial Corp. | (18,918 | ) | (1,244,804 | ) | (45.8 | ) | ||||||
Cintas Corp. | (630 | ) | (139,753 | ) | (5.1 | ) | ||||||
Citrix Systems, Inc. | (946 | ) | (137,179 | ) | (5.1 | ) | ||||||
Clorox Co. | (9,984 | ) | (1,861,417 | ) | (68.6 | ) | ||||||
Cognizant Technology Solutions Corp., Class A | (34,547 | ) | (2,004,417 | ) | (73.8 | ) | ||||||
Colfax Corp. | (48,401 | ) | (1,248,262 | ) | (46.0 | ) | ||||||
Commerce Bancshares, Inc. | (1,618 | ) | (99,005 | ) | (3.6 | ) | ||||||
Concho Resources, Inc. | (1,783 | ) | (101,132 | ) | (3.7 | ) | ||||||
Cooper Cos., Inc. | (3,763 | ) | (1,078,852 | ) | (39.7 | ) | ||||||
CoreLogic, Inc. | (7,242 | ) | (278,238 | ) | (10.2 | ) | ||||||
Corning, Inc. | (6,838 | ) | (150,504 | ) | (5.5 | ) | ||||||
Coty, Inc., Class A | (119,652 | ) | (652,103 | ) | (24.0 | ) | ||||||
Cousins Properties, Inc. | (5,751 | ) | (173,508 | ) | (6.4 | ) | ||||||
Credit Acceptance Corp. | (3,151 | ) | (981,757 | ) | (36.2 | ) | ||||||
Crowdstrike Holdings, Inc., Class A | (16,808 | ) | (1,137,229 | ) | (41.9 | ) | ||||||
Crown Holdings, Inc. | (11,303 | ) | (728,026 | ) | (26.8 | ) | ||||||
Darling International, Inc. | (29,290 | ) | (603,081 | ) | (22.2 | ) | ||||||
DaVita, Inc. | (2,419 | ) | (191,125 | ) | (7.0 | ) | ||||||
Devon Energy Corp. | (1,627 | ) | (20,289 | ) | (0.8 | ) | ||||||
Diamondback Energy, Inc. | (2,101 | ) | (91,478 | ) | (3.4 | ) | ||||||
Digital Realty Trust, Inc. | (907 | ) | (135,587 | ) | (5.0 | ) | ||||||
Dominion Energy, Inc. | (20,418 | ) | (1,574,840 | ) | (58.0 | ) | ||||||
DR Horton, Inc. | (3,515 | ) | (165,978 | ) | (6.1 | ) | ||||||
DXC Technology Co. | (19,478 | ) | (353,136 | ) | (13.0 | ) | ||||||
EastGroup Properties, Inc. | (2,424 | ) | (256,944 | ) | (9.5 | ) | ||||||
Eastman Chemical Co. | (6,253 | ) | (378,369 | ) | (13.9 | ) | ||||||
Eaton Corp. PLC | (20,522 | ) | (1,713,587 | ) | (63.1 | ) | ||||||
Eaton Vance Corp. | (8,742 | ) | (320,831 | ) | (11.8 | ) | ||||||
Element Solutions, Inc. | (25,731 | ) | (263,743 | ) | (9.7 | ) | ||||||
| Shares | Value | % of Basket Value | ||||||||||
| United States (continued) | ||||||||||||
Eli Lilly & Co. | (17,567 | ) | $ | (2,716,561 | ) | (100.0 | ) % | |||||
Envista Holdings Corp. | (4,093 | ) | (79,691 | ) | (2.9 | ) | ||||||
Essex Property Trust, Inc. | (736 | ) | (179,658 | ) | (6.6 | ) | ||||||
Everest Re Group Ltd. | (1,225 | ) | (212,084 | ) | (7.8 | ) | ||||||
Eversource Energy | (1,630 | ) | (131,541 | ) | (4.8 | ) | ||||||
Expedia Group, Inc. | (8,047 | ) | (571,176 | ) | (21.0 | ) | ||||||
Fifth Third Bancorp | (15,079 | ) | (281,826 | ) | (10.4 | ) | ||||||
FireEye, Inc. | (53,138 | ) | (611,618 | ) | (22.5 | ) | ||||||
First Citizens BancShares, Inc., Class A | (1,123 | ) | (428,986 | ) | (15.8 | ) | ||||||
FirstCash, Inc. | (4,156 | ) | (298,567 | ) | (11.0 | ) | ||||||
FirstEnergy Corp. | (90,868 | ) | (3,750,122 | ) | (138.1 | ) | ||||||
FleetCor Technologies, Inc. | (2,043 | ) | (492,874 | ) | (18.2 | ) | ||||||
Flex Ltd. | (66,583 | ) | (649,850 | ) | (23.9 | ) | ||||||
Flowers Foods, Inc. | (2,593 | ) | (57,772 | ) | (2.1 | ) | ||||||
Gaming and Leisure Properties, Inc. | (36,444 | ) | (1,029,179 | ) | (37.9 | ) | ||||||
Gap, Inc. | (16,566 | ) | (134,516 | ) | (5.0 | ) | ||||||
Genuine Parts Co. | (2,184 | ) | (173,148 | ) | (6.4 | ) | ||||||
Global Payments, Inc. | (8,034 | ) | (1,333,805 | ) | (49.1 | ) | ||||||
Graphic Packaging Holding Co. | (21,410 | ) | (285,823 | ) | (10.5 | ) | ||||||
Hain Celestial Group, Inc. | (17,599 | ) | (454,758 | ) | (16.7 | ) | ||||||
Hanesbrands, Inc. | (82,466 | ) | (819,712 | ) | (30.2 | ) | ||||||
The Hartford Financial Services Group, Inc. | (1,796 | ) | (68,230 | ) | (2.5 | ) | ||||||
Healthcare Realty Trust, Inc. | (8,612 | ) | (253,107 | ) | (9.3 | ) | ||||||
Healthpeak Properties, Inc. | (2,801 | ) | (73,218 | ) | (2.7 | ) | ||||||
Highwoods Properties, Inc. | (5,547 | ) | (215,279 | ) | (7.9 | ) | ||||||
HollyFrontier Corp. | (3,521 | ) | (116,334 | ) | (4.3 | ) | ||||||
Hormel Foods Corp. | (1,028 | ) | (48,162 | ) | (1.8 | ) | ||||||
Host Hotels & Resorts, Inc. | (82,926 | ) | (1,020,819 | ) | (37.6 | ) | ||||||
Howmet Aerospace, Inc. | (59,617 | ) | (779,194 | ) | (28.7 | ) | ||||||
Huntington Bancshares, Inc. | (36,003 | ) | (332,668 | ) | (12.3 | ) | ||||||
Hyatt Hotels Corp., Class A | (8,284 | ) | (466,058 | ) | (17.2 | ) | ||||||
ICU Medical, Inc. | (1,296 | ) | (284,226 | ) | (10.5 | ) | ||||||
II-VI, Inc. | (24,142 | ) | (830,968 | ) | (30.6 | ) | ||||||
Ingersoll Rand, Inc. | (23,420 | ) | (681,054 | ) | (25.1 | ) | ||||||
International Business Machines Corp. | (60,964 | ) | (7,654,640 | ) | (281.9 | ) | ||||||
Iridium Communications, Inc. | (25,252 | ) | (568,296 | ) | (20.9 | ) | ||||||
Jabil, Inc. | (73,305 | ) | (2,084,794 | ) | (76.8 | ) | ||||||
Jacobs Engineering Group, Inc. | (7,505 | ) | (621,039 | ) | (22.9 | ) | ||||||
JBG SMITH Properties | (31,422 | ) | (1,066,777 | ) | (39.3 | ) | ||||||
JM Smucker Co. | (8,424 | ) | (968,002 | ) | (35.7 | ) | ||||||
KBR, Inc. | (71,798 | ) | (1,454,627 | ) | (53.6 | ) | ||||||
Kemper Corp. | (2,464 | ) | (165,630 | ) | (6.1 | ) | ||||||
Kimberly-Clark Corp. | (15,691 | ) | (2,172,890 | ) | (80.0 | ) | ||||||
Kirby Corp. | (8,562 | ) | (457,382 | ) | (16.8 | ) | ||||||
Lear Corp. | (1,141 | ) | (111,419 | ) | (4.1 | ) | ||||||
Leidos Holdings, Inc. | (5,802 | ) | (573,296 | ) | (21.1 | ) | ||||||
Lennar Corp., Class A | (14,672 | ) | (734,627 | ) | (27.1 | ) | ||||||
Liberty Broadband Corp. | (6,088 | ) | (746,876 | ) | (27.5 | ) | ||||||
Liberty Media Corp-Liberty SiriusXM | (2,940 | ) | (100,166 | ) | (3.7 | ) | ||||||
Liberty SiriusXM Group | (1,656 | ) | (55,824 | ) | (2.1 | ) | ||||||
Lincoln Electric Holdings, Inc. | (13,616 | ) | (1,096,224 | ) | (40.4 | ) | ||||||
LKQ Corp. | (30,827 | ) | (806,126 | ) | (29.7 | ) | ||||||
Loews Corp. | (52,995 | ) | (1,836,807 | ) | (67.6 | ) | ||||||
LyondellBasell Industries NV, Class A | (3,168 | ) | (183,586 | ) | (6.8 | ) | ||||||
Madison Square Garden Co., Class A | (3,907 | ) | (669,347 | ) | (24.7 | ) | ||||||
ManpowerGroup, Inc. | (819 | ) | (60,803 | ) | (2.2 | ) | ||||||
Marriott International, Inc., Class A | (1,215 | ) | (110,492 | ) | (4.1 | ) | ||||||
Marriott Vacations Worldwide Corp. | (9,543 | ) | (792,069 | ) | (29.2 | ) | ||||||
MDU Resources Group, Inc. | (24,299 | ) | (545,756 | ) | (20.1 | ) | ||||||
Medpace Holdings, Inc. | (1,975 | ) | (157,723 | ) | (5.8 | ) | ||||||
Merck & Co., Inc. | (2,343 | ) | (185,894 | ) | (6.8 | ) | ||||||
MetLife, Inc. | (10,370 | ) | (374,150 | ) | (13.8 | ) | ||||||
| SCHEDULES OF INVESTMENTS | 53 |
Schedule of Investments (continued) April 30, 2020 | BlackRock Global Long/Short Equity Fund |
| Shares | Value | % of Basket Value | ||||||||||
| United States (continued) | ||||||||||||
MGM Resorts International | (27,788 | ) | $ | (467,672 | ) | (17.2 | ) % | |||||
Mid-America Apartment Communities, Inc. | (9,542 | ) | (1,067,941 | ) | (39.3 | ) | ||||||
MKS Instruments, Inc. | (5,755 | ) | (576,824 | ) | (21.2 | ) | ||||||
Morgan Stanley | (31,112 | ) | (1,226,746 | ) | (45.2 | ) | ||||||
Murphy USA, Inc. | (6,673 | ) | (712,676 | ) | (26.2 | ) | ||||||
National Fuel Gas Co. | (5,651 | ) | (231,691 | ) | (8.5 | ) | ||||||
National Retail Properties, Inc. | (5,387 | ) | (175,832 | ) | (6.5 | ) | ||||||
New Jersey Resources Corp. | (8,928 | ) | (301,588 | ) | (11.1 | ) | ||||||
New York Community Bancorp, Inc. | (21,930 | ) | (238,160 | ) | (8.8 | ) | ||||||
Newell Brands, Inc. | (7,900 | ) | (109,652 | ) | (4.0 | ) | ||||||
NewMarket Corp. | (5,250 | ) | (2,160,060 | ) | (79.5 | ) | ||||||
News Corp., Class A | (145,096 | ) | (1,437,901 | ) | (53.0 | ) | ||||||
NiSource, Inc. | (44,901 | ) | (1,127,464 | ) | (41.5 | ) | ||||||
NRG Energy, Inc. | (6,616 | ) | (221,834 | ) | (8.2 | ) | ||||||
Nucor Corp. | (1,100 | ) | (45,309 | ) | (1.7 | ) | ||||||
NVR, Inc. | (364 | ) | (1,128,400 | ) | (41.6 | ) | ||||||
O’Reilly Automotive, Inc. | (4,400 | ) | (1,699,896 | ) | (62.6 | ) | ||||||
Old Republic International Corp. | (6,859 | ) | (109,401 | ) | (4.0 | ) | ||||||
Ollie’s Bargain Outlet Holdings, Inc. | (8,865 | ) | (602,022 | ) | (22.2 | ) | ||||||
Omega Healthcare Investors, Inc. | (16,806 | ) | (489,895 | ) | (18.0 | ) | ||||||
Oracle Corp. | (75,880 | ) | (4,019,364 | ) | (148.0 | ) | ||||||
Oshkosh Corp. | (2,588 | ) | (174,768 | ) | (6.4 | ) | ||||||
PACCAR, Inc. | (33,830 | ) | (2,342,051 | ) | (86.3 | ) | ||||||
Parsley Energy, Inc., Class A | (1,890 | ) | (17,860 | ) | (0.7 | ) | ||||||
Paychex, Inc. | (20,962 | ) | (1,436,316 | ) | (52.9 | ) | ||||||
Peloton Interactive, Inc., Class A | (4,389 | ) | (138,253 | ) | (5.1 | ) | ||||||
Performance Food Group Co. | (1,117 | ) | (32,784 | ) | (1.2 | ) | ||||||
Philip Morris International, Inc. | (1,048 | ) | (78,181 | ) | (2.9 | ) | ||||||
Physicians Realty Trust | (1,779 | ) | (27,432 | ) | (1.0 | ) | ||||||
Pilgrim’s Pride Corp. | (10,901 | ) | (239,822 | ) | (8.8 | ) | ||||||
Pioneer Natural Resources Co. | (11,528 | ) | (1,029,566 | ) | (37.9 | ) | ||||||
Polaris Industries, Inc. | (16,347 | ) | (1,159,493 | ) | (42.7 | ) | ||||||
Primerica, Inc. | (536 | ) | (55,696 | ) | (2.1 | ) | ||||||
PTC, Inc. | (7,427 | ) | (514,320 | ) | (18.9 | ) | ||||||
Public Storage | (1,424 | ) | (264,081 | ) | (9.7 | ) | ||||||
Quaker Chemical Corp. | (5,519 | ) | (839,550 | ) | (30.9 | ) | ||||||
Ralph Lauren Corp. | (3,394 | ) | (250,409 | ) | (9.2 | ) | ||||||
Raymond James Financial, Inc. | (2,960 | ) | (195,123 | ) | (7.2 | ) | ||||||
RealPage, Inc. | (11,515 | ) | (742,602 | ) | (27.3 | ) | ||||||
Regions Financial Corp. | (10,875 | ) | (116,906 | ) | (4.3 | ) | ||||||
Rollins, Inc. | (20,434 | ) | (817,360 | ) | (30.1 | ) | ||||||
Royal Caribbean Cruises Ltd. | (32,249 | ) | (1,508,286 | ) | (55.5 | ) | ||||||
RPM International, Inc. | (9,031 | ) | (599,749 | ) | (22.1 | ) | ||||||
Sanderson Farms, Inc. | (9,912 | ) | (1,349,420 | ) | (49.7 | ) | ||||||
Scotts Miracle-Gro Co., Class A | (7,181 | ) | (890,659 | ) | (32.8 | ) | ||||||
Sempra Energy | (4,047 | ) | (501,221 | ) | (18.5 | ) | ||||||
Southern Co. | (19,737 | ) | (1,119,680 | ) | (41.2 | ) | ||||||
Spirit Realty Capital, Inc. | (13,916 | ) | (428,056 | ) | (15.8 | ) | ||||||
SS&C Technologies Holdings, Inc. | (24,631 | ) | (1,358,646 | ) | (50.0 | ) | ||||||
STAG Industrial, Inc. | (803 | ) | (21,079 | ) | (0.8 | ) | ||||||
Stericycle, Inc. | (9,980 | ) | (487,024 | ) | (17.9 | ) | ||||||
STERIS PLC | (10,573 | ) | (1,506,652 | ) | (55.5 | ) | ||||||
Stifel Financial Corp. | (11,723 | ) | (519,094 | ) | (19.1 | ) | ||||||
Sun Communities, Inc. | (2,115 | ) | (284,256 | ) | (10.5 | ) | ||||||
Synchrony Financial | (4,023 | ) | (79,615 | ) | (2.9 | ) | ||||||
Sysco Corp. | (12,747 | ) | (717,274 | ) | (26.4 | ) | ||||||
T-Mobile U.S., Inc. | (52,889 | ) | (4,643,654 | ) | (171.0 | ) | ||||||
Teradyne, Inc. | (15,234 | ) | (952,734 | ) | (35.1 | ) | ||||||
Textron, Inc. | (24,084 | ) | (634,854 | ) | (23.4 | ) | ||||||
Thor Industries, Inc. | (20,077 | ) | (1,329,097 | ) | (48.9 | ) | ||||||
Timken Co. | (7,618 | ) | (286,284 | ) | (10.5 | ) | ||||||
| Shares | Value | % of Basket Value | ||||||||||
| United States (continued) | ||||||||||||
TopBuild Corp. | (2,675 | ) | $ | (249,283 | ) | (9.2 | ) % | |||||
Travelers Cos., Inc. | (7,274 | ) | (736,202 | ) | (27.1 | ) | ||||||
TriNet Group, Inc. | (241 | ) | (11,802 | ) | (0.4 | ) | ||||||
TripAdvisor, Inc. | (3,851 | ) | (76,904 | ) | (2.8 | ) | ||||||
Tyler Technologies, Inc. | (3,429 | ) | (1,099,646 | ) | (40.5 | ) | ||||||
United Rentals, Inc. | (6,626 | ) | (851,441 | ) | (31.4 | ) | ||||||
Universal Health Services, Inc., Class B | (18,686 | ) | (1,974,923 | ) | (72.7 | ) | ||||||
US Foods Holding Corp. | (1,301 | ) | (27,971 | ) | (1.0 | ) | ||||||
VEREIT, Inc. | (113,718 | ) | (623,175 | ) | (23.0 | ) | ||||||
VeriSign, Inc. | (382 | ) | (80,025 | ) | (2.9 | ) | ||||||
Verizon Communications, Inc. | (103,185 | ) | (5,927,978 | ) | (218.3 | ) | ||||||
ViaSat, Inc. | (2,267 | ) | (96,121 | ) | (3.5 | ) | ||||||
Vishay Intertechnology, Inc. | (37,529 | ) | (622,606 | ) | (22.9 | ) | ||||||
Vistra Energy Corp. | (38,379 | ) | (749,926 | ) | (27.6 | ) | ||||||
Vornado Realty Trust | (23,499 | ) | (1,029,726 | ) | (37.9 | ) | ||||||
Voya Financial, Inc. | (17,944 | ) | (810,530 | ) | (29.9 | ) | ||||||
Waters Corp. | (1,503 | ) | (281,061 | ) | (10.4 | ) | ||||||
Watsco, Inc. | (4,214 | ) | (678,412 | ) | (25.0 | ) | ||||||
Wendy’s Co. | (8,906 | ) | (176,873 | ) | (6.5 | ) | ||||||
Western Alliance Bancorp | (475 | ) | (17,043 | ) | (0.6 | ) | ||||||
Western Union Co. | (11,536 | ) | (219,992 | ) | (8.1 | ) | ||||||
Whirlpool Corp. | (23,340 | ) | (2,608,012 | ) | (96.0 | ) | ||||||
Williams Cos., Inc. | (58,156 | ) | (1,126,482 | ) | (41.5 | ) | ||||||
WP Carey, Inc. | (3,413 | ) | (224,507 | ) | (8.3 | ) | ||||||
WR Grace & Co. | (2,307 | ) | (108,960 | ) | (4.0 | ) | ||||||
Wynn Resorts Ltd. | (13,118 | ) | (1,121,983 | ) | (41.3 | ) | ||||||
Xerox Holdings Corp. | (16,463 | ) | (301,108 | ) | (11.1 | ) | ||||||
Zillow Group, Inc., Class C | (13,592 | ) | (597,504 | ) | (22.0 | ) | ||||||
Zimmer Biomet Holdings, Inc. | (6,778 | ) | (811,327 | ) | (29.9 | ) | ||||||
Zoom Video Communications, Inc., Class A | (7,970 | ) | (1,077,305 | ) | (39.7 | ) | ||||||
Zynga, Inc., Class A | (26,569 | ) | (200,330 | ) | (7.4 | ) | ||||||
|
|
|
| |||||||||
| (178,678,590) | ||||||||||||
|
| |||||||||||
Total Reference Entity — Short |
| (291,401,519 | ) | |||||||||
|
| |||||||||||
Net Value of Reference Entity — Goldman Sachs & Co. |
| $ | 2,715,459 | |||||||||
|
| |||||||||||
The following table represents the individual long and short positions and related values of the equity securities underlying the total return swap with Goldman Sachs & Co. as of April 30, 2020 termination dates 11/04/20 — 02/28/23:
| Shares | Value | % of Basket Value | ||||||||||
Reference Entity — Long |
| |||||||||||
| Australia | ||||||||||||
ALS Ltd. | 4,435 | $ | 19,367 | (1.6 | )% | |||||||
Ansell Ltd. | 5,332 | 98,334 | (8.2 | ) | ||||||||
Blackmores, Ltd. | 1,933 | 94,879 | (8.0 | ) | ||||||||
BWP Trust | 46,158 | 105,483 | (8.8 | ) | ||||||||
Centuria Industrial REIT | 65,367 | 112,103 | (9.4 | ) | ||||||||
Centuria Office REIT | 35,709 | 44,997 | (3.8 | ) | ||||||||
Costa Group Holdings Ltd. | 10,888 | 20,338 | (1.7 | ) | ||||||||
Credit Corp. Group Ltd. | 3,027 | 32,235 | (2.7 | ) | ||||||||
CSR Ltd. | 19,750 | 47,468 | (4.0 | ) | ||||||||
Downer EDI Ltd. | 51,963 | 139,787 | (11.7 | ) | ||||||||
Growthpoint Properties Australia Ltd. | 30,847 | 61,886 | (5.2 | ) | ||||||||
GUD Holdings Ltd. | 13,392 | 79,494 | (6.7 | ) | ||||||||
| 54 | 2020 BLACKROCK ANNUAL REPORTTO SHAREHOLDERS |
Schedule of Investments (continued) April 30, 2020 | BlackRock Global Long/Short Equity Fund |
| Shares | Value | % of Basket Value | ||||||||||
| Australia (continued) | ||||||||||||
GWA Group Ltd. | 41,811 | $ | 75,049 | (6.3 | ) % | |||||||
IDP Education Ltd. | 5,033 | 47,709 | (4.0 | ) | ||||||||
IGO Ltd. | 21,952 | 66,595 | (5.6 | ) | ||||||||
Inghams Group Ltd. | 39,841 | 90,263 | (7.6 | ) | ||||||||
InvoCare Ltd. | 13,385 | 89,511 | (7.5 | ) | ||||||||
JB Hi-Fi Ltd. | 2,099 | 47,453 | (4.0 | ) | ||||||||
Kogan.com Ltd. | 3,320 | 17,286 | (1.4 | ) | ||||||||
Mineral Resources Ltd. | 7,166 | 77,234 | (6.5 | ) | ||||||||
Netwealth Group Ltd. | 9,637 | 47,214 | (4.0 | ) | ||||||||
OZ Minerals Ltd. | 12,948 | 74,635 | (6.3 | ) | ||||||||
Pendal Group Ltd. | 73,701 | 261,745 | (22.0 | ) | ||||||||
Perpetual Ltd. | 3,245 | 63,078 | (5.3 | ) | ||||||||
Regis Resources Ltd. | 22,274 | 63,690 | (5.3 | ) | ||||||||
Saracen Mineral Holdings Ltd. | 12,859 | 35,267 | (3.0 | ) | ||||||||
Service Stream Ltd. | 5,057 | 6,434 | (0.5 | ) | ||||||||
Steadfast Group Ltd. | 101,119 | 199,678 | (16.8 | ) | ||||||||
Tassal Group Ltd. | 6,901 | 16,833 | (1.4 | ) | ||||||||
Technology One Ltd. | 33,518 | 205,618 | (17.3 | ) | ||||||||
|
|
|
| |||||||||
| 2,341,663 | ||||||||||||
| Austria | ||||||||||||
ams AG | 1,692 | 22,211 | (1.9 | ) | ||||||||
S&T AG | 2,382 | 52,462 | (4.4 | ) | ||||||||
Telekom Austria AG | 29,402 | 206,853 | (17.4 | ) | ||||||||
UNIQA Insurance Group AG | 7,378 | 49,742 | (4.2 | ) | ||||||||
Vienna Insurance Group AG Wiener Versicherung Gruppe | 1,881 | 37,598 | (3.1 | ) | ||||||||
|
|
|
| |||||||||
| 368,866 | ||||||||||||
| Belgium | ||||||||||||
Akka Technologies | 1,959 | 62,357 | (5.2 | ) | ||||||||
Befimmo SA | 3,946 | 176,140 | (14.8 | ) | ||||||||
bpost SA | 7,439 | 51,906 | (4.4 | ) | ||||||||
Fagron | 2,760 | 62,232 | (5.2 | ) | ||||||||
Gimv NV | 889 | 48,842 | (4.1 | ) | ||||||||
Intervest Offices & Warehouses NV | 2,099 | 51,965 | (4.4 | ) | ||||||||
Orange Belgium SA | 6,803 | 113,165 | (9.5 | ) | ||||||||
|
|
|
| |||||||||
| 566,607 | ||||||||||||
| Canada | ||||||||||||
Aecon Group, Inc. | 13,951 | 153,246 | (12.9 | ) | ||||||||
Alaris Royalty Corp. | 21,863 | 159,266 | (13.4 | ) | ||||||||
Allied Properties Real Estate Investment Trust | 3,934 | 125,938 | (10.6 | ) | ||||||||
Altius Minerals Corp. | 12,547 | 77,520 | (6.5 | ) | ||||||||
Aritis REIT | 5,197 | 32,632 | (2.7 | ) | ||||||||
Aritzia, Inc. | 1,914 | 22,785 | (1.9 | ) | ||||||||
ATS Automation Tooling Systems, Inc. | 2,848 | 42,251 | (3.5 | ) | ||||||||
B2Gold Corp. | 7,905 | 39,981 | (3.4 | ) | ||||||||
Birchcliff Energy, Ltd. | 9,306 | 10,229 | (0.9 | ) | ||||||||
Canadian Western Bank | 24,616 | 389,591 | (32.7 | ) | ||||||||
Celestica, Inc. | 4,681 | 29,224 | (2.5 | ) | ||||||||
Computer Modelling Group Ltd. | 15,014 | 50,480 | (4.2 | ) | ||||||||
Corus Entertainment, Inc., -B Shares | 24,674 | 56,192 | (4.7 | ) | ||||||||
Crombie Real Estate Investment Trust | 7,083 | 66,151 | (5.5 | ) | ||||||||
CT Real Estate Investment Trust | 19,500 | 181,418 | (15.2 | ) | ||||||||
Dream Office Real Estate Investment Trust | 6,201 | 96,760 | (8.1 | ) | ||||||||
Enerflex Ltd. | 5,342 | 20,148 | (1.7 | ) | ||||||||
Equitable Group, Inc. | 1,352 | 66,048 | (5.5 | ) | ||||||||
Fiera Capital Corp. | 16,492 | 106,633 | (8.9 | ) | ||||||||
First Majestic Silver Corp. | 2,221 | 17,935 | (1.5 | ) | ||||||||
Freehold Royalties Ltd. | 16,736 | 44,847 | (3.8 | ) | ||||||||
Genworth MI Canada, Inc. | 6,717 | 165,615 | (13.9 | ) | ||||||||
Gibson Energy, Inc. | 2,664 | 37,952 | (3.2 | ) | ||||||||
HudBay Minerals, Inc. | 13,366 | 32,648 | (2.7 | ) | ||||||||
| Shares | Value | % of Basket Value | ||||||||||
| Canada (continued) | ||||||||||||
Killam Apartment Real Estate Investment Trust | 2,251 | $ | 27,055 | (2.3 | ) % | |||||||
Kirkland Lake Gold Ltd. | 1,049 | 43,363 | (3.6 | ) | ||||||||
Knight Therapeutics, Inc. | 3,650 | 19,903 | (1.7 | ) | ||||||||
Laurentian Bank of Canada | 17,593 | 392,950 | (33.0 | ) | ||||||||
Magellan Aerospace Corp. | 2,102 | 9,680 | (0.8 | ) | ||||||||
Major Drilling Group International, Inc. | 14,516 | 37,021 | (3.1 | ) | ||||||||
Minto Apartment Real Estate Investment Trust | 1,364 | 20,216 | (1.7 | ) | ||||||||
Morguard North American Residential Real Estate Investment Trust | 12,782 | 135,906 | (11.4 | ) | ||||||||
Morguard Real Estate Investment Trust | 5,241 | 21,801 | (1.8 | ) | ||||||||
Morneau Shepell, Inc. | 1,662 | 40,178 | (3.4 | ) | ||||||||
MTY Food Group, Inc. | 2,711 | 46,840 | (3.9 | ) | ||||||||
North West Co., Inc. | 1,109 | 20,954 | (1.8 | ) | ||||||||
NorthWest Healthcare Properties Real Estate Investment Trust | 28,033 | 196,560 | (16.5 | ) | ||||||||
Pan American Silver Corp. | 1,846 | 39,255 | (3.3 | ) | ||||||||
Parex Resources, Inc. | 3,559 | 39,017 | (3.3 | ) | ||||||||
Pason Systems, Inc. | 1,523 | 8,283 | (0.7 | ) | ||||||||
Peyto Exploration & Development Corp. | 8,073 | 16,297 | (1.4 | ) | ||||||||
Sandstorm Gold Ltd. | 45,687 | 354,809 | (29.8 | ) | ||||||||
Savaria Corp. | 10,498 | 86,355 | (7.2 | ) | ||||||||
Seabridge Gold, Inc. | 4,227 | 59,186 | (5.0 | ) | ||||||||
Secure Energy Services, Inc. | 15,748 | 14,142 | (1.2 | ) | ||||||||
ShawCor, Ltd. | 2,419 | 3,545 | (0.3 | ) | ||||||||
Sierra Wireless, Inc. | 3,650 | 34,246 | (2.9 | ) | ||||||||
SilverCrest Metals, Inc. | 4,945 | 32,080 | (2.7 | ) | ||||||||
Sleep Country Canada Holdings, Inc. | 4,358 | 41,233 | (3.5 | ) | ||||||||
Teranga Gold Corp. | 4,873 | 33,748 | (2.8 | ) | ||||||||
Timbercreek Financial Corp. | 7,357 | 41,596 | (3.5 | ) | ||||||||
TMX Group Ltd. | 582 | 50,421 | (4.2 | ) | ||||||||
TORC Oil & Gas, Ltd. | 2,672 | 2,150 | (0.2 | ) | ||||||||
TransAlta Renewables, Inc. | 6,607 | 71,389 | (6.0 | ) | ||||||||
Vermilion Energy, Inc. | 28,956 | 142,497 | (12.0 | ) | ||||||||
Whitecap Resources, Inc. | 7,426 | 9,763 | (0.8 | ) | ||||||||
|
|
|
| |||||||||
| 4,117,929 | ||||||||||||
| Chile | ||||||||||||
Liberty Latin America Ltd., Class C | 7,425 | 76,774 | (6.4 | ) | ||||||||
|
|
|
| |||||||||
| China | ||||||||||||
Ausnutria Dairy Corp. Ltd. | 38,000 | 70,081 | (5.9 | ) | ||||||||
|
|
|
| |||||||||
| Denmark | ||||||||||||
Alm Brand A/S | 11,109 | 87,054 | (7.3 | ) | ||||||||
Drilling Co. of 1972 A/S | 4,037 | 94,982 | (8.0 | ) | ||||||||
GN Store Nord A/S | 1,825 | 83,286 | (7.0 | ) | ||||||||
Royal Unibrew A/S | 1,172 | 90,673 | (7.6 | ) | ||||||||
Scandinavian Tobacco Group A/S | 5,337 | 61,332 | (5.1 | ) | ||||||||
|
|
|
| |||||||||
| 417,327 | ||||||||||||
| Finland | ||||||||||||
Aktia Bank OYJ | 16,590 | 139,923 | (11.8 | ) | ||||||||
Cargotec OYJ, -B Shares | 3,394 | 74,053 | (6.2 | ) | ||||||||
Citycon OYJ | 37,464 | 247,457 | (20.8 | ) | ||||||||
Huhtamaki OYJ | 898 | 33,517 | (2.8 | ) | ||||||||
Valmet OYJ | 4,383 | 100,235 | (8.4 | ) | ||||||||
YIT OYJ | 27,863 | 152,732 | (12.8 | ) | ||||||||
|
|
|
| |||||||||
| 747,917 | ||||||||||||
| France | ||||||||||||
Alten SA | 1,794 | 129,164 | (10.8 | ) | ||||||||
Cie des Alpes | 3,524 | 65,990 | (5.5 | ) | ||||||||
Coface SA | 3,518 | 20,692 | (1.7 | ) | ||||||||
Europcar Mobility Group | 18,688 | 34,835 | (2.9 | ) | ||||||||
Fnac Darty SA | 874 | 28,178 | (2.4 | ) | ||||||||
| SCHEDULES OF INVESTMENTS | 55 |
Schedule of Investments (continued) April 30, 2020 | BlackRock Global Long/Short Equity Fund |
| Shares | Value | % of Basket Value | ||||||||||
| France (continued) | ||||||||||||
Gaztransport Et Technigaz SA | 557 | $ | 40,381 | (3.4 | ) % | |||||||
GL Events | 1,818 | 21,776 | (1.8 | ) | ||||||||
Innate Pharma SA | 5,079 | 35,739 | (3.0 | ) | ||||||||
IPSOS | 4,853 | 93,446 | (7.9 | ) | ||||||||
Maisons du Monde SA | 2,978 | 26,791 | (2.3 | ) | ||||||||
Mersen SA | 2,618 | 57,768 | (4.9 | ) | ||||||||
Metropole Television SA | 9,343 | 103,995 | (8.7 | ) | ||||||||
Nexity SA | 9,117 | 279,653 | (23.5 | ) | ||||||||
Rubis SCA | 646 | 28,942 | (2.4 | ) | ||||||||
|
|
|
| |||||||||
| 967,350 | ||||||||||||
| Germany | ||||||||||||
Bilfinger SE | 1,043 | 19,614 | (1.6 | ) | ||||||||
Cewe Stiftung & Co. KGAA | 949 | 98,770 | (8.3 | ) | ||||||||
Deutsche Euroshop AG | 11,102 | 159,889 | (13.4 | ) | ||||||||
Deutsche Pfandbriefbank AG | 26,422 | 194,205 | (16.3 | ) | ||||||||
Duerr AG | 4,933 | 115,110 | (9.7 | ) | ||||||||
Encavis AG | 4,952 | 60,743 | (5.1 | ) | ||||||||
Freenet AG | 4,527 | 85,880 | (7.2 | ) | ||||||||
Gerresheimer AG | 157 | 12,486 | (1.0 | ) | ||||||||
Grand City Properties SA | 6,424 | 134,338 | (11.3 | ) | ||||||||
GRENKE AG | 1,797 | 125,423 | (10.5 | ) | ||||||||
HelloFresh SE | 1,375 | 49,009 | (4.1 | ) | ||||||||
Hypoport SE | 357 | 125,857 | (10.6 | ) | ||||||||
Indus Holding AG | 878 | 27,024 | (2.3 | ) | ||||||||
LEG Immobilien AG | 2,475 | 284,142 | (23.8 | ) | ||||||||
MLP SE | 37,081 | 191,061 | (16.0 | ) | ||||||||
Nemetschek SE | 2,522 | 158,671 | (13.3 | ) | ||||||||
New Work SE | 130 | 30,897 | (2.6 | ) | ||||||||
Norma Group SE | 2,234 | 55,950 | (4.7 | ) | ||||||||
ProSiebenSat.1 Media SE | 3,045 | 30,431 | (2.6 | ) | ||||||||
Rheinmetall AG | 2,422 | 163,919 | (13.8 | ) | ||||||||
Stroeer SE & Co. KGaA | 436 | 27,595 | (2.3 | ) | ||||||||
TAG Immobilien AG | 8,350 | 182,896 | (15.4 | ) | ||||||||
|
|
|
| |||||||||
| 2,333,910 | ||||||||||||
| Hong Kong | ||||||||||||
Dah Sing Financial Holdings, Ltd. | 67,200 | 221,676 | (18.6 | ) | ||||||||
Hang Lung Group Ltd. | 121,000 | 276,372 | (23.2 | ) | ||||||||
Hysan Development Co. Ltd. | 36,000 | 120,102 | (10.1 | ) | ||||||||
|
|
|
| |||||||||
| 618,150 | ||||||||||||
| India | ||||||||||||
Rhi Magnesita NV | 668 | 20,519 | (1.7 | ) | ||||||||
|
|
|
| |||||||||
| Ireland | ||||||||||||
UDG Healthcare PLC | 11,653 | 91,971 | (7.7 | ) | ||||||||
|
|
|
| |||||||||
| Israel | ||||||||||||
Amot Investments Ltd. | 11,465 | 64,394 | (5.4 | ) | ||||||||
Electra Ltd. | 138 | 63,299 | (5.3 | ) | ||||||||
Energix-Renewable Energies Ltd. | 19,331 | 67,397 | (5.7 | ) | ||||||||
Equital Ltd. | 1,119 | 27,829 | (2.3 | ) | ||||||||
FIBI Holdings Ltd. | 1,758 | 52,008 | (4.4 | ) | ||||||||
Hilan Ltd. | 3,364 | 132,621 | (11.1 | ) | ||||||||
Kornit Digital Ltd. | 1,966 | 65,222 | (5.5 | ) | ||||||||
Melisron Ltd. | 3,650 | 146,915 | (12.3 | ) | ||||||||
Mivne Real Estate KD Ltd. | 63,985 | 137,443 | (11.5 | ) | ||||||||
Nova Measuring Instruments Ltd. | 3,159 | 126,422 | (10.6 | ) | ||||||||
Paz Oil Co. Ltd. | 222 | 19,344 | (1.6 | ) | ||||||||
Property & Building Corp. Ltd. | 1,191 | 87,925 | (7.4 | ) | ||||||||
Radware Ltd. | 9,375 | 222,094 | (18.6 | ) | ||||||||
Shapir Engineering and Industry Ltd. | 7,728 | 54,178 | (4.6 | ) | ||||||||
Strauss Group Ltd. | 6,464 | 182,708 | (15.3 | ) | ||||||||
Tower Semiconductor, Ltd. | 6,354 | 124,474 | (10.5 | ) | ||||||||
|
|
|
| |||||||||
| 1,574,273 | ||||||||||||
| Shares | Value | % of Basket Value | ||||||||||
| Italy | ||||||||||||
Anima Holding SpA | 5,932 | $ | 21,001 | (1.8 | ) % | |||||||
Banca Farmafactoring SpA | 43,494 | 224,586 | (18.8 | ) | ||||||||
Credito Emiliano SpA | 5,383 | 23,860 | (2.0 | ) | ||||||||
DiaSorin SpA | 425 | 72,472 | (6.1 | ) | ||||||||
ERG SpA | 6,417 | 115,295 | (9.7 | ) | ||||||||
Hera SpA | 24,938 | 92,314 | (7.7 | ) | ||||||||
Immobiliare Grande Distribuzione SIIQ SpA | 6,080 | 24,073 | (2.0 | ) | ||||||||
Infrastrutture Wireless Italiane SpA | 2,985 | 31,583 | (2.6 | ) | ||||||||
Interpump Group SpA | 7,216 | 210,551 | (17.7 | ) | ||||||||
Italgas SpA | 63,574 | 356,194 | (29.9 | ) | ||||||||
MARR SpA | 7,735 | 101,907 | (8.6 | ) | ||||||||
Piaggio & C SpA | 49,254 | 112,921 | (9.5 | ) | ||||||||
RAI Way SpA | 4,359 | 23,499 | (2.0 | ) | ||||||||
Sesa SpA | 549 | 29,270 | (2.5 | ) | ||||||||
Technogym SpA | 17,715 | 131,034 | (11.0 | ) | ||||||||
Unipol Gruppo SpA | 34,323 | 118,428 | (9.9 | ) | ||||||||
|
|
|
| |||||||||
| 1,688,988 | ||||||||||||
| Japan | ||||||||||||
A/S One Corp. | 500 | 44,667 | (3.7 | ) | ||||||||
ADEKA Corp. | 8,600 | 107,992 | (9.1 | ) | ||||||||
Ai Holdings Corp. | 3,800 | 46,943 | (3.9 | ) | ||||||||
Aisan Industry Co. Ltd. | 7,600 | 40,301 | (3.4 | ) | ||||||||
Akita Bank Ltd. | 3,700 | 49,601 | (4.2 | ) | ||||||||
Anritsu Corp. | 1,300 | 26,462 | (2.2 | ) | ||||||||
AOKI Holdings, Inc. | 15,100 | 91,739 | (7.7 | ) | ||||||||
Aomori Bank Ltd. | 1,100 | 23,240 | (1.9 | ) | ||||||||
Aoyama Trading Co. Ltd. | 20,400 | 172,336 | (14.5 | ) | ||||||||
Arcland Sakamoto Co. Ltd. | 28,700 | 273,675 | (23.0 | ) | ||||||||
Arcland Service Holdings Co. Ltd. | 16,500 | 256,017 | (21.5 | ) | ||||||||
Ateam, Inc. | 3,000 | 19,672 | (1.6 | ) | ||||||||
Atom Corp. | 9,100 | 71,126 | (6.0 | ) | ||||||||
Autobacs Seven Co. Ltd. | 1,600 | 18,684 | (1.6 | ) | ||||||||
Bank of the Ryukyus Ltd. | 2,000 | 18,670 | (1.6 | ) | ||||||||
Bell System24 Holdings, Inc. | 21,800 | 257,998 | (21.7 | ) | ||||||||
Belluna Co. Ltd. | 21,900 | 102,307 | (8.6 | ) | ||||||||
BRONCO BILLY Co. Ltd. | 1,700 | 32,469 | (2.7 | ) | ||||||||
Bunka Shutter Co. Ltd. | 26,200 | 191,275 | (16.1 | ) | ||||||||
Canon Marketing Japan, Inc. | 3,000 | 57,740 | (4.8 | ) | ||||||||
Chiyoda Integre Co. Ltd. | 2,300 | 37,442 | (3.1 | ) | ||||||||
CMIC Holdings Co. Ltd. | 1,300 | 18,717 | (1.6 | ) | ||||||||
COMSYS Holdings Corp. | 10,200 | 280,477 | (23.5 | ) | ||||||||
CONEXIO Corp. | 2,400 | 32,279 | (2.7 | ) | ||||||||
Daiichi Jitsugyo Co. Ltd. | 300 | 10,143 | (0.8 | ) | ||||||||
Daiichikosho Co., Ltd. | 900 | 27,013 | (2.3 | ) | ||||||||
Daio Paper Corp. | 17,300 | 236,056 | (19.8 | ) | ||||||||
Daiseki Co. Ltd. | 7,700 | 170,112 | (14.3 | ) | ||||||||
DeNA Co. Ltd. | 8,700 | 107,098 | (9.0 | ) | ||||||||
Doshisha Co. Ltd. | 19,500 | 239,915 | (20.1 | ) | ||||||||
Doutor Nichires Holdings Co. Ltd. | 22,400 | 338,997 | (28.5 | ) | ||||||||
DTS Corp. | 4,700 | 90,080 | (7.6 | ) | ||||||||
DyDo Group Holdings, Inc. | 6,700 | 264,890 | (22.2 | ) | ||||||||
Eagle Industry Co. Ltd. | 12,800 | 80,516 | (6.8 | ) | ||||||||
Ebara Corp. | 1,100 | 24,590 | (2.1 | ) | ||||||||
EDION Corp. | 27,300 | 237,299 | (19.9 | ) | ||||||||
Elecom Co. Ltd. | 5,400 | 212,955 | (17.9 | ) | ||||||||
en-japan, Inc. | 3,100 | 68,334 | (5.7 | ) | ||||||||
EPS Holdings, Inc. | 12,100 | 125,842 | (10.6 | ) | ||||||||
Financial Products Group Co. Ltd. | 3,500 | 16,603 | (1.4 | ) | ||||||||
FP Corp. | 400 | 30,174 | (2.5 | ) | ||||||||
Frontier Real Estate Investment Corp. | 15 | 42,081 | (3.5 | ) | ||||||||
Fuji Soft, Inc. | 2,000 | 70,402 | (5.9 | ) | ||||||||
Fujicco Co. Ltd. | 5,000 | 89,876 | (7.5 | ) | ||||||||
| 56 | 2020 BLACKROCK ANNUAL REPORTTO SHAREHOLDERS |
Schedule of Investments (continued) April 30, 2020 | BlackRock Global Long/Short Equity Fund |
| Shares | Value | % of Basket Value | ||||||||||
| Japan (continued) | ||||||||||||
Fujitsu General Ltd. | 3,100 | $ | 51,324 | (4.3 | ) % | |||||||
Fukuoka REIT Corp. | 42 | 42,242 | (3.5 | ) | ||||||||
FULLCAST Holdings Co. Ltd. | 6,700 | 84,851 | (7.1 | ) | ||||||||
Furukawa Co., Ltd. | 5,900 | 60,306 | (5.1 | ) | ||||||||
Futaba Corp. | 6,300 | 58,822 | (4.9 | ) | ||||||||
Future Corp. | 3,600 | 47,633 | (4.0 | ) | ||||||||
Fuyo General Lease Co. Ltd. | 400 | 20,000 | (1.7 | ) | ||||||||
G-Tekt Corp. | 3,700 | 37,846 | (3.2 | ) | ||||||||
Gecoss Corp. | 5,800 | 46,753 | (3.9 | ) | ||||||||
Giken Ltd. | 3,200 | 116,875 | (9.8 | ) | ||||||||
Glory Ltd. | 2,300 | 51,691 | (4.3 | ) | ||||||||
Goldcrest Co. Ltd. | 3,900 | 58,832 | (4.9 | ) | ||||||||
Gree, Inc. | 5,100 | 20,050 | (1.7 | ) | ||||||||
GungHo Online Entertainment, Inc. | 1,300 | 20,160 | (1.7 | ) | ||||||||
Gunma Bank Ltd. | 33,400 | 106,935 | (9.0 | ) | ||||||||
H2O Retailing Corp. | 11,000 | 86,275 | (7.2 | ) | ||||||||
Hamakyorex Co. Ltd. | 9,800 | 267,881 | (22.5 | ) | ||||||||
Hanwa Co. Ltd. | 1,600 | 25,418 | (2.1 | ) | ||||||||
Hazama Ando Corp. | 13,900 | 86,566 | (7.3 | ) | ||||||||
Heiwa Corp. | 3,800 | 63,984 | (5.4 | ) | ||||||||
Heiwado Co. Ltd. | 9,900 | 168,723 | (14.2 | ) | ||||||||
Hiday Hidaka Corp. | 7,000 | 107,979 | (9.1 | ) | ||||||||
Hitachi Capital Corp. | 14,200 | 274,636 | (23.1 | ) | ||||||||
Hitachi Transport System Ltd. | 4,300 | 104,366 | (8.8 | ) | ||||||||
Hitachi Zosen Corp. | 9,800 | 32,425 | (2.7 | ) | ||||||||
Hokkaido Electric Power Co., Inc. | 21,300 | 81,513 | (6.8 | ) | ||||||||
Hokuetsu Corp. | 56,800 | 224,306 | (18.8 | ) | ||||||||
House Foods Group, Inc. | 6,100 | 192,119 | (16.1 | ) | ||||||||
Hyakujushi Bank Ltd. | 900 | 16,010 | (1.3 | ) | ||||||||
Ichigo Office REIT Investment Corp. | 31 | 19,543 | (1.6 | ) | ||||||||
Ichiyoshi Securities Co. Ltd. | 8,700 | 36,427 | (3.1 | ) | ||||||||
Internet Initiative Japan, Inc. | 1,700 | 58,109 | (4.9 | ) | ||||||||
Iriso Electronics Co. Ltd. | 600 | 16,720 | (1.4 | ) | ||||||||
Itochu Enex Co. Ltd. | 4,800 | 35,639 | (3.0 | ) | ||||||||
Itoham Yonekyu Holdings, Inc. | 6,200 | 35,970 | (3.0 | ) | ||||||||
Iwatani Corp. | 2,800 | 95,654 | (8.0 | ) | ||||||||
Izumi Co. Ltd. | 4,600 | 134,653 | (11.3 | ) | ||||||||
J Trust Co., Ltd. | 13,700 | 26,587 | (2.2 | ) | ||||||||
JAC Recruitment Co. Ltd. | 16,000 | 167,590 | (14.1 | ) | ||||||||
Jaccs Co. Ltd. | 16,400 | 272,260 | (22.9 | ) | ||||||||
Japan Investment Adviser Co. Ltd. | 2,800 | 18,399 | (1.5 | ) | ||||||||
JSP Corp. | 5,400 | 69,702 | (5.8 | ) | ||||||||
Kanamoto Co. Ltd. | 4,400 | 85,323 | (7.2 | ) | ||||||||
Kandenko Co. Ltd. | 2,800 | 23,431 | (2.0 | ) | ||||||||
Kanematsu Electronics Ltd. | 2,100 | 71,214 | (6.0 | ) | ||||||||
Kasai Kogyo Co. Ltd. | 7,000 | 32,532 | (2.7 | ) | ||||||||
Kisoji Co. Ltd. | 1,900 | 41,656 | (3.5 | ) | ||||||||
Kohnan Shoji Co. Ltd. | 2,100 | 48,740 | (4.1 | ) | ||||||||
Komeri Co. Ltd. | 4,900 | 95,175 | �� | (8.0 | ) | |||||||
Konoike Transport Co. Ltd. | 11,400 | 122,892 | (10.3 | ) | ||||||||
Kotobuki Spirits Co. Ltd. | 1,300 | 50,776 | (4.3 | ) | ||||||||
Kumagai Gumi Co., Ltd. | 4,300 | 94,214 | (7.9 | ) | ||||||||
Kyowa Exeo Corp. | 6,000 | 146,171 | (12.3 | ) | ||||||||
Kyushu Financial Group, Inc. | 6,000 | 25,312 | (2.1 | ) | ||||||||
LAC Co. Ltd. | 2,500 | 21,331 | (1.8 | ) | ||||||||
LIFULL Co. Ltd. | 16,800 | 51,309 | (4.3 | ) | ||||||||
Mars Group Holdings Corp. | 3,000 | 46,837 | (3.9 | ) | ||||||||
Maruha Nichiro Corp. | 13,200 | 276,238 | (23.2 | ) | ||||||||
Maruwa Unyu Kikan Co. Ltd. | 4,000 | 116,476 | (9.8 | ) | ||||||||
Marvelous, Inc. | 16,200 | 80,750 | (6.8 | ) | ||||||||
Matsuda Sangyo Co. Ltd. | 1,500 | 18,349 | (1.5 | ) | ||||||||
Matsumotokiyoshi Holdings Co. Ltd. | 7,700 | 265,023 | (22.2 | ) | ||||||||
| Shares | Value | % of Basket Value | ||||||||||
| Japan (continued) | ||||||||||||
MCUBS MidCity Investment Corp. | 122 | $ | 84,676 | (7.1 | ) % | |||||||
Meiko Network Japan Co. Ltd. | 2,000 | 14,531 | (1.2 | ) | ||||||||
Meitec Corp. | 1,400 | 61,816 | (5.2 | ) | ||||||||
METAWATER Co., Ltd. | 5,900 | 234,633 | (19.7 | ) | ||||||||
Mirait Holdings Corp. | 1,600 | 20,668 | (1.7 | ) | ||||||||
Miroku Jyoho Service Co. Ltd. | 5,900 | 148,771 | (12.5 | ) | ||||||||
Mitsubishi Pencil Co. Ltd. | 2,100 | 26,283 | (2.2 | ) | ||||||||
Mizuno Corp. | 10,600 | 183,893 | (15.4 | ) | ||||||||
Modec, Inc. | 3,300 | 46,758 | (3.9 | ) | ||||||||
Monogatari Corp. | 1,100 | 65,436 | (5.5 | ) | ||||||||
Morinaga & Co., Ltd. | 600 | 24,657 | (2.1 | ) | ||||||||
MOS Food Services, Inc. | 1,100 | 27,697 | (2.3 | ) | ||||||||
Musashino Bank Ltd. | 2,100 | 26,449 | (2.2 | ) | ||||||||
Nagaileben Co. Ltd. | 1,000 | 24,360 | (2.0 | ) | ||||||||
Nagase & Co. Ltd. | 7,900 | 95,026 | (8.0 | ) | ||||||||
Nankai Electric Railway Co. Ltd. | 3,400 | 75,902 | (6.4 | ) | ||||||||
Nanto Bank Ltd. | 2,600 | 54,528 | (4.6 | ) | ||||||||
Nichicon Corp. | 3,300 | 21,748 | (1.8 | ) | ||||||||
Nichiha Corp. | 5,100 | 93,161 | (7.8 | ) | ||||||||
Nihon Kohden Corp. | 2,400 | 85,847 | (7.2 | ) | ||||||||
Nihon M&A Center, Inc. | 2,500 | 81,556 | (6.8 | ) | ||||||||
Nihon Trim Co. Ltd. | 4,400 | 124,065 | (10.4 | ) | ||||||||
Nikkon Holdings Co. Ltd. | 14,100 | 273,786 | (23.0 | ) | ||||||||
Nippon Densetsu Kogyo Co. Ltd. | 1,300 | 25,338 | (2.1 | ) | ||||||||
Nippon Flour Mills Co. Ltd. | 6,700 | 105,473 | (8.9 | ) | ||||||||
Nippon Light Metal Holdings Co. Ltd. | 30,300 | 47,720 | (4.0 | ) | ||||||||
Nippon Paper Industries Co. Ltd. | 12,500 | 178,505 | (15.0 | ) | ||||||||
Nippon Seiki Co. Ltd. | 1,000 | 10,760 | (0.9 | ) | ||||||||
Nippon Sheet Glass Co. Ltd. | 9,800 | 31,000 | (2.6 | ) | ||||||||
Nippon Shokubai Co. Ltd. | 3,400 | 160,569 | (13.5 | ) | ||||||||
Nishimatsu Construction Co. Ltd. | 6,500 | 123,083 | (10.3 | ) | ||||||||
Nishimatsuya Chain Co. Ltd. | 10,000 | 79,112 | (6.6 | ) | ||||||||
Nishio Rent All Co. Ltd. | 13,400 | 275,918 | (23.2 | ) | ||||||||
Nissin Electric Co., Ltd. | 2,800 | 26,011 | (2.2 | ) | ||||||||
NOF Corp. | 700 | 23,196 | (1.9 | ) | ||||||||
Nomura Co. Ltd. | 28,900 | 218,927 | (18.4 | ) | ||||||||
Noritake Co. Ltd/Nagoya Japan | 1,600 | 52,401 | (4.4 | ) | ||||||||
Noritz Corp. | 10,300 | 114,583 | (9.6 | ) | ||||||||
Obara Group, Inc. | 1,800 | 46,637 | (3.9 | ) | ||||||||
Ohsho Food Service Corp. | 500 | 26,601 | (2.2 | ) | ||||||||
Oiles Corp. | 700 | 9,054 | (0.8 | ) | ||||||||
Okabe Co. Ltd. | 34,800 | 244,255 | (20.5 | ) | ||||||||
Okamura Corp. | 19,400 | 140,205 | (11.8 | ) | ||||||||
Oki Electric Industry Co. Ltd. | 14,100 | 135,628 | (11.4 | ) | ||||||||
Okumura Corp. | 900 | 19,203 | (1.6 | ) | ||||||||
Okuwa Co. Ltd. | 1,300 | 17,684 | (1.5 | ) | ||||||||
Open Door, Inc. | 5,500 | 48,762 | (4.1 | ) | ||||||||
Outsourcing, Inc. | 16,100 | 76,110 | (6.4 | ) | ||||||||
PIA Corp. | 900 | 24,498 | (2.1 | ) | ||||||||
Premier Investment Corp. | 93 | 93,390 | (7.8 | ) | ||||||||
Press Kogyo Co. Ltd. | 21,400 | 52,744 | (4.4 | ) | ||||||||
Prestige International, Inc. | 13,900 | 108,575 | (9.1 | ) | ||||||||
Rakus Co. Ltd. | 8,200 | 129,893 | (10.9 | ) | ||||||||
Relo Group, Inc. | 4,500 | 97,481 | (8.2 | ) | ||||||||
Riken Corp. | 800 | 21,341 | (1.8 | ) | ||||||||
Rock Field Co. Ltd. | 16,600 | 200,984 | (16.9 | ) | ||||||||
Rohto Pharmaceutical Co. Ltd. | 700 | 20,367 | (1.7 | ) | ||||||||
Roland DG Corp. | 5,300 | 65,054 | (5.5 | ) | ||||||||
Ryobi Ltd. | 2,700 | 31,813 | (2.7 | ) | ||||||||
S Foods, Inc. | 2,300 | 48,568 | (4.1 | ) | ||||||||
Sac’s Bar Holdings, Inc. | 900 | 4,617 | (0.4 | ) | ||||||||
Sangetsu Corp. | 13,100 | 194,968 | (16.4 | ) | ||||||||
| SCHEDULES OF INVESTMENTS | 57 |
Schedule of Investments (continued) April 30, 2020 | BlackRock Global Long/Short Equity Fund |
| Shares | Value | % of Basket Value | ||||||||||
| Japan (continued) | ||||||||||||
Sanki Engineering Co. Ltd. | 16,500 | $ | 186,050 | (15.6 | ) % | |||||||
Sankyu, Inc. | 3,100 | 119,126 | (10.0 | ) | ||||||||
Sanshin Electronics Co. Ltd. | 900 | 12,536 | (1.0 | ) | ||||||||
Sanwa Holdings Corp. | 2,600 | 20,175 | (1.7 | ) | ||||||||
Sanyo Chemical Industries Ltd. | 2,500 | 98,487 | (8.3 | ) | ||||||||
Sawai Pharmaceutical Co. Ltd. | 2,200 | 120,129 | (10.1 | ) | ||||||||
SCSK Corp. | 2,400 | 108,647 | (9.1 | ) | ||||||||
Sekisui Plastics Co. Ltd. | 5,800 | 32,451 | (2.7 | ) | ||||||||
Senko Group Holdings Co. Ltd. | 22,000 | 179,297 | (15.0 | ) | ||||||||
Seria Co. Ltd. | 6,300 | 204,752 | (17.2 | ) | ||||||||
SFP Holdings Co. Ltd. | 2,500 | 31,104 | (2.6 | ) | ||||||||
Shimachu Co. Ltd. | 800 | 19,979 | (1.7 | ) | ||||||||
Ship Healthcare Holdings, Inc. | 1,300 | 58,795 | (4.9 | ) | ||||||||
Sinko Industries Ltd. | 9,900 | 128,577 | (10.8 | ) | ||||||||
Sintokogio Ltd. | 1,400 | 9,678 | (0.8 | ) | ||||||||
SKY Perfect JSAT Holdings, Inc. | 25,400 | 95,488 | (8.0 | ) | ||||||||
SMS Co. Ltd. | 2,300 | 50,132 | (4.2 | ) | ||||||||
Sojitz Corp. | 60,400 | 139,786 | (11.7 | ) | ||||||||
Sourcenext Corp. | 7,500 | 21,894 | (1.8 | ) | ||||||||
St Marc Holdings Co. Ltd. | 14,900 | 248,791 | (20.9 | ) | ||||||||
Star Micronics Co. Ltd. | 11,200 | 123,647 | (10.4 | ) | ||||||||
Starts Corp., Inc. | 10,000 | 193,452 | (16.2 | ) | ||||||||
Studio Alice Co. Ltd. | 800 | 10,771 | (0.9 | ) | ||||||||
Sumitomo Bakelite Co. Ltd. | 3,900 | 100,732 | (8.5 | ) | ||||||||
Sumitomo Mitsui Construction Co., Ltd. | 16,100 | 66,434 | (5.6 | ) | ||||||||
Takamatsu Construction Group Co. Ltd. | 10,100 | 207,357 | (17.4 | ) | ||||||||
Takasago International Corp. | 400 | 8,480 | (0.7 | ) | ||||||||
Takasago Thermal Engineering Co. Ltd. | 4,800 | 75,663 | (6.3 | ) | ||||||||
Takuma Co. Ltd. | 3,500 | 37,841 | (3.2 | ) | ||||||||
Tanseisha Co. Ltd. | 16,900 | 108,387 | (9.1 | ) | ||||||||
TechMatrix Corp. | 1,300 | 32,481 | (2.7 | ) | ||||||||
Tenma Corp. | 800 | 11,541 | (1.0 | ) | ||||||||
Toagosei Co. Ltd. | 5,900 | 53,981 | (4.5 | ) | ||||||||
Toho Holdings Co., Ltd. | 2,300 | 47,633 | (4.0 | ) | ||||||||
Tokyo Kiraboshi Financial Group, Inc. | 1,600 | 15,570 | (1.3 | ) | ||||||||
Topcon Corp. | 4,900 | 40,233 | (3.4 | ) | ||||||||
Topre Corp. | 4,900 | 56,682 | (4.8 | ) | ||||||||
Topy Industries Ltd. | 5,700 | 66,648 | (5.6 | ) | ||||||||
Tosei Corp. | 6,600 | 64,052 | (5.4 | ) | ||||||||
Towa Pharmaceutical Co. Ltd. | 7,800 | 160,814 | (13.5 | ) | ||||||||
TPR Co. Ltd. | 11,200 | 130,743 | (11.0 | ) | ||||||||
Transcosmos, Inc. | 4,700 | 93,782 | (7.9 | ) | ||||||||
TSI Holdings Co. Ltd. | 25,100 | 97,175 | (8.2 | ) | ||||||||
Ube Industries Ltd. | 9,800 | 164,340 | (13.8 | ) | ||||||||
Ulvac, Inc. | 2,500 | 68,907 | (5.8 | ) | ||||||||
United Super Markets Holdings, Inc. | 6,500 | 63,872 | (5.4 | ) | ||||||||
Valor Holdings Co. Ltd. | 3,100 | 57,575 | (4.8 | ) | ||||||||
Vector, Inc. | 5,400 | 35,342 | (3.0 | ) | ||||||||
Vision Inc/Tokyo Japan | 8,000 | 55,119 | (4.6 | ) | ||||||||
YAMABIKO Corp. | 4,100 | 31,599 | (2.7 | ) | ||||||||
YAMADA Consulting Group Co. Ltd. | 4,400 | 45,594 | (3.8 | ) | ||||||||
Yamato Kogyo Co. Ltd. | 8,000 | 156,998 | (13.2 | ) | ||||||||
Yamazen Corp. | 8,100 | 68,118 | (5.7 | ) | ||||||||
Yaoko Co. Ltd. | 2,200 | 136,365 | (11.4 | ) | ||||||||
Yodogawa Steel Works Ltd. | 5,700 | 89,680 | (7.5 | ) | ||||||||
Yokohama Reito Co. Ltd. | 10,300 | 86,946 | (7.3 | ) | ||||||||
Yondoshi Holdings, Inc. | 7,400 | 119,939 | (10.1 | ) | ||||||||
Yuasa Trading Co. Ltd. | 2,400 | 64,584 | (5.4 | ) | ||||||||
Yumeshin Holdings Co. Ltd. | 16,300 | 90,111 | (7.6 | ) | ||||||||
Yurtec Corp. | 4,800 | 26,962 | (2.3 | ) | ||||||||
Yushin Precision Equipment Co. Ltd. | 1,100 | 6,786 | (0.6 | ) | ||||||||
Zenkoku Hosho Co. Ltd. | 9,100 | 265,156 | (22.3 | ) | ||||||||
ZIGExN Co. Ltd. | 6,500 | 18,946 | (1.6 | ) | ||||||||
|
|
|
| |||||||||
| 20,582,515 | ||||||||||||
| Shares | Value | % of Basket Value | ||||||||||
| Luxembourg | ||||||||||||
Stabilus SA | 495 | $ | 21,144 | (1.8 | ) % | |||||||
|
|
|
| |||||||||
| Netherlands | ||||||||||||
Arcadis NV | 8,709 | 135,426 | (11.3 | ) | ||||||||
Argenx SE | 1,012 | 151,343 | (12.7 | ) | ||||||||
ASM International NV | 1,815 | 199,792 | (16.8 | ) | ||||||||
ASR Nederland NV | 7,169 | 192,868 | (16.2 | ) | ||||||||
BE Semiconductor Industries NV | 3,868 | 160,080 | (13.4 | ) | ||||||||
Corbion NV | 4,625 | 165,480 | (13.9 | ) | ||||||||
Euronext NV | 6,517 | 547,128 | (45.9 | ) | ||||||||
Fugro NV | 11,989 | 44,910 | (3.8 | ) | ||||||||
Shop Apotheke Europe NV | 1,286 | 94,984 | (8.0 | ) | ||||||||
Vastned Retail NV | 1,287 | 23,738 | (2.0 | ) | ||||||||
|
|
|
| |||||||||
| 1,715,749 | ||||||||||||
| New Zealand | ||||||||||||
Z Energy Ltd. | 8,563 | 16,131 | (1.3 | ) | ||||||||
|
|
|
| |||||||||
| Norway | ||||||||||||
Austevoll Seafood ASA | 4,611 | 35,919 | (3.0 | ) | ||||||||
Entra ASA | 18,301 | 230,425 | (19.3 | ) | ||||||||
Grieg Seafood ASA | 1,420 | 13,926 | (1.2 | ) | ||||||||
Ocean Yield ASA | 43,410 | 112,558 | (9.4 | ) | ||||||||
Sbanken ASA | 27,457 | 146,224 | (12.3 | ) | ||||||||
SpareBank 1 SMN | 17,841 | 129,628 | (10.9 | ) | ||||||||
Veidekke ASA | 3,975 | 35,292 | (3.0 | ) | ||||||||
|
|
|
| |||||||||
| 703,972 | ||||||||||||
| Portugal | ||||||||||||
NOS SGPS SA | 40,730 | 152,559 | (12.8 | ) | ||||||||
REN-Redes Energeticas Nacionais SGPS SA | 34,542 | 93,562 | (7.9 | ) | ||||||||
|
|
|
| |||||||||
| 246,121 | ||||||||||||
| South Africa | ||||||||||||
Investec PLC | 19,099 | 39,198 | (3.3 | ) | ||||||||
|
|
|
| |||||||||
| Spain | ||||||||||||
Acciona SA | 455 | 45,097 | (3.8 | ) | ||||||||
Cia de Distribucion Integral Logista Holdings SA | 6,617 | 118,115 | (9.9 | ) | ||||||||
Ebro Foods SA | 2,397 | 50,959 | (4.3 | ) | ||||||||
Euskaltel SA | 12,014 | 95,845 | (8.0 | ) | ||||||||
Faes Farma SA | 3,366 | 14,718 | (1.2 | ) | ||||||||
Tecnicas Reunidas SA | 3,385 | 51,873 | (4.4 | ) | ||||||||
Zardoya Otis SA | 9,433 | 65,650 | (5.5 | ) | ||||||||
|
|
|
| |||||||||
| 442,257 | ||||||||||||
| Sweden | ||||||||||||
AF Poyry AB | 3,305 | 60,472 | (5.1 | ) | ||||||||
Atrium Ljungberg AB, -B Shares | 3,411 | 47,271 | (4.0 | ) | ||||||||
Axfood AB | 11,532 | 245,318 | (20.6 | ) | ||||||||
Bravida Holding AB | 3,475 | 28,057 | (2.4 | ) | ||||||||
Bufab AB | 1,686 | 13,592 | (1.1 | ) | ||||||||
Dios Fastigheter AB | 5,866 | 36,121 | (3.0 | ) | ||||||||
Dustin Group AB | 15,301 | 78,095 | (6.6 | ) | ||||||||
Elekta AB, B Shares, Class B | 10,657 | 96,823 | (8.1 | ) | ||||||||
Evolution Gaming Group AB | 1,132 | 51,842 | (4.3 | ) | ||||||||
Fabege AB | 4,332 | 51,316 | (4.3 | ) | ||||||||
Hufvudstaden AB, A Shares | 20,269 | 259,717 | (21.8 | ) | ||||||||
Indutrade AB | 871 | 28,106 | (2.4 | ) | ||||||||
Klovern AB, B Shares | 48,769 | 65,875 | (5.5 | ) | ||||||||
Kungsleden AB | 10,018 | 76,292 | (6.4 | ) | ||||||||
Lindab International AB | 2,413 | 22,110 | (1.9 | ) | ||||||||
Munters Group AB | 5,757 | 24,191 | (2.0 | ) | ||||||||
Nolato AB, -B Shares | 3,178 | 167,034 | (14.0 | ) | ||||||||
Peab AB | 15,305 | 116,593 | (9.8 | ) | ||||||||
Resurs Holding AB | 51,440 | 189,274 | (15.9 | ) | ||||||||
| 58 | 2020 BLACKROCK ANNUAL REPORTTO SHAREHOLDERS |
Schedule of Investments (continued) April 30, 2020 | BlackRock Global Long/Short Equity Fund |
| Shares | Value | % of Basket Value | ||||||||||
| Sweden (continued) | ||||||||||||
Scandi Standard AB | 8,080 | $ | 52,824 | (4.4 | ) % | |||||||
SkiStar AB | 1,610 | 14,956 | (1.3 | ) | ||||||||
Stillfront Group AB | 682 | 40,522 | (3.4 | ) | ||||||||
Sweco AB, -B Shares | 1,118 | 38,196 | (3.2 | ) | ||||||||
Thule Group AB | 10,859 | 202,486 | (17.0 | ) | ||||||||
Wihlborgs Fastigheter AB | 1,871 | 26,698 | (2.2 | ) | ||||||||
|
|
|
| |||||||||
| 2,033,781 | ||||||||||||
| Switzerland | ||||||||||||
ALSO Holding AG | 121 | 24,893 | (2.1 | ) | ||||||||
Arbonia AG | 16,059 | 136,168 | (11.4 | ) | ||||||||
Belimo Holding AG | 22 | 146,467 | (12.3 | ) | ||||||||
BKW AG | 4,522 | 366,806 | (30.8 | ) | ||||||||
Burkhalter Holding AG | 763 | 49,396 | (4.1 | ) | ||||||||
Emmi AG | 234 | 214,941 | (18.0 | ) | ||||||||
Galenica AG | 1,110 | 79,488 | (6.7 | ) | ||||||||
Implenia AG | 587 | 24,010 | (2.0 | ) | ||||||||
Inficon Holding AG | 62 | 41,910 | (3.5 | ) | ||||||||
IWG PLC | 17,142 | 51,260 | (4.3 | ) | ||||||||
Landis+Gyr Group AG | 221 | 14,924 | (1.3 | ) | ||||||||
LEM Holding SA | 22 | 28,451 | (2.4 | ) | ||||||||
Logitech International SA, Registered Shares | 1,160 | 55,869 | (4.7 | ) | ||||||||
Mediclinic International PLC | 15,512 | 50,435 | (4.2 | ) | ||||||||
Orior AG | 456 | 37,878 | (3.2 | ) | ||||||||
PSP Swiss Property AG, Registered Shares | 3,451 | 400,894 | (33.7 | ) | ||||||||
Sensirion Holding AG | 2,071 | 73,758 | (6.2 | ) | ||||||||
SIG Combibloc Group AG | 5,489 | 88,904 | (7.5 | ) | ||||||||
Stadler Rail AG | 286 | 12,495 | (1.0 | ) | ||||||||
Sunrise Communications Group AG | 6,321 | 506,322 | (42.5 | ) | ||||||||
Tecan Group AG | 1,297 | 417,559 | (35.1 | ) | ||||||||
U-Blox Holding AG | 620 | 43,427 | (3.6 | ) | ||||||||
Vontobel Holding AG | 338 | 17,553 | (1.5 | ) | ||||||||
Zur Rose Group AG | 117 | 19,248 | (1.6 | ) | ||||||||
|
|
|
| |||||||||
| 2,903,056 | ||||||||||||
| Ukraine | ||||||||||||
Ferrexpo PLC | 11,668 | 19,758 | (1.6 | ) | ||||||||
|
|
|
| |||||||||
| United Kingdom | ||||||||||||
AB Dynamics PLC | 3,776 | 85,600 | (7.2 | ) | ||||||||
Arrow Global Group PLC | 21,633 | 27,468 | (2.3 | ) | ||||||||
Ascential PLC | 5,696 | 18,090 | (1.5 | ) | ||||||||
Big Yellow Group PLC | 9,164 | 123,352 | (10.4 | ) | ||||||||
boohoo Group PLC | 11,257 | 45,796 | (3.8 | ) | ||||||||
Brewin Dolphin Holdings PLC | 16,429 | 56,607 | (4.8 | ) | ||||||||
Britvic PLC | 4,344 | 39,985 | (3.4 | ) | ||||||||
Countryside Properties PLC | 4,414 | 22,488 | (1.9 | ) | ||||||||
Craneware PLC | 831 | 20,096 | (1.7 | ) | ||||||||
Cranswick PLC | 3,442 | 160,995 | (13.5 | ) | ||||||||
Daily Mail & General Trust PLC | 7,304 | 64,864 | (5.4 | ) | ||||||||
Delphi Technologies PLC | 1,755 | 17,532 | (1.5 | ) | ||||||||
Derwent London PLC | 421 | 16,470 | (1.4 | ) | ||||||||
Dialog Semiconductor PLC | 5,113 | 160,573 | (13.5 | ) | ||||||||
Diploma PLC | 3,757 | 81,432 | (6.8 | ) | ||||||||
EMIS Group PLC | 5,530 | 72,994 | (6.1 | ) | ||||||||
Grainger PLC | 51,323 | 172,431 | (14.5 | ) | ||||||||
Helical PLC | 1,801 | 8,181 | (0.7 | ) | ||||||||
HomeServe PLC | 48,948 | 685,647 | (57.6 | ) | ||||||||
Hotel Chocolat Group PLC | 5,916 | 25,297 | (2.1 | ) | ||||||||
Howden Joinery Group PLC | 46,850 | 308,939 | (25.9 | ) | ||||||||
IG Group Holdings PLC | 22,164 | 210,076 | (17.6 | ) | ||||||||
John Wood Group PLC | 31,094 | 78,733 | (6.6 | ) | ||||||||
Jupiter Fund Management PLC | 55,293 | 151,999 | (12.8 | ) | ||||||||
Kainos Group PLC | 4,069 | 35,796 | (3.0 | ) | ||||||||
| Shares | Value | % of Basket Value | ||||||||||
| United Kingdom (continued) | ||||||||||||
LondonMetric Property PLC | 8,331 | $ | 20,354 | (1.7 | ) % | |||||||
Marshalls PLC | 2,095 | 16,779 | (1.4 | ) | ||||||||
Morgan Advanced Materials PLC | 17,336 | 47,822 | (4.0 | ) | ||||||||
Morgan Sindall Group PLC | 6,383 | 102,851 | (8.6 | ) | ||||||||
Ninety One PLC | 9,865 | 21,085 | (1.8 | ) | ||||||||
OneSavings Bank PLC | 31,528 | 96,761 | (8.1 | ) | ||||||||
Pennon Group PLC | 2,836 | 39,148 | (3.3 | ) | ||||||||
Pets at Home Group PLC | 10,726 | 34,342 | (2.9 | ) | ||||||||
Phoenix Group Holdings PLC | 3,156 | 23,949 | (2.0 | ) | ||||||||
Polypipe Group PLC | 11,441 | 71,770 | (6.0 | ) | ||||||||
Qinetiq Group PLC | 70,555 | 269,813 | (22.6 | ) | ||||||||
Redrow PLC | 5,750 | 33,409 | (2.8 | ) | ||||||||
Renishaw PLC | 568 | 25,139 | (2.1 | ) | ||||||||
Safestore Holdings PLC | 9,910 | 89,646 | (7.5 | ) | ||||||||
Shaftesbury PLC | 3,564 | 26,917 | (2.3 | ) | ||||||||
Telecom Plus PLC | 5,161 | 86,064 | (7.2 | ) | ||||||||
Travis Perkins PLC | 1,060 | 13,841 | (1.2 | ) | ||||||||
Vistry Group PLC | 7,829 | 79,508 | (6.7 | ) | ||||||||
Watkin Jones PLC | 29,156 | 63,246 | (5.3 | ) | ||||||||
|
|
|
| |||||||||
| 3,853,885 | ||||||||||||
| United States | ||||||||||||
1-800-Flowers.com, Inc., Class A | 3,519 | 67,530 | (5.7 | ) | ||||||||
2U, Inc. | 807 | 19,166 | (1.6 | ) | ||||||||
8x8, Inc. | 3,372 | 57,189 | (4.8 | ) | ||||||||
Aaron’s, Inc. | 780 | 24,890 | (2.1 | ) | ||||||||
Acadia Realty Trust | 5,365 | 66,472 | (5.6 | ) | ||||||||
Accelerate Diagnostics, Inc. | 6,056 | 66,071 | (5.5 | ) | ||||||||
ACCO Brands Corp. | 3,119 | 23,081 | (1.9 | ) | ||||||||
Addus HomeCare Corp. | 1,361 | 110,268 | (9.3 | ) | ||||||||
Advanced Drainage Systems, Inc. | 1,070 | 43,378 | (3.6 | ) | ||||||||
AeroVironment, Inc. | 846 | 50,980 | (4.3 | ) | ||||||||
Agree Realty Corp. | 772 | 50,265 | (4.2 | ) | ||||||||
Alarm.com Holdings, Inc. | 1,780 | 79,619 | (6.7 | ) | ||||||||
Alcoa Corp. | 20,622 | 168,069 | (14.1 | ) | ||||||||
Allegheny Technologies, Inc. | 3,217 | 24,160 | (2.0 | ) | ||||||||
ALLETE, Inc. | 3,056 | 175,903 | (14.8 | ) | ||||||||
Allscripts Healthcare Solutions, Inc. | 9,357 | 60,820 | (5.1 | ) | ||||||||
Altair Engineering, Inc., Class A | 1,979 | 65,287 | (5.5 | ) | ||||||||
Altra Industrial Motion Corp. | 1,006 | 28,077 | (2.4 | ) | ||||||||
Amalgamated Bank, Class A | 10,717 | 114,672 | (9.6 | ) | ||||||||
AMC Networks, Inc., Class A | 4,718 | 112,524 | (9.4 | ) | ||||||||
Amedisys, Inc. | 389 | 71,638 | (6.0 | ) | ||||||||
Ameresco, Inc., Class A | 3,263 | 58,930 | (4.9 | ) | ||||||||
American Campus Communities, Inc. | 2,569 | 90,660 | (7.6 | ) | ||||||||
American Homes 4 Rent, Class A | 5,570 | 134,460 | (11.3 | ) | ||||||||
Americold Realty Trust | 1,039 | 31,783 | (2.7 | ) | ||||||||
Apellis Pharmaceuticals, Inc. | 1,121 | 38,417 | (3.2 | ) | ||||||||
Apergy Corp. | 3,580 | 32,972 | (2.8 | ) | ||||||||
Apogee Enterprises, Inc. | 2,398 | 49,015 | (4.1 | ) | ||||||||
Appfolio, Inc., Class A | 102 | 11,206 | (0.9 | ) | ||||||||
AptarGroup, Inc. | 394 | 42,190 | (3.5 | ) | ||||||||
Archrock, Inc. | 23,621 | 113,617 | (9.5 | ) | ||||||||
Ares Management Corp., Class A | 3,406 | 114,271 | (9.6 | ) | ||||||||
Armada Hoffler Properties, Inc. | 21,182 | 203,559 | (17.1 | ) | ||||||||
Arvinas Holding Co. LLC | 946 | 49,665 | (4.2 | ) | ||||||||
Ashland Global Holdings, Inc. | 2,216 | 136,705 | (11.5 | ) | ||||||||
Associated Banc-Corp | 5,743 | 81,206 | (6.8 | ) | ||||||||
Assured Guaranty Ltd. | 1,439 | 42,781 | (3.6 | ) | ||||||||
Atkore International Group, Inc. | 3,792 | 92,297 | (7.7 | ) | ||||||||
Atrion Corp. | 126 | 79,611 | (6.7 | ) | ||||||||
Avista Corp. | 592 | 25,480 | (2.1 | ) | ||||||||
Axon Enterprise, Inc. | 1,403 | 102,012 | (8.6 | ) | ||||||||
| SCHEDULES OF INVESTMENTS | 59 |
Schedule of Investments (continued) April 30, 2020 | BlackRock Global Long/Short Equity Fund |
| Shares | Value | % of Basket Value | ||||||||||
| United States (continued) | ||||||||||||
Axonics Modulation Technologies, Inc. | 458 | $ | 14,752 | (1.2 | ) % | |||||||
Axos Financial, Inc. | 3,831 | 88,305 | (7.4 | ) | ||||||||
BancFirst Corp. | 1,598 | 61,539 | (5.2 | ) | ||||||||
Bancorp, Inc. | 1,517 | 10,573 | (0.9 | ) | ||||||||
Bandwidth, Inc., Class A | 757 | 61,741 | (5.2 | ) | ||||||||
BankUnited, Inc. | 4,505 | 89,244 | (7.5 | ) | ||||||||
Bar Harbor Bankshares | 3,259 | 59,900 | (5.0 | ) | ||||||||
Beazer Homes USA, Inc. | 3,728 | 26,245 | (2.2 | ) | ||||||||
Bed Bath & Beyond, Inc. | 11,903 | 73,680 | (6.2 | ) | ||||||||
Berkshire Hills Bancorp, Inc. | 7,524 | 128,209 | (10.8 | ) | ||||||||
Big Lots, Inc. | 3,837 | 89,978 | (7.6 | ) | ||||||||
Bio-Techne Corp. | 1,073 | 241,425 | (20.3 | ) | ||||||||
BioTelemetry, Inc. | 3,272 | 152,835 | (12.8 | ) | ||||||||
BJ’s Restaurants, Inc. | 2,598 | 56,792 | (4.8 | ) | ||||||||
Blackbaud, Inc. | 1,286 | 71,064 | (6.0 | ) | ||||||||
Blackline, Inc. | 978 | 59,404 | (5.0 | ) | ||||||||
Bloom Energy Corp., Class A | 8,608 | 66,023 | (5.5 | ) | ||||||||
Blucora, Inc. | 1,862 | 26,198 | (2.2 | ) | ||||||||
Blue Bird Corp. | 4,011 | 49,215 | (4.1 | ) | ||||||||
Bluebird Bio, Inc. | 335 | 18,050 | (1.5 | ) | ||||||||
Box, Inc., Class A | 2,759 | 44,530 | (3.7 | ) | ||||||||
Brandywine Realty Trust | 10,297 | 114,915 | (9.6 | ) | ||||||||
Bridge Bancorp, Inc. | 2,075 | 42,932 | (3.6 | ) | ||||||||
Brighthouse Financial, Inc. | 1,874 | 48,181 | (4.0 | ) | ||||||||
Brinker International, Inc. | 1,130 | 26,306 | (2.2 | ) | ||||||||
Bruker Corp. | 2,885 | 113,438 | (9.5 | ) | ||||||||
BWX Technologies, Inc. | 891 | 47,276 | (4.0 | ) | ||||||||
Cable One, Inc. | 83 | 158,767 | (13.3 | ) | ||||||||
Cabot Microelectronics Corp. | 437 | 53,550 | (4.5 | ) | ||||||||
CalAmp Corp. | 7,372 | 49,540 | (4.2 | ) | ||||||||
Camping World Holdings, Inc., Class A | 3,491 | 30,965 | (2.6 | ) | ||||||||
Cara Therapeutics, Inc. | 1,343 | 19,903 | (1.7 | ) | ||||||||
Cardiovascular Systems, Inc. | 1,305 | 54,810 | (4.6 | ) | ||||||||
CareTrust REIT, Inc. | 3,016 | 49,704 | (4.2 | ) | ||||||||
Cargurus, Inc. | 2,211 | 50,588 | (4.2 | ) | ||||||||
Carlisle Cos., Inc. | 1,924 | 232,727 | (19.5 | ) | ||||||||
Carpenter Technology Corp. | 4,013 | 88,968 | (7.5 | ) | ||||||||
Carriage Services, Inc. | 1,922 | 28,868 | (2.4 | ) | ||||||||
Casey’s General Stores, Inc. | 689 | 104,321 | (8.8 | ) | ||||||||
CBTX, Inc. | 2,106 | 38,034 | (3.2 | ) | ||||||||
Central Garden & Pet Co. | 1,105 | 36,399 | (3.1 | ) | ||||||||
Central Garden & Pet Co., Class A | 2,036 | 61,915 | (5.2 | ) | ||||||||
Cheesecake Factory, Inc. | 2,384 | 53,139 | (4.5 | ) | ||||||||
Chefs’ Warehouse, Inc. | 2,805 | 39,494 | (3.3 | ) | ||||||||
Chegg, Inc. | 4,626 | 197,761 | (16.6 | ) | ||||||||
Chemed Corp. | 129 | 53,738 | (4.5 | ) | ||||||||
Chuy’s Holdings, Inc. | 1,337 | 22,408 | (1.9 | ) | ||||||||
Ciena Corp. | 3,724 | 172,235 | (14.5 | ) | ||||||||
Cirrus Logic, Inc. | 3,427 | 259,081 | (21.7 | ) | ||||||||
CIT Group, Inc. | 7,853 | 149,050 | (12.5 | ) | ||||||||
Clearway Energy, Inc., Class C | 6,606 | 132,318 | (11.1 | ) | ||||||||
CNO Financial Group, Inc. | 2,524 | 35,487 | (3.0 | ) | ||||||||
Coherus Biosciences, Inc. | 2,152 | 35,723 | (3.0 | ) | ||||||||
Colony Capital, Inc. | 13,150 | 30,376 | (2.6 | ) | ||||||||
Columbus McKinnon Corp. | 1,355 | 36,693 | (3.1 | ) | ||||||||
CommScope Holding Co., Inc. | 2,324 | 25,587 | (2.1 | ) | ||||||||
Conduent, Inc. | 10,743 | 27,072 | (2.3 | ) | ||||||||
ConnectOne Bancorp, Inc. | 4,993 | 74,595 | (6.3 | ) | ||||||||
Corcept Therapeutics, Inc. | 5,163 | 65,364 | (5.5 | ) | ||||||||
CorEnergy Infrastructure Trust, Inc. | 630 | 7,648 | (0.6 | ) | ||||||||
CoreSite Realty Corp. | 136 | 16,482 | (1.4 | ) | ||||||||
Cornerstone OnDemand, Inc. | 6,165 | 206,897 | (17.4 | ) | ||||||||
| Shares | Value | % of Basket Value | ||||||||||
| United States (continued) | ||||||||||||
CorVel Corp. | 336 | $ | 17,704 | (1.5 | ) % | |||||||
Covenant Transportation Group, Inc., Class A | 2,219 | 19,705 | (1.7 | ) | ||||||||
Cowen, Inc., Class A | 2,119 | 23,203 | (1.9 | ) | ||||||||
Crocs, Inc. | 2,524 | 61,207 | (5.1 | ) | ||||||||
CryoLife, Inc. | 3,773 | 84,251 | (7.1 | ) | ||||||||
Cubic Corp. | 3,576 | 136,639 | (11.5 | ) | ||||||||
Curtiss-Wright Corp. | 2,345 | 243,059 | (20.4 | ) | ||||||||
CyrusOne, Inc. | 470 | 32,970 | (2.8 | ) | ||||||||
Deckers Outdoor Corp. | 1,060 | 157,686 | (13.2 | ) | ||||||||
Del Taco Restaurants, Inc. | 4,121 | 24,231 | (2.0 | ) | ||||||||
Dine Brands Global, Inc. | 577 | 25,613 | (2.2 | ) | ||||||||
Diversified Healthcare Trust | 7,380 | 22,952 | (1.9 | ) | ||||||||
Dolby Laboratories, Inc., Class A | 1,699 | 101,991 | (8.6 | ) | ||||||||
Douglas Dynamics, Inc. | 948 | 35,038 | (2.9 | ) | ||||||||
Douglas Emmett, Inc. | 3,942 | 120,192 | (10.1 | ) | ||||||||
Dycom Industries, Inc. | 2,473 | 80,620 | (6.8 | ) | ||||||||
Eagle Pharmaceuticals, Inc. | 1,409 | 71,831 | (6.0 | ) | ||||||||
eHealth, Inc. | 494 | 52,710 | (4.4 | ) | ||||||||
Elastic NV | 1,406 | 90,181 | (7.6 | ) | ||||||||
Eldorado Resorts, Inc. | 2,318 | 49,698 | (4.2 | ) | ||||||||
EMCOR Group, Inc. | 2,186 | 138,877 | (11.7 | ) | ||||||||
EnerSys | 2,471 | 144,282 | (12.1 | ) | ||||||||
Ensign Group, Inc. | 445 | 16,647 | (1.4 | ) | ||||||||
Enterprise Financial Services Corp. | 2,440 | 75,006 | (6.3 | ) | ||||||||
ESCO Technologies, Inc. | 1,843 | 140,621 | (11.8 | ) | ||||||||
Essent Group Ltd. | 2,099 | 57,345 | (4.8 | ) | ||||||||
Etsy, Inc. | 301 | 19,526 | (1.6 | ) | ||||||||
Evercore, Inc., Class A | 557 | 28,741 | (2.4 | ) | ||||||||
Everi Holdings, Inc. | 5,081 | 25,151 | (2.1 | ) | ||||||||
Exelixis, Inc. | 3,556 | 87,815 | (7.4 | ) | ||||||||
Exponent, Inc. | 1,848 | 129,970 | (10.9 | ) | ||||||||
FB Financial Corp. | 4,465 | 99,748 | (8.4 | ) | ||||||||
FBL Financial Group, Inc., Class A | 984 | 38,455 | (3.2 | ) | ||||||||
Federal Agricultural Mortgage Corp., Class C | 973 | 64,831 | (5.4 | ) | ||||||||
Federal Signal Corp. | 1,668 | 44,919 | (3.8 | ) | ||||||||
Federated Hermes, Inc. | 3,728 | 84,887 | (7.1 | ) | ||||||||
Financial Institutions, Inc. | 2,309 | 44,679 | (3.8 | ) | ||||||||
First Busey Corp. | 2,605 | 47,984 | (4.0 | ) | ||||||||
First Defiance Financial Corp. | 8,760 | 152,249 | (12.8 | ) | ||||||||
First Foundation, Inc. | 3,564 | 49,041 | (4.1 | ) | ||||||||
First Hawaiian, Inc. | 7,770 | 136,674 | (11.5 | ) | ||||||||
First Horizon National Corp. | 14,841 | 134,756 | (11.3 | ) | ||||||||
First Mid Bancshares, Inc. | 2,720 | 72,624 | (6.1 | ) | ||||||||
First Solar, Inc. | 1,487 | 65,443 | (5.5 | ) | ||||||||
Five9, Inc. | 1,099 | 101,844 | (8.5 | ) | ||||||||
Flexion Therapeutics, Inc. | 2,248 | 23,919 | (2.0 | ) | ||||||||
Flushing Financial Corp. | 6,055 | 75,627 | (6.3 | ) | ||||||||
FNB Corp. | 11,124 | 89,993 | (7.6 | ) | ||||||||
Four Corners Property Trust, Inc. | 5,574 | 124,802 | (10.5 | ) | ||||||||
Fox Factory Holding Corp. | 1,993 | 101,663 | (8.5 | ) | ||||||||
Franklin Covey Co. | 1,947 | 40,400 | (3.4 | ) | ||||||||
Franklin Electric Co., Inc. | 1,388 | 70,510 | (5.9 | ) | ||||||||
Freshpet, Inc. | 4,040 | 304,656 | (25.6 | ) | ||||||||
frontdoor, Inc. | 3,822 | 147,950 | (12.4 | ) | ||||||||
FTI Consulting, Inc. | 224 | 28,529 | (2.4 | ) | ||||||||
G-III Apparel Group Ltd. | 3,118 | 35,327 | (3.0 | ) | ||||||||
GameStop Corp., Class A | 7,538 | 43,193 | (3.6 | ) | ||||||||
Generac Holdings, Inc. | 2,006 | 195,465 | (16.4 | ) | ||||||||
Gentherm, Inc. | 2,643 | 98,954 | (8.3 | ) | ||||||||
Glaukos Corp. | 1,768 | 64,868 | (5.4 | ) | ||||||||
Global Medical REIT, Inc. | 1,831 | 19,079 | (1.6 | ) | ||||||||
Grand Canyon Education, Inc. | 194 | 16,688 | (1.4 | ) | ||||||||
| 60 | 2020 BLACKROCK ANNUAL REPORTTO SHAREHOLDERS |
Schedule of Investments (continued) April 30, 2020 | BlackRock Global Long/Short Equity Fund |
| Shares | Value | % of Basket Value | ||||||||||
| United States (continued) | ||||||||||||
Green Brick Partners, Inc. | 3,885 | $ | 34,615 | (2.9 | ) % | |||||||
Greif, Inc., Class A | 2,168 | 73,474 | (6.2 | ) | ||||||||
Grocery Outlet Holding Corp. | 1,362 | 45,314 | (3.8 | ) | ||||||||
Guardant Health, Inc. | 376 | 28,937 | (2.4 | ) | ||||||||
H&R Block, Inc. | 3,456 | 57,542 | (4.8 | ) | ||||||||
Hancock Whitney Corp. | 19,658 | 411,049 | (34.5 | ) | ||||||||
Hannon Armstrong Sustainable Infrastructure Capital, Inc. | 3,163 | 88,532 | (7.4 | ) | ||||||||
Hanover Insurance Group, Inc. | 1,103 | 110,719 | (9.3 | ) | ||||||||
Harsco Corp. | 5,804 | 57,924 | (4.9 | ) | ||||||||
Hawaiian Electric Industries, Inc. | 2,631 | 103,846 | (8.7 | ) | ||||||||
Health Catalyst, Inc. | 655 | 17,469 | (1.5 | ) | ||||||||
Healthcare Trust of America, Inc., Class A | 1,096 | 26,994 | (2.3 | ) | ||||||||
HealthEquity, Inc. | 439 | 24,703 | (2.1 | ) | ||||||||
Heartland Express, Inc. | 5,428 | 106,335 | (8.9 | ) | ||||||||
Helen of Troy Ltd. | 200 | 32,856 | (2.8 | ) | ||||||||
Heritage Commerce Corp. | 7,887 | 70,037 | (5.9 | ) | ||||||||
Heska Corp. | 801 | 56,711 | (4.8 | ) | ||||||||
Hillenbrand, Inc. | 9,186 | 192,447 | (16.2 | ) | ||||||||
HMS Holdings Corp. | 3,896 | 111,718 | (9.4 | ) | ||||||||
Hooker Furniture Corp. | 1,327 | 19,892 | (1.7 | ) | ||||||||
Horizon Bancorp | 3,495 | 39,773 | (3.3 | ) | ||||||||
Horizon Therapeutics PLC | 1,476 | 53,195 | (4.5 | ) | ||||||||
Houghton Mifflin Harcourt Co. | 10,233 | 16,373 | (1.4 | ) | ||||||||
Howard Hughes Corp. | 1,110 | 60,118 | (5.0 | ) | ||||||||
Hubbell, Inc. | 1,237 | 153,920 | (12.9 | ) | ||||||||
HubSpot, Inc. | 1,637 | 276,047 | (23.2 | ) | ||||||||
Hudson Pacific Properties, Inc. | 1,788 | 43,949 | (3.7 | ) | ||||||||
IAA, Inc. | 653 | 25,206 | (2.1 | ) | ||||||||
ICF International, Inc. | 2,141 | 157,449 | (13.2 | ) | ||||||||
IDACORP, Inc. | 1,183 | 108,576 | (9.1 | ) | ||||||||
Independence Realty Trust, Inc. | 17,563 | 176,859 | (14.8 | ) | ||||||||
Independent Bank Corp. | 21,857 | 321,079 | (27.0 | ) | ||||||||
Independent Bank Group, Inc. | 2,358 | 71,471 | (6.0 | ) | ||||||||
Ingevity Corp. | 2,601 | 135,044 | (11.3 | ) | ||||||||
Inphi Corp. | 1,276 | 123,185 | (10.3 | ) | ||||||||
Insight Enterprises, Inc. | 2,621 | 142,294 | (11.9 | ) | ||||||||
Inspire Medical Systems, Inc. | 731 | 52,383 | (4.4 | ) | ||||||||
Intercept Pharmaceuticals, Inc. | 331 | 27,116 | (2.3 | ) | ||||||||
INTL. FCStone, Inc. | 2,093 | 83,636 | (7.0 | ) | ||||||||
Invitae Corp. | 2,948 | 48,789 | (4.1 | ) | ||||||||
iRobot Corp. | 865 | 52,730 | (4.4 | ) | ||||||||
ITT, Inc. | 3,541 | 186,681 | (15.7 | ) | ||||||||
J&J Snack Foods Corp. | 1,779 | 225,986 | (19.0 | ) | ||||||||
Jack in the Box, Inc. | 2,121 | 127,896 | (10.7 | ) | ||||||||
John Bean Technologies Corp. | 847 | 64,999 | (5.5 | ) | ||||||||
Johnson Outdoors, Inc., Class A | 682 | 46,622 | (3.9 | ) | ||||||||
Kelly Services, Inc., Class A | 1,289 | 19,915 | (1.7 | ) | ||||||||
Kimball International, Inc., Class B | 1,283 | 15,742 | (1.3 | ) | ||||||||
Knowles Corp. | 8,211 | 127,681 | (10.7 | ) | ||||||||
Kraton Corp. | 3,860 | 60,255 | (5.1 | ) | ||||||||
Kratos Defense & Security Solutions, Inc. | 1,215 | 18,249 | (1.5 | ) | ||||||||
L Brands, Inc. | 2,197 | 26,122 | (2.2 | ) | ||||||||
La-Z-Boy, Inc. | 225 | 5,276 | (0.4 | ) | ||||||||
Lakeland Bancorp, Inc. | 7,157 | 80,087 | (6.7 | ) | ||||||||
Lancaster Colony Corp. | 398 | 53,583 | (4.5 | ) | ||||||||
Lands’ End, Inc. | 2,875 | 24,466 | (2.1 | ) | ||||||||
LeMaitre Vascular, Inc. | 1,176 | 33,504 | (2.8 | ) | ||||||||
LendingTree, Inc. | 185 | 46,133 | (3.9 | ) | ||||||||
Levi Strauss & Co., Class A | 4,430 | 57,103 | (4.8 | ) | ||||||||
LGI Homes, Inc. | 646 | 39,135 | (3.3 | ) | ||||||||
Limelight Networks, Inc. | 4,022 | 20,392 | (1.7 | ) | ||||||||
| Shares | Value | % of Basket Value | ||||||||||
| United States (continued) | ||||||||||||
Littelfuse, Inc. | 789 | $ | 114,594 | (9.6 | ) % | |||||||
LivaNova PLC | 757 | 40,212 | (3.4 | ) | ||||||||
Live Oak Bancshares, Inc. | 1,210 | 16,879 | (1.4 | ) | ||||||||
LivePerson, Inc. | 2,940 | 70,384 | (5.9 | ) | ||||||||
LPL Financial Holdings, Inc. | 1,164 | 70,096 | (5.9 | ) | ||||||||
Luminex Corp. | 966 | 34,824 | (2.9 | ) | ||||||||
Magellan Health, Inc. | 792 | 48,098 | (4.0 | ) | ||||||||
ManTech International Corp., Class A | 1,060 | 79,034 | (6.6 | ) | ||||||||
Marcus & Millichap, Inc. | 3,333 | 96,824 | (8.1 | ) | ||||||||
Marten Transport Ltd. | 2,611 | 58,539 | (4.9 | ) | ||||||||
Masimo Corp. | 1,379 | 294,982 | (24.8 | ) | ||||||||
MasTec, Inc. | 827 | 29,689 | (2.5 | ) | ||||||||
Materion Corp. | 60 | 3,104 | (0.3 | ) | ||||||||
Mattel, Inc. | 3,204 | 27,939 | (2.3 | ) | ||||||||
MaxLinear, Inc. | 4,972 | 81,988 | (6.9 | ) | ||||||||
MDC Holdings, Inc. | 3,193 | 93,395 | (7.8 | ) | ||||||||
Medallia, Inc. | 1,990 | 42,745 | (3.6 | ) | ||||||||
Medifast, Inc. | 435 | 33,008 | (2.8 | ) | ||||||||
MEDNAX, Inc. | 7,543 | 109,524 | (9.2 | ) | ||||||||
Mercantile Bank Corp. | 7,779 | 183,584 | (15.4 | ) | ||||||||
Mercury Systems, Inc. | 2,525 | 225,129 | (18.9 | ) | ||||||||
MGIC Investment Corp. | 13,090 | 95,688 | (8.0 | ) | ||||||||
Midland States Bancorp, Inc. | 8,544 | 138,584 | (11.6 | ) | ||||||||
Minerals Technologies, Inc. | 621 | 27,349 | (2.3 | ) | ||||||||
Model N, Inc. | 5,205 | 150,216 | (12.6 | ) | ||||||||
Modine Manufacturing Co. | 4,877 | 22,580 | (1.9 | ) | ||||||||
Morningstar, Inc. | 1,158 | 180,602 | (15.2 | ) | ||||||||
MRC Global, Inc. | 4,371 | 23,429 | (2.0 | ) | ||||||||
MSA Safety, Inc. | 2,734 | 307,657 | (25.8 | ) | ||||||||
MSC Industrial Direct Co., Inc., Class A | 3,424 | 204,207 | (17.1 | ) | ||||||||
MTS Systems Corp. | 1,360 | 28,927 | (2.4 | ) | ||||||||
Myers Industries, Inc. | 5,960 | 73,666 | (6.2 | ) | ||||||||
MYR Group, Inc. | 3,196 | 95,880 | (8.0 | ) | ||||||||
Myriad Genetics, Inc. | 2,498 | 38,619 | (3.2 | ) | ||||||||
NanoString Technologies, Inc. | 779 | 24,741 | (2.1 | ) | ||||||||
Natera, Inc. | 807 | 29,891 | (2.5 | ) | ||||||||
National General Holdings Corp. | 13,478 | 256,486 | (21.5 | ) | ||||||||
National Instruments Corp. | 1,700 | 65,314 | (5.5 | ) | ||||||||
National Research Corp., Class A | 1,851 | 95,493 | (8.0 | ) | ||||||||
Navient Corp. | 6,213 | 47,343 | (4.0 | ) | ||||||||
Neenah, Inc. | 4,351 | 212,590 | (17.8 | ) | ||||||||
NeoGenomics, Inc. | 2,687 | 73,463 | (6.2 | ) | ||||||||
NETGEAR, Inc. | 901 | 21,606 | (1.8 | ) | ||||||||
NetScout Systems, Inc. | 1,828 | 48,405 | (4.1 | ) | ||||||||
New Relic, Inc. | 4,457 | 239,296 | (20.1 | ) | ||||||||
New York Times Co., Class A | 3,987 | 129,657 | (10.9 | ) | ||||||||
Nexstar Media Group, Inc., Class A | 1,843 | 129,084 | (10.8 | ) | ||||||||
NextGen Healthcare, Inc. | 1,904 | 20,087 | (1.7 | ) | ||||||||
Nicolet Bankshares, Inc. | 2,309 | 127,041 | (10.7 | ) | ||||||||
NMI Holdings, Inc., Class A | 1,641 | 22,186 | (1.9 | ) | ||||||||
Nordson Corp. | 276 | 44,411 | (3.7 | ) | ||||||||
Nutanix, Inc., Class A | 1,267 | 25,961 | (2.2 | ) | ||||||||
NV5 Global, Inc. | 878 | 41,046 | (3.4 | ) | ||||||||
Oceaneering International, Inc. | 4,999 | 25,695 | (2.2 | ) | ||||||||
Omeros Corp. | 3,147 | 52,303 | (4.4 | ) | ||||||||
Omnicell, Inc. | 1,281 | 93,385 | (7.8 | ) | ||||||||
OraSure Technologies, Inc. | 2,255 | 35,945 | (3.0 | ) | ||||||||
Ormat Technologies, Inc. | 677 | 42,252 | (3.5 | ) | ||||||||
Orthofix Medical, Inc. | 1,596 | 56,578 | (4.7 | ) | ||||||||
Outfront Media, Inc. | 4,395 | 68,958 | (5.8 | ) | ||||||||
Pacific Biosciences of California, Inc. | 11,061 | 36,557 | (3.1 | ) | ||||||||
PacWest Bancorp | 1,768 | 35,784 | (3.0 | ) | ||||||||
| SCHEDULES OF INVESTMENTS | 61 |
Schedule of Investments (continued) April 30, 2020 | BlackRock Global Long/Short Equity Fund |
| Shares | Value | % of Basket Value | ||||||||||
| United States (continued) | ||||||||||||
PagerDuty, Inc. | 3,769 | $ | 79,564 | (6.7 | ) % | |||||||
Papa John’s International, Inc. | 1,653 | 118,884 | (10.0 | ) | ||||||||
Par Pacific Holdings, Inc. | 2,232 | 21,695 | (1.8 | ) | ||||||||
Parsons Corp. | 2,155 | 80,597 | (6.8 | ) | ||||||||
Patrick Industries, Inc. | 639 | 26,340 | (2.2 | ) | ||||||||
Peapack Gladstone Financial Corp. | 6,262 | 118,164 | (9.9 | ) | ||||||||
Perficient, Inc. | 3,977 | 138,519 | (11.6 | ) | ||||||||
PGT Innovations, Inc. | 1,486 | 15,365 | (1.3 | ) | ||||||||
Pinnacle Financial Partners, Inc. | 5,745 | 231,236 | (19.4 | ) | ||||||||
PlayAGS, Inc. | 5,462 | 23,978 | (2.0 | ) | ||||||||
Plexus Corp. | 827 | 51,845 | (4.4 | ) | ||||||||
Pluralsight, Inc., Class A | 4,859 | 79,882 | (6.7 | ) | ||||||||
PolyOne Corp. | 2,062 | 48,024 | (4.0 | ) | ||||||||
Portola Pharmaceuticals, Inc. | 3,128 | 22,146 | (1.9 | ) | ||||||||
Post Holdings, Inc. | 2,668 | 245,056 | (20.6 | ) | ||||||||
Power Integrations, Inc. | 951 | 97,335 | (8.2 | ) | ||||||||
PQ Group Holdings, Inc. | 1,532 | 17,955 | (1.5 | ) | ||||||||
PRA Group, Inc. | 1,054 | 29,238 | (2.5 | ) | ||||||||
PRA Health Sciences, Inc. | 1,039 | 100,263 | (8.4 | ) | ||||||||
Preferred Bank | 466 | 17,778 | (1.5 | ) | ||||||||
Primerica, Inc. | 2,174 | 225,900 | (19.0 | ) | ||||||||
Progress Software Corp. | 1,773 | 72,533 | (6.1 | ) | ||||||||
PROS Holdings, Inc. | 2,981 | 102,517 | (8.6 | ) | ||||||||
Proto Labs, Inc. | 1,741 | 176,868 | (14.8 | ) | ||||||||
Pure Storage, Inc., Class A | 8,942 | 128,765 | (10.8 | ) | ||||||||
Q2 Holdings, Inc. | 826 | 65,849 | (5.5 | ) | ||||||||
QCR Holdings, Inc. | 5,060 | 155,747 | (13.1 | ) | ||||||||
Qualys, Inc. | 1,682 | 177,350 | (14.9 | ) | ||||||||
Quanta Services, Inc. | 4,006 | 145,658 | (12.2 | ) | ||||||||
Quidel Corp. | 211 | 29,329 | (2.5 | ) | ||||||||
Quotient Technology, Inc. | 2,731 | 19,609 | (1.6 | ) | ||||||||
Qurate Retail, Inc., Series A | 3,668 | 29,546 | (2.5 | ) | ||||||||
Rambus, Inc. | 6,454 | 80,869 | (6.8 | ) | ||||||||
Rapid7, Inc. | 2,633 | 119,933 | (10.1 | ) | ||||||||
Raven Industries, Inc. | 5,040 | 112,241 | (9.4 | ) | ||||||||
Rayonier, Inc. | 2,233 | 53,659 | (4.5 | ) | ||||||||
RE/MAX Holdings, Inc., Class A | 2,367 | 62,228 | (5.2 | ) | ||||||||
RealReal, Inc. | 4,095 | 48,075 | (4.0 | ) | ||||||||
REGENXBIO, Inc. | 758 | 30,184 | (2.5 | ) | ||||||||
Reliance Steel & Aluminum Co. | 2,282 | 204,422 | (17.2 | ) | ||||||||
Repligen Corp. | 863 | 100,237 | (8.4 | ) | ||||||||
Republic Bancorp, Inc., Class A | 4,735 | 157,818 | (13.2 | ) | ||||||||
Revolve Group, Inc. | 2,481 | 27,266 | (2.3 | ) | ||||||||
RMR Group, Inc., Class A | 1,196 | 35,473 | (3.0 | ) | ||||||||
Saia, Inc. | 242 | 22,390 | (1.9 | ) | ||||||||
SailPoint Technologies Holding, Inc. | 3,399 | 63,187 | (5.3 | ) | ||||||||
Sandy Spring Bancorp, Inc. | 6,617 | 168,733 | (14.2 | ) | ||||||||
ScanSource, Inc. | 1,758 | 45,567 | (3.8 | ) | ||||||||
Scholastic Corp. | 946 | 27,500 | (2.3 | ) | ||||||||
SEACOR Holdings, Inc. | 176 | 4,974 | (0.4 | ) | ||||||||
Select Medical Holdings Corp. | 5,303 | 90,522 | (7.6 | ) | ||||||||
Sensient Technologies Corp. | 8,495 | 405,976 | (34.1 | ) | ||||||||
Shockwave Medical, Inc. | 1,697 | 68,084 | (5.7 | ) | ||||||||
Shutterstock, Inc. | 3,088 | 117,344 | (9.9 | ) | ||||||||
Silicon Laboratories, Inc. | 5,967 | 580,112 | (48.7 | ) | ||||||||
Simulations Plus, Inc. | 2,294 | 87,287 | (7.3 | ) | ||||||||
SiteOne Landscape Supply, Inc. | 796 | 70,549 | (5.9 | ) | ||||||||
Skechers U.S.A., Inc., Class A | 5,603 | 157,893 | (13.3 | ) | ||||||||
Smartsheet, Inc., Class A | 923 | 48,661 | (4.1 | ) | ||||||||
Solaris Oilfield Infrastructure, Inc., Class A | 5,503 | 37,641 | (3.2 | ) | ||||||||
Sonoco Products Co. | 827 | 40,391 | (3.4 | ) | ||||||||
Sonos, Inc. | 2,098 | 21,442 | (1.8 | ) | ||||||||
| Shares | Value | % of Basket Value | ||||||||||
| United States (continued) | ||||||||||||
SpartanNash Co. | 1,417 | $ | 24,302 | (2.0 | ) % | |||||||
Sprouts Farmers Market, Inc. | 4,944 | 102,736 | (8.6 | ) | ||||||||
Stamps.com, Inc. | 584 | 92,430 | (7.8 | ) | ||||||||
Standard Motor Products, Inc. | 1,220 | 49,642 | (4.2 | ) | ||||||||
Sterling Bancorp | 5,628 | 69,393 | (5.8 | ) | ||||||||
Sterling Construction Co., Inc. | 2,721 | 26,883 | (2.3 | ) | ||||||||
Stitch Fix, Inc., Class A | 2,195 | 35,230 | (3.0 | ) | ||||||||
STORE Capital Corp. | 7,780 | 156,145 | (13.1 | ) | ||||||||
Summit Materials, Inc., Class A | 2,514 | 37,987 | (3.2 | ) | ||||||||
Synaptics, Inc. | 304 | 19,879 | (1.7 | ) | ||||||||
SYNNEX Corp. | 1,128 | 98,768 | (8.3 | ) | ||||||||
Synovus Financial Corp. | 10,838 | 227,706 | (19.1 | ) | ||||||||
Tactile Systems Technology, Inc. | 73 | 3,768 | (0.3 | ) | ||||||||
TCF Financial Corp. | 4,260 | 126,479 | (10.6 | ) | ||||||||
TechTarget, Inc. | 5,330 | 124,296 | (10.4 | ) | ||||||||
Telephone & Data Systems, Inc. | 7,670 | 150,485 | (12.6 | ) | ||||||||
Tenable Holdings, Inc. | 1,095 | 28,536 | (2.4 | ) | ||||||||
Terex Corp. | 2,433 | 36,957 | (3.1 | ) | ||||||||
Terreno Realty Corp. | 1,100 | 60,302 | (5.1 | ) | ||||||||
Tetra Tech, Inc. | 1,251 | 94,175 | (7.9 | ) | ||||||||
Texas Roadhouse, Inc. | 555 | 26,135 | (2.2 | ) | ||||||||
Titan Machinery, Inc. | 6,765 | 63,591 | (5.3 | ) | ||||||||
Toro Co. | 1,763 | 112,497 | (9.4 | ) | ||||||||
TPI Composites, Inc. | 3,408 | 59,742 | (5.0 | ) | ||||||||
TreeHouse Foods, Inc. | 788 | 40,763 | (3.4 | ) | ||||||||
TriNet Group, Inc. | 412 | 20,176 | (1.7 | ) | ||||||||
Trinseo SA | 5,137 | 105,052 | (8.8 | ) | ||||||||
TriState Capital Holdings, Inc. | 8,639 | 122,847 | (10.3 | ) | ||||||||
Trupanion, Inc. | 2,222 | 66,460 | (5.6 | ) | ||||||||
Tupperware Brands Corp. | 6,551 | 21,094 | (1.8 | ) | ||||||||
UMB Financial Corp. | 799 | 40,621 | (3.4 | ) | ||||||||
United Fire Group, Inc. | 3,383 | 96,754 | (8.1 | ) | ||||||||
Univest Financial Corp. | 3,514 | 62,198 | (5.2 | ) | ||||||||
Upwork, Inc. | 2,640 | 21,991 | (1.8 | ) | ||||||||
US Concrete, Inc. | 5,934 | 113,814 | (9.6 | ) | ||||||||
USANA Health Sciences, Inc. | 271 | 24,179 | (2.0 | ) | ||||||||
Valmont Industries, Inc. | 1,498 | 175,625 | (14.7 | ) | ||||||||
Varonis Systems, Inc. | 271 | 18,171 | (1.5 | ) | ||||||||
Vectrus, Inc. | 1,497 | 77,859 | (6.5 | ) | ||||||||
Veracyte, Inc. | 820 | 22,115 | (1.9 | ) | ||||||||
Viad Corp. | 842 | 20,183 | (1.7 | ) | ||||||||
ViaSat, Inc. | 424 | 17,978 | (1.5 | ) | ||||||||
Vicor Corp. | 1,923 | 102,246 | (8.6 | ) | ||||||||
Virtus Investment Partners, Inc. | 895 | 72,737 | (6.1 | ) | ||||||||
Virtusa Corp. | 1,116 | 36,828 | (3.1 | ) | ||||||||
Visteon Corp. | 704 | 42,451 | (3.6 | ) | ||||||||
Vivint Solar, Inc. | 3,938 | 24,967 | (2.1 | ) | ||||||||
Vonage Holdings Corp. | 7,889 | 65,952 | (5.5 | ) | ||||||||
W&T Offshore, Inc. | 10,610 | 29,390 | (2.5 | ) | ||||||||
Wabash National Corp. | 14,959 | 122,664 | (10.3 | ) | ||||||||
WaVe Life Sciences Ltd. | 2,129 | 18,480 | (1.6 | ) | ||||||||
Weis Markets, Inc. | 2,734 | 136,782 | (11.5 | ) | ||||||||
Welbilt, Inc. | 8,959 | 44,168 | (3.7 | ) | ||||||||
Wendy’s Co. | 1,612 | 32,014 | (2.7 | ) | ||||||||
WesBanco, Inc. | 7,148 | 176,413 | (14.8 | ) | ||||||||
WESCO International, Inc. | 4,241 | 109,715 | (9.2 | ) | ||||||||
WillScot Corp. | 1,807 | 21,052 | (1.8 | ) | ||||||||
Wingstop, Inc. | 1,586 | 185,990 | (15.6 | ) | ||||||||
Wintrust Financial Corp. | 11,944 | 500,454 | (42.0 | ) | ||||||||
WisdomTree Investments, Inc. | 9,605 | 31,120 | (2.6 | ) | ||||||||
Woodward, Inc. | 1,871 | 113,308 | (9.5 | ) | ||||||||
Workiva, Inc. | 646 | 24,774 | (2.1 | ) | ||||||||
| 62 | 2020 BLACKROCK ANNUAL REPORTTO SHAREHOLDERS |
Schedule of Investments (continued) April 30, 2020 | BlackRock Global Long/Short Equity Fund |
| Shares | Value | % of Basket Value | ||||||||||
| United States (continued) | ||||||||||||
WSFS Financial Corp. | 4,259 | $ | 124,278 | (10.4 | ) % | |||||||
WW International, Inc. | 2,183 | 55,688 | (4.7 | ) | ||||||||
Yext, Inc. | 7,696 | 98,509 | (8.3 | ) | ||||||||
Zendesk, Inc. | 3,068 | 235,868 | (19.8 | ) | ||||||||
Zogenix, Inc. | 599 | 16,910 | (1.4 | ) | ||||||||
Zuora, Inc., Class A | 7,314 | 77,309 | (6.5 | ) | ||||||||
Zynga, Inc., Class A | 9,217 | 69,496 | (5.8 | ) | ||||||||
|
|
|
| |||||||||
| 34,342,438 | ||||||||||||
|
| |||||||||||
Total Reference Entity — Long |
| 82,922,330 | ||||||||||
|
| |||||||||||
Reference Entity — Short |
| |||||||||||
| Australia | ||||||||||||
Adelaide Brighton, Ltd. | (9,222 | ) | (16,244 | ) | 1.4 | |||||||
Afterpay Ltd. | (495 | ) | (9,843 | ) | 0.8 | |||||||
Altium Ltd. | (1,451 | ) | (31,851 | ) | 2.7 | |||||||
AP Eagers Ltd. | (8,964 | ) | (29,662 | ) | 2.5 | |||||||
ARB Corp. Ltd. | (2,625 | ) | (25,778 | ) | 2.2 | |||||||
Bravura Solutions Ltd. | (15,902 | ) | (49,657 | ) | 4.2 | |||||||
carsales.com, Ltd. | (14,631 | ) | (133,841 | ) | 11.2 | |||||||
Cleanaway Waste Management, Ltd. | (37,446 | ) | (45,180 | ) | 3.8 | |||||||
Domain Holdings Australia Ltd. | (22,249 | ) | (37,675 | ) | 3.2 | |||||||
EML Payments Ltd. | (22,501 | ) | (40,636 | ) | 3.4 | |||||||
G8 Education, Ltd. | (2,814 | ) | (1,450 | ) | 0.1 | |||||||
G8 Education, Ltd. | (14,340 | ) | (8,042 | ) | 0.7 | |||||||
Healius Ltd. | (36,131 | ) | (60,431 | ) | 5.1 | |||||||
Iluka Resources Ltd. | (8,948 | ) | (44,383 | ) | 3.7 | |||||||
Ingenia Communities Group | (37,434 | ) | (96,569 | ) | 8.1 | |||||||
Link Administration Holdings Ltd. | (66,110 | ) | (161,311 | ) | 13.5 | |||||||
McMillan Shakespeare Ltd. | (9,902 | ) | (42,773 | ) | 3.6 | |||||||
Orora Ltd. | (198,024 | ) | (329,089 | ) | 27.6 | |||||||
Qube Holdings Ltd. | (66,607 | ) | (138,656 | ) | 11.6 | |||||||
Village Roadshow Ltd. | (4,692 | ) | (6,820 | ) | 0.6 | |||||||
Webjet Ltd. | (61,812 | ) | (121,195 | ) | 10.2 | |||||||
Western Areas Ltd. | (12,281 | ) | (17,311 | ) | 1.4 | |||||||
|
|
|
| |||||||||
| (1,448,397 | ) | |||||||||||
| Austria | ||||||||||||
AT&S Austria Technologie & Systemtechnik AG | (6,920 | ) | (119,274 | ) | 10.0 | |||||||
FACC AG | (2,680 | ) | (21,467 | ) | 1.8 | |||||||
Kapsch TrafficCom AG | (935 | ) | (18,238 | ) | 1.6 | |||||||
Semperit AG Holding | (3,946 | ) | (49,096 | ) | 4.1 | |||||||
|
|
|
| |||||||||
| (208,075 | ) | |||||||||||
| Bahamas | ||||||||||||
OneSpaWorld Holdings Ltd. | (8,829 | ) | (57,477 | ) | 4.8 | |||||||
|
|
|
| |||||||||
| Belgium | ||||||||||||
Aedifica SA | (661 | ) | (64,063 | ) | 5.4 | |||||||
AGFA-Gevaert NV | (38,430 | ) | (152,233 | ) | 12.8 | |||||||
Cie d’Entreprises CFE | (3,018 | ) | (234,232 | ) | 19.7 | |||||||
D’ieteren SA | (717 | ) | (35,932 | ) | 3.0 | |||||||
Econocom Group SA | (20,449 | ) | (39,359 | ) | 3.3 | |||||||
Euronav NV | (5,467 | ) | (61,062 | ) | 5.1 | |||||||
Exmar NV | (34,473 | ) | (168,221 | ) | 14.1 | |||||||
Ion Beam Applications | (4,985 | ) | (41,353 | ) | 3.5 | |||||||
Mithra Pharmaceuticals SA | (1,691 | ) | (42,207 | ) | 3.5 | |||||||
|
|
|
| |||||||||
| (838,662 | ) | |||||||||||
| Bermuda | ||||||||||||
Enstar Group Ltd. | (498 | ) | (72,021 | ) | 6.0 | |||||||
Triton International Ltd. | (11,369 | ) | (352,211 | ) | 29.6 | |||||||
|
|
|
| |||||||||
| (424,232 | ) | |||||||||||
| Shares | Value | % of Basket Value | ||||||||||
| Canada | ||||||||||||
Canfor Corp. | (1,862 | ) | $ | (12,976 | ) | 1.1 | % | |||||
Colliers International Group, Inc. | (399 | ) | (21,897 | ) | 1.8 | |||||||
Element Financial Corp. | (28,666 | ) | (211,502 | ) | 17.7 | |||||||
Finning International, Inc. | (4,234 | ) | (53,748 | ) | 4.5 | |||||||
Great Canadian Gaming Corp. | (5,934 | ) | (115,572 | ) | 9.7 | |||||||
Interfor Corp. | (1,611 | ) | (9,502 | ) | 0.8 | |||||||
Northland Power, Inc. | (10,414 | ) | (223,475 | ) | 18.8 | |||||||
Park Lawn Corp. | (3,582 | ) | (56,151 | ) | 4.7 | |||||||
Superior Plus Corp. | (17,066 | ) | (121,134 | ) | 10.2 | |||||||
TransAlta Corp. | (40,225 | ) | (236,677 | ) | 19.9 | |||||||
Uranium Participation Corp. | (32,730 | ) | (115,217 | ) | 9.7 | |||||||
WPT Industrial Real Estate Investment Trust | (738 | ) | (8,465 | ) | 0.7 | |||||||
|
|
|
| |||||||||
| (1,186,316 | ) | |||||||||||
| Cayman Islands | ||||||||||||
Global Indemnity Ltd. | (4,443 | ) | (109,253 | ) | 9.2 | |||||||
|
|
|
| |||||||||
| China | ||||||||||||
Minth Group Ltd. | (30,000 | ) | (72,139 | ) | 6.0 | |||||||
|
|
|
| |||||||||
| Denmark | ||||||||||||
Ambu A/S, Class B | (1,016 | ) | (31,823 | ) | 2.7 | |||||||
D/S Norden A/S | (2,848 | ) | (40,029 | ) | 3.3 | |||||||
|
|
|
| |||||||||
| (71,852 | ) | |||||||||||
| Finland | ||||||||||||
Adapteo OYJ | (5,290 | ) | (37,933 | ) | 3.2 | |||||||
Caverion OYJ | (8,399 | ) | (47,866 | ) | 4.0 | |||||||
F-Secure OYJ | (38,508 | ) | (115,940 | ) | 9.7 | |||||||
Outokumpu OYJ | (56,403 | ) | (150,025 | ) | 12.6 | |||||||
Rovio Entertainment OYJ | (9,745 | ) | (58,307 | ) | 4.9 | |||||||
Sanoma OYJ | (12,193 | ) | (110,090 | ) | 9.3 | |||||||
TietoEVRY OYJ | (8,517 | ) | (207,530 | ) | 17.4 | |||||||
|
|
|
| |||||||||
| (727,691 | ) | |||||||||||
| France | ||||||||||||
Adevinta ASA | (3,881 | ) | (32,234 | ) | 2.7 | |||||||
Beneteau SA | (10,787 | ) | (68,303 | ) | 5.7 | |||||||
Boiron SA | (1,402 | ) | (51,622 | ) | 4.3 | |||||||
Bonduelle SCA | (4,290 | ) | (93,848 | ) | 7.9 | |||||||
Elis SA | (1,626 | ) | (20,042 | ) | 1.7 | |||||||
Guerbet | (641 | ) | (20,218 | ) | 1.7 | |||||||
Jacquet Metal Service SA | (1,394 | ) | (14,207 | ) | 1.2 | |||||||
LISI | (718 | ) | (11,613 | ) | 1.0 | |||||||
Nexans SA | (365 | ) | (13,001 | ) | 1.1 | |||||||
Tarkett SA | (5,276 | ) | (52,177 | ) | 4.4 | |||||||
Trigano SA | (393 | ) | (28,921 | ) | 2.4 | |||||||
|
|
|
| |||||||||
| (406,186 | ) | |||||||||||
| Germany | ||||||||||||
Aareal Bank AG | (1,307 | ) | (21,290 | ) | 1.8 | |||||||
ADO Properties SA | (1,737 | ) | (48,663 | ) | 4.1 | |||||||
Amadeus Fire AG | (282 | ) | (29,040 | ) | 2.4 | |||||||
Aurubis AG | (1,734 | ) | (89,891 | ) | 7.6 | |||||||
Bertrandt AG | (1,134 | ) | (43,681 | ) | 3.7 | |||||||
CECONOMY AG | (19,260 | ) | (49,302 | ) | 4.1 | |||||||
CropEnergies AG | (1,340 | ) | (10,578 | ) | 0.9 | |||||||
Dermapharm Holding SE | (428 | ) | (20,296 | ) | 1.7 | |||||||
Isra Vision AG | (2,252 | ) | (123,013 | ) | 10.3 | |||||||
JOST Werke AG | (1,670 | ) | (45,294 | ) | 3.8 | |||||||
Jungheinrich AG | (4,252 | ) | (76,784 | ) | 6.5 | |||||||
Kloeckner & Co. SE | (47,160 | ) | (193,281 | ) | 16.2 | |||||||
Krones AG | (2,568 | ) | (154,733 | ) | 13.0 | |||||||
OHB SE | (508 | ) | (19,100 | ) | 1.6 | |||||||
Salzgitter AG | (9,194 | ) | (122,834 | ) | 10.3 | |||||||
| SCHEDULES OF INVESTMENTS | 63 |
Schedule of Investments (continued) April 30, 2020 | BlackRock Global Long/Short Equity Fund |
| Shares | Value | % of Basket Value | ||||||||||
| Germany (continued) | ||||||||||||
Siltronic AG | (1,096 | ) | $ | (93,829 | ) | 7.9 | % | |||||
Sixt SE | (3,289 | ) | (223,887 | ) | 18.8 | |||||||
SMA Solar Technology AG | (3,120 | ) | (99,289 | ) | 8.3 | |||||||
STRATEC SE | (70 | ) | (6,629 | ) | 0.6 | |||||||
Suedzucker AG | (6,589 | ) | (87,177 | ) | 7.3 | |||||||
VERBIO Vereinigte BioEnergie AG | (6,220 | ) | (56,477 | ) | 4.7 | |||||||
Vossloh AG | (255 | ) | (9,630 | ) | 0.8 | |||||||
Wacker Chemie AG | (674 | ) | (39,299 | ) | 3.3 | |||||||
Wacker Neuson SE | (22,267 | ) | (276,460 | ) | 23.2 | |||||||
Washtec AG | (2,548 | ) | (100,533 | ) | 8.4 | |||||||
|
|
|
| |||||||||
| (2,040,990 | ) | |||||||||||
| Hong Kong | ||||||||||||
Johnson Electric Holdings, Ltd. | (12,000 | ) | (20,149 | ) | 1.7 | |||||||
Luk Fook Holdings International Ltd. | (33,000 | ) | (70,661 | ) | 5.9 | |||||||
|
|
|
| |||||||||
| (90,810 | ) | |||||||||||
| Ireland | ||||||||||||
COSMO Pharmaceuticals NV | (2,687 | ) | (204,527 | ) | 17.2 | |||||||
Dalata Hotel Group PLC | (44,909 | ) | (145,535 | ) | 12.2 | |||||||
Greencore Group PLC | (8,009 | ) | (18,343 | ) | 1.5 | |||||||
Keywords Studios PLC | (1,200 | ) | (24,040 | ) | 2.0 | |||||||
|
|
|
| |||||||||
| (392,445 | ) | |||||||||||
| Israel | ||||||||||||
Alony Hetz Properties & Investments Ltd. | (2,932 | ) | (35,290 | ) | 3.0 | |||||||
Cellcom Israel Ltd. | (2,285 | ) | (8,414 | ) | 0.7 | |||||||
Delek Automotive Systems Ltd. | (31,796 | ) | (167,424 | ) | 14.1 | |||||||
Delek Group Ltd. | (80 | ) | (3,642 | ) | 0.3 | |||||||
Delta Galil Industries Ltd. | (3,550 | ) | (63,184 | ) | 5.3 | |||||||
First International Bank Of Israel Ltd. | (13,230 | ) | (326,350 | ) | 27.4 | |||||||
Gazit-Globe Ltd. | (30,558 | ) | (226,248 | ) | 19.0 | |||||||
Harel Insurance Investments & Financial Services Ltd. | (23,900 | ) | (153,881 | ) | 12.9 | |||||||
IDI Insurance Co. Ltd. | (5,024 | ) | (154,440 | ) | 13.0 | |||||||
Israel Corp. Ltd. | (1,268 | ) | (163,612 | ) | 13.7 | |||||||
Matrix IT Ltd. | (3,454 | ) | (66,953 | ) | 5.6 | |||||||
Sapiens International Corp. NV | (1,338 | ) | (33,354 | ) | 2.8 | |||||||
Shufersal Ltd. | (9,778 | ) | (62,774 | ) | 5.3 | |||||||
Summit Real Estate Holdings Ltd. | (2,044 | ) | (25,534 | ) | 2.1 | |||||||
|
|
|
| |||||||||
| (1,491,100 | ) | |||||||||||
| Italy | ||||||||||||
Arnoldo Mondadori Editore SpA | (12,082 | ) | (16,439 | ) | 1.4 | |||||||
Banca Monte dei Paschi di Siena SpA | (40,443 | ) | (49,344 | ) | 4.1 | |||||||
Banca Popolare di Sondrio SCPA | (21,692 | ) | (34,438 | ) | 2.9 | |||||||
Cairo Communication SpA | (13,479 | ) | (24,309 | ) | 2.0 | |||||||
Danieli & C Officine Meccaniche SpA | (576 | ) | (7,321 | ) | 0.6 | |||||||
Danieli & C Officine Meccaniche SpA | (10,314 | ) | (76,601 | ) | 6.4 | |||||||
De’ Longhi SpA | (1,090 | ) | (19,701 | ) | 1.7 | |||||||
Falck Renewables SpA | (11,040 | ) | (54,262 | ) | 4.6 | |||||||
Fila SpA | (47,899 | ) | (432,891 | ) | 36.3 | |||||||
Freni Brembo SpA | (2,010 | ) | (17,051 | ) | 1.4 | |||||||
Gruppo MutuiOnline SpA | (1,190 | ) | (21,614 | ) | 1.8 | |||||||
Illimity Bank SpA | (4,110 | ) | (27,551 | ) | 2.3 | |||||||
Italmobiliare SpA | (3,735 | ) | (111,776 | ) | 9.4 | |||||||
Juventus Football Club SpA | (57,886 | ) | (57,371 | ) | 4.8 | |||||||
La Doria SpA | (2,192 | ) | (23,268 | ) | 1.9 | |||||||
OVS SpA | (70,461 | ) | (60,729 | ) | 5.1 | |||||||
SAES Getters SpA | (1,061 | ) | (25,685 | ) | 2.2 | |||||||
Salini Impregilo SpA | (31,135 | ) | (46,089 | ) | 3.9 | |||||||
Societa Cattolica di Assicurazioni | (3,693 | ) | (20,461 | ) | 1.7 | |||||||
Tamburi Investment Partners SpA | (17,287 | ) | (111,817 | ) | 9.4 | |||||||
Tod’s SpA | (3,328 | ) | (101,908 | ) | 8.6 | |||||||
|
|
|
| |||||||||
| (1,340,626 | ) | |||||||||||
| Shares | Value | % of Basket Value | ||||||||||
| Japan | ||||||||||||
77 Bank Ltd. | (5,300 | ) | $ | (70,674 | ) | 5.9 | % | |||||
Adastria Holdings Co., Ltd. | (6,100 | ) | (84,320 | ) | 7.1 | |||||||
Advance Residence Investment Corp. | (103 | ) | (316,031 | ) | 26.5 | |||||||
Aeon Delight Co. Ltd. | (1,100 | ) | (31,504 | ) | 2.6 | |||||||
Aida Engineering Ltd. | (2,700 | ) | (18,532 | ) | 1.6 | |||||||
Aiful Corp. | (53,100 | ) | (117,008 | ) | 9.8 | |||||||
Alpen Co. Ltd. | (10,800 | ) | (165,612 | ) | 13.9 | |||||||
Anest Iwata Corp. | (11,100 | ) | (85,894 | ) | 7.2 | |||||||
Arata Corp. | (5,800 | ) | (239,542 | ) | 20.1 | |||||||
Argo Graphics, Inc. | (600 | ) | (18,792 | ) | 1.6 | |||||||
Ariake Japan Co., Ltd. | (1,400 | ) | (80,737 | ) | 6.8 | |||||||
Asahi Holdings, Inc. | (2,300 | ) | (51,971 | ) | 4.4 | |||||||
Asics Corp. | (3,100 | ) | (29,395 | ) | 2.5 | |||||||
ASKUL Corp. | (2,800 | ) | (79,943 | ) | 6.7 | |||||||
Awa Bank Ltd. | (3,600 | ) | (78,329 | ) | 6.6 | |||||||
Bank of Okinawa Ltd. | (8,100 | ) | (240,041 | ) | 20.1 | |||||||
BayCurrent Consulting, Inc. | (600 | ) | (34,001 | ) | 2.9 | |||||||
Benefit One, Inc. | (1,500 | ) | (26,334 | ) | 2.2 | |||||||
Cawachi Ltd. | (10,200 | ) | (241,192 | ) | 20.2 | |||||||
Chofu Seisakusho Co. Ltd. | (3,000 | ) | (65,681 | ) | 5.5 | |||||||
Chubu Shiryo Co. Ltd. | (5,000 | ) | (76,647 | ) | 6.4 | |||||||
Chugoku Bank Ltd. | (3,100 | ) | (28,545 | ) | 2.4 | |||||||
Chugoku Marine Paints Ltd. | (9,500 | ) | (72,643 | ) | 6.1 | |||||||
Chukyo Bank Ltd. | (5,000 | ) | (97,690 | ) | 8.2 | |||||||
Citizen Watch Co. Ltd. | (37,000 | ) | (130,586 | ) | 11.0 | |||||||
CKD Corp. | (7,700 | ) | (128,373 | ) | 10.8 | |||||||
Comforia Residential REIT, Inc. | (66 | ) | (195,966 | ) | 16.4 | |||||||
Cosmo Energy Holdings Co. Ltd. | (1,500 | ) | (22,534 | ) | 1.9 | |||||||
Create Restaurants Holdings, Inc. | (5,400 | ) | (29,784 | ) | 2.5 | |||||||
Create SD Holdings Co. Ltd. | (8,700 | ) | (247,891 | ) | 20.8 | |||||||
Curves Holdings Co. Ltd. | (12,100 | ) | (57,955 | ) | 4.9 | |||||||
CYBERDYNE, Inc. | (17,400 | ) | (69,072 | ) | 5.8 | |||||||
Cybozu, Inc. | (1,800 | ) | (34,856 | ) | 2.9 | |||||||
Daibiru Corp. | (12,500 | ) | (114,382 | ) | 9.6 | |||||||
Daido Steel Co. Ltd. | (3,600 | ) | (118,892 | ) | 10.0 | |||||||
Daishi Hokuetsu Financial Group, Inc. | (5,000 | ) | (108,650 | ) | 9.1 | |||||||
Daiwa Office Investment Corp. | (16 | ) | (88,515 | ) | 7.4 | |||||||
Daiwa Securities Living Investments Corp. | (41 | ) | (34,262 | ) | 2.9 | |||||||
Daiwabo Holdings Co. Ltd. | (1,700 | ) | (104,728 | ) | 8.8 | |||||||
Denka Co., Ltd. | (6,200 | ) | (149,791 | ) | 12.6 | |||||||
Digital Garage, Inc. | (3,300 | ) | (118,235 | ) | 9.9 | |||||||
DMG Mori Co., Ltd. | (21,000 | ) | (214,718 | ) | 18.0 | |||||||
Dowa Holdings Co. Ltd. | (1,000 | ) | (27,658 | ) | 2.3 | |||||||
Duskin Co. Ltd. | (2,500 | ) | (64,603 | ) | 5.4 | |||||||
Earth Corp. | (2,500 | ) | (145,010 | ) | 12.2 | |||||||
Eiken Chemical Co. Ltd. | (5,200 | ) | (90,552 | ) | 7.6 | |||||||
Eizo Corp. | (2,600 | ) | (77,974 | ) | 6.5 | |||||||
Enplas Corp. | (3,900 | ) | (81,880 | ) | 6.9 | |||||||
ES-Con Japan Ltd. | (10,600 | ) | (71,307 | ) | 6.0 | |||||||
euglena Co. Ltd. | (2,900 | ) | (16,509 | ) | 1.4 | |||||||
Exedy Corp. | (1,200 | ) | (19,335 | ) | 1.6 | |||||||
Ezaki Glico Co., Ltd. | (11,300 | ) | (496,296 | ) | 41.7 | |||||||
Fancl Corp. | (4,600 | ) | (110,277 | ) | 9.3 | |||||||
Feed One Co. Ltd. | (12,900 | ) | (20,110 | ) | 1.7 | |||||||
Fuji Corp/Aichi | (16,700 | ) | (279,613 | ) | 23.5 | |||||||
Fuji Kyuko Co. Ltd. | (700 | ) | (20,449 | ) | 1.7 | |||||||
Fuji Oil Holdings, Inc. | (1,100 | ) | (25,663 | ) | 2.2 | |||||||
Fuji Seal International, Inc. | (8,100 | ) | (140,607 | ) | 11.8 | |||||||
Fujibo Holdings, Inc. | (5,200 | ) | (139,026 | ) | 11.7 | |||||||
Fujikura Ltd. | (15,900 | ) | (46,748 | ) | 3.9 | |||||||
Fujimi, Inc. | (5,300 | ) | (147,021 | ) | 12.3 | |||||||
Fujitec Co. Ltd. | (16,400 | ) | (233,937 | ) | 19.6 | |||||||
| 64 | 2020 BLACKROCK ANNUAL REPORTTO SHAREHOLDERS |
Schedule of Investments (continued) April 30, 2020 | BlackRock Global Long/Short Equity Fund |
| Shares | Value | % of Basket Value | ||||||||||
| Japan (continued) | ||||||||||||
Fujiya Co. Ltd. | (16,900 | ) | $ | (317,243 | ) | 26.6 | % | |||||
Fukushima Galilei Co. Ltd. | (8,900 | ) | (261,798 | ) | 22.0 | |||||||
Futaba Industrial Co. Ltd. | (12,400 | ) | (58,946 | ) | 4.9 | |||||||
G-7 Holdings, Inc. | (1,300 | ) | (28,540 | ) | 2.4 | |||||||
Gakken Holdings Co. Ltd. | (5,600 | ) | (92,146 | ) | 7.7 | |||||||
Genky DrugStores Co. Ltd. | (4,600 | ) | (104,835 | ) | 8.8 | |||||||
Global One Real Estate Investment Corp. | (84 | ) | (71,025 | ) | 6.0 | |||||||
GLP J-Reit | (18 | ) | (23,206 | ) | 1.9 | |||||||
Godo Steel Ltd. | (4,000 | ) | (75,250 | ) | 6.3 | |||||||
Gunosy, Inc. | (1,300 | ) | (10,414 | ) | 0.9 | |||||||
Gunze Ltd. | (5,400 | ) | (183,049 | ) | 15.4 | |||||||
Gurunavi, Inc. | (9,200 | ) | (49,051 | ) | 4.1 | |||||||
Hachijuni Bank Ltd. | (10,400 | ) | (37,137 | ) | 3.1 | |||||||
Haseko Corp. | (3,900 | ) | (42,341 | ) | 3.6 | |||||||
Heiwa Real Estate Co. Ltd. | (5,800 | ) | (155,735 | ) | 13.1 | |||||||
HIS Co. Ltd. | (1,900 | ) | (25,018 | ) | 2.1 | |||||||
Hodogaya Chemical Co. Ltd. | (3,300 | ) | (106,972 | ) | 9.0 | |||||||
Hokkoku Bank Ltd. | (3,000 | ) | (89,169 | ) | 7.5 | |||||||
Hokuriku Electric Power Co. | (15,400 | ) | (103,793 | ) | 8.7 | |||||||
Hokuto Corp. | (7,600 | ) | (136,142 | ) | 11.4 | |||||||
Hosiden Corp. | (15,100 | ) | (128,863 | ) | 10.8 | |||||||
Hosokawa Micron Corp. | (10,700 | ) | (487,095 | ) | 40.9 | |||||||
Ibiden Co. Ltd. | (19,800 | ) | (506,088 | ) | 42.5 | |||||||
Ichikoh Industries Ltd. | (13,900 | ) | (61,455 | ) | 5.2 | |||||||
Idec Corp. | (10,400 | ) | (152,230 | ) | 12.8 | |||||||
Industrial & Infrastructure Fund Investment Corp. | (14 | ) | (19,502 | ) | 1.6 | |||||||
Infocom Corp. | (3,400 | ) | (81,413 | ) | 6.8 | |||||||
Infomart Corp. | (7,100 | ) | (49,023 | ) | 4.1 | |||||||
Invesco Office J-Reit, Inc. | (795 | ) | (105,418 | ) | 8.8 | |||||||
Invincible Investment Corp. | (339 | ) | (86,737 | ) | 7.3 | |||||||
Ishihara Sangyo Kaisha Ltd. | (9,300 | ) | (55,292 | ) | 4.6 | |||||||
Ito En Ltd. | (5,700 | ) | (316,646 | ) | 26.6 | |||||||
Iyo Bank Ltd. | (34,500 | ) | (184,825 | ) | 15.5 | |||||||
Jafco Co., Ltd. | (1,400 | ) | (44,848 | ) | 3.8 | |||||||
Japan Aviation Electronics Industry, Ltd. | (2,600 | ) | (33,729 | ) | 2.8 | |||||||
Japan Best Rescue System Co. Ltd. | (1,000 | ) | (7,070 | ) | 0.6 | |||||||
Japan Lifeline Co. Ltd. | (7,800 | ) | (91,729 | ) | 7.7 | |||||||
Japan Logistics Fund, Inc. | (91 | ) | (213,917 | ) | 18.0 | |||||||
Japan Medical Dynamic Marketing, Inc. | (1,200 | ) | (17,645 | ) | 1.5 | |||||||
Japan Petroleum Exploration Co. Ltd. | (4,500 | ) | (77,344 | ) | 6.5 | |||||||
Japan Securities Finance Co. Ltd. | (8,600 | ) | (40,475 | ) | 3.4 | |||||||
Japan Steel Works, Ltd. | (13,500 | ) | (165,737 | ) | 13.9 | |||||||
JCU Corp. | (4,200 | ) | (98,250 | ) | 8.2 | |||||||
Jeol Ltd. | (5,400 | ) | (159,667 | ) | 13.4 | |||||||
Juroku Bank Ltd. | (8,600 | ) | (151,079 | ) | 12.7 | |||||||
Justsystems Corp. | (700 | ) | (42,806 | ) | 3.6 | |||||||
JVCKenwood Corp. | (11,900 | ) | (18,915 | ) | 1.6 | |||||||
Kadokawa Corp. | (2,200 | ) | (31,630 | ) | 2.7 | |||||||
Kaga Electronics Co. Ltd. | (2,800 | ) | (50,632 | ) | 4.2 | |||||||
Kagome Co., Ltd. | (2,400 | ) | (61,291 | ) | 5.1 | |||||||
Kaken Pharmaceutical Co. Ltd. | (1,600 | ) | (88,066 | ) | 7.4 | |||||||
Kameda Seika Co. Ltd. | (1,100 | ) | (52,751 | ) | 4.4 | |||||||
Kaneka Corp. | (10,500 | ) | (271,585 | ) | 22.8 | |||||||
Kansai Mirai Financial Group, Inc. | (47,600 | ) | (160,038 | ) | 13.4 | |||||||
Kawasaki Kisen Kaisha Ltd. | (2,000 | ) | (19,676 | ) | 1.7 | |||||||
Keihin Corp. | (12,100 | ) | (288,626 | ) | 24.2 | |||||||
Keiyo Bank Ltd. | (28,400 | ) | (138,416 | ) | 11.6 | |||||||
Keiyo Co. Ltd. | (3,800 | ) | (20,293 | ) | 1.7 | |||||||
Kenedix Residential Next Investment Corp. | (154 | ) | (243,028 | ) | 20.4 | |||||||
Kenko Mayonnaise Co. Ltd. | (300 | ) | (5,514 | ) | 0.5 | |||||||
Kewpie Corp. | (13,800 | ) | (274,042 | ) | 23.0 | |||||||
Key Coffee, Inc. | (15,500 | ) | (321,297 | ) | 27.0 | |||||||
| Shares | Value | % of Basket Value | ||||||||||
| Japan (continued) | ||||||||||||
KH Neochem Co. Ltd. | (2,200 | ) | $ | (38,007 | ) | 3.2 | % | |||||
Kintetsu Department Store Co. Ltd. | (6,600 | ) | (159,233 | ) | 13.4 | |||||||
Kintetsu World Express, Inc. | (24,200 | ) | (352,249 | ) | 29.6 | |||||||
Kitz Corp. | (10,500 | ) | (64,408 | ) | 5.4 | |||||||
Kiyo Bank Ltd. | (14,000 | ) | (206,874 | ) | 17.4 | |||||||
Kobe Steel, Ltd. | (67,700 | ) | (226,429 | ) | 19.0 | |||||||
Koei Tecmo Holdings Co. Ltd. | (5,600 | ) | (147,313 | ) | 12.4 | |||||||
Krosaki Harima Corp. | (2,300 | ) | (80,913 | ) | 6.8 | |||||||
Kumiai Chemical Industry Co. Ltd. | (30,500 | ) | (246,168 | ) | 20.7 | |||||||
Kurabo Industries Ltd. | (3,600 | ) | (82,418 | ) | 6.9 | |||||||
Kusuri no Aoki Holdings Co. Ltd. | (2,300 | ) | (180,929 | ) | 15.2 | |||||||
KYORIN Holdings, Inc. | (18,300 | ) | (380,289 | ) | 31.9 | |||||||
LaSalle Logiport REIT | (121 | ) | (169,390 | ) | 14.2 | |||||||
Lasertec Corp. | (2,100 | ) | (138,887 | ) | 11.7 | |||||||
LEC, Inc. | (8,000 | ) | (88,291 | ) | 7.4 | |||||||
LIXIL VIVA Corp. | (11,100 | ) | (188,929 | ) | 15.9 | |||||||
Mabuchi Motor Co., Ltd. | (2,100 | ) | (65,027 | ) | 5.5 | |||||||
Macnica Fuji Electronics Holdings, Inc. | (4,100 | ) | (55,811 | ) | 4.7 | |||||||
Mani, Inc. | (2,200 | ) | (49,000 | ) | 4.1 | |||||||
Maruwa Co. Ltd/Aichi | (2,400 | ) | (169,286 | ) | 14.2 | |||||||
Matsui Securities Co. Ltd. | (23,800 | ) | (173,721 | ) | 14.6 | |||||||
Matsuyafoods Holdings Co. Ltd. | (3,200 | ) | (114,910 | ) | 9.6 | |||||||
Max Co. Ltd. | (1,700 | ) | (25,243 | ) | 2.1 | |||||||
Megachips Corp. | (1,100 | ) | (16,539 | ) | 1.4 | |||||||
Megmilk Snow Brand Co. Ltd. | (900 | ) | (20,535 | ) | 1.7 | |||||||
Meiko Electronics Co. Ltd. | (4,100 | ) | (53,200 | ) | 4.5 | |||||||
Meisei Industrial Co. Ltd. | (17,600 | ) | (128,024 | ) | 10.7 | |||||||
Menicon Co. Ltd. | (2,500 | ) | (108,500 | ) | 9.1 | |||||||
Mimasu Semiconductor Industry Co. Ltd. | (3,600 | ) | (69,706 | ) | 5.9 | |||||||
Miraca Holdings, Inc. | (5,400 | ) | (135,213 | ) | 11.3 | |||||||
Mitsubishi Logisnext Co. Ltd. | (8,500 | ) | (79,074 | ) | 6.6 | |||||||
Mitsubishi Logistics Corp. | (15,400 | ) | (340,019 | ) | 28.5 | |||||||
Mitsui Fudosan Logistics Park, Inc. | (62 | ) | (243,854 | ) | 20.5 | |||||||
Mitsui Mining & Smelting Co., Ltd. | (10,100 | ) | (188,438 | ) | 15.8 | |||||||
Mitsui-Soko Holdings Co. Ltd. | (1,400 | ) | (18,968 | ) | 1.6 | |||||||
Miura Co. Ltd. | (500 | ) | (20,631 | ) | 1.7 | |||||||
Mixi, Inc. | (1,800 | ) | (31,057 | ) | 2.6 | |||||||
Mizuho Leasing Co. Ltd. | (2,200 | ) | (42,297 | ) | 3.6 | |||||||
Mori Hills REIT Investment Corp. | (86 | ) | (110,039 | ) | 9.2 | |||||||
Mori Trust Sogo Reit, Inc. | (91 | ) | (100,558 | ) | 8.4 | |||||||
Nachi-Fujikoshi Corp. | (3,500 | ) | (101,222 | ) | 8.5 | |||||||
Nanto Bank Ltd. | (1,000 | ) | (20,972 | ) | 1.8 | |||||||
NET One Systems Co. Ltd. | (800 | ) | (23,062 | ) | 1.9 | |||||||
Nextage Co. Ltd. | (3,300 | ) | (22,257 | ) | 1.9 | |||||||
NHK Spring Co. Ltd. | (57,600 | ) | (381,127 | ) | 32.0 | |||||||
Nichi-iko Pharmaceutical Co., Ltd. | (1,500 | ) | (19,503 | ) | 1.6 | |||||||
Nichias Corp. | (2,300 | ) | (45,724 | ) | 3.8 | |||||||
Nihon Nohyaku Co. Ltd. | (65,200 | ) | (260,908 | ) | 21.9 | |||||||
Nihon Parkerizing Co. Ltd. | (16,400 | ) | (167,828 | ) | 14.1 | |||||||
Nikkiso Co., Ltd. | (2,000 | ) | (15,562 | ) | 1.3 | |||||||
Nippon Accommodations Fund, Inc. | (50 | ) | (296,960 | ) | 24.9 | |||||||
Nippon Carbon Co. Ltd. | (4,700 | ) | (144,138 | ) | 12.1 | |||||||
Nippon Chemi-Con Corp. | (8,100 | ) | (91,359 | ) | 7.7 | |||||||
Nippon Denko Co. Ltd. | (3,500 | ) | (4,827 | ) | 0.4 | |||||||
Nippon Electric Glass Co. Ltd. | (2,000 | ) | (29,135 | ) | 2.4 | |||||||
Nippon Gas Co. Ltd. | (5,900 | ) | (194,575 | ) | 16.3 | |||||||
Nippon Kanzai Co. Ltd. | (6,900 | ) | (118,015 | ) | 9.9 | |||||||
NIPPON REIT Investment Corp. | (17 | ) | (50,636 | ) | 4.3 | |||||||
Nippon Sharyo Ltd. | (300 | ) | (7,675 | ) | 0.6 | |||||||
Nippon Soda Co. Ltd. | (6,500 | ) | (166,775 | ) | 14.0 | |||||||
Nipro Corp. | (72,800 | ) | (814,242 | ) | 68.3 | |||||||
Nishi-Nippon Financial Holdings, Inc. | (71,000 | ) | (414,362 | ) | 34.8 | |||||||
| SCHEDULES OF INVESTMENTS | 65 |
Schedule of Investments (continued) April 30, 2020 | BlackRock Global Long/Short Equity Fund |
| Shares | Value | % of Basket Value | ||||||||||
| Japan (continued) | ||||||||||||
Nissei ASB Machine Co. Ltd. | (1,100 | ) | $ | (29,603 | ) | 2.5 | % | |||||
Nisshinbo Holdings, Inc. | (31,100 | ) | (216,838 | ) | 18.2 | |||||||
Nissin Kogyo Co. Ltd. | (17,500 | ) | (363,093 | ) | 30.5 | |||||||
Nitto Boseki Co. Ltd. | (3,500 | ) | (165,529 | ) | 13.9 | |||||||
Nojima Corp. | (8,200 | ) | (142,131 | ) | 11.9 | |||||||
NOK Corp. | (1,900 | ) | (22,127 | ) | 1.9 | |||||||
North Pacific Bank, Ltd. | (44,000 | ) | (78,818 | ) | 6.6 | |||||||
NTN Corp. | (51,200 | ) | (98,203 | ) | 8.2 | |||||||
OBIC Business Consultants Co. Ltd. | (400 | ) | (17,886 | ) | 1.5 | |||||||
Ogaki Kyoritsu Bank Ltd. | (16,400 | ) | (334,629 | ) | 28.1 | |||||||
Okamoto Industries, Inc. | (3,000 | ) | (120,353 | ) | 10.1 | |||||||
OKUMA Corp. | (4,200 | ) | (158,360 | ) | 13.3 | |||||||
Open House Co. Ltd. | (5,100 | ) | (111,170 | ) | 9.3 | |||||||
Optorun Co. Ltd. | (1,300 | ) | (35,310 | ) | 3.0 | |||||||
Organo Corp. | (2,400 | ) | (127,471 | ) | 10.7 | |||||||
Oro Co. Ltd. | (1,234 | ) | (35,830 | ) | 3.0 | |||||||
Osaka Steel Co. Ltd. | (1,400 | ) | (15,308 | ) | 1.3 | |||||||
OSG Corp. | (6,600 | ) | (85,747 | ) | 7.2 | |||||||
Pacific Metals Co., Ltd. | (3,200 | ) | (49,333 | ) | 4.1 | |||||||
Pack Corp. | (2,100 | ) | (66,454 | ) | 5.6 | |||||||
PALTAC Corp. | (2,600 | ) | (135,782 | ) | 11.4 | |||||||
Paramount Bed Holdings Co. Ltd. | (4,200 | ) | (173,266 | ) | 14.5 | |||||||
Penta-Ocean Construction Co., Ltd. | (15,500 | ) | (78,304 | ) | 6.6 | |||||||
Pilot Corp. | (500 | ) | (16,751 | ) | 1.4 | |||||||
Pressance Corp. | (2,700 | ) | (27,633 | ) | 2.3 | |||||||
Qol Holdings Co. Ltd. | (7,300 | ) | (80,708 | ) | 6.8 | |||||||
Raito Kogyo Co. Ltd. | (6,300 | ) | (78,349 | ) | 6.6 | |||||||
Rengo Co. Ltd. | (11,500 | ) | (89,593 | ) | 7.5 | |||||||
Restar Holdings Corp. | (1,500 | ) | (24,192 | ) | 2.0 | |||||||
Rheon Automatic Machinery Co. Ltd. | (1,900 | ) | (21,495 | ) | 1.8 | |||||||
Ricoh Leasing Co. Ltd. | (2,000 | ) | (53,240 | ) | 4.5 | |||||||
Rokko Butter Co. Ltd. | (1,400 | ) | (18,552 | ) | 1.6 | |||||||
Rorze Corp. | (600 | ) | (24,686 | ) | 2.1 | |||||||
Round One Corp. | (2,900 | ) | (23,747 | ) | 2.0 | |||||||
Royal Holdings Co. Ltd. | (1,100 | ) | (18,119 | ) | 1.5 | |||||||
Ryosan Co. Ltd. | (3,600 | ) | (78,724 | ) | 6.6 | |||||||
Saizeriya Co. Ltd. | (3,400 | ) | (67,398 | ) | 5.7 | |||||||
Sakai Moving Service Co. Ltd. | (2,000 | ) | (105,175 | ) | 8.8 | |||||||
Sakata Seed Corp. | (13,500 | ) | (436,149 | ) | 36.6 | |||||||
San-In Godo Bank Ltd. | (13,800 | ) | (72,392 | ) | 6.1 | |||||||
Sansan, Inc. | (500 | ) | (24,534 | ) | 2.1 | |||||||
Sanyo Denki Co. Ltd. | (3,000 | ) | (131,779 | ) | 11.1 | |||||||
Sanyo Special Steel Co. Ltd. | (12,400 | ) | (108,273 | ) | 9.1 | |||||||
Sapporo Holdings, Ltd. | (41,900 | ) | (797,617 | ) | 67.0 | |||||||
SB Technology Corp. | (1,600 | ) | (39,725 | ) | 3.3 | |||||||
SBS Holdings, Inc. | (8,300 | ) | (140,352 | ) | 11.8 | |||||||
SCREEN Holdings Co., Ltd. | (1,600 | ) | (77,278 | ) | 6.5 | |||||||
SEC Carbon Ltd. | (100 | ) | (5,923 | ) | 0.5 | |||||||
Seino Holdings Co. Ltd. | (1,900 | ) | (22,620 | ) | 1.9 | |||||||
Seiren Co. Ltd. | (8,900 | ) | (105,376 | ) | 8.8 | |||||||
Sekisui House Reit, Inc. | (438 | ) | (267,553 | ) | 22.5 | |||||||
Shibaura Machine Co., Ltd. | (13,100 | ) | (257,715 | ) | 21.6 | |||||||
Shibuya Corp. | (2,400 | ) | (59,069 | ) | 5.0 | |||||||
Shiga Bank Ltd. | (5,000 | ) | (117,766 | ) | 9.9 | |||||||
Shin-Etsu Polymer Co. Ltd. | (37,300 | ) | (290,806 | ) | 24.4 | |||||||
Shinko Electric Industries Co. Ltd. | (6,700 | ) | (83,630 | ) | 7.0 | |||||||
Shinmaywa Industries Ltd. | (27,000 | ) | (274,217 | ) | 23.0 | |||||||
Shochiku Co. Ltd. | (700 | ) | (76,313 | ) | 6.4 | |||||||
Showa Corp. | (21,100 | ) | (443,372 | ) | 37.2 | |||||||
Showa Sangyo Co. Ltd. | (1,800 | ) | (53,904 | ) | 4.5 | |||||||
Sinanen Holdings Co. Ltd. | (5,700 | ) | (145,970 | ) | 12.3 | |||||||
Skylark Holdings Co. Ltd. | (4,200 | ) | (62,082 | ) | 5.2 | |||||||
| Shares | Value | % of Basket Value | ||||||||||
| Japan (continued) | ||||||||||||
Sodick Co. Ltd. | (7,800 | ) | $ | (53,759 | ) | 4.5 | % | |||||
Sotetsu Holdings, Inc. | (5,000 | ) | (128,203 | ) | 10.8 | |||||||
Starzen Co. Ltd. | (1,100 | ) | (44,906 | ) | 3.8 | |||||||
Sugi Holdings Co. Ltd. | (3,800 | ) | (229,148 | ) | 19.2 | |||||||
Sumitomo Densetsu Co. Ltd. | (15,000 | ) | (312,226 | ) | 26.2 | |||||||
Sumitomo Warehouse Co. Ltd. | (1,700 | ) | (19,405 | ) | 1.6 | |||||||
Sushiro Global Holdings Ltd. | (16,600 | ) | (256,028 | ) | 21.5 | |||||||
Tadano Ltd. | (37,300 | ) | (284,515 | ) | 23.9 | |||||||
Taiyo Holdings Co. Ltd. | (5,800 | ) | (237,169 | ) | 19.9 | |||||||
Takara Leben Real Estate Investment Corp. | (125 | ) | (96,806 | ) | 8.1 | |||||||
Takeuchi Manufacturing Co. Ltd. | (1,500 | ) | (21,557 | ) | 1.8 | |||||||
Tama Home Co. Ltd. | (3,300 | ) | (38,301 | ) | 3.2 | |||||||
Tanaka Chemical Corp. | (5,000 | ) | (25,039 | ) | 2.1 | |||||||
Teikoku Sen-I Co. Ltd. | (9,300 | ) | (189,511 | ) | 15.9 | |||||||
TIS Inc. | (2,700 | ) | (51,487 | ) | 4.3 | |||||||
Toa Corp. | (2,700 | ) | (35,408 | ) | 3.0 | |||||||
Tocalo Co. Ltd. | (43,900 | ) | (432,201 | ) | 36.3 | |||||||
Toei Animation Co. Ltd. | (1,400 | ) | (69,149 | ) | 5.8 | |||||||
Toei Co. Ltd. | (1,700 | ) | (211,143 | ) | 17.7 | |||||||
Toho Bank Ltd. | (31,200 | ) | (72,640 | ) | 6.1 | |||||||
Tokai Carbon Co. Ltd. | (10,983 | ) | (90,826 | ) | 7.6 | |||||||
Tokai Corp/Gifu | (4,700 | ) | (121,640 | ) | 10.2 | |||||||
Tokai Rika Co. Ltd. | (1,600 | ) | (20,649 | ) | 1.7 | |||||||
Tokai Tokyo Financial Holdings, Inc. | (64,800 | ) | (137,680 | ) | 11.6 | |||||||
Token Corp. | (800 | ) | (54,925 | ) | 4.6 | |||||||
Tokuyama Corp. | (2,900 | ) | (61,190 | ) | 5.1 | |||||||
Tokyo Broadcasting System Holdings, Inc. | (8,900 | ) | (137,602 | ) | 11.5 | |||||||
Tokyo Dome Corp. | (39,100 | ) | (285,649 | ) | 24.0 | |||||||
Tokyo Ohka Kogyo Co. Ltd. | (2,400 | ) | (103,221 | ) | 8.7 | |||||||
Tokyo Seimitsu Co. Ltd. | (600 | ) | (19,408 | ) | 1.6 | |||||||
Tokyo Steel Manufacturing Co. Ltd. | (8,400 | ) | (53,480 | ) | 4.5 | |||||||
Tokyo Tatemono Co. Ltd. | (12,700 | ) | (142,832 | ) | 12.0 | |||||||
Tokyotokeiba Co., Ltd. | (3,700 | ) | (121,927 | ) | 10.2 | |||||||
Tokyu REIT, Inc. | (14 | ) | (18,546 | ) | 1.6 | |||||||
TOMONY Holdings, Inc. | (90,000 | ) | (301,510 | ) | 25.3 | |||||||
Toppan Forms Co. Ltd. | (19,200 | ) | (168,676 | ) | 14.2 | |||||||
Toridoll Holdings Corp. | (4,800 | ) | (54,805 | ) | 4.6 | |||||||
Torii Pharmaceutical Co. Ltd. | (1,400 | ) | (38,546 | ) | 3.2 | |||||||
Toshiba TEC Corp. | (7,300 | ) | (237,714 | ) | 20.0 | |||||||
Toyo Construction Co. Ltd. | (17,800 | ) | (71,081 | ) | 6.0 | |||||||
Toyo Tanso Co. Ltd. | (6,900 | ) | (94,758 | ) | 8.0 | |||||||
Toyo Tire Corp. | (27,800 | ) | (325,517 | ) | 27.3 | |||||||
Toyota Boshoku Corp. | (11,600 | ) | (144,824 | ) | 12.2 | |||||||
Trusco Nakayama Corp. | (3,600 | ) | (77,877 | ) | 6.5 | |||||||
TS Tech Co. Ltd. | (8,200 | ) | (222,341 | ) | 18.7 | |||||||
Tsugami Corp. | (30,800 | ) | (266,025 | ) | 22.3 | |||||||
Tsukishima Kikai Co. Ltd. | (3,000 | ) | (33,799 | ) | 2.8 | |||||||
Tsumura & Co. | (1,000 | ) | (27,662 | ) | 2.3 | |||||||
Universal Entertainment Corp. | (3,500 | ) | (57,401 | ) | 4.8 | |||||||
Wacoal Holdings Corp. | (8,800 | ) | (177,486 | ) | 14.9 | |||||||
Wacom Co., Ltd. | (11,200 | ) | (38,948 | ) | 3.3 | |||||||
YAKUODO Holdings Co. Ltd. | (2,700 | ) | (63,961 | ) | 5.4 | |||||||
Yokogawa Bridge Holdings Corp. | (1,500 | ) | (26,328 | ) | 2.2 | |||||||
Yomiuri Land Co. Ltd. | (600 | ) | (19,258 | ) | 1.6 | |||||||
Zensho Holdings Co. Ltd. | (10,100 | ) | (198,813 | ) | 16.7 | |||||||
Zeon Corp. | (2,400 | ) | (21,335 | ) | 1.8 | |||||||
ZERIA Pharmaceutical Co. Ltd. | (10,400 | ) | (202,041 | ) | 17.0 | |||||||
|
|
|
| |||||||||
| (37,005,761 | ) | |||||||||||
| Jordan | ||||||||||||
Hikma Pharmaceuticals PLC | (3,531 | ) | (105,167 | ) | 8.8 | |||||||
|
|
|
| |||||||||
| 66 | 2020 BLACKROCK ANNUAL REPORTTO SHAREHOLDERS |
Schedule of Investments (continued) April 30, 2020 | BlackRock Global Long/Short Equity Fund |
| Shares | Value | % of Basket Value | ||||||||||
| Luxembourg | ||||||||||||
APERAM SA | (3,006 | ) | $ | (78,203 | ) | 6.6 | % | |||||
|
|
|
| |||||||||
| Netherlands | ||||||||||||
Aalberts NV | (8,496 | ) | (239,245 | ) | 20.1 | |||||||
Accell Group NV | (2,442 | ) | (45,635 | ) | 3.8 | |||||||
AMG Advanced Metallurgical Group NV | (3,476 | ) | (58,486 | ) | 4.9 | |||||||
Brack Capital Properties NV | (2,111 | ) | (191,893 | ) | 16.1 | |||||||
ForFarmers NV | (3,091 | ) | (20,595 | ) | 1.7 | |||||||
Intertrust NV | (8,617 | ) | (135,789 | ) | 11.4 | |||||||
SBM Offshore NV | (7,057 | ) | (89,448 | ) | 7.5 | |||||||
SIF Holding NV | (4,403 | ) | (47,161 | ) | 4.0 | |||||||
TKH Group NV | (831 | ) | (29,154 | ) | 2.5 | |||||||
|
|
|
| |||||||||
| (857,406 | ) | |||||||||||
| New Zealand | ||||||||||||
Chorus Ltd. | (4,396 | ) | (19,184 | ) | 1.6 | |||||||
Metlifecare Ltd. | (19,501 | ) | (49,897 | ) | 4.2 | |||||||
SKYCITY Entertainment Group Ltd. | (153,131 | ) | (247,139 | ) | 20.7 | |||||||
Summerset Group Holdings Ltd. | (6,002 | ) | (22,136 | ) | 1.9 | |||||||
Synlait Milk Ltd. | (1,474 | ) | (6,155 | ) | 0.5 | |||||||
|
|
|
| |||||||||
| (344,511 | ) | |||||||||||
| Norway | ||||||||||||
Axactor SE | (9,795 | ) | (6,375 | ) | 0.5 | |||||||
Frontline Ltd. | (3,615 | ) | (33,902 | ) | 2.9 | |||||||
Protector Forsikring ASA | (15,942 | ) | (53,620 | ) | 4.5 | |||||||
Sparebank 1 Oestlandet | (1,250 | ) | (10,178 | ) | 0.9 | |||||||
Stolt-Nielsen Ltd. | (9,824 | ) | (83,699 | ) | 7.0 | |||||||
TGS Nopec Geophysical Co. ASA | (10,176 | ) | (155,839 | ) | 13.1 | |||||||
TOMRA Systems ASA | (3,421 | ) | (113,669 | ) | 9.5 | |||||||
|
|
|
| |||||||||
| (457,282 | ) | |||||||||||
| Peru | ||||||||||||
Hochschild Mining PLC | (11,781 | ) | (20,554 | ) | 1.7 | |||||||
|
|
|
| |||||||||
| Portugal | ||||||||||||
Altri SGPS SA | (6,606 | ) | (34,865 | ) | 2.9 | |||||||
Corticeira Amorim SGPS SA | (5,458 | ) | (57,508 | ) | 4.8 | |||||||
Mota-Engil SGPS SA | (13,729 | ) | (17,290 | ) | 1.5 | |||||||
|
|
|
| |||||||||
| (109,663 | ) | |||||||||||
| Puerto Rico | ||||||||||||
EVERTEC, Inc. | (7,336 | ) | (185,894 | ) | 15.6 | |||||||
|
|
|
| |||||||||
| Singapore | ||||||||||||
Kenon Holdings Ltd. | (13,246 | ) | (269,279 | ) | 22.6 | |||||||
Kulicke & Soffa Industries, Inc. | (1,995 | ) | (47,820 | ) | 4.0 | |||||||
Mapletree Industrial Trust | (63,700 | ) | (114,364 | ) | 9.6 | |||||||
|
|
|
| |||||||||
| (431,463 | ) | |||||||||||
| Spain | ||||||||||||
Aedas Homes SA | (5,384 | ) | (82,363 | ) | 6.9 | |||||||
Almirall SA | (2,864 | ) | (36,934 | ) | 3.1 | |||||||
Befesa SA | (981 | ) | (30,991 | ) | 2.6 | |||||||
Fomento de Construcciones y Contratas SA | (10,015 | ) | (95,118 | ) | 8.0 | |||||||
Gestamp Automocion SA | (8,984 | ) | (22,497 | ) | 1.9 | |||||||
Grupo Empresarial San Jose SA | (11,064 | ) | (54,744 | ) | 4.6 | |||||||
Metrovacesa SA | (13,113 | ) | (72,264 | ) | 6.1 | |||||||
Neinor Homes SA | (6,499 | ) | (56,943 | ) | 4.8 | |||||||
Sacyr SA | (53,035 | ) | (99,466 | ) | 8.3 | |||||||
|
|
|
| |||||||||
| (551,320 | ) | |||||||||||
| Sweden | ||||||||||||
AAK AB | (2,860 | ) | (47,038 | ) | 4.0 | |||||||
Arjo AB, -B Shares | (10,445 | ) | (51,588 | ) | 4.3 | |||||||
Attendo AB | (16,851 | ) | (64,042 | ) | 5.4 | |||||||
Avanza Bank Holding AB | (5,265 | ) | (63,611 | ) | 5.4 | |||||||
| Shares | Value | % of Basket Value | ||||||||||
| Sweden (continued) | ||||||||||||
Beijer Ref AB | (2,416 | ) | $ | (49,643 | ) | 4.2 | % | |||||
Biotage AB | (3,491 | ) | (43,154 | ) | 3.6 | |||||||
Bonava AB, -B Shares | (2,911 | ) | (14,109 | ) | 1.2 | |||||||
Boozt AB | (1,541 | ) | (9,546 | ) | 0.8 | |||||||
Bure Equity AB | (2,662 | ) | (48,605 | ) | 4.1 | |||||||
Camurus AB | (2,258 | ) | (27,498 | ) | 2.3 | |||||||
Catena AB | (2,477 | ) | (78,817 | ) | 6.6 | |||||||
Electrolux Professional AB | (18,143 | ) | (41,770 | ) | 3.5 | |||||||
Eltel AB | (16,895 | ) | (34,312 | ) | 2.9 | |||||||
Embracer Group AB | (5,698 | ) | (60,333 | ) | 5.1 | |||||||
Fastighets AB Balder | (4,638 | ) | (183,281 | ) | 15.4 | |||||||
Granges AB | (7,550 | ) | (55,167 | ) | 4.6 | |||||||
Karo Pharma AB | (34,094 | ) | (194,377 | ) | 16.3 | |||||||
Loomis AB | (3,580 | ) | (87,301 | ) | 7.3 | |||||||
Mekonomen AB | (21,137 | ) | (109,465 | ) | 9.2 | |||||||
Modern Times Group MTG AB, -B Shares | (10,916 | ) | (109,821 | ) | 9.2 | |||||||
Nordic Entertainment Group AB | (1,451 | ) | (34,391 | ) | 2.9 | |||||||
Ratos AB, -B Shares | (30,795 | ) | (72,895 | ) | 6.1 | |||||||
RaySearch Laboratories AB | (5,983 | ) | (45,484 | ) | 3.8 | |||||||
SSAB AB, -B Shares | (57,416 | ) | (132,700 | ) | 11.1 | |||||||
Trelleborg AB, -B Shares | (1,125 | ) | (14,326 | ) | 1.2 | |||||||
Xvivo Perfusion AB | (1,961 | ) | (27,706 | ) | 2.3 | |||||||
|
|
|
| |||||||||
| (1,700,980 | ) | |||||||||||
| Switzerland | ||||||||||||
Ascom Holding AG | (6,942 | ) | (52,649 | ) | 4.4 | |||||||
Autoneum Holding AG | (349 | ) | (30,751 | ) | 2.6 | |||||||
Bachem Holding AG | (127 | ) | (30,001 | ) | 2.5 | |||||||
Bobst Group SA | (1,524 | ) | (76,074 | ) | 6.4 | |||||||
Bossard Holding AG | (176 | ) | (21,951 | ) | 1.8 | |||||||
Bucher Industries AG | (1,446 | ) | (407,823 | ) | 34.2 | |||||||
Burckhardt Compression Holding AG | (548 | ) | (111,195 | ) | 9.3 | |||||||
Cembra Money Bank AG | (1,107 | ) | (105,240 | ) | 8.8 | |||||||
Coltene Holding AG | (880 | ) | (58,783 | ) | 4.9 | |||||||
Comet Holding AG | (620 | ) | (83,096 | ) | 7.0 | |||||||
Conzzeta AG | (22 | ) | (18,855 | ) | 1.6 | |||||||
Daetwyler Holding AG | (1,028 | ) | (176,180 | ) | 14.8 | |||||||
dormakaba Holding AG | (163 | ) | (81,344 | ) | 6.8 | |||||||
Feintool International Holding AG | (496 | ) | (24,303 | ) | 2.0 | |||||||
Flughafen Zurich AG | (2,060 | ) | (254,753 | ) | 21.4 | |||||||
Forbo Holding AG | (166 | ) | (222,537 | ) | 18.7 | |||||||
Garrett Motion, Inc. | (4,400 | ) | (23,980 | ) | 2.0 | |||||||
Georg Fischer AG, Registered Shares | (496 | ) | (370,164 | ) | 31.1 | |||||||
Gurit Holding AG | (66 | ) | (94,121 | ) | 7.9 | |||||||
Huber + Suhner AG | (569 | ) | (36,336 | ) | 3.1 | |||||||
Interroll Holding AG | (13 | ) | (24,718 | ) | 2.1 | |||||||
Leonteq AG | (1,585 | ) | (57,144 | ) | 4.8 | |||||||
Medacta Group SA | (2,199 | ) | (153,055 | ) | 12.8 | |||||||
Medartis Holding AG | (375 | ) | (15,093 | ) | 1.3 | |||||||
Mobilezone Holding AG | (28,585 | ) | (253,134 | ) | 21.3 | |||||||
Mobimo Holding AG | (126 | ) | (34,732 | ) | 2.9 | |||||||
Orascom Development Holding AG | (4,412 | ) | (38,143 | ) | 3.2 | |||||||
St Galler Kantonalbank AG | (236 | ) | (101,904 | ) | 8.6 | |||||||
Stadler Rail AG | (286 | ) | (12,495 | ) | 1.1 | |||||||
TX Group AG | (306 | ) | (20,358 | ) | 1.7 | |||||||
|
|
|
| |||||||||
| (2,990,912 | ) | |||||||||||
| Thailand | ||||||||||||
Fabrinet | (290 | ) | (18,198 | ) | 1.5 | |||||||
|
|
|
| |||||||||
| United Arab Emirates | ||||||||||||
Network International Holdings PLC | (8,048 | ) | (41,975 | ) | 3.5 | |||||||
|
|
|
| |||||||||
| SCHEDULES OF INVESTMENTS | 67 |
Schedule of Investments (continued) April 30, 2020 | BlackRock Global Long/Short Equity Fund |
| Shares | Value | % of Basket Value | ||||||||||
| United Kingdom | ||||||||||||
Aggreko PLC | (5,798 | ) | $ | (33,435 | ) | 2.8 | % | |||||
Avast PLC | (10,930 | ) | (62,956 | ) | 5.3 | |||||||
Babcock International Group PLC | (1,729 | ) | (9,158 | ) | 0.8 | |||||||
Beazley PLC | (12,450 | ) | (61,559 | ) | 5.2 | |||||||
Bodycote PLC | (18,618 | ) | (136,207 | ) | 11.4 | |||||||
Cairn Energy PLC | (24,815 | ) | (34,963 | ) | 2.9 | |||||||
CVS Group PLC | (6,402 | ) | (73,779 | ) | 6.2 | |||||||
De La Rue PLC | (31,178 | ) | (26,231 | ) | 2.2 | |||||||
DS Smith PLC | (11,125 | ) | (43,621 | ) | 3.7 | |||||||
Equiniti Group PLC | (44,792 | ) | (96,568 | ) | 8.1 | |||||||
Essentra PLC | (8,831 | ) | (30,996 | ) | 2.6 | |||||||
Finablr PLC | (44,203 | ) | (3,062 | ) | 0.2 | |||||||
First Derivatives PLC | (1,789 | ) | (58,359 | ) | 4.9 | |||||||
Hill & Smith Holdings PLC | (4,025 | ) | (58,350 | ) | 4.9 | |||||||
IG Design Group PLC | (12,653 | ) | (83,619 | ) | 7.0 | |||||||
Intermediate Capital Group PLC | (2,249 | ) | (31,816 | ) | 2.7 | |||||||
J D Wetherspoon PLC | (1,936 | ) | (23,043 | ) | 1.9 | |||||||
Learning Technologies Group PLC | (103,979 | ) | (167,644 | ) | 14.1 | |||||||
LXI REIT PLC | (12,508 | ) | (16,657 | ) | 1.4 | |||||||
Pagegroup PLC | (11,301 | ) | (53,518 | ) | 4.5 | |||||||
Paragon Banking Group PLC | (20,124 | ) | (84,254 | ) | 7.1 | |||||||
Quilter PLC | (42,030 | ) | (65,245 | ) | 5.5 | |||||||
Redde Northgate PLC | (11,356 | ) | (25,619 | ) | 2.1 | |||||||
Restaurant Group PLC | (24,783 | ) | (16,858 | ) | 1.4 | |||||||
Restore PLC | (16,522 | ) | (80,509 | ) | 6.8 | |||||||
Rightmove PLC | (38,466 | ) | (240,506 | ) | 20.2 | |||||||
Rotork PLC | (35,207 | ) | (109,755 | ) | 9.2 | |||||||
Royal Mail PLC | (51,834 | ) | (108,170 | ) | 9.1 | |||||||
RWS Holdings PLC | (9,022 | ) | (60,937 | ) | 5.1 | |||||||
Savills PLC | (1,697 | ) | (20,659 | ) | 1.7 | |||||||
Serco Group PLC | (124,928 | ) | (202,220 | ) | 17.0 | |||||||
Serica Energy PLC | (20,882 | ) | (24,800 | ) | 2.1 | |||||||
Signature Aviation PLC | (93,254 | ) | (229,024 | ) | 19.2 | |||||||
Spectris PLC | (4,482 | ) | (151,136 | ) | 12.7 | |||||||
Stagecoach Group PLC | (35,325 | ) | (33,121 | ) | 2.8 | |||||||
Synthomer PLC | (11,415 | ) | (40,687 | ) | 3.4 | |||||||
Ted Baker PLC | (21,184 | ) | (40,689 | ) | 3.4 | |||||||
TP ICAP PLC | (38,796 | ) | (165,629 | ) | 13.9 | |||||||
Tritax Big Box REIT PLC | (55,081 | ) | (83,603 | ) | 7.0 | |||||||
UNITE Group PLC | (5,821 | ) | (64,277 | ) | 5.4 | |||||||
|
|
|
| |||||||||
| (2,953,239 | ) | |||||||||||
| United States | ||||||||||||
ABM Industries, Inc. | (1,178 | ) | (40,629 | ) | 3.4 | |||||||
Acadia Healthcare Co., Inc. | (2,268 | ) | (54,455 | ) | 4.6 | |||||||
ACI Worldwide, Inc. | (4,722 | ) | (129,383 | ) | 10.9 | |||||||
Acushnet Holdings Corp. | (7,868 | ) | (215,583 | ) | 18.1 | |||||||
Adient PLC | (2,131 | ) | (31,922 | ) | 2.7 | |||||||
ADT, Inc. | (11,688 | ) | (66,972 | ) | 5.6 | |||||||
Aegion Corp. | (1,472 | ) | (23,626 | ) | 2.0 | |||||||
Air Transport Services Group, Inc. | (3,172 | ) | (64,201 | ) | 5.4 | |||||||
Alamo Group, Inc. | (453 | ) | (44,593 | ) | 3.7 | |||||||
Alpha & Omega Semiconductor Ltd. | (8,128 | ) | (97,780 | ) | 8.2 | |||||||
Ambac Financial Group, Inc. | (1,856 | ) | (31,923 | ) | 2.7 | |||||||
AMC Entertainment Holdings, Inc., Class A | (9,196 | ) | (45,244 | ) | 3.8 | |||||||
American Assets Trust, Inc. | (6,662 | ) | (188,668 | ) | 15.8 | |||||||
American Equity Investment Life Holding Co. | (733 | ) | (15,408 | ) | 1.3 | |||||||
American Vanguard Corp. | (4,171 | ) | (52,429 | ) | 4.4 | |||||||
Ameris Bancorp | (7,265 | ) | (184,749 | ) | 15.5 | |||||||
AMERISAFE, Inc. | (1,086 | ) | (69,146 | ) | 5.8 | |||||||
ANGI Homeservices, Inc., Class A | (11,892 | ) | (80,568 | ) | 6.8 | |||||||
Anterix, Inc. | (658 | ) | (34,545 | ) | 2.9 | |||||||
Applied Industrial Technologies, Inc. | (1,154 | ) | (60,458 | ) | 5.1 | |||||||
| Shares | Value | % of Basket Value | ||||||||||
| United States (continued) | ||||||||||||
Arcosa, Inc. | (3,338 | ) | $ | (124,407 | ) | 10.4 | % | |||||
Argo Group International Holdings Ltd. | (1,002 | ) | (35,431 | ) | 3.0 | |||||||
Armstrong World Industries, Inc. | (2,750 | ) | (211,970 | ) | 17.8 | |||||||
Arrow Financial Corp. | (941 | ) | (26,819 | ) | 2.2 | |||||||
Aspen Technology, Inc. | (1,208 | ) | (123,518 | ) | 10.4 | |||||||
Atlantic Union Bankshares Corp. | (2,688 | ) | (64,163 | ) | 5.4 | |||||||
AutoNation, Inc. | (3,851 | ) | (143,411 | ) | 12.0 | |||||||
Avanos Medical, Inc. | (530 | ) | (16,456 | ) | 1.4 | |||||||
Avnet, Inc. | (2,879 | ) | (86,428 | ) | 7.3 | |||||||
Axcelis Technologies, Inc. | (1,814 | ) | (42,375 | ) | 3.6 | |||||||
Axis Capital Holdings Ltd. | (1,618 | ) | (59,219 | ) | 5.0 | |||||||
BancorpSouth Bank | (2,757 | ) | (60,351 | ) | 5.1 | |||||||
Bank of Marin Bancorp | (846 | ) | (27,884 | ) | 2.3 | |||||||
Bank OZK | (1,569 | ) | (35,491 | ) | 3.0 | |||||||
Beacon Roofing Supply, Inc. | (938 | ) | (20,636 | ) | 1.7 | |||||||
BGC Partners, Inc., Class A | (34,959 | ) | (108,198 | ) | 9.1 | |||||||
Bloomin’ Brands, Inc. | (2,208 | ) | (26,606 | ) | 2.2 | |||||||
BMC Stock Holdings, Inc. | (1,269 | ) | (26,966 | ) | 2.3 | |||||||
Boingo Wireless, Inc. | (1,673 | ) | (23,322 | ) | 2.0 | |||||||
Bonanza Creek Energy, Inc. | (3,050 | ) | (53,253 | ) | 4.5 | |||||||
Boston Omaha Corp., Class A | (619 | ) | (10,046 | ) | 0.8 | |||||||
BrightView Holdings, Inc. | (2,220 | ) | (28,460 | ) | 2.4 | |||||||
Brink’s Co. | (972 | ) | (49,689 | ) | 4.2 | |||||||
Brookdale Senior Living, Inc. | (1,647 | ) | (5,946 | ) | 0.5 | |||||||
Brooks Automation, Inc. | (694 | ) | (26,712 | ) | 2.2 | |||||||
Brunswick Corp. | (4,791 | ) | (228,627 | ) | 19.2 | |||||||
Bryn Mawr Bank Corp. | (2,812 | ) | (81,871 | ) | 6.9 | |||||||
Cabot Corp. | (690 | ) | (23,384 | ) | 2.0 | |||||||
Cactus, Inc. | (1,521 | ) | (27,043 | ) | 2.3 | |||||||
Cannae Holdings, Inc. | (1,083 | ) | (34,169 | ) | 2.9 | |||||||
Capitol Federal Financial, Inc. | (15,207 | ) | (182,332 | ) | 15.3 | |||||||
Cardtronics PLC, Class A | (5,553 | ) | (127,164 | ) | 10.7 | |||||||
Carter’s, Inc. | (688 | ) | (53,802 | ) | 4.5 | |||||||
Carvana Co. | (448 | ) | (35,889 | ) | 3.0 | |||||||
Casella Waste Systems, Inc. | (4,358 | ) | (202,124 | ) | 17.0 | |||||||
Cass Information Systems, Inc. | (1,143 | ) | (45,846 | ) | 3.8 | |||||||
Cathay General Bancorp | (7,300 | ) | (203,816 | ) | 17.1 | |||||||
Cato Corp., Class A | (1,865 | ) | (21,000 | ) | 1.8 | |||||||
Century Bancorp, Inc., Class A | (989 | ) | (73,868 | ) | 6.2 | |||||||
CEVA, Inc. | (2,727 | ) | (85,491 | ) | 7.2 | |||||||
Charles River Laboratories International, Inc. | (3,194 | ) | (462,076 | ) | 38.8 | |||||||
Chart Industries, Inc. | (982 | ) | (35,077 | ) | 2.9 | |||||||
Chatham Lodging Trust | (2,422 | ) | (18,189 | ) | 1.5 | |||||||
Chesapeake Utilities Corp. | (190 | ) | (16,697 | ) | 1.4 | |||||||
Children’s Place, Inc. | (1,208 | ) | (35,708 | ) | 3.0 | |||||||
Choice Hotels International, Inc. | (3,194 | ) | (239,710 | ) | 20.1 | |||||||
Cinemark Holdings, Inc. | (1,194 | ) | (17,050 | ) | 1.4 | |||||||
City Holding Co. | (1,105 | ) | (74,687 | ) | 6.3 | |||||||
Clearwater Paper Corp. | (267 | ) | (6,392 | ) | 0.5 | |||||||
Cleveland-Cliffs, Inc. | (4,923 | ) | (21,563 | ) | 1.8 | |||||||
Cloudera, Inc. | (5,624 | ) | (46,567 | ) | 3.9 | |||||||
CNX Resources Corp. | (2,439 | ) | (25,853 | ) | 2.2 | |||||||
Coca-Cola Bottling Co. Consolidated | (75 | ) | (17,660 | ) | 1.5 | |||||||
Colfax Corp. | (1,542 | ) | (39,768 | ) | 3.3 | |||||||
Columbia Financial, Inc. | (3,592 | ) | (50,845 | ) | 4.3 | |||||||
Columbia Sportswear Co. | (1,542 | ) | (112,396 | ) | 9.4 | |||||||
Community Bank System, Inc. | (566 | ) | (35,369 | ) | 3.0 | |||||||
CommVault Systems, Inc. | (1,304 | ) | (55,668 | ) | 4.7 | |||||||
CONMED Corp. | (339 | ) | (25,055 | ) | 2.1 | |||||||
Consolidated Communications Holdings, Inc. | (1,313 | ) | (8,233 | ) | 0.7 | |||||||
Construction Partners, Inc. | (2,607 | ) | (47,786 | ) | 4.0 | |||||||
Core-Mark Holding Co., Inc. | (2,390 | ) | (68,689 | ) | 5.8 | |||||||
| 68 | 2020 BLACKROCK ANNUAL REPORTTO SHAREHOLDERS |
Schedule of Investments (continued) April 30, 2020 | BlackRock Global Long/Short Equity Fund |
| Shares | Value | % of Basket Value | ||||||||||
| United States (continued) | ||||||||||||
CoreLogic, Inc. | (521 | ) | $ | (20,017 | ) | 1.7 | % | |||||
Covanta Holding Corp. | (5,644 | ) | (43,910 | ) | 3.7 | |||||||
Crane Co. | (3,278 | ) | (178,487 | ) | 15.0 | |||||||
Credit Acceptance Corp. | (203 | ) | (63,249 | ) | 5.3 | |||||||
CSG Systems International, Inc. | (376 | ) | (18,266 | ) | 1.5 | |||||||
CubeSmart | (2,859 | ) | (72,047 | ) | 6.0 | |||||||
Cushman & Wakefield PLC | (7,749 | ) | (94,305 | ) | 7.9 | |||||||
CVB Financial Corp. | (9,876 | ) | (205,273 | ) | 17.2 | |||||||
Cymabay Therapeutics, Inc. | (11,581 | ) | (20,498 | ) | 1.7 | |||||||
Darling International, Inc. | (7,077 | ) | (145,715 | ) | 12.2 | |||||||
Dave & Buster’s Entertainment, Inc. | (4,178 | ) | (61,166 | ) | 5.1 | |||||||
Delek US Holdings, Inc. | (1,288 | ) | (30,075 | ) | 2.5 | |||||||
Deluxe Corp. | (1,145 | ) | (32,255 | ) | 2.7 | |||||||
Dillard’s, Inc., Class A Class A | (1,364 | ) | (40,211 | ) | 3.4 | |||||||
DMC Global, Inc. | (1,108 | ) | (28,597 | ) | 2.4 | |||||||
Dril-Quip, Inc. | (250 | ) | (8,282 | ) | 0.7 | |||||||
Dunkin’ Brands Group, Inc. | (491 | ) | (30,854 | ) | 2.6 | |||||||
Eagle Materials, Inc. | (2,121 | ) | (129,402 | ) | 10.9 | |||||||
Easterly Government Properties, Inc. | (4,526 | ) | (121,795 | ) | 10.2 | |||||||
EastGroup Properties, Inc. | (757 | ) | (80,242 | ) | 6.7 | |||||||
EchoStar Corp. | (6,318 | ) | (199,333 | ) | 16.7 | |||||||
El Pollo Loco Holdings, Inc. | (1,609 | ) | (19,678 | ) | 1.6 | |||||||
elf Beauty, Inc. | (2,685 | ) | (35,093 | ) | 2.9 | |||||||
Empire State Realty Trust, Inc. | (5,254 | ) | (43,923 | ) | 3.7 | |||||||
Encompass Health Corp. | (5,568 | ) | (368,880 | ) | 31.0 | |||||||
Enerpac Tool Group Corp. | (4,229 | ) | (72,147 | ) | 6.1 | |||||||
Entegris, Inc. | (2,331 | ) | (126,410 | ) | 10.6 | |||||||
Equity Bancshares, Inc., Class A | (710 | ) | (13,305 | ) | 1.1 | |||||||
Essential Properties Realty Trust, Inc. | (13 | ) | (191 | ) | 0.0 | |||||||
Euronet Worldwide, Inc. | (571 | ) | (52,395 | ) | 4.4 | |||||||
EverQuote, Inc., Class A Class A | (480 | ) | (18,706 | ) | 1.6 | |||||||
Evo Payments, Inc., Class A | (2,096 | ) | (41,731 | ) | 3.5 | |||||||
EZCORP, Inc., Class A Class A | (3,911 | ) | (21,902 | ) | 1.8 | |||||||
Farmer Brothers Co. | (2,971 | ) | (27,452 | ) | 2.3 | |||||||
FireEye, Inc. | (2,808 | ) | (32,320 | ) | 2.7 | |||||||
First Bancorp/Southern Pines | (2,752 | ) | (73,176 | ) | 6.1 | |||||||
First Citizens BancShares, Inc., Class A | (554 | ) | (211,628 | ) | 17.8 | |||||||
First Commonwealth Financial Corp. | (5,242 | ) | (49,904 | ) | 4.2 | |||||||
First Financial Corp. | (3,488 | ) | (123,894 | ) | 10.4 | |||||||
First Interstate BancSystem, Inc., Class A | (1,998 | ) | (67,532 | ) | 5.7 | |||||||
FirstCash, Inc. | (4,249 | ) | (305,248 | ) | 25.6 | |||||||
Flagstar Bancorp, Inc. | (847 | ) | (21,946 | ) | 1.8 | |||||||
Floor & Decor Holdings, Inc., Class A | (1,124 | ) | (47,658 | ) | 4.0 | |||||||
Flowers Foods, Inc. | (8,072 | ) | (179,844 | ) | 15.1 | |||||||
Forestar Group, Inc. | (454 | ) | (5,988 | ) | 0.5 | |||||||
Forward Air Corp. | (1,104 | ) | (56,966 | ) | 4.8 | |||||||
Fossil Group, Inc. | (6,164 | ) | (24,409 | ) | 2.0 | |||||||
Fresh Del Monte Produce, Inc. | (1,026 | ) | (29,251 | ) | 2.5 | |||||||
Fulton Financial Corp. | (9,699 | ) | (113,381 | ) | 9.5 | |||||||
Gaming and Leisure Properties, Inc. | (1,662 | ) | (46,935 | ) | 3.9 | |||||||
Gates Industrial Corp. PLC | (5,217 | ) | (44,814 | ) | 3.8 | |||||||
Genco Shipping & Trading Ltd. | (13,263 | ) | (77,323 | ) | 6.5 | |||||||
Gentex Corp. | (1,770 | ) | (42,905 | ) | 3.6 | |||||||
German American Bancorp, Inc. | (2,100 | ) | (62,433 | ) | 5.2 | |||||||
Getty Realty Corp. | (1,019 | ) | (27,676 | ) | 2.3 | |||||||
Gibraltar Industries, Inc. | (959 | ) | (44,402 | ) | 3.7 | |||||||
Global Net Lease, Inc. | (14,617 | ) | (210,339 | ) | 17.7 | |||||||
Goodyear Tire & Rubber Co. | (4,651 | ) | (33,348 | ) | 2.8 | |||||||
Graphic Packaging Holding Co. | (10,624 | ) | (141,830 | ) | �� | 11.9 | ||||||
Greenbrier Cos., Inc. | (2,024 | ) | (34,368 | ) | 2.9 | |||||||
Group 1 Automotive, Inc. | (1,611 | ) | (91,166 | ) | 7.6 | |||||||
H&E Equipment Services, Inc. | (1,618 | ) | (26,309 | ) | 2.2 | |||||||
| Shares | Value | % of Basket Value | ||||||||||
| United States (continued) | ||||||||||||
Hain Celestial Group, Inc. | (1,460 | ) | $ | (37,726 | ) | 3.2 | % | |||||
Hanger, Inc. | (926 | ) | (17,001 | ) | 1.4 | |||||||
Harmonic, Inc. | (5,797 | ) | (33,623 | ) | 2.8 | |||||||
Haynes International, Inc. | (849 | ) | (18,763 | ) | 1.6 | |||||||
Healthcare Realty Trust, Inc. | (5,088 | ) | (149,536 | ) | 12.5 | |||||||
Healthcare Services Group, Inc. | (1,522 | ) | (38,796 | ) | 3.3 | |||||||
Heartland Financial USA, Inc. | (851 | ) | (28,908 | ) | 2.4 | |||||||
Hecla Mining Co. | (8,858 | ) | (23,297 | ) | 2.0 | |||||||
Helios Technologies, Inc. | (1,612 | ) | (57,339 | ) | 4.8 | |||||||
Helmerich & Payne, Inc. | (3,445 | ) | (68,108 | ) | 5.7 | |||||||
Hilltop Holdings, Inc. | (5,883 | ) | (113,542 | ) | 9.5 | |||||||
HNI Corp. | (2,456 | ) | (59,779 | ) | 5.0 | |||||||
HomeTrust Bancshares, Inc. | (3,972 | ) | (61,050 | ) | 5.1 | |||||||
Houlihan Lokey, Inc. | (960 | ) | (57,005 | ) | 4.8 | |||||||
Huntsman Corp. | (8,379 | ) | (140,851 | ) | 11.8 | |||||||
Ichor Holdings Ltd. | (1,749 | ) | (43,550 | ) | 3.7 | |||||||
II-VI, Inc. | (597 | ) | (20,549 | ) | 1.7 | |||||||
IMAX Corp. | (2,770 | ) | (31,855 | ) | 2.7 | |||||||
Innoviva, Inc. | (1,344 | ) | (19,058 | ) | 1.6 | |||||||
Installed Building Products, Inc. | (385 | ) | (18,984 | ) | 1.6 | |||||||
Insteel Industries, Inc. | (1,992 | ) | (34,999 | ) | 2.9 | |||||||
Integer Holdings Corp. | (1,024 | ) | (76,247 | ) | 6.4 | |||||||
Integra LifeSciences Holdings Corp. | (6,326 | ) | (322,942 | ) | 27.1 | |||||||
Interface, Inc. | (5,461 | ) | (50,460 | ) | 4.2 | |||||||
International Bancshares Corp. | (11,651 | ) | (337,762 | ) | 28.3 | |||||||
Iridium Communications, Inc. | (908 | ) | (20,435 | ) | 1.7 | |||||||
Itron, Inc. | (984 | ) | (68,703 | ) | 5.8 | |||||||
JBG SMITH Properties | (8,540 | ) | (289,933 | ) | 24.3 | |||||||
John B Sanfilippo & Son, Inc. | (200 | ) | (16,426 | ) | 1.4 | |||||||
Kadant, Inc. | (1,057 | ) | (88,883 | ) | 7.5 | |||||||
KAR Auction Services, Inc. | (3,073 | ) | (46,034 | ) | 3.9 | |||||||
KBR, Inc. | (10,305 | ) | (208,779 | ) | 17.5 | |||||||
Kearny Financial Corp. | (8,542 | ) | (79,441 | ) | 6.7 | |||||||
Kemper Corp. | (1,780 | ) | (119,652 | ) | 10.0 | |||||||
Kilroy Realty Corp. | (259 | ) | (16,125 | ) | 1.4 | |||||||
Kimball Electronics, Inc. | (1,432 | ) | (19,361 | ) | 1.6 | |||||||
Kirby Corp. | (3,893 | ) | (207,964 | ) | 17.5 | |||||||
Kite Realty Group Trust | (6,679 | ) | (68,326 | ) | 5.7 | |||||||
Knoll, Inc. | (3,336 | ) | (38,898 | ) | 3.3 | |||||||
Lattice Semiconductor Corp. | (913 | ) | (20,552 | ) | 1.7 | |||||||
LCI Industries | (263 | ) | (22,807 | ) | 1.9 | |||||||
LendingClub Corp. | (2,000 | ) | (15,340 | ) | 1.3 | |||||||
Lexington Realty Trust | (15,201 | ) | (158,850 | ) | 13.3 | |||||||
Liberty Latin America Ltd., Class A Class A | (4,749 | ) | (50,814 | ) | 4.3 | |||||||
Liberty Media Corp-Liberty Braves | (745 | ) | (14,967 | ) | 1.3 | |||||||
Lincoln Electric Holdings, Inc. | (4,782 | ) | (384,999 | ) | 32.3 | |||||||
Lions Gate Entertainment Corp. | (5,003 | ) | (33,420 | ) | 2.8 | |||||||
LTC Properties, Inc. | (836 | ) | (29,762 | ) | 2.5 | |||||||
Lumber Liquidators Holdings, Inc. | (6,023 | ) | (42,462 | ) | 3.6 | |||||||
M/A-COM Technology Solutions Holdings, Inc. | (4,086 | ) | (125,277 | ) | 10.5 | |||||||
Madison Square Garden Co., Class A | (417 | ) | (71,440 | ) | 6.0 | |||||||
Madison Square Garden Entertainment Corp. | (371 | ) | (30,682 | ) | 2.6 | |||||||
Marcus Corp. | (4,107 | ) | (59,716 | ) | 5.0 | |||||||
MarineMax, Inc. | (9,340 | ) | (134,589 | ) | 11.3 | |||||||
Marriott Vacations Worldwide Corp. | (656 | ) | (54,448 | ) | 4.6 | |||||||
Matson, Inc. | (745 | ) | (22,529 | ) | 1.9 | |||||||
MAXIMUS, Inc. | (5,781 | ) | (389,177 | ) | 32.7 | |||||||
MBIA, Inc. | (2,795 | ) | (22,751 | ) | 1.9 | |||||||
Mercury General Corp. | (677 | ) | (27,730 | ) | 2.3 | |||||||
Meridian Bancorp, Inc. | (3,565 | ) | (41,996 | ) | 3.5 | |||||||
Meritor, Inc. | (1,647 | ) | (33,764 | ) | 2.8 | |||||||
Mesa Laboratories, Inc. | (279 | ) | (66,402 | ) | 5.6 | |||||||
| SCHEDULES OF INVESTMENTS | 69 |
Schedule of Investments (continued) April 30, 2020 | BlackRock Global Long/Short Equity Fund |
| Shares | Value | % of Basket Value | ||||||||||
| United States (continued) | ||||||||||||
Methode Electronics, Inc. | (4,082 | ) | $ | (122,542 | ) | 10.3 | % | |||||
MGM Growth Properties LLC, Class A | (2,654 | ) | (66,801 | ) | 5.6 | |||||||
MicroStrategy, Inc., Class A | (168 | ) | (21,223 | ) | 1.8 | |||||||
Middlesex Water Co. | (2,110 | ) | (127,233 | ) | 10.7 | |||||||
Mimecast Ltd. | (625 | ) | (25,562 | ) | 2.1 | |||||||
MKS Instruments, Inc. | (1,918 | ) | (192,241 | ) | 16.1 | |||||||
Monro, Inc. | (1,774 | ) | (98,439 | ) | 8.3 | |||||||
Mr Cooper Group, Inc. | (1,535 | ) | (14,705 | ) | 1.2 | |||||||
MSG Networks, Inc. | (1,958 | ) | (23,261 | ) | 2.0 | |||||||
Mueller Industries, Inc. | (4,412 | ) | (114,271 | ) | 9.6 | |||||||
Murphy Oil Corp. | (1,953 | ) | (23,163 | ) | 1.9 | |||||||
Murphy USA, Inc. | (270 | ) | (28,836 | ) | 2.4 | |||||||
National Fuel Gas Co. | (17 | ) | (697 | ) | 0.1 | |||||||
National Presto Industries, Inc. | (221 | ) | (17,970 | ) | 1.5 | |||||||
NBT Bancorp, Inc. | (5,842 | ) | (193,545 | ) | 16.2 | |||||||
New Jersey Resources Corp. | (1,710 | ) | (57,764 | ) | 4.8 | |||||||
New York Community Bancorp, Inc. | (7,319 | ) | (79,484 | ) | 6.7 | |||||||
NewMarket Corp. | (502 | ) | (206,543 | ) | 17.3 | |||||||
nLight, Inc. | (2,755 | ) | (43,419 | ) | 3.6 | |||||||
Northern Oil and Gas, Inc. | (20,212 | ) | (16,921 | ) | 1.4 | |||||||
Northwest Bancshares, Inc. | (3,853 | ) | (40,880 | ) | 3.4 | |||||||
NorthWestern Corp. | (5,171 | ) | (298,315 | ) | 25.0 | |||||||
NVE Corp. | (1,357 | ) | (77,037 | ) | 6.5 | |||||||
nVent Electric PLC | (23,013 | ) | (429,192 | ) | 36.0 | |||||||
Odonate Therapeutics, Inc. | (1,550 | ) | (43,633 | ) | 3.7 | |||||||
Old Republic International Corp. | (20,385 | ) | (325,141 | ) | 27.3 | |||||||
ONE Gas, Inc. | (1,098 | ) | (87,522 | ) | 7.3 | |||||||
OneSpan, Inc. | (2,488 | ) | (41,798 | ) | 3.5 | |||||||
OrthoPediatrics Corp. | (809 | ) | (39,520 | ) | 3.3 | |||||||
Otter Tail Corp. | (3,128 | ) | (138,821 | ) | 11.7 | |||||||
Pacific Premier Bancorp, Inc. | (1,172 | ) | (25,022 | ) | 2.1 | |||||||
Pacira BioSciences, Inc. | (1,429 | ) | (59,003 | ) | 5.0 | |||||||
Park Aerospace Corp. | (2,880 | ) | (38,333 | ) | 3.2 | |||||||
PDC Energy, Inc. | (2,605 | ) | (33,839 | ) | 2.8 | |||||||
Pebblebrook Hotel Trust | (2,445 | ) | (28,949 | ) | 2.4 | |||||||
Perdoceo Education Corp. | (1,609 | ) | (20,917 | ) | 1.8 | |||||||
Perspecta, Inc. | (6,581 | ) | (141,952 | ) | 11.9 | |||||||
PetMed Express, Inc. | (2,152 | ) | (85,155 | ) | 7.1 | |||||||
PH Glatfelter Co. | (3,495 | ) | (51,027 | ) | 4.3 | |||||||
Phibro Animal Health Corp. | (760 | ) | (20,300 | ) | 1.7 | |||||||
Piedmont Office Realty Trust, Inc., Class A | (2,539 | ) | (44,052 | ) | 3.7 | |||||||
Piper Sandler Cos. | (531 | ) | (28,626 | ) | 2.4 | |||||||
Playa Hotels & Resorts NV | (17,065 | ) | (42,151 | ) | 3.5 | |||||||
PNM Resources, Inc. | (999 | ) | (40,450 | ) | 3.4 | |||||||
Portland General Electric Co. | (3,011 | ) | (140,885 | ) | 11.8 | |||||||
Preferred Apartment Communities, Inc. | (4,767 | ) | (35,323 | ) | 3.0 | |||||||
Prestige Consumer Healthcare, Inc. | (2,797 | ) | (113,810 | ) | 9.6 | |||||||
Primoris Services Corp. | (1,910 | ) | (29,815 | ) | 2.5 | |||||||
ProPetro Holding Corp. | (7,032 | ) | (29,816 | ) | 2.5 | |||||||
Providence Service Corp. | (607 | ) | (35,212 | ) | 3.0 | |||||||
PS Business Parks, Inc. | (640 | ) | (82,618 | ) | 6.9 | |||||||
Quaker Chemical Corp. | (697 | ) | (106,028 | ) | 8.9 | |||||||
Quanex Building Products Corp. | (4,379 | ) | (54,606 | ) | 4.6 | |||||||
RealPage, Inc. | (2,942 | ) | (189,730 | ) | 15.9 | |||||||
Regal-Beloit Corp. | (2,069 | ) | (146,920 | ) | 12.3 | |||||||
Regis Corp. | (756 | ) | (9,390 | ) | 0.8 | |||||||
Renewable Energy Group, Inc. | (890 | ) | (22,081 | ) | 1.9 | |||||||
Rent-A-Center, Inc. | (2,250 | ) | (44,786 | ) | 3.8 | |||||||
Retail Properties of America, Inc., Class A | (4,527 | ) | (28,067 | ) | 2.4 | |||||||
Rexnord Corp. | (1,169 | ) | (31,879 | ) | 2.7 | |||||||
Rush Enterprises, Inc., Class A Class A | (833 | ) | (31,238 | ) | 2.6 | |||||||
Saul Centers, Inc. | (1,633 | ) | (53,268 | ) | 4.5 | |||||||
| Shares | Value | % of Basket Value | ||||||||||
| United States (continued) | ||||||||||||
Schweitzer-Mauduit International, Inc. | (1,733 | ) | $ | (55,837 | ) | 4.7 | % | |||||
Scotts Miracle-Gro Co., Class A | (288 | ) | (35,721 | ) | 3.0 | |||||||
SeaWorld Entertainment, Inc. | (3,249 | ) | (47,728 | ) | 4.0 | |||||||
Selective Insurance Group, Inc. | (1,590 | ) | (79,707 | ) | 6.7 | |||||||
ServisFirst Bancshares, Inc. | (496 | ) | (17,618 | ) | 1.5 | |||||||
Shake Shack, Inc., Class A Class A | (2,004 | ) | (109,238 | ) | 9.2 | |||||||
SIGA Technologies, Inc. | (3,381 | ) | (19,982 | ) | 1.7 | |||||||
Signet Jewelers Ltd. | (2,647 | ) | (26,629 | ) | 2.2 | |||||||
Simply Good Foods Co. | (1,252 | ) | (23,600 | ) | 2.0 | |||||||
SITE Centers Corp. | (4,675 | ) | (28,331 | ) | 2.4 | |||||||
Sleep Number Corp. | (2,965 | ) | (88,654 | ) | 7.4 | |||||||
SMART Global Holdings, Inc. | (2,603 | ) | (65,830 | ) | 5.5 | |||||||
SolarEdge Technologies, Inc. | (224 | ) | (24,996 | ) | 2.1 | |||||||
South State Corp. | (1,915 | ) | (110,764 | ) | 9.3 | |||||||
Southwest Gas Holdings, Inc. | (2,150 | ) | (162,970 | ) | 13.7 | |||||||
Southwestern Energy Co. | (11,649 | ) | (37,626 | ) | 3.2 | |||||||
Spartan Motors, Inc. | (1,446 | ) | (20,374 | ) | 1.7 | |||||||
SPIRE, Inc. | (2,475 | ) | (180,576 | ) | 15.2 | |||||||
Spirit Realty Capital, Inc. | (1,410 | ) | (43,372 | ) | 3.6 | |||||||
SPX Corp. | (1,432 | ) | (54,602 | ) | 4.6 | |||||||
SPX FLOW, Inc. | (1,062 | ) | (34,589 | ) | 2.9 | |||||||
St Joe Co. | (8,543 | ) | (156,337 | ) | 13.1 | |||||||
STAAR Surgical Co. | (1,997 | ) | (76,525 | ) | 6.4 | |||||||
Stepan Co. | (191 | ) | (18,221 | ) | 1.5 | |||||||
Stericycle, Inc. | (2,545 | ) | (124,196 | ) | 10.4 | |||||||
Stifel Financial Corp. | (2,062 | ) | (91,305 | ) | 7.7 | |||||||
Sunstone Hotel Investors, Inc. | (10,458 | ) | (96,109 | ) | 8.1 | |||||||
Syneos Health, Inc. | (1,661 | ) | (92,667 | ) | 7.8 | |||||||
Team, Inc. | (1,392 | ) | (8,589 | ) | 0.7 | |||||||
TEGNA, Inc. | (1,303 | ) | (13,968 | ) | 1.2 | |||||||
Tejon Ranch Co. | (4,082 | ) | (55,923 | ) | 4.7 | |||||||
TerraForm Power, Inc. | (6,717 | ) | (116,338 | ) | 9.8 | |||||||
TFS Financial Corp. | (3,981 | ) | (54,341 | ) | 4.6 | |||||||
Thermon Group Holdings, Inc. | (3,338 | ) | (51,005 | ) | 4.3 | |||||||
Toll Brothers, Inc. | (1,523 | ) | (36,582 | ) | 3.1 | |||||||
Tompkins Financial Corp. | (1,143 | ) | (77,164 | ) | 6.5 | |||||||
Tootsie Roll Industries, Inc. | (10,001 | ) | (351,335 | ) | 29.5 | |||||||
TopBuild Corp. | (216 | ) | (20,129 | ) | 1.7 | |||||||
TRI Pointe Group, Inc. | (7,101 | ) | (81,519 | ) | 6.8 | |||||||
Tribune Publishing Co. | (684 | ) | (5,862 | ) | 0.5 | |||||||
TriCo Bancshares | (3,229 | ) | (97,257 | ) | 8.2 | |||||||
Trinity Industries, Inc. | (3,810 | ) | (73,495 | ) | 6.2 | |||||||
TrueBlue, Inc. | (2,739 | ) | (42,537 | ) | 3.6 | |||||||
Tucows, Inc., Class A | (1,416 | ) | (74,921 | ) | 6.3 | |||||||
Ultra Clean Holdings, Inc. | (4,333 | ) | (79,684 | ) | 6.7 | |||||||
Umpqua Holdings Corp. | (4,703 | ) | (58,905 | ) | 4.9 | |||||||
UniFirst Corp. | (245 | ) | (41,197 | ) | 3.5 | |||||||
United Bankshares, Inc. | (2,188 | ) | (65,552 | ) | 5.5 | |||||||
United Community Banks, Inc. | (3,740 | ) | (79,082 | ) | 6.6 | |||||||
United States Lime & Minerals, Inc. | (740 | ) | (59,274 | ) | 5.0 | |||||||
United States Steel Corp. | (6,193 | ) | (47,562 | ) | 4.0 | |||||||
Universal Health Realty Income Trust | (341 | ) | (36,473 | ) | 3.1 | |||||||
Urban Edge Properties | (8,384 | ) | (96,416 | ) | 8.1 | |||||||
Urstadt Biddle Properties, Inc., Class A | (1,861 | ) | (27,189 | ) | 2.3 | |||||||
US Ecology, Inc. | (806 | ) | (26,421 | ) | 2.2 | |||||||
Valley National Bancorp | (10,292 | ) | (86,041 | ) | 7.2 | |||||||
Veeco Instruments, Inc. | (1,923 | ) | (21,018 | ) | 1.8 | |||||||
Verint Systems, Inc. | (2,404 | ) | (102,747 | ) | 8.6 | |||||||
Verra Mobility Corp. | (2,591 | ) | (23,215 | ) | 1.9 | |||||||
Verso Corp., Class A | (2,216 | ) | (30,780 | ) | 2.6 | |||||||
ViewRay, Inc. | (12,768 | ) | (26,557 | ) | 2.2 | |||||||
Waddell & Reed Financial, Inc., Class A | (8,658 | ) | (125,974 | ) | 10.6 | |||||||
| 70 | 2020 BLACKROCK ANNUAL REPORTTO SHAREHOLDERS |
Schedule of Investments (continued) April 30, 2020 | BlackRock Global Long/Short Equity Fund |
| Shares | Value | % of Basket Value | ||||||||||
| United States (continued) | ||||||||||||
Warrior Met Coal, Inc. | (5,356 | ) | $ | (67,218 | ) | 5.6 | % | |||||
Washington Federal, Inc. | (2,159 | ) | (57,732 | ) | 4.8 | |||||||
Weingarten Realty Investors | (1,274 | ) | (23,174 | ) | 1.9 | |||||||
Westamerica BanCorp. | (3,756 | ) | (236,628 | ) | 19.9 | |||||||
Western Alliance Bancorp | (816 | ) | (29,278 | ) | 2.5 | |||||||
Westwood Holdings Group, Inc. | (1,984 | ) | (45,692 | ) | 3.8 | |||||||
Willdan Group, Inc. | (1,666 | ) | (42,250 | ) | 3.5 | |||||||
Wolverine World Wide, Inc. | (3,312 | ) | (67,863 | ) | 5.7 | |||||||
World Fuel Services Corp. | (1,603 | ) | (40,075 | ) | 3.4 | |||||||
Yelp, Inc. | (3,818 | ) | (85,332 | ) | 7.2 | |||||||
York Water Co. | (1,699 | ) | (68,504 | ) | 5.7 | |||||||
Zumiez, Inc. | (3,538 | ) | (74,793 | ) | 6.3 | |||||||
|
|
|
| |||||||||
| (25,354,874 | ) | |||||||||||
|
| |||||||||||
Total Reference Entity — Short |
| (84,113,653 | ) | |||||||||
|
| |||||||||||
Net Value of Reference Entity — Goldman Sachs & Co. |
| $ | (1,191,323 | ) | ||||||||
|
| |||||||||||
The following table represents the individual long and short positions and related values of the equity securities underlying the total return swap with UBS AG as of April 30, 2020 termination date 06/10/20 — 06/19/20:
| Shares | Value | % of Basket Value | ||||||||||
Reference Entity — Long | ||||||||||||
| Australia | ||||||||||||
Alumina Ltd. | 241,419 | $ | 267,794 | 97.3 | % | |||||||
Atlas Arteria Ltd. | 36,504 | 147,306 | 53.5 | |||||||||
Australia & New Zealand Banking Group Ltd. | 54,274 | 589,549 | 214.3 | |||||||||
BlueScope Steel Ltd. | 9,559 | 63,849 | 23.2 | |||||||||
Brambles Ltd. | 50,798 | 363,082 | 132.0 | |||||||||
Caltex Australia Ltd. | 1,540 | 24,794 | 9.0 | |||||||||
Harvey Norman Holdings Ltd. | 56,917 | 102,121 | 37.1 | |||||||||
IGO Ltd. | 138,175 | 419,178 | 152.4 | |||||||||
Mineral Resources Ltd. | 31,506 | 339,567 | 123.4 | |||||||||
National Australia Bank Ltd. | 29,834 | 326,905 | 118.8 | |||||||||
Newcrest Mining Ltd. | 4,112 | 81,965 | 29.8 | |||||||||
Oil Search Ltd. | 284,911 | 559,142 | 203.2 | |||||||||
Origin Energy Ltd. | 96,473 | 346,984 | 126.1 | |||||||||
OZ Minerals Ltd. | 5,161 | 29,749 | 10.8 | |||||||||
Regis Resources Ltd. | 11,921 | 34,087 | 12.4 | |||||||||
Rio Tinto Ltd. | 1,191 | 67,126 | 24.4 | |||||||||
SEEK Ltd. | 29,755 | 332,193 | 120.7 | |||||||||
South32 Ltd. | 268,133 | 337,218 | 122.6 | |||||||||
Spark Infrastructure Group | 477,283 | 586,197 | 213.0 | |||||||||
WiseTech Global Ltd. | 7,449 | 88,704 | 32.2 | |||||||||
Worley Ltd. | 77,993 | 452,066 | 164.3 | |||||||||
|
|
|
| |||||||||
| 5,559,576 | ||||||||||||
| Austria | ||||||||||||
Ams AG | 17,931 | 235,378 | 85.5 | |||||||||
OMV AG | 4,279 | 139,717 | 50.8 | |||||||||
|
|
|
| |||||||||
| 375,095 | ||||||||||||
| Brazil | ||||||||||||
Yamana Gold, Inc. | 32,782 | 154,495 | 56.2 | |||||||||
|
|
|
| |||||||||
| Canada | ||||||||||||
Bank of Nova Scotia | 15,941 | 639,037 | 232.2 | |||||||||
Boralex, Inc. | 6,630 | 128,366 | 46.7 | |||||||||
CAE, Inc. | 50,021 | 826,526 | 300.4 | |||||||||
Canadian Apartment Properties REIT | 2,922 | 100,552 | 36.5 | |||||||||
| Shares | Value | % of Basket Value | ||||||||||
| Canada (continued) | ||||||||||||
CCL Industries, Inc., Class B | 8,002 | $ | 250,129 | 90.9 | % | |||||||
CI Financial Corp. | 5,776 | 61,372 | 22.3 | |||||||||
Great-West Lifeco, Inc. | 25,104 | 413,365 | 150.2 | |||||||||
Husky Energy, Inc. | 14,064 | 45,164 | 16.4 | |||||||||
Innergex Renewable Energy, Inc. | 10,916 | 146,493 | 53.2 | |||||||||
Lightspeed POS, Inc. | 4,219 | 79,928 | 29.1 | |||||||||
Methanex Corp. | 16,768 | 266,587 | 96.9 | |||||||||
Onex Corp. | 10,944 | 504,449 | 183.3 | |||||||||
Parex Resources, Inc. | 3,123 | 34,238 | 12.4 | |||||||||
Parkland Fuel Corp. | 978 | 23,137 | 8.4 | |||||||||
Quebecor, Inc., Class B | 7,242 | 157,696 | 57.3 | |||||||||
SSR Mining, Inc. | 39,240 | 687,570 | 249.9 | |||||||||
Suncor Energy, Inc. | 864 | 15,406 | 5.6 | |||||||||
Teck Resources Ltd., Class B | 49,217 | 433,847 | 157.7 | |||||||||
TELUS Corp. | 55,978 | 914,903 | 332.5 | |||||||||
West Fraser Timber Co. Ltd. | 3,439 | 95,712 | 34.8 | |||||||||
|
|
|
| |||||||||
| 5,824,477 | ||||||||||||
| Denmark | ||||||||||||
Chr Hansen Holding A/S | 8,823 | 760,752 | 276.5 | |||||||||
Demant A/S | 2,142 | 51,210 | 18.6 | |||||||||
Novozymes A/S, Class B | 9,331 | 457,747 | 166.3 | |||||||||
Royal Unibrew A/S | 4,890 | 378,321 | 137.5 | |||||||||
SimCorp A/S | 2,774 | 256,231 | 93.1 | |||||||||
|
|
|
| |||||||||
| 1,904,261 | ||||||||||||
| Finland | ||||||||||||
Huhtamaki OYJ | 8,740 | 326,212 | 118.6 | |||||||||
Orion OYJ, Class B | 5,048 | 256,531 | 93.2 | |||||||||
|
|
|
| |||||||||
| 582,743 | ||||||||||||
| France | ||||||||||||
ALD SA | 2,358 | 22,971 | 8.3 | |||||||||
Alten SA | 3,492 | 251,416 | 91.4 | |||||||||
Cie Plastic Omnium SA | 7,481 | 141,658 | 51.5 | |||||||||
CNP Assurances | 97,388 | 1,004,724 | 365.1 | |||||||||
Danone SA | 497 | 34,454 | 12.5 | |||||||||
Korian SA | 4,612 | 154,905 | 56.3 | |||||||||
Orpea | 3,131 | 348,270 | 126.6 | |||||||||
Pernod Ricard SA | 1,878 | 286,268 | 104.0 | |||||||||
Remy Cointreau SA | 3,799 | 423,765 | 154.0 | |||||||||
Rexel SA | 21,381 | 199,694 | 72.6 | |||||||||
Rubis SCA | 1,037 | 46,547 | 16.9 | |||||||||
Societe Generale SA | 8,323 | 130,580 | 47.5 | |||||||||
Teleperformance | 575 | 128,805 | 46.8 | |||||||||
UbiSoft Entertainment SA | 3,713 | 276,180 | 100.4 | |||||||||
|
|
|
| |||||||||
| 3,450,237 | ||||||||||||
| Germany | ||||||||||||
Carl Zeiss Meditec AG, Bearer Shares | 781 | 77,013 | 28.0 | |||||||||
Deutsche Post AG, Registered Shares | 12,468 | 370,389 | 134.6 | |||||||||
E.ON SE | 40,794 | 408,645 | 148.5 | |||||||||
Evotec SE | 2,905 | 71,682 | 26.1 | |||||||||
Hochtief AG | 992 | 77,625 | 28.2 | |||||||||
Infineon Technologies AG | 19,748 | 366,812 | 133.3 | |||||||||
MTU Aero Engines AG | 3,171 | 431,812 | 156.9 | |||||||||
Puma SE | 2,660 | 167,260 | 60.8 | |||||||||
Rational AG | 255 | 123,057 | 44.7 | |||||||||
Rheinmetall AG | 5,209 | 352,541 | 128.1 | |||||||||
Sartorius AG, Preference Shares | 1,338 | 375,899 | 136.6 | |||||||||
Symrise AG | 152 | 15,378 | 5.6 | |||||||||
|
|
|
| |||||||||
| 2,838,113 | ||||||||||||
| SCHEDULES OF INVESTMENTS | 71 |
Schedule of Investments (continued) April 30, 2020 | BlackRock Global Long/Short Equity Fund |
| Shares | Value | % of Basket Value | ||||||||||
| Hong Kong | ||||||||||||
Hysan Development Co. Ltd. | 47,000 | $ | 156,799 | 57.0 | % | |||||||
NWS Holdings Ltd. | 80,000 | 83,373 | 30.3 | |||||||||
Swire Properties Ltd. | 62,600 | 175,579 | 63.8 | |||||||||
|
|
|
| |||||||||
| 415,751 | ||||||||||||
| Ireland | ||||||||||||
AIB Group PLC | 13,772 | 19,058 | 6.9 | |||||||||
Bank of Ireland Group PLC | 162,502 | 333,470 | 121.2 | |||||||||
Kerry Group PLC, Class A | 2,002 | 229,700 | 83.5 | |||||||||
Kingspan Group PLC | 5,743 | 292,646 | 106.3 | |||||||||
|
|
|
| |||||||||
| 874,874 | ||||||||||||
| Israel | ||||||||||||
Azrieli Group Ltd. | 516 | 30,554 | 11.1 | |||||||||
Shapir Engineering and Industry Ltd. | 23,929 | 167,756 | 61.0 | |||||||||
|
|
|
| |||||||||
| 198,310 | ||||||||||||
| Italy | ||||||||||||
Amplifon SpA | 3,062 | 70,163 | 25.5 | |||||||||
Davide Campari-Milano SpA | 38,714 | 300,899 | 109.3 | |||||||||
Ferrari NV | 1,311 | 204,903 | 74.5 | |||||||||
Interpump Group SpA | 1,390 | 40,488 | 14.7 | |||||||||
Terna Rete Elettrica Nazionale SpA | 34,535 | 216,256 | 78.6 | |||||||||
|
|
|
| |||||||||
| 832,709 | ||||||||||||
| Japan | ||||||||||||
ABC-Mart, Inc. | 4,200 | 213,438 | 77.6 | |||||||||
Advantest Corp. | 6,300 | 305,685 | 111.1 | |||||||||
Aeon Co. Ltd. | 5,700 | 114,750 | 41.7 | |||||||||
AEON Financial Service Co. Ltd. | 8,900 | 92,553 | 33.6 | |||||||||
Aeon Mall Co. Ltd. | 36,900 | 463,858 | 168.6 | |||||||||
AGC, Inc. | 2,600 | 64,116 | 23.3 | |||||||||
Ain Holdings, Inc. | 700 | 39,266 | 14.3 | |||||||||
Alfresa Holdings Corp. | 9,200 | 183,460 | 66.7 | |||||||||
Alps Alpine Co. Ltd. | 35,200 | 363,064 | 131.9 | |||||||||
Anritsu Corp. | 3,000 | 61,066 | 22.2 | |||||||||
Asahi Group Holdings Ltd. | 13,600 | 467,640 | 169.9 | |||||||||
Asahi Kasei Corp. | 35,600 | 252,563 | 91.8 | |||||||||
Bic Camera, Inc. | 1,500 | 14,033 | 5.1 | |||||||||
Bridgestone Corp. | 11,200 | 348,626 | 126.7 | |||||||||
Central Japan Railway Co. | 6,600 | 1,038,539 | 377.4 | |||||||||
Chugai Pharmaceutical Co. Ltd. | 5,900 | 703,290 | 255.6 | |||||||||
Coca-Cola Bottlers Japan Holdings, Inc. | 900 | 16,115 | 5.9 | |||||||||
COMSYS Holdings Corp. | 15,400 | 423,465 | 153.9 | |||||||||
Daiichi Sankyo Co. Ltd. | 1,000 | 68,741 | 25.0 | |||||||||
Daiichikosho Co., Ltd. | 12,800 | 384,182 | 139.6 | |||||||||
Daikin Industries Ltd. | 12,000 | 1,539,971 | 559.7 | |||||||||
Daito Trust Construction Co. Ltd. | 1,900 | 180,662 | 65.7 | |||||||||
Daiwa House Industry Co. Ltd. | 6,100 | 154,576 | 56.2 | |||||||||
DeNA Co. Ltd. | 32,900 | 405,002 | 147.2 | |||||||||
Dentsu Group Inc. | 56,700 | 1,184,115 | 430.3 | |||||||||
DIC Corp. | 9,700 | 225,258 | 81.9 | |||||||||
Dip Corp. | 25,800 | 550,633 | 200.1 | |||||||||
East Japan Railway Co. | 4,800 | 350,496 | 127.4 | |||||||||
Electric Power Development Co. Ltd. | 44,700 | 894,631 | 325.1 | |||||||||
FamilyMart Co. Ltd. | 32,300 | 547,731 | 199.1 | |||||||||
Fuji Media Holdings, Inc. | 20,300 | 201,651 | 73.3 | |||||||||
Fujitsu General Ltd. | 3,100 | 51,324 | 18.7 | |||||||||
Hitachi Transport System Ltd. | 5,000 | 121,356 | 44.1 | |||||||||
Hoshizaki Corp. | 3,300 | 251,483 | 91.4 | |||||||||
House Foods Group, Inc. | 9,700 | 305,501 | 111.0 | |||||||||
Isuzu Motors Ltd. | 70,800 | 538,048 | 195.5 | |||||||||
Izumi Co. Ltd. | 51,900 | 1,519,242 | 552.1 | |||||||||
Japan Retail Fund Investment Corp. | 167 | 182,068 | 66.2 | |||||||||
| Shares | Value | % of Basket Value | ||||||||||
| Japan (continued) | ||||||||||||
Japan Tobacco, Inc. | 29,500 | $ | 549,380 | 199.7 | % | |||||||
JCR Pharmaceuticals Co. Ltd. | 1,000 | 95,785 | 34.8 | |||||||||
JGC Holdings Corp. | 67,300 | 649,902 | 236.2 | |||||||||
Kajima Corp. | 31,800 | 330,426 | 120.1 | |||||||||
Kansai Paint Co. Ltd. | 3,400 | 64,582 | 23.5 | |||||||||
Konami Holdings Corp. | 3,900 | 122,457 | 44.5 | |||||||||
Konica Minolta, Inc. | 206,200 | 797,915 | 290.0 | |||||||||
Kyocera Corp. | 1,500 | 80,146 | 29.1 | |||||||||
Lintec Corp. | 18,100 | 388,416 | 141.2 | |||||||||
Mabuchi Motor Co. Ltd. | 3,200 | 99,088 | 36.0 | |||||||||
Maeda Corp. | 2,000 | 16,043 | 5.8 | |||||||||
Marubeni Corp. | 117,500 | 565,861 | 205.6 | |||||||||
Maruha Nichiro Corp. | 28,500 | 596,423 | 216.7 | |||||||||
Marui Group Co. Ltd. | 1,000 | 16,369 | 5.9 | |||||||||
Mazda Motor Corp. | 61,200 | 345,985 | 125.7 | |||||||||
Miraca Holdings, Inc. | 4,800 | 120,190 | 43.7 | |||||||||
Mitsui Chemicals, Inc. | 4,200 | 82,459 | 30.0 | |||||||||
Nexon Co. Ltd. | 35,500 | 573,182 | 208.3 | |||||||||
NGK Spark Plug Co. Ltd. | 1,600 | 23,956 | 8.7 | |||||||||
Nidec Corp. | 300 | 17,464 | 6.3 | |||||||||
Nihon M&A Center, Inc. | 3,400 | 110,916 | 40.3 | |||||||||
Nikon Corp. | 135,300 | 1,258,535 | 457.4 | |||||||||
Nippon Electric Glass Co. Ltd. | 21,000 | 305,922 | 111.2 | |||||||||
Nippon Kayaku Co. Ltd. | 2,200 | 21,283 | 7.7 | |||||||||
Nippon Paper Industries Co. Ltd. | 24,300 | 347,013 | 126.1 | |||||||||
Nippon Shinyaku Co. Ltd. | 3,900 | 273,872 | 99.5 | |||||||||
Nippon Shokubai Co. Ltd. | 15,500 | 732,007 | 266.0 | |||||||||
Nippon Steel Corp. | 10,900 | 91,709 | 33.3 | |||||||||
Nippon Suisan Kaisha Ltd. | 40,900 | 181,983 | 66.1 | |||||||||
Nisshin Seifun Group, Inc. | 19,000 | 295,224 | 107.3 | |||||||||
Nitori Holdings Co. Ltd. | 9,600 | 1,471,447 | 534.8 | |||||||||
Nitto Denko Corp. | 7,600 | 379,646 | 138.0 | |||||||||
Persol Holdings Co. Ltd. | 1,500 | 17,251 | 6.3 | |||||||||
Recruit Holdings Co. Ltd. | 4,700 | 137,105 | 49.8 | |||||||||
Rohm Co. Ltd. | 13,400 | 847,199 | 307.9 | |||||||||
Ryohin Keikaku Co. Ltd. | 88,700 | 1,055,663 | 383.6 | |||||||||
Sankyu, Inc. | 2,900 | 111,441 | 40.5 | |||||||||
Sanwa Holdings Corp. | 54,100 | 419,800 | 152.6 | |||||||||
Seiko Epson Corp. | 22,200 | 252,094 | 91.6 | |||||||||
Sekisui House Ltd. | 81,000 | 1,389,531 | 505.0 | |||||||||
Seria Co. Ltd. | 5,300 | 172,252 | 62.6 | |||||||||
Seven Bank Ltd. | 53,900 | 146,113 | 53.1 | |||||||||
Shionogi & Co. Ltd. | 3,200 | 176,728 | 64.2 | |||||||||
SKY Perfect JSAT Holdings, Inc. | 3,500 | 13,158 | 4.8 | |||||||||
SMS Co. Ltd. | 4,800 | 104,622 | 38.0 | |||||||||
Sumitomo Bakelite Co. Ltd. | 17,100 | 441,669 | 160.5 | |||||||||
Sumitomo Chemical Co. Ltd. | 500,600 | 1,535,441 | 558.0 | |||||||||
Sumitomo Dainippon Pharma Co. Ltd. | 1,700 | 23,521 | 8.5 | |||||||||
Sumitomo Mitsui Financial Group, Inc. | 10,300 | 270,861 | 98.4 | |||||||||
Sysmex Corp. | 6,100 | 421,432 | 153.2 | |||||||||
Taisei Corp. | 3,300 | 102,868 | 37.4 | |||||||||
Taisho Pharmaceutical Holdings Co. Ltd. | 16,100 | 1,005,868 | 365.5 | |||||||||
Takara Holdings, Inc. | 28,600 | 210,473 | 76.5 | |||||||||
Takeda Pharmaceutical Co. Ltd. | 23,300 | 840,232 | 305.4 | |||||||||
Terumo Corp. | 17,300 | 574,059 | 208.6 | |||||||||
Toho Co. Ltd. | 2,000 | 65,495 | 23.8 | |||||||||
Tokyo Electron Ltd. | 1,300 | 276,875 | 100.6 | |||||||||
Topcon Corp. | 4,800 | 39,412 | 14.3 | |||||||||
Toray Industries, Inc. | 67,500 | 309,468 | 112.5 | |||||||||
TOTO Ltd. | 4,300 | 149,671 | 54.4 | |||||||||
Toyo Seikan Group Holdings Ltd. | 7,000 | 71,014 | 25.8 | |||||||||
Ulvac, Inc. | 9,100 | 250,820 | 91.2 | |||||||||
| 72 | 2020 BLACKROCK ANNUAL REPORTTO SHAREHOLDERS |
Schedule of Investments (continued) April 30, 2020 | BlackRock Global Long/Short Equity Fund |
| Shares | Value | % of Basket Value | ||||||||||
| Japan (continued) | ||||||||||||
Yamaha Corp. | 6,300 | $ | 254,301 | 92.4 | % | |||||||
Yamaha Motor Co. Ltd. | 4,900 | 63,042 | 22.9 | |||||||||
Yamato Kogyo Co. Ltd. | 13,700 | 268,859 | 97.7 | |||||||||
Yokogawa Electric Corp. | 26,100 | 355,752 | 129.3 | |||||||||
Zenkoku Hosho Co. Ltd. | 2,500 | 72,845 | 26.5 | |||||||||
|
|
|
| |||||||||
| 38,274,719 | ||||||||||||
| Luxembourg | ||||||||||||
SES SA | 3,272 | 21,798 | 7.9 | |||||||||
|
|
|
| |||||||||
| Macau | ||||||||||||
Sands China Ltd. | 241,600 | 978,117 | 355.5 | |||||||||
|
|
|
| |||||||||
| Netherlands | ||||||||||||
Akzo Nobel NV | 9,752 | 740,077 | 269.0 | |||||||||
ASML Holding NV | 1,066 | 316,167 | 114.9 | |||||||||
BE Semiconductor Industries NV | 1,526 | 63,155 | 22.9 | |||||||||
Euronext NV | 13,533 | 1,136,149 | 412.9 | |||||||||
ING Groep NV | 49,541 | 277,568 | 100.9 | |||||||||
Just Eat Takeaway | 3,054 | 313,924 | 114.1 | |||||||||
|
|
|
| |||||||||
| 2,847,040 | ||||||||||||
| New Zealand | ||||||||||||
Fisher & Paykel Healthcare Corp. Ltd. | 2,966 | 49,552 | 18.0 | |||||||||
|
|
|
| |||||||||
| Norway | ||||||||||||
Aker BP ASA | 5,278 | 86,651 | 31.5 | |||||||||
Leroy Seafood Group ASA | 81,904 | 434,968 | 158.1 | |||||||||
Schibsted ASA, Class A | 11,653 | 247,219 | 89.8 | |||||||||
TGS Nopec Geophysical Co. ASA | 1,166 | 17,857 | 6.5 | |||||||||
|
|
|
| |||||||||
| 786,695 | ||||||||||||
| Portugal | ||||||||||||
Galp Energia SGPS SA | 3,937 | 45,437 | 16.5 | |||||||||
|
|
|
| |||||||||
| Singapore | ||||||||||||
City Developments Ltd. | 48,100 | 268,867 | 97.7 | |||||||||
ComfortDelGro Corp. Ltd. | 49,600 | 57,825 | 21.0 | |||||||||
Singapore Post Ltd. | 104,700 | 53,951 | 19.6 | |||||||||
Wilmar International Ltd. | 210,800 | 530,853 | 193.0 | |||||||||
|
|
|
| |||||||||
| 911,496 | ||||||||||||
| Spain | ||||||||||||
Industria de Diseno Textil SA | 7,377 | 188,942 | 68.6 | |||||||||
Merlin Properties Socimi SA | 10,646 | 98,698 | 35.9 | |||||||||
|
|
|
| |||||||||
| 287,640 | ||||||||||||
| Sweden | ||||||||||||
BillerudKorsnas AB | 18,755 | 236,445 | 85.9 | |||||||||
Castellum AB | 6,896 | 120,955 | 44.0 | |||||||||
Elekta AB, B Shares, Class B | 34,584 | 314,209 | 114.2 | |||||||||
Fabege AB | 76,076 | 901,190 | 327.5 | |||||||||
Hufvudstaden AB, A Shares | 44,446 | 569,510 | 207.0 | |||||||||
Indutrade AB | 4,151 | 133,450 | 48.5 | |||||||||
Investment AB Latour, -B Shares | 3,980 | 59,505 | 21.6 | |||||||||
L E Lundbergforetagen AB, B Shares | 1,531 | 64,282 | 23.4 | |||||||||
Swedish Match AB | 38 | 2,348 | 0.8 | |||||||||
|
|
|
| |||||||||
| 2,401,894 | ||||||||||||
| Switzerland | ||||||||||||
Belimo Holding AG | 24 | 159,782 | 58.1 | |||||||||
Coca-Cola HBC AG | 9,531 | 241,503 | 87.8 | |||||||||
Galenica AG | 3,386 | 242,473 | 88.1 | |||||||||
Geberit AG, Registered Shares | 225 | 100,621 | 36.6 | |||||||||
Givaudan SA, Registered Shares | 153 | 513,053 | 186.5 | |||||||||
Kuehne + Nagel International AG, Registered Shares | 670 | 95,838 | 34.8 | |||||||||
| Shares | Value | % of Basket Value | ||||||||||
| Switzerland (continued) | ||||||||||||
Landis+Gyr Group AG | 5,572 | $ | 376,277 | 136.7 | % | |||||||
PSP Swiss Property AG, Registered Shares | 233 | 27,067 | 9.8 | |||||||||
Sika AG, Registered Shares | 873 | 144,402 | 52.5 | |||||||||
Swiss Prime Site AG, Registered Shares | 6,631 | 631,314 | 229.4 | |||||||||
Vifor Pharma AG | 6,317 | 947,702 | 344.4 | |||||||||
|
|
|
| |||||||||
| 3,480,032 | ||||||||||||
| United Kingdom | ||||||||||||
Ashmore Group PLC | 278,798 | 1,329,262 | 483.1 | |||||||||
ASOS PLC | 460 | 13,870 | 5.0 | |||||||||
Barratt Developments PLC | 120,786 | 787,447 | 286.2 | |||||||||
Britvic PLC | 17,772 | 163,586 | 59.5 | |||||||||
Centrica PLC | 177,560 | 89,231 | 32.4 | |||||||||
Dialog Semiconductor PLC | 21,062 | 661,449 | 240.4 | |||||||||
Dunelm Group PLC | 37,736 | 435,994 | 158.4 | |||||||||
Fevertree Drinks PLC | 12,917 | 281,929 | 102.5 | |||||||||
Games Workshop Group PLC | 397 | 30,101 | 10.9 | |||||||||
Great Portland Estates PLC | 2,989 | 25,458 | 9.3 | |||||||||
Hiscox Ltd. | 1,638 | 14,410 | 5.2 | |||||||||
HomeServe PLC | 19,582 | 274,298 | 99.7 | |||||||||
Howden Joinery Group PLC | 158,731 | 1,046,705 | 380.4 | |||||||||
Informa PLC | 141,330 | 780,687 | 283.7 | |||||||||
Marks & Spencer Group PLC | 175,294 | 204,229 | 74.2 | |||||||||
Meggitt PLC | 191,094 | 669,145 | 243.2 | |||||||||
Melrose Industries PLC | 395,390 | 494,199 | 179.6 | |||||||||
Redrow PLC | 66,325 | 385,369 | 140.1 | |||||||||
Renishaw PLC | 842 | 37,267 | 13.5 | |||||||||
Schroders PLC | 7,541 | 251,866 | 91.5 | |||||||||
Taylor Wimpey PLC | 6,916 | 12,773 | 4.6 | |||||||||
Travis Perkins PLC | 22,497 | 293,754 | 106.8 | |||||||||
Vistry Group PLC | 68,380 | 694,437 | 252.4 | |||||||||
Vodafone Group PLC | 101,692 | 143,454 | 52.1 | |||||||||
WPP PLC | 93,044 | 721,940 | 262.4 | |||||||||
|
|
|
| |||||||||
| 9,842,860 | ||||||||||||
| United States | ||||||||||||
Elastic NV | 3,639 | 233,405 | 84.8 | |||||||||
Etsy, Inc. | 1,590 | 103,143 | 37.5 | |||||||||
Green Dot Corp., Class A | 1,257 | 38,339 | 13.9 | |||||||||
Hill-Rom Holdings, Inc. | 1,491 | 167,723 | 61.0 | |||||||||
HubSpot, Inc. | 1,911 | 322,252 | 117.1 | |||||||||
Mettler-Toledo International, Inc. | 171 | 123,110 | 44.7 | |||||||||
New Relic, Inc. | 1,993 | 107,004 | 38.9 | |||||||||
Paylocity Holding Corp. | 848 | 97,121 | 35.3 | |||||||||
Ryder System, Inc. | 2,465 | 87,261 | 31.7 | |||||||||
ServiceMaster Global Holdings, Inc. | 369 | 12,564 | 4.6 | |||||||||
Sims Ltd. | 2,536 | 11,400 | 4.1 | |||||||||
Snap-on, Inc. | 150 | 19,544 | 7.1 | |||||||||
TriNet Group, Inc. | 241 | 11,802 | 4.3 | |||||||||
|
|
|
| |||||||||
| 1,334,668 | ||||||||||||
| Zambia | ||||||||||||
First Quantum Minerals Ltd. | 34,511 | 210,743 | 76.6 | |||||||||
|
|
|
| |||||||||
Total Reference Entity — Long |
| 84,483,332 | ||||||||||
|
| |||||||||||
Reference Entity — Short | ||||||||||||
| Australia | ||||||||||||
AMP Ltd. | (88,853 | ) | (81,981 | ) | (29.8 | ) | ||||||
AusNet Services | (108,380 | ) | (132,183 | ) | (48.0 | ) | ||||||
Boral Ltd. | (63,451 | ) | (123,316 | ) | (44.8 | ) | ||||||
Cleanaway Waste Management, Ltd. | (326,180 | ) | (393,544 | ) | (143.0 | ) | ||||||
Domain Holdings Australia Ltd. | (11,461 | ) | (19,407 | ) | (7.1 | ) | ||||||
| SCHEDULES OF INVESTMENTS | 73 |
Schedule of Investments (continued) April 30, 2020 | BlackRock Global Long/Short Equity Fund |
| Shares | Value | % of Basket Value | ||||||||||
| Australia | ||||||||||||
Iluka Resources Ltd. | (35,701 | ) | $ | (177,078 | ) | (64.4 | ) % | |||||
Magellan Financial Group, Ltd. | (3,161 | ) | (103,544 | ) | (37.6 | ) | ||||||
Orora Ltd. | (326,789 | ) | (543,078 | ) | (197.4 | ) | ||||||
Qube Holdings Ltd. | (86,889 | ) | (180,878 | ) | (65.7 | ) | ||||||
Ramsay Health Care, Ltd. | (6,812 | ) | (276,646 | ) | (100.6 | ) | ||||||
Scentre Group | (151,868 | ) | (228,143 | ) | (82.9 | ) | ||||||
Seven Group Holdings Ltd. | (1,268 | ) | (12,469 | ) | (4.5 | ) | ||||||
Suncorp Group Ltd. | (8,353 | ) | (49,657 | ) | (18.1 | ) | ||||||
Tabcorp Holdings, Ltd. | (160,611 | ) | (334,854 | ) | (121.7 | ) | ||||||
TPG Telecom Ltd. | (70,312 | ) | (335,509 | ) | (121.9 | ) | ||||||
Vicinity Centres | (73,350 | ) | (70,220 | ) | (25.5 | ) | ||||||
Wesfarmers, Ltd. | (38,679 | ) | (939,491 | ) | (341.4 | ) | ||||||
Woolworths, Ltd. | (3,282 | ) | (76,459 | ) | (27.8 | ) | ||||||
|
|
|
| |||||||||
| (4,078,457 | ) | |||||||||||
| Canada | ||||||||||||
Alimentation Couche-Tard, Inc., Class B | (3,535 | ) | (98,638 | ) | (35.9 | ) | ||||||
Bombardier, Inc., Class B | (606,508 | ) | (213,505 | ) | (77.6 | ) | ||||||
Canadian Utilities, Ltd. | (7,702 | ) | (187,909 | ) | (68.3 | ) | ||||||
Centerra Gold, Inc. | (7,618 | ) | (60,913 | ) | (22.1 | ) | ||||||
Constellation Software, Inc. | (1,087 | ) | (1,045,283 | ) | (379.9 | ) | ||||||
Descartes Systems Group, Inc. | (498 | ) | (20,933 | ) | (7.6 | ) | ||||||
Empire Co. Ltd., Class A | (666 | ) | (14,703 | ) | (5.3 | ) | ||||||
Imperial Oil, Ltd. | (7,633 | ) | (123,328 | ) | (44.8 | ) | ||||||
Kinaxis, Inc. | (1,234 | ) | (124,043 | ) | (45.1 | ) | ||||||
Kinross Gold Corp. | (34,834 | ) | (229,983 | ) | (83.6 | ) | ||||||
Maple Leaf Foods, Inc. | (22,176 | ) | (409,920 | ) | (149.0 | ) | ||||||
Norbord, Inc. | (1,526 | ) | (24,755 | ) | (9.0 | ) | ||||||
Northland Power, Inc. | (4,303 | ) | (92,339 | ) | (33.6 | ) | ||||||
Novagold Resources, Inc. | (59,584 | ) | (668,632 | ) | (243.0 | ) | ||||||
Pembina Pipeline Corp. | (4,949 | ) | (113,490 | ) | (41.2 | ) | ||||||
Premium Brands Holdings Corp. | (9,588 | ) | (578,194 | ) | (210.1 | ) | ||||||
Restaurant Brands International, Inc. | (12,357 | ) | (602,780 | ) | (219.1 | ) | ||||||
Ritchie Bros Auctioneers, Inc. | (14,275 | ) | (614,401 | ) | (223.3 | ) | ||||||
Saputo, Inc. | (15,566 | ) | (391,401 | ) | (142.2 | ) | ||||||
Shopify, Inc., Class A | (204 | ) | (129,378 | ) | (47.0 | ) | ||||||
SmartCentres Real Estate Investment Trust | (30,881 | ) | (472,993 | ) | (171.9 | ) | ||||||
Stars Group, Inc. | (11,384 | ) | (317,569 | ) | (115.4 | ) | ||||||
TransAlta Corp. | (15,542 | ) | (91,446 | ) | (33.2 | ) | ||||||
|
|
|
| |||||||||
| (6,626,536 | ) | |||||||||||
| Chile | ||||||||||||
Antofagasta PLC | (21,628 | ) | (221,469 | ) | (80.5 | ) | ||||||
|
|
|
| |||||||||
| China | ||||||||||||
FIH Mobile, Ltd. | (48,000 | ) | (5,365 | ) | (1.9 | ) | ||||||
Minth Group Ltd. | (8,000 | ) | (19,237 | ) | (7.0 | ) | ||||||
|
|
|
| |||||||||
| (24,602 | ) | |||||||||||
| Denmark | ||||||||||||
AP Moeller — Maersk A/S | (512 | ) | (509,570 | ) | (185.2 | ) | ||||||
AP Moeller — Maersk A/S | (623 | ) | (577,269 | ) | (209.8 | ) | ||||||
Danske Bank A/S | (104,296 | ) | (1,238,314 | ) | (450.0 | ) | ||||||
ISS A/S | (2,569 | ) | (38,194 | ) | (13.9 | ) | ||||||
Jyske Bank A/S, Registered Shares | (4,814 | ) | (129,944 | ) | (47.2 | ) | ||||||
Rockwool International A/S, -B Shares | (2,808 | ) | (590,127 | ) | (214.5 | ) | ||||||
Topdanmark A/S | (4,746 | ) | (191,583 | ) | (69.6 | ) | ||||||
|
|
|
| |||||||||
| (3,275,001 | ) | |||||||||||
| Finland | ||||||||||||
Fortum OYJ | (3,093 | ) | (51,251 | ) | (18.6 | ) | ||||||
Metsa Board OYJ | (39,292 | ) | (273,683 | ) | (99.5 | ) | ||||||
Nordea Bank Abp | (91,373 | ) | (586,061 | ) | (213.0 | ) | ||||||
Stora Enso OYJ, -R Shares | (87,093 | ) | (1,024,610 | ) | (372.4 | ) | ||||||
TietoEVRY OYJ | (7,299 | ) | (177,852 | ) | (64.6 | ) | ||||||
|
|
|
| |||||||||
| (2,113,457 | ) | |||||||||||
| Shares | Value | % of Basket Value | ||||||||||
| France | ||||||||||||
Bollore SA | (299,916 | ) | $ | (794,844 | ) | (288.9 | ) % | |||||
Dassault Aviation SA | (104 | ) | (84,698 | ) | (30.8 | ) | ||||||
Eurazeo SE | (12,267 | ) | (587,505 | ) | (213.5 | ) | ||||||
Faurecia SE | (6,415 | ) | (229,859 | ) | (83.5 | ) | ||||||
La Francaise des Jeux SAEM | (5,898 | ) | (168,725 | ) | (61.3 | ) | ||||||
|
|
|
| |||||||||
| (1,865,631 | ) | |||||||||||
| Germany | ||||||||||||
Bayer AG, Registered Shares | (3,181 | ) | (209,212 | ) | (76.0 | ) | ||||||
Bechtle AG | (872 | ) | (126,107 | ) | (45.8 | ) | ||||||
Daimler AG | (3,461 | ) | (119,604 | ) | (43.5 | ) | ||||||
Deutsche Bank AG | (112,064 | ) | (829,971 | ) | (301.6 | ) | ||||||
Fuchs Petrolub SE | (8,311 | ) | (322,264 | ) | (117.1 | ) | ||||||
HeidelbergCement AG | (5,317 | ) | (252,085 | ) | (91.6 | ) | ||||||
LANXESS AG | (12,261 | ) | (603,307 | ) | (219.3 | ) | ||||||
Muenchener Rueckversicherungs-Gesellschaft AG in Muenchen | (754 | ) | (165,144 | ) | (60.0 | ) | ||||||
Schaeffler AG | (19,125 | ) | (129,140 | ) | (46.9 | ) | ||||||
TeamViewer AG | (7,814 | ) | (339,094 | ) | (123.3 | ) | ||||||
TUI AG | (92,770 | ) | (369,568 | ) | (134.3 | ) | ||||||
Volkswagen AG | (3,219 | ) | (447,863 | ) | (162.8 | ) | ||||||
|
|
|
| |||||||||
| (3,913,359 | ) | |||||||||||
| Hong Kong | ||||||||||||
Haitong International Securities Group Ltd. | (108,000 | ) | (25,286 | ) | (9.2 | ) | ||||||
Vitasoy International Holdings Ltd. | (24,000 | ) | (85,596 | ) | (31.1 | ) | ||||||
|
|
|
| |||||||||
| (110,882 | ) | |||||||||||
| Japan | ||||||||||||
Acom Co. Ltd. | (62,100 | ) | (250,898 | ) | (91.2 | ) | ||||||
Advance Residence Investment Corp. | (29 | ) | (88,980 | ) | (32.3 | ) | ||||||
Amada Co. Ltd. | (10,600 | ) | (95,814 | ) | (34.8 | ) | ||||||
Bank of Kyoto Ltd. | (24,200 | ) | (828,326 | ) | (301.0 | ) | ||||||
Brother Industries Ltd. | (8,400 | ) | (142,367 | ) | (51.7 | ) | ||||||
Canon Marketing Japan, Inc. | (1,800 | ) | (34,644 | ) | (12.6 | ) | ||||||
The Chiba Bank Ltd. | (5,200 | ) | (24,128 | ) | (8.8 | ) | ||||||
Chubu Electric Power Co., Inc. | (11,300 | ) | (152,821 | ) | (55.5 | ) | ||||||
Chugoku Bank Ltd. | (52,400 | ) | (482,500 | ) | (175.4 | ) | ||||||
Daiwa House REIT Investment Corp. | (21 | ) | (50,812 | ) | (18.5 | ) | ||||||
Daiwa Office Investment Corp. | (26 | ) | (143,838 | ) | (52.3 | ) | ||||||
DMG Mori Co., Ltd. | (27,700 | ) | (283,224 | ) | (102.9 | ) | ||||||
Dowa Holdings Co. Ltd. | (2,000 | ) | (55,316 | ) | (20.1 | ) | ||||||
Ebara Corp. | (1,500 | ) | (33,070 | ) | (12.0 | ) | ||||||
Ezaki Glico Co., Ltd. | (1,400 | ) | (61,488 | ) | (22.3 | ) | ||||||
FP Corp. | (3,800 | ) | (286,652 | ) | (104.2 | ) | ||||||
FUJIFILM Holdings Corp. | (21,000 | ) | (1,000,283 | ) | (363.5 | ) | ||||||
Fujitsu Ltd. | (6,200 | ) | (602,320 | ) | (218.9 | ) | ||||||
Furukawa Electric Co., Ltd. | (1,000 | ) | (18,823 | ) | (6.8 | ) | ||||||
GMO Payment Gateway, Inc. | (7,800 | ) | (695,365 | ) | (252.7 | ) | ||||||
Gunma Bank Ltd. | (23,700 | ) | (75,879 | ) | (27.6 | ) | ||||||
Hachijuni Bank Ltd. | (383,300 | ) | (1,368,707 | ) | (497.4 | ) | ||||||
Hamamatsu Photonics KK | (15,800 | ) | (690,606 | ) | (251.0 | ) | ||||||
Hitachi Construction Machinery Co., Ltd. | (47,800 | ) | (1,121,494 | ) | (407.6 | ) | ||||||
Hokuhoku Financial Group, Inc. | (3,500 | ) | (28,438 | ) | (10.3 | ) | ||||||
Hulic Co., Ltd. | (5,400 | ) | (53,406 | ) | (19.4 | ) | ||||||
Ibiden Co. Ltd. | (23,500 | ) | (600,660 | ) | (218.3 | ) | ||||||
Ichigo, Inc. | (58,200 | ) | (149,038 | ) | (54.2 | ) | ||||||
Ito En Ltd. | (11,200 | ) | (622,181 | ) | (226.1 | ) | ||||||
ITOCHU Corp. | (4,500 | ) | (88,223 | ) | (32.1 | ) | ||||||
Itochu Techno-Solutions Corp. | (31,300 | ) | (956,358 | ) | (347.6 | ) | ||||||
Iyo Bank Ltd. | (241,100 | ) | (1,291,630 | ) | (469.4 | ) | ||||||
Japan Airport Terminal Co. Ltd. | (19,400 | ) | (786,714 | ) | (285.9 | ) | ||||||
Japan Aviation Electronics Industry, Ltd. | (6,300 | ) | (81,728 | ) | (29.7 | ) | ||||||
Japan Exchange Group, Inc. | (5,000 | ) | (93,002 | ) | (33.8 | ) | ||||||
| 74 | 2020 BLACKROCK ANNUAL REPORTTO SHAREHOLDERS |
Schedule of Investments (continued) April 30, 2020 | BlackRock Global Long/Short Equity Fund |
| Shares | Value | % of Basket Value | ||||||||||
| Japan (continued) | ||||||||||||
JSR Corp. | (4,800 | ) | $ | (90,293 | ) | (32.8 | ) % | |||||
Kagome Co., Ltd. | (1,600 | ) | (40,860 | ) | (14.8 | ) | ||||||
Kaken Pharmaceutical Co. Ltd. | (4,600 | ) | (253,191 | ) | (92.0 | ) | ||||||
Kansai Mirai Financial Group, Inc. | (29,600 | ) | (99,519 | ) | (36.2 | ) | ||||||
Kawasaki Heavy Industries Ltd. | (2,800 | ) | (42,308 | ) | (15.4 | ) | ||||||
Kawasaki Kisen Kaisha Ltd. | (59,200 | ) | (582,421 | ) | (211.7 | ) | ||||||
Keihan Holdings Co. Ltd. | (11,100 | ) | (498,897 | ) | (181.3 | ) | ||||||
Keihin Corp. | (5,900 | ) | (140,735 | ) | (51.1 | ) | ||||||
Keikyu Corp. | (35,500 | ) | (583,466 | ) | (212.0 | ) | ||||||
Keio Corp. | (800 | ) | (45,254 | ) | (16.4 | ) | ||||||
Kikkoman Corp. | (4,200 | ) | (192,990 | ) | (70.1 | ) | ||||||
Kinden Corp. | (7,600 | ) | (122,292 | ) | (44.4 | ) | ||||||
Kintetsu Group Holdings Co. Ltd. | (11,000 | ) | (525,476 | ) | (191.0 | ) | ||||||
Kobayashi Pharmaceutical Co., Ltd. | (7,600 | ) | (704,502 | ) | (256.0 | ) | ||||||
Kobe Steel, Ltd. | (67,900 | ) | (227,098 | ) | (82.5 | ) | ||||||
Koei Tecmo Holdings Co. Ltd. | (29,800 | ) | (783,918 | ) | (284.9 | ) | ||||||
Kurita Water Industries Ltd. | (18,500 | ) | (516,129 | ) | (187.6 | ) | ||||||
Kyushu Financial Group, Inc. | (73,900 | ) | (311,759 | ) | (113.3 | ) | ||||||
LINE Corp. | (12,700 | ) | (621,228 | ) | (225.8 | ) | ||||||
Makita Corp. | (13,100 | ) | (426,568 | ) | (155.0 | ) | ||||||
Maruichi Steel Tube Ltd. | (5,300 | ) | (119,170 | ) | (43.3 | ) | ||||||
Mebuki Financial Group, Inc. | (14,300 | ) | (30,039 | ) | (10.9 | ) | ||||||
Minebea Mitsumi, Inc. | (2,300 | ) | (37,396 | ) | (13.6 | ) | ||||||
Mitsubishi Corp. | (34,900 | ) | (740,159 | ) | (269.0 | ) | ||||||
Mitsubishi Estate Co. Ltd. | (3,500 | ) | (56,624 | ) | (20.6 | ) | ||||||
Mitsubishi Heavy Industries, Ltd. | (21,500 | ) | (551,338 | ) | (200.4 | ) | ||||||
Mitsubishi Logistics Corp. | (2,100 | ) | (46,366 | ) | (16.9 | ) | ||||||
Mitsui OSK Lines Ltd. | (42,500 | ) | (737,149 | ) | (267.9 | ) | ||||||
Miura Co. Ltd. | (5,700 | ) | (235,192 | ) | (85.5 | ) | ||||||
Mizuho Financial Group, Inc. | (130,000 | ) | (151,375 | ) | (55.0 | ) | ||||||
Morinaga & Co., Ltd. | (500 | ) | (20,548 | ) | (7.5 | ) | ||||||
Nabtesco Corp. | (12,600 | ) | (360,553 | ) | (131.0 | ) | ||||||
Nagoya Railroad Co. Ltd. | (31,700 | ) | (907,132 | ) | (329.7 | ) | ||||||
NET One Systems Co. Ltd. | (700 | ) | (20,286 | ) | (7.4 | ) | ||||||
Nippo Corp. | (1,900 | ) | (42,728 | ) | (15.5 | ) | ||||||
Nippon Accommodations Fund, Inc. | (26 | ) | (154,419 | ) | (56.1 | ) | ||||||
Nippon Yusen KK | (6,400 | ) | (84,247 | ) | (30.6 | ) | ||||||
Nishi-Nippon Financial Holdings, Inc. | (2,800 | ) | (16,341 | ) | (5.9 | ) | ||||||
Nissan Shatai Co. Ltd. | (1,900 | ) | (15,210 | ) | (5.5 | ) | ||||||
NOF Corp. | (1,500 | ) | (49,705 | ) | (18.1 | ) | ||||||
Nomura Holdings, Inc. | (109,400 | ) | (453,968 | ) | (165.0 | ) | ||||||
Nomura Research Institute Ltd. | (800 | ) | (19,585 | ) | (7.1 | ) | ||||||
NTN Corp. | (19,100 | ) | (36,634 | ) | (13.3 | ) | ||||||
NTT Data Corp. | (7,600 | ) | (77,552 | ) | (28.2 | ) | ||||||
NTT DOCOMO, Inc. | (3,100 | ) | (91,361 | ) | (33.2 | ) | ||||||
OBIC Business Consultants Co. Ltd. | (5,700 | ) | (254,871 | ) | (92.6 | ) | ||||||
Oji Holdings Corp. | (10,600 | ) | (53,821 | ) | (19.6 | ) | ||||||
Olympus Corp. | (900 | ) | (14,280 | ) | (5.2 | ) | ||||||
Oracle Corp. Japan | (1,800 | ) | (185,306 | ) | (67.3 | ) | ||||||
Orient Corp. | (170,700 | ) | (195,246 | ) | (71.0 | ) | ||||||
Oriental Land Co. Ltd. | (1,100 | ) | (139,090 | ) | (50.5 | ) | ||||||
PALTAC Corp. | (1,100 | ) | (57,446 | ) | (20.9 | ) | ||||||
Panasonic Corp. | (50,900 | ) | (388,010 | ) | (141.0 | ) | ||||||
Pigeon Corp. | (7,000 | ) | (249,269 | ) | (90.6 | ) | ||||||
Rinnai Corp. | (1,300 | ) | (98,469 | ) | (35.8 | ) | ||||||
Sega Sammy Holdings, Inc. | (10,200 | ) | (123,551 | ) | (44.9 | ) | ||||||
Sekisui House Reit, Inc. | (34 | ) | (20,769 | ) | (7.5 | ) | ||||||
Sharp Corp. | (43,400 | ) | (477,750 | ) | (173.6 | ) | ||||||
Shiga Bank Ltd. | (30,000 | ) | (706,597 | ) | (256.8 | ) | ||||||
Shimano, Inc. | (100 | ) | (14,736 | ) | (5.4 | ) | ||||||
Shinsei Bank Ltd. | (28,700 | ) | (346,206 | ) | (125.8 | ) | ||||||
Shizuoka Bank Ltd. | (16,300 | ) | (98,961 | ) | (36.0 | ) | ||||||
Shochiku Co. Ltd. | (8,100 | ) | (883,046 | ) | (320.9 | ) | ||||||
Showa Corp. | (24,700 | ) | (519,018 | ) | (188.6 | ) | ||||||
| Shares | Value | % of Basket Value | ||||||||||
| Japan (continued) | ||||||||||||
Showa Denko KK | (7,100 | ) | $ | (155,404 | ) | (56.5 | ) % | |||||
Skylark Holdings Co. Ltd. | (49,500 | ) | (731,684 | ) | (265.9 | ) | ||||||
SMC Corp. | (1,200 | ) | (542,427 | ) | (197.1 | ) | ||||||
SoftBank Group Corp. | (600 | ) | (25,718 | ) | (9.3 | ) | ||||||
Sony Corp. | (6,600 | ) | (424,737 | ) | (154.4 | ) | ||||||
Sony Financial Holdings, Inc. | (40,700 | ) | (771,535 | ) | (280.4 | ) | ||||||
Square Enix Holdings Co. Ltd. | (3,200 | ) | (131,155 | ) | (47.7 | ) | ||||||
Sumco Corp. | (15,700 | ) | (223,522 | ) | (81.2 | ) | ||||||
Sumitomo Forestry Co., Ltd. | (4,400 | ) | (54,358 | ) | (19.8 | ) | ||||||
Sumitomo Heavy Industries Ltd. | (6,100 | ) | (128,552 | ) | (46.7 | ) | ||||||
Sumitomo Rubber Industries, Ltd. | (11,100 | ) | (107,743 | ) | (39.2 | ) | ||||||
Sushiro Global Holdings Ltd. | (49,700 | ) | (766,542 | ) | (278.6 | ) | ||||||
Suzuki Motor Corp. | (6,700 | ) | (213,832 | ) | (77.7 | ) | ||||||
Taiyo Nippon Sanso Corp. | (37,400 | ) | (580,101 | ) | (210.8 | ) | ||||||
Taiyo Yuden Co. Ltd. | (17,100 | ) | (476,795 | ) | (173.3 | ) | ||||||
Tobu Railway Co. Ltd. | (32,400 | ) | (1,099,009 | ) | (399.4 | ) | ||||||
Toho Gas Co. Ltd. | (26,500 | ) | (1,302,069 | ) | (473.2 | ) | ||||||
Tokai Carbon Co. Ltd. | (79,900 | ) | (660,746 | ) | (240.1 | ) | ||||||
Tokuyama Corp. | (10,600 | ) | (223,660 | ) | (81.3 | ) | ||||||
Tokyo Broadcasting System Holdings, Inc. | (3,000 | ) | (46,383 | ) | (16.9 | ) | ||||||
Tokyo Electric Power Co. Holdings, Inc. | (94,400 | ) | (317,780 | ) | (115.5 | ) | ||||||
Tokyo Tatemono Co. Ltd. | (7,000 | ) | (78,726 | ) | (28.6 | ) | ||||||
Toppan Printing Co., Ltd. | (6,100 | ) | (90,616 | ) | (32.9 | ) | ||||||
Toyo Suisan Kaisha Ltd. | (3,700 | ) | (177,921 | ) | (64.7 | ) | ||||||
Toyo Tire Corp. | (40,600 | ) | (475,396 | ) | (172.8 | ) | ||||||
Toyota Industries Corp. | (7,600 | ) | (382,536 | ) | (139.0 | ) | ||||||
Workman Co. Ltd. | (600 | ) | (37,965 | ) | (13.8 | ) | ||||||
Yamada Denki Co. Ltd. | (15,000 | ) | (71,132 | ) | (25.9 | ) | ||||||
Yamazaki Baking Co., Ltd. | (48,500 | ) | (857,676 | ) | (311.7 | ) | ||||||
Yoshinoya Holdings Co. Ltd. | (8,400 | ) | (173,591 | ) | (63.1 | ) | ||||||
Zensho Holdings Co. Ltd. | (5,500 | ) | (108,264 | ) | (39.3 | ) | ||||||
|
|
|
| |||||||||
| (41,467,731 | ) | |||||||||||
| Jordan | ||||||||||||
Hikma Pharmaceuticals PLC | (3,504 | ) | (104,363 | ) | (37.9 | ) | ||||||
|
|
|
| |||||||||
| Kazakhstan | ||||||||||||
KAZ Minerals PLC | (109,649 | ) | (570,299 | ) | (207.2 | ) | ||||||
|
|
|
| |||||||||
| Luxembourg | ||||||||||||
Millicom International Cellular SA | (1,097 | ) | (28,507 | ) | (10.4 | ) | ||||||
|
|
|
| |||||||||
| Macau | ||||||||||||
MGM China Holdings Ltd. | (53,200 | ) | (65,697 | ) | (23.9 | ) | ||||||
|
|
|
| |||||||||
| Netherlands | ||||||||||||
Aalberts NV | (4,387 | ) | (123,537 | ) | (44.9 | ) | ||||||
Koninklijke Ahold Delhaize NV | (527 | ) | (12,798 | ) | (4.6 | ) | ||||||
SBM Offshore NV | (37,135 | ) | (470,689 | ) | (171.1 | ) | ||||||
|
|
|
| |||||||||
| (607,024 | ) | |||||||||||
| New Zealand | ||||||||||||
a2 Milk Co. Ltd. | (45,198 | ) | (533,045 | ) | (193.7 | ) | ||||||
Fletcher Building Ltd. | (11,238 | ) | (25,179 | ) | (9.2 | ) | ||||||
Spark New Zealand Ltd. | (18,111 | ) | (49,014 | ) | (17.8 | ) | ||||||
|
|
|
| |||||||||
| (607,238 | ) | |||||||||||
| Norway | ||||||||||||
Equinor ASA | (5,086 | ) | (71,214 | ) | (25.9 | ) | ||||||
|
|
|
| |||||||||
| Singapore | ||||||||||||
Genting Singapore Ltd. | (338,300 | ) | (187,712 | ) | (68.2 | ) | ||||||
Golden Agri-Resources Ltd. | (270,800 | ) | (29,779 | ) | (10.8 | ) | ||||||
Keppel REIT | (93,900 | ) | (70,135 | ) | (25.5 | ) | ||||||
Mapletree North Asia Commercial Trust | (168,300 | ) | (111,775 | ) | (40.6 | ) | ||||||
SembCorp Industries Ltd. | (372,200 | ) | (426,395 | ) | (155.0 | ) | ||||||
Sembcorp Marine Ltd. | (2,731,863 | ) | (1,444,277 | ) | (524.9 | ) | ||||||
Suntec Real Estate Investment Trust | (183,000 | ) | (180,753 | ) | (65.7 | ) | ||||||
|
|
|
| |||||||||
| (2,450,826 | ) | |||||||||||
| SCHEDULES OF INVESTMENTS | 75 |
Schedule of Investments (continued) April 30, 2020 | BlackRock Global Long/Short Equity Fund |
| Shares | Value | % of Basket Value | ||||||||||
| Sweden | ||||||||||||
Electrolux Professional AB | (132,913 | ) | $ | (305,998 | ) | (111.2 | ) % | |||||
EQT AB | (17,932 | ) | (247,790 | ) | (90.0 | ) | ||||||
Essity AB | (4,183 | ) | (136,136 | ) | (49.5 | ) | ||||||
Fastighets AB Balder | (8,919 | ) | (352,454 | ) | (128.1 | ) | ||||||
Loomis AB | (21,130 | ) | (515,271 | ) | (187.3 | ) | ||||||
Nibe Industrier AB, -B Shares | (43,157 | ) | (805,170 | ) | (292.6 | ) | ||||||
Samhallsbyggnadsbolaget i Norden AB | (174,523 | ) | (337,974 | ) | (122.8 | ) | ||||||
Securitas AB, -B Shares | (24,229 | ) | (286,682 | ) | (104.2 | ) | ||||||
SKF AB, -B Shares | (49,440 | ) | (780,342 | ) | (283.6 | ) | ||||||
Svenska Cellulosa AB SCA, Class B | (13,643 | ) | (144,707 | ) | (52.6 | ) | ||||||
Volvo AB, -B Shares | (18,081 | ) | (231,700 | ) | (84.2 | ) | ||||||
|
|
|
| |||||||||
| (4,144,224 | ) | |||||||||||
| Switzerland | ||||||||||||
Banque Cantonale Vaudoise | (803 | ) | (709,025 | ) | (257.6 | ) | ||||||
Cembra Money Bank AG | (3,597 | ) | (341,959 | ) | (124.3 | ) | ||||||
EMS-Chemie Holding AG | (1,097 | ) | (709,399 | ) | (257.8 | ) | ||||||
Flughafen Zurich AG | (2,214 | ) | (273,798 | ) | (99.5 | ) | ||||||
Georg Fischer AG, Registered Shares | (376 | ) | (280,608 | ) | (102.0 | ) | ||||||
LafargeHolcim Ltd. | (49,940 | ) | (2,074,156 | ) | (753.8 | ) | ||||||
Lonza Group AG, Registered Shares | (387 | ) | (168,990 | ) | (61.4 | ) | ||||||
|
|
|
| |||||||||
| (4,557,935 | ) | |||||||||||
| United Kingdom | ||||||||||||
Admiral Group PLC | (13,110 | ) | (382,557 | ) | (139.0 | ) | ||||||
Auto Trader Group PLC | (74,555 | ) | (429,176 | ) | (156.0 | ) | ||||||
Avast PLC | (15,233 | ) | (87,742 | ) | (31.9 | ) | ||||||
| Shares | Value | % of Basket Value | ||||||||||
| United Kingdom (continued) | ||||||||||||
Barclays PLC | (32,757 | ) | $ | (45,808 | ) | (16.6 | ) % | |||||
BT Group PLC | (376,150 | ) | (548,247 | ) | (199.2 | ) | ||||||
CRH PLC | (8,905 | ) | (270,165 | ) | (98.2 | ) | ||||||
Domino’s Pizza Group PLC | (41,616 | ) | (180,338 | ) | (65.5 | ) | ||||||
DS Smith PLC | (86,959 | ) | (340,962 | ) | (123.9 | ) | ||||||
GVC Holdings PLC | (36,357 | ) | (345,094 | ) | (125.4 | ) | ||||||
Halma PLC | (26,889 | ) | (706,922 | ) | (256.9 | ) | ||||||
Inchcape PLC | (64,205 | ) | (404,433 | ) | (147.0 | ) | ||||||
InterContinental Hotels Group PLC | (4,555 | ) | (207,492 | ) | (75.4 | ) | ||||||
National Grid PLC | (5,807 | ) | (68,051 | ) | (24.7 | ) | ||||||
Pearson PLC | (20,041 | ) | (115,569 | ) | (42.0 | ) | ||||||
Pets at Home Group PLC | (15,340 | ) | (49,116 | ) | (17.9 | ) | ||||||
Prudential PLC | (30,438 | ) | (429,401 | ) | (156.1 | ) | ||||||
Signature Aviation PLC | (288,732 | ) | (709,100 | ) | (257.7 | ) | ||||||
St. James’s Place PLC | (3,411 | ) | (36,321 | ) | (13.2 | ) | ||||||
|
|
|
| |||||||||
| (5,356,494 | ) | |||||||||||
| United States | ||||||||||||
Carnival PLC | (20,090 | ) | (276,845 | ) | (100.6 | ) | ||||||
Chewy, Inc., Class A | (9,127 | ) | (394,651 | ) | (143.4 | ) | ||||||
Slack Technologies, Inc., Class A | (46,778 | ) | (1,248,505 | ) | (453.8 | ) | ||||||
Ubiquiti, Inc. | (168 | ) | (27,221 | ) | (9.9 | ) | ||||||
|
|
|
| |||||||||
| (1,947,222 | ) | |||||||||||
|
| |||||||||||
Total Reference Entity — Short |
| (84,208,168 | ) | |||||||||
|
| |||||||||||
Net Value of Reference Entity — UBS AG |
| $ | 275,164 | |||||||||
|
| |||||||||||
Balances Reported in the Statements of Assets and Liabilities for OTC Swaps and Options Written
Swap Premiums Paid | Swap Premiums Received | Unrealized Appreciation | Unrealized Depreciation | Value | ||||||||||||||||
OTC Swaps | $ | — | $ | — | $ | 17,381,863 | $ | (59,724 | ) | $ | — | |||||||||
Options Written | N/A | N/A | 1,713,716 | — | (361,470 | ) | ||||||||||||||
Derivative Financial Instruments Categorized by Risk Exposure
As of period end, the fair values of derivative financial instruments located in the Statements of Assets and Liabilities were as follows:
Commodity Contracts | Credit Contracts | Equity Contracts | Foreign Currency Exchange Contracts | Interest Rate Contracts | Other Contracts | Total | ||||||||||||||||||||||
Assets — Derivative Financial Instruments |
| |||||||||||||||||||||||||||
Futures contracts | ||||||||||||||||||||||||||||
Unrealized appreciation on futures contracts(a) | $ | — | $ | — | $ | 2,863,198 | $ | — | $ | — | $ | — | $ | 2,863,198 | ||||||||||||||
Options purchased(b) | ||||||||||||||||||||||||||||
Investments at value — unaffiliated(b) | — | — | 505,835 | — | — | — | 505,835 | |||||||||||||||||||||
Swaps — OTC | ||||||||||||||||||||||||||||
Unrealized appreciation on OTC swaps; Swap premiums paid | — | — | 17,381,863 | — | — | — | 17,381,863 | |||||||||||||||||||||
|
|
|
|
|
|
|
|
|
|
|
|
|
| |||||||||||||||
| $ | — | $ | — | $ | 20,750,896 | $ | — | $ | — | $ | — | $ | 20,750,896 | |||||||||||||||
|
|
|
|
|
|
|
|
|
|
|
|
|
| |||||||||||||||
Liabilities — Derivative Financial Instruments | ||||||||||||||||||||||||||||
Futures contracts | ||||||||||||||||||||||||||||
Unrealized depreciation on futures contracts(a) | $ | — | $ | — | $ | 2,984,945 | $ | — | $ | — | $ | — | $ | 2,984,945 | ||||||||||||||
Options written | ||||||||||||||||||||||||||||
Options written at value | — | — | 361,470 | — | — | — | 361,470 | |||||||||||||||||||||
Swaps — OTC | ||||||||||||||||||||||||||||
Unrealized depreciation on OTC swaps; Swap premiums received | — | — | 59,724 | — | — | — | 59,724 | |||||||||||||||||||||
|
|
|
|
|
|
|
|
|
|
|
|
|
| |||||||||||||||
| $ | — | $ | — | $ | 3,406,139 | $ | — | $ | — | $ | — | $ | 3,406,139 | |||||||||||||||
|
|
|
|
|
|
|
|
|
|
|
|
|
| |||||||||||||||
| (a) | Net cumulative unrealized appreciation (depreciation) on futures contracts and centrally cleared swaps, if any, are reported in the Schedule of Investments. In the Statements of Assets and Liabilities, only current day’s variation margin is reported in receivables or payables and the net cumulative unrealized appreciation (depreciation) is included in accumulated earnings (loss). |
| (b) | Includes options purchased at value as reported in the Schedule of Investments. |
| 76 | 2020 BLACKROCK ANNUAL REPORTTO SHAREHOLDERS |
Schedule of Investments (continued) April 30, 2020 | BlackRock Global Long/Short Equity Fund |
For the period ended April 30, 2020, the effect of derivative financial instruments in the Statements of Operations was as follows:
Commodity Contracts | Credit Contracts | Equity Contracts | Foreign Currency Exchange Contracts | Interest Rate Contracts | Other Contracts | Total | ||||||||||||||||||||||
Net Realized Gain (Loss) from: |
| |||||||||||||||||||||||||||
Futures contracts | $ | — | $ | — | $ | (5,045,402 | ) | $ | — | $ | — | $ | — | $ | (5,045,402 | ) | ||||||||||||
Options purchased(a) | — | — | (1,994,048 | ) | — | — | — | (1,994,048 | ) | |||||||||||||||||||
Options written | — | — | 1,298,304 | — | — | — | 1,298,304 | |||||||||||||||||||||
Swaps | — | — | (31,071,200 | ) | — | — | — | (31,071,200 | ) | |||||||||||||||||||
|
|
|
|
|
|
|
|
|
|
|
|
|
| |||||||||||||||
| $ | — | $ | — | $ | (36,812,346 | ) | $ | — | $ | — | $ | — | $ | (36,812,346 | ) | |||||||||||||
|
|
|
|
|
|
|
|
|
|
|
|
|
| |||||||||||||||
| Net Change in Unrealized Appreciation (Depreciation) on: | ||||||||||||||||||||||||||||
Futures contracts | $ | — | $ | — | $ | 673,710 | $ | — | $ | — | $ | — | $ | 673,710 | ||||||||||||||
Options purchased(b) | — | — | (2,110,559 | ) | — | — | — | (2,110,559 | ) | |||||||||||||||||||
Options written | — | — | 1,713,716 | — | — | — | 1,713,716 | |||||||||||||||||||||
Swaps | — | — | 13,222,024 | — | — | — | 13,222,024 | |||||||||||||||||||||
|
|
|
|
|
|
|
|
|
|
|
|
|
| |||||||||||||||
| $ | — | $ | — | $ | 13,498,891 | $ | — | $ | — | $ | — | $ | 13,498,891 | |||||||||||||||
|
|
|
|
|
|
|
|
|
|
|
|
|
| |||||||||||||||
| (a) | Options purchased are included in net realized gain (loss) from investments. |
| (b) | Options purchased are included in net change in unrealized appreciation (depreciation) on investments. |
Average Quarterly Balances of Outstanding Derivative Financial Instruments:
Futures contracts: |
| |||
Average notional value of contracts — long | $ | 87,114,766 | ||
Average notional value of contracts — short | 58,059,764 | |||
Options: |
| |||
Average value of option contracts purchased | 168,612 | |||
Average value of option contracts written | 120,490 | |||
Total return swaps: |
| |||
Average notional value | 4,426,994 | |||
For more information about the Fund’s investment risks regarding derivative financial instruments, refer to the Notes to Financial Statements.
Derivative Financial Instruments — Offsetting as of Period End
The Fund’s derivative assets and liabilities (by type) were as follows:
| Assets | Liabilities | |||||||
Derivative Financial Instruments: | ||||||||
Futures contracts | $ | 1,574,107 | $ | 821,893 | ||||
Options | 505,835 | (a) | 361,470 | |||||
Swaps — OTC(b) | 17,381,863 | 59,724 | ||||||
|
|
|
| |||||
Total derivative assets and liabilities in the Statements of Assets and Liabilities | $ | 19,461,805 | $ | 1,243,087 | ||||
Derivatives not subject to a Master Netting Agreement or similar agreement (“MNA”) | (2,079,942 | ) | (1,183,363 | ) | ||||
|
|
|
| |||||
Total derivative assets and liabilities subject to an MNA | $ | 17,381,863 | $ | 59,724 | ||||
|
|
|
| |||||
| (a) | Includes options purchased at value which is included in Investments at value — unaffiliated in the Statements of Assets and Liabilities and reported in the Schedule of Investments. |
| (b) | Includes unrealized appreciation (depreciation) on OTC swaps in the Statements of Assets and Liabilities. |
The following table presents the Fund’s derivative assets (and liabilities) by counterparty net of amounts available for offset under an MNA and net of the related collateral received (and pledged) by the Fund:
| Counterparty | Derivative Assets Subject to an MNA by Counterparty | Derivatives Available for Offset (a) | Non-cash Collateral Received | Cash Collateral Received | Net Amount of Derivative Assets (b) | |||||||||||||||
Bank of America, N.A. | $ | 1,594,892 | $ | — | $ | — | $ | — | $ | 1,594,892 | ||||||||||
Goldman Sachs & Co. | 13,040,752 | — | — | (12,580,000 | ) | 460,752 | ||||||||||||||
Morgan Stanley & Co. International PLC | 21,803 | (21,803 | ) | — | — | — | ||||||||||||||
UBS AG | 2,724,416 | — | — | — | 2,724,416 | |||||||||||||||
|
|
|
|
|
|
|
|
|
| |||||||||||
| $ | 17,381,863 | $ | (21,803 | ) | $ | — | $ | (12,580,000 | ) | $ | 4,780,060 | |||||||||
|
|
|
|
|
|
|
|
|
| |||||||||||
| SCHEDULES OF INVESTMENTS | 77 |
Schedule of Investments (continued) April 30, 2020 | BlackRock Global Long/Short Equity Fund |
| Counterparty | Derivative Liabilities Subject to an MNA by Counterparty | Derivatives Available for Offset (a) | Non-cash Collateral Pledged | Cash Collateral Pledged | Net Amount of Derivative Liabilities (c) | |||||||||||||||
Deutsche Bank A.G. | $ | 1,116 | $ | — | $ | — | $ | — | $ | 1,116 | ||||||||||
Morgan Stanley & Co. International PLC | 58,608 | (21,803 | ) | — | — | 36,805 | ||||||||||||||
|
|
|
|
|
|
|
|
|
| |||||||||||
| $ | 59,724 | $ | (21,803 | ) | $ | — | $ | — | $ | 37,921 | ||||||||||
|
|
|
|
|
|
|
|
|
| |||||||||||
| (a) | The amount of derivatives available for offset is limited to the amount of derivative asset and/or liabilities that are subject to an MNA. |
| (b) | Net amount represents the net amount receivable from the counterparty in the event of default. |
| (c) | Net amount represents the net amount payable due to counterparty in the event of default. Net amount may be offset further by the options written receivable/payable on the Statements of Assets and Liabilities. |
Fair Value Hierarchy as of Period End
Various inputs are used in determining the fair value of investments and derivative financial instruments. For information about the Fund’s policy regarding valuation of investments and derivative financial instruments, refer to the Notes to Financial Statements.
The following tables summarize the Fund’s investments and derivative financial instruments categorized in the disclosure hierarchy:
| Level 1 | Level 2 | Level 3 | Total | |||||||||||||
Assets: | ||||||||||||||||
Investments: | ||||||||||||||||
Long-Term Investments: | ||||||||||||||||
Preferred Securities(a) | $ | — | $ | — | $ | 3,671,711 | $ | 3,671,711 | ||||||||
U.S. Treasury Obligations | — | 38,015,855 | — | 38,015,855 | ||||||||||||
Short-Term Securities: | ||||||||||||||||
Money Market Fund | 14,238,130 | — | — | 14,238,130 | ||||||||||||
U.S. Treasury Obligations | — | 389,122,071 | — | 389,122,071 | ||||||||||||
Options Purchased: | ||||||||||||||||
Equity Contracts | — | 505,835 | — | 505,835 | ||||||||||||
|
|
|
|
|
|
|
| |||||||||
| $ | 14,238,130 | $ | 427,643,761 | $ | 3,671,711 | $ | 445,553,602 | |||||||||
|
|
|
|
|
|
|
| |||||||||
Derivative Financial Instruments(b) | ||||||||||||||||
Assets: | ||||||||||||||||
Equity contracts | $ | 2,863,198 | $ | 17,381,863 | $ | — | $ | 20,245,061 | ||||||||
Liabilities: | ||||||||||||||||
Equity contracts | (2,984,945 | ) | (421,194 | ) | — | (3,406,139 | ) | |||||||||
|
|
|
|
|
|
|
| |||||||||
| $ | (121,747 | ) | $ | 16,960,669 | $ | — | $ | 16,838,922 | ||||||||
|
|
|
|
|
|
|
| |||||||||
| (a) | See above Schedule of Investments for values in each country. |
| (b) | Derivative financial instruments are swaps and futures contracts and options written. Swaps and futures contracts are valued at the unrealized appreciation (depreciation) on the instrument and options written are shown at value. |
See notes to financial statements.
| 78 | 2020 BLACKROCK ANNUAL REPORTTO SHAREHOLDERS |
Statements of Assets and Liabilities
April 30, 2020
| BlackRock Advantage Emerging Markets Fund | BlackRock Global Long/Short Equity | |||||||
ASSETS | ||||||||
Investments at value — unaffiliated(a) | $ | 90,390,811 | $ | 431,315,472 | ||||
Investments at value — affiliated(b) | 10,615,413 | 14,238,130 | ||||||
Cash | — | 40,579,736 | ||||||
Cash pledged: | ||||||||
Collateral for OTC derivatives | — | 14,650,000 | ||||||
Futures contracts | 1,417,000 | 10,701,000 | ||||||
Foreign currency at value(c) | 462,128 | 12,568,445 | ||||||
Receivables: | ||||||||
Securities lending income — affiliated | 44 | — | ||||||
Swaps | — | 3,292,145 | ||||||
Capital shares sold | 746,461 | 776,601 | ||||||
Dividends — affiliated | 1,910 | 292,381 | ||||||
Dividends — unaffiliated | 94,445 | — | ||||||
Interest — unaffiliated | — | 594 | ||||||
From Manager | 149,568 | — | ||||||
Variation margin on futures contracts | — | 1,574,107 | ||||||
Unrealized appreciation on OTC swaps | 10,948 | 17,381,863 | ||||||
Prepaid expenses | 40,747 | 73,814 | ||||||
|
|
|
| |||||
Total assets | 103,929,475 | 547,444,288 | ||||||
|
|
|
| |||||
LIABILITIES | ||||||||
Cash received as collateral for OTC derivatives | — | 12,890,000 | ||||||
Options written at value(d) | — | 361,470 | ||||||
Payables: | ||||||||
Swaps | — | 2,631,122 | ||||||
Administration fees | 7,254 | 37,654 | ||||||
Capital shares redeemed | 1,952,324 | 1,621,947 | ||||||
Distribution fees | 1,727 | 13,952 | ||||||
Investment advisory fees | 127,085 | 1,116,698 | ||||||
Trustees’ and Officer’s | 2,585 | 2,332 | ||||||
Other accrued expenses | 253,878 | 493,033 | ||||||
Variation margin on futures contracts | 245,413 | 821,893 | ||||||
Unrealized depreciation on OTC swaps | 98,419 | 59,724 | ||||||
|
|
|
| |||||
Total liabilities | 2,688,685 | 20,049,825 | ||||||
|
|
|
| |||||
NET ASSETS | $ | 101,240,790 | $ | 527,394,463 | ||||
|
|
|
| |||||
NET ASSETS CONSIST OF | ||||||||
Paid-in capital | $ | 131,288,212 | $ | 587,557,794 | ||||
Accumulated loss | (30,047,422 | ) | (60,163,331 | ) | ||||
|
|
|
| |||||
NET ASSETS | $ | 101,240,790 | $ | 527,394,463 | ||||
|
|
|
| |||||
See notes to financial statements.
| FINANCIAL STATEMENTS | 79 |
Statements of Assets and Liabilities (continued)
April 30, 2020
| BlackRock Advantage Emerging Markets Fund | BlackRock Global Long/Short Equity | |||||||
NET ASSET VALUE | ||||||||
| Institutional | ||||||||
Net assets | $ | 9,688,892 | $ | 492,020,853 | ||||
|
|
|
| |||||
Shares outstanding(e) | 1,095,333 | 43,080,978 | ||||||
|
|
|
| |||||
Net asset value | $ | 8.85 | $ | 11.42 | ||||
|
|
|
| |||||
| Investor A | ||||||||
Net assets | $ | 5,224,393 | $ | 23,509,405 | ||||
|
|
|
| |||||
Shares outstanding(e) | 600,981 | 2,086,102 | ||||||
|
|
|
| |||||
Net asset value | $ | 8.69 | $ | 11.27 | ||||
|
|
|
| |||||
| Investor C | ||||||||
Net assets | $ | 1,163,947 | $ | 11,538,911 | ||||
|
|
|
| |||||
Shares outstanding(e) | 140,341 | 1,071,132 | ||||||
|
|
|
| |||||
Net asset value | $ | 8.29 | $ | 10.77 | ||||
|
|
|
| |||||
| Class K | ||||||||
Net assets | $ | 85,163,558 | $ | 325,294 | ||||
|
|
|
| |||||
Shares outstanding(e) | 9,633,114 | 28,425 | ||||||
|
|
|
| |||||
Net asset value | $ | 8.84 | $ | 11.44 | ||||
|
|
|
| |||||
(a) Investments at cost — unaffiliated | $ | 89,652,532 | $ | 434,589,538 | ||||
(b) Investments at cost — affiliated | $ | 10,615,413 | $ | 14,238,130 | ||||
(c) Foreign currency at cost | $ | 461,680 | $ | 12,467,418 | ||||
(d) Premiums received | $ | — | $ | 2,075,186 | ||||
(e) Unlimited number of shares authorized, $0.001 par value | ||||||||
See notes to financial statements.
| 80 | 2020 BLACKROCK ANNUAL REPORTTO SHAREHOLDERS |
| BlackRock Advantage Emerging Markets Fund | BlackRock Global Long/Short Equity Fund | |||||||||||||||||||
| Period from 08/01/19 to 04/30/20 | Year Ended 07/31/19 | Period from 08/01/19 to 04/30/20 | Year Ended 07/31/19 | |||||||||||||||||
INVESTMENT INCOME | ||||||||||||||||||||
Dividends — affiliated | $ | 59,205 | $ | 160,946 | $ | 253,609 | $ | 427,174 | ||||||||||||
Dividends — unaffiliated | 1,710,997 | 3,813,179 | — | — | ||||||||||||||||
Interest — unaffiliated | — | — | 6,197,210 | 11,964,582 | ||||||||||||||||
Securities lending income — affiliated — net | 184 | 2,621 | — | — | ||||||||||||||||
Non-cash dividends — unaffiliated | 109,218 | — | — | — | ||||||||||||||||
Other income — affiliated(a) | — | 5,923 | — | — | ||||||||||||||||
Foreign taxes withheld | (183,970 | ) | (458,291 | ) | — | — | ||||||||||||||
|
|
|
|
|
|
|
| |||||||||||||
Total investment income | 1,695,634 | 3,524,378 | 6,450,819 | 12,391,756 | ||||||||||||||||
|
|
|
|
|
|
|
| |||||||||||||
EXPENSES | ||||||||||||||||||||
Investment advisory | 632,750 | 1,103,381 | 6,515,798 | 9,332,399 | ||||||||||||||||
Professional | 164,725 | 137,614 | 150,879 | 116,552 | ||||||||||||||||
Custodian | 95,225 | 195,544 | 140,727 | 239,315 | ||||||||||||||||
Accounting services | 62,052 | 34,658 | 172,103 | 97,119 | ||||||||||||||||
Printing | 57,865 | 41,485 | 63,816 | 55,842 | ||||||||||||||||
Registration | 45,408 | 62,011 | 78,967 | 171,379 | ||||||||||||||||
Administration | 33,615 | 53,530 | 183,113 | 261,364 | ||||||||||||||||
Service and distribution — class specific | 20,380 | 34,738 | 165,421 | 313,778 | ||||||||||||||||
Administration — class specific | 15,819 | 25,190 | 86,877 | 124,433 | ||||||||||||||||
Trustees and Officer | 7,782 | 13,149 | 11,318 | 19,319 | ||||||||||||||||
Transfer agent — class specific | 7,129 | 7,103 | 315,403 | 448,564 | ||||||||||||||||
Organization and offering | — | 31,582 | — | — | ||||||||||||||||
Board realignment and consolidation | — | 3,275 | — | 19,243 | ||||||||||||||||
Miscellaneous | 21,301 | 31,877 | 90,877 | 87,080 | ||||||||||||||||
Recoupment of past waived and/or reimbursed fees — class specific | — | 7,087 | — | — | ||||||||||||||||
|
|
|
|
|
|
|
| |||||||||||||
Total expenses | 1,164,051 | 1,782,224 | 7,975,299 | 11,286,387 | ||||||||||||||||
Less: | ||||||||||||||||||||
Fees reimbursed by the Manager | (487,164 | ) | (604,741 | ) | (803,293 | ) | (586,588 | ) | ||||||||||||
Administration fees waived | — | (8,308 | ) | — | — | |||||||||||||||
Administration fees waived — class specific | (14,117 | ) | (20,206 | ) | (86,845 | ) | (124,433 | ) | ||||||||||||
Transfer agent fees waived and/or reimbursed | (1,269 | ) | (2,888 | ) | (98,394 | ) | (137,676 | ) | ||||||||||||
|
|
|
|
|
|
|
| |||||||||||||
Total expenses after fees waived and/or reimbursed | 661,501 | 1,146,081 | 6,986,767 | 10,437,690 | ||||||||||||||||
|
|
|
|
|
|
|
| |||||||||||||
Net investment income (loss) | 1,034,133 | 2,378,297 | (535,948 | ) | 1,954,066 | |||||||||||||||
|
|
|
|
|
|
|
| |||||||||||||
REALIZED AND UNREALIZED GAIN (LOSS) | ||||||||||||||||||||
Net realized gain (loss) from: | ||||||||||||||||||||
Capital gain distributions from investment companies — affiliated | 13 | — | 53 | — | ||||||||||||||||
Futures contracts | (1,202,885 | ) | 49,320 | (5,045,402 | ) | (1,748,244 | ) | |||||||||||||
Foreign currency transactions | (272,261 | ) | (215,337 | ) | (58,457 | ) | 910,503 | |||||||||||||
Investments — affiliated | (160 | ) | 730,468 | — | — | |||||||||||||||
Investments — unaffiliated | (11,726,790 | ) | (17,368,319 | ) | (2,021,203 | ) | (1,682,332 | ) | ||||||||||||
Options written | — | — | 1,298,304 | 1,220,764 | ||||||||||||||||
Swaps | (302 | ) | (195,062 | ) | (31,071,200 | ) | 38,890,034 | |||||||||||||
|
|
|
|
|
|
|
| |||||||||||||
| (13,202,385 | ) | (16,998,930 | ) | (36,897,905 | ) | 37,590,725 | ||||||||||||||
|
|
|
|
|
|
|
| |||||||||||||
Net change in unrealized appreciation (depreciation) on: | ||||||||||||||||||||
Futures contracts | 912,550 | (283,745 | ) | 673,710 | (800,298 | ) | ||||||||||||||
Foreign currency translations | 25,465 | (10,070 | ) | 187,699 | (58,756 | ) | ||||||||||||||
Investments — affiliated | — | (737,424 | ) | — | — | |||||||||||||||
Investments — unaffiliated | (2,094,224 | ) | 8,813,575 | (2,269,428 | ) | 586,213 | ||||||||||||||
Options written | — | — | 1,713,716 | — | ||||||||||||||||
Swaps | (150,980 | ) | (293,324 | ) | 13,222,024 | (8,933,437 | ) | |||||||||||||
|
|
|
|
|
|
|
| |||||||||||||
| (1,307,189 | ) | 7,489,012 | 13,527,721 | (9,206,278 | ) | |||||||||||||||
|
|
|
|
|
|
|
| |||||||||||||
Net realized and unrealized gain (loss) | (14,509,574 | ) | (9,509,918 | ) | (23,370,184 | ) | 28,384,447 | |||||||||||||
|
|
|
|
|
|
|
| |||||||||||||
NET INCREASE (DECREASE) IN NET ASSETS RESULTING FROM OPERATIONS | $ | (13,475,441 | ) | $ | (7,131,621 | ) | $ | (23,906,132 | ) | $ | 30,338,513 | |||||||||
|
|
|
|
|
|
|
| |||||||||||||
| (a) | See Note 6 of the Notes to Financial Statements. |
See notes to financial statements.
| FINANCIAL STATEMENTS | 81 |
Statements of Changes in Net Assets
| BlackRock Advantage Emerging Markets Fund | BlackRock Global Long/Short Equity Fund | |||||||||||||||||||||||||||||||||||
| Period from 08/01/19 to 04/30/20 | Year Ended July 31, | Period from 08/01/19 to 04/30/20 | Year Ended July 31, | |||||||||||||||||||||||||||||||||
| 2019 | 2018 | 2019 | 2018 | |||||||||||||||||||||||||||||||||
INCREASE (DECREASE) IN NET ASSETS | ||||||||||||||||||||||||||||||||||||
OPERATIONS | ||||||||||||||||||||||||||||||||||||
Net investment income (loss) | $ | 1,034,133 | $ | 2,378,297 | $ | 2,487,778 | $ | (535,948 | ) | $ | 1,954,066 | $ | (3,657,572 | ) | ||||||||||||||||||||||
Net realized gain (loss) | (13,202,385 | ) | (16,998,930 | ) | 16,195,469 | (36,897,905 | ) | 37,590,725 | 39,880,503 | |||||||||||||||||||||||||||
Net change in unrealized appreciation (depreciation) | (1,307,189 | ) | 7,489,012 | (19,213,037 | ) | 13,527,721 | (9,206,278 | ) | (7,933,702 | ) | ||||||||||||||||||||||||||
|
|
|
|
|
|
|
|
|
|
|
| |||||||||||||||||||||||||
Net increase (decrease) in net assets resulting from operations | (13,475,441 | ) | (7,131,621 | ) | (529,790 | ) | (23,906,132 | ) | 30,338,513 | 28,289,229 | ||||||||||||||||||||||||||
|
|
|
|
|
|
|
|
|
|
|
| |||||||||||||||||||||||||
DISTRIBUTIONS(a) | ||||||||||||||||||||||||||||||||||||
Institutional | (298,493 | ) | — | — | (34,641,431 | ) | (5,220,529 | ) | — | |||||||||||||||||||||||||||
Investor A | (79,169 | ) | — | — | (1,923,928 | ) | (407,324 | ) | — | |||||||||||||||||||||||||||
Investor C | (9,325 | ) | — | — | (858,199 | ) | (103,706 | ) | — | |||||||||||||||||||||||||||
Class K | (2,033,150 | ) | — | — | (24,794 | ) | (3,097 | ) | — | |||||||||||||||||||||||||||
|
|
|
|
|
|
|
|
|
|
|
| |||||||||||||||||||||||||
Decrease in net assets resulting from distributions to shareholders | (2,420,137 | ) | — | — | (37,448,352 | ) | (5,734,656 | ) | — | |||||||||||||||||||||||||||
|
|
|
|
|
|
|
|
|
|
|
| |||||||||||||||||||||||||
CAPITAL SHARE TRANSACTIONS | ||||||||||||||||||||||||||||||||||||
Net increase (decrease) in net assets derived from capital share transactions | 14,606,634 | (77,284,727 | ) | 74,137,236 | (25,061,624 | ) | (40,385,376 | ) | (4,621,417 | ) | ||||||||||||||||||||||||||
|
|
|
|
|
|
|
|
|
|
|
| |||||||||||||||||||||||||
NET ASSETS | ||||||||||||||||||||||||||||||||||||
Total increase (decrease) in net assets | (1,288,944 | ) | (84,416,348 | ) | 73,607,446 | (86,416,108 | ) | (15,781,519 | ) | 23,667,812 | ||||||||||||||||||||||||||
Beginning of period | 102,529,734 | 186,946,082 | 113,338,636 | 613,810,571 | 629,592,090 | 605,924,278 | ||||||||||||||||||||||||||||||
|
|
|
|
|
|
|
|
|
|
|
| |||||||||||||||||||||||||
End of period | $ | 101,240,790 | $ | 102,529,734 | $ | 186,946,082 | $ | 527,394,463 | $ | 613,810,571 | $ | 629,592,090 | ||||||||||||||||||||||||
|
|
|
|
|
|
|
|
|
|
|
| |||||||||||||||||||||||||
| (a) | Distributions for annual periods determined in accordance with U.S. federal income tax regulations. |
See notes to financial statements.
| 82 | 2020 BLACKROCK ANNUAL REPORTTO SHAREHOLDERS |
(For a share outstanding throughout each period)
| BlackRock Advantage Emerging Markets Fund | ||||||||||||||||||||||||||||
| Institutional | ||||||||||||||||||||||||||||
| Period from 08/01/19 to 04/30/20 | Year Ended July 31, | |||||||||||||||||||||||||||
| 2019 | 2018 | 2017 | 2016 | 2015 | ||||||||||||||||||||||||
Net asset value, beginning of period | $ | 10.25 | $ | 10.59 | $ | 10.10 | $ | 9.76 | $ | 9.84 | $ | 10.34 | ||||||||||||||||
|
|
|
|
|
|
|
|
|
|
|
| |||||||||||||||||
Net investment income (loss)(a) | 0.10 | 0.18 | 0.07 | (0.12 | ) | (0.14 | ) | (0.17 | ) | |||||||||||||||||||
Net realized and unrealized gain (loss) | (1.27 | ) | (0.52 | ) | 0.42 | 0.46 | 0.17 | (0.33 | ) | |||||||||||||||||||
|
|
|
|
|
|
|
|
|
|
|
| |||||||||||||||||
Net increase (decrease) from investment operations | (1.17 | ) | (0.34 | ) | 0.49 | 0.34 | 0.03 | (0.50 | ) | |||||||||||||||||||
|
|
|
|
|
|
|
|
|
|
|
| |||||||||||||||||
Distributions(b) | ||||||||||||||||||||||||||||
From net investment income | (0.23 | ) | — | — | — | — | — | |||||||||||||||||||||
From net realized gain | — | — | — | — | (0.11 | ) | — | |||||||||||||||||||||
|
|
|
|
|
|
|
|
|
|
|
| |||||||||||||||||
Total distributions | (0.23 | ) | — | — | — | (0.11 | ) | — | ||||||||||||||||||||
|
|
|
|
|
|
|
|
|
|
|
| |||||||||||||||||
Net asset value, end of period | $ | 8.85 | $ | 10.25 | $ | 10.59 | $ | 10.10 | $ | 9.76 | $ | 9.84 | ||||||||||||||||
|
|
|
|
|
|
|
|
|
|
|
| |||||||||||||||||
Total Return(c) | ||||||||||||||||||||||||||||
Based on net asset value | (11.78 | )%(d) | (3.21 | )%(e) | 4.85 | % | 3.48 | %(f) | 0.34 | % | (4.84 | )% | ||||||||||||||||
|
|
|
|
|
|
|
|
|
|
|
| |||||||||||||||||
Ratios to Average Net Assets(g) | ||||||||||||||||||||||||||||
Total expenses | 1.38 | %(h)(i) | 1.42 | %(j) | 1.28 | % | 1.91 | % | 1.85 | % | 1.86 | % | ||||||||||||||||
|
|
|
|
|
|
|
|
|
|
|
| |||||||||||||||||
Total expenses excluding recoupment of past fees waived and/or reimbursed | 1.38 | %(h)(i) | 1.39 | %(j) | 1.28 | % | 1.90 | % | 1.84 | % | 1.85 | % | ||||||||||||||||
|
|
|
|
|
|
|
|
|
|
|
| |||||||||||||||||
Total expenses after fees waived and/or reimbursed | 0.81 | %(h) | 0.92 | %(j) | 0.94 | % | 1.70 | % | 1.75 | % | 1.75 | % | ||||||||||||||||
|
|
|
|
|
|
|
|
|
|
|
| |||||||||||||||||
Net investment income (loss) | 1.38 | %(h) | 1.83 | % | 0.67 | % | (1.29 | )% | (1.49 | )% | (1.68 | )% | ||||||||||||||||
|
|
|
|
|
|
|
|
|
|
|
| |||||||||||||||||
Supplemental Data | ||||||||||||||||||||||||||||
Net assets, end of period (000) | $ | 9,689 | $ | 15,904 | $ | 32,775 | $ | 106,243 | $ | 177,981 | $ | 400,181 | ||||||||||||||||
|
|
|
|
|
|
|
|
|
|
|
| |||||||||||||||||
Portfolio turnover rate | 141 | %(k) | 128 | %(k) | 111 | %(k) | 7 | %(k) | — | % | — | % | ||||||||||||||||
|
|
|
|
|
|
|
|
|
|
|
| |||||||||||||||||
| (a) | Based on average shares outstanding. |
| (b) | Distributions for annual periods determined in accordance with U.S. federal income tax regulations. |
| (c) | Where applicable, assumes the reinvestment of distributions. |
| (d) | Aggregate total return. |
| (e) | Includes payment received from an affiliate, which had no impact on the Fund’s total return. |
| (f) | The Fund’s total return includes a reimbursement by an affiliate for a realized investment loss. Excluding this payment, the Fund’s total return would have been 3.38%. |
| (g) | Excludes expenses incurred indirectly as a result of investments in underlying funds as follows: |
| Period from 08/01/19 to 04/30/20 | Year Ended July 31, | |||||||||||||||||||||||||||
| 2019 | 2018 | 2017 | 2016 | 2015 | ||||||||||||||||||||||||
Investments in underlying funds | 0.01 | % | 0.02 | % | 0.07 | % | 0.17 | % | 0.18 | % | 0.16 | % | ||||||||||||||||
|
|
|
|
|
|
|
|
|
|
|
| |||||||||||||||||
| (h) | Annualized. |
| (i) | Audit, printing and tax costs were not annualized in the calculation of the expense ratios. If these expenses were annualized, the total expenses and total expenses excluding recoupment of past fees waived and/or reimbursed would have been 1.42%, respectively. |
| (j) | Includesnon-recurring expenses of offering costs. Without these costs, total expenses, total expenses excluding recoupment of past fees waived and/or reimbursed, and total expenses after fees waived and/or reimbursed would have been 1.40%, 1.37% and 0.90%, respectively. |
| (k) | Excludes investments underlying the total return swaps. |
See notes to financial statements.
| FINANCIAL HIGHLIGHTS | 83 |
Financial Highlights (continued)
(For a share outstanding throughout each period)
| BlackRock Advantage Emerging Markets Fund (continued) | ||||||||||||||||||||||||||||
| Investor A | ||||||||||||||||||||||||||||
| Period from 08/01/19 to 04/30/20 | Year Ended July 31, | |||||||||||||||||||||||||||
| 2019 | 2018 | 2017 | 2016 | 2015 | ||||||||||||||||||||||||
Net asset value, beginning of period | $ | 10.07 | $ | 10.43 | $ | 9.97 | $ | 9.67 | $ | 9.78 | $ | 10.29 | ||||||||||||||||
|
|
|
|
|
|
|
|
|
|
|
| |||||||||||||||||
Net investment income (loss)(a) | 0.07 | 0.17 | 0.14 | (0.15 | ) | (0.17 | ) | (0.19 | ) | |||||||||||||||||||
Net realized and unrealized gain (loss) | (1.25 | ) | (0.53 | ) | 0.32 | 0.45 | 0.17 | (0.32 | ) | |||||||||||||||||||
|
|
|
|
|
|
|
|
|
|
|
| |||||||||||||||||
Net increase (decrease) from investment operations | (1.18 | ) | (0.36 | ) | 0.46 | 0.30 | — | (0.51 | ) | |||||||||||||||||||
|
|
|
|
|
|
|
|
|
|
|
| |||||||||||||||||
Distributions(b) | ||||||||||||||||||||||||||||
From net investment income | (0.20 | ) | — | — | — | — | — | |||||||||||||||||||||
From net realized gain | — | — | — | — | (0.11 | ) | — | |||||||||||||||||||||
|
|
|
|
|
|
|
|
|
|
|
| |||||||||||||||||
Total distributions | (0.20 | ) | — | — | — | (0.11 | ) | — | ||||||||||||||||||||
|
|
|
|
|
|
|
|
|
|
|
| |||||||||||||||||
Net asset value, end of period | $ | 8.69 | $ | 10.07 | $ | 10.43 | $ | 9.97 | $ | 9.67 | $ | 9.78 | ||||||||||||||||
|
|
|
|
|
|
|
|
|
|
|
| |||||||||||||||||
Total Return(c) | ||||||||||||||||||||||||||||
Based on net asset value | (12.05 | )%(d) | (3.45 | )%(e) | 4.61 | % | 3.10 | %(e) | 0.03 | % | (4.96 | )% | ||||||||||||||||
|
|
|
|
|
|
|
|
|
|
|
| |||||||||||||||||
Ratios to Average Net Assets(f) | ||||||||||||||||||||||||||||
Total expenses | 1.70 | %(g)(h) | 1.69 | %(i) | 1.57 | % | 2.22 | % | 2.10 | % | 2.03 | % | ||||||||||||||||
|
|
|
|
|
|
|
|
|
|
|
| |||||||||||||||||
Total expenses excluding recoupment of past fees waived and/or reimbursed | 1.70 | %(g)(h) | 1.67 | %(i) | 1.55 | % | 2.21 | % | 2.08 | % | 2.02 | % | ||||||||||||||||
|
|
|
|
|
|
|
|
|
|
|
| |||||||||||||||||
Total expenses after fees waived and/or reimbursed | 1.12 | %(g) | 1.17 | %(i) | 1.19 | % | 1.99 | % | 2.00 | % | 1.95 | % | ||||||||||||||||
|
|
|
|
|
|
|
|
|
|
|
| |||||||||||||||||
Net investment income (loss) | 1.02 | %(g) | 1.74 | % | 1.32 | % | (1.62 | )% | (1.74 | )% | (1.89 | )% | ||||||||||||||||
|
|
|
|
|
|
|
|
|
|
|
| |||||||||||||||||
Supplemental Data | ||||||||||||||||||||||||||||
Net assets, end of period (000) | $ | 5,224 | $ | 3,817 | $ | 5,454 | $ | 3,272 | $ | 12,239 | $ | 19,036 | ||||||||||||||||
|
|
|
|
|
|
|
|
|
|
|
| |||||||||||||||||
Portfolio turnover rate | 141 | %(j) | 128 | %(j) | 111 | %(j) | 7 | %(j) | — | % | — | % | ||||||||||||||||
|
|
|
|
|
|
|
|
|
|
|
| |||||||||||||||||
| (a) | Based on average shares outstanding. |
| (b) | Distributions for annual periods determined in accordance with U.S. federal income tax regulations. |
| (c) | Where applicable, excludes the effects of any sales charges and assumes the reinvestment of distributions. |
| (d) | Aggregate total return. |
| (e) | Includes payment received from an affiliate, which had no impact on the Fund’s total return. |
| (f) | Excludes expenses incurred indirectly as a result of investments in underlying funds as follows: |
| Period from 08/01/19 to 04/30/20 | Year Ended July 31, | |||||||||||||||||||||||||||
| 2019 | 2018 | 2017 | 2016 | 2015 | ||||||||||||||||||||||||
Investments in underlying funds | 0.01 | % | 0.02 | % | 0.07 | % | 0.17 | % | 0.18 | % | 0.16 | % | ||||||||||||||||
|
|
|
|
|
|
|
|
|
|
|
| |||||||||||||||||
| (g) | Annualized. |
| (h) | Audit, printing and tax costs were not annualized in the calculation of the expense ratios. If these expenses were annualized, the total expenses and total expenses excluding recoupment of past fees waived and/or reimbursed would have been 1.74%, respectively. |
| (i) | Includesnon-recurring expenses of offering costs. Without these costs, total expenses, total expenses excluding recoupment of past fees waived and/or reimbursed, and total expenses after fees waived and/or reimbursed would have been 1.67%, 1.65% and 1.15%, respectively. |
| (j) | Excludes investments underlying the total return swaps. |
See notes to financial statements.
| 84 | 2020 BLACKROCK ANNUAL REPORTTO SHAREHOLDERS |
Financial Highlights (continued)
(For a share outstanding throughout each period)
| BlackRock Advantage Emerging Markets Fund (continued) | ||||||||||||||||||||||||||||
| Investor C | ||||||||||||||||||||||||||||
| Period from 08/01/19 to 04/30/20 | Year Ended July 31, | |||||||||||||||||||||||||||
| 2019 | 2018 | 2017 | 2016 | 2015 | ||||||||||||||||||||||||
Net asset value, beginning of period | $ | 9.53 | $ | 9.95 | $ | 9.58 | $ | 9.36 | $ | 9.53 | $ | 10.11 | ||||||||||||||||
|
|
|
|
|
|
|
|
|
|
|
| |||||||||||||||||
Net investment income (loss)(a) | 0.02 | 0.08 | 0.03 | (0.21 | ) | (0.23 | ) | (0.27 | ) | |||||||||||||||||||
Net realized and unrealized gain (loss) | (1.21 | ) | (0.50 | ) | 0.34 | 0.43 | 0.17 | (0.31 | ) | |||||||||||||||||||
|
|
|
|
|
|
|
|
|
|
|
| |||||||||||||||||
Net increase (decrease) from investment operations | (1.19 | ) | (0.42 | ) | 0.37 | 0.22 | (0.06 | ) | (0.58 | ) | ||||||||||||||||||
|
|
|
|
|
|
|
|
|
|
|
| |||||||||||||||||
Distributions(b) | ||||||||||||||||||||||||||||
From net investment income | (0.05 | ) | — | — | — | — | — | |||||||||||||||||||||
From net realized gain | — | — | — | — | (0.11 | ) | — | |||||||||||||||||||||
|
|
|
|
|
|
|
|
|
|
|
| |||||||||||||||||
Total distributions | (0.05 | ) | — | — | — | (0.11 | ) | — | ||||||||||||||||||||
|
|
|
|
|
|
|
|
|
|
|
| |||||||||||||||||
Net asset value, end of period | $ | 8.29 | $ | 9.53 | $ | 9.95 | $ | 9.58 | $ | 9.36 | $ | 9.53 | ||||||||||||||||
|
|
|
|
|
|
|
|
|
|
|
| |||||||||||||||||
Total Return(c) | ||||||||||||||||||||||||||||
Based on net asset value | (12.57 | )%(d) | (4.22 | )%(e) | 3.86 | % | 2.35 | %(e) | (0.60 | )% | (5.74 | )% | ||||||||||||||||
|
|
|
|
|
|
|
|
|
|
|
| |||||||||||||||||
Ratios to Average Net Assets(f) | ||||||||||||||||||||||||||||
Total expenses | 2.53 | %(g)(h) | 2.53 | %(i) | 2.38 | % | 2.91 | % | 2.85 | % | 2.81 | % | ||||||||||||||||
|
|
|
|
|
|
|
|
|
|
|
| |||||||||||||||||
Total expenses excluding recoupment of past fees waived and/or reimbursed | 2.53 | %(g)(h) | 2.53 | %(i) | 2.38 | % | 2.91 | % | 2.85 | % | 2.80 | % | ||||||||||||||||
|
|
|
|
|
|
|
|
|
|
|
| |||||||||||||||||
Total expenses after fees waived and/or reimbursed | 1.90 | %(g) | 1.92 | %(i) | 1.94 | % | 2.71 | % | 2.74 | % | 2.74 | % | ||||||||||||||||
|
|
|
|
|
|
|
|
|
|
|
| |||||||||||||||||
Net investment income (loss) | 0.26 | %(g) | 0.81 | % | 0.25 | % | (2.30 | )% | (2.48 | )% | (2.67 | )% | ||||||||||||||||
|
|
|
|
|
|
|
|
|
|
|
| |||||||||||||||||
Supplemental Data | ||||||||||||||||||||||||||||
Net assets, end of period (000) | $ | 1,164 | $ | 2,280 | $ | 3,240 | $ | 3,823 | $ | 5,979 | $ | 9,181 | ||||||||||||||||
|
|
|
|
|
|
|
|
|
|
|
| |||||||||||||||||
Portfolio turnover rate | 141 | %(j) | 128 | %(j) | 111 | %(j) | 7 | %(j) | — | % | — | % | ||||||||||||||||
|
|
|
|
|
|
|
|
|
|
|
| |||||||||||||||||
| (a) | Based on average shares outstanding. |
| (b) | Distributions for annual periods determined in accordance with U.S. federal income tax regulations. |
| (c) | Where applicable, excludes the effects of any sales charges and assumes the reinvestment of distributions. |
| (d) | Aggregate total return. |
| (e) | Includes payment from an affiliate, which had no impact on the Fund’s total return. |
| (f) | Excludes expenses incurred indirectly as a result of investments in underlying funds as follows: |
| Period from 08/01/19 to 04/30/20 | Year Ended July 31, | |||||||||||||||||||||||||||
| 2019 | 2018 | 2017 | 2016 | 2015 | ||||||||||||||||||||||||
Investments in underlying funds | 0.01 | % | 0.02 | % | 0.07 | % | 0.17 | % | 0.18 | % | 0.16 | % | ||||||||||||||||
|
|
|
|
|
|
|
|
|
|
|
| |||||||||||||||||
| (g) | Annualized. |
| (h) | Audit, printing and tax costs were not annualized in the calculation of the expense ratios. If these expenses were annualized, the total expenses and total expenses excluding recoupment of past fees waived and/or reimbursed would have been 2.57%, respectively. |
| (i) | Includesnon-recurring expenses of offering costs. Without these costs, total expenses, total expenses excluding recoupment of past fees waived and/or reimbursed, and total expenses after fees waived and/or reimbursed would have been 2.51%, 2.51% and 1.90%, respectively. |
| (j) | Excludes investments underlying the total return swaps. |
See notes to financial statements.
| FINANCIAL HIGHLIGHTS | 85 |
Financial Highlights (continued)
(For a share outstanding throughout each period)
| BlackRock Advantage Emerging Markets Fund (continued) | ||||||||||||
| Class K | ||||||||||||
| Period from 08/01/19 to 04/30/20 | Year Ended July 31, 2019 | Period from 01/25/18 (a) to 07/31/18 | ||||||||||
Net asset value, beginning of period | $ | 10.26 | $ | 10.59 | $ | 12.14 | ||||||
|
|
|
|
|
| |||||||
Net investment income(b) | 0.10 | 0.19 | 0.13 | |||||||||
Net realized and unrealized gain (loss) | (1.28 | ) | (0.52 | ) | (1.68 | ) | ||||||
|
|
|
|
|
| |||||||
Net increase (decrease) from investment operations | (1.18 | ) | (0.33 | ) | (1.55 | ) | ||||||
|
|
|
|
|
| |||||||
Distributions from net investment income(c) | (0.24 | ) | — | — | ||||||||
|
|
|
|
|
| |||||||
Net asset value, end of period | $ | 8.84 | $ | 10.26 | $ | 10.59 | ||||||
|
|
|
|
|
| |||||||
Total Return(d) | ||||||||||||
Based on net asset value | (11.87 | )%(e) | (3.12 | )%(f) | (12.77 | )%(e) | ||||||
|
|
|
|
|
| |||||||
Ratios to Average Net Assets(g) | ||||||||||||
Total expenses | 1.41 | %(h)(i) | 1.37 | %(j) | 1.32 | %(h)(k) | ||||||
|
|
|
|
|
| |||||||
Total expenses after fees waived and/or reimbursed | 0.81 | %(h) | 0.87 | %(j) | 0.89 | % | ||||||
|
|
|
|
|
| |||||||
Net investment income | 1.33 | %(h) | 1.93 | % | 2.33 | % | ||||||
|
|
|
|
|
| |||||||
Supplemental Data | ||||||||||||
Net assets, end of period (000) | $ | 85,164 | $ | 80,529 | $ | 145,476 | ||||||
|
|
|
|
|
| |||||||
Portfolio turnover rate | 141 | %(l) | 128 | %(l) | 111 | %(l)(m) | ||||||
|
|
|
|
|
| |||||||
| (a) | Commencement of operations. |
| (b) | Based on average shares outstanding. |
| (c) | Distributions for annual periods determined in accordance with U.S. federal income tax regulations. |
| (d) | Where applicable, assumes the reinvestment of distributions. |
| (e) | Aggregate total return. |
| (f) | Includes payment from an affiliate, which had no impact on the Fund’s total return. |
| (g) | Excludes expenses incurred indirectly as a result of investments in underlying funds as follows: |
| Period from 08/01/19 to 04/30/20 | Year Ended July 31, 2019 | Period from 01/25/18 (a) to 07/31/18 | ||||||||||
Investments in underlying funds | 0.01 | % | 0.02 | % | 0.07 | % | ||||||
|
|
|
|
|
| |||||||
| (h) | Annualized. |
| (i) | Audit, printing and tax costs were not annualized in the calculation of the expense ratios. If these expenses were annualized, the total expenses would have been 1.45%. |
| (j) | Includesnon-recurring expenses of offering costs. Without these costs, total expenses and total expenses after fees waived and/or reimbursed would have been 1.34% and 0.84%, respectively. |
| (k) | Offering costs were not annualized in the calculation of the expense ratios. If these expenses were annualized, the total expenses would have been 1.31%. |
| (l) | Excludes investments underlying the total return swaps. |
| (m) | Portfolio turnover is representative of the Fund for the entire year. |
See notes to financial statements.
| 86 | 2020 BLACKROCK ANNUAL REPORTTO SHAREHOLDERS |
Financial Highlights (continued)
(For a share outstanding throughout each period)
| BlackRock Global Long/Short Equity Fund | ||||||||||||||||||||||||||||
| Institutional | ||||||||||||||||||||||||||||
| Period from 08/01/19 to 04/30/20 | Year Ended July 31, | |||||||||||||||||||||||||||
| 2019 | 2018 | 2017 | 2016 | 2015 | ||||||||||||||||||||||||
Net asset value, beginning of period | $ | 12.67 | $ | 12.17 | $ | 11.62 | $ | 10.56 | $ | 11.92 | $ | 11.61 | ||||||||||||||||
|
|
|
|
|
|
|
|
|
|
|
| |||||||||||||||||
Net investment income (loss)(a) | (0.01 | ) | 0.05 | (0.06 | ) | (0.14 | ) | (0.15 | ) | (0.18 | ) | |||||||||||||||||
Net realized and unrealized gain (loss) | (0.46 | ) | 0.57 | 0.61 | 1.20 | (1.00 | ) | 0.50 | ||||||||||||||||||||
|
|
|
|
|
|
|
|
|
|
|
| |||||||||||||||||
Net increase (decrease) from investment operations | (0.47 | ) | 0.62 | 0.55 | 1.06 | (1.15 | ) | 0.32 | ||||||||||||||||||||
|
|
|
|
|
|
|
|
|
|
|
| |||||||||||||||||
Distributions(b) |
| |||||||||||||||||||||||||||
From net investment income | (0.04 | ) | — | — | — | — | — | |||||||||||||||||||||
From net realized gain | (0.74 | ) | (0.12 | ) | — | — | (0.21 | ) | (0.01 | ) | ||||||||||||||||||
|
|
|
|
|
|
|
|
|
|
|
| |||||||||||||||||
Total distributions | (0.78 | ) | (0.12 | ) | — | — | (0.21 | ) | (0.01 | ) | ||||||||||||||||||
|
|
|
|
|
|
|
|
|
|
|
| |||||||||||||||||
Net asset value, end of period | $ | 11.42 | $ | 12.67 | $ | 12.17 | $ | 11.62 | $ | 10.56 | $ | 11.92 | ||||||||||||||||
|
|
|
|
|
|
|
|
|
|
|
| |||||||||||||||||
Total Return(c) |
| |||||||||||||||||||||||||||
Based on net asset value | (3.80 | )%(d) | 5.09 | % | 4.73 | % | 10.04 | % | (9.77 | )% | 2.78 | % | ||||||||||||||||
|
|
|
|
|
|
|
|
|
|
|
| |||||||||||||||||
Ratios to Average Net Assets(e) |
| |||||||||||||||||||||||||||
Total expenses | 1.80 | %(f) | 1.76 | % | 1.73 | % | 1.78 | % | 1.68 | % | 1.67 | % | ||||||||||||||||
|
|
|
|
|
|
|
|
|
|
|
| |||||||||||||||||
Total expenses excluding recoupment of past fees waived and/or reimbursed | 1.80 | %(f) | 1.76 | % | 1.71 | % | 1.78 | % | 1.68 | % | 1.67 | % | ||||||||||||||||
|
|
|
|
|
|
|
|
|
|
|
| |||||||||||||||||
Total expenses after fees waived and/or reimbursed | 1.57 | %(f) | 1.63 | % | 1.66 | % | 1.70 | % | 1.62 | % | 1.60 | % | ||||||||||||||||
|
|
|
|
|
|
|
|
|
|
|
| |||||||||||||||||
Net investment income (loss) | (0.09 | )%(f) | 0.36 | % | (0.51 | )% | (1.28 | )% | (1.35 | )% | (1.53 | )% | ||||||||||||||||
|
|
|
|
|
|
|
|
|
|
|
| |||||||||||||||||
Supplemental Data |
| |||||||||||||||||||||||||||
Net assets, end of period (000) | $ | 492,021 | $ | 546,561 | $ | 559,028 | $ | 544,301 | $ | 824,306 | $ | 1,496,484 | ||||||||||||||||
|
|
|
|
|
|
|
|
|
|
|
| |||||||||||||||||
Portfolio turnover rate | 53 | %(g) | 7 | %(g) | 20 | %(g) | — | % | 34 | %(g) | 17 | %(g) | ||||||||||||||||
|
|
|
|
|
|
|
|
|
|
|
| |||||||||||||||||
| (a) | Based on average shares outstanding. |
| (b) | Distributions for annual periods determined in accordance with U.S. federal income tax regulations. |
| (c) | Where applicable, assumes the reinvestment of distributions. |
| (d) | Aggregate total return. |
| (e) | Excludes expenses incurred indirectly as a result of investments in underlying funds as follows: |
| Period from 08/01/19 to 04/30/20 | Year Ended July 31, | |||||||||||||||||||||||||||
| 2019 | 2018 | 2017 | 2016 | 2015 | ||||||||||||||||||||||||
Investments in underlying funds | 0.01 | % | 0.01 | % | 0.13 | % | 0.16 | % | 0.18 | % | 0.16 | % | ||||||||||||||||
|
|
|
|
|
|
|
|
|
|
|
| |||||||||||||||||
| (f) | Annualized. |
| (g) | Excludes investments underlying the total return swaps. |
See notes to financial statements.
| FINANCIAL HIGHLIGHTS | 87 |
Financial Highlights (continued)
(For a share outstanding throughout each period)
| BlackRock Global Long/Short Equity Fund (continued) | ||||||||||||||||||||||||||||
| Investor A | ||||||||||||||||||||||||||||
| Period from 08/01/19 to 04/30/20 | Year Ended July 31, | |||||||||||||||||||||||||||
| 2019 | 2018 | 2017 | 2016 | 2015 | ||||||||||||||||||||||||
Net asset value, beginning of period | $ | 12.50 | $ | 12.03 | $ | 11.52 | $ | 10.49 | $ | 11.84 | $ | 11.57 | ||||||||||||||||
|
|
|
|
|
|
|
|
|
|
|
| |||||||||||||||||
Net investment income (loss)(a) | (0.02 | ) | 0.01 | (0.10 | ) | (0.17 | ) | (0.18 | ) | (0.21 | ) | |||||||||||||||||
Net realized and unrealized gain (loss) | (0.46 | ) | 0.56 | 0.61 | 1.20 | (0.99 | ) | 0.49 | ||||||||||||||||||||
|
|
|
|
|
|
|
|
|
|
|
| |||||||||||||||||
Net increase (decrease) from investment operations | (0.48 | ) | 0.57 | 0.51 | 1.03 | (1.17 | ) | 0.28 | ||||||||||||||||||||
|
|
|
|
|
|
|
|
|
|
|
| |||||||||||||||||
Distributions(b) |
| |||||||||||||||||||||||||||
From net investment income | (0.01 | ) | — | — | — | — | — | |||||||||||||||||||||
From net realized gain | (0.74 | ) | (0.10 | ) | — | — | (0.18 | ) | (0.01 | ) | ||||||||||||||||||
|
|
|
|
|
|
|
|
|
|
|
| |||||||||||||||||
Total distributions | (0.75 | ) | (0.10 | ) | — | — | (0.18 | ) | (0.01 | ) | ||||||||||||||||||
|
|
|
|
|
|
|
|
|
|
|
| |||||||||||||||||
Net asset value, end of period | $ | 11.27 | $ | 12.50 | $ | 12.03 | $ | 11.52 | $ | 10.49 | $ | 11.84 | ||||||||||||||||
|
|
|
|
|
|
|
|
|
|
|
| |||||||||||||||||
Total Return(c) |
| |||||||||||||||||||||||||||
Based on net asset value | (3.94 | )%(d) | 4.79 | % | 4.43 | % | 9.82 | % | (10.02 | )% | 2.44 | % | ||||||||||||||||
|
|
|
|
|
|
|
|
|
|
|
| |||||||||||||||||
Ratios to Average Net Assets(e) |
| |||||||||||||||||||||||||||
Total expenses | 2.07 | %(f) | 2.04 | % | 2.03 | % | 2.10 | % | 1.95 | % | 1.93 | % | ||||||||||||||||
|
|
|
|
|
|
|
|
|
|
|
| |||||||||||||||||
Total expenses excluding recoupment of past fees waived and/or reimbursed | 2.07 | %(f) | 2.04 | % | 1.95 | % | 2.10 | % | 1.94 | % | 1.92 | % | ||||||||||||||||
|
|
|
|
|
|
|
|
|
|
|
| |||||||||||||||||
Total expenses after fees waived and/or reimbursed | 1.82 | %(f) | 1.88 | % | 1.96 | % | 1.98 | % | 1.88 | % | 1.86 | % | ||||||||||||||||
|
|
|
|
|
|
|
|
|
|
|
| |||||||||||||||||
Net investment income (loss) | (0.28 | )%(f) | 0.12 | % | (0.84 | )% | (1.60 | )% | (1.61 | )% | (1.80 | )% | ||||||||||||||||
|
|
|
|
|
|
|
|
|
|
|
| |||||||||||||||||
Supplemental Data |
| |||||||||||||||||||||||||||
Net assets, end of period (000) | $ | 23,509 | $ | 49,514 | $ | 49,180 | $ | 35,658 | $ | 122,464 | $ | 225,910 | ||||||||||||||||
|
|
|
|
|
|
|
|
|
|
|
| |||||||||||||||||
Portfolio turnover rate | 53 | %(g) | 7 | %(g) | 20 | %(g) | — | % | 34 | %(g) | 17 | %(g) | ||||||||||||||||
|
|
|
|
|
|
|
|
|
|
|
| |||||||||||||||||
| (a) | Based on average shares outstanding. |
| (b) | Distributions for annual periods determined in accordance with U.S. federal income tax regulations. |
| (c) | Where applicable, excludes the effects of any sales charges and assumes the reinvestment of distributions. |
| (d) | Aggregate total return. |
| (e) | Excludes expenses incurred indirectly as a result of investments in underlying funds as follows: |
| Period from 08/01/19 to 04/30/20 | Year Ended July 31, | |||||||||||||||||||||||||||
| 2019 | 2018 | 2017 | 2016 | 2015 | ||||||||||||||||||||||||
Investments in underlying funds | 0.01 | % | 0.01 | % | 0.13 | % | 0.16 | % | 0.18 | % | 0.16 | % | ||||||||||||||||
|
|
|
|
|
|
|
|
|
|
|
| |||||||||||||||||
| (f) | Annualized. |
| (g) | Excludes investments underlying the total return swaps. |
See notes to financial statements.
| 88 | 2020 BLACKROCK ANNUAL REPORTTO SHAREHOLDERS |
Financial Highlights (continued)
(For a share outstanding throughout each period)
| BlackRock Global Long/Short Equity Fund (continued) | ||||||||||||||||||||||||||||
| Investor C | ||||||||||||||||||||||||||||
| Period from 08/01/19 to 04/30/20 | Year Ended July 31, | |||||||||||||||||||||||||||
| 2019 | 2018 | 2017 | 2016 | 2015 | ||||||||||||||||||||||||
Net asset value, beginning of period | $ | 11.99 | $ | 11.59 | $ | 11.18 | $ | 10.26 | $ | 11.63 | $ | 11.45 | ||||||||||||||||
|
|
|
|
|
|
|
|
|
|
|
| |||||||||||||||||
Net investment loss(a) | (0.09 | ) | (0.08 | ) | (0.18 | ) | (0.24 | ) | (0.26 | ) | (0.30 | ) | ||||||||||||||||
Net realized and unrealized gain (loss) | (0.44 | ) | 0.54 | 0.59 | 1.16 | (0.97 | ) | 0.49 | ||||||||||||||||||||
|
|
|
|
|
|
|
|
|
|
|
| |||||||||||||||||
Net increase (decrease) from investment operations | (0.53 | ) | 0.46 | 0.41 | 0.92 | (1.23 | ) | 0.19 | ||||||||||||||||||||
|
|
|
|
|
|
|
|
|
|
|
| |||||||||||||||||
Distributions from net realized gain(b) | (0.69 | ) | (0.06 | ) | — | — | (0.14 | ) | (0.01 | ) | ||||||||||||||||||
|
|
|
|
|
|
|
|
|
|
|
| |||||||||||||||||
Net asset value, end of period | $ | 10.77 | $ | 11.99 | $ | 11.59 | $ | 11.18 | $ | 10.26 | $ | 11.63 | ||||||||||||||||
|
|
|
|
|
|
|
|
|
|
|
| |||||||||||||||||
Total Return(c) |
| |||||||||||||||||||||||||||
Based on net asset value | (4.51 | )%(d) | 4.02 | % | 3.67 | % | 8.97 | % | (10.66 | )% | 1.69 | % | ||||||||||||||||
|
|
|
|
|
|
|
|
|
|
|
| |||||||||||||||||
Ratios to Average Net Assets(e) |
| |||||||||||||||||||||||||||
Total expenses | 2.83 | %(f) | 2.79 | % | 2.76 | % | 2.81 | % | 2.71 | % | 2.70 | % | ||||||||||||||||
|
|
|
|
|
|
|
|
|
|
|
| |||||||||||||||||
Total expenses excluding recoupment of past fees waived and/or reimbursed | 2.83 | %(f) | 2.79 | % | 2.72 | % | 2.81 | % | 2.71 | % | 2.69 | % | ||||||||||||||||
|
|
|
|
|
|
|
|
|
|
|
| |||||||||||||||||
Total expenses after fees waived and/or reimbursed | 2.57 | %(f) | 2.63 | % | 2.69 | % | 2.72 | % | 2.64 | % | 2.63 | % | ||||||||||||||||
|
|
|
|
|
|
|
|
|
|
|
| |||||||||||||||||
Net investment loss | (1.04 | )%(f) | (0.64 | )% | (1.58 | )% | (2.32 | )% | (2.37 | )% | (2.57 | )% | ||||||||||||||||
|
|
|
|
|
|
|
|
|
|
|
| |||||||||||||||||
Supplemental Data |
| |||||||||||||||||||||||||||
Net assets, end of period (000) | $ | 11,539 | $ | 17,282 | $ | 21,168 | $ | 25,857 | $ | 62,597 | $ | 100,783 | ||||||||||||||||
|
|
|
|
|
|
|
|
|
|
|
| |||||||||||||||||
Portfolio turnover rate | 53 | %(g) | 7 | %(g) | 20 | %(g) | — | % | 34 | %(g) | 17 | %(g) | ||||||||||||||||
|
|
|
|
|
|
|
|
|
|
|
| |||||||||||||||||
| (a) | Based on average shares outstanding. |
| (b) | Distributions for annual periods determined in accordance with U.S. federal income tax regulations. |
| (c) | Where applicable, excludes the effects of any sales charges and assumes the reinvestment of distributions. |
| (d) | Aggregate total return. |
| (e) | Excludes expenses incurred indirectly as a result of investments in underlying funds as follows: |
| Period from 08/01/19 to 04/30/20 | Year Ended July 31, | |||||||||||||||||||||||||||
| 2019 | 2018 | 2017 | 2016 | 2015 | ||||||||||||||||||||||||
Investments in underlying funds | 0.01 | % | 0.01 | % | 0.13 | % | 0.16 | % | 0.18 | % | 0.16 | % | ||||||||||||||||
|
|
|
|
|
|
|
|
|
|
|
| |||||||||||||||||
| (f) | Annualized. |
| (g) | Excludes investments underlying the total return swaps. |
See notes to financial statements.
| FINANCIAL HIGHLIGHTS | 89 |
Financial Highlights (continued)
(For a share outstanding throughout each period)
| BlackRock Global Long/Short Equity Fund (continued) | ||||||||||||||||||||||||
| Class K | ||||||||||||||||||||||||
| Period from 08/01/19 to 04/30/20 | Year Ended July 31, | Period from 03/28/16 to (a) 07/31/16 | ||||||||||||||||||||||
| 2019 | 2018 | 2017 | ||||||||||||||||||||||
Net asset value, beginning of period | $ | 12.69 | $ | 12.19 | $ | 11.63 | $ | 10.56 | $ | 11.02 | ||||||||||||||
|
|
|
|
|
|
|
|
|
| |||||||||||||||
Net investment income (loss)(b) | (0.01 | ) | 0.06 | (0.01 | ) | (0.14 | ) | (0.04 | ) | |||||||||||||||
Net realized and unrealized gain (loss) | (0.46 | ) | 0.56 | 0.57 | 1.21 | (0.42 | ) | |||||||||||||||||
|
|
|
|
|
|
|
|
|
| |||||||||||||||
Net increase (decrease) from investment operations | (0.47 | ) | 0.62 | 0.56 | 1.07 | (0.46 | ) | |||||||||||||||||
|
|
|
|
|
|
|
|
|
| |||||||||||||||
Distributions(c) |
| |||||||||||||||||||||||
From net investment income | (0.04 | ) | — | — | — | — | ||||||||||||||||||
From net realized gain | (0.74 | ) | (0.12 | ) | — | — | — | |||||||||||||||||
|
|
|
|
|
|
|
|
|
| |||||||||||||||
Total distributions | (0.78 | ) | (0.12 | ) | — | — | — | |||||||||||||||||
|
|
|
|
|
|
|
|
|
| |||||||||||||||
Net asset value, end of period | $ | 11.44 | $ | 12.69 | $ | 12.19 | $ | 11.63 | $ | 10.56 | ||||||||||||||
|
|
|
|
|
|
|
|
|
| |||||||||||||||
Total Return(d) |
| |||||||||||||||||||||||
Based on net asset value | (3.77 | )%(e) | 5.11 | % | 4.82 | % | 10.13 | % | (4.17 | )%(e) | ||||||||||||||
|
|
|
|
|
|
|
|
|
| |||||||||||||||
Ratios to Average Net Assets(f) |
| |||||||||||||||||||||||
Total expenses | 1.76 | %(g) | 1.72 | % | 1.65 | % | 1.70 | % | 1.63 | % | ||||||||||||||
|
|
|
|
|
|
|
|
|
| |||||||||||||||
Total expenses excluding recoupment of past fees waived and/or reimbursed | 1.76 | %(g) | 1.72 | % | 1.64 | % | 1.70 | % | 1.63 | % | ||||||||||||||
|
|
|
|
|
|
|
|
|
| |||||||||||||||
Total expenses after fees waived and/or reimbursed | 1.52 | %(g) | 1.57 | % | 1.58 | % | 1.63 | % | 1.56 | % | ||||||||||||||
|
|
|
|
|
|
|
|
|
| |||||||||||||||
Net investment income (loss) | (0.07 | )%(g) | 0.45 | % | (0.04 | )% | (1.32 | )% | (1.15 | )% | ||||||||||||||
|
|
|
|
|
|
|
|
|
| |||||||||||||||
Supplemental Data |
| |||||||||||||||||||||||
Net assets, end of period (000) | $ | 325 | $ | 453 | $ | 217 | $ | 108 | $ | 52,455 | ||||||||||||||
|
|
|
|
|
|
|
|
|
| |||||||||||||||
Portfolio turnover rate | 53 | %(h) | 7 | %(h) | 20 | %(h) | — | % | 34 | %(h)(i) | ||||||||||||||
|
|
|
|
|
|
|
|
|
| |||||||||||||||
| (a) | Commencement of operations. |
| (b) | Based on average shares outstanding. |
| (c) | Distributions for annual periods determined in accordance with U.S. federal income tax regulations. |
| (d) | Where applicable, assumes the reinvestment of distributions. |
| (e) | Aggregate total return. |
| (f) | Excludes expenses incurred indirectly as a result of investments in underlying funds as follows: |
| Period from 08/01/19 to 04/30/20 | Year Ended July 31, | Period from 03/28/16 to (a) 07/31/16 | ||||||||||||||||||||||
| 2019 | 2018 | 2017 | ||||||||||||||||||||||
Investments in underlying funds | 0.01 | % | 0.01 | % | 0.13 | % | 0.16 | % | 0.18 | % | ||||||||||||||
|
|
|
|
|
|
|
|
|
|
|
| |||||||||||||
| (g) | Annualized. |
| (h) | Excludes investments underlying the total return swaps. |
| (i) | Portfolio turnover is representative of the Fund for the entire year. |
See notes to financial statements.
| 90 | 2020 BLACKROCK ANNUAL REPORTTO SHAREHOLDERS |
| 1. | ORGANIZATION |
BlackRock FundsSM (the “Trust”) is registered under the Investment Company Act of 1940, as amended (the “1940 Act”), as anopen-end management investment company. The Trust is organized as a Massachusetts business trust. The following, each of which is a series of the Trust, are referred to herein collectively as the “Funds” or individually as a “Fund”:
| Fund Name | Herein Referred To As | Diversification Classification | ||
BlackRock Advantage Emerging Markets Fund | Advantage Emerging Markets | Diversified | ||
BlackRock Global Long/Short Equity Fund | Global Long/Short Equity | Diversified |
Each Fund offers multiple classes of shares. All classes of shares have identical voting, dividend, liquidation and other rights and are subject to the same terms and conditions, except that certain classes bear expenses related to the shareholder servicing and distribution of such shares. Institutional and Class K Shares are sold only to certain eligible investors. Investor A and Investor C Shares bear certain expenses related to shareholder servicing of such shares, and Investor C Shares also bear certain expenses related to the distribution of such shares. Investor A and Investor C Shares are generally available through financial intermediaries. Each class has exclusive voting rights with respect to matters relating to its shareholder servicing and distribution expenditures (except that Investor C shareholders may vote on material changes to the Investor A Shares distribution and service plan).
| Share Class | Initial Sales Charge | CDSC | Conversion Privilege | |||||
Institutional and Class K Shares | No | No | None | |||||
Investor A Shares | Yes | No | (a) | None | ||||
Investor C Shares | No | Yes | (b) | To Investor A Shares after approximately 10 years | ||||
| (a) | Investor A Shares may be subject to a contingent deferred sales charge (“CDSC”) for certain redemptions where no initial sales charge was paid at the time of purchase. |
| (b) | A CDSC of 1.00% is assessed on certain redemptions of Investor C Shares made within one year after purchase. |
On November 13, 2019, the Board of Trustees of the Trust (the “Board”) approved a change in the fiscalyear-end of each Fund, effective as of April 30 from July 31 to April 30.
The Funds, together with certain other registered investment companies advised by BlackRock Advisors, LLC (the “Manager”) or its affiliates, are included in a complex of equity, multi-asset, index and money market funds referred to as the BlackRock Multi-Asset Complex.
| 2. | SIGNIFICANT ACCOUNTING POLICIES |
The financial statements are prepared in conformity with accounting principles generally accepted in the United States of America (“U.S. GAAP”), which may require management to make estimates and assumptions that affect the reported amounts of assets and liabilities in the financial statements, disclosure of contingent assets and liabilities at the date of the financial statements and the reported amounts of increases and decreases in net assets from operations during the reporting period. Actual results could differ from those estimates. Each Fund is considered an investment company under U.S. GAAP and follows the accounting and reporting guidance applicable to investment companies. Below is a summary of significant accounting policies:
Investment Transactions and Income Recognition:For financial reporting purposes, investment transactions are recorded on the dates the transactions are executed. Realized gains and losses on investment transactions are determined on the identified cost basis. Dividend income is recorded on theex-dividend date. Dividends from foreign securities where theex-dividend date may have passed are subsequently recorded when the Funds are informed of theex-dividend date. Under the applicable foreign tax laws, a withholding tax at various rates may be imposed on capital gains, dividends and interest. Upon notification from issuers, a portion of the dividend income received from a real estate investment trust may be redesignated as a reduction of cost of the related investment and/or realized gain. Interest income, including amortization and accretion of premiums and discounts on debt securities, is recognized on an accrual basis. Income, expenses and realized and unrealized gains and losses are allocated daily to each class based on its relative net assets.
Foreign Currency Translation:Each Fund’s books and records are maintained in U.S. dollars. Securities and other assets and liabilities denominated in foreign currencies are translated into U.S. dollars using exchange rates determined as of the close of trading on the New York Stock Exchange (“NYSE”). Purchases and sales of investments are recorded at the rates of exchange prevailing on the respective dates of such transactions. Generally, when the U.S. dollar rises in value against a foreign currency, the investments denominated in that currency will lose value; the opposite effect occurs if the U.S. dollar falls in relative value.
Each Fund does not isolate the portion of the results of operations arising as a result of changes in the exchange rates from the changes in the market prices of investments held or sold for financial reporting purposes. Accordingly, the effects of changes in exchange rates on investments are not segregated in the Statements of Operations from the effects of changes in market prices of those investments, but are included as a component of net realized and unrealized gain (loss) from investments. Each Fund reports realized currency gains (losses) on foreign currency related transactions as components of net realized gain (loss) for financial reporting purposes, whereas such components are generally treated as ordinary income for U.S. federal income tax purposes.
Segregation and Collateralization:In cases where a Fund enters into certain investments (e.g., futures contracts, options written and swaps) that would be treated as “senior securities” for 1940 Act purposes, a Fund may segregate or designate on its books and records cash or liquid assets having a market value at least equal to the amount of its future obligations under such investments. Doing so allows the investment to be excluded from treatment as a “senior security.” Furthermore, if required by an exchange or counterparty agreement, the Funds may be required to deliver/deposit cash and/or securities to/with an exchange, or broker-dealer or custodian as collateral for certain investments or obligations.
Distributions: Distributions paid by the Funds are recorded on theex-dividend date. Distributions of capital gains are recorded on theex-dividend date and made at least annually. The character and timing of distributions are determined in accordance with U.S. federal income tax regulations, which may differ from U.S. GAAP.
| NOTESTO FINANCIAL STATEMENTS | 91 |
Notes to Financial Statements (continued)
Indemnifications:In the normal course of business, a Fund enters into contracts that contain a variety of representations that provide general indemnification. A Fund’s maximum exposure under these arrangements is unknown because it involves future potential claims against a Fund, which cannot be predicted with any certainty.
Other: Expenses directly related to a Fund or its classes are charged to that Fund or the applicable class. Other operating expenses shared by several funds, including other funds managed by the Manager, are prorated among those funds on the basis of relative net assets or other appropriate methods. Expenses directly related to the Funds and other shared expenses prorated to the Funds are allocated daily to each class based on their relative net assets or other appropriate methods.
| 3. | INVESTMENT VALUATION AND FAIR VALUE MEASUREMENTS |
Investment Valuation Policies: The Funds’ investments are valued at fair value (also referred to as “market value” within the financial statements) as of the close of trading on the NYSE (generally 4:00 p.m., Eastern time). U.S. GAAP defines fair value as the price the Funds would receive to sell an asset or pay to transfer a liability in an orderly transaction between market participants at the measurement date. The Funds determine the fair values of their financial instruments using various independent dealers or pricing services under policies approved by the Board. If a security’s market price is not readily available or does not otherwise accurately represent the fair value of the security, the security will be valued in accordance with a policy approved by the Board as reflecting fair value. The BlackRock Global Valuation Methodologies Committee (the “Global Valuation Committee”) is the committee formed by management to develop global pricing policies and procedures and to oversee the pricing function for all financial instruments.
Fair Value Inputs and Methodologies: The following methods and inputs are used to establish the fair value of each Fund’s assets and liabilities:
| • | Equity investments traded on a recognized securities exchange are valued at the official closing price each day, if available. For equity investments traded on more than one exchange, the official closing price on the exchange where the stock is primarily traded is used. Equity investments traded on a recognized exchange for which there were no sales on that day may be valued at the last available bid (long positions) or ask (short positions) price. |
Generally, trading in foreign instruments is substantially completed each day at various times prior to the close of trading on the NYSE. Occasionally, events affecting the values of such instruments may occur between the foreign market close and the close of trading on the NYSE that may not be reflected in the computation of the Funds’ net assets. Each business day, the Funds use a pricing service to assist with the valuation of certain foreign exchange-traded equity securities and foreign exchange-traded andover-the-counter (“OTC”) options (the “Systematic Fair Value Price”). Using current market factors, the Systematic Fair Value Price is designed to value such foreign securities and foreign options at fair value as of the close of trading on the NYSE, which follows the close of the local markets.
| • | Investments inopen-end U.S. mutual funds are valued at net asset value (“NAV”) each business day. |
| • | Advantage Emerging Markets values its investment in SL Liquidity Series, LLC, Money Market Series (the “Money Market Series”) at fair value, which is ordinarily based upon its pro rata ownership in the underlying fund’s net assets. The Money Market Series seeks current income consistent with maintaining liquidity and preserving capital. Although the Money Market Series is not registered under the 1940 Act, its investments may follow the parameters of investments by a money market fund that is subject to Rule2a-7 under the 1940 Act. |
| • | Futures contracts traded on exchanges are valued at their last sale price. |
| • | Exchange-traded options are valued at the mean between the last bid and ask prices at the close of the options market in which the options trade. An exchange traded option for which there is no mean price is valued at the last bid (long positions) or ask (short positions) price. If no bid or ask price is available, the prior day’s price will be used, unless it is determined that the prior day’s price no longer reflects the fair value of the option. OTC options and options on swaps (“swaptions”) are valued by an independent pricing service using a mathematical model, which incorporates a number of market data factors, such as the trades and prices of the underlying instruments. |
| • | Swap agreements are valued utilizing quotes received daily by the Funds’ pricing service or through brokers, which are derived using daily swap curves and models that incorporate a number of market data factors, such as discounted cash flows, trades and values of the underlying reference instruments. |
If events (e.g., a company announcement, market volatility or a natural disaster) occur that are expected to materially affect the value of such investments, or in the event that the application of these methods of valuation results in a price for an investment that is deemed not to be representative of the market value of such investment, or if a price is not available, the investment will be valued by the Global Valuation Committee, or its delegate, in accordance with a policy approved by the Board as reflecting fair value (“Fair Valued Investments”). The fair valuation approaches that may be used by the Global Valuation Committee will include market approach, income approach and cost approach. Valuation techniques such as discounted cash flow, use of market comparables and matrix pricing are types of valuation approaches and are typically used in determining fair value. When determining the price for Fair Valued Investments, the Global Valuation Committee, or its delegate, seeks to determine the price that each Fund might reasonably expect to receive or pay from the current sale or purchase of that asset or liability in anarm’s-length transaction. Fair value determinations shall be based upon all available factors that the Global Valuation Committee, or its delegate, deems relevant and consistent with the principles of fair value measurement. The pricing of all Fair Valued Investments is subsequently reported to the Board or a committee thereof on a quarterly basis.
For investments in equity or debt issued by privately held companies or funds (“Private Company” or collectively, the “Private Companies”) and other Fair Valued Investments, the fair valuation approaches that are used by the Global Valuation Committee and third party pricing services utilize one or a combination of, but not limited to, the following inputs.
| Standard Inputs Generally Considered By Third Party Pricing Services | ||
Market approach | (i) recent market transactions, including subsequent rounds of financing, in the underlying investment or comparable issuers; (ii) recapitalizations and other transactions across the capital structure; and (iii) market multiples of comparable issuers. | |
Income approach | (i) future cash flows discounted to present and adjusted as appropriate for liquidity, credit, and/or market risks; (ii) quoted prices for similar investments or assets in active markets; and (iii) other risk factors, such as interest rates, yield curves, volatilities, prepayment speeds, loss severities, credit risks, recovery rates, liquidation amounts and/or default rates. |
| 92 | 2020 BLACKROCK ANNUAL REPORTTO SHAREHOLDERS |
Notes to Financial Statements (continued)
| Standard Inputs Generally Considered By Third Party Pricing Services | ||
Cost approach | (i) audited or unaudited financial statements, investor communications and financial or operational metrics issued by the Private Company; (ii) changes in the valuation of relevant indices or publicly traded companies comparable to the Private Company; (iii) relevant news and other public sources; and (iv) known secondary market transactions in the Private Company’s interests and merger or acquisition activity in companies comparable to the Private Company. |
Investments in series of preferred stock issued by Private Companies are typically valued utilizing market approach in determining the enterprise value of the company. Such investments often contain rights and preferences that differ from other series of preferred and common stock of the same issuer. Valuation techniques such as an option pricing model (“OPM”), a probability weighted expected return model (“PWERM”) or a hybrid of those techniques are used in allocating enterprise value of the company, as deemed appropriate under the circumstances. The use of OPM and PWERM techniques involve a determination of the exit scenarios of the investment in order to appropriately allocate the enterprise value of the company among the various parts of its capital structure.
The Private Companies are not subject to the public company disclosure, timing, and reporting standards as other investments held by a Fund. Typically, the most recently available information by a Private Company is as of a date that is earlier than the date a Fund is calculating its NAV. This factor may result in a difference between the value of the investment and the price a Fund could receive upon the sale of the investment.
Fair Value Hierarchy: Various inputs are used in determining the fair value of investments and derivative financial instruments. These inputs to valuation techniques are categorized into a fair value hierarchy consisting of three broad levels for financial statement purposes as follows:
| • | Level 1 — Unadjusted price quotations in active markets/exchanges for identical assets or liabilities that each Fund has the ability to access |
| • | Level 2 — Other observable inputs (including, but not limited to, quoted prices for similar assets or liabilities in markets that are active, quoted prices for identical or similar assets or liabilities in markets that are not active, inputs other than quoted prices that are observable for the assets or liabilities (such as interest rates, yield curves, volatilities, prepayment speeds, loss severities, credit risks and default rates) or other market-corroborated inputs) |
| • | Level 3 — Unobservable inputs based on the best information available in the circumstances, to the extent observable inputs are not available (including the Global Valuation Committee’s assumptions used in determining the fair value of investments and derivative financial instruments) |
The hierarchy gives the highest priority to unadjusted quoted prices in active markets for identical assets or liabilities (Level 1 measurements) and the lowest priority to unobservable inputs (Level 3 measurements). Accordingly, the degree of judgment exercised in determining fair value is greatest for instruments categorized in Level 3. The inputs used to measure fair value may fall into different levels of the fair value hierarchy. In such cases, for disclosure purposes, the fair value hierarchy classification is determined based on the lowest level input that is significant to the fair value measurement in its entirety. Investments classified within Level 3 have significant unobservable inputs used by the Global Valuation Committee in determining the price for Fair Valued Investments. Level 3 investments include equity or debt issued by Private Companies. There may not be a secondary market, and/or there are a limited number of investors. The categorization of a value determined for investments and derivative financial instruments is based on the pricing transparency of the investments and derivative financial instruments and is not necessarily an indication of the risks associated with investing in those securities.
| 4. | SECURITIES AND OTHER INVESTMENTS |
Preferred Stocks:Preferred stock has a preference over common stock in liquidation (and generally in receiving dividends as well), but is subordinated to the liabilities of the issuer in all respects. As a general rule, the market value of preferred stock with a fixed dividend rate and no conversion element varies inversely with interest rates and perceived credit risk, while the market price of convertible preferred stock generally also reflects some element of conversion value. Because preferred stock is junior to debt securities and other obligations of the issuer, deterioration in the credit quality of the issuer will cause greater changes in the value of a preferred stock than in a more senior debt security with similar stated yield characteristics. Unlike interest payments on debt securities, preferred stock dividends are payable only if declared by the issuer’s board of directors. Preferred stock also may be subject to optional or mandatory redemption provisions.
Securities Lending:Certain Funds may lend their securities to approved borrowers, such as brokers, dealers and other financial institutions. The borrower pledges and maintains with the Funds collateral consisting of cash, an irrevocable letter of credit issued by a bank, or securities issued or guaranteed by the U.S. Government. The initial collateral received by each Fund is required to have a value of at least 102% of the current value of the loaned securities for securities traded on U.S. exchanges and a value of at least 105% for all other securities. The collateral is maintained thereafter at a value equal to at least 100% of the current market value of the securities on loan. The market value of the loaned securities is determined at the close of each business day of the Fund and any additional required collateral is delivered to the Fund, or excess collateral returned by the Fund, on the next business day. During the term of the loan, the Funds are entitled to all distributions made on or in respect of the loaned securities, but do not receive interest income on securities received as collateral. Loans of securities are terminable at any time and the borrower, after notice, is required to return borrowed securities within the standard time period for settlement of securities transactions.
The market value of any securities on loan, all of which were classified as common stocks in the Funds’ Schedules of Investments, and the value of any related collateral are shown separately in the Statements of Assets and Liabilities as a component of investments at value-unaffiliated, and collateral on securities loaned at value, respectively. As of period end, any securities on loan were collateralized by cash and/or U.S. Government obligations. Cash collateral invested by the securities lending agent, BlackRock Investment Management, LLC (“BIM”), if any, is disclosed in the Schedules of Investments.
| NOTESTO FINANCIAL STATEMENTS | 93 |
Notes to Financial Statements (continued)
| 5. | DERIVATIVE FINANCIAL INSTRUMENTS |
The Funds engage in various portfolio investment strategies using derivative contracts both to increase the returns of the Funds and/or to manage their exposure to certain risks such as credit risk, equity risk, interest rate risk, foreign currency exchange rate risk, commodity price risk or other risks (e.g., inflation risk). Derivative financial instruments categorized by risk exposure are included in the Schedules of Investments. These contracts may be transacted on an exchange or OTC.
Futures Contracts:Futures contracts are purchased or sold to gain exposure to, or manage exposure to, changes in interest rates (interest rate risk) and changes in the value of equity securities (equity risk) or foreign currencies (foreign currency exchange rate risk).
Futures contracts are agreements between the Funds and a counterparty to buy or sell a specific quantity of an underlying instrument at a specified price and on a specified date. Depending on the terms of a contract, it is settled either through physical delivery of the underlying instrument on the settlement date or by payment of a cash amount on the settlement date. Upon entering into a futures contract, the Funds are required to deposit initial margin with the broker in the form of cash or securities in an amount that varies depending on a contract’s size and risk profile. The initial margin deposit must then be maintained at an established level over the life of the contract. Amounts pledged, which are considered restricted, are included in cash pledged for futures contracts in the Statements of Assets and Liabilities.
Securities deposited as initial margin are designated in the Schedules of Investments and cash deposited, if any, are shown as cash pledged for futures contracts in the Statements of Assets and Liabilities. Pursuant to the contract, the Funds agree to receive from or pay to the broker an amount of cash equal to the daily fluctuation in market value of the contract (“variation margin”). Variation margin is recorded as unrealized appreciation (depreciation) and, if any, shown as variation margin receivable (or payable) on futures contracts in the Statements of Assets and Liabilities. When the contract is closed, a realized gain or loss is recorded in the Statements of Operations equal to the difference between the notional amount of the contract at the time it was opened and the notional amount at the time it was closed. The use of futures contracts involves the risk of an imperfect correlation in the movements in the price of futures contracts and interest, foreign currency exchange rates or underlying assets.
Options:Certain Funds purchase and write call and put options to increase or decrease their exposure to the risks of underlying instruments, including equity risk, interest rate risk and/or commodity price risk and/or, in the case of options written, to generate gains from options premiums.
A call option gives the purchaser (holder) of the option the right (but not the obligation) to buy, and obligates the seller (writer) to sell (when the option is exercised) the underlying instrument at the exercise or strike price at any time or at a specified time during the option period. A put option gives the holder the right to sell and obligates the writer to buy the underlying instrument at the exercise or strike price at any time or at a specified time during the option period.
Premiums paid on options purchased and premiums received on options written, as well as the daily fluctuation in market value, are included in investments at value — unaffiliated and options written at value, respectively, in the Statements of Assets and Liabilities. When an instrument is purchased or sold through the exercise of an option, the premium is offset against the cost or proceeds of the underlying instrument. When an option expires, a realized gain or loss is recorded in the Statements of Operations to the extent of the premiums received or paid. When an option is closed or sold, a gain or loss is recorded in the Statements of Operations to the extent the cost of the closing transaction exceeds the premiums received or paid. When the Funds write a call option, such option is typically “covered,” meaning that they hold the underlying instrument subject to being called by the option counterparty. When the Funds write a put option, cash is segregated in an amount sufficient to cover the obligation. These amounts, which are considered restricted, are included in cash pledged as collateral for options written in the Statements of Assets and Liabilities.
In purchasing and writing options, the Funds bear the risk of an unfavorable change in the value of the underlying instrument or the risk that they may not be able to enter into a closing transaction due to an illiquid market. Exercise of a written option could result in the Funds purchasing or selling a security when they otherwise would not, or at a price different from the current market value.
Swaps:Swap contracts are entered into to manage exposure to issuers, markets and securities. Such contracts are agreements between the Funds and a counterparty to make periodic net payments on a specified notional amount or a net payment upon termination. Swap agreements are privately negotiated in the OTC market and may be entered into as a bilateral contract (“OTC swaps”) or centrally cleared (“centrally cleared swaps”).
For OTC swaps, any upfront premiums paid and any upfront fees received are shown as swap premiums paid and swap premiums received, respectively, in the Statements of Assets and Liabilities and amortized over the term of the contract. The daily fluctuation in market value is recorded as unrealized appreciation (depreciation) on OTC Swaps in the Statements of Assets and Liabilities. Payments received or paid are recorded in the Statements of Operations as realized gains or losses, respectively. When an OTC swap is terminated, a realized gain or loss is recorded in the Statements of Operations equal to the difference between the proceeds from (or cost of) the closing transaction and the Funds’ basis in the contract, if any. Generally, the basis of the contract is the premium received or paid.
In a centrally cleared swap, immediately following execution of the swap contract, the swap contract is novated to a central counterparty (the “CCP”) and the Funds’ counterparty on the swap agreement becomes the CCP. The Funds are required to interface with the CCP through the broker. Upon entering into a centrally cleared swap, the Funds are required to deposit initial margin with the broker in the form of cash or securities in an amount that varies depending on the size and risk profile of the particular swap. Securities deposited as initial margin are designated in the Schedules of Investments and cash deposited is shown as cash pledged for centrally cleared swaps in the Statements of Assets and Liabilities. Amounts pledged, which are considered restricted cash, are included in cash pledged for centrally cleared swaps in the Statements of Assets and Liabilities. Pursuant to the contract, the Funds agree to receive from or pay to the broker an amount of cash equal to the daily fluctuation in market value of the contract (“variation margin”). Variation margin is recorded as unrealized appreciation (depreciation) and shown as variation margin receivable (or payable) on centrally cleared swaps in the Statements of Assets and Liabilities. Payments received from (paid to) the counterparty, including at termination, are recorded as realized gains (losses) in the Statements of Operations.
| • | Total return swaps — Total return swaps are entered into to obtain exposure to a security or market without owning such security or investing directly in such market or to exchange the risk/return of one security or market (e.g., fixed-income) with another security or market (e.g., equity or commodity prices) (equity risk, commodity price risk and/or interest rate risk). |
| 94 | 2020 BLACKROCK ANNUAL REPORTTO SHAREHOLDERS |
Notes to Financial Statements (continued)
Total return swaps are agreements in which there is an exchange of cash flows whereby one party commits to make payments based on the total return (distributions plus capital gains/losses) of an underlying instrument, or basket of underlying instruments, in exchange for fixed or floating rate interest payments. If the total return of the instrument(s) or index underlying the transaction exceeds or falls short of the offsetting fixed or floating interest rate obligation, the Funds receive payment from or make a payment to the counterparty.
Certain total return swaps are designed to function as a portfolio of direct investments in long and short equity positions. This means that each Fund has the ability to trade in and out of these long and short positions within the swap and will receive the economic benefits and risks equivalent to direct investment in these positions, subject to certain adjustments due to events related to the counterparty. Benefits and risks include capital appreciation (depreciation), corporate actions and dividends received and paid, all of which are reflected in the swap’s market value. The market value also includes interest charges and credits (“financing fees”) related to the notional values of the long and short positions and cash balances within the swap. These interest charges and credits are based on a specified benchmark rate plus or minus a specified spread determined based upon the country and/or currency of the positions in the portfolio.
Positions within the swap and financing fees are reset periodically. During a reset, any unrealized appreciation (depreciation) on positions and accrued financing fees become available for cash settlement between the Funds and the counterparty. The amounts that are available for cash settlement are recorded as realized gains or losses in the Statements of Operations. Cash settlement in and out of the swap may occur at a reset date or any other date, at the discretion of the Funds and the counterparty, over the life of the agreement. Certain swaps have no stated expiration and can be terminated by either party at any time.
Swap transactions involve, to varying degrees, elements of interest rate, credit and market risk in excess of the amounts recognized in the Statements of Assets and Liabilities. Such risks involve the possibility that there will be no liquid market for these agreements, that the counterparty to the agreements may default on its obligation to perform or disagree as to the meaning of the contractual terms in the agreements, and that there may be unfavorable changes in interest rates and/or market values associated with these transactions.
Master Netting Arrangements: In order to define their contractual rights and to secure rights that will help them mitigate their counterparty risk, the Funds may enter into an International Swaps and Derivatives Association, Inc. Master Agreement (“ISDA Master Agreement”) or similar agreement with their counterparties. An ISDA Master Agreement is a bilateral agreement between each Fund and a counterparty that governs certain OTC derivatives and typically contains, among other things, collateral posting terms and netting provisions in the event of a default and/or termination event. Under an ISDA Master Agreement, each Fund may, under certain circumstances, offset with the counterparty certain derivative financial instruments’ payables and/or receivables with collateral held and/or posted and create one single net payment. The provisions of the ISDA Master Agreement typically permit a single net payment in the event of default including the bankruptcy or insolvency of the counterparty. Bankruptcy or insolvency laws of a particular jurisdiction may restrict or prohibit the right of offset in bankruptcy, insolvency or other events.
Collateral Requirements: For derivatives traded under an ISDA Master Agreement, the collateral requirements are typically calculated by netting themark-to-market amount for each transaction under such agreement and comparing that amount to the value of any collateral currently pledged by the Fund and the counterparty.
Cash collateral that has been pledged to cover obligations of the Funds and cash collateral received from the counterparty, if any, is reported separately in the Statements of Assets and Liabilities as cash pledged as collateral and cash received as collateral, respectively.Non-cash collateral pledged by the Funds, if any, is noted in the Schedules of Investments. Generally, the amount of collateral due from or to a counterparty is subject to a certain minimum transfer amount threshold before a transfer is required, which is determined at the close of business of the Funds. Any additional required collateral is delivered to/pledged by the Funds on the next business day. Typically, the counterparty is not permitted to sell,re-pledge or use cash andnon-cash collateral it receives. A Fund generally agrees not to usenon-cash collateral that it receives but may, absent default or certain other circumstances defined in the underlying ISDA Master Agreement, be permitted to use cash collateral received. In such cases, interest may be paid pursuant to the collateral arrangement with the counterparty. To the extent amounts due to the Funds from their counterparties are not fully collateralized, they bear the risk of loss from counterpartynon-performance. Likewise, to the extent the Funds have delivered collateral to a counterparty and stand ready to perform under the terms of their agreement with such counterparty, they bear the risk of loss from a counterparty in the amount of the value of the collateral in the event the counterparty fails to return such collateral. Based on the terms of agreements, collateral may not be required for all derivative contracts.
For financial reporting purposes, the Funds do not offset derivative assets and derivative liabilities that are subject to netting arrangements, if any, in the Statements of Assets and Liabilities.
| 6. | INVESTMENT ADVISORY AGREEMENT AND OTHER TRANSACTIONS WITH AFFILIATES |
Investment Advisory:The Trust, on behalf of the Funds, entered into an Investment Advisory Agreement with the Manager, the Funds’ investment adviser and an indirect, wholly-owned subsidiary of BlackRock, Inc. (“BlackRock”), to provide investment advisory services. The Manager is responsible for the management of each Fund’s portfolio and provides the personnel, facilities, equipment and certain other services necessary to the operations of each Fund.
For such services, each Fund pays the Manager a monthly fee at an annual rate equal to the following percentages of the average daily value of each Fund’s net assets.
| Average Daily Net Assets | Advantage Emerging Markets | Global Long/Short Equity | ||||||
First $1 Billion | 0.80 | % | 1.50 | % | ||||
$1 Billion — $3 Billion | 0.75 | 1.41 | ||||||
$3 Billion — $5 Billion | 0.72 | 1.35 | ||||||
$5 Billion — $10 Billion | 0.70 | 1.31 | ||||||
Greater than $10 Billion | 0.68 | 1.28 | ||||||
| NOTESTO FINANCIAL STATEMENTS | 95 |
Notes to Financial Statements (continued)
Service and Distribution Fees:The Trust, on behalf of each Fund, entered into a Distribution Agreement and a Distribution and Service Plan with BlackRock Investments, LLC (“BRIL”), an affiliate of the Manager. Pursuant to the Distribution and Service Plan and in accordance with Rule12b-1 under the 1940 Act, each Fund pays BRIL ongoing service and distribution fees. The fees are accrued daily and paid monthly at annual rates based upon the average daily net assets of the relevant share class of each Fund as follows:
| Service Fees | Distribution Fees | |||||||
Investor A | 0.25 | % | — | % | ||||
Investor C | 0.25 | 0.75 | ||||||
BRIL and broker-dealers, pursuant tosub-agreements with BRIL, provide shareholder servicing and distribution services to the Funds. The ongoing service and/or distribution fee compensates BRIL and each broker-dealer for providing shareholder servicing and/or distribution related services to shareholders.
The following table shows the class specific service and distribution fees borne directly by each share class of each Fund:
| Service and Distribution Fees | Period from 08/01/19 to 04/30/20 | Year Ended 07/31/19 | ||||||
Advantage Emerging Markets | ||||||||
Investor A | $ | 7,672 | $ | 9,156 | ||||
Investor C | 12,708 | 25,582 | ||||||
|
|
|
| |||||
Total | $ | 20,380 | $ | 34,738 | ||||
|
|
|
| |||||
Global Long/Short Equity | ||||||||
Investor A | $ | 57,697 | $ | 122,692 | ||||
Investor C | 107,724 | 191,086 | ||||||
|
|
|
| |||||
Total | $ | 165,421 | $ | 313,778 | ||||
|
|
|
| |||||
Administration:The Trust, on behalf of each Fund, entered into an Administration Agreement with the Manager, an indirect, wholly-owned subsidiary of BlackRock, to provide administrative services. For these services, the Manager receives an administration fee computed daily and payable monthly, based on a percentage of the average daily net assets of each Fund. The administration fee, which is shown as administration in the Statements of Operations, is paid at the annual rates below.
| Average Daily Net Assets | Administration Fee | |||
First $500 Million | 0.0425 | % | ||
$500 Million — $1 Billion | 0.0400 | |||
$1 Billion — $2 Billion | 0.0375 | |||
$2 Billion — $4 Billion | 0.0350 | |||
$4 Billion — $13 Billion | 0.0325 | |||
Greater than $13 Billion | 0.0300 | |||
In addition, the Manager charges each of the share classes an administration fee, which is shown as administration — class specific in the Statements of Operations, at an annual rate of 0.02% of the average daily net assets of each respective class.
The following table shows the class specific administration fees borne directly by each share class of each Fund:
| Administration Fees | Period from 08/01/19 to 04/30/20 | Year Ended 07/31/19 | ||||||
Advantage Emerging Markets | ||||||||
Institutional | $ | 1,999 | $ | 4,612 | ||||
Investor A | 614 | 732 | ||||||
Investor C | 254 | 511 | ||||||
Class K | 12,952 | 19,335 | ||||||
|
|
|
| |||||
Total | $ | 15,819 | $ | 25,190 | ||||
|
|
|
| |||||
Global Long/Short Equity | ||||||||
Institutional | $ | 80,046 | $ | 110,718 | ||||
Investor A | 4,616 | 9,815 | ||||||
Investor C | 2,154 | 3,822 | ||||||
Class K | 61 | 78 | ||||||
|
|
|
| |||||
Total | $ | 86,877 | $ | 124,433 | ||||
|
|
|
| |||||
| 96 | 2020 BLACKROCK ANNUAL REPORTTO SHAREHOLDERS |
Notes to Financial Statements (continued)
Transfer Agent: Pursuant to written agreements, certain financial intermediaries, some of which may be affiliates, provide the Funds withsub-accounting, recordkeeping,sub-transfer agency and other administrative services with respect to servicing of underlying investor accounts. For these services, these entities receive an asset-based fee or an annual fee per shareholder account, which will vary depending on share class and/or net assets. Global Long/Short Equity paid the following amounts to affiliates of BlackRock in return for these services, which are included in transfer agent — class specific in the Statements of Operations:
| Global Long/Short Equity | Period from 08/01/19 to 04/30/20 | Year Ended 07/31/19 | ||||||
Institutional | $ | 5,888 | $ | 4,069 | ||||
For the period ended April 30, 2020 and year ended July 31, 2019, Advantage Emerging Markets did not pay any amounts to affiliates in return for these services.
The Manager maintains a call center that is responsible for providing certain shareholder services to the Funds. Shareholder services include responding to inquiries and processing purchases and sales based upon instructions from shareholders. Each Fund reimbursed the Manager the following amounts for costs incurred in running the call center, which are included in transfer agent — class specific in the Statements of Operations:
Period from 08/01/19 to 04/30/20 | Year Ended 07/31/19 | |||||||
Advantage Emerging Markets | ||||||||
Institutional | $ | 100 | $ | 376 | ||||
Investor A | 215 | 307 | ||||||
Investor C | 31 | 263 | ||||||
Class K | 133 | 548 | ||||||
|
|
|
| |||||
Total | $ | 479 | $ | 1,494 | ||||
|
|
|
| |||||
Global Long/Short Equity | ||||||||
Institutional | $ | 856 | $ | 1,241 | ||||
Investor A | 486 | 621 | ||||||
Investor C | 155 | 551 | ||||||
Class K | — | 13 | ||||||
|
|
|
| |||||
Total | $ | 1,497 | $ | 2,426 | ||||
|
|
|
| |||||
The following table shows the class specific transfer agent fees borne directly by each share class of each Fund:
Period from 08/01/19 to 04/30/20 | Year Ended 07/31/19 | |||||||
Advantage Emerging Markets | ||||||||
Institutional | $ | 3,006 | $ | 1,621 | ||||
Investor A | 1,879 | 1,251 | ||||||
Investor C | 1,896 | 3,374 | ||||||
Class K | 348 | 857 | ||||||
|
|
|
| |||||
Total | $ | 7,129 | $ | 7,103 | ||||
|
|
|
| |||||
Global Long/Short Equity | ||||||||
Institutional | $ | 280,426 | $ | 381,445 | ||||
Investor A | 23,611 | 48,331 | ||||||
Investor C | 11,272 | 18,696 | ||||||
Class K | 94 | 92 | ||||||
|
|
|
| |||||
Total | $ | 315,403 | $ | 448,564 | ||||
|
|
|
| |||||
Other Fees: Affiliates earned underwriting discounts, direct commissions and dealer concessions on sales of each Fund’s Investor A Shares as follows:
Period from 08/01/19 to 04/30/20 | Year Ended 07/31/19 | |||||||
Advantage Emerging Markets | ||||||||
Investor A | $ | 74 | $ | 412 | ||||
Global Long/Short Equity | ||||||||
Investor A | $ | 3,980 | $ | 2,231 | ||||
| NOTESTO FINANCIAL STATEMENTS | 97 |
Notes to Financial Statements (continued)
Affiliates received CDSCs as follows:
Period from 08/01/19 to 04/30/20 | Year Ended 07/31/19 | |||||||
Advantage Emerging Markets | ||||||||
Investor C | $ | 12 | $ | 11 | ||||
Global Long/Short Equity | ||||||||
Investor A | $ | 2,642 | $ | 1,112 | ||||
Investor C | 1,332 | 380 | ||||||
Expense Limitations, Waivers, Reimbursements, and Recoupments:With respect to each Fund, the Manager contractually agreed to waive its investment advisory fees by the amount of investment advisory fees each Fund pays to the Manager indirectly through its investment in affiliated money market funds (the “affiliated money market fund waiver”) through November 30, 2020. The contractual agreement may be terminated upon 90 days’ notice by a majority of the trustees who are not “interested persons” of the Trust, as defined in the 1940 Act (“Independent Trustees”) or by a vote of a majority of the outstanding voting securities of a Fund. The amount of waivers and/or reimbursements of fees and expenses made pursuant to the expense limitation described below will be reduced by the amount of the affiliated money market fund waiver. Prior to May 24, 2019 for Advantage Emerging Markets and November 27, 2019 for Global Long/Short Equity, this waiver was voluntary. This amount is included in fees waived and/or reimbursed by the Manager in the Statements of Operations. The amounts waived were as follows:
| Fees waived by the Manager | Period from 08/01/19 to 04/30/20 | Year Ended 07/31/19 | ||||||
Advantage Emerging Markets | $ | 3,351 | $ | 5,482 | ||||
Global Long/Short Equity | 12,591 | 13,878 | ||||||
The Manager has contractually agreed to waive its investment advisory fee with respect to any portion of each Fund’s assets invested in affiliated equity and fixed-income mutual funds and affiliated exchange-traded funds that have a contractual management fee through November 30, 2020. The contractual agreement may be terminated upon 90 days’ notice by a majority of the Independent Trustees by a vote of a majority of the outstanding voting securities of a Fund. This amount is included in fees waived and/or reimbursed by the Manager in the Statements of Operations. The amount waived for Advantage Emerging Markets in investment advisory fees pursuant to these arrangements were as follows:
Period from 08/01/19 to 04/30/20 | Year Ended 07/31/19 | |||||||
Fees waived by the Manager | $ | — | $ | 5,545 | ||||
With respect to Global Long/Short Equity, for the period ended April 30, 2020 and year ended July 31, 2019, there were no fees waived and/or reimbursed by the Manager pursuant to this agreement.
With respect to Advantage Emerging Markets, the Manager contractually agreed to waive and/or reimburse fees or expenses in order to limit other expenses, excluding dividend expense, interest expense, acquired fund fees and expenses, and certain other fund expenses, which constitute extraordinary expenses not incurred in the ordinary course of the Fund’s business (“expense limitation”) through November 30, 2020. The current expense limitations as a percentage of average daily net assets are as follows:
| Share Class | Advantage Emerging Markets | |||
Institutional | 0.05 | % | ||
Investor A | 0.10 | |||
Investor C | 0.10 | |||
Class K | 0.01 | |||
With respect to Global Long/Short Equity, the Manager contractually agreed to waive and/or reimburse fees or expenses in order to limit expenses, excluding interest expense, dividend expense, tax expense, acquired fund fees and expenses, and certain other fund expenses, which constitute extraordinary expenses not incurred in the ordinary course of the Fund’s business. The current expense limitations as a percentage of average daily net assets are as follows:
| Share Class | Global Long/Short Equity | |||
Institutional | 1.57 | % | ||
Investor A | 1.82 | |||
Investor C | 2.57 | |||
Class K | 1.52 | |||
| 98 | 2020 BLACKROCK ANNUAL REPORTTO SHAREHOLDERS |
Notes to Financial Statements (continued)
The Manager has agreed not to reduce or discontinue these contractual expense limitations through November 30, 2020, unless approved by the Board, including a majority of the Independent Trustees, or by a vote of a majority of the outstanding voting securities of the Fund. Amounts included in the Statement of Operations were as follows:
| Fees waived and/or reimbursed by the Manager | Period from 08/01/19 to 04/30/20 | Year Ended 07/31/19 | ||||||
Advantage Emerging Markets | $ | 483,813 | $ | 590,439 | ||||
Global Long/Short Equity | 790,702 | 553,467 | ||||||
Prior to May 24, 2019, with respect to each Fund, the Manager contractually agreed to waive and/or reimburse fees or expenses in order to limit expenses, excluding interest expense, dividend expense, tax expense, acquired fund fees and expenses, and certain other fund expenses, which constitute extraordinary expenses not incurred in the ordinary course of each Fund’s business. The expense limitations as a percentage of average daily net assets were as follows:
| Share Class | Advantage Emerging Markets | Global Long/Short Equity | ||||||
Institutional | 0.94 | % | 1.64 | % | ||||
Investor A | 1.19 | 1.89 | ||||||
Investor C | 1.94 | 2.64 | ||||||
Class K | 0.89 | 1.59 | ||||||
For the period ended April 30, 2020, there were no fees waived and/or reimbursed by the Administrator. However, for the year ended July 31, 2019, with respect to Advantage Emerging Markets, the Manager waived $8,308, which is shown as administration fees waived in the Statements of Operations.
These amounts waived and/or reimbursed are included in administration fees waived — class specific and transfer agent fees waived and/or reimbursed, respectively, in the Statements of Operations. Class specific expense waivers and/or reimbursements were as follows:
| Administration Fees Waived | Period from 08/01/19 to 04/30/20 | Year Ended 07/31/19 | ||||||
Advantage Emerging Markets | ||||||||
Institutional | $ | 909 | $ | — | ||||
Investor A | 2 | 404 | ||||||
Investor C | 254 | 512 | ||||||
Class K | 12,952 | 19,290 | ||||||
|
|
|
| |||||
Total | $ | 14,117 | $ | 20,206 | ||||
|
|
|
| |||||
Global Long/Short Equity | ||||||||
Institutional | $ | 80,046 | $ | 110,718 | ||||
Investor A | 4,583 | 9,815 | ||||||
Investor C | 2,155 | 3,822 | ||||||
Class K | 61 | 78 | ||||||
|
|
|
| |||||
Total | $ | 86,845 | $ | 124,433 | ||||
|
|
|
| |||||
| Transfer Agent Fees Waived and/or Reimbursed | Period from 08/01/19 to 04/30/20 | Year Ended 07/31/19 | ||||||
Advantage Emerging Markets | ||||||||
Institutional | $ | 170 | $ | — | ||||
Investor A | — | 117 | ||||||
Investor C | 751 | 1,918 | ||||||
Class K | 348 | 853 | ||||||
|
|
|
| |||||
Total | $ | 1,269 | $ | 2,888 | ||||
|
|
|
| |||||
Global Long/Short Equity | ||||||||
Institutional | $ | 80,311 | $ | 104,650 | ||||
Investor A | 12,104 | 23,793 | ||||||
Investor C | 5,886 | 9,143 | ||||||
Class K | 93 | 90 | ||||||
|
|
|
| |||||
Total | $ | 98,394 | $ | 137,676 | ||||
|
|
|
| |||||
| NOTESTO FINANCIAL STATEMENTS | 99 |
Notes to Financial Statements (continued)
The Funds have incurred expenses in connection with the realignment and consolidation of the boards of trustees of certain BlackRock advised funds. The Manager has voluntarily agreed to reimburse the Funds for all or a portion of such expenses, which amounts are included in fees waived and/or reimbursed by the Manager in the Statements of Operations. The amounts reimbursed were as follows:
| Amounts reimbursed | Period from 08/01/19 to 04/30/20 | Year Ended 07/31/19 | ||||||
Advantage Emerging Markets | $ | — | $ | 3,275 | ||||
Global Long/Short Equity | — | 19,243 | ||||||
With respect to the contractual expense limitation, if during a Fund’s fiscal year the operating expenses of a share class, that at any time during the prior two fiscal years received a waiver and/or reimbursement from the Manager, are less than the current expense limitation for that share class, the Manager is entitled to be reimbursed by such share class up to the lesser of: (a) the amount of fees waived and/or expenses reimbursed during those prior two fiscal years under the agreement and (b) an amount not to exceed either the current expense limitation of that share class or the expense limitation of the share class in effect at the time that the share class received the applicable waiver and/or reimbursement, provided that:
(1) each Fund, of which the share class is a part, has more than $50 million in assets for the fiscal year, and
(2) the Manager or an affiliate continues to serve as a Fund’s investment adviser or administrator.
This repayment applies only to the contractual expense limitation on net expenses and does not apply to the contractual investment advisory fee waiver described above or any voluntary waivers that may be in effect from time to time. Effective December 1, 2019 for Advantage Emerging Markets and effective December 20, 2019 for Global Long/Short Equity, the repayment arrangement between each Fund and the Manager pursuant to which such Fund may be required to repay amounts waived and/or reimbursed under each Fund’s contractual caps on net expenses was terminated.
The Manager recouped the following fund level and class specific waivers and/or reimbursements previously recorded by Advantage Emerging Markets:
| Period from 08/01/19 to 04/30/20 | Year Ended 07/31/19 | |||||||
Institutional | $ | — | $ | 6,428 | ||||
Investor A | — | 659 | ||||||
The following fund level and class specific waivers and/or reimbursements previously recorded by the Funds, which were subject to recoupment by the Manager, expired on December 1, 2019 and December 20, 2019, respectively:
| Advantage Emerging Markets | ||||
Fund Level | $ | 1,298,948 | ||
Institutional | 66,642 | |||
Investor A | 1,941 | |||
Investor C | 7,366 | |||
Class K | 41,645 | |||
| Global Long/Short Equity | ||||
Fund Level | $ | 965,045 | ||
Institutional | 351,458 | |||
Investor A | 40,630 | |||
Investor C | 19,803 | |||
Class K | 463 | |||
Securities Lending:The U.S. Securities and Exchange Commission (“SEC”) has issued an exemptive order which permits BIM, an affiliate of the Manager, to serve as securities lending agent for the Funds, subject to applicable conditions. As securities lending agent, BIM bears all operational costs directly related to securities lending. The Funds are responsible for expenses in connection with the investment of cash collateral received for securities on loan (the “collateral investment expenses”). The cash collateral is invested in a private investment company managed by the Manager or its affiliates. However, BIM has agreed to cap the collateral investment expenses of the private investment company to an annual rate of 0.04%. The investment adviser to the private investment company will not charge any advisory fees with respect to shares purchased by the Funds. The private investment company in which the cash collateral has been invested may, under certain circumstances, impose a liquidity fee of up to 2% of the value withdrawn or temporarily restrict withdrawals for up to 10 business days during a 90 day period, in the event that the private investment company’s weekly liquid assets fall below certain thresholds.
Securities lending income is equal to the total of income earned from the reinvestment of cash collateral, net of fees and other payments to and from borrowers of securities, and less the collateral investment expenses. Each Fund retains a portion of securities lending income and remits a remaining portion to BIM as compensation for its services as securities lending agent.
Pursuant to the current securities lending agreement, each Fund retains 82% of securities lending income (which excludes collateral investment expenses), and this amount retained can never be less than 70% of the total of securities lending income plus the collateral investment expenses.
In addition, commencing the business day following the date that the aggregate securities lending income earned across the BlackRock Multi-Asset Complex in a calendar year exceeds a specified threshold, each Fund, pursuant to the securities lending agreement, will retain for the remainder of that calendar year securities lending income in an amount equal to 85% of securities lending income (which excludes collateral investment expenses), and this amount retained can never be less than 70% of the total of securities lending income plus the collateral investment expenses.
| 100 | 2020 BLACKROCK ANNUAL REPORTTO SHAREHOLDERS |
Notes to Financial Statements (continued)
The share of securities lending income earned by each Fund is shown as securities lending income — affiliated — net in the Statements of Operations. Advantage Emerging Markets paid BIM the following amounts for securities lending agent services:
| Period from 08/01/19 to 04/30/20 | Year Ended 07/31/19 | |||||||
Advantage Emerging Markets | $ | 64 | $ | 481 | ||||
Interfund Lending: In accordance with an exemptive order (the “Order”) from the SEC, each Fund may participate in a joint lending and borrowing facility for temporary purposes (the “Interfund Lending Program”), subject to compliance with the terms and conditions of the Order, and to the extent permitted by each Fund’s investment policies and restrictions. Each Fund is currently permitted to borrow and lend under the Interfund Lending Program.
A lending BlackRock fund may lend in aggregate up to 15% of its net assets, but may not lend more than 5% of its net assets to any one borrowing fund through the Interfund Lending Program. A borrowing BlackRock fund may not borrow through the Interfund Lending Program or from any other source more than 33 1/3% of its total assets (or any lower threshold provided for by the fund’s investment restrictions). If a borrowing BlackRock fund’s total outstanding borrowings exceed 10% of its total assets, each of its outstanding interfund loans will be subject to collateralization of at least 102% of the outstanding principal value of the loan. All interfund loans are for temporary or emergency purposes and the interest rate to be charged will be the average of the highest current overnight repurchase agreement rate available to a lending fund and the bank loan rate, as calculated according to a formula established by the Board.
During the period ended April 30, 2020, the Funds did not participate in the Interfund Lending Program.
Trustees and Officers:Certain trustees and/or officers of the Trust are directors and/or officers of BlackRock or its affiliates. The Funds reimburse the Manager for a portion of the compensation paid to the Trust’s Chief Compliance Officer, which is included in Trustees and Officer in the Statements of Operations.
Other Transactions: For the period ended April 30, 2020 there was no reimbursement from an affiliate related to an operating event, however during the year ended July 31, 2019, Advantage Emerging Markets received a reimbursement of $5,923 from an affiliate, which is included in other income — affiliated in the Statements of Operations, related to an operating event.
| 7. | PURCHASES AND SALES |
For the period ended April 30, 2020, purchases and sales of investments, excluding short-term securities, were as follows:
| Purchases | ||||||||
| Advantage Emerging Markets | Global Long/ Short Equity | |||||||
Non-U.S. Government Securities | $ | 146,145,485 | $ | — | ||||
U.S. Government Securities | — | 54,649,207 | ||||||
| Sales | ||||||||
| Advantage Emerging Markets | Global Long/ Short Equity | |||||||
Non-U.S. Government Securities | $ | 136,482,666 | $ | 341,029 | ||||
U.S. Government Securities | — | 85,300,000 | ||||||
| 8. | INCOME TAX INFORMATION |
It is each Fund’s policy to comply with the requirements of the Internal Revenue Code of 1986, as amended, applicable to regulated investment companies, and to distribute substantially all of its taxable income to its shareholders. Therefore, no U.S. federal income tax provision is required.
Each Fund files U.S. federal and various state and local tax returns. No income tax returns are currently under examination. The statute of limitations on each Fund’s U.S. federal tax returns generally remains open for the period ended April 30, 2020 and each of the four years ended July 30, 2019. The statutes of limitations on each Fund’s state and local tax returns may remain open for an additional year depending upon the jurisdiction.
Management has analyzed tax laws and regulations and their application to the Funds as of April 30, 2020, inclusive of the open tax return years, and does not believe that there are any uncertain tax positions that require recognition of a tax liability in the Funds’ financial statements.
The tax character of distributions paid was as follows:
| Advantage Emerging Markets | Global Long/ Short Equity | |||||||
Ordinary income | ||||||||
04/30/20 | $ | 2,420,137 | $ | 37,448,352 | ||||
07/31/19 | — | 3,000,069 | ||||||
Long-term capital gains | ||||||||
04/30/20 | — | — | ||||||
07/31/19 | — | 2,734,587 | ||||||
|
|
|
| |||||
04/30/20 | $ | 2,420,137 | $ | 37,448,352 | ||||
|
|
|
| |||||
07/31/19 | $ | — | $ | 5,734,656 | ||||
|
|
|
| |||||
| NOTESTO FINANCIAL STATEMENTS | 101 |
Notes to Financial Statements (continued)
As of period end, the tax components of accumulated loss were as follows:
| Advantage Emerging Markets | Global Long/Short Equity | |||||||
Undistributed ordinary income | $ | 75,173 | $ | 1,497,208 | ||||
Non-expiring Capital loss carryforwards(a) | (27,400,186 | ) | — | |||||
Net unrealized losses(b) | (2,722,409 | ) | (61,660,539 | ) | ||||
|
|
|
| |||||
| $ | (30,047,422 | ) | $ | (60,163,331 | ) | |||
|
|
|
| |||||
| (a) | Amounts available to offset future realized capital gains. |
| (b) | The difference between book-basis andtax-basis net unrealized losses was attributable primarily to the tax deferral of losses on wash sales and straddles, the realization for tax purposes of unrealized gains/losses on certain futures and foreign currency contracts, the realization for tax purposes of unrealized gain on investments in passive foreign investment companies, the timing and recognition of partnership income and the realization for tax purposes of unrealized gains on constructive sales. |
As of April 30, 2020, gross unrealized appreciation and depreciation for investments and derivatives based on cost for U.S. federal income tax purposes were as follows:
| Advantage Emerging Markets | Global Long/Short Equity | |||||||
Tax cost | $ | 103,494,922 | $ | 449,255,739 | ||||
|
|
|
| |||||
Gross unrealized appreciation | $ | 7,503,917 | $ | 22,797,316 | ||||
Gross unrealized depreciation | (10,226,719 | ) | (84,237,990 | ) | ||||
|
|
|
| |||||
Net unrealized depreciation | $ | (2,722,802 | ) | $ | (61,440,674 | ) | ||
|
|
|
| |||||
| 9. | BANK BORROWINGS |
The Trust, on behalf of the Funds along with certain other funds managed by the Manager and its affiliates (“Participating Funds”), is a party to a364-day, $2.25 billion credit agreement with a group of lenders. Under this agreement, the Funds may borrow to fund shareholder redemptions. Excluding commitments designated for certain individual funds, the Participating Funds, including the Funds, can borrow up to an aggregate commitment amount of $1.75 billion at any time outstanding, subject to asset coverage and other limitations as specified in the agreement. The credit agreement has the following terms: a fee of 0.10% per annum on unused commitment amounts and interest at a rate equal to the higher of(a) one-month LIBOR (but, in any event, not less than 0.00%) on the date the loan is made plus 0.80% per annum or (b) the Fed Funds rate (but, in any event, not less than 0.00%) in effect from time to time plus 0.80% per annum on amounts borrowed. The agreement expires in April 2021 unless extended or renewed. These fees were allocated among such funds based upon portions of the aggregate commitment available to them and relative net assets of Participating Funds. During the period ended April 30, 2020, the Funds did not borrow under the credit agreement.
| 10. | PRINCIPAL RISKS |
In the normal course of business, certain Funds invest in securities or other instruments and may enter into certain transactions, and such activities subject each Fund to various risks, including among others, fluctuations in the market (market risk) or failure of an issuer to meet all of its obligations. The value of securities or other instruments may also be affected by various factors, including, without limitation: (i) the general economy; (ii) the overall market as well as local, regional or global political and/or social instability; (iii) regulation, taxation or international tax treaties between various countries; or (iv) currency, interest rate and price fluctuations. Local, regional or global events such as war, acts of terrorism, the spread of infectious illness or other public health issues, recessions, or other events could have a significant impact on the Funds and their investments. Each Fund’s prospectus provides details of the risks to which each Fund is subject.
Investments in the securities of issuers domiciled in countries with emerging capital markets involve certain additional risks that do not generally apply to investments in securities of issuers in more developed capital markets, such as (i) low or nonexistent trading volume, resulting in a lack of liquidity and increased volatility in prices for such securities; (ii) uncertain national policies and social, political and economic instability, increasing the potential for expropriation of assets, confiscatory taxation, high rates of inflation or unfavorable diplomatic developments; and (iii) possible fluctuations in exchange rates, differing legal systems and the existence or possible imposition of exchange controls, custodial restrictions or other foreign or U.S. governmental laws or restrictions applicable to such investments.
The Funds may be exposed to additional risks when reinvesting cash collateral in money market funds that do not seek to maintain a stable NAV per share of $1.00, which may be subject to redemption gates or liquidity fees under certain circumstances.
Valuation Risk: The market values of equities, such as common stocks and preferred securities or equity related investments, such as futures and options, may decline due to general market conditions which are not specifically related to a particular company. They may also decline due to factors which affect a particular industry or industries. A Fund may invest in illiquid investments. An illiquid investment is any investment that a Fund reasonably expects cannot be sold or disposed of in current market conditions in seven calendar days or less without the sale or disposition significantly changing the market value of the investment. A Fund may experience difficulty in selling illiquid investments in a timely manner at the price that it believes the investments are worth. Prices may fluctuate widely over short or extended periods in response to company, market or economic news. Markets also tend to move in cycles, with periods of rising and falling prices. This volatility may cause each Fund’s NAV to experience significant increases or decreases over short periods of time. If there is a general decline in the securities and other markets, the NAV of a Fund may lose value, regardless of the individual results of the securities and other instruments in which a Fund invests.
| 102 | 2020 BLACKROCK ANNUAL REPORTTO SHAREHOLDERS |
Notes to Financial Statements (continued)
The price a Fund could receive upon the sale of any particular portfolio investment may differ from a Fund’s valuation of the investment, particularly for securities that trade in thin or volatile markets or that are valued using a fair valuation technique or a price provided by an independent pricing service. Changes to significant unobservable inputs and assumptions (i.e., publicly traded company multiples, growth rate, time to exit) due to the lack of observable inputs may significantly impact the resulting fair value and therefore a Fund’s results of operations. As a result, the price received upon the sale of an investment may be less than the value ascribed by a Fund, and a Fund could realize a greater than expected loss or lesser than expected gain upon the sale of the investment. A Fund’s ability to value its investments may also be impacted by technological issues and/or errors by pricing services or other third party service providers.
An outbreak of respiratory disease caused by a novel coronavirus has developed into a global pandemic and has resulted in closing borders, quarantines, disruptions to supply chains and customer activity, as well as general concern and uncertainty. The impact of this pandemic, and other global health crises that may arise in the future, could affect the economies of many nations, individual companies and the market in general in ways that cannot necessarily be foreseen at the present time. This pandemic may result in substantial market volatility and may adversely impact the prices and liquidity of a fund’s investments. The impact of the pandemic may be short term or may last for an extended period of time.
Counterparty Credit Risk:The Funds may be exposed to counterparty credit risk, or the risk that an entity may fail to or be unable to perform on its commitments related to unsettled or open transactions. The Funds manage counterparty credit risk by entering into transactions only with counterparties that the Manager believes have the financial resources to honor their obligations and by monitoring the financial stability of those counterparties. Financial assets, which potentially expose the Funds to market, issuer and counterparty credit risks, consist principally of financial instruments and receivables due from counterparties. The extent of the Funds’ exposure to market, issuer and counterparty credit risks with respect to these financial assets is approximately their value recorded in the Statements of Assets and Liabilities, less any collateral held by the Funds.
A derivative contract may suffer amark-to-market loss if the value of the contract decreases due to an unfavorable change in the market rates or values of the underlying instrument. Losses can also occur if the counterparty does not perform under the contract.
A Fund’s risk of loss from counterparty credit risk on OTC derivatives is generally limited to the aggregate unrealized gain less the value of any collateral held by such Fund.
For OTC options purchased, each Fund bears the risk of loss in the amount of the premiums paid plus the positive change in market values net of any collateral held by the Funds should the counterparty fail to perform under the contracts. Options written by the Funds do not typically give rise to counterparty credit risk, as options written generally obligate the Funds, and not the counterparty, to perform. The Funds may be exposed to counterparty credit risk with respect to options written to the extent each Fund deposits collateral with its counterparty to a written option.
With exchange-traded options purchased and futures, there is less counterparty credit risk to the Funds since the exchange or clearinghouse, as counterparty to such instruments, guarantees against a possible default. The clearinghouse stands between the buyer and the seller of the contract; therefore, credit risk is limited to failure of the clearinghouse. While offset rights may exist under applicable law, a Fund does not have a contractual right of offset against a clearing broker or clearinghouse in the event of a default (including the bankruptcy or insolvency). Additionally, credit risk exists in exchange-traded futures with respect to initial and variation margin that is held in a clearing broker’s customer accounts. While clearing brokers are required to segregate customer margin from their own assets, in the event that a clearing broker becomes insolvent or goes into bankruptcy and at that time there is a shortfall in the aggregate amount of margin held by the clearing broker for all its clients, typically the shortfall would be allocated on a pro rata basis across all the clearing broker’s customers, potentially resulting in losses to the Funds.
Concentration Risk:Certain Funds invest a substantial amount of their assets in issuers located in a single country or a limited number of countries. When the Funds concentrate their investments in this manner, it assumes the risk that economic, political and social conditions in those countries may have a significant impact on their investment performance. Foreign issuers may not be subject to the same uniform accounting, auditing and financial reporting standards and practices as used in the United States. Foreign securities markets may also be more volatile and less liquid than U.S. securities and may be less subject to governmental supervision not typically associated with investing in U.S. securities. Investment percentages in specific countries are presented in the Schedules of Investments.
Advantage Emerging Markets invests a significant portion of its assets in securities of issuers located in Asia or with significant exposure to Asian issuers or countries. The Asian financial markets have recently experienced volatility and adverse trends due to concerns in several Asian countries regarding monetary policy, government intervention in the markets, rising government debt levels or economic downturns. These events may spread to other countries in Asia and may affect the value and liquidity of certain of the Fund’s investments.
| 11. | CAPITAL SHARE TRANSACTIONS |
Transactions in capital shares for each class were as follows:
| Period from 08/01/19 to 04/30/20 | Year Ended 07/31/19 | Year Ended 07/31/18 | ||||||||||||||||||||||
| Advantage Emerging Markets Fund | Shares | Amount | Shares | Amount | Shares | Amount | ||||||||||||||||||
Institutional | ||||||||||||||||||||||||
Shares sold | 59,500 | $ | 583,098 | 679,066 | $ | 6,836,422 | 12,206,870 | $ | 136,269,042 | |||||||||||||||
Shares issued in reinvestment of distributions | 25,009 | 264,098 | — | — | — | — | ||||||||||||||||||
Shares redeemed | (540,784 | ) | (5,185,291 | ) | (2,222,832 | ) | (22,108,842 | ) | (19,634,436 | ) | (221,515,541 | ) | ||||||||||||
|
|
|
|
|
|
|
|
|
|
|
| |||||||||||||
Net decrease | (456,275 | ) | $ | (4,338,095 | ) | (1,543,766 | ) | $ | (15,272,420 | ) | (7,427,566 | ) | $ | (85,246,499 | ) | |||||||||
|
|
|
|
|
|
|
|
|
|
|
| |||||||||||||
| NOTESTO FINANCIAL STATEMENTS | 103 |
Notes to Financial Statements (continued)
| Period from 08/01/19 to 04/30/20 | Year Ended 07/31/19 | Year Ended 07/31/18 | ||||||||||||||||||||||
| Advantage Emerging Markets Fund | Shares | Amount | Shares | Amount | Shares | Amount | ||||||||||||||||||
Investor A | ||||||||||||||||||||||||
Shares sold and automatic conversion of shares | 287,739 | $ | 2,546,246 | 184,254 | $ | 1,895,000 | 368,426 | $ | 4,165,480 | |||||||||||||||
Shares issued in reinvestment of distributions | 7,600 | 78,963 | — | — | — | — | ||||||||||||||||||
Shares redeemed | (73,256 | ) | (695,697 | ) | (328,128 | ) | (3,161,389 | ) | (173,715 | ) | (1,861,090 | ) | ||||||||||||
|
|
|
|
|
|
|
|
|
|
|
| |||||||||||||
Net increase (decrease) | 222,083 | $ | 1,929,512 | (143,874 | ) | $ | (1,266,389 | ) | 194,711 | $ | 2,304,390 | |||||||||||||
|
|
|
|
|
|
|
|
|
|
|
| |||||||||||||
| Period from 08/01/19 to 04/30/20 | Year Ended 07/31/19 | Year Ended 07/31/18 | ||||||||||||||||||||||
| Advantage Emerging Markets Fund | Shares | Amount | Shares | Amount | Shares | Amount | ||||||||||||||||||
Investor C | ||||||||||||||||||||||||
Shares sold | 2,255 | $ | 22,122 | 6,834 | $ | 62,855 | 23,036 | $ | 244,705 | |||||||||||||||
Shares issued in reinvestment of distributions | 897 | 8,915 | — | — | — | — | ||||||||||||||||||
Shares redeemed and automatic conversion of shares | (102,004 | ) | (936,146 | ) | (93,436 | ) | (854,036 | ) | (96,301 | ) | (996,616 | ) | ||||||||||||
|
|
|
|
|
|
|
|
|
|
|
| |||||||||||||
Net decrease | (98,852 | ) | $ | (905,109 | ) | (86,602 | ) | $ | (791,181 | ) | (73,265 | ) | $ | (751,911 | ) | |||||||||
|
|
|
|
|
|
|
|
|
|
|
| |||||||||||||
| Period from 01/25/18 to 07/31/18 | ||||||||||||||||||||||||
Class K | ||||||||||||||||||||||||
Shares sold | 4,055,785 | $ | 39,786,672 | 4,600,094 | $ | 45,101,567 | 18,479,764 | $ | 209,961,919 | |||||||||||||||
Shares issued in reinvestment of distributions | 192,716 | 2,033,150 | — | — | — | — | ||||||||||||||||||
Shares redeemed | (2,465,921 | ) | (23,899,496 | ) | (10,485,440 | ) | (105,056,304 | ) | (4,743,884 | ) | (52,130,663 | ) | ||||||||||||
|
|
|
|
|
|
|
|
|
|
|
| |||||||||||||
Net increase (decrease) | 1,782,580 | $ | 17,920,326 | (5,885,346 | ) | $ | (59,954,737 | ) | 13,735,880 | $ | 157,831,256 | |||||||||||||
|
|
|
|
|
|
|
|
|
|
|
| |||||||||||||
Total Net Increase (Decrease) | 1,449,536 | $ | 14,606,634 | (7,659,588 | ) | $ | (77,284,727 | ) | 6,429,760 | $ | 74,137,236 | |||||||||||||
|
|
|
|
|
|
|
|
|
|
|
| |||||||||||||
| Period from 08/01/19 to 04/30/20 | Year Ended 07/31/19 | Year Ended 07/31/18 | ||||||||||||||||||||||
| Global Long/Short Equity | Shares | Amount | Shares | Amount | Shares | Amount | ||||||||||||||||||
Institutional | ||||||||||||||||||||||||
Shares sold | 19,507,283 | $ | 230,149,138 | 15,050,878 | $ | 186,626,984 | 22,736,814 | $ | 274,085,610 | |||||||||||||||
Shares issued in reinvestment of distributions | 2,010,045 | 23,115,520 | 270,407 | 3,293,554 | — | — | ||||||||||||||||||
Shares redeemed | (21,587,415 | ) | (251,472,473 | ) | (18,097,432 | ) | (224,453,776 | ) | (23,663,426 | ) | (284,313,042 | ) | ||||||||||||
|
|
|
|
|
|
|
|
|
|
|
| |||||||||||||
Net increase (decrease) | (70,087 | ) | $ | 1,792,185 | (2,776,147 | ) | $ | (34,533,238 | ) | (926,612 | ) | $ | (10,227,432 | ) | ||||||||||
|
|
|
|
|
|
|
|
|
|
|
| |||||||||||||
Investor A | ||||||||||||||||||||||||
Shares sold and automatic conversion of shares | 778,118 | $ | 9,051,266 | 675,932 | $ | 8,269,287 | 4,395,287 | $ | 52,035,112 | |||||||||||||||
Shares issued in reinvestment of distributions | 165,473 | 1,879,770 | 33,587 | 404,392 | — | — | ||||||||||||||||||
Shares redeemed | (2,817,305 | ) | (33,535,373 | ) | (836,781 | ) | (10,217,483 | ) | (3,404,106 | ) | (40,817,764 | ) | ||||||||||||
|
|
|
|
|
|
|
|
|
|
|
| |||||||||||||
Net increase (decrease) | (1,873,714 | ) | $ | (22,604,337 | ) | (127,262 | ) | $ | (1,543,804 | ) | 991,181 | $ | 11,217,348 | |||||||||||
|
|
|
|
|
|
|
|
|
|
|
| |||||||||||||
Investor C | ||||||||||||||||||||||||
Shares sold | 60,668 | $ | 681,106 | 196,342 | $ | 2,300,717 | 228,464 | $ | 2,635,606 | |||||||||||||||
Shares issued in reinvestment of distributions | 75,994 | 827,570 | 8,705 | 100,982 | — | — | ||||||||||||||||||
Shares redeemed and automatic conversion of shares | (506,845 | ) | (5,673,845 | ) | (589,686 | ) | (6,931,926 | ) | (715,500 | ) | (8,247,429 | ) | ||||||||||||
|
|
|
|
|
|
|
|
|
|
|
| |||||||||||||
Net decrease | (370,183 | ) | $ | (4,165,169 | ) | (384,639 | ) | $ | (4,530,227 | ) | (487,036 | ) | $ | (5,611,823 | ) | |||||||||
|
|
|
|
|
|
|
|
|
|
|
| |||||||||||||
Class K | ||||||||||||||||||||||||
Shares sold | 51,096 | $ | 595,204 | 38,310 | $ | 480,954 | 433,125 | $ | 5,162,914 | |||||||||||||||
Shares issued in reinvestment of distributions | 2,152 | 24,794 | 254 | 3,097 | — | — | ||||||||||||||||||
Shares redeemed | (60,550 | ) | (704,301 | ) | (20,617 | ) | (262,158 | ) | (424,652 | ) | (5,162,424 | ) | ||||||||||||
|
|
|
|
|
|
|
|
|
|
|
| |||||||||||||
Net increase (decrease) | (7,302 | ) | $ | (84,303 | ) | 17,947 | $ | 221,893 | 8,473 | $ | 490 | |||||||||||||
|
|
|
|
|
|
|
|
|
|
|
| |||||||||||||
Total Net Decrease | (2,321,286 | ) | $ | (25,061,624 | ) | (3,270,101 | ) | $ | (40,385,376 | ) | (413,994 | ) | $ | (4,621,417 | ) | |||||||||
|
|
|
|
|
|
|
|
|
|
|
| |||||||||||||
| 12. | SUBSEQUENT EVENTS |
Management has evaluated the impact of all subsequent events on the Funds through the date the financial statements were issued and has determined that there were no subsequent events requiring adjustment or additional disclosure in the financial statements.
| 104 | 2020 BLACKROCK ANNUAL REPORTTO SHAREHOLDERS |
Report of Independent Registered Public Accounting Firm
To the Shareholders of BlackRock Advantage Emerging Markets Fund and BlackRock Global Long/Short Equity Fund and the Board of Trustees of BlackRock FundsSM:
Opinion on the Financial Statements and Financial Highlights
We have audited the accompanying statements of assets and liabilities of BlackRock Advantage Emerging Markets Fund and BlackRock Global Long/Short Equity Fund of BlackRock FundsSM (the “Funds”), including the schedules of investments, as of April 30, 2020, the related statements of operations, the statements of changes in net assets, and the financial highlights for the period from August 1, 2019 through April 30, 2020, and the related notes. In our opinion, the financial statements and financial highlights present fairly, in all material respects, the financial position of the Funds as of April 30, 2020, and the results of their operations, the changes in their net assets, and the financial highlights for the period from August 1, 2019 through April 30, 2020, in conformity with accounting principles generally accepted in the United States of America.
The statements of operations for the year ended July 31, 2019, the statements of changes in net assets for each of the two years in the period ended July 31, 2019, and the financial highlights for each of the five years in the period ended July 31, 2019 of the Funds were audited by other auditors whose report dated September 24, 2019, expressed an unqualified opinion on those financial statements and financial highlights.
Basis for Opinion
These financial statements and financial highlights are the responsibility of the Funds’ management. Our responsibility is to express an opinion on the Funds’ financial statements and financial highlights based on our audits. We are a public accounting firm registered with the Public Company Accounting Oversight Board (United States) (PCAOB) and are required to be independent with respect to the Funds in accordance with the U.S. federal securities laws and the applicable rules and regulations of the Securities and Exchange Commission and the PCAOB.
We conducted our audits in accordance with the standards of the PCAOB. Those standards require that we plan and perform the audit to obtain reasonable assurance about whether the financial statements and financial highlights are free of material misstatement, whether due to error or fraud. The Funds are not required to have, nor were we engaged to perform, an audit of their internal control over financial reporting. As part of our audits we are required to obtain an understanding of internal control over financial reporting but not for the purpose of expressing an opinion on the effectiveness of the Funds’ internal control over financial reporting. Accordingly, we express no such opinion.
Our audits included performing procedures to assess the risks of material misstatement of the financial statements and financial highlights, whether due to error or fraud, and performing procedures that respond to those risks. Such procedures included examining, on a test basis, evidence regarding the amounts and disclosures in the financial statements and financial highlights. Our audits also included evaluating the accounting principles used and significant estimates made by management, as well as evaluating the overall presentation of the financial statements and financial highlights. Our procedures included confirmation of securities owned as of April 30, 2020, by correspondence with the custodian and brokers; when replies were not received from brokers, we performed other auditing procedures. We believe that our audits provide a reasonable basis for our opinion.
Deloitte & Touche LLP
Boston, Massachusetts
June 22, 2020
We have served as the auditor of one or more BlackRock investment companies since 1992.
| REPORTOF INDEPENDENT REGISTERED PUBLIC ACCOUNTING FIRM / IMPORTANT TAX INFORMATION | 105 |
Important Tax Information (unaudited)
The following maximum amounts are hereby designated as qualified dividend income for individuals for the fiscal year ended April 30, 2020:
| Fund | Qualified Dividend Income | |||
Advantage Emerging Markets | $ | 1,815,421 | ||
For the fiscal year ended April 30, 2020, the Fund intends to pass through to its shareholders foreign source income earned and foreign taxes paid by the underlying funds:
| Fund | Foreign Source Income Earned | Foreign Taxes Paid | ||||||
Advantage Emerging Markets | $ | 2,912,754 | $ | 620,462 | ||||
For the fiscal year ended April 30, 2020, the Funds hereby designate the following maximum amounts allowable as interest-related dividends eligible for exemption from U.S. withholding tax for nonresident aliens and foreign corporations:
| Fund | Interest-Related Dividends | |||
Advantage Emerging Markets | $ | 134,631 | ||
Global Long/Short Equity | 2,197,931 | |||
The Fund hereby designates the following amount of distributions from direct federal obligation interest for the fiscal year ended April 30, 2020:
| Fund | Federal Obligation Interest | |||
Global Long/Short Equity | $ | 2,196,588 | ||
The law varies in each state as to whether and what percent of ordinary income dividends attribute to federal obligations is exempt from state income tax. Shareholders are advised to check with their tax advisers to determine if any portion of the dividends received is exempt from state income tax.
The following distribution amounts are hereby designated for the fiscal year ended April 30, 2020:
| Fund | Short-Term Capital Gain Dividends | |||
Global Long/Short Equity | $ | 35,825,799 | ||
| 106 | 2020 BLACKROCK ANNUAL REPORTTO SHAREHOLDERS |
Statement Regarding Liquidity Risk Management Program
The Securities and Exchange Commission adopted Rule 22e-4 under the Investment Company Act of 1940, as amended (the “Liquidity Rule”) to promote effective liquidity risk management throughout the open-end investment company industry, thereby reducing the risk that funds will be unable to meet their redemption obligations and mitigating dilution of the interests of fund shareholders.
The Board of Trustees the “Board” of BlackRock FundsSM, on behalf of BlackRock Advantage Emerging Markets Fund and BlackRock Global Long/Short Equity Fund, met on November 12-13, 2019 (the “Meeting”) to review the liquidity risk management program (the “Program”) applicable to the BlackRock open-end funds, excluding money market funds (each, a “Fund”), pursuant to the Liquidity Rule. The Board has appointed BlackRock Advisors, LLC or BlackRock Fund Advisors (“BlackRock”), each an investment adviser to certain Funds, as the program administrator for each Fund’s Program, as applicable. BlackRock has delegated oversight of the Program to the 40 Act Liquidity Risk Management Committee (the “Committee”). At the Meeting, the Committee, on behalf of BlackRock, provided the Board with a report that addressed the operation of the Program and assessed its adequacy and effectiveness of implementation, including the operation of each Fund’s Highly Liquid Investment Minimum (“HLIM”) where applicable, and any material changes to the Program (the “Report”). The Report covered the period from December 1, 2018 through September 30, 2019 (the “Program Reporting Period”).
The Report described the Program’s liquidity classification methodology for categorizing a Fund’s investments (including derivative transactions) into one of four liquidity buckets. It also described BlackRock’s methodology in establishing a Fund’s HLIM and noted that the Committee reviews and ratifies the HLIM assigned to each Fund no less frequently than annually.
The Report noted that the Program complied with the key factors for consideration under the Liquidity Rule for assessing, managing and periodically reviewing a Fund’s liquidity risk, as follows:
A. The Fund’s investment strategy and liquidity of portfolio investments during both normal and reasonably foreseeable stressed conditions: During the Program Reporting Period, the Committee reviewed whether each Fund’s strategy is appropriate for an open-end fund structure with a focus on Funds with more significant and consistent holdings of less liquid and illiquid assets. The Committee also factored a Fund’s concentration in an issuer into the liquidity classification methodology by taking issuer position sizes into account. Where a Fund participated in borrowings for investment purposes (such as tender option bonds and reverse repurchase agreements), such borrowings were factored into the Program’s calculation of a Fund’s liquidity bucketing. Derivative exposure was also considered in such calculation.
B. Short-term and long-term cash flow projections during both normal and reasonably foreseeable stressed conditions: During the Program Reporting Period, the Committee reviewed historical net redemption activity and used this information as a component to establish each Fund’s reasonably anticipated trading size (“RATS”). Each Fund has adopted an in-kind redemption policy which may be utilized to meet larger redemption requests. The Committee may also take into consideration a Fund’sshareholder ownership concentration (which, depending on product type and distribution channel, may or may not be available), a Fund’s distribution channels, and the degree of certainty associated with a Fund’s short-term and long-term cash flow projections.
C. Holdings of cash and cash equivalents, as well as borrowing arrangements: The Committee considered the terms of the credit facility applicable to the Funds, the financial health of the institution providing the facility and the fact that the credit facility is shared among multiple Funds (including that a portion of the aggregate commitment amount is specifically designated for BlackRock Floating Rate Income Portfolio, a series of BlackRock Funds V). The Committee also considered other types of borrowing available to the Funds, such as the ability to use reverse repurchase agreements and interfund lending, as applicable.
There were no material changes to the Program during the Program Reporting Period. The Report provided to the Board stated that the Committee concluded that based on the operation of the functions, as described in the Report, the Program is operating as intended and is effective in implementing the requirements of the Liquidity Rule.
| STATEMENT REGARDING LIQUIDITY RISK MANAGEMENT PROGRAM | 107 |
Trustee and Officer Information
| Independent Trustees (a) | ||||||||
| Name Year of Birth (b) | Position(s) Held (Length of Service) (c) | Principal Occupation(s) During Past Five Years | Number of BlackRock-Advised Registered Investment Companies (“RICs”) Consisting of Investment Portfolios (“Portfolios”) Overseen | Public Company and Other Investment Company Directorships Held During Past Five Years | ||||
Mark Stalnecker 1951 | Chair of the Board (Since 2019) | Chief Investment Officer, University of Delaware from 1999 to 2013; Trustee and Chair of the Finance and Investment Committees, Winterthur Museum and Country Estate from 2005 to 2016; Member of the Investment Committee, Delaware Public Employees’ Retirement System since 2002; Member of the Investment Committee, Christiana Care Health System from 2009 to 2017; Member of the Investment Committee, Delaware Community Foundation from 2013 to 2014; Director and Chair of the Audit Committee, SEI Private Trust Co. from 2001 to 2014. | 36 RICs consisting of 150 Portfolios | None | ||||
Bruce R. Bond 1946 | Trustee (Since 2019) | Board Member, Amsphere Limited (software) since 2018; Trustee and Member of the Governance Committee, State Street Research Mutual Funds from 1997 to 2005; Board Member of Governance, Audit and Finance Committee, Avaya Inc. (computer equipment) from 2003 to 2007. | 36 RICs consisting of 150 Portfolios | None | ||||
Susan J. Carter 1956 | Trustee (Since 2016) | Director, Pacific Pension Institute from 2014 to 2018; Advisory Board Member, Center for Private Equity and Entrepreneurship at Tuck School of Business since 1997; Senior Advisor, Commonfund Capital, Inc. (“CCI”) (investment adviser) in 2015; Chief Executive Officer, CCI from 2013 to 2014; President & Chief Executive Officer, CCI from 1997 to 2013; Advisory Board Member, Girls Who Invest from 2015 to 2018 and Board Member thereof since 2018; Advisory Board Member, Bridges Fund Management since 2016; Trustee, Financial Accounting Foundation since 2017; Practitioner Advisory Board Member, Private Capital Research Institute (“PCRI”) since 2017; Lecturer in the Practice of Management, Yale School of Management since 2019. | 36 RICs consisting of 150 Portfolios | None | ||||
Collette Chilton 1958 | Trustee (Since 2015) | Chief Investment Officer, Williams College since 2006; Chief Investment Officer, Lucent Asset Management Corporation from 1998 to 2006. | 36 RICs consisting of 150 Portfolios | None | ||||
Neil A. Cotty 1954 | Trustee (Since 2016) | Bank of America Corporation from 1996 to 2015, serving in various senior finance leadership roles, including Chief Accounting Officer from 2009 to 2015, Chief Financial Officer of Global Banking, Markets and Wealth Management from 2008 to 2009, Chief Accounting Officer from 2004 to 2008, Chief Financial Officer of Consumer Bank from 2003 to 2004, Chief Financial Officer of Global Corporate Investment Bank from 1999 to 2002. | 36 RICs consisting of 150 Portfolios | None | ||||
Lena G. Goldberg 1949 | Trustee (Since 2019) | Senior Lecturer, Harvard Business School, since 2008; Director, Charles Stark Draper Laboratory, Inc. since 2013; FMR LLC/Fidelity Investments (financial services) from 1996 to 2008, serving in various senior roles including Executive Vice President — Strategic Corporate Initiatives and Executive Vice President and General Counsel; Partner, Sullivan & Worcester LLP from 1985 to 1996 and Associate thereof from 1979 to 1985. | 36 RICs consisting of 150 Portfolios | None | ||||
| 108 | 2020 BLACKROCK ANNUAL REPORTTO SHAREHOLDERS |
Trustee and Officer Information (continued)
| Independent Trustees (a)(continued) | ||||||||
| Name Year of Birth (b) | Position(s) Held (Length of Service) (c) | Principal Occupation(s) During Past Five Years | Number of BlackRock-Advised Registered Investment Companies (“RICs”) Consisting of Investment Portfolios (“Portfolios”) Overseen | Public Company and Other Investment Company Directorships Held During Past Five Years | ||||
Henry R. Keizer 1956 | Trustee (Since 2019) | Director, Park Indemnity Ltd. (captive insurer) since 2010; Director, MUFG Americas Holdings Corporation and MUFG Union Bank, N.A. (financial and bank holding company) from 2014 to 2016; Director, American Institute of Certified Public Accountants from 2009 to 2011; Director, KPMG LLP (audit, tax and advisory services) from 2004 to 2005 and 2010 to 2012; Director, KPMG International in 2012, Deputy Chairman and Chief Operating Officer thereof from 2010 to 2012 and U.S. Vice Chairman of Audit thereof from 2005 to 2010; Global Head of Audit, KPMGI (consortium of KPMG firms) from 2006 to 2010; Director, YMCA of Greater New York from 2006 to 2010. | 36 RICs consisting of 150 Portfolios | Hertz Global Holdings (car rental); Montpelier Re Holdings, Ltd. (publicly held property and casualty reinsurance) from 2013 until 2015; Sealed Air Corp. (packaging); WABCO (commercial vehicle safety systems) | ||||
Cynthia A. Montgomery 1952 | Trustee (Since 2007) | Professor, Harvard Business School since 1989. | 36 RICs consisting of 150 Portfolios | Newell Rubbermaid, Inc. (manufacturing) | ||||
Donald C. Opatrny 1952 | Trustee (Since 2019) | Trustee, Vice Chair, Member of the Executive Committee and Chair of the Investment Committee, Cornell University since 2004; President, Trustee and Member of the Investment Committee, The Aldrich Contemporary Art Museum from 2007 to 2014; Member of the Board and Investment Committee, University School from 2007 to 2018; Member of the Investment Committee, Mellon Foundation from 2009 to 2015; Trustee, Artstor (a Mellon Foundation affiliate) from 2010 to 2015; President and Trustee, the Center for the Arts, Jackson Hole from 2011 to 2018; Director, Athena Capital Advisors LLC (investment management firm) since 2013; Trustee and Chair of the Investment Committee, Community Foundation of Jackson Hole since 2014; Member of Affordable Housing Supply Board of Jackson, Wyoming since 2018; Member, Investment Funds Committee, State of Wyoming since 2017; Trustee, Phoenix Art Museum since 2018; Trustee, Arizona Community Foundation and Member of Investment Committee since 2020. | 36 RICs consisting of 150 Portfolios | None | ||||
Joseph P. Platt 1947 | Trustee (Since 2007) | General Partner, Thorn Partners, LP (private investments) since 1998; Director, WQED Multi-Media (public broadcastingnot-for-profit) since 2001; Chair, Basic Health International(non-profit) since 2015. | 36 RICs consisting of 150 Portfolios | Greenlight Capital Re, Ltd. (reinsurance company); Consol Energy Inc. | ||||
Kenneth L. Urish 1951 | Trustee (Since 2007) | Managing Partner, Urish Popeck & Co., LLC (certified public accountants and consultants) since 1976;Past-Chairman of the Professional Ethics Committee of the Pennsylvania Institute of Certified Public Accountants and Committee Member thereof since 2007; Member of External Advisory Board, The Pennsylvania State University Accounting Department since founding in 2001; Principal, UP Strategic Wealth Investment Advisors, LLC since 2013; Trustee, The Holy Family Institute from 2001 to 2010; President and Trustee, Pittsburgh Catholic Publishing Associates from 2003 to 2008; Director,Inter-Tel from 2006 to 2007. | 36 RICs consisting of 150 Portfolios | None | ||||
Claire A. Walton 1957 | Trustee (Since 2016) | Chief Operating Officer and Chief Financial Officer of Liberty Square Asset Management, LP from 1998 to 2015; General Partner of Neon Liberty Capital Management, LLC since 2003; Director, Boston Hedge Fund Group from 2009 to 2018; Director, Woodstock Ski Runners since 2013; Director, Massachusetts Council on Economic Education from 2013 to 2015. | 36 RICs consisting of 150 Portfolios | None | ||||
| TRUSTEEAND OFFICER INFORMATION | 109 |
Trustee and Officer Information (continued)
| Interested Trustees (a)(d) | ||||||||
| Name Year of Birth (b) | Position(s) Held (Length of Service) (c) | Principal Occupation(s) During Past Five Years | Number of BlackRock-Advised Registered Investment Companies (“RICs”) Consisting of Investment Portfolios (“Portfolios”) Overseen | Public Company and Other Investment Company Directorships Held During Past Five Years | ||||
Robert Fairbairn 1965 | Trustee (Since 2018) | Vice Chairman of BlackRock, Inc. since 2019; Member of BlackRock’s Global Executive and Global Operating Committees;Co-Chair of BlackRock’s Human Capital Committee; Senior Managing Director of BlackRock, Inc. from 2010 to 2019; oversaw BlackRock’s Strategic Partner Program and Strategic Product Management Group from 2012 to 2019; Member of the Board of Managers of BlackRock Investments, LLC from 2011 to 2018; Global Head of BlackRock’s Retail and iShares® businesses from 2012 to 2016. | 123 RICs consisting of 261 Portfolios | None | ||||
John M. Perlowski (e) 1964 | Trustee (Since 2015) and President and Chief Executive Officer (Since 2010) | Managing Director of BlackRock, Inc. since 2009; Head of BlackRock Global Accounting and Product Services since 2009; Advisory Director of Family Resource Network (charitable foundation) since 2009. | 124 RICs consisting of 262 Portfolios | None | ||||
(a) The address of each Trustee is c/o BlackRock, Inc., 55 East 52nd Street, New York, New York 10055. | ||||||||
(b) Independent Trustees serve until their resignation, retirement, removal or death, or until December 31 of the year in which they turn 75. The Board may determine to extend the terms of Independent Trustees on acase-by-case basis, as appropriate. | ||||||||
(c) Following the combination of Merrill Lynch Investment Managers, L.P. (“MLIM”) and BlackRock, Inc. in September 2006, the various legacy MLIM and legacy BlackRock fund boards were realigned and consolidated into three new fund boards in 2007. Furthermore, effective January 1, 2019, three BlackRock Fund Complexes were realigned and consolidated into two BlackRock Fund Complexes. As a result, although the chart shows the year that each Independent Trustee joined the Board, certain Independent Trustees first became members of the boards of other BlackRock-advised Funds, legacy MLIM funds or legacy BlackRock funds as follows: Bruce R. Bond, 2005; Cynthia A. Montgomery, 1994; Joseph P. Platt, 1999; Kenneth L. Urish, 1999; Lena G. Goldberg, 2016; Henry R. Keizer, 2016; Donald C. Opatrny, 2015. | ||||||||
(d) Mr. Fairbairn and Mr. Perlowski are both “interested persons,” as defined in the Act 1940 Act, of the Trust based on their positions with BlackRock, Inc. and its affiliates. Mr. Fairbairn and Mr. Perlowski are also board members of the BlackRock Fixed-Income Complex. | ||||||||
(e) Mr. Perlowski is also a trustee of the BlackRock Credit Strategies Fund. | ||||||||
| 110 | 2020 BLACKROCK ANNUAL REPORTTO SHAREHOLDERS |
Trustee and Officer Information (continued)
| Officers Who Are Not Trustees (a) | ||||
| Name Year of Birth (b) | Position(s) Held (Length of Service) | Principal Occupation(s) During Past Five Years | ||
Thomas Callahan 1968 | Vice President (Since 2016) | Managing Director of BlackRock, Inc. since 2013; Member of the Board of Managers of BlackRock Investments, LLC (principal underwriter) since 2019 and Managing Director thereof since 2017; Head of BlackRock’s Global Cash Management Business since 2016;Co-Head of the Global Cash Management Business from 2014 to 2016; Deputy Head of the Global Cash Management Business from 2013 to 2014; Member of the Cash Management Group Executive Committee since 2013; Chief Executive Officer of NYSE Liffe U.S. from 2008 to 2013. | ||
Jennifer McGovern 1977 | Vice President (Since 2014) | Managing Director of BlackRock, Inc. since 2016; Director of BlackRock, Inc. from 2011 to 2015; Head of Product Development and Oversight for BlackRock’s Strategic Product Management Group since 2019; Head of Product Structure and Oversight for BlackRock’s U.S. Wealth Advisory Group from 2013 to 2019. | ||
Neal J. Andrews 1966 | Chief Financial Officer (Since 2007) | Chief Financial Officer of the iShares® exchange traded funds from 2019 to 2020; Managing Director of BlackRock, Inc. since 2006. | ||
Jay M. Fife 1970 | Treasurer (Since 2007) | Managing Director of BlackRock, Inc. since 2007. | ||
Charles Park 1967 | Chief Compliance Officer (Since 2014) | Anti-Money Laundering Compliance Officer for certain BlackRock-advised Funds from 2014 to 2015; Chief Compliance Officer of BlackRock Advisors, LLC and the BlackRock-advised Funds in the BlackRock Multi-Asset Complex and the BlackRock Fixed-Income Complex since 2014; Principal of and Chief Compliance Officer for iShares® Delaware Trust Sponsor LLC since 2012 and BlackRock Fund Advisors (“BFA”) since 2006; Chief Compliance Officer for theBFA-advised iShares® exchange traded funds since 2006; Chief Compliance Officer for BlackRock Asset Management International Inc. since 2012. | ||
Lisa Belle 1968 | Anti-Money Laundering Compliance Officer (Since 2019) | Managing Director of BlackRock, Inc. since 2019; Global Financial Crime Head for Asset and Wealth Management of JP Morgan from 2013 to 2019; Managing Director of RBS Securities from 2012 to 2013; Head of Financial Crimes for Barclays Wealth Americas from 2010 to 2012. | ||
Janey Ahn 1975 | Secretary (Since 2019) | Managing Director of BlackRock, Inc. since 2018; Director of BlackRock, Inc. from 2009 to 2017. | ||
(a) The address of each Officer is c/o BlackRock, Inc., 55 East 52nd Street, New York, New York 10055. | ||||
(b) Officers of the Trust serve at the pleasure of the Board. | ||||
Further information about the Trust’s Trustees and Officers is available in the Trust’s Statement of Additional Information, which can be obtained without charge by calling(800) 441-7762.
Effective December 31, 2019, Robert M. Hernandez retired as Trustee of the Trusts.
Investment Adviser and Administrator
BlackRock Advisors, LLC
Wilmington, DE 19809
Sub-Adviser(a)
BlackRock International Limited
Edinburgh, EH3 8BL
United Kingdom
Accounting Agent and Custodian
State Street Bank and Trust Company
Boston, MA 02111
Transfer Agent
BNY Mellon Investment Servicing (US) Inc.
Wilmington, DE 19809
Distributor
BlackRock Investments, LLC
New York, NY 10022
Independent Registered Public Accounting Firm
Deloitte & Touche LLP
Boston, MA 02116
Legal Counsel
Sidley Austin LLP
New York, NY 10019
Address of the Trust
100 Bellevue Parkway
Wilmington, DE 19809
| (a) | For Global Long/Short Equity |
| TRUSTEEAND OFFICER INFORMATION | 111 |
General Information
Householding
The Funds will mail only one copy of shareholder documents, including prospectuses, annual and semi-annual reports and proxy statements, to shareholders with multiple accounts at the same address. This practice is commonly called “householding” and is intended to reduce expenses and eliminate duplicate mailings of shareholder documents. Mailings of your shareholder documents may be householded indefinitely unless you instruct us otherwise. If you do not want the mailing of these documents to be combined with those for other members of your household, please call the Funds at(800) 441-7762.
Availability of Quarterly Schedule of Investments
The Funds file their complete schedule of portfolio holdings with the SEC for the first and third quarters of each fiscal year as an exhibit to their reports on Form N-PORT, and for reporting periods ended prior to March 31, 2019, filed such information on Form N-Q. The Funds’ Forms N-PORT and N-Q are available on the SEC’s website at sec.gov. The Funds’ Forms N-Q may also be obtained upon request and without charge by calling (800) 441-7762.
Availability of Proxy Voting Policies and Procedures
A description of the policies and procedures that the Funds use to determine how to vote proxies relating to portfolio securities is available upon request and without charge (1) by calling (800) 441-7762; (2) atblackrock.com; and (3) on the SEC’s website at sec.gov.
Availability of Proxy Voting Record
Information about how the Funds voted proxies relating to securities held in the Funds’ portfolios during the most recent 12-month period ended June 30 is available upon request and without charge (1) atblackrock.com; or by calling (800) 441-7762 and (2) on the SEC’s website at sec.gov.
BlackRock’s Mutual Fund Family
BlackRock offers a diverse lineup of open-end mutual funds crossing all investment styles and managed by experts in equity, fixed-income and tax-exempt investing. Visitblackrock.com for more information.
Shareholder Privileges
Account Information
Call us at (800) 441-7762 from 8:00 AM to 6:00 PM ET on any business day to get information about your account balances, recent transactions and share prices. You can visitblackrock.com for more information.
Automatic Investment Plans
Investor class shareholders who want to invest regularly can arrange to have $50 or more automatically deducted from their checking or savings account and invested in any of the BlackRock funds.
Systematic Withdrawal Plans
Investor class shareholders can establish a systematic withdrawal plan and receive periodic payments of $50 or more from their BlackRock funds, as long as their account balance is at least $10,000.
Retirement Plans
Shareholders may make investments in conjunction with Traditional, Rollover, Roth, Coverdell, Simple IRAs, SEP IRAs and 403(b) Plans.
| 112 | 2020 BLACKROCK ANNUAL REPORTTO SHAREHOLDERS |
Additional Information (continued)
BlackRock Privacy Principles
BlackRock is committed to maintaining the privacy of its current and former fund investors and individual clients (collectively, “Clients”) and to safeguarding their non-public personal information. The following information is provided to help you understand what personal information BlackRock collects, how we protect that information and why in certain cases we share such information with select parties.
If you are located in a jurisdiction where specific laws, rules or regulations require BlackRock to provide you with additional or different privacy-related rights beyond what is set forth below, then BlackRock will comply with those specific laws, rules or regulations.
BlackRock obtains or verifies personal non-public information from and about you from different sources, including the following: (i) information we receive from you or, if applicable, your financial intermediary, on applications, forms or other documents; (ii) information about your transactions with us, our affiliates, or others; (iii) information we receive from a consumer reporting agency; and (iv) from visits to our websites.
BlackRock does not sell or disclose to non-affiliated third parties any non-public personal information about its Clients, except as permitted by law or as is necessary to respond to regulatory requests or to service Client accounts. These non-affiliated third parties are required to protect the confidentiality and security of this information and to use it only for its intended purpose.
We may share information with our affiliates to service your account or to provide you with information about other BlackRock products or services that may be of interest to you. In addition, BlackRock restricts access to non-public personal information about its Clients to those BlackRock employees with a legitimate business need for the information. BlackRock maintains physical, electronic and procedural safeguards that are designed to protect the non-public personal information of its Clients, including procedures relating to the proper storage and disposal of such information.
Glossary of Terms Used in this Report
| Currency | ||
| CHF | Swiss Franc | |
| Portfolio Abbreviations | ||
| ADR | American Depositary Receipts | |
| ETF | Exchange-Traded Fund | |
| GDR | Global Depositary Receipt | |
| JSC | Joint Stock Company | |
| MSCI | Morgan Stanley Capital International | |
| NVDR | Non-voting Depository Receipts | |
| OTC | Over-the-Counter | |
| PCL | Public Company Limited | |
| S&P | Standard and Poor’s | |
| ADDITIONAL INFORMATION / GLOSSARYOF TERMS USEDINTHIS REPORT | 113 |
Want to know more?
blackrock.com | 800-441-7762
This report is intended for current holders. It is not authorized for use as an offer of sale or a solicitation of an offer to buy shares of the Funds unless preceded or accompanied by the Funds’ current prospectus. Past performance results shown in this report should not be considered a representation of future performance. Investment returns and principal value of shares will fluctuate so that shares, when redeemed, may be worth more or less than their original cost. Statements and other information herein are as dated and are subject to change.
EMLSGLS-4/20-AR
|  |
| Item 3 – | Audit Committee Financial Expert – The registrant’s board of directors (the “board of directors”), has determined that (i) the registrant has the following audit committee financial experts serving on its audit committee and (ii) each audit committee financial expert is independent: |
Neil A. Cotty |
Henry R. Keizer |
Kenneth L. Urish |
Claire A. Walton |
Under applicable securities laws, a person determined to be an audit committee financial expert will not be deemed an “expert” for any purpose, including without limitation for the purposes of Section 11 of the Securities Act of 1933, as a result of being designated or identified as an audit committee financial expert. The designation or identification of a person as an audit committee financial expert does not impose on such person any duties, obligations, or liabilities greater than the duties, obligations, and liabilities imposed on such person as a member of the audit committee and board of directors in the absence of such designation or identification. The designation or identification of a person as an audit committee financial expert does not affect the duties, obligations, or liability of any other member of the audit committee or board of directors. |
| Item 4 – | Principal Accountant Fees and Services |
The following table presents fees billed by PricewaterhouseCoopers LLP (“PwC”) and Deloitte & Touche (“D&T”) in each of the last two fiscal years for the services rendered to the Fund: |
| (a) Audit Fees | (b) Audit-Related Fees1 | (c) Tax Fees2 | (d) All Other Fees | |||||||||||||
| Entity Name | Current Fiscal Year End3 | Previous End | Current End3 | Previous End | Current End3 | Previous End | Current End3 | Previous End | ||||||||
| BlackRock Advantage Emerging Markets Fund | $46,920 | $49,200 | $0 | $0 | $23,600 | $0 | $0 | $0 | ||||||||
| BlackRock Global Long/Short Equity Fund | $63,240 | $64,000 | $0 | $0 | $20,000 | $0 | $0 | $0 | ||||||||
2
The following table presents fees billed by PwC that were required to be approved by the registrant’s audit committee (the “Committee”) for services that relate directly to the operations or financial reporting of the Fund and that are rendered on behalf of BlackRock Advisors, LLC (“Investment Adviser” or “BlackRock”) and entities controlling, controlled by, or under common control with BlackRock (not including anysub-adviser whose role is primarily portfolio management and is subcontracted with or overseen by another investment adviser) that provide ongoing services to the Fund (“Affiliated Service Providers”): |
| Current Fiscal Year End3 | Previous Fiscal Year End | |||
(b) Audit-Related Fees1 | $0 | $0 | ||
(c) Tax Fees2 | $0 | $0 | ||
(d) All Other Fees4 | $0 | $0 |
1 The nature of the services includes assurance and related services reasonably related to the performance of the audit or review of financial statements not included in Audit Fees, including accounting consultations, agreed-upon procedure reports, attestation reports, comfort letters,out-of-pocket expenses and internal control reviews not required by regulators.
2 The nature of the services includes tax compliance and/or tax preparation, including services relating to the filing or amendment of federal, state or local income tax returns, regulated investment company qualification reviews, taxable income and tax distribution calculations.
3 BlackRock Advantage Emerging Markets Fund and BlackRock Global Long/Short Equity Fund each changed their fiscal year ends from July 31 to April 30 effective April 30, 2020 whereby the fiscal period for each fund consists of the nine months ended April 30.
4 Aggregate fees borne by BlackRock in connection with the review of compliance procedures and attestation thereto performed by PwC with respect to all of the registeredclosed-end funds and some of the registeredopen-end funds advised by BlackRock.
(e)(1) Audit CommitteePre-Approval Policies and Procedures:
The Committee has adopted policies and procedures with regard to thepre-approval of services. Audit, audit-related and tax compliance services provided to the registrant on an annual basis require specificpre-approval by the Committee. The Committee also must approve othernon-audit services provided to the registrant and thosenon-audit services provided to the Investment Adviser and Affiliated Service Providers that relate directly to the operations and the financial reporting of the registrant. Certain of thesenon-audit services that the Committee believes are (a) consistent with the SEC’s auditor independence rules and (b) routine and recurring services that will not impair the independence of the independent accountants may be approved by the Committee without consideration on a specificcase-by-case basis (“generalpre-approval”). The term of any generalpre-approval is 12 months from the date of thepre-approval, unless the Committee provides for a different period. Tax or othernon-audit services provided to the registrant which have a direct impact on the operations or financial reporting of the registrant will only be deemedpre-approved provided that any individual project does not exceed $10,000 attributable to the registrant or $50,000 per project. For this purpose, multiple projects will be aggregated to determine if they exceed the previously mentioned cost levels.
Any proposed services exceeding thepre-approved cost levels will require specificpre-approval by the Committee, as will any other services not subject to generalpre-approval (e.g., unanticipated but permissible services). The Committee is informed of each service approved subject to generalpre-approval at the next regularly scheduledin-person board meeting. At this meeting, an analysis of such services is presented to the Committee for ratification. The Committee may delegate to the Committee Chairman the authority to approve the provision of and fees for any specific engagement of permittednon-audit services, including services exceedingpre-approved cost levels.
(e)(2) None of the services described in each of Items 4(b) through (d) were approved by the Committee pursuant to the de minimis exception in paragraph (c)(7)(i)(C) of Rule2-01 of RegulationS-X. |
(f) Not Applicable |
3
(g) The aggregatenon-audit fees, defined as the sum of the fees shown under “Audit-Related Fees,” “Tax Fees” and “All Other Fees,” paid to the accountant for services rendered by the accountant to the registrant, the Investment Adviser and the Affiliated Service Providers were: |
| Entity Name | Current Fiscal Year End1 | Previous Fiscal Year End | ||
| BlackRock Advantage Emerging Markets Fund | $23,600 | $0 | ||
| BlackRock Global Long/Short Equity Fund | $20,000 | $0 |
1 BlackRock Advantage Emerging Markets Fund and BlackRock Global Long/Short Equity Fund each changed their fiscal year ends from
July 31 to April 30 effective April 30, 2020 whereby the fiscal period for each fund consists of the nine months ended April 30.
(h) The Committee has considered and determined that the provision ofnon-audit services that were rendered to the Investment Adviser and the Affiliated Service Providers that were notpre-approved pursuant to paragraph (c)(7)(ii) of Rule2-01 of RegulationS-X is compatible with maintaining the principal accountant’s independence. |
| Item 5 – | Audit Committee of Listed Registrant – Not Applicable |
| Item 6 – | Investments |
(a) The registrant’s Schedule of Investments is included as part of the Report to Stockholders filed under Item 1 of this Form. |
(b) Not Applicable due to no such divestments during the semi-annual period covered since the previous FormN-CSR filing. |
| Item 7 – | Disclosure of Proxy Voting Policies and Procedures forClosed-End Management Investment Companies – Not Applicable |
| Item 8 – | Portfolio Managers ofClosed-End Management Investment Companies – Not Applicable |
| Item 9 – | Purchases of Equity Securities byClosed-End Management Investment Company and Affiliated Purchasers – Not Applicable |
| Item 10 – | Submission of Matters to a Vote of Security Holders – There have been no material changes to these procedures. |
| Item 11 – | Controls and Procedures |
(a) The registrant’s principal executive and principal financial officers, or persons performing similar functions, have concluded that the registrant’s disclosure controls and procedures (as defined in Rule30a-3(c) under the Investment Company Act of 1940, as amended (the “1940 Act”)) are effective as of a date within 90 days of the filing of this report based on the evaluation of these controls and procedures required by Rule30a-3(b) under the 1940 Act and Rule 15d-15(b) under the Securities Exchange Act of 1934, as amended. |
(b) There were no changes in the registrant’s internal control over financial reporting (as defined in Rule30a-3(d) under the 1940 Act) that occurred during the period covered by this report that have materially affected, or are reasonably likely to materially affect, the registrant’s internal control over financial reporting. |
| Item 12 – | Disclosure of Securities Lending Activities forClosed-End Management Investment Companies –Not Applicable |
| Item 13 – | Exhibits attached hereto |
4
(a)(3) – Not Applicable |
(a)(4) – Not Applicable |
5
Pursuant to the requirements of the Securities Exchange Act of 1934 and the Investment Company Act of 1940, the registrant has duly caused this report to be signed on its behalf by the undersigned, thereunto duly authorized.
BlackRock Funds
| By: | /s/ John M. Perlowski | |
| John M. Perlowski | ||
| Chief Executive Officer (principal executive officer) of | ||
| BlackRock Funds |
Date: July 2, 2020
Pursuant to the requirements of the Securities Exchange Act of 1934 and the Investment Company Act of 1940, this report has been signed below by the following persons on behalf of the registrant and in the capacities and on the dates indicated.
| By: | /s/ John M. Perlowski | |
| John M. Perlowski | ||
| Chief Executive Officer (principal executive officer) of | ||
| BlackRock Funds |
Date: July 2, 2020
| By: | /s/ Neal J. Andrews | |
| Neal J. Andrews | ||
| Chief Financial Officer (principal financial officer) of | ||
| BlackRock Funds |
Date: July 2, 2020
6