UNITED STATES
SECURITIES AND EXCHANGE COMMISSION
Washington, D.C. 20549
FORMN-CSR
CERTIFIED SHAREHOLDER REPORT OF REGISTERED MANAGEMENT INVESTMENT COMPANIES
Investment Company Act file number:811-05742
Name of Fund: BlackRock Funds
BlackRock Total Emerging Markets Fund
Fund Address: 100 Bellevue Parkway, Wilmington, DE 19809
Name and address of agent for service: John M. Perlowski, Chief Executive Officer, BlackRock Funds, 55 East 52nd Street, New York, NY 10055
Registrant’s telephone number, including area code: (800)441-7762
Date of fiscal year end: 04/30/2020
Date of reporting period: 04/30/2020
Item 1 – Report to Stockholders
 | APRIL 30, 2020 |
| 2020 Annual Report | ||
BlackRock FundsSM
| · | BlackRock Total Emerging Markets Fund |
Beginning on January 1, 2021, as permitted by regulations adopted by the Securities and Exchange Commission, paper copies of the Fund’s shareholder reports will no longer be sent by mail, unless you specifically request paper copies of the reports from BlackRock or from your financial intermediary, such as a broker-dealer or bank. Instead, the reports will be made available on a website, and you will be notified by mail each time a report is posted and provided with a website link to access the report.
You may elect to receive all future reports in paper free of charge. If you hold accounts directly with BlackRock, you can call (800) 441-7762 to inform BlackRock that you wish to continue receiving paper copies of your shareholder reports. If you hold accounts through a financial intermediary, you can follow the instructions included with this disclosure, if applicable, or contact your financial intermediary to request that you continue to receive paper copies of your shareholder reports. Please note that not all financial intermediaries may offer this service. Your election to receive reports in paper will apply to all funds advised by BlackRock Advisors, LLC, BlackRock Fund Advisors or their affiliates, or all funds held with your financial intermediary, as applicable.
If you already elected to receive shareholder reports electronically, you will not be affected by this change and you need not take any action. You may elect to receive electronic delivery of shareholder reports and other communications by: (i) accessing the BlackRock website at blackrock.com/edelivery and logging into your accounts, if you hold accounts directly with BlackRock, or (ii) contacting your financial intermediary, if you hold accounts through a financial intermediary. Please note that not all financial intermediaries may offer this service.
| Not FDIC Insured • May Lose Value • No Bank Guarantee |
Dear Shareholder,
The last 12 months have been a time of sudden change in global financial markets, as a long period of growth and positive returns was interrupted in early 2020 by the emergence and spread of the coronavirus. For much of the reporting period, U.S. equities and bonds both delivered impressive returns, despite fears and doubts about the economy that were ultimately laid to rest with unprecedented monetary stimulus and a sluggish yet resolute performance from the U.S. economy. But as the threat from the coronavirus became more apparent throughout February and March 2020, leading countries around the world took economically disruptive countermeasures, causing equity prices to fall sharply. While markets have since recovered some of these losses as countries around the world begin reopening, there is still significant uncertainty surrounding the long-term impact of the pandemic on the global economy.
Returns for most securities were robust for the first three quarters of the reporting period, as investors began to realize that the U.S. economy was maintaining the modest yet steady growth that had characterized this economic cycle. However, once stay-at-home orders and closures of non-essential businesses became widespread, many workers were laid off and unemployment claims spiked. With large portions of the global economy on hold, all types of international equities ended the reporting period with negative performance, while in the U.S. only large-capitalization stocks delivered a slightly positive return.
The performance of different types of fixed-income securities diverged substantially due to a reduced investor appetite for risk. Treasuries benefited from the risk-off environment, and posted healthy returns, as the 10-year yield (which is inversely related to bond prices) fell to an all-time low. Investment-grade corporate bonds also delivered a positive return, while high-yield corporates were down due to credit concerns.
The U.S. Federal Reserve (the “Fed”) reduced interest rates three times in 2019, to support slowing economic growth. After the coronavirus outbreak, the Fed instituted two emergency rate cuts, pushing short-term interest rates close to zero. To stabilize credit markets, the Fed also announced a new bond-buying program, as did several other central banks around the world, including the European Central Bank and the Bank of Japan.
Looking ahead, while coronavirus-related disruption is certain to hurt worldwide economic growth, the global expansion is likely to continue once the impact of the outbreak subsides. Nonetheless, there are promising signs that a strong coordinated monetary and fiscal response is underway, both in the United States and abroad. With measures being taken to contain the virus and provide support to impacted businesses and individuals, we anticipate a sharp increase in economic activity as life returns to normal.
Overall, we favor a neutral stance toward risk, given the uncertainty surrounding the economic impact of coronavirus countermeasures. Among equities, we see an advantage in U.S. stocks compared to other developed markets, given the diversity of the U.S. economy and the impressive scope of monetary and fiscal stimulus. In bonds, the swift action taken by the world’s central banks means there are attractive opportunities in credit, and we expect credit spreads to narrow as markets stabilize. Both U.S. Treasuries and sustainable investments can help provide portfolio resilience, and the disruption created by the coronavirus appears to be accelerating the shift toward sustainable investments.
In this environment, investors need to think globally, extend their scope across a broad array of asset classes, and be nimble as market conditions change. We encourage you to talk with your financial advisor and visitblackrock.com for further insight about investing in today’s markets.
Sincerely,

Rob Kapito
President, BlackRock Advisors, LLC

Rob Kapito
President, BlackRock Advisors, LLC
| Total Returns as of April 30, 2020 | ||||
| 6-month | 12-month | |||
U.S. large cap equities | (3.16)% | 0.86% | ||
U.S. small cap equities | (15.47) | (16.39) | ||
International equities | (14.21) | (11.34) | ||
Emerging market equities | (10.50) | (12.00) | ||
3-month Treasury bills | 0.85 | 2.07 | ||
U.S. Treasury securities | 10.73 | 19.78 | ||
U.S. investment grade bonds | 4.86 | 10.84 | ||
Tax-exempt municipal bonds | (1.26) | 2.21 | ||
U.S. high yield bonds | (6.60) | (4.08) | ||
| Past performance is no guarantee of future results. Index performance is shown for illustrative purposes only. You cannot invest directly in an index. | ||||
| 2 | THIS PAGEISNOT PARTOF YOUR FUND REPORT |
| Page | ||||
| 2 | ||||
Annual Report: | ||||
| 4 | ||||
| 7 | ||||
| 7 | ||||
| 7 | ||||
Financial Statements: | ||||
| 8 | ||||
| 22 | ||||
| 23 | ||||
| 24 | ||||
| 25 | ||||
| 28 | ||||
| 39 | ||||
| 39 | ||||
| 40 | ||||
| 41 | ||||
| 45 | ||||
| 47 | ||||

| 3 |
| Fund Summary as of April 30, 2020 | BlackRock Total Emerging Markets Fund |
Investment Objective
BlackRock Total Emerging Markets Fund’s (the “Fund”) investment objective is to seek total return.
On November 13, 2019, the Board of Trustees of BlackRock FundsSM (the “Board”) approved a change in the fiscal year-end of the Fund, effective as of April 30, 2020, from October 31 to April 30.
Portfolio Management Commentary
How did the Fund perform?
For the abbreviated annual reporting period from November 1, 2019 to April 30, 2020, the Fund’s Institutional, Investor A and Investor C Shares returned (9.34)%, (9.52)% and (9.78)%, underperforming its custom blended benchmark, MSCI Emerging Markets Index (60%)/JPMorgan Emerging Markets Bond Index Plus (40%), which returned (8.18)%.
What factors influenced performance?
The Fund struggled against a highly changeable backdrop, as the financial markets experienced sharp rotations during the period. Although progress toward a resolution of the trade conflict between the United States and China initially supported stocks in late 2019 and early 2020, the global spread of coronavirus — and the resulting economic shutdowns — led to a steep downturn in risk assets in February and March. The sell-off led to one of the worst quarterly returns for equities on record as volatility hit levels last observed during the 2008-2009 global financial crisis.
Within the emerging markets specifically, equities began to decline in January as China shut down its economy. Once the coronavirus spread to the West, however, China outperformed the rest of the asset class.
The flight to quality in the February-March sell-off led to a tightening of financial conditions that impacted the world credit markets, particularly emerging market bonds. In this environment, the Fund’s underperformance was driven by losses across its fixed-income portfolio. Hard currency emerging market sovereign debt, especially in Argentina and Brazil, led the decline. Local currency bonds in Malaysia and Chile were slightly additive, but the benefit was not enough to offset the effect of the broader downturn.
The equity allocation also experienced mixed performance. Investors displayed a lack of focus on underlying company financials amid the prevalence of headline risk, resulting in losses across fundamental insights. Specifically, contrarian insights detracted as more traditional value measures — including an insight that compares companies based on sales — struggled due to growth concerns. This adverse effect was most pronounced in Asian stocks during January and February given the economic shutdowns throughout the region. In addition, traditional quality measures — such as balance sheet strength, cash flow generation and lower volatility — failed to provide the expected defensive characteristics.
On the plus side, the equity portfolio was helped by the outperformance of its macro thematic insights. This was highlighted by strength in a country-timing model that led to several underweight positions in countries across Latin America and Asia. An underweight in Brazil was especially beneficial as the sharp decline in oil prices reduced growth expectations for the country’s resource-heavy economy. An underweight stance in Chile, which experienced political uncertainty in the early part of the period, also contributed. Underweight positions in South Korea and Thailand were additive, as well. Industry-timing models aided Fund performance, due largely to underweights in consumer discretionary stocks in India and South Korea, as well as in Chinese communication services stocks. Fundamental insights related to environmental, social and governance (“ESG”) factors further helped results compared to more traditional quality measures, as they provided some defensive properties at a time of heightened market volatility. A recently added ESG insight that looks toward investor positioning in ESG-related holdings was another top performer, as it was able to capture the inflows into this space. The Fund’s regional China A model was slightly up for the period.
The Fund used total return swaps (a simple form of derivatives) to gain exposure to certain emerging equity markets. The Fund used derivatives as a means to achieve exposure to these markets in a more efficient manner than investing directly in equities, so this aspect of its approach did not have an effect on relative performance. As derivatives required less cash used as collateral, the portfolio had a higher cash balance as of period end. Since the Fund achieved its desired exposures through the use of derivatives, the cash position had no material impact on Fund performance. The Fund also used forward interest rate swaps to manage the currency risks of its positions in local currency bonds. The use of these instruments also had no material effect on Fund performance.
Describe recent portfolio activity.
The Fund maintained a balanced allocation of risk across all major return drivers in its equity portfolio, while adding a number of new signals to its stock selection model. In general, the investment adviser continued to build out models that are based on ESG factors and away from more generic quantitative measures. Given the dynamism of the broader market environment, the Fund also instituted enhanced signal constructs to identify emerging trends, such as domestically focused firms.
Describe portfolio positioning at period end.
Russia was the Fund’s largest equity overweight at end of April, primarily through positions in communications services stocks. The overweight was motivated by Russia’s attractive fundamentals relative to other emerging market countries. The Fund was overweight in Mexican equities, predominantly in the consumer staples sector. The Fund also moved to a slight overweight in China, with a preference for local China A shares. South Korea remained the Fund’s largest equity underweight. The position was largely focused on technology stocks due to the negative outlook for both reform and the nation’s export competitiveness.
On the fixed-income side, the portfolio was tilted toward local currency bonds in Malaysia and South Africa. In the hard currency sovereign bond category, the Fund was underweight in Croatia and overweight in higher-quality issuers such as Hungary and Poland.
The views expressed reflect the opinions of BlackRock as of the date of this report and are subject to change based on changes in market, economic or other conditions. These views are not intended to be a forecast of future events and are no guarantee of future results.
| 4 | 2020 BLACKROCK ANNUAL REPORTTO SHAREHOLDERS |
| Fund Summary as of April 30, 2020 (continued) | BlackRock Total Emerging Markets Fund |
TOTAL RETURN BASED ON A $10,000 INVESTMENT
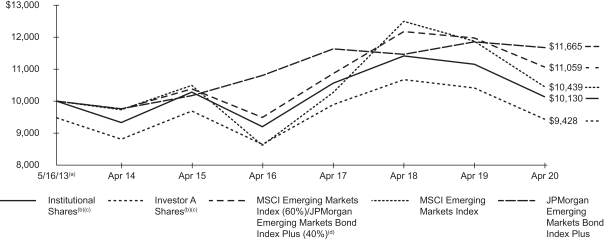
| (a) | Commencement of operations. |
| (b) | Assuming maximum sales charges, if any, transaction costs and other operating expenses, including investment advisory fees. Institutional Shares do not have a sales charge. |
| (c) | Under normal circumstances, the Fund seeks to invest at least 80% of its net assets plus any borrowings for investment purposes in equity and debt instruments and related derivative instruments issued by, or tied economically to, companies or other issuers located in emerging markets. |
| (d) | A customized weighted index comprised of the returns of the MSCI Emerging Markets Index (60%) and the JPMorgan Emerging Markets Bond Index Plus (40%). The MSCI Emerging Markets Index is a free float-adjusted market capitalization index that is designed to measure equity market performance of emerging markets and consists of the following 26 emerging market country indices: Argentina, Brazil, Chile, China, Colombia, Czech Republic, Egypt, Greece, Hungary, India, Indonesia, Korea, Malaysia, Mexico, Pakistan, Peru, Philippines, Poland, Qatar, Russia, Saudi Arabia, South Africa, Taiwan, Thailand, Turkey and United Arab Emirates. JPMorgan Emerging Markets Bond Index Plus is a market capitalization-weighted index that tracks returns for actively traded external debt instruments in emerging markets. |
Performance Summary for the Period Ended April 30, 2020
| Average Annual Total Returns (a) | ||||||||||||||||||||||||||||||||||||||||
| 1 Year | 5 Year | Since Inception (b) | ||||||||||||||||||||||||||||||||||||||
| 6-Month Total Returns | w/o sales charge | w/sales charge | w/o sales charge | w/sales charge | w/o sales charge | w/sales charge | ||||||||||||||||||||||||||||||||||
Institutional | (9.34 | )% | (9.15 | )% | N/A | (0.30 | )% | N/A | 0.19 | % | N/A | |||||||||||||||||||||||||||||
Investor A | (9.52 | ) | (9.42 | ) | (14.18 | )% | (0.55 | ) | (1.62 | )% | (0.07 | ) | (0.84 | )% | ||||||||||||||||||||||||||
Investor C | (9.78 | ) | (10.06 | ) | (10.95 | ) | (1.28 | ) | (1.28 | ) | (0.81 | ) | (0.81 | ) | ||||||||||||||||||||||||||
MSCI Emerging Markets Index (60%)/JPMorgan Emerging Markets Bond Index Plus (40%) | (8.18 | ) | (7.63 | ) | N/A | 1.28 | N/A | 1.46 | N/A | |||||||||||||||||||||||||||||||
MSCI Emerging Markets Index | (10.50 | ) | (12.00 | ) | N/A | (0.10 | ) | N/A | 0.62 | N/A | ||||||||||||||||||||||||||||||
JPMorgan Emerging Markets Bond Index Plus | (5.14 | ) | (1.54 | ) | N/A | 2.80 | N/A | 2.24 | N/A | |||||||||||||||||||||||||||||||
| (a) | Assuming maximum sales charges, if any. Average annual total returns with and without sales charges reflect reductions for distribution and service fees. See “About Fund Performance” on page 7 for a detailed description of share classes, including any related sales charges and fees. |
| (b) | The Fund commenced operations on May 16, 2013. |
N/A — Not applicable as share class and index do not have a sales charge.
Past performance is not indicative of future results.
Performance results may include adjustments made for financial reporting purposes in accordance with U.S. generally accepted accounting principles.
| FUND SUMMARY | 5 |
| Fund Summary as of April 30, 2020 (continued) | BlackRock Total Emerging Markets Fund |
| Actual | Hypothetical (b) | |||||||||||||||||||||||||||||||
| Beginning Account Value (11/01/19) | Ending Account Value (04/30/20) | Expenses Paid During the Period (a) | Beginning (11/01/19) | Ending Account Value (04/30/20) | Expenses Paid During the Period (a) | Annualized Ratio | ||||||||||||||||||||||||||
Institutional | $ | 1,000.00 | $ | 906.60 | $ | 4.03 | $ | 1,000.00 | $ | 1,020.64 | $ | 4.27 | 0.85 | % | ||||||||||||||||||
Investor A | 1,000.00 | 904.80 | 5.21 | 1,000.00 | 1,019.39 | 5.52 | 1.10 | |||||||||||||||||||||||||
Investor C | 1,000.00 | 902.20 | 8.75 | 1,000.00 | 1,015.66 | 9.27 | 1.85 | |||||||||||||||||||||||||
| (a) | For each class of the Fund, expenses are equal to the annualized net expense ratio for the class, multiplied by the average account value over the period, multiplied by 182/366 (to reflect the six-month period shown). |
| (b) | Hypothetical 5% annual return before expenses is calculated by prorating the number of days in the most recent six months divided by 366. |
See “Disclosure of Expenses” on Page 7 for further information on how expenses were calculated.
Portfolio Information
PORTFOLIO COMPOSITION
| Percent of Total Investments | ||||
Foreign Agency Obligations | 65 | % | ||
Short-Term Securities | 25 | |||
Investment Companies | 5 | |||
Common Stocks | 4 | |||
Corporate Bonds | 1 | |||
GEOGRAPHIC ALLOCATION
| Percentage of Total Investments (a) | ||||||||||||
| Country/Geographic Region | Long | Short | Total | |||||||||
United States | 19 | % | — | % | 19 | % | ||||||
China | 17 | — | 17 | |||||||||
Mexico | 6 | — | 6 | |||||||||
South Korea | 6 | — | 6 | |||||||||
Russia | 6 | — | 6 | |||||||||
Taiwan | 6 | — | 6 | |||||||||
Indonesia | 5 | — | 5 | |||||||||
Brazil | 5 | — | 5 | |||||||||
Turkey | 4 | — | 4 | |||||||||
South Africa | 4 | — | 4 | |||||||||
Philippines | 3 | — | 3 | |||||||||
Colombia | 3 | — | 3 | |||||||||
Chile | 2 | — | 2 | |||||||||
Hungary | 2 | — | 2 | |||||||||
Peru | 2 | — | 2 | |||||||||
Argentina | 2 | — | 2 | |||||||||
Malaysia | 1 | — | 1 | |||||||||
Panama | 1 | — | 1 | |||||||||
Ukraine | 1 | — | 1 | |||||||||
Poland | 1 | — | 1 | |||||||||
Romania | 1 | — | 1 | |||||||||
Saudi Arabia | 1 | — | 1 | |||||||||
Thailand | 1 | — | 1 | |||||||||
United Kingdom | 1 | — | 1 | |||||||||
Others(b) | — | (c) | — | — | (c) | |||||||
| (a) | Total investments include the gross notional values of long and short equity securities of the underlying derivative contracts utilized by the Fund and exclude short-term securities. |
| (b) | Includes holdings within countries representing 1% or less of long-term investments. Please refer to the Consolidated Schedule of Investments for such countries. |
| (c) | Rounds to less than 1%. |
| 6 | 2020 BLACKROCK ANNUAL REPORTTO SHAREHOLDERS |
Institutional Shares are not subject to any sales charge. These shares bear no ongoing distribution or service fees and are available only to certain eligible investors.
Investor A Shares are subject to a maximum initial sales charge (front-end load) of 5.25% and a service fee of 0.25% per year (but no distribution fee). Certain redemptions of these shares may be subject to a contingent deferred sales charge (“CDSC”) where no initial sales charge was paid at the time of purchase. These shares are generally available through financial intermediaries.
Investor C Shares are subject to a 1.00% CDSC if redeemed within one year of purchase. In addition, these shares are subject to a distribution fee of 0.75% per year and a service fee of 0.25% per year. These shares are generally available through financial intermediaries. These shares automatically convert to Investor A Shares after approximately ten years.
Performance information reflects past performance and does not guarantee future results. Current performance may be lower or higher than the performance data quoted. Refer toblackrock.com to obtain performance data current to the most recent month-end. Performance results do not reflect the deduction of taxes that a shareholder would pay on Fund distributions or the redemption of Fund shares. Figures shown in the performance tables on the previous page assume reinvestment of all distributions, if any, at net asset value (“NAV”) on the ex-dividend date or payable date, as applicable. Investment return and principal value of shares will fluctuate so that shares, when redeemed, may be worth more or less than their original cost. Distributions paid to each class of shares will vary because of the different levels of service, distribution and transfer agency fees applicable to each class, which are deducted from the income available to be paid to shareholders.
BlackRock Advisors, LLC (the “Manager”), the Fund’s investment adviser, has contractually agreed to waive and/or reimburse a portion of the Fund’s expenses. Without such waivers and/or reimbursements, the Fund’s performance would have been lower. With respect to the Fund’s contractual waivers, the Manager is under no obligation to continue waiving and/or reimbursing its fees after the applicable termination date of such agreements. See Note 6 of the Notes to Consolidated Financial Statements for additional information on waivers and/or reimbursements.
Shareholders of the Fund may incur the following charges: (a) transactional expenses, such as sales charges; and (b) operating expenses, including investment advisory fees, administration fees, service and distribution fees, including 12b-1 fees, acquired fund fees and expenses, and other fund expenses. The expense example shown on page 6 (which is based on a hypothetical investment of $1,000 invested on November 1, 2019 and held through April 30, 2020) is intended to assist shareholders both in calculating expenses based on an investment in the Fund and in comparing these expenses with similar costs of investing in other mutual funds.
The expense example provides information about actual account values and actual expenses. In order to estimate the expenses a shareholder paid during the period covered by this report, shareholders can divide their account value by $1,000 and then multiply the result by the number corresponding to their share class under the heading entitled “Expenses Paid During the Period.”
The expense example also provides information about hypothetical account values and hypothetical expenses based on the Fund’s actual expense ratio and an assumed rate of return of 5% per year before expenses. In order to assist shareholders in comparing the ongoing expenses of investing in the Fund and other funds, compare the 5% hypothetical examples with the 5% hypothetical examples that appear in shareholder reports of other funds.
The expenses shown in the expense example are intended to highlight shareholders’ ongoing costs only and do not reflect transactional expenses, such as sales charges, if any. Therefore, the hypothetical example is useful in comparing ongoing expenses only, and will not help shareholders determine the relative total expenses of owning different funds. If these transactional expenses were included, shareholder expenses would have been higher.
Derivative Financial Instruments
The Fund may invest in various derivative financial instruments. These instruments are used to obtain exposure to a security, commodity, index, market, and/or other assets without owning or taking physical custody of securities, commodities and/or other referenced assets or to manage market, equity, credit, interest rate, foreign currency exchange rate, commodity and/or other risks. Derivative financial instruments may give rise to a form of economic leverage and involve risks, including the imperfect correlation between the value of a derivative financial instrument and the underlying asset, possible default of the counterparty to the transaction or illiquidity of the instrument. The Fund’s successful use of a derivative financial instrument depends on the investment adviser’s ability to predict pertinent market movements accurately, which cannot be assured. The use of these instruments may result in losses greater than if they had not been used, may limit the amount of appreciation the Fund can realize on an investment and/or may result in lower distributions paid to shareholders. The Fund’s investments in these instruments, if any, are discussed in detail in the Notes to Consolidated Financial Statements.
| ABOUT FUND PERFORMANCE / DISCLOSUREOF EXPENSES / DERIVATIVE FINANCIAL INSTRUMENTS | 7 |
Consolidated Schedule of Investments April 30, 2020 | BlackRock Total Emerging Markets Fund (Percentages shown are based on Net Assets) |
| Security | Shares | Value | ||||||||||
Common Stocks — 3.1% |
| |||||||||||
| China — 3.1% | ||||||||||||
Anhui Conch Cement Co. Ltd., Class A | 10,900 | $ | 91,060 | |||||||||
Bank of Beijing Co. Ltd., Class A | 191,700 | 134,168 | ||||||||||
Bank of Hangzhou Co. Ltd., Class A | 96,074 | 111,494 | ||||||||||
Bank of Jiangsu Co. Ltd., Class A | 127,000 | 107,868 | ||||||||||
Beijing Sanju Environmental Protection and New Material Co. Ltd., Class A | 32,168 | 18,717 | ||||||||||
Betta Pharmaceuticals Co. Ltd., Class A | 3,164 | 41,531 | ||||||||||
Changchun High & New Technology Industry Group, Inc., Class A | 800 | 66,344 | ||||||||||
China Life Insurance Co. Ltd., Class A | 14,200 | 56,578 | ||||||||||
China Merchants Bank Co. Ltd., Class A | 15,600 | 76,549 | ||||||||||
East Money Information Co. Ltd., Class A | 25,277 | 64,095 | ||||||||||
First Capital Securities Co. Ltd., Class A | 21,800 | 21,104 | ||||||||||
Foshan Haitian Flavouring & Food Co. Ltd., Class A | 1,100 | 18,921 | ||||||||||
G-bits Network Technology Xiamen Co. Ltd., Class A | 900 | 47,804 | ||||||||||
GCL System Integration Technology Co. Ltd., | 53,800 | 19,053 | ||||||||||
Gigadevice Semiconductor Beijing, Inc., Class A | 1,300 | 50,330 | ||||||||||
Glodon Co. Ltd., Class A | 33,290 | 243,625 | ||||||||||
GoerTek, Inc., Class A | 19,632 | 52,729 | ||||||||||
Guotai Junan Securities Co. Ltd., Class A | 108,400 | 255,658 | ||||||||||
Henan Shuanghui Investment & Development Co. Ltd., Class A | 24,567 | 139,177 | ||||||||||
Huatai Securities Co. Ltd., Class A | 21,302 | 53,747 | ||||||||||
Inner Mongolia Yili Industrial Group Co. Ltd., Class A | 20,100 | 82,114 | ||||||||||
Jiangsu Hengrui Medicine Co. Ltd., Class A | 22,800 | 295,442 | ||||||||||
JonjeeHi-Tech Industrial And Commercial Holding Co. Ltd., Class A | 2,800 | 18,485 | ||||||||||
Kweichow Moutai Co. Ltd., Class A | 500 | 88,747 | ||||||||||
Luxshare Precision Industry Co. Ltd., Class A | 11,970 | 78,641 | ||||||||||
Muyuan Foodstuff Co. Ltd., Class A | 4,000 | 71,341 | ||||||||||
New Hope Liuhe Co. Ltd., Class A | 6,200 | 28,538 | ||||||||||
Poly Developments and Holdings Group Co. Ltd., Class A | 9,300 | 21,034 | ||||||||||
Sangfor Technologies, Inc., Class A | 5,600 | 150,456 | ||||||||||
Shanxi Xinghuacun Fen Wine Factory Co. Ltd., Class A | 2,300 | 34,482 | ||||||||||
Shenzhen Kangtai Biological Products Co. Ltd., Class A | 1,500 | 27,972 | ||||||||||
Shenzhen MindrayBio-Medical Electronics Co. Ltd., Class A | 539 | 19,241 | ||||||||||
Weihai Guangwei Composites Co. Ltd., Class A | 3,400 | 25,952 | ||||||||||
Wuhu Sanqi Interactive Entertainment Network Technology Group Co. Ltd., Class A | 17,100 | 86,471 | ||||||||||
Wuliangye Yibin Co. Ltd., Class A | 4,600 | 87,196 | ||||||||||
WuXi AppTec Co. Ltd., Class A | 1,500 | 21,128 | ||||||||||
Yealink Network Technology Corp. Ltd., Class A | 1,500 | 18,980 | ||||||||||
Yunnan Baiyao Group Co. Ltd., Class A | 1,900 | 24,120 | ||||||||||
Yunnan Energy New Material Co. Ltd. | 2,800 | 21,152 | ||||||||||
Zoomlion Heavy Industry Science and Technology Co. Ltd., Class A | 265,900 | 238,645 | ||||||||||
|
| |||||||||||
Total Common Stocks — 3.1% |
| 3,110,689 | ||||||||||
|
| |||||||||||
| Par (000) | ||||||||||||
Corporate Bonds — 0.8% |
| |||||||||||
| British Virgin Islands — 0.2% | ||||||||||||
China Great Wall International Holdings III Ltd., 2.63%, 10/27/21 | USD | 200 | 201,500 | |||||||||
|
| |||||||||||
| Security | Par (000) | Value | ||||||||||
| China — 0.3% | ||||||||||||
China Minmetals Corp.(5 year CMT + 4.72%), | USD | 200 | $ | 197,438 | ||||||||
Sinochem Overseas Capital Co. Ltd., 4.50%, 11/12/20 | 100 | 101,281 | ||||||||||
|
| |||||||||||
| 298,719 | ||||||||||||
| Malaysia — 0.2% | ||||||||||||
Petroliam Nasional Bhd, 7.63%, 10/15/26 | 100 | 127,199 | ||||||||||
|
| |||||||||||
| Philippines — 0.1% | ||||||||||||
Power Sector Assets & Liabilities Management Corp., 7.39%, 12/02/24 | 100 | 117,625 | ||||||||||
|
| |||||||||||
Total Corporate Bonds — 0.8% |
| 745,043 | ||||||||||
|
| |||||||||||
Foreign Agency Obligations — 55.0% |
| |||||||||||
Argentina — 2.1% |
| |||||||||||
Argentine Republic Government International Bond: | ||||||||||||
6.88%, 04/22/21(d) | 550 | 157,609 | ||||||||||
5.63%, 01/26/22(d) | 600 | 165,000 | ||||||||||
7.50%, 04/22/26(d) | 900 | 239,344 | ||||||||||
6.88%, 01/26/27(d) | 2,900 | 717,750 | ||||||||||
6.63%, 07/06/28(d) | 150 | 37,547 | ||||||||||
8.28%, 12/31/33(d) | 624 | 217,307 | ||||||||||
7.13%, 07/06/36(d) | 350 | 83,672 | ||||||||||
3.75%, 12/31/38(d)(e) | 900 | 283,500 | ||||||||||
7.63%, 04/22/46(d) | 450 | 110,250 | ||||||||||
7.13%, 06/28/17(d) | 300 | 69,656 | ||||||||||
|
| |||||||||||
| 2,081,635 | ||||||||||||
| Brazil — 3.5% | ||||||||||||
Brazilian Government International Bond: | ||||||||||||
4.88%, 01/22/21 | 250 | 255,312 | ||||||||||
2.63%, 01/05/23 | 200 | 200,625 | ||||||||||
4.25%, 01/07/25 | 400 | 414,250 | ||||||||||
6.00%, 04/07/26 | 440 | 482,212 | ||||||||||
4.63%, 01/13/28 | 500 | 517,500 | ||||||||||
7.13%, 01/20/37 | 400 | 452,750 | ||||||||||
5.63%, 01/07/41 | 200 | 199,188 | ||||||||||
5.00%, 01/27/45 | 400 | 372,375 | ||||||||||
5.63%, 02/21/47 | 600 | 603,000 | ||||||||||
|
| |||||||||||
| 3,497,212 | ||||||||||||
| Chile — 3.0% | ||||||||||||
Bonos del Banco Central de Chile en UF, 3.00%, 03/01/22 | CLP | 2,137,459 | 2,735,837 | |||||||||
Chile Government International Bond, 3.13%, 01/21/26 | USD | 200 | 213,438 | |||||||||
|
| |||||||||||
| 2,949,275 | ||||||||||||
| Colombia — 3.4% | ||||||||||||
Colombia Government International Bond: | ||||||||||||
4.38%, 07/12/21 | 200 | 203,437 | ||||||||||
2.63%, 03/15/23 | 200 | 196,250 | ||||||||||
4.00%, 02/26/24 | 200 | 202,313 | ||||||||||
8.13%, 05/21/24 | 100 | 115,469 | ||||||||||
4.50%, 01/28/26 | 400 | 410,250 | ||||||||||
3.88%, 04/25/27 | 400 | 394,625 | ||||||||||
7.38%, 09/18/37 | 300 | 370,500 | ||||||||||
6.13%, 01/18/41 | 400 | 445,875 | ||||||||||
5.63%, 02/26/44 | 400 | 429,500 | ||||||||||
5.00%, 06/15/45 | 600 | 603,000 | ||||||||||
|
| |||||||||||
| 3,371,219 | ||||||||||||
| 8 | 2020 BLACKROCK ANNUAL REPORTTO SHAREHOLDERS |
Consolidated Schedule of Investments (continued) April 30, 2020 | BlackRock Total Emerging Markets Fund (Percentages shown are based on Net Assets) |
| Security | Par (000) | Value | ||||||||||
| Croatia — 0.2% | ||||||||||||
Croatia Government International Bond, 6.00%, 01/26/24 | USD | 200 | $ | 222,875 | ||||||||
|
| |||||||||||
| Ecuador — 0.4% | ||||||||||||
Ecuador Government International Bond, 7.88%, 01/23/28(d) | 1,500 | 423,750 | ||||||||||
|
| |||||||||||
| Hungary — 2.5% | ||||||||||||
Hungary Government International Bond: | ||||||||||||
6.38%, 03/29/21 | 400 | 415,912 | ||||||||||
5.38%, 02/21/23 | 398 | 431,084 | ||||||||||
5.75%, 11/22/23 | 500 | 556,875 | ||||||||||
5.38%, 03/25/24 | 500 | 558,125 | ||||||||||
7.63%, 03/29/41 | 200 | 321,186 | ||||||||||
MFB Magyar Fejlesztesi Bank Zrt, 6.25%, 10/21/20 | 200 | 204,666 | ||||||||||
|
| |||||||||||
| 2,487,848 | ||||||||||||
| Indonesia — 6.6% | ||||||||||||
Indonesia Government International Bond: | ||||||||||||
4.88%, 05/05/21 | 300 | 306,750 | ||||||||||
3.75%, 04/25/22 | 200 | 203,500 | ||||||||||
3.38%, 04/15/23 | 400 | 405,750 | ||||||||||
5.88%, 01/15/24 | 400 | 440,500 | ||||||||||
4.13%, 01/15/25 | 400 | 417,000 | ||||||||||
4.75%, 01/08/26 | 200 | 216,500 | ||||||||||
4.35%, 01/08/27 | 200 | 212,250 | ||||||||||
7.75%, 01/17/38 | 400 | 564,000 | ||||||||||
5.25%, 01/17/42 | 200 | 227,000 | ||||||||||
4.63%, 04/15/43 | 300 | 319,500 | ||||||||||
6.75%, 01/15/44 | 400 | 536,000 | ||||||||||
5.13%, 01/15/45 | 400 | 450,500 | ||||||||||
5.95%, 01/08/46 | 200 | 248,750 | ||||||||||
5.25%, 01/08/47 | 200 | 228,000 | ||||||||||
Indonesia Treasury Bond, 7.00%, 05/15/27 | IDR | 23,913,000 | 1,538,470 | |||||||||
Perusahaan Penerbit SBSN Indonesia III, 4.35%, 09/10/24 | USD | 200 | 209,100 | |||||||||
|
| |||||||||||
| 6,523,570 | ||||||||||||
| Kazakhstan — 0.2% | ||||||||||||
Kazakhstan Government International Bond, 5.13%, 07/21/25 | 200 | 222,000 | ||||||||||
|
| |||||||||||
| Malaysia — 0.2% | ||||||||||||
Export-Import Bank of Malaysia Bhd, Class A, 2.48%, 10/20/21 | 200 | 200,500 | ||||||||||
|
| |||||||||||
| Mexico — 6.7% | ||||||||||||
Mexican Udibonos, 4.50%, 12/04/25 | MXN | 31,029 | 1,386,412 | |||||||||
Mexico Government International Bond: | ||||||||||||
3.63%, 03/15/22 | USD | 300 | 307,219 | |||||||||
4.00%, 10/02/23 | 500 | 510,937 | ||||||||||
3.60%, 01/30/25 | 400 | 401,250 | ||||||||||
4.13%, 01/21/26 | 600 | 611,250 | ||||||||||
4.15%, 03/28/27 | 400 | 401,375 | ||||||||||
6.75%, 09/27/34 | 300 | 360,562 | ||||||||||
6.05%, 01/11/40 | 400 | 436,375 | ||||||||||
4.75%, 03/08/44 | 400 | 372,250 | ||||||||||
5.55%, 01/21/45 | 350 | 364,328 | ||||||||||
4.60%, 01/23/46 | 400 | 363,250 | ||||||||||
4.35%, 01/15/47 | 600 | 529,875 | ||||||||||
4.60%, 02/10/48 | 400 | 364,800 | ||||||||||
5.75%, 10/12/2110 | 200 | 190,188 | ||||||||||
|
| |||||||||||
| 6,600,071 | ||||||||||||
| Panama — 1.7% | ||||||||||||
Panama Government International Bond: | ||||||||||||
4.00%, 09/22/24 | 200 | 211,750 | ||||||||||
| Security | Par (000) | Value | ||||||||||
| Panama (continued) | ||||||||||||
7.13%, 01/29/26 | USD | 250 | $ | 302,031 | ||||||||
3.88%, 03/17/28 | 400 | 431,250 | ||||||||||
9.38%, 04/01/29 | 100 | 140,250 | ||||||||||
6.70%, 01/26/36 | 300 | 392,625 | ||||||||||
4.30%, 04/29/53 | 200 | 219,750 | ||||||||||
|
| |||||||||||
| 1,697,656 | ||||||||||||
| Peru — 1.6% | ||||||||||||
Peruvian Government International Bond: | ||||||||||||
7.35%, 07/21/25 | 200 | 250,375 | ||||||||||
4.13%, 08/25/27 | 300 | 337,406 | ||||||||||
6.55%, 03/14/37 | 300 | 429,844 | ||||||||||
5.63%, 11/18/50 | 400 | 594,625 | ||||||||||
|
| |||||||||||
| 1,612,250 | ||||||||||||
| Philippines — 3.7% | ||||||||||||
Philippine Government International Bond: | ||||||||||||
4.00%, 01/15/21 | 100 | 101,375 | ||||||||||
4.20%, 01/21/24 | 200 | 214,938 | ||||||||||
5.50%, 03/30/26 | 200 | 233,812 | ||||||||||
9.50%, 02/02/30 | 350 | 556,281 | ||||||||||
7.75%, 01/14/31 | 300 | 439,219 | ||||||||||
6.38%, 01/15/32 | 300 | 406,031 | ||||||||||
6.38%, 10/23/34 | 550 | 782,203 | ||||||||||
5.00%, 01/13/37 | 200 | 254,125 | ||||||||||
3.95%, 01/20/40 | 200 | 231,750 | ||||||||||
3.70%, 03/01/41 | 200 | 229,625 | ||||||||||
3.70%, 02/02/42 | 200 | 230,688 | ||||||||||
|
| |||||||||||
| 3,680,047 | ||||||||||||
| Poland — 1.0% | ||||||||||||
Poland Government International Bond: | ||||||||||||
5.13%, 04/21/21 | 300 | 311,250 | ||||||||||
3.00%, 03/17/23 | 300 | 314,344 | ||||||||||
3.25%, 04/06/26 | 300 | 327,000 | ||||||||||
|
| |||||||||||
| 952,594 | ||||||||||||
| Romania — 1.1% | ||||||||||||
Romanian Government International Bond: | ||||||||||||
4.38%, 08/22/23 | 600 | 623,625 | ||||||||||
4.88%, 01/22/24 | 200 | 212,250 | ||||||||||
6.13%, 01/22/44 | 200 | 238,000 | ||||||||||
|
| |||||||||||
| 1,073,875 | ||||||||||||
| Russia — 5.0% | ||||||||||||
Russian Foreign Bond — Eurobond: | ||||||||||||
4.50%, 04/04/22 | 200 | 210,400 | ||||||||||
4.88%, 09/16/23 | 400 | 436,125 | ||||||||||
4.75%, 05/27/26 | 400 | 443,200 | ||||||||||
4.25%, 06/23/27 | 200 | 217,000 | ||||||||||
7.50%, 03/31/30(d) | 1,416 | 1,608,487 | ||||||||||
5.63%, 04/04/42 | 400 | 508,250 | ||||||||||
5.88%, 09/16/43 | 200 | 262,750 | ||||||||||
5.25%, 06/23/47 | 1,000 | 1,241,563 | ||||||||||
|
| |||||||||||
| 4,927,775 | ||||||||||||
| South Africa — 3.1% | ||||||||||||
Republic of South Africa Government International Bond: | ||||||||||||
5.88%, 05/30/22 | 100 | 102,844 | ||||||||||
4.67%, 01/17/24 | 300 | 296,437 | ||||||||||
5.88%, 09/16/25 | 200 | 199,500 | ||||||||||
4.88%, 04/14/26 | 200 | 185,688 | ||||||||||
4.30%, 10/12/28 | 200 | 167,500 | ||||||||||
5.38%, 07/24/44 | 200 | 155,063 | ||||||||||
5.00%, 10/12/46 | 200 | 149,625 | ||||||||||
| CONSOLIDATED SCHEDULE OF INVESTMENTS | 9 |
Consolidated Schedule of Investments (continued) April 30, 2020 | BlackRock Total Emerging Markets Fund (Percentages shown are based on Net Assets) |
| Security | Par (000) | Value | ||||||||||
| South Africa (continued) | ||||||||||||
South Africa Government Bond — CPI Linked, 5.50%, 12/07/23 | ZAR | 29,816 | $ | 1,758,597 | ||||||||
|
| |||||||||||
| 3,015,254 | ||||||||||||
| South Korea — 2.1% | ||||||||||||
Inflation Linked Korea Treasury Bond, 1.13%, 06/10/23 | KRW | 2,459,732 | 2,047,506 | |||||||||
|
| |||||||||||
| Turkey — 5.2% | ||||||||||||
Turkey Government International Bond: | ||||||||||||
7.00%, 06/05/20 | USD | 350 | 350,875 | |||||||||
5.63%, 03/30/21 | 400 | 402,000 | ||||||||||
5.13%, 03/25/22 | 200 | 197,375 | ||||||||||
6.25%, 09/26/22 | 400 | 400,750 | ||||||||||
3.25%, 03/23/23 | 250 | 230,547 | ||||||||||
5.75%, 03/22/24 | 200 | 193,000 | ||||||||||
7.38%, 02/05/25 | 400 | 405,000 | ||||||||||
4.25%, 04/14/26 | 200 | 172,062 | ||||||||||
4.88%, 10/09/26 | 500 | 439,844 | ||||||||||
6.00%, 03/25/27 | 400 | 367,625 | ||||||||||
11.88%, 01/15/30 | 300 | 377,719 | ||||||||||
6.75%, 05/30/40 | 300 | 258,000 | ||||||||||
6.00%, 01/14/41 | 400 | 320,500 | ||||||||||
4.88%, 04/16/43 | 600 | 435,750 | ||||||||||
6.63%, 02/17/45 | 400 | 336,375 | ||||||||||
5.75%, 05/11/47 | 400 | 303,500 | ||||||||||
|
| |||||||||||
| 5,190,922 | ||||||||||||
| Ukraine — 1.6% | ||||||||||||
Ukraine Government International Bond: | ||||||||||||
7.75%, 09/01/20 | 200 | 194,750 | ||||||||||
7.75%, 09/01/21 | 200 | 192,000 | ||||||||||
7.75%, 09/01/23 | 300 | 284,250 | ||||||||||
7.75%, 09/01/24 | 100 | 94,500 | ||||||||||
7.75%, 09/01/26 | 200 | 185,600 | ||||||||||
7.75%, 09/01/27 | 100 | 92,100 | ||||||||||
7.38%, 09/25/32 | 600 | 531,562 | ||||||||||
|
| |||||||||||
| 1,574,762 | ||||||||||||
| Uruguay — 0.1% | ||||||||||||
Uruguay Government International Bond, 4.13%, 11/20/45 | 100 | 103,000 | ||||||||||
|
| |||||||||||
| Security | Par (000) | Value | ||||||||||
| Venezuela — 0.0% | ||||||||||||
Venezuela Government International Bond, 7.75%, 10/13/2019(a)(d) | USD | 377 | $ | 32,011 | ||||||||
|
| |||||||||||
Total Foreign Agency Obligations — 55.0% |
| 54,487,607 | ||||||||||
|
| |||||||||||
| Shares | ||||||||||||
Investment Companies — 4.6% |
| |||||||||||
Equity Funds — 4.6% |
| |||||||||||
iShares MSCI India ETF(h) | 167,683 | 4,535,825 | ||||||||||
|
| |||||||||||
Total Investment Companies — 4.6% |
| 4,535,825 | ||||||||||
|
| |||||||||||
Total Long-Term Investments — 63.5% |
| 62,879,164 | ||||||||||
|
| |||||||||||
Short-Term Securities — 21.1% |
| |||||||||||
BlackRock Liquidity Funds,T-Fund, Institutional Class, 0.12%(f)(g)(h) | 20,955,814 | 20,955,814 | ||||||||||
|
| |||||||||||
Total Short-Term Securities — 21.1% |
| 20,955,814 | ||||||||||
|
| |||||||||||
Total Investments — 84.6% |
| 83,834,978 | ||||||||||
Other Assets Less Liabilities — 15.4% |
| 15,281,350 | ||||||||||
|
| |||||||||||
Net Assets — 100.0% |
| $ | 99,116,328 | |||||||||
|
| |||||||||||
| (a) | Non-income producing security. |
| (b) | Variable rate security. Security may be issued at a fixed coupon rate, which converts to a variable rate at a specified date. Rate shown is the rate in effect as of period end. |
| (c) | Perpetual security with no stated maturity date. |
| (d) | Issuer filed for bankruptcy and/or is in default. |
| (e) | Step-up bond that pays an initial coupon rate for the first period and then a higher coupon rate for the following periods. Rate as of period end. |
| (f) | Annualized7-day yield as of period end. |
| (g) | All or a portion of the security is held by a wholly-owned subsidiary. See Note 1 of the Notes to Consolidated Financial Statements for details on the wholly-owned subsidiary. |
| (h) | Investments in issuers considered to be an affiliate/affiliates of the Fund during the period ended April 30, 2020 for purposes of Section 2(a)(3) of the Investment Company Act of 1940, as amended, were as follows: |
| Affiliated Issuer | Shares Held at 10/31/19 | Shares Purchased | Shares Sold | Shares Held at 04/30/20 | Value at 04/30/20 | Income | Net Realized Gain (Loss) (a) | Change in Unrealized Appreciation (Depreciation) | ||||||||||||||||||||||||
BlackRock Liquidity Funds,T-Fund, Institutional Class | 59,039,225 | — | (38,083,411 | )(b) | 20,955,814 | $ | 20,955,814 | $ | 283,105 | $ | 112 | $ | — | |||||||||||||||||||
iShares MSCI India ETF | 182,768 | 49,329 | (64,414 | ) | 167,683 | 4,535,825 | 5,864 | (246,985 | ) | (1,122,243 | ) | |||||||||||||||||||||
|
|
|
|
|
|
|
| |||||||||||||||||||||||||
| $ | 25,491,639 | $ | 288,969 | $ | (246,873 | ) | $ | (1,122,243 | ) | |||||||||||||||||||||||
|
|
|
|
|
|
|
| |||||||||||||||||||||||||
| (a) | Includes net capital gain distributions, if applicable. |
| (b) | Represents net shares purchased (sold). |
| 10 | 2020 BLACKROCK ANNUAL REPORTTO SHAREHOLDERS |
Consolidated Schedule of Investments (continued) April 30, 2020 | BlackRock Total Emerging Markets Fund |
Derivative Financial Instruments Outstanding as of Period End
Futures Contracts
| Description | Number of Contracts | Expiration Date | Notional Amount (000) | Value/ (Depreciation) | ||||||||||||
Short Contracts | ||||||||||||||||
MSCI Emerging Markets Index | 15 | 06/19/20 | $ | 679 | $ | (6,945 | ) | |||||||||
|
| |||||||||||||||
Forward Foreign Currency Exchange Contracts
| Currency Purchased | Currency Sold | Counterparty | Settlement Date | Unrealized Appreciation (Depreciation) | ||||||||||||||||
| AUD | 874,000 | USD | 557,192 | BNP Paribas S.A. | 05/13/20 | $ | 12,363 | |||||||||||||
| AUD | 1,067,000 | USD | 660,733 | BNP Paribas S.A. | 05/13/20 | 34,593 | ||||||||||||||
| AUD | 1,333,709 | USD | 844,158 | Deutsche Bank AG | 05/13/20 | 24,974 | ||||||||||||||
| AUD | 106,000 | USD | 68,975 | Goldman Sachs International | 05/13/20 | 102 | ||||||||||||||
| AUD | 182,291 | USD | 115,336 | Goldman Sachs International | 05/13/20 | 3,457 | ||||||||||||||
| AUD | 106,000 | USD | 68,918 | JPMorgan Chase Bank N.A. | 05/13/20 | 158 | ||||||||||||||
| AUD | 208,000 | USD | 131,537 | JPMorgan Chase Bank N.A. | 05/13/20 | 4,010 | ||||||||||||||
| CAD | 275,000 | USD | 197,008 | BNP Paribas S.A. | 05/13/20 | 557 | ||||||||||||||
| CAD | 497,000 | USD | 356,485 | BNP Paribas S.A. | 05/13/20 | 569 | ||||||||||||||
| CAD | 602,000 | USD | 429,679 | BNP Paribas S.A. | 05/13/20 | 2,809 | ||||||||||||||
| CAD | 641,000 | USD | 456,596 | Deutsche Bank AG | 05/13/20 | 3,910 | ||||||||||||||
| CAD | 275,000 | USD | 197,087 | JPMorgan Chase Bank N.A. | 05/13/20 | 478 | ||||||||||||||
| CHF | 220,000 | EUR | 207,770 | Morgan Stanley & Co. International PLC | 05/13/20 | 250 | ||||||||||||||
| CHF | 229,000 | EUR | 216,128 | Morgan Stanley & Co. International PLC | 05/13/20 | 416 | ||||||||||||||
| CHF | 404,000 | EUR | 380,872 | Morgan Stanley & Co. International PLC | 05/13/20 | 1,193 | ||||||||||||||
| CHF | 475,000 | EUR | 449,015 | Morgan Stanley & Co. International PLC | 05/13/20 | 79 | ||||||||||||||
| CLP | 209,942,000 | USD | 246,555 | Credit Suisse International | 05/13/20 | 4,983 | ||||||||||||||
| CLP | 213,736,000 | USD | 253,542 | JPMorgan Chase Bank N.A. | 05/13/20 | 2,543 | ||||||||||||||
| COP | 398,730,000 | USD | 98,818 | JPMorgan Chase Bank N.A. | 05/13/20 | 1,823 | ||||||||||||||
| COP | 212,440,000 | USD | 52,948 | Morgan Stanley & Co. International PLC | 05/13/20 | 673 | ||||||||||||||
| EUR | 172,920 | CHF | 182,000 | Citibank N.A. | 05/13/20 | 930 | ||||||||||||||
| EUR | 569,624 | CHF | 599,000 | Deutsche Bank AG | 05/13/20 | 3,618 | ||||||||||||||
| EUR | 1,180,587 | CHF | 1,248,000 | Deutsche Bank AG | 05/13/20 | 732 | ||||||||||||||
| EUR | 412,070 | CHF | 434,000 | Goldman Sachs International | 05/13/20 | 1,913 | ||||||||||||||
| EUR | 90,488 | NOK | 1,013,000 | Deutsche Bank AG | 05/13/20 | 294 | ||||||||||||||
| EUR | 242,585 | PLN | 1,101,000 | BNP Paribas S.A. | 05/13/20 | 523 | ||||||||||||||
| EUR | 703,405 | PLN | 3,198,000 | Goldman Sachs International | 05/13/20 | 186 | ||||||||||||||
| EUR | 470,000 | USD | 511,519 | BNP Paribas S.A. | 05/13/20 | 3,602 | ||||||||||||||
| EUR | 470,000 | USD | 511,790 | BNP Paribas S.A. | 05/13/20 | 3,331 | ||||||||||||||
| EUR | 856,000 | USD | 930,018 | BNP Paribas S.A. | 05/13/20 | 8,159 | ||||||||||||||
| EUR | 856,000 | USD | 931,424 | JPMorgan Chase Bank N.A. | 05/13/20 | 6,753 | ||||||||||||||
| EUR | 2,048,570 | USD | 2,215,266 | JPMorgan Chase Bank N.A. | 05/13/20 | 29,969 | ||||||||||||||
| GBP | 47,000 | USD | 58,771 | Citibank N.A. | 05/13/20 | 426 | ||||||||||||||
| GBP | 95,000 | USD | 118,401 | Citibank N.A. | 05/13/20 | 1,254 | ||||||||||||||
| GBP | 95,000 | USD | 118,443 | Citibank N.A. | 05/13/20 | 1,212 | ||||||||||||||
| GBP | 55,000 | USD | 68,723 | JPMorgan Chase Bank N.A. | 05/13/20 | 551 | ||||||||||||||
| GBP | 275,000 | USD | 339,889 | JPMorgan Chase Bank N.A. | 05/13/20 | 6,482 | ||||||||||||||
| HUF | 44,548,000 | EUR | 123,405 | BNP Paribas S.A. | 05/13/20 | 3,219 | ||||||||||||||
| HUF | 165,678,000 | EUR | 462,309 | Deutsche Bank AG | 05/13/20 | 8,295 | ||||||||||||||
| IDR | 1,861,192,000 | USD | 118,774 | JPMorgan Chase Bank N.A. | 05/13/20 | 4,230 | ||||||||||||||
| IDR | 11,313,770,000 | USD | 672,638 | Merrill Lynch International | 05/13/20 | 75,079 | ||||||||||||||
| INR | 41,591,000 | USD | 539,317 | BNP Paribas S.A. | 05/13/20 | 12,065 | ||||||||||||||
| JPY | 14,725,000 | USD | 136,901 | Goldman Sachs International | 05/13/20 | 322 | ||||||||||||||
| JPY | 183,436,000 | USD | 1,697,035 | JPMorgan Chase Bank N.A. | 05/13/20 | 12,417 | ||||||||||||||
| KRW | 212,113,000 | USD | 173,780 | Morgan Stanley & Co. International PLC | 05/13/20 | 892 | ||||||||||||||
| KRW | 266,366,000 | USD | 218,984 | Morgan Stanley & Co. International PLC | 05/13/20 | 365 | ||||||||||||||
| MXN | 9,598,000 | USD | 392,021 | Citibank N.A. | 05/13/20 | 5,674 | ||||||||||||||
| MXN | 2,914,000 | USD | 117,371 | Goldman Sachs International | 05/13/20 | 3,371 | ||||||||||||||
| MXN | 11,779,000 | USD | 475,391 | Goldman Sachs International | 05/13/20 | 12,674 | ||||||||||||||
| NOK | 414,000 | EUR | 36,644 | Goldman Sachs International | 05/13/20 | 249 | ||||||||||||||
| NOK | 616,000 | EUR | 54,770 | Morgan Stanley & Co. International PLC | 05/13/20 | 101 | ||||||||||||||
| CONSOLIDATED SCHEDULE OF INVESTMENTS | 11 |
Consolidated Schedule of Investments (continued) April 30, 2020 | BlackRock Total Emerging Markets Fund |
Forward Foreign Currency Exchange Contracts (continued)
| Currency Purchased | Currency Sold | Counterparty | Settlement Date | Unrealized Appreciation (Depreciation) | ||||||||||||||||
| NZD | 97,000 | USD | 58,831 | BNP Paribas S.A. | 05/13/20 | $ | 669 | |||||||||||||
| NZD | 179,000 | USD | 109,276 | Citibank N.A. | 05/13/20 | 523 | ||||||||||||||
| NZD | 2,286,000 | USD | 1,345,969 | Deutsche Bank AG | 05/13/20 | 56,269 | ||||||||||||||
| NZD | 179,000 | USD | 109,708 | Goldman Sachs International | 05/13/20 | 91 | ||||||||||||||
| NZD | 97,000 | USD | 58,738 | JPMorgan Chase Bank N.A. | 05/13/20 | 763 | ||||||||||||||
| NZD | 446,000 | USD | 266,816 | JPMorgan Chase Bank N.A. | 05/13/20 | 6,761 | ||||||||||||||
| PLN | 9,326,000 | EUR | 2,033,830 | Deutsche Bank AG | 05/13/20 | 18,569 | ||||||||||||||
| RON | 936,000 | EUR | 192,397 | Deutsche Bank AG | 05/13/20 | 869 | ||||||||||||||
| RUB | 10,113,000 | USD | 135,636 | JPMorgan Chase Bank N.A. | 05/13/20 | 409 | ||||||||||||||
| RUB | 16,234,000 | USD | 213,633 | JPMorgan Chase Bank N.A. | 05/13/20 | 4,754 | ||||||||||||||
| SEK | 787,000 | EUR | 73,155 | BNP Paribas S.A. | 05/13/20 | 499 | ||||||||||||||
| SEK | 885,000 | EUR | 82,002 | BNP Paribas S.A. | 05/13/20 | 848 | ||||||||||||||
| SEK | 1,436,000 | EUR | 131,714 | Goldman Sachs International | 05/13/20 | 2,847 | ||||||||||||||
| SEK | 1,514,000 | EUR | 141,511 | JPMorgan Chase Bank N.A. | 05/13/20 | 106 | ||||||||||||||
| SEK | 18,092,000 | EUR | 1,651,149 | JPMorgan Chase Bank N.A. | 05/13/20 | 44,972 | ||||||||||||||
| SEK | 1,514,000 | EUR | 141,320 | Morgan Stanley & Co. International PLC | 05/13/20 | 315 | ||||||||||||||
| SGD | 659,000 | USD | 460,066 | HSBC Bank USA N.A. | 05/13/20 | 7,269 | ||||||||||||||
| THB | 16,260,944 | USD | 497,413 | BNP Paribas S.A. | 05/13/20 | 5,176 | ||||||||||||||
| THB | 4,994,056 | USD | 152,751 | Deutsche Bank AG | 05/13/20 | 1,604 | ||||||||||||||
| THB | 13,578,000 | USD | 412,329 | HSBC Bank USA N.A. | 05/13/20 | 7,336 | ||||||||||||||
| TWD | 3,656,000 | USD | 122,213 | Credit Suisse International | 05/13/20 | 760 | ||||||||||||||
| TWD | 41,732,000 | USD | 1,388,521 | Credit Suisse International | 05/13/20 | 15,175 | ||||||||||||||
| USD | 382,349 | AUD | 584,000 | Deutsche Bank AG | 05/13/20 | 1,777 | ||||||||||||||
| USD | 1,339,045 | BRL | 7,111,000 | BNP Paribas S.A. | 05/13/20 | 32,163 | ||||||||||||||
| USD | 215,985 | BRL | 1,115,000 | Morgan Stanley & Co. International PLC | 05/13/20 | 11,067 | ||||||||||||||
| USD | 1,099,390 | CAD | 1,527,000 | Deutsche Bank AG | 05/13/20 | 2,366 | ||||||||||||||
| USD | 367,055 | GBP | 291,000 | Deutsche Bank AG | 05/13/20 | 532 | ||||||||||||||
| USD | 1,112,297 | JPY | 118,936,000 | Deutsche Bank AG | 05/13/20 | 3,925 | ||||||||||||||
| USD | 98,866 | MXN | 2,385,000 | HSBC Bank USA N.A. | 05/13/20 | 43 | ||||||||||||||
| USD | 346,076 | NZD | 561,000 | Deutsche Bank AG | 05/13/20 | 1,957 | ||||||||||||||
| USD | 23,902 | TRY | 165,000 | BNP Paribas S.A. | 05/13/20 | 321 | ||||||||||||||
| USD | 330,410 | TRY | 2,234,000 | BNP Paribas S.A. | 05/13/20 | 11,137 | ||||||||||||||
| USD | 1,547,542 | IDR | 22,632,808,000 | Standard Chartered Bank | 06/17/20 | 65,042 | ||||||||||||||
| USD | 2,129,533 | KRW | 2,540,000,000 | Citibank N.A. | 06/17/20 | 37,433 | ||||||||||||||
| USD | 1,481,780 | MXN | 31,620,000 | Barclays Bank PLC | 06/17/20 | 178,847 | ||||||||||||||
| USD | 2,081,820 | ZAR | 33,500,000 | BNP Paribas S.A. | 06/17/20 | 282,485 | ||||||||||||||
|
| |||||||||||||||||||
| 1,114,507 | ||||||||||||||||||||
|
| |||||||||||||||||||
| AUD | 190,000 | USD | 124,251 | BNP Paribas S.A. | 05/13/20 | (434 | ) | |||||||||||||
| AUD | 190,000 | USD | 124,395 | Morgan Stanley & Co. International PLC | 05/13/20 | (579 | ) | |||||||||||||
| BRL | 1,103,000 | USD | 205,715 | BNP Paribas S.A. | 05/13/20 | (3,002 | ) | |||||||||||||
| BRL | 1,238,000 | USD | 235,182 | Morgan Stanley & Co. International PLC | 05/13/20 | (7,659 | ) | |||||||||||||
| BRL | 2,600,000 | USD | 498,222 | Morgan Stanley & Co. International PLC | 05/13/20 | (20,385 | ) | |||||||||||||
| CAD | 497,000 | USD | 357,847 | JPMorgan Chase Bank N.A. | 05/13/20 | (793 | ) | |||||||||||||
| CHF | 404,000 | EUR | 382,601 | BNP Paribas S.A. | 05/13/20 | (702 | ) | |||||||||||||
| CHF | 4,088,000 | EUR | 3,876,749 | Barclays Bank PLC | 05/13/20 | (12,886 | ) | |||||||||||||
| CHF | 227,000 | EUR | 215,198 | JPMorgan Chase Bank N.A. | 05/13/20 | (637 | ) | |||||||||||||
| CHF | 101,000 | EUR | 95,987 | Morgan Stanley & Co. International PLC | 05/13/20 | (545 | ) | |||||||||||||
| EUR | 485,109 | HUF | 177,854,000 | Deutsche Bank AG | 05/13/20 | (21,154 | ) | |||||||||||||
| EUR | 184,171 | HUF | 65,476,000 | Goldman Sachs International | 05/13/20 | (1,671 | ) | |||||||||||||
| EUR | 694,669 | NOK | 7,890,000 | Credit Suisse International | 05/13/20 | (8,801 | ) | |||||||||||||
| EUR | 306,605 | NOK | 3,583,000 | Deutsche Bank AG | 05/13/20 | (13,705 | ) | |||||||||||||
| EUR | 146,550 | NOK | 1,658,000 | Goldman Sachs International | 05/13/20 | (1,222 | ) | |||||||||||||
| EUR | 163,925 | NOK | 1,844,000 | JPMorgan Chase Bank N.A. | 05/13/20 | (334 | ) | |||||||||||||
| EUR | 96,388 | SEK | 1,048,000 | Barclays Bank PLC | 05/13/20 | (1,790 | ) | |||||||||||||
| EUR | 120,414 | SEK | 1,308,000 | Citibank N.A. | 05/13/20 | (2,111 | ) | |||||||||||||
| EUR | 442,470 | SEK | 4,734,000 | Deutsche Bank AG | 05/13/20 | (340 | ) | |||||||||||||
| EUR | 90,780 | SEK | 988,000 | Goldman Sachs International | 05/13/20 | (1,786 | ) | |||||||||||||
| EUR | 451,069 | SEK | 4,912,000 | Morgan Stanley & Co. International PLC | 05/13/20 | (9,163 | ) | |||||||||||||
| HUF | 39,242,000 | EUR | 111,732 | Goldman Sachs International | 05/13/20 | (480 | ) | |||||||||||||
| JPY | 20,988,000 | USD | 196,796 | BNP Paribas S.A. | 05/13/20 | (1,208 | ) | |||||||||||||
| JPY | 38,523,000 | USD | 361,888 | BNP Paribas S.A. | 05/13/20 | (2,890 | ) | |||||||||||||
| JPY | 20,988,000 | USD | 196,896 | JPMorgan Chase Bank N.A. | 05/13/20 | (1,307 | ) | |||||||||||||
| 12 | 2020 BLACKROCK ANNUAL REPORTTO SHAREHOLDERS |
Consolidated Schedule of Investments (continued) April 30, 2020 | BlackRock Total Emerging Markets Fund |
Forward Foreign Currency Exchange Contracts (continued)
| Currency Purchased | Currency Sold | Counterparty | Settlement Date | Unrealized Appreciation (Depreciation) | ||||||||||||||||
| JPY | 38,523,000 | USD | 361,360 | JPMorgan Chase Bank N.A. | 05/13/20 | $ | (2,362 | ) | ||||||||||||
| PLN | 1,201,000 | EUR | 264,736 | Deutsche Bank AG | 05/13/20 | (699 | ) | |||||||||||||
| USD | 112,258 | AUD | 180,000 | Citibank N.A. | 05/13/20 | (5,042 | ) | |||||||||||||
| USD | 226,958 | AUD | 356,000 | Citibank N.A. | 05/13/20 | (5,035 | ) | |||||||||||||
| USD | 2,799,134 | AUD | 4,636,000 | HSBC Bank USA N.A. | 05/13/20 | (221,985 | ) | |||||||||||||
| USD | 4,244 | CAD | 6,000 | Barclays Bank PLC | 05/13/20 | (66 | ) | |||||||||||||
| USD | 311,673 | CAD | 441,000 | Citibank N.A. | 05/13/20 | (5,149 | ) | |||||||||||||
| USD | 1,040,676 | CAD | 1,467,000 | Goldman Sachs International | 05/13/20 | (13,243 | ) | |||||||||||||
| USD | 125,142 | CAD | 176,000 | JPMorgan Chase Bank N.A. | 05/13/20 | (1,299 | ) | |||||||||||||
| USD | 160,507 | CLP | 138,036,000 | JPMorgan Chase Bank N.A. | 05/13/20 | (4,879 | ) | |||||||||||||
| USD | 1,108,485 | CLP | 952,632,000 | JPMorgan Chase Bank N.A. | 05/13/20 | (32,897 | ) | |||||||||||||
| USD | 45,530 | COP | 180,846,000 | JPMorgan Chase Bank N.A. | 05/13/20 | (116 | ) | |||||||||||||
| USD | 558,530 | EUR | 514,000 | BNP Paribas S.A. | 05/13/20 | (4,814 | ) | |||||||||||||
| USD | 51,114 | EUR | 47,000 | Deutsche Bank AG | 05/13/20 | (398 | ) | |||||||||||||
| USD | 117,315 | EUR | 108,000 | Deutsche Bank AG | 05/13/20 | (1,054 | ) | |||||||||||||
| USD | 237,448 | EUR | 220,000 | Deutsche Bank AG | 05/13/20 | (3,672 | ) | |||||||||||||
| USD | 445,640 | EUR | 408,000 | Deutsche Bank AG | 05/13/20 | (1,528 | ) | |||||||||||||
| USD | 2,874,442 | EUR | 2,624,000 | Deutsche Bank AG | 05/13/20 | (1,465 | ) | |||||||||||||
| USD | 256,827 | EUR | 236,000 | JPMorgan Chase Bank N.A. | 05/13/20 | (1,830 | ) | |||||||||||||
| USD | 1,088,918 | EUR | 1,005,000 | JPMorgan Chase Bank N.A. | 05/13/20 | (12,564 | ) | |||||||||||||
| USD | 62,085 | GBP | 50,339 | BNP Paribas S.A. | 05/13/20 | (1,318 | ) | |||||||||||||
| USD | 140,743 | GBP | 113,000 | Goldman Sachs International | 05/13/20 | (1,584 | ) | |||||||||||||
| USD | 211,727 | GBP | 172,000 | HSBC Bank USA N.A. | 05/13/20 | (4,912 | ) | |||||||||||||
| USD | 195,207 | GBP | 157,000 | JPMorgan Chase Bank N.A. | 05/13/20 | (2,539 | ) | |||||||||||||
| USD | 418,476 | GBP | 339,000 | JPMorgan Chase Bank N.A. | 05/13/20 | (8,505 | ) | |||||||||||||
| USD | 500,123 | IDR | 7,996,967,000 | BNP Paribas S.A. | 05/13/20 | (28,389 | ) | |||||||||||||
| USD | 168,177 | IDR | 2,743,945,000 | Morgan Stanley & Co. International PLC | 05/13/20 | (13,168 | ) | |||||||||||||
| USD | 191,497 | INR | 14,725,000 | Barclays Bank PLC | 05/13/20 | (3,716 | ) | |||||||||||||
| USD | 359,281 | INR | 27,600,000 | JPMorgan Chase Bank N.A. | 05/13/20 | (6,619 | ) | |||||||||||||
| USD | 130,413 | JPY | 14,054,637 | Citibank N.A. | 05/13/20 | (563 | ) | |||||||||||||
| USD | 163,477 | JPY | 17,543,000 | Deutsche Bank AG | 05/13/20 | (8 | ) | |||||||||||||
| USD | 533,460 | JPY | 57,488,363 | Deutsche Bank AG | 05/13/20 | (2,277 | ) | |||||||||||||
| USD | 452,345 | JPY | 49,203,000 | HSBC Bank USA N.A. | 05/13/20 | (6,181 | ) | |||||||||||||
| USD | 747,543 | KRW | 920,913,000 | Merrill Lynch International | 05/13/20 | (10,816 | ) | |||||||||||||
| USD | 507,802 | KRW | 617,011,000 | Morgan Stanley & Co. International PLC | 05/13/20 | (298 | ) | |||||||||||||
| USD | 136,287 | MXN | 3,319,000 | Goldman Sachs International | 05/13/20 | (1,237 | ) | |||||||||||||
| USD | 82,411 | NZD | 137,000 | Citibank N.A. | 05/13/20 | (1,625 | ) | |||||||||||||
| USD | 443,896 | NZD | 740,000 | HSBC Bank USA N.A. | 05/13/20 | (10,021 | ) | |||||||||||||
| USD | 787,554 | PHP | 40,433,000 | JPMorgan Chase Bank N.A. | 05/13/20 | (13,293 | ) | |||||||||||||
| USD | 279,899 | RUB | 21,625,000 | Barclays Bank PLC | 05/13/20 | (11,011 | ) | |||||||||||||
| USD | 377,712 | SGD | 539,000 | BNP Paribas S.A. | 05/13/20 | (4,524 | ) | |||||||||||||
| USD | 63,827 | SGD | 91,000 | HSBC Bank USA N.A. | 05/13/20 | (706 | ) | |||||||||||||
| USD | 95,626 | SGD | 136,000 | JPMorgan Chase Bank N.A. | 05/13/20 | (819 | ) | |||||||||||||
| USD | 285,274 | THB | 9,345,000 | Goldman Sachs International | 05/13/20 | (3,559 | ) | |||||||||||||
| USD | 399,248 | THB | 12,946,000 | Goldman Sachs International | 05/13/20 | (884 | ) | |||||||||||||
| USD | 782,355 | TWD | 23,455,000 | Credit Suisse International | 05/13/20 | (6,577 | ) | |||||||||||||
| USD | 497,929 | TWD | 14,909,000 | JPMorgan Chase Bank N.A. | 05/13/20 | (3,549 | ) | |||||||||||||
| USD | 147,917 | ZAR | 2,782,000 | Goldman Sachs International | 05/13/20 | (2,027 | ) | |||||||||||||
| ZAR | 5,918,000 | USD | 328,419 | BNP Paribas S.A. | 05/13/20 | (9,451 | ) | |||||||||||||
| USD | 2,646,879 | CLP | 2,208,000,000 | Citibank N.A. | 06/17/20 | (643 | ) | |||||||||||||
|
| |||||||||||||||||||
| (596,500 | ) | |||||||||||||||||||
|
| |||||||||||||||||||
| Net unrealized appreciation | $ | 518,007 | ||||||||||||||||||
|
| |||||||||||||||||||
Centrally Cleared Interest Rate Swaps
| Paid by the Fund | Received by the Fund | Effective Date(a) | Termination Date | Notional Amount (000) | Value | Upfront Premium Paid (Received) | Unrealized Appreciation (Depreciation) | |||||||||||||||||||||||||
| Rate | Frequency | Rate | Frequency | |||||||||||||||||||||||||||||
| 3-Month JIBAR, 4.58% | Quarterly | 6.62% | Quarterly | 09/16/20 | 09/16/25 | ZAR | 41,470 | $ | 34,099 | $ | 47 | $ | 34,052 | |||||||||||||||||||
|
|
|
|
|
| |||||||||||||||||||||||||||
| (a) | Forward swap |
| CONSOLIDATED SCHEDULE OF INVESTMENTS | 13 |
Consolidated Schedule of Investments (continued) April 30, 2020 | BlackRock Total Emerging Markets Fund |
OTC Interest Rate Swaps
| Paid by the Fund | Received by the Fund | Counterparty | Effective Date(a) | Termination Date | Notional Amount (000) | Value | Upfront Premium Paid (Received) | Unrealized Appreciation (Depreciation) | ||||||||||||||||||||||||||||||
| Rate | Frequency | Rate | Frequency | |||||||||||||||||||||||||||||||||||
| 3-Month KRW LIBOR, 1.01%, | Quarterly | 0.91% | Quarterly | BNP Paribas S.A. | 09/16/20 | 09/16/25 | KRW | 2,653,170 | $ | (7,157 | ) | $ | — | $ | (7,157 | ) | ||||||||||||||||||||||
| 6-Months CLP Interbank Rate, | Semi-Annual | 2.08 | Semi-Annual | Goldman Sachs Bank USA | 09/16/20 | 09/16/25 | CLP | 1,626,110 | 18,681 | — | 18,681 | |||||||||||||||||||||||||||
| 6-Month BIBOR, | Semi-Annual | 0.66 | Semi-Annual | Goldman Sachs Bank USA | 09/16/20 | 09/16/25 | THB | 71,930 | (21,452 | ) | — | (21,452 | ) | |||||||||||||||||||||||||
| 3-Month TWD Secondary Bank Rate | Quarterly | 0.58 | Quarterly | JPMorgan Chase Bank N.A. | 09/16/20 | 09/16/25 | TWD | 63,650 | 6,291 | — | 6,291 | |||||||||||||||||||||||||||
| 3-Month KLIBOR, 2.79%, | Quarterly | 2.41 | Quarterly | Bank of America N.A. | 09/17/20 | 09/17/25 | MYR | 18,080 | 49,709 | — | 49,709 | |||||||||||||||||||||||||||
|
|
|
|
|
| |||||||||||||||||||||||||||||||||
| $ | 46,072 | $ | — | $ | 46,072 | |||||||||||||||||||||||||||||||||
|
|
|
|
|
| |||||||||||||||||||||||||||||||||
| (a) | Forward swap |
OTC Total Return Swaps(a)
| Reference Entity | Counterparty | Termination Date | Net Notional | Unrealized Appreciation (Depreciation) | Net Value of Reference Entity | Gross Notional Amount Net Asset Percentage | ||||||||||||||||||||||
Equity Securities Long | Goldman Sachs & Co. | 05/12/20 – 02/28/23 | USD | 26,362,081 | $ | 369,752 | (b) | $ | 26,462,717 | 26.6 | % | |||||||||||||||||
| UBS AG | 1/21/2021 | USD | 26,920,342 | (648,747 | )(c) | 26,207,018 | 27.2 | % | ||||||||||||||||||||
|
|
|
| |||||||||||||||||||||||||
| $ | (278,995 | ) | $ | 52,669,735 | ||||||||||||||||||||||||
|
|
|
| |||||||||||||||||||||||||
| (a) | In regards to total return swaps with multiple financing rate benchmarks, the Fund receives the total return on a portfolio of long positions underlying the total return swap. In addition, the Fund pays a variable rate of interest, based on a specified benchmark, plus or minus a spread in a range of25-175 basis points. The benchmark and spread are determined based upon the country and/or currency of the individual underlying positions. The following are the specified benchmarks used in determining the variable rate of interest: |
EUR — 1D Effective Overnight Index Average (EONIA)
USD — 1D Overnight Bank Funding Rate (OBFR01)
USD — 1D Overnight Fed Funds Effective Rate (FEDL01)
USD — 1W US Dollar LIBOR BBA
| (b) | Amount includes $269,116 of net dividends and financing fees. |
| (c) | Amount includes $64,577 of net dividends and financing fees. |
| 14 | 2020 BLACKROCK ANNUAL REPORTTO SHAREHOLDERS |
Consolidated Schedule of Investments (continued) April 30, 2020 | BlackRock Total Emerging Markets Fund |
The following table represents the individual long positions and related values of the equity securities underlying the total return swap with Goldman Sachs & Co. as of April 30, 2020 termination dates 05/12/20 — 02/28/23:
| Shares | Value | % of Basket Value | ||||||||||
Reference Entity — Long |
| |||||||||||
| Brazil | ||||||||||||
AMBEV SA — ADR | 35,029 | $ | 75,312 | 0.3 | % | |||||||
B3 SA — Brasil Bolsa Balcao | 18,590 | 131,343 | 0.5 | |||||||||
Banco Bradesco SA, Preference Shares | 130,047 | 457,971 | 1.7 | |||||||||
Cia Energetica de Minas Gerais, Preference Shares | 11,966 | 20,949 | 0.1 | |||||||||
Cia Siderurgica Nacional SA | 11,750 | 19,360 | 0.1 | |||||||||
Cosan Ltd., Class A | 1,486 | 19,823 | 0.1 | |||||||||
Itau Unibanco Holding SA, Preference Shares | 13,623 | 57,043 | 0.2 | |||||||||
Klabin SA | 22,349 | 73,197 | 0.3 | |||||||||
Lojas Americanas SA, Preference Shares | 9,457 | 43,269 | 0.1 | |||||||||
Petroleo Brasileiro SA, Preference Shares | 34,003 | 112,866 | 0.4 | |||||||||
Raia Drogasil SA | 2,925 | 56,360 | 0.2 | |||||||||
Vale SA | 41,559 | 342,841 | 1.3 | |||||||||
|
|
|
| |||||||||
| 1,410,334 | ||||||||||||
| Chile | ||||||||||||
Cia Cervecerias Unidas SA, ADR | 2,427 | 34,512 | 0.1 | |||||||||
|
|
|
| |||||||||
| China | ||||||||||||
Alibaba Group Holding Ltd. — ADR | 21,334 | 4,323,762 | 16.3 | |||||||||
Anhui Conch Cement Co. Ltd., Class H | 5,500 | 43,370 | 0.2 | |||||||||
ANTA Sports Products Ltd. | 3,000 | 25,548 | 0.1 | |||||||||
Baidu, Inc. — ADR | 3,844 | 387,975 | 1.5 | |||||||||
Bank of China Ltd., Class H | 549,000 | 209,006 | 0.8 | |||||||||
China Construction Bank Corp., Class H | 256,000 | 205,482 | 0.8 | |||||||||
China Mengniu Dairy Co. Ltd. | 37,000 | 131,021 | 0.5 | |||||||||
China Merchants Bank Co. Ltd., Class H | 9,500 | 44,957 | 0.2 | |||||||||
China Mobile Ltd. | 7,000 | 56,273 | 0.2 | |||||||||
China Mobile Ltd. — ADR | 2,984 | 119,270 | 0.4 | |||||||||
China Pacific Insurance Group Co. Ltd., Class H | 13,400 | 44,333 | 0.2 | |||||||||
China Resources Cement Holdings Ltd. | 34,000 | 46,264 | 0.2 | |||||||||
China Telecom Corp. Ltd., Class H | 660,000 | 227,964 | 0.9 | |||||||||
China Tower Corp. Ltd., Class H | 108,000 | 24,035 | 0.1 | |||||||||
Country Garden Services Holdings Co. Ltd. | 29,000 | 133,985 | 0.5 | |||||||||
GDS Holdings Ltd. — ADR | 413 | 23,673 | 0.1 | |||||||||
Geely Automobile Holdings Ltd. | 9,000 | 14,000 | 0.1 | |||||||||
Industrial & Commercial Bank of China Ltd., Class H | 213,000 | 142,818 | 0.5 | |||||||||
JD.com, Inc. — ADR | 10,262 | 442,292 | 1.7 | |||||||||
JOYY, Inc., ADR | 456 | 27,798 | 0.1 | |||||||||
Kingdee International Software Group Co. Ltd. | 28,000 | 40,045 | 0.1 | |||||||||
Kingsoft Corp. Ltd. | 10,000 | 34,342 | 0.1 | |||||||||
Kunlun Energy Co. Ltd. | 274,000 | 178,510 | 0.7 | |||||||||
Lenovo Group Ltd. | 392,000 | 211,757 | 0.8 | |||||||||
Luye Pharma Group Ltd. | 239,500 | 116,296 | 0.4 | |||||||||
Momo, Inc., ADR | 1,472 | 35,446 | 0.1 | |||||||||
NetEase, Inc. — ADR | 1,032 | 355,999 | 1.3 | |||||||||
New Oriental Education & Technology Group, Inc. — ADR | 1,778 | 226,979 | 0.9 | |||||||||
PetroChina Co. Ltd., ADR | 1,794 | 64,279 | 0.2 | |||||||||
Pinduoduo, Inc., ADR | 3,088 | 146,495 | 0.5 | |||||||||
Ping An Insurance Group Co. of China Ltd., Class H | 83,000 | 844,629 | 3.2 | |||||||||
Sohu.com Ltd., ADR | 2,296 | 19,263 | 0.1 | |||||||||
Sunac China Holdings Ltd. | 8,000 | 35,786 | 0.1 | |||||||||
TAL Education Group — ADR | 4,557 | 246,944 | 0.9 | |||||||||
Tencent Holdings Ltd. | 12,000 | 630,833 | 2.4 | |||||||||
Tingyi Cayman Islands Holding Corp. | 76,000 | 134,908 | 0.5 | |||||||||
Trip.com Group Ltd., ADR | 3,749 | 96,574 | 0.4 | |||||||||
| Shares | Value | % of Basket Value | ||||||||||
| China (continued) | ||||||||||||
Vipshop Holdings Ltd. — ADR | 4,714 | $ | 75,094 | 0.3 | % | |||||||
Want Want China Holdings Ltd. | 23,000 | 16,393 | 0.1 | |||||||||
Xiaomi Corp., Class B | 49,600 | 65,055 | 0.2 | |||||||||
Yum China Holdings, Inc. | 2,025 | 98,132 | 0.4 | |||||||||
Zai Lab Ltd., ADR | 345 | 21,638 | 0.1 | |||||||||
Zijin Mining Group Co. Ltd., Class H | 90,000 | 36,744 | 0.1 | |||||||||
ZTO Express Cayman, Inc., — ADR | 3,585 | 106,690 | 0.4 | |||||||||
|
|
|
| |||||||||
| 10,512,657 | ||||||||||||
| Colombia | ||||||||||||
Bancolombia SA — ADR | 2,012 | 52,513 | 0.2 | |||||||||
|
|
|
| |||||||||
| Hong Kong | ||||||||||||
Nine Dragons Paper Holdings Ltd. | 19,000 | 18,178 | 0.1 | |||||||||
|
|
|
| |||||||||
| Hungary | ||||||||||||
Richter Gedeon Nyrt | 1,433 | 30,621 | 0.1 | |||||||||
|
|
|
| |||||||||
| Malaysia | ||||||||||||
CIMB Group Holdings Bhd | 130,100 | 104,025 | 0.4 | |||||||||
Petronas Dagangan Bhd | 49,400 | 233,033 | 0.9 | |||||||||
Top Glove Corp. Bhd | 38,700 | 65,223 | 0.2 | |||||||||
|
|
|
| |||||||||
| 402,281 | ||||||||||||
| Mexico | ||||||||||||
America Movil SAB de CV, Series L | 392,692 | 237,887 | 0.9 | |||||||||
Coca-Cola Femsa SAB de CV | 72,296 | 291,272 | 1.1 | |||||||||
Fomento Economico Mexicano SAB de CV | 79,935 | 516,637 | 2.0 | |||||||||
Grupo Aeroportuario del Centro Norte SAB de CV | 53,075 | 193,352 | 0.7 | |||||||||
Grupo Aeroportuario del Pacifico SAB de CV, Class B | 15,934 | 99,567 | 0.4 | |||||||||
Grupo Financiero Banorte SAB de CV, Series O | 8,671 | 23,713 | 0.1 | |||||||||
Kimberly-Clark de Mexico SAB de CV, Class A | 292,500 | 413,124 | 1.6 | |||||||||
Wal-Mart de Mexico SAB de CV | 80,730 | 194,179 | 0.7 | |||||||||
|
|
|
| |||||||||
| 1,969,731 | ||||||||||||
| Philippines | ||||||||||||
Metropolitan Bank & Trust Co. | 4 | 3 | 0.0 | |||||||||
|
|
|
| |||||||||
| Poland | ||||||||||||
Bank Polska Kasa Opieki SA | 3,953 | 50,143 | 0.2 | |||||||||
Polski Koncern Naftowy ORLEN SA | 2,847 | 43,216 | 0.2 | |||||||||
Powszechna Kasa Oszczednosci Bank Polski SA | 4,985 | 26,678 | 0.1 | |||||||||
|
|
|
| |||||||||
| 120,037 | ||||||||||||
| Qatar | ||||||||||||
Masraf Al Rayan QSC | 150,028 | 155,853 | 0.6 | |||||||||
Ooredoo QPSC | 25,608 | 44,472 | 0.1 | |||||||||
Qatar Islamic Bank SAQ | 104,742 | 441,851 | 1.7 | |||||||||
|
|
|
| |||||||||
| 642,176 | ||||||||||||
| Russia | ||||||||||||
Gazprom PJSC — ADR | 6,162 | 31,204 | 0.1 | |||||||||
Lukoil PJSC — ADR | 763 | 49,777 | 0.2 | |||||||||
Magnit PJSC — GDR | 2,665 | 29,393 | 0.1 | |||||||||
Mobile TeleSystems PJSC — ADR | 11,890 | 101,897 | 0.4 | |||||||||
Novatek PJSC | 3,108 | 43,229 | 0.2 | |||||||||
Sistema PJSC FC — GDR | 7,854 | 30,835 | 0.1 | |||||||||
Tatneft PJSC | 16,991 | 125,081 | 0.5 | |||||||||
|
|
|
| |||||||||
| 411,416 | ||||||||||||
| Saudi Arabia | ||||||||||||
Al Rajhi Bank | 29,068 | 441,858 | 1.7 | |||||||||
Alinma Bank | 102,836 | 434,787 | 1.6 | |||||||||
Almarai Co. JSC | 3,775 | 49,221 | 0.2 | |||||||||
National Commercial Bank | 8,644 | 85,311 | 0.3 | |||||||||
Saudi Basic Industries Corp. | 1,428 | 28,338 | 0.1 | |||||||||
|
|
|
| |||||||||
| 1,039,515 | ||||||||||||
| CONSOLIDATED SCHEDULE OF INVESTMENTS | 15 |
Consolidated Schedule of Investments (continued) April 30, 2020 | BlackRock Total Emerging Markets Fund |
| Shares | Value | % of Basket Value | ||||||||||
| South Africa | ||||||||||||
Anglo American PLC | 4,127 | $ | 73,497 | 0.3 | % | |||||||
AngloGold Ashanti Ltd. | 1,537 | 37,518 | 0.1 | |||||||||
Bid Corp. Ltd. | 1,853 | 24,149 | 0.1 | |||||||||
Clicks Group Ltd. | 6,911 | 86,021 | 0.3 | |||||||||
FirstRand Ltd. | 89,482 | 195,295 | 0.7 | |||||||||
MTN Group Ltd. | 17,901 | 47,041 | 0.2 | |||||||||
MultiChoice Group | 8,753 | 41,024 | 0.2 | |||||||||
Naspers Ltd., Class N | 1,993 | 310,207 | 1.2 | |||||||||
Standard Bank Group Ltd. | 6,027 | 33,209 | 0.1 | |||||||||
|
|
|
| |||||||||
| 847,961 | ||||||||||||
| South Korea | ||||||||||||
KT Corp. — ADR | 12,348 | 121,134 | 0.5 | |||||||||
LG Electronics, Inc. | 6,070 | 273,181 | 1.0 | |||||||||
|
|
|
| |||||||||
| 394,315 | ||||||||||||
| Taiwan | ||||||||||||
ASPEED Technology, Inc. | 1,000 | 39,544 | 0.2 | |||||||||
Catcher Technology Co. Ltd. | 11,000 | 83,319 | 0.3 | |||||||||
Cathay Financial Holding Co. Ltd. | 34,000 | 45,367 | 0.2 | |||||||||
Chailease Holding Co. Ltd. | 56,692 | 215,393 | 0.8 | |||||||||
Chunghwa Telecom Co. Ltd. | 14,000 | 51,456 | 0.2 | |||||||||
CTBC Financial Holding Co. Ltd. | 228,000 | 151,938 | 0.6 | |||||||||
Delta Electronics, Inc. | 13,000 | 60,635 | 0.2 | |||||||||
Fubon Financial Holding Co. Ltd. | 84,000 | 118,774 | 0.5 | |||||||||
Hon Hai Precision Industry Co. Ltd. | 83,000 | 213,307 | 0.8 | |||||||||
Largan Precision Co. Ltd. | 2,000 | 272,627 | 1.0 | |||||||||
MediaTek, Inc. | 36,000 | 497,103 | 1.9 | |||||||||
President Chain Store Corp. | 11,000 | 113,748 | 0.4 | |||||||||
Realtek Semiconductor Corp. | 30,000 | 256,900 | 1.0 | |||||||||
Sercomm Corp. | 46,000 | 114,947 | 0.4 | |||||||||
Sunonwealth Electric Machine Industry Co. Ltd. | 67,000 | 87,441 | 0.3 | |||||||||
Taishin Financial Holding Co. Ltd. | 204,000 | 86,768 | 0.3 | |||||||||
Taiwan Cooperative Financial Holding Co. Ltd. | 393,000 | 263,905 | 1.0 | |||||||||
Taiwan Mobile Co. Ltd. | 99,000 | 356,708 | 1.3 | |||||||||
Taiwan Semiconductor Manufacturing Co. Ltd. | 356,000 | 3,591,255 | 13.6 | |||||||||
Taiwan Semiconductor Manufacturing Co. Ltd.—ADR | 3,313 | 176,020 | 0.7 | |||||||||
TPK Holding Co. Ltd. | 161,000 | 225,226 | 0.9 | |||||||||
Uni-President Enterprises Corp. | 330,000 | 768,367 | 2.9 | |||||||||
Yuanta Financial Holding Co. Ltd. | 65,000 | 37,049 | 0.1 | |||||||||
|
|
|
| |||||||||
| 7,827,797 | ||||||||||||
| Thailand | ||||||||||||
Advanced Info Service PCL, Foreign Registered Shares | 22,300 | 135,602 | 0.5 | |||||||||
Bangkok Bank PCL, Foreign Registered Shares | 6,900 | 22,004 | 0.1 | |||||||||
CP ALL PCL | 27,300 | 59,429 | 0.2 | |||||||||
Home Product Center PCL | 202,000 | 83,945 | 0.3 | |||||||||
|
|
|
| |||||||||
| 300,980 | ||||||||||||
| Turkey | ||||||||||||
KOC Holding AS | 31,355 | 68,801 | 0.3 | |||||||||
Tupras Turkiye Petrol Rafinerileri AS | 6,061 | 78,709 | 0.3 | |||||||||
Turkcell Iletisim Hizmetleri AS | 40,555 | 80,792 | 0.3 | |||||||||
|
|
|
| |||||||||
| 228,302 | ||||||||||||
| United States | ||||||||||||
Genpact Ltd. | 6,372 | 219,388 | 0.8 | |||||||||
|
|
|
| |||||||||
Total Reference Entity — Long |
| 26,462,717 | ||||||||||
|
| |||||||||||
Net Value of Reference Entity — Goldman Sachs & Co. |
| $ | 26,462,717 | |||||||||
|
| |||||||||||
The following table represents the individual long positions and related values of the equity securities underlying the total return swap with UBS AG as of April 30, 2020 termination date 01/12/21:
| Shares | Value | % of Basket Value | ||||||||||
Reference Entity — Long |
| |||||||||||
| Brazil | ||||||||||||
Ambev SA | 65,285 | $ | 136,143 | 0.5 | % | |||||||
Banco Bradesco SA, Preference Shares | 5,288 | 44,392 | 0.2 | |||||||||
Banco Bradesco SA, Preference Shares | 1 | 3 | 0.0 | |||||||||
BRF SA | 4,897 | 17,461 | 0.1 | |||||||||
Cia Energetica de Sao Paulo, Preference B Shares | 4,308 | 22,309 | 0.1 | |||||||||
Cia Siderurgica Nacional SA | 2,850 | 4,696 | 0.0 | |||||||||
Equatorial Energia SA | 6,978 | 23,521 | 0.1 | |||||||||
Hapvida Participacoes e Investimentos SA | 1,881 | 18,139 | 0.1 | |||||||||
Hypera SA | 3,870 | 20,695 | 0.1 | |||||||||
Itau Unibanco Holding SA, Preference Shares | 51,142 | 214,146 | 0.8 | |||||||||
Itausa — Investimentos Itau SA, Preference Shares | 13,584 | 22,482 | 0.1 | |||||||||
Notre Dame Intermedica Participacoes SA | 5,577 | 56,212 | 0.2 | |||||||||
Raia Drogasil SA | 3,779 | 72,816 | 0.3 | |||||||||
TIM Participacoes SA | 11,856 | 27,820 | 0.1 | |||||||||
Totvs SA | 37,125 | 403,822 | 1.5 | |||||||||
Ultrapar Participacoes SA | 16,000 | 42,664 | 0.1 | |||||||||
Vale SA | 2,190 | 18,066 | 0.1 | |||||||||
WEG SA | 23,236 | 170,663 | 0.7 | |||||||||
|
|
|
| |||||||||
| 1,316,050 | ||||||||||||
| Chile | ||||||||||||
Cia Cervecerias Unidas SA | 3,798 | 27,294 | 0.1 | |||||||||
|
|
|
| |||||||||
| China | ||||||||||||
3SBio, Inc. | 73,500 | 74,516 | 0.3 | |||||||||
AAC Technologies Holdings, Inc. | 6,500 | 30,742 | 0.1 | |||||||||
Agricultural Bank of China Ltd., Class H | 64,000 | 26,623 | 0.1 | |||||||||
Alibaba Health Information Technology Ltd. | 46,000 | 110,032 | 0.4 | |||||||||
Anhui Conch Cement Co. Ltd., Class H | 2,500 | 19,713 | 0.1 | |||||||||
Anhui Expressway Co. Ltd., Class H | 28,000 | 14,431 | 0.1 | |||||||||
ANTA Sports Products Ltd. | 5,000 | 42,580 | 0.2 | |||||||||
Bank of China Ltd., Class H | 563,000 | 214,336 | 0.8 | |||||||||
China Construction Bank Corp., Class H | 1,274,000 | 1,022,593 | 3.9 | |||||||||
China Life Insurance Co. Ltd., Class H | 261,000 | 556,634 | 2.1 | |||||||||
China Medical System Holdings Ltd. | 11,000 | 12,949 | 0.0 | |||||||||
China Merchants Bank Co. Ltd., Class H | 14,500 | 68,619 | 0.3 | |||||||||
China Mobile Ltd. | 89,000 | 715,476 | 2.7 | |||||||||
China Railway Group Ltd., Class H | 61,000 | 36,474 | 0.1 | |||||||||
China Resources Beer Holdings Co. Ltd. | 14,000 | 65,937 | 0.3 | |||||||||
China Resources Land Ltd. | 6,000 | 24,793 | 0.1 | |||||||||
China Telecom Corp. Ltd., Class H | 96,000 | 33,158 | 0.1 | |||||||||
China Unicom Hong Kong Ltd. | 480,000 | 310,432 | 1.2 | |||||||||
CNOOC Ltd. | 153,000 | 169,160 | 0.6 | |||||||||
Country Garden Services Holdings Co. Ltd. | 6,000 | 27,721 | 0.1 | |||||||||
CSPC Pharmaceutical Group Ltd. | 78,000 | 154,418 | 0.6 | |||||||||
ENN Energy Holdings Ltd. | 30,200 | 340,428 | 1.3 | |||||||||
Genscript Biotech Corp. | 8,000 | 14,267 | 0.1 | |||||||||
Hansoh Pharmaceutical Group Co. Ltd. | 6,000 | 23,168 | 0.1 | |||||||||
Industrial & Commercial Bank of China Ltd., Class H | 579,000 | 388,225 | 1.5 | |||||||||
Innovent Biologics, Inc. | 11,000 | 54,173 | 0.2 | |||||||||
Kunlun Energy Co. Ltd. | 210,000 | 136,814 | 0.5 | |||||||||
Li Ning Co. Ltd. | 37,000 | 116,827 | 0.4 | |||||||||
Meituan Dianping, Class B | 22,500 | 301,254 | 1.1 | |||||||||
PetroChina Co. Ltd., Class H | 322,000 | 115,660 | 0.4 | |||||||||
Ping An Healthcare and Technology Co. Ltd. | 3,500 | 48,216 | 0.2 | |||||||||
Poly Property Development Co. Ltd., Class H | 2,600 | 27,645 | 0.1 | |||||||||
Shandong Weigao Group Medical Polymer Co. Ltd., Class H | 24,000 | 36,460 | 0.1 | |||||||||
| 16 | 2020 BLACKROCK ANNUAL REPORTTO SHAREHOLDERS |
Consolidated Schedule of Investments (continued) April 30, 2020 | BlackRock Total Emerging Markets Fund |
| Shares | Value | % of Basket Value | ||||||||||
| China (continued) | ||||||||||||
Shanghai Fosun Pharmaceutical Group Co. Ltd., Class H | 4,000 | $ | 15,112 | 0.1 | % | |||||||
Shanghai Pharmaceuticals Holding Co. Ltd., Class H | 5,600 | 9,857 | 0.0 | |||||||||
Sinopec Shanghai Petrochemical Co. Ltd., Class H | 214,000 | 58,101 | 0.2 | |||||||||
Sinopharm Group Co. Ltd., Class H | 55,200 | 148,839 | 0.6 | |||||||||
Sunny Optical Technology Group Co. Ltd. | 14,900 | 207,490 | 0.8 | |||||||||
Tencent Holdings Ltd. | 76,900 | 4,042,589 | 15.4 | |||||||||
Tingyi Cayman Islands Holding Corp. | 16,000 | 28,402 | 0.1 | |||||||||
Want Want China Holdings Ltd. | 60,000 | 42,765 | 0.2 | |||||||||
WuXi AppTec Co. Ltd., Class H | 1,400 | 19,738 | 0.1 | |||||||||
Wuxi Biologics Cayman, Inc. | 10,500 | 163,447 | 0.6 | |||||||||
Xiaomi Corp., Class B | 32,200 | 42,233 | 0.2 | |||||||||
|
|
|
| |||||||||
| 10,113,047 | ||||||||||||
| Colombia | ||||||||||||
Cementos Argos SA | 1,951 | 1,920 | 0.0 | |||||||||
Corp. Financiera Colombiana SA | 212 | 1,382 | 0.0 | |||||||||
Ecopetrol SA | 26,107 | 13,782 | 0.1 | |||||||||
Grupo Argos SA | 1,923 | 4,478 | 0.0 | |||||||||
Grupo de Inversiones Suramericana SA | 1,587 | 8,627 | 0.0 | |||||||||
Interconexion Electrica SA | 4,360 | 20,043 | 0.1 | |||||||||
|
|
|
| |||||||||
| 50,232 | ||||||||||||
| Greece | ||||||||||||
Alpha Bank AE | 24,775 | 18,091 | 0.1 | |||||||||
Eurobank Ergasias Services and Holdings SA | 32,070 | 12,954 | 0.0 | |||||||||
FF Group | 1,346 | 15 | 0.0 | |||||||||
Hellenic Telecommunications Organization SA | 3,539 | 46,755 | 0.2 | |||||||||
JUMBO SA | 1,713 | 26,808 | 0.1 | |||||||||
Motor Oil Hellas Corinth Refineries SA | 875 | 12,965 | 0.1 | |||||||||
National Bank of Greece SA | 4,608 | 6,249 | 0.0 | |||||||||
OPAP SA | 3,303 | 29,586 | 0.1 | |||||||||
|
|
|
| |||||||||
| 153,423 | ||||||||||||
| Hong Kong | ||||||||||||
Sino Biopharmaceutical Ltd. | 93,000 | 135,557 | 0.5 | |||||||||
|
|
|
| |||||||||
| Hungary | ||||||||||||
Richter Gedeon Nyrt | 1,459 | 31,177 | 0.1 | |||||||||
|
|
|
| |||||||||
| Indonesia | ||||||||||||
Astra International Tbk PT | 351,300 | 89,851 | 0.3 | |||||||||
Bank Central Asia Tbk PT | 186,600 | 323,227 | 1.2 | |||||||||
Bank Mandiri Persero Tbk PT | 409,500 | 121,728 | 0.5 | |||||||||
Bank Negara Indonesia Persero Tbk PT | 266,300 | 72,672 | 0.3 | |||||||||
Bank Rakyat Indonesia Persero Tbk PT | 100,600 | 18,298 | 0.1 | |||||||||
Kalbe Farma Tbk PT | 146,000 | 14,104 | 0.1 | |||||||||
Perusahaan Gas Negara Persero Tbk PT | 374,600 | 21,254 | 0.1 | |||||||||
Telekomunikasi Indonesia Persero Tbk PT | 391,900 | 90,118 | 0.3 | |||||||||
Unilever Indonesia Tbk PT | 65,700 | 36,431 | 0.1 | |||||||||
|
|
|
| |||||||||
| 787,683 | ||||||||||||
| Malaysia | ||||||||||||
CIMB Group Holdings Bhd | 572,100 | 457,440 | 1.7 | |||||||||
Hartalega Holdings Bhd | 71,600 | 126,485 | 0.5 | |||||||||
Hong Leong Bank Bhd | 49,700 | 153,319 | 0.6 | |||||||||
IHH Healthcare Bhd | 22,400 | 27,257 | 0.1 | |||||||||
Malayan Banking Bhd | 112,500 | 197,444 | 0.8 | |||||||||
Public Bank Bhd | 41,800 | 158,864 | 0.6 | |||||||||
Westports Holdings Bhd | 92,900 | 79,290 | 0.3 | |||||||||
|
|
|
| |||||||||
| 1,200,099 | ||||||||||||
| Peru | ||||||||||||
Hochschild Mining PLC | 315,221 | 549,944 | 2.1 | |||||||||
|
|
|
| |||||||||
| Shares | Value | % of Basket Value | ||||||||||
| Poland | ||||||||||||
Bank Polska Kasa Opieki SA | 5,920 | $ | 75,094 | 0.3 | % | |||||||
Powszechna Kasa Oszczednosci Bank Polski SA | 59,166 | 316,642 | 1.2 | |||||||||
|
|
|
| |||||||||
| 391,736 | ||||||||||||
| Russia | ||||||||||||
Detsky Mir PJSC | 29,143 | 34,421 | 0.1 | |||||||||
Gazprom PJSC — ADR | 5,332 | 27,001 | 0.1 | |||||||||
Highland Gold Mining Ltd. | 12,760 | 37,677 | 0.2 | |||||||||
Inter RAO UES PJSC | 5,323,469 | 356,623 | 1.4 | |||||||||
Lukoil PJSC | 9,516 | 614,045 | 2.3 | |||||||||
Lukoil PJSC — ADR | 4,968 | 324,101 | 1.2 | |||||||||
Magnit PJSC — GDR | 2,743 | 30,253 | 0.1 | |||||||||
Magnitogorsk Iron & Steel Works PJSC | 602,984 | 324,367 | 1.2 | |||||||||
MMC Norilsk Nickel PJSC | 1,240 | 336,889 | 1.3 | |||||||||
Novatek PJSC — GDR | 1,266 | 177,533 | 0.7 | |||||||||
PhosAgro PJSC, — GDR | 11,054 | 133,245 | 0.5 | |||||||||
Severstal PJSC | 12,287 | 145,922 | 0.6 | |||||||||
|
|
|
| |||||||||
| 2,542,077 | ||||||||||||
| South Africa | ||||||||||||
Absa Group, Ltd. | 19,783 | 97,632 | 0.4 | |||||||||
Anglo American Platinum Ltd. | 2,604 | 136,658 | 0.5 | |||||||||
Aspen Pharmacare Holdings Ltd. | 3,849 | 24,009 | 0.1 | |||||||||
FirstRand Ltd. | 9,417 | 20,553 | 0.1 | |||||||||
Gold Fields Ltd. | 20,687 | 153,986 | 0.6 | |||||||||
Life Healthcare Group Holdings Ltd. | 12,293 | 11,845 | 0.0 | |||||||||
Naspers Ltd., Class N | 4,869 | 757,852 | 2.9 | |||||||||
Nedbank Group Ltd. | 8,602 | 50,007 | 0.2 | |||||||||
Netcare Ltd. | 24,764 | 20,708 | 0.1 | |||||||||
Shoprite Holdings Ltd. | 3,048 | 17,617 | 0.1 | |||||||||
Spar Group Ltd. | 5,069 | 48,317 | 0.2 | |||||||||
Standard Bank Group Ltd. | 28,222 | 155,502 | 0.6 | |||||||||
|
|
|
| |||||||||
| 1,494,686 | ||||||||||||
| South Korea | ||||||||||||
Amorepacific Corp. | 204 | 29,549 | 0.1 | |||||||||
Celltrion Healthcare Co. Ltd. | 577 | 39,992 | 0.2 | |||||||||
Celltrion, Inc. | 1,571 | 271,526 | 1.0 | |||||||||
HLB, Inc. | 32 | 454 | 0.0 | |||||||||
HLB, Inc. | 322 | 25,248 | 0.1 | |||||||||
Hyundai Mobis Co. Ltd. | 242 | 34,214 | 0.1 | |||||||||
Hyundai Motor Co. | 1,272 | 98,316 | 0.4 | |||||||||
Kakao Corp. | 634 | 95,809 | 0.4 | |||||||||
KB Financial Group, Inc. | 739 | 21,144 | 0.1 | |||||||||
KT&G Corp. | 362 | 24,170 | 0.1 | |||||||||
Kumho Petrochemical Co. Ltd. | 554 | 34,936 | 0.1 | |||||||||
LG Chem Ltd. | 594 | 184,564 | 0.7 | |||||||||
LG Electronics, Inc. | 2,028 | 91,270 | 0.3 | |||||||||
LG Household & Health Care Ltd. | 165 | 187,109 | 0.7 | |||||||||
NAVER Corp. | 1,982 | 321,343 | 1.2 | |||||||||
NCSoft Corp. | 207 | 109,679 | 0.4 | |||||||||
POSCO | 2,336 | 352,982 | 1.3 | |||||||||
Posco ICT Co. Ltd. | 1 | 4 | 0.0 | |||||||||
Samsung Biologics Co. Ltd. | 210 | 100,313 | 0.4 | |||||||||
Samsung Electronics Co. Ltd. | 69,151 | 2,843,318 | 10.8 | |||||||||
Samsung SDI Co. Ltd. | 323 | 76,304 | 0.3 | |||||||||
Shinhan Financial Group Co. Ltd. | 6,442 | 163,321 | 0.6 | |||||||||
SK Hynix, Inc. | 4,085 | 281,120 | 1.1 | |||||||||
SK Innovation Co. Ltd. | 271 | 21,862 | 0.1 | |||||||||
SK Telecom Co. Ltd. | 289 | 50,229 | 0.2 | |||||||||
Yuhan Corp. | 390 | 15,152 | 0.1 | |||||||||
|
|
|
| |||||||||
| 5,473,928 | ||||||||||||
| CONSOLIDATED SCHEDULE OF INVESTMENTS | 17 |
Consolidated Schedule of Investments (continued) April 30, 2020 | BlackRock Total Emerging Markets Fund |
| Shares | Value | % of Basket Value | ||||||||||
| Thailand | ||||||||||||
Advanced Info Service PCL, Foreign Registered Shares | 3,100 | $ | 18,850 | 0.1 | % | |||||||
Bangkok Bank PCL, Foreign Registered Shares | 8,600 | 27,425 | 0.1 | |||||||||
Bangkok Dusit Medical Services PCL, Class F | 120,200 | 76,120 | 0.3 | |||||||||
Bumrungrad Hospital PCL | 3,600 | 13,074 | 0.1 | |||||||||
CP ALL PCL | 146,200 | 318,265 | 1.2 | |||||||||
Home Product Center PCL | 92,400 | 38,399 | 0.1 | |||||||||
Kasikornbank PCL, Foreign Registered Shares | 42,200 | 110,076 | 0.4 | |||||||||
|
|
|
| |||||||||
| 602,209 | ||||||||||||
| Shares | Value | % of Basket Value | ||||||||||
| Turkey | ||||||||||||
Akbank TAS | 116,357 | $ | 98,229 | 0.4 | % | |||||||
BIM Birlesik Magazalar AS | 16,887 | 134,088 | 0.5 | |||||||||
Eregli Demir ve Celik Fabrikalari TAS | 91,528 | 105,522 | 0.4 | |||||||||
Turkcell Iletisim Hizmetleri AS | 140,228 | 279,358 | 1.1 | |||||||||
|
|
|
| |||||||||
| 617,197 | ||||||||||||
| United Kingdom | ||||||||||||
Mondi PLC | 40,442 | 720,679 | 2.7 | |||||||||
|
|
|
| |||||||||
Total Reference Entity — Long |
| 26,207,018 | ||||||||||
|
| |||||||||||
Net Value of Reference Entity — UBS AG |
| $ | 26,207,018 | |||||||||
|
| |||||||||||
Balances Reported in the Consolidated Statement of Assets and Liabilities for Centrally Cleared Swaps and OTC Swaps
| Swap Premiums Paid | Swap Premiums Received | Unrealized Appreciation | Unrealized Depreciation | |||||||||||||
Centrally Cleared Swaps(a) | $ | 47 | $ | — | $ | 34,052 | $ | — | ||||||||
OTC Swaps | — | — | 444,433 | (677,356 | ) | |||||||||||
| (a) | Includes cumulative appreciation (depreciation) on centrally cleared swaps, as reported in the Consolidated Schedule of Investments. Only current day’s variation margin is reported within the Consolidated Statement of Assets and Liabilities and is net of any previously paid (received) swap premium amounts. |
Derivative Financial Instruments Categorized by Risk Exposure
As of period end, the fair values of derivative financial instruments located in the Consolidated Statement of Assets and Liabilities were as follows:
| Commodity Contracts | Credit Contracts | Equity Contracts | Foreign Currency Exchange Contracts | Interest Rate Contracts | Other Contracts | Total | ||||||||||||||||||||||
Assets — Derivative Financial Instruments | ||||||||||||||||||||||||||||
Forward foreign currency exchange contracts | ||||||||||||||||||||||||||||
Unrealized appreciation on forward foreign currency exchange contracts | $ | — | $ | — | $ | — | $ | 1,114,507 | $ | — | $ | — | $ | 1,114,507 | ||||||||||||||
Swaps — centrally cleared | ||||||||||||||||||||||||||||
Unrealized appreciation on centrally cleared swaps(a) | — | — | — | — | 34,052 | — | 34,052 | |||||||||||||||||||||
Swaps — OTC | ||||||||||||||||||||||||||||
Unrealized appreciation on OTC swaps; Swap premiums paid | — | — | 369,752 | — | 74,681 | — | 444,433 | |||||||||||||||||||||
|
|
|
|
|
|
|
|
|
|
|
|
|
| |||||||||||||||
| $ | — | $ | — | $ | 369,752 | $ | 1,114,507 | $ | 108,733 | $ | — | $ | 1,592,992 | |||||||||||||||
|
|
|
|
|
|
|
|
|
|
|
|
|
| |||||||||||||||
Liabilities — Derivative Financial Instruments | ||||||||||||||||||||||||||||
Futures contracts | ||||||||||||||||||||||||||||
Unrealized depreciation on futures contracts(a) | $ | — | $ | — | $ | 6,945 | $ | — | $ | — | $ | — | $ | 6,945 | ||||||||||||||
Forward foreign currency exchange contracts | ||||||||||||||||||||||||||||
Unrealized depreciation on forward foreign currency exchange contracts | — | — | — | 596,500 | — | — | 596,500 | |||||||||||||||||||||
Swaps — OTC | ||||||||||||||||||||||||||||
Unrealized appreciation on OTC swaps; Swap premiums paid | — | — | 648,747 | — | 28,609 | — | 677,356 | |||||||||||||||||||||
|
|
|
|
|
|
|
|
|
|
|
|
|
| |||||||||||||||
| $ | — | $ | — | $ | 655,692 | $ | 596,500 | $ | 28,609 | $ | — | $ | 1,280,801 | |||||||||||||||
|
|
|
|
|
|
|
|
|
|
|
|
|
| |||||||||||||||
| (a) | Net cumulative unrealized appreciation (depreciation) on futures contracts and centrally cleared swaps, if any, are reported in the Consolidated Schedule of Investments. In the Consolidated Statement of Assets and Liabilities, only current day’s variation margin is reported in receivables or payables and the net cumulative unrealized appreciation (depreciation) is included in accumulated earnings (loss). |
| 18 | 2020 BLACKROCK ANNUAL REPORTTO SHAREHOLDERS |
Consolidated Schedule of Investments (continued) April 30, 2020 | BlackRock Total Emerging Markets Fund |
For the period ended April 30, 2020, the effect of derivative financial instruments in the Consolidated Statements of Operations was as follows:
| Commodity Contracts | Credit Contracts | Equity Contracts | Foreign Currency Exchange Contracts | Interest Rate Contracts | Other Contracts | Total | ||||||||||||||||||||||
Net Realized Gain (Loss) from: | ||||||||||||||||||||||||||||
Futures contracts | $ | — | $ | — | $ | (322,759 | ) | $ | — | $ | — | $ | — | $ | (322,759 | ) | ||||||||||||
Forward foreign currency exchange contracts | — | — | — | 1,078,229 | — | — | 1,078,229 | |||||||||||||||||||||
Swaps | — | — | (3,884,929 | ) | — | 332,732 | — | (3,552,197 | ) | |||||||||||||||||||
|
|
|
|
|
|
|
|
|
|
|
|
|
| |||||||||||||||
| $ | — | $ | — | $ | (4,207,688 | ) | $ | 1,078,229 | $ | 332,732 | $ | — | $ | (2,796,727 | ) | |||||||||||||
|
|
|
|
|
|
|
|
|
|
|
|
|
| |||||||||||||||
| Commodity Contracts | Credit Contracts | Equity Contracts | Foreign Currency Exchange Contracts | Interest Rate Contracts | Other Contracts | Total | ||||||||||||||||||||||
Net Change in Unrealized Appreciation (Depreciation) on: | ||||||||||||||||||||||||||||
Futures contracts | $ | — | $ | — | $ | (7,605 | ) | $ | — | $ | — | $ | — | $ | (7,605 | ) | ||||||||||||
Forward foreign currency exchange contracts | — | — | — | 416,538 | — | — | 416,538 | |||||||||||||||||||||
Swaps | — | — | (4,643,459 | ) | — | 176,592 | — | (4,466,867 | ) | |||||||||||||||||||
|
|
|
|
|
|
|
|
|
|
|
|
|
| |||||||||||||||
| $ | — | $ | — | $ | (4,651,064 | ) | $ | 416,538 | $ | 176,592 | $ | — | $ | (4,057,934 | ) | |||||||||||||
|
|
|
|
|
|
|
|
|
|
|
|
|
| |||||||||||||||
Average Quarterly Balances of Outstanding Derivative Financial Instruments
Futures contracts: |
| |||
Average notional value of contracts — long | $ | — | (a) | |
Average notional value of contracts — short | 339,713 | |||
Forward foreign currency exchange contracts: |
| |||
Average amounts purchased — in USD | 76,884,320 | |||
Average amounts sold — in USD | 63,872,640 | |||
Interest rate swaps: |
| |||
Average notional value-receives fixed rate | 15,197,337 | |||
Total return swaps: |
| |||
Average notional value | 61,582,332 | |||
| (a) | Derivative not held at anyquarter-end. The risk exposure table serves as an indicator of activity during the period. |
For more information about the Fund’s investment risks regarding derivative financial instruments, refer to the Notes to Consolidated Financial Statements.
Derivative Financial Instruments — Offsetting as of Period End
The Fund’s derivative assets and liabilities (by type) were as follows:
| Assets | Liabilities | |||||||
Derivative Financial Instruments: | ||||||||
Futures contracts | $ | 14,593 | $ | — | ||||
Forward foreign currency exchange contracts | 1,114,507 | 596,500 | ||||||
Swaps — Centrally cleared | 25,157 | — | ||||||
Swaps — OTC(a) | 444,433 | 677,356 | ||||||
|
|
|
| |||||
Total derivative assets and liabilities in the Consolidated Statement of Assets and Liabilities | $ | 1,598,690 | $ | 1,273,856 | ||||
Derivatives not subject to a Master Netting Agreement or similar agreement (“MNA”) | (39,750 | ) | — | |||||
|
|
|
| |||||
Total derivative assets and liabilities subject to an MNA | $ | 1,558,940 | $ | 1,273,856 | ||||
|
|
|
| |||||
| (a) | Includes unrealized appreciation (depreciation) on OTC swaps in the Consolidated Statement of Assets and Liabilities. |
| CONSOLIDATED SCHEDULE OF INVESTMENTS | 19 |
Consolidated Schedule of Investments (continued) April 30, 2020 | BlackRock Total Emerging Markets Fund |
The following table presents the Fund’s derivative assets (and liabilities) by counterparty net of amounts available for offset under an MNA and net of the related collateral received (and pledged) by the Fund:
| Counterparty | Derivative Assets Subject to an MNA by Counterparty | Derivatives Available for Offset (a) | Non-cash Collateral Received | Cash Collateral Received (b) | Net Amount of Derivative Asset (c)(d) | |||||||||||||||
Bank of America N.A. | $ | 49,709 | $ | — | $ | — | $ | — | $ | 49,709 | ||||||||||
Barclays Bank PLC | 178,847 | (29,469 | ) | — | — | 149,378 | ||||||||||||||
BNP Paribas S.A. | 415,088 | (63,889 | ) | — | — | 351,199 | ||||||||||||||
Citibank N.A. | 47,452 | (20,168 | ) | — | (20,000 | ) | 7,284 | |||||||||||||
Credit Suisse International | 20,918 | (15,378 | ) | — | — | 5,540 | ||||||||||||||
Deutsche Bank AG | 129,691 | (46,300 | ) | — | — | 83,391 | ||||||||||||||
Goldman Sachs & Co. | 369,752 | �� | — | — | — | 369,752 | ||||||||||||||
Goldman Sachs Bank USA | 18,681 | (18,681 | ) | — | — | — | ||||||||||||||
Goldman Sachs International | 25,212 | (25,212 | ) | — | — | — | ||||||||||||||
HSBC Bank USA N.A. | 14,648 | (14,648 | ) | — | — | — | ||||||||||||||
JPMorgan Chase Bank N.A. | 133,470 | (94,342 | ) | — | — | 39,128 | ||||||||||||||
Merrill Lynch International | 75,079 | (10,816 | ) | — | — | 64,263 | ||||||||||||||
Morgan Stanley & Co. International PLC | 15,351 | (15,351 | ) | — | — | — | ||||||||||||||
Standard Chartered Bank | 65,042 | — | — | — | 65,042 | |||||||||||||||
|
|
|
|
|
|
|
|
|
| |||||||||||
| $ | 1,558,940 | $ | (354,254 | ) | $ | — | $ | (20,000 | ) | $ | 1,184,686 | |||||||||
|
|
|
|
|
|
|
|
|
| |||||||||||
| Counterparty | Derivative Liabilities Subject to an MNA by Counterparty | Derivatives Available for Offset (a) | Non-cash Collateral Pledged | Cash Collateral Pledged (e) | Net Amount of Derivative Liabilities (d)(f) | |||||||||||||||
Barclays Bank PLC | $ | 29,469 | $ | (29,469 | ) | $ | — | $ | — | $ | — | |||||||||
BNP Paribas S.A. | 63,889 | (63,889 | ) | — | — | — | ||||||||||||||
Citibank N.A. | 20,168 | (20,168 | ) | — | — | — | ||||||||||||||
Credit Suisse International | 15,378 | (15,378 | ) | — | — | — | ||||||||||||||
Deutsche Bank AG | 46,300 | (46,300 | ) | — | — | — | ||||||||||||||
Goldman Sachs Bank USA | 21,452 | (18,681 | ) | — | — | 2,771 | ||||||||||||||
Goldman Sachs International | 27,693 | (25,212 | ) | — | — | 2,481 | ||||||||||||||
HSBC Bank USA N.A. | 243,805 | (14,648 | ) | — | — | 229,157 | ||||||||||||||
JPMorgan Chase Bank N.A. | 94,342 | (94,342 | ) | — | — | — | ||||||||||||||
Merrill Lynch International | 10,816 | (10,816 | ) | — | — | — | ||||||||||||||
Morgan Stanley & Co. International PLC | 51,797 | (15,351 | ) | — | — | 36,446 | ||||||||||||||
UBS AG | 648,747 | — | — | (648,747 | ) | — | ||||||||||||||
|
|
|
|
|
|
|
|
|
| |||||||||||
| $ | 1,273,856 | $ | (354,254 | ) | $ | — | $ | (648,747 | ) | $ | 270,855 | |||||||||
|
|
|
|
|
|
|
|
|
| |||||||||||
| (a) | The amount of derivatives available for offset is limited to the amount of derivative asset and/or liabilities that are subject to an MNA. |
| (b) | Excess of collateral received from the individual counterparty is not shown for financial reporting purposes. |
| (c) | Net amount represents the net amount receivable from the counterparty in the event of default. |
| (d) | Net amount may also include forward foreign currency exchange contracts that are not required to be collateralized. |
| (e) | Excess of collateral pledged to the individual counterparty is not shown for financial reporting purposes. |
| (f) | Net amount represents the net amount payable due to counterparty in the event of default. |
Fair Value Hierarchy as of Period End
Various inputs are used in determining the fair value of investments and derivative financial instruments. For information about the Fund’s policy regarding valuation of investments and derivative financial instruments, refer to the Notes to Consolidated Financial Statements.
The following tables summarize the Fund’s investments and derivative financial instruments categorized in the disclosure hierarchy:
| Level 1 | Level 2 | Level 3 | Total | |||||||||||||
Assets: |
| |||||||||||||||
Investments: |
| |||||||||||||||
Common Stocks(a) | $ | — | $ | 3,110,689 | $ | — | $ | 3,110,689 | ||||||||
Corporate Bonds(a) | — | 745,043 | — | 745,043 | ||||||||||||
Foreign Agency Obligations(a) | — | 54,487,607 | — | 54,487,607 | ||||||||||||
Investment Companies(a) | 4,535,825 | — | — | 4,535,825 | ||||||||||||
Short-Term Securities | 20,955,814 | — | — | 20,955,814 | ||||||||||||
|
|
|
|
|
|
|
| |||||||||
| $ | 25,491,639 | $ | 58,343,339 | $ | — | $ | 83,834,978 | |||||||||
|
|
|
|
|
|
|
| |||||||||
| 20 | 2020 BLACKROCK ANNUAL REPORTTO SHAREHOLDERS |
Consolidated Schedule of Investments (continued) April 30, 2020 | BlackRock Total Emerging Markets Fund |
Fair Value Hierarchy as of Period End (continued)
| Level 1 | Level 2 | Level 3 | Total | |||||||||||||
Derivative Financial Instruments(b) |
| |||||||||||||||
Assets: |
| |||||||||||||||
Equity contracts | $ | — | $ | 369,752 | $ | — | $ | 369,752 | ||||||||
Forward foreign currency contracts | — | 1,114,507 | — | 1,114,507 | ||||||||||||
Interest rate contracts | — | 108,733 | — | 108,733 | ||||||||||||
Liabilities: |
| |||||||||||||||
Equity contracts | (6,945 | ) | (648,747 | ) | — | (655,692 | ) | |||||||||
Forward foreign currency contracts | — | (596,500 | ) | — | (596,500 | ) | ||||||||||
Interest rate contracts | — | (28,609 | ) | — | (28,609 | ) | ||||||||||
|
|
|
|
|
|
|
| |||||||||
| $ | (6,945 | ) | $ | 319,136 | $ | — | $ | 312,191 | ||||||||
|
|
|
|
|
|
|
| |||||||||
| (a) | See above Consolidated Schedule of Investments for values in each security type or country. |
| (b) | Derivative financial instruments are swaps, futures contracts and forward foreign currency exchange contracts. Swaps, futures contracts and forward foreign currency exchange contracts are valued at the unrealized appreciation (depreciation) on the instrument. |
See notes to consolidated financial statements
| CONSOLIDATED SCHEDULE OF INVESTMENTS | 21 |
Consolidated Statement of Assets and Liabilities
April 30, 2020
| BlackRock Total Emerging Markets Fund | ||||
ASSETS |
| |||
Investments at value — unaffiliated (cost — $63,941,100) | $ | 58,343,339 | ||
Investments at value — affiliated (cost — $26,198,154) | 25,491,639 | |||
Cash | 683,486 | |||
Due from broker | 490,000 | |||
Cash pledged: |
| |||
Collateral — OTC derivatives | 10,610,000 | |||
Futures contracts | 84,000 | |||
Centrally cleared swaps | 170,597 | |||
Foreign currency at value (cost — $2,397,894) | 2,373,592 | |||
Receivables: |
| |||
Investments sold | 215,603 | |||
Capital shares sold | 30,609 | |||
Dividends — affiliated | 2,321 | |||
Dividends — unaffiliated | 256 | |||
Interest — unaffiliated | 799,502 | |||
Variation margin on futures contracts | 14,593 | |||
Variation margin on centrally cleared swaps | 25,157 | |||
Unrealized appreciation on: |
| |||
Forward foreign currency exchange contracts | 1,114,507 | |||
OTC swaps | 444,433 | |||
Prepaid expenses | 41,954 | |||
|
| |||
Total assets | 100,935,588 | |||
|
| |||
LIABILITIES |
| |||
Cash received as collateral for OTC derivatives | 20,000 | |||
Payables: |
| |||
Administration fees | 5,943 | |||
Capital shares redeemed | 211,758 | |||
Investment advisory fees | 15,588 | |||
Trustees’ and Officer’s | 2,599 | |||
Other accrued expenses | 284,825 | |||
Service and distribution fees | 4,691 | |||
Unrealized depreciation on: |
| |||
Forward foreign currency exchange contracts | 596,500 | |||
OTC swaps | 677,356 | |||
|
| |||
Total liabilities | 1,819,260 | |||
|
| |||
NET ASSETS | $ | 99,116,328 | ||
|
| |||
NET ASSETS CONSIST OF |
| |||
Paid-in capital | $ | 126,365,304 | ||
Accumulated loss | (27,248,976 | ) | ||
|
| |||
NET ASSETS | $ | 99,116,328 | ||
|
| |||
NET ASSET VALUE |
| |||
Institutional — Based on net assets of $85,305,128 and 10,132,127 shares outstanding, unlimited number of shares authorized, $0.001 par value | $ | 8.42 | ||
|
| |||
Investor A — Based on net assets of $10,621,921 and 1,266,119 shares outstanding, unlimited number of shares authorized, $0.001 par value | $ | 8.39 | ||
|
| |||
Investor C — Based on net assets of $3,189,279 and 382,466 shares outstanding, unlimited number of shares authorized, $0.001 par value | $ | 8.34 | ||
|
| |||
See notes to consolidated financial statements.
| 22 | 2020 BLACKROCK ANNUAL REPORTTO SHAREHOLDERS |
Consolidated Statements of Operations
| BlackRock Total Emerging Markets Fund | ||||||||
| Period from 11/01/19 to 04/30/20 | Year Ended 10/31/19 | |||||||
INVESTMENT INCOME |
| |||||||
Dividends — affiliated | $ | 288,969 | $ | 1,333,290 | ||||
Interest — unaffiliated | 1,796,397 | 4,342,011 | ||||||
Foreign taxes withheld | (7,515 | ) | (16,862 | ) | ||||
|
|
|
| |||||
Total investment income | 2,077,851 | 5,658,439 | ||||||
|
|
|
| |||||
EXPENSES |
| |||||||
Investment advisory | 505,758 | 1,203,844 | ||||||
Professional | 169,040 | 146,926 | ||||||
Transfer agent — class specific | 75,313 | 194,033 | ||||||
Custodian | 52,546 | 51,043 | ||||||
Accounting services | 48,971 | 56,737 | ||||||
Printing | 39,486 | 45,347 | ||||||
Service and distribution — class specific | 35,803 | 88,984 | ||||||
Administration | 28,660 | 68,218 | ||||||
Registration | 25,878 | 58,936 | ||||||
Administration — class specific | 13,487 | 32,102 | ||||||
Trustees and Officer | 5,915 | 12,732 | ||||||
Board realignment and consolidation | — | 7,824 | ||||||
Miscellaneous | 10,747 | 31,084 | ||||||
|
|
|
| |||||
Total expenses | 1,011,604 | 1,997,810 | ||||||
Less: |
| |||||||
Fees waived and/or reimbursed by the Manager | (313,588 | ) | (313,768 | ) | ||||
Fees waived and/or reimbursed by administrator — class specific | (13,487 | ) | (32,102 | ) | ||||
Transfer agent fees waived and/or reimbursed | (75,311 | ) | (194,029 | ) | ||||
|
|
|
| |||||
Total expenses after fees waived and/or reimbursed | 609,218 | 1,457,911 | ||||||
|
|
|
| |||||
Net investment income | 1,468,633 | 4,200,528 | ||||||
|
|
|
| |||||
REALIZED AND UNREALIZED GAIN (LOSS) |
| |||||||
Net realized gain (loss) from: |
| |||||||
Capital gain distributions from investment companies — affiliated | 112 | — | ||||||
Futures contracts | (322,759 | ) | 49,769 | |||||
Forward foreign currency exchange contracts | 1,078,229 | (702,057 | ) | |||||
Foreign currency transactions | (232,952 | ) | 245,674 | |||||
Investments — affiliated | (246,985 | ) | — | |||||
Investments — unaffiliated | (2,279,838 | ) | (2,292,703 | ) | ||||
Swaps | (3,552,197 | ) | (746,696 | ) | ||||
|
|
|
| |||||
| (5,556,390 | ) | (3,446,013 | ) | |||||
|
|
|
| |||||
Net change in unrealized appreciation (depreciation) on: | ||||||||
Futures contracts | (7,605 | ) | 2,206 | |||||
Forward foreign currency exchange contracts | 416,538 | (38,672 | ) | |||||
Foreign currency translations | (29,264 | ) | 5,436 | |||||
Investments — affiliated | (1,122,243 | ) | 1,052,952 | |||||
Investments — unaffiliated | (3,440,866 | ) | 9,331,601 | |||||
Swaps | (4,466,867 | ) | 11,806,956 | |||||
|
|
|
| |||||
| (8,650,307 | ) | 22,160,479 | ||||||
|
|
|
| |||||
Net realized and unrealized gain (loss) | (14,206,697 | ) | 18,714,466 | |||||
|
|
|
| |||||
NET INCREASE (DECREASE) IN NET ASSETS RESULTING FROM OPERATIONS | $ | (12,738,064 | ) | $ | 22,914,994 | |||
|
|
|
| |||||
See notes to consolidated financial statements.
| FINANCIAL STATEMENTS | 23 |
Consolidated Statements of Changes in Net Assets
| BlackRock Total Emerging Markets Fund | ||||||||||||||||
| Period from 11/01/19 to 04/30/20 | Year Ended October 31, | |||||||||||||||
| 2019 | 2018 | |||||||||||||||
INCREASE (DECREASE) IN NET ASSETS | ||||||||||||||||
OPERATIONS |
| |||||||||||||||
Net investment income | $ | 1,468,633 | $ | 4,200,528 | $ | 6,943,014 | ||||||||||
Net realized loss | (5,556,390 | ) | (3,446,013 | ) | (2,177,672 | ) | ||||||||||
Net change in unrealized appreciation (depreciation) | (8,650,307 | ) | 22,160,479 | (41,504,637 | ) | |||||||||||
|
|
|
|
|
| |||||||||||
Net increase (decrease) in net assets resulting from operations | (12,738,064 | ) | 22,914,994 | (36,739,295 | ) | |||||||||||
|
|
|
|
|
| |||||||||||
DISTRIBUTIONS(a) |
| |||||||||||||||
Institutional | (3,669,025 | ) | (8,217,305 | ) | (17,673,074 | ) | ||||||||||
Investor A | (360,355 | ) | (872,268 | ) | (2,094,142 | ) | ||||||||||
Investor C | (70,624 | ) | (217,483 | ) | (289,405 | ) | ||||||||||
|
|
|
|
|
| |||||||||||
Decrease in net assets resulting from distributions to shareholders | (4,100,004 | ) | (9,307,056 | ) | (20,056,621 | ) | ||||||||||
|
|
|
|
|
| |||||||||||
CAPITAL SHARE TRANSACTIONS |
| |||||||||||||||
Net decrease in net assets derived from capital share transactions | (33,892,342 | ) | (51,159,483 | ) | (194,769,178 | ) | ||||||||||
|
|
|
|
|
| |||||||||||
NET ASSETS |
| |||||||||||||||
Total decrease in net assets | (50,730,410 | ) | (37,551,545 | ) | (251,565,094 | ) | ||||||||||
Beginning of period | 149,846,738 | 187,398,283 | 438,963,377 | |||||||||||||
|
|
|
|
|
| |||||||||||
End of period | $ | 99,116,328 | $ | 149,846,738 | $ | 187,398,283 | ||||||||||
|
|
|
|
|
| |||||||||||
| (a) | Distributions for annual periods determined in accordance with U.S. federal income tax regulations. |
See notes to consolidated financial statements.
| 24 | 2020 BLACKROCK ANNUAL REPORTTO SHAREHOLDERS |
Consolidated Financial Highlights
(For a share outstanding throughout each period)
| BlackRock Total Emerging Markets Fund | ||||||||||||||||||||||||||||
| Institutional | ||||||||||||||||||||||||||||
| Period from 11/01/19 to 04/30/20 | Year Ended October 31, | |||||||||||||||||||||||||||
| 2019 | 2018 | 2017 | 2016 | 2015 | ||||||||||||||||||||||||
Net asset value, beginning of period | $ | 9.55 | $ | 8.86 | $ | 10.87 | $ | 9.72 | $ | 8.70 | $ | 9.84 | ||||||||||||||||
|
|
|
|
|
|
|
|
|
|
|
| |||||||||||||||||
Net investment income(a) | 0.10 | 0.25 | 0.22 | 0.22 | 0.17 | 0.11 | ||||||||||||||||||||||
Net realized and unrealized gain (loss) | (0.95 | ) | 0.97 | (1.74 | ) | 1.14 | 0.95 | (1.19 | ) | |||||||||||||||||||
|
|
|
|
|
|
|
|
|
|
|
| |||||||||||||||||
Net increase (decrease) from investment operations | (0.85 | ) | 1.22 | (1.52 | ) | 1.36 | 1.12 | (1.08 | ) | |||||||||||||||||||
|
|
|
|
|
|
|
|
|
| �� |
|
| ||||||||||||||||
Distributions(b) | ||||||||||||||||||||||||||||
From net investment income | (0.28 | ) | (0.52 | ) | (0.16 | ) | (0.10 | ) | (0.10 | ) | (0.06 | ) | ||||||||||||||||
From net realized gain | — | (0.01 | ) | (0.33 | ) | (0.11 | ) | — | — | |||||||||||||||||||
|
|
|
|
|
|
|
|
|
|
|
| |||||||||||||||||
Total distributions | (0.28 | ) | (0.53 | ) | (0.49 | ) | (0.21 | ) | (0.10 | ) | (0.06 | ) | ||||||||||||||||
|
|
|
|
|
|
|
|
|
|
|
| |||||||||||||||||
Net asset value, end of period | $ | 8.42 | $ | 9.55 | $ | 8.86 | $ | 10.87 | $ | 9.72 | $ | 8.70 | ||||||||||||||||
|
|
|
|
|
|
|
|
|
|
|
| |||||||||||||||||
Total Return(c) | ||||||||||||||||||||||||||||
Based on net asset value | (9.34 | )%(d) | 14.33 | % | (14.66 | )% | 14.49 | % | 13.16 | % | (10.97 | )% | ||||||||||||||||
|
|
|
|
|
|
|
|
|
|
|
| |||||||||||||||||
Ratios to Average Net Assets(e) | ||||||||||||||||||||||||||||
Total expenses | 1.34 | %(f)(g) | 1.18 | % | 1.08 | % | 1.03 | % | 1.44 | % | 1.74 | % | ||||||||||||||||
|
|
|
|
|
|
|
|
|
|
|
| |||||||||||||||||
Total expenses after fees waived and/or reimbursed | 0.85 | %(f) | 0.85 | % | 0.85 | % | 0.85 | % | 1.04 | % | 1.40 | % | ||||||||||||||||
|
|
|
|
|
|
|
|
|
|
|
| |||||||||||||||||
Net investment income | 2.23 | %(f) | 2.67 | % | 2.12 | % | 2.17 | % | 1.88 | % | 1.14 | % | ||||||||||||||||
|
|
|
|
|
|
|
|
|
|
|
| |||||||||||||||||
Supplemental Data | ||||||||||||||||||||||||||||
Net assets, end of period (000) | $ | 85,305 | $ | 131,680 | $ | 165,034 | $ | 385,137 | $ | 205,782 | $ | 54,526 | ||||||||||||||||
|
|
|
|
|
|
|
|
|
|
|
| |||||||||||||||||
Portfolio turnover rate(h) | 21 | % | 11 | % | 61 | % | 140 | % | 22 | % | 34 | % | ||||||||||||||||
|
|
|
|
|
|
|
|
|
|
|
| |||||||||||||||||
| (a) | Based on average shares outstanding. |
| (b) | Distributions for annual periods determined in accordance with U.S. federal income tax regulations. |
| (c) | Where applicable, assumes the reinvestment of distributions. |
| (d) | Aggregate total return. |
| (e) | Excludes expenses incurred indirectly as a result of investments in underlying funds as follows: |
| Period from 11/01/19 to 04/30/20 | Year Ended October 31, | |||||||||||||||||||||||||||
| 2019 | 2018 | 2017 | 2016 | 2015 | ||||||||||||||||||||||||
Investments in underlying funds | 0.08 | % | 0.09 | % | 0.06 | % | 0.06 | % | 0.08 | % | 0.11 | % | ||||||||||||||||
|
|
|
|
|
|
|
|
|
|
|
| |||||||||||||||||
| (f) | Annualized. |
| (g) | Audit, printing and tax costs were not annualized in the calculation of the expense ratios. If these expenses were annualized, the total expenses would have been 1.44%. |
| (h) | Excludes investments underlying the total return swaps. |
See notes to consolidated financial statements.
| FINANCIAL HIGHLIGHTS | 25 |
Consolidated Financial Highlights (continued)
(For a share outstanding throughout each period)
| BlackRock Total Emerging Markets Fund (continued) | ||||||||||||||||||||||||||||
| Investor A | ||||||||||||||||||||||||||||
| Period from 11/01/19 to 04/30/20 | Year Ended October 31, | |||||||||||||||||||||||||||
| 2019 | 2018 | 2017 | 2016 | 2015 | ||||||||||||||||||||||||
Net asset value, beginning of period | $ | 9.51 | $ | 8.79 | $ | 10.80 | $ | 9.67 | $ | 8.67 | $ | 9.81 | ||||||||||||||||
|
|
|
|
|
|
|
|
|
|
|
| |||||||||||||||||
Net investment income(a) | 0.09 | 0.23 | 0.19 | 0.19 | 0.16 | 0.10 | ||||||||||||||||||||||
Net realized and unrealized gain (loss) | (0.96 | ) | 0.97 | (1.73 | ) | 1.15 | 0.93 | (1.19 | ) | |||||||||||||||||||
|
|
|
|
|
|
|
|
|
|
|
| |||||||||||||||||
Net increase (decrease) from investment operations | (0.87 | ) | 1.20 | (1.54 | ) | 1.34 | 1.09 | (1.09 | ) | |||||||||||||||||||
|
|
|
|
|
|
|
|
|
|
|
| |||||||||||||||||
Distributions(b) | ||||||||||||||||||||||||||||
From net investment income | (0.25 | ) | (0.47 | ) | (0.14 | ) | (0.10 | ) | (0.09 | ) | (0.05 | ) | ||||||||||||||||
From net realized gain | – | (0.01 | ) | (0.33 | ) | (0.11 | ) | — | — | |||||||||||||||||||
|
|
|
|
|
|
|
|
|
|
|
| |||||||||||||||||
Total distributions | (0.25 | ) | (0.48 | ) | (0.47 | ) | (0.21 | ) | (0.09 | ) | (0.05 | ) | ||||||||||||||||
|
|
|
|
|
|
|
|
|
|
|
| |||||||||||||||||
Net asset value, end of period | $ | 8.39 | $ | 9.51 | $ | 8.79 | $ | 10.80 | $ | 9.67 | $ | 8.67 | ||||||||||||||||
|
|
|
|
|
|
|
|
|
|
|
| |||||||||||||||||
Total Return(c) | ||||||||||||||||||||||||||||
Based on net asset value | (9.52 | )%(d) | 14.20 | % | (14.94 | )% | 14.25 | % | 12.74 | % | (11.15 | )% | ||||||||||||||||
|
|
|
|
|
|
|
|
|
|
|
| |||||||||||||||||
Ratios to Average Net Assets(e) | ||||||||||||||||||||||||||||
Total expenses | 1.65 | %(f)(g) | 1.48 | % | 1.40 | % | 1.37 | % | 1.56 | % | 2.15 | % | ||||||||||||||||
|
|
|
|
|
|
|
|
|
|
|
| |||||||||||||||||
Total expenses after fees waived and/or reimbursed | 1.10 | %(f) | 1.10 | % | 1.10 | % | 1.10 | % | 1.17 | % | 1.65 | % | ||||||||||||||||
|
|
|
|
|
|
|
|
|
|
|
|
|
| |||||||||||||||
Net investment income | 1.98 | %(f) | 2.43 | % | 1.86 | % | 1.91 | % | 1.65 | % | 1.02 | % | ||||||||||||||||
|
|
|
|
|
|
|
|
|
|
|
| |||||||||||||||||
Supplemental Data | ||||||||||||||||||||||||||||
Net assets, end of period (000) | $ | 10,622 | $ | 13,923 | $ | 17,020 | $ | 46,427 | $ | 37,058 | $ | 1,628 | ||||||||||||||||
|
|
|
|
|
|
|
|
|
|
|
| |||||||||||||||||
Portfolio turnover rate(h) | 21 | % | 11 | % | 61 | % | 140 | % | 22 | % | 34 | % | ||||||||||||||||
|
|
|
|
|
|
|
|
|
|
|
| |||||||||||||||||
| (a) | Based on average shares outstanding. |
| (b) | Distributions for annual periods determined in accordance with U.S. federal income tax regulations. |
| (c) | Where applicable, excludes the effects of any sales charges and assumes the reinvestment of distributions. |
| (d) | Aggregate total return. |
| (e) | Excludes expenses incurred indirectly as a result of investments in underlying funds as follows: |
| Period from 11/01/19 to 04/30/20 | Year Ended October 31, | |||||||||||||||||||||||||||
| 2019 | 2018 | 2017 | 2016 | 2015 | ||||||||||||||||||||||||
Investments in underlying funds | 0.08 | % | 0.09 | % | 0.06 | % | 0.06 | % | 0.08 | % | 0.11 | % | ||||||||||||||||
|
|
|
|
|
|
|
|
|
|
|
| |||||||||||||||||
| (f) | Annualized. |
| (g) | Audit, printing and tax costs were not annualized in the calculation of the expense ratios. If these expenses were annualized, the total expenses would have been 1.75%. |
| (h) | Excludes investments underlying the total return swaps. |
See notes to consolidated financial statements.
| 26 | 2020 BLACKROCK ANNUAL REPORTTO SHAREHOLDERS |
Consolidated Financial Highlights (continued)
(For a share outstanding throughout each period)
| �� | BlackRock Total Emerging Markets Fund (continued) | |||||||||||||||||||||||||||
| Investor C | ||||||||||||||||||||||||||||
| Period from 11/01/19 to 04/30/20 | Year Ended October 31, | |||||||||||||||||||||||||||
| 2019 | 2018 | 2017 | 2016 | 2015 | ||||||||||||||||||||||||
Net asset value, beginning of period | $ | 9.40 | $ | 8.69 | $ | 10.70 | $ | 9.61 | $ | 8.58 | $ | 9.73 | ||||||||||||||||
|
|
|
|
|
|
|
|
|
|
|
| |||||||||||||||||
Net investment income (loss)(a) | 0.06 | 0.16 | 0.12 | 0.11 | 0.08 | (0.01 | ) | |||||||||||||||||||||
Net realized and unrealized gain (loss) | (0.96 | ) | 0.95 | (1.72 | ) | 1.14 | 0.95 | (1.14 | ) | |||||||||||||||||||
|
|
|
|
|
|
|
|
|
|
|
| |||||||||||||||||
Net increase (decrease) from investment operations | (0.90 | ) | 1.11 | (1.60 | ) | 1.25 | 1.03 | (1.15 | ) | |||||||||||||||||||
|
|
|
|
|
|
|
|
|
|
|
| |||||||||||||||||
Distributions(b) | ||||||||||||||||||||||||||||
From net investment income | (0.16 | ) | (0.39 | ) | (0.08 | ) | (0.05 | ) | — | — | ||||||||||||||||||
From net realized gain | — | (0.01 | ) | (0.33 | ) | (0.11 | ) | — | — | |||||||||||||||||||
|
|
|
|
|
|
|
|
|
|
|
| |||||||||||||||||
Total distributions | (0.16 | ) | (0.40 | ) | (0.41 | ) | (0.16 | ) | — | — | ||||||||||||||||||
|
|
|
|
|
|
|
|
|
|
|
| |||||||||||||||||
Net asset value, end of period | $ | 8.34 | $ | 9.40 | $ | 8.69 | $ | 10.70 | $ | 9.61 | $ | 8.58 | ||||||||||||||||
|
|
|
|
|
|
|
|
|
|
|
| |||||||||||||||||
Total Return(c) | ||||||||||||||||||||||||||||
Based on net asset value | (9.78 | )%(d) | 13.22 | % | (15.59 | )% | 13.39 | % | 12.01 | % | (11.82 | )% | ||||||||||||||||
|
|
|
|
|
|
|
|
|
|
|
| |||||||||||||||||
Ratios to Average Net Assets(e) | ||||||||||||||||||||||||||||
Total expenses | 2.39 | %(f)(g) | 2.21 | % | 2.16 | % | 2.11 | % | 2.61 | % | 2.91 | % | ||||||||||||||||
|
|
|
|
|
|
|
|
|
|
|
| |||||||||||||||||
Total expenses after fees waived and/or reimbursed | 1.85 | %(f) | 1.85 | % | 1.85 | % | 1.85 | % | 2.10 | % | 2.40 | % | ||||||||||||||||
|
|
|
|
|
|
|
|
|
|
|
| |||||||||||||||||
Net investment income (loss) | 1.21 | %(f) | 1.71 | % | 1.19 | % | 1.18 | % | 0.88 | % | (0.10 | )% | ||||||||||||||||
|
|
|
|
|
|
|
|
|
|
|
| |||||||||||||||||
Supplemental Data | ||||||||||||||||||||||||||||
Net assets, end of period (000) | $ | 3,189 | $ | 4,244 | $ | 5,344 | $ | 7,399 | $ | 2,435 | $ | 898 | ||||||||||||||||
|
|
|
|
|
|
|
|
|
|
|
| |||||||||||||||||
Portfolio turnover rate(h) | 21 | % | 11 | % | 61 | % | 140 | % | 22 | % | 34 | % | ||||||||||||||||
|
|
|
|
|
|
|
|
|
|
|
| |||||||||||||||||
| (a) | Based on average shares outstanding. |
| (b) | Distributions for annual periods determined in accordance with U.S. federal income tax regulations. |
| (c) | Where applicable, excludes the effects of any sales charges and assumes the reinvestment of distributions. |
| (d) | Aggregate total return. |
| (e) | Excludes expenses incurred indirectly as a result of investments in underlying funds as follows: |
| Period from 11/01/19 to 04/30/20 | Year Ended October 31, | |||||||||||||||||||||||||||
| 2019 | 2018 | 2017 | 2016 | 2015 | ||||||||||||||||||||||||
Investments in underlying funds | 0.08 | % | 0.09 | % | 0.06 | % | 0.06 | % | 0.08 | % | 0.11 | % | ||||||||||||||||
|
|
|
|
|
|
|
|
|
|
|
| |||||||||||||||||
| (f) | Annualized. |
| (g) | Audit, printing and tax costs were not annualized in the calculation of the expense ratios. If these expenses were annualized, the total expenses would have been 2.49%. |
| (h) | Excludes investments underlying the total return swaps. |
See notes to consolidated financial statements.
| FINANCIAL HIGHLIGHTS | 27 |
Notes to Consolidated Financial Statements
| 1. | ORGANIZATION |
BlackRock FundsSM (the “Trust”) is registered under the Investment Company Act of 1940, as amended (the “1940 Act”), as anopen-end management investment company. The Trust is organized as a Massachusetts business trust. BlackRock Total Emerging Markets Fund (the “Fund”) is a series of the Trust. The Fund is classified as diversified.
The Fund offers multiple classes of shares. All classes of shares have identical voting, dividend, liquidation and other rights and are subject to the same terms and conditions, except that certain classes bear expenses related to the shareholder servicing and distribution of such shares. Institutional Shares are sold only to certain eligible investors. Investor A and Investor C Shares bear certain expenses related to shareholder servicing of such shares, and Investor C Shares also bear certain expenses related to the distribution of such shares. Investor A and Investor C Shares are generally available through financial intermediaries. Each class has exclusive voting rights with respect to matters relating to its shareholder servicing and distribution expenditures (except that Investor C shareholders may vote on material changes to the Investor A Shares distribution and service plan).
| Share Class | Initial Sales Charge | CDSC | Conversion Privilege | |||||
Institutional | No | No | None | |||||
Investor A Shares | Yes | No | (a) | None | ||||
Investor C Shares | No | Yes | (b) | To Investor A Shares after approximately 10 years | ||||
| (a) | Investor A Shares may be subject to a contingent deferred sales charge (“CDSC”) for certain redemptions where no initial sales charge was paid at the time of purchase. |
| (b) | A CDSC of 1.00% is assessed on certain redemptions of Investor C Shares made within one year after purchase. |
On November 13, 2019, the Board of Trustees of the Trust (the “Board”) approved a change in the fiscalyear-end of the Fund, effective as of April 30, 2020, from October 31 to April 30.
The Fund, together with certain other registered investment companies advised by BlackRock Advisors, LLC (the “Manager”) or its affiliates, is included in a complex of equity, multi-asset, index and money market funds referred to as the BlackRock Multi-Asset Complex.
Basis of Consolidation:The accompanying consolidated financial statements of the Fund include the account of BlackRock Cayman Emerging Market Allocation Fund, Ltd. (the “Subsidiary”), which is a wholly-owned subsidiary of the Fund and primarily invests in commodity-related instruments and other derivatives. The Subsidiary enables the Fund to hold these commodity-related instruments and satisfy regulated investment company tax requirements. The Fund may invest up to 25% of its total assets in the Subsidiary. The net assets of the Subsidiary as of period end were $12,908, which is less than 0.1% of the Fund’s consolidated net assets. Intercompany accounts and transactions, if any, have been eliminated. The Subsidiary is subject to the same investment policies and restrictions that apply to the Fund, except that the Subsidiary may invest without limitation in commodity-related instruments.
| 2. | SIGNIFICANT ACCOUNTING POLICIES |
The consolidated financial statements are prepared in conformity with accounting principles generally accepted in the United States of America (“U.S. GAAP”), which may require management to make estimates and assumptions that affect the reported amounts of assets and liabilities in the consolidated financial statements, disclosure of contingent assets and liabilities at the date of the consolidated financial statements and the reported amounts of increases and decreases in net assets from operations during the reporting period. Actual results could differ from those estimates. The Fund is considered an investment company under U.S. GAAP and follows the accounting and reporting guidance applicable to investment companies. Below is a summary of significant accounting policies:
Investment Transactions and Income Recognition: For financial reporting purposes, investment transactions are recorded on the dates the transactions are executed. Realized gains and losses on investment transactions are determined on the identified cost basis. Dividend income is recorded on theex-dividend date. Dividends from foreign securities where the ex-dividend date may have passed are subsequently recorded when the Fund is informed of the ex-dividend date. Under the applicable foreign tax laws, a withholding tax at various rates may be imposed on capital gains, dividends and interest. Interest income, including amortization and accretion of premiums and discounts on debt securities, is recognized on an accrual basis. Income, expenses and realized and unrealized gains and losses are allocated daily to each class based on its relative net assets.
Foreign Currency Translation: The Fund’s books and records are maintained in U.S. dollars. Securities and other assets and liabilities denominated in foreign currencies are translated into U.S. dollars using exchange rates determined as of the close of trading on the New York Stock Exchange (“NYSE”). Purchases and sales of investments are recorded at the rates of exchange prevailing on the respective dates of such transactions. Generally, when the U.S. dollar rises in value against a foreign currency, the investments denominated in that currency will lose value; the opposite effect occurs if the U.S. dollar falls in relative value.
The Fund does not isolate the portion of the results of operations arising as a result of changes in the exchange rates from the changes in the market prices of investments held or sold for financial reporting purposes. Accordingly, the effects of changes in exchange rates on investments are not segregated in the Consolidated Statements of Operations from the effects of changes in market prices of those investments, but are included as a component of net realized and unrealized gain (loss) from investments. The Fund reports realized currency gains (losses) on foreign currency related transactions as components of net realized gain (loss) for financial reporting purposes, whereas such components are generally treated as ordinary income for U.S. federal income tax purposes.
Segregation and Collateralization:In cases where the Fund enters into certain investments (e.g., futures contracts, forward foreign currency exchange contracts and swaps) that would be treated as “senior securities” for 1940 Act purposes, the Fund may segregate or designate on its books and records cash or liquid assets having a market value at least equal to the amount of its future obligations under such investments. Doing so allows the investment to be excluded from treatment as a “senior security.” Furthermore, if required by an exchange or counterparty agreement, the Fund may be required to deliver/deposit cash and/or securities to/with an exchange, or broker-dealer or custodian as collateral for certain investments or obligations.
| 28 | 2020 BLACKROCK ANNUAL REPORTTO SHAREHOLDERS |
Notes to Consolidated Financial Statements (continued)
Distributions: Distributions paid by the Fund are recorded on theex-dividend date. Distributions of capital gains are recorded on theex-dividend date and made at least annually. The character and timing of distributions are determined in accordance with U.S. federal income tax regulations, which may differ from U.S. GAAP.
Net income and realized gains from investments held by the Subsidiary are treated as ordinary income for tax purposes. If a net loss is realized by the Subsidiary in any taxable year, the loss will generally not be available to offset the Fund’s ordinary income and/or capital gains for that year.
Indemnifications:In the normal course of business, the Fund enters into contracts that contain a variety of representations that provide general indemnification. The Fund’s maximum exposure under these arrangements is unknown because it involves future potential claims against the Fund, which cannot be predicted with any certainty.
Other: Expenses directly related to the Fund or its classes are charged to the Fund or the applicable class. Other operating expenses shared by several funds, including other funds managed by the Manager, are prorated among those funds on the basis of relative net assets or other appropriate methods. Expenses directly related to the Fund and other shared expenses prorated to the Fund are allocated daily to each class based on its relative net assets or other appropriate methods.
| 3. | INVESTMENT VALUATION AND FAIR VALUE MEASUREMENTS |
Investment Valuation Policies: The Fund’s investments are valued at fair value (also referred to as “market value” within the financial statements) as of the close of trading on the NYSE (generally 4:00 p.m., Eastern time). U.S. GAAP defines fair value as the price the Fund would receive to sell an asset or pay to transfer a liability in an orderly transaction between market participants at the measurement date. The Fund determines the fair values of its financial instruments using various independent dealers or pricing services under policies approved by the Board. If a security’s market price is not readily available or does not otherwise accurately represent the fair value of the security, the security will be valued in accordance with a policy approved by the Board as reflecting fair value. The BlackRock Global Valuation Methodologies Committee (the “Global Valuation Committee”) is the committee formed by management to develop global pricing policies and procedures and to oversee the pricing function for all financial instruments.
Fair Value Inputs and Methodologies: The following methods and inputs are used to establish the fair value of the Fund’s assets and liabilities:
| • | Equity investments traded on a recognized securities exchange are valued at the official closing price each day, if available. For equity investments traded on more than one exchange, the official closing price on the exchange where the stock is primarily traded is used. Equity investments traded on a recognized exchange for which there were no sales on that day may be valued at the last available bid (long positions) or ask (short positions) price. |
| • | Fixed-income securities for which market quotations are readily available are generally valued using the last available bid prices or current market quotations provided by independent dealers or third party pricing services. Floating rate loan interests are valued at the mean of the bid prices from one or more independent brokers or dealers as obtained from a third party pricing service. Pricing services generally value fixed-income securities assuming orderly transactions of an institutional round lot size, but a fund may hold or transact in such securities in smaller, odd lot sizes. Odd lots may trade at lower prices than institutional round lots. The pricing services may use matrix pricing or valuation models that utilize certain inputs and assumptions to derive values, including transaction data (e.g., recent representative bids and offers), credit quality information, perceived market movements, news, and other relevant information. Certain fixed-income securities, including asset-backed and mortgage related securities may be valued based on valuation models that consider the estimated cash flows of each tranche of the entity, establish a benchmark yield and develop an estimated tranche specific spread to the benchmark yield based on the unique attributes of the tranche. The amortized cost method of valuation may be used with respect to debt obligations with sixty days or less remaining to maturity unless the Manager determines such method does not represent fair value. |
Generally, trading in foreign instruments is substantially completed each day at various times prior to the close of trading on the NYSE. Occasionally, events affecting the values of such instruments may occur between the foreign market close and the close of trading on the NYSE that may not be reflected in the computation of the Fund’s net assets. Each business day, the Fund uses a pricing service to assist with the valuation of certain foreign exchange-traded equity securities and foreign exchange-traded andover-the-counter (“OTC”) options (the “Systematic Fair Value Price”). Using current market factors, the Systematic Fair Value Price is designed to value such foreign securities and foreign options at fair value as of the close of trading on the NYSE, which follows the close of the local markets.
| • | Investments inopen-end U.S. mutual funds are valued at net asset value (“NAV”) each business day. |
| • | Futures contracts traded on exchanges are valued at their last sale price. |
| • | Forward foreign currency exchange contracts are valued at the mean between the bid and ask prices and are determined as of the close of trading on the NYSE based on that day’s prevailing forward exchange rate for the underlying currencies. Interpolated values are derived when the settlement date of the contract is an interim date for which quotations are not available. |
| • | Swap agreements are valued utilizing quotes received daily by the Fund’s pricing service or through brokers, which are derived using daily swap curves and models that incorporate a number of market data factors, such as discounted cash flows, trades and values of the underlying reference instruments. |
If events (e.g., a company announcement, market volatility or a natural disaster) occur that are expected to materially affect the value of such investments, or in the event that the application of these methods of valuation results in a price for an investment that is deemed not to be representative of the market value of such investment, or if a price is not available, the investment will be valued by the Global Valuation Committee, or its delegate, in accordance with a policy approved by the Board as reflecting fair value (“Fair Valued Investments”). The fair valuation approaches that may be used by the Global Valuation Committee will include market approach, income approach and cost approach. Valuation techniques such as discounted cash flow, use of market comparables and matrix pricing are types of valuation approaches and are typically used in determining fair value. When determining the price for Fair Valued Investments, the Global Valuation Committee, or its delegate, seeks to determine the price that the Fund might reasonably expect to receive or pay from the current sale or purchase of that asset or liability in anarm’s-length transaction. Fair value determinations shall be based upon all available factors that the Global Valuation Committee, or its delegate, deems relevant and consistent with the principles of fair value measurement. The pricing of all Fair Valued Investments is subsequently reported to the Board or a committee thereof on a quarterly basis.
| NOTESTO CONSOLIDATED FINANCIAL STATEMENTS | 29 |
Notes to Consolidated Financial Statements (continued)
Fair Value Hierarchy: Various inputs are used in determining the fair value of investments and derivative financial instruments. These inputs to valuation techniques are categorized into a fair value hierarchy consisting of three broad levels for financial statement purposes as follows:
| • | Level 1 — Unadjusted price quotations in active markets/exchanges for identical assets or liabilities that the Fund has the ability to access |
| • | Level 2 — Other observable inputs (including, but not limited to, quoted prices for similar assets or liabilities in markets that are active, quoted prices for identical or similar assets or liabilities in markets that are not active, inputs other than quoted prices that are observable for the assets or liabilities (such as interest rates, yield curves, volatilities, prepayment speeds, loss severities, credit risks and default rates) or other market-corroborated inputs) |
| • | Level 3 — Unobservable inputs based on the best information available in the circumstances, to the extent observable inputs are not available (including the Global Valuation Committee’s assumptions used in determining the fair value of investments and derivative financial instruments) |
The hierarchy gives the highest priority to unadjusted quoted prices in active markets for identical assets or liabilities (Level 1 measurements) and the lowest priority to unobservable inputs (Level 3 measurements). Accordingly, the degree of judgment exercised in determining fair value is greatest for instruments categorized in Level 3. The inputs used to measure fair value may fall into different levels of the fair value hierarchy. In such cases, for disclosure purposes, the fair value hierarchy classification is determined based on the lowest level input that is significant to the fair value measurement in its entirety. Investments classified within Level 3 have significant unobservable inputs used by the Global Valuation Committee in determining the price for Fair Valued Investments. Level 3 investments include equity or debt issued by privately held companies or funds. There may not be a secondary market, and/or there are a limited number of investors. The categorization of a value determined for investments and derivative financial instruments is based on the pricing transparency of the investments and derivative financial instruments and is not necessarily an indication of the risks associated with investing in those securities.
| 4. | SECURITIES AND OTHER INVESTMENTS |
Inflation-Indexed Bonds: Inflation-indexed bonds (other than municipal inflation-indexed and certain corporate inflation-indexed bonds) are fixed-income securities whose principal value is periodically adjusted according to the rate of inflation. If the index measuring inflation rises or falls, the principal value of inflation-indexed bonds (other than municipal inflation-indexed and certain corporate inflation-indexed bonds) will be adjusted upward or downward, and consequently the interest payable on these securities (calculated with respect to a larger or smaller principal amount) will be increased or reduced, respectively. Any upward or downward adjustment in the principal amount of an inflation-indexed bond will be included as interest income in the Consolidated Statements of Operations, even though investors do not receive their principal until maturity. Repayment of the original bond principal upon maturity (as adjusted for inflation) is guaranteed in the case of U.S. Treasury inflation-indexed bonds. For bonds that do not provide a similar guarantee, the adjusted principal value of the bond repaid at maturity may be less than the original principal. With regard to municipal inflation-indexed bonds and certain corporate inflation-indexed bonds, the inflation adjustment is typically reflected in the semi-annual coupon payment. As a result, the principal value of municipal inflation-indexed bonds and such corporate inflation-indexed bonds does not adjust according to the rate of inflation.
| 5. | DERIVATIVE FINANCIAL INSTRUMENTS |
The Fund engages in various portfolio investment strategies using derivative contracts both to increase the returns of the Fund and/or to manage its exposure to certain risks such as credit risk, equity risk, interest rate risk, foreign currency exchange rate risk, commodity price risk or other risks (e.g., inflation risk). Derivative financial instruments categorized by risk exposure are included in the Consolidated Schedule of Investments. These contracts may be transacted on an exchange or OTC.
Futures Contracts:Futures contracts are purchased or sold to gain exposure to, or manage exposure to, changes in interest rates (interest rate risk) and changes in the value of equity securities (equity risk) or foreign currencies (foreign currency exchange rate risk).
Futures contracts are agreements between the Fund and a counterparty to buy or sell a specific quantity of an underlying instrument at a specified price and on a specified date. Depending on the terms of a contract, it is settled either through physical delivery of the underlying instrument on the settlement date or by payment of a cash amount on the settlement date. Upon entering into a futures contract, the Fund is required to deposit initial margin with the broker in the form of cash or securities in an amount that varies depending on a contract’s size and risk profile. The initial margin deposit must then be maintained at an established level over the life of the contract. Amounts pledged, which are considered restricted, are included in cash pledged for futures contracts in the Consolidated Statement of Assets and Liabilities.
Securities deposited as initial margin are designated in the Consolidated Schedule of Investments and cash deposited, if any, are shown as cash pledged for futures contracts in the Consolidated Statement of Assets and Liabilities. Pursuant to the contract, the Fund agrees to receive from or pay to the broker an amount of cash equal to the daily fluctuation in market value of the contract (“variation margin”). Variation margin is recorded as unrealized appreciation (depreciation) and, if any, shown as variation margin receivable (or payable) on futures contracts in the Consolidated Statement of Assets and Liabilities. When the contract is closed, a realized gain or loss is recorded in the Consolidated Statements of Operations equal to the difference between the notional amount of the contract at the time it was opened and the notional amount at the time it was closed. The use of futures contracts involves the risk of an imperfect correlation in the movements in the price of futures contracts and interest, foreign currency exchange rates or underlying assets.
Forward Foreign Currency Exchange Contracts: Forward foreign currency exchange contracts are entered into to gain or reduce exposure to foreign currencies (foreign currency exchange rate risk).
A forward foreign currency exchange contract is an agreement between two parties to buy and sell a currency at a set exchange rate on a specified date. These contracts help to manage the overall exposure to the currencies in which some of the investments held by the Fund are denominated and in some cases, may be used to obtain exposure to a particular market.
The contract ismarked-to-market daily and the change in market value is recorded as unrealized appreciation (depreciation) in the Consolidated Statement of Assets and Liabilities. When a contract is closed, a realized gain or loss is recorded in the Consolidated Statements of Operations equal to the difference between the value at the time
| 30 | 2020 BLACKROCK ANNUAL REPORTTO SHAREHOLDERS |
Notes to Consolidated Financial Statements (continued)
it was opened and the value at the time it was closed.Non-deliverable forward foreign currency exchange contracts are settled with the counterparty in cash without the delivery of foreign currency. The use of forward foreign currency exchange contracts involves the risk that the value of a forward foreign currency exchange contract changes unfavorably due to movements in the value of the referenced foreign currencies, and such value may exceed the amount(s) reflected in the Consolidated Statement of Assets and Liabilities. Cash amounts pledged for forward foreign currency exchange contracts are considered restricted and are included in cash pledged as collateral for OTC derivatives in the Consolidated Statement of Assets and Liabilities.
Swaps:Swap contracts are entered into to manage exposure to issuers, markets and securities. Such contracts are agreements between the Fund and a counterparty to make periodic net payments on a specified notional amount or a net payment upon termination. Swap agreements are privately negotiated in the OTC market and may be entered into as a bilateral contract (“OTC swaps”) or centrally cleared (“centrally cleared swaps”).
For OTC swaps, any upfront premiums paid and any upfront fees received are shown as swap premiums paid and swap premiums received, respectively, in the Consolidated Statement of Assets and Liabilities and amortized over the term of the contract. The daily fluctuation in market value is recorded as unrealized appreciation (depreciation) on OTC Swaps in the Consolidated Statement of Assets and Liabilities. Payments received or paid are recorded in the Consolidated Statements of Operations as realized gains or losses, respectively. When an OTC swap is terminated, a realized gain or loss is recorded in the Consolidated Statements of Operations equal to the difference between the proceeds from (or cost of) the closing transaction and the Fund’s basis in the contract, if any. Generally, the basis of the contract is the premium received or paid.
In a centrally cleared swap, immediately following execution of the swap contract, the swap contract is novated to a central counterparty (the “CCP”) and the Fund’s counterparty on the swap agreement becomes the CCP. The Fund is required to interface with the CCP through the broker. Upon entering into a centrally cleared swap, the Fund is required to deposit initial margin with the broker in the form of cash or securities in an amount that varies depending on the size and risk profile of the particular swap. Securities deposited as initial margin are designated in the Consolidated Schedule of Investments and cash deposited is shown as cash pledged for centrally cleared swaps in the Consolidated Statement of Assets and Liabilities. Amounts pledged, which are considered restricted cash, are included in cash pledged for centrally cleared swaps in the Consolidated Statement of Assets and Liabilities. Pursuant to the contract, the Fund agrees to receive from or pay to the broker an amount of cash equal to the daily fluctuation in market value of the contract (“variation margin”). Variation margin is recorded as unrealized appreciation (depreciation) and shown as variation margin receivable (or payable) on centrally cleared swaps in the Consolidated Statement of Assets and Liabilities. Payments received from (paid to) the counterparty, including at termination, are recorded as realized gains (losses) in the Consolidated Statements of Operations.
| • | Total return swaps — Total return swaps are entered into to obtain exposure to a security or market without owning such security or investing directly in such market or to exchange the risk/return of one security or market (e.g., fixed-income) with another security or market (e.g., equity or commodity prices) (equity risk, commodity price risk and/or interest rate risk). |
Total return swaps are agreements in which there is an exchange of cash flows whereby one party commits to make payments based on the total return (distributions plus capital gains/losses) of an underlying instrument, or basket of underlying instruments, in exchange for fixed or floating rate interest payments. If the total return of the instrument(s) or index underlying the transaction exceeds or falls short of the offsetting fixed or floating interest rate obligation, the Fund receives payment from or makes a payment to the counterparty.
Certain total return swaps are designed to function as a portfolio of direct investments in long and short equity positions. This means that the Fund has the ability to trade in and out of these long and short positions within the swap and will receive the economic benefits and risks equivalent to direct investment in these positions, subject to certain adjustments due to events related to the counterparty. Benefits and risks include capital appreciation (depreciation), corporate actions and dividends received and paid, all of which are reflected in the swap’s market value. The market value also includes interest charges and credits (“financing fees”) related to the notional values of the long and short positions and cash balances within the swap. These interest charges and credits are based on a specified benchmark rate plus or minus a specified spread determined based upon the country and/or currency of the positions in the portfolio.
Positions within the swap and financing fees are reset periodically. During a reset, any unrealized appreciation (depreciation) on positions and accrued financing fees become available for cash settlement between the Fund and the counterparty. The amounts that are available for cash settlement are recorded as realized gains or losses in the Consolidated Statements of Operations. Cash settlement in and out of the swap may occur at a reset date or any other date, at the discretion of the Fund and the counterparty, over the life of the agreement. Certain swaps have no stated expiration and can be terminated by either party at any time.
| • | Interest rate swaps — Interest rate swaps are entered into to gain or reduce exposure to interest rates or to manage duration, the yield curve or interest rate (interest rate risk). |
Interest rate swaps are agreements in which one party pays a stream of interest payments, either fixed or floating, in exchange for another party’s stream of interest payments, either fixed or floating, on the same notional amount for a specified period of time. In more complex interest rate swaps, the notional principal amount may decline (or amortize) over time.
| • | Forward swaps — The Fund enters into forward interest rate swaps and forward total return swaps. In a forward swap, the Fund and the counterparty agree to make periodic net payments beginning on a specified date or a net payment at termination. |
Swap transactions involve, to varying degrees, elements of interest rate, credit and market risk in excess of the amounts recognized in the Consolidated Statement of Assets and Liabilities. Such risks involve the possibility that there will be no liquid market for these agreements, that the counterparty to the agreements may default on its obligation to perform or disagree as to the meaning of the contractual terms in the agreements, and that there may be unfavorable changes in interest rates and/or market values associated with these transactions.
Master Netting Arrangements: In order to define its contractual rights and to secure rights that will help it mitigate its counterparty risk, the Fund may enter into an International Swaps and Derivatives Association, Inc. Master Agreement (“ISDA Master Agreement”) or similar agreement with its counterparties. An ISDA Master Agreement is a bilateral agreement between the Fund and a counterparty that governs certain OTC derivatives and typically contains, among other things, collateral
| NOTESTO CONSOLIDATED FINANCIAL STATEMENTS | 31 |
Notes to Consolidated Financial Statements (continued)
posting terms and netting provisions in the event of a default and/or termination event. Under an ISDA Master Agreement, the Fund may, under certain circumstances, offset with the counterparty certain derivative financial instruments’ payables and/or receivables with collateral held and/or posted and create one single net payment. The provisions of the ISDA Master Agreement typically permit a single net payment in the event of default including the bankruptcy or insolvency of the counterparty. Bankruptcy or insolvency laws of a particular jurisdiction may restrict or prohibit the right of offset in bankruptcy, insolvency or other events.
Collateral Requirements: For derivatives traded under an ISDA Master Agreement, the collateral requirements are typically calculated by netting themark-to-market amount for each transaction under such agreement and comparing that amount to the value of any collateral currently pledged by the Fund and the counterparty.
Cash collateral that has been pledged to cover obligations of the Fund and cash collateral received from the counterparty, if any, is reported separately in the Consolidated Statement of Assets and Liabilities as cash pledged as collateral and cash received as collateral, respectively.Non-cash collateral pledged by the Fund, if any, is noted in the Consolidated Schedule of Investments. Generally, the amount of collateral due from or to a counterparty is subject to a certain minimum transfer amount threshold before a transfer is required, which is determined at the close of business of the Fund. Any additional required collateral is delivered to/pledged by the Fund on the next business day. Typically, the counterparty is not permitted to sell,re-pledge or use cash andnon-cash collateral it receives. The Fund generally agrees not to usenon-cash collateral that it receives but may, absent default or certain other circumstances defined in the underlying ISDA Master Agreement, be permitted to use cash collateral received. In such cases, interest may be paid pursuant to the collateral arrangement with the counterparty. To the extent amounts due to the Fund from its counterparties are not fully collateralized, it bears the risk of loss from counterpartynon-performance. Likewise, to the extent the Fund has delivered collateral to a counterparty and stands ready to perform under the terms of its agreement with such counterparty, it bears the risk of loss from a counterparty in the amount of the value of the collateral in the event the counterparty fails to return such collateral. Based on the terms of agreements, collateral may not be required for all derivative contracts.
For financial reporting purposes, the Fund does not offset derivative assets and derivative liabilities that are subject to netting arrangements, if any, in the Consolidated Statement of Assets and Liabilities.
| 6. | INVESTMENT ADVISORY AGREEMENT AND OTHER TRANSACTIONS WITH AFFILIATES |
Investment Advisory:The Trust, on behalf of the Fund, entered into an Investment Advisory Agreement with the Manager, the Fund’s investment adviser and an indirect, wholly-owned subsidiary of BlackRock, Inc. (“BlackRock”), to provide investment advisory services. The Manager is responsible for the management of the Fund’s portfolio and provides the personnel, facilities, equipment and certain other services necessary to the operations of the Fund.
For such services, the Fund pays the Manager a monthly fee at an annual rate equal to the following percentages of the average daily value of the Fund’s net assets.
| Average Daily Net Assets | Investment Advisory Fee | |||
First $1 Billion | 0.75 | % | ||
$1 Billion — $3 Billion | 0.71 | |||
$3 Billion — $5 Billion | 0.68 | |||
$5 Billion — $10 Billion | 0.65 | |||
Greater than $10 Billion | 0.64 | |||
The Manager provides investment management and other services to the Subsidiary. The Manager does not receive separate compensation from the Subsidiary for providing investment management or administrative services. However, the Fund pays the Manager based on the Fund’s net assets, which includes the assets of the Subsidiary.
The Manager entered into asub-advisory agreement with BlackRock International Limited (“BIL”), BlackRock Asset Management North Asia Limited (“BAMNA”) and BlackRock (Singapore) Limited (“BRS”) (collectively, the“Sub-Advisers”), each an affiliate of the Manager. The Manager pays BIL, BAMNA and BRS for services they provide for that portion of the Fund for which BIL, BAMNA and BRS, as applicable, acts assub-adviser, a monthly fee that is equal to a percentage of the investment advisory fees paid by the Fund to the Manager.
Service and Distribution Fees:The Trust, on behalf of the Fund, entered into a Distribution Agreement and a Distribution and Service Plan with BlackRock Investments, LLC (“BRIL”), an affiliate of the Manager. Pursuant to the Distribution and Service Plan and in accordance with Rule12b-1 under the 1940 Act, the Fund pays BRIL ongoing service and distribution fees. The fees are accrued daily and paid monthly at annual rates based upon the average daily net assets of the relevant share class of the Fund as follows:
| Investor A | Investor C | |||||||
Service Fees | 0.25 | % | 0.25 | % | ||||
Distribution Fees | — | 0.75 | ||||||
BRIL and broker-dealers, pursuant tosub-agreements with BRIL, provide shareholder servicing and distribution services to the Fund. The ongoing service and/or distribution fee compensates BRIL and each broker-dealer for providing shareholder servicing and/or distribution related services to shareholders.
The following table shows the class specific service and distribution fees borne directly by each share class of the Fund:
Period from 11/01/19 to 04/30/20 | Year Ended 10/31/19 | |||||||
Investor A | $ | 16,367 | $ | 39,246 | ||||
Investor C | 19,436 | 49,738 | ||||||
Total | $ | 35,803 | $ | 88,984 | ||||
| 32 | 2020 BLACKROCK ANNUAL REPORTTO SHAREHOLDERS |
Notes to Consolidated Financial Statements (continued)
Administration: The Trust, on behalf of the Fund, entered into an Administration Agreement with the Manager, an indirect, wholly-owned subsidiary of BlackRock, to provide administrative services. For these services, the Manager receives an administration fee computed daily and payable monthly, based on a percentage of the average daily net assets of the Fund. The administration fee, which is shown as administration in the Consolidated Statements of Operations, is paid at the annual rates below.
| Average Daily Net Assets | Administration Fee | |||
First $500 Million | 0.0425 | % | ||
$500 Million — $1 Billion | 0.0400 | |||
$1 Billion — $2 Billion | 0.0375 | |||
$2 Billion — $4 Billion | 0.0350 | |||
$4 Billion — $13 Billion | 0.0325 | |||
Greater than $13 Billion | 0.0300 | |||
In addition, the Manager charges each of the share classes an administration fee, which is shown as administration — class specific in the Consolidated Statements of Operations, at an annual rate of 0.02% of the average daily net assets of each respective class.
The following table shows the class specific administration fees borne directly by each share class of the Fund:
Period from 11/01/19 to 04/30/20 | Year Ended 10/31/19 | |||||||
Institutional | $ | 11,789 | $ | 27,968 | ||||
Investor A | 1,309 | 3,139 | ||||||
Investor C | 389 | 995 | ||||||
Total | $ | 13,487 | $ | 32,102 | ||||
Transfer Agent: Pursuant to written agreements, certain financial intermediaries, some of which may be affiliates, provide the Fund withsub-accounting, recordkeeping,sub-transfer agency and other administrative services with respect to servicing of underlying investor accounts. For these services, these entities receive an asset-based fee or an annual fee per shareholder account, which will vary depending on share class and/or net assets. For the period ended April 30, 2020 and the year ended October 31, 2019, the Fund did not pay any amounts to affiliates in return for these services.
The Manager maintains a call center that is responsible for providing certain shareholder services to the Fund. Shareholder services include responding to inquiries and processing purchases and sales based upon instructions from shareholders. The Fund reimbursed the Manager the following amounts for costs incurred in running the call center, which are included in transfer agent — class specific in the Consolidated Statements of Operations:
Period from 11/01/19 to 04/30/20 | Year Ended 10/31/19 | |||||||
Institutional | $ | 63 | $ | 428 | ||||
Investor A | 304 | 488 | ||||||
Investor C | 92 | 152 | ||||||
Total | $ | 459 | $ | 1,068 | ||||
The following table shows the class specific transfer agent fees borne directly by each share class of the Fund:
Period from 11/01/19 to 04/30/20 | Year Ended 10/31/19 | |||||||
Institutional | $ | 61,956 | $ | 161,265 | ||||
Investor A | 10,452 | 25,541 | ||||||
Investor C | 2,905 | 7,227 | ||||||
Total | $ | 75,313 | $ | 194,033 | ||||
Other Fees: Affiliates earned underwriting discounts, direct commissions and dealer concessions on sales of the Fund’s Investor A Shares as follows:
Period from 11/01/19 to 04/30/20 | Year Ended 10/31/19 | |||||||
Investor A | $ | 301 | $ | 882 | ||||
Affiliates received CDSCs as follows:
Period from 11/01/19 to 04/30/20 | Year Ended 10/31/19 | |||||||
Investor C | $ | 263 | $ | 805 | ||||
| NOTESTO CONSOLIDATED FINANCIAL STATEMENTS | 33 |
Notes to Consolidated Financial Statements (continued)
Expense Limitations, Waivers, Reimbursements, and Recoupments:The Manager contractually agreed to waive its investment advisory fees by the amount of investment advisory fees the Fund pays to the Manager indirectly through its investment in affiliated money market funds (the “affiliated money market fund waiver”) through February 28, 2021. The contractual agreement may be terminated upon 90 days’ notice by a majority of the trustees who are not “interested persons” of the Fund, as defined in the 1940 Act (“Independent Trustees”), or by a vote of a majority of the outstanding voting securities of the Fund. The amount of waivers and/or reimbursements of fees and expenses made pursuant to the expense limitation described below will be reduced by the amount of the affiliated money market fund waiver. Prior to February 28, 2020, this waiver was voluntary. These amounts are included in fees waived and/or reimbursed by the Manager in the Consolidated Statements of Operations. The amounts waived were as follows:
Period from 11/01/19 to 04/30/20 | Year Ended 10/31/19 | |||||||
Amounts waived | $ | 15,183 | $ | 39,967 | ||||
The Manager has contractually agreed to waive its investment advisory fee with respect to any portion of the Fund’s assets invested in affiliated equity and fixed-income mutual funds and affiliated exchange-traded funds that have a contractual management fee through February 28, 2021. The contractual agreement may be terminated upon 90 days’ notice by a majority of the Independent Trustees, or by a vote of a majority of the outstanding voting securities of the Fund. These amounts are included in fees waived and/or reimbursed by the Manager in the Consolidated Statements of Operations. The amounts waived in investment advisory fees pursuant to these arrangements were as follows:
Period from 11/01/19 to 04/30/20 | Year Ended 10/31/19 | |||||||
Amounts waived | $ | 21,693 | $ | 52,712 | ||||
The Fund has incurred expenses in connection with the realignment and consolidation of the boards of trustees of certain BlackRock-advised funds. The Manager has voluntarily agreed to reimburse the Fund for all or a portion of such expenses, which amounts are included in fees waived and/or reimbursed by the Manager in the Consolidated Statements of Operations. The amounts reimbursed were as follows:
Period from 11/01/19 to 04/30/20 | Year Ended 10/31/19 | |||||||
Amounts reimbursed | $ | — | $ | 5,760 | ||||
The Manager contractually agreed to waive and/or reimburse fees or expenses in order to limit expenses, excluding interest expense, dividend expense, tax expense, acquired fund fees and expenses, and certain other fund expenses, which constitute extraordinary expenses not incurred in the ordinary course of the Fund’s business (“expense limitation”). The expense limitations as a percentage of average daily net assets are as follows:
| Share Class | Expense Limitation | |||
Institutional Investor A Investor C | | 0.85 1.10 1.85 | %
| |
The Manager has agreed not to reduce or discontinue these contractual expense limitations through February 28, 2021, unless approved by the Board, including a majority of the Independent Trustees, or by a vote of a majority of the outstanding voting securities of the Fund. The amounts included in the Consolidated Statements of Operations were as follows:
Period from 11/01/19 to 04/30/20 | Year Ended 10/31/19 | |||||||
Fees waived and/or reimbursed by the Manager | $ | 276,712 | $ | 215,329 | ||||
These amounts waived and/or reimbursed are included in administration fees waived — class specific and transfer agent fees waived and/or reimbursed, respectively, in the Consolidated Statements of Operations.Class specific expense waivers and/or reimbursements were as follows:
| Administration Fees Waiver – Class Specific | Period from 11/01/19 to 04/30/20 | Year Ended 10/31/19 | ||||||
Institutional | $ | 11,789 | $ | 27,968 | ||||
Investor A | 1,309 | 3,139 | ||||||
Investor C | 389 | 995 | ||||||
Total | $ | 13,487 | $ | 32,102 | ||||
| 34 | 2020 BLACKROCK ANNUAL REPORTTO SHAREHOLDERS |
Notes to Consolidated Financial Statements (continued)
| Transfer Agent Fees Waiver and/or reimbursed – Class Specific | Period from 11/01/19 to 04/30/20 | Year Ended 10/31/19 | ||||||
Institutional | $ | 61,956 | $ | 161,264 | ||||
Investor A | 10,451 | 25,540 | ||||||
Investor C | 2,904 | 7,225 | ||||||
Total | $ | 75,311 | $ | 194,029 | ||||
With respect to the contractual expense limitation, if during the Fund’s fiscal year the operating expenses of a share class, that at any time during the prior two fiscal years received a waiver and/or reimbursement from the Manager, are less than the current expense limitation for that share class, the Manager is entitled to be reimbursed by
such share class up to the lesser of: (a) the amount of fees waived and/or expenses reimbursed during those prior two fiscal years under the agreement and (b) an amount not to exceed either the current expense limitation of that share class or the expense limitation of the share class in effect at the time that the share class received the applicable waiver and/or reimbursement, provided that:
(1) the Fund has more than $50 million in assets for the fiscal year, and
(2) the Manager or an affiliate continues to serve as the Fund’s investment adviser or administrator.
This repayment applies only to the contractual expense limitation on net expenses and does not apply to the contractual investment advisory fee waiver described above or any voluntary waivers that may be in effect from time to time. Effective May 16, 2020, the repayment arrangement between the Fund and the Manager pursuant to which such Fund may be required to repay amounts waived and/or reimbursed under the Fund’s contractual caps on net expenses will be terminated.
On April 30, 2020, the fund level and class specific waivers and/or reimbursements subject to possible future recoupment under the expense limitation agreement are as follows:
Expiring May 16, 2020 | ||||
Fund Level | $ | 623,042 | ||
Institutional | 410,537 | |||
Investor A | 67,261 | |||
Investor C | 17,622 | |||
The following fund level and class specific waivers and/or reimbursements previously recorded by the Fund, which were subject to recoupment by the Manager, expired on April 30, 2020:
Expired April 30, 2020 | ||||
Fund Level | $ | 88,746 | ||
Institutional | 191,409 | |||
Investor A | 43,348 | |||
Investor C | 7,465 | |||
Interfund Lending: In accordance with an exemptive order (the “Order”) from the U.S. Securities and Exchange Commission (“SEC”), the Fund may participate in a joint lending and borrowing facility for temporary purposes (the “Interfund Lending Program”), subject to compliance with the terms and conditions of the Order, and to the extent permitted by the Fund’s investment policies and restrictions. The Fund is currently permitted to borrow and lend under the Interfund Lending Program.
A lending BlackRock fund may lend in aggregate up to 15% of its net assets, but may not lend more than 5% of its net assets to any one borrowing fund through the Interfund Lending Program. A borrowing BlackRock fund may not borrow through the Interfund Lending Program or from any other source more than 33 1/3% of its total assets (or any lower threshold provided for by the fund’s investment restrictions). If a borrowing BlackRock fund’s total outstanding borrowings exceed 10% of its total assets, each of its outstanding interfund loans will be subject to collateralization of at least 102% of the outstanding principal value of the loan. All interfund loans are for temporary or emergency purposes and the interest rate to be charged will be the average of the highest current overnight repurchase agreement rate available to a lending fund and the bank loan rate, as calculated according to a formula established by the Board.
During the period ended April 30, 2020, the Fund did not participate in the Interfund Lending Program.
Trustees and Officers:Certain trustees and/or officers of the Trust are directors and/or officers of BlackRock or its affiliates. The Fund reimburses the Manager for a portion of the compensation paid to the Trust’s Chief Compliance Officer, which is included in Trustees and Officer in the Consolidated Statements of Operations.
| 7. | PURCHASES AND SALES |
For the period ended April 30, 2020, purchases and sales of investments, excluding short-term securities, were $19,063,705 and $35,534,350, respectively.
| 8. | INCOME TAX INFORMATION |
It is the Fund’s policy to comply with the requirements of the Internal Revenue Code of 1986, as amended, applicable to regulated investment companies, and to distribute substantially all of its taxable income to its shareholders. Therefore, no U.S. federal income tax provision is required.
| NOTESTO CONSOLIDATED FINANCIAL STATEMENTS | 35 |
Notes to Consolidated Financial Statements (continued)
The Fund files U.S. federal and various state and local tax returns. No income tax returns are currently under examination. The statute of limitations on the Fund’s U.S. federal tax returns generally remains open for the period ended April 30, 2020 and each of the four years ended October 31, 2019. The statutes of limitations on the Fund’s state and local tax returns may remain open for an additional year depending upon the jurisdiction.
Management has analyzed tax laws and regulations and their application to the Fund as of April 30, 2020, inclusive of the open tax return years, and does not believe that there are any uncertain tax positions that require recognition of a tax liability in the Fund’s consolidated financial statements.
The tax character of distributions paid was as follows:
| 04/30/20 | 10/31/19 | 10/31/18 | ||||||||||
Ordinary income | $ | 4,100,004 | $ | 9,307,056 | $ | 16,066,189 | ||||||
Long-term capital gains | — | — | 3,990,432 | |||||||||
|
|
|
|
|
| |||||||
| $ | 4,100,004 | $ | 9,307,056 | $ | 20,056,621 | |||||||
|
|
|
|
|
| |||||||
As of period end, the tax components of accumulated loss were as follows:
Undistributed ordinary income | $ | 2,336,861 | ||
Non-expiring capital loss carryforwards(a) | (20,078,135 | ) | ||
Net unrealized losses(b) | (9,507,702 | ) | ||
|
| |||
Total | $ | (27,248,976 | ) | |
|
|
| (a) | Amount available to offset future realized capital gains. |
| (b) | The difference between book-basis and tax-basis net unrealized gains (losses) was attributable primarily to the tax deferral of losses on wash sales, the realization for tax purposes of unrealized gains/losses on certain futures and foreign currency contracts, the accrual of income on securities in default, and the accounting for swap agreements. |
As of April 30, 2020, gross unrealized appreciation and depreciation for investments and derivatives based on cost for U.S. federal income tax purposes were as follows:
Tax cost | $ | 91,090,719 | ||
|
| |||
Gross unrealized appreciation | $ | 3,313,319 | ||
Gross unrealized depreciation | (12,784,716 | ) | ||
|
| |||
Net unrealized depreciation | $ | (9,471,397 | ) | |
|
|
| 9. | BANK BORROWINGS |
The Trust, on behalf of the Fund, along with certain other funds managed by the Manager and its affiliates (“Participating Funds”), is a party to a364-day, $2.25 billion credit agreement with a group of lenders. Under this agreement, the Fund may borrow to fund shareholder redemptions. Excluding commitments designated for certain individual funds, the Participating Funds, including the Fund, can borrow up to an aggregate commitment amount of $1.75 billion at any time outstanding, subject to asset coverage and other limitations as specified in the agreement. The credit agreement has the following terms: a fee of 0.10% per annum on unused commitment amounts and interest at a rate equal to the higher of(a) one-month LIBOR (but, in any event, not less than 0.00%) on the date the loan is made plus 0.80% per annum or (b) the Fed Funds rate (but, in any event, not less than 0.00%) in effect from time to time plus 0.80% per annum on amounts borrowed. The agreement expires in April 2021 unless extended or renewed. These fees were allocated among such funds based upon portions of the aggregate commitment available to them and relative net assets of Participating Funds. During the period ended April 30, 2020, the Fund did not borrow under the credit agreement.
| 10. | PRINCIPAL RISKS |
In the normal course of business, the Fund invests in securities or other instruments and may enter into certain transactions, and such activities subject the Fund to various risks, including among others, fluctuations in the market (market risk) or failure of an issuer to meet all of its obligations. The value of securities or other instruments may also be affected by various factors, including, without limitation: (i) the general economy; (ii) the overall market as well as local, regional or global political and/or social instability; (iii) regulation, taxation or international tax treaties between various countries; or (iv) currency, interest rate and price fluctuations. Local, regional or global events such as war, acts of terrorism, the spread of infectious illness or other public health issues, recessions, or other events could have a significant impact on the Fund and its investments. The Fund’s prospectus provides details of the risks to which the Fund is subject.
Investments in the securities of issuers domiciled in countries with emerging capital markets involve certain additional risks that do not generally apply to investments in securities of issuers in more developed capital markets, such as (i) low or nonexistent trading volume, resulting in a lack of liquidity and increased volatility in prices for such securities; (ii) uncertain national policies and social, political and economic instability, increasing the potential for expropriation of assets, confiscatory taxation, high rates of inflation or unfavorable diplomatic developments; and (iii) possible fluctuations in exchange rates, differing legal systems and the existence or possible imposition of exchange controls, custodial restrictions or other foreign or U.S. governmental laws or restrictions applicable to such investments.
The Fund may be exposed to prepayment risk, which is the risk that borrowers may exercise their option to prepay principal earlier than scheduled during periods of declining interest rates, which would force the Fund to reinvest in lower yielding securities. The Fund may also be exposed to reinvestment risk, which is the risk that income from the Fund’s portfolio will decline if the Fund invests the proceeds from matured, traded or called fixed-income securities at market interest rates that are below the Fund portfolio’s current earnings rate.
| 36 | 2020 BLACKROCK ANNUAL REPORTTO SHAREHOLDERS |
Notes to Consolidated Financial Statements (continued)
Valuation Risk: The market values of equities, such as common stocks and preferred securities or equity related investments, such as futures and options, may decline due to general market conditions which are not specifically related to a particular company. They may also decline due to factors which affect a particular industry or industries. The Fund may invest in illiquid investments. An illiquid investment is any investment that the Fund reasonably expects cannot be sold or disposed of in current market conditions in seven calendar days or less without the sale or disposition significantly changing the market value of the investment. The Fund may experience difficulty in selling illiquid investments in a timely manner at the price that it believes the investments are worth. Prices may fluctuate widely over short or extended periods in response to company, market or economic news. Markets also tend to move in cycles, with periods of rising and falling prices. This volatility may cause the Fund’s NAV to experience significant increases or decreases over short periods of time. If there is a general decline in the securities and other markets, the NAV of the Fund may lose value, regardless of the individual results of the securities and other instruments in which the Fund invests.
An outbreak of respiratory disease caused by a novel coronavirus has developed into a global pandemic and has resulted in closing borders, quarantines, disruptions to supply chains and customer activity, as well as general concern and uncertainty. The impact of this pandemic, and other global health crises that may arise in the future, could affect the economies of many nations, individual companies and the market in general in ways that cannot necessarily be foreseen at
the present time. This pandemic may result in substantial market volatility and may adversely impact the prices and liquidity of a fund’s investments. The impact of the pandemic may be short term or may last for an extended period of time.
Counterparty Credit Risk:The Fund may be exposed to counterparty credit risk, or the risk that an entity may fail to or be unable to perform on its commitments related to unsettled or open transactions. The Fund manages counterparty credit risk by entering into transactions only with counterparties that the Manager believes have the financial resources to honor their obligations and by monitoring the financial stability of those counterparties. Financial assets, which potentially expose the Fund to market, issuer and counterparty credit risks, consist principally of financial instruments and receivables due from counterparties. The extent of the Fund’s exposure to market, issuer and counterparty credit risks with respect to these financial assets is approximately their value recorded in the Consolidated Statement of Assets and Liabilities, less any collateral held by the Fund.
A derivative contract may suffer amark-to-market loss if the value of the contract decreases due to an unfavorable change in the market rates or values of the underlying instrument. Losses can also occur if the counterparty does not perform under the contract.
The Fund’s risk of loss from counterparty credit risk on OTC derivatives is generally limited to the aggregate unrealized gain less the value of any collateral held by the Fund.
With exchange-traded futures and centrally cleared swaps, there is less counterparty credit risk to the Fund since the exchange or clearinghouse, as counterparty to such instruments, guarantees against a possible default. The clearinghouse stands between the buyer and the seller of the contract; therefore, credit risk is limited to failure of the clearinghouse. While offset rights may exist under applicable law, the Fund does not have a contractual right of offset against a clearing broker or clearinghouse in the event of a default (including the bankruptcy or insolvency). Additionally, credit risk exists in exchange-traded futures and centrally cleared swaps with respect to initial and variation margin that is held in a clearing broker’s customer accounts. While clearing brokers are required to segregate customer margin from their own assets, in the event that a clearing broker becomes insolvent or goes into bankruptcy and at that time there is a shortfall in the aggregate amount of margin held by the clearing broker for all its clients, typically the shortfall would be allocated on a pro rata basis across all the clearing broker’s customers, potentially resulting in losses to the Fund.
Concentration Risk:The Fund invests a significant portion of its assets in fixed-income securities and/or uses derivatives tied to the fixed-income markets. Changes in market interest rates or economic conditions may affect the value and/or liquidity of such investments. Interest rate risk is the risk that prices of bonds and other fixed-income securities will increase as interest rates fall and decrease as interest rates rise. The Fund may be subject to a greater risk of rising interest rates due to the current period of historically low rates.
The Fund invests a significant portion of its assets in securities of issuers located in Asia or with significant exposure to Asian issuers or countries. The Asian financial markets have recently experienced volatility and adverse trends due to concerns in several Asian countries regarding monetary policy, government intervention in the markets, rising government debt levels or economic downturns. These events may spread to other countries in Asia and may affect the value and liquidity of certain of the Fund’s investments.
| 11. | CAPITAL SHARE TRANSACTIONS |
Transactions in capital shares for each class were as follows:
| Period From 11/01/19 to 04/30/20 | Year Ended 10/31/19 | Year Ended 10/31/18 | ||||||||||||||||||||||
| Shares | Amount | Shares | Amount | Shares | Amount | |||||||||||||||||||
Institutional | ||||||||||||||||||||||||
Shares sold | 1,486,479 | $ | 14,318,303 | 4,803,364 | $ | 44,144,137 | 12,220,151 | $ | 127,268,814 | |||||||||||||||
Shares issued in reinvestment of distributions | 367,267 | 3,588,194 | 920,541 | 7,907,448 | 1,613,980 | 16,753,115 | ||||||||||||||||||
Shares redeemed | (5,506,574 | ) | (49,527,298 | ) | (10,574,982 | ) | (97,307,169 | ) | (30,619,463 | ) | (315,161,612 | ) | ||||||||||||
|
|
|
|
|
|
|
|
|
|
|
| |||||||||||||
Net decrease | (3,652,828 | ) | $ | (31,620,801 | ) | (4,851,077 | ) | $ | (45,255,584 | ) | (16,785,332 | ) | $ | (171,139,683 | ) | |||||||||
|
|
|
|
|
|
|
|
|
|
|
| |||||||||||||
Investor A | ||||||||||||||||||||||||
Shares sold and automatic conversion of shares | 98,270 | $ | 940,419 | 448,526 | $ | 4,154,355 | 1,121,935 | $ | 11,750,290 | |||||||||||||||
Shares issued in reinvestment of distributions | 36,233 | 353,268 | 100,652 | 862,585 | 201,533 | 2,081,841 | ||||||||||||||||||
Shares redeemed | (332,954 | ) | (2,943,997 | ) | (1,020,373 | ) | (9,407,159 | ) | (3,685,189 | ) | (36,778,682 | ) | ||||||||||||
|
|
|
|
|
|
|
|
|
|
|
| |||||||||||||
Net decrease | (198,451 | ) | $ | (1,650,310 | ) | (471,195 | ) | $ | (4,390,219 | ) | (2,361,721 | ) | $ | (22,946,551 | ) | |||||||||
|
|
|
|
|
|
|
|
|
|
|
| |||||||||||||
| NOTESTO CONSOLIDATED FINANCIAL STATEMENTS | 37 |
Notes to Consolidated Financial Statements (continued)
| Period From 11/01/19 to 04/30/20 | Year Ended 10/31/19 | Year Ended 10/31/18 | ||||||||||||||||||||||
| Shares | Amount | Shares | Amount | Shares | Amount | |||||||||||||||||||
Investor C | ||||||||||||||||||||||||
Shares sold | 7,271 | $ | 70,144 | 62,316 | $ | 555,924 | 149,144 | $ | 1,538,341 | |||||||||||||||
Shares issued in reinvestment of distributions | 7,249 | 70,456 | 25,449 | 217,077 | 28,106 | 288,942 | ||||||||||||||||||
Shares redeemed and automatic conversion of shares | (83,407 | ) | (761,831 | ) | (251,466 | ) | (2,286,681 | ) | (253,900 | ) | (2,510,227 | ) | ||||||||||||
|
|
|
|
|
|
|
|
|
|
|
| |||||||||||||
Net decrease | (68,887 | ) | $ | (621,231 | ) | (163,701 | ) | $ | (1,513,680 | ) | (76,650 | ) | $ | (682,944 | ) | |||||||||
|
|
|
|
|
|
|
|
|
|
|
| |||||||||||||
Total Net Decrease | (3,920,166 | ) | $ | (33,892,342 | ) | (5,485,973 | ) | $ | (51,159,483 | ) | (19,223,703 | ) | $ | (194,769,178 | ) | |||||||||
|
|
|
|
|
|
|
|
|
|
|
| |||||||||||||
| 12. | SUBSEQUENT EVENTS |
Management has evaluated the impact of all subsequent events on the Fund through the date the financial statements were issued and has determined that there were no subsequent events requiring adjustment or additional disclosure in the financial statements.
| 38 | 2020 BLACKROCK ANNUAL REPORTTO SHAREHOLDERS |
Report of Independent Registered Public Accounting Firm
To the Shareholders of BlackRock Total Emerging Markets Fund and the Board of Trustees of BlackRock FundsSM:
Opinion on the Financial Statements and Financial Highlights
We have audited the accompanying consolidated statement of assets and liabilities of BlackRock Total Emerging Markets Fund of BlackRock FundsSM (the “Fund”), including the consolidated schedule of investments, as of April 30, 2020, the related consolidated statements of operations for the period from November 1, 2019 through April 30, 2020 and for the year ended October 31, 2019, the consolidated statements of changes in net assets for the period from November 1, 2019 through April 30, 2020 and for each of the two years in the period ended October 31, 2019, the consolidated financial highlights for the period from November 1, 2019 through April 30, 2020 and for each of the five years in the period ended October 31, 2019, and the related notes. In our opinion, the financial statements and financial highlights present fairly, in all material respects, the financial position of the Fund as of April 30, 2020, and the results of its operations for the period from November 1, 2019 through April 30, 2020 and for the year ended October 31, 2019, the changes in its net assets for the period from November 1, 2019 through April 30, 2020 and for each of the two years in the period ended October 31, 2019, and the financial highlights for the period from November 1, 2019 through April 30, 2020 and each of the five years in the period ended October 31, 2019, in conformity with accounting principles generally accepted in the United States of America.
Basis for Opinion
These financial statements and financial highlights are the responsibility of the Fund’s management. Our responsibility is to express an opinion on the Fund’s financial statements and financial highlights based on our audits. We are a public accounting firm registered with the Public Company Accounting Oversight Board (United States) (PCAOB) and are required to be independent with respect to the Fund in accordance with the U.S. federal securities laws and the applicable rules and regulations of the Securities and Exchange Commission and the PCAOB.
We conducted our audits in accordance with the standards of the PCAOB. Those standards require that we plan and perform the audit to obtain reasonable assurance about whether the financial statements and financial highlights are free of material misstatement, whether due to error or fraud. The Fund is not required to have, nor were we engaged to perform, an audit of its internal control over financial reporting. As part of our audits we are required to obtain an understanding of internal control over financial reporting but not for the purpose of expressing an opinion on the effectiveness of the Fund’s internal control over financial reporting. Accordingly, we express no such opinion.
Our audits included performing procedures to assess the risks of material misstatement of the financial statements and financial highlights, whether due to error or fraud, and performing procedures that respond to those risks. Such procedures included examining, on a test basis, evidence regarding the amounts and disclosures in the financial statements and financial highlights. Our audits also included evaluating the accounting principles used and significant estimates made by management, as well as evaluating the overall presentation of the financial statements and financial highlights. Our procedures included confirmation of securities owned as of April 30, 2020, by correspondence with the custodian and brokers; when replies were not received from brokers, we performed other auditing procedures. We believe that our audits provide a reasonable basis for our opinion.
Deloitte & Touche LLP
Boston, Massachusetts
June 22, 2020
We have served as the auditor of one or more BlackRock investment companies since 1992.
Important Tax Information (unaudited)
For the period ended April 30, 2020, the Fund hereby designates the following maximum amount allowable as interest-related dividends eligible for exemption from U.S. withholding tax for nonresident aliens and foreign corporations:
| Fund | Interest-Related Dividends | |||
BlackRock Total Emerging Markets Fund | $ | 209,344 | ||
The Fund hereby designates the following amount of distributions from direct federal obligation interest for the period ended April 30, 2020:
| Fund | Federal Obligation Interest | |||
BlackRock Total Emerging Markets Fund | $ | 147,265 | ||
The law varies in each state as to whether and what percent of ordinary income dividends attribute to federal obligations is exempt from state income tax. Shareholders are advised to check with their tax advisers to determine if any portion of the dividends received is exempt from state income tax.
| REPORTOF INDEPENDENT REGISTERED PUBLIC ACCOUNTING FIRM / IMPORTANT TAX INFORMATION | 39 |
Statement Regarding Liquidity Risk Management Program
The Securities and Exchange Commission adopted Rule 22e-4 under the Investment Company Act of 1940, as amended (the “Liquidity Rule”) to promote effective liquidity risk management throughout the open-end investment company industry, thereby reducing the risk that funds will be unable to meet their redemption obligations and mitigating dilution of the interests of fund shareholders.
The Board of Trustees (the “Board”) of BlackRock FundsSM, on behalf of BlackRock Total Emerging Markets Fund, met on November 12-13, 2019 (the “Meeting”) to review the liquidity risk management program (the “Program”) applicable to the BlackRock open-end funds, excluding money market funds (each, a “Fund”), pursuant to the Liquidity Rule. The Board has appointed BlackRock Advisors, LLC or BlackRock Fund Advisors (“BlackRock”), each an investment adviser to certain Funds, as the program administrator for each Fund’s Program, as applicable. BlackRock has delegated oversight of the Program to the 40 Act Liquidity Risk Management Committee (the “Committee”). At the Meeting, the Committee, on behalf of BlackRock, provided the Board with a report that addressed the operation of the Program and assessed its adequacy and effectiveness of implementation, including the operation of each Fund’s Highly Liquid Investment Minimum (“HLIM”) where applicable, and any material changes to the Program (the “Report”). The Report covered the period from December 1, 2018 through September 30, 2019 (the “Program Reporting Period”).
The Report described the Program’s liquidity classification methodology for categorizing a Fund’s investments (including derivative transactions) into one of four liquidity buckets. It also described BlackRock’s methodology in establishing a Fund’s HLIM and noted that the Committee reviews and ratifies the HLIM assigned to each Fund no less frequently than annually.
The Report noted that the Program complied with the key factors for consideration under the Liquidity Rule for assessing, managing and periodically reviewing a Fund’s liquidity risk, as follows:
A. The Fund’s investment strategy and liquidity of portfolio investments during both normal and reasonably foreseeable stressed conditions: During the Program Reporting Period, the Committee reviewed whether each Fund’s strategy is appropriate for an open-end fund structure with a focus on Funds with more significant and consistent holdings of less liquid and illiquid assets. The Committee also factored a Fund’s concentration in an issuer into the liquidity classification methodology by taking issuer position sizes into account. Where a Fund participated in borrowings for investment purposes (such as tender option bonds and reverse repurchase agreements), such borrowings were factored into the Program’s calculation of a Fund’s liquidity bucketing. Derivative exposure was also considered in such calculation.
B. Short-term and long-term cash flow projections during both normal and reasonably foreseeable stressed conditions: During the Program Reporting Period, the Committee reviewed historical net redemption activity and used this information as a component to establish each Fund’s reasonably anticipated trading size (“RATS”). Each Fund has adopted an in-kind redemption policy which may be utilized to meet larger redemption requests. The Committee may also take into consideration a Fund’s shareholder ownership concentration (which, depending on product type and distribution channel, may or may not be available), a Fund’s distribution channels, and the degree of certainty associated with a Fund’s short-term and long-term cash flow projections.
C. Holdings of cash and cash equivalents, as well as borrowing arrangements: The Committee considered the terms of the credit facility applicable to the Funds, the financial health of the institution providing the facility and the fact that the credit facility is shared among multiple Funds (including that a portion of the aggregate commitment amount is specifically designated for BlackRock Floating Rate Income Portfolio, a series of BlackRock Funds V). The Committee also considered other types of borrowing available to the Funds, such as the ability to use reverse repurchase agreements and interfund lending, as applicable.
There were no material changes to the Program during the Program Reporting Period. The Report provided to the Board stated that the Committee concluded that based on the operation of the functions, as described in the Report, the Program is operating as intended and is effective in implementing the requirements of the Liquidity Rule.
| 40 | 2020 BLACKROCK ANNUAL REPORTTO SHAREHOLDERS |
Trustee and Officer Information
| Independent Trustees (a) | ||||||||
Name Year of Birth (b) | Position(s) Held (Length of Service) (c) | Principal Occupation(s) During Past Five Years | Number of BlackRock-Advised Registered Investment Companies (“RICs”) Consisting of Investment Portfolios (“Portfolios”) Overseen | Public Company and Other Investment Company Directorships Held During Past Five Years | ||||
Mark Stalnecker 1951 | Chair of the Board (Since 2019) and Trustee (Since 2015) | Chief Investment Officer, University of Delaware from 1999 to 2013; Trustee and Chair of the Finance and Investment Committees, Winterthur Museum and Country Estate from 2005 to 2016; Member of the Investment Committee, Delaware Public Employees’ Retirement System since 2002; Member of the Investment Committee, Christiana Care Health System from 2009 to 2017; Member of the Investment Committee, Delaware Community Foundation from 2013 to 2014; Director and Chair of the Audit Committee, SEI Private Trust Co. from 2001 to 2014. | 36 RICs consisting of 150 Portfolios | None | ||||
Bruce R. Bond 1946 | Trustee (Since 2019) | Board Member, Amsphere Limited (software) since 2018; Trustee and Member of the Governance Committee, State Street Research Mutual Funds from 1997 to 2005; Board Member of Governance, Audit and Finance Committee, Avaya Inc. (computer equipment) from 2003 to 2007. | 36 RICs consisting of 150 Portfolios | None | ||||
Susan J. Carter 1956 | Trustee (Since 2016) | Director, Pacific Pension Institute from 2014 to 2018; Advisory Board Member, Center for Private Equity and Entrepreneurship at Tuck School of Business since 1997; Senior Advisor, Commonfund Capital, Inc. (“CCI”) (investment adviser) in 2015; Chief Executive Officer, CCI from 2013 to 2014; President & Chief Executive Officer, CCI from 1997 to 2013; Advisory Board Member, Girls Who Invest from 2015 to 2018 and Board Member thereof since 2018; Advisory Board Member, Bridges Fund Management since 2016; Trustee, Financial Accounting Foundation since 2017; Practitioner Advisory Board Member, Private Capital Research Institute ("PCRI") since 2017; Lecturer in the Practice of Management, Yale School of Management since 2019. | 36 RICs consisting of 150 Portfolios | None | ||||
Collette Chilton 1958 | Trustee (Since 2015) | Chief Investment Officer, Williams College since 2006; Chief Investment Officer, Lucent Asset Management Corporation from 1998 to 2006. | 36 RICs consisting of 150 Portfolios | None | ||||
Neil A. Cotty 1954 | Trustee (Since 2016) | Bank of America Corporation from 1996 to 2015, serving in various senior finance leadership roles, including Chief Accounting Officer from 2009 to 2015, Chief Financial Officer of Global Banking, Markets and Wealth Management from 2008 to 2009, Chief Accounting Officer from 2004 to 2008, Chief Financial Officer of Consumer Bank from 2003 to 2004, Chief Financial Officer of Global Corporate Investment Bank from 1999 to 2002. | 36 RICs consisting of 150 Portfolios | None | ||||
Lena G. Goldberg 1949 | Trustee (Since 2019) | Senior Lecturer, Harvard Business School, since 2008; Director, Charles Stark Draper Laboratory, Inc. since 2013; FMR LLC/Fidelity Investments (financial services) from 1996 to 2008, serving in various senior roles including Executive Vice President — Strategic Corporate Initiatives and Executive Vice President and General Counsel; Partner, Sullivan & Worcester LLP from 1985 to 1996 and Associate thereof from 1979 to 1985. | 36 RICs consisting of 150 Portfolios | None | ||||
| TRUSTEEAND OFFICER INFORMATION | 41 |
Trustee and Officer Information (continued)
| Independent Trustees (a)(continued) | ||||||||
Name Year of Birth (b) | Position(s) Held (Length of Service) (c) | Principal Occupation(s) During Past Five Years | Number of BlackRock-Advised Registered Investment Companies (“RICs”) Consisting of Investment Portfolios (“Portfolios”) Overseen | Public Company and Other Investment Company Directorships Held During Past Five Years | ||||
Henry R. Keizer 1956 | Trustee (Since 2019) | Director, Park Indemnity Ltd. (captive insurer) since 2010; Director, MUFG Americas Holdings Corporation and MUFG Union Bank, N.A. (financial and bank holding company) from 2014 to 2016; Director, American Institute of Certified Public Accountants from 2009 to 2011; Director, KPMG LLP (audit, tax and advisory services) from 2004 to 2005 and 2010 to 2012; Director, KPMG International in 2012, Deputy Chairman and Chief Operating Officer thereof from 2010 to 2012 and U.S. Vice Chairman of Audit thereof from 2005 to 2010; Global Head of Audit, KPMGI (consortium of KPMG firms) from 2006 to 2010; Director, YMCA of Greater New York from 2006 to 2010. | 36 RICs consisting of 150 Portfolios | Hertz Global Holdings (car rental); Montpelier Re Holdings, Ltd. (publicly held property and casualty reinsurance) from 2013 until 2015; Sealed Air Corp. (packaging); WABCO (commercial vehicle safety systems) | ||||
Cynthia A. Montgomery 1952 | Trustee (Since 2007) | Professor, Harvard Business School since 1989. | 36 RICs consisting of 150 Portfolios | Newell Rubbermaid, Inc. (manufacturing) | ||||
Donald C. Opatrny 1952 | Trustee (Since 2019) | Trustee, Vice Chair, Member of the Executive Committee and Chair of the Investment Committee, Cornell University since 2004; President, Trustee and Member of the Investment Committee, The Aldrich Contemporary Art Museum from 2007 to 2014; Member of the Board and Investment Committee, University School from 2007 to 2018; Member of the Investment Committee, Mellon Foundation from 2009 to 2015; Trustee, Artstor (a Mellon Foundation affiliate) from 2010 to 2015; President and Trustee, the Center for the Arts, Jackson Hole from 2011 to 2018; Director, Athena Capital Advisors LLC (investment management firm) since 2013; Trustee and Chair of the Investment Committee, Community Foundation of Jackson Hole since 2014; Member of Affordable Housing Supply Board of Jackson, Wyoming since 2018; Member, Investment Funds Committee, State of Wyoming since 2017; Trustee, Phoenix Art Museum since 2018; Trustee, Arizona Community Foundation and Member of Investment Committee since 2020. | 36 RICs consisting of 150 Portfolios | None | ||||
Joseph P. Platt 1947 | Trustee (Since 2007) | General Partner, Thorn Partners, LP (private investments) since 1998; Director, WQED Multi-Media (public broadcasting not-for-profit) since 2001; Chair, Basic Health International (non-profit) since 2015. | 36 RICs consisting of 150 Portfolios | Greenlight Capital Re, Ltd. (reinsurance company); Consol Energy Inc. | ||||
Kenneth L. Urish 1951 | Trustee (Since 2007) | Managing Partner, Urish Popeck & Co., LLC (certified public accountants and consultants) since 1976; Past-Chairman of the Professional Ethics Committee of the Pennsylvania Institute of Certified Public Accountants and Committee Member thereof since 2007; Member of External Advisory Board, The Pennsylvania State University Accounting Department since founding in 2001; Principal, UP Strategic Wealth Investment Advisors, LLC since 2013; Trustee, The Holy Family Institute from 2001 to 2010; President and Trustee, Pittsburgh Catholic Publishing Associates from 2003 to 2008; Director, Inter-Tel from 2006 to 2007. | 36 RICs consisting of 150 Portfolios | None | ||||
Claire A. Walton 1957 | Trustee (Since 2016) | Chief Operating Officer and Chief Financial Officer of Liberty Square Asset Management, LP from 1998 to 2015; General Partner of Neon Liberty Capital Management, LLC since 2003; Director, Boston Hedge Fund Group from 2009 to 2018; Director, Woodstock Ski Runners since 2013; Director, Massachusetts Council on Economic Education from 2013 to 2015. | 36 RICs consisting of 150 Portfolios | None | ||||
| 42 | 2020 BLACKROCK ANNUAL REPORTTO SHAREHOLDERS |
Trustee and Officer Information (continued)
| Interested Trustees (a)(d) | ||||||||
Name Year of Birth (b) | Position(s) Held (Length of Service) (c) | Principal Occupation(s) During Past Five Years | Number of BlackRock-Advised Registered Investment Companies (“RICs”) Consisting of Investment | Public Company and Other Investment Company Directorships Held During Past Five Years | ||||
Robert Fairbairn 1965 | Trustee (Since 2018) | Vice Chairman of BlackRock, Inc. since 2019; Member of BlackRock's Global Executive and Global Operating Committees; Co-Chair of BlackRock's Human Capital Committee; Senior Managing Director of BlackRock, Inc. from 2010 to 2019; oversaw BlackRock's Strategic Partner Program and Strategic Product Management Group from 2012 to 2019; Member of the Board of Managers of BlackRock Investments, LLC from 2011 to 2018; Global Head of BlackRock's Retail and iShares® businesses from 2012 to 2016. | 123 RICs consisting of 261 Portfolios | None | ||||
John M. Perlowski (e) 1964 | Trustee (Since 2015) and President and Chief Executive Officer (Since 2010) | Managing Director of BlackRock, Inc. since 2009; Head of BlackRock Global Accounting and Product Services since 2009; Advisory Director of Family Resource Network (charitable foundation) since 2009. | 124 RICs consisting of 262 Portfolios | None | ||||
(a) The address of each Trustee is c/o BlackRock, Inc., 55 East 52nd Street, New York, New York 10055. (b) Independent Trustees serve until their resignation, retirement, removal or death, or until December 31 of the year in which they turn 75. The Board may determine to extend the terms of Independent Trustees on a case-by-case basis, as appropriate. (c) Following the combination of Merrill Lynch Investment Managers, L.P. ("MLIM") and BlackRock, Inc. in September 2006, the various legacy MLIM and legacy BlackRock fund boards were realigned and consolidated into three new fund boards in 2007. Furthermore, effective January 1, 2019, three BlackRock Fund Complexes were realigned and consolidated into two BlackRock Fund Complexes. As a result, although the chart shows the year that each Independent Trustee joined the Board, certain Independent Trustees first became members of the boards of other BlackRock-advised Funds, legacy MLIM funds or legacy BlackRock funds as follows: Bruce R. Bond, 2005; Cynthia A. Montgomery, 1994; Joseph P. Platt, 1999; Kenneth L. Urish, 1999; Lena G. Goldberg, 2016; Henry R. Keizer, 2016; Donald C. Opatrny, 2015. (d) Mr. Fairbairn and Mr. Perlowski are both “interested persons,” as defined in the 1940 Act, of the Trust based on their positions with BlackRock, Inc. and its affiliates. Mr. Fairbairn and Mr. Perlowski are also board members of the BlackRock Fixed-Income Complex. (e) Mr. Perlowski is also a trustee of the BlackRock Credit Strategies Fund. | ||||||||
| Officers Who Are Not Trustees (a) | ||||
Name Year of Birth (b) | Position(s) Held (Length of Service) | Principal Occupation(s) During Past Five Years | ||
Thomas Callahan 1968 | Vice President (Since 2016) | Managing Director of BlackRock, Inc. since 2013; Member of the Board of Managers of BlackRock Investments, LLC (principal underwriter) since 2019 and Managing Director thereof since 2017; Head of BlackRock’s Global Cash Management Business since 2016; Co-Head of the Global Cash Management Business from 2014 to 2016; Deputy Head of the Global Cash Management Business from 2013 to 2014; Member of the Cash Management Group Executive Committee since 2013; Chief Executive Officer of NYSE Liffe U.S. from 2008 to 2013. | ||
Jennifer McGovern 1977 | Vice President (Since 2014) | Managing Director of BlackRock, Inc. since 2016; Director of BlackRock, Inc. from 2011 to 2015; Head of Product Development and Oversight for BlackRock’s Strategic Product Management Group since 2019; Head of Product Structure and Oversight for BlackRock's U.S. Wealth Advisory Group from 2013 to 2019. | ||
Neal J. Andrews 1966 | Chief Financial Officer (Since 2007) | Chief Financial Officer of the iShares® exchange traded funds from 2019 to 2020; Managing Director of BlackRock, Inc. since 2006. | ||
Jay M. Fife 1970 | Treasurer (Since 2007) | Managing Director of BlackRock, Inc. since 2007. | ||
Charles Park 1967 | Chief Compliance Officer (Since 2014) | Anti-Money Laundering Compliance Officer for certain BlackRock-advised Funds from 2014 to 2015; Chief Compliance Officer of BlackRock Advisors, LLC and the BlackRock-advised Funds in the BlackRock Multi-Asset Complex and the BlackRock Fixed-Income Complex since 2014; Principal of and Chief Compliance Officer for iShares® Delaware Trust Sponsor LLC since 2012 and BlackRock Fund Advisors (“BFA”) since 2006; Chief Compliance Officer for the BFA-advised iShares® exchange traded funds since 2006; Chief Compliance Officer for BlackRock Asset Management International Inc. since 2012. | ||
Lisa Belle 1968 | Anti-Money Laundering Compliance Officer (Since 2019) | Managing Director of BlackRock, Inc. since 2019; Global Financial Crime Head for Asset and Wealth Management of JP Morgan from 2013 to 2019; Managing Director of RBS Securities from 2012 to 2013; Head of Financial Crimes for Barclays Wealth Americas from 2010 to 2012. | ||
Janey Ahn 1975 | Secretary (Since 2019) | Managing Director of BlackRock, Inc. since 2018; Director of BlackRock, Inc. from 2009 to 2017. | ||
(a) The address of each Officer is c/o BlackRock, Inc., 55 East 52nd Street, New York, New York 10055. (b) Officers of the Trust serve at the pleasure of the Board. | ||||
Further information about the Trust's Trustees and Officers is available in the Fund’s Statement of Additional Information, which can be obtained without charge by calling (800) 441-7762.
Effective December 31, 2019, Robert M. Hernandez retired as Trustee of the Trust.
| TRUSTEEAND OFFICER INFORMATION | 43 |
Trustee and Officer Information (continued)
Investment Adviser and Administrator
BlackRock Advisors, LLC
Wilmington, DE 19809
Accounting Agent and Custodian
State Street Bank and Trust Company
Boston, MA 02111
Sub-Advisers
BlackRock International Limited
Edinburgh, EH3 8BL
United Kingdom
BlackRock Asset Management North Asia Limited
Hong Kong, China
BlackRock (Singapore) Limited
079912 Singapore
Transfer Agent
BNY Mellon Investment Servicing (US) Inc.
Wilmington, DE 19809
Independent Registered Public Accounting Firm
Deloitte & Touche LLP
Boston, MA 02116
Distributor
BlackRock Investments, LLC
New York, NY 10022
Legal Counsel
Sidley Austin LLP
New York, NY 10019
Address of the Trust
100 Bellevue Parkway
Wilmington, DE 19809
| 44 | 2020 BLACKROCK ANNUAL REPORTTO SHAREHOLDERS |
General Information
Householding
The Fund will mail only one copy of shareholder documents, including prospectuses, annual and semi-annual reports and proxy statements, to shareholders with multiple accounts at the same address. This practice is commonly called “householding” and is intended to reduce expenses and eliminate duplicate mailings of shareholder documents. Mailings of your shareholder documents may be householded indefinitely unless you instruct us otherwise. If you do not want the mailing of these documents to be combined with those for other members of your household, please call the Fund at(800) 441-7762.
Availability of Quarterly Schedule of Investments
The Fund files its complete schedule of portfolio holdings with the SEC for the first and third quarters of each fiscal year as an exhibit to its reports on Form N-PORT, and for reporting periods ended prior to March 31, 2019, filed such information on Form N-Q. The Fund’s Form N-PORT andN-Q are available on the SEC’s website at sec.gov. The Fund’s Form N-Q may also be obtained upon request and without charge by calling (800) 441-7762.
Availability of Proxy Voting Policies and Procedures
A description of the policies and procedures that the Fund uses to determine how to vote proxies relating to portfolio securities is available upon request and without charge (1) by calling (800) 441-7762; (2) atblackrock.com; and (3) on the SEC’s website at sec.gov.
Availability of Proxy Voting Record
Information about how the Fund voted proxies relating to securities held in the Fund’s portfolio during the most recent 12-month period ended June 30 is available upon request and without charge (1) atblackrock.com; or by calling (800) 441-7762 and (2) on the SEC’s website at sec.gov.
BlackRock’s Mutual Fund Family
BlackRock offers a diverse lineup of open-end mutual funds crossing all investment styles and managed by experts in equity, fixed-income and tax-exempt investing. Visitblackrock.com for more information.
Shareholder Privileges
Account Information
Call us at (800) 441-7762 from 8:00 AM to 6:00 PM ET on any business day to get information about your account balances, recent transactions and share prices. You can also visitblackrock.com for more information.
Automatic Investment Plans
Investor class shareholders who want to invest regularly can arrange to have $50 or more automatically deducted from their checking or savings account and invested in any of the BlackRock funds.
Systematic Withdrawal Plans
Investor class shareholders can establish a systematic withdrawal plan and receive periodic payments of $50 or more from their BlackRock funds, as long as their account balance is at least $10,000.
Retirement Plans
Shareholders may make investments in conjunction with Traditional, Rollover, Roth, Coverdell, Simple IRAs, SEP IRAs and 403(b) Plans.
| ADDITIONAL INFORMATION | 45 |
Additional Information (continued)
BlackRock Privacy Principles
BlackRock is committed to maintaining the privacy of its current and former fund investors and individual clients (collectively, “Clients”) and to safeguarding their non-public personal information. The following information is provided to help you understand what personal information BlackRock collects, how we protect that information and why in certain cases we share such information with select parties.
If you are located in a jurisdiction where specific laws, rules or regulations require BlackRock to provide you with additional or different privacy-related rights beyond what is set forth below, then BlackRock will comply with those specific laws, rules or regulations.
BlackRock obtains or verifies personal non-public information from and about you from different sources, including the following: (i) information we receive from you or, if applicable, your financial intermediary, on applications, forms or other documents; (ii) information about your transactions with us, our affiliates, or others; (iii) information we receive from a consumer reporting agency; and (iv) from visits to our websites.
BlackRock does not sell or disclose to non-affiliated third parties any non-public personal information about its Clients, except as permitted by law or as is necessary to respond to regulatory requests or to service Client accounts. These non-affiliated third parties are required to protect the confidentiality and security of this information and to use it only for its intended purpose.
We may share information with our affiliates to service your account or to provide you with information about other BlackRock products or services that may be of interest to you. In addition, BlackRock restricts access to non-public personal information about its Clients to those BlackRock employees with a legitimate business need for the information. BlackRock maintains physical, electronic and procedural safeguards that are designed to protect the non-public personal information of its Clients, including procedures relating to the proper storage and disposal of such information.
| 46 | 2020 BLACKROCK ANNUAL REPORTTO SHAREHOLDERS |
Glossary of Terms Used in this Report
| Currency | ||
| AUD | Australian Dollar | |
| BHD | Bahraini Dinar | |
| BRL | Brazilian Real | |
| CAD | Canadian Dollar | |
| CHF | Swiss Franc | |
| CLP | Chilean Peso | |
| COP | Colombian Peso | |
| EUR | Euro | |
| GBP | British Pound | |
| HUF | Hungarian Forint | |
| IDR | Indonesian Rupiah | |
| INR | Indian Rupee | |
| JPY | Japanese Yen | |
| KRW | South Korean Won | |
| MXN | Mexican Peso | |
| MYR | Malaysian Ringgit | |
| NOK | Norwegian Krone | |
| NZD | New Zealand Dollar | |
| PHP | Philippine Peso | |
| PLN | Polish Zloty | |
| RON | Romanian New Leu | |
| RUB | Russian Ruble | |
| SEK | Swedish Krona | |
| SGD | Singapore Dollar | |
| THB | Thai Baht | |
| TRY | Turkish Lira | |
| TWD | Taiwan Dollar | |
| USD | U.S. Dollar | |
| ZAR | South African Rand | |
| Portfolio Abbreviations | ||
| ADR | American Depositary Receipts | |
| GDR | Global Depositary Receipt | |
| JSC | Joint Stock Company | |
| OTC | Over-the-Counter | |
| PCL | Public Company Limited | |
| GLOSSARYOF TERMS USEDINTHIS REPORT | 47 |
Want to know more?
blackrock.com | 800-441-7762
This report is intended for current holders. It is not authorized for use as an offer of sale or a solicitation of an offer to buy shares of the Fund unless preceded or accompanied by the Fund’s current prospectus. Past performance results shown in this report should not be considered a representation of future performance. Investment returns and principal value of shares will fluctuate so that shares, when redeemed, may be worth more or less than their original cost. Statements and other information herein are as dated and are subject to change.
TEM-4/20-AR
|  |
| Code of Ethics – The registrant (or the “Fund”) has adopted a code of ethics, as of the end of the period covered by this report, applicable to the registrant’s principal executive officer, principal financial officer, principal accounting officer or controller, or persons performing similar functions. During the period covered by this report, the code of ethics was amended to update certain information and to make other non-material changes. During the period covered by this report, there have been no waivers granted under the code of ethics. The registrant undertakes to provide a copy of the code of ethics to any person upon request, without charge, who calls 1-800-441-7762. | ||
Item 3 – | Audit Committee Financial Expert – The registrant’s board of directors (the “board of directors”), has determined that (i) the registrant has the following audit committee financial experts serving on its audit committee and (ii) each audit committee financial expert is independent: | |
Neil A. Cotty Henry R. Keizer Kenneth L. Urish Claire A. Walton | ||
| Under applicable securities laws, a person determined to be an audit committee financial expert will not be deemed an “expert” for any purpose, including without limitation for the purposes of Section 11 of the Securities Act of 1933, as a result of being designated or identified as an audit committee financial expert. The designation or identification of a person as an audit committee financial expert does not impose on such person any duties, obligations, or liabilities greater than the duties, obligations, and liabilities imposed on such person as a member of the audit committee and board of directors in the absence of such designation or identification. The designation or identification of a person as an audit committee financial expert does not affect the duties, obligations, or liability of any other member of the audit committee or board of directors. | ||
Item 4 – | Principal Accountant Fees and Services | |
| The following table presents fees billed by Deloitte & Touche LLP (“D&T”) in each of the last two fiscal years for the services rendered to the Fund: | ||
| (a) Audit Fees | (b) Audit-Related Fees1 | (c) Tax Fees2 | (d) All Other Fees | | ||||||||||||||
| Entity Name | Current Fiscal Year End3 | Previous Fiscal Year End | Current Fiscal Year End3 | Previous Fiscal Year End | Current Fiscal Year End3 | Previous Fiscal Year End | Current Fiscal Year End3 | Previous Fiscal Year End | ||||||||||
| BlackRock Total Emerging Markets Fund | $76,092 | $76,092 | $0 | $0 | $20,600 | $21,200 | $0 | $0 | ||||||||||
| The following table presents fees billed by D&T that were required to be approved by the registrant’s audit committee (the “Committee”) for services that relate directly to the operations or financial reporting of the Fund and that are rendered on behalf of BlackRock Advisors, LLC (the “Investment Adviser” or “BlackRock”) and entities controlling, controlled by, or under common control with BlackRock (not including any sub-adviser whose role is primarily portfolio management and is subcontracted with or overseen by another investment adviser) that provide ongoing services to the Fund (“Affiliated Service Providers”): |
| Current Fiscal Year End3 | Previous Fiscal Year End | |||
| (b) Audit-Related Fees1 | $0 | $0 | ||
| (c) Tax Fees2 | $0 | $0 | ||
| (d) All Other Fees4 | $1,984,000 | $2,050,500 |
1 The nature of the services includes assurance and related services reasonably related to the performance of the audit or review of financial statements not included in Audit Fees, including accounting consultations, agreed-upon procedure reports, attestation reports, comfort letters, out-of-pocket expenses and internal control reviews not required by regulators.
2
2 The nature of the services includes tax compliance and/or tax preparation, including services relating to the filing or amendment of federal, state or local income tax returns, regulated investment company qualification reviews, taxable income and tax distribution calculations.
3 The registrant changed its fiscal year end from October 31 to April 30 effective April 30, 2020 whereby this fiscal year consists of the six months ended April 30, 2020.
4 Non-audit fees of $1,984,000 and $2,050,500 for the current fiscal year and previous fiscal year, respectively, were paid to the Fund’s principal accountant in their entirety by BlackRock, in connection with services provided to the Affiliated Service Providers of the Fund and of certain other funds sponsored and advised by BlackRock or its affiliates for a service organization review and an accounting research tool subscription. These amounts represent aggregate fees paid by BlackRock and were not allocated on a per fund basis.
(e)(1) Audit CommitteePre-Approval Policies and Procedures:
| The Committee has adopted policies and procedures with regard to the pre-approval of services. Audit, audit-related and tax compliance services provided to the registrant on an annual basis require specific pre-approval by the Committee. The Committee also must approve other non-audit services provided to the registrant and those non-audit services provided to the Investment Adviser and Affiliated Service Providers that relate directly to the operations and the financial reporting of the registrant. Certain of these non-audit services that the Committee believes are (a) consistent with the SEC’s auditor independence rules and (b) routine and recurring services that will not impair the independence of the independent accountants may be approved by the Committee without consideration on a specific case-by-case basis (“general pre-approval”). The term of any general pre-approval is 12 months from the date of the pre-approval, unless the Committee provides for a different period. Tax or other non-audit services provided to the registrant which have a direct impact on the operations or financial reporting of the registrant will only be deemed pre-approved provided that any individual project does not exceed $10,000 attributable to the registrant or $50,000 per project. For this purpose, multiple projects will be aggregated to determine if they exceed the previously mentioned cost levels. | |
Any proposed services exceeding the pre-approved cost levels will require specific pre-approval by the Committee, as will any other services not subject to general pre-approval (e.g., unanticipated but permissible services). The Committee is informed of each service approved subject to general pre-approval at the next regularly scheduled in-person board meeting. At this meeting, an analysis of such services is presented to the Committee for ratification. The Committee may delegate to the Committee Chairman the authority to approve the provision of and fees for any specific engagement of permitted non-audit services, including services exceeding pre-approved cost levels. | ||
| (e)(2) None of the services described in each of Items 4(b) through (d) were approved by the Committee pursuant to the de minimis exception in paragraph (c)(7)(i)(C) of Rule 2-01 of Regulation S-X. | ||
| (f) Not Applicable | ||
| (g) The aggregate non-audit fees, defined as the sum of the fees shown under “Audit-Related Fees,” “Tax Fees” and “All Other Fees,” paid to the accountant for services rendered by the accountant to the registrant, the Investment Adviser and the Affiliated Service Providers were: | ||
| Entity Name | Current Fiscal Year End1 | Previous Fiscal Year End | |||
| BlackRock Total Emerging Markets Fund | $20,600 | $21,200 |
1 The registrant changed its fiscal year end from October 31 to April 30 effective April 30, 2020 whereby this fiscal year consists of the six months ended April 30, 2020.
3
| Additionally, the amounts billed by D&T in connection with services provided to the Affiliated Service Providers of the Fund and of other funds sponsored and advised by BlackRock or its affiliates during the current and previous fiscal years for a service organization review and an accounting research tool subscription were: |
Current Fiscal Year End1 | Previous Fiscal Year End | |
$1,984,000 | $2,050,500 |
1 The registrant changed its fiscal year end from October 31 to April 30 effective April 30, 2020 whereby this fiscal year consists of the six months ended April 30, 2020.
| These amounts represent aggregate fees paid by BlackRock and were not allocated on a per fund basis. | ||
| (h) The Committee has considered and determined that the provision of non-audit services that were rendered to the Investment Adviser and the Affiliated Service Providers that were not pre-approved pursuant to paragraph (c)(7)(ii) of Rule 2-01 of Regulation S-X is compatible with maintaining the principal accountant’s independence. | ||
Item 5 – | Audit Committee of Listed Registrant – Not Applicable | |
Item 6 – | Investments | |
| (a) The registrant’s Schedule of Investments is included as part of the Report to Stockholders filed under Item 1 of this Form. | ||
| (b) Not Applicable due to no such divestments during the semi-annual period covered since the previous Form N-CSR filing. | ||
Item 7 – | Disclosure of Proxy Voting Policies and Procedures for Closed-End Management Investment Companies – Not Applicable | |
Item 8 – | Portfolio Managers of Closed-End Management Investment Companies – Not Applicable | |
Item 9 – | Purchases of Equity Securities by Closed-End Management Investment Company and Affiliated Purchasers – Not Applicable | |
Item 10 – | Submission of Matters to a Vote of Security Holders – There have been no material changes to these procedures. | |
Item 11 – | Controls and Procedures | |
| (a) The registrant’s principal executive and principal financial officers, or persons performing similar functions, have concluded that the registrant’s disclosure controls and procedures (as defined in Rule 30a-3(c) under the Investment Company Act of 1940, as amended (the “1940 Act”)) are effective as of a date within 90 days of the filing of this report based on the evaluation of these controls and procedures required by Rule 30a-3(b) under the 1940 Act and Rule 15d-15(b) under the Securities Exchange Act of 1934, as amended. | ||
4
| (b) There were no changes in the registrant’s internal control over financial reporting (as defined in Rule 30a-3(d) under the 1940 Act) that occurred during the period covered by this report that have materially affected, or are reasonably likely to materially affect, the registrant’s internal control over financial reporting. | ||
Item 12 – | Disclosure of Securities Lending Activities forClosed-End Management Investment Companies – Not Applicable | |
Item 13 – | Exhibits attached hereto | |
| (a)(1) Code of Ethics – See Item 2 | ||
| (a)(2) Section 302 Certifications are attached | ||
| (a)(3) Not Applicable | ||
| (a)(4) Not Applicable | ||
| (b) Section 906 Certifications are attached | ||
5
Pursuant to the requirements of the Securities Exchange Act of 1934 and the Investment Company Act of 1940, the registrant has duly caused this report to be signed on its behalf by the undersigned, thereunto duly authorized.
BlackRock Funds
| By: | /s/ John M. Perlowski | |
| John M. Perlowski | ||
| Chief Executive Officer (principal executive officer) of | ||
| BlackRock Funds |
Date: July 2, 2020
Pursuant to the requirements of the Securities Exchange Act of 1934 and the Investment Company Act of 1940, this report has been signed below by the following persons on behalf of the registrant and in the capacities and on the dates indicated.
| By: | /s/ John M. Perlowski | |
| John M. Perlowski | ||
| Chief Executive Officer (principal executive officer) of | ||
| BlackRock Funds |
Date: July 2, 2020
| By: | /s/ Neal J. Andrews | |
| Neal J. Andrews | ||
| Chief Financial Officer (principal financial officer) of | ||
| BlackRock Funds |
Date: July 2, 2020
6