UNITED STATES
SECURITIES AND EXCHANGE COMMISSION
Washington, D.C. 20549
FORM N-CSR
CERTIFIED SHAREHOLDER REPORT OF REGISTERED MANAGEMENT INVESTMENT COMPANIES
Investment Company Act file number: 811-05742
Name of Fund: BlackRock FundsSM
BlackRock Advantage International Fund
BlackRock Advantage Large Cap Growth Fund
BlackRock Advantage Small Cap Core Fund
BlackRock Energy Opportunities Fund (Formerly BlackRock All-Cap Energy & Resources Portfolio)
BlackRock High Equity Income Fund
BlackRock International Dividend Fund
Fund Address: 100 Bellevue Parkway, Wilmington, DE 19809
Name and address of agent for service: John M. Perlowski, Chief Executive Officer, BlackRock FundsSM, 55 East 52nd Street, New York, NY 10055
Registrant’s telephone number, including area code: (800) 441-7762
Date of fiscal year end: 05/31/2020
Date of reporting period: 05/31/2020
Item 1 – Report to Stockholders
 | MAY 31, 2020 |
| 2020 Annual Report | ||
BlackRock FundsSM
| · | BlackRock Advantage International Fund |
| · | BlackRock Advantage Large Cap Growth Fund |
| · | BlackRock Advantage Small Cap Core Fund |
Beginning on January 1, 2021, as permitted by regulations adopted by the Securities and Exchange Commission, paper copies of each Fund’s shareholder reports will no longer be sent by mail, unless you specifically request paper copies of the reports from BlackRock or from your financial intermediary, such as a broker-dealer or bank. Instead, the reports will be made available on a website, and you will be notified by mail each time a report is posted and provided with a website link to access the report.
You may elect to receive all future reports in paper free of charge. If you hold accounts directly with BlackRock, you can call (800) 441-7762 to inform BlackRock that you wish to continue receiving paper copies of your shareholder reports. If you hold accounts through a financial intermediary, you can follow the instructions included with this disclosure, if applicable, or contact your financial intermediary to request that you continue to receive paper copies of your shareholder reports. Please note that not all financial intermediaries may offer this service. Your election to receive reports in paper will apply to all funds advised by BlackRock Advisors, LLC, BlackRock Fund Advisors or their affiliates, or all funds held with your financial intermediary, as applicable.
If you already elected to receive shareholder reports electronically, you will not be affected by this change and you need not take any action. You may elect to receive electronic delivery of shareholder reports and other communications by: (i) accessing the BlackRock website at blackrock.com/edelivery and logging into your accounts, if you hold accounts directly with BlackRock, or (ii) contacting your financial intermediary, if you hold accounts through a financial intermediary. Please note that not all financial intermediaries may offer this service.
| Not FDIC Insured • May Lose Value • No Bank Guarantee |
Dear Shareholder,
The last 12 months have been a time of sudden change in global financial markets, as a long period of growth and positive returns was interrupted in early 2020 by the emergence and spread of the coronavirus. For the first part of the reporting period, U.S. equities and bonds both delivered impressive returns, despite fears and doubts about the economy that were ultimately laid to rest with unprecedented monetary stimulus and a sluggish yet resolute performance from the U.S. economy. But as the threat from the coronavirus became more apparent throughout February and March 2020, leading countries around the world took economically disruptive countermeasures, causing equity prices to fall sharply. While markets have since recovered some of these losses as countries around the world begin reopening, there is still significant uncertainty surrounding the long-term impact of the pandemic on the global economy.
Returns for most securities were robust for the first part of the reporting period, as investors began to realize that the U.S. economy was maintaining the modest yet steady growth that had characterized this economic cycle. However, once stay-at-home orders and closures of non-essential businesses became widespread, many workers were laid off and unemployment claims spiked. With large portions of the global economy on hold, all types of international equities ended the 12-month reporting period with negative performance, while in the United States large-capitalization stocks, which investors saw as more resilient than smaller companies, delivered solid returns.
The performance of different types of fixed-income securities diverged substantially due to a reduced investor appetite for risk. Treasuries benefited from the risk-off environment, and posted healthy returns, as the 10-year U.S. Treasury yield (which is inversely related to bond prices) fell to an all-time low. Investment-grade corporate bonds also delivered a solid return, while high-yield corporate returns were muted due to credit concerns.
The U.S. Federal Reserve (the “Fed”) reduced interest rates three times in 2019, to support slowing economic growth. After the coronavirus outbreak, the Fed instituted two emergency rate cuts, pushing short-term interest rates close to zero. To stabilize credit markets, the Fed also announced a new bond-buying program, as did several other central banks around the world, including the European Central Bank and the Bank of Japan.
Looking ahead, while coronavirus-related disruption is certain to hurt worldwide economic growth, the global expansion is likely to continue once the impact of the outbreak subsides. We are encouraged by the strong coordinated monetary and fiscal response that is underway, both in the United States and abroad. However, there remains a risk that policy fatigue and recent improvements in economic indicators could lead lawmakers to retreat from needed stimulus measures too soon.
Overall, we favor a neutral stance toward risk, given the uncertainty surrounding the path to recovery. Among equities, we see an advantage in U.S. stocks compared to other developed markets, given the diversity of the U.S. economy and the impressive scope of monetary and fiscal stimulus. In bonds, the swift action taken by the world’s central banks means there are attractive opportunities in credit, and we expect credit spreads to narrow as markets stabilize. Both U.S. Treasuries and sustainable investments can help provide portfolio resilience, and the disruption created by the coronavirus appears to be accelerating the shift toward sustainable investments.
In this environment, our view is that investors need to think globally, extend their scope across a broad array of asset classes, and be nimble as market conditions change. We encourage you to talk with your financial advisor and visit blackrock.com for further insight about investing in today’s markets.
Sincerely,

Rob Kapito
President, BlackRock Advisors, LLC

Rob Kapito
President, BlackRock Advisors, LLC
| Total Returns as of May 31, 2020 | ||||
| 6-Month | 12-Month | |||
U.S. large cap equities | (2.10)% | 12.84% | ||
U.S. small cap equities | (13.53) | (3.44) | ||
International equities | (11.48) | (2.81) | ||
Emerging market equities | (9.69) | (4.39) | ||
3-month Treasury bills | 0.73 | 1.84 | ||
U.S. Treasury securities | 11.55 | 15.87 | ||
U.S. investment grade bonds | 5.40 | 9.42 | ||
Tax-exempt municipal bonds | 1.52 | 3.87 | ||
U.S. high yield bonds | (2.84) | 1.31 | ||
| Past performance is no guarantee of future results. Index performance is shown for illustrative purposes only. You cannot invest directly in an index. | ||||
| 2 | THIS PAGEIS NOT PARTOF YOUR FUND REPORT |
| Page | ||||
| 2 | ||||
Annual Report: | ||||
| 4 | ||||
| 13 | ||||
| 13 | ||||
| 14 | ||||
Financial Statements: | ||||
| 15 | ||||
| 41 | ||||
| 43 | ||||
| 45 | ||||
| 48 | ||||
| 63 | ||||
| 80 | ||||
| 81 | ||||
| 82 | ||||
| 85 | ||||
| 89 | ||||
| 91 | ||||

| 3 |
| Fund Summary as of May 31, 2020 | BlackRock Advantage International Fund |
Investment Objective
BlackRock Advantage International Fund’s (the “Fund”) investment objective is to provide long-term capital appreciation.
On November 13, 2019, the Board of Trustees of BlackRock FundsSM approved a change in the fiscal year-end of the Fund, effective as of May 31, 2020, from September 30 to May 31.
Portfolio Management Commentary
How did the Fund perform?
For the abbreviated annual reporting period from October 1, 2019 to May 31, 2020, the Fund’s Institutional, Investor A, Investor C, Class K and Class R Shares returned (7.45)%, (7.61)%, (8.05)%, (7.40)% and (7.75)%, respectively, underperforming its benchmark, the MSCI EAFE® Index, which returned (7.26)%.
What factors influenced performance?
The Fund struggled in the highly volatile market backdrop that created a sharp bifurcation in equity returns during the period. Markets initially reached new highs in a strong risk-on rally that lasted through mid-February, driven by anticipation of the resolution of trade disputes between the United States and China and excitement about the resulting phase-one trade deal. However, the spread of the coronavirus across the globe was an inflection point and led to a steep market decline. Investor concerns mounted amid broadly enforced economic shutdowns, as expectations of growth and employment fell sharply. The speed of the selloff in the first quarter of 2020 led to one of the worst quarterly returns for equities on record, as volatility hit levels last observed during the global financial crisis. Policymakers stepped in with both fiscal and monetary stimulus packages aimed at supporting the market. The Bank of Japan, for example, invested in a record level of equity exchange-traded funds (“ETFs”) to help bolster Japanese equity markets. This helped stocks recover significantly by period end, but it was not enough to fully offset prior losses.
The Fund’s performance followed a similar pattern. While returns were initially in line with the benchmark, market volatility brought losses in the first quarter of 2020 that led to relative underperformance for the period as a whole. Among macro-thematic signals, a style-timing model struggled in March through a preference for dividend yield. Positioning within real estate securities drove losses for this insight, as the Fund demonstrated a preference for higher-yielding stocks. This came under significant pressure as investors weighed the impact of mass economic closures on their business models. Positioning in Japan also weighed on relative performance, as the Fund maintained an underweight allocation to retail stocks, including automakers. That positioning underperformed because of the Bank of Japan’s ETF purchases, which helped Japanese equities outperform other regions. Elsewhere, proprietary trend-based insights demonstrated some weakness, as volatility rose among momentum styles from the end of April into May. In particular, several signals aimed at identifying less obvious company linkages across different dimensions reversed earlier gains.
Conversely, sentiment insights strongly contributed to relative performance, especially during the market’s rebound from the March lows. A signal that combines the quantitative investing platform’s best ideas provided positive exposure to a number of underappreciated earnings trends. Unsurprisingly, signals that are driven from more timely data were able to capture the rapid market evolution correctly and provide gains, including insights that approximate sales from online browsing activity and mobile app uses. Measurements of broker sentiment through machine-learned text analysis also added value over the period. Also, helping to provide ballast for the portfolio, fundamental stock selection insights contributed to relative performance, giving much-needed defense during the market decline. Notably, quality measures like profitability and operational sustainability insights were some of the best performers. A signal that looks at dividend policy, for example, successfully motivated an underweight position in stocks in the United Kingdom. Valuation-focused fundamental insights were also broadly additive during the period.
Describe recent portfolio activity.
The Fund maintained a balanced allocation of risk across all major drivers of return during the period. However, there were several new stock selection insights added to the Fund. These included a new signal that uses the existing library of systematic active equity insights to create bespoke allocation models at the individual stock level. This signal builds on earlier machine-learned capabilities the investment adviser developed. Additionally, the Fund added an insight that looks to capture investor positioning toward environmental, social and governance (“ESG”)-related holdings. This led to the Fund’s continuing to build out its positioning based on investor flows into ESG-related positions and away from generic quantitative investing exposure. Given the dynamic nature of the current market environment, the Fund instituted enhanced signal constructs to identify emerging trends, such as “work from home.”
During May, the investment adviser implemented several new research initiatives designed to move the portfolio more fully toward the economic re-opening theme. This included a fresh round of enhancements to several insights using natural language processing to have them focus more fully on this narrative. Labor market data was another research arc for the investment adviser, as analysis suggests that evidence of hiring intentions are likely to provide a timely read on companies that are leading or lagging the re-opening process. At the other end of the spectrum, research on more-distressed businesses that change their labor structures suggests an improved probability of survival, providing a means to selectively seek out value with confidence.
At the macro level, the Fund added a completely new insight that uses an alternative data source measuring aggregated “mobility” in order to identify regions and economies that are ahead of the re-opening curve. The addition of these signals was funded from reduced exposure to earlier coronavirus research designed to identify winners and losers as economies were going into lockdown.
Describe portfolio positioning at period end.
At period end, the Fund remained largely neutral, both geographically and in terms of sector allocation. The Fund showed slight preferences for equities in France, Germany, and the Netherlands, and was slightly underweight in Spain, Hong Kong and Ireland. From a sector perspective, the Fund was overweight in communication services stocks, while maintaining underweight allocations to the consumer discretionary, utilities and financial sectors.
The views expressed reflect the opinions of BlackRock as of the date of this report and are subject to change based on changes in market, economic or other conditions. These views are not intended to be a forecast of future events and are no guarantee of future results.
| 4 | 2020 BLACKROCK ANNUAL REPORTTO SHAREHOLDERS |
| Fund Summary as of May 31, 2020 (continued) | BlackRock Advantage International Fund |
TOTAL RETURN BASED ON $10,000 INVESTMENT
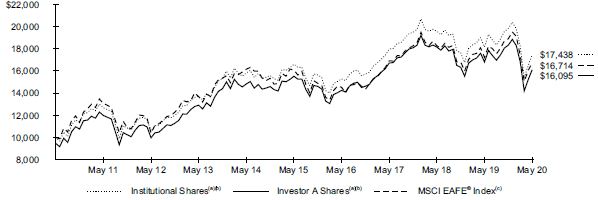
| (a) | Assuming maximum sales charges, if any, transaction costs and other operating expenses, including investment advisory fees and administration fees, if any. Institutional Shares do not have a sales charge. |
| (b) | Under normal circumstances, the Fund seeks to invest at least 80% of its net assets plus the amount of any borrowings for investment purposes in non-U.S. equity securities and equity-like instruments of companies that are components of, or have characteristics similar to, the companies included in the MSCI EAFE® Index and derivatives that are tied economically to securities of the MSCI EAFE® Index. The Fund’s total returns prior to June 12, 2017 are the returns of the Fund when it followed different investment strategies under the name BlackRock Global Opportunities Portfolio. |
| (c) | The MSCI EAFE® Index is an index designed to represent the performance of large- and mid-cap securities across 21 developed markets in Europe, Australasia and the Far East, excluding the U.S. and Canada. As of March 31, 2020, it had 915 constituents and covered approximately 85% of the free float-adjusted market capitalization in each country. |
Performance Summary for the Period Ended May 31, 2020
| Average Annual Total Returns(a)(b) | ||||||||||||||||||||||||||||||||||||||||
|
| |||||||||||||||||||||||||||||||||||||||
| 1 Year | 5 Years | 10 Years | ||||||||||||||||||||||||||||||||||||||
|
|
|
|
|
| |||||||||||||||||||||||||||||||||||
| 6-Month Total Returns | Without Sales Charge | With Sales Charge | Without Sales Charge | With Sales Charge | Without Sales Charge | With Sales Charge | ||||||||||||||||||||||||||||||||||
Institutional | (11.98 | )% | (3.87 | )% | N/A | 1.01 | % | N/A | 5.72 | % | N/A | |||||||||||||||||||||||||||||
Investor A | (12.08 | ) | (4.12 | ) | (9.15 | )% | 0.74 | (0.34 | )% | 5.44 | 4.87 | % | ||||||||||||||||||||||||||||
Investor C | (12.43 | ) | (4.85 | ) | (5.78 | ) | (0.03 | ) | (0.03 | ) | 4.62 | 4.62 | ||||||||||||||||||||||||||||
Class K | (11.99 | ) | (3.82 | ) | N/A | 1.03 | N/A | 5.73 | N/A | |||||||||||||||||||||||||||||||
Class R | (12.21 | ) | (4.38 | ) | N/A | 0.44 | N/A | 5.08 | N/A | |||||||||||||||||||||||||||||||
MSCI EAFE® Index | (11.48 | ) | (2.81 | ) | N/A | 0.79 | N/A | 5.27 | N/A | |||||||||||||||||||||||||||||||
| (a) | Assuming maximum sales charges, if any. Average annual total returns with and without sales charges reflect reductions for distribution and service fees. See “About Fund Performance” on page 13 for a detailed description of share classes, including any related sales charges and fees, and how performance was calculated for certain share classes. |
| (b) | Under normal circumstances, the Fund seeks to invest at least 80% of its net assets plus the amount of borrowings for investment purposes in non-U.S. equity securities and equity-like instruments of companies that are components of, or have characteristics similar to, the companies included in the MSCI EAFE® Index and derivatives that are tied economically to securities of the MSCI EAFE® Index. The Fund’s total returns prior to June 12, 2017 are the returns of the Fund when it followed different investments strategies under the name BlackRock Global Opportunities Portfolio. |
N/A — Not applicable as share class and index do not have a sales charge.
Past performance is not indicative of future results.
Performance results may include adjustments made for financial reporting purposes in accordance with U.S. generally accepted accounting principles.
| FUND SUMMARY | 5 |
| Fund Summary as of May 31, 2020 (continued) | BlackRock Advantage International Fund |
Expense Example
| Actual | Hypothetical(a) | |||||||||||||||||||||||||||||||
| | Beginning Account Value (12/01/19 | ) | | Ending Account Value (05/31/20 | ) | | Expenses Paid During the Period | (b) | | Beginning Account Value (12/01/19 | ) | | Ending Account Value (05/31/20 | ) | | Expenses Paid During the Period | (b) | | Annualized Expense Ratio | | ||||||||||||
Institutional | $ 1,000.00 | $ 880.20 | $ 2.35 | $ 1,000.00 | $ 1,022.50 | $ 2.53 | 0.50 | % | ||||||||||||||||||||||||
Investor A | 1,000.00 | 879.20 | 3.52 | 1,000.00 | 1,021.25 | 3.79 | 0.75 | |||||||||||||||||||||||||
Investor C | 1,000.00 | 875.70 | 7.03 | 1,000.00 | 1,017.50 | 7.57 | 1.50 | |||||||||||||||||||||||||
Class K | 1,000.00 | 880.10 | 2.12 | 1,000.00 | 1,022.75 | 2.28 | 0.45 | |||||||||||||||||||||||||
Class R | 1,000.00 | 877.90 | 4.69 | 1,000.00 | 1,020.00 | 5.05 | 1.00 | |||||||||||||||||||||||||
| (a) | Hypothetical 5% annual return before expenses is calculated by prorating the number of days in the most recent six-months divided by 366. |
| (b) | For each class of the Fund, expenses are equal to the annualized expense ratio for the class, multiplied by the average account value over the period, multiplied by 183/366 (to reflect the six-month period shown). |
See “Disclosure of Expenses” on page 13 for further information on how expenses were calculated.
Portfolio Information
TEN LARGEST HOLDINGS
| Security(a) | Percent of Net Assets | |||
Nestlé SA, Registered Shares | 3 | % | ||
Novartis AG, Registered Shares | 1 | |||
Roche Holding AG | 1 | |||
Siemens AG, Registered Shares | 1 | |||
Novo Nordisk A/S, Class B | 1 | |||
SAP SE | 1 | |||
AstraZeneca PLC | 1 | |||
L’Oreal SA | 1 | |||
ASML Holding NV | 1 | |||
Diageo PLC | 1 | |||
GEOGRAPHIC ALLOCATION
| Country | Percent of Net Assets | |||
Japan | 25 | % | ||
United Kingdom | 13 | |||
France | 11 | |||
Switzerland | 10 | |||
Germany | 9 | |||
Australia | 7 | |||
Netherlands | 5 | |||
Sweden | 3 | |||
United States | 3 | |||
Hong Kong | 2 | |||
Italy | 2 | |||
Denmark | 2 | |||
Spain | 2 | |||
Finland | 1 | |||
Singapore | 1 | |||
Belgium | 1 | |||
China | 1 | |||
Other Assets Less Liabilities | 2 | |||
| (a) | Excludes short-term securities. |
| 6 | 2020 BLACKROCK ANNUAL REPORTTO SHAREHOLDERS |
| Fund Summary as of May 31, 2020 | BlackRock Advantage Large Cap Growth Fund |
Investment Objective
BlackRock Advantage Large Cap Growth Fund’s (the “Fund”) investment objective is to seek long-term capital appreciation.
On November 13, 2019, the Board of Trustees of BlackRock FundsSM approved a change in the fiscal year-end of the Fund, effective as of May 31, 2020, from September 30 to May 31.
Portfolio Management Commentary
How did the Fund perform?
For the abbreviated annual reporting period from October 1, 2019 to May 31, 2020, the Fund’s Institutional, Service, Investor A, Investor C, Class K and Class R Shares returned 15.34%, 15.19%, 15.16%, 14.56%,15.40% and 14.99%, respectively, underperforming its benchmark, the Russell 1000® Growth Index, which returned 16.41%.
What factors influenced performance?
The Fund struggled amid a highly volatile market backdrop as equities experienced a sharp bifurcation with two distinct return environments. Initially, markets hit new highs in a strong risk-on rally through mid-February amid excitement for a phase-one trade deal between the United States and China. However, the spread of coronavirus provided an inflection point, which prompted a steep market decline. Investor concerns mounted through broadly enforced economic shutdowns, as expectations of growth and employment were impacted. The speed of the selloff between mid-February and the last week of March resulted in one of the worst quarterly returns for U.S. equities on record as volatility hit levels last observed during the global financial crisis. As a result, policy makers stepped in with fiscal and monetary packages to support the market. With accommodative policies, expectations of gradual reopening and economic data that appeared to have troughed, equities rallied strongly in April and May.
Losses in March drove the Fund’s underperformance for the period, as economic shutdowns forced investors to question prior growth and earnings expectations. This ultimately resulted in a sharp market inflection point and led to equally sharp declines across fundamental stock selection insights, notably valuation-based measures. These more contrarian insights detracted as investors focused on the long-term economic impact of shutdowns needed to stop the spread of the coronavirus. In particular, the future earnings prospects of many cyclical parts of the market came into question. More traditional signals that seek to identify attractively priced growth companies, such as comparing valuations across earnings, struggled given the backdrop. Elsewhere, text-based analyses that seek to identify trends across company fundamentals and earnings detracted as investors doubted prior guidance. Additionally, certain macro-thematic insights struggled amid the changing trends in hiring as the evolving coronavirus concerns impacted the usefulness of job market data. Similarly, performance of macro insights that look toward import costs also suffered in the period.
Select insights were able to provide gains. In this vein, sentiment measures were broadly additive. In particular, signals that evaluate cross-asset class sentiment proved beneficial, including bond-related measures given credit spread volatility. Trend-based sentiment measures were able overall to successfully keep pace with the evolving marketplace, most notably alternative data sets which captured supply chain disruptions. Unsurprisingly, given the volatility, fundamental stock selection signals provided needed portfolio ballast. Notably, the defensive profile of quality measures, such as balance sheet strength and a preference for lower volatility stocks, allowed them to produce strong results given the sharp risk-off tone to the market. Additionally, there was continued strength from less traditional quality measures, such as insights related to environmental, social and governance (“ESG”) factors. A recently added insight that identifies investor flows into ESG-related positions was one of the top-performing signals after successfully capturing an evolving investor preference for sustainability.
Describe recent portfolio activity.
Over the course of the period, the portfolio maintained a balanced allocation of risk across all major return drivers. However, a number of new stock selection insights were added to the portfolio. Among these is a new signal that uses the investment adviser’s existing library of insights to create allocation models across individual stocks, building upon earlier machine-learned capabilities developed by the investment adviser. Additionally, a new insight that looks to identify trade crowding from broker concentration was added. Finally, given the dynamism of the current environment, the Fund has instituted enhanced signals constructed to identify emerging trends, such as “work from home.”
Describe portfolio positioning at period end.
Relative to the Russell 1000® Growth Index, the Fund was positioned essentially neutrally from a sector perspective. The Fund had slight overweight positions in the consumer discretionary and consumer staples sectors and slight underweight positions in the industrials and communications services sectors.
The views expressed reflect the opinions of BlackRock as of the date of this report and are subject to change based on changes in market, economic or other conditions. These views are not intended to be a forecast of future events and are no guarantee of future results.
| FUND SUMMARY | 7 |
| Fund Summary as of May 31, 2020 (continued) | BlackRock Advantage Large Cap Growth Fund |
TOTAL RETURN BASED ON $10,000 INVESTMENT
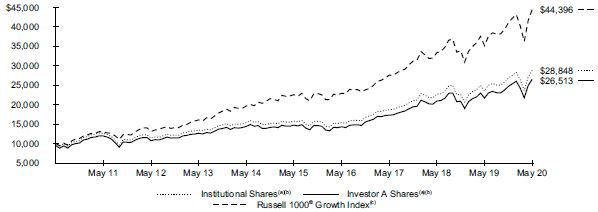
| (a) | Assuming maximum sales charges, if any, transaction costs and other operating expenses, including investment advisory fees and administration fees, if any. Institutional Shares do not have a sales charge. |
| (b) | Under normal circumstances, the Fund seeks to invest at least 80% of its net assets plus the amount of any borrowings for investment purposes in large cap equity securities of U.S. issuers and derivatives that have similar economic characteristics to such securities. The Fund’s total returns prior to June 12, 2017 are the returns of the Fund when it followed different investment strategies under the name BlackRock Flexible Equity Fund. |
| (c) | An unmanaged index that measures the performance of the large cap growth segment of the U.S. equity universe and consists of those Russell 1000® securities with higher price-to- book ratios and higher forcasted growth values. |
Performance Summary for the Period Ended May 31, 2020
| Average Annual Total Returns(a)(b) | ||||||||||||||||||||||||||||||||||||||||
|
| |||||||||||||||||||||||||||||||||||||||
| 1 Year | 5 Years | 10 Years | ||||||||||||||||||||||||||||||||||||||
|
|
|
|
|
| |||||||||||||||||||||||||||||||||||
| 6-Month Total Returns | Without Sales Charge | With Sales Charge | Without Sales Charge | With Sales Charge | Without Sales Charge | With Sales Charge | ||||||||||||||||||||||||||||||||||
Institutional | 7.64 | % | 22.63 | % | N/A | 12.77 | % | N/A | 11.18 | % | N/A | |||||||||||||||||||||||||||||
Service | 7.48 | 22.29 | N/A | 12.45 | N/A | 10.84 | N/A | |||||||||||||||||||||||||||||||||
Investor A | 7.44 | 22.25 | 15.83 | % | 12.45 | 11.24 | % | 10.84 | 10.24 | % | ||||||||||||||||||||||||||||||
Investor C | 7.02 | 21.37 | 20.37 | 11.58 | 11.58 | 9.99 | 9.99 | |||||||||||||||||||||||||||||||||
Class K | 7.63 | 22.69 | N/A | 12.61 | N/A | 10.92 | N/A | |||||||||||||||||||||||||||||||||
Class R | 7.36 | 21.94 | N/A | 12.12 | N/A | 10.47 | N/A | |||||||||||||||||||||||||||||||||
Russell 1000® Growth Index | 8.41 | 26.25 | N/A | 14.50 | N/A | 16.07 | N/A | |||||||||||||||||||||||||||||||||
| (a) | Assuming maximum sales charges, if any. Average annual total returns with and without sales charges reflect reductions for distribution and service fees. See “About Fund Performance” on page 13 for a detailed description of share classes, including any related sales charges and fees, and how performance was calculated for certain share classes. |
| (b) | Under normal circumstances, the Fund seeks to invest at least 80% of its net assets plus the amount of any borrowings for investment purposes in large cap equity securities of U.S. issuers and derivatives that have similar economic characteristics to such securities. The Fund’s total returns prior to June 12, 2017 are the returns of the Fund when it followed different investment strategies under the name BlackRock Flexible Equity Fund. |
N/A — Not applicable as share class and index do not have a sales charge.
Past performance is not indicative of future results.
Performance results may include adjustments made for financial reporting purposes in accordance with U.S. generally accepted accounting principles.
| 8 | 2020 BLACKROCK ANNUAL REPORTTO SHAREHOLDERS |
| Fund Summary as of May 31, 2020 (continued) | BlackRock Advantage Large Cap Growth Fund |
Expense Example
| Actual | Hypothetical(a) | |||||||||||||||||||||||||||||||
| | Beginning Account Value (12/01/19 | ) | | Ending Account Value (05/31/20 | ) | | Expenses Paid During the Period | (b) | | Beginning Account Value (12/01/19 | ) | | Ending Account Value (05/31/20 | ) | | Expenses Paid During the Period | (b) | | Annualized Expense Ratio | | ||||||||||||
Institutional | $ 1,000.00 | $ 1,076.40 | $ 3.22 | $ 1,000.00 | $ 1,021.90 | $ 3.13 | 0.62 | % | ||||||||||||||||||||||||
Service | 1,000.00 | 1,074.80 | 4.51 | 1,000.00 | 1,020.65 | 4.39 | 0.87 | |||||||||||||||||||||||||
Investor A | 1,000.00 | 1,074.40 | 4.51 | 1,000.00 | 1,020.65 | 4.39 | 0.87 | |||||||||||||||||||||||||
Investor C | 1,000.00 | 1,070.20 | 8.38 | 1,000.00 | 1,016.90 | 8.17 | 1.62 | |||||||||||||||||||||||||
Class K | 1,000.00 | 1,076.30 | 2.96 | 1,000.00 | 1,022.15 | 2.88 | 0.57 | |||||||||||||||||||||||||
Class R | 1,000.00 | 1,073.60 | 5.81 | 1,000.00 | 1,019.40 | 5.65 | 1.12 | |||||||||||||||||||||||||
| (a) | Hypothetical 5% annual return before expenses is calculated by prorating the number of days in the most recent six-months divided by 366. |
| (b) | For each class of the Fund, expenses are equal to the annualized expense ratio for the class, multiplied by the average account value over the period, multiplied by 183/366 (to reflect the six-month period shown). |
See “Disclosure of Expenses” on page 13 for further information on how expenses were calculated.
Portfolio Information
TEN LARGEST HOLDINGS
| Security(a) | Percent of Net Assets | |||
Microsoft Corp. | 9 | % | ||
Apple Inc. | 8 | |||
Amazon.com, Inc. | 7 | |||
Facebook, Inc., Class A | 3 | |||
Alphabet, Inc., Class C | 3 | |||
Alphabet, Inc., Class A | 2 | |||
Mastercard, Inc., Class A | 2 | |||
UnitedHealth Group, Inc. | 2 | |||
PayPal Holdings, Inc. | 2 | |||
Costco Wholesale Corp. | 2 | |||
SECTOR ALLOCATION
| Sector(b) | Percent of Net Assets | |||
Information Technology | 39 | % | ||
Consumer Discretionary | 15 | |||
Health Care | 14 | |||
Communication Services | 11 | |||
Industrials | 7 | |||
Consumer Staples | 5 | |||
Financials | 3 | |||
Real Estate | 2 | |||
Materials | 1 | |||
Short-Term Securities | 3 | |||
| (a) | Excludes short-term securities. |
| (b) | For Fund compliance purposes, the Fund’s sector classifications refer to one or more of the sector sub-classifications used by one or more widely recognized market indexes or ratings group indexes, and/or as defined by the investment adviser. These definitions may not apply for purposes of this report, which may combine such sector sub-classifications for reporting ease. |
| FUND SUMMARY | 9 |
| Fund Summary as of May 31, 2020 | BlackRock Advantage Small Cap Core Fund |
Investment Objective
BlackRock Advantage Small Cap Core Fund’s (the “Fund”) investment objective is to seek capital appreciation over the long term.
Portfolio Management Commentary
How did the Fund perform?
For the 12-month period ended May 31, 2020, the Fund outperformed its benchmark, the Russell 2000® Index.
What factors influenced performance?
The Fund performed well navigating a highly volatile market backdrop as equities experienced a sharp bifurcation with two distinct return environments. Initially, markets hit new highs in a strong risk-on rally through mid-February amid excitement for a phase-one trade deal between the United States and China. However, the spread of coronavirus provided an inflection point, which prompted a steep market decline. Investor concerns mounted through broadly enforced economic shutdowns, as expectations of growth and employment were impacted. The speed of the selloff in the first quarter of 2020 represented one of the worst quarterly returns for U.S. equities on record as volatility hit levels last observed during the global financial crisis. As a result, policy makers stepped in with both fiscal and monetary packages to support the market. With accommodative policies, expectations of gradual reopening, and economic data that appeared to have troughed, equities enjoyed strong rallies in April and May. Notably, however, small-cap securities underperformed their large-cap counterparts, as investors sought the relative safety of size and resilience amid the market volatility.
Unsurprisingly, given the heightened risks, fundamental quality stock selection signals drove the Fund’s relative outperformance given their defensive tilt. The top-performing signals were quality measures that look toward company management across financials and health care. These included looking to identify potential management communication “spin” to the investor community as well as companies that have founding members still serving in operational capacities. The latter signal, specifically, has a growth orientation which benefited performance as that style continued to perform well during the period. Traditional quality measures, such as profitability and lower-volatility preferences, also benefited performance. Additionally, there was continued strength from insights related to environmental, social and governance (“ESG”) factors, which tend to demonstrate resilience during market declines. A recently added insight that identifies investor flows into ESG-related positions was one of the top-performing signals after successfully capturing an evolving investor preference for sustainability. Strength also emerged through trend-based signals that benefit from alternative data. These were able to successfully identify the evolving economic landscape as traditional data sets struggled to keep pace. These included looking towards online search activity, hotel bookings and brand sentiment to identify trends in expected earnings. Coronavirus-related trend insights were also additive, with noted strength from a signal that looks to identify companies that may benefit from development of a treatment. Finally, valuation-based insights, or those that have a contrarian orientation, also provided gains. This was driven by returns from an insight that compares stock valuations across research and development expenditures as it has a growth orientation. This insight drove gains through successful positioning in biotechnology companies.
Despite demonstrating resilience and performance strength during the period, the Fund struggled amid the sizable market rotations in March. As markets came under duress with investors attempting to account for economic shortfalls due to lockdown measures, the market experienced a historic level of deleveraging. This was acute across the normally informed investor community, which also led to liquidity challenges in the small-cap universe that adversely impacted Fund performance. Unsurprisingly, sentiment stock selection insights that seek to capture the positioning of informed investors struggled as a result. Notable weakness stemmed from a recently implemented signal that looks toward corporate manager meeting activity in order to impute potential institutional interest in the stock. Having demonstrated strong performance prior to the period, the signal struggled after motivating an overweight to restaurants prior to the implementation of large-scale economic shutdowns. Similarly, sentiment insights that look to capture positioning from the hedge fund community detracted across consumer discretionary stocks. Importantly, however, insights looking toward bond markets to gauge sentiment performed well as credit spreads rose sharply during the selloff. This helped ballast the sentiment signal composite, as a focus on corporate resilience and debt servicing performed well with investors seeking relative safety. Elsewhere, macro-thematic insights also declined driven by notable weakness across a regional model. However, gains from both a currency and industry model helped to partially offset those losses.
Describe recent portfolio activity.
During the 12-month period, the Fund maintained a balanced allocation of risk across all major return drivers. However, a number of new stock selection insights were added to the Fund. The Fund added a new signal that uses the existing library of the investment adviser’s insights to create bespoke allocation models at the individual stock level. This builds upon earlier machine-learned capabilities developed by the investment adviser. Additionally, a new insight that looks to identify trade crowding from broker concentration was added. Finally, given the dynamism of the current environment, the Fund has instituted enhanced signal constructs to best identify emerging trends, such as “work from home.”
The Fund utilized derivatives via futures contracts as means to equitize cash. The Fund’s use of futures contracts had a positive impact on Fund performance.
Describe Fund positioning at period end.
Relative to the Russell 2000® Index, the Fund remained largely sector-neutral at period end. The Fund ended the period with slight overweight positions in health care and consumer discretionary, while being slightly underweight in industrials and financials.
The views expressed reflect the opinions of BlackRock as of the date of this report and are subject to change based on changes in market, economic or other conditions. These views are not intended to be a forecast of future events and are no guarantee of future results.
| 10 | 2020 BLACKROCK ANNUAL REPORTTO SHAREHOLDERS |
| Fund Summary as of May 31, 2020 (continued) | BlackRock Advantage Small Cap Core Fund |
TOTAL RETURN BASED ON $10,000 INVESTMENT
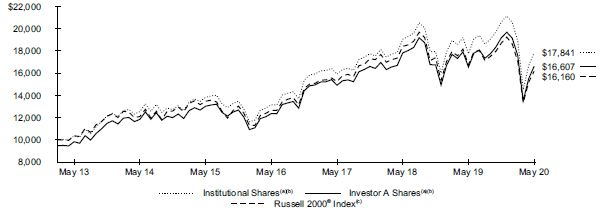
The Fund commenced operations on March 14, 2013.
| (a) | Assuming maximum sales charges, if any, transaction costs and other operating expenses, including investment advisory fees and administration fees, if any. Institutional Shares do not have a sales charge. |
| (b) | Under normal circumstances, the Fund seeks to invest at least 80% of its net assets plus any borrowings for investment purposes in equity securities or other financial instruments that are components of, or have market capitalizations similar to, the securities included in the Russell 2000® Index. |
| (c) | An unmanaged index that is a subset of the Russell 3000® Index representing approximately 10% of the total market capitalization of that index. It includes approximately 2,000 of the smallest securities based on a combination of their market cap and current index membership. |
Performance Summary for the Period Ended May 31, 2020
| Average Annual Total Returns(a)(b) | ||||||||||||||||||||||||||||||||||||||||
|
| |||||||||||||||||||||||||||||||||||||||
| 1 Year | 5 Years | Since Inception(c) | ||||||||||||||||||||||||||||||||||||||
|
|
|
|
|
| |||||||||||||||||||||||||||||||||||
| 6-Month Total Returns | Without Sales Charge | With Sales Charge | Without Sales Charge | With Sales Charge | Without Sales Charge | With Sales Charge | ||||||||||||||||||||||||||||||||||
Institutional | (13.29 | )% | 0.61 | % | N/A | 5.25 | % | N/A | 8.36 | % | N/A | |||||||||||||||||||||||||||||
Investor A | (13.36 | ) | 0.45 | (4.83 | )% | 4.99 | 3.86 | % | 8.09 | 7.28 | % | |||||||||||||||||||||||||||||
Investor C | (13.68 | ) | (0.33 | ) | (1.33 | ) | 4.19 | 4.19 | 7.27 | 7.27 | ||||||||||||||||||||||||||||||
Class K | (13.26 | ) | 0.73 | N/A | 5.29 | N/A | 8.38 | N/A | ||||||||||||||||||||||||||||||||
Russell 2000® Index | (13.53 | ) | (3.44 | ) | N/A | 3.72 | N/A | 6.88 | N/A | |||||||||||||||||||||||||||||||
| (a) | Assuming maximum sales charges, if any. Average annual total returns with and without sales charges reflect reductions for distribution and service fees. See “About Fund Performance” on page 13 for a detailed description of share classes, including any related sales charges and fees, and how performance was calculated for certain share classes. |
| (b) | Under normal circumstances, the Fund seeks to invest at least 80% of its net assets plus the amount of any borrowings for investment purposes in equity securities or other financial instruments that are components of, or have market capitalizations similar to, the securities included in the Russell 2000® Index. |
| (c) | The Fund commenced operations on March 14, 2013. |
N/A — Not applicable as share class and index do not have a sales charge.
Past performance is not indicative of future results.
Performance results may include adjustments made for financial reporting purposes in accordance with U.S. generally accepted accounting principles.
| FUND SUMMARY | 11 |
| Fund Summary as of May 31, 2020 (continued) | BlackRock Advantage Small Cap Core Fund |
Expense Example
| Actual | Hypothetical(a) | |||||||||||||||||||||||||||||||
| | Beginning Account Value (12/01/19 | ) | | Ending Account Value (05/31/20 | ) | | Expenses Paid During the Period | (b) | | Beginning Account Value (12/01/19 | ) | | Ending Account Value (05/31/20 | ) | | Expenses Paid During the Period | (b) | | Annualized Expense Ratio | | ||||||||||||
Institutional | $ 1,000.00 | $867.10 | $ 2.33 | $ 1,000.00 | $ 1,022.50 | $ 2.53 | 0.50 | % | ||||||||||||||||||||||||
Investor A | 1,000.00 | 866.40 | 3.50 | 1,000.00 | 1,021.25 | 3.79 | 0.75 | |||||||||||||||||||||||||
Investor C | 1,000.00 | 863.20 | 6.99 | 1,000.00 | 1,017.50 | 7.57 | 1.50 | |||||||||||||||||||||||||
Class K | 1,000.00 | 867.40 | 2.10 | 1,000.00 | 1,022.75 | 2.28 | 0.45 | |||||||||||||||||||||||||
| (a) | Hypothetical 5% annual return before expenses is calculated by prorating the number of days in the most recent six-months divided by 366. |
| (b) | For each class of the Fund, expenses are equal to the annualized expense ratio for the class, multiplied by the average account value over the period, multiplied by 183/366 (to reflect the six-month period shown). |
See “Disclosure of Expenses” on page 13 for further information on how expenses were calculated.
Portfolio Information
TEN LARGEST HOLDINGS
| Security(a) | Percent of Net Assets | |||
Cirrus Logic, Inc. | 1 | % | ||
ESCO Technologies, Inc. | 1 | |||
Teladoc Health, Inc. | 1 | |||
QTS Realty Trust, Inc., Class A | 1 | |||
EastGroup Properties, Inc. | 1 | |||
MDC Holdings, Inc. | 1 | |||
New Jersey Resources Corp. | 1 | |||
ManTech International Corp, Class A | 1 | |||
Sandy Spring Bancorp, Inc. | 1 | |||
SPS Commerce, Inc. | 1 | |||
SECTOR ALLOCATION
| Sector(b) | Percent of Net Assets | |||
Health Care | 22 | % | ||
Information Technology | 15 | |||
Industrials | 14 | |||
Financials | 14 | |||
Consumer Discretionary | 11 | |||
Real Estate | 6 | |||
Utilities | 4 | |||
Consumer Staples | 3 | |||
Materials | 3 | |||
Communication Services | 2 | |||
Energy | 2 | |||
Short-Term Securities | 8 | |||
Liabilities in Excess of Other Assets | (4 | ) | ||
| (a) | Excludes short-term securities. |
| (b) | For Fund compliance purposes, the Fund’s sector classifications refer to one or more of the sector sub-classifications used by one or more widely recognized market indexes or ratings group indexes, and/or as defined by the investment adviser. These definitions may not apply for purposes of this report, which may combine such sector sub-classifications for reporting ease. |
| 12 | 2020 BLACKROCK ANNUAL REPORTTO SHAREHOLDERS |
Institutional and Class K Shares are not subject to any sales charge. These shares bear no ongoing distribution or service fees and are available only to certain eligible investors. BlackRock Advantage International Fund’s Class K Shares performance shown prior to the Class K Shares inception date of January 25, 2018 is that of Institutional Shares. BlackRock Advantage Large Cap Growth Fund’s Class K Shares performance shown prior to the Class K Shares inception date of January 25, 2018 is that of Investor A Shares. BlackRock Advantage Small Cap Core Fund’s Class K Shares performance shown prior to the Class K Shares inception date of March 28, 2016 is that of Institutional Shares. The performance of each Fund’s Class K Shares would be substantially similar to Investor A Shares or Institutional Shares, as applicable, because the share classes of a Fund invest in the same portfolio of securities and performance would only differ to the extent that Class K Shares and Investor A Shares or Institutional Shares, as applicable, have different expenses. The actual returns of Class K Shares would have been higher than those of Investor A Shares or Institutional Shares, as applicable, because Class K Shares have lower expenses than Investor A Shares and Institutional Shares.
Service Shares (available only in BlackRock Advantage Large Cap Growth Fund) are not subject to any sales charge. These shares are subject to a service fee of 0.25% per year (but no distribution fee) and are only available to certain eligible investors.
Investor A Shares are subject to a maximum initial sales charge (front-end load) of 5.25% and a service fee of 0.25% per year (but no distribution fee). Certain redemptions of these shares may be subject to a contingent deferred sales charge (“CDSC”) where no initial sales charge was paid at the time of purchase. These shares are generally available through financial intermediaries.
Investor C Shares are subject to a 1.00% CDSC if redeemed within one year of purchase. In addition, these shares are subject to a distribution fee of 0.75% per year and a service fee of 0.25% per year. These shares are generally available through financial intermediaries. These shares automatically convert to Investor A Shares after approximately ten years.
Class R Shares (available only in BlackRock Advantage International Fund and BlackRock Advantage Large Cap Growth Fund) are not subject to any sales charge. These shares are subject to a distribution fee of 0.25% per year and a service fee of 0.25% per year. These shares are available only to certain employer-sponsored retirement plans. BlackRock Advantage International Fund’s Class R Shares performance shown prior to the Class R Shares inception date of September 12, 2011 is that of Institutional Shares (which have no distribution or service fees) and was restated to reflect Class R Shares fees. BlackRock Advantage Large Cap Growth Fund’s Class R Shares performance shown prior to the Class R Shares inception date of July 30, 2010 is that of Investor A Shares (which have no distribution fees) and was restated to reflect Class R Shares fees.
Performance information reflects past performance and does not guarantee future results. Current performance may be lower or higher than the performance data quoted. Refer to blackrock.com to obtain performance data current to the most recent month-end. Performance results do not reflect the deduction of taxes that a shareholder would pay on Fund distributions or the redemption of Fund shares. Figures shown in the performance tables on the previous pages assume reinvestment of all distributions, if any, at net asset value (“NAV”) on the ex-dividend date or payable date, as applicable. Investment return and principal value of shares will fluctuate so that shares, when redeemed, may be worth more or less than their original cost. Distributions paid to each class of shares will vary because of the different levels of service, distribution and transfer agency fees applicable to each class, which are deducted from the income available to be paid to shareholders.
BlackRock Advisors, LLC (the “Manager”), each Fund’s investment adviser, has contractually and/or voluntarily agreed to waive and/or reimburse a portion of each Fund’s expenses. Without such waivers and/or reimbursements, each Fund’s performance would have been lower. With respect to BlackRock Advantage Small Cap Core Fund’s voluntary waiver, the Manager is under no obligation to waive and/or reimburse or to continue waiving and/or reimbursing its fees and such voluntary waiver may be reduced or discontinued at any time. With respect to each Fund’s contractual waivers, the Manager is under no obligation to continue waiving and/or reimbursing its fees after the applicable termination date of such agreements. See Note 6 of the Notes to Financial Statements for additional information on waivers and/or reimbursements.
Shareholders of each Fund may incur the following charges: (a) transactional expenses, such as sales charges; and (b) operating expenses, including investment advisory fees, administration fees, service and distribution fees, including 12b-1 fees, acquired fund fees and expenses and other fund expenses. The expense examples on the previous pages (which are based on a hypothetical investment of $1,000 invested on December 1, 2019 and held through May 31, 2020) are intended to assist shareholders both in calculating expenses based on an investment in each Fund and in comparing these expenses with similar costs of investing in other mutual funds.
The expense examples provide information about actual account values and actual expenses. In order to estimate the expenses a shareholder paid during the period covered by this report, shareholders can divide their account value by $1,000 and then multiply the result by the number corresponding to their Fund and share class under the heading entitled “Expenses Paid During the Period.”
The expense examples also provide information about hypothetical account values and hypothetical expenses based on a Fund’s actual expense ratio and an assumed rate of return of 5% per year before expenses. In order to assist shareholders in comparing the ongoing expenses of investing in these Funds and other funds, compare the 5% hypothetical examples with the 5% hypothetical examples that appear in shareholder reports of other funds.
The expenses shown in the expense examples are intended to highlight shareholders’ ongoing costs only and do not reflect transactional expenses, such as sales charges, if any. Therefore, the hypothetical examples are useful in comparing ongoing expenses only, and will not help shareholders determine the relative total expenses of owning different funds. If these transactional expenses were included, shareholder expenses would have been higher.
| ABOUT FUND PERFORMANCE | 13 |
Derivative Financial Instruments
The Funds may invest in various derivative financial instruments. These instruments are used to obtain exposure to a security, commodity, index, market and/or other assets without owning or taking physical custody of securities, commodities and/or other referenced assets or to manage market, equity, credit, interest rate, foreign currency exchange rate, commodity and/or other risks. Derivative financial instruments may give rise to a form of economic leverage and involve risks, including the imperfect correlation between the value of a derivative financial instrument and the underlying asset, possible default of the counterparty to the transaction or illiquidity of the instrument. The Funds’ successful use of a derivative financial instrument depends on the investment adviser’s ability to predict pertinent market movements accurately, which cannot be assured. The use of these instruments may result in losses greater than if they had not been used, may limit the amount of appreciation a Fund can realize on an investment and/or may result in lower distributions paid to shareholders. The Funds’ investments in these instruments, if any, are discussed in detail in the Notes to Financial Statements.
| 14 | 2020 BLACKROCK ANNUAL REPORTTO SHAREHOLDERS |
May 31, 2020 | BlackRock Advantage International Fund (Percentages shown are based on Net Assets) |
| Security | Shares | Value | ||||||
Common Stocks | ||||||||
Australia — 6.6% | ||||||||
Afterpay Ltd.(a) | 7,555 | $ | 241,029 | |||||
ALS Ltd. | 4,163 | 19,823 | ||||||
Altium Ltd. | 1,033 | 25,678 | ||||||
Alumina Ltd. | 224,154 | 221,913 | ||||||
Ansell Ltd. | 41,905 | 983,425 | ||||||
Aristocrat Leisure Ltd. | 231,304 | 3,989,812 | ||||||
ASX Ltd. | 4,622 | 272,412 | ||||||
Atlas Arteria Ltd. | 50,445 | 224,498 | ||||||
Aurizon Holdings Ltd. | 57,530 | 182,505 | ||||||
Australia & New Zealand Banking Group Ltd. | 597,859 | 7,115,446 | ||||||
Bendigo & Adelaide Bank Ltd. | 233,286 | 958,172 | ||||||
BHP Group Ltd. | 226,375 | 5,327,937 | ||||||
BHP Group PLC | 116,813 | 2,297,216 | ||||||
Brambles Ltd. | 290,570 | 2,261,797 | ||||||
Challenger Ltd. | 59,177 | 198,286 | ||||||
Cochlear Ltd. | 8,802 | 1,135,193 | ||||||
Commonwealth Bank of Australia | 55,702 | 2,365,337 | ||||||
CSL Ltd. | 40,791 | 7,554,254 | ||||||
Downer EDI Ltd. | 6,658 | 20,077 | ||||||
Ensogo Ltd.(b) | 122,284 | 1 | ||||||
Goodman Group | 145,062 | 1,490,267 | ||||||
GPT Group | 38,325 | 102,068 | ||||||
Harvey Norman Holdings Ltd. | 37,964 | 82,383 | ||||||
IDP Education Ltd. | 28,436 | 323,891 | ||||||
IGO Ltd. | 49,176 | 164,749 | ||||||
Insurance Australia Group Ltd. | 60,629 | 247,576 | ||||||
Lendlease Group | 17,096 | 147,790 | ||||||
Macquarie Group Ltd. | 51,552 | 3,791,675 | ||||||
Metcash Ltd. | 25,600 | 46,082 | ||||||
Mineral Resources Ltd. | 14,248 | 179,039 | ||||||
Mirvac Group | 780,247 | 1,224,118 | ||||||
National Australia Bank Ltd. | 357,781 | 4,218,768 | ||||||
Newcrest Mining Ltd. | 9,132 | 185,041 | ||||||
Oil Search Ltd. | 14,303 | 33,255 | ||||||
Orica Ltd. | 14,799 | 169,958 | ||||||
Origin Energy Ltd. | 10,383 | 40,815 | ||||||
OZ Minerals Ltd. | 29,050 | 183,291 | ||||||
Perpetual Ltd. | 809 | 16,906 | ||||||
Platinum Asset Management Ltd. | 45 | 120 | ||||||
QBE Insurance Group Ltd. | 51,468 | 303,251 | ||||||
Qube Holdings Ltd. | 24,490 | 44,316 | ||||||
REA Group Ltd. | 789 | 53,059 | ||||||
Rio Tinto Ltd. | 20,087 | 1,254,620 | ||||||
Rio Tinto PLC | 51,998 | 2,820,071 | ||||||
SEEK Ltd. | 11,912 | 160,019 | ||||||
South32 Ltd. | 313,120 | 395,899 | ||||||
Spark Infrastructure Group | 242,346 | 341,298 | ||||||
Stockland | 120,237 | 287,072 | ||||||
Sydney Airport | 4,753 | 18,596 | ||||||
Technology One Ltd. | 14,890 | 91,048 | ||||||
Transurban Group | 56,719 | 541,743 | ||||||
Treasury Wine Estates Ltd. | 48,730 | 313,309 | ||||||
Westpac Banking Corp. | 252,257 | 2,877,226 | ||||||
WiseTech Global Ltd.(c) | 12,656 | 172,554 | ||||||
Woodside Petroleum Ltd. | 57,792 | 871,938 | ||||||
Woolworths Group Ltd. | 34,141 | 804,243 | ||||||
Worley Ltd. | 5,637 | 31,665 | ||||||
|
| |||||||
| 59,424,530 | ||||||||
| Austria — 0.2% | ||||||||
ams AG(a) | 35,584 | 543,353 | ||||||
| Security | Shares | Value | ||||||
| Austria (continued) | ||||||||
ANDRITZ AG(a) | 8,545 | $ | 320,145 | |||||
OMV AG | 1,624 | 53,663 | ||||||
Raiffeisen Bank International AG | 10,582 | 193,890 | ||||||
Vienna Insurance Group AG Wiener Versicherung Gruppe | 20,640 | 435,287 | ||||||
|
| |||||||
| 1,546,338 | ||||||||
| Belgium — 0.8% | ||||||||
Anheuser-Busch InBev SA | 92,802 | 4,330,619 | ||||||
Barco NV | 695 | 121,739 | ||||||
Galapagos NV(a) | 3,034 | 615,503 | ||||||
Groupe Bruxelles Lambert SA | 15,299 | 1,241,699 | ||||||
KBC Group NV | 3,202 | 168,000 | ||||||
Solvay SA | 2,078 | 158,676 | ||||||
Umicore SA | 6,847 | 304,247 | ||||||
|
| |||||||
| 6,940,483 | ||||||||
| China — 0.8% | ||||||||
BOC Hong Kong Holdings Ltd. | 958,000 | 2,698,317 | ||||||
Prosus NV(a) | 49,834 | 4,126,741 | ||||||
|
| |||||||
| 6,825,058 | ||||||||
| Colombia — 0.0% | ||||||||
Millicom International Cellular SA | 6,550 | 156,443 | ||||||
|
| |||||||
| Denmark — 1.8% | ||||||||
Chr Hansen Holding A/S | 12,792 | 1,242,297 | ||||||
Demant A/S(a) | 7,473 | 211,936 | ||||||
Genmab A/S(a) | 5,000 | 1,548,139 | ||||||
H Lundbeck A/S | 14,553 | 561,789 | ||||||
Novo Nordisk A/S, Class B | 158,858 | 10,405,942 | ||||||
Novozymes A/S, B Shares | 799 | 43,641 | ||||||
Orsted A/S(c)(d) | 18,992 | 2,233,550 | ||||||
SimCorp A/S | 1,895 | 209,235 | ||||||
|
| |||||||
| 16,456,529 | ||||||||
| Finland — 1.3% | ||||||||
Elisa Oyj | 22,910 | 1,427,584 | ||||||
Kesko Oyj, B Shares | 11,949 | 201,883 | ||||||
Metso Oyj | 7,559 | 246,485 | ||||||
Neste Oyj | 13,092 | 533,485 | ||||||
Nokia Oyj | 984,676 | 3,915,659 | ||||||
Orion Oyj, Class B | 1,108 | 59,304 | ||||||
UPM-Kymmene Oyj | 130,382 | 3,762,014 | ||||||
Valmet Oyj(a) | 1,565 | 40,919 | ||||||
Wartsila Oyj Abp | 187,506 | 1,471,241 | ||||||
|
| |||||||
| 11,658,574 | ||||||||
| France — 11.2% | ||||||||
Aeroports de Paris | 2,014 | 209,941 | ||||||
Air Liquide SA | 14,700 | 1,998,905 | ||||||
Airbus SE(a) | 64,374 | 4,113,952 | ||||||
Alstom SA | 15,394 | 647,927 | ||||||
Amundi SA(a)(d) | 5,793 | 432,680 | ||||||
AXA SA | 213,663 | 3,920,485 | ||||||
Bouygues SA(a) | 15,186 | 465,917 | ||||||
Capgemini SE | 11,042 | 1,140,579 | ||||||
Carrefour SA | 90,965 | 1,384,095 | ||||||
Casino Guichard Perrachon SA | 6,151 | 231,720 | ||||||
Christian Dior SE | 6,277 | 2,670,659 | ||||||
CNP Assurances(a) | 62,995 | 666,465 | ||||||
Compagnie de Saint-Gobain | 5,347 | 174,983 | ||||||
Credit Agricole SA(a) | 124,282 | 1,091,093 | ||||||
Danone SA | 50,482 | 3,473,186 | ||||||
Dassault Systemes SE | 19,939 | 3,404,224 | ||||||
Edenred | 4,200 | 175,746 | ||||||
| SCHEDULES OF INVESTMENTS | 15 |
Schedule of Investments (continued) May 31, 2020 | BlackRock Advantage International Fund (Percentages shown are based on Net Assets) |
| Security | Shares | Value | ||||||
| France (continued) | ||||||||
Engie SA(a) | 148,634 | $ | 1,766,410 | |||||
EssilorLuxottica SA | 24,949 | 3,247,064 | ||||||
Eutelsat Communications SA | 18,871 | 188,939 | ||||||
Gaztransport Et Technigaz SA | 296 | 22,218 | ||||||
Gecina SA | 270 | 34,691 | ||||||
Hermes International | 3,604 | 3,011,855 | ||||||
Iliad SA | 3,051 | 534,446 | ||||||
Kering SA | 6,392 | 3,351,069 | ||||||
Legrand SA | 29,630 | 2,030,153 | ||||||
L’Oreal SA | 31,936 | 9,367,199 | ||||||
LVMH Moet Hennessy Louis Vuitton SE | 18,831 | 7,900,085 | ||||||
Natixis SA | 170,787 | 382,976 | ||||||
Orange SA | 175,437 | 2,109,890 | ||||||
Pernod Ricard SA | 43,541 | 6,785,287 | ||||||
Peugeot SA(a) | 39,856 | 572,149 | ||||||
Publicis Groupe SA | 7,728 | 220,211 | ||||||
Renault SA(a) | 26,623 | 603,506 | ||||||
Rexel SA | 372,558 | 3,798,296 | ||||||
Rubis SCA | 340 | 16,294 | ||||||
Safran SA(a) | 24,310 | 2,342,484 | ||||||
Sanofi | 76,350 | 7,468,163 | ||||||
Sartorius Stedim Biotech(a) | 1,715 | 466,788 | ||||||
Schneider Electric SE | 82,931 | 8,211,231 | ||||||
SCOR SE(a) | 16,698 | 418,745 | ||||||
SEB SA | 1,642 | 226,429 | ||||||
Societe BIC SA | 1,363 | 72,775 | ||||||
Société Générale SA(a) | 80,530 | 1,191,269 | ||||||
Sodexo SA | 330 | 22,263 | ||||||
Sopra Steria Group | 344 | 40,824 | ||||||
Teleperformance | 3,493 | 831,744 | ||||||
Thales SA | 989 | 75,701 | ||||||
TOTAL SA | 81,153 | 3,077,387 | ||||||
Ubisoft Entertainment SA(a) | 21,251 | 1,648,944 | ||||||
Unibail-Rodamco-Westfield | 12,537 | 664,935 | ||||||
Valeo SA | 951 | 23,508 | ||||||
Vivendi SA | 21,015 | 480,515 | ||||||
Wendel SE | 739 | 68,207 | ||||||
Worldline SA(a)(d) | 14,411 | 1,082,069 | ||||||
|
| |||||||
| 100,559,276 | ||||||||
| Germany — 8.7% | ||||||||
adidas AG(a) | 26,412 | 7,004,663 | ||||||
Allianz SE, Registered Shares | 14,720 | 2,667,797 | ||||||
Aroundtown SA | 98,695 | 542,829 | ||||||
BASF SE | 76,364 | 4,156,326 | ||||||
Bayer AG, Registered Shares | 40,572 | 2,773,487 | ||||||
Beiersdorf AG | 14,476 | 1,520,547 | ||||||
Carl Zeiss Meditec AG(a) | 9,447 | 966,730 | ||||||
Commerzbank AG(a) | 47,401 | 183,771 | ||||||
Continental AG | 2,018 | 199,566 | ||||||
CTS Eventim AG & Co. KGaA(a) | 1,887 | 85,934 | ||||||
Delivery Hero SE(a)(d) | 14,875 | 1,431,158 | ||||||
Deutsche Boerse AG | 39,834 | 6,558,738 | ||||||
Deutsche Post AG, Registered Shares | 178,082 | 5,577,213 | ||||||
Deutsche Wohnen SE | 10,369 | 464,306 | ||||||
Duerr AG | 7,157 | 170,177 | ||||||
E.ON SE | 124,055 | 1,315,934 | ||||||
Evonik Industries AG | 1,993 | 49,247 | ||||||
Grand City Properties SA | 1,703 | 38,716 | ||||||
GRENKE AG(c) | 1,734 | 140,532 | ||||||
Hella GmbH & Co. KGaA | 1,145 | 44,950 | ||||||
HelloFresh SE(a) | 1,154 | 47,184 | ||||||
Henkel AG & Co. KGaA | 7,693 | 618,686 | ||||||
| Security | Shares | Value | ||||||
| Germany (continued) | ||||||||
HOCHTIEF AG | 16,337 | $ | 1,447,443 | |||||
Infineon Technologies AG | 134,934 | 2,844,104 | ||||||
Knorr-Bremse AG | 11,419 | 1,209,416 | ||||||
Merck KGaA | 60,753 | 7,003,306 | ||||||
MorphoSys AG(a) | 820 | 106,991 | ||||||
MTU Aero Engines AG | 11,586 | 1,872,603 | ||||||
Muenchener Rueckversicherungs-Gesellschaft AG, Registered Shares | 655 | 149,366 | ||||||
Puma SE(a) | 21,122 | 1,519,563 | ||||||
Rational AG | 2,098 | 1,128,791 | ||||||
Rheinmetall AG | 8,831 | 719,244 | ||||||
SAP SE | 78,148 | 9,973,430 | ||||||
Siemens AG, Registered Shares | 95,416 | 10,520,069 | ||||||
TAG Immobilien AG | 30,619 | 713,713 | ||||||
Telefonica Deutschland Holding AG | 39,087 | 119,203 | ||||||
Uniper SE | 13,066 | 408,658 | ||||||
Vonovia SE | 33,595 | 1,932,319 | ||||||
|
| |||||||
| 78,226,710 | ||||||||
| Hong Kong — 2.4% | ||||||||
AIA Group Ltd. | 635,000 | 5,210,672 | ||||||
ASM Pacific Technology Ltd. | 13,800 | 126,614 | ||||||
CLP Holdings Ltd. | 330,500 | 3,244,103 | ||||||
Dah Sing Financial Holdings Ltd. | 17,600 | 49,259 | ||||||
Hang Seng Bank Ltd. | 9,500 | 145,906 | ||||||
Henderson Land Development Co. Ltd. | 171,420 | 616,739 | ||||||
HKT Trust & HKT Ltd. | 462,000 | 657,241 | ||||||
Hong Kong & China Gas Co. Ltd. | 26,000 | 43,865 | ||||||
Hong Kong Exchanges & Clearing Ltd. | 54,200 | 1,907,483 | ||||||
Hongkong Land Holdings Ltd. | 126,000 | 475,420 | ||||||
Hutchison Port Holdings Trust | 485,500 | 55,999 | ||||||
Hysan Development Co. Ltd. | 119,000 | 324,419 | ||||||
Kerry Properties Ltd. | 305,000 | 725,383 | ||||||
Link REIT | 347,800 | 2,626,475 | ||||||
MTR Corp. Ltd. | 68,500 | 330,547 | ||||||
NWS Holdings Ltd. | 214,000 | 168,794 | ||||||
Sino Land Co. Ltd. | 190,000 | 223,015 | ||||||
Swire Pacific Ltd., Class A | 260,000 | 1,367,930 | ||||||
Swire Properties Ltd. | 651,400 | 1,461,583 | ||||||
Techtronic Industries Co. Ltd. | 194,500 | 1,696,796 | ||||||
Wharf Real Estate Investment Co. Ltd. | 22,000 | 85,313 | ||||||
|
| |||||||
| 21,543,556 | ||||||||
| India — 0.0% | ||||||||
Jasper Infotech Private Ltd. (Acquired 05/07/14, cost $804,375)(a)(b)(e) | 1,080 | 226,919 | ||||||
|
| |||||||
| Ireland — 0.2% | ||||||||
AIB Group PLC(a) | 13,609 | 15,010 | ||||||
CRH PLC | 3,199 | 103,013 | ||||||
Kerry Group PLC, Class A | 2,387 | 295,751 | ||||||
Kingspan Group PLC | 11,042 | 680,886 | ||||||
Smurfit Kappa Group PLC | 9,260 | 302,392 | ||||||
|
| |||||||
| 1,397,052 | ||||||||
| Israel — 0.3% | ||||||||
Bank Hapoalim BM | 127,265 | 783,515 | ||||||
Bank Leumi Le-Israel BM | 93,647 | 497,400 | ||||||
Delek Group Ltd. | 678 | 18,269 | ||||||
First International Bank Of Israel Ltd. | 5,863 | 133,705 | ||||||
Isracard Ltd. | 1 | 3 | ||||||
Israel Discount Bank Ltd., Class A | 76,405 | 242,593 | ||||||
Mizrahi Tefahot Bank Ltd. | 4,919 | 96,291 | ||||||
| 16 | 2020 BLACKROCK ANNUAL REPORTTO SHAREHOLDERS |
Schedule of Investments (continued) May 31, 2020 | BlackRock Advantage International Fund (Percentages shown are based on Net Assets) |
| Security | Shares | Value | ||||||
| Israel (continued) | ||||||||
Nice Ltd.(a) | 2,990 | $ | 554,825 | |||||
Shapir Engineering and Industry Ltd.(a) | 14,411 | 92,840 | ||||||
|
| |||||||
| 2,419,441 | ||||||||
| Italy — 2.1% | ||||||||
Assicurazioni Generali SpA | 229,082 | 3,193,658 | ||||||
Banca Mediolanum SpA | 10,579 | 70,725 | ||||||
Davide Campari-Milano SpA | 18,031 | 147,133 | ||||||
DiaSorin SpA | 1,620 | 340,447 | ||||||
Enel SpA | 412,642 | 3,190,436 | ||||||
Ferrari NV | 18,877 | 3,209,587 | ||||||
Interpump Group SpA | 8,474 | 254,671 | ||||||
Intesa Sanpaolo SpA(a) | 1,282,665 | 2,231,926 | ||||||
Italgas SpA | 190,848 | 1,039,246 | ||||||
Mediobanca Banca di Credito Finanziario SpA | 298,695 | 1,964,919 | ||||||
Moncler SpA(a) | 467 | 17,499 | ||||||
Pirelli & C SpA(d) | 18,863 | 84,894 | ||||||
Snam SpA | 84,391 | 395,318 | ||||||
Terna Rete Elettrica Nazionale SpA | 403,200 | 2,739,226 | ||||||
Unipol Gruppo SpA(a) | 5,033 | 17,767 | ||||||
|
| |||||||
| 18,897,452 | ||||||||
| Japan — 24.9% | ||||||||
ABC-Mart, Inc. | 900 | 54,669 | ||||||
Advantest Corp. | 6,900 | 342,444 | ||||||
Aeon Co. Ltd. | 21,800 | 483,098 | ||||||
AEON Financial Service Co. Ltd. | 6,100 | 68,836 | ||||||
Aeon Mall Co. Ltd. | 2,500 | 35,127 | ||||||
AGC, Inc. | 8,200 | 232,580 | ||||||
Alfresa Holdings Corp. | 17,600 | 355,258 | ||||||
Alps Alpine Co. Ltd. | 78,200 | 947,751 | ||||||
Amada Co. Ltd. | 35,300 | 315,445 | ||||||
Anritsu Corp. | 32,100 | 636,572 | ||||||
Asahi Group Holdings Ltd. | 41,200 | 1,550,348 | ||||||
Asahi Intecc Co. Ltd. | 28,600 | 877,981 | ||||||
Asahi Kasei Corp. | 173,900 | 1,382,118 | ||||||
Astellas Pharma, Inc. | 109,700 | 1,960,113 | ||||||
Benesse Holdings, Inc. | 36,900 | 1,001,132 | ||||||
Bridgestone Corp. | 74,600 | 2,475,987 | ||||||
Canon Marketing Japan, Inc. | 900 | 18,355 | ||||||
Canon, Inc. | 188,590 | 3,872,618 | ||||||
Central Japan Railway Co. | 17,800 | 3,050,597 | ||||||
Chugai Pharmaceutical Co. Ltd. | 26,900 | 3,975,071 | ||||||
Citizen Watch Co. Ltd. | 246,700 | 884,499 | ||||||
COMSYS Holdings Corp. | 2,900 | 80,790 | ||||||
CyberAgent, Inc. | 6,500 | 328,695 | ||||||
Dai Nippon Printing Co. Ltd. | 2,800 | 63,831 | ||||||
Daicel Corp. | 18,900 | 160,406 | ||||||
Dai-ichi Life Holdings, Inc. | 237,900 | 3,120,934 | ||||||
Daiichi Sankyo Co. Ltd. | 37,400 | 3,514,303 | ||||||
Daiichikosho Co. Ltd. | 600 | 21,083 | ||||||
Daikin Industries Ltd. | 33,000 | 4,859,093 | ||||||
Daito Trust Construction Co. Ltd. | 10,000 | 1,058,114 | ||||||
Daiwa House Industry Co. Ltd. | 31,100 | 771,672 | ||||||
Daiwa Securities Group, Inc. | 43,500 | 181,240 | ||||||
Denso Corp. | 59,300 | 2,284,122 | ||||||
Dentsu Group, Inc. | 49,700 | 1,328,189 | ||||||
DIC Corp. | 52,900 | 1,382,676 | ||||||
Dip Corp. | 4,600 | 108,268 | ||||||
East Japan Railway Co. | 65,600 | 5,152,404 | ||||||
Eisai Co. Ltd. | 22,800 | 1,789,600 | ||||||
Electric Power Development Co. Ltd. | 67,200 | 1,272,279 | ||||||
FamilyMart Co. Ltd. | 22,700 | 425,538 | ||||||
FANUC Corp. | 14,400 | 2,573,260 | ||||||
| Security | Shares | Value | ||||||
| Japan (continued) | ||||||||
Fast Retailing Co. Ltd. | 3,900 | $ | 2,192,134 | |||||
Fuji Media Holdings, Inc. | 74,500 | 748,698 | ||||||
FUJIFILM Holdings Corp. | 42,500 | 1,949,329 | ||||||
Glory Ltd. | 19,100 | 454,124 | ||||||
GS Yuasa Corp. | 7,100 | 125,959 | ||||||
Hakuhodo DY Holdings, Inc. | 3,900 | 48,568 | ||||||
Hitachi Transport System Ltd. | 1,700 | 46,750 | ||||||
Honda Motor Co. Ltd. | 80,900 | 2,106,523 | ||||||
Horiba Ltd. | 900 | 47,511 | ||||||
Hoshizaki Corp. | 4,600 | 371,377 | ||||||
House Foods Group, Inc. | 700 | 23,733 | ||||||
Isuzu Motors Ltd. | 101,300 | 951,476 | ||||||
Izumi Co. Ltd. | 34,800 | 1,095,687 | ||||||
Japan Airlines Co. Ltd. | 1,100 | 21,600 | ||||||
Japan Post Holdings Co. Ltd. | 60,400 | 440,596 | ||||||
Japan Retail Fund Investment Corp. | 140 | 184,642 | ||||||
Japan Tobacco, Inc. | 50,600 | 1,004,217 | ||||||
JFE Holdings, Inc. | 115,000 | 846,812 | ||||||
JTEKT Corp. | 20,000 | 161,926 | ||||||
JXTG Holdings, Inc. | 844,700 | 3,264,711 | ||||||
Kajima Corp. | 119,600 | 1,358,053 | ||||||
Kakaku.com, Inc. | 18,100 | 439,549 | ||||||
Kaneka Corp. | 33,300 | 893,136 | ||||||
Kansai Paint Co. Ltd. | 3,400 | 70,477 | ||||||
Kao Corp. | 73,200 | 5,892,616 | ||||||
KDDI Corp. | 231,400 | 6,754,380 | ||||||
Kenedix Office Investment Corp. | 7 | 38,696 | ||||||
Keyence Corp. | 19,400 | 7,990,844 | ||||||
Kirin Holdings Co. Ltd. | 28,600 | 587,000 | ||||||
Kobayashi Pharmaceutical Co. Ltd. | 300 | 26,839 | ||||||
Koito Manufacturing Co. Ltd. | 7,700 | 327,510 | ||||||
Komatsu Ltd. | 17,200 | 347,809 | ||||||
Konami Holdings Corp. | 25,700 | 902,921 | ||||||
Konica Minolta, Inc. | 454,800 | 1,689,696 | ||||||
Kose Corp. | 600 | 75,559 | ||||||
Kubota Corp. | 18,400 | 247,775 | ||||||
Kyocera Corp. | 54,500 | 2,952,244 | ||||||
Kyowa Exeo Corp. | 7,000 | 161,238 | ||||||
Kyushu Electric Power Co., Inc. | 26,200 | 218,370 | ||||||
Lintec Corp. | 37,500 | 897,048 | ||||||
M3, Inc. | 9,900 | 399,904 | ||||||
Marubeni Corp. | 293,100 | 1,427,022 | ||||||
Maruha Nichiro Corp. | 2,600 | 56,351 | ||||||
Matsui Securities Co. Ltd. | 2,800 | 22,080 | ||||||
Mazda Motor Corp. | 65,900 | 425,418 | ||||||
McDonald’s Holdings Co. Japan Ltd. | 4,400 | 234,152 | ||||||
MEIJI Holdings Co. Ltd. | 2,300 | 173,679 | ||||||
Mercari, Inc.(a) | 1,500 | 44,890 | ||||||
Mitsubishi Chemical Holdings Corp. | 227,600 | 1,340,648 | ||||||
Mitsubishi Estate Co. Ltd. | 2,300 | 36,557 | ||||||
Mitsubishi Materials Corp. | 26,800 | 611,386 | ||||||
Mitsubishi Motors Corp. | 186,800 | 529,177 | ||||||
Mitsubishi UFJ Lease & Finance Co. Ltd. | 15,100 | 74,044 | ||||||
Mitsui Chemicals, Inc. | 21,400 | 446,260 | ||||||
Mitsui Fudosan Co. Ltd. | 2,200 | 42,322 | ||||||
Mizuho Financial Group, Inc. | 264,800 | 330,508 | ||||||
MonotaRO Co. Ltd. | 30,700 | 1,116,784 | ||||||
MS&AD Insurance Group Holdings, Inc. | 89,300 | 2,630,320 | ||||||
Murata Manufacturing Co. Ltd. | 58,100 | 3,267,997 | ||||||
Nankai Electric Railway Co. Ltd. | 1,900 | 46,235 | ||||||
Nexon Co. Ltd. | 36,100 | 752,173 | ||||||
NGK Spark Plug Co. Ltd. | 5,700 | 92,223 | ||||||
| SCHEDULES OF INVESTMENTS | 17 |
Schedule of Investments (continued) May 31, 2020 | BlackRock Advantage International Fund (Percentages shown are based on Net Assets) |
| Security | Shares | Value | ||||||
| Japan (continued) | ||||||||
Nidec Corp. | 3,900 | $ | 240,071 | |||||
Nifco, Inc. | 2,600 | 56,972 | ||||||
Nihon Kohden Corp. | 7,400 | 247,026 | ||||||
Nikon Corp. | 107,400 | 988,508 | ||||||
Nintendo Co. Ltd. | 13,700 | 5,570,131 | ||||||
Nippon Electric Glass Co. Ltd. | 45,500 | 722,806 | ||||||
Nippon Paint Holdings Co. Ltd. | 8,400 | 587,816 | ||||||
Nippon Shinyaku Co. Ltd. | 6,400 | 553,040 | ||||||
Nippon Shokubai Co. Ltd. | 16,200 | 908,023 | ||||||
Nippon Steel Corp. | 23,900 | 220,680 | ||||||
Nippon Telegraph & Telephone Corp. | 44,300 | 1,008,321 | ||||||
Nippon Television Holdings, Inc. | 25,600 | 296,228 | ||||||
Nisshin Seifun Group, Inc. | 5,100 | 79,601 | ||||||
Nitori Holdings Co. Ltd. | 20,200 | 3,657,288 | ||||||
Nitto Denko Corp. | 34,200 | 1,857,079 | ||||||
NOK Corp. | 3,600 | 46,469 | ||||||
Nomura Real Estate Master Fund, Inc. | 285 | 349,879 | ||||||
Nomura Research Institute Ltd. | 6,800 | 180,334 | ||||||
NTT DOCOMO, Inc. | 39,700 | 1,091,102 | ||||||
Obic Co. Ltd. | 7,100 | 1,233,557 | ||||||
Omron Corp. | 6,300 | 418,343 | ||||||
Ono Pharmaceutical Co. Ltd. | 6,200 | 177,836 | ||||||
Oriental Land Co. Ltd. | 6,000 | 871,614 | ||||||
Otsuka Holdings Co. Ltd. | 47,700 | 2,151,368 | ||||||
Panasonic Corp. | 7,300 | 65,400 | ||||||
PeptiDream, Inc.(a) | 23,900 | 1,074,471 | ||||||
Persol Holdings Co. Ltd. | 7,600 | 100,440 | ||||||
Pola Orbis Holdings, Inc. | 90,200 | 1,763,233 | ||||||
Rakuten, Inc. | 49,600 | 451,579 | ||||||
Recruit Holdings Co. Ltd. | 153,000 | 5,270,382 | ||||||
Resona Holdings, Inc. | 205,900 | 744,630 | ||||||
Rohm Co. Ltd. | 10,800 | 731,589 | ||||||
Ryohin Keikaku Co. Ltd. | 57,000 | 864,431 | ||||||
Sankyu, Inc. | 1,100 | 44,900 | ||||||
Santen Pharmaceutical Co. Ltd. | 37,900 | 701,986 | ||||||
Sanwa Holdings Corp. | 58,700 | 504,392 | ||||||
SCSK Corp. | 1,300 | 63,853 | ||||||
Secom Co. Ltd. | 12,000 | 1,041,588 | ||||||
Sega Sammy Holdings, Inc. | 6,800 | 88,760 | ||||||
Seiko Epson Corp. | 99,400 | 1,126,328 | ||||||
Sekisui Chemical Co. Ltd. | 7,900 | 110,735 | ||||||
Sekisui House Ltd. | 10,400 | 198,527 | ||||||
Seven & i Holdings Co. Ltd. | 63,000 | 2,160,970 | ||||||
SG Holdings Co. Ltd. | 26,600 | 869,782 | ||||||
Shimadzu Corp. | 6,600 | 179,459 | ||||||
Shimamura Co. Ltd. | 300 | 21,125 | ||||||
Shimizu Corp. | 7,200 | 60,946 | ||||||
Shin-Etsu Chemical Co. Ltd. | 11,300 | 1,323,377 | ||||||
Shionogi & Co. Ltd. | 42,400 | 2,514,360 | ||||||
Shiseido Co. Ltd. | 2,300 | 141,105 | ||||||
SKY Perfect JSAT Holdings, Inc. | 15,900 | 64,819 | ||||||
Softbank Corp. | 57,100 | 725,049 | ||||||
SoftBank Group Corp. | 94,300 | 4,307,226 | ||||||
Sompo Holdings, Inc. | 9,100 | 324,612 | ||||||
Sony Corp. | 96,500 | 6,249,907 | ||||||
Subaru Corp. | 22,500 | 498,481 | ||||||
Sumitomo Chemical Co. Ltd. | 461,700 | 1,434,773 | ||||||
Sumitomo Dainippon Pharma Co. Ltd. | 5,600 | 79,311 | ||||||
Sumitomo Heavy Industries Ltd. | 12,200 | 279,891 | ||||||
Sumitomo Mitsui Financial Group, Inc. | 265,300 | 7,699,624 | ||||||
Sumitomo Mitsui Trust Holdings, Inc. | 35,500 | 1,050,265 | ||||||
Sumitomo Rubber Industries Ltd. | 72,400 | 739,555 | ||||||
| Security | Shares | Value | ||||||
| Japan (continued) | ||||||||
Suntory Beverage & Food Ltd. | 38,600 | $ | 1,579,715 | |||||
Sysmex Corp. | 23,500 | 1,885,869 | ||||||
T&D Holdings, Inc. | 166,700 | 1,514,167 | ||||||
Taisei Corp. | 26,600 | 924,023 | ||||||
Taisho Pharmaceutical Holdings Co. Ltd. | 7,300 | 464,960 | ||||||
Takara Holdings, Inc. | 2,200 | 17,779 | ||||||
Takeda Pharmaceutical Co. Ltd. | 123,400 | 4,827,322 | ||||||
Teijin Ltd. | 47,900 | 785,051 | ||||||
Terumo Corp. | 58,700 | 2,308,891 | ||||||
Toho Co. Ltd. | 900 | 33,090 | ||||||
Tokio Marine Holdings, Inc. | 30,300 | 1,314,711 | ||||||
Tokyo Electron Ltd. | 11,000 | 2,213,566 | ||||||
Tokyo Gas Co. Ltd. | 3,600 | 86,191 | ||||||
Topcon Corp. | 50,000 | 440,201 | ||||||
Toray Industries, Inc. | 118,500 | 576,888 | ||||||
Toyo Seikan Group Holdings Ltd. | 5,900 | 62,828 | ||||||
Toyota Motor Corp. | 71,000 | 4,474,586 | ||||||
Toyota Tsusho Corp. | 1,900 | 48,341 | ||||||
Trend Micro, Inc. | 16,600 | 913,702 | ||||||
TS Tech Co. Ltd. | 14,900 | 421,513 | ||||||
Tsuruha Holdings, Inc. | 6,000 | 888,348 | ||||||
Ube Industries Ltd. | 147,300 | 2,635,450 | ||||||
Ulvac, Inc. | 2,300 | 69,461 | ||||||
Unicharm Corp. | 30,800 | 1,150,098 | ||||||
Welcia Holdings Co. Ltd. | 12,200 | 1,026,476 | ||||||
West Japan Railway Co. | 1,800 | 116,528 | ||||||
Yamaguchi Financial Group, Inc. | 57,200 | 342,867 | ||||||
Yamaha Corp. | 9,400 | 458,579 | ||||||
Yamaha Motor Co. Ltd. | 122,400 | 1,772,998 | ||||||
Yamato Holdings Co. Ltd. | 33,300 | 740,856 | ||||||
Yamato Kogyo Co. Ltd. | 1,700 | 35,099 | ||||||
Yaskawa Electric Corp. | 2,600 | 93,788 | ||||||
Yokogawa Electric Corp. | 65,900 | 953,194 | ||||||
Z Holdings Corp. | 132,500 | 544,980 | ||||||
Zenkoku Hosho Co. Ltd. | 19,500 | 753,298 | ||||||
ZOZO, Inc. | 9,800 | 180,742 | ||||||
|
| |||||||
| 222,897,468 | ||||||||
| Jordan — 0.1% | ||||||||
Hikma Pharmaceuticals PLC | 16,620 | 529,343 | ||||||
|
| |||||||
| Luxembourg — 0.2% | ||||||||
ArcelorMittal SA | 71,330 | 683,162 | ||||||
Eurofins Scientific SE | 1,373 | 933,495 | ||||||
RTL Group SA | 5,393 | 183,387 | ||||||
|
| |||||||
| 1,800,044 | ||||||||
| Netherlands — 4.6% | ||||||||
Aalberts NV | 5,037 | 138,284 | ||||||
ABN AMRO Group NV, CVA(d) | 160,759 | 1,279,116 | ||||||
Akzo Nobel NV | 46,430 | 3,812,730 | ||||||
Argenx SE(a) | 639 | 137,512 | ||||||
ASML Holding NV | 27,707 | 9,076,254 | ||||||
ASR Nederland NV | 51,472 | 1,415,033 | ||||||
Euronext NV(d) | 8,497 | 789,399 | ||||||
EXOR NV | 4,693 | 253,180 | ||||||
Heineken NV | 5,485 | 502,190 | ||||||
ING Groep NV | 342,679 | 2,227,964 | ||||||
Just Eat Takeaway.com NV(a)(d) | 18,956 | 2,063,831 | ||||||
Koninklijke DSM NV | 26,148 | 3,344,715 | ||||||
Koninklijke KPN NV | 467,856 | 1,143,613 | ||||||
Koninklijke Philips NV(a) | 29,650 | 1,347,978 | ||||||
NN Group NV | 51,040 | 1,566,676 | ||||||
Royal Dutch Shell PLC, A Shares | 283,290 | 4,483,910 | ||||||
| 18 | 2020 BLACKROCK ANNUAL REPORTTO SHAREHOLDERS |
Schedule of Investments (continued) May 31, 2020 | BlackRock Advantage International Fund (Percentages shown are based on Net Assets) |
| Security | Shares | Value | ||||||
| Netherlands (continued) | ||||||||
Royal Dutch Shell PLC, B Shares | 278,758 | $ | 4,255,743 | |||||
Signify NV(a)(d) | 17,988 | 387,343 | ||||||
Wolters Kluwer NV | 37,345 | 2,971,482 | ||||||
|
| |||||||
| 41,196,953 | ||||||||
| New Zealand — 0.2% | ||||||||
a2 Milk Co. Ltd.(a) | 17,716 | 209,310 | ||||||
Auckland International Airport Ltd. | 4,872 | 19,736 | ||||||
Contact Energy Ltd. | 18,464 | 71,471 | ||||||
Fisher & Paykel Healthcare Corp. Ltd. | 56,950 | 1,061,810 | ||||||
Xero Ltd.(a)(c) | 5,864 | 334,174 | ||||||
|
| |||||||
| 1,696,501 | ||||||||
| Norway — 0.4% | ||||||||
Aker BP ASA | 9,126 | 147,515 | ||||||
Gjensidige Forsikring ASA(a) | 14,821 | 270,200 | ||||||
Leroy Seafood Group ASA | 12,932 | 72,592 | ||||||
Schibsted ASA, B Shares(a) | 11,122 | 266,886 | ||||||
Schibsted ASA, Class A(a) | 34,218 | 850,349 | ||||||
Telenor ASA | 123,692 | 1,874,852 | ||||||
Tomra Systems ASA | 9 | 324 | ||||||
|
| |||||||
| 3,482,718 | ||||||||
| Portugal — 0.2% | ||||||||
Galp Energia SGPS SA | 126,755 | 1,508,156 | ||||||
Jeronimo Martins SGPS SA | 41,617 | 709,641 | ||||||
|
| |||||||
| 2,217,797 | ||||||||
| Singapore — 0.9% | ||||||||
DBS Group Holdings Ltd. | 116,900 | 1,617,252 | ||||||
Oversea-Chinese Banking Corp. Ltd.(c) | 160,000 | 971,448 | ||||||
Singapore Airlines Ltd. | 229,600 | 621,453 | ||||||
Singapore Post Ltd. | 86,800 | 47,465 | ||||||
Singapore Telecommunications Ltd. | 1,122,800 | 1,977,304 | ||||||
United Overseas Bank Ltd. | 183,800 | 2,545,719 | ||||||
|
| |||||||
| 7,780,641 | ||||||||
| South Africa — 0.1% | ||||||||
Anglo American PLC | 49,814 | 1,054,510 | ||||||
|
| |||||||
| Spain — 1.8% | ||||||||
ACS Actividades de Construccion y Servicios SA | 6,216 | 159,068 | ||||||
Amadeus IT Group SA | 41,244 | 2,156,707 | ||||||
Banco Bilbao Vizcaya Argentaria SA | 1,387,964 | 4,274,731 | ||||||
Banco de Sabadell SA | 419,581 | 128,544 | ||||||
Bankinter SA | 18,432 | 78,305 | ||||||
Endesa SA | 20,209 | 482,719 | ||||||
Grifols SA | 47,663 | 1,487,385 | ||||||
Iberdrola SA | 83,714 | 906,412 | ||||||
Industria de Diseno Textil SA | 105,110 | 2,927,676 | ||||||
Mediaset Espana Comunicacion SA | 24 | 86 | ||||||
Naturgy Energy Group SA | 101,631 | 1,895,281 | ||||||
Repsol SA | 33,356 | 314,049 | ||||||
Telefonica SA | 225,459 | 1,055,756 | ||||||
Zardoya Otis SA | 4,497 | 32,100 | ||||||
|
| |||||||
| 15,898,819 | ||||||||
| Sweden — 2.9% | ||||||||
Alfa Laval AB(a) | 14,608 | 296,865 | ||||||
Assa Abloy AB, Class B | 188,541 | 3,848,194 | ||||||
Atlas Copco AB, A Shares | 29,422 | 1,163,786 | ||||||
Atlas Copco AB, B Shares | 37,777 | 1,342,675 | ||||||
Axfood AB | 8,706 | 195,238 | ||||||
Boliden AB | 23,907 | 522,401 | ||||||
Castellum AB | 46,601 | 876,237 | ||||||
Elekta AB, B Shares | 109,763 | 1,158,517 | ||||||
| Security | Shares | Value | ||||||
| Sweden (continued) | ||||||||
Fabege AB | 266,629 | $ | 3,246,843 | |||||
Fastighets AB Balder, B Shares(a) | 2,340 | 96,092 | ||||||
Hennes & Mauritz AB, B Shares | 8,984 | 136,634 | ||||||
Hexagon AB, B Shares(a) | 15,537 | 861,720 | ||||||
Hufvudstaden AB, A Shares | 108,506 | 1,399,483 | ||||||
Indutrade AB(a) | 5,971 | 228,859 | ||||||
Intrum AB | 1,763 | 29,327 | ||||||
Investment AB Latour, B Shares | 22,519 | 406,111 | ||||||
Investor AB, B Shares | 27,621 | 1,482,403 | ||||||
JM AB | 1,839 | 36,268 | ||||||
Kinnevik AB, Class B | 64,766 | 1,641,980 | ||||||
L E Lundbergforetagen AB, B Shares(a) | 46,592 | 2,324,566 | ||||||
Saab AB, Class B(a) | 29,663 | 724,126 | ||||||
Sandvik AB(a) | 61,551 | 1,028,984 | ||||||
Skanska AB, B Shares(a) | 4,337 | 87,186 | ||||||
Svenska Cellulosa AB SCA, Class B(a) | 5,165 | 64,630 | ||||||
Swedish Match AB | 4,455 | 310,928 | ||||||
Swedish Orphan Biovitrum AB(a) | 1,833 | 40,030 | ||||||
Tele2 AB, B Shares | 55,895 | 740,604 | ||||||
Telefonaktiebolaget LM Ericsson, B Shares | 137,810 | 1,261,974 | ||||||
Telia Co. AB | 229,378 | 784,555 | ||||||
|
| |||||||
| 26,337,216 | ||||||||
| Switzerland — 9.7% | ||||||||
Alcon, Inc.(a) | 38,781 | 2,510,518 | ||||||
Baloise Holding AG, Registered Shares | 465 | 66,539 | ||||||
Barry Callebaut AG, Registered Shares | 205 | 413,471 | ||||||
Belimo Holding AG, Registered Shares | 4 | 30,317 | ||||||
Chocoladefabriken Lindt & Spruengli AG, Registered Shares | 1 | 87,202 | ||||||
Cie Financiere Richemont SA, Registered Shares | 38,417 | 2,258,141 | ||||||
Clariant AG, Registered Shares | 13,496 | 249,225 | ||||||
Coca-Cola HBC AG | 19,804 | 501,487 | ||||||
Credit Suisse Group AG, Registered Shares | 178,243 | 1,638,140 | ||||||
Dufry AG, Registered Shares | 2,905 | 86,938 | ||||||
EMS-Chemie Holding AG, Registered Shares | 442 | 328,416 | ||||||
Geberit AG, Registered Shares | 15,154 | 7,414,711 | ||||||
Givaudan SA, Registered Shares | 1,542 | 5,552,864 | ||||||
Kuehne + Nagel International AG, Registered Shares(a) | 286 | 41,364 | ||||||
Landis+Gyr Group AG | 1,031 | 68,067 | ||||||
Logitech International SA, Registered Shares | 14,484 | 860,580 | ||||||
Lonza Group AG, Registered Shares | 1,603 | 791,595 | ||||||
Nestlé SA, Registered Shares | 266,429 | 28,928,076 | ||||||
Novartis AG, Registered Shares | 136,068 | 11,845,532 | ||||||
OC Oerlikon Corp. AG, Registered Shares | 4,820 | 39,467 | ||||||
Partners Group Holding AG | 1,082 | 901,387 | ||||||
Roche Holding AG | 34,077 | 11,828,869 | ||||||
Schindler Holding AG | 1,102 | 257,456 | ||||||
Schindler Holding AG, Registered Shares | 1,484 | 346,535 | ||||||
Sika AG, Registered Shares | 19,430 | 3,337,881 | ||||||
Sonova Holding AG, Registered Shares | 3,345 | 737,438 | ||||||
Straumann Holding AG, Registered Shares | 1,545 | 1,260,049 | ||||||
Sulzer AG, Registered Shares | 2 | 160 | ||||||
Sunrise Communications Group AG(d) | 13,081 | 1,097,925 | ||||||
Swiss Life Holding AG, Registered Shares | 1,980 | 701,828 | ||||||
Swiss Re AG | 27,079 | 1,849,267 | ||||||
Swisscom AG, Registered Shares | 111 | 57,765 | ||||||
Vifor Pharma AG | 6,590 | 1,009,827 | ||||||
|
| |||||||
| 87,099,037 | ||||||||
| United Kingdom — 13.1% | ||||||||
Ashmore Group PLC | 114,043 | 605,568 | ||||||
ASOS PLC(a) | 506 | 18,854 | ||||||
| SCHEDULES OF INVESTMENTS | 19 |
Schedule of Investments (continued) May 31, 2020 | BlackRock Advantage International Fund (Percentages shown are based on Net Assets) |
| Security | Shares | Value | ||||||
| United Kingdom (continued) | ||||||||
AstraZeneca PLC | 88,876 | $ | 9,571,887 | |||||
Auto Trader Group PLC(d) | 314,032 | 2,182,772 | ||||||
AVEVA Group PLC | 9,291 | 472,054 | ||||||
Aviva PLC | 211,536 | 652,488 | ||||||
BAE Systems PLC | 73,129 | 451,338 | ||||||
Barratt Developments PLC | 241,480 | 1,493,694 | ||||||
Bellway PLC | 19,637 | 626,845 | ||||||
Berkeley Group Holdings PLC | 14,662 | 746,904 | ||||||
boohoo Group PLC(a) | 84,038 | 404,451 | ||||||
BP PLC | 1,071,437 | 4,097,095 | ||||||
British American Tobacco PLC | 169,969 | 6,741,017 | ||||||
British Land Co. PLC | 168,821 | 855,662 | ||||||
Britvic PLC | 8,241 | 73,419 | ||||||
Burberry Group PLC | 11,573 | 216,107 | ||||||
Centrica PLC | 1,093,511 | 496,099 | ||||||
Cineworld Group PLC | 28,325 | 29,808 | ||||||
Close Brothers Group PLC | 15 | 201 | ||||||
Compass Group PLC | 116,561 | 1,708,707 | ||||||
Croda International PLC | 9,044 | 581,859 | ||||||
DCC PLC | 12,921 | 1,083,851 | ||||||
Dechra Pharmaceuticals PLC | 2,967 | 102,345 | ||||||
Diageo PLC | 257,714 | 8,991,577 | ||||||
Dialog Semiconductor PLC(a) | 15,381 | 615,072 | ||||||
Direct Line Insurance Group PLC | 188,329 | 616,900 | ||||||
easyJet PLC | 59,980 | 509,643 | ||||||
Experian PLC | 251,462 | 8,819,365 | ||||||
Games Workshop Group PLC | 712 | 70,457 | ||||||
GlaxoSmithKline PLC | 337,855 | 6,997,872 | ||||||
Great Portland Estates PLC | 4,886 | 39,427 | ||||||
Greggs PLC | 11,645 | 266,797 | ||||||
Halma PLC | 6,298 | 182,766 | ||||||
Hiscox Ltd. | 6,607 | 60,729 | ||||||
HomeServe PLC | 103,959 | 1,675,656 | ||||||
Howden Joinery Group PLC | 224,978 | 1,650,224 | ||||||
HSBC Holdings PLC | 1,093,792 | 5,037,249 | ||||||
IG Group Holdings PLC | 114,577 | 1,083,479 | ||||||
Informa PLC | 572,535 | 3,279,754 | ||||||
Intermediate Capital Group PLC | 5,524 | 86,869 | ||||||
Intertek Group PLC | 9,162 | 627,024 | ||||||
ITV PLC | 147,117 | 146,702 | ||||||
J Sainsbury PLC | 195,259 | 468,197 | ||||||
JD Sports Fashion PLC | 28,124 | 230,571 | ||||||
John Wood Group PLC | 59,428 | 142,705 | ||||||
Jupiter Fund Management PLC | 10,502 | 32,557 | ||||||
Land Securities Group PLC | 5,710 | 42,940 | ||||||
Legal & General Group PLC | 109,741 | 270,942 | ||||||
Lloyds Banking Group PLC | 3,781,680 | 1,394,689 | ||||||
London Stock Exchange Group PLC | 7,311 | 729,218 | ||||||
M&G PLC | 127,397 | 221,722 | ||||||
Man Group PLC | 122,041 | 214,809 | ||||||
Marks & Spencer Group PLC | 180,414 | 219,057 | ||||||
Meggitt PLC | 129,205 | 446,609 | ||||||
Melrose Industries PLC | 290,289 | 418,497 | ||||||
Micro Focus International PLC | 22,597 | 111,316 | ||||||
Moneysupermarket.com Group PLC | 307,195 | 1,311,161 | ||||||
National Grid PLC | 90,893 | 1,045,771 | ||||||
Ocado Group PLC(a) | 58,639 | 1,594,823 | ||||||
Prudential PLC | 65,402 | 848,215 | ||||||
Reckitt Benckiser Group PLC | 31,335 | 2,806,556 | ||||||
RELX PLC | 97,229 | 2,263,045 | ||||||
Rentokil Initial PLC | 189,129 | 1,169,674 | ||||||
Rightmove PLC | 455,670 | 3,319,857 | ||||||
| Security | Shares | Value | ||||||
| United Kingdom (continued) | ||||||||
Rolls-Royce Holdings PLC | 17,972 | $ | 61,257 | |||||
Rotork PLC | 36,109 | 119,534 | ||||||
Royal Bank of Scotland Group PLC | 96,099 | 131,451 | ||||||
Sage Group PLC | 26,328 | 225,766 | ||||||
Schroders PLC | 14,978 | 551,129 | ||||||
Segro PLC | 3,581 | 37,212 | ||||||
Smith & Nephew PLC | 28,102 | 573,321 | ||||||
Smiths Group PLC | 139,707 | 2,277,866 | ||||||
Spirax-Sarco Engineering PLC | 4,361 | 535,230 | ||||||
SSE PLC | 13,291 | 204,283 | ||||||
Standard Chartered PLC | 37,790 | 172,398 | ||||||
Tate & Lyle PLC | 13,249 | 110,516 | ||||||
Taylor Wimpey PLC | 142,978 | 256,112 | ||||||
Tesco PLC | 518,796 | 1,473,119 | ||||||
Unilever NV | 171,631 | 8,869,535 | ||||||
Unilever PLC | 69,009 | 3,705,327 | ||||||
Vistry Group PLC | 1,345 | 12,779 | ||||||
Vodafone Group PLC | 2,134,513 | 3,510,192 | ||||||
Wm Morrison Supermarkets PLC | 526,038 | 1,220,433 | ||||||
WPP PLC | 48,452 | 368,741 | ||||||
|
| |||||||
| 117,689,719 | ||||||||
| United States — 0.1% | ||||||||
Ferguson PLC | 15,568 | 1,227,813 | ||||||
Sims Ltd. | 4,685 | 24,313 | ||||||
|
| |||||||
| 1,252,126 | ||||||||
|
| |||||||
Total Common Stocks — 95.6% |
| 857,211,253 | ||||||
|
| |||||||
Preferred Securities | ||||||||
Preferred Stocks — 0.3% | ||||||||
| Germany — 0.2% | ||||||||
Henkel AG & Co. KGaA | 24,482 | 2,189,533 | ||||||
|
| |||||||
| United States — 0.1% | ||||||||
Palantir Technologies, Inc., Series I (Acquired 02/07/14, | 153,710 | 1,000,652 | ||||||
|
| |||||||
Total Preferred Securities — 0.3% |
| 3,190,185 | ||||||
|
| |||||||
Rights | ||||||||
Italy — 0.0% | ||||||||
Davide Campari-Milano SpA (Expires 06/21/20, Strike Price EUR 8.376) | 18,031 | — | ||||||
|
| |||||||
Total Rights — 0.0% |
| — | ||||||
|
| |||||||
Total Long-Term Investments — 95.9% |
| 860,401,438 | ||||||
|
| |||||||
| 20 | 2020 BLACKROCK ANNUAL REPORTTO SHAREHOLDERS |
Schedule of Investments (continued) May 31, 2020 | BlackRock Advantage International Fund (Percentages shown are based on Net Assets) |
| Security | Shares | Value | ||||||
Short-Term Securities(f)(g) | ||||||||
| Money Market Funds — 2.5% | ||||||||
BlackRock Liquidity Funds, T-Fund, Institutional Class, 0.11% | 22,359,927 | $ | 22,359,927 | |||||
SL Liquidity Series, LLC, Money Market Series, 0.63%(h) | 96,120 | 96,216 | ||||||
|
| |||||||
Total Short-Term Securities — 2.5% | 22,456,143 | |||||||
|
| |||||||
Total Investments — 98.4% | 882,857,581 | |||||||
Other Assets Less Liabilities — 1.6% | 14,073,619 | |||||||
|
| |||||||
Net Assets — 100.0% | $ | 896,931,200 | ||||||
|
| |||||||
| (a) | Non-income producing security. |
| (b) | Security is valued using significant unobservable inputs and is classified as Level 3 in the fair value hierarchy. |
| (c) | All or a portion of this security is on loan. |
| (d) | Security exempt from registration pursuant to Rule 144A under the Securities Act of 1933, as amended. These securities may be resold in transactions exempt from registration to qualified institutional investors. |
| (e) | Restricted security as to resale, excluding 144A securities. The Fund held restricted securities with a current value of $1,227,571, representing 0.1% of its net assets as of period end, and an original cost of $1,746,617. |
| (f) | Affiliate of the Fund. |
| (g) | Annualized 7-day yield as of period end. |
| (h) | All or a portion of this security was purchased with the cash collateral from loaned securities. |
Affiliates
Investments in issuers considered to be an affiliate/affiliates of the Fund during the period ended May 31, 2020 for purposes of Section 2(a)(3) of the Investment Company Act of 1940, as amended, were as follows:
Affiliated Issuer | | Shares Held at 09/30/19 |
| | Shares Purchased |
| | Shares Sold |
| | Shares Held at 05/31/20 |
| | Value at 05/31/20 |
| Income | | Net Realized Gain (Loss) |
(a) | | Change in Unrealized Appreciation (Depreciation) |
| ||||||||||
BlackRock Liquidity Funds, T-Fund, Institutional Class | 48,016,367 | — | (25,656,440 | )(b) | 22,359,927 | $ | 22,359,927 | $ | 97,268 | $ | 18 | $ | — | |||||||||||||||||||
SL Liquidity Series, LLC, Money Market Series | 748,834 | — | (576,162 | )(b) | 96,120 | 96,216 | 6,665 | (c) | 1,677 | 145 | ||||||||||||||||||||||
|
|
|
|
|
|
|
| |||||||||||||||||||||||||
| $ | 22,456,143 | $ | 103,933 | $ | 1,695 | $ | 145 | |||||||||||||||||||||||||
|
|
|
|
|
|
|
|
| (a) | Includes net capital gain distributions, if applicable. |
| (b) | Represents net shares purchased (sold). |
| (c) | Represents securities lending income earned from the reinvestment of cash collateral from loaned securities, net of fees and collateral investment expenses, and other payments to and from borrowers of securities. |
Futures Contracts
| Description | Number of Contracts | Expiration Date | Notional Amount (000) | Value/ Unrealized Appreciation (Depreciation) | ||||||||||||
Long Contracts | ||||||||||||||||
MSCI EAFE Index | 364 | 06/19/20 | $ | 31,406 | $ | 1,971,363 | ||||||||||
|
| |||||||||||||||
Derivative Financial Instruments Categorized by Risk Exposure
As of period end, the fair values of derivative financial instruments located in the Statements of Assets and Liabilities were as follows:
Commodity Contracts | Credit Contracts | Equity Contracts | Foreign Currency Exchange Contracts | Interest Rate Contracts | Other Contracts | Total | ||||||||||||||||||||||
Assets — Derivative Financial Instruments | ||||||||||||||||||||||||||||
Futures contracts | ||||||||||||||||||||||||||||
Unrealized appreciation(a) | $ | — | $ | — | $ | 1,971,363 | $ | — | $ | — | $ | — | $ | 1,971,363 | ||||||||||||||
|
|
|
|
|
|
|
|
|
|
|
|
|
| |||||||||||||||
| (a) | Net cumulative unrealized appreciation (depreciation) on futures contracts, if any, as reported in the Schedule of Investments. In the Statements of Assets and Liabilities, only current day’s variation margin is reported in receivables or payables and the net cumulative unrealized appreciation (depreciation) is included in accumulated earnings (loss). |
| SCHEDULES OF INVESTMENTS | 21 |
Schedule of Investments (continued) May 31, 2020 | BlackRock Advantage International Fund |
For the period ended May 31, 2020, the effect of derivative financial instruments in the Statements of Operations was as follows:
Commodity Contracts | Credit Contracts | Equity Contracts | Foreign Currency Exchange Contracts | Interest Rate Contracts | Other Contracts | Total | ||||||||||||||||||||||
Net Realized Gain (Loss) from | ||||||||||||||||||||||||||||
Futures contracts | $ | — | $ | — | $ | (2,002,798 | ) | $ | — | $ | — | $ | — | $ | (2,002,798 | ) | ||||||||||||
|
|
|
|
|
|
|
|
|
|
|
|
|
| |||||||||||||||
Net Change in Unrealized Appreciation (Depreciation) on | ||||||||||||||||||||||||||||
Futures contracts | $ | — | $ | — | $ | 1,759,223 | $ | — | $ | — | $ | — | $ | 1,759,223 | ||||||||||||||
|
|
|
|
|
|
|
|
|
|
|
|
|
| |||||||||||||||
Average Quarterly Balances of Outstanding Derivative Financial Instruments
Futures contracts | ||||
Average notional value of contracts — long | $ | 30,532,457 |
For more information about the Fund’s investment risks regarding derivative financial instruments, refer to the Notes to Financial Statements.
Fair Value Hierarchy as of Period End
Various inputs are used in determining the fair value of investments and derivative financial instruments. For information about the Fund’s policy regarding valuation of investments and derivative financial instruments, refer to the Notes to Financial Statements.
The following table summarizes the Fund’s investments and derivative financial instruments categorized in the disclosure hierarchy:
| Level 1 | Level 2 | Level 3 | Total | |||||||||||||
Assets | ||||||||||||||||
Investments | ||||||||||||||||
Long-Term Investments | ||||||||||||||||
Common Stocks | ||||||||||||||||
Australia | $ | — | $ | 59,424,529 | $ | 1 | $ | 59,424,530 | ||||||||
Austria | — | 1,546,338 | — | 1,546,338 | ||||||||||||
Belgium | — | 6,940,483 | — | 6,940,483 | ||||||||||||
China | 4,126,741 | 2,698,317 | — | 6,825,058 | ||||||||||||
Colombia | — | 156,443 | — | 156,443 | ||||||||||||
Denmark | — | 16,456,529 | — | 16,456,529 | ||||||||||||
Finland | — | 11,658,574 | — | 11,658,574 | ||||||||||||
France | — | 100,559,276 | — | 100,559,276 | ||||||||||||
Germany | — | 78,226,710 | — | 78,226,710 | ||||||||||||
Hong Kong | — | 21,543,556 | — | 21,543,556 | ||||||||||||
India | — | — | 226,919 | 226,919 | ||||||||||||
Ireland | 680,886 | 716,166 | — | 1,397,052 | ||||||||||||
Israel | — | 2,419,441 | — | 2,419,441 | ||||||||||||
Italy | — | 18,897,452 | — | 18,897,452 | ||||||||||||
Japan | — | 222,897,468 | — | 222,897,468 | ||||||||||||
Jordan | — | 529,343 | — | 529,343 | ||||||||||||
Luxembourg | — | 1,800,044 | — | 1,800,044 | ||||||||||||
Netherlands | 3,473,672 | 37,723,281 | — | 41,196,953 | ||||||||||||
New Zealand | — | 1,696,501 | — | 1,696,501 | ||||||||||||
Norway | — | 3,482,718 | — | 3,482,718 | ||||||||||||
Portugal | — | 2,217,797 | — | 2,217,797 | ||||||||||||
Singapore | — | 7,780,641 | — | 7,780,641 | ||||||||||||
South Africa | — | 1,054,510 | — | 1,054,510 | ||||||||||||
Spain | — | 15,898,819 | — | 15,898,819 | ||||||||||||
Sweden | — | 26,337,216 | — | 26,337,216 | ||||||||||||
Switzerland | — | 87,099,037 | — | 87,099,037 | ||||||||||||
United Kingdom | — | 117,689,719 | — | 117,689,719 | ||||||||||||
United States | — | 1,252,126 | — | 1,252,126 | ||||||||||||
Preferred Securities | — | 2,189,533 | 1,000,652 | 3,190,185 | ||||||||||||
Rights | — | — | — | — | ||||||||||||
| 22 | 2020 BLACKROCK ANNUAL REPORTTO SHAREHOLDERS |
Schedule of Investments (continued) May 31, 2020 | BlackRock Advantage International Fund |
| Level 1 | Level 2 | Level 3 | Total | |||||||||||||
Short-Term Securities | ||||||||||||||||
Money Market Funds | $ | 22,359,927 | $ | — | $ | — | $ | 22,359,927 | ||||||||
|
|
|
|
|
|
|
| |||||||||
| $ | 30,641,226 | $ | 850,892,567 | $ | 1,227,572 | 882,761,365 | ||||||||||
|
|
|
|
|
|
|
| |||||||||
Investments Valued at NAV(a) | 96,216 | |||||||||||||||
|
| |||||||||||||||
| $ | 882,857,581 | |||||||||||||||
|
| |||||||||||||||
Derivative Financial Instruments(b) | ||||||||||||||||
Assets | ||||||||||||||||
Equity Contracts | $ | 1,971,363 | $ | — | $ | — | $ | 1,971,363 | ||||||||
|
|
|
|
|
|
|
| |||||||||
| (a) | Certain investments of the Fund were fair valued using NAV per share as no quoted market value is available and therefore have been excluded from the fair value hierarchy. |
| (b) | Derivative financial instruments are futures contracts. Futures contracts are valued at the unrealized appreciation (depreciation) on the instrument. |
See notes to financial statements.
| SCHEDULES OF INVESTMENTS | 23 |
Schedule of Investments May 31, 2020 | BlackRock Advantage Large Cap Growth Fund (Percentages shown are based on Net Assets) |
| Security | Shares | Value | ||||||
Common Stocks | ||||||||
| Aerospace & Defense — 1.6% | ||||||||
Boeing Co. | 1,030 | $ | 150,225 | |||||
HEICO Corp. | 21,410 | 2,157,272 | ||||||
Hexcel Corp. | 3,887 | 140,671 | ||||||
L3Harris Technologies, Inc. | 5,649 | 1,126,693 | ||||||
Lockheed Martin Corp. | 13,889 | 5,395,043 | ||||||
Northrop Grumman Corp. | 6,711 | 2,249,527 | ||||||
Teledyne Technologies, Inc.(a) | 5,639 | 2,109,663 | ||||||
|
| |||||||
| 13,329,094 | ||||||||
| Air Freight & Logistics — 0.4% | ||||||||
Expeditors International of Washington, Inc. | 1,203 | 91,873 | ||||||
United Parcel Service, Inc., Class B | 28,027 | 2,794,572 | ||||||
|
| |||||||
| 2,886,445 | ||||||||
| Airlines — 0.1% | ||||||||
Delta Air Lines, Inc. | 29,974 | 755,645 | ||||||
Southwest Airlines Co. | 3,101 | 99,542 | ||||||
|
| |||||||
| 855,187 | ||||||||
| Automobiles — 0.5% | ||||||||
Tesla, Inc.(a) | 4,626 | 3,862,710 | ||||||
|
| |||||||
| Banks — 0.1% | ||||||||
Cullen/Frost Bankers, Inc. | 9,293 | 705,989 | ||||||
Wells Fargo & Co. | 19,326 | 511,559 | ||||||
|
| |||||||
| 1,217,548 | ||||||||
| Beverages — 1.5% | ||||||||
Coca-Cola Co. | 66,216 | 3,090,963 | ||||||
Coca-Cola European Partners PLC | �� | 8,036 | 302,957 | |||||
PepsiCo, Inc. | 69,158 | 9,097,735 | ||||||
|
| |||||||
| 12,491,655 | ||||||||
| Biotechnology — 4.3% | ||||||||
AbbVie, Inc. | 116,576 | 10,803,098 | ||||||
Alexion Pharmaceuticals, Inc.(a) | 3,468 | 415,813 | ||||||
Amgen, Inc. | 33,355 | 7,661,644 | ||||||
Biogen, Inc.(a) | 882 | 270,853 | ||||||
Gilead Sciences, Inc. | 72,604 | 5,650,769 | ||||||
Incyte Corp.(a) | 11,464 | 1,168,296 | ||||||
Moderna, Inc.(a) | 10,150 | 624,225 | ||||||
Regeneron Pharmaceuticals, Inc.(a) | 2,059 | 1,261,776 | ||||||
Vertex Pharmaceuticals, Inc.(a) | 26,985 | 7,770,601 | ||||||
|
| |||||||
| 35,627,075 | ||||||||
| Building Products — 0.6% | ||||||||
Allegion PLC | 45,761 | 4,562,372 | ||||||
|
| |||||||
| Capital Markets — 1.9% | ||||||||
Charles Schwab Corp. | 51,694 | 1,856,332 | ||||||
CME Group, Inc. | 644 | 117,594 | ||||||
FactSet Research Systems, Inc. | 8,193 | 2,519,429 | ||||||
Intercontinental Exchange, Inc. | 21,092 | 2,051,197 | ||||||
MarketAxess Holdings, Inc. | 413 | 210,048 | ||||||
Moody’s Corp.(b) | 5,433 | 1,452,839 | ||||||
S&P Global, Inc. | 19,538 | 6,350,241 | ||||||
T Rowe Price Group, Inc. | 1,928 | 233,095 | ||||||
TD Ameritrade Holding Corp. | 11,664 | 434,717 | ||||||
|
| |||||||
| 15,225,492 | ||||||||
| Chemicals — 0.9% | ||||||||
Cabot Corp. | 1 | 36 | ||||||
Ecolab, Inc. | 18,509 | 3,934,643 | ||||||
PPG Industries, Inc. | 2,520 | 256,208 | ||||||
Sherwin-Williams Co. | 5,416 | 3,216,292 | ||||||
|
| |||||||
| 7,407,179 | ||||||||
| Security | Shares | Value | ||||||
| Commercial Services & Supplies — 0.4% | ||||||||
Cintas Corp. | 7,066 | $ | 1,752,085 | |||||
Copart, Inc.(a) | 13,171 | 1,177,356 | ||||||
|
| |||||||
| 2,929,441 | ||||||||
| Communications Equipment — 1.8% | ||||||||
Ciena Corp.(a) | 17,787 | 982,910 | ||||||
Cisco Systems, Inc. | 278,278 | 13,307,254 | ||||||
Motorola Solutions, Inc. | 1,419 | 192,033 | ||||||
|
| |||||||
| 14,482,197 | ||||||||
| Construction & Engineering — 0.3% | ||||||||
EMCOR Group, Inc. | 28,707 | 1,824,330 | ||||||
MasTec, Inc.(a)(b) | 22,576 | 883,850 | ||||||
|
| |||||||
| 2,708,180 | ||||||||
| Consumer Finance — 0.4% | ||||||||
Ally Financial, Inc. | 63,720 | 1,111,276 | ||||||
American Express Co. | 13,026 | 1,238,382 | ||||||
LendingTree, Inc.(a) | 3,390 | 881,468 | ||||||
|
| |||||||
| 3,231,126 | ||||||||
| Containers & Packaging — 0.0% | ||||||||
Ball Corp. | 2,213 | 157,698 | ||||||
|
| |||||||
| Distributors — 0.1% | ||||||||
Pool Corp. | 3,245 | 872,970 | ||||||
|
| |||||||
| Diversified Consumer Services — 0.3% | ||||||||
Bright Horizons Family Solutions, Inc.(a) | 7,507 | 839,883 | ||||||
Grand Canyon Education, Inc.(a) | 1,969 | 192,155 | ||||||
H&R Block, Inc. | 67,082 | 1,140,394 | ||||||
|
| |||||||
| 2,172,432 | ||||||||
| Diversified Financial Services — 0.1% | ||||||||
Berkshire Hathaway, Inc., Class B(a) | 2,529 | 469,332 | ||||||
|
| |||||||
| Electric Utilities — 0.1% | ||||||||
NextEra Energy, Inc. | 4,078 | 1,042,174 | ||||||
|
| |||||||
| Electrical Equipment — 0.3% | ||||||||
AMETEK, Inc. | 7,334 | 672,601 | ||||||
Hubbell, Inc. | 15,956 | 1,953,334 | ||||||
|
| |||||||
| 2,625,935 | ||||||||
| Electronic Equipment, Instruments & Components — 0.4% | ||||||||
Avnet, Inc. | 24,470 | 666,563 | ||||||
CDW Corp. | 5,746 | 637,289 | ||||||
Keysight Technologies, Inc.(a) | 1,833 | 198,202 | ||||||
National Instruments Corp. | 56,694 | 2,195,192 | ||||||
|
| |||||||
| 3,697,246 | ||||||||
| Entertainment — 1.5% | ||||||||
Electronic Arts, Inc.(a) | 7,781 | 956,129 | ||||||
Netflix, Inc.(a) | 20,970 | 8,801,738 | ||||||
Spotify Technology SA(a) | 4,245 | 768,048 | ||||||
Zynga, Inc., Class A(a) | 167,181 | 1,529,706 | ||||||
|
| |||||||
| 12,055,621 | ||||||||
| Equity Real Estate Investment Trusts (REITs) — 1.8% | ||||||||
Alexandria Real Estate Equities, Inc. | 3,111 | 478,223 | ||||||
American Tower Corp. | 17,823 | 4,601,364 | ||||||
Apartment Investment & Management Co., Class A | 4,394 | 162,007 | ||||||
AvalonBay Communities, Inc. | 1,551 | 241,971 | ||||||
Boston Properties, Inc. | 26,140 | 2,247,517 | ||||||
Crown Castle International Corp. | 8,523 | 1,467,320 | ||||||
Douglas Emmett, Inc. | 9,913 | 291,046 | ||||||
Equinix, Inc. | 2,363 | 1,648,500 | ||||||
Equity Residential | 3,377 | 204,511 | ||||||
Lamar Advertising Co., Class A | 2,726 | 180,734 | ||||||
| 24 | 2020 BLACKROCK ANNUAL REPORTTO SHAREHOLDERS |
Schedule of Investments (continued) May 31, 2020 | BlackRock Advantage Large Cap Growth Fund (Percentages shown are based on Net Assets) |
| Security | Shares | Value | ||||||
| Equity Real Estate Investment Trusts (REITs) (continued) | ||||||||
Park Hotels & Resorts, Inc. | 76,067 | $ | 747,738 | |||||
Prologis, Inc. | 17,216 | 1,575,264 | ||||||
Realty Income Corp. | 3,436 | 190,045 | ||||||
SBA Communications Corp. | 3,498 | 1,098,827 | ||||||
|
| |||||||
| 15,135,067 | ||||||||
| Food & Staples Retailing — 1.9% | ||||||||
Costco Wholesale Corp. | 46,662 | 14,393,827 | ||||||
Sprouts Farmers Market, Inc.(a) | 36,535 | 918,125 | ||||||
|
| |||||||
| 15,311,952 | ||||||||
| Food Products — 0.9% | ||||||||
General Mills, Inc. | 50,724 | 3,197,641 | ||||||
Hershey Co. | 33,675 | 4,569,024 | ||||||
|
| |||||||
| 7,766,665 | ||||||||
| Health Care Equipment & Supplies — 2.5% | ||||||||
Abbott Laboratories | 22,282 | 2,115,007 | ||||||
Boston Scientific Corp.(a) | 7,547 | 286,710 | ||||||
DexCom, Inc.(a) | 3,951 | 1,494,703 | ||||||
Edwards Lifesciences Corp.(a) | 24,668 | 5,543,393 | ||||||
Hologic, Inc.(a) | 5,600 | 296,800 | ||||||
IDEXX Laboratories, Inc.(a) | 13,839 | 4,274,590 | ||||||
Intuitive Surgical, Inc.(a) | 1,932 | 1,120,618 | ||||||
STERIS PLC | 3,130 | 519,236 | ||||||
Stryker Corp. | 24,952 | 4,883,855 | ||||||
West Pharmaceutical Services, Inc. | 489 | 105,644 | ||||||
|
| |||||||
| 20,640,556 | ||||||||
| Health Care Providers & Services — 2.8% | ||||||||
AMN Healthcare Services, Inc.(a)(b) | 4,758 | 211,065 | ||||||
Anthem, Inc. | 10,966 | 3,225,210 | ||||||
Cardinal Health, Inc. | 1,374 | 75,144 | ||||||
Centene Corp.(a) | 6,190 | 410,088 | ||||||
Cigna Corp. | 2,159 | 426,014 | ||||||
CVS Health Corp. | 2,056 | 134,812 | ||||||
HCA Healthcare, Inc. | 4,417 | 472,177 | ||||||
LHC Group, Inc.(a) | 502 | 81,580 | ||||||
McKesson Corp. | 9,996 | 1,586,065 | ||||||
UnitedHealth Group, Inc. | 53,628 | 16,348,496 | ||||||
|
| |||||||
| 22,970,651 | ||||||||
| Health Care Technology — 0.6% | ||||||||
Teladoc Health, Inc.(a) | 4,718 | 821,215 | ||||||
Veeva Systems, Inc., Class A(a) | 17,492 | 3,828,474 | ||||||
|
| |||||||
| 4,649,689 | ||||||||
| Hotels, Restaurants & Leisure — 1.7% | ||||||||
Boyd Gaming Corp. | 18,808 | 402,115 | ||||||
Carnival Corp. | 7,053 | 111,014 | ||||||
Chipotle Mexican Grill, Inc.(a) | 1,590 | 1,596,217 | ||||||
Choice Hotels International, Inc. | 2,764 | 223,414 | ||||||
Darden Restaurants, Inc. | 18,391 | 1,413,532 | ||||||
Domino’s Pizza, Inc. | 4,348 | 1,677,632 | ||||||
Dunkin’ Brands Group, Inc. | 1,788 | 114,200 | ||||||
Extended Stay America, Inc. | 6,748 | 77,602 | ||||||
Hilton Worldwide Holdings, Inc. | 8,583 | 680,718 | ||||||
Hyatt Hotels Corp., Class A | 1,908 | 105,112 | ||||||
Marriott Vacations Worldwide Corp. | 1,621 | 145,615 | ||||||
McDonald’s Corp. | 4,410 | 821,671 | ||||||
Penn National Gaming, Inc.(a) | 8,598 | 282,100 | ||||||
Royal Caribbean Cruises Ltd. | 10,790 | 559,677 | ||||||
Texas Roadhouse, Inc. | 17,008 | 881,865 | ||||||
Vail Resorts, Inc. | 2,973 | 589,635 | ||||||
Wingstop, Inc.(b) | 6,387 | 778,895 | ||||||
Wyndham Destinations, Inc. | 2,994 | 95,209 | ||||||
| Security | Shares | Value | ||||||
| Hotels, Restaurants & Leisure (continued) | ||||||||
Wyndham Hotels & Resorts, Inc. | 2,787 | $ | 128,007 | |||||
Yum China Holdings, Inc. | 6,985 | 323,685 | ||||||
Yum! Brands, Inc. | 33,897 | 3,041,578 | ||||||
|
| |||||||
| 14,049,493 | ||||||||
| Household Products — 0.5% | ||||||||
Church & Dwight Co., Inc. | 11,443 | 859,026 | ||||||
Clorox Co. | 12,846 | 2,649,487 | ||||||
Procter & Gamble Co. | 8,650 | 1,002,708 | ||||||
|
| |||||||
| 4,511,221 | ||||||||
| Industrial Conglomerates — 0.7% | ||||||||
3M Co. | 9,728 | 1,521,848 | ||||||
Carlisle Cos., Inc. | 4,273 | 512,162 | ||||||
Honeywell International, Inc. | 18,279 | 2,665,992 | ||||||
Roper Technologies, Inc. | 2,185 | 860,453 | ||||||
|
| |||||||
| 5,560,455 | ||||||||
| Insurance — 0.4% | ||||||||
Cincinnati Financial Corp. | 9,597 | 565,743 | ||||||
First American Financial Corp. | 7,333 | 370,243 | ||||||
Marsh & McLennan Cos., Inc. | 18,839 | 1,995,427 | ||||||
Prudential Financial, Inc. | 3,102 | 189,098 | ||||||
|
| |||||||
| 3,120,511 | ||||||||
| Interactive Media & Services — 8.3% | ||||||||
Alphabet, Inc., Class A(a) | 13,084 | 18,756,176 | ||||||
Alphabet, Inc., Class C(a) | 14,932 | 21,336,633 | ||||||
Cargurus, Inc.(a) | 8,409 | 218,466 | ||||||
Facebook, Inc., Class A(a) | 109,577 | 24,664,687 | ||||||
Pinterest, Inc., Class A(a) | 18,652 | 378,449 | ||||||
Twitter, Inc.(a) | 64,282 | 1,990,813 | ||||||
Yelp, Inc.(a) | 13,516 | 293,838 | ||||||
|
| |||||||
| 67,639,062 | ||||||||
| Internet & Direct Marketing Retail — 7.8% | ||||||||
Amazon.com, Inc.(a) | 24,411 | 59,620,694 | ||||||
eBay, Inc. | 56,640 | 2,579,386 | ||||||
Etsy, Inc.(a) | 7,030 | 569,289 | ||||||
Grubhub, Inc.(a) | 18,676 | 1,059,676 | ||||||
Wayfair, Inc., Class A(a) | 1,081 | 185,446 | ||||||
|
| |||||||
| 64,014,491 | ||||||||
| IT Services — 8.4% | ||||||||
Accenture PLC, Class A | 20,838 | 4,201,358 | ||||||
Automatic Data Processing, Inc. | 61,625 | 9,027,446 | ||||||
Broadridge Financial Solutions, Inc. | 679 | 82,227 | ||||||
Fiserv, Inc.(a)(b) | 25,411 | 2,713,132 | ||||||
Jack Henry & Associates, Inc. | 9,980 | 1,804,983 | ||||||
Mastercard, Inc., Class A | 57,100 | 17,180,819 | ||||||
Paychex, Inc. | 64,627 | 4,671,239 | ||||||
PayPal Holdings, Inc. | 93,493 | 14,492,350 | ||||||
Square, Inc., Class A(a) | 8,238 | 667,937 | ||||||
Twilio, Inc., Class A(a)(b) | 1,178 | 232,773 | ||||||
VeriSign, Inc.(a) | 2,205 | 482,917 | ||||||
Visa, Inc., Class A | 69,070 | 13,485,227 | ||||||
|
| |||||||
| 69,042,408 | ||||||||
| Life Sciences Tools & Services — 0.5% | ||||||||
Bio-Rad Laboratories, Inc., Class A(a) | 2,472 | 1,214,543 | ||||||
Illumina, Inc.(a) | 1,164 | 422,590 | ||||||
Mettler-Toledo International, Inc.(a) | 699 | 555,705 | ||||||
Thermo Fisher Scientific, Inc. | 4,276 | 1,493,137 | ||||||
Waters Corp.(a) | 785 | 156,882 | ||||||
|
| |||||||
| 3,842,857 | ||||||||
| SCHEDULES OF INVESTMENTS | 25 |
Schedule of Investments (continued) May 31, 2020 | BlackRock Advantage Large Cap Growth Fund (Percentages shown are based on Net Assets) |
| Security | Shares | Value | ||||||
| Machinery — 0.9% | ||||||||
Deere & Co. | 536 | $ | 81,536 | |||||
IDEX Corp. | 1,420 | 226,305 | ||||||
Illinois Tool Works, Inc. | 21,296 | 3,672,708 | ||||||
Oshkosh Corp. | 24,263 | 1,742,569 | ||||||
Snap-on, Inc. | 3,851 | 499,436 | ||||||
Toro Co. | 1,126 | 80,025 | ||||||
Xylem, Inc. | 15,726 | 1,043,263 | ||||||
|
| |||||||
| 7,345,842 | ||||||||
| Media — 1.0% | ||||||||
AMC Networks, Inc., Class A(a)(b) | 13,183 | 372,683 | ||||||
Comcast Corp., Class A | 51,331 | 2,032,708 | ||||||
Interpublic Group of Cos., Inc. | 116,292 | 1,989,756 | ||||||
Nexstar Media Group, Inc., Class A | 1,632 | 135,962 | ||||||
Sirius XM Holdings, Inc. | 659,126 | 3,836,113 | ||||||
|
| |||||||
| 8,367,222 | ||||||||
| Metals & Mining — 0.0% | ||||||||
Reliance Steel & Aluminum Co. | 1,891 | 183,427 | ||||||
|
| |||||||
| Multiline Retail — 0.5% | ||||||||
Dollar General Corp. | 16,478 | 3,155,702 | ||||||
Target Corp. | 7,492 | 916,496 | ||||||
|
| |||||||
| 4,072,198 | ||||||||
| Multi-Utilities — 0.1% | ||||||||
CMS Energy Corp. | 11,251 | 659,084 | ||||||
|
| |||||||
| Oil, Gas & Consumable Fuels — 0.1% | ||||||||
Continental Resources, Inc. | 27,234 | 333,072 | ||||||
EOG Resources, Inc. | 8,418 | 429,066 | ||||||
Marathon Oil Corp. | 67,848 | 362,308 | ||||||
|
| |||||||
| 1,124,446 | ||||||||
| Paper & Forest Products — 0.1% | ||||||||
Domtar Corp. | 27,782 | 566,753 | ||||||
|
| |||||||
| Personal Products — 0.1% | ||||||||
Estee Lauder Cos., Inc., Class A | 4,553 | 899,081 | ||||||
|
| |||||||
| Pharmaceuticals — 3.1% | ||||||||
Bristol-Myers Squibb Co. | 51,074 | 3,050,139 | ||||||
Eli Lilly & Co. | 33,848 | 5,177,052 | ||||||
Merck & Co., Inc. | 131,456 | 10,611,128 | ||||||
Zoetis, Inc. | 45,793 | 6,383,086 | ||||||
|
| |||||||
| 25,221,405 | ||||||||
| Professional Services — 0.3% | ||||||||
IHS Markit Ltd. | 15,239 | 1,058,501 | ||||||
Robert Half International, Inc. | 35,414 | 1,796,906 | ||||||
|
| |||||||
| 2,855,407 | ||||||||
| Road & Rail — 0.8% | ||||||||
AMERCO | 2,612 | 842,370 | ||||||
CSX Corp. | 1,919 | 137,362 | ||||||
Landstar System, Inc. | 3,218 | 374,125 | ||||||
Norfolk Southern Corp. | 402 | 71,672 | ||||||
Union Pacific Corp. | 28,080 | 4,769,669 | ||||||
|
| |||||||
| 6,195,198 | ||||||||
| Semiconductors & Semiconductor Equipment — 4.2% | ||||||||
Advanced Micro Devices, Inc.(a) | 33,579 | 1,806,550 | ||||||
Applied Materials, Inc. | 36,609 | 2,056,694 | ||||||
Broadcom, Inc. | 7,396 | 2,154,233 | ||||||
Cabot Microelectronics Corp. | 1 | 145 | ||||||
Cirrus Logic, Inc.(a) | 28,101 | 2,036,761 | ||||||
Intel Corp. | 18,771 | 1,181,259 | ||||||
Lam Research Corp. | 14,522 | 3,974,236 | ||||||
Maxim Integrated Products, Inc. | 11,858 | 683,969 | ||||||
| Security | Shares | Value | ||||||
| Semiconductors & Semiconductor Equipment (continued) | ||||||||
Monolithic Power Systems, Inc. | 1,451 | $ | 304,347 | |||||
NVIDIA Corp. | 36,852 | 13,083,197 | ||||||
Skyworks Solutions, Inc. | 21,421 | 2,539,245 | ||||||
Texas Instruments, Inc. | 36,020 | 4,277,015 | ||||||
|
| |||||||
| 34,097,651 | ||||||||
| Software — 16.0% | ||||||||
Adobe, Inc.(a) | 36,096 | 13,954,714 | ||||||
Atlassian Corp. PLC, Class A(a) | 10,504 | 1,946,391 | ||||||
Autodesk, Inc.(a) | 6,829 | 1,436,685 | ||||||
Cadence Design Systems, Inc. | 6,005 | 548,197 | ||||||
Citrix Systems, Inc. | 10,554 | 1,563,259 | ||||||
Cloudflare, Inc., Class A(a) | 29,476 | 856,867 | ||||||
DocuSign, Inc.(a) | 14,069 | 1,966,002 | ||||||
FreedomPay, Inc.(a)(c) | 43,051 | 0 | ||||||
HubSpot, Inc.(a) | 6,094 | 1,218,434 | ||||||
Intuit, Inc. | 16,156 | 4,690,410 | ||||||
Microsoft Corp. | 411,276 | 75,366,327 | ||||||
New Relic, Inc.(a) | 17,379 | 1,149,621 | ||||||
Paycom Software, Inc.(a) | 474 | 140,887 | ||||||
Paylocity Holding Corp.(a) | 9,858 | 1,281,589 | ||||||
RingCentral, Inc., Class A(a) | 6,809 | 1,867,368 | ||||||
salesforce.com, Inc.(a) | 51,318 | 8,969,873 | ||||||
ServiceNow, Inc.(a) | 13,152 | 5,102,055 | ||||||
Slack Technologies, Inc., Class A(a) | 24,394 | 855,010 | ||||||
Smartsheet, Inc., Class A(a) | 18,460 | 1,064,404 | ||||||
Workday, Inc., Class A(a) | 19,397 | 3,557,992 | ||||||
Zendesk, Inc.(a) | 15,343 | 1,315,662 | ||||||
Zoom Video Communications, Inc., Class A(a) | 4,624 | 829,916 | ||||||
Zscaler, Inc.(a)(b) | 13,725 | 1,346,285 | ||||||
|
| |||||||
| 131,027,948 | ||||||||
| Specialty Retail — 3.0% | ||||||||
Best Buy Co., Inc. | 11,115 | 867,970 | ||||||
Home Depot, Inc. | 49,646 | 12,336,038 | ||||||
Lowe’s Cos., Inc. | 58,175 | 7,583,111 | ||||||
TJX Cos., Inc. | 38,751 | 2,044,503 | ||||||
Tractor Supply Co. | 9,587 | 1,169,806 | ||||||
Williams-Sonoma, Inc. | 11,685 | 972,309 | ||||||
|
| |||||||
| 24,973,737 | ||||||||
| Technology Hardware, Storage & Peripherals — 8.1% | ||||||||
Apple Inc. | 207,724 | 66,043,769 | ||||||
|
| |||||||
| Textiles, Apparel & Luxury Goods — 1.3% | ||||||||
Lululemon Athletica, Inc.(a) | 9,209 | 2,763,575 | ||||||
NIKE, Inc., Class B | 78,930 | 7,780,920 | ||||||
VF Corp. | 1,303 | 73,098 | ||||||
|
| |||||||
| 10,617,593 | ||||||||
| Trading Companies & Distributors — 0.3% | ||||||||
Fastenal Co. | 1,840 | 75,918 | ||||||
GATX Corp. | 22,729 | 1,426,017 | ||||||
SiteOne Landscape Supply, Inc.(a) | 783 | 83,241 | ||||||
WW Grainger, Inc. | 3,222 | 997,596 | ||||||
|
| |||||||
| 2,582,772 | ||||||||
| Water Utilities — 0.0% | ||||||||
American Water Works Co., Inc. | 1,965 | 249,555 | ||||||
|
| |||||||
| Wireless Telecommunication Services — 0.2% | ||||||||
Telephone & Data Systems, Inc. | 29,168 | 597,652 | ||||||
United States Cellular Corp.(a) | 32,194 | 1,014,433 | ||||||
|
| |||||||
| 1,612,085 | ||||||||
|
| |||||||
Total Common Stocks — 96.5% |
| 790,859,360 | ||||||
|
| |||||||
| 26 | 2020 BLACKROCK ANNUAL REPORTTO SHAREHOLDERS |
Schedule of Investments (continued) May 31, 2020 | BlackRock Advantage Large Cap Growth Fund (Percentages shown are based on Net Assets) |
| Security | Shares | Value | ||||||
Rights | ||||||||
| Pharmaceuticals — 0.0% | ||||||||
Bristol-Myers Squibb Co., CVR(a) | 36,866 | $ | 121,289 | |||||
|
| |||||||
Total Rights — 0.0% |
| 121,289 | ||||||
|
| |||||||
Total Long-Term Investments — 96.5% | 790,980,649 | |||||||
|
| |||||||
| Short-Term Securities(d)(e) | ||||||||
| Money Market Funds — 3.4% | ||||||||
BlackRock Liquidity Funds, T-Fund, Institutional Class, 0.11% | 24,850,774 | 24,850,774 | ||||||
SL Liquidity Series, LLC, Money Market Series, 0.63%(f) | 2,791,032 | 2,793,823 | ||||||
|
| |||||||
Total Short-Term Securities — 3.4% | 27,644,597 | |||||||
|
| |||||||
Total Investments — 99.9% | 818,625,246 | |||||||
Other Assets Less Liabilities — 0.1% | 506,091 | |||||||
|
| |||||||
Net Assets — 100.0% | $ | 819,131,337 | ||||||
|
| |||||||
| (a) | Non-income producing security. |
| (b) | All or a portion of this security is on loan. |
| (c) | Security is valued using significant unobservable inputs and is classified as Level 3 in the fair value hierarchy. |
| (d) | Affiliate of the Fund. |
| (e) | Annualized 7-day yield as of period end. |
| (f) | All or a portion of this security was purchased with the cash collateral from loaned securities. |
Affiliates
Investments in issuers considered to be an affiliate/affiliates of the Fund during the period ended May 31, 2020 for purposes of Section 2(a)(3) of the Investment Company Act of 1940, as amended, were as follows:
Affiliated Issuer | | Shares Held at 09/30/19 | | | Shares Purchased | | | Shares Sold | | | Shares Held at 05/31/20 | | | Value at 05/31/20 | | Income | | Net Realized Gain (Loss) |
(a) | | Change in Unrealized Appreciation (Depreciation) | | ||||||||||
BlackRock Liquidity Funds, T-Fund, Institutional Class | 7,520,756 | 17,330,018 | (b) | — | 24,850,774 | $ | 24,850,774 | $ | 61,146 | $ | 14 | $ | — | |||||||||||||||||||
SL Liquidity Series, LLC, Money Market Series | 706,825 | 2,084,207 | (b) | — | 2,791,032 | 2,793,823 | 11,454 | (c) | (556 | ) | 1,136 | |||||||||||||||||||||
|
|
|
|
|
|
|
| |||||||||||||||||||||||||
| $ | 27,644,597 | $ | 72,600 | $ | (542 | ) | $ | 1,136 | ||||||||||||||||||||||||
|
|
|
|
|
|
|
|
| (a) | Includes net capital gain distributions, if applicable. |
| (b) | Represents net shares purchased (sold). |
| (c) | Represents securities lending income earned from the reinvestment of cash collateral from loaned securities, net of fees and collateral investment expenses, and other payments to and from borrowers of securities. |
For Fund compliance purposes, the Fund’s sector classifications refer to one or more of the sector sub-classifications used by one or more widely recognized market indexes or rating group indexes, and/or as defined by the investment adviser. These definitions may not apply for purposes of this report, which may combine such sector sub-classifications for reporting ease.
Futures Contracts
| Description | Number of Contracts | Expiration Date | Notional Amount (000) | Value/ Unrealized Appreciation (Depreciation) | ||||||||||||
Long Contracts | ||||||||||||||||
S&P 500 E-Mini Index | 189 | 06/19/20 | $ | 28,747 | $ | 1,608,668 | ||||||||||
|
| |||||||||||||||
| SCHEDULES OF INVESTMENTS | 27 |
Schedule of Investments (continued) May 31, 2020 | BlackRock Advantage Large Cap Growth Fund
|
Derivative Financial Instruments Categorized by Risk Exposure
As of period end, the fair values of derivative financial instruments located in the Statements of Assets and Liabilities were as follows:
Commodity Contracts | Credit Contracts | Equity Contracts | Foreign Currency Exchange Contracts | Interest Rate Contracts | Other Contracts | Total | ||||||||||||||||||||||
Assets — Derivative Financial Instruments | ||||||||||||||||||||||||||||
Futures contracts | ||||||||||||||||||||||||||||
Unrealized appreciation(a) | $ | — | $ | — | $ | 1,608,668 | $ | — | $ | — | $ | — | $ | 1,608,668 | ||||||||||||||
|
|
|
|
|
|
|
|
|
|
|
|
|
| |||||||||||||||
| (a) | Net cumulative unrealized appreciation (depreciation) on futures contracts, if any, as reported in the Schedule of Investments. In the Statements of Assets and Liabilities, only current day’s variation margin is reported in receivables or payables and the net cumulative unrealized appreciation (depreciation) is included in accumulated earnings (loss). |
For the period ended May 31, 2020, the effect of derivative financial instruments in the Statements of Operations was as follows:
Commodity Contracts | Credit Contracts | Equity Contracts | Foreign Currency Exchange Contracts | Interest Rate Contracts | Other Contracts | Total | ||||||||||||||||||||||
Net Realized Gain (Loss) from | ||||||||||||||||||||||||||||
Futures contracts | $ | — | $ | — | $ | 433,249 | $ | — | $ | — | $ | — | $ | 433,249 | ||||||||||||||
|
|
|
|
|
|
|
|
|
|
|
|
|
| |||||||||||||||
Net Change in Unrealized Appreciation (Depreciation) on | ||||||||||||||||||||||||||||
Futures contracts | $ | — | $ | — | $ | 1,690,861 | $ | — | $ | — | $ | — | $ | 1,690,861 | ||||||||||||||
|
|
|
|
|
|
|
|
|
|
|
|
|
| |||||||||||||||
Average Quarterly Balances of Outstanding Derivative Financial Instruments
Futures contracts | ||||
Average notional value of contracts — long | $ | 20,522,500 |
For more information about the Fund’s investment risks regarding derivative financial instruments, refer to the Notes to Financial Statements.
Fair Value Hierarchy as of Period End
Various inputs are used in determining the fair value of investments and derivative financial instruments. For information about the Fund’s policy regarding valuation of investments and derivative financial instruments, refer to the Notes to Financial Statements.
The following table summarizes the Fund’s investments and derivative financial instruments categorized in the disclosure hierarchy:
| Level 1 | Level 2 | Level 3 | Total | |||||||||||||
Assets | ||||||||||||||||
Investments | ||||||||||||||||
Long-Term Investments | ||||||||||||||||
Common Stocks(a) | $ | 790,859,360 | $ | — | $ | — | $ | 790,859,360 | ||||||||
Rights(a) | 121,289 | — | — | 121,289 | ||||||||||||
Short-Term Securities | ||||||||||||||||
Money Market Funds | 24,850,774 | — | — | 24,850,774 | ||||||||||||
|
|
|
|
|
|
|
| |||||||||
| $ | 815,831,423 | $ | — | $ | — | 815,831,423 | ||||||||||
|
|
|
|
|
|
|
| |||||||||
Investments Valued at NAV(b) | 2,793,823 | |||||||||||||||
|
| |||||||||||||||
| $ | 818,625,246 | |||||||||||||||
|
| |||||||||||||||
Derivative Financial Instruments(c) | ||||||||||||||||
Assets | ||||||||||||||||
Equity Contracts | $ | 1,608,668 | $ | — | $ | — | $ | 1,608,668 | ||||||||
|
|
|
|
|
|
|
| |||||||||
| (a) | See above Schedule of Investments for values in each industry. |
| (b) | Certain investments of the Fund were fair valued using NAV per share as no quoted market value is available and therefore have been excluded from the fair value hierarchy. |
| (c) | Derivative financial instruments are futures contracts. Futures contracts are valued at the unrealized appreciation (depreciation) on the instrument. |
See notes to financial statements.
| 28 | 2020 BLACKROCK ANNUAL REPORTTO SHAREHOLDERS |
Schedule of Investments May 31, 2020 | BlackRock Advantage Small Cap Core Fund (Percentages shown are based on Net Assets) |
| Security | Shares | Value | ||||||
Common Stocks | ||||||||
| Aerospace & Defense — 0.9% | ||||||||
AAR Corp. | 23,042 | $ | 464,757 | |||||
Aerojet Rocketdyne Holdings, Inc.(a) | 46,742 | 2,049,637 | ||||||
Axon Enterprise, Inc.(a)(b) | 29,866 | 2,268,621 | ||||||
Cubic Corp. | 4,912 | 202,424 | ||||||
HEICO Corp., Class A | 10,955 | 919,672 | ||||||
Kratos Defense & Security Solutions, Inc.(a) | 12,058 | 223,676 | ||||||
Maxar Technologies, Inc. | 29,459 | 443,947 | ||||||
Mercury Systems, Inc.(a) | 32,763 | 2,927,374 | ||||||
Moog, Inc., Class A | 30,331 | 1,646,670 | ||||||
PAE, Inc.(a)(b) | 20,248 | 190,331 | ||||||
Park Aerospace Corp. | 17,053 | 206,853 | ||||||
Vectrus, Inc.(a) | 3,800 | 208,696 | ||||||
|
| |||||||
| 11,752,658 | ||||||||
| Air Freight & Logistics — 0.4% | ||||||||
Echo Global Logistics, Inc.(a) | 9,859 | 204,081 | ||||||
Forward Air Corp. | 24,417 | 1,213,037 | ||||||
Hub Group, Inc., Class A(a) | 91,837 | 4,295,216 | ||||||
Radiant Logistics, Inc.(a) | 51,839 | 206,838 | ||||||
|
| |||||||
| 5,919,172 | ||||||||
| Airlines — 0.1% | ||||||||
Allegiant Travel Co. | 2,895 | 308,462 | ||||||
Spirit Airlines, Inc.(a)(b) | 109,347 | 1,416,044 | ||||||
|
| |||||||
| 1,724,506 | ||||||||
| Auto Components — 0.9% | ||||||||
Adient PLC(a) | 22,198 | 377,588 | ||||||
Cooper-Standard Holdings, Inc.(a) | 29,708 | 311,637 | ||||||
Dana, Inc. | 16,952 | 214,273 | ||||||
Dorman Products, Inc.(a) | 16,249 | 1,136,130 | ||||||
Fox Factory Holding Corp.(a)(b) | 25,205 | 1,817,533 | ||||||
LCI Industries | 64,553 | 6,386,228 | ||||||
Standard Motor Products, Inc. | 16,678 | 709,649 | ||||||
Visteon Corp.(a) | 20,902 | 1,504,944 | ||||||
|
| |||||||
| 12,457,982 | ||||||||
| Banks — 7.5% | ||||||||
ACNB Corp. | 14,941 | 371,134 | ||||||
Amalgamated Bank, Class A | 7,829 | 87,920 | ||||||
Ameris Bancorp | 11,962 | 289,839 | ||||||
Atlantic Union Bankshares Corp. | 13,890 | 321,553 | ||||||
BancFirst Corp. | 90,067 | 3,433,354 | ||||||
Bancorp, Inc.(a) | 191,896 | 1,688,685 | ||||||
BancorpSouth Bank | 44,750 | 994,792 | ||||||
Bank of Commerce Holdings | 50,450 | 384,933 | ||||||
Bank7 Corp. | 276 | 2,815 | ||||||
BankFinancial Corp. | 31,027 | 281,725 | ||||||
Bankwell Financial Group, Inc. | 10,886 | 159,371 | ||||||
Banner Corp. | 67,339 | 2,529,253 | ||||||
Berkshire Hills Bancorp, Inc. | 32,728 | 354,117 | ||||||
BOK Financial Corp. | 2 | 102 | ||||||
Boston Private Financial Holdings, Inc. | 38,520 | 264,632 | ||||||
Bridge Bancorp, Inc. | 9,311 | 198,324 | ||||||
Cadence BanCorp. | 61,227 | 494,102 | ||||||
Capital City Bank Group, Inc. | 64,227 | 1,307,019 | ||||||
Capstar Financial Holdings, Inc. | 52,415 | 603,821 | ||||||
Cathay General Bancorp | 229,172 | 6,231,187 | ||||||
CenterState Bank Corp. | 191,530 | 3,026,174 | ||||||
Central Pacific Financial Corp. | 18,484 | 297,777 | ||||||
City Holding Co. | 2,455 | 154,420 | ||||||
Civista Bancshares, Inc. | 13,217 | 201,427 | ||||||
Community Bank System, Inc. | 17,787 | 1,056,904 | ||||||
| Security | Shares | Value | ||||||
| Banks (continued) | ||||||||
Community Bankers Trust Corp. | 27,257 | $ | 153,457 | |||||
Community Trust Bancorp, Inc. | 2,600 | 85,384 | ||||||
Customers Bancorp, Inc.(a) | 17,187 | 190,604 | ||||||
CVB Financial Corp. | 52,811 | 1,030,343 | ||||||
Enterprise Financial Services Corp. | 2,482 | 72,896 | ||||||
Financial Institutions, Inc. | 11,079 | 195,988 | ||||||
First Bancorp | 5,888 | 149,673 | ||||||
First BanCorp | 151,125 | 826,654 | ||||||
First Commonwealth Financial Corp. | 31,962 | 261,449 | ||||||
First Community Bankshares, Inc. | 73,453 | 1,569,691 | ||||||
First Financial Bankshares, Inc. | 57,472 | 1,760,942 | ||||||
First Financial Corp. | 31,125 | 1,092,487 | ||||||
First Financial Northwest, Inc. | 70,603 | 689,791 | ||||||
First Foundation, Inc. | 15,820 | 235,718 | ||||||
First Horizon National Corp. | 12,016 | 112,350 | ||||||
First Interstate BancSystem, Inc., Class A | 3,358 | 104,938 | ||||||
First Midwest Bancorp, Inc. | 36,821 | 480,514 | ||||||
First United Corp. | 33,701 | 463,726 | ||||||
Flushing Financial Corp. | 9,189 | 104,203 | ||||||
Fulton Financial Corp. | 91,673 | 1,027,654 | ||||||
Glacier Bancorp, Inc. | 37,412 | 1,541,000 | ||||||
Hancock Whitney Corp. | 108,487 | 2,345,489 | ||||||
HBT Financial, Inc. | 161,915 | 2,059,559 | ||||||
Heartland Financial USA, Inc. | 26,918 | 861,645 | ||||||
Heritage Commerce Corp. | 19,837 | 161,275 | ||||||
Hilltop Holdings, Inc. | 19,300 | 360,717 | ||||||
Home BancShares, Inc. | 266,421 | 3,855,112 | ||||||
IBERIABANK Corp. | 37,440 | 1,587,830 | ||||||
Independent Bank Corp. | 8,147 | 565,972 | ||||||
Independent Bank Corp. | 52,975 | 732,114 | ||||||
Independent Bank Group, Inc. | 65,245 | 2,471,481 | ||||||
International Bancshares Corp. | 22,985 | 707,478 | ||||||
Investar Holding Corp. | 17,357 | 226,509 | ||||||
Investors Bancorp, Inc. | 356,003 | 3,090,106 | ||||||
Lakeland Bancorp, Inc. | 119,227 | 1,323,420 | ||||||
Lakeland Financial Corp. | 20,152 | 860,289 | ||||||
Macatawa Bank Corp. | 19,763 | 146,049 | ||||||
Mercantile Bank Corp. | 60,729 | 1,393,123 | ||||||
National Bank Holdings Corp., Class A | 24,426 | 642,404 | ||||||
Northrim BanCorp, Inc. | 1,600 | 36,912 | ||||||
OceanFirst Financial Corp. | 25,603 | 427,570 | ||||||
Opus Bank | 61,261 | 1,193,977 | ||||||
Pacific Mercantile Bancorp(a) | 201,219 | 764,632 | ||||||
Park National Corp. | 2,253 | 168,682 | ||||||
QCR Holdings, Inc. | 11,451 | 347,767 | ||||||
Renasant Corp. | 10,974 | 264,693 | ||||||
Republic Bancorp, Inc., Class A | 38,747 | 1,241,841 | ||||||
Republic First Bancorp, Inc.(a) | 1,076,564 | 2,551,457 | ||||||
Sandy Spring Bancorp, Inc. | 344,230 | 8,347,577 | ||||||
Sierra Bancorp | 95,026 | 1,790,290 | ||||||
Simmons First National Corp., Class A | 28,371 | 486,563 | ||||||
South Plains Financial, Inc. | 45,542 | 601,154 | ||||||
South State Corp. | 64,696 | 3,401,069 | ||||||
Southern National Bancorp of Virginia, Inc. | 20,115 | 202,357 | ||||||
Southside Bancshares, Inc. | 9,753 | 275,035 | ||||||
Synovus Financial Corp. | 38,426 | 737,395 | ||||||
Towne Bank | 28,229 | 532,399 | ||||||
TriCo Bancshares | 24,273 | 688,625 | ||||||
TriState Capital Holdings, Inc.(a) | 267,267 | 3,995,642 | ||||||
Trustmark Corp. | 28,756 | 684,105 | ||||||
UMB Financial Corp. | 2,241 | 114,918 | ||||||
United Bankshares, Inc. | 47,088 | 1,369,319 | ||||||
| SCHEDULES OF INVESTMENTS | 29 |
Schedule of Investments (continued) May 31, 2020 | BlackRock Advantage Small Cap Core Fund (Percentages shown are based on Net Assets) |
| Security | Shares | Value | ||||||
| Banks (continued) | ||||||||
United Community Banks, Inc. | 110,433 | $ | 2,158,965 | |||||
United Security Bancshares | 7,219 | 44,252 | ||||||
Univest Financial Corp. | 85,725 | 1,409,319 | ||||||
Valley National Bancorp | 38,868 | 310,167 | ||||||
Washington Trust Bancorp, Inc. | 42,039 | 1,343,987 | ||||||
WesBanco, Inc. | 34,028 | 728,880 | ||||||
West Bancorporation, Inc. | 21,127 | 372,680 | ||||||
Westamerica BanCorp. | 3,019 | 178,061 | ||||||
Wintrust Financial Corp. | 32,903 | 1,393,771 | ||||||
|
| |||||||
| 98,439,475 | ||||||||
| Beverages — 0.3% | ||||||||
Boston Beer Co., Inc., Class A(a) | 3,931 | 2,219,954 | ||||||
National Beverage Corp.(a) | 30,488 | 1,737,206 | ||||||
|
| |||||||
| 3,957,160 | ||||||||
| Biotechnology — 10.0% | ||||||||
ACADIA Pharmaceuticals, Inc.(a)(b) | 114,205 | 5,673,704 | ||||||
Acceleron Pharma, Inc.(a)(b) | 40,051 | 3,958,240 | ||||||
ADMA Biologics, Inc.(a) | 58,074 | 191,063 | ||||||
Adverum Biotechnologies, Inc.(a) | 8,260 | 170,404 | ||||||
Agenus, Inc.(a) | 523,646 | 1,953,200 | ||||||
Aimmune Therapeutics, Inc.(a) | 6,798 | 112,915 | ||||||
Akebia Therapeutics, Inc.(a) | 129,064 | 1,502,305 | ||||||
Akero Therapeutics, Inc.(a) | 9,785 | 248,735 | ||||||
Alector, Inc.(a) | 37,394 | 1,222,784 | ||||||
Allakos, Inc.(a)(b) | 2,279 | 148,135 | ||||||
Allogene Therapeutics, Inc.(a) | 13,657 | 657,721 | ||||||
Amicus Therapeutics, Inc.(a)(b) | 131,585 | 1,641,523 | ||||||
AnaptysBio, Inc.(a) | 8,900 | 169,812 | ||||||
Apellis Pharmaceuticals, Inc.(a) | 35,736 | 1,203,946 | ||||||
Aptinyx, Inc.(a) | 24,653 | 92,202 | ||||||
Arcus Biosciences, Inc.(a)(b) | 46,513 | 1,458,182 | ||||||
Ardelyx, Inc.(a) | 40,628 | 297,803 | ||||||
Arena Pharmaceuticals, Inc.(a) | 18,290 | 1,093,193 | ||||||
Arrowhead Pharmaceuticals, Inc.(a)(b) | 82,720 | 2,666,893 | ||||||
Assembly Biosciences, Inc.(a) | 12,622 | 246,003 | ||||||
Atara Biotherapeutics, Inc.(a)(b) | 81,128 | 932,972 | ||||||
Athenex, Inc.(a) | 29,269 | 318,154 | ||||||
Athersys, Inc.(a) | 119,213 | 346,910 | ||||||
Beam Therapeutics, Inc.(a)(b) | 47,662 | 1,217,764 | ||||||
Beyondspring, Inc.(a) | 1,202 | 20,434 | ||||||
BioCryst Pharmaceuticals, Inc.(a)(b) | 394,388 | 1,772,774 | ||||||
Biohaven Pharmaceutical Holding Co. Ltd.(a) | 29,511 | 1,843,552 | ||||||
Blueprint Medicines Corp.(a) | 46,104 | 3,003,214 | ||||||
Bridgebio Pharma, Inc.(a) | 37,424 | 1,097,646 | ||||||
Calithera Biosciences, Inc.(a)(b) | 158,519 | 922,581 | ||||||
Castle Biosciences, Inc.(a)(b) | 5,861 | 225,238 | ||||||
Celldex Therapeutics, Inc.(a) | 23 | 61 | ||||||
ChemoCentryx, Inc.(a) | 30,616 | 1,910,132 | ||||||
Chimerix, Inc.(a)(b) | 70,382 | 219,592 | ||||||
Clovis Oncology, Inc.(a)(b) | 43,488 | 300,937 | ||||||
Coherus Biosciences, Inc.(a) | 143,013 | 2,665,762 | ||||||
Constellation Pharmaceuticals, Inc.(a) | 4,297 | 152,672 | ||||||
Corvus Pharmaceuticals, Inc.(a)(b) | 40,634 | 140,187 | ||||||
Crinetics Pharmaceuticals, Inc.(a) | 8,110 | 132,517 | ||||||
Cytokinetics, Inc.(a) | 10,498 | 217,414 | ||||||
CytomX Therapeutics, Inc.(a) | 59,124 | 523,839 | ||||||
Deciphera Pharmaceuticals, Inc.(a) | 28,986 | 1,697,710 | ||||||
Denali Therapeutics, Inc.(a) | 22,733 | 632,659 | ||||||
Dynavax Technologies Corp.(a) | 39,888 | 244,115 | ||||||
Editas Medicine, Inc.(a)(b) | 52,075 | 1,409,670 | ||||||
Emergent BioSolutions, Inc.(a) | 43,493 | 3,631,231 | ||||||
Enanta Pharmaceuticals, Inc.(a) | 56,042 | 2,885,603 | ||||||
| Security | Shares | Value | ||||||
| Biotechnology (continued) | ||||||||
Epizyme, Inc.(a)(b) | 48,420 | $ | 849,771 | |||||
Exact Sciences Corp.(a) | 9,348 | 802,806 | ||||||
Exelixis, Inc.(a) | 15,198 | 375,543 | ||||||
Fate Therapeutics, Inc.(a)(b) | 68,960 | 2,236,373 | ||||||
FibroGen, Inc.(a)(b) | 81,326 | 2,719,541 | ||||||
Flexion Therapeutics, Inc.(a) | 53,218 | 608,282 | ||||||
Frequency Therapeutics, Inc.(a)(b) | 16,270 | 301,971 | ||||||
G1 Therapeutics, Inc.(a)(b) | 16,933 | 287,353 | ||||||
Global Blood Therapeutics, Inc.(a)(b) | 32,530 | 2,274,498 | ||||||
Gossamer Bio, Inc.(a) | 34,480 | 418,932 | ||||||
Halozyme Therapeutics, Inc.(a) | 169,908 | 4,123,667 | ||||||
Harpoon Therapeutics, Inc.(a) | 103,398 | 2,249,940 | ||||||
Heron Therapeutics, Inc.(a) | 76,048 | 1,385,594 | ||||||
ImmunoGen, Inc.(a) | 50,349 | 235,633 | ||||||
Immunomedics, Inc.(a) | 113,579 | 3,815,119 | ||||||
Inovio Pharmaceuticals, Inc.(a)(b) | 175,609 | 2,590,233 | ||||||
Insmed, Inc.(a) | 43,061 | 1,045,952 | ||||||
Intellia Therapeutics, Inc.(a) | 132,633 | 2,322,404 | ||||||
Intercept Pharmaceuticals, Inc.(a)(b) | 20,823 | 1,504,670 | ||||||
Invitae Corp.(a) | 64,998 | 1,093,266 | ||||||
Iovance Biotherapeutics, Inc.(a) | 61,379 | 1,969,652 | ||||||
Ironwood Pharmaceuticals, Inc.(a) | 268,604 | 2,613,517 | ||||||
Kadmon Holdings, Inc.(a) | 50,146 | 222,648 | ||||||
Karuna Therapeutics, Inc.(a) | 2,994 | 281,017 | ||||||
Karyopharm Therapeutics, Inc.(a) | 19,969 | 369,227 | ||||||
Kodiak Sciences, Inc.(a) | 12,186 | 787,337 | ||||||
Ligand Pharmaceuticals, Inc.(a) | 30,494 | 3,097,276 | ||||||
MacroGenics, Inc.(a) | 91,278 | 1,756,189 | ||||||
Mirati Therapeutics, Inc.(a) | 19,626 | 1,946,703 | ||||||
Momenta Pharmaceuticals, Inc.(a)(b) | 72,693 | 2,288,376 | ||||||
Myriad Genetics, Inc.(a) | 23,769 | 345,364 | ||||||
Natera, Inc.(a) | 59,564 | 2,611,881 | ||||||
Novavax, Inc.(a) | 51,208 | 2,357,616 | ||||||
OPKO Health, Inc.(a)(b) | 338,001 | 770,642 | ||||||
Portola Pharmaceuticals, Inc.(a) | 54,681 | 981,524 | ||||||
Precigen, Inc.(a)(b) | 54,022 | 118,848 | ||||||
Prevail Therapeutics, Inc.(a) | 25,686 | 428,442 | ||||||
Principia Biopharma, Inc.(a) | 18,003 | 1,150,212 | ||||||
PTC Therapeutics, Inc.(a) | 12,459 | 631,796 | ||||||
Puma Biotechnology, Inc.(a) | 59,265 | 605,096 | ||||||
Radius Health, Inc.(a) | 17,566 | 222,386 | ||||||
REGENXBIO, Inc.(a)(b) | 43,784 | 1,648,905 | ||||||
Replimune Group, Inc.(a)(b) | 34,191 | 642,107 | ||||||
Retrophin, Inc.(a) | 157,641 | 2,472,599 | ||||||
Rigel Pharmaceuticals, Inc.(a)(b) | 667,873 | 1,305,692 | ||||||
Sangamo Therapeutics, Inc.(a) | 127,684 | 1,428,784 | ||||||
Seres Therapeutics, Inc.(a) | 76,875 | 422,044 | ||||||
Spectrum Pharmaceuticals, Inc.(a) | 115,457 | 339,444 | ||||||
Stemline Therapeutics, Inc.(a)(b) | 32,870 | 390,496 | ||||||
Syndax Pharmaceuticals, Inc.(a) | 25,129 | 407,090 | ||||||
Turning Point Therapeutics, Inc.(a) | 6,312 | 437,106 | ||||||
Ultragenyx Pharmaceutical, Inc.(a)(b) | 66,457 | 4,549,646 | ||||||
UNITY Biotechnology, Inc.(a) | 38,152 | 312,083 | ||||||
UroGen Pharma Ltd.(a)(b) | 14,829 | 348,037 | ||||||
Vanda Pharmaceuticals, Inc.(a) | 68,698 | 805,141 | ||||||
Veracyte, Inc.(a) | 95,749 | 2,387,980 | ||||||
Verastem, Inc.(a) | 80,815 | 150,316 | ||||||
Vericel Corp.(a) | 28,040 | 403,215 | ||||||
Vir Biotechnology, Inc.(a) | 48,211 | 1,647,852 | ||||||
Voyager Therapeutics, Inc.(a) | 20,082 | 242,992 | ||||||
| 30 | 2020 BLACKROCK ANNUAL REPORTTO SHAREHOLDERS |
Schedule of Investments (continued) May 31, 2020 | BlackRock Advantage Small Cap Core Fund (Percentages shown are based on Net Assets) |
| Security | Shares | Value | ||||||
| Biotechnology (continued) | ||||||||
Xencor, Inc.(a) | 42,168 | $ | 1,275,582 | |||||
Y-mAbs Therapeutics, Inc.(a) | 11,845 | 452,242 | ||||||
|
| |||||||
| 132,040,753 | ||||||||
| Building Products — 1.1% | ||||||||
AAON, Inc. | 9,747 | 527,995 | ||||||
Advanced Drainage Systems, Inc. | 52,286 | 2,318,361 | ||||||
American Woodmark Corp.(a) | 12,552 | 787,764 | ||||||
Builders FirstSource, Inc.(a) | 188,743 | 3,927,742 | ||||||
Caesarstone Ltd. | 19,767 | 220,205 | ||||||
Gibraltar Industries, Inc.(a) | 12,734 | 560,423 | ||||||
Trex Co., Inc.(a) | 49,327 | 5,925,159 | ||||||
|
| |||||||
| 14,267,649 | ||||||||
| Capital Markets — 1.7% | ||||||||
Ares Management Corp., Class A | 83,894 | 3,167,838 | ||||||
Artisan Partners Asset Management, Inc., Class A | 32,545 | 942,829 | ||||||
Brightsphere Investment Group, Inc. | 157,759 | 1,317,288 | ||||||
Cohen & Steers, Inc. | 13,464 | 855,637 | ||||||
Donnelley Financial Solutions, Inc.(a) | 103,647 | 844,723 | ||||||
Federated Hermes, Inc. | 47,049 | 1,041,665 | ||||||
Focus Financial Partners, Inc., Class A(a) | 22,864 | 636,534 | ||||||
Hamilton Lane, Inc., Class A | 30,270 | 2,214,856 | ||||||
Houlihan Lokey, Inc. | 20,905 | 1,264,334 | ||||||
Moelis & Co., Class A | 50,418 | 1,695,557 | ||||||
PJT Partners, Inc., Class A | 4,521 | 247,254 | ||||||
Silvercrest Asset Management Group, Inc., Class A | 7,019 | 79,104 | ||||||
Stifel Financial Corp. | 67,675 | 3,228,774 | ||||||
Virtus Investment Partners, Inc. | 36,882 | 3,429,288 | ||||||
Waddell & Reed Financial, Inc., Class A | 29,434 | 383,819 | ||||||
Westwood Holdings Group, Inc. | 15,308 | 271,411 | ||||||
WisdomTree Investments, Inc. | 127,503 | 381,234 | ||||||
|
| |||||||
| 22,002,145 | ||||||||
| Chemicals — 1.2% | ||||||||
Balchem Corp. | 32,125 | 3,233,381 | ||||||
HB Fuller Co. | 8,741 | 328,837 | ||||||
Ingevity Corp.(a)(b) | 44,445 | 2,340,918 | ||||||
Innospec, Inc. | 17,930 | 1,382,224 | ||||||
Kronos Worldwide, Inc. | 41,099 | 401,126 | ||||||
Orion Engineered Carbons SA | 42,665 | 471,875 | ||||||
PolyOne Corp. | 225,231 | 5,581,224 | ||||||
PQ Group Holdings, Inc.(a) | 41,095 | 515,742 | ||||||
Sensient Technologies Corp. | 13,706 | 686,945 | ||||||
Stepan Co. | 9,351 | 908,543 | ||||||
Trinseo SA | 34,454 | 709,063 | ||||||
|
| |||||||
| 16,559,878 | ||||||||
| Commercial Services & Supplies — 1.9% | ||||||||
ABM Industries, Inc. | 12,374 | 380,253 | ||||||
Advanced Disposal Services, Inc.(a)(b) | 52,116 | 1,624,977 | ||||||
ARC Document Solutions, Inc. | 47,300 | 48,246 | ||||||
CECO Environmental Corp.(a) | 26,071 | 138,437 | ||||||
Ennis, Inc. | 42,612 | 758,494 | ||||||
Healthcare Services Group, Inc. | 34,564 | 826,771 | ||||||
Kimball International, Inc., Class B | 9,608 | 107,513 | ||||||
McGrath RentCorp | 128,922 | 7,188,691 | ||||||
Mobile Mini, Inc. | 176,715 | 5,661,948 | ||||||
MSA Safety, Inc. | 23,456 | 2,789,857 | ||||||
Steelcase, Inc., Class A | 321,671 | 3,724,950 | ||||||
Tetra Tech, Inc. | 19,209 | 1,515,590 | ||||||
|
| |||||||
| 24,765,727 | ||||||||
| Communications Equipment — 0.9% | ||||||||
Acacia Communications, Inc.(a)(b) | 26,416 | 1,783,080 | ||||||
| Security | Shares | Value | ||||||
| Communications Equipment (continued) | ||||||||
Calix, Inc.(a)(b) | 166,011 | $ | 2,340,755 | |||||
Ciena Corp.(a) | 67,643 | 3,737,952 | ||||||
Lumentum Holdings, Inc.(a) | 31,063 | 2,277,539 | ||||||
NETGEAR, Inc.(a) | 12,540 | 322,654 | ||||||
NetScout Systems, Inc.(a)(b) | 23,838 | 654,830 | ||||||
TESSCO Technologies, Inc. | 94,551 | 503,012 | ||||||
|
| |||||||
| 11,619,822 | ||||||||
| Construction & Engineering — 1.3% | ||||||||
Comfort Systems USA, Inc. | 194,672 | 7,202,864 | ||||||
Dycom Industries, Inc.(a) | 53,816 | 2,265,654 | ||||||
EMCOR Group, Inc. | 48,506 | 3,082,556 | ||||||
MasTec, Inc.(a) | 56,233 | 2,201,522 | ||||||
MYR Group, Inc.(a) | 54,218 | 1,562,021 | ||||||
WillScot Corp.(a) | 26,624 | 355,164 | ||||||
|
| |||||||
| 16,669,781 | ||||||||
| Construction Materials — 0.2% | ||||||||
Summit Materials, Inc., Class A(a)(b) | 176,415 | 2,679,744 | ||||||
|
| |||||||
| Consumer Finance — 0.9% | ||||||||
Encore Capital Group, Inc.(a)(b) | 9,765 | 310,234 | ||||||
Enova International, Inc.(a) | 81,874 | 1,158,517 | ||||||
FirstCash, Inc. | 85,709 | 5,979,917 | ||||||
Green Dot Corp., Class A(a) | 27,409 | 1,046,476 | ||||||
Nelnet, Inc., Class A | 3,957 | 195,041 | ||||||
PRA Group, Inc.(a) | 58,461 | 1,994,689 | ||||||
Regional Management Corp.(a) | 63,522 | 1,007,459 | ||||||
World Acceptance Corp.(a)(b) | 1,849 | 122,958 | ||||||
|
| |||||||
| 11,815,291 | ||||||||
| Containers & Packaging — 0.0% | ||||||||
Greif, Inc., Class A | 5,719 | 194,332 | ||||||
|
| |||||||
| Distributors — 0.1% | ||||||||
Core-Mark Holding Co., Inc. | 58,906 | 1,648,190 | ||||||
|
| |||||||
| Diversified Consumer Services — 1.2% | ||||||||
Chegg, Inc.(a) | 125,876 | 7,688,506 | ||||||
Laureate Education, Inc., Class A(a) | 55,005 | 535,199 | ||||||
Perdoceo Education Corp.(a) | 9,141 | 148,815 | ||||||
Strategic Education, Inc. | 31,432 | 5,331,810 | ||||||
WW International, Inc.(a) | 103,084 | 2,463,708 | ||||||
Zovio, Inc.(a) | 44 | 123 | ||||||
|
| |||||||
| 16,168,161 | ||||||||
| Diversified Financial Services — 0.2% | ||||||||
Alerus Financial Corp. | 5,366 | 97,285 | ||||||
Cannae Holdings, Inc.(a) | 32,684 | 1,203,752 | ||||||
FGL Holdings | 104,511 | 1,155,735 | ||||||
On Deck Capital, Inc.(a) | 16 | 12 | ||||||
|
| |||||||
| 2,456,784 | ||||||||
| Diversified Telecommunication Services — 0.6% | ||||||||
Anterix, Inc.(a) | 3,799 | 203,626 | ||||||
ATN International, Inc. | 9,033 | 536,560 | ||||||
Cogent Communications Holdings, Inc. | 48,044 | 3,676,327 | ||||||
Consolidated Communications Holdings, Inc. | 52,355 | 317,271 | ||||||
IDT Corp., Class B(a) | 22,890 | 145,123 | ||||||
Iridium Communications, Inc.(a) | 11,740 | 270,020 | ||||||
Ooma, Inc.(a) | 57,378 | 719,520 | ||||||
ORBCOMM, Inc.(a) | 77,080 | 211,199 | ||||||
Vonage Holdings Corp.(a) | 157,655 | 1,518,218 | ||||||
|
| |||||||
| 7,597,864 | ||||||||
| Electric Utilities — 1.2% | ||||||||
ALLETE, Inc. | 26,309 | 1,545,128 | ||||||
| SCHEDULES OF INVESTMENTS | 31 |
Schedule of Investments (continued) May 31, 2020 | BlackRock Advantage Small Cap Core Fund (Percentages shown are based on Net Assets) |
| Security | Shares | Value | ||||||
| Electric Utilities (continued) | ||||||||
El Paso Electric Co. | 29,119 | $ | 1,979,218 | |||||
IDACORP, Inc. | 73,650 | 6,866,389 | ||||||
MGE Energy, Inc. | 5,738 | 389,553 | ||||||
PNM Resources, Inc. | 33,440 | 1,365,021 | ||||||
Portland General Electric Co. | 81,520 | 3,840,407 | ||||||
|
| |||||||
| 15,985,716 | ||||||||
| Electrical Equipment — 0.9% | ||||||||
Atkore International Group, Inc.(a) | 120,802 | 3,242,326 | ||||||
AZZ, Inc. | 24,471 | 774,752 | ||||||
Encore Wire Corp. | 33,530 | 1,619,164 | ||||||
Generac Holdings, Inc.(a)(b) | 47,332 | 5,266,631 | ||||||
LSI Industries, Inc. | 73,401 | 450,682 | ||||||
|
| |||||||
| 11,353,555 | ||||||||
| Electronic Equipment, Instruments & Components — 2.4% | ||||||||
Anixter International, Inc.(a) | 21,862 | 2,092,412 | ||||||
Arlo Technologies, Inc.(a) | 70,333 | 155,436 | ||||||
Badger Meter, Inc. | 3,369 | 206,149 | ||||||
Belden, Inc. | 6,172 | 210,095 | ||||||
Daktronics, Inc. | 36,190 | 153,446 | ||||||
ePlus, Inc.(a) | 48,564 | 3,579,652 | ||||||
Fabrinet(a) | 13,028 | 833,010 | ||||||
FARO Technologies, Inc.(a) | 2,518 | 141,713 | ||||||
Fitbit, Inc., Class A(a) | 101,975 | 646,522 | ||||||
II-VI, Inc.(a) | 23,000 | 1,093,190 | ||||||
Insight Enterprises, Inc.(a) | 8,164 | 418,487 | ||||||
Novanta, Inc.(a) | 5,795 | 595,204 | ||||||
OSI Systems, Inc.(a) | 94,921 | 7,192,164 | ||||||
PC Connection, Inc.(b) | 99,943 | 4,325,533 | ||||||
Rogers Corp.(a) | 6,093 | 659,628 | ||||||
Sanmina Corp.(a) | 95,545 | 2,542,453 | ||||||
ScanSource, Inc.(a) | 144,222 | 3,555,072 | ||||||
Tech Data Corp.(a) | 25,486 | 3,472,213 | ||||||
|
| |||||||
| 31,872,379 | ||||||||
| Energy Equipment & Services — 0.5% | ||||||||
Archrock, Inc. | 324,759 | 2,062,220 | ||||||
Dril-Quip, Inc.(a) | 22,153 | 673,230 | ||||||
Exterran Corp.(a) | 51,371 | 329,802 | ||||||
Forum Energy Technologies, Inc.(a)(b) | 779,955 | 226,187 | ||||||
Liberty Oilfield Services, Inc., Class A | 39,343 | 202,616 | ||||||
Natural Gas Services Group, Inc.(a) | 33,524 | 209,860 | ||||||
NexTier Oilfield Solutions, Inc.(a)(b) | 26,715 | 77,473 | ||||||
Oceaneering International, Inc.(a) | 321,258 | 2,062,476 | ||||||
Oil States International, Inc.(a) | 57,409 | 243,414 | ||||||
Pioneer Energy Services Corp.(a) | 286 | 8 | ||||||
Seadrill Ltd.(a)(b) | 25,412 | 11,946 | ||||||
Solaris Oilfield Infrastructure, Inc., Class A | 52,889 | 366,521 | ||||||
|
| |||||||
| 6,465,753 | ||||||||
| Entertainment — 0.1% | ||||||||
Eros International PLC(a) | 59,813 | 193,196 | ||||||
IMAX Corp.(a) | 51,945 | 655,026 | ||||||
Marcus Corp. | 24,179 | 325,933 | ||||||
|
| |||||||
| 1,174,155 | ||||||||
| Equity Real Estate Investment Trusts (REITs) — 5.7% | ||||||||
Acadia Realty Trust | 182,020 | 2,135,095 | ||||||
Agree Realty Corp. | 7,822 | 490,987 | ||||||
Alexander & Baldwin, Inc. | 72,325 | 825,228 | ||||||
American Finance Trust, Inc. | 20,963 | 153,449 | ||||||
Armada Hoffler Properties, Inc. | 185,118 | 1,595,717 | ||||||
Braemar Hotels & Resorts, Inc. | 47,560 | 161,704 | ||||||
CareTrust REIT, Inc. | 39,197 | 730,240 | ||||||
| Security | Shares | Value | ||||||
| Equity Real Estate Investment Trusts (REITs) (continued) | ||||||||
City Office REIT, Inc. | 347,091 | $ | 3,221,004 | |||||
Community Healthcare Trust, Inc. | 4,061 | 147,902 | ||||||
CoreCivic, Inc. | 11,102 | 133,557 | ||||||
CorePoint Lodging, Inc. | 37,683 | 149,225 | ||||||
DiamondRock Hospitality Co. | 471,086 | 2,821,805 | ||||||
Diversified Healthcare Trust | 173,294 | 620,393 | ||||||
EastGroup Properties, Inc. | 86,582 | 10,065,157 | ||||||
Essential Properties Realty Trust, Inc. | 43,546 | 593,967 | ||||||
First Industrial Realty Trust, Inc. | 169,014 | 6,402,250 | ||||||
Four Corners Property Trust, Inc. | 284,470 | 6,150,241 | ||||||
GEO Group, Inc. | 29,192 | 349,720 | ||||||
Gladstone Commercial Corp. | 14,326 | 256,722 | ||||||
Hannon Armstrong Sustainable Infrastructure Capital, Inc. | 29,151 | 845,671 | ||||||
Healthcare Realty Trust, Inc. | 11,173 | 343,011 | ||||||
Hersha Hospitality Trust | 227,458 | 1,146,388 | ||||||
Mack-Cali Realty Corp. | 25,390 | 386,182 | ||||||
Monmouth Real Estate Investment Corp. | 19,961 | 259,094 | ||||||
National Health Investors, Inc. | 18,285 | 1,014,635 | ||||||
National Storage Affiliates Trust | 34,229 | 1,027,212 | ||||||
NexPoint Residential Trust, Inc. | 113,842 | 3,640,667 | ||||||
Pebblebrook Hotel Trust | 156,356 | 2,135,823 | ||||||
Physicians Realty Trust | 83,956 | 1,449,920 | ||||||
Plymouth Industrial REIT, Inc. | 129,295 | 1,913,566 | ||||||
QTS Realty Trust, Inc., Class A | 153,822 | 10,552,189 | ||||||
Retail Opportunity Investments Corp. | 36,094 | 338,923 | ||||||
Retail Value, Inc. | 1,907 | 22,102 | ||||||
RLJ Lodging Trust(b) | 375,325 | 3,869,601 | ||||||
Ryman Hospitality Properties, Inc. | 38,381 | 1,311,863 | ||||||
Sabra Health Care REIT, Inc. | 130,865 | 1,761,443 | ||||||
STAG Industrial, Inc. | 18,899 | 508,383 | ||||||
Summit Hotel Properties, Inc. | 436,551 | 2,728,444 | ||||||
Sunstone Hotel Investors, Inc. | 18,987 | 168,035 | ||||||
Terreno Realty Corp. | 30,106 | 1,541,126 | ||||||
Uniti Group, Inc. | 111,367 | 918,778 | ||||||
Washington Real Estate Investment Trust | 22,707 | 497,965 | ||||||
Xenia Hotels & Resorts, Inc. | 53,520 | 481,680 | ||||||
|
| |||||||
| 75,867,064 | ||||||||
| Food & Staples Retailing — 0.8% | ||||||||
BJ’s Wholesale Club Holdings, Inc.(a) | 48,293 | 1,738,548 | ||||||
Ingles Markets, Inc., Class A | 27,018 | 1,151,237 | ||||||
Natural Grocers by Vitamin Cottage, Inc. | 47,627 | 685,829 | ||||||
Performance Food Group Co.(a) | 86,503 | 2,305,305 | ||||||
Rite Aid Corp.(a)(b) | 79,407 | 1,042,614 | ||||||
SpartanNash Co. | 62,965 | 1,348,081 | ||||||
United Natural Foods, Inc.(a) | 24,130 | 472,948 | ||||||
Weis Markets, Inc. | 37,302 | 2,078,840 | ||||||
|
| |||||||
| 10,823,402 | ||||||||
| Food Products — 1.8% | ||||||||
Calavo Growers, Inc. | 91,598 | 5,359,399 | ||||||
Freshpet, Inc.(a)(b) | 82,796 | 6,390,195 | ||||||
Hostess Brands, Inc.(a)(b) | 160,011 | 1,932,133 | ||||||
J&J Snack Foods Corp. | 32,342 | 4,160,151 | ||||||
John B. Sanfilippo & Son, Inc. | 38,622 | 3,357,797 | ||||||
Lancaster Colony Corp. | 10,154 | 1,558,233 | ||||||
Simply Good Foods Co(a) | 24,586 | 418,700 | ||||||
|
| |||||||
| 23,176,608 | ||||||||
| Gas Utilities — 1.5% | ||||||||
New Jersey Resources Corp. | 255,997 | 8,990,615 | ||||||
Northwest Natural Holding Co. | 16,065 | 1,029,927 | ||||||
| 32 | 2020 BLACKROCK ANNUAL REPORTTO SHAREHOLDERS |
Schedule of Investments (continued) May 31, 2020 | BlackRock Advantage Small Cap Core Fund (Percentages shown are based on Net Assets) |
| Security | Shares | Value | ||||||
| Gas Utilities (continued) | ||||||||
ONE Gas, Inc. | 14,829 | $ | 1,245,191 | |||||
Southwest Gas Holdings, Inc. | 105,298 | 7,997,383 | ||||||
|
| |||||||
| 19,263,116 | ||||||||
| Health Care Equipment & Supplies — 3.2% | ||||||||
Accelerate Diagnostics, Inc.(a)(b) | 19,440 | 162,324 | ||||||
Accuray, Inc.(a) | 12,868 | 27,023 | ||||||
AngioDynamics, Inc.(a) | 9,315 | 95,106 | ||||||
AtriCure, Inc.(a) | 12,588 | 601,832 | ||||||
Atrion Corp. | 662 | 424,997 | ||||||
Avanos Medical, Inc.(a) | 4,851 | 140,970 | ||||||
Cardiovascular Systems, Inc.(a) | 50,019 | 1,936,736 | ||||||
Cerus Corp.(a)(b) | 84,675 | 526,678 | ||||||
GenMark Diagnostics, Inc.(a)(b) | 44,044 | 417,978 | ||||||
Glaukos Corp.(a) | 34,561 | 1,347,188 | ||||||
Globus Medical, Inc., Class A(a) | 54,919 | 3,001,323 | ||||||
Haemonetics Corp.(a) | 42,766 | 4,690,575 | ||||||
Inogen, Inc.(a) | 31,167 | 1,184,346 | ||||||
Integer Holdings Corp.(a) | 33,779 | 2,674,621 | ||||||
iRadimed Corp.(a) | 8,930 | 207,623 | ||||||
iRhythm Technologies, Inc.(a)(b) | 27,313 | 3,395,279 | ||||||
LivaNova PLC(a) | 19,378 | 1,036,529 | ||||||
Merit Medical Systems, Inc.(a) | 36,809 | 1,656,037 | ||||||
Natus Medical, Inc.(a) | 7,512 | 160,757 | ||||||
Neogen Corp.(a) | 26,223 | 1,867,602 | ||||||
Nevro Corp.(a) | 7,233 | 908,465 | ||||||
Novocure Ltd.(a)(b) | 59,976 | 4,044,182 | ||||||
NuVasive, Inc.(a) | 8,265 | 500,859 | ||||||
Orthofix Medical, Inc.(a) | 6,821 | 232,460 | ||||||
Quidel Corp.(a)(b) | 21,385 | 3,742,375 | ||||||
SeaSpine Holdings Corp.(a) | 31,050 | 330,682 | ||||||
Shockwave Medical, Inc.(a) | 22,105 | 972,841 | ||||||
SI-BONE, Inc.(a) | 19,810 | 346,477 | ||||||
Silk Road Medical, Inc.(a) | 28,173 | 1,078,181 | ||||||
Tactile Systems Technology, Inc.(a) | 8,097 | 392,300 | ||||||
Tandem Diabetes Care, Inc.(a) | 24,141 | 2,007,324 | ||||||
TransMedics Group, Inc.(a) | 62,583 | 826,721 | ||||||
Varex Imaging Corp.(a) | 18,099 | 339,537 | ||||||
Wright Medical Group NV(a) | 29,456 | 870,425 | ||||||
|
| |||||||
| 42,148,353 | ||||||||
| Health Care Providers & Services — 2.3% | ||||||||
Amedisys, Inc.(a) | 18,667 | 3,584,997 | ||||||
AMN Healthcare Services, Inc.(a) | 52,147 | 2,313,241 | ||||||
Brookdale Senior Living, Inc.(a) | 105,819 | 387,298 | ||||||
Chemed Corp. | 1,603 | 767,052 | ||||||
CorVel Corp.(a) | 16,864 | 1,144,897 | ||||||
Ensign Group, Inc.(b) | 24,788 | 1,083,731 | ||||||
HealthEquity, Inc.(a) | 47,308 | 2,931,677 | ||||||
LHC Group, Inc.(a) | 25,425 | 4,131,817 | ||||||
Magellan Health, Inc.(a) | 12,748 | 955,972 | ||||||
National HealthCare Corp. | 2,909 | 195,107 | ||||||
Patterson Cos., Inc. | 165,080 | 3,250,425 | ||||||
PetIQ, Inc.(a) | 8,144 | 249,858 | ||||||
Select Medical Holdings Corp.(a)(b) | 221,280 | 3,571,459 | ||||||
Tenet Healthcare Corp.(a) | 37,658 | 819,438 | ||||||
Triple-S Management Corp., Class B(a) | 12,913 | 256,969 | ||||||
U.S. Physical Therapy, Inc. | 62,786 | 4,654,954 | ||||||
|
| |||||||
| 30,298,892 | ||||||||
| Health Care Technology — 2.6% | ||||||||
Allscripts Healthcare Solutions, Inc.(a) | 385,282 | 2,434,982 | ||||||
Castlight Health, Inc., Class B(a)(b) | 356,531 | 280,839 | ||||||
Evolent Health, Inc., Class A(a) | 111,179 | 987,270 | ||||||
| Security | Shares | Value | ||||||
| Health Care Technology (continued) | ||||||||
Health Catalyst, Inc.(a) | 21,600 | $ | 586,224 | |||||
HealthStream, Inc.(a) | 6,016 | 137,045 | ||||||
HMS Holdings Corp.(a) | 37,828 | 1,181,747 | ||||||
Inovalon Holdings, Inc., Class A(a)(b) | 163,194 | 3,071,311 | ||||||
Inspire Medical Systems, Inc.(a) | 26,131 | 2,130,722 | ||||||
Livongo Health, Inc.(a) | 30,895 | 1,851,537 | ||||||
NextGen Healthcare, Inc.(a) | 19,126 | 197,380 | ||||||
Omnicell, Inc.(a) | 69,323 | 4,638,402 | ||||||
Phreesia, Inc.(a) | 164,705 | 4,829,151 | ||||||
Tabula Rasa HealthCare, Inc.(a) | 3,029 | 161,839 | ||||||
Teladoc Health, Inc.(a) | 62,948 | 10,956,729 | ||||||
Vocera Communications, Inc.(a) | 55,260 | 1,084,754 | ||||||
|
| |||||||
| 34,529,932 | ||||||||
| Hotels, Restaurants & Leisure — 2.5% | ||||||||
BBX Capital Corp. | 40,832 | 73,089 | ||||||
BJ’s Restaurants, Inc. | 19,930 | 432,880 | ||||||
Bloomin’ Brands, Inc. | 17,572 | 200,497 | ||||||
Boyd Gaming Corp. | 41,441 | 886,009 | ||||||
Brinker International, Inc. | 18,805 | 495,512 | ||||||
Cheesecake Factory, Inc. | 88,546 | 1,901,968 | ||||||
Churchill Downs, Inc. | 30,253 | 4,013,665 | ||||||
Chuy’s Holdings, Inc.(a) | 5,336 | 85,323 | ||||||
Cracker Barrel Old Country Store, Inc. | 18,054 | 1,934,125 | ||||||
Denny’s Corp.(a)(b) | 14,727 | 159,714 | ||||||
Dine Brands Global, Inc. | 5,183 | 235,256 | ||||||
Eldorado Resorts, Inc.(a)(b) | 30,612 | 1,085,502 | ||||||
Everi Holdings, Inc.(a) | 53,192 | 330,322 | ||||||
J. Alexander’s Holdings, Inc.(a) | 55,608 | 235,778 | ||||||
Jack in the Box, Inc. | 7,521 | 504,057 | ||||||
Marriott Vacations Worldwide Corp. | 16,415 | 1,474,559 | ||||||
Papa John’s International, Inc. | 37,980 | 2,958,262 | ||||||
Penn National Gaming, Inc.(a) | 74,953 | 2,459,208 | ||||||
PlayAGS, Inc.(a)(b) | 122,482 | 638,131 | ||||||
Red Rock Resorts, Inc., Class A | 53,792 | 742,330 | ||||||
Ruth’s Hospitality Group, Inc. | 63,505 | 515,026 | ||||||
Scientific Games Corp.(a) | 16,876 | 265,459 | ||||||
Target Hospitality Corp.(a)(b) | 141,861 | 337,629 | ||||||
Texas Roadhouse, Inc. | 125,081 | 6,485,450 | ||||||
Wingstop, Inc. | 35,563 | 4,336,908 | ||||||
|
| |||||||
| 32,786,659 | ||||||||
| Household Durables — 1.5% | ||||||||
Bassett Furniture Industries, Inc. | 14,810 | 94,784 | ||||||
Century Communities, Inc.(a) | 66,202 | 1,955,607 | ||||||
Ethan Allen Interiors, Inc. | 23,502 | 265,573 | ||||||
Green Brick Partners, Inc.(a) | 131,679 | 1,408,965 | ||||||
Helen of Troy Ltd.(a) | 10,810 | 1,966,555 | ||||||
Hooker Furniture Corp. | 30,517 | 497,427 | ||||||
iRobot Corp.(a)(b) | 8,579 | 632,444 | ||||||
La-Z-Boy, Inc. | 42,011 | 1,080,523 | ||||||
LGI Homes, Inc.(a) | 8,812 | 735,097 | ||||||
MDC Holdings, Inc. | 273,067 | 9,281,547 | ||||||
TopBuild Corp.(a) | 10,375 | 1,189,909 | ||||||
ZAGG, Inc.(a)(b) | 77,324 | 230,812 | ||||||
|
| |||||||
| 19,339,243 | ||||||||
| Household Products — 0.2% | ||||||||
Central Garden & Pet Co.(a) | 7,097 | 260,389 | ||||||
Central Garden & Pet Co., Class A(a) | 17,441 | 597,529 | ||||||
WD-40 Co. | 6,652 | 1,276,186 | ||||||
|
| |||||||
| 2,134,104 | ||||||||
| Independent Power and Renewable Electricity Producers — 0.0% | ||||||||
Ormat Technologies, Inc. | 9,807 | 714,048 | ||||||
|
| |||||||
| SCHEDULES OF INVESTMENTS | 33 |
Schedule of Investments (continued) May 31, 2020 | BlackRock Advantage Small Cap Core Fund (Percentages shown are based on Net Assets) |
| Security | Shares | Value | ||||||
| Insurance — 1.9% | ||||||||
Ambac Financial Group, Inc.(a) | 12,946 | $ | 173,735 | |||||
Argo Group International Holdings Ltd. | 30,894 | 948,137 | ||||||
BRP Group, Inc., Class A(a) | 56,511 | 700,737 | ||||||
CNO Financial Group, Inc. | 340,438 | 4,885,285 | ||||||
eHealth, Inc.(a) | 12,588 | 1,641,727 | ||||||
Employers Holdings, Inc. | 32,390 | 968,137 | ||||||
Enstar Group Ltd.(a) | 3,320 | 472,768 | ||||||
FedNat Holding Co. | 44,618 | 543,894 | ||||||
Genworth Financial, Inc., Class A(a) | 247,727 | 755,567 | ||||||
Global Indemnity Ltd. | 5,683 | 137,870 | ||||||
Greenlight Capital Re Ltd., Class A(a) | 34,985 | 253,291 | ||||||
HCI Group, Inc. | 8,739 | 391,944 | ||||||
Heritage Insurance Holdings, Inc. | 65,906 | 826,461 | ||||||
Kinsale Capital Group, Inc. | 12,701 | 1,896,513 | ||||||
National General Holdings Corp. | 164,475 | 3,338,843 | ||||||
Protective Insurance Corp., Class B | 43,144 | 596,250 | ||||||
RLI Corp. | 39,162 | 3,092,232 | ||||||
Safety Insurance Group, Inc. | 3,804 | 290,017 | ||||||
Selective Insurance Group, Inc. | 26,180 | 1,373,141 | ||||||
Trupanion, Inc.(a) | 12,432 | 374,452 | ||||||
United Fire Group, Inc. | 4,617 | 123,874 | ||||||
United Insurance Holdings Corp. | 46,700 | 366,128 | ||||||
Universal Insurance Holdings, Inc. | 15,720 | 280,759 | ||||||
Watford Holdings Ltd.(a) | 66,451 | 981,481 | ||||||
|
| |||||||
| 25,413,243 | ||||||||
| Interactive Media & Services — 0.4% | ||||||||
Cargurus, Inc.(a) | 47,237 | 1,227,217 | ||||||
Cars.com, Inc.(a) | 63,871 | 394,084 | ||||||
EverQuote, Inc., Class A(a) | 18,850 | 1,016,392 | ||||||
QuinStreet, Inc.(a) | 29,265 | 296,747 | ||||||
TrueCar, Inc.(a) | 160,072 | 432,194 | ||||||
Yelp, Inc.(a)(b) | 84,460 | 1,836,161 | ||||||
|
| |||||||
| 5,202,795 | ||||||||
| Internet & Direct Marketing Retail — 0.8% | ||||||||
1-800-Flowers.com, Inc., Class A(a) | 101,249 | 2,241,653 | ||||||
Blue Apron Holdings, Inc., Class A(a)(b) | 36,025 | 339,355 | ||||||
Overstock.com, Inc.(a)(b) | 97,094 | 1,783,617 | ||||||
RealReal, Inc.(a) | 66,337 | 889,579 | ||||||
Shutterstock, Inc. | 57,131 | 2,166,408 | ||||||
Stamps.com, Inc.(a) | 18,514 | 3,668,549 | ||||||
|
| |||||||
| 11,089,161 | ||||||||
| IT Services — 2.2% | ||||||||
CSG Systems International, Inc. | 135,343 | 6,408,491 | ||||||
Hackett Group, Inc. | 154,410 | 2,129,314 | ||||||
International Money Express, Inc.(a) | 87,828 | 968,743 | ||||||
KBR, Inc. | 93,380 | 2,189,761 | ||||||
LiveRamp Holdings, Inc.(a) | 67,772 | 3,417,742 | ||||||
ManTech International Corp, Class A | 108,955 | 8,470,162 | ||||||
Perficient, Inc.(a) | 35,390 | 1,204,676 | ||||||
Perspecta, Inc. | 7,462 | 165,432 | ||||||
Repay Holdings Corp.(a)(b) | 103,527 | 2,385,262 | ||||||
Science Applications International Corp. | 2,477 | 218,075 | ||||||
Verra Mobility Corp.(a) | 127,982 | 1,396,284 | ||||||
Virtusa Corp.(a)(b) | 7,835 | 235,598 | ||||||
|
| |||||||
| 29,189,540 | ||||||||
| Leisure Products — 0.1% | ||||||||
Malibu Boats, Inc., Class A(a)(b) | 26,993 | 1,272,180 | ||||||
Nautilus, Inc.(a)(b) | 37,986 | 232,094 | ||||||
YETI Holdings, Inc.(a) | 15,056 | 483,298 | ||||||
|
| |||||||
| 1,987,572 | ||||||||
| Security | Shares | Value | ||||||
| Life Sciences Tools & Services — 1.3% | ||||||||
Adaptive Biotechnologies Corp.(a) | 7,296 | $ | 282,355 | |||||
Luminex Corp. | 80,605 | 2,511,652 | ||||||
Medpace Holdings, Inc.(a)(b) | 31,226 | 2,898,398 | ||||||
NanoString Technologies, Inc.(a)(b) | 38,357 | 1,171,039 | ||||||
NeoGenomics, Inc.(a) | 98,038 | 2,616,634 | ||||||
Pacific Biosciences of California, Inc.(a)(b) | 136,297 | 479,766 | ||||||
Personalis, Inc.(a)(b) | 46,267 | 547,801 | ||||||
Repligen Corp.(a) | 26,535 | 3,475,289 | ||||||
Syneos Health, Inc.(a) | 44,487 | 2,713,262 | ||||||
|
| |||||||
| 16,696,196 | ||||||||
| Machinery — 2.6% | ||||||||
Albany International Corp., Class A | 4,651 | 280,455 | ||||||
Altra Industrial Motion Corp. | 37,308 | 1,156,548 | ||||||
Blue Bird Corp.(a) | 81,248 | 1,165,909 | ||||||
Chart Industries, Inc.(a) | 7,446 | 292,256 | ||||||
CIRCOR International, Inc.(a) | 13,867 | 222,981 | ||||||
EnPro Industries, Inc. | 9,399 | 423,707 | ||||||
ESCO Technologies, Inc. | 134,307 | 11,095,101 | ||||||
Evoqua Water Technologies Corp.(a)(b) | 153,610 | 2,889,404 | ||||||
Federal Signal Corp. | 10,559 | 307,689 | ||||||
Franklin Electric Co., Inc. | 20,018 | 1,015,313 | ||||||
Greenbrier Cos., Inc. | 33,049 | 701,300 | ||||||
Hillenbrand, Inc. | 93,482 | 2,406,227 | ||||||
John Bean Technologies Corp. | 16,335 | 1,341,920 | ||||||
Kennametal, Inc. | 62,057 | 1,721,461 | ||||||
Miller Industries, Inc. | 45,797 | 1,356,965 | ||||||
Mueller Water Products, Inc., Class A | 15,906 | 148,562 | ||||||
Park-Ohio Holdings Corp. | 11,248 | 164,108 | ||||||
Proto Labs, Inc.(a) | 9,625 | 1,216,119 | ||||||
RBC Bearings, Inc.(a) | 11,495 | 1,616,772 | ||||||
REV Group, Inc. | 15,190 | 92,659 | ||||||
Rexnord Corp. | 45,511 | 1,369,881 | ||||||
SPX Corp.(a) | 33,180 | 1,326,536 | ||||||
SPX FLOW, Inc.(a) | 5,822 | 201,325 | ||||||
Standex International Corp. | 3,967 | 209,894 | ||||||
Wabash National Corp. | 123,725 | 1,181,574 | ||||||
Watts Water Technologies, Inc., Class A | 7,957 | 661,704 | ||||||
|
| |||||||
| 34,566,370 | ||||||||
| Media — 0.7% | ||||||||
Cardlytics, Inc.(a) | 17,232 | 1,173,327 | ||||||
Entravision Communications Corp., Class A | 337,759 | 506,639 | ||||||
EW Scripps Co, Class A | 71,191 | 617,226 | ||||||
Gray Television, Inc.(a) | 78,671 | 1,096,674 | ||||||
iHeartMedia, Inc., Class A(a)(b) | 237,023 | 2,062,100 | ||||||
MSG Networks, Inc., Class A(a) | 43,775 | 541,934 | ||||||
Scholastic Corp. | 27,455 | 807,177 | ||||||
TechTarget, Inc.(a) | 63,311 | 1,740,419 | ||||||
TEGNA, Inc. | 36,837 | 431,730 | ||||||
|
| |||||||
| 8,977,226 | ||||||||
| Metals & Mining — 1.0% | ||||||||
Carpenter Technology Corp. | 31,588 | 738,211 | ||||||
Commercial Metals Co. | 47,713 | 818,755 | ||||||
Kaiser Aluminum Corp. | 8,837 | 634,055 | ||||||
Materion Corp. | 79,162 | 4,156,005 | ||||||
Novagold Resources, Inc.(a) | 200,069 | 1,912,660 | ||||||
Olympic Steel, Inc. | 37,790 | 416,824 | ||||||
Ryerson Holding Corp.(a) | 123,970 | 618,610 | ||||||
Schnitzer Steel Industries, Inc., Class A | 237,789 | 3,733,287 | ||||||
Worthington Industries, Inc. | 7,601 | 227,422 | ||||||
|
| |||||||
| 13,255,829 | ||||||||
| 34 | 2020 BLACKROCK ANNUAL REPORTTO SHAREHOLDERS |
Schedule of Investments (continued) May 31, 2020 | BlackRock Advantage Small Cap Core Fund (Percentages shown are based on Net Assets) |
| Security | Shares | Value | ||||||
| Mortgage Real Estate Investment Trusts (REITs) — 0.4% | ||||||||
Apollo Commercial Real Estate Finance, Inc. | 58,376 | $ | 480,434 | |||||
Ares Commercial Real Estate Corp. | 19,054 | 141,952 | ||||||
Blackstone Mortgage Trust, Inc., Class A | 61,627 | 1,453,781 | ||||||
Colony Credit Real Estate, Inc. | 49,652 | 245,777 | ||||||
Ellington Financial, Inc. | 40,849 | 416,660 | ||||||
Great Ajax Corp. | 58,793 | 482,103 | ||||||
Invesco Mortgage Capital, Inc. | 224,114 | 620,796 | ||||||
KKR Real Estate Finance Trust, Inc. | 54,707 | 885,706 | ||||||
Ladder Capital Corp. | 54,410 | 432,560 | ||||||
|
| |||||||
| 5,159,769 | ||||||||
| Multiline Retail — 0.3% | ||||||||
Big Lots, Inc. | 98,387 | 3,812,496 | ||||||
|
| |||||||
| Multi-Utilities — 0.8% | ||||||||
Avista Corp. | 30,393 | 1,190,494 | ||||||
Black Hills Corp. | 51,496 | 3,177,818 | ||||||
NorthWestern Corp. | 105,921 | 6,367,971 | ||||||
|
| |||||||
| 10,736,283 | ||||||||
| Oil, Gas & Consumable Fuels — 1.1% | ||||||||
Ardmore Shipping Corp. | 47,724 | 278,708 | ||||||
Brigham Minerals, Inc., Class A | 90,734 | 1,202,226 | ||||||
Callon Petroleum Co.(a)(b) | 116,804 | 78,107 | ||||||
CNX Resources Corp.(a) | 76,381 | 778,322 | ||||||
CVR Energy, Inc. | 49,028 | 1,000,171 | ||||||
Delek U.S. Holdings, Inc. | 88,796 | 1,746,617 | ||||||
DHT Holdings, Inc. | 91,190 | 541,669 | ||||||
Evolution Petroleum Corp. | 294,742 | 719,171 | ||||||
Golar LNG Ltd. | 78,142 | 619,666 | ||||||
Laredo Petroleum, Inc.(a) | 231,861 | 196,734 | ||||||
Magnolia Oil & Gas Corp., Class A(a) | 271,221 | 1,505,277 | ||||||
Matador Resources Co.(a) | 124,474 | 975,876 | ||||||
Montage Resources Corp.(a) | 1 | 6 | ||||||
Nordic American Tankers Ltd.(b) | 184,461 | 842,987 | ||||||
PDC Energy, Inc.(a) | 64,461 | 785,135 | ||||||
Scorpio Tankers, Inc. | 41,971 | 744,566 | ||||||
SFL Corp. Ltd. | 31,059 | 308,105 | ||||||
SM Energy Co. | 87,587 | 308,306 | ||||||
Southwestern Energy Co.(a)(b) | 171,539 | 516,332 | ||||||
Talos Energy, Inc.(a)(b) | 68,064 | 826,978 | ||||||
Teekay Corp.(a) | 87,568 | 256,574 | ||||||
Teekay Tankers Ltd., Class A(a) | 15,767 | 274,030 | ||||||
World Fuel Services Corp. | 7,553 | 192,450 | ||||||
|
| |||||||
| 14,698,013 | ||||||||
| Paper & Forest Products — 0.6% | ||||||||
Boise Cascade Co. | 226,410 | 7,704,732 | ||||||
Neenah, Inc. | 8,257 | 417,474 | ||||||
|
| |||||||
| 8,122,206 | ||||||||
| Personal Products — 0.2% | ||||||||
BellRing Brands, Inc., Class A(a)(b) | 8,453 | 169,736 | ||||||
Edgewell Personal Care Co.(a) | 30,264 | 920,631 | ||||||
elf Beauty, Inc.(a) | 34,020 | 583,103 | ||||||
Medifast, Inc. | 4,868 | 498,191 | ||||||
Natural Health Trends Corp. | 80 | 584 | ||||||
USANA Health Sciences, Inc.(a) | 5,506 | 466,468 | ||||||
|
| |||||||
| 2,638,713 | ||||||||
| Pharmaceuticals — 2.4% | ||||||||
Aerie Pharmaceuticals, Inc.(a) | 73,289 | 1,028,245 | ||||||
AMAG Pharmaceuticals, Inc.(a)(b) | 23,195 | 178,833 | ||||||
Amneal Pharmaceuticals, Inc.(a)(b) | 292,542 | 1,424,680 | ||||||
Amphastar Pharmaceuticals, Inc.(a) | 168,881 | 3,147,942 | ||||||
Arvinas, Inc.(a) | 3,711 | 123,465 | ||||||
| Security | Shares | Value | ||||||
| Pharmaceuticals (continued) | ||||||||
Axsome Therapeutics, Inc.(a) | 8,502 | $ | 654,484 | |||||
BioDelivery Sciences International, Inc.(a) | 190,382 | 910,026 | ||||||
Corcept Therapeutics, Inc.(a) | 101,070 | 1,530,200 | ||||||
Endo International PLC(a) | 174,829 | 674,840 | ||||||
Horizon Therapeutics PLC(a) | 6,980 | 354,095 | ||||||
Innoviva, Inc.(a)(b) | 123,619 | 1,726,957 | ||||||
Intersect ENT, Inc.(a) | 71,481 | 797,013 | ||||||
Intra-Cellular Therapies, Inc.(a) | 38,889 | 812,002 | ||||||
MyoKardia, Inc.(a) | 21,595 | 2,208,953 | ||||||
NGM Biopharmaceuticals, Inc.(a) | 84,098 | 1,659,254 | ||||||
Omeros Corp.(a)(b) | 37,224 | 553,893 | ||||||
Pacira BioSciences, Inc.(a) | 68,273 | 3,000,598 | ||||||
Phibro Animal Health Corp., Class A | 24,293 | 636,477 | ||||||
Prestige Consumer Healthcare, Inc.(a)(b) | 96,153 | 4,057,657 | ||||||
Reata Pharmaceuticals, Inc., Class A(a)(b) | 17,504 | 2,543,681 | ||||||
Supernus Pharmaceuticals, Inc.(a) | 87,378 | 2,107,557 | ||||||
Theravance Biopharma, Inc.(a) | 40,946 | 1,033,886 | ||||||
Tricida, Inc.(a) | 17,153 | 460,730 | ||||||
WaVe Life Sciences Ltd.(a) | 29,956 | 304,952 | ||||||
Zogenix, Inc.(a) | 5,901 | 171,896 | ||||||
|
| |||||||
| 32,102,316 | ||||||||
| Professional Services — 2.2% | ||||||||
ASGN, Inc.(a) | 90,096 | 5,549,013 | ||||||
CRA International, Inc. | 43,360 | 1,751,310 | ||||||
Exponent, Inc. | 25,880 | 1,921,331 | ||||||
Forrester Research, Inc.(a) | 18,036 | 566,330 | ||||||
Franklin Covey Co.(a) | 95,325 | 2,030,422 | ||||||
FTI Consulting, Inc.(a) | 11,852 | 1,427,692 | ||||||
Huron Consulting Group, Inc.(a) | 12,407 | 573,948 | ||||||
ICF International, Inc. | 41,930 | 2,749,769 | ||||||
Insperity, Inc. | 95,490 | 4,950,202 | ||||||
Kforce, Inc. | 150,414 | 4,542,503 | ||||||
TriNet Group, Inc.(a) | 61,301 | 3,293,703 | ||||||
|
| |||||||
| 29,356,223 | ||||||||
| Real Estate Management & Development — 0.6% | ||||||||
Cushman & Wakefield PLC(a) | 12,437 | 127,479 | ||||||
Kennedy-Wilson Holdings, Inc. | 65,291 | 915,380 | ||||||
Marcus & Millichap, Inc.(a) | 30,825 | 849,845 | ||||||
RE/MAX Holdings, Inc., Class A | 122,921 | 3,440,559 | ||||||
Realogy Holdings Corp. | 58,406 | 353,940 | ||||||
Redfin Corp.(a) | 15,608 | 468,084 | ||||||
RMR Group, Inc., Class A | 49,326 | 1,329,829 | ||||||
St. Joe Co(a) | 14,208 | 273,504 | ||||||
|
| |||||||
| 7,758,620 | ||||||||
| Road & Rail — 0.8% | ||||||||
Covenant Transportation Group, Inc., Class A(a) | 151,483 | 1,908,686 | ||||||
Heartland Express, Inc. | 127,999 | 2,803,178 | ||||||
Marten Transport Ltd. | 99,810 | 2,554,138 | ||||||
Saia, Inc.(a)(b) | 16,006 | 1,735,690 | ||||||
Universal Logistics Holdings, Inc. | 64,866 | 963,909 | ||||||
|
| |||||||
| 9,965,601 | ||||||||
| Semiconductors & Semiconductor Equipment — 3.6% | ||||||||
Advanced Energy Industries, Inc.(a) | 9,459 | 632,145 | ||||||
Ambarella, Inc.(a)(b) | 85,616 | 4,857,852 | ||||||
Amkor Technology, Inc.(a) | 418,011 | 4,422,556 | ||||||
Brooks Automation, Inc. | 43,614 | 1,743,252 | ||||||
Cabot Microelectronics Corp. | 8,191 | 1,186,548 | ||||||
Cirrus Logic, Inc.(a)(b) | 173,722 | 12,591,371 | ||||||
DSP Group, Inc.(a) | 12,855 | 231,647 | ||||||
Enphase Energy, Inc.(a) | 34,313 | 1,996,673 | ||||||
FormFactor, Inc.(a) | 198,594 | 4,998,611 | ||||||
| SCHEDULES OF INVESTMENTS | 35 |
Schedule of Investments (continued) May 31, 2020 | BlackRock Advantage Small Cap Core Fund (Percentages shown are based on Net Assets) |
| Security | Shares | Value | ||||||
| Semiconductors & Semiconductor Equipment (continued) | ||||||||
Inphi Corp.(a) | 26,750 | $ | 3,361,673 | |||||
MaxLinear, Inc.(a) | 80,047 | 1,386,414 | ||||||
Onto Innovation, Inc.(a)(b) | 6,735 | 209,324 | ||||||
Power Integrations, Inc.(b) | 24,241 | 2,626,512 | ||||||
Rambus, Inc.(a) | 129,608 | 2,014,108 | ||||||
Semtech Corp.(a)(b) | 35,961 | 1,912,406 | ||||||
Silicon Laboratories, Inc.(a) | 27,691 | 2,593,539 | ||||||
Synaptics, Inc.(a) | 6,041 | 384,933 | ||||||
|
| |||||||
| 47,149,564 | ||||||||
| Software — 5.5% | ||||||||
8x8, Inc.(a) | 209,960 | 3,052,818 | ||||||
A10 Networks, Inc.(a)(b) | 72,706 | 494,401 | ||||||
ACI Worldwide, Inc.(a)(b) | 12,430 | 342,819 | ||||||
Alarm.com Holdings, Inc.(a)(b) | 85,072 | 4,023,055 | ||||||
Avaya Holdings Corp.(a)(b) | 14,673 | 214,226 | ||||||
Benefitfocus, Inc.(a)(b) | 340,161 | 4,330,250 | ||||||
Blackbaud, Inc. | 34,568 | 2,026,030 | ||||||
Blackline, Inc.(a) | 8,109 | 602,499 | ||||||
Bottomline Technologies DE, Inc.(a) | 82,759 | 4,187,605 | ||||||
Box, Inc., Class A(a) | 216,074 | 4,317,159 | ||||||
Cloudera, Inc.(a) | 87,907 | 901,047 | ||||||
CommVault Systems, Inc.(a) | 79,904 | 3,232,916 | ||||||
Cornerstone OnDemand, Inc.(a) | 11,010 | 425,536 | ||||||
Everbridge, Inc.(a) | 19,972 | 2,921,105 | ||||||
Five9, Inc.(a) | 33,485 | 3,489,137 | ||||||
J2 Global, Inc. | 17,977 | 1,407,599 | ||||||
LivePerson, Inc.(a) | 24,772 | 927,711 | ||||||
Model N, Inc.(a) | 65,465 | 2,102,736 | ||||||
Paylocity Holding Corp.(a) | 27,777 | 3,611,149 | ||||||
Ping Identity Holding Corp.(a) | 34,619 | 980,064 | ||||||
PROS Holdings, Inc.(a)(b) | 40,702 | 1,585,343 | ||||||
Q2 Holdings, Inc.(a) | 11,848 | 978,882 | ||||||
Qualys, Inc.(a)(b) | 50,150 | 5,783,298 | ||||||
Rapid7, Inc.(a)(b) | 65,093 | 3,182,397 | ||||||
RingCentral, Inc., Class A(a) | 17,956 | 4,924,433 | ||||||
Rosetta Stone, Inc.(a) | 11,514 | 213,930 | ||||||
Sailpoint Technologies Holdings, Inc.(a)(b) | 10,204 | 232,957 | ||||||
SPS Commerce, Inc.(a) | 120,816 | 8,234,819 | ||||||
SVMK, Inc.(a) | 29,383 | 592,067 | ||||||
Tenable Holdings, Inc.(a) | 4,692 | 146,719 | ||||||
Varonis Systems, Inc.(a) | 3,597 | 303,551 | ||||||
Veritone, Inc.(a) | 40,604 | 344,728 | ||||||
Workiva, Inc.(a) | 2,952 | 131,482 | ||||||
Yext, Inc.(a)(b) | 178,136 | 2,812,767 | ||||||
|
| |||||||
| 73,057,235 | ||||||||
| Specialty Retail — 2.2% | ||||||||
Aaron’s, Inc. | 90,566 | 3,342,791 | ||||||
Abercrombie & Fitch Co., Class A | 199,139 | 2,313,995 | ||||||
America’s Car-Mart, Inc.(a) | 15,099 | 1,201,427 | ||||||
Asbury Automotive Group, Inc.(a)(b) | 35,674 | 2,578,517 | ||||||
Bed Bath & Beyond, Inc.(b) | 251,104 | 1,825,526 | ||||||
Children’s Place, Inc. | 5,692 | 237,015 | ||||||
Designer Brands, Inc., Class A | 50,844 | 311,674 | ||||||
GameStop Corp., Class A(a)(b) | 341,891 | 1,388,077 | ||||||
Group 1 Automotive, Inc. | 15,990 | 1,006,411 | ||||||
Lithia Motors, Inc., Class A | 17,025 | 2,053,045 | ||||||
MarineMax, Inc.(a)(b) | 114,664 | 2,182,056 | ||||||
Michaels Cos., Inc.(a) | 600,131 | 2,316,506 | ||||||
Murphy USA, Inc.(a)(b) | 5,524 | 641,336 | ||||||
National Vision Holdings, Inc.(a)(b) | 27,339 | 732,138 | ||||||
Office Depot, Inc. | 1,123,946 | 2,776,147 | ||||||
Sally Beauty Holdings, Inc.(a) | 73,466 | 957,997 | ||||||
| Security | Shares | Value | ||||||
| Specialty Retail (continued) | ||||||||
Shoe Carnival, Inc. | 10,612 | $ | 275,806 | |||||
Sonic Automotive, Inc., Class A | 65,783 | 1,728,777 | ||||||
Tilly’s, Inc., Class A | 41,524 | 212,603 | ||||||
Zumiez, Inc.(a)(b) | 31,130 | 758,638 | ||||||
|
| |||||||
| 28,840,482 | ||||||||
| Technology Hardware, Storage & Peripherals — 0.0% | ||||||||
Super Micro Computer, Inc.(a)(b) | 23,843 | 618,964 | ||||||
|
| |||||||
| Textiles, Apparel & Luxury Goods — 1.1% | ||||||||
Crocs, Inc.(a) | 121,659 | 3,485,530 | ||||||
Culp, Inc. | 11,050 | 85,196 | ||||||
Deckers Outdoor Corp.(a) | 12,303 | 2,245,667 | ||||||
G-III Apparel Group Ltd.(a) | 74,256 | 767,064 | ||||||
Oxford Industries, Inc. | 106,597 | 4,543,164 | ||||||
Steven Madden Ltd. | 110,163 | 2,591,034 | ||||||
Wolverine World Wide, Inc. | 14,881 | 311,608 | ||||||
|
| |||||||
| 14,029,263 | ||||||||
| Thrifts & Mortgage Finance — 1.4% | ||||||||
Capitol Federal Financial, Inc. | 66,054 | 774,483 | ||||||
Essent Group Ltd. | 79,646 | 2,632,300 | ||||||
Federal Agricultural Mortgage Corp., Class C | 37,841 | 2,426,743 | ||||||
First Defiance Financial Corp. | 96,847 | 1,608,629 | ||||||
Flagstar Bancorp, Inc. | 3,550 | 104,015 | ||||||
Merchants Bancorp. | 40,004 | 683,268 | ||||||
Meridian Bancorp, Inc. | 53,144 | 612,219 | ||||||
NMI Holdings, Inc., Class A(a) | 26,208 | 402,686 | ||||||
Northwest Bancshares, Inc. | 136,652 | 1,361,054 | ||||||
Provident Bancorp, Inc. | 49,769 | 424,032 | ||||||
Provident Financial Services, Inc. | 23,391 | 304,785 | ||||||
Radian Group, Inc. | 129,355 | 2,054,158 | ||||||
Riverview Bancorp, Inc. | 253,347 | 1,266,735 | ||||||
Walker & Dunlop, Inc. | 9,702 | 392,931 | ||||||
Washington Federal, Inc. | 129,748 | 3,355,283 | ||||||
WSFS Financial Corp. | 19,809 | 548,115 | ||||||
|
| |||||||
| 18,951,436 | ||||||||
| Tobacco — 0.1% | ||||||||
Vector Group Ltd. | 66,612 | 761,375 | ||||||
|
| |||||||
| Trading Companies & Distributors — 1.9% | ||||||||
Applied Industrial Technologies, Inc. | 134,755 | 7,815,790 | ||||||
BMC Stock Holdings, Inc.(a) | 124,419 | 3,256,045 | ||||||
DXP Enterprises, Inc.(a) | 15,876 | 279,894 | ||||||
Foundation Building Materials, Inc.(a) | 124,125 | 1,653,345 | ||||||
GATX Corp. | 14,058 | 881,999 | ||||||
GMS, Inc.(a) | 31,104 | 637,321 | ||||||
H&E Equipment Services, Inc. | 99,691 | 1,708,704 | ||||||
Herc Holdings, Inc.(a) | 150,401 | 4,286,428 | ||||||
Lawson Products, Inc.(a) | 13 | 404 | ||||||
MRC Global, Inc.(a) | 33,318 | 197,243 | ||||||
SiteOne Landscape Supply, Inc.(a) | 36,511 | 3,881,484 | ||||||
|
| |||||||
| 24,598,657 | ||||||||
| Water Utilities — 0.4% | ||||||||
American States Water Co. | 38,121 | 3,126,303 | ||||||
California Water Service Group | 27,143 | 1,275,721 | ||||||
SJW Group | 14,323 | 900,058 | ||||||
|
| |||||||
| 5,302,082 | ||||||||
| Wireless Telecommunication Services — 0.2% | ||||||||
Boingo Wireless, Inc.(a) | 16,021 | 219,488 | ||||||
| 36 | 2020 BLACKROCK ANNUAL REPORTTO SHAREHOLDERS |
Schedule of Investments (continued) May 31, 2020 | BlackRock Advantage Small Cap Core Fund (Percentages shown are based on Net Assets) |
| Security | Shares | Value | ||||||
| Wireless Telecommunication Services (continued) | ||||||||
Shenandoah Telecommunications Co. | 31,660 | $ | 1,665,632 | |||||
Spok Holdings, Inc. | 40,681 | 417,794 | ||||||
|
| |||||||
| 2,302,914 | ||||||||
|
| |||||||
Total Common Stocks — 95.4% |
| 1,259,010,197 | ||||||
|
| |||||||
| Rights | ||||||||
| Biotechnology — 0.0% | ||||||||
Alder Biopharmaceuticals, Inc., CVR(a)(c) | 38,614 | 33,980 | ||||||
|
| |||||||
| Metals & Mining — 0.0% | ||||||||
Pan American Silver Corp., CVR(a)(b) | 125,419 | 81,510 | ||||||
|
| |||||||
Total Rights — 0.0% | 115,490 | |||||||
|
| |||||||
Total Long-Term Investments — 95.4% |
| 1,259,125,687 | ||||||
|
| |||||||
| Short-Term Securities(d)(e) | ||||||||
| Money Market Funds — 8.1% | ||||||||
BlackRock Liquidity Funds, T-Fund, Institutional Class, 0.11% | 43,962,860 | 43,962,860 | ||||||
SL Liquidity Series, LLC, Money Market Series, 0.63%(f) | 62,738,633 | 62,801,371 | ||||||
|
| |||||||
Total Short-Term Securities — 8.1% |
| 106,764,231 | ||||||
|
| |||||||
Total Investments — 103.5% |
| 1,365,889,918 | ||||||
Liabilities in Excess of Other Assets — (3.5)% |
| (46,371,468 | ) | |||||
|
| |||||||
Net Assets — 100.0% | $ | 1,319,518,450 | ||||||
|
| |||||||
| (a) | Non-income producing security. |
| (b) | All or a portion of this security is on loan. |
| (c) | Security is valued using significant unobservable inputs and is classified as Level 3 in the fair value hierarchy. |
| (d) | Affiliate of the Fund. |
| (e) | Annualized 7-day yield as of period end. |
| (f) | All or a portion of this security was purchased with the cash collateral from loaned securities. |
Affiliates
Investments in issuers considered to be an affiliate/affiliates of the Fund during the year ended May 31, 2020 for purposes of Section 2(a)(3) of the Investment Company Act of 1940, as amended, were as follows:
Affiliated Issuer | | Shares Held at 05/31/19 | | | Shares Purchased | | | Shares Sold | | | Shares Held at 05/31/20 | | | Value at 05/31/20 | | Income | | Net Realized Gain (Loss) |
(a) | | Change in Unrealized Appreciation (Depreciation) | | ||||||||||
BlackRock Liquidity Funds, T-Fund, Institutional Class | 30,107,987 | 13,854,873 | (b) | — | 43,962,860 | $ | 43,962,860 | $ | 226,568 | $ | 22 | $ | — | |||||||||||||||||||
SL Liquidity Series, LLC, Money Market Series | 32,030,621 | 30,708,012 | (b) | — | 62,738,633 | 62,801,371 | 545,149 | (c) | (1,264 | ) | 59,141 | |||||||||||||||||||||
|
|
|
|
|
|
|
| |||||||||||||||||||||||||
| $ | 106,764,231 | $ | 771,717 | $ | (1,242 | ) | $ | 59,141 | ||||||||||||||||||||||||
|
|
|
|
|
|
|
|
| (a) | Includes net capital gain distributions, if applicable. |
| (b) | Represents net shares purchased (sold). |
| (c) | Represents securities lending income earned from the reinvestment of cash collateral from loaned securities, net of fees and collateral investment expenses, and other payments to and from borrowers of securities. |
| SCHEDULES OF INVESTMENTS | 37 |
Schedule of Investments (continued) May 31, 2020 | BlackRock Advantage Small Cap Core Fund
|
For Fund compliance purposes, the Fund’s sector classifications refer to one or more of the sector sub-classifications used by one or more widely recognized market indexes or rating group indexes, and/or as defined by the investment adviser. These definitions may not apply for purposes of this report, which may combine such sector sub-classifications for reporting ease.
Futures Contracts
| Description | Number of Contracts | Expiration Date | Notional Amount (000) | Value/ Unrealized Appreciation (Depreciation) | ||||||||||||
Long Contracts | ||||||||||||||||
Russell 2000 E-Mini Index | 644 | 06/19/20 | $ | 44,848 | $ | 1,857,700 | ||||||||||
|
| |||||||||||||||
Derivative Financial Instruments Categorized by Risk Exposure
As of period end, the fair values of derivative financial instruments located in the Statements of Assets and Liabilities were as follows:
Commodity Contracts | Credit Contracts | Equity Contracts | Foreign Currency Exchange Contracts | Interest Rate Contracts | Other Contracts | Total | ||||||||||||||||||||||
Assets — Derivative Financial Instruments | ||||||||||||||||||||||||||||
Futures contracts | ||||||||||||||||||||||||||||
Unrealized appreciation(a) | $ | — | $ | — | $ | 1,857,700 | $ | — | $ | — | $ | — | $ | 1,857,700 | ||||||||||||||
|
|
|
|
|
|
|
|
|
|
|
|
|
| |||||||||||||||
| (a) | Net cumulative unrealized appreciation (depreciation) on futures contracts, if any, as reported in the Schedule of Investments. In the Statements of Assets and Liabilities, only current day’s variation margin is reported in receivables or payables and the net cumulative unrealized appreciation (depreciation) is included in accumulated earnings (loss). |
For the year ended May 31, 2020, the effect of derivative financial instruments in the Statements of Operations was as follows:
Commodity Contracts | Credit Contracts | Equity Contracts | Foreign Currency Exchange Contracts | Interest Rate Contracts | Other Contracts | Total | ||||||||||||||||||||||
Net Realized Gain (Loss) from | ||||||||||||||||||||||||||||
Futures contracts | $ | — | $ | — | $ | 3,288,371 | $ | — | $ | — | $ | — | $ | 3,288,371 | ||||||||||||||
|
|
|
|
|
|
|
|
|
|
|
|
|
| |||||||||||||||
Net Change in Unrealized Appreciation (Depreciation) on | ||||||||||||||||||||||||||||
Futures contracts | $ | — | $ | — | $ | 1,871,646 | $ | — | $ | — | $ | — | $ | 1,871,646 | ||||||||||||||
|
|
|
|
|
|
|
|
|
|
|
|
|
| |||||||||||||||
Average Quarterly Balances of Outstanding Derivative Financial Instruments
Futures contracts | ||||
Average notional value of contracts — long | $ | 20,793,864 |
For more information about the Fund’s investment risks regarding derivative financial instruments, refer to the Notes to Financial Statements.
Fair Value Hierarchy as of Period End
Various inputs are used in determining the fair value of investments and derivative financial instruments. For information about the Fund’s policy regarding valuation of investments and derivative financial instruments, refer to the Notes to Financial Statements.
The following table summarizes the Fund’s investments and derivative financial instruments categorized in the disclosure hierarchy:
| Level 1 | Level 2 | Level 3 | Total | |||||||||||||
Assets | ||||||||||||||||
Investments | ||||||||||||||||
Long-Term Investments | ||||||||||||||||
Common Stocks | ||||||||||||||||
Aerospace & Defense | $ | 11,752,658 | $ | — | $ | — | $ | 11,752,658 | ||||||||
Air Freight & Logistics | 5,919,172 | — | — | 5,919,172 | ||||||||||||
Airlines | 1,724,506 | — | — | 1,724,506 | ||||||||||||
Auto Components | 12,457,982 | — | — | 12,457,982 | ||||||||||||
Banks | 98,439,475 | — | — | 98,439,475 | ||||||||||||
Beverages | 3,957,160 | — | — | 3,957,160 | ||||||||||||
Biotechnology | 132,040,753 | — | — | 132,040,753 | ||||||||||||
| 38 | 2020 BLACKROCK ANNUAL REPORTTO SHAREHOLDERS |
Schedule of Investments (continued) May 31, 2020 | BlackRock Advantage Small Cap Core Fund
|
| Level 1 | Level 2 | Level 3 | Total | |||||||||||||
Common Stocks (continued) | ||||||||||||||||
Building Products | $ | 14,267,649 | $ | — | $ | — | $ | 14,267,649 | ||||||||
Capital Markets | 22,002,145 | — | — | 22,002,145 | ||||||||||||
Chemicals | 16,559,878 | — | — | 16,559,878 | ||||||||||||
Commercial Services & Supplies | 24,765,727 | — | — | 24,765,727 | ||||||||||||
Communications Equipment | 11,619,822 | — | — | 11,619,822 | ||||||||||||
Construction & Engineering | 16,669,781 | — | — | 16,669,781 | ||||||||||||
Construction Materials | 2,679,744 | — | — | 2,679,744 | ||||||||||||
Consumer Finance | 11,815,291 | — | — | 11,815,291 | ||||||||||||
Containers & Packaging | 194,332 | — | — | 194,332 | ||||||||||||
Distributors | 1,648,190 | — | — | 1,648,190 | ||||||||||||
Diversified Consumer Services | 16,168,161 | — | — | 16,168,161 | ||||||||||||
Diversified Financial Services | 1,301,049 | 1,155,735 | — | 2,456,784 | ||||||||||||
Diversified Telecommunication Services | 7,597,864 | — | — | 7,597,864 | ||||||||||||
Electric Utilities | 15,985,716 | — | — | 15,985,716 | ||||||||||||
Electrical Equipment | 11,353,555 | — | — | 11,353,555 | ||||||||||||
Electronic Equipment, Instruments & Components | 31,872,379 | — | — | 31,872,379 | ||||||||||||
Energy Equipment & Services | 6,465,753 | — | — | 6,465,753 | ||||||||||||
Entertainment | 1,174,155 | — | — | 1,174,155 | ||||||||||||
Equity Real Estate Investment Trusts (REITs) | 75,867,064 | — | — | 75,867,064 | ||||||||||||
Food & Staples Retailing | 10,823,402 | — | — | 10,823,402 | ||||||||||||
Food Products | 23,176,608 | — | — | 23,176,608 | ||||||||||||
Gas Utilities | 19,263,116 | — | — | 19,263,116 | ||||||||||||
Health Care Equipment & Supplies | 42,148,353 | — | — | 42,148,353 | ||||||||||||
Health Care Providers & Services | 30,298,892 | — | — | 30,298,892 | ||||||||||||
Health Care Technology | 34,529,932 | — | — | 34,529,932 | ||||||||||||
Hotels, Restaurants & Leisure | 32,786,659 | — | — | 32,786,659 | ||||||||||||
Household Durables | 19,339,243 | — | — | 19,339,243 | ||||||||||||
Household Products | 2,134,104 | — | — | 2,134,104 | ||||||||||||
Independent Power and Renewable Electricity Producers | 714,048 | — | — | 714,048 | ||||||||||||
Insurance | 25,413,243 | — | — | 25,413,243 | ||||||||||||
Interactive Media & Services | 5,202,795 | — | — | 5,202,795 | ||||||||||||
Internet & Direct Marketing Retail | 11,089,161 | — | — | 11,089,161 | ||||||||||||
IT Services | 29,189,540 | — | — | 29,189,540 | ||||||||||||
Leisure Products | 1,987,572 | — | — | 1,987,572 | ||||||||||||
Life Sciences Tools & Services | 16,696,196 | — | — | 16,696,196 | ||||||||||||
Machinery | 34,566,370 | — | — | 34,566,370 | ||||||||||||
Media | 8,977,226 | — | — | 8,977,226 | ||||||||||||
Metals & Mining | 13,255,829 | — | — | 13,255,829 | ||||||||||||
Mortgage Real Estate Investment Trusts (REITs) | 5,159,769 | — | — | 5,159,769 | ||||||||||||
Multiline Retail | 3,812,496 | — | — | 3,812,496 | ||||||||||||
Multi-Utilities | 10,736,283 | — | — | 10,736,283 | ||||||||||||
Oil, Gas & Consumable Fuels | 14,698,013 | — | — | 14,698,013 | ||||||||||||
Paper & Forest Products | 8,122,206 | — | — | 8,122,206 | ||||||||||||
Personal Products | 2,638,713 | — | — | 2,638,713 | ||||||||||||
Pharmaceuticals | 32,102,316 | — | — | 32,102,316 | ||||||||||||
Professional Services | 29,356,223 | — | — | 29,356,223 | ||||||||||||
Real Estate Management & Development | 7,758,620 | — | — | 7,758,620 | ||||||||||||
Road & Rail | 9,965,601 | — | — | 9,965,601 | ||||||||||||
Semiconductors & Semiconductor Equipment | 47,149,564 | — | — | 47,149,564 | ||||||||||||
Software | 73,057,235 | — | — | 73,057,235 | ||||||||||||
Specialty Retail | 28,840,482 | — | — | 28,840,482 | ||||||||||||
Technology Hardware, Storage & Peripherals | 618,964 | — | — | 618,964 | ||||||||||||
Textiles, Apparel & Luxury Goods | 14,029,263 | — | — | 14,029,263 | ||||||||||||
Thrifts & Mortgage Finance | 18,951,436 | — | — | 18,951,436 | ||||||||||||
Tobacco | 761,375 | — | — | 761,375 | ||||||||||||
Trading Companies & Distributors | 24,598,657 | — | — | 24,598,657 | ||||||||||||
Water Utilities | 5,302,082 | — | — | 5,302,082 | ||||||||||||
Wireless Telecommunication Services | 2,302,914 | — | — | 2,302,914 | ||||||||||||
Rights | 81,510 | — | 33,980 | 115,490 | ||||||||||||
| SCHEDULES OF INVESTMENTS | 39 |
Schedule of Investments (continued) May 31, 2020 | BlackRock Advantage Small Cap Core Fund
|
| Level 1 | Level 2 | Level 3 | Total | |||||||||||||
Short-Term Securities | ||||||||||||||||
Money Market Funds | $ | 43,962,860 | $ | — | $ | — | $ | 43,962,860 | ||||||||
|
|
|
|
|
|
|
| |||||||||
| $ | 1,301,898,832 | $ | 1,155,735 | $ | 33,980 | 1,303,088,547 | ||||||||||
|
|
|
|
|
|
|
| |||||||||
Investments Valued at NAV(a) | 62,801,371 | |||||||||||||||
|
| |||||||||||||||
| $ | 1,365,889,918 | |||||||||||||||
|
| |||||||||||||||
Derivative Financial Instruments | ||||||||||||||||
Assets | ||||||||||||||||
Equity Contracts(b) | $ | 1,857,700 | $ | — | $ | — | $ | 1,857,700 | ||||||||
|
|
|
|
|
|
|
| |||||||||
| (a) | Certain investments of the Fund were fair valued using NAV per share as no quoted market value is available and therefore have been excluded from the fair value hierarchy. |
| (b) | Derivative financial instruments are futures contracts. Futures contracts are valued at the unrealized appreciation (depreciation) on the instrument. |
See notes to financial statements.
| 40 | 2020 BLACKROCK ANNUAL REPORTTO SHAREHOLDERS |
Statements of Assets and Liabilities
May 31, 2020
BlackRock Advantage International Fund | BlackRock Advantage Large Cap Growth Fund | BlackRock Advantage Small Cap Core Fund | ||||||||||
ASSETS | ||||||||||||
Investments at value — unaffiliated(a)(b) | $ | 860,401,438 | $ | 790,980,649 | $ | 1,259,125,687 | ||||||
Investments at value — affiliated(c) | 22,456,143 | 27,644,597 | 106,764,231 | |||||||||
Cash pledged for futures contracts | 3,147,000 | 2,194,000 | 4,099,000 | |||||||||
Foreign currency at value(d) | 5,550,465 | 80,559 | — | |||||||||
Receivables: | ||||||||||||
Investments sold | 44,446,487 | 14,044,743 | 2,403,256 | |||||||||
Securities lending income — affiliated | 3,164 | 933 | 166,418 | |||||||||
Capital shares sold | 3,088,754 | 717,011 | 20,415,727 | |||||||||
Dividends — affiliated | 1,921 | 2,285 | 3,503 | |||||||||
Dividends — unaffiliated | 4,450,946 | 733,278 | 842,333 | |||||||||
From the Manager | 73,116 | 60,188 | 59,943 | |||||||||
From transfer agent | 1,097,239 | — | — | |||||||||
Variation margin on futures contracts | — | 29,269 | — | |||||||||
Prepaid expenses | 63,862 | 63,917 | 109,081 | |||||||||
|
|
|
|
|
| |||||||
Total assets | 944,780,535 | 836,551,429 | 1,393,989,179 | |||||||||
|
|
|
|
|
| |||||||
LIABILITIES | ||||||||||||
Cash collateral on securities loaned at value | 1,191,716 | 2,793,970 | 62,736,986 | |||||||||
Payables: | ||||||||||||
Investments purchased | 43,897,520 | 13,107,447 | 4,878,927 | |||||||||
Administration fees | 29,797 | 27,713 | 41,790 | |||||||||
Capital shares redeemed | 1,771,832 | 668,630 | 5,633,208 | |||||||||
Investment advisory fees | 197,482 | 326,692 | 396,486 | |||||||||
Trustees’ and Officer’s fees | 2,693 | 2,344 | 3,211 | |||||||||
Other accrued expenses | 138,745 | 333,224 | 255,426 | |||||||||
Other affiliates | 440,666 | 1,557 | 21,911 | |||||||||
Service and distribution fees | 80,662 | 158,515 | 59,913 | |||||||||
Variation margin on futures contracts | 98,222 | — | 442,871 | |||||||||
|
|
|
|
|
| |||||||
Total liabilities | 47,849,335 | 17,420,092 | 74,470,729 | |||||||||
|
|
|
|
|
| |||||||
NET ASSETS | $ | 896,931,200 | $ | 819,131,337 | $ | 1,319,518,450 | ||||||
|
|
|
|
|
| |||||||
NET ASSETS CONSIST OF | ||||||||||||
Paid-in capital | $ | 1,002,616,996 | $ | 589,795,906 | $ | 1,352,290,504 | ||||||
Accumulated earnings (loss) | (105,685,796 | ) | 229,335,431 | (32,772,054 | ) | |||||||
|
|
|
|
|
| |||||||
NET ASSETS | $ | 896,931,200 | $ | 819,131,337 | $ | 1,319,518,450 | ||||||
|
|
|
|
|
| |||||||
(a) Investments at cost — unaffiliated | $ | 825,276,974 | $ | 564,070,894 | $ | 1,266,653,296 | ||||||
(b) Securities loaned at value | $ | 1,156,904 | $ | 3,042,433 | $ | 60,745,806 | ||||||
(c) Investments at cost — affiliated | $ | 22,455,832 | $ | 27,643,443 | $ | 106,699,633 | ||||||
(d) Foreign currency at cost | $ | 5,515,488 | $ | 84,187 | $ | — | ||||||
FINANCIAL STATEMENTS | 41 |
Statements of Assets and Liabilities (continued)
May 31, 2020
BlackRock Advantage International Fund | BlackRock Advantage Large Cap Growth Fund | BlackRock Advantage Small Cap Core Fund | ||||||||||
NET ASSET VALUE | ||||||||||||
| Institutional | ||||||||||||
Net assets | $ | 477,943,885 | $ | 89,737,229 | $ | 847,752,781 | ||||||
|
|
|
|
|
| |||||||
Shares outstanding | 32,920,075 | 4,923,327 | 64,742,781 | |||||||||
|
|
|
|
|
| |||||||
Net asset value | $ | 14.52 | $ | 18.23 | $ | 13.09 | ||||||
|
|
|
|
|
| |||||||
Shares authorized | Unlimited | Unlimited | Unlimited | |||||||||
|
|
|
|
|
| |||||||
Par value | $ | 0.001 | $ | 0.001 | $ | 0.001 | ||||||
|
|
|
|
|
| |||||||
| Service | ||||||||||||
Net assets | $ | — | $ | 253,325 | $ | N/A | ||||||
|
|
|
|
|
| |||||||
Shares outstanding | — | 14,163 | N/A | |||||||||
|
|
|
|
|
| |||||||
Net asset value | $ | — | $ | 17.89 | $ | N/A | ||||||
|
|
|
|
|
| |||||||
Shares authorized | Unlimited | Unlimited | N/A | |||||||||
|
|
|
|
|
| |||||||
Par value | $ | 0.001 | $ | 0.001 | $ | N/A | ||||||
|
|
|
|
|
| |||||||
| Investor A | ||||||||||||
Net assets | $ | 366,411,295 | $ | 713,161,739 | $ | 277,925,997 | ||||||
|
|
|
|
|
| |||||||
Shares outstanding | 25,535,716 | 41,102,019 | 21,353,679 | |||||||||
|
|
|
|
|
| |||||||
Net asset value | $ | 14.35 | $ | 17.35 | $ | 13.02 | ||||||
|
|
|
|
|
| |||||||
Shares authorized | Unlimited | Unlimited | Unlimited | |||||||||
|
|
|
|
|
| |||||||
Par value | $ | 0.001 | $ | 0.001 | $ | 0.001 | ||||||
|
|
|
|
|
| |||||||
| Investor C | ||||||||||||
Net assets | $ | 6,193,476 | $ | 14,727,908 | $ | 4,954,833 | ||||||
|
|
|
|
|
| |||||||
Shares outstanding | 444,069 | 1,003,756 | 389,063 | |||||||||
|
|
|
|
|
| |||||||
Net asset value | $ | 13.95 | $ | 14.67 | $ | 12.74 | ||||||
|
|
|
|
|
| |||||||
Shares authorized | Unlimited | Unlimited | Unlimited | |||||||||
|
|
|
|
|
| |||||||
Par value | $ | 0.001 | $ | 0.001 | $ | 0.001 | ||||||
|
|
|
|
|
| |||||||
| Class K | ||||||||||||
Net assets | $ | 43,072,980 | $ | 715,297 | $ | 188,884,839 | ||||||
|
|
|
|
|
| |||||||
Shares outstanding | 2,966,484 | 39,247 | 14,415,839 | |||||||||
|
|
|
|
|
| |||||||
Net asset value | $ | 14.52 | $ | 18.23 | $ | 13.10 | ||||||
|
|
|
|
|
| |||||||
Shares authorized | Unlimited | Unlimited | Unlimited | |||||||||
|
|
|
|
|
| |||||||
Par value | $ | 0.001 | $ | 0.001 | $ | 0.001 | ||||||
|
|
|
|
|
| |||||||
| Class R | ||||||||||||
Net assets | $ | 3,309,564 | $ | 535,839 | $ | N/A | ||||||
|
|
|
|
|
| |||||||
Shares outstanding | 230,524 | 29,604 | N/A | |||||||||
|
|
|
|
|
| |||||||
Net asset value | $ | 14.36 | $ | 18.10 | $ | N/A | ||||||
|
|
|
|
|
| |||||||
Shares authorized | Unlimited | Unlimited | N/A | |||||||||
|
|
|
|
|
| |||||||
Par value | $ | 0.001 | $ | 0.001 | $ | N/A | ||||||
|
|
|
|
|
| |||||||
See notes to financial statements.
| 42 | 2020 BLACKROCK ANNUAL REPORTTO SHAREHOLDERS |
| BlackRock Advantage International Fund | BlackRock Advantage Large Cap Growth Fund | |||||||||||||||||||||||||
Period from 10/01/19 to 05/31/20 | Year Ended 09/30/19 | . Period from 10/01/19 to 05/31/20 | Year Ended 09/30/19 | |||||||||||||||||||||||
INVESTMENT INCOME | ||||||||||||||||||||||||||
Dividends — unaffiliated | $ | 17,752,132 | $ | 29,194,307 | $ | 6,477,414 | $ | 11,074,033 | ||||||||||||||||||
Dividends — affiliated | 97,268 | 272,308 | 61,146 | 163,122 | ||||||||||||||||||||||
Interest — unaffiliated | 33 | 143 | 17 | 59 | ||||||||||||||||||||||
Securities lending income — affiliated — net | 6,665 | 178,780 | 11,454 | 60,946 | ||||||||||||||||||||||
Other income | — | — | 3,245 | 7,322 | ||||||||||||||||||||||
Foreign taxes withheld | (1,777,569 | ) | (2,483,644 | ) | — | — | ||||||||||||||||||||
|
|
|
|
|
|
|
| |||||||||||||||||||
Total investment income | 16,078,529 | 27,161,894 | 6,553,276 | 11,305,482 | ||||||||||||||||||||||
|
|
|
|
|
|
|
| |||||||||||||||||||
EXPENSES | ||||||||||||||||||||||||||
Investment advisory | 2,745,229 | 4,313,476 | 2,950,276 | 4,473,103 | ||||||||||||||||||||||
Transfer agent — class specific | 1,047,312 | 1,330,997 | 914,260 | 1,413,129 | ||||||||||||||||||||||
Service and distribution — class specific | 737,247 | 1,028,377 | 1,238,356 | 1,932,893 | ||||||||||||||||||||||
Custodian | 432,135 | 396,391 | 24,399 | 32,119 | ||||||||||||||||||||||
Administration | 252,355 | 333,660 | 215,370 | 326,402 | ||||||||||||||||||||||
Professional | 136,266 | 119,949 | 82,561 | 144,474 | ||||||||||||||||||||||
Administration — class specific | 122,048 | 160,532 | 103,537 | 156,983 | ||||||||||||||||||||||
Registration | 106,324 | 89,390 | 66,617 | 95,379 | ||||||||||||||||||||||
Accounting services | 58,566 | 81,167 | 53,385 | 80,151 | ||||||||||||||||||||||
Printing | 31,604 | 74,578 | 42,712 | 47,930 | ||||||||||||||||||||||
Trustees and Officer | 11,638 | 23,246 | 10,071 | 23,387 | ||||||||||||||||||||||
Offering | — | 16,687 | — | 16,687 | ||||||||||||||||||||||
Board realignment and consolidation | — | 7,930 | — | 12,955 | ||||||||||||||||||||||
Recoupment of past waived and/or reimbursed fees — class specific | — | — | — | 10 | ||||||||||||||||||||||
Reorganization | — | 123,081 | — | — | ||||||||||||||||||||||
Miscellaneous | 35,658 | 98,044 | 15,478 | 26,383 | ||||||||||||||||||||||
|
|
|
|
|
|
|
| |||||||||||||||||||
Total expenses | 5,716,382 | 8,197,505 | 5,717,022 | 8,781,985 | ||||||||||||||||||||||
Less: | ||||||||||||||||||||||||||
Fees waived and/or reimbursed by the Manager | (1,064,120 | ) | (1,363,905 | ) | (510,036 | ) | (806,416 | ) | ||||||||||||||||||
Administration fees waived — class specific | (122,048 | ) | (160,532 | ) | (103,527 | ) | (156,960 | ) | ||||||||||||||||||
Transfer agent fees waived and/or reimbursed — class specific | (758,142 | ) | (933,943 | ) | (657,274 | ) | (1,021,522 | ) | ||||||||||||||||||
|
|
|
|
|
|
|
| |||||||||||||||||||
Total expenses after fees waived and/or reimbursed | 3,772,072 | 5,739,125 | 4,446,185 | 6,797,087 | ||||||||||||||||||||||
|
|
|
|
|
|
|
| |||||||||||||||||||
Net investment income | 12,306,457 | 21,422,769 | 2,107,091 | 4,508,395 | ||||||||||||||||||||||
|
|
|
|
|
|
|
| |||||||||||||||||||
REALIZED AND UNREALIZED GAIN (LOSS) | ||||||||||||||||||||||||||
Net realized gain (loss) from: | ||||||||||||||||||||||||||
Investments — unaffiliated | (84,763,047 | ) | (51,793,223 | ) | 8,789,294 | 23,274,937 | ||||||||||||||||||||
Investments — affiliated | 1,677 | 85 | (556 | ) | 2,423 | |||||||||||||||||||||
Capital gain distributions from investment companies — affiliated | 18 | — | 14 | — | ||||||||||||||||||||||
Futures contracts | (2,002,798 | ) | 2,424,726 | 433,249 | 11,022 | |||||||||||||||||||||
Forward foreign currency exchange contracts | — | 16,470 | — | — | ||||||||||||||||||||||
Foreign currency transactions | (513,999 | ) | (401,013 | ) | (96 | ) | — | |||||||||||||||||||
|
|
|
|
|
|
|
| |||||||||||||||||||
| (87,278,149 | ) | (49,752,955 | ) | 9,221,905 | 23,288,382 | |||||||||||||||||||||
|
|
|
|
|
|
|
| |||||||||||||||||||
Net change in unrealized appreciation (depreciation) on: | ||||||||||||||||||||||||||
Investments — unaffiliated | 6,238,920 | 16,613,973 | 97,631,730 | (25,310,291 | ) | |||||||||||||||||||||
Investments — affiliated | 145 | 192 | 1,136 | 18 | ||||||||||||||||||||||
Futures contracts | 1,759,223 | (554,179 | ) | 1,690,861 | (101,632 | ) | ||||||||||||||||||||
Foreign currency translations | 206,650 | (70,251 | ) | 1,570 | (5,160 | ) | ||||||||||||||||||||
|
|
|
|
|
|
|
| |||||||||||||||||||
| 8,204,938 | 15,989,735 | 99,325,297 | (25,417,065 | ) | ||||||||||||||||||||||
|
|
|
|
|
|
|
| |||||||||||||||||||
Net realized and unrealized gain (loss) | (79,073,211 | ) | (33,763,220 | ) | 108,547,202 | (2,128,683 | ) | |||||||||||||||||||
|
|
|
|
|
|
|
| |||||||||||||||||||
NET INCREASE (DECREASE) IN NET ASSETS RESULTING FROM OPERATIONS | $ | (66,766,754 | ) | $ | (12,340,451 | ) | $ | 110,654,293 | $ | 2,379,712 | ||||||||||||||||
|
|
|
|
|
|
|
| |||||||||||||||||||
See notes to financial statements.
| FINANCIAL STATEMENTS | 43 |
Statements of Operations (continued)
BlackRock Advantage Small Cap Core Fund | ||||
Year Ended 05/31/20 | ||||
INVESTMENT INCOME | ||||
Dividends — unaffiliated | $ | 15,460,362 | ||
Dividends — affiliated | 226,568 | |||
Interest — unaffiliated | 1,447 | |||
Securities lending income — affiliated — net | 545,149 | |||
Other income | 7,574 | |||
Foreign taxes withheld | (3,350 | ) | ||
|
| |||
Total investment income | 16,237,750 | |||
|
| |||
EXPENSES | ||||
Investment advisory | 4,894,130 | |||
Transfer agent — class specific | 1,157,395 | |||
Service and distribution — class specific | 706,767 | |||
Custodian | 70,800 | |||
Administration | 447,725 | |||
Professional | 116,176 | |||
Administration — class specific | 218,715 | |||
Registration | 157,350 | |||
Accounting services | 97,903 | |||
Printing | 44,779 | |||
Trustees and Officer | 23,114 | |||
Miscellaneous | 25,650 | |||
|
| |||
Total expenses | 7,960,504 | |||
Less: | ||||
Fees waived and/or reimbursed by the Manager | (949,211 | ) | ||
Administration fees waived — class specific | (218,712 | ) | ||
Transfer agent fees waived and/or reimbursed — class specific | (678,708 | ) | ||
|
| |||
Total expenses after fees waived and/or reimbursed | 6,113,873 | |||
|
| |||
Net investment income | 10,123,877 | |||
|
| |||
REALIZED AND UNREALIZED GAIN (LOSS) | ||||
Net realized gain (loss) from: | ||||
Investments — unaffiliated | (15,284,208 | ) | ||
Investments — affiliated | (1,264 | ) | ||
Capital gain distributions from investment companies — affiliated | 22 | |||
Futures contracts | 3,288,371 | |||
|
| |||
| (11,997,079 | ) | |||
|
| |||
Net change in unrealized appreciation (depreciation) on: | ||||
Investments — unaffiliated | 10,038,545 | |||
Investments — affiliated | 59,141 | |||
Futures contracts | 1,871,646 | |||
|
| |||
| 11,969,332 | ||||
|
| |||
Net realized and unrealized loss | (27,747 | ) | ||
|
| |||
NET INCREASE IN NET ASSETS RESULTING FROM OPERATIONS | $ | 10,096,130 | ||
|
| |||
See notes to financial statements.
| 44 | 2020 BLACKROCK ANNUAL REPORTTO SHAREHOLDERS |
Statements of Changes in Net Assets
| BlackRock Advantage International Fund | ||||||||||||
| Period from | ||||||||||||
| 10/01/19 | Year Ended September 30, | |||||||||||
| to 05/31/20 | 2019 | 2018 | ||||||||||
INCREASE (DECREASE) IN NET ASSETS | ||||||||||||
OPERATIONS | ||||||||||||
Net investment income | $ | 12,306,457 | $ | 21,422,769 | $ | 16,198,706 | ||||||
Net realized loss | (87,278,149 | ) | (49,752,955 | ) | (8,206,114 | ) | ||||||
Net change in unrealized appreciation (depreciation) | 8,204,938 | 15,989,735 | (3,023,978 | ) | ||||||||
|
|
|
|
|
| |||||||
Net increase (decrease) in net assets resulting from operations | (66,766,754 | ) | (12,340,451 | ) | 4,968,614 | |||||||
|
|
|
|
|
| |||||||
DISTRIBUTIONS TO SHAREHOLDERS(a) | ||||||||||||
Institutional | (12,598,153 | ) | (10,162,498 | ) | (1,075,242 | ) | ||||||
Investor A | (11,082,568 | ) | (7,937,835 | ) | (1,762,109 | ) | ||||||
Investor C | (158,038 | ) | (88,346 | ) | — | |||||||
Class K | (1,303,076 | ) | (224,376 | ) | — | |||||||
Class R | (116,369 | ) | (128,026 | ) | (12,673 | ) | ||||||
|
|
|
|
|
| |||||||
Decrease in net assets resulting from distributions to shareholders | (25,258,204 | ) | (18,541,081 | ) | (2,850,024 | ) | ||||||
|
|
|
|
|
| |||||||
CAPITAL SHARE TRANSACTIONS | ||||||||||||
Net increase in net assets derived from capital share transactions | 78,972,558 | 196,132,910 | 423,944,360 | |||||||||
|
|
|
|
|
| |||||||
NET ASSETS | ||||||||||||
Total increase (decrease) in net assets | (13,052,400 | ) | 165,251,378 | 426,062,950 | ||||||||
Beginning of period | 909,983,600 | 744,732,222 | 318,669,272 | |||||||||
|
|
|
|
|
| |||||||
End of period | $ | 896,931,200 | $ | 909,983,600 | $ | 744,732,222 | ||||||
|
|
|
|
|
| |||||||
| (a) | Distributions for annual periods determined in accordance with U.S. federal income tax regulations. |
See notes to financial statements.
| FINANCIAL STATEMENTS | 45 |
Statements of Changes in Net Assets (continued)
| BlackRock Advantage Large Cap Growth Fund | ||||||||||||
| Period from | ||||||||||||
| 10/01/19 | Year Ended September 30, | |||||||||||
| to 05/31/20 | 2019 | 2018 | ||||||||||
INCREASE (DECREASE) IN NET ASSETS | ||||||||||||
OPERATIONS | ||||||||||||
Net investment income | $ | 2,107,091 | $ | 4,508,395 | $ | 4,324,280 | ||||||
Net realized gain | 9,221,905 | 23,288,382 | 62,748,523 | |||||||||
Net change in unrealized appreciation (depreciation) | 99,325,297 | (25,417,065 | ) | 103,074,108 | ||||||||
|
|
|
|
|
| |||||||
Net increase in net assets resulting from operations | 110,654,293 | 2,379,712 | 170,146,911 | |||||||||
|
|
|
|
|
| |||||||
DISTRIBUTIONS TO SHAREHOLDERS(a) | ||||||||||||
Institutional | (3,224,617 | ) | (5,518,754 | ) | (4,040,287 | ) | ||||||
Service | (8,241 | ) | (11,470 | ) | (11,593 | ) | ||||||
Investor A | (28,134,627 | ) | (54,769,508 | ) | (40,782,554 | ) | ||||||
Investor B | — | — | (23,111 | ) | ||||||||
Investor C | (647,015 | ) | (1,425,491 | ) | (3,038,950 | ) | ||||||
Class K | (43,395 | ) | (44,757 | ) | — | |||||||
Class R | (30,985 | ) | (108,589 | ) | (102,816 | ) | ||||||
|
|
|
|
|
| |||||||
Decrease in net assets resulting from distributions to shareholders | (32,088,880 | ) | (61,878,569 | ) | (47,999,311 | ) | ||||||
|
|
|
|
|
| |||||||
CAPITAL SHARE TRANSACTIONS | ||||||||||||
Net increase (decrease) in net assets derived from capital share transactions | (55,560,322 | ) | (1,592,425 | ) | 297,413,538 | |||||||
|
|
|
|
|
| |||||||
NET ASSETS | ||||||||||||
Total increase (decrease) in net assets | 23,005,091 | (61,091,282 | ) | 419,561,138 | ||||||||
|
|
|
|
|
| |||||||
Beginning of period | 796,126,246 | 857,217,528 | 437,656,390 | |||||||||
|
|
|
|
|
| |||||||
End of period | $ | 819,131,337 | $ | 796,126,246 | $ | 857,217,528 | ||||||
|
|
|
|
|
| |||||||
| (a) | Distributions for annual periods determined in accordance with U.S. federal income tax regulations. |
See notes to financial statements.
| 46 | 2020 BLACKROCK ANNUAL REPORTTO SHAREHOLDERS |
Statements of Changes in Net Assets (continued)
| BlackRock Advantage Small Cap Core Fund | ||||||||||||||||
|
| |||||||||||||||
| Year Ended May 31, | ||||||||||||||||
| 2020 | 2019 | |||||||||||||||
INCREASE (DECREASE) IN NET ASSETS | ||||||||||||||||
OPERATIONS | ||||||||||||||||
Net investment income | $ | 10,123,877 | $ | 5,917,879 | ||||||||||||
Net realized gain (loss) | (11,997,079 | ) | 3,599,037 | |||||||||||||
Net change in unrealized appreciation (depreciation) | 11,969,332 | (60,332,838 | ) | |||||||||||||
|
|
|
| |||||||||||||
Net increase (decrease) in net assets resulting from operations | 10,096,130 | (50,815,922 | ) | |||||||||||||
|
|
|
| |||||||||||||
DISTRIBUTIONS TO SHAREHOLDERS(a) | ||||||||||||||||
Institutional | (6,389,241 | ) | (21,632,996 | ) | ||||||||||||
Investor A | (1,849,729 | ) | (8,535,809 | ) | ||||||||||||
Investor C | (6,537 | ) | (118,597 | ) | ||||||||||||
Class K | (1,008,409 | ) | (524,047 | ) | ||||||||||||
|
|
|
| |||||||||||||
Decrease in net assets resulting from distributions to shareholders | (9,253,916 | ) | (30,811,449 | ) | ||||||||||||
|
|
|
| |||||||||||||
CAPITAL SHARE TRANSACTIONS | ||||||||||||||||
Net increase in net assets derived from capital share transactions | 457,591,723 | 437,175,198 | ||||||||||||||
|
|
|
| |||||||||||||
NET ASSETS | ||||||||||||||||
Total increase in net assets | 458,433,937 | 355,547,827 | ||||||||||||||
Beginning of year | 861,084,513 | 505,536,686 | ||||||||||||||
|
|
|
| |||||||||||||
End of year | $ | 1,319,518,450 | $ | 861,084,513 | ||||||||||||
|
|
|
| |||||||||||||
| (a) | Distributions for annual periods determined in accordance with U.S. federal income tax regulations. |
See notes to financial statements.
| FINANCIAL STATEMENTS | 47 |
(For a share outstanding throughout each period)
| BlackRock Advantage International Fund | ||||||||||||||||||||||||||||
| Institutional | ||||||||||||||||||||||||||||
| Period from | ||||||||||||||||||||||||||||
| 10/01/19 | Year Ended September 30, | |||||||||||||||||||||||||||
to 05/31/20 | 2019 | 2018 | 2017 | 2016 | 2015 | |||||||||||||||||||||||
| �� | ||||||||||||||||||||||||||||
Net asset value, beginning of period | $ | 16.12 | $ | 16.97 | $ | 16.77 | $ | 14.50 | $ | 13.34 | $ | 14.19 | ||||||||||||||||
|
|
|
|
|
|
|
|
|
|
|
| |||||||||||||||||
Net investment income(a) | 0.22 | 0.44 | 0.45 | 0.19 | 0.09 | 0.09 | ||||||||||||||||||||||
Net realized and unrealized gain (loss) | (1.37 | ) | (0.90 | ) | (0.12 | ) | 2.37 | 1.18 | (0.69 | ) | ||||||||||||||||||
|
|
|
|
|
|
|
|
|
|
|
| |||||||||||||||||
Net increase (decrease) from investment operations | (1.15 | ) | (0.46 | ) | 0.33 | 2.56 | 1.27 | (0.60 | ) | |||||||||||||||||||
|
|
|
|
|
|
|
|
|
|
|
| |||||||||||||||||
Distributions from net investment income(b) | (0.45 | ) | (0.39 | ) | (0.13 | ) | (0.29 | ) | (0.11 | ) | (0.25 | ) | ||||||||||||||||
|
|
|
|
|
|
|
|
|
|
|
| |||||||||||||||||
Net asset value, end of period | $ | 14.52 | $ | 16.12 | $ | 16.97 | $ | 16.77 | $ | 14.50 | $ | 13.34 | ||||||||||||||||
|
|
|
|
|
|
|
|
|
|
|
| |||||||||||||||||
Total Return(c) | ||||||||||||||||||||||||||||
Based on net asset value | (7.45 | )%(d) | (2.52 | )% | 1.94 | %(e) | 17.99 | % | 9.60 | % | (4.28 | )% | ||||||||||||||||
|
|
|
|
|
|
|
|
|
|
|
| |||||||||||||||||
Ratios to Average Net Assets | ||||||||||||||||||||||||||||
Total expenses | 0.82 | %(f) | 0.88 | % | 0.86 | % | 1.10 | % | 1.21 | % | 1.21 | % | ||||||||||||||||
|
|
|
|
|
|
|
|
|
|
|
| |||||||||||||||||
Total expenses after fees waived and/or reimbursed | 0.50 | %(f) | 0.59 | % | 0.64 | % | 0.86 | % | 1.06 | % | 1.06 | % | ||||||||||||||||
|
|
|
|
|
|
|
|
|
|
|
| |||||||||||||||||
Net investment income | 2.17 | %(f) | 2.78 | % | 2.61 | % | 1.20 | % | 0.68 | % | 0.62 | % | ||||||||||||||||
|
|
|
|
|
|
|
|
|
|
|
| |||||||||||||||||
Supplemental Data | ||||||||||||||||||||||||||||
Net assets, end of period (000) | $ | 477,944 | $ | 446,831 | $ | 403,149 | $ | 116,595 | $ | 52,490 | $ | 57,826 | ||||||||||||||||
|
|
|
|
|
|
|
|
|
|
|
| |||||||||||||||||
Portfolio turnover rate | 131 | % | 140 | % | 106 | % | 177 | % | 67 | % | 64 | % | ||||||||||||||||
|
|
|
|
|
|
|
|
|
|
|
| |||||||||||||||||
| (a) | Based on average shares outstanding. |
| (b) | Distributions for annual periods determined in accordance with U.S. federal income tax regulations. |
| (c) | Where applicable, assumes the reinvestment of distributions. |
| (d) | Aggregate total return. |
| (e) | Includes the litigation settlement amount. Excluding this amount, the Fund’s total return is 1.82% |
| (f) | Annualized. |
See notes to financial statements.
| 48 | 2020 BLACKROCK ANNUAL REPORTTO SHAREHOLDERS |
Financial Highlights (continued)
(For a share outstanding throughout each period)
| BlackRock Advantage International Fund (continued) | ||||||||||||||||||||||||||||||
| Investor A | ||||||||||||||||||||||||||||||
| Period from | ||||||||||||||||||||||||||||||
| 10/01/19 | Year Ended September 30, | |||||||||||||||||||||||||||||
| to 05/31/20 | 2019 | 2018 | 2017 | 2016 | 2015 | |||||||||||||||||||||||||
Net asset value, beginning of period | $ | 15.93 | $ | 16.78 | $ | 16.60 | $ | 14.35 | $ | 13.20 | $ | 14.04 | ||||||||||||||||||
|
|
|
|
|
|
|
|
|
|
|
| |||||||||||||||||||
Net investment income(a) | 0.19 | 0.40 | 0.38 | 0.12 | 0.06 | 0.05 | ||||||||||||||||||||||||
Net realized and unrealized gain (loss) | (1.35 | ) | (0.90 | ) | (0.10 | ) | 2.38 | 1.16 | (0.68 | ) | ||||||||||||||||||||
|
|
|
|
|
|
|
|
|
|
|
| |||||||||||||||||||
Net increase (decrease) from investment operations | (1.16 | ) | (0.50 | ) | 0.28 | 2.50 | 1.22 | (0.63 | ) | |||||||||||||||||||||
|
|
|
|
|
|
|
|
|
|
|
| |||||||||||||||||||
Distributions from net investment income(b) | (0.42 | ) | (0.35 | ) | (0.10 | ) | (0.25 | ) | (0.07 | ) | (0.21 | ) | ||||||||||||||||||
|
|
|
|
|
|
|
|
|
|
|
| |||||||||||||||||||
Net asset value, end of period | $ | 14.35 | $ | 15.93 | $ | 16.78 | $ | 16.60 | $ | 14.35 | $ | 13.20 | ||||||||||||||||||
|
|
|
|
|
|
|
|
|
|
|
| |||||||||||||||||||
Total Return(c) | ||||||||||||||||||||||||||||||
Based on net asset value | (7.61 | )%(d) | (2.77 | )% | 1.68 | %(e) | 17.71 | % | 9.30 | % | (4.55 | )% | ||||||||||||||||||
|
|
|
|
|
|
|
|
|
|
|
| |||||||||||||||||||
Ratios to Average Net Assets | ||||||||||||||||||||||||||||||
Total expenses | 1.08 | %(f) | 1.16 | % | 1.15 | % | 1.42 | % | 1.49 | % | 1.48 | % | ||||||||||||||||||
|
|
|
|
|
|
|
|
|
|
|
| |||||||||||||||||||
Total expenses after fees waived and/or reimbursed | 0.75 | %(f) | 0.84 | % | 0.89 | % | 1.19 | % | 1.33 | % | 1.33 | % | ||||||||||||||||||
|
|
|
|
|
|
|
|
|
|
|
| |||||||||||||||||||
Net investment income | 1.85 | %(f) | 2.56 | % | 2.20 | % | 0.82 | % | 0.46 | % | 0.35 | % | ||||||||||||||||||
|
|
|
|
|
|
|
|
|
|
|
| |||||||||||||||||||
Supplemental Data | ||||||||||||||||||||||||||||||
Net assets, end of period (000) | $ | 366,411 | $ | 404,739 | $ | 302,725 | $ | 169,806 | $ | 153,886 | $ | 163,932 | ||||||||||||||||||
|
|
|
|
|
|
|
|
|
|
|
| |||||||||||||||||||
Portfolio turnover rate | 131 | % | 140 | % | 106 | % | 177 | % | 67 | % | 64 | % | ||||||||||||||||||
|
|
|
|
|
|
|
|
|
|
|
| |||||||||||||||||||
| (a) | Based on average shares outstanding. |
| (b) | Distributions for annual periods determined in accordance with U.S. federal income tax regulations. |
| (c) | Where applicable, excludes the effects of any sales charges and assumes the reinvestment of distributions. |
| (d) | Aggregate total return. |
| (e) | Includes the litigation settlement amount. Excluding this amount, the Fund’s total return is 1.56% |
| (f) | Annualized. |
See notes to financial statements.
| FINANCIAL HIGHLIGHTS | 49 |
Financial Highlights (continued)
(For a share outstanding throughout each period)
| BlackRock Advantage International Fund (continued) | ||||||||||||||||||||||||||||||
| Investor C | ||||||||||||||||||||||||||||||
| Period from | ||||||||||||||||||||||||||||||
| 10/01/19 | Year Ended September 30, | |||||||||||||||||||||||||||||
| to 05/31/20 | 2019 | 2018 | 2017 | 2016 | 2015 | |||||||||||||||||||||||||
Net asset value, beginning of period | $ | 15.43 | $ | 16.11 | $ | 15.96 | $ | 13.81 | $ | 12.74 | $ | 13.54 | ||||||||||||||||||
|
|
|
|
|
|
|
|
|
|
|
| |||||||||||||||||||
Net investment income (loss)(a) | 0.10 | 0.23 | 0.23 | (0.01 | ) | (0.05 | ) | (0.06 | ) | |||||||||||||||||||||
Net realized and unrealized gain (loss) | (1.31 | ) | (0.80 | ) | (0.08 | ) | 2.29 | 1.12 | (0.66 | ) | ||||||||||||||||||||
|
|
|
|
|
|
|
|
|
|
|
| |||||||||||||||||||
Net increase (decrease) from investment operations | (1.21 | ) | (0.57 | ) | 0.15 | 2.28 | 1.07 | (0.72 | ) | |||||||||||||||||||||
|
|
|
|
|
|
|
|
|
|
|
| |||||||||||||||||||
Distributions from net investment income(b) | (0.27 | ) | (0.11 | ) | — | (0.13 | ) | (0.00 | )(c) | (0.08 | ) | |||||||||||||||||||
|
|
|
|
|
|
|
|
|
|
|
| |||||||||||||||||||
Net asset value, end of period | $ | 13.95 | $ | 15.43 | $ | 16.11 | $ | 15.96 | $ | 13.81 | $ | 12.74 | ||||||||||||||||||
|
|
|
|
|
|
|
|
|
|
|
| |||||||||||||||||||
Total Return(d) | ||||||||||||||||||||||||||||||
Based on net asset value | (8.05 | )%(e) | (3.51 | )% | 0.94 | %(f) | 16.70 | % | 8.44 | % | (5.32 | )% | ||||||||||||||||||
|
|
|
|
|
|
|
|
|
|
|
| |||||||||||||||||||
Ratios to Average Net Assets | ||||||||||||||||||||||||||||||
Total expenses | 1.84 | %(g) | 1.88 | % | 1.89 | % | 2.22 | %(h) | 2.27 | %(h) | 2.27 | % | ||||||||||||||||||
|
|
|
|
|
|
|
|
|
|
|
| |||||||||||||||||||
Total expenses after fees waived and/or reimbursed | 1.50 | %(g) | 1.59 | % | 1.64 | % | 2.03 | % | 2.14 | % | 2.14 | % | ||||||||||||||||||
|
|
|
|
|
|
|
|
|
|
|
| |||||||||||||||||||
Net investment income (loss) | 1.04 | %(g) | 1.52 | % | 1.39 | % | (0.05 | )% | (0.35 | )% | (0.47 | )% | ||||||||||||||||||
|
|
|
|
|
|
|
|
|
|
|
| |||||||||||||||||||
Supplemental Data | ||||||||||||||||||||||||||||||
Net assets, end of period (000) | $ | 6,193 | $ | 9,448 | $ | 23,111 | $ | 24,717 | $ | 43,218 | $ | 42,066 | ||||||||||||||||||
|
|
|
|
|
|
|
|
|
|
|
| |||||||||||||||||||
Portfolio turnover rate | 131 | % | 140 | % | 106 | % | 177 | % | 67 | % | 64 | % | ||||||||||||||||||
|
|
|
|
|
|
|
|
|
|
|
| |||||||||||||||||||
| (a) | Based on average shares outstanding. |
| (b) | Distributions for annual periods determined in accordance with U.S. federal income tax regulations. |
| (c) | Amount is greater than $(0.005) per share. |
| (d) | Where applicable, excludes the effects of any sales charges and assumes the reinvestment of distributions. |
| (e) | Aggregate total return. |
| (f) | Includes the litigation settlement amount. Excluding this amount, the Fund’s total return is 0.81% |
| (g) | Annualized. |
| (h) | Includes recoupment of past waived and/or reimbursed fees with no financial impact to the expense ratios. |
See notes to financial statements.
| 50 | 2020 BLACKROCK ANNUAL REPORTTO SHAREHOLDERS |
Financial Highlights (continued)
(For a share outstanding throughout each period)
| BlackRock Advantage International Fund (continued) | ||||||
| Class K | ||||||
Period from | Period from | |||||||||||
| 10/01/19 | Year Ended | 01/25/18 | (a) | |||||||||
| to 05/31/20 | 09/30/19 | to 09/30/18 | ||||||||||
Net asset value, beginning of period | $ | 16.12 | $ | 16.98 | $ | 18.33 | ||||||||||||||
|
|
|
|
|
| |||||||||||||||
Net investment income(b) | 0.23 | 0.56 | 0.39 | |||||||||||||||||
Net realized and unrealized loss | (1.37 | ) | (1.03 | ) | (1.74 | ) | ||||||||||||||
|
|
|
|
|
| |||||||||||||||
Net decrease from investment operations | (1.14 | ) | (0.47 | ) | (1.35 | ) | ||||||||||||||
|
|
|
|
|
| |||||||||||||||
Distributions from net investment income(c) | (0.46 | ) | (0.39 | ) | — | |||||||||||||||
|
|
|
|
|
| |||||||||||||||
Net asset value, end of period | $ | 14.52 | $ | 16.12 | $ | 16.98 | ||||||||||||||
|
|
|
|
|
| |||||||||||||||
Total Return(d) | ||||||||||||||||||||
Based on net asset value | (7.40 | )%(e) | (2.53 | )% | (7.37 | )%(e)(f) | ||||||||||||||
|
|
|
|
|
| |||||||||||||||
Ratios to Average Net Assets | ||||||||||||||||||||
Total expenses | 0.65 | %(g) | 0.75 | % | 0.80 | %(g) | ||||||||||||||
|
|
|
|
|
| |||||||||||||||
Total expenses after fees waived and/or reimbursed | 0.45 | %(g) | 0.54 | % | 0.59 | %(g) | ||||||||||||||
|
|
|
|
|
| |||||||||||||||
Net investment income | 2.20 | %(g) | 3.59 | % | 3.33 | %(g) | ||||||||||||||
|
|
|
|
|
| |||||||||||||||
Supplemental Data | ||||||||||||||||||||
Net assets, end of period (000) | $ | 43,073 | $ | 43,721 | $ | 8,175 | ||||||||||||||
|
|
|
|
|
| |||||||||||||||
Portfolio turnover rate | 131 | % | 140 | % | 106 | %(h) | ||||||||||||||
|
|
|
|
|
| |||||||||||||||
| (a) | Commencement of operations. |
| (b) | Based on average shares outstanding. |
| (c) | Distributions for annual periods determined in accordance with U.S. federal income tax regulations. |
| (d) | Where applicable, assumes the reinvestment of distributions. |
| (e) | Aggregate total return. |
| (f) | Includes the litigation settlement amount. Excluding this amount, the Fund’s total return is (7.42)% |
| (g) | Annualized. |
| (h) | Portfolio turnover is representative of the Fund for the entire year. |
See notes to financial statements.
| FINANCIAL HIGHLIGHTS | 51 |
Financial Highlights (continued)
(For a share outstanding throughout each period)
| BlackRock Advantage International Fund (continued) | ||||||||||||||||||||||||||||||||
| Class R | ||||||||||||||||||||||||||||||||
| Period from | ||||||||||||||||||||||||||||||||
| 10/01/19 | Year Ended September 30, | |||||||||||||||||||||||||||||||
| to 05/31/20 | 2019 | 2018 | 2017 | 2016 | 2015 | |||||||||||||||||||||||||||
Net asset value, beginning of period | $ | 15.91 | $ | 16.74 | $ | 16.53 | $ | 14.29 | $ | 13.12 | $ | 13.94 | ||||||||||||||||||||
|
|
|
|
|
|
|
|
|
|
|
| |||||||||||||||||||||
Net investment income (loss)(a) | 0.15 | 0.34 | 0.32 | 0.07 | 0.01 | (0.01 | ) | |||||||||||||||||||||||||
Net realized and unrealized gain (loss) | (1.34 | ) | (0.88 | ) | (0.08 | ) | 2.36 | 1.16 | (0.68 | ) | ||||||||||||||||||||||
|
|
|
|
|
|
|
|
|
|
|
| |||||||||||||||||||||
Net increase (decrease) from investment operations | (1.19 | ) | (0.54 | ) | 0.24 | 2.43 | 1.17 | (0.69 | ) | |||||||||||||||||||||||
|
|
|
|
|
|
|
|
|
|
|
| |||||||||||||||||||||
Distributions from net investment income(b) | (0.36 | ) | (0.29 | ) | (0.03 | ) | (0.19 | ) | (0.00 | )(c) | (0.13 | ) | ||||||||||||||||||||
|
|
|
|
|
|
|
|
|
|
|
| |||||||||||||||||||||
Net asset value, end of period | $ | 14.36 | $ | 15.91 | $ | 16.74 | $ | 16.53 | $ | 14.29 | $ | 13.12 | ||||||||||||||||||||
|
|
|
|
|
|
|
|
|
|
|
| |||||||||||||||||||||
Total Return(d) | ||||||||||||||||||||||||||||||||
Based on net asset value | (7.75 | )%(e) | (3.04 | )% | 1.44 | %(f) | 17.26 | % | 8.96 | % | (4.95 | )% | ||||||||||||||||||||
|
|
|
|
|
|
|
|
|
|
|
| |||||||||||||||||||||
Ratios to Average Net Assets | ||||||||||||||||||||||||||||||||
Total expenses | 1.37 | %(g) | 1.44 | % | 1.45 | % | 1.75 | %(h) | 1.83 | %(h) | 1.81 | %(h) | ||||||||||||||||||||
|
|
|
|
|
|
|
|
|
|
|
| |||||||||||||||||||||
Total expenses after fees waived and/or reimbursed | 1.00 | %(g) | 1.09 | % | 1.14 | % | 1.55 | % | 1.72 | % | 1.72 | % | ||||||||||||||||||||
|
|
|
|
|
|
|
|
|
|
|
| |||||||||||||||||||||
Net investment income (loss) | 1.47 | %(g) | 2.20 | % | 1.91 | % | 0.46 | % | 0.08 | % | (0.07 | )% | ||||||||||||||||||||
|
|
|
|
|
|
|
|
|
|
|
| |||||||||||||||||||||
Supplemental Data | ||||||||||||||||||||||||||||||||
Net assets, end of period (000) | $ | 3,310 | $ | 5,244 | $ | 7,572 | $ | 7,551 | $ | 8,343 | $ | 8,308 | ||||||||||||||||||||
|
|
|
|
|
|
|
|
|
|
|
| |||||||||||||||||||||
Portfolio turnover rate | 131 | % | 140 | % | 106 | % | 177 | % | 67 | % | 64 | % | ||||||||||||||||||||
|
|
|
|
|
|
|
|
|
| �� |
| |||||||||||||||||||||
| (a) | Based on average shares outstanding. |
| (b) | Distributions for annual periods determined in accordance with U.S. federal income tax regulations. |
| (c) | Amount is greater than $(0.005) per share. |
| (d) | Where applicable, assumes the reinvestment of distributions. |
| (e) | Aggregate total return. |
| (f) | Includes the litigation settlement amount. Excluding this amount, the Fund’s total return is 1.26% |
| (g) | Annualized. |
| (h) | Includes recoupment of past waived and/or reimbursed fees with no financial impact to the expense ratios. |
See notes to financial statements.
| 52 | 2020 BLACKROCK ANNUAL REPORTTO SHAREHOLDERS |
Financial Highlights (continued)
(For a share outstanding throughout each period)
| BlackRock Advantage Large Cap Growth Fund | ||||||||||||||||||||||||||||||||
| Institutional | ||||||||||||||||||||||||||||||||
| Period from | ||||||||||||||||||||||||||||||||
| 10/01/19 | Year Ended September 30, | |||||||||||||||||||||||||||||||
| to 05/31/20 | 2019 | 2018 | 2017 | (a) | 2016 | (a) | 2015 | (a) | ||||||||||||||||||||||||
Net asset value, beginning of period | $ | 16.49 | $ | 17.89 | $ | 15.20 | $ | 12.32 | $ | 12.07 | $ | 14.51 | ||||||||||||||||||||
|
|
|
|
|
|
|
|
|
|
|
| |||||||||||||||||||||
Net investment income(b) | 0.07 | 0.13 | 0.13 | 0.12 | 0.10 | 0.06 | ||||||||||||||||||||||||||
Net realized and unrealized gain (loss) | 2.40 | (0.22 | ) | 3.52 | 2.87 | 1.06 | (0.25 | ) | ||||||||||||||||||||||||
|
|
|
|
|
|
|
|
|
|
|
| |||||||||||||||||||||
Net increase (decrease) from investment operations | 2.47 | (0.09 | ) | 3.65 | 2.99 | 1.16 | (0.19 | ) | ||||||||||||||||||||||||
|
|
|
|
|
|
|
|
|
|
|
| |||||||||||||||||||||
Distributions(c) | ||||||||||||||||||||||||||||||||
From net investment income | (0.14 | ) | (0.13 | ) | (0.08 | ) | (0.11 | ) | (0.07 | ) | (0.41 | ) | ||||||||||||||||||||
From net realized gain | (0.59 | ) | (1.18 | ) | (0.88 | ) | — | (0.84 | ) | (1.84 | ) | |||||||||||||||||||||
|
|
|
|
|
|
|
|
|
|
|
| |||||||||||||||||||||
Total distributions | (0.73 | ) | (1.31 | ) | (0.96 | ) | (0.11 | ) | (0.91 | ) | (2.25 | ) | ||||||||||||||||||||
|
|
|
|
|
|
|
|
|
|
|
| |||||||||||||||||||||
Net asset value, end of period | $ | 18.23 | $ | 16.49 | $ | 17.89 | $ | 15.20 | $ | 12.32 | $ | 12.07 | ||||||||||||||||||||
|
|
|
|
|
|
|
|
|
|
|
| |||||||||||||||||||||
Total Return(d) | ||||||||||||||||||||||||||||||||
Based on net asset value | 15.34 | %(e) | 0.41 | % | 25.31 | % | 24.43 | % | 9.75 | % | (2.15 | )% | ||||||||||||||||||||
|
|
|
|
|
|
|
|
|
|
|
| |||||||||||||||||||||
Ratios to Average Net Assets | ||||||||||||||||||||||||||||||||
Total expenses | 0.86 | %(f) | 0.87 | % | 0.86 | % | 1.10 | % | 1.14 | % | 1.11 | %(g) | ||||||||||||||||||||
|
|
|
|
|
|
|
|
|
|
|
| |||||||||||||||||||||
Total expenses after fees waived and/or reimbursed | 0.62 | %(f) | 0.62 | % | 0.62 | % | 0.84 | % | 0.92 | % | 0.92 | %(g) | ||||||||||||||||||||
|
|
|
|
|
|
|
|
|
|
|
| |||||||||||||||||||||
Net investment income | 0.65 | %(f) | 0.82 | % | 0.83 | % | 0.91 | % | 0.86 | % | 0.46 | %(g) | ||||||||||||||||||||
|
|
|
|
|
|
|
|
|
|
|
| |||||||||||||||||||||
Supplemental Data | ||||||||||||||||||||||||||||||||
Net assets, end of period (000) | $ | 89,737 | $ | 79,564 | $ | 74,886 | $ | 36,574 | $ | 37,417 | $ | 40,870 | ||||||||||||||||||||
|
|
|
|
|
|
|
|
|
|
|
| |||||||||||||||||||||
Portfolio turnover rate | 70 | % | 154 | % | 162 | % | 130 | % | 36 | % | 156 | % | ||||||||||||||||||||
|
|
|
|
|
|
|
|
|
|
|
| |||||||||||||||||||||
| (a) | Consolidated Financial Highlights. |
| (b) | Based on average shares outstanding. |
| (c) | Distributions for annual periods determined in accordance with U.S. federal income tax regulations. |
| (d) | Where applicable, assumes the reinvestment of distributions. |
| (e) | Aggregate total return. |
| (f) | Annualized. |
| (g) | Ratios do not include expenses incurred indirectly as a result of investments in underlying funds of approximately 0.01%. |
See notes to financial statements.
| FINANCIAL HIGHLIGHTS | 53 |
Financial Highlights (continued)
(For a share outstanding throughout each period)
| BlackRock Advantage Large Cap Growth Fund (continued) | ||||||||||||||||||||||||||||||||
| Service | ||||||||||||||||||||||||||||||||
| Period from | ||||||||||||||||||||||||||||||||
| 10/01/19 | Year Ended September 30, | |||||||||||||||||||||||||||||||
| to 05/31/20 | 2019 | 2018 | 2017 | (a) | 2016 | (a) | 2015 | (a) | ||||||||||||||||||||||||
Net asset value, beginning of period | $ | 16.18 | $ | 17.57 | $ | 14.95 | $ | 12.12 | $ | 11.86 | $ | 14.29 | ||||||||||||||||||||
|
|
|
|
|
|
|
|
|
|
|
| |||||||||||||||||||||
Net investment income(b) | 0.04 | 0.09 | 0.09 | 0.08 | 0.06 | 0.01 | ||||||||||||||||||||||||||
Net realized and unrealized gain (loss) | 2.36 | (0.22 | ) | 3.46 | 2.82 | 1.05 | (0.24 | ) | ||||||||||||||||||||||||
|
|
|
|
|
|
|
|
|
|
|
| |||||||||||||||||||||
Net increase (decrease) from investment operations | 2.40 | (0.13 | ) | 3.55 | 2.90 | 1.11 | (0.23 | ) | ||||||||||||||||||||||||
|
|
|
|
|
|
|
|
|
|
|
| |||||||||||||||||||||
Distributions(c) | ||||||||||||||||||||||||||||||||
From net investment income | (0.10 | ) | (0.08 | ) | (0.05 | ) | (0.07 | ) | (0.01 | ) | (0.36 | ) | ||||||||||||||||||||
From net realized gain | (0.59 | ) | (1.18 | ) | (0.88 | ) | — | (0.84 | ) | (1.84 | ) | |||||||||||||||||||||
|
|
|
|
|
|
|
|
|
|
|
| |||||||||||||||||||||
Total distributions | (0.69 | ) | (1.26 | ) | (0.93 | ) | (0.07 | ) | (0.85 | ) | (2.20 | ) | ||||||||||||||||||||
|
|
|
|
|
|
|
|
|
|
|
| |||||||||||||||||||||
Net asset value, end of period | $ | 17.89 | $ | 16.18 | $ | 17.57 | $ | 14.95 | $ | 12.12 | $ | 11.86 | ||||||||||||||||||||
|
|
|
|
|
|
|
|
|
|
|
| |||||||||||||||||||||
Total Return(d) | ||||||||||||||||||||||||||||||||
Based on net asset value | 15.19 | %(e) | 0.15 | % | 24.96 | % | 24.03 | % | 9.44 | % | (2.49 | )% | ||||||||||||||||||||
|
|
|
|
|
|
|
|
|
|
|
| |||||||||||||||||||||
Ratios to Average Net Assets | ||||||||||||||||||||||||||||||||
Total expenses(f) | 1.06 | %(g) | 0.98 | % | 1.03 | % | 1.24 | % | 1.26 | % | 1.33 | %(h) | ||||||||||||||||||||
|
|
|
|
|
|
|
|
|
|
|
| |||||||||||||||||||||
Total expenses after fees waived and/or reimbursed | 0.87 | %(g) | 0.87 | % | 0.87 | % | 1.11 | % | 1.24 | % | 1.23 | %(h) | ||||||||||||||||||||
|
|
|
|
|
|
|
|
|
|
|
| |||||||||||||||||||||
Net investment income | 0.39 | %(g) | 0.57 | % | 0.55 | % | 0.59 | % | 0.54 | % | 0.10 | %(h) | ||||||||||||||||||||
|
|
|
|
|
|
|
|
|
|
|
| |||||||||||||||||||||
Supplemental Data | ||||||||||||||||||||||||||||||||
Net assets, end of period (000) | $ | 253 | $ | 198 | $ | 160 | $ | 189 | $ | 119 | $ | 108 | ||||||||||||||||||||
|
|
|
|
|
|
|
|
|
|
|
| |||||||||||||||||||||
Portfolio turnover rate | 70 | % | 154 | % | 162 | % | 130 | % | 36 | % | 156 | % | ||||||||||||||||||||
|
|
|
|
|
|
|
|
|
|
|
| |||||||||||||||||||||
| (a) | Consolidated Financial Highlights. |
| (b) | Based on average shares outstanding. |
| (c) | Distributions for annual periods determined in accordance with U.S. federal income tax regulations. |
| (d) | Where applicable, assumes the reinvestment of distributions. |
| (e) | Aggregate total return. |
| (f) | Includes recoupment of past waived and/or reimbursed fees. Excluding the recoupment of past waived and/or reimbursed fees, the ratios were as follows: |
| Period from | ||||||||||||||||||||||||||||||||||||||||||||||||||||
| 10/01/19 | Year Ended September 30, | |||||||||||||||||||||||||||||||||||||||||||||||||||
| to 5/31/20 | 2019 | 2018 | 2017 | 2016 | 2015 | |||||||||||||||||||||||||||||||||||||||||||||||
Expense ratios | N/A | 0.97 | % | N/A | N/A | 1.21 | % | 1.30 | % | |||||||||||||||||||||||||||||||||||||||||||
|
|
|
|
|
|
|
|
|
|
|
| |||||||||||||||||||||||||||||||||||||||||
| (g) | Annualized. |
| (h) | Ratios do not include expenses incurred indirectly as a result of investments in underlying funds of approximately 0.01%. |
See notes to financial statements.
| 54 | 2020 BLACKROCK ANNUAL REPORTTO SHAREHOLDERS |
Financial Highlights (continued)
(For a share outstanding throughout each period)
| BlackRock Advantage Large Cap Growth Fund (continued) | ||||||||||||||||||||||||||||||||
| Investor A | ||||||||||||||||||||||||||||||||
| Period from | ||||||||||||||||||||||||||||||||
|
| 10/01/19 | Year Ended September 30, | ||||||||||||||||||||||||||||||
| to 05/31/20 | 2019 | 2018 | 2017 | (a) | 2016 | (a) | 2015 | (a) | ||||||||||||||||||||||||
Net asset value, beginning of period | $ | 15.71 | $ | 17.11 | $ | 14.59 | $ | 11.83 | $ | 11.61 | $ | 14.04 | ||||||||||||||||||||
|
|
|
|
|
|
|
|
|
|
|
| |||||||||||||||||||||
Net investment income(b) | 0.04 | 0.09 | 0.09 | 0.08 | 0.06 | 0.02 | ||||||||||||||||||||||||||
Net realized and unrealized gain (loss) | 2.28 | (0.22 | ) | 3.37 | 2.75 | 1.02 | (0.24 | ) | ||||||||||||||||||||||||
|
|
|
|
|
|
|
|
|
|
|
| |||||||||||||||||||||
Net increase (decrease) from investment operations | 2.32 | (0.13 | ) | 3.46 | 2.83 | 1.08 | (0.22 | ) | ||||||||||||||||||||||||
|
|
|
|
|
|
|
|
|
|
|
| |||||||||||||||||||||
Distributions(c) | ||||||||||||||||||||||||||||||||
From net investment income | (0.09 | ) | (0.09 | ) | (0.06 | ) | (0.07 | ) | (0.02 | ) | (0.37 | ) | ||||||||||||||||||||
From net realized gain | (0.59 | ) | (1.18 | ) | (0.88 | ) | — | (0.84 | ) | (1.84 | ) | |||||||||||||||||||||
|
|
|
|
|
|
|
|
|
|
|
| |||||||||||||||||||||
Total distributions | (0.68 | ) | (1.27 | ) | (0.94 | ) | (0.07 | ) | (0.86 | ) | (2.21 | ) | ||||||||||||||||||||
|
|
|
|
|
|
|
|
|
|
|
| |||||||||||||||||||||
Net asset value, end of period | $ | 17.35 | $ | 15.71 | $ | 17.11 | $ | 14.59 | $ | 11.83 | $ | 11.61 | ||||||||||||||||||||
|
|
|
|
|
|
|
|
|
|
|
| |||||||||||||||||||||
Total Return(d) | ||||||||||||||||||||||||||||||||
Based on net asset value | 15.16 | %(e) | 0.15 | % | 24.98 | % | 24.03 | % | 9.39 | % | (2.46 | )% | ||||||||||||||||||||
|
|
|
|
|
|
|
|
|
|
|
| |||||||||||||||||||||
Ratios to Average Net Assets | ||||||||||||||||||||||||||||||||
Total expenses | 1.12 | %(f) | 1.12 | % | 1.12 | % | 1.35 | % | 1.42 | % | 1.41 | %(g) | ||||||||||||||||||||
|
|
|
|
|
|
|
|
|
|
|
| |||||||||||||||||||||
Total expenses after fees waived and/or reimbursed | 0.87 | %(f) | 0.87 | % | 0.87 | % | 1.13 | % | 1.24 | % | 1.24 | %(g) | ||||||||||||||||||||
|
|
|
|
|
|
|
|
|
|
|
| |||||||||||||||||||||
Net investment income | 0.40 | %(f) | 0.57 | % | 0.58 | % | 0.60 | % | 0.54 | % | 0.14 | %(g) | ||||||||||||||||||||
|
|
|
|
|
|
|
|
|
|
|
| |||||||||||||||||||||
Supplemental Data | ||||||||||||||||||||||||||||||||
Net assets, end of period (000) | $ | 713,162 | $ | 699,247 | $ | 730,996 | $ | 351,398 | $ | 323,297 | $ | 355,844 | ||||||||||||||||||||
|
|
|
|
|
|
|
|
|
|
|
| |||||||||||||||||||||
Portfolio turnover rate | 70 | % | 154 | % | 162 | % | 130 | % | 36 | % | 156 | % | ||||||||||||||||||||
|
|
|
|
|
|
|
|
|
|
|
| |||||||||||||||||||||
| (a) | Consolidated Financial Highlights. |
| (b) | Based on average shares outstanding. |
| (c) | Distributions for annual periods determined in accordance with U.S. federal income tax regulations. |
| (d) | Where applicable, excludes the effects of any sales charges and assumes the reinvestment of distributions. |
| (e) | Aggregate total return. |
| (f) | Annualized. |
| (g) | Ratios do not include expenses incurred indirectly as a result of investments in underlying funds of approximately 0.01%. |
See notes to financial statements.
| FINANCIAL HIGHLIGHTS | 55 |
Financial Highlights (continued)
(For a share outstanding throughout each period)
| BlackRock Advantage Large Cap Growth Fund (continued) | ||||||||||||||||||||||||||||||||
| Investor C | ||||||||||||||||||||||||||||||||
| Period from | ||||||||||||||||||||||||||||||||
|
| 10/01/19 | Year Ended September 30, | ||||||||||||||||||||||||||||||
| to 05/31/20 | 2019 | 2018 | 2017 | (a) | 2016 | (a) | 2015 | (a) | ||||||||||||||||||||||||
Net asset value, beginning of period | $ | 13.35 | $ | 14.55 | $ | 12.53 | $ | 10.19 | $ | 10.16 | $ | 12.57 | ||||||||||||||||||||
|
|
|
|
|
|
|
|
|
|
|
| |||||||||||||||||||||
Net investment loss(b) | (0.03 | ) | (0.03 | ) | (0.03 | ) | (0.02 | ) | (0.02 | ) | (0.07 | ) | ||||||||||||||||||||
Net realized and unrealized gain (loss) | 1.93 | (0.17 | ) | 2.89 | 2.36 | 0.89 | (0.20 | ) | ||||||||||||||||||||||||
|
|
|
|
|
|
|
|
|
|
|
| |||||||||||||||||||||
Net increase (decrease) from investment operations | 1.90 | (0.20 | ) | 2.86 | 2.34 | 0.87 | (0.27 | ) | ||||||||||||||||||||||||
|
|
|
|
|
|
|
|
|
|
|
| |||||||||||||||||||||
Distributions(c) | ||||||||||||||||||||||||||||||||
From net investment income | — | — | — | — | — | (0.30 | ) | |||||||||||||||||||||||||
From net realized gain | (0.58 | ) | (1.00 | ) | (0.84 | ) | — | (0.84 | ) | (1.84 | ) | |||||||||||||||||||||
|
|
|
|
|
|
|
|
|
|
|
| |||||||||||||||||||||
Total distributions | (0.58 | ) | (1.00 | ) | (0.84 | ) | — | (0.84 | ) | (2.14 | ) | |||||||||||||||||||||
|
|
|
|
|
|
|
|
|
|
|
| |||||||||||||||||||||
Net asset value, end of period | $ | 14.67 | $ | 13.35 | $ | 14.55 | $ | 12.53 | $ | 10.19 | $ | 10.16 | ||||||||||||||||||||
|
|
|
|
|
|
|
|
|
|
|
| |||||||||||||||||||||
Total Return(d) | ||||||||||||||||||||||||||||||||
Based on net asset value | 14.56 | %(e) | (0.59 | )% | 24.09 | % | 22.96 | % | 8.63 | % | (3.26 | )% | ||||||||||||||||||||
|
|
|
|
|
|
|
|
|
|
|
| |||||||||||||||||||||
Ratios to Average Net Assets | ||||||||||||||||||||||||||||||||
Total expenses | 1.83 | %(f) | 1.85 | % | 1.87 | % | 2.12 | % | 2.17 | % | 2.15 | %(g) | ||||||||||||||||||||
|
|
|
|
|
|
|
|
|
|
|
| |||||||||||||||||||||
Total expenses after fees waived and/or reimbursed | | 1.62 | %(f) | 1.62 | % | 1.62 | % | 1.91 | % | 2.01 | % | 2.01 | %(g) | |||||||||||||||||||
|
|
|
|
|
|
|
|
|
|
|
| |||||||||||||||||||||
Net investment loss | (0.35 | )%(f) | (0.22 | )% | (0.19 | )% | (0.16 | )% | (0.23 | )% | (0.63 | )%(g) | ||||||||||||||||||||
|
|
|
|
|
|
|
|
|
|
|
| |||||||||||||||||||||
Supplemental Data | ||||||||||||||||||||||||||||||||
Net assets, end of period (000) | $ | 14,728 | $ | 15,277 | $ | 48,702 | $ | 46,804 | $ | 63,586 | $ | 72,966 | ||||||||||||||||||||
|
|
|
|
|
|
|
|
|
|
|
| |||||||||||||||||||||
Portfolio turnover rate | 70 | % | 154 | % | 162 | % | 130 | % | 36 | % | 156 | % | ||||||||||||||||||||
|
|
|
|
|
|
|
|
|
|
|
| |||||||||||||||||||||
| (a) | Consolidated Financial Highlights. |
| (b) | Based on average shares outstanding. |
| (c) | Distributions for annual periods determined in accordance with U.S. federal income tax regulations. |
| (d) | Where applicable, excludes the effects of any sales charges and assumes the reinvestment of distributions. |
| (e) | Aggregate total return. |
| (f) | Annualized. |
| (g) | Ratios do not include expenses incurred indirectly as a result of investments in underlying funds of approximately 0.01%. |
See notes to financial statements.
| 56 | 2020 BLACKROCK ANNUAL REPORTTO SHAREHOLDERS |
Financial Highlights (continued)
(For a share outstanding throughout each period)
| BlackRock Advantage Large Cap Growth Fund (continued) | ||||||
| Class K | ||||||
| Period from | Period from | |||||||||||
| 10/01/19 | Year Ended | 01/25/18 | (a) | |||||||||
| to 05/31/20 | 09/30/19 | to 09/30/18 | ||||||||||
Net asset value, beginning of period | $ | 16.49 | $ | 17.89 | $ | 16.37 | ||||||||||
|
|
|
|
|
| |||||||||||
Net investment income(b) | 0.08 | 0.14 | 0.11 | |||||||||||||
Net realized and unrealized gain (loss) | 2.40 | (0.23 | ) | 1.41 | ||||||||||||
|
|
|
|
|
| |||||||||||
Net increase (decrease) from investment operations | 2.48 | (0.09 | ) | 1.52 | ||||||||||||
|
|
|
|
|
| |||||||||||
Distributions(c) | ||||||||||||||||
From net investment income | (0.15 | ) | (0.13 | ) | — | |||||||||||
From net realized gain | (0.59 | ) | (1.18 | ) | — | |||||||||||
|
|
|
|
|
| |||||||||||
Total distributions | (0.74 | ) | (1.31 | ) | — | |||||||||||
|
|
|
|
|
| |||||||||||
Net asset value, end of period | $ | 18.23 | $ | 16.49 | $ | 17.89 | ||||||||||
|
|
|
|
|
| |||||||||||
Total Return(d) | ||||||||||||||||
Based on net asset value | 15.40 | %(e) | 0.47 | % | 9.29 | %(e) | ||||||||||
|
|
|
|
|
| |||||||||||
Ratios to Average Net Assets | ||||||||||||||||
Total expenses | 0.70 | %(f) | 0.71 | % | 0.72 | %(f) | ||||||||||
|
|
|
|
|
| |||||||||||
Total expenses after fees waived and/or reimbursed | 0.57 | %(f) | 0.57 | % | 0.57 | %(f) | ||||||||||
|
|
|
|
|
| |||||||||||
Net investment income | 0.72 | %(f) | 0.85 | % | 0.93 | %(f) | ||||||||||
|
|
|
|
|
| |||||||||||
Supplemental Data | ||||||||||||||||
Net assets, end of period (000) | $ | 715 | $ | 973 | $ | 609 | ||||||||||
|
|
|
|
|
| |||||||||||
Portfolio turnover rate | 70 | % | 154 | % | 162 | %(g) | ||||||||||
|
|
|
|
|
| |||||||||||
| (a) | Commencement of operations. |
| (b) | Based on average shares outstanding. |
| (c) | Distributions for annual periods determined in accordance with U.S. federal income tax regulations. |
| (d) | Where applicable, assumes the reinvestment of distributions. |
| (e) | Aggregate total return. |
| (f) | Annualized. |
| (g) | Portfolio turnover is representative of the Fund for the entire year. |
See notes to financial statements.
| FINANCIAL HIGHLIGHTS | 57 |
Financial Highlights (continued)
(For a share outstanding throughout each period)
| BlackRock Advantage Large Cap Growth Fund (continued) | ||||||||||||||||||||||||||||||||
| Class R | ||||||||||||||||||||||||||||||||
| Period from | ||||||||||||||||||||||||||||||||
| 10/01/19 | Year Ended September 30, | |||||||||||||||||||||||||||||||
| to 05/31/20 | 2019 | 2018 | 2017 | (a) | 2016 | (a) | 2015 | (a) | ||||||||||||||||||||||||
Net asset value, beginning of period | $ | 16.32 | $ | 17.69 | $ | 15.01 | $ | 12.17 | $ | 11.94 | $ | 14.41 | ||||||||||||||||||||
|
|
|
|
|
|
|
|
|
|
|
| |||||||||||||||||||||
Net investment income (loss)(b) | 0.02 | 0.05 | 0.05 | 0.04 | 0.02 | (0.03 | ) | |||||||||||||||||||||||||
Net realized and unrealized gain (loss) | 2.38 | (0.23 | ) | 3.49 | 2.84 | 1.05 | (0.25 | ) | ||||||||||||||||||||||||
|
|
|
|
|
|
|
|
|
|
|
| |||||||||||||||||||||
Net increase (decrease) from investment operations | 2.40 | (0.18 | ) | 3.54 | 2.88 | 1.07 | (0.28 | ) | ||||||||||||||||||||||||
|
|
|
|
|
|
|
|
|
|
|
| |||||||||||||||||||||
Distributions(c) | ||||||||||||||||||||||||||||||||
From net investment income | (0.03 | ) | (0.01 | ) | — | (0.04 | ) | — | (0.35 | ) | ||||||||||||||||||||||
From net realized gain | (0.59 | ) | (1.18 | ) | (0.86 | ) | — | (0.84 | ) | (1.84 | ) | |||||||||||||||||||||
|
|
|
|
|
|
|
|
|
|
|
| |||||||||||||||||||||
Total distributions | (0.62 | ) | (1.19 | ) | (0.86 | ) | (0.04 | ) | (0.84 | ) | (2.19 | ) | ||||||||||||||||||||
|
|
|
|
|
|
|
|
|
|
|
| |||||||||||||||||||||
Net asset value, end of period | $ | 18.10 | $ | 16.32 | $ | 17.69 | $ | 15.01 | $ | 12.17 | $ | 11.94 | ||||||||||||||||||||
|
|
|
|
|
|
|
|
|
|
|
| |||||||||||||||||||||
Total Return(d) | ||||||||||||||||||||||||||||||||
Based on net asset value | 14.99 | %(e) | (0.15 | )% | 24.68 | % | 23.68 | % | 9.04 | % | (2.86 | )% | ||||||||||||||||||||
|
|
|
|
|
|
|
|
|
|
|
| |||||||||||||||||||||
Ratios to Average Net Assets | ||||||||||||||||||||||||||||||||
Total expenses | 1.46 | %(f) | 1.42 | % | 1.40 | % | 1.66 | % | 1.74 | % | 1.69 | %(g) | ||||||||||||||||||||
|
|
|
|
|
|
|
|
|
|
|
| |||||||||||||||||||||
Total expenses after fees waived and/or reimbursed | 1.12 | %(f) | 1.12 | % | 1.12 | % | 1.45 | % | 1.60 | % | 1.60 | %(g) | ||||||||||||||||||||
|
|
|
|
|
|
|
|
|
|
|
| |||||||||||||||||||||
Net investment income (loss) | 0.16 | %(f) | 0.33 | % | 0.30 | % | 0.28 | % | 0.20 | % | (0.23 | )%(g) | ||||||||||||||||||||
|
|
|
|
|
|
|
|
|
|
|
| |||||||||||||||||||||
Supplemental Data | ||||||||||||||||||||||||||||||||
Net assets, end of period (000) | $ | 536 | $ | 867 | $ | 1,864 | $ | 2,332 | $ | 1,875 | $ | 1,138 | ||||||||||||||||||||
|
|
|
|
|
|
|
|
|
|
|
| |||||||||||||||||||||
Portfolio turnover rate | 70 | % | 154 | % | 162 | % | 130 | % | 36 | % | 156 | % | ||||||||||||||||||||
|
|
|
|
|
|
|
|
|
|
|
| |||||||||||||||||||||
| (a) | Consolidated Financial Highlights. |
| (b) | Based on average shares outstanding. |
| (c) | Distributions for annual periods determined in accordance with U.S. federal income tax regulations. |
| (d) | Where applicable, assumes the reinvestment of distributions. |
| (e) | Aggregate total return. |
| (f) | Annualized. |
| (g) | Ratios do not include expenses incurred indirectly as a result of investments in underlying funds of approximately 0.01%. |
See notes to financial statements.
| 58 | 2020 BLACKROCK ANNUAL REPORTTO SHAREHOLDERS |
Financial Highlights (continued)
(For a share outstanding throughout each period)
| BlackRock Advantage Small Cap Core Fund | ||||||||||||||||||||||||
| Institutional | ||||||||||||||||||||||||
| Year Ended May 31, | ||||||||||||||||||||||||
| 2020 | 2019 | 2018 | 2017 | 2016 | ||||||||||||||||||||
Net asset value, beginning of year | $ | 13.13 | $ | 14.80 | $ | 12.70 | $ | 10.59 | $ | 11.74 | ||||||||||||||
|
|
|
|
|
|
|
|
|
| |||||||||||||||
Net investment income(a) | 0.14 | 0.13 | 0.11 | 0.10 | 0.08 | |||||||||||||||||||
Net realized and unrealized gain (loss) | (0.05 | ) | (1.13 | ) | 2.37 | 2.10 | (0.64 | ) | ||||||||||||||||
|
|
|
|
|
|
|
|
|
| |||||||||||||||
Net increase (decrease) from investment operations | 0.09 | (1.00 | ) | 2.48 | 2.20 | (0.56 | ) | |||||||||||||||||
|
|
|
|
|
|
|
|
|
| |||||||||||||||
Distributions(b) | ||||||||||||||||||||||||
From net investment income | (0.13 | ) | (0.11 | ) | (0.09 | ) | (0.06 | ) | (0.10 | ) | ||||||||||||||
From net realized gain | (0.00 | )(c) | (0.56 | ) | (0.29 | ) | (0.03 | ) | (0.49 | ) | ||||||||||||||
|
|
|
|
|
|
|
|
|
| |||||||||||||||
Total distributions | (0.13 | ) | (0.67 | ) | (0.38 | ) | (0.09 | ) | (0.59 | ) | ||||||||||||||
|
|
|
|
|
|
|
|
|
| |||||||||||||||
Net asset value, end of year | $ | 13.09 | $ | 13.13 | $ | 14.80 | $ | 12.70 | $ | 10.59 | ||||||||||||||
|
|
|
|
|
|
|
|
|
| |||||||||||||||
Total Return(d) | ||||||||||||||||||||||||
Based on net asset value | 0.61 | % | (6.89 | )% | 19.82 | % | 20.84 | % | (4.80 | )% | ||||||||||||||
|
|
|
|
|
|
|
|
|
| |||||||||||||||
Ratios to Average Net Assets | ||||||||||||||||||||||||
Total expenses | 0.64 | % | 0.70 | % | 0.66 | % | 1.05 | % | 3.15 | % | ||||||||||||||
|
|
|
|
|
|
|
|
|
| |||||||||||||||
Total expenses after fees waived and/or reimbursed | 0.50 | % | 0.49 | % | 0.50 | % | 0.54 | % | 0.69 | % | ||||||||||||||
|
|
|
|
|
|
|
|
|
| |||||||||||||||
Net investment income | 0.99 | % | 0.95 | % | 0.83 | % | 0.78 | % | 0.80 | % | ||||||||||||||
|
|
|
|
|
|
|
|
|
| |||||||||||||||
Supplemental Data | ||||||||||||||||||||||||
Net assets, end of year (000) | $ | 847,753 | $ | 551,833 | $ | 356,274 | $ | 56,603 | $ | 10,302 | ||||||||||||||
|
|
|
|
|
|
|
|
|
| |||||||||||||||
Portfolio turnover rate | 101 | % | 100 | % | 104 | % | 127 | % | 171 | % | ||||||||||||||
|
|
|
|
|
|
|
|
|
| |||||||||||||||
| (a) | Based on average shares outstanding. |
| (b) | Distributions for annual periods determined in accordance with U.S. federal income tax regulations. |
| (c) | Amount is greater than $(0.005) per share. |
| (d) | Where applicable, assumes the reinvestment of distributions. |
See notes to financial statements.
| FINANCIAL HIGHLIGHTS | 59 |
Financial Highlights (continued)
(For a share outstanding throughout each period)
| BlackRock Advantage Small Cap Core Fund (continued) | ||||||||||||||||||||||||
| Investor A | ||||||||||||||||||||||||
| Year Ended May 31, | ||||||||||||||||||||||||
| 2020 | 2019 | 2018 | 2017 | 2016 | ||||||||||||||||||||
Net asset value, beginning of year | $ | 13.05 | $ | 14.73 | $ | 12.66 | $ | 10.56 | $ | 11.71 | ||||||||||||||
|
|
|
|
|
|
|
|
|
| |||||||||||||||
Net investment income(a) | 0.10 | 0.09 | 0.09 | 0.06 | 0.06 | |||||||||||||||||||
Net realized and unrealized gain (loss) | (0.03 | ) | (1.13 | ) | 2.34 | 2.10 | (0.65 | ) | ||||||||||||||||
|
|
|
|
|
|
|
|
|
| |||||||||||||||
Net increase (decrease) from investment operations | 0.07 | (1.04 | ) | 2.43 | 2.16 | (0.59 | ) | |||||||||||||||||
|
|
|
|
|
|
|
|
|
| |||||||||||||||
Distributions(b) | ||||||||||||||||||||||||
From net investment income | (0.10 | ) | (0.08 | ) | (0.07 | ) | (0.03 | ) | (0.07 | ) | ||||||||||||||
From net realized gain | (0.00 | )(c) | (0.56 | ) | (0.29 | ) | (0.03 | ) | (0.49 | ) | ||||||||||||||
|
|
|
|
|
|
|
|
|
| |||||||||||||||
Total distributions | (0.10 | ) | (0.64 | ) | (0.36 | ) | (0.06 | ) | (0.56 | ) | ||||||||||||||
|
|
|
|
|
|
|
|
|
| |||||||||||||||
Net asset value, end of year | $ | 13.02 | $ | 13.05 | $ | 14.73 | $ | 12.66 | $ | 10.56 | ||||||||||||||
|
|
|
|
|
|
|
|
|
| |||||||||||||||
Total Return(d) | ||||||||||||||||||||||||
Based on net asset value | 0.45 | % | (7.16 | )% | 19.51 | % | 20.51 | % | (5.02 | )% | ||||||||||||||
|
|
|
|
|
|
|
|
|
| |||||||||||||||
Ratios to Average Net Assets | ||||||||||||||||||||||||
Total expenses | 1.01 | % | 1.03 | % | 1.08 | % | 1.39 | % | 3.60 | % | ||||||||||||||
|
|
|
|
|
|
|
|
|
| |||||||||||||||
Total expenses after fees waived and/or reimbursed | 0.75 | % | 0.75 | % | 0.75 | % | 0.83 | % | 0.95 | % | ||||||||||||||
|
|
|
|
|
|
|
|
|
| |||||||||||||||
Net investment income | 0.75 | % | 0.69 | % | 0.64 | % | 0.51 | % | 0.58 | % | ||||||||||||||
|
|
|
|
|
|
|
|
|
| |||||||||||||||
Supplemental Data | ||||||||||||||||||||||||
Net assets, end of year (000) | $ | 277,926 | $ | 248,574 | $ | 79,515 | $ | 6,389 | $ | 3,191 | ||||||||||||||
|
|
|
|
|
|
|
|
|
| |||||||||||||||
Portfolio turnover rate | 101 | % | 100 | % | 104 | % | 127 | % | 171 | % | ||||||||||||||
|
|
|
|
|
|
|
|
|
| |||||||||||||||
| (a) | Based on average shares outstanding. |
| (b) | Distributions for annual periods determined in accordance with U.S. federal income tax regulations. |
| (c) | Amount is greater than $(0.005) per share. |
| (d) | Where applicable, excludes the effects of any sales charges and assumes the reinvestment of distributions. |
See notes to financial statements.
| 60 | 2020 BLACKROCK ANNUAL REPORTTO SHAREHOLDERS |
Financial Highlights (continued)
(For a share outstanding throughout each period)
| BlackRock Advantage Small Cap Core Fund (continued) | ||||||||||||||||||||
| Investor C | ||||||||||||||||||||
| Year Ended May 31, | ||||||||||||||||||||
| 2020 | 2019 | 2018 | 2017 | 2016 | ||||||||||||||||
Net asset value, beginning of year | $ | 12.80 | $ | 14.48 | $ | 12.44 | $ | 10.44 | $ | 11.60 | ||||||||||
|
|
|
|
|
|
|
|
|
| |||||||||||
Net investment income (loss)(a) | 0.00 | (b) | (0.01 | ) | (0.02 | ) | (0.03 | ) | (0.02 | ) | ||||||||||
Net realized and unrealized gain (loss) | (0.04 | ) | (1.10 | ) | 2.31 | 2.06 | (0.64 | ) | ||||||||||||
|
|
|
|
|
|
|
|
|
| |||||||||||
Net increase (decrease) from investment operations | (0.04 | ) | (1.11 | ) | 2.29 | 2.03 | (0.66 | ) | ||||||||||||
|
|
|
|
|
|
|
|
|
| |||||||||||
Distributions(c) | ||||||||||||||||||||
From net investment income | (0.02 | ) | (0.01 | ) | — | — | (0.01 | ) | ||||||||||||
From net realized gain | (0.00 | )(d) | (0.56 | ) | (0.25 | ) | (0.03 | ) | (0.49 | ) | ||||||||||
|
|
|
|
|
|
|
|
|
| |||||||||||
Total distributions | (0.02 | ) | (0.57 | ) | (0.25 | ) | (0.03 | ) | (0.50 | ) | ||||||||||
|
|
|
|
|
|
|
|
|
| |||||||||||
Net asset value, end of year | $ | 12.74 | $ | 12.80 | $ | 14.48 | $ | 12.44 | $ | 10.44 | ||||||||||
|
|
|
|
|
|
|
|
|
| |||||||||||
Total Return(e) | ||||||||||||||||||||
Based on net asset value | (0.33 | )% | (7.83 | )% | 18.65 | % | 19.47 | % | (5.71 | )% | ||||||||||
|
|
|
|
|
|
|
|
|
| |||||||||||
Ratios to Average Net Assets | ||||||||||||||||||||
Total expenses | 1.71 | % | 1.81 | % | 1.94 | % | 2.22 | % | 4.41 | % | ||||||||||
|
|
|
|
|
|
|
|
|
| |||||||||||
Total expenses after fees waived and/or reimbursed | 1.50 | % | 1.50 | % | 1.50 | % | 1.57 | % | 1.70 | % | ||||||||||
|
|
|
|
|
|
|
|
|
| |||||||||||
Net investment income (loss) | 0.01 | % | (0.06 | )% | (0.16 | )% | (0.25 | )% | (0.19 | )% | ||||||||||
|
|
|
|
|
|
|
|
|
| |||||||||||
Supplemental Data | ||||||||||||||||||||
Net assets, end of year (000) | $ | 4,955 | $ | 4,363 | $ | 1,373 | $ | 764 | $ | 423 | ||||||||||
|
|
|
|
|
|
|
|
|
| |||||||||||
Portfolio turnover rate | 101 | % | 100 | % | 104 | % | 127 | % | 171 | % | ||||||||||
|
|
|
|
|
|
|
|
|
| |||||||||||
| (a) | Based on average shares outstanding. |
| (b) | Amount is less than $0.005 per share. |
| (c) | Distributions for annual periods determined in accordance with U.S. federal income tax regulations. |
| (d) | Amount is greater than $(0.005) per share. |
| (e) | Where applicable, excludes the effects of any sales charges and assumes the reinvestment of distributions. |
See notes to financial statements.
| FINANCIAL HIGHLIGHTS | 61 |
Financial Highlights (continued)
(For a share outstanding throughout each period)
| BlackRock Advantage Small Cap Core Fund (continued) | ||||||||||||||||||||||||
| Class K | ||||||||||||||||||||||||
| Period from | ||||||||||||||||||||||||
| Year Ended May 31, | 03/28/16 | (a) | ||||||||||||||||||||||
| 2020 | 2019 | 2018 | 2017 | to 05/31/16 | ||||||||||||||||||||
Net asset value, beginning of period | $ | 13.13 | $ | 14.81 | $ | 12.70 | $ | 10.60 | $ | 9.88 | ||||||||||||||
|
|
|
|
|
|
|
|
|
| |||||||||||||||
Net investment income(b) | 0.14 | 0.14 | 0.12 | 0.12 | 0.02 | |||||||||||||||||||
Net realized and unrealized gain (loss) | (0.03 | ) | (1.15 | ) | 2.37 | 2.07 | 0.70 | |||||||||||||||||
|
|
|
|
|
|
|
|
|
| |||||||||||||||
Net increase (decrease) from investment operations | 0.11 | (1.01 | ) | 2.49 | 2.19 | 0.72 | ||||||||||||||||||
|
|
|
|
|
|
|
|
|
| |||||||||||||||
Distributions(c) | ||||||||||||||||||||||||
From net investment income | (0.14 | ) | (0.11 | ) | (0.09 | ) | (0.06 | ) | — | |||||||||||||||
From net realized gain | (0.00 | )(d) | (0.56 | ) | (0.29 | ) | (0.03 | ) | — | |||||||||||||||
|
|
|
|
|
|
|
|
|
| |||||||||||||||
Total distributions | (0.14 | ) | (0.67 | ) | (0.38 | ) | (0.09 | ) | — | |||||||||||||||
|
|
|
|
|
|
|
|
|
| |||||||||||||||
Net asset value, end of period | $ | 13.10 | $ | 13.13 | $ | 14.81 | $ | 12.70 | $ | 10.60 | ||||||||||||||
|
|
|
|
|
|
|
|
|
| |||||||||||||||
Total Return(e) | ||||||||||||||||||||||||
Based on net asset value | 0.73 | % | (6.93 | )% | 19.94 | % | 20.74 | % | 7.29 | %(f) | ||||||||||||||
|
|
|
|
|
|
|
|
|
| |||||||||||||||
Ratios to Average Net Assets | ||||||||||||||||||||||||
Total expenses | 0.56 | % | 0.61 | % | 0.65 | % | 1.62 | % | 3.59 | %(g) | ||||||||||||||
|
|
|
|
|
|
|
|
|
| |||||||||||||||
Total expenses after fees waived and/or reimbursed | 0.45 | % | 0.45 | % | 0.45 | % | 0.45 | % | 0.60 | %(g) | ||||||||||||||
|
|
|
|
|
|
|
|
|
| |||||||||||||||
Net investment income | 0.99 | % | 1.00 | % | 0.90 | % | 0.95 | % | 0.83 | %(g) | ||||||||||||||
|
|
|
|
|
|
|
|
|
| |||||||||||||||
Supplemental Data | ||||||||||||||||||||||||
Net assets, end of period (000) | $ | 188,885 | $ | 56,316 | $ | 68,375 | $ | 58,557 | $ | 214 | ||||||||||||||
|
|
|
|
|
|
|
|
|
| |||||||||||||||
Portfolio turnover rate | 101 | % | 100 | % | 104 | % | 127 | % | 171 | %(h) | ||||||||||||||
|
|
|
|
|
|
|
|
|
| |||||||||||||||
| (a) | Commencement of operations. |
| (b) | Based on average shares outstanding. |
| (c) | Distributions for annual periods determined in accordance with U.S. federal income tax regulations. |
| (d) | Amount is greater than $(0.005) per share. |
| (e) | Where applicable, assumes the reinvestment of distributions. |
| (f) | Aggregate total return. |
| (g) | Annualized. |
| (h) | Portfolio turnover is representative of the Fund for the entire year. |
See notes to financial statements.
| 62 | 2020 BLACKROCK ANNUAL REPORTTO SHAREHOLDERS |
| 1. | ORGANIZATION |
BlackRock FundsSM (the “Trust”) is registered under the Investment Company Act of 1940, as amended (the “1940 Act”), as an open-end management investment company. The Trust is organized as a Massachusetts business trust. The following, each of which is a series of the Trust, are referred to herein collectively as the “Funds” or individually as a “Fund”:
| Fund Name | Herein Referred To As | Diversification Classification | ||
BlackRock Advantage International Fund | Advantage International | Diversified | ||
BlackRock Advantage Large Cap Growth Fund | Advantage Large Cap Growth | Diversified | ||
BlackRock Advantage Small Cap Core Fund | Advantage Small Cap Core | Diversified |
Each Fund offers multiple classes of shares. All classes of shares have identical voting, dividend, liquidation and other rights and are subject to the same terms and conditions, except that certain classes bear expenses related to the shareholder servicing and distribution of such shares. Institutional, Service and Class K Shares are sold only to certain eligible investors. Service, Investor A, Investor C and Class R Shares bear certain expenses related to shareholder servicing of such shares, and Investor C and Class R Shares also bear certain expenses related to the distribution of such shares. Investor A and Investor C Shares are generally available through financial intermediaries. Class R Shares are sold only to certain employer-sponsored retirement plans. Each class has exclusive voting rights with respect to matters relating to its shareholder servicing and distribution expenditures (except that Investor C shareholders may vote on material changes to the Investor A Shares distribution and service plan).
| Share Class | Initial Sales Charge | CDSC | Conversion Privilege | |||
Institutional, Service, Class K and Class R Shares | No | No | None | |||
Investor A Shares | Yes | No(a) | None | |||
Investor C Shares | No | Yes(b) | To Investor A Shares after approximately 10 years |
| (a) | Investor A Shares may be subject to a contingent deferred sales charge (“CDSC”) for certain redemptions where no initial sales charge was paid at the time of purchase. |
| (b) | A CDSC of 1.00% is assessed on certain redemptions of Investor C Shares made within one year after purchase. |
On November 13, 2019, the Board of Trustees of the Trust (the “Board”) approved a change in the fiscal year-end of Advantage International and Advantage Large Cap Growth, effective as of May 31, 2020, from September 30 to May 31.
The Funds, together with certain other registered investment companies advised by BlackRock Advisors, LLC (the “Manager”) or its affiliates, are included in a complex of equity, multi-asset, index and money market funds referred to as the BlackRock Multi-Asset Complex.
Prior Year Reorganizations: The Board and the Board of Trustees of State Farm Mutual Fund Trust and shareholders of State Farm International Equity Fund (the “Target Fund”) approved the reorganization of the Target Fund into Advantage International. As a result, Advantage International acquired all of the assets and assumed certain of the liabilities of the Target Fund in exchange for an equal aggregate value of newly-issued shares of Advantage International.
Each shareholder of the Target Fund received shares of Advantage International in an amount equal to the aggregate net asset value (“NAV”) of such shareholder’s Target Fund shares, as determined at the close of business on November 16, 2018, less the costs of the Target Fund’s reorganization.
The reorganization was accomplished by a tax-free exchange of shares of Advantage International in the following amounts and at the following conversion ratios:
| Target Fund’s Share Class | Shares Prior to Reorganization | Conversion Ratio | Advantage International’s Share Class | Shares of Advantage International | ||||||||||||
Class A | 2,038,749 | 0.72388825 | Investor A | 1,475,826 | ||||||||||||
Class B | 30,592 | 0.72323294 | Investor A | 22,125 | ||||||||||||
Institutional | 1,548,107 | 0.72329278 | Institutional | 1,119,735 | ||||||||||||
Class R-1 | 71,547 | 0.71993693 | Investor A | 51,509 | ||||||||||||
Class R-2 | 324,627 | 0.72254519 | Investor A | 234,558 | ||||||||||||
Class R-3 | 99,013 | 0.72435088 | Institutional | 71,720 | ||||||||||||
Legacy Class B | 19,795 | 0.74049155 | Investor A | 14,658 | ||||||||||||
Premier | 2,955,714 | 0.73171950 | Investor A | 2,162,754 | ||||||||||||
The Target Fund’s net assets and composition of net assets on November 16, 2018, the valuation date of the reorganization, were as follows:
| Target Fund | ||||
Net assets | $ | 79,635,612 | ||
|
| |||
Paid-in capital | $ | 80,326,765 | ||
Accumulated loss | (691,153 | ) | ||
For financial reporting purposes, assets received and shares issued by Advantage International were recorded at fair value. However, the cost basis of the investments received from the Target Fund was carried forward to align ongoing reporting of Advantage International’s realized and unrealized gains and losses with amounts distributable to shareholders for tax purposes.
| NOTESTO FINANCIAL STATEMENTS | 63 |
Notes to Financial Statements (continued)
The net assets of Advantage International before the reorganization were $702,389,703. The aggregate net assets of Advantage International immediately after the reorganization amounted to $782,025,315. The Target Fund’s fair value and cost of investments prior to the reorganization were as follows:
| Target Fund | Fair Value of Investments | Cost of Investments | ||||||
State Farm International Equity Fund | $ | 77,948,036 | $ | 77,740,666 | ||||
The purpose of the transaction was to combine the assets of the Target Fund with the assets of Advantage International. The reorganization was a tax-free event and was effective on November 19, 2018.
Assuming the reorganization had been completed on October 1, 2018, the beginning of the fiscal reporting period of Advantage International, the pro forma results of operations for the year ended September 30, 2019, are as follows:
| • | Net investment income: $21,454,038. |
| • | Net realized and change in unrealized loss on investments: $(41,599,331). |
| • | Net decrease in net assets resulting from operations: $(20,145,293). |
Because the combined investment portfolios have been managed as a single integrated portfolio since the reorganization was completed, it is not practicable to separate the amounts of revenue and earnings of the Target Fund that have been included in Advantage International’s Statements of Operations since November 19, 2018.
Reorganization costs incurred by Advantage International in connection with the reorganization were expensed by Advantage International. The Manager reimbursed Advantage International $123,081, which is included in fees waived and/or reimbursed by the Manager in the Statements of Operations.
The Board and the Board of Trustees of State Farm Mutual Fund Trust and shareholders of State Farm Small/Mid Cap Equity Fund (the “Target Fund”) approved the reorganization of the Target Fund into Advantage Small Cap Core Fund. As a result, Advantage Small Cap Core acquired all of the assets and assumed certain of the liabilities of the Target Fund in exchange for an equal aggregate value of newly-issued shares of Advantage Small Cap Core.
Each shareholder of the Target Fund received shares of Advantage Small Cap Core in an amount equal to the aggregate NAV of such shareholder’s Target Fund shares, as determined at the close of business on November 16, 2018, less the costs of the Target Fund’s reorganization.
The reorganization was accomplished by a tax-free exchange of shares of Advantage Small Cap Core in the following amounts and at the following conversion ratios:
| Target Fund’s Share Class | Shares Prior to Reorganization | Conversion Ratio | Advantage Small Cap Core’s Share Class | Shares of Advantage Small Cap Core | ||||||||||||
Class A | 7,126,838 | 0.75888860 | Investor A | 5,408,476 | ||||||||||||
Class B | 125,802 | 0.68575337 | Investor A | 86,269 | ||||||||||||
Institutional | 4,346,454 | 0.78381192 | Institutional | 3,406,803 | ||||||||||||
Class R-1 | 191,852 | 0.70344278 | Investor A | 134,957 | ||||||||||||
Class R-2 | 857,908 | 0.73130103 | Investor A | 627,389 | ||||||||||||
Class R-3 | 127,368 | 0.77373804 | Institutional | 98,550 | ||||||||||||
Legacy Class B | 130,671 | 0.66507916 | Investor A | 86,907 | ||||||||||||
Premier | 8,816,419 | 0.73670003 | Investor A | 6,495,056 | ||||||||||||
The Target Fund’s net assets and composition of net assets on November 16, 2018, the valuation date of the reorganization, were as follows:
| Target Fund | ||||
Net assets | $ | 223,658,309 | ||
|
| |||
Paid-in capital | $ | 229,294,750 | ||
Accumulated loss | (5,636,441 | ) | ||
For financial reporting purposes, assets received and shares issued by Advantage Small Cap Core were recorded at fair value. However, the cost basis of the investments received from the Target Fund was carried forward to align ongoing reporting of Advantage Small Cap Core’s realized and unrealized gains and losses with amounts distributable to shareholders for tax purposes.
The net assets of Advantage Small Cap Core before the reorganization were $549,465,399. The aggregate net assets of Advantage Small Cap Core immediately after the reorganization amounted to $773,123,708. The Target Fund’s fair value and cost of investments prior to the reorganization were as follows:
| Target Fund | Fair Value of Investments | Cost of Investments | ||||||
State Farm Small/Mid Cap Equity Fund | $ | 215,469,047 | $ | 221,094,974 | ||||
The purpose of the transaction was to combine the assets of the Target Fund with the assets of Advantage Small Cap Core. The reorganization was a tax-free event and was effective on November 19, 2018.
| 64 | 2020 BLACKROCK ANNUAL REPORTTO SHAREHOLDERS |
Notes to Financial Statements (continued)
Assuming the reorganization had been completed on June 1, 2018, the beginning of the fiscal reporting period of Advantage Small Cap Core, the pro forma results of operations for the year ended May 31, 2019, are as follows:
| • | Net investment income: $7,054,366. |
| • | Net realized and change in unrealized loss on investments: $(70,245,909). |
| • | Net decrease in net assets resulting from operations: $(63,191,543). |
Because the combined investment portfolios have been managed as a single integrated portfolio since the reorganization was completed, it is not practicable to separate the amounts of revenue and earnings of the Target Fund that have been included in Advantage Small Cap Core’s Statements of Operations since November 19, 2018.
Reorganization costs incurred by Advantage Small Cap Core in connection with the reorganization were expensed by Advantage Small Cap Core.
| 2. | SIGNIFICANT ACCOUNTING POLICIES |
The financial statements are prepared in conformity with accounting principles generally accepted in the United States of America (“U.S. GAAP”), which may require management to make estimates and assumptions that affect the reported amounts of assets and liabilities in the financial statements, disclosure of contingent assets and liabilities at the date of the financial statements and the reported amounts of increases and decreases in net assets from operations during the reporting period. Actual results could differ from those estimates. Each Fund is considered an investment company under U.S. GAAP and follows the accounting and reporting guidance applicable to investment companies. Below is a summary of significant accounting policies:
Investment Transactions and Income Recognition: For financial reporting purposes, investment transactions are recorded on the dates the transactions are executed. Realized gains and losses on investment transactions are determined on the identified cost basis. Dividend income and non-cash dividend income, if any, are recorded on the ex-dividend date. Dividends from foreign securities where the ex-dividend date may have passed are subsequently recorded when the Funds are informed of the ex-dividend date. Under the applicable foreign tax laws, a withholding tax at various rates may be imposed on capital gains, dividends and interest. Upon notification from issuers, a portion of the dividend income received from a real estate investment trust may be redesignated as a reduction of cost of the related investment and/or realized gain. Interest income, including amortization and accretion of premiums and discounts on debt securities, is recognized on an accrual basis. Income, expenses and realized and unrealized gains and losses are allocated daily to each class based on its relative net assets.
Foreign Currency Translation: Each Fund’s books and records are maintained in U.S. dollars. Securities and other assets and liabilities denominated in foreign currencies are translated into U.S. dollars using exchange rates determined as of the close of trading on the New York Stock Exchange (“NYSE”). Purchases and sales of investments are recorded at the rates of exchange prevailing on the respective dates of such transactions. Generally, when the U.S. dollar rises in value against a foreign currency, the investments denominated in that currency will lose value; the opposite effect occurs if the U.S. dollar falls in relative value.
Each Fund does not isolate the portion of the results of operations arising as a result of changes in the exchange rates from the changes in the market prices of investments held or sold for financial reporting purposes. Accordingly, the effects of changes in exchange rates on investments are not segregated in the Statements of Operations from the effects of changes in market prices of those investments, but are included as a component of net realized and unrealized gain (loss) from investments. Each Fund reports realized currency gains (losses) on foreign currency related transactions as components of net realized gain (loss) for financial reporting purposes, whereas such components are generally treated as ordinary income for U.S. federal income tax purposes.
Segregation and Collateralization: In cases where a Fund enters into certain investments (e.g., futures contracts and forward foreign currency exchange contracts) that would be treated as “senior securities” for 1940 Act purposes, a Fund may segregate or designate on its books and records cash or liquid assets having a market value at least equal to the amount of its future obligations under such investments. Doing so allows the investment to be excluded from treatment as a “senior security.” Furthermore, if required by an exchange or counterparty agreement, the Funds may be required to deliver/deposit cash and/or securities to/with an exchange, or broker-dealer or custodian as collateral for certain investments or obligations.
Distributions: Distributions paid by the Funds are recorded on the ex-dividend date. The character and timing of distributions are determined in accordance with U.S. federal income tax regulations, which may differ from U.S. GAAP.
Offering Costs: Offering costs are amortized over a 12-month period beginning with the commencement of operations of a class of shares.
Indemnifications: In the normal course of business, a Fund enters into contracts that contain a variety of representations that provide general indemnification. A Fund’s maximum exposure under these arrangements is unknown because it involves future potential claims against a Fund, which cannot be predicted with any certainty.
Other: Expenses directly related to a Fund or its classes are charged to that Fund or the applicable class. Other operating expenses shared by several funds, including other funds managed by the Manager, are prorated among those funds on the basis of relative net assets or other appropriate methods. Expenses directly related to the Funds and other shared expenses prorated to the Funds are allocated daily to each class based on their relative net assets or other appropriate methods.
The Funds have an arrangement with their custodian whereby credits are earned on uninvested cash balances, which could be used to reduce custody fees and/or overdraft charges. The Funds may incur charges on overdrafts, subject to certain conditions.
| 3. | INVESTMENT VALUATION AND FAIR VALUE MEASUREMENTS |
Investment Valuation Policies: The Funds’ investments are valued at fair value (also referred to as “market value” within the financial statements) as of the close of trading on the NYSE (generally 4:00 p.m., Eastern time) (or if the reporting date falls on a day the NYSE is closed, investments are valued at fair value as of the period end). U.S. GAAP
| NOTESTO FINANCIAL STATEMENTS | 65 |
Notes to Financial Statements (continued)
defines fair value as the price the Funds would receive to sell an asset or pay to transfer a liability in an orderly transaction between market participants at the measurement date. The Funds determine the fair values of their financial instruments using various independent dealers or pricing services under policies approved by the Board. If a security’s market price is not readily available or does not otherwise accurately represent the fair value of the security, the security will be valued in accordance with a policy approved by the Board as reflecting fair value. The BlackRock Global Valuation Methodologies Committee (the “Global Valuation Committee”) is the committee formed by management to develop global pricing policies and procedures and to oversee the pricing function for all financial instruments.
Fair Value Inputs and Methodologies: The following methods and inputs are used to establish the fair value of each Fund’s assets and liabilities:
| • | Equity investments traded on a recognized securities exchange are valued at the official closing price each day, if available. For equity investments traded on more than one exchange, the official closing price on the exchange where the stock is primarily traded is used. Equity investments traded on a recognized exchange for which there were no sales on that day may be valued at the last available bid (long positions) or ask (short positions) price. |
Generally, trading in foreign instruments is substantially completed each day at various times prior to the close of trading on the NYSE. Occasionally, events affecting the values of such instruments may occur between the foreign market close and the close of trading on the NYSE that may not be reflected in the computation of the Funds’ net assets. Each business day, the Funds use a pricing service to assist with the valuation of certain foreign exchange-traded equity securities and foreign exchange-traded and over-the-counter (“OTC”) options (the “Systematic Fair Value Price”). Using current market factors, the Systematic Fair Value Price is designed to value such foreign securities and foreign options at fair value as of the close of trading on the NYSE, which follows the close of the local markets.
| • | Investments in open-end U.S. mutual funds are valued at NAV each business day. |
| • | The Funds value their investment in SL Liquidity Series, LLC, Money Market Series (the “Money Market Series”) at fair value, which is ordinarily based upon their pro rata ownership in the underlying fund’s net assets. The Money Market Series seeks current income consistent with maintaining liquidity and preserving capital. Although the Money Market Series is not registered under the 1940 Act, its investments may follow the parameters of investments by a money market fund that is subject to Rule 2a-7 under the 1940 Act. |
| • | Futures contracts traded on exchanges are valued at their last sale price. |
| • | Forward foreign currency exchange contracts are valued at the mean between the bid and ask prices and are determined as of the close of trading on the NYSE based on that day’s prevailing forward exchange rate for the underlying currencies. Interpolated values are derived when the settlement date of the contract is an interim date for which quotations are not available. |
If events (e.g., a company announcement, market volatility or a natural disaster) occur that are expected to materially affect the value of such investments, or in the event that the application of these methods of valuation results in a price for an investment that is deemed not to be representative of the market value of such investment, or if a price is not available, the investment will be valued by the Global Valuation Committee, or its delegate, in accordance with a policy approved by the Board as reflecting fair value (“Fair Valued Investments”). The fair valuation approaches that may be used by the Global Valuation Committee will include market approach, income approach and cost approach. Valuation techniques such as discounted cash flow, use of market comparables and matrix pricing are types of valuation approaches and are typically used in determining fair value. When determining the price for Fair Valued Investments, the Global Valuation Committee, or its delegate, seeks to determine the price that each Fund might reasonably expect to receive or pay from the current sale or purchase of that asset or liability in an arm’s-length transaction. Fair value determinations shall be based upon all available factors that the Global Valuation Committee, or its delegate, deems relevant and consistent with the principles of fair value measurement. The pricing of all Fair Valued Investments is subsequently reported to the Board or a committee thereof on a quarterly basis.
For investments in equity or debt issued by privately held companies or funds (“Private Company” or collectively, the “Private Companies”) and other Fair Valued Investments, the fair valuation approaches that are used by the Global Valuation Committee and third party pricing services utilize one or a combination of, but not limited to, the following inputs.
| Standard Inputs Generally Considered By Third Party Pricing Services | ||||
Market approach | (i) | recent market transactions, including subsequent rounds of financing, in the underlying investment or comparable issuers; | ||
(ii) | recapitalizations and other transactions across the capital structure; and | |||
(iii) | market multiples of comparable issuers. | |||
Income approach | (i) | future cash flows discounted to present and adjusted as appropriate for liquidity, credit and/or market risks; | ||
(ii) | quoted prices for similar investments or assets in active markets; and | |||
(iii) | other risk factors, such as interest rates, yield curves, volatilities, prepayment speeds, loss severities, credit risks, recovery rates, liquidation amounts and/or default rates. | |||
Cost approach | (i) | audited or unaudited financial statements, investor communications and financial or operational metrics issued by the Private Company; | ||
(ii) | changes in the valuation of relevant indices or publicly traded companies comparable to the Private Company; | |||
(iii) | relevant news and other public sources; and | |||
(iv) | known secondary market transactions in the Private Company’s interests and merger or acquisition activity in companies comparable to the Private Company. | |||
Investments in series of preferred stock issued by Private Companies are typically valued utilizing market approach in determining the enterprise value of the company. Such investments often contain rights and preferences that differ from other series of preferred and common stock of the same issuer. Valuation techniques such as an option pricing model (“OPM”), a probability weighted expected return model (“PWERM”) or a hybrid of those techniques are used in allocating enterprise value of the company, as deemed appropriate under the circumstances. The use of OPM and PWERM techniques involve a determination of the exit scenarios of the investment in order to appropriately allocate the enterprise value of the company among the various parts of its capital structure.
| 66 | 2020 BLACKROCK ANNUAL REPORTTO SHAREHOLDERS |
Notes to Financial Statements (continued)
The Private Companies are not subject to the public company disclosure, timing, and reporting standards as other investments held by a Fund. Typically, the most recently available information by a Private Company is as of a date that is earlier than the date a Fund is calculating its NAV. This factor may result in a difference between the value of the investment and the price a Fund could receive upon the sale of the investment.
Fair Value Hierarchy: Various inputs are used in determining the fair value of investments and derivative financial instruments. These inputs to valuation techniques are categorized into a fair value hierarchy consisting of three broad levels for financial statement purposes as follows:
| • | Level 1 — Unadjusted price quotations in active markets/exchanges for identical assets or liabilities that each Fund has the ability to access |
| • | Level 2 — Other observable inputs (including, but not limited to, quoted prices for similar assets or liabilities in markets that are active, quoted prices for identical or similar assets or liabilities in markets that are not active, inputs other than quoted prices that are observable for the assets or liabilities (such as interest rates, yield curves, volatilities, prepayment speeds, loss severities, credit risks and default rates) or other market–corroborated inputs) |
| • | Level 3 — Unobservable inputs based on the best information available in the circumstances, to the extent observable inputs are not available (including the Global Valuation Committee’s assumptions used in determining the fair value of investments and derivative financial instruments) |
The hierarchy gives the highest priority to unadjusted quoted prices in active markets for identical assets or liabilities (Level 1 measurements) and the lowest priority to unobservable inputs (Level 3 measurements). Accordingly, the degree of judgment exercised in determining fair value is greatest for instruments categorized in Level 3. The inputs used to measure fair value may fall into different levels of the fair value hierarchy. In such cases, for disclosure purposes, the fair value hierarchy classification is determined based on the lowest level input that is significant to the fair value measurement in its entirety. Investments classified within Level 3 have significant unobservable inputs used by the Global Valuation Committee in determining the price for Fair Valued Investments. Level 3 investments include equity or debt issued by Private Companies. There may not be a secondary market, and/or there are a limited number of investors. The categorization of a value determined for investments and derivative financial instruments is based on the pricing transparency of the investments and derivative financial instruments and is not necessarily an indication of the risks associated with investing in those securities.
As of May 31, 2020, certain investments of the Funds were fair valued using NAV per share as no quoted market value is available and therefore have been excluded from the fair value hierarchy.
| 4. | SECURITIES AND OTHER INVESTMENTS |
Preferred Stocks: Preferred stock has a preference over common stock in liquidation (and generally in receiving dividends as well), but is subordinated to the liabilities of the issuer in all respects. As a general rule, the market value of preferred stock with a fixed dividend rate and no conversion element varies inversely with interest rates and perceived credit risk, while the market price of convertible preferred stock generally also reflects some element of conversion value. Because preferred stock is junior to debt securities and other obligations of the issuer, deterioration in the credit quality of the issuer will cause greater changes in the value of a preferred stock than in a more senior debt security with similar stated yield characteristics. Unlike interest payments on debt securities, preferred stock dividends are payable only if declared by the issuer’s board of directors. Preferred stock also may be subject to optional or mandatory redemption provisions.
Securities Lending: Certain Funds may lend their securities to approved borrowers, such as brokers, dealers and other financial institutions. The borrower pledges and maintains with the Funds collateral consisting of cash, an irrevocable letter of credit issued by a bank, or securities issued or guaranteed by the U.S. Government. The initial collateral received by each Fund is required to have a value of at least 102% of the current value of the loaned securities for securities traded on U.S. exchanges and a value of at least 105% for all other securities. The collateral is maintained thereafter at a value equal to at least 100% of the current market value of the securities on loan. The market value of the loaned securities is determined at the close of each business day of the Fund and any additional required collateral is delivered to the Fund, or excess collateral returned by the Fund, on the next business day. During the term of the loan, the Funds are entitled to all distributions made on or in respect of the loaned securities, but do not receive interest income on securities received as collateral. Loans of securities are terminable at any time and the borrower, after notice, is required to return borrowed securities within the standard time period for settlement of securities transactions.
The market value of any securities on loan, all of which were classified as common stocks in the Funds’ Schedules of Investments, and the value of any related collateral are shown separately in the Statements of Assets and Liabilities as a component of investments at value — unaffiliated, and collateral on securities loaned at value, respectively. As of period end, any securities on loan were collateralized by cash and/or U.S. Government obligations. Cash collateral invested by the securities lending agent, BlackRock Investment Management, LLC (“BIM”), if any, is disclosed in the Schedules of Investments.
Securities lending transactions are entered into by the Funds under Master Securities Lending Agreements (each, an “MSLA”), which provide the right, in the event of default (including bankruptcy or insolvency), for the non-defaulting party to liquidate the collateral and calculate a net exposure to the defaulting party or request additional collateral. In the event that a borrower defaults, the Fund, as lender, would offset the market value of the collateral received against the market value of the securities loaned. When the value of the collateral is greater than that of the market value of the securities loaned, the lender is left with a net amount payable to the defaulting party. However, bankruptcy or insolvency laws of a particular jurisdiction may impose restrictions on or prohibitions against such a right of offset in the event of an MSLA counterparty’s bankruptcy or insolvency. Under the MSLA, absent an event of default, the borrower can resell or re-pledge the loaned securities, and a Fund can reinvest cash collateral received in connection with loaned securities. Upon an event of default, the parties’ obligations to return the securities or collateral to the other party are extinguished, and the parties can resell or re-pledge the loaned securities or the collateral received in connection with the loaned securities in order to satisfy the defaulting party’s net payment obligation for all transactions under the MSLA. The defaulting party remains liable for any deficiency.
| NOTESTO FINANCIAL STATEMENTS | 67 |
Notes to Financial Statements (continued)
As of period end, the following tables are a summary of the Funds’ securities lending agreements by counterparty which are subject to offset under an MSLA:
Fund Name/Counterparty | | Securities Loaned at Value |
| | Cash Collateral Received | (a) | | Net Amount | (b) | |||
Advantage International(c) | ||||||||||||
Citigroup Global Markets, Inc. | $ | 310,435 | $ | (301,813 | ) | $ | 8,622 | |||||
Deutsche Bank Securities, Inc. | 68,171 | (68,171 | ) | — | ||||||||
J.P. Morgan Securities LLC | 7,857 | (7,857 | ) | — | ||||||||
Jefferies LLC | 64,168 | (64,168 | ) | — | ||||||||
Morgan Stanley & Co. LLC | 706,273 | (706,273 | ) | — | ||||||||
|
|
|
|
|
| |||||||
| $ | 1,156,904 | $ | (1,148,282 | ) | $ | 8,622 | ||||||
|
|
|
|
|
| |||||||
Advantage Large Cap Growth | ||||||||||||
Credit Suisse Securities (USA) LLC | $ | 1,709,684 | $ | (1,709,684 | ) | $ | — | |||||
UBS Securities LLC | 1,332,749 | (1,051,634 | ) | 281,115 | ||||||||
|
|
|
|
|
| |||||||
| $ | 3,042,433 | $ | (2,761,318 | ) | $ | 281,115 | ||||||
|
|
|
|
|
| |||||||
Advantage Small Cap Core | ||||||||||||
Barclays Capital, Inc. | $ | 1,315,203 | $ | (1,315,203 | ) | $ | — | |||||
BNP Paribas Securities Corp. | 815,376 | (764,600 | ) | 50,776 | ||||||||
BofA Securities, Inc. | 1,920,927 | (1,857,001 | ) | 63,926 | ||||||||
Citigroup Global Markets, Inc. | 5,837,138 | (5,837,138 | ) | — | ||||||||
Credit Suisse Securities (USA) LLC | 10,191,245 | (10,191,245 | ) | — | ||||||||
Deutsche Bank Securities, Inc. | 975,093 | (975,093 | ) | — | ||||||||
J.P. Morgan Securities LLC | 30,432,996 | (30,432,996 | ) | — | ||||||||
Jefferies LLC | 488,691 | (488,691 | ) | — | ||||||||
Morgan Stanley & Co. LLC | 6,571,601 | (6,571,601 | ) | — | ||||||||
National Financial Services LLC | 1,949,268 | (1,935,629 | ) | 13,639 | ||||||||
State Street Bank & Trust Co. | 248,268 | (248,268 | ) | — | ||||||||
|
|
|
|
|
| |||||||
| $ | 60,745,806 | $ | (60,617,465 | ) | $ | 128,341 | ||||||
|
|
|
|
|
|
| (a) | Collateral received in excess of the market value of securities on loan is not presented in this table. The total cash collateral received by each Fund is disclosed in the Funds’ Statements of Assets and Liabilities. |
| (b) | The market value of the loaned securities is determined as of May 31, 2020. Additional collateral is delivered to the Fund on the next business day in accordance with the MSLA. The net amount would be subject to the borrower default indemnity in the event of default by the counterparty. |
| (c) | Securities loaned with a value of $8,992 have been sold and are pending settlement as of May 31, 2020. |
The risks of securities lending include the risk that the borrower may not provide additional collateral when required or may not return the securities when due. To mitigate these risks, the Funds benefit from a borrower default indemnity provided by BIM. BIM’s indemnity allows for full replacement of the securities loaned to the extent the collateral received does not cover the value on the securities loaned in the event of borrower default. Each Fund could incur a loss if the value of an investment purchased with cash collateral falls below the market value of loaned securities or if the value of an investment purchased with cash collateral falls below the value of the original cash collateral received. Such losses are borne entirely by the Funds.
| 5. | DERIVATIVE FINANCIAL INSTRUMENTS |
The Funds engage in various portfolio investment strategies using derivative contracts both to increase the returns of the Funds and/or to manage their exposure to certain risks such as credit risk, equity risk, interest rate risk, foreign currency exchange rate risk, commodity price risk or other risks (e.g., inflation risk). Derivative financial instruments categorized by risk exposure are included in the Schedules of Investments. These contracts may be transacted on an exchange or OTC.
Futures Contracts: Futures contracts are purchased or sold to gain exposure to, or manage exposure to, changes in interest rates (interest rate risk) and changes in the value of equity securities (equity risk) or foreign currencies (foreign currency exchange rate risk).
Futures contracts are agreements between the Funds and a counterparty to buy or sell a specific quantity of an underlying instrument at a specified price and on a specified date. Depending on the terms of a contract, it is settled either through physical delivery of the underlying instrument on the settlement date or by payment of a cash amount on the settlement date. Upon entering into a futures contract, the Funds are required to deposit initial margin with the broker in the form of cash or securities in an amount that varies depending on a contract’s size and risk profile. The initial margin deposit must then be maintained at an established level over the life of the contract. Amounts pledged, which are considered restricted, are included in cash pledged for futures contracts in the Statements of Assets and Liabilities.
Securities deposited as initial margin are designated in the Schedules of Investments and cash deposited, if any, are shown as cash pledged for futures contracts in the Statements of Assets and Liabilities. Pursuant to the contract, the Funds agree to receive from or pay to the broker an amount of cash equal to the daily fluctuation in market value of the contract (“variation margin”). Variation margin is recorded as unrealized appreciation (depreciation) and, if any, shown as variation margin receivable (or payable) on futures contracts in the Statements of Assets and Liabilities. When the contract is closed, a realized gain or loss is recorded in the Statements of Operations equal to the difference between the notional amount of the contract at the time it was opened and the notional amount at the time it was closed. The use of futures contracts involves the risk of an imperfect correlation in the movements in the price of futures contracts and interest, foreign currency exchange rates or underlying assets.
Forward Foreign Currency Exchange Contracts: Forward foreign currency exchange contracts are entered into to gain or reduce exposure to foreign currencies (foreign currency exchange rate risk).
| 68 | 2020 BLACKROCK ANNUAL REPORTTO SHAREHOLDERS |
Notes to Financial Statements (continued)
A forward foreign currency exchange contract is an agreement between two parties to buy and sell a currency at a set exchange rate on a specified date. These contracts help to manage the overall exposure to the currencies in which some of the investments held by the Funds are denominated and in some cases, may be used to obtain exposure to a particular market.
The contract is marked-to-market daily and the change in market value is recorded as unrealized appreciation (depreciation) in the Statements of Assets and Liabilities. When a contract is closed, a realized gain or loss is recorded in the Statements of Operations equal to the difference between the value at the time it was opened and the value at the time it was closed. Non-deliverable forward foreign currency exchange contracts are settled with the counterparty in cash without the delivery of foreign currency. The use of forward foreign currency exchange contracts involves the risk that the value of a forward foreign currency exchange contract changes unfavorably due to movements in the value of the referenced foreign currencies, and such value may exceed the amounts reflected in the Statements of Assets and Liabilities. Cash amounts pledged for forward foreign currency exchange contracts are considered restricted and are included in cash pledged as collateral for OTC derivatives in the Statements of Assets and Liabilities.
Master Netting Arrangements: In order to define their contractual rights and to secure rights that will help them mitigate their counterparty risk, the Funds may enter into an International Swaps and Derivatives Association, Inc. Master Agreement (“ISDA Master Agreement”) or similar agreement with their counterparties. An ISDA Master Agreement is a bilateral agreement between each Fund and a counterparty that governs certain OTC derivatives and typically contains, among other things, collateral posting terms and netting provisions in the event of a default and/or termination event. Under an ISDA Master Agreement, each Fund may, under certain circumstances, offset with the counterparty certain derivative financial instruments’ payables and/or receivables with collateral held and/or posted and create one single net payment. The provisions of the ISDA Master Agreement typically permit a single net payment in the event of default including the bankruptcy or insolvency of the counterparty. Bankruptcy or insolvency laws of a particular jurisdiction may restrict or prohibit the right of offset in bankruptcy, insolvency or other events.
Collateral Requirements: For derivatives traded under an ISDA Master Agreement, the collateral requirements are typically calculated by netting the mark-to-market amount for each transaction under such agreement and comparing that amount to the value of any collateral currently pledged by the Fund and the counterparty.
Cash collateral that has been pledged to cover obligations of the Funds and cash collateral received from the counterparty, if any, is reported separately in the Statements of Assets and Liabilities as cash pledged as collateral and cash received as collateral, respectively. Non-cash collateral pledged by the Funds, if any, is noted in the Schedules of Investments. Generally, the amount of collateral due from or to a counterparty is subject to a certain minimum transfer amount threshold before a transfer is required, which is determined at the close of business of the Funds. Any additional required collateral is delivered to/pledged by the Funds on the next business day. Typically, the counterparty is not permitted to sell, re-pledge or use cash and non-cash collateral it receives. A Fund generally agrees not to use non-cash collateral that it receives but may, absent default or certain other circumstances defined in the underlying ISDA Master Agreement, be permitted to use cash collateral received. In such cases, interest may be paid pursuant to the collateral arrangement with the counterparty. To the extent amounts due to the Funds from their counterparties are not fully collateralized, they bear the risk of loss from counterparty non-performance. Likewise, to the extent the Funds have delivered collateral to a counterparty and stand ready to perform under the terms of their agreement with such counterparty, they bear the risk of loss from a counterparty in the amount of the value of the collateral in the event the counterparty fails to return such collateral. Based on the terms of agreements, collateral may not be required for all derivative contracts.
For financial reporting purposes, the Funds do not offset derivative assets and derivative liabilities that are subject to netting arrangements, if any, in the Statements of Assets and Liabilities.
| 6. | INVESTMENT ADVISORY AGREEMENT AND OTHER TRANSACTIONS WITH AFFILIATES |
Investment Advisory: The Trust, on behalf of the Funds, entered into an Investment Advisory Agreement with the Manager, the Funds’ investment adviser and an indirect, wholly-owned subsidiary of BlackRock, Inc. (“BlackRock”), to provide investment advisory services. The Manager is responsible for the management of each Fund’s portfolio and provides the personnel, facilities, equipment and certain other services necessary to the operations of each Fund.
For such services, each Fund pays the Manager a monthly fee at an annual rate equal to the following percentages of the average daily value of each Fund’s net assets:
| Investment Advisory Fees | ||||||||||||
| Average Daily Net Assets | Advantage International | Advantage Large Cap Growth | Advantage Small Cap Core | |||||||||
First $1 billion | 0.45 | % | 0.57 | % | 0.45 | % | ||||||
$1 billion — $3 billion | 0.42 | 0.54 | 0.42 | |||||||||
$3 billion — $5 billion | 0.41 | 0.51 | 0.41 | |||||||||
$5 billion — $10 billion | 0.39 | 0.50 | 0.39 | |||||||||
Greater than $10 billion | 0.38 | 0.48 | 0.38 | |||||||||
| NOTESTO FINANCIAL STATEMENTS | 69 |
Notes to Financial Statements (continued)
Service and Distribution Fees: The Trust, on behalf of the Funds, entered into a Distribution Agreement and a Distribution and Service Plan with BlackRock Investments, LLC (“BRIL”), an affiliate of the Manager. Pursuant to the Distribution and Service Plan and in accordance with Rule 12b-1 under the 1940 Act, each Fund pays BRIL ongoing service and distribution fees. The fees are accrued daily and paid monthly at annual rates based upon the average daily net assets of the relevant share class of each Fund as follows:
|
| Advantage International | Advantage Large Cap Growth | Advantage Small Cap Core | |||||||||||||||||||||
| Share Class | Service Fees | Distribution Fees | Service Fees | Distribution Fees | Service Fees | Distribution Fees | ||||||||||||||||||
Service | 0.25 | % | N/A | 0.25 | % | N/A | N/A | N/A | ||||||||||||||||
Investor A | 0.25 | N/A | 0.25 | N/A | 0.25 | % | N/A | |||||||||||||||||
Investor C | 0.25 | 0.75 | % | 0.25 | 0.75 | % | 0.25 | 0.75 | % | |||||||||||||||
Class R | 0.25 | 0.25 | 0.25 | 0.25 | N/A | N/A | ||||||||||||||||||
BRIL and broker-dealers, pursuant to sub-agreements with BRIL, provide shareholder servicing and distribution services to the Funds. The ongoing service and/or distribution fee compensates BRIL and each broker-dealer for providing shareholder servicing and/or distribution related services to shareholders.
The following table shows the class specific service and distribution fees borne directly by each share class of each Fund:
| ||||||||||||||||||||
|
| Advantage International | Advantage Large Cap Growth | Advantage Small Cap Core | |||||||||||||||||
|
|
|
|
|
| |||||||||||||||
| Share Class | Period from 10/01/19 to 05/31/20 | Year Ended 09/30/19 | Period from 10/01/19 to 05/31/20 | Year Ended 09/30/19 | Year Ended 05/31/20 | |||||||||||||||
| ||||||||||||||||||||
Service | $ | — | $ | — | $ | 353 | $ | 434 | $ | — | ||||||||||
Investor A | 669,224 | 874,742 | 1,133,842 | 1,722,650 | 660,567 | |||||||||||||||
Investor C | 53,547 | 122,717 | 101,801 | 203,495 | 46,200 | |||||||||||||||
Class R | 14,476 | 30,918 | 2,360 | 6,314 | — | |||||||||||||||
|
|
|
|
|
|
|
|
|
| |||||||||||
| $ | 737,247 | $ | 1,028,377 | $ | 1,238,356 | $ | 1,932,893 | $ | 706,767 | |||||||||||
|
|
|
|
|
|
|
|
|
| |||||||||||
Administration: The Trust, on behalf of the Funds, entered into an Administration Agreement with the Manager, an indirect, wholly-owned subsidiary of BlackRock, to provide administrative services. For these services, the Manager receives an administration fee computed daily and payable monthly, based on a percentage of the average daily net assets of each Fund. The administration fee, which is shown as administration in the Statements of Operations, is paid at the annual rates below.
| ||
| Average Daily Net Assets | Administration Fee | |
| ||
First $500 million | 0.0425% | |
$500 million — $1 billion | 0.0400 | |
$1 billion — $2 billion | 0.0375 | |
$2 billion — $4 billion | 0.0350 | |
$4 billion — $13 billion | 0.0325 | |
Greater than $13 billion | 0.0300 | |
| ||
In addition, the Manager charges each of the share classes an administration fee, which is shown as administration — class specific in the Statements of Operations, at an annual rate of 0.02% of the average daily net assets of each respective class.
The following table shows the class specific administration fees borne directly by each share class of each Fund:
| ||||||||||||||||||||
|
| Advantage International | Advantage Large Cap Growth | Advantage Small Cap Core | |||||||||||||||||
| Share Class | Period from 10/01/19 to 05/31/20 | Year Ended 09/30/19 | Period from 10/01/19 to 05/31/20 | Year Ended 09/30/19 | Year Ended 05/31/20 | |||||||||||||||
| ||||||||||||||||||||
Institutional | $ | 60,910 | $ | 84,861 | $ | 10,634 | $ | 14,777 | $ | 137,765 | ||||||||||
Service | — | — | 28 | 35 | — | |||||||||||||||
Investor A | 53,498 | 69,972 | 90,617 | 137,665 | 52,760 | |||||||||||||||
Investor C | 1,075 | 2,469 | 2,043 | 4,092 | 921 | |||||||||||||||
Class K | 5,986 | 1,992 | 121 | 161 | 27,269 | |||||||||||||||
Class R | 579 | 1,238 | 94 | 253 | — | |||||||||||||||
|
|
|
|
|
|
|
|
|
| |||||||||||
| $ | 122,048 | $ | 160,532 | $ | 103,537 | $ | 156,983 | $ | 218,715 | |||||||||||
|
|
|
|
|
|
|
|
|
| |||||||||||
Transfer Agent: Pursuant to written agreements, certain financial intermediaries, some of which may be affiliates, provide the Funds with sub-accounting, recordkeeping, sub-transfer agency and other administrative services with respect to servicing of underlying investor accounts. For these services, these entities receive an asset-based fee
| 70 | 2020 BLACKROCK ANNUAL REPORTTO SHAREHOLDERS |
Notes to Financial Statements (continued)
or an annual fee per shareholder account, which will vary depending on share class and/or net assets. The Funds paid the following amounts to affiliates of BlackRock in return for these services, which are included in transfer agent — class specific in the Statements of Operations:
| ||||||||||||||||||||
|
| Advantage International | Advantage Large Cap Growth | Advantage Small Cap Core | |||||||||||||||||
| Share Class | Period from 10/01/19 to 05/31/20 | Year Ended 09/30/19 | Period from 10/01/19 to 05/31/20 | Year Ended 09/30/19 | Year Ended 05/31/20 | |||||||||||||||
| ||||||||||||||||||||
Institutional | $ | 660,444 | $ | 445,254 | $ | — | $ | — | $ | 164,631 | ||||||||||
Investor A | — | — | — | 36 | — | |||||||||||||||
|
|
|
|
|
|
|
|
|
| |||||||||||
| $ | 660,444 | $ | 445,254 | $ | — | $ | 36 | $ | 164,631 | |||||||||||
|
|
|
|
|
|
|
|
|
| |||||||||||
The Manager maintains a call center that is responsible for providing certain shareholder services to the Funds. Shareholder services include responding to inquiries and processing purchases and sales based upon instructions from shareholders. Each Fund reimbursed the Manager the following amounts for costs incurred in running the call center, which are included in transfer agent — class specific in the Statements of Operations:
| ||||||||||||||||||||
|
| Advantage International | Advantage Large Cap Growth | Advantage Small Cap Core | |||||||||||||||||
| Share Class | Period from 10/01/19 to 05/31/20 | Year Ended 09/30/19 | Period from 10/01/19 to 05/31/20 | Year Ended 09/30/19 | Year Ended 05/31/20 | |||||||||||||||
| ||||||||||||||||||||
Institutional | $ | 3,380 | $ | 3,941 | $ | 1,229 | $ | 1,453 | $ | 4,824 | ||||||||||
Investor A | 9,448 | 10,965 | 50,211 | 57,009 | 17,754 | |||||||||||||||
Investor C | 862 | 1,360 | 1,383 | 2,164 | 725 | |||||||||||||||
Class K | 85 | 25 | 3 | 24 | 840 | |||||||||||||||
Class R | 58 | 66 | 14 | 15 | — | |||||||||||||||
|
|
|
|
|
|
|
|
|
| |||||||||||
| $ | 13,833 | $ | 16,357 | $ | 52,840 | $ | 60,665 | $ | 24,143 | |||||||||||
|
|
|
|
|
|
|
|
|
| |||||||||||
The following table shows the class specific transfer agent fees borne directly by each share class of each Fund:
| ||||||||||||||||||||
|
| Advantage International | Advantage Large Cap Growth | Advantage Small Cap Core | |||||||||||||||||
| Share Class | Period from 10/01/19 to 05/31/20 | Year Ended 09/30/19 | Period from 10/01/19 to 05/31/20 | Year Ended 09/30/19 | Year Ended 05/31/20 | |||||||||||||||
| ||||||||||||||||||||
Institutional | $ | 533,128 | $ | 667,671 | $ | 90,609 | $ | 127,854 | $ | 598,615 | ||||||||||
Service | — | — | 179 | 59 | — | |||||||||||||||
Investor A | 494,253 | 629,218 | 807,818 | 1,250,069 | 545,451 | |||||||||||||||
Investor C | 10,471 | 19,177 | 14,298 | 32,206 | 7,089 | |||||||||||||||
Class K | 2,907 | 1,849 | 54 | 128 | 6,240 | |||||||||||||||
Class R | 6,553 | 13,082 | 1,302 | 2,813 | — | |||||||||||||||
|
|
|
|
|
|
|
|
|
| |||||||||||
| $ | 1,047,312 | $ | 1,330,997 | $ | 914,260 | $ | 1,413,129 | $ | 1,157,395 | |||||||||||
|
|
|
|
|
|
|
|
|
| |||||||||||
Other Fees: Affiliates earned underwriting discounts, direct commissions and dealer concessions on sales of each Fund’s Investor A Shares as follows:
| ||||||||||||||||||||
|
| Advantage International | Advantage Large Cap Growth | Advantage Small Cap Core | |||||||||||||||||
| Period from 10/01/19 to 05/31/20 | Year Ended 09/30/19 | Period from 10/01/19 to 05/31/20 | Year Ended 09/30/19 | Year Ended 05/31/20 | ||||||||||||||||
| ||||||||||||||||||||
Other fees | $ | 6,384 | $ | 10,758 | $ | 11,150 | $ | 7,892 | $ | 24,262 | ||||||||||
|
|
|
|
|
|
|
|
|
| |||||||||||
Affiliates received CDSCs as follows:
| ||||||||||||||||||||
|
| Advantage International | Advantage Large Cap Growth | Advantage Small Cap Core | |||||||||||||||||
| Share Class | Period from 10/01/19 to 05/31/20 | Year Ended 09/30/19 | Period from 10/01/19 to 05/31/20 | Year Ended 09/30/19 | Year Ended 05/31/20 | |||||||||||||||
| ||||||||||||||||||||
Investor A | $ | 3,014 | $ | 2,653 | $ | 29 | $ | — | $ | 1,495 | ||||||||||
Investor C | 2,215 | 882 | 522 | 629 | 1,387 | |||||||||||||||
|
|
|
|
|
|
|
|
|
| |||||||||||
| $ | 5,229 | $ | 3,535 | $ | 551 | $ | 629 | $ | 2,882 | |||||||||||
|
|
|
|
|
|
|
|
|
| |||||||||||
Expense Limitations, Waivers, Reimbursements and Recoupments: With respect to Advantage International and Advantage Large Cap Growth, the Manager contractually agreed to waive its investment advisory fees by the amount of investment advisory fees each Fund pays to the Manager indirectly through its investment in affiliated money market funds (the “affiliated money market fund waiver”) through January 31, 2021. The contractual agreement may be terminated upon 90 days’ notice by a majority of the trustees who are not “interested persons” of the Trust, as defined in the 1940 Act (“Independent Trustees”), or by a vote of a majority of the outstanding voting securities of a Fund. The amount of waivers and/or reimbursements of fees and expenses made pursuant to the expense limitation described below will be reduced by the amount of the affiliated money market fund waiver. Prior to January 28, 2020, this waiver was voluntary.
| NOTESTO FINANCIAL STATEMENTS | 71 |
Notes to Financial Statements (continued)
With respect to Advantage Small Cap Core Fund, the Manager voluntarily agreed to waive its investment advisory fees by the amount of investment advisory fees the Fund pays to the Manager indirectly through its investment in affiliated money market funds (the “affiliated money market fund waiver”). The amount of waivers and/or reimbursements of fees and expenses made pursuant to the expense limitation described below will be reduced by the amount of the affiliated money market fund waiver. This amount is included in fees waived and/or reimbursed by the Manager in the Statement of Operations.
These amounts are included in fees waived and/or reimbursed by the Manager in the Statements of Operations. The amounts waived were as follows:
| ||||||||||||||||||||
|
| Advantage International | Advantage Large Cap Growth | Advantage Small Cap Core | |||||||||||||||||
| Period from 10/01/19 to 05/31/20 | Year Ended 09/30/19 | Period from 10/01/19 to 05/31/20 | Year Ended 09/30/19 | Year Ended 05/31/20 | ||||||||||||||||
| ||||||||||||||||||||
Amounts waived | $ | 6,957 | $ | 9,033 | $ | 5,952 | $ | 5,254 | $ | 14,824 | ||||||||||
|
|
|
|
|
|
|
|
|
| |||||||||||
The Manager has contractually agreed to waive its investment advisory fee with respect to any portion of each Fund’s assets invested in affiliated equity and fixed-income mutual funds and affiliated exchange-traded funds that have a contractual management fee through January 31, 2021 (for Advantage International and Advantage Large Cap Growth) and September 30, 2021 (for Advantage Small Cap Core). The contractual agreement may be terminated upon 90 days’ notice by a majority of the Independent Trustees or by a vote of a majority of the outstanding voting securities of a Fund. For the period and year ended May 31, 2020 and year ended September 30, 2019, there were no fees waived and/or reimbursed by the Manager pursuant to this arrangement.
The Funds have incurred expenses in connection with the realignment and consolidation of the boards of trustees of certain BlackRock-advised funds. The Manager has voluntarily agreed to reimburse the Funds for all or a portion of such expenses, which amounts are included in fees waived and/or reimbursed by the Manager in the Statements of Operations. For the year ended September 30, 2019, the amounts reimbursed to Advantage International and Advantage Large Cap Growth were $7,930 and $12,955, respectively.
With respect to each Fund, the Manager contractually agreed to waive and/or reimburse fees or expenses in order to limit expenses, excluding interest expense, dividend expense, tax expense, acquired fund fees and expenses, and certain other fund expenses, which constitute extraordinary expenses not incurred in the ordinary course of each Fund’s business (“expense limitation”). The expense limitations as a percentage of average daily net assets are as follows:
| Fund Name | Institutional | Service | Investor A | Investor C | Class K | Class R | ||||||||||||||||||
Advantage International(a) | 0.50 | % | 0.75 | %(b) | 0.75 | % | 1.50 | % | 0.45 | % | 1.00 | % | ||||||||||||
Advantage Large Cap Growth(a) | 0.62 | 0.87 | 0.87 | 1.62 | 0.57 | 1.12 | (c) | |||||||||||||||||
Advantage Small Cap Core(d) | 0.50 | N/A | 0.75 | 1.50 | 0.45 | N/A | ||||||||||||||||||
| (a) | The Manager has agreed not to reduce or discontinue these contractual expense limitations through January 31, 2021 (or January 31, 2030 with respect to Advantage Large Cap Growth Class R Shares), unless approved by the Board, including a majority of the Independent Trustees or by a vote of a majority of the outstanding voting securities of the Fund. |
| (b) | There were no shares outstanding as of May 31, 2020. |
| (c) | On February 1 of each year, the waiver agreement will renew automatically for an additional one year so that the agreement will have a perpetual ten-year term. |
| (d) | The Manager has agreed not to reduce or discontinue these contractual expense limitations through September 30, 2021, unless approved by the Board, including a majority of the Independent Trustees, or by a vote of a majority of the outstanding voting securities of the Fund. |
The amounts included in fees waived and/or reimbursed by the Manager in the Statements of Operations were as follows:
| ||||||||||||||||||||
|
| Advantage International | Advantage Large Cap Growth | Advantage Small Cap Core | |||||||||||||||||
| Period from 10/01/19 to 05/31/20 | Year Ended 09/30/19 | Period from 10/01/19 to 05/31/20 | Year Ended 09/30/19 | Year Ended 05/31/20 | ||||||||||||||||
| ||||||||||||||||||||
Amounts waived | $ | 1,057,163 | $ | 1,223,861 | $ | 504,084 | $ | 788,207 | $ | 934,387 | ||||||||||
|
|
|
|
|
|
|
|
|
| |||||||||||
These amounts waived and/or reimbursed are included in administration fees waived — class specific and transfer agent fees waived and/or reimbursed — class specific, respectively, in the Statements of Operations. Class specific expense waivers and/or reimbursements are as follows:
| ||||||||||||||||||||
|
| Administration Fees Waived | |||||||||||||||||||
|
| Advantage International | Advantage Large Cap Growth | Advantage Small Cap Core | |||||||||||||||||
| Share Class | Period from 10/01/19 to 05/31/20 | Year Ended 09/30/19 | Period from 10/01/19 to 05/31/20 | Year Ended 09/30/19 | Year Ended 05/31/20 | |||||||||||||||
| ||||||||||||||||||||
Institutional | $ | 60,910 | $ | 84,861 | $ | 10,634 | $ | 14,776 | $ | 137,765 | ||||||||||
Service | — | — | 26 | 12 | — | |||||||||||||||
Investor A | 53,498 | 69,972 | 90,617 | 137,667 | 52,760 | |||||||||||||||
Investor C | 1,075 | 2,469 | 2,043 | 4,092 | 921 | |||||||||||||||
Class K | 5,986 | 1,992 | 113 | 160 | 27,266 | |||||||||||||||
Class R | 579 | 1,238 | 94 | 253 | — | |||||||||||||||
|
|
|
|
|
|
|
|
|
| |||||||||||
| $ | 122,048 | $ | 160,532 | $ | 103,527 | $ | 156,960 | $ | 218,712 | |||||||||||
|
|
|
|
|
|
|
|
|
| |||||||||||
| 72 | 2020 BLACKROCK ANNUAL REPORTTO SHAREHOLDERS |
Notes to Financial Statements (continued)
| ||||||||||||||||||||
|
| Transfer Agent Fees Waived and/or Reimbursed | |||||||||||||||||||
|
| Advantage International | Advantage Large Cap Growth | Advantage Small Cap Core | |||||||||||||||||
| Share Class | Period from 10/01/19 to 05/31/20 | Year Ended 09/30/19 | Period from 10/01/19 to 05/31/20 | Year Ended 09/30/19 | Year Ended 05/31/20 | |||||||||||||||
| ||||||||||||||||||||
Institutional | $ | 380,805 | $ | 455,386 | $ | 64,080 | $ | 90,852 | $ | 253,380 | ||||||||||
Service | — | — | 111 | 5 | — | |||||||||||||||
Investor A | 361,648 | 454,386 | 583,101 | 907,426 | 414,241 | |||||||||||||||
Investor C | 7,675 | 12,350 | 8,853 | 20,936 | 4,868 | |||||||||||||||
Class K | 2,907 | 1,849 | 62 | 128 | 6,219 | |||||||||||||||
Class R | 5,107 | 9,972 | 1,067 | 2,175 | — | |||||||||||||||
|
|
|
|
|
|
|
|
|
| |||||||||||
| $ | 758,142 | $ | 933,943 | $ | 657,274 | $ | 1,021,522 | $ | 678,708 | |||||||||||
|
|
|
|
|
|
|
|
|
| |||||||||||
With respect to the contractual expense limitations, if during a Fund’s fiscal year the operating expenses of a share class, that at any time during the prior two fiscal years received a waiver and/or reimbursement from the Manager, are less than the current expense limitation for that share class, the Manager is entitled to be reimbursed by such share class up to the lesser of: (a) the amount of fees waived and/or expenses reimbursed during those prior two fiscal years under the agreement and (b) an amount not to exceed either the current expense limitation of that share class or the expense limitation of the share class in effect at the time that the share class received the applicable waiver and/or reimbursement, provided that:
| (1) | each Fund, of which the share class is a part, has more than $50 million in assets for the fiscal year, and |
| (2) | the Manager or an affiliate continues to serve as a Fund’s investment adviser or administrator. |
This repayment applies only to the contractual expense limitation on net expenses and does not apply to the contractual investment advisory fee waiver described above or any voluntary waivers that may be in effect from time to time. Effective December 1, 2019 for Advantage International and Advantage Large Cap Growth and March 14, 2020 for Advantage Small Cap Core, the repayment arrangement between each Fund and the Manager pursuant to which such Fund may be required to repay amounts waived and/or reimbursed under each Fund’s contractual caps on net expenses was terminated.
For the year ended September 30, 2019, the Manager recouped Service class specific waivers and/or reimbursements of $10 previously recorded by Advantage Large Cap Growth.
The fund level and class specific waivers and/or reimbursements previously recorded by the Funds, which were subject to recoupment by the Manager, were as follows:
| ||||||||
|
| Expired | |||||||
| Fund Name/Fund Level/Share Class | December 1, 2019 | March 14, 2020 | ||||||
| ||||||||
Advantage International | ||||||||
Fund Level | $ | 2,306,559 | $ | — | ||||
Institutional | 954,839 | — | ||||||
Investor A | 1,016,961 | — | ||||||
Investor C | 47,731 | — | ||||||
Class K | 6,824 | — | ||||||
Class R | 27,786 | — | ||||||
Advantage Large Cap Growth | ||||||||
Fund Level | 1,619,082 | — | ||||||
Institutional | 217,061 | — | ||||||
Service | 146 | — | ||||||
Investor A | 2,254,391 | — | ||||||
Investor C | 100,376 | — | ||||||
Class K | 421 | — | ||||||
Class R | 6,613 | — | ||||||
Advantage Small Cap Core | ||||||||
Fund Level | — | 1,963,283 | ||||||
Institutional | — | 671,522 | ||||||
Investor A | — | 724,567 | ||||||
Investor C | — | 13,212 | ||||||
Class K | — | 37,849 | ||||||
| ||||||||
Securities Lending: The U.S. Securities and Exchange Commission (“SEC”) has issued an exemptive order which permits BIM, an affiliate of the Manager, to serve as securities lending agent for the Funds, subject to applicable conditions. As securities lending agent, BIM bears all operational costs directly related to securities lending. The Funds are responsible for expenses in connection with the investment of cash collateral received for securities on loan (the “collateral investment expenses”). The cash collateral is invested in a private investment company managed by the Manager or its affiliates. However, BIM has agreed to cap the collateral investment expenses of the private investment company to an annual rate of 0.04%. The investment adviser to the private investment company will not charge any advisory fees with respect to shares purchased by the Funds. The private investment company in which the cash collateral has been invested may, under certain circumstances, impose a liquidity fee of up to 2% of the value withdrawn or temporarily restrict withdrawals for up to 10 business days during a 90 day period, in the event that the private investment company’s weekly liquid assets fall below certain thresholds.
| NOTESTO FINANCIAL STATEMENTS | 73 |
Notes to Financial Statements (continued)
Securities lending income is equal to the total of income earned from the reinvestment of cash collateral, net of fees and other payments to and from borrowers of securities, and less the collateral investment expenses. Each Fund retains a portion of securities lending income and remits a remaining portion to BIM as compensation for its services as securities lending agent.
Pursuant to the current securities lending agreement, each Fund, with the exception of Advantage International, retains 75% of securities lending income (which excludes collateral investment expenses), and this amount retained can never be less than 70% of the total of securities lending income plus the collateral investment expenses. Pursuant to the current securities lending agreement, Advantage International retains 82% of securities lending income (which excludes collateral investment expenses), and this amount retained can never be less than 70% of the total of securities lending income plus the collateral investment expenses.
In addition, commencing the business day following the date that the aggregate securities lending income earned across the BlackRock Multi-Asset Complex in a calendar year exceeds a specified threshold, each Fund with the exception of Advantage International, pursuant to the securities lending agreement, will retain for the remainder of that calendar year securities lending income in an amount equal to 80% of securities lending income (which excludes collateral investment expenses), and this amount retained can never be less than 70% of the total of securities lending income plus the collateral investment expenses. Advantage International, pursuant to the securities lending agreement, will retain for the remainder of that calendar year securities lending income in an amount equal to 85% of securities lending income (which excludes collateral investment expenses), and this amount retained can never be less than 70% of the total of securities lending income plus the collateral investment expenses.
Prior to January 1, 2020, each Fund, with the exception of Advantage International, retained 73.5% of securities lending income (which excluded collateral investment expenses) and the amount retained could never be less than 70% of the total of securities lending income plus the collateral investment expenses. In addition, commencing the business day following the date that the aggregate securities lending income earned across the BlackRock Multi-Asset Complex in a calendar year exceeded a specified threshold, the Fund would retain for the remainder of that calendar year 80% of securities lending income (which excluded collateral investment expenses), and the amount retained could never be less than 70% of the total of securities lending income plus the collateral investment expenses.
The share of securities lending income earned by each Fund is shown as securities lending income — affiliated — net in the Statements of Operations. Each Fund paid BIM the following amounts for securities lending agent services:
| ||||||||||||||||||||
|
| Advantage International | Advantage Large Cap Growth | Advantage Small Cap Core | |||||||||||||||||
| Period from 10/01/19 to 05/31/20 | Year Ended 09/30/19 | Period from 10/01/19 to 05/31/20 | Year Ended 09/30/19 | Year Ended 05/31/20 | ||||||||||||||||
| ||||||||||||||||||||
Amounts | $ | 1,324 | $ | 36,881 | $ | 3,469 | $ | 21,748 | $ | 177,246 | ||||||||||
|
|
|
|
|
|
|
|
|
| |||||||||||
Interfund Lending: In accordance with an exemptive order (the “Order”) from the SEC, Advantage International and Advantage Small Cap Core may participate in a joint lending and borrowing facility for temporary purposes (the “Interfund Lending Program”), subject to compliance with the terms and conditions of the Order, and to the extent permitted by each Fund’s investment policies and restrictions. Advantage International is currently permitted to borrow under the Interfund Lending Program. In addition, Advantage Small Cap Core is currently permitted to borrow and lend under the Interfund Lending Program.
A lending BlackRock fund may lend in aggregate up to 15% of its net assets, but may not lend more than 5% of its net assets to any one borrowing fund through the Interfund Lending Program. A borrowing BlackRock fund may not borrow through the Interfund Lending Program or from any other source more than 33 1/3% of its total assets (or any lower threshold provided for by the fund’s investment restrictions). If a borrowing BlackRock fund’s total outstanding borrowings exceed 10% of its total assets, each of its outstanding interfund loans will be subject to collateralization of at least 102% of the outstanding principal value of the loan. All interfund loans are for temporary or emergency purposes and the interest rate to be charged will be the average of the highest current overnight repurchase agreement rate available to a lending fund and the bank loan rate, as calculated according to a formula established by the Board.
During the period and year ended May 31, 2020, Advantage International and Advantage Small Cap Core did not participate in the Interfund Lending Program.
Trustees and Officers: Certain trustees and/or officers of the Trust are directors and/or officers of BlackRock or its affiliates. The Funds reimburse the Manager for a portion of the compensation paid to the Funds’ Chief Compliance Officer, which is included in Trustees and Officer in the Statements of Operations.
Other Transactions: The Funds may purchase securities from, or sell securities to, an affiliated fund provided the affiliation is due solely to having a common investment adviser, common officers, or common trustees. For the period ended May 31, 2020, the purchase and sale transactions and any net realized gains (losses) with an affiliated fund in compliance with Rule 17a-7 under the 1940 Act were as follows:
| ||||||||||||
| Fund Name | Purchases | Sales | Net Realized Gain | |||||||||
| ||||||||||||
Advantage International | $ | 3,556,086 | $ | — | $ | — | ||||||
| ||||||||||||
| 7. | PURCHASES AND SALES |
For the period ended May 31, 2020, purchases and sales of investments, excluding short-term securities and equity-linked notes, were as follows:
| Fund Name | Purchases | Sales | ||
Advantage International | $ 1,217,645,476 | $ 1,157,550,287 | ||
Advantage Large Cap Growth | 536,676,445 | 640,459,414 | ||
Advantage Small Cap Core | 1,503,394,987 | 1,083,936,436 |
| 74 | 2020 BLACKROCK ANNUAL REPORTTO SHAREHOLDERS |
Notes to Financial Statements (continued)
| 8. | INCOME TAX INFORMATION |
It is each Fund’s policy to comply with the requirements of the Internal Revenue Code of 1986, as amended, applicable to regulated investment companies, and to distribute substantially all of its taxable income to its shareholders. Therefore, no U.S. federal income tax provision is required.
Each Fund files U.S. federal and various state and local tax returns. No income tax returns are currently under examination. The statute of limitations on each Fund’s U.S. federal tax returns generally remains open for the period ended May 31, 2020 and each of the four years ended September 30, 2019, except for Advantage Small Cap Core, which remains open for each of the four years ended May 31, 2020.. The statutes of limitations on each Fund’s state and local tax returns may remain open for an additional year depending upon the jurisdiction.
Management has analyzed tax laws and regulations and their application to the Funds as of May 31, 2020, inclusive of the open tax return years, and does not believe that there are any uncertain tax positions that require recognition of a tax liability in the Funds’ financial statements.
The tax character of distributions paid was as follows:
| Period | | Advantage International | | | Advantage Large Cap Growth | | | Advantage Small Cap Core | (a) | |||||
Ordinary income | 05/31/20 | $ | 25,258,204 | $ | 9,531,500 | $ | 9,116,585 | |||||||
| 09/30/19 | 18,541,081 | 51,815,343 | — | |||||||||||
| 05/31/19 | — | — | 25,761,845 | |||||||||||
| 09/30/18 | 2,850,024 | 4,859,696 | — | |||||||||||
Long-term capital gains | 05/31/20 | — | 22,557,380 | 137,331 | ||||||||||
| 09/30/19 | — | 10,063,226 | — | |||||||||||
| 05/31/19 | — | — | 6,519,163 | |||||||||||
| 09/30/18 | — | 43,139,615 | — | |||||||||||
|
|
|
|
|
| |||||||||
Total | 05/31/20 | $ | 25,258,204 | $ | 32,088,880 | $ | 9,253,916 | |||||||
|
|
|
|
|
| |||||||||
| 09/30/19 | $ | 18,541,081 | $ | 61,878,569 | $ | — | ||||||||
|
|
|
|
|
| |||||||||
| 05/31/19 | $ | — | $ | — | $ | 32,281,008 | ||||||||
|
|
|
|
|
| |||||||||
| 09/30/18 | $ | 2,850,024 | $ | 47,999,311 | $ | — | ||||||||
|
|
|
|
|
|
| (a) | Distribution amounts may include a portion of the proceeds from redeemed shares. |
As of period end, the tax components of accumulated earnings (losses) were as follows:
| ||||||||||||
| Advantage International | Advantage Large Cap | Advantage Core | ||||||||||
| ||||||||||||
Undistributed ordinary income | $ | 8,584,280 | $ | 1,005,347 | $ | 2,725,035 | ||||||
Undistributed long-term capital gains | — | 14,257,795 | — | |||||||||
Non-expiring capital loss carryforwards(a) | (115,792,483 | ) | — | — | ||||||||
Net unrealized gains (losses)(b) | 1,522,407 | 220,219,233 | (18,472,150 | ) | ||||||||
Qualified late-year losses(c) | — | (6,146,944 | ) | (17,024,939 | ) | |||||||
|
|
|
|
|
| |||||||
| $ | (105,685,796 | ) | $ | 229,335,431 | $ | (32,772,054 | ) | |||||
|
|
|
|
|
| |||||||
| (a) | Amounts available to offset future realized capital gains. |
| (b) | The differences between book-basis and tax-basis net unrealized gains were attributable primarily to the tax deferral of losses on wash sales, the realization for tax purposes of unrealized gains on investments in passive foreign investment companies, the realization for tax purposes of unrealized gains/losses on certain futures contracts and foreign currency contracts and the timing and recognition of partnership income. |
| (c) | The Fund has elected to defer certain qualified late-year losses and recognize such losses in the next taxable year. |
As of May 31, 2020, gross unrealized appreciation and depreciation for investments and derivatives based on cost for U.S. federal income tax purposes were as follows:
| ||||||||||||
| Advantage International | Advantage Large Cap Growth | Advantage Small Cap Core | ||||||||||
| ||||||||||||
Tax cost | $ | 881,386,556 | $ | 598,455,350 | $ | 1,385,059,524 | ||||||
|
|
|
|
|
| |||||||
Gross unrealized appreciation | $ | 51,948,215 | $ | 235,398,923 | $ | 161,941,527 | ||||||
Gross unrealized depreciation | (50,486,612 | ) | (15,229,027 | ) | (181,111,133 | ) | ||||||
|
|
|
|
|
| |||||||
Net unrealized appreciation (depreciation) | $ | 1,461,603 | $ | 220,169,896 | $ | (19,169,606 | ) | |||||
|
|
|
|
|
| |||||||
| NOTESTO FINANCIAL STATEMENTS | 75 |
Notes to Financial Statements (continued)
| 9. | BANK BORROWINGS |
The Trust, on behalf of the Funds, along with certain other funds managed by the Manager and its affiliates (“Participating Funds”), is a party to a 364-day, $2.25 billion credit agreement with a group of lenders. Under this agreement, the Funds may borrow to fund shareholder redemptions. Excluding commitments designated for certain individual funds, the Participating Funds, including the Funds, can borrow up to an aggregate commitment amount of $1.75 billion at any time outstanding, subject to asset coverage and other limitations as specified in the agreement. The credit agreement has the following terms: a fee of 0.10% per annum on unused commitment amounts and interest at a rate equal to the higher of (a) one-month LIBOR (but, in any event, not less than 0.00%) on the date the loan is made plus 0.80% per annum or (b) the Fed Funds rate (but, in any event, not less than 0.00%) in effect from time to time plus 0.80% per annum on amounts borrowed. The agreement expires in April 2021 unless extended or renewed. These fees were allocated among such funds based upon portions of the aggregate commitment available to them and relative net assets of Participating Funds. During the period ended May 31, 2020 and the years ended September 30, 2019 and May 31, 2020, the Funds did not borrow under the credit agreement.
| 10. | PRINCIPAL RISKS |
In the normal course of business, certain Funds invest in securities or other instruments and may enter into certain transactions, and such activities subject each Fund to various risks, including among others, fluctuations in the market (market risk) or failure of an issuer to meet all of its obligations. The value of securities or other instruments may also be affected by various factors, including, without limitation: (i) the general economy; (ii) the overall market as well as local, regional or global political and/or social instability; (iii) regulation, taxation or international tax treaties between various countries; or (iv) currency, interest rate and price fluctuations. Local, regional or global events such as war, acts of terrorism, the spread of infectious illness or other public health issues, recessions, or other events could have a significant impact on the Funds and their investments. Each Fund’s prospectus provides details of the risks to which each Fund is subject.
The Funds may be exposed to additional risks when reinvesting cash collateral in money market funds that do not seek to maintain a stable NAV per share of $1.00, which may be subject to redemption gates or liquidity fees under certain circumstances.
Valuation Risk: The market values of equities, such as common stocks and preferred securities or equity related investments, such as futures and options, may decline due to general market conditions which are not specifically related to a particular company. They may also decline due to factors which affect a particular industry or industries. A Fund may invest in illiquid investments. An illiquid investment is any investment that a Fund reasonably expects cannot be sold or disposed of in current market conditions in seven calendar days or less without the sale or disposition significantly changing the market value of the investment. A Fund may experience difficulty in selling illiquid investments in a timely manner at the price that it believes the investments are worth. Prices may fluctuate widely over short or extended periods in response to company, market or economic news. Markets also tend to move in cycles, with periods of rising and falling prices. This volatility may cause each Fund’s NAV to experience significant increases or decreases over short periods of time. If there is a general decline in the securities and other markets, the NAV of a Fund may lose value, regardless of the individual results of the securities and other instruments in which a Fund invests.
The price a Fund could receive upon the sale of any particular portfolio investment may differ from a Fund’s valuation of the investment, particularly for securities that trade in thin or volatile markets or that are valued using a fair valuation technique or a price provided by an independent pricing service. Changes to significant unobservable inputs and assumptions (i.e., publicly traded company multiples, growth rate, time to exit) due to the lack of observable inputs may significantly impact the resulting fair value and therefore a Fund’s results of operations. As a result, the price received upon the sale of an investment may be less than the value ascribed by a Fund, and a Fund could realize a greater than expected loss or lesser than expected gain upon the sale of the investment. A Fund’s ability to value its investments may also be impacted by technological issues and/or errors by pricing services or other third party service providers.
An outbreak of respiratory disease caused by a novel coronavirus has developed into a global pandemic and has resulted in closing borders, quarantines, disruptions to supply chains and customer activity, as well as general concern and uncertainty. The impact of this pandemic, and other global health crises that may arise in the future, could affect the economies of many nations, individual companies and the market in general in ways that cannot necessarily be foreseen at the present time. This pandemic may result in substantial market volatility and may adversely impact the prices and liquidity of a fund’s investments. The duration of this pandemic and its effects cannot be determined with certainty.
Counterparty Credit Risk: The Funds may be exposed to counterparty credit risk, or the risk that an entity may fail to or be unable to perform on its commitments related to unsettled or open transactions. The Funds manage counterparty credit risk by entering into transactions only with counterparties that the Manager believes have the financial resources to honor their obligations and by monitoring the financial stability of those counterparties. Financial assets, which potentially expose the Funds to market, issuer and counterparty credit risks, consist principally of financial instruments and receivables due from counterparties. The extent of the Funds’ exposure to market, issuer and counterparty credit risks with respect to these financial assets is approximately their value recorded in the Statements of Assets and Liabilities, less any collateral held by the Funds.
A derivative contract may suffer a mark-to-market loss if the value of the contract decreases due to an unfavorable change in the market rates or values of the underlying instrument. Losses can also occur if the counterparty does not perform under the contract.
A Fund’s risk of loss from counterparty credit risk on OTC derivatives is generally limited to the aggregate unrealized gain less the value of any collateral held by such Fund.
With exchange-traded futures there is less counterparty credit risk to the Funds since the exchange or clearinghouse, as counterparty to such instruments, guarantees against a possible default. The clearinghouse stands between the buyer and the seller of the contract; therefore, credit risk is limited to failure of the clearinghouse. While offset rights may exist under applicable law, a Fund does not have a contractual right of offset against a clearing broker or clearinghouse in the event of a default (including the bankruptcy or insolvency). Additionally, credit risk exists in exchange-traded futures with respect to initial and variation margin that is held in a clearing broker’s customer accounts. While clearing brokers are required to segregate customer margin from their own assets, in the event that a clearing broker becomes insolvent or goes into bankruptcy and at that time there is a shortfall in the aggregate amount of margin held by the clearing broker for all its clients, typically the shortfall would be allocated on a pro rata basis across all the clearing broker’s customers, potentially resulting in losses to the Funds.
| 76 | 2020 BLACKROCK ANNUAL REPORTTO SHAREHOLDERS |
Notes to Financial Statements (continued)
Concentration Risk: As of period end, Advantage Large Cap Growth invested a significant portion of its assets in securities in the information technology sector. Changes in economic conditions affecting such sector would have a greater impact on the Fund and could affect the value, income and/or liquidity of positions in such securities.
Advantage International invests a significant portion of its assets in securities of issuers located in Europe or with significant exposure to European issuers or countries. The European financial markets have recently experienced volatility and adverse trends due to concerns about economic downturns in, or rising government debt levels of, several European countries. These events may spread to other countries in Europe and may affect the value and liquidity of certain of the Fund’s investments.
Responses to the financial problems by European governments, central banks and others, including austerity measures and reforms, may not work, may result in social unrest and may limit future growth and economic recovery or have other unintended consequences. Further defaults or restructurings by governments and others of their debt could have additional adverse effects on economies, financial markets and asset valuations around the world. In addition, the United Kingdom has withdrawn from the European Union, and one or more other countries may withdraw from the European Union and/or abandon the Euro, the common currency of the European Union. The impact of these actions, especially if they occur in a disorderly fashion, is not clear but could be significant and far reaching.
Advantage International invests a significant portion of its assets in securities of issuers located in Asia or with significant exposure to Asian issuers or countries. The Asian financial markets have recently experienced volatility and adverse trends due to concerns in several Asian countries regarding monetary policy, government intervention in the markets, rising government debt levels or economic downturns. These events may spread to other countries in Asia and may affect the value and liquidity of certain of the Fund’s investments.
| 11. | CAPITAL SHARE TRANSACTIONS |
Transactions in capital shares for each class were as follows:
| Period from 10/01/19 to 05/31/20 | Year Ended 09/30/19 | Year Ended 09/30/18 | ||||||||||||||||||||||
| Fund Name/Share Class | Shares | Amounts | Shares | Amounts | Shares | Amounts | ||||||||||||||||||
Advantage International | ||||||||||||||||||||||||
Institutional | ||||||||||||||||||||||||
Shares sold | 10,053,656 | $ | 149,989,026 | 7,187,213 | $ | 112,138,877 | 21,713,713 | $ | 370,322,674 | |||||||||||||||
Shares issued in reinvestment of distributions | 752,851 | 12,406,978 | 679,659 | 10,004,600 | 58,116 | 984,479 | ||||||||||||||||||
Shares issued in reorganization(a) | — | — | 1,191,455 | 18,579,616 | — | — | ||||||||||||||||||
Shares redeemed | (5,606,234 | ) | (84,809,969 | ) | (5,091,175 | ) | (79,480,738 | ) | (4,971,457 | ) | (85,594,298 | ) | ||||||||||||
|
|
|
|
|
|
|
|
|
|
|
| |||||||||||||
| 5,200,273 | $ | 77,586,035 | 3,967,152 | $ | 61,242,355 | 16,800,372 | $ | 285,712,855 | ||||||||||||||||
|
|
|
|
|
|
|
|
|
|
|
| |||||||||||||
Investor A | ||||||||||||||||||||||||
Shares sold and automatic conversion of shares | 7,354,726 | $ | 109,718,575 | 7,413,242 | $ | 114,556,452 | 11,970,282 | $ | 202,841,111 | |||||||||||||||
Shares issued in reinvestment of distributions | 641,324 | 10,459,991 | 506,134 | 7,379,502 | 94,736 | 1,589,682 | ||||||||||||||||||
Shares issued in reorganization(a) | — | — | 3,961,430 | 61,055,996 | — | — | ||||||||||||||||||
Shares redeemed | (7,868,559 | ) | (118,716,806 | ) | (4,512,726 | ) | (69,568,154 | ) | (4,254,197 | ) | (72,565,782 | ) | ||||||||||||
|
|
|
|
|
|
|
|
|
|
|
| |||||||||||||
| 127,491 | $ | 1,461,760 | 7,368,080 | $ | 113,423,796 | 7,810,821 | $ | 131,865,011 | ||||||||||||||||
|
|
|
|
|
|
|
|
|
|
|
| |||||||||||||
Investor C | ||||||||||||||||||||||||
Shares sold | 35,703 | $ | 520,481 | 104,380 | $ | 1,581,801 | 248,228 | $ | 4,114,167 | |||||||||||||||
Shares issued in reinvestment of distributions | 9,703 | 154,382 | 6,077 | 86,360 | — | — | ||||||||||||||||||
Shares redeemed and automatic conversion of shares | (213,615 | ) | (3,108,992 | ) | (932,769 | ) | (14,025,339 | ) | (362,134 | ) | (5,929,229 | ) | ||||||||||||
|
|
|
|
|
|
|
|
|
|
|
| |||||||||||||
| (168,209 | ) | $ | (2,434,129 | ) | (822,312 | ) | $ | (12,357,178 | ) | (113,906 | ) | $ | (1,815,062 | ) | ||||||||||
|
|
|
|
|
|
|
|
|
|
|
| |||||||||||||
Class K | ||||||||||||||||||||||||
Shares sold | 839,709 | $ | 12,679,206 | 2,442,351 | $ | 39,126,033 | 517,949 | $ | 8,863,657 | (b) | ||||||||||||||
Shares issued in reinvestment of distributions | 78,765 | 1,298,043 | 14,952 | 220,087 | — | — | ||||||||||||||||||
Shares redeemed | (663,551 | ) | (10,063,996 | ) | (227,253 | ) | (3,579,204 | ) | (36,438 | ) | (619,146 | )(b) | ||||||||||||
|
|
|
|
|
|
|
|
|
|
|
| |||||||||||||
| 254,923 | $ | 3,913,253 | 2,230,050 | $ | 35,766,916 | 481,511 | $ | 8,244,511 | ||||||||||||||||
|
|
|
|
|
|
|
|
|
|
|
| |||||||||||||
Class R | ||||||||||||||||||||||||
Shares sold | 43,569 | $ | 623,878 | 74,667 | $ | 1,148,306 | 143,859 | $ | 2,462,428 | |||||||||||||||
Shares issued in reinvestment of distributions | 7,122 | 116,369 | 8,775 | 128,026 | 756 | 12,673 | ||||||||||||||||||
Shares redeemed | (149,798 | ) | (2,294,608 | ) | (206,197 | ) | (3,219,311 | ) | (149,092 | ) | (2,538,056 | ) | ||||||||||||
|
|
|
|
|
|
|
|
|
|
|
| |||||||||||||
| (99,107 | ) | $ | (1,554,361 | ) | (122,755 | ) | $ | (1,942,979 | ) | (4,477 | ) | $ | (62,955 | ) | ||||||||||
|
|
|
|
|
|
|
|
|
|
|
| |||||||||||||
| 5,315,371 | $ | 78,972,558 | 12,620,215 | $ | 196,132,910 | 24,974,321 | $ | 423,944,360 | ||||||||||||||||
|
|
|
|
|
|
|
|
|
|
|
| |||||||||||||
| NOTESTO FINANCIAL STATEMENTS | 77 |
Notes to Financial Statements (continued)
| Period from 10/01/19 to 05/31/20 | Year Ended 09/30/19 | Year Ended 09/30/18 | ||||||||||||||||||||||
| Fund Name/Share Class | Shares | Amounts | Shares | Amounts | Shares | Amounts | ||||||||||||||||||
Advantage Large Cap Growth | ||||||||||||||||||||||||
Institutional | ||||||||||||||||||||||||
Shares sold | 1,664,670 | $ | 28,270,459 | 1,417,588 | $ | 22,049,536 | 3,601,409 | $ | 56,894,145 | |||||||||||||||
Shares issued in reinvestment of distributions | 187,678 | 3,149,241 | 368,193 | 5,382,985 | 255,779 | 3,811,099 | ||||||||||||||||||
Shares redeemed | (1,755,297 | ) | (29,497,286 | ) | (1,146,041 | ) | (18,321,402 | ) | (2,077,371 | ) | (33,173,476 | ) | ||||||||||||
|
|
|
|
|
|
|
|
|
|
|
| |||||||||||||
| 97,051 | $ | 1,922,414 | 639,740 | $ | 9,111,119 | 1,779,817 | $ | 27,531,768 | ||||||||||||||||
|
|
|
|
|
|
|
|
|
|
|
| |||||||||||||
Service | ||||||||||||||||||||||||
Shares sold | 2,000 | $ | 30,700 | 5,103 | $ | 72,800 | 1,442 | $ | 22,529 | |||||||||||||||
Shares issued in reinvestment of distributions | 500 | 8,241 | 798 | 11,470 | 790 | 11,594 | ||||||||||||||||||
Shares redeemed | (599 | ) | (9,940 | ) | (2,748 | ) | (38,251 | ) | (5,764 | ) | (92,467 | ) | ||||||||||||
|
|
|
|
|
|
|
|
|
|
|
| |||||||||||||
| 1,901 | $ | 29,001 | 3,153 | $ | 46,019 | (3,532 | ) | $ | (58,344 | ) | ||||||||||||||
|
|
|
|
|
|
|
|
|
|
|
| |||||||||||||
Investor A | ||||||||||||||||||||||||
Shares sold and automatic conversion of shares | 4,446,628 | $ | 70,607,642 | 6,662,252 | $ | 98,680,539 | 25,326,040 | $ | 382,314,969 | |||||||||||||||
Shares issued in reinvestment of distributions | 1,731,744 | 27,690,590 | 3,864,428 | 53,947,453 | 2,812,294 | 40,187,674 | ||||||||||||||||||
Shares issued from conversion(c) | — | — | — | — | 25,487 | 372,621 | ||||||||||||||||||
Shares redeemed | (9,579,253 | ) | (153,256,890 | ) | (8,739,543 | ) | (133,123,440 | ) | (9,532,359 | ) | (146,966,634 | ) | ||||||||||||
|
|
|
|
|
|
|
|
|
|
|
| |||||||||||||
| (3,400,881 | ) | $ | (54,958,658 | ) | 1,787,137 | $ | 19,504,552 | 18,631,462 | $ | 275,908,630 | ||||||||||||||
|
|
|
|
|
|
|
|
|
|
|
| |||||||||||||
Investor B | ||||||||||||||||||||||||
Shares issued in reinvestment of distributions | — | $ | — | — | $ | — | 1,864 | $ | 23,163 | |||||||||||||||
Shares converted(c) | — | — | — | — | (29,387 | ) | (372,621 | ) | ||||||||||||||||
Shares redeemed and automatic conversion of shares | — | — | — | — | (769 | ) | (10,047 | ) | ||||||||||||||||
|
|
|
|
|
|
|
|
|
|
|
| |||||||||||||
| — | $ | �� | — | $ | — | (28,292 | ) | $ | (359,505 | ) | ||||||||||||||
|
|
|
|
|
|
|
|
|
|
|
| |||||||||||||
Investor C | ||||||||||||||||||||||||
Shares sold | 106,476 | $ | 1,432,407 | 184,277 | $ | 1,733,438 | 226,432 | $ | 2,397,773 | |||||||||||||||
Shares issued in reinvestment of distributions | 47,034 | 638,252 | 70,938 | 1,408,299 | 200,984 | 3,019,063 | ||||||||||||||||||
Shares redeemed and automatic conversion of shares | (294,141 | ) | (3,931,007 | ) | (2,457,686 | ) | (32,944,701 | ) | (814,678 | ) | (10,761,745 | ) | ||||||||||||
|
|
|
|
|
|
|
|
|
|
|
| |||||||||||||
| (140,631 | ) | $ | (1,860,348 | ) | (2,202,471 | ) | $ | (29,802,964 | ) | (387,262 | ) | $ | (5,344,909 | ) | ||||||||||
|
|
|
|
|
|
|
|
|
|
|
| |||||||||||||
Class K | ||||||||||||||||||||||||
Shares sold | 7,318 | $ | 111,250 | 25,965 | $ | 399,000 | 34,044 | $ | 555,945 | (b) | ||||||||||||||
Shares issued in reinvestment of distributions | 2,052 | 34,414 | 1,964 | 28,695 | — | — | ||||||||||||||||||
Shares redeemed | (29,155 | ) | (438,862 | ) | (2,941 | ) | (48,101 | ) | — | — | ||||||||||||||
|
|
|
|
|
|
|
|
|
|
|
| |||||||||||||
| (19,785 | ) | $ | (293,198 | ) | 24,988 | $ | 379,594 | 34,044 | $ | 555,945 | ||||||||||||||
|
|
|
|
|
|
|
|
|
|
|
| |||||||||||||
Class R | ||||||||||||||||||||||||
Shares sold | 12,423 | $ | 196,016 | 13,537 | $ | 208,300 | 24,765 | $ | 398,186 | |||||||||||||||
Shares issued in reinvestment of distributions | 1,855 | 30,985 | 7,473 | 108,590 | 6,947 | 102,816 | ||||||||||||||||||
Shares redeemed | (37,771 | ) | (626,534 | ) | (73,310 | ) | (1,147,635 | ) | (81,737 | ) | (1,321,049 | ) | ||||||||||||
|
|
|
|
|
|
|
|
|
|
|
| |||||||||||||
| (23,493 | ) | $ | (399,533 | ) | (52,300 | ) | $ | (830,745 | ) | (50,025 | ) | $ | (820,047 | ) | ||||||||||
|
|
|
|
|
|
|
|
|
|
|
| |||||||||||||
| (3,485,838 | ) | $ | (55,560,322 | ) | 200,247 | $ | (1,592,425 | ) | 19,976,212 | $ | 297,413,538 | |||||||||||||
|
|
|
|
|
|
|
|
|
|
|
| |||||||||||||
| 78 | 2020 BLACKROCK ANNUAL REPORTTO SHAREHOLDERS |
Notes to Financial Statements (continued)
| Year Ended 05/31/20 | Year Ended 05/31/19 | |||||||||||||||||||||||
| Fund Name/Share Class | Shares | Amounts | Shares | Amounts | ||||||||||||||||||||
Advantage Small Cap Core | ||||||||||||||||||||||||
Institutional | ||||||||||||||||||||||||
Shares sold | 40,948,676 | $ | 521,146,487 | 27,459,862 | $ | 382,948,737 | ||||||||||||||||||
Shares issued in reinvestment of distributions | 431,317 | 6,386,298 | 1,601,351 | 21,595,911 | ||||||||||||||||||||
Shares issued in reorganization(a) | — | — | 3,505,353 | 48,158,360 | ||||||||||||||||||||
Shares redeemed | (18,677,824 | ) | (236,251,203 | ) | (14,592,965 | ) | (194,281,935 | ) | ||||||||||||||||
|
|
|
|
|
|
|
| |||||||||||||||||
| 22,702,169 | $ | 291,281,582 | 17,973,601 | $ | 258,421,073 | |||||||||||||||||||
|
|
|
|
|
|
|
| |||||||||||||||||
Investor A | ||||||||||||||||||||||||
Shares sold and automatic conversion of shares | 7,452,876 | $ | 95,188,119 | 3,330,822 | $ | 44,649,411 | ||||||||||||||||||
Shares issued in reinvestment of distributions | 125,295 | 1,848,839 | 652,504 | 8,532,371 | ||||||||||||||||||||
Shares issued in reorganization(a) | — | — | 12,839,054 | 175,499,949 | ||||||||||||||||||||
Shares redeemed | (5,273,975 | ) | (72,027,825 | ) | (3,170,434 | ) | (43,385,981 | ) | ||||||||||||||||
|
|
|
|
|
|
|
| |||||||||||||||||
| 2,304,196 | $ | 25,009,133 | 13,651,946 | $ | 185,295,750 | |||||||||||||||||||
|
|
|
|
|
|
|
| |||||||||||||||||
Investor C | ||||||||||||||||||||||||
Shares sold | 194,007 | $ | 2,542,061 | 298,315 | $ | 4,186,270 | ||||||||||||||||||
Shares issued in reinvestment of distributions | 445 | 6,537 | 9,104 | 118,839 | ||||||||||||||||||||
Shares redeemed and automatic conversion of shares | (146,329 | ) | (1,866,475 | ) | (61,275 | ) | (824,049 | ) | ||||||||||||||||
|
|
|
|
|
|
|
| |||||||||||||||||
| 48,123 | $ | 682,123 | 246,144 | $ | 3,481,060 | |||||||||||||||||||
|
|
|
|
|
|
|
| |||||||||||||||||
Class K | ||||||||||||||||||||||||
Shares sold | 17,939,631 | $ | 258,512,762 | 4,322,302 | $ | 60,859,074 | ||||||||||||||||||
Shares issued in reinvestment of distributions | 67,762 | 1,006,554 | 37,947 | 515,263 | ||||||||||||||||||||
Shares redeemed | (7,879,299 | ) | (118,900,431 | ) | (4,689,101 | ) | (71,397,022 | ) | ||||||||||||||||
|
|
|
|
|
|
|
| |||||||||||||||||
| 10,128,094 | $ | 140,618,885 | (328,852 | ) | $ | (10,022,685 | ) | |||||||||||||||||
|
|
|
|
|
|
|
| |||||||||||||||||
| 35,182,582 | $ | 457,591,723 | 31,542,839 | $ | 437,175,198 | |||||||||||||||||||
|
|
|
|
|
|
|
| |||||||||||||||||
| (a) | See Note 1 regarding the reorganization. |
| (b) | For the period from January 25, 2018 (commencement of operations) to September 30, 2018. |
| (c) | On December 27, 2017, the Fund’s Investor B Shares converted into Investor A Shares. |
As of May 31, 2020, BlackRock Financial Management, Inc., an affiliate of the Funds, owned 12,217 Class K Shares of Advantage Large Cap Growth.
| 12. | SUBSEQUENT EVENTS |
Management has evaluated the impact of all subsequent events on the Funds through the date the financial statements were issued and has determined that there were no subsequent events requiring adjustment or additional disclosure in the financial statements.
| NOTESTO FINANCIAL STATEMENTS | 79 |
Report of Independent Registered Public Accounting Firm
To the Shareholders of BlackRock Advantage International Fund, BlackRock Advantage Large Cap Growth Fund, and BlackRock Advantage Small Cap Core Fund and the Board of Trustees of BlackRock FundsSM:
Opinion on the Financial Statements and Financial Highlights
We have audited the accompanying statements of assets and liabilities of BlackRock Advantage International Fund, BlackRock Advantage Large Cap Growth Fund, and BlackRock Advantage Small Cap Core Fund of BlackRock FundsSM (the “Funds”), including the schedules of investments, as of May 31, 2020, the related statements of operations, changes in net assets, and the financial highlights for the periods indicated in the table below, and the related notes. In our opinion, the financial statements and financial highlights present fairly, in all material respects, the financial position of the Funds as of May 31, 2020, and the results of their operations, changes in net assets, and the financial highlights for the periods indicated in the table below, in conformity with accounting principles generally accepted in the United States of America.
| Fund | Statements of Operations | Statements of Changes in Net Assets | Financial Highlights | |||
| BlackRock Advantage International Fund and BlackRock Advantage Large Cap Growth Fund | For the period from October 1, 2019 through May 31, 2020 and for the year ended September 30, 2019 | For the period from October 1, 2019 through May 31, 2020 and for each of the two years in the period ended September 30, 2019 | For the period from October 1, 2019 through May 31, 2020 and for each of the five years in the period ended September 30, 2019 | |||
| BlackRock Advantage Small Cap Core Fund | For the year ended May 31, 2020 | For each of the two years in the period ended May 31, 2020 | For each of the five years in the period ended May 31, 2020 |
Basis for Opinion
These financial statements and financial highlights are the responsibility of the Funds’ management. Our responsibility is to express an opinion on the Funds’ financial statements and financial highlights based on our audits. We are a public accounting firm registered with the Public Company Accounting Oversight Board (United States) (PCAOB) and are required to be independent with respect to the Funds in accordance with the U.S. federal securities laws and the applicable rules and regulations of the Securities and Exchange Commission and the PCAOB.
We conducted our audits in accordance with the standards of the PCAOB. Those standards require that we plan and perform the audit to obtain reasonable assurance about whether the financial statements and financial highlights are free of material misstatement, whether due to error or fraud. The Funds are not required to have, nor were we engaged to perform, an audit of their internal control over financial reporting. As part of our audits we are required to obtain an understanding of internal control over financial reporting but not for the purpose of expressing an opinion on the effectiveness of the Funds’ internal control over financial reporting. Accordingly, we express no such opinion.
Our audits included performing procedures to assess the risks of material misstatement of the financial statements and financial highlights, whether due to error or fraud, and performing procedures that respond to those risks. Such procedures included examining, on a test basis, evidence regarding the amounts and disclosures in the financial statements and financial highlights. Our audits also included evaluating the accounting principles used and significant estimates made by management, as well as evaluating the overall presentation of the financial statements and financial highlights. Our procedures included confirmation of securities owned as of May 31, 2020, by correspondence with the custodian and brokers; when replies were not received from brokers, we performed other auditing procedures. We believe that our audits provide a reasonable basis for our opinion.
Deloitte & Touche LLP
Boston, Massachusetts
July 22, 2020
We have served as the auditor of one or more BlackRock investment companies since 1992.
| 80 | 2020 BLACKROCK ANNUAL REPORTTO SHAREHOLDERS |
Important Tax Information (unaudited)
For corporate shareholders, the percentage of ordinary income distributions paid during the period ended May 31, 2020 that qualified for the dividends-received deduction were as follows:
| Fund Name | Dividends-Received Deduction | |||
Advantage Large Cap Growth | 100.00 | % | ||
Advantage Small Cap Core | 100.00 | |||
The following maximum amounts are hereby designated as qualified dividend income for individuals for the period ended May 31, 2020:
| Fund Name | Qualified Dividend Income | |||
Advantage International | $ | 19,587,741 | ||
Advantage Large Cap Growth | 12,721,260 | |||
Advantage Small Cap Core | 13,909,889 | |||
For the period ended May 31, 2020, the Funds intend to pass through to their shareholders foreign source income earned and foreign taxes paid by the underlying funds:
| Fund Name | Foreign Source Income Earned | Foreign Taxes Paid | ||||||
Advantage International | $ | 17,220,880 | $ | 1,407,325 | ||||
For the period ended May 31, 2020, the Fund hereby designates the following maximum amounts allowable as interest-related dividends eligible for exemption from U.S. withholding tax for nonresident aliens and foreign corporations:
| Fund Name | Interest-Related Dividends | |||
Advantage Large Cap Growth | $ | 5,021,474 | ||
The following distribution amounts are hereby designated for the period ended May 31, 2020:
| Fund Name | Short-Term Capital Gain Dividends | 20% Rate Long-Term Capital Gain Dividends | ||||||
Advantage Large Cap Growth | $ | 5,021,474 | $ | 22,557,380 | ||||
Advantage Small Cap Core | — | 137,331 | ||||||
| IMPORTANT TAX INFORMATION | 81 |
Disclosure of Investment Advisory Agreement
The Board of Trustees (the “Board,” the members of which are referred to as “Board Members”) of BlackRock FundsSM (the “Trust”) met on April 7, 2020 (the “April Meeting”) and May 11-13, 2020 (the “May Meeting”) to consider the approval of the investment advisory agreement (the “Agreement”) between the Trust, on behalf of BlackRock Advantage International Fund (“Advantage International Fund”), BlackRock Advantage Large Cap Growth Fund (“Advantage Large Cap Growth Fund”) and BlackRock Advantage Small Cap Core Fund (“Advantage Small Cap Core Fund,” and together with Advantage International Fund and Advantage Large Cap Growth Fund, the “Funds”), each a series of the Trust, and BlackRock Advisors, LLC (the “Manager” or “BlackRock”), the Funds’ investment advisor.
Activities and Composition of the Board
On the date of the May Meeting, the Board consisted of fourteen individuals, twelve of whom were not “interested persons” of the Trust as defined in the Investment Company Act of 1940, as amended (the “1940 Act”) (the “Independent Board Members”). The Board Members are responsible for the oversight of the operations of the Trust and perform the various duties imposed on the directors of investment companies by the 1940 Act. The Independent Board Members have retained independent legal counsel to assist them in connection with their duties. The Chair of the Board is an Independent Board Member. The Board has established five standing committees: an Audit Committee, a Governance and Nominating Committee, a Compliance Committee, a Performance Oversight Committee and an Ad Hoc Topics Committee, each of which is chaired by an Independent Board Member and composed of Independent Board Members (except for the Ad Hoc Topics Committee, which also has one interested Board Member).
The Agreement
Consistent with the requirements of the 1940 Act, the Board considers the continuation of the Agreement on an annual basis. The Board has four quarterly meetings per year, each typically extending for two days, and additional in-person and telephonic meetings throughout the year, as needed. While the Board also has a fifth one-day meeting to consider specific information surrounding the renewal of the Agreement, the Board’s consideration entails a year-long deliberative process whereby the Board and its committees assess BlackRock’s services to the Funds. In particular, the Board assessed, among other things, the nature, extent and quality of the services provided to the Funds by BlackRock, BlackRock’s personnel and affiliates, including (as applicable): investment management services; accounting oversight; administrative and shareholder services; oversight of each Fund’s service providers; risk management and oversight; and legal, regulatory and compliance services. Throughout the year, including during the contract renewal process, the Independent Board Members were advised by independent legal counsel, and met with independent legal counsel in various executive sessions outside of the presence of BlackRock’s management.
During the year, the Board, acting directly and through its committees, considers information that is relevant to its annual consideration of the renewal of the Agreement, including the services and support provided by BlackRock to each Fund and its shareholders. BlackRock also furnished additional information to the Board in response to specific questions from the Board. This additional information is discussed further in the section titled “Board Considerations in Approving the Agreement.” Among the matters the Board considered were: (a) investment performance for one-year, three-year, five-year and/or since inception periods, as applicable, against peer funds, an applicable benchmark, and other performance metrics, as applicable, as well as BlackRock senior management’s and portfolio managers’ analyses of the reasons for any outperformance or underperformance relative to its peers, benchmarks, and other performance metrics, as applicable; (b) fees, including advisory, administration, if applicable, and other amounts paid to BlackRock and its affiliates by the Funds for services; (c) Fund operating expenses and how BlackRock allocates expenses to the Funds (d) the resources devoted to, risk oversight of, and compliance reports relating to, implementation of each Fund’s investment objective, policies and restrictions, and meeting regulatory requirements; (e) BlackRock’s and the Trust’s adherence to applicable compliance policies and procedures; (f) the nature, character and scope of non-investment management services provided by BlackRock and its affiliates and the estimated cost of such services; (g) BlackRock’s and other service providers’ internal controls and risk and compliance oversight mechanisms; (h) BlackRock’s implementation of the proxy voting policies approved by the Board; (i) the use of brokerage commissions and execution quality of portfolio transactions; (j) BlackRock’s implementation of the Trust’s valuation and liquidity procedures; (k) an analysis of management fees for products with similar investment mandates across the open-end fund, exchange-traded fund (“ETF”), closed-end fund, sub-advised mutual fund, separately managed account, collective investment trust, and institutional separate account product channels, as applicable, and the similarities and differences between these products and the services provided as compared to the Funds; (l) BlackRock’s compensation methodology for its investment professionals and the incentives and accountability it creates, along with investment professionals’ investments in the fund(s) they manage; and (m) periodic updates on BlackRock’s business.
Board Considerations in Approving the Agreement
The Approval Process: Prior to the April Meeting, the Board requested and received materials specifically relating to the Agreement. The Independent Board Members are continuously engaged in a process with their independent legal counsel and BlackRock to review the nature and scope of the information provided to the Board to better assist its deliberations. The materials provided in connection with the April Meeting included, among other things: (a) information independently compiled and prepared by Broadridge Financial Solutions, Inc. (“Broadridge”), based on either a Lipper classification or Morningstar category, regarding each Fund’s fees and expenses as compared with a peer group of funds as determined by Broadridge (“Expense Peers”) and the investment performance of each Fund as compared with a peer group of funds (“Performance Peers”); (b) information on the composition of the Expense Peers and Performance Peers, and a description of Broadridge’s methodology; (c) information on the estimated profits realized by BlackRock and its affiliates pursuant to the Agreement and a discussion of fall-out benefits to BlackRock and its affiliates; (d) a general analysis provided by BlackRock concerning investment management fees received in connection with other types of investment products, such as institutional accounts, sub-advised mutual funds, ETFs, closed-end funds, open-end funds, and separately managed accounts under similar investment mandates, as well as the performance of such other products, as applicable; (e) a review of non-management fees; (f) the existence, impact and sharing of potential economies of scale, if any, with the Funds; (g) a summary of aggregate amounts paid by each Fund to BlackRock; (h) sales and redemption data regarding each Fund’s shares; and (i) various additional information requested by the Board as appropriate regarding BlackRock’s and the Funds’ operations.
At the April Meeting, the Board reviewed materials relating to its consideration of the Agreement. As a result of the discussions that occurred during the April Meeting, and as a culmination of the Board’s year-long deliberative process, the Board presented BlackRock with questions and requests for additional information. BlackRock responded to these questions and requests with additional written information in advance of the May Meeting.
At the May Meeting, the Board concluded its assessment of, among other things: (a) the nature, extent and quality of the services provided by BlackRock; (b) the investment performance of each Fund as compared to its Performance Peers and to other metrics, as applicable; (c) the advisory fee and the estimated cost of the services and estimated
| 82 | 2020 BLACKROCK ANNUAL REPORTTO SHAREHOLDERS |
Disclosure of Investment Advisory Agreement (continued)
profits realized by BlackRock and its affiliates from their relationship with the Funds; (d) each Fund’s fees and expenses compared to its Expense Peers; (e) the existence and sharing of potential economies of scale; (f) any fall-out benefits to BlackRock and its affiliates as a result of BlackRock’s relationship with the Funds; and (g) other factors deemed relevant by the Board Members.
The Board also considered other matters it deemed important to the approval process, such as other payments made to BlackRock or its affiliates relating to securities lending and cash management, and BlackRock’s services related to the valuation and pricing of Fund portfolio holdings. The Board noted the willingness of BlackRock’s personnel to engage in open, candid discussions with the Board. The Board did not identify any particular information as determinative, and each Board Member may have attributed different weights to the various items considered.
A. Nature, Extent and Quality of the Services Provided by BlackRock: The Board, including the Independent Board Members, reviewed the nature, extent and quality of services provided by BlackRock, including the investment advisory services and the resulting performance of each Fund. Throughout the year, the Board compared Fund performance to the performance of a comparable group of mutual funds, relevant benchmark, and performance metrics, as applicable. The Board met with BlackRock’s senior management personnel responsible for investment activities, including the senior investment officers. The Board also reviewed the materials provided by each Fund’s portfolio management team discussing the Fund’s performance, investment strategies and outlook.
The Board considered, among other factors, with respect to BlackRock: the number, education and experience of investment personnel generally and each Fund’s portfolio management team; research capabilities; investments by portfolio managers in the funds they manage; portfolio trading capabilities; use of technology; commitment to compliance; credit analysis capabilities; risk analysis and oversight capabilities; and the approach to training and retaining portfolio managers and other research, advisory and management personnel. The Board also considered BlackRock’s overall risk management program, including the continued efforts of BlackRock and its affiliates to address cybersecurity risks and the role of BlackRock’s Risk & Quantitative Analysis Group. The Board engaged in a review of BlackRock’s compensation structure with respect to each Fund’s portfolio management team and BlackRock’s ability to attract and retain high-quality talent and create performance incentives.
In addition to investment advisory services, the Board considered the nature and quality of the administrative and other non-investment advisory services provided to each Fund. BlackRock and its affiliates provide each Fund with certain administrative, shareholder and other services (in addition to any such services provided to the Funds by third parties) and officers and other personnel as are necessary for the operations of the Funds. In particular, BlackRock and its affiliates provide the Funds with administrative services including, among others: (i) responsibility for disclosure documents, such as the prospectus, the summary prospectus (as applicable), the statement of additional information and periodic shareholder reports; (ii) oversight of daily accounting and pricing; (iii) responsibility for periodic filings with regulators; (iv) overseeing and coordinating the activities of third-party service providers including, among others, each Fund’s custodian, fund accountant, transfer agent, and auditor; (v) organizing Board meetings and preparing the materials for such Board meetings; (vi) providing legal and compliance support; (vii) furnishing analytical and other support to assist the Board in its consideration of strategic issues such as the merger, consolidation or repurposing of certain open-end funds; and (viii) performing or managing administrative functions necessary for the operation of the Funds, such as tax reporting, expense management, fulfilling regulatory filing requirements, overseeing each Fund’s distribution partners, and shareholder call center and other services. The Board reviewed the structure and duties of BlackRock’s fund administration, shareholder services, and legal & compliance departments and considered BlackRock’s policies and procedures for assuring compliance with applicable laws and regulations.
B. The Investment Performance of the Funds and BlackRock: The Board, including the Independent Board Members, also reviewed and considered the performance history of each Fund. In preparation for the April Meeting, the Board was provided with reports independently prepared by Broadridge, which included an analysis of each Fund’s performance as of December 31, 2019, as compared to its Performance Peers. Broadridge ranks funds in quartiles, ranging from first to fourth, where first is the most desirable quartile position and fourth is the least desirable. In connection with its review, the Board received and reviewed information regarding the investment performance of each Fund as compared to its Performance Peers. The Board and its Performance Oversight Committee regularly review, and meet with Fund management to discuss, the performance of each Fund throughout the year.
In evaluating performance, the Board focused particular attention on funds with less favorable performance records. The Board also noted that while it found the data provided by Broadridge generally useful, it recognized the limitations of such data, including in particular, that notable differences may exist between a fund and its Performance Peers (for example, the investment objectives and strategies). Further, the Board recognized that the performance data reflects a snapshot of a period as of a particular date and that selecting a different performance period could produce significantly different results. The Board also acknowledged that long-term performance could be impacted by even one period of significant outperformance or underperformance, and that a single investment theme could have the ability to disproportionately affect long-term performance.
The Board noted that for each of the one-, three- and five-year periods reported, Advantage Small Cap Core Fund ranked in the first quartile against its Performance Peers.
The Board noted that for the one-, three- and five-year periods reported, Advantage Large Cap Growth Fund ranked in the second, third and third quartiles, respectively, against its Performance Peers. The Board and BlackRock reviewed the Fund’s underperformance relative to its Performance Peers during the applicable periods.
The Board noted that for the one-, three- and five-year periods reported, Advantage International Fund ranked in the third, third and second quartiles, respectively, against its Performance Peers. The Board and BlackRock reviewed the Fund’s underperformance relative to its Performance Peers during the applicable periods.
C. Consideration of the Advisory/Management Fees and the Estimated Cost of the Services and Estimated Profits Realized by BlackRock and its Affiliates from their Relationship with each Fund: The Board, including the Independent Board Members, reviewed each Fund’s contractual management fee rate compared with those of its Expense Peers. The contractual management fee rate represents a combination of the advisory fee and any administrative fees, before taking into account any reimbursements or fee waivers. The Board also compared each Fund’s total expense ratio, as well as its actual management fee rate, to those of its Expense Peers. The total expense ratio represents a fund’s total net operating expenses, including any 12b-1 or non-12b-1 service fees. The total expense ratio gives effect to any expense reimbursements or fee waivers, and the actual management fee rate gives effect to any management fee reimbursements or waivers. The Board considered the services provided and the fees charged by BlackRock and its affiliates to other types of clients with similar investment mandates, as applicable, including institutional accounts and sub-advised mutual funds (including mutual funds sponsored by third parties).
The Board received and reviewed statements relating to BlackRock’s financial condition. The Board reviewed BlackRock’s profitability methodology and was also provided with an estimated profitability analysis that detailed the revenues earned and the expenses incurred by BlackRock for services provided to each Fund. The Board reviewed BlackRock’s estimated profitability with respect to each Fund and other funds the Board currently oversees for the year ended December 31, 2019 compared to available
| DISCLOSUREOF INVESTMENT ADVISORY AGREEMENT | 83 |
Disclosure of Investment Advisory Agreement (continued)
aggregate estimated profitability data provided for the prior two years. The Board reviewed BlackRock’s estimated profitability with respect to certain other U.S. fund complexes managed by BlackRock and/or its affiliates. The Board reviewed BlackRock’s assumptions and methodology of allocating expenses in the estimated profitability analysis, noting the inherent limitations in allocating costs among various advisory products. The Board recognized that profitability may be affected by numerous factors including, among other things, fee waivers and expense reimbursements by BlackRock, the types of funds managed, precision of expense allocations and business mix. The Board thus recognized that calculating and comparing profitability at the individual fund level is difficult.
The Board noted that, in general, individual fund or product line profitability of other advisors is not publicly available. The Board reviewed BlackRock’s overall operating margin, in general, compared to that of certain other publicly-traded asset management firms. The Board considered the differences between BlackRock and these other firms, including the contribution of technology at BlackRock, BlackRock’s expense management, and the relative product mix.
The Board considered whether BlackRock has the financial resources necessary to attract and retain high quality investment management personnel to perform its obligations under the Agreement and to continue to provide the high quality of services that is expected by the Board. The Board further considered factors including but not limited to BlackRock’s commitment of time, assumption of risk, and liability profile in servicing the Funds, including in contrast to what is required of BlackRock with respect to other products with similar investment mandates across the open-end fund, ETF, closed-end fund, sub-advised mutual fund, separately managed account, collective investment trust, and institutional separate account product channels, as applicable.
The Board noted that Advantage Small Cap Core Fund’s and Advantage Large Cap Growth Fund’s contractual management fee rate ranked in the first quartile, and that the actual management fee rate and total expense ratio each ranked in the first quartile relative to the Fund’s Expense Peers. The Board also noted that each Fund has an advisory fee arrangement that includes breakpoints that adjust the fee rate downward as the size of each Fund increases above certain contractually specified levels. The Board noted that if the size of a Fund were to decrease, the Fund could lose the benefit of one or more breakpoints. The Board further noted that BlackRock and the Board have contractually agreed to a cap on each Fund’s total expenses as a percentage of the Fund’s average daily net assets on a class-by-class basis.
The Board noted that Advantage International Fund’s contractual management fee rate ranked in the first quartile, and that the actual management fee rate and total expense ratio each ranked in the first quartile relative to the Fund’s Expense Peers. The Board also noted that the Fund has an advisory fee arrangement that includes breakpoints that adjust the fee rate downward as the size of the Fund increases above certain contractually specified levels. The Board noted that if the size of the Fund were to decrease, the Fund could lose the benefit of one or more breakpoints. The Board also noted that BlackRock proposed, and the Board agreed to, a contractual adjustment to reduce specified levels within the breakpoint schedule. This adjustment was implemented on May 24, 2019. The Board further noted that BlackRock and the Board have contractually agreed to a cap on the Fund’s total expenses as a percentage of the Fund’s average daily net assets on a class-by-class basis. In addition, the Board noted that BlackRock proposed, and the Board agreed to, a lower contractual expense cap on a class-by-class basis. This expense cap reduction was implemented on May 24, 2019.
D. Economies of Scale: The Board, including the Independent Board Members, considered the extent to which economies of scale might be realized as the assets of the Funds increase, including the existence of fee waivers and/or expense caps, as applicable, noting that any contractual fee waivers and contractual expense caps had been approved by the Board. In its consideration, the Board further considered the continuation and/or implementation of fee waivers and/or expense caps, as applicable. The Board also considered the extent to which the Funds benefits from such economies of scale in a variety of ways and whether there should be changes in the advisory fee rate or breakpoint structure in order to enable the Funds to more fully participate in these economies of scale. The Board considered each Fund’s asset levels and whether the current fee schedule was appropriate.
E. Other Factors Deemed Relevant by the Board Members: The Board, including the Independent Board Members, also took into account other ancillary or “fall-out” benefits that BlackRock or its affiliates may derive from BlackRock’s respective relationships with the Funds, both tangible and intangible, such as BlackRock’s ability to leverage its investment professionals who manage other portfolios and its risk management personnel, an increase in BlackRock’s profile in the investment advisory community, and the engagement of BlackRock’s affiliates as service providers to the Funds, including for administrative, distribution, securities lending and cash management services. The Board also considered BlackRock’s overall operations and its efforts to expand the scale of, and improve the quality of, its operations. The Board also noted that, subject to applicable law, BlackRock may use and benefit from third-party research obtained by soft dollars generated by certain registered fund transactions to assist in managing all or a number of its other client accounts.
In connection with its consideration of the Agreement, the Board also received information regarding BlackRock’s brokerage and soft dollar practices. The Board received reports from BlackRock which included information on brokerage commissions and trade execution practices throughout the year.
The Board noted the competitive nature of the open-end fund marketplace, and that shareholders are able to redeem their Fund shares if they believe that the pertinent Fund’s fees and expenses are too high or if they are dissatisfied with the performance of the Fund.
Conclusion
The Board, including the Independent Board Members, unanimously approved the continuation of the Agreement between the Manager and the Trust, on behalf of each Fund, for a one-year term ending June 30, 2021. Based upon its evaluation of all of the aforementioned factors in their totality, as well as other information, the Board, including the Independent Board Members, was satisfied that the terms of the Agreement were fair and reasonable and in the best interest of each Fund and its shareholders. In arriving at its decision to approve the Agreement, the Board did not identify any single factor or group of factors as all-important or controlling, but considered all factors together, and different Board Members may have attributed different weights to the various factors considered. The Independent Board Members were also assisted by the advice of independent legal counsel in making this determination.
| 84 | 2020 BLACKROCK ANNUAL REPORTTO SHAREHOLDERS |
Trustee and Officer Information
| Independent Trustees(a) | ||||||||
Name Year of Birth(b) | Position(s) Held (Length of Service)(c) | Principal Occupation(s) During Past Five Years | Number of BlackRock-Advised Registered Investment Companies (“RICs”) Consisting of Investment | Public Company and Other Investment Company Directorships Held During Past Five Years | ||||
Mark Stalnecker 1951 | Chair of the Board (Since 2019) and Trustee (Since 2015) | Chief Investment Officer, University of Delaware from 1999 to 2013; Trustee and Chair of the Finance and Investment Committees, Winterthur Museum and Country Estate from 2005 to 2016; Member of the Investment Committee, Delaware Public Employees’ Retirement System since 2002; Member of the Investment Committee, Christiana Care Health System from 2009 to 2017; Member of the Investment Committee, Delaware Community Foundation from 2013 to 2014; Director and Chair of the Audit Committee, SEI Private Trust Co. from 2001 to 2014. | 36 RICs consisting of 153 Portfolios | None | ||||
Bruce R. Bond 1946 | Trustee (Since 2019) | Board Member, Amsphere Limited (software) since 2018; Trustee and Member of the Governance Committee, State Street Research Mutual Funds from 1997 to 2005; Board Member of Governance, Audit and Finance Committee, Avaya Inc. (computer equipment) from 2003 to 2007. | 36 RICs consisting of 153 Portfolios | None | ||||
Susan J. Carter 1956 | Trustee (Since 2016) | Director, Pacific Pension Institute from 2014 to 2018; Advisory Board Member, Center for Private Equity and Entrepreneurship at Tuck School of Business since 1997; Senior Advisor, Commonfund Capital, Inc. (“CCI”) (investment adviser) in 2015; Chief Executive Officer, CCI from 2013 to 2014; President & Chief Executive Officer, CCI from 1997 to 2013; Advisory Board Member, Girls Who Invest from 2015 to 2018 and Board Member thereof since 2018; Advisory Board Member, Bridges Fund Management since 2016; Trustee, Financial Accounting Foundation since 2017; Practitioner Advisory Board Member, Private Capital Research Institute (“PCRI”) since 2017; Lecturer in the Practice of Management, Yale School of Management since 2019. | 36 RICs consisting of 153 Portfolios | None | ||||
Collette Chilton 1958 | Trustee (Since 2015) | Chief Investment Officer, Williams College since 2006; Chief Investment Officer, Lucent Asset Management Corporation from 1998 to 2006. | 36 RICs consisting of 153 Portfolios | None | ||||
Neil A. Cotty 1954 | Trustee (Since 2016) | Bank of America Corporation from 1996 to 2015, serving in various senior finance leadership roles, including Chief Accounting Officer, from 2009 to 2015, Chief Financial Officer of Global Banking, Markets and Wealth Management from 2008 to 2009, Chief Accounting Officer from 2004 to 2008, Chief Financial Officer of Consumer Bank from 2003 to 2004, Chief Financial Officer of Global Corporate Investment Bank from 1999 to 2002. | 36 RICs consisting of 153 Portfolios | None | ||||
Lena G. Goldberg 1949 | Trustee (Since 2019) | Senior Lecturer, Harvard Business School, since 2008; Director, Charles Stark Draper Laboratory, Inc. since 2013; FMR LLC/Fidelity Investments (financial services) from 1996 to 2008, serving in various senior roles including Executive Vice President — Strategic Corporate Initiatives and Executive Vice President and General Counsel; Partner, Sullivan & Worcester LLP from 1985 to 1996 and Associate thereof from 1979 to 1985. | 36 RICs consisting of 153 Portfolios | None | ||||
Henry R. Keizer 1956 | Trustee (Since 2019) | Director, Park Indemnity Ltd. (captive insurer) since 2010; Director, MUFG Americas Holdings Corporation and MUFG Union Bank, N.A. (financial and bank holding company) from 2014 to 2016; Director, American Institute of Certified Public Accountants from 2009 to 2011; Director, KPMG LLP (audit, tax and advisory services) from 2004 to 2005 and 2010 to 2012; Director, KPMG International in 2012, Deputy Chairman and Chief Operating Officer thereof from 2010 to 2012 and U.S. Vice Chairman of Audit thereof from 2005 to 2010; Global Head of Audit, KPMGI (consortium of KPMG firms) from 2006 to 2010; Director, YMCA of Greater New York from 2006 to 2010. | 36 RICs consisting of 153 Portfolios | Hertz Global Holdings (car rental); Montpelier Re Holdings, Ltd. (publicly held property and casualty reinsurance) from 2013 until 2015; WABCO (commercial vehicle safety systems); Sealed Air Corp. (packaging) | ||||
| TRUSTEEAND OFFICER INFORMATION | 85 |
Trustee and Officer Information (continued)
| Independent Trustees(a) | ||||||||
Name Year of Birth(b) | Position(s) Held (Length of Service)(c) | Principal Occupation(s) During Past Five Years | Number of BlackRock-Advised Registered Investment Companies (“RICs”) Consisting of Investment Portfolios (“Portfolios”) Overseen | Public Company and Other Investment Company Directorships Held During Past Five Years | ||||
Cynthia A. Montgomery 1952 | Trustee (Since 2007) | Professor, Harvard Business School since 1989. | 36 RICs consisting of 153 Portfolios | Newell Rubbermaid, Inc. (manufacturing) | ||||
Donald C. Opatrny 1952 | Trustee (Since 2019) | Trustee, Vice Chair, Member of the Executive Committee and Chair of the Investment Committee, Cornell University since 2004; President, Trustee and Member of the Investment Committee, The Aldrich Contemporary Art Museum from 2007 to 2014; Member of the Board and Investment Committee, University School from 2007 to 2018; Member of the Investment Committee, Mellon Foundation from 2009 to 2015; Trustee, Artstor (a Mellon Foundation affiliate) from 2010 to 2015; President and Trustee, the Center for the Arts, Jackson Hole from 2011 to 2018; Director, Athena Capital Advisors LLC (investment management firm) since 2013; Trustee and Chair of the Investment Committee, Community Foundation of Jackson Hole since 2014; Member of Affordable Housing Supply Board of Jackson, Wyoming since 2018; Member, Investment Funds Committee, State of Wyoming since 2017; Trustee, Phoenix Art Museum since 2018; Trustee, Arizona Community Foundation and Member of Investment Committee since 2020. | 36 RICs consisting of 153 Portfolios | None | ||||
Joseph P. Platt 1947 | Trustee (Since 2007) | General Partner, Thorn Partners, LP (private investments) since 1998; Director, WQED Multi-Media (public broadcasting not-for-profit) since 2001; Chair, Basic Health International (non-profit) since 2015. | 36 RICs consisting of 153 Portfolios | Greenlight Capital Re, Ltd. (reinsurance company); Consol Energy Inc. | ||||
Kenneth L. Urish 1951 | Trustee (Since 2007) | Managing Partner, Urish Popeck & Co., LLC (certified public accountants and consultants) since 1976; Past-Chairman of the Professional Ethics Committee of the Pennsylvania Institute of Certified Public Accountants and Committee Member thereof since 2007; Member of External Advisory Board, The Pennsylvania State University Accounting Department since founding in 2001; Principal, UP Strategic WealthInvestment Advisors, LLC since 2013; Trustee, The Holy Family Institute from 2001 to 2010; President and Trustee, Pittsburgh Catholic Publishing Associates from 2003 to 2008; Director, Inter-Tel from 2006 to 2007. | 36 RICs consisting of 153 Portfolios | None | ||||
Claire A. Walton 1957 | Trustee (Since 2016) | Chief Operating Officer and Chief Financial Officer of Liberty Square Asset Management, LP from 1998 to 2015; General Partner of Neon Liberty Capital Management, LLC since 2003; Director, Boston Hedge Fund Group from 2009 to 2018; Director, Woodstock Ski Runners since 2013; Director, Massachusetts Council on Economic Education from 2013 to 2015. | 36 RICs consisting of 153 Portfolios | None | ||||
| 86 | 2020 BLACKROCK ANNUAL REPORTTO SHAREHOLDERS |
Trustee and Officer Information (continued)
| Interested Trustees(a)(d) | ||||||||
Name Year of Birth(b) | Position(s) Held (Length of Service)(c) | Principal Occupation(s) During Past Five Years | Number of BlackRock-Advised Registered Investment Companies (“RICs”) Consisting of Investment Portfolios (“Portfolios”) Overseen | Public Company and Other Investment Company Directorships Held During Past Five Years | ||||
Robert Fairbairn 1965 | Trustee (Since 2018) | Vice Chairman of BlackRock, Inc. since 2019; Member of BlackRock’s Global Executive and Global Operating Committees; Co-Chair of BlackRock’s Human Capital Committee; Senior Managing Director of BlackRock, Inc. from 2010 to 2019; oversaw BlackRock’s Strategic Partner Program and Strategic Product Management Group from 2012 to 2019; Member of the Board of Managers of BlackRock Investments, LLC from 2011 to 2018; Global Head of BlackRock’s Retail and iShares® businesses from 2012 to 2016. | 123 RICs consisting of 264 Portfolios | None | ||||
John M. Perlowski 1964(e) | Trustee (Since 2015), President, and Chief Executive Officer (Since 2010) | Managing Director of BlackRock, Inc. since 2009; Head of BlackRock Global Accounting and Product Services since 2009; Advisory Director of Family Resource Network (charitable foundation) since 2009. | 124 RICs consisting of 265 Portfolios | None | ||||
| (a) | The address of each Trustee is c/o BlackRock, Inc., 55 East 52nd Street, New York, New York 10055. |
| (b) | Independent Trustees serve until their resignation, retirement, removal or death, or until December 31 of the year in which they turn 75. The Board may determine to extend the terms of Independent Trustees on a case-by-case basis, as appropriate. |
| (c) | Following the combination of Merrill Lynch Investment Managers, L.P. (“MLIM”) and BlackRock, Inc. in September 2006, the various legacy MLIM and legacy BlackRock fund boards were realigned and consolidated into three new fund boards in 2007. Furthermore, effective January 1, 2019, three BlackRock Fund Complexes were realigned and consolidated into two BlackRock Fund Complexes. As a result, although the chart shows the year that each Independent Trustee joined the Board, certain Independent Trustees first became members of the boards of other BlackRock-advised Funds, legacy MLIM funds or legacy BlackRock funds as follows: Bruce R. Bond, 2005; Cynthia A. Montgomery, 1994; Joseph P. Platt, 1999; Kenneth L. Urish, 1999; Lena G. Goldberg, 2016; Henry R. Keizer, 2016; Donald C. Opatrny, 2015. |
| (d) | Mr. Fairbairn and Mr. Perlowski are both “interested persons,” as defined in the 1940 Act, of the Trust based on their positions with BlackRock, Inc. and its affiliates. Mr. Fairbairn and Mr. Perlowski are also board members of the BlackRock Fixed-Income Complex. |
| (e) | Mr. Perlowski is also a trustee of the BlackRock Credit Strategies Fund. |
| TRUSTEEAND OFFICER INFORMATION | 87 |
Trustee and Officer Information (continued)
| Officers Who Are Not Trustees(a) | ||||
Name Year of Birth(b) | Position(s) Held (Length of Service) | Principal Occupation(s) During Past Five Years | ||
Thomas Callahan 1968 | Vice President (Since 2016) | Managing Director of BlackRock, Inc. since 2013; Member of the Board of Managers of BlackRock Investments, LLC (principal underwriter) since 2019 and Managing Director thereof since 2017; Head of BlackRock’s Global Cash Management Business since 2016; Co-Head of the Global Cash Management Business from 2014 to 2016; Deputy Head of the Global Cash Management Business from 2013 to 2014; Member of the Cash Management Group Executive Committee since 2013; Chief Executive Officer of NYSE Liffe U.S. from 2008 to 2013. | ||
Jennifer McGovern 1977 | Vice President (Since 2014) | Managing Director of BlackRock, Inc. since 2016; Director of BlackRock, Inc. from 2011 to 2015; Head of Americas Product Development and Governance for BlackRock’s Global Product Group since 2019; Head of Product Structure and Oversight for BlackRock’s U.S. Wealth Advisory Group from 2013 to 2019. | ||
Neal J. Andrews 1966 | Chief Financial Officer (Since 2007) | Chief Financial Officer of the iShares® exchange traded funds from 2019 to 2020; Managing Director of BlackRock, Inc. since 2006. | ||
Jay M. Fife 1970 | Treasurer (Since 2007) | Managing Director of BlackRock, Inc. since 2007. | ||
Charles Park 1967 | Chief Compliance Officer (Since 2014) | Anti-Money Laundering Compliance Officer for certain BlackRock-advised Funds from 2014 to 2015; Chief Compliance Officer of BlackRock Advisors, LLC and the BlackRock-advised Funds in the BlackRock Multi-Asset Complex and the BlackRock Fixed-Income Complex since 2014; Principal of and Chief Compliance Officer for iShares® Delaware Trust Sponsor LLC since 2012 and BlackRock Fund Advisors (“BFA”) since 2006; Chief Compliance Officer for the BFA-advised iShares® exchange traded funds since 2006; Chief Compliance Officer for BlackRock Asset Management International Inc. since 2012. | ||
Lisa Belle 1968 | Anti-Money Laundering Compliance Officer (Since 2019) | Managing Director of BlackRock, Inc. since 2019; Global Financial Crime Head of Asset and Wealth Management of JP Morgan from 2013 to 2019; Managing Director of RBS Securities from 2012 to 2013; Head of Financial Crimes for Barclays Wealth Americas from 2010 to 2012. | ||
Janey Ahn 1975 | Secretary (Since 2019) | Managing Director of BlackRock, Inc. since 2018; Director of BlackRock, Inc. from 2009 to 2017. | ||
| (a) | The address of each Officer is c/o BlackRock, Inc., 55 East 52nd Street, New York, New York 10055. |
| (b) | Officers of the Trust serve at the pleasure of the Board. |
Further information about the Trust’s Trustees and Officers is available in the Trust’s Statement of Additional Information, which can be obtained without charge by calling (800) 441-7762.
Effective December 31, 2019, Robert M. Hernandez retired as Trustee of the Trust.
Investment Adviser and Administrator
BlackRock Advisors, LLC
Wilmington, DE 19809
Accounting Agent and Transfer Agent
BNY Mellon Investment Servicing (US) Inc.
Wilmington, DE 19809
Custodian
The Bank of New York Mellon
New York, NY 10286
Distributor
BlackRock Investments, LLC
New York, NY 10022
Independent Registered Public Accounting Firm
Deloitte & Touche LLP
Boston, MA 02116
Legal Counsel
Sidley Austin LLP
New York, NY 10019
Address of the Trust
100 Bellevue Parkway
Wilmington, DE 19809
| 88 | 2020 BLACKROCK ANNUAL REPORTTO SHAREHOLDERS |
General Information
Householding
The Funds will mail only one copy of shareholder documents, including prospectuses, annual and semi-annual reports and proxy statements, to shareholders with multiple accounts at the same address. This practice is commonly called “householding” and is intended to reduce expenses and eliminate duplicate mailings of shareholder documents. Mailings of your shareholder documents may be householded indefinitely unless you instruct us otherwise. If you do not want the mailing of these documents to be combined with those for other members of your household, please call the Funds at (800) 441-7762.
Availability of Quarterly Schedule of Investments
The Funds file their complete schedules of portfolio holdings with the SEC for the first and third quarters of each fiscal year as an exhibit to their reports on Form N-PORT. The Funds’ Forms N-PORT are available on the SEC’s website at sec.gov.
Availability of Proxy Voting Policies and Procedures
A description of the policies and procedures that the Funds use to determine how to vote proxies relating to portfolio securities is available upon request and without charge (1) by calling (800) 441-7762; (2) at blackrock.com; and (3) on the SEC’s website at sec.gov.
Availability of Proxy Voting Record
Information about how the Funds voted proxies relating to securities held in the Funds’ portfolios during the most recent 12-month period ended June 30 is available upon request and without charge (1) at blackrock.com; or by calling (800) 441-7762 and (2) on the SEC’s website at sec.gov.
BlackRock’s Mutual Fund Family
BlackRock offers a diverse lineup of open-end mutual funds crossing all investment styles and managed by experts in equity, fixed-income and tax-exempt investing. Visit blackrock.com for more information.
Shareholder Privileges
Account Information
Call us at (800) 441-7762 from 8:00 AM to 6:00 PM ET on any business day to get information about your account balances, recent transactions and share prices. You can also visit blackrock.com for more information.
Automatic Investment Plans
Investor class shareholders who want to invest regularly can arrange to have $50 or more automatically deducted from their checking or savings account and invested in any of the BlackRock funds.
Systematic Withdrawal Plans
Investor class shareholders can establish a systematic withdrawal plan and receive periodic payments of $50 or more from their BlackRock funds, as long as their account balance is at least $10,000.
Retirement Plans
Shareholders may make investments in conjunction with Traditional, Rollover, Roth, Coverdell, Simple IRAs, SEP IRAs and 403(b) Plans.
| ADDITIONAL INFORMATION | 89 |
Additional Information (continued)
BlackRock Privacy Principles
BlackRock is committed to maintaining the privacy of its current and former fund investors and individual clients (collectively, “Clients”) and to safeguarding their non-public personal information. The following information is provided to help you understand what personal information BlackRock collects, how we protect that information and why in certain cases we share such information with select parties.
If you are located in a jurisdiction where specific laws, rules or regulations require BlackRock to provide you with additional or different privacy-related rights beyond what is set forth below, then BlackRock will comply with those specific laws, rules or regulations.
BlackRock obtains or verifies personal non-public information from and about you from different sources, including the following: (i) information we receive from you or, if applicable, your financial intermediary, on applications, forms or other documents; (ii) information about your transactions with us, our affiliates, or others; (iii) information we receive from a consumer reporting agency; and (iv) from visits to our websites.
BlackRock does not sell or disclose to non-affiliated third parties any non-public personal information about its Clients, except as permitted by law or as is necessary to respond to regulatory requests or to service Client accounts. These non-affiliated third parties are required to protect the confidentiality and security of this information and to use it only for its intended purpose.
We may share information with our affiliates to service your account or to provide you with information about other BlackRock products or services that may be of interest to you. In addition, BlackRock restricts access to non-public personal information about its Clients to those BlackRock employees with a legitimate business need for the information. BlackRock maintains physical, electronic and procedural safeguards that are designed to protect the non-public personal information of its Clients, including procedures relating to the proper storage and disposal of such information.
| 90 | 2020 BLACKROCK ANNUAL REPORTTO SHAREHOLDERS |
Glossary of Terms Used in this Report
| Portfolio Abbreviation | ||
| CVR | Contingent Value Rights | |
| REIT | Real Estate Investment Trust | |
| S&P | Standard & Poor’s | |
| GLOSSARYOF TERMS USEDINTHIS REPORT | 91 |
Want to know more?
blackrock.com | 800-441-7762
This report is intended for current holders. It is not authorized for use as an offer of sale or a solicitation of an offer to buy shares of the Funds unless preceded or accompanied by the Funds’ current prospectus. Past performance results shown in this report should not be considered a representation of future performance. Investment returns and principal value of shares will fluctuate so that shares, when redeemed, may be worth more or less than their original cost. Statements and other information herein are as dated and are subject to change.
SC2-5/20-AR
|  |
 | MAY 31, 2020 |
| 2020 Annual Report | ||
BlackRock FundsSM
| · | BlackRock Energy Opportunities Fund |
| · | BlackRock High Equity Income Fund |
| · | BlackRock International Dividend Fund |
Beginning on January 1, 2021, as permitted by regulations adopted by the Securities and Exchange Commission, paper copies of each Fund’s shareholder reports will no longer be sent by mail, unless you specifically request paper copies of the reports from BlackRock or from your financial intermediary, such as a broker-dealer or bank. Instead, the reports will be made available on a website, and you will be notified by mail each time a report is posted and provided with a website link to access the report.
You may elect to receive all future reports in paper free of charge. If you hold accounts directly with BlackRock, you can call (800) 441-7762 to inform BlackRock that you wish to continue receiving paper copies of your shareholder reports. If you hold accounts through a financial intermediary, you can follow the instructions included with this disclosure, if applicable, or contact your financial intermediary to request that you continue to receive paper copies of your shareholder reports. Please note that not all financial intermediaries may offer this service. Your election to receive reports in paper will apply to all funds advised by BlackRock Advisors, LLC, BlackRock Fund Advisors or their affiliates, or all funds held with your financial intermediary, as applicable.
If you already elected to receive shareholder reports electronically, you will not be affected by this change and you need not take any action. You may elect to receive electronic delivery of shareholder reports and other communications by: (i) accessing the BlackRock website at blackrock.com/edelivery and logging into your accounts, if you hold accounts directly with BlackRock, or (ii) contacting your financial intermediary, if you hold accounts through a financial intermediary. Please note that not all financial intermediaries may offer this service.
| Not FDIC Insured • May Lose Value • No Bank Guarantee |
Dear Shareholder,
The last 12 months have been a time of sudden change in global financial markets, as a long period of growth and positive returns was interrupted in early 2020 by the emergence and spread of the coronavirus. For the first part of the reporting period, U.S. equities and bonds both delivered impressive returns, despite fears and doubts about the economy that were ultimately laid to rest with unprecedented monetary stimulus and a sluggish yet resolute performance from the U.S. economy. But as the threat from the coronavirus became more apparent throughout February and March 2020, leading countries around the world took economically disruptive countermeasures, causing equity prices to fall sharply. While markets have since recovered some of these losses as countries around the world begin reopening, there is still significant uncertainty surrounding the long-term impact of the pandemic on the global economy.
Returns for most securities were robust for the first part of the reporting period, as investors began to realize that the U.S. economy was maintaining the modest yet steady growth that had characterized this economic cycle. However, once stay-at-home orders and closures of non-essential businesses became widespread, many workers were laid off and unemployment claims spiked. With large portions of the global economy on hold, all types of international equities ended the 12-month reporting period with negative performance, while in the United States large-capitalization stocks, which investors saw as more resilient than smaller companies, delivered solid returns.
The performance of different types of fixed-income securities diverged substantially due to a reduced investor appetite for risk. Treasuries benefited from the risk-off environment, and posted healthy returns, as the 10-year U.S. Treasury yield (which is inversely related to bond prices) fell to an all-time low. Investment-grade corporate bonds also delivered a solid return, while high-yield corporate returns were muted due to credit concerns.
The U.S. Federal Reserve (the “Fed”) reduced interest rates three times in 2019, to support slowing economic growth. After the coronavirus outbreak, the Fed instituted two emergency rate cuts, pushing short-term interest rates close to zero. To stabilize credit markets, the Fed also announced a new bond-buying program, as did several other central banks around the world, including the European Central Bank and the Bank of Japan.
Looking ahead, while coronavirus-related disruption is certain to hurt worldwide economic growth, the global expansion is likely to continue once the impact of the outbreak subsides. We are encouraged by the strong coordinated monetary and fiscal response that is underway, both in the United States and abroad. However, there remains a risk that policy fatigue and recent improvements in economic indicators could lead lawmakers to retreat from needed stimulus measures too soon.
Overall, we favor a neutral stance toward risk, given the uncertainty surrounding the path to recovery. Among equities, we see an advantage in U.S. stocks compared to other developed markets, given the diversity of the U.S. economy and the impressive scope of monetary and fiscal stimulus. In bonds, the swift action taken by the world’s central banks means there are attractive opportunities in credit, and we expect credit spreads to narrow as markets stabilize. Both U.S. Treasuries and sustainable investments can help provide portfolio resilience, and the disruption created by the coronavirus appears to be accelerating the shift toward sustainable investments.
In this environment, our view is that investors need to think globally, extend their scope across a broad array of asset classes, and be nimble as market conditions change. We encourage you to talk with your financial advisor and visit blackrock.com for further insight about investing in today’s markets.
Sincerely,

Rob Kapito
President, BlackRock Advisors, LLC

Rob Kapito
President, BlackRock Advisors, LLC
| Total Returns as of May 31, 2020 | ||||
| 6-Month | 12-Month | |||
U.S. large cap equities | (2.10)% | 12.84% | ||
U.S. small cap equities | (13.53) | (3.44) | ||
International equities | (11.48) | (2.81) | ||
Emerging market equities | (9.69) | (4.39) | ||
3-month Treasury bills | 0.73 | 1.84 | ||
U.S. Treasury securities | 11.55 | 15.87 | ||
U.S. investment grade bonds | 5.40 | 9.42 | ||
Tax-exempt municipal bonds | 1.52 | 3.87 | ||
U.S. high yield bonds | (2.84) | 1.31 | ||
| Past performance is no guarantee of future results. Index performance is shown for illustrative purposes only. You cannot invest directly in an index. | ||||
| 2 | THIS PAGEIS NOT PARTOF YOUR FUND REPORT |
| Page | ||||
| 2 | ||||
Annual Report: | ||||
| 4 | ||||
| 13 | ||||
| 13 | ||||
| 13 | ||||
Financial Statements: | ||||
| 14 | ||||
| 24 | ||||
| 26 | ||||
| 28 | ||||
| 30 | ||||
| 44 | ||||
| 59 | ||||
| 60 | ||||
Disclosure of Investment Advisory Agreements and Sub-Advisory Agreements | 61 | |||
| 65 | ||||
| 69 | ||||
| 71 | ||||

| 3 |
| Fund Summary as of May 31, 2020 | BlackRock Energy Opportunities Fund |
Investment Objective
BlackRock Energy Opportunities Fund’s (the “Fund”) investment objective is to provide long-term growth of capital.
At a meeting held on July 31, 2019, the Board of Trustees of BlackRock FundsSM (the “Board”) approved the Reorganization (the “Reorganization”) of BlackRock Energy & Resources Portfolio (the “Target Fund”) with and into BlackRock All-Cap Energy & Resources Portfolio (the “Acquiring Fund”). The Reorganization closed on January 13, 2020 and was not subject to approval by each Fund’s shareholders. Effective upon the closing of the Reorganization, the Acquiring Fund changed its name to BlackRock Energy Opportunities Fund.
On November 13, 2019, the Board approved a change in the fiscal year-end of the Fund, effective as of May 31, 2020, from September 30 to May 31.
Portfolio Management Commentary
How did the Fund perform?
For the abbreviated annual reporting period from October 1, 2019 to May 31, 2020, the Fund’s Institutional, Service, Investor A and Investor C Shares returned (29.02)%, (29.17)%, (29.23)% and (29.51)%, respectively, outperforming its benchmark, the MSCI World Energy Index, which returned (31.72)%.
What factors influenced performance?
Energy stocks suffered a substantial downturn in the eight-month period. The bulk of the slump occurred in March, when the start of a price war between Russia and Saudi Arabia led to a significant increase in crude oil supply. At the same time, the demand outlook cratered as the spread of the coronavirus prompted many world governments to shut down large portions of their economies. These unfavorable conditions contributed to a decline in the price of West Texas Intermediate crude oil to its lowest level in more than 20 years. While the energy sector rallied from late March onward behind significant fiscal and monetary stimulus, it nonetheless finished in the red for the full period.
The Fund’s positions in more defensive energy companies were generally the leading contributors to its relative performance. Among these were the European integrated oil companies Total SA and BP PLC, as well as the pipeline operator TC Energy Corp. The Fund further benefited from not owning Occidental Petroleum Corp. and holding a large underweight in Schlumberger Ltd., as both stocks underperformed.
The oil refiner Marathon Petroleum Corp., which lagged due to the rising supply of gasoline, was a key detractor. The smaller exploration and production (“E&P”) companies Kosmos Energy Ltd. and Noble Corp. also detracted from results, as did an underweight position in the pipeline operator Enbridge, Inc.
The Fund maintained an above-average cash position to help cushion the effect of ongoing market volatility. However, this stance had no material impact on the Fund’s performance.
Describe recent portfolio activity.
The investment adviser sought to capitalize on elevated market volatility by purchasing what it believed were higher-quality, financially strong companies near historically low valuations. The investment adviser primarily added to existing positions in large-cap international companies that it saw as being in the best position to take advantage of an eventual recovery.
Describe portfolio positioning at period end.
The Fund was positioned in a defensive manner, favoring companies that were maintaining capital discipline and returning cash to shareholders. Conversely, the Fund was underweight in higher-cost producers, companies with weak balance sheets, and commoditized oil services companies.
The Fund was overweight in the E&P and oil services subsectors at the close of the period, and it was underweight in the integrated, distribution, and refining and marketing industries.
The views expressed reflect the opinions of BlackRock as of the date of this report and are subject to change based on changes in market, economic or other conditions. These views are not intended to be a forecast of future events and are no guarantee of future results.
| 4 | 2020 BLACKROCK ANNUAL REPORTTO SHAREHOLDERS |
| Fund Summary as of May 31, 2020 (continued) | BlackRock Energy Opportunities Fund |
TOTAL RETURN BASED ON $10,000 INVESTMENT
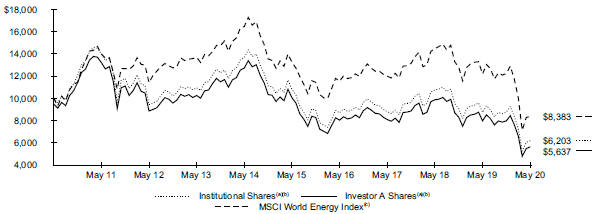
| (a) | Assuming maximum sales charges, if any, transaction costs and other operating expenses, including investment advisory fees and administration fees, if any. Institutional Shares do not have a sales charge. |
| (b) | Under normal market conditions, the Fund invests at least 80% of its total assets in equity securities of global energy and natural resources companies and companies in associated businesses, as well as utilities (such as gas, water, cable, electrical and telecommunications utilities). |
| (c) | A free float-adjusted market capitalization index that represents the energy segment in global developed market equity performance. |
Performance Summary for the Period Ended May 31, 2020
| Average Annual Total Returns(a) | ||||||||||||||||||||||||||||||||||||||||
| 1 Year | 5 Years | 10 Years | ||||||||||||||||||||||||||||||||||||||
6-Month Total Returns | Without Sales Charge | With Sales Charge | Without Sales Charge | With Sales Charge | Without Sales Charge | With Sales Charge | ||||||||||||||||||||||||||||||||||
Institutional | (29.10 | )% | (29.02 | )% | N/A | (10.53 | )% | N/A | (4.66 | )% | N/A | |||||||||||||||||||||||||||||
Service | (29.24 | ) | (29.24 | ) | N/A | (10.91 | ) | N/A | (5.04 | ) | N/A | |||||||||||||||||||||||||||||
Investor A | (29.30 | ) | (29.30 | ) | (33.02 | )% | (10.92 | ) | (11.88 | )% | (5.06 | ) | (5.57 | )% | ||||||||||||||||||||||||||
Investor C | (29.51 | ) | (29.75 | ) | (30.44 | ) | (11.54 | ) | (11.54 | ) | (5.73 | ) | (5.73 | ) | ||||||||||||||||||||||||||
MSCI World Energy Index | (31.49 | ) | (31.19 | ) | N/A | (8.73 | ) | N/A | (1.75 | ) | N/A | |||||||||||||||||||||||||||||
| (a) | Assuming maximum sales charges, if any. Average annual total returns with and without sales charges reflect reductions for distribution and service fees. See “About Fund Performance” on page 13 for a detailed description of share classes, including any related sales charges and fees. |
N/A — Not applicable as share class and index do not have a sales charge.
Past performance is not indicative of future results.
Performance results may include adjustments made for financial reporting purposes in accordance with U.S. generally accepted accounting principles.
Expense Example
| Actual | Hypothetical(a) | |||||||||||||||||||||||||||||||
| | Beginning Account Value (12/01/19) |
| | Ending Account Value (05/31/20) |
| | Expenses Paid During the Period |
(b) | | Beginning Account Value (12/01/19) |
| | Ending Account Value (05/31/20) |
| | Expenses Paid During the Period |
(b) | | Annualized Expense Ratio |
| ||||||||||||
Institutional | $ 1,000.00 | $ 709.00 | $ 3.89 | $ 1,000.00 | $ 1,020.45 | $ 4.60 | 0.91 | % | ||||||||||||||||||||||||
Service | 1,000.00 | 707.60 | 5.62 | 1,000.00 | 1,018.42 | 6.64 | 1.32 | |||||||||||||||||||||||||
Investor A | 1,000.00 | 707.00 | 5.63 | 1,000.00 | 1,018.40 | 6.66 | 1.32 | |||||||||||||||||||||||||
Investor C | 1,000.00 | 704.90 | 8.70 | 1,000.00 | 1,014.80 | 10.28 | 2.04 | |||||||||||||||||||||||||
| (a) | Hypothetical 5% annual return before expenses is calculated by prorating the number of days in the most recent six-months divided by 366. |
| (b) | For each class of the Fund, expenses are equal to the annualized expense ratio for the class, multiplied by the average account value over the period, multiplied by 183/366 (to reflect the six-month period shown). |
See “Disclosure of Expenses” on page 13 for further information on how expenses were calculated.
| FUND SUMMARY | 5 |
| Fund Summary as of May 31, 2020 (continued) | BlackRock Energy Opportunities Fund |
Portfolio Information
TEN LARGEST HOLDINGS
| Security(a) | Percent of Net Assets | |||
Chevron Corp. | 12 | % | ||
Royal Dutch Shell PLC, A Shares | 9 | |||
TOTAL SA | 9 | |||
BP PLC | 7 | |||
ConocoPhillips | 5 | |||
TC Energy Corp. | 4 | |||
Williams Cos., Inc. | 4 | |||
Kinder Morgan, Inc. | 4 | |||
Suncor Energy, Inc. | 4 | |||
Pioneer Natural Resources Co. | 3 | |||
INDUSTRY ALLOCATION
| Industry(b) | Percent of Net Assets | |||
Oil, Gas & Consumable Fuels | 91 | % | ||
Energy Equipment & Services | 4 | |||
Short-Term Securities | 4 | |||
Other Assets | 1 | |||
| (a) | Excludes short-term securities. |
| (b) | For Fund compliance purposes, the Fund’s industry classifications refer to one or more of the industry sub-classifications used by one or more widely recognized market indexes or ratings group indexes, and/or as defined by the investment adviser. These definitions may not apply for purposes of this report, which may combine such industry sub-classifications for reporting ease. |
| 6 | 2020 BLACKROCK ANNUAL REPORTTO SHAREHOLDERS |
| Fund Summary as of May 31, 2020 | BlackRock High Equity Income Fund |
Investment Objective
BlackRock High Equity Income Fund’s (the “Fund”) investment objective is to seek high current income while maintaining prospects for capital appreciation.
On November 13, 2019, the Board of Trustees of BlackRock FundsSM approved a change in the fiscal year-end of the Fund, effective as of May 31, 2020, from September 30 to May 31.
Portfolio Management Commentary
How did the Fund perform?
For the abbreviated annual reporting period from October 1, 2019 to May 31, 2020, the Fund’s Institutional, Service, Investor A, Investor C and Class K Shares returned (9.94)%, (10.08)%, (10.09)%, (10.52)% and (9.94)%, respectively, underperforming its benchmark, the Russell 1000® Value Index, which returned (9.45)%.
What factors influenced performance?
The Fund’s stock selection and allocation decisions within the consumer discretionary sector were the largest detractors from relative performance. Among industries within the sector, overweight exposure to automobiles, underweight exposure to specialty retail, and stock selection in household durables weighed on relative returns. In utilities, an underweight exposure had a negative impact on relative returns during the market’s volatile period in the first quarter of 2020, as did the Fund’s stock selection within the electric utilities industry. In health care, stock selection decisions had an adverse impact on performance, most notably in the health care equipment & supplies and biotechnology industries. Lastly, an underweight exposure to materials, a combination of stock selection and allocation decisions in communication services, and stock selection in information technology hindered relative results.
The largest contribution to the Fund’s performance came from an underweight exposure to the real estate sector. In particular, a lack of exposure to equity real estate investment trusts benefited relative returns. A combination of stock selection and an underweight exposure to industrials also boosted relative performance, primarily due to stock selection among aerospace & defense stocks and an underweight exposure to airlines. In the consumer staples sector, stock selection among food products companies contributed to Fund performance. Lastly, the Fund’s use of equity-linked notes benefited the returns.
Describe recent portfolio activity.
The Fund increased its exposure to the health care sector during the period, along with holdings within utilities. The Fund reduced its exposure to the financials and energy sectors.
Describe portfolio positioning at period end.
The Fund ended the period with its largest absolute allocations in the financials, health care and energy sectors. Relative to the benchmark, the Fund’s largest overweight positions were in energy, health care and financials, while the largest relative underweights were in the industrials, real estate and materials sectors.
The views expressed reflect the opinions of BlackRock as of the date of this report and are subject to change based on changes in market, economic or other conditions. These views are not intended to be a forecast of future events and are no guarantee of future results.
| FUND SUMMARY | 7 |
| Fund Summary as of May 31, 2020 (continued) | BlackRock High Equity Income Fund |
TOTAL RETURN BASED ON $10,000 INVESTMENT

| (a) | Assuming maximum sales charges, if any, transaction costs and other operating expenses, including investment advisory fees and administration fees, if any. Institutional Shares do not have a sales charge. |
| (b) | Under normal circumstances, the Fund will invest at least 80% of its net assets, plus the amount of any borrowings for investment purposes, in equity securities and equity-related instruments, including equity-linked notes. The Fund may invest in securities of companies with any market capitalization, but will generally focus on large cap securities. The Fund’s total returns prior to June 12, 2017 are the returns of the Fund when it followed different investment strategies under the name BlackRock U.S. Opportunities Portfolio. |
| (c) | The Russell 1000® Value Index is an unmanaged index that is a subset of the Russell 1000® Index and consists of those Russell 1000® securities with lower price-to-book ratios and lower expected growth values. |
Performance Summary for the Period Ended May 31, 2020
| Average Annual Total Returns(a)(b) | ||||||||||||||||||||||||||||||||||||||||
| 1 Year | 5 Years | 10 Years | ||||||||||||||||||||||||||||||||||||||
| 6-Month Total Returns | Without Sales Charge | With Sales Charge | Without Sales Charge | With Sales Charge | Without Sales Charge | With Sales Charge | ||||||||||||||||||||||||||||||||||
Institutional | (13.18 | )% | (3.28 | )% | N/A | 2.15 | % | N/A | 8.74 | % | N/A | |||||||||||||||||||||||||||||
Service | (13.26 | ) | (3.48 | ) | N/A | 1.85 | N/A | 8.35 | N/A | |||||||||||||||||||||||||||||||
Investor A | (13.24 | ) | (3.47 | ) | (8.54 | )% | 1.86 | 0.76 | % | 8.34 | 7.76 | % | ||||||||||||||||||||||||||||
Investor C | (13.58 | ) | (4.14 | ) | (5.02 | ) | 1.10 | 1.10 | 7.54 | 7.54 | ||||||||||||||||||||||||||||||
Class K | (13.18 | ) | (3.27 | ) | N/A | 2.15 | N/A | 8.74 | N/A | |||||||||||||||||||||||||||||||
Russell 1000® Value Index | (13.38 | ) | (1.64 | ) | N/A | 4.36 | N/A | 9.85 | N/A | |||||||||||||||||||||||||||||||
| (a) | Assuming maximum sales charges, if any. Average annual total returns with and without sales charges reflect reductions for distribution and service fees. See “About Fund Performance” on page 13 for a detailed description of share classes, including any related sales charges and fees, and how performance was calculated for certain share classes. |
| (b) | Under normal circumstances, the Fund will invest at least 80% of its net assets, plus the amount of any borrowings for investment purposes, in equity securities and equity-related instruments, including equity-linked notes. The Fund may invest in securities of companies with any market capitalization, but will generally focus on large cap securities. The Fund’s total returns prior to June 12, 2017 are the returns of the Fund when it followed different investment strategies under the name BlackRock U.S. Opportunities Portfolio. |
N/A — Not applicable as share class and index do not have a sales charge.
Past performance is not indicative of future results.
Performance results may include adjustments made for financial reporting purposes in accordance with U.S. generally accepted accounting principles.
| 8 | 2020 BLACKROCK ANNUAL REPORTTO SHAREHOLDERS |
| Fund Summary as of May 31, 2020 (continued) | BlackRock High Equity Income Fund |
Expense Example
| Actual | Hypothetical(a) | |||||||||||||||||||||||||||||||
| | Beginning Account Value (12/01/19) |
| | Ending Account Value (05/31/20) |
| | Expenses Paid During the Period |
(b) | | Beginning Account Value (12/01/19) |
| | Ending Account Value (05/31/20) |
| | Expenses Paid During the Period |
(b) | | Annualized Expense Ratio |
| ||||||||||||
Institutional | $ 1,000.00 | $ 868.20 | $ 3.97 | $ 1,000.00 | $ 1,020.75 | $ 4.29 | 0.85 | % | ||||||||||||||||||||||||
Service | 1,000.00 | 867.40 | 5.14 | 1,000.00 | 1,019.50 | 5.55 | 1.10 | |||||||||||||||||||||||||
Investor A | 1,000.00 | 867.60 | 5.14 | 1,000.00 | 1,019.50 | 5.55 | 1.10 | |||||||||||||||||||||||||
Investor C | 1,000.00 | 864.20 | 8.62 | 1,000.00 | 1,015.75 | 9.32 | 1.85 | |||||||||||||||||||||||||
Class K | 1,000.00 | 868.20 | 3.74 | 1,000.00 | 1,021.00 | 4.04 | 0.80 | |||||||||||||||||||||||||
| (a) | Hypothetical 5% annual return before expenses is calculated by prorating the number of days in the most recent six-months divided by 366. |
| (b) | For each class of the Fund, expenses are equal to the annualized expense ratio for the class, multiplied by the average account value over the period, multiplied by 183/366 (to reflect the six-month period shown). |
See “Disclosure of Expenses” on page 13 for further information on how expenses were calculated.
Portfolio Information
| TEN LARGEST HOLDINGS |
| |||
| Security(a) | Percent of Net Assets | |||
Verizon Communications, Inc. | 5 | % | ||
Sanofi | 3 | |||
FirstEnergy Corp. | 3 | |||
Wells Fargo & Co. | 3 | |||
Pfizer, Inc. | 3 | |||
Williams Cos., Inc. | 2 | |||
CVS Health Corp. | 2 | |||
Unilever NV, NY Shares | 2 | |||
BP PLC | 2 | |||
Cisco Systems, Inc. | 2 | |||
| SECTOR ALLOCATION |
| |||||||
| Sector(b) | Percent of Net Assets | |||||||
Financials | 23 | % | ||||||
Health Care | 19 | |||||||
Energy | 11 | |||||||
Consumer Staples | 10 | |||||||
Communication Services | 9 | |||||||
Utilities | 9 | |||||||
Information Technology | 8 | |||||||
Industrials | 5 | |||||||
Consumer Discretionary | 4 | |||||||
Materials | 2 | |||||||
| (a) | Excludes short-term securities. |
| (b) | For Fund compliance purposes, the Fund’s industry classifications refer to one or more of the industry sub-classifications used by one or more widely recognized market indexes or ratings group indexes, and/or as defined by the investment adviser. These definitions may not apply for purposes of this report, which may combine such industry sub-classifications for reporting ease. |
| FUND SUMMARY | 9 |
| Fund Summary as of May 31, 2020 | BlackRock International Dividend Fund |
Investment Objective
BlackRock International Dividend Fund’s (the “Fund”) investment objective is to seek long-term total return and current income.
On November 13, 2019, the Board of Trustees of BlackRock FundsSM approved a change in the fiscal year-end of the Fund, effective as of May 31, 2020, from September 30 to May 31.
Portfolio Management Commentary
How did the Fund perform?
For the abbreviated annual reporting period from October 1, 2019 to May 31, 2020, the Fund’s Institutional, Service, Investor A, Investor C and Class K Shares returned 0.08%, (0.10)%, (0.08)%, (0.58)% and 0.09%, respectively, outperforming its benchmark, the MSCI All Country World Index (“ACWI”) ex-U.S., which returned (7.25)%.
What factors influenced performance?
An underweight exposure to the financial sector was the largest contributor to the Fund’s relative performance during the period. An overweight allocation to the health care sector and stock selection within industrials also added to Fund performance. Among individual stocks, the largest contributors were Denmark-based biotechnology company Novo Nordisk A/S, lifting equipment specialist Kone Oyj, and British American Tobacco PLC. These high-quality companies were resilient in a challenging market environment.
The largest detractor from relative performance was the Fund’s underweight exposure to, and negative stock selection in, consumer discretionary stocks. An underweight exposure to information technology (“IT”) and stock selection within communication services also detracted. Overweight exposure to Singapore’s United Overseas Bank Ltd. was the most significant detractor from Fund performance among individual stocks. A lack of exposure to Chinese internet stocks Alibaba Group Holding Ltd. and Tencent Holdings Ltd. also weighed on performance, as IT was the best-performing sector during the period.
Describe recent portfolio activity.
The Fund’s investment adviser was active in changing the portfolio due to the impact of the coronavirus pandemic during the second half of the period. The Fund added to its overweight exposure to consumer staples by initiating a position in household products company Reckitt Benckiser Group PLC as well as increasing position sizes across the beverages, food, household products, and personal products industries. The Fund also further increased its overweight exposure to health care, adding to positions in pharmaceuticals, health care providers and health care equipment.
In contrast, the Fund reduced its overweight exposure to industrials through the sale of conglomerate 3M Co. and by reducing positions across the air freight, aerospace and electrical equipment industries. Exposure to financials also decreased through the Fund’s sale of Sweden’s Svenska Handelsbanken AB.
Describe portfolio positioning at period end.
The Fund focuses on high-quality dividend-paying companies and at period end looked very different from its benchmark, the MSCI ACWI ex-U.S, in terms of portfolio positioning. The Fund ended the period with its most significant absolute and relative exposure to the health care and consumer staples sectors, specifically within the pharmaceutical, personal products and beverage industries. The Fund continued to have no exposure to energy, real estate or utilities. From a regional perspective, the Fund’s most significant exposure was to Europe ex-U.K., the United Kingdom, Canada and Asia.
The views expressed reflect the opinions of BlackRock as of the date of this report and are subject to change based on changes in market, economic or other conditions. These views are not intended to be a forecast of future events and are no guarantee of future results.
| 10 | 2020 BLACKROCK ANNUAL REPORTTO SHAREHOLDERS |
| Fund Summary as of May 31, 2020 (continued) | BlackRock International Dividend Fund |
TOTAL RETURN BASED ON $10,000 INVESTMENT
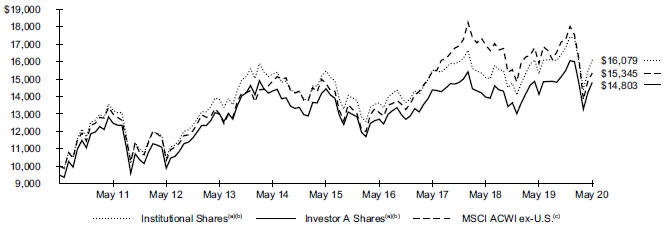
| (a) | Assuming maximum sales charges, if any, transaction costs and other operating expenses, including investment advisory fees and administration fees, if any. Institutional Shares do not have a sales charge. |
| (b) | Under normal circumstances, the Fund will invest at least 80% of its net assets, plus the amount of any borrowings for investment purposes, in dividend-paying equity securities issued by foreign companies of any market capitalization and derivatives that have similar economic characteristics to such securities. The Fund’s total returns prior to June 12, 2017 are the returns of the Fund when it followed different investment strategies under the name BlackRock International Opportunities Portfolio. |
| (c) | The MSCI ACWI ex-U.S. is a free float-adjusted market capitalization weighted index designed to measure the combined equity market performance of developed and emerging market countries, excluding the United States. |
Performance Summary for the Period Ended May 31, 2020
| Average Annual Total Returns(a)(b) | ||||||||||||||||||||||||||||||||||||||||
| 1 Year | 5 Years | 10 Years | ||||||||||||||||||||||||||||||||||||||
| 6-Month Total Returns | Without Sales Charge | With Sales Charge | Without Sales Charge | With Sales Charge | Without Sales Charge | With Sales Charge | ||||||||||||||||||||||||||||||||||
Institutional | (4.30 | )% | 5.09 | % | N/A | 0.78 | % | N/A | 4.86 | % | N/A | |||||||||||||||||||||||||||||
Service | (4.42 | ) | 4.85 | N/A | 0.50 | N/A | 4.51 | N/A | ||||||||||||||||||||||||||||||||
Investor A | (4.40 | ) | 4.83 | (0.67 | )% | 0.50 | (0.58 | )% | 4.56 | 4.00 | % | |||||||||||||||||||||||||||||
Investor C | (4.76 | ) | 4.07 | 3.07 | (0.25 | ) | (0.25 | ) | 3.78 | 3.78 | ||||||||||||||||||||||||||||||
Class K | (4.27 | ) | 5.14 | N/A | 0.81 | N/A | 4.88 | N/A | ||||||||||||||||||||||||||||||||
MSCI ACWI ex-U.S. | (11.16 | ) | (3.43 | ) | N/A | 0.79 | N/A | 4.38 | N/A | |||||||||||||||||||||||||||||||
| (a) | Assuming maximum sales charges, if any. Average annual total returns with and without sales charges reflect reductions for distribution and service fees. See “About Fund Performance” on page 13 for a detailed description of share classes, including any related sales charges and fees, and how performance was calculated for certain share classes. |
| (b) | Under normal circumstances, the Fund will invest at least 80% of its net assets, plus the amount of any borrowings for investment purposes, in dividend-paying equity securities issued by foreign companies of any market capitalization and derivatives that have similar economic characteristics to such securities. The Fund’s total returns prior to June 12, 2017 are the returns of the Fund when it followed different investment strategies under the name BlackRock International Opportunities Portfolio. |
N/A — Not applicable as share class and index do not have a sales charge.
Past performance is not indicative of future results.
Performance results may include adjustments made for financial reporting purposes in accordance with U.S. generally accepted accounting principles.
Expense Example
| Actual | Hypothetical(a) | |||||||||||||||||||||||||||||||
| | Beginning Account Value (12/01/19) |
| | Ending Account Value (05/31/20) |
| | Expenses Paid During the Period |
(b) | | Beginning Account Value (12/01/19) |
| | Ending Account Value (05/31/20) |
| | Expenses Paid During the Period |
(b) | | Annualized Expense Ratio |
| ||||||||||||
Institutional | $ 1,000.00 | $ 957.00 | $ 4.11 | $ 1,000.00 | $ 1,020.80 | $ 4.24 | 0.84 | % | ||||||||||||||||||||||||
Service | 1,000.00 | 955.80 | 5.33 | 1,000.00 | 1,019.55 | 5.50 | 1.09 | |||||||||||||||||||||||||
Investor A | 1,000.00 | 956.00 | 5.33 | 1,000.00 | 1,019.55 | 5.50 | 1.09 | |||||||||||||||||||||||||
Investor C | 1,000.00 | 952.40 | 8.98 | 1,000.00 | 1,015.80 | 9.27 | 1.84 | |||||||||||||||||||||||||
Class K | 1,000.00 | 957.30 | 3.87 | 1,000.00 | 1,021.05 | 3.99 | 0.79 | |||||||||||||||||||||||||
| (a) | Hypothetical 5% annual return before expenses is calculated by prorating the number of days in the most recent six-months divided by 366. |
| (b) | For each class of the Fund, expenses are equal to the annualized expense ratio for the class, multiplied by the average account value over the period, multiplied by 183/366 (to reflect the six-month period shown). |
See “Disclosure of Expenses” on page 13 for further information on how expenses were calculated.
| FUND SUMMARY | 11 |
| Fund Summary as of May 31, 2020 (continued) | BlackRock International Dividend Fund |
Portfolio Information
TEN LARGEST HOLDINGS
| Security(a) | Percent of Net Assets | |||
Unilever PLC | 6 | % | ||
Novartis AG, Registered Shares | 5 | |||
TELUS Corp. | 5 | |||
Nestlé SA, Registered Shares | 5 | |||
Sanofi | 5 | |||
British American Tobacco PLC | 4 | |||
Rogers Communications, Inc., Class B | 4 | |||
Amcor PLC, CDI | 4 | |||
Heineken NV | 4 | |||
GlaxoSmithKline PLC | 4 | |||
GEOGRAPHIC ALLOCATION
| Country | Percent of Net Assets | |||
United Kingdom | 28 | % | ||
Switzerland | 15 | |||
Canada | 10 | |||
Netherlands | 8 | |||
France | 7 | |||
Australia | 6 | |||
United States | 5 | |||
Singapore | 4 | |||
Denmark | 3 | |||
Finland | 3 | |||
Germany | 3 | |||
China | 3 | |||
Sweden | 3 | |||
Taiwan | 2 | |||
India | 1 | |||
Liabilities in Excess of Other Assets | (1 | ) | ||
| (a) | Excludes short-term securities. |
| 12 | 2020 BLACKROCK ANNUAL REPORTTO SHAREHOLDERS |
| About Fund Performance |
Institutional and Class K Shares (Class K Shares are available only for BlackRock High Equity Income Fund and BlackRock International Dividend Fund) are not subject to any sales charge. These shares bear no ongoing distribution or service fees and are available only to certain eligible investors. BlackRock High Equity Income Fund’s Class K Shares performance shown prior to the Class K Shares inception date of April 21, 2020 is that of Institutional Shares. BlackRock International Dividend Fund’s Class K Shares performance shown prior to the Class K Shares inception date of January 25, 2018 is that of Institutional Shares. The performance of each Fund’s Class K Shares would be substantially similar to Institutional Shares, because the share classes of a Fund invest in the same portfolio of securities and performance would only differ to the extent that Class K Shares and Institutional Shares have different expenses. The actual returns of Class K Shares would have been higher than those of Institutional Shares because Class K Shares have lower expenses than Institutional Shares.
Service Shares are not subject to any sales charge. These shares are subject to a service fee of 0.25% per year (but no distribution fee) and are only available to certain eligible investors.
Investor A Shares are subject to a maximum initial sales charge (front-end load) of 5.25% and a service fee of 0.25% per year (but no distribution fee). Certain redemptions of these shares may be subject to a contingent deferred sales charge (“CDSC”) where no initial sales charge was paid at the time of purchase. These shares are generally available through financial intermediaries.
Investor C Shares are subject to a 1.00% CDSC if redeemed within one year of purchase. In addition, these shares are subject to a distribution fee of 0.75% per year and a service fee of 0.25% per year. These shares are generally available through financial intermediaries. These shares automatically convert to Investor A Shares after approximately ten years.
Performance information reflects past performance and does not guarantee future results. Current performance may be lower or higher than the performance data quoted. Refer to blackrock.com to obtain performance data current to the most recent month-end. Performance results do not reflect the deduction of taxes that a shareholder would pay on Fund distributions or the redemption of Fund shares. Figures shown in the performance tables on the previous pages assume reinvestment of all distributions, if any, at net asset value (“NAV”) on the ex-dividend date or payable date, as applicable. Investment return and principal value of shares will fluctuate so that shares, when redeemed, may be worth more or less than their original cost. Distributions paid to each class of shares will vary because of the different levels of service, distribution and transfer agency fees applicable to each class, which are deducted from the income available to be paid to shareholders.
BlackRock Advisors, LLC (the “Manager”), each Fund’s investment adviser, has contractually agreed to waive and/or reimburse a portion of each Fund’s expenses. Without such waivers and/or reimbursements, each Fund’s performance would have been lower. With respect to each Fund’s contractual waivers, the Manager is under no obligation to continue waiving and/or reimbursing its fees after the applicable termination date of such agreement. See Note 6 of the Notes to Financial Statements for additional information on waivers and/or reimbursements.
Shareholders of the Funds may incur the following charges: (a) transactional expenses, such as sales charges; and (b) operating expenses, including investment advisory fees, administration fees, service and distribution fees, including 12b-1 fees, acquired fund fees and expenses and other fund expenses. The expense examples on the previous pages (which are based on a hypothetical investment of $1,000 invested on December 1, 2019 and held through May 31, 2020) are intended to assist shareholders both in calculating expenses based on an investment in each Fund and in comparing these expenses with similar costs of investing in other mutual funds.
The expense examples provide information about actual account values and actual expenses. In order to estimate the expenses a shareholder paid during the period covered by this report, shareholders can divide their account value by $1,000 and then multiply the result by the number corresponding to their Fund and share class under the heading entitled “Expenses Paid During the Period.”
The expense examples also provide information about hypothetical account values and hypothetical expenses based on a Fund’s actual expense ratio and an assumed rate of return of 5% per year before expenses. In order to assist shareholders in comparing the ongoing expenses of investing in these Funds and other funds, compare the 5% hypothetical examples with the 5% hypothetical examples that appear in shareholder reports of other funds.
The expenses shown in the expense examples are intended to highlight shareholders’ ongoing costs only and do not reflect transactional expenses, such as sales charges, if any. Therefore, the hypothetical examples are useful in comparing ongoing expenses only, and will not help shareholders determine the relative total expenses of owning different funds. If these transactional expenses were included, shareholder expenses would have been higher.
Derivative Financial Instruments
The Funds may invest in various derivative financial instruments. These instruments are used to obtain exposure to a security, commodity, index, market and/or other assets without owning or taking physical custody of securities, commodities and/or other referenced assets or to manage market, equity, credit, interest rate, foreign currency exchange rate, commodity and/or other risks. Derivative financial instruments may give rise to a form of economic leverage and involve risks, including the imperfect correlation between the value of a derivative financial instrument and the underlying asset, possible default of the counterparty to the transaction or illiquidity of the instrument. The Funds’ successful use of a derivative financial instrument depends on the investment adviser’s ability to predict pertinent market movements accurately, which cannot be assured. The use of these instruments may result in losses greater than if they had not been used, may limit the amount of appreciation a Fund can realize on an investment and/or may result in lower distributions paid to shareholders. The Funds’ investments in these instruments, if any, are discussed in detail in the Notes to Financial Statements.
| ABOUT FUND PERFORMANCE | 13 |
May 31, 2020 | BlackRock Energy Opportunities Fund (Percentages shown are based on Net Assets) |
| Security | Shares | Value | ||||||
Common Stocks | ||||||||
| Energy Equipment & Services — 4.2% | ||||||||
Baker Hughes Co. | 117,371 | $ | 1,937,795 | |||||
Poseidon Concepts Corp.(a) | 35,081 | 7 | ||||||
Schlumberger Ltd. | 172,760 | 3,190,877 | ||||||
|
| |||||||
| 5,128,679 | ||||||||
| Oil, Gas & Consumable Fuels — 91.1% | ||||||||
BP PLC | 2,324,242 | 8,887,728 | ||||||
Cairn Energy PLC(a) | 665,363 | 1,034,070 | ||||||
Canadian Natural Resources Ltd. | 102,958 | 1,880,665 | ||||||
Chevron Corp. | 156,817 | 14,380,119 | ||||||
CNOOC Ltd. | 1,067,000 | 1,219,006 | ||||||
Concho Resources, Inc. | 34,306 | 1,870,363 | ||||||
ConocoPhillips | 148,590 | 6,267,526 | ||||||
Enbridge, Inc. | 78,320 | 2,547,242 | ||||||
EOG Resources, Inc. | 67,930 | 3,462,392 | ||||||
Equinor ASA | 185,290 | 2,702,204 | ||||||
Exxon Mobil Corp. | 55,802 | 2,537,317 | ||||||
Galp Energia SGPS SA | 177,152 | 2,107,789 | ||||||
Gazprom PJSC, ADR | 79,500 | 446,454 | ||||||
Hess Corp. | 67,534 | 3,205,839 | ||||||
Kinder Morgan, Inc. | 323,236 | 5,107,129 | ||||||
Kosmos Energy Ltd. | 688,603 | 1,253,258 | ||||||
Longview Energy Co. (Acquired 8/13/04, | 85,400 | 125,538 | ||||||
LUKOIL PJSC, ADR | 10,660 | 800,937 | ||||||
Lundin Energy AB | 102,090 | 2,490,832 | ||||||
Marathon Petroleum Corp. | 74,381 | 2,613,748 | ||||||
Oil Search Ltd. | 495,312 | 1,151,611 | ||||||
Petroleo Brasileiro SA, ADR | 203,329 | 1,551,400 | ||||||
Pioneer Natural Resources Co. | 37,834 | 3,465,594 | ||||||
Royal Dutch Shell PLC, A Shares | 722,518 | 11,436,004 | ||||||
| Security | Shares | Value | ||||||
| Oil, Gas & Consumable Fuels (continued) | ||||||||
Santos Ltd. | 298,050 | $ | 1,067,749 | |||||
Suncor Energy, Inc. | 260,150 | 4,472,347 | ||||||
TC Energy Corp. | 117,153 | 5,279,692 | ||||||
TOTAL SA | 293,936 | 11,146,291 | ||||||
Valero Energy Corp. | 35,910 | 2,393,042 | ||||||
Williams Cos., Inc. | 252,739 | 5,163,458 | ||||||
|
| |||||||
| 112,067,344 | ||||||||
|
| |||||||
Total Long-Term Investments — 95.3% |
| 117,196,023 | ||||||
|
| |||||||
Short-Term Securities(d)(e) |
| |||||||
| Money Market Funds — 4.0% | ||||||||
BlackRock Liquidity Funds, T-Fund, Institutional Class, 0.11% | 4,933,763 | 4,933,763 | ||||||
|
| |||||||
Total Short-Term Securities — 4.0% |
| 4,933,763 | ||||||
|
| |||||||
Total Investments — 99.3% |
| 122,129,786 | ||||||
Other Assets Less Liabilities — 0.7% |
| 849,602 | ||||||
|
| |||||||
Net Assets — 100.0% |
| $ | 122,979,388 | |||||
|
| |||||||
| (a) | Non-income producing security. |
| (b) | Security is valued using significant unobservable inputs and is classified as Level 3 in the fair value hierarchy. |
| (c) | Restricted security as to resale, excluding 144A securities. The Fund held restricted securities with a current value of $125,538, representing 0.1% of its net assets as of period end, and an original cost of $1,281,000. |
| (d) | Affiliate of the Fund. |
| (e) | Annualized 7-day yield as of period end. |
Affiliates
Investments in issuers considered to be an affiliate/affiliates of the Fund during the period ended May 31, 2020 for purposes of Section 2(a)(3) of the Investment Company Act of 1940, as amended, were as follows:
Affiliated Issuer | | Shares Held at 09/30/19 |
| | Shares Purchased |
| | Shares Sold |
| | Shares Held at 05/31/20 |
| | Value at 05/31/20 |
| Income | | Net Realized Gain (Loss) |
(a) | | Change in Unrealized Appreciation (Depreciation) |
| ||||||||||
BlackRock Liquidity Funds, T-Fund, Institutional Class | 1,409,004 | 3,524,759 | (b) | — | 4,933,763 | $ | 4,933,763 | $ | 17,841 | $ | 4 | $ | — | |||||||||||||||||||
SL Liquidity Series, LLC, Money Market Series(c) | — | — | — | — | — | 12 | (d) | (32 | ) | — | ||||||||||||||||||||||
|
|
|
|
|
|
|
| |||||||||||||||||||||||||
| $ | 4,933,763 | $ | 17,853 | $ | (28 | ) | $ | — | ||||||||||||||||||||||||
|
|
|
|
|
|
|
|
| (a) | Includes net capital gain distributions, if applicable. |
| (b) | Represents net shares purchased (sold). |
| (c) | As of period end, the entity is no longer held by the Fund. |
| (d) | Represents securities lending income earned from the reinvestment of cash collateral from loaned securities, net of fees and collateral investment expenses, and other payments to and from borrowers of securities. |
| 14 | 2020 BLACKROCK ANNUAL REPORTTO SHAREHOLDERS |
Schedule of Investments (continued) May 31, 2020 | BlackRock Energy Opportunities Fund
|
For Fund compliance purposes, the Fund’s industry classifications refer to one or more of the industry sub-classifications used by one or more widely recognized market indexes or rating group indexes, and/or as defined by the investment adviser. These definitions may not apply for purposes of this report, which may combine such industry sub-classifications for reporting ease.
Fair Value Hierarchy as of Period End
Various inputs are used in determining the fair value of investments. For information about the Fund’s policy regarding valuation of investments, refer to the Notes to Financial Statements.
The following table summarizes the Fund’s investments categorized in the disclosure hierarchy:
| Level 1 | Level 2 | Level 3 | Total | |||||||||||||
Assets | ||||||||||||||||
Investments | ||||||||||||||||
Long-Term Investments | ||||||||||||||||
Common Stocks | ||||||||||||||||
Energy Equipment & Services | $ | 5,128,672 | $ | 7 | $ | — | $ | 5,128,679 | ||||||||
Oil, Gas & Consumable Fuels | 67,451,131 | 44,490,675 | 125,538 | 112,067,344 | ||||||||||||
Short-Term Securities | ||||||||||||||||
Money Market Funds | 4,933,763 | — | — | 4,933,763 | ||||||||||||
|
|
|
|
|
|
|
| |||||||||
| $ | 77,513,566 | $ | 44,490,682 | $ | 125,538 | $ | 122,129,786 | |||||||||
|
|
|
|
|
|
|
| |||||||||
See notes to financial statements.
| SCHEDULES OF INVESTMENTS | 15 |
Schedule of Investments May 31, 2020 | BlackRock High Equity Income Fund (Percentages shown are based on Net Assets) |
| Security | Shares | Value | ||||||
Common Stocks | ||||||||
| Aerospace & Defense — 1.1% | ||||||||
BAE Systems PLC | 599,467 | $ | 3,699,793 | |||||
|
| |||||||
| Air Freight & Logistics — 0.7% | ||||||||
United Parcel Service, Inc., Class B | 23,285 | 2,321,747 | ||||||
|
| |||||||
| Auto Components — 0.4% | ||||||||
Lear Corp. | 11,870 | 1,258,814 | ||||||
|
| |||||||
| Automobiles — 1.7% | ||||||||
General Motors Co. | 220,063 | 5,695,230 | ||||||
|
| |||||||
| Banks — 6.8% | ||||||||
Comerica, Inc. | 97,670 | 3,550,304 | ||||||
Regions Financial Corp. | 111,519 | 1,261,280 | ||||||
Truist Financial Corp. | 112,450 | 4,135,911 | ||||||
US Bancorp | 140,560 | 4,998,314 | ||||||
Wells Fargo & Co. | 326,382 | 8,639,332 | ||||||
|
| |||||||
| 22,585,141 | ||||||||
| Beverages — 0.3% | ||||||||
PepsiCo, Inc. | 6,597 | 867,835 | ||||||
|
| |||||||
| Biotechnology — 1.2% | ||||||||
Acerta Pharma BV, Series B (Acquired 05/06/15, cost $1,815,300)(a)(b)(c) | 31,555,035 | 4,152,327 | ||||||
|
| |||||||
| Capital Markets — 4.7% | ||||||||
Apollo Global Management, Inc. | 140,550 | 6,690,180 | ||||||
Blackstone Group, Inc., Class A | 25,740 | 1,462,032 | ||||||
CME Group, Inc. | 11,570 | 2,112,682 | ||||||
Morgan Stanley | 69,495 | 3,071,679 | ||||||
Northern Trust Corp. | 19,850 | 1,568,348 | ||||||
UBS Group AG | 77,730 | 831,711 | ||||||
|
| |||||||
| 15,736,632 | ||||||||
| Chemicals — 1.3% | ||||||||
Corteva, Inc. | 57,003 | 1,556,752 | ||||||
Dow, Inc. | 42,420 | 1,637,412 | ||||||
DuPont de Nemours, Inc. | 23,568 | 1,195,605 | ||||||
|
| |||||||
| 4,389,769 | ||||||||
| Communications Equipment — 2.0% | ||||||||
Cisco Systems, Inc. | 142,248 | 6,802,299 | ||||||
|
| |||||||
| Diversified Financial Services — 1.0% | ||||||||
Equitable Holdings, Inc. | 174,713 | 3,338,765 | ||||||
|
| |||||||
| Diversified Telecommunication Services — 6.3% | ||||||||
BCE, Inc. | 91,430 | 3,791,602 | ||||||
Verizon Communications, Inc. | 301,303 | 17,288,766 | ||||||
|
| |||||||
| 21,080,368 | ||||||||
| Electric Utilities — 4.2% | ||||||||
Edison International | 78,176 | 4,542,807 | ||||||
FirstEnergy Corp. | 221,187 | 9,347,363 | ||||||
|
| |||||||
| 13,890,170 | ||||||||
| Food Products — 1.7% | ||||||||
Conagra Brands, Inc. | 46,105 | 1,603,993 | ||||||
Kellogg Co. | 4 | 261 | ||||||
Kraft Heinz Co. | 135,162 | 4,118,386 | ||||||
|
| |||||||
| 5,722,640 | ||||||||
| Health Care Equipment & Supplies — 2.6% | ||||||||
Koninklijke Philips NV(b) | 73,997 | 3,364,125 | ||||||
Medtronic PLC | 53,071 | 5,231,739 | ||||||
|
| |||||||
| 8,595,864 | ||||||||
| Security | Shares | Value | ||||||
| Health Care Providers & Services — 4.1% | ||||||||
Anthem, Inc. | 18,286 | $ | 5,378,095 | |||||
Cardinal Health, Inc. | 16,900 | 924,261 | ||||||
CVS Health Corp. | 113,303 | 7,429,278 | ||||||
|
| |||||||
| 13,731,634 | ||||||||
| Household Durables — 0.9% | ||||||||
Newell Brands, Inc. | 218,999 | 2,879,837 | ||||||
|
| |||||||
| Household Products — 0.9% | ||||||||
Kimberly-Clark Corp. | 20,932 | 2,960,622 | ||||||
|
| |||||||
| Industrial Conglomerates — 1.7% | ||||||||
Siemens AG, Registered Shares | 51,856 | 5,717,371 | ||||||
|
| |||||||
| Insurance — 7.0% | ||||||||
American International Group, Inc. | 133,223 | 4,004,683 | ||||||
Arthur J. Gallagher & Co. | 40,105 | 3,781,100 | ||||||
CNA Financial Corp. | 49,618 | 1,499,952 | ||||||
Fidelity National Financial, Inc. | 140,542 | 4,483,290 | ||||||
MetLife, Inc. | 89,904 | 3,237,443 | ||||||
Prudential Financial, Inc. | 47,692 | 2,907,304 | ||||||
Swiss Re AG | 49,815 | 3,401,944 | ||||||
|
| |||||||
| 23,315,716 | ||||||||
| IT Services — 0.8% | ||||||||
International Business Machines Corp. | 21,034 | 2,627,147 | ||||||
|
| |||||||
| Multi-Utilities — 3.0% | ||||||||
Consolidated Edison, Inc. | 32,065 | 2,406,799 | ||||||
National Grid PLC, ADR(d) | 53,707 | 3,067,744 | ||||||
Public Service Enterprise Group, Inc. | 86,170 | 4,398,117 | ||||||
|
| |||||||
| 9,872,660 | ||||||||
| Oil, Gas & Consumable Fuels — 9.0% | ||||||||
BP PLC | 1,816,229 | 6,945,125 | ||||||
ConocoPhillips | 81,262 | 3,427,631 | ||||||
Kinder Morgan, Inc. | 271,620 | 4,291,596 | ||||||
Marathon Petroleum Corp. | 150,124 | 5,275,357 | ||||||
TOTAL SA, ADR | 61,682 | 2,318,010 | ||||||
Williams Cos., Inc. | 389,614 | 7,959,814 | ||||||
|
| |||||||
| 30,217,533 | ||||||||
| Personal Products — 2.2% | ||||||||
Unilever NV, NY Shares | 140,797 | 7,253,861 | ||||||
|
| |||||||
| Pharmaceuticals — 9.8% | ||||||||
AstraZeneca PLC | 20,904 | 2,251,347 | ||||||
Bayer AG, Registered Shares | 99,281 | 6,786,812 | ||||||
Bristol-Myers Squibb Co. | 47,717 | 2,849,659 | ||||||
Johnson & Johnson | 17,865 | 2,657,419 | ||||||
Pfizer, Inc. | 221,777 | 8,469,664 | ||||||
Sanofi | 100,363 | 9,816,990 | ||||||
|
| |||||||
| 32,831,891 | ||||||||
| Semiconductors & Semiconductor Equipment — 0.5% | ||||||||
QUALCOMM, Inc. | 21,984 | 1,778,066 | ||||||
|
| |||||||
| Technology Hardware, Storage & Peripherals — 1.8% | ||||||||
Samsung Electronics Co. Ltd., GDR | 5,855 | 6,043,457 | ||||||
|
| |||||||
| Tobacco — 3.2% | ||||||||
Altria Group, Inc. | 147,670 | 5,766,514 | ||||||
British American Tobacco PLC | 121,780 | 4,829,828 | ||||||
|
| |||||||
| 10,596,342 | ||||||||
| Wireless Telecommunication Services — 1.2% | ||||||||
China Mobile Ltd., ADR | 115,684 | 4,067,449 | ||||||
|
| |||||||
Total Common Stocks — 82.1% | 274,030,980 | |||||||
|
| |||||||
| 16 | 2020 BLACKROCK ANNUAL REPORTTO SHAREHOLDERS |
Schedule of Investments (continued) May 31, 2020 | BlackRock High Equity Income Fund (Percentages shown are based on Net Assets) |
| Security | Par (000) | Value | ||||||||||
Equity-Linked Notes | ||||||||||||
| Aerospace & Defense — 0.3% | ||||||||||||
JP Morgan Securities PLC (BAE Systems PLC) 19.19% 07/03/20 | GBP | 151,600 | $ | 940,097 | ||||||||
|
| |||||||||||
| Air Freight & Logistics — 0.5% | ||||||||||||
RBC Capital Markets LLC (United Parcel Service, Inc.) 24.94% 07/09/20 | USD | 15,600 | 1,538,995 | |||||||||
|
| |||||||||||
| Auto Components — 0.1% | ||||||||||||
BOFA Securities, Inc. (Lear Corp.) 24.99% 06/19/20 | 2,900 | 300,114 | ||||||||||
|
| |||||||||||
| Banks — 0.2% | ||||||||||||
BOFA Securities, Inc. (US Bancorp) 21.76% 07/02/20 | 24,100 | 835,378 | ||||||||||
|
| |||||||||||
| Beverages — 0.1% | ||||||||||||
BOFA Securities, Inc. (PepsiCo, Inc.) 23.58% 06/12/20 | 1,600 | 208,574 | ||||||||||
|
| |||||||||||
| Capital Markets — 1.5% | ||||||||||||
BOFA Securities, Inc. (Apollo Global Management, Inc.) 24.99% 07/02/20 | 35,500 | 1,586,753 | ||||||||||
BOFA Securities, Inc. (Blackstone Group, Inc.) 20.54% 07/02/20 | 6,400 | 345,336 | ||||||||||
BOFA Securities, Inc. (State Street Corp.) 24.99% 07/02/20 | 17,800 | 1,050,266 | ||||||||||
CIBC World Markets Corp. (CME Group, Inc.) 17.18% 06/26/20 | 7,700 | 1,401,390 | ||||||||||
JP Morgan Securities LLC (Morgan Stanley) 24.99% 06/19/20 | 17,500 | 739,798 | ||||||||||
|
| |||||||||||
| 5,123,543 | ||||||||||||
| Chemicals — 0.2% | ||||||||||||
RBC Capital Markets LLC (Corteva, Inc.) 21.59% 06/19/20 | 14,300 | 390,077 | ||||||||||
RBC Capital Markets LLC (DuPont de Nemours, Inc.) 20.97% 06/19/20 | 5,500 | 275,597 | ||||||||||
|
| |||||||||||
| 665,674 | ||||||||||||
| Communications Equipment — 0.5% | ||||||||||||
BMO Capital Markets Corp. (Cisco Systems, Inc.) 19.83% 06/26/20 | 40,700 | 1,813,784 | ||||||||||
|
| |||||||||||
| Containers & Packaging — 0.2% | ||||||||||||
JP Morgan Securities LLC (International Paper Co.) 24.99% 06/05/20 | 17,700 | 605,316 | ||||||||||
|
| |||||||||||
| Diversified Telecommunication Services — 1.6% | ||||||||||||
Citigroup Global Markets Inc. (Verizon Communications, Inc.) 15.25% 06/26/20 | 76,200 | 4,294,645 | ||||||||||
JP Morgan Securities LLC (BCE, Inc.) 19.63% 06/12/20 | 23,100 | 956,531 | ||||||||||
|
| |||||||||||
| 5,251,176 | ||||||||||||
| Electric Utilities — 1.2% | ||||||||||||
RBC Capital Markets LLC (Edison International) 21.73% 06/19/20 | 19,700 | 1,159,495 | ||||||||||
RBC Capital Markets LLC (FirstEnergy Corp.) 24.99% 06/05/20 | 65,700 | 2,787,756 | ||||||||||
|
| |||||||||||
| 3,947,251 | ||||||||||||
| Food Products — 0.7% | ||||||||||||
BOFA Securities, Inc. (Kraft Heinz Co.) 21.18% 07/02/20 | 34,100 | 1,024,882 | ||||||||||
CIBC World Markets Corp. (Kellogg Co.) 22.90% 06/26/20 | 9,100 | 596,064 | ||||||||||
RBC Capital Markets LLC (Conagra Brands, Inc.) 23.25% 06/19/20 | 17,500 | 609,970 | ||||||||||
|
| |||||||||||
| 2,230,916 | ||||||||||||
| Security | Par (000) | Value | ||||||||||
| Health Care Equipment & Supplies — 0.4% | ||||||||||||
BOFA Securities, Inc. (Medtronic PLC) 20.26% 06/12/20 | USD | 13,400 | $ | 1,317,707 | ||||||||
|
| |||||||||||
| Household Durables — 0.6% | ||||||||||||
BOFA Securities, Inc. (Newell Brands, Inc.) 24.99% 06/12/20 | 147,600 | 1,940,001 | ||||||||||
|
| |||||||||||
| Household Products — 0.6% | ||||||||||||
Credit Suisse Securities (USA) LLC (Kimberly-Clark Corp.) 21.05% 06/12/20 | 14,100 | 1,979,347 | ||||||||||
|
| |||||||||||
| Industrial Conglomerates — 0.4% | ||||||||||||
Credit Suisse Securities (USA) LLC (Siemens AG) 19.25% 07/03/20 | EUR | 13,100 | 1,282,941 | |||||||||
|
| |||||||||||
| Insurance — 1.8% | ||||||||||||
BOFA Securities, Inc. (American International Group, Inc.) 24.99% 07/02/20 | USD | 33,700 | 950,132 | |||||||||
CIBC World Markets Corp. (Fidelity National Financial, Inc.) 22.75% 06/05/20 | 17,700 | 526,286 | ||||||||||
CIBC World Markets Corp. (MetLife, Inc.) 22.42% 06/26/20 | 22,700 | 816,748 | ||||||||||
Credit Suisse Securities (USA) LLC (Arthur J. Gallagher & Co.) 23.80% 07/09/20 | 10,100 | 915,160 | ||||||||||
Credit Suisse Securities (USA) LLC (CNA Financial Corp.) 21.90% 06/12/20 | 33,400 | 1,010,701 | ||||||||||
JP Morgan Securities LLC (Prudential Financial, Inc.) 24.99% 07/09/20 | 32,100 | 1,941,948 | ||||||||||
|
| |||||||||||
| 6,160,975 | ||||||||||||
| IT Services — 0.5% | ||||||||||||
RBC Capital Markets LLC (International Business Machines Corp.) 24.38% 06/05/20 | 14,100 | 1,768,231 | ||||||||||
|
| |||||||||||
| Multi-Utilities — 0.5% | ||||||||||||
JP Morgan Securities LLC (Public Service Enterprise Group, Inc.) 22.62% 06/05/20 | 5,400 | 276,411 | ||||||||||
RBC Capital Markets LLC (Consolidated Edison, Inc.) 23.82% 06/19/20 | 8,000 | 609,485 | ||||||||||
RBC Capital Markets LLC (National Grid PLC) 18.22% 06/05/20 | 13,500 | 773,281 | ||||||||||
|
| |||||||||||
| 1,659,177 | ||||||||||||
| Oil, Gas & Consumable Fuels — 1.6% | ||||||||||||
BOFA Securities, Inc. (TOTAL SA) 24.99% 06/19/20 | 15,600 | 568,077 | ||||||||||
BOFA Securities, Inc. (Williams Cos., Inc.) 23.68% 07/02/20 | 109,200 | 2,188,843 | ||||||||||
CIBC World Markets Corp. (Conocophillips) 18.70% 06/26/20 | 20,500 | 855,582 | ||||||||||
Credit Suisse Securities (USA) LLC (BP PLC) 15.95% 07/03/20 | GBP | 459,500 | 1,733,632 | |||||||||
|
| |||||||||||
| 5,346,134 | ||||||||||||
| Personal Products — 0.2% | ||||||||||||
Credit Suisse Securities (USA) LLC (Unilever NV) 17.15% 06/12/20 | USD | 10,400 | 535,279 | |||||||||
|
| |||||||||||
| Pharmaceuticals — 1.3% | ||||||||||||
BMO Capital Markets Corp. (Pfizer, Inc.) 20.59% 06/26/20 | 56,000 | 2,096,887 | ||||||||||
JP Morgan Securities PLC (AstraZeneca PLC) 16.50% 07/03/20 | GBP | 5,200 | 546,840 | |||||||||
RBC Capital Markets LLC (Bristol-Myers Squibb Co.) 18.36% 06/19/20 | USD | 12,000 | 722,996 | |||||||||
RBC Capital Markets LLC (Johnson & Johnson) 18.80% 06/05/20 | 5,800 | 865,405 | ||||||||||
|
| |||||||||||
| 4,232,128 | ||||||||||||
| SCHEDULES OF INVESTMENTS | 17 |
Schedule of Investments (continued) May 31, 2020 | BlackRock High Equity Income Fund (Percentages shown are based on Net Assets) |
| Security | Par (000) | Value | ||||||||||
| Semiconductors & Semiconductor Equipment — 0.3% | ||||||||||||
JP Morgan Securities LLC (QUALCOMM, Inc.) 21.86% 07/02/20 | USD | 14,700 | $ | 1,179,254 | ||||||||
|
| |||||||||||
| Technology Hardware, Storage & Peripherals — 0.2% | ||||||||||||
JP Morgan Securities LLC (NetApp, Inc.) 19.56% 07/02/20 | 15,800 | 691,059 | ||||||||||
|
| |||||||||||
| Tobacco — 0.3% | ||||||||||||
CIBC World Markets Corp. (Altria Group, Inc.) 22.82% 06/05/20 | 30,000 | 1,172,935 | ||||||||||
|
| |||||||||||
| Wireless Telecommunication Services — 0.3% | ||||||||||||
CIBC World Markets Corp. (China Mobile Ltd.) 22.52% 06/26/20 | 29,200 |
| 1,038,222 |
| ||||||||
|
| |||||||||||
Total Equity-Linked Notes — 16.1% | 53,764,208 | |||||||||||
|
| |||||||||||
| Shares | ||||||||||||
Preferred Securities | ||||||||||||
Preferred Stocks — 1.4% | ||||||||||||
| Software — 1.4% | ||||||||||||
Palantir Technologies, Inc., Series I (Acquired 02/07/14, | 701,470 | 4,566,570 | ||||||||||
|
| |||||||||||
Total Preferred Securities — 1.4% |
| 4,566,570 | ||||||||||
|
| |||||||||||
Total Long-Term Investments — 99.6% |
| 332,361,758 | ||||||||||
|
| |||||||||||
| Security |
Shares | Value | ||||||
Short-Term Securities(e)(f) | ||||||||
| Money Market Funds — 0.5% | ||||||||
BlackRock Liquidity Funds, T-Fund, Institutional Class, 0.11% | 529,567 | $ | 529,567 | |||||
SL Liquidity Series, LLC, Money Market Series, 0.63%(g) | 938,664 | 939,602 | ||||||
|
| |||||||
Total Short-Term Securities — 0.5% |
| 1,469,169 | ||||||
|
| |||||||
Total Investments — 100.1% | 333,830,927 | |||||||
Liabilities in Excess of Other Assets — (0.1)% |
| (187,789 | ) | |||||
|
| |||||||
Net Assets — 100.0% | $ | 333,643,138 | ||||||
|
| |||||||
| (a) | Security is valued using significant unobservable inputs and is classified as Level 3 in the fair value hierarchy. |
| (b) | Non-income producing security. |
| (c) | Restricted security as to resale, excluding 144A securities. The Fund held restricted securities with a current value of $8,718,897, representing 2.6% of its net assets as of period end, and an original cost of $6,115,311. |
| (d) | All or a portion of this security is on loan. |
| (e) | Affiliate of the Fund. |
| (f) | Annualized 7-day yield as of period end. |
| (g) | All or a portion of this security was purchased with the cash collateral from loaned securities. |
Affiliates
Investments in issuers considered to be an affiliate/affiliates of the Fund during the period ended May 31, 2020 for purposes of Section 2(a)(3) of the Investment Company Act of 1940, as amended, were as follows:
| ||||||||||||||||||||||||||||||||
Affiliated Issuer | | Shares Held at 09/30/19 |
| | Shares Purchased |
| | Shares Sold |
| | Shares Held at 05/31/20 |
| | Value at 05/31/20 |
| Income | | Net Realized Gain (Loss) |
(a) | | Change in Unrealized Appreciation (Depreciation) |
| ||||||||||
| ||||||||||||||||||||||||||||||||
BlackRock Liquidity Funds, T-Fund, Institutional Class | 7,488,275 | — | (6,958,708 | )(b) | 529,567 | $ | 529,567 | $ | 60,948 | $ | 3 | $ | — | |||||||||||||||||||
SL Liquidity Series, LLC, Money Market Series | — | 938,664 | (b) | — | 938,664 | 939,602 | 7,473 | (c) | 89 | — | ||||||||||||||||||||||
|
|
|
|
|
|
|
| |||||||||||||||||||||||||
| $ | 1,469,169 | $ | 68,421 | $ | 92 | $ | — | |||||||||||||||||||||||||
|
|
|
|
|
|
|
| |||||||||||||||||||||||||
| (a) | Includes net capital gain distributions, if applicable. |
| (b) | Represents net shares purchased (sold). |
| (c) | Represents securities lending income earned from the reinvestment of cash collateral from loaned securities, net of fees and collateral investment expenses, and other payments to and from borrowers of securities. |
| 18 | 2020 BLACKROCK ANNUAL REPORTTO SHAREHOLDERS |
Schedule of Investments (continued) May 31, 2020 | BlackRock High Equity Income Fund
|
For Fund compliance purposes, the Fund’s sector classifications refer to one or more of the sector sub-classifications used by one or more widely recognized market indexes or rating group indexes, and/or as defined by the investment adviser. These definitions may not apply for purposes of this report, which may combine such sector sub-classifications for reporting ease.
Fair Value Hierarchy as of Period End
Various inputs are used in determining the fair value of investments. For information about the Fund’s policy regarding valuation of investments, refer to the Notes to Financial Statements.
The following table summarizes the Fund’s investments categorized in the disclosure hierarchy:
| Level 1 | Level 2 | Level 3 | Total | |||||||||||||
Assets | ||||||||||||||||
Investments | ||||||||||||||||
Long-Term Investments | ||||||||||||||||
Common Stocks | ||||||||||||||||
Aerospace & Defense | $ | — | $ | 3,699,793 | $ | — | $ | 3,699,793 | ||||||||
Air Freight & Logistics | 2,321,747 | — | — | 2,321,747 | ||||||||||||
Auto Components | 1,258,814 | — | — | 1,258,814 | ||||||||||||
Automobiles | 5,695,230 | — | — | 5,695,230 | ||||||||||||
Banks | 22,585,141 | — | — | 22,585,141 | ||||||||||||
Beverages | 867,835 | — | — | 867,835 | ||||||||||||
Biotechnology | — | — | 4,152,327 | 4,152,327 | ||||||||||||
Capital Markets | 15,736,632 | — | — | 15,736,632 | ||||||||||||
Chemicals | 4,389,769 | — | — | 4,389,769 | ||||||||||||
Communications Equipment | 6,802,299 | — | — | 6,802,299 | ||||||||||||
Diversified Financial Services | 3,338,765 | — | — | 3,338,765 | ||||||||||||
Diversified Telecommunication Services | 21,080,368 | — | — | 21,080,368 | ||||||||||||
Electric Utilities | 13,890,170 | — | — | 13,890,170 | ||||||||||||
Food Products | 5,722,640 | — | — | 5,722,640 | ||||||||||||
Health Care Equipment & Supplies | 5,231,739 | 3,364,125 | — | 8,595,864 | ||||||||||||
Health Care Providers & Services | 13,731,634 | — | — | 13,731,634 | ||||||||||||
Household Durables | 2,879,837 | — | — | 2,879,837 | ||||||||||||
Household Products | 2,960,622 | — | — | 2,960,622 | ||||||||||||
Industrial Conglomerates | — | 5,717,371 | — | 5,717,371 | ||||||||||||
Insurance | 19,913,772 | 3,401,944 | — | 23,315,716 | ||||||||||||
IT Services | 2,627,147 | — | — | 2,627,147 | ||||||||||||
Multi-Utilities | 9,872,660 | — | — | 9,872,660 | ||||||||||||
Oil, Gas & Consumable Fuels | 23,272,408 | 6,945,125 | — | 30,217,533 | ||||||||||||
Personal Products | 7,253,861 | — | — | 7,253,861 | ||||||||||||
Pharmaceuticals | 13,976,742 | 18,855,149 | — | 32,831,891 | ||||||||||||
Semiconductors & Semiconductor Equipment | 1,778,066 | — | — | 1,778,066 | ||||||||||||
Technology Hardware, Storage & Peripherals | — | 6,043,457 | — | 6,043,457 | ||||||||||||
Tobacco | 5,766,514 | 4,829,828 | — | 10,596,342 | ||||||||||||
Wireless Telecommunication Services | 4,067,449 | — | — | 4,067,449 | ||||||||||||
Equity-Linked Notes(a) | — | 53,764,208 | — | 53,764,208 | ||||||||||||
Preferred Securities(a) | — | — | 4,566,570 | 4,566,570 | ||||||||||||
Short-Term Securities | ||||||||||||||||
Money Market Funds | 529,567 | — | — | 529,567 | ||||||||||||
|
|
|
|
|
|
|
| |||||||||
| $ | 217,551,428 | $ | 106,621,000 | $ | 8,718,897 | 332,891,325 | ||||||||||
|
|
|
|
|
|
|
| |||||||||
Investments Valued at NAV(b) | 939,602 | |||||||||||||||
|
| |||||||||||||||
| $ | 333,830,927 | |||||||||||||||
|
| |||||||||||||||
| (a) | See above Schedule of Investments for values in each industry. |
| (b) | Certain investments of the Fund were fair valued using NAV per share as no quoted market value is available and therefore have been excluded from the fair value hierarchy. |
| SCHEDULES OF INVESTMENTS | 19 |
Schedule of Investments (continued) May 31, 2020 | BlackRock High Equity Income Fund |
A reconciliation of Level 3 investments is presented when the Fund had a significant amount of Level 3 investments at the beginning and/or end of the year in relation to net assets. The following table is a reconciliation of Level 3 investments for which significant unobservable inputs were used in determining fair value:
Common Stocks | Preferred Stocks | Equity-Linked Notes | Total | |||||||||||||
Assets | ||||||||||||||||
Opening balance, as of September 30, 2019 | $ | 8,895,657 | $ | 4,271,952 | $ | 11,822,546 | $ | 24,990,155 | ||||||||
Transfers into Level 3 | — | — | — | — | ||||||||||||
Transfers out of Level 3 | — | — | — | — | ||||||||||||
Other | — | — | — | — | ||||||||||||
Net realized gain (loss) | (3,498,184 | ) | — | (247,656 | ) | (3,745,840 | ) | |||||||||
Net change in unrealized appreciation (depreciation)(a)(b) | 2,856,399 | 294,618 | 45,004 | 3,196,021 | ||||||||||||
Purchases | — | — | — | — | ||||||||||||
Sales | (4,101,545 | ) | — | (11,619,894 | ) | (15,721,439 | ) | |||||||||
|
|
|
|
|
|
|
| |||||||||
Closing balance, as of May 31, 2020 | $ | 4,152,327 | �� | $ | 4,566,570 | $ | — | $ | 8,718,897 | |||||||
|
|
|
|
|
|
|
| |||||||||
Net change in unrealized appreciation (depreciation) on investments still held at May 31, 2020(b) | $ | 223,725 | $ | 294,618 | $ | — | $ | 518,343 | ||||||||
|
|
|
|
|
|
|
| |||||||||
| (a) | Included in the related net change in unrealized appreciation (depreciation) in the Statements of Operations. |
| (b) | Any difference between net change in unrealized appreciation (depreciation) and net change in unrealized appreciation (depreciation) on investments still held at May 31, 2020, is generally due to investments no longer held or categorized as Level 3 at period end. |
The following table summarizes the valuation approaches used and unobservable inputs utilized by the BlackRock Global Valuation Methodologies Committee (the “Global Valuation Committee”) to determine the value of certain of the Fund’s Level 3 investments as of period end.
| Value | Valuation Approach | Unobservable Inputs | Range of Unobservable Inputs Utilized(a) | |||||||||||||
Assets | ||||||||||||||||
Common Stocks | $ | 4,152,327 | Income | Discount Rate | 2% | |||||||||||
Preferred Securities | 4,566,570 | Market | Revenue Multiple | 16.00x | ||||||||||||
|
| |||||||||||||||
| $ | 8,718,897 | |||||||||||||||
|
| |||||||||||||||
| (a) | A significant change in unobservable input would have resulted in a correlated (inverse) significant change to value. |
See notes to financial statements.
| 20 | 2020 BLACKROCK ANNUAL REPORTTO SHAREHOLDERS |
Schedule of Investments May 31, 2020 | BlackRock International Dividend Fund (Percentages shown are based on Net Assets) |
| Security | Shares | Value | ||||||
Common Stocks | ||||||||
| Australia — 5.5% | ||||||||
Ansell Ltd. | 183,959 | $ | 4,317,145 | |||||
Sonic Healthcare Ltd. | 332,330 | 6,247,329 | ||||||
|
| |||||||
| 10,564,474 | ||||||||
| Canada — 9.5% | ||||||||
Rogers Communications, Inc., Class B | 197,863 | 8,291,895 | ||||||
TELUS Corp. | 575,240 | 9,968,570 | ||||||
|
| |||||||
| 18,260,465 | ||||||||
| Denmark — 3.5% | ||||||||
Novo Nordisk A/S, Class B | 101,707 | 6,662,284 | ||||||
|
| |||||||
| Finland — 3.4% | ||||||||
Kone Oyj, Class B | 96,401 | 6,479,815 | ||||||
|
| |||||||
| France — 6.7% | ||||||||
Sanofi | 90,006 | 8,803,922 | ||||||
Schneider Electric SE | 41,128 | 4,072,199 | ||||||
|
| |||||||
| 12,876,121 | ||||||||
| Germany — 3.0% | ||||||||
Deutsche Post AG, Registered Shares | 185,724 | 5,816,547 | ||||||
|
| |||||||
| India — 1.1% | ||||||||
Jasper Infotech Private Ltd. (Acquired 05/07/14, cost $7,423,816)(a)(b)(c) | 9,970 | 2,094,797 | ||||||
|
| |||||||
| Netherlands — 7.5% | ||||||||
Heineken NV | 82,862 | 7,586,593 | ||||||
Koninklijke Philips NV(b) | 148,743 | 6,762,300 | ||||||
|
| |||||||
| 14,348,893 | ||||||||
| Singapore — 4.3% | ||||||||
DBS Group Holdings Ltd. | 300,000 | 4,150,348 | ||||||
United Overseas Bank Ltd. | 302,500 | 4,189,771 | ||||||
|
| |||||||
| 8,340,119 | ||||||||
| Sweden — 2.6% | ||||||||
Tele2 AB, B Shares | 372,854 | 4,940,280 | ||||||
|
| |||||||
| Switzerland — 14.9% | ||||||||
Cie Financiere Richemont SA, Registered Shares | 68,385 | 4,019,652 | ||||||
Nestlé SA, Registered Shares | 90,859 | 9,865,203 | ||||||
Novartis AG, Registered Shares | 118,721 | 10,335,372 | ||||||
SGS SA, Registered Shares | 1,830 | 4,317,492 | ||||||
|
| |||||||
| 28,537,719 | ||||||||
| Taiwan — 2.3% | ||||||||
Taiwan Semiconductor Manufacturing Co. Ltd. | 447,000 | 4,345,410 | ||||||
|
| |||||||
| United Kingdom — 28.4% | ||||||||
AstraZeneca PLC | 49,553 | 5,336,826 | ||||||
| Security | Shares | Value | ||||||
| United Kingdom (continued) | ||||||||
BAE Systems PLC | 957,676 | $ | 5,910,588 | |||||
British American Tobacco PLC | 214,843 | 8,520,732 | ||||||
Diageo PLC | 156,704 | 5,467,363 | ||||||
GlaxoSmithKline PLC | 337,052 | 6,981,240 | ||||||
Reckitt Benckiser Group PLC | 73,779 | 6,608,103 | ||||||
RELX PLC | 206,568 | 4,767,166 | ||||||
Unilever PLC | 203,237 | 10,912,483 | ||||||
|
| |||||||
| 54,504,501 | ||||||||
| United States — 4.2% | ||||||||
Amcor PLC, CDI | 822,215 | 8,178,673 | ||||||
|
| |||||||
Total Common Stocks — 96.9% | 185,950,098 | |||||||
|
| |||||||
Preferred Securities | ||||||||
| Preferred Stocks — 2.7% | ||||||||
| China — 2.7% | ||||||||
Xiaoju Kuaizhi, Inc., Series A-17 (Acquired 07/28/15, | 101,000 | 5,139,890 | ||||||
|
| |||||||
Total Preferred Securities — 2.7% | 5,139,890 | |||||||
|
| |||||||
Total Long-Term Investments — 99.6% | 191,089,988 | |||||||
|
| |||||||
Short-Term Securities(d)(e) | ||||||||
| Money Market Funds — 1.1% | ||||||||
BlackRock Liquidity Funds, T-Fund, Institutional Class, 0.11% | 2,002,612 | 2,002,612 | ||||||
|
| |||||||
Total Short-Term Securities — 1.1% | 2,002,612 | |||||||
|
| |||||||
Total Investments — 100.7% | 193,092,600 | |||||||
Liabilities in Excess of Other Assets — (0.7)% |
| (1,247,003 | ) | |||||
|
| |||||||
Net Assets — 100.0% | $ | 191,845,597 | ||||||
|
| |||||||
| (a) | Security is valued using significant unobservable inputs and is classified as Level 3 in the fair value hierarchy. |
| (b) | Non-income producing security. |
| (c) | Restricted security as to resale, excluding 144A securities. The Fund held restricted securities with a current value of $7,234,687, representing 3.8% of its net assets as of period end, and an original cost of $10,193,862. |
| (d) | Affiliate of the Fund. |
| (e) | Annualized 7-day yield as of period end. |
Affiliates
Investments in issuers considered to be an affiliate/affiliates of the Fund during the period ended May 31, 2020 for purposes of Section 2(a)(3) of the Investment Company Act of 1940, as amended, were as follows:
| ||||||||||||||||||||||||||||||||
Affiliated Issuer | | Shares Held at 09/30/19 |
| | Shares Purchased |
| | Shares Sold |
| | Shares Held at 05/31/20 |
| | Value at 05/31/20 |
| Income | | Net Realized Gain (Loss) |
(a) | | Change in Unrealized Appreciation (Depreciation) |
| ||||||||||
| ||||||||||||||||||||||||||||||||
BlackRock Liquidity Funds, T-Fund, Institutional Class | — | 2,002,612 | (b) | — | 2,002,612 | $ | 2,002,612 | $ | 8,017 | $ | 1 | $ | — | |||||||||||||||||||
|
|
|
|
|
|
|
| |||||||||||||||||||||||||
| (a) | Includes net capital gain distributions, if applicable. |
| (b) | Represents net shares purchased (sold). |
| SCHEDULES OF INVESTMENTS | 21 |
Schedule of Investments (continued) May 31, 2020 | BlackRock International Dividend Fund |
Fair Value Hierarchy as of Period End
Various inputs are used in determining the fair value of investments. For information about the Fund’s policy regarding valuation of investments, refer to the Notes to Financial Statements.
The following table summarizes the Fund’s investments categorized in the disclosure hierarchy:
| Level 1 | Level 2 | Level 3 | Total | |||||||||||||
Assets | ||||||||||||||||
Investments | ||||||||||||||||
Long-Term Investments | ||||||||||||||||
Common Stocks | ||||||||||||||||
Australia | $ | — | $ | 10,564,474 | $ | — | $ | 10,564,474 | ||||||||
Canada | 18,260,465 | — | — | 18,260,465 | ||||||||||||
Denmark | — | 6,662,284 | — | 6,662,284 | ||||||||||||
Finland | — | 6,479,815 | — | 6,479,815 | ||||||||||||
France | — | 12,876,121 | — | 12,876,121 | ||||||||||||
Germany | — | 5,816,547 | — | 5,816,547 | ||||||||||||
India | — | — | 2,094,797 | 2,094,797 | ||||||||||||
Netherlands | 7,586,593 | 6,762,300 | — | 14,348,893 | ||||||||||||
Singapore | — | 8,340,119 | — | 8,340,119 | ||||||||||||
Sweden | — | 4,940,280 | — | 4,940,280 | ||||||||||||
Switzerland | — | 28,537,719 | — | 28,537,719 | ||||||||||||
Taiwan | — | 4,345,410 | — | 4,345,410 | ||||||||||||
United Kingdom | 4,767,166 | 49,737,335 | — | 54,504,501 | ||||||||||||
United States | — | 8,178,673 | — | 8,178,673 | ||||||||||||
Preferred Securities(a) | — | — | 5,139,890 | 5,139,890 | ||||||||||||
Short-Term Securities | ||||||||||||||||
Money Market Funds | 2,002,612 | — | — | 2,002,612 | ||||||||||||
|
|
|
|
|
|
|
| |||||||||
| $ | 32,616,836 | $ | 153,241,077 | $ | 7,234,687 | $ | 193,092,600 | |||||||||
|
|
|
|
|
|
|
| |||||||||
| (a) | See above Schedule of Investments for values in each country. |
A reconciliation of Level 3 investments is presented when the Fund had a significant amount of Level 3 investments at the beginning and/or end of the period in relation to net assets. The following table is a reconciliation of Level 3 investments for which significant unobservable inputs were used in determining fair value:
Common Stocks | Preferred Stocks | Total | ||||||||||
Assets | ||||||||||||
Opening balance, as of September 30, 2019 | $ | 2,530,785 | $ | 5,143,930 | $ | 7,674,715 | ||||||
Transfers into Level 3 | — | — | — | |||||||||
Transfers out of Level 3 | — | — | — | |||||||||
Other | — | — | — | |||||||||
Net realized gain (loss) | — | — | — | |||||||||
Net change in unrealized appreciation (depreciation)(a)(b) | (435,988 | ) | (4,040 | ) | (440,028 | ) | ||||||
Purchases | — | — | — | |||||||||
Sales | — | — | — | |||||||||
|
|
|
|
|
| |||||||
Closing balance, as of May 31, 2020 | $ | 2,094,797 | $ | 5,139,890 | $ | 7,234,687 | ||||||
|
|
|
|
|
| |||||||
Net change in unrealized appreciation (depreciation) on investments still held at May 31, 2020(b) | $ | (435,988 | ) | $ | (4,040 | ) | $ | (440,028 | ) | |||
|
|
|
|
|
| |||||||
| (a) | Included in the related net change in unrealized appreciation (depreciation) in the Statements of Operations. |
| (b) | Any difference between net change in unrealized appreciation (depreciation) and net change in unrealized appreciation (depreciation) on investments still held at May 31, 2020, is generally due to investments no longer held or categorized as Level 3 at period end. |
| 22 | 2020 BLACKROCK ANNUAL REPORTTO SHAREHOLDERS |
Schedule of Investments (continued) May 31, 2020 | BlackRock International Dividend Fund
|
The following table summarizes the valuation approaches used and unobservable inputs utilized by the BlackRock Global Valuation Methodologies Committee (the “Global Valuation Committee”) to determine the value of certain of the Fund’s Level 3 investments as of period end.
| Value | Valuation Approach | Unobservable Inputs | Range of Unobservable Inputs Utilized(a) | |||||||||||||
Assets | ||||||||||||||||
Common Stocks | $ | 2,094,797 | Market | Revenue Multiple | 5.75x | |||||||||||
Preferred Securities | 5,139,890 | Market | Revenue Multiple | 2.75x | ||||||||||||
|
| |||||||||||||||
| $ | 7,234,687 | |||||||||||||||
|
| |||||||||||||||
| (a) | A significant change in unobservable input would have resulted in a correlated (inverse) significant change to value. |
See notes to financial statements.
| SCHEDULES OF INVESTMENTS | 23 |
Statements of Assets and Liabilities
May 31, 2020
BlackRock Energy Opportunities Fund | BlackRock High Equity Income Fund | BlackRock International Dividend Fund | ||||||||||
ASSETS | ||||||||||||
Investments at value — unaffiliated(a)(b) | $ | 117,196,023 | $ | 332,361,758 | $ | 191,089,988 | ||||||
Investments at value — affiliated(c) | 4,933,763 | 1,469,169 | 2,002,612 | |||||||||
Cash | 31,997 | — | — | |||||||||
Foreign currency at value(d) | 44,420 | — | 175,641 | |||||||||
Receivables: | ||||||||||||
Investments sold | 735,722 | — | 13,164 | |||||||||
Securities lending income — affiliated | — | 354 | — | |||||||||
Capital shares sold | 607,241 | 218,565 | 188,842 | |||||||||
Dividends — affiliated | 529 | 969 | 279 | |||||||||
Dividends — unaffiliated | 813,068 | 1,572,809 | 1,476,071 | |||||||||
Interest — unaffiliated | — | 490,573 | — | |||||||||
From the Manager | 79,705 | 16,918 | 12,189 | |||||||||
Deferred offering costs | — | 12,793 | — | |||||||||
Prepaid expenses | 71,168 | 48,595 | 36,732 | |||||||||
|
|
|
|
|
| |||||||
Total assets | 124,513,636 | 336,192,503 | 194,995,518 | |||||||||
|
|
|
|
|
| |||||||
LIABILITIES | ||||||||||||
Cash collateral on securities loaned at value | — | 939,456 | — | |||||||||
Payables: | ||||||||||||
Investments purchased | 775,783 | — | 1,560,271 | |||||||||
Administration fees | 4,219 | 11,496 | 6,652 | |||||||||
Capital shares redeemed | 476,304 | 754,451 | 1,173,652 | |||||||||
Income dividend distributions | — | 207,151 | — | |||||||||
Investment advisory fees | 29,504 | 173,269 | 90,940 | |||||||||
Trustees’ and Officer’s fees | 2,121 | 2,383 | 2,213 | |||||||||
Other accrued expenses | 116,902 | 279,920 | 189,142 | |||||||||
Other affiliates | 1,984 | 2,890 | 8,394 | |||||||||
Service and distribution fees | 25,598 | 58,294 | 30,752 | |||||||||
Transfer agent fees | 101,833 | 120,055 | 87,905 | |||||||||
|
|
|
|
|
| |||||||
Total liabilities | 1,534,248 | 2,549,365 | 3,149,921 | |||||||||
|
|
|
|
|
| |||||||
NET ASSETS | $ | 122,979,388 | $ | 333,643,138 | $ | 191,845,597 | ||||||
|
|
|
|
|
| |||||||
NET ASSETS CONSIST OF | ||||||||||||
Paid-in capital | $ | 462,770,864 | $ | 382,096,608 | $ | 196,714,275 | ||||||
Accumulated loss | (339,791,476 | ) | (48,453,470 | ) | (4,868,678 | ) | ||||||
|
|
|
|
|
| |||||||
NET ASSETS | $ | 122,979,388 | $ | 333,643,138 | $ | 191,845,597 | ||||||
|
|
|
|
|
| |||||||
(a) Investments at cost — unaffiliated | $ | 140,862,068 | $ | 339,111,368 | $ | 182,907,932 | ||||||
(b) Securities loaned at value | $ | — | $ | 921,231 | $ | — | ||||||
(c) Investments at cost — affiliated | $ | 4,933,763 | $ | 1,469,054 | $ | 2,002,612 | ||||||
(d) Foreign currency at cost | $ | 44,252 | $ | — | $ | 174,999 | ||||||
| 24 | 2020 BLACKROCK ANNUAL REPORTTO SHAREHOLDERS |
Statements of Assets and Liabilities (continued)
May 31, 2020
BlackRock Energy Opportunities Fund | BlackRock High Equity Income Fund | BlackRock International Dividend Fund | ||||||||||
NET ASSET VALUE | ||||||||||||
| Institutional | ||||||||||||
Net assets | $ | 38,778,711 | $ | 128,474,326 | $ | 74,681,416 | ||||||
|
|
|
|
|
| |||||||
Shares outstanding | 5,839,539 | 5,631,715 | 2,645,730 | |||||||||
|
|
|
|
|
| |||||||
Net asset value | $ | 6.64 | $ | 22.81 | $ | 28.23 | ||||||
|
|
|
|
|
| |||||||
Shares authorized | Unlimited | Unlimited | Unlimited | |||||||||
|
|
|
|
|
| |||||||
Par value | $ | 0.001 | $ | 0.001 | $ | 0.001 | ||||||
|
|
|
|
|
| |||||||
| Service | ||||||||||||
Net assets | $ | 314,996 | $ | 8,022,544 | $ | 3,239,391 | ||||||
|
|
|
|
|
| |||||||
Shares outstanding | 48,468 | 392,180 | 121,328 | |||||||||
|
|
|
|
|
| |||||||
Net asset value | $ | 6.50 | $ | 20.46 | $ | 26.70 | ||||||
|
|
|
|
|
| |||||||
Shares authorized | Unlimited | Unlimited | Unlimited | |||||||||
|
|
|
|
|
| |||||||
Par value | $ | 0.001 | $ | 0.001 | $ | 0.001 | ||||||
|
|
|
|
|
| |||||||
| Investor A | ||||||||||||
Net assets | $ | 72,733,481 | $ | 172,695,569 | $ | 100,752,715 | ||||||
|
|
|
|
|
| |||||||
Shares outstanding | 11,254,770 | 9,023,850 | 3,837,053 | |||||||||
|
|
|
|
|
| |||||||
Net asset value | $ | 6.46 | $ | 19.14 | $ | 26.26 | ||||||
|
|
|
|
|
| |||||||
Shares authorized | Unlimited | Unlimited | Unlimited | |||||||||
|
|
|
|
|
| |||||||
Par value | $ | 0.001 | $ | 0.001 | $ | 0.001 | ||||||
|
|
|
|
|
| |||||||
| Investor C | ||||||||||||
Net assets | $ | 11,152,200 | $ | 24,162,892 | $ | 9,906,439 | ||||||
|
|
|
|
|
| |||||||
Shares outstanding | 1,788,056 | 2,017,406 | 433,590 | |||||||||
|
|
|
|
|
| |||||||
Net asset value | $ | 6.24 | $ | 11.98 | $ | 22.85 | ||||||
|
|
|
|
|
| |||||||
Shares authorized | Unlimited | Unlimited | Unlimited | |||||||||
|
|
|
|
|
| |||||||
Par value | $ | 0.001 | $ | 0.001 | $ | 0.001 | ||||||
|
|
|
|
|
| |||||||
| Class K | ||||||||||||
Net assets | $ | N/A | $ | 287,807 | $ | 3,265,636 | ||||||
|
|
|
|
|
| |||||||
Shares outstanding | N/A | 12,615 | 115,673 | |||||||||
|
|
|
|
|
| |||||||
Net asset value | $ | N/A | $ | 22.81 | $ | 28.23 | ||||||
|
|
|
|
|
| |||||||
Shares authorized | N/A | Unlimited | Unlimited | |||||||||
|
|
|
|
|
| |||||||
Par value | $ | N/A | $ | 0.001 | $ | 0.001 | ||||||
|
|
|
|
|
| |||||||
| Class R | ||||||||||||
Net assets | $ | — | $ | — | $ | — | ||||||
|
|
|
|
|
| |||||||
Shares outstanding | — | — | — | |||||||||
|
|
|
|
|
| |||||||
Net asset value | $ | — | $ | — | $ | — | ||||||
|
|
|
|
|
| |||||||
Shares authorized | Unlimited | Unlimited | Unlimited | |||||||||
|
|
|
|
|
| |||||||
Par value | $ | 0.001 | $ | 0.001 | $ | 0.001 | ||||||
|
|
|
|
|
| |||||||
See notes to financial statements.
| FINANCIAL STATEMENTS | 25 |
| BlackRock Energy Opportunities Fund | BlackRock High Equity Income Fund | |||||||||||||||||||||||
Period from 10/01/19 to 05/31/20 | Year Ended 09/30/19 | Period from 10/01/19 to 05/31/20 | Year Ended 09/30/19 | |||||||||||||||||||||
INVESTMENT INCOME | ||||||||||||||||||||||||
Dividends — unaffiliated | $ | 3,337,763 | $ | 2,751,264 | $ | 8,942,205 | $ | 13,001,985 | ||||||||||||||||
Dividends — affiliated | 17,841 | 27,401 | 60,948 | 143,013 | ||||||||||||||||||||
Interest — unaffiliated | 12 | 2 | 7,670,629 | 12,284,697 | ||||||||||||||||||||
Securities lending income — affiliated — net | 12 | 192 | 7,473 | 5 | ||||||||||||||||||||
Foreign taxes withheld | (219,643 | ) | (199,626 | ) | (289,326 | ) | (409,131 | ) | ||||||||||||||||
|
|
|
|
|
|
|
| |||||||||||||||||
Total investment income | 3,135,985 | 2,579,233 | 16,391,929 | 25,020,569 | ||||||||||||||||||||
|
|
|
|
|
|
|
| |||||||||||||||||
EXPENSES | ||||||||||||||||||||||||
Investment advisory | 480,221 | 516,031 | 2,056,441 | 3,583,635 | ||||||||||||||||||||
Transfer agent — class specific | 244,296 | 137,924 | 371,503 | 664,939 | ||||||||||||||||||||
Service and distribution — class specific | 158,199 | 202,196 | 544,892 | 1,078,844 | ||||||||||||||||||||
Professional | 104,382 | 70,475 | 102,290 | 90,520 | ||||||||||||||||||||
Reorganization | 56,433 | 3,067 | — | — | ||||||||||||||||||||
Registration | 55,077 | 65,025 | 64,241 | 65,260 | ||||||||||||||||||||
Printing | 30,418 | 29,681 | 35,524 | 70,661 | ||||||||||||||||||||
Accounting services | 27,984 | 40,058 | 38,617 | 60,981 | ||||||||||||||||||||
Administration | 27,212 | 29,241 | 107,900 | 187,963 | ||||||||||||||||||||
Administration — class specific | 12,795 | 13,766 | 50,804 | 88,555 | ||||||||||||||||||||
Custodian | 7,038 | 15,536 | 24,219 | 45,978 | ||||||||||||||||||||
Trustees and Officer | 4,464 | 11,396 | 8,069 | 18,373 | ||||||||||||||||||||
Offering | — | — | 7,318 | — | ||||||||||||||||||||
Board realignment and consolidation | — | 5,474 | — | 20,248 | ||||||||||||||||||||
Recoupment of past waived and/or reimbursed fees — class specific | — | 156 | — | — | ||||||||||||||||||||
Miscellaneous | 11,823 | 5,688 | 20,419 | 47,799 | ||||||||||||||||||||
|
|
|
|
|
|
|
| |||||||||||||||||
Total expenses | 1,220,342 | 1,145,714 | 3,432,237 | 6,023,756 | ||||||||||||||||||||
Less: | ||||||||||||||||||||||||
Fees waived and/or reimbursed by the Manager | (222,231 | ) | (162,379 | ) | (327,480 | ) | (432,566 | ) | ||||||||||||||||
Administration fees waived — class specific | (12,785 | ) | (13,384 | ) | (50,804 | ) | (88,555 | ) | ||||||||||||||||
Transfer agent fees waived and/or reimbursed — class specific | (174,625 | ) | (58,425 | ) | (350,970 | ) | (657,994 | ) | ||||||||||||||||
|
|
|
|
|
|
|
| |||||||||||||||||
Total expenses after fees waived and/or reimbursed | 810,701 | 911,526 | 2,702,983 | 4,844,641 | ||||||||||||||||||||
|
|
|
|
|
|
|
| |||||||||||||||||
Net investment income | 2,325,284 | 1,667,707 | 13,688,946 | 20,175,928 | ||||||||||||||||||||
|
|
|
|
|
|
|
| |||||||||||||||||
REALIZED AND UNREALIZED GAIN (LOSS) | ||||||||||||||||||||||||
Net realized gain (loss) from: | ||||||||||||||||||||||||
Investments — unaffiliated | (16,832,024 | ) | (2,067,030 | ) | (24,146,065 | ) | (6,719,585 | ) | ||||||||||||||||
Investments — affiliated | (32 | ) | 5 | 89 | — | |||||||||||||||||||
Capital gain distributions from investment companies — affiliated | 4 | — | 3 | — | ||||||||||||||||||||
Forward foreign currency exchange contracts | — | 327 | — | (313 | ) | |||||||||||||||||||
Foreign currency transactions | (3,572 | ) | (165 | ) | (368,777 | ) | 216,345 | |||||||||||||||||
|
|
|
|
|
|
|
| |||||||||||||||||
| (16,835,624 | ) | (2,066,863 | ) | (24,514,750 | ) | (6,503,553 | ) | |||||||||||||||||
|
|
|
|
|
|
|
| |||||||||||||||||
Net change in unrealized appreciation (depreciation) on: | ||||||||||||||||||||||||
Investments — unaffiliated | (29,544,596 | ) | (15,752,600 | ) | (31,411,256 | ) | (11,278,318 | ) | ||||||||||||||||
Investments — affiliated | — | — | 115 | — | ||||||||||||||||||||
Foreign currency translations | 1,253 | (1,278 | ) | 8,246 | (66,061 | ) | ||||||||||||||||||
|
|
|
|
|
|
|
| |||||||||||||||||
| (29,543,343 | ) | (15,753,878 | ) | (31,402,895 | ) | (11,344,379 | ) | |||||||||||||||||
|
|
|
|
|
|
|
| |||||||||||||||||
Net realized and unrealized loss | (46,378,967 | ) | (17,820,741 | ) | (55,917,645 | ) | (17,847,932 | ) | ||||||||||||||||
|
|
|
|
|
|
|
| |||||||||||||||||
NET INCREASE (DECREASE) IN NET ASSETS RESULTING FROM OPERATIONS | $ | (44,053,683 | ) | $ | (16,153,034 | ) | $ | (42,228,699 | ) | $ | 2,327,996 | |||||||||||||
|
|
|
|
|
|
|
| |||||||||||||||||
See notes to financial statements.
| 26 | 2020 BLACKROCK ANNUAL REPORTTO SHAREHOLDERS |
Statements of Operations (continued)
| BlackRock International Dividend Fund | ||||||||||||
Period from 10/01/19 to 05/31/20 | Year Ended 09/30/19 | |||||||||||
INVESTMENT INCOME | ||||||||||||
Dividends — unaffiliated | $ | 4,666,897 | $ | 8,946,214 | ||||||||
Dividends — affiliated | 8,017 | 16,491 | ||||||||||
Securities lending income — affiliated — net | — | 2,590 | ||||||||||
Foreign taxes withheld | (352,443 | ) | (688,155 | ) | ||||||||
|
|
|
| |||||||||
Total investment income | 4,322,471 | 8,277,140 | ||||||||||
|
|
|
| |||||||||
EXPENSES | ||||||||||||
Investment advisory | 1,126,562 | 1,940,282 | ||||||||||
Transfer agent — class specific | 236,092 | 377,291 | ||||||||||
Service and distribution — class specific | 280,257 | 541,383 | ||||||||||
Professional | 111,277 | 85,538 | ||||||||||
Registration | 63,970 | 73,362 | ||||||||||
Printing | 46,726 | 101,350 | ||||||||||
Accounting services | 32,386 | 49,959 | ||||||||||
Administration | 60,606 | 104,382 | ||||||||||
Administration — class specific | 28,539 | 49,165 | ||||||||||
Custodian | 21,596 | 31,715 | ||||||||||
Trustees and Officer | 8,044 | 14,675 | ||||||||||
Offering | — | 16,687 | ||||||||||
Board realignment and consolidation | — | 15,180 | ||||||||||
Recoupment of past waived and/or reimbursed fees — class specific | 72 | 598 | ||||||||||
Miscellaneous | 19,058 | 13,809 | ||||||||||
|
|
|
| |||||||||
Total expenses | 2,035,185 | 3,415,376 | ||||||||||
Less: | ||||||||||||
Fees waived and/or reimbursed by the Manager | (363,644 | ) | (503,538 | ) | ||||||||
Administration fees waived — class specific | (28,476 | ) | (48,663 | ) | ||||||||
Transfer agent fees waived and/or reimbursed — class specific | (165,615 | ) | (252,067 | ) | ||||||||
|
|
|
| |||||||||
Total expenses after fees waived and/or reimbursed | 1,477,450 | 2,611,108 | ||||||||||
|
|
|
| |||||||||
Net investment income | 2,845,021 | 5,666,032 | ||||||||||
|
|
|
| |||||||||
REALIZED AND UNREALIZED GAIN (LOSS) | ||||||||||||
Net realized gain (loss) from: | ||||||||||||
Investments — unaffiliated | (11,413,995 | ) | (1,110,254 | ) | ||||||||
Investments — affiliated | — | (525 | ) | |||||||||
Capital gain distributions from investment companies — affiliated | 1 | — | ||||||||||
Forward foreign currency exchange contracts | — | 417 | ||||||||||
Foreign currency transactions | (64,146 | ) | (98,510 | ) | ||||||||
|
|
|
| |||||||||
| (11,478,140 | ) | (1,208,872 | ) | |||||||||
|
|
|
| |||||||||
Net change in unrealized appreciation (depreciation) on: | ||||||||||||
Investments — unaffiliated | 9,362,341 | 2,037,431 | ||||||||||
Foreign currency translations | 58,108 | (50,283 | ) | |||||||||
|
|
|
| |||||||||
| 9,420,449 | 1,987,148 | |||||||||||
|
|
|
| |||||||||
Net realized and unrealized gain (loss) | (2,057,691 | ) | 778,276 | |||||||||
|
|
|
| |||||||||
NET INCREASE IN NET ASSETS RESULTING FROM OPERATIONS | $ | 787,330 | $ | 6,444,308 | ||||||||
|
|
|
| |||||||||
See notes to financial statements.
| FINANCIAL STATEMENTS | 27 |
Statements of Changes in Net Assets
| BlackRock Energy Opportunities Fund | BlackRock High Equity Income Fund | |||||||||||||||||||||||||||
| Period from | Period from | |||||||||||||||||||||||||||
| 10/01/19 | Year Ended September 30, | 10/01/19 | Year Ended September 30, | |||||||||||||||||||||||||
| to 05/31/20 | 2019 | 2018 | to 05/31/20 | 2019 | 2018 | |||||||||||||||||||||||
INCREASE (DECREASE) IN NET ASSETS | ||||||||||||||||||||||||||||
OPERATIONS | ||||||||||||||||||||||||||||
Net investment income | $ | 2,325,284 | $ | 1,667,707 | $ | 1,240,184 | $ | 13,688,946 | $ | 20,175,928 | $ | 31,352,717 | ||||||||||||||||
Net realized gain (loss) | (16,835,624 | ) | (2,066,863 | ) | 4,631,867 | (24,514,750 | ) | (6,503,553 | ) | 19,319,756 | ||||||||||||||||||
Net change in unrealized appreciation (depreciation) | (29,543,343 | ) | (15,753,878 | ) | 4,804,889 | (31,402,895 | ) | (11,344,379 | ) | (147,316 | ) | |||||||||||||||||
|
|
|
|
|
|
|
|
|
|
|
| |||||||||||||||||
Net increase (decrease) in net assets resulting from operations | (44,053,683 | ) | (16,153,034 | ) | 10,676,940 | (42,228,699 | ) | 2,327,996 | 50,525,157 | |||||||||||||||||||
|
|
|
|
|
|
|
|
|
|
|
| |||||||||||||||||
DISTRIBUTIONS TO SHAREHOLDERS(a) | ||||||||||||||||||||||||||||
Institutional | (816,189 | ) | (495,974 | ) | (495,032 | ) | (6,556,434 | ) | (14,273,425 | ) | (15,561,974 | ) | ||||||||||||||||
Service | (13,464 | ) | (12,604 | ) | (15,288 | ) | (459,139 | ) | (938,768 | ) | (730,528 | ) | ||||||||||||||||
Investor A | (914,901 | ) | (998,577 | ) | (1,116,732 | ) | (9,928,356 | ) | (19,307,342 | ) | (11,718,874 | ) | ||||||||||||||||
Investor B | — | — | — | — | — | (3,922 | ) | |||||||||||||||||||||
Investor C | (141,501 | ) | (71,490 | ) | (477,396 | ) | (2,032,197 | ) | (7,759,253 | ) | (6,763,577 | ) | ||||||||||||||||
Class K | — | — | — | (2,364 | ) | — | — | |||||||||||||||||||||
|
|
|
|
|
|
|
|
|
|
|
| |||||||||||||||||
Decrease in net assets resulting from distributions to shareholders | (1,886,055 | ) | (1,578,645 | ) | (2,104,448 | ) | (18,978,490 | ) | (42,278,788 | ) | (34,778,875 | ) | ||||||||||||||||
|
|
|
|
|
|
|
|
|
|
|
| |||||||||||||||||
CAPITAL SHARE TRANSACTIONS | ||||||||||||||||||||||||||||
Net increase (decrease) in net assets derived from capital share transactions | 102,761,416 | (2,487,880 | ) | (9,313,635 | ) | (18,173,074 | ) | (115,715,731 | ) | (329,777,732 | ) | |||||||||||||||||
|
|
|
|
|
|
|
|
|
|
|
| |||||||||||||||||
NET ASSETS | ||||||||||||||||||||||||||||
Total increase (decrease) in net assets | 56,821,678 | (20,219,559 | ) | (741,143 | ) | (79,380,263 | ) | (155,666,523 | ) | (314,031,450 | ) | |||||||||||||||||
Beginning of period | 66,157,710 | 86,377,269 | 87,118,412 | 413,023,401 | 568,689,924 | 882,721,374 | ||||||||||||||||||||||
|
|
|
|
|
|
|
|
|
|
|
| |||||||||||||||||
End of period | $ | 122,979,388 | $ | 66,157,710 | $ | 86,377,269 | $ | 333,643,138 | $ | 413,023,401 | $ | 568,689,924 | ||||||||||||||||
|
|
|
|
|
|
|
|
|
|
|
| |||||||||||||||||
| (a) | Distributions for annual periods determined in accordance with U.S. federal income tax regulations. |
See notes to financial statements.
| 28 | 2020 BLACKROCK ANNUAL REPORTTO SHAREHOLDERS |
Statements of Changes in Net Assets (continued)
| BlackRock International Dividend Fund | ||||||||||||
| Period from | ||||||||||||
| 10/01/19 | Year Ended September 30, | |||||||||||
| to 05/31/20 | 2019 | 2018 | ||||||||||
INCREASE (DECREASE) IN NET ASSETS | ||||||||||||
OPERATIONS | ||||||||||||
Net investment income | $ | 2,845,021 | $ | 5,666,032 | $ | 8,285,987 | ||||||
Net realized gain (loss) | (11,478,140 | ) | (1,208,872 | ) | 10,597,600 | |||||||
Net change in unrealized appreciation (depreciation) | 9,420,449 | 1,987,148 | (29,545,674 | ) | ||||||||
|
|
|
|
|
| |||||||
Net increase (decrease) in net assets resulting from operations | 787,330 | 6,444,308 | (10,662,087 | ) | ||||||||
|
|
|
|
|
| |||||||
DISTRIBUTIONS TO SHAREHOLDERS(a) | ||||||||||||
Institutional | (1,285,194 | ) | (4,812,078 | ) | (6,666,341 | ) | ||||||
Service | (48,355 | ) | (201,787 | ) | (253,271 | ) | ||||||
Investor A | (1,779,666 | ) | (7,373,881 | ) | (7,765,879 | ) | ||||||
Investor B | — | — | (86 | ) | ||||||||
Investor C | (150,614 | ) | (1,251,082 | ) | (1,777,012 | ) | ||||||
Class K | (60,650 | ) | (190,815 | ) | (68,313 | ) | ||||||
|
|
|
|
|
| |||||||
Decrease in net assets resulting from distributions to shareholders | (3,324,479 | ) | (13,829,643 | ) | (16,530,902 | ) | ||||||
|
|
|
|
|
| |||||||
CAPITAL SHARE TRANSACTIONS | ||||||||||||
Net decrease in net assets derived from capital share transactions | (36,475,196 | ) | (49,101,794 | ) | (269,810,738 | ) | ||||||
|
|
|
|
|
| |||||||
NET ASSETS | ||||||||||||
Total decrease in net assets | (39,012,345 | ) | (56,487,129 | ) | (297,003,727 | ) | ||||||
Beginning of period | 230,857,942 | 287,345,071 | 584,348,798 | |||||||||
|
|
|
|
|
| |||||||
End of period | $ | 191,845,597 | $ | 230,857,942 | $ | 287,345,071 | ||||||
|
|
|
|
|
| |||||||
| (a) | Distributions for annual periods determined in accordance with U.S. federal income tax regulations. |
See notes to financial statements.
| FINANCIAL STATEMENTS | 29 |
(For a share outstanding throughout each period)
| BlackRock Energy Opportunities Fund | ||||||||||||||||||||||||
| Institutional | ||||||||||||||||||||||||
| Period from | ||||||||||||||||||||||||
| 10/01/19 | Year Ended September 30, | |||||||||||||||||||||||
| to 05/31/20 | 2019 | 2018 | 2017 | 2016 | 2015 | |||||||||||||||||||
Net asset value, beginning of period | $ | 9.66 | $ | 12.34 | $ | 11.13 | $ | 11.06 | $ | 9.91 | $ | 16.26 | ||||||||||||
|
|
|
|
|
|
|
|
|
|
|
| |||||||||||||
Net investment income(a) | 0.21 | 0.29 | 0.23 | 0.31 | (b) | 0.22 | 0.23 | |||||||||||||||||
Net realized and unrealized gain (loss) | (2.93 | ) | (2.66 | ) | 1.30 | 0.04 | 1.17 | (6.34 | ) | |||||||||||||||
|
|
|
|
|
|
|
|
|
|
|
| |||||||||||||
Net increase (decrease) from investment operations | (2.72 | ) | (2.37 | ) | 1.53 | 0.35 | 1.39 | (6.11 | ) | |||||||||||||||
|
|
|
|
|
|
|
|
|
|
|
| |||||||||||||
Distributions from net investment income(c) | (0.30 | ) | (0.31 | ) | (0.32 | ) | (0.28 | ) | (0.24 | ) | (0.24 | ) | ||||||||||||
|
|
|
|
|
|
|
|
|
|
|
| |||||||||||||
Net asset value, end of period | $ | 6.64 | $ | 9.66 | $ | 12.34 | $ | 11.13 | $ | 11.06 | $ | 9.91 | ||||||||||||
|
|
|
|
|
|
|
|
|
|
|
| |||||||||||||
Total Return(d) | ||||||||||||||||||||||||
Based on net asset value | (29.02 | )%(e) | (19.24 | )% | 14.08 | % | 2.98 | % | 14.33 | % | (37.94 | )% | ||||||||||||
|
|
|
|
|
|
|
|
|
|
|
| |||||||||||||
Ratios to Average Net Assets | ||||||||||||||||||||||||
Total expenses | 1.40 | %(f)(g) | 1.30 | % | 1.29 | % | 1.25 | % | 1.18 | % | 1.11 | %(h) | ||||||||||||
|
|
|
|
|
|
|
|
|
|
|
| |||||||||||||
Total expenses after fees waived and/or reimbursed | 0.91 | %(f)(g) | 0.91 | % | 0.92 | % | 0.91 | % | 0.95 | % | 0.96 | % | ||||||||||||
|
|
|
|
|
|
|
|
|
|
|
| |||||||||||||
Net investment income | 3.89 | %(f) | 2.91 | % | 1.97 | % | 2.89 | %(b) | 2.16 | % | 1.75 | % | ||||||||||||
|
|
|
|
|
|
|
|
|
|
|
| |||||||||||||
Supplemental Data | ||||||||||||||||||||||||
Net assets, end of period (000) | $ | 38,779 | $ | 23,579 | $ | 22,255 | $ | 18,703 | $ | 25,123 | $ | 20,753 | ||||||||||||
|
|
|
|
|
|
|
|
|
|
|
| |||||||||||||
Portfolio turnover rate | 39 | % | 37 | % | 37 | % | 14 | % | 66 | % | 51 | % | ||||||||||||
|
|
|
|
|
|
|
|
|
|
|
| |||||||||||||
| (a) | Based on average shares outstanding. |
| (b) | Net investment income per share and the ratio of net investment income to average net assets includes $0.10 per share and 0.92%, respectively, resulting from a special dividend. |
| (c) | Distributions for annual periods determined in accordance with U.S. federal income tax regulations. |
| (d) | Where applicable, assumes the reinvestment of distributions. |
| (e) | Aggregate total return. |
| (f) | Annualized. |
| (g) | Reorganization, Audit and Printing costs were not annualized in the calculation of the expense ratios. If these expenses were annualized, the total expenses and total expenses after fees waived and/or reimbursed would have been 1.47% and 0.91%, respectively. |
| (h) | Includes recoupment of past waived and/or reimbursed fees with no financial impact to the expense ratios. |
See notes to financial statements.
| 30 | 2020 BLACKROCK ANNUAL REPORTTO SHAREHOLDERS |
Financial Highlights (continued)
(For a share outstanding throughout each period)
| BlackRock Energy Opportunities Fund (continued) | ||||||||||||||||||||||||
| Service | ||||||||||||||||||||||||
| Period from | ||||||||||||||||||||||||
| 10/01/19 | Year Ended September 30, | |||||||||||||||||||||||
| to 05/31/20 | 2019 | 2018 | 2017 | 2016 | 2015 | |||||||||||||||||||
Net asset value, beginning of period | $ | 9.44 | $ | 12.05 | $ | 10.88 | $ | 10.81 | $ | 9.65 | $ | 15.81 | ||||||||||||
|
|
|
|
|
|
|
|
|
|
|
| |||||||||||||
Net investment income(a) | 0.17 | 0.23 | 0.17 | 0.25 | (b) | 0.17 | 0.17 | |||||||||||||||||
Net realized and unrealized gain (loss) | (2.85 | ) | (2.59 | ) | 1.28 | 0.04 | 1.14 | (6.16 | ) | |||||||||||||||
|
|
|
|
|
|
|
|
|
|
|
| |||||||||||||
Net increase (decrease) from investment operations | (2.68 | ) | (2.36 | ) | 1.45 | 0.29 | 1.31 | (5.99 | ) | |||||||||||||||
|
|
|
|
|
|
|
|
|
|
|
| |||||||||||||
Distributions from net investment income(c) | (0.26 | ) | (0.25 | ) | (0.28 | ) | (0.22 | ) | (0.15 | ) | (0.17 | ) | ||||||||||||
|
|
|
|
|
|
|
|
|
|
|
| |||||||||||||
Net asset value, end of period | $ | 6.50 | $ | 9.44 | $ | 12.05 | $ | 10.88 | $ | 10.81 | $ | 9.65 | ||||||||||||
|
|
|
|
|
|
|
|
|
|
|
| |||||||||||||
Total Return(d) | ||||||||||||||||||||||||
Based on net asset value | (29.17 | )%(e) | (19.63 | )% | 13.63 | % | 2.58 | % | 13.77 | % | (38.17 | )% | ||||||||||||
|
|
|
|
|
|
|
|
|
|
|
| |||||||||||||
Ratios to Average Net Assets | ||||||||||||||||||||||||
Total expenses(f) | 1.70 | %(g)(h) | 1.57 | % | 1.55 | % | 1.50 | % | 1.51 | % | 1.41 | % | ||||||||||||
|
|
|
|
|
|
|
|
|
|
|
| |||||||||||||
Total expenses after fees waived and/or reimbursed | 1.32 | %(g)(h) | 1.33 | % | 1.34 | % | 1.33 | % | 1.36 | % | 1.38 | % | ||||||||||||
|
|
|
|
|
|
|
|
|
|
|
| |||||||||||||
Net investment income | 3.11 | %(g) | 2.34 | % | 1.51 | % | 2.35 | %(b) | 1.67 | % | 1.33 | % | ||||||||||||
|
|
|
|
|
|
|
|
|
|
|
| |||||||||||||
Supplemental Data | ||||||||||||||||||||||||
Net assets, end of period (000) | $ | 315 | $ | 451 | $ | 599 | $ | 628 | $ | 787 | $ | 1,025 | ||||||||||||
|
|
|
|
|
|
|
|
|
|
|
| |||||||||||||
Portfolio turnover rate | 39 | % | 37 | % | 37 | % | 14 | % | 66 | % | 51 | % | ||||||||||||
|
|
|
|
|
|
|
|
|
|
|
| |||||||||||||
(a) Based on average shares outstanding. (b) Net investment income per share and the ratio of net investment income to average net assets includes $0.10 per share and 0.92%, respectively, resulting from a special dividend. (c) Distributions for annual periods determined in accordance with U.S. federal income tax regulations. (d) Where applicable, assumes the reinvestment of distributions. (e) Aggregate total return. (f) Includes recoupment of past waived and/or reimbursed fees. Excluding the recoupment of past waived and/or reimbursed fees, the ratios were as follows: |
| |||||||||||||||||||||||
| Period from | ||||||||||||||||||||||||
| 10/01/19 | Year Ended September 30, | |||||||||||||||||||||||
| to 5/31/20 | 2019 | 2018 | 2017 | 2016 | 2015 | |||||||||||||||||||
Expense ratios | 1.70 | % | 1.55 | % | N/A | N/A | N/A | N/A | ||||||||||||||||
| (g) | Annualized. |
| (h) | Reorganization, Audit and Printing costs were not annualized in the calculation of the expense ratios. If these expenses were annualized, the total expenses and total expenses after fees waived and/or reimbursed would have been 1.79% and 1.32%, respectively. |
See notes to financial statements.
| FINANCIAL HIGHLIGHTS | 31 |
Financial Highlights (continued)
(For a share outstanding throughout each period)
| BlackRock Energy Opportunities Fund (continued) | ||||||||||||||||||||||||
| Investor A | ||||||||||||||||||||||||
| Period from | ||||||||||||||||||||||||
| 10/01/19 | Year Ended September 30, | |||||||||||||||||||||||
| to 05/31/20 | 2019 | 2018 | 2017 | 2016 | 2015 | |||||||||||||||||||
Net asset value, beginning of period | $ | 9.39 | $ | 11.99 | $ | 10.83 | $ | 10.76 | $ | 9.63 | $ | 15.77 | ||||||||||||
|
|
|
|
|
|
|
|
|
|
|
| |||||||||||||
Net investment income(a) | 0.18 | 0.24 | 0.17 | 0.26 | (b) | 0.17 | 0.17 | |||||||||||||||||
Net realized and unrealized gain (loss) | (2.85 | ) | (2.59 | ) | 1.27 | 0.03 | 1.14 | (6.15 | ) | |||||||||||||||
|
|
|
|
|
|
|
|
|
|
|
| |||||||||||||
Net increase (decrease) from investment operations | (2.67 | ) | (2.35 | ) | 1.44 | 0.29 | 1.31 | (5.98 | ) | |||||||||||||||
|
|
|
|
|
|
|
|
|
|
|
| |||||||||||||
Distributions from net investment income(c) | (0.26 | ) | (0.25 | ) | (0.28 | ) | (0.22 | ) | (0.18 | ) | (0.16 | ) | ||||||||||||
|
|
|
|
|
|
|
|
|
|
|
| |||||||||||||
Net asset value, end of period | $ | 6.46 | $ | 9.39 | $ | 11.99 | $ | 10.83 | $ | 10.76 | $ | 9.63 | ||||||||||||
|
|
|
|
|
|
|
|
|
|
|
| |||||||||||||
Total Return(d) | ||||||||||||||||||||||||
Based on net asset value | (29.23 | )%(e) | (19.61 | )% | 13.59 | % | 2.57 | % | 13.88 | % | (38.17 | )% | ||||||||||||
|
|
|
|
|
|
|
|
|
|
|
| |||||||||||||
Ratios to Average Net Assets | ||||||||||||||||||||||||
Total expenses | 1.94 | %(f)(g) | 1.66 | % | 1.65 | % | 1.60 | % | 1.55 | % | 1.48 | %(h) | ||||||||||||
|
|
|
|
|
|
|
|
|
|
|
| |||||||||||||
Total expenses after fees waived and/or reimbursed | 1.32 | %(f)(g) | 1.33 | % | 1.34 | % | 1.33 | % | 1.36 | % | 1.38 | % | ||||||||||||
|
|
|
|
|
|
|
|
|
|
|
| |||||||||||||
Net investment income | 3.65 | %(f) | 2.44 | % | 1.52 | % | 2.42 | %(b) | 1.72 | % | 1.33 | % | ||||||||||||
|
|
|
|
|
|
|
|
|
|
|
| |||||||||||||
Supplemental Data | ||||||||||||||||||||||||
Net assets, end of period (000) | $ | 72,733 | $ | 34,574 | $ | 41,644 | $ | 43,765 | $ | 59,065 | $ | 51,005 | ||||||||||||
|
|
|
|
|
|
|
|
|
|
|
| |||||||||||||
Portfolio turnover rate | 39 | % | 37 | % | 37 | % | 14 | % | 66 | % | 51 | % | ||||||||||||
|
|
|
|
|
|
|
|
|
|
|
| |||||||||||||
| (a) | Based on average shares outstanding. |
| (b) | Net investment income per share and the ratio of net investment income to average net assets includes $0.10 per share and 0.92%, respectively, resulting from a special dividend. |
| (c) | Distributions for annual periods determined in accordance with U.S. federal income tax regulations. |
| (d) | Where applicable, excludes the effects of any sales charges and assumes the reinvestment of distributions. |
| (e) | Aggregate total return. |
| (f) | Annualized. |
| (g) | Reorganization, Audit and Printing costs were not annualized in the calculation of the expense ratios. If these expenses were annualized, the total expenses and total expenses after fees waived and/or reimbursed would have been 2.00% and 1.32%, respectively. |
| (h) | Includes recoupment of past waived and/or reimbursed fees with no financial impact to the expense ratios. |
See notes to financial statements.
| 32 | 2020 BLACKROCK ANNUAL REPORTTO SHAREHOLDERS |
Financial Highlights (continued)
(For a share outstanding throughout each period)
| BlackRock Energy Opportunities Fund (continued) | ||||||||||||||||||||||||
| Investor C | ||||||||||||||||||||||||
| Period from | ||||||||||||||||||||||||
| 10/01/19 | Year Ended September 30, | |||||||||||||||||||||||
| to 05/31/20 | 2019 | 2018 | 2017 | 2016 | 2015 | |||||||||||||||||||
Net asset value, beginning of period | $ | 9.03 | $ | 11.39 | $ | 10.30 | $ | 10.23 | $ | 9.14 | $ | 14.94 | ||||||||||||
|
|
|
|
|
|
|
|
|
|
|
| |||||||||||||
Net investment income(a) | 0.14 | 0.14 | 0.09 | 0.17 | (b) | 0.09 | 0.07 | |||||||||||||||||
Net realized and unrealized gain (loss) | (2.75 | ) | (2.44 | ) | 1.22 | 0.03 | 1.08 | (5.82 | ) | |||||||||||||||
|
|
|
|
|
|
|
|
|
|
|
| |||||||||||||
Net increase (decrease) from investment operations | (2.61 | ) | (2.30 | ) | 1.31 | 0.20 | 1.17 | (5.75 | ) | |||||||||||||||
|
|
|
|
|
|
|
|
|
|
|
| |||||||||||||
Distributions from net investment income(c) | (0.18 | ) | (0.06 | ) | (0.22 | ) | (0.13 | ) | (0.08 | ) | (0.05 | ) | ||||||||||||
|
|
|
|
|
|
|
|
|
|
|
| |||||||||||||
Net asset value, end of period | $ | 6.24 | $ | 9.03 | $ | 11.39 | $ | 10.30 | $ | 10.23 | $ | 9.14 | ||||||||||||
|
|
|
|
|
|
|
|
|
|
|
| |||||||||||||
Total Return(d) | ||||||||||||||||||||||||
Based on net asset value | (29.51 | )%(e) | (20.21 | )% | 12.90 | % | 1.84 | % | 12.91 | % | (38.60 | )% | ||||||||||||
|
|
|
|
|
|
|
|
|
|
|
| |||||||||||||
Ratios to Average Net Assets | ||||||||||||||||||||||||
Total expenses(f) | 2.61 | %(g)(h) | 2.35 | % | 2.36 | % | 2.32 | % | 2.28 | % | 2.18 | % | ||||||||||||
|
|
|
|
|
|
|
|
|
|
|
| |||||||||||||
Total expenses after fees waived and/or reimbursed | 2.04 | %(g)(h) | 2.05 | % | 2.06 | % | 2.05 | % | 2.09 | % | 2.10 | % | ||||||||||||
|
|
|
|
|
|
|
|
|
|
|
| |||||||||||||
Net investment income | 2.77 | %(g) | 1.48 | % | 0.80 | % | 1.66 | %(b) | 1.00 | % | 0.61 | % | ||||||||||||
|
|
|
|
|
|
|
|
|
|
|
| |||||||||||||
Supplemental Data | ||||||||||||||||||||||||
Net assets, end of period (000) | $ | 11,152 | $ | 7,554 | $ | 21,878 | $ | 23,996 | $ | 31,847 | $ | 32,693 | ||||||||||||
|
|
|
|
|
|
|
|
|
|
|
| |||||||||||||
Portfolio turnover rate | 39 | % | 37 | % | 37 | % | 14 | % | 66 | % | 51 | % | ||||||||||||
|
|
|
|
|
|
|
|
|
|
|
| |||||||||||||
(a) Based on average shares outstanding. (b) Net investment income per share and the ratio of net investment income to average net assets includes $0.10 per share and 0.92%, respectively, resulting from a special dividend. (c) Distributions for annual periods determined in accordance with U.S. federal income tax regulations. (d) Where applicable, excludes the effects of any sales charges and assumes the reinvestment of distributions. (e) Aggregate total return. (f) Includes recoupment of past waived and/or reimbursed fees. Excluding the recoupment of past waived and/or reimbursed fees, the ratios were as follows:
|
| |||||||||||||||||||||||
| Period from | ||||||||||||||||||||||||
| 10/01/19 | Year Ended September 30, | |||||||||||||||||||||||
| to 5/31/20 | 2019 | 2018 | 2017 | 2016 | 2015 | |||||||||||||||||||
Expense ratios | 2.61 | % | 2.35 | % | N/A | N/A | 2.27 | % | N/A | |||||||||||||||
| (g) | Annualized. |
| (h) | Reorganization, Audit and Printing costs were not annualized in the calculation of the expense ratios. If these expenses were annualized, the total expenses and total expenses after fees waived and/or reimbursed would have been 2.67% and 2.04%, respectively. |
See notes to financial statements.
| FINANCIAL HIGHLIGHTS | 33 |
Financial Highlights
(For a share outstanding throughout each period)
| BlackRock High Equity Income Fund | ||||||||||||||||||||||||
| Institutional | ||||||||||||||||||||||||
| Period from | ||||||||||||||||||||||||
| 10/01/19 | Year Ended September 30, | |||||||||||||||||||||||
| to 05/31/20 | 2019 | 2018 | 2017 | 2016 | 2015 | |||||||||||||||||||
Net asset value, beginning of period | $ | 26.57 | $ | 28.16 | $ | 27.33 | $ | 37.84 | $ | 37.71 | $ | 42.91 | ||||||||||||
|
|
|
|
|
|
|
|
|
|
|
| |||||||||||||
Net investment income(a) | 0.94 | 1.24 | 1.32 | 0.16 | 0.24 | 0.09 | ||||||||||||||||||
Net realized and unrealized gain (loss) | (3.54 | ) | (0.73 | ) | 0.75 | 5.09 | 2.81 | 0.89 | ||||||||||||||||
|
|
|
|
|
|
|
|
|
|
|
| |||||||||||||
Net increase (decrease) from investment operations | (2.60 | ) | 0.51 | 2.07 | 5.25 | 3.05 | 0.98 | |||||||||||||||||
|
|
|
|
|
|
|
|
|
|
|
| |||||||||||||
Distributions(b) | ||||||||||||||||||||||||
From net investment income | (1.16 | ) | (1.05 | ) | (1.05 | ) | (0.23 | ) | — | — | ||||||||||||||
From net realized gain | — | (1.05 | ) | (0.19 | ) | (15.53 | ) | (2.92 | ) | (6.18 | ) | |||||||||||||
|
|
|
|
|
|
|
|
|
|
|
| |||||||||||||
Total distributions | (1.16 | ) | (2.10 | ) | (1.24 | ) | (15.76 | ) | (2.92 | ) | (6.18 | ) | ||||||||||||
|
|
|
|
|
|
|
|
|
|
|
| |||||||||||||
Net asset value, end of period | $ | 22.81 | $ | 26.57 | $ | 28.16 | $ | 27.33 | $ | 37.84 | $ | 37.71 | ||||||||||||
|
|
|
|
|
|
|
|
|
|
|
| |||||||||||||
Total Return(c) | ||||||||||||||||||||||||
Based on net asset value | (9.94 | )%(d) | 2.27 | % | 7.81 | % | 15.40 | % | 8.64 | % | 2.21 | % | ||||||||||||
|
|
|
|
|
|
|
|
|
|
|
| |||||||||||||
Ratios to Average Net Assets | ||||||||||||||||||||||||
Total expenses | 1.12 | %(e) | 1.12 | % | 1.09 | % | 1.19 | % | 1.19 | %(f) | 1.33 | % | ||||||||||||
|
|
|
|
|
|
|
|
|
|
|
| |||||||||||||
Total expenses after fees waived and/or reimbursed | 0.85 | %(e) | 0.85 | % | 0.85 | % | 0.97 | % | 0.91 | %(f) | 0.91 | % | ||||||||||||
|
|
|
|
|
|
|
|
|
|
|
| |||||||||||||
Net investment income | 5.63 | %(e) | 4.80 | % | 4.79 | % | 0.46 | % | 0.67 | %(f) | 0.22 | % | ||||||||||||
|
|
|
|
|
|
|
|
|
|
|
| |||||||||||||
Supplemental Data | ||||||||||||||||||||||||
Net assets, end of period (000) | $ | 128,474 | $ | 151,747 | $ | 248,847 | $ | 462,487 | $ | 686,845 | $ | 768,068 | ||||||||||||
|
|
|
|
|
|
|
|
|
|
|
| |||||||||||||
Portfolio turnover rate | 76 | % | 79 | % | 75 | % | 154 | % | 72 | % | 64 | % | ||||||||||||
|
|
|
|
|
|
|
|
|
|
|
| |||||||||||||
| (a) | Based on average shares outstanding. |
| (b) | Distributions for annual periods determined in accordance with U.S. federal income tax regulations. |
| (c) | Where applicable, assumes the reinvestment of distributions. |
| (d) | Aggregate total return. |
| (e) | Annualized. |
| (f) | Ratios do not include expenses incurred indirectly as a result of investments in underlying funds of approximately 0.01%. |
See notes to financial statements.
| 34 | 2020 BLACKROCK ANNUAL REPORTTO SHAREHOLDERS |
Financial Highlights (continued)
(For a share outstanding throughout each period)
| BlackRock High Equity Income Fund (continued) | ||||||||||||||||||||||||
| Service | ||||||||||||||||||||||||
| Period from | ||||||||||||||||||||||||
| 10/01/19 | Year Ended September 30, | |||||||||||||||||||||||
| to 05/31/20 | 2019 | 2018 | 2017 | 2016 | 2015 | |||||||||||||||||||
Net asset value, beginning of period | $ | 23.91 | $ | 25.56 | $ | 24.87 | $ | 35.61 | $ | 35.80 | $ | 40.51 | ||||||||||||
|
|
|
|
|
|
|
|
|
|
|
| |||||||||||||
Net investment income (loss)(a) | 0.80 | 1.06 | 1.15 | 0.10 | 0.09 | (0.11 | ) | |||||||||||||||||
Net realized and unrealized gain (loss) | (3.17 | ) | (0.66 | ) | 0.67 | 4.73 | 2.64 | 0.89 | ||||||||||||||||
|
|
|
|
|
|
|
|
|
|
|
| |||||||||||||
Net increase (decrease) from investment operations | (2.37 | ) | 0.40 | 1.82 | 4.83 | 2.73 | 0.78 | |||||||||||||||||
|
|
|
|
|
|
|
|
|
|
|
| |||||||||||||
Distributions(b) | ||||||||||||||||||||||||
From net investment income | (1.08 | ) | (1.00 | ) | (0.94 | ) | (0.04 | ) | — | — | ||||||||||||||
From net realized gain | — | (1.05 | ) | (0.19 | ) | (15.53 | ) | (2.92 | ) | (5.49 | ) | |||||||||||||
|
|
|
|
|
|
|
|
|
|
|
| |||||||||||||
Total distributions | (1.08 | ) | (2.05 | ) | (1.13 | ) | (15.57 | ) | (2.92 | ) | (5.49 | ) | ||||||||||||
|
|
|
|
|
|
|
|
|
|
|
| |||||||||||||
Net asset value, end of period | $ | 20.46 | $ | 23.91 | $ | 25.56 | $ | 24.87 | $ | 35.61 | $ | 35.80 | ||||||||||||
|
|
|
|
|
|
|
|
|
|
|
| |||||||||||||
Total Return(c) | ||||||||||||||||||||||||
Based on net asset value | (10.08 | )%(d) | 2.05 | % | 7.54 | % | 15.09 | % | 8.18 | % | 1.80 | % | ||||||||||||
|
|
|
|
|
|
|
|
|
|
|
| |||||||||||||
Ratios to Average Net Assets | ||||||||||||||||||||||||
Total expenses(e) | 1.36 | %(f) | 1.31 | % | 1.32 | % | 1.37 | %(g) | 1.43 | %(h) | 1.68 | % | ||||||||||||
|
|
|
|
|
|
|
|
|
|
|
| |||||||||||||
Total expenses after fees waived and/or reimbursed | 1.10 | %(f) | 1.10 | % | 1.10 | % | 1.25 | % | 1.31 | %(h) | 1.31 | % | ||||||||||||
|
|
|
|
|
|
|
|
|
|
|
| |||||||||||||
Net investment income (loss) | 5.30 | %(f) | 4.56 | % | 4.58 | % | 0.29 | % | 0.27 | %(h) | (0.28 | )% | ||||||||||||
|
|
|
|
|
|
|
|
|
|
|
| |||||||||||||
Supplemental Data | ||||||||||||||||||||||||
Net assets, end of period (000) | $ | 8,023 | $ | 10,024 | $ | 12,348 | $ | 18,087 | $ | 24,305 | $ | 27,489 | ||||||||||||
|
|
|
|
|
|
|
|
|
|
|
| |||||||||||||
Portfolio turnover rate | 76 | % | 79 | % | 75 | % | 154 | % | 72 | % | 64 | % | ||||||||||||
|
|
|
|
|
|
|
|
|
|
|
| |||||||||||||
(a) Based on average shares outstanding. (b) Distributions for annual periods determined in accordance with U.S. federal income tax regulations. (c) Where applicable, assumes the reinvestment of distributions. (d) Aggregate total return. (e) Includes recoupment of past waived and/or reimbursed fees. Excluding the recoupment of past waived and/or reimbursed fees, the ratios were as follows: |
| |||||||||||||||||||||||
| Period from | ||||||||||||||||||||||||
| 10/01/19 | Year Ended September 30, | |||||||||||||||||||||||
| to 5/31/20 | 2019 | 2018 | 2017 | 2016 | 2015 | |||||||||||||||||||
Expense ratios | N/A | N/A | N/A | 1.37 | % | 1.30 | % | 1.67 | % | |||||||||||||||
| (f) | Annualized. |
| (g) | Includes recoupment of past waived and/or reimbursed fees with no financial impact to the expense ratios. |
| (h) | Ratios do not include expenses incurred indirectly as a result of investments in underlying funds of approximately 0.01%. |
See notes to financial statements.
| FINANCIAL HIGHLIGHTS | 35 |
Financial Highlights (continued)
(For a share outstanding throughout each period)
| BlackRock High Equity Income Fund (continued) | ||||||||||||||||||||||||
| Investor A | ||||||||||||||||||||||||
| Period from | ||||||||||||||||||||||||
| 10/01/19 | Year Ended September 30, | |||||||||||||||||||||||
| to 05/31/20 | 2019 | 2018 | 2017 | 2016 | 2015 | |||||||||||||||||||
Net asset value, beginning of period | $ | 22.43 | $ | 24.12 | $ | 23.53 | $ | 34.47 | $ | 34.74 | $ | 39.96 | ||||||||||||
|
|
|
|
|
|
|
|
|
|
|
| |||||||||||||
Net investment income (loss)(a) | 0.75 | 1.00 | 1.08 | 0.11 | 0.09 | (0.07 | ) | |||||||||||||||||
Net realized and unrealized gain (loss) | (2.98 | ) | (0.64 | ) | 0.65 | 4.54 | 2.56 | 0.85 | ||||||||||||||||
|
|
|
|
|
|
|
|
|
|
|
| |||||||||||||
Net increase (decrease) from investment operations | (2.23 | ) | 0.36 | 1.73 | 4.65 | 2.65 | 0.78 | |||||||||||||||||
|
|
|
|
|
|
|
|
|
|
|
| |||||||||||||
Distributions(b) | ||||||||||||||||||||||||
From net investment income | (1.06 | ) | (1.00 | ) | (0.95 | ) | (0.06 | ) | — | — | ||||||||||||||
From net realized gain | — | (1.05 | ) | (0.19 | ) | (15.53 | ) | (2.92 | ) | (6.00 | ) | |||||||||||||
|
|
|
|
|
|
|
|
|
|
|
| |||||||||||||
Total distributions | (1.06 | ) | (2.05 | ) | (1.14 | ) | (15.59 | ) | (2.92 | ) | (6.00 | ) | ||||||||||||
|
|
|
|
|
|
|
|
|
|
|
| |||||||||||||
Net asset value, end of period | $ | 19.14 | $ | 22.43 | $ | 24.12 | $ | 23.53 | $ | 34.47 | $ | 34.74 | ||||||||||||
|
|
|
|
|
|
|
|
|
|
|
| |||||||||||||
Total Return(c) | ||||||||||||||||||||||||
Based on net asset value | (10.09 | )%(d) | 2.02 | % | 7.58 | % | 15.06 | % | 8.20 | % | 1.82 | % | ||||||||||||
|
|
|
|
|
|
|
|
|
|
|
| |||||||||||||
Ratios to Average Net Assets | ||||||||||||||||||||||||
Total expenses(e) | 1.40 | %(f) | 1.37 | % | 1.38 | % | 1.45 | % | 1.47 | %(g) | 1.60 | % | ||||||||||||
|
|
|
|
|
|
|
|
|
|
|
| |||||||||||||
Total expenses after fees waived and/or reimbursed | 1.10 | %(f) | 1.10 | % | 1.10 | % | 1.25 | % | 1.31 | %(g) | 1.31 | % | ||||||||||||
|
|
|
|
|
|
|
|
|
|
|
| |||||||||||||
Net investment income (loss) | 5.35 | %(f) | 4.55 | % | 4.57 | % | 0.36 | % | 0.27 | %(g) | (0.18 | )% | ||||||||||||
|
|
|
|
|
|
|
|
|
|
|
| |||||||||||||
Supplemental Data | ||||||||||||||||||||||||
Net assets, end of period (000) | $ | 172,696 | $ | 215,121 | $ | 214,095 | $ | 278,649 | $ | 377,271 | $ | 404,123 | ||||||||||||
|
|
|
|
|
|
|
|
|
|
|
| |||||||||||||
Portfolio turnover rate | 76 | % | 79 | % | 75 | % | 154 | % | 72 | % | 64 | % | ||||||||||||
|
|
|
|
|
|
|
|
|
|
|
| |||||||||||||
(a) Based on average shares outstanding. (b) Distributions for annual periods determined in accordance with U.S. federal income tax regulations. (c) Where applicable, excludes the effects of any sales charges and assumes the reinvestment of distributions. (d) Aggregate total return. (e) Includes recoupment of past waived and/or reimbursed fees. Excluding the recoupment of past waived and/or reimbursed fees, the ratios were as follows:
|
| |||||||||||||||||||||||
| Period from | ||||||||||||||||||||||||
| 10/01/19 | Year Ended September 30, | |||||||||||||||||||||||
| to 5/31/20 | 2019 | 2018 | 2017 | 2016 | 2015 | |||||||||||||||||||
Expense ratios | N/A | N/A | N/A | N/A | N/A | 1.59 | % | |||||||||||||||||
| (f) | Annualized. |
| (g) | Ratios do not include expenses incurred indirectly as a result of investments in underlying funds of approximately 0.01%. |
See notes to financial statements.
| 36 | 2020 BLACKROCK ANNUAL REPORTTO SHAREHOLDERS |
Financial Highlights (continued)
(For a share outstanding throughout each period)
| BlackRock High Equity Income Fund (continued) | ||||||||||||||||||||||||
| Investor C | ||||||||||||||||||||||||
| Period from | ||||||||||||||||||||||||
| 10/01/19 | Year Ended September 30, | |||||||||||||||||||||||
| to 05/31/20 | 2019 | 2018 | 2017 | 2016 | 2015 | |||||||||||||||||||
Net asset value, beginning of period | $ | 14.35 | $ | 16.19 | $ | 16.13 | $ | 28.15 | $ | 29.10 | $ | 34.43 | ||||||||||||
|
|
|
|
|
|
|
|
|
|
|
| |||||||||||||
Net investment income (loss)(a) | 0.41 | 0.55 | 0.61 | (0.12 | ) | (0.13 | ) | (0.30 | ) | |||||||||||||||
Net realized and unrealized gain (loss) | (1.88 | ) | (0.45 | ) | 0.44 | 3.63 | 2.10 | 0.74 | ||||||||||||||||
|
|
|
|
|
|
|
|
|
|
|
| |||||||||||||
Net increase (decrease) from investment operations | (1.47 | ) | 0.10 | 1.05 | 3.51 | 1.97 | 0.44 | |||||||||||||||||
|
|
|
|
|
|
|
|
|
|
|
| |||||||||||||
Distributions(b) | ||||||||||||||||||||||||
From net investment income | (0.90 | ) | (0.89 | ) | (0.80 | ) | — | — | — | |||||||||||||||
From net realized gain | — | (1.05 | ) | (0.19 | ) | (15.53 | ) | (2.92 | ) | (5.77 | ) | |||||||||||||
|
|
|
|
|
|
|
|
|
|
|
| |||||||||||||
Total distributions | (0.90 | ) | (1.94 | ) | (0.99 | ) | (15.53 | ) | (2.92 | ) | (5.77 | ) | ||||||||||||
|
|
|
|
|
|
|
|
|
|
|
| |||||||||||||
Net asset value, end of period | $ | 11.98 | $ | 14.35 | $ | 16.19 | $ | 16.13 | $ | 28.15 | $ | 29.10 | ||||||||||||
|
|
|
|
|
|
|
|
|
|
|
| |||||||||||||
Total Return(c) | ||||||||||||||||||||||||
Based on net asset value | (10.52 | )%(d) | 1.30 | % | 6.75 | % | 14.23 | % | 7.38 | % | 1.03 | % | ||||||||||||
|
|
|
|
|
|
|
|
|
|
|
| |||||||||||||
Ratios to Average Net Assets | ||||||||||||||||||||||||
Total expenses | 2.16 | %(e) | 2.12 | % | 2.10 | % | 2.18 | % | 2.20 | %(f)(g) | 2.32 | %(g) | ||||||||||||
|
|
|
|
|
|
|
|
|
|
|
| |||||||||||||
Total expenses after fees waived and/or reimbursed | 1.85 | %(e) | 1.85 | % | 1.85 | % | 2.00 | % | 2.05 | %(f) | 2.06 | % | ||||||||||||
|
|
|
|
|
|
|
|
|
|
|
| |||||||||||||
Net investment income (loss) | 4.57 | %(e) | 3.84 | % | 3.82 | % | (0.48 | )% | (0.47 | )%(f) | (0.93 | )% | ||||||||||||
|
|
|
|
|
|
|
|
|
|
|
| |||||||||||||
Supplemental Data | ||||||||||||||||||||||||
Net assets, end of period (000) | $ | 24,163 | $ | 36,132 | $ | 93,399 | $ | 123,321 | $ | 173,249 | $ | 198,760 | ||||||||||||
|
|
|
|
|
|
|
|
|
|
|
| |||||||||||||
Portfolio turnover rate | 76 | % | 79 | % | 75 | % | 154 | % | 72 | % | 64 | % | ||||||||||||
|
|
|
|
|
|
|
|
|
|
|
| |||||||||||||
| (a) | Based on average shares outstanding. |
| (b) | Distributions for annual periods determined in accordance with U.S. federal income tax regulations. |
| (c) | Where applicable, excludes the effects of any sales charges and assumes the reinvestment of distributions. |
| (d) | Aggregate total return. |
| (e) | Annualized. |
| (f) | Ratios do not include expenses incurred indirectly as a result of investments in underlying funds of approximately 0.01%. |
| (g) | Includes recoupment of past waived and/or reimbursed fees with no financial impact to the expense ratios. |
See notes to financial statements.
| FINANCIAL HIGHLIGHTS | 37 |
Financial Highlights (continued)
(For a share outstanding throughout each period)
BlackRock High Equity Income Fund | ||||
Class K | ||||
| | Period from 04/21/20 to 05/31/20 | (a)
| ||
Net asset value, beginning of period | $ | 21.04 | ||
|
| |||
Net investment income | 0.20 | |||
Net realized and unrealized gain | 1.77 | |||
|
| |||
Net increase from investment operations | 1.97 | |||
|
| |||
Distributions from net investment income(b) | (0.20 | ) | ||
|
| |||
Net asset value, end of period | $ | 22.81 | ||
|
| |||
Total Return(c) | ||||
Based on net asset value | 9.35 | %(d) | ||
|
| |||
Ratios to Average Net Assets | ||||
Total expenses | 0.99 | %(e) | ||
|
| |||
Total expenses after fees waived and/or reimbursed | 0.80 | %(e) | ||
|
| |||
Net investment income | 8.28 | %(e) | ||
|
| |||
Supplemental Data | ||||
Net assets, end of period (000) | $ | 288 | ||
|
| |||
Portfolio turnover rate | 76 | %(f) | ||
|
| |||
| (a) | Commencement of operations. |
| (b) | Distributions for annual periods determined in accordance with U.S. federal income tax regulations. |
| (c) | Where applicable, assumes the reinvestment of distributions. |
| (d) | Aggregate total return. |
| (e) | Annualized. |
| (f) | Portfolio turnover is representative of the Fund for the entire year. |
See notes to financial statements.
| 38 | 2020 BLACKROCK ANNUAL REPORTTO SHAREHOLDERS |
Financial Highlights
(For a share outstanding throughout each period)
| BlackRock International Dividend Fund | ||||||||||||||||||||||||
| Institutional | ||||||||||||||||||||||||
| Period from | ||||||||||||||||||||||||
| 10/01/19 | Year Ended September 30, | |||||||||||||||||||||||
| to 05/31/20 | 2019 | 2018 | 2017 | 2016 | 2015 | |||||||||||||||||||
Net asset value, beginning of period | $ | 28.67 | $ | 29.16 | $ | 31.36 | $ | 33.58 | $ | 31.10 | $ | 38.51 | ||||||||||||
|
|
|
|
|
|
|
|
|
|
|
| |||||||||||||
Net investment income(a) | 0.42 | 0.70 | 0.76 | 0.49 | 0.36 | 0.27 | ||||||||||||||||||
Net realized and unrealized gain (loss) | (0.40 | ) | 0.32 | (1.57 | ) | 2.85 | 2.18 | (3.05 | ) | |||||||||||||||
|
|
|
|
|
|
|
|
|
|
|
| |||||||||||||
Net increase (decrease) from investment operations | 0.02 | 1.02 | (0.81 | ) | 3.34 | 2.54 | (2.78 | ) | ||||||||||||||||
|
|
|
|
|
|
|
|
|
|
|
| |||||||||||||
Distributions(b) | ||||||||||||||||||||||||
From net investment income | (0.39 | ) | (0.66 | ) | (0.98 | ) | (1.47 | ) | (0.06 | ) | (0.92 | ) | ||||||||||||
From net realized gain | (0.07 | ) | (0.85 | ) | (0.41 | ) | (4.09 | ) | — | (3.71 | ) | |||||||||||||
|
|
|
|
|
|
|
|
|
|
|
| |||||||||||||
Total distributions | (0.46 | ) | (1.51 | ) | (1.39 | ) | (5.56 | ) | (0.06 | ) | (4.63 | ) | ||||||||||||
|
|
|
|
|
|
|
|
|
|
|
| |||||||||||||
Net asset value, end of period | $ | 28.23 | $ | 28.67 | $ | 29.16 | $ | 31.36 | $ | 33.58 | $ | 31.10 | ||||||||||||
|
|
|
|
|
|
|
|
|
|
|
| |||||||||||||
Total Return(c) | ||||||||||||||||||||||||
Based on net asset value | 0.08 | %(d) | 3.86 | % | (2.67 | )%(e) | 10.61 | % | 8.20 | % | (7.60 | )% | ||||||||||||
|
|
|
|
|
|
|
|
|
|
|
| |||||||||||||
Ratios to Average Net Assets | ||||||||||||||||||||||||
Total expenses | 1.17 | %(f)(g) | 1.15 | % | 1.14 | % | 1.23 | %(h) | 1.26 | %(h)(i) | 1.27 | % | ||||||||||||
|
|
|
|
|
|
|
|
|
|
|
| |||||||||||||
Total expenses after fees waived and/or reimbursed | 0.84 | %(f)(g) | 0.84 | % | 0.84 | % | 1.01 | % | 1.06 | %(i) | 1.14 | % | ||||||||||||
|
|
|
|
|
|
|
|
|
|
|
| |||||||||||||
Net investment income | 2.23 | %(f) | 2.52 | % | 2.50 | % | 1.51 | % | 1.15 | %(i) | 0.77 | % | ||||||||||||
|
|
|
|
|
|
|
|
|
|
|
| |||||||||||||
Supplemental Data | ||||||||||||||||||||||||
Net assets, end of period (000) | $ | 74,681 | $ | 83,814 | $ | 102,541 | $ | 198,206 | $ | 353,512 | $ | 424,099 | ||||||||||||
|
|
|
|
|
|
|
|
|
|
|
| |||||||||||||
Portfolio turnover rate | 29 | % | 22 | % | 25 | % | 130 | % | 47 | % | 66 | % | ||||||||||||
|
|
|
|
|
|
|
|
|
|
|
| |||||||||||||
| (a) | Based on average shares outstanding. |
| (b) | Distributions for annual periods determined in accordance with U.S. federal income tax regulations. |
| (c) | Where applicable, assumes the reinvestment of distributions. |
| (d) | Aggregate total return. |
| (e) | Includes the litigation settlement amount. Excluding this amount, the Fund’s total return is (2.81)%. |
| (f) | Annualized. |
| (g) | Audit and Printing costs were not annualized in the calculation of the expense ratios. If these expenses were annualized, the total expenses and total expenses after fees waived and/or reimbursed would have been 1.19% and 0.84% respectively. |
| (h) | Includes recoupment of past waived and/or reimbursed fees with no financial impact to the expense ratios. |
| (i) | Ratios do not include expenses incurred indirectly as a result of investments in underlying funds of approximately 0.01%. |
See notes to financial statements.
| FINANCIAL HIGHLIGHTS | 39 |
Financial Highlights (continued)
(For a share outstanding throughout each period)
| BlackRock International Dividend Fund (continued) | ||||||||||||||||||||||||
| Service | ||||||||||||||||||||||||
| Period from | ||||||||||||||||||||||||
| 10/01/19 | Year Ended September 30, | |||||||||||||||||||||||
| to 05/31/20 | 2019 | 2018 | 2017 | 2016 | 2015 | |||||||||||||||||||
Net asset value, beginning of period | $ | 27.14 | $ | 27.68 | $ | 29.76 | $ | 32.05 | $ | 29.72 | $ | 37.01 | ||||||||||||
|
|
|
|
|
|
|
|
|
|
|
| |||||||||||||
Net investment income(a) | 0.36 | 0.59 | 0.65 | 0.35 | 0.23 | 0.17 | ||||||||||||||||||
Net realized and unrealized gain (loss) | (0.39 | ) | 0.31 | (1.49 | ) | 2.75 | 2.10 | (2.93 | ) | |||||||||||||||
|
|
|
|
|
|
|
|
|
|
|
| |||||||||||||
Net increase (decrease) from investment operations | (0.03 | ) | 0.90 | (0.84 | ) | 3.10 | 2.33 | (2.76 | ) | |||||||||||||||
|
|
|
|
|
|
|
|
|
|
|
| |||||||||||||
Distributions(b) | ||||||||||||||||||||||||
From net investment income | (0.34 | ) | (0.59 | ) | (0.83 | ) | (1.30 | ) | — | (0.82 | ) | |||||||||||||
From net realized gain | (0.07 | ) | (0.85 | ) | (0.41 | ) | (4.09 | ) | — | (3.71 | ) | |||||||||||||
|
|
|
|
|
|
|
|
|
|
|
| |||||||||||||
Total distributions | (0.41 | ) | (1.44 | ) | (1.24 | ) | (5.39 | ) | — | (4.53 | ) | |||||||||||||
|
|
|
|
|
|
|
|
|
|
|
| |||||||||||||
Net asset value, end of period | $ | 26.70 | $ | 27.14 | $ | 27.68 | $ | 29.76 | $ | 32.05 | $ | 29.72 | ||||||||||||
|
|
|
|
|
|
|
|
|
|
|
| |||||||||||||
Total Return(c) | ||||||||||||||||||||||||
Based on net asset value | (0.10 | )%(d) | 3.62 | % | (2.90 | )%(e) | 10.29 | % | 7.84 | % | (7.86 | )% | ||||||||||||
|
|
|
|
|
|
|
|
|
|
|
| |||||||||||||
Ratios to Average Net Assets | ||||||||||||||||||||||||
Total expenses(f) | 1.41 | %(g)(h) | 1.33 | % | 1.37 | % | 1.48 | % | 1.54 | %(i) | 1.53 | % | ||||||||||||
|
|
|
|
|
|
|
|
|
|
|
| |||||||||||||
Total expenses after fees waived and/or reimbursed | 1.09 | %(g)(h) | 1.09 | % | 1.09 | % | 1.32 | % | 1.38 | %(i) | 1.42 | % | ||||||||||||
|
|
|
|
|
|
|
|
|
|
|
| |||||||||||||
Net investment income | 2.01 | %(g) | 2.25 | % | 2.27 | % | 1.13 | % | 0.76 | %(i) | 0.51 | % | ||||||||||||
|
|
|
|
|
|
|
|
|
|
|
| |||||||||||||
Supplemental Data | ||||||||||||||||||||||||
Net assets, end of period (000) | $ | 3,239 | $ | 3,196 | $ | 4,434 | $ | 7,142 | $ | 12,706 | $ | 19,269 | ||||||||||||
|
|
|
|
|
|
|
|
|
|
|
| |||||||||||||
Portfolio turnover rate | 29 | % | 22 | % | 25 | % | 130 | % | 47 | % | 66 | % | ||||||||||||
|
|
|
|
|
|
|
|
|
|
|
| |||||||||||||
(a) Based on average shares outstanding. (b) Distributions for annual periods determined in accordance with U.S. federal income tax regulations. (c) Where applicable, assumes the reinvestment of distributions. (d) Aggregate total return. (e) Includes the litigation settlement amount. Excluding this amount, the Fund’s total return is (3.04)%. (f) Includes recoupment of past waived and/or reimbursed fees. Excluding the recoupment of past waived and/or reimbursed fees, the ratios were as follows:
|
| |||||||||||||||||||||||
| Period from | ||||||||||||||||||||||||
| 10/01/19 | Year Ended September 30, | |||||||||||||||||||||||
| to 5/31/20 | 2019 | 2018 | 2017 | 2016 | 2015 | |||||||||||||||||||
Expense ratios | 1.41 | % | N/A | N/A | N/A | 1.53 | % | N/A | ||||||||||||||||
| (g) | Annualized. |
| (h) | Audit and Printing costs were not annualized in the calculation of the expense ratios. If these expenses were annualized, the total expenses and total expenses after fees waived and/or reimbursed would have been 1.43% and 1.09%, respectively. |
| (i) | Ratios do not include expenses incurred indirectly as a result of investments in underlying funds of approximately 0.01%. |
See notes to financial statements.
| 40 | 2020 BLACKROCK ANNUAL REPORTTO SHAREHOLDERS |
Financial Highlights (continued)
(For a share outstanding throughout each period)
| BlackRock International Dividend Fund (continued) | ||||||||||||||||||||||||||||
| Investor A | ||||||||||||||||||||||||||||
| Period from 10/01/19 to 05/31/20 | Year Ended September 30, | |||||||||||||||||||||||||||
| 2019 | 2018 | 2017 | 2016 | 2015 | ||||||||||||||||||||||||
Net asset value, beginning of period | $ | 26.69 | $ | 27.26 | $ | 29.30 | $ | 31.68 | $ | 29.38 | $ | 36.64 | ||||||||||||||||
|
|
|
|
|
|
|
|
|
|
|
| |||||||||||||||||
Net investment income(a) | 0.34 | 0.60 | 0.61 | 0.37 | 0.24 | 0.15 | ||||||||||||||||||||||
Net realized and unrealized gain (loss) | (0.37 | ) | 0.27 | (1.43 | ) | 2.69 | 2.06 | (2.88 | ) | |||||||||||||||||||
|
|
|
|
|
|
|
|
|
|
|
| |||||||||||||||||
Net increase (decrease) from investment operations | (0.03 | ) | 0.87 | (0.82 | ) | 3.06 | 2.30 | (2.73 | ) | |||||||||||||||||||
|
|
|
|
|
|
|
|
|
|
|
| |||||||||||||||||
Distributions(b) | ||||||||||||||||||||||||||||
From net investment income | (0.33 | ) | (0.59 | ) | (0.81 | ) | (1.35 | ) | — | (0.82 | ) | |||||||||||||||||
From net realized gain | (0.07 | ) | (0.85 | ) | (0.41 | ) | (4.09 | ) | — | (3.71 | ) | |||||||||||||||||
|
|
|
|
|
|
|
|
|
|
|
| |||||||||||||||||
Total distributions | (0.40 | ) | (1.44 | ) | (1.22 | ) | (5.44 | ) | — | (4.53 | ) | |||||||||||||||||
|
|
|
|
|
|
|
|
|
|
|
| |||||||||||||||||
Net asset value, end of period | $ | 26.26 | $ | 26.69 | $ | 27.26 | $ | 29.30 | $ | 31.68 | $ | 29.38 | ||||||||||||||||
|
|
|
|
|
|
|
|
|
|
|
| |||||||||||||||||
Total Return(c) | ||||||||||||||||||||||||||||
Based on net asset value | (0.08 | )%(d) | 3.57 | % | (2.89 | )%(e) | 10.27 | % | 7.83 | % | (7.87 | )% | ||||||||||||||||
|
|
|
|
|
|
|
|
|
|
|
| |||||||||||||||||
Ratios to Average Net Assets | ||||||||||||||||||||||||||||
Total expenses | 1.48 | %(f)(g) | 1.43 | % | 1.44 | % | 1.54 | %(h) | 1.57 | %(h)(i) | 1.58 | %(h) | ||||||||||||||||
|
|
|
|
|
|
|
|
|
|
|
| |||||||||||||||||
Total expenses after fees waived and/or reimbursed | 1.09 | %(f)(g) | 1.09 | % | 1.09 | % | 1.30 | % | 1.39 | %(i) | 1.46 | % | ||||||||||||||||
|
|
|
|
|
|
|
|
|
|
|
| |||||||||||||||||
Net investment income | 1.92 | %(f) | 2.30 | % | 2.14 | % | 1.20 | % | 0.81 | %(i) | 0.44 | % | ||||||||||||||||
|
|
|
|
|
|
|
|
|
|
|
| |||||||||||||||||
Supplemental Data | ||||||||||||||||||||||||||||
Net assets, end of period (000) | $ | 100,753 | $ | 125,196 | $ | 140,473 | $ | 325,103 | $ | 350,855 | $ | 415,805 | ||||||||||||||||
|
|
|
|
|
|
|
|
|
|
|
| |||||||||||||||||
Portfolio turnover rate | 29 | % | 22 | % | 25 | % | 130 | % | 47 | % | 66 | % | ||||||||||||||||
|
|
|
|
|
|
|
|
|
|
|
| |||||||||||||||||
| (a) | Based on average shares outstanding. |
| (b) | Distributions for annual periods determined in accordance with U.S. federal income tax regulations. |
| (c) | Where applicable, excludes the effects of any sales charges and assumes the reinvestment of distributions. |
| (d) | Aggregate total return. |
| (e) | Includes the litigation settlement amount. Excluding this amount, the Fund’s total return is (3.03)%. |
| (f) | Annualized. |
| (g) | Audit and Printing costs were not annualized in the calculation of the expense ratios. If these expenses were annualized, the total expenses and total expenses after fees waived and/or reimbursed would have been 1.51% and 1.09%, respectively. |
| (h) | Includes recoupment of past waived and/or reimbursed fees with no financial impact to the expense ratios. |
| (i) | Ratios do not include expenses incurred indirectly as a result of investments in underlying funds of approximately 0.01%. |
See notes to financial statements.
| FINANCIAL HIGHLIGHTS | 41 |
Financial Highlights (continued)
(For a share outstanding throughout each period)
| BlackRock International Dividend Fund (continued) | ||||||||||||||||||||||||||||
| Investor C | ||||||||||||||||||||||||||||
Period from 10/01/19 to 05/31/20 | Year Ended September 30, | |||||||||||||||||||||||||||
| 2019 | 2018 | 2017 | 2016 | 2015 | ||||||||||||||||||||||||
Net asset value, beginning of period | $ | 23.25 | $ | 23.94 | $ | 25.81 | $ | 28.39 | $ | 26.52 | $ | 33.56 | ||||||||||||||||
|
|
|
|
|
|
|
|
|
|
|
| |||||||||||||||||
Net investment income (loss)(a) | 0.18 | 0.32 | 0.39 | 0.12 | 0.02 | (0.07 | ) | |||||||||||||||||||||
Net realized and unrealized gain (loss) | (0.32 | ) | 0.26 | (1.30 | ) | 2.42 | 1.85 | (2.63 | ) | |||||||||||||||||||
|
|
|
|
|
|
|
|
|
|
|
| |||||||||||||||||
Net increase (decrease) from investment operations | (0.14 | ) | 0.58 | (0.91 | ) | 2.54 | 1.87 | (2.70 | ) | |||||||||||||||||||
|
|
|
|
|
|
|
|
|
|
|
| |||||||||||||||||
Distributions(b) | ||||||||||||||||||||||||||||
From net investment income | (0.19 | ) | (0.42 | ) | (0.55 | ) | (1.03 | ) | — | (0.63 | ) | |||||||||||||||||
From net realized gain | (0.07 | ) | (0.85 | ) | (0.41 | ) | (4.09 | ) | — | (3.71 | ) | |||||||||||||||||
|
|
|
|
|
|
|
|
|
|
|
| |||||||||||||||||
Total distributions | (0.26 | ) | (1.27 | ) | (0.96 | ) | (5.12 | ) | — | (4.34 | ) | |||||||||||||||||
|
|
|
|
|
|
|
|
|
|
|
| |||||||||||||||||
Net asset value, end of period | $ | 22.85 | $ | 23.25 | $ | 23.94 | $ | 25.81 | $ | 28.39 | $ | 26.52 | ||||||||||||||||
|
|
|
|
|
|
|
|
|
|
|
| |||||||||||||||||
Total Return(c) | ||||||||||||||||||||||||||||
Based on net asset value | (0.58 | )%(d) | 2.80 | % | (3.63 | )%(e) | 9.46 | % | 7.05 | % | (8.56 | )% | ||||||||||||||||
|
|
|
|
|
|
|
|
|
|
|
| |||||||||||||||||
Ratios to Average Net Assets | ||||||||||||||||||||||||||||
Total expenses | 2.27 | %(f)(g) | 2.20 | % | 2.19 | % | 2.30 | %(h) | 2.35 | %(h)(i) | 2.32 | % | ||||||||||||||||
|
|
|
|
|
|
|
|
|
|
|
| |||||||||||||||||
Total expenses after fees waived and/or reimbursed | 1.84 | %(f)(g) | 1.84 | % | 1.84 | % | 2.05 | % | 2.13 | %(i) | 2.20 | % | ||||||||||||||||
|
|
|
|
|
|
|
|
|
|
|
| |||||||||||||||||
Net investment income (loss) | 1.15 | %(f) | 1.39 | % | 1.57 | % | 0.44 | % | 0.07 | %(i) | (0.24 | )% | ||||||||||||||||
|
|
|
|
|
|
|
|
|
|
|
| |||||||||||||||||
Supplemental Data | ||||||||||||||||||||||||||||
Net assets, end of period (000) | $ | 9,906 | $ | 14,805 | $ | 36,239 | $ | 53,884 | $ | 76,630 | $ | 96,334 | ||||||||||||||||
|
|
|
|
|
|
|
|
|
|
|
| |||||||||||||||||
Portfolio turnover rate | 29 | % | 22 | % | 25 | % | 130 | % | 47 | % | 66 | % | ||||||||||||||||
|
|
|
|
|
|
|
|
|
|
|
| |||||||||||||||||
| (a) | Based on average shares outstanding. |
| (b) | Distributions for annual periods determined in accordance with U.S. federal income tax regulations. |
| (c) | Where applicable, excludes the effects of any sales charges and assumes the reinvestment of distributions. |
| (d) | Aggregate total return. |
| (e) | Includes the litigation settlement amount. Excluding this amount, the Fund’s total return is (3.79)%. |
| (f) | Annualized. |
| (g) | Audit and Printing costs were not annualized in the calculation of the expense ratios. If these expenses were annualized, the total expenses and total expenses after fees waived and/or reimbursed would have been 2.29% and 1.84%, respectively. |
| (h) | Includes recoupment of past waived and/or reimbursed fees with no financial impact to the expense ratios. |
| (i) | Ratios do not include expenses incurred indirectly as a result of investments in underlying funds of approximately 0.01%. |
See notes to financial statements.
| 42 | 2020 BLACKROCK ANNUAL REPORTTO SHAREHOLDERS |
Financial Highlights (continued)
(For a share outstanding throughout each period)
| BlackRock International Dividend Fund (continued) | ||||||||||||
| Class K | ||||||||||||
| | Period from 10/01/19 to 05/31/20 |
| | Year Ended 09/30/19 |
| | Period from 01/25/18 to 09/30/18 | (a)
| ||||
Net asset value, beginning of period | $ | 28.68 | $ | 29.17 | $ | 32.08 | ||||||
|
|
|
|
|
| |||||||
Net investment income(b) | 0.44 | 0.73 | 0.56 | |||||||||
Net realized and unrealized gain (loss) | (0.42 | ) | 0.30 | (2.91 | ) | |||||||
|
|
|
|
|
| |||||||
Net increase (decrease) from investment operations | 0.02 | 1.03 | (2.35 | ) | ||||||||
|
|
|
|
|
| |||||||
Distributions(c) | ||||||||||||
From net investment income | (0.40 | ) | (0.67 | ) | (0.56 | ) | ||||||
From net realized gain | (0.07 | ) | (0.85 | ) | — | |||||||
|
|
|
|
|
| |||||||
Total distributions | (0.47 | ) | (1.52 | ) | (0.56 | ) | ||||||
|
|
|
|
|
| |||||||
Net asset value, end of period | $ | 28.23 | $ | 28.68 | $ | 29.17 | ||||||
|
|
|
|
|
| |||||||
Total Return(d) | ||||||||||||
Based on net asset value | 0.09 | %(e) | 3.92 | % | (7.33 | )%(e)(f) | ||||||
|
|
|
|
|
| |||||||
Ratios to Average Net Assets | ||||||||||||
Total expenses | 1.08 | %(g)(h) | 1.04 | % | 1.02 | %(g)(i) | ||||||
|
|
|
|
|
| |||||||
Total expenses after fees waived and/or reimbursed | 0.79 | %(g)(h) | 0.79 | % | 0.79 | %(g) | ||||||
|
|
|
|
|
| |||||||
Net investment income | 2.28 | %(g) | 2.63 | % | 2.81 | %(g) | ||||||
|
|
|
|
|
| |||||||
Supplemental Data | ||||||||||||
Net assets, end of period (000) | $ | 3,266 | $ | 3,847 | $ | 3,659 | ||||||
|
|
|
|
|
| |||||||
Portfolio turnover rate | 29 | % | 22 | % | 25 | %(j) | ||||||
|
|
|
|
|
| |||||||
| (a) | Commencement of operations. |
| (b) | Based on average shares outstanding. |
| (c) | Distributions for annual periods determined in accordance with U.S. federal income tax regulations. |
| (d) | Where applicable, assumes the reinvestment of distributions. |
| (e) | Aggregate total return. |
| (f) | Includes the litigation settlement amount. Excluding this amount, the Fund’s total return is (7.45)%. |
| (g) | Annualized. |
| (h) | Audit and Printing costs were not annualized in the calculation of the expense ratios. If these expenses were annualized, the total expenses and total expenses after fees waived and/or reimbursed would have been 1.10% and 0.79%, respectively. |
| (i) | Offering and board realignment consolidation costs were not annualized in the calculation of the expense ratio. If these expenses were annualized, the total expense ratio would have been 1.03%. |
| (j) | Portfolio turnover is representative of the Fund for the entire year. |
See notes to financial statements.
| FINANCIAL HIGHLIGHTS | 43 |
| 1. | ORGANIZATION |
BlackRock FundsSM (the “Trust”) is registered under the Investment Company Act of 1940, as amended (the “1940 Act”), as an open-end management investment company. The Trust is organized as a Massachusetts business trust. The following, each of which is a series of the Trust, are referred to herein collectively as the “Funds” or individually as a “Fund”:
| ||||||||
| Fund Name | Herein Referred To As | Diversification Classification | ||||||
| ||||||||
BlackRock Energy Opportunities Fund | Energy Opportunities | Non-Diversified | ||||||
BlackRock High Equity Income Fund | High Equity Income | Diversified | ||||||
BlackRock International Dividend Fund | International Dividend | Diversified | ||||||
| ||||||||
Each Fund offers multiple classes of shares. All classes of shares have identical voting, dividend, liquidation and other rights and are subject to the same terms and conditions, except that certain classes bear expenses related to the shareholder servicing and distribution of such shares. Institutional and Class K Shares are sold only to certain eligible investors. Investor A, Investor C and Class R Shares bear certain expenses related to shareholder servicing of such shares, and Investor C and Class R Shares also bear certain expenses related to the distribution of such shares. Investor A and Investor C Shares are generally available through financial intermediaries. Class R Shares are sold only to certain employer-sponsored retirement plans. Each class has exclusive voting rights with respect to matters relating to its shareholder servicing and distribution expenditures (except that Investor C shareholders may vote on material changes to the Investor A Shares distribution and service plan).
| ||||||
| Share Class | Initial Sales Charge | CDSC | Conversion Privilege | |||
| ||||||
Institutional, Service, Class K and Class R Shares(a) | No | No | None | |||
Investor A Shares | Yes | No(b) | None | |||
Investor C Shares | No | Yes(c) | To Investor A Shares after approximately 10 years | |||
| ||||||
| (a) | With respect to High Equity Income, Class K Shares commenced operations on April 21, 2020. |
| (b) | Investor A Shares may be subject to a contingent deferred sales charge (“CDSC”) for certain redemptions where no initial sales charge was paid at the time of purchase. |
| (c) | A CDSC of 1.00% is assessed on certain redemptions of Investor C Shares made within one year after purchase. |
The Funds, together with certain other registered investment companies advised by BlackRock Advisors, LLC (the “Manager”) or its affiliates, are included in a complex of equity, multi-asset, index and money market funds referred to as the BlackRock Multi-Asset Complex.
On July 31, 2019, the Board of Trustees of the Trust (the “Board”) approved a fund name change effective as of January 13, 2020, from BlackRock All-Cap Energy & Resources Portfolio to BlackRock Energy Opportunities Fund.
On November 13, 2019, the Board approved a change in the fiscal year-end of the Funds, effective as of May 31, 2020, from September 30 to May 31.
Reorganization: The Board approved the reorganization of BlackRock Energy & Resources Portfolio (the “Target Fund” ) into Energy Opportunities. As a result, Energy Opportunities acquired substantially all of the assets and assumed certain liabilities of the Target Fund in exchange for an equal aggregate value of newly-issued shares of Energy Opportunities.
Each shareholder of the Target Fund received shares of Energy Opportunities in an amount equal to the aggregate net asset value (“NAV”) of such shareholder’s Target Fund shares, as determined at the close of business on January 10, 2020, less the costs of the Target Fund’s reorganization.
The reorganization was accomplished by a tax-free exchange of shares of Energy Opportunities in the following amounts and at the following conversion ratios:
| ||||||||||||||||
| Target Fund’s Share Class | Shares Prior to Reorganization | Conversion Ratio | Energy Opportunities Share Class | Shares of Energy Opportunities | ||||||||||||
| ||||||||||||||||
Institutional | 666,762 | 1.64341300 | Institutional | 1,095,766 | ||||||||||||
Investor A | 4,649,385 | 1.44165000 | Investor A | 6,702,786 | ||||||||||||
Investor C | 861,498 | 1.03784900 | Investor C | 894,104 | ||||||||||||
| ||||||||||||||||
The Target Fund’s net assets and composition of net assets on January 10, 2020, the valuation date of the reorganization, were as follows:
| ||||
| Target Fund | ||||
| ||||
Net assets | $ | 84,426,614 | ||
|
| |||
Paid-in capital | $ | 344,108,684 | ||
Accumulated loss | (259,682,070 | ) | ||
| ||||
For financial reporting purposes, assets received and shares issued by Energy Opportunities were recorded at fair value. However, the cost basis of the investments received from the Target Fund was carried forward to align ongoing reporting of the Fund’s realized and unrealized gains and losses with amounts distributable to shareholders for tax purposes.
| 44 | 2020 BLACKROCK ANNUAL REPORTTO SHAREHOLDERS |
Notes to Financial Statements (continued)
The net assets of Energy Opportunities before the reorganization were $72,886,652. The aggregate net assets of Energy Opportunities immediately after the reorganization amounted to $157,313,266. The Target Fund’s fair value and cost of investments prior to the reorganization were as follows:
| Target Fund | Fair Value of Investments | Cost of Investments | ||||||
BlackRock Energy & Resources Portfolio | $ | 84,656,807 | $ | 81,991,609 | ||||
The purpose of this transaction was to combine two funds managed by the Manager with substantially similar (but not identical) investment objectives, investment policies, strategies, risks and restrictions. The reorganization was a tax-free event and was effective on January 13, 2020.
Assuming the reorganization had been completed on October 1, 2019, the beginning of the fiscal reporting period of Energy Opportunities, the pro forma results of operations for the period ended May 31, 2020, are as follows:
| • | Net investment income: $2,510,797 |
| • | Net realized and change in unrealized loss on investments: $(41,741,062) |
| • | Net decrease in net assets resulting from operations: $(39,230,265) |
Because the combined investment portfolios have been managed as a single integrated portfolio since the reorganization was completed, it is not practicable to separate the amounts of revenue and earnings of the Target Fund that have been included in Energy Opportunities’ Statements of Operations since January 13, 2020.
Reorganization costs incurred in connection with the reorganization were expensed by Energy Opportunities.
| 2. | SIGNIFICANT ACCOUNTING POLICIES |
The financial statements are prepared in conformity with accounting principles generally accepted in the United States of America (“U.S. GAAP”), which may require management to make estimates and assumptions that affect the reported amounts of assets and liabilities in the financial statements, disclosure of contingent assets and liabilities at the date of the financial statements and the reported amounts of increases and decreases in net assets from operations during the reporting period. Actual results could differ from those estimates. Each Fund is considered an investment company under U.S. GAAP and follows the accounting and reporting guidance applicable to investment companies. Below is a summary of significant accounting policies:
Investment Transactions and Income Recognition: For financial reporting purposes, investment transactions are recorded on the dates the transactions are executed. Realized gains and losses on investment transactions are determined on the identified cost basis. Dividend income and non-cash dividend income, if any, are recorded on the ex-dividend date. Dividends from foreign securities where the ex-dividend date may have passed are subsequently recorded when the Funds are informed of the ex-dividend date. Under the applicable foreign tax laws, a withholding tax at various rates may be imposed on capital gains, dividends and interest. Upon notification from issuers, a portion of the dividend income received from a real estate investment trust may be redesignated as a reduction of cost of the related investment and/or realized gain. Interest income, including amortization and accretion of premiums and discounts on debt securities, is recognized on an accrual basis. Income, expenses and realized and unrealized gains and losses are allocated daily to each class based on its relative net assets.
Foreign Currency Translation: Each Fund’s books and records are maintained in U.S. dollars. Securities and other assets and liabilities denominated in foreign currencies are translated into U.S. dollars using exchange rates determined as of the close of trading on the New York Stock Exchange (“NYSE”). Purchases and sales of investments are recorded at the rates of exchange prevailing on the respective dates of such transactions. Generally, when the U.S. dollar rises in value against a foreign currency, the investments denominated in that currency will lose value; the opposite effect occurs if the U.S. dollar falls in relative value.
Each Fund does not isolate the portion of the results of operations arising as a result of changes in the exchange rates from the changes in the market prices of investments held or sold for financial reporting purposes. Accordingly, the effects of changes in exchange rates on investments are not segregated in the Statements of Operations from the effects of changes in market prices of those investments, but are included as a component of net realized and unrealized gain (loss) from investments. Each Fund reports realized currency gains (losses) on foreign currency related transactions as components of net realized gain (loss) for financial reporting purposes, whereas such components are generally treated as ordinary income for U.S. federal income tax purposes.
Distributions: Distributions paid by the Funds are recorded on the ex-dividend date. The character and timing of distributions are determined in accordance with U.S. federal income tax regulations, which may differ from U.S. GAAP.
Offering Costs: Offering costs are amortized over a 12-month period beginning with the commencement of operations of a class of shares.
Indemnifications: In the normal course of business, a Fund enters into contracts that contain a variety of representations that provide general indemnification. A Fund’s maximum exposure under these arrangements is unknown because it involves future potential claims against a Fund, which cannot be predicted with any certainty.
Other: Expenses directly related to a Fund or its classes are charged to that Fund or the applicable class. Other operating expenses shared by several funds, including other funds managed by the Manager, are prorated among those funds on the basis of relative net assets or other appropriate methods. Expenses directly related to the Funds and other shared expenses prorated to the Fund are allocated daily to each class based on their relative net assets or other appropriate methods.
The Funds have an arrangement with their custodian whereby credits are earned on uninvested cash balances, which could be used to reduce custody fees and/or overdraft charges. The Funds may incur charges on overdrafts, subject to certain conditions.
| NOTESTO FINANCIAL STATEMENTS | 45 |
Notes to Financial Statements (continued)
| 3. | INVESTMENT VALUATION AND FAIR VALUE MEASUREMENTS |
Investment Valuation Policies: The Fund’s investments are valued at fair value (also referred to as “market value” within the financial statements) as of the close of trading on the NYSE (generally 4:00 p.m., Eastern time) (or if the reporting date falls on a day the NYSE is closed, investments are valued at fair value as of the period end). U.S. GAAP defines fair value as the price the Funds would receive to sell an asset or pay to transfer a liability in an orderly transaction between market participants at the measurement date. The Fund determine the fair values of their financial instruments using various independent dealers or pricing services under policies approved by the Board. If a security’s market price is not readily available or does not otherwise accurately represent the fair value of the security, the security will be valued in accordance with a policy approved by the Board as reflecting fair value. The BlackRock Global Valuation Methodologies Committee (the “Global Valuation Committee”) is the committee formed by management to develop global pricing policies and procedures and to oversee the pricing function for all financial instruments.
Fair Value Inputs and Methodologies: The following methods and inputs are used to establish the fair value of each Fund’s assets and liabilities:
| • | Equity investments traded on a recognized securities exchange are valued at the official closing price each day, if available. For equity investments traded on more than one exchange, the official closing price on the exchange where the stock is primarily traded is used. Equity investments traded on a recognized exchange for which there were no sales on that day may be valued at the last available bid (long positions) or ask (short positions) price. |
Generally, trading in foreign instruments is substantially completed each day at various times prior to the close of trading on the NYSE. Occasionally, events affecting the values of such instruments may occur between the foreign market close and the close of trading on the NYSE that may not be reflected in the computation of the Fund’s net assets. Each business day, the Funds use a pricing service to assist with the valuation of certain foreign exchange-traded equity securities and foreign exchange-traded and over-the-counter (“OTC”) options (the “Systematic Fair Value Price”). Using current market factors, the Systematic Fair Value Price is designed to value such foreign securities and foreign options at fair value as of the close of trading on the NYSE, which follows the close of the local markets.
| • | Investments in open-end U.S. mutual funds are valued at NAV each business day. |
| • | The Funds value their investment in SL Liquidity Series, LLC, Money Market Series (the “Money Market Series”) at fair value, which is ordinarily based upon their pro rata ownership in the underlying fund’s net assets. The Money Market Series seeks current income consistent with maintaining liquidity and preserving capital. Although the Money Market Series is not registered under the 1940 Act, its investments may follow the parameters of investments by a money market fund that is subject to Rule 2a-7 under the 1940 Act. |
| • | Equity-Linked Notes are valued utilizing quotes received daily by the Fund’s pricing service or through brokers. The Fund’s pricing service utilizes models that incorporate a number of market data factors, such as historical and forecasted discrete dividend information and historical values of the underlying reference instruments. |
If events (e.g., a company announcement, market volatility or a natural disaster) occur that are expected to materially affect the value of such investments, or in the event that the application of these methods of valuation results in a price for an investment that is deemed not to be representative of the market value of such investment, or if a price is not available, the investment will be valued by the Global Valuation Committee, or its delegate, in accordance with a policy approved by the Board as reflecting fair value (“Fair Valued Investments”). The fair valuation approaches that may be used by the Global Valuation Committee will include market approach, income approach and cost approach. Valuation techniques such as discounted cash flow, use of market comparables and matrix pricing are types of valuation approaches and are typically used in determining fair value. When determining the price for Fair Valued Investments, the Global Valuation Committee, or its delegate, seeks to determine the price that each Fund might reasonably expect to receive or pay from the current sale or purchase of that asset or liability in an arm’s-length transaction. Fair value determinations shall be based upon all available factors that the Global Valuation Committee, or its delegate, deems relevant and consistent with the principles of fair value measurement. The pricing of all Fair Valued Investments is subsequently reported to the Board or a committee thereof on a quarterly basis.
For investments in equity or debt issued by privately held companies or funds (“Private Company” or collectively, the “Private Companies”) and other Fair Valued Investments, the fair valuation approaches that are used by the Global Valuation Committee and third party pricing services utilize one or a combination of, but not limited to, the following inputs.
| Standard Inputs Generally Considered By Third Party Pricing Services | ||||
Market approach | (i) | recent market transactions, including subsequent rounds of financing, in the underlying investment or comparable issuers; | ||
(ii) | recapitalizations and other transactions across the capital structure; and | |||
(iii) | market multiples of comparable issuers. | |||
Income approach | (i) | future cash flows discounted to present and adjusted as appropriate for liquidity, credit and/or market risks; | ||
(ii) | quoted prices for similar investments or assets in active markets; and | |||
(iii) | other risk factors, such as interest rates, yield curves, volatilities, prepayment speeds, loss severities, credit risks, recovery rates, liquidation amounts and/or default rates. | |||
Cost approach | (i) | audited or unaudited financial statements, investor communications and financial or operational metrics issued by the Private Company; | ||
(ii) | changes in the valuation of relevant indices or publicly traded companies comparable to the Private Company; | |||
(iii) | relevant news and other public sources; and | |||
(iv) | known secondary market transactions in the Private Company’s interests and merger or acquisition activity in companies comparable to the Private Company. | |||
Investments in series of preferred stock issued by Private Companies are typically valued utilizing market approach in determining the enterprise value of the company. Such investments often contain rights and preferences that differ from other series of preferred and common stock of the same issuer. Valuation techniques such as an option pricing model (“OPM”), a probability weighted expected return model (“PWERM”) or a hybrid of those techniques are used in allocating enterprise value of the company, as deemed appropriate under the circumstances. The use of OPM and PWERM techniques involve a determination of the exit scenarios of the investment in order to appropriately allocate the enterprise value of the company among the various parts of its capital structure.
| 46 | 2020 BLACKROCK ANNUAL REPORTTO SHAREHOLDERS |
Notes to Financial Statements (continued)
The Private Companies are not subject to the public company disclosure, timing, and reporting standards as other investments held by a Fund. Typically, the most recently available information by a Private Company is as of a date that is earlier than the date a Fund is calculating its NAV. This factor may result in a difference between the value of the investment and the price a Fund could receive upon the sale of the investment.
Fair Value Hierarchy: Various inputs are used in determining the fair value of investments. These inputs to valuation techniques are categorized into a fair value hierarchy consisting of three broad levels for financial statement purposes as follows:
| • | Level 1 — Unadjusted price quotations in active markets/exchanges for identical assets or liabilities that each Fund has the ability to access |
| • | Level 2 — Other observable inputs (including, but not limited to, quoted prices for similar assets or liabilities in markets that are active, quoted prices for identical or similar assets or liabilities in markets that are not active, inputs other than quoted prices that are observable for the assets or liabilities (such as interest rates, yield curves, volatilities, prepayment speeds, loss severities, credit risks and default rates) or other market-corroborated inputs) |
| • | Level 3 — Unobservable inputs based on the best information available in the circumstances, to the extent observable inputs are not available (including the Global Valuation Committee’s assumptions used in determining the fair value of investments) |
The hierarchy gives the highest priority to unadjusted quoted prices in active markets for identical assets or liabilities (Level 1 measurements) and the lowest priority to unobservable inputs (Level 3 measurements). Accordingly, the degree of judgment exercised in determining fair value is greatest for instruments categorized in Level 3. The inputs used to measure fair value may fall into different levels of the fair value hierarchy. In such cases, for disclosure purposes, the fair value hierarchy classification is determined based on the lowest level input that is significant to the fair value measurement in its entirety. Investments classified within Level 3 have significant unobservable inputs used by the Global Valuation Committee in determining the price for Fair Valued Investments. Level 3 investments include equity or debt issued by privately held companies or funds. There may not be a secondary market, and/or there are a limited number of investors. The categorization of a value determined for investments is based on the pricing transparency of the investments and is not necessarily an indication of the risks associated with investing in those securities.
As of May 31, 2020, certain investments of the Funds were fair valued using NAV per share as no quoted market value is available and therefore have been excluded from the fair value hierarchy.
| 4. | SECURITIES AND OTHER INVESTMENTS |
Equity-Linked Notes: Equity-linked notes seek to generate income and provide exposure to the performance of an underlying security, group of securities or exchange-traded funds (the “underlying reference instrument”). In an equity-linked note, a fund purchases a note from a bank or broker-dealer and in return, the issuer provides for interest payments during the term of the note. At maturity or when the security is sold, a fund will either settle by taking physical delivery of the underlying reference instrument or by receipt of a cash settlement amount equal to the value of the note at termination or maturity. The use of equity-linked notes involves the risk that the value of the note changes unfavorably due to movements in the value of the underlying reference instrument. Equity-linked notes are considered general unsecured contractual obligations of the bank or broker-dealer. A fund must rely on the creditworthiness of the issuer for its investment returns.
Preferred Stocks: Preferred stock has a preference over common stock in liquidation (and generally in receiving dividends as well), but is subordinated to the liabilities of the issuer in all respects. As a general rule, the market value of preferred stock with a fixed dividend rate and no conversion element varies inversely with interest rates and perceived credit risk, while the market price of convertible preferred stock generally also reflects some element of conversion value. Because preferred stock is junior to debt securities and other obligations of the issuer, deterioration in the credit quality of the issuer will cause greater changes in the value of a preferred stock than in a more senior debt security with similar stated yield characteristics. Unlike interest payments on debt securities, preferred stock dividends are payable only if declared by the issuer’s board of directors. Preferred stock also may be subject to optional or mandatory redemption provisions.
Securities Lending: Certain Funds may lend their securities to approved borrowers, such as brokers, dealers and other financial institutions. The borrower pledges and maintains with the Fund collateral consisting of cash, an irrevocable letter of credit issued by a bank, or securities issued or guaranteed by the U.S. Government. The initial collateral received by each Fund is required to have a value of at least 102% of the current value of the loaned securities for securities traded on U.S. exchanges and a value of at least 105% for all other securities. The collateral is maintained thereafter at a value equal to at least 100% of the current market value of the securities on loan. The market value of the loaned securities is determined at the close of each business day of the Fund and any additional required collateral is delivered to the Fund, or excess collateral returned by the Fund, on the next business day. During the term of the loan, the Fund is entitled to all distributions made on or in respect of the loaned securities, but do not receive interest income on securities received as collateral. Loans of securities are terminable at any time and the borrower, after notice, is required to return borrowed securities within the standard time period for settlement of securities transactions.
The market value of any securities on loan, all of which were classified as common stocks in the Fund’s Schedules of Investments, and the value of any related collateral are shown separately in the Statements of Assets and Liabilities as a component of investments at value — unaffiliated, and collateral on securities loaned at value, respectively. As of period end, any securities on loan were collateralized by cash and/or U.S. Government obligations. Cash collateral invested by the securities lending agent, BlackRock Investment Management, LLC (“BIM”), if any, is disclosed in the Schedules of Investments.
Securities lending transactions are entered into by the Funds under Master Securities Lending Agreements (each, an “MSLA”), which provide the right, in the event of default (including bankruptcy or insolvency), for the non-defaulting party to liquidate the collateral and calculate a net exposure to the defaulting party or request additional collateral. In the event that a borrower defaults, the Fund, as lender, would offset the market value of the collateral received against the market value of the securities loaned. When the value of the collateral is greater than that of the market value of the securities loaned, the lender is left with a net amount payable to the defaulting party. However, bankruptcy or insolvency laws of a particular jurisdiction may impose restrictions on or prohibitions against such a right of offset in the event of an MSLA counterparty’s bankruptcy or
| NOTESTO FINANCIAL STATEMENTS | 47 |
Notes to Financial Statements (continued)
insolvency. Under the MSLA, absent an event of default, the borrower can resell or re-pledge the loaned securities, and a Fund can reinvest cash collateral received in connection with loaned securities. Upon an event of default, the parties’ obligations to return the securities or collateral to the other party are extinguished, and the parties can resell or re-pledge the loaned securities or the collateral received in connection with the loaned securities in order to satisfy the defaulting party’s net payment obligation for all transactions under the MSLA. The defaulting party remains liable for any deficiency.
As of period end, the following table is a summary of High Equity Income’s securities lending agreements by counterparty which are subject to offset under an MSLA:
| Fund Name/Counterparty | | Securities Loaned at Value | | | Cash Collateral Received | (a) | | Net Amount | | |||
High Equity Income | ||||||||||||
Credit Suisse Securities (USA) LLC | $ | 921,231 | $ | (921,231 | ) | $ | — | |||||
|
|
|
|
|
|
| (a) | Collateral received in excess of the market value of securities on loan is not presented in this table. The total cash collateral received by each Fund is disclosed in the Fund’s Statements of Assets and Liabilities. |
The risks of securities lending include the risk that the borrower may not provide additional collateral when required or may not return the securities when due. To mitigate these risks, the Funds benefit from a borrower default indemnity provided by BIM. BIM’s indemnity allows for full replacement of the securities loaned to the extent the collateral received does not cover the value on the securities loaned in the event of borrower default. Each Fund could incur a loss if the value of an investment purchased with cash collateral falls below the market value of loaned securities or if the value of an investment purchased with cash collateral falls below the value of the original cash collateral received. Such losses are borne entirely by the Fund.
| 5. | DERIVATIVE FINANCIAL INSTRUMENTS |
The Funds engage in various portfolio investment strategies using derivative contracts both to increase the returns of the Funds and/or to manage their exposure to certain risks such as credit risk, equity risk, interest rate risk, foreign currency exchange rate risk, commodity price risk or other risks (e.g., inflation risk). Derivative financial instruments categorized by risk exposure are included in the Schedules of Investments. These contracts may be transacted on an exchange or OTC.
Forward Foreign Currency Exchange Contracts: Forward foreign currency exchange contracts are entered into to gain or reduce exposure to foreign currencies (foreign currency exchange rate risk).
A forward foreign currency exchange contract is an agreement between two parties to buy and sell a currency at a set exchange rate on a specified date. These contracts help to manage the overall exposure to the currencies in which some of the investments held by the Funds are denominated and in some cases, may be used to obtain exposure to a particular market.
The contract is marked-to-market daily and the change in market value is recorded as unrealized appreciation (depreciation) in the Statements of Assets and Liabilities. When a contract is closed, a realized gain or loss is recorded in the Statements of Operations equal to the difference between the value at the time it was opened and the value at the time it was closed. Non-deliverable forward foreign currency exchange contracts are settled with the counterparty in cash without the delivery of foreign currency. The use of forward foreign currency exchange contracts involves the risk that the value of a forward foreign currency exchange contract changes unfavorably due to movements in the value of the referenced foreign currencies, and such value may exceed the amounts reflected in the Statements of Assets and Liabilities. Cash amounts pledged for forward foreign currency exchange contracts are considered restricted and are included in cash pledged as collateral for OTC derivatives in the Statements of Assets and Liabilities.
| 6. | INVESTMENT ADVISORY AGREEMENT AND OTHER TRANSACTIONS WITH AFFILIATES |
Investment Advisory: The Trust, on behalf of the Funds, entered into an Investment Advisory Agreement with the Manager, the Funds’ investment adviser and an indirect, wholly-owned subsidiary of BlackRock, Inc. (“BlackRock”), to provide investment advisory services. The Manager is responsible for the management of each Fund’s portfolio and provides the personnel, facilities, equipment and certain other services necessary to the operations of each Fund.
For such services, each Fund pays the Manager a monthly fee at an annual rate equal to the following percentages of the average daily value of each Fund’s net assets:
| Investment Advisory Fees | ||||||||
| Average Daily Net Assets | Energy Opportunities | |||||||
First $1 billion | 0.750 | % | ||||||
$1 billion — $2 billion | 0.700 | |||||||
$2 billion — $3 billion | 0.675 | |||||||
Greater than $3 billion | 0.650 | |||||||
| 48 | 2020 BLACKROCK ANNUAL REPORTTO SHAREHOLDERS |
Notes to Financial Statements (continued)
| Investment Advisory Fees | ||||||||||||
| Average Daily Net Assets | High Equity Income | International Dividend | ||||||||||
First $1 billion | 0.810 | % | 0.790 | % | ||||||||
$1 billion — $3 billion | 0.760 | 0.740 | ||||||||||
$3 billion — $5 billion | 0.730 | 0.710 | ||||||||||
$5 billion — $10 billion | 0.700 | 0.690 | ||||||||||
Greater than $10 billion | 0.680 | 0.670 | ||||||||||
With respect to Energy Opportunities and International Dividend, the Manager entered into separate sub-advisory agreements with BlackRock International Limited (“BIL”), an affiliate of the Manager. The Manager pays BIL, for services it provides for that portion of each applicable Fund for which BIL acts as sub-adviser, a monthly fee that is equal to a percentage of the investment advisory fees paid by each Fund to the Manager.
Service and Distribution Fees: The Trust, on behalf of the Funds, entered into a Distribution Agreement and a Distribution and Service Plan with BlackRock Investments, LLC (“BRIL”), an affiliate of the Manager. Pursuant to the Distribution and Service Plan and in accordance with Rule 12b-1 under the 1940 Act, each Fund pays BRIL ongoing service and distribution fees. The fees are accrued daily and paid monthly at annual rates based upon the average daily net assets of the relevant share class of each Fund as follows:
| Share Class | Service Fees | Distribution Fees | ||||||
Service | 0.25 | % | N/A | |||||
Investor A | 0.25 | N/A | ||||||
Investor C | 0.25 | 0.75 | % | |||||
Class R | 0.25 | 0.25 | ||||||
BRIL and broker-dealers, pursuant to sub-agreements with BRIL, provide shareholder servicing and distribution services to the Funds. The ongoing service and/or distribution fee compensates BRIL and each broker-dealer for providing shareholder servicing and/or distribution related services to shareholders.
The following table shows the class specific service and distribution fees borne directly by each share class of each Fund:
| Energy Opportunities | High Equity Income | International Dividend | ||||||||||||||||||||||
| Share Class | Period from 10/01/19 to 05/31/20 | Year Ended 09/30/19 | Period from 10/01/19 to 05/31/20 | Year Ended 09/30/19 | Period from 10/01/19 to 05/31/20 | Year Ended 09/30/19 | ||||||||||||||||||
Service | $ | 650 | $ | 1,371 | $ | 16,391 | $ | 25,885 | $ | 5,307 | $ | 8,804 | ||||||||||||
Investor A | 94,657 | 92,746 | 329,008 | 524,379 | 192,282 | 323,327 | ||||||||||||||||||
Investor C | 62,892 | 108,079 | 199,493 | 528,580 | 82,668 | 209,252 | ||||||||||||||||||
|
|
|
|
|
|
|
|
|
|
|
| |||||||||||||
| $ | 158,199 | $ | 202,196 | $ | 544,892 | $ | 1,078,844 | $ | 280,257 | $ | 541,383 | |||||||||||||
|
|
|
|
|
|
|
|
|
|
|
| |||||||||||||
Administration: The Trust, on behalf of the Funds, entered into an Administration Agreement with the Manager, an indirect, wholly-owned subsidiary of BlackRock, to provide administrative services. For these services, the Manager receives an administration fee computed daily and payable monthly, based on a percentage of the average daily net assets of each Fund. The administration fee, which is shown as administration in the Statements of Operations, is paid at the annual rates below.
| Average Daily Net Assets | Administration Fee | |||
First $500 million | 0.0425 | % | ||
$500 million — $1 billion | 0.0400 | |||
$1 billion — $2 billion | 0.0375 | |||
$2 billion — $4 billion | 0.0350 | |||
$4 billion — $13 billion | 0.0325 | |||
Greater than $13 billion | 0.0300 | |||
In addition, the Manager charges each of the share classes an administration fee, which is shown as administration — class specific in the Statements of Operations, at an annual rate of 0.02% of the average daily net assets of each respective class.
The following table shows the class specific administration fees borne directly by each share class of each Fund:
| Energy Opportunities | High Equity Income | International Dividend | ||||||||||||||||||||||
| Share Class | Period from 10/01/19 to 05/31/20 | Year Ended 09/30/19 | Period from 10/01/19 to 05/31/20 | Year Ended 09/30/19 | Period from 10/01/19 to 05/31/20 | Year Ended 09/30/19 | ||||||||||||||||||
Institutional | $ | 3,901 | $ | 4,014 | $ | 19,176 | $ | 33,739 | $ | 10,564 | $ | 17,315 | ||||||||||||
Service | 52 | 111 | 1,327 | 2,113 | 430 | 715 | ||||||||||||||||||
Investor A | 7,577 | 7,463 | 26,294 | 42,078 | 15,403 | 26,186 | ||||||||||||||||||
Investor C | 1,265 | 2,178 | 4,001 | 10,625 | 1,663 | 4,220 | ||||||||||||||||||
Class K | — | — | 6 | — | 479 | 729 | ||||||||||||||||||
|
|
|
|
|
|
|
|
|
|
|
| |||||||||||||
| $ | 12,795 | $ | 13,766 | $ | 50,804 | $ | 88,555 | $ | 28,539 | $ | 49,165 | |||||||||||||
|
|
|
|
|
|
|
|
|
|
|
| |||||||||||||
| NOTESTO FINANCIAL STATEMENTS | 49 |
Notes to Financial Statements (continued)
Transfer Agent: Pursuant to written agreements, certain financial intermediaries, some of which may be affiliates, provide the Funds with sub-accounting, recordkeeping, sub-transfer agency and other administrative services with respect to servicing of underlying investor accounts. For these services, these entities receive an asset-based fee or an annual fee per shareholder account, which will vary depending on share class and/or net assets. The Funds paid the following amounts to affiliates of BlackRock in return for these services, which are included in transfer agent — class specific in the Statements of Operations:
| High Equity Income | International Dividend | |||||||||||||||
| Share Class | Period from 10/01/19 to 05/31/20 | Year Ended 09/30/19 | Period from 10/01/19 to 05/31/20 | Year Ended 09/30/19 | ||||||||||||
Institutional | $ | 217 | $ | 163 | $ | 76 | $ | 52 | ||||||||
Investor A | — | 33 | 618 | 613 | ||||||||||||
|
|
|
|
|
|
|
| |||||||||
| $ | 217 | $ | 196 | $ | 694 | $ | 665 | |||||||||
|
|
|
|
|
|
|
| |||||||||
The Manager maintains a call center that is responsible for providing certain shareholder services to the Funds. Shareholder services include responding to inquiries and processing purchases and sales based upon instructions from shareholders. Each Fund reimbursed the Manager the following amounts for costs incurred in running the call center, which are included in transfer agent — class specific in the Statements of Operations:
| Energy Opportunities | High Equity Income | International Dividend | ||||||||||||||||||||||
| Share Class | Period from 10/01/19 to 05/31/20 | Year Ended 09/30/19 | Period from 10/01/19 to 05/31/20 | Year Ended 09/30/19 | Period from 10/01/19 to 05/31/20 | Year Ended 09/30/19 | ||||||||||||||||||
Institutional | $ | 1,353 | $ | 754 | $ | 431 | $ | 557 | $ | 885 | $ | 1,106 | ||||||||||||
Service | 19 | — | — | — | — | — | ||||||||||||||||||
Investor A | 21,955 | 8,524 | 13,140 | 16,548 | 6,948 | 10,018 | ||||||||||||||||||
Investor C | 2,221 | 1,330 | 1,832 | 4,292 | 981 | 1,957 | ||||||||||||||||||
Class K | — | — | — | — | 24 | 43 | ||||||||||||||||||
|
|
|
|
|
|
|
|
|
|
|
| |||||||||||||
| $ | 25,548 | $ | 10,608 | $ | 15,403 | $ | 21,397 | $ | 8,838 | $ | 13,124 | |||||||||||||
|
|
|
|
|
|
|
|
|
|
|
| |||||||||||||
The following table shows the class specific transfer agent fees borne directly by each share class of each Fund:
| Energy Opportunities | High Equity Income | International Dividend | ||||||||||||||||||||||
| Share Class | Period from 10/01/19 to 05/31/20 | Year Ended 09/30/19 | Period from 10/01/19 to 05/31/20 | Year Ended 09/30/19 | Period from 10/01/19 to 05/31/20 | Year Ended 09/30/19 | ||||||||||||||||||
Institutional | $ | 30,657 | $ | 26,994 | $ | 122,281 | $ | 257,850 | $ | 67,249 | $ | 111,393 | ||||||||||||
Service | 471 | 717 | 7,935 | 10,556 | 2,416 | 1,670 | ||||||||||||||||||
Investor A | 188,322 | 90,419 | 207,041 | 314,947 | 146,572 | 224,016 | ||||||||||||||||||
Investor C | 24,846 | 19,794 | 34,246 | 81,586 | 19,079 | 39,281 | ||||||||||||||||||
Class K | — | — | — | — | 776 | 931 | ||||||||||||||||||
|
|
|
|
|
|
|
|
|
|
|
| |||||||||||||
| $ | 244,296 | $ | 137,924 | $ | 371,503 | $ | 664,939 | $ | 236,092 | $ | 377,291 | |||||||||||||
|
|
|
|
|
|
|
|
|
|
|
| |||||||||||||
Other Fees: Affiliates earned underwriting discounts, direct commissions and dealer concessions on sales of each Fund’s Investor A Shares as follows:
| Energy Opportunities | High Equity Income | International Dividend | ||||||||||||||||||||||
| Period from 10/01/19 to 05/31/20 | Year Ended 09/30/19 | Period from 10/01/19 to 05/31/20 | Year Ended 09/30/19 | Period from 10/01/19 to 05/31/20 | Year Ended 09/30/19 | |||||||||||||||||||
Other fees | $ | 8,310 | $ | 4,500 | $ | 6,180 | $ | 9,907 | $ | 1,923 | $ | 2,986 | ||||||||||||
|
|
|
|
|
|
|
|
|
|
|
| |||||||||||||
Affiliates received CDSCs as follows:
| Energy Opportunities | High Equity Income | International Dividend | ||||||||||||||||||||||
| Share Class | Period from 10/01/19 to 05/31/20 | Year Ended 09/30/19 | Period from 10/01/19 to 05/31/20 | Year Ended 09/30/19 | Period from 10/01/19 to 05/31/20 | Year Ended 09/30/19 | ||||||||||||||||||
Investor A | $ | 95 | $ | 179 | $ | 366 | $ | 166 | $ | 1 | $ | 799 | ||||||||||||
Investor C | 435 | 1,487 | 3,305 | 755 | 201 | 287 | ||||||||||||||||||
|
|
|
|
|
|
|
|
|
|
|
| |||||||||||||
| $ | 530 | $ | 1,666 | $ | 3,671 | $ | 921 | $ | 202 | $ | 1,086 | |||||||||||||
|
|
|
|
|
|
|
|
|
|
|
| |||||||||||||
Expense Limitations, Waivers and Reimbursements: With respect to each Fund, the Manager contractually agreed to waive its investment advisory fees by the amount of investment advisory fees each Fund pays to the Manager indirectly through its investment in affiliated money market funds (the “affiliated money market fund waiver”) through September 30, 2022 for High Equity Income and through September 30, 2021 for Energy Opportunities and International Dividend. The contractual agreement may be terminated upon 90 days’ notice by a majority of the trustees who are not “interested persons” of the Trust, as defined in the 1940 Act (“Independent Trustees”), or by a vote of a majority of the outstanding voting securities of each Fund. The amount of waivers and/or reimbursements of fees and expenses made pursuant to the expense limitation
| 50 | 2020 BLACKROCK ANNUAL REPORTTO SHAREHOLDERS |
Notes to Financial Statements (continued)
described below will be reduced by the amount of the affiliated money market fund waiver. Prior to January 28, 2020, this waiver was voluntary. This amount is included in fees waived and/or reimbursed by the Manager in the Statements of Operations. The amounts waived were as follows:
| Energy Opportunities | High Equity Income | International Dividend | ||||||||||||||||||||||
Period from 10/01/19 to 05/31/20 | Year Ended 09/30/19 | Period from 10/01/19 to 05/31/20 | Year Ended 09/30/19 | Period from 10/01/19 to 05/31/20 | Year Ended 09/30/19 | |||||||||||||||||||
Amounts waived | $ | 1,735 | $ | 887 | $ | 3,431 | $ | 4,617 | $ | 949 | $ | 528 | ||||||||||||
|
|
|
|
|
|
|
|
|
|
|
| |||||||||||||
The Manager has contractually agreed to waive its investment advisory fee with respect to any portion of each Fund’s assets invested in affiliated equity and fixed-income mutual funds and affiliated exchange-traded funds that have a contractual management fee through, September 30, 2022 for High Equity Income and through September 30, 2021 for Energy Opportunities and International Dividend. The contractual agreement may be terminated upon 90 days’ notice by a majority of the Independent Trustees, or by a vote of a majority of the outstanding voting securities of a Fund. For the period ended May 31, 2020 and the year ended September 30, 2019, there were no fees waived and/or reimbursed by the Manager pursuant to this arrangement.
The Funds have incurred expenses in connection with the realignment and consolidation of the boards of trustees of certain BlackRock-advised funds. The Manager has voluntarily agreed to reimburse the Funds for all or a portion of such expenses, which amounts are included in fees waived and/or reimbursed by the Manager in the Statements of Operations. For the year ended September 30, 2019, the amounts reimbursed to Energy Opportunities, High Equity Income and International Dividend were $2,354, $20,248, and $15,180 respectively.
With respect to each Fund, the Manager contractually agreed to waive and/or reimburse fees or expenses in order to limit expenses, excluding interest expense, dividend expense, tax expense, acquired fund fees and expenses, and certain other fund expenses, which constitute extraordinary expenses not incurred in the ordinary course of each Fund’s business (“expense limitation”). The expense limitations as a percentage of average daily net assets are as follows:
| Fund Name | Institutional | Service | Investor A | Investor C | Class R | Class K | ||||||||||||||||||
Energy Opportunities | 0.91 | % | 1.32 | % | 1.32 | % | 2.04 | % | 1.83 | %(a) | 0.91 | %(a) | ||||||||||||
High Equity Income | 0.85 | 1.10 | 1.10 | 1.85 | 1.35 | (a) | 0.80 | |||||||||||||||||
International Dividend | 0.84 | 1.09 | 1.09 | 1.84 | 1.34 | (a) | 0.79 | |||||||||||||||||
| (a) | There were no shares outstanding as of May 31, 2020 |
The Manager has agreed not to reduce or discontinue these contractual expense limitations through January 31, 2021, with the exception of High Equity Income, which is through January 31, 2022, unless approved by the Board, including a majority of the Independent Trustees or by a vote of a majority of the outstanding voting securities of the Funds. For the period ended May 31, 2020 and the year ended September 30, 2019, the amounts included in fees waived and/or reimbursed by the Manager in the Statements of Operations were as follows:
| Energy Opportunities | High Equity Income | International Dividend | ||||||||||||||||||||||
Period from 10/01/19 to 05/31/20 | Year Ended 09/30/19 | Period from 10/01/19 to 05/31/20 | Year Ended 09/30/19 | Period from 10/01/19 to 05/31/20 | Year Ended 09/30/19 | |||||||||||||||||||
Amounts waived | $ | 220,496 | $ | 159,138 | $ | 324,049 | $ | 410,822 | $ | 362,695 | $ | 490,951 | ||||||||||||
|
|
|
|
|
|
|
|
|
|
|
| |||||||||||||
These amounts waived and/or reimbursed are included in administration fees waived — class specific and transfer agent fees waived and/or reimbursed — class specific, respectively, in the Statements of Operations. For the period ended May 31, 2020 and the year ended September 30, 2019, class specific expense waivers and/or reimbursements are as follows:
| Administration Fees Waived | ||||||||||||||||||||||||
| Energy Opportunities | High Equity Income | International Dividend | ||||||||||||||||||||||
| Share Class | Period from 10/01/19 to 05/31/20 | Year Ended 09/30/19 | Period from 10/01/19 to 05/31/20 | Year Ended 09/30/19 | Period from 10/01/19 to 05/31/20 | Year Ended 09/30/19 | ||||||||||||||||||
Institutional | $ | 3,901 | $ | 4,014 | $ | 19,176 | $ | 33,739 | $ | 10,564 | $ | 17,315 | ||||||||||||
Service | 42 | 10 | 1,327 | 2,113 | 367 | 213 | ||||||||||||||||||
Investor A | 7,577 | 7,330 | 26,294 | 42,078 | 15,403 | 26,186 | ||||||||||||||||||
Investor C | 1,265 | 2,030 | 4,001 | 10,625 | 1,663 | 4,220 | ||||||||||||||||||
Class K | — | — | 6 | — | 479 | 729 | ||||||||||||||||||
|
|
|
|
|
|
|
|
|
|
|
| |||||||||||||
| $ | 12,785 | $ | 13,384 | $ | 50,804 | $ | 88,555 | $ | 28,476 | $ | 48,663 | |||||||||||||
|
|
|
|
|
|
|
|
|
|
|
| |||||||||||||
| NOTESTO FINANCIAL STATEMENTS | 51 |
Notes to Financial Statements (continued)
| Transfer Agent Fees Waived and/or Reimbursed | ||||||||||||||||||||||||
| Energy Opportunities | High Equity Income | International Dividend | ||||||||||||||||||||||
| Share Class | Period from 10/01/19 to 05/31/20 | Year Ended 09/30/19 | Period from 10/01/19 to 05/31/20 | Year Ended 09/30/19 | Period from 10/01/19 to 05/31/20 | Year Ended 09/30/19 | ||||||||||||||||||
Institutional | $ | 30,658 | $ | 26,994 | $ | 114,254 | $ | 256,570 | $ | 40,852 | $ | 68,148 | ||||||||||||
Service | 82 | — | 7,248 | 9,990 | 1,416 | 848 | ||||||||||||||||||
Investor A | 127,646 | 27,274 | 197,222 | 312,322 | 108,009 | 154,866 | ||||||||||||||||||
Investor C | 16,239 | 4,157 | 32,246 | 79,112 | 14,562 | 27,274 | ||||||||||||||||||
Class K | — | — | — | — | 776 | 931 | ||||||||||||||||||
|
|
|
|
|
|
|
|
|
|
|
| |||||||||||||
| $ | 174,625 | $ | 58,425 | $ | 350,970 | $ | 657,994 | $ | 165,615 | $ | 252,067 | |||||||||||||
|
|
|
|
|
|
|
|
|
|
|
| |||||||||||||
With respect to the contractual expense limitations, if during a Fund’s fiscal year the operating expenses of a share class, that at any time during the prior two fiscal years received a waiver and/or reimbursement from the Manager, are less than the current expense limitation for that share class, the Manager is entitled to be reimbursed by such share class up to the lesser of: (a) the amount of fees waived and/or expenses reimbursed during those prior two fiscal years under the agreement and (b) an amount not to exceed either the current expense limitation of that share class or the expense limitation of the share class in effect at the time that the share class received the applicable waiver and/or reimbursement, provided that:
(1) each Fund, of which the share class is a part, has more than $50 million in assets for the fiscal year, and
(2) the Manager or an affiliate continues to serve as a Fund’s investment adviser or administrator.
This repayment applies only to the contractual expense limitation on net expenses and does not apply to the contractual investment advisory fee waiver described above or any voluntary waivers that may be in effect from time to time. Effective December 1, 2019, the repayment arrangement between each Fund and the Manager pursuant to which such Fund may be required to repay amounts waived and/or reimbursed under each Fund’s contractual caps on net expenses was terminated.
The Manager recouped the following class specific waivers and/or reimbursements previously recorded by the Funds:
| Energy Opportunities | International Dividend | |||||||||||
| Share Class | Year Ended 09/30/19 | Period from 10/01/19 to 05/31/20 | Year Ended 09/30/19 | |||||||||
Service | $ | 128 | $ | 72 | $ | 598 | ||||||
Investor C | 28 | — | — | |||||||||
|
|
|
|
|
| |||||||
| $ | 156 | $ | 72 | $ | 598 | |||||||
|
|
|
|
|
| |||||||
The following fund level and class specific waivers and/or reimbursements previously recorded by the Funds, which were subject to recoupment by the Manager, expired on December 1, 2019:
| Fund Level/Share Class | Amounts | |||
Energy Opportunities | ||||
Fund Level | $ | 316,846 | ||
Institutional | 73,788 | |||
Service | 132 | |||
Investor A | 95,531 | |||
Investor C | 31,471 | |||
High Equity Income | ||||
Fund Level | 1,025,849 | |||
Institutional | 837,237 | |||
Service | 34,312 | |||
Investor A | 863,133 | |||
Investor C | 277,116 | |||
International Dividend | ||||
Fund Level | 1,131,355 | |||
Institutional | 290,300 | |||
Service | 7,895 | |||
Investor A | 572,069 | |||
Investor C | 118,562 | |||
Class K | 2,886 | |||
Securities Lending: The U.S. Securities and Exchange Commission (“SEC”) has issued an exemptive order which permits BIM, an affiliate of the Manager, to serve as securities lending agent for the Funds, subject to applicable conditions. As securities lending agent, BIM bears all operational costs directly related to securities lending. The Funds are responsible for expenses in connection with the investment of cash collateral received for securities on loan (the “collateral investment expenses”). The cash collateral is invested in a private investment company managed by the Manager or its affiliates. However, BIM has agreed to cap the collateral investment expenses of the private investment company to an annual rate of 0.04%. The investment adviser to the private investment company will not charge any advisory fees with respect to shares
| 52 | 2020 BLACKROCK ANNUAL REPORTTO SHAREHOLDERS |
Notes to Financial Statements (continued)
purchased by the Funds. The private investment company in which the cash collateral has been invested may, under certain circumstances, impose a liquidity fee of up to 2% of the value withdrawn or temporarily restrict withdrawals for up to 10 business days during a 90 day period, in the event that the private investment company’s weekly liquid assets fall below certain thresholds.
Securities lending income is equal to the total of income earned from the reinvestment of cash collateral, net of fees and other payments to and from borrowers of securities, and less the collateral investment expenses. Each Fund retains a portion of securities lending income and remits a remaining portion to BIM as compensation for its services as securities lending agent.
Pursuant to the current securities lending agreement, High Equity Income retains 75% of securities lending income (which excludes collateral investment expenses), and this amount retained can never be less than 70% of the total of securities lending income plus the collateral investment expenses. Pursuant to the current securities lending agreement, Energy Opportunities and International Dividend retain 82% of securities lending income (which excludes collateral investment expenses), and this amount retained can never be less than 70% of the total of securities lending income plus the collateral investment expenses.
In addition, commencing the business day following the date that the aggregate securities lending income earned across the BlackRock Multi-Asset Complex in a calendar year exceeds a specified threshold, High Equity Income pursuant to the securities lending agreement, will retain for the remainder of that calendar year securities lending income in an amount equal to 80% of securities lending income (which excludes collateral investment expenses), and this amount retained can never be less than 70% of the total of securities lending income plus the collateral investment expenses. Energy Opportunities and International Dividend, pursuant to the securities lending agreement, will retain for the remainder of that calendar year securities lending income in an amount equal to 85% of securities lending income (which excludes collateral investment expenses), and this amount retained can never be less than 70% of the total of securities lending income plus the collateral investment expenses.
Prior to January 1, 2020, High Equity Income retained 73.5% of securities lending income (which excluded collateral investment expenses) and the amount retained could never be less than 70% of the total of securities lending income plus the collateral investment expenses. In addition, commencing the business day following the date that the aggregate securities lending income earned across the BlackRock Multi-Asset Complex in a calendar year exceeded a specified threshold, the Fund would retain for the remainder of that calendar year 80% of securities lending income (which excluded collateral investment expenses), and the amount retained could never be less than 70% of the total of securities lending income plus the collateral investment expenses.
The share of securities lending income earned by each Fund is shown as securities lending income — affiliated — net in the Statements of Operations. Each Fund paid BIM the following amounts for securities lending agent services:
| Energy Opportunities | High Equity Income | International Dividend | ||||||||||||||||||||||
Period from 10/01/19 to 05/31/20 | Year Ended 09/30/19 | Period from 10/01/19 to 05/31/20 | Year Ended 09/30/19 | Period from 10/01/19 to 05/31/20 | Year Ended 09/30/19 | |||||||||||||||||||
Amounts | $ | 3 | $ | 35 | $ | 1,948 | $ | 2 | $ | — | $ | 401 | ||||||||||||
|
|
|
|
|
|
|
|
|
|
|
| |||||||||||||
Trustees and Officers: Certain trustees and/or officers of the Trust are directors and/or officers of BlackRock or its affiliates. The Funds reimburse the Manager for a portion of the compensation paid to the Trust’s Chief Compliance Officer, which is included in Trustees and Officer in the Statements of Operations.
| 7. | PURCHASES AND SALES |
Purchases and sales of investments, excluding short-term securities and equity-linked notes, were as follows:
| Fund Name | Purchases | Sales | ||||||
Energy Opportunities | $ 51,875,574 | $ 35,923,148 | ||||||
High Equity Income | 229,857,631 | 254,410,942 | ||||||
International Dividend | 62,121,198 | 94,565,678 | ||||||
For the period ended May 31, 2020, purchases and sales related to equity-linked notes for High Equity Income were $362,103,511 and $360,267,516, respectively
| 8. | INCOME TAX INFORMATION |
It is each Fund’s policy to comply with the requirements of the Internal Revenue Code of 1986, as amended, applicable to regulated investment companies, and to distribute substantially all of its taxable income to its shareholders. Therefore, no U.S. federal income tax provision is required.
Each Fund files U.S. federal and various state and local tax returns. No income tax returns are currently under examination. The statute of limitations on each Fund’s U.S. federal tax returns generally remains open for the period ended May 31, 2020 and each of the four years ended September 30, 2019. The statutes of limitations on each Fund’s state and local tax returns may remain open for an additional year depending upon the jurisdiction.
Management has analyzed tax laws and regulations and their application to the Funds as of May 31, 2020, inclusive of the open tax return years, and does not believe that there are any uncertain tax positions that require recognition of a tax liability in the Funds’ financial statements.
| NOTESTO FINANCIAL STATEMENTS | 53 |
Notes to Financial Statements (continued)
U.S. GAAP requires that certain components of net assets be adjusted to reflect permanent differences between financial and tax reporting. These reclassifications have no effect on net assets or NAVs per share. As of period end, the following permanent differences attributable to non-deductible expenses, were reclassified to the following accounts:
| ||||||||||||
Energy Opportunities | High Equity Income | International Dividend | ||||||||||
| ||||||||||||
Paid-in capital | $ | (56,433 | ) | $ | (7,318 | ) | $ | — | ||||
Accumulated earnings (loss) | 56,433 | 7,318 | — | |||||||||
The tax character of distributions paid was as follows:
| ||||||||||||||||
| Period | Energy Opportunities | High Equity Income | International Dividend | |||||||||||||
| ||||||||||||||||
Ordinary income | 05/31/20 | $ | 1,886,055 | $ | 18,978,490 | $ | 2,735,014 | |||||||||
| 09/30/19 | 1,578,645 | 23,585,242 | 5,522,189 | |||||||||||||
| 09/30/18 | 2,104,448 | 34,088,082 | 14,143,999 | |||||||||||||
Long-term capital gains | 05/31/20 | — | — | 589,465 | ||||||||||||
| 09/30/19 | — | 18,693,546 | 8,307,454 | |||||||||||||
| 09/30/18 | — | 690,793 | 2,386,903 | |||||||||||||
|
|
|
|
|
| |||||||||||
Total | 05/31/20 | $ | 1,886,055 | $ | 18,978,490 | $ | 3,324,479 | |||||||||
|
|
|
|
|
| |||||||||||
| 09/30/19 | $ | 1,578,645 | $ | 42,278,788 | $ | 13,829,643 | ||||||||||
|
|
|
|
|
| |||||||||||
| 09/30/18 | $ | 2,104,448 | $ | 34,778,875 | $ | 16,530,902 | ||||||||||
|
|
|
|
|
| |||||||||||
As of period end, the tax components of accumulated net earnings (losses) were as follows:
| ||||||||||||
Energy Opportunities | High Equity Income | International Dividend | ||||||||||
| ||||||||||||
Undistributed ordinary income | $ | 1,921,883 | $ | 198,759 | $ | 919,705 | ||||||
Non-expiring capital loss carryforwards(a) | (305,519,272 | ) | (29,124,037 | ) | (11,180,830 | ) | ||||||
Net unrealized gains (losses)(b) | (36,194,087 | ) | (19,528,192 | ) | 5,392,447 | |||||||
|
|
|
|
|
| |||||||
| $ | (339,791,476 | ) | $ | (48,453,470 | ) | $ | (4,868,678 | ) | ||||
|
|
|
|
|
| |||||||
| (a) | Amounts available to offset future realized capital gains. |
| (b) | The difference between book-basis and tax-basis net unrealized gains and losses was attributable primarily to the tax deferral of losses on wash sales, the realization for tax purposes of unrealized gains on investments in passive foreign investment companies, the realization for tax purposes of unrealized gains/losses on certain foreign currency contracts and the timing and recognition of partnership income. |
As of May 31, 2020, gross unrealized appreciation and depreciation for investments based on cost for U.S. federal income tax purposes were as follows:
| ||||||||||||
Energy Opportunities | High Equity Income | International Dividend | ||||||||||
| ||||||||||||
Tax cost | $ | 158,324,938 | $ | 353,372,599 | $ | 187,688,799 | ||||||
|
|
|
|
|
| |||||||
Gross unrealized appreciation | $ | 3,167,752 | $ | 22,541,442 | $ | 21,329,943 | ||||||
Gross unrealized depreciation | (39,362,904 | ) | (42,083,114 | ) | (15,926,142 | ) | ||||||
|
|
|
|
|
| |||||||
Net unrealized appreciation (depreciation) | $ | (36,195,152 | ) | $ | (19,541,672 | ) | $ | 5,403,801 | ||||
|
|
|
|
|
| |||||||
| 9. | BANK BORROWINGS |
The Trust, on behalf of the Funds, along with certain other funds managed by the Manager and its affiliates (“Participating Funds”), is a party to a 364-day, $2.25 billion credit agreement with a group of lenders. Under this agreement, the Funds may borrow to fund shareholder redemptions. Excluding commitments designated for certain individual funds, the Participating Funds, including the Funds, can borrow up to an aggregate commitment amount of $1.75 billion at any time outstanding, subject to asset coverage and other limitations as specified in the agreement. The credit agreement has the following terms: a fee of 0.10% per annum on unused commitment amounts and interest at a rate equal to the higher of (a) one-month LIBOR (but, in any event, not less than 0.00%) on the date the loan is made plus 0.80% per annum or (b) the Fed Funds rate (but, in any event, not less than 0.00%) in effect from time to time plus 0.80% per annum on amounts borrowed. The agreement expires in April 2021 unless extended or renewed. These fees were allocated among such funds based upon portions of the aggregate commitment available to them and relative net assets of Participating Funds. During the period ended May 31, 2020 and year ended September 30, 2019, the Funds did not borrow under the credit agreement.
| 54 | 2020 BLACKROCK ANNUAL REPORTTO SHAREHOLDERS |
Notes to Financial Statements (continued)
| 10. | PRINCIPAL RISKS |
In the normal course of business, the Funds invest in securities or other instruments and may enter into certain transactions, and such activities subject each Fund to various risks, including among others, fluctuations in the market (market risk) or failure of an issuer to meet all of its obligations. The value of securities or other instruments may also be affected by various factors, including, without limitation: (i) the general economy; (ii) the overall market as well as local, regional or global political and/or social instability; (iii) regulation, taxation or international tax treaties between various countries; or (iv) currency, interest rate and price fluctuations. Local, regional or global events such as war, acts of terrorism, the spread of infectious illness or other public health issues, recessions, or other events could have a significant impact on the Funds and their investments. Each Fund’s prospectus provides details of the risks to which each Fund is subject.
The Funds may be exposed to additional risks when reinvesting cash collateral in money market funds that do not seek to maintain a stable NAV per share of $1.00, which may be subject to redemption gates or liquidity fees under certain circumstances.
Valuation Risk: The market values of equities, such as common stocks and preferred securities or equity related investments, such as futures and options, may decline due to general market conditions which are not specifically related to a particular company. They may also decline due to factors which affect a particular industry or industries. A Fund may invest in illiquid investments. An illiquid investment is any investment that a Fund reasonably expects cannot be sold or disposed of in current market conditions in seven calendar days or less without the sale or disposition significantly changing the market value of the investment. A Fund may experience difficulty in selling illiquid investments in a timely manner at the price that it believes the investments are worth. Prices may fluctuate widely over short or extended periods in response to company, market or economic news. Markets also tend to move in cycles, with periods of rising and falling prices. This volatility may cause each Fund’s NAV to experience significant increases or decreases over short periods of time. If there is a general decline in the securities and other markets, the NAV of a Fund may lose value, regardless of the individual results of the securities and other instruments in which a Fund invests.
An outbreak of respiratory disease caused by a novel coronavirus has developed into a global pandemic and has resulted in closing borders, quarantines, disruptions to supply chains and customer activity, as well as general concern and uncertainty. The impact of this pandemic, and other global health crises that may arise in the future, could affect the economies of many nations, individual companies and the market in general in ways that cannot necessarily be foreseen at the present time. This pandemic may result in substantial market volatility and may adversely impact the prices and liquidity of a fund’s investments. The duration of this pandemic and its effects cannot be determined with certainty.
Counterparty Credit Risk: The Funds may be exposed to counterparty credit risk, or the risk that an entity may fail to or be unable to perform on its commitments related to unsettled or open transactions. The Funds manage counterparty credit risk by entering into transactions only with counterparties that the Manager believes have the financial resources to honor their obligations and by monitoring the financial stability of those counterparties. Financial assets, which potentially expose the Funds to market, issuer and counterparty credit risks, consist principally of financial instruments and receivables due from counterparties. The extent of the Funds’ exposure to market, issuer and counterparty credit risks with respect to these financial assets is approximately their value recorded in the Statements of Assets and Liabilities, less any collateral held by the Funds.
A derivative contract may suffer a mark-to-market loss if the value of the contract decreases due to an unfavorable change in the market rates or values of the underlying instrument. Losses can also occur if the counterparty does not perform under the contract.
With futures, there is less counterparty credit risk to the Funds since the exchange or clearinghouse, as counterparty to such instruments, guarantees against a possible default. The clearinghouse stands between the buyer and the seller of the contract; therefore, credit risk is limited to failure of the clearinghouse. While offset rights may exist under applicable law, a Fund does not have a contractual right of offset against a clearing broker or clearinghouse in the event of a default (including the bankruptcy or insolvency). Additionally, credit risk exists in exchange-traded futures and centrally cleared swaps with respect to initial and variation margin that is held in a clearing broker’s customer accounts. While clearing brokers are required to segregate customer margin from their own assets, in the event that a clearing broker becomes insolvent or goes into bankruptcy and at that time there is a shortfall in the aggregate amount of margin held by the clearing broker for all its clients, typically the shortfall would be allocated on a pro rata basis across all the clearing broker’s customers, potentially resulting in losses to the Funds.
Concentration Risk: As of period end, Energy Opportunities invested a significant portion of its assets in securities in the energy sector. Changes in economic conditions affecting such sector would have a greater impact on the Fund and could affect the value, income and/or liquidity of positions in such securities.
International Dividend invests a significant portion of its assets in securities of issuers located in Europe or with significant exposure to European issuers or countries. The European financial markets have recently experienced volatility and adverse trends due to concerns about economic downturns in, or rising government debt levels of, several European countries. These events may spread to other countries in Europe and may affect the value and liquidity of certain of International Dividend’s investments.
Responses to the financial problems by European governments, central banks and others, including austerity measures and reforms, may not work, may result in social unrest and may limit future growth and economic recovery or have other unintended consequences. Further defaults or restructurings by governments and others of their debt could have additional adverse effects on economies, financial markets and asset valuations around the world. In addition, the United Kingdom withdrawn from the European Union, and one or more other countries may withdraw from the European Union and/or abandon the Euro, the common currency of the European Union. The impact of these actions, especially if they occur in a disorderly fashion, is not clear but could be significant and far reaching.
International Dividend invests a substantial amount of its assets in issuers located in a single country or a limited number of countries. When the Fund concentrates its investments in this manner, it assumes the risk that economic, political and social conditions in those countries may have a significant impact on its investment performance. Foreign issuers may not be subject to the same uniform accounting, auditing and financial reporting standards and practices as used in the United States. Foreign securities markets may also be more volatile and less liquid than U.S. securities and may be less subject to governmental supervision not typically associated with investing in U.S. securities. Investment percentages in specific countries are presented in the Schedule of Investments.
| NOTESTO FINANCIAL STATEMENTS | 55 |
Notes to Financial Statements (continued)
| 11. | CAPITAL SHARE TRANSACTIONS |
Transactions in capital shares for each class were as follows:
| Period from 10/01/19 to 05/31/20 | Year Ended 09/30/19 | Year Ended 09/30/18 | ||||||||||||||||||||||
| Fund Name/Share Class | Shares | Amounts | Shares | Amounts | Shares | Amounts | ||||||||||||||||||
Energy Opportunities | ||||||||||||||||||||||||
Institutional | ||||||||||||||||||||||||
Shares sold | 5,065,828 | $ | 33,290,855 | 2,483,977 | $ | 24,371,687 | 1,123,324 | $ | 13,418,105 | |||||||||||||||
Shares issued in reinvestment of distributions | 87,022 | 810,172 | 49,857 | 489,099 | 43,017 | 477,056 | ||||||||||||||||||
Shares issued in reorganization | 1,095,766 | 10,918,076 | — | — | — | — | ||||||||||||||||||
Shares redeemed | (2,850,173 | ) | (19,099,849 | ) | (1,895,756 | ) | (19,174,792 | ) | (1,043,928 | ) | (12,186,601 | ) | ||||||||||||
|
|
|
|
|
|
|
|
|
|
|
| |||||||||||||
| 3,398,443 | $ | 25,919,254 | 638,078 | $ | 5,685,994 | 122,413 | $ | 1,708,560 | ||||||||||||||||
|
|
|
|
|
|
|
|
|
|
|
| |||||||||||||
Service | ||||||||||||||||||||||||
Shares sold | 15,017 | $ | 122,595 | 24,220 | $ | 243,144 | 1,313 | $ | 15,222 | |||||||||||||||
Shares issued in reinvestment of distributions | 1,476 | 13,464 | 1,310 | 12,604 | 1,408 | 15,288 | ||||||||||||||||||
Shares redeemed | (15,756 | ) | (136,156 | ) | (27,520 | ) | (270,216 | ) | (10,737 | ) | (122,612 | ) | ||||||||||||
|
|
|
|
|
|
|
|
|
|
|
| |||||||||||||
| 737 | $ | (97 | ) | (1,990 | ) | $ | (14,468 | ) | (8,016 | ) | $ | (92,102 | ) | |||||||||||
|
|
|
|
|
|
|
|
|
|
|
| |||||||||||||
Investor A | ||||||||||||||||||||||||
Shares sold and automatic conversion of shares | 3,010,887 | $ | 19,388,660 | 1,317,090 | $ | 13,255,143 | 538,501 | $ | 6,103,310 | |||||||||||||||
Shares issued in reinvestment of distributions | 98,657 | 894,817 | 102,248 | 978,518 | 101,381 | 1,095,931 | ||||||||||||||||||
Shares issued in reorganization | 6,702,786 | 65,103,473 | — | — | — | — | ||||||||||||||||||
Shares issued from conversion(a) | — | — | — | — | 2,306 | 26,086 | ||||||||||||||||||
Shares redeemed | (2,238,892 | ) | (16,712,188 | ) | (1,210,425 | ) | (11,796,567 | ) | (1,211,899 | ) | (13,767,989 | ) | ||||||||||||
|
|
|
|
|
|
|
|
|
|
|
| |||||||||||||
| 7,573,438 | $ | 68,674,762 | 208,913 | $ | 2,437,094 | (569,711 | ) | $ | (6,542,662 | ) | ||||||||||||||
|
|
|
|
|
|
|
|
|
|
|
| |||||||||||||
Investor B | ||||||||||||||||||||||||
Shares converted(a) | — | $ | — | — | $ | — | (2,317 | ) | $ | (26,086 | ) | |||||||||||||
Shares redeemed and automatic conversion of shares | — | — | — | — | (209 | ) | (2,227 | ) | ||||||||||||||||
|
|
|
|
|
|
|
|
|
|
|
| |||||||||||||
| — | $ | — | — | $ | — | (2,526 | ) | $ | (28,313 | ) | ||||||||||||||
|
|
|
|
|
|
|
|
|
|
|
| |||||||||||||
Investor C | ||||||||||||||||||||||||
Shares sold | 584,542 | $ | 3,535,677 | 57,281 | $ | 536,851 | 131,415 | $ | 1,424,430 | |||||||||||||||
Shares issued in reinvestment of distributions | 15,328 | 134,730 | 7,437 | 68,863 | 45,312 | 467,616 | ||||||||||||||||||
Shares issued in reorganization | 894,104 | 8,405,065 | — | — | — | — | ||||||||||||||||||
Shares redeemed and automatic conversion of shares | (542,412 | ) | (3,907,975 | ) | (1,149,546 | ) | (11,202,214 | ) | (584,248 | ) | (6,251,164 | ) | ||||||||||||
|
|
|
|
|
|
|
|
|
|
|
| |||||||||||||
| 951,562 | $ | 8,167,497 | (1,084,828 | ) | $ | (10,596,500 | ) | (407,521 | ) | $ | (4,359,118 | ) | ||||||||||||
|
|
|
|
|
|
|
|
|
|
|
| |||||||||||||
| 11,924,180 | $ | 102,761,416 | (239,827 | ) | $ | (2,487,880 | ) | (865,361 | ) | $ | (9,313,635 | ) | ||||||||||||
|
|
|
|
|
|
|
|
|
|
|
| |||||||||||||
High Equity Income | ||||||||||||||||||||||||
Institutional | ||||||||||||||||||||||||
Shares sold | 1,234,208 | $ | 30,999,399 | 1,620,135 | $ | 41,789,821 | 1,795,530 | $ | 49,454,889 | |||||||||||||||
Shares issued in reinvestment of distributions | 268,023 | 6,437,855 | 551,850 | 14,113,022 | 534,018 | 14,591,812 | ||||||||||||||||||
Shares redeemed | (1,581,496 | ) | (37,167,927 | ) | (5,297,435 | ) | (138,484,099 | ) | (10,417,182 | ) | (287,023,270 | ) | ||||||||||||
|
|
|
|
|
|
|
|
|
|
|
| |||||||||||||
| (79,265 | ) | $ | 269,327 | (3,125,450 | ) | $ | (82,581,256 | ) | (8,087,634 | ) | $ | (222,976,569 | ) | |||||||||||
|
|
|
|
|
|
|
|
|
|
|
| |||||||||||||
Service | ||||||||||||||||||||||||
Shares sold | 93,228 | $ | 2,240,316 | 53,252 | $ | 1,231,694 | 22,811 | $ | 571,015 | |||||||||||||||
Shares issued in reinvestment of distributions | 21,143 | 458,397 | 40,695 | 937,357 | 29,405 | 729,748 | ||||||||||||||||||
Shares redeemed | (141,512 | ) | (3,082,149 | ) | (157,690 | ) | (3,664,934 | ) | (296,460 | ) | (7,447,946 | ) | ||||||||||||
|
|
|
|
|
|
|
|
|
|
|
| |||||||||||||
| (27,141 | ) | $ | (383,436 | ) | (63,743 | ) | $ | (1,495,883 | ) | (244,244 | ) | $ | (6,147,183 | ) | ||||||||||
|
|
|
|
|
|
|
|
|
|
|
| |||||||||||||
| 56 | 2020 BLACKROCK ANNUAL REPORTTO SHAREHOLDERS |
Notes to Financial Statements (continued)
| Period from | ||||||||||||||||||||||||
| 10/01/19 to 05/31/20 | Year Ended 09/30/19 | Year Ended 09/30/18 | ||||||||||||||||||||||
| Fund Name/Share Class | Shares | Amounts | Shares | Amounts | Shares | Amounts | ||||||||||||||||||
High Equity Income (continued) | ||||||||||||||||||||||||
Investor A | ||||||||||||||||||||||||
Shares sold and automatic conversion of shares | 766,121 | $ | 16,215,908 | 2,710,471 | $ | 60,252,847 | 1,003,085 | $ | 23,776,514 | |||||||||||||||
Shares issued in reinvestment of distributions | 481,834 | 9,769,745 | 879,629 | 19,031,831 | 476,822 | 11,184,532 | ||||||||||||||||||
Shares redeemed | (1,816,723 | ) | (37,760,664 | ) | (2,874,581 | ) | (62,930,089 | ) | (4,443,882 | ) | (105,249,999 | ) | ||||||||||||
|
|
|
|
|
|
|
|
|
|
|
| |||||||||||||
| (568,768 | ) | $ | (11,775,011 | ) | 715,519 | $ | 16,354,589 | (2,963,975 | ) | $ | (70,288,953 | ) | ||||||||||||
|
|
|
|
|
|
|
|
|
|
|
| |||||||||||||
Investor B | ||||||||||||||||||||||||
Shares sold | — | $ | — | — | $ | — | — | $ | 40 | |||||||||||||||
Shares issued in reinvestment of distributions | — | — | — | — | 243 | 3,922 | ||||||||||||||||||
Shares redeemed and automatic conversion of shares | — | — | — | — | (11,237 | ) | (181,858 | ) | ||||||||||||||||
|
|
|
|
|
|
|
|
|
|
|
| |||||||||||||
| — | $ | — | — | $ | — | (10,994 | ) | $ | (177,896 | ) | ||||||||||||||
|
|
|
|
|
|
|
|
|
|
|
| |||||||||||||
Investor C | ||||||||||||||||||||||||
Shares sold | 249,452 | $ | 3,461,843 | 481,593 | $ | 6,896,158 | 895,301 | $ | 14,543,893 | |||||||||||||||
Shares issued in reinvestment of distributions | 155,445 | 2,003,623 | 541,742 | 7,642,459 | 407,989 | 6,484,420 | ||||||||||||||||||
Shares redeemed and automatic conversions of shares | (905,943 | ) | (12,015,621 | ) | (4,273,236 | ) | (62,531,798 | ) | (3,179,671 | ) | (51,215,444 | ) | ||||||||||||
|
|
|
|
|
|
|
|
|
|
|
| |||||||||||||
| (501,046 | ) | $ | (6,550,155 | ) | (3,249,901 | ) | $ | (47,993,181 | ) | (1,876,381 | ) | $ | (30,187,131 | ) | ||||||||||
|
|
|
|
|
|
|
|
|
|
|
| |||||||||||||
Class K | ||||||||||||||||||||||||
Shares sold | 12,615 | (b) | $ | 266,201 | (b) | — | $ | — | — | $ | — | |||||||||||||
Shares issued in reinvestment of distributions | 2 | (b) | 38 | (b) | — | — | — | — | ||||||||||||||||
Shares redeemed | (2 | )(b) | (38 | )(b) | — | — | — | — | ||||||||||||||||
|
|
|
|
|
|
|
|
|
|
|
| |||||||||||||
| 12,615 | $ | 266,201 | — | $ | — | — | $ | — | ||||||||||||||||
|
|
|
|
|
|
|
|
|
|
|
| |||||||||||||
| (1,163,605 | ) | $ | (18,173,074 | ) | (5,723,575 | ) | $ | (115,715,731 | ) | (13,183,228 | ) | $ | (329,777,732 | ) | ||||||||||
|
|
|
|
|
|
|
|
|
|
|
| |||||||||||||
International Dividend | ||||||||||||||||||||||||
Institutional | ||||||||||||||||||||||||
Shares sold | 383,884 | $ | 10,400,289 | 664,263 | $ | 18,644,829 | 1,012,358 | $ | 30,836,121 | |||||||||||||||
Shares issued in reinvestment of distributions | 43,702 | 1,226,610 | 165,910 | 4,496,962 | 200,664 | 6,064,305 | ||||||||||||||||||
Shares redeemed | (705,271 | ) | (19,935,519 | ) | (1,423,038 | ) | (39,171,088 | ) | (4,017,740 | ) | (121,958,241 | ) | ||||||||||||
|
|
|
|
|
|
|
|
|
|
|
| |||||||||||||
| (277,685 | ) | $ | (8,308,620 | ) | (592,865 | ) | $ | (16,029,297 | ) | (2,804,718 | ) | $ | (85,057,815 | ) | ||||||||||
|
|
|
|
|
|
|
|
|
|
|
| |||||||||||||
Service | ||||||||||||||||||||||||
Shares sold | 10,686 | $ | 285,762 | 9,711 | $ | 257,339 | 16,160 | $ | 465,478 | |||||||||||||||
Shares issued in reinvestment of distributions | 1,756 | 46,603 | 7,635 | 195,594 | 8,638 | 247,644 | ||||||||||||||||||
Shares redeemed | (8,898 | ) | (234,545 | ) | (59,704 | ) | (1,556,385 | ) | (104,612 | ) | (3,011,003 | ) | ||||||||||||
|
|
|
|
|
|
|
|
|
|
|
| |||||||||||||
| 3,544 | $ | 97,820 | (42,358 | ) | $ | (1,103,452 | ) | (79,814 | ) | $ | (2,297,881 | ) | ||||||||||||
|
|
|
|
|
|
|
|
|
|
|
| |||||||||||||
Investor A | ||||||||||||||||||||||||
Shares sold and automatic conversion of shares | 281,795 | $ | 7,501,342 | — | $ | — | 673,834 | $ | 19,033,336 | |||||||||||||||
Shares issued in reinvestment of distributions | 66,211 | 1,737,096 | 285,028 | 7,196,565 | 264,520 | 7,462,762 | ||||||||||||||||||
Shares issued from conversion(a) | — | — | 889,911 | 23,000,163 | 477 | 13,819 | ||||||||||||||||||
Shares redeemed | (1,201,472 | ) | (32,299,675 | ) | (1,638,441 | ) | (42,437,755 | ) | (6,881,762 | ) | (198,379,510 | ) | ||||||||||||
|
|
|
|
|
|
|
|
|
|
|
| |||||||||||||
| (853,466 | ) | $ | (23,061,237 | ) | (463,502 | ) | $ | (12,241,027 | ) | (5,942,931 | ) | $ | (171,869,593 | ) | ||||||||||
|
|
|
|
|
|
|
|
|
|
|
| |||||||||||||
Investor B | ||||||||||||||||||||||||
Shares issued in reinvestment of distributions | — | $ | — | — | $ | — | 3 | $ | 86 | |||||||||||||||
Shares converted(a) | — | — | — | — | (513 | ) | (13,819 | ) | ||||||||||||||||
Shares redeemed and automatic conversion of shares | — | — | — | — | (4 | ) | (114 | ) | ||||||||||||||||
|
|
|
|
|
|
|
|
|
|
|
| |||||||||||||
| — | $ | — | — | $ | — | (514 | ) | $ | (13,847 | ) | ||||||||||||||
|
|
|
|
|
|
|
|
|
|
|
| |||||||||||||
| NOTESTO FINANCIAL STATEMENTS | 57 |
Notes to Financial Statements (continued)
| Period from | ||||||||||||||||||||||||
| 10/01/19 to 05/31/20 | Year Ended 09/30/19 | Year Ended 09/30/18 | ||||||||||||||||||||||
| Fund Name/Share Class | Shares | Amounts | Shares | Amounts | Shares | Amounts | ||||||||||||||||||
International Dividend (continued) | ||||||||||||||||||||||||
Investor C | ||||||||||||||||||||||||
Shares sold | 23,737 | $ | 555,488 | 45,047 | $ | 998,328 | 79,923 | $ | 1,999,619 | |||||||||||||||
Shares issued in reinvestment of distributions | 6,416 | 147,783 | 56,149 | 1,232,770 | 68,497 | 1,702,995 | ||||||||||||||||||
Shares redeemed and automatic conversion of shares | (233,349 | ) | (5,373,215 | ) | (978,393 | ) | (22,187,137 | ) | (722,537 | ) | (17,945,511 | ) | ||||||||||||
|
|
|
|
|
|
|
|
|
|
|
| |||||||||||||
| (203,196 | ) | $ | (4,669,944 | ) | (877,197 | ) | $ | (19,956,039 | ) | (574,117 | ) | $ | (14,242,897 | ) | ||||||||||
|
|
|
|
|
|
|
|
|
|
|
| |||||||||||||
Class K | ||||||||||||||||||||||||
Shares sold | 14,731 | $ | 413,583 | 40,090 | $ | 1,112,479 | 143,149 | (c) | $ | 4,187,215 | (c) | |||||||||||||
Shares issued in reinvestment of distributions | 2,087 | 58,541 | 6,665 | 181,244 | 2,263 | (c) | 66,602 | (c) | ||||||||||||||||
Shares redeemed | (35,288 | ) | (1,005,339 | ) | (38,053 | ) | (1,065,702 | ) | (19,971 | )(c) | (582,522 | )(c) | ||||||||||||
|
|
|
|
|
|
|
|
|
|
|
| |||||||||||||
| (18,470 | ) | $ | (533,215 | ) | 8,702 | $ | 228,021 | 125,441 | $ | 3,671,295 | ||||||||||||||
|
|
|
|
|
|
|
|
|
|
|
| |||||||||||||
| (1,349,273 | ) | $ | (36,475,196 | ) | (1,967,220 | ) | $ | (49,101,794 | ) | (9,276,653 | ) | $ | (269,810,738 | ) | ||||||||||
|
|
|
|
|
|
|
|
|
|
|
| |||||||||||||
| (a) | On December 27, 2017, the Fund’s Investor B Shares converted into Investor A Shares. |
| (b) | For the period from April 21, 2020 (commencement of operations) to May 31, 2020. |
| (c) | For the period from January 25th, 2018 (commencement of operations) to September 30th, 2018. |
As of May 31, 2020, BlackRock Financial Management, Inc., an affiliate of the Fund, owned 11,882 Class K Shares of High Equity Income.
| 12. | SUBSEQUENT EVENTS |
Management has evaluated the impact of all subsequent events on the Fund through the date the financial statements were issued and has determined that there were no subsequent events requiring adjustment or additional disclosure in the financial statements.
| 58 | 2020 BLACKROCK ANNUAL REPORTTO SHAREHOLDERS |
| Report of Independent Registered Public Accounting Firm |
To the Shareholders of BlackRock Energy Opportunities Fund, BlackRock High Equity Income Fund, BlackRock International Dividend Fund, and the Board of Trustees of BlackRock FundsSM:
Opinion on the Financial Statements and Financial Highlights
We have audited the accompanying statements of assets and liabilities of BlackRock Energy Opportunities Fund (formerly, BlackRock All-Cap Energy & Resources Portfolio), BlackRock High Equity Income Fund, and BlackRock International Dividend Fund of BlackRock FundsSM (the “Funds”), including the schedules of investments, as of May 31, 2020, the related statements of operations for the period from October 1, 2019 through May 31, 2020 and for the year ended September 30, 2019, the statements of changes in net assets for the period from October 1, 2019 through May 31, 2020 and for each of the two years in the period ended September 30, 2019, the financial highlights for the period from October 1, 2019 through May 31, 2020 and for each of the five years in the period ended September 30, 2019, and the related notes. In our opinion, the financial statements and financial highlights present fairly, in all material respects, the financial position of the Funds as of May 31, 2020, and the results of their operations for the period from October 1, 2019 through May 31, 2020 and for the year ended September 30, 2019, the changes in their net assets for the period from October 1, 2019 through May 31, 2020 and for each of the two years in the period ended September 30, 2019, and the financial highlights for the period from October 1, 2019 through May 31, 2020 and each of the five years in the period ended September 30, 2019, in conformity with accounting principles generally accepted in the United States of America.
Basis for Opinion
These financial statements and financial highlights are the responsibility of the Funds’ management. Our responsibility is to express an opinion on the Funds’ financial statements and financial highlights based on our audits. We are a public accounting firm registered with the Public Company Accounting Oversight Board (United States) (PCAOB) and are required to be independent with respect to the Funds in accordance with the U.S. federal securities laws and the applicable rules and regulations of the Securities and Exchange Commission and the PCAOB.
We conducted our audits in accordance with the standards of the PCAOB. Those standards require that we plan and perform the audit to obtain reasonable assurance about whether the financial statements and financial highlights are free of material misstatement, whether due to error or fraud. The Funds are not required to have, nor were we engaged to perform, an audit of their internal control over financial reporting. As part of our audits we are required to obtain an understanding of internal control over financial reporting but not for the purpose of expressing an opinion on the effectiveness of the Funds’ internal control over financial reporting. Accordingly, we express no such opinion.
Our audits included performing procedures to assess the risks of material misstatement of the financial statements and financial highlights, whether due to error or fraud, and performing procedures that respond to those risks. Such procedures included examining, on a test basis, evidence regarding the amounts and disclosures in the financial statements and financial highlights. Our audits also included evaluating the accounting principles used and significant estimates made by management, as well as evaluating the overall presentation of the financial statements and financial highlights. Our procedures included confirmation of securities owned as of May 31, 2020, by correspondence with the custodian and brokers; when replies were not received from brokers, we performed other auditing procedures. We believe that our audits provide a reasonable basis for our opinion.
Deloitte & Touche LLP
Boston, Massachusetts
July 22, 2020
We have served as the auditor of one or more BlackRock investment companies since 1992.
| REPORT OF INDEPENDENT REGISTERED PUBLIC ACCOUNTING FIRM | 59 |
| Important Tax Information (unaudited) |
For corporate shareholders, the percentage of ordinary income distributions paid during the period ended May 31, 2020 that qualified for the dividends-received deduction were as follows:
| Fund Name | Dividends-Received Deduction | |||
Energy Opportunities | 56.41 | % | ||
High Equity Income | 42.90 | |||
International Dividend | 3.60 | |||
The following maximum amounts are hereby designated as qualified dividend income for individuals for the period ended May 31, 2020:
| Fund Name | Qualified Dividend Income | |||
Energy Opportunities | $ | 3,280,320 | ||
High Equity Income | 8,552,963 | |||
International Dividend | 3,974,177 | |||
For the period ended May 31, 2020, the Funds earned foreign source income and paid foreign taxes which it intends to pass through to its shareholders:
| Fund Name | Foreign Source Income Earned | Foreign Taxes Paid | ||||||
Energy Opportunities | $ | 1,451,811 | $ | 133,250 | ||||
International Dividend | 3,087,509 | 326,100 | ||||||
For the period ended May 31, 2020, the Funds hereby designate the following maximum amounts allowable as interest-related dividends eligible for exemption from U.S. withholding tax for nonresident aliens and foreign corporations:
| Fund Name | Interest-Related Dividends | |||
Energy Opportunities | $ | 13,487 | ||
High Equity Income | 50,397 | |||
The law varies in each state as to whether and what percent of ordinary income dividends attribute to federal obligations is exempt from state income tax. Shareholders are advised to check with their tax advisers to determine if any portion of the dividends received is exempt from state income tax.
The following distribution amounts are hereby designated for the period ended May 31, 2020:
| Fund Name | 20% Rate Long-Term Capital Gain Dividends | |||
International Dividend | $ | 589,465 | ||
| 60 | 2020 BLACKROCK ANNUAL REPORTTO SHAREHOLDERS |
Disclosure of Investment Advisory Agreements and Sub-Advisory Agreements
The Board of Trustees (the “Board,” the members of which are referred to as “Board Members”) of BlackRock FundsSM (the “Trust”) met on April 7, 2020 (the “April Meeting”) and May 11-13, 2020 (the “May Meeting”) to consider the approval of the investment advisory agreement (the “Advisory Agreement”) between the Trust, on behalf of BlackRock Energy Opportunities Fund (“Energy Opportunities Fund”), BlackRock High Equity Income Fund (“High Equity Income Fund”) and BlackRock International Dividend Fund (“International Dividend Fund” and, together with Energy Opportunities Fund and High Equity Income Fund, the “Funds”), each a series of the Trust, and BlackRock Advisors, LLC (the “Manager”), the Funds’ investment advisor. The Board also considered the approval of the sub-advisory agreement between the Manager and BlackRock International Limited (the “Sub-Advisor”) with respect to Energy Opportunities Fund (the “Energy Opportunities Fund Sub-Advisory Agreement”) and the sub-advisory agreement between the Manager and the Sub-Advisor with respect to International Dividend Fund (the “International Dividend Fund Sub-Advisory Agreement” and, together with the Energy Opportunities Agreement, the “Sub-Advisory Agreements”). The Manager and the Sub-Advisor are referred to herein as “BlackRock.” The Advisory Agreement and the Sub-Advisory Agreements are referred to herein as the “Agreements.”
Activities and Composition of the Board
On the date of the May Meeting, the Board consisted of fourteen individuals, twelve of whom were not “interested persons” of the Trust as defined in the Investment Company Act of 1940, as amended (the “1940 Act”) (the “Independent Board Members”). The Board Members are responsible for the oversight of the operations of the Trust and perform the various duties imposed on the directors of investment companies by the 1940 Act. The Independent Board Members have retained independent legal counsel to assist them in connection with their duties. The Chair of the Board is an Independent Board Member. The Board has established five standing committees: an Audit Committee, a Governance and Nominating Committee, a Compliance Committee, a Performance Oversight Committee and an Ad Hoc Topics Committee, each of which is chaired by an Independent Board Member and composed of Independent Board Members (except for the Ad Hoc Topics Committee, which also has one interested Board Member).
The Agreements
Consistent with the requirements of the 1940 Act, the Board considers the continuation of the Agreements on an annual basis. The Board has four quarterly meetings per year, each typically extending for two days, and additional in-person and telephonic meetings throughout the year, as needed. While the Board also has a fifth one-day meeting to consider specific information surrounding the renewal of the Agreements, the Board’s consideration entails a year-long deliberative process whereby the Board and its committees assess BlackRock’s services to the Fund. In particular, the Board assessed, among other things, the nature, extent and quality of the services provided to the Fund by BlackRock, BlackRock’s personnel and affiliates, including (as applicable): investment management services; accounting oversight, administrative and shareholder services; oversight of the Fund’s service providers; risk management and oversight; and legal, regulatory and compliance services. Throughout the year, including during the contract renewal process, the Independent Board Members were advised by independent legal counsel, and met with independent legal counsel in various executive sessions outside of the presence of BlackRock’s management.
During the year, the Board, acting directly and through its committees, considers information that is relevant to its annual consideration of the renewal of the Agreements, including the services and support provided by BlackRock to the Fund and its shareholders. BlackRock also furnished additional information to the Board in response to specific questions from the Board. This additional information is discussed further in the section titled “Board Considerations in Approving the Agreements.” Among the matters the Board considered were: (a) investment performance for one-year, three-year, five-year, and/or since inception periods, as applicable, against peer funds, an applicable benchmark, and other performance metrics, as applicable, as well as BlackRock senior management’s and portfolio managers’ analyses of the reasons for any outperformance or underperformance relative to its peers, benchmarks, and other performance metrics, as applicable; (b) fees, including advisory, administration, if applicable, and other amounts paid to BlackRock and its affiliates by the Fund for services; (c) Fund operating expenses and how BlackRock allocates expenses to the Fund; (d) the resources devoted to risk oversight of, and compliance reports relating to, implementation of the Fund’s investment objective, policies and restrictions, and meeting regulatory requirements; (e) BlackRock’s and the Trust’s adherence to applicable compliance policies and procedures; (f) the nature, character and scope of non-investment management services provided by BlackRock and its affiliates and the estimated cost of such services; (g) BlackRock’s and other service providers’ internal controls and risk and compliance oversight mechanisms; (h) BlackRock’s implementation of the proxy voting policies approved by the Board; (i) the use of brokerage commissions and execution quality of portfolio transactions; (j) BlackRock’s implementation of the Trust’s valuation and liquidity procedures; (k) an analysis of management fees for products with similar investment mandates across the open-end fund, exchange-traded fund (“ETF”), closed-end fund, sub-advised mutual fund, separately managed account, collective investment trust, and institutional separate account product channels, as applicable, and the similarities and differences between these products and the services provided as compared to the Fund; (l) BlackRock’s compensation methodology for its investment professionals and the incentives and accountability it creates, along with investment professionals’ investments in the fund(s) they manage; and (m) periodic updates on BlackRock’s business.
Board Considerations in Approving the Agreements
The Approval Process: Prior to the April Meeting, the Board requested and received materials specifically relating to the Agreements. The Independent Board Members are continuously engaged in a process with their independent legal counsel and BlackRock to review the nature and scope of the information provided to the Board to better assist its deliberations. The materials provided in connection with the April Meeting included, among other things: (a) information independently compiled and prepared by Broadridge Financial Solutions, Inc. (“Broadridge”), based on either a Lipper classification or Morningstar category, regarding each Fund’s fees and expenses as compared with a peer group of funds as determined by Broadridge (“Expense Peers”) and the investment performance of each Fund as compared with a peer group of funds (“Performance Peers”); (b) information on the composition of the Expense Peers and Performance Peers and a description of Broadridge’s methodology; (c) information on the estimated profits realized by BlackRock and its affiliates pursuant to the Agreements and a discussion of fall-out benefits to BlackRock and its affiliates; (d) a general analysis provided by BlackRock concerning investment management fees received in connection with other types of investment products, such as institutional accounts, sub-advised mutual funds, ETFs, closed-end funds, open-end funds, and separately managed accounts under similar investment mandates, as well as the performance of such other products, as applicable; (e) a review of non-management fees; (f) the existence, impact and sharing of potential economies of scale, if any, with the Funds; (g) a summary of aggregate amounts paid by each Fund to BlackRock; (h) sales and redemption data regarding each Fund’s shares; and (i) various additional information requested by the Board as appropriate regarding BlackRock’s and the Funds’ operations.
| DISCLOSUREOF INVESTMENT ADVISORY AGREEMENTSAND SUB-ADVISORY AGREEMENTS | 61 |
Disclosure of Investment Advisory Agreements and Sub-Advisory Agreements (continued)
At the April Meeting, the Board reviewed materials relating to its consideration of the Agreements. As a result of the discussions that occurred during the April Meeting, and as a culmination of the Board’s year-long deliberative process, the Board presented BlackRock with questions and requests for additional information. BlackRock responded to these questions and requests with additional written information in advance of the May Meeting.
At the May Meeting, the Board concluded its assessment of, among other things: (a) the nature, extent and quality of the services provided by BlackRock; (b) the investment performance of each Fund as compared to its Performance Peers and to other metrics, as applicable; (c) the advisory fee and the estimated cost of the services and estimated profits realized by BlackRock and its affiliates from their relationship with the Funds; (d) each Fund’s fees and expenses compared to its Expense Peers; (e) the existence and sharing of potential economies of scale; (f) any fall-out benefits to BlackRock and its affiliates as a result of BlackRock’s relationship with the Funds; and (g) other factors deemed relevant by the Board Members.
The Board also considered other matters it deemed important to the approval process, such as other payments made to BlackRock or its affiliates relating to securities lending and cash management, and BlackRock’s services related to the valuation and pricing of Fund portfolio holdings. The Board noted the willingness of BlackRock’s personnel to engage in open, candid discussions with the Board. The Board did not identify any particular information as determinative, and each Board Member may have attributed different weights to the various items considered.
A. Nature, Extent and Quality of the Services Provided by BlackRock: The Board, including the Independent Board Members, reviewed the nature, extent and quality of services provided by BlackRock, including the investment advisory services and the resulting performance of each Fund. Throughout the year, the Board compared each Fund’s performance to the performance of a comparable group of mutual funds, relevant benchmark, and performance metrics, as applicable. The Board met with BlackRock’s senior management personnel responsible for investment activities, including the senior investment officers. The Board also reviewed the materials provided by each Fund’s portfolio management team discussing the Fund’s performance, investment strategies and outlook.
The Board considered, among other factors, with respect to BlackRock: the number, education and experience of investment personnel generally and each Fund’s portfolio management team; research capabilities; investments by portfolio managers in the funds they manage; portfolio trading capabilities; use of technology; commitment to compliance; credit analysis capabilities; risk analysis and oversight capabilities; and the approach to training and retaining portfolio managers and other research, advisory and management personnel. The Board also considered BlackRock’s overall risk management program, including the continued efforts of BlackRock and its affiliates to address cybersecurity risks and the role of BlackRock’s Risk & Quantitative Analysis Group. The Board engaged in a review of BlackRock’s compensation structure with respect to each Fund’s portfolio management team and BlackRock’s ability to attract and retain high-quality talent and create performance incentives.
In addition to investment advisory services, the Board considered the nature and quality of the administrative and other non-investment advisory services provided to each Fund. BlackRock and its affiliates provide the Funds with certain administrative, shareholder and other services (in addition to any such services provided to the Funds by third-parties) and officers and other personnel as are necessary for the operations of the Funds. In particular, BlackRock and its affiliates provide the Funds with administrative services including, among others: (i) responsibility for disclosure documents, such as the prospectus, the summary prospectus (as applicable), the statement of additional information and periodic shareholder reports; (ii) oversight of daily accounting and pricing; (iii) responsibility for periodic filings with regulators; (iv) overseeing and coordinating the activities of third-party service providers, including, among others, each Fund’s custodian, fund accountant, transfer agent, and auditor; (v) organizing Board meetings and preparing the materials for such Board meetings; (vi) providing legal and compliance support; (vii) furnishing analytical and other support to assist the Board in its consideration of strategic issues such as the merger, consolidation or repurposing of certain open-end funds; and (viii) performing or managing administrative functions necessary for the operation of the Funds, such as tax reporting, expense management, fulfilling regulatory filing requirements, overseeing each Fund’s distribution partners, and shareholder call center and other services. The Board reviewed the structure and duties of BlackRock’s fund administration, shareholder services, and legal & compliance departments and considered BlackRock’s policies and procedures for assuring compliance with applicable laws and regulations.
B. The Investment Performance of the Funds and BlackRock: The Board, including the Independent Board Members, also reviewed and considered the performance history of each Fund. In preparation for the April Meeting, the Board was provided with reports independently prepared by Broadridge, which included an analysis of each Fund’s performance as of December 31, 2019, as compared to its Performance Peers. Broadridge ranks funds in quartiles, ranging from first to fourth, where first is the most desirable quartile position and fourth is the least desirable. In connection with its review, with respect to each Fund, the Board received and reviewed information regarding the investment performance of the Fund as compared to its Performance Peers. The Board and its Performance Oversight Committee regularly review, and meet with Fund management to discuss, the performance of each Fund throughout the year.
In evaluating performance, the Board focused particular attention on funds with less favorable performance records. The Board also noted that while it found the data provided by Broadridge generally useful, it recognized the limitations of such data, including in particular, that notable differences may exist between a fund and its Performance Peers (for example, the investment objectives and strategies). Further, the Board recognized that the performance data reflects a snapshot of a period as of a particular date and that selecting a different performance period could produce significantly different results. The Board also acknowledged that long-term performance could be impacted by even one period of significant outperformance or underperformance, and that a single investment theme could have the ability to disproportionately affect long-term performance.
The Board noted that for the one-, three- and five-year periods reported, Energy Opportunities Fund ranked in the first, first and second quartiles, respectively, against its Performance Peers.
The Board noted that for the one-, three- and five-year periods reported, International Dividend Fund ranked in the first, third and second quartiles, respectively, against its Performance Peers. The Board and BlackRock reviewed the Fund’s underperformance relative to its Performance Peers during the applicable periods.
The Board noted that for the one-, three- and five-year periods reported, High Equity Income Fund ranked in the fourth, third and fourth quartiles, respectively, against its Performance Peers. The Board and BlackRock reviewed the Fund’s underperformance relative to its Performance Peers during the applicable periods.
C. Consideration of the Advisory/Management Fees and the Estimated Cost of the Services and Estimated Profits Realized by BlackRock and its Affiliates from their Relationship with the Funds: The Board, including the Independent Board Members, reviewed each Fund’s contractual management fee rate compared with those of its Expense Peers. The contractual management fee rate represents a combination of the advisory fee and any administrative fees, before taking into account any reimbursements or fee waivers. The Board also compared each Fund’s total expense ratio, as well as its actual management fee rate, to those of its Expense Peers. The total expense ratio represents a fund’s total net operating expenses, including any 12b-1 or non-12b-1 service fees. The total expense ratio gives effect to any expense
| 62 | 2020 BLACKROCK ANNUAL REPORTTO SHAREHOLDERS |
Disclosure of Investment Advisory Agreements and Sub-Advisory Agreements (continued)
reimbursements or fee waivers, and the actual management fee rate gives effect to any management fee reimbursements or waivers. The Board considered the services provided and the fees charged by BlackRock and its affiliates to other types of clients with similar investment mandates, as applicable, including institutional accounts and sub-advised mutual funds (including mutual funds sponsored by third parties).
The Board received and reviewed statements relating to BlackRock’s financial condition. The Board reviewed BlackRock’s profitability methodology and was also provided with an estimated profitability analysis that detailed the revenues earned and the expenses incurred by BlackRock for services provided to each Fund. The Board reviewed BlackRock’s estimated profitability with respect to each Fund and other funds the Board currently oversees for the year ended December 31, 2019 compared to available aggregate estimated profitability data provided for the prior two years. The Board reviewed BlackRock’s estimated profitability with respect to certain other U.S. fund complexes managed by BlackRock and/or its affiliates. The Board reviewed BlackRock’s assumptions and methodology of allocating expenses in the estimated profitability analysis, noting the inherent limitations in allocating costs among various advisory products. The Board recognized that profitability may be affected by numerous factors including, among other things, fee waivers and expense reimbursements by BlackRock, the types of funds managed, precision of expense allocations and business mix. The Board thus recognized that calculating and comparing profitability at the individual fund level is difficult.
The Board noted that, in general, individual fund or product line profitability of other advisors is not publicly available. The Board reviewed BlackRock’s overall operating margin, in general, compared to that of certain other publicly-traded asset management firms. The Board considered the differences between BlackRock and these other firms, including the contribution of technology at BlackRock, BlackRock’s expense management, and the relative product mix.
The Board considered whether BlackRock has the financial resources necessary to attract and retain high quality investment management personnel to perform its obligations under the Agreements and to continue to provide the high quality of services that is expected by the Board. The Board further considered factors including but not limited to BlackRock’s commitment of time, assumption of risk, and liability profile in servicing the Funds, including in contrast to what is required of BlackRock with respect to other products with similar investment mandates across the open-end fund, ETF, closed-end fund, sub-advised mutual fund, separately managed account, collective investment trust, and institutional separate account product channels, as applicable.
The Board noted that International Dividend Fund’s contractual management fee rate ranked in the second quartile, and that the actual management fee rate and total expense ratio each ranked in the first quartile relative to the Fund’s Expense Peers. The Board also noted that based on a pro-forma Broadridge expense group chosen based on recent changes made to the investment objective of the Fund, the Fund’s contractual management fee rate ranked in the third quartile, and the Fund’s actual management fee rate and total expense ratio ranked in the second and first quartiles, respectively.
The Board noted that Energy Opportunities Fund’s contractual management fee rate ranked in the second quartile, and that the actual management fee rate and total expense ratio ranked in the third and first quartiles, respectively, relative to the Fund’s Expense Peers.
The Board noted that High Equity Income Fund’s contractual management fee rate ranked in the fourth quartile, and that the actual management fee rate and total expense ratio ranked in the fourth and third quartiles, respectively, relative to the Fund’s Expense Peers. The Board also noted that based on a pro-forma Broadridge expense group chosen based on recent changes made to the investment objective of the Fund, the Fund’s contractual management fee rate ranked in the third quartile, and the Fund’s actual management fee rate and total expense ratio ranked in the second and first quartiles, respectively.
The Board also noted that each Fund has an advisory fee arrangement that includes breakpoints that adjust the fee rate downward as the size of the Fund increases above certain contractually specified levels. The Board noted that if the size of a Fund were to decrease, the Fund could lose the benefit of one or more breakpoints. The Board further noted that BlackRock and the Board have contractually agreed to a cap on each Fund’s total operating expenses as a percentage of the Fund’s average daily net assets on a class-by-class basis.
D. Economies of Scale: The Board, including the Independent Board Members, considered the extent to which economies of scale might be realized as the assets of the Funds increase, including the existence of fee waivers and/or expense caps, as applicable, noting that any contractual fee waivers and contractual expense caps had been approved by the Board. In its consideration, the Board further considered the continuation and/or implementation of fee waivers and/or expense caps, as applicable. The Board also considered the extent to which the Funds benefit from such economies of scale in a variety of ways and whether there should be changes in the advisory fee rate or breakpoint structure in order to enable the Funds to more fully participate in these economies of scale. The Board considered each Fund’s asset levels and whether the current fee schedule was appropriate.
E. Other Factors Deemed Relevant by the Board Members: The Board, including the Independent Board Members, also took into account other ancillary or “fall-out” benefits that BlackRock or its affiliates may derive from BlackRock’s respective relationships with the Funds, both tangible and intangible, such as BlackRock’s ability to leverage its investment professionals who manage other portfolios and its risk management personnel, an increase in BlackRock’s profile in the investment advisory community, and the engagement of BlackRock’s affiliates as service providers to the Funds, including for administrative, distribution, securities lending and cash management services. The Board also considered BlackRock’s overall operations and its efforts to expand the scale of, and improve the quality of, its operations. The Board also noted that, subject to applicable law, BlackRock may use and benefit from third-party research obtained by soft dollars generated by certain registered fund transactions to assist in managing all or a number of its other client accounts.
In connection with its consideration of the Agreements, the Board also received information regarding BlackRock’s brokerage and soft dollar practices. The Board received reports from BlackRock which included information on brokerage commissions and trade execution practices throughout the year.
The Board noted the competitive nature of the open-end fund marketplace, and that shareholders are able to redeem their Fund shares if they believe that the pertinent Fund’s fees and expenses are too high or if they are dissatisfied with the performance of the Fund.
Conclusion
The Board, including the Independent Board Members, unanimously approved the continuation of the Advisory Agreement between the Manager and the Trust, on behalf of each Fund, for a one-year term ending June 30, 2021, the International Dividend Fund Sub-Advisory Agreement between the Manager and the Sub-Advisor with respect to International Dividend Fund and the Energy Opportunities Fund Sub-Advisory Agreement between the Manager and the Sub-Advisor with respect to Energy Opportunities
| DISCLOSUREOF INVESTMENT ADVISORY AGREEMENTSAND SUB-ADVISORY AGREEMENTS | 63 |
Disclosure of Investment Advisory Agreements and Sub-Advisory Agreements (continued)
Fund each for a one-year term ending June 30, 2021. Based upon its evaluation of all of the aforementioned factors in their totality, as well as other information, the Board, including the Independent Board Members, was satisfied that the terms of the Agreements were fair and reasonable and, in the best interest of each Fund and its shareholders. In arriving at its decision to approve the Agreements, the Board did not identify any single factor or group of factors as all-important or controlling, but considered all factors together, and different Board Members may have attributed different weights to the various factors considered. The Independent Board Members were also assisted by the advice of independent legal counsel in making this determination.
| 64 | 2020 BLACKROCK ANNUAL REPORTTO SHAREHOLDERS |
Trustee and Officer Information
| Independent Trustees(a) | ||||||||
Name Year of Birth(b) | Position(s) Held (Length of Service)(c) | Principal Occupation(s) During Past Five Years | Number of BlackRock-Advised Registered Investment Companies (“RICs”) Consisting of Investment Portfolios (“Portfolios”) Overseen | Public Company and Other Investment Company Directorships Held During Past Five Years | ||||
Mark Stalnecker 1951 | Chair of the Board (Since 2019) and Trustee (Since 2015) | Chief Investment Officer, University of Delaware from 1999 to 2013; Trustee and Chair of the Finance and Investment Committees, Winterthur Museum and Country Estate from 2005 to 2016; Member of the Investment Committee, Delaware Public Employees’ Retirement System since 2002; Member of the Investment Committee, Christiana Care Health System from 2009 to 2017; Member of the Investment Committee, Delaware Community Foundation from 2013 to 2014; Director and Chair of the Audit Committee, SEI Private Trust Co. from 2001 to 2014. | 37 RICs consisting of 179 Portfolios | None | ||||
Bruce R. Bond 1946 | Trustee (Since 2019) | Board Member, Amsphere Limited (software) since 2018; Trustee and Member of the Governance Committee, State Street Research Mutual Funds from 1997 to 2005; Board Member of Governance, Audit and Finance Committee, Avaya Inc. (computer equipment) from 2003 to 2007. | 37 RICs consisting of 179 Portfolios | None | ||||
Susan J. Carter 1956 | Trustee (Since 2016) | Director, Pacific Pension Institute from 2014 to 2018; Advisory Board Member, Center for Private Equity and Entrepreneurship at Tuck School of Business since 1997; Senior Advisor, Commonfund Capital, Inc. (“CCI”) (investment adviser) in 2015; Chief Executive Officer, CCI from 2013 to 2014; President & Chief Executive Officer, CCI from 1997 to 2013; Advisory Board Member, Girls Who Invest from 2015 to 2018 and Board Member thereof since 2018; Advisory Board Member, Bridges Fund Management since 2016; Trustee, Financial Accounting Foundation since 2017; Practitioner Advisory Board Member, Private Capital Research Institute (“PCRI”) since 2017; Lecturer in the Practice of Management, Yale School of Management since 2019. | 37 RICs consisting of 179 Portfolios | None | ||||
Collette Chilton 1958 | Trustee (Since 2015) | Chief Investment Officer, Williams College since 2006; Chief Investment Officer, Lucent Asset Management Corporation from 1998 to 2006. | 37 RICs consisting of 179 Portfolios | None | ||||
Neil A. Cotty 1954 | Trustee (Since 2016) | Bank of America Corporation from 1996 to 2015, serving in various senior finance leadership roles, including Chief Accounting Officer from 2009 to 2015, Chief Financial Officer of Global Banking, Markets and Wealth Management from 2008 to 2009 Chief Accounting Officer from 2004 to 2008, Chief Financial Officer of Consumer Bank from 2003 to 2004, Chief Financial Officer of Global Corporate Investment Bank from 1999 to 2002. | 37 RICs consisting of 179 Portfolios | None | ||||
Lena G. Goldberg 1949 | Trustee (Since 2019) | Senior Lecturer, Harvard Business School, since 2008; Director, Charles Stark Draper Laboratory, Inc. since 2013; FMR LLC/Fidelity Investments (financial services) from 1996 to 2008, serving in various senior roles including Executive Vice President — Strategic Corporate Initiatives and Executive Vice President and General Counsel; Partner, Sullivan & Worcester LLP from 1985 to 1996 and Associate thereof from 1979 to 1985. | 37 RICs consisting of 179 Portfolios | None | ||||
Henry R. Keizer 1956 | Trustee (Since 2019) | Director, Park Indemnity Ltd. (captive insurer) since 2010; Director, MUFG Americas Holdings Corporation and MUFG Union Bank, N.A. (financial and bank holding company) from 2014 to 2016; Director, American Institute of Certified Public Accountants from 2009 to 2011; Director, KPMG LLP (audit, tax and advisory services) from 2004 to 2005 and 2010 to 2012; Director, KPMG International in 2012, Deputy Chairman and Chief Operating Officer thereof from 2010 to 2012 and U.S. Vice Chairman of Audit thereof from 2005 to 2010; Global Head of Audit, KPMGI (consortium of KPMG firms) from 2006 to 2010; Director, YMCA of Greater New York from 2006 to 2010. | 37 RICs consisting of 179 Portfolios | Hertz Global Holdings (car rental); Montpelier Re Holdings, Ltd. (publicly held property and casualty reinsurance) from 2013 until 2015; WABCO (commercial vehicle safety systems); Sealed Air Corp. (packaging) | ||||
Cynthia A. Montgomery 1952 | Trustee (Since 2007) | Professor, Harvard Business School since 1989. | 37 RICs consisting of 179 Portfolios | Newell Rubbermaid, Inc. (manufacturing) | ||||
| TRUSTEEAND OFFICER INFORMATION | 65 |
Trustee and Officer Information (continued)
| Independent Trustees(a) | ||||||||
Name Year of Birth(b) | Position(s) Held (Length of Service)(c) | Principal Occupation(s) During Past Five Years | Number of BlackRock-Advised Registered Investment Companies (“RICs”) Consisting of Investment Portfolios (“Portfolios”) Overseen | Public Company and Other Investment Company Directorships Held During Past Five Years | ||||
Donald C. Opatrny 1952 | Trustee (Since 2019) | Trustee, Vice Chair, Member of the Executive Committee and Chair of the Investment Committee, Cornell University since 2004; President, Trustee and Member of the Investment Committee, The Aldrich Contemporary Art Museum from 2007 to 2014; Member of the Board and Investment Committee, University School from 2007 to 2018; Member of the Investment Committee, Mellon Foundation from 2009 to 2015; Trustee, Artstor (a Mellon Foundation affiliate) from 2010 to 2015; President and Trustee, the Center for the Arts, Jackson Hole from 2011 to 2018; Director, Athena Capital Advisors LLC (investment management firm) since 2013; Trustee and Chair of the Investment Committee, Community Foundation of Jackson Hole since 2014; Member of Affordable Housing Supply Board of Jackson, Wyoming since 2018; Member, Investment Funds Committee, State of Wyoming since 2017; Trustee, Phoenix Art Museum since 2018; Trustee, Arizona Community Foundation and Member of Investment Committee since 2020. | 37 RICs consisting of 179 Portfolios | None | ||||
Joseph P. Platt 1947 | Trustee (Since 2007) | General Partner, Thorn Partners, LP (private investments) since 1998; Director, WQED Multi-Media (public broadcasting not-for-profit) since 2001; Chair, Basic Health International (non-profit) since 2015. | 37 RICs consisting of 179 Portfolios | Greenlight Capital Re, Ltd. (reinsurance company); Consol Energy Inc. | ||||
Kenneth L. Urish 1951 | Trustee (Since 2007) | Managing Partner, Urish Popeck & Co., LLC (certified public accountants and consultants) since 1976; Past-Chairman of the Professional Ethics Committee of the Pennsylvania Institute of Certified Public Accountants and Committee Member thereof since 2007; Member of External Advisory Board, The Pennsylvania State University Accounting Department since founding in 2001; Principal, UP Strategic Wealth Investment Advisors, LLC since 2013; Trustee, The Holy Family Institute from 2001 to 2010; President and Trustee, Pittsburgh Catholic Publishing Associates from 2003 to 2008; Director, Inter-Tel from 2006 to 2007. | 37 RICs consisting of 179 Portfolios | None | ||||
Claire A. Walton 1957 | Trustee (Since 2016) | Chief Operating Officer and Chief Financial Officer of Liberty Square Asset Management, LP from 1998 to 2015; General Partner of Neon Liberty Capital Management, LLC since 2003; Director, Boston Hedge Fund Group from 2009 to 2018; Director, Woodstock Ski Runners since 2013; Director, Massachusetts Council on Economic Education from 2013 to 2015. | 37 RICs consisting of 179 Portfolios | None | ||||
| 66 | 2020 BLACKROCK ANNUAL REPORTTO SHAREHOLDERS |
Trustee and Officer Information (continued)
| Interested Trustees(a)(d) | ||||||||
Name Year of Birth(b) | Position(s) Held (Length of Service)(c) | Principal Occupation(s) During Past Five Years | Number of BlackRock-Advised Registered Investment Companies (“RICs”) Consisting of Investment Portfolios (“Portfolios”) Overseen | Public Company and Other Investment Company Directorships Held During Past Five Years | ||||
Robert Fairbairn 1965 | Trustee (Since 2018) | Vice Chairman of BlackRock, Inc. since 2019; Member of BlackRock’s Global Executive and Global Operating Committees; Co-Chair of BlackRock’s Human Capital Committee; Senior Managing Director of BlackRock, Inc. from 2010 to 2019; oversaw BlackRock’s Strategic Partner Program and Strategic Product Management Group from 2012 to 2019; Member of the Board of Managers of BlackRock Investments, LLC from 2011 to 2018; Global Head of BlackRock’s Retail and iShares® businesses from 2012 to 2016. | 123 RICs consisting of 289 Portfolios | None | ||||
John M. Perlowski(e) 1964 | Trustee (Since 2015), President and Chief Executive Officer (Since 2010) | Managing Director of BlackRock, Inc. since 2009; Head of BlackRock Global Accounting and Product Services since 2009; Advisory Director of Family Resource Network (charitable foundation) since 2009. | 124 RICs consisting of 290 Portfolios | None | ||||
| (a) | The address of each Trustee is c/o BlackRock, Inc., 55 East 52nd Street, New York, New York 10055. |
| (b) | Each Independent Trustee holds office until his or her successor is duly elected and qualifies or until his or her earlier death, resignation, retirement or removal as provided by the Fund’s by-laws or charter or statute, or until December 31 of the year in which he or she turns 75. Trustees who are “interested persons,” as defined in the 1940 Act, serve until their successor is duly elected and qualifies or until their earlier death, resignation, retirement or removal as provided by the Trust’s by-laws or statute, or until December 31 of the year in which they turn 72. The Board may determine to extend the terms of Independent Trustees on a case-by-case basis, as appropriate. |
| (c) | Following the combination of MLIM and BlackRock, Inc. in September 2006, the various legacy MLIM and legacy BlackRock fund boards were realigned and consolidated into three new fund boards in 2007. In addition, effective January 1, 2019, three BlackRock Fund Complexes were realigned and consolidated into two BlackRock Fund Complexes. As a result, although the chart shows the year that each Independent Trustee joined the Board, certain Independent Trustees first became members of the boards of other BlackRock-advised Funds, legacy MLIM funds or legacy BlackRock funds as follows: Bruce R. Bond, 2005; Susan J. Carter, 2016; Collette Chilton, 2015; Neil A. Cotty, 2016; Robert M. Hernandez, 1996; Cynthia A. Montgomery, 1994; Joseph P. Platt, 1999; Mark Stalnecker, 2015; Kenneth L. Urish, 1999; Claire A. Walton, 2016. |
| (d) | Mr. Fairbairn and Mr. Perlowski are both “interested persons,” as defined in the 1940 Act, of the Trust based on their positions with BlackRock, Inc. and its affiliates. Mr. Fairbairn and Mr. Perlowski are also board members of the BlackRock Fixed-Income Complex. |
| (e) | Mr. Perlowski is also a trustee of the BlackRock Credit Strategies Fund. |
| TRUSTEEAND OFFICER INFORMATION | 67 |
Trustee and Officer Information (continued)
| Officers Who Are Not Trustees(a) | ||||
Name Year of Birth(b) | Position(s) Held (Length of Service) | Principal Occupation(s) During Past Five Years | ||
Thomas Callahan 1968 | Vice President (Since 2016) | Managing Director of BlackRock, Inc. since 2013; Member of the Board of Managers of BlackRock Investments, LLC (principal underwriter) since 2019 and Managing Director thereof since 2017; Head of BlackRock’s Global Cash Management Business since 2016; Co-Head of the Global Cash Management Business from 2014 to 2016; Deputy Head of the Global Cash Management Business from 2013 to 2014; Member of the Cash Management Group Executive Committee since 2013; Chief Executive Officer of NYSE Liffe U.S. from 2008 to 2013. | ||
Jennifer McGovern 1977 | Vice President (Since 2014) | Managing Director of BlackRock, Inc. since 2016; Director of BlackRock, Inc. from 2011 to 2015; Head of Americas Product Development and Governance for BlackRock’s Global Product Group since 2019; Head of Product Structure and Oversight for BlackRock’s U.S. Wealth Advisory Group from 2013 to 2019. | ||
Neal J. Andrews 1966 | Chief Financial Officer (Since 2007) | Chief Financial Officer of the iShares® exchange traded funds from 2019 to 2020; Managing Director of BlackRock, Inc. since 2006. | ||
Jay M. Fife 1970 | Treasurer (Since 2007) | Managing Director of BlackRock, Inc. since 2007. | ||
Charles Park 1967 | Chief Compliance Officer (Since 2014) | Anti-Money Laundering Compliance Officer for certain BlackRock-advised Funds from 2014 to 2015; Chief Compliance Officer of BlackRock Advisors, LLC and the BlackRock-advised Funds in the BlackRock Multi-Asset Complex and the BlackRock Fixed-Income Complex since 2014; Principal of and Chief Compliance Officer for iShares® Delaware Trust Sponsor LLC since 2012 and BlackRock Fund Advisors (“BFA”) since 2006; Chief Compliance Officer for the BFA-advised iShares® exchange traded funds since 2006; Chief Compliance Officer for BlackRock Asset Management International Inc. since 2012. | ||
Lisa Belle 1968 | Anti-Money Laundering Compliance Officer (Since 2019) | Managing Director of BlackRock, Inc. since 2019; Global Financial Crime Head for Asset and Wealth Management of JP Morgan from 2013 to 2019; Managing Director of RBS Securities from 2012 to 2013; Head of Financial Crimes for Barclays Wealth Americas from 2010 to 2012. | ||
Janey Ahn 1975 | Secretary (Since 2019) | Managing Director of BlackRock, Inc. since 2018; Director of BlackRock, Inc. from 2009 to 2017. | ||
| (a) | The address of each Officer is c/o BlackRock, Inc., 55 East 52nd Street, New York, New York 10055. |
| (b) | Officers of the Trust serve at the pleasure of the Board. |
Further information about the Trust’s Trustees and Officers is available in the Trust’s Statement of Additional Information, which can be obtained without charge by calling (800) 441-7762.
Effective December 31, 2019, Robert M. Hernandez retired as Trustee of the Trust.
Investment Adviser and Administrator
BlackRock Advisors, LLC
Wilmington, DE 19809
Sub-Adviser(a)
BlackRock International Limited
Edinburgh, EH3 8BL
United Kingdom
Accounting Agent and Transfer Agent
BNY Mellon Investment Servicing (US) Inc.
Wilmington, DE 19809
Custodian
The Bank of New York Mellon
New York, NY 10286
Distributor
BlackRock Investments, LLC
New York, NY 10022
Independent Registered Public Accounting Firm
Deloitte & Touche LLP
Boston, MA 02116
Legal Counsel
Sidley Austin LLP
New York, NY 10019-6018
Address of the Trust
100 Bellevue Parkway
Wilmington, DE 19809
| (a) | BlackRock Energy Opportunities Fund and BlackRock International Dividend Fund. |
| 68 | 2020 BLACKROCK ANNUAL REPORTTO SHAREHOLDERS |
General Information
Householding
The Funds will mail only one copy of shareholder documents, including prospectuses, annual and semi-annual reports and proxy statements, to shareholders with multiple accounts at the same address. This practice is commonly called “householding” and is intended to reduce expenses and eliminate duplicate mailings of shareholder documents. Mailings of your shareholder documents may be householded indefinitely unless you instruct us otherwise. If you do not want the mailing of these documents to be combined with those for other members of your household, please call the Funds at (800) 441-7762.
Availability of Quarterly Schedule of Investments
The Funds file their complete schedules of portfolio holdings with the SEC for the first and third quarters of each fiscal year as an exhibit to their reports on Form N-PORT. The Funds’ Forms N-PORT are available on the SEC’s website at sec.gov.
Availability of Proxy Voting Policies and Procedures
A description of the policies and procedures that the Funds use to determine how to vote proxies relating to portfolio securities is available upon request and without charge (1) by calling (800) 441-7762; (2) at blackrock.com; and (3) on the SEC’s website at sec.gov.
Availability of Proxy Voting Record
Information about how the Funds voted proxies relating to securities held in the Funds’ portfolios during the most recent 12-month period ended June 30 is available upon request and without charge (1) at blackrock.com; or by calling (800) 441-7762 and (2) on the SEC’s website at sec.gov.
BlackRock’s Mutual Fund Family
BlackRock offers a diverse lineup of open-end mutual funds crossing all investment styles and managed by experts in equity, fixed-income and tax-exempt investing. Visit blackrock.com for more information.
Shareholder Privileges
Account Information
Call us at (800) 441-7762 from 8:00 AM to 6:00 PM ET on any business day to get information about your account balances, recent transactions and share prices. You can also visit blackrock.com for more information.
Automatic Investment Plans
Investor class shareholders who want to invest regularly can arrange to have $50 or more automatically deducted from their checking or savings account and invested in any of the BlackRock funds.
Systematic Withdrawal Plans
Investor class shareholders can establish a systematic withdrawal plan and receive periodic payments of $50 or more from their BlackRock funds, as long as their account balance is at least $10,000.
Retirement Plans
Shareholders may make investments in conjunction with Traditional, Rollover, Roth, Coverdell, Simple IRAs, SEP IRAs and 403(b) Plans.
| ADDITIONAL INFORMATION | 69 |
Additional Information (continued)
BlackRock Privacy Principles
BlackRock is committed to maintaining the privacy of its current and former fund investors and individual clients (collectively, “Clients”) and to safeguarding their non-public personal information. The following information is provided to help you understand what personal information BlackRock collects, how we protect that information and why in certain cases we share such information with select parties.
If you are located in a jurisdiction where specific laws, rules or regulations require BlackRock to provide you with additional or different privacy-related rights beyond what is set forth below, then BlackRock will comply with those specific laws, rules or regulations.
BlackRock obtains or verifies personal non-public information from and about you from different sources, including the following: (i) information we receive from you or, if applicable, your financial intermediary, on applications, forms or other documents; (ii) information about your transactions with us, our affiliates, or others; (iii) information we receive from a consumer reporting agency; and (iv) from visits to our websites.
BlackRock does not sell or disclose to non-affiliated third parties any non-public personal information about its Clients, except as permitted by law or as is necessary to respond to regulatory requests or to service Client accounts. These non-affiliated third parties are required to protect the confidentiality and security of this information and to use it only for its intended purpose.
We may share information with our affiliates to service your account or to provide you with information about other BlackRock products or services that may be of interest to you. In addition, BlackRock restricts access to non-public personal information about its Clients to those BlackRock employees with a legitimate business need for the information. BlackRock maintains physical, electronic and procedural safeguards that are designed to protect the non-public personal information of its Clients, including procedures relating to the proper storage and disposal of such information.
| 70 | 2020 BLACKROCK ANNUAL REPORTTO SHAREHOLDERS |
Glossary of Terms Used in this Report
| Currency Abbreviation | ||
| EUR | Euro | |
| GBP | British Pound | |
| USD | United States Dollar | |
| Portfolio Abbreviation | ||
| ADR | American Depositary Receipt | |
| CDI | CREST Depository Interest | |
| GDR | Global Depositary Receipt | |
| GLOSSARYOF TERMS USEDINTHIS REPORT | 71 |
Want to know more?
blackrock.com | 800-441-7762
This report is intended for current holders. It is not authorized for use as an offer of sale or a solicitation of an offer to buy shares of the Funds unless preceded or accompanied by the Funds’ current prospectus. Past performance results shown in this report should not be considered a representation of future performance. Investment returns and principal value of shares will fluctuate so that shares, when redeemed, may be worth more or less than their original cost. Statements and other information herein are as dated and are subject to change.
EHI-5/20-AR
 |  |
| Item 3 – | Audit Committee Financial Expert – The registrant’s board of directors (the “board of directors”), has determined that (i) the registrant has the following audit committee financial experts serving on its audit committee and (ii) each audit committee financial expert is independent: |
Neil A. Cotty
Henry R. Keizer
Kenneth L. Urish
Under applicable securities laws, a person determined to be an audit committee financial expert will not be deemed an “expert” for any purpose, including without limitation for the purposes of Section 11 of the Securities Act of 1933, as a result of being designated or identified as an audit committee financial expert. The designation or identification of a person as an audit committee financial expert does not impose on such person any duties, obligations, or liabilities greater than the duties, obligations, and liabilities imposed on such person as a member of the audit committee and board of directors in the absence of such designation or identification. The designation or identification of a person as an audit committee financial expert does not affect the duties, obligations, or liability of any other member of the audit committee or board of directors.
| Item 4 – | Principal Accountant Fees and Services |
The following table presents fees billed by Deloitte & Touche LLP (“D&T”) in each of the last two fiscal years for the services rendered to the Fund:
| (a) Audit Fees | (b) Audit-Related Fees1 | (c) Tax Fees2 | (d) All Other Fees | |||||||||||||
| Entity Name | Current Fiscal Year End3 | Previous Fiscal Year End | Current Fiscal Year End3 | Previous Fiscal Year End | Current Fiscal Year End3 | Previous Fiscal Year End | Current Fiscal Year End3 | Previous Fiscal Year End | ||||||||
| BlackRock Advantage International Fund | $33,150 | $33,150 | $0 | $0 | $13,700 | $14,100 | $0 | $0 | ||||||||
| BlackRock Advantage Large Cap Growth Fund | $18,972 | $18,972 | $0 | $0 | $12,700 | $15,200 | $0 | $0 | ||||||||
| BlackRock Advantage Small Cao Core Fund | $30,600 | $36,414 | $0 | $0 | $14,800 | $13,850 | $0 | $0 | ||||||||
| BlackRock Energy Opportunities Fund (Formerly BlackRock All-Cap Energy & Resources Portfolio) | $18,462 | $18,462 | $6,500 | $0 | $25,800 | $15,200 | $0 | $0 | ||||||||
| BlackRock High Equity Income Fund | $22,134 | $22,134 | $4,000 | $0 | $12,700 | $15,200 | $0 | $0 | ||||||||
| BlackRock International Dividend Fund | $25,296 | $25,296 | $0 | $0 | $13,700 | $16,200 | $0 | $0 | ||||||||
2
The following table presents fees billed by D&T that were required to be approved by the registrant’s audit committee (the “Committee”) for services that relate directly to the operations or financial reporting of the Fund and that are rendered on behalf of BlackRock Advisors, LLC (the “Investment Adviser” or “BlackRock”) and entities controlling, controlled by, or under common control with BlackRock (not including any sub-adviser whose role is primarily portfolio management and is subcontracted with or overseen by another investment adviser) that provide ongoing services to the Fund (“Affiliated Service Providers”):
| Current Fiscal Year End3 | Previous Fiscal Year End | |||
(b) Audit-Related Fees1 | $0 | $0 | ||
(c) Tax Fees2 | $0 | $0 | ||
(d) All Other Fees4 | $1,984,000 | $2,050,500 |
1 The nature of the services includes assurance and related services reasonably related to the performance of the audit or review of financial statements not included in Audit Fees, including accounting consultations, agreed-upon procedure reports, attestation reports, comfort letters, out-of-pocket expenses and internal control reviews not required by regulators.
2 The nature of the services includes tax compliance and/or tax preparation, including services relating to the filing or amendment of federal, state or local income tax returns, regulated investment company qualification reviews, taxable income and tax distribution calculations.
3Certain funds of the registrant changed their fiscal year end from September 30 to May 31 effective May 31, 2020 whereby this fiscal year consists of the eight months ended May 31, 2020.
4 Non-audit fees of $1,984,000 and $2,050,500 for the current fiscal year and previous fiscal year, respectively, were paid to the Fund’s principal accountant in their entirety by BlackRock, in connection with services provided to the Affiliated Service Providers of the Fund and of certain other funds sponsored and advised by BlackRock or its affiliates for a service organization review and an accounting research tool subscription. These amounts represent aggregate fees paid by BlackRock and were not allocated on a per fund basis.
(e)(1) Audit Committee Pre-Approval Policies and Procedures:
The Committee has adopted policies and procedures with regard to the pre-approval of services. Audit, audit-related and tax compliance services provided to the registrant on an annual basis require specific pre-approval by the Committee. The Committee also must approve other non-audit services provided to the registrant and those non-audit services provided to the Investment Adviser and Affiliated Service Providers that relate directly to the operations and the financial reporting of the registrant. Certain of these non-audit services that the Committee believes are (a) consistent with the SEC’s auditor independence rules and (b) routine and recurring services that will not impair the independence of the independent accountants may be approved by the Committee without consideration on a specific case-by-case basis (“general pre-approval”). The term of any general pre-approval is 12 months from the date of the pre-approval, unless the Committee provides for a different period. Tax or other non-audit services provided to the registrant which have a direct impact on the operations or financial reporting of the registrant will only be deemed pre-approved provided that any individual project does not exceed $10,000 attributable to the registrant or $50,000 per project. For this purpose, multiple projects will be aggregated to determine if they exceed the previously mentioned cost levels.
Any proposed services exceeding the pre-approved cost levels will require specific pre-approval by the Committee, as will any other services not subject to general pre-approval (e.g., unanticipated but permissible services). The Committee is informed of each service approved subject to general pre-approval at the next regularly scheduled in-person board meeting. At this meeting, an analysis of such services is presented to the Committee for ratification. The Committee may delegate to the Committee Chairman the authority to approve the provision of and fees for any specific engagement of permitted non-audit services, including services exceeding pre-approved cost levels.
3
(e)(2) None of the services described in each of Items 4(b) through (d) were approved by the Committee pursuant to the de minimis exception in paragraph (c)(7)(i)(C) of Rule 2-01 of Regulation S-X.
(f) Not Applicable
(g) The aggregate non-audit fees, defined as the sum of the fees shown under “Audit-Related Fees,” “Tax Fees” and “All Other Fees,” paid to the accountant for services rendered by the accountant to the registrant, the Investment Adviser and the Affiliated Service Providers were:
| Entity Name | Current Fiscal Year End1 | Previous Fiscal Year End | ||||
| BlackRock Advantage International Fund | $13,700 | $14,100 | ||||
| BlackRock Advantage Large Cap Growth Fund | $12,700 | $15,200 | ||||
| BlackRock Advantage Small Cap Core Fund | $14,800 | $13,850 | ||||
| BlackRock Energy Opportunities Fund (Formerly BlackRock All-Cap Energy & Resources Portfolio) | $32,300 | $15,200 | ||||
| BlackRock High Equity Income Fund | $16,700 | $15,200 | ||||
| BlackRock International Dividend Fund | $13,700 | $16,200 |
1Certain funds of the registrant changed their fiscal year end from September 30 to May 31 effective May 31, 2020 whereby this fiscal year consists of the eight months ended May 31, 2020.
Additionally, the amounts billed by D&T in connection with services provided to the Affiliated Service Providers of the Fund and of other funds sponsored and advised by BlackRock or its affiliates during the current and previous fiscal years for a service organization review and an accounting research tool subscription were:
| Current Fiscal Year End 1 | Previous Fiscal Year End | |||
$1,984,000 | $2,050,500 |
1Certain funds of the registrant changed their fiscal year end from September 30 to May 31 effective May 31, 2020 whereby this fiscal year consists of the eight months ended May 31, 2020.
These amounts represent aggregate fees paid by BlackRock and were not allocated on a per fund basis.
(h) The Committee has considered and determined that the provision of non-audit services that were rendered to the Investment Adviser and the Affiliated Service Providers that were not pre-approved pursuant to paragraph (c)(7)(ii) of Rule 2-01 of Regulation S-X is compatible with maintaining the principal accountant’s independence.
| Item 5 – | Audit Committee of Listed Registrant – Not Applicable |
| Item 6 – | Investments |
4
(a) The registrant’s Schedule of Investments is included as part of the Report to Stockholders filed under Item 1 of this Form.
(b) Not Applicable due to no such divestments during the semi-annual period covered since the previous Form N-CSR filing.
| Item 7 – | Disclosure of Proxy Voting Policies and Procedures for Closed-End Management Investment Companies – Not Applicable |
| Item 8 – | Portfolio Managers of Closed-End Management Investment Companies – Not Applicable |
| Item 9 – | Purchases of Equity Securities by Closed-End Management Investment Company and Affiliated Purchasers – Not Applicable |
| Item 10 – | Submission of Matters to a Vote of Security Holders – There have been no material changes to these procedures. |
| Item 11 – | Controls and Procedures |
(a) The registrant’s principal executive and principal financial officers, or persons performing similar functions, have concluded that the registrant’s disclosure controls and procedures (as defined in Rule 30a-3(c) under the Investment Company Act of 1940, as amended (the “1940 Act”)) are effective as of a date within 90 days of the filing of this report based on the evaluation of these controls and procedures required by Rule 30a-3(b) under the 1940 Act and Rule 15d-15(b) under the Securities Exchange Act of 1934, as amended.
(b) There were no changes in the registrant’s internal control over financial reporting (as defined in Rule 30a-3(d) under the 1940 Act) that occurred during the period covered by this report that have materially affected, or are reasonably likely to materially affect, the registrant’s internal control over financial reporting.
| Item 12 – | Disclosure of Securities Lending Activities for Closed-End Management Investment Companies – Not Applicable |
| Item 13 – | Exhibits attached hereto |
(a)(1) – Code of Ethics – See Item 2
(a)(2) – Section 302 Certifications are attached
(a)(3) – Not Applicable
(a)(4) – Not Applicable
(b) – Section 906 Certifications are attached
5
Pursuant to the requirements of the Securities Exchange Act of 1934 and the Investment Company Act of 1940, the registrant has duly caused this report to be signed on its behalf by the undersigned, thereunto duly authorized.
| BlackRock FundsSM | ||
| By: | /s/ John M. Perlowski | |
| John M. Perlowski | ||
| Chief Executive Officer (principal executive officer) of BlackRock FundsSM | ||
Date: August 4, 2020
Pursuant to the requirements of the Securities Exchange Act of 1934 and the Investment Company Act of 1940, this report has been signed below by the following persons on behalf of the registrant and in the capacities and on the dates indicated.
| By: | /s/ John M. Perlowski | |
| John M. Perlowski | ||
| Chief Executive Officer (principal executive officer) of BlackRock FundsSM |
Date: August 4, 2020
| By: | /s/ Neal J. Andrews | |
| Neal J. Andrews | ||
| Chief Financial Officer (principal financial officer) of BlackRock FundsSM |
Date: August 4, 2020
6