UNITED STATES
SECURITIES AND EXCHANGE COMMISSION
Washington, D.C. 20549
FORM N-CSR
CERTIFIED SHAREHOLDER REPORT OF REGISTERED MANAGEMENT INVESTMENT COMPANIES
Investment Company Act file number: 811-05742
Name of Fund: BlackRock FundsSM
BlackRock Total Factor Fund
Fund Address: 100 Bellevue Parkway, Wilmington, DE 19809
Name and address of agent for service: John M. Perlowski, Chief Executive Officer, BlackRock FundsSM, 55 East
52nd Street, New York, NY 10055
Registrant’s telephone number, including area code: (800) 441-7762
Date of fiscal year end: 07/31/2020
Date of reporting period: 07/31/2020
Item 1 – Report to Stockholders
 | JULY 31, 2020 |
| 2020 Annual Report | ||
BlackRock FundsSM
| · | BlackRock Total Factor Fund |
Beginning on January 1, 2021, as permitted by regulations adopted by the Securities and Exchange Commission, paper copies of the Fund’s shareholder reports will no longer be sent by mail, unless you specifically request paper copies of the reports from BlackRock or from your financial intermediary, such as a broker-dealer or bank. Instead, the reports will be made available on a website, and you will be notified by mail each time a report is posted and provided with a website link to access the report.
You may elect to receive all future reports in paper free of charge. If you hold accounts directly with BlackRock, you can call (800) 441-7762 to inform BlackRock that you wish to continue receiving paper copies of your shareholder reports. If you hold accounts through a financial intermediary, you can follow the instructions included with this disclosure, if applicable, or contact your financial intermediary to request that you continue to receive paper copies of your shareholder reports. Please note that not all financial intermediaries may offer this service. Your election to receive reports in paper will apply to all funds advised by BlackRock Advisors, LLC, BlackRock Fund Advisors or their affiliates, or all funds held with your financial intermediary, as applicable.
If you already elected to receive shareholder reports electronically, you will not be affected by this change and you need not take any action. You may elect to receive electronic delivery of shareholder reports and other communications by: (i) accessing the BlackRock website at blackrock.com/edelivery and logging into your accounts, if you hold accounts directly with BlackRock, or (ii) contacting your financial intermediary, if you hold accounts through a financial intermediary. Please note that not all financial intermediaries may offer this service.
| Not FDIC Insured • May Lose Value • No Bank Guarantee |
Dear Shareholder,
The last 12 months have been a time of sudden change in global financial markets, as a long period of growth and positive returns was interrupted in early 2020 by the emergence and spread of the coronavirus. For the first half of the reporting period, U.S. equities and bonds both delivered impressive returns, despite fears and doubts about the economy that were ultimately laid to rest with unprecedented monetary stimulus and a sluggish yet resolute performance from the U.S. economy. But as the threat from the coronavirus (or “COVID-19”) became more apparent throughout February and March 2020, countries around the world took economically disruptive countermeasures, causing a global recession and a sharp fall in equity prices. While markets have since recovered most of these losses as countries around the world adapt to life with the virus, lingering uncertainty about the depth and duration of the pandemic and an uptick in global infection rates tempered optimism late in the reporting period.
Returns for most securities were robust for the first half of the reporting period, as investors began to realize that the U.S. economy was maintaining the modest yet steady growth that had characterized this economic cycle. However, once stay-at-home orders and closures of non-essential businesses became widespread, many workers were laid off and unemployment claims spiked. The subsequent rapid decline in equity prices was followed by a slow recovery, and some economic indicators began to improve. U.S. large-capitalization stocks, which are often considered more resilient than smaller companies during market turbulence, advanced significantly. International equities from developed economies ended the 12-month reporting period with negative performance, while emerging market stocks posted a positive return.
The performance of different types of fixed-income securities diverged substantially due to a reduced investor appetite for risk. Treasuries benefited from the risk-off environment, and posted healthy returns, as the 10-year U.S. Treasury yield (which is inversely related to bond prices) fell to an all-time low. Investment-grade corporate bonds also delivered solid returns, while high-yield corporate returns were more modest due to credit concerns.
The U.S. Federal Reserve (the “Fed”) reduced interest rates three times in 2019, to support slowing economic growth. After the coronavirus outbreak, the Fed instituted two emergency rate cuts, pushing short-term interest rates close to zero. To stabilize credit markets, the Fed also implemented a new bond-buying program, as did several other central banks around the world, including the European Central Bank and the Bank of Japan.
Looking ahead, while coronavirus-related disruptions have clearly hindered worldwide economic growth, we believe that the global expansion is likely to continue once the outbreak subsides. Several risks remain, however, including a potential resurgence of the coronavirus amid loosened restrictions, policy fatigue among governments already deep into deficit spending, and structural damage to the financial system from lengthy economic interruptions.
Overall, we favor a moderately positive stance toward risk, and in particular toward credit given the extraordinary central bank measures taken in recent months. This support extends beyond investment-grade corporates and into high-yield, leading to attractive opportunities throughout the credit market. We believe that both U.S. Treasuries and sustainable investments can help provide portfolio resilience, and the disruption created by the coronavirus appears to be accelerating the shift toward sustainable investments. We remain neutral on equities overall while favoring European stocks, which are poised for cyclical upside as re-openings continue.
In this environment, our view is that investors need to think globally, extend their scope across a broad array of asset classes, and be nimble as market conditions change. We encourage you to talk with your financial advisor and visit blackrock.com for further insight about investing in today’s markets.
Sincerely,

Rob Kapito
President, BlackRock Advisors, LLC

Rob Kapito
President, BlackRock Advisors, LLC
| Total Returns as of July 31, 2020 | ||||
| 6-Month | 12-Month | |||
U.S. large cap equities | 2.42% | 11.96% | ||
U.S. small cap equities | (7.61) | (4.59) | ||
International equities | (7.34) | (1.67) | ||
Emerging market equities | 3.08 | 6.55 | ||
3-month Treasury bills | 0.48 | 1.46 | ||
U.S. Treasury securities | 9.92 | 15.55 | ||
U.S. investment grade bonds | 5.69 | 10.12 | ||
Tax-exempt municipal bonds | 1.75 | 4.89 | ||
U.S. high yield bonds | 0.62 | 4.07 | ||
Past performance is no guarantee of future results. Index performance is shown for illustrative purposes only. You cannot invest directly in an index. | ||||
| 2 | THIS PAGEISNOT PARTOF YOUR FUND REPORT |
| Page | ||||
| 2 | ||||
Annual Report: | ||||
| 4 | ||||
| 7 | ||||
| 7 | ||||
| 8 | ||||
Consolidated Financial Statements: | ||||
| 9 | ||||
| 43 | ||||
| 44 | ||||
| 45 | ||||
| 46 | ||||
| 50 | ||||
| 60 | ||||
| 61 | ||||
Disclosure of Investment Advisory Agreement and Sub-Advisory Agreement | 62 | |||
| 65 | ||||
| 69 | ||||
| 71 | ||||

| 3 |
| Fund Summary as of July 31, 2020 | BlackRock Total Factor Fund |
Investment Objective
BlackRock Total Factor Fund’s (the “Fund”) investment objective is to seek total return.
Portfolio Management Commentary
How did the Fund perform?
For the 12-month period ended July 31, 2020, the Fund underperformed its reference benchmark, a blend of 60% MSCI World Index Hedged USD Net/40% Bloomberg Barclays U.S. Aggregate Bond Index. For the same period, the Fund also underperformed its secondary benchmark, the ICE BofAML 3-Month U.S. Treasury Bill Index.
What factors influenced performance?
The Fund utilizes a factor investing approach in order to provide a diversified engine for growth. The Fund targets multiple return drivers, or factors, across many asset classes and geographies. By leveraging a long/short implementation framework, the strategy seeks to isolate broad and persistent sources of returns, while maintaining a low correlation to equity and fixed-income markets in order to be resilient to market shocks and drawdowns.
The long/short single-name equity component was the primary detractor from the Fund’s relative performance, accounting for the majority of losses during the period. In 2020, single-name equity value strategies surpassed their longest drawdown on record in a continuation of challenging market conditions for the factor. A flattening yield curve, coupled with the continued strong performance from growth strategies, had a significant impact on the efficacy of the factor. Additionally, the defensively oriented single-name equity factors, quality and low volatility, struggled toward the end of the period as a flood of monetary stimulus from global central banks provided a backstop for stocks with high levels of idiosyncratic risk and poor balance sheets. From a factor perspective, the pro-cyclical momentum and carry insights were key detractors. The dissolution of OPEC+ in March (OPEC+ consists of OPEC nations and high oil-exporting non-OPEC nations such as Russia and Kazakhstan) resulted in a partial unwinding of carry insights, while the whipsawing seen in the sharp market downturn in the first quarter of 2020 and the subsequent market recovery brought headwinds for momentum strategies.
By contrast, the Fund’s macroeconomic factors fared better than the long/short market-neutral portion of the portfolio. Across the risk-balanced macro component, the defensively oriented fixed-income factors, real rates and inflation, were the top contributors. Heightened market volatility stemming from escalating trade tensions between the United States and China and the spread of COVID-19 supported a strong flight-to-quality bid, causing rates to rally. Within the long/short style factor component, the Fund’s derivatives-based allocations remained resilient. Commodities and equity markets finished positive, supported by value and carry strategies respectively. From a factor perspective, value strategies were broadly the top-returning insights, with particularly strong performance across bonds, commodities, and currencies.
The Fund routinely holds derivatives including futures, swaps, and currency forwards to gain exposure to single name stocks, global bonds, currencies, commodities, and equity market indices in a cost-efficient and capital-efficient manner. Additionally, some of the Fund’s currency forwards were held as a means to protect against unintended exposure to foreign currency risk. Over the period, the overall use of derivatives had a negative impact on Fund performance.
The Fund holds large unencumbered cash positions to meet collateral calls on derivative positions. The cash balance did not have a material impact on performance during the period.
Describe recent portfolio activity.
Following the announcement of the dissolution of OPEC+ in March 2020 and a spike in correlations among asset classes and factors, the Fund acted to protect investor capital by reducing total exposure across both macro and style factors. The adjustments targeted approximately one-third lower overall risk at the Fund level. Although the majority of the Fund’s target exposures were restored by the end of the period, some of its more commodity-sensitive exposures remain under a watchful eye by the investment adviser.
Describe portfolio positioning at period end.
The Fund continued to seek to deliver positive absolute returns by balancing risks among equities, bonds, commodities, currencies and diversifying strategies. At the end of the period, the Fund was positioned more defensively, with overweight positioning in low volatility and quality strategies within single-name equities, a slight tilt away from carry toward value and momentum across derivatives, and a modest overweight toward fixed income.
The views expressed reflect the opinions of BlackRock as of the date of this report and are subject to change based on changes in market, economic or other conditions. These views are not intended to be a forecast of future events and are no guarantee of future results.
| 4 | 2020 BLACKROCK ANNUAL REPORTTO SHAREHOLDERS |
| Fund Summary as of July 31, 2020 (continued) | BlackRock Total Factor Fund |
Portfolio Information
PORTFOLIO COMPOSITION
| Asset Type | Percent of Total Investments (a) | |||
Foreign Government Obligations | 52 | % | ||
U.S. Treasury Obligations | 48 | |||
Common Stocks | — | (b) | ||
| (a) | Excludes short-term securities. |
| (b) | Represents less than 1% of the Fund’s total investments. |
PORTFOLIO HOLDINGS
| Security | Percent of TotaI Investments (a) | |||
U.S. Treasury Inflation Linked Notes | 32 | % | ||
U.S. Treasury Inflation Linked Bonds | 17 | |||
Canadian Government Bond | 15 | |||
Commonwealth of Australia | 12 | |||
U.K. Treasury Inflation Linked Bonds | 12 | |||
French Republic | 9 | |||
Federal Republic of Germany | 3 | |||
| (a) | Excludes short-term securities. |
TOTAL RETURN BASED ON A $10,000 INVESTMENT
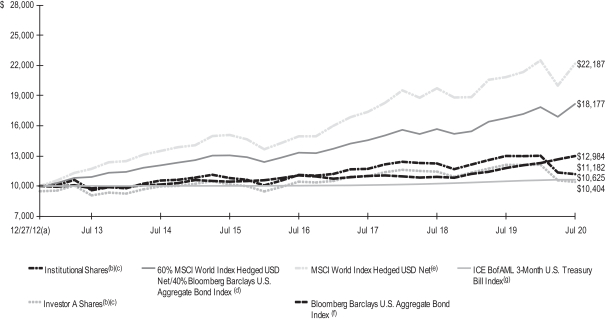
| (a) | Commencement of operations. |
| (b) | Assuming maximum sales charges, if any, transaction costs and other operating expenses, including investment advisory fees and administration fees, if any. Institutional Shares do not have a sales charge. |
| (c) | The Fund seeks to achieve its investment objective by investing in a broad range of global asset classes, such as equity securities (which may include derivative instruments that are tied economically to equity securities), fixed and floating rate debt instruments, derivatives, other investment companies, including exchange-traded funds (“ETFs”), real estate investment trusts (“REITs”) and commodity-related instruments. The Fund’s total returns prior to February 3, 2017 are the returns of the Fund when it followed different investment strategies under the name “BlackRock Strategic Risk Allocation Fund”. |
| (d) | This customized weighted index is comprised of the returns of the MSCI World Index Hedged USD Net (60%) and the Bloomberg Barclays U.S. Aggregate Bond Index (40%). |
| (e) | Represents a close estimation of the performance that can be achieved by hedging the currency exposures of its parent index, the MSCI World Index, to the U.S. Dollar (“USD”), the “home” currency for the hedged index. The index is 100% hedged to the USD by selling each foreign currency forward at the one-month forward weight. The parent index is composed of large and mid cap stocks across 23 developed market countries and its local performance is calculated in 13 different currencies, including the Euro. |
| (f) | A broad-based flagship benchmark that measures the investment grade, U.S. dollar-denominated, fixed-rate taxable bond market. The index includes U.S. Treasuries, government-related and corporate securities, mortgage-backed securities (agency fixed-rate pass-throughs), asset-backed securities and commercial mortgage-backed securities (agency and non-agency). |
| (g) | An unmanaged index that tracks 3-month U.S. Treasury securities. Effective January 1, 2020, the Fund’s benchmark was renamed from ICE BofAML 3-Month U.S. Treasury Bill Index to ICE BofA 3-Month U.S. Treasury Bill Index. |
FUND SUMMARY | 5 |
| Fund Summary as of July 31, 2020 (continued) | BlackRock Total Factor Fund |
Performance Summary for the Period Ended July 31, 2020
| Average Annual Total Returns (a)(b) | ||||||||||||||||||||||||||||||||||||||||
| 1 Year | 5 Years | Since Inception (c) | ||||||||||||||||||||||||||||||||||||||
| 6-Month Total Returns | w/o sales charge | w/sales charge | w/o sales charge | w/sales charge | w/o sales charge | w/sales charge | ||||||||||||||||||||||||||||||||||
Institutional | (14.09 | )% | (13.93 | )% | N/A | 0.71 | % | N/A | 1.48 | % | N/A | |||||||||||||||||||||||||||||
Investor A | (14.15 | ) | (14.07 | ) | (18.58 | )% | 0.48 | (0.60 | )% | 1.24 | 0.52 | % | ||||||||||||||||||||||||||||
Investor C | (14.51 | ) | (14.68 | ) | (15.52 | ) | (0.28 | ) | (0.28 | ) | 0.48 | 0.48 | ||||||||||||||||||||||||||||
Class K | (14.08 | ) | (13.89 | ) | N/A | 0.75 | N/A | 1.51 | N/A | |||||||||||||||||||||||||||||||
60% MSCI World Index Hedged USD Net/40% Bloomberg Barclays U.S. | ||||||||||||||||||||||||||||||||||||||||
Aggregate Bond Index | 1.79 | 8.41 | N/A | 6.85 | N/A | 8.19 | N/A | |||||||||||||||||||||||||||||||||
MSCI World Index Hedged USD Net | (1.45 | ) | 6.40 | N/A | 8.02 | N/A | 11.07 | N/A | ||||||||||||||||||||||||||||||||
Bloomberg Barclays U.S. Aggregate Bond Index | 5.69 | 10.12 | N/A | 4.47 | N/A | 3.50 | N/A | |||||||||||||||||||||||||||||||||
ICE BofAML 3-Month U.S. Treasury Bill Index | 0.48 | 1.46 | N/A | 1.20 | N/A | 0.80 | N/A | |||||||||||||||||||||||||||||||||
| (a) | Assuming maximum sales charges, if any. Average annual total returns with and without sales charges reflect reductions for distribution and service fees. See “About Fund Performance” on page 7 for a detailed description of share classes, including any related sales charges and fees, and how performance was calculated for certain share classes. |
| (b) | The Fund seeks to achieve its investment objective by investing in a broad range of global asset classes, such as equity securities (which may include derivative instruments that are tied economically to equity securities), fixed and floating rate debt instruments, derivatives, other investment companies, including ETFs, REITs and commodity-related instruments. The Fund’s total returns prior to February 3, 2017 are the returns of the Fund when it followed different investment strategies under the name “BlackRock Strategic Risk Allocation Fund”. |
| (c) | The Fund commenced operations on December 27, 2012. |
N/A — Not applicable as share class and index do not have a sales charge.
Past performance is not indicative of future results.
Performance results may include adjustments made for financial reporting purposes in accordance with U.S. generally accepted accounting principles.
| 6 | 2020 BLACKROCK ANNUAL REPORTTO SHAREHOLDERS |
Institutional and Class K Shares are not subject to any sales charge. These shares bear no ongoing distribution or service fees and are available only to certain eligible investors. Class K Shares performance shown prior to the Class K Shares inception date of February 3, 2017 is that of Institutional Shares. The performance of the Fund’s Class K Shares would be substantially similar to Institutional Shares because Class K Shares and Institutional Shares invest in the same portfolio of securities and performance would only differ to the extent that Class K Shares and Institutional Shares have different expenses. The actual returns of Class K Shares would have been higher than those of the Institutional Shares because Class K Shares have lower expenses than the Institutional Shares.
Investor A Shares are subject to a maximum initial sales charge (front-end load) of 5.25% and a service fee of 0.25% per year (but no distribution fee). Certain redemptions of these shares may be subject to a contingent deferred sales charge (“CDSC”) where no initial sales charge was paid at the time of purchase. These shares are generally available through financial intermediaries.
Investor C Shares are subject to a 1.00% CDSC if redeemed within one year of purchase. In addition, these shares are subject to a distribution fee of 0.75% per year and a service fee of 0.25% per year. These shares are generally available through financial intermediaries. These shares automatically convert to Investor A Shares after approximately ten years.
Performance information reflects past performance and does not guarantee future results. Current performance may be lower or higher than the performance data quoted. Refer to blackrock.com to obtain performance data current to the most recent month-end. Performance results do not reflect the deduction of taxes that a shareholder would pay on Fund distributions or the redemption of Fund shares. Figures shown in the performance tables on the previous page assume reinvestment of all distributions, if any, at net asset value (“NAV”) on the ex-dividend date or payable date, as applicable. Investment return and principal value of shares will fluctuate so that shares, when redeemed, may be worth more or less than their original cost. Distributions paid to each class of shares will vary because of the different levels of service, distribution and transfer agency fees applicable to each class, which are deducted from the income available to be paid to shareholders.
BlackRock Advisors, LLC (the “Manager”), the Fund’s investment adviser, has contractually agreed to waive and/or reimburse a portion of the Fund’s expenses. Without such waiver and/or reimbursement, the Fund’s performance would have been lower. With respect to the Fund’s contractual waivers, the Manager is under no obligation to continue waiving and/or reimbursing its fees after the applicable termination date of such agreement. See Note 6 of the Notes to Consolidated Financial Statements for additional information on waivers and/or reimbursements.
Shareholders of the Fund may incur the following charges: (a) transactional expenses, such as sales charges; and (b) operating expenses, including investment advisory fees, administration fees, service and distribution fees, including 12b-1 fees, acquired fund fees and expenses, and other fund expenses. The expense example shown below (which is based on a hypothetical investment of $1,000 invested on February 1, 2020 and held through July 31, 2020) is intended to assist shareholders both in calculating expenses based on an investment in the Fund and in comparing these expenses with similar costs of investing in other mutual funds.
The expense example provides information about actual account values and actual expenses. In order to estimate the expenses a shareholder paid during the period covered by this report, shareholders can divide their account value by $1,000 and then multiply the result by the number corresponding to their share class under the heading entitled “Expenses Paid During the Period.”
The expense example also provides information about hypothetical account values and hypothetical expenses based on the Fund’s actual expense ratio and an assumed rate of return of 5% per year before expenses. In order to assist shareholders in comparing the ongoing expenses of investing in the Fund and other funds, compare the 5% hypothetical example with the 5% hypothetical examples that appear in shareholder reports of other funds.
The expenses shown in the expense example are intended to highlight shareholders’ ongoing costs only and do not reflect transactional expenses, such as sales charges, if any. Therefore, the hypothetical example is useful in comparing ongoing expenses only, and will not help shareholders determine the relative total expenses of owning different funds. If these transactional expenses were included, shareholder expenses would have been higher.
Actual | Hypothetical (a) | |||||||||||||||||||||||||||||||
| Beginning Account Value (02/01/20) | Ending Account Value (07/31/20) | Expenses Paid During the Period (b) | Beginning Account Value (02/01/20) | Ending Account Value (07/31/20) | Expenses Paid During the Period (b) | Annualized Expense Ratio | ||||||||||||||||||||||||||
Institutional | $ | 1,000.00 | $ | 859.10 | $ | 2.54 | $ | 1,000.00 | $ | 1,022.13 | $ | 2.77 | 0.55 | % | ||||||||||||||||||
Investor A | 1,000.00 | 858.50 | 3.70 | 1,000.00 | 1,020.89 | 4.02 | 0.80 | |||||||||||||||||||||||||
Investor C | 1,000.00 | 854.90 | 7.15 | 1,000.00 | 1,017.16 | 7.77 | 1.55 | |||||||||||||||||||||||||
Class K | 1,000.00 | 859.20 | 2.31 | 1,000.00 | 1,022.38 | 2.51 | 0.50 | |||||||||||||||||||||||||
| (a) | Hypothetical 5% annual return before expenses is calculated by prorating the number of days in the most recent fiscal half year divided by 366. |
| (b) | For each class of the Fund, expenses are equal to the annualized expense ratio for the class, multiplied by the average account value over the period, multiplied by 182/366 (to reflect the one-half year period shown). |
ABOUT FUND PERFORMANCE / DISCLOSUREOF EXPENSES | 7 |
Derivative Financial Instruments
The Fund may invest in various derivative financial instruments. These instruments are used to obtain exposure to a security, commodity, index, market, and/or other assets without owning or taking physical custody of securities, commodities and/or other referenced assets or to manage market, equity, credit, interest rate, foreign currency exchange rate, commodity and/or other risks. Derivative financial instruments may give rise to a form of economic leverage and involve risks, including the imperfect correlation between the value of a derivative financial instrument and the underlying asset, possible default of the counterparty to the transaction or illiquidity of the instrument. The Fund’s successful use of a derivative financial instrument depends on the investment adviser’s ability to predict pertinent market movements accurately, which cannot be assured. The use of these instruments may result in losses greater than if they had not been used, may limit the amount of appreciation the Fund can realize on an investment and/or may result in lower distributions paid to shareholders. The Fund’s investments in these instruments, if any, are discussed in detail in the Notes to Consolidated Financial Statements.
| 8 | 2020 BLACKROCK ANNUAL REPORTTO SHAREHOLDERS |
Consolidated Schedule of Investments July 31, 2020 | BlackRock Total Factor Fund (Percentages shown are based on Net Assets) |
| Security | Shares | Value | ||||||
Common Stocks — 0.0% |
| |||||||
United States — 0.0% |
| |||||||
Avaya Holdings Corp.(a) | 15 | $ | 190 | |||||
|
| |||||||
Total Common Stocks — 0.0% | 190 | |||||||
|
| |||||||
| Par (000) | ||||||||
| Foreign Government Obligations — 4.3% | ||||||||
| Australia — 1.0% | ||||||||
Commonwealth of Australia: |
| |||||||
1.25%, 02/21/22 | AUD 688 | 500,587 | ||||||
3.00%, 09/20/25 | 792 | 667,244 | ||||||
0.75%, 11/21/27 | 464 | 360,903 | ||||||
2.50%, 09/20/30 | 549 | 514,502 | ||||||
2.00%, 08/21/35 | 402 | 389,530 | ||||||
1.25%, 08/21/40 | 343 | 316,186 | ||||||
1.00%, 02/21/50 | 339 | 317,726 | ||||||
|
| |||||||
| 3,066,678 | ||||||||
| Canada — 1.3% | ||||||||
Canadian Government Bond: |
| |||||||
6.98%, 12/01/21 | CAD 474 | 376,044 | ||||||
6.61%, 12/01/26 | 454 | 448,782 | ||||||
4.00%, 12/01/31 | 483 | 541,993 | ||||||
3.98%, 12/01/36 | 432 | 501,930 | ||||||
2.46%, 12/01/41 | 448 | 494,392 | ||||||
1.77%, 12/01/44 | 507 | 537,128 | ||||||
1.38%, 12/01/47 | 475 | 501,499 | ||||||
0.53%, 12/01/50 | 387 | 355,375 | ||||||
|
| |||||||
| 3,757,143 | ||||||||
| France — 0.8% | ||||||||
French Republic: |
| |||||||
0.11%, 07/25/21 | EUR 64 | 76,194 | ||||||
1.25%, 07/25/22 | 183 | 224,101 | ||||||
2.40%, 07/25/23 | 167 | 214,099 | ||||||
0.27%, 07/25/24 | 154 | 192,272 | ||||||
0.10%, 03/01/25 | 96 | 118,537 | ||||||
0.10%, 03/01/26 | 25 | 31,531 | ||||||
2.07%, 07/25/27 | 192 | 275,644 | ||||||
0.10%, 03/01/28 | 103 | 131,478 | ||||||
0.10%, 03/01/29 | 70 | 91,597 | ||||||
4.43%, 07/25/29 | 96 | 161,454 | ||||||
0.74%, 07/25/30(b) | 127 | 178,384 | ||||||
4.08%, 07/25/32 | 111 | 201,637 | ||||||
0.10%, 07/25/36(b) | 56 | 77,747 | ||||||
2.16%, 07/25/40(b) | 116 | 217,355 | ||||||
0.11%, 07/25/47(b) | 85 | 129,242 | ||||||
|
| |||||||
| 2,321,272 | ||||||||
| Germany — 0.2% | ||||||||
Federal Republic of Germany: |
| |||||||
0.11%, 04/15/23 | 145 | 174,904 | ||||||
0.11%, 04/15/26 | 141 | 180,182 | ||||||
0.53%, 04/15/30 | 149 | 208,874 | ||||||
0.11%, 04/15/46 | 80 | 135,385 | ||||||
|
| |||||||
| 699,345 | ||||||||
| United Kingdom — 1.0% | ||||||||
U.K. Treasury Inflation Linked Bonds: |
| |||||||
1.88%, 11/22/22 | GBP 57 | 82,561 | ||||||
0.13%, 03/22/24 | 53 | 77,172 | ||||||
| Security | Par (000) | Value | ||||||
| United Kingdom (continued) | ||||||||
2.50%, 07/17/24 | GBP 60 | $ | 94,562 | |||||
0.13%, 03/22/26 | 44 | 68,608 | ||||||
1.25%, 11/22/27 | 62 | 109,121 | ||||||
0.13%, 08/10/28 | 42 | 70,413 | ||||||
0.13%, 03/22/29 | 55 | 94,794 | ||||||
4.13%, 07/22/30 | 30 | 71,333 | ||||||
1.25%, 11/22/32 | 52 | 111,831 | ||||||
0.75%, 03/22/34 | 53 | 110,750 | ||||||
2.00%, 01/26/35 | 44 | 104,886 | ||||||
0.13%, 11/22/36 | 43 | 88,855 | ||||||
1.13%, 11/22/37 | 52 | 126,939 | ||||||
0.63%, 03/22/40 | 55 | 132,111 | ||||||
0.13%, 08/10/41 | 31 | 71,427 | ||||||
0.63%, 11/22/42 | 50 | 125,902 | ||||||
0.13%, 03/22/44 | 54 | 129,507 | ||||||
0.13%, 03/22/46 | 44 | 109,579 | ||||||
0.75%, 11/22/47 | 48 | 138,629 | ||||||
0.13%, 08/10/48 | 33 | 85,879 | ||||||
0.50%, 03/22/50 | 48 | 138,912 | ||||||
0.25%, 03/22/52 | 43 | 125,063 | ||||||
1.25%, 11/22/55 | 44 | 169,420 | ||||||
0.13%, 11/22/56 | 19 | 58,102 | ||||||
0.13%, 03/22/58 | 35 | 112,511 | ||||||
0.38%, 03/22/62 | 45 | 163,233 | ||||||
0.13%, 11/22/65 | 24 | 89,019 | ||||||
0.13%, 03/22/68 | 42 | 170,758 | ||||||
|
| |||||||
| 3,031,877 | ||||||||
|
| |||||||
Total Foreign Government Obligations — 4.3% |
| 12,876,315 | ||||||
|
| |||||||
| U.S. Treasury Obligations — 3.9% | ||||||||
U.S. Treasury Inflation Linked Bonds: |
| |||||||
2.38%, 01/15/25 - 01/15/27 | USD 442 | 525,333 | ||||||
2.00%, 01/15/26 | 194 | 228,333 | ||||||
1.75%, 01/15/28 | 143 | 174,189 | ||||||
3.63%, 04/15/28 | 200 | 273,834 | ||||||
2.50%, 01/15/29 | 127 | 165,658 | ||||||
3.88%, 04/15/29 | 228 | 328,574 | ||||||
3.38%, 04/15/32 | 54 | 81,798 | ||||||
2.13%, 02/15/40 - 02/15/41 | 346 | 541,525 | ||||||
0.75%, 02/15/42 - 02/15/45 | 384 | 495,611 | ||||||
0.63%, 02/15/43 | 192 | 240,356 | ||||||
1.38%, 02/15/44 | 189 | 274,648 | ||||||
1.00%, 02/15/46 - 02/15/49 | 429 | 604,101 | ||||||
0.88%, 02/15/47 | 149 | 203,042 | ||||||
0.25%, 02/15/50 | 60 | 72,914 | ||||||
U.S. Treasury Inflation Linked Notes: | ||||||||
0.63%, 07/15/21 - 01/15/26 | 1,344 | 1,422,226 | ||||||
0.13%, 01/15/22 - 01/15/30 | 2,846 | 2,987,985 | ||||||
0.38%, 07/15/23 - 07/15/27 | 1,266 | 1,373,085 | ||||||
0.50%, 04/15/24 - 01/15/28 | 547 | 598,695 | ||||||
0.25%, 01/15/25 - 07/15/29 | 631 | 688,615 | ||||||
0.75%, 07/15/28 | 281 | 323,513 | ||||||
0.88%, 01/15/29 | 275 | 320,585 | ||||||
|
| |||||||
Total U.S. Treasury Obligations — 3.9% |
| 11,924,620 | ||||||
|
| |||||||
Total Long-Term Investments — 8.2% |
| 24,801,125 | ||||||
|
| |||||||
CONSOLIDATED SCHEDULE OF INVESTMENTS | 9 |
Consolidated Schedule of Investments (continued) July 31, 2020 | BlackRock Total Factor Fund (Percentages shown are based on Net Assets) |
| Security | Shares | Value | ||||||
| Short-Term Securities — 77.0% | ||||||||
| Money Market Funds — 16.8% | ||||||||
BlackRock Liquidity Funds, | 50,698,955 | $ | 50,698,955 | |||||
|
| |||||||
Total Money Market Funds — 16.8% |
| 50,698,955 | ||||||
|
| |||||||
| Par (000) | ||||||||
| U.S. Treasury Obligations — 60.2% | ||||||||
U.S. Treasury Bills(d): | ||||||||
0.11%, 09/10/20 | 35,000 | 34,996,582 | ||||||
0.14%, 04/22/21 | 50,000 | 49,959,972 | ||||||
| Security | Par (000) | Value | ||||||
| U.S. Treasury Obligations (continued) | ||||||||
0.18%, 05/20/21 | USD 55,000 | $ | 54,947,941 | |||||
1.44%, 08/13/20 | 42,000 | 41,998,950 | ||||||
|
| |||||||
Total U.S. Treasury Obligations — 60.2% |
| 181,903,445 | ||||||
|
| |||||||
Total Short-Term Securities — 77.0% |
| 232,602,400 | ||||||
|
| |||||||
Total Investments — 85.2% |
| 257,403,525 | ||||||
Other Assets Less Liabilities — 14.8% |
| 44,781,798 | ||||||
|
| |||||||
Net Assets — 100.0% |
| $ | 302,185,323 | |||||
|
| |||||||
| (a) | Non-income producing security. |
| (b) | Security exempt from registration pursuant to Rule 144A under the Securities Act of 1933, as amended. These securities may be resold in transactions exempt from registration to qualified institutional investors. |
| (c) | Annualized 7-day yield as of period end. |
| (d) | Rates are discount rates or a range of discount rates as of period end. |
| * | Investments in issuers considered to be an affiliate/affiliates of the Fund during the year ended July 31, 2020 for purposes of Section 2(a)(3) of the Investment Company Act of 1940, as amended, were as follows: |
| Affiliated Issuer | Shares Held at 07/31/19 | Shares Purchased | Shares Sold | Shares Held at 07/31/20 | Value at 07/31/20 | Income | Net Realized Gain (Loss) (a) | Change in Unrealized Appreciation (Depreciation) | ||||||||||||||||||||||||
BlackRock Liquidity Funds, T-Fund, Institutional Class(b) | 13,562,162 | 37,136,793 | — | 50,698,955 | $ | 50,698,955 | $ | 175,196 | $ | 31 | $ | — | ||||||||||||||||||||
|
|
|
|
|
|
|
| |||||||||||||||||||||||||
| (a) | Includes net capital gain distributions, if applicable. |
| (b) | Represents net shares purchased (sold). |
| 10 | 2020 BLACKROCK ANNUAL REPORTTO SHAREHOLDERS |
Consolidated Schedule of Investments (continued) July 31, 2020 | BlackRock Total Factor Fund |
Derivative Financial Instruments Outstanding as of Period End
Futures Contracts
| Description | Number of Contracts | Expiration Date | Notional Amount (000) | Value/ Unrealized Appreciation (Depreciation) | ||||||||||||
| Long Contracts | ||||||||||||||||
CAC 40 10 Euro Index | 302 | 08/21/20 | $ | 17,008 | $ | (945,727 | ) | |||||||||
IBEX 35 Index | 61 | 08/21/20 | 4,967 | (344,711 | ) | |||||||||||
Brent Crude Oil (a) | 43 | 08/28/20 | 1,871 | 5,049 | ||||||||||||
Hang Seng China Enterprises Index | 33 | 08/28/20 | 2,138 | (23,358 | ) | |||||||||||
Hang Seng Index | 20 | 08/28/20 | 3,169 | (16,268 | ) | |||||||||||
Low Sulphur Gasoil (a) | 250 | 09/10/20 | 9,188 | (113,143 | ) | |||||||||||
TOPIX Index | 61 | 09/10/20 | 8,624 | (518,467 | ) | |||||||||||
Australia 10 Year Bond | 411 | 09/15/20 | 43,885 | 166,330 | ||||||||||||
FTSE/MIB Index | 43 | 09/18/20 | 4,836 | (185,393 | ) | |||||||||||
U.S. Treasury 10 Year Note | 1,110 | 09/21/20 | 155,487 | 1,542,262 | ||||||||||||
Long Gilt | 378 | 09/28/20 | 68,555 | 318,913 | ||||||||||||
Silver (a) | 18 | 09/28/20 | 2,179 | 227,328 | ||||||||||||
100 oz Gold (a) | 28 | 12/29/20 | 5,561 | 189,381 | ||||||||||||
|
| |||||||||||||||
| 302,196 | ||||||||||||||||
|
| |||||||||||||||
| Short Contracts | ||||||||||||||||
WTI Crude Oil (a) | 40 | 08/20/20 | 1,611 | 8,071 | ||||||||||||
AEX Index | 20 | 08/21/20 | 2,560 | 140,672 | ||||||||||||
OMXS30 Index | 100 | 08/21/20 | 1,948 | 52,391 | ||||||||||||
Natural Gas (a) | 180 | 08/27/20 | 3,238 | (223,589 | ) | |||||||||||
SGX NIFTY 50 Index | 224 | 08/27/20 | 4,975 | 36,711 | ||||||||||||
RBOB Gasoline (a) | 77 | 08/31/20 | 3,787 | 274,149 | ||||||||||||
Euro-Bund | 464 | 09/08/20 | 97,027 | (1,467,882 | ) | |||||||||||
S&P/TSX 60 Index | 17 | 09/17/20 | 2,451 | (117,265 | ) | |||||||||||
SPI 200 Index | 120 | 09/17/20 | 12,599 | 117,893 | ||||||||||||
DAX Index | 18 | 09/18/20 | 6,547 | (79,719 | ) | |||||||||||
FTSE 100 Index | 96 | 09/18/20 | 7,397 | 315,837 | ||||||||||||
S&P 500 E-Mini Index | 50 | 09/18/20 | 8,159 | (487,162 | ) | |||||||||||
Canada 10 Year Bond | 324 | 09/21/20 | 37,420 | 45,042 | ||||||||||||
|
| |||||||||||||||
| (1,384,851 | ) | |||||||||||||||
|
| |||||||||||||||
| $ | (1,082,655 | ) | ||||||||||||||
|
| |||||||||||||||
(a) All or a portion of the security is held by a wholly-owned subsidiary. See Note 1 of the Notes to Consolidated Financial Statements for details on the wholly-owned subsidiary. |
Forward Foreign Currency Exchange Contracts
Currency Purchased | Currency Sold | Counterparty | Settlement Date | Unrealized Appreciation (Depreciation) | ||||||||||||||||
| AUD | 2,505,000 (a) | USD | 1,716,719 | JPMorgan Chase Bank NA | 09/16/20 | $ | 73,280 | |||||||||||||
| AUD | 22,588,000 (a) | USD | 15,557,610 | Morgan Stanley & Co. International plc | 09/16/20 | 583,107 | ||||||||||||||
| BRL | 4,319,000 (a) | USD | 811,011 | Deutsche Bank AG | 09/16/20 | 15,492 | ||||||||||||||
| BRL | 2,021,000 (a) | USD | 377,454 | Morgan Stanley & Co. International plc | 09/16/20 | 9,294 | ||||||||||||||
| CAD | 4,927,000 (a) | USD | 3,630,712 | JPMorgan Chase Bank NA | 09/16/20 | 48,041 | ||||||||||||||
| CAD | 14,163,276 (a) | USD | 10,518,647 | Morgan Stanley & Co. International plc | 09/16/20 | 56,390 | ||||||||||||||
| CHF | 1,474,000 (a) | USD | 1,556,784 | Morgan Stanley & Co. International plc | 09/16/20 | 56,995 | ||||||||||||||
| EUR | 24,373,000 (a) | USD | 27,571,043 | Morgan Stanley & Co. International plc | 09/16/20 | 1,166,244 | ||||||||||||||
| GBP | 15,067,000 (a) | USD | 18,868,875 | Morgan Stanley & Co. International plc | 09/16/20 | 858,578 | ||||||||||||||
| HKD | 9,510,000 (a) | USD | 1,226,854 | Morgan Stanley & Co. International plc | 09/16/20 | 202 | ||||||||||||||
| INR | 132,420,000 (a) | USD | 1,733,870 | Deutsche Bank AG | 09/16/20 | 24,849 | ||||||||||||||
| INR | 49,506,000 (a) | USD | 648,417 | HSBC Bank plc | 09/16/20 | 9,091 | ||||||||||||||
| JPY | 819,287,000 (a) | USD | 7,663,091 | Morgan Stanley & Co. International plc | 09/16/20 | 80,691 | ||||||||||||||
| KRW | 3,495,405,766 (a) | USD | 2,908,515 | BNP Paribas SA | 09/16/20 | 16,877 | ||||||||||||||
| KRW | 1,841,853,000 (a) | USD | 1,529,330 | Deutsche Bank AG | 09/16/20 | 12,163 | ||||||||||||||
| KRW | 4,343,699,234 (a) | USD | 3,616,945 | HSBC Bank plc | 09/16/20 | 18,406 | ||||||||||||||
| NZD | 39,217,000 (a) | USD | 25,490,243 | Morgan Stanley & Co. International plc | 09/16/20 | 519,645 | ||||||||||||||
| SEK | 3,143,000 (a) | USD | 345,645 | Morgan Stanley & Co. International plc | 09/16/20 | 12,482 | ||||||||||||||
CONSOLIDATED SCHEDULE OF INVESTMENTS | 11 |
Consolidated Schedule of Investments (continued) July 31, 2020 | BlackRock Total Factor Fund |
Forward Foreign Currency Exchange Contracts (continued)
Currency Purchased | Currency Sold | Counterparty | Settlement Date | Unrealized Appreciation (Depreciation) | ||||||||||||||||||
| TWD | 14,548,000 (a) | USD | 497,487 | Barclays Bank plc | 09/16/20 | $ | 274 | |||||||||||||||
| TWD | 46,857,000 (a) | USD | 1,602,289 | BNP Paribas SA | 09/16/20 | 925 | ||||||||||||||||
| TWD | 113,230,000 (a) | USD | 3,869,391 | Deutsche Bank AG | 09/16/20 | 4,779 | ||||||||||||||||
| TWD | 140,245,000 (a) | USD | 4,794,701 | HSBC Bank plc | 09/16/20 | 3,789 | ||||||||||||||||
| TWD | 372,582,000 (a) | USD | 12,647,047 | JPMorgan Chase Bank NA | 09/16/20 | 100,866 | ||||||||||||||||
| USD | 8,138,518 (a) | AUD | 11,302,000 | Morgan Stanley & Co. International plc | 09/16/20 | 62,443 | ||||||||||||||||
| USD | 5,535,190 (a) | BRL | 27,723,000 | Deutsche Bank AG | 09/16/20 | 229,990 | ||||||||||||||||
| USD | 846,990 (a) | EUR | 712,000 | Morgan Stanley & Co. International plc | 09/16/20 | 7,498 | ||||||||||||||||
| USD | 1,125,292 (a) | GBP | 857,000 | Morgan Stanley & Co. International plc | 09/16/20 | 3,209 | ||||||||||||||||
| USD | 615,677 (a) | JPY | 64,611,000 | Morgan Stanley & Co. International plc | 09/16/20 | 4,983 | ||||||||||||||||
| USD | 1,410,027 (a) | KRW | 1,682,289,000 | BNP Paribas SA | 09/16/20 | 2,077 | ||||||||||||||||
| USD | 1,463,849 (a) | KRW | 1,744,878,000 | HSBC Bank plc | 09/16/20 | 3,517 | ||||||||||||||||
| USD | 256,039 (a) | KRW | 304,931,000 | Morgan Stanley & Co. International plc | 09/16/20 | 834 | ||||||||||||||||
| USD | 904,438 (a) | RUB | 66,679,000 | Deutsche Bank AG | 09/16/20 | 11,018 | ||||||||||||||||
| USD | 626,396 (a) | RUB | 43,475,000 | HSBC Bank plc | 09/16/20 | 43,882 | ||||||||||||||||
| USD | 1,247,137 (a) | TWD | 36,375,000 | Bank of America NA | 09/16/20 | 2,565 | ||||||||||||||||
| USD | 332,134 (a) | TWD | 9,691,000 | HSBC Bank plc | 09/16/20 | 556 | ||||||||||||||||
| USD | 1,082,006 (a) | TWD | 31,508,000 | JPMorgan Chase Bank NA | 09/16/20 | 3,958 | ||||||||||||||||
| MXN | 61,771,000 (a) | USD | 2,691,617 | Morgan Stanley & Co. International plc | 09/17/20 | 67,863 | ||||||||||||||||
| USD | 3,191,330 (a) | MXN | 70,493,000 | Morgan Stanley & Co. International plc | 09/17/20 | 42,214 | ||||||||||||||||
|
| |||||||||||||||||||||
| 4,159,067 | ||||||||||||||||||||||
|
| |||||||||||||||||||||
| BRL | 2,105,000 (a) | USD | 409,702 | BNP Paribas SA | 09/16/20 | (6,880 | ) | |||||||||||||||
| BRL | 4,489,000 (a) | USD | 865,783 | Deutsche Bank AG | 09/16/20 | (6,748 | ) | |||||||||||||||
| CAD | 3,413,000 (a) | USD | 2,554,424 | Morgan Stanley & Co. International plc | 09/16/20 | (6,101 | ) | |||||||||||||||
| INR | 238,463,000 (a) | USD | 3,175,692 | BNP Paribas SA | 09/16/20 | (8,575 | ) | |||||||||||||||
| INR | 155,983,000 (a) | USD | 2,077,043 | Goldman Sachs International | 09/16/20 | (5,374 | ) | |||||||||||||||
| INR | 42,173,000 (a) | USD | 561,498 | HSBC Bank plc | 09/16/20 | (1,383 | ) | |||||||||||||||
| KRW | 484,831,000 (a) | USD | 405,791 | HSBC Bank plc | 09/16/20 | (24 | ) | |||||||||||||||
| NZD | 15,254,000 (a) | USD | 10,227,712 | Morgan Stanley & Co. International plc | 09/16/20 | (110,801 | ) | |||||||||||||||
| RUB | 167,643,847 (a) | USD | 2,386,390 | Deutsche Bank AG | 09/16/20 | (140,158 | ) | |||||||||||||||
| RUB | 209,564,600 (a) | USD | 2,924,073 | HSBC Bank plc | 09/16/20 | (116,153 | ) | |||||||||||||||
| RUB | 195,556,553 (a) | USD | 2,711,591 | JPMorgan Chase Bank NA | 09/16/20 | (91,362 | ) | |||||||||||||||
| RUB | 149,004,000 (a) | USD | 2,139,940 | Morgan Stanley & Co. International plc | 09/16/20 | (143,460 | ) | |||||||||||||||
| TWD | 11,047,000 (a) | USD | 378,244 | Barclays Bank plc | 09/16/20 | (271 | ) | |||||||||||||||
| USD | 950,120 (a) | AUD | 1,366,000 | JPMorgan Chase Bank NA | 09/16/20 | (25,983 | ) | |||||||||||||||
| USD | 38,287,304 (a) | AUD | 54,823,062 | Morgan Stanley & Co. International plc | 09/16/20 | (887,631 | ) | |||||||||||||||
| USD | 3,640,734 (a) | BRL | 19,615,000 | Deutsche Bank AG | 09/16/20 | (112,882 | ) | |||||||||||||||
| USD | 1,000,000 (a) | BRL | 5,371,900 | JPMorgan Chase Bank NA | 09/16/20 | (27,991 | ) | |||||||||||||||
| USD | 207,402 (a) | BRL | 1,114,100 | Morgan Stanley & Co. International plc | 09/16/20 | (5,798 | ) | |||||||||||||||
| USD | 1,313,676 (a) | CAD | 1,775,000 | JPMorgan Chase Bank NA | 09/16/20 | (11,631 | ) | |||||||||||||||
| USD | 15,282,381 (a) | CAD | 20,750,000 | Morgan Stanley & Co. International plc | 09/16/20 | (210,644 | ) | |||||||||||||||
| USD | 2,015,505 (a) | CHF | 1,911,000 | Morgan Stanley & Co. International plc | 09/16/20 | (76,714 | ) | |||||||||||||||
| USD | 53,026,769 (a) | EUR | 46,667,335 | Morgan Stanley & Co. International plc | 09/16/20 | (1,996,929 | ) | |||||||||||||||
| USD | 17,223,326 (a) | GBP | 13,640,006 | Morgan Stanley & Co. International plc | 09/16/20 | (635,743 | ) | |||||||||||||||
| USD | 1,619,007 (a) | HKD | 12,557,000 | Morgan Stanley & Co. International plc | 09/16/20 | (1,196 | ) | |||||||||||||||
| USD | 636,948 (a) | INR | 48,487,000 | Barclays Bank plc | 09/16/20 | (7,026 | ) | |||||||||||||||
| USD | 758,578 (a) | INR | 57,923,000 | BNP Paribas SA | 09/16/20 | (10,719 | ) | |||||||||||||||
| USD | 4,977,242 (a) | INR | 382,949,000 | JPMorgan Chase Bank NA | 09/16/20 | (108,847 | ) | |||||||||||||||
| USD | 12,319,619 (a) | JPY | 1,333,825,633 | Morgan Stanley & Co. International plc | 09/16/20 | (287,508 | ) | |||||||||||||||
| USD | 18,692,507 (a) | KRW | 22,570,268,000 | Bank of America NA | 09/16/20 | (197,112 | ) | |||||||||||||||
| USD | 768,647 (a) | KRW | 925,805,000 | BNP Paribas SA | 09/16/20 | (6,182 | ) | |||||||||||||||
| USD | 766,336 (a) | KRW | 927,925,000 | HSBC Bank plc | 09/16/20 | (10,268 | ) | |||||||||||||||
| USD | 154,623 (a) | NOK | 1,438,000 | Morgan Stanley & Co. International plc | 09/16/20 | (3,396 | ) | |||||||||||||||
| USD | 2,555,427 (a) | NZD | 3,935,000 | Morgan Stanley & Co. International plc | 09/16/20 | (54,383 | ) | |||||||||||||||
| USD | 897,464 (a) | SEK | 8,248,468 | Morgan Stanley & Co. International plc | 09/16/20 | (42,403 | ) | |||||||||||||||
| USD | 188,737 (a) | SGD | 263,000 | Morgan Stanley & Co. International plc | 09/16/20 | (2,689 | ) | |||||||||||||||
| USD | 1,755,363 (a) | TWD | 51,390,000 | Deutsche Bank AG | 09/16/20 | (2,949 | ) | |||||||||||||||
| MXN | 21,750,000 (a) | USD | 982,740 | Morgan Stanley & Co. International plc | 09/17/20 | (11,108 | ) | |||||||||||||||
| USD | 6,632,552 (a) | MXN | 151,486,000 | Morgan Stanley & Co. International plc | 09/17/20 | (134,743 | ) | |||||||||||||||
|
| |||||||||||||||||||||
| (5,509,765 | ) | |||||||||||||||||||||
|
| |||||||||||||||||||||
| 12 | 2020 BLACKROCK ANNUAL REPORTTO SHAREHOLDERS |
Consolidated Schedule of Investments (continued) July 31, 2020 | BlackRock Total Factor Fund |
| (a) | All or a portion of the security is held by a wholly-owned subsidiary. See Note 1 of the Notes to Consolidated Financial Statements for details on the wholly-owned subsidiary. |
Centrally Cleared Credit Default Swaps — Sell Protection
| Reference Obligation/Index | Financing Rate Received by the Fund | Payment Frequency | Termination Date | Credit Rating (a) | Notional Amount | Value | Upfront Premium Paid (Received) | Unrealized Appreciation (Depreciation) | ||||||||||||||||||||||||||||
CDX.NA.HY.34.V7 | 5.00 | % | Quarterly | 06/20/25 | B+ | USD | 3,190 | $ | 108,397 | $ | (87,369 | ) | $ | 195,766 | ||||||||||||||||||||||
ITRAXX.EUR. CROSSOVER.33.V1 | 5.00 | Quarterly | 06/20/25 | B | EUR | 2,246 | 157,346 | 56,474 | 100,872 | |||||||||||||||||||||||||||
|
|
|
|
|
| |||||||||||||||||||||||||||||||
| $ | 265,743 | $ | (30,895 | ) | $ | 296,638 | ||||||||||||||||||||||||||||||
|
|
|
|
|
| |||||||||||||||||||||||||||||||
| (a) | Using the rating of the issuer or the underlying securities of the index, as applicable, provided by S&P Global Ratings. |
| (b) | The maximum potential amount the Fund may pay should a negative credit event take place as defined under the terms of the agreement. |
OTC Total Return Swaps
| Reference Entity | Fixed Amount Paid / (Received) by the Fund (a) | Counterparty | Termination Date | Notional Amount (000) | Value | Upfront Premium Paid (Received) | Unrealized Appreciation (Depreciation) | |||||||||||||||||||||||||
BOVESPA Index Futures August 2020 | BRL | 2,945,697 | | Merrill Lynch International & Co. | | 08/12/20 | BRL 2,946 | $ | 48,364 $ | — | $ | 48,364 | ||||||||||||||||||||
BOVESPA Index Futures August 2020 | BRL | 3,519,010 | | Merrill Lynch International & Co. | | 08/12/20 | BRL 3,519 | 37,340 | — | 37,340 | ||||||||||||||||||||||
Taiwan Capitalization Weighted Stock Index Future August 2020 | TWD | 578,543,323 | | Merrill Lynch International & Co. | | 08/19/20 | TWD 578,543 | 942,835 | — | 942,835 | ||||||||||||||||||||||
Taiwan Capitalization Weighted Stock Index Future August 2020 | TWD | 67,591,694 | | Merrill Lynch International & Co. | | 08/19/20 | TWD 67,592 | 96,739 | — | 96,739 | ||||||||||||||||||||||
Taiwan Capitalization Weighted Stock Index Future August 2020 | TWD | 9,861,526 | | Merrill Lynch International & Co. | | 08/19/20 | TWD 9,862 | 6,802 | — | 6,802 | ||||||||||||||||||||||
KOSPI 200 Index Futures September 2020 | KRW | (3,462,166,800 | ) | | Merrill Lynch International & Co. | | 09/10/20 | KRW 3,462,167 | (109,143 | ) | — | (109,143) | ||||||||||||||||||||
Swiss Market Index Futures September 2020 | CHF | 4,917,137 | | JPMorgan Chase Bank NA | | 09/18/20 | CHF 4,917 | 203,852 | — | 203,852 | ||||||||||||||||||||||
Swiss Market Index Futures September 2020 | CHF | 404,701 | | JPMorgan Chase Bank NA | | 09/18/20 | CHF 405 | (4,834 | ) | — | (4,834) | |||||||||||||||||||||
|
|
|
|
|
| |||||||||||||||||||||||||||
| $ | 1,221,955 | $ | — | $ | 1,221,955 | |||||||||||||||||||||||||||
|
|
|
|
|
| |||||||||||||||||||||||||||
| (a) | At termination, the fixed amount paid (received) will be exchanged for the total return of the reference entity. |
OTC Total Return Swaps
| Reference Entity | Payment Frequency | Counterparty | Termination Date | Net Notional | Accrued Unrealized Appreciation (Depreciation) | Net Value of Reference Entity | Gross Notional Amount Net Asset Percentage | |||||||||||||||||
| Equity Securities Long/Short | Monthly | Bank of America NA(a) | 02/15/23 | $ | 2,536,469 | $ | 379,073 | (b) | $ | 2,905,782 | 52.7 | % | ||||||||||||
| Monthly | Citibank NA(c) | 02/24/23-02/27/23 | 3,079,402 | 466,467 | (d) | 3,455,144 | 62.5 | |||||||||||||||||
| Credit Suisse | ||||||||||||||||||||||||
| Monthly | International(e) | 02/08/23 | 2,804,872 | 275,390 | (f) | 3,088,386 | 64.5 | |||||||||||||||||
| Deutsche Bank | ||||||||||||||||||||||||
| Monthly | AG(g) | 03/29/21-02/17/23 | 3,099,986 | (286,495 | )(h) | 2,818,726 | 3.5 | |||||||||||||||||
| JPMorgan Chase | ||||||||||||||||||||||||
| Monthly | Bank NA(i) | 02/08/23 | 26 | 10,039 | (j) | 24 | 0.0 | |||||||||||||||||
|
|
|
| |||||||||||||||||||||
| $ | 844,474 | $ | 12,268,062 | |||||||||||||||||||||
|
|
|
| |||||||||||||||||||||
CONSOLIDATED SCHEDULE OF INVESTMENTS | 13 |
Consolidated Schedule of Investments (continued) July 31, 2020 | BlackRock Total Factor Fund |
| (a) | The Fund receives the total return on a portfolio of long positions underlying the total return swap. The Fund pays the total return on a portfolio of short positions underlying the total return swap. In addition, the Fund pays or receives a variable rate of interest, based on a specified benchmark, plus or minus a spread in a range of 0-89 basis points. The benchmark and spread are determined based upon the country and/or currency of the individual underlying positions. The following are the specified benchmarks used in determining the variable rate of interest: |
ASX Australian Bank Bill Short Term Rates 1 Month
Bank of Canada Overnight Rate Target
Copenhagen Interbank Swap Rate 1 Week
Intercontinental Exchange LIBOR:
CHF 1 Week
EUR 1 Week
GBP 1 Week
JPY 1 Week
USD 1 Week
Norway Interbank Offer Rate 1 Week
Stockholm Interbank Offer Rate 1 Week
| (b) | Amount includes $9,760 of net dividends and financing fees. |
| (c) | The Fund receives the total return on a portfolio of long positions underlying the total return swap. The Fund pays the total return on a portfolio of short positions underlying the total return swap. In addition, the Fund pays or receives a variable rate of interest, based on a specified benchmark, plus or minus a spread in a range of 5-194 basis points. The benchmark and spread are determined based upon the country and/or currency of the individual underlying positions. The following are the specified benchmarks used in determining the variable rate of interest: |
Association of Banks in Singapore Swap Offer Rate Fixing 1 Month
ASX Australian Bank Bill Short Term Rates 1 Month
Bank of Canada Overnight Repo Rate
Copenhagen Interbank Swap Rate 1 Week
Hong Kong Interbank Offer rate 1 Week
Intercontinental Exchange LIBOR:
CHF 1 Week
EUR 1 Week
GBP 1 Week
JPY 1 Week
USD 1 Week
USD 1 Month
Norway Interbank Offer Rate 1 Week
Stockholm Interbank Offer Rate 1 Week
| (d) | Amount includes $90,725 of net dividends and financing fees. |
| (e) | The Fund receives the total return on a portfolio of long positions underlying the total return swap. The Fund pays the total return on a portfolio of short positions underlying the total return swap. In addition, the Fund pays or receives a variable rate of interest, based on a specified benchmark, plus or minus a spread in a range of 6-200 basis points. The benchmark and spread are determined based upon the country and/or currency of the individual underlying positions. The following are the specified benchmarks used in determining the variable rate of interest: |
Association of Banks in Singapore SGD 1 Month
ASX Australian Bank Bill Short Term Rates 1 Month
Canada Bankers Acceptances 1 Month
Copenhagen Interbank Offer Rate 1 Month
Hong Kong Interbank Offer Rate 1 Month
Intercontinental Exchange LIBOR:
CHF 1 Month
EUR 1 Month
GBP 1 Month
JPY 1 Month
USD 1 Month
Norway Interbank Offer Rate 1 Month
Stockholm Interbank Offer Rate 1 Month
USD Overnight Bank Funding Rate
| (f) | Amount includes $(8,124) of net dividends and financing fees. |
| (g) | The Fund receives the total return on a portfolio of long positions underlying the total return swap. The Fund pays the total return on a portfolio of short positions underlying the total return swap. In addition, the Fund pays or receives a variable rate of interest, based on a specified benchmark, plus or minus a spread of 0 basis points. The benchmark and spread are determined based upon the country and/or currency of the individual underlying positions. The following are the specified benchmarks used in determining the variable rate of interest: |
Copenhagen Interbank Overnight Deposit MID Rate
Intercontinental Exchange LIBOR:
EUR 1 Week
GBP 1 Week
Norwegian Overnight Weighted Average
Stockholm Interbank Offer Rate 1 Week
| (h) | Amount includes $(5,235) of net dividends and financing fees. |
| (i) | The Fund receives the total return on a portfolio of long positions underlying the total return swap. The Fund pays the total return on a portfolio of short positions underlying the total return swap. In addition, the Fund pays or receives a variable rate of interest, based on a specified benchmark, plus or minus a spread in a range of 18-35 basis points. The benchmark and spread are determined based upon the country and/or currency of the individual underlying positions. The following are the specified benchmarks used in determining the variable rate of interest: |
Intercontinental Exchange Rate USD 1 Month
USD Overnight Bank Funding Rate
| (j) | Amount includes $10,041 of net dividends and financing fees. |
| 14 | 2020 BLACKROCK ANNUAL REPORTTO SHAREHOLDERS |
Consolidated Schedule of Investments (continued) July 31, 2020 | BlackRock Total Factor Fund |
The following table represents the individual long and short positions and related values of equity securities underlying the total return swap with Bank of America NA, as of July 31, 2020, expiration date 02/15/23:
| Shares | Value | % of Basket Value | ||||||||||
Reference Entity — Long |
| |||||||||||
| Australia | ||||||||||||
AGL Energy Ltd. | 23,442 | $ | 277,681 | 9.6 | % | |||||||
ASX Ltd. | 3,043 | 179,295 | 6.2 | |||||||||
Aurizon Holdings Ltd. | 119,384 | 380,710 | 13.1 | |||||||||
Brambles Ltd. | 14,060 | 108,554 | 3.7 | |||||||||
Cochlear Ltd. | 3,920 | 534,938 | 18.4 | |||||||||
Coles Group Ltd. | 6,620 | 85,826 | 2.9 | |||||||||
Macquarie Group Ltd. | 1,674 | 147,114 | 5.1 | |||||||||
Rio Tinto Ltd. | 5,089 | 372,457 | 12.8 | |||||||||
Rio Tinto plc | 5,645 | 343,624 | 11.8 | |||||||||
Santos Ltd. | 51,490 | 192,331 | 6.6 | |||||||||
Telstra Corp. Ltd. | 48,220 | 115,464 | 4.0 | |||||||||
Wesfarmers Ltd. | 4,420 | 146,955 | 5.1 | |||||||||
Woodside Petroleum Ltd. | 8,890 | 126,470 | 4.3 | |||||||||
|
| |||||||||||
| 3,011,419 | ||||||||||||
| Belgium | ||||||||||||
Colruyt SA | 963 | 55,928 | 1.9 | |||||||||
Groupe Bruxelles Lambert SA | 2,542 | 220,494 | 7.6 | |||||||||
|
| |||||||||||
| 276,422 | ||||||||||||
| Canada | ||||||||||||
Agnico Eagle Mines Ltd. | 4,050 | 321,934 | 11.1 | |||||||||
Bank of Nova Scotia (The) | 580 | 23,820 | 0.8 | |||||||||
BCE, Inc. | 2,180 | 91,402 | 3.1 | |||||||||
Canadian Pacific Railway Ltd. | 160 | 44,003 | 1.5 | |||||||||
Constellation Software, Inc. | 970 | 1,147,366 | 39.5 | |||||||||
Hydro One Ltd. | 28,980 | 617,484 | 21.3 | |||||||||
Loblaw Cos. Ltd. | 2,020 | 104,797 | 3.6 | |||||||||
Manulife Financial Corp. | 5,700 | 76,386 | 2.6 | |||||||||
Rogers Communications, Inc., | ||||||||||||
Class B | 4,530 | 184,995 | 6.4 | |||||||||
Royal Bank of Canada | 5,760 | 397,345 | 13.7 | |||||||||
Sun Life Financial, Inc. | 260 | 10,134 | 0.4 | |||||||||
Suncor Energy, Inc. | 23,681 | 372,510 | 12.8 | |||||||||
TC Energy Corp. | 1,860 | 84,776 | 2.9 | |||||||||
|
| |||||||||||
| 3,476,952 | ||||||||||||
| Denmark | ||||||||||||
Coloplast A/S, Class B | 2,040 | 348,222 | 12.0 | |||||||||
Genmab A/S | 750 | 258,155 | 8.9 | |||||||||
GN Store Nord A/S | 240 | 14,759 | 0.5 | |||||||||
Novo Nordisk A/S, Class B | 12,050 | 790,632 | 27.2 | |||||||||
Novozymes A/S, Class B | 2,330 | 139,379 | 4.8 | |||||||||
|
| |||||||||||
| 1,551,147 | ||||||||||||
| Finland | ||||||||||||
Fortum OYJ | 8,014 | 162,659 | 5.6 | |||||||||
Stora Enso OYJ, Class R | 12,590 | 157,900 | 5.4 | |||||||||
|
| |||||||||||
| 320,559 | ||||||||||||
| France | ||||||||||||
Alstom SA | 3,460 | 192,802 | 6.6 | |||||||||
BNP Paribas SA | 2,550 | 102,877 | 3.5 | |||||||||
Carrefour SA | 2,240 | 35,600 | 1.2 | |||||||||
Cie de Saint-Gobain | 16,367 | 605,497 | 20.8 | |||||||||
Dassault Systemes SE | 1,870 | 340,515 | 11.7 | |||||||||
Eiffage SA | 3,110 | 271,792 | 9.4 | |||||||||
Engie SA | 7,740 | 103,106 | 3.5 | |||||||||
Ipsen SA | 590 | 56,582 | 1.9 | |||||||||
Legrand SA | 3,535 | 273,461 | 9.4 | |||||||||
Orange SA | 37,940 | 444,690 | 15.3 | |||||||||
Publicis Groupe SA | 3,730 | 119,271 | 4.1 | |||||||||
| Shares | Value | % of Basket Value | ||||||||||
| France (continued) | ||||||||||||
Sartorius Stedim Biotech | 757 | $ | 236,776 | 8.1 | % | |||||||
Schneider Electric SE | 5,516 | 632,484 | 21.8 | |||||||||
Sodexo SA | 1,080 | 74,535 | 2.6 | |||||||||
Suez SA | 15,770 | 207,987 | 7.2 | |||||||||
Thales SA | 1,370 | 99,039 | 3.4 | |||||||||
Veolia Environnement SA | 3,949 | 90,462 | 3.1 | |||||||||
Vivendi SA | 36,520 | 969,110 | 33.4 | |||||||||
|
| |||||||||||
| 4,856,586 | ||||||||||||
| Germany | ||||||||||||
Allianz SE (Registered) | 1,938 | 402,085 | 13.8 | |||||||||
Deutsche Post AG (Registered) | 39,019 | 1,583,788 | 54.5 | |||||||||
Deutsche Telekom AG (Registered) | 40,572 | 677,339 | 23.3 | |||||||||
Evonik Industries AG | 7,153 | 193,247 | 6.7 | |||||||||
HeidelbergCement AG | 7,401 | 410,721 | 14.1 | |||||||||
Muenchener Rueckversicherungs-Gesellschaft AG (Registered) | 1,180 | 312,786 | 10.8 | |||||||||
Puma SE | 740 | 57,600 | 2.0 | |||||||||
Rational AG | 400 | 237,582 | 8.2 | |||||||||
Symrise AG | 990 | 123,761 | 4.3 | |||||||||
|
| |||||||||||
| 3,998,909 | ||||||||||||
| Italy | ||||||||||||
Assicurazioni Generali SpA | 2,820 | 42,344 | 1.5 | |||||||||
Enel SpA | 33,810 | 309,717 | 10.7 | |||||||||
Eni SpA | 13,360 | 119,008 | 4.1 | |||||||||
Intesa Sanpaolo SpA | 40,070 | 81,677 | 2.8 | |||||||||
Moncler SpA | 4,440 | 171,659 | 5.9 | |||||||||
Recordati SpA | 2,920 | 156,834 | 5.4 | |||||||||
Terna Rete Elettrica Nazionale SpA | 9,720 | 72,538 | 2.5 | |||||||||
|
| |||||||||||
| 953,777 | ||||||||||||
| Japan | ||||||||||||
Advantest Corp. | 200 | 10,920 | 0.4 | |||||||||
Aeon Co. Ltd. | 13,000 | 307,366 | 10.6 | |||||||||
AGC, Inc. | 12,500 | 351,386 | 12.1 | |||||||||
Ajinomoto Co., Inc. | 8,500 | 153,507 | 5.3 | |||||||||
Asahi Group Holdings Ltd. | 5,800 | 189,056 | 6.5 | |||||||||
Astellas Pharma, Inc. | 36,600 | 570,886 | 19.6 | |||||||||
Bandai Namco Holdings, Inc. | 2,500 | 138,056 | 4.7 | |||||||||
Bridgestone Corp. | 18,300 | 539,037 | 18.5 | |||||||||
Chugai Pharmaceutical Co. Ltd. | 3,600 | 162,537 | 5.6 | |||||||||
Daito Trust Construction Co. Ltd. | 1,600 | 125,476 | 4.3 | |||||||||
East Japan Railway Co. | 2,700 | 155,641 | 5.4 | |||||||||
ENEOS Holdings, Inc. | 102,500 | 359,428 | 12.4 | |||||||||
Fujitsu Ltd. | 9,000 | 1,205,056 | 41.5 | |||||||||
Honda Motor Co. Ltd. | 7,900 | 192,601 | 6.6 | |||||||||
Hoshizaki Corp. | 600 | 45,738 | 1.6 | |||||||||
Hoya Corp. | 1,400 | 138,067 | 4.8 | |||||||||
Inpex Corp. | 45,900 | 261,998 | 9.0 | |||||||||
Japan Exchange Group, Inc. | 2,200 | 52,241 | 1.8 | |||||||||
KDDI Corp. | 2,400 | 76,314 | 2.6 | |||||||||
Kikkoman Corp. | 3,100 | 145,489 | 5.0 | |||||||||
Kyocera Corp. | 5,200 | 289,590 | 10.0 | |||||||||
Marubeni Corp. | 66,300 | 305,240 | 10.5 | |||||||||
MEIJI Holdings Co. Ltd. | 1,300 | 102,082 | 3.5 | |||||||||
MINEBEA MITSUMI, Inc. | 3,600 | 59,038 | 2.0 | |||||||||
Mitsubishi Chemical Holdings Corp. | 38,600 | 207,391 | 7.1 | |||||||||
Mitsubishi Electric Corp. | 53,400 | 697,088 | 24.0 | |||||||||
Mitsubishi Heavy Industries Ltd. | 5,800 | 134,929 | 4.6 | |||||||||
Mitsui & Co. Ltd. | 11,000 | 164,451 | 5.7 | |||||||||
Mizuho Financial Group, Inc. | 73,500 | 89,600 | 3.1 | |||||||||
CONSOLIDATED SCHEDULE OF INVESTMENTS | 15 |
Consolidated Schedule of Investments (continued) July 31, 2020 | BlackRock Total Factor Fund |
| Shares | Value | % of Basket Value | ||||||||||
| Japan (continued) | ||||||||||||
NEC Corp. | 2,000 | $ | 112,051 | 3.9 | % | |||||||
Nintendo Co. Ltd. | 200 | 87,962 | 3.0 | |||||||||
Nippon Steel Corp. | 11,100 | 91,013 | 3.1 | |||||||||
Nissin Foods Holdings Co. Ltd. | 2,000 | 180,662 | 6.2 | |||||||||
Nitori Holdings Co. Ltd. | 1,900 | 415,979 | 14.3 | |||||||||
Nitto Denko Corp. | 16,200 | 918,223 | 31.6 | |||||||||
Olympus Corp. | 3,900 | 70,147 | 2.4 | |||||||||
Omron Corp. | 1,400 | 100,842 | 3.5 | |||||||||
Ono Pharmaceutical Co. Ltd. | 7,500 | 210,805 | 7.3 | |||||||||
Rakuten, Inc. | 48,200 | 442,925 | 15.2 | |||||||||
Rohm Co. Ltd. | 300 | 19,264 | 0.7 | |||||||||
Sekisui House Ltd. | 15,200 | 277,609 | 9.6 | |||||||||
Seven & i Holdings Co. Ltd. | 2,800 | 84,615 | 2.9 | |||||||||
Shin-Etsu Chemical Co. Ltd. | 400 | 46,816 | 1.6 | |||||||||
Subaru Corp. | 7,200 | 135,989 | 4.7 | |||||||||
Sumitomo Electric Industries Ltd. | 500 | 5,586 | 0.2 | |||||||||
Sumitomo Mitsui Financial Group, Inc. | 8,800 | 234,489 | 8.1 | |||||||||
TDK Corp. | 2,800 | 311,744 | 10.7 | |||||||||
Terumo Corp. | 2,100 | 79,445 | 2.7 | |||||||||
Tokyo Electron Ltd. | 1,200 | 332,061 | 11.4 | |||||||||
Tokyo Gas Co. Ltd. | 3,100 | 65,820 | 2.3 | |||||||||
Toray Industries, Inc. | 14,300 | 61,898 | 2.1 | |||||||||
Trend Micro, Inc. | 1,800 | 105,568 | 3.6 | |||||||||
West Japan Railway Co. | 2,700 | 116,599 | 4.0 | |||||||||
Yakult Honsha Co. Ltd. | 800 | 45,724 | 1.6 | |||||||||
Yamaha Corp. | 800 | 36,885 | 1.3 | |||||||||
|
| |||||||||||
| 11,820,930 | ||||||||||||
| Netherlands | ||||||||||||
ING Groep NV | 7,610 | 53,064 | 1.8 | |||||||||
Koninklijke Ahold Delhaize NV | 14,060 | 404,940 | 13.9 | |||||||||
Koninklijke KPN NV | 118,230 | 311,466 | 10.7 | |||||||||
Koninklijke Philips NV | 3,343 | 172,736 | 6.0 | |||||||||
|
| |||||||||||
| 942,206 | ||||||||||||
| Norway | ||||||||||||
Orkla ASA | 8 | 78 | 0.0 | |||||||||
Telenor ASA | 19,856 | 306,950 | 10.6 | |||||||||
|
| |||||||||||
| 307,028 | ||||||||||||
| Portugal | ||||||||||||
Galp Energia SGPS SA | 22,070 | 231,091 | 8.0 | |||||||||
Jeronimo Martins SGPS SA | 3,010 | 50,466 | 1.7 | |||||||||
|
| |||||||||||
| 281,557 | ||||||||||||
| Spain | ||||||||||||
Aena SME SA | 210 | 27,381 | 1.0 | |||||||||
Banco Bilbao Vizcaya Argentaria SA | 34,030 | 105,960 | 3.7 | |||||||||
Cia de Distribucion Integral Logista Holdings SA | 54 | 1,008 | 0.0 | |||||||||
Iberdrola SA | 11,470 | 148,253 | 5.1 | |||||||||
Industria de Diseno Textil SA | 1,420 | 37,627 | 1.3 | |||||||||
Repsol SA | 35,889 | 283,011 | 9.7 | |||||||||
Telefonica SA | 435 | 1,822 | 0.1 | |||||||||
|
| |||||||||||
| 605,062 | ||||||||||||
| Sweden | ||||||||||||
Atlas Copco AB, Class A | 1,390 | 61,704 | 2.1 | |||||||||
Essity AB, Class B | 20,133 | 664,277 | 22.9 | |||||||||
Hennes & Mauritz AB, Class B | 8,200 | 127,816 | 4.4 | |||||||||
Investor AB, Class B | 9,976 | 591,922 | 20.4 | |||||||||
Lundin Energy AB | 11,840 | 276,175 | 9.5 | |||||||||
Skanska AB, Class B | 10,950 | 221,039 | 7.6 | |||||||||
SKF AB, Class B | 3,320 | 61,463 | 2.1 | |||||||||
| Shares | Value | % of Basket Value | ||||||||||
| Sweden (continued) | ||||||||||||
Swedish Match AB | 6,745 | $ | 519,694 | 17.9 | % | |||||||
Volvo AB, Class B | 11,482 | 198,430 | 6.8 | |||||||||
|
| |||||||||||
| 2,722,520 | ||||||||||||
| Switzerland | ||||||||||||
Coca-Cola HBC AG | 19,905 | 518,202 | 17.8 | |||||||||
Givaudan SA (Registered) | 60 | 248,503 | 8.5 | |||||||||
Kuehne + Nagel International AG (Registered) | 1,230 | 212,036 | 7.3 | |||||||||
LafargeHolcim Ltd. (Registered) | 13,080 | 618,821 | 21.3 | |||||||||
Novartis AG (Registered) | 2,184 | 179,890 | 6.2 | |||||||||
Partners Group Holding AG | 90 | 87,184 | 3.0 | |||||||||
Roche Holding AG | 1,323 | 458,230 | 15.8 | |||||||||
SGS SA (Registered) | 170 | 445,206 | 15.3 | |||||||||
Sonova Holding AG (Registered) | 1,671 | 377,820 | 13.0 | |||||||||
STMicroelectronics NV | 1,210 | 33,997 | 1.2 | |||||||||
Straumann Holding AG (Registered) | 130 | 128,778 | 4.4 | |||||||||
|
| |||||||||||
| 3,308,667 | ||||||||||||
| Taiwan | ||||||||||||
Chunghwa Telecom Co. Ltd. | 11,000 | 41,108 | 1.4 | |||||||||
|
| |||||||||||
| United Kingdom | ||||||||||||
3i Group plc | 27,540 | 316,999 | 10.9 | |||||||||
Associated British Foods plc | 487 | 11,154 | 0.4 | |||||||||
BAE Systems plc | 111,580 | 715,106 | 24.6 | |||||||||
Berkeley Group Holdings plc | 330 | 19,147 | 0.7 | |||||||||
BP plc | 51,590 | 186,834 | 6.4 | |||||||||
Bunzl plc | 8,230 | 235,757 | 8.1 | |||||||||
Burberry Group plc | 9,610 | 156,583 | 5.4 | |||||||||
Coca-Cola European Partners plc | 950 | 39,112 | 1.3 | |||||||||
DCC plc | 140 | 12,449 | 0.4 | |||||||||
Diageo plc | 11,750 | 429,940 | 14.8 | |||||||||
Experian plc | 5,390 | 188,273 | 6.5 | |||||||||
JD Sports Fashion plc | 10,070 | 79,607 | 2.7 | |||||||||
Next plc | 1,710 | 120,695 | 4.2 | |||||||||
RSA Insurance Group plc | 5,558 | 31,022 | 1.1 | |||||||||
Sage Group plc (The) | 19,931 | 189,143 | 6.5 | |||||||||
Severn Trent plc | 130 | 4,143 | 0.1 | |||||||||
Smith & Nephew plc | 3,000 | 59,212 | 2.0 | |||||||||
Unilever NV | 880 | 51,999 | 1.8 | |||||||||
Vodafone Group plc | 28,102 | 42,233 | 1.5 | |||||||||
|
| |||||||||||
| 2,889,408 | ||||||||||||
| United States | ||||||||||||
AbbVie, Inc. | 1,940 | 184,125 | 6.3 | |||||||||
ABIOMED, Inc. | 130 | 38,992 | 1.3 | |||||||||
Adobe, Inc. | 1,952 | 867,313 | 29.8 | |||||||||
Advance Auto Parts, Inc. | 120 | 18,017 | 0.6 | |||||||||
Agilent Technologies, Inc. | 1,060 | 102,110 | 3.5 | |||||||||
Akamai Technologies, Inc. | 1,686 | 189,574 | 6.5 | |||||||||
Align Technology, Inc. | 1,370 | 402,533 | 13.9 | |||||||||
Allegion plc | 1,260 | 125,320 | 4.3 | |||||||||
Allstate Corp. (The) | 5,240 | 494,604 | 17.0 | |||||||||
Ally Financial, Inc. | 2,100 | 42,210 | 1.5 | |||||||||
Alphabet, Inc., Class A | 320 | 476,144 | 16.4 | |||||||||
Amdocs Ltd. | 790 | 49,059 | 1.7 | |||||||||
Ameren Corp. | 2,156 | 172,997 | 6.0 | |||||||||
American Express Co. | 523 | 48,806 | 1.7 | |||||||||
American Water Works Co., Inc. | 1,870 | 275,395 | 9.5 | |||||||||
Ameriprise Financial, Inc. | 2,131 | 327,386 | 11.3 | |||||||||
AMETEK, Inc. | 2 | 187 | 0.0 | |||||||||
Anaplan, Inc. | 4,740 | 215,243 | 7.4 | |||||||||
Aon plc, Class A | 440 | 90,297 | 3.1 | |||||||||
| 16 | 2020 BLACKROCK ANNUAL REPORTTO SHAREHOLDERS |
Consolidated Schedule of Investments (continued) July 31, 2020 | BlackRock Total Factor Fund |
| Shares | Value | % of Basket Value | ||||||||||
| United States (continued) | ||||||||||||
Arch Capital Group Ltd. | 10,040 | $ | 308,730 | 10.6 | % | |||||||
Assurant, Inc. | 430 | 46,212 | 1.6 | |||||||||
Autodesk, Inc. | 1,891 | 447,089 | 15.4 | |||||||||
Best Buy Co., Inc. | 2,515 | 250,469 | 8.6 | |||||||||
Bio-Rad Laboratories, Inc., Class A | 1,100 | 577,379 | 19.9 | |||||||||
Booking Holdings, Inc. | 213 | 354,034 | 12.2 | |||||||||
Booz Allen Hamilton Holding Corp. | 937 | 76,609 | 2.6 | |||||||||
Bright Horizons Family Solutions, Inc. | 5,260 | 564,082 | 19.4 | |||||||||
Bristol-Myers Squibb Co. | 820 | 48,101 | 1.7 | |||||||||
Bristol-Myers Squibb Co., CVR | 2,860 | 10,296 | 0.4 | |||||||||
Bruker Corp. | 3,520 | 157,062 | 5.4 | |||||||||
Cadence Design Systems, Inc. | 1,010 | 110,343 | 3.8 | |||||||||
Campbell Soup Co. | 790 | 39,160 | 1.3 | |||||||||
Capital One Financial Corp. | 1,720 | 109,736 | 3.8 | |||||||||
Carlisle Cos., Inc. | 819 | 97,527 | 3.4 | |||||||||
Cboe Global Markets, Inc. | 1,170 | 102,609 | 3.5 | |||||||||
CDW Corp. | 4,082 | 474,533 | 16.3 | |||||||||
Chemed Corp. | 140 | 68,907 | 2.4 | |||||||||
Chipotle Mexican Grill, Inc. | 40 | 46,206 | 1.6 | |||||||||
Cintas Corp. | 1,025 | 309,417 | 10.7 | |||||||||
Citigroup, Inc. | 20,190 | 1,009,702 | 34.7 | |||||||||
Citizens Financial Group, Inc. | 15,060 | 373,639 | 12.9 | |||||||||
Citrix Systems, Inc. | 2,562 | 365,751 | 12.6 | |||||||||
CME Group, Inc. | 490 | 81,428 | 2.8 | |||||||||
Colgate-Palmolive Co. | 4,420 | 341,224 | 11.7 | |||||||||
ConocoPhillips | 10,058 | 376,069 | 12.9 | |||||||||
Crown Holdings, Inc. | 450 | 32,211 | 1.1 | |||||||||
Darden Restaurants, Inc. | 3,618 | 274,606 | 9.5 | |||||||||
Delta Air Lines, Inc. | 2,580 | 64,423 | 2.2 | |||||||||
DexCom, Inc. | 470 | 204,704 | 7.0 | |||||||||
Dollar General Corp. | 260 | 49,504 | 1.7 | |||||||||
Domino’s Pizza, Inc. | 180 | 69,590 | 2.4 | |||||||||
Dover Corp. | 2,606 | 268,236 | 9.2 | |||||||||
Duke Energy Corp. | 1,650 | 139,821 | 4.8 | |||||||||
Edwards Lifesciences Corp. | 7,270 | 570,041 | 19.6 | |||||||||
Electronic Arts, Inc. | 1,620 | 229,424 | 7.9 | |||||||||
Eli Lilly and Co. | 2,026 | 304,488 | 10.5 | |||||||||
Emerson Electric Co. | 2,810 | 174,248 | 6.0 | |||||||||
Entergy Corp. | 3,904 | 410,428 | 14.1 | |||||||||
Equitable Holdings, Inc. | 6,630 | 135,650 | 4.7 | |||||||||
Evergy, Inc. | 4,516 | 292,772 | 10.1 | |||||||||
Exelixis, Inc. | 4,550 | 105,060 | 3.6 | |||||||||
Facebook, Inc., Class A | 1,310 | 332,308 | 11.4 | |||||||||
Fair Isaac Corp. | 220 | 96,622 | 3.3 | |||||||||
FedEx Corp. | 530 | 89,252 | 3.1 | |||||||||
Ferguson plc | 2,100 | 185,122 | 6.4 | |||||||||
Fifth Third Bancorp | 12,556 | 249,362 | 8.6 | |||||||||
FMC Corp. | 680 | 72,114 | 2.5 | |||||||||
Fortinet, Inc. | 340 | 47,022 | 1.6 | |||||||||
Fortive Corp. | 690 | 48,431 | 1.7 | |||||||||
Fortune Brands Home & Security, Inc. | 3,520 | 269,280 | 9.3 | |||||||||
General Motors Co. | 4,280 | 106,529 | 3.7 | |||||||||
Gentex Corp. | 2,500 | 67,475 | 2.3 | |||||||||
GoDaddy, Inc., Class A | 2,690 | 189,053 | 6.5 | |||||||||
Herbalife Nutrition Ltd. | 7,780 | 398,647 | 13.7 | |||||||||
Hershey Co. (The) | 3,825 | 556,193 | 19.1 | |||||||||
Hill-Rom Holdings, Inc. | 330 | 32,083 | 1.1 | |||||||||
Hologic, Inc. | 2,124 | 148,213 | 5.1 | |||||||||
Home Depot, Inc. (The) | 1,860 | 493,811 | 17.0 | |||||||||
HP, Inc. | 23,966 | 421,322 | 14.5 | |||||||||
Hubbell, Inc. | 3,562 | 480,763 | 16.5 | |||||||||
| Shares | Value | % of Basket Value | ||||||||||
| United States (continued) | ||||||||||||
Humana, Inc. | 150 | $ | 58,868 | 2.0 | % | |||||||
IDEXX Laboratories, Inc. | 311 | 123,700 | 4.3 | |||||||||
Illinois Tool Works, Inc. | 1,070 | 197,939 | 6.8 | |||||||||
Illumina, Inc. | 180 | 68,789 | 2.4 | |||||||||
Incyte Corp. | 5,980 | 590,585 | 20.3 | |||||||||
Intel Corp. | 9,600 | 458,208 | 15.8 | |||||||||
Intercontinental Exchange, Inc. | 6,780 | 656,168 | 22.6 | |||||||||
Intuit, Inc. | 2,982 | 913,595 | 31.4 | |||||||||
James Hardie Industries plc, CDI | 13,860 | 286,061 | 9.8 | |||||||||
Jazz Pharmaceuticals plc | 1,240 | 134,230 | 4.6 | |||||||||
Jones Lang LaSalle, Inc. | 680 | 67,259 | 2.3 | |||||||||
JPMorgan Chase & Co. | 1,920 | 185,549 | 6.4 | |||||||||
Juniper Networks, Inc. | 4,630 | 117,509 | 4.0 | |||||||||
Kansas City Southern | 250 | 42,963 | 1.5 | |||||||||
KeyCorp | 5,990 | 71,940 | 2.5 | |||||||||
Keysight Technologies, Inc. | 1,990 | 198,781 | 6.8 | |||||||||
Kinder Morgan, Inc. | 638 | 8,996 | 0.3 | |||||||||
Kroger Co. (The) | 2,530 | 88,019 | 3.0 | |||||||||
Liberty Broadband Corp., Class C | 2,010 | 275,913 | 9.5 | |||||||||
Liberty Media Corp-Liberty Formula One, Class C | 2,740 | 97,106 | 3.3 | |||||||||
Liberty Media Corp-Liberty SiriusXM, Class C | 744 | 26,033 | 0.9 | |||||||||
LKQ Corp. | 5,200 | 146,588 | 5.0 | |||||||||
Loews Corp. | 1,820 | 66,266 | 2.3 | |||||||||
Lowe’s Cos., Inc. | 1,450 | 215,920 | 7.4 | |||||||||
LPL Financial Holdings, Inc. | 1,542 | 121,849 | 4.2 | |||||||||
Lululemon Athletica, Inc. | 260 | 84,653 | 2.9 | |||||||||
MarketAxess Holdings, Inc. | 430 | 222,181 | 7.6 | |||||||||
Masco Corp. | 8,644 | 494,091 | 17.0 | |||||||||
Masimo Corp. | 1,130 | 248,736 | 8.6 | |||||||||
McDonald’s Corp. | 560 | 108,797 | 3.7 | |||||||||
McKesson Corp. | 510 | 76,582 | 2.6 | |||||||||
Mettler-Toledo International, Inc. | 350 | 327,250 | 11.3 | |||||||||
Microsoft Corp. | 620 | 127,106 | 4.4 | |||||||||
Mondelez International, Inc., Class A | 5,668 | 314,517 | 10.8 | |||||||||
Monster Beverage Corp. | 1,360 | 106,733 | 3.7 | |||||||||
Moody’s Corp. | 490 | 137,837 | 4.7 | |||||||||
Motorola Solutions, Inc. | 1,950 | 272,610 | 9.4 | |||||||||
MSCI, Inc. | 310 | 116,554 | 4.0 | |||||||||
Nasdaq, Inc. | 2,520 | 330,901 | 11.4 | |||||||||
Neurocrine Biosciences, Inc. | 1,940 | 233,498 | 8.0 | |||||||||
New York Times Co. (The), Class A | 1,470 | 67,826 | 2.3 | |||||||||
NextEra Energy, Inc. | 387 | 108,631 | 3.7 | |||||||||
NIKE, Inc., Class B | 2,110 | 205,957 | 7.1 | |||||||||
NortonLifeLock, Inc. | 1,890 | 40,541 | 1.4 | |||||||||
NRG Energy, Inc. | 15,328 | 518,240 | 17.8 | |||||||||
NVR, Inc. | 62 | 243,669 | 8.4 | |||||||||
OGE Energy Corp. | 9,216 | 303,206 | 10.4 | |||||||||
O’Reilly Automotive, Inc. | 370 | 176,631 | 6.1 | |||||||||
Owens Corning | 960 | 58,051 | 2.0 | |||||||||
Parker-Hannifin Corp. | 660 | 118,087 | 4.1 | |||||||||
Philip Morris International, Inc. | 410 | 31,492 | 1.1 | |||||||||
Phillips 66 | 1,753 | 108,721 | 3.7 | |||||||||
Procter & Gamble Co. (The) | 2,030 | 266,174 | 9.2 | |||||||||
Proofpoint, Inc. | 1,140 | 131,864 | 4.5 | |||||||||
QUALCOMM, Inc. | 2,230 | 235,510 | 8.1 | |||||||||
Reinsurance Group of America, Inc. | 970 | 82,693 | 2.8 | |||||||||
Republic Services, Inc. | 3,280 | 286,180 | 9.9 | |||||||||
RingCentral, Inc., Class A | 1,130 | 328,005 | 11.3 | |||||||||
CONSOLIDATED SCHEDULE OF INVESTMENTS | 17 |
Consolidated Schedule of Investments (continued) July 31, 2020 | BlackRock Total Factor Fund |
| Shares | Value | % of Basket Value | ||||||||||
| United States (continued) | ||||||||||||
Robert Half International, Inc. | 4,898 | $ | 249,161 | 8.6 | % | |||||||
Rockwell Automation, Inc. | 880 | 191,963 | 6.6 | |||||||||
RPM International, Inc. | 5,920 | 483,013 | 16.6 | |||||||||
S&P Global, Inc. | 1,800 | 630,450 | 21.7 | |||||||||
Sirius XM Holdings, Inc. | 39,750 | 233,730 | 8.0 | |||||||||
Skyworks Solutions, Inc. | 360 | 52,409 | 1.8 | |||||||||
Southern Co. (The) | 3,260 | 178,029 | 6.1 | |||||||||
Starbucks Corp. | 5,506 | 421,374 | 14.5 | |||||||||
STERIS plc | 30 | 4,789 | 0.2 | |||||||||
Synopsys, Inc. | 270 | 53,789 | 1.9 | |||||||||
Sysco Corp. | 1,630 | 86,146 | 3.0 | |||||||||
Take-Two Interactive Software, Inc. | 3,160 | 518,303 | 17.8 | |||||||||
Target Corp. | 750 | 94,410 | 3.3 | |||||||||
Toro Co. (The) | 3,350 | 239,023 | 8.2 | |||||||||
Tractor Supply Co. | 560 | 79,934 | 2.8 | |||||||||
Ulta Beauty, Inc. | 60 | 11,579 | 0.4 | |||||||||
United Airlines Holdings, Inc. | 6,275 | 196,910 | 6.8 | |||||||||
United Parcel Service, Inc., Class B | 2,520 | 359,755 | 12.4 | |||||||||
Universal Health Services, Inc., Class B | 1,310 | 143,969 | 5.0 | |||||||||
US Bancorp | 4,490 | 165,412 | 5.7 | |||||||||
VeriSign, Inc. | 4,644 | 983,042 | 33.8 | |||||||||
Verizon Communications, Inc. | 7,720 | 443,746 | 15.3 | |||||||||
Vertex Pharmaceuticals, Inc. | 2,240 | 609,280 | 21.0 | |||||||||
Vistra Corp. | 1,890 | 35,267 | 1.2 | |||||||||
Waters Corp. | 915 | 195,032 | 6.7 | |||||||||
West Pharmaceutical Services, Inc. | 1,017 | 273,441 | 9.4 | |||||||||
Workday, Inc., Class A | 2,150 | 388,978 | 13.4 | |||||||||
WW Grainger, Inc. | 710 | 242,486 | 8.3 | |||||||||
Yum! Brands, Inc. | 7,582 | 690,341 | 23.8 | |||||||||
Zendesk, Inc. | 980 | 89,327 | 3.1 | |||||||||
|
| |||||||||||
| 38,552,880 | ||||||||||||
|
| |||||||||||
Total Reference Entity — Long | 79,917,137 | |||||||||||
|
| |||||||||||
Reference Entity — Short |
| |||||||||||
| Australia | ||||||||||||
Australia & New Zealand Banking Group Ltd. | (6,464 | ) | (82,097 | ) | (2.8 | ) | ||||||
Commonwealth Bank of Australia | (2,130 | ) | (108,363 | ) | (3.7 | ) | ||||||
CSL Ltd. | (990 | ) | (192,558 | ) | (6.6 | ) | ||||||
Fortescue Metals Group Ltd. | (37,094 | ) | (461,717 | ) | (15.9 | ) | ||||||
Insurance Australia Group Ltd. | (10,230 | ) | (37,243 | ) | (1.3 | ) | ||||||
Magellan Financial Group Ltd. | (4,514 | ) | (196,112 | ) | (6.8 | ) | ||||||
National Australia Bank Ltd. | (50,525 | ) | (630,758 | ) | (21.7 | ) | ||||||
Newcrest Mining Ltd. | (1,350 | ) | (34,392 | ) | (1.2 | ) | ||||||
Ramsay Health Care Ltd. | (290 | ) | (12,818 | ) | (0.4 | ) | ||||||
Sonic Healthcare Ltd. | (4,300 | ) | (98,447 | ) | (3.4 | ) | ||||||
Sydney Airport | (148,711 | ) | (556,973 | ) | (19.2 | ) | ||||||
Transurban Group | (18,320 | ) | (181,212 | ) | (6.2 | ) | ||||||
Westpac Banking Corp. | (49,217 | ) | (591,036 | ) | (20.3 | ) | ||||||
|
| |||||||||||
| (3,183,726 | ) | |||||||||||
| Austria | ||||||||||||
Erste Group Bank AG | (2,720 | ) | (60,882 | ) | (2.1 | ) | ||||||
|
| |||||||||||
| Belgium | ||||||||||||
Anheuser-Busch InBev SA/NV | (6,588 | ) | (357,749 | ) | (12.3 | ) | ||||||
KBC Group NV | (510 | ) | (29,078 | ) | (1.0 | ) | ||||||
Solvay SA | (490 | ) | (38,031 | ) | (1.3 | ) | ||||||
| Shares | Value | % of Basket Value | ||||||||||
| Belgium (continued) | ||||||||||||
Umicore SA | (11,916 | ) | $ | (562,758 | ) | (19.4 | )% | |||||
|
| |||||||||||
| (987,616 | ) | |||||||||||
| Bermuda | ||||||||||||
RenaissanceRe Holdings Ltd. | (1,050 | ) | (189,399 | ) | (6.5 | ) | ||||||
|
| |||||||||||
| Canada | ||||||||||||
Alimentation Couche-Tard, Inc., Class B | (1,730 | ) | (60,123 | ) | (2.1 | ) | ||||||
Brookfield Asset Management, Inc., Class A | (920 | ) | (29,744 | ) | (1.0 | ) | ||||||
Canadian National Railway Co. | (7,393 | ) | (722,162 | ) | (24.8 | ) | ||||||
Canadian Natural Resources Ltd. | (1,740 | ) | (30,696 | ) | (1.1 | ) | ||||||
CGI, Inc. | (9,970 | ) | (712,106 | ) | (24.5 | ) | ||||||
Dollarama, Inc. | (3,010 | ) | (110,067 | ) | (3.8 | ) | ||||||
Fortis, Inc. | (6,480 | ) | (263,902 | ) | (9.1 | ) | ||||||
Intact Financial Corp. | (3,030 | ) | (330,813 | ) | (11.4 | ) | ||||||
Nutrien Ltd. | (10,910 | ) | (355,557 | ) | (12.2 | ) | ||||||
Power Corp. of Canada | (11,400 | ) | (202,305 | ) | (7.0 | ) | ||||||
Shaw Communications, Inc., Class B | (10,130 | ) | (185,289 | ) | (6.4 | ) | ||||||
Thomson Reuters Corp. | (4,620 | ) | (322,661 | ) | (11.1 | ) | ||||||
Toronto-Dominion Bank (The) | (5,920 | ) | (261,957 | ) | (9.0 | ) | ||||||
|
| |||||||||||
| (3,587,382 | ) | |||||||||||
| Denmark | ||||||||||||
Danske Bank A/S | (21,211 | ) | (343,532 | ) | (11.8 | ) | ||||||
Demant A/S | (3,630 | ) | (112,685 | ) | (3.9 | ) | ||||||
DSV Panalpina A/S | (530 | ) | (72,523 | ) | (2.5 | ) | ||||||
Orsted A/S | (300 | ) | (42,757 | ) | (1.5 | ) | ||||||
Vestas Wind Systems A/S | (890 | ) | (114,085 | ) | (3.9 | ) | ||||||
|
| |||||||||||
| (685,582 | ) | |||||||||||
| Finland | ||||||||||||
Nordea Bank Abp | (84,313 | ) | (649,293 | ) | (22.3 | ) | ||||||
Sampo OYJ, Class A | (860 | ) | (31,084 | ) | (1.1 | ) | ||||||
|
| |||||||||||
| (680,377 | ) | |||||||||||
| France | ||||||||||||
Aeroports de Paris | (732 | ) | (69,007 | ) | (2.4 | ) | ||||||
Airbus SE | (1,030 | ) | (75,392 | ) | (2.6 | ) | ||||||
Arkema SA | (930 | ) | (96,753 | ) | (3.3 | ) | ||||||
Atos SE | (2,840 | ) | (242,846 | ) | (8.4 | ) | ||||||
AXA SA | (35,180 | ) | (705,841 | ) | (24.3 | ) | ||||||
BioMerieux | (910 | ) | (146,666 | ) | (5.0 | ) | ||||||
Bouygues SA | (6,930 | ) | (244,813 | ) | (8.4 | ) | ||||||
Capgemini SE | (400 | ) | (51,878 | ) | (1.8 | ) | ||||||
Getlink SE | (5,997 | ) | (90,228 | ) | (3.1 | ) | ||||||
Iliad SA | (480 | ) | (93,874 | ) | (3.2 | ) | ||||||
Ingenico Group SA | (2,525 | ) | (408,629 | ) | (14.1 | ) | ||||||
Kering SA | (80 | ) | (45,335 | ) | (1.6 | ) | ||||||
L’Oreal SA | (2,920 | ) | (980,033 | ) | (33.7 | ) | ||||||
LVMH Moet Hennessy Louis Vuitton SE | (730 | ) | (317,435 | ) | (10.9 | ) | ||||||
Natixis SA | (13,080 | ) | (31,994 | ) | (1.1 | ) | ||||||
Orpea | (2,400 | ) | (306,184 | ) | (10.5 | ) | ||||||
Renault SA | (2,500 | ) | (59,413 | ) | (2.0 | ) | ||||||
Safran SA | (550 | ) | (58,493 | ) | (2.0 | ) | ||||||
Sanofi | (800 | ) | (83,998 | ) | (2.9 | ) | ||||||
SCOR SE | (2,550 | ) | (65,629 | ) | (2.3 | ) | ||||||
Teleperformance | (856 | ) | (250,521 | ) | (8.6 | ) | ||||||
Valeo SA | (10,893 | ) | (279,540 | ) | (9.6 | ) | ||||||
Worldline SA | (2,820 | ) | (242,603 | ) | (8.3 | ) | ||||||
|
| |||||||||||
| (4,947,105 | ) | |||||||||||
| 18 | 2020 BLACKROCK ANNUAL REPORTTO SHAREHOLDERS |
Consolidated Schedule of Investments (continued) July 31, 2020 | BlackRock Total Factor Fund |
| Shares | Value | % of Basket Value | ||||||||||
| Germany | ||||||||||||
adidas AG | (560 | ) | $ | (154,435 | ) | (5.3 | )% | |||||
BASF SE | (960 | ) | (52,959 | ) | (1.8 | ) | ||||||
Carl Zeiss Meditec AG | (1,470 | ) | (153,849 | ) | (5.3 | ) | ||||||
Continental AG | (950 | ) | (91,769 | ) | (3.1 | ) | ||||||
Covestro AG | (4,090 | ) | (158,722 | ) | (5.5 | ) | ||||||
Daimler AG (Registered) | (8,880 | ) | (388,269 | ) | (13.4 | ) | ||||||
Deutsche Bank AG (Registered) | (3,510 | ) | (31,564 | ) | (1.1 | ) | ||||||
Deutsche Wohnen SE | (980 | ) | (47,683 | ) | (1.6 | ) | ||||||
Fresenius Medical Care AG & Co. KGaA | (2,200 | ) | (193,825 | ) | (6.7 | ) | ||||||
Knorr-Bremse AG | (320 | ) | (37,442 | ) | (1.3 | ) | ||||||
LEG Immobilien AG | (230 | ) | (32,070 | ) | (1.1 | ) | ||||||
MTU Aero Engines AG | (1,026 | ) | (177,895 | ) | (6.1 | ) | ||||||
SAP SE | (270 | ) | (42,620 | ) | (1.5 | ) | ||||||
Sartorius AG (Preference) | (820 | ) | (315,505 | ) | (10.8 | ) | ||||||
Siemens AG (Registered) | (1,480 | ) | (188,605 | ) | (6.5 | ) | ||||||
Siemens Healthineers AG | (2,600 | ) | (135,360 | ) | (4.7 | ) | ||||||
Uniper SE | (11,104 | ) | (383,345 | ) | (13.2 | ) | ||||||
Volkswagen AG | (1,322 | ) | (205,825 | ) | (7.1 | ) | ||||||
Vonovia SE | (710 | ) | (45,891 | ) | (1.6 | ) | ||||||
|
| |||||||||||
| (2,837,633 | ) | |||||||||||
Italy | ||||||||||||
Amplifon SpA | (16,210 | ) | (554,931 | ) | (19.1 | ) | ||||||
Davide Campari-Milano NV | (4,090 | ) | (41,290 | ) | (1.4 | ) | ||||||
FinecoBank Banca Fineco SpA | (21,420 | ) | (312,256 | ) | (10.8 | ) | ||||||
Nexi SpA | (12,890 | ) | (231,567 | ) | (8.0 | ) | ||||||
Poste Italiane SpA | (4,930 | ) | (45,299 | ) | (1.6 | ) | ||||||
|
| |||||||||||
| (1,185,343 | ) | |||||||||||
Japan | ||||||||||||
Asahi Kasei Corp. | (18,100 | ) | (130,196 | ) | (4.5 | ) | ||||||
Canon, Inc. | (6,400 | ) | (102,992 | ) | (3.5 | ) | ||||||
Central Japan Railway Co. | (1,300 | ) | (157,702 | ) | (5.4 | ) | ||||||
Chubu Electric Power Co., Inc. | (9,600 | ) | (114,154 | ) | (3.9 | ) | ||||||
Dai-ichi Life Holdings, Inc. | (9,400 | ) | (110,886 | ) | (3.8 | ) | ||||||
Daikin Industries Ltd. | (3,500 | ) | (615,813 | ) | (21.2 | ) | ||||||
Daiwa House Industry Co. Ltd. | (9,900 | ) | (218,466 | ) | (7.5 | ) | ||||||
Dentsu Group, Inc. | (6,600 | ) | (147,247 | ) | (5.1 | ) | ||||||
FUJIFILM Holdings Corp. | (3,300 | ) | (147,584 | ) | (5.1 | ) | ||||||
Idemitsu Kosan Co. Ltd. | (22,400 | ) | (466,607 | ) | (16.1 | ) | ||||||
Isuzu Motors Ltd. | (9,200 | ) | (75,040 | ) | (2.6 | ) | ||||||
ITOCHU Corp. | (4,700 | ) | (103,054 | ) | (3.5 | ) | ||||||
Japan Airlines Co. Ltd. | (13,500 | ) | (218,528 | ) | (7.5 | ) | ||||||
Japan Post Holdings Co. Ltd. | (28,000 | ) | (191,234 | ) | (6.6 | ) | ||||||
Japan Tobacco, Inc. | (11,700 | ) | (199,982 | ) | (6.9 | ) | ||||||
Kintetsu Group Holdings Co. Ltd. | (4,600 | ) | (179,226 | ) | (6.2 | ) | ||||||
Kirin Holdings Co. Ltd. | (13,100 | ) | (252,420 | ) | (8.7 | ) | ||||||
Komatsu Ltd. | (28,800 | ) | (565,831 | ) | (19.5 | ) | ||||||
Kubota Corp. | (13,300 | ) | (189,392 | ) | (6.5 | ) | ||||||
Mitsubishi Estate Co. Ltd. | (4,600 | ) | (66,080 | ) | (2.3 | ) | ||||||
Mitsui Fudosan Co. Ltd. | (8,800 | ) | (137,579 | ) | (4.7 | ) | ||||||
Murata Manufacturing Co. Ltd. | (1,600 | ) | (102,769 | ) | (3.5 | ) | ||||||
Nidec Corp. | (1,300 | ) | (103,268 | ) | (3.6 | ) | ||||||
Nippon Paint Holdings Co. Ltd. | (3,200 | ) | (218,820 | ) | (7.5 | ) | ||||||
Nissan Motor Co. Ltd. | (87,000 | ) | (297,589 | ) | (10.2 | ) | ||||||
Nomura Holdings, Inc. | (20,600 | ) | (96,947 | ) | (3.3 | ) | ||||||
Nomura Research Institute Ltd. | (9,400 | ) | (248,098 | ) | (8.5 | ) | ||||||
Obic Co. Ltd. | (2,200 | ) | (394,525 | ) | (13.6 | ) | ||||||
Otsuka Corp. | (2,800 | ) | (145,990 | ) | (5.0 | ) | ||||||
Pan Pacific International Holdings Corp. | (5,300 | ) | (120,125 | ) | (4.1 | ) | ||||||
Secom Co. Ltd. | (400 | ) | (34,592 | ) | (1.2 | ) | ||||||
SG Holdings Co. Ltd. | (4,200 | ) | (154,134 | ) | (5.3 | ) | ||||||
| Shares | Value | % of Basket Value | ||||||||||
Japan (continued) | ||||||||||||
Shiseido Co. Ltd. | (3,800 | ) | $ | (211,722 | ) | (7.3 | )% | |||||
Sony Corp. | (4,000 | ) | (310,780 | ) | (10.7 | ) | ||||||
Sumitomo Corp. | (10,400 | ) | (115,541 | ) | (4.0 | ) | ||||||
Sumitomo Realty & Development Co. Ltd. | (4,200 | ) | (107,109 | ) | (3.7 | ) | ||||||
Suzuki Motor Corp. | (2,100 | ) | (68,908 | ) | (2.4 | ) | ||||||
T&D Holdings, Inc. | (14,900 | ) | (122,649 | ) | (4.2 | ) | ||||||
Takeda Pharmaceutical Co. Ltd. | (11,500 | ) | (417,068 | ) | (14.4 | ) | ||||||
Tokyo Electric Power Co. Holdings, Inc. | (81,100 | ) | (216,313 | ) | (7.4 | ) | ||||||
Toyota Industries Corp. | (2,000 | ) | (101,606 | ) | (3.5 | ) | ||||||
Toyota Motor Corp. | (6,100 | ) | (362,120 | ) | (12.5 | ) | ||||||
Yamato Holdings Co. Ltd. | (1,900 | ) | (48,993 | ) | (1.7 | ) | ||||||
Yaskawa Electric Corp. | (400 | ) | (13,299 | ) | (0.5 | ) | ||||||
|
| |||||||||||
| (8,402,978 | ) | |||||||||||
Jordan | ||||||||||||
Hikma Pharmaceuticals plc | (3,220 | ) | (90,227 | ) | (3.1 | ) | ||||||
|
| |||||||||||
Netherlands | ||||||||||||
ABN AMRO Bank NV, CVA | (14,710 | ) | (122,178 | ) | (4.2 | ) | ||||||
Aegon NV | (41,870 | ) | (122,696 | ) | (4.2 | ) | ||||||
ASML Holding NV | (550 | ) | (195,546 | ) | (6.7 | ) | ||||||
Heineken NV | (2,600 | ) | (251,874 | ) | (8.7 | ) | ||||||
|
| |||||||||||
| (692,294 | ) | |||||||||||
Norway | ||||||||||||
Aker BP ASA | (3,620 | ) | (68,932 | ) | (2.4 | ) | ||||||
DNB ASA | (10,120 | ) | (155,437 | ) | (5.4 | ) | ||||||
Mowi ASA | (6,312 | ) | (114,633 | ) | (3.9 | ) | ||||||
Norsk Hydro ASA | (38,510 | ) | (108,780 | ) | (3.7 | ) | ||||||
|
| |||||||||||
| (447,782 | ) | |||||||||||
Portugal | ||||||||||||
EDP - Energias de Portugal SA | (123,100 | ) | (315,606 | ) | (10.9 | ) | ||||||
|
| |||||||||||
Spain | ||||||||||||
CaixaBank SA | (24,060 | ) | (51,754 | ) | (1.8 | ) | ||||||
Cia de Distribucion Integral Logista Holdings SA | (54 | ) | (1,008 | ) | (0.0 | ) | ||||||
Enagas SA | (10,380 | ) | (261,881 | ) | (9.0 | ) | ||||||
Ferrovial SA | (6,600 | ) | (161,614 | ) | (5.6 | ) | ||||||
Grifols SA | (3,930 | ) | (114,502 | ) | (3.9 | ) | ||||||
Red Electrica Corp. SA | (10,670 | ) | (208,010 | ) | (7.2 | ) | ||||||
Siemens Gamesa Renewable Energy SA | (17,575 | ) | (414,687 | ) | (14.3 | ) | ||||||
|
| |||||||||||
| (1,213,456 | ) | |||||||||||
Sweden | ||||||||||||
ICA Gruppen AB | (1,470 | ) | (72,211 | ) | (2.5 | ) | ||||||
Nibe Industrier AB, Class B | (2,780 | ) | (66,890 | ) | (2.3 | ) | ||||||
Sandvik AB | (4,080 | ) | (76,249 | ) | (2.6 | ) | ||||||
Skandinaviska Enskilda Banken AB, Class A | (11,160 | ) | (107,974 | ) | (3.7 | ) | ||||||
Svenska Cellulosa AB SCA, Class B | (4,520 | ) | (54,895 | ) | (1.9 | ) | ||||||
Svenska Handelsbanken AB, Class A | (21,450 | ) | (202,284 | ) | (7.0 | ) | ||||||
Swedbank AB, Class A | (31,170 | ) | (506,146 | ) | (17.4 | ) | ||||||
Swedish Orphan Biovitrum AB | (2,000 | ) | (42,029 | ) | (1.4 | ) | ||||||
Telefonaktiebolaget LM Ericsson, Class B | (11,860 | ) | (137,992 | ) | (4.8 | ) | ||||||
Telia Co. AB | (31,240 | ) | (121,734 | ) | (4.2 | ) | ||||||
|
| |||||||||||
| (1,388,404 | ) | |||||||||||
CONSOLIDATED SCHEDULE OF INVESTMENTS | 19 |
Consolidated Schedule of Investments (continued) July 31, 2020 | BlackRock Total Factor Fund |
| Shares | Value | % of Basket Value | ||||||||||
| Switzerland | ||||||||||||
ABB Ltd. (Registered) | (11,600 | ) | $ | (291,315 | ) | (10.0 | )% | |||||
Adecco Group AG (Registered) | (600 | ) | (28,352 | ) | (1.0 | ) | ||||||
Barry Callebaut AG (Registered) | (50 | ) | (104,116 | ) | (3.6 | ) | ||||||
Cie Financiere Richemont SA (Registered) | (12,686 | ) | (787,561 | ) | (27.1 | ) | ||||||
Clariant AG (Registered) | (10,325 | ) | (195,149 | ) | (6.7 | ) | ||||||
Sika AG (Registered) | (383 | ) | (84,158 | ) | (2.9 | ) | ||||||
Swiss Re AG | (6,270 | ) | (494,760 | ) | (17.0 | ) | ||||||
Temenos AG (Registered) | (1,070 | ) | (158,127 | ) | (5.4 | ) | ||||||
Vifor Pharma AG | (1,095 | ) | (154,556 | ) | (5.3 | ) | ||||||
|
| |||||||||||
| (2,298,094 | ) | |||||||||||
| United Kingdom | ||||||||||||
AstraZeneca plc | (830 | ) | (91,698 | ) | (3.2 | ) | ||||||
Barratt Developments plc | (41,530 | ) | (275,870 | ) | (9.5 | ) | ||||||
British American Tobacco plc | (8,020 | ) | (265,048 | ) | (9.1 | ) | ||||||
BT Group plc | (25,250 | ) | (32,445 | ) | (1.1 | ) | ||||||
CNH Industrial NV | (17,830 | ) | (121,153 | ) | (4.2 | ) | ||||||
Croda International plc | (2,390 | ) | (178,376 | ) | (6.1 | ) | ||||||
Fiat Chrysler Automobiles NV | (10,640 | ) | (108,170 | ) | (3.7 | ) | ||||||
Hargreaves Lansdown plc | (14,407 | ) | (326,963 | ) | (11.3 | ) | ||||||
HSBC Holdings plc | (105,748 | ) | (476,165 | ) | (16.4 | ) | ||||||
Informa plc | (35,980 | ) | (170,602 | ) | (5.9 | ) | ||||||
London Stock Exchange Group plc | (1,760 | ) | (194,408 | ) | (6.7 | ) | ||||||
Melrose Industries plc | (88,450 | ) | (97,668 | ) | (3.4 | ) | ||||||
National Grid plc | (37,475 | ) | (439,652 | ) | (15.1 | ) | ||||||
Persimmon plc | (3,114 | ) | (97,220 | ) | (3.3 | ) | ||||||
Prudential plc | (17,910 | ) | (255,948 | ) | (8.8 | ) | ||||||
Reckitt Benckiser Group plc | (5,419 | ) | (543,361 | ) | (18.7 | ) | ||||||
Rightmove plc | (6,240 | ) | (45,033 | ) | (1.6 | ) | ||||||
Royal Bank of Scotland Group plc | (185,540 | ) | (255,529 | ) | (8.8 | ) | ||||||
Smiths Group plc | (18,772 | ) | (330,696 | ) | (11.4 | ) | ||||||
Spirax-Sarco Engineering plc | (938 | ) | (125,350 | ) | (4.3 | ) | ||||||
St James’s Place plc | (4,050 | ) | (49,534 | ) | (1.7 | ) | ||||||
Taylor Wimpey plc | (28,637 | ) | (44,173 | ) | (1.5 | ) | ||||||
Tesco plc | (194,857 | ) | (549,953 | ) | (18.9 | ) | ||||||
Whitbread plc | (26,220 | ) | (744,484 | ) | (25.6 | ) | ||||||
Wm Morrison Supermarkets plc | (73,530 | ) | (178,364 | ) | (6.1 | ) | ||||||
WPP plc | (3,990 | ) | (29,591 | ) | (1.0 | ) | ||||||
|
| |||||||||||
| (6,027,454 | ) | |||||||||||
| United States | ||||||||||||
3M Co. | (3,266 | ) | (491,435 | ) | (16.9 | ) | ||||||
Abbott Laboratories | (890 | ) | (89,570 | ) | (3.1 | ) | ||||||
AECOM | (13,149 | ) | (475,862 | ) | (16.4 | ) | ||||||
AmerisourceBergen Corp. | (1,170 | ) | (117,222 | ) | (4.0 | ) | ||||||
Amgen, Inc. | (240 | ) | (58,721 | ) | (2.0 | ) | ||||||
Analog Devices, Inc. | (2,403 | ) | (275,985 | ) | (9.5 | ) | ||||||
Anthem, Inc. | (790 | ) | (216,302 | ) | (7.4 | ) | ||||||
AO Smith Corp. | (1,560 | ) | (75,098 | ) | (2.6 | ) | ||||||
Apache Corp. | (6,972 | ) | (107,020 | ) | (3.7 | ) | ||||||
Apple, Inc. | (500 | ) | (212,520 | ) | (7.3 | ) | ||||||
Archer-Daniels-Midland Co. | (10,800 | ) | (462,564 | ) | (15.9 | ) | ||||||
Arthur J Gallagher & Co. | (1,391 | ) | (149,519 | ) | (5.1 | ) | ||||||
Aspen Technology, Inc. | (910 | ) | (88,507 | ) | (3.0 | ) | ||||||
Ball Corp. | (3,713 | ) | (273,388 | ) | (9.4 | ) | ||||||
Baxter International, Inc. | (1,670 | ) | (144,255 | ) | (5.0 | ) | ||||||
Becton Dickinson and Co. | (1,069 | ) | (300,752 | ) | (10.3 | ) | ||||||
Berkshire Hathaway, Inc., Class B | (1,020 | ) | (199,696 | ) | (6.9 | ) | ||||||
BioMarin Pharmaceutical, Inc. | (3,293 | ) | (394,534 | ) | (13.6 | ) | ||||||
Bio-Techne Corp. | (726 | ) | (199,766 | ) | (6.9 | ) | ||||||
Black Knight, Inc. | (5,540 | ) | (415,057 | ) | (14.3 | ) | ||||||
| Shares | Value | % of Basket Value | ||||||||||
| United States (continued) | ||||||||||||
Boeing Co. (The) | (2,852 | ) | $ | (450,616 | ) | (15.5 | )% | |||||
BorgWarner, Inc. | (2,800 | ) | (102,480 | ) | (3.5 | ) | ||||||
Boston Scientific Corp. | (13,736 | ) | (529,798 | ) | (18.2 | ) | ||||||
Broadcom, Inc. | (1,410 | ) | (446,618 | ) | (15.4 | ) | ||||||
Broadridge Financial Solutions, Inc. | (2,360 | ) | (317,042 | ) | (10.9 | ) | ||||||
Cabot Oil & Gas Corp. | (10,020 | ) | (187,374 | ) | (6.4 | ) | ||||||
Caesars Entertainment, Inc. | (2,128 | ) | (66,074 | ) | (2.3 | ) | ||||||
CarMax, Inc. | (3,150 | ) | (305,456 | ) | (10.5 | ) | ||||||
Catalent, Inc. | (2,840 | ) | (248,046 | ) | (8.5 | ) | ||||||
Caterpillar, Inc. | (5,148 | ) | (684,066 | ) | (23.5 | ) | ||||||
CBRE Group, Inc., Class A | (1,440 | ) | (63,086 | ) | (2.2 | ) | ||||||
Centene Corp. | (810 | ) | (52,853 | ) | (1.8 | ) | ||||||
CenturyLink, Inc. | (3,110 | ) | (30,012 | ) | (1.0 | ) | ||||||
Ceridian HCM Holding, Inc. | (1,476 | ) | (115,556 | ) | (4.0 | ) | ||||||
CH Robinson Worldwide, Inc. | (3,430 | ) | (321,460 | ) | (11.1 | ) | ||||||
Cheniere Energy, Inc. | (700 | ) | (34,636 | ) | (1.2 | ) | ||||||
Chevron Corp. | (2,903 | ) | (243,678 | ) | (8.4 | ) | ||||||
Cigna Corp. | (970 | ) | (167,509 | ) | (5.8 | ) | ||||||
Cincinnati Financial Corp. | (1,010 | ) | (78,709 | ) | (2.7 | ) | ||||||
Cisco Systems, Inc. | (965 | ) | (45,451 | ) | (1.6 | ) | ||||||
Coca-Cola Co. (The) | (6,941 | ) | (327,893 | ) | (11.3 | ) | ||||||
Commerce Bancshares, Inc. | (5,000 | ) | (286,300 | ) | (9.9 | ) | ||||||
Conagra Brands, Inc. | (5,950 | ) | (222,827 | ) | (7.7 | ) | ||||||
Consolidated Edison, Inc. | (530 | ) | (40,720 | ) | (1.4 | ) | ||||||
Constellation Brands, Inc., Class A | (255 | ) | (45,441 | ) | (1.6 | ) | ||||||
Cooper Cos., Inc. (The) | (110 | ) | (31,122 | ) | (1.1 | ) | ||||||
Copart, Inc. | (340 | ) | (31,705 | ) | (1.1 | ) | ||||||
CoStar Group, Inc. | (880 | ) | (747,789 | ) | (25.7 | ) | ||||||
Coupa Software, Inc. | (1,050 | ) | (321,772 | ) | (11.1 | ) | ||||||
Credit Acceptance Corp. | (160 | ) | (74,870 | ) | (2.6 | ) | ||||||
Danaher Corp. | (2,937 | ) | (598,561 | ) | (20.6 | ) | ||||||
Discovery, Inc., Class C | (4,380 | ) | (83,001 | ) | (2.9 | ) | ||||||
DISH Network Corp., Class A | (3,990 | ) | (128,119 | ) | (4.4 | ) | ||||||
Dominion Energy, Inc. | (3,118 | ) | (252,652 | ) | (8.7 | ) | ||||||
DuPont de Nemours, Inc. | (7,119 | ) | (380,724 | ) | (13.1 | ) | ||||||
E*TRADE Financial Corp. | (1,674 | ) | (84,989 | ) | (2.9 | ) | ||||||
Eastman Chemical Co. | (8,450 | ) | (630,623 | ) | (21.7 | ) | ||||||
Edison International | (780 | ) | (43,423 | ) | (1.5 | ) | ||||||
Entegris, Inc. | (2,557 | ) | (183,874 | ) | (6.3 | ) | ||||||
EPAM Systems, Inc. | (550 | ) | (159,544 | ) | (5.5 | ) | ||||||
Essential Utilities, Inc. | (8,691 | ) | (394,137 | ) | (13.6 | ) | ||||||
Everest Re Group Ltd. | (190 | ) | (41,570 | ) | (1.4 | ) | ||||||
Eversource Energy | (510 | ) | (45,936 | ) | (1.6 | ) | ||||||
Exact Sciences Corp. | (1,678 | ) | (158,991 | ) | (5.5 | ) | ||||||
Fox Corp., Class B | (1,890 | ) | (48,705 | ) | (1.7 | ) | ||||||
Franklin Resources, Inc. | (1,990 | ) | (41,890 | ) | (1.4 | ) | ||||||
Gartner, Inc. | (2,578 | ) | (321,322 | ) | (11.1 | ) | ||||||
General Electric Co. | (7,304 | ) | (44,335 | ) | (1.5 | ) | ||||||
General Mills, Inc. | (980 | ) | (62,005 | ) | (2.1 | ) | ||||||
Genuine Parts Co. | (1,330 | ) | (119,900 | ) | (4.1 | ) | ||||||
Globe Life, Inc. | (900 | ) | (71,640 | ) | (2.5 | ) | ||||||
Guardant Health, Inc. | (1,130 | ) | (96,253 | ) | (3.3 | ) | ||||||
Guidewire Software, Inc. | (5,538 | ) | (651,601 | ) | (22.4 | ) | ||||||
Halliburton Co. | (17,810 | ) | (255,217 | ) | (8.8 | ) | ||||||
Honeywell International, Inc. | (2,230 | ) | (333,095 | ) | (11.5 | ) | ||||||
Hormel Foods Corp. | (10,394 | ) | (528,639 | ) | (18.2 | ) | ||||||
Howmet Aerospace, Inc. | (1,043 | ) | (15,416 | ) | (0.5 | ) | ||||||
Huntington Bancshares, Inc. | (16,000 | ) | (148,320 | ) | (5.1 | ) | ||||||
Huntington Ingalls Industries, Inc. | (72 | ) | (12,507 | ) | (0.4 | ) | ||||||
IDEX Corp. | (245 | ) | (40,381 | ) | (1.4 | ) | ||||||
Ingersoll Rand, Inc. | (30,714 | ) | (970,255 | ) | (33.4 | ) | ||||||
| 20 | 2020 BLACKROCK ANNUAL REPORTTO SHAREHOLDERS |
Consolidated Schedule of Investments (continued) July 31, 2020 | BlackRock Total Factor Fund |
| Shares | Value | % of Basket Value | ||||||||||
| United States (continued) | ||||||||||||
International Business Machines Corp. | (2,440 | ) | $ | (299,974 | ) | (10.3 | )% | |||||
International Flavors & Fragrances, Inc. | (570 | ) | (71,791 | ) | (2.5 | ) | ||||||
International Paper Co. | (1,030 | ) | (35,834 | ) | (1.2 | ) | ||||||
Interpublic Group of Cos., Inc. (The) | (8,520 | ) | (153,786 | ) | (5.3 | ) | ||||||
Intuitive Surgical, Inc. | (240 | ) | (164,506 | ) | (5.7 | ) | ||||||
IPG Photonics Corp. | (180 | ) | (32,222 | ) | (1.1 | ) | ||||||
Jacobs Engineering Group, Inc. | (6,544 | ) | (558,530 | ) | (19.2 | ) | ||||||
JM Smucker Co. (The) | (520 | ) | (56,862 | ) | (2.0 | ) | ||||||
Kellogg Co. | (2,440 | ) | (168,336 | ) | (5.8 | ) | ||||||
Keurig Dr Pepper, Inc. | (1,050 | ) | (32,120 | ) | (1.1 | ) | ||||||
Knight-Swift Transportation Holdings, Inc. | (5,690 | ) | (247,458 | ) | (8.5 | ) | ||||||
Kraft Heinz Co. (The) | (11,150 | ) | (383,337 | ) | (13.2 | ) | ||||||
L3Harris Technologies, Inc. | (1,254 | ) | (211,086 | ) | (7.3 | ) | ||||||
Laboratory Corp. of America Holdings | (1,650 | ) | (318,318 | ) | (11.0 | ) | ||||||
Las Vegas Sands Corp. | (4,880 | ) | (212,963 | ) | (7.3 | ) | ||||||
Lear Corp. | (1,710 | ) | (188,750 | ) | (6.5 | ) | ||||||
Leidos Holdings, Inc. | (1,000 | ) | (95,160 | ) | (3.3 | ) | ||||||
Lennox International, Inc. | (630 | ) | (168,928 | ) | (5.8 | ) | ||||||
Lincoln National Corp. | (5,497 | ) | (204,873 | ) | (7.0 | ) | ||||||
Marriott International, Inc., Class A | (8,102 | ) | (679,150 | ) | (23.4 | ) | ||||||
Martin Marietta Materials, Inc. | (700 | ) | (145,026 | ) | (5.0 | ) | ||||||
McCormick & Co., Inc. (Non- Voting) | (973 | ) | (189,638 | ) | (6.5 | ) | ||||||
MetLife, Inc. | (442 | ) | (16,730 | ) | (0.6 | ) | ||||||
Microchip Technology, Inc. | (3,220 | ) | (327,571 | ) | (11.3 | ) | ||||||
Molina Healthcare, Inc. | (290 | ) | (53,563 | ) | (1.8 | ) | ||||||
Molson Coors Beverage Co., Class B | (5,860 | ) | (219,867 | ) | (7.6 | ) | ||||||
Monolithic Power Systems, Inc. | (1,450 | ) | (384,265 | ) | (13.2 | ) | ||||||
Morgan Stanley | (2,750 | ) | (134,420 | ) | (4.6 | ) | ||||||
National Oilwell Varco, Inc. | (5,085 | ) | (58,528 | ) | (2.0 | ) | ||||||
Netflix, Inc. | (130 | ) | (63,554 | ) | (2.2 | ) | ||||||
Newell Brands, Inc. | (9,500 | ) | (155,800 | ) | (5.4 | ) | ||||||
Newmont Corp. | (710 | ) | (49,132 | ) | (1.7 | ) | ||||||
Noble Energy, Inc. | (12,220 | ) | (122,078 | ) | (4.2 | ) | ||||||
Nordson Corp. | (379 | ) | (73,386 | ) | (2.5 | ) | ||||||
Norfolk Southern Corp. | (2,050 | ) | (394,031 | ) | (13.6 | ) | ||||||
Northern Trust Corp. | (790 | ) | (61,897 | ) | (2.1 | ) | ||||||
Nucor Corp. | (17,620 | ) | (739,159 | ) | (25.4 | ) | ||||||
Okta, Inc. | (235 | ) | (51,930 | ) | (1.8 | ) | ||||||
Omnicom Group, Inc. | (4,200 | ) | (225,666 | ) | (7.8 | ) | ||||||
ON Semiconductor Corp. | (4,350 | ) | (89,610 | ) | (3.1 | ) | ||||||
ONEOK, Inc. | (3,680 | ) | (102,709 | ) | (3.5 | ) | ||||||
Oracle Corp. | (1,760 | ) | (97,592 | ) | (3.4 | ) | ||||||
PACCAR, Inc. | (500 | ) | (42,540 | ) | (1.5 | ) | ||||||
Packaging Corp. of America | (2,740 | ) | (263,369 | ) | (9.1 | ) | ||||||
Paycom Software, Inc. | (419 | ) | (119,151 | ) | (4.1 | ) | ||||||
PayPal Holdings, Inc. | (1,170 | ) | (229,402 | ) | (7.9 | ) | ||||||
PerkinElmer, Inc. | (3,087 | ) | (367,075 | ) | (12.6 | ) | ||||||
Pfizer, Inc. | (2,230 | ) | (85,810 | ) | (3.0 | ) | ||||||
Pool Corp. | (610 | ) | (193,187 | ) | (6.6 | ) | ||||||
Principal Financial Group, Inc. | (2,150 | ) | (91,225 | ) | (3.1 | ) | ||||||
Progressive Corp. (The) | (2,470 | ) | (223,140 | ) | (7.7 | ) | ||||||
Prudential Financial, Inc. | (3,760 | ) | (238,271 | ) | (8.2 | ) | ||||||
Quest Diagnostics, Inc. | (3,690 | ) | (468,888 | ) | (16.1 | ) | ||||||
Raymond James Financial, Inc. | (2,800 | ) | (194,544 | ) | (6.7 | ) | ||||||
Regeneron Pharmaceuticals, Inc. | (60 | ) | (37,924 | ) | (1.3 | ) | ||||||
ResMed, Inc. | (462 | ) | (93,560 | ) | (3.2 | ) | ||||||
| Shares | Value | % of Basket Value | ||||||||||
| United States (continued) | ||||||||||||
Roper Technologies, Inc. | (833 | ) | $ | (360,231 | ) | (12.4 | )% | |||||
Ross Stores, Inc. | (2,230 | ) | (199,964 | ) | (6.9 | ) | ||||||
Royal Caribbean Cruises Ltd. | (4,010 | ) | (195,327 | ) | (6.7 | ) | ||||||
salesforce.com, Inc. | (350 | ) | (68,197 | ) | (2.3 | ) | ||||||
Santander Consumer USA Holdings, Inc. | (1,830 | ) | (33,599 | ) | (1.2 | ) | ||||||
Schlumberger Ltd. | (3,136 | ) | (56,887 | ) | (2.0 | ) | ||||||
Service Corp. International | (810 | ) | (35,122 | ) | (1.2 | ) | ||||||
SS&C Technologies Holdings, Inc. | (1,310 | ) | (75,325 | ) | (2.6 | ) | ||||||
State Street Corp. | (7,266 | ) | (463,498 | ) | (15.9 | ) | ||||||
Steel Dynamics, Inc. | (2,340 | ) | (64,139 | ) | (2.2 | ) | ||||||
TD Ameritrade Holding Corp. | (1,649 | ) | (59,183 | ) | (2.0 | ) | ||||||
Teleflex, Inc. | (200 | ) | (74,620 | ) | (2.6 | ) | ||||||
Thermo Fisher Scientific, Inc. | (17 | ) | (7,037 | ) | (0.2 | ) | ||||||
Tiffany & Co. | (2,500 | ) | (313,400 | ) | (10.8 | ) | ||||||
T-Mobile US, Inc. | (4,260 | ) | (457,439 | ) | (15.7 | ) | ||||||
Truist Financial Corp. | (890 | ) | (33,339 | ) | (1.1 | ) | ||||||
Twitter, Inc. | (4,110 | ) | (149,604 | ) | (5.1 | ) | ||||||
Tyler Technologies, Inc. | (160 | ) | (57,160 | ) | (2.0 | ) | ||||||
Tyson Foods, Inc., Class A | (2,350 | ) | (144,407 | ) | (5.0 | ) | ||||||
Ubiquiti, Inc. | (1,440 | ) | (266,832 | ) | (9.2 | ) | ||||||
Union Pacific Corp. | (740 | ) | (128,279 | ) | (4.4 | ) | ||||||
UnitedHealth Group, Inc. | (740 | ) | (224,057 | ) | (7.7 | ) | ||||||
Vail Resorts, Inc. | (690 | ) | (132,501 | ) | (4.6 | ) | ||||||
Valero Energy Corp. | (690 | ) | (38,799 | ) | (1.3 | ) | ||||||
Verisk Analytics, Inc. | (810 | ) | (152,855 | ) | (5.3 | ) | ||||||
VF Corp. | (3,190 | ) | (192,548 | ) | (6.6 | ) | ||||||
ViacomCBS, Inc. | (24,103 | ) | (628,365 | ) | (21.6 | ) | ||||||
Voya Financial, Inc. | (3,060 | ) | (151,164 | ) | (5.2 | ) | ||||||
Vulcan Materials Co. | (800 | ) | (93,936 | ) | (3.2 | ) | ||||||
Walgreens Boots Alliance, Inc. | (990 | ) | (40,303 | ) | (1.4 | ) | ||||||
Walt Disney Co. (The) | (8,623 | ) | (1,008,374 | ) | (34.7 | ) | ||||||
Waste Management, Inc. | (920 | ) | (100,832 | ) | (3.5 | ) | ||||||
Western Digital Corp. | (7,828 | ) | (337,387 | ) | (11.6 | ) | ||||||
Western Union Co. (The) | (8,480 | ) | (205,894 | ) | (7.1 | ) | ||||||
Westlake Chemical Corp. | (8,210 | ) | (447,445 | ) | (15.4 | ) | ||||||
WestRock Co. | (4,772 | ) | (128,176 | ) | (4.4 | ) | ||||||
WEX, Inc. | (1,189 | ) | (188,302 | ) | (6.5 | ) | ||||||
Williams Cos., Inc. (The) | (4,460 | ) | (85,320 | ) | (2.9 | ) | ||||||
Wynn Resorts Ltd. | (5,113 | ) | (370,335 | ) | (12.7 | ) | ||||||
Xcel Energy, Inc. | (1,120 | ) | (77,325 | ) | (2.7 | ) | ||||||
Xilinx, Inc. | (1,120 | ) | (120,232 | ) | (4.1 | ) | ||||||
Zillow Group, Inc., Class C | (430 | ) | (29,408 | ) | (1.0 | ) | ||||||
Zoetis, Inc. | (2,592 | ) | (393,155 | ) | (13.5 | ) | ||||||
Zscaler, Inc. | (3,043 | ) | (395,134 | ) | (13.6 | ) | ||||||
|
| |||||||||||
| (37,790,015 | ) | |||||||||||
|
| |||||||||||
Total Reference Entity — Short |
| (77,011,355 | ) | |||||||||
|
| |||||||||||
Net Value of Reference Entity — Bank of America NA |
| $ | 2,905,782 | |||||||||
|
| |||||||||||
The following table represents the individual long and short positions and related values of equity securities underlying the total return swap with Citibank NA, as of July 31, 2020, expiration dates 02/24/23-02/27/23:
|
| |||||||||||
Reference Entity — Long |
| |||||||||||
| Australia | ||||||||||||
AGL Energy Ltd. | 470 | 5,567 | 0.2 | |||||||||
Aristocrat Leisure Ltd. | 7,170 | 134,434 | 3.9 | |||||||||
ASX Ltd. | 8,840 | 520,858 | 15.1 | |||||||||
Aurizon Holdings Ltd. | 194,160 | 619,166 | 17.9 | |||||||||
BHP Group Ltd. | 5,827 | 153,418 | 4.4 | |||||||||
Brambles Ltd. | 8,733 | 67,426 | 1.9 | |||||||||
CONSOLIDATED SCHEDULE OF INVESTMENTS | 21 |
Consolidated Schedule of Investments (continued) July 31, 2020 | BlackRock Total Factor Fund |
| Shares | Value | % of Basket Value | ||||||||||
| Australia (continued) | ||||||||||||
Cochlear Ltd. | 610 | $ | 83,243 | 2.4 | % | |||||||
Coles Group Ltd. | 5,130 | 66,509 | 1.9 | |||||||||
Macquarie Group Ltd. | 220 | 19,334 | 0.6 | |||||||||
Rio Tinto Ltd. | 3,287 | 240,571 | 7.0 | |||||||||
Santos Ltd. | 25,500 | 95,251 | 2.8 | |||||||||
South32 Ltd. | 123,880 | 181,886 | 5.3 | |||||||||
Telstra Corp. Ltd. | 26,220 | 62,784 | 1.8 | |||||||||
Woodside Petroleum Ltd. | 9,050 | 128,747 | 3.7 | |||||||||
Woolworths Group Ltd. | 1,190 | 32,944 | 1.0 | |||||||||
|
| |||||||||||
| 2,412,138 | ||||||||||||
| Austria | ||||||||||||
OMV AG | 9,143 | 288,753 | 8.4 | |||||||||
|
| |||||||||||
| Belgium | ||||||||||||
Colruyt SA | 1,167 | 67,775 | 1.9 | |||||||||
Proximus SADP | 5,190 | 106,764 | 3.1 | |||||||||
|
| |||||||||||
| 174,539 | ||||||||||||
| Canada | ||||||||||||
Agnico Eagle Mines Ltd. | 280 | 22,257 | 0.7 | |||||||||
Bank of Nova Scotia (The) | 1,360 | 55,854 | 1.6 | |||||||||
BCE, Inc. | 6,223 | 260,916 | 7.6 | |||||||||
Canadian Pacific Railway Ltd. | 190 | 52,253 | 1.5 | |||||||||
Hydro One Ltd. | 4,820 | 102,701 | 3.0 | |||||||||
Loblaw Cos. Ltd. | 1,280 | 66,406 | 1.9 | |||||||||
Magna International, Inc. | 780 | 36,013 | 1.0 | |||||||||
Manulife Financial Corp. | 8,600 | 115,249 | 3.3 | |||||||||
National Bank of Canada | 14,858 | 701,497 | 20.3 | |||||||||
Rogers Communications, Inc., Class B | 3,180 | 129,864 | 3.8 | |||||||||
Royal Bank of Canada | 1,350 | 93,128 | 2.7 | |||||||||
TC Energy Corp. | 2,350 | 107,109 | 3.1 | |||||||||
|
| |||||||||||
| 1,743,247 | ||||||||||||
| China | ||||||||||||
BOC Hong Kong Holdings Ltd. | 120,000 | 334,567 | 9.7 | |||||||||
|
| |||||||||||
| Denmark | ||||||||||||
Coloplast A/S, Class B | 2,650 | 452,348 | 13.1 | |||||||||
Genmab A/S | 300 | 103,262 | 3.0 | |||||||||
GN Store Nord A/S | 4,248 | 261,231 | 7.6 | |||||||||
Novozymes A/S, Class B | 2,630 | 157,325 | 4.6 | |||||||||
|
| |||||||||||
| 974,166 | ||||||||||||
| Finland | ||||||||||||
Fortum OYJ | 10,300 | 209,057 | 6.1 | |||||||||
Stora Enso OYJ, Class R | 8,960 | 112,374 | 3.3 | |||||||||
UPM-Kymmene OYJ | 2,512 | 67,054 | 1.9 | |||||||||
|
| |||||||||||
| 388,485 | ||||||||||||
| France | ||||||||||||
Alstom SA | 10 | 557 | 0.0 | |||||||||
BNP Paribas SA | 5,590 | 225,522 | 6.5 | |||||||||
Cie de Saint-Gobain | 3,640 | 134,662 | 3.9 | |||||||||
Credit Agricole SA | 8,640 | 83,166 | 2.4 | |||||||||
Dassault Systemes SE | 480 | 87,405 | 2.5 | |||||||||
Eiffage SA | 1,898 | 165,872 | 4.8 | |||||||||
Engie SA | 1,460 | 19,449 | 0.6 | |||||||||
Legrand SA | 1,063 | 82,232 | 2.4 | |||||||||
Orange SA | 9,860 | 115,568 | 3.3 | |||||||||
Peugeot SA | 1,713 | 27,536 | 0.8 | |||||||||
Publicis Groupe SA | 4,270 | 136,538 | 4.0 | |||||||||
Schneider Electric SE | 470 | 53,892 | 1.6 | |||||||||
Sodexo SA | 1,700 | 117,324 | 3.4 | |||||||||
Suez SA | 18,039 | 237,912 | 6.9 | |||||||||
Thales SA | 3,110 | 224,826 | 6.5 | |||||||||
| Shares | Value | % of Basket Value | ||||||||||
| France (continued) | ||||||||||||
Veolia Environnement SA | 14,062 | $ | 322,126 | 9.3 | % | |||||||
Vivendi SA | 15,910 | 422,194 | 12.2 | |||||||||
|
| |||||||||||
| 2,456,781 | ||||||||||||
| Germany | ||||||||||||
Allianz SE (Registered) | 83 | 17,220 | 0.5 | |||||||||
Brenntag AG | 3,560 | 219,698 | 6.4 | |||||||||
Deutsche Boerse AG | 1,580 | 287,471 | 8.3 | |||||||||
Deutsche Post AG (Registered) | 9,500 | 385,607 | 11.2 | |||||||||
Deutsche Telekom AG (Registered) | 3,410 | 56,929 | 1.6 | |||||||||
Evonik Industries AG | 9,313 | 251,602 | 7.3 | |||||||||
HeidelbergCement AG | 1,107 | 61,434 | 1.8 | |||||||||
HOCHTIEF AG | 3,037 | 247,970 | 7.2 | |||||||||
Merck KGaA | 6,230 | 796,230 | 23.0 | |||||||||
Muenchener Rueckversicherungs-Gesellschaft AG (Registered) | 847 | 224,517 | 6.5 | |||||||||
Puma SE | 1,750 | 136,216 | 3.9 | |||||||||
Rational AG | 1,310 | 778,081 | 22.5 | |||||||||
Scout24 AG | 710 | 61,030 | 1.8 | |||||||||
Symrise AG | 4,200 | 525,045 | 15.2 | |||||||||
|
| |||||||||||
| 4,049,050 | ||||||||||||
| Italy | ||||||||||||
Assicurazioni Generali SpA | 9,330 | 140,097 | 4.1 | |||||||||
Enel SpA | 16,030 | 146,843 | 4.2 | |||||||||
Eni SpA | 6,010 | 53,536 | 1.5 | |||||||||
Intesa Sanpaolo SpA | 79,180 | 161,396 | 4.7 | |||||||||
Moncler SpA | 2,520 | 97,428 | 2.8 | |||||||||
|
| |||||||||||
| 599,300 | ||||||||||||
| Japan | ||||||||||||
Aeon Co. Ltd. | 13,700 | 323,917 | 9.4 | |||||||||
AGC, Inc. | 1,300 | 36,544 | 1.1 | |||||||||
Ajinomoto Co., Inc. | 9,300 | 167,954 | 4.9 | |||||||||
Astellas Pharma, Inc. | 27,000 | 421,145 | 12.2 | |||||||||
Bandai Namco Holdings, Inc. | 1,300 | 71,789 | 2.1 | |||||||||
Bridgestone Corp. | 10,900 | 321,065 | 9.3 | |||||||||
Chugai Pharmaceutical Co. Ltd. | 1,800 | 81,269 | 2.4 | |||||||||
Denso Corp. | 1,700 | 62,887 | 1.8 | |||||||||
East Japan Railway Co. | 2,800 | 161,405 | 4.7 | |||||||||
ENEOS Holdings, Inc. | 33,500 | 117,471 | 3.4 | |||||||||
Fujitsu Ltd. | 300 | 40,169 | 1.2 | |||||||||
Hoya Corp. | 5,400 | 532,545 | 15.4 | |||||||||
Inpex Corp. | 2,300 | 13,128 | 0.4 | |||||||||
Kao Corp. | 400 | 29,018 | 0.8 | |||||||||
Kikkoman Corp. | 1,800 | 84,478 | 2.4 | |||||||||
Kyocera Corp. | 7,000 | 389,832 | 11.3 | |||||||||
Kyowa Kirin Co. Ltd. | 3,400 | 83,970 | 2.4 | |||||||||
Marubeni Corp. | 67,000 | 308,463 | 8.9 | |||||||||
MEIJI Holdings Co. Ltd. | 3,900 | 306,245 | 8.9 | |||||||||
MINEBEA MITSUMI, Inc. | 12,600 | 206,632 | 6.0 | |||||||||
Mitsubishi Chemical Holdings Corp. | 43,500 | 233,718 | 6.8 | |||||||||
Mitsubishi Electric Corp. | 5,000 | 65,270 | 1.9 | |||||||||
Mitsubishi Heavy Industries Ltd. | 11,100 | 258,226 | 7.5 | |||||||||
MS&AD Insurance Group Holdings, Inc. | 5,000 | 125,640 | 3.6 | |||||||||
NEC Corp. | 7,700 | 431,397 | 12.5 | |||||||||
Nippon Steel Corp. | 11,800 | 96,753 | 2.8 | |||||||||
Nissin Foods Holdings Co. Ltd. | 600 | 54,199 | 1.6 | |||||||||
Nitori Holdings Co. Ltd. | 900 | 197,043 | 5.7 | |||||||||
Nitto Denko Corp. | 12,000 | 680,166 | 19.7 | |||||||||
NTT Data Corp. | 4,500 | 51,162 | 1.5 | |||||||||
NTT DOCOMO, Inc. | 3,900 | 107,371 | 3.1 | |||||||||
| 22 | 2020 BLACKROCK ANNUAL REPORTTO SHAREHOLDERS |
Consolidated Schedule of Investments (continued) July 31, 2020 | BlackRock Total Factor Fund |
| Shares | Value | % of Basket Value | ||||||||||
| Japan (continued) | �� | |||||||||||
Olympus Corp. | 11,400 | $ | 205,046 | 5.9 | % | |||||||
Ono Pharmaceutical Co. Ltd. | 7,700 | 216,427 | 6.3 | |||||||||
ORIX Corp. | 9,400 | 101,662 | 2.9 | |||||||||
Recruit Holdings Co. Ltd. | 1,100 | 34,315 | 1.0 | |||||||||
Ricoh Co. Ltd. | 39,500 | 254,371 | 7.4 | |||||||||
Rohm Co. Ltd. | 2,700 | 173,377 | 5.0 | |||||||||
Sekisui House Ltd. | 46,800 | 854,744 | 24.7 | |||||||||
Seven & i Holdings Co. Ltd. | 4,000 | 120,878 | 3.5 | |||||||||
Shimadzu Corp. | 13,700 | 349,614 | 10.1 | |||||||||
Shin-Etsu Chemical Co. Ltd. | 400 | 46,815 | 1.4 | |||||||||
Softbank Corp. | 24,300 | 325,285 | 9.4 | |||||||||
Sumitomo Electric Industries Ltd. | 10,900 | 121,782 | 3.5 | |||||||||
Sumitomo Mitsui Financial Group, Inc. | 17,000 | 452,990 | 13.1 | |||||||||
Taisei Corp. | 3,900 | 133,964 | 3.9 | |||||||||
TDK Corp. | 700 | 77,936 | 2.3 | |||||||||
Terumo Corp. | 1,500 | 56,747 | 1.6 | |||||||||
Tokyo Electron Ltd. | 600 | 166,030 | 4.8 | |||||||||
Tokyo Gas Co. Ltd. | 6,900 | 146,502 | 4.2 | |||||||||
Toray Industries, Inc. | 25,000 | 108,214 | 3.1 | |||||||||
Trend Micro, Inc. | 100 | 5,865 | 0.2 | |||||||||
West Japan Railway Co. | 2,200 | 95,007 | 2.7 | |||||||||
Yakult Honsha Co. Ltd. | 800 | 45,724 | 1.3 | |||||||||
Yamaha Corp. | 8,700 | 401,128 | 11.6 | |||||||||
|
| |||||||||||
| 10,555,294 | ||||||||||||
| Luxembourg | ||||||||||||
Tenaris SA | 7,340 | 43,259 | 1.2 | |||||||||
|
| |||||||||||
| Macau | ||||||||||||
Sands China Ltd. | 88,000 | 335,528 | 9.7 | |||||||||
|
| |||||||||||
| Netherlands | ||||||||||||
EXOR NV | 880 | 49,419 | 1.4 | |||||||||
ING Groep NV | 13,870 | 96,714 | 2.8 | |||||||||
Koninklijke Ahold Delhaize NV | 18,700 | 538,576 | 15.6 | |||||||||
Koninklijke DSM NV | 1,240 | 189,802 | 5.5 | |||||||||
Koninklijke KPN NV | 31,780 | 83,721 | 2.4 | |||||||||
Koninklijke Philips NV | 2,169 | 112,074 | 3.3 | |||||||||
Royal Dutch Shell plc, Class A | 10,166 | 148,582 | 4.3 | |||||||||
Wolters Kluwer NV | 854 | 67,259 | 2.0 | |||||||||
|
| |||||||||||
| 1,286,147 | ||||||||||||
| Norway | ||||||||||||
Orkla ASA | 10,133 | 99,667 | 2.9 | |||||||||
|
| |||||||||||
| Portugal | ||||||||||||
Galp Energia SGPS SA | 11,690 | 122,404 | 3.5 | |||||||||
|
| |||||||||||
| South Africa | ||||||||||||
Anglo American plc | 8,190 | 198,264 | 5.7 | |||||||||
|
| |||||||||||
| South Korea | ||||||||||||
Hana Financial Group, Inc. | 12,492 | 309,992 | 9.0 | |||||||||
Hyundai Mobis Co. Ltd. | 5,159 | 892,697 | 25.8 | |||||||||
Kia Motors Corp. | 20,525 | 698,597 | 20.2 | |||||||||
LG Electronics, Inc. | 5,300 | 315,163 | 9.1 | |||||||||
NCSoft Corp. | 72 | 49,061 | 1.4 | |||||||||
POSCO | 476 | 76,812 | 2.2 | |||||||||
Samsung C&T Corp. | 1,600 | 142,522 | 4.1 | |||||||||
Samsung Electronics Co. Ltd. (Preference) | 5,820 | 243,089 | 7.0 | |||||||||
Shinhan Financial Group Co. Ltd. | 772 | 19,372 | 0.6 | |||||||||
SK Telecom Co. Ltd. | 709 | 131,314 | 3.8 | |||||||||
|
| |||||||||||
| 2,878,619 | ||||||||||||
| Shares | Value | % of Basket Value | ||||||||||
| Spain | ||||||||||||
ACS Actividades de Construccion y Servicios SA | 26,090 | $ | 605,197 | 17.5 | % | |||||||
Aena SME SA | 560 | 73,016 | 2.1 | |||||||||
Banco Bilbao Vizcaya Argentaria SA | 63,310 | 197,129 | 5.7 | |||||||||
Repsol SA | 49,236 | 388,262 | 11.2 | |||||||||
|
| |||||||||||
| 1,263,604 | ||||||||||||
| Sweden | ||||||||||||
Alfa Laval AB | 8,600 | 203,719 | 5.9 | |||||||||
Atlas Copco AB, Class A | 2,870 | 127,404 | 3.7 | |||||||||
Fastighets AB Balder, Class B | 2,700 | 111,817 | 3.2 | |||||||||
Hennes & Mauritz AB, Class B | 10,650 | 166,006 | 4.8 | |||||||||
Investor AB, Class B | 5,145 | 305,277 | 8.8 | |||||||||
Lundin Energy AB | 10,500 | 244,919 | 7.1 | |||||||||
Swedish Match AB | 3,357 | 258,653 | 7.5 | |||||||||
Volvo AB, Class B | 4,927 | 85,147 | 2.5 | |||||||||
|
| |||||||||||
| 1,502,942 | ||||||||||||
| Switzerland | ||||||||||||
Baloise Holding AG (Registered) | 680 | 103,751 | 3.0 | |||||||||
Coca-Cola HBC AG | 14,614 | 380,458 | 11.0 | |||||||||
Geberit AG (Registered) | 380 | 209,728 | 6.1 | |||||||||
Givaudan SA (Registered) | 130 | 538,424 | 15.6 | |||||||||
Kuehne + Nagel International AG (Registered) | 1,720 | 296,505 | 8.6 | |||||||||
LafargeHolcim Ltd. (Registered) | 9,222 | 436,297 | 12.6 | |||||||||
Nestle SA (Registered) | 390 | 46,380 | 1.3 | |||||||||
Partners Group Holding AG | 130 | 125,932 | 3.7 | |||||||||
Roche Holding AG | 3,190 | 1,104,877 | 32.0 | |||||||||
Schindler Holding AG | 930 | 236,392 | 6.8 | |||||||||
SGS SA (Registered) | 20 | 52,377 | 1.5 | |||||||||
Sonova Holding AG (Registered) | 1,711 | 386,864 | 11.2 | |||||||||
STMicroelectronics NV | 3,570 | 100,307 | 2.9 | |||||||||
Swatch Group AG (The) | 470 | 98,534 | 2.9 | |||||||||
Swiss Prime Site AG (Registered) | 1,100 | 100,390 | 2.9 | |||||||||
|
| |||||||||||
| 4,217,216 | ||||||||||||
| Taiwan | ||||||||||||
Chunghwa Telecom Co. Ltd. | 345,000 | 1,289,311 | 37.3 | |||||||||
Delta Electronics, Inc. | 36,000 | 246,077 | 7.1 | |||||||||
MediaTek, Inc. | 12,000 | 286,537 | 8.3 | |||||||||
Taiwan Semiconductor Manufacturing Co. Ltd. | 107,000 | 1,557,235 | 45.1 | |||||||||
|
| |||||||||||
| 3,379,160 | ||||||||||||
| United Kingdom | ||||||||||||
Aviva plc | 86,560 | 297,685 | 8.6 | |||||||||
BAE Systems plc | 11,640 | 74,600 | 2.2 | |||||||||
Barclays plc | 28,540 | 37,002 | 1.1 | |||||||||
Berkeley Group Holdings plc | 4,580 | 265,736 | 7.7 | |||||||||
BP plc | 45,888 | 166,184 | 4.8 | |||||||||
Bunzl plc | 2,660 | 76,198 | 2.2 | |||||||||
Burberry Group plc | 2,010 | 32,751 | 0.9 | |||||||||
CK Hutchison Holdings Ltd. | 138,500 | 904,377 | 26.2 | |||||||||
DCC plc | 1,850 | 164,503 | 4.8 | |||||||||
Diageo plc | 3,140 | 114,895 | 3.3 | |||||||||
GlaxoSmithKline plc | 12,467 | 248,347 | 7.2 | |||||||||
InterContinental Hotels Group plc | 5,040 | 232,148 | 6.7 | |||||||||
International Consolidated Airlines Group SA | 78,180 | 168,503 | 4.9 | |||||||||
JD Sports Fashion plc | 19,620 | 155,103 | 4.5 | |||||||||
Legal & General Group plc | 28,520 | 78,951 | 2.3 | |||||||||
Linde plc | 1,665 | 408,108 | 11.8 | |||||||||
CONSOLIDATED SCHEDULE OF INVESTMENTS | 23 |
Consolidated Schedule of Investments (continued) July 31, 2020 | BlackRock Total Factor Fund |
| Shares | Value | % of Basket Value | ||||||||||
| United Kingdom (continued) | ||||||||||||
Next plc | 4,630 | $ | 326,795 | 9.5 | % | |||||||
Rolls-Royce Holdings plc | 68,750 | 206,240 | 6.0 | |||||||||
RSA Insurance Group plc | 17,890 | 99,852 | 2.9 | |||||||||
Sage Group plc (The) | 36,065 | 342,252 | 9.9 | |||||||||
Severn Trent plc | 2,870 | 91,459 | 2.6 | |||||||||
Smith & Nephew plc | 42,336 | 835,606 | 24.2 | |||||||||
Vodafone Group plc | 114,800 | 172,527 | 5.0 | |||||||||
|
| |||||||||||
| 5,499,822 | ||||||||||||
| United States | ||||||||||||
AbbVie, Inc. | 60 | 5,695 | 0.2 | |||||||||
ABIOMED, Inc. | 130 | 38,992 | 1.1 | |||||||||
Adobe, Inc. | 380 | 168,842 | 4.9 | |||||||||
Advance Auto Parts, Inc. | 180 | 27,025 | 0.8 | |||||||||
Aflac, Inc. | 10,565 | 375,797 | 10.9 | |||||||||
Agilent Technologies, Inc. | 1,970 | 189,770 | 5.5 | |||||||||
Air Products and Chemicals, Inc. | 1,247 | 357,428 | 10.3 | |||||||||
Akamai Technologies, Inc. | 5,508 | 619,320 | 17.9 | |||||||||
Alexion Pharmaceuticals, Inc. | 620 | 63,544 | 1.8 | |||||||||
Align Technology, Inc. | 420 | 123,404 | 3.6 | |||||||||
Alleghany Corp. | 89 | 46,486 | 1.3 | |||||||||
Allegion plc | 780 | 77,579 | 2.2 | |||||||||
Alliant Energy Corp. | 8,289 | 446,363 | 12.9 | |||||||||
Allstate Corp. (The) | 870 | 82,119 | 2.4 | |||||||||
Ally Financial, Inc. | 18,098 | 363,770 | 10.5 | |||||||||
Alphabet, Inc., Class A | 308 | 457,390 | 13.2 | |||||||||
Ameren Corp. | 1,454 | 116,669 | 3.4 | |||||||||
American Express Co. | 1,155 | 107,785 | 3.1 | |||||||||
American Financial Group, Inc. | 1,112 | 67,576 | 2.0 | |||||||||
American Water Works Co., Inc. | 1,810 | 266,559 | 7.7 | |||||||||
Ameriprise Financial, Inc. | 230 | 35,335 | 1.0 | |||||||||
AMETEK, Inc. | 256 | 23,872 | 0.7 | |||||||||
Anaplan, Inc. | 3,600 | 163,476 | 4.7 | |||||||||
Aon plc, Class A | 260 | 53,357 | 1.5 | |||||||||
Applied Materials, Inc. | 2,270 | 146,029 | 4.2 | |||||||||
AptarGroup, Inc. | 1,755 | 202,176 | 5.9 | |||||||||
Assurant, Inc. | 710 | 76,304 | 2.2 | |||||||||
Atmos Energy Corp. | 1,678 | 177,851 | 5.1 | |||||||||
AutoZone, Inc. | 271 | 327,211 | 9.5 | |||||||||
Bank of America Corp. | 11,370 | 282,886 | 8.2 | |||||||||
Bank of New York Mellon Corp. (The) | 1,250 | 44,812 | 1.3 | |||||||||
Bio-Rad Laboratories, Inc., Class A | 260 | 136,471 | 3.9 | |||||||||
Booz Allen Hamilton Holding Corp. | 14,514 | 1,186,665 | 34.3 | |||||||||
Bright Horizons Family Solutions, Inc. | 16 | 1,716 | 0.0 | |||||||||
Bristol-Myers Squibb Co. | 12,230 | 717,412 | 20.8 | |||||||||
Bristol-Myers Squibb Co., CVR | 1,987 | 7,153 | 0.2 | |||||||||
Burlington Stores, Inc. | 3,490 | 656,120 | 19.0 | |||||||||
Cadence Design Systems, Inc. | 17,239 | 1,883,361 | 54.5 | |||||||||
Campbell Soup Co. | 109 | 5,403 | 0.2 | |||||||||
Capital One Financial Corp. | 3,530 | 225,214 | 6.5 | |||||||||
CDW Corp. | 924 | 107,415 | 3.1 | |||||||||
Celanese Corp. | 1,870 | 181,764 | 5.3 | |||||||||
Cerner Corp. | 2,234 | 155,151 | 4.5 | |||||||||
Chemed Corp. | 740 | 364,221 | 10.5 | |||||||||
Chipotle Mexican Grill, Inc. | 85 | 98,189 | 2.8 | |||||||||
Ciena Corp. | 1,427 | 84,921 | 2.5 | |||||||||
Cintas Corp. | 442 | 133,427 | 3.9 | |||||||||
Citizens Financial Group, Inc. | 10,847 | 269,114 | 7.8 | |||||||||
Clorox Co. (The) | 370 | 87,509 | 2.5 | |||||||||
CME Group, Inc. | 1,170 | 194,431 | 5.6 | |||||||||
CMS Energy Corp. | 3,330 | 213,719 | 6.2 | |||||||||
| Shares | Value | % of Basket Value | ||||||||||
| United States (continued) | ||||||||||||
Cognizant Technology Solutions Corp., Class A | 4,970 | $ | 339,550 | 9.8 | % | |||||||
Colgate-Palmolive Co. | 580 | 44,776 | 1.3 | |||||||||
Comerica, Inc. | 4,419 | 170,220 | 4.9 | |||||||||
ConocoPhillips | 1,260 | 47,111 | 1.4 | |||||||||
Costco Wholesale Corp. | 270 | 87,893 | 2.5 | |||||||||
Crown Holdings, Inc. | 2,880 | 206,150 | 6.0 | |||||||||
CVS Health Corp. | 6,000 | 377,640 | 10.9 | |||||||||
Darden Restaurants, Inc. | 1,840 | 139,656 | 4.0 | |||||||||
DaVita, Inc. | 6,445 | 563,229 | 16.3 | |||||||||
Delta Air Lines, Inc. | 8,280 | 206,752 | 6.0 | |||||||||
DENTSPLY SIRONA, Inc. | 7,190 | 320,674 | 9.3 | |||||||||
DexCom, Inc. | 120 | 52,265 | 1.5 | |||||||||
Discover Financial Services | 1,267 | 62,628 | 1.8 | |||||||||
Dollar General Corp. | 190 | 36,176 | 1.0 | |||||||||
Domino’s Pizza, Inc. | 340 | 131,447 | 3.8 | |||||||||
Dover Corp. | 3,584 | 368,901 | 10.7 | |||||||||
DTE Energy Co. | 4,118 | 476,164 | 13.8 | |||||||||
Duke Energy Corp. | 2,310 | 195,749 | 5.7 | |||||||||
eBay, Inc. | 22,534 | 1,245,680 | 36.1 | |||||||||
Edwards Lifesciences Corp. | 5,520 | 432,823 | 12.5 | |||||||||
Electronic Arts, Inc. | 4,280 | 606,134 | 17.5 | |||||||||
Eli Lilly and Co. | 1,136 | 170,729 | 4.9 | |||||||||
Entergy Corp. | 3,060 | 321,698 | 9.3 | |||||||||
Euronet Worldwide, Inc. | 980 | 94,217 | 2.7 | |||||||||
Evergy, Inc. | 673 | 43,631 | 1.3 | |||||||||
Exelon Corp. | 890 | 34,363 | 1.0 | |||||||||
Expeditors International of Washington, Inc. | 19,264 | 1,628,001 | 47.1 | |||||||||
Facebook, Inc., Class A | 750 | 190,253 | 5.5 | |||||||||
Fair Isaac Corp. | 948 | 416,352 | 12.0 | |||||||||
FedEx Corp. | 660 | 111,144 | 3.2 | |||||||||
Ferguson plc | 2,030 | 178,952 | 5.2 | |||||||||
Fifth Third Bancorp | 6,837 | 135,783 | 3.9 | |||||||||
First American Financial Corp. | 6,290 | 320,853 | 9.3 | |||||||||
FMC Corp. | 3,860 | 409,353 | 11.8 | |||||||||
Fortinet, Inc. | 3,708 | 512,816 | 14.8 | |||||||||
Fortive Corp. | 2,740 | 192,321 | 5.6 | |||||||||
Fortune Brands Home & Security, Inc. | 1,689 | 129,209 | 3.7 | |||||||||
General Motors Co. | 5,260 | 130,921 | 3.8 | |||||||||
Gentex Corp. | 15,660 | 422,663 | 12.2 | |||||||||
GoDaddy, Inc., Class A | 4,240 | 297,987 | 8.6 | |||||||||
Graco, Inc. | 1,010 | 53,772 | 1.6 | |||||||||
HCA Healthcare, Inc. | 4,837 | 612,558 | 17.7 | |||||||||
Henry Schein, Inc. | 1,400 | 96,222 | 2.8 | |||||||||
Hershey Co. (The) | 230 | 33,444 | 1.0 | |||||||||
Hewlett Packard Enterprise Co. | 22,699 | 224,039 | 6.5 | |||||||||
Hill-Rom Holdings, Inc. | 400 | 38,888 | 1.1 | |||||||||
Home Depot, Inc. (The) | 1,800 | 477,882 | 13.8 | |||||||||
Hubbell, Inc. | 3,100 | 418,407 | 12.1 | |||||||||
Humana, Inc. | 130 | 51,018 | 1.5 | |||||||||
IDEXX Laboratories, Inc. | 150 | 59,663 | 1.7 | |||||||||
Illinois Tool Works, Inc. | 650 | 120,244 | 3.5 | |||||||||
Illumina, Inc. | 190 | 72,610 | 2.1 | |||||||||
Incyte Corp. | 2,280 | 225,173 | 6.5 | |||||||||
Insulet Corp. | 390 | 79,310 | 2.3 | |||||||||
Intel Corp. | 5,030 | 240,082 | 6.9 | |||||||||
Intercontinental Exchange, Inc. | 4,120 | 398,734 | 11.5 | |||||||||
Intuit, Inc. | 4,523 | 1,385,712 | 40.1 | |||||||||
James Hardie Industries plc, CDI | 5,260 | 108,563 | 3.1 | |||||||||
Jazz Pharmaceuticals plc | 1,090 | 117,993 | 3.4 | |||||||||
JB Hunt Transport Services, Inc. | 890 | 115,166 | 3.3 | |||||||||
JPMorgan Chase & Co. | 2,690 | 259,962 | 7.5 | |||||||||
| 24 | 2020 BLACKROCK ANNUAL REPORTTO SHAREHOLDERS |
Consolidated Schedule of Investments (continued) July 31, 2020 | BlackRock Total Factor Fund |
| Shares | Value | % of Basket Value | ||||||||||
| United States (continued) | ||||||||||||
Juniper Networks, Inc. | 11,120 | $ | 282,226 | 8.2 | % | |||||||
Kansas City Southern | 1,360 | 233,716 | 6.8 | |||||||||
KeyCorp | 10,950 | 131,509 | 3.8 | |||||||||
Keysight Technologies, Inc. | 2,796 | 279,292 | 8.1 | |||||||||
Kinder Morgan, Inc. | 1,463 | 20,628 | 0.6 | |||||||||
Kroger Co. (The) | 1,740 | 60,535 | 1.8 | |||||||||
Lam Research Corp. | 601 | 226,673 | 6.6 | |||||||||
Lamb Weston Holdings, Inc. | 2,770 | 166,422 | 4.8 | |||||||||
Liberty Broadband Corp., Class C | 1,140 | 156,488 | 4.5 | |||||||||
Liberty Media Corp-Liberty SiriusXM, Class C | 23,749 | 830,978 | 24.1 | |||||||||
LKQ Corp. | 870 | 24,525 | 0.7 | |||||||||
LPL Financial Holdings, Inc. | 7,067 | 558,434 | 16.2 | |||||||||
Lululemon Athletica, Inc. | 340 | 110,701 | 3.2 | |||||||||
M&T Bank Corp. | 360 | 38,142 | 1.1 | |||||||||
MarketAxess Holdings, Inc. | 740 | 382,358 | 11.1 | |||||||||
Masco Corp. | 3,352 | 191,600 | 5.5 | |||||||||
Masimo Corp. | 220 | 48,426 | 1.4 | |||||||||
Maxim Integrated Products, Inc. | 694 | 47,254 | 1.4 | |||||||||
McDonald’s Corp. | 760 | 147,653 | 4.3 | |||||||||
Merck & Co., Inc. | 2,831 | 227,159 | 6.6 | |||||||||
Microsoft Corp. | 1,380 | 282,914 | 8.2 | |||||||||
Monster Beverage Corp. | 1,740 | 136,555 | 4.0 | |||||||||
Moody’s Corp. | 1,390 | 391,007 | 11.3 | |||||||||
Motorola Solutions, Inc. | 1,257 | 175,729 | 5.1 | |||||||||
MSCI, Inc. | 620 | 233,108 | 6.7 | |||||||||
Nasdaq, Inc. | 1,990 | 261,307 | 7.6 | |||||||||
NetApp, Inc. | 14,130 | 625,959 | 18.1 | |||||||||
Neurocrine Biosciences, Inc. | 2,980 | 358,673 | 10.4 | |||||||||
NIKE, Inc., Class B | 3,990 | 389,464 | 11.3 | |||||||||
NRG Energy, Inc. | 8,485 | 286,878 | 8.3 | |||||||||
Nuance Communications, Inc. | 1,350 | 36,922 | 1.1 | |||||||||
OGE Energy Corp. | 1,182 | 38,888 | 1.1 | |||||||||
Old Dominion Freight Line, Inc. | 310 | 56,674 | 1.6 | |||||||||
Parker-Hannifin Corp. | 790 | 141,347 | 4.1 | |||||||||
Paychex, Inc. | 4,906 | 352,840 | 10.2 | |||||||||
Pentair plc | 8,058 | 345,285 | 10.0 | |||||||||
PepsiCo, Inc. | 7,302 | 1,005,193 | 29.1 | |||||||||
Phillips 66 | 1,950 | 120,939 | 3.5 | |||||||||
PPG Industries, Inc. | 4,113 | 442,764 | 12.8 | |||||||||
Procter & Gamble Co. (The) | 550 | 72,116 | 2.1 | |||||||||
PulteGroup, Inc. | 4,500 | 196,200 | 5.7 | |||||||||
Qorvo, Inc. | 456 | 58,436 | 1.7 | |||||||||
QUALCOMM, Inc. | 1,935 | 204,355 | 5.9 | |||||||||
Reinsurance Group of America, Inc. | 310 | 26,427 | 0.8 | |||||||||
Reliance Steel & Aluminum Co. | 2,938 | 288,688 | 8.4 | |||||||||
Robert Half International, Inc. | 2,826 | 143,759 | 4.2 | |||||||||
Royal Gold, Inc. | 1,850 | 258,870 | 7.5 | |||||||||
RPM International, Inc. | 3,883 | 316,814 | 9.2 | |||||||||
S&P Global, Inc. | 1,140 | 399,285 | 11.6 | |||||||||
ServiceNow, Inc. | 1,272 | 558,662 | 16.2 | |||||||||
Sherwin-Williams Co. (The) | 408 | 264,351 | 7.7 | |||||||||
Signature Bank | 1,910 | 195,832 | 5.7 | |||||||||
Sirius XM Holdings, Inc. | 11,350 | 66,738 | 1.9 | |||||||||
Snap-on, Inc. | 1,212 | 176,794 | 5.1 | |||||||||
Southern Co. (The) | 5,010 | 273,596 | 7.9 | |||||||||
Spotify Technology SA | 660 | 170,161 | 4.9 | |||||||||
Square, Inc., Class A | 391 | 50,771 | 1.5 | |||||||||
STERIS plc | 2,328 | 371,619 | 10.8 | |||||||||
Stryker Corp. | 1,822 | 352,193 | 10.2 | |||||||||
Synopsys, Inc. | 1,287 | 256,396 | 7.4 | |||||||||
Take-Two Interactive Software, Inc. | 570 | 93,491 | 2.7 | |||||||||
| Shares | Value | % of Basket Value | ||||||||||
| United States (continued) | ||||||||||||
Teledyne Technologies, Inc. | 197 | $ | 60,420 | 1.7 | % | |||||||
Teradyne, Inc. | 5,440 | 483,942 | 14.0 | |||||||||
Texas Instruments, Inc. | 5,189 | 661,857 | 19.2 | |||||||||
TJX Cos., Inc. (The) | 800 | 41,592 | 1.2 | |||||||||
Toro Co. (The) | 2,200 | 156,970 | 4.5 | |||||||||
Tractor Supply Co. | 290 | 41,395 | 1.2 | |||||||||
Ulta Beauty, Inc. | 420 | 81,056 | 2.3 | |||||||||
United Airlines Holdings, Inc. | 9,276 | 291,081 | 8.4 | |||||||||
United Parcel Service, Inc., | 1,140 | 162,746 | 4.7 | |||||||||
Universal Health Services, Inc., | 180 | 19,782 | 0.6 | |||||||||
US Bancorp | 1,010 | 37,208 | 1.1 | |||||||||
US Foods Holding Corp. | 2,020 | 41,006 | 1.2 | |||||||||
Veeva Systems, Inc., Class A | 1,770 | 468,289 | 13.6 | |||||||||
Verizon Communications, Inc. | 2,910 | 167,267 | 4.8 | |||||||||
Vertex Pharmaceuticals, Inc. | 3,650 | 992,800 | 28.7 | |||||||||
Waters Corp. | 1,250 | 266,437 | 7.7 | |||||||||
West Pharmaceutical Services, Inc. | 662 | 177,992 | 5.2 | |||||||||
Whirlpool Corp. | 350 | 57,092 | 1.7 | |||||||||
Willis Towers Watson plc | 2,166 | 454,882 | 13.2 | |||||||||
Workday, Inc., Class A | 1,338 | 242,071 | 7.0 | |||||||||
WW Grainger, Inc. | 280 | 95,628 | 2.8 | |||||||||
Zendesk, Inc. | 4,780 | 435,697 | 12.6 | |||||||||
Zions Bancorp NA | 7,965 | 258,624 | 7.5 | |||||||||
|
| |||||||||||
| 49,625,657 | ||||||||||||
|
| |||||||||||
Total Reference Entity — Long |
| 94,428,609 | ||||||||||
|
| |||||||||||
Reference Entity — Short |
| |||||||||||
| Australia | ||||||||||||
Australia & New Zealand Banking Group Ltd. | (3,990 | ) | (50,676 | ) | (1.5 | ) | ||||||
Commonwealth Bank of Australia | (6,700 | ) | (340,862 | ) | (9.9 | ) | ||||||
CSL Ltd. | (491 | ) | (95,501 | ) | (2.8 | ) | ||||||
Ramsay Health Care Ltd. | (11,660 | ) | (515,362 | ) | (14.9 | ) | ||||||
Sonic Healthcare Ltd. | (12,510 | ) | (286,411 | ) | (8.3 | ) | ||||||
|
| |||||||||||
| (1,288,812 | ) | |||||||||||
| Belgium | ||||||||||||
Anheuser-Busch InBev SA/NV | (8,737 | ) | (474,447 | ) | (13.7 | ) | ||||||
|
| |||||||||||
| Bermuda | ||||||||||||
RenaissanceRe Holdings Ltd. | (360 | ) | (64,937 | ) | (1.9 | ) | ||||||
|
| |||||||||||
| Brazil | ||||||||||||
Wheaton Precious Metals Corp. | (2,810 | ) | (152,453 | ) | (4.4 | ) | ||||||
|
| |||||||||||
| Canada | ||||||||||||
Alimentation Couche-Tard, Inc., Class B | (2,460 | ) | (85,493 | ) | (2.5 | ) | ||||||
Brookfield Asset Management, Inc., Class A | (9,111 | ) | (294,559 | ) | (8.5 | ) | ||||||
Canadian National Railway Co. | (5,560 | ) | (543,111 | ) | (15.7 | ) | ||||||
Canadian Natural Resources Ltd. | (1,730 | ) | (30,520 | ) | (0.9 | ) | ||||||
Cenovus Energy, Inc. | (16,374 | ) | (72,858 | ) | (2.1 | ) | ||||||
Dollarama, Inc. | (2,700 | ) | (98,732 | ) | (2.9 | ) | ||||||
Enbridge, Inc. | (3,428 | ) | (109,715 | ) | (3.2 | ) | ||||||
Fortis, Inc. | (2,560 | ) | (104,258 | ) | (3.0 | ) | ||||||
Great-West Lifeco, Inc. | (14,480 | ) | (255,990 | ) | (7.4 | ) | ||||||
Imperial Oil Ltd. | (1,830 | ) | (28,623 | ) | (0.8 | ) | ||||||
Metro, Inc. | (10,540 | ) | (462,377 | ) | (13.4 | ) | ||||||
Nutrien Ltd. | (3,510 | ) | (114,391 | ) | (3.3 | ) | ||||||
CONSOLIDATED SCHEDULE OF INVESTMENTS | 25 |
Consolidated Schedule of Investments (continued) July 31, 2020 | BlackRock Total Factor Fund |
| Shares | Value | % of Basket Value | ||||||||||
| Canada (continued) | ||||||||||||
Power Corp. of Canada | (9,320 | ) | $ | (165,394 | ) | (4.8 | )% | |||||
Shopify, Inc., Class A | (455 | ) | (465,303 | ) | (13.5 | ) | ||||||
TELUS Corp. | (3,040 | ) | (52,722 | ) | (1.5 | ) | ||||||
Thomson Reuters Corp. | (2,580 | ) | (180,187 | ) | (5.2 | ) | ||||||
|
| |||||||||||
| (3,064,233 | ) | |||||||||||
| China | ||||||||||||
Prosus NV | (12,820 | ) | (1,247,731 | ) | (36.1 | ) | ||||||
|
| |||||||||||
| Denmark | ||||||||||||
Chr Hansen Holding A/S | (603 | ) | (68,810 | ) | (2.0 | ) | ||||||
Danske Bank A/S | (31,070 | ) | (503,208 | ) | (14.6 | ) | ||||||
DSV Panalpina A/S | (6,880 | ) | (941,429 | ) | (27.3 | ) | ||||||
Orsted A/S | (5,416 | ) | (771,915 | ) | (22.3 | ) | ||||||
Vestas Wind Systems A/S | (1,260 | ) | (161,513 | ) | (4.7 | ) | ||||||
|
| |||||||||||
| (2,446,875 | ) | |||||||||||
| Finland | ||||||||||||
Kone OYJ, Class B | (430 | ) | (34,146 | ) | (1.0 | ) | ||||||
Nokia OYJ | (55,770 | ) | (267,703 | ) | (7.7 | ) | ||||||
Sampo OYJ, Class A | (2,060 | ) | (74,457 | ) | (2.2 | ) | ||||||
|
| |||||||||||
| (376,306 | ) | |||||||||||
| France | ||||||||||||
Accor SA | (3,940 | ) | (99,179 | ) | (2.9 | ) | ||||||
Aeroports de Paris | (1,255 | ) | (118,311 | ) | (3.4 | ) | ||||||
Airbus SE | (380 | ) | (27,815 | ) | (0.8 | ) | ||||||
Atos SE | (4,240 | ) | (362,559 | ) | (10.5 | ) | ||||||
AXA SA | (9,220 | ) | (184,987 | ) | (5.3 | ) | ||||||
Bollore SA | (3 | ) | (10 | ) | (0.0 | ) | ||||||
Bouygues SA | (11,040 | ) | (390,005 | ) | (11.3 | ) | ||||||
Capgemini SE | (680 | ) | (88,192 | ) | (2.5 | ) | ||||||
Cie Generale des Etablissements Michelin SCA | (2,150 | ) | (222,667 | ) | (6.4 | ) | ||||||
Getlink SE | (2,203 | ) | (33,145 | ) | (1.0 | ) | ||||||
Kering SA | (550 | ) | (311,678 | ) | (9.0 | ) | ||||||
L’Oreal SA | (1,400 | ) | (469,879 | ) | (13.6 | ) | ||||||
Natixis SA | (99,800 | ) | (244,110 | ) | (7.1 | ) | ||||||
Orpea | (640 | ) | (81,649 | ) | (2.4 | ) | ||||||
Renault SA | (7,240 | ) | (172,060 | ) | (5.0 | ) | ||||||
Safran SA | (3,660 | ) | (389,247 | ) | (11.3 | ) | ||||||
Teleperformance | (279 | ) | (81,654 | ) | (2.4 | ) | ||||||
Ubisoft Entertainment SA | (670 | ) | (55,960 | ) | (1.6 | ) | ||||||
Worldline SA | (1,580 | ) | (135,926 | ) | (3.9 | ) | ||||||
|
| |||||||||||
| (3,469,033 | ) | |||||||||||
| Germany | ||||||||||||
adidas AG | (90 | ) | (24,820 | ) | (0.7 | ) | ||||||
BASF SE | (2,210 | ) | (121,917 | ) | (3.5 | ) | ||||||
Bayer AG (Registered) | (5,980 | ) | (397,272 | ) | (11.5 | ) | ||||||
Commerzbank AG | (43,071 | ) | (221,348 | ) | (6.4 | ) | ||||||
Continental AG | (1,750 | ) | (169,048 | ) | (4.9 | ) | ||||||
Covestro AG | (3,380 | ) | (131,169 | ) | (3.8 | ) | ||||||
Deutsche Wohnen SE | (1,110 | ) | (54,009 | ) | (1.6 | ) | ||||||
E.ON SE | (2,560 | ) | (30,054 | ) | (0.9 | ) | ||||||
Fresenius Medical Care AG & Co. KGaA | (4,010 | ) | (353,289 | ) | (10.2 | ) | ||||||
Infineon Technologies AG | (7,356 | ) | (187,544 | ) | (5.4 | ) | ||||||
KION Group AG | (4,329 | ) | (330,848 | ) | (9.6 | ) | ||||||
Knorr-Bremse AG | (980 | ) | (114,667 | ) | (3.3 | ) | ||||||
METRO AG | (1 | ) | (9 | ) | (0.0 | ) | ||||||
MTU Aero Engines AG | (82 | ) | (14,218 | ) | (0.4 | ) | ||||||
Sartorius AG (Preference) | (786 | ) | (302,423 | ) | (8.8 | ) | ||||||
Siemens AG (Registered) | (250 | ) | (31,859 | ) | (0.9 | ) | ||||||
Uniper SE | (3,930 | ) | (135,676 | ) | (3.9 | ) | ||||||
|
| |||||||||||
| (2,620,170 | ) | |||||||||||
| Shares | Value | % of Basket Value | ||||||||||
| Hong Kong | ||||||||||||
AIA Group Ltd. | (45,800 | ) | $ | (412,976 | ) | (11.9 | )% | |||||
CLP Holdings Ltd. | (30,500 | ) | (288,399 | ) | (8.3 | ) | ||||||
Hong Kong & China Gas Co. Ltd. | (64,000 | ) | (91,701 | ) | (2.7 | ) | ||||||
Hong Kong Exchanges & Clearing Ltd. | (1,300 | ) | (61,897 | ) | (1.8 | ) | ||||||
MTR Corp. Ltd. | (97,339 | ) | (483,740 | ) | (14.0 | ) | ||||||
Sun Hung Kai Properties Ltd. | (4,000 | ) | (48,647 | ) | (1.4 | ) | ||||||
Wharf Real Estate Investment Co. Ltd. | (65,000 | ) | (229,896 | ) | (6.7 | ) | ||||||
|
| |||||||||||
| (1,617,256 | ) | |||||||||||
| Italy | ||||||||||||
Amplifon SpA | (8,450 | ) | (289,276 | ) | (8.4 | ) | ||||||
Atlantia SpA | (4,170 | ) | (66,808 | ) | (1.9 | ) | ||||||
FinecoBank Banca Fineco SpA | (6,810 | ) | (99,275 | ) | (2.9 | ) | ||||||
Nexi SpA | (10,804 | ) | (194,092 | ) | (5.6 | ) | ||||||
|
| |||||||||||
| (649,451 | ) | |||||||||||
| Japan | ||||||||||||
ANA Holdings, Inc. | (39,100 | ) | (809,541 | ) | (23.4 | ) | ||||||
Asahi Intecc Co. Ltd. | (1,200 | ) | (33,481 | ) | (1.0 | ) | ||||||
Asahi Kasei Corp. | (6,800 | ) | (48,913 | ) | (1.4 | ) | ||||||
Canon, Inc. | (8,900 | ) | (143,224 | ) | (4.1 | ) | ||||||
Daifuku Co. Ltd. | (3,000 | ) | (273,378 | ) | (7.9 | ) | ||||||
Dai-ichi Life Holdings, Inc. | (11,200 | ) | (132,120 | ) | (3.8 | ) | ||||||
Daiichi Sankyo Co. Ltd. | (1,500 | ) | (132,730 | ) | (3.8 | ) | ||||||
Daikin Industries Ltd. | (200 | ) | (35,189 | ) | (1.0 | ) | ||||||
FamilyMart Co. Ltd. | (15,800 | ) | (354,676 | ) | (10.3 | ) | ||||||
Fast Retailing Co. Ltd. | (300 | ) | (159,541 | ) | (4.6 | ) | ||||||
FUJIFILM Holdings Corp. | (5,300 | ) | (237,030 | ) | (6.9 | ) | ||||||
ITOCHU Corp. | (10,700 | ) | (234,612 | ) | (6.8 | ) | ||||||
Japan Airlines Co. Ltd. | (34,800 | ) | (563,317 | ) | (16.3 | ) | ||||||
Japan Post Bank Co. Ltd. | (86,000 | ) | (641,591 | ) | (18.6 | ) | ||||||
Japan Post Holdings Co. Ltd. | (51,600 | ) | (352,418 | ) | (10.2 | ) | ||||||
Kansai Electric Power Co., Inc. (The) | (50,100 | ) | (476,563 | ) | (13.8 | ) | ||||||
Keyence Corp. | (1,400 | ) | (590,362 | ) | (17.1 | ) | ||||||
Kintetsu Group Holdings Co. Ltd. | (4,100 | ) | (159,745 | ) | (4.6 | ) | ||||||
Kirin Holdings Co. Ltd. | (3,500 | ) | (67,440 | ) | (2.0 | ) | ||||||
Komatsu Ltd. | (10,400 | ) | (204,328 | ) | (5.9 | ) | ||||||
Kubota Corp. | (25,000 | ) | (355,999 | ) | (10.3 | ) | ||||||
M3, Inc. | (6,800 | ) | (349,198 | ) | (10.1 | ) | ||||||
Mitsubishi Estate Co. Ltd. | (6,800 | ) | (97,684 | ) | (2.8 | ) | ||||||
Mitsubishi UFJ Financial Group, Inc. | (4,000 | ) | (14,989 | ) | (0.4 | ) | ||||||
Mitsui Fudosan Co. Ltd. | (1,900 | ) | (29,705 | ) | (0.9 | ) | ||||||
Nexon Co. Ltd. | (18,600 | ) | (477,868 | ) | (13.8 | ) | ||||||
Nippon Paint Holdings Co. Ltd. | (6,700 | ) | (458,154 | ) | (13.3 | ) | ||||||
Nippon Telegraph & Telephone Corp. | (4,100 | ) | (95,167 | ) | (2.8 | ) | ||||||
Nissan Motor Co. Ltd. | (48,100 | ) | (164,529 | ) | (4.8 | ) | ||||||
Nomura Holdings, Inc. | (32,700 | ) | (153,892 | ) | (4.5 | ) | ||||||
Nomura Research Institute Ltd. | (1,900 | ) | (50,148 | ) | (1.5 | ) | ||||||
Obic Co. Ltd. | (700 | ) | (125,531 | ) | (3.6 | ) | ||||||
Oriental Land Co. Ltd. | (400 | ) | (48,257 | ) | (1.4 | ) | ||||||
Otsuka Corp. | (1,000 | ) | (52,139 | ) | (1.5 | ) | ||||||
Pan Pacific International Holdings Corp. | (17,400 | ) | (394,371 | ) | (11.4 | ) | ||||||
Panasonic Corp. | (25,400 | ) | (219,999 | ) | (6.4 | ) | ||||||
Resona Holdings, Inc. | (35,700 | ) | (117,034 | ) | (3.4 | ) | ||||||
SG Holdings Co. Ltd. | (14,600 | ) | (535,800 | ) | (15.5 | ) | ||||||
Sharp Corp. | (37,200 | ) | (367,160 | ) | (10.6 | ) | ||||||
Shimano, Inc. | (2,500 | ) | (542,845 | ) | (15.7 | ) | ||||||
Sompo Holdings, Inc. | (1,600 | ) | (52,727 | ) | (1.5 | ) | ||||||
| 26 | 2020 BLACKROCK ANNUAL REPORTTO SHAREHOLDERS |
Consolidated Schedule of Investments (continued) July 31, 2020 | BlackRock Total Factor Fund |
| Shares | Value | % of Basket Value | ||||||||||
| Japan (continued) | ||||||||||||
Square Enix Holdings Co. Ltd. | (2,200 | ) | $ | (118,205 | ) | (3.4 | )% | |||||
Sumitomo Corp. | (2,600 | ) | (28,885 | ) | (0.8 | ) | ||||||
Sumitomo Metal Mining Co. Ltd. | (17,300 | ) | (520,030 | ) | (15.1 | ) | ||||||
Sumitomo Mitsui Trust Holdings, Inc. | (4,400 | ) | (112,966 | ) | (3.3 | ) | ||||||
Sumitomo Realty & Development Co. Ltd. | (2,400 | ) | (61,205 | ) | (1.8 | ) | ||||||
Suzuki Motor Corp. | (5,900 | ) | (193,599 | ) | (5.6 | ) | ||||||
T&D Holdings, Inc. | (37,500 | ) | (308,681 | ) | (8.9 | ) | ||||||
Takeda Pharmaceutical Co. Ltd. | (21,800 | ) | (790,616 | ) | (22.9 | ) | ||||||
Tokio Marine Holdings, Inc. | (900 | ) | (38,002 | ) | (1.1 | ) | ||||||
Tokyo Electric Power Co. Holdings, Inc. | (68,500 | ) | (182,706 | ) | (5.3 | ) | ||||||
Toyota Industries Corp. | (4,600 | ) | (233,695 | ) | (6.8 | ) | ||||||
Toyota Motor Corp. | (300 | ) | (17,809 | ) | (0.5 | ) | ||||||
Unicharm Corp. | (2,900 | ) | (131,175 | ) | (3.8 | ) | ||||||
Yamato Holdings Co. Ltd. | (15,200 | ) | (391,941 | ) | (11.3 | ) | ||||||
|
| |||||||||||
| (13,482,910 | ) | |||||||||||
| Luxembourg | ||||||||||||
Eurofins Scientific SE | (50 | ) | (32,727 | ) | (0.9 | ) | ||||||
|
| |||||||||||
| Macau | ||||||||||||
Galaxy Entertainment Group Ltd. | (73,000 | ) | (497,841 | ) | (14.4 | ) | ||||||
|
| |||||||||||
| Netherlands | ||||||||||||
ASML Holding NV | (660 | ) | (234,655 | ) | (6.8 | ) | ||||||
Heineken NV | (2,430 | ) | (235,405 | ) | (6.8 | ) | ||||||
Koninklijke Vopak NV | (740 | ) | (40,403 | ) | (1.2 | ) | ||||||
NN Group NV | (2,440 | ) | (89,309 | ) | (2.6 | ) | ||||||
|
| |||||||||||
| (599,772 | ) | |||||||||||
| Norway | ||||||||||||
Aker BP ASA | (4,020 | ) | (76,549 | ) | (2.2 | ) | ||||||
DNB ASA | (10,320 | ) | (158,509 | ) | (4.6 | ) | ||||||
Equinor ASA | (11,700 | ) | (175,420 | ) | (5.1 | ) | ||||||
Mowi ASA | (32,265 | ) | (585,969 | ) | (17.0 | ) | ||||||
Norsk Hydro ASA | (56,388 | ) | (159,281 | ) | (4.6 | ) | ||||||
|
| |||||||||||
| (1,155,728 | ) | |||||||||||
| Singapore | ||||||||||||
Oversea-Chinese Banking Corp. Ltd. | (47,800 | ) | (299,408 | ) | (8.7 | ) | ||||||
Singapore Telecommunications Ltd. | (39,900 | ) | (72,413 | ) | (2.1 | ) | ||||||
|
| |||||||||||
| (371,821 | ) | |||||||||||
| South Korea | ||||||||||||
Celltrion Healthcare Co. Ltd. | (8,227 | ) | (653,294 | ) | (18.9 | ) | ||||||
Hyundai Motor Co. | (2,765 | ) | (294,917 | ) | (8.5 | ) | ||||||
LG Chem Ltd. | (1,152 | ) | (551,624 | ) | (16.0 | ) | ||||||
Samsung Electro-Mechanics Co. Ltd. | (1,365 | ) | (161,482 | ) | (4.7 | ) | ||||||
Samsung SDI Co. Ltd. | (852 | ) | (285,234 | ) | (8.2 | ) | ||||||
SK Holdings Co. Ltd. | (799 | ) | (148,931 | ) | (4.3 | ) | ||||||
SK Hynix, Inc. | (4,436 | ) | (310,592 | ) | (9.0 | ) | ||||||
SK Innovation Co. Ltd. | (3,793 | ) | (405,814 | ) | (11.7 | ) | ||||||
|
| |||||||||||
| (2,811,888 | ) | |||||||||||
| Spain | ||||||||||||
Acciona SA | (440 | ) | (48,846 | ) | (1.4 | ) | ||||||
Amadeus IT Group SA | (2,120 | ) | (105,863 | ) | (3.1 | ) | ||||||
CaixaBank SA | (48,040 | ) | (103,336 | ) | (3.0 | ) | ||||||
Cellnex Telecom SA | (17,520 | ) | (587,937 | ) | (17.0 | ) | ||||||
Enagas SA | (2,620 | ) | (66,101 | ) | (1.9 | ) | ||||||
Ferrovial SA | (6,750 | ) | (165,287 | ) | (4.8 | ) | ||||||
| Shares | Value | % of Basket Value | ||||||||||
| Spain (continued) | ||||||||||||
Grifols SA | (4,170 | ) | $ | (121,495 | ) | (3.5 | )% | |||||
Naturgy Energy Group SA | (8,980 | ) | (167,100 | ) | (4.8 | ) | ||||||
Siemens Gamesa Renewable Energy SA | (3,140 | ) | (74,089 | ) | (2.1 | ) | ||||||
|
| |||||||||||
| (1,440,054 | ) | |||||||||||
| Sweden | ||||||||||||
Boliden AB | (9,816 | ) | (268,057 | ) | (7.8 | ) | ||||||
Nibe Industrier AB, Class B | (1,930 | ) | (46,438 | ) | (1.3 | ) | ||||||
Sandvik AB | (1,680 | ) | (31,397 | ) | (0.9 | ) | ||||||
Svenska Cellulosa AB SCA, Class B | (4,840 | ) | (58,781 | ) | (1.7 | ) | ||||||
Svenska Handelsbanken AB, Class A | (9,840 | ) | (92,796 | ) | (2.7 | ) | ||||||
Swedbank AB, Class A | (8,710 | ) | (141,435 | ) | (4.1 | ) | ||||||
Telefonaktiebolaget LM Ericsson, Class B | (9,484 | ) | (110,347 | ) | (3.2 | ) | ||||||
Telia Co. AB | (93,470 | ) | (364,228 | ) | (10.5 | ) | ||||||
|
| |||||||||||
| (1,113,479 | ) | |||||||||||
| Switzerland | ||||||||||||
ABB Ltd. (Registered) | (13,880 | ) | (348,574 | ) | (10.1 | ) | ||||||
Barry Callebaut AG (Registered) | (40 | ) | (83,293 | ) | (2.4 | ) | ||||||
Credit Suisse Group AG (Registered) | (43,010 | ) | (458,670 | ) | (13.3 | ) | ||||||
Lonza Group AG (Registered) | (862 | ) | (539,039 | ) | (15.6 | ) | ||||||
Swisscom AG (Registered) | (340 | ) | (180,732 | ) | (5.2 | ) | ||||||
Temenos AG (Registered) | (2,260 | ) | (333,988 | ) | (9.7 | ) | ||||||
UBS Group AG (Registered) | (55,396 | ) | (652,608 | ) | (18.9 | ) | ||||||
|
| |||||||||||
| (2,596,904 | ) | |||||||||||
| Taiwan | ||||||||||||
Catcher Technology Co. Ltd. | (135,000 | ) | (996,795 | ) | (28.9 | ) | ||||||
Cathay Financial Holding Co. Ltd. | (72,000 | ) | (97,331 | ) | (2.8 | ) | ||||||
Formosa Plastics Corp. | (40,000 | ) | (107,128 | ) | (3.1 | ) | ||||||
Hon Hai Precision Industry Co. Ltd. | (240 | ) | (641 | ) | (0.0 | ) | ||||||
Nanya Technology Corp. | (247,000 | ) | (511,118 | ) | (14.8 | ) | ||||||
|
| |||||||||||
| (1,713,013 | ) | |||||||||||
| United Kingdom | ||||||||||||
Admiral Group plc | (4,230 | ) | (131,911 | ) | (3.8 | ) | ||||||
BT Group plc | (82,360 | ) | (105,829 | ) | (3.1 | ) | ||||||
CNH Industrial NV | (4,450 | ) | (30,237 | ) | (0.9 | ) | ||||||
Croda International plc | (900 | ) | (67,171 | ) | (1.9 | ) | ||||||
Fiat Chrysler Automobiles NV . | (19,740 | ) | (200,684 | ) | (5.8 | ) | ||||||
HSBC Holdings plc | (32,270 | ) | (145,306 | ) | (4.2 | ) | ||||||
Imperial Brands plc | (2,580 | ) | (42,985 | ) | (1.2 | ) | ||||||
Informa plc | (13,580 | ) | (64,391 | ) | (1.9 | ) | ||||||
London Stock Exchange Group plc | (390 | ) | (43,079 | ) | (1.3 | ) | ||||||
Melrose Industries plc | (29,990 | ) | (33,116 | ) | (1.0 | ) | ||||||
Taylor Wimpey plc | (111,180 | ) | (171,498 | ) | (5.0 | ) | ||||||
Tesco plc | (47,210 | ) | (133,243 | ) | (3.9 | ) | ||||||
WPP plc | (11,560 | ) | (85,732 | ) | (2.5 | ) | ||||||
|
| |||||||||||
| (1,255,182 | ) | |||||||||||
| United States | ||||||||||||
3M Co. | (2,079 | ) | (312,827 | ) | (9.1 | ) | ||||||
Accenture plc, Class A | (1,360 | ) | (305,701 | ) | (8.8 | ) | ||||||
AECOM | (7,500 | ) | (271,425 | ) | (7.9 | ) | ||||||
Albemarle Corp. | (2,074 | ) | (171,022 | ) | (4.9 | ) | ||||||
Altria Group, Inc. | (2,615 | ) | (107,607 | ) | (3.1 | ) | ||||||
American Airlines Group, Inc. | (5,015 | ) | (55,767 | ) | (1.6 | ) | ||||||
American International Group, Inc. | (5,993 | ) | (192,615 | ) | (5.6 | ) | ||||||
CONSOLIDATED SCHEDULE OF INVESTMENTS | 27 |
Consolidated Schedule of Investments (continued) July 31, 2020 | BlackRock Total Factor Fund |
| Shares | Value | % of Basket Value | ||||||||||
| United States (continued) | ||||||||||||
AmerisourceBergen Corp. | (3,300 | ) | $ | (330,627 | ) | (9.6 | )% | |||||
Amgen, Inc. | (260 | ) | (63,614 | ) | (1.8 | ) | ||||||
Amphenol Corp., Class A | (4,188 | ) | (442,923 | ) | (12.8 | ) | ||||||
Analog Devices, Inc. | (4,780 | ) | (548,983 | ) | (15.9 | ) | ||||||
Anthem, Inc. | (80 | ) | (21,904 | ) | (0.6 | ) | ||||||
AO Smith Corp. | (1,410 | ) | (67,877 | ) | (2.0 | ) | ||||||
Aptiv plc | (6,060 | ) | (471,165 | ) | (13.6 | ) | ||||||
Arista Networks, Inc. | (500 | ) | (129,885 | ) | (3.8 | ) | ||||||
AT&T, Inc. | (3,250 | ) | (96,135 | ) | (2.8 | ) | ||||||
Athene Holding Ltd., Class A | (10,324 | ) | (332,949 | ) | (9.6 | ) | ||||||
Avangrid, Inc. | (1,610 | ) | (80,162 | ) | (2.3 | ) | ||||||
Ball Corp. | (630 | ) | (46,387 | ) | (1.3 | ) | ||||||
Bausch Health Cos., Inc. | (12,010 | ) | (219,423 | ) | (6.4 | ) | ||||||
Becton Dickinson and Co. | (3,927 | ) | (1,104,822 | ) | (32.0 | ) | ||||||
BioMarin Pharmaceutical, Inc. | (458 | ) | (54,873 | ) | (1.6 | ) | ||||||
Bio-Techne Corp. | (1,220 | ) | (335,695 | ) | (9.7 | ) | ||||||
Black Knight, Inc. | (9,970 | ) | (746,952 | ) | (21.6 | ) | ||||||
BorgWarner, Inc. | (1,320 | ) | (48,312 | ) | (1.4 | ) | ||||||
Boston Scientific Corp. | (8,609 | ) | (332,049 | ) | (9.6 | ) | ||||||
Broadcom, Inc. | (490 | ) | (155,208 | ) | (4.5 | ) | ||||||
Broadridge Financial Solutions, Inc. | (1,260 | ) | (169,268 | ) | (4.9 | ) | ||||||
Brown-Forman Corp., Class B | (2,630 | ) | (182,364 | ) | (5.3 | ) | ||||||
Bunge Ltd. | (1,035 | ) | (44,960 | ) | (1.3 | ) | ||||||
Cable One, Inc. | (150 | ) | (273,384 | ) | (7.9 | ) | ||||||
Cabot Oil & Gas Corp. | (3,860 | ) | (72,182 | ) | (2.1 | ) | ||||||
Campbell Soup Co. | (109 | ) | (5,403 | ) | (0.2 | ) | ||||||
CarMax, Inc. | (3,960 | ) | (384,001 | ) | (11.1 | ) | ||||||
Caterpillar, Inc. | (260 | ) | (34,549 | ) | (1.0 | ) | ||||||
CBRE Group, Inc., Class A | (2,390 | ) | (104,706 | ) | (3.0 | ) | ||||||
Centene Corp. | (4,549 | ) | (296,822 | ) | (8.6 | ) | ||||||
CenterPoint Energy, Inc. | (8,080 | ) | (153,601 | ) | (4.4 | ) | ||||||
CenturyLink, Inc. | (3,880 | ) | (37,442 | ) | (1.1 | ) | ||||||
Ceridian HCM Holding, Inc. | (7,940 | ) | (621,623 | ) | (18.0 | ) | ||||||
Charles River Laboratories International, Inc. | (180 | ) | (35,818 | ) | (1.0 | ) | ||||||
Charles Schwab Corp. (The) | (5,395 | ) | (178,844 | ) | (5.2 | ) | ||||||
Charter Communications, Inc., Class A | (330 | ) | (191,400 | ) | (5.5 | ) | ||||||
Chevron Corp. | (3,100 | ) | (260,214 | ) | (7.5 | ) | ||||||
Church & Dwight Co., Inc. | (2,233 | ) | (215,105 | ) | (6.2 | ) | ||||||
Cincinnati Financial Corp. | (1,520 | ) | (118,454 | ) | (3.4 | ) | ||||||
Cisco Systems, Inc. | (13,280 | ) | (625,488 | ) | (18.1 | ) | ||||||
Coca-Cola Co. (The) | (640 | ) | (30,234 | ) | (0.9 | ) | ||||||
Comcast Corp., Class A | (3,750 | ) | (160,500 | ) | (4.6 | ) | ||||||
Commerce Bancshares, Inc. | (2,760 | ) | (158,038 | ) | (4.6 | ) | ||||||
Conagra Brands, Inc. | (3,730 | ) | (139,689 | ) | (4.0 | ) | ||||||
Concho Resources, Inc. | (10,047 | ) | (527,869 | ) | (15.3 | ) | ||||||
Consolidated Edison, Inc. | (210 | ) | (16,134 | ) | (0.5 | ) | ||||||
Cooper Cos., Inc. (The) | (220 | ) | (62,245 | ) | (1.8 | ) | ||||||
Copart, Inc. | (3,460 | ) | (322,645 | ) | (9.3 | ) | ||||||
Corning, Inc. | (13,040 | ) | (404,240 | ) | (11.7 | ) | ||||||
Credit Acceptance Corp. | (1,300 | ) | (608,322 | ) | (17.6 | ) | ||||||
Danaher Corp. | (2,588 | ) | (527,434 | ) | (15.3 | ) | ||||||
Deere & Co. | (610 | ) | (107,549 | ) | (3.1 | ) | ||||||
Dell Technologies, Inc., Class C | (8,220 | ) | (491,803 | ) | (14.2 | ) | ||||||
Discovery, Inc., Class C | (2,560 | ) | (48,512 | ) | (1.4 | ) | ||||||
DocuSign, Inc. | (582 | ) | (126,195 | ) | (3.7 | ) | ||||||
Dollar Tree, Inc. | (2,275 | ) | (212,371 | ) | (6.1 | ) | ||||||
Dominion Energy, Inc. | (520 | ) | (42,136 | ) | (1.2 | ) | ||||||
DR Horton, Inc. | (2,929 | ) | (193,783 | ) | (5.6 | ) | ||||||
Eastman Chemical Co. | (780 | ) | (58,211 | ) | (1.7 | ) | ||||||
Eaton Corp. plc | (1,028 | ) | (95,738 | ) | (2.8 | ) | ||||||
Edison International | (13,965 | ) | (777,432 | ) | (22.5 | ) | ||||||
Elanco Animal Health, Inc. | (3,895 | ) | (92,039 | ) | (2.7 | ) | ||||||
| Shares | Value | % of Basket Value | ||||||||||
| United States (continued) | ||||||||||||
Entegris, Inc. | (1,300 | ) | $ | (93,483 | ) | (2.7 | )% | |||||
EPAM Systems, Inc. | (1,010 | ) | (292,981 | ) | (8.5 | ) | ||||||
Equifax, Inc. | (4,251 | ) | (691,043 | ) | (20.0 | ) | ||||||
Everest Re Group Ltd. | (690 | ) | (150,965 | ) | (4.4 | ) | ||||||
Exact Sciences Corp. | (4,739 | ) | (449,020 | ) | (13.0 | ) | ||||||
Exxon Mobil Corp. | (26,190 | ) | (1,102,075 | ) | (31.9 | ) | ||||||
Fastenal Co. | (10,990 | ) | (516,970 | ) | (15.0 | ) | ||||||
Fidelity National Information Services, Inc. | (3,540 | ) | (517,937 | ) | (15.0 | ) | ||||||
First Republic Bank | (969 | ) | (108,993 | ) | (3.2 | ) | ||||||
Fiserv, Inc. | (2,224 | ) | (221,933 | ) | (6.4 | ) | ||||||
FLIR Systems, Inc. | (1,400 | ) | (58,324 | ) | (1.7 | ) | ||||||
Ford Motor Co. | (73,240 | ) | (484,116 | ) | (14.0 | ) | ||||||
Fox Corp., Class B | (5,550 | ) | (143,024 | ) | (4.1 | ) | ||||||
Freeport-McMoRan, Inc. | (56,750 | ) | (733,210 | ) | (21.2 | ) | ||||||
Gartner, Inc. | (350 | ) | (43,624 | ) | (1.3 | ) | ||||||
General Mills, Inc. | (1,220 | ) | (77,189 | ) | (2.2 | ) | ||||||
Genuine Parts Co. | (2,640 | ) | (237,996 | ) | (6.9 | ) | ||||||
Global Payments, Inc. | (2,240 | ) | (398,765 | ) | (11.5 | ) | ||||||
Globe Life, Inc. | (2,540 | ) | (202,184 | ) | (5.9 | ) | ||||||
Guardant Health, Inc. | (2,730 | ) | (232,541 | ) | (6.7 | ) | ||||||
Guidewire Software, Inc. | (1,796 | ) | (211,317 | ) | (6.1 | ) | ||||||
Halliburton Co. | (3,410 | ) | (48,865 | ) | (1.4 | ) | ||||||
Hasbro, Inc. | (2,870 | ) | (208,821 | ) | (6.0 | ) | ||||||
Hormel Foods Corp. | (3,070 | ) | (156,140 | ) | (4.5 | ) | ||||||
Howmet Aerospace, Inc. | (6,913 | ) | (102,174 | ) | (3.0 | ) | ||||||
Huntington Ingalls Industries, Inc. | (920 | ) | (159,813 | ) | (4.6 | ) | ||||||
IHS Markit Ltd. | (3,700 | ) | (298,701 | ) | (8.6 | ) | ||||||
Ingersoll Rand, Inc. | (2,240 | ) | (70,762 | ) | (2.0 | ) | ||||||
International Business Machines Corp. | (480 | ) | (59,011 | ) | (1.7 | ) | ||||||
International Flavors & Fragrances, Inc. | (7,302 | ) | (919,687 | ) | (26.6 | ) | ||||||
International Paper Co. | (7,550 | ) | (262,665 | ) | (7.6 | ) | ||||||
Intuitive Surgical, Inc. | (461 | ) | (315,988 | ) | (9.1 | ) | ||||||
IQVIA Holdings, Inc. | (1,400 | ) | (221,746 | ) | (6.4 | ) | ||||||
Jacobs Engineering Group, Inc. | (2,220 | ) | (189,477 | ) | (5.5 | ) | ||||||
JM Smucker Co. (The) | (1,310 | ) | (143,249 | ) | (4.1 | ) | ||||||
Johnson & Johnson | (725 | ) | (105,676 | ) | (3.1 | ) | ||||||
Kellogg Co. | (1,160 | ) | (80,028 | ) | (2.3 | ) | ||||||
Keurig Dr Pepper, Inc. | (10,199 | ) | (311,987 | ) | (9.0 | ) | ||||||
Kimberly-Clark Corp. | (690 | ) | (104,908 | ) | (3.0 | ) | ||||||
Kraft Heinz Co. (The) | (6,980 | ) | (239,972 | ) | (6.9 | ) | ||||||
L3Harris Technologies, Inc. | (1,510 | ) | (254,178 | ) | (7.4 | ) | ||||||
Las Vegas Sands Corp. | (3,110 | ) | (135,720 | ) | (3.9 | ) | ||||||
Lear Corp. | (1,620 | ) | (178,816 | ) | (5.2 | ) | ||||||
Leidos Holdings, Inc. | (660 | ) | (62,806 | ) | (1.8 | ) | ||||||
Lennox International, Inc. | (570 | ) | (152,840 | ) | (4.4 | ) | ||||||
Live Nation Entertainment, Inc. | (1,019 | ) | (47,699 | ) | (1.4 | ) | ||||||
LyondellBasell Industries NV, Class A | (3,600 | ) | (225,072 | ) | (6.5 | ) | ||||||
Marriott International, Inc., Class A | (3,516 | ) | (294,729 | ) | (8.5 | ) | ||||||
Marvell Technology Group Ltd. | (23,673 | ) | (863,354 | ) | (25.0 | ) | ||||||
McCormick & Co., Inc. (Non- Voting) | (660 | ) | (128,634 | ) | (3.7 | ) | ||||||
Medtronic plc | (1,570 | ) | (151,474 | ) | (4.4 | ) | ||||||
MetLife, Inc. | (1,090 | ) | (41,257 | ) | (1.2 | ) | ||||||
Microchip Technology, Inc. | (2,821 | ) | (286,980 | ) | (8.3 | ) | ||||||
Micron Technology, Inc. | (3,340 | ) | (167,184 | ) | (4.8 | ) | ||||||
Moderna, Inc. | (1,350 | ) | (100,035 | ) | (2.9 | ) | ||||||
MongoDB, Inc. | (210 | ) | (48,107 | ) | (1.4 | ) | ||||||
Morgan Stanley | (5,430 | ) | (265,418 | ) | (7.7 | ) | ||||||
Mylan NV | (15,159 | ) | (244,211 | ) | (7.1 | ) | ||||||
| 28 | 2020 BLACKROCK ANNUAL REPORTTO SHAREHOLDERS |
Consolidated Schedule of Investments (continued) July 31, 2020 | BlackRock Total Factor Fund |
| Shares | Value | % of Basket Value | ||||||||||
| United States (continued) | ||||||||||||
National Oilwell Varco, Inc. | (7,380 | ) | $ | (84,944 | ) | (2.5 | )% | |||||
Newell Brands, Inc. | (11,184 | ) | (183,418 | ) | (5.3 | ) | ||||||
Newmont Corp. | (2,110 | ) | (146,012 | ) | (4.2 | ) | ||||||
Norfolk Southern Corp. | (2,006 | ) | (385,573 | ) | (11.2 | ) | ||||||
Northern Trust Corp. | (3,700 | ) | (289,895 | ) | (8.4 | ) | ||||||
Nucor Corp. | (8,490 | ) | (356,156 | ) | (10.3 | ) | ||||||
Omnicom Group, Inc. | (1,820 | ) | (97,789 | ) | (2.8 | ) | ||||||
ON Semiconductor Corp. | (3,630 | ) | (74,778 | ) | (2.2 | ) | ||||||
Oracle Corp. | (2,000 | ) | (110,900 | ) | (3.2 | ) | ||||||
PACCAR, Inc. | (3,000 | ) | (255,240 | ) | (7.4 | ) | ||||||
Packaging Corp. of America | (4,551 | ) | (437,442 | ) | (12.7 | ) | ||||||
Paycom Software, Inc. | (927 | ) | (263,611 | ) | (7.6 | ) | ||||||
PayPal Holdings, Inc. | (470 | ) | (92,153 | ) | (2.7 | ) | ||||||
PerkinElmer, Inc. | (2,825 | ) | (335,921 | ) | (9.7 | ) | ||||||
Perrigo Co. plc | (12,548 | ) | (665,295 | ) | (19.3 | ) | ||||||
PNC Financial Services Group, Inc. (The) | (300 | ) | (32,001 | ) | (0.9 | ) | ||||||
Pool Corp. | (330 | ) | (104,511 | ) | (3.0 | ) | ||||||
Principal Financial Group, Inc. | (7,120 | ) | (302,102 | ) | (8.7 | ) | ||||||
Progressive Corp. (The) | (510 | ) | (46,073 | ) | (1.3 | ) | ||||||
Prudential Financial, Inc. | (5,730 | ) | (363,110 | ) | (10.5 | ) | ||||||
PTC, Inc. | (2,806 | ) | (240,081 | ) | (6.9 | ) | ||||||
QIAGEN NV | (3,689 | ) | (182,421 | ) | (5.3 | ) | ||||||
Quest Diagnostics, Inc. | (800 | ) | (101,656 | ) | (2.9 | ) | ||||||
Raymond James Financial, Inc. | (970 | ) | (67,396 | ) | (2.0 | ) | ||||||
Regeneron Pharmaceuticals, Inc. | (270 | ) | (170,659 | ) | (4.9 | ) | ||||||
Regions Financial Corp. | (10,170 | ) | (110,446 | ) | (3.2 | ) | ||||||
Rollins, Inc. | (1,160 | ) | (60,784 | ) | (1.8 | ) | ||||||
Roper Technologies, Inc. | (460 | ) | (198,927 | ) | (5.8 | ) | ||||||
Sarepta Therapeutics, Inc. | (2,050 | ) | (314,716 | ) | (9.1 | ) | ||||||
Schlumberger Ltd. | (15,550 | ) | (282,077 | ) | (8.2 | ) | ||||||
Seattle Genetics, Inc. | (2,320 | ) | (385,746 | ) | (11.2 | ) | ||||||
Service Corp. International | (2,210 | ) | (95,826 | ) | (2.8 | ) | ||||||
Southwest Airlines Co. | (5,900 | ) | (182,251 | ) | (5.3 | ) | ||||||
SS&C Technologies Holdings, Inc. | (2,293 | ) | (131,848 | ) | (3.8 | ) | ||||||
State Street Corp. | (770 | ) | (49,118 | ) | (1.4 | ) | ||||||
TD Ameritrade Holding Corp. | (2,600 | ) | (93,314 | ) | (2.7 | ) | ||||||
Teleflex, Inc. | (150 | ) | (55,965 | ) | (1.6 | ) | ||||||
Tesla, Inc. | (469 | ) | (671,026 | ) | (19.4 | ) | ||||||
Thermo Fisher Scientific, Inc. | (1,220 | ) | (505,019 | ) | (14.6 | ) | ||||||
Tiffany & Co. | (1,783 | ) | (223,517 | ) | (6.5 | ) | ||||||
T-Mobile US, Inc. | (1,530 | ) | (164,291 | ) | (4.8 | ) | ||||||
Trade Desk, Inc. (The), Class A | (1,650 | ) | (744,678 | ) | (21.6 | ) | ||||||
Travelers Cos., Inc. (The) | (380 | ) | (43,480 | ) | (1.3 | ) | ||||||
Trimble, Inc. | (1,580 | ) | (70,326 | ) | (2.0 | ) | ||||||
Truist Financial Corp. | (9,920 | ) | (371,603 | ) | (10.8 | ) | ||||||
Twilio, Inc., Class A | (2,410 | ) | (668,582 | ) | (19.4 | ) | ||||||
Twitter, Inc. | (13,640 | ) | (496,496 | ) | (14.4 | ) | ||||||
Tyler Technologies, Inc. | (160 | ) | (57,160 | ) | (1.7 | ) | ||||||
UGI Corp. | (1,440 | ) | (48,010 | ) | (1.4 | ) | ||||||
Union Pacific Corp. | (3,090 | ) | (535,652 | ) | (15.5 | ) | ||||||
United Rentals, Inc. | (880 | ) | (136,726 | ) | (4.0 | ) | ||||||
UnitedHealth Group, Inc. | (1,180 | ) | (357,280 | ) | (10.3 | ) | ||||||
Universal Display Corp. | (600 | ) | (104,670 | ) | (3.0 | ) | ||||||
Vail Resorts, Inc. | (1,540 | ) | (295,726 | ) | (8.6 | ) | ||||||
Valero Energy Corp. | (440 | ) | (24,741 | ) | (0.7 | ) | ||||||
Varian Medical Systems, Inc. | (540 | ) | (77,069 | ) | (2.2 | ) | ||||||
VF Corp. | (110 | ) | (6,640 | ) | (0.2 | ) | ||||||
Visa, Inc., Class A | (3,151 | ) | (599,950 | ) | (17.4 | ) | ||||||
Voya Financial, Inc. | (630 | ) | (31,122 | ) | (0.9 | ) | ||||||
Vulcan Materials Co. | (1,160 | ) | (136,207 | ) | (3.9 | ) | ||||||
Walt Disney Co. (The) | (9,780 | ) | (1,143,673 | ) | (33.1 | ) | ||||||
Wells Fargo & Co. | (4,720 | ) | (114,507 | ) | (3.3 | ) | ||||||
| Shares | Value | % of Basket Value | ||||||||||
| United States (continued) | ||||||||||||
Westlake Chemical Corp. | (4,802 | ) | $ | (261,709 | ) | (7.6 | )% | |||||
WestRock Co. | (6,740 | ) | (181,036 | ) | (5.2 | ) | ||||||
Williams Cos., Inc. (The) | (2,190 | ) | (41,895 | ) | (1.2 | ) | ||||||
Xcel Energy, Inc. | (1,390 | ) | (95,966 | ) | (2.8 | ) | ||||||
|
| |||||||||||
| (46,430,442 | ) | |||||||||||
|
| |||||||||||
Total Reference Entity — Short |
| (90,973,465 | ) | |||||||||
|
| |||||||||||
Net Value of Reference Entity — Citibank NA |
| $ | 3,455,144 | |||||||||
|
| |||||||||||
The following table represents the individual long and short positions and related values of equity securities underlying the total return swap with Credit Suisse International, as of July 31, 2020, expiration date 02/08/23:
|
| |||||||||||
Reference Entity — Long | ||||||||||||
| Australia | ||||||||||||
AGL Energy Ltd. | 9,385 | 111,170 | 3.6 | |||||||||
Aristocrat Leisure Ltd. | 1,340 | 25,124 | 0.8 | |||||||||
Aurizon Holdings Ltd. | 20,110 | 64,130 | 2.1 | |||||||||
BHP Group plc | 18,432 | 398,563 | 12.9 | |||||||||
Brambles Ltd. | 6,920 | 53,428 | 1.7 | |||||||||
Cochlear Ltd. | 1,080 | 147,381 | 4.8 | |||||||||
Macquarie Group Ltd. | 4,460 | 391,954 | 12.7 | |||||||||
QBE Insurance Group Ltd. | 71,168 | 498,424 | 16.1 | |||||||||
Rio Tinto plc | 1,370 | 83,395 | 2.7 | |||||||||
Santos Ltd. | 96,890 | 361,914 | 11.7 | |||||||||
South32 Ltd. | 52,950 | 77,743 | 2.5 | |||||||||
Suncorp Group Ltd. | 6,560 | 40,067 | 1.3 | |||||||||
Wesfarmers Ltd. | 9,847 | 327,391 | 10.6 | |||||||||
Woodside Petroleum Ltd. | 5,140 | 73,122 | 2.4 | |||||||||
|
| |||||||||||
| 2,653,806 | ||||||||||||
| Austria | ||||||||||||
OMV AG | 19,565 | 617,899 | 20.0 | |||||||||
|
| |||||||||||
| Belgium | ||||||||||||
Colruyt SA | 2,190 | 127,188 | 4.1 | |||||||||
Groupe Bruxelles Lambert SA | 4,484 | 388,945 | 12.6 | |||||||||
UCB SA | 2,118 | 272,145 | 8.8 | |||||||||
|
| |||||||||||
| 788,278 | ||||||||||||
| Canada | ||||||||||||
Agnico Eagle Mines Ltd. | 1,990 | 158,185 | 5.1 | |||||||||
Bank of Montreal | 2,147 | 117,460 | 3.8 | |||||||||
Bank of Nova Scotia (The) | 2,100 | 86,245 | 2.8 | |||||||||
BCE, Inc. | 4,150 | 174,000 | 5.6 | |||||||||
Canadian Imperial Bank of Commerce | 2,730 | 188,998 | 6.1 | |||||||||
Canadian Pacific Railway Ltd. | 240 | 66,004 | 2.1 | |||||||||
Constellation Software, Inc. | 70 | 82,800 | 2.7 | |||||||||
Franco-Nevada Corp. | 1,830 | 292,510 | 9.5 | |||||||||
Hydro One Ltd. | 8,540 | 181,964 | 5.9 | |||||||||
Loblaw Cos. Ltd. | 2,970 | 154,082 | 5.0 | |||||||||
Magna International, Inc. | 7,272 | 335,748 | 10.9 | |||||||||
Manulife Financial Corp. | 48,730 | 653,032 | 21.1 | |||||||||
Pembina Pipeline Corp. | 3,823 | 92,903 | 3.0 | |||||||||
Rogers Communications, Inc., Class B | 7,084 | 289,294 | 9.4 | |||||||||
Royal Bank of Canada | 4,038 | 278,556 | 9.0 | |||||||||
Sun Life Financial, Inc. | 9,150 | 356,655 | 11.5 | |||||||||
Suncor Energy, Inc. | 1,111 | 17,476 | 0.6 | |||||||||
TC Energy Corp. | 3,500 | 159,525 | 5.2 | |||||||||
|
| |||||||||||
| 3,685,437 | ||||||||||||
CONSOLIDATED SCHEDULE OF INVESTMENTS | 29 |
Consolidated Schedule of Investments (continued) July 31, 2020 | BlackRock Total Factor Fund |
| Shares | Value | % of Basket Value | ||||||||||
| Denmark | ||||||||||||
Carlsberg A/S, Class B | 10,534 | $ | 1,555,762 | 50.4 | % | |||||||
Genmab A/S | 410 | 141,125 | 4.6 | |||||||||
Novo Nordisk A/S, Class B | 7,748 | 508,366 | 16.4 | |||||||||
Novozymes A/S, Class B | 4,540 | 271,580 | 8.8 | |||||||||
|
| |||||||||||
| 2,476,833 | ||||||||||||
| Finland | ||||||||||||
Fortum OYJ | 7,620 | 154,662 | 5.0 | |||||||||
Stora Enso OYJ, Class R | 11,590 | 145,358 | 4.7 | |||||||||
|
| |||||||||||
| 300,020 | ||||||||||||
| France | ||||||||||||
Alstom SA | 830 | 46,250 | 1.5 | |||||||||
BNP Paribas SA | 2,880 | 116,190 | 3.8 | |||||||||
Carrefour SA | 11,104 | 176,475 | 5.7 | |||||||||
Cie de Saint-Gobain | 8,010 | 296,330 | 9.6 | |||||||||
Credit Agricole SA | 7,910 | 76,140 | 2.5 | |||||||||
Dassault Systemes SE | 1,590 | 289,529 | 9.4 | |||||||||
Eiffage SA | 2,714 | 237,184 | 7.7 | |||||||||
Engie SA | 21,970 | 292,666 | 9.5 | |||||||||
Ipsen SA | 1,040 | 99,738 | 3.2 | |||||||||
Legrand SA | 11,161 | 863,396 | 28.0 | |||||||||
Orange SA | 55,361 | 648,879 | 21.0 | |||||||||
Peugeot SA | 28,165 | 452,744 | 14.7 | |||||||||
Publicis Groupe SA | 6,690 | 213,920 | 6.9 | |||||||||
Sartorius Stedim Biotech | 300 | 93,835 | 3.0 | |||||||||
Schneider Electric SE | 3,530 | 404,762 | 13.1 | |||||||||
Sodexo SA | 3,070 | 211,873 | 6.9 | |||||||||
Thales SA | 1,000 | 72,291 | 2.3 | |||||||||
Veolia Environnement SA | 14,185 | 324,944 | 10.5 | |||||||||
Vivendi SA | 1,574 | 41,768 | 1.3 | |||||||||
|
| |||||||||||
| 4,958,914 | ||||||||||||
| Germany | ||||||||||||
Aroundtown SA | 16,640 | 100,199 | 3.2 | |||||||||
Brenntag AG | 1,800 | 111,083 | 3.6 | |||||||||
Deutsche Boerse AG | 1,530 | 278,374 | 9.0 | |||||||||
Deutsche Post AG (Registered) | 5,867 | 238,143 | 7.7 | |||||||||
Deutsche Telekom AG (Registered) | 27,505 | 459,189 | 14.9 | |||||||||
Evonik Industries AG | 7,350 | 198,569 | 6.4 | |||||||||
HeidelbergCement AG | 9,354 | 519,104 | 16.8 | |||||||||
HOCHTIEF AG | 8,409 | 686,593 | 22.2 | |||||||||
Muenchener Rueckversicherungs-Gesellschaft AG (Registered) | 2,051 | 543,665 | 17.6 | |||||||||
Porsche Automobil Holding SE (Preference) | 660 | 37,358 | 1.2 | |||||||||
Puma SE | 3,390 | 263,870 | 8.5 | |||||||||
Symrise AG | 2,150 | 268,773 | 8.7 | |||||||||
Telefonica Deutschland Holding AG | 55,400 | 151,162 | 4.9 | |||||||||
|
| |||||||||||
| 3,856,082 | ||||||||||||
| Hong Kong | ||||||||||||
Hang Seng Bank Ltd. | 32,700 | 514,520 | 16.6 | |||||||||
Techtronic Industries Co. Ltd. | 28,000 | 292,853 | 9.5 | |||||||||
|
| |||||||||||
| 807,373 | ||||||||||||
| Italy | ||||||||||||
Assicurazioni Generali SpA | 4,240 | 63,667 | 2.0 | |||||||||
Enel SpA | 10,030 | 91,880 | 3.0 | |||||||||
Eni SpA | 4,580 | 40,798 | 1.3 | |||||||||
Intesa Sanpaolo SpA | 51,090 | 104,139 | 3.4 | |||||||||
Moncler SpA | 7,970 | 308,135 | 10.0 | |||||||||
| Shares | Value | % of Basket Value | ||||||||||
| Italy (continued) | ||||||||||||
Recordati SpA | 740 | $ | 39,746 | 1.3 | % | |||||||
|
| |||||||||||
| 648,365 | ||||||||||||
| Japan | ||||||||||||
Advantest Corp. | 700 | 38,219 | 1.2 | |||||||||
Aeon Co. Ltd. | 2,900 | 68,566 | 2.2 | |||||||||
AGC, Inc. | 27,500 | 773,050 | 25.0 | |||||||||
Ajinomoto Co., Inc. | 20,100 | 362,998 | 11.8 | |||||||||
Asahi Group Holdings Ltd. | 2,300 | 74,971 | 2.4 | |||||||||
Astellas Pharma, Inc. | 4,300 | 67,071 | 2.2 | |||||||||
Bandai Namco Holdings, Inc. | 800 | 44,178 | 1.4 | |||||||||
Bridgestone Corp. | 13,500 | 397,650 | 12.9 | |||||||||
Denso Corp. | 14,500 | 536,393 | 17.4 | |||||||||
East Japan Railway Co. | 2,100 | 121,054 | 3.9 | |||||||||
Eisai Co. Ltd. | 800 | 64,565 | 2.1 | |||||||||
ENEOS Holdings, Inc. | 106,500 | 373,454 | 12.1 | |||||||||
Hitachi Ltd. | 19,500 | 584,104 | 18.9 | |||||||||
Hoshizaki Corp. | 600 | 45,738 | 1.5 | |||||||||
Hoya Corp. | 1,700 | 167,653 | 5.4 | |||||||||
Inpex Corp. | 19,300 | 110,165 | 3.6 | |||||||||
Kose Corp. | 700 | 70,900 | 2.3 | |||||||||
Kyocera Corp. | 6,500 | 361,987 | 11.7 | |||||||||
Marubeni Corp. | 9,900 | 45,579 | 1.5 | |||||||||
MEIJI Holdings Co. Ltd. | 10,900 | 855,917 | 27.7 | |||||||||
MINEBEA MITSUMI, Inc. | 17,200 | 282,069 | 9.1 | |||||||||
Mitsubishi Chemical Holdings Corp. | 800 | 4,298 | 0.1 | |||||||||
Mitsubishi Electric Corp. | 36,700 | 479,085 | 15.5 | |||||||||
Mitsubishi Heavy Industries Ltd. | 38,200 | 888,670 | 28.8 | |||||||||
Mizuho Financial Group, Inc. | 173,400 | 211,383 | 6.8 | |||||||||
NEC Corp. | 8,400 | 470,615 | 15.2 | |||||||||
Nippon Steel Corp. | 2,600 | 21,318 | 0.7 | |||||||||
Nissin Foods Holdings Co. Ltd. | 5,300 | 478,754 | 15.5 | |||||||||
Nitori Holdings Co. Ltd. | 1,000 | 218,936 | 7.1 | |||||||||
Nitto Denko Corp. | 9,600 | 544,132 | 17.6 | |||||||||
Olympus Corp. | 4,600 | 82,738 | 2.7 | |||||||||
Ono Pharmaceutical Co. Ltd. | 15,200 | 427,232 | 13.8 | |||||||||
ORIX Corp. | 2,600 | 28,119 | 0.9 | |||||||||
Otsuka Holdings Co. Ltd. | 11,200 | 464,504 | 15.0 | |||||||||
Ricoh Co. Ltd. | 4,500 | 28,979 | 0.9 | |||||||||
Rohm Co. Ltd. | 5,000 | 321,069 | 10.4 | |||||||||
Sekisui House Ltd. | 34,400 | 628,274 | 20.3 | |||||||||
Seven & i Holdings Co. Ltd. | 1,100 | 33,241 | 1.1 | |||||||||
Shimadzu Corp. | 4,700 | 119,941 | 3.9 | |||||||||
Shionogi & Co. Ltd. | 800 | 47,593 | 1.5 | |||||||||
Softbank Corp. | 200 | 2,677 | 0.1 | |||||||||
Subaru Corp. | 6,900 | 130,323 | 4.2 | |||||||||
Sumitomo Chemical Co. Ltd. | 54,500 | 157,266 | 5.1 | |||||||||
Sumitomo Electric Industries Ltd. | 35,600 | 397,745 | 12.9 | |||||||||
Sumitomo Mitsui Financial Group, Inc. | 10,700 | 285,117 | 9.2 | |||||||||
TDK Corp. | 800 | 89,070 | 2.9 | |||||||||
Terumo Corp. | 3,000 | 113,493 | 3.7 | |||||||||
Tokyo Electron Ltd. | 500 | 138,359 | 4.5 | |||||||||
Toray Industries, Inc. | 68,200 | 295,208 | 9.6 | |||||||||
Trend Micro, Inc. | 1,500 | 87,973 | 2.9 | |||||||||
West Japan Railway Co. | 100 | 4,319 | 0.1 | |||||||||
Yakult Honsha Co. Ltd. | 4,200 | 240,052 | 7.8 | |||||||||
Yamaha Corp. | 400 | 18,443 | 0.6 | |||||||||
|
| |||||||||||
| 12,905,207 | ||||||||||||
| 30 | 2020 BLACKROCK ANNUAL REPORTTO SHAREHOLDERS |
Consolidated Schedule of Investments (continued) July 31, 2020 | BlackRock Total Factor Fund |
| Shares | Value | % of Basket Value | ||||||||||
| Luxembourg | ||||||||||||
ArcelorMittal SA | 5,630 | $ | 62,334 | 2.0 | % | |||||||
Tenaris SA | 41,000 | 241,636 | 7.9 | |||||||||
|
| |||||||||||
| 303,970 | ||||||||||||
| Macau | ||||||||||||
Sands China Ltd. | 60,400 | 230,294 | 7.5 | |||||||||
|
| |||||||||||
| Netherlands | ||||||||||||
Akzo Nobel NV | 6,254 | 589,280 | 19.1 | |||||||||
EXOR NV | 571 | 32,066 | 1.0 | |||||||||
Koninklijke Ahold Delhaize NV | 6,300 | 181,445 | 5.9 | |||||||||
Koninklijke DSM NV | 607 | 92,911 | 3.0 | |||||||||
Koninklijke KPN NV | 32,840 | 86,514 | 2.8 | |||||||||
Koninklijke Philips NV | 11,680 | 603,516 | 19.5 | |||||||||
Royal Dutch Shell plc, Class A | 27,180 | 397,251 | 12.9 | |||||||||
Wolters Kluwer NV | 15,418 | 1,214,287 | 39.3 | |||||||||
|
| |||||||||||
| 3,197,270 | ||||||||||||
| Norway | ||||||||||||
Orkla ASA | 45,430 | 446,842 | 14.5 | |||||||||
Telenor ASA | 8,550 | 132,172 | 4.3 | |||||||||
|
| |||||||||||
| 579,014 | ||||||||||||
| Portugal | ||||||||||||
Galp Energia SGPS SA | 510 | 5,340 | 0.2 | |||||||||
Jeronimo Martins SGPS SA | 11,890 | 199,351 | 6.4 | |||||||||
|
| |||||||||||
| 204,691 | ||||||||||||
| Singapore | ||||||||||||
United Overseas Bank Ltd. | 12,900 | 181,626 | 5.9 | |||||||||
|
| |||||||||||
| South Africa | ||||||||||||
Anglo American plc | 33,160 | 802,740 | 26.0 | |||||||||
|
| |||||||||||
| South Korea | ||||||||||||
KB Financial Group, Inc. | 11,379 | 336,765 | 10.9 | |||||||||
Kia Motors Corp. | 21,380 | 727,698 | 23.6 | |||||||||
KT&G Corp. | 9,666 | 656,070 | 21.2 | |||||||||
LG Electronics, Inc. | 3,950 | 234,886 | 7.6 | |||||||||
NCSoft Corp. | 249 | 169,668 | 5.5 | |||||||||
POSCO | 1,248 | 201,389 | 6.5 | |||||||||
Samsung C&T Corp. | 620 | 55,227 | 1.8 | |||||||||
Samsung Electronics Co. Ltd. (Preference) | 3,740 | 156,212 | 5.1 | |||||||||
Shinhan Financial Group Co. Ltd. | 20,025 | 502,492 | 16.3 | |||||||||
SK Telecom Co. Ltd. | 590 | 109,274 | 3.5 | |||||||||
|
| |||||||||||
| 3,149,681 | ||||||||||||
| Spain | ||||||||||||
Aena SME SA | 630 | 82,143 | 2.7 | |||||||||
Banco Bilbao Vizcaya Argentaria SA | 156,060 | 485,927 | 15.7 | |||||||||
Banco Santander SA | 20,320 | 43,576 | 1.4 | |||||||||
Industria de Diseno Textil SA | 9,356 | 247,914 | 8.0 | |||||||||
|
| |||||||||||
| 859,560 | ||||||||||||
| Sweden | ||||||||||||
Alfa Laval AB | 12,360 | 292,787 | 9.5 | |||||||||
Assa Abloy AB, Class B | 2,240 | 49,451 | 1.6 | |||||||||
Essity AB, Class B | 11,414 | 376,598 | 12.2 | |||||||||
Fastighets AB Balder, Class B | 6,090 | 252,211 | 8.1 | |||||||||
Investor AB, Class B | 2,430 | 144,183 | 4.7 | |||||||||
Lundin Energy AB | 7,400 | 172,610 | 5.6 | |||||||||
SKF AB, Class B | 2,290 | 42,394 | 1.4 | |||||||||
Swedish Match AB | 7,981 | 614,926 | 19.9 | |||||||||
|
| |||||||||||
| 1,945,160 | ||||||||||||
| Shares | Value | % of Basket Value | ||||||||||
| Switzerland | ||||||||||||
Coca-Cola HBC AG | 450 | $ | 11,715 | 0.4 | % | |||||||
Geberit AG (Registered) | 400 | 220,767 | 7.1 | |||||||||
Givaudan SA (Registered) | 100 | 414,172 | 13.4 | |||||||||
Kuehne + Nagel International AG (Registered) | 1,110 | 191,349 | 6.2 | |||||||||
LafargeHolcim Ltd. (Registered) | 3,700 | 175,049 | 5.7 | |||||||||
Novartis AG (Registered) | 4,308 | 354,838 | 11.5 | |||||||||
Partners Group Holding AG | 210 | 203,429 | 6.6 | |||||||||
Sonova Holding AG (Registered) | 763 | 172,518 | 5.6 | |||||||||
STMicroelectronics NV | 4,310 | 121,099 | 3.9 | |||||||||
Straumann Holding AG (Registered) | 130 | 128,778 | 4.2 | |||||||||
Swatch Group AG (The) | 1,745 | 365,835 | 11.8 | |||||||||
Swiss Life Holding AG (Registered) | 714 | 260,925 | 8.4 | |||||||||
Swiss Prime Site AG (Registered) | 280 | 25,554 | 0.8 | |||||||||
|
| |||||||||||
| 2,646,028 | ||||||||||||
| United Kingdom | ||||||||||||
3i Group plc | 1,970 | 22,676 | 0.7 | |||||||||
Associated British Foods plc | 12,759 | 292,235 | 9.5 | |||||||||
Aviva plc | 159,653 | 549,055 | 17.8 | |||||||||
BAE Systems plc | 27,990 | 179,385 | 5.8 | |||||||||
Barclays plc | 98,780 | 128,068 | 4.1 | |||||||||
Berkeley Group Holdings plc | 2,910 | 168,841 | 5.5 | |||||||||
BP plc | 34,390 | 124,544 | 4.0 | |||||||||
Bunzl plc | 664 | 19,021 | 0.6 | |||||||||
Burberry Group plc | 2,060 | 33,565 | 1.1 | |||||||||
CK Hutchison Holdings Ltd. | 89,500 | 584,417 | 18.9 | |||||||||
Compass Group plc | 5,442 | 74,878 | 2.4 | |||||||||
DCC plc | 3,080 | 273,875 | 8.9 | |||||||||
Diageo plc | 3,800 | 139,045 | 4.5 | |||||||||
Experian plc | 5,140 | 179,541 | 5.8 | |||||||||
GlaxoSmithKline plc | 27,987 | 557,510 | 18.1 | |||||||||
Halma plc | 12,016 | 341,300 | 11.1 | |||||||||
International Consolidated Airlines Group SA | 83,370 | 179,690 | 5.8 | |||||||||
JD Sports Fashion plc | 4,260 | 33,677 | 1.1 | |||||||||
Linde plc | 1,360 | 333,350 | 10.8 | |||||||||
RELX plc | 1,310 | 27,578 | 0.9 | |||||||||
Rentokil Initial plc | 12,260 | 85,530 | 2.8 | |||||||||
RSA Insurance Group plc | 109,100 | 608,936 | 19.7 | |||||||||
Sage Group plc (The) | 73,550 | 697,981 | 22.6 | |||||||||
Smith & Nephew plc | 15,441 | 304,766 | 9.9 | |||||||||
Unilever NV | 11,470 | 677,766 | 21.9 | |||||||||
Vodafone Group plc | 120,100 | 180,492 | 5.8 | |||||||||
|
| |||||||||||
| 6,797,722 | ||||||||||||
| United States | ||||||||||||
ABIOMED, Inc. | 400 | 119,976 | 3.9 | |||||||||
Adobe, Inc. | 501 | 222,604 | 7.2 | |||||||||
Advance Auto Parts, Inc. | 360 | 54,050 | 1.7 | |||||||||
Agilent Technologies, Inc. | 1,920 | 184,954 | 6.0 | |||||||||
Akamai Technologies, Inc. | 210 | 23,612 | 0.8 | |||||||||
Alexion Pharmaceuticals, Inc. | 4,840 | 496,052 | 16.1 | |||||||||
Align Technology, Inc. | 330 | 96,961 | 3.1 | |||||||||
Alleghany Corp. | 390 | 203,705 | 6.6 | |||||||||
Allegion plc | 730 | 72,606 | 2.4 | |||||||||
Alliant Energy Corp. | 15,136 | 815,074 | 26.4 | |||||||||
Allstate Corp. (The) | 11,812 | 1,114,935 | 36.1 | |||||||||
Ally Financial, Inc. | 5,800 | 116,580 | 3.8 | |||||||||
Alphabet, Inc., Class C | 147 | 217,995 | 7.1 | |||||||||
Amdocs Ltd. | 7,642 | 474,568 | 15.4 | |||||||||
Ameren Corp. | 857 | 68,766 | 2.2 | |||||||||
CONSOLIDATED SCHEDULE OF INVESTMENTS | 31 |
Consolidated Schedule of Investments (continued) July 31, 2020 | BlackRock Total Factor Fund |
| Shares | Value | % of Basket Value | ||||||||||
| United States (continued) | ||||||||||||
American Financial Group, Inc. | 1,506 | $ | 91,520 | 3.0 | % | |||||||
American Water Works Co., Inc. | 2,360 | 347,557 | 11.3 | |||||||||
Ameriprise Financial, Inc. | 480 | 73,742 | 2.4 | |||||||||
AMETEK, Inc. | 7,525 | 701,706 | 22.7 | |||||||||
Aon plc, Class A | 1,620 | 332,456 | 10.8 | |||||||||
Applied Materials, Inc. | 15,515 | 998,080 | 32.3 | |||||||||
AptarGroup, Inc. | 1,720 | 198,144 | 6.4 | |||||||||
Arch Capital Group Ltd. | 3,262 | 100,307 | 3.2 | |||||||||
Assurant, Inc. | 990 | 106,395 | 3.4 | |||||||||
Atmos Energy Corp. | 2,120 | 224,699 | 7.3 | |||||||||
Autodesk, Inc. | 1,820 | 430,303 | 13.9 | |||||||||
Automatic Data Processing, Inc. | 1,976 | 262,630 | 8.5 | |||||||||
Avery Dennison Corp. | 1,892 | 214,439 | 6.9 | |||||||||
Bank of America Corp. | 6,990 | 173,911 | 5.6 | |||||||||
Best Buy Co., Inc. | 4,415 | 439,690 | 14.2 | |||||||||
Biogen, Inc. | 3,280 | 900,983 | 29.2 | |||||||||
Bio-Rad Laboratories, Inc., Class A | 150 | 78,733 | 2.5 | |||||||||
Booz Allen Hamilton Holding Corp. | 2,721 | 222,469 | 7.2 | |||||||||
Bristol-Myers Squibb Co., CVR | 8,815 | 31,734 | 1.0 | |||||||||
Brown & Brown, Inc. | 5,300 | 240,991 | 7.8 | |||||||||
Bruker Corp. | 5,600 | 249,872 | 8.1 | |||||||||
Cadence Design Systems, Inc. | 1,305 | 142,571 | 4.6 | |||||||||
Capital One Financial Corp. | 5,795 | 369,721 | 12.0 | |||||||||
Carnival Corp. | 24,830 | 344,640 | 11.2 | |||||||||
Cboe Global Markets, Inc. | 3,130 | 274,501 | 8.9 | |||||||||
CDW Corp. | 1,323 | 153,799 | 5.0 | |||||||||
Cerner Corp. | 12,620 | 876,459 | 28.4 | |||||||||
Chemed Corp. | 130 | 63,985 | 2.1 | |||||||||
Chipotle Mexican Grill, Inc. | 100 | 115,516 | 3.7 | |||||||||
Ciena Corp. | 11,810 | 702,813 | 22.8 | |||||||||
Citigroup, Inc. | 9,685 | 484,347 | 15.7 | |||||||||
Citrix Systems, Inc. | 2,101 | 299,939 | 9.7 | |||||||||
Clorox Co. (The) | 440 | 104,064 | 3.4 | |||||||||
CME Group, Inc. | 1,490 | 247,608 | 8.0 | |||||||||
CMS Energy Corp. | 350 | 22,463 | 0.7 | |||||||||
Cognizant Technology Solutions Corp., Class A | 2,830 | 193,346 | 6.3 | |||||||||
Colgate-Palmolive Co. | 1,920 | 148,224 | 4.8 | |||||||||
ConocoPhillips | 2,170 | 81,136 | 2.6 | |||||||||
Cummins, Inc. | 2,417 | 467,109 | 15.1 | |||||||||
DaVita, Inc. | 2,160 | 188,762 | 6.1 | |||||||||
Delta Air Lines, Inc. | 19,140 | 477,926 | 15.5 | |||||||||
DENTSPLY SIRONA, Inc. | 2,410 | 107,486 | 3.5 | |||||||||
Discover Financial Services | 1,689 | 83,487 | 2.7 | |||||||||
Dollar General Corp. | 2,500 | 476,000 | 15.4 | |||||||||
Domino’s Pizza, Inc. | 1,130 | 436,869 | 14.1 | |||||||||
Dover Corp. | 3,758 | 386,811 | 12.5 | |||||||||
DTE Energy Co. | 280 | 32,376 | 1.0 | |||||||||
Duke Energy Corp. | 1,950 | 165,243 | 5.3 | |||||||||
Edwards Lifesciences Corp. | 5,380 | 421,846 | 13.7 | |||||||||
Electronic Arts, Inc. | 2,140 | 303,067 | 9.8 | |||||||||
Eli Lilly and Co. | 744 | 111,816 | 3.6 | |||||||||
Emerson Electric Co. | 2,110 | 130,841 | 4.2 | |||||||||
Equitable Holdings, Inc. | 7,130 | 145,880 | 4.7 | |||||||||
Euronet Worldwide, Inc. | 350 | 33,649 | 1.1 | |||||||||
Evergy, Inc. | 1,427 | 92,512 | 3.0 | |||||||||
Exelixis, Inc. | 1,880 | 43,409 | 1.4 | |||||||||
Exelon Corp. | 6,950 | 268,340 | 8.7 | |||||||||
F5 Networks, Inc. | 2,190 | 297,621 | 9.6 | |||||||||
Facebook, Inc., Class A | 1,235 | 313,282 | 10.1 | |||||||||
Fair Isaac Corp. | 254 | 111,554 | 3.6 | |||||||||
First American Financial Corp. | 3,130 | 159,661 | 5.2 | |||||||||
FMC Corp. | 300 | 31,815 | 1.0 | |||||||||
| Shares | Value | % of Basket Value | ||||||||||
| United States (continued) | ||||||||||||
Fortive Corp. | 730 | $ | 51,239 | 1.7 | % | |||||||
Fortune Brands Home & Security, Inc. | 2,698 | 206,397 | 6.7 | |||||||||
General Motors Co. | 15,940 | 396,747 | 12.8 | |||||||||
Gentex Corp. | 2,000 | 53,980 | 1.7 | |||||||||
GoDaddy, Inc., Class A | 4,420 | 310,638 | 10.1 | |||||||||
Graco, Inc. | 2,860 | 152,266 | 4.9 | |||||||||
HCA Healthcare, Inc. | 3,958 | 501,241 | 16.2 | |||||||||
Hershey Co. (The) | 5,888 | 856,174 | 27.7 | |||||||||
Hologic, Inc. | 4,370 | 304,939 | 9.9 | |||||||||
Home Depot, Inc. (The) | 820 | 217,702 | 7.0 | |||||||||
HP, Inc. | 2,950 | 51,861 | 1.7 | |||||||||
Hubbell, Inc. | 3,170 | 427,855 | 13.9 | |||||||||
Humana, Inc. | 120 | 47,094 | 1.5 | |||||||||
IAC/InterActiveCorp. | 110 | 14,566 | 0.5 | |||||||||
IDEXX Laboratories, Inc. | 601 | 239,048 | 7.7 | |||||||||
Illinois Tool Works, Inc. | 1,530 | 283,035 | 9.2 | |||||||||
Illumina, Inc. | 130 | 49,681 | 1.6 | |||||||||
Incyte Corp. | 1,780 | 175,793 | 5.7 | |||||||||
Insulet Corp. | 430 | 87,445 | 2.8 | |||||||||
Intel Corp. | 7,175 | 342,463 | 11.1 | |||||||||
Intercontinental Exchange, Inc. | 3,920 | 379,378 | 12.3 | |||||||||
Intuit, Inc. | 747 | 228,858 | 7.4 | |||||||||
James Hardie Industries plc, CDI | 3,430 | 70,793 | 2.3 | |||||||||
Jazz Pharmaceuticals plc | 2,230 | 241,398 | 7.8 | |||||||||
Johnson Controls International plc | 5,340 | 205,483 | 6.7 | |||||||||
Juniper Networks, Inc. | 650 | 16,497 | 0.5 | |||||||||
Kansas City Southern | 470 | 80,770 | 2.6 | |||||||||
KeyCorp | 18,410 | 221,104 | 7.2 | |||||||||
Keysight Technologies, Inc. | 3,520 | 351,613 | 11.4 | |||||||||
Kinder Morgan, Inc. | 3,250 | 45,825 | 1.5 | |||||||||
Kroger Co. (The) | 3,880 | 134,985 | 4.4 | |||||||||
Lam Research Corp. | 669 | 252,320 | 8.2 | |||||||||
Lamb Weston Holdings, Inc. | 510 | 30,641 | 1.0 | |||||||||
Liberty Media Corp-Liberty SiriusXM, Class C | 2,824 | 98,812 | 3.2 | |||||||||
LKQ Corp. | 1,650 | 46,514 | 1.5 | |||||||||
Lowe’s Cos., Inc. | 910 | 135,508 | 4.4 | |||||||||
LPL Financial Holdings, Inc. | 7,020 | 554,720 | 18.0 | |||||||||
Lululemon Athletica, Inc. | 1,360 | 442,802 | 14.3 | |||||||||
M&T Bank Corp. | 420 | 44,499 | 1.4 | |||||||||
Markel Corp. | 60 | 62,672 | 2.0 | |||||||||
Masco Corp. | 3,420 | 195,487 | 6.3 | |||||||||
Masimo Corp. | 790 | 173,895 | 5.6 | |||||||||
Match Group, Inc. | 237 | 24,340 | 0.8 | |||||||||
McKesson Corp. | 1,720 | 258,275 | 8.4 | |||||||||
Merck & Co., Inc. | 4,652 | 373,276 | 12.1 | |||||||||
Microsoft Corp. | 1,810 | 371,068 | 12.0 | |||||||||
Mondelez International, Inc., Class A | 3,775 | 209,475 | 6.8 | |||||||||
Monster Beverage Corp. | 2,650 | 207,972 | 6.7 | |||||||||
Moody’s Corp. | 325 | 91,423 | 3.0 | |||||||||
Nasdaq, Inc. | 1,220 | 160,198 | 5.2 | |||||||||
Neurocrine Biosciences, Inc. | 1,500 | 180,540 | 5.8 | |||||||||
NIKE, Inc., Class B | 5,841 | 570,140 | 18.5 | |||||||||
NiSource, Inc. | 14,120 | 345,234 | 11.2 | |||||||||
NortonLifeLock, Inc. | 2,020 | 43,329 | 1.4 | |||||||||
Norwegian Cruise Line Holdings Ltd. | 3,340 | 45,557 | 1.5 | |||||||||
OGE Energy Corp. | 2,132 | 70,143 | 2.3 | |||||||||
Old Dominion Freight Line, Inc. | 220 | 40,220 | 1.3 | |||||||||
O’Reilly Automotive, Inc. | 637 | 304,091 | 9.8 | |||||||||
Owens Corning | 1,140 | 68,936 | 2.2 | |||||||||
| 32 | 2020 BLACKROCK ANNUAL REPORTTO SHAREHOLDERS |
Consolidated Schedule of Investments (continued) July 31, 2020 | BlackRock Total Factor Fund |
| Shares | Value | % of Basket Value | ||||||||||
| United States (continued) | ||||||||||||
Paychex, Inc. | 8,584 | $ | 617,361 | 20.0 | % | |||||||
Pentair plc | 1,640 | 70,274 | 2.3 | |||||||||
PepsiCo, Inc. | 920 | 126,647 | 4.1 | |||||||||
PG&E Corp. | 5,910 | 55,259 | 1.8 | |||||||||
Philip Morris International, Inc. | 430 | 33,028 | 1.1 | |||||||||
Phillips 66 | 2,008 | 124,536 | 4.0 | |||||||||
PRA Health Sciences, Inc. | 370 | 39,427 | 1.3 | |||||||||
Procter & Gamble Co. (The) | 570 | 74,738 | 2.4 | |||||||||
PulteGroup, Inc. | 7,260 | 316,536 | 10.2 | |||||||||
Qorvo, Inc. | 193 | 24,733 | 0.8 | |||||||||
QUALCOMM, Inc. | 2,240 | 236,566 | 7.7 | |||||||||
Reinsurance Group of America, Inc. | 1,800 | 153,450 | 5.0 | |||||||||
Reliance Steel & Aluminum Co. | 5,990 | 588,577 | 19.1 | |||||||||
Robert Half International, Inc. | 1,334 | 67,861 | 2.2 | |||||||||
Rockwell Automation, Inc. | 1,990 | 434,099 | 14.1 | |||||||||
RPM International, Inc. | 3,320 | 270,879 | 8.8 | |||||||||
S&P Global, Inc. | 1,330 | 465,833 | 15.1 | |||||||||
SEI Investments Co. | 543 | 28,415 | 0.9 | |||||||||
Sensata Technologies Holding plc | 2,120 | 80,518 | 2.6 | |||||||||
ServiceNow, Inc. | 860 | 377,712 | 12.2 | |||||||||
Sherwin-Williams Co. (The) | 320 | 207,334 | 6.7 | |||||||||
Signature Bank | 1,020 | 104,581 | 3.4 | |||||||||
Skyworks Solutions, Inc. | 160 | 23,293 | 0.8 | |||||||||
Snap-on, Inc. | 840 | 122,531 | 4.0 | |||||||||
Southern Co. (The) | 740 | 40,411 | 1.3 | |||||||||
Square, Inc., Class A | 1,050 | 136,343 | 4.4 | |||||||||
Starbucks Corp. | 9,000 | 688,770 | 22.3 | |||||||||
Stryker Corp. | 2,965 | 573,135 | 18.6 | |||||||||
Synchrony Financial | 14,984 | 331,596 | 10.7 | |||||||||
Synopsys, Inc. | 4,432 | 882,943 | 28.6 | |||||||||
Take-Two Interactive Software, Inc. | 1,250 | 205,025 | 6.6 | |||||||||
Target Corp. | 2,200 | 276,936 | 9.0 | |||||||||
Teledyne Technologies, Inc. | 453 | 138,935 | 4.5 | |||||||||
Teradyne, Inc. | 6,498 | 578,062 | 18.7 | |||||||||
Texas Instruments, Inc. | 190 | 24,235 | 0.8 | |||||||||
TJX Cos., Inc. (The) | 7,815 | 406,302 | 13.2 | |||||||||
Toro Co. (The) | 2,910 | 207,629 | 6.7 | |||||||||
Tractor Supply Co. | 230 | 32,830 | 1.1 | |||||||||
Ulta Beauty, Inc. | 800 | 154,392 | 5.0 | |||||||||
United Airlines Holdings, Inc. | 1,850 | 58,053 | 1.9 | |||||||||
United Parcel Service, Inc., Class B | 840 | 119,918 | 3.9 | |||||||||
Universal Health Services, Inc., Class B | 17 | 1,868 | 0.1 | |||||||||
US Foods Holding Corp. | 7,420 | 150,626 | 4.9 | |||||||||
Veeva Systems, Inc., Class A | 460 | 121,702 | 3.9 | |||||||||
VeriSign, Inc. | 1,717 | 363,455 | 11.8 | |||||||||
Verizon Communications, Inc. | 570 | 32,764 | 1.1 | |||||||||
Vertex Pharmaceuticals, Inc. | 670 | 182,240 | 5.9 | |||||||||
Vistra Corp. | 6,897 | 128,698 | 4.2 | |||||||||
Walmart, Inc. | 1,240 | 160,456 | 5.2 | |||||||||
West Pharmaceutical Services, Inc. | 2,950 | 793,167 | 25.7 | |||||||||
Workday, Inc., Class A | 1,020 | 184,538 | 6.0 | |||||||||
WW Grainger, Inc. | 380 | 129,781 | 4.2 | |||||||||
Yum! Brands, Inc. | 851 | 77,484 | 2.5 | |||||||||
Zebra Technologies Corp., Class A | 770 | 216,178 | 7.0 | |||||||||
| Shares | Value | % of Basket Value | ||||||||||
| United States (continued) | ||||||||||||
Zendesk, Inc. | 1,400 | $ | 127,610 | 4.1 | % | |||||||
|
| |||||||||||
| 44,934,518 | ||||||||||||
|
| |||||||||||
Total Reference Entity — Long |
| 99,530,488 | ||||||||||
|
| |||||||||||
Reference Entity — Short |
| |||||||||||
| Australia | ||||||||||||
Australia & New Zealand Banking Group Ltd. | (19,330 | ) | (245,504 | ) | (7.9 | ) | ||||||
Commonwealth Bank of Australia | (3,638 | ) | (185,083 | ) | (6.0 | ) | ||||||
CSL Ltd. | (1,480 | ) | (287,864 | ) | (9.3 | ) | ||||||
Fortescue Metals Group Ltd. | (6,580 | ) | (81,903 | ) | (2.7 | ) | ||||||
Glencore plc | (171,823 | ) | (393,227 | ) | (12.7 | ) | ||||||
Insurance Australia Group Ltd. | (112,310 | ) | (408,875 | ) | (13.2 | ) | ||||||
National Australia Bank Ltd. | (35,132 | ) | (438,591 | ) | (14.2 | ) | ||||||
Ramsay Health Care Ltd. | (1,600 | ) | (70,719 | ) | (2.3 | ) | ||||||
Sonic Healthcare Ltd. | (12,370 | ) | (283,206 | ) | (9.2 | ) | ||||||
Transurban Group | (55,798 | ) | (551,926 | ) | (17.9 | ) | ||||||
Westpac Banking Corp. | (14,007 | ) | (168,207 | ) | (5.4 | ) | ||||||
|
| |||||||||||
| (3,115,105 | ) | |||||||||||
| Belgium | ||||||||||||
Anheuser-Busch InBev SA/NV | (5,845 | ) | (317,402 | ) | (10.2 | ) | ||||||
Solvay SA | (470 | ) | (36,478 | ) | (1.2 | ) | ||||||
Umicore SA | (9,088 | ) | (429,200 | ) | (13.9 | ) | ||||||
|
| |||||||||||
| (783,080 | ) | |||||||||||
| Brazil | ||||||||||||
Wheaton Precious Metals Corp. | (2,650 | ) | (143,772 | ) | (4.7 | ) | ||||||
|
| |||||||||||
| Canada | ||||||||||||
Brookfield Asset Management, Inc., Class A | (15,740 | ) | (508,874 | ) | (16.5 | ) | ||||||
Canadian Natural Resources Ltd. | (400 | ) | (7,057 | ) | (0.2 | ) | ||||||
CGI, Inc. | (2,480 | ) | (177,134 | ) | (5.7 | ) | ||||||
Fortis, Inc. | (4,590 | ) | (186,931 | ) | (6.1 | ) | ||||||
Great-West Lifeco, Inc. | (13,210 | ) | (233,538 | ) | (7.6 | ) | ||||||
Imperial Oil Ltd. | (800 | ) | (12,513 | ) | (0.4 | ) | ||||||
Nutrien Ltd. | (1,640 | ) | (53,448 | ) | (1.7 | ) | ||||||
Power Corp. of Canada | (4,780 | ) | (84,826 | ) | (2.8 | ) | ||||||
Shaw Communications, Inc., Class B | (2,780 | ) | (50,849 | ) | (1.6 | ) | ||||||
Thomson Reuters Corp. | (990 | ) | (69,142 | ) | (2.2 | ) | ||||||
|
| |||||||||||
| (1,384,312 | ) | |||||||||||
| Denmark | ||||||||||||
Chr Hansen Holding A/S | (2,310 | ) | (263,600 | ) | (8.5 | ) | ||||||
Danske Bank A/S | (16,520 | ) | (267,557 | ) | (8.7 | ) | ||||||
Demant A/S | (1,976 | ) | (61,341 | ) | (2.0 | ) | ||||||
H Lundbeck A/S | (1,180 | ) | (43,023 | ) | (1.4 | ) | ||||||
|
| |||||||||||
| (635,521 | ) | |||||||||||
| Finland | ||||||||||||
Elisa OYJ | (2,210 | ) | (131,072 | ) | (4.2 | ) | ||||||
Kone OYJ, Class B | (1,580 | ) | (125,466 | ) | (4.1 | ) | ||||||
Nokia OYJ | (61,120 | ) | (293,383 | ) | (9.5 | ) | ||||||
Nordea Bank Abp | (38,216 | ) | (294,301 | ) | (9.5 | ) | ||||||
Sampo OYJ, Class A | (18,720 | ) | (676,621 | ) | (21.9 | ) | ||||||
|
| |||||||||||
| (1,520,843 | ) | |||||||||||
| France | ||||||||||||
Airbus SE | (990 | ) | (72,464 | ) | (2.4 | ) | ||||||
Arkema SA | (300 | ) | (31,210 | ) | (1.0 | ) | ||||||
Atos SE | (2,640 | ) | (225,744 | ) | (7.3 | ) | ||||||
Bouygues SA | (8,090 | ) | (285,792 | ) | (9.3 | ) | ||||||
CONSOLIDATED SCHEDULE OF INVESTMENTS | 33 |
Consolidated Schedule of Investments (continued) July 31, 2020 | BlackRock Total Factor Fund |
| Shares | Value | % of Basket Value | ||||||||||
| France (continued) | ||||||||||||
Cie Generale des Etablissements | ||||||||||||
Michelin SCA | (1,020 | ) | $ | (105,637 | ) | (3.4 | )% | |||||
Edenred | (8,174 | ) | (405,465 | ) | (13.1 | ) | ||||||
Iliad SA | (2,623 | ) | (512,984 | ) | (16.6 | ) | ||||||
Kering SA | (190 | ) | (107,670 | ) | (3.5 | ) | ||||||
LVMH Moet Hennessy Louis Vuitton SE | (1,022 | ) | (444,410 | ) | (14.4 | ) | ||||||
Orpea | (4,262 | ) | (543,732 | ) | (17.6 | ) | ||||||
Pernod Ricard SA | (470 | ) | (80,769 | ) | (2.6 | ) | ||||||
Renault SA | (10,240 | ) | (243,356 | ) | (7.9 | ) | ||||||
Safran SA | (2,070 | ) | (220,148 | ) | (7.1 | ) | ||||||
Ubisoft Entertainment SA | (2,330 | ) | (194,607 | ) | (6.3 | ) | ||||||
Valeo SA | (2,298 | ) | (58,972 | ) | (1.9 | ) | ||||||
Vinci SA | (1,210 | ) | (104,139 | ) | (3.4 | ) | ||||||
Worldline SA | (3,570 | ) | (307,125 | ) | (9.9 | ) | ||||||
|
| |||||||||||
| (3,944,224 | ) | |||||||||||
| Germany | ||||||||||||
BASF SE | (1,110 | ) | (61,234 | ) | (2.0 | ) | ||||||
Bayer AG (Registered) | (3,200 | ) | (212,587 | ) | (6.9 | ) | ||||||
Carl Zeiss Meditec AG | (810 | ) | (84,774 | ) | (2.7 | ) | ||||||
Commerzbank AG | (107,552 | ) | (552,726 | ) | (17.9 | ) | ||||||
Covestro AG | (2,100 | ) | (81,495 | ) | (2.6 | ) | ||||||
Delivery Hero SE | (7,035 | ) | (807,557 | ) | (26.1 | ) | ||||||
Deutsche Bank AG (Registered) | (89,309 | ) | (803,109 | ) | (26.0 | ) | ||||||
E.ON SE | (20,510 | ) | (240,788 | ) | (7.8 | ) | ||||||
Fresenius Medical Care AG & Co. KGaA | (6,070 | ) | (534,780 | ) | (17.3 | ) | ||||||
Fresenius SE & Co. KGaA | (3,350 | ) | (167,144 | ) | (5.4 | ) | ||||||
KION Group AG | (3,183 | ) | (243,264 | ) | (7.9 | ) | ||||||
Knorr-Bremse AG | (3,840 | ) | (449,308 | ) | (14.5 | ) | ||||||
Siemens AG (Registered) | (1,010 | ) | (128,710 | ) | (4.2 | ) | ||||||
Siemens Healthineers AG | (3,170 | ) | (165,035 | ) | (5.3 | ) | ||||||
United Internet AG (Registered) | (8,721 | ) | (395,732 | ) | (12.8 | ) | ||||||
Zalando SE | (5,517 | ) | (398,273 | ) | (12.9 | ) | ||||||
|
| |||||||||||
| (5,326,516 | ) | |||||||||||
| Italy | ||||||||||||
Amplifon SpA | (2,260 | ) | (77,369 | ) | (2.5 | ) | ||||||
Atlantia SpA | (5,371 | ) | (86,050 | ) | (2.8 | ) | ||||||
Ferrari NV | (390 | ) | (69,738 | ) | (2.3 | ) | ||||||
Infrastrutture Wireless Italiane SpA | (97,040 | ) | (979,201 | ) | (31.7 | ) | ||||||
Nexi SpA | (10,610 | ) | (190,607 | ) | (6.2 | ) | ||||||
Poste Italiane SpA | (10,160 | ) | (93,355 | ) | (3.0 | ) | ||||||
|
| |||||||||||
| (1,496,320 | ) | |||||||||||
| Japan | ||||||||||||
ANA Holdings, Inc. | (8,500 | ) | (175,987 | ) | (5.7 | ) | ||||||
Asahi Kasei Corp. | (17,000 | ) | (122,283 | ) | (4.0 | ) | ||||||
Canon, Inc. | (15,700 | ) | (252,653 | ) | (8.2 | ) | ||||||
Central Japan Railway Co. | (800 | ) | (97,048 | ) | (3.1 | ) | ||||||
Chubu Electric Power Co., Inc. | (45,400 | ) | (539,855 | ) | (17.5 | ) | ||||||
Daifuku Co. Ltd. | (5,500 | ) | (501,194 | ) | (16.2 | ) | ||||||
Dai-ichi Life Holdings, Inc. | (32,700 | ) | (385,742 | ) | (12.5 | ) | ||||||
Daiichi Sankyo Co. Ltd. | (1,100 | ) | (97,335 | ) | (3.1 | ) | ||||||
Daikin Industries Ltd. | (1,700 | ) | (299,109 | ) | (9.7 | ) | ||||||
Daiwa House Industry Co. Ltd. | (7,100 | ) | (156,677 | ) | (5.1 | ) | ||||||
Disco Corp. | (200 | ) | (48,467 | ) | (1.6 | ) | ||||||
FamilyMart Co. Ltd. | (3,300 | ) | (74,078 | ) | (2.4 | ) | ||||||
FANUC Corp. | (1,500 | ) | (253,085 | ) | (8.2 | ) | ||||||
Fast Retailing Co. Ltd. | (300 | ) | (159,541 | ) | (5.2 | ) | ||||||
FUJIFILM Holdings Corp. | (1,100 | ) | (49,195 | ) | (1.6 | ) | ||||||
Idemitsu Kosan Co. Ltd. | (15,300 | ) | (318,709 | ) | (10.3 | ) | ||||||
Isuzu Motors Ltd. | (19,100 | ) | (155,789 | ) | (5.0 | ) | ||||||
ITOCHU Corp. | (3,900 | ) | (85,513 | ) | (2.8 | ) | ||||||
| Shares | Value | % of Basket Value | ||||||||||
| Japan (continued) | ||||||||||||
Japan Airlines Co. Ltd. | (21,600 | ) | $ | (349,645 | ) | (11.3 | )% | |||||
Japan Post Holdings Co. Ltd. | (11,600 | ) | (79,226 | ) | (2.6 | ) | ||||||
Japan Tobacco, Inc. | (6,900 | ) | (117,938 | ) | (3.8 | ) | ||||||
Kansai Electric Power Co., Inc. (The) | (20,600 | ) | (195,952 | ) | (6.3 | ) | ||||||
Keyence Corp. | (900 | ) | (379,518 | ) | (12.3 | ) | ||||||
Kintetsu Group Holdings Co. Ltd. | (1,900 | ) | (74,028 | ) | (2.4 | ) | ||||||
Kirin Holdings Co. Ltd. | (2,800 | ) | (53,952 | ) | (1.7 | ) | ||||||
Komatsu Ltd. | (14,400 | ) | (282,916 | ) | (9.2 | ) | ||||||
Kubota Corp. | (4,900 | ) | (69,776 | ) | (2.3 | ) | ||||||
Mitsubishi Estate Co. Ltd. | (10,800 | ) | (155,145 | ) | (5.0 | ) | ||||||
Mitsubishi UFJ Financial Group, Inc. | (12,600 | ) | (47,216 | ) | (1.5 | ) | ||||||
Mitsui Fudosan Co. Ltd. | (6,700 | ) | (104,748 | ) | (3.4 | ) | ||||||
MonotaRO Co. Ltd. | (18,100 | ) | (769,775 | ) | (24.9 | ) | ||||||
Nidec Corp. | (8,100 | ) | (643,440 | ) | (20.8 | ) | ||||||
Nissan Motor Co. Ltd. | (31,300 | ) | (107,064 | ) | (3.5 | ) | ||||||
Nomura Holdings, Inc. | (60,800 | ) | (286,135 | ) | (9.3 | ) | ||||||
Obic Co. Ltd. | (1,600 | ) | (286,927 | ) | (9.3 | ) | ||||||
Oriental Land Co. Ltd. | (5,000 | ) | (603,213 | ) | (19.5 | ) | ||||||
Otsuka Corp. | (7,800 | ) | (406,686 | ) | (13.2 | ) | ||||||
Pan Pacific International Holdings Corp. | (4,800 | ) | (108,792 | ) | (3.5 | ) | ||||||
Renesas Electronics Corp. | (26,000 | ) | (143,012 | ) | (4.6 | ) | ||||||
Resona Holdings, Inc. | (25,100 | ) | (82,285 | ) | (2.7 | ) | ||||||
Sharp Corp. | (36,700 | ) | (362,225 | ) | (11.7 | ) | ||||||
Shiseido Co. Ltd. | (2,900 | ) | (161,577 | ) | (5.2 | ) | ||||||
SMC Corp. | (1,200 | ) | (630,659 | ) | (20.4 | ) | ||||||
SoftBank Group Corp. | (14,500 | ) | (914,560 | ) | (29.6 | ) | ||||||
Sony Corp. | (800 | ) | (62,156 | ) | (2.0 | ) | ||||||
Square Enix Holdings Co. Ltd. | (1,000 | ) | (53,730 | ) | (1.7 | ) | ||||||
Sumitomo Corp. | (12,900 | ) | (143,315 | ) | (4.6 | ) | ||||||
Sumitomo Metal Mining Co. Ltd. | (5,600 | ) | (168,334 | ) | (5.4 | ) | ||||||
Sumitomo Realty & Development Co. Ltd. | (4,800 | ) | (122,410 | ) | (4.0 | ) | ||||||
Suzuki Motor Corp. | (3,600 | ) | (118,128 | ) | (3.8 | ) | ||||||
Sysmex Corp. | (1,600 | ) | (123,035 | ) | (4.0 | ) | ||||||
Tokio Marine Holdings, Inc. | (2,900 | ) | (122,452 | ) | (4.0 | ) | ||||||
Tokyo Electric Power Co. Holdings, Inc. | (8,500 | ) | (22,672 | ) | (0.7 | ) | ||||||
Toshiba Corp. | (3,600 | ) | (110,092 | ) | (3.6 | ) | ||||||
Unicharm Corp. | (1,900 | ) | (85,942 | ) | (2.8 | ) | ||||||
Yamato Holdings Co. Ltd. | (8,200 | ) | (211,442 | ) | (6.8 | ) | ||||||
Yaskawa Electric Corp. | (12,600 | ) | (418,917 | ) | (13.6 | ) | ||||||
Z Holdings Corp. | (23,200 | ) | (123,372 | ) | (4.0 | ) | ||||||
|
| |||||||||||
| (13,074,667 | ) | |||||||||||
| Jordan | ||||||||||||
Hikma Pharmaceuticals plc | (3,911 | ) | (109,590 | ) | (3.6 | ) | ||||||
|
| |||||||||||
| Luxembourg | ||||||||||||
Eurofins Scientific SE | (1,245 | ) | (814,885 | ) | (26.4 | ) | ||||||
|
| |||||||||||
| Netherlands | ||||||||||||
Adyen NV | (60 | ) | (100,149 | ) | (3.3 | ) | ||||||
ASML Holding NV | (480 | ) | (170,658 | ) | (5.5 | ) | ||||||
Just Eat Takeaway.com NV | (6,591 | ) | (711,283 | ) | (23.0 | ) | ||||||
Koninklijke Vopak NV | (1,910 | ) | (104,282 | ) | (3.4 | ) | ||||||
|
| |||||||||||
| (1,086,372 | ) | |||||||||||
| Norway | ||||||||||||
DNB ASA | (3,980 | ) | (61,130 | ) | (2.0 | ) | ||||||
Equinor ASA | (33,820 | ) | (507,068 | ) | (16.4 | ) | ||||||
Mowi ASA | (26,585 | ) | (482,814 | ) | (15.6 | ) | ||||||
| 34 | 2020 BLACKROCK ANNUAL REPORTTO SHAREHOLDERS |
Consolidated Schedule of Investments (continued) July 31, 2020 | BlackRock Total Factor Fund |
| Shares | Value | % of Basket Value | ||||||||||
| Norway (continued) | ||||||||||||
Norsk Hydro ASA | (70,570 | ) | $ | (199,341 | ) | (6.5 | )% | |||||
|
| |||||||||||
| (1,250,353 | ) | |||||||||||
| Singapore | ||||||||||||
Singapore Telecommunications Ltd. | (70,400 | ) | (127,767 | ) | (4.2 | ) | ||||||
|
| |||||||||||
| South Africa | ||||||||||||
Mondi plc | (16,970 | ) | (300,585 | ) | (9.7 | ) | ||||||
|
| |||||||||||
| South Korea | ||||||||||||
Celltrion Healthcare Co. Ltd. | (8,002 | ) | (635,427 | ) | (20.6 | ) | ||||||
Celltrion, Inc. | (3,138 | ) | (782,274 | ) | (25.3 | ) | ||||||
Hyundai Motor Co. | (2,462 | ) | (262,599 | ) | (8.5 | ) | ||||||
LG Chem Ltd. | (1,128 | ) | (540,132 | ) | (17.5 | ) | ||||||
Samsung Biologics Co. Ltd. | (501 | ) | (308,896 | ) | (10.0 | ) | ||||||
Samsung Electro-Mechanics Co. Ltd. | (287 | ) | (33,953 | ) | (1.1 | ) | ||||||
Samsung SDI Co. Ltd. | (796 | ) | (266,486 | ) | (8.6 | ) | ||||||
SK Hynix, Inc. | (2,330 | ) | (163,138 | ) | (5.3 | ) | ||||||
SK Innovation Co. Ltd. | (522 | ) | (55,849 | ) | (1.8 | ) | ||||||
|
| |||||||||||
| (3,048,754 | ) | |||||||||||
| Spain | ||||||||||||
Acciona SA | (310 | ) | (34,415 | ) | (1.1 | ) | ||||||
Amadeus IT Group SA | (1,550 | ) | (77,400 | ) | (2.5 | ) | ||||||
CaixaBank SA | (27,310 | ) | (58,745 | ) | (1.9 | ) | ||||||
Cellnex Telecom SA | (13,140 | ) | (440,953 | ) | (14.3 | ) | ||||||
Enagas SA | (2,480 | ) | (62,569 | ) | (2.0 | ) | ||||||
Grifols SA | (26,350 | ) | (767,719 | ) | (24.9 | ) | ||||||
Naturgy Energy Group SA | (4,090 | ) | (76,107 | ) | (2.5 | ) | ||||||
Siemens Gamesa Renewable Energy SA | (34,888 | ) | (823,191 | ) | (26.6 | ) | ||||||
Telefonica SA | (25,750 | ) | (107,841 | ) | (3.5 | ) | ||||||
|
| |||||||||||
| (2,448,940 | ) | |||||||||||
| Sweden | ||||||||||||
Boliden AB | (22,983 | ) | (627,624 | ) | (20.3 | ) | ||||||
Epiroc AB, Class A | (4,930 | ) | (68,932 | ) | (2.2 | ) | ||||||
Hexagon AB, Class B | (4,483 | ) | (293,177 | ) | (9.5 | ) | ||||||
ICA Gruppen AB | (7,726 | ) | (379,526 | ) | (12.3 | ) | ||||||
Nibe Industrier AB, Class B | (7,580 | ) | (182,383 | ) | (5.9 | ) | ||||||
Sandvik AB | (6,090 | ) | (113,813 | ) | (3.7 | ) | ||||||
Skandinaviska Enskilda Banken AB, Class A | (5,940 | ) | (57,470 | ) | (1.9 | ) | ||||||
Svenska Cellulosa AB SCA, Class B | (7,600 | ) | (92,301 | ) | (3.0 | ) | ||||||
Svenska Handelsbanken AB, Class A | (23,510 | ) | (221,710 | ) | (7.2 | ) | ||||||
Swedish Orphan Biovitrum AB | (12,100 | ) | (254,277 | ) | (8.2 | ) | ||||||
|
| |||||||||||
| (2,291,213 | ) | |||||||||||
| Switzerland | ||||||||||||
ABB Ltd. (Registered) | (4,380 | ) | (109,997 | ) | (3.6 | ) | ||||||
Clariant AG (Registered) | (12,650 | ) | (239,093 | ) | (7.7 | ) | ||||||
Swiss Re AG | (2,049 | ) | (161,685 | ) | (5.2 | ) | ||||||
Vifor Pharma AG | (610 | ) | (86,100 | ) | (2.8 | ) | ||||||
Zurich Insurance Group AG | (730 | ) | (269,956 | ) | (8.7 | ) | ||||||
|
| |||||||||||
| (866,831 | ) | |||||||||||
| United Kingdom | ||||||||||||
Admiral Group plc | (9,800 | ) | (305,610 | ) | (9.9 | ) | ||||||
AstraZeneca plc | (1,980 | ) | (218,750 | ) | (7.1 | ) | ||||||
Auto Trader Group plc | (20,380 | ) | (142,365 | ) | (4.6 | ) | ||||||
Barratt Developments plc | (56,690 | ) | (376,573 | ) | (12.2 | ) | ||||||
British American Tobacco plc | (25,091 | ) | (829,216 | ) | (26.9 | ) | ||||||
BT Group plc | (20,390 | ) | (26,200 | ) | (0.8 | ) | ||||||
| Shares | Value | % of Basket Value | ||||||||||
| United Kingdom (continued) | ||||||||||||
CNH Industrial NV | (12,510 | ) | $ | (85,004 | ) | (2.8 | )% | |||||
Croda International plc | (1,170 | ) | (87,322 | ) | (2.8 | ) | ||||||
DS Smith plc | (105,843 | ) | (357,920 | ) | (11.6 | ) | ||||||
Hargreaves Lansdown plc | (14,579 | ) | (330,867 | ) | (10.7 | ) | ||||||
Imperial Brands plc | (17,300 | ) | (288,232 | ) | (9.3 | ) | ||||||
Intertek Group plc | (1,170 | ) | (82,285 | ) | (2.7 | ) | ||||||
J Sainsbury plc | (33,630 | ) | (81,968 | ) | (2.7 | ) | ||||||
London Stock Exchange Group plc | (981 | ) | (108,360 | ) | (3.5 | ) | ||||||
Melrose Industries plc | (159,596 | ) | (176,229 | ) | (5.7 | ) | ||||||
National Grid plc | (15,498 | ) | (181,821 | ) | (5.9 | ) | ||||||
Ocado Group plc | (33,078 | ) | (886,155 | ) | (28.7 | ) | ||||||
Persimmon plc | (18,007 | ) | (562,183 | ) | (18.2 | ) | ||||||
Prudential plc | (46,274 | ) | (661,291 | ) | (21.4 | ) | ||||||
Reckitt Benckiser Group plc | (7,668 | ) | (768,868 | ) | (24.9 | ) | ||||||
Royal Bank of Scotland Group plc | (27,900 | ) | (38,424 | ) | (1.2 | ) | ||||||
Spirax-Sarco Engineering plc | (4,878 | ) | (651,872 | ) | (21.1 | ) | ||||||
SSE plc | (9,754 | ) | (165,451 | ) | (5.4 | ) | ||||||
St James’s Place plc | (21,602 | ) | (264,206 | ) | (8.6 | ) | ||||||
Taylor Wimpey plc | (305,046 | ) | (470,542 | ) | (15.2 | ) | ||||||
Tesco plc | (247,580 | ) | (698,756 | ) | (22.6 | ) | ||||||
United Utilities Group plc | (16,180 | ) | (189,752 | ) | (6.1 | ) | ||||||
WPP plc | (13,100 | ) | (97,153 | ) | (3.1 | ) | ||||||
|
| |||||||||||
| (9,133,375 | ) | |||||||||||
| United States | ||||||||||||
Abbott Laboratories | (3,650 | ) | (367,336 | ) | (11.9 | ) | ||||||
Advanced Micro Devices, Inc. | (2,119 | ) | (164,074 | ) | (5.3 | ) | ||||||
AECOM | (9,860 | ) | (356,833 | ) | (11.6 | ) | ||||||
Alnylam Pharmaceuticals, Inc. | (2,500 | ) | (364,400 | ) | (11.8 | ) | ||||||
Altria Group, Inc. | (2,750 | ) | (113,163 | ) | (3.7 | ) | ||||||
American Airlines Group, Inc. | (6,830 | ) | (75,950 | ) | (2.5 | ) | ||||||
Amphenol Corp., Class A | (4,635 | ) | (490,198 | ) | (15.9 | ) | ||||||
Analog Devices, Inc. | (2,980 | ) | (342,253 | ) | (11.1 | ) | ||||||
ANSYS, Inc. | (340 | ) | (105,604 | ) | (3.4 | ) | ||||||
AO Smith Corp. | (3,440 | ) | (165,602 | ) | (5.4 | ) | ||||||
Aptiv plc | (1,455 | ) | (113,126 | ) | (3.7 | ) | ||||||
Aramark | (3,580 | ) | (75,610 | ) | (2.4 | ) | ||||||
Archer-Daniels-Midland Co. | (15,290 | ) | (654,871 | ) | (21.2 | ) | ||||||
Arista Networks, Inc. | (1,192 | ) | (309,646 | ) | (10.0 | ) | ||||||
Athene Holding Ltd., Class A | (3,370 | ) | (108,683 | ) | (3.5 | ) | ||||||
Atlassian Corp. plc, Class A | (1,808 | ) | (319,383 | ) | (10.3 | ) | ||||||
Avangrid, Inc. | (1,010 | ) | (50,288 | ) | (1.6 | ) | ||||||
Ball Corp. | (4,065 | ) | (299,306 | ) | (9.7 | ) | ||||||
Bausch Health Cos., Inc. | (19,506 | ) | (356,375 | ) | (11.5 | ) | ||||||
Becton Dickinson and Co. | (130 | ) | (36,574 | ) | (1.2 | ) | ||||||
BioMarin Pharmaceutical, Inc. | (1,090 | ) | (130,593 | ) | (4.2 | ) | ||||||
Black Knight, Inc. | (3,860 | ) | (289,191 | ) | (9.4 | ) | ||||||
Boeing Co. (The) | (910 | ) | (143,780 | ) | (4.7 | ) | ||||||
BorgWarner, Inc. | (4,030 | ) | (147,498 | ) | (4.8 | ) | ||||||
Boston Scientific Corp. | (2,020 | ) | (77,911 | ) | (2.5 | ) | ||||||
Broadcom, Inc. | (760 | ) | (240,730 | ) | (7.8 | ) | ||||||
Broadridge Financial Solutions, Inc. | (940 | ) | (126,280 | ) | (4.1 | ) | ||||||
Bunge Ltd. | (7,567 | ) | (328,710 | ) | (10.6 | ) | ||||||
Cabot Oil & Gas Corp. | (2,080 | ) | (38,896 | ) | (1.3 | ) | ||||||
CarMax, Inc. | (1,860 | ) | (180,364 | ) | (5.8 | ) | ||||||
Catalent, Inc. | (14,370 | ) | (1,255,076 | ) | (40.6 | ) | ||||||
Caterpillar, Inc. | (2,222 | ) | (295,259 | ) | (9.6 | ) | ||||||
CBRE Group, Inc., Class A | (8,530 | ) | (373,699 | ) | (12.1 | ) | ||||||
Centene Corp. | (10,220 | ) | (666,855 | ) | (21.6 | ) | ||||||
CenturyLink, Inc. | (6,200 | ) | (59,830 | ) | (1.9 | ) | ||||||
Ceridian HCM Holding, Inc. | (3,540 | ) | (277,147 | ) | (9.0 | ) | ||||||
CF Industries Holdings, Inc. | (1,080 | ) | (33,836 | ) | (1.1 | ) | ||||||
CONSOLIDATED SCHEDULE OF INVESTMENTS | 35 |
Consolidated Schedule of Investments (continued) July 31, 2020 | BlackRock Total Factor Fund |
| Shares | Value | % of Basket Value | ||||||||||
| United States (continued) | ||||||||||||
CH Robinson Worldwide, Inc. | (2,680 | ) | $ | (251,170 | ) | (8.1 | )% | |||||
Charles River Laboratories International, Inc. | (1,540 | ) | (306,445 | ) | (9.9 | ) | ||||||
Charles Schwab Corp. (The) | (8,820 | ) | (292,383 | ) | (9.5 | ) | ||||||
Cheniere Energy, Inc. | (2,470 | ) | (122,216 | ) | (4.0 | ) | ||||||
Chevron Corp. | (360 | ) | (30,218 | ) | (1.0 | ) | ||||||
Cigna Corp. | (360 | ) | (62,168 | ) | (2.0 | ) | ||||||
Cincinnati Financial Corp. | (1,690 | ) | (131,702 | ) | (4.3 | ) | ||||||
Cisco Systems, Inc. | (12,840 | ) | (604,764 | ) | (19.6 | ) | ||||||
Cognex Corp. | (7,604 | ) | (508,479 | ) | (16.5 | ) | ||||||
Commerce Bancshares, Inc. | (4,050 | ) | (231,903 | ) | (7.5 | ) | ||||||
Conagra Brands, Inc. | (3,783 | ) | (141,673 | ) | (4.6 | ) | ||||||
Consolidated Edison, Inc. | (1,070 | ) | (82,208 | ) | (2.7 | ) | ||||||
Constellation Brands, Inc., | (1,490 | ) | (265,518 | ) | (8.6 | ) | ||||||
Continental Resources, Inc. | (12,870 | ) | (222,522 | ) | (7.2 | ) | ||||||
Cooper Cos., Inc. (The) | (150 | ) | (42,440 | ) | (1.4 | ) | ||||||
CoStar Group, Inc. | (190 | ) | (161,454 | ) | (5.2 | ) | ||||||
Danaher Corp. | (4,530 | ) | (923,214 | ) | (29.9 | ) | ||||||
Deere & Co. | (2,537 | ) | (447,298 | ) | (14.5 | ) | ||||||
Dell Technologies, Inc., Class C | (2,630 | ) | (157,353 | ) | (5.1 | ) | ||||||
Discovery, Inc., Class C | (2,560 | ) | (48,512 | ) | (1.6 | ) | ||||||
DISH Network Corp., Class A | (6,875 | ) | (220,756 | ) | (7.1 | ) | ||||||
Dollar Tree, Inc. | (2,950 | ) | (275,383 | ) | (8.9 | ) | ||||||
DuPont de Nemours, Inc. | (1,700 | ) | (90,916 | ) | (2.9 | ) | ||||||
E*TRADE Financial Corp. | (1,650 | ) | (83,771 | ) | (2.7 | ) | ||||||
Eastman Chemical Co. | (5,030 | ) | (375,389 | ) | (12.2 | ) | ||||||
Eaton Corp. plc | (710 | ) | (66,122 | ) | (2.1 | ) | ||||||
Elanco Animal Health, Inc. | (21,780 | ) | (514,661 | ) | (16.7 | ) | ||||||
Estee Lauder Cos., Inc. (The), Class A | (460 | ) | (90,868 | ) | (2.9 | ) | ||||||
Everest Re Group Ltd. | (180 | ) | (39,382 | ) | (1.3 | ) | ||||||
Eversource Energy | (580 | ) | (52,241 | ) | (1.7 | ) | ||||||
Exact Sciences Corp. | (1,910 | ) | (180,973 | ) | (5.9 | ) | ||||||
Exxon Mobil Corp. | (4,060 | ) | (170,845 | ) | (5.5 | ) | ||||||
First Republic Bank | (2,858 | ) | (321,468 | ) | (10.4 | ) | ||||||
FirstEnergy Corp. | (870 | ) | (25,230 | ) | (0.8 | ) | ||||||
Franklin Resources, Inc. | (18,320 | ) | (385,636 | ) | (12.5 | ) | ||||||
Garmin Ltd. | (1,560 | ) | (153,800 | ) | (5.0 | ) | ||||||
Gartner, Inc. | (2,233 | ) | (278,321 | ) | (9.0 | ) | ||||||
GCI Liberty, Inc., Class A | (3,960 | ) | (310,424 | ) | (10.1 | ) | ||||||
General Mills, Inc. | (2,920 | ) | (184,748 | ) | (6.0 | ) | ||||||
Globe Life, Inc. | (1,610 | ) | (128,156 | ) | (4.2 | ) | ||||||
Guardant Health, Inc. | (1,240 | ) | (105,623 | ) | (3.4 | ) | ||||||
Halliburton Co. | (3,210 | ) | (45,999 | ) | (1.5 | ) | ||||||
Hasbro, Inc. | (2,080 | ) | (151,341 | ) | (4.9 | ) | ||||||
HEICO Corp., Class A | (3,230 | ) | (247,257 | ) | (8.0 | ) | ||||||
Hess Corp. | (11,306 | ) | (556,368 | ) | (18.0 | ) | ||||||
Honeywell International, Inc. | (1,338 | ) | (199,857 | ) | (6.5 | ) | ||||||
Hormel Foods Corp. | (5,701 | ) | (289,953 | ) | (9.4 | ) | ||||||
HubSpot, Inc. | (414 | ) | (97,129 | ) | (3.1 | ) | ||||||
Huntington Bancshares, Inc. | (13,620 | ) | (126,257 | ) | (4.1 | ) | ||||||
Huntington Ingalls Industries, Inc. | (930 | ) | (161,550 | ) | (5.2 | ) | ||||||
IHS Markit Ltd. | (2,350 | ) | (189,716 | ) | (6.1 | ) | ||||||
Ingredion, Inc. | (1,130 | ) | (97,745 | ) | (3.2 | ) | ||||||
International Business Machines Corp. | (3,930 | ) | (483,154 | ) | (15.6 | ) | ||||||
International Paper Co. | (8,640 | ) | (300,586 | ) | (9.7 | ) | ||||||
Interpublic Group of Cos., Inc. (The) | (6,200 | ) | (111,910 | ) | (3.6 | ) | ||||||
Intuitive Surgical, Inc. | (75 | ) | (51,408 | ) | (1.7 | ) | ||||||
IPG Photonics Corp. | (6,881 | ) | (1,231,768 | ) | (39.9 | ) | ||||||
Jack Henry & Associates, Inc. | (1,350 | ) | (240,705 | ) | (7.8 | ) | ||||||
Jacobs Engineering Group, Inc. | (3,888 | ) | (331,841 | ) | (10.7 | ) | ||||||
| Shares | Value | % of Basket Value | ||||||||||
| United States (continued) | ||||||||||||
Johnson & Johnson | (280 | ) | $ | (40,813 | ) | (1.3 | )% | |||||
Kellogg Co. | (1,400 | ) | (96,586 | ) | (3.1 | ) | ||||||
Kimberly-Clark Corp. | (1,040 | ) | (158,122 | ) | (5.1 | ) | ||||||
Knight-Swift Transportation Holdings, Inc. | (2,970 | ) | (129,165 | ) | (4.2 | ) | ||||||
Kraft Heinz Co. (The) | (6,600 | ) | (226,908 | ) | (7.3 | ) | ||||||
Laboratory Corp. of America Holdings | (1,340 | ) | (258,513 | ) | (8.4 | ) | ||||||
Las Vegas Sands Corp. | (6,560 | ) | (286,278 | ) | (9.3 | ) | ||||||
Lear Corp. | (600 | ) | (66,228 | ) | (2.1 | ) | ||||||
Leidos Holdings, Inc. | (3,280 | ) | (312,125 | ) | (10.1 | ) | ||||||
Lennar Corp., Class A | (5,891 | ) | (426,214 | ) | (13.8 | ) | ||||||
Lennox International, Inc. | (460 | ) | (123,344 | ) | (4.0 | ) | ||||||
Live Nation Entertainment, Inc. | (1,690 | ) | (79,109 | ) | (2.6 | ) | ||||||
LyondellBasell Industries NV, Class A | (1,955 | ) | (122,227 | ) | (4.0 | ) | ||||||
Marathon Petroleum Corp. | (2,605 | ) | (99,511 | ) | (3.2 | ) | ||||||
Martin Marietta Materials, Inc. | (260 | ) | (53,867 | ) | (1.7 | ) | ||||||
Marvell Technology Group Ltd. | (5,820 | ) | (212,255 | ) | (6.9 | ) | ||||||
McCormick & Co., Inc. (Non- Voting) | (940 | ) | (183,206 | ) | (5.9 | ) | ||||||
Medtronic plc | (2,540 | ) | (245,059 | ) | (7.9 | ) | ||||||
MetLife, Inc. | (3,760 | ) | (142,316 | ) | (4.6 | ) | ||||||
Microchip Technology, Inc. | (2,425 | ) | (246,695 | ) | (8.0 | ) | ||||||
Mohawk Industries, Inc. | (4,626 | ) | (369,386 | ) | (12.0 | ) | ||||||
Molson Coors Beverage Co., Class B | (3,580 | ) | (134,322 | ) | (4.4 | ) | ||||||
Monolithic Power Systems, Inc. | (1,030 | ) | (272,960 | ) | (8.8 | ) | ||||||
Morgan Stanley | (1,841 | ) | (89,988 | ) | (2.9 | ) | ||||||
Mylan NV | (15,260 | ) | (245,839 | ) | (8.0 | ) | ||||||
Newell Brands, Inc. | (20,222 | ) | (331,641 | ) | (10.7 | ) | ||||||
Newmont Corp. | (1,270 | ) | (87,884 | ) | (2.8 | ) | ||||||
Noble Energy, Inc. | (9,630 | ) | (96,204 | ) | (3.1 | ) | ||||||
Nordson Corp. | (460 | ) | (89,070 | ) | (2.9 | ) | ||||||
Norfolk Southern Corp. | (1,800 | ) | (345,978 | ) | (11.2 | ) | ||||||
Norwegian Cruise Line Holdings Ltd. | (17,341 | ) | (236,531 | ) | (7.7 | ) | ||||||
Nucor Corp. | (5,860 | ) | (245,827 | ) | (8.0 | ) | ||||||
Occidental Petroleum Corp. | (33,491 | ) | (489,417 | ) | (15.8 | ) | ||||||
Omnicom Group, Inc. | (1,370 | ) | (73,610 | ) | (2.4 | ) | ||||||
ON Semiconductor Corp. | (20,690 | ) | (426,214 | ) | (13.8 | ) | ||||||
Oracle Corp. | (370 | ) | (20,517 | ) | (0.7 | ) | ||||||
PACCAR, Inc. | (1,955 | ) | (166,331 | ) | (5.4 | ) | ||||||
Paycom Software, Inc. | (320 | ) | (90,998 | ) | (2.9 | ) | ||||||
PerkinElmer, Inc. | (5,070 | ) | (602,874 | ) | (19.5 | ) | ||||||
Perrigo Co. plc | (400 | ) | (21,208 | ) | (0.7 | ) | ||||||
Pfizer, Inc. | (3,410 | ) | (131,217 | ) | (4.2 | ) | ||||||
PNC Financial Services Group, Inc. (The) | (1,880 | ) | (200,540 | ) | (6.5 | ) | ||||||
Pool Corp. | (340 | ) | (107,678 | ) | (3.5 | ) | ||||||
Post Holdings, Inc. | (900 | ) | (79,866 | ) | (2.6 | ) | ||||||
Principal Financial Group, Inc. | (3,380 | ) | (143,413 | ) | (4.6 | ) | ||||||
Progressive Corp. (The) | (610 | ) | (55,107 | ) | (1.8 | ) | ||||||
Prudential Financial, Inc. | (9,970 | ) | (631,799 | ) | (20.5 | ) | ||||||
QIAGEN NV | (3,730 | ) | (185,285 | ) | (6.0 | ) | ||||||
Quest Diagnostics, Inc. | (550 | ) | (69,889 | ) | (2.3 | ) | ||||||
Raymond James Financial, Inc. | (740 | ) | (51,415 | ) | (1.7 | ) | ||||||
Regeneron Pharmaceuticals, Inc. | (90 | ) | (56,886 | ) | (1.8 | ) | ||||||
ResMed, Inc. | (386 | ) | (78,169 | ) | (2.5 | ) | ||||||
Roku, Inc. | (1,934 | ) | (299,557 | ) | (9.7 | ) | ||||||
Rollins, Inc. | (5,100 | ) | (267,240 | ) | (8.7 | ) | ||||||
Roper Technologies, Inc. | (2,060 | ) | (890,847 | ) | (28.8 | ) | ||||||
Royal Caribbean Cruises Ltd. | (4,360 | ) | (212,376 | ) | (6.9 | ) | ||||||
Sarepta Therapeutics, Inc. | (190 | ) | (29,169 | ) | (0.9 | ) | ||||||
| 36 | 2020 BLACKROCK ANNUAL REPORTTO SHAREHOLDERS |
Consolidated Schedule of Investments (continued) July 31, 2020 | BlackRock Total Factor Fund |
| Shares | Value | % of Basket Value | ||||||||||
| United States (continued) | ||||||||||||
Schlumberger Ltd. | (3,390 | ) | $ | (61,495 | ) | (2.0 | )% | |||||
Service Corp. International | (3,100 | ) | (134,416 | ) | (4.4 | ) | ||||||
Splunk, Inc. | (1,160 | ) | (243,391 | ) | (7.9 | ) | ||||||
SS&C Technologies Holdings, Inc. | (610 | ) | (35,075 | ) | (1.1 | ) | ||||||
SVB Financial Group | (900 | ) | (201,843 | ) | (6.5 | ) | ||||||
T. Rowe Price Group, Inc. | (1,550 | ) | (214,055 | ) | (6.9 | ) | ||||||
TD Ameritrade Holding Corp. | (6,280 | ) | (225,389 | ) | (7.3 | ) | ||||||
Tiffany & Co. | (4,020 | ) | (503,947 | ) | (16.3 | ) | ||||||
T-Mobile US, Inc. | (968 | ) | (103,944 | ) | (3.4 | ) | ||||||
Trane Technologies plc | (330 | ) | (36,917 | ) | (1.2 | ) | ||||||
Travelers Cos., Inc. (The) | (1,310 | ) | (149,890 | ) | (4.9 | ) | ||||||
Trimble, Inc. | (1,230 | ) | (54,747 | ) | (1.8 | ) | ||||||
Truist Financial Corp. | (9,430 | ) | (353,248 | ) | (11.4 | ) | ||||||
Tyler Technologies, Inc. | (1,125 | ) | (401,906 | ) | (13.0 | ) | ||||||
Ubiquiti, Inc. | (630 | ) | (116,739 | ) | (3.8 | ) | ||||||
UGI Corp. | (5,420 | ) | (180,703 | ) | (5.9 | ) | ||||||
Union Pacific Corp. | (1,520 | ) | (263,492 | ) | (8.5 | ) | ||||||
United Rentals, Inc. | (1,550 | ) | (240,824 | ) | (7.8 | ) | ||||||
Universal Display Corp. | (220 | ) | (38,379 | ) | (1.2 | ) | ||||||
Vail Resorts, Inc. | (170 | ) | (32,645 | ) | (1.1 | ) | ||||||
Valero Energy Corp. | (3,410 | ) | (191,744 | ) | (6.2 | ) | ||||||
Varian Medical Systems, Inc. | (1,677 | ) | (239,341 | ) | (7.8 | ) | ||||||
Verisk Analytics, Inc. | (1,100 | ) | (207,581 | ) | (6.7 | ) | ||||||
Visa, Inc., Class A | (4,740 | ) | (902,496 | ) | (29.2 | ) | ||||||
Vulcan Materials Co. | (1,100 | ) | (129,162 | ) | (4.2 | ) | ||||||
Walt Disney Co. (The) | (820 | ) | (95,891 | ) | (3.1 | ) | ||||||
Wells Fargo & Co. | (649 | ) | (15,745 | ) | (0.5 | ) | ||||||
Western Digital Corp. | (12,648 | ) | (545,129 | ) | (17.7 | ) | ||||||
Western Union Co. (The) | (6,120 | ) | (148,594 | ) | (4.8 | ) | ||||||
Westinghouse Air Brake Technologies Corp. | (950 | ) | (59,081 | ) | (1.9 | ) | ||||||
Westlake Chemical Corp. | (5,850 | ) | (318,825 | ) | (10.3 | ) | ||||||
WestRock Co. | (4,870 | ) | (130,808 | ) | (4.2 | ) | ||||||
WEX, Inc. | (850 | ) | (134,615 | ) | (4.4 | ) | ||||||
WR Berkley Corp. | (5,280 | ) | (326,040 | ) | (10.6 | ) | ||||||
Wynn Resorts Ltd. | (1,545 | ) | (111,904 | ) | (3.6 | ) | ||||||
Xilinx, Inc. | (1,310 | ) | (140,629 | ) | (4.6 | ) | ||||||
Xylem, Inc. | (6,228 | ) | (454,519 | ) | (14.7 | ) | ||||||
Zillow Group, Inc., Class C | (10,910 | ) | (746,135 | ) | (24.2 | ) | ||||||
Zimmer Biomet Holdings, Inc. | (550 | ) | (74,173 | ) | (2.4 | ) | ||||||
|
| |||||||||||
| (43,539,077 | ) | |||||||||||
|
| |||||||||||
Total Reference Entity — Short |
| (96,442,102 | ) | |||||||||
|
| |||||||||||
Net Value of Reference Entity — Credit Suisse International |
| $ | 3,088,386 | |||||||||
|
| |||||||||||
The following table represents the individual long and short positions and related values of equity securities underlying the total return swap with Deutsche Bank AG, as of July 31, 2020, expiration dates 03/29/21-02/17/23:
|
| |||||||||||
Reference Entity — Long |
| |||||||||||
| Austria | ||||||||||||
OMV AG | 3,390 | 107,063 | 3.8 | |||||||||
|
| |||||||||||
| Belgium | ||||||||||||
Galapagos NV | 180 | 33,430 | 1.2 | |||||||||
Proximus SADP | 4,180 | 85,987 | 3.0 | |||||||||
|
| |||||||||||
| 119,417 | ||||||||||||
| Denmark | ||||||||||||
Coloplast A/S, Class B | 730 | 124,609 | 4.4 | |||||||||
Genmab A/S | 140 | 48,189 | 1.7 | |||||||||
GN Store Nord A/S | 1,210 | 74,409 | 2.6 | |||||||||
| Shares | Value | % of Basket Value | ||||||||||
| Denmark (continued) | ||||||||||||
Novo Nordisk A/S, Class B | 1,270 | $ | 83,328 | 3.0 | % | |||||||
Novozymes A/S, Class B | 2,398 | 143,447 | 5.1 | |||||||||
|
| |||||||||||
| 473,982 | ||||||||||||
| Finland | ||||||||||||
Fortum OYJ | 2,810 | 57,034 | 2.0 | |||||||||
Neste OYJ | 2,140 | 98,294 | 3.5 | |||||||||
Stora Enso OYJ, Class R | 7,360 | 92,307 | 3.3 | |||||||||
|
| |||||||||||
| 247,635 | ||||||||||||
| France | ||||||||||||
Air Liquide SA | 210 | 34,541 | 1.2 | |||||||||
Carrefour SA | 11,060 | 175,776 | 6.2 | |||||||||
Credit Agricole SA | 4,170 | 40,139 | 1.4 | |||||||||
Dassault Systemes SE | 230 | 41,882 | 1.5 | |||||||||
Eiffage SA | 350 | 30,588 | 1.1 | |||||||||
Engie SA | 950 | 12,655 | 0.4 | |||||||||
Hermes International | 120 | 97,289 | 3.5 | |||||||||
Ipsen SA | 3,436 | 329,520 | 11.7 | |||||||||
Orange SA | 2,910 | 34,108 | 1.2 | |||||||||
Publicis Groupe SA | 930 | 29,738 | 1.1 | |||||||||
Schneider Electric SE | 690 | 79,118 | 2.8 | |||||||||
Suez SA | 3,160 | 41,676 | 1.5 | |||||||||
Thales SA | 2,460 | 177,837 | 6.3 | |||||||||
Veolia Environnement SA | 1,650 | 37,797 | 1.3 | |||||||||
|
| |||||||||||
| 1,162,664 | ||||||||||||
| Germany | ||||||||||||
HeidelbergCement AG | 1,480 | 82,133 | 2.9 | |||||||||
Nemetschek SE | 560 | 41,051 | 1.5 | |||||||||
Porsche Automobil Holding SE (Preference) | 590 | 33,396 | 1.2 | |||||||||
Puma SE | 2,670 | 207,827 | 7.4 | |||||||||
Telefonica Deutschland Holding AG | 22,480 | 61,338 | 2.2 | |||||||||
|
| |||||||||||
| 425,745 | ||||||||||||
| Italy | ||||||||||||
Eni SpA | 14,760 | 131,479 | 4.7 | |||||||||
Intesa Sanpaolo SpA | 84,470 | 172,179 | 6.1 | |||||||||
Mediobanca Banca di Credito Finanziario SpA | 9,590 | 77,449 | 2.8 | |||||||||
Moncler SpA | 770 | 29,770 | 1.1 | |||||||||
Prysmian SpA | 1,360 | 34,777 | 1.2 | |||||||||
Recordati SpA | 1,430 | 76,806 | 2.7 | |||||||||
|
| |||||||||||
| 522,460 | ||||||||||||
| Japan | ||||||||||||
Yamaha Corp. | 100 | 4,611 | 0.2 | |||||||||
|
| |||||||||||
| Luxembourg | ||||||||||||
Tenaris SA | 13,020 | 76,734 | 2.7 | |||||||||
|
| |||||||||||
| Netherlands | ||||||||||||
EXOR NV | 1,080 | 60,650 | 2.1 | |||||||||
Koninklijke Ahold Delhaize NV | 37,800 | 1,088,672 | 38.6 | |||||||||
Koninklijke DSM NV | 550 | 84,186 | 3.0 | |||||||||
Koninklijke KPN NV | 28,410 | 74,844 | 2.7 | |||||||||
Koninklijke Philips NV | 4,728 | 244,300 | 8.7 | |||||||||
NN Group NV | 1,186 | 43,410 | 1.5 | |||||||||
|
| |||||||||||
| 1,596,062 | ||||||||||||
| Norway | ||||||||||||
Yara International ASA | 860 | 36,278 | 1.3 | |||||||||
|
| |||||||||||
CONSOLIDATED SCHEDULE OF INVESTMENTS | 37 |
Consolidated Schedule of Investments (continued) July 31, 2020 | BlackRock Total Factor Fund |
| Shares | Value | % of Basket Value | ||||||||||
| Spain | ||||||||||||
ACS Actividades de Construccion y Servicios SA | 3,880 | $ | 90,003 | 3.2 | % | |||||||
Aena SME SA | 320 | 41,723 | 1.5 | |||||||||
|
| |||||||||||
| 131,726 | ||||||||||||
| Sweden | ||||||||||||
Hennes & Mauritz AB, Class B | 16,040 | 250,022 | 8.9 | |||||||||
Lundin Energy AB | 4,710 | 109,864 | 3.9 | |||||||||
SKF AB, Class B | 2,220 | 41,098 | 1.5 | |||||||||
Tele2 AB, Class B | 6,860 | 97,325 | 3.4 | |||||||||
|
| |||||||||||
| 498,309 | ||||||||||||
| Switzerland | ||||||||||||
Coca-Cola HBC AG | 2,540 | 66,126 | 2.3 | |||||||||
STMicroelectronics NV | 3,390 | 95,249 | 3.4 | |||||||||
|
| |||||||||||
| 161,375 | ||||||||||||
| United Kingdom | ||||||||||||
Ashtead Group plc | 1,570 | 49,995 | 1.8 | |||||||||
BAE Systems plc | 14,970 | 95,941 | 3.4 | |||||||||
Berkeley Group Holdings plc | 630 | 36,553 | 1.3 | |||||||||
BP plc | 17,290 | 62,616 | 2.2 | |||||||||
Burberry Group plc | 5,990 | 97,600 | 3.5 | |||||||||
easyJet plc | 149 | 958 | 0.0 | |||||||||
InterContinental Hotels Group plc | 680 | 31,322 | 1.1 | |||||||||
International Consolidated Airlines Group SA | 45,970 | 99,080 | 3.5 | |||||||||
JD Sports Fashion plc | 4,650 | 36,760 | 1.3 | |||||||||
Rolls-Royce Holdings plc | 95,690 | 287,056 | 10.2 | |||||||||
Smith & Nephew plc | 2,440 | 48,159 | 1.7 | |||||||||
|
| |||||||||||
| 846,040 | ||||||||||||
|
| |||||||||||
Total Reference Entity — Long |
| 6,410,101 | ||||||||||
|
| |||||||||||
Reference Entity — Short |
| |||||||||||
| Australia | ||||||||||||
Glencore plc | (22,700 | ) | (51,950 | ) | (1.8 | ) | ||||||
|
| |||||||||||
| Belgium | ||||||||||||
Solvay SA | (940 | ) | (72,957 | ) | (2.6 | ) | ||||||
|
| |||||||||||
| Denmark | ||||||||||||
H Lundbeck A/S | (2,790 | ) | (101,724 | ) | (3.6 | ) | ||||||
|
| |||||||||||
| Finland | ||||||||||||
Sampo OYJ, Class A | (1,960 | ) | (70,843 | ) | (2.5 | ) | ||||||
|
| |||||||||||
| France | ||||||||||||
Airbus SE | (620 | ) | (45,382 | ) | (1.6 | ) | ||||||
Capgemini SE | (620 | ) | (80,410 | ) | (2.9 | ) | ||||||
Electricite de France SA | (5,670 | ) | (57,418 | ) | (2.0 | ) | ||||||
Natixis SA | (11,820 | ) | (28,912 | ) | (1.0 | ) | ||||||
Remy Cointreau SA | (4,700 | ) | (753,777 | ) | (26.7 | ) | ||||||
Ubisoft Entertainment SA | (510 | ) | (42,596 | ) | (1.5 | ) | ||||||
|
| |||||||||||
| (1,008,495 | ) | |||||||||||
| Germany | ||||||||||||
Carl Zeiss Meditec AG | (930 | ) | (97,333 | ) | (3.5 | ) | ||||||
Continental AG | (430 | ) | (41,538 | ) | (1.5 | ) | ||||||
Fresenius SE & Co. KGaA | (1,360 | ) | (67,855 | ) | (2.4 | ) | ||||||
Infineon Technologies AG | (1,320 | ) | (33,654 | ) | (1.2 | ) | ||||||
KION Group AG | (1,050 | ) | (80,247 | ) | (2.8 | ) | ||||||
Knorr-Bremse AG | (530 | ) | (62,014 | ) | (2.2 | ) | ||||||
LEG Immobilien AG | (340 | ) | (47,408 | ) | (1.7 | ) | ||||||
Sartorius AG (Preference) | (240 | ) | (92,343 | ) | (3.3 | ) | ||||||
Siemens Healthineers AG | (1,120 | ) | (58,309 | ) | (2.1 | ) | ||||||
| Shares | Value | % of Basket Value | ||||||||||
| Germany (continued) | ||||||||||||
Uniper SE | (5,150 | ) | $ | (177,794 | ) | (6.3 | )% | |||||
|
| |||||||||||
| (758,495 | ) | |||||||||||
| Italy | ||||||||||||
Amplifon SpA | (1,540 | ) | (52,720 | ) | (1.9 | ) | ||||||
|
| |||||||||||
| Japan | ||||||||||||
Yamaha Corp. | (100 | ) | (4,611 | ) | (0.2 | ) | ||||||
|
| |||||||||||
| Netherlands | ||||||||||||
NN Group NV | (1,186 | ) | (43,410 | ) | (1.5 | ) | ||||||
|
| |||||||||||
| Norway | ||||||||||||
DNB ASA | (3,675 | ) | (56,445 | ) | (2.0 | ) | ||||||
Mowi ASA | (1,580 | ) | (28,695 | ) | (1.0 | ) | ||||||
Norsk Hydro ASA | (3,840 | ) | (10,847 | ) | (0.4 | ) | ||||||
|
| |||||||||||
| (95,987 | ) | |||||||||||
| South Africa | ||||||||||||
Mondi plc | (4,230 | ) | (74,925 | ) | (2.7 | ) | ||||||
|
| |||||||||||
| Spain | ||||||||||||
Amadeus IT Group SA | (930 | ) | (46,440 | ) | (1.7 | ) | ||||||
Enagas SA | (3,120 | ) | (78,715 | ) | (2.8 | ) | ||||||
Grifols SA | (2,050 | ) | (59,728 | ) | (2.1 | ) | ||||||
|
| |||||||||||
| (184,883 | ) | |||||||||||
| Sweden | ||||||||||||
Svenska Cellulosa AB SCA, Class B | (5,210 | ) | (63,275 | ) | (2.3 | ) | ||||||
|
| |||||||||||
| United Kingdom | ||||||||||||
Admiral Group plc | (1,280 | ) | (39,916 | ) | (1.4 | ) | ||||||
AstraZeneca plc | (400 | ) | (44,192 | ) | (1.6 | ) | ||||||
Barratt Developments plc | (8,940 | ) | (59,385 | ) | (2.1 | ) | ||||||
Croda International plc | (990 | ) | (73,888 | ) | (2.6 | ) | ||||||
DS Smith plc | (13,490 | ) | (45,618 | ) | (1.6 | ) | ||||||
easyJet plc | (149 | ) | (958 | ) | (0.0 | ) | ||||||
Fiat Chrysler Automobiles NV | (2,930 | ) | (29,787 | ) | (1.1 | ) | ||||||
HSBC Holdings plc | (5,980 | ) | (26,927 | ) | (1.0 | ) | ||||||
Imperial Brands plc | (2,690 | ) | (44,818 | ) | (1.6 | ) | ||||||
Informa plc | (18,870 | ) | (89,474 | ) | (3.2 | ) | ||||||
London Stock Exchange Group plc | (510 | ) | (56,334 | ) | (2.0 | ) | ||||||
Melrose Industries plc | (19,870 | ) | (21,941 | ) | (0.8 | ) | ||||||
Reckitt Benckiser Group plc | (650 | ) | (65,175 | ) | (2.3 | ) | ||||||
Spirax-Sarco Engineering plc | (500 | ) | (66,817 | ) | (2.4 | ) | ||||||
Tesco plc | (51,430 | ) | (145,153 | ) | (5.1 | ) | ||||||
United Utilities Group plc | (800 | ) | (9,382 | ) | (0.3 | ) | ||||||
Whitbread plc | (2,285 | ) | (64,880 | ) | (2.3 | ) | ||||||
Wm Morrison Supermarkets plc | (29,600 | ) | (71,802 | ) | (2.5 | ) | ||||||
WPP plc | (6,830 | ) | (50,653 | ) | (1.8 | ) | ||||||
|
| |||||||||||
| (1,007,100 | ) | |||||||||||
|
| |||||||||||
Total Reference Entity — Short |
| (3,591,375 | ) | |||||||||
|
| |||||||||||
Net Value of Reference Entity — Deutsche Bank AG |
| $ | 2,818,726 | |||||||||
|
| |||||||||||
| 38 | 2020 BLACKROCK ANNUAL REPORTTO SHAREHOLDERS |
Consolidated Schedule of Investments (continued) July 31, 2020 | BlackRock Total Factor Fund |
The following table represents the individual long and short positions and related values of equity securities underlying the total return swap with JPMorgan Chase Bank NA, as of July 31, 2020, expiration date 02/08/23:
Reference Entity — Long | ||||||||||||
| South Korea | ||||||||||||
HDC Holdings Co. Ltd. | 1 | $ | 8 | 33.4 | % | |||||||
|
| |||||||||||
| United States | ||||||||||||
Fortive Corp. | 1 | 70 | 286.6 | |||||||||
|
| |||||||||||
Total Reference Entity — Long |
| 78 | ||||||||||
|
| |||||||||||
Reference Entity — Short | ||||||||||||
| United States | ||||||||||||
Lennar Corp., Class B | (1 | ) | (54 | ) | (220.0 | ) | ||||||
|
| |||||||||||
Total Reference Entity — Short |
| (54 | ) | |||||||||
|
| |||||||||||
Net Value of Reference Entity — JPMorgan |
| $ | 24 | |||||||||
|
| |||||||||||
Balances Reported in the Consolidated Statement of Assets and Liabilities for Centrally Cleared Swaps and OTC Swaps
| Swap Premiums Paid | Swap Premiums Received | Unrealized Appreciation | Unrealized Depreciation | |||||||||||||
Centrally Cleared Swaps (a) | $ | 56,474 | $ | (87,369 | ) | $ | 296,638 | $ | — | |||||||
OTC Swaps | — | — | 2,466,901 | (400,472 | ) | |||||||||||
| (a) | Includes cumulative appreciation (depreciation) on centrally cleared swaps, as reported in the Consolidated Schedule of Investments. Only current day’s variation margin is reported within the Consolidated Statement of Assets and Liabilities and is net of any previously paid (received) swap premium amounts. |
Derivative Financial Instruments Categorized by Risk Exposure
As of period end, the fair values of derivative financial instruments located in the Consolidated Statement of Assets and Liabilities were as follows:
| Commodity Contracts | Credit Contracts | Equity Contracts | Foreign Currency Exchange Contracts | Interest Rate Contracts | Other Contracts | Total | ||||||||||||||||||||||
Assets — Derivative Financial Instruments | ||||||||||||||||||||||||||||
Futures contracts | ||||||||||||||||||||||||||||
Unrealized appreciation on futures contracts(a) | $ | 703,978 | $ | — | $ | 663,504 | $ | — | $ | 2,072,547 | $ | — | $ | 3,440,029 | ||||||||||||||
Forward foreign currency exchange contracts | ||||||||||||||||||||||||||||
Unrealized appreciation on forward foreign currency exchange contracts | — | — | — | 4,159,067 | — | — | 4,159,067 | |||||||||||||||||||||
Swaps — centrally cleared | ||||||||||||||||||||||||||||
Unrealized appreciation on centrally cleared swaps(a). | — | 296,638 | — | — | — | — | 296,638 | |||||||||||||||||||||
Swaps — OTC | ||||||||||||||||||||||||||||
Unrealized appreciation on OTC swaps; Swap premiums paid | — | — | 2,466,901 | — | — | — | 2,466,901 | |||||||||||||||||||||
|
| |||||||||||||||||||||||||||
| $703,978 | $296,638 | $ | 3,130,405 | $4,159,067 | $ | 2,072,547 | $ | — | $10,362,635 | |||||||||||||||||||
|
| |||||||||||||||||||||||||||
| Liabilities — Derivative Financial Instruments | ||||||||||||||||||||||||||||
Futures contracts | ||||||||||||||||||||||||||||
Unrealized depreciation on futures contracts (a) | 336,732 | — | 2,718,070 | — | 1,467,882 | — | 4,522,684 | |||||||||||||||||||||
Forward foreign currency exchange contracts | ||||||||||||||||||||||||||||
Unrealized depreciation on forward foreign currency exchange contracts | — | — | — | 5,509,765 | — | — | 5,509,765 | |||||||||||||||||||||
Swaps — OTC | ||||||||||||||||||||||||||||
Unrealized depreciation on OTC swaps; Swap premiums received | — | — | 400,472 | — | — | — | 400,472 | |||||||||||||||||||||
|
| |||||||||||||||||||||||||||
| $336,732 | $ | — | $3,118,542 | $5,509,765 | $1,467,882 | $ | — | $10,432,921 | ||||||||||||||||||||
|
| |||||||||||||||||||||||||||
CONSOLIDATED SCHEDULE OF INVESTMENTS | 39 |
Consolidated Schedule of Investments (continued) July 31, 2020 | BlackRock Total Factor Fund |
| (a) | Net cumulative unrealized appreciation (depreciation) on futures contracts and centrally cleared swaps, if any, are reported in the Consolidated Schedule of Investments. In the Consolidated Statement of Assets and Liabilities, only current day’s variation margin is reported in receivables or payables and the net cumulative unrealized appreciation (depreciation) is included in accumulated earnings (loss). |
For the year ended July 31, 2020, the effect of derivative financial instruments in the Consolidated Statement of Operations was as follows:
| Commodity Contracts | Credit Contracts | Equity Contracts | Foreign Currency Exchange Contracts | Interest Rate Contracts | Other Contracts | Total | ||||||||||||||||||||||
Net Realized Gain (Loss) from: | ||||||||||||||||||||||||||||
Futures contracts | $ | 2,465,922 | $ | — | $ | (11,336,856 | ) | $ | — | $ | 6,035,879 | $ | — | $ | (2,835,055 | ) | ||||||||||||
Forward foreign currency exchange contracts | — | — | — | (284,939 | ) | — | — | (284,939 | ) | |||||||||||||||||||
Swaps | — | (5,311,967 | ) | (45,802,282 | ) | — | — | — | (51,114,249 | ) | ||||||||||||||||||
|
| |||||||||||||||||||||||||||
| $ | 2,465,922 | $ | (5,311,967 | ) | $ | (57,139,138 | ) | $ | (284,939 | ) | $ | 6,035,879 | $ | — | $ | (54,234,243 | ) | |||||||||||
|
| |||||||||||||||||||||||||||
| Net Change in Unrealized Appreciation (Depreciation) on: | ||||||||||||||||||||||||||||
Futures contracts | (527,125 | ) | — | (1,428,372 | ) | — | (2,932,177 | ) | — | (4,887,674 | ) | |||||||||||||||||
Forward foreign currency exchange contracts | — | — | — | (3,670,021 | ) | — | — | (3,670,021 | ) | |||||||||||||||||||
Swaps | — | 34,260 | 1,237,438 | — | — | — | 1,271,698 | |||||||||||||||||||||
|
| |||||||||||||||||||||||||||
| $ | (527,125 | ) | $ | 34,260 | $ | (190,934 | ) | $ | (3,670,021 | ) | $ | (2,932,177 | ) | $ | — | $ | (7,285,997 | ) | ||||||||||
|
| |||||||||||||||||||||||||||
Average Quarterly Balances of Outstanding Derivative Financial Instruments
Futures contracts: | ||||
Average notional value of contracts — long | $ | 437,764,537 | ||
Average notional value of contracts — short | 245,407,359 | |||
Forward foreign currency exchange contracts: | ||||
Average amounts purchased — in USD | 340,098,400 | |||
Average amounts sold — in USD | 303,919,610 | |||
Credit default swaps: | ||||
Average notional value — sell protection | 21,545,704 | |||
Total return swaps: | ||||
Average notional value | 61,161,928 |
For more information about the Fund’s investment risks regarding derivative financial instruments, refer to the Notes to Consolidated Financial Statements.
Derivative Financial Instruments — Offsetting as of Period End
The Fund’s derivative assets and liabilities (by type) were as follows:
| Assets | Liabilities | |||||||
Derivative Financial Instruments: | ||||||||
Futures contracts | $ | 1,207,459 | $ | 869,793 | ||||
Forward foreign currency exchange contracts | 4,159,067 | 5,509,765 | ||||||
Swaps — Centrally cleared | 4,103 | — | ||||||
Swaps — OTC (a) | 2,466,901 | 400,472 | ||||||
|
| |||||||
Total derivative assets and liabilities in the Consolidated Statement of Assets and Liabilities | $ | 7,837,530 | $ | 6,780,030 | ||||
Derivatives not subject to a Master Netting Agreement or similar agreement (“MNA”) | (1,211,562 | ) | (869,793 | ) | ||||
|
| |||||||
Total derivative assets and liabilities subject to an MNA | $ | 6,625,968 | $ | 5,910,237 | ||||
|
| |||||||
| (a) | Includes unrealized appreciation (depreciation) on OTC swaps and swap premiums paid/received in the Consolidated Statement of Assets and Liabilities. |
| 40 | 2020 BLACKROCK ANNUAL REPORTTO SHAREHOLDERS |
Consolidated Schedule of Investments (continued) July 31, 2020 | BlackRock Total Factor Fund |
The following tables present the Fund’s derivative assets and liabilities by counterparty net of amounts available for offset under an MNA and net of the related collateral received and pledged by the Fund:
| Counterparty | Derivative Assets Subject to an MNA by Counterparty | Derivatives Available for Offset (a) | Non-cash Collateral Received | Cash Collateral Received (b) | Net Amount of Derivative Assets (c)(d) | |||||||||||||||
Bank of America NA | $ | 379,073 | $ | — | $ | — | $ | — | $ | 379,073 | ||||||||||
Bank of America NA (e) | 2,565 | (2,565 | ) | — | — | — | ||||||||||||||
Barclays Bank plc (e) | 274 | (274 | ) | — | — | — | ||||||||||||||
BNP Paribas SA (e) | 19,879 | (19,879 | ) | — | — | — | ||||||||||||||
Citibank NA | 466,467 | — | — | (400,000 | ) | 66,467 | ||||||||||||||
Credit Suisse International | 275,390 | — | — | — | 275,390 | |||||||||||||||
Deutsche Bank AG (e) | 298,291 | (262,737 | ) | — | — | 35,554 | ||||||||||||||
HSBC Bank plc (e) | 79,241 | (79,241 | ) | — | — | — | ||||||||||||||
JPMorgan Chase Bank NA | 213,891 | (4,834 | ) | — | (209,057 | ) | — | |||||||||||||
JPMorgan Chase Bank NA (e) | 226,145 | (226,145 | ) | — | — | — | ||||||||||||||
Merrill Lynch International & Co. | 1,132,080 | (109,143 | ) | — | (1,022,937 | ) | — | |||||||||||||
Morgan Stanley & Co. International plc (e) | 3,532,672 | (3,532,672 | ) | — | — | — | ||||||||||||||
|
| |||||||||||||||||||
| $ | 6,625,968 | $ | (4,237,490 | ) | $ | — | $ | (1,631,994 | ) | $ | 756,484 | |||||||||
|
| |||||||||||||||||||
| Counterparty | Derivative Liabilities Subject to an MNA by Counterparty | Derivatives Available for Offset (a) | Non-cash Collateral Pledged | Cash Collateral Pledged | Net Amount of Derivative Liabilities (d)(f) | |||||||||||||||
Bank of America NA (e) | $ | 197,112 | $ | (2,565 | ) | $ | — | $ | — | $ | 194,547 | |||||||||
Barclays Bank plc (e) | 7,297 | (274 | ) | — | — | 7,023 | ||||||||||||||
BNP Paribas SA (e) | 32,356 | (19,879 | ) | — | — | 12,477 | ||||||||||||||
Deutsche Bank AG | 286,495 | — | — | — | 286,495 | |||||||||||||||
Deutsche Bank AG (e) | 262,737 | (262,737 | ) | — | — | — | ||||||||||||||
Goldman Sachs International (e) | 5,374 | — | — | — | 5,374 | |||||||||||||||
HSBC Bank plc (e) | 127,828 | (79,241 | ) | — | — | 48,587 | ||||||||||||||
JPMorgan Chase Bank NA | 4,834 | (4,834 | ) | — | — | — | ||||||||||||||
JPMorgan Chase Bank NA (e) | 265,814 | (226,145 | ) | — | — | 39,669 | ||||||||||||||
Merrill Lynch International & Co. | 109,143 | (109,143 | ) | — | — | — | ||||||||||||||
Morgan Stanley & Co. International plc (e) | 4,611,247 | (3,532,672 | ) | — | (900,000 | ) | 178,575 | |||||||||||||
|
| |||||||||||||||||||
| $ | 5,910,237 | $ | (4,237,490 | ) | $ | — | $ | (900,000 | ) | $ | 772,747 | |||||||||
|
| |||||||||||||||||||
| (a) | The amount of derivatives available for offset is limited to the amount of derivative assets and/or liabilities that are subject to an MNA. |
| (b) | Excess of collateral received from the individual counterparty is not shown for financial reporting purposes. |
| (c) | Net amount represents the net amount receivable from the counterparty in the event of default. |
| (d) | Net amount may also include forward foreign currency exchange contracts that are not required to be collateralized. |
| (e) | Represents derivatives owned by the BlackRock Cayman Strategic Risk Allocation Fund, Ltd., a wholly-owned subsidiary of the Fund. See Note 1 of the Notes to Consolidated Financial Statements. |
| (f) | Net amount represents the net amount payable due to the counterparty in the event of default. |
CONSOLIDATED SCHEDULE OF INVESTMENTS | 41 |
Consolidated Schedule of Investments (continued) July 31, 2020 | BlackRock Total Factor Fund |
Fair Value Hierarchy as of Period End
Various inputs are used in determining the fair value of investments and derivative financial instruments. For information about the Fund’s policy regarding valuation of investments and derivative financial instruments, refer to the Notes to Consolidated Financial Statements.
The following tables summarize the Fund’s investments and derivative financial instruments categorized in the disclosure hierarchy:
| Level 1 | Level 2 | Level 3 | Total | |||||||||||||
Assets: | ||||||||||||||||
Investments: | ||||||||||||||||
Long-Term Investments: | ||||||||||||||||
Common Stocks | $ | 190 | $ | — | $ | — | $ | 190 | ||||||||
Foreign Government Obligations | — | 12,876,315 | — | 12,876,315 | ||||||||||||
U.S. Treasury Obligations | — | 11,924,620 | — | 11,924,620 | ||||||||||||
Short-Term Securities: | ||||||||||||||||
Money Market Funds | 50,698,955 | — | — | 50,698,955 | ||||||||||||
U.S. Treasury Obligations | — | 181,903,445 | — | 181,903,445 | ||||||||||||
|
|
|
|
|
|
|
| |||||||||
| $ | 50,699,145 | $ | 206,704,380 | $ | — | $ | 257,403,525 | |||||||||
|
|
|
|
|
|
|
| |||||||||
Derivative Financial Instruments (a) |
| |||||||||||||||
Assets: |
| |||||||||||||||
Commodity contracts | $ | 703,978 | $ | — | $ | — | $ | 703,978 | ||||||||
Credit contracts | — | 296,638 | — | 296,638 | ||||||||||||
Equity contracts | 663,504 | 2,466,901 | — | 3,130,405 | ||||||||||||
Foreign currency exchange contracts | — | 4,159,067 | — | 4,159,067 | ||||||||||||
Interest rate contracts | 2,072,547 | — | — | 2,072,547 | ||||||||||||
Liabilities: |
| |||||||||||||||
Commodity contracts | (336,732 | ) | — | — | (336,732 | ) | ||||||||||
Equity contracts | (2,718,070 | ) | (400,472 | ) | — | (3,118,542 | ) | |||||||||
Foreign currency exchange contracts | — | (5,509,765 | ) | — | (5,509,765 | ) | ||||||||||
Interest rate contracts | (1,467,882 | ) | — | — | (1,467,882 | ) | ||||||||||
|
|
|
|
|
|
|
| |||||||||
| $ | (1,082,655 | ) | $ | 1,012,369 | $ | — | $ | (70,286 | ) | |||||||
|
|
|
|
|
|
|
| |||||||||
The breakdown of the Fund’s investments into major categories is disclosed in the Consolidated Schedule of Investments above.
| (a) | Derivative financial instruments are swaps, futures contracts and forward foreign currency exchange contracts. Swaps, futures contracts and forward foreign currency exchange contracts are valued at the unrealized appreciation (depreciation) on the instrument. |
See notes to consolidated financial statements.
| 42 | 2020 BLACKROCK ANNUAL REPORTTO SHAREHOLDERS |
Consolidated Statement of Assets and Liabilities
July 31, 2020
| BlackRock Total Factor Fund | ||||
ASSETS | ||||
Investments at value — unaffiliated (cost — $204,883,642) | $ | 206,704,570 | ||
Investments at value — affiliated (cost — $50,698,955) | 50,698,955 | |||
Cash | 6,486,398 | |||
Cash pledged: | ||||
Collateral — OTC derivatives | 10,690,000 | |||
Futures contracts | 17,951,000 | |||
Centrally cleared swaps | 626,000 | |||
Foreign currency at value (cost — $9,953,555) | 10,275,394 | |||
Receivables: | ||||
Swaps | 47,174 | |||
Capital shares sold | 370,069 | |||
Dividends — affiliated | 3,156 | |||
From the Manager | 13,210 | |||
Variation margin on futures contracts | 1,207,459 | |||
Variation margin on centrally cleared swaps | 4,103 | |||
Unrealized appreciation on: | ||||
Forward foreign currency exchange contracts | 4,159,067 | |||
OTC swaps | 2,466,901 | |||
Prepaid expenses | 65,064 | |||
|
| |||
Total assets | 311,768,520 | |||
|
| |||
LIABILITIES | ||||
Due to broker | 247,086 | |||
Cash received as collateral for OTC derivatives | 1,820,000 | |||
Payables: | ||||
Accounting services fees | 105,922 | |||
Administration fees | 10,933 | |||
Capital shares redeemed | 321,920 | |||
Investment advisory fees | 63,262 | |||
Trustees’ and Officer’s fees | 663 | |||
Other affiliate fees | 235 | |||
Professional fees | 81,869 | |||
Service and distribution fees | 1,775 | |||
Variation margin on futures contracts | 869,793 | |||
Other accrued expenses | 149,502 | |||
Unrealized depreciation on: | ||||
Forward foreign currency exchange contracts | 5,509,765 | |||
OTC swaps | 400,472 | |||
|
| |||
Total liabilities | 9,583,197 | |||
|
| |||
NET ASSETS | $ | 302,185,323 | ||
|
| |||
NET ASSETS CONSIST OF | ||||
Paid-in capital | $ | 356,657,867 | ||
Accumulated loss | (54,472,544 | ) | ||
|
| |||
NET ASSETS | $ | 302,185,323 | ||
|
| |||
NET ASSET VALUE | ||||
Institutional — Based on net assets of $265,507,212 and 30,228,221 shares outstanding, unlimited number of shares authorized, $0.001 par value | $ | 8.78 | ||
|
| |||
Investor A — Based on net assets of $6,916,176 and 791,490 shares outstanding, unlimited number of shares authorized, $0.001 par value | $ | 8.74 | ||
|
| |||
Investor C — Based on net assets of $304,123 and 35,138 shares outstanding, unlimited number of shares authorized, $0.001 par value | $ | 8.66 | ||
|
| |||
Class K — Based on net assets of $29,457,812 and 3,350,702 shares outstanding, unlimited number of shares authorized, $0.001 par value | $ | 8.79 | ||
|
| |||
See notes to consolidated financial statements.
CONSOLIDATED FINANCIAL STATEMENTS | 43 |
Consolidated Statement of Operations
Year Ended July 31, 2020
BlackRock Total Factor Fund | ||||
INVESTMENT INCOME | ||||
Dividends — affiliated | $ | 175,196 | ||
Dividends — unaffiliated | 1,094 | |||
Interest — unaffiliated (a) | 4,687,526 | |||
|
| |||
Total investment income | 4,863,816 | |||
|
| |||
EXPENSES | ||||
Investment advisory | 1,596,474 | |||
Accounting services | 241,550 | |||
Transfer agent — class specific | 237,312 | |||
Professional | 143,644 | |||
Administration | 135,700 | |||
Registration | 123,181 | |||
Administration — class specific | 63,855 | |||
Pricing | 41,772 | |||
Printing and postage | 37,216 | |||
Custodian | 36,611 | |||
Service and distribution — class specific | 26,812 | |||
Trustees and Officer | 6,369 | |||
Miscellaneous | 3,845 | |||
|
| |||
Total expenses | 2,694,341 | |||
Less: | ||||
Administration fees waived — class specific | (62,328) | |||
Fees waived and/or reimbursed by the Manager | (769,894) | |||
Transfer agent fees waived and/or reimbursed — class specific | (91,746) | |||
|
| |||
Total expenses after fees waived and/or reimbursed | 1,770,373 | |||
|
| |||
Net investment income | 3,093,443 | |||
|
| |||
REALIZED AND UNREALIZED GAIN (LOSS) | ||||
Net realized gain (loss) from: | ||||
Investments — unaffiliated | (2,554,968) | |||
Capital gain distributions from underlying funds — affiliated | 31 | |||
Forward foreign currency exchange contracts | (284,939) | |||
Foreign currency transactions | 399,436 | |||
Futures contracts | (2,835,055) | |||
Swaps | (51,114,249) | |||
|
| |||
| (56,389,744) | ||||
|
| |||
Net change in unrealized appreciation (depreciation) on: | ||||
Investments — unaffiliated | 1,115,824 | |||
Forward foreign currency exchange contracts | (3,670,021) | |||
Foreign currency translations | (434,174) | |||
Futures contracts | (4,887,674) | |||
Swaps | 1,271,698 | |||
|
| |||
| (6,604,347) | ||||
|
| |||
Net realized and unrealized loss | (62,994,091) | |||
|
| |||
NET DECREASE IN NET ASSETS RESULTING FROM OPERATIONS | $ | (59,900,648) | ||
|
| |||
| (a) | Includes net inflationary and deflationary adjustments. See Note 4 of the Notes to Consolidated Financial Statements. |
See notes to consolidated financial statements.
| 44 | 2020 BLACKROCK ANNUAL REPORTTO SHAREHOLDERS |
Consolidated Statements of Changes in Net Assets
| BlackRock Total Factor Fund | ||||||||
| Year Ended July 31, | ||||||||
| 2020 | 2019 | |||||||
INCREASE (DECREASE) IN NET ASSETS | ||||||||
OPERATIONS | ||||||||
Net investment income | $ | 3,093,443 | $ | 2,703,958 | ||||
Net realized gain (loss) | (56,389,744 | ) | 4,700,080 | |||||
Net change in unrealized appreciation (depreciation) | (6,604,347 | ) | 5,332,960 | |||||
|
| |||||||
Net increase (decrease) in net assets resulting from operations | (59,900,648 | ) | 12,736,998 | |||||
|
| |||||||
DISTRIBUTIONS TO SHAREHOLDERS (a) | ||||||||
Institutional | (7,545,741 | ) | (3,930,218 | ) | ||||
Investor A | (251,603 | ) | (137,786 | ) | ||||
Investor C | (16,900 | ) | (11,637 | ) | ||||
Class K | (567,568 | ) | (506,840 | ) | ||||
|
| |||||||
Decrease in net assets resulting from distributions to shareholders | (8,381,812 | ) | (4,586,481 | ) | ||||
|
| |||||||
CAPITAL SHARE TRANSACTIONS | ||||||||
Net increase in net assets derived from capital share transactions | 137,702,357 | 67,856,470 | ||||||
|
| |||||||
NET ASSETS | ||||||||
Total increase in net assets | 69,419,897 | 76,006,987 | ||||||
Beginning of year | 232,765,426 | 156,758,439 | ||||||
|
| |||||||
End of year | $ | 302,185,323 | $ | 232,765,426 | ||||
|
| |||||||
| (a) | Distributions for annual periods determined in accordance with U.S. federal income tax regulations. |
See notes to consolidated financial statements.
CONSOLIDATED FINANCIAL STATEMENTS | 45 |
Consolidated Financial Highlights
(For a share outstanding throughout each period)
| BlackRock Total Factor Fund | ||||||||||||||||||||
| Institutional | ||||||||||||||||||||
| Year Ended July 31, | ||||||||||||||||||||
| 2020 | 2019 | 2018 | 2017 | 2016 | ||||||||||||||||
| ||||||||||||||||||||
Net asset value, beginning of year | $ | 10.50 | $ | 10.18 | $ | 10.18 | $ | 9.79 | $ | 9.96 | ||||||||||
|
| |||||||||||||||||||
Net investment income (loss) (a) | 0.09 | 0.16 | 0.08 | 0.00 | (b) | (0.04 | ) | |||||||||||||
Net realized and unrealized gain (loss) | (1.51 | ) | 0.44 | 0.39 | 0.53 | 0.29 | ||||||||||||||
|
| |||||||||||||||||||
Net increase (decrease) from investment operations | (1.42 | ) | 0.60 | 0.47 | 0.53 | 0.25 | ||||||||||||||
|
| |||||||||||||||||||
Distributions (c) | ||||||||||||||||||||
From net investment income | (0.01 | ) | (0.24 | ) | — | (0.04 | ) | (0.42 | ) | |||||||||||
From net realized gain | (0.29 | ) | (0.04 | ) | (0.47 | ) | (0.10 | ) | — | |||||||||||
|
| |||||||||||||||||||
Total distributions | (0.30 | ) | (0.28 | ) | (0.47 | ) | (0.14 | ) | (0.42 | ) | ||||||||||
|
| |||||||||||||||||||
Net asset value, end of year | $ | 8.78 | $ | 10.50 | $ | 10.18 | $ | 10.18 | $ | 9.79 | ||||||||||
|
| |||||||||||||||||||
Total Return (d) | ||||||||||||||||||||
Based on net asset value | (13.93 | )% | 6.10 | % | 4.59 | % | 5.46 | % | 2.86 | % | ||||||||||
|
| |||||||||||||||||||
Ratios to Average Net Assets (e) | ||||||||||||||||||||
Total expenses | 0.84 | % | 1.29 | % | 1.82 | % | 1.65 | % | 1.61 | % | ||||||||||
|
| |||||||||||||||||||
Total expenses after fees waived and/or reimbursed | 0.55 | % | 0.55 | % | 0.54 | % | 0.68 | % | 1.00 | % | ||||||||||
|
| |||||||||||||||||||
Net investment income (loss) | 0.97 | % | 1.55 | % | 0.76 | % | (0.03 | )% | (0.45 | )% | ||||||||||
|
| |||||||||||||||||||
Supplemental Data | ||||||||||||||||||||
Net assets, end of year (000) | $ | 265,507 | $ | 206,351 | $ | 122,627 | $ | 31,334 | $ | 27,712 | ||||||||||
|
| |||||||||||||||||||
Portfolio turnover rate | 166 | % | 74 | % | 64 | % | 73 | % | 11 | % | ||||||||||
|
| |||||||||||||||||||
| (a) | Based on average shares outstanding. |
| (b) | Amount is greater than $(0.005) per share. |
| (c) | Distributions for annual periods determined in accordance with U.S. federal income tax regulations. |
| (d) | Where applicable, assumes the reinvestment of distributions. |
| (e) | Excludes expenses incurred indirectly as a result of investments in underlying funds as follows: |
| Year Ended July 31, | ||||||||||||||||||||
| 2020 | 2019 | 2018 | 2017 | 2016 | ||||||||||||||||
| ||||||||||||||||||||
Investments in underlying funds | 0.01 | % | 0.01 | % | 0.05 | % | 0.11 | % | 0.08 | % | ||||||||||
|
| |||||||||||||||||||
See notes to consolidated financial statements.
| 46 | 2020 BLACKROCK ANNUAL REPORTTO SHAREHOLDERS |
Consolidated Financial Highlights (continued)
(For a share outstanding throughout each period)
| BlackRock Total Factor Fund | ||||||||||||||||||||
| Investor A | ||||||||||||||||||||
| Year Ended July 31, | ||||||||||||||||||||
| 2020 | 2019 | 2018 | 2017 | 2016 | ||||||||||||||||
| ||||||||||||||||||||
Net asset value, beginning of year | $ | 10.46 | $ | 10.15 | $ | 10.15 | $ | 9.77 | $ | 9.93 | ||||||||||
|
| |||||||||||||||||||
Net investment income (loss) (a) | 0.07 | 0.13 | 0.02 | (0.02 | ) | (0.07 | ) | |||||||||||||
Net realized and unrealized gain (loss) | (1.50 | ) | 0.44 | 0.42 | 0.52 | 0.30 | ||||||||||||||
|
| |||||||||||||||||||
Net increase (decrease) from investment operations | (1.43 | ) | 0.57 | 0.44 | 0.50 | 0.23 | ||||||||||||||
|
| |||||||||||||||||||
Distributions (b) | ||||||||||||||||||||
From net investment income | (0.00 | )(c) | (0.22 | ) | — | (0.02 | ) | (0.39 | ) | |||||||||||
From net realized gain | (0.29 | ) | (0.04 | ) | (0.44 | ) | (0.10 | ) | — | |||||||||||
|
| |||||||||||||||||||
Total distributions | (0.29 | ) | (0.26 | ) | (0.44 | ) | (0.12 | ) | (0.39 | ) | ||||||||||
|
| |||||||||||||||||||
Net asset value, end of year | $ | 8.74 | $ | 10.46 | $ | 10.15 | $ | 10.15 | $ | 9.77 | ||||||||||
|
| |||||||||||||||||||
Total Return (d) | ||||||||||||||||||||
Based on net asset value | (14.07 | )% | 5.80 | % | 4.35 | % | 5.16 | % | 2.68 | % | ||||||||||
|
| |||||||||||||||||||
Ratios to Average Net Assets (e) | ||||||||||||||||||||
Total expenses | 1.22 | % | 1.65 | % | 2.20 | % | 2.09 | % | 2.03 | % | ||||||||||
|
| |||||||||||||||||||
Total expenses after fees waived and/or reimbursed | 0.80 | % | 0.80 | % | 0.80 | % | 0.91 | % | 1.25 | % | ||||||||||
|
| |||||||||||||||||||
Net investment income (loss) | 0.73 | % | 1.28 | % | 0.18 | % | (0.21 | )% | (0.70 | )% | ||||||||||
|
| |||||||||||||||||||
Supplemental Data | ||||||||||||||||||||
Net assets, end of year (000) | $ | 6,916 | $ | 7,423 | $ | 4,936 | $ | 2,327 | $ | 1,448 | ||||||||||
|
| |||||||||||||||||||
Portfolio turnover rate | 166 | % | 74 | % | 64 | % | 73 | % | 11 | % | ||||||||||
|
| |||||||||||||||||||
| (a) | Based on average shares outstanding. |
| (b) | Distributions for annual periods determined in accordance with U.S. federal income tax regulations. |
| (c) | Amount is greater than $(0.005) per share. |
| (d) | Where applicable, excludes the effects of any sales charges and assumes the reinvestment of distributions. |
| (e) | Excludes expenses incurred indirectly as a result of investments in underlying funds as follows: |
| Year Ended July 31, | ||||||||||||||||||||
| 2020 | 2019 | 2018 | 2017 | 2016 | ||||||||||||||||
| ||||||||||||||||||||
Investments in underlying funds | 0.01 | % | 0.01 | % | 0.05 | % | 0.11 | % | 0.08 | % | ||||||||||
|
| |||||||||||||||||||
See notes to consolidated financial statements.
CONSOLIDATED FINANCIAL HIGHLIGHTS | 47 |
Consolidated Financial Highlights (continued)
(For a share outstanding throughout each period)
| BlackRock Total Factor Fund | ||||||||||||||||||||
| Investor C | ||||||||||||||||||||
| Year Ended July 31, | ||||||||||||||||||||
| 2020 | 2019 | 2018 | 2017 | 2016 | ||||||||||||||||
| ||||||||||||||||||||
Net asset value, beginning of year | $ | 10.40 | $ | 10.08 | $ | 10.07 | $ | 9.71 | $ | 9.84 | ||||||||||
|
| |||||||||||||||||||
Net investment income (loss) (a) | (0.01 | ) | 0.04 | (0.11 | ) | (0.10 | ) | (0.13 | ) | |||||||||||
Net realized and unrealized gain (loss) | (1.48 | ) | 0.44 | 0.48 | 0.52 | 0.29 | ||||||||||||||
|
| |||||||||||||||||||
Net increase (decrease) from investment operations | (1.49 | ) | 0.48 | 0.37 | 0.42 | 0.16 | ||||||||||||||
|
| |||||||||||||||||||
Distributions (b) | ||||||||||||||||||||
From net investment income | (0.00 | )(c) | (0.12 | ) | — | — | (0.29 | ) | ||||||||||||
From net realized gain | (0.25 | ) | (0.04 | ) | (0.36 | ) | (0.06 | ) | — | |||||||||||
|
| |||||||||||||||||||
Total distributions | (0.25 | ) | (0.16 | ) | (0.36 | ) | (0.06 | ) | (0.29 | ) | ||||||||||
|
| |||||||||||||||||||
Net asset value, end of year | $ | 8.66 | $ | 10.40 | $ | 10.08 | $ | 10.07 | $ | 9.71 | ||||||||||
|
| |||||||||||||||||||
Total Return (d) | ||||||||||||||||||||
Based on net asset value | (14.68 | )% | 4.95 | % | 3.62 | % | 4.40 | % | 1.82 | % | ||||||||||
|
| |||||||||||||||||||
Ratios to Average Net Assets (e) | ||||||||||||||||||||
Total expenses | 1.92 | % | 2.47 | % | 2.98 | % | 2.80 | % | 2.72 | % | ||||||||||
|
| |||||||||||||||||||
Total expenses after fees waived and/or reimbursed | 1.55 | % | 1.55 | % | 1.55 | % | 1.68 | % | 2.00 | % | ||||||||||
|
| |||||||||||||||||||
Net investment income (loss) | (0.06 | )% | 0.41 | % | (1.08 | )% | (1.01 | )% | (1.45 | )% | ||||||||||
|
| |||||||||||||||||||
Supplemental Data | ||||||||||||||||||||
Net assets, end of year (000) | $ | 304 | $ | 608 | $ | 755 | $ | 908 | $ | 659 | ||||||||||
|
| |||||||||||||||||||
Portfolio turnover rate | 166 | % | 74 | % | 64 | % | 73 | % | 11 | % | ||||||||||
|
| |||||||||||||||||||
| (a) | Based on average shares outstanding. |
| (b) | Distributions for annual periods determined in accordance with U.S. federal income tax regulations. |
| (c) | Amount is greater than $(0.005) per share. |
| (d) | Where applicable, excludes the effects of any sales charges and assumes the reinvestment of distributions. |
| (e) | Excludes expenses incurred indirectly as a result of investments in underlying funds as follows: |
| Year Ended July 31, | ||||||||||||||||||||
| 2020 | 2019 | 2018 | 2017 | 2016 | ||||||||||||||||
| ||||||||||||||||||||
Investments in underlying funds | 0.01 | % | 0.01 | % | 0.05 | % | 0.11 | % | 0.08 | % | ||||||||||
|
| |||||||||||||||||||
See notes to consolidated financial statements.
| 48 | 2020 BLACKROCK ANNUAL REPORTTO SHAREHOLDERS |
Consolidated Financial Highlights (continued)
(For a share outstanding throughout each period)
| BlackRock Total Factor Fund | ||||||||||||||||
| Class K | ||||||||||||||||
| Year Ended July 31, | Period from 02/03/17 (a) | |||||||||||||||
| 2020 | 2019 | 2018 | ||||||||||||||
| ||||||||||||||||
Net asset value, beginning of period | $ | 10.51 | $ | 10.18 | $ | 10.18 | $ | 9.76 | ||||||||
|
| |||||||||||||||
Net investment income (b) | 0.10 | 0.14 | 0.28 | 0.01 | ||||||||||||
Net realized and unrealized gain (loss) | (1.52 | ) | 0.47 | 0.19 | 0.41 | |||||||||||
|
| |||||||||||||||
Net increase (decrease) from investment operations | (1.42 | ) | 0.61 | 0.47 | 0.42 | |||||||||||
|
| |||||||||||||||
Distributions (c) | ||||||||||||||||
From net investment income | (0.01 | ) | (0.24 | ) | — | — | ||||||||||
From net realized gain | (0.29 | ) | (0.04 | ) | (0.47 | ) | — | |||||||||
|
| |||||||||||||||
Total distributions | (0.30 | ) | (0.28 | ) | (0.47 | ) | — | |||||||||
|
| |||||||||||||||
Net asset value, end of period | $ | 8.79 | $ | 10.51 | $ | 10.18 | $ | 10.18 | ||||||||
|
| |||||||||||||||
Total Return (d) | ||||||||||||||||
Based on net asset value | (13.89 | )% | 6.23 | % | 4.61 | % | 4.30 | %(e) | ||||||||
|
| |||||||||||||||
Ratios to Average Net Assets (f) | ||||||||||||||||
Total expenses | 0.77 | % | 1.29 | % | 1.81 | % | 1.84 | %(g) | ||||||||
|
| |||||||||||||||
Total expenses after fees waived and/or reimbursed | 0.50 | % | 0.50 | % | 0.50 | % | 0.49 | %(g) | ||||||||
|
| |||||||||||||||
Net investment income | 1.08 | % | 1.43 | % | 2.79 | % | 0.28 | %(g) | ||||||||
|
| |||||||||||||||
Supplemental Data | ||||||||||||||||
Net assets, end of period (000) | $ | 29,458 | $ | 18,383 | $ | 28,440 | $ | 230 | ||||||||
|
| |||||||||||||||
Portfolio turnover rate | 166 | % | 74 | % | 64 | % | 73 | %(h) | ||||||||
|
| |||||||||||||||
| (a) | Commencement of operations. |
| (b) | Based on average shares outstanding. |
| (c) | Distributions for annual periods determined in accordance with U.S. federal income tax regulations. |
| (d) | Where applicable, assumes the reinvestment of distributions. |
| (e) | Aggregate total return. |
| (f) | Excludes expenses incurred indirectly as a result of investments in underlying funds as follows: |
| Year Ended July 31, | Period from 02/03/17 (a) to 07/31/17 | |||||||||||||||
| 2020 | 2019 | 2018 | ||||||||||||||
| ||||||||||||||||
Investments in underlying funds | 0.01 | % | 0.01 | % | 0.05 | % | 0.11 | % | ||||||||
|
| |||||||||||||||
| (g) | Annualized. |
| (h) | Portfolio turnover rate is representative of the Fund for the entire year. |
See notes to consolidated financial statements.
CONSOLIDATED FINANCIAL HIGHLIGHTS | 49 |
Notes to Consolidated Financial Statements
| 1. | ORGANIZATION |
BlackRock FundsSM (the “Trust”) is registered under the Investment Company Act of 1940, as amended (the “1940 Act”), as an open-end management investment company. The Trust is organized as a Massachusetts business trust. BlackRock Total Factor Fund (the “Fund”) is a series of the Trust. The Fund is classified as diversified. The Fund’s classification changed from non-diversified to diversified during the period.
The Fund offers multiple classes of shares. All classes of shares have identical voting, dividend, liquidation and other rights and are subject to the same terms and conditions, except that certain classes bear expenses related to the shareholder servicing and distribution of such shares. Institutional and Class K Shares are sold only to certain eligible investors. Investor A and Investor C Shares bear certain expenses related to shareholder servicing of such shares, and Investor C Shares also bear certain expenses related to the distribution of such shares. Investor A and Investor C Shares are generally available through financial intermediaries. Each class has exclusive voting rights with respect to matters relating to its shareholder servicing and distribution expenditures (except that Investor C shareholders may vote on material changes to the Investor A Shares distribution and service plan).
| Share Class | Initial Sales Charge | CDSC | Conversion Privilege | |||||
Institutional and Class K Shares | No | No | None | |||||
Investor A Shares | Yes | No | (a) | None | ||||
Investor C Shares | No | Yes | (b) | To Investor A Shares after approximately 10 years | ||||
| (a) | Investor A Shares may be subject to a contingent deferred sales charge (“CDSC”) for certain redemptions where no initial sales charge was paid at the time of purchase. |
| (b) | A CDSC of 1.00% is assessed on certain redemptions of Investor C Shares made within one year after purchase. |
The Fund, together with certain other registered investment companies advised by BlackRock Advisors, LLC (the “Manager”) or its affiliates, is included in a complex of equity, multi-asset, index and money market funds referred to as the BlackRock Multi-Asset Complex.
Basis of Consolidation: The accompanying consolidated financial statements of the Fund include the accounts of BlackRock Cayman Strategic Risk Allocation Fund, Ltd. (the “Subsidiary”), which is a wholly-owned subsidiary of the Fund and primarily invests in commodity-related instruments and other derivatives. The Subsidiary enables the Fund to hold these commodity-related instruments and satisfy regulated investment company tax requirements. The Fund may invest up to 25% of its total assets in the Subsidiary. The net assets of the Subsidiary as of period end were $9,398,875, which is 3.1% of the Fund’s consolidated net assets. Intercompany accounts and transactions, if any, have been eliminated. The Subsidiary is subject to the same investment policies and restrictions that apply to the Fund, except that the Subsidiary may invest without limitation in commodity-related instruments.
| 2. | SIGNIFICANT ACCOUNTING POLICIES |
The consolidated financial statements are prepared in conformity with accounting principles generally accepted in the United States of America (“U.S. GAAP”), which may require management to make estimates and assumptions that affect the reported amounts of assets and liabilities in the consolidated financial statements, disclosure of contingent assets and liabilities at the date of the consolidated financial statements and the reported amounts of increases and decreases in net assets from operations during the reporting period. Actual results could differ from those estimates. The Fund is considered an investment company under U.S. GAAP and follows the accounting and reporting guidance applicable to investment companies. Below is a summary of significant accounting policies:
Investment Transactions and Income Recognition: For financial reporting purposes, investment transactions are recorded on the dates the transactions are executed. Realized gains and losses on investment transactions are determined on the identified cost basis. Dividend income and non-cash dividend income, if any, are recorded on the ex-dividend date. Interest income, including amortization and accretion of premiums and discounts on debt securities, is recognized on an accrual basis. Income, expenses and realized and unrealized gains and losses are allocated daily to each class based on its relative net assets.
Foreign Currency Translation: The Fund’s books and records are maintained in U.S. dollars. Securities and other assets and liabilities denominated in foreign currencies are translated into U.S. dollars using exchange rates determined as of the close of trading on the New York Stock Exchange (“NYSE”). Purchases and sales of investments are recorded at the rates of exchange prevailing on the respective dates of such transactions. Generally, when the U.S. dollar rises in value against a foreign currency, the investments denominated in that currency will lose value; the opposite effect occurs if the U.S. dollar falls in relative value.
The Fund does not isolate the portion of the results of operations arising as a result of changes in the exchange rates from the changes in the market prices of investments held or sold for financial reporting purposes. Accordingly, the effects of changes in exchange rates on investments are not segregated in the Consolidated Statement of Operations from the effects of changes in market prices of those investments, but are included as a component of net realized and unrealized gain (loss) from investments. The Fund reports realized currency gains (losses) on foreign currency related transactions as components of net realized gain (loss) for financial reporting purposes, whereas such components are generally treated as ordinary income for U.S. federal income tax purposes.
Segregation and Collateralization: In cases where the Fund enters into certain investments (e.g., futures contracts, forward foreign currency exchange contracts and swaps) that would be treated as “senior securities” for 1940 Act purposes, the Fund may segregate or designate on its books and records cash or liquid assets having a market value at least equal to the amount of its future obligations under such investments. Doing so allows the investment to be excluded from treatment as a “senior security.” Furthermore, if required by an exchange or counterparty agreement, the Fund may be required to deliver/deposit cash and/or securities to/with an exchange, or broker-dealer or custodian as collateral for certain investments or obligations.
Distributions: Distributions from net investment income are declared daily and paid at least annually. Distributions of capital gains are recorded on the ex-dividend date and made at least annually. The character and timing of distributions are determined in accordance with U.S. federal income tax regulations, which may differ from U.S. GAAP. Net income and realized gains from investments held by the Subsidiary are treated as ordinary income for tax purposes. If a net loss is realized by the Subsidiary in any taxable year, the loss will generally not be available to offset the Fund’s ordinary income and/or capital gains for that year.
| 50 | 2020 BLACKROCK ANNUAL REPORTTO SHAREHOLDERS |
Notes to Consolidated Financial Statements (continued)
Indemnifications: In the normal course of business, the Fund enters into contracts that contain a variety of representations that provide general indemnification. The Fund’s maximum exposure under these arrangements is unknown because it involves future potential claims against the Fund, which cannot be predicted with any certainty.
Other: Expenses directly related to the Fund or its classes are charged to the Fund or the applicable class. Expenses directly related to the Fund and other shared expenses prorated to the Fund are allocated daily to each class based on its relative net assets or other appropriate methods. Other operating expenses shared by several funds, including other funds managed by the Manager, are prorated among those funds on the basis of relative net assets or other appropriate methods.
| 3. | INVESTMENT VALUATION AND FAIR VALUE MEASUREMENTS |
Investment Valuation Policies: The Fund’s investments are valued at fair value (also referred to as “market value” within the consolidated financial statements) as of the close of trading on the NYSE (generally 4:00 p.m., Eastern time). U.S. GAAP defines fair value as the price the Fund would receive to sell an asset or pay to transfer a liability in an orderly transaction between market participants at the measurement date. The Fund determines the fair values of its financial instruments using various independent dealers or pricing services under policies approved by the Board of Trustees of the Trust (the “Board”). If a security’s market price is not readily available or does not otherwise accurately represent the fair value of the security, the security will be valued in accordance with a policy approved by the Board as reflecting fair value. The BlackRock Global Valuation Methodologies Committee (the “Global Valuation Committee”) is the committee formed by management to develop global pricing policies and procedures and to oversee the pricing function for all financial instruments.
Fair Value Inputs and Methodologies: The following methods and inputs are used to establish the fair value of the Fund’s assets and liabilities:
| • | Equity investments traded on a recognized securities exchange are valued at the official closing price each day, if available. For equity investments traded on more than one exchange, the official closing price on the exchange where the stock is primarily traded is used. Equity investments traded on a recognized exchange for which there were no sales on that day may be valued at the last available bid (long positions) or ask (short positions) price. |
| • | Fixed-income securities for which market quotations are readily available are generally valued using the last available bid prices or current market quotations provided by independent dealers or third party pricing services. Floating rate loan interests are valued at the mean of the bid prices from one or more independent brokers or dealers as obtained from a third party pricing service. Pricing services generally value fixed-income securities assuming orderly transactions of an institutional round lot size, but a fund may hold or transact in such securities in smaller, odd lot sizes. Odd lots may trade at lower prices than institutional round lots. The pricing services may use matrix pricing or valuation models that utilize certain inputs and assumptions to derive values, including transaction data (e.g., recent representative bids and offers), credit quality information, perceived market movements, news, and other relevant information. Certain fixed-income securities, including asset-backed and mortgage related securities may be valued based on valuation models that consider the estimated cash flows of each tranche of the entity, establish a benchmark yield and develop an estimated tranche specific spread to the benchmark yield based on the unique attributes of the tranche. The amortized cost method of valuation may be used with respect to debt obligations with sixty days or less remaining to maturity unless the Manager determines such method does not represent fair value. |
Generally, trading in foreign instruments is substantially completed each day at various times prior to the close of trading on the NYSE. Occasionally, events affecting the values of such instruments may occur between the foreign market close and the close of trading on the NYSE that may not be reflected in the computation of the Fund’s net assets. Each business day, the Fund uses a pricing service to assist with the valuation of certain foreign exchange-traded equity securities and foreign exchange-traded and over-the-counter (“OTC”) options (the “Systematic Fair Value Price”). Using current market factors, the Systematic Fair Value Price is designed to value such foreign securities and foreign options at fair value as of the close of trading on the NYSE, which follows the close of the local markets.
| • | Investments in open-end U.S. mutual funds are valued at net asset value (“NAV”) each business day. |
| • | Futures contracts are valued based on that day’s last reported settlement price on the exchange where the contract is traded. |
| • | Forward foreign currency exchange contracts are valued at the mean between the bid and ask prices and are determined as of the close of trading on the NYSE based on that day’s prevailing forward exchange rate for the underlying currencies. Interpolated values are derived when the settlement date of the contract is an interim date for which quotations are not available. |
| • | Swap agreements are valued utilizing quotes received daily by the Fund’s pricing service or through brokers, which are derived using daily swap curves and models that incorporate a number of market data factors, such as discounted cash flows, trades and values of the underlying reference instruments. |
If events (e.g., a company announcement, market volatility or a natural disaster) occur that are expected to materially affect the value of such investments, or in the event that the application of these methods of valuation results in a price for an investment that is deemed not to be representative of the market value of such investment, or if a price is not available, the investment will be valued by the Global Valuation Committee, or its delegate, in accordance with a policy approved by the Board as reflecting fair value (“Fair Valued Investments”). The fair valuation approaches that may be used by the Global Valuation Committee will include market approach, income approach and cost approach. Valuation techniques such as discounted cash flow, use of market comparables and matrix pricing are types of valuation approaches and are typically used in determining fair value. When determining the price for Fair Valued Investments, the Global Valuation Committee, or its delegate, seeks to determine the price that the Fund might reasonably expect to receive or pay from the current sale or purchase of that asset or liability in an arm’s-length transaction. Fair value determinations shall be based upon all available factors that the Global Valuation Committee, or its delegate, deems relevant and consistent with the principles of fair value measurement. The pricing of all Fair Valued Investments is subsequently reported to the Board or a committee thereof on a quarterly basis.
Fair Value Hierarchy: Various inputs are used in determining the fair value of investments and derivative financial instruments. These inputs to valuation techniques are categorized into a fair value hierarchy consisting of three broad levels for financial statement purposes as follows:
| • | Level 1 — Unadjusted price quotations in active markets/exchanges for identical assets or liabilities that the Fund has the ability to access |
| • | Level 2 — Other observable inputs (including, but not limited to, quoted prices for similar assets or liabilities in markets that are active, quoted prices for identical or |
NOTESTO CONSOLIDATED FINANCIAL STATEMENTS | 51 |
Notes to Consolidated Financial Statements (continued)
| similar assets or liabilities in markets that are not active, inputs other than quoted prices that are observable for the assets or liabilities (such as interest rates, yield curves, volatilities, prepayment speeds, loss severities, credit risks and default rates) or other market–corroborated inputs) |
| • | Level 3 — Unobservable inputs based on the best information available in the circumstances, to the extent observable inputs are not available (including the Global Valuation Committee’s assumptions used in determining the fair value of investments and derivative financial instruments) |
The hierarchy gives the highest priority to unadjusted quoted prices in active markets for identical assets or liabilities (Level 1 measurements) and the lowest priority to unobservable inputs (Level 3 measurements). Accordingly, the degree of judgment exercised in determining fair value is greatest for instruments categorized in Level 3. The inputs used to measure fair value may fall into different levels of the fair value hierarchy. In such cases, for disclosure purposes, the fair value hierarchy classification is determined based on the lowest level input that is significant to the fair value measurement in its entirety. Investments classified within Level 3 have significant unobservable inputs used by the Global Valuation Committee in determining the price for Fair Valued Investments. Level 3 investments include equity or debt issued by privately held companies or funds. There may not be a secondary market, and/or there are a limited number of investors. The categorization of a value determined for investments and derivative financial instruments is based on the pricing transparency of the investments and derivative financial instruments and is not necessarily an indication of the risks associated with investing in those securities.
| 4. | SECURITIES AND OTHER INVESTMENTS |
Inflation-Indexed Bonds: Inflation-indexed bonds (other than municipal inflation-indexed and certain corporate inflation-indexed bonds) are fixed-income securities whose principal value is periodically adjusted according to the rate of inflation. If the index measuring inflation rises or falls, the principal value of inflation-indexed bonds (other than municipal inflation-indexed and certain corporate inflation-indexed bonds) will be adjusted upward or downward, and consequently the interest payable on these securities (calculated with respect to a larger or smaller principal amount) will be increased or reduced, respectively. Any upward or downward adjustment in the principal amount of an inflation-indexed bond will be included as interest income in the Consolidated Statement of Operations, even though investors do not receive their principal until maturity. Repayment of the original bond principal upon maturity (as adjusted for inflation) is guaranteed in the case of U.S. Treasury inflation-indexed bonds. For bonds that do not provide a similar guarantee, the adjusted principal value of the bond repaid at maturity may be less than the original principal. With regard to municipal inflation-indexed bonds and certain corporate inflation-indexed bonds, the inflation adjustment is typically reflected in the semi-annual coupon payment. As a result, the principal value of municipal inflation-indexed bonds and such corporate inflation-indexed bonds does not adjust according to the rate of inflation.
| 5. | DERIVATIVE FINANCIAL INSTRUMENTS |
The Fund engages in various portfolio investment strategies using derivative contracts both to increase the returns of the Fund and/or to manage its exposure to certain risks such as credit risk, equity risk, interest rate risk, foreign currency exchange rate risk, commodity price risk or other risks (e.g., inflation risk). Derivative financial instruments categorized by risk exposure are included in the Consolidated Schedule of Investments. These contracts may be transacted on an exchange OTC.
Futures Contracts: Futures contracts are purchased or sold to gain exposure to, or manage exposure to, changes in interest rates (interest rate risk) and changes in the value of equity securities (equity risk) or foreign currencies (foreign currency exchange rate risk).
Futures contracts are agreements between the Fund and a counterparty to buy or sell a specific quantity of an underlying instrument at a specified price and on a specified date. Depending on the terms of a contract, it is settled either through physical delivery of the underlying instrument on the settlement date or by payment of a cash amount on the settlement date. Upon entering into a futures contract, the Fund is required to deposit initial margin with the broker in the form of cash or securities in an amount that varies depending on a contract’s size and risk profile. The initial margin deposit must then be maintained at an established level over the life of the contract. Amounts pledged, which are considered restricted, are included in cash pledged for futures contracts in the Consolidated Statement of Assets and Liabilities.
Securities deposited as initial margin are designated in the Consolidated Schedule of Investments and cash deposited, if any, are shown as cash pledged for futures contracts in the Consolidated Statement of Assets and Liabilities. Pursuant to the contract, the Fund agrees to receive from or pay to the broker an amount of cash equal to the daily fluctuation in market value of the contract (“variation margin”). Variation margin is recorded as unrealized appreciation (depreciation) and, if any, shown as variation margin receivable (or payable) on futures contracts in the Consolidated Statement of Assets and Liabilities. When the contract is closed, a realized gain or loss is recorded in the Consolidated Statement of Operations equal to the difference between the notional amount of the contract at the time it was opened and the notional amount at the time it was closed. The use of futures contracts involves the risk of an imperfect correlation in the movements in the price of futures contracts and interest, foreign currency exchange rates or underlying assets.
Forward Foreign Currency Exchange Contracts: Forward foreign currency exchange contracts are entered into to gain or reduce exposure to foreign currencies (foreign currency exchange rate risk).
A forward foreign currency exchange contract is an agreement between two parties to buy and sell a currency at a set exchange rate on a specified date. These contracts help to manage the overall exposure to the currencies in which some of the investments held by the Fund are denominated and in some cases, may be used to obtain exposure to a particular market.
The contract is marked-to-market daily and the change in market value is recorded as unrealized appreciation (depreciation) in the Consolidated Statement of Assets and Liabilities. When a contract is closed, a realized gain or loss is recorded in the Consolidated Statement of Operations equal to the difference between the value at the time it was opened and the value at the time it was closed. Non-deliverable forward foreign currency exchange contracts are settled with the counterparty in cash without the delivery of foreign currency. The use of forward foreign currency exchange contracts involves the risk that the value of a forward foreign currency exchange contract changes unfavorably due to movements in the value of the referenced foreign currencies, and such value may exceed the amount(s) reflected in the Consolidated Statement of Assets and Liabilities. Cash amounts pledged for forward foreign currency exchange contracts are considered restricted and are included in cash pledged as collateral for OTC derivatives in the Consolidated Statement of Assets and Liabilities.
| 52 | 2020 BLACKROCK ANNUAL REPORTTO SHAREHOLDERS |
Notes to Consolidated Financial Statements (continued)
Swaps: Swap contracts are entered into to manage exposure to issuers, markets and securities. Such contracts are agreements between the Fund and a counterparty to make periodic net payments on a specified notional amount or a net payment upon termination. Swap agreements are privately negotiated in the OTC market and may be entered into as a bilateral contract (“OTC swaps”) or centrally cleared (“centrally cleared swaps”).
For OTC swaps, any upfront premiums paid and any upfront fees received are shown as swap premiums paid and swap premiums received, respectively, in the Consolidated Statement of Assets and Liabilities and amortized over the term of the contract. The daily fluctuation in market value is recorded as unrealized appreciation (depreciation) on OTC Swaps in the Consolidated Statement of Assets and Liabilities. Payments received or paid are recorded in the Consolidated Statement of Operations as realized gains or losses, respectively. When an OTC swap is terminated, a realized gain or loss is recorded in the Consolidated Statement of Operations equal to the difference between the proceeds from (or cost of) the closing transaction and the Fund’s basis in the contract, if any. Generally, the basis of the contract is the premium received or paid.
In a centrally cleared swap, immediately following execution of the swap contract, the swap contract is novated to a central counterparty (the “CCP”) and the Fund’s counterparty on the swap agreement becomes the CCP. The Fund is required to interface with the CCP through the broker. Upon entering into a centrally cleared swap, the Fund is required to deposit initial margin with the broker in the form of cash or securities in an amount that varies depending on the size and risk profile of the particular swap. Securities deposited as initial margin are designated in the Consolidated Schedule of Investments and cash deposited is shown as cash pledged for centrally cleared swaps in the Consolidated Statement of Assets and Liabilities. Amounts pledged, which are considered restricted cash, are included in cash pledged for centrally cleared swaps in the Consolidated Statement of Assets and Liabilities. Pursuant to the contract, the Fund agrees to receive from or pay to the broker an amount of cash equal to the daily fluctuation in market value of the contract (“variation margin”). Variation margin is recorded as unrealized appreciation (depreciation) and shown as variation margin receivable (or payable) on centrally cleared swaps in the Consolidated Statement of Assets and Liabilities. Payments received from (paid to) the counterparty, including at termination, are recorded as realized gains (losses) in the Consolidated Statement of Operations.
| • | Credit default swaps — Credit default swaps are entered into to manage exposure to the market or certain sectors of the market, to reduce risk exposure to defaults of corporate and/or sovereign issuers or to create exposure to corporate and/or sovereign issuers to which a fund is not otherwise exposed (credit risk). |
The Fund may either buy or sell (write) credit default swaps on single-name issuers (corporate or sovereign), a combination or basket of single-name issuers or traded indexes. Credit default swaps are agreements in which the protection buyer pays fixed periodic payments to the seller in consideration for a promise from the protection seller to make a specific payment should a negative credit event take place with respect to the referenced entity (e.g., bankruptcy, failure to pay, obligation acceleration, repudiation, moratorium or restructuring). As a buyer, if an underlying credit event occurs, the Fund will either (i) receive from the seller an amount equal to the notional amount of the swap and deliver the referenced security or underlying securities comprising the index, or (ii) receive a net settlement of cash equal to the notional amount of the swap less the recovery value of the security or underlying securities comprising the index. As a seller (writer), if an underlying credit event occurs, the Fund will either pay the buyer an amount equal to the notional amount of the swap and take delivery of the referenced security or underlying securities comprising the index or pay a net settlement of cash equal to the notional amount of the swap less the recovery value of the security or underlying securities comprising the index.
| • | Total return swaps — Total return swaps are entered into to obtain exposure to a security or market without owning such security or investing directly in such market or to exchange the risk/return of one security or market (e.g., fixed-income) with another security or market (e.g., equity or commodity prices) (equity risk, commodity price risk and/or interest rate risk). |
Total return swaps are agreements in which there is an exchange of cash flows whereby one party commits to make payments based on the total return (distributions plus capital gains/losses) of an underlying instrument, or basket of underlying instruments, in exchange for fixed or floating rate interest payments. If the total return of the instrument(s) or index underlying the transaction exceeds or falls short of the offsetting fixed or floating interest rate obligation, the Fund receives payment from or makes a payment to the counterparty.
Certain total return swaps are designed to function as a portfolio of direct investments in long and short equity positions. This means that the Fund has the ability to trade in and out of these long and short positions within the swap and will receive the economic benefits and risks equivalent to direct investment in these positions, subject to certain adjustments due to events related to the counterparty. Benefits and risks include capital appreciation (depreciation), corporate actions and dividends received and paid, all of which are reflected in the swap’s market value. The market value also includes interest charges and credits (“financing fees”) related to the notional values of the long and short positions and cash balances within the swap. These interest charges and credits are based on a specified benchmark rate plus or minus a specified spread determined based upon the country and/or currency of the positions in the portfolio.
Positions within the swap and financing fees are reset periodically. During a reset, any unrealized appreciation (depreciation) on positions and accrued financing fees become available for cash settlement between the Fund and the counterparty. The amounts that are available for cash settlement are recorded as realized gains or losses in the Consolidated Statement of Operations. Cash settlement in and out of the swap may occur at a reset date or any other date, at the discretion of the Fund and the counterparty, over the life of the agreement. Certain swaps have no stated expiration and can be terminated by either party at any time.
Swap transactions involve, to varying degrees, elements of interest rate, credit and market risk in excess of the amounts recognized in the Consolidated Statement of Assets and Liabilities. Such risks involve the possibility that there will be no liquid market for these agreements, that the counterparty to the agreements may default on its obligation to perform or disagree as to the meaning of the contractual terms in the agreements, and that there may be unfavorable changes in interest rates and/or market values associated with these transactions.
Master Netting Arrangements: In order to define its contractual rights and to secure rights that will help it mitigate its counterparty risk, the Fund may enter into an International Swaps and Derivatives Association, Inc. Master Agreement (“ISDA Master Agreement”) or similar agreement with its counterparties. An ISDA Master Agreement is a bilateral agreement between the Fund and a counterparty that governs certain OTC derivatives and typically contains, among other things, collateral posting terms and netting provisions in the event of a default and/or termination event. Under an ISDA Master Agreement, the Fund may, under certain circumstances, offset with the counterparty certain derivative financial instruments’ payables and/or receivables with collateral held and/or posted and create one single net payment. The provisions of the ISDA Master Agreement typically permit a single net payment in the event of default including the bankruptcy or insolvency of the counterparty. Bankruptcy or insolvency laws of a particular jurisdiction may restrict or prohibit the right of offset in bankruptcy, insolvency or other events.
NOTESTO CONSOLIDATED FINANCIAL STATEMENTS | 53 |
Notes to Consolidated Financial Statements (continued)
Collateral Requirements: For derivatives traded under an ISDA Master Agreement, the collateral requirements are typically calculated by netting the mark-to-market amount for each transaction under such agreement and comparing that amount to the value of any collateral currently pledged by the Fund and the counterparty.
Cash collateral that has been pledged to cover obligations of the Fund and cash collateral received from the counterparty, if any, is reported separately in the Consolidated Statement of Assets and Liabilities as cash pledged as collateral and cash received as collateral, respectively. Non-cash collateral pledged by the Fund, if any, is noted in the Consolidated Schedule of Investments. Generally, the amount of collateral due from or to a counterparty is subject to a certain minimum transfer amount threshold before a transfer is required, which is determined at the close of business of the Fund. Any additional required collateral is delivered to/pledged by the Fund on the next business day. Typically, the counterparty is not permitted to sell, re-pledge or use cash and non-cash collateral it receives. The Fund generally agrees not to use non-cash collateral that it receives but may, absent default or certain other circumstances defined in the underlying ISDA Master Agreement, be permitted to use cash collateral received. In such cases, interest may be paid pursuant to the collateral arrangement with the counterparty. To the extent amounts due to the Fund from its counterparties are not fully collateralized, it bears the risk of loss from counterparty non-performance. Likewise, to the extent the Fund has delivered collateral to a counterparty and stands ready to perform under the terms of its agreement with such counterparty, it bears the risk of loss from a counterparty in the amount of the value of the collateral in the event the counterparty fails to return such collateral. Based on the terms of agreements, collateral may not be required for all derivative contracts.
For financial reporting purposes, the Fund does not offset derivative assets and derivative liabilities that are subject to netting arrangements, if any, in the Consolidated Statement of Assets and Liabilities.
| 6. | INVESTMENT ADVISORY AGREEMENT AND OTHER TRANSACTIONS WITH AFFILIATES |
Investment Advisory: The Trust, on behalf of the Fund, entered into an Investment Advisory Agreement with the Manager, the Fund’s investment adviser and an indirect, wholly-owned subsidiary of BlackRock, Inc. (“BlackRock”), to provide investment advisory services. The Manager is responsible for the management of the Fund’s portfolio and provides the personnel, facilities, equipment and certain other services necessary to the operations of the Fund.
For such services, the Fund pays the Manager a monthly fee at an annual rate equal to the following percentages of the average daily value of the Fund’s net assets:
| Average Daily Net Assets | Investment Advisory Fees | |||
First $1 Billion | 0.50 | % | ||
$1 Billion — $3 Billion | 0.47 | |||
$3 Billion — $5 Billion | 0.45 | |||
$5 Billion — $10 Billion | 0.44 | |||
Greater than $10 Billion | 0.43 | |||
The Manager provides investment management and other services to the Subsidiary. The Manager does not receive separate compensation from the Subsidiary for providing investment management or administrative services. However, the Fund pays the Manager based on the Fund’s net assets, which includes the assets of the Subsidiary.
The Manager entered into a sub-advisory agreement with BlackRock International Limited (“BIL”), an affiliate of the Manager. The Manager pays BIL for services it provides for that portion of the Fund for which BIL acts as sub-adviser, a monthly fee that is equal to a percentage of the investment advisory fees paid by the Fund to the Manager.
Service and Distribution Fees: The Trust, on behalf of the Fund, entered into a Distribution Agreement and a Distribution and Service Plan with BlackRock Investments, LLC (“BRIL”), an affiliate of the Manager. Pursuant to the Distribution and Service Plan and in accordance with Rule 12b-1 under the 1940 Act, the Fund pays BRIL ongoing service and distribution fees. The fees are accrued daily and paid monthly at annual rates based upon the average daily net assets of the relevant share class of the Fund as follows:
| ||||||||
| Service Fees | Distribution Fees | |||||||
| ||||||||
Investor A | 0.25 | % | — | % | ||||
Investor C | 0.25 | 0.75 | ||||||
| ||||||||
BRIL and broker-dealers, pursuant to sub-agreements with BRIL, provide shareholder servicing and distribution services to the Fund. The ongoing service and/or distribution fee compensates BRIL and each broker-dealer for providing shareholder servicing and/or distribution related services to shareholders.
For the year ended July 31, 2020, the following table shows the class specific service and distribution fees borne directly by each share class of the Fund:
| ||||
| Service and Distribution Fees | ||||
| ||||
Investor A | $ | 20,455 | ||
Investor C | 6,357 | |||
| ||||
| $ | 26,812 | |||
| ||||
| 54 | 2020 BLACKROCK ANNUAL REPORTTO SHAREHOLDERS |
Notes to Consolidated Financial Statements (continued)
Administration: The Trust, on behalf of the Fund, entered into an Administration Agreement with the Manager, an indirect, wholly-owned subsidiary of BlackRock, to provide administrative services. For these services, the Manager receives an administration fee computed daily and payable monthly, based on a percentage of the average daily net assets of the Fund. The administration fee, which is shown as administration in the Consolidated Statement of Operations, is paid at the annual rates below.
| Average Daily Net Assets | Administration Fees | |||
First $500 Million | 0.0425 | % | ||
$500 Million — $1 Billion | 0.0400 | |||
$1 Billion — $2 Billion | 0.0375 | |||
$2 Billion — $4 Billion | 0.0350 | |||
$4 Billion — $13 Billion | 0.0325 | |||
Greater than $13 Billion | 0.0300 | |||
In addition, the Manager charges each of the share classes an administration fee, which is shown as administration — class specific in the Consolidated Statement of Operations, at an annual rate of 0.02% of the average daily net assets of each respective class.
For the year ended July 31, 2020, the Fund paid the following to the Manager in return for these services, which are included in administration — class specific in the Consolidated Statement of Operations:
Institutional | $ | 57,564 | ||
Investor A | 1,635 | |||
Investor C | 127 | |||
Class K | 4,529 | |||
| $ | 63,855 |
Transfer Agent: Pursuant to written agreements, certain financial intermediaries, some of which may be affiliates, provide the Fund with sub-accounting, recordkeeping, sub-transfer agency and other administrative services with respect to servicing of underlying investor accounts. For these services, these entities receive an asset-based fee or an annual fee per shareholder account, which will vary depending on share class and/or net assets. For the year ended July 31, 2020, the Fund did not pay any amounts to affiliates in return for these services.
The Manager maintains a call center that is responsible for providing certain shareholder services to the Fund. Shareholder services include responding to inquiries and processing purchases and sales based upon instructions from shareholders. For the year ended July 31, 2020, the Fund reimbursed the Manager the following amounts for costs incurred in running the call center, which are included in transfer agent — class specific in the Consolidated Statement of Operations:
Institutional | $ | 519 | ||
Investor A | 121 | |||
Investor C | 7 | |||
Class K | 220 | |||
| $ | 867 |
For the year ended July 31, 2020, the following table shows the class specific transfer agent fees borne directly by each share class of the Fund:
Institutional | $ | 218,414 | ||
Investor A | 16,632 | |||
Investor C | 958 | |||
Class K | 1,308 | |||
| $ | 237,312 |
Other Fees: For the year ended July 31, 2020, affiliates earned underwriting discounts, direct commissions and dealer concessions on sales of the Fund’s Investor A Shares of $247.
For the year ended July 31, 2020, affiliates received CDSCs of $239 for Investor C Shares.
Expense Limitations, Waivers, Reimbursements and Recoupments: The Manager contractually agreed to waive its investment advisory fees by the amount of investment advisory fees the Fund pays to the Manager indirectly through its investment in affiliated money market funds (the “affiliated money market fund waiver”) through November 30, 2020. The contractual agreement may be terminated upon 90 days’ notice by a majority of the trustees who are not “interested persons” of the Trust, as defined in the 1940 Act (“Independent Trustees”), or by a vote of a majority of the outstanding voting securities of the Fund. The amount of waivers and/or reimbursements of fees and expenses made pursuant to the expense limitation described below will be reduced by the amount of the affiliated money market fund waiver. Prior to November 27, 2019, this waiver was voluntary. This amount is included in fees waived and/or reimbursed by the Manager in the Consolidated Statement of Operations. For the year ended July 31, 2020, the amount waived was $17,377
The Manager has contractually agreed to waive its investment advisory fee with respect to any portion of the Fund’s assets invested in affiliated equity and fixed-income mutual funds and affiliated exchange-traded funds that have a contractual management fee through November 30, 2020. The contractual agreement may be terminated upon 90 days’ notice by a majority of the Independent Trustees, or by a vote of a majority of the outstanding voting securities of the Fund. For the year ended July 31, 2020, there were no fees waived and/or reimbursed by the Manager pursuant to this arrangement.
NOTESTO CONSOLIDATED FINANCIAL STATEMENTS | 55 |
Notes to Consolidated Financial Statements (continued)
The Manager contractually agreed to waive and/or reimburse fees or expenses in order to limit expenses, excluding interest expense, dividend expense, tax expense, acquired fund fees and expenses, and certain other fund expenses, which constitute extraordinary expenses not incurred in the ordinary course of the Fund’s business (“expense limitation”). The expense limitations as a percentage of average daily net assets are as follows:
Institutional | 0.55 | % | ||
Investor A | 0.80 | |||
Investor C | 1.55 | |||
Class K | 0.50 |
The Manager has agreed not to reduce or discontinue these contractual expense limitations through November 30, 2020, unless approved by the Board, including a majority of the Independent Trustees, or by a vote of a majority of the outstanding voting securities of the Fund. For the year ended July 31, 2020, the Manager waived and/or reimbursed $752,517 which is included in fees waived and/or reimbursed by the Manager in the Consolidated Statement of Operations.
These amounts waived and/or reimbursed are included in administration fees waived — class specific and transfer agent fees waived and/or reimbursed — class specific, respectively, in the Consolidated Statement of Operations. For the year ended July 31, 2020, class specific expense waivers and/or reimbursements were as follows:
| ||||
| Administration Fees Waived | ||||
| ||||
Institutional | $ 56,102 | |||
Investor A | 1,635 | |||
Investor C | 127 | |||
Class K | 4,464 | |||
| ||||
| $ 62,328 | ||||
| ||||
| ||||
| Transfer Agent Fees Waived and/or Reimbursed | ||||
| ||||
Institutional | $ 76,980 | |||
Investor A | 12,808 | |||
Investor C | 669 | |||
Class K | 1,289 | |||
| ||||
| $ 91,746 | ||||
| ||||
With respect to the contractual expense limitation, if during the Fund’s fiscal year the operating expenses of a share class, that at any time during the prior two fiscal years received a waiver and/or reimbursement from the Manager, are less than the current expense limitation for that share class, the Manager is entitled to be reimbursed by such share class up to the lesser of: (a) the amount of fees waived and/or expenses reimbursed during those prior two fiscal years under the agreement and (b) an amount not to exceed either the current expense limitation of that share class or the expense limitation of the share class in effect at the time that the share class received the applicable waiver and/or reimbursement, provided that:
| (1) | the Fund, of which the share class is a part, has more than $50 million in assets for the fiscal year, and |
| (2) | the Manager or an affiliate continues to serve as the Fund’s investment adviser or administrator. |
This repayment applies only to the contractual expense limitation on net expenses and does not apply to the contractual investment advisory fee waiver described above or any voluntary waivers that may be in effect from time to time. Effective December 27, 2019, the repayment arrangement between the Fund and the Manager pursuant to which such Fund may be required to repay amounts waived and/or reimbursed under the Fund’s contractual caps on net expenses was terminated.
The following fund level and class specific waivers and/or reimbursements previously recorded by the Fund, which were subject to recoupment by the Manager, expired on December 27, 2019:
Fund Level | $ | 2,394,598 | ||
Institutional | 69,506 | |||
Investor A | 16,391 | |||
Investor C | 2,549 | |||
Class K | 10,446 |
Interfund Lending: In accordance with an exemptive order (the “Order”) from the U.S. Securities and Exchange Commission (“SEC”), the Fund may participate in a joint lending and borrowing facility for temporary purposes (the “Interfund Lending Program”), subject to compliance with the terms and conditions of the Order, and to the extent permitted by the Fund’s investment policies and restrictions. The Fund is currently permitted to borrow and lend under the Interfund Lending Program.
A lending BlackRock fund may lend in aggregate up to 15% of its net assets, but may not lend more than 5% of its net assets to any one borrowing fund through the Interfund Lending Program. A borrowing BlackRock fund may not borrow through the Interfund Lending Program or from any other source more than 33 1/3% of its total assets (or any lower threshold provided for by the fund’s investment restrictions). If a borrowing BlackRock fund’s total outstanding borrowings exceed 10% of its total assets, each of its outstanding interfund loans will be subject to collateralization of at least 102% of the outstanding principal value of the loan. All interfund loans are for temporary or emergency purposes and the interest rate to be charged will be the average of the highest current overnight repurchase agreement rate available to a lending fund and the bank loan rate, as calculated according to a formula established by the Board.
During the year ended July 31, 2020, the Fund did not participate in the Interfund Lending Program.
| 56 | 2020 BLACKROCK ANNUAL REPORTTO SHAREHOLDERS |
Notes to Consolidated Financial Statements (continued)
Trustees and Officers: Certain trustees and/or officers of the Trust are directors and/or officers of BlackRock or its affiliates. The Fund reimburses the Manager for a portion of the compensation paid to the Trust’s Chief Compliance Officer, which is included in Trustees and Officer in the Consolidated Statement of Operations.
| 7. | PURCHASES AND SALES |
For the year ended July 31, 2020, purchases and sales of investments, excluding short-term securities, were as follows:
| Purchases | Sales | |||||||
Non-U.S. Government Securities | $ | 56,192,250 | $ | 71,652,075 | ||||
U.S. Government Securities | 12,842,804 | 6,323,768 | ||||||
| 8. | INCOME TAX INFORMATION |
It is the Fund’s policy to comply with the requirements of the Internal Revenue Code of 1986, as amended, applicable to regulated investment companies, and to distribute substantially all of its taxable income to its shareholders. Therefore, no U.S. federal income tax provision is required.
The Fund files U.S. federal and various state and local tax returns. No income tax returns are currently under examination. The statute of limitations on the Fund’s U.S. federal tax returns generally remains open for each of the four years ended July 31, 2020. The statutes of limitations on the Fund’s state and local tax returns may remain open for an additional year depending upon the jurisdiction.
Management has analyzed tax laws and regulations and their application to the Fund as of July 31, 2020, inclusive of the open tax return years, and does not believe that there are any uncertain tax positions that require recognition of a tax liability in the Fund’s consolidated financial statements.
U.S. GAAP requires that certain components of net assets be adjusted to reflect permanent differences between financial and tax reporting. These reclassifications have no effect on net assets or NAVs per share. As of period end, the following permanent difference attributable to income recognized from the Fund’s wholly owned subsidiary was reclassified to the following accounts:
Paid-in capital | $ | (5,502,899 | ) | |
Accumulated earnings (loss) | 5,502,899 |
The tax character of distributions paid was as follows:
| 07/31/20 | 07/31/19 | |||||||
Ordinary income | $ | 5,986,605 | $ | 5,462,104 | ||||
Long-term capital gains | 2,395,207 | 388,717 | ||||||
|
|
|
| |||||
| $ | 8,381,812 | $ | 5,850,821 | |||||
|
|
|
| |||||
As of period end, the tax components of accumulated net earnings (loss) were as follows:
Non-expiring capital loss carryforwards (a) | $ | (3,865,479 | ) | |
Net unrealized gains (losses) (b) | 147,261 | |||
Qualified late-year losses (c) | (50,754,326 | ) | ||
|
| |||
| $ | (54,472,544 | ) | ||
|
|
| (a) | Amounts available to offset future realized capital gains. |
| (b) | The difference between book-basis and tax-basis net unrealized gains (losses) were attributable primarily to the deferral of losses on wash sales and straddles, the realization for tax purposes of unrealized gains/losses on certain futures and foreign currency contracts, amortization methods for premiums and discounts on fixed income securities, investment in wholly owned subsidiaries and the accounting for swap agreements. |
| (c) | The Fund has elected to defer certain qualified late-year losses and recognize such losses in next taxable year. |
As of July 31, 2020, gross unrealized appreciation and depreciation for investments and derivatives based on cost for U.S. federal income tax purposes were as follows:
Tax cost | $ | 255,760,409 | ||
|
| |||
Gross unrealized appreciation | $ | 11,216,839 | ||
Gross unrealized depreciation | (10,546,657 | ) | ||
|
| |||
Net unrealized appreciation (depreciation) | $ | 670,182 | ||
|
|
NOTESTO CONSOLIDATED FINANCIAL STATEMENTS | 57 |
Notes to Consolidated Financial Statements (continued)
| 9. | BANK BORROWINGS |
The Trust, on behalf of the Fund, along with certain other funds managed by the Manager and its affiliates (“Participating Funds”), is a party to a 364-day, $2.25 billion credit agreement with a group of lenders. Under this agreement, the Fund may borrow to fund shareholder redemptions. Excluding commitments designated for certain individual funds, the Participating Funds, including the Fund, can borrow up to an aggregate commitment amount of $1.75 billion at any time outstanding, subject to asset coverage and other limitations as specified in the agreement. The credit agreement has the following terms: a fee of 0.10% per annum on unused commitment amounts and interest at a rate equal to the higher of (a) one-month LIBOR (but, in any event, not less than 0.00%) on the date the loan is made plus 0.80% per annum or (b) the Fed Funds rate (but, in any event, not less than 0.00%) in effect from time to time plus 0.80% per annum on amounts borrowed. The agreement expires in April 2021 unless extended or renewed. These fees were allocated among such funds based upon portions of the aggregate commitment available to them and relative net assets of Participating Funds. During the year ended July 31, 2020, the Fund did not borrow under the credit agreement.
| 10. | PRINCIPAL RISKS |
In the normal course of business, the Fund invests in securities or other instruments and may enter into certain transactions, and such activities subject the Fund to various risks, including among others, fluctuations in the market (market risk) or failure of an issuer to meet all of its obligations. The value of securities or other instruments may also be affected by various factors, including, without limitation: (i) the general economy; (ii) the overall market as well as local, regional or global political and/or social instability; (iii) regulation, taxation or international tax treaties between various countries; or (iv) currency, interest rate and price fluctuations. Local, regional or global events such as war, acts of terrorism, the spread of infectious illness or other public health issues, recessions, or other events could have a significant impact on the Fund and its investments. The Fund’s prospectus provides details of the risks to which the Fund is subject.
The Fund may be exposed to prepayment risk, which is the risk that borrowers may exercise their option to prepay principal earlier than scheduled during periods of declining interest rates, which would force the Fund to reinvest in lower yielding securities. The Fund may also be exposed to reinvestment risk, which is the risk that income from the Fund’s portfolio will decline if the Fund invests the proceeds from matured, traded or called fixed-income securities at market interest rates that are below the Fund portfolio’s current earnings rate.
Valuation Risk: The market values of equities, such as common stocks and preferred securities or equity related investments, such as futures and options, may decline due to general market conditions which are not specifically related to a particular company. They may also decline due to factors which affect a particular industry or industries. The Fund may invest in illiquid investments. An illiquid investment is any investment that the Fund reasonably expects cannot be sold or disposed of in current market conditions in seven calendar days or less without the sale or disposition significantly changing the market value of the investment. The Fund may experience difficulty in selling illiquid investments in a timely manner at the price that it believes the investments are worth. Prices may fluctuate widely over short or extended periods in response to company, market or economic news. Markets also tend to move in cycles, with periods of rising and falling prices. This volatility may cause the Fund’s NAV to experience significant increases or decreases over short periods of time. If there is a general decline in the securities and other markets, the NAV of the Fund may lose value, regardless of the individual results of the securities and other instruments in which the Fund invests.
The price the Fund could receive upon the sale of any particular portfolio investment may differ from the Fund’s valuation of the investment, particularly for securities that trade in thin or volatile markets or that are valued using a fair valuation technique or a price provided by an independent pricing service. Changes to significant unobservable inputs and assumptions (i.e., publicly traded company multiples, growth rate, time to exit) due to the lack of observable inputs may significantly impact the resulting fair value and therefore the Fund’s results of operations. As a result, the price received upon the sale of an investment may be less than the value ascribed by the Fund, and the Fund could realize a greater than expected loss or lesser than expected gain upon the sale of the investment. The Fund’s ability to value its investments may also be impacted by technological issues and/or errors by pricing services or other third party service providers.
An outbreak of respiratory disease caused by a novel coronavirus has developed into a global pandemic and has resulted in closing borders, quarantines, disruptions to supply chains and customer activity, as well as general concern and uncertainty. The impact of this pandemic, and other global health crises that may arise in the future, could affect the economies of many nations, individual companies and the market in general in ways that cannot necessarily be foreseen at the present time. This pandemic may result in substantial market volatility and may adversely impact the prices and liquidity of a fund’s investments. The duration of this pandemic and its effects cannot be determined with certainty.
Counterparty Credit Risk: The Fund may be exposed to counterparty credit risk, or the risk that an entity may fail to or be unable to perform on its commitments related to unsettled or open transactions. The Fund manages counterparty credit risk by entering into transactions only with counterparties that the Manager believes have the financial resources to honor their obligations and by monitoring the financial stability of those counterparties. Financial assets, which potentially expose the Fund to market, issuer and counterparty credit risks, consist principally of financial instruments and receivables due from counterparties. The extent of the Fund’s exposure to market, issuer and counterparty credit risks with respect to these financial assets is approximately their value recorded in the Consolidated Statement of Assets and Liabilities, less any collateral held by the Fund.
A derivative contract may suffer a mark-to-market loss if the value of the contract decreases due to an unfavorable change in the market rates or values of the underlying instrument. Losses can also occur if the counterparty does not perform under the contract.
The Fund’s risk of loss from counterparty credit risk on OTC derivatives is generally limited to the aggregate unrealized gain less the value of any collateral held by the Fund.
With exchange-traded futures and centrally cleared swaps, there is less counterparty credit risk to the Fund since the exchange or clearinghouse, as counterparty to such instruments, guarantees against a possible default. The clearinghouse stands between the buyer and the seller of the contract; therefore, credit risk is limited to failure of the clearinghouse. While offset rights may exist under applicable law, the Fund does not have a contractual right of offset against a clearing broker or clearinghouse in the event of a default (including the bankruptcy or insolvency). Additionally, credit risk exists in exchange-traded futures and centrally cleared swaps with respect to initial and variation margin that is held in a clearing broker’s customer accounts. While clearing brokers are required to segregate customer margin from their own assets, in the event that a
| 58 | 2020 BLACKROCK ANNUAL REPORTTO SHAREHOLDERS |
Notes to Consolidated Financial Statements (continued)
clearing broker becomes insolvent or goes into bankruptcy and at that time there is a shortfall in the aggregate amount of margin held by the clearing broker for all its clients, typically the shortfall would be allocated on a pro rata basis across all the clearing broker’s customers, potentially resulting in losses to the Fund.
Concentration Risk: The Fund invests a significant portion of its assets in fixed-income securities and/or uses derivatives tied to the fixed-income markets. Changes in market interest rates or economic conditions may affect the value and/or liquidity of such investments. Interest rate risk is the risk that prices of bonds and other fixed-income securities will increase as interest rates fall and decrease as interest rates rise. The Fund may be subject to a greater risk of rising interest rates due to the current period of historically low rates.
The Fund invests a significant portion of its assets in securities of issuers located in Europe or with significant exposure to European issuers or countries. The European financial markets have recently experienced volatility and adverse trends due to concerns about economic downturns in, or rising government debt levels of, several European countries. These events may spread to other countries in Europe and may affect the value and liquidity of certain of the Fund’s investments.
Responses to the financial problems by European governments, central banks and others, including austerity measures and reforms, may not work, may result in social unrest and may limit future growth and economic recovery or have other unintended consequences. Further defaults or restructurings by governments and others of their debt could have additional adverse effects on economies, financial markets and asset valuations around the world. In addition, the United Kingdom has withdrawn from the European Union, and one or more other countries may withdraw from the European Union and/or abandon the Euro, the common currency of the European Union. The impact of these actions, especially if they occur in a disorderly fashion, is not clear but could be significant and far reaching.
LIBOR Transition Risk: The United Kingdom’s Financial Conduct Authority announced a phase out of the London Interbank Offered Rate (“LIBOR”) by the end of 2021, and it is expected that LIBOR will cease to be published after that time. The Fund may be exposed to financial instruments tied to LIBOR to determine payment obligations, financing terms, hedging strategies or investment value. The transition process away from LIBOR might lead to increased volatility and illiquidity in markets for, and reduce the effectiveness of new hedges placed against, instruments whose terms currently include LIBOR. The ultimate effect of the LIBOR transition process on the Fund is uncertain.
| 11. | CAPITAL SHARE TRANSACTIONS |
Transactions in capital shares for each class were as follows:
| Year Ended 07/31/20 | Year Ended 07/31/19 | |||||||||||||||
| Shares | Amount | Shares | Amount | |||||||||||||
Institutional | ||||||||||||||||
Shares sold | 25,158,025 | $ | 253,451,052 | 14,250,924 | $ | 142,379,931 | ||||||||||
Shares issued in reinvestment of distributions | 659,597 | 6,741,082 | 363,611 | 3,512,487 | ||||||||||||
Shares redeemed | (15,239,548 | ) | (138,351,670 | ) | (7,011,880 | ) | (69,633,579 | ) | ||||||||
|
| |||||||||||||||
Net increase | 10,578,074 | $ | 121,840,464 | 7,602,655 | $ | 76,258,839 | ||||||||||
|
| |||||||||||||||
Investor A | ||||||||||||||||
Shares sold and automatic conversion of shares | 555,698 | $ | 5,622,773 | 495,638 | $ | 4,953,372 | ||||||||||
Shares issued in reinvestment of distributions | 24,603 | 250,453 | 13,966 | 134,634 | ||||||||||||
Shares redeemed | (498,310 | ) | (4,740,113 | ) | (286,397 | ) | (2,856,377 | ) | ||||||||
|
| |||||||||||||||
Net increase | 81,991 | $ | 1,133,113 | 223,207 | $ | 2,231,629 | ||||||||||
|
| |||||||||||||||
Investor C | ||||||||||||||||
Shares sold | 18,610 | $ | 192,871 | 17,287 | $ | 178,659 | ||||||||||
Shares issued in reinvestment of distributions | 1,668 | 16,900 | 1,165 | 11,221 | ||||||||||||
Shares redeemed and automatic conversion of shares | (43,586 | ) | (387,232 | ) | (34,885 | ) | (345,819 | ) | ||||||||
|
| |||||||||||||||
Net decrease | (23,308 | ) | $ | (177,461 | ) | (16,433 | ) | $ | (155,939 | ) | ||||||
|
| |||||||||||||||
Class K | ||||||||||||||||
Shares sold | 3,277,222 | $ | 30,256,148 | 451,565 | $ | 4,522,254 | ||||||||||
Shares issued in reinvestment of distributions | 55,535 | 571,969 | 51,821 | 501,104 | ||||||||||||
Shares redeemed | (1,731,696 | ) | (15,921,876 | ) | (1,546,880 | ) | (15,501,417 | ) | ||||||||
|
| |||||||||||||||
Net increase (decrease) | 1,601,061 | $ | 14,906,241 | (1,043,494 | ) | $ | (10,478,059 | ) | ||||||||
|
| |||||||||||||||
Total Net Increase | 12,237,818 | $ | 137,702,357 | 6,765,935 | $ | 67,856,470 | ||||||||||
|
| |||||||||||||||
| 12. | SUBSEQUENT EVENTS |
Management has evaluated the impact of all subsequent events on the Fund through the date the consolidated financial statements were issued and has determined that there were no subsequent events requiring adjustment or additional disclosure in the consolidated financial statements.
NOTESTO CONSOLIDATED FINANCIAL STATEMENTS | 59 |
| Report of Independent Registered Public Accounting Firm |
To the Board of Trustees of
BlackRock FundsSM and Shareholders of BlackRock Total Factor Fund
Opinion on the Financial Statements
We have audited the accompanying consolidated statement of assets and liabilities, including the consolidated schedule of investments, of BlackRock Total Factor Fund and its subsidiary (one of the funds constituting BlackRock FundsSM, referred to hereafter as the “Fund”) as of July 31, 2020, the related consolidated statement of operations for the year ended July 31, 2020, the consolidated statements of changes in net assets for each of the two years in the period ended July 31, 2020, including the related notes, and the consolidated financial highlights for each of the periods indicated therein ended on or after July 31, 2017 (collectively referred to as the “consolidated financial statements”). In our opinion, the consolidated financial statements present fairly, in all material respects, the financial position of the Fund as of July 31, 2020, the results of its operations for the year then ended, the changes in its net assets for each of the two years in the period ended July 31, 2020 and the financial highlights for each of the periods indicated therein ended on or after July 31, 2017 in conformity with accounting principles generally accepted in the United States of America.
The consolidated financial statements as of and for the year ended July 31, 2016 and the consolidated financial highlights for each of the years or periods ended on or prior to July 31, 2016 (not presented herein, other than the consolidated financial highlights) were audited by other auditors whose report dated September 27, 2016 expressed an unqualified opinion on those consolidated financial statements and consolidated financial highlights.
Basis for Opinion
These consolidated financial statements are the responsibility of the Fund’s management. Our responsibility is to express an opinion on the Fund’s consolidated financial statements based on our audits. We are a public accounting firm registered with the Public Company Accounting Oversight Board (United States) (PCAOB) and are required to be independent with respect to the Fund in accordance with the U.S. federal securities laws and the applicable rules and regulations of the Securities and Exchange Commission and the PCAOB.
We conducted our audits of these consolidated financial statements in accordance with the standards of the PCAOB. Those standards require that we plan and perform the audit to obtain reasonable assurance about whether the consolidated financial statements are free of material misstatement, whether due to error or fraud.
Our audits included performing procedures to assess the risks of material misstatement of the consolidated financial statements, whether due to error or fraud, and performing procedures that respond to those risks. Such procedures included examining, on a test basis, evidence regarding the amounts and disclosures in the consolidated financial statements. Our audits also included evaluating the accounting principles used and significant estimates made by management, as well as evaluating the overall presentation of the consolidated financial statements. Our procedures included confirmation of securities owned as of July 31, 2020 by correspondence with the custodian, transfer agent and brokers; when replies were not received from brokers, we performed other auditing procedures. We believe that our audits provide a reasonable basis for our opinion.
/s/PricewaterhouseCoopers LLP
Philadelphia, Pennsylvania
September 22, 2020
We have served as the auditor of one or more BlackRock investment companies since 2000.
| 60 | 2020 BLACKROCK ANNUAL REPORTTO SHAREHOLDERS |
Important Tax Information (unaudited)
For the fiscal year ended July 31, 2020, the Fund hereby designates the following maximum amount allowable as interest-related dividends eligible for exemption from U.S. withholding tax for nonresident aliens and foreign corporations:
| Fund | Interest-Related Dividends | |||
BlackRock Total Factor Fund | $ | 206,489 | ||
The Fund hereby designates the following amount of distributions from direct federal obligation interest for the fiscal year ended July 31, 2020:
| Fund | Federal Obligation Interest | |||
BlackRock Total Factor Fund | $ | 2,178,858 | ||
The law varies in each state as to whether and what percent of ordinary income dividends attribute to federal obligations is exempt from state income tax. Shareholders are advised to check with their tax advisers to determine if any portion of the dividends received is exempt from state income tax.
The following distribution amounts are hereby designated for the fiscal year ended July 31, 2020:
| Fund | Short-Term Capital Gain Dividends | 20% Rate Long-Term Capital Gain Dividends | ||||||
BlackRock Total Factor Fund | $ | 5,780,076 | $ | 2,395,207 | ||||
IMPORTANT TAX INFORMATION | 61 |
Disclosure of Investment Advisory Agreement and Sub-Advisory Agreement
The Board of Trustees (the “Board,” the members of which are referred to as “Board Members”) of BlackRock FundsSM (the “Trust”) met on April 7, 2020 (the “April Meeting”) and May 11-13, 2020 (the “May Meeting”) to consider the approval of the investment advisory agreement (the “Advisory Agreement”) between the Trust, on behalf of BlackRock Total Factor Fund (the “Fund”), a series of the Trust, and BlackRock Advisors, LLC (the “Manager”), the Trust’s investment advisor. The Board also considered the approval of the sub-advisory agreement (the “Sub-Advisory Agreement”) between the Manager and BlackRock International Limited (the “Sub-Advisor”) with respect to the Fund. The Manager and the Sub-Advisor are referred to herein as “BlackRock.” The Advisory Agreement and the Sub-Advisory Agreement are referred to herein as the “Agreements.”
Activities and Composition of the Board
On the date of the May Meeting, the Board consisted of fourteen individuals, twelve of whom were not “interested persons” of the Trust as defined in the Investment Company Act of 1940, as amended (the “1940 Act”) (the “Independent Board Members”). The Board Members are responsible for the oversight of the operations of the Trust and perform the various duties imposed on the directors of investment companies by the 1940 Act. The Independent Board Members have retained independent legal counsel to assist them in connection with their duties. The Chair of the Board is an Independent Board Member. The Board has established five standing committees: an Audit Committee, a Governance and Nominating Committee, a Compliance Committee, a Performance Oversight Committee and an Ad Hoc Topics Committee, each of which is chaired by an Independent Board Member and composed of Independent Board Members (except for the Ad Hoc Topics Committee, which also has one interested Board Member).
The Agreements
Consistent with the requirements of the 1940 Act, the Board considers the continuation of the Agreements on an annual basis. The Board has four quarterly meetings per year, each typically extending for two days, and additional in-person and telephonic meetings throughout the year, as needed. While the Board also has a fifth one-day meeting to consider specific information surrounding the renewal of the Agreements, the Board’s consideration entails a year-long deliberative process whereby the Board and its committees assess BlackRock’s services to the Fund. In particular, the Board assessed, among other things, the nature, extent and quality of the services provided to the Fund by BlackRock, BlackRock’s personnel and affiliates, including (as applicable): investment management services; accounting oversight; administrative and shareholder services; oversight of the Fund’s service providers; risk management and oversight; and legal, regulatory and compliance services. Throughout the year, including during the contract renewal process, the Independent Board Members were advised by independent legal counsel, and met with independent legal counsel in various executive sessions outside of the presence of BlackRock’s management.
During the year, the Board, acting directly and through its committees, considers information that is relevant to its annual consideration of the renewal of the Agreements, including the services and support provided by BlackRock to the Fund and its shareholders. BlackRock also furnished additional information to the Board in response to specific questions from the Board. This additional information is discussed further in the section titled “Board Considerations in Approving the Agreements.” Among the matters the Board considered were: (a) investment performance for one-year, three-year, five-year, and/or since inception periods, as applicable, against peer funds, an applicable benchmark, and other performance metrics, as applicable, as well as BlackRock senior management’s and portfolio managers’ analyses of the reasons for any outperformance or underperformance relative to its peers, benchmarks, and other performance metrics, as applicable; (b) fees, including advisory, administration, if applicable, and other amounts paid to BlackRock and its affiliates by the Fund for services; (c) Fund operating expenses and how BlackRock allocates expenses to the Fund; (d) the resources devoted to risk oversight of, and compliance reports relating to, implementation of the Fund’s investment objective, policies and restrictions, and meeting regulatory requirements; (e) BlackRock’s and the Trust’s adherence to applicable compliance policies and procedures; (f) the nature, character and scope of non-investment management services provided by BlackRock and its affiliates and the estimated cost of such services; (g) BlackRock’s and other service providers’ internal controls and risk and compliance oversight mechanisms; (h) BlackRock’s implementation of the proxy voting policies approved by the Board; (i) the use of brokerage commissions and execution quality of portfolio transactions; (j) BlackRock’s implementation of the Trust’s valuation and liquidity procedures; (k) an analysis of management fees for products with similar investment mandates across the open-end fund, exchange-traded fund (“ETF”), closed-end fund, sub-advised mutual fund, separately managed account, collective investment trust, and institutional separate account product channels, as applicable, and the similarities and differences between these products and the services provided as compared to the Fund; (l) BlackRock’s compensation methodology for its investment professionals and the incentives and accountability it creates, along with investment professionals’ investments in the fund(s) they manage; and (m) periodic updates on BlackRock’s business.
Board Considerations in Approving the Agreements
The Approval Process: Prior to the April Meeting, the Board requested and received materials specifically relating to the Agreements. The Independent Board Members are continuously engaged in a process with their independent legal counsel and BlackRock to review the nature and scope of the information provided to the Board to better assist its deliberations. The materials provided in connection with the April Meeting included, among other things: (a) information independently compiled and prepared by Broadridge Financial Solutions, Inc. (“Broadridge”), based on either a Lipper classification or Morningstar category, regarding the Fund’s fees and expenses as compared with a peer group of funds as determined by Broadridge (“Expense Peers”) and the investment performance of the Fund as compared with a peer group of funds (“Performance Peers”); (b) information on the composition of the Expense Peers and Performance Peers, and a description of Broadridge’s methodology; (c) information on the estimated profits realized by BlackRock and its affiliates pursuant to the Agreements and a discussion of fall-out benefits to BlackRock and its affiliates; (d) a general analysis provided by BlackRock concerning investment management fees received in connection with other types of investment products, such as institutional accounts, sub-advised mutual funds, ETFs, closed-end funds, open-end funds, and separately managed accounts under similar investment mandates, as well as the performance of such other products, as applicable; (e) a review of non-management fees; (f) the existence, impact and sharing of potential economies of scale, if any, with the Fund; (g) a summary of aggregate amounts paid by the Fund to BlackRock; (h) sales and redemption data regarding the Fund’s shares; and (i) various additional information requested by the Board as appropriate regarding BlackRock’s and the Fund’s operations.
At the April Meeting, the Board reviewed materials relating to its consideration of the Agreements. As a result of the discussions that occurred during the April Meeting, and as a culmination of the Board’s year-long deliberative process, the Board presented BlackRock with questions and requests for additional information. BlackRock responded to these questions and requests with additional written information in advance of the May Meeting.
| 62 | 2020 BLACKROCK ANNUAL REPORTTO SHAREHOLDERS |
Disclosure of Investment Advisory Agreement and Sub-Advisory Agreement (continued)
At the May Meeting, the Board concluded its assessment of, among other things: (a) the nature, extent and quality of the services provided by BlackRock; (b) the investment performance of the Fund as compared to its Performance Peers and to other metrics, as applicable; (c) the advisory fee and the estimated cost of the services and estimated profits realized by BlackRock and its affiliates from their relationship with the Fund; (d) the Fund’s fees and expenses compared to its Expense Peers; (e) the existence and sharing of potential economies of scale; (f) any fall-out benefits to BlackRock and its affiliates as a result of BlackRock’s relationship with the Fund; and (g) other factors deemed relevant by the Board Members.
The Board also considered other matters it deemed important to the approval process, such as other payments made to BlackRock or its affiliates relating to securities lending and cash management, and BlackRock’s services related to the valuation and pricing of Fund portfolio holdings. The Board noted the willingness of BlackRock’s personnel to engage in open, candid discussions with the Board. The Board did not identify any particular information as determinative, and each Board Member may have attributed different weights to the various items considered.
A. Nature, Extent and Quality of the Services Provided by BlackRock: The Board, including the Independent Board Members, reviewed the nature, extent and quality of services provided by BlackRock, including the investment advisory services, and the resulting performance of the Fund. Throughout the year, the Board compared Fund performance to the performance of a comparable group of mutual funds, relevant benchmark, and performance metrics, as applicable. The Board met with BlackRock’s senior management personnel responsible for investment activities, including the senior investment officers. The Board also reviewed the materials provided by the Fund’s portfolio management team discussing the Fund’s performance, investment strategies and outlook.
The Board considered, among other factors, with respect to BlackRock: the number, education and experience of investment personnel generally and the Fund’s portfolio management team; research capabilities; investments by portfolio managers in the funds they manage; portfolio trading capabilities; use of technology; commitment to compliance; credit analysis capabilities; risk analysis and oversight capabilities; and the approach to training and retaining portfolio managers and other research, advisory and management personnel. The Board also considered BlackRock’s overall risk management program, including the continued efforts of BlackRock and its affiliates to address cybersecurity risks and the role of BlackRock’s Risk & Quantitative Analysis Group. The Board engaged in a review of BlackRock’s compensation structure with respect to the Fund’s portfolio management team and BlackRock’s ability to attract and retain high-quality talent and create performance incentives.
In addition to investment advisory services, the Board considered the nature and quality of the administrative and other non-investment advisory services provided to the Fund. BlackRock and its affiliates provide the Fund with certain administrative, shareholder and other services (in addition to any such services provided to the Fund by third-parties) and officers and other personnel as are necessary for the operations of the Fund. In particular, BlackRock and its affiliates provide the Fund with administrative services including, among others: (i) responsibility for disclosure documents, such as the prospectus, the summary prospectus (as applicable), the statement of additional information and periodic shareholder reports; (ii) oversight of daily accounting and pricing; (iii) responsibility for periodic filings with regulators; (iv) overseeing and coordinating the activities of third-party service providers, including, among others, the Fund’s custodian, fund accountant, transfer agent, and auditor; (v) organizing Board meetings and preparing the materials for such Board meetings; (vi) providing legal and compliance support; (vii) furnishing analytical and other support to assist the Board in its consideration of strategic issues such as the merger, consolidation or repurposing of certain open-end funds; and (viii) performing or managing administrative functions necessary for the operation of the Fund, such as tax reporting, expense management, fulfilling regulatory filing requirements, overseeing the Fund’s distribution partners, and shareholder call center and other services. The Board reviewed the structure and duties of BlackRock’s fund administration, shareholder services, and legal & compliance departments and considered BlackRock’s policies and procedures for assuring compliance with applicable laws and regulations.
B. The Investment Performance of the Fund and BlackRock: The Board, including the Independent Board Members, also reviewed and considered the performance history of the Fund. In preparation for the April Meeting, the Board was provided with reports independently prepared by Broadridge, which included an analysis of the Fund’s performance as of December 31, 2019, as compared to its Performance Peers. Broadridge ranks funds in quartiles, ranging from first to fourth, where first is the most desirable quartile position and fourth is the least desirable. In connection with its review, the Board received and reviewed information regarding the investment performance of the Fund as compared to its Performance Peers and, in light of the Fund’s outcome-oriented investment objective, certain performance metrics (“Outcome-Oriented Performance Metrics”). The Board and its Performance Oversight Committee regularly review, and meet with Fund management to discuss, the performance of the Fund throughout the year.
In evaluating performance, the Board focused particular attention on funds with less favorable performance records. The Board also noted that while it found the data provided by Broadridge generally useful, it recognized the limitations of such data, including in particular, that notable differences may exist between a fund and its Performance Peers (for example, the investment objectives and strategies). Further, the Board recognized that the performance data reflects a snapshot of a period as of a particular date and that selecting a different performance period could produce significantly different results. The Board also acknowledged that long-term performance could be impacted by even one period of significant outperformance or underperformance, and that a single investment theme could have the ability to disproportionately affect long-term performance.
The Board reviewed and considered the Fund’s performance relative to the Fund’s Outcome-Oriented Performance Metrics including a total return target. The Board noted that for each of the one-year and since-inception periods reported, the Fund underperformed its total return target. The Board noted that BlackRock believes that the Outcome-Oriented Performance Metrics are an appropriate performance metric for the Fund, and that BlackRock has explained its rationale for this belief to the Board. The Board and BlackRock reviewed the Fund’s underperformance relative to its total return target during the applicable periods.
C. Consideration of the Advisory/Management Fees and the Estimated Cost of the Services and Estimated Profits Realized by BlackRock and its Affiliates from their Relationship with the Fund: The Board, including the Independent Board Members, reviewed the Fund’s contractual management fee rate compared with those of its Expense Peers. The contractual management fee rate represents a combination of the advisory fee and any administrative fees, before taking into account any reimbursements or fee waivers. The Board also compared the Fund’s total expense ratio, as well as its actual management fee rate, to those of its Expense Peers. The total expense ratio represents a fund’s total net operating expenses, including any 12b-1 or non-12b-1 service fees. The total expense ratio gives effect to any expense reimbursements or fee waivers, and the actual management fee rate gives effect to any management fee reimbursements or waivers. The Board considered the services provided and the fees charged by BlackRock and its affiliates to other types of clients with similar investment mandates, as applicable, including institutional accounts and sub-advised mutual funds (including mutual funds sponsored by third parties).
DISCLOSURE OF INVESTMENT ADVISORY AGREEMENT AND SUB-ADVISORY AGREEMENT | 63 |
Disclosure of Investment Advisory Agreement and Sub-Advisory Agreement (continued)
The Board received and reviewed statements relating to BlackRock’s financial condition. The Board reviewed BlackRock’s profitability methodology and was also provided with an estimated profitability analysis that detailed the revenues earned and the expenses incurred by BlackRock for services provided to the Fund. The Board reviewed BlackRock’s estimated profitability with respect to the Fund and other funds the Board currently oversees for the year ended December 31, 2019 compared to available aggregate estimated profitability data provided for the prior two years. The Board reviewed BlackRock’s estimated profitability with respect to certain other U.S. fund complexes managed by BlackRock and/or its affiliates. The Board reviewed BlackRock’s assumptions and methodology of allocating expenses in the estimated profitability analysis, noting the inherent limitations in allocating costs among various advisory products. The Board recognized that profitability may be affected by numerous factors including, among other things, fee waivers and expense reimbursements by BlackRock, the types of funds managed, precision of expense allocations and business mix. The Board thus recognized that calculating and comparing profitability at the individual fund level is difficult.
The Board noted that, in general, individual fund or product line profitability of other advisors is not publicly available. The Board reviewed BlackRock’s overall operating margin, in general, compared to that of certain other publicly traded asset management firms. The Board considered the differences between BlackRock and these other firms, including the contribution of technology at BlackRock, BlackRock’s expense management, and the relative product mix.
The Board considered whether BlackRock has the financial resources necessary to attract and retain high quality investment management personnel to perform its obligations under the Agreements and to continue to provide the high quality of services that is expected by the Board. The Board further considered factors including but not limited to BlackRock’s commitment of time, assumption of risk, and liability profile in servicing the Fund, including in contrast to what is required of BlackRock with respect to other products with similar investment mandates across the open-end fund, ETF, closed-end fund, sub-advised mutual fund, separately managed account, collective investment trust, and institutional separate account product channels, as applicable.
The Board noted that the Fund’s contractual management fee rate ranked in the first quartile, and that the actual management fee rate and total expense ratio each ranked in the first quartile relative to the Fund’s Expense Peers. The Board also noted that the Fund has an advisory fee arrangement that includes breakpoints that adjust the fee rate downward as the size of the Fund increases above certain contractually specified levels. The Board noted that if the size of the Fund were to decrease, the Fund could lose the benefit of one or more breakpoints. The Board further noted that BlackRock and the Board have contractually agreed to a cap on the Fund’s total expenses as a percentage of the Fund’s average daily net assets on a class-by-class basis.
D. Economies of Scale: The Board, including the Independent Board Members, considered the extent to which economies of scale might be realized as the assets of the Fund increase, including the existence of fee waivers and/or expense caps, as applicable, noting that any contractual fee waivers and contractual expense caps had been approved by the Board. In its consideration, the Board further considered the continuation and/or implementation of fee waivers and/or expense caps, as applicable. The Board also considered the extent to which the Fund benefits from such economies of scale in a variety of ways and whether there should be changes in the advisory fee rate or breakpoint structure in order to enable the Fund to more fully participate in these economies of scale. The Board considered the Fund’s asset levels and whether the current fee schedule was appropriate.
E. Other Factors Deemed Relevant by the Board Members: The Board, including the Independent Board Members, also took into account other ancillary or “fall-out” benefits that BlackRock or its affiliates may derive from BlackRock’s respective relationships with the Fund, both tangible and intangible, such as BlackRock’s ability to leverage its investment professionals who manage other portfolios and its risk management personnel, an increase in BlackRock’s profile in the investment advisory community, and the engagement of BlackRock’s affiliates as service providers to the Fund, including for administrative, distribution, securities lending and cash management services. The Board also considered BlackRock’s overall operations and its efforts to expand the scale of, and improve the quality of, its operations. The Board also noted that, subject to applicable law, BlackRock may use and benefit from third-party research obtained by soft dollars generated by certain registered fund transactions to assist in managing all or a number of its other client accounts.
In connection with its consideration of the Agreements, the Board also received information regarding BlackRock’s brokerage and soft dollar practices. The Board received reports from BlackRock which included information on brokerage commissions and trade execution practices throughout the year.
The Board noted the competitive nature of the open-end fund marketplace, and that shareholders are able to redeem their Fund shares if they believe that the Fund’s fees and expenses are too high or if they are dissatisfied with the performance of the Fund.
Conclusion
The Board, including the Independent Board Members, unanimously approved the continuation of the Advisory Agreement between the Manager and the Trust, on behalf of the Fund, for a one-year term ending June 30, 2021, and the Sub-Advisory Agreement between the Manager and the Sub-Advisor with respect to the Fund, for a one-year term ending June 30, 2021. Based upon its evaluation of all of the aforementioned factors in their totality, as well as other information, the Board, including the Independent Board Members, was satisfied that the terms of the Agreements were fair and reasonable and in the best interest of the Fund and its shareholders. In arriving at its decision to approve the Agreements, the Board did not identify any single factor or group of factors as all-important or controlling, but considered all factors together, and different Board Members may have attributed different weights to the various factors considered. The Independent Board Members were also assisted by the advice of independent legal counsel in making this determination.
| 64 | 2020 BLACKROCK ANNUAL REPORTTO SHAREHOLDERS |
Trustee and Officer Information
| Independent Trustees (a) | ||||||||
Name Year of Birth (b) | Position(s) Held (Length of Service) (c) | Principal Occupation(s) During Past Five Years | Number of BlackRock-Advised Registered Investment Companies Investment Portfolios (“Portfolios”) Overseen | Public Company and Other Investment Company Directorships Held During the Past Five Years | ||||
| Mark Stalnecker 1951 | Chair of the Board (Since 2019) and Trustee (Since 2015) | Chief Investment Officer, University of Delaware from 1999 to 2013; Trustee and Chair of the Finance and Investment Committees, Winterthur Museum and Country Estate from 2005 to 2016; Member of the Investment Committee, Delaware Public Employees’ Retirement System since 2002; Member of the Investment Committee, Christiana Care Health System from 2009 to 2017; Member of the Investment Committee, Delaware Community Foundation from 2013 to 2014; Director and Chair of the Audit Committee, SEI Private Trust Co. from 2001 to 2014. | 36 RICs consisting of 155 Portfolios | None | ||||
| Bruce R. Bond 1946 | Trustee (Since 2019) | Board Member, Amsphere Limited (software) since 2018; Trustee and Member of the Governance Committee, State Street Research Mutual Funds from 1997 to 2005; Board Member of Governance, Audit and Finance Committee, Avaya Inc. (computer equipment) from 2003 to 2007. | 36 RICs consisting of 155 Portfolios | None | ||||
| Susan J. Carter 1956 | Trustee (Since 2016) | Director, Pacific Pension Institute from 2014 to 2018; Advisory Board Member, Center for Private Equity and Entrepreneurship at Tuck School of Business since 1997; Senior Advisor, Commonfund Capital, Inc. (“CCI”) (investment adviser) in 2015; Chief Executive Officer, CCI from 2013 to 2014; President & Chief Executive Officer, CCI from 1997 to 2013; Advisory Board Member, Girls Who Invest from 2015 to 2018 and Board Member thereof since 2018; Advisory Board Member, Bridges Fund Management since 2016; Trustee, Financial Accounting Foundation since 2017; Practitioner Advisory Board Member, Private Capital Research Institute (“PCRI”) since 2017; Lecturer in the Practice of Management, Yale School of Management since 2019. | 36 RICs consisting of 155 Portfolios | None | ||||
| Collette Chilton 1958 | Trustee (Since 2015) | Chief Investment Officer, Williams College since 2006; Chief Investment Officer, Lucent Asset Management Corporation from 1998 to 2006. | 36 RICs consisting of 155 Portfolios | None | ||||
| Neil A. Cotty 1954 | Trustee (Since 2016) | Bank of America Corporation from 1996 to 2015, serving in various senior finance leadership roles, including Chief Accounting Officer, from 2009 to 2015, Chief Financial Officer of Global Banking, Markets and Wealth Management from 2008 to 2009, Chief Accounting Officer from 2004 to 2008, Chief Financial Officer of Consumer Bank from 2003 to 2004, Chief Financial Officer of Global Corporate Investment Bank from 1999 to 2002. | 36 RICs consisting of 155 Portfolios | None | ||||
| Lena G. Goldberg 1949 | Trustee (Since 2019) | Senior Lecturer, Harvard Business School, since 2008; Director, Charles Stark Draper Laboratory, Inc. since 2013; FMR LLC/ Fidelity Investments (financial services) from 1996 to 2008, serving in various senior roles including Executive Vice President - Strategic Corporate Initiatives and Executive Vice President and General Counsel; Partner, Sullivan & Worcester LLP from 1985 to 1996 and Associate thereof from 1979 to 1985. | 36 RICs consisting of 155 Portfolios | None | ||||
| Henry R. Keizer 1956 | Trustee (Since 2019) | Director, Park Indemnity Ltd. (captive insurer) since 2010; Director, MUFG Americas Holdings Corporation and MUFG Union Bank, N.A. (financial and bank holding company) from 2014 to 2016; Director, American Institute of Certified Public Accountants from 2009 to 2011; Director, KPMG LLP (audit, tax and advisory services) from 2004 to 2005 and 2010 to 2012; Director, KPMG International in 2012, Deputy Chairman and Chief Operating Officer thereof from 2010 to 2012 and U.S. Vice Chairman of Audit thereof from 2005 to 2010; Global Head of Audit, KPMGI (consortium of KPMG firms) from 2006 to 2010; Director, YMCA of Greater New York from 2006 to 2010. | 36 RICs consisting of 155 Portfolios | Hertz Global Holdings (car rental); Montpelier Re Holdings, Ltd. (publicly held property and casualty reinsurance) from 2013 until 2015; WABCO (commercial vehicle safety systems); Sealed Air Corp. (packaging) | ||||
| Cynthia A. Montgomery 1952 | Trustee (Since 2007) | Professor, Harvard Business School since 1989. | 36 RICs consisting of 155 Portfolios | Newell Rubbermaid, Inc. (manufacturing) | ||||
TRUSTEEAND OFFICER INFORMATION | 65 |
Trustee and Officer Information (continued)
| Independent Trustees (a) (continued) | ||||||||
Name Year of Birth (b) | Position(s) Held (Length of Service) (c) | Principal Occupation(s) During Past Five Years | Number of BlackRock-Advised Registered Investment Companies | Public Company and Other Investment Company Directorships Held During the Past Five Years | ||||
| Donald C. Opatrny 1952 | Trustee (Since 2019) | Trustee, Vice Chair, Member of the Executive Committee and Chair of the Investment Committee, Cornell University since 2004; President, Trustee and Member of the Investment Committee, The Aldrich Contemporary Art Museum from 2007 to 2014; Member of the Board and Investment Committee, University School from 2007 to 2018; Member of the Investment Committee, Mellon Foundation from 2009 to 2015; Trustee, Artstor (a Mellon Foundation affiliate) from 2010 to 2015; President and Trustee, the Center for the Arts, Jackson Hole from 2011 to 2018; Director, Athena Capital Advisors LLC (investment management firm) since 2013; Trustee and Chair of the Investment Committee, Community Foundation of Jackson Hole since 2014; Member of Affordable Housing Supply Board of Jackson, Wyoming since 2018; Member, Investment Funds Committee, State of Wyoming since 2017; Trustee, Phoenix Art Museum since 2018; Trustee, Arizona Community Foundation and Member of Investment Committee since 2020. | 36 RICs consisting of 155 Portfolios | None | ||||
| Joseph P. Platt 1947 | Trustee (Since 2007) | General Partner, Thorn Partners, LP (private investments) since 1998; Director, WQED Multi-Media (public broadcasting not-for-profit) since 2001; Chair, Basic Health International (non-profit) since 2015. | 36 RICs consisting of 155 Portfolios | Greenlight Capital Re, Ltd. (reinsurance company); Consol Energy Inc. | ||||
| Kenneth L. Urish 1951 | Trustee (Since 2007) | Managing Partner, Urish Popeck & Co., LLC (certified public accountants and consultants) since 1976; Past-Chairman of the Professional Ethics Committee of the Pennsylvania Institute of Certified Public Accountants and Committee Member thereof since 2007; Member of External Advisory Board, The Pennsylvania State University Accounting Department since founding in 2001; Principal, UP Strategic Wealth Investment Advisors, LLC since 2013; Trustee, The Holy Family Institute from 2001 to 2010; President and Trustee, Pittsburgh Catholic Publishing Associates from 2003 to 2008; Director, Inter-Tel from 2006 to 2007. | 36 RICs consisting of 155 Portfolios | None | ||||
| Claire A. Walton 1957 | Trustee (Since 2016) | Chief Operating Officer and Chief Financial Officer of Liberty Square Asset Management, LP from 1998 to 2015; General Partner of Neon Liberty Capital Management, LLC since 2003; Director, Boston Hedge Fund Group from 2009 to 2018; Director, Woodstock Ski Runners since 2013; Director, Massachusetts Council on Economic Education from 2013 to 2015. | 36 RICs consisting of 155 Portfolios | None | ||||
| 66 | 2020 BLACKROCK ANNUAL REPORTTO SHAREHOLDERS |
Trustee and Officer Information (continued)
| Interested Trustees (a)(d) | ||||||||
Name Year of Birth (b) | Position(s) Held (Length of Service) (c) | Principal Occupation(s) During Past Five Years | Number of BlackRock-Advised Registered Investment Companies | Public Company and Other Investment Company Directorships Held During the Past Five Years | ||||
| Robert Fairbairn 1965 | Trustee (Since 2018) | Vice Chairman of BlackRock, Inc. since 2019; Member of BlackRock’s Global Executive and Global Operating Committees; Co-Chair of BlackRock’s Human Capital Committee; Senior Managing Director of BlackRock, Inc. from 2010 to 2019; oversaw BlackRock’s Strategic Partner Program and Strategic Product Management Group from 2012 to 2019; Member of the Board of Managers of BlackRock Investments, LLC from 2011 to 2018; Global Head of BlackRock’s Retail and iShares® businesses from 2012 to 2016. | 122 RICs consisting of 265 Portfolios | None | ||||
| John M. Perlowski (e) 1964 | Trustee (Since 2015); President (Since 2018) and Chief Executive Officer (Since 2010) | Managing Director of BlackRock, Inc. since 2009; Head of BlackRock Global Accounting and Product Services since 2009; Advisory Director of Family Resource Network (charitable foundation) since 2009. | 123 RICs consisting of 266 Portfolios | None | ||||
(a) The address of each Trustee is c/o BlackRock, Inc., 55 East 52nd Street, New York, New York 10055. (b) Independent Trustees serve until their resignation, retirement, removal or death, or until December 31 of the year in which they turn 75. The Board may determine to extend the terms of Independent Trustees on a case-by-case basis, as appropriate. (c) Following the combination of Merrill Lynch Investment Managers, L.P. (“MLIM”) and BlackRock, Inc. in September 2006, the various legacy MLIM and legacy BlackRock fund boards were realigned and consolidated into three new fund boards in 2007. Furthermore, effective January 1, 2019, three BlackRock Fund Complexes were realigned and consolidated into two BlackRock Fund Complexes. As a result, although the chart shows the year that each Independent Trustee joined the Board, certain Independent Trustees first became members of the boards of other BlackRock-advised Funds, legacy MLIM funds or legacy BlackRock funds as follows: Bruce R. Bond, 2005; Cynthia A. Montgomery, 1994; Joseph P. Platt, 1999; Kenneth L. Urish, 1999; Lena G. Goldberg, 2016; Henry R. Keizer, 2016; Donald C. Opatrny, 2015. (d) Mr. Fairbairn and Mr. Perlowski are both “interested persons,” as defined in the 1940 Act, of the Trust based on their positions with BlackRock, Inc. and its affiliates. Mr. Fairbairn and Mr. Perlowski are also board members of the BlackRock Fixed-Income Complex. (e) Mr. Perlowski is also a trustee of the BlackRock Credit Strategies Fund. | ||||||||
TRUSTEEAND OFFICER INFORMATION | 67 |
Trustee and Officer Information (continued)
| Officers Who Are Not Trustees (a) | ||||
Name Year of Birth(b) | Position(s) Held (Length of Service) | Principal Occupation(s) During Past Five Years | ||
| Thomas Callahan 1968 | Vice President (Since 2016) | Managing Director of BlackRock, Inc. since 2013; Member of the Board of Managers of BlackRock Investments, LLC (principal underwriter) since 2019 and Managing Director thereof since 2017; Head of BlackRock’s Global Cash Management Business since 2016; Co-Head of the Global Cash Management Business from 2014 to 2016; Deputy Head of the Global Cash Management Business from 2013 to 2014; Member of the Cash Management Group Executive Committee since 2013; Chief Executive Officer of NYSE Liffe U.S. from 2008 to 2013. | ||
| Jennifer McGovern 1977 | Vice President (Since 2014) | Managing Director of BlackRock, Inc. since 2016; Director of BlackRock, Inc. from 2011 to 2015; Head of Americas Product Development and Governance for BlackRock’s Global Product Group since 2019; Head of Product Structure and Oversight for BlackRock’s U.S. Wealth Advisory Group from 2013 to 2019. | ||
| Neal J. Andrews 1966 | Chief Financial Officer (Since 2007) | Chief Financial Officer of the iShares® exchange traded funds from 2019 to 2020; Managing Director of BlackRock, Inc. since 2006. | ||
| Jay M. Fife 1970 | Treasurer (Since 2007) | Managing Director of BlackRock, Inc. since 2007. | ||
| Charles Park 1967 | Chief Compliance Officer (Since 2014) | Anti-Money Laundering Compliance Officer for certain BlackRock-advised Funds from 2014 to 2015; Chief Compliance Officer of BlackRock Advisors, LLC and the BlackRock-advised Funds in the BlackRock Multi-Asset Complex and the BlackRock Fixed-Income Complex since 2014; Principal of and Chief Compliance Officer for iShares® Delaware Trust Sponsor LLC since 2012 and BlackRock Fund Advisors (“BFA”) since 2006; Chief Compliance Officer for the BFA-advised iShares® exchange traded funds since 2006; Chief Compliance Officer for BlackRock Asset Management International Inc. since 2012. | ||
| Lisa Belle 1968 | Anti-Money Laundering Compliance Officer (Since 2019) | Managing Director of BlackRock, Inc. since 2019; Global Financial Crime Head for Asset and Wealth Management of JP Morgan from 2013 to 2019; Managing Director of RBS Securities from 2012 to 2013; Head of Financial Crimes for Barclays Wealth Americas from 2010 to 2012. | ||
| Janey Ahn 1975 | Secretary (Since 2019) | Managing Director of BlackRock, Inc. since 2018; Director of BlackRock, Inc. from 2009 to 2017. | ||
(a) The address of each Officer is c/o BlackRock, Inc., 55 East 52nd Street, New York, New York 10055. | ||||
(b) Officers of the Trust serve at the pleasure of the Board. | ||||
Further information about the Trust’s Trustees and Officers is available in the Trust’s Statement of Additional Information, which can be obtained without charge by calling (800) 441-7762.
Investment Adviser and Administrator
BlackRock Advisors, LLC
Wilmington, DE 19809
Sub-Adviser
BlackRock International Limited
Edinburgh, EH3 8BL
United Kingdom
Accounting Agent
JPMorgan Chase Bank, N.A.
New York, NY 10179
Transfer Agent
BNY Mellon Investment Servicing (US) Inc.
Wilmington, DE 19809
Custodian
JPMorgan Chase Bank, N.A.
New York, NY 10179
Independent Registered Public Accounting Firm
PricewaterhouseCoopers LLP
Philadelphia, PA 19103
Distributor
BlackRock Investments, LLC
New York, NY 10022
Legal Counsel
Sidley Austin LLP
New York, NY 10019
Address of the Trust
100 Bellevue Parkway
Wilmington, DE 19809
| 68 | 2020 BLACKROCK ANNUAL REPORTTO SHAREHOLDERS |
General Information
Householding
The Fund will mail only one copy of shareholder documents, including prospectuses, annual and semi-annual reports and proxy statements, to shareholders with multiple accounts at the same address. This practice is commonly called “householding” and is intended to reduce expenses and eliminate duplicate mailings of shareholder documents. Mailings of your shareholder documents may be householded indefinitely unless you instruct us otherwise. If you do not want the mailing of these documents to be combined with those for other members of your household, please call the Fund at (800) 441-7762.
Availability of Quarterly Schedule of Investments
The Fund files its complete schedule of portfolio holdings with the SEC for the first and third quarters of each fiscal year as an exhibit to its reports on Form N-PORT. The Fund’s Form N-PORT is available on the SEC’s website at sec.gov.
Availability of Proxy Voting Policies and Procedures
A description of the policies and procedures that the Funds use to determine how to vote proxies relating to portfolio securities is available upon request and without charge (1) by calling (800) 441-7762; (2) at blackrock.com; and (3) on the SEC’s website at sec.gov.
Availability of Proxy Voting Record
Information about how the Fund voted proxies relating to securities held in the Funds’ portfolios during the most recent 12-month period ended June 30 is available upon request and without charge (1) at blackrock.com; or by calling (800) 441-7762 and (2) on the SEC’s website at sec.gov.
BlackRock’s Mutual Fund Family
BlackRock offers a diverse lineup of open-end mutual funds crossing all investment styles and managed by experts in equity, fixed-income and tax-exempt investing. Visit blackrock.com for more information.
Shareholder Privileges
Account Information
Call us at (800) 441-7762 from 8:00 AM to 6:00 PM ET on any business day to get information about your account balances, recent transactions and share prices. You can also visit blackrock.com for more information.
Automatic Investment Plans
Investor class shareholders who want to invest regularly can arrange to have $50 or more automatically deducted from their checking or savings account and invested in any of the BlackRock funds.
Systematic Withdrawal Plans
Investor class shareholders can establish a systematic withdrawal plan and receive periodic payments of $50 or more from their BlackRock funds, as long as their account balance is at least $10,000.
Retirement Plans
Shareholders may make investments in conjunction with Traditional, Rollover, Roth, Coverdell, Simple IRAs, SEP IRAs and 403(b) Plans.
ADDITIONAL INFORMATION | 69 |
Additional Information (continued)
BlackRock Privacy Principles
BlackRock is committed to maintaining the privacy of its current and former fund investors and individual clients (collectively, “Clients”) and to safeguarding their non-public personal information. The following information is provided to help you understand what personal information BlackRock collects, how we protect that information and why in certain cases we share such information with select parties.
If you are located in a jurisdiction where specific laws, rules or regulations require BlackRock to provide you with additional or different privacy-related rights beyond what is set forth below, then BlackRock will comply with those specific laws, rules or regulations.
BlackRock obtains or verifies personal non-public information from and about you from different sources, including the following: (i) information we receive from you or, if applicable, your financial intermediary, on applications, forms or other documents; (ii) information about your transactions with us, our affiliates, or others; (iii) information we receive from a consumer reporting agency; and (iv) from visits to our websites.
BlackRock does not sell or disclose to non-affiliated third parties any non-public personal information about its Clients, except as permitted by law or as is necessary to respond to regulatory requests or to service Client accounts. These non-affiliated third parties are required to protect the confidentiality and security of this information and to use it only for its intended purpose.
We may share information with our affiliates to service your account or to provide you with information about other BlackRock products or services that may be of interest to you. In addition, BlackRock restricts access to non-public personal information about its Clients to those BlackRock employees with a legitimate business need for the information. BlackRock maintains physical, electronic and procedural safeguards that are designed to protect the non-public personal information of its Clients, including procedures relating to the proper storage and disposal of such information.
| 70 | 2020 BLACKROCK ANNUAL REPORTTO SHAREHOLDERS |
Glossary of Terms Used in this Report
| Currency | ||
| AUD | Australian Dollar | |
| BRL | Brazilian Real | |
| CAD | Canadian Dollar | |
| CHF | Swiss Franc | |
| EUR | Euro | |
| GBP | British Pound | |
| HKD | Hong Kong Dollar | |
| INR | Indian Rupee | |
| JPY | Japanese Yen | |
| KRW | South Korean Won | |
| MXN | Mexican Peso | |
| NOK | Norwegian Krone | |
| NZD | New Zealand Dollar | |
| RUB | New Russian Ruble | |
| SEK | Swedish Krona | |
| SGD | Singapore Dollar | |
| TWD | Taiwan New Dollar | |
| USD | United States Dollar | |
| Portfolio Abbreviations | ||
| CDI | Crest Depository Interests | |
| CVA | Certification Van Aandelon (Dutch Certificate) | |
| CVR | Contingent Value Rights | |
| HIBOR | Hong Kong Interbank Offer Rate | |
| LIBOR | London Interbank Offered Rate | |
| MSCI | Morgan Stanley Capital International | |
| OTC | Over-the-counter | |
| RBOB | Reformulated Gasoline Blend Stock for Oxygen Blending | |
| S&P | Standard & Poor’s | |
| SCA | Svenska Cellulosa Aktiebolaget | |
| WTI | West Texas Intermediate | |
GLOSSARYOF TERMS USEDINTHIS REPORT | 71 |
Want to know more?
blackrock.com | 800-441-7762
This report is intended for current holders. It is not authorized for use as an offer of sale or a solicitation of an offer to buy shares of the Fund unless preceded or accompanied by the Fund’s current prospectus. Past performance results shown in this report should not be considered a representation of future performance. Investment returns and principal value of shares will fluctuate so that shares, when redeemed, may be worth more or less than their original cost. Statements and other information herein are as dated and are subject to change.
SRA-7/20-AR
|  |
| Item 3 – | Audit Committee Financial Expert – The registrant’s board of directors (the “board of directors”), has determined that (i) the registrant has the following audit committee financial experts serving on its audit committee and (ii) each audit committee financial expert is independent: |
Neil A. Cotty |
Henry R. Keizer |
Kenneth L. Urish |
Under applicable securities laws, a person determined to be an audit committee financial expert will not be deemed an “expert” for any purpose, including without limitation for the purposes of Section 11 of the Securities Act of 1933, as a result of being designated or identified as an audit committee financial expert. The designation or identification of a person as an audit committee financial expert does not impose on such person any duties, obligations, or liabilities greater than the duties, obligations, and liabilities imposed on such person as a member of the audit committee and board of directors in the absence of such designation or identification. The designation or identification of a person as an audit committee financial expert does not affect the duties, obligations, or liability of any other member of the audit committee or board of directors.
| Item 4 – | Principal Accountant Fees and Services |
The following table presents fees billed by Pricewaterhouse Coopers (“PwC”) in each of the last two fiscal years for the services rendered to the Fund:
| (a) Audit Fees | (b) Audit-Related Fees1 | (c) Tax Fees2 | (d) All Other Fees | |||||||||||||
| Entity Name | Current Fiscal Year End | Previous Fiscal Year End | Current Fiscal Year End | Previous Fiscal Year End | Current Fiscal Year End | Previous Fiscal Year End | Current Fiscal Year End | Previous Fiscal Year End | ||||||||
BlackRock Total Factor Fund | $42,000 | $42,000 | $0 | $0 | $0 | $0 | $0 | $0 | ||||||||
The following table presents fees billed by PwC that were required to be approved by the registrant’s audit committee (the “Committee”) for services that relate directly to the operations or financial reporting of the Fund and that are rendered on behalf of BlackRock Advisors, LLC (the “Investment Adviser” or “BlackRock”) and entities controlling, controlled by, or under common control with BlackRock (not including any sub-adviser whose role is primarily portfolio management and is subcontracted with or overseen by another investment adviser) that provide ongoing services to the Fund (“Affiliated Service Providers”):
| Current Fiscal Year End | Previous Fiscal Year End | |||
(b) Audit-Related Fees1 | $0 | $0 | ||
(c) Tax Fees2 | $0 | $0 | ||
(d) All Other Fees3 | $0 | $0 |
2
1 The nature of the services includes assurance and related services reasonably related to the performance of the audit or review of financial statements not included in Audit Fees, including accounting consultations, agreed-upon procedure reports, attestation reports, comfort letters, out-of-pocket expenses and internal control reviews not required by regulators.
2 The nature of the services includes tax compliance and/or tax preparation, including services relating to the filing or amendment of federal, state or local income tax returns, regulated investment company qualification reviews, taxable income and tax distribution calculations.
3 Aggregate fees borne by BlackRock in connection with the review of compliance procedures and attestation thereto performed by PwC with respect to all of the registered closed-end funds and some of the registered open-end funds advised by BlackRock.
(e)(1) Audit Committee Pre-Approval Policies and Procedures:
The Committee has adopted policies and procedures with regard to the pre-approval of services. Audit, audit-related and tax compliance services provided to the registrant on an annual basis require specific pre-approval by the Committee. The Committee also must approve other non-audit services provided to the registrant and those non-audit services provided to the Investment Adviser and Affiliated Service Providers that relate directly to the operations and the financial reporting of the registrant. Certain of these non-audit services that the Committee believes are (a) consistent with the SEC’s auditor independence rules and (b) routine and recurring services that will not impair the independence of the independent accountants may be approved by the Committee without consideration on a specific case-by-case basis (“general pre-approval”). The term of any general pre-approval is 12 months from the date of the pre-approval, unless the Committee provides for a different period. Tax or other non-audit services provided to the registrant which have a direct impact on the operations or financial reporting of the registrant will only be deemed pre-approved provided that any individual project does not exceed $10,000 attributable to the registrant or $50,000 per project. For this purpose, multiple projects will be aggregated to determine if they exceed the previously mentioned cost levels.
Any proposed services exceeding the pre-approved cost levels will require specific pre-approval by the Committee, as will any other services not subject to general pre-approval (e.g., unanticipated but permissible services). The Committee is informed of each service approved subject to general pre-approval at the next regularly scheduled in-person board meeting. At this meeting, an analysis of such services is presented to the Committee for ratification. The Committee may delegate to the Committee Chairman the authority to approve the provision of and fees for any specific engagement of permitted non-audit services, including services exceeding pre-approved cost levels.
(e)(2) None of the services described in each of Items 4(b) through (d) were approved by the Committee pursuant to the de minimis exception in paragraph (c)(7)(i)(C) of Rule 2-01 of Regulation S-X.
(f) Not Applicable
(g) The aggregate non-audit fees, defined as the sum of the fees shown under “Audit-Related Fees,” “Tax Fees” and “All Other Fees,” paid to the accountant for services rendered by the accountant to the registrant, the Investment Adviser and the Affiliated Service Providers were:
| Entity Name | Current Fiscal Year End | Previous Fiscal Year End | ||
| BlackRock Total Factor Fund | $0 | $0 |
(h) The Committee has considered and determined that the provision of non-audit services that were rendered to the Investment Adviser and the Affiliated Service Providers that were not pre-approved
3
pursuant to paragraph (c)(7)(ii) of Rule 2-01 of Regulation S-X is compatible with maintaining the principal accountant’s independence.
| Item 5 – | Audit Committee of Listed Registrant – Not Applicable |
| Item 6 – | Investments |
(a) The registrant’s Schedule of Investments is included as part of the Report to Stockholders filed under Item 1 of this Form.
(b) Not Applicable due to no such divestments during the semi-annual period covered since the previous Form N-CSR filing.
| Item 7 – | Disclosure of Proxy Voting Policies and Procedures for Closed-End Management Investment Companies – Not Applicable |
| Item 8 – | Portfolio Managers of Closed-End Management Investment Companies – Not Applicable |
| Item 9 – | Purchases of Equity Securities by Closed-End Management Investment Company and Affiliated Purchasers – Not Applicable |
| Item 10 – | Submission of Matters to a Vote of Security Holders – There have been no material changes to these procedures. |
| Item 11 – | Controls and Procedures |
(a) The registrant’s principal executive and principal financial officers, or persons performing similar functions, have concluded that the registrant’s disclosure controls and procedures (as defined in Rule 30a-3(c) under the Investment Company Act of 1940, as amended (the “1940 Act”)) are effective as of a date within 90 days of the filing of this report based on the evaluation of these controls and procedures required by Rule 30a-3(b) under the 1940 Act and Rule 15d-15(b) under the Securities Exchange Act of 1934, as amended.
(b) There were no changes in the registrant’s internal control over financial reporting (as defined in Rule 30a-3(d) under the 1940 Act) that occurred during the period covered by this report that have materially affected, or are reasonably likely to materially affect, the registrant’s internal control over financial reporting.
| Item 12 – | Disclosure of Securities Lending Activities for Closed-End Management Investment Companies –Not Applicable |
| Item 13 – | Exhibits attached hereto |
(a)(1) – Code of Ethics – See Item 2
(a)(2) – Section 302 Certifications are attached
(a)(3) – Not Applicable
(a)(4) – Not Applicable
4
Pursuant to the requirements of the Securities Exchange Act of 1934 and the Investment Company Act of 1940, the registrant has duly caused this report to be signed on its behalf by the undersigned, thereunto duly authorized.
BlackRock FundsSM
| By: | /s/ John M. Perlowski | |
John M. Perlowski | ||
Chief Executive Officer (principal executive officer) of | ||
BlackRock FundsSM | ||
| Date: | October 2, 2020 | |
Pursuant to the requirements of the Securities Exchange Act of 1934 and the Investment Company Act of 1940, this report has been signed below by the following persons on behalf of the registrant and in the capacities and on the dates indicated.
| By: | /s/ John M. Perlowski | |
| John M. Perlowski | ||
| Chief Executive Officer (principal executive officer) of | ||
| BlackRock FundsSM | ||
| Date: | October 2, 2020 | |
| By: | /s/ Neal J. Andrews | |
| Neal J. Andrews | ||
| Chief Financial Officer (principal financial officer) of | ||
| BlackRock FundsSM | ||
| Date: | October 2, 2020 | |
6