UNITED STATES
SECURITIES AND EXCHANGE COMMISSION
Washington, D.C. 20549
FORM N-CSR
CERTIFIED SHAREHOLDER REPORT OF REGISTERED MANAGEMENT
INVESTMENT COMPANIES
Investment Company Act file number: 811-05742
| Name of Fund: | BlackRock FundsSM |
| BlackRock Advantage Small Cap Growth Fund |
| BlackRock Health Sciences Opportunities Portfolio |
| BlackRock Mid-Cap Growth Equity Portfolio |
| BlackRock Technology Opportunities Fund |
| Fund Address: | 100 Bellevue Parkway, Wilmington, DE 19809 |
Name and address of agent for service: John M. Perlowski, Chief Executive Officer, BlackRock FundsSM, 55 East 52nd Street, New York, NY 10055
Registrant’s telephone number, including area code: (800) 441-7762
Date of fiscal year end: 09/30/2020
Date of reporting period: 09/30/2020
Item 1 – Report to Stockholders
| SEPTEMBER 30, 2020 |

| 2020 Annual Report | ||
BlackRock FundsSM
| · | BlackRock Advantage Small Cap Growth Fund |
| · | BlackRock Health Sciences Opportunities Portfolio |
| · | BlackRock Mid-Cap Growth Equity Portfolio |
| · | BlackRock Technology Opportunities Fund |
Beginning on January 1, 2021, as permitted by regulations adopted by the Securities and Exchange Commission, paper copies of each Fund’s shareholder reports will no longer be sent by mail, unless you specifically request paper copies of the reports from BlackRock or from your financial intermediary, such as a broker-dealer or bank. Instead, the reports will be made available on a website, and you will be notified by mail each time a report is posted and provided with a website link to access the report.
You may elect to receive all future reports in paper free of charge. If you hold accounts directly with BlackRock, you can call (800) 441-7762 to inform BlackRock that you wish to continue receiving paper copies of your shareholder reports. If you hold accounts through a financial intermediary, you can follow the instructions included with this disclosure, if applicable, or contact your financial intermediary to request that you continue to receive paper copies of your shareholder reports. Please note that not all financial intermediaries may offer this service. Your election to receive reports in paper will apply to all funds advised by BlackRock Advisors, LLC, BlackRock Fund Advisors or their affiliates, or all funds held with your financial intermediary, as applicable.
If you already elected to receive shareholder reports electronically, you will not be affected by this change and you need not take any action. You may elect to receive electronic delivery of shareholder reports and other communications by: (i) accessing the BlackRock website at blackrock.com/edelivery and logging into your accounts, if you hold accounts directly with BlackRock, or (ii) contacting your financial intermediary, if you hold accounts through a financial intermediary. Please note that not all financial intermediaries may offer this service.
| Not FDIC Insured • May Lose Value • No Bank Guarantee |
Dear Shareholder,
The 12-month reporting period as of September 30, 2020 has been a time of sudden change in global financial markets, as the emergence and spread of the coronavirus (or “COVID-19”) led to a vast disruption in the global economy and financial markets. Prior to the outbreak of the virus, U.S. equities and bonds both delivered impressive returns, despite fears and doubts about the economy that were ultimately laid to rest with unprecedented monetary stimulus and a sluggish yet resolute performance from the U.S. economy. But as the threat from the coronavirus became more apparent throughout February and March 2020, countries around the world took economically disruptive countermeasures. Stay-at-home orders and closures of non-essential businesses became widespread, many workers were laid off, and unemployment claims spiked, causing a global recession and a sharp fall in equity prices.
After markets hit their lowest point during the reporting period in late March 2020, a steady recovery ensued, as businesses began to re-open and governments learned to adapt to life with the virus. Equity prices continued to rise throughout the summer, fed by strong fiscal and monetary support and improving economic indicators. Many equity indices neared or surpassed all-time highs in early September 2020 before retreating amid concerns about a second wave of infections. In the United States, large-capitalization stocks advanced, outperforming small-capitalization stocks, which gained only marginally during the reporting period. International equities from developed economies were nearly flat, lagging emerging market stocks, which rebounded sharply.
During the market downturn, the performance of different types of fixed-income securities initially diverged due to a reduced investor appetite for risk. U.S. Treasuries benefited from the risk-off environment, and posted solid returns, as the 10-year U.S. Treasury yield (which is inversely related to bond prices) touched an all-time low. In the corporate bond market, support from the U.S. Federal Reserve (the “Fed”) assuaged credit concerns and both investment-grade and high-yield bonds recovered to post positive returns.
The Fed reduced short-term interest rates in late 2019 to support slowing economic growth. After the coronavirus outbreak, the Fed instituted an additional two emergency rate cuts, pushing short-term interest rates close to zero. To stabilize credit markets, the Fed also implemented a new bond-buying program, as did several other central banks around the world, including the European Central Bank and the Bank of Japan.
Looking ahead, while coronavirus-related disruptions have clearly hindered worldwide economic growth, we believe that the global expansion is likely to continue as economic activity resumes. Several risks remain, however, including a potential resurgence of the coronavirus amid loosened restrictions, policy fatigue among governments already deep into deficit spending, and structural damage to the financial system from lengthy economic interruptions.
Overall, we favor a moderately positive stance toward risk, and in particular toward credit given the extraordinary central bank measures taken in recent months. This support extends beyond investment-grade corporates and into high-yield, leading to attractive opportunities in that end of the market. We believe that international diversification and a focus on sustainability can help provide portfolio resilience, and the disruption created by the coronavirus appears to be accelerating the shift toward sustainable investments. We remain neutral on equities overall while favoring European stocks, which are poised for cyclical upside as re-openings continue.
In this environment, our view is that investors need to think globally, extend their scope across a broad array of asset classes, and be nimble as market conditions change. We encourage you to talk with your financial advisor and visit blackrock.com for further insight about investing in today’s markets.
Sincerely,

Rob Kapito
President, BlackRock Advisors, LLC

Rob Kapito
President, BlackRock Advisors, LLC
| Total Returns as of September 30, 2020 | ||||||||
| 6-Month | 12-Month | |||||||
U.S. large cap equities
| 31.31% | 15.15% | ||||||
U.S. small cap equities
| 31.60 | 0.39 | ||||||
International equities
| 20.39 | 0.49 | ||||||
Emerging market equities (MSCI Emerging Markets Index)
| 29.37 | 10.54 | ||||||
3-month Treasury bills
| 0.06 | 1.10 | ||||||
U.S. Treasury securities
| 0.71 | 10.74 | ||||||
U.S. investment grade bonds (Bloomberg Barclays U.S. Aggregate Bond Index)
| 3.53 | 6.98 | ||||||
Tax-exempt municipal bonds (S&P Municipal Bond Index)
| 3.78 | 3.85 | ||||||
U.S. high yield bonds
| 15.18 | 3.20 | ||||||
Past performance is not an indication of future results. Index performance is shown for illustrative purposes only. You cannot invest directly in an index. |
| |||||||
| 2 | THIS PAGE IS NOT PART OF YOUR FUND REPORT |
| Page | ||||
| 2 | ||||
Annual Report: | ||||
| 4 | ||||
| 16 | ||||
| 16 | ||||
| 17 | ||||
Financial Statements: | ||||
| 18 | ||||
| 40 | ||||
| 42 | ||||
| 44 | ||||
| 46 | ||||
| 70 | ||||
| 86 | ||||
| 87 | ||||
| 88 | ||||
| 91 | ||||
| 95 | ||||
| 97 | ||||

| 3 |
| Fund Summary as of September 30, 2020 | BlackRock Advantage Small Cap Growth Fund |
Investment Objective
BlackRock Advantage Small Cap Growth Fund’s (the “Fund”) investment objective is to seek long-term capital growth.
Portfolio Management Commentary
How did the Fund perform?
For the 12-month period ended September 30, 2020, all of the Fund’s share classes outperformed its benchmark, the Russell 2000® Growth Index , except for Class R Shares, which performed in line with, and Investor C Shares, which underperformed, the benchmark.
What factors influenced performance?
Overall, the Fund performed well, navigating a highly volatile market backdrop during the period. The economic shutdowns following the COVID-19 outbreak caused equity markets to experience a sharp bifurcation that resulted in two distinct return environments. After reaching new highs through mid-February 2020, the spread of COVID-19 prompted a historic market decline, as volatility hit levels last observed during the global financial crisis. Mounting concerns over collapsing growth expectations and rising unemployment led policymakers to respond with monetary and fiscal measures to support the economy and the markets. The unprecedented policy support enabled equities to retrace losses more quickly than expected.
Combined with improving macroeconomic data and levels of business activity, several equity indices reached new highs early in September 2020, including U.S. large cap stocks. However, markets ended the period on a more cautious footing, as investor concerns once again rose following a resurgence in COVID-19 cases and the prospects of further shutdowns. The failure of policymakers to agree on additional fiscal support also weighed on expectations about whether the recovery could sustain its momentum.
Unsurprisingly given the volatility, fundamental stock selection insights were the primary contributor to the Fund’s relative outperformance. Specifically, a quality preference within the portfolio added to returns, with growth-oriented quality insights providing gains. An insight focusing on management quality performed well by identifying founder-led firms, as did an insight comparing management comments to regulatory filings. Both insights prompted favorable positioning in the healthcare and financial sectors. Less traditional environmental, social and governance (“ESG”) related quality measures also performed well, as they demonstrated resilience consistent with their historical success in times of market duress. A recently added insight that identifies investor flows into ESG-related positions was one of the top-performing signals after successfully capturing an evolving investor preference for sustainable investing. Elsewhere among fundamentals, insights looking to identify attractively priced growth companies were additive. This included an insight comparing valuations in relation to research and development expenditures that performed well, as it demonstrated a growth preference and was particularly successful in positioning within the biotechnology industry.
Additionally, insights that capture trends for stocks using higher frequency alternative data delivered gains amid the evolving marketplace. Collectively, these insights correctly positioned the Fund during earnings season. Data that looks at supply chain dynamics and company linkages performed well in the industrial sector, while more nuanced trends such as hotel bookings and online search activity were highly additive across retail stocks. Finally, a recently added insight that looks to invest in companies that are researching a treatment for COVID-19 was a strong performer, given a heightened investor focus on progress in development.
Despite the Fund’s overall outperformance, there were select periods of portfolio weakness. In March 2020, sentiment measures that seek to capture informed investor positioning resulted in losses, as extreme market conditions caught the informed investor community completely by surprise. An insight that looks at company manager meeting activity as a gauge for institutional interest in stocks struggled after prompting an overweight position in restaurants prior to COVID-related shutdowns. Similarly, sentiment insights that look to capture positioning from the hedge fund community detracted from performance within the financial sector.
Later in the period, September 2020 was also a challenging time for the Fund, as previously successful positions suffered a reversal. Somewhat surprisingly, traditional defensive measures struggled during the market correction. A preference for lower-risk securities detracted, with noted weakness within the biotechnology industry. Additionally, positioning within software stocks, motivated by an expectation of more people working from home, also detracted. Finally, macro-thematic positioning had mixed performance overall, as losses from a regional model evaluating revenue sensitivity to local economic trends were offset by gains from industry positioning.
Describe recent portfolio activity.
The Fund maintained a balanced allocation of risk across all major drivers of return during the period. However, there were several new stock selection insights added to the Fund. Given the dynamic nature of the current market environment, the Fund instituted enhanced signal constructs to identify emerging trends from the COVID-19 pandemic, such as “work from home” and vaccine development. Additionally, a new alternative data-driven insight that looks to capture brand sentiment among consumers was added.
Describe portfolio positioning at period end.
Relative to the Russell 2000® Growth Index, the Fund remained largely sector neutral. The Fund maintained slight overweight positions to consumer discretionary and industrial stocks, and maintained slight underweight positions in consumer staples and utilities.
The views expressed reflect the opinions of BlackRock as of the date of this report and are subject to change based on changes in market, economic or other conditions. These views are not intended to be a forecast of future events and are no guarantee of future results.
| 4 | 2 0 2 0 BLACK ROCK ANNUAL REPORT TO SHAREHOLDERS |
| Fund Summary as of September 30, 2020 (continued) | BlackRock Advantage Small Cap Growth Fund |
TOTAL RETURN BASED ON $10,000 INVESTMENT
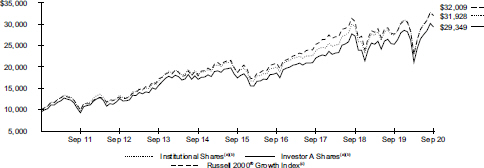
| (a) | Assuming maximum sales charges, if any, transaction costs and other operating expenses, including investment advisory fees and administration fees, if any. Institutional Shares do not have a sales charge. |
| (b) | Under normal circumstances, the Fund will invest at least 80% of its net assets (plus any borrowings for investment purposes) in equity securities of small cap companies and at least 80% of its net assets (plus any borrowings for investment purposes) in securities or instruments of issuers located in the United States. |
| (c) | An unmanaged index that measures performance of the small-cap growth segment of the U.S. equity universe. It includes those Russell 2000® Index companies with higher price-to-value ratios and higher forecasted growth values. |
Performance Summary for the Period Ended September 30, 2020
| Average Annual Total Returns(a) | ||||||||||||||||||||||||||||||||||||||||
| 1 Year | 5 Years | 10 Years | ||||||||||||||||||||||||||||||||||||||
| 6-Month Total Returns | Without Sales Charge | With Sales Charge | Without Sales Charge | With Sales Charge | Without Sales Charge | With Sales Charge | ||||||||||||||||||||||||||||||||||
Institutional | 39.56 | % | 16.32 | % | N/A | 11.27 | % | N/A | 12.31 | % | N/A | |||||||||||||||||||||||||||||
Service | 39.32 | 15.99 | N/A | 11.00 | N/A | 12.00 | N/A | |||||||||||||||||||||||||||||||||
Investor A | 39.27 | 16.03 | 9.94 | % | 10.98 | 9.79 | % | 11.97 | 11.37 | % | ||||||||||||||||||||||||||||||
Investor C | 38.89 | 15.18 | 14.21 | 10.13 | 10.13 | 11.10 | 11.10 | |||||||||||||||||||||||||||||||||
Class K | 39.56 | 16.37 | N/A | 11.30 | N/A | 12.32 | N/A | |||||||||||||||||||||||||||||||||
Class R | 39.20 | 15.75 | N/A | 10.72 | N/A | 11.75 | N/A | |||||||||||||||||||||||||||||||||
Russell 2000® Growth Index | 39.93 | 15.71 | N/A | 11.42 | N/A | 12.34 | N/A | |||||||||||||||||||||||||||||||||
| (a) | Assuming maximum sales charges, if any. Average annual total returns with and without sales charges reflect reductions for distribution and service fees. See “About Fund Performance” on page 16 for a detailed description of share classes, including any related sales charges and fees, and how performance was calculated for certain share classes. |
N/A - Not applicable as share class and index do not have a sales charge.
Past performance is not an indication of future results.
Performance results may include adjustments made for financial reporting purposes in accordance with U.S. generally accepted accounting principles.
Expense Example
| Actual | Hypothetical(a) | |||||||||||||||||||||||||||||||
| | Beginning Account Value (04/01/20) | | | Ending Account Value (09/30/20) | | | Expenses Paid During the Period | (b) | | Beginning Account Value (04/01/20) | | | Ending Account Value (09/30/20) | | | Expenses Paid During the Period | (b) | | Annualized Expense Ratio | | ||||||||||||
Institutional | $ 1,000.00 | $ 1,395.60 | $ 2.99 | $ 1,000.00 | $ 1,022.50 | $ 2.53 | 0.50 | % | ||||||||||||||||||||||||
Service | 1,000.00 | 1,393.20 | 4.49 | 1,000.00 | 1,021.25 | 3.79 | 0.75 | |||||||||||||||||||||||||
Investor A | 1,000.00 | 1,392.70 | 4.49 | 1,000.00 | 1,021.25 | 3.79 | 0.75 | |||||||||||||||||||||||||
Investor C | 1,000.00 | 1,388.90 | 8.96 | 1,000.00 | 1,017.50 | 7.57 | 1.50 | |||||||||||||||||||||||||
Class K | 1,000.00 | 1,395.60 | 2.70 | 1,000.00 | 1,022.75 | 2.28 | 0.45 | |||||||||||||||||||||||||
Class R | 1,000.00 | 1,392.00 | 5.98 | 1,000.00 | 1,020.00 | 5.05 | 1.00 | |||||||||||||||||||||||||
| (a) | Hypothetical 5% annual return before expenses is calculated by prorating the number of days in the most recent fiscal half year divided by 366. |
| (b) | For each class of the Fund, expenses are equal to the annualized expense ratio for the class, multiplied by the average account value over the period, multiplied by 183/366 (to reflect the one-half year period shown). |
See “Disclosure of Expenses” on page 16 for further information on how expenses were calculated.
F U N D S U M M A R Y | 5 |
| Fund Summary as of September 30, 2020 (continued) | BlackRock Advantage Small Cap Growth Fund |
Portfolio Information
TEN LARGEST HOLDINGS
| Security(a) | Percent of Net Assets | |||
Qualys, Inc. | 1 | % | ||
QTS Realty Trust, Inc., Class A | 1 | |||
Hamilton Lane, Inc., Class A | 1 | |||
Werner Enterprises, Inc. | 1 | |||
Texas Roadhouse, Inc. | 1 | |||
OSI Systems, Inc. | 1 | |||
Sunrun, Inc. | 1 | |||
Wingstop, Inc. | 1 | |||
International Game Technology PLC | 1 | |||
SiteOne Landscape Supply, Inc. | 1 | |||
SECTOR ALLOCATION
| Sector(b) | Percent of Net Assets | |||
Health Care | 33 | % | ||
Information Technology | 20 | |||
Consumer Discretionary | 14 | |||
Industrials | 14 | |||
Financials | 4 | |||
Real Estate | 3 | |||
Communication Services | 3 | |||
Consumer Staples | 2 | |||
Materials | 2 | |||
Utilities | 1 | |||
Energy | 1 | |||
Short-Term Securities | 11 | |||
Liabilities in Excess of Other Assets | (8 | ) | ||
| (a) | Excludes short-term investments. |
| (b) | For Fund compliance purposes, the Fund’s sector classifications refer to one or more of the sector sub-classifications used by one or more widely recognized market indexes or ratings group indexes, and/or as defined by the investment adviser. These definitions may not apply for purposes of this report, which may combine such sector sub-classifications for reporting ease. |
| 6 | 2 0 2 0 BLACK ROCK ANNUAL REPORT TO SHAREHOLDERS |
| Fund Summary as of September 30, 2020 | BlackRock Health Sciences Opportunities Portfolio |
Investment Objective
BlackRock Health Sciences Opportunities Portfolio’s (the “Fund”) investment objective is to provide long-term growth of capital.
Portfolio Management Commentary
How did the Fund perform?
For the 12-month period ended September 30, 2020, the Fund outperformed its benchmark, the Russell 3000® Health Care Index.
What factors influenced performance?
Health care stocks delivered a strong gain and outpaced the broader equity market during the 12-month period. The sector is seen as being less sensitive to economic disruptions stemming from COVID-19, which fueled positive relative performance. In addition, shares of many companies rose on expectations that they could develop diagnostics or treatments for the virus.
Stock selection, particularly in the healthcare providers & services and biotechnology sub-sectors, was the primary driver of the Fund’s favorable results. At the individual stock level, an overweight in the U.S. biotechnology company Seattle Genetics, Inc. was the top contributor. The stock rallied after the company shared details about investigational therapies, positive feedback on its cancer drugs and the expansion of its product pipeline. Overweight positions in the U.S.-based virtual health care companies Teladoc Health, Inc. and Livongo Health, Inc. were also among the Fund’s largest contributors. The spread of COVID-19 and subsequent social distancing and lockdown measures resulted in higher demand for virtual diagnostics and telemedicine, which led to the increased adoption of both companies’ services. The two firms also announced a merger, with Teladoc acquiring Livongo for $18.5 billion. An out-of-benchmark position in the health care provider Oak Street Health, Inc., which operates primary care centers for the Medicare-eligible population, further contributed to the Fund’s results.
Stock selection in the medical devices & supplies sub-sector detracted from Fund performance. Sector allocation also detracted, primarily driven by the overweight allocation to medical devices.
The Fund’s lack of a position in the medical devices & supplies firm Danaher Corp.—which capitalized on the increased demand for diagnostic testing stemming from COVID-19—was the largest detractor from relative performance. Similarly, a zero weighting in the diabetes-management solutions provider Dexcom, Inc., which benefited from continued demand for its continuous glucose monitoring device, also hurt results. An overweight position in Baxter International, Inc. was an additional detractor. Allegations of improper accounting practices on foreign exchange transactions pressured the company’s shares in late 2019. The Fund maintained its position in the stock.
Describe recent portfolio activity.
The Fund reduced its weighting in the medical devices & supplies industry, and it added to its positions in the biotechnology and pharmaceuticals industries. Its weighting in the health care providers & services sub-sector remained the same.
Describe portfolio positioning at period end.
The Fund is a diversified health care portfolio constructed using the investment adviser’s bottom-up, fundamental investment process. From an aggregate level, there are two broad themes in the portfolio: innovation and value-based health care. Innovation in medical technology and biotechnology remains a secular growth driver for the sector as companies continue to develop new therapies or products that are either fulfilling previously unmet medical needs or improving current treatments. With respect to value-based health care, the Fund is overweight in the health care providers & services sub-sector, and primarily the managed care industry. Here, the investment adviser seeks companies it believes will continue to execute on their underlying businesses and are well positioned to leverage their scale and analytical capabilities to reduce health care costs.
At the end of the period, the Fund was overweight in health care providers & services and medical devices & supplies. The Fund had an equal weighting in biotechnology and was underweight in pharmaceuticals.
The views expressed reflect the opinions of BlackRock as of the date of this report and are subject to change based on changes in market, economic or other conditions. These views are not intended to be a forecast of future events and are no guarantee of future results.
F U N D S U M M A R Y | 7 |
| Fund Summary as of September 30, 2020 (continued) | BlackRock Health Sciences Opportunities Portfolio |
TOTAL RETURN BASED ON $10,000 INVESTMENT
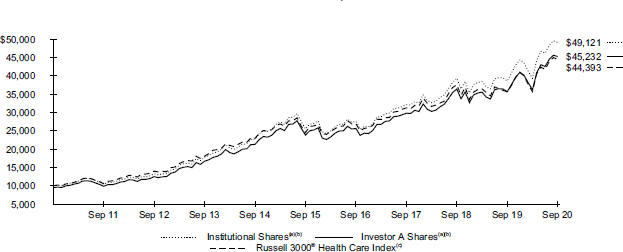
| (a) | Assuming maximum sales charges, if any, transaction costs and other operating expenses, including investment advisory fees and administration fees, if any. Institutional Shares do not have a sales charge. |
| (b) | Under normal market conditions, the Fund invests at least 80% of its total assets in equity securities, primarily common stock, of companies in health sciences and related industries. |
| (c) | The Russell 3000® Health Care Index is an unmanaged index that features companies involved in medical services or health care in the Russell 3000® Index, which includes the largest 3,000 U.S. companies as determined by total market capitalization. |
Performance Summary for the Period Ended September 30, 2020
| Average Annual Total Returns(a) | ||||||||||||||||||||||||||||||||||||||||
| 1 Year | 5 Years | 10 Years | ||||||||||||||||||||||||||||||||||||||
| 6-Month Total Returns | Without Sales Charge | With Sales Charge | Without Sales Charge | With Sales Charge | Without Sales Charge | With Sales Charge | ||||||||||||||||||||||||||||||||||
Institutional | 25.10 | % | 27.34 | % | N/A | 14.01 | % | N/A | 17.25 | % | N/A | |||||||||||||||||||||||||||||
Service | 24.90 | 26.96 | N/A | 13.67 | N/A | 16.91 | N/A | |||||||||||||||||||||||||||||||||
Investor A | 24.93 | 26.99 | 20.32 | % | 13.69 | 12.47 | % | 16.92 | 16.29 | % | ||||||||||||||||||||||||||||||
Investor C | 24.48 | 26.09 | 25.09 | 12.87 | 12.87 | 16.08 | 16.08 | |||||||||||||||||||||||||||||||||
Class K | 25.15 | 27.47 | N/A | 14.06 | N/A | 17.11 | N/A | |||||||||||||||||||||||||||||||||
Class R | 24.73 | 26.60 | N/A | 13.33 | N/A | 16.55 | N/A | |||||||||||||||||||||||||||||||||
Russell 3000® Health Care Index | 24.45 | 24.60 | N/A | 12.61 | N/A | 16.07 | N/A | |||||||||||||||||||||||||||||||||
| (a) | Assuming maximum sales charges, if any. Average annual total returns with and without sales charges reflect reductions for distribution and service fees. See “About Fund Performance” on page 16 for a detailed description of share classes, including any related sales charges and fees, and how performance was calculated for certain share classes. |
N/A - Not applicable as share class and index do not have a sales charge.
Past performance is not an indication of future results.
Performance results may include adjustments made for financial reporting purposes in accordance with U.S. generally accepted accounting principles.
Expense Example
| Actual | Hypothetical(a) | |||||||||||||||||||||||||||||||
| | Beginning Account Value (04/01/20) | | | Ending Account Value (09/30/20) | | | Expenses Paid During the Period | (b) | | Beginning Account Value (04/01/20) | | | Ending Account Value (09/30/20) | | | Expenses Paid During the Period | (b) | | Annualized Expense Ratio | | ||||||||||||
Institutional | $ 1,000.00 | $ 1,251.00 | $ 4.75 | $ 1,000.00 | $ 1,020.78 | $ 4.27 | 0.84 | % | ||||||||||||||||||||||||
Service | 1,000.00 | 1,249.00 | 6.46 | 1,000.00 | 1,019.26 | 5.80 | 1.15 | |||||||||||||||||||||||||
Investor A | 1,000.00 | 1,249.30 | 6.24 | 1,000.00 | 1,019.45 | 5.60 | 1.11 | |||||||||||||||||||||||||
Investor C | 1,000.00 | 1,244.80 | 10.35 | 1,000.00 | 1,015.78 | 9.29 | 1.84 | |||||||||||||||||||||||||
Class K | 1,000.00 | 1,251.50 | 4.20 | 1,000.00 | 1,021.27 | 3.77 | 0.75 | |||||||||||||||||||||||||
Class R | 1,000.00 | 1,247.30 | 8.10 | 1,000.00 | 1,017.79 | 7.27 | 1.44 | |||||||||||||||||||||||||
| (a) | Hypothetical 5% annual return before expenses is calculated by prorating the number of days in the most recent fiscal half year divided by 366. |
| (b) | For each class of the Fund, expenses are equal to the annualized expense ratio for the class, multiplied by the average account value over the period, multiplied by 183/366 (to reflect the one-half year period shown). |
See “Disclosure of Expenses” on page 16 for further information on how expenses were calculated.
| 8 | 2 0 2 0 BLACK ROCK ANNUAL REPORT TO SHAREHOLDERS |
| Fund Summary as of September 30, 2020 (continued) | BlackRock Health Sciences Opportunities Portfolio |
Portfolio Information
TEN LARGEST HOLDINGS
| Security(a) | Percent of Net Assets | |||
UnitedHealth Group, Inc. | 7 | % | ||
Abbott Laboratories | 5 | |||
Johnson & Johnson | 4 | |||
Thermo Fisher Scientific, Inc. | 3 | |||
Boston Scientific Corp. | 3 | |||
Amgen, Inc. | 3 | |||
Medtronic PLC | 3 | |||
Humana, Inc. | 3 | |||
Seattle Genetics, Inc. | 2 | |||
Stryker Corp. | 2 | |||
INDUSTRY ALLOCATION
| Industry(b) | Percent of Net Assets | |||
Health Care Equipment & Supplies | 30 | % | ||
Biotechnology | 21 | |||
Pharmaceuticals | 20 | |||
Health Care Providers & Services | 18 | |||
Life Sciences Tools & Services | 8 | |||
Health Care Technology | 1 | |||
Short-Term Securities | 4 | |||
Liabilities in Excess of Other Assets | (2 | ) | ||
| (a) | Excludes short-term investments. |
| (b) | For Fund compliance purposes, the Fund’s industry classifications refer to one or more of the industry sub-classifications used by one or more widely recognized market indexes or ratings group indexes, and/or as defined by the investment adviser. These definitions may not apply for purposes of this report, which may combine such industry sub-classifications for reporting ease. |
FUND SUMMARY | 9 |
| Fund Summary as of September 30, 2020 | BlackRock Mid-Cap Growth Equity Portfolio |
Investment Objective
BlackRock Mid-Cap Growth Equity Portfolio’s (the “Fund”) investment objective is long-term capital appreciation.
Portfolio Management Commentary
How did the Fund perform?
For the 12-month period ended September 30, 2020, the Fund outperformed its benchmark, the Russell Midcap® Growth Index.
What factors influenced performance?
The largest contributors to the Fund’s relative performance over the period were stock selection in the information technology (“IT”) and financials sectors along with a lack of exposure to energy. Within IT, selection in IT services contributed to performance, specifically an out-of-benchmark position in Adyen NV and an overweight position in Okta, Inc. Within financials, an overweight to capital markets, most notably positions in MSCI, Inc., Tradeweb Markets, Inc. and MarketAxess Holdings, Inc., drove positive relative returns.
The largest detractors from relative performance were selection in the consumer discretionary and communication services sectors along with the portfolio’s small cash position. Within consumer discretionary, overweight exposure to diversified consumer services, most notably an overweight to Bright Horizons Family Solutions, Inc., weighed on performance. Within communication services, selection in the entertainment sub-sector, most notably an overweight in Live Nation Entertainment, Inc., detracted from relative performance.
Describe recent portfolio activity.
During the period, exposure to IT increased, most notably with respect to the software segment. Exposure to the health care sector increased as well. Conversely, exposure to consumer discretionary experienced the largest decrease due to a lowered allocation to diversified consumer services. Exposure to the industrials sector decreased as well.
Describe portfolio positioning at period end.
Relative to the Russell Midcap® Growth Index, at the end of the reporting period the Fund’s largest overweight allocation was to the industrials sector, followed by financials and communication services. The largest underweight was to consumer discretionary, followed by consumer staples and health care.
The views expressed reflect the opinions of BlackRock as of the date of this report and are subject to change based on changes in market, economic or other conditions. These views are not intended to be a forecast of future events and are no guarantee of future results.
| 10 | 2 0 2 0 BLACK ROCK ANNUAL REPORT TO SHAREHOLDERS |
| Fund Summary as of September 30, 2020 (continued) | BlackRock Mid-Cap Growth Equity Portfolio |
TOTAL RETURN BASED ON $10,000 INVESTMENT
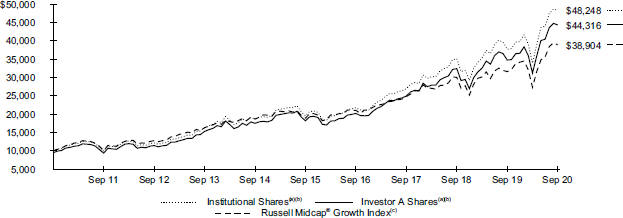
| (a) | Assuming maximum sales charges, if any, transaction costs and other operating expenses, including investment advisory fees and administration fees, if any. Institutional Shares do not have a sales charge. |
| (b) | The Fund normally invests at least 80% of its net assets in equity securities issued by U.S. mid-capitalization companies which Fund management believes have above-average earnings growth potential. |
| (c) | An unmanaged index that consists of the bottom 800 securities of the Russell 1000® Index with greater-than-average growth orientation as ranked by total market capitalization. Securities in the index generally have higher price-to-book and price-to-earnings ratios, lower dividend yields and higher forecasted growth values. |
Performance Summary for the Period Ended September 30, 2020
| Average Annual Total Returns(a) | ||||||||||||||||||||||||||||||||||||||||
| 1 Year | 5 Years | 10 Years | ||||||||||||||||||||||||||||||||||||||
| 6-Month Total Returns | Without Sales Charge | With Sales Charge | Without Sales Charge | With Sales Charge | Without Sales Charge | With Sales Charge | ||||||||||||||||||||||||||||||||||
Institutional | 42.26 | % | 27.98 | % | N/A | 19.85 | % | N/A | 17.04 | % | N/A | |||||||||||||||||||||||||||||
Service | 42.09 | 27.68 | N/A | 19.60 | N/A | 16.64 | N/A | |||||||||||||||||||||||||||||||||
Investor A | 42.12 | 27.61 | 20.92 | % | 19.51 | 18.23 | % | 16.68 | 16.05 | % | ||||||||||||||||||||||||||||||
Investor C | 41.60 | 26.72 | 25.72 | 18.65 | 18.65 | 15.82 | 15.82 | |||||||||||||||||||||||||||||||||
Class K | 42.31 | 28.06 | N/A | 19.94 | N/A | 17.09 | N/A | |||||||||||||||||||||||||||||||||
Class R | 41.90 | 27.33 | N/A | 19.20 | N/A | 16.41 | N/A | |||||||||||||||||||||||||||||||||
Russell Midcap® Growth Index | 42.47 | 23.23 | N/A | 15.53 | N/A | 14.55 | N/A | |||||||||||||||||||||||||||||||||
| (a) | Assuming maximum sales charges, if any. Average annual total returns with and without sales charges reflect reductions for distribution and service fees. See “About Fund Performance” on page 16 for a detailed description of share classes, including any related sales charges and fees, and how performance was calculated for certain share classes. |
N/A - Not applicable as share class and index do not have a sales charge.
Past performance is not an indication of future results.
Performance results may include adjustments made for financial reporting purposes in accordance with U.S. generally accepted accounting principles.
Expense Example
| Actual | Hypothetical(a) | |||||||||||||||||||||||||||||||
| | Beginning Account Value (04/01/20) | | | Ending Account Value (09/30/20) | | | Expenses Paid During the Period | (b) | | Beginning Account Value (04/01/20) | | | Ending Account Value (09/30/20) | | | Expenses Paid During the Period | (b) | | Annualized Expense Ratio | | ||||||||||||
Institutional | $ 1,000.00 | $ 1,422.60 | $ 4.85 | $ 1,000.00 | $ 1,021.00 | $ 4.04 | 0.80 | % | ||||||||||||||||||||||||
Service | 1,000.00 | 1,420.90 | 6.35 | 1,000.00 | 1,019.75 | 5.30 | 1.05 | |||||||||||||||||||||||||
Investor A | 1,000.00 | 1,421.20 | 6.36 | 1,000.00 | 1,019.75 | 5.30 | 1.05 | |||||||||||||||||||||||||
Investor C | 1,000.00 | 1,416.00 | 10.87 | 1,000.00 | 1,016.00 | 9.07 | 1.80 | |||||||||||||||||||||||||
Class K | 1,000.00 | 1,423.10 | 4.41 | 1,000.00 | 1,021.36 | 3.68 | 0.73 | |||||||||||||||||||||||||
Class R | 1,000.00 | 1,419.00 | 7.86 | 1,000.00 | 1,018.50 | 6.56 | 1.30 | |||||||||||||||||||||||||
| (a) | Hypothetical 5% annual return before expenses is calculated by prorating the number of days in the most recent fiscal half year divided by 366. |
| (b) | For each class of the Fund, expenses are equal to the annualized expense ratio for the class, multiplied by the average account value over the period, multiplied by 183/366 (to reflect the one-half year period shown). |
See “Disclosure of Expenses” on page 16 for further information on how expenses were calculated.
FUND SUMMARY | 11 |
| Fund Summary as of September 30, 2020 (continued) | BlackRock Mid-Cap Growth Equity Portfolio |
Portfolio Information
TEN LARGEST HOLDINGS
| Security(a) | Percent of Net Assets | |||
CoStar Group, Inc. | 3 | % | ||
Copart, Inc. | 3 | |||
Fair Isaac Corp. | 3 | |||
IDEXX Laboratories, Inc. | 3 | |||
Adyen NV | 3 | |||
Paycom Software, Inc. | 3 | |||
MSCI, Inc. | 3 | |||
Cadence Design Systems, Inc. | 3 | |||
Masimo Corp. | 3 | |||
Entegris, Inc. | 3 | |||
SECTOR ALLOCATION
| Sector(b) | Percent of Net Assets | |||
Information Technology | 37 | % | ||
Health Care | 21 | |||
Industrials | 17 | |||
Communication Services | 8 | |||
Financials | 8 | |||
Consumer Discretionary | 7 | |||
Real Estate | 2 | |||
Short-Term Securities | 4 | |||
Liabilities in Excess of Other Assets | (4 | ) | ||
| (a) | Excludes short-term investments. |
| (b) | For Fund compliance purposes, the Fund’s sector classifications refer to one or more of the sector sub-classifications used by one or more widely recognized market indexes or ratings group indexes, and/or as defined by the investment adviser. These definitions may not apply for purposes of this report, which may combine such sector sub-classifications for reporting ease. |
| 12 | 2 0 2 0 BLACK ROCK ANNUAL REPORT TO SHAREHOLDERS |
| Fund Summary as of September 30, 2020 | BlackRock Technology Opportunities Fund |
Investment Objective
BlackRock Technology Opportunities Fund’s (the “Fund”) investment objective is to provide long-term capital appreciation.
Portfolio Management Commentary
How did the Fund perform?
For the 12-month period ended September 30, 2020, the Fund outperformed its benchmark, the MSCI All-Country World Information Technology Index.
What factors influenced performance?
Stock selection drove the vast majority of the Fund’s relative outperformance during the period. The Fund’s out-of-benchmark position in electric vehicle maker Tesla, Inc. was the top contributor to relative returns, as the company posted strong revenue growth and four consecutive quarters of positive earnings. The Fund’s lack of a position in technology conglomerate Cisco Systems, Inc. also contributed, as the company announced a bleaker-than-expected outlook for the first quarter of fiscal 2021 as well as new cost-cutting measures. Finally, the Fund’s avoidance of a position in semiconductor giant Intel Corp. was also a significant contributor to performance. The company delayed the release of its next-generational semiconductor chip, which put pressure on its stock.
By contrast, the Fund’s underweight position in Apple Inc. was the largest detractor from performance. Apple continued to report better-than-expected iPhone sales, and investors anticipated the coming release of the 5G iPhone. The second-largest individual stock detractor was an underweight position in semiconductor company NVIDIA Corp., whose stock rose throughout the period due to increased data-center demand during the COVID-19 pandemic. Lastly, an underweight position in semiconductor company Taiwan Semiconductor Manufacturing Co. was also among the largest detractors from performance. Its stock climbed following Intel’s announcement of its semiconductor chip release delay, which was seen as benefitting Taiwan Semiconductor Manufacturing.
Describe recent portfolio activity.
The Fund reduced its exposure to software, semiconductor, internet, and gaming & data center companies during the period, while increasing its exposure to hardware and services companies.
Describe portfolio positioning at period end.
Social distancing and the migration to remote work have accelerated the pace of adoption in trends benefiting the positions that the Fund had already taken. The investment thesis for these companies is unimpeded by the intermediate-term impact of the COVID-19 pandemic. In fact, many of these companies have experienced increased demand as enterprise customers modernize their operations and consumers leverage technology in a socially distanced world.
The Fund’s largest sub-sector exposures were in the internet and software industries, as the investment adviser believes these areas of tech have the best prospects for secular organic growth driven by innovation as well as less sensitivity to late-cycle macroeconomic trends. The Fund also had a substantial allocation to the digital transformation theme as global enterprises continued to invest in the modernization and digitalization of their operations.
The Fund’s cash position at the end of the period was 5.7%. The slightly elevated balance resulted from strong inflows to the Fund and from the investment adviser seeking attractive investment opportunities. Over the period, the cash position detracted slightly from Fund performance.
The views expressed reflect the opinions of BlackRock as of the date of this report and are subject to change based on changes in market, economic or other conditions. These views are not intended to be a forecast of future events and are no guarantee of future results.
FUND SUMMARY | 13 |
| Fund Summary as of September 30, 2020 (continued) | BlackRock Technology Opportunities Fund |
TOTAL RETURN BASED ON $10,000 INVESTMENT
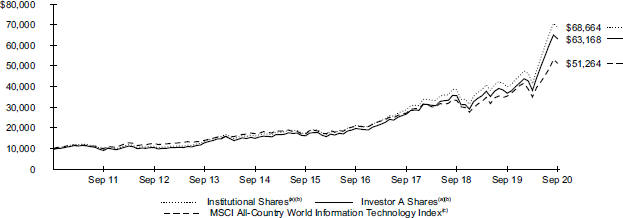
| (a) | Assuming maximum sales charges, if any, transaction costs and other operating expenses, including investment advisory fees and administration fees, if any. Institutional Shares do not have a sales charge. |
| (b) | Under normal market conditions, the Fund invests at least 80% of its net assets, plus the amount of any borrowings for investment purposes, in equity securities issued by U.S. and non-U.S. technology companies in all market capitalization ranges, selected for their rapid and sustainable growth potential from the development, advancement and use of technology. The Fund’s total returns prior to December 30, 2017 are the returns of the Fund when it followed different investment strategies under the name BlackRock Science & Technology Opportunities Portfolio. |
| (c) | An index that measures the performance of the technology sector in developed and emerging equity markets. |
Performance Summary for the Period Ended September 30, 2020
| Average Annual Total Returns(a)(b) | ||||||||||||||||||||||||||||||||||||||||
| 1 Year | 5 Years | 10 Years | ||||||||||||||||||||||||||||||||||||||
| 6-Month Total Returns | Without Sales Charge | With Sales Charge | Without Sales Charge | With Sales Charge | Without Sales Charge | With Sales Charge | ||||||||||||||||||||||||||||||||||
Institutional | 65.86 | % | 72.07 | % | N/A | 31.74 | % | N/A | 21.25 | % | N/A | |||||||||||||||||||||||||||||
Service | 65.71 | 71.68 | N/A | 31.42 | N/A | 21.00 | N/A | |||||||||||||||||||||||||||||||||
Investor A | 65.67 | 71.65 | 62.64 | % | 31.38 | 29.97 | % | 20.89 | 20.24 | % | ||||||||||||||||||||||||||||||
Investor C | 65.06 | 70.39 | 69.39 | 30.39 | 30.39 | 19.92 | 19.92 | |||||||||||||||||||||||||||||||||
Class K | 65.95 | 72.16 | N/A | 31.75 | N/A | 21.25 | N/A | |||||||||||||||||||||||||||||||||
Class R | 65.49 | 71.20 | N/A | 31.03 | N/A | 20.56 | N/A | |||||||||||||||||||||||||||||||||
MSCI All-Country World Information Technology Index | 46.50 | 44.79 | N/A | 24.74 | N/A | 17.76 | N/A | |||||||||||||||||||||||||||||||||
| (a) | Assuming maximum sales charges, if any. Average annual total returns with and without sales charges reflect reductions for distribution and service fees. See “About Fund Performance” on page 16 for a detailed description of share classes, including any related sales charges and fees, and how performance was calculated for certain share classes. |
| (b) | Under normal market conditions, the Fund invests at least 80% of its net assets, plus the amount of any borrowings for investment purposes, in equity securities issued by U.S. and non-U.S. technology companies in all market capitalization ranges, selected for their rapid and sustainable growth potential from the development, advancement and use of technology. The Fund’s total returns prior to December 30, 2017 are the returns of the Fund when it followed different investment strategies under the name BlackRock Science & Technology Opportunities Portfolio. |
N/A - Not applicable as share class and index do not have a sales charge.
Past performance is not an indication of future results.
Performance results may include adjustments made for financial reporting purposes in accordance with U.S. generally accepted accounting principles.
| 14 | 2 0 2 0 BLACK ROCK ANNUAL REPORT TO SHAREHOLDERS |
| Fund Summary as of September 30, 2020 (continued) | BlackRock Technology Opportunities Fund |
Expense Example
| Actual | Hypothetical(a) | |||||||||||||||||||||||||||||||
| | Beginning Account Value (04/01/20) | | | Ending Account Value (09/30/20) | | | Expenses Paid During the Period | (b) | | Beginning Account Value (04/01/20) | | | Ending Account Value (09/30/20) | | | Expenses Paid During the Period | (b) | | Annualized Expense Ratio | | ||||||||||||
Institutional | $ 1,000.00 | $ 1,658.60 | $ 6.11 | $ 1,000.00 | $ 1,020.40 | $ 4.65 | 0.92 | % | ||||||||||||||||||||||||
Service | 1,000.00 | 1,657.10 | 7.77 | 1,000.00 | 1,019.15 | 5.90 | 1.17 | |||||||||||||||||||||||||
Investor A | 1,000.00 | 1,656.70 | 7.77 | 1,000.00 | 1,019.15 | 5.91 | 1.17 | |||||||||||||||||||||||||
Investor C | 1,000.00 | 1,650.60 | 12.72 | 1,000.00 | 1,015.40 | 9.67 | 1.92 | |||||||||||||||||||||||||
Class K | 1,000.00 | 1,659.50 | 5.70 | 1,000.00 | 1,020.71 | 4.33 | 0.86 | |||||||||||||||||||||||||
Class R | 1,000.00 | 1,654.90 | 9.42 | 1,000.00 | 1,017.90 | 7.16 | 1.42 | |||||||||||||||||||||||||
| (a) | Hypothetical 5% annual return before expenses is calculated by prorating the number of days in the most recent fiscal half year divided by 366. |
| (b) | For each class of the Fund, expenses are equal to the annualized expense ratio for the class, multiplied by the average account value over the period, multiplied by 183/366 (to reflect the one-half year period shown). |
See “Disclosure of Expenses” on page 16 for further information on how expenses were calculated.
Portfolio Information
TEN LARGEST HOLDINGS
| Security(a) |
Percent of | |||
Apple Inc. | 4 | % | ||
Microsoft Corp. | 4 | |||
Amazon.com, Inc. | 3 | |||
Tesla, Inc. | 2 | |||
Alibaba Group Holding Ltd., ADR | 2 | |||
Tencent Holdings Ltd. | 2 | |||
Square, Inc., Class A | 2 | |||
PayPal Holdings, Inc. | 2 | |||
LG Chem Ltd. | 2 | |||
Alphabet, Inc., Class A | 2 | |||
INDUSTRY ALLOCATION
| Industry(b) |
Percent of | |||
Software | 23 | % | ||
Semiconductors & Semiconductor Equipment | 15 | |||
IT Services | 14 | |||
Internet & Direct Marketing Retail | 11 | |||
Interactive Media & Services | 10 | |||
Entertainment | 4 | |||
Technology Hardware, Storage & Peripherals | 4 | |||
Automobiles | 3 | |||
Diversified Consumer Services | 2 | |||
Chemicals | 2 | |||
Health Care Technology | 1 | |||
Multiline Retail | 1 | |||
Real Estate Management & Development | 1 | |||
Professional Services | 1 | |||
Specialty Retail | 1 | |||
Diversified Telecommunication Services | 1 | |||
Equity Real Estate Investment Trusts (REITs) | 1 | |||
Short-Term Securities | 10 | |||
Liabilities in Excess of Other Assets | (5 | ) | ||
| (a) | Excludes short-term investments. |
| (b) | For Fund compliance purposes, the Fund’s industry classifications refer to one or more of the industry sub-classifications used by one or more widely recognized market indexes or ratings group indexes, and/or as defined by the investment adviser. These definitions may not apply for purposes of this report, which may combine such industry sub-classifications for reporting ease. |
FUND SUMMARY | 15 |
Institutional and Class K Shares are not subject to any sales charge. These shares bear no ongoing distribution or service fees and are available only to certain eligible investors. BlackRock Advantage Small Cap Growth Fund Class K Shares performance shown prior to the Class K Shares inception date of January 25, 2018 is that of Institutional Shares. BlackRock Health Sciences Opportunities Portfolio’s Class K Shares performance shown prior to the Class K Shares inception date of June 8, 2016 is that of Investor A Shares. BlackRock Mid-Cap Growth Equity Portfolio Class K Shares performance shown prior to the Class K Shares inception date of March 28, 2016 is that of Institutional Shares. BlackRock Technology Opportunities Fund’s Class K Shares performance shown prior to the Class K Shares inception date of December 10, 2019 is that of Institutional Shares. The performance of each Fund’s Class K Shares would be substantially similar to Investor A Shares or Institutional Shares, as applicable, because the share classes of a Fund invest in the same portfolio of securities and performance would only differ to the extent that Class K Shares and Investor A Shares or Institutional Shares, as applicable, have different expenses. The actual returns of Class K Shares would have been higher than those of the Investor A Shares or Institutional Shares, as applicable, because Class K Shares have lower expenses than the Investor A Shares and Institutional Shares.
Service Shares are not subject to any sales charge. These shares are subject to a service fee of 0.25% per year (but no distribution fee) and are only available to certain eligible investors.
Investor A Shares are subject to a maximum initial sales charge (front-end load) of 5.25% and a service fee of 0.25% per year (but no distribution fee). Certain redemptions of these shares may be subject to a contingent deferred sales charge (“CDSC”) where no initial sales charge was paid at the time of purchase. These shares are generally available through financial intermediaries.
Investor C Shares are subject to a 1.00% CDSC if redeemed within one year of purchase. In addition, these shares are subject to a distribution fee of 0.75% per year and a service fee of 0.25% per year. These shares are generally available through financial intermediaries. These shares automatically convert to Investor A Shares after approximately ten years. Effective November 23, 2020, the automatic conversion feature will be modified to reduce the conversion period from ten years to eight years.
Class R Shares are not subject to any sales charge. These shares are subject to a distribution fee of 0.25% per year and a service fee of 0.25% per year. These shares are available only to certain employer-sponsored retirement plans. BlackRock Advantage Small Cap Growth Fund Class R Share performance shown prior to the Class R Shares inception date of March 2, 2018 is that of Institutional Shares and was restated to reflect Class R Shares fees. BlackRock Health Sciences Opportunities Portfolio’s Class R Shares performance shown prior to the Class R Shares inception date of September 12, 2011 is that of Investor A Shares and was restated to reflect Class R Shares fees.
Past performance is not an indication of future results. Financial markets have experienced extreme volatility and trading in many instruments has been disrupted. These circumstances may continue for an extended period of time, and may continue to affect adversely the value and liquidity of the fund’s investments. As a result, current performance may be lower or higher than the performance data quoted. Refer to blackrock.com to obtain performance data current to the most recent month-end. Performance results do not reflect the deduction of taxes that a shareholder would pay on Fund distributions or the redemption of Fund shares. Figures shown in the performance tables on the previous pages assume reinvestment of all distributions, if any, at net asset value ( “NAV” ) on the ex-dividend date or payable date, as applicable. Investment return and principal value of shares will fluctuate so that shares, when redeemed, may be worth more or less than their original cost. Distributions paid to each class of shares will vary because of the different levels of service, distribution and transfer agency fees applicable each class, which are deducted from the income available to be paid to shareholders.
BlackRock Advisors, LLC (the Manager”), each Fund’s investment adviser, has contractually and/or voluntarily agreed to waive and/or reimburse a portion of each Fund’s expenses. Without such waiver and/or reimbursement, each Fund’s performance would have been lower. With respect to each Fund’s voluntary waiver(s), if any, the Manager is under no obligation to waive and/or reimburse or to continue waiving and/or reimbursing its fees and such voluntary waiver(s) may be reduced or discontinued at any time. With respect to each Fund’s contractual waiver(s), if any, the Manager is under no obligation to continue waiving and/or reimbursing its fees after the applicable termination date of such agreement. See the Notes to Financial Statements for additional information on waivers and/or reimbursements.
Shareholders of the Funds may incur the following charges: (a) transactional expenses, such as sales charges; and (b) operating expenses, including investment advisory fees, administration fees, service and distribution fees, including 12b-1 fees, acquired fund fees and expenses and other fund expenses. The expense examples on the previous pages (which are based on a hypothetical investment of $1,000 invested on April 1, 2020 and held through September 30, 2020) are intended to assist shareholders both in calculating expenses based on an investment in each Fund and in comparing these expenses with similar costs of investing in other mutual funds.
The expense examples provide information about actual account values and actual expenses. In order to estimate the expenses a shareholder paid during the period covered by this report, shareholders can divide their account value by $1,000 and then multiply the result by the number corresponding to their Fund and share class under the heading entitled “Expenses Paid During the Period.”
The expense examples also provide information about hypothetical account values and hypothetical expenses based on a Fund’s actual expense ratio and an assumed rate of return of 5% per year before expenses. In order to assist shareholders in comparing the ongoing expenses of investing in these Funds and other funds, compare the 5% hypothetical examples with the 5% hypothetical examples that appear in shareholder reports of other funds.
The expenses shown in the expense examples are intended to highlight shareholders’ ongoing costs only and do not reflect transactional expenses, such as sales charges, if any. Therefore, the hypothetical examples are useful in comparing ongoing expenses only, and will not help shareholders determine the relative total expenses of owning different funds. If these transactional expenses were included, shareholder expenses would have been higher.
| 16 | 2 0 2 0 BLACK ROCK ANNUAL REPORT TO SHAREHOLDERS |
Derivative Financial Instruments
The Funds may invest in various derivative financial instruments. These instruments are used to obtain exposure to a security, commodity, index, market and/or other assets without owning or taking physical custody of securities, commodities and/or other referenced assets or to manage market, equity, credit, interest rate, foreign currency exchange rate, commodity and/or other risks. Derivative financial instruments may give rise to a form of economic leverage and involve risks, including the imperfect correlation between the value of a derivative financial instrument and the underlying asset, possible default of the counterparty to the transaction or illiquidity of the instrument. The Funds’ successful use of a derivative financial instrument depends on the investment adviser’s ability to predict pertinent market movements accurately, which cannot be assured. The use of these instruments may result in losses greater than if they had not been used, may limit the amount of appreciation a Fund can realize on an investment and/or may result in lower distributions paid to shareholders. The Funds’ investments in these instruments, if any, are discussed in detail in the Notes to Financial Statements.
ABOUT FUND PERFORMANCE | 17 |
September 30, 2020 | BlackRock Advantage Small Cap Growth Fund (Percentages shown are based on Net Assets) |
| Security | Shares | Value | ||||||
Common Stocks | ||||||||
| Aerospace & Defense — 0.5% | ||||||||
Aerojet Rocketdyne Holdings, Inc.(a) | 46,236 | $ | 1,844,354 | |||||
AeroVironment, Inc.(a) | 9,187 | 551,312 | ||||||
Cubic Corp. | 1,650 | 95,981 | ||||||
Kratos Defense & Security Solutions, | 19,691 | 379,642 | ||||||
Mercury Systems, Inc.(a)(b) | 6,740 | 522,080 | ||||||
|
| |||||||
| 3,393,369 | ||||||||
| Air Freight & Logistics — 0.9% | ||||||||
Echo Global Logistics, Inc.(a) | 57,325 | 1,477,265 | ||||||
Forward Air Corp. | 28,295 | 1,623,567 | ||||||
Hub Group, Inc., Class A(a) | 74,184 | 3,723,666 | ||||||
|
| |||||||
| 6,824,498 | ||||||||
| Airlines — 0.1% | ||||||||
Allegiant Travel Co. | 4,703 | 563,419 | ||||||
|
| |||||||
| Auto Components — 1.5% | ||||||||
Dorman Products, Inc.(a) | 10,021 | 905,698 | ||||||
Fox Factory Holding Corp.(a) | 41,944 | 3,117,697 | ||||||
LCI Industries | 37,902 | 4,028,604 | ||||||
Standard Motor Products, Inc. | 7,638 | 341,037 | ||||||
Visteon Corp.(a) | 36,732 | 2,542,589 | ||||||
|
| |||||||
| 10,935,625 | ||||||||
| Automobiles — 0.1% | ||||||||
Winnebago Industries, Inc. | 9,737 | 503,111 | ||||||
|
| |||||||
| Banks — 0.2% | ||||||||
Atlantic Union Bankshares Corp. | 4 | 85 | ||||||
Capital City Bank Group, Inc. | 3,741 | 70,293 | ||||||
First Financial Bankshares, Inc. | 6,848 | 191,128 | ||||||
First Financial Northwest, Inc. | 660 | 6,019 | ||||||
Glacier Bancorp, Inc. | 31,450 | 1,007,973 | ||||||
|
| |||||||
| 1,275,498 | ||||||||
| Beverages — 0.1% | ||||||||
National Beverage Corp.(a) | 10,735 | 730,087 | ||||||
|
| |||||||
| Biotechnology — 17.5% | ||||||||
ACADIA Pharmaceuticals, Inc.(a) | 10,489 | 432,671 | ||||||
Acceleron Pharma, Inc.(a) | 4,383 | 493,219 | ||||||
Aduro Biotech, Inc.(a) | 94,824 | 230,422 | ||||||
Adverum Biotechnologies, Inc.(a) | 26,404 | 271,961 | ||||||
Affimed NV(a) | 174,408 | 591,243 | ||||||
Agenus, Inc.(a)(b) | 239,197 | 956,788 | ||||||
Aimmune Therapeutics, Inc.(a) | 16,700 | 575,315 | ||||||
Akebia Therapeutics, Inc.(a) | 96,097 | 241,203 | ||||||
Akero Therapeutics, Inc.(a) | 8,127 | 250,230 | ||||||
Alector, Inc.(a) | 76,451 | 805,411 | ||||||
Allakos, Inc.(a)(b) | 9,745 | 793,730 | ||||||
Allogene Therapeutics, Inc.(a) | 57,227 | 2,158,030 | ||||||
Allovir, Inc.(a) | 30,979 | 851,923 | ||||||
ALX Oncology Holdings, Inc.(a)(b) | 1,529 | 57,704 | ||||||
Amicus Therapeutics, Inc.(a) | 143,924 | 2,032,207 | ||||||
Anika Therapeutics, Inc.(a) | 10,297 | 364,411 | ||||||
Apellis Pharmaceuticals, Inc.(a) | 30,609 | 923,474 | ||||||
Applied Molecular Transport, Inc.(a) | 3,440 | 109,461 | ||||||
Applied Therapeutics, Inc.(a) | 2,731 | 56,696 | ||||||
Aptinyx, Inc.(a) | 30,008 | 101,427 | ||||||
Arcturus Therapeutics Holdings, Inc.(a) | 7,576 | 325,010 | ||||||
Arcus Biosciences, Inc.(a) | 50,955 | 873,369 | ||||||
Arcutis Biotherapeutics, Inc.(a) | 9,014 | 264,110 | ||||||
Arrowhead Pharmaceuticals, Inc.(a)(b) | 77,931 | 3,355,709 | ||||||
Assembly Biosciences, Inc.(a) | 11,297 | 185,723 | ||||||
Atara Biotherapeutics, Inc.(a) | 60,175 | 779,868 | ||||||
| Security | Shares | Value | ||||||
| Biotechnology (continued) | ||||||||
Athenex, Inc.(a) | 80,705 | $ | 976,531 | |||||
Athersys, Inc.(a)(b) | 249,378 | 486,287 | ||||||
AVEO Pharmaceuticals, Inc.(a) | 21,859 | 129,842 | ||||||
Avidity Biosciences, Inc.(a) | 2,238 | 63,000 | ||||||
Avrobio, Inc.(a) | 9,726 | 126,633 | ||||||
Beyondspring, Inc.(a) | 25,179 | 335,133 | ||||||
BioCryst Pharmaceuticals, Inc.(a) | 114,058 | 391,789 | ||||||
Biohaven Pharmaceutical Holding Co. | 24,108 | 1,567,261 | ||||||
Black Diamond Therapeutics, Inc.(a) | 2,691 | 81,349 | ||||||
Blueprint Medicines Corp.(a) | 33,377 | 3,094,048 | ||||||
Bridgebio Pharma, Inc.(a) | 55,412 | 2,079,058 | ||||||
Calithera Biosciences, Inc.(a) | 79,326 | 273,675 | ||||||
CareDx, Inc.(a) | 37,180 | 1,410,609 | ||||||
Catabasis Pharmaceuticals, Inc.(a) | 9,186 | 56,861 | ||||||
Cellular Biomedicine Group, Inc.(a) | 20,983 | 384,828 | ||||||
Checkmate Pharmaceuticals, Inc.(a) | 17,089 | 196,694 | ||||||
ChemoCentryx, Inc.(a) | 23,154 | 1,268,839 | ||||||
Chimerix, Inc.(a) | 37,592 | 93,604 | ||||||
Cidara Therapeutics, Inc.(a) | 25,698 | 73,239 | ||||||
Clovis Oncology, Inc.(a)(b) | 47,947 | 279,531 | ||||||
Coherus Biosciences, Inc.(a) | 48,977 | 898,238 | ||||||
Constellation Pharmaceuticals, Inc.(a) | 9,817 | 198,892 | ||||||
Corvus Pharmaceuticals, Inc.(a)(b) | 24,901 | 99,853 | ||||||
Crinetics Pharmaceuticals, Inc.(a) | 15,058 | 235,959 | ||||||
Cue Biopharma, Inc.(a) | 53,708 | 808,305 | ||||||
Cytokinetics, Inc.(a) | 44,823 | 970,418 | ||||||
CytomX Therapeutics, Inc.(a) | 73,685 | 490,005 | ||||||
Deciphera Pharmaceuticals, Inc.(a) | 24,332 | 1,248,232 | ||||||
Denali Therapeutics, Inc.(a) | 30,172 | 1,081,063 | ||||||
Dicerna Pharmaceuticals, Inc.(a) | 22,724 | 408,805 | ||||||
Dynavax Technologies Corp.(a) | 51,031 | 220,454 | ||||||
Eagle Pharmaceuticals, Inc.(a) | 18,804 | 798,794 | ||||||
Editas Medicine, Inc.(a)(b) | 67,267 | 1,887,512 | ||||||
Eidos Therapeutics, Inc.(a)(b) | 9,572 | 483,673 | ||||||
Eiger BioPharmaceuticals, Inc.(a) | 39,131 | 318,526 | ||||||
Emergent BioSolutions, Inc.(a)(b) | 36,237 | 3,744,369 | ||||||
Enanta Pharmaceuticals, Inc.(a) | 16,664 | 762,878 | ||||||
EPIRUS Biopharmaceuticals, Inc.(a) | 6,060 | 22 | ||||||
Epizyme, Inc.(a)(b) | 76,806 | 916,296 | ||||||
Esperion Therapeutics, Inc.(a)(b) | 2,420 | 89,951 | ||||||
Exact Sciences Corp.(a) | 1,689 | 172,194 | ||||||
Fate Therapeutics, Inc.(a)(b) | 59,839 | 2,391,765 | ||||||
FibroGen, Inc.(a)(b) | 66,497 | 2,734,357 | ||||||
Flexion Therapeutics, Inc.(a) | 94,795 | 986,816 | ||||||
Forma Therapeutics Holdings, Inc.(a) | 2,047 | 102,023 | ||||||
Frequency Therapeutics, Inc.(a)(b) | 28,212 | 541,953 | ||||||
G1 Therapeutics, Inc.(a) | 13,865 | 160,141 | ||||||
Galera Therapeutics, Inc.(a) | 6,942 | 62,756 | ||||||
Gossamer Bio, Inc.(a) | 63,253 | 784,970 | ||||||
Halozyme Therapeutics, Inc.(a)(b) | 121,532 | 3,193,861 | ||||||
Harpoon Therapeutics, Inc.(a) | 40,888 | 694,687 | ||||||
Heron Therapeutics, Inc.(a) | 18,673 | 276,734 | ||||||
Homology Medicines, Inc.(a) | 15,730 | 168,311 | ||||||
Hookipa Pharma, Inc.(a)(b) | 9,981 | 94,520 | ||||||
ImmunoGen, Inc.(a)(b) | 53,109 | 191,192 | ||||||
Immunovant, Inc.(a) | 7,763 | 273,180 | ||||||
Inhibrx, Inc.(a)(b) | 11,532 | 207,576 | ||||||
Inovio Pharmaceuticals, Inc.(a)(b) | 110,588 | 1,282,821 | ||||||
Insmed, Inc.(a) | 53,171 | 1,708,916 | ||||||
Intellia Therapeutics, Inc.(a)(b) | 67,548 | 1,342,854 | ||||||
Intercept Pharmaceuticals, Inc.(a) | 6,659 | 276,082 | ||||||
Invitae Corp.(a)(b) | 86,993 | 3,771,147 | ||||||
| 18 | 2 0 2 0 BLACK ROCK ANNUAL REPORT TO SHAREHOLDERS |
Schedule of Investments (continued) September 30, 2020 | BlackRock Advantage Small Cap Growth Fund (Percentages shown are based on Net Assets) |
| Security | Shares | Value | ||||||
| Biotechnology (continued) | ||||||||
Ironwood Pharmaceuticals, Inc.(a) | 137,150 | $ | 1,233,664 | |||||
iTeos Therapeutics, Inc.(a)(b) | 5,227 | 128,950 | ||||||
Jounce Therapeutics, Inc.(a) | 20,195 | 164,791 | ||||||
Kadmon Holdings, Inc.(a) | 72,096 | 282,616 | ||||||
KalVista Pharmaceuticals, Inc.(a) | 11,454 | 144,206 | ||||||
Karuna Therapeutics, Inc.(a) | 3,320 | 256,702 | ||||||
Karyopharm Therapeutics, Inc.(a) | 95,072 | 1,388,051 | ||||||
Kiniksa Pharmaceuticals Ltd., Class A(a) | 32,391 | 496,230 | ||||||
Kodiak Sciences, Inc.(a) | 12,040 | 712,888 | ||||||
Krystal Biotech, Inc.(a) | 5,939 | 255,674 | ||||||
Kura Oncology, Inc.(a) | 16,288 | 499,064 | ||||||
Kymera Therapeutics, Inc.(a) | 4,338 | 140,161 | ||||||
Ligand Pharmaceuticals, Inc.(a)(b) | 17,273 | 1,646,462 | ||||||
MacroGenics, Inc.(a) | 28,932 | 728,797 | ||||||
Madrigal Pharmaceuticals, Inc.(a) | 9,299 | 1,104,070 | ||||||
Magenta Therapeutics, Inc.(a) | 4,279 | 29,097 | ||||||
MannKind Corp.(a)(b) | 134,247 | 252,384 | ||||||
MeiraGTx Holdings PLC(a) | 12,891 | 170,677 | ||||||
Mersana Therapeutics, Inc.(a) | 6,749 | 125,666 | ||||||
Mirati Therapeutics, Inc.(a) | 23,658 | 3,928,411 | ||||||
Molecular Templates, Inc.(a) | 9,835 | 107,398 | ||||||
Momenta Pharmaceuticals, Inc.(a) | 69,579 | 3,651,506 | ||||||
Morphic Holding, Inc.(a)(b) | 13,151 | 359,548 | ||||||
Natera, Inc.(a) | 57,052 | 4,121,437 | ||||||
Neoleukin Therapeutics, Inc.(a)(b) | 14,264 | 171,168 | ||||||
Nkarta, Inc.(a) | 7,549 | 226,923 | ||||||
Novavax, Inc.(a) | 16,381 | 1,774,881 | ||||||
Nurix Therapeutics, Inc.(a)(b) | 4,591 | 160,272 | ||||||
Nymox Pharmaceutical Corp.(a) | 4,639 | 11,412 | ||||||
OPKO Health, Inc.(a) | 97,108 | 358,329 | ||||||
Organogenesis Holdings, Inc.(a) | 21,460 | 82,406 | ||||||
ORIC Pharmaceuticals, Inc.(a) | 10,785 | 269,733 | ||||||
Oyster Point Pharma, Inc.(a) | 14,163 | 298,981 | ||||||
Passage Bio, Inc.(a) | 14,205 | 186,228 | ||||||
Pieris Pharmaceuticals, Inc.(a) | 25,446 | 52,673 | ||||||
Poseida Therapeutics, Inc.(a) | 21,441 | 190,182 | ||||||
Precision BioSciences, Inc.(a) | 45,396 | 279,639 | ||||||
Prevail Therapeutics, Inc.(a) | 73,965 | 752,964 | ||||||
Prothena Corp. PLC(a) | 14,724 | 147,093 | ||||||
PTC Therapeutics, Inc.(a) | 57,752 | 2,699,906 | ||||||
Puma Biotechnology, Inc.(a) | 51,946 | 524,135 | ||||||
Radius Health, Inc.(a) | 91,919 | 1,042,361 | ||||||
REGENXBIO, Inc.(a) | 48,856 | 1,344,517 | ||||||
Relay Therapeutics, Inc.(a) | 23,727 | 1,010,533 | ||||||
Replimune Group, Inc.(a) | 26,416 | 608,096 | ||||||
Retrophin, Inc.(a)(b) | 58,602 | 1,081,793 | ||||||
REVOLUTION Medicines, Inc.(a) | 9,764 | 339,787 | ||||||
Rigel Pharmaceuticals, Inc.(a)(b) | 264,179 | 634,030 | ||||||
Rubius Therapeutics, Inc.(a) | 13,802 | 69,148 | ||||||
Sangamo Therapeutics, Inc.(a)(b) | 115,823 | 1,094,527 | ||||||
Selecta Biosciences, Inc.(a) | 30,080 | 74,598 | ||||||
Seres Therapeutics, Inc.(a)(b) | 61,217 | 1,733,053 | ||||||
Solid Biosciences, Inc.(a) | 20,393 | 41,398 | ||||||
Sorrento Therapeutics, Inc.(a)(b) | 103,292 | 1,151,706 | ||||||
Spectrum Pharmaceuticals, Inc.(a) | 159,321 | 650,030 | ||||||
Spero Therapeutics, Inc.(a) | 7,364 | 82,182 | ||||||
SpringWorks Therapeutics, Inc.(a) | 7,829 | 373,208 | ||||||
Stoke Therapeutics, Inc.(a)(b) | 3,741 | 125,286 | ||||||
Sutro Biopharma, Inc.(a) | 45,276 | 455,024 | ||||||
Syndax Pharmaceuticals, Inc.(a) | 22,787 | 336,336 | ||||||
Syros Pharmaceuticals, Inc.(a)(b) | 32,151 | 284,215 | ||||||
TG Therapeutics, Inc.(a) | 42,104 | 1,126,703 | ||||||
| Security | Shares | Value | ||||||
| Biotechnology (continued) | ||||||||
Translate Bio, Inc.(a)(b) | 14,767 | $ | 200,979 | |||||
Turning Point Therapeutics, Inc.(a)(b) | 15,144 | 1,322,980 | ||||||
Twist Bioscience Corp.(a)(b) | 23,051 | 1,751,185 | ||||||
Ultragenyx Pharmaceutical, Inc.(a) | 48,804 | 4,011,201 | ||||||
UroGen Pharma Ltd.(a) | 9,546 | 184,142 | ||||||
Vanda Pharmaceuticals, Inc.(a) | 13,245 | 127,947 | ||||||
Vaxcyte, Inc.(a) | 1,541 | 76,095 | ||||||
Veracyte, Inc.(a)(b) | 62,604 | 2,034,004 | ||||||
Viela Bio, Inc.(a) | 7,183 | 201,699 | ||||||
Vir Biotechnology, Inc.(a)(b) | 37,750 | 1,295,958 | ||||||
Voyager Therapeutics, Inc.(a) | 23,466 | 250,382 | ||||||
vTv Therapeutics, Inc., Class A(a) | 2 | 4 | ||||||
Xencor, Inc.(a)(b) | 47,795 | 1,853,968 | ||||||
Y-mAbs Therapeutics, Inc.(a) | 23,187 | 890,149 | ||||||
Zentalis Pharmaceuticals, Inc.(a) | 6,490 | 212,158 | ||||||
ZIOPHARM Oncology, Inc.(a) | 39,399 | 99,286 | ||||||
|
| |||||||
| 126,817,270 | ||||||||
| Building Products — 1.1% | ||||||||
AAON, Inc. | 21,726 | 1,308,992 | ||||||
Advanced Drainage Systems, Inc. | 6,779 | 423,281 | ||||||
Builders FirstSource, Inc.(a)(b) | 87,852 | 2,865,732 | ||||||
Masonite International Corp.(a) | 7,943 | 781,591 | ||||||
Trex Co., Inc.(a) | 36,099 | 2,584,688 | ||||||
|
| |||||||
| 7,964,284 | ||||||||
| Capital Markets — 2.0% | ||||||||
Artisan Partners Asset Management, Inc., Class A | 20,576 | 802,258 | ||||||
Assetmark Financial Holdings, Inc.(a) | 36,742 | 798,771 | ||||||
Cohen & Steers, Inc. | 34,824 | 1,941,090 | ||||||
Federated Hermes, Inc. | 52,742 | 1,134,480 | ||||||
Hamilton Lane, Inc., Class A | 109,508 | 7,073,122 | ||||||
Houlihan Lokey, Inc. | 22,264 | 1,314,689 | ||||||
Moelis & Co., Class A | 27,980 | 983,217 | ||||||
PJT Partners, Inc., Class A | 4,268 | 258,684 | ||||||
Pzena Investment Management, Inc., Class A | 5,425 | 29,078 | ||||||
WisdomTree Investments, Inc. | 63,514 | 203,245 | ||||||
|
| |||||||
| 14,538,634 | ||||||||
| Chemicals — 1.2% | ||||||||
Avient Corp. | 2,640 | 69,854 | ||||||
Balchem Corp. | 35,069 | 3,423,787 | ||||||
Chase Corp. | 1,208 | 115,243 | ||||||
HB Fuller Co. | 29,883 | 1,368,044 | ||||||
Ingevity Corp.(a) | 34,680 | 1,714,579 | ||||||
Innospec, Inc. | 6,761 | 428,107 | ||||||
Livent Corp.(a) | 38,622 | 346,439 | ||||||
Trinseo SA | 38,317 | 982,448 | ||||||
|
| |||||||
| 8,448,501 | ||||||||
| Commercial Services & Supplies — 1.6% | ||||||||
ACCO Brands Corp. | 11,282 | 65,436 | ||||||
Advanced Disposal Services, Inc.(a) | 35,077 | 1,060,378 | ||||||
Cimpress PLC(a) | 15,459 | 1,161,898 | ||||||
Healthcare Services Group, Inc. | 13,086 | 281,742 | ||||||
Herman Miller, Inc. | 81,097 | 2,445,885 | ||||||
Kimball International, Inc., Class B | 16,382 | 172,666 | ||||||
McGrath RentCorp | 50,481 | 3,008,163 | ||||||
Steelcase, Inc., Class A | 92,263 | 932,779 | ||||||
Tetra Tech, Inc. | 26,521 | 2,532,755 | ||||||
UniFirst Corp. | 980 | 185,583 | ||||||
|
| |||||||
| 11,847,285 | ||||||||
| Communications Equipment — 0.7% | ||||||||
Acacia Communications, Inc.(a) | 27,291 | 1,839,414 | ||||||
S C H E D U L E S O F I N V E S T M E N T S | 19 |
Schedule of Investments (continued) September 30, 2020 | BlackRock Advantage Small Cap Growth Fund (Percentages shown are based on Net Assets) |
| Security | Shares | Value | ||||||
| Communications Equipment (continued) | ||||||||
Applied Optoelectronics, Inc.(a) | 6,165 | $ | 69,356 | |||||
Calix, Inc.(a) | 98,145 | 1,745,018 | ||||||
Casa Systems, Inc.(a) | 24,038 | 96,873 | ||||||
Ciena Corp.(a) | 8,788 | 348,796 | ||||||
Extreme Networks, Inc.(a) | 97,509 | 391,986 | ||||||
InterDigital, Inc. | 7,985 | 455,624 | ||||||
NETGEAR, Inc.(a) | 2,959 | 91,196 | ||||||
|
| |||||||
| 5,038,263 | ||||||||
| Construction & Engineering — 0.8% | ||||||||
Comfort Systems USA, Inc. | 40,913 | 2,107,428 | ||||||
Dycom Industries, Inc.(a) | 2,845 | 150,273 | ||||||
EMCOR Group, Inc. | 26,055 | 1,764,184 | ||||||
MasTec, Inc.(a) | 25,414 | 1,072,471 | ||||||
MYR Group, Inc.(a) | 2,415 | 89,790 | ||||||
WillScot Mobile Mini Holdings Corp.(a) | 53,129 | 886,192 | ||||||
|
| |||||||
| 6,070,338 | ||||||||
| Construction Materials — 0.1% | ||||||||
Summit Materials, Inc., Class A(a) | 46,770 | 773,576 | ||||||
|
| |||||||
| Consumer Finance — 0.3% | ||||||||
FirstCash, Inc. | 32,922 | 1,883,468 | ||||||
Green Dot Corp., Class A(a) | 5,594 | 283,112 | ||||||
|
| |||||||
| 2,166,580 | ||||||||
| Diversified Consumer Services — 0.4% | ||||||||
Chegg, Inc.(a) | 8,366 | 597,667 | ||||||
Strategic Education, Inc. | 20,231 | 1,850,530 | ||||||
WW International, Inc.(a) | 33,885 | 639,410 | ||||||
|
| |||||||
| 3,087,607 | ||||||||
| Diversified Telecommunication Services — 0.9% | ||||||||
Bandwidth, Inc., Class A(a)(b) | 18,319 | 3,197,948 | ||||||
Cogent Communications Holdings, Inc | 32,201 | 1,933,670 | ||||||
IDT Corp., Class B(a) | 16,274 | 107,083 | ||||||
Ooma, Inc.(a)(b) | 82,386 | 1,075,137 | ||||||
Vonage Holdings Corp.(a) | 54,225 | 554,722 | ||||||
|
| |||||||
| 6,868,560 | ||||||||
| Electric Utilities — 0.1% | ||||||||
IDACORP, Inc. | 7,037 | 562,256 | ||||||
|
| |||||||
| Electrical Equipment — 2.1% | ||||||||
Atkore International Group, Inc.(a) | 44,923 | 1,021,100 | ||||||
Generac Holdings, Inc.(a) | 21,785 | 4,218,447 | ||||||
Plug Power, Inc.(a) | 171,387 | 2,298,300 | ||||||
Sunrun, Inc.(a) | 69,362 | 5,345,729 | ||||||
Vicor Corp.(a)(b) | 15,209 | 1,182,196 | ||||||
Vivint Solar, Inc.(a) | 18,571 | 786,482 | ||||||
|
| |||||||
| 14,852,254 | ||||||||
| Electronic Equipment, Instruments & Components — 2.2% | ||||||||
Badger Meter, Inc. | 5,639 | 368,622 | ||||||
ePlus, Inc.(a) | 33,550 | 2,455,860 | ||||||
FARO Technologies, Inc.(a) | 8,899 | 542,661 | ||||||
Fitbit, Inc., Class A(a) | 266,567 | 1,855,306 | ||||||
II-VI, Inc.(a) | 27,061 | 1,097,594 | ||||||
Iteris, Inc.(a) | 18,222 | 74,710 | ||||||
Itron, Inc.(a)(b) | 7,960 | 483,490 | ||||||
Novanta, Inc.(a) | 14,150 | 1,490,561 | ||||||
OSI Systems, Inc.(a) | 70,324 | 5,457,846 | ||||||
PAR Technology Corp.(a) | 16,007 | 648,444 | ||||||
PC Connection, Inc. | 32,672 | 1,341,512 | ||||||
|
| |||||||
| 15,816,606 | ||||||||
| Security | Shares | Value | ||||||
| Energy Equipment & Services — 0.1% | ||||||||
Aspen Aerogels, Inc.(a) | 30 | $ | 329 | |||||
Cactus, Inc., Class A | 21,391 | 410,493 | ||||||
|
| |||||||
| 410,822 | ||||||||
| Entertainment — 0.1% | ||||||||
Gaia, Inc.(a) | 7,404 | 72,781 | ||||||
Glu Mobile, Inc.(a) | 74,031 | 568,188 | ||||||
|
| |||||||
| 640,969 | ||||||||
| Equity Real Estate Investment Trusts (REITs) — 2.0% | ||||||||
CareTrust REIT, Inc. | 17,329 | 308,369 | ||||||
CorePoint Lodging, Inc. | 66,650 | 363,242 | ||||||
First Industrial Realty Trust, Inc. | 6,042 | 240,472 | ||||||
Four Corners Property Trust, Inc. | 93,376 | 2,389,492 | ||||||
Monmouth Real Estate Investment Corp. | 10,694 | 148,112 | ||||||
NexPoint Residential Trust, Inc. | 23,947 | 1,062,049 | ||||||
Plymouth Industrial REIT, Inc. | 14,590 | 180,041 | ||||||
PS Business Parks, Inc. | 1 | 122 | ||||||
QTS Realty Trust, Inc., Class A | 117,682 | 7,416,320 | ||||||
Terreno Realty Corp. | 28,260 | 1,547,518 | ||||||
Uniti Group, Inc. | 81,917 | 862,996 | ||||||
|
| |||||||
| 14,518,733 | ||||||||
| Food & Staples Retailing — 0.3% | ||||||||
BJ’s Wholesale Club Holdings, Inc.(a) | 39,957 | 1,660,213 | ||||||
Natural Grocers by Vitamin Cottage, Inc. | 6,378 | 62,887 | ||||||
PriceSmart, Inc. | 279 | 18,540 | ||||||
Weis Markets, Inc. | 14,740 | 707,520 | ||||||
|
| |||||||
| 2,449,160 | ||||||||
| Food Products — 1.6% | ||||||||
Calavo Growers, Inc. | 30,264 | 2,005,595 | ||||||
Freshpet, Inc.(a)(b) | 36,293 | 4,052,114 | ||||||
J & J Snack Foods Corp. | 27,518 | 3,588,072 | ||||||
John B. Sanfilippo & Son, Inc. | 13,533 | 1,020,118 | ||||||
Lancaster Colony Corp. | 6,015 | 1,075,482 | ||||||
Vital Farms, Inc.(a) | 2,712 | 109,917 | ||||||
|
| |||||||
| 11,851,298 | ||||||||
| Gas Utilities — 0.6% | ||||||||
Brookfield Infrastructure Corp., Class A | 29,559 | 1,637,273 | ||||||
New Jersey Resources Corp. | 71,163 | 1,922,824 | ||||||
Northwest Natural Holding Co. | 4,784 | 217,146 | ||||||
Southwest Gas Holdings, Inc. | 10,101 | 637,373 | ||||||
|
| |||||||
| 4,414,616 | ||||||||
| Health Care Equipment & Supplies — 5.8% | ||||||||
Accuray, Inc.(a) | 64,912 | 155,789 | ||||||
AtriCure, Inc.(a) | 28,746 | 1,146,965 | ||||||
Atrion Corp. | 2,682 | 1,678,932 | ||||||
Axogen, Inc.(a) | 22,214 | 258,349 | ||||||
Cantel Medical Corp. | 27,611 | 1,213,227 | ||||||
Cardiovascular Systems, Inc.(a) | 67,633 | 2,661,359 | ||||||
Cerus Corp.(a) | 264,978 | 1,658,762 | ||||||
CryoLife, Inc.(a) | 60,402 | 1,115,625 | ||||||
CryoPort, Inc.(a) | 30,009 | 1,422,427 | ||||||
Cutera, Inc.(a) | 4,725 | 89,633 | ||||||
GenMark Diagnostics, Inc.(a) | 31,426 | 446,249 | ||||||
Globus Medical, Inc., Class A(a) | 25,819 | 1,278,557 | ||||||
Haemonetics Corp.(a) | 18,396 | 1,605,051 | ||||||
Heska Corp.(a) | 1,152 | 113,806 | ||||||
Inari Medical, Inc.(a) | 1,598 | 110,294 | ||||||
Inogen, Inc.(a) | 19,542 | 566,718 | ||||||
Integer Holdings Corp.(a) | 12,191 | 719,391 | ||||||
iRadimed Corp.(a) | 8,442 | 180,490 | ||||||
iRhythm Technologies, Inc.(a) | 15,420 | 3,671,656 | ||||||
| 20 | 2 0 2 0 BLACK ROCK ANNUAL REPORT TO SHAREHOLDERS |
Schedule of Investments (continued) September 30, 2020 | BlackRock Advantage Small Cap Growth Fund (Percentages shown are based on Net Assets) |
| Security | Shares | Value | ||||||
| Health Care Equipment & Supplies (continued) | ||||||||
LeMaitre Vascular, Inc. | 27,114 | $ | 882,018 | |||||
LivaNova PLC(a) | 25,940 | 1,172,747 | ||||||
Meridian Bioscience, Inc.(a) | 36,288 | 616,170 | ||||||
Merit Medical Systems, Inc.(a) | 31,947 | 1,389,695 | ||||||
Mesa Laboratories, Inc. | 705 | 179,606 | ||||||
Natus Medical, Inc.(a) | 7,299 | 125,032 | ||||||
Neogen Corp.(a) | 43,809 | 3,428,054 | ||||||
Nevro Corp.(a) | 34,269 | 4,773,672 | ||||||
Novocure Ltd.(a) | 5,126 | 570,575 | ||||||
NuVasive, Inc.(a) | 21,837 | 1,060,623 | ||||||
OraSure Technologies, Inc.(a)(b) | 57,193 | 696,039 | ||||||
Quotient Ltd.(a) | 4,188 | 21,526 | ||||||
SeaSpine Holdings Corp.(a) | 9,719 | 138,982 | ||||||
Shockwave Medical, Inc.(a) | 22,069 | 1,672,830 | ||||||
Silk Road Medical, Inc.(a) | 14,528 | 976,427 | ||||||
Tactile Systems Technology, Inc.(a) | 84,142 | 3,078,756 | ||||||
TransMedics Group, Inc.(a) | 27,249 | 375,491 | ||||||
Varex Imaging Corp.(a) | 5,925 | 75,366 | ||||||
VolitionRX Ltd.(a)(b) | 35,738 | 114,719 | ||||||
Wright Medical Group NV(a) | 6,080 | 185,683 | ||||||
Zynex, Inc.(a) | 11,841 | 206,626 | ||||||
|
| |||||||
| 41,833,917 | ||||||||
| Health Care Providers & Services — 3.3% | ||||||||
1Life Healthcare, Inc.(a) | 47,400 | 1,344,264 | ||||||
AMN Healthcare Services, Inc.(a)(b) | 29,093 | 1,700,777 | ||||||
BioTelemetry, Inc.(a) | 39,119 | 1,783,044 | ||||||
CorVel Corp.(a) | 9,884 | 844,390 | ||||||
Ensign Group, Inc. | 16,296 | 929,850 | ||||||
HealthEquity, Inc.(a) | 57,002 | 2,928,193 | ||||||
Joint Corp.(a) | 21,851 | 379,989 | ||||||
LHC Group, Inc.(a) | 22,468 | 4,775,798 | ||||||
Magellan Health, Inc.(a) | 6,921 | 524,473 | ||||||
National Research Corp. | 10,392 | 511,390 | ||||||
Ontrak, Inc.(a) | 6,523 | 391,380 | ||||||
Option Care Health, Inc.(a)(b) | 33,964 | 454,099 | ||||||
Pennant Group, Inc.(a) | 3,542 | 136,580 | ||||||
PetIQ, Inc.(a) | 39,837 | 1,311,434 | ||||||
Progyny, Inc.(a)(b) | 45,550 | 1,340,536 | ||||||
RadNet, Inc.(a)(b) | 23,910 | 367,019 | ||||||
Select Medical Holdings Corp.(a) | 52,009 | 1,082,827 | ||||||
U.S. Physical Therapy, Inc. | 27,002 | 2,345,934 | ||||||
Viemed Healthcare, Inc.(a) | 73,344 | 633,692 | ||||||
|
| |||||||
| 23,785,669 | ||||||||
| Health Care Technology — 2.6% | ||||||||
Accolade, Inc.(a) | 36,097 | 1,403,090 | ||||||
Castlight Health, Inc., Class B(a) | 208,033 | 235,077 | ||||||
Health Catalyst, Inc.(a) | 11,394 | 417,020 | ||||||
HMS Holdings Corp.(a) | 54,122 | 1,296,222 | ||||||
Inovalon Holdings, Inc., Class A(a)(b) | 124,953 | 3,305,007 | ||||||
Inspire Medical Systems, Inc.(a) | 14,956 | 1,930,072 | ||||||
NextGen Healthcare, Inc.(a) | 32,595 | 415,260 | ||||||
Omnicell, Inc.(a)(b) | 43,408 | 3,240,841 | ||||||
Phreesia, Inc.(a) | 77,176 | 2,479,665 | ||||||
Schrodinger, Inc.(a) | 7,394 | 351,289 | ||||||
Simulations Plus, Inc. | 1,156 | 87,116 | ||||||
Tabula Rasa HealthCare, Inc.(a) | 6,859 | 279,642 | ||||||
Teladoc Health, Inc.(a)(b) | 10,346 | 2,268,257 | ||||||
Vocera Communications, Inc.(a)(b) | 31,647 | 920,295 | ||||||
|
| |||||||
| 18,628,853 | ||||||||
| Hotels, Restaurants & Leisure — 5.1% | ||||||||
Caesars Entertainment, Inc.(a) | 67,094 | 3,761,290 | ||||||
| Security | Shares | Value | ||||||
| Hotels, Restaurants & Leisure (continued) | ||||||||
Cheesecake Factory, Inc. | 69,344 | $ | 1,923,603 | |||||
Churchill Downs, Inc. | 18,267 | 2,992,500 | ||||||
Chuy’s Holdings, Inc.(a) | 5,447 | 106,652 | ||||||
Cracker Barrel Old Country Store, Inc. | 7,120 | 816,379 | ||||||
Denny’s Corp.(a) | 132,020 | 1,320,200 | ||||||
Dine Brands Global, Inc. | 18,513 | 1,010,625 | ||||||
GAN Ltd.(a)(b) | 11,767 | 198,862 | ||||||
International Game Technology PLC | 470,011 | 5,231,222 | ||||||
Jack in the Box, Inc. | 20,088 | 1,593,179 | ||||||
Lindblad Expeditions Holdings, Inc.(a) | 18,792 | 159,920 | ||||||
Papa John’s International, Inc. | 19,977 | 1,643,708 | ||||||
Penn National Gaming, Inc.(a) | 51,560 | 3,748,412 | ||||||
Ruth’s Hospitality Group, Inc. | 6,356 | 70,297 | ||||||
Scientific Games Corp.(a) | 12,289 | 429,009 | ||||||
SeaWorld Entertainment, Inc.(a) | 16,238 | 320,213 | ||||||
Texas Roadhouse, Inc. | 100,693 | 6,121,128 | ||||||
Wingstop, Inc. | 38,603 | 5,275,100 | ||||||
|
| |||||||
| 36,722,299 | ||||||||
| Household Durables — 2.0% | ||||||||
Ethan Allen Interiors, Inc. | 7,250 | 98,165 | ||||||
GoPro, Inc., Class A(a)(b) | 30,191 | 136,765 | ||||||
Helen of Troy Ltd.(a) | 11,852 | 2,293,599 | ||||||
Hooker Furniture Corp. | 9,388 | 242,492 | ||||||
Installed Building Products, Inc.(a) | 1,139 | 115,893 | ||||||
iRobot Corp.(a)(b) | 57,000 | 4,326,300 | ||||||
La-Z-Boy, Inc. | 17,455 | 552,101 | ||||||
LGI Homes, Inc.(a) | 6,870 | 798,088 | ||||||
MDC Holdings, Inc. | 85,650 | 4,034,115 | ||||||
Sonos, Inc.(a) | 38,987 | 591,823 | ||||||
TopBuild Corp.(a) | 8,975 | 1,531,943 | ||||||
|
| |||||||
| 14,721,284 | ||||||||
| Household Products — 0.2% | ||||||||
Central Garden & Pet Co.(a) | 2,203 | 87,966 | ||||||
Central Garden & Pet Co., Class A(a) | 21,027 | 759,915 | ||||||
WD-40 Co. | 2,764 | 523,253 | ||||||
|
| |||||||
| 1,371,134 | ||||||||
| Independent Power and Renewable Electricity Producers — 0.1% | ||||||||
Brookfield Renewable Corp., Class A | 2,215 | 129,799 | ||||||
Ormat Technologies, Inc. | 9,912 | 585,898 | ||||||
|
| |||||||
| 715,697 | ||||||||
| Insurance — 1.1% | ||||||||
eHealth, Inc.(a) | 5,243 | 414,197 | ||||||
Kinsale Capital Group, Inc. | 13,295 | 2,528,443 | ||||||
National General Holdings Corp. | 22,695 | 765,956 | ||||||
RLI Corp. | 10,470 | 876,653 | ||||||
Trupanion, Inc.(a) | 43,721 | 3,449,587 | ||||||
|
| |||||||
| 8,034,836 | ||||||||
| Interactive Media & Services — 0.9% | ||||||||
Cargurus, Inc.(a)(b) | 159,762 | 3,455,652 | ||||||
Eventbrite, Inc., Class A(a) | 40,686 | 441,443 | ||||||
EverQuote, Inc., Class A(a) | 19,660 | 759,662 | ||||||
QuinStreet, Inc.(a)(b) | 44,294 | 701,617 | ||||||
Yelp, Inc.(a)(b) | 34,361 | 690,313 | ||||||
ZoomInfo Technologies, Inc., Class A(a) | 10,244 | 440,390 | ||||||
|
| |||||||
| 6,489,077 | ||||||||
| Internet & Direct Marketing Retail — 1.5% | ||||||||
1-800-Flowers.com, Inc., Class A(a) | 44,176 | 1,101,750 | ||||||
Overstock.com, Inc.(a)(b) | 40,148 | 2,916,752 | ||||||
RealReal, Inc.(a)(b) | 68,405 | 989,820 | ||||||
S C H E D U L E S O F I N V E S T M E N T S | 21 |
Schedule of Investments (continued) September 30, 2020 | BlackRock Advantage Small Cap Growth Fund (Percentages shown are based on Net Assets) |
| Security | Shares | Value | ||||||
| Internet & Direct Marketing Retail (continued) | ||||||||
Stamps.com, Inc.(a) | 19,736 | $ | 4,755,389 | |||||
Stitch Fix, Inc., Class A(a)(b) | 39,111 | 1,061,082 | ||||||
|
| |||||||
| 10,824,793 | ||||||||
| IT Services — 2.0% | ||||||||
Brightcove, Inc.(a) | 14,382 | 147,272 | ||||||
Cardtronics PLC, Class A(a) | 9,481 | 187,724 | ||||||
CSG Systems International, Inc. | 59,599 | 2,440,579 | ||||||
Grid Dynamics Holdings, Inc.(a)(b) | 38,564 | 298,100 | ||||||
Hackett Group, Inc. | 88,004 | 983,885 | ||||||
International Money Express, Inc.(a) | 42,790 | 614,678 | ||||||
KBR, Inc. | 8,980 | 200,793 | ||||||
Limelight Networks, Inc.(a) | 77,582 | 446,872 | ||||||
ManTech International Corp., Class A | 38,229 | 2,633,214 | ||||||
MAXIMUS, Inc. | 70,103 | 4,795,746 | ||||||
NIC, Inc. | 16,346 | 322,016 | ||||||
Rackspace Technology, Inc.(a) | 5,080 | 97,993 | ||||||
TTEC Holdings, Inc. | 2,177 | 118,755 | ||||||
Verra Mobility Corp.(a) | 65,332 | 631,107 | ||||||
Virtusa Corp.(a) | 8,110 | 398,688 | ||||||
|
| |||||||
| 14,317,422 | ||||||||
| Leisure Products — 0.9% | ||||||||
Malibu Boats, Inc., Class A(a) | 31,386 | 1,555,490 | ||||||
YETI Holdings, Inc.(a) | 102,524 | 4,646,388 | ||||||
|
| |||||||
| 6,201,878 | ||||||||
| Life Sciences Tools & Services — 1.9% | ||||||||
Codexis, Inc.(a)(b) | 64,634 | 758,803 | ||||||
Fluidigm Corp.(a) | 28,746 | 213,583 | ||||||
Luminex Corp. | 57,296 | 1,504,020 | ||||||
Medpace Holdings, Inc.(a) | 25,472 | 2,846,496 | ||||||
NanoString Technologies, Inc.(a) | 38,801 | 1,734,405 | ||||||
NeoGenomics, Inc.(a) | 91,960 | 3,392,404 | ||||||
Pacific Biosciences of California, Inc.(a)(b) | 95,199 | 939,614 | ||||||
Personalis, Inc.(a) | 38,124 | 826,147 | ||||||
Quanterix Corp.(a) | 23,998 | 809,693 | ||||||
Repligen Corp.(a) | 3,961 | 584,406 | ||||||
|
| |||||||
| 13,609,571 | ||||||||
| Machinery — 2.3% | ||||||||
Blue Bird Corp.(a) | 51,635 | 627,882 | ||||||
Energy Recovery, Inc.(a) | 8,269 | 67,806 | ||||||
ESCO Technologies, Inc. | 50,604 | 4,076,658 | ||||||
Evoqua Water Technologies Corp.(a) | 91,577 | 1,943,264 | ||||||
Federal Signal Corp. | 16,644 | 486,837 | ||||||
Franklin Electric Co., Inc. | 57,464 | 3,380,607 | ||||||
Hyster-Yale Materials Handling, Inc. | 3,301 | 122,632 | ||||||
John Bean Technologies Corp.(b) | 16,941 | 1,556,708 | ||||||
Proto Labs, Inc.(a)(b) | 20,004 | 2,590,518 | ||||||
RBC Bearings, Inc.(a) | 12,367 | 1,499,004 | ||||||
SPX Corp.(a) | 14,413 | 668,475 | ||||||
|
| |||||||
| 17,020,391 | ||||||||
| Media — 0.5% | ||||||||
Cardlytics, Inc.(a) | 32,197 | 2,272,142 | ||||||
iHeartMedia, Inc., Class A(a) | 14,918 | 121,134 | ||||||
TechTarget, Inc.(a) | 33,869 | 1,488,881 | ||||||
Tremor International Ltd.(a) | 2,418 | 5,804 | ||||||
|
| |||||||
| 3,887,961 | ||||||||
| Metals & Mining — 0.6% | ||||||||
Materion Corp. | 19,049 | 991,119 | ||||||
Novagold Resources, Inc.(a) | 259,277 | 3,082,804 | ||||||
| Security | Shares | Value | ||||||
| Metals & Mining (continued) | ||||||||
Ryerson Holding Corp.(a) | 1,969 | $ | 11,282 | |||||
Schnitzer Steel Industries, Inc., Class A | 14,911 | 286,739 | ||||||
|
| |||||||
| 4,371,944 | ||||||||
| Multiline Retail — 0.1% | ||||||||
Big Lots, Inc. | 16,738 | 746,515 | ||||||
|
| |||||||
| Oil, Gas & Consumable Fuels — 0.6% | ||||||||
CVR Energy, Inc. | 52,041 | 644,268 | ||||||
Delek U.S. Holdings, Inc. | 209,637 | 2,333,260 | ||||||
Evolution Petroleum Corp. | 149,892 | 335,758 | ||||||
Golar LNG Ltd.(a) | 36,316 | 219,893 | ||||||
Magnolia Oil & Gas Corp., Class A(a) | 14,193 | 73,378 | ||||||
Montage Resources Corp.(a) | 1 | 4 | ||||||
Par Pacific Holdings, Inc.(a) | 47,313 | 320,309 | ||||||
PBF Energy, Inc., Class A | 118,111 | 672,052 | ||||||
|
| |||||||
| 4,598,922 | ||||||||
| Paper & Forest Products — 0.4% | ||||||||
Boise Cascade Co. | 72,558 | 2,896,515 | ||||||
|
| |||||||
| Personal Products — 0.1% | ||||||||
elf Beauty, Inc.(a) | 30,745 | 564,786 | ||||||
USANA Health Sciences, Inc.(a) | 5,734 | 422,309 | ||||||
|
| |||||||
| 987,095 | ||||||||
| Pharmaceuticals — 1.9% | ||||||||
Aerie Pharmaceuticals, Inc.(a)(b) | 57,061 | 671,608 | ||||||
Amneal Pharmaceuticals, Inc.(a) | 50,938 | 197,639 | ||||||
Amphastar Pharmaceuticals, Inc.(a) | 104,754 | 1,964,137 | ||||||
Arvinas, Inc.(a) | 18,488 | 436,502 | ||||||
Axsome Therapeutics, Inc.(a) | 11,450 | 815,812 | ||||||
BioDelivery Sciences International, Inc.(a)(b) | 107,008 | 399,140 | ||||||
Cara Therapeutics, Inc.(a) | 38,518 | 490,142 | ||||||
Eloxx Pharmaceuticals, Inc.(a)(b) | 30,661 | 80,638 | ||||||
Innoviva, Inc.(a) | 87,260 | 911,867 | ||||||
Intersect ENT, Inc.(a) | 38,780 | 632,502 | ||||||
Liquidia Technologies, Inc.(a) | 5,454 | 26,834 | ||||||
MyoKardia, Inc.(a) | 3,265 | 445,117 | ||||||
NGM Biopharmaceuticals, Inc.(a) | 53,179 | 846,078 | ||||||
Omeros Corp.(a) | 89,758 | 907,005 | ||||||
Optinose, Inc.(a) | 20,944 | 81,682 | ||||||
Phibro Animal Health Corp., Class A | 13,579 | 236,275 | ||||||
Prestige Consumer Healthcare, Inc.(a) | 11,790 | 429,392 | ||||||
Provention Bio, Inc.(a) | 26,091 | 334,747 | ||||||
Revance Therapeutics, Inc.(a) | 17,604 | 442,565 | ||||||
Supernus Pharmaceuticals, Inc.(a) | 111,130 | 2,315,949 | ||||||
Theravance Biopharma, Inc.(a) | 79,222 | 1,171,297 | ||||||
WaVe Life Sciences Ltd.(a) | 21,954 | 186,389 | ||||||
|
| |||||||
| 14,023,317 | ||||||||
| Professional Services — 1.7% | ||||||||
ASGN, Inc.(a) | 27,827 | 1,768,684 | ||||||
CRA International, Inc. | 14,613 | 547,549 | ||||||
Exponent, Inc. | 36,524 | 2,630,824 | ||||||
Forrester Research, Inc.(a) | 20,406 | 669,113 | ||||||
Franklin Covey Co.(a) | 59,310 | 1,052,159 | ||||||
Huron Consulting Group, Inc.(a) | 3,189 | 125,423 | ||||||
ICF International, Inc. | 5,064 | 311,588 | ||||||
Insperity, Inc. | 24,747 | 1,620,681 | ||||||
Kforce, Inc. | 70,705 | 2,274,580 | ||||||
TriNet Group, Inc.(a) | 27,910 | 1,655,621 | ||||||
|
| |||||||
| 12,656,222 | ||||||||
| Real Estate Management & Development — 1.1% | ||||||||
Cushman & Wakefield PLC(a) | 6,999 | 73,560 | ||||||
| 22 | 2 0 2 0 BLACK ROCK ANNUAL REPORT TO SHAREHOLDERS |
Schedule of Investments (continued) September 30, 2020 | BlackRock Advantage Small Cap Growth Fund (Percentages shown are based on Net Assets) |
| Security | Shares | Value | ||||||
| Real Estate Management & Development (continued) | ||||||||
Fathom Holdings, Inc.(a) | 5,805 | $ | 91,371 | |||||
FRP Holdings, Inc.(a) | 1,534 | 63,922 | ||||||
Marcus & Millichap, Inc.(a) | 117,641 | 3,237,480 | ||||||
RE/MAX Holdings, Inc., Class A | 11,611 | 380,028 | ||||||
Redfin Corp.(a) | 67,953 | 3,392,893 | ||||||
RMR Group, Inc., Class A | 31,902 | 876,348 | ||||||
St. Joe Co.(a) | 2,348 | 48,439 | ||||||
|
| |||||||
| 8,164,041 | ||||||||
| Road & Rail — 1.7% | ||||||||
Avis Budget Group, Inc.(a) | 27,392 | 720,957 | ||||||
Heartland Express, Inc. | 42,276 | 786,334 | ||||||
Marten Transport Ltd. | 23,625 | 385,560 | ||||||
Saia, Inc.(a) | 21,422 | 2,702,171 | ||||||
Universal Logistics Holdings, Inc. | 43,741 | 912,437 | ||||||
Werner Enterprises, Inc. | 157,153 | 6,598,855 | ||||||
|
| |||||||
| 12,106,314 | ||||||||
| Semiconductors & Semiconductor Equipment — 4.1% | ||||||||
Advanced Energy Industries, Inc.(a) | 7,859 | 494,645 | ||||||
Ambarella, Inc.(a) | 34,960 | 1,824,213 | ||||||
Axcelis Technologies, Inc.(a) | 16,501 | 363,022 | ||||||
Brooks Automation, Inc. | 45,621 | 2,110,428 | ||||||
Cabot Microelectronics Corp. | 7,786 | 1,111,919 | ||||||
Cirrus Logic, Inc.(a) | 59,849 | 4,036,815 | ||||||
CyberOptics Corp.(a) | 3,555 | 113,191 | ||||||
FormFactor, Inc.(a) | 62,187 | 1,550,322 | ||||||
Ichor Holdings Ltd.(a)(b) | 16,383 | 353,381 | ||||||
Inphi Corp.(a) | 9,391 | 1,054,140 | ||||||
Lattice Semiconductor Corp.(a)(b) | 29,046 | 841,172 | ||||||
Maxeon Solar Technologies Ltd.(a)(b) | 50,325 | 853,512 | ||||||
MaxLinear, Inc.(a) | 45,945 | 1,067,762 | ||||||
Power Integrations, Inc. | 83,258 | 4,612,493 | ||||||
Semtech Corp.(a) | 51,367 | 2,720,396 | ||||||
Silicon Laboratories, Inc.(a) | 40,540 | 3,966,839 | ||||||
SiTime Corp.(a) | 3,967 | 333,347 | ||||||
Synaptics, Inc.(a) | 31,267 | 2,514,492 | ||||||
|
| |||||||
| 29,922,089 | ||||||||
| Software — 10.5% | ||||||||
8x8, Inc.(a) | 238,583 | 3,709,966 | ||||||
A10 Networks, Inc.(a) | 139,819 | 890,647 | ||||||
ACI Worldwide, Inc.(a) | 50,811 | 1,327,691 | ||||||
Alarm.com Holdings, Inc.(a) | 32,317 | 1,785,514 | ||||||
Altair Engineering, Inc., Class A(a) | 59,105 | 2,481,228 | ||||||
American Software, Inc., Class A | 3,666 | 51,471 | ||||||
Appfolio, Inc., Class A(a) | 23,859 | 3,383,445 | ||||||
Appian Corp.(a) | 14,691 | 951,242 | ||||||
Avaya Holdings Corp.(a) | 17,700 | 269,040 | ||||||
Benefitfocus, Inc.(a) | 58,093 | 650,642 | ||||||
Blackbaud, Inc. | 29,149 | 1,627,389 | ||||||
Blackline, Inc.(a) | 6,457 | 578,741 | ||||||
Bottomline Technologies DE, Inc.(a) | 49,429 | 2,083,927 | ||||||
Box, Inc., Class A(a)(b) | 144,215 | 2,503,572 | ||||||
ChannelAdvisor Corp.(a) | 5,617 | 81,278 | ||||||
Cloudera, Inc.(a) | 4,808 | 52,359 | ||||||
CommVault Systems, Inc.(a) | 14,620 | 596,496 | ||||||
Digital Turbine, Inc.(a) | 27,679 | 906,210 | ||||||
Domo, Inc., Class B(a) | 22,494 | 862,195 | ||||||
Everbridge, Inc.(a)(b) | 5,435 | 683,343 | ||||||
Five9, Inc.(a)(b) | 11,424 | 1,481,464 | ||||||
J2 Global, Inc.(a) | 25,117 | 1,738,599 | ||||||
LivePerson, Inc.(a) | 38,587 | 2,006,138 | ||||||
MicroStrategy, Inc., Class A(a) | 4,552 | 685,349 | ||||||
| Security | Shares | Value | ||||||
| Software (continued) | ||||||||
Model N, Inc.(a)(b) | 34,307 | $ | 1,210,351 | |||||
Palantir Technologies, Inc., Class A (Acquired 02/06/14, cost $1,999,999)(a)(c) | 326,264 | 2,946,164 | ||||||
Palantir Technologies, Inc., Class A(a) | 6 | 57 | ||||||
Paylocity Holding Corp.(a) | 6,404 | 1,033,734 | ||||||
Ping Identity Holding Corp.(a) | 23,159 | 722,792 | ||||||
Progress Software Corp. | 45,504 | 1,669,087 | ||||||
PROS Holdings, Inc.(a)(b) | 89,977 | 2,873,865 | ||||||
Q2 Holdings, Inc.(a) | 1,747 | 159,431 | ||||||
QAD, Inc., Class A | 42,872 | 1,809,198 | ||||||
Qualys, Inc.(a) | 97,355 | 9,541,764 | ||||||
Rapid7, Inc.(a) | 74,715 | 4,575,547 | ||||||
Rimini Street, Inc.(a) | 103,141 | 332,114 | ||||||
RingCentral, Inc., Class A(a) | 7,334 | 2,013,990 | ||||||
Sailpoint Technologies Holdings, Inc.(a) | 30,120 | 1,191,848 | ||||||
Sapiens International Corp. NV | 32,960 | 1,007,917 | ||||||
Sprout Social, Inc., Class A(a) | 16,334 | 628,859 | ||||||
SPS Commerce, Inc.(a) | 54,710 | 4,260,268 | ||||||
Sumo Logic, Inc.(a) | 7,743 | 168,797 | ||||||
SVMK, Inc.(a) | 59,443 | 1,314,285 | ||||||
Telenav, Inc.(a) | 15,497 | 55,789 | ||||||
Varonis Systems, Inc.(a) | 27,155 | 3,134,230 | ||||||
Verint Systems, Inc.(a) | 15,102 | 727,614 | ||||||
Yext, Inc.(a)(b) | 203,085 | 3,082,830 | ||||||
Zuora, Inc., Class A(a) | 26,973 | 278,901 | ||||||
|
| |||||||
| 76,127,378 | ||||||||
| Specialty Retail — 1.6% | ||||||||
America’s Car-Mart, Inc.(a) | 6,149 | 521,927 | ||||||
Asbury Automotive Group, Inc.(a) | 11,369 | 1,107,909 | ||||||
At Home Group, Inc.(a) | 34,288 | 509,520 | ||||||
Boot Barn Holdings, Inc.(a) | 992 | 27,915 | ||||||
Buckle, Inc. | 63,339 | 1,291,482 | ||||||
Camping World Holdings, Inc., Class A | 54,271 | 1,614,562 | ||||||
Chico’s FAS, Inc. | 206 | 200 | ||||||
Conn’s, Inc.(a) | 8,843 | 93,559 | ||||||
Guess?, Inc. | 40,748 | 473,492 | ||||||
Haverty Furniture Cos., Inc. | 12 | 251 | ||||||
MarineMax, Inc.(a) | 3,631 | 93,208 | ||||||
Monro, Inc. | 40,108 | 1,627,182 | ||||||
Rent-A-Center, Inc. | 30,341 | 906,892 | ||||||
RH(a) | 2,855 | 1,092,380 | ||||||
Shoe Carnival, Inc. | 10,072 | 338,218 | ||||||
Tilly’s, Inc., Class A | 43,259 | 260,852 | ||||||
Urban Outfitters, Inc.(a) | 51,028 | 1,061,893 | ||||||
Winmark Corp. | 613 | 105,546 | ||||||
Zumiez, Inc.(a) | 19,074 | 530,639 | ||||||
|
| |||||||
| 11,657,627 | ||||||||
| Textiles, Apparel & Luxury Goods — 1.0% | ||||||||
Crocs, Inc.(a) | 26,668 | 1,139,524 | ||||||
Deckers Outdoor Corp.(a) | 19,800 | 4,356,198 | ||||||
Oxford Industries, Inc. | 14,875 | 600,355 | ||||||
Steven Madden Ltd. | 36,286 | 707,577 | ||||||
Wolverine World Wide, Inc. | 7,234 | 186,926 | ||||||
|
| |||||||
| 6,990,580 | ||||||||
| Thrifts & Mortgage Finance — 0.1% | ||||||||
Federal Agricultural Mortgage Corp., Class C | 5,891 | 375,021 | ||||||
Riverview Bancorp, Inc. | 23,598 | 97,932 | ||||||
TFS Financial Corp. | 13,549 | 199,035 | ||||||
|
| |||||||
| 671,988 | ||||||||
| Trading Companies & Distributors — 1.2% | ||||||||
Applied Industrial Technologies, Inc. | 42,933 | 2,365,608 | ||||||
SCHEDULES OF INVESTMENTS | 23 |
Schedule of Investments (continued) September 30, 2020 | BlackRock Advantage Small Cap Growth Fund (Percentages shown are based on Net Assets) |
| Security | Shares | Value | ||||||
| Trading Companies & Distributors (continued) | ||||||||
Foundation Building Materials, Inc.(a) | 52,872 | $ | 831,148 | |||||
H&E Equipment Services, Inc. | 26,740 | 525,708 | ||||||
SiteOne Landscape Supply, Inc.(a) | 39,942 | 4,870,927 | ||||||
|
| |||||||
| 8,593,391 | ||||||||
| Water Utilities — 0.3% | ||||||||
American States Water Co. | 25,803 | 1,933,935 | ||||||
SJW Group | 2,443 | 148,681 | ||||||
|
| |||||||
| 2,082,616 | ||||||||
| Wireless Telecommunication Services — 0.2% | ||||||||
Shenandoah Telecommunications Co. | 24,861 | 1,104,698 | ||||||
|
| |||||||
Total Common Stocks — 96.5% |
| 699,229,253 | ||||||
|
| |||||||
Preferred Securities | ||||||||
| Preferred Stocks — 0.2% | ||||||||
| Household Durables — 0.0% | ||||||||
AliphCom | ||||||||
Series 6 (Acquired 06/03/14, cost $0)(a)(c)(d)(e) | 8,264 | 0 | ||||||
Series 8 (Acquired 08/31/15, | 192,156 | 2 | ||||||
|
| |||||||
| 2 | ||||||||
| Software — 0.2% | ||||||||
Illumio, Inc., Series C (Acquired 03/10/15, cost $1,000,317)(a)(c)(e) | 311,155 | 1,446,871 | ||||||
|
| |||||||
Total Preferred Securities — 0.2% | 1,446,873 | |||||||
|
| |||||||
Rights | ||||||||
| Metals & Mining — 0.0% | ||||||||
Pan American Silver Corp., CVR(a) | 57,348 | 44,726 | ||||||
|
| |||||||
| Security | Shares | Value | ||||||
| Pharmaceuticals — 0.0% | ||||||||
H. Lundbeck A/S, CVR(a)(e) | 46,530 | $ | 40,946 | |||||
|
| |||||||
Total Rights — 0.0% | 85,672 | |||||||
|
| |||||||
Total Long-Term Investments — 96.7% | 700,761,798 | |||||||
|
| |||||||
Short-Term Securities(f)(g) | ||||||||
| Money Market Funds — 10.9% | ||||||||
BlackRock Liquidity Funds, T-Fund, Institutional Class, 0.02% | 23,964,419 | 23,964,419 | ||||||
SL Liquidity Series, LLC, Money Market Series, 0.25%(h) | 55,193,556 | 55,215,634 | ||||||
|
| |||||||
Total Short-Term Securities — 10.9% |
| 79,180,053 | ||||||
|
| |||||||
Total Investments — 107.6% |
| 779,941,851 | ||||||
Liabilities in Excess of Other Assets — (7.6)% |
| (54,900,490 | ) | |||||
|
| |||||||
Net Assets — 100.0% | $ | 725,041,361 | ||||||
|
| |||||||
| (a) | Non-income producing security. |
| (b) | All or a portion of this security is on loan. |
| (c) | Restricted security as to resale, excluding 144A securities. The Fund held restricted securities with a current value of $4,393,037, representing 0.6% of its net assets as of period end, and an original cost of $4,175,300. |
| (d) | Issuer filed for bankruptcy and/or is in default. |
| (e) | Security is valued using significant unobservable inputs and is classified as Level 3 in the fair value hierarchy. |
| (f) | Affiliate of the Fund. |
| (g) | Annualized 7-day yield as of period end. |
| (h) | All or a portion of this security was purchased with the cash collateral from loaned securities. |
Affiliates
Investments in issuers considered to be affiliate(s) of the Fund during the year ended September 30, 2020 for purposes of Section 2(a)(3) of the Investment Company Act of 1940, as amended, were as follows:
| Affiliated Issuer | | Value at 09/30/19 |
| | Purchases at Cost |
| | Proceeds from Sale |
| | Net Realized Gain (Loss) |
| | Change in Unrealized | | | Value at 09/30/20 |
| | Shares Held at 09/30/20 |
| Income | | Capital Gain Distributions from Underlying Funds |
| |||||||||||
BlackRock Liquidity Funds, T-Fund, Institutional Class | $ | 5,370,690 | $ | 18,593,729 | (a) | $ | — | $ | — | $ | — | $ | 23,964,419 | 23,964,419 | $ | 54,495 | $ | 13 | ||||||||||||||||||
SL Liquidity Series, LLC, Money Market Series | 42,978,875 | 12,227,913 | (a) | — | (4,141 | ) | 12,987 | 55,215,634 | 55,193,556 | 436,583 | (b) | — | ||||||||||||||||||||||||
|
|
|
|
|
|
|
|
|
| |||||||||||||||||||||||||||
| $ | (4,141 | ) | $ | 12,987 | $ | 79,180,053 | $ | 491,078 | $ | 13 | ||||||||||||||||||||||||||
|
|
|
|
|
|
|
|
|
|
| (a) | Represents net amount purchased (sold). |
| (b) | All or a portion represents securities lending income earned from the reinvestment of cash collateral from loaned securities, net of fees and collateral investment expenses, and other payments to and from borrowers of securities. |
For Fund compliance purposes, the Fund’s industry classifications refer to one or more of the industry sub-classifications used by one or more widely recognized market indexes or rating group indexes, and/or as defined by the investment adviser. These definitions may not apply for purposes of this report, which may combine such industry subclassifications for reporting ease.
| 24 | 2 0 2 0 BLACK ROCK ANNUAL REPORT TO SHAREHOLDERS |
Schedule of Investments (continued) September 30, 2020 | BlackRock Advantage Small Cap Growth Fund |
Derivative Financial Instruments Outstanding as of Period End
Futures Contracts
| Description | Number of Contracts | Expiration Date | Notional Amount (000) | Value/ Appreciation (Depreciation) | ||||||||||||
Long Contracts | ||||||||||||||||
Russell 2000 E-Mini Index | 336 | 12/18/20 | $ | 25,274 | $ | 986,131 | ||||||||||
|
| |||||||||||||||
Derivative Financial Instruments Categorized by Risk Exposure
As of period end, the fair values of derivative financial instruments located in the Statements of Assets and Liabilities were as follows:
| Commodity Contracts | Credit Contracts | Equity Contracts | Foreign Currency Exchange Contracts | Interest Rate Contracts | Other Contracts | Total | ||||||||||||||||||||||
Assets — Derivative Financial Instruments |
| |||||||||||||||||||||||||||
Futures contracts | ||||||||||||||||||||||||||||
Unrealized appreciation(a) | $ | — | $ | — | $ | 986,131 | $ | — | $ | — | $ | — | $ | 986,131 | ||||||||||||||
|
|
|
|
|
|
|
|
|
|
|
|
|
| |||||||||||||||
| (a) | Net cumulative unrealized appreciation (depreciation) on futures contracts, if any, are reported in the Schedule of Investments. In the Statements of Assets and Liabilities, only current day’s variation margin is reported in receivables or payables and the net cumulative unrealized appreciation (depreciation) is included in accumulated earnings (loss). |
For the year ended September 30, 2020, the effect of derivative financial instruments in the Statements of Operations was as follows:
Commodity Contracts | Credit Contracts | Equity Contracts | Foreign Currency Exchange Contracts | Interest Rate | Other Contracts | Total | ||||||||||||||||||||||
Net Realized Gain (Loss) from | ||||||||||||||||||||||||||||
Futures contracts | $ | — | $ | — | $ | 3,354,539 | $ | — | $ | — | $ | — | $ | 3,354,539 | ||||||||||||||
|
|
|
|
|
|
|
|
|
|
|
|
|
| |||||||||||||||
Net Change in Unrealized Appreciation (Depreciation) on |
| |||||||||||||||||||||||||||
Futures contracts | $ | — | $ | — | $ | 1,179,123 | $ | — | $ | — | $ | — | $ | 1,179,123 | ||||||||||||||
|
|
|
|
|
|
|
|
|
|
|
|
|
| |||||||||||||||
Average Quarterly Balances of Outstanding Derivative Financial Instruments
Futures contracts | ||||||||||||||||||||||||||||
Average notional value of contracts — long | $ | 17,620,933 |
For more information about the Fund’s investment risks regarding derivative financial instruments, refer to the Notes to Financial Statements.
Fair Value Hierarchy as of Period End
Various inputs are used in determining the fair value of financial instruments. For description of the input levels and information about the Fund’s policy regarding valuation of financial instruments, refer to the Notes to Financial Statements.
The following tables summarize the Fund’s investments and derivative financial instruments categorized in the disclosure hierarchy. The breakdown of the Fund’s investments into major categories is disclosed in the Schedule of Investments above.
| Level 1 | Level 2 | Level 3 | Total | |||||||||||||
Assets | ||||||||||||||||
Investments | ||||||||||||||||
Long-Term Investments | ||||||||||||||||
Common Stocks | ||||||||||||||||
Aerospace & Defense | $ 3,393,369 | $ — | $ — | $ 3,393,369 | ||||||||||||
Air Freight & Logistics | 6,824,498 | — | — | 6,824,498 | ||||||||||||
Airlines | 563,419 | — | — | 563,419 | ||||||||||||
Auto Components | 10,935,625 | — | — | 10,935,625 | ||||||||||||
Automobiles | 503,111 | — | — | 503,111 | ||||||||||||
Banks | 1,275,498 | — | — | 1,275,498 | ||||||||||||
Beverages | 730,087 | — | — | 730,087 | ||||||||||||
SCHEDULES OF INVESTMENTS | 25 |
Schedule of Investments (continued) September 30, 2020 | BlackRock Advantage Small Cap Growth Fund |
| Level 1 | Level 2 | Level 3 | Total | |||||||||||||
Common Stocks (continued) | ||||||||||||||||
Biotechnology | $ | 126,817,270 | $ | — | $ | — | $ | 126,817,270 | ||||||||
Building Products | 7,964,284 | — | — | 7,964,284 | ||||||||||||
Capital Markets | 14,538,634 | — | — | 14,538,634 | ||||||||||||
Chemicals | 8,448,501 | — | — | 8,448,501 | ||||||||||||
Commercial Services & Supplies | 11,847,285 | — | — | 11,847,285 | ||||||||||||
Communications Equipment | 5,038,263 | — | — | 5,038,263 | ||||||||||||
Construction & Engineering | 6,070,338 | — | — | 6,070,338 | ||||||||||||
Construction Materials | 773,576 | — | — | 773,576 | ||||||||||||
Consumer Finance | 2,166,580 | — | — | 2,166,580 | ||||||||||||
Diversified Consumer Services | 3,087,607 | — | — | 3,087,607 | ||||||||||||
Diversified Telecommunication Services | 6,868,560 | — | — | 6,868,560 | ||||||||||||
Electric Utilities | 562,256 | — | — | 562,256 | ||||||||||||
Electrical Equipment | 14,852,254 | — | — | 14,852,254 | ||||||||||||
Electronic Equipment, Instruments & Components | 15,816,606 | — | — | 15,816,606 | ||||||||||||
Energy Equipment & Services | 410,822 | — | — | 410,822 | ||||||||||||
Entertainment | 640,969 | — | — | 640,969 | ||||||||||||
Equity Real Estate Investment Trusts (REITs) | 14,518,733 | — | — | 14,518,733 | ||||||||||||
Food & Staples Retailing | 2,449,160 | — | — | 2,449,160 | ||||||||||||
Food Products | 11,851,298 | — | — | 11,851,298 | ||||||||||||
Gas Utilities | 4,414,616 | — | — | 4,414,616 | ||||||||||||
Health Care Equipment & Supplies | 41,833,917 | — | — | 41,833,917 | ||||||||||||
Health Care Providers & Services | 23,785,669 | — | — | 23,785,669 | ||||||||||||
Health Care Technology | 18,628,853 | — | — | 18,628,853 | ||||||||||||
Hotels, Restaurants & Leisure | 36,722,299 | — | — | 36,722,299 | ||||||||||||
Household Durables | 14,721,284 | — | — | 14,721,284 | ||||||||||||
Household Products | 1,371,134 | — | — | 1,371,134 | ||||||||||||
Independent Power and Renewable Electricity Producers | 715,697 | — | — | 715,697 | ||||||||||||
Insurance | 8,034,836 | — | — | 8,034,836 | ||||||||||||
Interactive Media & Services | 6,489,077 | — | — | 6,489,077 | ||||||||||||
Internet & Direct Marketing Retail | 10,824,793 | — | — | 10,824,793 | ||||||||||||
IT Services | 14,317,422 | — | — | 14,317,422 | ||||||||||||
Leisure Products | 6,201,878 | — | — | 6,201,878 | ||||||||||||
Life Sciences Tools & Services | 13,609,571 | — | — | 13,609,571 | ||||||||||||
Machinery | 17,020,391 | — | — | 17,020,391 | ||||||||||||
Media | 3,887,961 | — | — | 3,887,961 | ||||||||||||
Metals & Mining | 4,371,944 | — | — | 4,371,944 | ||||||||||||
Multiline Retail | 746,515 | — | — | 746,515 | ||||||||||||
Oil, Gas & Consumable Fuels | 4,598,922 | — | — | 4,598,922 | ||||||||||||
Paper & Forest Products | 2,896,515 | — | — | 2,896,515 | ||||||||||||
Personal Products | 987,095 | — | — | 987,095 | ||||||||||||
Pharmaceuticals | 14,023,317 | — | — | 14,023,317 | ||||||||||||
Professional Services | 12,656,222 | — | — | 12,656,222 | ||||||||||||
Real Estate Management & Development | 8,164,041 | — | — | 8,164,041 | ||||||||||||
Road & Rail | 12,106,314 | — | — | 12,106,314 | ||||||||||||
Semiconductors & Semiconductor Equipment | 29,922,089 | — | — | 29,922,089 | ||||||||||||
Software | 73,181,214 | 2,946,164 | — | 76,127,378 | ||||||||||||
Specialty Retail | 11,657,627 | — | — | 11,657,627 | ||||||||||||
Textiles, Apparel & Luxury Goods | 6,990,580 | — | — | 6,990,580 | ||||||||||||
Thrifts & Mortgage Finance | 671,988 | — | — | 671,988 | ||||||||||||
Trading Companies & Distributors | 8,593,391 | — | — | 8,593,391 | ||||||||||||
Water Utilities | 2,082,616 | — | — | 2,082,616 | ||||||||||||
Wireless Telecommunication Services | 1,104,698 | — | — | 1,104,698 | ||||||||||||
Preferred Securities | — | — | 1,446,873 | 1,446,873 | ||||||||||||
Rights | 44,726 | — | 40,946 | 85,672 | ||||||||||||
Short-Term Securities | ||||||||||||||||
Money Market Funds | 23,964,419 | — | — | 23,964,419 | ||||||||||||
|
|
|
|
|
|
|
| |||||||||
| $ | 720,292,234 | $ | 2,946,164 | $ | 1,487,819 | 724,726,217 | ||||||||||
|
|
|
|
|
|
|
| |||||||||
Investments Valued at NAV(a) | 55,215,634 | |||||||||||||||
|
| |||||||||||||||
| $ | 779,941,851 | |||||||||||||||
|
| |||||||||||||||
| 26 | 2 0 2 0 BLACK ROCK ANNUAL REPORT TO SHAREHOLDERS |
Schedule of Investments (continued) September 30, 2020 | BlackRock Advantage Small Cap Growth Fund |
| Level 1 | Level 2 | Level 3 | Total | |||||||||||||
Derivative Financial Instruments(b) | ||||||||||||||||
Assets | ||||||||||||||||
Equity Contracts | $ | 986,131 | $ | — | $ | — | $ | 986,131 | ||||||||
|
|
|
|
|
|
|
| |||||||||
| (a) | Certain investments of the Fund were fair valued using NAV per share as no quoted market value is available and therefore have been excluded from the fair value hierarchy. |
| (b) | Derivative financial instruments are futures contracts. Futures contracts are valued at the unrealized appreciation (depreciation) on the instrument. |
See notes to financial statements.
SCHEDULES OF INVESTMENTS | 27 |
Schedule of Investments September 30, 2020 | BlackRock Health Sciences Opportunities Portfolio (Percentages shown are based on Net Assets) |
| Security | Shares | Value | ||||||
Common Stocks |
| |||||||
Biotechnology — 20.7% | ||||||||
Acceleron Pharma, Inc.(a)(b) | 741,134 | $ | 83,399,809 | |||||
Acerta Pharma BV, Series B (Acquired 05/06/15, cost $17,141,679)(a)(c)(d) | 297,971,595 | 39,874,559 | ||||||
Agios Pharmaceuticals, Inc.(a)(b) | 477,319 | 16,706,165 | ||||||
Alexion Pharmaceuticals, Inc.(a) | 512,703 | 58,668,604 | ||||||
Allakos, Inc.(a)(b) | 533,126 | 43,423,113 | ||||||
Allogene Therapeutics, Inc.(a)(b) | 587,622 | 22,159,226 | ||||||
Alnylam Pharmaceuticals, Inc.(a)(b) | 588,046 | 85,619,498 | ||||||
Amgen, Inc. | 1,077,181 | 273,776,323 | ||||||
Annexon, Inc.(a)(b) | 326,239 | 9,862,205 | ||||||
Apellis Pharmaceuticals, Inc.(a)(b) | 395,224 | 11,923,908 | ||||||
Arcutis Biotherapeutics, Inc.(a)(b) | 736,963 | 21,593,016 | ||||||
Arena Pharmaceuticals, Inc.(a)(b) | 365,647 | 27,346,739 | ||||||
Atreca, Inc., Class A(a)(b) | 342,563 | 4,785,605 | ||||||
Biogen, Inc.(a) | 206,479 | 58,573,963 | ||||||
BioMarin Pharmaceutical, Inc.(a) | 675,462 | 51,389,149 | ||||||
Blueprint Medicines Corp.(a)(b) | 183,842 | 17,042,153 | ||||||
ChemoCentryx, Inc.(a) | 98,900 | 5,419,720 | ||||||
Dicerna Pharmaceuticals, Inc.(a)(b) | 275,717 | 4,960,149 | ||||||
Eidos Therapeutics, Inc.(a)(b) | 147,496 | 7,452,973 | ||||||
Everest Medicines Ltd.(a)(e) | 599,500 | 4,254,489 | ||||||
FibroGen, Inc.(a) | 113,518 | 4,667,860 | ||||||
Galapagos NV, ADR(a)(b) | 116,688 | 16,559,194 | ||||||
Genfit, ADR(a) | 21,818 | 116,072 | ||||||
Genmab A/S(a) | 276,221 | 100,242,143 | ||||||
Genmab A/S, ADR(a)(b) | 949,031 | 34,744,025 | ||||||
Gilead Sciences, Inc. | 1,472,779 | 93,064,905 | ||||||
Halozyme Therapeutics, Inc.(a) | 493,660 | 12,973,385 | ||||||
Humanigen, Inc.(a)(b) | 403,293 | 4,291,037 | ||||||
Immunomedics, Inc.(a) | 610,371 | 51,899,846 | ||||||
Immunovant, Inc.(a)(b) | 660,326 | 23,236,872 | ||||||
Incyte Corp.(a) | 438,230 | 39,326,760 | ||||||
Intellia Therapeutics, Inc.(a)(b) | 261,944 | 5,207,447 | ||||||
Iovance Biotherapeutics, Inc.(a)(b) | 590,214 | 19,429,845 | ||||||
Kodiak Sciences, Inc.(a)(b) | 164,366 | 9,732,111 | ||||||
Krystal Biotech, Inc.(a) | 90,270 | 3,886,123 | ||||||
Mersana Therapeutics, Inc.(a)(b) | 1,093,068 | 20,352,926 | ||||||
Mirati Therapeutics, Inc.(a)(b) | 96,149 | 15,965,541 | ||||||
Molecular Templates, Inc.(a)(b) | 376,174 | 4,107,820 | ||||||
Neurocrine Biosciences, Inc.(a) | 412,341 | 39,650,710 | ||||||
Passage Bio, Inc.(a)(b) | 142,321 | 1,865,828 | ||||||
Prothena Corp. PLC(a) | 407,340 | 4,069,327 | ||||||
RAPT Therapeutics, Inc.(a) | 147,420 | 4,746,924 | ||||||
Regeneron Pharmaceuticals, Inc.(a) | 240,320 | 134,526,330 | ||||||
Relay Therapeutics, Inc.(a)(b) | 211,031 | 8,987,810 | ||||||
Sarepta Therapeutics, Inc.(a)(b) | 166,957 | 23,445,771 | ||||||
Seattle Genetics, Inc.(a)(b) | 1,216,385 | 238,034,381 | ||||||
Seres Therapeutics, Inc.(a)(b) | 509,590 | 14,426,493 | ||||||
Taysha Gene Therapies, Inc.(a)(b) | 266,334 | 5,965,882 | ||||||
TCR2 Therapeutics, Inc.(a) | 197,144 | 4,005,966 | ||||||
Vertex Pharmaceuticals, Inc.(a) | 799,090 | 217,448,371 | ||||||
Vir Biotechnology, Inc.(a)(b) | 148,391 | 5,094,263 | ||||||
|
| |||||||
| 2,010,303,334 | ||||||||
| Diversified Financial Services — 0.4% | ||||||||
ARYA Sciences Acquisition Corp. II(a)(b) | 241,015 | 2,651,165 | ||||||
ARYA Sciences Acquisition Corp. III, Class A(a) | 320,000 | 3,430,400 | ||||||
BCTG Acquisition Corp.(a) | 186,560 | 2,022,310 | ||||||
Deerfield Healthcare Technology Acquisitions Corp.(a) | 442,160 | 4,700,161 | ||||||
FS Development Corp., Class A(a) | 333,943 | 3,740,162 | ||||||
| Security | Shares | Value | ||||||
| Diversified Financial Services (continued) | ||||||||
Health Sciences Acquisitions Corp. 2(a) | 264,960 | $ | 2,914,560 | |||||
Longview Acquisition Corp.(a) | 657,724 | 6,675,898 | ||||||
Panacea Acquisition Corp.(a) | 232,064 | 2,784,768 | ||||||
Therapeutics Acquisition Corp., Class A(a) | 518,000 | 7,448,840 | ||||||
|
| |||||||
| 36,368,264 | ||||||||
| Health Care Equipment & Supplies — 29.9% | ||||||||
Abbott Laboratories | 4,671,001 | 508,345,039 | ||||||
ABIOMED, Inc.(a) | 207,094 | 57,377,464 | ||||||
Alcon, Inc.(a)(b) | 2,243,141 | 127,746,880 | ||||||
Baxter International, Inc. | 2,394,045 | 192,529,099 | ||||||
Becton Dickinson and Co. | 616,331 | 143,407,897 | ||||||
Boston Scientific Corp.(a) | 7,197,462 | 275,015,023 | ||||||
Edwards Lifesciences Corp.(a) | 2,888,315 | 230,545,303 | ||||||
Envista Holdings Corp.(a)(b) | 641,613 | 15,835,009 | ||||||
Intuitive Surgical, Inc.(a)(b) | 265,816 | 188,607,085 | ||||||
Kangji Medical Holdings Ltd. (Acquired 06/22/20, cost $9,107,188)(a)(d) | 5,034,659 | 12,262,401 | ||||||
Masimo Corp.(a) | 542,152 | 127,980,401 | ||||||
Medtronic PLC | 2,548,473 | 264,837,314 | ||||||
Nevro Corp.(a) | 269,337 | 37,518,644 | ||||||
ResMed, Inc. | 490,747 | 84,128,758 | ||||||
SI-BONE, Inc.(a) | 77,477 | 1,837,754 | ||||||
Silk Road Medical, Inc.(a)(b) | 162,374 | 10,913,157 | ||||||
Straumann Holding AG, Registered Shares | 49,430 | 50,003,462 | ||||||
Stryker Corp. | 1,139,144 | 237,363,435 | ||||||
Teleflex, Inc. | 341,740 | 116,335,131 | ||||||
Varian Medical Systems, Inc.(a) | 772,886 | 132,936,392 | ||||||
Zimmer Biomet Holdings, Inc. | 587,850 | 80,029,899 | ||||||
|
| |||||||
| 2,895,555,547 | ||||||||
| Health Care Providers & Services — 17.9% | ||||||||
Amedisys, Inc.(a) | 356,798 | 84,357,751 | ||||||
AmerisourceBergen Corp. | 271,535 | 26,317,172 | ||||||
Anthem, Inc. | 715,541 | 192,187,157 | ||||||
Cardinal Health, Inc. | 483,577 | 22,703,940 | ||||||
Centene Corp.(a) | 1,572,220 | 91,707,593 | ||||||
Cigna Corp. | 994,810 | 168,530,762 | ||||||
Encompass Health Corp. | 773,075 | 50,234,414 | ||||||
Humana, Inc. | 595,910 | 246,641,190 | ||||||
LHC Group, Inc.(a)(b) | 382,896 | 81,388,374 | ||||||
McKesson Corp. | 118,971 | 17,718,351 | ||||||
Oak Street Health, Inc. (Acquired 03/04/20, cost $10,075,391)(a)(d) | 958,228 | 49,429,659 | ||||||
Oak Street Health, Inc.(a)(b) | 163,510 | 8,737,974 | ||||||
Quest Diagnostics, Inc. | 243,566 | 27,885,871 | ||||||
UnitedHealth Group, Inc. | 2,141,043 | 667,512,976 | ||||||
|
| |||||||
| 1,735,353,184 | ||||||||
| Health Care Technology — 1.1% | ||||||||
GoodRx Holdings, Inc., Class A(a) | 114,119 | 6,345,016 | ||||||
Livongo Health, Inc.(a)(b) | 286,428 | 40,114,242 | ||||||
Teladoc Health, Inc.(a)(b) | 255,491 | 56,013,847 | ||||||
|
| |||||||
| 102,473,105 | ||||||||
| Insurance — 0.1% | ||||||||
GoHealth, Inc., Class A(a) | 708,797 | 9,232,081 | ||||||
Selectquote, Inc.(a)(b) | 189,940 | 3,846,285 | ||||||
|
| |||||||
| 13,078,366 | ||||||||
| Life Sciences Tools & Services — 7.7% | ||||||||
Agilent Technologies, Inc. | 262,937 | 26,540,861 | ||||||
Avantor, Inc.(a) | 2,442,010 | 54,920,805 | ||||||
Illumina, Inc.(a) | 277,053 | 85,631,541 | ||||||
IQVIA Holdings, Inc.(a) | 485,690 | 76,559,315 | ||||||
| 28 | 2 0 2 0 BLACK ROCK ANNUAL REPORT TO SHAREHOLDERS |
Schedule of Investments (continued) September 30, 2020 | BlackRock Health Sciences Opportunities Portfolio (Percentages shown are based on Net Assets) |
| Security | Shares | Value | ||||||
| Life Sciences Tools & Services (continued) | ||||||||
PPD, Inc.(a) | 1,506,681 | $ | 55,732,130 | |||||
Thermo Fisher Scientific, Inc. | 735,688 | 324,820,966 | ||||||
WuXi AppTec Co. Ltd., H Shares(e) | 4,351,114 | 62,920,450 | ||||||
Wuxi Biologics Cayman, Inc.(a)(e) | 2,222,500 | 54,469,183 | ||||||
|
| |||||||
| 741,595,251 | ||||||||
| Pharmaceuticals — 20.0% | ||||||||
AstraZeneca PLC | 288,197 | 31,489,836 | ||||||
Bristol-Myers Squibb Co. | 3,151,089 | 189,979,156 | ||||||
Eisai Co. Ltd. | 544,800 | 49,757,851 | ||||||
Eli Lilly & Co. | 1,412,894 | 209,136,570 | ||||||
Hansoh Pharmaceutical Group Co. | 16,862,176 | 82,416,213 | ||||||
Hua Medicine(a)(b)(e) | 13,366,370 | 8,606,162 | ||||||
Johnson & Johnson | 2,926,342 | 435,673,797 | ||||||
Merck & Co., Inc. | 1,913,871 | 158,755,600 | ||||||
Merck KGaA | 468,716 | 68,335,605 | ||||||
MyoKardia, Inc.(a)(b) | 128,574 | 17,528,493 | ||||||
Nektar Therapeutics(a)(b) | 427,710 | 7,095,709 | ||||||
Ocumension Therapeutics (Acquired 07/06/20, cost $1,234,288)(a)(d) | 646,000 | 1,891,142 | ||||||
Pfizer, Inc. | 6,325,128 | 232,132,198 | ||||||
Roche Holding AG | 224,979 | 77,064,432 | ||||||
Royalty Pharma PLC, Class A | 294,506 | 12,389,867 | ||||||
Sanofi(b) | 1,327,382 | 133,020,151 | ||||||
Sanofi, ADR | 1,049,151 | 52,635,906 | ||||||
Zoetis, Inc. | 1,034,140 | 171,015,732 | ||||||
|
| |||||||
| 1,938,924,420 | ||||||||
|
| |||||||
Total Common Stocks — 97.8% |
| 9,473,651,471 | ||||||
|
| |||||||
| Par (000) | ||||||||
Corporate Bonds | ||||||||
Biotechnology — 0.1% |
| |||||||
Kronos Bio, Inc., (Acquired 08/20/20, cost | ||||||||
$5,050,000), 0.00%, 02/14/22(a)(c)(d)(f) | USD 5,050 | 5,050,000 | ||||||
|
| |||||||
Total Corporate Bonds — 0.1% | 5,050,000 | |||||||
|
| |||||||
Other Interests | ||||||||
Afferent Pharmaceuticals, Inc., Series C, | 3,421 | 4,549,451 | ||||||
|
| |||||||
Total Other Interests — 0.0% |
| 4,549,451 | ||||||
|
| |||||||
| Shares | ||||||||
Preferred Securities | ||||||||
Preferred Stocks — 0.2% |
| |||||||
| Biotechnology — 0.1% | ||||||||
Goldfinch Bio, Inc., Series B (Acquired 06/26/20, cost $2,768,121)(a)(c)(d) | 2,345,865 | 2,768,121 | ||||||
| Security | Shares | Value | ||||||
| Biotechnology (continued) | ||||||||
Sigilon Therapeutics, Inc., Series B (Acquired 02/14/20, cost | 768,000 | $ | 4,646,400 | |||||
Taysha Gene Therapies, Inc., Series B (Acquired 07/30/20, cost | 334,477 | 7,131,050 | ||||||
|
| |||||||
| 14,545,571 | ||||||||
| Pharmaceuticals — 0.1% | ||||||||
Annexon, Inc., Series D (Acquired 06/26/20, cost $3,589,917)(a)(d) | 286,515 | 8,391,884 | ||||||
|
| |||||||
Total Preferred Securities — 0.2% |
| 22,937,455 | ||||||
|
| |||||||
Total Long-Term Investments — 98.1% |
| 9,506,188,377 | ||||||
|
| |||||||
| Short-Term Securities(g)(h) | ||||||||
Money Market Funds — 4.4% | ||||||||
BlackRock Liquidity Funds, T-Fund, Institutional Class, 0.02% | 217,777,914 | 217,777,914 | ||||||
SL Liquidity Series, LLC, Money Market Series, 0.25%(i) | 203,960,882 | 204,042,466 | ||||||
|
| |||||||
Total Short-Term Securities — 4.4% |
| 421,820,380 | ||||||
|
| |||||||
Total Investments — 102.5% |
| 9,928,008,757 | ||||||
Liabilities in Excess of Other Assets — (2.5)% |
| (239,852,603 | ) | |||||
|
| |||||||
Net Assets — 100.0% |
| $ | 9,688,156,154 | |||||
|
| |||||||
| (a) | Non-income producing security. |
| (b) | All or a portion of this security is on loan. |
| (c) | Security is valued using significant unobservable inputs and is classified as Level 3 in the fair value hierarchy. |
| (d) | Restricted security as to resale, excluding 144A securities. The Fund held restricted securities with a current value of $131,445,216, representing 1.4% of its net assets as of period end, and an original cost of $58,793,584. |
| (e) | Security exempt from registration pursuant to Rule 144A under the Securities Act of 1933, as amended. These securities may be resold in transactions exempt from registration to qualified institutional investors. |
| (f) | Convertible security. |
| (g) | Affiliate of the Fund. |
| (h) | Annualized 7-day yield as of period end. |
| (i) | All or a portion of this security was purchased with the cash collateral from loaned securities. |
S C H E D U L E S O F I N V E S T M E N T S | 29 |
Schedule of Investments (continued) September 30, 2020 | BlackRock Health Sciences Opportunities Portfolio |
Affiliates
Investments in issuers considered to be affiliate(s) of the Fund during the year ended September 30, 2020 for purposes of Section 2(a)(3) of the Investment Company Act of 1940, as amended, were as follows:
| ||||||||||||||||||||||||||||||||||||
| Affiliated Issuer | Value at 09/30/19 | Purchases at Cost | Proceeds from Sale | Net Realized Gain (Loss) | Change in Unrealized Appreciation (Depreciation) | Value at 09/30/20 | Shares Held at 09/30/20 | Income | Capital Gain Distributions from Underlying Funds | |||||||||||||||||||||||||||
| ||||||||||||||||||||||||||||||||||||
BlackRock Liquidity Funds, T-Fund, Institutional Class | $ | 227,834,577 | $ | — | $ | (10,056,663 | )(a) | $ | — | $ | — | $ | 217,777,914 | 217,777,914 | $ | 894,474 | $ | 19 | ||||||||||||||||||
SL Liquidity Series, LLC, Money Market Series | 159,609,574 | 44,362,654 | (a) | — | (25,639 | ) | 95,877 | 204,042,466 | 203,960,882 | 1,625,755 | (b) | — | ||||||||||||||||||||||||
|
|
|
|
|
|
|
|
|
| |||||||||||||||||||||||||||
| $ | (25,639 | ) | $ | 95,877 | $ | 421,820,380 | $ | 2,520,229 | $ | 19 | ||||||||||||||||||||||||||
|
|
|
|
|
|
|
|
|
| |||||||||||||||||||||||||||
| (a) | Represents net amount purchased (sold). |
| (b) | All or a portion represents securities lending income earned from the reinvestment of cash collateral from loaned securities, net of fees and collateral investment expenses, and other payments to and from borrowers of securities. |
For Fund compliance purposes, the Fund’s industry classifications refer to one or more of the industry sub-classifications used by one or more widely recognized market indexes or rating group indexes, and/or as defined by the investment adviser. These definitions may not apply for purposes of this report, which may combine such industry subclassifications for reporting ease.
Derivative Financial Instruments Categorized by Risk Exposure
For the year ended September 30, 2020, the effect of derivative financial instruments in the Statements of Operations was as follows:
| Commodity Contracts | Credit Contracts | Equity Contracts | Foreign Currency Exchange Contracts | Interest Rate Contracts | Other Contracts | Total | ||||||||||||||||||||||
Net Realized Gain (Loss) from | ||||||||||||||||||||||||||||
Forward foreign currency exchange contracts | $ | — | $ | — | $ | — | $ | 598,301 | $ | — | $ | — | $ | 598,301 | ||||||||||||||
|
|
|
|
|
|
|
|
|
|
|
|
|
| |||||||||||||||
Net Change in Unrealized Appreciation (Depreciation) on | ||||||||||||||||||||||||||||
Forward foreign currency exchange contracts | $ | — | $ | — | $ | — | $ | (4,310,704 | ) | $ | — | $ | — | $ | (4,310,704 | ) | ||||||||||||
|
|
|
|
|
|
|
|
|
|
|
|
|
| |||||||||||||||
Average Quarterly Balances of Outstanding Derivative Financial Instruments
Forward foreign currency exchange contracts | ||||
Average amounts purchased — in USD | $ | 59,467,386 | ||
Average amounts sold — in USD | $ | 20,481,253 |
For more information about the Fund’s investment risks regarding derivative financial instruments, refer to the Notes to Financial Statements.
Fair Value Hierarchy as of Period End
Various inputs are used in determining the fair value of financial instruments. For description of the input levels and information about the Fund’s policy regarding valuation of financial instruments, refer to the Notes to Financial Statements.
The following table summarizes the Fund’s investments categorized in the disclosure hierarchy. The breakdown of the Fund’s investments into major categories is disclosed in the Schedule of Investments above.
| ||||||||||||||||
| Level 1 | Level 2 | Level 3 | Total | |||||||||||||
| ||||||||||||||||
Assets | ||||||||||||||||
Investments | ||||||||||||||||
Long-Term Investments | ||||||||||||||||
Common Stocks | ||||||||||||||||
Biotechnology | $ | 1,865,932,143 | $ | 104,496,632 | $ | 39,874,559 | $ | 2,010,303,334 | ||||||||
Diversified Financial Services | 36,368,264 | — | — | 36,368,264 | ||||||||||||
Health Care Equipment & Supplies | 2,833,289,684 | 62,265,863 | — | 2,895,555,547 | ||||||||||||
Health Care Providers & Services | 1,685,923,525 | 49,429,659 | — | 1,735,353,184 | ||||||||||||
Health Care Technology | 102,473,105 | — | — | 102,473,105 | ||||||||||||
Insurance | 13,078,366 | — | — | 13,078,366 | ||||||||||||
| 30 | 2 0 2 0 BLACK ROCK ANNUAL REPORT TO SHAREHOLDERS |
Schedule of Investments (continued) September 30, 2020 | BlackRock Health Sciences Opportunities Portfolio |
| Level 1 | Level 2 | Level 3 | Total | |||||||||||||
Common Stocks (continued) | ||||||||||||||||
Life Sciences Tools & Services | $ | 624,205,618 | $ | 117,389,633 | $ | — | $ | 741,595,251 | ||||||||
Pharmaceuticals | 1,494,949,190 | 443,975,230 | — | 1,938,924,420 | ||||||||||||
Corporate Bonds | — | — | 5,050,000 | 5,050,000 | ||||||||||||
Other Interests | — | — | 4,549,451 | 4,549,451 | ||||||||||||
Preferred Securities(a) | — | 15,522,934 | 7,414,521 | 22,937,455 | ||||||||||||
Short-Term Securities | ||||||||||||||||
Money Market Funds | 217,777,914 | — | — | 217,777,914 | ||||||||||||
|
|
|
|
|
|
|
| |||||||||
| $ | 8,873,997,809 | $ | 793,079,951 | $ | 56,888,531 | 9,723,966,291 | ||||||||||
|
|
|
|
|
|
|
| |||||||||
Investments Valued at NAV(b) | 204,042,466 | |||||||||||||||
|
| |||||||||||||||
| $ | 9,928,008,757 | |||||||||||||||
|
| |||||||||||||||
| (a) | See above Schedule of Investments for values in each industry. |
| (b) | Certain investments of the Fund were fair valued using NAV per share as no quoted market value is available and therefore have been excluded from the fair value hierarchy. |
See notes to financial statements.
S C H E D U L E S O F I N V E S T M E N T S | 31 |
Schedule of Investments September 30, 2020 | BlackRock Mid-Cap Growth Equity Portfolio (Percentages shown are based on Net Assets) |
| Security | Shares | Value | ||||||
Common Stocks |
| |||||||
| Aerospace & Defense — 3.9% | ||||||||
HEICO Corp.(a) | 1,425,416 | $ | 149,184,039 | |||||
Mercury Systems, Inc.(a)(b) | 1,578,399 | 122,262,786 | ||||||
Teledyne Technologies, Inc.(b) | 417,599 | 129,543,386 | ||||||
|
| |||||||
| 400,990,211 | ||||||||
| Automobiles — 1.3% | ||||||||
Ferrari NV | 761,404 | 140,166,862 | ||||||
|
| |||||||
| Banks — 0.6% | ||||||||
SVB Financial Group(b) | 251,446 | 60,502,936 | ||||||
|
| |||||||
| Building Products — 0.4% | ||||||||
AZEK Co., Inc.(a)(b) | 1,208,959 | 42,083,863 | ||||||
|
| |||||||
| Capital Markets — 7.9% | ||||||||
KKR & Co., Inc. | 4,707,314 | 161,649,163 | ||||||
MarketAxess Holdings, Inc. | 408,638 | 196,795,974 | ||||||
MSCI, Inc. | 776,548 | 277,056,796 | ||||||
Tradeweb Markets, Inc., Class A(a) | 3,207,930 | 186,059,940 | ||||||
|
| |||||||
| 821,561,873 | ||||||||
| Commercial Services & Supplies — 4.1% | ||||||||
Copart, Inc.(a)(b) | 2,980,437 | 313,422,755 | ||||||
Waste Connections, Inc.(a) | 1,043,145 | 108,278,451 | ||||||
|
| |||||||
| 421,701,206 | ||||||||
| Distributors — 1.0% | ||||||||
Pool Corp. | 309,355 | 103,491,622 | ||||||
|
| |||||||
| Diversified Consumer Services — 0.3% | ||||||||
Bright Horizons Family Solutions, Inc.(a)(b) | 225,977 | 34,357,543 | ||||||
|
| |||||||
| Diversified Telecommunication Services — 2.0% | ||||||||
GCI Liberty, Inc., Class A(b) | 2,533,386 | 207,636,317 | ||||||
|
| |||||||
| Electronic Equipment, Instruments & Components — 0.7% | ||||||||
Keysight Technologies, Inc.(a)(b) | 685,618 | 67,725,346 | ||||||
|
| |||||||
| Entertainment — 2.2% | ||||||||
Liberty Media Corp. - Liberty Formula One, Class C(b) | 4,070,453 | 147,635,331 | ||||||
Madison Square Garden Sports Corp.(a)(b) | 211,236 | 31,786,793 | ||||||
Netflix, Inc.(b) | 92,743 | 46,374,282 | ||||||
|
| |||||||
| 225,796,406 | ||||||||
| Equity Real Estate Investment Trusts (REITs) — 1.8% | ||||||||
Rexford Industrial Realty, Inc. | 1,840,667 | 84,228,922 | ||||||
SBA Communications Corp. | 334,030 | 106,381,874 | ||||||
|
| |||||||
| 190,610,796 | ||||||||
| Health Care Equipment & Supplies — 13.9% | ||||||||
Cooper Cos., Inc.(a) | 421,087 | 141,956,849 | ||||||
DexCom, Inc.(b) | 182,375 | 75,180,446 | ||||||
IDEXX Laboratories, Inc.(b) | 735,281 | 289,046,314 | ||||||
Masimo Corp.(b) | 1,154,052 | 272,425,515 | ||||||
STERIS PLC | 1,033,703 | 182,128,132 | ||||||
Teleflex, Inc. | 643,021 | 218,897,209 | ||||||
West Pharmaceutical Services, Inc. | 943,072 | 259,250,493 | ||||||
|
| |||||||
| 1,438,884,958 | ||||||||
| Hotels, Restaurants & Leisure — 2.9% | ||||||||
Churchill Downs, Inc.(a) | 1,001,183 | 164,013,799 | ||||||
Domino’s Pizza, Inc. | 77,529 | 32,971,533 | ||||||
Planet Fitness, Inc., Class A(a)(b) | 1,608,323 | 99,104,863 | ||||||
|
| |||||||
| 296,090,195 | ||||||||
| Security | Shares | Value | ||||||
| Interactive Media & Services — 2.3% | ||||||||
IAC/InterActiveCorp(b) | 491,770 | $ | 58,904,211 | |||||
Match Group, Inc.(a)(b) | 1,580,171 | 174,845,921 | ||||||
|
| |||||||
| 233,750,132 | ||||||||
| IT Services — 13.7% | ||||||||
Adyen NV(b)(c) | 155,911 | 287,577,012 | ||||||
Booz Allen Hamilton Holding Corp. | 1,967,503 | 163,263,399 | ||||||
Chindata Group Holdings Ltd., ADR(b) | 845,637 | 13,724,689 | ||||||
Jack Henry & Associates, Inc. | 612,665 | 99,613,202 | ||||||
MongoDB, Inc.(a)(b) | 668,432 | 154,748,692 | ||||||
Okta, Inc.(a)(b) | 1,204,320 | 257,543,832 | ||||||
Twilio, Inc., Class A(a)(b) | 1,038,871 | 256,694,636 | ||||||
Wix.com Ltd.(a)(b) | 733,674 | 186,976,819 | ||||||
|
| |||||||
| 1,420,142,281 | ||||||||
| Life Sciences Tools & Services — 5.1% | ||||||||
10X Genomics, Inc., Class A(a)(b) | 782,358 | 97,544,395 | ||||||
Bio-Techne Corp. | 898,902 | 222,684,993 | ||||||
Charles River Laboratories | 919,213 | 208,155,784 | ||||||
|
| |||||||
| 528,385,172 | ||||||||
| Machinery — 2.3% | ||||||||
Dover Corp. | 1,096,705 | 118,817,020 | ||||||
IDEX Corp. | 638,346 | 116,440,694 | ||||||
|
| |||||||
| 235,257,714 | ||||||||
| Media — 2.0% | ||||||||
Cable One, Inc.(a) | 108,222 | 204,045,005 | ||||||
|
| |||||||
| Pharmaceuticals — 1.6% | ||||||||
Catalent, Inc.(b) | 1,949,329 | 166,979,522 | ||||||
|
| |||||||
| Professional Services — 5.7% | ||||||||
CoStar Group, Inc.(a)(b) | 409,523 | 347,484,361 | ||||||
TransUnion | 1,047,122 | 88,094,374 | ||||||
Verisk Analytics, Inc.(a) | 832,341 | 154,241,110 | ||||||
|
| |||||||
| 589,819,845 | ||||||||
| Road & Rail — 0.9% | ||||||||
Old Dominion Freight Line, Inc. | 529,576 | 95,810,890 | ||||||
|
| |||||||
| Semiconductors & Semiconductor Equipment — 5.3% | ||||||||
Cree, Inc.(a)(b) | 700,822 | 44,670,394 | ||||||
Entegris, Inc. | 3,609,478 | 268,328,595 | ||||||
Monolithic Power Systems, Inc. | 854,463 | 238,916,399 | ||||||
|
| |||||||
| 551,915,388 | ||||||||
| Software — 17.1% | ||||||||
Bill.com Holdings, Inc.(a)(b) | 587,589 | 58,941,053 | ||||||
Cadence Design Systems, Inc.(b) | 2,589,055 | 276,070,935 | ||||||
Coupa Software, Inc.(a)(b) | 728,255 | 199,716,651 | ||||||
Fair Isaac Corp.(a)(b) | 693,046 | 294,807,907 | ||||||
Globant SA(a)(b) | 725,760 | 130,070,707 | ||||||
Palantir Technologies, Inc., Class A (Acquired 02/07/14, cost $2,249,526)(b)(d) | 366,970 | 3,313,739 | ||||||
Paycom Software, Inc.(b) | 916,543 | 285,319,836 | ||||||
RealPage, Inc.(a)(b) | 1,157,409 | 66,713,055 | ||||||
Sumo Logic, Inc.(b) | 108,527 | 2,365,889 | ||||||
Synopsys, Inc.(a)(b) | 1,180,885 | 252,685,772 | ||||||
Tyler Technologies, Inc.(a)(b) | 404,065 | 140,840,896 | ||||||
Unity Software, Inc.(a)(b) | 668,065 | 58,308,713 | ||||||
|
| |||||||
| 1,769,155,153 | ||||||||
| Specialty Retail — 0.7% | ||||||||
Vroom, Inc.(a)(b) | 1,499,270 | 77,632,201 | ||||||
|
| |||||||
Total Common Stocks — 99.7% |
| 10,324,493,437 | ||||||
|
| |||||||
| 32 | 2 0 2 0 BLACK ROCK ANNUAL REPORT TO SHAREHOLDERS |
Schedule of Investments (continued) September 30, 2020 | BlackRock Mid-Cap Growth Equity Portfolio (Percentages shown are based on Net Assets) |
| Security | Shares | Value | ||||||
Preferred Securities |
| |||||||
| Preferred Stocks — 0.2% | ||||||||
| Internet & Direct Marketing Retail — 0.2% | ||||||||
Postmates, Inc., Series F (Acquired 01/08/19, cost $16,580,003)(b)(d)(e) | 2,077,929 | $ | 26,410,477 | |||||
|
| |||||||
Total Preferred Securities — 0.2% |
| 26,410,477 | ||||||
|
| |||||||
Total Long-Term Investments — 99.9% | 10,350,903,914 | |||||||
|
| |||||||
Short-Term Securities(f)(g) | ||||||||
| Money Market Funds — 4.0% | ||||||||
BlackRock Liquidity Funds, T-Fund, Institutional Class, 0.02% | 29,537,549 | 29,537,549 | ||||||
SL Liquidity Series, LLC, Money Market Series, 0.25%(h) | 383,826,724 | 383,980,255 | ||||||
|
| |||||||
Total Short-Term Securities — 4.0% |
| 413,517,804 | ||||||
|
| |||||||
Total Investments — 103.9% |
| 10,764,421,718 | ||||||
Liabilities in Excess of Other Assets — (3.9)% |
| (408,407,855 | ) | |||||
|
| |||||||
Net Assets — 100.0% | $ | 10,356,013,863 | ||||||
|
| |||||||
| (a) | All or a portion of this security is on loan. |
| (b) | Non-income producing security. |
| (c) | Security exempt from registration pursuant to Rule 144A under the Securities Act of 1933, as amended. These securities may be resold in transactions exempt from registration to qualified institutional investors. |
| (d) | Restricted security as to resale, excluding 144A securities. The Fund held restricted securities with a current value of $29,724,216, representing 0.3% of its net assets as of period end, and an original cost of $18,829,529. |
| (e) | Security is valued using significant unobservable inputs and is classified as Level 3 in the fair value hierarchy. |
| (f) | Affiliate of the Fund. |
| (g) | Annualized 7-day yield as of period end. |
| (h) | All or a portion of this security was purchased with the cash collateral from loaned securities. |
Affiliates
Investments in issuers considered to be affiliate(s) of the Fund during the year ended September 30, 2020 for purposes of Section 2(a)(3) of the Investment Company Act of 1940, as amended, were as follows:
| Affiliated Issuer | Value at 09/30/19 | Purchases at Cost | Proceeds from Sale | Net Realized Gain (Loss) | Change in Unrealized Appreciation (Depreciation) | Value at 09/30/20 | Shares Held at 09/30/20 | Income | Capital Gain Distributions from Underlying Funds | |||||||||||||||||||||||||||
BlackRock Liquidity Funds, T-Fund, Institutional Class | $ | 44,963,337 | $ | — | $ | (15,425,788 | )(a) | $ | — | $ | — | $ | 29,537,549 | 29,537,549 | $ | 401,465 | $ | 65 | ||||||||||||||||||
SL Liquidity Series, LLC, Money Market Series | 287,440,891 | 96,618,023 | (a) | — | (171,564 | ) | 92,905 | 383,980,255 | 383,826,724 | 2,470,585 | (b) | — | ||||||||||||||||||||||||
Tradeweb Markets, Inc., | 85,307,054 | 43,132,055 | (385,616 | ) | (27,454 | ) | 5,206,594 | N/A | N/A | 924,654 | — | |||||||||||||||||||||||||
|
|
|
|
|
|
|
|
|
| |||||||||||||||||||||||||||
| $ | (199,018 | ) | $ | 5,299,499 | $ | 413,517,804 | $ | 3,796,704 | $ | 65 | ||||||||||||||||||||||||||
|
|
|
|
|
|
|
|
|
| |||||||||||||||||||||||||||
| (a) | Represents net amount purchased (sold). |
| (b) | All or a portion represents securities lending income earned from the reinvestment of cash collateral from loaned securities, net of fees and collateral investment expenses, and other payments to and from borrowers of securities. |
| (c) | As of period end, the entity is no longer an affiliate. |
For Fund compliance purposes, the Fund’s industry classifications refer to one or more of the industry sub-classifications used by one or more widely recognized market indexes or rating group indexes, and/or as defined by the investment adviser. These definitions may not apply for purposes of this report, which may combine such industry subclassifications for reporting ease.
Fair Value Hierarchy as of Period End
Various inputs are used in determining the fair value of financial instruments. For description of the input levels and information about the Fund’s policy regarding valuation of financial instruments, refer to the Notes to Financial Statements.
S C H E D U L E S O F I N V E S T M E N T S | 33 |
Schedule of Investments (continued) September 30, 2020 | BlackRock Mid-Cap Growth Equity Portfolio |
The following table summarizes the Fund’s investments categorized in the disclosure hierarchy. The breakdown of the Fund’s investments into major categories is disclosed in the Schedule of Investments above.
| Level 1 | Level 2 | Level 3 | Total | |||||||||||||
Assets | ||||||||||||||||
Investments | ||||||||||||||||
Long-Term Investments | ||||||||||||||||
Common Stocks | ||||||||||||||||
Aerospace & Defense | $ | 400,990,211 | $ | — | $ | — | $ | 400,990,211 | ||||||||
Automobiles | 140,166,862 | — | — | 140,166,862 | ||||||||||||
Banks | 60,502,936 | — | — | 60,502,936 | ||||||||||||
Building Products | 42,083,863 | — | — | 42,083,863 | ||||||||||||
Capital Markets | 821,561,873 | — | — | 821,561,873 | ||||||||||||
Commercial Services & Supplies | 421,701,206 | — | — | 421,701,206 | ||||||||||||
Distributors | 103,491,622 | — | — | 103,491,622 | ||||||||||||
Diversified Consumer Services | 34,357,543 | — | — | 34,357,543 | ||||||||||||
Diversified Telecommunication Services | 207,636,317 | — | — | 207,636,317 | ||||||||||||
Electronic Equipment, Instruments & Components | 67,725,346 | — | — | 67,725,346 | ||||||||||||
Entertainment | 225,796,406 | — | — | 225,796,406 | ||||||||||||
Equity Real Estate Investment Trusts (REITs) | 190,610,796 | — | — | 190,610,796 | ||||||||||||
Health Care Equipment & Supplies | 1,438,884,958 | — | — | 1,438,884,958 | ||||||||||||
Hotels, Restaurants & Leisure | 296,090,195 | — | — | 296,090,195 | ||||||||||||
Interactive Media & Services | 233,750,132 | — | — | 233,750,132 | ||||||||||||
IT Services | 1,132,565,269 | 287,577,012 | — | 1,420,142,281 | ||||||||||||
Life Sciences Tools & Services | 528,385,172 | — | — | 528,385,172 | ||||||||||||
Machinery | 235,257,714 | — | — | 235,257,714 | ||||||||||||
Media | 204,045,005 | — | — | 204,045,005 | ||||||||||||
Pharmaceuticals | 166,979,522 | — | — | 166,979,522 | ||||||||||||
Professional Services | 589,819,845 | — | — | 589,819,845 | ||||||||||||
Road & Rail | 95,810,890 | — | — | 95,810,890 | ||||||||||||
Semiconductors & Semiconductor Equipment | 551,915,388 | — | — | 551,915,388 | ||||||||||||
Software | 1,765,841,414 | 3,313,739 | — | 1,769,155,153 | ||||||||||||
Specialty Retail | 77,632,201 | — | — | 77,632,201 | ||||||||||||
Preferred Securities | — | — | 26,410,477 | 26,410,477 | ||||||||||||
Short-Term Securities | ||||||||||||||||
Money Market Funds | 29,537,549 | — | — | 29,537,549 | ||||||||||||
|
|
|
|
|
|
|
| |||||||||
| $ | 10,063,140,235 | $ | 290,890,751 | $ | 26,410,477 | 10,380,441,463 | ||||||||||
|
|
|
|
|
|
|
| |||||||||
Investments Valued at NAV(a) | 383,980,255 | |||||||||||||||
|
| |||||||||||||||
| $ | 10,764,421,718 | |||||||||||||||
|
| |||||||||||||||
| (a) | Certain investments of the Fund were fair valued using NAV per share as no quoted market value is available and therefore have been excluded from the fair value hierarchy. |
See notes to financial statements.
| 34 | 2 0 2 0 BLACK ROCK ANNUAL REPORT TO SHAREHOLDERS |
Schedule of Investments September 30, 2020 | BlackRock Technology Opportunities Fund (Percentages shown are based on Net Assets) |
| Security | Shares | Value | ||||||
Common Stocks |
| |||||||
| Automobiles — 2.7% | ||||||||
NIO, Inc., ADR(a) | 1,358,002 | $ | 28,816,803 | |||||
Tesla, Inc.(a) | 306,810 | 131,624,558 | ||||||
|
| |||||||
| 160,441,361 | ||||||||
| Banks — 0.2% | ||||||||
Klarna Holdings AB (Acquired 09/15/20, cost $11,017,172)(a)(b)(c) | 25,600 | 10,816,438 | ||||||
|
| |||||||
| Chemicals — 1.6% | ||||||||
LG Chem Ltd. | 166,476 | 92,921,883 | ||||||
|
| |||||||
| Diversified Consumer Services — 1.9% | ||||||||
Arco Platform Ltd., Class A(a) | 192,934 | 7,879,424 | ||||||
Chegg, Inc.(a) | 742,363 | 53,034,413 | ||||||
TAL Education Group, ADR(a) | 709,278 | 53,933,499 | ||||||
|
| |||||||
| 114,847,336 | ||||||||
| Diversified Financial Services — 0.4% | ||||||||
Reinvent Technology Partners(a) | 1,447,600 | 16,632,779 | ||||||
TransferWise (Acquired 06/03/19, cost $3,861,759)(a)(b)(c) | 43,665 | 5,468,168 | ||||||
|
| |||||||
| 22,100,947 | ||||||||
| Diversified Telecommunication Services — 0.6% | ||||||||
Bandwidth, Inc., Class A(a)(d) | 200,076 | 34,927,267 | ||||||
|
| |||||||
| Entertainment — 4.4% | ||||||||
Activision Blizzard, Inc. | 685,960 | 55,528,462 | ||||||
NetEase, Inc., ADR | 110,647 | 50,307,871 | ||||||
Netflix, Inc.(a) | 52,901 | 26,452,087 | ||||||
Roku, Inc.(a) | 249,182 | 47,045,562 | ||||||
Tencent Music Entertainment Group, | 3,240,052 | 47,855,568 | ||||||
Warner Music Group Corp., Class A | 1,161,550 | 33,382,947 | ||||||
|
| |||||||
| 260,572,497 | ||||||||
| Equity Real Estate Investment Trusts (REITs) — 0.5% | ||||||||
Equinix, Inc. | 37,031 | 28,148,374 | ||||||
|
| |||||||
| Health Care Technology — 1.4% | ||||||||
Ping An Healthcare and Technology Co. | 2,676,959 | 34,540,424 | ||||||
Teladoc Health, Inc.(a)(d) | 217,497 | 47,684,042 | ||||||
|
| |||||||
| 82,224,466 | ||||||||
| Interactive Media & Services — 9.6% | ||||||||
Alphabet, Inc., Class A(a) | 62,205 | 91,167,648 | ||||||
Facebook, Inc., Class A(a) | 264,390 | 69,243,741 | ||||||
Kakao Corp. | 278,882 | 86,719,360 | ||||||
Pinterest, Inc., Class A(a) | 1,245,075 | 51,683,063 | ||||||
Snap, Inc., Class A(a) | 1,849,803 | 48,298,357 | ||||||
Tencent Holdings Ltd. | 1,714,700 | 115,816,651 | ||||||
Yandex NV, Class A(a) | 684,499 | 44,663,560 | ||||||
ZoomInfo Technologies, Inc., Class A(a) | 1,311,872 | 56,397,377 | ||||||
|
| |||||||
| 563,989,757 | ||||||||
| Internet & Direct Marketing Retail — 11.0% | ||||||||
Alibaba Group Holding Ltd., ADR(a) | 446,653 | 131,307,049 | ||||||
Amazon.com, Inc.(a) | 50,150 | 157,908,809 | ||||||
Delivery Hero SE(a)(e) | 531,407 | 60,973,604 | ||||||
Ensogo Ltd.(a)(b) | 94,425 | 1 | ||||||
Farfetch Ltd., Class A(a)(d) | 1,884,429 | 47,412,234 | ||||||
Jasper Infotech Private Ltd. (Acquired 05/07/14, cost $1,414,399)(a)(b)(c) | 1,900 | 457,672 | ||||||
Meituan Dianping, Class B(a) | 1,956,730 | 61,639,547 | ||||||
MercadoLibre, Inc.(a) | 65,653 | 71,068,059 | ||||||
Pinduoduo, Inc., ADR(a) | 562,390 | 41,701,219 | ||||||
| Security | Shares | Value | ||||||
| Internet & Direct Marketing Retail (continued) | ||||||||
THG Holdings Ltd.(a) | 3,890,450 | $ | 30,030,029 | |||||
Zalando SE(a)(e) | 487,810 | 45,576,301 | ||||||
|
| |||||||
| 648,074,524 | ||||||||
| IT Services — 13.9% | ||||||||
Adyen NV(a)(e) | 26,345 | 48,593,213 | ||||||
GDS Holdings Ltd., ADR(a)(d) | 597,539 | 48,896,616 | ||||||
GMO Payment Gateway, Inc. | 404,400 | 43,320,405 | ||||||
Mastercard, Inc., Class A | 220,843 | 74,682,477 | ||||||
MongoDB, Inc.(a)(d) | 172,038 | 39,828,517 | ||||||
Okta, Inc.(a) | 219,247 | 46,885,971 | ||||||
Pagseguro Digital Ltd., Class A(a)(d) | 924,607 | 34,866,930 | ||||||
PayPal Holdings, Inc.(a) | 499,738 | 98,463,378 | ||||||
Shopify, Inc., Class A(a) | 56,091 | 57,379,410 | ||||||
Snowflake, Inc., Class A(a) | 53,853 | 13,517,103 | ||||||
Square, Inc., Class A(a) | 636,512 | 103,465,026 | ||||||
StoneCo Ltd., Class A(a) | 1,071,550 | 56,674,280 | ||||||
Twilio, Inc., Class A(a)(d) | 341,548 | 84,393,095 | ||||||
Visa, Inc., Class A | 355,248 | 71,038,943 | ||||||
|
| |||||||
| 822,005,364 | ||||||||
| Multiline Retail — 1.1% | ||||||||
Magazine Luiza SA | 4,106,711 | 65,484,779 | ||||||
|
| |||||||
| Professional Services — 0.8% | ||||||||
Clarivate PLC(a) | 1,553,088 | 48,130,197 | ||||||
|
| |||||||
| Real Estate Management & Development — 0.8% | ||||||||
KE Holdings, Inc., ADR(a)(d) | 788,616 | 48,342,161 | ||||||
|
| |||||||
| Semiconductors & Semiconductor Equipment — 14.5% | ||||||||
Advanced Micro Devices, Inc.(a) | 1,052,789 | 86,318,170 | ||||||
Analog Devices, Inc. | 320,606 | 37,427,544 | ||||||
ASML Holding NV | 162,915 | 60,176,762 | ||||||
Cree, Inc.(a)(d) | 849,073 | 54,119,913 | ||||||
Inphi Corp.(a)(d) | 547,105 | 61,412,536 | ||||||
Lam Research Corp. | 201,502 | 66,848,289 | ||||||
Marvell Technology Group Ltd. | 1,815,936 | 72,092,659 | ||||||
Monolithic Power Systems, Inc. | 223,337 | 62,447,259 | ||||||
NVIDIA Corp. | 121,036 | 65,507,104 | ||||||
NXP Semiconductors NV | 398,317 | 49,713,945 | ||||||
Skyworks Solutions, Inc. | 376,611 | 54,796,901 | ||||||
SOITEC(a) | 387,871 | 55,852,084 | ||||||
STMicroelectronics NV | 2,077,397 | 63,714,161 | ||||||
Taiwan Semiconductor Manufacturing Co. Ltd., ADR | 825,783 | 66,946,228 | ||||||
|
| |||||||
| 857,373,555 | ||||||||
| Software — 22.9% | ||||||||
Adobe, Inc.(a)(d) | 112,009 | 54,932,574 | ||||||
Agora, Inc., ADR(a)(d) | 530,914 | 22,818,684 | ||||||
Altium Ltd. | 1,621,801 | 42,168,937 | ||||||
Atlassian Corp. PLC, Class A(a)(d) | 283,212 | 51,485,109 | ||||||
Autodesk, Inc.(a) | 206,202 | 47,634,724 | ||||||
Avalara, Inc.(a) | 304,009 | 38,712,506 | ||||||
Cadence Design Systems, Inc.(a) | 461,492 | 49,208,892 | ||||||
Crowdstrike Holdings, Inc., Class A(a)(d) | 366,027 | 50,262,828 | ||||||
Databricks, Inc. (Acquired 07/24/20-09/02/20, cost $5,122,891)(a)(b)(c) | 106,661 | 5,119,728 | ||||||
DocuSign, Inc.(a) | 201,481 | 43,366,770 | ||||||
Elastic NV(a) | 428,474 | 46,228,060 | ||||||
Fair Isaac Corp.(a) | 102,713 | 43,692,056 | ||||||
Globant SA(a) | 244,576 | 43,832,911 | ||||||
Intuit, Inc. | 154,345 | 50,348,882 | ||||||
Kingdee International Software Group Co. Ltd. | 18,961,000 | 49,456,046 | ||||||
Microsoft Corp. | 1,012,178 | 212,891,399 | ||||||
S C H E D U L E S O F I N V E S T M E N T S | 35 |
Schedule of Investments (continued) September 30, 2020 | BlackRock Technology Opportunities Fund (Percentages shown are based on Net Assets) |
| Security | Shares | Value | ||||||
| Software (continued) | ||||||||
Palantir Technologies, Inc., Class A (Acquired 02/07/14, cost | 195,760 | $ | 1,767,713 | |||||
Palantir Technologies, Inc., Class A(a) | 48,940 | 464,930 | ||||||
Paycom Software, Inc.(a) | 112,315 | 34,963,660 | ||||||
RingCentral, Inc., Class A(a) | 202,316 | 55,557,997 | ||||||
salesforce.com, Inc.(a) | 212,519 | 53,410,275 | ||||||
ServiceNow, Inc.(a) | 138,199 | 67,026,515 | ||||||
Splunk, Inc.(a)(d) | 237,341 | 44,650,962 | ||||||
SVMK, Inc.(a) | 726,654 | 16,066,320 | ||||||
TeamViewer AG(a)(e) | 808,310 | 39,865,958 | ||||||
Think & Learn Private Ltd. (Acquired 09/30/20, cost $3,427,642)(a)(b)(c) | 2,241 | 3,405,767 | ||||||
Vertex, Inc., Class A(a) | 134,223 | 3,087,129 | ||||||
Weimob, Inc.(a)(d)(e) | 26,452,000 | 35,792,824 | ||||||
Xero Ltd.(a) | 522,176 | 38,090,190 | ||||||
Zoom Video Communications, Inc., Class A(a) | 97,166 | 45,678,708 | ||||||
Zscaler, Inc.(a)(d) | 405,060 | 56,987,891 | ||||||
|
| |||||||
| 1,348,976,945 | ||||||||
| Specialty Retail — 0.7% | ||||||||
Vroom, Inc.(a)(d) | 812,107 | 42,050,901 | ||||||
|
| |||||||
| Technology Hardware, Storage & Peripherals — 4.3% | ||||||||
Apple Inc. | 2,187,408 | 253,323,721 | ||||||
|
| |||||||
Total Common Stocks — 93.3% |
| 5,504,752,473 | ||||||
|
| |||||||
Preferred Securities | ||||||||
Preferred Stocks — 1.3% | ||||||||
| Diversified Financial Services — 0.1% | ||||||||
TransferWise | ||||||||
Series A (Acquired 06/03/19, cost $1,569,103)(a)(b)(c) | 17,742 | 2,221,831 | ||||||
Series B (Acquired 06/03/19, cost $450,607)(a)(b)(c) | 5,095 | 638,047 | ||||||
Series C (Acquired 06/03/19, cost $251,969)(a)(b)(c) | 2,849 | 356,780 | ||||||
Series D (Acquired 06/03/19, cost $69,694)(a)(b)(c) | 788 | 98,681 | ||||||
Series E (Acquired 06/03/19, cost $7,429)(a)(b)(c) | 84 | 10,519 | ||||||
TransferWise (Seed Preferred) (Acquired 06/03/19, cost $1,327,042)(a)(b)(c) | 15,005 | 1,879,076 | ||||||
|
| |||||||
| 5,204,934 | ||||||||
| Food Products — 0.1% | ||||||||
Farmer’s Business Network, Inc., Series F (Acquired 07/31/20, cost | 194,200 | 6,420,252 | ||||||
|
| |||||||
| Internet & Direct Marketing Retail — 0.2% | ||||||||
Postmates, Inc., Series F (Acquired 01/08/19, cost $6,260,003)(a)(b)(c) | 784,550 | 9,971,631 | ||||||
|
| |||||||
| Road & Rail — 0.1% | ||||||||
FlixMobility GmbH, Series F (Acquired 07/26/19, cost $2,492,260)(a)(b)(c) | 125 | 1,284,656 | ||||||
Xiaoju Kuaizhi, Inc., Series A-17 (Acquired 07/28/15, cost | 39,400 | 1,929,812 | ||||||
|
| |||||||
| 3,214,468 | ||||||||
| Security | Shares | Value | ||||||
| Semiconductors & Semiconductor Equipment — 0.2% | ||||||||
PsiQuantum Corp., Series C (Acquired 09/09/19, cost $2,698,453)(a)(b)(c) | 581,814 | $ | 2,687,981 | |||||
SambaNova Systems, Inc., Series C (Acquired 02/20/20, cost | 184,153 | 10,224,174 | ||||||
|
| |||||||
| 12,912,155 | ||||||||
| Software — 0.6% | ||||||||
Avidxchange, Inc. (Acquired 07/29/20, cost $3,798,430)(a)(b)(c) | 77,500 | 3,798,275 | ||||||
C3 AI, Inc., Series H (Acquired 08/14/19, cost $5,995,815)(a)(b)(c) | 1,190,000 | 6,318,900 | ||||||
Databricks, Inc., Series F (Acquired 10/22/19, cost $3,700,005)(a)(b)(c) | 86,150 | 4,135,200 | ||||||
GitLab, Inc., Series E (Acquired 09/10/19, cost $5,163,325)(a)(b)(c) | 277,160 | 5,917,366 | ||||||
Think & Learn Private Ltd., Series F (Acquired 09/30/20, cost | 2,371 | 6,846,337 | ||||||
Unqork, Inc., Series C (Acquired 09/18/20, cost $8,323,340)(a)(b)(c) | 7,600 | 8,323,340 | ||||||
|
| |||||||
| 35,339,418 | ||||||||
|
| |||||||
Total Preferred Securities — 1.3% | 73,062,858 | |||||||
|
| |||||||
Total Long-Term Investments — 94.6% | 5,577,815,331 | |||||||
|
| |||||||
| Short-Term Securities(f)(g) | ||||||||
| Money Market Funds — 10.4% | ||||||||
BlackRock Liquidity Funds, T-Fund, Institutional Class, 0.02% | 334,231,401 | 334,231,401 | ||||||
SL Liquidity Series, LLC, Money Market Series, 0.25%(h) | 281,290,097 | 281,402,613 | ||||||
|
| |||||||
Total Short-Term Securities — 10.4% |
| 615,634,014 | ||||||
|
| |||||||
Total Investments — 105.0% |
| 6,193,449,345 | ||||||
Liabilities in Excess of Other Assets — (5.0)% |
| (295,696,435 | ) | |||||
|
| |||||||
Net Assets — 100.0% |
| $ | 5,897,752,910 | |||||
|
| |||||||
| (a) | Non-income producing security. |
| (b) | Security is valued using significant unobservable inputs and is classified as Level 3 in the fair value hierarchy. |
| (c) | Restricted security as to resale, excluding 144A securities. The Fund held restricted securities with a current value of $100,098,344, representing 1.7% of its net assets as of period end, and an original cost of $92,323,851. |
| (d) | All or a portion of this security is on loan. |
| (e) | Security exempt from registration pursuant to Rule 144A under the Securities Act of 1933, as amended. These securities may be resold in transactions exempt from registration to qualified institutional investors. |
| (f) | Affiliate of the Fund. |
| (g) | Annualized 7-day yield as of period end. |
| (h) | All or a portion of this security was purchased with the cash collateral from loaned securities. |
| 36 | 2 0 2 0 BLACK ROCK ANNUAL REPORT TO SHAREHOLDERS |
Schedule of Investments (continued) September 30, 2020 | BlackRock Technology Opportunities Fund |
Affiliates
Investments in issuers considered to be affiliate(s) of the Fund during the year ended September 30, 2020 for purposes of Section 2(a)(3) of the Investment Company Act of 1940, as amended, were as follows:
| ||||||||||||||||||||||||||||||||||||
| Affiliated Issuer | Value at 09/30/19 | Purchases at Cost | Proceeds from Sale | Net Realized Gain (Loss) | Change in Unrealized Appreciation (Depreciation) | Value at 09/30/20 | Shares Held at 09/30/20 | Income | Capital Gain Distributions from Underlying Funds | |||||||||||||||||||||||||||
| ||||||||||||||||||||||||||||||||||||
BlackRock Liquidity Funds, T-Fund, Institutional Class | $ | 17,180,622 | $ | 317,050,779 | (a) | $ — | $ | — | $ | — | $ | 334,231,401 | 334,231,401 | $ | 617,982 | $ | 106 | |||||||||||||||||||
SL Liquidity Series, LLC, Money Market Series | 145,579,337 | 135,839,680 | (a) | — | (95,721 | ) | 79,317 | 281,402,613 | 281,290,097 | 2,490,108 | (b) | — | ||||||||||||||||||||||||
|
|
|
|
|
|
|
|
|
| |||||||||||||||||||||||||||
| $ | (95,721 | ) | $ | 79,317 | $ | 615,634,014 | $ | 3,108,090 | $ | 106 | ||||||||||||||||||||||||||
|
|
|
|
|
|
|
|
|
| |||||||||||||||||||||||||||
| (a) | Represents net amount purchased (sold). |
| (b) | All or a portion represents securities lending income earned from the reinvestment of cash collateral from loaned securities, net of fees and collateral investment expenses, and other payments to and from borrowers of securities. |
For Fund compliance purposes, the Fund’s industry classifications refer to one or more of the industry sub-classifications used by one or more widely recognized market indexes or rating group indexes, and/or as defined by the investment adviser. These definitions may not apply for purposes of this report, which may combine such industry subclassifications for reporting ease.
Derivative Financial Instruments Categorized by Risk Exposure
For the year ended September 30, 2020, the effect of derivative financial instruments in the Statements of Operations was as follows:
| Commodity Contracts | Credit Contracts | Equity Contracts | Foreign Currency Exchange Contracts | Interest Rate Contracts | Other Contracts | Total | ||||||||||||||||||||||
Net Realized Gain (Loss) from | ||||||||||||||||||||||||||||
Options purchased(a) | $ | — | $ | — | $ | (10,900 | ) | $ | — | $ | — | $ | — | $ | (10,900 | ) | ||||||||||||
Options written | — | — | 3,140,605 | — | — | — | 3,140,605 | |||||||||||||||||||||
|
|
|
|
|
|
|
|
|
|
|
|
|
| |||||||||||||||
| $ | — | $ | — | $ | 3,129,705 | $ | — | $ | — | $ | — | $ | 3,129,705 | |||||||||||||||
|
|
|
|
|
|
|
|
|
|
|
|
|
| |||||||||||||||
Net Change in Unrealized Appreciation (Depreciation) on | ||||||||||||||||||||||||||||
Options purchased(b) | $ | — | $ | — | $ | 2,015 | $ | — | $ | — | $ | — | $ | 2,015 | ||||||||||||||
Options written | — | — | (2,295,938 | ) | — | — | — | (2,295,938 | ) | |||||||||||||||||||
|
|
|
|
|
|
|
|
|
|
|
|
|
| |||||||||||||||
| $ | — | $ | — | $ | (2,293,923 | ) | $ | — | $ | — | $ | — | $ | (2,293,923 | ) | |||||||||||||
|
|
|
|
|
|
|
|
|
|
|
|
|
| |||||||||||||||
| (a) | Options purchased are included in net realized gain (loss) from investments — unaffiliated. |
| (b) | Options purchased are included in net change in unrealized appreciation (depreciation) on investments — unaffiliated. |
Average Quarterly Balances of Outstanding Derivative Financial Instruments
Options | ||||
Average value of option contracts purchased | $ | — | (a) | |
Average value of option contracts written | $ | — | (a) |
| (a) | Derivative not held at any quarter-end. The risk exposure table serves as an indicator of activity during the period. |
For more information about the Fund’s investment risks regarding derivative financial instruments, refer to the Notes to Financial Statements.
Fair Value Hierarchy as of Period End
Various inputs are used in determining the fair value of financial instruments. For description of the input levels and information about the Fund’s policy regarding valuation of financial instruments, refer to the Notes to Financial Statements.
S C H E D U L E S O F I N V E S T M E N T S | 37 |
Schedule of Investments (continued) September 30, 2020 | BlackRock Technology Opportunities Fund |
The following table summarizes the Fund’s investments categorized in the disclosure hierarchy. The breakdown of the Fund’s investments into major categories is disclosed in the Schedule of Investments above.
| Level 1 | Level 2 | Level 3 | Total | |||||||||||||
Assets | ||||||||||||||||
Investments | ||||||||||||||||
Long-Term Investments | ||||||||||||||||
Common Stocks | ||||||||||||||||
Automobiles | $ | 160,441,361 | $ | — | $ | — | $ | 160,441,361 | ||||||||
Banks | — | — | 10,816,438 | 10,816,438 | ||||||||||||
Chemicals | — | 92,921,883 | — | 92,921,883 | ||||||||||||
Diversified Consumer Services | 114,847,336 | — | — | 114,847,336 | ||||||||||||
Diversified Financial Services | 16,632,779 | — | 5,468,168 | 22,100,947 | ||||||||||||
Diversified Telecommunication Services | 34,927,267 | — | — | 34,927,267 | ||||||||||||
Entertainment | 260,572,497 | — | — | 260,572,497 | ||||||||||||
Equity Real Estate Investment Trusts (REITs) | 28,148,374 | — | — | 28,148,374 | ||||||||||||
Health Care Technology | 47,684,042 | 34,540,424 | — | 82,224,466 | ||||||||||||
Interactive Media & Services | 361,453,746 | 202,536,011 | — | 563,989,757 | ||||||||||||
Internet & Direct Marketing Retail | 479,427,399 | 168,189,452 | 457,673 | 648,074,524 | ||||||||||||
IT Services | 730,091,746 | 91,913,618 | — | 822,005,364 | ||||||||||||
Multiline Retail | 65,484,779 | — | — | 65,484,779 | ||||||||||||
Professional Services | 48,130,197 | — | — | 48,130,197 | ||||||||||||
Real Estate Management & Development | 48,342,161 | — | — | 48,342,161 | ||||||||||||
Semiconductors & Semiconductor Equipment | 677,630,548 | 179,743,007 | — | 857,373,555 | ||||||||||||
Software | 1,133,309,782 | 207,141,668 | 8,525,495 | 1,348,976,945 | ||||||||||||
Specialty Retail | 42,050,901 | — | — | 42,050,901 | ||||||||||||
Technology Hardware, Storage & Peripherals | 253,323,721 | — | — | 253,323,721 | ||||||||||||
Preferred Securities | — | — | 73,062,858 | 73,062,858 | ||||||||||||
Short-Term Securities | ||||||||||||||||
Money Market Funds | 334,231,401 | — | — | 334,231,401 | ||||||||||||
|
|
|
|
|
|
|
| |||||||||
| $ | 4,836,730,037 | $ | 976,986,063 | $ | 98,330,632 | 5,912,046,732 | ||||||||||
|
|
|
|
|
|
|
| |||||||||
Investments Valued at NAV(a) | 281,402,613 | |||||||||||||||
|
| |||||||||||||||
| $ | 6,193,449,345 | |||||||||||||||
|
| |||||||||||||||
| (a) | Certain investments of the Fund were fair valued using NAV per share as no quoted market value is available and therefore have been excluded from the fair value hierarchy. |
A reconciliation of Level 3 investments is presented when the Fund had a significant amount of Level 3 investments at the beginning and/or end of the period in relation to net assets. The following table is a reconciliation of Level 3 investments for which significant unobservable inputs were used in determining fair value:
Common Stocks | Preferred Securities | Total | ||||||||||
Opening Balance, as of September 30, 2019 | $ | 4,466,728 | $ | 30,773,810 | $ | 35,240,538 | ||||||
Transfers into Level 3 | — | — | — | |||||||||
Transfers out of Level 3 | (1,490,223 | ) | — | (1,490,223 | ) | |||||||
Accrued discounts/premiums | — | — | — | |||||||||
Other(a) | 1,490,223 | (1,490,223 | ) | — | ||||||||
Net realized gain (loss) | — | — | — | |||||||||
Net change in unrealized appreciation (depreciation)(b)(c) | 1,233,342 | 4,863,932 | 6,097,274 | |||||||||
Purchases | 19,567,704 | 38,915,339 | 58,483,043 | |||||||||
Sales | — | — | — | |||||||||
|
|
|
|
|
| |||||||
Closing Balance, as of September 30, 2020 | $ | 25,267,774 | $ | 73,062,858 | $ | 98,330,632 | ||||||
|
|
|
|
|
| |||||||
Net change in unrealized appreciation (depreciation) on investments still held at September 30, 2020(c) | $ | 1,233,342 | $ | 4,863,932 | $ | 6,097,274 | ||||||
|
|
|
|
|
| |||||||
| (a) | Certain Level 3 investments were re-classified between Common Stocks and Preferred Securities. |
| (b) | Included in the related net change in unrealized appreciation (depreciation) in the Statements of Operations. |
| (c) | Any difference between net change in unrealized appreciation (depreciation) and net change in unrealized appreciation (depreciation) on investments still held at September 30, 2020, is generally due to investments no longer held or categorized as Level 3 at period end. |
| 38 | 2 0 2 0 BLACK ROCK ANNUAL REPORT TO SHAREHOLDERS |
Schedule of Investments (continued) September 30, 2020 | BlackRock Technology Opportunities Fund |
The following table summarizes the valuation approaches used and unobservable inputs utilized by the BlackRock Global Valuation Methodologies Committee to determine the value of certain of the Fund’s Level 3 investments as of period end.
| Value | Valuation Approach | Unobservable Inputs | Range of Unobservable Inputs Utilized(a) | Weighted Average of Unobservable Inputs Based on Fair Value | ||||||||||||||||
Assets | ||||||||||||||||||||
Common Stocks | $ | 25,267,774 | Market | Revenue Multiple | 8.00x - 10.64x | 10.44x | ||||||||||||||
| Recent Transactions | — | — | ||||||||||||||||||
Preferred Securities(b)(c) | 73,062,858 | Revenue Multiple | 2.50x - 21.50x | 10.69x | ||||||||||||||||
| Market | Volatility | 55% - 61% | 60% | |||||||||||||||||
| Time to Exit | 3.0 - 5.0 | 3.4 | ||||||||||||||||||
| Recent Transactions | — | — | ||||||||||||||||||
|
| |||||||||||||||||||
| $ | 98,330,632 | |||||||||||||||||||
|
| |||||||||||||||||||
| (a) | A significant change in unobservable input would have resulted in a correlated (inverse) significant change to value. |
| (b) | For the period end September 30, 2020, the valuation technique for investments classified as Preferred Stocks amounting to $2,687,981 changed to Option Pricing Model. The investments were previously valued utilizing Transaction Price approach. The change was due to consideration of the information that was available at the time the investments were valued. |
| (c) | For the period end September 30, 2020, the valuation technique for investments classified as Preferred Stocks amounting to $15,450,734 changed to Current Value Method. The investments were previously valued utilizing Transaction Price approach. The change was due to consideration of the information that was available at the time the investments were valued. |
See notes to financial statements.
SCHEDULES OF INVESTMENTS | 39 |
Statements of Assets and Liabilities
September 30, 2020
BlackRock Advantage Small Cap Growth Fund | BlackRock Health Sciences Opportunities Portfolio | BlackRock Mid-Cap Growth Equity Portfolio | BlackRock Technology Opportunities Fund | |||||||||||||
| ||||||||||||||||
ASSETS | ||||||||||||||||
Investments at value — unaffiliated(a)(b) | $ | 700,761,798 | $ | 9,506,188,377 | $ | 10,350,903,914 | $ | 5,577,815,331 | ||||||||
Investments at value — affiliated(c) | 79,180,053 | 421,820,380 | 413,517,804 | 615,634,014 | ||||||||||||
Cash | 13,003 | — | — | — | ||||||||||||
Cash pledged: | ||||||||||||||||
Collateral — exchange-traded options written | — | — | — | 200 | ||||||||||||
Futures contracts | 1,975,000 | — | — | — | ||||||||||||
Foreign currency at value(d) | — | — | 1,758 | 6,150 | ||||||||||||
Receivables: | ||||||||||||||||
Investments sold | 5,440,669 | 374,251 | 950,096 | 3,311,865 | ||||||||||||
Securities lending income — affiliated | 39,404 | 46,741 | 58,520 | 157,485 | ||||||||||||
Capital shares sold | 1,335,269 | 14,278,370 | 30,127,673 | 15,530,324 | ||||||||||||
Dividends — affiliated | 1,138 | 8,801 | 1,341 | 12,492 | ||||||||||||
Dividends — unaffiliated | 209,488 | 7,162,723 | 823,216 | 927,513 | ||||||||||||
From the Manager | 58,139 | — | 139,259 | 99,006 | ||||||||||||
Deferred offering costs | — | — | — | 20,176 | ||||||||||||
Prepaid expenses | 44,149 | 164,015 | 205,686 | 132,645 | ||||||||||||
|
|
|
|
|
|
|
| |||||||||
Total assets | 789,058,110 | 9,950,043,658 | 10,796,729,267 | 6,213,647,201 | ||||||||||||
|
|
|
|
|
|
|
| |||||||||
LIABILITIES | ||||||||||||||||
Bank overdraft | — | — | — | 10,295,388 | ||||||||||||
Cash collateral on securities loaned at value | 55,194,927 | 203,934,414 | 384,031,669 | 281,413,885 | ||||||||||||
Payables: | ||||||||||||||||
Investments purchased | 6,267,020 | 27,483,408 | 29,216,543 | 6,102,758 | ||||||||||||
Administration fees | 22,821 | 426,057 | 311,557 | 169,242 | ||||||||||||
Capital shares redeemed | 1,563,444 | 20,375,230 | 18,458,974 | 11,953,175 | ||||||||||||
Investment advisory fees | 198,210 | 5,214,841 | 5,160,237 | 3,540,406 | ||||||||||||
Trustees’ and Officer’s fees | 2,660 | 29,187 | 28,597 | 5,058 | ||||||||||||
Other accrued expenses | 665,774 | 2,938,987 | 2,859,830 | 1,782,283 | ||||||||||||
Other affiliate fees | 2,381 | 106,081 | 970 | 522 | ||||||||||||
Service and distribution fees | 53,283 | 1,379,299 | 647,027 | 631,574 | ||||||||||||
Variation margin on futures contracts | 46,229 | — | — | — | ||||||||||||
|
|
|
|
|
|
|
| |||||||||
Total liabilities | 64,016,749 | 261,887,504 | 440,715,404 | 315,894,291 | ||||||||||||
|
|
|
|
|
|
|
| |||||||||
NET ASSETS | $ | 725,041,361 | $ | 9,688,156,154 | $ | 10,356,013,863 | $ | 5,897,752,910 | ||||||||
|
|
|
|
|
|
|
| |||||||||
NET ASSETS CONSIST OF | ||||||||||||||||
Paid-in capital | $ | 595,369,091 | $ | 5,625,155,875 | $ | 7,633,760,040 | $ | 3,523,839,346 | ||||||||
Accumulated earnings | 129,672,270 | 4,063,000,279 | 2,722,253,823 | 2,373,913,564 | ||||||||||||
|
|
|
|
|
|
|
| |||||||||
NET ASSETS | $ | 725,041,361 | $ | 9,688,156,154 | $ | 10,356,013,863 | $ | 5,897,752,910 | ||||||||
|
|
|
|
|
|
|
| |||||||||
(a) Investments at cost — unaffiliated | $ | 609,371,223 | $ | 5,783,464,352 | $ | 7,461,976,303 | $ | 3,261,704,560 | ||||||||
(b) Securities loaned at value | $ | 53,645,429 | $ | 200,861,229 | $ | 373,066,492 | $ | 271,046,299 | ||||||||
(c) Investments at cost — affiliated | $ | 79,159,689 | $ | 421,696,315 | $ | 413,399,994 | $ | 615,537,112 | ||||||||
(d) Foreign currency at cost | $ | — | $ | — | $ | 1,927 | $ | 6,298 | ||||||||
| 40 | 2 0 2 0 BLACK ROCK ANNUAL REPORT TO SHAREHOLDERS |
Statements of Assets and Liabilities (continued)
September 30, 2020
BlackRock Advantage Small Cap Growth Fund | BlackRock Health Sciences Opportunities Portfolio | BlackRock Mid-Cap Growth Equity Portfolio | BlackRock Technology Opportunities Fund | |||||||||||||
NET ASSET VALUE | ||||||||||||||||
Institutional | ||||||||||||||||
Net assets | $ | 508,084,448 | $ | 5,133,190,671 | $ | 6,003,279,994 | $ | 3,641,519,206 | ||||||||
|
|
|
|
|
|
|
| |||||||||
Shares outstanding | 25,583,895 | 68,102,863 | 164,202,308 | 65,813,974 | ||||||||||||
|
|
|
|
|
|
|
| |||||||||
Net asset value | $ | 19.86 | $ | 75.37 | $ | 36.56 | $ | 55.33 | ||||||||
|
|
|
|
|
|
|
| |||||||||
Shares authorized | Unlimited | Unlimited | Unlimited | Unlimited | ||||||||||||
|
|
|
|
|
|
|
| |||||||||
Par value | $ | 0.001 | $ | 0.001 | $ | 0.001 | $ | 0.001 | ||||||||
|
|
|
|
|
|
|
| |||||||||
Service | ||||||||||||||||
Net assets | $ | 12,295,642 | $ | 40,252,150 | $ | 83,679,762 | $ | 50,710,262 | ||||||||
|
|
|
|
|
|
|
| |||||||||
Shares outstanding | 769,533 | 561,943 | 2,539,617 | 971,544 | ||||||||||||
|
|
|
|
|
|
|
| |||||||||
Net asset value | $ | 15.98 | $ | 71.63 | $ | 32.95 | $ | 52.20 | ||||||||
|
|
|
|
|
|
|
| |||||||||
Shares authorized | Unlimited | Unlimited | Unlimited | Unlimited | ||||||||||||
|
|
|
|
|
|
|
| |||||||||
Par value | $ | 0.001 | $ | 0.001 | $ | 0.001 | $ | 0.001 | ||||||||
|
|
|
|
|
|
|
| |||||||||
Investor A | ||||||||||||||||
Net assets | $ | 168,456,533 | $ | 3,135,881,634 | $ | 1,917,773,037 | $ | 1,773,398,616 | ||||||||
|
|
|
|
|
|
|
| |||||||||
Shares outstanding | 12,021,945 | 43,935,712 | 60,913,896 | 34,732,317 | ||||||||||||
|
|
|
|
|
|
|
| |||||||||
Net asset value | $ | 14.01 | $ | 71.37 | $ | 31.48 | $ | 51.06 | ||||||||
|
|
|
|
|
|
|
| |||||||||
Shares authorized | Unlimited | Unlimited | Unlimited | Unlimited | ||||||||||||
|
|
|
|
|
|
|
| |||||||||
Par value | $ | 0.001 | $ | 0.001 | $ | 0.001 | $ | 0.001 | ||||||||
|
|
|
|
|
|
|
| |||||||||
Investor C | ||||||||||||||||
Net assets | $ | 11,626,993 | $ | 773,522,046 | $ | 280,143,467 | $ | 317,791,914 | ||||||||
|
|
|
|
|
|
|
| |||||||||
Shares outstanding | 2,115,439 | 12,603,062 | 11,574,638 | 7,473,905 | ||||||||||||
|
|
|
|
|
|
|
| |||||||||
Net asset value | $ | 5.50 | $ | 61.38 | $ | 24.20 | $ | 42.52 | ||||||||
|
|
|
|
|
|
|
| |||||||||
Shares authorized | Unlimited | Unlimited | Unlimited | Unlimited | ||||||||||||
|
|
|
|
|
|
|
| |||||||||
Par value | $ | 0.001 | $ | 0.001 | $ | 0.001 | $ | 0.001 | ||||||||
|
|
|
|
|
|
|
| |||||||||
Class K | ||||||||||||||||
Net assets | $ | 13,263,812 | $ | 344,821,629 | $ | 2,011,726,916 | $ | 75,426,044 | ||||||||
|
|
|
|
|
|
|
| |||||||||
Shares outstanding | 667,765 | 4,567,020 | 54,875,688 | 1,362,496 | ||||||||||||
|
|
|
|
|
|
|
| |||||||||
Net asset value | $ | 19.86 | $ | 75.50 | $ | 36.66 | $ | 55.36 | ||||||||
|
|
|
|
|
|
|
| |||||||||
Shares authorized | Unlimited | Unlimited | Unlimited | Unlimited | ||||||||||||
|
|
|
|
|
|
|
| |||||||||
Par value | $ | 0.001 | $ | 0.001 | $ | 0.001 | $ | 0.001 | ||||||||
|
|
|
|
|
|
|
| |||||||||
Class R | ||||||||||||||||
Net assets | $ | 11,313,933 | $ | 260,488,024 | $ | 59,410,687 | $ | 38,906,868 | ||||||||
|
|
|
|
|
|
|
| |||||||||
Shares outstanding | 808,564 | 3,746,135 | 1,925,644 | 757,388 | ||||||||||||
|
|
|
|
|
|
|
| |||||||||
Net asset value | $ | 13.99 | $ | 69.54 | $ | 30.85 | $ | 51.37 | ||||||||
|
|
|
|
|
|
|
| |||||||||
Shares authorized | Unlimited | Unlimited | Unlimited | Unlimited | ||||||||||||
|
|
|
|
|
|
|
| |||||||||
Par value | $ | 0.001 | $ | 0.001 | $ | 0.001 | $ | 0.001 | ||||||||
|
|
|
|
|
|
|
| |||||||||
See notes to financial statements.
FINANCIAL STATEMENTS | 41 |
Year Ended September 30, 2020
BlackRock Advantage Small Cap Growth Fund | BlackRock Health Sciences Opportunities Portfolio | BlackRock Mid-Cap Growth Equity Portfolio | BlackRock Technology Opportunities Fund | |||||||||||||
INVESTMENT INCOME | ||||||||||||||||
Dividends — unaffiliated | $ | 4,257,906 | $ | 90,766,023 | $ | 23,039,197 | $ | 11,834,544 | ||||||||
Dividends — affiliated | 54,495 | 894,474 | 1,326,119 | 617,982 | ||||||||||||
Interest — unaffiliated | 41 | 52 | 9,192 | 33 | ||||||||||||
Securities lending income — affiliated — net | 436,583 | 1,625,755 | 2,470,585 | 2,490,108 | ||||||||||||
Foreign taxes withheld | (4,195 | ) | (1,313,279 | ) | (352,846 | ) | (834,624 | ) | ||||||||
|
|
|
|
|
|
|
| |||||||||
Total investment income | 4,744,830 | 91,973,025 | 26,492,247 | 14,108,043 | ||||||||||||
|
|
|
|
|
|
|
| |||||||||
EXPENSES | ||||||||||||||||
Investment advisory | 2,839,830 | 54,843,910 | 45,769,022 | 25,793,417 | ||||||||||||
Transfer agent — class specific | 1,077,001 | 8,943,282 | 8,000,448 | 3,816,115 | ||||||||||||
Service and distribution — class specific | 688,157 | 16,396,533 | 6,735,726 | 5,033,545 | ||||||||||||
Administration | 264,859 | 2,842,195 | 2,503,558 | 1,239,289 | ||||||||||||
Administration — class specific | 126,196 | 1,632,904 | 1,422,489 | 661,766 | ||||||||||||
Registration | 107,795 | 272,071 | 1,232,918 | 334,221 | ||||||||||||
Professional | 79,046 | 168,856 | 109,443 | 140,388 | ||||||||||||
Accounting services | 71,934 | 493,935 | 435,581 | 222,331 | ||||||||||||
Printing and postage | 53,185 | 172,283 | 104,053 | 75,387 | ||||||||||||
Custodian | 28,345 | 202,646 | 87,452 | 231,422 | ||||||||||||
Trustees and Officer | 11,464 | 111,187 | 117,769 | 24,997 | ||||||||||||
Offering | — | — | — | 70,747 | ||||||||||||
Recoupment of past waived and/or reimbursed fees — class specific | — | — | 8,901 | — | ||||||||||||
Miscellaneous | 25,465 | 94,096 | 94,142 | 93,253 | ||||||||||||
|
|
|
|
|
|
|
| |||||||||
Total expenses | 5,373,277 | 86,173,898 | 66,621,502 | 37,736,878 | ||||||||||||
Less: | ||||||||||||||||
Fees waived and/or reimbursed by the Manager | (642,005 | ) | (114,263 | ) | (56,100 | ) | (142,411 | ) | ||||||||
Administration fees waived — class specific | (126,196 | ) | — | (1,182,166 | ) | (652,346 | ) | |||||||||
Transfer agent fees waived and/or reimbursed — class specific | (765,849 | ) | — | (2,466,563 | ) | (1,415,795 | ) | |||||||||
|
|
|
|
|
|
|
| |||||||||
Total expenses after fees waived and/or reimbursed | 3,839,227 | 86,059,635 | 62,916,673 | 35,526,326 | ||||||||||||
|
|
|
|
|
|
|
| |||||||||
Net investment income (loss) | 905,603 | 5,913,390 | (36,424,426 | ) | (21,418,283 | ) | ||||||||||
|
|
|
|
|
|
|
| |||||||||
| 42 | 2 0 2 0 BLACK ROCK ANNUAL REPORT TO SHAREHOLDERS |
Statements of Operations (continued)
Year Ended September 30, 2020
BlackRock Advantage Small Cap Growth Fund | BlackRock Health Sciences Opportunities Portfolio | BlackRock Mid-Cap Growth Equity Portfolio | BlackRock Technology Opportunities Fund | |||||||||||||
REALIZED AND UNREALIZED GAIN (LOSS) | ||||||||||||||||
Net realized gain (loss) from: | ||||||||||||||||
Investments — unaffiliated | $ | 41,183,657 | $ | 470,342,858 | $ | (135,875,392 | ) | $ | 172,962,436 | |||||||
Investments — affiliated | (4,141 | ) | (25,639 | ) | (199,018 | ) | (95,721 | ) | ||||||||
Capital gain distributions from investment companies — affiliated | 13 | 19 | 65 | 106 | ||||||||||||
Options written | — | — | — | 3,140,605 | ||||||||||||
Futures contracts | 3,354,539 | — | — | — | ||||||||||||
Forward foreign currency exchange contracts | — | 598,301 | — | — | ||||||||||||
Foreign currency transactions | — | (299,635 | ) | (4,397 | ) | (57,065 | ) | |||||||||
Payment by affiliate | — | 5,622 | — | — | ||||||||||||
|
|
|
|
|
|
|
| |||||||||
| 44,534,068 | 470,621,526 | (136,078,742 | ) | 175,950,361 | ||||||||||||
|
|
|
|
|
|
|
| |||||||||
Net change in unrealized appreciation (depreciation) on: | ||||||||||||||||
Investments — unaffiliated | 51,317,069 | 1,457,649,689 | 2,120,729,988 | 1,780,578,241 | ||||||||||||
Investments — affiliated | 12,987 | 95,877 | 5,299,499 | 79,317 | ||||||||||||
Options written | — | — | — | (2,295,938 | ) | |||||||||||
Futures contracts | 1,179,123 | — | — | — | ||||||||||||
Forward foreign currency exchange contracts | — | (4,310,704 | ) | — | — | |||||||||||
Foreign currency translations | — | 35,927 | 550 | 2,125 | ||||||||||||
|
|
|
|
|
|
|
| |||||||||
| 52,509,179 | 1,453,470,789 | 2,126,030,037 | 1,778,363,745 | |||||||||||||
|
|
|
|
|
|
|
| |||||||||
Net realized and unrealized gain | 97,043,247 | 1,924,092,315 | 1,989,951,295 | 1,954,314,106 | ||||||||||||
|
|
|
|
|
|
|
| |||||||||
NET INCREASE IN NET ASSETS RESULTING FROM OPERATIONS | $ | 97,948,850 | $ | 1,930,005,705 | $ | 1,953,526,869 | $ | 1,932,895,823 | ||||||||
|
|
|
|
|
|
|
| |||||||||
See notes to financial statements.
FINANCIAL STATEMENTS | 43 |
Statements of Changes in Net Assets
| BlackRock Advantage Small Cap Growth Fund | BlackRock Health Sciences Opportunities Portfolio | |||||||||||||||||||
| Year Ended September 30, | Year Ended September 30, | |||||||||||||||||||
| 2020 | 2019 | 2020 | 2019 | |||||||||||||||||
INCREASE (DECREASE) IN NET ASSETS | ||||||||||||||||||||
OPERATIONS | ||||||||||||||||||||
Net investment income | $ | 905,603 | $ | 1,807,638 | $ | 5,913,390 | $ | 14,156,658 | ||||||||||||
Net realized gain | 44,534,068 | 42,235,986 | 470,621,526 | 248,179,419 | ||||||||||||||||
Net change in unrealized appreciation (depreciation) | 52,509,179 | (103,128,580 | ) | 1,453,470,789 | (405,539,429 | ) | ||||||||||||||
|
|
|
|
|
|
|
| |||||||||||||
Net increase (decrease) in net assets resulting from operations | 97,948,850 | (59,084,956 | ) | 1,930,005,705 | (143,203,352 | ) | ||||||||||||||
�� |
|
|
|
|
|
|
| |||||||||||||
DISTRIBUTIONS TO SHAREHOLDERS(a) | ||||||||||||||||||||
Institutional | (22,542,658 | ) | (74,458,038 | ) | (133,372,174 | ) | (213,418,441 | ) | ||||||||||||
Service | (796,771 | ) | (2,791,794 | ) | (1,566,602 | ) | (2,760,129 | ) | ||||||||||||
Investor A | (13,203,810 | ) | (44,990,538 | ) | (110,003,143 | ) | (205,102,599 | ) | ||||||||||||
Investor C | (3,146,455 | ) | (9,282,270 | ) | (32,853,783 | ) | (64,666,685 | ) | ||||||||||||
Class K | (278,739 | ) | (350,176 | ) | (8,869,488 | ) | (9,775,861 | ) | ||||||||||||
Class R | (1,135,168 | ) | (4,253,264 | ) | (9,076,173 | ) | (17,068,915 | ) | ||||||||||||
|
|
|
|
|
|
|
| |||||||||||||
Decrease in net assets resulting from distributions to shareholders | (41,103,601 | ) | (136,126,080 | ) | (295,741,363 | ) | (512,792,630 | ) | ||||||||||||
|
|
|
|
|
|
|
| |||||||||||||
CAPITAL SHARE TRANSACTIONS | ||||||||||||||||||||
Net increase in net assets derived from capital share transactions | 40,892,198 | 19,995,066 | 1,182,928,419 | 387,357,211 | ||||||||||||||||
|
|
|
|
|
|
|
| |||||||||||||
NET ASSETS | ||||||||||||||||||||
Total increase (decrease) in net assets | 97,737,447 | (175,215,970 | ) | 2,817,192,761 | (268,638,771 | ) | ||||||||||||||
Beginning of year | 627,303,914 | 802,519,884 | 6,870,963,393 | 7,139,602,164 | ||||||||||||||||
|
|
|
|
|
|
|
| |||||||||||||
End of year | $ | 725,041,361 | $ | 627,303,914 | $ | 9,688,156,154 | $ | 6,870,963,393 | ||||||||||||
|
|
|
|
|
|
|
| |||||||||||||
| (a) | Distributions for annual periods determined in accordance with U.S. federal income tax regulations. |
See notes to financial statements.
| 44 | 2 0 2 0 BLACK ROCK ANNUAL REPORT TO SHAREHOLDERS |
Statements of Changes in Net Assets (continued)
| BlackRock Mid-Cap Growth Equity Portfolio | BlackRock Technology Opportunities Fund | |||||||||||||||||||
| Year Ended September 30, | Year Ended September 30, | |||||||||||||||||||
| 2020 | 2019 | 2020 | 2019 | |||||||||||||||||
INCREASE (DECREASE) IN NET ASSETS | ||||||||||||||||||||
OPERATIONS | ||||||||||||||||||||
Net investment loss | $ | (36,424,426 | ) | $ | (15,689,683 | ) | $ | (21,418,283 | ) | $ | (8,157,876 | ) | ||||||||
Net realized gain (loss) | (136,078,742 | ) | 28,921,072 | 175,950,361 | (61,661,485 | ) | ||||||||||||||
Net change in unrealized appreciation (depreciation) | 2,126,030,037 | 264,145,012 | 1,778,363,745 | 132,051,456 | ||||||||||||||||
|
|
|
|
|
|
|
| |||||||||||||
Net increase in net assets resulting from operations | 1,953,526,869 | 277,376,401 | 1,932,895,823 | 62,232,095 | ||||||||||||||||
|
|
|
|
|
|
|
| |||||||||||||
DISTRIBUTIONS TO SHAREHOLDERS(a) | ||||||||||||||||||||
Institutional | (11,711,597 | ) | (46,726,775 | ) | (17,084,274 | ) | (6,001,514 | ) | ||||||||||||
Service | (273,908 | ) | (1,401,342 | ) | (352,518 | ) | (157,877 | ) | ||||||||||||
Investor A | (6,421,423 | ) | (34,767,549 | ) | (11,380,166 | ) | (6,288,805 | ) | ||||||||||||
Investor C | (1,289,821 | ) | (7,179,094 | ) | (3,074,126 | ) | (1,647,499 | ) | ||||||||||||
Class K | (3,237,003 | ) | (6,780,414 | ) | — | — | ||||||||||||||
Class R | (199,360 | ) | (1,021,014 | ) | (319,966 | ) | (145,876 | ) | ||||||||||||
|
|
|
|
|
|
|
| |||||||||||||
Decrease in net assets resulting from distributions to shareholders | (23,133,112 | ) | (97,876,188 | ) | (32,211,050 | ) | (14,241,571 | ) | ||||||||||||
|
|
|
|
|
|
|
| |||||||||||||
CAPITAL SHARE TRANSACTIONS | ||||||||||||||||||||
Net increase in net assets derived from capital share transactions | 3,425,268,658 | 2,596,390,711 | 2,099,939,457 | 465,131,159 | ||||||||||||||||
|
|
|
|
|
|
|
| |||||||||||||
NET ASSETS | ||||||||||||||||||||
Total increase in net assets | 5,355,662,415 | 2,775,890,924 | 4,000,624,230 | 513,121,683 | ||||||||||||||||
Beginning of year | 5,000,351,448 | 2,224,460,524 | 1,897,128,680 | 1,384,006,997 | ||||||||||||||||
|
|
|
|
|
|
|
| |||||||||||||
End of year | $ | 10,356,013,863 | $ | 5,000,351,448 | $ | 5,897,752,910 | $ | 1,897,128,680 | ||||||||||||
|
|
|
|
|
|
|
| |||||||||||||
| (a) | Distributions for annual periods determined in accordance with U.S. federal income tax regulations. |
See notes to financial statements.
FINANCIAL STATEMENTS | 45 |
(For a share outstanding throughout each period)
| BlackRock Advantage Small Cap Growth Fund | ||||||||||||||||||||
| Institutional | ||||||||||||||||||||
| Year Ended September 30, | ||||||||||||||||||||
| 2020 | 2019 | 2018 | 2017 | 2016 | ||||||||||||||||
Net asset value, beginning of year | $ | 18.01 | $ | 23.65 | $ | 21.37 | $ | 17.94 | $ | 17.82 | ||||||||||
|
|
|
|
|
|
|
|
|
| |||||||||||
Net investment income(a) | 0.05 | 0.07 | 0.07 | 0.07 | 0.03 | |||||||||||||||
Net realized and unrealized gain (loss) | 2.84 | (2.03 | ) | 4.48 | 3.37 | 1.11 | ||||||||||||||
|
|
|
|
|
|
|
|
|
| |||||||||||
Net increase (decrease) from investment operations | 2.89 | (1.96 | ) | 4.55 | 3.44 | 1.14 | ||||||||||||||
|
|
|
|
|
|
|
|
|
| |||||||||||
Distributions(b) | ||||||||||||||||||||
From net investment income | (0.07 | ) | (0.05 | ) | (0.09 | ) | (0.01 | ) | — | |||||||||||
From net realized gain | (0.97 | ) | (3.63 | ) | (2.18 | ) | — | (1.02 | ) | |||||||||||
|
|
|
|
|
|
|
|
|
| |||||||||||
Total distributions | (1.04 | ) | (3.68 | ) | (2.27 | ) | (0.01 | ) | (1.02 | ) | ||||||||||
|
|
|
|
|
|
|
|
|
| |||||||||||
Net asset value, end of year | $ | 19.86 | $ | 18.01 | $ | 23.65 | $ | 21.37 | $ | 17.94 | ||||||||||
|
|
|
|
|
|
|
|
|
| |||||||||||
Total Return(c) | ||||||||||||||||||||
Based on net asset value | 16.32 | % | (6.80 | )% | 23.62 | % | 19.18 | % | 6.81 | % | ||||||||||
|
|
|
|
|
|
|
|
|
| |||||||||||
Ratios to Average Net Assets | ||||||||||||||||||||
Total expenses | 0.73 | % | 0.74 | % | 0.82 | % | 0.77 | % | 0.86 | % | ||||||||||
|
|
|
|
|
|
|
|
|
| |||||||||||
Total expenses after fees waived and/or reimbursed | 0.50 | % | 0.50 | % | 0.50 | % | 0.56 | % | 0.86 | % | ||||||||||
|
|
|
|
|
|
|
|
|
| |||||||||||
Net investment income | 0.25 | % | 0.40 | % | 0.32 | % | 0.34 | % | 0.20 | % | ||||||||||
|
|
|
|
|
|
|
|
|
| |||||||||||
Supplemental Data | ||||||||||||||||||||
Net assets, end of year (000) | $ | 508,084 | $ | 396,388 | $ | 502,400 | $ | 533,904 | $ | 490,215 | ||||||||||
|
|
|
|
|
|
|
|
|
| |||||||||||
Portfolio turnover rate | 126 | % | 120 | % | 129 | % | 100 | % | 103 | % | ||||||||||
|
|
|
|
|
|
|
|
|
| |||||||||||
| (a) | Based on average shares outstanding. |
| (b) | Distributions for annual periods determined in accordance with U.S. federal income tax regulations. |
| (c) | Where applicable, assumes the reinvestment of distributions. |
See notes to financial statements.
| 46 | 2 0 2 0 BLACK ROCK ANNUAL REPORT TO SHAREHOLDERS |
Financial Highlights (continued)
(For a share outstanding throughout each period)
| BlackRock Advantage Small Cap Growth Fund (continued) | ||||||||||||||||||||
| Service | ||||||||||||||||||||
| Year Ended September 30, | ||||||||||||||||||||
| 2020 | 2019 | 2018 | 2017 | 2016 | ||||||||||||||||
Net asset value, beginning of year | $ | 14.68 | $ | 20.07 | $ | 18.46 | $ | 15.53 | $ | 15.55 | ||||||||||
|
|
|
|
|
|
|
|
|
| |||||||||||
Net investment income (loss)(a) | 0.00 | (b) | 0.02 | 0.01 | 0.01 | (0.01 | ) | |||||||||||||
Net realized and unrealized gain (loss) | 2.30 | (1.76 | ) | 3.81 | 2.92 | 0.97 | ||||||||||||||
|
|
|
|
|
|
|
|
|
| |||||||||||
Net increase (decrease) from investment operations | 2.30 | (1.74 | ) | 3.82 | 2.93 | 0.96 | ||||||||||||||
|
|
|
|
|
|
|
|
|
| |||||||||||
Distributions(c) | ||||||||||||||||||||
From net investment income | (0.03 | ) | (0.02 | ) | (0.03 | ) | — | — | ||||||||||||
From net realized gain | (0.97 | ) | (3.63 | ) | (2.18 | ) | — | (0.98 | ) | |||||||||||
|
|
|
|
|
|
|
|
|
| |||||||||||
Total distributions | (1.00 | ) | (3.65 | ) | (2.21 | ) | — | (0.98 | ) | |||||||||||
|
|
|
|
|
|
|
|
|
| |||||||||||
Net asset value, end of year | $ | 15.98 | $ | 14.68 | $ | 20.07 | $ | 18.46 | $ | 15.53 | ||||||||||
|
|
|
|
|
|
|
|
|
| |||||||||||
Total Return(d) | ||||||||||||||||||||
Based on net asset value | 15.99 | % | (6.98 | )% | 23.27 | % | 18.87 | % | 6.57 | % | ||||||||||
|
|
|
|
|
|
|
|
|
| |||||||||||
Ratios to Average Net Assets | ||||||||||||||||||||
Total expenses | 1.00 | % | 1.00 | % | 1.02 | % | 1.04 | % | 1.13 | %(e) | ||||||||||
|
|
|
|
|
|
|
|
|
| |||||||||||
Total expenses after fees waived and/or reimbursed | 0.75 | % | 0.75 | % | 0.75 | % | 0.82 | % | 1.13 | % | ||||||||||
|
|
|
|
|
|
|
|
|
| |||||||||||
Net investment income (loss) | 0.00 | %(f) | 0.15 | % | 0.07 | % | 0.07 | % | (0.07 | )% | ||||||||||
|
|
|
|
|
|
|
|
|
| |||||||||||
Supplemental Data | ||||||||||||||||||||
Net assets, end of year (000) | $ | 12,296 | $ | 11,715 | $ | 15,257 | $ | 9,545 | $ | 12,054 | ||||||||||
|
|
|
|
|
|
|
|
|
| |||||||||||
Portfolio turnover rate | 126 | % | 120 | % | 129 | % | 100 | % | 103 | % | ||||||||||
|
|
|
|
|
|
|
|
|
| |||||||||||
| (a) | Based on average shares outstanding. |
| (b) | Amount is less than $0.005 per share. |
| (c) | Distributions for annual periods determined in accordance with U.S. federal income tax regulations. |
| (d) | Where applicable, assumes the reinvestment of distributions. |
| (e) | Includes recoupment of past waived and/or reimbursed fees with no financial impact to the expense ratios. |
| (f) | Amount is less than 0.005%. |
See notes to financial statements.
FINANCIAL HIGHLIGHTS | 47 |
Financial Highlights (continued)
(For a share outstanding throughout each period)
| BlackRock Advantage Small Cap Growth Fund (continued) | ||||||||||||||||||||
| Investor A | ||||||||||||||||||||
| Year Ended September 30, | ||||||||||||||||||||
| 2020 | 2019 | 2018 | 2017 | 2016 | ||||||||||||||||
Net asset value, beginning of year | $ | 12.98 | $ | 18.25 | $ | 16.97 | $ | 14.28 | $ | 14.38 | ||||||||||
|
|
|
|
|
|
|
|
|
| |||||||||||
Net investment income (loss)(a) | 0.00 | (b) | 0.02 | 0.01 | 0.01 | (0.01 | ) | |||||||||||||
Net realized and unrealized gain (loss) | 2.04 | (1.65 | ) | 3.47 | 2.68 | 0.88 | ||||||||||||||
|
|
|
|
|
|
|
|
|
| |||||||||||
Net increase (decrease) from investment operations | 2.04 | (1.63 | ) | 3.48 | 2.69 | 0.87 | ||||||||||||||
|
|
|
|
|
|
|
|
|
| |||||||||||
Distributions(c) | ||||||||||||||||||||
From net investment income | (0.04 | ) | (0.01 | ) | (0.02 | ) | — | — | ||||||||||||
From net realized gain | (0.97 | ) | (3.63 | ) | (2.18 | ) | — | (0.97 | ) | |||||||||||
|
|
|
|
|
|
|
|
|
| |||||||||||
Total distributions | (1.01 | ) | (3.64 | ) | (2.20 | ) | — | (0.97 | ) | |||||||||||
|
|
|
|
|
|
|
|
|
| |||||||||||
Net asset value, end of year | $ | 14.01 | $ | 12.98 | $ | 18.25 | $ | 16.97 | $ | 14.28 | ||||||||||
|
|
|
|
|
|
|
|
|
| |||||||||||
Total Return(d) | ||||||||||||||||||||
Based on net asset value | 16.03 | % | (7.05 | )% | 23.27 | % | 18.84 | % | 6.57 | % | ||||||||||
|
|
|
|
|
|
|
|
|
| |||||||||||
Ratios to Average Net Assets | ||||||||||||||||||||
Total expenses | 1.02 | % | 1.00 | % | 1.11 | % | 1.07 | % | 1.14 | % | ||||||||||
|
|
|
|
|
|
|
|
|
| |||||||||||
Total expenses after fees waived and/or reimbursed | 0.75 | % | 0.75 | % | 0.75 | % | 0.82 | % | 1.14 | % | ||||||||||
|
|
|
|
|
|
|
|
|
| |||||||||||
Net investment income (loss) | 0.00 | %(e) | 0.15 | % | 0.06 | % | 0.07 | % | (0.09 | )% | ||||||||||
|
|
|
|
|
|
|
|
|
| |||||||||||
Supplemental Data | ||||||||||||||||||||
Net assets, end of year (000) | $ | 168,457 | $ | 178,847 | $ | 223,619 | $ | 198,777 | $ | 250,357 | ||||||||||
|
|
|
|
|
|
|
|
|
| |||||||||||
Portfolio turnover rate | 126 | % | 120 | % | 129 | % | 100 | % | 103 | % | ||||||||||
|
|
|
|
|
|
|
|
|
| |||||||||||
| (a) | Based on average shares outstanding. |
| (b) | Amount is less than $0.005 per share. |
| (c) | Distributions for annual periods determined in accordance with U.S. federal income tax regulations. |
| (d) | Where applicable, excludes the effects of any sales charges and assumes the reinvestment of distributions. |
| (e) | Amount is less than 0.005%. |
See notes to financial statements.
| 48 | 2 0 2 0 BLACK ROCK ANNUAL REPORT TO SHAREHOLDERS |
Financial Highlights (continued)
(For a share outstanding throughout each period)
| BlackRock Advantage Small Cap Growth Fund (continued) | ||||||||||||||||||||
| Investor C | ||||||||||||||||||||
| Year Ended September 30, | ||||||||||||||||||||
| 2020 | 2019 | 2018 | 2017 | 2016 | ||||||||||||||||
Net asset value, beginning of year | $ | 5.66 | $ | 10.34 | $ | 10.48 | $ | 8.88 | $ | 9.37 | ||||||||||
|
|
|
|
|
|
|
|
|
| |||||||||||
Net investment loss(a) | (0.04 | ) | (0.04 | ) | (0.07 | ) | (0.07 | ) | (0.08 | ) | ||||||||||
Net realized and unrealized gain (loss) | 0.86 | (1.07 | ) | 1.98 | 1.67 | 0.56 | ||||||||||||||
|
|
|
|
|
|
|
|
|
| |||||||||||
Net increase (decrease) from investment operations | 0.82 | (1.11 | ) | 1.91 | 1.60 | 0.48 | ||||||||||||||
|
|
|
|
|
|
|
|
|
| |||||||||||
Distributions(b) | ||||||||||||||||||||
From net investment income | (0.01 | ) | — | — | — | — | ||||||||||||||
From net realized gain(b) | (0.97 | ) | (3.57 | ) | (2.05 | ) | — | (0.97 | ) | |||||||||||
|
|
|
|
|
|
|
|
|
| |||||||||||
Total distributions | (0.98 | ) | (3.57 | ) | — | — | — | |||||||||||||
|
|
|
|
|
|
|
|
|
| |||||||||||
Net asset value, end of year | $ | 5.50 | $ | 5.66 | $ | 10.34 | $ | 10.48 | $ | 8.88 | ||||||||||
|
|
|
|
|
|
|
|
|
| |||||||||||
Total Return(c) | ||||||||||||||||||||
Based on net asset value | 15.18 | % | (7.78 | )% | 22.36 | % | 18.02 | % | 5.72 | % | ||||||||||
|
|
|
|
|
|
|
|
|
| |||||||||||
Ratios to Average Net Assets | ||||||||||||||||||||
Total expenses | 1.80 | % | 1.77 | % | 1.93 | % | 1.85 | % | 1.95 | % | ||||||||||
|
|
|
|
|
|
|
|
|
| |||||||||||
Total expenses after fees waived and/or reimbursed | 1.50 | % | 1.50 | % | 1.50 | % | 1.57 | % | 1.95 | % | ||||||||||
|
|
|
|
|
|
|
|
|
| |||||||||||
Net investment loss | (0.74 | )% | (0.62 | )% | (0.69 | )% | (0.69 | )% | (0.90 | )% | ||||||||||
|
|
|
|
|
|
|
|
|
| |||||||||||
Supplemental Data | ||||||||||||||||||||
Net assets, end of year (000) | $ | 11,627 | $ | 19,205 | $ | 35,847 | $ | 19,605 | $ | 23,689 | ||||||||||
|
|
|
|
|
|
|
|
|
| |||||||||||
Portfolio turnover rate | 126 | % | 120 | % | 129 | % | 100 | % | 103 | % | ||||||||||
|
|
|
|
|
|
|
|
|
| |||||||||||
| (a) | Based on average shares outstanding. |
| (b) | Distributions for annual periods determined in accordance with U.S. federal income tax regulations. |
| (c) | Where applicable, excludes the effects of any sales charges and assumes the reinvestment of distributions. |
See notes to financial statements.
FINANCIAL HIGHLIGHTS | 49 |
Financial Highlights (continued)
(For a share outstanding throughout each period)
| BlackRock Advantage Small Cap Growth Fund (continued) | ||||||||||||||||
| Class K | ||||||||||||||||
| Year Ended September 30, | | Period from 01/25/18 to 09/30/18 | (a)
| |||||||||||||
| 2020 | 2019 | |||||||||||||||
Net asset value, beginning of period | $ | 18.01 | $ | 23.65 | $ | 20.82 | ||||||||||
|
|
|
|
|
| |||||||||||
Net investment income(b) | 0.05 | 0.09 | 0.05 | |||||||||||||
Net realized and unrealized gain (loss) | 2.85 | (2.04 | ) | 2.78 | ||||||||||||
|
|
|
|
|
| |||||||||||
Net increase (decrease) from investment operations | 2.90 | �� | (1.95 | ) | 2.83 | |||||||||||
|
|
|
|
|
| |||||||||||
Distributions(c) | ||||||||||||||||
From net investment income | (0.08 | ) | (0.06 | ) | — | |||||||||||
From net realized gain | (0.97 | ) | (3.63 | ) | — | |||||||||||
|
|
|
|
|
| |||||||||||
Total distributions | (1.05 | ) | (3.69 | ) | — | |||||||||||
|
|
|
|
|
| |||||||||||
Net asset value, end of period | $ | 19.86 | $ | 18.01 | $ | 23.65 | ||||||||||
|
|
|
|
|
| |||||||||||
Total Return(d) | ||||||||||||||||
Based on net asset value | 16.37 | % | (6.75 | )% | 13.59 | %(e) | ||||||||||
|
|
|
|
|
| |||||||||||
Ratios to Average Net Assets | ||||||||||||||||
Total expenses | 0.58 | % | 0.60 | % | 0.67 | %(f)(g) | ||||||||||
|
|
|
|
|
| |||||||||||
Total expenses after fees waived and/or reimbursed | 0.45 | % | 0.45 | % | 0.45 | %(f) | ||||||||||
|
|
|
|
|
| |||||||||||
Net investment income | 0.27 | % | 0.52 | % | 0.30 | %(f) | ||||||||||
|
|
|
|
|
| |||||||||||
Supplemental Data | ||||||||||||||||
Net assets, end of period (000) | $ | 13,264 | $ | 5,131 | $ | 2,221 | ||||||||||
|
|
|
|
|
| |||||||||||
Portfolio turnover rate | 126 | % | 120 | % | 129 | %(h) | ||||||||||
|
|
|
|
|
| |||||||||||
| (a) | Commencement of operations. |
| (b) | Based on average shares outstanding. |
| (c) | Distributions for annual periods determined in accordance with U.S. federal income tax regulations. |
| (d) | Where applicable, assumes the reinvestment of distributions. |
| (e) | Aggregate total return. |
| (f) | Annualized. |
| (g) | Offering, board realignment and consolidation costs were not annualized in the calculation of the expense ratios. If these expenses were annualized, the total expenses would have been 0.68%. |
| (h) | Portfolio turnover is representative of the Fund for the entire year. |
See notes to financial statements.
| 50 | 2 0 2 0 BLACK ROCK ANNUAL REPORT TO SHAREHOLDERS |
Financial Highlights (continued)
(For a share outstanding throughout each period)
| BlackRock Advantage Small Cap Growth Fund (continued) | ||||||||||||||||||||||||
| Class R | ||||||||||||||||||||||||
| Year Ended September 30, | | Period from 03/02/18 | (a) | |||||||||||||||||||||
| 2020 | 2019 | to 09/30/18 | ||||||||||||||||||||||
Net asset value, beginning of period | $ | 12.96 | $ | 18.22 | $ | 15.55 | ||||||||||||||||||
|
|
|
|
|
| |||||||||||||||||||
Net investment loss(b) | (0.03 | ) | (0.01 | ) | (0.02 | ) | ||||||||||||||||||
Net realized and unrealized gain (loss) | 2.03 | (1.64 | ) | 2.69 | ||||||||||||||||||||
|
|
|
|
|
| |||||||||||||||||||
Net increase (decrease) from investment operations | 2.00 | (1.65 | ) | 2.67 | ||||||||||||||||||||
|
|
|
|
|
| |||||||||||||||||||
Distributions from net realized gain(c) | (0.97 | ) | (3.61 | ) | — | |||||||||||||||||||
|
|
|
|
|
| |||||||||||||||||||
Net asset value, end of period | $ | 13.99 | $ | 12.96 | $ | 18.22 | ||||||||||||||||||
|
|
|
|
|
| |||||||||||||||||||
Total Return(d) | ||||||||||||||||||||||||
Based on net asset value | 15.75 | % | (7.27 | )% | 17.17 | %(e) | ||||||||||||||||||
|
|
|
|
|
| |||||||||||||||||||
Ratios to Average Net Assets | ||||||||||||||||||||||||
Total expenses | 1.27 | % | 1.30 | % | 1.38 | %(f)(g) | ||||||||||||||||||
|
|
|
|
|
| |||||||||||||||||||
Total expenses after fees waived and/or reimbursed | 1.00 | % | 1.00 | % | 1.00 | %(f) | ||||||||||||||||||
|
|
|
|
|
| |||||||||||||||||||
Net investment loss | (0.24 | )% | (0.10 | )% | (0.20 | )%(f) | ||||||||||||||||||
|
|
|
|
|
| |||||||||||||||||||
Supplemental Data | ||||||||||||||||||||||||
Net assets, end of period (000) | $ | 11,314 | $ | 16,019 | $ | 23,175 | ||||||||||||||||||
|
|
|
|
|
| |||||||||||||||||||
Portfolio turnover rate | 126 | % | 120 | % | 129 | %(h) | ||||||||||||||||||
|
|
|
|
|
| |||||||||||||||||||
| (a) | Commencement of operations. |
| (b) | Based on average shares outstanding. |
| (c) | Distributions for annual periods determined in accordance with U.S. federal income tax regulations. |
| (d) | Where applicable, assumes the reinvestment of distributions. |
| (e) | Aggregate total return. |
| (f) | Annualized. |
| (g) | Offering, board realignment and consolidation costs were not annualized in the calculation of the expense ratios. If these expenses were annualized, the total expenses would have been 1.39%. |
| (h) | Portfolio turnover is representative of the Fund for the entire year. |
See notes to financial statements.
FINANCIAL HIGHLIGHTS | 51 |
Financial Highlights (continued)
(For a share outstanding throughout each period)
| BlackRock Health Sciences Opportunities Portfolio | ||||||||||||||||||||
| Institutional | ||||||||||||||||||||
| Year Ended September 30, | ||||||||||||||||||||
| 2020 | 2019 | 2018 | 2017 | 2016 | ||||||||||||||||
Net asset value, beginning of year | $ | 61.55 | $ | 67.67 | $ | 57.28 | $ | 50.30 | $ | 52.51 | ||||||||||
|
|
|
|
|
|
|
|
|
| |||||||||||
Net investment income(a) | 0.19 | 0.28 | 0.24 | 0.14 | 0.13 | |||||||||||||||
Net realized and unrealized gain (loss) | 16.26 | (1.64 | ) | 12.18 | 7.92 | 3.87 | ||||||||||||||
|
|
|
|
|
|
|
|
|
| |||||||||||
Net increase (decrease) from investment operations | 16.45 | (1.36 | ) | 12.42 | 8.06 | 4.00 | ||||||||||||||
|
|
|
|
|
|
|
|
|
| |||||||||||
Distributions(b) | ||||||||||||||||||||
From net investment income | (0.32 | ) | (0.23 | ) | (0.02 | ) | — | (0.77 | ) | |||||||||||
From net realized gain | (2.31 | ) | (4.53 | ) | (2.01 | ) | (1.08 | ) | (5.44 | ) | ||||||||||
|
|
|
|
|
|
|
|
|
| |||||||||||
Total distributions | (2.63 | ) | (4.76 | ) | (2.03 | ) | (1.08 | ) | (6.21 | ) | ||||||||||
|
|
|
|
|
|
|
|
|
| |||||||||||
Net asset value, end of year | $ | 75.37 | $ | 61.55 | $ | 67.67 | $ | 57.28 | $ | 50.30 | ||||||||||
|
|
|
|
|
|
|
|
|
| |||||||||||
Total Return(c) | ||||||||||||||||||||
Based on net asset value | 27.34 | %(d) | (1.84 | )% | 22.47 | % | 16.53 | % | 7.99 | % | ||||||||||
|
|
|
|
|
|
|
|
|
| |||||||||||
Ratios to Average Net Assets | ||||||||||||||||||||
Total expenses | 0.85 | % | 0.85 | %(e) | 0.87 | % | 0.89 | % | 0.90 | %(e) | ||||||||||
|
|
|
|
|
|
|
|
|
| |||||||||||
Total expenses after fees waived and/or reimbursed | 0.85 | % | 0.84 | %(e) | 0.86 | % | 0.89 | % | 0.90 | %(e) | ||||||||||
|
|
|
|
|
|
|
|
|
| |||||||||||
Net investment income | 0.28 | % | 0.45 | %(e) | 0.40 | % | 0.27 | % | 0.25 | %(e) | ||||||||||
|
|
|
|
|
|
|
|
|
| |||||||||||
Supplemental Data | ||||||||||||||||||||
Net assets, end of year (000) | $ | 5,133,191 | $ | 3,095,352 | $ | 2,944,146 | $ | 2,190,418 | $ | 1,544,880 | ||||||||||
|
|
|
|
|
|
|
|
|
| |||||||||||
Portfolio turnover rate | 28 | % | 41 | % | 39 | % | 39 | % | 50 | % | ||||||||||
|
|
|
|
|
|
|
|
|
| |||||||||||
| (a) | Based on average shares outstanding. |
| (b) | Distributions for annual periods determined in accordance with U.S. federal income tax regulations. |
| (c) | Where applicable, assumes the reinvestment of distributions. |
| (d) | Includes a payment received from an affiliate, which had no impact on the Fund’s total return. |
| (e) | Excludes expenses incurred indirectly as a result of investments in underlying funds as follows: |
| Year Ended September 30, | ||||||||||||||||||||
| 2020 | 2019 | 2018 | 2017 | 2016 | ||||||||||||||||
Investments in underlying funds | — | % | 0.01 | % | — | % | — | % | 0.01 | % | ||||||||||
|
|
|
|
|
|
|
|
|
| |||||||||||
See notes to financial statements.
| 52 | 2 0 2 0 BLACK ROCK ANNUAL REPORT TO SHAREHOLDERS |
Financial Highlights (continued)
(For a share outstanding throughout each period)
| BlackRock Health Sciences Opportunities Portfolio (continued) | ||||||||||||||||||||
| Service | ||||||||||||||||||||
| Year Ended September 30, | ||||||||||||||||||||
| 2020 | 2019 | 2018 | 2017 | 2016 | ||||||||||||||||
Net asset value, beginning of year | $ | 58.66 | $ | 64.73 | $ | 54.90 | $ | 48.39 | $ | 50.77 | ||||||||||
|
|
|
|
|
|
|
|
|
| |||||||||||
Net investment income (loss)(a) | (0.01 | ) | 0.08 | 0.05 | (0.01 | ) | (0.01 | ) | ||||||||||||
Net realized and unrealized gain (loss) | 15.48 | (1.57 | ) | 11.67 | 7.60 | 3.74 | ||||||||||||||
|
|
|
|
|
|
|
|
|
| |||||||||||
Net increase (decrease) from investment operations | 15.47 | (1.49 | ) | 11.72 | 7.59 | 3.73 | ||||||||||||||
|
|
|
|
|
|
|
|
|
| |||||||||||
Distributions(b) | ||||||||||||||||||||
From net investment income | (0.19 | ) | (0.05 | ) | — | — | (0.67 | ) | ||||||||||||
From net realized gain | (2.31 | ) | (4.53 | ) | (1.89 | ) | (1.08 | ) | (5.44 | ) | ||||||||||
|
|
|
|
|
|
|
|
|
| |||||||||||
Total distributions | (2.50 | ) | (4.58 | ) | (1.89 | ) | (1.08 | ) | (6.11 | ) | ||||||||||
|
|
|
|
|
|
|
|
|
| |||||||||||
Net asset value, end of year | $ | 71.63 | $ | 58.66 | $ | 64.73 | $ | 54.90 | $ | 48.39 | ||||||||||
|
|
|
|
|
|
|
|
|
| |||||||||||
Total Return(c) | ||||||||||||||||||||
Based on net asset value | 26.96 | %(d) | (2.16 | )% | 22.10 | % | 16.20 | % | 7.69 | % | ||||||||||
|
|
|
|
|
|
|
|
|
| |||||||||||
Ratios to Average Net Assets | ||||||||||||||||||||
Total expenses | 1.15 | % | 1.15 | %(e) | 1.17 | % | 1.17 | % | 1.17 | %(e) | ||||||||||
|
|
|
|
|
|
|
|
|
| |||||||||||
Total expenses after fees waived and/or reimbursed | 1.15 | % | 1.15 | %(e) | 1.16 | % | 1.17 | % | 1.17 | %(e) | ||||||||||
|
|
|
|
|
|
|
|
|
| |||||||||||
Net investment income (loss) | (0.02 | )% | 0.14 | %(e) | 0.10 | % | (0.02 | )% | (0.03 | )%(e) | ||||||||||
|
|
|
|
|
|
|
|
|
| |||||||||||
Supplemental Data | ||||||||||||||||||||
Net assets, end of year (000) | $ | 40,252 | $ | 34,708 | $ | 39,325 | $ | 33,231 | $ | 31,917 | ||||||||||
|
|
|
|
|
|
|
|
|
| |||||||||||
Portfolio turnover rate | 28 | % | 41 | % | 39 | % | 39 | % | 50 | % | ||||||||||
|
|
|
|
|
|
|
|
|
| |||||||||||
| (a) | Based on average shares outstanding. |
| (b) | Distributions for annual periods determined in accordance with U.S. federal income tax regulations. |
| (c) | Where applicable, assumes the reinvestment of distributions. |
| (d) | Includes a payment received from an affiliate, which had no impact on the Fund’s total return. |
| (e) | Excludes expenses incurred indirectly as a result of investments in underlying funds as follows: |
| Year Ended September 30, | ||||||||||||||||||||
| 2020 | 2019 | 2018 | 2017 | 2016 | ||||||||||||||||
Investments in underlying funds | — | % | 0.01 | % | — | % | — | % | 0.01 | % | ||||||||||
|
|
|
|
|
|
|
|
|
| |||||||||||
See notes to financial statements.
FINANCIAL HIGHLIGHTS | 53 |
Financial Highlights (continued)
(For a share outstanding throughout each period)
| BlackRock Health Sciences Opportunities Portfolio (continued) | ||||||||||||||||||||
| Investor A | ||||||||||||||||||||
| Year Ended September 30, | ||||||||||||||||||||
| 2020 | 2019 | 2018 | 2017 | 2016 | ||||||||||||||||
Net asset value, beginning of year | $ | 58.45 | $ | 64.50 | $ | 54.70 | $ | 48.22 | $ | 50.61 | ||||||||||
|
|
|
|
|
|
|
|
|
| |||||||||||
Net investment income (loss)(a) | 0.01 | 0.10 | 0.06 | (0.01 | ) | (0.01 | ) | |||||||||||||
Net realized and unrealized gain (loss) | 15.42 | (1.56 | ) | 11.63 | 7.57 | 3.73 | ||||||||||||||
|
|
|
|
|
|
|
|
|
| |||||||||||
Net increase (decrease) from investment operations | 15.43 | (1.46 | ) | 11.69 | 7.56 | 3.72 | ||||||||||||||
|
|
|
|
|
|
|
|
|
| |||||||||||
Distributions(b) | ||||||||||||||||||||
From net investment income | (0.20 | ) | (0.06 | ) | — | — | (0.67 | ) | ||||||||||||
From net realized gain | (2.31 | ) | (4.53 | ) | (1.89 | ) | (1.08 | ) | (5.44 | ) | ||||||||||
|
|
|
|
|
|
|
|
|
| |||||||||||
Total distributions | (2.51 | ) | (4.59 | ) | (1.89 | ) | (1.08 | ) | (6.11 | ) | ||||||||||
|
|
|
|
|
|
|
|
|
| |||||||||||
Net asset value, end of year | $ | 71.37 | $ | 58.45 | $ | 64.50 | $ | 54.70 | $ | 48.22 | ||||||||||
|
|
|
|
|
|
|
|
|
| |||||||||||
Total Return(c) | ||||||||||||||||||||
Based on net asset value | 26.99 | %(d) | (2.11 | )% | 22.13 | % | 16.20 | % | 7.70 | % | ||||||||||
|
|
|
|
|
|
|
|
|
| |||||||||||
Ratios to Average Net Assets | ||||||||||||||||||||
Total expenses | 1.11 | % | 1.12 | %(e) | 1.15 | % | 1.17 | % | 1.18 | %(e) | ||||||||||
|
|
|
|
|
|
|
|
|
| |||||||||||
Total expenses after fees waived and/or reimbursed | 1.11 | % | 1.12 | %(e) | 1.14 | % | 1.17 | % | 1.18 | %(e) | ||||||||||
|
|
|
|
|
|
|
|
|
| |||||||||||
Net investment income (loss) | 0.01 | % | 0.17 | %(e) | 0.11 | % | (0.02 | )% | (0.03 | )%(e) | ||||||||||
|
|
|
|
|
|
|
|
|
| |||||||||||
Supplemental Data | ||||||||||||||||||||
Net assets, end of year (000) | $ | 3,135,882 | $ | 2,598,888 | $ | 2,767,303 | $ | 2,597,901 | $ | 2,701,948 | ||||||||||
|
|
|
|
|
|
|
|
|
| |||||||||||
Portfolio turnover rate | 28 | % | 41 | % | 39 | % | 39 | % | 50 | % | ||||||||||
|
|
|
|
|
|
|
|
|
| |||||||||||
| (a) | Based on average shares outstanding. |
| (b) | Distributions for annual periods determined in accordance with U.S. federal income tax regulations. |
| (c) | Where applicable, excludes the effects of any sales charges and assumes the reinvestment of distributions. |
| (d) | Includes a payment received from an affiliate, which had no impact on the Fund’s total return. |
| (e) | Excludes expenses incurred indirectly as a result of investments in underlying funds as follows: |
| Year Ended September 30, | ||||||||||||||||||||
| 2020 | 2019 | 2018 | 2017 | 2016 | ||||||||||||||||
Investments in underlying funds | — | % | 0.01 | % | — | % | — | % | 0.01 | % | ||||||||||
|
|
|
|
|
|
|
|
|
| |||||||||||
See notes to financial statements.
| 54 | 2 0 2 0 BLACK ROCK ANNUAL REPORT TO SHAREHOLDERS |
Financial Highlights (continued)
(For a share outstanding throughout each period)
| BlackRock Health Sciences Opportunities Portfolio (continued) | ||||||||||||||||||||
| Investor C | ||||||||||||||||||||
| Year Ended September 30, | ||||||||||||||||||||
| 2020 | 2019 | 2018 | 2017 | 2016 | ||||||||||||||||
Net asset value, beginning of year | $ | 50.74 | $ | 56.55 | $ | 48.54 | $ | 43.22 | $ | 46.05 | ||||||||||
|
|
|
|
|
|
|
|
|
| |||||||||||
Net investment loss(a) | (0.40 | ) | (0.28 | ) | (0.30 | ) | (0.33 | ) | (0.32 | ) | ||||||||||
Net realized and unrealized gain (loss) | 13.34 | (1.38 | ) | 10.20 | 6.73 | 3.37 | ||||||||||||||
|
|
|
|
|
|
|
|
|
| |||||||||||
Net increase (decrease) from investment operations | 12.94 | (1.66 | ) | 9.90 | 6.40 | 3.05 | ||||||||||||||
|
|
|
|
|
|
|
|
|
| |||||||||||
Distributions(b) | ||||||||||||||||||||
From net investment income | — | — | — | — | (0.44 | ) | ||||||||||||||
From net realized gain | (2.30 | ) | (4.15 | ) | (1.89 | ) | (1.08 | ) | (5.44 | ) | ||||||||||
|
|
|
|
|
|
|
|
|
| |||||||||||
Total distributions | (2.30 | ) | (4.15 | ) | (1.89 | ) | (1.08 | ) | (5.88 | ) | ||||||||||
|
|
|
|
|
|
|
|
|
| |||||||||||
Net asset value, end of year | $ | 61.38 | $ | 50.74 | $ | 56.55 | $ | 48.54 | $ | 43.22 | ||||||||||
|
|
|
|
|
|
|
|
|
| |||||||||||
Total Return(c) | ||||||||||||||||||||
Based on net asset value | 26.09 | %(d) | (2.82 | )% | 21.22 | % | 15.37 | % | 6.92 | % | ||||||||||
|
|
|
|
|
|
|
|
|
| |||||||||||
Ratios to Average Net Assets | ||||||||||||||||||||
Total expenses | 1.85 | % | 1.85 | %(e) | 1.87 | % | 1.90 | % | 1.90 | %(e) | ||||||||||
|
|
|
|
|
|
|
|
|
| |||||||||||
Total expenses after fees waived and/or reimbursed | 1.85 | % | 1.85 | %(e) | 1.87 | % | 1.90 | % | 1.90 | %(e) | ||||||||||
|
|
|
|
|
|
|
|
|
| |||||||||||
Net investment loss | (0.72 | )% | (0.56 | )%(e) | (0.61 | )% | (0.75 | )% | (0.75 | )%(e) | ||||||||||
|
|
|
|
|
|
|
|
|
| |||||||||||
Supplemental Data | ||||||||||||||||||||
Net assets, end of year (000) | $ | 773,522 | $ | 745,636 | $ | 1,017,205 | $ | 954,780 | $ | 1,130,051 | ||||||||||
|
|
|
|
|
|
|
|
|
| |||||||||||
Portfolio turnover rate | 28 | % | 41 | % | 39 | % | 39 | % | 50 | % | ||||||||||
|
|
|
|
|
|
|
|
|
| |||||||||||
| (a) | Based on average shares outstanding. |
| (b) | Distributions for annual periods determined in accordance with U.S. federal income tax regulations. |
| (c) | Where applicable, excludes the effects of any sales charges and assumes the reinvestment of distributions. |
| (d) | Includes a payment received from an affiliate, which had no impact on the Fund’s total return. |
| (e) | Excludes expenses incurred indirectly as a result of investments in underlying funds as follows: |
| Year Ended September 30, | ||||||||||||||||||||
| 2020 | 2019 | 2018 | 2017 | 2016 | ||||||||||||||||
Investments in underlying funds | — | % | 0.01 | % | — | % | — | % | 0.01 | % | ||||||||||
|
|
|
|
|
|
|
|
|
| |||||||||||
See notes to financial statements.
FINANCIAL HIGHLIGHTS | 55 |
Financial Highlights (continued)
(For a share outstanding throughout each period)
| BlackRock Health Sciences Opportunities Portfolio (continued) | ||||||||||||||||||||||||
| Class K | ||||||||||||||||||||||||
| Year Ended September 30, | | Period from 06/08/16 to 09/30/16 | (a)
| |||||||||||||||||||||
| 2020 | 2019 | 2018 | 2017 | |||||||||||||||||||||
Net asset value, beginning of period | $ | 61.63 | $ | 67.75 | $ | 57.37 | $ | 50.32 | $ | 49.82 | ||||||||||||||
|
|
|
|
|
|
|
|
|
| |||||||||||||||
Net investment income(b) | 0.27 | 0.34 | 0.32 | 0.26 | 0.09 | |||||||||||||||||||
Net realized and unrealized gain (loss) | 16.28 | (1.65 | ) | 12.17 | 7.87 | 0.41 | ||||||||||||||||||
|
|
|
|
|
|
|
|
|
| |||||||||||||||
Net increase (decrease) from investment operations | 16.55 | (1.31 | ) | 12.49 | 8.13 | 0.50 | ||||||||||||||||||
|
|
|
|
|
|
|
|
|
| |||||||||||||||
Distributions(c) | ||||||||||||||||||||||||
From net investment income | (0.37 | ) | (0.28 | ) | (0.10 | ) | — | — | ||||||||||||||||
From net realized gain | (2.31 | ) | (4.53 | ) | (2.01 | ) | (1.08 | ) | — | |||||||||||||||
|
|
|
|
|
|
|
|
|
| |||||||||||||||
Total distributions | (2.68 | ) | (4.81 | ) | (2.11 | ) | (1.08 | ) | — | |||||||||||||||
|
|
|
|
|
|
|
|
|
| |||||||||||||||
Net asset value, end of period | $ | 75.50 | $ | 61.63 | $ | 67.75 | $ | 57.37 | $ | 50.32 | ||||||||||||||
|
|
|
|
|
|
|
|
|
| |||||||||||||||
Total Return(d) | ||||||||||||||||||||||||
Based on net asset value | 27.47 | %(e) | (1.75 | )% | 22.58 | % | 16.67 | % | 1.00 | %(f) | ||||||||||||||
|
|
|
|
|
|
|
|
|
| |||||||||||||||
Ratios to Average Net Assets | ||||||||||||||||||||||||
Total expenses | 0.75 | % | 0.75 | %(g) | 0.77 | % | 0.78 | % | 0.82 | %(g) | ||||||||||||||
|
|
|
|
|
|
|
|
|
| |||||||||||||||
Total expenses after fees waived and/or reimbursed | 0.75 | % | 0.75 | %(g) | 0.76 | % | 0.78 | % | 0.82 | %(g) | ||||||||||||||
|
|
|
|
|
|
|
|
|
| |||||||||||||||
Net investment income | 0.39 | % | 0.55 | %(g) | 0.53 | % | 0.47 | % | 0.54 | %(g) | ||||||||||||||
|
|
|
|
|
|
|
|
|
| |||||||||||||||
Supplemental Data | ||||||||||||||||||||||||
Net assets, end of period (000) | $ | 344,822 | $ | 171,517 | $ | 130,129 | $ | 48,253 | $ | 2,495 | ||||||||||||||
|
|
|
|
|
|
|
|
|
| |||||||||||||||
Portfolio turnover rate | 28 | % | 41 | % | 39 | % | 39 | % | 50 | %(h) | ||||||||||||||
|
|
|
|
|
|
|
|
|
| |||||||||||||||
| (a) | Commencement of operations. |
| (b) | Based on average shares outstanding. |
| (c) | Distributions for annual periods determined in accordance with U.S. federal income tax regulations. |
| (d) | Where applicable, assumes the reinvestment of distributions. |
| (e) | Includes a payment received from an affiliate, which had no impact on the Fund’s total return. |
| (f) | Aggregate total return. |
| (g) | Excludes expenses incurred indirectly as a result of investments in underlying funds as follows: |
| Year Ended September 30, | | Period from 06/08/16(a) to 09/30/16 |
| |||||||||||||||||||||
| 2020 | 2019 | 2018 | 2017 | |||||||||||||||||||||
Investments in underlying funds | — | % | 0.01 | % | — | % | — | % | 0.01 | % | ||||||||||||||
|
|
|
|
|
|
|
|
|
| |||||||||||||||
| (h) | Portfolio turnover is representative of the Fund for the entire year. |
See notes to financial statements.
| 56 | 2 0 2 0 BLACK ROCK ANNUAL REPORT TO SHAREHOLDERS |
Financial Highlights (continued)
(For a share outstanding throughout each period)
| BlackRock Health Sciences Opportunities Portfolio (continued) | ||||||||||||||||||||
| Class R | ||||||||||||||||||||
| Year Ended September 30, | ||||||||||||||||||||
| 2020 | 2019 | 2018 | 2017 | 2016 | ||||||||||||||||
Net asset value, beginning of year | $ | 57.05 | $ | 63.09 | $ | 53.71 | $ | 47.51 | $ | 50.04 | ||||||||||
|
|
|
|
|
|
|
|
|
| |||||||||||
Net investment loss(a) | (0.20 | ) | (0.09 | ) | (0.11 | ) | (0.16 | ) | (0.17 | ) | ||||||||||
Net realized and unrealized gain (loss) | 15.05 | (1.53 | ) | 11.38 | 7.44 | 3.68 | ||||||||||||||
|
|
|
|
|
|
|
|
|
| |||||||||||
Net increase (decrease) from investment operations | 14.85 | (1.62 | ) | 11.27 | 7.28 | 3.51 | ||||||||||||||
|
|
|
|
|
|
|
|
|
| |||||||||||
Distributions(b) | ||||||||||||||||||||
From net investment income | (0.05 | ) | — | — | — | (0.60 | ) | |||||||||||||
From net realized gain | (2.31 | ) | (4.42 | ) | (1.89 | ) | (1.08 | ) | (5.44 | ) | ||||||||||
|
|
|
|
|
|
|
|
|
| |||||||||||
Total distributions | (2.36 | ) | (4.42 | ) | (1.89 | ) | (1.08 | ) | (6.04 | ) | ||||||||||
|
|
|
|
|
|
|
|
|
| |||||||||||
Net asset value, end of year | $ | 69.54 | $ | 57.05 | $ | 63.09 | $ | 53.71 | $ | 47.51 | ||||||||||
|
|
|
|
|
|
|
|
|
| |||||||||||
Total Return(c) | ||||||||||||||||||||
Based on net asset value | 26.60 | %(d) | (2.44 | )% | 21.75 | % | 15.85 | % | 7.33 | % | ||||||||||
|
|
|
|
|
|
|
|
|
| |||||||||||
Ratios to Average Net Assets | ||||||||||||||||||||
Total expenses | 1.45 | % | 1.45 | %(e) | 1.46 | % | 1.49 | % | 1.51 | %(e) | ||||||||||
|
|
|
|
|
|
|
|
|
| |||||||||||
Total expenses after fees waived and/or reimbursed | 1.45 | % | 1.45 | %(e) | 1.46 | % | 1.49 | % | 1.51 | %(e) | ||||||||||
|
|
|
|
|
|
|
|
|
| |||||||||||
Net investment loss | (0.32 | )% | (0.15 | )%(e) | (0.20 | )% | (0.33 | )% | (0.35 | )%(e) | ||||||||||
|
|
|
|
|
|
|
|
|
| |||||||||||
Supplemental Data | ||||||||||||||||||||
Net assets, end of year (000) | $ | 260,488 | $ | 224,862 | $ | 241,495 | $ | 198,426 | $ | 172,640 | ||||||||||
|
|
|
|
|
|
|
|
|
| |||||||||||
Portfolio turnover rate | 28 | % | 41 | % | 39 | % | 39 | % | 50 | % | ||||||||||
|
|
|
|
|
|
|
|
|
| |||||||||||
(a) Based on average shares outstanding.
(b) Distributions for annual periods determined in accordance with U.S. federal income tax regulations.
(c) Where applicable, assumes the reinvestment of distributions.
(d) Includes a payment received from an affiliate, which had no impact on the Fund’s total return.
(e) Excludes expenses incurred indirectly as a result of investments in underlying funds as follows:
| Year Ended September 30, | ||||||||||||||||||||
| 2020 | 2019 | 2018 | 2017 | 2016 | ||||||||||||||||
Investments in underlying funds | — | % | 0.01 | % | — | % | — | % | 0.01 | % | ||||||||||
|
|
|
|
|
|
|
|
|
| |||||||||||
See notes to financial statements.
FINANCIAL HIGHLIGHTS | 57 |
Financial Highlights (continued)
(For a share outstanding throughout each period)
| BlackRock Mid-Cap Growth Equity Portfolio | ||||||||||||||||||||
| Institutional | ||||||||||||||||||||
| Year Ended September 30, | ||||||||||||||||||||
| 2020 | 2019 | 2018 | 2017 | 2016 | ||||||||||||||||
Net asset value, beginning of year | $ | 28.68 | $ | 27.87 | $ | 22.10 | $ | 17.87 | $ | 16.42 | ||||||||||
|
|
|
|
|
|
|
|
|
| |||||||||||
Net investment loss(a) | (0.14 | ) | (0.09 | ) | (0.11 | ) | (0.05 | )(b) | (0.12 | ) | ||||||||||
Net realized and unrealized gain | 8.14 | 1.95 | 6.63 | 4.28 | 2.00 | |||||||||||||||
|
|
|
|
|
|
|
|
|
| |||||||||||
Net increase from investment operations | 8.00 | 1.86 | 6.52 | 4.23 | 1.88 | |||||||||||||||
|
|
|
|
|
|
|
|
|
| |||||||||||
Distributions from net realized gain(c) | (0.12 | ) | (1.05 | ) | (0.75 | ) | — | (0.43 | ) | |||||||||||
|
|
|
|
|
|
|
|
|
| |||||||||||
Net asset value, end of year | $ | 36.56 | $ | 28.68 | $ | 27.87 | $ | 22.10 | $ | 17.87 | ||||||||||
|
|
|
|
|
|
|
|
|
| |||||||||||
Total Return(d) | ||||||||||||||||||||
Based on net asset value | 27.98 | % | 7.43 | % | 30.34 | % | 23.67 | % | 11.60 | % | ||||||||||
|
|
|
|
|
|
|
|
|
| |||||||||||
Ratios to Average Net Assets | ||||||||||||||||||||
Total expenses | 0.85 | % | 0.87 | % | 0.93 | %(e) | 1.08 | %(e) | 1.11 | %(e) | ||||||||||
|
|
|
|
|
|
|
|
|
| |||||||||||
Total expenses after fees waived and/or reimbursed | 0.80 | % | 0.80 | % | 0.86 | % | 1.08 | % | 1.08 | % | ||||||||||
|
|
|
|
|
|
|
|
|
| |||||||||||
Net investment loss | (0.43 | )% | (0.34 | )% | (0.45 | )% | (0.25 | )%(b) | (0.71 | )% | ||||||||||
|
|
|
|
|
|
|
|
|
| |||||||||||
Supplemental Data | ||||||||||||||||||||
Net assets, end of year (000) | $ | 6,003,280 | $ | 2,700,531 | $ | 1,063,328 | $ | 278,701 | $ | 99,759 | ||||||||||
|
|
|
|
|
|
|
|
|
| |||||||||||
Portfolio turnover rate | 35 | % | 38 | % | 43 | % | 59 | % | 81 | % | ||||||||||
|
|
|
|
|
|
|
|
|
| |||||||||||
| (a) | Based on average shares outstanding. |
| (b) | Net investment income per share and the ratio of net investment income to average net assets includes $0.06 per share and 0.35%, respectively, resulting from a special dividend. |
| (c) | Distributions for annual periods determined in accordance with U.S. federal income tax regulations. |
| (d) | Where applicable, assumes the reinvestment of distributions. |
| (e) | Includes recoupment of past waived and/or reimbursed fees. Excluding the recoupment of past waived and/or reimbursed fees, the ratios were as follows: |
| Year Ended September 30, | ||||||||||||||||||||
| 2020 | 2019 | 2018 | 2017 | 2016 | ||||||||||||||||
Expense ratios | N/A | N/A | 0.93 | % | 1.07 | % | 1.10 | % | ||||||||||||
|
|
|
|
|
|
|
|
|
| |||||||||||
See notes to financial statements.
| 58 | 2 0 2 0 BLACK ROCK ANNUAL REPORT TO SHAREHOLDERS |
Financial Highlights (continued)
(For a share outstanding throughout each period)
| BlackRock Mid-Cap Growth Equity Portfolio (continued) | ||||||||||||||||||||
| Service | ||||||||||||||||||||
| Year Ended September 30, | ||||||||||||||||||||
| 2020 | 2019 | 2018 | 2017 | 2016 | ||||||||||||||||
Net asset value, beginning of year | $ | 25.92 | $ | 25.30 | $ | 20.18 | $ | 16.35 | $ | 15.00 | ||||||||||
|
|
|
|
|
|
|
|
|
| |||||||||||
Net investment loss(a) | (0.19 | ) | (0.15 | ) | (0.17 | ) | (0.12 | )(b) | (0.13 | ) | ||||||||||
Net realized and unrealized gain | 7.34 | 1.76 | 6.04 | 3.95 | 1.82 | |||||||||||||||
|
|
|
|
|
|
|
|
|
| |||||||||||
Net increase from investment operations | 7.15 | 1.61 | 5.87 | 3.83 | 1.69 | |||||||||||||||
|
|
|
|
|
|
|
|
|
| |||||||||||
Distributions from net realized gain(c) | (0.12 | ) | (0.99 | ) | (0.75 | ) | — | (0.34 | ) | |||||||||||
|
|
|
|
|
|
|
|
|
| |||||||||||
Net asset value, end of year | $ | 32.95 | $ | 25.92 | $ | 25.30 | $ | 20.18 | $ | 16.35 | ||||||||||
|
|
|
|
|
|
|
|
|
| |||||||||||
Total Return(d) | ||||||||||||||||||||
Based on net asset value | 27.68 | % | 7.15 | % | 30.03 | % | 23.43 | % | 11.39 | % | ||||||||||
|
|
|
|
|
|
|
|
|
| |||||||||||
Ratios to Average Net Assets | ||||||||||||||||||||
Total expenses | 1.11 | % | 1.16 | % | 1.25 | %(e) | 1.29 | % | 1.26 | %(e) | ||||||||||
|
|
|
|
|
|
|
|
|
| |||||||||||
Total expenses after fees waived and/or reimbursed | 1.05 | % | 1.05 | % | 1.12 | % | 1.29 | % | 1.25 | % | ||||||||||
|
|
|
|
|
|
|
|
|
| |||||||||||
Net investment loss | (0.67 | )% | (0.59 | )% | (0.73 | )% | (0.67 | )%(b) | (0.88 | )% | ||||||||||
|
|
|
|
|
|
|
|
|
| |||||||||||
Supplemental Data | ||||||||||||||||||||
Net assets, end of year (000) | $ | 83,680 | $ | 61,293 | $ | 33,768 | $ | 12,718 | $ | 1,343 | ||||||||||
|
|
|
|
|
|
|
|
|
| |||||||||||
Portfolio turnover rate | 35 | % | 38 | % | 43 | % | 59 | % | 81 | % | ||||||||||
|
|
|
|
|
|
|
|
|
| |||||||||||
| (a) | Based on average shares outstanding. |
| (b) | Net investment income per share and the ratio of net investment income to average net assets includes $0.06 per share and 0.35%, respectively, resulting from a special dividend. |
| (c) | Distributions for annual periods determined in accordance with U.S. federal income tax regulations. |
| (d) | Where applicable, assumes the reinvestment of distributions. |
| (e) | Includes recoupment of past waived and/or reimbursed fees. Excluding the recoupment of past waived and/or reimbursed fees, the ratios were as follows: |
| Year Ended September 30, | ||||||||||||||||||||
| 2020 | 2019 | 2018 | 2017 | 2016 | ||||||||||||||||
Expenseratios | N/A | N/A | 1.25 | % | N/A | 1.24 | % | |||||||||||||
|
|
|
|
|
|
|
|
|
| |||||||||||
See notes to financial statements.
FINANCIAL HIGHLIGHTS | 59 |
Financial Highlights (continued)
(For a share outstanding throughout each period)
| BlackRock Mid-Cap Growth Equity Portfolio (continued) | ||||||||||||||||||||
| Investor A | ||||||||||||||||||||
| Year Ended September 30, | ||||||||||||||||||||
| 2020 | 2019 | 2018 | 2017 | 2016 | ||||||||||||||||
Net asset value, beginning of year | $ | 24.78 | $ | 24.22 | $ | 19.30 | $ | 15.66 | $ | 14.43 | ||||||||||
|
|
|
|
|
|
|
|
|
| |||||||||||
Net investment loss(a) | (0.18 | ) | (0.14 | ) | (0.18 | ) | (0.10 | )(b) | (0.15 | ) | ||||||||||
Net realized and unrealized gain | 7.00 | 1.68 | 5.79 | 3.74 | 1.76 | |||||||||||||||
|
|
|
|
|
|
|
|
|
| |||||||||||
Net increase from investment operations | 6.82 | 1.54 | 5.61 | 3.64 | 1.61 | |||||||||||||||
|
|
|
|
|
|
|
|
|
| |||||||||||
Distributions from net realized gain(c) | (0.12 | ) | (0.98 | ) | (0.69 | ) | — | (0.38 | ) | |||||||||||
|
|
|
|
|
|
|
|
|
| |||||||||||
Net asset value, end of year | $ | 31.48 | $ | 24.78 | $ | 24.22 | $ | 19.30 | $ | 15.66 | ||||||||||
|
|
|
|
|
|
|
|
|
| |||||||||||
Total Return(d) | ||||||||||||||||||||
Based on net asset value | 27.61 | % | 7.17 | % | 29.98 | % | 23.24 | % | 11.29 | % | ||||||||||
|
|
|
|
|
|
|
|
|
| |||||||||||
Ratios to Average Net Assets | ||||||||||||||||||||
Total expenses | 1.14 | % | 1.16 | % | 1.29 | %(e) | 1.41 | %(e) | 1.45 | % | ||||||||||
|
|
|
|
|
|
|
|
|
| |||||||||||
Total expenses after fees waived and/or reimbursed | 1.05 | % | 1.05 | % | 1.19 | % | 1.39 | % | 1.39 | % | ||||||||||
|
|
|
|
|
|
|
|
|
| |||||||||||
Net investment loss | (0.67 | )% | (0.58 | )% | (0.82 | )% | (0.59 | )%(b) | (1.02 | )% | ||||||||||
|
|
|
|
|
|
|
|
|
| |||||||||||
Supplemental Data | ||||||||||||||||||||
Net assets, end of year (000) | $ | 1,917,773 | $ | 1,335,467 | $ | 801,263 | $ | 525,736 | $ | 394,544 | ||||||||||
|
|
|
|
|
|
|
|
|
| |||||||||||
Portfolio turnover rate | 35 | % | 38 | % | 43 | % | 59 | % | 81 | % | ||||||||||
|
|
|
|
|
|
|
|
|
| |||||||||||
| (a) | Based on average shares outstanding. |
| (b) | Net investment income per share and the ratio of net investment income to average net assets includes $0.06 per share and 0.35%, respectively, resulting from a special dividend. |
| (c) | Distributions for annual periods determined in accordance with U.S. federal income tax regulations. |
| (d) | Where applicable, excludes the effects of any sales charges and assumes the reinvestment of distributions. |
| (e) | Includes recoupment of past waived and/or reimbursed fees. Excluding the recoupment of past waived and/or reimbursed fees, the ratios were as follows: |
| Year Ended September 30, | ||||||||||||||||||||
| 2020 | 2019 | 2018 | 2017 | 2016 | ||||||||||||||||
Expense ratios | N/A | N/A | 1.26 | % | 1.39 | % | N/A | |||||||||||||
|
|
|
|
|
|
|
|
|
| |||||||||||
See notes to financial statements.
| 60 | 2 0 2 0 BLACK ROCK ANNUAL REPORT TO SHAREHOLDERS |
Financial Highlights (continued)
(For a share outstanding throughout each period)
| BlackRock Mid-Cap Growth Equity Portfolio (continued) | ||||||||||||||||||||
| Investor C | ||||||||||||||||||||
| Year Ended September 30, | ||||||||||||||||||||
| 2020 | 2019 | 2018 | 2017 | 2016 | ||||||||||||||||
Net asset value, beginning of year | $ | 19.21 | $ | 19.04 | $ | 15.36 | $ | 12.55 | $ | 11.68 | ||||||||||
|
|
|
|
|
|
|
|
|
| |||||||||||
Net investment loss(a) | (0.30 | ) | (0.24 | ) | (0.26 | ) | (0.18 | )(b) | (0.20 | ) | ||||||||||
Net realized and unrealized gain | 5.41 | 1.28 | 4.57 | 2.99 | 1.41 | |||||||||||||||
|
|
|
|
|
|
|
|
|
| |||||||||||
Net increase from investment operations | 5.11 | 1.04 | 4.31 | 2.81 | 1.21 | |||||||||||||||
|
|
|
|
|
|
|
|
|
| |||||||||||
Distributions from net realized gain(c) | (0.12 | ) | (0.87 | ) | (0.63 | ) | — | (0.34 | ) | |||||||||||
|
|
|
|
|
|
|
|
|
| |||||||||||
Net asset value, end of year | $ | 24.20 | $ | 19.21 | $ | 19.04 | $ | 15.36 | $ | 12.55 | ||||||||||
|
|
|
|
|
|
|
|
|
| |||||||||||
Total Return(d) | ||||||||||||||||||||
Based on net asset value | 26.72 | % | 6.33 | % | 29.05 | % | 22.39 | % | 10.48 | % | ||||||||||
|
|
|
|
|
|
|
|
|
| |||||||||||
Ratios to Average Net Assets | ||||||||||||||||||||
Total expenses | 1.84 | % | 1.86 | % | 1.94 | %(e) | 2.11 | %(e) | 2.14 | %(e) | ||||||||||
|
|
|
|
|
|
|
|
|
| |||||||||||
Total expenses after fees waived and/or reimbursed | 1.80 | % | 1.80 | % | 1.88 | % | 2.10 | % | 2.12 | % | ||||||||||
|
|
|
|
|
|
|
|
|
| |||||||||||
Net investment loss | (1.42 | )% | (1.33 | )% | (1.49 | )% | (1.30 | )%(b) | (1.75 | )% | ||||||||||
|
|
|
|
|
|
|
|
|
| |||||||||||
Supplemental Data | ||||||||||||||||||||
Net assets, end of year (000) | $ | 280,143 | $ | 209,923 | $ | 164,083 | $ | 72,814 | $ | 52,723 | ||||||||||
|
|
|
|
|
|
|
|
|
| |||||||||||
Portfolio turnover rate | 35 | % | 38 | % | 43 | % | 59 | % | 81 | % | ||||||||||
|
|
|
|
|
|
|
|
|
| |||||||||||
| (a) | Based on average shares outstanding. |
| (b) | Net investment income per share and the ratio of net investment income to average net assets includes $0.06 per share and 0.35%, respectively, resulting from a special dividend. |
| (c) | Distributions for annual periods determined in accordance with U.S. federal income tax regulations. |
| (d) | Where applicable, excludes the effects of any sales charges and assumes the reinvestment of distributions. |
| (e) | Includes recoupment of past waived and/or reimbursed fees. Excluding the recoupment of past waived and/or reimbursed fees, the ratios were as follows: |
| Year Ended September 30, | ||||||||||||||||||||
| 2020 | 2019 | 2018 | 2017 | 2016 | ||||||||||||||||
Expense ratios | N/A | N/A | 1.94 | % | 2.10 | % | 2.13 | % | ||||||||||||
|
|
|
|
|
|
|
|
|
| |||||||||||
See notes to financial statements.
F I N A N C I A L H I G H L I G H T S | 61 |
Financial Highlights (continued)
(For a share outstanding throughout each period)
| BlackRock Mid-Cap Growth Equity Portfolio (continued) | ||||||||||||||||||||||||
| Class K | ||||||||||||||||||||||||
| Year Ended September 30, | | Period from 03/28/16 to 09/30/16 | (a)
| |||||||||||||||||||||
| 2020 | 2019 | 2018 | 2017 | |||||||||||||||||||||
Net asset value, beginning of period | $ | 28.74 | $ | 27.93 | $ | 22.14 | $ | 17.88 | $ | 15.57 | ||||||||||||||
|
|
|
|
|
|
|
|
|
| |||||||||||||||
Net investment loss(b) | (0.12 | ) | (0.09 | ) | (0.07 | ) | (0.03 | )(c) | (0.05 | ) | ||||||||||||||
Net realized and unrealized gain | 8.16 | 1.96 | 6.62 | 4.29 | 2.36 | |||||||||||||||||||
|
|
|
|
|
|
|
|
|
| |||||||||||||||
Net increase from investment operations | 8.04 | 1.87 | 6.55 | 4.26 | 2.31 | |||||||||||||||||||
|
|
|
|
|
|
|
|
|
| |||||||||||||||
Distributions from net realized gain(d) | (0.12 | ) | (1.06 | ) | (0.76 | ) | — | — | ||||||||||||||||
|
|
|
|
|
|
|
|
|
| |||||||||||||||
Net asset value, end of period | $ | 36.66 | $ | 28.74 | $ | 27.93 | $ | 22.14 | $ | 17.88 | ||||||||||||||
|
|
|
|
|
|
|
|
|
| |||||||||||||||
Total Return(e) | ||||||||||||||||||||||||
Based on net asset value | 28.06 | % | 7.47 | % | 30.46 | % | 23.83 | % | 14.84 | %(f) | ||||||||||||||
|
|
|
|
|
|
|
|
|
| |||||||||||||||
Ratios to Average Net Assets | ||||||||||||||||||||||||
Total expenses | 0.73 | %(g) | 0.76 | %(g) | 0.80 | %(g) | 0.95 | % | 0.98 | %(h) | ||||||||||||||
|
|
|
|
|
|
|
|
|
| |||||||||||||||
Total expenses after fees waived and/or reimbursed | 0.73 | % | 0.75 | % | �� | 0.76 | % | 0.95 | % | 0.97 | %(h) | |||||||||||||
|
|
|
|
|
|
|
|
|
| |||||||||||||||
Net investment loss | (0.36 | )% | (0.31 | )% | (0.29 | )% | (0.17 | )%(c) | (0.59 | )%(h) | ||||||||||||||
|
|
|
|
|
|
|
|
|
| |||||||||||||||
Supplemental Data | ||||||||||||||||||||||||
Net assets, end of period (000) | $ | 2,011,727 | $ | 652,138 | $ | 139,138 | $ | 4,103 | $ | 230 | ||||||||||||||
|
|
|
|
|
|
|
|
|
| |||||||||||||||
Portfolio turnover rate | 35 | % | 38 | % | 43 | % | 59 | % | 81 | %(i) | ||||||||||||||
|
|
|
|
|
|
|
|
|
| |||||||||||||||
| (a) | Commencement of operations. |
| (b) | Based on average shares outstanding. |
| (c) | Net investment income per share and the ratio of net investment income to average net assets includes $0.06 per share and 0.35%, respectively, resulting from a special dividend. |
| (d) | Distributions for annual periods determined in accordance with U.S. federal income tax regulations. |
| (e) | Where applicable, assumes the reinvestment of distributions. |
| (f) | Aggregate total return. |
| (g) | Includes recoupment of past waived and/or reimbursed fees. Excluding the recoupment of past waived and/or reimbursed fees, the ratios were as follows: |
| Year Ended September 30, | | Period from 03/28/2016(a) to 09/30/16 |
| |||||||||||||||||
| 2020 | 2019 | 2018 | 2017 | |||||||||||||||||
Expense ratios | 0.73 | % | 0.75 | % | 0.80 | % | N/A | N/A | ||||||||||||
|
|
|
|
|
|
|
|
|
| |||||||||||
| (h) | Annualized. |
| (i) | Portfolio turnover is representative of the Fund for the entire year. |
See notes to financial statements.
| 62 | 2 0 2 0 BLACK ROCK ANNUAL REPORT TO SHAREHOLDERS |
Financial Highlights (continued)
(For a share outstanding throughout each period)
| BlackRock Mid-Cap Growth Equity Portfolio (continued) | ||||||||||||||||||||||||
| Class R | ||||||||||||||||||||||||
| Year Ended September 30, | ||||||||||||||||||||||||
| 2020 | 2019 | 2018 | 2017 | 2016 | ||||||||||||||||||||
Net asset value, beginning of year | $ | 24.34 | $ | 23.83 | $ | 19.02 | $ | 15.47 | $ | 14.27 | ||||||||||||||
|
|
|
|
|
|
|
|
|
| |||||||||||||||
Net investment loss(a) | (0.24 | ) | (0.19 | ) | (0.22 | ) | (0.14 | )(b) | (0.18 | ) | ||||||||||||||
Net realized and unrealized gain | 6.87 | 1.65 | 5.69 | 3.69 | 1.72 | |||||||||||||||||||
|
|
|
|
|
|
|
|
|
| |||||||||||||||
Net increase from investment operations | 6.63 | 1.46 | 5.47 | 3.55 | 1.54 | |||||||||||||||||||
|
|
|
|
|
|
|
|
|
| |||||||||||||||
Distributions from net realized gain(c) | (0.12 | ) | (0.95 | ) | (0.66 | ) | — | (0.34 | ) | |||||||||||||||
|
|
|
|
|
|
|
|
|
| |||||||||||||||
Net asset value, end of year | $ | 30.85 | $ | 24.34 | $ | 23.83 | $ | 19.02 | $ | 15.47 | ||||||||||||||
|
|
|
|
|
|
|
|
|
| |||||||||||||||
Total Return(d) | ||||||||||||||||||||||||
Based on net asset value | 27.33 | % | 6.89 | % | 29.63 | % | 22.95 | % | 10.94 | % | ||||||||||||||
|
|
|
|
|
|
|
|
|
| |||||||||||||||
Ratios to Average Net Assets | ||||||||||||||||||||||||
Total expenses | 1.45 | % | 1.47 | % | 1.59 | %(e) | 1.76 | % | 1.78 | % | ||||||||||||||
|
|
|
|
|
|
|
|
|
| |||||||||||||||
Total expenses after fees waived and/or reimbursed | 1.30 | % | 1.30 | % | 1.43 | % | 1.65 | % | 1.65 | % | ||||||||||||||
|
|
|
|
|
|
|
|
|
| |||||||||||||||
Net investment loss | (0.92 | )% | (0.83 | )% | (1.05 | )% | (0.86 | )%(b) | (1.28 | )% | ||||||||||||||
|
|
|
|
|
|
|
|
|
| |||||||||||||||
Supplemental Data | ||||||||||||||||||||||||
Net assets, end of year (000) | $ | 59,411 | $ | 40,999 | $ | 22,880 | $ | 10,177 | $ | 7,646 | ||||||||||||||
|
|
|
|
|
|
|
|
|
| |||||||||||||||
Portfolio turnover rate | 35 | % | 38 | % | 43 | % | 59 | % | 81 | % | ||||||||||||||
|
|
|
|
|
|
|
|
|
| |||||||||||||||
| (a) | Based on average shares outstanding. |
| (b) | Net investment income per share and the ratio of net investment income to average net assets includes $0.06 per share and 0.35%, respectively, resulting from a special dividend. |
| (c) | Distributions for annual periods determined in accordance with U.S. federal income tax regulations. |
| (d) | Where applicable, assumes the reinvestment of distributions. |
| (e) | Includes recoupment of past waived and/or reimbursed fees. Excluding the recoupment of past waived and/or reimbursed fees, the ratios were as follows: |
| Year Ended September 30, | ||||||||||||||||||||
| 2020 | 2019 | 2018 | 2017 | 2016 | ||||||||||||||||
Expense ratios | N/A | N/A | 1.58 | % | N/A | N/A | ||||||||||||||
|
|
|
|
|
|
|
|
|
| |||||||||||
See notes to financial statements.
FINANCIAL HIGHLIGHTS | 63 |
Financial Highlights (continued)
(For a share outstanding throughout each period)
| BlackRock Technology Opportunities Fund | ||||||||||||||||||||||||
| Institutional | ||||||||||||||||||||||||
| Year Ended September 30, | ||||||||||||||||||||||||
| 2020 | 2019 | 2018 | 2017 | 2016 | ||||||||||||||||||||
Net asset value, beginning of year | $ | 32.63 | $ | 31.83 | $ | 25.64 | $ | 19.18 | $ | 15.61 | ||||||||||||||
|
|
|
|
|
|
|
|
|
| |||||||||||||||
Net investment loss(a) | (0.22 | ) | (0.10 | ) | (0.09 | ) | (0.12 | ) | (0.08 | ) | ||||||||||||||
Net realized and unrealized gain | 23.43 | 1.20 | 8.25 | 6.78 | 3.65 | |||||||||||||||||||
|
|
|
|
|
|
|
|
|
| |||||||||||||||
Net increase from investment operations | 23.21 | 1.10 | 8.16 | 6.66 | 3.57 | |||||||||||||||||||
|
|
|
|
|
|
|
|
|
| |||||||||||||||
Distributions from net realized gain(b) | (0.51 | ) | (0.30 | ) | (1.97 | ) | (0.20 | ) | — | |||||||||||||||
|
|
|
|
|
|
|
|
|
| |||||||||||||||
Net asset value, end of year | $ | 55.33 | $ | 32.63 | $ | 31.83 | $ | 25.64 | $ | 19.18 | ||||||||||||||
|
|
|
|
|
|
|
|
|
| |||||||||||||||
Total Return(c) | ||||||||||||||||||||||||
Based on net asset value | 72.07 | % | 3.63 | % | 34.02 | % | 35.13 | % | 22.87 | % | ||||||||||||||
|
|
|
|
|
|
|
|
|
| |||||||||||||||
Ratios to Average Net Assets | ||||||||||||||||||||||||
Total expenses | 0.98 | %(d) | 1.02 | %(d) | 1.10 | %(d) | 1.22 | %(e) | 1.27 | % | ||||||||||||||
|
|
|
|
|
|
|
|
|
| |||||||||||||||
Total expenses after fees waived and/or reimbursed | 0.92 | %(d) | 0.92 | %(d) | 0.99 | %(d) | 1.21 | % | 1.23 | % | ||||||||||||||
|
|
|
|
|
|
|
|
|
| |||||||||||||||
Net investment loss | (0.50 | )%(d) | (0.32 | )%(d) | (0.32 | )%(d) | (0.54 | )% | (0.49 | )% | ||||||||||||||
|
|
|
|
|
|
|
|
|
| |||||||||||||||
Supplemental Data | ||||||||||||||||||||||||
Net assets, end of year (000) | $ | 3,641,519 | $ | 1,033,286 | $ | 584,654 | $ | 147,796 | $ | 78,179 | ||||||||||||||
|
|
|
|
|
|
|
|
|
| |||||||||||||||
Portfolio turnover rate | 27 | % | 33 | % | 49 | % | 51 | % | 84 | % | ||||||||||||||
|
|
|
|
|
|
|
|
|
| |||||||||||||||
| (a) | Based on average shares outstanding. |
| (b) | Distributions for annual periods determined in accordance with U.S. federal income tax regulations. |
| (c) | Where applicable, assumes the reinvestment of distributions. |
| (d) | Excludes expenses incurred indirectly as a result of investments in underlying funds as follows: |
| Year Ended September 30, | ||||||||||||||||||||||
| 2020 | 2019 | 2018 | 2017 | 2016 | ||||||||||||||||||
Investments in underlying funds | 0.01 | % | 0.01 | % | 0.01 | % | — | % | — | % | ||||||||||||
|
|
|
|
|
|
|
|
|
| |||||||||||||
| (e) | Includes recoupment of past waived and/or reimbursed fees with no financial impact to the expense ratios. |
See notes to financial statements.
| 64 | 2 0 2 0 BLACK ROCK ANNUAL REPORT TO SHAREHOLDERS |
Financial Highlights (continued)
(For a share outstanding throughout each period)
| BlackRock Technology Opportunities Fund (continued) | ||||||||||||||||||||||||
| Service | ||||||||||||||||||||||||
| Year Ended September 30, | ||||||||||||||||||||||||
| 2020 | 2019 | 2018 | 2017 | 2016 | ||||||||||||||||||||
Net asset value, beginning of year | $ | 30.88 | $ | 30.22 | $ | 24.44 | $ | 18.34 | $ | 14.96 | ||||||||||||||
|
|
|
|
|
|
|
|
|
| |||||||||||||||
Net investment loss(a) | (0.30 | ) | (0.17 | ) | (0.15 | ) | (0.16 | ) | (0.12 | ) | ||||||||||||||
Net realized and unrealized gain | 22.13 | 1.13 | 7.85 | 6.46 | 3.50 | |||||||||||||||||||
|
|
|
|
|
|
|
|
|
| |||||||||||||||
Net increase from investment operations | 21.83 | 0.96 | 7.70 | 6.30 | 3.38 | |||||||||||||||||||
|
|
|
|
|
|
|
|
|
| |||||||||||||||
Distributions from net realized gain(b) | (0.51 | ) | (0.30 | ) | (1.92 | ) | (0.20 | ) | — | |||||||||||||||
|
|
|
|
|
|
|
|
|
| |||||||||||||||
Net asset value, end of year | $ | 52.20 | $ | 30.88 | $ | 30.22 | $ | 24.44 | $ | 18.34 | ||||||||||||||
|
|
|
|
|
|
|
|
|
| |||||||||||||||
Total Return(c) | ||||||||||||||||||||||||
Based on net asset value | 71.68 | % | 3.36 | % | 33.74 | % | 34.77 | % | 22.59 | % | ||||||||||||||
|
|
|
|
|
|
|
|
|
| |||||||||||||||
Ratios to Average Net Assets | ||||||||||||||||||||||||
Total expenses | 1.19 | %(d) | 1.25 | %(d)(e) | 1.37 | %(d) | 1.48 | %(e) | 1.49 | % | ||||||||||||||
|
|
|
|
|
|
|
|
|
| |||||||||||||||
Total expenses after fees waived and/or reimbursed | 1.17 | %(d) | 1.17 | %(d) | 1.22 | %(d) | 1.47 | % | 1.49 | % | ||||||||||||||
|
|
|
|
|
|
|
|
|
| |||||||||||||||
Net investment loss | (0.74 | )%(d) | (0.57 | )%(d) | (0.55 | )%(d) | (0.77 | )% | (0.74 | )% | ||||||||||||||
|
|
|
|
|
|
|
|
|
| |||||||||||||||
Supplemental Data | ||||||||||||||||||||||||
Net assets, end of year (000) | $ | 50,710 | $ | 20,429 | $ | 15,208 | $ | 6,312 | $ | 2,583 | ||||||||||||||
|
|
|
|
|
|
|
|
|
| |||||||||||||||
Portfolio turnover rate | 27 | % | 33 | % | 49 | % | 51 | % | 84 | % | ||||||||||||||
|
|
|
|
|
|
|
|
|
| |||||||||||||||
| (a) | Based on average shares outstanding. |
| (b) | Distributions for annual periods determined in accordance with U.S. federal income tax regulations. |
| (c) | Where applicable, assumes the reinvestment of distributions. |
| (d) | Excludes expenses incurred indirectly as a result of investments in underlying funds as follows: |
| Year Ended September 30, | ||||||||||||||||||||||
| 2020 | 2019 | 2018 | 2017 | 2016 | ||||||||||||||||||
Investments in underlying funds | 0.01 | % | 0.01 | % | 0.01 | % | — | % | — | % | ||||||||||||
|
|
|
|
|
|
|
|
|
| |||||||||||||
| (e) | Includes recoupment of past waived and/or reimbursed fees with no financial impact to the expense ratios. |
See notes to financial statements.
FINANCIAL HIGHLIGHTS | 65 |
Financial Highlights (continued)
(For a share outstanding throughout each period)
| BlackRock Technology Opportunities Fund (continued) | ||||||||||||||||||||||||
| Investor A | ||||||||||||||||||||||||
| Year Ended September 30, | ||||||||||||||||||||||||
| 2020 | 2019 | 2018 | 2017 | 2016 | ||||||||||||||||||||
Net asset value, beginning of year | $ | 30.22 | $ | 29.58 | $ | 23.95 | $ | 17.98 | $ | 14.68 | ||||||||||||||
|
|
|
|
|
|
|
|
|
| |||||||||||||||
Net investment loss(a) | (0.29 | ) | (0.17 | ) | (0.16 | ) | (0.17 | ) | (0.13 | ) | ||||||||||||||
Net realized and unrealized gain | 21.64 | 1.11 | 7.69 | 6.34 | 3.43 | |||||||||||||||||||
|
|
|
|
|
|
|
|
|
| |||||||||||||||
Net increase from investment operations | 21.35 | 0.94 | 7.53 | 6.17 | 3.30 | |||||||||||||||||||
|
|
|
|
|
|
|
|
|
| |||||||||||||||
Distributions from net realized gain(b) | (0.51 | ) | (0.30 | ) | (1.90 | ) | (0.20 | ) | — | |||||||||||||||
|
|
|
|
|
|
|
|
|
| |||||||||||||||
Net asset value, end of year | $ | 51.06 | $ | 30.22 | $ | 29.58 | $ | 23.95 | $ | 17.98 | ||||||||||||||
|
|
|
|
|
|
|
|
|
| |||||||||||||||
Total Return(c) | ||||||||||||||||||||||||
Based on net asset value | 71.65 | % | 3.36 | % | 33.70 | % | 34.74 | % | 22.48 | % | ||||||||||||||
|
|
|
|
|
|
|
|
|
| |||||||||||||||
Ratios to Average Net Assets | ||||||||||||||||||||||||
Total expenses | 1.25 | %(d) | 1.29 | %(d) | 1.38 | %(d)(e) | 1.50 | % | 1.56 | %(e) | ||||||||||||||
|
|
|
|
|
|
|
|
|
| |||||||||||||||
Total expenses after fees waived and/or reimbursed | 1.17 | %(d) | 1.17 | %(d) | 1.26 | %(d) | 1.49 | % | 1.55 | % | ||||||||||||||
|
|
|
|
|
|
|
|
|
| |||||||||||||||
Net investment loss | (0.74 | )%(d) | (0.58 | )%(d) | (0.59 | )%(d) | (0.83 | )% | (0.81 | )% | ||||||||||||||
|
|
|
|
|
|
|
|
|
| |||||||||||||||
Supplemental Data | ||||||||||||||||||||||||
Net assets, end of year (000) | $ | 1,773,399 | $ | 672,110 | $ | 627,626 | $ | 271,307 | $ | 180,658 | ||||||||||||||
|
|
|
|
|
|
|
|
|
| |||||||||||||||
Portfolio turnover rate | 27 | % | 33 | % | 49 | % | 51 | % | 84 | % | ||||||||||||||
|
|
|
|
|
|
|
|
|
| |||||||||||||||
| (a) | Based on average shares outstanding. |
| (b) | Distributions for annual periods determined in accordance with U.S. federal income tax regulations. |
| (c) | Where applicable, excludes the effects of any sales charges and assumes the reinvestment of distributions. |
| (d) | Excludes expenses incurred indirectly as a result of investments in underlying funds as follows: |
| Year Ended September 30, | ||||||||||||||||||||||
| 2020 | 2019 | 2018 | 2017 | 2016 | ||||||||||||||||||
Investments in underlying funds | 0.01 | % | 0.01 | % | 0.01 | % | — | % | — | % | ||||||||||||
|
|
|
|
|
|
|
|
|
| |||||||||||||
| (e) | Includes recoupment of past waived and/or reimbursed fees. Excluding the recoupment of past waived and/or reimbursed fees, the ratios were as follows: |
| Year Ended September 30, | ||||||||||||||||||||||
| 2020 | 2019 | 2018 | 2017 | 2016 | ||||||||||||||||||
Expense ratios | N/A | N/A | 1.37 | % | N/A | 1.55 | % | |||||||||||||||
|
|
|
|
|
|
|
|
|
| |||||||||||||
See notes to financial statements.
| 66 | 2 0 2 0 BLACK ROCK ANNUAL REPORT TO SHAREHOLDERS |
Financial Highlights (continued)
(For a share outstanding throughout each period)
| BlackRock Technology Opportunities Fund (continued) | ||||||||||||||||||||
| Investor C | ||||||||||||||||||||
| Year Ended September 30, | ||||||||||||||||||||
| 2020 | 2019 | 2018 | 2017 | 2016 | ||||||||||||||||
Net asset value, beginning of year | $ | 25.43 | $ | 25.13 | $ | 20.72 | $ | 15.70 | $ | 12.92 | ||||||||||
|
|
|
|
|
|
|
|
|
| |||||||||||
Net investment loss(a) | (0.48 | ) | (0.32 | ) | (0.31 | ) | (0.28 | ) | (0.22 | ) | ||||||||||
Net realized and unrealized gain | 18.08 | 0.92 | 6.57 | 5.50 | 3.00 | |||||||||||||||
|
|
|
|
|
|
|
|
|
| |||||||||||
Net increase from investment operations | 17.60 | 0.60 | 6.26 | 5.22 | 2.78 | |||||||||||||||
|
|
|
|
|
|
|
|
|
| |||||||||||
Distributions from net realized gain(b) | (0.51 | ) | (0.30 | ) | (1.85 | ) | (0.20 | ) | — | |||||||||||
|
|
|
|
|
|
|
|
|
| |||||||||||
Net asset value, end of year | $ | 42.52 | $ | 25.43 | $ | 25.13 | $ | 20.72 | $ | 15.70 | ||||||||||
|
|
|
|
|
|
|
|
|
| |||||||||||
Total Return(c) | ||||||||||||||||||||
Based on net asset value | 70.39 | % | 2.60 | % | 32.68 | % | 33.73 | % | 21.52 | % | ||||||||||
|
|
|
|
|
|
|
|
|
| |||||||||||
Ratios to Average Net Assets | ||||||||||||||||||||
Total expenses | 1.98 | %(d) | 2.02 | %(d) | 2.10 | %(d)(e) | 2.27 | % | 2.35 | % | ||||||||||
|
|
|
|
|
|
|
|
|
| |||||||||||
Total expenses after fees waived and/or reimbursed | 1.92 | %(d) | 1.92 | %(d) | 2.01 | %(d) | 2.25 | % | 2.35 | % | ||||||||||
|
|
|
|
|
|
|
|
|
| |||||||||||
Net investment loss | (1.49 | )%(d) | (1.33 | )%(d) | (1.34 | )%(d) | (1.59 | )% | (1.61 | )% | ||||||||||
|
|
|
|
|
|
|
|
|
| |||||||||||
Supplemental Data | ||||||||||||||||||||
Net assets, end of year (000) | $ | 317,792 | $ | 152,505 | $ | 142,942 | $ | 76,957 | $ | 56,707 | ||||||||||
|
|
|
|
|
|
|
|
|
| |||||||||||
Portfolio turnover rate | 27 | % | 33 | % | 49 | % | 51 | % | 84 | % | ||||||||||
|
|
|
|
|
|
|
|
|
| |||||||||||
| (a) | Based on average shares outstanding. |
| (b) | Distributions for annual periods determined in accordance with U.S. federal income tax regulations. |
| (c) | Where applicable, excludes the effects of any sales charges and assumes the reinvestment of distributions. |
| (d) | Excludes expenses incurred indirectly as a result of investments in underlying funds as follows: |
| Year Ended September 30, | ||||||||||||||||||||
| 2020 | 2019 | 2018 | 2017 | 2016 | ||||||||||||||||
Investments in underlying funds | 0.01 | % | 0.01 | % | 0.01 | % | — | % | — | % | ||||||||||
|
|
|
|
|
|
|
|
|
| |||||||||||
| (e) | Includes recoupment of past waived and/or reimbursed fees. Excluding the recoupment of past waived and/or reimbursed fees, the ratios were as follows: |
| Year Ended September 30, | ||||||||||||||||||||
| 2020 | 2019 | 2018 | 2017 | 2016 | ||||||||||||||||
Expense ratios | N/A | N/A | 2.09 | % | N/A | N/A | ||||||||||||||
|
|
|
|
|
|
|
|
|
| |||||||||||
See notes to financial statements.
FINANCIAL HIGHLIGHTS | 67 |
Financial Highlights (continued)
(For a share outstanding throughout each period)
| BlackRock Technology Opportunities Fund (continued) | ||||||||||||||||||||
| Class K | ||||||||||||||||||||
| | Period from 12/10/19 to 09/30/20 | (a)
| ||||||||||||||||||
Net asset value, beginning of period | $ | 34.59 | ||||||||||||||||||
|
| |||||||||||||||||||
Net investment loss(b) | (0.16 | ) | ||||||||||||||||||
Net realized and unrealized gain | 20.93 | |||||||||||||||||||
|
| |||||||||||||||||||
Net increase from investment operations | 20.77 | |||||||||||||||||||
|
| |||||||||||||||||||
Net asset value, end of period | $ | 55.36 | ||||||||||||||||||
|
| |||||||||||||||||||
Total Return(c) | ||||||||||||||||||||
Based on net asset value | 60.05 | %(d) | ||||||||||||||||||
|
| |||||||||||||||||||
Ratios to Average Net Assets | ||||||||||||||||||||
Total expenses | 0.87 | %(e)(f) | ||||||||||||||||||
|
| |||||||||||||||||||
Total expenses after fees waived and/or reimbursed | 0.86 | %(e)(f) | ||||||||||||||||||
|
| |||||||||||||||||||
Net investment loss | (0.46 | )%(e)(f) | ||||||||||||||||||
|
| |||||||||||||||||||
Supplemental Data | ||||||||||||||||||||
Net assets, end of period (000) | $ | 75,426 | ||||||||||||||||||
|
| |||||||||||||||||||
Portfolio turnover rate | 27 | %(g) | ||||||||||||||||||
|
| |||||||||||||||||||
| (a) | Commencement of operations. |
| (b) | Based on average shares outstanding. |
| (c) | Where applicable, assumes the reinvestment of distributions. |
| (d) | Aggregate total return. |
| (e) | Annualized. |
| (f) | Excludes expenses incurred indirectly as a result of investments in underlying funds of 0.01%. |
| (g) | Portfolio turnover is representative of the Fund for the entire year. |
See notes to financial statements.
| 68 | 2 0 2 0 BLACK ROCK ANNUAL REPORT TO SHAREHOLDERS |
Financial Highlights (continued)
(For a share outstanding throughout each period)
| BlackRock Technology Opportunities Fund (continued) | ||||||||||||||||||||
| Class R | ||||||||||||||||||||
| Year Ended September 30, | ||||||||||||||||||||
| 2020 | 2019 | 2018 | 2017 | 2016 | ||||||||||||||||
Net asset value, beginning of year | $ | 30.48 | $ | 29.90 | $ | 24.20 | $ | 18.21 | $ | 14.92 | ||||||||||
|
|
|
|
|
|
|
|
|
| |||||||||||
Net investment loss(a) | (0.38 | ) | (0.24 | ) | (0.23 | ) | (0.23 | ) | (0.17 | ) | ||||||||||
Net realized and unrealized gain | 21.78 | 1.12 | 7.78 | 6.42 | 3.46 | |||||||||||||||
|
|
|
|
|
|
|
|
|
| |||||||||||
Net increase from investment operations | 21.40 | 0.88 | 7.55 | 6.19 | 3.29 | |||||||||||||||
|
|
|
|
|
|
|
|
|
| |||||||||||
Distributions from net realized gain(b) | (0.51 | ) | (0.30 | ) | (1.85 | ) | (0.20 | ) | — | |||||||||||
|
|
|
|
|
|
|
|
|
| |||||||||||
Net asset value, end of year | $ | 51.37 | $ | 30.48 | $ | 29.90 | $ | 24.20 | $ | 18.21 | ||||||||||
|
|
|
|
|
|
|
|
|
| |||||||||||
Total Return(c) | ||||||||||||||||||||
Based on net asset value | 71.20 | % | 3.12 | % | 33.35 | % | 34.41 | % | 22.05 | % | ||||||||||
|
|
|
|
|
|
|
|
|
| |||||||||||
Ratios to Average Net Assets | ||||||||||||||||||||
Total expenses | 1.57 | %(d) | 1.60 | %(d) | 1.69 | %(d) | 1.81 | % | 1.85 | %(e) | ||||||||||
|
|
|
|
|
|
|
|
|
| |||||||||||
Total expenses after fees waived and/or reimbursed | 1.42 | %(d) | 1.42 | %(d) | 1.53 | %(d) | 1.77 | % | 1.83 | % | ||||||||||
|
|
|
|
|
|
|
|
|
| |||||||||||
Net investment loss | (0.99 | )%(d) | (0.83 | )%(d) | (0.87 | )%(d) | (1.11 | )% | (1.09 | )% | ||||||||||
|
|
|
|
|
|
|
|
|
| |||||||||||
Supplemental Data | ||||||||||||||||||||
Net assets, end of year (000) | $ | 38,907 | $ | 18,799 | $ | 13,577 | $ | 9,700 | $ | 6,054 | ||||||||||
|
|
|
|
|
|
|
|
|
| |||||||||||
Portfolio turnover rate | 27 | % | 33 | % | 49 | % | 51 | % | 84 | % | ||||||||||
|
|
|
|
|
|
|
|
|
| |||||||||||
| (a) | Based on average shares outstanding. |
| (b) | Distributions for annual periods determined in accordance with U.S. federal income tax regulations. |
| (c) | Where applicable, assumes the reinvestment of distributions. |
| (d) | Excludes expenses incurred indirectly as a result of investments in underlying funds as follows: |
| Year Ended September 30, | ||||||||||||||||||||
| 2020 | 2019 | 2018 | 2017 | 2016 | ||||||||||||||||
Investments in underlying funds | 0.01 | % | 0.01 | % | 0.01 | % | — | % | — | % | ||||||||||
|
|
|
|
|
|
|
|
|
| |||||||||||
| (e) | Includes recoupment of past waived and/or reimbursed fees. Excluding the recoupment of past waived and/or reimbursed fees, the ratios were as follows: |
| Year Ended September 30, | ||||||||||||||||||||
| 2020 | 2019 | 2018 | 2017 | 2016 | ||||||||||||||||
Expense ratios | N/A | N/A | N/A | N/A | 1.84 | % | ||||||||||||||
|
|
|
|
|
|
|
|
|
| |||||||||||
See notes to financial statements.
FINANCIAL HIGHLIGHTS | 69 |
| 1. | ORGANIZATION |
BlackRock FundsSM (the “Trust”) is registered under the Investment Company Act of 1940, as amended (the “1940 Act”), as an open-end management investment company. The Trust is organized as a Massachusetts business trust. The following, each of which is a series of the Trust, are referred to herein collectively as the “Funds” or individually as a “Fund”:
| Fund Name | Herein Referred To As | Diversification Classification | ||||
BlackRock Advantage Small Cap Growth Fund | Advantage Small Cap Growth | Diversified | ||||
BlackRock Health Sciences Opportunities Portfolio | Health Sciences Opportunities | Diversified | ||||
BlackRock Mid-Cap Growth Equity Portfolio | Mid-Cap Growth Equity | Diversified | ||||
BlackRock Technology Opportunities Fund | Technology Opportunities | Diversified |
Each Fund offers multiple classes of shares. All classes of shares have identical voting, dividend, liquidation and other rights and are subject to the same terms and conditions, except that certain classes bear expenses related to the shareholder servicing and distribution of such shares. Institutional, Service and Class K Shares are sold only to certain eligible investors. Service, Investor A, Investor C and Class R Shares bear certain expenses related to shareholder servicing of such shares, and Investor C and Class R Shares also bear certain expenses related to the distribution of such shares. Investor A and Investor C Shares are generally available through financial intermediaries. Class R Shares are sold only to certain employer-sponsored retirement plans. Each class has exclusive voting rights with respect to matters relating to its shareholder servicing and distribution expenditures (except that Investor C shareholders may vote on material changes to the Investor A Shares distribution and service plan).
| ||||||||||
| Share Class | Initial Sales Charge | CDSC | Conversion Privilege | |||||||
| ||||||||||
Institutional, Service, Class K and Class R Shares | No | No | None | |||||||
Investor A Shares | Yes | No | (a) | None | ||||||
Investor C Shares | No | Yes | (b) | To Investor A Shares after approximately 10 years | (c) | |||||
| ||||||||||
| (a) | Investor A Shares may be subject to a contingent deferred sales charge (“CDSC”) for certain redemptions where no initial sales charge was paid at the time of purchase. |
| (b) | A CDSC of 1.00% is assessed on certain redemptions of Investor C Shares made within one year after purchase. |
| (c) | Effective November 23, 2020, the automatic conversion feature will be modified to reduce the conversion period from ten years to eight years. |
The Funds, together with certain other registered investment companies advised by BlackRock Advisors, LLC (the “Manager”) or its affiliates, are included in a complex of equity, multi-asset, index and money market funds referred to as the BlackRock Multi-Asset Complex.
| 2. | SIGNIFICANT ACCOUNTING POLICIES |
The financial statements are prepared in conformity with accounting principles generally accepted in the United States of America (“U.S. GAAP”), which may require management to make estimates and assumptions that affect the reported amounts of assets and liabilities in the financial statements, disclosure of contingent assets and liabilities at the date of the financial statements and the reported amounts of increases and decreases in net assets from operations during the reporting period. Actual results could differ from those estimates. Each Fund is considered an investment company under U.S. GAAP and follows the accounting and reporting guidance applicable to investment companies. Below is a summary of significant accounting policies:
Investment Transactions and Income Recognition: For financial reporting purposes, investment transactions are recorded on the dates the transactions are executed. Realized gains and losses on investment transactions are determined on the identified cost basis. Dividend income and capital gain distributions, if any, are recorded on the ex-dividend date. Non-cash dividends, if any, are recorded on the ex-dividend date at fair value. Dividends from foreign securities where the ex-dividend date may have passed are subsequently recorded when the Funds are informed of the ex-dividend date. Under the applicable foreign tax laws, a withholding tax at various rates may be imposed on capital gains, dividends and interest. Upon notification from issuers, a portion of the dividend income received from a real estate investment trust may be redesignated as a reduction of cost of the related investment and/or realized gain. Interest income, including amortization and accretion of premiums and discounts on debt securities, are recognized daily on an accrual basis. Income, expenses and realized and unrealized gains and losses are allocated daily to each class based on its relative net assets. For convertible securities, premiums attributable to the debt instrument are amortized, but premiums attributable to the conversion feature are not amortized.
Foreign Currency Translation: Each Fund’s books and records are maintained in U.S. dollars. Securities and other assets and liabilities denominated in foreign currencies are translated into U.S. dollars using exchange rates determined as of the close of trading on the New York Stock Exchange (“NYSE”). Purchases and sales of investments are recorded at the rates of exchange prevailing on the respective dates of such transactions. Generally, when the U.S. dollar rises in value against a foreign currency, the investments denominated in that currency will lose value; the opposite effect occurs if the U.S. dollar falls in relative value.
Each Fund does not isolate the effect of fluctuations in foreign exchange rates from the effect of fluctuations in the market prices of investments for financial reporting purposes. Accordingly, the effects of changes in exchange rates on investments are not segregated in the Statements of Operations from the effects of changes in market prices of those investments, but are included as a component of net realized and unrealized gain (loss) from investments. Each Fund reports realized currency gains (losses) on foreign currency related transactions as components of net realized gain (loss) for financial reporting purposes, whereas such components are generally treated as ordinary income for U.S. federal income tax purposes.
Foreign Taxes: The Funds may be subject to foreign taxes (a portion of which may be reclaimable) on income, stock dividends, capital gains on investments, or certain foreign currency transactions. All foreign taxes are recorded in accordance with the applicable foreign tax regulations and rates that exist in the foreign jurisdictions in which each Fund invests. These foreign taxes, if any, are paid by each Fund and are reflected in its Statements of Operations as follows: foreign taxes withheld at source are presented as a reduction of income, foreign taxes on securities lending income are presented as a reduction of securities lending income, foreign taxes on stock dividends are presented as “Foreign taxes withheld”, and foreign taxes on capital gains from sales of investments and foreign taxes on foreign currency transactions are included in their respective net realized gain (loss) categories. Foreign taxes payable or deferred as of September 30, 2020, if any, are disclosed in the Statements of Assets and Liabilities.
| 70 | 2 0 2 0 BLACK ROCK ANNUAL REPORT TO SHAREHOLDERS |
Notes to Financial Statements (continued)
Segregation and Collateralization: In cases where a Fund enters into certain investments (e.g., futures contracts, forward foreign currency exchange contracts and options written) that would be treated as “senior securities” for 1940 Act purposes, a Fund may segregate or designate on its books and records cash or liquid assets having a market value at least equal to the amount of its future obligations under such investments. Doing so allows the investment to be excluded from treatment as a “senior security.” Furthermore, if required by an exchange or counterparty agreement, the Funds may be required to deliver/deposit cash and/or securities to/with an exchange, or broker-dealer or custodian as collateral for certain investments or obligations.
Distributions: Distributions paid by the Funds are recorded on the ex-dividend dates. The character and timing of distributions are determined in accordance with U.S. federal income tax regulations, which may differ from U.S. GAAP.
Offering Costs: Offering costs are amortized over a 12-month period beginning with the commencement of operations of a class of shares.
Indemnifications: In the normal course of business, a Fund enters into contracts that contain a variety of representations that provide general indemnification. A Fund’s maximum exposure under these arrangements is unknown because it involves future potential claims against a Fund, which cannot be predicted with any certainty.
Other: Expenses directly related to a Fund or its classes are charged to that Fund or the applicable class. Expenses directly related to the Funds and other shared expenses prorated to the Funds are allocated daily to each class based on their relative net assets or other appropriate methods. Other operating expenses shared by several funds, including other funds managed by the Manager, are prorated among those funds on the basis of relative net assets or other appropriate methods.
The Funds have an arrangement with their custodian whereby credits are earned on uninvested cash balances, which could be used to reduce custody fees and/or overdraft charges. The Funds may incur charges on overdrafts, subject to certain conditions.
| 3. | INVESTMENT VALUATION AND FAIR VALUE MEASUREMENTS |
Investment Valuation Policies: The Funds’ investments are valued at fair value (also referred to as “market value” within the financial statements) each day that the Funds are open for business and, for financial reporting purposes, as of the report date. U.S. GAAP defines fair value as the price the Funds would receive to sell an asset or pay to transfer a liability in an orderly transaction between market participants at the measurement date. The Funds determine the fair values of their financial instruments using various independent dealers or pricing services under policies approved by the Board of Trustees of the Trust (the “Board”). If a security’s market price is not readily available or does not otherwise accurately represent the fair value of the security, the security will be valued in accordance with a policy approved by the Board as reflecting fair value. The BlackRock Global Valuation Methodologies Committee (the “Global Valuation Committee”) is the committee formed by management to develop global pricing policies and procedures and to oversee the pricing function for all financial instruments.
Fair Value Inputs and Methodologies: The following methods and inputs are used to establish the fair value of each Funds’ assets and liabilities:
| • | Equity investments traded on a recognized securities exchange are valued at that day’s official closing price, as applicable, on the exchange where the stock is primarily traded. Equity investments traded on a recognized exchange for which there were no sales on that day may be valued at the last available bid (long positions) or ask (short positions) price. |
Generally, trading in foreign instruments is substantially completed each day at various times prior to the close of trading on the Fund’s listing exchange. Occasionally, events affecting the values of such instruments may occur between the foreign market close and the close of trading on the Fund’s listing exchange that may not be reflected in the computation of the Funds’ net assets. Each business day, the Funds use a pricing service to assist with the valuation of certain foreign exchange-traded equity securities and foreign exchange-traded and over-the-counter (“OTC”) options (the “Systematic Fair Value Price”). Using current market factors, the Systematic Fair Value Price is designed to value such foreign securities and foreign options at fair value as of the close of trading on the NYSE, which follows the close of the local markets.
| • | Investments in open-end U.S. mutual funds (including money market funds) are valued at that day’s published NAV. |
| • | The Funds value their investment in SL Liquidity Series, LLC, Money Market Series (the “Money Market Series”) at fair value, which is ordinarily based upon their pro rata ownership in the underlying fund’s net assets. |
| • | Futures contracts are valued based on that day’s last reported settlement price on the exchange where the contract is traded. |
| • | Forward foreign currency exchange contracts are valued at the mean between the bid and ask prices and are determined as of the close of trading on the NYSE based on that day’s prevailing forward exchange rate for the underlying currencies. |
| • | Exchange-traded equity options for which market quotations are readily available will be valued at the National Best Bid and Offer quotes (“NBBO”). NBBO represents the mean of the bid and ask prices as quoted on the exchange on which such options are traded. In the event that there is no mean price available, the last bid (long positions) or ask (short positions) price will be used. If no bid or ask price is available, the prior day’s price may be used. OTC options are valued by an independent pricing service using a mathematical model, which incorporates a number of market data factors, such as the trades and prices of the underlying instruments. |
If events (e.g., a company announcement, market volatility or a natural disaster) occur that are expected to materially affect the value of such investment, or in the event that the application of these methods of valuation results in a price for an investment that is deemed not to be representative of the market value of such investment, or if a price is not available, the investment will be valued by the Global Valuation Committee, or its delegate, in accordance with a policy approved by the Board as reflecting fair value (“Fair Valued Investments”). The fair valuation approaches that may be used by the Global Valuation Committee will include market approach, income approach and cost approach. Valuation techniques such as discounted cash flow, use of market comparables and matrix pricing are types of valuation approaches and are typically used in determining fair value. When determining the price for Fair Valued Investments, the Global Valuation Committee, or its delegate, seeks to determine the price that each Fund might reasonably expect to receive or pay from the current sale or purchase of that asset or liability in an arm’s-length transaction. Fair value determinations shall be based upon all available factors that the Global Valuation Committee, or its delegate, deems relevant and consistent with the principles of fair value measurement. The pricing of all Fair Valued Investments is subsequently reported to the Board or a committee thereof on a quarterly basis.
NOTES TO FINANCIAL STATEMENTS | 71 |
Notes to Financial Statements (continued)
For investments in equity or debt issued by privately held companies or funds (“Private Company” or collectively, the “Private Companies”) and other Fair Valued Investments, the fair valuation approaches that are used by the Global Valuation Committee and third party pricing services utilize one or a combination of, but not limited to, the following inputs.
| Standard Inputs Generally Considered By Third Party Pricing Services | ||||||
Market approach | (i) | recent market transactions, including subsequent rounds of financing, in the underlying investment or | ||||
comparable issuers; | ||||||
| (ii) | recapitalizations and other transactions across the capital structure; and | |||||
| (iii) | market multiples of comparable issuers. | |||||
Income approach | (i) | future cash flows discounted to present and adjusted as appropriate for liquidity, credit and/or market risks; | ||||
| (ii) | quoted prices for similar investments or assets in active markets; and | |||||
| (iii) | other risk factors, such as interest rates, yield curves, volatilities, prepayment speeds, loss severities, credit | |||||
risks, recovery rates, liquidation amounts and/or default rates. | ||||||
Cost approach | (i) | audited or unaudited financial statements, investor communications and financial or operational metrics | ||||
issued by the Private Company; | ||||||
| (ii) | changes in the valuation of relevant indices or publicly traded companies comparable to the Private Company; | |||||
| (iii) | relevant news and other public sources; and | |||||
| (iv) | known secondary market transactions in the Private Company’s interests and merger or acquisition activity in | |||||
companies comparable to the Private Company. | ||||||
Investments in series of preferred stock issued by Private Companies are typically valued utilizing market approach in determining the enterprise value of the company. Such investments often contain rights and preferences that differ from other series of preferred and common stock of the same issuer. Valuation techniques such as an option pricing model (“OPM”), a probability weighted expected return model (“PWERM”) or a hybrid of those techniques are used in allocating enterprise value of the company, as deemed appropriate under the circumstances. The use of OPM and PWERM techniques involve a determination of the exit scenarios of the investment in order to appropriately allocate the enterprise value of the company among the various parts of its capital structure.
The Private Companies are not subject to the public company disclosure, timing, and reporting standards applicable to other investments held by a Fund. Typically, the most recently available information by a Private Company is as of a date that is earlier than the date a Fund is calculating its NAV. This factor may result in a difference between the value of the investment and the price a Fund could receive upon the sale of the investment.
Fair Value Hierarchy: Various inputs are used in determining the fair value of financial instruments. These inputs to valuation techniques are categorized into a fair value hierarchy consisting of three broad levels for financial reporting purposes as follows:
| • | Level 1 – Unadjusted price quotations in active markets/exchanges for identical assets or liabilities that each Fund has the ability to access |
| • | Level 2 – Other observable inputs (including, but not limited to, quoted prices for similar assets or liabilities in markets that are active, quoted prices for identical or similar assets or liabilities in markets that are not active, inputs other than quoted prices that are observable for the assets or liabilities (such as interest rates, yield curves, volatilities, prepayment speeds, loss severities, credit risks and default rates) or other market–corroborated inputs) |
| • | Level 3 – Unobservable inputs based on the best information available in the circumstances, to the extent observable inputs are not available (including the Global Valuation Committee’s assumptions used in determining the fair value of financial instruments) |
The hierarchy gives the highest priority to unadjusted quoted prices in active markets for identical assets or liabilities (Level 1 measurements) and the lowest priority to unobservable inputs (Level 3 measurements). Accordingly, the degree of judgment exercised in determining fair value is greatest for instruments categorized in Level 3. The inputs used to measure fair value may fall into different levels of the fair value hierarchy. In such cases, for disclosure purposes, the fair value hierarchy classification is determined based on the lowest level input that is significant to the fair value measurement in its entirety. Investments classified within Level 3 have significant unobservable inputs used by the Global Valuation Committee in determining the price for Fair Valued Investments. Level 3 investments include equity or debt issued by Private Companies that may not have a secondary market and/or may have a limited number of investors. The categorization of a value determined for financial instruments is based on the pricing transparency of the financial instruments and is not necessarily an indication of the risks associated with investing in those securities.
As of September 30, 2020, certain investments of the Funds were fair valued using NAV per share as no quoted market value is available and therefore have been excluded from the fair value hierarchy.
| 4. | SECURITIES AND OTHER INVESTMENTS |
Preferred Stocks: Preferred stock has a preference over common stock in liquidation (and generally in receiving dividends as well), but is subordinated to the liabilities of the issuer in all respects. As a general rule, the market value of preferred stock with a fixed dividend rate and no conversion element varies inversely with interest rates and perceived credit risk, while the market price of convertible preferred stock generally also reflects some element of conversion value. Because preferred stock is junior to debt securities and other obligations of the issuer, deterioration in the credit quality of the issuer will cause greater changes in the value of a preferred stock than in a more senior debt security with similar stated yield characteristics. Unlike interest payments on debt securities, preferred stock dividends are payable only if declared by the issuer’s board of directors. Preferred stock also may be subject to optional or mandatory redemption provisions.
Forward Commitments, When-Issued and Delayed Delivery Securities: Certain Funds may purchase securities on a when-issued basis and may purchase or sell securities on a forward commitment basis. Settlement of such transactions normally occurs within a month or more after the purchase or sale commitment is made. A Fund may purchase securities under such conditions with the intention of actually acquiring them, but may enter into a separate agreement to sell the securities before the settlement date. Since the value of securities purchased may fluctuate prior to settlement, a Fund may be required to pay more at settlement than the security is worth. In addition, a Fund
| 72 | 2 0 2 0 BLACK ROCK ANNUAL REPORT TO SHAREHOLDERS |
Notes to Financial Statements (continued)
is not entitled to any of the interest earned prior to settlement. When purchasing a security on a delayed delivery basis, the Fund assumes the rights and risks of ownership of the security, including the risk of price and yield fluctuations. In the event of default by the counterparty, the Fund’s maximum amount of loss is the unrealized appreciation of unsettled when-issued transactions.
Securities Lending: Certain Funds may lend their securities to approved borrowers, such as brokers, dealers and other financial institutions. The borrower pledges and maintains with the Funds collateral consisting of cash, an irrevocable letter of credit issued by a bank, or securities issued or guaranteed by the U.S. Government. The initial collateral received by each Fund is required to have a value of at least 102% of the current value of the loaned securities for securities traded on U.S. exchanges and a value of at least 105% for all other securities. The collateral is maintained thereafter at a value equal to at least 100% of the current market value of the securities on loan. The market value of the loaned securities is determined at the close of each business day of the Fund and any additional required collateral is delivered to the Fund, or excess collateral returned by the Fund, on the next business day. During the term of the loan, the Funds are entitled to all distributions made on or in respect of the loaned securities, but do not receive interest income on securities received as collateral. Loans of securities are terminable at any time and the borrower, after notice, is required to return borrowed securities within the standard time period for settlement of securities transactions.
The market value of any securities on loan, all of which were classified as common stocks in the Funds’ Schedules of Investments, and the value of any related collateral are shown separately in the Statements of Assets and Liabilities as a component of investments at value – unaffiliated, and collateral on securities loaned at value, respectively. As of period end, any securities on loan were collateralized by cash and/or U.S. Government obligations. Cash collateral invested by the securities lending agent, BlackRock Investment Management, LLC (“BIM”), if any, is disclosed in the Schedules of Investments.
Securities lending transactions are entered into by the Funds under Master Securities Lending Agreements (each, an “MSLA”), which provide the right, in the event of default (including bankruptcy or insolvency), for the non-defaulting party to liquidate the collateral and calculate a net exposure to the defaulting party or request additional collateral. In the event that a borrower defaults, the Funds, as lender, would offset the market value of the collateral received against the market value of the securities loaned. When the value of the collateral is greater than that of the market value of the securities loaned, the lender is left with a net amount payable to the defaulting party. However, bankruptcy or insolvency laws of a particular jurisdiction may impose restrictions on or prohibitions against such a right of offset in the event of an MSLA counterparty’s bankruptcy or insolvency. Under the MSLA, absent an event of default, the borrower can resell or re-pledge the loaned securities, and a Fund can reinvest cash collateral received in connection with loaned securities. Upon an event of default, the parties’ obligations to return the securities or collateral to the other party are extinguished, and the parties can resell or re-pledge the loaned securities or the collateral received in connection with the loaned securities in order to satisfy the defaulting party’s net payment obligation for all transactions under the MSLA. The defaulting party remains liable for any deficiency.
As of period end, the following tables are a summary of the Funds’ securities on loan by counterparty which are subject to offset under an MSLA:
| Fund Name/Counterparty | | Securities Loaned at Value | | | Cash Collateral Received | (a) | | Net Amount | | |||
Advantage Small Cap Growth | ||||||||||||
Barclays Capital, Inc. | $ | 591,728 | $ | (591,728 | ) | $ | — | |||||
Citigroup Global Markets, Inc. | 10,593,667 | (10,593,667 | ) | — | ||||||||
Credit Suisse Securities (USA) LLC | 7,058,720 | (7,058,720 | ) | — | ||||||||
Deutsche Bank Securities, Inc. | 1,082,936 | (1,082,936 | ) | — | ||||||||
Goldman Sachs & Co. | 7,004,876 | (7,004,876 | ) | — | ||||||||
J.P. Morgan Securities LLC | 13,536,679 | (13,536,679 | ) | — | ||||||||
Jefferies LLC | 519,088 | (519,088 | ) | — | ||||||||
National Financial Services LLC | 4,366,854 | (4,366,854 | ) | — | ||||||||
State Street Bank & Trust Co. | 2,247,534 | (2,247,534 | ) | — | ||||||||
TD Prime Services LLC | 6,461,750 | (6,461,750 | ) | — | ||||||||
UBS Securities LLC | 181,597 | (181,597 | ) | — | ||||||||
|
|
|
|
|
| |||||||
| $ | 53,645,429 | $ | (53,645,429 | ) | $ | — | ||||||
|
|
|
|
|
| |||||||
Health Sciences Opportunities | ||||||||||||
Barclays Capital, Inc. | $ | 251,100 | $ | (251,100 | ) | $ | — | |||||
Citigroup Global Markets, Inc. | 67,632,764 | (67,632,764 | ) | — | ||||||||
Credit Suisse Securities (USA) LLC | 2,612,442 | (2,612,442 | ) | — | ||||||||
Deutsche Bank Securities, Inc. | 1,016,155 | (1,016,155 | ) | — | ||||||||
Goldman Sachs & Co. | 1,681,488 | (1,681,488 | ) | — | ||||||||
J.P. Morgan Securities LLC | 43,635,761 | (43,635,761 | ) | — | ||||||||
Jefferies LLC | 615,060 | (615,060 | ) | — | ||||||||
Morgan Stanley & Co. LLC | 67,045,354 | (67,045,354 | ) | — | ||||||||
National Financial Services LLC | 10,977,805 | (10,977,805 | ) | — | ||||||||
State Street Bank & Trust Co. | 1,105,939 | (1,105,939 | ) | — | ||||||||
TD Prime Services LLC | 4,287,361 | (4,287,361 | ) | — | ||||||||
|
|
|
|
|
| |||||||
| $ | 200,861,229 | $ | (200,861,229 | ) | $ | — | ||||||
|
|
|
|
|
| |||||||
Mid-Cap Growth Equity | ||||||||||||
Citigroup Global Markets, Inc. | $ | 34,521,818 | $ | (34,521,818 | ) | $ | — | |||||
Credit Suisse Securities (USA) LLC | 54,477,995 | (54,477,995 | ) | — | ||||||||
Goldman Sachs & Co. | 2,810,934 | (2,810,934 | ) | — | ||||||||
J.P. Morgan Securities LLC | 206,852,206 | (206,852,206 | ) | — | ||||||||
Morgan Stanley & Co. LLC | 52,585,640 | (52,585,640 | ) | — | ||||||||
National Financial Services LLC | 6,083,602 | (6,083,602 | ) | — |
NOTES TO FINANCIAL STATEMENTS | 73 |
Notes to Financial Statements (continued)
| Fund Name/Counterparty | | Securities Loaned at Value | | | Cash Collateral Received | (a) | | Net Amount | | |||
Mid-Cap Growth Equity (continued) | ||||||||||||
State Street Bank & Trust Co. | $ | 5,571,008 | $ | (5,571,008 | ) | $ | — | |||||
TD Prime Services LLC | 10,163,289 | (10,163,289 | ) | — | ||||||||
|
|
|
|
|
| |||||||
| $ | 373,066,492 | $ | (373,066,492 | ) | $ | — | ||||||
|
|
|
|
|
| |||||||
Technology Opportunities | ||||||||||||
Barclays Capital, Inc. | $ | 3,870,858 | $ | (3,870,858 | ) | $ | — | |||||
BofA Securities, Inc. | 135,312 | (135,312 | ) | — | ||||||||
Citigroup Global Markets, Inc. | 53,456,786 | (53,456,786 | ) | — | ||||||||
Credit Suisse Securities (USA) LLC | 26,385,918 | (26,385,918 | ) | — | ||||||||
J.P. Morgan Securities LLC | 115,706,190 | (115,706,190 | ) | — | ||||||||
Jefferies LLC | 11,616,434 | (11,616,434 | ) | — | ||||||||
National Financial Services LLC | 32,034,433 | (32,034,433 | ) | — | ||||||||
State Street Bank & Trust Co. | 3,819,501 | (3,819,501 | ) | — | ||||||||
TD Prime Services LLC | 24,020,867 | (24,020,867 | ) | — | ||||||||
|
|
|
|
|
| |||||||
| $ | 271,046,299 | $ | (271,046,299 | ) | $ | — | ||||||
|
|
|
|
|
|
| (a) | Collateral received in excess of the market value of securities on loan is not presented in this table. The total cash collateral received by each Fund is disclosed in the Funds’ Statements of Assets and Liabilities. |
The risks of securities lending include the risk that the borrower may not provide additional collateral when required or may not return the securities when due. To mitigate these risks, the Funds benefit from a borrower default indemnity provided by BIM. BIM’s indemnity allows for full replacement of the securities loaned to the extent the collateral received does not cover the value on the securities loaned in the event of borrower default. Each Fund could incur a loss if the value of an investment purchased with cash collateral falls below the market value of loaned securities or if the value of an investment purchased with cash collateral falls below the value of the original cash collateral received. Such losses are borne entirely by the Funds.
| 5. | DERIVATIVE FINANCIAL INSTRUMENTS |
The Funds engage in various portfolio investment strategies using derivative contracts both to increase the returns of the Funds and/or to manage their exposure to certain risks such as credit risk, equity risk, interest rate risk, foreign currency exchange rate risk, commodity price risk or other risks (e.g., inflation risk). Derivative financial instruments categorized by risk exposure are included in the Schedules of Investments. These contracts may be transacted on an exchange or OTC.
Futures Contracts: Futures contracts are purchased or sold to gain exposure to, or manage exposure to, changes in interest rates (interest rate risk) and changes in the value of equity securities (equity risk) or foreign currencies (foreign currency exchange rate risk).
Futures contracts are agreements between the Fund and a counterparty to buy or sell a specific quantity of an underlying instrument at a specified price and on a specified date. Depending on the terms of a contract, it is settled either through physical delivery of the underlying instrument on the settlement date or by payment of a cash amount on the settlement date. Upon entering into a futures contract, the Funds are required to deposit initial margin with the broker in the form of cash or securities in an amount that varies depending on a contract’s size and risk profile. The initial margin deposit must then be maintained at an established level over the life of the contract. Amounts pledged, which are considered restricted, are included in cash pledged for futures contracts in the Statements of Assets and Liabilities.
Securities deposited as initial margin are designated in the Schedules of Investments and cash deposited, if any, are shown as cash pledged for futures contracts in the Statements of Assets and Liabilities. Pursuant to the contract, the Funds agree to receive from or pay to the broker an amount of cash equal to the daily fluctuation in market value of the contract (“variation margin”). Variation margin is recorded as unrealized appreciation (depreciation) and, if any, shown as variation margin receivable (or payable) on futures contracts in the Statements of Assets and Liabilities. When the contract is closed, a realized gain or loss is recorded in the Statements of Operations equal to the difference between the notional amount of the contract at the time it was opened and the notional amount at the time it was closed. The use of futures contracts involves the risk of an imperfect correlation in the movements in the price of futures contracts and interest, foreign currency exchange rates or underlying assets.
Forward Foreign Currency Exchange Contracts: Forward foreign currency exchange contracts are entered into to gain or reduce exposure to foreign currencies (foreign currency exchange rate risk).
A forward foreign currency exchange contract is an agreement between two parties to buy and sell a currency at a set exchange rate on a specified date. These contracts help to manage the overall exposure to the currencies in which some of the investments held by the Funds are denominated and in some cases, may be used to obtain exposure to a particular market.
The contract is marked-to-market daily and the change in market value is recorded as unrealized appreciation (depreciation) in the Statements of Assets and Liabilities. When a contract is closed, a realized gain or loss is recorded in the Statements of Operations equal to the difference between the value at the time it was opened and the value at the time it was closed. Non-deliverable forward foreign currency exchange contracts are settled with the counterparty in cash without the delivery of foreign currency. The use of forward foreign currency exchange contracts involves the risk that the value of a forward foreign currency exchange contract changes unfavorably due to movements in the value of the referenced foreign currencies, and such value may exceed the amounts reflected in the Statements of Assets and Liabilities. Cash amounts pledged for forward foreign currency exchange contracts are considered restricted and are included in cash pledged as collateral for OTC derivatives in the Statements of Assets and Liabilities.
Options: Certain Funds purchase and write call and put options to increase or decrease their exposure to the risks of underlying instruments, including equity risk, interest rate risk and/or commodity price risk and/or, in the case of options written, to generate gains from options premiums.
| 74 | 2 0 2 0 BLACK ROCK ANNUAL REPORT TO SHAREHOLDERS |
Notes to Financial Statements (continued)
A call option gives the purchaser (holder) of the option the right (but not the obligation) to buy, and obligates the seller (writer) to sell (when the option is exercised) the underlying instrument at the exercise or strike price at any time or at a specified time during the option period. A put option gives the holder the right to sell and obligates the writer to buy the underlying instrument at the exercise or strike price at any time or at a specified time during the option period.
Premiums paid on options purchased and premiums received on options written, as well as the daily fluctuation in market value, are included in investments at value – unaffiliated and options written at value, respectively, in the Statements of Assets and Liabilities. When an instrument is purchased or sold through the exercise of an option, the premium is offset against the cost or proceeds of the underlying instrument. When an option expires, a realized gain or loss is recorded in the Statements of Operations to the extent of the premiums received or paid. When an option is closed or sold, a gain or loss is recorded in the Statements of Operations to the extent the cost of the closing transaction exceeds the premiums received or paid. When the Funds write a call option, such option is typically “covered,” meaning that they hold the underlying instrument subject to being called by the option counterparty. When the Funds write a put option, cash is segregated in an amount sufficient to cover the obligation. These amounts, which are considered restricted, are included in cash pledged as collateral for options written in the Statements of Assets and Liabilities.
In purchasing and writing options, the Funds bear the risk of an unfavorable change in the value of the underlying instrument or the risk that they may not be able to enter into a closing transaction due to an illiquid market. Exercise of a written option could result in the Funds purchasing or selling a security when it otherwise would not, or at a price different from the current market value.
Collateral Requirements: For derivatives traded under an ISDA Master Agreement, the collateral requirements are typically calculated by netting the mark-to-market amount for each transaction under such agreement and comparing that amount to the value of any collateral currently pledged by the Fund and the counterparty.
Cash collateral that has been pledged to cover obligations of the Funds and cash collateral received from the counterparty, if any, is reported separately in the Statements of Assets and Liabilities as cash pledged as collateral and cash received as collateral, respectively. Non-cash collateral pledged by the Funds, if any, is noted in the Schedules of Investments. Generally, the amount of collateral due from or to a counterparty is subject to a certain minimum transfer amount threshold before a transfer is required, which is determined at the close of business of the Funds. Any additional required collateral is delivered to/pledged by the Funds on the next business day. Typically, the counterparty is not permitted to sell, re-pledge or use cash and non-cash collateral it receives. A Fund generally agrees not to use non-cash collateral that it receives but may, absent default or certain other circumstances defined in the underlying ISDA Master Agreement, be permitted to use cash collateral received. In such cases, interest may be paid pursuant to the collateral arrangement with the counterparty. To the extent amounts due to the Fund from their counterparties are not fully collateralized, they bear the risk of loss from counterparty non-performance. Likewise, to the extent the Funds have delivered collateral to a counterparty and stand ready to perform under the terms of their agreement with such counterparty, they bear the risk of loss from a counterparty in the amount of the value of the collateral in the event the counterparty fails to return such collateral. Based on the terms of agreements, collateral may not be required for all derivative contracts.
For financial reporting purposes, the Funds do not offset derivative assets and derivative liabilities that are subject to netting arrangements, if any, in the Statements of Assets and Liabilities.
| 6. | INVESTMENT ADVISORY AGREEMENT AND OTHER TRANSACTIONS WITH AFFILIATES |
Investment Advisory: The Trust, on behalf of the Funds, entered into an Investment Advisory Agreement with the Manager, the Funds’ investment adviser and an indirect, wholly-owned subsidiary of BlackRock, Inc. (“BlackRock”), to provide investment advisory services. The Manager is responsible for the management of each Fund’s portfolio and provides the personnel, facilities, equipment and certain other services necessary to the operations of each Fund.
For such services, each Fund pays the Manager a monthly fee at an annual rate equal to the following percentages of the average daily value of each Fund’s net assets:
| Investment Advisory Fees | ||||||||||||
| Average Daily Net Assets | Advantage Small Cap Growth | Mid-Cap Growth Equity | Technology Opportunities | |||||||||
First $1 billion | 0.450 | % | 0.700 | % | 0.820% | |||||||
$1 billion - $3 billion | 0.420 | 0.660 | 0.770 | |||||||||
$3 billion - $5 billion | 0.410 | 0.630 | 0.740 | |||||||||
$5 billion - $10 billion | 0.390 | 0.610 | 0.710 | |||||||||
Greater than $10 billion | 0.380 | 0.600 | 0.700 | |||||||||
| Investment Advisory Fees | ||||
| Average Daily Net Assets | Health Sciences Opportunities | |||
First $1 billion | 0.750% | |||
$1 billion - $2 billion | 0.700 | |||
$2 billion - $3 billion | 0.675 | |||
$3 billion - $10 billion | 0.650 | |||
Greater than $10 billion(a) | 0.640 | |||
| (a) | Effective June 1, 2020. |
NOTES TO FINANCIAL STATEMENTS | 75 |
Notes to Financial Statements (continued)
Service and Distribution Fees: The Trust, on behalf of the Funds, entered into a Distribution Agreement and a Distribution and Service Plan with BlackRock Investments, LLC (“BRIL”), an affiliate of the Manager. Pursuant to the Distribution and Service Plan and in accordance with Rule 12b-1 under the 1940 Act, each Fund pays BRIL ongoing service and distribution fees. The fees are accrued daily and paid monthly at annual rates based upon the average daily net assets of the relevant share class of each Fund as follows:
| ||||||||
| Share Class | Service Fees | Distribution Fees | ||||||
| ||||||||
Service | 0.25 | % | N/A | |||||
Investor A | 0.25 | N/A | ||||||
Investor C | 0.25 | 0.75% | ||||||
Class R | 0.25 | 0.25 | ||||||
| ||||||||
BRIL and broker-dealers, pursuant to sub-agreements with BRIL, provide shareholder servicing and distribution services to the Funds. The ongoing service and/or distribution fee compensates BRIL and each broker-dealer for providing shareholder servicing and/or distribution related services to shareholders.
For the year ended September 30, 2020, the following table shows the class specific service and distribution fees borne directly by each share class of each Fund:
| Fund Name | Service | Investor A | Investor C | Class R | Total | |||||||||||||||
Advantage Small Cap Growth | $ | 30,498 | $ | 419,798 | $ | 170,569 | $ | 67,292 | $ | 688,157 | ||||||||||
Health Sciences Opportunities | 101,211 | 7,278,983 | 7,805,909 | 1,210,430 | 16,396,533 | |||||||||||||||
Mid-Cap Growth Equity | 174,714 | 3,937,537 | 2,387,761 | 235,714 | 6,735,726 | |||||||||||||||
Technology Opportunities | 79,019 | 2,657,034 | 2,160,128 | 137,364 | 5,033,545 | |||||||||||||||
Administration: The Trust, on behalf of the Funds, entered into an Administration Agreement with the Manager, an indirect, wholly-owned subsidiary of BlackRock, to provide administrative services. For these services, the Manager receives an administration fee computed daily and payable monthly, based on a percentage of the average daily net assets of each Fund. The administration fee, which is shown as administration in the Statements of Operations, is paid at the annual rates below.
| Average Daily Net Assets | Administration Fees | |||
First $500 million | 0.0425 | % | ||
$500 million - $1 billion | 0.0400 | |||
$1 billion - $2 billion | 0.0375 | |||
$2 billion - $4 billion | 0.0350 | |||
$4 billion - $13 billion | 0.0325 | |||
Greater than $13 billion | 0.0300 | |||
In addition, the Manager charges each of the share classes an administration fee, which is shown as administration — class specific in the Statements of Operations, at an annual rate of 0.02% of the average daily net assets of each respective class.
For the year ended September 30, 2020, the following table shows the class specific administration fees borne directly by each share class of each Fund:
| Fund Name | Institutional | Service | Investor A | Investor C | Class K | Class R | Total | |||||||||||||||||||||
Advantage Small Cap Growth | $ 82,495 | $ 2,438 | $ 33,565 | $ 3,416 | $ 1,592 | $ 2,690 | $ 126,196 | |||||||||||||||||||||
Health Sciences Opportunities | 785,331 | 8,088 | 581,628 | 155,999 | 53,499 | 48,359 | 1,632,904 | |||||||||||||||||||||
Mid-Cap Growth Equity | 792,820 | 13,962 | 314,477 | 47,687 | 244,131 | 9,412 | 1,422,489 | |||||||||||||||||||||
Technology Opportunities | 386,504 | 6,299 | 211,858 | 43,098 | 8,528 | 5,479 | 661,766 | |||||||||||||||||||||
Transfer Agent: Pursuant to written agreements, certain financial intermediaries, some of which may be affiliates, provide the Funds with sub-accounting, recordkeeping, sub-transfer agency and other administrative services with respect to servicing of underlying investor accounts. For these services, these entities receive an asset-based fee or an annual fee per shareholder account, which will vary depending on share class and/or net assets. For the year ended September 30, 2020, the Funds paid the following amounts to affiliates of BlackRock in return for these services, which are included in transfer agent — class specific in the Statements of Operations:
| Fund Name | Institutional | Investor A | Total | |||||||||
Advantage Small Cap Growth | $ 3,138 | $ 3,824 | $ 6,962 | |||||||||
Health Sciences Opportunities | 1,513 | — | 1,513 | |||||||||
Mid-Cap Growth Equity | 765 | 1,977 | 2,742 | |||||||||
Technology Opportunities | 1,512 | — | 1,512 | |||||||||
| 76 | 2 0 2 0 BLACK ROCK ANNUAL REPORT TO SHAREHOLDERS |
Notes to Financial Statements (continued)
The Manager maintains a call center that is responsible for providing certain shareholder services to the Funds. Shareholder services include responding to inquiries and processing purchases and sales based upon instructions from shareholders. For the year ended September 30, 2020, each Fund reimbursed the Manager the following amounts for costs incurred in running the call center, which are included in transfer agent — class specific in the Statements of Operations:
| Fund Name | Institutional | Service | Investor A | Investor C | Class K | Class R | Total | |||||||||||||||||||||
Advantage Small Cap Growth | $ 1,223 | $145 | $ 10,721 | $ | 2,903 | $ | 5 | $ | — | $ | 14,997 | |||||||||||||||||
Health Sciences Opportunities | 18,517 | 246 | 95,796 | 21,739 | 1,186 | 1,553 | 139,037 | |||||||||||||||||||||
Mid-Cap Growth Equity | 11,257 | 36 | 130,458 | 7,952 | 3,848 | 724 | 154,275 | |||||||||||||||||||||
Technology Opportunities | 10,649 | 138 | 27,506 | 9,953 | 222 | 342 | 48,810 | |||||||||||||||||||||
For the year ended September 30, 2020, the following table shows the class specific transfer agent fees borne directly by each share class of each Fund:
| Fund Name | Institutional | Service | Investor A | Investor C | Class K | Class R | Total | |||||||||||||||||||||
Advantage Small Cap Growth | $ | 652,888 | $ | 21,909 | $ | 335,868 | $ | 39,092 | $ | 954 | $ | 26,290 | $ | 1,077,001 | ||||||||||||||
Health Sciences Opportunities | 4,080,680 | 62,296 | 3,482,115 | 821,134 | 10,675 | 486,382 | 8,943,282 | |||||||||||||||||||||
Mid-Cap Growth Equity | 4,909,367 | 90,954 | 2,554,829 | 271,860 | 71,961 | 101,477 | 8,000,448 | |||||||||||||||||||||
Technology Opportunities | 2,172,677 | 20,107 | 1,347,837 | 221,564 | 546 | 53,384 | 3,816,115 | |||||||||||||||||||||
Other Fees: For the year ended September 30, 2020, affiliates earned underwriting discounts, direct commissions and dealer concessions on sales of each Fund’s Investor A Shares as follows:
| Fund Name | Amounts | |||
Advantage Small Cap Growth | $ | 15,232 | ||
Health Sciences Opportunities | 241,469 | |||
Mid-Cap Growth Equity | 199,112 | |||
Technology Opportunities | 281,769 | |||
For the year ended September 30, 2020, affiliates received CDSCs as follows:
| Share Class | Advantage Small Cap Growth | Health Sciences Opportunities | Mid-Cap Growth Equity | Technology Opportunities | ||||||||||||
Investor A | $ 10,831 | $ 15,589 | $ 28,698 | $ 6,607 | ||||||||||||
Investor C | 285 | 63,558 | 56,029 | 57,842 | ||||||||||||
|
|
|
|
|
|
|
| |||||||||
| $ 11,116 | $ 79,147 | $ 84,727 | $ 64,449 | |||||||||||||
|
|
|
|
|
|
|
| |||||||||
Expense Limitations, Waivers, Reimbursements, and Recoupments: With respect to each Fund, the Manager contractually agreed to waive its investment advisory fees by the amount of investment advisory fees each Fund pays to the Manager indirectly through its investment in affiliated money market funds (the “affiliated money market fund waiver”) through January 31, 2021. The contractual agreement may be terminated upon 90 days’ notice by a majority of the trustees who are not “interested persons” of the Trust, as defined in the 1940 Act (“Independent Trustees”), or by a vote of a majority of the outstanding voting securities of a Fund. The amount of waivers and/or reimbursements of fees and expenses made pursuant to the expense limitation described below will be reduced by the amount of the affiliated money market fund waiver. Prior to January 28, 2020, this waiver was voluntary. These amounts are included in fees waived and/or reimbursed by the Manager in the Statements of Operations. For the year ended September 30, 2020, the amounts waived were as follows:
| Fund Name | Amounts Waived | |||
Advantage Small Cap Growth | $ 9,662 | |||
Health Sciences Opportunities | 114,263 | |||
Mid-Cap Growth Equity | 56,100 | |||
Technology Opportunities | 125,193 | |||
The Manager has contractually agreed to waive its investment advisory fee with respect to any portion of each Fund’s assets invested in affiliated equity and fixed-income mutual funds and affiliated exchange-traded funds that have a contractual management fee through January 31, 2021. These contractual agreements may be terminated upon 90 days’ notice by a majority of the Independent Trustees, or by a vote of a majority of the outstanding voting securities of a Fund. For the year ended September 30, 2020, there were no fees waived and/or reimbursed by the Manager pursuant to this arrangement.
NOTES TO FINANCIAL STATEMENTS | 77 |
Notes to Financial Statements (continued)
With respect to each Fund, the Manager contractually agreed to waive and/or reimburse fees or expenses in order to limit expenses, excluding interest expense, dividend expense, tax expense, acquired fund fees and expenses, and certain other fund expenses, which constitute extraordinary expenses not incurred in the ordinary course of each Fund’s business (“expense limitation”). The expense limitations as a percentage of average daily net assets are as follows:
| Share Class | Advantage Small Cap Growth | Health Sciences Opportunities | Mid-Cap Growth Equity | Technology Opportunities | ||||||||||||
Institutional | 0.50 | % | N/A | 0.80 | % | 0.92 | % | |||||||||
Service | 0.75 | N/A | 1.05 | 1.17 | ||||||||||||
Investor A | 0.75 | N/A | 1.05 | 1.17 | ||||||||||||
Investor C | 1.50 | N/A | 1.80 | 1.92 | ||||||||||||
Class K | 0.45 | N/A | 0.75 | 0.87 | (a) | |||||||||||
Class R | 1.00 | N/A | 1.30 | 1.42 | ||||||||||||
| (a) | Commencement of operations December 10, 2019. |
The Manager has agreed not to reduce or discontinue these contractual expense limitations through January 31, 2021, unless approved by the Board, including a majority of the Independent Trustees, or by a vote of a majority of the outstanding voting securities of the Funds.
For the year ended September 30, 2020, the amounts included in fees waived and/or reimbursed by the Manager in the Statements of Operations were as follows:
| Fund Name | Amounts Waived | |||
Advantage Small Cap Growth | $ 632,343 | |||
Technology Opportunities | 17,218 | |||
These amounts waived and/or reimbursed are included in administration fees waived — class specific and transfer agent fees waived and/or reimbursed — class specific, respectively, in the Statements of Operations. For the year ended September 30, 2020, class specific expense waivers and/or reimbursements are as follows:
| Administration Fees Waived | ||||||||||||||||||||||||||||
| Fund Name | Institutional | Service | Investor A | Investor C | Class K | Class R | Total | |||||||||||||||||||||
Advantage Small Cap Growth | $ | 82,495 | $ | 2,438 | $ | 33,565 | $ | 3,416 | $ | 1,592 | $ | 2,690 | $ | 126,196 | ||||||||||||||
Mid-Cap Growth Equity | 792,820 | 13,962 | 314,477 | 47,687 | 3,808 | 9,412 | 1,182,166 | |||||||||||||||||||||
Technology Opportunities | 386,505 | 3,482 | 211,858 | 42,447 | 2,575 | 5,479 | 652,346 | |||||||||||||||||||||
| Transfer Agent Fees Waived and/or Reimbursed | ||||||||||||||||||||||||||||
| Fund Name | Institutional | Service | Investor A | Investor C | Class K | Class R | Total | |||||||||||||||||||||
Advantage Small Cap Growth | $ | 446,591 | $ | 15,846 | $ | 252,423 | $ | 30,412 | $ | 953 | $ | 19,624 | $ | 765,849 | ||||||||||||||
Mid-Cap Growth Equity | 1,209,016 | 27,197 | 1,117,626 | 53,963 | — | 58,761 | 2,466,563 | |||||||||||||||||||||
Technology Opportunities | 730,283 | 396 | 579,956 | 70,887 | — | 34,273 | 1,415,795 | |||||||||||||||||||||
With respect to the contractual expense limitations, if during a Fund’s fiscal year the operating expenses of a share class, that at any time during the prior two fiscal years received a waiver and/or reimbursement from the Manager, are less than the current expense limitation for that share class, the Manager is entitled to be reimbursed by such share class up to the lesser of: (a) the amount of fees waived and/or expenses reimbursed during those prior two fiscal years under the agreement and (b) an amount not to exceed either the current expense limitation of that share class or the expense limitation of the share class in effect at the time that the share class received the applicable waiver and/or reimbursement, provided that:
(1) each Fund, of which the share class is a part, has more than $50 million in assets for the fiscal year, and
(2) the Manager or an affiliate continues to serve as a Fund’s investment adviser or administrator.
This repayment applies only to the contractual expense limitation on net expenses and does not apply to the contractual investment advisory fee waiver described above or any voluntary waivers that may be in effect from time to time. Effective December 1, 2019, the repayment arrangement between each Fund and the Manager pursuant to which such Fund may be required to repay amounts waived and/or reimbursed under each Fund’s contractual caps on net expenses was terminated.
For the year ended September 30, 2020, the Manager recouped the following fund level and class specific waivers and/or reimbursements previously recorded by the Funds:
| Fund Name | Investor A | Investor C | Class K | Class R | Total | |||||||||||||||
Mid-Cap Growth Equity | $ — | $ — | $ 8,901 | $ — | $ 8,901 | |||||||||||||||
| 78 | 2 0 2 0 BLACK ROCK ANNUAL REPORT TO SHAREHOLDERS |
Notes to Financial Statements (continued)
The following fund level and class specific waivers and/or reimbursements previously recorded by the Funds, which were subject to recoupment by the Manager, expired on December 1, 2019:
| Fund Name/Fund Level/Share Class | Amounts | |||
Advantage Small Cap Growth | ||||
Fund Level | $ | 1,672,563 | ||
Institutional | 1,440,826 | |||
Service | 32,747 | |||
Investor A | 726,364 | |||
Investor C | 119,948 | |||
Class K | 2,170 | |||
Class R | 65,965 | |||
Mid-Cap Growth Equity | ||||
Fund Level | 50,353 | |||
Institutional | 1,893,276 | |||
Service | 86,088 | |||
Investor A | 1,872,538 | |||
Investor C | 178,806 | |||
Class K | 10,602 | |||
Class R | 85,721 | |||
Technology Opportunities | ||||
Fund Level | 85,605 | |||
Institutional | 1,143,320 | |||
Service | 24,850 | |||
Investor A | 1,273,078 | |||
Investor C | 235,711 | |||
Class R | 47,898 | |||
Securities Lending: The U.S. Securities and Exchange Commission (“SEC”) has issued an exemptive order which permits BIM, an affiliate of the Manager, to serve as securities lending agent for the Funds, subject to applicable conditions. As securities lending agent, BIM bears all operational costs directly related to securities lending. The Funds are responsible for expenses in connection with the investment of cash collateral received for securities on loan (the “collateral investment expenses”). The cash collateral is invested in a private investment company, SL Liquidity Series, LLC (“Money Market Series”), managed by the Manager or its affiliates. However, BIM has agreed to cap the collateral investment expenses of the Money Market Series to an annual rate of 0.04%. The investment adviser to the Money Market Series will not charge any advisory fees with respect to shares purchased by the Funds. The Money Market Series may, under certain circumstances, impose a liquidity fee of up to 2% of the value withdrawn or temporarily restrict withdrawals for up to 10 business days during a 90 day period, in the event that the private investment company’s weekly liquid assets fall below certain thresholds. The Money Market Series seeks current income consistent with maintaining liquidity and preserving capital. Although the Money Market Series is not registered under the 1940 Act, its investments may follow the parameters of investments by a money market fund that is subject to Rule 2a-7 under the 1940 Act.
Securities lending income is equal to the total of income earned from the reinvestment of cash collateral, net of fees and other payments to and from borrowers of securities, and less the collateral investment expenses. Each Fund retains a portion of securities lending income and remits a remaining portion to BIM as compensation for its services as securities lending agent.
Pursuant to the current securities lending agreement, Advantage Small Cap Growth, Health Science Opportunities, and Mid-Cap Growth retains 75% of securities lending income (which excludes collateral investment expenses), and this amount retained can never be less than 70% of the total of securities lending income plus the collateral investment expenses. Pursuant to the current securities lending agreement, Technology Opportunities retains 82% of securities lending income (which excludes collateral investment expenses), and this amount retained can never be less than 70% of the total of securities lending income plus the collateral investment expenses.
In addition, commencing the business day following the date that the aggregate securities lending income earned across the BlackRock Multi-Asset Complex in a calendar year exceeds a specified threshold, Advantage Small Cap Growth, Health Sciences Opportunities and Mid-Cap Growth Equity, pursuant to the securities lending agreement, will retain for the remainder of that calendar year securities lending income in an amount equal to 80% of securities lending income (which excludes collateral investment expenses), and this amount retained can never be less than 70% of the total of securities lending income plus the collateral investment expenses. Technology Opportunities, pursuant to the securities lending agreement, will retain for the remainder of that calendar year securities lending income in an amount equal to 85% of securities lending income (which excludes collateral investment expenses), and this amount retained can never be less than 70% of the total of securities lending income plus the collateral investment expenses.
Prior to January 1, 2020, Advantage Small Cap Growth, Health Sciences Opportunities, and Mid Cap-Growth Equity retained 73.5% of securities lending income (which excluded collateral investment expenses) and the amount retained could never be less than 70% of the total of securities lending income plus the collateral investment expenses. In addition, commencing the business day following the date that the aggregate securities lending income earned across the BlackRock Multi-Asset Complex in a calendar year exceeded a specified threshold, the Fund would retain for the remainder of that calendar year 80% of securities lending income (which excluded collateral investment expenses), and the amount retained could never be less than 70% of the total of securities lending income plus the collateral investment expenses.
NOTES TO FINANCIAL STATEMENTS | 79 |
Notes to Financial Statements (continued)
The share of securities lending income earned by each Fund is shown as securities lending income — affiliated — net in the Statements of Operations. For the year ended September 30, 2020, each Fund paid BIM the following amounts for securities lending agent services:
| Fund Name | Amounts | |||
Advantage Small Cap Growth | $ 128,054 | |||
Health Sciences Opportunities | 467,578 | |||
Mid-Cap Growth Equity | 775,191 | |||
Technology Opportunities | 490,098 | |||
Trustees and Officers: Certain trustees and/or officers of the Trust are directors and/or officers of BlackRock or its affiliates. The Funds reimburse the Manager for a portion of the compensation paid to the Trust’s Chief Compliance Officer, which is included in Trustees and Officer in the Statements of Operations.
Other Transactions: During the year ended September 30, 2020, Health Sciences Opportunities received a reimbursement of $5,622 from an affiliate, which is included in payment by affiliate in the Statements of Operations related to an operating event.
The Funds may purchase securities from, or sell securities to, an affiliated fund provided the affiliation is due solely to having a common investment adviser, common officers, or common trustees. For the year ended September 30, 2020, the purchase and sale transactions and any net realized gain (loss) with an affiliated fund in compliance with Rule 17a-7 under the 1940 Act were as follows:
| Fund Name | Purchases | Sales | Net Realized Loss | |||||||||
Technology Opportunities | $ 9,052,236 | �� | $ 109,156 | $ (51,821) | ||||||||
| 7. | PURCHASES AND SALES |
For the year ended September 30, 2020, purchases and sales of investments, excluding short-term investments transactions, were as follows:
| Fund Name | Purchases | Sales | ||||||
Advantage Small Cap Growth | $ 784,232,130 | $ 797,816,996 | ||||||
Health Sciences Opportunities | 3,166,656,867 | 2,245,306,386 | ||||||
Mid-Cap Growth Equity | 5,916,162,033 | 2,526,351,282 | ||||||
Technology Opportunities | 2,600,172,919 | 855,243,612 | ||||||
| 8. | INCOME TAX INFORMATION |
It is each Fund’s policy to comply with the requirements of the Internal Revenue Code of 1986, as amended, applicable to regulated investment companies, and to distribute substantially all of its taxable income to its shareholders. Therefore, no U.S. federal income tax provision is required.
Each Fund files U.S. federal and various state and local tax returns. No income tax returns are currently under examination. The statute of limitations on each Fund’s U.S. federal tax returns generally remains open for a period of three fiscal years after they are filed. The statutes of limitations on each Fund’s state and local tax returns may remain open for an additional year depending upon the jurisdiction.
Management has analyzed tax laws and regulations and their application to the Funds as of September 30, 2020, inclusive of the open tax return years, and does not believe that there are any uncertain tax positions that require recognition of a tax liability in the Funds’ financial statements.
U.S. GAAP requires that certain components of net assets be adjusted to reflect permanent differences between financial and tax reporting. These reclassifications have no effect on net assets or net asset values per share. As of period end, the following permanent differences attributable to certain deemed distributions, net operating losses and non-deductible expenses were reclassified to the following accounts:
| Advantage Small Cap Growth | Health Sciences Opportunities | Mid-Cap Growth Equity | Technology Opportunities | |||||||||||||
Paid-in capital | $ — | $ 21,269,914 | $ (21,320,949 | ) | $ (6,963,428 | ) | ||||||||||
Accumulated earnings (loss) | — | (21,269,914 | ) | 21,320,949 | 6,963,428 | |||||||||||
| 80 | 2 0 2 0 BLACK ROCK ANNUAL REPORT TO SHAREHOLDERS |
Notes to Financial Statements (continued)
The tax character of distributions paid was as follows:
| Period | | Advantage Small Cap Growth | | | Health Sciences Opportunities | (a) | | Mid-Cap Growth Equity | | | Technology Opportunities | | ||||||||
Ordinary income | 09/30/20 | $ | 2,068,751 | $ | 31,718,031 | $ | — | $ | — | |||||||||||
| 09/30/19 | 53,234,295 | 50,031,146 | 40,022,297 | — | ||||||||||||||||
Long-term capital gains | 09/30/20 | 39,034,850 | 285,293,246 | 23,133,112 | 32,211,050 | |||||||||||||||
| 09/30/19 | 82,891,785 | 476,061,355 | 57,853,891 | 14,241,571 | ||||||||||||||||
|
|
|
|
|
|
|
| |||||||||||||
Total | 09/30/20 | $ | 41,103,601 | $ | 317,011,277 | $ | 23,133,112 | $ | 32,211,050 | |||||||||||
|
|
|
|
|
|
|
| |||||||||||||
| 09/30/19 | $ | 136,126,080 | $ | 526,092,501 | $ | 97,876,188 | $ | 14,241,571 | ||||||||||||
|
|
|
|
|
|
|
| |||||||||||||
| (a) | Distribution amounts may include a portion of the proceeds from redeemed shares. |
As of period end, the tax components of accumulated net earnings were as follows:
| Advantage Small Cap Growth | Health Sciences | Mid-Cap Growth | Technology Opportunities | |||||||||||||
Undistributed ordinary income | $ | 17,156,993 | $ | 81,932,310 | $ | — | $ | — | ||||||||
Undistributed long-term capital gains | 28,327,250 | 279,611,181 | — | 82,406,453 | ||||||||||||
Non-expiring capital loss carryforwards(a) | — | — | (136,498,079 | ) | — | |||||||||||
Net unrealized gains(b) | 84,188,027 | 3,701,456,788 | 2,888,039,619 | 2,308,921,837 | ||||||||||||
Qualified late-year losses(c) | — | — | (29,287,717 | ) | (17,414,726 | ) | ||||||||||
|
|
|
|
|
|
|
| |||||||||
| $ | 129,672,270 | $ | 4,063,000,279 | $ | 2,722,253,823 | $ | 2,373,913,564 | |||||||||
|
|
|
|
|
|
|
| |||||||||
| (a) | Amounts available to offset future realized capital gains. |
| (b) | The difference between book-basis and tax-basis net unrealized gains (losses) was attributable primarily to the tax deferral of losses on wash sales and straddles, the realization for tax purposes of unrealized gains on investments in passive foreign investment companies, the realization for tax purposes of unrealized gains/losses on certain futures contracts and the timing and recognitiion of partnership income. |
| (c) | The Fund has elected to defer certain qualified late-year losses and recognize such losses in the next taxable year. |
During the year ended September 30, 2020, Technology Opportunities utilized $60,373,178 of its capital loss carryforward.
As of September 30, 2020, gross unrealized appreciation and depreciation for investments based on cost for U.S. federal income tax purposes were as follows:
| Advantage Small Cap Growth | Health Sciences | Mid-Cap Growth Equity | Technology Opportunities | |||||||||||||
Tax cost | $ | 695,753,824 | $ | 6,226,579,438 | $ | 7,876,382,402 | $ | 3,884,230,942 | ||||||||
|
|
|
|
|
|
|
| |||||||||
Gross unrealized appreciation | $ | 121,287,894 | $ | 3,733,358,078 | $ | 2,910,616,956 | $ | 2,311,911,515 | ||||||||
Gross unrealized depreciation | (37,099,867 | ) | (31,928,759 | ) | (22,577,640 | ) | (2,693,112 | ) | ||||||||
|
|
|
|
|
|
|
| |||||||||
Net unrealized appreciation (depreciation) | $ | 84,188,027 | $ | 3,701,429,319 | $ | 2,888,039,316 | $ | 2,309,218,403 | ||||||||
|
|
|
|
|
|
|
| |||||||||
9. BANK BORROWINGS
The Trust, on behalf of the Funds, along with certain other funds managed by the Manager and its affiliates (“Participating Funds”), is a party to a 364-day, $2.25 billion credit agreement with a group of lenders. Under this agreement, the Funds may borrow to fund shareholder redemptions. Excluding commitments designated for certain individual funds, the Participating Funds, including the Funds, can borrow up to an aggregate commitment amount of $1.75 billion at any time outstanding, subject to asset coverage and other limitations as specified in the agreement. The credit agreement has the following terms: a fee of 0.10% per annum on unused commitment amounts and interest at a rate equal to the higher of (a) one-month LIBOR (but, in any event, not less than 0.00%) on the date the loan is made plus 0.80% per annum or (b) the Fed Funds rate but, in any event, not less than 0.00%) in effect from time to time plus 0.80% per annum on amounts borrowed. The agreement expires in April 2021 unless extended or renewed. These fees were allocated among such funds based upon portions of the aggregate commitment available to them and relative net assets of Participating Funds. During the year ended September 30, 2020, the Funds did not borrow under the credit agreement.
10. PRINCIPAL RISKS
In the normal course of business, certain Funds invest in securities or other instruments and may enter into certain transactions, and such activities subject each Fund to various risks, including among others, fluctuations in the market (market risk) or failure of an issuer to meet all of its obligations. The value of securities or other instruments may also be affected by various factors, including, without limitation: (i) the general economy; (ii) the overall market as well as local, regional or global political and/or social instability; (iii) regulation, taxation or international tax treaties between various countries; or (iv) currency, interest rate and price fluctuations. Local, regional or global events
NOTES TO FINANCIAL STATEMENTS | 81 |
Notes to Financial Statements (continued)
such as war, acts of terrorism, the spread of infectious illness or other public health issues, recessions, or other events could have a significant impact on the Funds and their investments. Each Fund’s prospectus provides details of the risks to which each Fund is subject.
The Funds may be exposed to additional risks when reinvesting cash collateral in money market funds that do not seek to maintain a stable NAV per share of $1.00, which may be subject to redemption gates or liquidity fees under certain circumstances.
Market Risk: An outbreak of respiratory disease caused by a novel coronavirus has developed into a global pandemic and has resulted in closing borders, quarantines, disruptions to supply chains and customer activity, as well as general concern and uncertainty. The impact of this pandemic, and other global health crises that may arise in the future, could affect the economies of many nations, individual companies and the market in general in ways that cannot necessarily be foreseen at the present time. This pandemic may result in substantial market volatility and may adversely impact the prices and liquidity of a fund’s investments. The duration of this pandemic and its effects cannot be determined with certainty.
Valuation Risk: The market values of equities, such as common stocks and preferred securities or equity related investments, such as futures and options, may decline due to general market conditions which are not specifically related to a particular company. They may also decline due to factors which affect a particular industry or industries. A Fund may invest in illiquid investments. An illiquid investment is any investment that a Fund reasonably expects cannot be sold or disposed of in current market conditions in seven calendar days or less without the sale or disposition significantly changing the market value of the investment. A Fund may experience difficulty in selling illiquid investments in a timely manner at the price that it believes the investments are worth. Prices may fluctuate widely over short or extended periods in response to company, market or economic news. Markets also tend to move in cycles, with periods of rising and falling prices. This volatility may cause each Fund’s NAV to experience significant increases or decreases over short periods of time. If there is a general decline in the securities and other markets, the NAV of a Fund may lose value, regardless of the individual results of the securities and other instruments in which a Fund invests.
The price a Fund could receive upon the sale of any particular portfolio investment may differ from a Fund’s valuation of the investment, particularly for securities that trade in thin or volatile markets or that are valued using a fair valuation technique or a price provided by an independent pricing service. Changes to significant unobservable inputs and assumptions (i.e., publicly traded company multiples, growth rate, time to exit) due to the lack of observable inputs may significantly impact the resulting fair value and therefore a Fund’s results of operations. As a result, the price received upon the sale of an investment may be less than the value ascribed by a Fund, and a Fund could realize a greater than expected loss or lesser than expected gain upon the sale of the investment. A Fund’s ability to value its investments may also be impacted by technological issues and/or errors by pricing services or other third party service providers.
Counterparty Credit Risk: The Funds may be exposed to counterparty credit risk, or the risk that an entity may fail to or be unable to perform on its commitments related to unsettled or open transactions, including making timely interest and/or principal payments or otherwise honoring its obligations. The Funds manage counterparty credit risk by entering into transactions only with counterparties that the Manager believes have the financial resources to honor their obligations and by monitoring the financial stability of those counterparties. Financial assets, which potentially expose the Funds to market, issuer and counterparty credit risks, consist principally of financial instruments and receivables due from counterparties. The extent of the Funds’ exposure to market, issuer and counterparty credit risks with respect to these financial assets is approximately their value recorded in the Statements of Assets and Liabilities, less any collateral held by the Funds.
A derivative contract may suffer a mark-to-market loss if the value of the contract decreases due to an unfavorable change in the market rates or values of the underlying instrument. Losses can also occur if the counterparty does not perform under the contract.
With exchange-traded options purchased and futures, there is less counterparty credit risk to the Funds since the exchange or clearinghouse, as counterparty to such instruments, guarantees against a possible default. The clearinghouse stands between the buyer and the seller of the contract; therefore, credit risk is limited to failure of the clearinghouse. While offset rights may exist under applicable law, a Fund does not have a contractual right of offset against a clearing broker or clearinghouse in the event of a default (including the bankruptcy or insolvency). Additionally, credit risk exists in exchange-traded futures with respect to initial and variation margin that is held in a clearing broker’s customer accounts. While clearing brokers are required to segregate customer margin from their own assets, in the event that a clearing broker becomes insolvent or goes into bankruptcy and at that time there is a shortfall in the aggregate amount of margin held by the clearing broker for all its clients, typically the shortfall would be allocated on a pro rata basis across all the clearing broker’s customers, potentially resulting in losses to the Funds.
Concentration Risk: A diversified portfolio, where this is appropriate and consistent with a fund’s objectives, minimizes the risk that a price change of a particular investment will have a material impact on the NAV of a fund. The investment concentrations within certain Fund’s portfolio are disclosed in its Schedule of Investments.
Certain Funds invest a significant portion of their assets in securities within a single or limited number of market sectors. When a Fund concentrates its investments in this manner, it assumes the risk that economic, regulatory, political and social conditions affecting such sectors may have a significant impact on the Fund and could affect the income from, or the value or liquidity of, the Fund’s portfolio. Investment percentages in specific sectors are presented in the Schedules of Investments.
LIBOR Transition Risk: The United Kingdom’s Financial Conduct Authority announced a phase out of the London Interbank Offered Rate (“LIBOR”) by the end of 2021, and it is expected that LIBOR will cease to be published after that time. The Funds may be exposed to financial instruments tied to LIBOR to determine payment obligations, financing terms, hedging strategies or investment value. The transition process away from LIBOR might lead to increased volatility and illiquidity in markets for, and reduce the effectiveness of new hedges placed against, instruments whose terms currently include LIBOR. The ultimate effect of the LIBOR transition process on the Funds is uncertain.
| 82 | 2 0 2 0 BLACK ROCK ANNUAL REPORT TO SHAREHOLDERS |
Notes to Financial Statements (continued)
| 11. | CAPITAL SHARE TRANSACTIONS |
Transactions in capital shares for each class were as follows:
| Year Ended 09/30/20 | Year Ended 09/30/19 | |||||||||||||||
| Fund Name/Share Class | Shares | Amounts | Shares | Amounts | ||||||||||||
Advantage Small Cap Growth | ||||||||||||||||
Institutional | ||||||||||||||||
Shares sold | 9,729,691 | $ | 177,665,109 | 6,450,881 | $ | 115,836,092 | ||||||||||
Shares issued in reinvestment of distributions | 1,057,626 | 19,978,548 | 4,092,957 | 67,370,100 | ||||||||||||
Shares redeemed | (7,210,518 | ) | (128,263,587 | ) | (9,779,328 | ) | (178,127,806 | ) | ||||||||
|
|
|
|
|
|
|
| |||||||||
| 3,576,799 | $ | 69,380,070 | 764,510 | $ | 5,078,386 | |||||||||||
|
|
|
|
|
|
|
| |||||||||
Service | ||||||||||||||||
Shares sold | 104,959 | $ | 1,498,729 | 182,363 | $ | 2,696,164 | ||||||||||
Shares issued in reinvestment of distributions | 52,316 | 796,771 | 207,722 | 2,791,794 | ||||||||||||
Shares redeemed | (185,990 | ) | (2,689,551 | ) | (351,903 | ) | (5,249,510 | ) | ||||||||
|
|
|
|
|
|
|
| |||||||||
| (28,715 | ) | $ | (394,051 | ) | 38,182 | $ | 238,448 | |||||||||
|
|
|
|
|
|
|
| |||||||||
Investor A | ||||||||||||||||
Shares sold and automatic conversion of shares | 3,283,336 | $ | 41,419,471 | 3,380,899 | $ | 45,870,296 | ||||||||||
Shares issued in reinvestment of distributions | 967,337 | 12,923,621 | 3,700,056 | 43,993,503 | ||||||||||||
Shares redeemed | (6,002,518 | ) | (77,479,548 | ) | (5,559,666 | ) | (73,084,085 | ) | ||||||||
|
|
|
|
|
|
|
| |||||||||
| (1,751,845 | ) | $ | (23,136,456 | ) | 1,521,289 | $ | 16,779,714 | |||||||||
|
|
|
|
|
|
|
| |||||||||
Investor C | ||||||||||||||||
Shares sold | 397,155 | $ | 1,974,507 | 539,522 | $ | 3,199,311 | ||||||||||
Shares issued in reinvestment of distributions | 588,856 | 3,103,274 | 1,742,820 | 9,097,526 | ||||||||||||
Shares redeemed and automatic conversion of shares | (2,264,043 | ) | (11,843,711 | ) | (2,356,800 | ) | (16,761,791 | ) | ||||||||
|
|
|
|
|
|
|
| |||||||||
| (1,278,032 | ) | $ | (6,765,930 | ) | (74,458 | ) | $ | (4,464,954 | ) | |||||||
|
|
|
|
|
|
|
| |||||||||
Class K | ||||||||||||||||
Shares sold | 539,510 | $ | 9,931,388 | 337,013 | $ | 6,313,553 | ||||||||||
Shares issued in reinvestment of distributions | 14,225 | 268,698 | 19,118 | 314,677 | ||||||||||||
Shares redeemed | (170,769 | ) | (3,068,516 | ) | (165,215 | ) | (3,008,110 | ) | ||||||||
|
|
|
|
|
|
|
| |||||||||
| 382,966 | $ | 7,131,570 | 190,916 | $ | 3,620,120 | |||||||||||
|
|
|
|
|
|
|
| |||||||||
Class R | ||||||||||||||||
Shares sold | 227,518 | $ | 2,912,566 | 343,297 | $ | 4,624,723 | ||||||||||
Shares issued in reinvestment of distributions | 84,897 | 1,135,066 | 357,385 | 4,252,884 | ||||||||||||
Shares redeemed | (739,408 | ) | (9,370,637 | ) | (736,783 | ) | (10,134,255 | ) | ||||||||
|
|
|
|
|
|
|
| |||||||||
| (426,993 | ) | $ | (5,323,005 | ) | (36,101 | ) | $ | (1,256,648 | ) | |||||||
|
|
|
|
|
|
|
| |||||||||
| 474,180 | $ | 40,892,198 | 2,404,338 | $ | 19,995,066 | |||||||||||
|
|
|
|
|
|
|
| |||||||||
Health Sciences Opportunities | ||||||||||||||||
Institutional | ||||||||||||||||
Shares sold | 30,734,976 | $ | 2,097,120,978 | 16,325,905 | $ | 988,684,149 | ||||||||||
Shares issued in reinvestment of distributions | 1,925,274 | 127,299,118 | 3,378,060 | 203,122,898 | ||||||||||||
Shares redeemed | (14,848,220 | ) | (990,084,681 | ) | (12,922,800 | ) | (782,762,821 | ) | ||||||||
|
|
|
|
|
|
|
| |||||||||
| 17,812,030 | $ | 1,234,335,415 | 6,781,165 | $ | 409,044,226 | |||||||||||
|
|
|
|
|
|
|
| |||||||||
Service | ||||||||||||||||
Shares sold | 211,062 | $ | 13,288,854 | 139,988 | $ | 8,089,568 | ||||||||||
Shares issued in reinvestment of distributions | 24,556 | 1,546,767 | 46,803 | 2,689,300 | ||||||||||||
Shares redeemed | (265,322 | ) | (17,362,844 | ) | (202,720 | ) | (11,765,167 | ) | ||||||||
|
|
|
|
|
|
|
| |||||||||
| (29,704 | ) | $ | (2,527,223 | ) | (15,929 | ) | $ | (986,299 | ) | |||||||
|
|
|
|
|
|
|
| |||||||||
NOTES TO FINANCIAL STATEMENTS | 83 |
Notes to Financial Statements (continued)
| Year Ended 09/30/20 | Year Ended 09/30/19 | |||||||||||||||
| Fund Name/Share Class | Shares | Amounts | Shares | Amounts | ||||||||||||
Health Sciences Opportunities (continued) | ||||||||||||||||
Investor A | ||||||||||||||||
Shares sold and automatic conversion of shares | 9,778,601 | $ | 634,881,833 | 9,513,222 | $ | 559,253,517 | ||||||||||
Shares issued in reinvestment of distributions | 1,709,241 | 107,254,886 | 3,500,360 | 200,325,664 | ||||||||||||
Shares redeemed | (12,019,324 | ) | (779,501,605 | ) | (11,451,134 | ) | (662,324,377 | ) | ||||||||
|
|
|
|
|
|
|
| |||||||||
| (531,482 | ) | $ | (37,364,886 | ) | 1,562,448 | $ | 97,254,804 | |||||||||
|
|
|
|
|
|
|
| |||||||||
Investor C | ||||||||||||||||
Shares sold | 2,168,957 | $ | 121,404,339 | 1,894,248 | $ | 95,470,146 | ||||||||||
Shares issued in reinvestment of distributions | 591,997 | 32,133,581 | 1,265,770 | 63,261,217 | ||||||||||||
Shares redeemed and automatic conversion of shares | (4,852,896 | ) | (272,499,312 | ) | (6,451,239 | ) | (335,742,806 | ) | ||||||||
|
|
|
|
|
|
|
| |||||||||
| (2,091,942 | ) | $ | (118,961,392 | ) | (3,291,221 | ) | $ | (177,011,443 | ) | |||||||
|
|
|
|
|
|
|
| |||||||||
Class K | ||||||||||||||||
Shares sold | 2,729,431 | $ | 182,542,819 | 1,230,466 | $ | 74,794,211 | ||||||||||
Shares issued in reinvestment of distributions | 134,010 | 8,868,769 | 162,449 | 9,774,577 | ||||||||||||
Shares redeemed | (1,079,477 | ) | (73,224,544 | ) | (530,603 | ) | (31,999,450 | ) | ||||||||
|
|
|
|
|
|
|
| |||||||||
| 1,783,964 | $ | 118,187,044 | 862,312 | $ | 52,569,338 | |||||||||||
|
|
|
|
|
|
|
| |||||||||
Class R | ||||||||||||||||
Shares sold | 839,083 | $ | 52,510,559 | 726,290 | $ | 41,078,199 | ||||||||||
Shares issued in reinvestment of distributions | 147,933 | 9,068,275 | 304,568 | 17,058,868 | ||||||||||||
Shares redeemed | (1,182,354 | ) | (72,319,373 | ) | (917,169 | ) | (51,650,482 | ) | ||||||||
|
|
|
|
|
|
|
| |||||||||
| (195,338 | ) | $ | (10,740,539 | ) | 113,689 | $ | 6,486,585 | |||||||||
|
|
|
|
|
|
|
| |||||||||
| 16,747,528 | $ | 1,182,928,419 | 6,012,464 | $ | 387,357,211 | |||||||||||
|
|
|
|
|
|
|
| |||||||||
Mid-Cap Growth Equity | ||||||||||||||||
Institutional | ||||||||||||||||
Shares sold | 119,501,228 | $ | 3,693,132,346 | 77,104,859 | $ | 2,090,482,380 | ||||||||||
Shares issued in reinvestment of distributions | 380,726 | 11,273,296 | 1,898,609 | 45,281,831 | ||||||||||||
Shares redeemed | (49,837,122 | ) | (1,510,293,813 | ) | (22,995,193 | ) | (606,312,188 | ) | ||||||||
|
|
|
|
|
|
|
| |||||||||
| 70,044,832 | $ | 2,194,111,829 | 56,008,275 | $ | 1,529,452,023 | |||||||||||
|
|
|
|
|
|
|
| |||||||||
Service | ||||||||||||||||
Shares sold | 1,433,911 | $ | 39,876,738 | 1,790,116 | $ | 44,014,646 | ||||||||||
Shares issued in reinvestment of distributions | 10,189 | 272,453 | 64,877 | 1,401,341 | ||||||||||||
Shares redeemed | (1,268,814 | ) | (34,549,372 | ) | (825,133 | ) | (20,739,416 | ) | ||||||||
|
|
|
|
|
|
|
| |||||||||
| 175,286 | $ | 5,599,819 | 1,029,860 | $ | 24,676,571 | |||||||||||
|
|
|
|
|
|
|
| |||||||||
Investor A | ||||||||||||||||
Shares sold and automatic conversion of shares | 26,513,449 | $ | 701,674,743 | 32,742,208 | $ | 775,528,504 | ||||||||||
Shares issued in reinvestment of distributions | 248,010 | 6,336,662 | 1,655,927 | 34,178,259 | ||||||||||||
Shares redeemed | (19,750,826 | ) | (514,754,885 | ) | (13,577,841 | ) | (313,360,429 | ) | ||||||||
|
|
|
|
|
|
|
| |||||||||
| 7,010,633 | $ | 193,256,520 | 20,820,294 | $ | 496,346,334 | |||||||||||
|
|
|
|
|
|
|
| |||||||||
Investor C | ||||||||||||||||
Shares sold | 4,255,862 | $ | 86,460,753 | 5,584,965 | $ | 101,748,422 | ||||||||||
Shares issued in reinvestment of distributions | 64,403 | 1,272,594 | 443,988 | 7,151,409 | ||||||||||||
Shares redeemed and automatic conversion of shares | (3,670,980 | ) | (75,460,685 | ) | (3,721,184 | ) | (65,694,126 | ) | ||||||||
|
|
|
|
|
|
|
| |||||||||
| 649,285 | $ | 12,272,662 | 2,307,769 | $ | 43,205,705 | |||||||||||
|
|
|
|
|
|
|
| |||||||||
Class K | ||||||||||||||||
Shares sold | 44,515,608 | $ | 1,398,814,727 | 20,683,547 | $ | 567,677,643 | ||||||||||
Shares issued in reinvestment of distributions | 101,794 | 3,020,245 | 227,587 | 5,437,051 | ||||||||||||
Shares redeemed | (12,432,818 | ) | (388,414,776 | ) | (3,201,951 | ) | (86,697,184 | ) | ||||||||
|
|
|
|
|
|
|
| |||||||||
| 32,184,584 | $ | 1,013,420,196 | 17,709,183 | $ | 486,417,510 | |||||||||||
|
|
|
|
|
|
|
| |||||||||
| 84 | 2 0 2 0 BLACK ROCK ANNUAL REPORT TO SHAREHOLDERS |
Notes to Financial Statements (continued)
| Year Ended 09/30/20 | Year Ended 09/30/19 | |||||||||||||||
| Fund Name/Share Class | Shares | Amounts | Shares | Amounts | ||||||||||||
Mid-Cap Growth Equity (continued) | ||||||||||||||||
Class R | ||||||||||||||||
Shares sold | 1,006,329 | $ | 26,333,792 | 1,092,886 | $ | 24,805,586 | ||||||||||
Shares issued in reinvestment of distributions | 7,945 | 199,360 | 50,247 | 1,021,014 | ||||||||||||
Shares redeemed | (772,971 | ) | (19,925,520 | ) | (418,800 | ) | (9,534,032 | ) | ||||||||
|
|
|
|
|
|
|
| |||||||||
| 241,303 | $ | 6,607,632 | 724,333 | $ | 16,292,568 | |||||||||||
|
|
|
|
|
|
|
| |||||||||
| 110,305,923 | $ | 3,425,268,658 | 98,599,714 | $ | 2,596,390,711 | |||||||||||
|
|
|
|
|
|
|
| |||||||||
Technology Opportunities | ||||||||||||||||
Institutional | ||||||||||||||||
Shares sold | 54,122,759 | $ | 2,319,352,317 | 24,052,716 | $ | 739,645,950 | ||||||||||
Shares issued in reinvestment of distributions | 471,213 | 16,237,989 | 207,296 | 5,657,118 | ||||||||||||
Shares redeemed | (20,448,471 | ) | (864,871,214 | ) | (10,959,717 | ) | (333,674,502 | ) | ||||||||
|
|
|
|
|
|
|
| |||||||||
| 34,145,501 | $ | 1,470,719,092 | 13,300,295 | $ | 411,628,566 | |||||||||||
|
|
|
|
|
|
|
| |||||||||
Service | ||||||||||||||||
Shares sold | 912,863 | $ | 37,615,435 | 429,103 | $ | 12,520,533 | ||||||||||
Shares issued in reinvestment of distributions | 10,689 | 348,246 | 6,056 | 156,799 | ||||||||||||
Shares redeemed | (613,522 | ) | (24,717,111 | ) | (276,902 | ) | (8,156,518 | ) | ||||||||
|
|
|
|
|
|
|
| |||||||||
| 310,030 | $ | 13,246,570 | 158,257 | $ | 4,520,814 | |||||||||||
|
|
|
|
|
|
|
| |||||||||
Investor A | ||||||||||||||||
Shares sold and automatic conversion of shares | 23,205,370 | $ | 928,916,120 | 8,881,029 | $ | 253,971,288 | ||||||||||
Shares issued in reinvestment of distributions | 343,246 | 10,939,261 | 238,235 | 6,034,551 | ||||||||||||
Shares redeemed | (11,056,738 | ) | (429,065,205 | ) | (8,097,325 | ) | (223,707,727 | ) | ||||||||
|
|
|
|
|
|
|
| |||||||||
| 12,491,878 | $ | 510,790,176 | 1,021,939 | $ | 36,298,112 | |||||||||||
|
|
|
|
|
|
|
| |||||||||
Investor C | ||||||||||||||||
Shares sold | 3,632,921 | $ | 119,929,010 | 1,884,110 | $ | 45,401,724 | ||||||||||
Shares issued in reinvestment of distributions | 113,196 | 3,022,331 | 75,643 | 1,622,352 | ||||||||||||
Shares redeemed and automatic conversion of shares | (2,268,659 | ) | (75,398,136 | ) | (1,650,779 | ) | (38,974,671 | ) | ||||||||
|
|
|
|
|
|
|
| |||||||||
| 1,477,458 | $ | 47,553,205 | 308,974 | $ | 8,049,405 | |||||||||||
|
|
|
|
|
|
|
| |||||||||
Class K | ||||||||||||||||
Shares sold | 2,128,339 | $ | 83,664,037 | (a) | — | $ | — | |||||||||
Shares redeemed | (765,843 | ) | (30,913,420 | )(a) | — | — | ||||||||||
|
|
|
|
|
|
|
| |||||||||
| 1,362,496 | $ | 52,750,617 | — | $ | — | |||||||||||
|
|
|
|
|
|
|
| |||||||||
Class R | ||||||||||||||||
Shares sold | 512,640 | $ | 19,501,932 | 347,493 | $ | 9,898,454 | ||||||||||
Shares issued in reinvestment of distributions | 9,842 | 316,225 | 5,613 | 143,693 | ||||||||||||
Shares redeemed | (381,908 | ) | (14,938,360 | ) | (190,325 | ) | (5,407,885 | ) | ||||||||
|
|
|
|
|
|
|
| |||||||||
| 140,574 | $ | 4,879,797 | 162,781 | $ | 4,634,262 | |||||||||||
|
|
|
|
|
|
|
| |||||||||
| 49,927,937 | $ | 2,099,939,457 | 14,952,246 | $ | 465,131,159 | |||||||||||
|
|
|
|
|
|
|
| |||||||||
| (a) | For the period from December 10, 2019 (commencement of operations) to September 30, 2020. |
As of September 30, 2020, 8,673 Class K Shares of the Technology Opportunities were owned by BlackRock Financial Management, Inc., an affiliate of the Fund.
| 12. | SUBSEQUENT EVENTS |
Management has evaluated the impact of all subsequent events on the Funds through the date the financial statements were issued and has determined that there were no subsequent events requiring adjustment or additional disclosure in the financial statements.
NOTES TO FINANCIAL STATEMENTS | 85 |
Report of Independent Registered Public Accounting Firm
To the Shareholders of BlackRock Advantage Small Cap Growth Fund, BlackRock Health Sciences Opportunities Portfolio, BlackRock Mid-Cap Growth Equity Portfolio, and BlackRock Technology Opportunities Fund and the Board of Trustees of BlackRock FundsSM:
Opinion on the Financial Statements and Financial Highlights
We have audited the accompanying statements of assets and liabilities of BlackRock Advantage Small Cap Growth Fund, BlackRock Health Sciences Opportunities Portfolio, BlackRock Mid-Cap Growth Equity Portfolio, and BlackRock Technology Opportunities Fund of BlackRock FundsSM (the “Funds”), including the schedules of investments, as of September 30, 2020, the related statements of operations for the year then ended, the statements of changes in net assets for each of the two years in the period then ended, the financial highlights for each of the five years in the period then ended, and the related notes. In our opinion, the financial statements and financial highlights present fairly, in all material respects, the financial position of the Funds as of September 30, 2020, and the results of their operations for the year then ended, the changes in their net assets for each of the two years in the period then ended, and the financial highlights for each of the five years in the period then ended, in conformity with accounting principles generally accepted in the United States of America.
Basis for Opinion
These financial statements and financial highlights are the responsibility of the Funds’ management. Our responsibility is to express an opinion on the Funds’ financial statements and financial highlights based on our audits. We are a public accounting firm registered with the Public Company Accounting Oversight Board (United States) (PCAOB) and are required to be independent with respect to the Funds in accordance with the U.S. federal securities laws and the applicable rules and regulations of the Securities and Exchange Commission and the PCAOB.
We conducted our audits in accordance with the standards of the PCAOB. Those standards require that we plan and perform the audit to obtain reasonable assurance about whether the financial statements and financial highlights are free of material misstatement, whether due to error or fraud. The Funds are not required to have, nor were we engaged to perform, an audit of their internal control over financial reporting. As part of our audits we are required to obtain an understanding of internal control over financial reporting but not for the purpose of expressing an opinion on the effectiveness of the Funds’ internal control over financial reporting. Accordingly, we express no such opinion.
Our audits included performing procedures to assess the risks of material misstatement of the financial statements and financial highlights, whether due to error or fraud, and performing procedures that respond to those risks. Such procedures included examining, on a test basis, evidence regarding the amounts and disclosures in the financial statements and financial highlights. Our audits also included evaluating the accounting principles used and significant estimates made by management, as well as evaluating the overall presentation of the financial statements and financial highlights. Our procedures included confirmation of securities owned as of September 30, 2020, by correspondence with the custodian and brokers; when replies were not received from brokers, we performed other auditing procedures. We believe that our audits provide a reasonable basis for our opinion.
Deloitte & Touche LLP
Boston, Massachusetts
November 20, 2020
We have served as the auditor of one or more BlackRock investment companies since 1992.
| 86 | 2 0 2 0 BLACK ROCK ANNUAL REPORT TO SHAREHOLDERS |
Important Tax Information (unaudited)
For corporate shareholders, the percentage of ordinary income distributions paid during the fiscal year ended September 30, 2020 that qualified for the dividends-received deduction were as follows:
| Fund Name | Dividends-Received Deduction | |||
Advantage Small Cap Growth | 100.00 | % | ||
Health Sciences Opportunities | 83.06 | |||
The following maximum amounts are hereby designated as qualified dividend income for individuals for the fiscal year ended September 30, 2020:
| Fund Name | Qualified Dividend Income | |||
Advantage Small Cap Growth | $ 2,068,751 | |||
Health Sciences Opportunities | 72,365,144 | |||
The following distribution amounts are hereby designated for the fiscal year ended September 30, 2020:
| Fund Name | Short-Term Capital Gain Dividends | 20% Rate Long-Term Capital Gain Dividends | ||||||
Advantage Small Cap Growth | $ — | $ 39,034,850 | ||||||
Health Sciences Opportunities | 1,810,408 | 267,500,072 | ||||||
Mid-Cap Growth Equity | — | 23,133,112 | ||||||
Technology Opportunities | — | 32,211,050 | ||||||
I M P O R T A N T T A X I N F O R M A T I O N | 87 |
Disclosure of Investment Advisory Agreement
The Board of Trustees (the “Board,” the members of which are referred to as “Board Members”) of BlackRock Funds (the “Trust”) met on April 7, 2020 (the “April Meeting”) and May 11-13, 2020 (the “May Meeting”) to consider the approval of the investment advisory agreement (the “Agreement”) between the Trust, on behalf of BlackRock Mid-Cap Growth Equity Portfolio (“Mid-Cap Growth Equity Portfolio”), BlackRock Advantage Small Cap Growth Fund (“Advantage Small Cap Growth Fund”), BlackRock Health Sciences Opportunities Portfolio (“Health Sciences Opportunities Portfolio”) and BlackRock Technology Opportunities Fund (“Technology Opportunities Fund,” and together with Mid-Cap Growth Equity Portfolio, Advantage Small Cap Growth Fund and Health Sciences Opportunities Portfolio, the “Funds”), each a series of the Trust, and BlackRock Advisors, LLC (the “Manager”), the Trust’s investment advisor.
Activities and Composition of the Board
On the date of the May Meeting, the Board consisted of fourteen individuals, twelve of whom were not “interested persons” of the Trust as defined in the Investment Company Act of 1940, as amended (the “1940 Act”) (the “Independent Board Members”). The Board Members are responsible for the oversight of the operations of the Trust and perform the various duties imposed on the directors of investment companies by the 1940 Act. The Independent Board Members have retained independent legal counsel to assist them in connection with their duties. The Chair of the Board is an Independent Board Member. The Board has established five standing committees: an Audit Committee, a Governance and Nominating Committee, a Compliance Committee, a Performance Oversight Committee and an Ad Hoc Topics Committee, each of which is chaired by an Independent Board Member and composed of Independent Board Members (except for the Ad Hoc Topics Committee, which also has one interested Board Member).
The Agreement
Consistent with the requirements of the 1940 Act, the Board considers the continuation of the Agreement on an annual basis. The Board has four quarterly meetings per year, each typically extending for two days, and additional in-person and telephonic meetings throughout the year, as needed. While the Board also has a fifth one-day meeting to consider specific information surrounding the renewal of the Agreement, the Board’s consideration entails a year-long deliberative process whereby the Board and its committees assess BlackRock’s services to the Funds. In particular, the Board assessed, among other things, the nature, extent and quality of the services provided to each Fund by BlackRock, BlackRock’s personnel and affiliates, including (as applicable): investment management services; accounting oversight; administrative and shareholder services; oversight of each Fund’s service providers; risk management and oversight; and legal, regulatory and compliance services. Throughout the year, including during the contract renewal process, the Independent Board Members were advised by independent legal counsel, and met with independent legal counsel in various executive sessions outside of the presence of BlackRock’s management.
During the year, the Board, acting directly and through its committees, considers information that is relevant to its annual consideration of the renewal of the Agreement, including the services and support provided by BlackRock to each Fund and its shareholders. BlackRock also furnished additional information to the Board in response to specific questions from the Board. This additional information is discussed further below in the section titled “Board Considerations in Approving the Agreement.” Among the matters the Board considered were: (a) with respect to each Fund, investment performance for one-year, three-year, five-year and/or since inception periods, as applicable, against peer funds, an applicable benchmark, and other performance metrics, as applicable, as well as BlackRock senior management’s and portfolio managers’ analyses of the reasons for any outperformance or underperformance relative to the Fund’s peers, benchmarks, and other performance metrics, as applicable; (b) fees, including advisory, administration, if applicable, and other amounts paid to BlackRock and its affiliates by each Fund for services; (c) Fund operating expenses and how BlackRock allocates expenses to each Fund; (d) the resources devoted to risk oversight of, and compliance reports relating to, implementation of each Fund’s investment objective, policies and restrictions, and meeting regulatory requirements; (e) BlackRock’s and the Trust’s adherence to applicable compliance policies and procedures; (f) the nature, character and scope of non-investment management services provided by BlackRock and its affiliates and the estimated cost of such services; (g) BlackRock’s and other service providers’ internal controls and risk and compliance oversight mechanisms; (h) BlackRock’s implementation of the proxy voting policies approved by the Board; (i) the use of brokerage commissions and execution quality of portfolio transactions; (j) BlackRock’s implementation of the Trust’s valuation and liquidity procedures; (k) an analysis of management fees for products with similar investment mandates across the open-end fund, exchange-traded fund (“ETF”), closed-end fund, sub-advised mutual fund, separately managed account, collective investment trust, and institutional separate account product channels, as applicable, and the similarities and differences between these products and the services provided as compared to each Fund; (l) BlackRock’s compensation methodology for its investment professionals and the incentives and accountability it creates, along with investment professionals’ investments in the fund(s) they manage; and (m) periodic updates on BlackRock’s business.
Board Considerations in Approving the Agreement
The Approval Process: Prior to the April Meeting, the Board requested and received materials specifically relating to the Agreement. The Independent Board Members are continuously engaged in a process with their independent legal counsel and BlackRock to review the nature and scope of the information provided to the Board to better assist its deliberations. The materials provided in connection with the April Meeting included, among other things: (a) information independently compiled and prepared by Broadridge Financial Solutions, Inc. (“Broadridge”), based on either a Lipper classification or Morningstar category, regarding each Fund’s fees and expenses as compared with a peer group of funds as determined by Broadridge (“Expense Peers”) and the investment performance of each Fund as compared with a peer group of funds (“Performance Peers”); (b) information on the composition of the Expense Peers and Performance Peers, and a description of Broadridge’s methodology; (c) information on the estimated profits realized by BlackRock and its affiliates pursuant to the Agreement and a discussion of fall-out benefits to BlackRock and its affiliates; (d) a general analysis provided by BlackRock concerning investment management fees received in connection with other types of investment products, such as institutional accounts, sub-advised mutual funds, ETFs, closed-end funds, open-end funds, and separately managed accounts under similar investment mandates, as well as the performance of such other products, as applicable; (e) a review of non-management fees; (f) the existence, impact and sharing of potential economies of scale, if any, with the Funds; (g) a summary of aggregate amounts paid by each Fund to BlackRock; (h) sales and redemption data regarding each Fund’s shares; and (i) various additional information requested by the Board as appropriate regarding BlackRock’s and each Fund’s operations.
At the April Meeting, the Board reviewed materials relating to its consideration of the Agreement. As a result of the discussions that occurred during the April Meeting, and as a culmination of the Board’s year-long deliberative process, the Board presented BlackRock with questions and requests for additional information. BlackRock responded to these questions and requests with additional written information in advance of the May Meeting.
| 88 | 2 0 2 0 BLACK ROCK ANNUAL REPORT TO SHAREHOLDERS |
Disclosure of Investment Advisory Agreement (continued)
At the May Meeting, the Board concluded its assessment of, among other things: (a) the nature, extent and quality of the services provided by BlackRock; (b) the investment performance of each Fund as compared to its Performance Peers and to other metrics, as applicable; (c) the advisory fee and the estimated cost of the services and estimated profits realized by BlackRock and its affiliates from their relationship with the Funds; (d) each Fund’s fees and expenses compared to its Expense Peers; (e) the existence and sharing of potential economies of scale; (f) any fall-out benefits to BlackRock and its affiliates as a result of BlackRock’s relationship with the Funds; and (g) other factors deemed relevant by the Board Members.
The Board also considered other matters it deemed important to the approval process, such as other payments made to BlackRock or its affiliates relating to securities lending and cash management, and BlackRock’s services related to the valuation and pricing of each Fund’s portfolio holdings. The Board noted the willingness of BlackRock’s personnel to engage in open, candid discussions with the Board. The Board did not identify any particular information as determinative, and each Board Member may have attributed different weights to the various items considered.
A. Nature, Extent and Quality of the Services Provided by BlackRock: The Board, including the Independent Board Members, reviewed the nature, extent and quality of services provided by BlackRock, including the investment advisory services, and the resulting performance of each Fund. Throughout the year, the Board compared each Fund’s performance to the performance of a comparable group of mutual funds, relevant benchmark, and performance metrics, as applicable. The Board met with BlackRock’s senior management personnel responsible for investment activities, including the senior investment officers. The Board also reviewed the materials provided by each Fund’s portfolio management team discussing the Fund’s performance, investment strategies and outlook.
The Board considered, among other factors, with respect to BlackRock: the number, education and experience of investment personnel generally and each Fund’s portfolio management team; research capabilities; investments by portfolio managers in the funds they manage; portfolio trading capabilities; use of technology; commitment to compliance; credit analysis capabilities; risk analysis and oversight capabilities; and the approach to training and retaining portfolio managers and other research, advisory and management personnel. The Board also considered BlackRock’s overall risk management program, including the continued efforts of BlackRock and its affiliates to address cybersecurity risks and the role of BlackRock’s Risk & Quantitative Analysis Group. The Board engaged in a review of BlackRock’s compensation structure with respect to each Fund’s portfolio management team and BlackRock’s ability to attract and retain high-quality talent and create performance incentives.
In addition to investment advisory services, the Board considered the nature and quality of the administrative and other non-investment advisory services provided to each Fund. BlackRock and its affiliates provide the Funds with certain administrative, shareholder and other services (in addition to any such services provided to the Funds by third parties) and officers and other personnel as are necessary for the operations of the Funds. In particular, BlackRock and its affiliates provide the Funds with administrative services including, among others: (i) responsibility for disclosure documents, such as the prospectus, the summary prospectus (as applicable), the statement of additional information and periodic shareholder reports; (ii) oversight of daily accounting and pricing; (iii) responsibility for periodic filings with regulators; (iv) overseeing and coordinating the activities of third-party service providers, including, among others, each Fund’s custodian, fund accountant, transfer agent, and auditor; (v) organizing Board meetings and preparing the materials for such Board meetings; (vi) providing legal and compliance support; (vii) furnishing analytical and other support to assist the Board in its consideration of strategic issues such as the merger, consolidation or repurposing of certain open-end funds; and (viii) performing or managing administrative functions necessary for the operation of each Fund, such as tax reporting, expense management, fulfilling regulatory filing requirements, overseeing each Fund’s distribution partners, and shareholder call center and other services. The Board reviewed the structure and duties of BlackRock’s fund administration, shareholder services, and legal & compliance departments and considered BlackRock’s policies and procedures for assuring compliance with applicable laws and regulations.
B. The Investment Performance of the Funds and BlackRock: The Board, including the Independent Board Members, also reviewed and considered the performance history of each Fund. In preparation for the April Meeting, the Board was provided with reports independently prepared by Broadridge, which included an analysis of each Fund’s performance as of December 31, 2019, as compared to its Performance Peers. Broadridge ranks funds in quartiles, ranging from first to fourth, where first is the most desirable quartile position and fourth is the least desirable. In connection with its review, the Board received and reviewed information regarding the investment performance of each Fund as compared to its Performance Peers. The Board and its Performance Oversight Committee regularly review, and meet with Fund management to discuss, the performance of each Fund throughout the year.
In evaluating performance, the Board focused particular attention on funds with less favorable performance records. The Board also noted that while it found the data provided by Broadridge generally useful, it recognized the limitations of such data, including in particular, that notable differences may exist between a fund and its Performance Peers (for example, the investment objectives and strategies). Further, the Board recognized that the performance data reflects a snapshot of a period as of a particular date and that selecting a different performance period could produce significantly different results. The Board also acknowledged that long-term performance could be impacted by even one period of significant outperformance or underperformance, and that a single investment theme could have the ability to disproportionately affect long-term performance.
The Board noted that for the one-, three- and five-year periods reported, Advantage Small Cap Growth Fund ranked in the first, third and third quartiles, respectively, against its Performance Peers. The Board and BlackRock reviewed the Fund’s underperformance relative to its Performance Peers during the applicable periods.
The Board noted that for each of the one-, three- and five-year periods reported, each of Mid-Cap Growth Equity Portfolio, Health Sciences Opportunities Portfolio and Technology Opportunities Fund ranked in the second, first and first quartiles, respectively, against its Performance Peers.
C. Consideration of the Advisory/Management Fees and the Estimated Cost of the Services and Estimated Profits Realized by BlackRock and its Affiliates from their Relationship with the Funds: The Board, including the Independent Board Members, reviewed each Fund’s contractual management fee rate compared with those of its Expense Peers. The contractual management fee rate represents a combination of the advisory fee and any administrative fees, before taking into account any reimbursements or fee waivers. The Board also compared each Fund’s total expense ratio, as well as its actual management fee rate, to those of its Expense Peers. The total expense ratio represents a fund’s total net operating expenses, including any 12b-1 or non-12b-1 service fees. The total expense ratio gives effect to any expense reimbursements or fee waivers, and the actual management fee rate gives effect to any management fee reimbursements or waivers. The Board considered the services provided and the fees charged by BlackRock and its affiliates to other types of clients with similar investment mandates, as applicable, including institutional accounts and sub-advised mutual funds (including mutual funds sponsored by third parties).
The Board received and reviewed statements relating to BlackRock’s financial condition. The Board reviewed BlackRock’s profitability methodology and was also provided with an estimated profitability analysis that detailed the revenues earned and the expenses incurred by BlackRock for services provided to each Fund. The Board reviewed
D I S C L O S U R E O F I N V E S T M E N T A D V I S O R Y A G R E E M E N T | 89 |
Disclosure of Investment Advisory Agreement (continued)
BlackRock’s estimated profitability with respect to each Fund and other funds the Board currently oversees for the year ended December 31, 2019 compared to available aggregate estimated profitability data provided for the prior two years. The Board reviewed BlackRock’s estimated profitability with respect to certain other U.S. fund complexes managed by BlackRock and/or its affiliates. The Board reviewed BlackRock’s assumptions and methodology of allocating expenses in the estimated profitability analysis, noting the inherent limitations in allocating costs among various advisory products. The Board recognized that profitability may be affected by numerous factors including, among other things, fee waivers and expense reimbursements by BlackRock, the types of funds managed, precision of expense allocations and business mix. The Board thus recognized that calculating and comparing profitability at the individual fund level is difficult.
The Board noted that, in general, individual fund or product line profitability of other advisors is not publicly available. The Board reviewed BlackRock’s overall operating margin, in general, compared to that of certain other publicly traded asset management firms. The Board considered the differences between BlackRock and these other firms, including the contribution of technology at BlackRock, BlackRock’s expense management, and the relative product mix.
The Board considered whether BlackRock has the financial resources necessary to attract and retain high quality investment management personnel to perform its obligations under the Agreement and to continue to provide the high quality of services that is expected by the Board. The Board further considered factors including but not limited to BlackRock’s commitment of time, assumption of risk, and liability profile in servicing the Funds, including in contrast to what is required of BlackRock with respect to other products with similar investment mandates across the open-end fund, ETF, closed-end fund, sub-advised mutual fund, separately managed account, collective investment trust, and institutional separate account product channels, as applicable.
The Board noted that Advantage Small Cap Growth Fund’s contractual management fee rate ranked in the first quartile, and that the actual management fee rate and total expense ratio each ranked in the first quartile relative to the Fund’s Expense Peers.
The Board noted that Mid-Cap Growth Equity Portfolio’s contractual management fee rate ranked in the second quartile, and that the actual management fee rate and total expense ratio ranked in the second and first quartiles, respectively, relative to the Fund’s Expense Peers.
The Board noted that Technology Opportunities Fund’s contractual management fee rate ranked in the third quartile, and that the actual management fee rate and total expense ratio ranked in the fourth and second quartiles, respectively, relative to the Fund’s Expense Peers.
With respect to Advantage Small Cap Growth Fund, Mid-Cap Growth Equity Portfolio and Technology Opportunities Fund, the Board also noted that each Fund has an advisory fee arrangement that includes breakpoints that adjust the fee rate downward as the size of the pertinent Fund increases above certain contractually specified levels. The Board noted that if the size of the pertinent Fund were to decrease, the Fund could lose the benefit of one or more breakpoints. The Board further noted that BlackRock and the Board have contractually agreed to a cap on each Fund’s total expenses as a percentage of the pertinent Fund’s average daily net assets on a class-by-class basis.
The Board noted that Health Sciences Opportunities Portfolio’s contractual management fee rate ranked in the fourth quartile, and that the actual management fee rate and total expense ratio ranked in the fourth and third quartiles, respectively, relative to the Fund’s Expense Peers. The Board also noted that the Fund has an advisory fee arrangement that includes breakpoints that adjust the fee rate downward as the size of the Fund increases above certain contractually specified levels. The Board noted that if the size of the Fund were to decrease, the Fund could lose the benefit of one or more breakpoints. After discussion between the Board, including the Independent Board Members, and BlackRock, the Board and BlackRock agreed to a contractual adjustment to reduce specified levels within the breakpoint schedule. This adjustment was implemented on June 1, 2020.
D. Economies of Scale: The Board, including the Independent Board Members, considered the extent to which economies of scale might be realized as the assets of the Funds increase, including the existence of fee waivers and/or expense caps, as applicable, noting that any contractual fee waivers and contractual expense caps had been approved by the Board. In its consideration, the Board further considered the continuation and/or implementation of fee waivers and/or expense caps, as applicable. The Board also considered the extent to which each Fund benefits from such economies of scale in a variety of ways and whether there should be changes in the advisory fee rate or breakpoint structure in order to enable the Funds to more fully participate in these economies of scale. The Board considered each Fund’s asset levels and whether the current fee schedule was appropriate.
E. Other Factors Deemed Relevant by the Board Members: The Board, including the Independent Board Members, also took into account other ancillary or “fall-out” benefits that BlackRock or its affiliates may derive from BlackRock’s respective relationships with the Funds, both tangible and intangible, such as BlackRock’s ability to leverage its investment professionals who manage other portfolios and its risk management personnel, an increase in BlackRock’s profile in the investment advisory community, and the engagement of BlackRock’s affiliates as service providers to the Funds, including for administrative, distribution, securities lending and cash management services. The Board also considered BlackRock’s overall operations and its efforts to expand the scale of, and improve the quality of, its operations. The Board also noted that, subject to applicable law, BlackRock may use and benefit from third-party research obtained by soft dollars generated by certain registered fund transactions to assist in managing all or a number of its other client accounts.
In connection with its consideration of the Agreement, the Board also received information regarding BlackRock’s brokerage and soft dollar practices. The Board received reports from BlackRock which included information on brokerage commissions and trade execution practices throughout the year.
The Board noted the competitive nature of the open-end fund marketplace, and that shareholders are able to redeem their Fund shares if they believe that the pertinent Fund’s fees and expenses are too high or if they are dissatisfied with the performance of the Fund.
Conclusion
The Board, including the Independent Board Members, unanimously approved the continuation of the Agreement between the Manager and the Trust, on behalf of each Fund, for a one-year term ending June 30, 2021. Based upon its evaluation of all of the aforementioned factors in their totality, as well as other information, the Board, including the Independent Board Members, was satisfied that the terms of the Agreement were fair and reasonable and in the best interest of each Fund, as pertinent, and its shareholders. In arriving at its decision to approve the Agreement, the Board did not identify any single factor or group of factors as all-important or controlling, but considered all factors together, and different Board Members may have attributed different weights to the various factors considered. The Independent Board Members were also assisted by the advice of independent legal counsel in making this determination.
| 90 | 2 0 2 0 BLACK ROCK ANNUAL REPORT TO SHAREHOLDERS |
Trustee and Officer Information
| Independent Trustees(a) | ||||||||
Name Year of Birth(b) | Position(s) Held (Length of Service)(c) | Principal Occupation(s) During Past Five Years | Number of BlackRock-Advised Registered Investment Companies (“RICs”) Consisting of Investment Portfolios (“Portfolios”) Overseen | Public Company and Other Investment Company Directorships Held During Past Five Years | ||||
Mark Stalnecker 1951 | Chair of the Board and Trustee | Chief Investment Officer, University of Delaware from 1999 to 2013; Trustee and Chair of the Finance and Investment Committees, Winterthur Museum and Country Estate from 2005 to 2016; Member of the Investment Committee, Delaware Public Employees’ Retirement System since 2002; Member of the Investment Committee, Christiana Care Health System from 2009 to 2017; Member of the Investment Committee, Delaware Community Foundation from 2013 to 2014; Director and Chair of the Audit Committee, SEI Private Trust Co. from 2001 to 2014. | 35 RICs consisting of 158 Portfolios | None | ||||
Bruce R. Bond 1946 | Trustee (Since 2019) | Board Member, Amsphere Limited (software) since 2018; Trustee and Member of the Governance Committee, State Street Research Mutual Funds from 1997 to 2005; Board Member of Governance, Audit and Finance Committee, Avaya Inc. (computer equipment) from 2003 to 2007. | 35 RICs consisting of 158 Portfolios | None | ||||
Susan J. Carter 1956 | Trustee (Since 2016) | Director, Pacific Pension Institute from 2014 to 2018; Advisory Board Member, Center for Private Equity and Entrepreneurship at Tuck School of Business since 1997; Senior Advisor, Commonfund Capital, Inc. (“CCI”) (investment adviser) in 2015; Chief Executive Officer, CCI from 2013 to 2014; President & Chief Executive Officer, CCI from 1997 to 2013; Advisory Board Member, Girls Who Invest from 2015 to 2018 and Board Member thereof since 2018; Advisory Board Member, Bridges Fund Management since 2016; Trustee, Financial Accounting Foundation since 2017; Practitioner Advisory Board Member, Private Capital Research Institute (“PCRI”) since 2017. Lecturer in the Practice of Management, Yale School of Management since 2019. | 35 RICs consisting of 158 Portfolios | None | ||||
Collette Chilton 1958 | Trustee (Since 2015) | Chief Investment Officer, Williams College since 2006; Chief Investment Officer, Lucent Asset Management Corporation from 1998 to 2006. | 35 RICs consisting of 158 Portfolios | None | ||||
Neil A. Cotty 1954 | Trustee (Since 2016) | Bank of America Corporation from 1996 to 2015, serving in various senior finance leadership roles, including Chief Accounting Officer, from 2009 to 2015, Chief Financial Officer of Global Banking, Markets and Wealth Management from 2008 to 2009, Chief Accounting Officer from 2004 to 2008, Chief Financial Officer of Consumer Bank from 2003 to 2004, Chief Financial Officer of Global Corporate Investment Bank from 1999 to 2002. | 35 RICs consisting of 158 Portfolios | None | ||||
Lena G. Goldberg 1949 | Trustee (Since 2019) | Senior Lecturer, Harvard Business School, since 2008; Director, Charles Stark Draper Laboratory, Inc. since 2013; FMR LLC/Fidelity Investments (financial services) from 1996 to 2008, serving in various senior roles including Executive Vice President - Strategic Corporate Initiatives and Executive Vice President and General Counsel; Partner, Sullivan & Worcester LLP from 1985 to 1996 and Associate thereof from 1979 to 1985. | 35 RICs consisting of 158 Portfolios | None | ||||
Henry R. Keizer 1956 | Trustee (Since 2019) | Director, Park Indemnity Ltd. (captive insurer) since 2010; Director, MUFG Americas Holdings Corporation and MUFG Union Bank, N.A. (financial and bank holding company) from 2014 to 2016; Director, American Institute of Certified Public Accountants from 2009 to 2011; Director, KPMG LLP (audit, tax and advisory services) from 2004 to 2005 and 2010 to 2012; Director, KPMG International in 2012, Deputy Chairman and Chief Operating Officer thereof from 2010 to 2012 and U.S. Vice Chairman of Audit thereof from 2005 to 2010; Global Head of Audit, KPMGI (consortium of KPMG firms) from 2006 to 2010; Director, YMCA of Greater New York from 2006 to 2010. | 35 RICs consisting of 158 Portfolios | Hertz Global Holdings (car rental); Montpelier Re Holdings, Ltd. (publicly held property and casualty reinsurance) from 2013 until 2015; WABCO (commercial vehicle safety systems); Sealed Air Corp. (packaging) | ||||
Cynthia A. Montgomery 1952 | Trustee (Since 2007) | Professor, Harvard Business School since 1989. | 35 RICs consisting of 158 Portfolios | Newell Rubbermaid, Inc. (manufacturing) | ||||
TRUSTEE AND OFFICER INFORMATION | 91 |
Trustee and Officer Information (continued)
| Independent Trustees(a) | ||||||||
Name Year of Birth(b) | Position(s) Held (Length of Service)(c) | Principal Occupation(s) During Past Five Years | Number of BlackRock-Advised Registered Investment Companies (“RICs”) Consisting of Investment Portfolios (“Portfolios”) Overseen | Public Company and Other Investment Company Directorships Held During Past Five Years | ||||
Donald C. Opatrny 1952 | Trustee (Since 2019) | Trustee, Vice Chair, Member of the Executive Committee and Chair of the Investment Committee, Cornell University since 2004; President, Trustee and Member of the Investment Committee, The Aldrich Contemporary Art Museum from 2007 to 2014; Member of the Board and Investment Committee, University School from 2007 to 2018; Member of the Investment Committee, Mellon Foundation from 2009 to 2015; Trustee, Artstor (a Mellon Foundation affiliate) from 2010 to 2015; President and Trustee, the Center for the Arts, Jackson Hole from 2011 to 2018; Director, Athena Capital Advisors LLC (investment management firm) since 2013; Trustee and Chair of the Investment Committee, Community Foundation of Jackson Hole since 2014; Member of Affordable Housing Supply Board of Jackson, Wyoming since 2018; Member, Investment Funds Committee, State of Wyoming since 2017; Trustee, Phoenix Art Museum since 2018; Trustee, Arizona Community Foundation and Member of Investment Committee since 2020. | 35 RICs consisting of 158 Portfolios | None | ||||
Joseph P. Platt 1947 | Trustee (Since 2007) | General Partner, Thorn Partners, LP (private investments) since 1998; Director, WQED Multi-Media (public broadcasting not-for-profit) since 2001; Chair, Basic Health International (non-profit) since 2015. | 35 RICs consisting of 158 Portfolios | Greenlight Capital Re, Ltd. (reinsurance company); Consol Energy Inc. | ||||
Kenneth L. Urish 1951 | Trustee (Since 2007) | Managing Partner, Urish Popeck & Co., LLC (certified public accountants and consultants) since 1976; Past-Chairman of the Professional Ethics Committee of the Pennsylvania Institute of Certified Public Accountants and Committee Member thereof since 2007; Member of External Advisory Board, The Pennsylvania State University Accounting Department since founding in 2001; Principal, UP Strategic Wealth Investment Advisors, LLC since 2013; Trustee, The Holy Family Institute from 2001 to 2010; President and Trustee, Pittsburgh Catholic Publishing Associates from 2003 to 2008; Director, Inter-Tel from 2006 to 2007. | 35 RICs consisting of 158 Portfolios | None | ||||
Claire A. Walton 1957 | Trustee (Since 2016) | Chief Operating Officer and Chief Financial Officer of Liberty Square Asset Management, LP from 1998 to 2015; General Partner of Neon Liberty Capital Management, LLC since 2003; Director, Boston Hedge Fund Group from 2009 to 2018; Director, Woodstock Ski Runners since 2013; Director, Massachusetts Council on Economic Education from 2013 to 2015. | 35 RICs consisting of 158 Portfolios | None | ||||
| Interested Trustees(a)(d) | ||||||||
Name Year of Birth(b) | Position(s) Held (Length of Service)(c) | Principal Occupation(s) During Past Five Years | Number of BlackRock-Advised Registered Investment Companies (“RICs”) Consisting of Investment | Public Company and Other Company | ||||
Robert Fairbairn 1965 | Trustee (Since 2018) | Vice Chairman of BlackRock, Inc. since 2019; Member of BlackRock’s Global Executive and Global Operating Committees; Co-Chair of BlackRock’s Human Capital Committee; Senior Managing Director of BlackRock, Inc. from 2010 to 2019; oversaw BlackRock’s Strategic Partner Program and Strategic Product Management Group from 2012 to 2019; Member of the Board of Managers of BlackRock Investments, LLC from 2011 to 2018; Global Head of BlackRock’s Retail and iShares® businesses from 2012 to 2016. | 122 RICs consisting of 269 Portfolios | None | ||||
| 92 | 2 0 2 0 BLACK ROCK ANNUAL REPORT TO SHAREHOLDERS |
Trustee and Officer Information (continued)
| Interested Trustees(a)(d) | ||||||||
Name Year of Birth(b) | Position(s) Held (Length of Service)(c) | Principal Occupation(s) During Past Five Years | Number of BlackRock-Advised Registered Investment Companies (“RICs”) Consisting of Investment | Public Company and Other Investment Company Directorships Held During Past | ||||
John M. Perlowski(e) 1964 | Trustee (Since 2015), President, and Chief Executive Officer (Since 2010) | Managing Director of BlackRock, Inc. since 2009; Head of BlackRock Global Accounting and Product Services since 2009; Advisory Director of Family Resource Network (charitable foundation) since 2009. | 123 RICs consisting of 270 Portfolios | None | ||||
(a) The address of each Trustee is c/o BlackRock, Inc., 55 East 52nd Street, New York, New York 10055.
(b) Independent Trustees serve until their resignation, retirement, removal or death, or until December 31 of the year in which they turn 75. The Board may determine to extend the terms of Independent Trustees on a case-by-case basis, as appropriate.
(c) Following the combination of Merrill Lynch Investment Managers, L.P. (“MLIM”) and BlackRock, Inc. in September 2006, the various legacy MLIM and legacy BlackRock fund boards were realigned and consolidated into three new fund boards in 2007. Furthermore, effective January 1, 2019, three BlackRock Fund Complexes were realigned and consolidated into two BlackRock Fund Complexes. As a result, although the chart shows the year that each Independent Trustee joined the Board, certain Independent Trustees first became members of the boards of other BlackRock-advised Funds, legacy MLIM funds or legacy BlackRock funds as follows: Bruce R. Bond, 2005; Cynthia A. Montgomery, 1994; Joseph P. Platt, 1999; Kenneth L. Urish, 1999; Lena G. Goldberg, 2016; Henry R. Keizer, 2016; Donald C. Opatrny, 2015.
(d) Mr. Fairbairn and Mr. Perlowski are both “interested persons,” as defined in the 1940 Act, of the Trust based on their positions with BlackRock, Inc. and its affiliates. Mr. Fairbairn and Mr. Perlowski are also board members of the BlackRock Fixed-Income Complex.
(e) Mr. Perlowski is also a trustee of the BlackRock Credit Strategies Fund. | ||||||||
TRUSTEE AND OFFICER INFORMATION | 93 |
Trustee and Officer Information (continued)
| Officers Who Are Not Trustees(a) | ||||
| Name Year of Birth(b) | Position(s) Held (Length of Service) | Principal Occupation(s) During Past Five Years | ||
| Thomas Callahan 1968 | Vice President (Since 2016) | Managing Director of BlackRock, Inc. since 2013; Member of the Board of Managers of BlackRock Investments, LLC (principal underwriter) since 2019 and Managing Director thereof since 2017; Head of BlackRock’s Global Cash Management Business since 2016; Co-Head of the Global Cash Management Business from 2014 to 2016; Deputy Head of the Global Cash Management Business from 2013 to 2014; Member of the Cash Management Group Executive Committee since 2013; Chief Executive Officer of NYSE Liffe U.S. from 2008 to 2013. | ||
| Jennifer McGovern 1977 | Vice President (Since 2014) | Managing Director of BlackRock, Inc. since 2016; Director of BlackRock, Inc. from 2011 to 2015; Head of Americas Product Development and Governance for BlackRock’s Global Product Group since 2019; Head of Product Structure and Oversight for BlackRock’s U.S. Wealth Advisory Group from 2013 to 2019. | ||
| Neal J. Andrews 1966 | Chief Financial Officer (Since 2007) | Chief Financial Officer of the iShares® exchange traded funds from 2019 to 2020; Managing Director of BlackRock, Inc. since 2006. | ||
| Jay M. Fife 1970 | Treasurer (Since 2007) | Managing Director of BlackRock, Inc. since 2007. | ||
| Charles Park 1967 | Chief Compliance Officer (Since 2014) | Anti-Money Laundering Compliance Officer for certain BlackRock-advised Funds from 2014 to 2015; Chief Compliance Officer of BlackRock Advisors, LLC and the BlackRock-advised Funds in the BlackRock Multi-Asset Complex and the BlackRock Fixed-Income Complex since 2014; Principal of and Chief Compliance Officer for iShares® Delaware Trust Sponsor LLC since 2012 and BlackRock Fund Advisors (“BFA”) since 2006; Chief Compliance Officer for the BFA-advised iShares® exchange traded funds since 2006; Chief Compliance Officer for BlackRock Asset Management International Inc. since 2012. | ||
| Lisa Belle 1968 | Anti-Money Laundering Compliance Officer (Since 2019) | Managing Director of BlackRock, Inc. since 2019; Global Financial Crime Head for Asset and Wealth Management of JP Morgan from 2013 to 2019; Managing Director of RBS Securities from 2012 to 2013; Head of Financial Crimes for Barclays Wealth Americas from 2010 to 2012. | ||
| Janey Ahn 1975 | Secretary (Since 2019) | Managing Director of BlackRock, Inc. since 2018; Director of BlackRock, Inc. from 2009 to 2017. | ||
(a) The address of each Officer is c/o BlackRock, Inc., 55 East 52nd Street, New York, New York 10055. | ||||
(b) Officers of the Trust serve at the pleasure of the Board. | ||||
Further information about the Trust’s Trustees and Officers is available in the Trust’s Statement of Additional Information, which can be obtained without charge by calling (800) 441-7762.
| 94 | 2 0 2 0 BLACK ROCK ANNUAL REPORT TO SHAREHOLDERS |
General Information
Householding
The Funds will mail only one copy of shareholder documents, including prospectuses, annual and semi-annual reports and proxy statements, to shareholders with multiple accounts at the same address. This practice is commonly called “householding” and is intended to reduce expenses and eliminate duplicate mailings of shareholder documents. Mailings of your shareholder documents may be householded indefinitely unless you instruct us otherwise. If you do not want the mailing of these documents to be combined with those for other members of your household, please call the Funds at (800) 441-7762.
Availability of Quarterly Schedule of Investments
The Funds file their complete schedules of portfolio holdings with the SEC for the first and third quarters of each fiscal year as an exhibit to their reports on Form N-PORT. The Funds’ Forms N-PORT are available on the SEC’s website at sec.gov.
Availability of Proxy Voting Policies and Procedures
A description of the policies and procedures that the Funds use to determine how to vote proxies relating to portfolio securities is available upon request and without charge (1) by calling (800) 441-7762; (2) at blackrock.com; and (3) on the SEC’s website at sec.gov.
Availability of Proxy Voting Record
Information about how the Funds voted proxies relating to securities held in the Funds’ portfolios during the most recent 12-month period ended June 30 is available upon request and without charge (1) at blackrock.com; or by calling (800) 441-7762 and (2) on the SEC’s website at sec.gov.
BlackRock’s Mutual Fund Family
BlackRock offers a diverse lineup of open-end mutual funds crossing all investment styles and managed by experts in equity, fixed-income and tax-exempt investing. Visit blackrock.com for more information.
Shareholder Privileges
Account Information
Call us at (800) 441-7762 from 8:00 AM to 6:00 PM ET on any business day to get information about your account balances, recent transactions and share prices. You can also visit blackrock.com for more information.
Automatic Investment Plans
Investor class shareholders who want to invest regularly can arrange to have $50 or more automatically deducted from their checking or savings account and invested in any of the BlackRock funds.
Systematic Withdrawal Plans
Investor class shareholders can establish a systematic withdrawal plan and receive periodic payments of $50 or more from their BlackRock funds, as long as their account balance is at least $10,000.
Retirement Plans
Shareholders may make investments in conjunction with Traditional, Rollover, Roth, Coverdell, Simple IRAs, SEP IRAs and 403(b) Plans.
ADDITIONAL INFORMATION | 95 |
Additional Information (continued)
BlackRock Privacy Principles
BlackRock is committed to maintaining the privacy of its current and former fund investors and individual clients (collectively, “Clients”) and to safeguarding their non-public personal information. The following information is provided to help you understand what personal information BlackRock collects, how we protect that information and why in certain cases we share such information with select parties.
If you are located in a jurisdiction where specific laws, rules or regulations require BlackRock to provide you with additional or different privacy-related rights beyond what is set forth below, then BlackRock will comply with those specific laws, rules or regulations.
BlackRock obtains or verifies personal non-public information from and about you from different sources, including the following: (i) information we receive from you or, if applicable, your financial intermediary, on applications, forms or other documents; (ii) information about your transactions with us, our affiliates, or others; (iii) information we receive from a consumer reporting agency; and (iv) from visits to our websites.
BlackRock does not sell or disclose to non-affiliated third parties any non-public personal information about its Clients, except as permitted by law or as is necessary to respond to regulatory requests or to service Client accounts. These non-affiliated third parties are required to protect the confidentiality and security of this information and to use it only for its intended purpose.
We may share information with our affiliates to service your account or to provide you with information about other BlackRock products or services that may be of interest to you. In addition, BlackRock restricts access to non-public personal information about its Clients to those BlackRock employees with a legitimate business need for the information. BlackRock maintains physical, electronic and procedural safeguards that are designed to protect the non-public personal information of its Clients, including procedures relating to the proper storage and disposal of such information.
| Fund and Service Providers | ||
| Investment Adviser and Administrator | Independent Registered Public Accounting Firm | |
BlackRock Advisors, LLC Wilmington, DE 19809 | Deloitte & Touche LLP Boston, MA 02116 | |
| Accounting Agent and Transfer Agent | Distributor | |
BNY Mellon Investment Servicing (US) Inc. Wilmington, DE 19809 | BlackRock Investments, LLC New York, NY 10022 | |
| Custodian | Legal Counsel | |
The Bank of New York Mellon New York, NY 10286 | Sidley Austin LLP New York, NY 10019 | |
| Address of the Trust | ||
100 Bellevue Parkway Wilmington, DE 19809 | ||
| 96 | 2 0 2 0 BLACK ROCK ANNUAL REPORT TO SHAREHOLDERS |
Glossary of Terms Used in this Report
| Currency Abbreviation | ||
| USD | United States Dollar | |
| Portfolio Abbreviation | ||
| ADR | American Depositary Receipt | |
| CVR | Contingent Value Rights | |
| REIT | Real Estate Investment Trust | |
GLOSSARY OF TERMS USED IN THIS REPORT | 97 |
Want to know more?
blackrock.com | 800-441-7762
This report is intended for current holders. It is not authorized for use as an offer of sale or a solicitation of an offer to buy shares of the Funds unless preceded or accompanied by the Funds’ current prospectus. Past performance results shown in this report should not be considered a representation of future performance. Investment returns and principal value of shares will fluctuate so that shares, when redeemed, may be worth more or less than their original cost. Statements and other information herein are as dated and are subject to change.
GROPPS-9/20-AR
|  |

| Item 3 – | Audit Committee Financial Expert – The registrant’s board of directors (the “board of directors”), has determined that (i) the registrant has the following audit committee financial experts serving on its audit committee and (ii) each audit committee financial expert is independent: |
Neil A. Cotty
Henry R. Keizer
Kenneth L. Urish
Under applicable securities laws, a person determined to be an audit committee financial expert will not be deemed an “expert” for any purpose, including without limitation for the purposes of Section 11 of the Securities Act of 1933, as a result of being designated or identified as an audit committee financial expert. The designation or identification of a person as an audit committee financial expert does not impose on such person any duties, obligations, or liabilities greater than the duties, obligations, and liabilities imposed on such person as a member of the audit committee and board of directors in the absence of such designation or identification. The designation or identification of a person as an audit committee financial expert does not affect the duties, obligations, or liability of any other member of the audit committee or board of directors.
| Item 4 – | Principal Accountant Fees and Services |
The following table presents fees billed by Deloitte & Touche LLP (“D&T”) in each of the last two fiscal years for the services rendered to the Fund:
(a) Audit Fees |
(b) Audit-Related Fees1 |
(c) Tax Fees2 |
(d) All Other Fees | |||||||||||||
| Entity Name | Current Fiscal Year End | Previous Fiscal Year End | Current Fiscal Year End | Previous Fiscal Year End | Current Fiscal Year End | Previous Fiscal Year End | Current Fiscal Year End | Previous Fiscal Year End | ||||||||
| BlackRock Advantage Small Cap Growth Fund | $29,682 | $29,682 | $0 | $0 | $12,700 | $15,200 | $0 | $0 | ||||||||
| BlackRock Health Sciences Opportunities Portfolio | $30,600 | $38,658 | $0 | $0 | $12,700 | $15,200 | $0 | $0 | ||||||||
| BlackRock Mid-Cap Growth Equity Portfolio | $18,768 | $18,768 | $0 | $0 | $12,700 | $15,200 | $0 | $0 | ||||||||
| BlackRock Technology Opportunities Fund | $36,720 | $36,720 | $0 | $0 | $12,700 | $15,200 | $0 | $0 | ||||||||
The following table presents fees billed by D&T that were required to be approved by the registrant’s audit committee (the “Committee”) for services that relate directly to the operations or financial reporting of the Fund and that are rendered on behalf of BlackRock Advisors, LLC (the “Investment Adviser” or “BlackRock”) and entities controlling, controlled by, or under common control with BlackRock (not including any sub-adviser whose role is primarily portfolio management and is subcontracted with or overseen by another investment adviser) that provide ongoing services to the Fund (“Affiliated Service Providers”):
| Current Fiscal Year End | Previous Fiscal Year End | |||
| (b) Audit-Related Fees1 | $0 | $0 | ||
(c) Tax Fees2 | $0 | $0 | ||
(d) All Other Fees3 | $1,984,000 | $2,050,500 |
1 The nature of the services includes assurance and related services reasonably related to the performance of the audit or review of financial statements not included in Audit Fees, including accounting consultations, agreed-upon procedure reports, attestation reports, comfort letters, out-of-pocket expenses and internal control reviews not required by regulators.
2 The nature of the services includes tax compliance and/or tax preparation, including services relating to the filing or amendment of federal, state or local income tax returns, regulated investment company qualification reviews, taxable income and tax distribution calculations.
3 Non-audit fees of $1,984,000 and $2,050,500 for the current fiscal year and previous fiscal year, respectively, were paid to the Fund’s principal accountant in their entirety by BlackRock, in connection with services provided to the Affiliated Service Providers of the Fund and of certain other funds sponsored and advised by BlackRock or its affiliates for a service organization review and an accounting research tool subscription. These amounts represent aggregate fees paid by BlackRock and were not allocated on a per fund basis.
(e)(1) Audit Committee Pre-Approval Policies and Procedures:
The Committee has adopted policies and procedures with regard to the pre-approval of services. Audit, audit-related and tax compliance services provided to the registrant on an annual basis require specific pre-approval by the Committee. The Committee also must approve other non-audit services provided to the registrant and those non-audit services provided to the Investment Adviser and Affiliated Service Providers that relate directly to the operations and the financial reporting of the registrant. Certain of these non-audit services that the Committee believes are (a) consistent with the SEC’s auditor independence rules and (b) routine and recurring services that will not impair the independence of the independent accountants may be approved by the Committee without consideration on a specific case-by-case basis (“general pre-approval”). The term of any general pre-approval is 12 months from the date of the pre-approval, unless the Committee provides for a different period. Tax or other non-audit services provided to the registrant which have a direct impact on the operations or financial reporting of the registrant will only be deemed pre-approved provided that any individual project does not exceed $10,000 attributable to the registrant or $50,000 per project. For this purpose, multiple projects will be aggregated to determine if they exceed the previously mentioned cost levels.
Any proposed services exceeding the pre-approved cost levels will require specific pre-approval by the Committee, as will any other services not subject to general pre-approval (e.g., unanticipated but permissible services). The Committee is informed of each service approved subject to general pre-approval at the next regularly scheduled in-person board meeting. At this meeting, an analysis of such services is presented to the Committee for ratification. The Committee may delegate to the Committee Chairman the authority to approve the provision of and fees for any specific engagement of permitted non-audit services, including services exceeding pre-approved cost levels.
(e)(2) None of the services described in each of Items 4(b) through (d) were approved by the Committee pursuant to the de minimis exception in paragraph (c)(7)(i)(C) of Rule 2-01 of Regulation S-X.
(f) Not Applicable
(g) The aggregate non-audit fees, defined as the sum of the fees shown under “Audit-Related Fees,” “Tax Fees” and “All Other Fees,” paid to the accountant for services rendered by the accountant to the registrant, the Investment Adviser and the Affiliated Service Providers were:
Entity Name | Current Fiscal Year End | Previous Fiscal Year End | ||||
BlackRock Advantage Small Cap Growth Fund | $12,700 | $15,200 | ||||
BlackRock Health Sciences Opportunities Portfolio | $12,700 | $15,200 | ||||
BlackRock Mid-Cap Growth Equity Portfolio | $12,700 | $15,200 | ||||
BlackRock Technology Opportunities Fund | $12,700 | $15,200 |
Additionally, the amounts billed by D&T in connection with services provided to the Affiliated Service Providers of the Fund and of other funds sponsored and advised by BlackRock or its affiliates during the current and previous fiscal years for a service organization review and an accounting research tool subscription were:
Current Fiscal Year End | Previous Fiscal Year End | |
$1,984,000 | $2,050,500 |
These amounts represent aggregate fees paid by BlackRock and were not allocated on a per fund basis.
(h) The Committee has considered and determined that the provision of non-audit services that were rendered to the Investment Adviser and the Affiliated Service Providers that were not pre-approved pursuant to paragraph (c)(7)(ii) of
Rule 2-01 of Regulation S-X is compatible with maintaining the principal accountant’s independence.
| Item 5 – | Audit Committee of Listed Registrant – Not Applicable |
| Item 6 – | Investments |
(a) The registrant’s Schedule of Investments is included as part of the Report to Stockholders filed under Item 1 of this Form.
(b) Not Applicable due to no such divestments during the semi-annual period covered since the previous Form N-CSR filing.
| Item 7 – | Disclosure of Proxy Voting Policies and Procedures for Closed-End Management Investment Companies – Not Applicable |
| Item 8 – | Portfolio Managers of Closed-End Management Investment Companies – Not Applicable |
| Item 9 – | Purchases of Equity Securities by Closed-End Management Investment Company and Affiliated Purchasers – Not Applicable |
| Item 10 – | Submission of Matters to a Vote of Security Holders – There have been no material changes to these procedures. |
| Item 11 – | Controls and Procedures |
(a) The registrant’s principal executive and principal financial officers, or persons performing similar functions, have concluded that the registrant’s disclosure controls and procedures (as defined in Rule 30a-3(c) under the Investment Company Act of 1940, as amended (the “1940 Act”)) are effective as of a date within 90 days of the filing of this report based on the evaluation of these controls and procedures required by Rule 30a-3(b) under the 1940 Act and Rule 15d-15(b) under the Securities Exchange Act of 1934, as amended.
(b) There were no changes in the registrant’s internal control over financial reporting (as defined in Rule 30a-3(d) under the 1940 Act) that occurred during the period covered by this report that have materially affected, or are reasonably likely to materially affect, the registrant’s internal control over financial reporting.
| Item 12 – | Disclosure of Securities Lending Activities for Closed-End Management Investment Companies – Not Applicable |
| Item 13 – | Exhibits attached hereto |
(a)(1) Code of Ethics – See Item 2
(a)(2) Section 302 Certifications are attached
(a)(3) Not Applicable
(a)(4) Not Applicable
(b) Section 906 Certifications are attached
Pursuant to the requirements of the Securities Exchange Act of 1934 and the Investment Company Act of 1940, the registrant has duly caused this report to be signed on its behalf by the undersigned, thereunto duly authorized.
BlackRock FundsSM
| By: | /s/ John M. Perlowski | |||
| John M. Perlowski | ||||
| Chief Executive Officer (principal executive officer) of | ||||
| BlackRock FundsSM |
Date: December 3, 2020
Pursuant to the requirements of the Securities Exchange Act of 1934 and the Investment Company Act of 1940, this report has been signed below by the following persons on behalf of the registrant and in the capacities and on the dates indicated.
| By: | /s/ John M. Perlowski | |||
| John M. Perlowski | ||||
| Chief Executive Officer (principal executive officer) of | ||||
| BlackRock FundsSM |
Date: December 3, 2020
| By: | /s/ Neal J. Andrews | |||
| Neal J. Andrews | ||||
| Chief Financial Officer (principal financial officer) of | ||||
| BlackRock FundsSM |
Date: December 3, 2020