UNITED STATES
SECURITIES AND EXCHANGE COMMISSION
Washington, D.C. 20549
FORM N-CSR/A
CERTIFIED SHAREHOLDER REPORT OF REGISTERED MANAGEMENT
INVESTMENT COMPANIES
Investment Company Act file number: 811-05742
| Name of Fund: | BlackRock Funds |
| BlackRock Advantage Emerging Markets Fund |
| BlackRock Global Equity Market Neutral Fund (Formerly BlackRock Global |
| Long/Short Equity Fund) |
| Fund Address: | 100 Bellevue Parkway, Wilmington, DE 19809 |
Name and address of agent for service: John M. Perlowski, Chief Executive Officer, BlackRock Funds, 50 Hudson Yards, New York, NY 10001
Registrant’s telephone number, including area code: (800) 441-7762
Date of fiscal year end: 04/30/2023
Date of reporting period: 04/30/2023
Item 1 – Report to Stockholders
Explanatory Note: The Registrant is filing this amendment to its Form N-CSR for the period ended April 30, 2023, filed with the Securities and Exchange Commission on July 3, 2023 (Accession Number 0001193125-23-181254). The sole purpose of this amendment is the removal of the term “Unaudited” from the page header in the section entitled “Statements of Assets and Liabilities”, which was inadvertently included in the original filing. Except for such change, this amendment does not amend, update or change any other items or disclosures found in the original Form N-CSR filing.
(a) The Report to Shareholders is attached herewith.
| APRIL 30, 2023 |

2023 Annual Report
| ||
BlackRock FundsSM
| · | BlackRock Advantage Emerging Markets Fund |
| · | BlackRock Global Equity Market Neutral Fund |
Not FDIC Insured • May Lose Value • No Bank Guarantee
|
Dear Shareholder,
Investors faced an uncertain economic landscape during the 12-month reporting period ended April 30, 2023, amid mixed indicators and rapidly changing market conditions. The U.S. economy returned to modest growth beginning in the third quarter of 2022, although the pace of growth slowed thereafter. Inflation was elevated, reaching a 40-year high as labor costs grew rapidly and unemployment rates reached the lowest levels in decades. However, inflation moderated as the period continued, while continued strength in consumer spending backstopped the economy.
Equity returns varied substantially, as large-capitalization U.S. stocks gained for the period amid a rebound in big tech stocks, whereas small-capitalization U.S. stocks declined. International equities from developed markets advanced strongly, while emerging market stocks declined, pressured by higher interest rates and volatile commodities prices.
The 10-year U.S. Treasury yield rose during the reporting period, driving its price down, as investors reacted to elevated inflation and attempted to anticipate future interest rate changes. The corporate bond market also faced inflationary headwinds, although high-yield corporate bonds posted a positive return as demand from yield-seeking investors remained strong.
The U.S. Federal Reserve (the “Fed”), acknowledging that inflation has been more persistent than expected, raised interest rates eight times. Furthermore, the Fed wound down its bond-buying programs and incrementally reduced its balance sheet by not replacing securities that reach maturity. In addition, the Fed added liquidity to markets amid the failure of prominent regional banks.
Restricted labor supply kept inflation elevated even as other inflation drivers, such as goods prices and energy costs, moderated. While economic growth was modest in the last year, we believe that stickiness in services inflation and continued wage growth will keep inflation above central bank targets for some time. Although the Fed has decelerated the pace of interest rate hikes and indicated a pause could be its next step, we believe that the Fed still seems determined to get inflation back to target. With this in mind, we believe the possibility of a U.S. recession in the near term is high, but the dimming economic outlook has not yet been fully reflected in current market prices. We believe investors should expect a period of higher volatility as markets adjust to the new economic reality and policymakers attempt to adapt to rapidly changing conditions. Turmoil in the banking sector late in the period highlighted the potential for the rapid increase in interest rates to disrupt markets with little warning.
While we favor an overweight to equities in the long term, we prefer an underweight stance on equities overall in the near term. Expectations for corporate earnings remain elevated, which seems inconsistent with the possibility of a recession. Nevertheless, we are overweight on emerging market stocks as we believe a weakening U.S. dollar could provide a supportive backdrop. We also see selective, long-term opportunities in credit, where we believe that valuations are appealing, and higher yields offer attractive income. However, we are neutral on credit in the near term, as we’re concerned about tightening credit and financial conditions. For fixed income investing with a six- to twelve-month horizon, we see the most significant opportunities in short-term U.S. Treasuries, global inflation-linked bonds, and emerging market bonds denominated in local currency.
Overall, our view is that investors need to think globally, position themselves to be prepared for a decarbonizing economy, and be nimble as market conditions change. We encourage you to talk with your financial advisor and visit blackrock.com for further insight about investing in today’s markets.
Sincerely,

Rob Kapito
President, BlackRock Advisors, LLC

Rob Kapito
President, BlackRock Advisors, LLC
Total Returns as of April 30, 2023
| ||||
6-Month
|
12-Month
| |||
U.S. large cap equities
| 8.63% | 2.66% | ||
U.S. small cap equities
| (3.45) | (3.65) | ||
International equities
| 24.19 | 8.42 | ||
Emerging market equities
| 16.36 | (6.51) | ||
3-month Treasury bills
| 2.09 | 2.83 | ||
U.S. Treasury securities
| 7.14 | (1.68) | ||
U.S. investment grade bonds
| 6.91 | (0.43) | ||
Tax-exempt municipal bonds
| 7.65 | 2.87 | ||
U.S. high yield bonds
| 6.21 | 1.21 | ||
Past performance is not an indication of future results. Index performance is shown for illustrative purposes only. You cannot invest directly in an index.
| ||||
| 2 | THIS PAGE IS NOT PART OF YOUR FUND REPORT |
Table of Contents
| Page | ||||
| 2 | ||||
Annual Report: | ||||
| 4 | ||||
| 10 | ||||
| 10 | ||||
| 10 | ||||
Financial Statements: | ||||
| 11 | ||||
| 125 | ||||
| 127 | ||||
| 128 | ||||
| 129 | ||||
| 137 | ||||
| 151 | ||||
| 152 | ||||
| 153 | ||||
| 154 | ||||
| 158 | ||||
| 160 | ||||

| 3 |
| Fund Summary as of April 30, 2023 | BlackRock Advantage Emerging Markets Fund |
Investment Objective
BlackRock Advantage Emerging Markets Fund’s (the “Fund”) investment objective is to seek long-term capital appreciation.
Portfolio Management Commentary
How did the Fund perform?
For the 12-month period ended April 30, 2023, all of the Fund’s share classes outperformed its benchmark, the MSCI Emerging Markets Index.
What factors influenced performance?
Emerging market (“EM”) equities fell during the period, as investor skepticism about risk assets deepened. Initially, inflationary pressures benefited commodities markets, but as fears of a U.S. recession intensified, equities in commodity-driven markets came under pressure. Interest rate increases in the United States, coupled with more hawkish commentary from the Fed, continued to lead the retreat in the EM benchmark. There was a notable recovery toward the end of 2022 and the beginning of 2023, however, as sentiment in China improved due to a potential COVID reopening, while hopes for a soft landing in the United States seemed to have evaporated as inflation in services prices and wages proved to be stickier than initially expected, prompting the Fed to reiterate a hawkish stance. Late in the reporting period, EM equities took a pause from their broad-based rally in the first quarter of 2023 as investors shifted their attention to U.S.-China tensions, while a strong U.S. jobs report and reduced growth in the Consumer Price Index contributed to a preference for developed markets over EM. Asia drove losses as concerns about the property sector and ongoing COVID-19 lockdowns weighed on China, and Korea and Taiwan also struggled amid global recessionary fears and continued tech weakness. Commodity outperformance provided a tailwind for Latin America and for parts of Europe, the Middle East, and Africa, but parts of Eastern Europe continued to struggle as the Russian invasion of Ukraine continued and high inflation rates persisted. The real estate, utilities, materials, and information technology (“IT”) sectors led detractors within the benchmark, while consumer staples and energy fared better.
Sentiment measures drove positive performance, as they were able to correctly capture emerging market themes. Insights designed to track analyst, broker, and informed investor views contributed to performance and positioned the portfolio around the China reopening theme. This was most observable from the Fund’s overweight allocation to onshore Chinese equities in the consumer discretionary sector. Other consumer intent-related sentiment measures evaluating mobile app usage and downloads also helped correctly position the portfolio.
Elsewhere, defensive quality measures performed well amid broader market stability concerns stemming from developed market banking turmoil. Insights with a preference for lower volatility, as well as measures designed to evaluate company financing ability, did best amid a broader market focus on the financial health of businesses. Other nontraditional quality measures, such as insights tracking new “green” patents, also benefited performance. Measures evaluating green patents helped motivate successful positioning across utilities stocks.
Conversely, despite strong contributions from stock selection insights, broader macro positioning detracted from performance. In an effort to fund overweight positions to Taiwan IT stocks, the portfolio was underweight Korean IT stocks, which struggled as broader Asian tech stocks benefited from supportive Chinese policy. Also, despite getting positive contributions from broader position in onshore equities in China, China-specific consumer indication insights detracted, as did text-based measures tracking companies exposed to the country’s clean energy transition.
The Fund’s cash balance at period-end was 6.2%. The cash balance did not materially affect relative performance during the period.
Describe recent portfolio activity.
Over the course of the reporting period, the portfolio maintained a balanced allocation of risk across all major return drivers. There were, however, several new signals added within the stock selection model. The Fund built upon its alternative data capabilities with enhanced data sets that capture informed-investor positioning as well as news flow. Additionally, the Fund added to its complex of consumer intent insights with a measure that looks toward social media activity as a measure of potential revenue growth.
Describe portfolio positioning at period end.
Relative to the benchmark, the Fund ended the reporting period with largely neutral positioning from a sector and country positioning perspective. The Fund had slight overweight positions in the healthcare and communication services sectors, and maintained slight underweights in financials and industrials stocks. From a geographical perspective, the Fund had a slight overweight position to Indonesia and maintained a slight underweight position to Korea.
The views expressed reflect the opinions of BlackRock as of the date of this report and are subject to change based on changes in market, economic or other conditions. These views are not intended to be a forecast of future events and are no guarantee of future results.
| 4 | 2 0 2 3 BLACK ROCK ANNUAL REPORT TO SHAREHOLDERS |
| Fund Summary as of April 30, 2023 (continued) | BlackRock Advantage Emerging Markets Fund |
GROSS OF $10,000 INVESTMENT
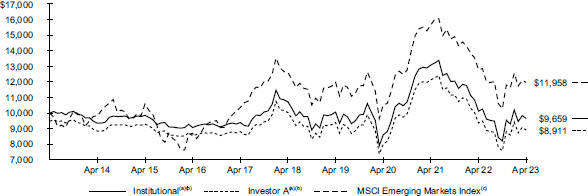
| (a) | Assuming maximum sales charges, if any, transaction costs and other operating expenses, including investment advisory fees. Institutional Shares do not have a sales charge. |
| (b) | Under normal circumstances, the Fund seeks to invest at least 80% of its net assets plus the amount of any borrowings for investment purposes in equity securities issued by, or tied economically to, companies in emerging markets and derivatives that have similar economic characteristics to such securities. The Fund’s total returns prior to June 12, 2017 are the returns of the Fund when it followed different investment strategies under the name BlackRock Emerging Markets Long/Short Equity Fund. |
| (c) | An index that captures large- and mid-cap representation across Emerging Markets countries. The index covers approximately 85% of the free float-adjusted market capitalization in each country. |
Performance
| Average Annual Total Returns(a)(b) | ||||||||||||||||||||||||
| 1 Year | 5 Years | 10 Years | ||||||||||||||||||||||
| Without Sales Charge | With Sales Charge | Without Sales Charge | With Sales Charge | Without Sales Charge | With Sales Charge | |||||||||||||||||||
Institutional | (4.57 | )% | N/A | (2.06 | )% | N/A | (0.35 | )% | N/A | |||||||||||||||
Investor A | (4.84 | ) | (9.84 | )% | (2.34 | ) | (3.39 | )% | (0.61 | ) | (1.15 | )% | ||||||||||||
Investor C | (5.51 | ) | (6.42 | ) | (3.06 | ) | (3.06 | ) | (1.22 | ) | (1.22 | ) | ||||||||||||
Class K | (4.53 | ) | N/A | (2.02 | ) | N/A | (0.33 | ) | N/A | |||||||||||||||
MSCI Emerging Markets Index | (6.51 | ) | N/A | (1.05 | ) | N/A | 1.80 | N/A | ||||||||||||||||
| (a) | Assuming maximum sales charges, if any. Average annual total returns with and without sales charges reflect reductions for distribution and service fees. See “About Fund Performance” for a detailed description of share classes, including any related sales charges and fees, and how performance was calculated for certain share classes. |
| (b) | Under normal circumstances, the Fund seeks to invest at least 80% of its net assets plus the amount of any borrowings for investment purposes in equity securities issued by, or tied economically to, companies in emerging markets and derivatives that have similar economic characteristics to such securities. The Fund’s total returns prior to June 12, 2017 are the returns of the Fund when it followed different investment strategies under the name BlackRock Emerging Markets Long/Short Equity Fund. |
N/A — Not applicable as the share class and index do not have a sales charge.
Past performance is not an indication of future results.
Performance results may include adjustments made for financial reporting purposes in accordance with U.S. generally accepted accounting principles.
Expense Example
| Actual | Hypothetical 5% Return | |||||||||||||||||||||||||||||
|
|
|
| |||||||||||||||||||||||||||
| | Beginning Account Value (11/01/22) | | | Ending Account Value (04/30/23) | | | Expenses Paid During the Period | (a) | | Beginning Account Value (11/01/22) | | | Ending Account Value (04/30/23) | | | Expenses Paid During the Period | (a) | | Annualized Expense Ratio | | ||||||||||
Institutional | $ 1,000.00 | $ 1,176.60 | $ 4.59 | $ 1,000.00 | $ 1,020.58 | $ 4.26 | 0.85 | % | ||||||||||||||||||||||
Investor A | 1,000.00 | 1,175.30 | 6.20 | 1,000.00 | 1,019.09 | 5.76 | 1.15 | |||||||||||||||||||||||
Investor C | 1,000.00 | 1,171.60 | 10.23 | 1,000.00 | 1,015.37 | 9.49 | 1.90 | |||||||||||||||||||||||
Class K | 1,000.00 | 1,177.00 | 4.37 | 1,000.00 | 1,020.78 | 4.06 | 0.81 | |||||||||||||||||||||||
| (a) | For each class of the Fund, expenses are equal to the annualized expense ratio for the class, multiplied by the average account value over the period, multiplied by 181/365 (to reflect the one-half year period shown). |
See “Disclosure of Expenses” for further information on how expenses were calculated.
FUND SUMMARY | 5 |
| Fund Summary as of April 30, 2023 (continued) | BlackRock Advantage Emerging Markets Fund |
Portfolio Information
GEOGRAPHIC ALLOCATION
|
| |||
| Country/Geographic Region | Percent of Net Assets | |||
China | 31.4 | % | ||
Taiwan | 15.0 | |||
India | 11.5 | |||
South Korea | 8.7 | |||
Brazil | 7.4 | |||
United States | 6.2 | |||
Indonesia | 4.5 | |||
Saudi Arabia | 3.5 | |||
Thailand | 2.8 | |||
South Africa | 1.1 | |||
Other# | 7.5 | |||
Other Assets Less Liabilities | 0.4 | |||
| # | Includes holdings within countries/geographic regions that are less than 1.0% of net assets. Please refer to the Schedule of Investments for such countries/geographic regions. |
| 6 | 2 0 2 3 BLACK ROCK ANNUAL REPORT TO SHAREHOLDERS |
| Fund Summary as of April 30, 2023 | BlackRock Global Equity Market Neutral Fund |
Investment Objective
BlackRock Global Equity Market Neutral Fund’s (the “Fund”) investment objective is to seek total return over the long term.
On May 10, 2022, the Board of Trustees (the “Board”) of BlackRock FundsSM (the “Trust”) approved a change in the name of the Fund to BlackRock Global Equity Market Neutral Fund. While the Fund’s investment process and investment strategy were not changed in connection with the name change, certain updates were made to the Fund’s investment process and investment strategy disclosure in order to align the disclosure with the Fund’s new name. These changes were effective as of September 1, 2022.
Portfolio Management Commentary
How did the Fund perform?
For the 12-month period ended April 30, 2023, all of the Fund’s share classes outperformed its benchmark, the ICE BofA 3-Month U.S. Treasury Bill Index.
What factors influenced performance?
The reporting period was highlighted by market volatility as investors weighed the trajectory of monetary policy amid stubbornly high inflation and an evolving economic backdrop. While inflation in goods prices moderated, inflation in services prices remained well above expectations, leading to continued aggressive policy tightening. This resulted in a persistently inverted yield curve, which is often a precursor to a recession. Despite this backdrop, though, equity markets were roughly flat during the reporting period, masking the intra-period volatility. Global equities performed strongly in early 2023 despite cracks threatening the stability of the financial system, with the banking sector coming under pressure beginning in March 2023 and accelerating into April 2023 as the U.S. banking system experienced the second-largest bank failure in history. Yet despite the turmoil taking a toll on consumer confidence, as spending data showed signs of weakness, investors’ focus shifted to measures to support banks and depositors. This appears to have prevented a widespread crisis, and although measures of economic activity slowed, online job postings continued to point to labor market strength and sticky inflation. This was corroborated by the latest Employment Cost Index report, and taken together, these varying data points identified the challenges markets faced between keeping monetary policy tight versus pivoting to support growth.
The Fund proved remarkably resilient during the reporting period, delivering strong performance across stock selection. A key theme was a focus on dynamism during the period, with positioning shifting between stagflation and a defensive posture to a more optimistic soft-landing scenario and back again. Unsurprisingly, sentiment insights were the primary contributors to performance as they correctly captured the evolving market backdrop. Notably, text-based measures designed to capture forward-looking company fundamentals across analysts and company executives performed well. These measures helped identify emergent themes during the reporting period, such as companies likely to benefit from the quick reopening of the Chinese economy as well as the shift in investor attention to artificial intelligence-driven information technology (“IT”) infrastructure with the launch of ChatGPT. Collectively, long positions in luxury brands and large-cap IT companies performed well. Informed investor positioning was a final source of gains among sentiment insights, notably around hedge fund and credit analysts, with the latter performing well amid the sharp rise in interest rates.
Stock selection across company fundamentals was also additive during the reporting period. This was highlighted by strength across contrarian quality measures as investors began to focus on the stability of corporate financial results later in the period. In this context, evaluating dividend policy and levels of external financing were some of the top performers. Finally, valuation measures, such as book value to stock price, were additive, correctly capturing the preference for value styles early in the reporting period.
By contrast, despite the Fund’s overall outperformance, certain macro-related insights struggled against the oscillation between defensive and growth preferences during the period. Notably, the speed with which preferences shifted was often at odds with the Fund’s positioning. Initially, macro insights motivated an overly defensive posture that ran counter to the market recovery. Industry insights motivated positioning that ultimately went against with the market’s peak inflation narrative during the fourth quarter of 2022. However, as macro positioning caught up with the past peak inflation narrative that subsequently manifested itself, the Fund’s exposures proved wrong-footed in light of surprise inflation data and hawkish rhetoric in February 2023. The inflation data ultimately moved the Fund to a higher for longer posture in March 2023, which ran against the capitulation in bond yields as the banking crisis priced in a dovish policy pivot. Of note, though, the Fund’s macro positioning for an environment of stagflation — higher inflation with slowing economic growth — was additive at period-end.
The Fund was fully invested throughout the reporting period. The Fund’s cash exposure had no material impact on performance, as cash was principally held in conjunction with the Fund taking long and short positions via the use of derivatives, such as total return swap contracts.
Describe recent portfolio activity.
The Fund’s name changed from Global Long/Short Equity to Global Equity Market Neutral on September 1, 2022. There was no change to strategy implementation or portfolio management as a result.
Over the course of the reporting period, the portfolio maintained a balanced allocation of risk across all major return drivers. There were, however, several new signals added within the stock selection group of insights. The Fund built upon its alternative data capabilities with enhanced data sets that capture informed-investor positioning as well as news flow. Additionally, the Fund developed a new bank quality insight to better identify firms with less exposure to uninsured deposits and commercial real estate amid the emerging crisis in the banking industry in March 2023.
Describe portfolio positioning at period end.
The views of the Fund’s top-down macro models reflected the trilemma of financial stability, weakening growth, and stubborn inflation. Measures of regime similarity are pointing to historical periods associated with elevated recessionary risks as being most closely aligned with the current macroeconomic environment.
FUND SUMMARY | 7 |
| Fund Summary as of April 30, 2023 (continued) | BlackRock Global Equity Market Neutral Fund |
The Fund’s resultant defensive stance at period end was most notable along the style dimension, with a long position in size favoring large-cap stocks being offset by a short stance on leverage and high-risk companies. Industry positioning within the Fund also continued to reflect a preference toward investments that perform well in inflationary environments as well as defensive stocks, with the portfolio retaining long positions in commodity producers and healthcare companies over financials and real estate stocks.
Of note, the Fund maintained a net neutral posture for the majority of the reporting period, resulting in no contribution to performance.
The views expressed reflect the opinions of BlackRock as of the date of this report and are subject to change based on changes in market, economic or other conditions. These views are not intended to be a forecast of future events and are no guarantee of future results.
GROWTH OF $10,000 INVESTMENT
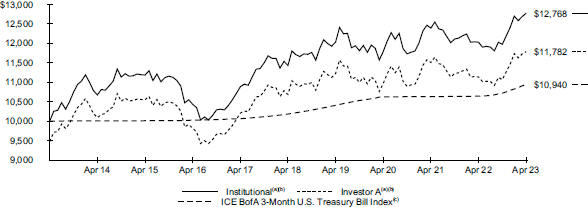
| (a) | Assuming maximum sales charges, if any, transaction costs and other operating expenses, including investment advisory fees. Institutional Shares do not have a sales charge. |
| (b) | Under normal circumstances, the Fund invests at least 80% of its total assets in equity instruments and related derivative instruments issued by, or tied economically to, companies located in developed markets. |
| (c) | An unmanaged index that measures returns of 3-month Treasury Bills. On 3/1/2021 the Fund began to track the 4pm pricing variant of the ICE BofA 3-Month U.S. Treasury Bill Index (the “Index”). Historical index data prior to 3/1/2021 is for the 3pm pricing variant of the Index. Index data on and after 3/1/2021 is for the 4pm pricing variant of the Index. |
Performance
| Average Annual Total Returns(a) | ||||||||||||||||||||||||||||||||||
|
| |||||||||||||||||||||||||||||||||
| 1 Year | 5 Years | 10 Years | ||||||||||||||||||||||||||||||||
|
|
|
|
|
| |||||||||||||||||||||||||||||
| Without Sales Charge | With Sales Charge | Without Sales Charge | With Sales Charge | Without Sales Charge | With Sales Charge | |||||||||||||||||||||||||||||
Institutional | 6.09 | % | N/A | 2.24 | % | N/A | 2.47 | % | N/A | |||||||||||||||||||||||||
Investor A | 5.84 | 0.29 | % | 1.98 | 0.88 | % | 2.20 | 1.65 | % | |||||||||||||||||||||||||
Investor C | 5.08 | 4.08 | 1.23 | 1.23 | 1.59 | 1.59 | ||||||||||||||||||||||||||||
Class K | 6.16 | N/A | 2.29 | N/A | 2.51 | N/A | ||||||||||||||||||||||||||||
ICE BofA 3-Month U.S. Treasury Bill Index | 2.83 | N/A | 1.45 | N/A | 0.90 | N/A | ||||||||||||||||||||||||||||
| (a) | Assuming maximum sales charges, if any. Average annual total returns with and without sales charges reflect reductions for distribution and service fees. See “About Fund Performance” for a detailed description of share classes, including any related sales charges and fees, and how performance was calculated for certain share classes. |
N/A — Not applicable as the share class and index do not have a sales charge.
Past performance is not an indication of future results.
Performance results may include adjustments made for financial reporting purposes in accordance with U.S. generally accepted accounting principles.
| 8 | 2 0 2 3 BLACK ROCK ANNUAL REPORT TO SHAREHOLDERS |
| Fund Summary as of April 30, 2023 (continued) | BlackRock Global Equity Market Neutral Fund |
Expense Example
| Actual | Hypothetical 5% Return | |||||||||||||||||||||||||||||||
|
|
|
| |||||||||||||||||||||||||||||
| | Beginning Account Value (11/01/22) | | | Ending Account Value (04/30/23) | | | Expenses Paid During the Period | (a) | | Beginning Account Value (11/01/22) | | | Ending Account Value (04/30/23) | | | Expenses Paid During the Period | (a) | | Annualized Expense Ratio | | ||||||||||||
Institutional | $ 1,000.00 | $ 1,066.50 | $ 6.87 | $ 1,000.00 | $ 1,018.15 | $ 6.71 | 1.34 | % | ||||||||||||||||||||||||
Investor A | 1,000.00 | 1,065.00 | 8.14 | 1,000.00 | 1,016.91 | 7.95 | 1.59 | |||||||||||||||||||||||||
Investor C | 1,000.00 | 1,061.70 | 11.96 | 1,000.00 | 1,013.19 | 11.68 | 2.34 | |||||||||||||||||||||||||
Class K | 1,000.00 | 1,067.20 | 6.61 | 1,000.00 | 1,018.40 | 6.46 | 1.29 | |||||||||||||||||||||||||
| (a) | For each class of the Fund, expenses are equal to the annualized expense ratio for the class, multiplied by the average account value over the period, multiplied by 181/365 (to reflect the one-half year period shown). |
See “Disclosure of Expenses” for further information on how expenses were calculated.
Portfolio Information
| GEOGRAPHIC ALLOCATION |
| |||||||||||
| | Percent of Total Investments(a) |
| ||||||||||
| Country/Geographic Region | Long | Short | Total | |||||||||
United States | 24.8 | % | 22.4 | % | 47.2% | |||||||
Japan | 10.1 | 10.3 | 20.4 | |||||||||
United Kingdom | 2.8 | 2.5 | 5.3 | |||||||||
Canada | 1.9 | 2.6 | 4.5 | |||||||||
Australia | 1.7 | 1.6 | 3.3 | |||||||||
Germany | 1.3 | 1.3 | 2.6 | |||||||||
France | 1.2 | 1.1 | 2.3 | |||||||||
Switzerland | 0.8 | 1.1 | 1.9 | |||||||||
Sweden | 1.0 | 0.9 | 1.9 | |||||||||
Other# | 5.2 | 5.4 | 10.6 | |||||||||
| 50.8 | % | 49.2 | % | 100.0% | ||||||||
|
|
|
|
|
| |||||||
| (a) | Total investments include the gross values of long and short equity securities of the underlying derivative contracts utilized by the Fund and exclude short-term securities. |
| # | Includes holdings within countries/geographic regions that are less than 1.0% of net assets. Please refer to the Schedule of Investments for such countries/geographic regions. |
FUND SUMMARY | 9 |
Institutional and Class K Shares are not subject to any sales charge. These shares bear no ongoing distribution or service fees and are available only to certain eligible investors. Class K Shares performance of BlackRock Global Equity Market Neutral Fund shown prior to the Class K Shares inception date of March 28, 2016 is that of Institutional Shares. Class K Shares performance of BlackRock Advantage Emerging Markets Fund shown prior to the Class K Shares inception date of January 25, 2018 is that of Institutional Shares. The performance of each Fund’s Class K Shares would be substantially similar to Institutional Shares because Class K Shares and Institutional Shares invest in the same portfolio of securities and performance would only differ to the extent that Class K Shares and Institutional Shares have different expenses. The actual returns of Class K Shares would have been higher than those of the Institutional Shares because Class K Shares have lower expenses than the Institutional Shares.
Investor A Shares are subject to a maximum initial sales charge (front-end load) of 5.25% and a service fee of 0.25% per year (but no distribution fee). Certain redemptions of these shares may be subject to a contingent deferred sales charge (“CDSC”) where no initial sales charge was paid at the time of purchase. These shares are generally available through financial intermediaries.
Investor C Shares are subject to a 1.00% CDSC if redeemed within one year of purchase. In addition, these shares are subject to a distribution fee of 0.75% per year and a service fee of 0.25% per year. These shares are generally available through financial intermediaries. These shares automatically convert to Investor A Shares after approximately eight years.
Past performance is not an indication of future results. Financial markets have experienced extreme volatility and trading in many instruments has been disrupted. These circumstances may continue for an extended period of time and may continue to affect adversely the value and liquidity of each Fund’s investments. As a result, current performance may be lower or higher than the performance data quoted. Refer to blackrock.com to obtain performance data current to the most recent month-end. Performance results do not reflect the deduction of taxes that a shareholder would pay on Fund distributions or the redemption of Fund shares. Figures shown in the performance table(s) assume reinvestment of all distributions, if any, at net asset value (“NAV”) on the ex-dividend date or payable date, as applicable. Investment return and principal value of shares will fluctuate so that shares, when redeemed, may be worth more or less than their original cost. Distributions paid to each class of shares will vary because of the different levels of service, distribution and transfer agency fees applicable to each class, which are deducted from the income available to be paid to shareholders.
BlackRock Advisors, LLC (the “Manager”), each Fund’s investment adviser, has contractually and/or voluntarily agreed to waive and/or reimburse a portion of each Fund’s expenses. Without such waiver(s) and/or reimbursement(s), each Fund’s performance would have been lower. With respect to each Fund’s voluntary waiver(s), if any, the Manager is under no obligation to waive and/or reimburse or to continue waiving and/or reimbursing its fees and such voluntary waiver(s) may be reduced or discontinued at any time. With respect to each Fund’s contractual waiver(s), if any, the Manager is under no obligation to continue waiving and/or reimbursing its fees after the applicable termination date of such agreement. See the Notes to Financial Statements for additional information on waivers and/or reimbursements.
Shareholders of each Fund may incur the following charges: (a) transactional expenses, such as sales charges; and (b) operating expenses, including investment advisory fees, administration fees, service and distribution fees, including 12b-1 fees, acquired fund fees and expenses, and other fund expenses. The expense examples shown (which are based on a hypothetical investment of $1,000 invested at the beginning of the period and held through the end of the period) are intended to assist shareholders both in calculating expenses based on an investment in each Fund and in comparing these expenses with similar costs of investing in other mutual funds.
The expense examples provide information about actual account values and actual expenses. Annualized expense ratios reflect contractual and voluntary fee waivers, if any. In order to estimate the expenses a shareholder paid during the period covered by this report, shareholders can divide their account value by $1,000 and then multiply the result by the number corresponding to their Fund and share class under the heading entitled “Expenses Paid During the Period.”
The expense examples also provide information about hypothetical account values and hypothetical expenses based on a Fund’s actual expense ratio and an assumed rate of return of 5% per year before expenses. In order to assist shareholders in comparing the ongoing expenses of investing in these Funds and other funds, compare the 5% hypothetical examples with the 5% hypothetical examples that appear in shareholder reports of other funds.
The expenses shown in the expense examples are intended to highlight shareholders’ ongoing costs only and do not reflect transactional expenses, such as sales charges, if any. Therefore, the hypothetical examples are useful in comparing ongoing expenses only and will not help shareholders determine the relative total expenses of owning different funds. If these transactional expenses were included, shareholder expenses would have been higher.
Derivative Financial Instruments
The Funds may invest in various derivative financial instruments. These instruments are used to obtain exposure to a security, commodity, index, market, and/or other assets without owning or taking physical custody of securities, commodities and/or other referenced assets or to manage market, equity, credit, interest rate, foreign currency exchange rate, commodity and/or other risks. Derivative financial instruments may give rise to a form of economic leverage and involve risks, including the imperfect correlation between the value of a derivative financial instrument and the underlying asset, possible default of the counterparty to the transaction or illiquidity of the instrument. Pursuant to Rule 18f-4 under the 1940 Act, among other things, the Funds must either use derivative financial instruments with embedded leverage in a limited manner or comply with an outer limit on fund leverage risk based on value-at-risk. The Funds’ successful use of a derivative financial instrument depends on the investment adviser’s ability to predict pertinent market movements accurately, which cannot be assured. The use of these instruments may result in losses greater than if they had not been used, may limit the amount of appreciation a Fund can realize on an investment and/or may result in lower distributions paid to shareholders. The Funds’ investments in these instruments, if any, are discussed in detail in the Notes to Financial Statements.
| 10 | 2 0 2 3 BLACK ROCK ANNUAL REPORT TO SHAREHOLDERS |
April 30, 2023 | BlackRock Advantage Emerging Markets Fund (Percentages shown are based on Net Assets) |
| Security | Shares | Value | ||||||
Common Stocks |
| |||||||
| Australia — 0.9% | ||||||||
BHP Group Ltd. | 26,935 | $ | 790,325 | |||||
|
| |||||||
| Brazil — 6.4% | ||||||||
Ambev SA | 267,024 | 758,062 | ||||||
Ambev SA, ADR | 76,049 | 212,937 | ||||||
BB Seguridade Participacoes SA | 21,418 | 147,330 | ||||||
Cia de Saneamento de Minas Gerais-COPASA | 126,498 | 432,160 | ||||||
Cia Paranaense de Energia, Preference Shares | 351,134 | 564,596 | ||||||
Cogna Educacao(a) | 2,055,737 | 840,792 | ||||||
CPFL Energia SA | 30,305 | 201,353 | ||||||
Fleury SA | 195,514 | 569,161 | ||||||
Porto Seguro SA | 5,294 | 26,673 | ||||||
Qualicorp Consultoria e Corretora de Seguros SA | 51,497 | 40,988 | ||||||
Telefonica Brasil SA | 7,450 | 61,419 | ||||||
Ultrapar Participacoes SA | 8,942 | 25,888 | ||||||
Vale SA | 92,009 | 1,335,549 | ||||||
Vale SA, ADR | 11,283 | 162,588 | ||||||
|
| |||||||
| 5,379,496 | ||||||||
| China — 31.4% | ||||||||
3SBio, Inc.(b) | 295,500 | 296,080 | ||||||
Alibaba Group Holding Ltd.(a) | 258,720 | 2,735,608 | ||||||
BAIC Motor Corp. Ltd., Class H(b) | 626,500 | 176,322 | ||||||
Baidu, Inc., Class A(a) | 67,492 | 1,015,883 | ||||||
BYD Co. Ltd., Class A | 22,500 | 833,884 | ||||||
BYD Electronic International Co. Ltd. | 72,500 | 219,873 | ||||||
China Construction Bank Corp., Class H | 1,617,000 | 1,081,007 | ||||||
China Life Insurance Co. Ltd., Class H | 101,000 | 194,037 | ||||||
China Merchants Bank Co. Ltd., Class A | 49,400 | 240,466 | ||||||
China Merchants Bank Co. Ltd., Class H | 180,500 | 871,296 | ||||||
China Pacific Insurance Group Co. Ltd., Class H | 146,000 | 436,107 | ||||||
China Yongda Automobiles Services Holdings Ltd. | 325,500 | 218,902 | ||||||
CMOC Group Ltd., Class H | 102,000 | 62,528 | ||||||
Contemporary Amperex Technology Co. Ltd., Class A | 16,560 | 554,228 | ||||||
CSPC Pharmaceutical Group Ltd. | 388,000 | 395,099 | ||||||
Geely Automobile Holdings Ltd. | 46,000 | 57,106 | ||||||
Industrial & Commercial Bank of China Ltd., Class H | 1,146,000 | 616,553 | ||||||
JA Solar Technology Co. Ltd., Class A | 81,340 | 474,651 | ||||||
JD.com, Inc., Class A | 47,260 | 843,489 | ||||||
Keymed Biosciences, Inc.(a)(b) | 22,500 | 179,762 | ||||||
Kuaishou Technology(a)(b) | 79,100 | 523,653 | ||||||
Kunlun Energy Co. Ltd. | 242,000 | 224,336 | ||||||
Kweichow Moutai Co. Ltd., Class A | 3,700 | 942,027 | ||||||
Lenovo Group Ltd. | 280,000 | 286,461 | ||||||
LONGi Green Energy Technology Co. Ltd., Class A | 73,600 | 371,843 | ||||||
Luye Pharma Group Ltd.(a)(b) | 110,500 | 54,347 | ||||||
Meituan, Class B(a)(b) | 62,780 | 1,072,938 | ||||||
MMG Ltd.(a) | 536,000 | 196,125 | ||||||
NetEase, Inc. | 68,870 | 1,226,051 | ||||||
People’s Insurance Co. Group of China Ltd., Class H | 464,000 | 182,491 | ||||||
PetroChina Co. Ltd., Class H | 1,131,700 | 786,118 | ||||||
PICC Property & Casualty Co. Ltd., Class H | 40,000 | 48,378 | ||||||
Ping An Insurance Group Co. of China Ltd., Class H | 188,500 | 1,375,206 | ||||||
RiseSun Real Estate Development Co. Ltd., Class A(a) | 1 | — | ||||||
Shanghai Pharmaceuticals Holding Co. Ltd., Class H | 247,600 | 503,364 | ||||||
Shanxi Xinghuacun Fen Wine Factory Co. Ltd., Class A | 24,000 | 862,420 | ||||||
Shenzhen Inovance Technology Co. Ltd., Class A | 8,400 | 74,940 | ||||||
Suzhou Maxwell Technologies Co. Ltd., Class A | 9,067 | 360,225 | ||||||
Tencent Holdings Ltd. | 94,400 | 4,192,881 | ||||||
Trip.com Group Ltd.(a) | 13,200 | 469,325 | ||||||
Tsingtao Brewery Co. Ltd., Class H | 6,000 | 63,977 | ||||||
| Security | Shares | Value | ||||||
| China (continued) | ||||||||
Uni-President China Holdings Ltd. | 80,000 | $ | 79,877 | |||||
Xiabuxiabu Catering Management China Holdings Co. Ltd.(b) | 35,500 | 27,043 | ||||||
Yangtze Optical Fibre & Cable Joint Stock Ltd. Co., Class H(b) | 18,000 | 35,228 | ||||||
Zhejiang Jingsheng Mechanical & Electrical Co. Ltd., Class A | 48,900 | 484,464 | ||||||
Zijin Mining Group Co. Ltd., Class H | 212,000 | 358,928 | ||||||
ZTE Corp., Class H | 84,400 | 271,834 | ||||||
|
| |||||||
| 26,577,361 | ||||||||
| Greece — 0.9% | ||||||||
Hellenic Telecommunications Organization SA | 38,284 | 559,394 | ||||||
OPAP SA | 11,276 | 192,286 | ||||||
|
| |||||||
| 751,680 | ||||||||
| Hong Kong — 0.6% | ||||||||
China Resources Beer Holdings Co. Ltd. | 16,000 | 123,596 | ||||||
Shougang Fushan Resources Group Ltd. | 604,000 | 205,298 | ||||||
Sun Art Retail Group Ltd. | 381,000 | 165,613 | ||||||
|
| |||||||
| 494,507 | ||||||||
| India — 11.5% | ||||||||
ACC Ltd. | 783 | 16,923 | ||||||
Adani Enterprises Ltd. | 2,038 | 48,182 | ||||||
Adani Green Energy Ltd.(a) | 3,883 | 45,329 | ||||||
Adani Ports & Special Economic Zone Ltd. | 6,293 | 52,608 | ||||||
Adani Total Gas Ltd. | 3,370 | 39,050 | ||||||
Adani Transmission Ltd.(a) | 3,418 | 43,111 | ||||||
Ambuja Cements Ltd.(a) | 7,098 | 34,516 | ||||||
APL Apollo Tubes Ltd. | 35,676 | 522,681 | ||||||
Cummins India Ltd. | 41,341 | 798,352 | ||||||
Dalmia Bharat Ltd. | 3,502 | 85,689 | ||||||
HDFC Asset Management Co. Ltd.(b) | 2,832 | 61,216 | ||||||
HDFC Bank Ltd. | 19,622 | 405,689 | ||||||
HDFC Bank Ltd., ADR(c) | 5,579 | 389,414 | ||||||
Hindustan Zinc Ltd. | 50,981 | 196,419 | ||||||
Housing Development Finance Corp. Ltd. | 20,831 | 709,751 | ||||||
ICICI Bank Ltd. | 98,984 | 1,116,647 | ||||||
ICICI Bank Ltd., ADR | 7,385 | 168,009 | ||||||
Infosys Ltd. | 56,516 | 871,994 | ||||||
ITC Ltd. | 66,921 | 348,977 | ||||||
Kotak Mahindra Bank Ltd. | 36,838 | 876,746 | ||||||
L&T Technology Services Ltd.(b) | 5,430 | 252,225 | ||||||
Nestle India Ltd. | 825 | 219,779 | ||||||
Polycab India Ltd. | 899 | 35,338 | ||||||
Reliance Industries Ltd. | 17,121 | 508,445 | ||||||
Tata Consultancy Services Ltd. | 31,596 | 1,249,201 | ||||||
Zydus Lifesciences Ltd. | 93,418 | 594,901 | ||||||
|
| |||||||
| 9,691,192 | ||||||||
| Indonesia — 4.5% | ||||||||
AKR Corporindo Tbk PT | 3,499,700 | 387,332 | ||||||
Bank Central Asia Tbk PT | 1,955,600 | 1,210,225 | ||||||
Bank Mandiri Persero Tbk PT | 1,884,400 | 666,135 | ||||||
Bank Rakyat Indonesia Persero Tbk PT | 3,100,100 | 1,080,320 | ||||||
Perusahaan Gas Negara Tbk PT | 4,858,200 | 475,246 | ||||||
|
| |||||||
| 3,819,258 | ||||||||
| Kuwait — 0.5% | ||||||||
Kuwait Finance House KSCP | 139,614 | 341,159 | ||||||
National Bank of Kuwait SAKP | 35,509 | 116,577 | ||||||
|
| |||||||
| 457,736 | ||||||||
SCHEDULE OF INVESTMENTS | 11 |
Schedule of Investments (continued) April 30, 2023 | BlackRock Advantage Emerging Markets Fund (Percentages shown are based on Net Assets) |
| Security | Shares | Value | ||||||
| Malaysia — 0.7% | ||||||||
CIMB Group Holdings Bhd | 96,100 | $ | 109,181 | |||||
IHH Healthcare Bhd | 199,500 | 256,730 | ||||||
Petronas Dagangan Bhd | 13,900 | 70,552 | ||||||
Public Bank Bhd | 203,000 | 177,269 | ||||||
|
| |||||||
| 613,732 | ||||||||
| Mexico — 0.2% | ||||||||
Grupo Mexico SAB de CV, Series B | 32,703 | 160,809 | ||||||
|
| |||||||
| Peru — 0.8% | ||||||||
Southern Copper Corp. | 8,910 | 684,555 | ||||||
|
| |||||||
| Philippines — 0.2% | ||||||||
SM Investments Corp. | 9,420 | 152,646 | ||||||
|
| |||||||
| Qatar — 0.9% | ||||||||
Industries Qatar QSC | 42,690 | 150,179 | ||||||
Ooredoo QPSC | 107,444 | 291,909 | ||||||
Qatar National Bank QPSC | 67,618 | 285,851 | ||||||
|
| |||||||
| 727,939 | ||||||||
| Russia(d) — 0.0% | ||||||||
Alrosa PJSC(a) | 1,407,496 | 176 | ||||||
LUKOIL PJSC | 23,527 | 3 | ||||||
Novatek PJSC | 29,650 | 4 | ||||||
|
| |||||||
| 183 | ||||||||
| Saudi Arabia — 3.5% | ||||||||
Al Rajhi Bank | 46,025 | 949,953 | ||||||
Saudi Arabian Mining Co.(a) | 16,109 | 301,348 | ||||||
Saudi Arabian Oil Co.(b) | 69,257 | 667,572 | ||||||
Saudi Basic Industries Corp. | 39,652 | 981,096 | ||||||
Saudi National Bank | 7,746 | 101,664 | ||||||
|
| |||||||
| 3,001,633 | ||||||||
| South Africa — 1.1% | ||||||||
FirstRand Ltd. | 156,922 | 553,036 | ||||||
Truworths International Ltd. | 136,589 | 406,052 | ||||||
|
| |||||||
| 959,088 | ||||||||
| South Korea — 8.7% | ||||||||
Celltrion, Inc. | 2,829 | 340,865 | ||||||
CJ Logistics Corp. | 4,021 | 232,249 | ||||||
Green Cross Corp. | 2,587 | 239,707 | ||||||
GS Retail Co. Ltd. | 3,972 | 79,120 | ||||||
Hite Jinro Co. Ltd. | 16,264 | 271,165 | ||||||
Hugel, Inc.(a) | 4,086 | 347,771 | ||||||
Hyundai Mobis Co. Ltd. | 3,263 | 531,413 | ||||||
KCC Corp. | 2,284 | 380,717 | ||||||
Kia Corp. | 15,476 | 980,146 | ||||||
KT Corp. | 9,608 | 215,630 | ||||||
KT Corp., ADR | 20,478 | 231,401 | ||||||
Samsung Electronics Co. Ltd. | 55,160 | 2,714,097 | ||||||
SK Telecom Co. Ltd. | 16,540 | 589,378 | ||||||
SK Telecom Co. Ltd., ADR | 9,854 | 194,715 | ||||||
|
| |||||||
| 7,348,374 | ||||||||
| Taiwan — 15.0% | ||||||||
Accton Technology Corp. | 45,000 | 439,600 | ||||||
Arcadyan Technology Corp. | 127,000 | 416,982 | ||||||
Chroma ATE, Inc. | 87,000 | 540,070 | ||||||
Chunghwa Telecom Co. Ltd. | 46,000 | 190,340 | ||||||
| Security | Shares | Value | ||||||
| Taiwan (continued) | ||||||||
Chunghwa Telecom Co. Ltd., ADR | 7,555 | $ | 311,417 | |||||
Delta Electronics, Inc. | 30,000 | 293,879 | ||||||
Elan Microelectronics Corp. | 14,000 | 43,122 | ||||||
Hon Hai Precision Industry Co. Ltd. | 326,000 | 1,110,861 | ||||||
Makalot Industrial Co. Ltd. | 108,000 | 784,377 | ||||||
MediaTek, Inc. | 36,000 | 782,778 | ||||||
Mega Financial Holding Co. Ltd. | 99,000 | 109,834 | ||||||
PCL Technologies, Inc. | 41,000 | 143,250 | ||||||
Poya International Co. Ltd. | 41,000 | 767,399 | ||||||
President Chain Store Corp. | 14,000 | 123,339 | ||||||
Primax Electronics Ltd. | 221,000 | 432,497 | ||||||
Sercomm Corp. | 44,000 | 117,982 | ||||||
Simplo Technology Co. Ltd. | 37,000 | 371,427 | ||||||
Sino-American Silicon Products, Inc. | 66,000 | 318,095 | ||||||
Taiwan Cooperative Financial Holding Co. Ltd. | 224,000 | 195,254 | ||||||
Taiwan Semiconductor Manufacturing Co. Ltd. | 268,000 | 4,388,659 | ||||||
Teco Electric and Machinery Co. Ltd. | 18,000 | 25,913 | ||||||
Wistron Corp. | 70,000 | 105,879 | ||||||
Wistron NeWeb Corp. | 235,000 | 708,840 | ||||||
|
| |||||||
| 12,721,794 | ||||||||
| Thailand — 2.8% | ||||||||
Bangchak Corp. PCL, NVDR | 434,900 | 386,862 | ||||||
Bangkok Dusit Medical Services PCL, NVDR | 1,050,000 | 902,024 | ||||||
Bumrungrad Hospital PCL, NVDR | 6,000 | 41,819 | ||||||
Mega Lifesciences PCL, NVDR | 17,100 | 20,576 | ||||||
PTT Exploration & Production PCL, NVDR | 198,200 | 862,378 | ||||||
Tisco Financial Group PCL, NVDR | 44,000 | 116,421 | ||||||
|
| |||||||
| 2,330,080 | ||||||||
| Turkey — 0.6% | ||||||||
Anadolu Efes Biracilik Ve Malt Sanayii A/S | 33,204 | 107,535 | ||||||
Migros Ticaret A/S | 41,668 | 373,854 | ||||||
|
| |||||||
| 481,389 | ||||||||
| United Arab Emirates — 0.3% | ||||||||
Emirates NBD Bank PJSC | 59,474 | 228,754 | ||||||
First Abu Dhabi Bank PJSC | 12,993 | 50,241 | ||||||
|
| |||||||
| 278,995 | ||||||||
| United Kingdom — 0.9% | ||||||||
Anglo American PLC | 25,753 | 791,441 | ||||||
|
| |||||||
| United States — 0.7% | ||||||||
Genpact Ltd. | 13,790 | 614,345 | ||||||
|
| |||||||
Total Common Stocks — 93.1% | 78,828,558 | |||||||
|
| |||||||
| 12 | 2 0 2 3 BLACK ROCK ANNUAL REPORT TO SHAREHOLDERS |
Schedule of Investments (continued) April 30, 2023 | BlackRock Advantage Emerging Markets Fund (Percentages shown are based on Net Assets) |
| Security | Shares | Value | ||||||
| Preferred Securities | ||||||||
| Preferred Stocks — 1.1% | ||||||||
| Brazil — 1.1% | ||||||||
Cia Energetica de Minas Gerais, Preference Shares | 83,538 | $ | 206,844 | |||||
Usinas Siderurgicas de Minas Gerais SA Usiminas, Preference A Shares | 474,169 | 684,473 | ||||||
|
| |||||||
| 891,317 | ||||||||
|
| |||||||
Total Preferred Securities — 1.1% |
| 891,317 | ||||||
|
| |||||||
Total Long-Term Investments — 94.2% |
| 79,719,875 | ||||||
|
| |||||||
Short-Term Securities | ||||||||
| Money Market Funds — 5.4% | ||||||||
BlackRock Liquidity Funds, T-Fund, Institutional Class, 4.72%(e)(f) | 4,592,936 | 4,592,936 | ||||||
SL Liquidity Series, LLC, Money Market Series, 5.02%(e)(f)(g) | 8,989 | 8,990 | ||||||
|
| |||||||
Total Short-Term Securities — 5.4% |
| 4,601,926 | ||||||
|
| |||||||
Total Investments — 99.6% |
| 84,321,801 | ||||||
Other Assets Less Liabilities — 0.4% | 314,239 | |||||||
|
| |||||||
Net Assets — 100.0% | $ | 84,636,040 | ||||||
|
| |||||||
| (a) | Non-income producing security. |
| (b) | Security exempt from registration pursuant to Rule 144A under the Securities Act of 1933, as amended. These securities may be resold in transactions exempt from registration to qualified institutional investors. |
| (c) | All or a portion of this security is on loan. |
| (d) | Security is valued using significant unobservable inputs and is classified as Level 3 in the fair value hierarchy. |
| (e) | Affiliate of the Fund. |
| (f) | Annualized 7-day yield as of period end. |
| (g) | All or a portion of this security was purchased with the cash collateral from loaned securities. |
Affiliates
Investments in issuers considered to be affiliate(s) of the Fund during the year ended April 30, 2023 for purposes of Section 2(a)(3) of the Investment Company Act of 1940, as amended, were as follows:
| Affiliated Issuer | Value at 04/30/22 | Purchases at Cost | Proceeds from Sales | Net Realized Gain (Loss) | Change in | Value at 04/30/23 | Shares Held at 04/30/23 | Income | Capital Gain Distributions from Underlying Funds | |||||||||||||||||||||||||||||||||||||
BlackRock Liquidity Funds, T-Fund, Institutional Class | $ | 7,133,591 | $ | — | $ | (2,540,655 | )(a) | $ | — | $ | — | $ | 4,592,936 | 4,592,936 | $ | 131,469 | $ | — | ||||||||||||||||||||||||||||
SL Liquidity Series, LLC, Money Market Series | 254,881 | — | (245,978 | )(a) | 81 | 6 | 8,990 | 8,989 | 5,000 | (b) | — | |||||||||||||||||||||||||||||||||||
|
|
|
|
|
|
|
|
|
| |||||||||||||||||||||||||||||||||||||
| $ | 81 | $ | 6 | $ | 4,601,926 | $ | 136,469 | $ | — | |||||||||||||||||||||||||||||||||||||
|
|
|
|
|
|
|
|
|
| |||||||||||||||||||||||||||||||||||||
| (a) | Represents net amount purchased (sold). |
| (b) | All or a portion represents securities lending income earned from the reinvestment of cash collateral from loaned securities, net of fees and collateral investment expenses, and other payments to and from borrowers of securities. |
Derivative Financial Instruments Outstanding as of Period End
Futures Contracts
| Description | Number of Contracts | Expiration Date | Notional Amount (000) | Value/ Unrealized Appreciation (Depreciation) | ||||||||||||
Long Contracts | ||||||||||||||||
MSCI Emerging Markets Index | 91 | 06/16/23 | $ | 4,478 | $ | 85,782 | ||||||||||
|
| |||||||||||||||
SCHEDULE OF INVESTMENTS | 13 |
Schedule of Investments (continued) April 30, 2023 | BlackRock Advantage Emerging Markets Fund |
Derivative Financial Instruments Categorized by Risk Exposure
As of period end, the fair values of derivative financial instruments located in the Statements of Assets and Liabilities were as follows:
| Commodity Contracts | Credit Contracts | Equity Contracts | Foreign Currency Exchange Contracts | Interest Rate Contracts | Other Contracts | Total | ||||||||||||||||||||||
Assets — Derivative Financial Instruments | ||||||||||||||||||||||||||||
Futures contracts | ||||||||||||||||||||||||||||
Unrealized appreciation on futures contracts(a) | $ | — | $ | — | $ | 85,782 | $ | — | $ | — | $ | — | $ | 85,782 | ||||||||||||||
|
|
|
|
|
|
|
|
|
|
|
|
|
| |||||||||||||||
| (a) | Net cumulative unrealized appreciation (depreciation) on futures contracts and centrally cleared swaps, if any, are reported in the Schedule of Investments. In the Statements of Assets and Liabilities, only current day’s variation margin is reported in receivables or payables and the net cumulative unrealized appreciation (depreciation) is included in accumulated earnings (loss). |
For the period ended April 30, 2023, the effect of derivative financial instruments in the Statements of Operations was as follows:
| Commodity Contracts | Credit Contracts | Equity Contracts | Foreign Currency Exchange Contracts | Interest Rate Contracts | Other Contracts | Total | ||||||||||||||||||||||
Net Realized Gain (Loss) from: | ||||||||||||||||||||||||||||
Futures contracts | $ | — | $ | — | $ | (1,796,119 | ) | $ | — | $ | — | $ | — | $ | (1,796,119 | ) | ||||||||||||
|
|
|
|
|
|
|
|
|
|
|
|
|
| |||||||||||||||
Net Change in Unrealized Appreciation (Depreciation) on: | ||||||||||||||||||||||||||||
Futures contracts | $ | — | $ | — | $ | 468,819 | $ | — | $ | — | $ | — | $ | 468,819 | ||||||||||||||
|
|
|
|
|
|
|
|
|
|
|
|
|
| |||||||||||||||
Average Quarterly Balances of Outstanding Derivative Financial Instruments
| ||||
Futures contracts: | ||||
Average notional value of contracts — long | $ | 4,934,900 | ||
| ||||
For more information about the Fund’s investment risks regarding derivative financial instruments, refer to the Notes to Financial Statements.
Fair Value Hierarchy as of Period End
Various inputs are used in determining the fair value of financial instruments. For a description of the input levels and information about the Fund’s policy regarding valuation of financial instruments, refer to the Notes to Financial Statements.
The following table summarizes the Fund’s financial instruments categorized in the fair value hierarchy. The breakdown of the Fund’s financial instruments into major categories is disclosed in the Schedule of Investments above.
| ||||||||||||||||||||||||||||
| Level 1 | Level 2 | Level 3 | Total | |||||||||||||||||||||||||
| ||||||||||||||||||||||||||||
Assets | ||||||||||||||||||||||||||||
Investments | ||||||||||||||||||||||||||||
Long-Term Investments | ||||||||||||||||||||||||||||
Common Stocks | ||||||||||||||||||||||||||||
Australia | $ | — | $ | 790,325 | $ | — | $ | 790,325 | ||||||||||||||||||||
Brazil | 5,379,496 | — | — | 5,379,496 | ||||||||||||||||||||||||
China | — | 26,577,361 | — | 26,577,361 | ||||||||||||||||||||||||
Greece | — | 751,680 | — | 751,680 | ||||||||||||||||||||||||
Hong Kong | — | 494,507 | — | 494,507 | ||||||||||||||||||||||||
India | 557,423 | 9,133,769 | — | 9,691,192 | ||||||||||||||||||||||||
Indonesia | — | 3,819,258 | — | 3,819,258 | ||||||||||||||||||||||||
Kuwait | — | 457,736 | — | 457,736 | ||||||||||||||||||||||||
Malaysia | 70,552 | 543,180 | — | 613,732 | ||||||||||||||||||||||||
Mexico | 160,809 | — | — | 160,809 | ||||||||||||||||||||||||
Peru | 684,555 | — | — | 684,555 | ||||||||||||||||||||||||
Philippines | — | 152,646 | — | 152,646 | ||||||||||||||||||||||||
Qatar | — | 727,939 | — | 727,939 | ||||||||||||||||||||||||
Russia | — | — | 183 | 183 | ||||||||||||||||||||||||
Saudi Arabia | — | 3,001,633 | — | 3,001,633 | ||||||||||||||||||||||||
South Africa | 406,052 | 553,036 | — | 959,088 | ||||||||||||||||||||||||
South Korea | 426,116 | 6,922,258 | — | 7,348,374 | ||||||||||||||||||||||||
Taiwan | 311,417 | 12,410,377 | — | 12,721,794 | ||||||||||||||||||||||||
| 14 | 2 0 2 3 BLACK ROCK ANNUAL REPORT TO SHAREHOLDERS |
Schedule of Investments (continued) April 30, 2023 | BlackRock Advantage Emerging Markets Fund |
Fair Value Hierarchy as of Period End (continued)
| ||||||||||||||||||||||||||||
| Level 1 | Level 2 | Level 3 | Total | |||||||||||||||||||||||||
| ||||||||||||||||||||||||||||
Common Stocks (continued) | ||||||||||||||||||||||||||||
Thailand | $ | — | $ | 2,330,080 | $ | — | $ | 2,330,080 | ||||||||||||||||||||
Turkey | — | 481,389 | — | 481,389 | ||||||||||||||||||||||||
United Arab Emirates | — | 278,995 | — | 278,995 | ||||||||||||||||||||||||
United Kingdom | — | 791,441 | — | 791,441 | ||||||||||||||||||||||||
United States | 614,345 | — | — | 614,345 | ||||||||||||||||||||||||
Preferred Securities | ||||||||||||||||||||||||||||
Preferred Stocks | 891,317 | — | — | 891,317 | ||||||||||||||||||||||||
Short-Term Securities | ||||||||||||||||||||||||||||
Money Market Funds | 4,592,936 | — | — | 4,592,936 | ||||||||||||||||||||||||
|
|
|
|
|
|
|
| |||||||||||||||||||||
| $ | 14,095,018 | $ | 70,217,610 | $ | 183 | 84,312,811 | ||||||||||||||||||||||
|
|
|
|
|
|
|
| |||||||||||||||||||||
Investments Valued at NAV(a) | 8,990 | |||||||||||||||||||||||||||
|
| |||||||||||||||||||||||||||
| $ | 84,321,801 | |||||||||||||||||||||||||||
|
| |||||||||||||||||||||||||||
Derivative Financial Instruments(b) | ||||||||||||||||||||||||||||
Assets | ||||||||||||||||||||||||||||
Equity Contracts | $ | 85,782 | $ | — | $ | — | $ | 85,782 | ||||||||||||||||||||
|
|
|
|
|
|
|
| |||||||||||||||||||||
| (a) | Certain investments of the Fund were fair valued using NAV as a practical expedient as no quoted market value is available and therefore have been excluded from the fair value hierarchy. |
| (b) | Derivative financial instruments are futures contracts. Futures contracts are valued at the unrealized appreciation (depreciation) on the instrument. |
See notes to financial statements.
SCHEDULE OF INVESTMENTS | 15 |
Schedule of Investments April 30, 2023 | BlackRock Global Equity Market Neutral Fund (Percentages shown are based on Net Assets) |
| Security | Shares | Value | ||||||
Common Stocks | ||||||||
| United States — 0.0% | ||||||||
Palantir Technologies, Inc., Class A(a) | 4 | $ | 31 | |||||
|
| |||||||
Total Common Stocks — 0.0% | 31 | |||||||
|
| |||||||
Preferred Securities | ||||||||
| Preferred Stocks — 0.5%(b) | ||||||||
| United States — 0.5% | ||||||||
AliphCom, Inc. | ||||||||
Series 6, (Acquired 12/15/15, Cost: $—)(c) | 8,264 | — | ||||||
Series 8 | 823,530 | 8 | ||||||
Illumio, Inc., Series C, (Acquired 03/10/15, | 466,730 | 3,467,804 | ||||||
|
| |||||||
| 3,467,812 | ||||||||
|
| |||||||
Total Preferred Securities — 0.5% | 3,467,812 | |||||||
|
| |||||||
| Par (000) | ||||||||
U.S. Treasury Obligations | ||||||||
U.S. Treasury Floating Rate Notes(d) | ||||||||
(3-mo. Treasury money market yield + 0.14%), 5.27%, 10/31/24 | $ | 34,540 | 34,579,489 | |||||
(3-mo. Treasury money market yield + 0.20%), 5.33%, 01/31/25 | 20,175 | 20,214,233 | ||||||
|
| |||||||
Total U.S. Treasury Obligations — 7.6% | 54,793,722 | |||||||
|
| |||||||
Total Long-Term Investments — 8.1% | 58,261,565 | |||||||
|
| |||||||
| Shares | ||||||||
Short-Term Securities | ||||||||
| Money Market Funds — 0.2% | ||||||||
BlackRock Liquidity Funds, T-Fund, Institutional Class, 4.72%(e)(f) | 1,420,426 | 1,420,426 | ||||||
|
| |||||||
| Par (000) | ||||||||
| U.S. Treasury Obligations — 85.8% | ||||||||
U.S. Treasury Bills(g) | ||||||||
4.67%, 05/02/23 | $ | 35,000 | 34,995,960 | |||||
4.68%, 05/02/23 - 05/11/23 | 64,000 | 63,990,525 | ||||||
4.71%, 05/04/23 - 06/20/23 | 89,000 | 88,747,211 | ||||||
4.64%, 05/09/23 | 12,000 | 11,989,013 | ||||||
| Security | Par (000) | Value | ||||||
| U.S. Treasury Obligations (continued) | ||||||||
U.S. Treasury Bills(g) (continued) | ||||||||
4.75%, 05/09/23 - 05/23/23 | $ | 23,000 | $ | 22,965,918 | ||||
4.26%, 05/11/23 - 05/18/23 | 13,500 | 13,473,624 | ||||||
4.69%, 05/11/23 | 2,000 | 1,997,681 | ||||||
4.74%, 05/11/23 | 1,500 | 1,498,260 | ||||||
4.76%, 05/11/23 | 25,000 | 24,971,007 | ||||||
4.27%, 05/16/23 | 55,000 | 54,903,349 | ||||||
4.45%, 05/16/23 | 2,750 | 2,745,167 | ||||||
4.54%, 05/16/23 | 33,970 | 33,910,305 | ||||||
2.16%, 05/18/23 | 2,080 | 2,075,730 | ||||||
4.48%, 05/18/23 | 1,000 | 997,947 | ||||||
4.44%, 05/23/23 | 4,285 | 4,274,101 | ||||||
4.59%, 05/23/23 | 2,000 | 1,994,913 | ||||||
4.29%, 05/25/23(h) | 1,000 | 997,169 | ||||||
4.70%, 05/30/23(h) | 100,000 | 99,668,715 | ||||||
4.80%, 06/01/23 | 2,000 | 1,992,633 | ||||||
4.85%, 06/01/23 | 10,000 | 9,963,166 | ||||||
4.96%, 07/06/23 | 8,595 | 8,517,394 | ||||||
4.98%, 07/06/23 | 8,905 | 8,824,595 | ||||||
4.89%, 08/08/23 | 13,900 | 13,709,401 | ||||||
4.90%, 08/08/23 | 26,965 | 26,595,251 | ||||||
5.14%, 08/29/23 | 27,850 | 27,389,011 | ||||||
4.57%, 11/30/23 | 1,335 | 1,300,193 | ||||||
U.S. Treasury Floating Rate Notes(d) | ||||||||
(3-mo. Treasury money market yield + -0.02%), 5.12%, 01/31/24 | 20,365 | 20,368,314 | ||||||
(3-mo. Treasury money market yield + -0.08%), 5.06%, 04/30/24 | 4,885 | 4,881,351 | ||||||
U.S. Treasury Notes | ||||||||
0.13%, 05/15/23 - 05/31/23 | 19,025 | 18,990,785 | ||||||
1.75%, 05/15/23 | 5,485 | 5,478,927 | ||||||
|
| |||||||
| 614,207,616 | ||||||||
|
| |||||||
Total Short-Term Securities — 86.0% | 615,628,042 | |||||||
|
| |||||||
Total Investments — 94.1% | 673,889,607 | |||||||
Other Assets Less Liabilities — 5.9% | 42,278,989 | |||||||
|
| |||||||
Net Assets — 100.0% | $ | 716,168,596 | ||||||
|
| |||||||
| (a) | Non-income producing security. |
| (b) | Security is valued using significant unobservable inputs and is classified as Level 3 in the fair value hierarchy. |
| (c) | Restricted security as to resale, excluding 144A securities. The Fund held restricted securities with a current value of $3,467,804, representing 0.5% of its net assets as of period end, and an original cost of $1,500,001. |
| (d) | Variable rate security. Interest rate resets periodically. The rate shown is the effective interest rate as of period end. Security description also includes the reference rate and spread if published and available. |
| (e) | Affiliate of the Fund. |
| (f) | Annualized 7-day yield as of period end. |
| (g) | Rates are discount rates or a range of discount rates as of period end. |
| (h) | When-issued security. |
| 16 | 2 0 2 3 BLACK ROCK ANNUAL REPORT TO SHAREHOLDERS |
Schedule of Investments (continued) April 30, 2023 | BlackRock Global Equity Market Neutral Fund |
Affiliates
Investments in issuers considered to be affiliate(s) of the Fund during the year ended April 30, 2023 for purposes of Section 2(a)(3) of the Investment Company Act of 1940, as amended, were as follows:
| Affiliated Issuer | Value at 04/30/22 | Purchases at Cost | Proceeds from Sales | Net Realized Gain (Loss) | Change in Unrealized Appreciation (Depreciation) | Value at 04/30/23 | Shares Held at 04/30/23 | Income | Capital Gain Distributions from Underlying Funds | |||||||||||||||||||||||||||
BlackRock Liquidity Funds, T-Fund, Institutional Class | $ | 36,355,831 | $ | — | $ | (34,935,405 | )(a) | $ | — | $ | — | $ | 1,420,426 | 1,420,426 | $ | 440,621 | $ | — | ||||||||||||||||||
|
|
|
|
|
|
|
|
|
| |||||||||||||||||||||||||||
| (a) | Represents net amount purchased (sold). |
Derivative Financial Instruments Outstanding as of Period End
Futures Contracts
| Description | Number of Contracts | Expiration Date | Notional Amount (000) | Value/ Unrealized Appreciation (Depreciation) | ||||||||||||
Long Contracts | ||||||||||||||||
S&P 500 E-Mini Index | 35 | 06/16/23 | $ | 7,330 | $ | 247 | ||||||||||
|
| |||||||||||||||
OTC Total Return Swaps
| Reference Entity | Payment Frequency | Counterparty(a) | Termination Date | Net Notional | Accrued Unrealized Appreciation (Depreciation) | Net Value of Reference Entity | Gross Notional Amount Net Asset Percentage | |||||||||||||||||||
Equity Securities Long/Short | Monthly | Bank of America N.A.(b) | 02/15/28 | $ | 158,409 | $ | (985,179 | )(c) | $ | (670,259 | ) | 76.9 | % | |||||||||||||
| Monthly | Bank of America N.A.(d) | 02/15/28 | (187,542 | ) | (596,336 | )(e) | (735,397 | ) | 47.9 | |||||||||||||||||
| Monthly | BNP Paribas SA(f) | 03/21/25 – 04/14/25 | (2,443,073 | ) | 2,183,099 | (g) | (105,984 | ) | 99.3 | |||||||||||||||||
| Monthly | BNP Paribas SA(h) | 03/17/25 – 04/17/25 | 175,164 | (34,626 | )(i) | 141,392 | 1.4 | |||||||||||||||||||
| Monthly | Goldman Sachs Bank USA(j) | 06/12/23 – 08/19/26 | 437,216 | (1,432,026 | )(k) | (1,159,224 | ) | 94.1 | ||||||||||||||||||
| Monthly | Goldman Sachs Bank USA(l) | 07/03/23 – 08/19/26 | (1,840,532 | ) | 1,724,502 | (m) | 50,570 | 111.2 | ||||||||||||||||||
| Monthly | UBS AG(n) | 04/03/28 – 04/24/28 | (491,732 | ) | (43,734 | )(o) | (459,101 | ) | 65.5 | |||||||||||||||||
| Monthly | UBS AG(p) | 04/03/28 – 04/24/28 | 171,971 | 717 | (q) | 174,402 | 1.0 | |||||||||||||||||||
|
|
|
| |||||||||||||||||||||||
| $ | 816,417 | $ | (2,763,601 | ) | ||||||||||||||||||||||
|
|
|
| |||||||||||||||||||||||
| (a) | The Fund receives the total return on a portfolio of long positions underlying the total return swap. The Fund pays the total return on a portfolio of short positions underlying the total return swap. In addition, the Fund pays or receives a variable rate of interest, based on a specified benchmark. The benchmark and spread are determined based upon the country and/or currency of the individual underlying positions. |
| (c) | Amount includes $(156,511) of net dividends and financing fees. |
| (e) | Amount includes $(48,481) of net dividends and financing fees. |
| (g) | Amount includes $(153,990) of net dividends and financing fees. |
| (i) | Amount includes $(854) of net dividends and financing fees. |
| (k) | Amount includes $164,414 of net dividends and financing fees. |
| (m) | Amount includes $(166,600) of net dividends and financing fees. |
| (o) | Amount includes $(76,365) of net dividends and financing fees. |
| (q) | Amount includes $(1,714) of net dividends and financing fees. |
The following are the specified benchmarks (plus or minus a range) used in determining the variable rate of interest:
SCHEDULE OF INVESTMENTS | 17 |
Schedule of Investments (continued) April 30, 2023 | BlackRock Global Equity Market Neutral Fund |
| OTC Total Return Swaps (continued) | ||||||
| Range: Benchmarks: | (b) 0 basis points AUD - 1D Overnight Reserve Bank of Australia Rate (AONIA) Bank of Canada Overnight Rate Target (CABROVER) CHF - Swiss Average Rate O/N (SSARON) DKK - 1W Copenhagen Interbank Swap Rate (CIBOR) EUR - 1D Euro Short Term Rate (ESTR) GBP - 1D Sterling Overnight Index Average (SONIA) HKD - Overnight Index Average (HONIA) ILS - 1M Tel Aviv Interbank Offer Rate (TELBOR) JPY - Provisional 1D Overnight Tokyo Average Rate (TONA) NOK - 1W Norway Interbank Offer Rate (NIBOR) NZD - 1M New Zealand Bank Bill Rate (BBR) SEK - 1W Stockholm Interbank Offer Rate (STIBOR) SGD - Overnight Rate Average (SORA) USD - 1D Overnight Bank Funding Rate (OBFR01) | (d) 0 basis points AUD - 1D Overnight Reserve Bank of Australia Rate (AONIA) Bank of Canada Overnight Rate Target (CABROVER) CHF - Swiss Average Rate O/N (SSARON) DKK - 1W Copenhagen Interbank Swap Rate (CIBOR) EUR - 1D Euro Short Term Rate (ESTR) GBP - 1D Sterling Overnight Index Average (SONIA) HKD - Overnight Index Average (HONIA) ILS - 1M Tel Aviv Interbank Offer Rate (TELBOR) JPY - Provisional 1D Overnight Tokyo Average Rate (TONA) NOK - 1W Norway Interbank Offer Rate (NIBOR) NZD - 1M New Zealand Bank Bill Rate (BBR) SEK - 1W Stockholm Interbank Offer Rate (STIBOR) SGD - Overnight Rate Average (SORA) USD - 1D Overnight Bank Funding Rate (OBFR01) | (f) 0-500 basis points AUD - 1D Overnight Reserve Bank of Australia Rate (AONIA) Bank of Canada Overnight Rate Target (CABROVER) CHF - Swiss Average Rate O/N (SSARON) DKK - Annualized Overnight Deposit MID Rate EUR - 1D Euro Short Term Rate (ESTR) GBP - 1D Sterling Overnight Index Average (SONIA) HKD - Overnight Index Average (HONIA) ILS - 1M Tel Aviv Interbank Offer Rate (TELBOR) JPY - 1D Overnight Tokyo Average Rate (TONA) NOK - Norwegian Overnight Weighted Average (NOWA) NZD - 1D New Zealand Official Overnight Deposit Rate (NZOCO) SEK - 1W Stockholm Interbank Offer Rate (STIBOR) SGD - Overnight Rate Average (SORA) USD - 1D Overnight Bank Funding Rate (OBFR01) | |||
| (h) | (j) | (l) | ||||
| 15-570 basis points | 0-1414 basis points | 10-167 basis points | ||||
AUD - 1D Overnight Reserve Bank of Australia Rate (AONIA) Bank of Canada Overnight Rate Target (CABROVER) CHF - Swiss Average Rate O/N (SSARON) DKK - Danish Tom/Next Reference Rate (DETNT/N) EUR - 1D Euro Short Term Rate (ESTR) GBP - 1D Sterling Overnight Index Average (SONIA) JPY - Provisional 1D Overnight Tokyo Average Rate (TONA) NOK - Norwegian Overnight Weighted Average (NOWA) SEK - 1D Overnight Stockholm Interbank Offer Rate (STIBOR) SGD - Overnight Rate Average (SORA) USD - 1D Overnight Fed Funds Effective Rate (FEDL01) | AUD - 1D Overnight Reserve Bank of Australia Rate (AONIA) CAD - 1D Overnight Bank of Canada Repo Rate (CORRA) CHF - Swiss Average Rate O/N (SSARON) DKK - Danish Tom/Next Reference Rate (DETNT/N) EUR - 1D Euro Short Term Rate (ESTR) GBP - 1D Sterling Overnight Index Average (SONIA) HKD - Overnight Index Average (HONIA) ILS - 1D Overnight Tel Aviv Interbank Offer Rate (TELBOR) JPY - Provisional 1D Overnight Tokyo Average Rate (TONA) NOK - Norwegian Overnight Weighted Average (NOWA) NZD - 1D New Zealand Official Overnight Deposit Rate (NZOCO) SEK - 1D Overnight Stockholm Interbank Offer Rate (STIBOR) SGD - Overnight Rate Average (SORA) USD - 1D Overnight Fed Funds Effective Rate (FEDL01) | AUD - 1D Overnight Reserve Bank of Australia Rate (AONIA) CAD - 1D Overnight Bank of Canada Repo Rate (CORRA) CHF - Swiss Average Rate O/N (SSARON) DKK - Danish Tom/Next Reference Rate (DETNT/N) EUR - 1D Euro Short Term Rate (ESTR) GBP - 1D Sterling Overnight Index Average (SONIA) HKD - Overnight Index Average (HONIA) ILS - 1D Overnight Tel Aviv Interbank Offer Rate (TELBOR) JPY - Provisional 1D Overnight Tokyo Average Rate (TONA) NOK - Norwegian Overnight Weighted Average (NOWA) NZD - 1D New Zealand Official Overnight Deposit Rate (NZOCO) SEK - 1D Overnight Stockholm Interbank Offer Rate (STIBOR) SGD - Overnight Rate Average (SORA) USD - 1D Overnight Bank Funding Rate (OBFR01) | ||||
| 18 | 2 0 2 3 BLACK ROCK ANNUAL REPORT TO SHAREHOLDERS |
Schedule of Investments (continued) April 30, 2023 | BlackRock Global Equity Market Neutral Fund |
| OTC Total Return Swaps (continued) | ||||||
| (n) | (p) | |||||
| 0 basis points | 0 basis points | |||||
AUD - 1D Overnight Reserve Bank of Australia Rate (AONIA) CAD - 1D Overnight Bank of Canada Repo Rate (CORRA) DKK - 1W Copenhagen Interbank Swap Rate (CIBOR) EUR - 1D Euro Short Term Rate (ESTR) GBP - 1D Sterling Overnight Index Average (SONIA) HKD - Overnight Index Average (HONIA) ILS - 1D Overnight Tel Aviv Interbank Offer Rate (TELBOR) JPY - Provisional 1D Overnight Tokyo Average Rate (TONA) NOK - Norwegian Overnight Weighted Average (NOWA) NZD - 1M New Zealand Bank Bill Rate (BBR) SEK - TN Stockholm Interbank Offer Rate (STIBOR) SGD - Overnight Rate Average (SORA) USD - 1D Overnight Bank Funding Rate (OBFR01) | AUD - 1D Overnight Reserve Bank of Australia Rate (AONIA) CAD - 1D Overnight Bank of Canada Repo Rate (CORRA) DKK - 1W Copenhagen Interbank Swap Rate (CIBOR) EUR - 1D Euro Short Term Rate (ESTR) GBP - 1D Sterling Overnight Index Average (SONIA) JPY - Provisional 1D Overnight Tokyo Average Rate (TONA) NOK - Norwegian Overnight Weighted Average (NOWA) SEK - TN Stockholm Interbank Offer Rate (STIBOR) USD - 1D Overnight Fed Funds Effective Rate (FEDL01) | |||||
The following table represents the individual long and short positions and related values of the equity securities underlying the total return swap with Bank of America N.A. as of period end, termination date 02/15/28:
| Security | Shares | Value | % of Basket Value | |||||||||
Reference Entity — Long | ||||||||||||
| Common Stocks | ||||||||||||
| Australia | ||||||||||||
Abacus Property Group | 13,324 | $ | 23,608 | (3.5 | )% | |||||||
Accent Group Ltd. | 109,069 | 184,702 | (27.6 | ) | ||||||||
Arena REIT | 29,580 | 73,584 | (11.0 | ) | ||||||||
Australian Ethical Investment Ltd. | 56,549 | 122,130 | (18.2 | ) | ||||||||
Charter Hall Long Wale REIT | 21,546 | 62,413 | (9.3 | ) | ||||||||
Charter Hall Retail REIT | 407,925 | 1,050,751 | (156.8 | ) | ||||||||
Charter Hall Social Infrastructure REIT | 89,779 | 180,726 | (27.0 | ) | ||||||||
Clinuvel Pharmaceuticals Ltd. | 12,014 | 161,780 | (24.1 | ) | ||||||||
Codan Ltd. | 2,235 | 10,864 | (1.6 | ) | ||||||||
Credit Corp. Group Ltd. | 22,689 | 273,389 | (40.8 | ) | ||||||||
Eagers Automotive Ltd. | 28,547 | 269,765 | (40.2 | ) | ||||||||
Elders Ltd. | 17,528 | 94,437 | (14.1 | ) | ||||||||
GrainCorp Ltd. | 24,217 | 109,797 | (16.4 | ) | ||||||||
Growthpoint Properties Australia Ltd. | 120,216 | 260,760 | (38.9 | ) | ||||||||
Imdex Ltd. | 122,844 | 169,870 | (25.3 | ) | ||||||||
Johns Lyng Group Ltd. | 12,510 | 56,440 | (8.4 | ) | ||||||||
Jumbo Interactive Ltd. | 24,304 | 211,558 | (31.6 | ) | ||||||||
Karoon Energy Ltd. | 20,979 | 30,010 | (4.5 | ) | ||||||||
Lifestyle Communities Ltd. | 6,959 | 78,843 | (11.8 | ) | ||||||||
Lovisa Holdings Ltd. | 12,498 | 221,880 | (33.1 | ) | ||||||||
McMillan Shakespeare Ltd. | 2,503 | 25,586 | (3.8 | ) | ||||||||
Nanosonics Ltd. | 117,537 | 448,067 | (66.9 | ) | ||||||||
National Storage REIT | 252,349 | 420,592 | (62.8 | ) | ||||||||
Netwealth Group Ltd. | 19,615 | 178,359 | (26.6 | ) | ||||||||
Nick Scali Ltd. | 31,779 | 205,823 | (30.7 | ) | ||||||||
Objective Corp. Ltd. | 8,957 | 76,729 | (11.4 | ) | ||||||||
oOh!media Ltd. | 272,912 | 299,219 | (44.6 | ) | ||||||||
| Security | Shares | Value | % of Basket Value | |||||||||
| Australia (continued) | ||||||||||||
Perenti Ltd. | 530,538 | $ | 406,846 | (60.7 | )% | |||||||
Perseus Mining Ltd. | 247,408 | 365,897 | (54.6 | ) | ||||||||
Pinnacle Investment Management Group Ltd. | 11,170 | 61,554 | (9.2 | ) | ||||||||
PolyNovo Ltd. | 26,714 | 29,042 | (4.3 | ) | ||||||||
Premier Investments Ltd. | 16,071 | 279,882 | (41.8 | ) | ||||||||
PWR Holdings Ltd. | 16,694 | 111,588 | (16.6 | ) | ||||||||
Ramelius Resources Ltd. | 208,733 | 182,288 | (27.2 | ) | ||||||||
Regis Resources Ltd., Registered Shares | 219,175 | 310,328 | (46.3 | ) | ||||||||
Silver Lake Resources Ltd. | 253,750 | 214,059 | (31.9 | ) | ||||||||
SmartGroup Corp. Ltd. | 1,915 | 8,577 | (1.3 | ) | ||||||||
SolGold PLC | 180,556 | 42,656 | (6.4 | ) | ||||||||
Technology One Ltd. | 80,172 | 808,833 | (120.7 | ) | ||||||||
Ventia Services Group Pty Ltd. | 138,544 | 241,459 | (36.0 | ) | ||||||||
Viva Energy Group Ltd. | 128,145 | 265,054 | (39.5 | ) | ||||||||
Waypoint REIT Ltd. | 219,248 | 381,041 | (56.8 | ) | ||||||||
West African Resources Ltd. | 58,525 | 37,891 | (5.7 | ) | ||||||||
|
|
|
| |||||||||
| 9,048,677 | ||||||||||||
| Austria | ||||||||||||
Immofinanz AG | 11,262 | 183,213 | (27.3 | ) | ||||||||
Palfinger AG | 2,064 | 67,566 | (10.1 | ) | ||||||||
Porr AG | 976 | 14,841 | (2.2 | ) | ||||||||
Schoeller-Bleckmann Oilfield Equipment AG | 1,335 | 83,479 | (12.5 | ) | ||||||||
UNIQA Insurance Group AG | 10,888 | 97,265 | (14.5 | ) | ||||||||
Vienna Insurance Group AG Wiener Versicherung Gruppe | 16,036 | 469,770 | (70.1 | ) | ||||||||
|
|
|
| |||||||||
| 916,134 | ||||||||||||
| Belgium | ||||||||||||
Barco NV | 22,052 | 641,170 | (95.7 | ) | ||||||||
Econocom Group SA/NV | 5,297 | 18,102 | (2.7 | ) | ||||||||
Etablissements Franz Colruyt NV | 7,917 | 218,950 | (32.7 | ) | ||||||||
Euronav NV | 25,507 | 434,967 | (64.9 | ) | ||||||||
Exmar NV | 11,809 | 153,910 | (23.0 | ) | ||||||||
Fagron | 26,228 | 485,372 | (72.4 | ) | ||||||||
SCHEDULE OF INVESTMENTS | 19 |
Schedule of Investments (continued) April 30, 2023 | BlackRock Global Equity Market Neutral Fund |
| Security | Shares | Value | % of Basket Value | |||||||||
| Belgium (continued) | ||||||||||||
Ion Beam Applications | 1,813 | $ | 33,058 | (4.9 | )% | |||||||
Melexis NV | 9,130 | 866,246 | (129.2 | ) | ||||||||
Montea NV | 1,327 | 115,769 | (17.3 | ) | ||||||||
Shurgard Self Storage Ltd. | 4,213 | 216,903 | (32.4 | ) | ||||||||
Telenet Group Holding NV | 1,485 | 34,464 | (5.1 | ) | ||||||||
|
|
|
| |||||||||
| 3,218,911 | ||||||||||||
| Brazil | ||||||||||||
ERO Copper Corp. | 1,535 | 30,036 | (4.5 | ) | ||||||||
|
|
|
| |||||||||
| Canada | ||||||||||||
Advantage Energy Ltd. | 5,015 | 28,024 | (4.2 | ) | ||||||||
Aecon Group, Inc. | 39,075 | 362,889 | (54.1 | ) | ||||||||
Altius Minerals Corp. | 24,897 | 387,999 | (57.9 | ) | ||||||||
Artis Real Estate Investment Trust | 22,615 | 116,750 | (17.4 | ) | ||||||||
Badger Infrastructure Solutions Ltd. | 372 | 8,100 | (1.2 | ) | ||||||||
Boardwalk Real Estate Investment Trust | 3,587 | 152,552 | (22.8 | ) | ||||||||
Boyd Group Services, Inc. | 160 | 26,594 | (4.0 | ) | ||||||||
Canaccord Genuity Group, Inc. | 35,497 | 281,416 | (42.0 | ) | ||||||||
Canada Goose Holdings, Inc. | 10,886 | 212,035 | (31.6 | ) | ||||||||
Cardinal Energy Ltd. | 26,255 | 140,535 | (21.0 | ) | ||||||||
Celestica, Inc. | 22,489 | 242,316 | (36.1 | ) | ||||||||
Centerra Gold, Inc. | 33,431 | 224,501 | (33.5 | ) | ||||||||
Cogeco Communications, Inc. | 4,693 | 225,965 | (33.7 | ) | ||||||||
Crew Energy, Inc. | 11,169 | 37,676 | (5.6 | ) | ||||||||
Crombie Real Estate Investment Trust | 8,012 | 90,599 | (13.5 | ) | ||||||||
CT Real Estate Investment Trust | 3,545 | 41,827 | (6.2 | ) | ||||||||
Dream Unlimited Corp. | 3,005 | 49,774 | (7.4 | ) | ||||||||
Dundee Precious Metals, Inc. | 35,753 | 260,603 | (38.9 | ) | ||||||||
ECN Capital Corp. | 27,448 | 63,615 | (9.5 | ) | ||||||||
Evertz Technologies Ltd. | 7,733 | 67,281 | (10.0 | ) | ||||||||
Fortuna Silver Mines, Inc. | 72,356 | 269,584 | (40.2 | ) | ||||||||
H&R Real Estate Investment Trust | 22,356 | 192,634 | (28.7 | ) | ||||||||
Hudbay Minerals, Inc. | 78,014 | 388,361 | (57.9 | ) | ||||||||
IAMGOLD Corp. | 22,569 | 64,220 | (9.6 | ) | ||||||||
Interfor Corp. | 3,793 | 59,116 | (8.8 | ) | ||||||||
Kelt Exploration Ltd. | 24,947 | 90,548 | (13.5 | ) | ||||||||
Knight Therapeutics, Inc. | 4,409 | 14,544 | (2.2 | ) | ||||||||
Laurentian Bank of Canada | 4,022 | 95,023 | (14.2 | ) | ||||||||
Lundin Gold, Inc. | 17,036 | 214,651 | (32.0 | ) | ||||||||
Morguard North American Residential Real Estate Investment Trust | 866 | 10,803 | (1.6 | ) | ||||||||
Mullen Group Ltd. | 9,669 | 106,436 | (15.9 | ) | ||||||||
New Gold, Inc. | 115,535 | 147,416 | (22.0 | ) | ||||||||
NFI Group, Inc. | 2,145 | 12,450 | (1.9 | ) | ||||||||
Novagold Resources, Inc. | 65,723 | 353,729 | (52.8 | ) | ||||||||
Pason Systems, Inc. | 29,110 | 251,920 | (37.6 | ) | ||||||||
PrairieSky Royalty Ltd. | 35,659 | 559,185 | (83.4 | ) | ||||||||
Precision Drilling Corp. | 7,329 | 362,669 | (54.1 | ) | ||||||||
Richelieu Hardware Ltd. | 15,392 | 459,907 | (68.6 | ) | ||||||||
Rogers Sugar, Inc. | 13,377 | 61,519 | (9.2 | ) | ||||||||
Russel Metals, Inc. | 9,181 | 232,288 | (34.7 | ) | ||||||||
Savaria Corp. | 17,027 | 207,561 | (31.0 | ) | ||||||||
Secure Energy Services, Inc. | 40,601 | 187,800 | (28.0 | ) | ||||||||
Silvercorp Metals, Inc. | 19,003 | 69,135 | (10.3 | ) | ||||||||
Slate Grocery REIT | 23,044 | 223,924 | (33.4 | ) | ||||||||
Sleep Country Canada Holdings, Inc. | 10,879 | 187,591 | (28.0 | ) | ||||||||
SmartCentres Real Estate Investment Trust | 5,736 | 110,122 | (16.4 | ) | ||||||||
SunOpta, Inc. | 27,048 | 227,588 | (34.0 | ) | ||||||||
Superior Plus Corp. | 7,419 | 54,648 | (8.2 | ) | ||||||||
Taseko Mines Ltd. | 169,063 | 276,428 | (41.2 | ) | ||||||||
| Security | Shares | Value | % of Basket Value | |||||||||
| Canada (continued) | ||||||||||||
Topaz Energy Corp. | 20,619 | $ | 293,516 | (43.8 | )% | |||||||
Torex Gold Resources, Inc. | 16,155 | 263,355 | (39.3 | ) | ||||||||
TransAlta Renewables, Inc. | 48,168 | 446,903 | (66.7 | ) | ||||||||
Trican Well Service Ltd. | 2,856 | 6,639 | (1.0 | ) | ||||||||
|
|
|
| |||||||||
| 9,523,264 | ||||||||||||
| China | ||||||||||||
Health & Happiness H&H International Holdings Ltd. | 126,500 | 216,620 | (32.3 | ) | ||||||||
|
|
|
| |||||||||
| Denmark | ||||||||||||
Dfds A/S | 3,811 | 152,836 | (22.8 | ) | ||||||||
H Lundbeck A/S, A Shares | 2,159 | 10,804 | (1.6 | ) | ||||||||
NKT A/S | 3,488 | 182,527 | (27.3 | ) | ||||||||
Scandinavian Tobacco Group A/S | 11,326 | 220,272 | (32.9 | ) | ||||||||
Schouw & Co. A/S | 477 | 40,431 | (6.0 | ) | ||||||||
SimCorp A/S | 572 | 61,808 | (9.2 | ) | ||||||||
Sydbank AS | 3,805 | 169,053 | (25.2 | ) | ||||||||
|
|
|
| |||||||||
| 837,731 | ||||||||||||
| Egypt | ||||||||||||
Centamin PLC | 278,754 | 356,980 | (53.3 | ) | ||||||||
|
|
|
| |||||||||
| Faeroe Islands | ||||||||||||
Bakkafrost P/F | 1,382 | 100,473 | (15.0 | ) | ||||||||
|
|
|
| |||||||||
| Finland | ||||||||||||
Cargotec OYJ, B Shares | 3,181 | 175,071 | (26.1 | ) | ||||||||
Citycon OYJ | 102,372 | 770,178 | (114.9 | ) | ||||||||
Finnair OYJ | 79,514 | 46,364 | (6.9 | ) | ||||||||
Kemira OYJ | 24,412 | 426,261 | (63.6 | ) | ||||||||
Nokian Renkaat OYJ | 22,823 | 221,400 | (33.1 | ) | ||||||||
Revenio Group OYJ | 3,024 | 113,120 | (16.9 | ) | ||||||||
YIT OYJ | 24,487 | 63,129 | (9.4 | ) | ||||||||
|
|
|
| |||||||||
| 1,815,523 | ||||||||||||
| France | ||||||||||||
Atos SE | 20,810 | 287,379 | (42.9 | ) | ||||||||
Believe SA | 2,838 | 33,664 | (5.0 | ) | ||||||||
Cie des Alpes | 3,840 | 60,652 | (9.0 | ) | ||||||||
Cie Plastic Omnium SA | 23,224 | 409,388 | (61.1 | ) | ||||||||
Esker SA | 796 | 120,659 | (18.0 | ) | ||||||||
Etablissements Maurel et Prom SA | 10,949 | 41,603 | (6.2 | ) | ||||||||
Eutelsat Communications SA | 22,522 | 149,037 | (22.2 | ) | ||||||||
Interparfums SA | 1,361 | 107,622 | (16.1 | ) | ||||||||
IPSOS | 5,721 | 308,824 | (46.1 | ) | ||||||||
Kaufman & Broad SA | 2,393 | 77,531 | (11.6 | ) | ||||||||
Korian SA | 25,766 | 222,654 | (33.2 | ) | ||||||||
Mercialys SA | 16,952 | 169,728 | (25.3 | ) | ||||||||
Mersen SA | 3,180 | 127,696 | (19.1 | ) | ||||||||
Rubis SCA | 3,873 | 113,972 | (17.0 | ) | ||||||||
SES-imagotag SA | 1,405 | 223,920 | (33.4 | ) | ||||||||
SMCP SA | 21,395 | 188,571 | (28.1 | ) | ||||||||
Television Francaise 1 | 87,746 | 703,653 | (105.0 | ) | ||||||||
Verallia SA | 7,824 | 316,151 | (47.2 | ) | ||||||||
Vicat SA | 7,966 | 231,306 | (34.5 | ) | ||||||||
Vilmorin & Cie SA | 561 | 26,402 | (3.9 | ) | ||||||||
Wavestone | 325 | 16,643 | (2.5 | ) | ||||||||
|
|
|
| |||||||||
| 3,937,055 | ||||||||||||
| Germany | ||||||||||||
1&1 AG | 8,586 | 99,760 | (14.9 | ) | ||||||||
Adesso SE | 908 | 135,558 | (20.2 | ) | ||||||||
Atoss Software AG | 2,432 | 485,840 | (72.5 | ) | ||||||||
| 20 | 2 0 2 3 BLACK ROCK ANNUAL REPORT TO SHAREHOLDERS |
Schedule of Investments (continued) April 30, 2023 | BlackRock Global Equity Market Neutral Fund |
| Security | Shares | Value | % of Basket Value | |||||||||
| Germany (continued) | ||||||||||||
AURELIUS Equity Opportunities SE & Co. KGaA | 6,703 | $ | 123,537 | (18.4 | )% | |||||||
Bank of Georgia Group PLC | 9,676 | 355,439 | (53.0 | ) | ||||||||
Bilfinger SE | 10,590 | 456,241 | (68.1 | ) | ||||||||
CropEnergies AG | 4,065 | 46,870 | (7.0 | ) | ||||||||
Datagroup SE | 179 | 13,099 | (2.0 | ) | ||||||||
Deutsche Pfandbriefbank AG | 50,438 | 463,165 | (69.1 | ) | ||||||||
Deutz AG | 65,537 | 433,787 | (64.7 | ) | ||||||||
Duerr AG | 16,972 | 586,310 | (87.5 | ) | ||||||||
Eckert & Ziegler Strahlen- und Medizintechnik AG | 405 | 20,856 | (3.1 | ) | ||||||||
Elmos Semiconductor SE | 2,069 | 155,647 | (23.2 | ) | ||||||||
ElringKlinger AG | 12,569 | 140,682 | (21.0 | ) | ||||||||
GFT Technologies SE | 2,499 | 98,264 | (14.7 | ) | ||||||||
Grand City Properties SA | 26,985 | 224,394 | (33.5 | ) | ||||||||
Heidelberger Druckmaschinen AG | 92,748 | 191,510 | (28.6 | ) | ||||||||
Hornbach Holding AG & Co. KGaA | 759 | 64,215 | (9.6 | ) | ||||||||
Krones AG | 4,553 | 595,894 | (88.9 | ) | ||||||||
Nagarro SE | 420 | 45,023 | (6.7 | ) | ||||||||
Orion Engineered Carbons SA | 6,515 | 157,728 | (23.5 | ) | ||||||||
Pfeiffer Vacuum Technology AG | 582 | 96,727 | (14.4 | ) | ||||||||
Siltronic AG | 1,124 | 80,636 | (12.0 | ) | ||||||||
Stabilus SE | 971 | 63,166 | (9.4 | ) | ||||||||
Steico SE | 1,047 | 51,921 | (7.8 | ) | ||||||||
TAG Immobilien AG | 52,536 | 447,944 | (66.8 | ) | ||||||||
TBC Bank Group PLC | 1,109 | 32,413 | (4.8 | ) | ||||||||
Vitesco Technologies Group AG | 4,144 | 282,489 | (42.2 | ) | ||||||||
|
|
|
| |||||||||
| 5,949,115 | ||||||||||||
| Guatemala | ||||||||||||
Millicom International Cellular SA, SDR | 4,509 | 80,323 | (12.0 | ) | ||||||||
|
|
|
| |||||||||
| Hong Kong | ||||||||||||
Cowell e Holdings, Inc. | 5,000 | 9,671 | (1.5 | ) | ||||||||
HKBN Ltd. | 38,500 | 27,167 | (4.1 | ) | ||||||||
Melco Resorts & Entertainment Ltd., ADR | 9,502 | 129,607 | (19.3 | ) | ||||||||
Nissin Foods Co. Ltd. | 79,000 | 70,572 | (10.5 | ) | ||||||||
United Laboratories International Holdings Ltd. | 92,000 | 74,488 | (11.1) | |||||||||
| 311,505 | ||||||||||||
| Indonesia | ||||||||||||
Bumitama Agri Ltd. | 66,900 | 28,818 | (4.3 | ) | ||||||||
First Resources Ltd. | 109,400 | 125,732 | (18.8 | ) | ||||||||
Golden Agri-Resources Ltd. | 151,400 | 31,215 | (4.6 | ) | ||||||||
|
|
|
| |||||||||
| 185,765 | ||||||||||||
| Iraq | ||||||||||||
Gulf Keystone Petroleum Ltd. | 24,923 | 41,902 | (6.3 | ) | ||||||||
|
|
|
| |||||||||
| Ireland | ||||||||||||
Cimpress PLC | 2,194 | 113,978 | (17.0 | ) | ||||||||
Dalata Hotel Group PLC | 85,174 | 426,319 | (63.6 | ) | ||||||||
|
|
|
| |||||||||
| 540,297 | ||||||||||||
| Israel | ||||||||||||
Cellcom Israel Ltd. | 12,857 | 45,893 | (6.8 | ) | ||||||||
Kornit Digital Ltd. | 10,306 | 188,188 | (28.1 | ) | ||||||||
Plus500 Ltd. | 20,508 | 423,434 | (63.2 | ) | ||||||||
Radware Ltd. | 488 | 9,833 | (1.5 | ) | ||||||||
Taboola.com Ltd. | 16,559 | 38,251 | (5.7 | ) | ||||||||
|
|
|
| |||||||||
| 705,599 | ||||||||||||
| Italy | ||||||||||||
Banca Popolare di Sondrio SPA | 67,419 | 305,025 | (45.5 | ) | ||||||||
Biesse SpA | 3,671 | 55,842 | (8.3 | ) | ||||||||
Brembo SpA | 6,730 | 98,458 | (14.7 | ) | ||||||||
| Security | Shares | Value | % of Basket Value | |||||||||
| Italy (continued) | ||||||||||||
Brunello Cucinelli SpA | 379 | $ | 36,124 | (5.4 | )% | |||||||
Danieli & C Officine Meccaniche SpA | 2,414 | 62,536 | (9.3 | ) | ||||||||
Datalogic SpA | 11,059 | 91,432 | (13.6 | ) | ||||||||
Iren SpA | 85,663 | 184,333 | (27.5 | ) | ||||||||
Maire Tecnimont SpA | 26,261 | 112,215 | (16.8 | ) | ||||||||
MFE-MediaForEurope NV | 38,641 | 28,332 | (4.2 | ) | ||||||||
OVS SpA | 8,069 | 24,152 | (3.6 | ) | ||||||||
Pharmanutra SpA | 719 | 39,716 | (5.9 | ) | ||||||||
Piaggio & C SpA | 46,348 | 189,844 | (28.3 | ) | ||||||||
RAI Way SpA | 4,736 | 30,206 | (4.5 | ) | ||||||||
Sanlorenzo SpA/Ameglia | 3,067 | 137,038 | (20.5 | ) | ||||||||
Sesa SpA | 1,564 | 190,830 | (28.5 | ) | ||||||||
Tod’s SpA | 1,540 | 64,807 | (9.7 | ) | ||||||||
Unipol Gruppo SpA | 32,173 | 180,095 | (26.9 | ) | ||||||||
Webuild SpA | 165,414 | 354,108 | (52.8 | ) | ||||||||
Wiit SpA | 1,686 | 36,535 | (5.5 | ) | ||||||||
|
|
|
| |||||||||
| 2,221,628 | ||||||||||||
| Japan | ||||||||||||
77 Bank Ltd. | 14,600 | 242,075 | (36.1 | ) | ||||||||
Aeon Delight Co. Ltd. | 14,300 | 323,192 | (48.2 | ) | ||||||||
Aichi Corp. | 25,400 | 160,426 | (23.9 | ) | ||||||||
Aida Engineering Ltd. | 13,300 | 85,446 | (12.7 | ) | ||||||||
Alpen Co. Ltd. | 13,700 | 213,651 | (31.9 | ) | ||||||||
Anicom Holdings, Inc. | 21,700 | 86,190 | (12.9 | ) | ||||||||
Arata Corp. | 1,500 | 49,705 | (7.4 | ) | ||||||||
Autobacs Seven Co. Ltd. | 6,800 | 78,851 | (11.8 | ) | ||||||||
Avex, Inc. | 4,300 | 50,243 | (7.5 | ) | ||||||||
Bell System24 Holdings, Inc. | 28,200 | 295,716 | (44.1 | ) | ||||||||
Belluna Co. Ltd. | 3,500 | 19,579 | (2.9 | ) | ||||||||
Bunka Shutter Co. Ltd. | 33,100 | 287,508 | (42.9 | ) | ||||||||
Central Glass Co. Ltd. | 24,800 | 546,473 | (81.5 | ) | ||||||||
Chugoku Marine Paints Ltd. | 5,700 | 50,767 | (7.6 | ) | ||||||||
Citizen Watch Co. Ltd. | 42,400 | 239,314 | (35.7 | ) | ||||||||
CKD Corp. | 13,500 | 209,747 | (31.3 | ) | ||||||||
Comture Corp. | 4,800 | 72,248 | (10.8 | ) | ||||||||
Create SD Holdings Co. Ltd. | 18,700 | 462,810 | (69.0 | ) | ||||||||
Curves Holdings Co. Ltd. | 6,800 | 40,455 | (6.0 | ) | ||||||||
Daihen Corp. | 5,000 | 167,958 | (25.1 | ) | ||||||||
Daiken Corp. | 8,600 | 150,773 | (22.5 | ) | ||||||||
Daiseki Co. Ltd. | 7,600 | 221,606 | (33.1 | ) | ||||||||
Digital Arts, Inc. | 13,900 | 527,628 | (78.7 | ) | ||||||||
Digital Garage, Inc. | 9,800 | 352,418 | (52.6 | ) | ||||||||
dip Corp. | 30,800 | 775,737 | (115.7 | ) | ||||||||
Doutor Nichires Holdings Co. Ltd. | 11,400 | 183,426 | (27.4 | ) | ||||||||
DTS Corp. | 1,200 | 29,088 | (4.3 | ) | ||||||||
DyDo Group Holdings, Inc. | 2,500 | 95,317 | (14.2 | ) | ||||||||
eGuarantee, Inc. | 19,200 | 304,516 | (45.4 | ) | ||||||||
Eiken Chemical Co. Ltd. | 26,400 | 312,880 | (46.7 | ) | ||||||||
Eizo Corp. | 3,900 | 130,387 | (19.5 | ) | ||||||||
Elan Corp. | 45,700 | 348,953 | (52.1 | ) | ||||||||
Elecom Co. Ltd. | 53,600 | 518,735 | (77.4 | ) | ||||||||
euglena Co. Ltd. | 25,300 | 169,053 | (25.2 | ) | ||||||||
FCC Co. Ltd. | 17,600 | 231,270 | (34.5 | ) | ||||||||
Financial Partners Group Co. Ltd. | 59,700 | 496,618 | (74.1 | ) | ||||||||
Fuji Co. Ltd. | 19,200 | 255,694 | (38.1 | ) | ||||||||
Fuji Corp. | 18,800 | 321,540 | (48.0 | ) | ||||||||
Fujimi, Inc. | 1,500 | 79,275 | (11.8 | ) | ||||||||
Fujimori Kogyo Co. Ltd. | 1,500 | 35,549 | (5.3 | ) | ||||||||
Fukuoka REIT Corp. | 223 | 273,281 | (40.8 | ) | ||||||||
Fullcast Holdings Co., Ltd. | 12,000 | 222,208 | (33.2 | ) | ||||||||
Funai Soken Holdings, Inc. | 29,500 | 576,775 | (86.1 | ) | ||||||||
SCHEDULE OF INVESTMENTS | 21 |
Schedule of Investments (continued) April 30, 2023 | BlackRock Global Equity Market Neutral Fund |
| Security | Shares | Value | % of Basket Value | |||||||||
| Japan (continued) | ||||||||||||
Future Corp. | 2,400 | $ | 31,369 | (4.7 | )% | |||||||
Geo Holdings Corp. | 18,500 | 228,283 | (34.1 | ) | ||||||||
Giken Ltd. | 12,000 | 192,399 | (28.7 | ) | ||||||||
GNI Group Ltd. | 28,900 | 222,254 | (33.2 | ) | ||||||||
Goldcrest Co. Ltd. | 9,200 | 125,734 | (18.8 | ) | ||||||||
Gree, Inc. | 16,000 | 84,554 | (12.6 | ) | ||||||||
G-Tekt Corp. | 22,100 | 246,807 | (36.8 | ) | ||||||||
Gunma Bank Ltd. | 49,600 | 173,223 | (25.8 | ) | ||||||||
H2O Retailing Corp. | 55,300 | 668,578 | (99.7 | ) | ||||||||
Halows Co. Ltd. | 4,500 | 108,839 | (16.2 | ) | ||||||||
Hankyu Hanshin REIT, Inc. | 79 | 86,358 | (12.9 | ) | ||||||||
Hanwa Co. Ltd. | 1,800 | 56,852 | (8.5 | ) | ||||||||
Heiwa Real Estate Co. Ltd. | 9,400 | 274,340 | (40.9 | ) | ||||||||
Hiday Hidaka Corp. | 18,900 | 324,450 | (48.4 | ) | ||||||||
Hioki EE Corp. | 800 | 54,399 | (8.1 | ) | ||||||||
Hitachi Zosen Corp. | 49,000 | 310,137 | (46.3 | ) | ||||||||
Hogy Medical Co. Ltd. | 8,600 | 219,686 | (32.8 | ) | ||||||||
Hokkoku Financial Holdings, Inc. | 1,900 | 67,655 | (10.1 | ) | ||||||||
Hosiden Corp. | 10,000 | 130,650 | (19.5 | ) | ||||||||
Ichigo, Inc. | 302,200 | 589,843 | (88.0 | ) | ||||||||
IDOM, Inc. | 2,500 | 15,750 | (2.3 | ) | ||||||||
Inaba Denki Sangyo Co. Ltd. | 3,700 | 84,293 | (12.6 | ) | ||||||||
Infocom Corp. | 7,600 | 128,981 | (19.2 | ) | ||||||||
Infomart Corp. | 132,300 | 289,975 | (43.3 | ) | ||||||||
JAC Recruitment Co. Ltd. | 30,000 | 572,066 | (85.3 | ) | ||||||||
JAFCO Group Co. ltd. | 73,500 | 957,050 | (142.8 | ) | ||||||||
Japan Elevator Service Holdings Co. Ltd. | 12,400 | 188,228 | (28.1 | ) | ||||||||
Japan Lifeline Co. Ltd. | 4,700 | 32,974 | (4.9 | ) | ||||||||
Japan Material Co. Ltd. | 4,100 | 62,762 | (9.4 | ) | ||||||||
Japan Securities Finance Co. Ltd. | 5,000 | 38,477 | (5.7 | ) | ||||||||
JCU Corp. | 24,900 | 599,956 | (89.5 | ) | ||||||||
JINS Holdings, Inc. | 22,600 | 496,879 | (74.1 | ) | ||||||||
Kaga Electronics Co. Ltd. | 4,500 | 162,857 | (24.3 | ) | ||||||||
Kanematsu Corp. | 22,400 | 297,332 | (44.4 | ) | ||||||||
Kato Sangyo Co. Ltd. | 3,500 | 94,900 | (14.2 | ) | ||||||||
KeePer Technical Laboratory Co. Ltd. | 5,500 | 208,535 | (31.1 | ) | ||||||||
Keihanshin Building Co. Ltd. | 29,100 | 279,797 | (41.7 | ) | ||||||||
KFC Holdings Japan Ltd. | 11,300 | 245,247 | (36.6 | ) | ||||||||
Kintetsu Department Store Co. Ltd. | 6,700 | 124,716 | (18.6 | ) | ||||||||
Kissei Pharmaceutical Co. Ltd. | 11,800 | 243,745 | (36.4 | ) | ||||||||
Kitz Corp. | 7,300 | 50,906 | (7.6 | ) | ||||||||
KOMEDA Holdings Co. Ltd. | 24,900 | 479,563 | (71.5 | ) | ||||||||
Konoike Transport Co. Ltd. | 23,500 | 282,066 | (42.1 | ) | ||||||||
Koshidaka Holdings Co. Ltd. | 22,500 | 194,370 | (29.0 | ) | ||||||||
Kumiai Chemical Industry Co. Ltd. | 38,400 | 260,666 | (38.9 | ) | ||||||||
Kureha Corp. | 9,600 | 607,364 | (90.6 | ) | ||||||||
Kyokuto Kaihatsu Kogyo Co. Ltd. | 24,400 | 313,765 | (46.8 | ) | ||||||||
Kyorin Pharmaceutical Co. Ltd. | 5,000 | 65,633 | (9.8 | ) | ||||||||
Kyoritsu Maintenance Co. Ltd. | 14,000 | 576,510 | (86.0 | ) | ||||||||
Life Corp. | 11,000 | 237,990 | (35.5 | ) | ||||||||
Link And Motivation, Inc. | 54,600 | 199,957 | (29.8 | ) | ||||||||
M&A Capital Partners Co. Ltd. | 3,900 | 112,340 | (16.8 | ) | ||||||||
Maeda Kosen Co. Ltd. | 9,400 | 229,464 | (34.2 | ) | ||||||||
Mandom Corp. | 51,100 | 619,696 | (92.5 | ) | ||||||||
Maruzen Showa Unyu Co. Ltd. | 1,800 | 45,954 | (6.9 | ) | ||||||||
Max Co. Ltd. | 5,900 | 96,113 | (14.3 | ) | ||||||||
MCJ Co. Ltd. | 2,000 | 14,112 | (2.1 | ) | ||||||||
Megmilk Snow Brand Co. Ltd. | 9,000 | 131,601 | (19.6 | ) | ||||||||
Meidensha Corp. | 10,500 | 145,481 | (21.7 | ) | ||||||||
Meitec Corp. | 38,400 | 662,119 | (98.8 | ) | ||||||||
METAWATER Co. Ltd. | 36,900 | 496,280 | (74.0 | ) | ||||||||
Mie Kotsu Group Holdings, Inc. | 2,200 | 9,699 | (1.4 | ) | ||||||||
| Security | Shares | Value | % of Basket Value | |||||||||
| Japan (continued) | ||||||||||||
Milbon Co. Ltd. | 1,100 | $ | 47,293 | (7.1 | )% | |||||||
Mimasu Semiconductor Industry Co. Ltd. | 5,500 | 108,498 | (16.2 | ) | ||||||||
Mitsubishi Pencil Co. Ltd. | 11,300 | 150,710 | (22.5 | ) | ||||||||
Mitsubishi Shokuhin Co. Ltd. | 22,100 | 581,994 | (86.8 | ) | ||||||||
Mitsui DM Sugar Holdings Co. Ltd. | 14,700 | 251,334 | (37.5 | ) | ||||||||
Mitsui-Soko Holdings Co. Ltd. | 2,800 | 83,841 | (12.5 | ) | ||||||||
MIXI, Inc. | 7,400 | 159,560 | (23.8 | ) | ||||||||
Mizuho Leasing Co. Ltd. | 8,800 | 251,434 | (37.5 | ) | ||||||||
Mizuno Corp. | 2,400 | 61,072 | (9.1 | ) | ||||||||
Mochida Pharmaceutical Co. Ltd. | 4,300 | 112,709 | (16.8 | ) | ||||||||
Modec, Inc. | 9,500 | 105,124 | (15.7 | ) | ||||||||
Monogatari Corp. | 11,900 | 255,084 | (38.1 | ) | ||||||||
Morita Holdings Corp. | 10,900 | 117,100 | (17.5 | ) | ||||||||
MOS Food Services, Inc. | 37,700 | 883,629 | (131.8 | ) | ||||||||
Nakanishi, Inc. | 36,000 | 695,732 | (103.8 | ) | ||||||||
Nichias Corp. | 14,700 | 303,090 | (45.2 | ) | ||||||||
Nichicon Corp. | 38,100 | 368,425 | (55.0 | ) | ||||||||
Nichiden Corp. | 4,700 | 71,049 | (10.6 | ) | ||||||||
Nippn Corp. | 6,100 | 80,850 | (12.1 | ) | ||||||||
Nippon Ceramic Co. Ltd. | 16,000 | 326,669 | (48.7 | ) | ||||||||
Nippon Gas Co. Ltd. | 44,200 | 631,843 | (94.3 | ) | ||||||||
Nippon Light Metal Holdings Co. Ltd. | 10,300 | 110,099 | (16.4 | ) | ||||||||
Nippon Paper Industries Co. Ltd. | 48,900 | 399,545 | (59.6 | ) | ||||||||
Nippon Parking Development Co. Ltd. | 113,400 | 199,356 | (29.7 | ) | ||||||||
Nippon REIT Investment Corp. | 219 | 523,884 | (78.2 | ) | ||||||||
Nippon Road Co. Ltd. | 2,000 | 120,785 | (18.0 | ) | ||||||||
Nippon Seiki Co. Ltd. | 31,600 | 205,113 | (30.6 | ) | ||||||||
Nippon Soda Co. Ltd. | 7,900 | 277,907 | (41.5 | ) | ||||||||
Nishi-Nippon Financial Holdings, Inc. | 59,300 | 503,832 | (75.2 | ) | ||||||||
Nissan Shatai Co. Ltd. | 40,000 | 280,128 | (41.8 | ) | ||||||||
Nisshin Oillio Group Ltd. | 6,300 | 160,524 | (23.9 | ) | ||||||||
Nisshinbo Holdings, Inc. | 13,900 | 109,135 | (16.3 | ) | ||||||||
Nissui Corp. | 86,400 | 385,269 | (57.5 | ) | ||||||||
Nittetsu Mining Co. Ltd. | 4,100 | 113,131 | (16.9 | ) | ||||||||
Nitto Boseki Co. Ltd. | 21,200 | 302,031 | (45.1 | ) | ||||||||
Nohmi Bosai Ltd. | 4,500 | 59,180 | (8.8 | ) | ||||||||
Nomura Co. Ltd. | 24,400 | 172,283 | (25.7 | ) | ||||||||
Noritsu Koki Co. Ltd. | 20,400 | 342,053 | (51.0 | ) | ||||||||
NSD Co. Ltd. | 28,000 | 525,382 | (78.4 | ) | ||||||||
NTN Corp. | 120,000 | 302,242 | (45.1 | ) | ||||||||
Obara Group, Inc. | 3,700 | 118,501 | (17.7 | ) | ||||||||
Oiles Corp. | 23,800 | 306,786 | (45.8 | ) | ||||||||
Okamura Corp. | 11,600 | 126,232 | (18.8 | ) | ||||||||
Oki Electric Industry Co. Ltd. | 55,700 | 308,185 | (46.0 | ) | ||||||||
Okinawa Cellular Telephone Co | 7,600 | 173,191 | (25.8 | ) | ||||||||
Okinawa Electric Power Co., Inc. | 51,600 | 429,400 | (64.1 | ) | ||||||||
Okumura Corp. | 4,600 | 115,079 | (17.2 | ) | ||||||||
Open Up Group, Inc. | 11,600 | 175,231 | (26.1 | ) | ||||||||
Optex Group Co. Ltd. | 6,800 | 104,352 | (15.6 | ) | ||||||||
Osaka Organic Chemical Industry Ltd. | 11,900 | 183,995 | (27.5 | ) | ||||||||
Outsourcing, Inc. | 12,700 | 131,184 | (19.6 | ) | ||||||||
Pacific Metals Co. Ltd. | 9,400 | 133,416 | (19.9 | ) | ||||||||
Pasona Group, Inc. | 20,400 | 286,328 | (42.7 | ) | ||||||||
PHC Holdings Corp. | 700 | 7,342 | (1.1 | ) | ||||||||
Pilot Corp. | 3,000 | 101,965 | (15.2 | ) | ||||||||
PKSHA Technology, Inc. | 900 | 12,776 | (1.9 | ) | ||||||||
Plus Alpha Consulting Co. Ltd. | 11,900 | 259,556 | (38.7 | ) | ||||||||
Prestige International, Inc. | 45,500 | 202,537 | (30.2 | ) | ||||||||
Raito Kogyo Co. Ltd. | 29,700 | 446,653 | (66.6 | ) | ||||||||
Riso Kyoiku Co. Ltd. | 52,400 | 116,754 | (17.4 | ) | ||||||||
Round One Corp. | 99,100 | 436,963 | (65.2 | ) | ||||||||
Royal Holdings Co. Ltd. | 7,300 | 157,880 | (23.6 | ) | ||||||||
| 22 | 2 0 2 3 BLACK ROCK ANNUAL REPORT TO SHAREHOLDERS |
Schedule of Investments (continued) April 30, 2023 | BlackRock Global Equity Market Neutral Fund |
| Security | Shares | Value | % of Basket Value | |||||||||
| Japan (continued) | ||||||||||||
RS Technologies Co. Ltd. | 7,500 | $ | 171,962 | (25.7 | )% | |||||||
S Foods, Inc. | 4,700 | 106,640 | (15.9 | ) | ||||||||
Saizeriya Co. Ltd. | 12,700 | 325,784 | (48.6 | ) | ||||||||
Sakai Moving Service Co. Ltd. | 300 | 10,774 | (1.6 | ) | ||||||||
Sakata Seed Corp. | 18,100 | 540,141 | (80.6 | ) | ||||||||
Sangetsu Corp. | 7,100 | 120,730 | (18.0 | ) | ||||||||
Sanken Electric Co. Ltd. | 2,700 | 207,243 | (30.9 | ) | ||||||||
Sanyo Chemical Industries Ltd. | 3,300 | 105,712 | (15.8 | ) | ||||||||
Sanyo Special Steel Co. Ltd. | 5,300 | 95,666 | (14.3 | ) | ||||||||
Sato Holdings Corp. | 4,100 | 70,746 | (10.6 | ) | ||||||||
Seiren Co. Ltd. | 28,900 | 490,076 | (73.1 | ) | ||||||||
Septeni Holdings Co. Ltd. | 28,600 | 80,353 | (12.0 | ) | ||||||||
Seria Co. Ltd. | 17,200 | 311,962 | (46.5 | ) | ||||||||
Shin-Etsu Polymer Co. Ltd. | 22,000 | 221,277 | (33.0 | ) | ||||||||
Shoei Co. Ltd. | 15,800 | 299,086 | (44.6 | ) | ||||||||
Solasto Corp. | 1,800 | 8,560 | (1.3 | ) | ||||||||
Sosei Group Corp. | 13,700 | 275,360 | (41.1 | ) | ||||||||
S-Pool, Inc. | 23,600 | 111,620 | (16.7 | ) | ||||||||
Star Asia Investment Corp. | 1,356 | 566,240 | (84.5 | ) | ||||||||
Starts Corp., Inc. | 18,200 | 350,762 | (52.3 | ) | ||||||||
Starts Proceed Investment Corp. | 17 | 29,360 | (4.4 | ) | ||||||||
Strike Co. Ltd. | 3,800 | 104,061 | (15.5 | ) | ||||||||
Sumitomo Mitsui Construction Co. Ltd. | 44,500 | 128,713 | (19.2 | ) | ||||||||
Sumitomo Warehouse Co. Ltd. | 12,100 | 205,080 | (30.6 | ) | ||||||||
Sun Frontier Fudousan Co. Ltd. | 53,300 | 527,667 | (78.7 | ) | ||||||||
Systena Corp. | 249,200 | 525,765 | (78.4 | ) | ||||||||
Tadano Ltd. | 19,300 | 153,761 | (22.9 | ) | ||||||||
Taikisha Ltd. | 400 | 11,050 | (1.6 | ) | ||||||||
Taiyo Holdings Co. Ltd. | 22,900 | 422,285 | (63.0 | ) | ||||||||
Takamatsu Construction Group Co. Ltd. | 18,100 | 299,334 | (44.7 | ) | ||||||||
Takara Standard Co. Ltd. | 900 | 11,098 | (1.7 | ) | ||||||||
Takeuchi Manufacturing Co. Ltd. | 800 | 21,955 | (3.3 | ) | ||||||||
Takuma Co. Ltd. | 39,600 | 422,056 | (63.0 | ) | ||||||||
Tamron Co. Ltd. | 37,000 | 919,523 | (137.2 | ) | ||||||||
TechMatrix Corp. | 6,400 | 77,893 | (11.6 | ) | ||||||||
T-Gaia Corp. | 28,400 | 355,377 | (53.0 | ) | ||||||||
TKC Corp. | 800 | 22,058 | (3.3 | ) | ||||||||
Tocalo Co. Ltd. | 25,200 | 241,374 | (36.0 | ) | ||||||||
TOKAI Corp. | 5,800 | 89,339 | (13.3 | ) | ||||||||
Tokai Rika Co. Ltd. | 20,600 | 289,606 | (43.2 | ) | ||||||||
Token Corp. | 3,300 | 195,952 | (29.2 | ) | ||||||||
Tokyo Seimitsu Co. Ltd. | 6,000 | 225,955 | (33.7 | ) | ||||||||
Tokyo Steel Manufacturing Co. Ltd. | 21,100 | 216,593 | (32.3 | ) | ||||||||
Tokyotokeiba Co. Ltd. | 10,600 | 341,349 | (50.9 | ) | ||||||||
Tokyu Construction Co. Ltd. | 90,800 | 490,953 | (73.2 | ) | ||||||||
Tokyu REIT, Inc. | 196 | 267,078 | (39.8 | ) | ||||||||
Topcon Corp. | 17,100 | 248,435 | (37.1 | ) | ||||||||
Toridoll Holdings Corp. | 30,400 | 661,480 | (98.7 | ) | ||||||||
Torii Pharmaceutical Co. Ltd. | 1,600 | 41,415 | (6.2 | ) | ||||||||
Tosei Corp. | 21,000 | 254,696 | (38.0 | ) | ||||||||
Towa Pharmaceutical Co. Ltd. | 22,700 | 330,416 | (49.3 | ) | ||||||||
Toyo Ink SC Holdings Co. Ltd. | 8,700 | 143,192 | (21.4 | ) | ||||||||
Toyo Tanso Co. Ltd. | 8,300 | 246,390 | (36.8 | ) | ||||||||
TRE Holdings Corp. | 6,600 | 58,463 | (8.7 | ) | ||||||||
Tri Chemical Laboratories, Inc. | 11,600 | 191,529 | (28.6 | ) | ||||||||
Tsubakimoto Chain Co. | 4,900 | 123,763 | (18.5 | ) | ||||||||
United Arrows Ltd. | 38,400 | 571,823 | (85.3 | ) | ||||||||
Universal Entertainment Corp. | 12,500 | 268,389 | (40.0 | ) | ||||||||
Usen-Next Holdings Co. Ltd. | 3,600 | 82,435 | (12.3 | ) | ||||||||
UT Group Co. Ltd. | 22,100 | 431,331 | (64.4 | ) | ||||||||
Valor Holdings Co. Ltd. | 13,000 | 202,928 | (30.3 | ) | ||||||||
| Security | Shares | Value | % of Basket Value | |||||||||
| Japan (continued) | ||||||||||||
ValueCommerce Co. Ltd. | 48,100 | $ | 478,291 | (71.4 | )% | |||||||
Vision, Inc. | 7,100 | 90,847 | (13.6 | ) | ||||||||
VT Holdings Co. Ltd. | 37,400 | 149,804 | (22.3 | ) | ||||||||
Wakita & Co. Ltd. | 24,600 | 255,308 | (38.1 | ) | ||||||||
WDB Holdings Co. Ltd. | 3,600 | 54,845 | (8.2 | ) | ||||||||
Yamazen Corp. | 16,900 | 133,720 | (19.9 | ) | ||||||||
Yellow Hat Ltd. | 8,800 | 127,520 | (19.0 | ) | ||||||||
Yurtec Corp. | 3,200 | 19,838 | (3.0 | ) | ||||||||
Zenrin Co. Ltd. | 46,600 | 307,442 | (45.9 | ) | ||||||||
Zuken, Inc. | 7,000 | 181,345 | (27.1 | ) | ||||||||
|
|
|
| |||||||||
| 57,242,459 | ||||||||||||
| Jersey | ||||||||||||
JTC PLC | 8,304 | 81,795 | (12.2 | ) | ||||||||
|
|
|
| |||||||||
| Luxembourg | ||||||||||||
SES SA | 34,235 | 211,436 | (31.5 | ) | ||||||||
|
|
|
| |||||||||
| Malta | ||||||||||||
Kambi Group PLC | 7,885 | 130,983 | (19.5 | ) | ||||||||
|
|
|
| |||||||||
| Netherlands | ||||||||||||
PostNL NV | 73,694 | 132,008 | (19.7 | ) | ||||||||
Shop Apotheke Europe NV | 855 | 84,989 | (12.7 | ) | ||||||||
TomTom NV | 36,765 | 313,846 | (46.8 | ) | ||||||||
uniQure NV | 6,020 | 116,848 | (17.4 | ) | ||||||||
Van Lanschot Kempen NV | 6,585 | 199,244 | (29.7 | ) | ||||||||
Vastned Retail NV | 874 | 19,826 | (3.0 | ) | ||||||||
Wereldhave NV | 17,899 | 273,605 | (40.8 | ) | ||||||||
|
|
|
| |||||||||
| 1,140,366 | ||||||||||||
| New Zealand | ||||||||||||
a2 Milk Co. Ltd. | 42,035 | 152,334 | (22.7 | ) | ||||||||
Chorus Ltd. | 13,436 | 71,310 | (10.6 | ) | ||||||||
Genesis Energy Ltd. | 5,117 | 8,523 | (1.3 | ) | ||||||||
|
|
|
| |||||||||
| 232,167 | ||||||||||||
| Norway | ||||||||||||
Aker Solutions ASA | 40,179 | 142,989 | (21.3 | ) | ||||||||
Austevoll Seafood ASA | 39,403 | 369,989 | (55.2 | ) | ||||||||
Borregaard ASA, Registered Shares | 4,613 | 76,965 | (11.5 | ) | ||||||||
DNO ASA | 180,240 | 179,752 | (26.8 | ) | ||||||||
Elkem ASA | 76,283 | 257,424 | (38.4 | ) | ||||||||
Frontline PLC | 42,292 | 654,067 | (97.6 | ) | ||||||||
Grieg Seafood ASA | 8,657 | 72,393 | (10.8 | ) | ||||||||
Nykode Therapeutics ASA | 6,272 | 15,135 | (2.3 | ) | ||||||||
Protector Forsikring ASA | 8,472 | 122,671 | (18.3 | ) | ||||||||
Schibsted ASA, B Shares | 1,592 | 25,702 | (3.8 | ) | ||||||||
SpareBank 1 Nord Norge | 5,749 | 51,900 | (7.7 | ) | ||||||||
SpareBank 1 SMN | 22,506 | 290,144 | (43.3 | ) | ||||||||
SpareBank 1 SR-Bank ASA | 4,285 | 50,279 | (7.5 | ) | ||||||||
Stolt-Nielsen Ltd. | 5,751 | 165,292 | (24.7 | ) | ||||||||
Storebrand ASA | 21,994 | 169,205 | (25.2 | ) | ||||||||
TGS ASA | 34,284 | 536,041 | (80.0 | ) | ||||||||
Veidekke ASA | 2,520 | 28,909 | (4.3 | ) | ||||||||
Wallenius Wilhelmsen ASA | 4,467 | 33,329 | (5.0 | ) | ||||||||
|
|
|
| |||||||||
| 3,242,186 | ||||||||||||
| Peru | ||||||||||||
Hochschild Mining PLC | 134,226 | 119,529 | (17.8 | ) | ||||||||
|
|
|
| |||||||||
SCHEDULE OF INVESTMENTS | 23 |
Schedule of Investments (continued) April 30, 2023 | BlackRock Global Equity Market Neutral Fund |
| Security | Shares | Value | % of Basket Value | |||||||||
| Portugal | ||||||||||||
REN - Redes Energeticas Nacionais SGPS SA | 93,679 | $ | 270,795 | (40.4 | )% | |||||||
Sonae SGPS SA | 69,023 | 78,364 | (11.7 | ) | ||||||||
|
|
|
| |||||||||
| 349,159 | ||||||||||||
| Puerto Rico | ||||||||||||
Evertec, Inc. | 22,543 | 782,017 | (116.7 | ) | ||||||||
Liberty Latin America Ltd. | 22,319 | 197,969 | (29.5 | ) | ||||||||
|
|
|
| |||||||||
| 979,986 | ||||||||||||
| Singapore | ||||||||||||
BW LPG Ltd. | 39,120 | 315,167 | (47.0 | ) | ||||||||
Capitaland India Trust | 318,000 | 259,599 | (38.7 | ) | ||||||||
Far East Hospitality Trust | 372,600 | 172,992 | (25.8 | ) | ||||||||
Frasers Centrepoint Trust | 78,200 | 129,518 | (19.3 | ) | ||||||||
IGG, Inc. | 691,000 | 571,198 | (85.2 | ) | ||||||||
Sheng Siong Group Ltd. | 76,100 | 100,751 | (15.1 | ) | ||||||||
|
|
|
| |||||||||
| 1,549,225 | ||||||||||||
| South Africa | ||||||||||||
Scatec ASA | 32,815 | 213,899 | (31.9 | ) | ||||||||
|
|
|
| |||||||||
| South Korea | ||||||||||||
Magnachip Semiconductor Corp. | 16,367 | 145,339 | (21.7 | ) | ||||||||
|
|
|
| |||||||||
| Spain | ||||||||||||
Almirall SA | 28,915 | 294,705 | (44.0 | ) | ||||||||
Cia de Distribucion Integral Logista Holdings SA | 22,895 | 619,010 | (92.4 | ) | ||||||||
Ebro Foods SA | 3,920 | 72,441 | (10.8 | ) | ||||||||
Laboratorios Farmaceuticos Rovi SA | 4,902 | 215,882 | (32.2 | ) | ||||||||
Mediaset Espana Comunicacion SA | 71,351 | 236,176 | (35.2 | ) | ||||||||
Melia Hotels International SA | 19,388 | 124,631 | (18.6 | ) | ||||||||
Pharma Mar SA | 3,699 | 152,835 | (22.8 | ) | ||||||||
Tecnicas Reunidas SA | 6,921 | 63,939 | (9.5 | ) | ||||||||
Unicaja Banco SA | 149,536 | 151,026 | (22.5 | ) | ||||||||
Viscofan SA | 3,635 | 247,999 | (37.0 | ) | ||||||||
|
|
|
| |||||||||
| 2,178,644 | ||||||||||||
| Sweden | ||||||||||||
AAK AB | 34,086 | 682,690 | (101.9 | ) | ||||||||
AddLife AB, Class A | 5,970 | 70,394 | (10.5 | ) | ||||||||
AddTech AB, B Shares | 63,744 | 1,269,911 | (189.5 | ) | ||||||||
Alleima AB | 25,049 | 127,867 | (19.1 | ) | ||||||||
Arjo AB, B Shares | 21,367 | 94,228 | (14.1 | ) | ||||||||
Betsson AB | 34,775 | 373,203 | (55.7 | ) | ||||||||
BioGaia AB, B Shares | 35,953 | 354,885 | (52.9 | ) | ||||||||
Biotage AB | 19,749 | 244,219 | (36.4 | ) | ||||||||
Boozt AB | 5,530 | 63,617 | (9.5 | ) | ||||||||
Bravida Holding AB | 28,669 | 346,901 | (51.8 | ) | ||||||||
Bure Equity AB | 3,541 | 90,004 | (13.4 | ) | ||||||||
Camurus AB | 936 | 21,184 | (3.2 | ) | ||||||||
Corem Property Group AB, B Shares | 111,831 | 88,202 | (13.2 | ) | ||||||||
Fortnox AB | 35,402 | 242,575 | (36.2 | ) | ||||||||
HMS Networks AB | 8,127 | 375,898 | (56.1 | ) | ||||||||
Intrum AB | 31,875 | 286,481 | (42.7 | ) | ||||||||
INVISIO AB | 1,010 | 20,619 | (3.1 | ) | ||||||||
MIPS AB | 8,492 | 456,439 | (68.1 | ) | ||||||||
Modern Times Group MTG AB, B Shares | 1,995 | 15,941 | (2.4 | ) | ||||||||
Mycronic AB | 14,747 | 311,216 | (46.4 | ) | ||||||||
Nolato AB, B Shares | 54,598 | 301,106 | (44.9 | ) | ||||||||
NP3 Fastigheter AB | 601 | 11,495 | (1.7 | ) | ||||||||
Nyfosa AB | 21,692 | 147,649 | (22.0 | ) | ||||||||
Orron Energy ab | 4,730 | 5,486 | (0.8 | ) | ||||||||
Paradox Interactive AB | 1,588 | 38,773 | (5.8 | ) | ||||||||
| Security | Shares | Value | % of Basket Value | |||||||||
| Sweden (continued) | ||||||||||||
Resurs Holding AB | 4,636 | $ | 8,755 | (1.3 | )% | |||||||
Samhallsbyggnadsbolaget i Norden AB | 64,953 | 97,763 | (14.6 | ) | ||||||||
Sdiptech AB, Class B | 1,900 | 43,646 | (6.5 | ) | ||||||||
Sectra AB, B Shares | 15,611 | 244,949 | (36.5 | ) | ||||||||
Svolder AB | 1,796 | 10,783 | (1.6 | ) | ||||||||
Thule Group AB | 4,295 | 123,541 | (18.4 | ) | ||||||||
Troax Group AB | 1,025 | 23,091 | (3.4 | ) | ||||||||
Vitrolife AB | 5,534 | 123,916 | (18.5 | ) | ||||||||
Xvivo Perfusion AB | 1,718 | 50,997 | (7.6 | ) | ||||||||
|
|
|
| |||||||||
| 6,768,424 | ||||||||||||
| Switzerland | ||||||||||||
Allreal Holding AG, Registered Shares | 1,681 | 298,875 | (44.6 | ) | ||||||||
Basilea Pharmaceutica AG, Registered Shares | 7,172 | 348,220 | (51.9 | ) | ||||||||
Bossard Holding AG, Registered Shares | 297 | 72,980 | (10.9 | ) | ||||||||
Bucher Industries AG, Registered Shares | 1,297 | 585,160 | (87.3 | ) | ||||||||
Burkhalter Holding AG | 229 | 24,655 | (3.7 | ) | ||||||||
Cembra Money Bank AG | 2,113 | 170,021 | (25.4 | ) | ||||||||
Comet Holding AG, Registered Shares | 531 | 128,584 | (19.2 | ) | ||||||||
Gurit Holding AG | 1,326 | 133,903 | (20.0 | ) | ||||||||
Huber & Suhner AG, Registered Shares | 2,065 | 170,421 | (25.4 | ) | ||||||||
Implenia AG, Registered Shares | 545 | 24,641 | (3.7 | ) | ||||||||
Inficon Holding AG, Registered Shares | 99 | 107,968 | (16.1 | ) | ||||||||
Kardex Holding AG, Registered Shares | 354 | 81,048 | (12.1 | ) | ||||||||
LEM Holding SA, Registered Shares | 12 | 26,524 | (4.0 | ) | ||||||||
Medacta Group SA | 82 | 11,041 | (1.6 | ) | ||||||||
Medartis Holding AG | 562 | 47,175 | (7.0 | ) | ||||||||
Medmix AG | 913 | 21,706 | (3.2 | ) | ||||||||
Mobilezone Holding AG, Registered Shares | 617 | 9,460 | (1.4 | ) | ||||||||
Orior AG | 2,283 | 213,462 | (31.8 | ) | ||||||||
Sensirion Holding AG | 183 | 19,890 | (3.0 | ) | ||||||||
Sulzer AG, Registered Shares | 884 | 74,214 | (11.1 | ) | ||||||||
Swissquote Group Holding SA, Registered Shares | 1,930 | 413,939 | (61.8 | ) | ||||||||
Vetropack Holding AG, Registered Shares | 3,146 | 163,254 | (24.4 | ) | ||||||||
Ypsomed Holding AG, Registered Shares | 1,126 | 262,241 | (39.1 | ) | ||||||||
|
|
|
| |||||||||
| 3,409,382 | ||||||||||||
| Turkey | ||||||||||||
Eldorado Gold Corp. | 32,399 | 355,757 | (53.1 | ) | ||||||||
|
|
|
| |||||||||
| United Kingdom | ||||||||||||
888 Holdings PLC | 265,663 | 265,138 | (39.6 | ) | ||||||||
AG Barr PLC | 49,402 | 308,201 | (46.0 | ) | ||||||||
AJ Bell PLC | 67,273 | 272,042 | (40.6 | ) | ||||||||
Alliance Pharma PLC | 17,430 | 13,776 | (2.1 | ) | ||||||||
Alpha Group International PLC | 740 | 19,920 | (3.0 | ) | ||||||||
Ashmore Group PLC | 40,371 | 122,169 | (18.2 | ) | ||||||||
ASOS PLC | 6,847 | 62,882 | (9.4 | ) | ||||||||
Avon Protection PLC | 566 | 6,975 | (1.0 | ) | ||||||||
Babcock International Group PLC | 12,794 | 50,682 | (7.6 | ) | ||||||||
Balanced Commercial Property Trust Ltd. | 613,243 | 626,732 | (93.5 | ) | ||||||||
Big Yellow Group PLC | 14,544 | 221,050 | (33.0 | ) | ||||||||
Bodycote PLC | 38,796 | 332,432 | (49.6 | ) | ||||||||
boohoo Group PLC | 255,762 | 156,478 | (23.3 | ) | ||||||||
Breedon Group PLC | 40,055 | 34,120 | (5.1 | ) | ||||||||
Bytes Technology Group PLC | 130,228 | 671,759 | (100.2 | ) | ||||||||
Central Asia Metals PLC | 3,851 | 9,805 | (1.5 | ) | ||||||||
Chemring Group PLC | 70,013 | 247,250 | (36.9 | ) | ||||||||
Clarkson PLC | 5,803 | 223,159 | (33.3 | ) | ||||||||
Cranswick PLC | 13,060 | 521,386 | (77.8 | ) | ||||||||
CVS Group PLC | 25,241 | 663,871 | (99.0 | ) | ||||||||
| 24 | 2 0 2 3 BLACK ROCK ANNUAL REPORT TO SHAREHOLDERS |
Schedule of Investments (continued) April 30, 2023 | BlackRock Global Equity Market Neutral Fund |
| Security | Shares | Value | % of Basket Value | |||||||||
| United Kingdom (continued) | ||||||||||||
Deliveroo PLC | 59,363 | $ | 80,586 | (12.0 | )% | |||||||
DiscoverIE Group PLC | 36,204 | 379,672 | (56.6 | ) | ||||||||
Dr Martens PLC | 55,044 | 113,237 | (16.9 | ) | ||||||||
Dunelm Group PLC | 18,078 | 256,927 | (38.3 | ) | ||||||||
Ergomed PLC | 578 | 7,665 | (1.1 | ) | ||||||||
Essentra PLC | 156,836 | 402,737 | (60.1 | ) | ||||||||
FD Technologies PLC | 4,323 | 101,213 | (15.1 | ) | ||||||||
Fevertree Drinks PLC | 5,189 | 87,338 | (13.0 | ) | ||||||||
Forterra PLC | 14,144 | 33,943 | (5.1 | ) | ||||||||
Frasers Group PLC | 40,541 | 386,498 | (57.7 | ) | ||||||||
Gamma Communications PLC | 14,842 | 214,778 | (32.0 | ) | ||||||||
Genuit Group PLC | 87,210 | 325,347 | (48.5 | ) | ||||||||
Genus PLC | 2,538 | 84,656 | (12.6 | ) | ||||||||
Grafton Group PLC, CDI | 2,633 | 28,546 | (4.3 | ) | ||||||||
Grainger PLC | 132,887 | 426,514 | (63.6 | ) | ||||||||
Hammerson PLC | 2,467,392 | 859,453 | (128.2 | ) | ||||||||
Helios Towers PLC | 47,167 | 60,886 | (9.1 | ) | ||||||||
Hill & Smith PLC | 3,969 | 67,743 | (10.1 | ) | ||||||||
Hunting PLC | 46,648 | 135,400 | (20.2 | ) | ||||||||
Ibstock PLC | 166,294 | 350,156 | (52.2 | ) | ||||||||
Impax Asset Management Group PLC | 26,541 | 259,018 | (38.6 | ) | ||||||||
IntegraFin Holdings PLC | 1,898 | 6,407 | (1.0 | ) | ||||||||
Johnson Service Group PLC | 63,202 | 95,346 | (14.2 | ) | ||||||||
Judges Scientific PLC | 2,471 | 304,627 | (45.5 | ) | ||||||||
Jupiter Fund Management PLC | 117,011 | 188,973 | (28.2 | ) | ||||||||
Just Group PLC | 479,825 | 525,455 | (78.4 | ) | ||||||||
Kainos Group PLC | 49,116 | 756,841 | (112.9 | ) | ||||||||
Lancashire Holdings Ltd. | 47,003 | 357,886 | (53.4 | ) | ||||||||
Learning Technologies Group PLC | 38,273 | 53,300 | (8.0 | ) | ||||||||
Luxfer Holdings PLC | 6,600 | 100,650 | (15.0 | ) | ||||||||
Marshalls PLC | 53,905 | 200,930 | (30.0 | ) | ||||||||
Mitchells & Butlers PLC | 30,472 | 66,171 | (9.9 | ) | ||||||||
Moneysupermarket.com Group PLC | 93,963 | 320,559 | (47.8 | ) | ||||||||
Morgan Advanced Materials PLC | 51,222 | 195,549 | (29.2 | ) | ||||||||
Morgan Sindall Group PLC | 10,210 | 214,798 | (32.0 | ) | ||||||||
National Express Group PLC | 361,430 | 545,144 | (81.3 | ) | ||||||||
Oxford Instruments PLC | 2,738 | 93,772 | (14.0 | ) | ||||||||
Oxford Nanopore Technologies PLC | 26,490 | 75,475 | (11.3 | ) | ||||||||
Paragon Banking Group PLC | 37,718 | 235,307 | (35.1 | ) | ||||||||
Polar Capital Holdings PLC | 12,440 | 75,436 | (11.3 | ) | ||||||||
Premier Foods PLC | 28,253 | 43,947 | (6.6 | ) | ||||||||
QinetiQ Group PLC | 117,838 | 543,496 | (81.1 | ) | ||||||||
Quilter PLC | 289,065 | 305,554 | (45.6 | ) | ||||||||
Redde Northgate PLC | 29,095 | 135,710 | (20.2 | ) | ||||||||
RWS Holdings PLC | 16,484 | 52,012 | (7.8 | ) | ||||||||
Safestore Holdings PLC | 17,437 | 214,635 | (32.0 | ) | ||||||||
Savills PLC | 10,482 | 125,244 | (18.7 | ) | ||||||||
Shaftesbury Capital PLC | 109,111 | 159,476 | (23.8 | ) | ||||||||
SIG PLC | 199,367 | 110,325 | (16.5 | ) | ||||||||
Smart Metering Systems PLC | 36,533 | 359,470 | (53.6 | ) | ||||||||
Softcat PLC | 53,723 | 893,396 | (133.3 | ) | ||||||||
SThree PLC | 46,995 | 245,747 | (36.7 | ) | ||||||||
Telecom Plus PLC | 8,905 | 199,318 | (29.7 | ) | ||||||||
TP ICAP Group PLC | 72,247 | 152,425 | (22.7 | ) | ||||||||
Trainline PLC | 25,125 | 77,706 | (11.6 | ) | ||||||||
Trustpilot Group PLC | 54,732 | 59,990 | (9.0 | ) | ||||||||
UK Commercial Property REIT Ltd. | 932,099 | 621,412 | (92.7 | ) | ||||||||
Vanquis Banking Group PLC | 4,366 | 12,179 | (1.8 | ) | ||||||||
Vesuvius PLC | 35,352 | 178,195 | (26.6 | ) | ||||||||
Victrex PLC | 3,282 | 69,047 | (10.3 | ) | ||||||||
Virgin Money UK PLC | 300,284 | 582,544 | (86.9 | ) | ||||||||
| Security | Shares | Value | % of Basket Value | |||||||||
| United Kingdom (continued) | ||||||||||||
Volution Group PLC | 60,390 | $ | 324,605 | (48.4 | )% | |||||||
Wickes Group PLC | 756 | 1,264 | (0.2 | ) | ||||||||
YouGov PLC | 14,637 | 154,270 | (23.0 | ) | ||||||||
|
|
|
| |||||||||
| 19,526,733 | ||||||||||||
| United States | ||||||||||||
1-800-Flowers.com, Inc., Class A | 2,122 | 19,544 | (2.9 | ) | ||||||||
1st Source Corp. | 3,474 | 144,796 | (21.6 | ) | ||||||||
2seventy bio, Inc. | 3,817 | 36,300 | (5.4 | ) | ||||||||
2U, Inc. | 17,174 | 95,144 | (14.2 | ) | ||||||||
8x8, Inc. | 63,300 | 181,671 | (27.1 | ) | ||||||||
A10 Networks, Inc. | 44,065 | 623,079 | (93.0 | ) | ||||||||
AAON, Inc. | 2,126 | 208,348 | (31.1 | ) | ||||||||
Aaron’s Co., Inc. | 15,274 | 203,908 | (30.4 | ) | ||||||||
Abercrombie & Fitch Co., Class A | 15,888 | 374,004 | (55.8 | ) | ||||||||
ACADIA Pharmaceuticals, Inc. | 3,773 | 80,478 | (12.0 | ) | ||||||||
ACI Worldwide, Inc. | 10,022 | 253,857 | (37.9 | ) | ||||||||
ACM Research, Inc., Class A | 2,847 | 26,619 | (4.0 | ) | ||||||||
Acushnet Holdings Corp. | 9,331 | 467,763 | (69.8 | ) | ||||||||
Adaptive Biotechnologies Corp. | 2,939 | 20,984 | (3.1 | ) | ||||||||
Advanced Energy Industries, Inc. | 9,597 | 830,140 | (123.9 | ) | ||||||||
AdvanSix, Inc. | 4,277 | 161,157 | (24.0 | ) | ||||||||
Agios Pharmaceuticals, Inc. | 7,671 | 175,436 | (26.2 | ) | ||||||||
Air Transport Services Group, Inc. | 5,077 | 103,114 | (15.4 | ) | ||||||||
Alarm.com Holdings, Inc. | 11,818 | 563,600 | (84.1 | ) | ||||||||
Albany International Corp., Class A | 3,315 | 302,361 | (45.1 | ) | ||||||||
Alector, Inc. | 11,438 | 75,491 | (11.3 | ) | ||||||||
Alexander & Baldwin, Inc. | 7,701 | 148,090 | (22.1 | ) | ||||||||
Alignment Healthcare, Inc. | 6,532 | 41,086 | (6.1 | ) | ||||||||
Allegiant Travel Co. | 1,801 | 187,142 | (27.9 | ) | ||||||||
ALLETE, Inc. | 4,578 | 285,576 | (42.6 | ) | ||||||||
Allogene Therapeutics, Inc. | 27,995 | 152,013 | (22.7 | ) | ||||||||
Alpha & Omega Semiconductor Ltd. | 4,382 | 104,642 | (15.6 | ) | ||||||||
Alpha Metallurgical Resources, Inc. | 1,613 | 236,401 | (35.3 | ) | ||||||||
Altice USA, Inc. | 2,076 | 7,266 | (1.1 | ) | ||||||||
Amalgamated Financial Corp. | 12,159 | 197,949 | (29.5 | ) | ||||||||
Ambac Financial Group, Inc. | 7,646 | 121,954 | (18.2 | ) | ||||||||
Ambarella, Inc. | 2,601 | 161,210 | (24.1 | ) | ||||||||
Amedisys, Inc. | 10,956 | 879,767 | (131.3 | ) | ||||||||
American Assets Trust, Inc. | 34,090 | 620,438 | (92.6 | ) | ||||||||
American Axle & Manufacturing Holdings, Inc. | 28,064 | 200,658 | (29.9 | ) | ||||||||
American Software, Inc. | 12,575 | 150,146 | (22.4 | ) | ||||||||
American Woodmark Corp. | 129 | 6,517 | (1.0 | ) | ||||||||
AMERISAFE, Inc. | 4,262 | 237,180 | (35.4 | ) | ||||||||
Amicus Therapeutics, Inc. | 13,508 | 155,882 | (23.3 | ) | ||||||||
Amneal Pharmaceuticals, Inc. | 39,996 | 77,192 | (11.5 | ) | ||||||||
Amphastar Pharmaceuticals, Inc. | 9,913 | 354,588 | (52.9 | ) | ||||||||
AnaptysBio, Inc. | 11,451 | 238,410 | (35.6 | ) | ||||||||
AngioDynamics, Inc. | 10,320 | 85,862 | (12.8 | ) | ||||||||
Anika Therapeutics, Inc. | 1,606 | 41,210 | (6.1 | ) | ||||||||
Apogee Enterprises, Inc. | 20,620 | 877,587 | (130.9 | ) | ||||||||
Appfolio, Inc. | 808 | 112,813 | (16.8 | ) | ||||||||
Arbor Realty Trust, Inc. | 47,480 | 544,596 | (81.3 | ) | ||||||||
Archrock, Inc. | 26,908 | 276,883 | (41.3 | ) | ||||||||
Arcus Biosciences, Inc. | 11,643 | 207,828 | (31.0 | ) | ||||||||
Armada Hoffler Properties, Inc. | 15,072 | 176,644 | (26.4 | ) | ||||||||
Artisan Partners Asset Management, Inc., Class A | 15,685 | 543,799 | (81.1 | ) | ||||||||
Artivion, Inc. | 2,235 | 30,999 | (4.6 | ) | ||||||||
Arvinas, Inc. | 8,461 | 221,763 | (33.1 | ) | ||||||||
ASGN, Inc. | 977 | 69,943 | (10.4 | ) | ||||||||
Associated Banc-Corp. | 11,421 | 203,636 | (30.4 | ) | ||||||||
SCHEDULE OF INVESTMENTS | 25 |
Schedule of Investments (continued) April 30, 2023 | BlackRock Global Equity Market Neutral Fund |
| Security | Shares | Value | % of Basket Value | |||||||||
| United States (continued) | ||||||||||||
Assured Guaranty Ltd. | 14,818 | $ | 798,246 | (119.1 | )% | |||||||
Astec Industries, Inc. | 1,782 | 73,561 | (11.0 | ) | ||||||||
AtriCure, Inc. | 12,643 | 556,166 | (83.0 | ) | ||||||||
Avantax, Inc. | 16,303 | 413,607 | (61.7 | ) | ||||||||
Avid Bioservices, Inc. | 7,114 | 128,408 | (19.2 | ) | ||||||||
Avid Technology, Inc. | 12,501 | 368,905 | (55.0 | ) | ||||||||
AvidXchange Holdings, Inc. | 18,933 | 140,672 | (21.0 | ) | ||||||||
Avient Corp. | 13,614 | 524,275 | (78.2 | ) | ||||||||
Axogen, Inc. | 4,978 | 44,902 | (6.7 | ) | ||||||||
Axonics, Inc. | 5,646 | 324,419 | (48.4 | ) | ||||||||
Axos Financial, Inc. | 2,931 | 119,204 | (17.8 | ) | ||||||||
Badger Meter, Inc. | 3,724 | 492,797 | (73.5 | ) | ||||||||
Bally’s Corp. | 3,523 | 60,596 | (9.0 | ) | ||||||||
BancFirst Corp. | 610 | 48,733 | (7.3 | ) | ||||||||
Bandwidth, Inc., Class A | 18,371 | 223,575 | (33.4 | ) | ||||||||
Bank of Hawaii Corp. | 2,489 | 120,542 | (18.0 | ) | ||||||||
Bar Harbor Bankshares | 1,046 | 25,941 | (3.9 | ) | ||||||||
Beam Therapeutics, Inc. | 7,187 | 220,713 | (32.9 | ) | ||||||||
Belden, Inc. | 4,727 | 372,913 | (55.6 | ) | ||||||||
Benchmark Electronics, Inc. | 1,844 | 39,369 | (5.9 | ) | ||||||||
Berry Corp. | 40,650 | 310,566 | (46.3 | ) | ||||||||
BGC Partners, Inc., Class A | 5,423 | 24,566 | (3.7 | ) | ||||||||
BJ’s Restaurants, Inc. | 3,204 | 104,258 | (15.6 | ) | ||||||||
Blackbaud, Inc. | 884 | 61,310 | (9.1 | ) | ||||||||
Bluebird Bio, Inc. | 22,267 | 96,861 | (14.5 | ) | ||||||||
Bluegreen Vacations Holding Corp. | 1,651 | 47,532 | (7.1 | ) | ||||||||
BlueLinx Holdings, Inc. | 443 | 31,037 | (4.6 | ) | ||||||||
Blueprint Medicines Corp. | 3,521 | 179,747 | (26.8 | ) | ||||||||
Boise Cascade Co. | 5,482 | 374,475 | (55.9 | ) | ||||||||
BOK Financial Corp. | 3,095 | 259,578 | (38.7 | ) | ||||||||
Bread Financial Holdings, Inc. | 5,102 | 140,815 | (21.0 | ) | ||||||||
BrightView Holdings, Inc. | 2,167 | 11,984 | (1.8 | ) | ||||||||
Brink’s Co. | 10,260 | 644,841 | (96.2 | ) | ||||||||
Broadstone Net Lease, Inc. | 6,364 | 102,906 | (15.4 | ) | ||||||||
Brookdale Senior Living, Inc. | 87,493 | 375,345 | (56.0 | ) | ||||||||
Buckle, Inc. | 33,883 | 1,136,097 | (169.5 | ) | ||||||||
Burford Capital Ltd. | 5,562 | 72,213 | (10.8 | ) | ||||||||
Business First Bancshares, Inc. | 2,919 | 45,011 | (6.7 | ) | ||||||||
Byline Bancorp, Inc. | 14,435 | 279,317 | (41.7 | ) | ||||||||
C4 Therapeutics, Inc. | 1,941 | 5,862 | (0.9 | ) | ||||||||
Caleres, Inc. | 8,410 | 191,748 | (28.6 | ) | ||||||||
California Resources Corp. | 13,131 | 531,806 | (79.3 | ) | ||||||||
Cal-Maine Foods, Inc. | 3,209 | 152,428 | (22.7 | ) | ||||||||
Camden National Corp. | 2,588 | 82,687 | (12.3 | ) | ||||||||
Cannae Holdings, Inc. | 1,489 | 27,159 | (4.1 | ) | ||||||||
Cara Therapeutics, Inc. | 5,375 | 22,575 | (3.4 | ) | ||||||||
CareDx, Inc. | 6,525 | 52,787 | (7.9 | ) | ||||||||
CareTrust REIT, Inc. | 6,058 | 118,070 | (17.6 | ) | ||||||||
Cargurus, Inc. | 6,631 | 109,014 | (16.3 | ) | ||||||||
Catalyst Pharmaceuticals, Inc. | 7,865 | 125,211 | (18.7 | ) | ||||||||
Century Aluminum Co. | 4,130 | 35,477 | (5.3 | ) | ||||||||
Century Communities, Inc. | 1,309 | 88,148 | (13.2 | ) | ||||||||
Cerence, Inc. | 6,064 | 154,935 | (23.1 | ) | ||||||||
Cerus Corp. | 34,094 | 78,757 | (11.7 | ) | ||||||||
CEVA, Inc. | 2,852 | 71,671 | (10.7 | ) | ||||||||
Chatham Lodging Trust | 23,073 | 236,268 | (35.2 | ) | ||||||||
Chefs’ Warehouse, Inc. | 4,000 | 133,040 | (19.8 | ) | ||||||||
Chegg, Inc. | 23,999 | 431,502 | (64.4 | ) | ||||||||
Chico’s FAS, Inc. | 62,050 | 312,732 | (46.7 | ) | ||||||||
Chimera Investment Corp. | 63,553 | 360,981 | (53.9 | ) | ||||||||
Cinemark Holdings, Inc. | 16,263 | 274,519 | (41.0 | ) | ||||||||
CIRCOR International, Inc. | 9,128 | 254,124 | (37.9 | ) | ||||||||
| Security | Shares | Value | % of Basket Value | |||||||||
| United States (continued) | ||||||||||||
Clean Energy Fuels Corp. | 59,272 | $ | 253,091 | (37.8 | )% | |||||||
Clearwater Analytics Holdings, Inc., Class A | 2,331 | 35,921 | (5.4 | ) | ||||||||
Clearwater Paper Corp. | 7,633 | 275,551 | (41.1 | ) | ||||||||
Clearway Energy, Inc., Class A | 9,045 | 262,124 | (39.1 | ) | ||||||||
CNO Financial Group, Inc. | 46,106 | 1,034,619 | (154.4 | ) | ||||||||
CNX Resources Corp. | 2,529 | 39,275 | (5.9 | ) | ||||||||
Codexis, Inc. | 76,577 | 300,182 | (44.8 | ) | ||||||||
Coeur Mining, Inc. | 24,864 | 84,538 | (12.6 | ) | ||||||||
Cohen & Steers, Inc. | 1,606 | 96,456 | (14.4 | ) | ||||||||
Coherus Biosciences, Inc. | 33,554 | 242,595 | (36.2 | ) | ||||||||
Collegium Pharmaceutical, Inc. | 1,129 | 26,272 | (3.9 | ) | ||||||||
CommScope Holding Co., Inc. | 9,287 | 45,785 | (6.8 | ) | ||||||||
Community Health Systems, Inc. | 25,411 | 161,106 | (24.0 | ) | ||||||||
CommVault Systems, Inc. | 7,734 | 450,660 | (67.2 | ) | ||||||||
Compass Minerals International, Inc. | 14,801 | 484,437 | (72.3 | ) | ||||||||
ConnectOne Bancorp, Inc. | 18,363 | 289,768 | (43.2 | ) | ||||||||
Corcept Therapeutics, Inc. | 26,341 | 593,463 | (88.5 | ) | ||||||||
Core & Main, Inc., Class A | 25,347 | 660,543 | (98.5 | ) | ||||||||
CoreCivic, Inc. | 3,875 | 34,061 | (5.1 | ) | ||||||||
CorVel Corp. | 1,128 | 227,890 | (34.0 | ) | ||||||||
Covenant Logistics Group, Inc. | 3,288 | 129,514 | (19.3 | ) | ||||||||
CrossFirst Bankshares, Inc. | 8,048 | 80,721 | (12.0 | ) | ||||||||
CSG Systems International, Inc. | 6,605 | 347,951 | (51.9 | ) | ||||||||
CSW Industrials, Inc. | 1,227 | 165,240 | (24.7 | ) | ||||||||
Dana, Inc. | 5,651 | 83,578 | (12.5 | ) | ||||||||
Dave & Buster’s Entertainment, Inc. | 12,135 | 430,307 | (64.2 | ) | ||||||||
Deciphera Pharmaceuticals, Inc. | 12,798 | 181,860 | (27.1 | ) | ||||||||
Denny’s Corp. | 6,166 | 69,121 | (10.3 | ) | ||||||||
DiamondRock Hospitality Co. | 17,172 | 139,265 | (20.8 | ) | ||||||||
Digi International, Inc. | 15,596 | 470,375 | (70.2 | ) | ||||||||
DigitalBridge Group, Inc. | 3,019 | 37,526 | (5.6 | ) | ||||||||
DigitalOcean Holdings, Inc. | 4,859 | 153,253 | (22.9 | ) | ||||||||
Dime Community Bancshares, Inc. | 9,885 | 203,631 | (30.4 | ) | ||||||||
Diversified Energy Co. PLC | 127,756 | 150,114 | (22.4 | ) | ||||||||
DMC Global, Inc. | 904 | 17,122 | (2.6 | ) | ||||||||
Domo, Inc. | 12,606 | 200,183 | (29.9 | ) | ||||||||
Dorian LPG Ltd. | 20,359 | 452,377 | (67.5 | ) | ||||||||
Duckhorn Portfolio, Inc. | 96,692 | 1,460,049 | (217.8 | ) | ||||||||
Ducommun, Inc. | 4,606 | 230,300 | (34.4 | ) | ||||||||
Dycom Industries, Inc. | 4,093 | 379,094 | (56.6 | ) | ||||||||
Dyne Therapeutics, Inc. | 6,792 | 70,365 | (10.5 | ) | ||||||||
Eagle Pharmaceuticals, Inc. | 9,817 | 275,661 | (41.1 | ) | ||||||||
EchoStar Corp. | 47,762 | 815,297 | (121.6 | ) | ||||||||
Ecovyst, Inc. | 61,447 | 697,423 | (104.1 | ) | ||||||||
Editas Medicine, Inc. | 17,148 | 139,928 | (20.9 | ) | ||||||||
Elme Communities | 22,763 | 392,206 | (58.5 | ) | ||||||||
Embecta Corp. | 7,677 | 213,037 | (31.8 | ) | ||||||||
Emergent BioSolutions, Inc. | 32,111 | 283,540 | (42.3 | ) | ||||||||
Enanta Pharmaceuticals, Inc. | 1,086 | 38,607 | (5.8 | ) | ||||||||
Encore Wire Corp. | 1,088 | 170,087 | (25.4 | ) | ||||||||
Energy Recovery, Inc. | 28,873 | 650,509 | (97.1 | ) | ||||||||
Enerpac Tool Group Corp. | 13,954 | 331,547 | (49.5 | ) | ||||||||
Enfusion, Inc. | 1,072 | 8,983 | (1.3 | ) | ||||||||
Ennis, Inc. | 568 | 11,036 | (1.6 | ) | ||||||||
Enova International, Inc. | 13,815 | 606,755 | (90.5 | ) | ||||||||
EnPro Industries, Inc. | 196 | 18,477 | (2.8 | ) | ||||||||
Enstar Group Ltd. | 662 | 159,277 | (23.8 | ) | ||||||||
EPR Properties | 26,368 | 1,106,401 | (165.1 | ) | ||||||||
Equitrans Midstream Corp. | 36,123 | 186,033 | (27.8 | ) | ||||||||
Equity Bancshares, Inc. | 668 | 15,731 | (2.3 | ) | ||||||||
ESCO Technologies, Inc. | 3,288 | 307,658 | (45.9 | ) | ||||||||
Essent Group Ltd. | 5,591 | 237,450 | (35.4 | ) | ||||||||
| 26 | 2 0 2 3 BLACK ROCK ANNUAL REPORT TO SHAREHOLDERS |
Schedule of Investments (continued) April 30, 2023 | BlackRock Global Equity Market Neutral Fund |
| Security | Shares | Value | % of Basket Value | |||||||||
| United States (continued) | ||||||||||||
Ethan Allen Interiors, Inc. | 22,006 | $ | 614,628 | (91.7 | )% | |||||||
Eventbrite, Inc. | 55,993 | 407,069 | (60.7 | ) | ||||||||
Everbridge, Inc. | 6,915 | 181,726 | (27.1 | ) | ||||||||
Everi Holdings, Inc. | 10,908 | 165,802 | (24.7 | ) | ||||||||
eXp World Holdings, Inc. | 25,839 | 302,058 | (45.1 | ) | ||||||||
Exponent, Inc. | 10,024 | 922,709 | (137.7 | ) | ||||||||
Extreme Networks, Inc. | 44,521 | 791,583 | (118.1 | ) | ||||||||
EZCORP, Inc. | 11,414 | 98,275 | (14.7 | ) | ||||||||
Fate Therapeutics, Inc. | 57,805 | 350,876 | (52.3 | ) | ||||||||
FibroGen, Inc. | 7,726 | 132,269 | (19.7 | ) | ||||||||
Financial Institutions, Inc. | 2 | 35 | (0.0 | ) | ||||||||
First Bancshares, Inc. | 4,593 | 115,284 | (17.2 | ) | ||||||||
First Busey Corp. | 13,531 | 245,994 | (36.7 | ) | ||||||||
First Financial Corp. | 1,528 | 52,792 | (7.9 | ) | ||||||||
First Foundation, Inc. | 10,111 | 63,598 | (9.5 | ) | ||||||||
First Hawaiian, Inc. | 11,816 | 225,804 | (33.7 | ) | ||||||||
First Interstate BancSystem, Inc. | 18,537 | 474,362 | (70.8 | ) | ||||||||
First Mid Bancshares, Inc. | 472 | 12,442 | (1.9 | ) | ||||||||
First of Long Island Corp. | 12,051 | 140,997 | (21.0 | ) | ||||||||
Fiverr International Ltd. | 14,499 | 529,503 | (79.0 | ) | ||||||||
Flushing Financial Corp. | 19,873 | 239,072 | (35.7 | ) | ||||||||
Forrester Research, Inc. | 1,650 | 51,051 | (7.6 | ) | ||||||||
Franklin BSP Realty Trust, Inc. | 5,540 | 69,970 | (10.4 | ) | ||||||||
Franklin Covey Co. | 11,996 | 440,493 | (65.7 | ) | ||||||||
Franklin Electric Co., Inc. | 2,365 | 211,597 | (31.6 | ) | ||||||||
FTAI Aviation Ltd. | 13,683 | 389,281 | (58.1 | ) | ||||||||
Fulton Financial Corp. | 20,534 | 244,971 | (36.5 | ) | ||||||||
FutureFuel Corp. | 885 | 6,638 | (1.0 | ) | ||||||||
GATX Corp. | 5,557 | 632,998 | (94.4 | ) | ||||||||
Genco Shipping & Trading Ltd. | 16,921 | 260,753 | (38.9 | ) | ||||||||
Genesco, Inc. | 6,862 | 237,837 | (35.5 | ) | ||||||||
Gentherm, Inc. | 2,651 | 158,132 | (23.6 | ) | ||||||||
GEO Group, Inc. | 6,683 | 50,323 | (7.5 | ) | ||||||||
Gibraltar Industries, Inc. | 3,281 | 164,181 | (24.5 | ) | ||||||||
Gladstone Land Corp. | 5,115 | 82,403 | (12.3 | ) | ||||||||
Global Industrial Co. | 13,602 | 362,493 | (54.1 | ) | ||||||||
GMS, Inc. | 2,401 | 139,402 | (20.8 | ) | ||||||||
Gogo, Inc. | 1,736 | 23,280 | (3.5 | ) | ||||||||
Golden Entertainment, Inc. | 11,727 | 494,410 | (73.8 | ) | ||||||||
GoodRx Holdings, Inc. | 62,040 | 289,727 | (43.2 | ) | ||||||||
Goosehead Insurance, Inc. | 3,927 | 225,803 | (33.7 | ) | ||||||||
GoPro, Inc., Class A | 161,767 | 692,363 | (103.3 | ) | ||||||||
Grand Canyon Education, Inc. | 487 | 57,807 | (8.6 | ) | ||||||||
Granite Point Mortgage Trust, Inc. | 9,956 | 44,503 | (6.6 | ) | ||||||||
Gray Television, Inc. | 23,207 | 178,926 | (26.7 | ) | ||||||||
Great Lakes Dredge & Dock Corp. | 10,550 | 60,452 | (9.0 | ) | ||||||||
Greif, Inc. | 294 | 23,150 | (3.5 | ) | ||||||||
Griffon Corp. | 5,249 | 149,334 | (22.3 | ) | ||||||||
Group 1 Automotive, Inc. | 1,883 | 422,696 | (63.1 | ) | ||||||||
Guardant Health, Inc. | 24,009 | 541,643 | (80.8 | ) | ||||||||
H&E Equipment Services, Inc. | 2,280 | 83,220 | (12.4 | ) | ||||||||
Hackett Group, Inc. | 11,540 | 214,182 | (32.0 | ) | ||||||||
Hain Celestial Group, Inc. | 9,983 | 178,995 | (26.7 | ) | ||||||||
Hamilton Lane, Inc., Class A | 1,821 | 134,171 | (20.0 | ) | ||||||||
Hancock Whitney Corp. | 9,092 | 332,040 | (49.5 | ) | ||||||||
Hanesbrands, Inc. | 13,450 | 70,478 | (10.5 | ) | ||||||||
Hannon Armstrong Sustainable Infrastructure Capital, Inc. | 5,235 | 148,569 | (22.2 | ) | ||||||||
Harmony Biosciences Holdings, Inc. | 17,567 | 566,360 | (84.5 | ) | ||||||||
Harsco Corp. | 20,821 | 143,040 | (21.3 | ) | ||||||||
Haverty Furniture Cos., Inc. | 6,137 | 184,969 | (27.6 | ) | ||||||||
Hawaiian Holdings, Inc. | 63,020 | 524,957 | (78.3 | ) | ||||||||
| Security | Shares | Value | % of Basket Value | |||||||||
| United States (continued) | ||||||||||||
HBT Financial, Inc. | 4,917 | $ | 86,736 | (12.9 | )% | |||||||
Healthcare Services Group, Inc. | 6,779 | 105,820 | (15.8 | ) | ||||||||
Heartland Financial USA, Inc. | 2,857 | 93,024 | (13.9 | ) | ||||||||
Heidrick & Struggles International, Inc. | 7,875 | 197,741 | (29.5 | ) | ||||||||
Helen of Troy Ltd. | 4,191 | 420,525 | (62.7 | ) | ||||||||
Helix Energy Solutions Group, Inc. | 39,580 | 286,955 | (42.8 | ) | ||||||||
Herbalife Ltd. | 8,091 | 120,232 | (17.9 | ) | ||||||||
Heron Therapeutics, Inc. | 25,993 | 62,123 | (9.3 | ) | ||||||||
Hingham Institution For Savings The | 163 | 31,713 | (4.7 | ) | ||||||||
Horizon Bancorp, Inc. | 39,118 | 411,913 | (61.5 | ) | ||||||||
Hub Group, Inc., Class A | 7,262 | 547,555 | (81.7 | ) | ||||||||
Huron Consulting Group, Inc. | 4,855 | 411,655 | (61.4 | ) | ||||||||
I3 Verticals, Inc., Class A | 5,417 | 125,945 | (18.8 | ) | ||||||||
IDT Corp. | 9,546 | 317,023 | (47.3 | ) | ||||||||
IGM Biosciences, Inc. | 3,243 | 35,122 | (5.2 | ) | ||||||||
iHeartMedia, Inc. | 11,250 | 39,038 | (5.8 | ) | ||||||||
ImmunoGen, Inc. | 33,784 | 182,096 | (27.2 | ) | ||||||||
Independent Bank Corp. | 10,243 | 182,530 | (27.2 | ) | ||||||||
Independent Bank Group, Inc. | 3,345 | 121,691 | (18.2 | ) | ||||||||
Infinera Corp. | 10,943 | 69,269 | (10.3 | ) | ||||||||
Innoviva, Inc. | 2,211 | 25,935 | (3.9 | ) | ||||||||
Inovio Pharmaceuticals, Inc. | 3,229 | 2,494 | (0.4 | ) | ||||||||
Integer Holdings Corp. | 1,019 | 83,915 | (12.5 | ) | ||||||||
Inter Parfums, Inc. | 2,627 | 398,752 | (59.5 | ) | ||||||||
Intercept Pharmaceuticals, Inc. | 12,631 | 218,769 | (32.6 | ) | ||||||||
Interface, Inc. | 13,927 | 109,188 | (16.3 | ) | ||||||||
International Bancshares Corp. | 7,237 | 308,803 | (46.1 | ) | ||||||||
International Seaways, Inc. | 3,112 | 123,920 | (18.5 | ) | ||||||||
Iovance Biotherapeutics, Inc. | 5,353 | 30,191 | (4.5 | ) | ||||||||
Ironwood Pharmaceuticals, Inc. | 43,474 | 452,564 | (67.5 | ) | ||||||||
J & J Snack Foods Corp. | 511 | 78,285 | (11.7 | ) | ||||||||
Jamf Holding Corp. | 11,590 | 219,283 | (32.7 | ) | ||||||||
Janus International Group, Inc. | 42,319 | 380,871 | (56.8 | ) | ||||||||
JELD-WEN Holding, Inc. | 9,794 | 125,167 | (18.7 | ) | ||||||||
JetBlue Airways Corp. | 88,955 | 635,139 | (94.8 | ) | ||||||||
John Bean Technologies Corp. | 954 | 103,709 | (15.5 | ) | ||||||||
Johnson Outdoors, Inc. | 692 | 40,136 | (6.0 | ) | ||||||||
Kadant, Inc. | 5,255 | 976,537 | (145.7 | ) | ||||||||
Kaiser Aluminum Corp. | 2,134 | 140,246 | (20.9 | ) | ||||||||
Kaman Corp. | 707 | 15,603 | (2.3 | ) | ||||||||
KAR Auction Services, Inc. | 15,120 | 204,725 | (30.5 | ) | ||||||||
Karyopharm Therapeutics, Inc. | 7,872 | 28,182 | (4.2 | ) | ||||||||
Kearny Financial Corp. | 16,707 | 130,148 | (19.4 | ) | ||||||||
Kennametal, Inc. | 10,794 | 280,212 | (41.8 | ) | ||||||||
Kforce, Inc. | 733 | 43,350 | (6.5 | ) | ||||||||
Knowles Corp. | 33,405 | 563,876 | (84.1 | ) | ||||||||
Kodiak Sciences, Inc. | 3,393 | 14,861 | (2.2 | ) | ||||||||
Kohl’s Corp. | 19,551 | 430,709 | (64.3 | ) | ||||||||
Kontoor Brands, Inc. | 6,413 | 289,675 | (43.2 | ) | ||||||||
Korn Ferry | 9,528 | 457,535 | (68.3 | ) | ||||||||
Kratos Defense & Security Solutions, Inc. | 6,908 | 89,113 | (13.3 | ) | ||||||||
Kura Oncology, Inc. | 28,695 | 279,489 | (41.7 | ) | ||||||||
Ladder Capital Corp. | 12,717 | 118,904 | (17.7 | ) | ||||||||
Laureate Education, Inc. | 30,973 | 383,755 | (57.3 | ) | ||||||||
La-Z-Boy, Inc. | 10,306 | 296,091 | (44.2 | ) | ||||||||
LeMaitre Vascular, Inc. | 10,410 | 562,140 | (83.9 | ) | ||||||||
LendingTree, Inc. | 12,914 | 307,741 | (45.9 | ) | ||||||||
Liberty Media Corp.-Liberty Braves | 3,264 | 127,851 | (19.1 | ) | ||||||||
Ligand Pharmaceuticals, Inc. | 5,455 | 416,489 | (62.1 | ) | ||||||||
Lindsay Corp. | 4,043 | 488,152 | (72.8 | ) | ||||||||
Lions Gate Entertainment Corp. | 16,123 | 185,415 | (27.7 | ) | ||||||||
LivaNova PLC | 23,253 | 1,113,819 | (166.2 | ) | ||||||||
SCHEDULE OF INVESTMENTS | 27 |
Schedule of Investments (continued) April 30, 2023 | BlackRock Global Equity Market Neutral Fund |
| Security | Shares | Value | % of Basket Value | |||||||||
| United States (continued) | ||||||||||||
Live Oak Bancshares, Inc. | 6,164 | $ | 145,224 | (21.7 | )% | |||||||
LivePerson, Inc. | 61,915 | 286,666 | (42.8 | ) | ||||||||
LiveRamp Holdings, Inc. | 15,485 | 373,034 | (55.7 | ) | ||||||||
LSB Industries, Inc. | 13,370 | 119,394 | (17.8 | ) | ||||||||
Lumen Technologies, Inc. | 73,476 | 174,138 | (26.0 | ) | ||||||||
LXP Industrial Trust | 45,087 | 423,818 | (63.2 | ) | ||||||||
Macerich Co. | 12,106 | 120,939 | (18.0 | ) | ||||||||
Malibu Boats, Inc., Class A | 2,453 | 139,208 | (20.8 | ) | ||||||||
Manitowoc Co., Inc. | 2,080 | 31,803 | (4.7 | ) | ||||||||
Marcus Corp. | 30,224 | 529,524 | (79.0 | ) | ||||||||
MarineMax, Inc. | 4,746 | 138,204 | (20.6 | ) | ||||||||
Marten Transport Ltd. | 12,958 | 261,622 | (39.0 | ) | ||||||||
Masonite International Corp. | 1,371 | 125,323 | (18.7 | ) | ||||||||
Matson, Inc. | 5,017 | 341,307 | (50.9 | ) | ||||||||
MaxLinear, Inc. | 12,143 | 293,011 | (43.7 | ) | ||||||||
McGrath RentCorp | 39 | 3,466 | (0.5 | ) | ||||||||
MDC Holdings, Inc. | 4,979 | 203,990 | (30.4 | ) | ||||||||
MediaAlpha, Inc., Class A | 821 | 6,075 | (0.9 | ) | ||||||||
Medifast, Inc. | 4,503 | 412,700 | (61.6 | ) | ||||||||
Mercantile Bank Corp. | 955 | 26,797 | (4.0 | ) | ||||||||
Merchants Bancorp/IN | 6,547 | 151,890 | (22.7 | ) | ||||||||
Mercury General Corp. | 18,984 | 577,303 | (86.1 | ) | ||||||||
MFA Financial, Inc. | 47,968 | 512,778 | (76.5 | ) | ||||||||
MGE Energy, Inc. | 2,219 | 169,998 | (25.4 | ) | ||||||||
MGP Ingredients, Inc. | 8,704 | 858,911 | (128.1 | ) | ||||||||
Midland States Bancorp, Inc. | 12,809 | 256,180 | (38.2 | ) | ||||||||
MidWestOne Financial Group, Inc. | 7,715 | 159,701 | (23.8 | ) | ||||||||
Mister Car Wash, Inc. | 14,399 | 126,999 | (18.9 | ) | ||||||||
Mitek Systems, Inc. | 3,106 | 28,016 | (4.2 | ) | ||||||||
Model N, Inc. | 2,295 | 70,686 | (10.5 | ) | ||||||||
ModivCare, Inc. | 853 | 54,251 | (8.1 | ) | ||||||||
Momentive Global, Inc. | 8,651 | 81,233 | (12.1 | ) | ||||||||
Monarch Casino & Resort, Inc. | 9,921 | 688,121 | (102.7 | ) | ||||||||
Moog, Inc., Class A | 476 | 42,892 | (6.4 | ) | ||||||||
Movado Group, Inc. | 3,796 | 97,254 | (14.5 | ) | ||||||||
Mr Cooper Group, Inc. | 7,784 | 360,399 | (53.8 | ) | ||||||||
MRC Global, Inc. | 6,877 | 66,982 | (10.0 | ) | ||||||||
MSA Safety, Inc. | 2,711 | 351,752 | (52.5 | ) | ||||||||
Myers Industries, Inc. | 8,021 | 151,998 | (22.7 | ) | ||||||||
MYR Group, Inc. | 3,385 | 433,246 | (64.6 | ) | ||||||||
Myriad Genetics, Inc. | 433 | 9,219 | (1.4 | ) | ||||||||
Nabors Industries Ltd. | 3,884 | 387,390 | (57.8 | ) | ||||||||
Napco Security Technologies, Inc. | 10,206 | 316,386 | (47.2 | ) | ||||||||
National Beverage Corp. | 12,421 | 617,324 | (92.1 | ) | ||||||||
National HealthCare Corp. | 3,414 | 197,705 | (29.5 | ) | ||||||||
National Research Corp. | 615 | 26,771 | (4.0 | ) | ||||||||
National Vision Holdings, Inc. | 19,561 | 411,563 | (61.4 | ) | ||||||||
Navient Corp. | 10,218 | 169,006 | (25.2 | ) | ||||||||
Nektar Therapeutics | 29,072 | 21,871 | (3.3 | ) | ||||||||
NeoGenomics, Inc. | 8,302 | 121,375 | (18.1 | ) | ||||||||
NETGEAR, Inc. | 11,643 | 164,516 | (24.5 | ) | ||||||||
Nevro Corp. | 15,572 | 455,792 | (68.0 | ) | ||||||||
New York Mortgage Trust, Inc. | 8,009 | 82,333 | (12.3 | ) | ||||||||
Newmark Group, Inc. | 18,319 | 116,142 | (17.3 | ) | ||||||||
NexPoint Residential Trust, Inc. | 17,232 | 739,770 | (110.4 | ) | ||||||||
NextEra Energy Partners LP | 8,987 | 516,842 | (77.1 | ) | ||||||||
NextGen Healthcare, Inc. | 21,058 | 352,511 | (52.6 | ) | ||||||||
Nordstrom, Inc. | 29,946 | 462,965 | (69.1 | ) | ||||||||
NOW, Inc. | 31,099 | 331,826 | (49.5 | ) | ||||||||
Nurix Therapeutics, Inc. | 3,418 | 32,915 | (4.9 | ) | ||||||||
NV5 Global, Inc. | 954 | 90,372 | (13.5 | ) | ||||||||
Oceaneering International, Inc. | 19,570 | 346,976 | (51.8 | ) | ||||||||
| Security | Shares | Value | % of Basket Value | |||||||||
| United States (continued) | ||||||||||||
Oil States International, Inc. | 11,820 | $ | 83,213 | (12.4 | )% | |||||||
Omega Flex, Inc. | 414 | 45,544 | (6.8 | ) | ||||||||
OmniAb, Inc., 12.50 Earnout Shares | 518 | — | 0.0 | |||||||||
OmniAb, Inc., 15.00 Earnout Shares | 518 | — | 0.0 | |||||||||
Organogenesis Holdings, Inc. | 3,191 | 6,542 | (1.0 | ) | ||||||||
Oscar Health, Inc. | 10,488 | 70,584 | (10.5 | ) | ||||||||
OSI Systems, Inc. | 2,297 | 259,469 | (38.7 | ) | ||||||||
Outfront Media, Inc. | 31,836 | 530,388 | (79.1 | ) | ||||||||
Owens & Minor, Inc. | 7,338 | 114,033 | (17.0 | ) | ||||||||
Oxford Industries, Inc. | 5,563 | 574,046 | (85.6 | ) | ||||||||
Pacira BioSciences, Inc. | 11,401 | 516,579 | (77.1 | ) | ||||||||
Pactiv Evergreen, Inc. | 1,504 | 11,882 | (1.8 | ) | ||||||||
PagerDuty, Inc. | 1,160 | 34,870 | (5.2 | ) | ||||||||
Palomar Holdings, Inc. | 4,625 | 232,453 | (34.7 | ) | ||||||||
Papa John’s International, Inc. | 1,102 | 82,419 | (12.3 | ) | ||||||||
Par Pacific Holdings, Inc. | 3,633 | 85,121 | (12.7 | ) | ||||||||
Park Hotels & Resorts, Inc. | 72,209 | 870,118 | (129.8 | ) | ||||||||
Patterson-UTI Energy, Inc. | 10,139 | 113,455 | (16.9 | ) | ||||||||
Payoneer Global, Inc. | 24,115 | 131,668 | (19.6 | ) | ||||||||
PC Connection, Inc. | 932 | 37,532 | (5.6 | ) | ||||||||
Pebblebrook Hotel Trust | 12,684 | 180,493 | (26.9 | ) | ||||||||
PennyMac Financial Services, Inc. | 2,966 | 185,345 | (27.7 | ) | ||||||||
Peoples Bancorp, Inc. | 110 | 2,867 | (0.4 | ) | ||||||||
Perdoceo Education Corp. | 7,017 | �� | 91,081 | (13.6 | ) | |||||||
Petco Health & Wellness Co., Inc. | 21,479 | 213,931 | (31.9 | ) | ||||||||
PGT Innovations, Inc. | 3,646 | 93,556 | (14.0 | ) | ||||||||
Photronics, Inc. | 36,640 | 529,814 | (79.0 | ) | ||||||||
Pilgrim’s Pride Corp. | 11,712 | 267,151 | (39.9 | ) | ||||||||
PJT Partners, Inc. | 4,282 | 294,473 | (43.9 | ) | ||||||||
Plains GP Holdings LP, Class A | 52,017 | 697,028 | (104.0 | ) | ||||||||
Playa Hotels & Resorts NV | 39,550 | 368,211 | (54.9 | ) | ||||||||
PMV Pharmaceuticals, Inc. | 15,083 | 69,533 | (10.4 | ) | ||||||||
Point Biopharma Global, Inc. | 6,291 | 48,692 | (7.3 | ) | ||||||||
Poseida Therapeutics, Inc. | 1,797 | 4,744 | (0.7 | ) | ||||||||
PowerSchool Holdings, Inc., Class A | 1,057 | 22,070 | (3.3 | ) | ||||||||
Premier Financial Corp. | 12,463 | 207,010 | (30.9 | ) | ||||||||
Prestige Consumer Healthcare, Inc. | 11,347 | 698,181 | (104.2 | ) | ||||||||
PriceSmart, Inc. | 3,216 | 236,955 | (35.4 | ) | ||||||||
PROS Holdings, Inc. | 10,308 | 292,438 | (43.6 | ) | ||||||||
Protagonist Therapeutics, Inc. | 6,027 | 136,210 | (20.3 | ) | ||||||||
Q2 Holdings, Inc. | 13,782 | 339,313 | (50.6 | ) | ||||||||
QCR Holdings, Inc. | 1,442 | 59,699 | (8.9 | ) | ||||||||
Quaker Chemical Corp. | 1,005 | 187,563 | (28.0 | ) | ||||||||
Quanex Building Products Corp. | 8,370 | 159,867 | (23.9 | ) | ||||||||
Qurate Retail, Inc., Series A | 10,460 | 8,332 | (1.2 | ) | ||||||||
RadNet, Inc. | 4,555 | 125,991 | (18.8 | ) | ||||||||
Rayonier, Inc. | 5,785 | 181,418 | (27.1 | ) | ||||||||
RCI Hospitality Holdings, Inc. | 367 | 27,488 | (4.1 | ) | ||||||||
RE/MAX Holdings, Inc., Class A | 18,469 | 356,636 | (53.2 | ) | ||||||||
Red Rock Resorts, Inc. | 4,438 | 216,574 | (32.3 | ) | ||||||||
REGENXBIO, Inc., Registered Shares | 14,217 | 275,241 | (41.1 | ) | ||||||||
Repay Holdings Corp. | 11,025 | 69,127 | (10.3 | ) | ||||||||
Retail Opportunity Investments Corp. | 35,350 | 460,611 | (68.7 | ) | ||||||||
Revolve Group, Inc. | 10,718 | 221,327 | (33.0 | ) | ||||||||
REX American Resources Corp. | 6,833 | 193,306 | (28.8 | ) | ||||||||
RLJ Lodging Trust | 33,722 | 340,592 | (50.8 | ) | ||||||||
RMR Group, Inc., Class A | 15,633 | 371,284 | (55.4 | ) | ||||||||
RPC, Inc. | 3,918 | 28,954 | (4.3 | ) | ||||||||
RPT Realty | 4,243 | 39,460 | (5.9 | ) | ||||||||
Rush Enterprises, Inc. | 5,268 | 308,599 | (46.0 | ) | ||||||||
Rush Enterprises, Inc., Class A | 14,901 | 791,392 | (118.1 | ) | ||||||||
Ruth’s Hospitality Group, Inc. | 37,517 | 606,275 | (90.5 | ) | ||||||||
| 28 | 2 0 2 3 BLACK ROCK ANNUAL REPORT TO SHAREHOLDERS |
Schedule of Investments (continued) April 30, 2023 | BlackRock Global Equity Market Neutral Fund |
| Security | Shares | Value | % of Basket Value | |||||||||
| United States (continued) | ||||||||||||
Safehold, Inc. | 12,977 | $ | 359,722 | (53.7 | )% | |||||||
Sangamo Therapeutics, Inc. | 22,322 | 32,813 | (4.9 | ) | ||||||||
Sanmina Corp. | 26,116 | 1,364,822 | (203.6 | ) | ||||||||
Saul Centers, Inc. | 418 | 15,061 | (2.2 | ) | ||||||||
ScanSource, Inc. | 4,056 | 110,932 | (16.5 | ) | ||||||||
Schneider National, Inc. | 32,922 | 861,569 | (128.5 | ) | ||||||||
Schnitzer Steel Industries, Inc. | 23,031 | 665,366 | (99.3 | ) | ||||||||
SEMrush Holdings, Inc., Class A | 7,671 | 74,102 | (11.1 | ) | ||||||||
Semtech Corp. | 29,446 | 573,903 | (85.6 | ) | ||||||||
Sensient Technologies Corp. | 5,804 | 432,166 | (64.5 | ) | ||||||||
Seritage Growth Properties | 5,285 | 39,585 | (5.9 | ) | ||||||||
Service Properties Trust | 8,283 | 72,642 | (10.8 | ) | ||||||||
ServisFirst Bancshares, Inc. | 499 | 25,200 | (3.8 | ) | ||||||||
Shoe Carnival, Inc. | 3,892 | 90,489 | (13.5 | ) | ||||||||
Shutterstock, Inc. | 9,890 | 662,630 | (98.9 | ) | ||||||||
Shyft Group, Inc. | 9,154 | 229,582 | (34.3 | ) | ||||||||
Silk Road Medical, Inc. | 5,103 | 224,634 | (33.5 | ) | ||||||||
Simpson Manufacturing Co., Inc. | 4,554 | 572,802 | (85.5 | ) | ||||||||
Simulations Plus, Inc. | 2,727 | 113,852 | (17.0 | ) | ||||||||
Sinclair Broadcast Group, Inc., Class A | 3,544 | 70,490 | (10.5 | ) | ||||||||
Six Flags Entertainment Corp. | 24,096 | 584,810 | (87.3 | ) | ||||||||
SkyWest, Inc. | 5,034 | 142,462 | (21.3 | ) | ||||||||
Sleep Number Corp. | 2,896 | 65,305 | (9.7 | ) | ||||||||
SmartFinancial, Inc. | 1,364 | 29,381 | (4.4 | ) | ||||||||
SolarWinds Corp. | 9,474 | 81,666 | (12.2 | ) | ||||||||
Sonic Automotive, Inc., Class A | 2,673 | 119,002 | (17.8 | ) | ||||||||
South Plains Financial, Inc. | 389 | 7,986 | (1.2 | ) | ||||||||
Sovos Brands, Inc. | 5,660 | 97,069 | (14.5 | ) | ||||||||
SpartanNash Co. | 19,662 | 482,112 | (71.9 | ) | ||||||||
Sportsman’s Warehouse Holdings, Inc. | 2,604 | 16,197 | (2.4 | ) | ||||||||
Sprinklr, Inc. | 1,573 | 18,813 | (2.8 | ) | ||||||||
Sprout Social, Inc., Class A | 5,420 | 266,989 | (39.8 | ) | ||||||||
SPX Technologies, Inc. | 6,183 | 393,733 | (58.7 | ) | ||||||||
STAAR Surgical Co. | 1,182 | 83,296 | (12.4 | ) | ||||||||
Standard Motor Products, Inc. | 7,852 | 282,751 | (42.2 | ) | ||||||||
Standex International Corp. | 2,731 | 335,394 | (50.0 | ) | ||||||||
Steelcase, Inc. | 3,416 | 27,328 | (4.1 | ) | ||||||||
Stepan Co. | 2,588 | 238,614 | (35.6 | ) | ||||||||
Sterling Check Corp. | 1,268 | 14,252 | (2.1 | ) | ||||||||
Sterling Infrastructure, Inc. | 10,885 | 401,874 | (60.0 | ) | ||||||||
Steven Madden Ltd. | 1,731 | 60,654 | (9.0 | ) | ||||||||
Stoneridge, Inc. | 3,118 | 58,712 | (8.8 | ) | ||||||||
StoneX Group, Inc. | 1,048 | 102,777 | (15.3 | ) | ||||||||
Summit Hotel Properties, Inc. | 6,348 | 40,881 | (6.1 | ) | ||||||||
SunCoke Energy, Inc. | 8,722 | 67,857 | (10.1 | ) | ||||||||
Sunnova Energy International, Inc. | 3,813 | 68,481 | (10.2 | ) | ||||||||
SunPower Corp. | 3,864 | 51,082 | (7.6 | ) | ||||||||
Supernus Pharmaceuticals, Inc. | 7,218 | 266,055 | (39.7 | ) | ||||||||
Sylvamo Corp. | 3,298 | 151,114 | (22.5 | ) | ||||||||
Talos Energy, Inc. | 9,430 | 128,531 | (19.2 | ) | ||||||||
Tandem Diabetes Care, Inc. | 9,482 | 375,298 | (56.0 | ) | ||||||||
Target Hospitality Corp. | 5,590 | 70,490 | (10.5 | ) | ||||||||
TechTarget, Inc. | 13,044 | 444,670 | (66.3 | ) | ||||||||
Tellurian, Inc. | 7,040 | 9,997 | (1.5 | ) | ||||||||
Theravance Biopharma, Inc. | 12,216 | 132,299 | (19.7 | ) | ||||||||
Thermon Group Holdings, Inc. | 4,106 | 85,323 | (12.7 | ) | ||||||||
Thryv Holdings, Inc. | 5,186 | 116,478 | (17.4 | ) | ||||||||
Titan International, Inc. | 5,825 | 56,852 | (8.5 | ) | ||||||||
Titan Machinery, Inc. | 8,998 | 282,087 | (42.1 | ) | ||||||||
TPG RE Finance Trust, Inc. | 21,956 | 156,546 | (23.4 | ) | ||||||||
| Security | Shares | Value | % of Basket Value | |||||||||
| United States (continued) | ||||||||||||
Transcat, Inc. | 1,473 | $ | 112,375 | (16.8 | )% | |||||||
Travere Therapeutics, Inc. | 25,465 | 549,280 | (81.9 | ) | ||||||||
Treace Medical Concepts, Inc. | 9,210 | 225,553 | (33.7 | ) | ||||||||
Tri Pointe Homes, Inc. | 8,208 | 235,405 | (35.1 | ) | ||||||||
Trinity Industries, Inc. | 5,060 | 121,187 | (18.1 | ) | ||||||||
Trinseo PLC | 1,966 | 35,624 | (5.3 | ) | ||||||||
TripAdvisor, Inc. | 2,242 | 39,751 | (5.9 | ) | ||||||||
Triumph Financial, Inc. | 3,004 | 156,088 | (23.3 | ) | ||||||||
Triumph Group, Inc. | 8,476 | 91,626 | (13.7 | ) | ||||||||
TTM Technologies, Inc. | 4,716 | 55,696 | (8.3 | ) | ||||||||
Turning Point Brands, Inc. | 58,963 | 1,402,730 | (209.3 | ) | ||||||||
Tutor Perini Corp. | 22,611 | 119,838 | (17.9 | ) | ||||||||
Twist Bioscience Corp. | 5,867 | 73,220 | (10.9 | ) | ||||||||
Ultragenyx Pharmaceutical, Inc. | 16,794 | 733,394 | (109.4 | ) | ||||||||
UMB Financial Corp. | 273 | 17,366 | (2.6 | ) | ||||||||
Under Armour, Inc. | 15,861 | 127,522 | (19.0 | ) | ||||||||
United States Cellular Corp. | 10,422 | 221,363 | (33.0 | ) | ||||||||
United States Lime & Minerals, Inc. | 129 | 20,756 | (3.1 | ) | ||||||||
Uniti Group, Inc. | 13,663 | 46,727 | (7.0 | ) | ||||||||
Unitil Corp. | 10,647 | 591,867 | (88.3 | ) | ||||||||
Universal Insurance Holdings, Inc. | 697 | 10,748 | (1.6 | ) | ||||||||
Univest Financial Corp. | 9,040 | 181,885 | (27.1 | ) | ||||||||
Urban Edge Properties | 8,563 | 125,619 | (18.7 | ) | ||||||||
US Physical Therapy, Inc. | 2,351 | 250,287 | (37.3 | ) | ||||||||
US Silica Holdings, Inc. | 43,251 | 564,426 | (84.2 | ) | ||||||||
USANA Health Sciences, Inc. | 11,086 | 735,778 | (109.8 | ) | ||||||||
Utz Brands, Inc. | 4,374 | 82,712 | (12.3 | ) | ||||||||
UWM Holdings Corp. | 13,430 | 80,580 | (12.0 | ) | ||||||||
Vanda Pharmaceuticals, Inc. | 25,046 | 153,782 | (22.9 | ) | ||||||||
Varex Imaging Corp. | 17,339 | 307,594 | (45.9 | ) | ||||||||
Varonis Systems, Inc. | 907 | 21,006 | (3.1 | ) | ||||||||
Vector Group Ltd. | 137,667 | 1,753,878 | (261.7 | ) | ||||||||
Veeco Instruments, Inc. | 17,250 | 317,745 | (47.4 | ) | ||||||||
Veracyte, Inc. | 5,330 | 120,671 | (18.0 | ) | ||||||||
Veradigm, Inc. | 68,845 | 859,874 | (128.3 | ) | ||||||||
Vericel Corp. | 8,186 | 257,941 | (38.5 | ) | ||||||||
Veritiv Corp. | 2,157 | 247,775 | (37.0 | ) | ||||||||
Vertex, Inc., Class A | 1,680 | 34,692 | (5.2 | ) | ||||||||
Vicor Corp. | 4,130 | 177,466 | (26.5 | ) | ||||||||
Victory Capital Holdings, Inc., Class A | 14,363 | 438,646 | (65.4 | ) | ||||||||
Vimeo, Inc. | 3,557 | 11,703 | (1.7 | ) | ||||||||
Virtus Investment Partners, Inc. | 218 | 39,722 | (5.9 | ) | ||||||||
Vishay Precision Group, Inc. | 2,745 | 103,047 | (15.4 | ) | ||||||||
Vital Farms, Inc. | 6,879 | 88,602 | (13.2 | ) | ||||||||
Wabash National Corp. | 5,806 | 149,040 | (22.2 | ) | ||||||||
Walker & Dunlop, Inc. | 3,285 | 221,113 | (33.0 | ) | ||||||||
Warby Parker, Inc. | 10,740 | 113,092 | (16.9 | ) | ||||||||
Warrior Met Coal, Inc. | 9,148 | 316,246 | (47.2 | ) | ||||||||
Washington Trust Bancorp, Inc. | 4,781 | 134,394 | (20.0 | ) | ||||||||
Watts Water Technologies, Inc., Class A | 2,724 | 440,553 | (65.7 | ) | ||||||||
Weis Markets, Inc. | 3,806 | 313,957 | (46.8 | ) | ||||||||
Whitestone REIT | 33,648 | 301,150 | (44.9 | ) | ||||||||
Winmark Corp. | 3,660 | 1,222,147 | (182.3 | ) | ||||||||
World Acceptance Corp. | 762 | 76,886 | (11.5 | ) | ||||||||
World Fuel Services Corp. | 26,781 | 633,103 | (94.5 | ) | ||||||||
Xencor, Inc. | 12,971 | 342,953 | (51.2 | ) | ||||||||
Xerox Holdings Corp. | 53,913 | 844,817 | (126.0 | ) | ||||||||
Yelp, Inc. | 34,190 | 1,022,965 | (152.6 | ) | ||||||||
Yext, Inc. | 18,987 | 166,706 | (24.9 | ) | ||||||||
Zeta Global Holdings Corp. | 9,168 | 89,021 | (13.3 | ) | ||||||||
SCHEDULE OF INVESTMENTS | 29 |
Schedule of Investments (continued) April 30, 2023 | BlackRock Global Equity Market Neutral Fund |
| Security | Shares | Value | % of Basket Value | |||||||||
| United States (continued) | ||||||||||||
ZipRecruiter, Inc. | 24,449 | $ | 414,166 | (61.8 | )% | |||||||
Zumiez, Inc. | 25,572 | 447,126 | (66.7 | ) | ||||||||
Zynex, Inc. | 1,060 | 12,126 | (1.8 | ) | ||||||||
|
|
|
| |||||||||
| 135,743,654 | ||||||||||||
| Preferred Stocks | ||||||||||||
| Germany | ||||||||||||
Kloeckner & Co. SE | 76,146 | 841,531 | (125.6 | ) | ||||||||
Schaeffler AG | 18,354 | 132,739 | (19.8 | ) | ||||||||
|
|
|
| |||||||||
| 974,270 | ||||||||||||
|
| |||||||||||
Total Reference Entity — Long |
| 274,632,931 | ||||||||||
|
| |||||||||||
| Reference Entity — Short | ||||||||||||
| Common Stocks | ||||||||||||
| Australia | ||||||||||||
ARB Corp. Ltd. | (13,030 | ) | (278,544 | ) | 41.6 | |||||||
AUB Group Ltd. | (7,485 | ) | (137,273 | ) | 20.5 | |||||||
Australian Clinical Labs Ltd. | (126,103 | ) | (296,088 | ) | 44.2 | |||||||
Bapcor Ltd. | (56,022 | ) | (244,625 | ) | 36.5 | |||||||
Bellevue Gold Ltd. | (256,138 | ) | (240,610 | ) | 35.9 | |||||||
Breville Group Ltd. | (44,710 | ) | (614,612 | ) | 91.7 | |||||||
Brickworks Ltd. | (7,813 | ) | (130,081 | ) | 19.4 | |||||||
BWP Trust | (45,366 | ) | (117,020 | ) | 17.5 | |||||||
Capricorn Metals Ltd. | (167,865 | ) | (494,281 | ) | 73.7 | |||||||
Centuria Capital Group | (3 | ) | (3 | ) | 0.0 | |||||||
Chalice Mining Ltd. | (32,321 | ) | (171,946 | ) | 25.7 | |||||||
Collins Foods Ltd. | (10,146 | ) | (58,536 | ) | 8.7 | |||||||
Corporate Travel Management Ltd. | (36,690 | ) | (513,685 | ) | 76.6 | |||||||
Costa Group Holdings Ltd. | (47,478 | ) | (78,841 | ) | 11.8 | |||||||
De Grey Mining Ltd. | (180,490 | ) | (193,856 | ) | 28.9 | |||||||
Dicker Data Ltd. | (15,439 | ) | (83,607 | ) | 12.5 | |||||||
G8 Education Ltd. | (30,956 | ) | (25,084 | ) | 3.7 | |||||||
Gold Road Resources Ltd. | (125,457 | ) | (156,205 | ) | 23.3 | |||||||
GUD Holdings Ltd. | (30,464 | ) | (194,458 | ) | 29.0 | |||||||
Hansen Technologies Ltd. | (3,371 | ) | (10,104 | ) | 1.5 | |||||||
HomeCo Daily Needs REIT | (137,536 | ) | (110,019 | ) | 16.4 | |||||||
Ingenia Communities Group | (136,038 | ) | (387,984 | ) | 57.9 | |||||||
Inghams Group Ltd. | (106,242 | ) | (198,459 | ) | 29.6 | |||||||
Integral Diagnostics Ltd. | (4,712 | ) | (9,878 | ) | 1.5 | |||||||
IRESS Ltd. | (9,410 | ) | (64,699 | ) | 9.6 | |||||||
Leo Lithium Ltd. | (103,393 | ) | (36,337 | ) | 5.4 | |||||||
Link Administration Holdings Ltd. | (73,110 | ) | (103,218 | ) | 15.4 | |||||||
Megaport Ltd. | (32,888 | ) | (124,417 | ) | 18.6 | |||||||
Mincor Resources NL | (7,103 | ) | (6,644 | ) | 1.0 | |||||||
nib holdings Ltd. | (13,003 | ) | (66,765 | ) | 10.0 | |||||||
Nine Entertainment Co. Holdings Ltd. | (222,495 | ) | (307,119 | ) | 45.8 | |||||||
NRW Holdings Ltd. | (14,014 | ) | (22,537 | ) | 3.4 | |||||||
Omni Bridgeway Ltd. | (37,884 | ) | (57,808 | ) | 8.6 | |||||||
Paladin Energy Ltd. | (240,665 | ) | (105,917 | ) | 15.8 | |||||||
PEXA Group Ltd. | (61,120 | ) | (542,798 | ) | 81.0 | |||||||
Select Harvests Ltd. | (13,225 | ) | (38,833 | ) | 5.8 | |||||||
Sigma Healthcare Ltd. | (78,283 | ) | (36,357 | ) | 5.4 | |||||||
Super Retail Group Ltd. | (17,183 | ) | (155,174 | ) | 23.1 | |||||||
United Malt Grp Ltd. | (152,955 | ) | (448,432 | ) | 66.9 | |||||||
|
|
|
| |||||||||
| (6,862,854 | ) | |||||||||||
| Austria | ||||||||||||
CA Immobilien Anlagen AG | (11,792 | ) | (340,664 | ) | 50.8 | |||||||
| Security | Shares | Value | % of Basket Value | |||||||||
| Austria (continued) | ||||||||||||
EVN AG | (4,219 | ) | $ | (101,243 | ) | 15.1 | % | |||||
Semperit AG Holding | (16,397 | ) | (428,835 | ) | 64.0 | |||||||
|
|
|
| |||||||||
| (870,742 | ) | |||||||||||
| Bahamas | ||||||||||||
OneSpaWorld Holdings Ltd. | (6,575 | ) | (78,900 | ) | 11.8 | |||||||
|
|
|
| |||||||||
| Belgium | ||||||||||||
Aedifica SA | (7,881 | ) | (655,494 | ) | 97.8 | |||||||
Bekaert SA | (5,207 | ) | (241,362 | ) | 36.0 | |||||||
bpost SA | (16,081 | ) | (78,684 | ) | 11.7 | |||||||
Cofinimmo SA | (4,648 | ) | (442,220 | ) | 66.0 | |||||||
Deme Group NV | (1,432 | ) | (188,663 | ) | 28.2 | |||||||
Intervest Offices & Warehouses NV | (2,825 | ) | (58,091 | ) | 8.7 | |||||||
KBC Ancora | (388 | ) | (18,592 | ) | 2.8 | |||||||
Kinepolis Group NV | (9,327 | ) | (470,077 | ) | 70.1 | |||||||
Recticel SA | (4,064 | ) | (57,615 | ) | 8.6 | |||||||
Tessenderlo Group SA | (10,676 | ) | (352,202 | ) | 52.5 | |||||||
VGP NV | (5,205 | ) | (542,598 | ) | 81.0 | |||||||
Xior Student Housing NV | (3,316 | ) | (104,855 | ) | 15.6 | |||||||
|
|
|
| |||||||||
| (3,210,453 | ) | |||||||||||
| Bermuda | ||||||||||||
Cool Co. Ltd. | (11,818 | ) | (145,206 | ) | 21.7 | |||||||
SiriusPoint Ltd. | (2,238 | ) | (19,448 | ) | 2.9 | |||||||
|
|
|
| |||||||||
| (164,654 | ) | |||||||||||
| Canada | ||||||||||||
Absolute Software Corp. | (5,237 | ) | (40,598 | ) | 6.1 | |||||||
ADENTRA, Inc. | (6,318 | ) | (120,589 | ) | 18.0 | |||||||
Ag Growth International, Inc. | (3,270 | ) | (142,131 | ) | 21.2 | |||||||
Allied Properties Real Estate Investment Trust | (12,243 | ) | (204,522 | ) | 30.5 | |||||||
Altus Group Ltd. | (6,664 | ) | (262,916 | ) | 39.2 | |||||||
Andlauer Healthcare Group, Inc. | (828 | ) | (31,281 | ) | 4.7 | |||||||
ATS Corp. | (9,799 | ) | (417,511 | ) | 62.3 | |||||||
Aurinia Pharmaceuticals, Inc. | (71,351 | ) | (802,699 | ) | 119.8 | |||||||
BELLUS Health, Inc. | (1,458 | ) | (20,948 | ) | 3.1 | |||||||
Brookfield Reinsurance Ltd. | (4,216 | ) | (135,835 | ) | 20.3 | |||||||
Calian Group Ltd. | (274 | ) | (12,623 | ) | 1.9 | |||||||
Canadian Western Bank | (40,210 | ) | (716,684 | ) | 106.9 | |||||||
Cascades, Inc. | (9,137 | ) | (73,971 | ) | 11.0 | |||||||
CES Energy Solutions Corp. | (8,240 | ) | (16,257 | ) | 2.4 | |||||||
Choice Properties Real Estate Investment Trust | (48,274 | ) | (518,341 | ) | 77.3 | |||||||
Chorus Aviation, Inc. | (16,054 | ) | (34,964 | ) | 5.2 | |||||||
Cogeco, Inc. | (7,743 | ) | (327,490 | ) | 48.9 | |||||||
Converge Technology Solutions Corp. | (102,371 | ) | (247,681 | ) | 37.0 | |||||||
Definity Financial Corp. | (13,237 | ) | (356,727 | ) | 53.2 | |||||||
Dream Office Real Estate Investment Trust | (2,620 | ) | (25,611 | ) | 3.8 | |||||||
Enghouse Systems Ltd. | (962 | ) | (26,307 | ) | 3.9 | |||||||
Exchange Income Corp. | (16,906 | ) | (647,298 | ) | 96.6 | |||||||
Extendicare, Inc. | (160,686 | ) | (762,404 | ) | 113.7 | |||||||
Fiera Capital Corp. | (2,110 | ) | (11,496 | ) | 1.7 | |||||||
Filo Mining Corp. | (26,734 | ) | (441,821 | ) | 65.9 | |||||||
GDI Integrated Facility Services, Inc. | (2,675 | ) | (86,355 | ) | 12.9 | |||||||
Headwater Exploration, Inc. | (58,674 | ) | (267,580 | ) | 39.9 | |||||||
InterRent Real Estate Investment Trust | (9,561 | ) | (90,873 | ) | 13.6 | |||||||
Jamieson Wellness, Inc. | (6,071 | ) | (148,979 | ) | 22.2 | |||||||
Killam Apartment Real Estate Investment Trust | (9,559 | ) | (118,022 | ) | 17.6 | |||||||
Labrador Iron Ore Royalty Corp. | (8,691 | ) | (194,696 | ) | 29.1 | |||||||
Lassonde Industries, Inc. | (1,172 | ) | (83,383 | ) | 12.4 | |||||||
Maple Leaf Foods, Inc. | (23,869 | ) | (485,986 | ) | 72.5 | |||||||
Minto Apartment Real Estate Investment Trust | (2,469 | ) | (25,655 | ) | 3.8 | |||||||
| 30 | 2 0 2 3 BLACK ROCK ANNUAL REPORT TO SHAREHOLDERS |
Schedule of Investments (continued) April 30, 2023 | BlackRock Global Equity Market Neutral Fund |
| Security | Shares | Value | % of Basket Value | |||||||||
| Canada (continued) | ||||||||||||
MTY Food Group, Inc. | (6,143 | ) | $ | (265,007 | ) | 39.5 | % | |||||
Neighbourly Pharmacy, Inc. | (1,327 | ) | (20,681 | ) | 3.1 | |||||||
Nexus Industrial REIT | (2,904 | ) | (21,128 | ) | 3.2 | |||||||
North West Co., Inc. | (23,513 | ) | (685,327 | ) | 102.3 | |||||||
NorthWest Healthcare Properties Real Estate Investment Trust | (19,231 | ) | (114,930 | ) | 17.1 | |||||||
Orla Mining Ltd. | (8,777 | ) | (39,384 | ) | 5.9 | |||||||
Osisko Mining, Inc. | (23,044 | ) | (65,227 | ) | 9.7 | |||||||
Park Lawn Corp. | (5,313 | ) | (102,736 | ) | 15.3 | |||||||
Pet Valu Holdings Ltd. | (41,739 | ) | (1,110,523 | ) | 165.7 | |||||||
Premium Brands Holdings Corp. | (6,603 | ) | (492,548 | ) | 73.5 | |||||||
Primaris Real Estate Investment Trust | (16,259 | ) | (159,287 | ) | 23.8 | |||||||
Seabridge Gold, Inc. | (13,564 | ) | (188,890 | ) | 28.2 | |||||||
Sienna Senior Living, Inc. | (61,536 | ) | (491,874 | ) | 73.4 | |||||||
SilverCrest Metals, Inc. | (2,205 | ) | (14,342 | ) | 2.1 | |||||||
Spartan Delta Corp. | (58,906 | ) | (664,199 | ) | 99.1 | |||||||
Stella-Jones, Inc. | (12,511 | ) | (486,452 | ) | 72.6 | |||||||
StorageVault Canada, Inc. | (101,134 | ) | (429,318 | ) | 64.1 | |||||||
Surge Energy, Inc. | (1,013 | ) | (6,514 | ) | 1.0 | |||||||
Timbercreek Financial Corp. | (14,951 | ) | (86,391 | ) | 12.9 | |||||||
Trisura Group Ltd. | (6,481 | ) | (148,825 | ) | 22.2 | |||||||
Westshore Terminals Investment Corp. | (1,141 | ) | (23,181 | ) | 3.5 | |||||||
Winpak Ltd. | (14,098 | ) | (467,436 | ) | 69.7 | |||||||
Xenon Pharmaceuticals, Inc. | (10,922 | ) | (439,938 | ) | 65.6 | |||||||
|
|
|
| |||||||||
| (14,424,372 | ) | |||||||||||
| China | ||||||||||||
TI Fluid Systems PLC | (93,900 | ) | (123,289 | ) | 18.4 | |||||||
Yanlord Land Group Ltd. | (1,600 | ) | (1,019 | ) | 0.1 | |||||||
|
|
|
| |||||||||
| (124,308 | ) | |||||||||||
| Colombia | ||||||||||||
Frontera Energy Corp. | (3,341 | ) | (31,397 | ) | 4.7 | |||||||
|
|
|
| |||||||||
| Costa Rica | ||||||||||||
Establishment Labs Holdings, Inc. | (3,871 | ) | (269,770 | ) | 40.2 | |||||||
|
|
|
| |||||||||
| Cyprus | ||||||||||||
Atalaya Mining PLC | (13,815 | ) | (56,669 | ) | 8.5 | |||||||
|
|
|
| |||||||||
| Denmark | ||||||||||||
Alm Brand A/S | (273,050 | ) | (502,999 | ) | 75.0 | |||||||
Netcompany Group A/S | (4,116 | ) | (158,634 | ) | 23.7 | |||||||
NTG Nordic Transport Group A/S | (3,007 | ) | (159,249 | ) | 23.8 | |||||||
Ringkjoebing Landbobank A/S | (5,343 | ) | (748,019 | ) | 111.6 | |||||||
Solar A/S, B Shares | (154 | ) | (12,545 | ) | 1.9 | |||||||
Topdanmark AS | (16,142 | ) | (848,068 | ) | 126.5 | |||||||
Zealand Pharma A/S | (17,554 | ) | (591,038 | ) | 88.2 | |||||||
|
|
|
| |||||||||
| (3,020,552 | ) | |||||||||||
| Egypt | ||||||||||||
Energean PLC | (33,200 | ) | (510,014 | ) | 76.1 | |||||||
|
|
|
| |||||||||
| Finland | ||||||||||||
Aktia Bank OYJ | (13,308 | ) | (133,297 | ) | 19.9 | |||||||
Anora Group OYJ | (16,393 | ) | (95,380 | ) | 14.3 | |||||||
Jervois Global Ltd. | (435,872 | ) | (25,664 | ) | 3.8 | |||||||
Konecranes OYJ | (6,859 | ) | (267,567 | ) | 39.9 | |||||||
Metsa Board OYJ | (14,867 | ) | (106,747 | ) | 15.9 | |||||||
Musti Group OYJ | (1,848 | ) | (38,133 | ) | 5.7 | |||||||
Oriola OYJ | (8,788 | ) | (14,019 | ) | 2.1 | |||||||
| Security | Shares | Value | % of Basket Value | |||||||||
| Finland (continued) | ||||||||||||
Sanoma OYJ | (28,895 | ) | $ | (249,472 | ) | 37.2 | % | |||||
TietoEVRY OYJ | (7,515 | ) | (239,070 | ) | 35.7 | |||||||
Tokmanni Group Corp. | (70,767 | ) | (964,586 | ) | 143.9 | |||||||
|
|
|
| |||||||||
| (2,133,935 | ) | |||||||||||
| France | ||||||||||||
ABC arbitrage | (4,150 | ) | (27,591 | ) | 4.1 | |||||||
Altarea SCA | (558 | ) | (72,729 | ) | 10.9 | |||||||
Alten SA | (3,836 | ) | (649,401 | ) | 96.9 | |||||||
Antin Infrastructure Partners SA | (20,354 | ) | (342,038 | ) | 51.0 | |||||||
Carmila SA | (4,159 | ) | (70,099 | ) | 10.5 | |||||||
Chargeurs SA | (11,864 | ) | (194,027 | ) | 28.9 | |||||||
Coface SA | (32,616 | ) | (497,098 | ) | 74.2 | |||||||
Derichebourg SA | (34,397 | ) | (211,802 | ) | 31.6 | |||||||
Euroapi SA | (32,868 | ) | (393,018 | ) | 58.6 | |||||||
Fnac Darty SA | (9,147 | ) | (343,382 | ) | 51.2 | |||||||
Imerys SA | (12,654 | ) | (518,004 | ) | 77.3 | |||||||
Maisons du Monde SA | (10,397 | ) | (109,190 | ) | 16.3 | |||||||
Metropole Television SA | (9,748 | ) | (156,647 | ) | 23.4 | |||||||
Societe BIC SA | (6,527 | ) | (400,989 | ) | 59.8 | |||||||
Sopra Steria Group SACA | (2,495 | ) | (537,760 | ) | 80.2 | |||||||
Trigano SA | (3,880 | ) | (503,227 | ) | 75.1 | |||||||
Valneva SE | (4,211 | ) | (20,368 | ) | 3.0 | |||||||
Virbac SA | (47 | ) | (15,985 | ) | 2.4 | |||||||
Voltalia SA, Registered Shares | (11,846 | ) | (179,356 | ) | 26.8 | |||||||
|
|
|
| |||||||||
| (5,242,711 | ) | |||||||||||
| Gambia | ||||||||||||
BW Energy Ltd. | (40,302 | ) | (108,108 | ) | 16.1 | |||||||
|
|
|
| |||||||||
| Germany | ||||||||||||
About You Holding SE | (35,785 | ) | (219,400 | ) | 32.7 | |||||||
Auto1 Group SE | (49,523 | ) | (389,197 | ) | 58.1 | |||||||
BayWa AG | (7,932 | ) | (338,118 | ) | 50.5 | |||||||
Borussia Dortmund GmbH & Co. KGaA | (25,065 | ) | (124,863 | ) | 18.6 | |||||||
CANCOM SE | (10,409 | ) | (373,345 | ) | 55.7 | |||||||
Ceconomy AG | (73,679 | ) | (223,922 | ) | 33.4 | |||||||
Cewe Stiftung & Co. KGAA | (816 | ) | (83,682 | ) | 12.5 | |||||||
CompuGroup Medical SE & Co. KgaA | (2,440 | ) | (133,566 | ) | 19.9 | |||||||
Dermapharm Holding SE | (5,247 | ) | (262,253 | ) | 39.1 | |||||||
DIC Asset AG | (18,486 | ) | (140,118 | ) | 20.9 | |||||||
Energiekontor AG | (3,193 | ) | (254,704 | ) | 38.0 | |||||||
Hamborner REIT AG | (28,125 | ) | (220,896 | ) | 33.0 | |||||||
Hamburger Hafen und Logistik AG | (21,781 | ) | (299,289 | ) | 44.7 | |||||||
Hypoport SE | (596 | ) | (95,187 | ) | 14.2 | |||||||
Indus Holding AG | (7,481 | ) | (220,594 | ) | 32.9 | |||||||
Instone Real Estate Group SE | (7,254 | ) | (57,778 | ) | 8.6 | |||||||
Jenoptik AG | (8,488 | ) | (269,762 | ) | 40.3 | |||||||
JOST Werke SE | (3,788 | ) | (208,345 | ) | 31.1 | |||||||
KWS Saat SE & Co. KGaA | (170 | ) | (10,974 | ) | 1.6 | |||||||
MBB SE | (582 | ) | (52,825 | ) | 7.9 | |||||||
Medios AG | (1,521 | ) | (30,384 | ) | 4.5 | |||||||
Mercer International, Inc. | (6,996 | ) | (68,071 | ) | 10.2 | |||||||
Norma Group SE | (9,095 | ) | (215,380 | ) | 32.1 | |||||||
PNE AG | (4,078 | ) | (66,333 | ) | 9.9 | |||||||
Sirius Real Estate Ltd. | (308,644 | ) | (308,478 | ) | 46.0 | |||||||
Softwareone Holding AG | (31,094 | ) | (469,904 | ) | 70.1 | |||||||
SCHEDULE OF INVESTMENTS | 31 |
Schedule of Investments (continued) April 30, 2023 | BlackRock Global Equity Market Neutral Fund |
| Security | Shares | Value | % of Basket Value | |||||||||
| Germany (continued) | ||||||||||||
Stroeer SE & Co. KGaA | (10,181 | ) | $ | (555,905 | ) | 82.9 | % | |||||
Wuestenrot & Wuerttembergische AG | (6,568 | ) | (118,960 | ) | 17.8 | |||||||
|
|
|
| |||||||||
| (5,812,233 | ) | |||||||||||
| Ghana | ||||||||||||
Kosmos Energy Ltd. | (39,582 | ) | (253,325 | ) | 37.8 | |||||||
Tullow Oil PLC | (193,669 | ) | (67,087 | ) | 10.0 | |||||||
|
|
|
| |||||||||
| (320,412 | ) | |||||||||||
| Hong Kong | ||||||||||||
SUNeVision Holdings Ltd. | (32,000 | ) | (18,181 | ) | 2.7 | |||||||
|
|
|
| |||||||||
| Indonesia | ||||||||||||
Nickel Industries Ltd. | (84,745 | ) | (53,954 | ) | 8.0 | |||||||
|
|
|
| |||||||||
| Ireland | ||||||||||||
C&C Group PLC | (399,065 | ) | (775,203 | ) | 115.6 | |||||||
Cairn Homes PLC | (375,755 | ) | (422,134 | ) | 63.0 | |||||||
Glenveagh Properties PLC | (25,595 | ) | (26,562 | ) | 4.0 | |||||||
Greencore Group PLC | (11,099 | ) | (11,811 | ) | 1.8 | |||||||
Keywords Studios PLC | (2,085 | ) | (70,006 | ) | 10.4 | |||||||
Origin Enterprises PLC | (2,425 | ) | (10,521 | ) | 1.6 | |||||||
Prothena Corp. PLC | (6,109 | ) | (321,456 | ) | 47.9 | |||||||
|
|
|
| |||||||||
| (1,637,693 | ) | |||||||||||
| Israel | ||||||||||||
Clal Insurance Enterprises Holdings Ltd. | (9,863 | ) | (151,085 | ) | 22.6 | |||||||
Doral Group Renewable Energy Resources Ltd. | (104,434 | ) | (225,698 | ) | 33.7 | |||||||
Electra Consumer Products 1970 Ltd. | (1,062 | ) | (24,961 | ) | 3.7 | |||||||
FIBI Holdings Ltd. | (292 | ) | (10,844 | ) | 1.6 | |||||||
Innoviz Technologies Ltd. | (33,734 | ) | (84,335 | ) | 12.6 | |||||||
Isracard Ltd. | (26,912 | ) | (109,089 | ) | 16.3 | |||||||
JFrog Ltd. | (42,078 | ) | (781,389 | ) | 116.6 | |||||||
Nano Dimension Ltd., ADR | (32,616 | ) | (80,562 | ) | 12.0 | |||||||
Naphtha Israel Petroleum Corp. Ltd. | (29,630 | ) | (126,112 | ) | 18.8 | |||||||
Perion Network Ltd. | (453 | ) | (16,250 | ) | 2.4 | |||||||
|
|
|
| |||||||||
| (1,610,325 | ) | |||||||||||
| Italy | ||||||||||||
ACEA SpA | (6,820 | ) | (99,577 | ) | 14.9 | |||||||
Ariston Holding NV | (4,881 | ) | (55,497 | ) | 8.3 | |||||||
BFF Bank SpA | (24,471 | ) | (234,456 | ) | 35.0 | |||||||
Danieli & C Officine Meccaniche SpA | (971 | ) | (19,801 | ) | 2.9 | |||||||
Digital Bros SpA | (35,543 | ) | (804,857 | ) | 120.1 | |||||||
doValue SpA | (39,085 | ) | (273,231 | ) | 40.8 | |||||||
Enav SpA | (32,588 | ) | (152,484 | ) | 22.7 | |||||||
Esprinet SpA | (2,661 | ) | (23,472 | ) | 3.5 | |||||||
Fila SpA | (2,179 | ) | (17,969 | ) | 2.7 | |||||||
Gruppo MutuiOnline SpA | (3,732 | ) | (115,876 | ) | 17.3 | |||||||
GVS SpA | (41,104 | ) | (279,275 | ) | 41.7 | |||||||
Illimity Bank SpA | (8,645 | ) | (60,725 | ) | 9.1 | |||||||
Industrie De Nora SpA | (16,554 | ) | (328,730 | ) | 49.0 | |||||||
MARR SpA | (4,288 | ) | (66,894 | ) | 10.0 | |||||||
MFE-MediaForEurope NV | (612,627 | ) | (288,221 | ) | 43.0 | |||||||
Salvatore Ferragamo SpA | (2,536 | ) | (44,391 | ) | 6.6 | |||||||
Saras SpA | (179,932 | ) | (231,562 | ) | 34.5 | |||||||
Tamburi Investment Partners SpA | (1,828 | ) | (17,382 | ) | 2.6 | |||||||
Technogym SpA | (30,711 | ) | (279,001 | ) | 41.6 | |||||||
Technoprobe SpA | (36,955 | ) | (261,764 | ) | 39.0 | |||||||
|
|
|
| |||||||||
| (3,655,165 | ) | |||||||||||
| Japan | ||||||||||||
ADEKA Corp. | (30,300 | ) | (521,870 | ) | 77.9 | |||||||
Advance Logistics Investment Corp. | (370 | ) | (382,431 | ) | 57.1 | |||||||
| Security | Shares | Value | % of Basket Value | |||||||||
| Japan (continued) | ||||||||||||
Aeon Hokkaido Corp. | (50,600 | ) | $ | (309,713 | ) | 46.2 | % | |||||
Aichi Financial Group, Inc. | (23,200 | ) | (371,605 | ) | 55.4 | |||||||
Aiful Corp. | (32,400 | ) | (89,882 | ) | 13.4 | |||||||
Airtrip Corp. | (14,000 | ) | (287,296 | ) | 42.9 | |||||||
Alpha Systems, Inc. | (1,200 | ) | (37,256 | ) | 5.6 | |||||||
Appier Group, Inc. | (20,800 | ) | (240,961 | ) | 35.9 | |||||||
ARCLANDS Corp. | (40,200 | ) | (464,314 | ) | 69.3 | |||||||
Arcs Co. Ltd. | (10,000 | ) | (185,424 | ) | 27.7 | |||||||
ARTERIA Networks Corp. | (9,300 | ) | (90,849 | ) | 13.6 | |||||||
Asahi Holdings, Inc. | (50,700 | ) | (761,587 | ) | 113.6 | |||||||
Atom Corp. | (26,600 | ) | (167,121 | ) | 24.9 | |||||||
Awa Bank Ltd. | (8,600 | ) | (131,197 | ) | 19.6 | |||||||
Axial Retailing, Inc. | (7,200 | ) | (190,615 | ) | 28.4 | |||||||
Belc Co. Ltd. | (5,100 | ) | (235,010 | ) | 35.1 | |||||||
BML, Inc. | (9,700 | ) | (222,172 | ) | 33.1 | |||||||
Bushiroad, Inc. | (12,600 | ) | (84,288 | ) | 12.6 | |||||||
Canon Electronics, Inc. | (2,400 | ) | (33,368 | ) | 5.0 | |||||||
Cawachi Ltd. | (13,800 | ) | (241,311 | ) | 36.0 | |||||||
CellSource Co. Ltd. | (4,400 | ) | (84,940 | ) | 12.7 | |||||||
Change Holdings, Inc. | (34,700 | ) | (599,351 | ) | 89.4 | |||||||
Chiyoda Corp. | (102,300 | ) | (307,872 | ) | 45.9 | |||||||
Chofu Seisakusho Co. Ltd. | (5,100 | ) | (93,863 | ) | 14.0 | |||||||
Chudenko Corp. | (15,000 | ) | (250,843 | ) | 37.4 | |||||||
CI Takiron Corp. | (14,100 | ) | (52,985 | ) | 7.9 | |||||||
Colowide Co. Ltd. | (16,100 | ) | (251,663 | ) | 37.5 | |||||||
Comforia Residential REIT, Inc. | (102 | ) | (260,203 | ) | 38.8 | |||||||
CRE Logistics REIT, Inc. | (166 | ) | (233,091 | ) | 34.8 | |||||||
Create Restaurants Holdings, Inc. | (7,200 | ) | (53,601 | ) | 8.0 | |||||||
Cyberdyne, Inc. | (2,800 | ) | (5,905 | ) | 0.9 | |||||||
Daiho Corp. | (7,800 | ) | (228,484 | ) | 34.1 | |||||||
Daiki Aluminium Industry Co. Ltd. | (3,700 | ) | (38,721 | ) | 5.8 | |||||||
Daikokutenbussan Co. Ltd. | (8,400 | ) | (343,005 | ) | 51.2 | |||||||
Daishi Hokuetsu Financial Group, Inc. | (2,500 | ) | (56,828 | ) | 8.5 | |||||||
Daiwabo Holdings Co. Ltd. | (9,900 | ) | (190,484 | ) | 28.4 | |||||||
DCM Holdings Co. Ltd. | (29,200 | ) | (312,063 | ) | 46.6 | |||||||
Demae-Can Co. Ltd. | (184,600 | ) | (525,281 | ) | 78.4 | |||||||
Dexerials Corp. | (30,300 | ) | (588,159 | ) | 87.7 | |||||||
Duskin Co. Ltd. | (15,800 | ) | (395,251 | ) | 59.0 | |||||||
Earth Corp. | (4,900 | ) | (183,166 | ) | 27.3 | |||||||
EDION Corp. | (47,800 | ) | (479,717 | ) | 71.6 | |||||||
EM Systems Co. Ltd. | (16,700 | ) | (98,394 | ) | 14.7 | |||||||
eRex Co. Ltd. | (4,000 | ) | (52,168 | ) | 7.8 | |||||||
ES-Con Japan Ltd. | (47,500 | ) | (309,287 | ) | 46.1 | |||||||
Exedy Corp. | (36,300 | ) | (532,742 | ) | 79.5 | |||||||
Ferrotec Holdings Corp. | (9,800 | ) | (226,099 | ) | 33.7 | |||||||
Freee KK | (3,000 | ) | (87,558 | ) | 13.1 | |||||||
Fuji Seal International, Inc. | (16,700 | ) | (193,498 | ) | 28.9 | |||||||
Fuji Soft, Inc. | (6,000 | ) | (364,906 | ) | 54.4 | |||||||
Fujicco Co. Ltd. | (17,700 | ) | (255,568 | ) | 38.1 | |||||||
Fujio Food Group, Inc. | (18,300 | ) | (193,392 | ) | 28.9 | |||||||
Fujitec Co. Ltd. | (6,100 | ) | (165,717 | ) | 24.7 | |||||||
Fujiya Co. Ltd. | (17,800 | ) | (337,046 | ) | 50.3 | |||||||
Fukushima Galilei Co. Ltd. | (7,000 | ) | (269,122 | ) | 40.1 | |||||||
Fukuyama Transporting Co. Ltd. | (5,300 | ) | (144,468 | ) | 21.6 | |||||||
Furukawa Co. Ltd. | (9,300 | ) | (93,731 | ) | 14.0 | |||||||
Globeride, Inc. | (11,700 | ) | (218,737 | ) | 32.6 | |||||||
GMO Financial Gate, Inc. | (2,200 | ) | (181,213 | ) | 27.0 | |||||||
GMO Financial Holdings, Inc. | (30,100 | ) | (140,172 | ) | 20.9 | |||||||
GMO GlobalSign Holdings KK | (13,100 | ) | (379,020 | ) | 56.5 | |||||||
Gunze Ltd. | (5,900 | ) | (208,165 | ) | 31.1 | |||||||
Hakuto Co. Ltd. | (8,600 | ) | (275,649 | ) | 41.1 | |||||||
| 32 | 2 0 2 3 BLACK ROCK ANNUAL REPORT TO SHAREHOLDERS |
Schedule of Investments (continued) April 30, 2023 | BlackRock Global Equity Market Neutral Fund |
| Security | Shares | Value | % of Basket Value | |||||||||
| Japan (continued) | ||||||||||||
Hazama Ando Corp. | (15,300 | ) | $ | (102,984 | ) | 15.4 | % | |||||
Heiwa Real Estate REIT, Inc. | (305 | ) | (364,316 | ) | 54.4 | |||||||
Heiwado Co. Ltd. | (12,600 | ) | (195,240 | ) | 29.1 | |||||||
Hirata Corp. | (2,900 | ) | (147,648 | ) | 22.0 | |||||||
HIS Co. Ltd. | (2,000 | ) | (30,742 | ) | 4.6 | |||||||
Hokkaido Electric Power Co., Inc. | (79,600 | ) | (305,886 | ) | 45.6 | |||||||
Hokuetsu Corp. | (130,900 | ) | (883,183 | ) | 131.8 | |||||||
Hokuhoku Financial Group, Inc. | (47,000 | ) | (345,250 | ) | 51.5 | |||||||
Hokuriku Electric Power Co. | (10,900 | ) | (51,953 | ) | 7.7 | |||||||
Hokuto Corp. | (8,500 | ) | (118,996 | ) | 17.8 | |||||||
Hoshino Resorts REIT, Inc. | (45 | ) | (239,094 | ) | 35.7 | |||||||
Hyakugo Bank Ltd. | (162,300 | ) | (477,945 | ) | 71.3 | |||||||
Ichibanya Co. Ltd. | (13,000 | ) | (526,761 | ) | 78.6 | |||||||
Idec Corp. | (7,700 | ) | (192,291 | ) | 28.7 | |||||||
Iino Kaiun Kaisha Ltd. | (12,100 | ) | (92,902 | ) | 13.9 | |||||||
Inabata & Co. Ltd. | (19,200 | ) | (399,685 | ) | 59.6 | |||||||
Inageya Co. Ltd. | (27,000 | ) | (332,930 | ) | 49.7 | |||||||
Insource Co. Ltd. | (6,000 | ) | (56,124 | ) | 8.4 | |||||||
Iriso Electronics Co. Ltd. | (2,800 | ) | (97,821 | ) | 14.6 | |||||||
Itochu Enex Co. Ltd. | (8,700 | ) | (75,912 | ) | 11.3 | |||||||
Itochu-Shokuhin Co. Ltd. | (3,500 | ) | (143,101 | ) | 21.3 | |||||||
J Trust Co. Ltd. | (41,700 | ) | (124,122 | ) | 18.5 | |||||||
Jaccs Co. Ltd. | (7,400 | ) | (253,039 | ) | 37.8 | |||||||
Japan Display, Inc. | (31,900 | ) | (9,856 | ) | 1.5 | |||||||
JDC Corp. | (21,100 | ) | (97,363 | ) | 14.5 | |||||||
J-Oil Mills, Inc. | (19,200 | ) | (232,355 | ) | 34.7 | |||||||
Joshin Denki Co. Ltd. | (12,000 | ) | (182,511 | ) | 27.2 | |||||||
JTOWER, Inc. | (5,600 | ) | (245,979 | ) | 36.7 | |||||||
Juroku Financial Group, Inc. | (5,400 | ) | (121,945 | ) | 18.2 | |||||||
Kameda Seika Co. Ltd. | (16,100 | ) | (546,877 | ) | 81.6 | |||||||
Kanamoto Co. Ltd. | (8,600 | ) | (146,958 | ) | 21.9 | |||||||
Kappa Create Co. Ltd. | (39,200 | ) | (444,307 | ) | 66.3 | |||||||
Keiyo Bank Ltd. | (55,400 | ) | (234,736 | ) | 35.0 | |||||||
Keiyo Co. Ltd. | (62,100 | ) | (391,793 | ) | 58.5 | |||||||
Kenedix Residential Next Investment Corp. | (159 | ) | (254,366 | ) | 37.9 | |||||||
KH Neochem Co. Ltd. | (11,100 | ) | (195,226 | ) | 29.1 | |||||||
Kisoji Co. Ltd. | (42,800 | ) | (757,167 | ) | 113.0 | |||||||
Ki-Star Real Estate Co. Ltd. | (27,500 | ) | (842,838 | ) | 125.7 | |||||||
Kiyo Bank Ltd. | (21,100 | ) | (251,609 | ) | 37.5 | |||||||
Koa Corp. | (3,900 | ) | (49,931 | ) | 7.4 | |||||||
Kohnan Shoji Co. Ltd. | (3,600 | ) | (99,086 | ) | 14.8 | |||||||
Komeri Co. Ltd. | (31,000 | ) | (734,630 | ) | 109.6 | |||||||
Konishi Co. Ltd. | (13,300 | ) | (203,668 | ) | 30.4 | |||||||
Kumagai Gumi Co. Ltd. | (12,200 | ) | (264,444 | ) | 39.5 | |||||||
Kura Sushi, Inc. | (21,100 | ) | (515,535 | ) | 76.9 | |||||||
KYB Corp. | (15,300 | ) | (497,541 | ) | 74.2 | |||||||
Kyoei Steel Ltd. | (3,900 | ) | (53,693 | ) | 8.0 | |||||||
Leopalace21 Corp. | (19,500 | ) | (52,481 | ) | 7.8 | |||||||
LIFENET INSURANCE CO. | (1,500 | ) | (13,335 | ) | 2.0 | |||||||
LITALICO, Inc. | (9,900 | ) | (180,905 | ) | 27.0 | |||||||
Macnica Holdings, Inc. | (7,800 | ) | (218,594 | ) | 32.6 | |||||||
Makino Milling Machine Co. Ltd. | (600 | ) | (22,373 | ) | 3.3 | |||||||
Management Solutions Co. Ltd. | (9,400 | ) | (227,284 | ) | 33.9 | |||||||
Maruha Nichiro Corp. | (25,200 | ) | (478,416 | ) | 71.4 | |||||||
Maruwa Co. Ltd. | (800 | ) | (104,095 | ) | 15.5 | |||||||
Matsuda Sangyo Co. Ltd. | (700 | ) | (11,867 | ) | 1.8 | |||||||
Maxvalu Tokai Co. Ltd. | (1,800 | ) | (36,598 | ) | 5.5 | |||||||
Medley, Inc. | (20,700 | ) | (551,695 | ) | 82.3 | |||||||
Meiko Electronics Co. Ltd. | (15,700 | ) | (323,151 | ) | 48.2 | |||||||
Micronics Japan Co. Ltd. | (8,000 | ) | (74,396 | ) | 11.1 | |||||||
Mirai Corp. | (131 | ) | (44,017 | ) | 6.6 | |||||||
MIRAIT ONE corp. | (24,000 | ) | (304,085 | ) | 45.4 | |||||||
| Security | Shares | Value | % of Basket Value | |||||||||
| Japan (continued) | ||||||||||||
Mitani Sekisan Co. Ltd. | (3,200 | ) | $ | (115,314 | ) | 17.2 | % | |||||
Mitsubishi Estate Logistics REIT Investment Corp. | (55 | ) | (172,024 | ) | 25.7 | |||||||
Mitsubishi Research Institute, Inc. | (4,900 | ) | (181,429 | ) | 27.1 | |||||||
Mitsuboshi Belting Ltd. | (6,900 | ) | (201,666 | ) | 30.1 | |||||||
Musashi Seimitsu Industry Co. Ltd. | (51,200 | ) | (703,501 | ) | 105.0 | |||||||
Musashino Bank Ltd. | (1,200 | ) | (19,874 | ) | 3.0 | |||||||
Nachi-Fujikoshi Corp. | (4,800 | ) | (138,364 | ) | 20.6 | |||||||
Nafco Co. Ltd. | (20,200 | ) | (281,408 | ) | 42.0 | |||||||
Nagawa Co. Ltd. | (1,400 | ) | (66,666 | ) | 9.9 | |||||||
Nanto Bank Ltd. | (10,000 | ) | (185,488 | ) | 27.7 | |||||||
Nichiha Corp. | (5,300 | ) | (114,162 | ) | 17.0 | |||||||
Nihon Parkerizing Co. Ltd. | (7,700 | ) | (61,455 | ) | 9.2 | |||||||
Nikkiso Co. Ltd. | (3,800 | ) | (27,223 | ) | 4.1 | |||||||
Nikkon Holdings Co. Ltd. | (7,800 | ) | (154,113 | ) | 23.0 | |||||||
Nippon Carbon Co. Ltd. | (8,200 | ) | (256,312 | ) | 38.2 | |||||||
Nippon Kanzai Holdings Co. Ltd. | (16,200 | ) | (321,776 | ) | 48.0 | |||||||
Nippon Pillar Packing Co. Ltd. | (2,800 | ) | (79,375 | ) | 11.8 | |||||||
Nippon Signal Company Ltd. | (8,900 | ) | (74,135 | ) | 11.1 | |||||||
Nippon Television Holdings, Inc. | (10,100 | ) | (92,677 | ) | 13.8 | |||||||
Nishimatsu Construction Co. Ltd. | (10,400 | ) | (278,716 | ) | 41.6 | |||||||
Nishimatsuya Chain Co. Ltd. | (45,700 | ) | (552,936 | ) | 82.5 | |||||||
Nishio Holdings Co. Ltd. | (7,500 | ) | (181,721 | ) | 27.1 | |||||||
Nissha Co. Ltd. | (21,800 | ) | (303,421 | ) | 45.3 | |||||||
Nitta Corp. | (1,200 | ) | (27,836 | ) | 4.2 | |||||||
Nitto Kogyo Corp. | (5,000 | ) | (100,961 | ) | 15.1 | |||||||
Nojima Corp. | (23,100 | ) | (252,726 | ) | 37.7 | |||||||
Noritake Co. Ltd. | (1,000 | ) | (35,025 | ) | 5.2 | |||||||
North Pacific Bank Ltd. | (4,900 | ) | (10,693 | ) | 1.6 | |||||||
NS United Kaiun Kaisha Ltd. | (10,600 | ) | (317,234 | ) | 47.3 | |||||||
NTT UD REIT Investment Corp. | (473 | ) | (464,413 | ) | 69.3 | |||||||
Ogaki Kyoritsu Bank Ltd. | (28,900 | ) | (401,377 | ) | 59.9 | |||||||
Ohsho Food Service Corp. | (6,500 | ) | (301,919 | ) | 45.0 | |||||||
Oisix ra daichi, Inc. | (13,200 | ) | (252,021 | ) | 37.6 | |||||||
Okasan Securities Group, Inc. | (104,200 | ) | (333,586 | ) | 49.8 | |||||||
One REIT, Inc. | (16 | ) | (28,874 | ) | 4.3 | |||||||
Open Door, Inc. | (6,500 | ) | (71,524 | ) | 10.7 | |||||||
Optorun Co. Ltd. | (12,200 | ) | (189,759 | ) | 28.3 | |||||||
Organo Corp. | (14,600 | ) | (359,639 | ) | 53.7 | |||||||
Osaka Soda Co. Ltd. | (13,200 | ) | (436,355 | ) | 65.1 | |||||||
OSAKA Titanium Technologies Co. Ltd. | (14,600 | ) | (317,245 | ) | 47.3 | |||||||
Pacific Industrial Co. Ltd. | (32,100 | ) | (295,456 | ) | 44.1 | |||||||
PAL GROUP Holdings Co. Ltd. | (1,100 | ) | (25,808 | ) | 3.8 | |||||||
Paramount Bed Holdings Co. Ltd. | (4,000 | ) | (72,333 | ) | 10.8 | |||||||
Piolax, Inc. | (23,200 | ) | (351,248 | ) | 52.4 | |||||||
Prima Meat Packers Ltd. | (5,700 | ) | (98,435 | ) | 14.7 | |||||||
Retail Partners Co. Ltd. | (52,100 | ) | (597,556 | ) | 89.2 | |||||||
Ricoh Leasing Co. Ltd. | (2,500 | ) | (73,746 | ) | 11.0 | |||||||
Riken Keiki Co. Ltd. | (7,100 | ) | (278,227 | ) | 41.5 | |||||||
Riken Vitamin Co. Ltd. | (3,900 | ) | (59,649 | ) | 8.9 | |||||||
Ringer Hut Co. Ltd. | (9,400 | ) | (170,237 | ) | 25.4 | |||||||
Riso Kagaku Corp. | (7,400 | ) | (137,528 | ) | 20.5 | |||||||
Roland Corp. | (8,300 | ) | (253,757 | ) | 37.9 | |||||||
Rorze Corp. | (7,200 | ) | (543,918 | ) | 81.1 | |||||||
Ryoyo Electro Corp. | (16,400 | ) | (305,268 | ) | 45.5 | |||||||
Saibu Gas Holdings Co. Ltd. | (21,900 | ) | (310,871 | ) | 46.4 | |||||||
Sakata INX Corp. | (18,300 | ) | (152,202 | ) | 22.7 | |||||||
SAMTY Co. Ltd. | (9,000 | ) | (149,796 | ) | 22.3 | |||||||
Samty Residential Investment Corp. | (380 | ) | (329,704 | ) | 49.2 | |||||||
San-A Co. Ltd. | (6,400 | ) | (220,724 | ) | 32.9 | |||||||
San-Ai Obbli Co. Ltd. | (7,900 | ) | (84,849 | ) | 12.7 | |||||||
SanBio Co. Ltd. | (18,400 | ) | (86,663 | ) | 12.9 | |||||||
SCHEDULE OF INVESTMENTS | 33 |
Schedule of Investments (continued) April 30, 2023 | BlackRock Global Equity Market Neutral Fund |
| Security | Shares | Value | % of Basket Value | |||||||||
| Japan (continued) | ||||||||||||
San-In Godo Bank Ltd. | (7,500 | ) | $ | (42,994 | ) | 6.4 | % | |||||
Sanki Engineering Co. Ltd. | (9,400 | ) | (105,991 | ) | 15.8 | |||||||
Sansan, Inc. | (3,200 | ) | (43,791 | ) | 6.5 | |||||||
Sanyo Denki Co. Ltd. | (7,100 | ) | (361,109 | ) | 53.9 | |||||||
SB Technology Corp. | (4,900 | ) | (85,283 | ) | 12.7 | |||||||
SBS Holdings, Inc. | (16,800 | ) | (417,624 | ) | 62.3 | |||||||
Seiko Group Corp. | (4,000 | ) | (89,522 | ) | 13.4 | |||||||
Sekisui Jushi Corp. | (15,700 | ) | (257,054 | ) | 38.3 | |||||||
Senko Group Holdings Co. Ltd. | (28,500 | ) | (207,726 | ) | 31.0 | |||||||
Shibaura Machine Co. Ltd. | (6,900 | ) | (163,798 | ) | 24.4 | |||||||
Shibuya Corp. | (3,900 | ) | (73,562 | ) | 11.0 | |||||||
Shiga Bank Ltd. | (12,800 | ) | (272,085 | ) | 40.6 | |||||||
Shikoku Kasei Holdings Corp. | (2,400 | ) | (25,509 | ) | 3.8 | |||||||
Shin Nippon Biomedical Laboratories Ltd. | (19,800 | ) | (368,569 | ) | 55.0 | |||||||
Shinmaywa Industries Ltd. | (1,300 | ) | (11,933 | ) | 1.8 | |||||||
Shoei Foods Corp. | (7,200 | ) | (216,217 | ) | 32.3 | |||||||
Showa Sangyo Co. Ltd. | (11,100 | ) | (222,837 | ) | 33.2 | |||||||
Simplex Holdings, Inc. | (12,800 | ) | (227,103 | ) | 33.9 | |||||||
SKY Perfect JSAT Holdings, Inc. | (14,400 | ) | (57,284 | ) | 8.5 | |||||||
SRE Holdings Corp. | (13,200 | ) | (302,119 | ) | 45.1 | |||||||
Sumitomo Densetsu Co. Ltd. | (2,200 | ) | (46,660 | ) | 7.0 | |||||||
Sumitomo Osaka Cement Co. Ltd. | (5,100 | ) | (146,260 | ) | 21.8 | |||||||
Suruga Bank Ltd. | (62,100 | ) | (240,265 | ) | 35.8 | |||||||
T Hasegawa Co. Ltd. | (5,900 | ) | (143,302 | ) | 21.4 | |||||||
Takara Leben Real Estate Investment Corp. | (214 | ) | (146,807 | ) | 21.9 | |||||||
Takasago International Corp. | (6,900 | ) | (134,200 | ) | 20.0 | |||||||
Takasago Thermal Engineering Co. Ltd. | (2,300 | ) | (39,368 | ) | 5.9 | |||||||
Tama Home Co. Ltd. | (12,200 | ) | (340,329 | ) | 50.8 | |||||||
Toa Corp. | (27,300 | ) | (604,024 | ) | 90.1 | |||||||
Toagosei Co. Ltd. | (20,900 | ) | (184,508 | ) | 27.5 | |||||||
Toei Co. Ltd. | (1,900 | ) | (261,000 | ) | 38.9 | |||||||
Toho Bank Ltd. | (127,900 | ) | (215,405 | ) | 32.1 | |||||||
Toho Holdings Co. Ltd. | (30,600 | ) | (622,443 | ) | 92.9 | |||||||
TOKAI Holdings Corp. | (38,600 | ) | (255,797 | ) | 38.2 | |||||||
Tokai Tokyo Financial Holdings, Inc. | (94,600 | ) | (250,201 | ) | 37.3 | |||||||
Tokushu Tokai Paper Co. Ltd. | (12,400 | ) | (275,200 | ) | 41.1 | |||||||
Tokuyama Corp. | (27,700 | ) | (460,587 | ) | 68.7 | |||||||
Tokyo Electron Device Ltd. | (9,300 | ) | (544,450 | ) | 81.2 | |||||||
TOMONY Holdings, Inc. | (108,200 | ) | (300,148 | ) | 44.8 | |||||||
Tomy Co. Ltd. | (58,800 | ) | (677,475 | ) | 101.1 | |||||||
Topre Corp. | (18,600 | ) | (192,095 | ) | 28.7 | |||||||
Toyo Construction Co. Ltd. | (21,600 | ) | (157,814 | ) | 23.5 | |||||||
Toyo Gosei Co. Ltd. | (5,300 | ) | (308,235 | ) | 46.0 | |||||||
Trancom Co. Ltd. | (1,200 | ) | (61,545 | ) | 9.2 | |||||||
Transcosmos, Inc. | (7,800 | ) | (185,586 | ) | 27.7 | |||||||
Tsuburaya Fields Holdings, Inc. | (22,400 | ) | (310,961 | ) | 46.4 | |||||||
Tsugami Corp. | (4,800 | ) | (50,823 | ) | 7.6 | |||||||
TV Asahi Holdings Corp. | (16,400 | ) | (193,362 | ) | 28.8 | |||||||
Union Tool Co. | (500 | ) | (12,196 | ) | 1.8 | |||||||
United Super Markets Holdings, Inc. | (18,400 | ) | (162,022 | ) | 24.2 | |||||||
Wacoal Holdings Corp. | (12,200 | ) | (241,957 | ) | 36.1 | |||||||
Wacom Co. Ltd. | (46,000 | ) | (238,255 | ) | 35.5 | |||||||
Weathernews, Inc. | (2,400 | ) | (122,847 | ) | 18.3 | |||||||
West Holdings Corp. | (5,900 | ) | (143,484 | ) | 21.4 | |||||||
WingArc1st, Inc. | (5,900 | ) | (98,157 | ) | 14.6 | |||||||
W-Scope Corp. | (18,200 | ) | (154,213 | ) | 23.0 | |||||||
YAMABIKO Corp. | (21,400 | ) | (216,272 | ) | 32.3 | |||||||
YA-MAN Ltd. | (34,700 | ) | (305,773 | ) | 45.6 | |||||||
Yodogawa Steel Works Ltd. | (10,600 | ) | (226,569 | ) | 33.8 | |||||||
Yokogawa Bridge Holdings Corp. | (11,300 | ) | (188,550 | ) | 28.1 | |||||||
Yokorei Co. Ltd. | (13,800 | ) | (113,249 | ) | 16.9 | |||||||
| Security | Shares | Value | % of Basket Value | |||||||||
| Japan (continued) | ||||||||||||
Yokowo Co. Ltd. | (15,800 | ) | $ | (238,359 | ) | 35.6 | % | |||||
Yonex Co. Ltd. | (8,900 | ) | (108,320 | ) | 16.2 | |||||||
Yoshinoya Holdings Co. Ltd. | (22,100 | ) | (416,808 | ) | 62.2 | |||||||
Zojirushi Corp. | (24,300 | ) | (325,145 | ) | 48.5 | |||||||
|
|
|
| |||||||||
| (58,162,083 | ) | |||||||||||
| Luxembourg | ||||||||||||
B&S Group Sarl | (5,386 | ) | (23,195 | ) | 3.5 | |||||||
|
|
|
| |||||||||
| Malta | ||||||||||||
Kindred Group PLC | (24,958 | ) | (305,504 | ) | 45.6 | |||||||
|
|
|
| |||||||||
| Netherlands | ||||||||||||
AMG Advanced Metallurgical Group NV | (686 | ) | (25,501 | ) | 3.8 | |||||||
Arcadis NV | (11,335 | ) | (466,154 | ) | 69.5 | |||||||
Corbion NV | (2,493 | ) | (78,118 | ) | 11.7 | |||||||
Flow Traders Ltd. | (4,140 | ) | (102,093 | ) | 15.2 | |||||||
Fugro NV | (20,715 | ) | (292,432 | ) | 43.6 | |||||||
Meltwater NV | (34,416 | ) | (55,853 | ) | 8.3 | |||||||
NSI NV | (1,602 | ) | (36,627 | ) | 5.5 | |||||||
Sligro Food Group NV | (652 | ) | (11,328 | ) | 1.7 | |||||||
TKH Group NV | (5,366 | ) | (258,588 | ) | 38.6 | |||||||
|
|
|
| |||||||||
| (1,326,694 | ) | |||||||||||
| Norway | ||||||||||||
Aker Carbon Capture ASA | (63,566 | ) | (65,013 | ) | 9.7 | |||||||
Atea ASA | (1,690 | ) | (23,156 | ) | 3.5 | |||||||
BEWi ASA | (2,223 | ) | (8,714 | ) | 1.3 | |||||||
Bonheur ASA | (3,826 | ) | (85,204 | ) | 12.7 | |||||||
Crayon Group Holding ASA | (39,692 | ) | (305,966 | ) | 45.7 | |||||||
Europris ASA | (1,537 | ) | (10,977 | ) | 1.6 | |||||||
FREYR Battery SA | (17,079 | ) | (120,749 | ) | 18.0 | |||||||
Hexagon Composites ASA | (15,174 | ) | (45,886 | ) | 6.8 | |||||||
Hexagon Purus ASA | (54,964 | ) | (116,394 | ) | 17.4 | |||||||
MPC Container Ships ASA | (33,206 | ) | (54,327 | ) | 8.1 | |||||||
Norske Skog ASA | (7,130 | ) | (31,590 | ) | 4.7 | |||||||
|
|
|
| |||||||||
| (867,976 | ) | |||||||||||
| Philippines | ||||||||||||
TaskUS, Inc., Class A | (5,386 | ) | (72,496 | ) | 10.8 | |||||||
|
|
|
| |||||||||
| Portugal | ||||||||||||
Altri SGPS SA | (50,429 | ) | (259,896 | ) | 38.8 | |||||||
Corticeira Amorim SGPS SA | (24,323 | ) | (273,254 | ) | 40.8 | |||||||
Greenvolt-Energias Renovaveis SA | (141,923 | ) | (960,210 | ) | 143.2 | |||||||
Navigator Co. SA | (70,024 | ) | (255,882 | ) | 38.2 | |||||||
NOS SGPS SA | (13,926 | ) | (60,931 | ) | 9.1 | |||||||
|
|
|
| |||||||||
| (1,810,173 | ) | |||||||||||
| Puerto Rico | ||||||||||||
First BanCorp | (1,631 | ) | (19,164 | ) | 2.9 | |||||||
Liberty Latin America Ltd. | (4,407 | ) | (39,134 | ) | 5.8 | |||||||
|
|
|
| |||||||||
| (58,298 | ) | |||||||||||
| Singapore | ||||||||||||
Kulicke & Soffa Industries, Inc. | (810 | ) | (38,604 | ) | 5.8 | |||||||
TDCX, Inc. | (27,093 | ) | (190,464 | ) | 28.4 | |||||||
|
|
|
| |||||||||
| (229,068 | ) | |||||||||||
| Spain | ||||||||||||
Atresmedia Corp. de Medios de Comunicacion SA | (11,586 | ) | (46,124 | ) | 6.9 | |||||||
Befesa SA | (7,616 | ) | (341,417 | ) | 50.9 | |||||||
CIE Automotive SA | (8,332 | ) | (250,177 | ) | 37.3 | |||||||
Construcciones y Auxiliar de Ferrocarriles SA | (1,480 | ) | (45,727 | ) | 6.8 | |||||||
Faes Farma SA | (24,297 | ) | (85,289 | ) | 12.7 | |||||||
Gestamp Automocion SA | (34,041 | ) | (146,534 | ) | 21.9 | |||||||
| 34 | 2 0 2 3 BLACK ROCK ANNUAL REPORT TO SHAREHOLDERS |
Schedule of Investments (continued) April 30, 2023 | BlackRock Global Equity Market Neutral Fund |
| Security | Shares | Value | % of Basket Value | |||||||||
| Spain (continued) | ||||||||||||
Global Dominion Access SA | (16,299 | ) | $ | (67,783 | ) | 10.1 | % | |||||
Grenergy Renovables SA | (6,106 | ) | (177,947 | ) | 26.6 | |||||||
Linea Directa Aseguradora SA Cia de Seguros y Reaseguros | (201,247 | ) | (184,868 | ) | 27.6 | |||||||
Opdenergy Holdings SA | (28,078 | ) | (116,306 | ) | 17.4 | |||||||
Soltec Power Holdings SA | (54,560 | ) | (310,639 | ) | 46.3 | |||||||
Talgo SA | (10,590 | ) | (36,682 | ) | 5.5 | |||||||
Vidrala SA | (231 | ) | (24,139 | ) | 3.6 | |||||||
|
|
|
| |||||||||
| (1,833,632 | ) | |||||||||||
| Sweden | ||||||||||||
AcadeMedia AB | (72,089 | ) | (363,615 | ) | 54.3 | |||||||
AFRY AB | (4,763 | ) | (89,015 | ) | 13.3 | |||||||
Attendo AB | (11,971 | ) | (42,190 | ) | 6.3 | |||||||
Beijer Alma AB | (12,389 | ) | (280,134 | ) | 41.8 | |||||||
Bilia AB, A Shares | (17,664 | ) | (198,049 | ) | 29.5 | |||||||
Billerud AB | (30,577 | ) | (291,839 | ) | 43.5 | |||||||
Cibus Nordic Real Estate AB | (15,974 | ) | (169,794 | ) | 25.3 | |||||||
Cint Group AB | (57,406 | ) | (89,842 | ) | 13.4 | |||||||
Clas Ohlson AB, B Shares | (25,753 | ) | (193,265 | ) | 28.8 | |||||||
Coor Service Management Holding AB | (17,318 | ) | (111,986 | ) | 16.7 | |||||||
Dios Fastigheter AB | (4,060 | ) | (28,792 | ) | 4.3 | |||||||
Dometic Group AB | (41,806 | ) | (298,093 | ) | 44.5 | |||||||
Duni AB | (9,939 | ) | (107,921 | ) | 16.1 | |||||||
Dustin Group AB | (25,814 | ) | (88,299 | ) | 13.2 | |||||||
Electrolux Professional AB | (26,682 | ) | (154,674 | ) | 23.1 | |||||||
Fabege AB | (24,637 | ) | (196,341 | ) | 29.3 | |||||||
Granges AB | (33,745 | ) | (333,689 | ) | 49.8 | |||||||
Hemnet Group AB | (20,955 | ) | (341,176 | ) | 50.9 | |||||||
Hexpol AB | (2,260 | ) | (26,465 | ) | 4.0 | |||||||
Hufvudstaden AB, A Shares | (31,581 | ) | (447,612 | ) | 66.8 | |||||||
Instalco AB | (20,954 | ) | (109,496 | ) | 16.3 | |||||||
JM AB | (13,953 | ) | (222,631 | ) | 33.2 | |||||||
KNOW IT AB | (6,403 | ) | (147,518 | ) | 22.0 | |||||||
Lindab International AB | (11,838 | ) | (188,459 | ) | 28.1 | |||||||
Loomis AB | (15,806 | ) | (502,794 | ) | 75.0 | |||||||
Medicover AB, B Shares | (623 | ) | (10,205 | ) | 1.5 | |||||||
MEKO AB | (7,603 | ) | (92,687 | ) | 13.8 | |||||||
Munters Group AB | (6,228 | ) | (60,762 | ) | 9.1 | |||||||
NCC AB, B Shares | (9,687 | ) | (95,801 | ) | 14.3 | |||||||
New Wave Group AB, B Shares | (2,829 | ) | (56,814 | ) | 8.5 | |||||||
Nordnet AB publ | (8,941 | ) | (139,720 | ) | 20.8 | |||||||
Pandox AB | (5,542 | ) | (65,589 | ) | 9.8 | |||||||
Peab AB | (39,783 | ) | (209,179 | ) | 31.2 | |||||||
Ratos AB, B Shares | (32,632 | ) | (112,152 | ) | 16.7 | |||||||
Rvrc Holding AB | (32,800 | ) | (97,441 | ) | 14.5 | |||||||
SkiStar AB | (9,328 | ) | (119,385 | ) | 17.8 | |||||||
SSAB AB, B Shares | (10,459 | ) | (70,287 | ) | 10.5 | |||||||
Stillfront Group AB | (219,702 | ) | (465,532 | ) | 69.5 | |||||||
Viaplay Group AB | (3,527 | ) | (89,578 | ) | 13.4 | |||||||
Wallenstam AB, B Shares | (109,750 | ) | (432,869 | ) | 64.6 | |||||||
Wihlborgs Fastigheter AB | (58,394 | ) | (469,017 | ) | 70.0 | |||||||
|
|
|
| |||||||||
| (7,610,707 | ) | |||||||||||
| Switzerland | ||||||||||||
ALSO Holding AG, Registered Shares | (1,963 | ) | (421,551 | ) | 62.9 | |||||||
Burckhardt Compression Holding AG | (91 | ) | (56,296 | ) | 8.4 | |||||||
Bystronic AG | (345 | ) | (249,508 | ) | 37.2 | |||||||
Daetwyler Holding AG | (1,984 | ) | (502,848 | ) | 75.0 | |||||||
dormakaba Holding AG | (1,542 | ) | (692,035 | ) | 103.2 | |||||||
EFG International AG | (4,520 | ) | (43,583 | ) | 6.5 | |||||||
Forbo Holding AG, Registered Shares | (357 | ) | (526,512 | ) | 78.6 | |||||||
| Security | Shares | Value | % of Basket Value | |||||||||
| Switzerland (continued) | ||||||||||||
Interroll Holding AG, Registered Shares | (40 | ) | $ | (146,264 | ) | 21.8 | % | |||||
Komax Holding AG, Registered Shares | (1,226 | ) | (325,567 | ) | 48.6 | |||||||
Landis&Gyr Group AG | (3,084 | ) | (255,902 | ) | 38.2 | |||||||
Leonteq AG | (2,601 | ) | (141,372 | ) | 21.1 | |||||||
Metall Zug AG, Registered Shares | (5 | ) | (10,340 | ) | 1.5 | |||||||
Mobimo Holding AG, Registered Shares | (126 | ) | (33,854 | ) | 5.1 | |||||||
OC Oerlikon Corp. AG, Registered Shares | (19,039 | ) | (106,804 | ) | 15.9 | |||||||
Peach Property Group AG | (4,394 | ) | (68,769 | ) | 10.3 | |||||||
SFS Group AG | (1,633 | ) | (213,794 | ) | 31.9 | |||||||
Siegfried Holding AG, Registered Shares | (270 | ) | (208,481 | ) | 31.1 | |||||||
SKAN Group AG | (2,843 | ) | (274,679 | ) | 41.0 | |||||||
St Galler Kantonalbank AG, Registered Shares | (241 | ) | (135,996 | ) | 20.3 | |||||||
TX Group AG | (615 | ) | (71,766 | ) | 10.7 | |||||||
Valiant Holding AG, Registered Shares | (797 | ) | (92,807 | ) | 13.8 | |||||||
Vontobel Holding AG, Registered Shares | (3,436 | ) | (230,568 | ) | 34.4 | |||||||
Zehnder Group AG | (1,330 | ) | (108,835 | ) | 16.2 | |||||||
Zur Rose Group AG | (6,206 | ) | (272,034 | ) | 40.6 | |||||||
|
|
|
| |||||||||
| (5,190,165 | ) | |||||||||||
| United Arab Emirates | ||||||||||||
Network International Holdings PLC | (82,311 | ) | (395,267 | ) | 59.0 | |||||||
|
|
|
| |||||||||
| United Kingdom | ||||||||||||
AO World PLC | (252,373 | ) | (241,801 | ) | 36.1 | |||||||
Ascential PLC | (49,628 | ) | (157,124 | ) | 23.5 | |||||||
Assura PLC | (667,728 | ) | (421,702 | ) | 62.9 | |||||||
Auction Technology Group PLC | (6,325 | ) | (55,032 | ) | 8.2 | |||||||
Bridgepoint Group PLC, Registered Shares | (18,917 | ) | (56,692 | ) | 8.5 | |||||||
Capita PLC | (145,377 | ) | (62,646 | ) | 9.4 | |||||||
Close Brothers Group PLC | (3,274 | ) | (36,946 | ) | 5.5 | |||||||
Coats Group PLC | (405,678 | ) | (393,562 | ) | 58.7 | |||||||
Computacenter PLC | (4,923 | ) | (140,904 | ) | 21.0 | |||||||
Craneware PLC | (535 | ) | (8,974 | ) | 1.3 | |||||||
Crest Nicholson Holdings PLC | (23,826 | ) | (79,560 | ) | 11.9 | |||||||
Currys PLC | (23,053 | ) | (16,349 | ) | 2.5 | |||||||
Domino’s Pizza Group PLC | (59,399 | ) | (216,982 | ) | 32.4 | |||||||
Elementis PLC | (48,632 | ) | (75,803 | ) | 11.3 | |||||||
Firstgroup PLC | (58,906 | ) | (82,009 | ) | 12.2 | |||||||
GB Group PLC | (90,742 | ) | (366,211 | ) | 54.6 | |||||||
Great Portland Estates PLC | (8,315 | ) | (55,051 | ) | 8.2 | |||||||
Greatland Gold PLC | (2,468,683 | ) | (246,163 | ) | 36.7 | |||||||
Halfords Group PLC | (70,907 | ) | (184,919 | ) | 27.6 | |||||||
Hays PLC | (367,439 | ) | (520,344 | ) | 77.6 | |||||||
Home Reit PLC | (319,295 | ) | (133,597 | ) | 19.9 | |||||||
Impact Healthcare Reit PLC | (84,935 | ) | (103,264 | ) | 15.4 | |||||||
IP Group PLC | (154,485 | ) | (107,847 | ) | 16.1 | |||||||
J D Wetherspoon PLC | (30,101 | ) | (266,369 | ) | 39.8 | |||||||
John Wood Group PLC | (60,953 | ) | (170,699 | ) | 25.5 | |||||||
Kape Technologies PLC | (228,282 | ) | (812,602 | ) | 121.2 | |||||||
Keller Group PLC | (17,730 | ) | (146,859 | ) | 21.9 | |||||||
Kier Group PLC | (46,642 | ) | (44,390 | ) | 6.6 | |||||||
Liontrust Asset Management PLC | (7,161 | ) | (76,574 | ) | 11.4 | |||||||
LondonMetric Property PLC | (83,640 | ) | (200,316 | ) | 29.9 | |||||||
LXI REIT PLC | (431,979 | ) | (565,703 | ) | 84.4 | |||||||
Marlowe PLC | (10,051 | ) | (62,813 | ) | 9.4 | |||||||
Mitie Group PLC | (729,419 | ) | (833,456 | ) | 124.4 | |||||||
Molten Ventures PLC | (110,799 | ) | (384,685 | ) | 57.4 | |||||||
NCC Group PLC | (234,456 | ) | (312,512 | ) | 46.6 | |||||||
Ninety One PLC | (40,664 | ) | (91,309 | ) | 13.6 | |||||||
Pagegroup PLC | (128,488 | ) | (723,778 | ) | 108.0 | |||||||
Petrofac Ltd. | (202,777 | ) | (179,807 | ) | 26.8 | |||||||
Pets at Home Group PLC | (45,402 | ) | (217,404 | ) | 32.4 | |||||||
SCHEDULE OF INVESTMENTS | 35 |
Schedule of Investments (continued) April 30, 2023 | BlackRock Global Equity Market Neutral Fund |
| Security | Shares | Value | % of Basket Value | |||||||||
| United Kingdom (continued) | ||||||||||||
PRS REIT PLC | (22,746 | ) | $ | (24,328 | ) | 3.6 | % | |||||
PZ Cussons PLC | (10,713 | ) | (26,642 | ) | 4.0 | |||||||
Rathbones Group PLC | (4,633 | ) | (112,493 | ) | 16.8 | |||||||
Reach PLC | (113,577 | ) | (119,056 | ) | 17.8 | |||||||
Redrow PLC | (18,819 | ) | (121,170 | ) | 18.1 | |||||||
Renewi PLC | (49,342 | ) | (368,062 | ) | 54.9 | |||||||
S4 Capital PLC | (74,758 | ) | (135,626 | ) | 20.2 | |||||||
Spirent Communications PLC | (57,682 | ) | (129,459 | ) | 19.3 | |||||||
SSP Group PLC | (148,335 | ) | (474,490 | ) | 70.8 | |||||||
Synthomer PLC | (46,082 | ) | (68,505 | ) | 10.2 | |||||||
Tyman PLC | (39,274 | ) | (120,088 | ) | 17.9 | |||||||
Urban Logistics REIT PLC | (95,479 | ) | (167,510 | ) | 25.0 | |||||||
Volex PLC | (131,709 | ) | (417,755 | ) | 62.3 | |||||||
WH Smith PLC | (12,252 | ) | (239,867 | ) | 35.8 | |||||||
Wincanton PLC | (50,320 | ) | (134,228 | ) | 20.0 | |||||||
Workspace Group PLC | (11,754 | ) | (69,624 | ) | 10.4 | |||||||
Yellow Cake PLC | (128,883 | ) | (601,962 | ) | 89.8 | |||||||
|
|
|
| |||||||||
| (12,183,623 | ) | |||||||||||
| United States | ||||||||||||
23andMe Holding Co., Class A | (60,599 | ) | (119,380 | ) | 17.8 | |||||||
3D Systems Corp. | (45,282 | ) | (414,783 | ) | 61.9 | |||||||
AAR Corp. | (6,744 | ) | (355,948 | ) | 53.1 | |||||||
ABM Industries, Inc. | (17,997 | ) | (766,312 | ) | 114.3 | |||||||
Acadia Realty Trust | (4,531 | ) | (61,214 | ) | 9.1 | |||||||
ACCO Brands Corp. | (5,371 | ) | (24,599 | ) | 3.7 | |||||||
Accolade, Inc. | (6,811 | ) | (92,153 | ) | 13.7 | |||||||
Aclaris Therapeutics, Inc. | (2,481 | ) | (22,056 | ) | 3.3 | |||||||
ACV Auctions, Inc., Class B | (43,492 | ) | (566,701 | ) | 84.5 | |||||||
AdaptHealth Corp. | (32,620 | ) | (387,526 | ) | 57.8 | |||||||
Addus HomeCare Corp. | (792 | ) | (64,738 | ) | 9.7 | |||||||
Adeia, Inc. | (15,226 | ) | (116,327 | ) | 17.4 | |||||||
Adicet Bio, Inc. | (9,816 | ) | (57,325 | ) | 8.6 | |||||||
Adtalem Global Education, Inc. | (8,753 | ) | (355,109 | ) | 53.0 | |||||||
ADTRAN Holdings, Inc. | (9,693 | ) | (88,400 | ) | 13.2 | |||||||
Advantage Solutions, Inc. | (2,827 | ) | (3,619 | ) | 0.5 | |||||||
Aehr Test Systems | (14,861 | ) | (367,810 | ) | 54.9 | |||||||
AeroVironment, Inc. | (1,197 | ) | (120,526 | ) | 18.0 | |||||||
Aeva Technologies, Inc. | (62,334 | ) | (61,829 | ) | 9.2 | |||||||
Agiliti, Inc. | (28,876 | ) | (482,807 | ) | 72.0 | |||||||
Agilysys, Inc. | (1,301 | ) | (101,530 | ) | 15.1 | |||||||
Akero Therapeutics, Inc. | (3,106 | ) | (138,962 | ) | 20.7 | |||||||
Alexander’s, Inc. | (1,595 | ) | (296,782 | ) | 44.3 | |||||||
Alkami Technology, Inc. | (8,150 | ) | (97,718 | ) | 14.6 | |||||||
Allbirds, Inc., Class A | (62,259 | ) | (77,824 | ) | 11.6 | |||||||
Allovir, Inc. | (3,597 | ) | (12,374 | ) | 1.8 | |||||||
Alphatec Holdings, Inc. | (10,086 | ) | (145,642 | ) | 21.7 | |||||||
Altair Engineering, Inc., Class A | (1,102 | ) | (76,093 | ) | 11.4 | |||||||
Altus Power, Inc. | (9,233 | ) | (41,918 | ) | 6.3 | |||||||
A-Mark Precious Metals, Inc. | (11,965 | ) | (428,347 | ) | 63.9 | |||||||
AMC Networks, Inc. | (7,776 | ) | (137,557 | ) | 20.5 | |||||||
Amerant Bancorp, Inc. | (8,776 | ) | (163,234 | ) | 24.4 | |||||||
Ameresco, Inc., Class A | (3,721 | ) | (154,794 | ) | 23.1 | |||||||
American Eagle Outfitters, Inc. | (3,216 | ) | (43,062 | ) | 6.4 | |||||||
American States Water Co. | (2,733 | ) | (242,554 | ) | 36.2 | |||||||
American Well Corp., Class A | (18,242 | ) | (39,950 | ) | 6.0 | |||||||
America’s Car-Mart, Inc. | (4,600 | ) | (369,794 | ) | 55.2 | |||||||
Ameris Bancorp | (4,080 | ) | (136,680 | ) | 20.4 | |||||||
Amplitude, Inc. | (39,450 | ) | (447,757 | ) | 66.8 | |||||||
Anavex Life Sciences Corp. | (28,607 | ) | (232,861 | ) | 34.7 | |||||||
Andersons, Inc. | (4,621 | ) | (206,559 | ) | 30.8 | |||||||
| Security | Shares | Value | % of Basket Value | |||||||||
| United States (continued) | ||||||||||||
ANI Pharmaceuticals, Inc. | (1,409 | ) | $ | (53,147 | ) | 7.9 | % | |||||
Apartment Investment and Management Co. | (7,946 | ) | (62,217 | ) | 9.3 | |||||||
API Group Corp. | (6,620 | ) | (150,671 | ) | 22.5 | |||||||
Apollo Commercial Real Estate Finance, Inc. | (15,566 | ) | (157,528 | ) | 23.5 | |||||||
Apollo Medical Holdings, Inc. | (2,052 | ) | (72,825 | ) | 10.9 | |||||||
Appian Corp., Class A | (12,085 | ) | (453,792 | ) | 67.7 | |||||||
ArcBest Corp. | (2,612 | ) | (246,573 | ) | 36.8 | |||||||
Arcellx, Inc. | (10,281 | ) | (438,793 | ) | 65.5 | |||||||
Arcosa, Inc. | (4,721 | ) | (318,856 | ) | 47.6 | |||||||
Arcturus Therapeutics Holdings, Inc. | (6,351 | ) | (169,064 | ) | 25.2 | |||||||
Ardelyx, Inc. | (41,058 | ) | (183,119 | ) | 27.3 | |||||||
Ares Commercial Real Estate Corp. | (31,146 | ) | (268,167 | ) | 40.0 | |||||||
Argan, Inc. | (9,187 | ) | (369,593 | ) | 55.1 | |||||||
ARMOUR Residential REIT, Inc. | (94,997 | ) | (484,485 | ) | 72.3 | |||||||
Array Technologies, Inc. | (14,025 | ) | (286,811 | ) | 42.8 | |||||||
Artesian Resources Corp., Class A | (621 | ) | (34,018 | ) | 5.1 | |||||||
Atea Pharmaceuticals, Inc. | (21,109 | ) | (69,026 | ) | 10.3 | |||||||
Atlantic Union Bankshares Corp. | (17,127 | ) | (490,175 | ) | 73.1 | |||||||
Atlanticus Holdings Corp. | (464 | ) | (13,530 | ) | 2.0 | |||||||
Avanos Medical, Inc. | (4,907 | ) | (144,953 | ) | 21.6 | |||||||
AvePoint, Inc. | (33,342 | ) | (144,704 | ) | 21.6 | |||||||
Avidity Biosciences, Inc. | (3,325 | ) | (41,230 | ) | 6.2 | |||||||
Avista Corp. | (16,954 | ) | (747,163 | ) | 111.5 | |||||||
Axsome Therapeutics, Inc. | (8,855 | ) | (633,398 | ) | 94.5 | |||||||
AZZ, Inc. | (5,112 | ) | (192,876 | ) | 28.8 | |||||||
Babcock & Wilcox Enterprises, Inc. | (80,638 | ) | (501,568 | ) | 74.8 | |||||||
Balchem Corp. | (552 | ) | (72,533 | ) | 10.8 | |||||||
Banc of California, Inc. | (3,437 | ) | (39,010 | ) | 5.8 | |||||||
Banner Corp. | (9,906 | ) | (494,508 | ) | 73.8 | |||||||
Barnes Group, Inc. | (7,535 | ) | (316,696 | ) | 47.2 | |||||||
Barrett Business Services, Inc. | (2,409 | ) | (201,416 | ) | 30.1 | |||||||
Beauty Health Co. | (49,290 | ) | (564,863 | ) | 84.3 | |||||||
Benson Hill, Inc. | (2,874 | ) | (3,046 | ) | 0.5 | |||||||
Big Lots, Inc. | (1,270 | ) | (11,417 | ) | 1.7 | |||||||
BigCommerce Holdings, Inc. | (49,425 | ) | (365,251 | ) | 54.5 | |||||||
BioCryst Pharmaceuticals, Inc. | (14,624 | ) | (111,289 | ) | 16.6 | |||||||
Biohaven Ltd. | (20,766 | ) | (271,619 | ) | 40.5 | |||||||
BioLife Solutions, Inc. | (3,531 | ) | (62,004 | ) | 9.3 | |||||||
Bionano Genomics, Inc. | (6,262 | ) | (4,308 | ) | 0.6 | |||||||
Bioxcel Therapeutics, Inc. | (16,864 | ) | (347,736 | ) | 51.9 | |||||||
Bloomin’ Brands, Inc. | (11,794 | ) | (292,137 | ) | 43.6 | |||||||
Blue Bird Corp. | (512 | ) | (9,574 | ) | 1.4 | |||||||
Boot Barn Holdings, Inc. | (4,878 | ) | (353,509 | ) | 52.7 | |||||||
Boston Omaha Corp., Class A | (13,434 | ) | (274,860 | ) | 41.0 | |||||||
Brady Corp., Class A | (7,836 | ) | (399,871 | ) | 59.7 | |||||||
Braze, Inc. | (35,846 | ) | (1,053,872 | ) | 157.2 | |||||||
BRC, Inc. | (2,935 | ) | (15,291 | ) | 2.3 | |||||||
Brightsphere Investment Group, Inc. | (5,271 | ) | (119,019 | ) | 17.8 | |||||||
BrightSpire Capital, Inc. | (2,234 | ) | (12,734 | ) | 1.9 | |||||||
Brinker International, Inc. | (12,087 | ) | (482,513 | ) | 72.0 | |||||||
BRP Group, Inc., Class A | (13,223 | ) | (333,087 | ) | 49.7 | |||||||
Butterfly Network, Inc. | (34,563 | ) | (74,656 | ) | 11.1 | |||||||
Cadre Holdings, Inc. | (2,020 | ) | (42,541 | ) | 6.3 | |||||||
Calavo Growers, Inc. | (6,332 | ) | (202,371 | ) | 30.2 | |||||||
California Water Service Group | (5,788 | ) | (324,591 | ) | 48.4 | |||||||
Camping World Holdings, Inc., Class A | (56,215 | ) | (1,258,654 | ) | 187.8 | |||||||
Cano Health, Inc. | (129,464 | ) | (150,178 | ) | 22.4 | |||||||
Capitol Federal Financial, Inc. | (24,876 | ) | (154,231 | ) | 23.0 | |||||||
CareMax, Inc. | (47,226 | ) | (119,010 | ) | 17.8 | |||||||
Caribou Biosciences, Inc. | (17,105 | ) | (73,552 | ) | 11.0 | |||||||
Carriage Services, Inc. | (7,409 | ) | (212,712 | ) | 31.7 | |||||||
| 36 | 2 0 2 3 BLACK ROCK ANNUAL REPORT TO SHAREHOLDERS |
Schedule of Investments (continued) April 30, 2023 | BlackRock Global Equity Market Neutral Fund |
| Security | Shares | Value | % of Basket Value | |||||||||
| United States (continued) | ||||||||||||
Cars.com, Inc. | (2,304 | ) | $ | (45,089 | ) | 6.7 | % | |||||
Casella Waste Systems, Inc., Class A | (6,033 | ) | (536,937 | ) | 80.1 | |||||||
Cass Information Systems, Inc. | (8,677 | ) | (317,405 | ) | 47.4 | |||||||
Cassava Sciences, Inc. | (14,062 | ) | (326,520 | ) | 48.7 | |||||||
Cathay General Bancorp | (4,015 | ) | (127,958 | ) | 19.1 | |||||||
Cavco Industries, Inc. | (1,683 | ) | (505,270 | ) | 75.4 | |||||||
CBIZ, Inc. | (2,175 | ) | (114,601 | ) | 17.1 | |||||||
CCC Intelligent Solutions Holdings, Inc. | (36,668 | ) | (318,278 | ) | 47.5 | |||||||
Celldex Therapeutics, Inc. | (5,917 | ) | (186,030 | ) | 27.8 | |||||||
Centerspace | (3,518 | ) | (198,345 | ) | 29.6 | |||||||
Central Garden & Pet Co. | (1,949 | ) | (71,801 | ) | 10.7 | |||||||
Central Garden & Pet Co., Class A | (1,641 | ) | (57,977 | ) | 8.6 | |||||||
Cerevel Therapeutics Holdings, Inc. | (17,256 | ) | (501,114 | ) | 74.8 | |||||||
Certara, Inc. | (26,836 | ) | (648,626 | ) | 96.8 | |||||||
Chase Corp. | (633 | ) | (69,206 | ) | 10.3 | |||||||
Cheesecake Factory, Inc. | (11,923 | ) | (401,686 | ) | 59.9 | |||||||
Chesapeake Utilities Corp. | (1,078 | ) | (133,133 | ) | 19.9 | |||||||
Children’s Place, Inc. | (12,532 | ) | (371,448 | ) | 55.4 | |||||||
Chuy’s Holdings, Inc. | (2,561 | ) | (89,328 | ) | 13.3 | |||||||
City Holding Co. | (880 | ) | (80,247 | ) | 12.0 | |||||||
Claros Mortgage Trust, Inc. | (66,690 | ) | (797,612 | ) | 119.0 | |||||||
Clarus Corp. | (2,605 | ) | (25,347 | ) | 3.8 | |||||||
Clearfield, Inc. | (3,156 | ) | (137,854 | ) | 20.6 | |||||||
Clearway Energy, Inc., Class C | (13,416 | ) | (407,444 | ) | 60.8 | |||||||
Clover Health Investments Corp. | (89,617 | ) | (66,191 | ) | 9.9 | |||||||
Cogent Biosciences, Inc. | (6,778 | ) | (72,931 | ) | 10.9 | |||||||
Cogent Communications Holdings, Inc. | (9,125 | ) | (629,990 | ) | 94.0 | |||||||
Cohu, Inc. | (5,139 | ) | (173,904 | ) | 25.9 | |||||||
Columbia Financial, Inc. | (8,232 | ) | (138,133 | ) | 20.6 | |||||||
Columbus McKinnon Corp. | (3,074 | ) | (106,699 | ) | 15.9 | |||||||
Community Bank System, Inc. | (5,163 | ) | (257,943 | ) | 38.5 | |||||||
Community Healthcare Trust, Inc. | (19,595 | ) | (701,305 | ) | 104.6 | |||||||
Community Trust Bancorp, Inc. | (4,969 | ) | (178,934 | ) | 26.7 | |||||||
Compass, Inc. | (12,949 | ) | (30,301 | ) | 4.5 | |||||||
Conduent, Inc. | (37,027 | ) | (129,965 | ) | 19.4 | |||||||
CONMED Corp. | (8,917 | ) | (1,119,708 | ) | 167.1 | |||||||
Consensus Cloud Solutions, Inc. | (7,407 | ) | (276,503 | ) | 41.3 | |||||||
ContextLogic, Inc. | (2,842 | ) | (20,491 | ) | 3.1 | |||||||
Core Laboratories NV | (3,536 | ) | (79,595 | ) | 11.9 | |||||||
Corporate Office Properties Trust | (20,355 | ) | (465,926 | ) | 69.5 | |||||||
Coursera, Inc. | (22,751 | ) | (283,022 | ) | 42.2 | |||||||
CRA International, Inc. | (200 | ) | (21,028 | ) | 3.1 | |||||||
Credo Technology Group Holding Ltd. | (54,725 | ) | (443,820 | ) | 66.2 | |||||||
Crinetics Pharmaceuticals, Inc. | (6,989 | ) | (136,565 | ) | 20.4 | |||||||
Cross Country Healthcare, Inc. | (9,632 | ) | (211,711 | ) | 31.6 | |||||||
CryoPort, Inc. | (4,162 | ) | (87,568 | ) | 13.1 | |||||||
CS Disco, Inc. | (9,377 | ) | (55,137 | ) | 8.2 | |||||||
CTI BioPharma Corp. | (42,554 | ) | (206,812 | ) | 30.9 | |||||||
CTS Corp. | (3,010 | ) | (118,022 | ) | 17.6 | |||||||
Cullinan Oncology, Inc. | (10,950 | ) | (106,543 | ) | 15.9 | |||||||
Cushman & Wakefield PLC | (21,880 | ) | (215,518 | ) | 32.2 | |||||||
Cymabay Therapeutics, Inc. | (1,073 | ) | (11,545 | ) | 1.7 | |||||||
Cytek Biosciences, Inc. | (7,326 | ) | (84,102 | ) | 12.5 | |||||||
Definitive Healthcare Corp. | (1,831 | ) | (19,592 | ) | 2.9 | |||||||
Delek US Holdings, Inc. | (16,580 | ) | (360,615 | ) | 53.8 | |||||||
Deluxe Corp. | (2,351 | ) | (35,618 | ) | 5.3 | |||||||
Denali Therapeutics, Inc. | (905 | ) | (22,480 | ) | 3.4 | |||||||
Designer Brands, Inc. | (2,025 | ) | (16,585 | ) | 2.5 | |||||||
Diamond Offshore Drilling, Inc. | (19,314 | ) | (221,918 | ) | 33.1 | |||||||
DICE Therapeutics, Inc. | (4,750 | ) | (154,375 | ) | 23.0 | |||||||
Digital Turbine, Inc. | (30,622 | ) | (359,196 | ) | 53.6 | |||||||
Dine Brands Global, Inc. | (6,575 | ) | (426,915 | ) | 63.7 | |||||||
| Security | Shares | Value | % of Basket Value | |||||||||
| United States (continued) | ||||||||||||
DocGo, Inc. | (10,804 | ) | $ | (91,834 | ) | 13.7 | % | |||||
Donnelley Financial Solutions, Inc. | (8,791 | ) | (380,211 | ) | 56.7 | |||||||
Dorman Products, Inc. | (3,384 | ) | (291,565 | ) | 43.5 | |||||||
Douglas Dynamics, Inc. | (4,905 | ) | (143,766 | ) | 21.4 | |||||||
Douglas Elliman, Inc. | (50,253 | ) | (160,307 | ) | 23.9 | |||||||
Dril-Quip, Inc. | (2,511 | ) | (68,500 | ) | 10.2 | |||||||
Driven Brands Holdings, Inc. | (3,546 | ) | (108,862 | ) | 16.2 | |||||||
Dynavax Technologies Corp. | (2,958 | ) | (30,793 | ) | 4.6 | |||||||
Dynex Capital, Inc. | (24,720 | ) | (293,179 | ) | 43.7 | |||||||
E2open Parent Holdings, Inc. | (96,677 | ) | (608,098 | ) | 90.7 | |||||||
Eagle Bulk Shipping, Inc. | (675 | ) | (30,186 | ) | 4.5 | |||||||
Easterly Government Properties, Inc. | (40,661 | ) | (572,100 | ) | 85.4 | |||||||
Eastern Bankshares, Inc. | (15,422 | ) | (179,666 | ) | 26.8 | |||||||
Ebix, Inc. | (22,932 | ) | (372,874 | ) | 55.6 | |||||||
Edgewell Personal Care Co. | (1,680 | ) | (73,366 | ) | 10.9 | |||||||
Ellington Financial, Inc. | (35,510 | ) | (453,463 | ) | 67.7 | |||||||
Empire State Realty Trust, Inc. | (30,432 | ) | (185,940 | ) | 27.7 | |||||||
Encore Capital Group, Inc. | (6,686 | ) | (343,527 | ) | 51.3 | |||||||
Energizer Holdings, Inc. | (6,799 | ) | (227,291 | ) | 33.9 | |||||||
Energy Vault Holdings, Inc. | (35,009 | ) | (59,165 | ) | 8.8 | |||||||
EnerSys | (2,416 | ) | (200,456 | ) | 29.9 | |||||||
Enovix Corp. | (32,689 | ) | (353,695 | ) | 52.8 | |||||||
Enterprise Financial Services Corp. | (3,029 | ) | (129,520 | ) | 19.3 | |||||||
ePlus, Inc. | (3,110 | ) | (135,409 | ) | 20.2 | |||||||
Equity Commonwealth | (154 | ) | (3,191 | ) | 0.5 | |||||||
Esab Corp. | (6,517 | ) | (380,332 | ) | 56.7 | |||||||
Esperion Therapeutics, Inc. | (7,116 | ) | (9,393 | ) | 1.4 | |||||||
ESS Tech, Inc. | (6,478 | ) | (6,931 | ) | 1.0 | |||||||
Essential Properties Realty Trust, Inc. | (11,174 | ) | (276,556 | ) | 41.3 | |||||||
European Wax Center, Inc., Class A | (19,685 | ) | (370,865 | ) | 55.3 | |||||||
EverCommerce, Inc. | (45,199 | ) | (545,552 | ) | 81.4 | |||||||
EverQuote, Inc. | (5,413 | ) | (37,729 | ) | 5.6 | |||||||
Evolent Health, Inc., Class A | (9,172 | ) | (333,953 | ) | 49.8 | |||||||
Evolus, Inc. | (26,379 | ) | (230,552 | ) | 34.4 | |||||||
Evolv Technologies Holdings, Inc. | (7,464 | ) | (26,870 | ) | 4.0 | |||||||
Excelerate Energy, Inc. | (9,088 | ) | (195,392 | ) | 29.2 | |||||||
Expro Group Holdings NV | (5,913 | ) | (117,610 | ) | 17.5 | |||||||
Farmers National Banc Corp. | (1,016 | ) | (11,877 | ) | 1.8 | |||||||
Farmland Partners, Inc. | (33,937 | ) | (354,302 | ) | 52.9 | |||||||
Fastly, Inc. | (4,195 | ) | (62,002 | ) | 9.3 | |||||||
FB Financial Corp. | (319 | ) | (9,388 | ) | 1.4 | |||||||
Federal Agricultural Mortgage Corp. | (1,779 | ) | (237,123 | ) | 35.4 | |||||||
Federal Signal Corp. | (1,075 | ) | (55,234 | ) | 8.2 | |||||||
Federated Hermes, Inc. | (31,153 | ) | (1,289,423 | ) | 192.4 | |||||||
Figs, Inc., Class A | (29,065 | ) | (209,268 | ) | 31.2 | |||||||
First Advantage Corp. | (5,156 | ) | (66,306 | ) | 9.9 | |||||||
First Bancorp/Southern Pines NC | (19,647 | ) | (604,735 | ) | 90.2 | |||||||
First Commonwealth Financial Corp. | (1,740 | ) | (21,715 | ) | 3.2 | |||||||
First Financial Bankshares, Inc. | (8,888 | ) | (260,063 | ) | 38.8 | |||||||
First Merchants Corp. | (2,499 | ) | (72,921 | ) | 10.9 | |||||||
FirstCash Holdings, Inc. | (639 | ) | (65,836 | ) | 9.8 | |||||||
Flywire Corp. | (14,244 | ) | (415,497 | ) | 62.0 | |||||||
FormFactor, Inc. | (5,529 | ) | (150,997 | ) | 22.5 | |||||||
Forward Air Corp. | (4,616 | ) | (487,034 | ) | 72.7 | |||||||
Four Corners Property Trust, Inc. | (26,357 | ) | (672,367 | ) | 100.3 | |||||||
Franchise Group, Inc. | (9,642 | ) | (282,028 | ) | 42.1 | |||||||
Fresh Del Monte Produce, Inc. | (8,025 | ) | (230,398 | ) | 34.4 | |||||||
Freshpet, Inc. | (6,929 | ) | (477,893 | ) | 71.3 | |||||||
fuboTV, Inc. | (72,669 | ) | (82,843 | ) | 12.4 | |||||||
FuelCell Energy, Inc. | (142,900 | ) | (268,652 | ) | 40.1 | |||||||
Fulcrum Therapeutics, Inc. | (24,056 | ) | (60,140 | ) | 9.0 | |||||||
Funko, Inc., Class A | (38,223 | ) | (376,879 | ) | 56.2 | |||||||
SCHEDULE OF INVESTMENTS | 37 |
Schedule of Investments (continued) April 30, 2023 | BlackRock Global Equity Market Neutral Fund |
| Security | Shares | Value | % of Basket Value | |||||||||
| United States (continued) | ||||||||||||
Genworth Financial, Inc., Class A | (60,490 | ) | $ | (351,447 | ) | 52.4 | % | |||||
German American Bancorp, Inc. | (4,035 | ) | (117,297 | ) | 17.5 | |||||||
Geron Corp. | (49,103 | ) | (120,793 | ) | 18.0 | |||||||
Getty Realty Corp. | (6,095 | ) | (203,146 | ) | 30.3 | |||||||
Gevo, Inc. | (26,197 | ) | (30,389 | ) | 4.5 | |||||||
G-III Apparel Group Ltd. | (5,054 | ) | (79,348 | ) | 11.8 | |||||||
Glacier Bancorp, Inc. | (3,488 | ) | (115,906 | ) | 17.3 | |||||||
Gladstone Commercial Corp. | (3,879 | ) | (46,315 | ) | 6.9 | |||||||
Glaukos Corp. | (10,793 | ) | (512,775 | ) | 76.5 | |||||||
Global Medical REIT, Inc. | (7,412 | ) | (68,783 | ) | 10.3 | |||||||
Global Net Lease, Inc. | (33,709 | ) | (379,563 | ) | 56.6 | |||||||
Globalstar, Inc. | (102,435 | ) | (92,806 | ) | 13.8 | |||||||
GrafTech International Ltd. | (19,990 | ) | (94,153 | ) | 14.0 | |||||||
Graham Holdings Co. | (19 | ) | (10,936 | ) | 1.6 | |||||||
Granite Construction, Inc. | (13,827 | ) | (527,224 | ) | 78.7 | |||||||
Great Southern Bancorp, Inc. | (641 | ) | (32,614 | ) | 4.9 | |||||||
Green Brick Partners, Inc. | (7,599 | ) | (283,215 | ) | 42.3 | |||||||
Green Dot Corp., Class A | (648 | ) | (11,139 | ) | 1.7 | |||||||
Greenbrier Cos., Inc. | (15,520 | ) | (410,504 | ) | 61.2 | |||||||
Greif, Inc. | (4,176 | ) | (262,211 | ) | 39.1 | |||||||
Grid Dynamics Holdings, Inc. | (14,019 | ) | (152,387 | ) | 22.7 | |||||||
Guess?, Inc. | (12,961 | ) | (244,315 | ) | 36.5 | |||||||
Hagerty, Inc. | (1,883 | ) | (18,849 | ) | 2.8 | |||||||
Harmonic, Inc. | (17,247 | ) | (243,010 | ) | 36.3 | |||||||
Hawaiian Electric Industries, Inc. | (24,670 | ) | (967,311 | ) | 144.3 | |||||||
Hawkins, Inc. | (554 | ) | (22,348 | ) | 3.3 | |||||||
Hayward Holdings, Inc. | (37,344 | ) | (449,622 | ) | 67.1 | |||||||
Heartland Express, Inc. | (4,275 | ) | (61,902 | ) | 9.2 | |||||||
Hecla Mining Co. | (21,793 | ) | (131,848 | ) | 19.7 | |||||||
Helios Technologies, Inc. | (3,889 | ) | (233,884 | ) | 34.9 | |||||||
Heritage Commerce Corp. | (17,152 | ) | (145,792 | ) | 21.8 | |||||||
Heritage-Crystal Clean, Inc. | (5,621 | ) | (196,510 | ) | 29.3 | |||||||
Hibbett, Inc. | (3,995 | ) | (217,048 | ) | 32.4 | |||||||
Highwoods Properties, Inc. | (4,164 | ) | (95,439 | ) | 14.2 | |||||||
Hillenbrand, Inc. | (9,535 | ) | (434,987 | ) | 64.9 | |||||||
Hillman Solutions Corp. | (30,743 | ) | (258,241 | ) | 38.5 | |||||||
Hilltop Holdings, Inc. | (14,276 | ) | (442,842 | ) | 66.1 | |||||||
Hims & Hers Health, Inc. | (14,973 | ) | (173,537 | ) | 25.9 | |||||||
Hippo Holdings, Inc. | (3,940 | ) | (71,866 | ) | 10.7 | |||||||
HireRight Holdings Corp. | (6,750 | ) | (71,550 | ) | 10.7 | |||||||
Home BancShares, Inc. | (6,588 | ) | (143,421 | ) | 21.4 | |||||||
Hostess Brands, Inc. | (19,433 | ) | (500,594 | ) | 74.7 | |||||||
Hyliion Holdings Corp. | (43,590 | ) | (59,718 | ) | 8.9 | |||||||
Hyster-Yale Materials Handling, Inc. | (3,322 | ) | (174,937 | ) | 26.1 | |||||||
Ichor Holdings Ltd. | (6,081 | ) | (169,356 | ) | 25.3 | |||||||
Ideaya Biosciences, Inc. | (764 | ) | (13,951 | ) | 2.1 | |||||||
IMAX Corp. | (6,333 | ) | (132,676 | ) | 19.8 | |||||||
Immunovant, Inc. | (8,129 | ) | (131,202 | ) | 19.6 | |||||||
Impinj, Inc. | (3,458 | ) | (305,722 | ) | 45.6 | |||||||
Independent Bank Corp. | (2,551 | ) | (142,856 | ) | 21.3 | |||||||
Informatica, Inc. | (8,324 | ) | (128,689 | ) | 19.2 | |||||||
Ingles Markets, Inc. | (3,671 | ) | (337,879 | ) | 50.4 | |||||||
Inhibrx, Inc. | (11,894 | ) | (249,774 | ) | 37.3 | |||||||
Inogen, Inc. | (698 | ) | (9,290 | ) | 1.4 | |||||||
Insmed, Inc. | (9,207 | ) | (179,536 | ) | 26.8 | |||||||
Insteel Industries, Inc. | (509 | ) | (14,013 | ) | 2.1 | |||||||
Intapp, Inc. | (4,376 | ) | (176,440 | ) | 26.3 | |||||||
InterDigital, Inc. | (7,517 | ) | (509,202 | ) | 76.0 | |||||||
Intrepid Potash, Inc. | (1,858 | ) | (47,899 | ) | 7.1 | |||||||
InvenTrust Properties Corp. | (4,280 | ) | (96,514 | ) | 14.4 | |||||||
Invitae Corp. | (29,932 | ) | (40,708 | ) | 6.1 | |||||||
IonQ, Inc. | (25,574 | ) | (140,913 | ) | 21.0 | |||||||
| Security | Shares | Value | % of Basket Value | |||||||||
| United States (continued) | ||||||||||||
Itron, Inc. | (3,377 | ) | $ | (180,332 | ) | 26.9 | % | |||||
Ivanhoe Electric, Inc. | (9,014 | ) | (107,357 | ) | 16.0 | |||||||
Jack in the Box, Inc. | (7,941 | ) | (736,051 | ) | 109.8 | |||||||
Jackson Financial, Inc. | (14,685 | ) | (528,807 | ) | 78.9 | |||||||
JBG SMITH Properties | (37,981 | ) | (541,989 | ) | 80.9 | |||||||
Joby Aviation, Inc. | (23,743 | ) | (102,807 | ) | 15.3 | |||||||
John B Sanfilippo & Son, Inc. | (877 | ) | (91,164 | ) | 13.6 | |||||||
John Wiley & Sons, Inc. | (36,235 | ) | (1,397,584 | ) | 208.5 | |||||||
KB Home | (13,022 | ) | (570,624 | ) | 85.1 | |||||||
Kelly Services, Inc., Class A | (894 | ) | (14,671 | ) | 2.2 | |||||||
Kemper Corp. | (5,099 | ) | (248,066 | ) | 37.0 | |||||||
Kennedy-Wilson Holdings, Inc. | (19,801 | ) | (332,261 | ) | 49.6 | |||||||
Keros Therapeutics, Inc. | (2,157 | ) | (95,674 | ) | 14.3 | |||||||
Kezar Life Sciences, Inc. | (8,803 | ) | (21,391 | ) | 3.2 | |||||||
Kinetik Holdings, Inc. | (25,360 | ) | (781,088 | ) | 116.5 | |||||||
KKR Real Estate Finance Trust, Inc. | (29,896 | ) | (321,083 | ) | 47.9 | |||||||
Koppers Holdings, Inc. | (1,537 | ) | (50,429 | ) | 7.5 | |||||||
Krispy Kreme, Inc. | (75,398 | ) | (1,159,621 | ) | 173.0 | |||||||
Kronos Worldwide, Inc. | (2,568 | ) | (23,882 | ) | 3.6 | |||||||
Kura Sushi USA, Inc., Class A | (2,975 | ) | (205,037 | ) | 30.6 | |||||||
Kyndryl Holdings, Inc. | (22,227 | ) | (321,402 | ) | 48.0 | |||||||
Lakeland Bancorp, Inc. | (8,080 | ) | (115,867 | ) | 17.3 | |||||||
Lakeland Financial Corp. | (348 | ) | (17,633 | ) | 2.6 | |||||||
Latham Group, Inc. | (9,446 | ) | (22,765 | ) | 3.4 | |||||||
LCI Industries | (4,280 | ) | (483,469 | ) | 72.1 | |||||||
Lemonade, Inc. | (25,826 | ) | (279,954 | ) | 41.8 | |||||||
Leonardo DRS, Inc. | (18,511 | ) | (278,591 | ) | 41.6 | |||||||
Leslie’s, Inc. | (1,640 | ) | (17,794 | ) | 2.7 | |||||||
LGI Homes, Inc. | (4,381 | ) | (520,463 | ) | 77.7 | |||||||
Liberty Energy, Inc. | (21,708 | ) | (278,079 | ) | 41.5 | |||||||
Liberty Media Corp.-Liberty Braves | (10,783 | ) | (409,970 | ) | 61.2 | |||||||
Life Time Group Holdings, Inc. | (11,606 | ) | (241,289 | ) | 36.0 | |||||||
Lightwave Logic, Inc. | (58,693 | ) | (264,118 | ) | 39.4 | |||||||
Lindblad Expeditions Holdings, Inc. | (1,103 | ) | (12,475 | ) | 1.9 | |||||||
Lions Gate Entertainment Corp. | (1,054 | ) | (11,246 | ) | 1.7 | |||||||
Lovesac Co. | (3,438 | ) | (90,385 | ) | 13.5 | |||||||
LTC Properties, Inc. | (9,061 | ) | (303,090 | ) | 45.2 | |||||||
Luminar Technologies, Inc. | (36,474 | ) | (219,573 | ) | 32.8 | |||||||
M/I Homes, Inc. | (5,037 | ) | (340,703 | ) | 50.8 | |||||||
Madison Square Garden Entertainment Corp. | (3,437 | ) | (110,912 | ) | 16.5 | |||||||
Magnite, Inc. | (969 | ) | (9,109 | ) | 1.4 | |||||||
Marcus & Millichap, Inc. | (6,308 | ) | (198,513 | ) | 29.6 | |||||||
Masterbrand, Inc. | (44,438 | ) | (358,615 | ) | 53.5 | |||||||
Materion Corp. | (468 | ) | (50,689 | ) | 7.6 | |||||||
Mativ Holdings, Inc. | (353 | ) | (6,838 | ) | 1.0 | |||||||
Matterport, Inc. | (40,105 | ) | (93,445 | ) | 13.9 | |||||||
Matthews International Corp. | (2,873 | ) | (108,801 | ) | 16.2 | |||||||
MaxCyte, Inc. | (15,107 | ) | (75,535 | ) | 11.3 | |||||||
MBIA, Inc. | (1,266 | ) | (12,736 | ) | 1.9 | |||||||
Mercury Systems, Inc. | (18,299 | ) | (872,313 | ) | 130.1 | |||||||
MeridianLink, Inc. | (13,361 | ) | (199,613 | ) | 29.8 | |||||||
Mesa Laboratories, Inc. | (239 | ) | (39,796 | ) | 5.9 | |||||||
Methode Electronics, Inc. | (4,455 | ) | (182,610 | ) | 27.2 | |||||||
Metrocity Bankshares, Inc. | (570 | ) | (9,320 | ) | 1.4 | |||||||
Metropolitan Bank Holding Corp. | (1,073 | ) | (34,433 | ) | 5.1 | |||||||
MillerKnoll, Inc. | (12,387 | ) | (210,703 | ) | 31.4 | |||||||
Minerals Technologies, Inc. | (4,130 | ) | (244,744 | ) | 36.5 | |||||||
Mirion Technologies, Inc. | (98,529 | ) | (798,085 | ) | 119.1 | |||||||
Mirum Pharmaceuticals, Inc. | (12,093 | ) | (324,697 | ) | 48.4 | |||||||
Mission Produce, Inc. | (7,443 | ) | (84,776 | ) | 12.6 | |||||||
Modine Manufacturing Co. | (2,136 | ) | (44,664 | ) | 6.7 | |||||||
Moelis & Co., Class A | (16,146 | ) | (611,610 | ) | 91.2 | |||||||
| 38 | 2 0 2 3 BLACK ROCK ANNUAL REPORT TO SHAREHOLDERS |
Schedule of Investments (continued) April 30, 2023 | BlackRock Global Equity Market Neutral Fund |
| Security | Shares | Value | % of Basket Value | |||||||||
| United States (continued) | ||||||||||||
Monro, Inc. | (4,827 | ) | $ | (235,944 | ) | 35.2 | % | |||||
Montrose Environmental Group, Inc. | (10,195 | ) | (310,540 | ) | 46.3 | |||||||
Morphic Holding, Inc. | (8,986 | ) | (424,678 | ) | 63.4 | |||||||
Mueller Water Products, Inc., Class A | (36,259 | ) | (485,871 | ) | 72.5 | |||||||
N-able, Inc. | (9,275 | ) | (118,256 | ) | 17.6 | |||||||
NanoString Technologies, Inc. | (2,407 | ) | (23,589 | ) | 3.5 | |||||||
National Bank Holdings Corp. | (2,249 | ) | (71,518 | ) | 10.7 | |||||||
National Health Investors, Inc. | (10,008 | ) | (498,098 | ) | 74.3 | |||||||
National Presto Industries, Inc. | (3,123 | ) | (212,426 | ) | 31.7 | |||||||
Navitas Semiconductor Corp. | (12,496 | ) | (66,604 | ) | 9.9 | |||||||
NBT Bancorp, Inc. | (6,248 | ) | (201,436 | ) | 30.1 | |||||||
nCino, Inc. | (17,828 | ) | (440,886 | ) | 65.8 | |||||||
Necessity Retail REIT, Inc. | (39,543 | ) | (217,882 | ) | 32.5 | |||||||
Nelnet, Inc. | (4,598 | ) | (442,787 | ) | 66.1 | |||||||
NetScout Systems, Inc. | (1,226 | ) | (33,359 | ) | 5.0 | |||||||
NETSTREIT Corp. | (1,758 | ) | (32,031 | ) | 4.8 | |||||||
NewMarket Corp. | (654 | ) | (261,338 | ) | 39.0 | |||||||
NextDecade Corp. | (5,204 | ) | (32,421 | ) | 4.8 | |||||||
NexTier Oilfield Solutions, Inc. | (58,039 | ) | (468,955 | ) | 70.0 | |||||||
Nicolet Bankshares, Inc. | (1,097 | ) | (62,869 | ) | 9.4 | |||||||
nLight, Inc. | (44,888 | ) | (393,668 | ) | 58.7 | |||||||
NMI Holdings, Inc., Class A | (2,076 | ) | (48,578 | ) | 7.2 | |||||||
Northern Oil and Gas, Inc. | (27,505 | ) | (912,341 | ) | 136.1 | |||||||
Northfield Bancorp, Inc. | (6,848 | ) | (71,356 | ) | 10.6 | |||||||
Northwest Bancshares, Inc. | (2,099 | ) | (24,537 | ) | 3.7 | |||||||
Northwest Natural Holding Co. | (3,752 | ) | (176,194 | ) | 26.3 | |||||||
NorthWestern Corp. | (12,129 | ) | (711,002 | ) | 106.1 | |||||||
Nu Skin Enterprises, Inc., Class A | (4,742 | ) | (187,119 | ) | 27.9 | |||||||
Nuvalent, Inc., Class A | (12,004 | ) | (424,822 | ) | 63.4 | |||||||
Nuvation Bio, Inc. | (2,316 | ) | (3,729 | ) | 0.6 | |||||||
OceanFirst Financial Corp. | (1,172 | ) | (18,752 | ) | 2.8 | |||||||
Office Properties Income Trust | (7,859 | ) | (51,241 | ) | 7.6 | |||||||
O-I Glass, Inc. | (4,942 | ) | (111,047 | ) | 16.6 | |||||||
Olo, Inc. | (41,542 | ) | (284,563 | ) | 42.5 | |||||||
ON24, Inc. | (30,579 | ) | (266,037 | ) | 39.7 | |||||||
OneSpan, Inc. | (8,755 | ) | (129,049 | ) | 19.3 | |||||||
Open Lending Corp. | (35,898 | ) | (252,363 | ) | 37.7 | |||||||
Opendoor Technologies, Inc. | (91,247 | ) | (125,921 | ) | 18.8 | |||||||
OraSure Technologies, Inc. | (3,153 | ) | (21,440 | ) | 3.2 | |||||||
Origin Bancorp, Inc. | (6,758 | ) | (198,888 | ) | 29.7 | |||||||
Orthofix Medical, Inc. | �� | (5,982 | ) | (112,641 | ) | 16.8 | ||||||
OrthoPediatrics Corp. | (2,726 | ) | (137,499 | ) | 20.5 | |||||||
Otter Tail Corp. | (1,374 | ) | (98,859 | ) | 14.7 | |||||||
Outset Medical, Inc. | (7,376 | ) | (132,694 | ) | 19.8 | |||||||
Pacific Biosciences of California, Inc. | (48,713 | ) | (516,358 | ) | 77.0 | |||||||
PAR Technology Corp. | (13,388 | ) | (409,539 | ) | 61.1 | |||||||
Paragon 28, Inc. | (3,299 | ) | (60,768 | ) | 9.1 | |||||||
Park National Corp. | (211 | ) | (22,856 | ) | 3.4 | |||||||
Patrick Industries, Inc. | (2,876 | ) | (197,380 | ) | 29.4 | |||||||
Patterson Cos., Inc. | (3,327 | ) | (90,195 | ) | 13.5 | |||||||
Paymentus Holdings, Inc. | (40,282 | ) | (331,521 | ) | 49.5 | |||||||
PDF Solutions, Inc. | (2,650 | ) | (95,532 | ) | 14.3 | |||||||
Peapack-Gladstone Financial Corp. | (932 | ) | (24,754 | ) | 3.7 | |||||||
Pediatrix Medical Group, Inc. | (23,348 | ) | (334,577 | ) | 49.9 | |||||||
PennyMac Mortgage Investment Trust | (21,600 | ) | (268,488 | ) | 40.1 | |||||||
Perficient, Inc. | (4,447 | ) | (288,699 | ) | 43.1 | |||||||
Perimeter Solutions SA | (13,758 | ) | (102,910 | ) | 15.4 | |||||||
Phillips Edison & Co., Inc. | (13,463 | ) | (424,623 | ) | 63.4 | |||||||
Physicians Realty Trust | (49,086 | ) | (707,820 | ) | 105.6 | |||||||
Piedmont Lithium, Inc. | (14,234 | ) | (818,455 | ) | 122.1 | |||||||
Piper Sandler Cos | (2,001 | ) | (271,015 | ) | 40.4 | |||||||
Pitney Bowes, Inc. | (16,077 | ) | (56,430 | ) | 8.4 | |||||||
| Security | Shares | Value | % of Basket Value | |||||||||
| United States (continued) | ||||||||||||
Planet Labs PBC | (36,509 | ) | $ | (148,957 | ) | 22.2 | % | |||||
Plexus Corp. | (8,263 | ) | (722,765 | ) | 107.8 | |||||||
Pliant Therapeutics, Inc. | (7,018 | ) | (198,258 | ) | 29.6 | |||||||
Plymouth Industrial REIT, Inc. | (16,765 | ) | (339,324 | ) | 50.6 | |||||||
PolyPeptide Group AG | (14,936 | ) | (375,397 | ) | 56.0 | |||||||
Portillo’s, Inc., Class A | (8,849 | ) | (191,315 | ) | 28.5 | |||||||
PotlatchDeltic Corp. | (11,603 | ) | (536,407 | ) | 80.0 | |||||||
PRA Group, Inc. | (21,921 | ) | (795,075 | ) | 118.6 | |||||||
Premier, Inc., Class A | (27,984 | ) | (932,707 | ) | 139.2 | |||||||
PROCEPT BioRobotics Corp. | (13,381 | ) | (406,649 | ) | 60.7 | |||||||
ProFrac Holding Corp. | (39,810 | ) | (445,872 | ) | 66.5 | |||||||
PROG Holdings, Inc. | (4,956 | ) | (149,820 | ) | 22.4 | |||||||
Progress Software Corp. | (4,657 | ) | (255,576 | ) | 38.1 | |||||||
Proterra, Inc. | (23,338 | ) | (27,305 | ) | 4.1 | |||||||
Proto Labs, Inc. | (3,471 | ) | (99,861 | ) | 14.9 | |||||||
Provident Financial Services, Inc. | (2,283 | ) | (39,907 | ) | 6.0 | |||||||
PubMatic, Inc. | (12,594 | ) | (172,034 | ) | 25.7 | |||||||
Pulmonx Corp. | (28,650 | ) | (336,637 | ) | 50.2 | |||||||
PureCycle Technologies, Inc. | (24,735 | ) | (162,509 | ) | 24.2 | |||||||
Quanterix Corp. | (9,629 | ) | (121,711 | ) | 18.2 | |||||||
Rackspace Technology, Inc. | (26,107 | ) | (38,116 | ) | 5.7 | |||||||
Ramaco Resources, Inc. | (3,194 | ) | (25,967 | ) | 3.9 | |||||||
RAPT Therapeutics, Inc. | (1,167 | ) | (21,239 | ) | 3.2 | |||||||
Ready Capital Corp. | (63,320 | ) | (679,424 | ) | 101.4 | |||||||
Relay Therapeutics, Inc. | (7,378 | ) | (83,888 | ) | 12.5 | |||||||
Reliance Worldwide Corp. Ltd. | (163,087 | ) | (445,047 | ) | 66.4 | |||||||
Remitly Global, Inc. | (6,952 | ) | (116,794 | ) | 17.4 | |||||||
Renasant Corp. | (2,805 | ) | (78,877 | ) | 11.8 | |||||||
Resideo Technologies, Inc. | (22,407 | ) | (398,845 | ) | 59.5 | |||||||
Resources Connection, Inc. | (4,017 | ) | (58,608 | ) | 8.7 | |||||||
REV Group, Inc. | (21,557 | ) | (231,307 | ) | 34.5 | |||||||
Revance Therapeutics, Inc. | (12,453 | ) | (396,379 | ) | 59.1 | |||||||
Revolution Medicines, Inc. | (4,394 | ) | (103,215 | ) | 15.4 | |||||||
Reynolds Consumer Products, Inc. | (1,998 | ) | (56,004 | ) | 8.4 | |||||||
Rhythm Pharmaceuticals, Inc. | (10,719 | ) | (216,202 | ) | 32.3 | |||||||
Rimini Street, Inc. | (6,144 | ) | (22,979 | ) | 3.4 | |||||||
Rocket Lab USA, Inc. | (203,876 | ) | (799,194 | ) | 119.2 | |||||||
Rocket Pharmaceuticals, Inc. | (1,778 | ) | (31,862 | ) | 4.8 | |||||||
Rogers Corp. | (247 | ) | (39,755 | ) | 5.9 | |||||||
Roivant Sciences Ltd. | (4,593 | ) | (39,270 | ) | 5.9 | |||||||
Rover Group, Inc. | (2,933 | ) | (13,286 | ) | 2.0 | |||||||
RXO, Inc. | (15,374 | ) | (278,116 | ) | 41.5 | |||||||
Ryerson Holding Corp. | (4,774 | ) | (180,314 | ) | 26.9 | |||||||
S&T Bancorp, Inc. | (2,986 | ) | (82,205 | ) | 12.3 | |||||||
Sabra Health Care REIT, Inc. | (4,472 | ) | (50,981 | ) | 7.6 | |||||||
Sabre Corp. | (3,065 | ) | (12,260 | ) | 1.8 | |||||||
Safety Insurance Group, Inc. | (1,095 | ) | (80,034 | ) | 11.9 | |||||||
Sage Therapeutics, Inc. | (7,048 | ) | (344,295 | ) | 51.4 | |||||||
Sally Beauty Holdings, Inc. | (13,613 | ) | (193,713 | ) | 28.9 | |||||||
Sandy Spring Bancorp, Inc. | (4,810 | ) | (108,129 | ) | 16.1 | |||||||
Scholastic Corp. | (523 | ) | (20,120 | ) | 3.0 | |||||||
Schrodinger, Inc. | (11,527 | ) | (340,277 | ) | 50.8 | |||||||
Seacoast Banking Corp. of Florida | (5,672 | ) | (125,862 | ) | 18.8 | |||||||
Seer, Inc. | (4,818 | ) | (16,092 | ) | 2.4 | |||||||
Select Energy Services, Inc. | (12,053 | ) | (89,554 | ) | 13.4 | |||||||
Select Medical Holdings Corp. | (10,774 | ) | (328,607 | ) | 49.0 | |||||||
Senseonics Holdings, Inc. | (51,805 | ) | (30,829 | ) | 4.6 | |||||||
Shake Shack, Inc., Class A | (3,992 | ) | (218,802 | ) | 32.6 | |||||||
Shenandoah Telecommunications Co. | (12,896 | ) | (268,366 | ) | 40.0 | |||||||
SI-BONE, Inc. | (20,123 | ) | (444,718 | ) | 66.3 | |||||||
Silgan Holdings, Inc. | (2,480 | ) | (122,165 | ) | 18.2 | |||||||
SilverBow Resources, Inc. | (12,073 | ) | (287,941 | ) | 43.0 | |||||||
SCHEDULE OF INVESTMENTS | 39 |
Schedule of Investments (continued) April 30, 2023 | BlackRock Global Equity Market Neutral Fund |
| Security | Shares | Value | % of Basket Value | |||||||||
| United States (continued) | ||||||||||||
Simmons First National Corp., Class A | (22,138 | ) | $ | (369,926 | ) | 55.2 | % | |||||
Simply Good Foods Co | (12,738 | ) | (463,281 | ) | 69.1 | |||||||
SITE Centers Corp. | (26,225 | ) | (323,616 | ) | 48.3 | |||||||
SiTime Corp. | (2,015 | ) | (218,567 | ) | 32.6 | |||||||
SJW Group | (8,910 | ) | (676,447 | ) | 100.9 | |||||||
SMART Global Holdings, Inc. | (7,811 | ) | (120,446 | ) | 18.0 | |||||||
SmartRent, Inc. | (47,292 | ) | (122,013 | ) | 18.2 | |||||||
Snap One Holdings Corp. | (2,237 | ) | (21,833 | ) | 3.3 | |||||||
Solid Power, Inc. | (8,711 | ) | (19,774 | ) | 2.9 | |||||||
SomaLogic, Inc. | (23,103 | ) | (64,688 | ) | 9.7 | |||||||
Sonos, Inc. | (3,898 | ) | (82,404 | ) | 12.3 | |||||||
Sotera Health Co. | (1,136 | ) | (19,051 | ) | 2.8 | |||||||
Southside Bancshares, Inc. | (3,364 | ) | (106,740 | ) | 15.9 | |||||||
Spectrum Brands Holdings, Inc. | (11,262 | ) | (748,923 | ) | 111.7 | |||||||
Sphere Entertainment Co. | (3,437 | ) | (96,717 | ) | 14.4 | |||||||
Spire, Inc. | (281 | ) | (19,032 | ) | 2.8 | |||||||
Sprouts Farmers Market, Inc. | (5,201 | ) | (180,267 | ) | 26.9 | |||||||
Squarespace, Inc. | (2,287 | ) | (71,126 | ) | 10.6 | |||||||
St Joe Co. | (12,671 | ) | (520,778 | ) | 77.7 | |||||||
Stellar Bancorp, Inc. | (4,147 | ) | (95,132 | ) | 14.2 | |||||||
Stem, Inc. | (77,071 | ) | (326,010 | ) | 48.6 | |||||||
StepStone Group, Inc., Class A | (3,306 | ) | (72,831 | ) | 10.9 | |||||||
Stericycle, Inc. | (11,337 | ) | (517,534 | ) | 77.2 | |||||||
Stock Yards Bancorp, Inc. | (2,116 | ) | (102,838 | ) | 15.3 | |||||||
Strategic Education, Inc. | (7,021 | ) | (617,848 | ) | 92.2 | |||||||
Sun Country Airlines Holdings, Inc. | (4,977 | ) | (98,196 | ) | 14.7 | |||||||
Sunstone Hotel Investors, Inc. | (41,269 | ) | (393,294 | ) | 58.7 | |||||||
Sweetgreen, Inc. | (46,648 | ) | (370,385 | ) | 55.3 | |||||||
Syndax Pharmaceuticals, Inc. | (22,229 | ) | (456,806 | ) | 68.2 | |||||||
Tejon Ranch Co. | (4,246 | ) | (73,371 | ) | 10.9 | |||||||
Telephone and Data Systems, Inc. | (2,932 | ) | (29,320 | ) | 4.4 | |||||||
Telos Corp. | (12,733 | ) | (21,646 | ) | 3.2 | |||||||
Tennant Co. | (1,688 | ) | (128,997 | ) | 19.2 | |||||||
Terex Corp. | (4,992 | ) | (222,593 | ) | 33.2 | |||||||
Texas Capital Bancshares, Inc. | (7,110 | ) | (357,277 | ) | 53.3 | |||||||
TFS Financial Corp. | (37,056 | ) | (446,154 | ) | 66.6 | |||||||
TG Therapeutics, Inc. | (20,450 | ) | (507,773 | ) | 75.8 | |||||||
Tidewater, Inc. | (9,470 | ) | (426,434 | ) | 63.6 | |||||||
TimkenSteel Corp. | (9,086 | ) | (152,100 | ) | 22.7 | |||||||
Tootsie Roll Industries, Inc. | (8,676 | ) | (354,675 | ) | 52.9 | |||||||
Towne Bank/Portsmouth VA | (17,458 | ) | (413,580 | ) | 61.7 | |||||||
TPG, Inc. | (10,160 | ) | (294,335 | ) | 43.9 | |||||||
TPI Composites, Inc. | (18,021 | ) | (222,740 | ) | 33.2 | |||||||
Traeger, Inc. | (2,810 | ) | (8,542 | ) | 1.3 | |||||||
TransMedics Group, Inc. | (1,056 | ) | (83,530 | ) | 12.5 | |||||||
Tredegar Corp. | (11,008 | ) | (103,255 | ) | 15.4 | |||||||
TreeHouse Foods, Inc. | (1,570 | ) | (83,602 | ) | 12.5 | |||||||
TriCo Bancshares | (3,875 | ) | (138,764 | ) | 20.7 | |||||||
TriMas Corp. | (2,623 | ) | (66,650 | ) | 9.9 | |||||||
Tronox Holdings PLC | (20,987 | ) | (287,312 | ) | 42.9 | |||||||
Trupanion, Inc. | (8,532 | ) | (299,559 | ) | 44.7 | |||||||
TrustCo Bank Corp. NY | (1,984 | ) | (59,203 | ) | 8.8 | |||||||
Trustmark Corp. | (7,174 | ) | (171,387 | ) | 25.6 | |||||||
TTEC Holdings, Inc. | (2,941 | ) | (100,200 | ) | 14.9 | |||||||
Tucows, Inc. | (5,204 | ) | (116,518 | ) | 17.4 | |||||||
TuSimple Holdings, Inc. | (16,506 | ) | (19,972 | ) | 3.0 | |||||||
Two Harbors Investment Corp. | (8,469 | ) | (117,973 | ) | 17.6 | |||||||
UFP Technologies, Inc. | (93 | ) | (12,819 | ) | 1.9 | |||||||
Ultra Clean Holdings, Inc. | (6,281 | ) | (179,260 | ) | 26.7 | |||||||
UMH Properties, Inc. | (18,588 | ) | (282,538 | ) | 42.2 | |||||||
| Security | Shares | Value | % of Basket Value | |||||||||
| United States (continued) | ||||||||||||
UniFirst Corp. | (2,210 | ) | $ | (361,733 | ) | 54.0 | % | |||||
United Bankshares, Inc. | (3,315 | ) | (109,826 | ) | 16.4 | |||||||
United Community Banks, Inc. | (5,256 | ) | (130,874 | ) | 19.5 | |||||||
United Natural Foods, Inc. | (9,893 | ) | (269,782 | ) | 40.3 | |||||||
Universal Corp. | (7,197 | ) | (395,043 | ) | 58.9 | |||||||
Universal Health Realty Income Trust | (8,457 | ) | (367,879 | ) | 54.9 | |||||||
Universal Logistics Holdings, Inc. | (1,258 | ) | (32,205 | ) | 4.8 | |||||||
Upbound Group, Inc. | (15,977 | ) | (425,947 | ) | 63.5 | |||||||
Urban Outfitters, Inc. | (21,479 | ) | (581,222 | ) | 86.7 | |||||||
Urstadt Biddle Properties, Inc., Class A | (11,503 | ) | (198,082 | ) | 29.6 | |||||||
V2X, Inc. | (1,693 | ) | (73,138 | ) | 10.9 | |||||||
VAALCO Energy, Inc. | (5,804 | ) | (24,841 | ) | 3.7 | |||||||
Vaxcyte, Inc. | (5,587 | ) | (239,291 | ) | 35.7 | |||||||
Velo3D, Inc. | (43,192 | ) | (101,069 | ) | 15.1 | |||||||
Ventyx Biosciences, Inc. | (1,675 | ) | (62,980 | ) | 9.4 | |||||||
Veris Residential, Inc. | (43,398 | ) | (709,557 | ) | 105.9 | |||||||
Verra Mobility Corp. | (38,604 | ) | (654,338 | ) | 97.6 | |||||||
Viasat, Inc. | (6,128 | ) | (214,664 | ) | 32.0 | |||||||
Viavi Solutions, Inc. | (22,493 | ) | (201,537 | ) | 30.1 | |||||||
Victoria’s Secret & Co. | (5,234 | ) | (162,306 | ) | 24.2 | |||||||
Viking Therapeutics, Inc. | (26,601 | ) | (566,867 | ) | 84.6 | |||||||
Virgin Galactic Holdings, Inc. | (42,347 | ) | (154,143 | ) | 23.0 | |||||||
Viridian Therapeutics, Inc. | (10,459 | ) | (293,166 | ) | 43.7 | |||||||
Vishay Intertechnology, Inc. | (33,525 | ) | (713,747 | ) | 106.5 | |||||||
Vista Outdoor, Inc. | (18,958 | ) | (456,888 | ) | 68.2 | |||||||
Vita Coco Co., Inc. | (1,599 | ) | (34,618 | ) | 5.2 | |||||||
Vitesse Energy, Inc. | (17,570 | ) | (323,288 | ) | 48.2 | |||||||
Vobile Group Ltd. | (156,000 | ) | (60,876 | ) | 9.1 | |||||||
VSE Corp. | (4,697 | ) | (198,636 | ) | 29.6 | |||||||
Vuzix Corp. | (22,530 | ) | (90,571 | ) | 13.5 | |||||||
Washington Federal, Inc. | (4,359 | ) | (122,226 | ) | 18.2 | |||||||
Waterstone Financial, Inc. | (833 | ) | (11,537 | ) | 1.7 | |||||||
WD-40 Co. | (788 | ) | (150,035 | ) | 22.4 | |||||||
Werner Enterprises, Inc. | (12,047 | ) | (544,163 | ) | 81.2 | |||||||
Westamerica BanCorp | (3,537 | ) | (143,284 | ) | 21.4 | |||||||
White Mountains Insurance Group Ltd. | (162 | ) | (232,007 | ) | 34.6 | |||||||
WideOpenWest, Inc. | (8,952 | ) | (102,321 | ) | 15.3 | |||||||
Winnebago Industries, Inc. | (5,009 | ) | (291,223 | ) | 43.4 | |||||||
Wolverine World Wide, Inc. | (29,737 | ) | (497,797 | ) | 74.3 | |||||||
Workhorse Group, Inc. | (59,284 | ) | (55,857 | ) | 8.3 | |||||||
Worthington Industries, Inc. | (1,747 | ) | (103,754 | ) | 15.5 | |||||||
Xenia Hotels & Resorts, Inc. | (23,788 | ) | (301,156 | ) | 44.9 | |||||||
Xometry, Inc. | (22,083 | ) | (306,733 | ) | 45.8 | |||||||
XPEL, Inc. | (379 | ) | (27,690 | ) | 4.1 | |||||||
Xperi, Inc. | (8,684 | ) | (82,411 | ) | 12.3 | |||||||
Xponential Fitness, Inc., Class A | (5,717 | ) | (189,118 | ) | 28.2 | |||||||
Zentalis Pharmaceuticals, Inc. | (8,561 | ) | (188,599 | ) | 28.1 | |||||||
Zuora, Inc. | (8,378 | ) | (65,265 | ) | 9.7 | |||||||
|
|
|
| |||||||||
| (134,793,004 | ) | |||||||||||
Preferred Stocks | ||||||||||||
| Germany | ||||||||||||
Jungheinrich AG | (4,603 | ) | (177,730 | ) | 26.5 | |||||||
Sixt SE | (541 | ) | (42,921 | ) | 6.4 | |||||||
|
|
|
| |||||||||
| (220,651 | ) | |||||||||||
| 40 | 2 0 2 3 BLACK ROCK ANNUAL REPORT TO SHAREHOLDERS |
Schedule of Investments (continued) April 30, 2023 | BlackRock Global Equity Market Neutral Fund |
| Security | Shares | Value | % of Basket Value | |||||||||
| Germany (continued) | ||||||||||||
| Rights | ||||||||||||
| Spain | ||||||||||||
Faes Farma SA (Expires 05/10/23) | (24,297 | ) | $ | (3,252 | ) | 0.5 | % | |||||
|
|
|
| |||||||||
Total Reference Entity — Short | (275,303,190 | ) | ||||||||||
|
| |||||||||||
Net Value of Reference Entity — Bank of America N.A |
| $ | (670,259 | ) | ||||||||
|
| |||||||||||
The following table represents the individual long and short positions and related values of the equity securities underlying the total return swap with Bank of America N.A. as of period end, termination date 02/15/28:
| Security | Shares | Value | % of Basket Value | |||||||||
Reference Entity — Long | ||||||||||||
| Common Stocks | ||||||||||||
| Australia | ||||||||||||
AMP Ltd. | 289,510 | $ | 219,035 | (29.8 | )% | |||||||
Bank of Queensland Ltd. | 89,913 | 347,454 | (47.2 | ) | ||||||||
Beach Energy Ltd. | 43,526 | 42,871 | (5.8 | ) | ||||||||
Bendigo & Adelaide Bank Ltd. | 22,674 | 130,629 | (17.8 | ) | ||||||||
Boral Ltd. | 41,859 | 114,975 | (15.6 | ) | ||||||||
Charter Hall Group | 42,538 | 316,694 | (43.1 | ) | ||||||||
CSR Ltd. | 28,124 | 98,520 | (13.4 | ) | ||||||||
Fortescue Metals Group Ltd. | 2,293 | 32,104 | (4.4 | ) | ||||||||
GPT Group | 128,282 | 377,473 | (51.3 | ) | ||||||||
IDP Education Ltd. | 3,876 | 72,868 | (9.9 | ) | ||||||||
Iluka Resources Ltd. | 7,492 | 55,088 | (7.5 | ) | ||||||||
Insignia Financial Ltd. | 6,517 | 12,944 | (1.8 | ) | ||||||||
Macquarie Group Ltd. | 1,666 | 203,374 | (27.7 | ) | ||||||||
Magellan Financial Group Ltd. | 21,063 | 114,227 | (15.5 | ) | ||||||||
Mineral Resources Ltd. | 343 | 16,933 | (2.3 | ) | ||||||||
Mirvac Group | 10,881 | 17,480 | (2.4 | ) | ||||||||
National Australia Bank Ltd. | 27,829 | 536,101 | (72.9 | ) | ||||||||
Orora Ltd. | 144,045 | 329,448 | (44.8 | ) | ||||||||
Pilbara Minerals Ltd. | 26,463 | 75,370 | (10.3 | ) | ||||||||
Pro Medicus Ltd. | 4,574 | 187,878 | (25.5 | ) | ||||||||
Region RE Ltd., Registered Shares | 79,135 | 129,589 | (17.6 | ) | ||||||||
Rio Tinto Ltd. | 1,670 | 125,343 | (17.0 | ) | ||||||||
Star Entertainment Grp Ltd. | 142,964 | 121,271 | (16.5 | ) | ||||||||
Steadfast Group Ltd. | 8,437 | 33,285 | (4.5 | ) | ||||||||
Westpac Banking Corp. | 4,034 | 60,426 | (8.2 | ) | ||||||||
WiseTech Global Ltd. | 6,944 | 318,291 | (43.3 | ) | ||||||||
|
|
|
| |||||||||
| 4,089,671 | ||||||||||||
| Austria | ||||||||||||
ams-OSRAM AG | 25,577 | 176,952 | (24.1 | ) | ||||||||
|
|
|
| |||||||||
| Belgium | ||||||||||||
Elia Group SA/NV | 1,138 | 155,360 | (21.2 | ) | ||||||||
Euronav NV | 15,873 | 273,015 | (37.1 | ) | ||||||||
Sofina SA | 2,577 | 589,101 | (80.1 | ) | ||||||||
Solvay SA | 1,804 | 215,562 | (29.3 | ) | ||||||||
|
|
|
| |||||||||
| 1,233,038 | ||||||||||||
| Brazil | ||||||||||||
Wheaton Precious Metals Corp. | 968 | 47,458 | (6.5 | ) | ||||||||
|
|
|
| |||||||||
| Canada | ||||||||||||
Birchcliff Energy Ltd. | 1,129 | 6,798 | (0.9 | ) | ||||||||
Bombardier, Inc., Class B | 8,220 | 352,421 | (47.9 | ) | ||||||||
| Security | Shares | Value | % of Basket Value | |||||||||
| Canada (continued) | ||||||||||||
Canada Goose Holdings, Inc. | 33,983 | $ | 666,746 | (90.7 | )% | |||||||
Element Fleet Management Corp. | 29,165 | 379,100 | (51.6 | ) | ||||||||
Enerplus Corp. | 10,088 | 149,880 | (20.4 | ) | ||||||||
First Majestic Silver Corp. | 51,275 | 359,854 | (48.9 | ) | ||||||||
FirstService Corp. | 584 | 87,304 | (11.9 | ) | ||||||||
Franco-Nevada Corp. | 312 | 47,039 | (6.4 | ) | ||||||||
GFL Environmental, Inc. | 2,556 | 92,266 | (12.5 | ) | ||||||||
Lithium Americas Corp. | 10,701 | 212,493 | (28.9 | ) | ||||||||
NuVista Energy Ltd. | 29,065 | 250,663 | (34.1 | ) | ||||||||
Parex Resources, Inc. | 810 | 16,341 | (2.2 | ) | ||||||||
Restaurant Brands International, Inc. | 2,141 | 149,140 | (20.3 | ) | ||||||||
RioCan Real Estate Investment Trust | 5,440 | 83,694 | (11.4 | ) | ||||||||
Tourmaline Oil Corp. | 1,418 | 63,300 | (8.6 | ) | ||||||||
TransAlta Corp. | 10,641 | 94,279 | (12.8 | ) | ||||||||
West Fraser Timber Co. Ltd. | 383 | 27,521 | (3.7 | ) | ||||||||
|
|
|
| |||||||||
| 3,038,839 | ||||||||||||
| Chile | ||||||||||||
Lundin Mining Corp. | 4,298 | 32,623 | (4.4 | ) | ||||||||
|
|
|
| |||||||||
| China | ||||||||||||
Shangri-La Asia Ltd. | 16,000 | 14,760 | (2.0 | ) | ||||||||
SITC International Holdings Co. Ltd. | 64,000 | 118,375 | (16.1 | ) | ||||||||
Wharf Holdings Ltd. | 5,000 | 11,427 | (1.6 | ) | ||||||||
Yangzijiang Shipbuilding Holdings Ltd. | 31,000 | 28,817 | (3.9 | ) | ||||||||
|
|
|
| |||||||||
| 173,379 | ||||||||||||
| Comoros | ||||||||||||
Golar LNG Ltd. | 4,005 | 90,914 | (12.4 | ) | ||||||||
|
|
|
| |||||||||
| Denmark | ||||||||||||
D/S Norden A/S | 14,483 | 905,814 | (123.2 | ) | ||||||||
Genmab A/S | 146 | 59,735 | (8.1 | ) | ||||||||
H Lundbeck A/S | 25,083 | 132,226 | (18.0 | ) | ||||||||
Novozymes A/S, B Shares | 3,032 | 157,128 | (21.3 | ) | ||||||||
|
|
|
| |||||||||
| 1,254,903 | ||||||||||||
| Finland | ||||||||||||
Kone OYJ, Class B | 6,714 | 381,436 | (51.9 | ) | ||||||||
Outokumpu OYJ | 9,624 | 52,237 | (7.1 | ) | ||||||||
Wartsila OYJ ABP | 17,848 | 206,213 | (28.0 | ) | ||||||||
|
|
|
| |||||||||
| 639,886 | ||||||||||||
| France | ||||||||||||
Accor SA | 20,318 | 717,718 | (97.6 | ) | ||||||||
Aeroports de Paris | 482 | 76,272 | (10.4 | ) | ||||||||
Arkema SA | 2,633 | 259,371 | (35.3 | ) | ||||||||
Bureau Veritas SA | 7,833 | 224,858 | (30.6 | ) | ||||||||
Carrefour SA | 5,876 | 121,699 | (16.5 | ) | ||||||||
Cie de Saint-Gobain | 1,187 | 68,426 | (9.3 | ) | ||||||||
Danone SA | 10,055 | 662,545 | (90.1 | ) | ||||||||
Dassault Aviation SA | 574 | 111,674 | (15.2 | ) | ||||||||
Edenred | 6,230 | 403,033 | (54.8 | ) | ||||||||
EssilorLuxottica SA | 309 | 60,899 | (8.3 | ) | ||||||||
Gaztransport Et Technigaz SA | 1,691 | 180,049 | (24.5 | ) | ||||||||
Getlink SE | 24,513 | 456,164 | (62.0 | ) | ||||||||
Hermes International | 582 | 1,258,077 | (171.1 | ) | ||||||||
ICADE | 9,851 | 460,664 | (62.6 | ) | ||||||||
JCDecaux SE | 3,799 | 83,730 | (11.4 | ) | ||||||||
LVMH Moet Hennessy Louis Vuitton SE | 219 | 209,694 | (28.5 | ) | ||||||||
Neoen SA | 22,970 | 686,633 | (93.4 | ) | ||||||||
Pernod Ricard SA | 1,820 | 418,416 | (56.9 | ) | ||||||||
Renault SA | 695 | 25,703 | (3.5 | ) | ||||||||
SCHEDULE OF INVESTMENTS | 41 |
Schedule of Investments (continued) April 30, 2023 | BlackRock Global Equity Market Neutral Fund |
| Security | Shares | Value | % of Basket Value | |||||||||
| France (continued) | ||||||||||||
Societe Generale SA | 11,719 | $ | 283,457 | (38.5 | )% | |||||||
Vallourec SA | 8,250 | 93,824 | (12.8 | ) | ||||||||
Wendel SE | 6,778 | 757,051 | (102.9 | ) | ||||||||
|
|
|
| |||||||||
| 7,619,957 | ||||||||||||
| Germany | ||||||||||||
Carl Zeiss Meditec AG | 292 | 39,098 | (5.3 | ) | ||||||||
Covestro AG | 5,343 | 233,437 | (31.7 | ) | ||||||||
Encavis AG | 34,646 | 596,538 | (81.1 | ) | ||||||||
Freenet AG | 23,890 | 678,121 | (92.2 | ) | ||||||||
GEA Group AG | 484 | 22,662 | (3.1 | ) | ||||||||
HUGO BOSS AG | 254 | 19,066 | (2.6 | ) | ||||||||
LEG Immobilien SE | 965 | 59,811 | (8.1 | ) | ||||||||
Mercedes-Benz Group AG | 6,379 | 495,311 | (67.4 | ) | ||||||||
Merck KGaA | 1,351 | 241,242 | (32.8 | ) | ||||||||
METRO AG | 43 | 364 | (0.1 | ) | ||||||||
Nemetschek SE | 2,961 | 230,519 | (31.3 | ) | ||||||||
ProSiebenSat.1 Media SE | 233,859 | 2,088,895 | (284.1 | ) | ||||||||
SUSE SA | 5,037 | 94,836 | (12.9 | ) | ||||||||
Talanx AG | 2,704 | 135,403 | (18.4 | ) | ||||||||
United Internet AG, Registered Shares | 19,579 | 334,679 | (45.5 | ) | ||||||||
Volkswagen AG | 3,884 | 649,245 | (88.3 | ) | ||||||||
|
|
|
| |||||||||
| 5,919,227 | ||||||||||||
| Hong Kong | ||||||||||||
ASMPT Ltd. | 33,400 | 262,586 | (35.7 | ) | ||||||||
Bank of East Asia Ltd. | 155,800 | 205,324 | (27.9 | ) | ||||||||
Cathay Pacific Airways Ltd. | 475,000 | 459,610 | (62.5 | ) | ||||||||
Dah Sing Banking Group Ltd. | 130,800 | 104,910 | (14.3 | ) | ||||||||
Haitong International Securities Group Ltd. | 174,900 | 14,763 | (2.0 | ) | ||||||||
Hang Lung Properties Ltd. | 101,000 | 184,615 | (25.1 | ) | ||||||||
Hongkong Land Holdings Ltd. | 17,900 | 79,663 | (10.8 | ) | ||||||||
Hutchison Port Holdings Trust | 648,300 | 122,983 | (16.7 | ) | ||||||||
Hysan Development Co. Ltd. | 39,000 | 110,212 | (15.0 | ) | ||||||||
Kerry Properties Ltd. | 44,500 | 114,811 | (15.6 | ) | ||||||||
Link REIT | 9,800 | 64,099 | (8.7 | ) | ||||||||
New World Development Co. Ltd. | 20,000 | 53,336 | (7.3 | ) | ||||||||
Swire Pacific Ltd. | 46,500 | 369,112 | (50.2 | ) | ||||||||
Swire Properties Ltd. | 115,000 | 309,080 | (42.0 | ) | ||||||||
Yue Yuen Industrial Holdings Ltd. | 38,500 | 57,938 | (7.9 | ) | ||||||||
|
|
|
| |||||||||
| 2,513,042 | ||||||||||||
| Ireland | ||||||||||||
Ryanair Holdings PLC | 31,524 | 514,658 | (70.0 | ) | ||||||||
Smurfit Kappa Group PLC | 6,178 | 227,900 | (31.0 | ) | ||||||||
|
|
|
| |||||||||
| 742,558 | ||||||||||||
| Israel | ||||||||||||
Alony Hetz Properties & Investments Ltd. | 33,955 | 266,939 | (36.3 | ) | ||||||||
Harel Insurance Investments & Financial Services Ltd. | 9,222 | 82,414 | (11.2 | ) | ||||||||
Nova Ltd. | 6,633 | 606,588 | (82.5 | ) | ||||||||
Phoenix Holdings Ltd. | 6,634 | 70,858 | (9.6 | ) | ||||||||
|
|
|
| |||||||||
| 1,026,799 | ||||||||||||
| Italy | ||||||||||||
Banco BPM SpA | 8,493 | 34,365 | (4.7 | ) | ||||||||
Buzzi Unicem SpA | 17,950 | 444,404 | (60.4 | ) | ||||||||
Ferrari NV | 474 | 131,494 | (17.9 | ) | ||||||||
FinecoBank Banca Fineco SpA | 9,593 | 144,747 | (19.7 | ) | ||||||||
Hera SpA | 107,853 | 334,367 | (45.5 | ) | ||||||||
Italgas SpA | 46,044 | 299,318 | (40.7 | ) | ||||||||
PRADA SpA | 30,200 | 222,346 | (30.2 | ) | ||||||||
| Security | Shares | Value | % of Basket Value | |||||||||
| Italy (continued) | ||||||||||||
Reply SpA | 3,409 | $ | 395,398 | (53.8 | )% | |||||||
Snam SpA | 38,763 | 214,488 | (29.1 | ) | ||||||||
UnipolSai Assicurazioni SpA | 55,770 | 149,374 | (20.3 | ) | ||||||||
|
|
|
| |||||||||
| 2,370,301 | ||||||||||||
| Japan | ||||||||||||
Acom Co. Ltd. | 83,800 | 209,413 | (28.5 | ) | ||||||||
AEON Financial Service Co. Ltd. | 15,300 | 139,031 | (18.9 | ) | ||||||||
Ain Holdings, Inc. | 2,900 | 123,020 | (16.7 | ) | ||||||||
Aisin Corp. | 2,400 | 71,743 | (9.8 | ) | ||||||||
Amano Corp. | 5,600 | 116,271 | (15.8 | ) | ||||||||
Anritsu Corp. | 41,300 | 385,726 | (52.5 | ) | ||||||||
Asahi Kasei Corp. | 10,700 | 77,075 | (10.5 | ) | ||||||||
Astellas Pharma, Inc. | 38,200 | 586,304 | (79.7 | ) | ||||||||
AZ-COM MARUWA Holdings, Inc. | 15,800 | 237,660 | (32.3 | ) | ||||||||
Brother Industries Ltd. | 22,100 | 353,887 | (48.1 | ) | ||||||||
Canon Marketing Japan, Inc. | 1,600 | 40,761 | (5.5 | ) | ||||||||
Casio Computer Co. Ltd. | 17,300 | 167,907 | (22.8 | ) | ||||||||
Coca-Cola Bottlers Japan Holdings, Inc. | 27,300 | 300,046 | (40.8 | ) | ||||||||
Concordia Financial Group Ltd. | 41,400 | 160,226 | (21.8 | ) | ||||||||
Cosmos Pharmaceutical Corp. | 2,300 | 230,620 | (31.4 | ) | ||||||||
CyberAgent, Inc. | 119,600 | 1,064,785 | (144.8 | ) | ||||||||
Daicel Corp. | 39,300 | 315,889 | (43.0 | ) | ||||||||
Daifuku Co. Ltd. | 900 | 16,909 | (2.3 | ) | ||||||||
Dai-ichi Life Holdings, Inc. | 28,100 | 532,996 | (72.5 | ) | ||||||||
Denka Co. Ltd. | 300 | 6,129 | (0.8 | ) | ||||||||
DIC Corp. | 12,400 | 233,610 | (31.8 | ) | ||||||||
Fuji Electric Co. Ltd. | 11,100 | 456,556 | (62.1 | ) | ||||||||
FUJIFILM Holdings Corp. | 6,600 | 350,759 | (47.7 | ) | ||||||||
Fujikura Ltd. | 45,200 | 314,249 | (42.7 | ) | ||||||||
Hamamatsu Photonics KK | 7,600 | 411,037 | (55.9 | ) | ||||||||
Hitachi Ltd. | 6,100 | 344,458 | (46.8 | ) | ||||||||
House Foods Group, Inc. | 4,100 | 91,925 | (12.5 | ) | ||||||||
Information Services International-Dentsu Ltd. | 5,800 | 208,819 | (28.4 | ) | ||||||||
INFRONEER Holdings, Inc. | 62,100 | 500,141 | (68.0 | ) | ||||||||
Internet Initiative Japan, Inc. | 900 | 18,994 | (2.6 | ) | ||||||||
J Front Retailing Co. Ltd. | 45,600 | 489,446 | (66.6 | ) | ||||||||
Japan Steel Works Ltd. | 4,100 | 75,988 | (10.3 | ) | ||||||||
JGC Holdings Corp. | 2,800 | 35,729 | (4.9 | ) | ||||||||
JTEKT Corp. | 2,900 | 24,392 | (3.3 | ) | ||||||||
Kakaku.com, Inc. | 39,800 | 558,541 | (75.9 | ) | ||||||||
Kamigumi Co. Ltd. | 2,000 | 44,683 | (6.1 | ) | ||||||||
Kandenko Co. Ltd. | 30,600 | 234,931 | (31.9 | ) | ||||||||
Kaneka Corp. | 7,200 | 195,318 | (26.6 | ) | ||||||||
Kawasaki Kisen Kaisha Ltd. | 14,100 | 342,923 | (46.6 | ) | ||||||||
KDDI Corp. | 1,500 | 47,743 | (6.5 | ) | ||||||||
Kewpie Corp. | 32,700 | 559,925 | (76.1 | ) | ||||||||
Koei Tecmo Holdings Co. Ltd. | 13,400 | 251,014 | (34.1 | ) | ||||||||
Kuraray Co. Ltd. | 11,900 | 113,486 | (15.4 | ) | ||||||||
Kusuri no Aoki Holdings Co. Ltd. | 3,800 | 185,971 | (25.3 | ) | ||||||||
Kyocera Corp. | 9,300 | 497,771 | (67.7 | ) | ||||||||
Kyowa Kirin Co. Ltd. | 13,500 | 306,574 | (41.7 | ) | ||||||||
Lintec Corp. | 28,600 | 487,654 | (66.3 | ) | ||||||||
Lion Corp. | 67,000 | 744,928 | (101.3 | ) | ||||||||
Lixil Corp. | 21,500 | 345,008 | (46.9 | ) | ||||||||
M3, Inc. | 1,800 | 45,095 | (6.1 | ) | ||||||||
Mani, Inc. | 18,100 | 241,732 | (32.9 | ) | ||||||||
Maruichi Steel Tube Ltd. | 23,100 | 532,917 | (72.5 | ) | ||||||||
MISUMI Group, Inc. | 3,000 | 77,142 | (10.5 | ) | ||||||||
Mitsubishi Chemical Group Corp. | 26,000 | 155,235 | (21.1 | ) | ||||||||
Mitsubishi Estate Co. Ltd. | 1,700 | 21,360 | (2.9 | ) | ||||||||
Mitsubishi Gas Chemical Co., Inc. | 16,500 | 245,031 | (33.3 | ) | ||||||||
| 42 | 2 0 2 3 BLACK ROCK ANNUAL REPORT TO SHAREHOLDERS |
Schedule of Investments (continued) April 30, 2023 | BlackRock Global Equity Market Neutral Fund |
| Security | Shares | Value | % of Basket Value | |||||||||
| Japan (continued) | ||||||||||||
Mitsubishi Heavy Industries Ltd. | 1,100 | $ | 42,555 | (5.8 | )% | |||||||
Mitsubishi Motors Corp. | 79,600 | 311,918 | (42.4 | ) | ||||||||
Mitsui & Co. Ltd. | 20,000 | 636,830 | (86.6 | ) | ||||||||
Mitsui Chemicals, Inc. | 8,100 | 209,049 | (28.4 | ) | ||||||||
Mitsui Fudosan Co. Ltd. | 23,800 | 481,704 | (65.5 | ) | ||||||||
Nabtesco Corp. | 3,000 | 73,733 | (10.0 | ) | ||||||||
NEC Networks & System Integration Corp. | 23,400 | 297,374 | (40.4 | ) | ||||||||
NET One Systems Co. Ltd. | 700 | 16,834 | (2.3 | ) | ||||||||
Nidec Corp. | 4,300 | 217,000 | (29.5 | ) | ||||||||
Nihon M&A Center Holdings, Inc. | 11,300 | 88,076 | (12.0 | ) | ||||||||
Nikon Corp. | 32,100 | 338,232 | (46.0 | ) | ||||||||
Nippon Express Holdings, Inc. | 4,200 | 251,363 | (34.2 | ) | ||||||||
Nippon Shinyaku Co. Ltd. | 4,400 | 205,241 | (27.9 | ) | ||||||||
Nippon Telegraph & Telephone Corp. | 600 | 18,668 | (2.5 | ) | ||||||||
Nipro Corp. | 9,800 | 75,301 | (10.2 | ) | ||||||||
Nissan Motor Co. Ltd. | 23,500 | 86,109 | (11.7 | ) | ||||||||
Niterra Co. Ltd. | 48,300 | 1,032,299 | (140.4 | ) | ||||||||
Nitto Denko Corp. | 3,800 | 250,439 | (34.1 | ) | ||||||||
NS Solutions Corp. | 2,400 | 66,591 | (9.1 | ) | ||||||||
NSK Ltd. | 187,500 | 1,079,728 | (146.8 | ) | ||||||||
OBIC Business Consultants Co. Ltd. | 4,100 | 158,752 | (21.6 | ) | ||||||||
Olympus Corp. | 15,800 | 282,343 | (38.4 | ) | ||||||||
Omron Corp. | 4,300 | 257,125 | (35.0 | ) | ||||||||
Ono Pharmaceutical Co. Ltd. | 1,000 | 20,536 | (2.8 | ) | ||||||||
Oracle Corp. Japan | 5,900 | 431,587 | (58.7 | ) | ||||||||
Otsuka Holdings Co. Ltd. | 7,500 | 260,146 | (35.4 | ) | ||||||||
Penta-Ocean Construction Co. Ltd. | 4,700 | 23,292 | (3.2 | ) | ||||||||
Pigeon Corp. | 1,800 | 28,575 | (3.9 | ) | ||||||||
Recruit Holdings Co. Ltd. | 12,800 | 366,182 | (49.8 | ) | ||||||||
Ricoh Co. Ltd. | 77,100 | 650,552 | (88.5 | ) | ||||||||
Rohm Co. Ltd. | 2,900 | 222,932 | (30.3 | ) | ||||||||
Sanrio Co. Ltd. | 15,500 | 731,814 | (99.5 | ) | ||||||||
Sapporo Holdings Ltd. | 6,100 | 173,537 | (23.6 | ) | ||||||||
Sawai Group Holdings Co. Ltd. | 8,100 | 239,036 | (32.5 | ) | ||||||||
Seiko Epson Corp. | 25,300 | 394,414 | (53.6 | ) | ||||||||
Shionogi & Co. Ltd. | 1,200 | 54,797 | (7.4 | ) | ||||||||
SoftBank Group Corp. | 1,700 | 65,029 | (8.8 | ) | ||||||||
Sompo Holdings, Inc. | 4,800 | 203,834 | (27.7 | ) | ||||||||
Subaru Corp. | 41,800 | 695,371 | (94.6 | ) | ||||||||
Sumitomo Chemical Co. Ltd. | 32,900 | 112,658 | (15.3 | ) | ||||||||
Sumitomo Mitsui Trust Holdings, Inc. | 18,400 | 676,414 | (92.0 | ) | ||||||||
Sumitomo Pharma Co. Ltd. | 25,700 | 164,390 | (22.4 | ) | ||||||||
T&D Holdings, Inc. | 21,800 | 272,405 | (37.0 | ) | ||||||||
Taisei Corp. | 4,500 | 155,920 | (21.2 | ) | ||||||||
Taisho Pharmaceutical Holdings Co. Ltd. | 2,000 | 88,096 | (12.0 | ) | ||||||||
Takara Bio, Inc. | 8,000 | 102,982 | (14.0 | ) | ||||||||
Terumo Corp. | 27,000 | 824,551 | (112.1 | ) | ||||||||
Toho Co. Ltd. | 12,700 | 514,496 | (70.0 | ) | ||||||||
Tokyo Ohka Kogyo Co. Ltd. | 5,900 | 314,241 | (42.7 | ) | ||||||||
Toray Industries, Inc. | 63,800 | 367,879 | (50.0 | ) | ||||||||
TOTO Ltd. | 2,500 | 87,207 | (11.9 | ) | ||||||||
Toyoda Gosei Co. Ltd. | 18,400 | 321,597 | (43.7 | ) | ||||||||
Toyota Boshoku Corp. | 1,000 | 16,141 | (2.2 | ) | ||||||||
Toyota Industries Corp. | 1,900 | 112,556 | (15.3 | ) | ||||||||
TS Tech Co. Ltd. | 12,400 | 170,343 | (23.2 | ) | ||||||||
UBE Corp. | 1,600 | 25,890 | (3.5 | ) | ||||||||
Ulvac, Inc. | 8,100 | 328,168 | (44.6 | ) | ||||||||
Ushio, Inc. | 1,500 | 19,028 | (2.6 | ) | ||||||||
Welcia Holdings Co. Ltd. | 4,800 | 102,494 | (13.9 | ) | ||||||||
Yamaha Corp. | 3,100 | 124,599 | (16.9 | ) | ||||||||
| Security | Shares | Value | % of Basket Value | |||||||||
| Japan (continued) | ||||||||||||
Yamato Kogyo Co. Ltd. | 18,800 | $ | 753,522 | (102.5 | )% | |||||||
Zeon Corp. | 44,800 | 471,845 | (64.2 | ) | ||||||||
ZOZO, Inc. | 20,100 | 432,118 | (58.8 | ) | ||||||||
|
|
|
| |||||||||
| 32,525,921 | ||||||||||||
| Luxembourg | ||||||||||||
L’Occitane International SA | 45,250 | 115,116 | (15.7 | ) | ||||||||
|
|
|
| |||||||||
| Macau | ||||||||||||
Galaxy Entertainment Group Ltd. | 37,000 | 263,331 | (35.8 | ) | ||||||||
MGM China Holdings Ltd. | 108,400 | 148,056 | (20.1 | ) | ||||||||
Sands China Ltd. | 33,200 | 118,899 | (16.2 | ) | ||||||||
SJM Holdings Ltd. | 34,000 | 17,704 | (2.4 | ) | ||||||||
Wynn Macau Ltd. | 2,000 | 2,164 | (0.3 | ) | ||||||||
|
|
|
| |||||||||
| 550,154 | ||||||||||||
| Netherlands | ||||||||||||
ABN AMRO Bank NV, CVA | 10,917 | 174,189 | (23.7 | ) | ||||||||
Aegon NV | 10,929 | 49,648 | (6.7 | ) | ||||||||
ASML Holding NV | 1,070 | 676,060 | (91.9 | ) | ||||||||
Koninklijke DSM NV | 1,376 | 179,838 | (24.5 | ) | ||||||||
Koninklijke Vopak NV | 8,621 | 327,943 | (44.6 | ) | ||||||||
NN Group NV | 1,229 | 45,625 | (6.2 | ) | ||||||||
Wolters Kluwer NV | 4,802 | 633,384 | (86.1 | ) | ||||||||
|
|
|
| |||||||||
| 2,086,687 | ||||||||||||
| New Zealand | ||||||||||||
a2 Milk Co. Ltd. | 3,116 | 11,255 | (1.5 | ) | ||||||||
Contact Energy Ltd. | 14,764 | 71,092 | (9.7 | ) | ||||||||
Infratil Ltd. | 7,422 | 43,573 | (5.9 | ) | ||||||||
|
|
|
| |||||||||
| 125,920 | ||||||||||||
| Norway | ||||||||||||
Aker BP ASA | 26,603 | 634,098 | (86.2 | ) | ||||||||
AutoStore Holdings Ltd. | 33,767 | 72,517 | (9.9 | ) | ||||||||
Gjensidige Forsikring ASA | 10,522 | 182,758 | (24.9 | ) | ||||||||
Kongsberg Gruppen ASA | 1,722 | 77,120 | (10.5 | ) | ||||||||
NEL ASA | 143,347 | 196,482 | (26.7 | ) | ||||||||
Nordic Semiconductor ASA | 26,586 | 287,042 | (39.0 | ) | ||||||||
TOMRA Systems ASA | 25,529 | 390,301 | (53.1 | ) | ||||||||
Var Energi ASA | 6,753 | 17,671 | (2.4 | ) | ||||||||
|
|
|
| |||||||||
| 1,857,989 | ||||||||||||
| Poland | ||||||||||||
InPost SA | 1,427 | 15,252 | (2.1 | ) | ||||||||
|
|
|
| |||||||||
| Singapore | ||||||||||||
ComfortDelGro Corp. Ltd. | 155,200 | 138,497 | (18.8 | ) | ||||||||
Mapletree Industrial Trust | 19,300 | 34,393 | (4.7 | ) | ||||||||
Mapletree Logistics Trust | 42,500 | 55,442 | (7.5 | ) | ||||||||
Mapletree Pan Asia Commercial Trust | 149,500 | 197,406 | (26.8 | ) | ||||||||
Singapore Airlines Ltd. | 64,500 | 282,799 | (38.5 | ) | ||||||||
StarHub Ltd. | 95,300 | 71,329 | (9.7 | ) | ||||||||
|
|
|
| |||||||||
| 779,866 | ||||||||||||
| Spain | ||||||||||||
Banco de Sabadell SA | 723,075 | 749,920 | (102.0 | ) | ||||||||
Bankinter SA | 11,419 | 67,214 | (9.1 | ) | ||||||||
EDP Renovaveis SA | 3,328 | 73,647 | (10.0 | ) | ||||||||
Fluidra SA | 1,017 | 17,347 | (2.4 | ) | ||||||||
Merlin Properties Socimi SA | 19,198 | 169,015 | (23.0 | ) | ||||||||
Sacyr SA | 39,273 | 129,368 | (17.6 | ) | ||||||||
|
|
|
| |||||||||
| 1,206,511 | ||||||||||||
SCHEDULE OF INVESTMENTS | 43 |
Schedule of Investments (continued) April 30, 2023 | BlackRock Global Equity Market Neutral Fund |
| Security | Shares | Value | % of Basket Value | |||||||||
| Sweden | ||||||||||||
Atlas Copco AB, A Shares | 27,923 | $ | 401,702 | (54.6 | )% | |||||||
Atlas Copco AB, B Shares | 40,167 | 512,389 | (69.7 | ) | ||||||||
Avanza Bank Holding AB | 2,286 | 48,350 | (6.6 | ) | ||||||||
Beijer Ref AB | 10,299 | 167,396 | (22.8 | ) | ||||||||
Castellum AB | 3,927 | 47,448 | (6.4 | ) | ||||||||
Elekta AB, B Shares | 24,132 | 201,666 | (27.4 | ) | ||||||||
Epiroc AB, Class A | 45,386 | 903,504 | (122.8 | ) | ||||||||
Epiroc AB, Class B | 6,328 | 108,268 | (14.7 | ) | ||||||||
Getinge AB, B Shares | 13,958 | 352,031 | (47.9 | ) | ||||||||
Indutrade AB | 4,933 | 117,786 | (16.0 | ) | ||||||||
Investor AB, A Shares | 1,218 | 26,546 | (3.6 | ) | ||||||||
L E Lundbergforetagen AB, B Shares | 7,186 | 342,728 | (46.6 | ) | ||||||||
Nibe Industrier AB, B Shares | 19,348 | 215,218 | (29.3 | ) | ||||||||
Sagax AB | 3,375 | 82,285 | (11.2 | ) | ||||||||
Sweco AB, B Shares | 8,395 | 111,890 | (15.2 | ) | ||||||||
Volvo Car AB | 11,940 | 49,004 | (6.7 | ) | ||||||||
|
|
|
| |||||||||
| 3,688,211 | ||||||||||||
| Switzerland | ||||||||||||
ABB Ltd., Registered Shares | 7,032 | 254,131 | (34.6 | ) | ||||||||
Banque Cantonale Vaudoise, Registered Shares | 2,406 | 253,634 | (34.5 | ) | ||||||||
Belimo Holding AG, Registered Shares | 978 | 472,888 | (64.3 | ) | ||||||||
Chocoladefabriken Lindt & Spruengli AG, Participation Certificates | 9 | 111,332 | (15.1 | ) | ||||||||
Cie Financiere Richemont SA, Registered Shares | 208 | 34,367 | (4.7 | ) | ||||||||
Dufry AG, Registered Shares | 107 | 4,956 | (0.7 | ) | ||||||||
Geberit AG, Registered Shares | 669 | 381,725 | (51.9 | ) | ||||||||
Georg Fischer AG, Registered Shares | 1,965 | 143,564 | (19.5 | ) | ||||||||
Givaudan SA, Registered Shares | 378 | 1,324,721 | (180.1 | ) | ||||||||
Idorsia Ltd. | 4,326 | 41,895 | (5.7 | ) | ||||||||
Partners Group Holding AG | 324 | 315,096 | (42.8 | ) | ||||||||
Schindler Holding AG | 588 | 131,645 | (17.9 | ) | ||||||||
Swatch Group AG, Registered Shares | 1,369 | 86,527 | (11.8 | ) | ||||||||
Swiss Prime Site AG, Registered Shares | 1,433 | 129,951 | (17.7 | ) | ||||||||
Tecan Group AG, Registered Shares | 455 | 198,660 | (27.0 | ) | ||||||||
Temenos AG, Registered Shares | 245 | 20,670 | (2.8 | ) | ||||||||
VAT Group AG | 170 | 60,084 | (8.2 | ) | ||||||||
|
|
|
| |||||||||
| 3,965,846 | ||||||||||||
| Thailand | ||||||||||||
Fabrinet | 318 | 30,194 | (4.1 | ) | ||||||||
|
|
|
| |||||||||
| United Kingdom | ||||||||||||
Auto Trader Group PLC | 32,942 | 260,010 | (35.4 | ) | ||||||||
British American Tobacco PLC | 7,285 | 265,659 | (36.1 | ) | ||||||||
British Land Co. PLC | 103,710 | 515,903 | (70.1 | ) | ||||||||
Bunzl PLC | 10,730 | 421,455 | (57.3 | ) | ||||||||
Centrica PLC | 76,490 | 108,484 | (14.7 | ) | ||||||||
ConvaTec Group PLC | 37,675 | 102,785 | (14.0 | ) | ||||||||
Diploma PLC | 4,627 | 154,736 | (21.0 | ) | ||||||||
easyJet PLC | 59,881 | 370,712 | (50.4 | ) | ||||||||
Games Workshop Group PLC | 155 | 19,099 | (2.6 | ) | ||||||||
IG Group Holdings PLC | 8,416 | 76,677 | (10.4 | ) | ||||||||
Inchcape PLC | 1,174 | 11,804 | (1.6 | ) | ||||||||
Intermediate Capital Group PLC | 19,582 | 317,463 | (43.2 | ) | ||||||||
Intertek Group PLC | 2,249 | 116,127 | (15.8 | ) | ||||||||
ITV PLC | 783,153 | 786,604 | (107.0 | ) | ||||||||
Land Securities Group PLC | 5,794 | 48,554 | (6.6 | ) | ||||||||
Legal & General Group PLC | 13,121 | 38,166 | (5.2 | ) | ||||||||
Liberty Global PLC | 19,064 | 371,939 | (50.6 | ) | ||||||||
Moneysupermarket.com Group PLC | 2 | 7 | (0.0 | ) | ||||||||
Nomad Foods Ltd. | 52,332 | 983,842 | (133.8 | ) | ||||||||
| Security | Shares | Value | % of Basket Value | |||||||||
| United Kingdom (continued) | ||||||||||||
OSB Group PLC | 4,206 | $ | 25,994 | (3.5 | )% | |||||||
Pennon Group PLC | 19,311 | 206,109 | (28.0 | ) | ||||||||
Phoenix Group Holdings PLC | 20,350 | 149,696 | (20.4 | ) | ||||||||
Renishaw PLC | 5,492 | 245,810 | (33.4 | ) | ||||||||
Rightmove PLC | 97,843 | 698,898 | (95.0 | ) | ||||||||
Rotork PLC | 58,685 | 238,791 | (32.5 | ) | ||||||||
RS GROUP PLC | 1,681 | 19,254 | (2.6 | ) | ||||||||
Segro PLC | 4,542 | 47,218 | (6.4 | ) | ||||||||
Smiths Group PLC | 2,206 | 46,040 | (6.3 | ) | ||||||||
Spirax-Sarco Engineering PLC | 2,111 | 290,968 | (39.6 | ) | ||||||||
Standard Chartered PLC | 18,166 | 142,048 | (19.3 | ) | ||||||||
Taylor Wimpey PLC | 28,018 | 44,659 | (6.1 | ) | ||||||||
Tritax Big Box REIT PLC | 34,240 | 66,065 | (9.0 | ) | ||||||||
United Utilities Group PLC | 66,090 | 886,075 | (120.5 | ) | ||||||||
|
|
|
| |||||||||
| 8,077,651 | ||||||||||||
| United States | ||||||||||||
Acadia Healthcare Co., Inc. | 562 | 40,627 | (5.5 | ) | ||||||||
Adobe, Inc. | 2,825 | 1,066,607 | (145.0 | ) | ||||||||
AECOM | 577 | 47,920 | (6.5 | ) | ||||||||
Affiliated Managers Group, Inc. | 994 | 143,514 | (19.5 | ) | ||||||||
Agilent Technologies, Inc. | 13,601 | 1,841,983 | (250.5 | ) | ||||||||
Air Lease Corp. | 475 | 19,105 | (2.6 | ) | ||||||||
Alcoa Corp. | 5,192 | 192,831 | (26.2 | ) | ||||||||
Alkermes PLC | 13,378 | 381,942 | (51.9 | ) | ||||||||
Allstate Corp. | 2,274 | 263,238 | (35.8 | ) | ||||||||
Ally Financial, Inc. | 21,685 | 572,050 | (77.8 | ) | ||||||||
Alnylam Pharmaceuticals, Inc. | 169 | 33,665 | (4.6 | ) | ||||||||
Alphabet, Inc., Class A | 24,904 | 2,673,195 | (363.5 | ) | ||||||||
Altria Group, Inc. | 6,677 | 317,224 | (43.1 | ) | ||||||||
Amazon.com, Inc. | 2,990 | 315,296 | (42.9 | ) | ||||||||
American Airlines Group, Inc. | 37,076 | 505,717 | (68.8 | ) | ||||||||
American Financial Group, Inc. | 5,632 | 691,215 | (94.0 | ) | ||||||||
American Tower Corp. | 146 | 29,841 | (4.1 | ) | ||||||||
AMETEK, Inc. | 12,042 | 1,660,953 | (225.9 | ) | ||||||||
Amgen, Inc. | 1,762 | 422,422 | (57.4 | ) | ||||||||
AMN Healthcare Services, Inc. | 842 | 72,707 | (9.9 | ) | ||||||||
ATI, Inc. | 1,014 | 39,161 | (5.3 | ) | ||||||||
Autodesk, Inc. | 151 | 29,413 | (4.0 | ) | ||||||||
Avis Budget Group, Inc. | 1,431 | 252,815 | (34.4 | ) | ||||||||
Axcelis Technologies, Inc. | 19 | 2,248 | (0.3 | ) | ||||||||
Bath & Body Works, Inc. | 4,754 | 166,865 | (22.7 | ) | ||||||||
Beacon Roofing Supply, Inc. | 2,346 | 141,182 | (19.2 | ) | ||||||||
BioMarin Pharmaceutical, Inc. | 2,285 | 219,451 | (29.8 | ) | ||||||||
Bio-Techne Corp. | 496 | 39,620 | (5.4 | ) | ||||||||
Block, Inc. | 431 | 26,200 | (3.6 | ) | ||||||||
Booz Allen Hamilton Holding Corp. | 7,262 | 695,119 | (94.5 | ) | ||||||||
Box, Inc. | 35,808 | 947,480 | (128.8 | ) | ||||||||
Boyd Gaming Corp. | 7,266 | 504,260 | (68.6 | ) | ||||||||
Brighthouse Financial, Inc. | 4,352 | 192,358 | (26.2 | ) | ||||||||
Bristol-Myers Squibb Co. | 22,840 | 1,525,027 | (207.4 | ) | ||||||||
CACI International, Inc., Class A | 105 | 32,899 | (4.5 | ) | ||||||||
Camden Property Trust | 662 | 72,853 | (9.9 | ) | ||||||||
Capri Holdings Ltd. | 12,929 | 536,553 | (73.0 | ) | ||||||||
Carlisle Cos., Inc. | 1,880 | 405,798 | (55.2 | ) | ||||||||
Carnival Corp. | 38,009 | 350,063 | (47.6 | ) | ||||||||
Charles Schwab Corp. | 909 | 47,486 | (6.5 | ) | ||||||||
Charter Communications, Inc. | 523 | 192,830 | (26.2 | ) | ||||||||
Chemed Corp. | 763 | 420,604 | (57.2 | ) | ||||||||
Chevron Corp. | 3,065 | 516,698 | (70.3 | ) | ||||||||
Chewy, Inc., Class A | 2,285 | 70,858 | (9.6 | ) | ||||||||
Church & Dwight Co., Inc. | 4,163 | 404,311 | (55.0 | ) | ||||||||
| 44 | 2 0 2 3 BLACK ROCK ANNUAL REPORT TO SHAREHOLDERS |
Schedule of Investments (continued) April 30, 2023 | BlackRock Global Equity Market Neutral Fund |
| Security | Shares | Value | % of Basket Value | |||||||||
| United States (continued) | ||||||||||||
Cigna Group | 1,833 | $ | 464,281 | (63.1 | )% | |||||||
Cincinnati Financial Corp. | 1,760 | 187,334 | (25.5 | ) | ||||||||
Cintas Corp. | 1,111 | 506,360 | (68.9 | ) | ||||||||
Citizens Financial Group, Inc. | 10,555 | 326,572 | (44.4 | ) | ||||||||
Cleveland-Cliffs, Inc. | 12,821 | 197,187 | (26.8 | ) | ||||||||
Coca-Cola Co. | 43,744 | 2,806,178 | (381.6 | ) | ||||||||
Columbia Banking System, Inc. | 3,283 | 70,125 | (9.5 | ) | ||||||||
Columbia Sportswear Co. | 1,801 | 150,456 | (20.5 | ) | ||||||||
Comerica, Inc. | 4,326 | 187,619 | (25.5 | ) | ||||||||
CoStar Group, Inc. | 2,404 | 184,988 | (25.2 | ) | ||||||||
Costco Wholesale Corp. | 780 | 392,512 | (53.4 | ) | ||||||||
Credit Acceptance Corp. | 1,671 | 817,954 | (111.2 | ) | ||||||||
Curtiss-Wright Corp. | 2,341 | 397,572 | (54.1 | ) | ||||||||
Danaher Corp. | 2,200 | 521,202 | (70.9 | ) | ||||||||
Deckers Outdoor Corp. | 522 | 250,215 | (34.0 | ) | ||||||||
Devon Energy Corp. | 6,099 | 325,870 | (44.3 | ) | ||||||||
Diamondback Energy, Inc. | 949 | 134,948 | (18.3 | ) | ||||||||
Dick’s Sporting Goods, Inc. | 160 | 23,202 | (3.2 | ) | ||||||||
Domino’s Pizza, Inc. | 2,407 | 764,150 | (103.9 | ) | ||||||||
Dover Corp. | 3,758 | 549,269 | (74.7 | ) | ||||||||
Dropbox, Inc. | 7,036 | 143,112 | (19.5 | ) | ||||||||
DuPont de Nemours, Inc. | 23,855 | 1,663,171 | (226.2 | ) | ||||||||
eBay, Inc. | 7,168 | 332,810 | (45.3 | ) | ||||||||
Edwards Lifesciences Corp. | 781 | 68,712 | (9.3 | ) | ||||||||
Electronic Arts, Inc. | 3,631 | 462,154 | (62.8 | ) | ||||||||
Elevance Health, Inc. | 1,286 | 602,684 | (82.0 | ) | ||||||||
Enovis Corp. | 12,075 | 703,369 | (95.6 | ) | ||||||||
EOG Resources, Inc. | 715 | 85,421 | (11.6 | ) | ||||||||
EPAM Systems, Inc. | 632 | 178,502 | (24.3 | ) | ||||||||
Equinix, Inc. | 416 | 301,217 | (41.0 | ) | ||||||||
Equity LifeStyle Properties, Inc. | 3,949 | 272,086 | (37.0 | ) | ||||||||
Equity Residential | 96 | 6,072 | (0.8 | ) | ||||||||
Etsy, Inc. | 309 | 31,218 | (4.2 | ) | ||||||||
Exelixis, Inc. | 2,612 | 47,800 | (6.5 | ) | ||||||||
Expedia Group, Inc. | 745 | 70,000 | (9.5 | ) | ||||||||
Experian PLC | 22,083 | 771,560 | (104.9 | ) | ||||||||
Exxon Mobil Corp. | 3,508 | 415,137 | (56.4 | ) | ||||||||
Fair Isaac Corp. | 422 | 307,195 | (41.8 | ) | ||||||||
Fidelity National Information Services, Inc. | 4,338 | 254,727 | (34.6 | ) | ||||||||
Five Below, Inc. | 92 | 18,157 | (2.5 | ) | ||||||||
Flowers Foods, Inc. | 1,650 | 45,392 | (6.2 | ) | ||||||||
Fortinet, Inc. | 1,768 | 111,472 | (15.2 | ) | ||||||||
Freeport-McMoRan, Inc. | 1,054 | 39,957 | (5.4 | ) | ||||||||
Gap, Inc. | 11,006 | 105,658 | (14.4 | ) | ||||||||
Garmin Ltd. | 12,451 | 1,222,315 | (166.2 | ) | ||||||||
Gartner, Inc. | 743 | 224,728 | (30.6 | ) | ||||||||
General Electric Co. | 245 | 24,248 | (3.3 | ) | ||||||||
Gentex Corp. | 668 | 18,430 | (2.5 | ) | ||||||||
Globant SA | 229 | 35,923 | (4.9 | ) | ||||||||
Globus Medical, Inc. | 827 | 48,082 | (6.5 | ) | ||||||||
Graco, Inc. | 634 | 50,270 | (6.8 | ) | ||||||||
Guidewire Software, Inc. | 4,023 | 306,512 | (41.7 | ) | ||||||||
Halozyme Therapeutics, Inc. | 3,036 | 97,547 | (13.3 | ) | ||||||||
Hanover Insurance Group, Inc. | 1,652 | 197,513 | (26.9 | ) | ||||||||
HEICO Corp. | 171 | 28,837 | (3.9 | ) | ||||||||
Helmerich & Payne, Inc. | 6,603 | 218,955 | (29.8 | ) | ||||||||
Herc Holdings, Inc. | 2,130 | 213,043 | (29.0 | ) | ||||||||
Holcim AG | 9,451 | 625,618 | (85.1 | ) | ||||||||
Hologic, Inc. | 6,994 | 601,554 | (81.8 | ) | ||||||||
Hormel Foods Corp. | 2,256 | 91,233 | (12.4 | ) | ||||||||
Howard Hughes Corp. | 3,770 | 291,685 | (39.7 | ) | ||||||||
IDACORP, Inc. | 2,166 | 240,686 | (32.7 | ) | ||||||||
| Security | Shares | Value | % of Basket Value | |||||||||
| United States (continued) | ||||||||||||
IDEXX Laboratories, Inc. | 2,053 | $ | 1,010,404 | (137.4 | )% | |||||||
Inari Medical, Inc. | 569 | 37,793 | (5.1 | ) | ||||||||
Incyte Corp. | 1,359 | 101,123 | (13.7 | ) | ||||||||
Ingersoll Rand, Inc. | 1,597 | 91,061 | (12.4 | ) | ||||||||
Integra LifeSciences Holdings Corp. | 2,162 | 119,602 | (16.3 | ) | ||||||||
Intuitive Surgical, Inc. | 897 | 270,194 | (36.7 | ) | ||||||||
Invesco Ltd. | 37,798 | 647,480 | (88.0 | ) | ||||||||
Ionis Pharmaceuticals, Inc. | 1,861 | 65,824 | (8.9 | ) | ||||||||
IQVIA Holdings, Inc. | 112 | 21,082 | (2.9 | ) | ||||||||
ITT, Inc. | 5,562 | 469,655 | (63.9 | ) | ||||||||
J M Smucker Co. | 1,062 | 163,983 | (22.3 | ) | ||||||||
Jack Henry & Associates, Inc. | 2,289 | 373,885 | (50.8 | ) | ||||||||
Johnson & Johnson | 557 | 91,181 | (12.4 | ) | ||||||||
Johnson Controls International PLC | 10,050 | 601,392 | (81.8 | ) | ||||||||
Keysight Technologies, Inc. | 4,965 | 718,138 | (97.7 | ) | ||||||||
Knight-Swift Transportation Holdings, Inc. | 1,493 | 84,086 | (11.4 | ) | ||||||||
Laboratory Corp. of America Holdings | 1,886 | 427,575 | (58.1 | ) | ||||||||
Landstar System, Inc. | 1,279 | 225,142 | (30.6 | ) | ||||||||
Liberty Broadband Corp. | 2,848 | 241,453 | (32.8 | ) | ||||||||
Light & Wonder, Inc. | 730 | 44,012 | (6.0 | ) | ||||||||
Louisiana-Pacific Corp. | 21,104 | 1,260,753 | (171.4 | ) | ||||||||
Lyft, Inc. | 9,332 | 95,653 | (13.0 | ) | ||||||||
Macy’s, Inc. | 16,503 | 269,659 | (36.7 | ) | ||||||||
Manhattan Associates, Inc. | 6,881 | 1,140,044 | (155.0 | ) | ||||||||
Marathon Oil Corp. | 27,884 | 673,677 | (91.6 | ) | ||||||||
Marriott Vacations Worldwide Corp. | 3,629 | 488,318 | (66.4 | ) | ||||||||
Masco Corp. | 20,078 | 1,074,374 | (146.1 | ) | ||||||||
Match Group, Inc. | 14,350 | 529,515 | (72.0 | ) | ||||||||
McCormick & Co., Inc. | 5,185 | 455,502 | (61.9 | ) | ||||||||
McDonald’s Corp. | 563 | 166,507 | (22.6 | ) | ||||||||
Medical Properties Trust, Inc. | 11,761 | 103,144 | (14.0 | ) | ||||||||
Merit Medical Systems, Inc. | 305 | 24,793 | (3.4 | ) | ||||||||
MetLife, Inc. | 11,523 | 706,706 | (96.1 | ) | ||||||||
Mettler-Toledo International, Inc. | 48 | 71,592 | (9.7 | ) | ||||||||
MGIC Investment Corp. | 26,946 | 400,687 | (54.5 | ) | ||||||||
MGM Resorts International | 7,962 | 357,653 | (48.6 | ) | ||||||||
Micron Technology, Inc. | 2,800 | 180,208 | (24.5 | ) | ||||||||
Mid-America Apartment Communities, Inc. | 340 | 52,292 | (7.1 | ) | ||||||||
Mohawk Industries, Inc. | 1,075 | 113,843 | (15.5 | ) | ||||||||
Molson Coors Beverage Co., Class B | 1,457 | 86,662 | (11.8 | ) | ||||||||
MSCI, Inc. | 33 | 15,921 | (2.2 | ) | ||||||||
Nasdaq, Inc. | 4,915 | 272,144 | (37.0 | ) | ||||||||
Nestle SA, Registered Shares | 1,859 | 238,385 | (32.4 | ) | ||||||||
Neurocrine Biosciences, Inc. | 2,216 | 223,905 | (30.4 | ) | ||||||||
Newmont Corp. | 1,281 | 60,719 | (8.3 | ) | ||||||||
Nexstar Media Group, Inc. | 999 | 173,277 | (23.6 | ) | ||||||||
Norfolk Southern Corp. | 2,271 | 461,081 | (62.7 | ) | ||||||||
Novocure Ltd. | 802 | 52,852 | (7.2 | ) | ||||||||
NVIDIA Corp. | 1,644 | 456,194 | (62.0 | ) | ||||||||
Occidental Petroleum Corp. | 4,895 | 301,189 | (41.0 | ) | ||||||||
OneMain Holdings, Inc. | 5,382 | 206,507 | (28.1 | ) | ||||||||
O’Reilly Automotive, Inc. | 290 | 266,020 | (36.2 | ) | ||||||||
Oshkosh Corp. | 2,109 | 161,381 | (21.9 | ) | ||||||||
Otis Worldwide Corp. | 8,738 | 745,351 | (101.4 | ) | ||||||||
Ovintiv, Inc. | 14,602 | 526,840 | (71.6 | ) | ||||||||
Ovintiv, Inc. | 7,309 | 262,561 | (35.7 | ) | ||||||||
Palo Alto Networks, Inc. | 102 | 18,611 | (2.5 | ) | ||||||||
Paycom Software, Inc. | 225 | 65,333 | (8.9 | ) | ||||||||
PDC Energy, Inc. | 1,888 | 122,814 | (16.7 | ) | ||||||||
Penn Entertainment, Inc. | 9,912 | 295,278 | (40.1 | ) | ||||||||
PepsiCo., Inc. | 15,617 | 2,981,129 | (405.4 | ) | ||||||||
Philip Morris International, Inc. | 16,515 | 1,651,005 | (224.5 | ) | ||||||||
SCHEDULE OF INVESTMENTS | 45 |
Schedule of Investments (continued) April 30, 2023 | BlackRock Global Equity Market Neutral Fund |
| Security | Shares | Value | % of Basket Value | |||||||||
| United States (continued) | ||||||||||||
Pinnacle Financial Partners, Inc. | 3,767 | $ | 204,284 | (27.8 | )% | |||||||
Pool Corp. | 414 | 145,446 | (19.8 | ) | ||||||||
Power Integrations, Inc. | 7,641 | 556,112 | (75.6 | ) | ||||||||
Primo Water Corp. | 11,153 | 168,323 | (22.9 | ) | ||||||||
PTC Therapeutics, Inc. | 1,172 | 64,624 | (8.8 | ) | ||||||||
Qorvo, Inc. | 5,255 | 483,880 | (65.8 | ) | ||||||||
Qualys, Inc. | 2,538 | 286,642 | (39.0 | ) | ||||||||
Quest Diagnostics, Inc. | 3,113 | 432,116 | (58.8 | ) | ||||||||
Rambus, Inc. | 534 | 23,678 | (3.2 | ) | ||||||||
Regeneron Pharmaceuticals, Inc., Registered Shares | 381 | 305,482 | (41.5 | ) | ||||||||
Repligen Corp. | 399 | 60,500 | (8.2 | ) | ||||||||
ResMed, Inc. | 675 | 162,648 | (22.1 | ) | ||||||||
RingCentral, Inc., Class A | 7,497 | 206,617 | (28.1 | ) | ||||||||
ROBLOX Corp. | 1,299 | 46,244 | (6.3 | ) | ||||||||
Roche Holding AG | 2,149 | 728,569 | (99.1 | ) | ||||||||
Rollins, Inc. | 3,275 | 138,369 | (18.8 | ) | ||||||||
Royal Gold, Inc. | 1,141 | 151,114 | (20.5 | ) | ||||||||
S&P Global, Inc. | 1,130 | 409,715 | (55.7 | ) | ||||||||
SBA Communications Corp. | 397 | 103,573 | (14.1 | ) | ||||||||
Schneider Electric SE | 2,301 | 399,565 | (54.3 | ) | ||||||||
Scotts Miracle-Gro Co. | 8,836 | 590,333 | (80.3 | ) | ||||||||
SEI Investments Co. | 4,884 | 287,716 | (39.1 | ) | ||||||||
Sims Ltd. | 21,006 | 220,289 | (30.0 | ) | ||||||||
SiteOne Landscape Supply, Inc. | 588 | 86,871 | (11.8 | ) | ||||||||
Snap-on, Inc. | 638 | 165,504 | (22.5 | ) | ||||||||
Steel Dynamics, Inc. | 978 | 101,663 | (13.8 | ) | ||||||||
Sun Communities, Inc. | 1,063 | 147,683 | (20.1 | ) | ||||||||
Sunrun, Inc. | 5,402 | 113,658 | (15.5 | ) | ||||||||
Synchrony Financial | 12,501 | 368,905 | (50.2 | ) | ||||||||
Synopsys, Inc. | 101 | 37,503 | (5.1 | ) | ||||||||
Synovus Financial Corp. | 512 | 15,770 | (2.1 | ) | ||||||||
T Rowe Price Group, Inc. | 5,540 | 622,308 | (84.6 | ) | ||||||||
TD SYNNEX Corp. | 282 | 25,109 | (3.4 | ) | ||||||||
Tempur Sealy International, Inc. | 3,697 | 138,527 | (18.8 | ) | ||||||||
Teradyne, Inc. | 21,019 | 1,920,716 | (261.2 | ) | ||||||||
Texas Pacific Land Corp. | 293 | 432,951 | (58.9 | ) | ||||||||
Textron, Inc. | 328 | 21,956 | (3.0 | ) | ||||||||
Thor Industries, Inc. | 242 | 19,123 | (2.6 | ) | ||||||||
TJX Cos., Inc. | 6,112 | 481,748 | (65.5 | ) | ||||||||
Transocean Ltd. | 118,261 | 697,740 | (94.9 | ) | ||||||||
Travelers Cos., Inc. | 1,412 | 255,770 | (34.8 | ) | ||||||||
Trex Co., Inc. | 2,561 | 139,984 | (19.0 | ) | ||||||||
Trimble, Inc. | 17,527 | 825,522 | (112.3 | ) | ||||||||
UGI Corp. | 2,964 | 100,420 | (13.7 | ) | ||||||||
Ulta Beauty, Inc. | 1,111 | 612,639 | (83.3 | ) | ||||||||
United States Steel Corp. | 2,458 | 56,239 | (7.6 | ) | ||||||||
United Therapeutics Corp. | 550 | 126,572 | (17.2 | ) | ||||||||
US Bancorp | 4,102 | 140,617 | (19.1 | ) | ||||||||
Veeva Systems, Inc., Class A | 611 | 109,418 | (14.9 | ) | ||||||||
VeriSign, Inc. | 6,647 | 1,474,305 | (200.5 | ) | ||||||||
Virtu Financial, Inc., Class A | 1,004 | 20,130 | (2.7 | ) | ||||||||
Visteon Corp. | 607 | 85,217 | (11.6 | ) | ||||||||
Vulcan Materials Co. | 373 | 65,320 | (8.9 | ) | ||||||||
Walmart, Inc. | 8,366 | 1,263,015 | (171.7 | ) | ||||||||
Waste Connections, Inc. | 2,359 | 328,255 | (44.6 | ) | ||||||||
Waters Corp. | 221 | 66,380 | (9.0 | ) | ||||||||
Wayfair, Inc. | 1,639 | 57,086 | (7.8 | ) | ||||||||
Westlake Corp. | 3,859 | 439,077 | (59.7 | ) | ||||||||
WeWork, Inc. | 51 | 22 | (0.0 | ) | ||||||||
Willis Towers Watson PLC | 2,715 | 628,794 | (85.5 | ) | ||||||||
| Security | Shares | Value | % of Basket Value | |||||||||
| United States (continued) | ||||||||||||
WillScot Mobile Mini Holdings Corp. | 3,033 | $ | 137,698 | (18.7 | )% | |||||||
Workiva, Inc. | 198 | 18,497 | (2.5 | ) | ||||||||
World Wrestling Entertainment, Inc., Class A | 2,556 | 273,927 | (37.2 | ) | ||||||||
WP Carey, Inc. | 2,478 | 183,868 | (25.0 | ) | ||||||||
WW Grainger, Inc. | 241 | 167,632 | (22.8 | ) | ||||||||
Xylem, Inc. | 12,147 | 1,261,344 | (171.5 | ) | ||||||||
YETI Holdings, Inc. | 1,951 | 76,967 | (10.5 | ) | ||||||||
Ziff Davis, Inc. | 814 | 59,536 | (8.1 | ) | ||||||||
Zions Bancorp NA | 7,814 | 217,698 | (29.6 | ) | ||||||||
|
|
|
| |||||||||
| 84,337,627 | ||||||||||||
| Preferred Stocks | ||||||||||||
| Germany | ||||||||||||
Bayerische Motoren Werke AG | 1,145 | 121,180 | (16.5 | ) | ||||||||
Fuchs Petrolub SE, Preference Shares | 9,732 | 382,655 | (52.0 | ) | ||||||||
Sartorius AG | 743 | 287,496 | (39.1 | ) | ||||||||
Volkswagen AG | 883 | 120,051 | (16.3 | ) | ||||||||
|
|
|
| |||||||||
| 911,382 | ||||||||||||
| Warrants | ||||||||||||
| Australia | ||||||||||||
Magellan Financial Group Ltd., (Issued/Exercisable 04/14/22, 1 Share for 1 Warrant, Expires 04/16/27, Strike Price AUD 35.00) | 679 | 92 | (0.0 | ) | ||||||||
|
|
|
| |||||||||
Total Reference Entity — Long | 171,243,966 | |||||||||||
|
| |||||||||||
Reference Entity — Short |
| |||||||||||
| Common Stocks | ||||||||||||
| Australia | ||||||||||||
Champion Iron Ltd. | (97,978 | ) | (425,996 | ) | 57.9 | |||||||
Cleanaway Waste Management Ltd. | (13,016 | ) | (20,976 | ) | 2.9 | |||||||
Flutter Entertainment PLC | (6,375 | ) | (1,268,334 | ) | 172.5 | |||||||
Glencore PLC | (50,273 | ) | (292,733 | ) | 39.8 | |||||||
Goodman Group | (26,242 | ) | (338,531 | ) | 46.0 | |||||||
Newcrest Mining Ltd. | (5,530 | ) | (104,417 | ) | 14.2 | |||||||
|
|
|
| |||||||||
| (2,450,987 | ) | |||||||||||
| Austria | ||||||||||||
Erste Group Bank AG | (1,123 | ) | (40,653 | ) | 5.5 | |||||||
|
|
|
| |||||||||
| Belgium | ||||||||||||
Ackermans & van Haaren NV | (114 | ) | (19,964 | ) | 2.7 | |||||||
Ageas SA/NV | (8,745 | ) | (387,923 | ) | 52.8 | |||||||
D’ieteren Group | (2,372 | ) | (444,646 | ) | 60.5 | |||||||
Galapagos NV | (1,622 | ) | (62,658 | ) | 8.5 | |||||||
KBC Group NV | (246 | ) | (17,508 | ) | 2.4 | |||||||
UCB SA | (4,462 | ) | (412,876 | ) | 56.1 | |||||||
Umicore SA | (4,856 | ) | (158,705 | ) | 21.6 | |||||||
|
|
|
| |||||||||
| (1,504,280 | ) | |||||||||||
| Brazil | ||||||||||||
Yara International ASA | (25,228 | ) | (1,012,709 | ) | 137.7 | |||||||
|
|
|
| |||||||||
| Canada | ||||||||||||
BlackBerry Ltd. | (23,797 | ) | (92,119 | ) | 12.5 | |||||||
Canadian Apartment Properties REIT | (21,966 | ) | (799,664 | ) | 108.7 | |||||||
Canadian Solar, Inc. | (2,939 | ) | (109,977 | ) | 15.0 | |||||||
Canadian Utilities Ltd. | (9,015 | ) | (258,971 | ) | 35.2 | |||||||
CCL Industries, Inc., Class B | (15,778 | ) | (737,083 | ) | 100.2 | |||||||
CI Financial Corp. | (1,851 | ) | (18,108 | ) | 2.5 | |||||||
Dream Industrial Real Estate Investment Trust | (76,643 | ) | (834,068 | ) | 113.4 | |||||||
Fairfax Financial Holdings Ltd. | (627 | ) | (435,445 | ) | 59.2 | |||||||
| 46 | 2 0 2 3 BLACK ROCK ANNUAL REPORT TO SHAREHOLDERS |
Schedule of Investments (continued) April 30, 2023 | BlackRock Global Equity Market Neutral Fund |
| Security | Shares | Value | % of Basket Value | |||||||||
| Canada (continued) | ||||||||||||
George Weston Ltd. | (13,094 | ) | $ | (1,746,983 | ) | 237.6 | % | |||||
iA Financial Corp., Inc. | (10,850 | ) | (723,504 | ) | 98.4 | |||||||
IGM Financial, Inc. | (8,049 | ) | (245,455 | ) | 33.4 | |||||||
Intact Financial Corp. | (13,071 | ) | (1,964,583 | ) | 267.2 | |||||||
Metro, Inc. | (3,579 | ) | (202,691 | ) | 27.6 | |||||||
National Bank of Canada | (6,250 | ) | (463,142 | ) | 63.0 | |||||||
Nuvei Corp. | (18,254 | ) | (736,456 | ) | 100.1 | |||||||
Onex Corp. | (3,510 | ) | (160,556 | ) | 21.8 | |||||||
Open Text Corp. | (1,190 | ) | (44,781 | ) | 6.1 | |||||||
Paramount Resources Ltd., Class A | (6,638 | ) | (156,164 | ) | 21.2 | |||||||
Parkland Corp. | (1,498 | ) | (35,105 | ) | 4.8 | |||||||
Peyto Exploration & Development Corp. | (2,259 | ) | (20,439 | ) | 2.8 | |||||||
Power Corp. of Canada | (14,919 | ) | (397,090 | ) | 54.0 | |||||||
Quebecor, Inc. | (6,092 | ) | (156,254 | ) | 21.3 | |||||||
Rogers Communications, Inc. | (2,130 | ) | (104,592 | ) | 14.2 | |||||||
Saputo, Inc. | (24,269 | ) | (624,336 | ) | 84.9 | |||||||
Shopify, Inc., Class A | (1,501 | ) | (72,261 | ) | 9.8 | |||||||
SNC-Lavalin Group, Inc. | (7,502 | ) | (171,646 | ) | 23.3 | |||||||
Tamarack Valley Energy Ltd. | (318,911 | ) | (874,407 | ) | 118.9 | |||||||
Toromont Industries Ltd. | (8,804 | ) | (706,893 | ) | 96.1 | |||||||
WSP Global, Inc. | (4,631 | ) | (607,303 | ) | 82.6 | |||||||
|
|
|
| |||||||||
| (13,500,076 | ) | |||||||||||
| Denmark | ||||||||||||
AP Moller - Maersk A/S, Class A | (12 | ) | (21,349 | ) | 2.9 | |||||||
Bavarian Nordic A/S | (18,445 | ) | (504,997 | ) | 68.7 | |||||||
Carlsberg A/S | (143 | ) | (23,562 | ) | 3.2 | |||||||
ISS A/S | (11,570 | ) | (240,835 | ) | 32.7 | |||||||
Pandora A/S | (544 | ) | (50,125 | ) | 6.8 | |||||||
Royal Unibrew A/S | (538 | ) | (47,864 | ) | 6.5 | |||||||
|
|
|
| |||||||||
| (888,732 | ) | |||||||||||
| Finland | ||||||||||||
Huhtamaki OYJ | (4,113 | ) | (147,590 | ) | 20.1 | |||||||
Kesko OYJ, B Shares | (16,341 | ) | (339,034 | ) | 46.1 | |||||||
Kojamo OYJ | (12,463 | ) | (154,077 | ) | 20.9 | |||||||
Nordea Bank Abp | (5,924 | ) | (65,393 | ) | 8.9 | |||||||
Stora Enso OYJ, R Shares | (2,547 | ) | (32,175 | ) | 4.4 | |||||||
Valmet OYJ | (3,061 | ) | (103,156 | ) | 14.0 | |||||||
|
|
|
| |||||||||
| (841,425 | ) | |||||||||||
| France | ||||||||||||
Adevinta ASA | (34,166 | ) | (262,420 | ) | 35.7 | |||||||
BioMerieux | (7,378 | ) | (769,024 | ) | 104.6 | |||||||
BNP Paribas SA | (3,667 | ) | (235,886 | ) | 32.1 | |||||||
Capgemini SE | (7 | ) | (1,271 | ) | 0.2 | |||||||
Credit Agricole SA | (56,611 | ) | (688,973 | ) | 93.7 | |||||||
Eiffage SA | (1,593 | ) | (188,792 | ) | 25.7 | |||||||
Elis SA | (34,295 | ) | (678,279 | ) | 92.2 | |||||||
Eramet SA | (4,734 | ) | (459,018 | ) | 62.4 | |||||||
Eurazeo SE | (9,899 | ) | (703,634 | ) | 95.7 | |||||||
Ipsen SA | (715 | ) | (86,333 | ) | 11.7 | |||||||
Rexel SA | (77 | ) | (1,776 | ) | 0.2 | |||||||
Safran SA | (2,754 | ) | (426,399 | ) | 58.0 | |||||||
Technip Energies NV | (3,510 | ) | (77,526 | ) | 10.5 | |||||||
Thales SA | (2,263 | ) | (343,792 | ) | 46.8 | |||||||
TotalEnergies SE | (344 | ) | (21,992 | ) | 3.0 | |||||||
Valeo | (8,616 | ) | (167,475 | ) | 22.8 | |||||||
Worldline SA/France | (22,298 | ) | (965,858 | ) | 131.3 | |||||||
|
|
|
| |||||||||
| (6,078,448 | ) | |||||||||||
| Security | Shares | Value | % of Basket Value | |||||||||
| Germany | ||||||||||||
adidas AG | (657 | ) | $ | (115,187 | ) | 15.7 | % | |||||
Aixtron SE | (5,724 | ) | (161,274 | ) | 21.9 | |||||||
Aroundtown SA | (136,272 | ) | (184,866 | ) | 25.1 | |||||||
Aurubis AG | (627 | ) | (58,565 | ) | 8.0 | |||||||
Bechtle AG | (13,523 | ) | (626,213 | ) | 85.1 | |||||||
Continental AG | (963 | ) | (67,266 | ) | 9.1 | |||||||
Deutsche Boerse AG | (154 | ) | (29,232 | ) | 4.0 | |||||||
Deutsche Post AG, Registered Shares | (6,833 | ) | (327,217 | ) | 44.5 | |||||||
Deutsche Wohnen SE | (8,439 | ) | (190,257 | ) | 25.9 | |||||||
Evotec SE | (11,514 | ) | (210,478 | ) | 28.6 | |||||||
Gerresheimer AG | (4,060 | ) | (440,624 | ) | 59.9 | |||||||
Hannover Rueck SE | (1,523 | ) | (323,996 | ) | 44.1 | |||||||
Infineon Technologies AG | (1,199 | ) | (43,465 | ) | 5.9 | |||||||
KION Group AG | (1,525 | ) | (62,978 | ) | 8.6 | |||||||
SAP SE | (937 | ) | (126,246 | ) | 17.2 | |||||||
Sixt SE | (8,097 | ) | (1,000,278 | ) | 136.0 | |||||||
Telefonica Deutschland Holding AG | (71,688 | ) | (241,181 | ) | 32.8 | |||||||
Traton SE | (15,119 | ) | (348,219 | ) | 47.3 | |||||||
|
|
|
| |||||||||
| (4,557,542 | ) | |||||||||||
| Hong Kong | ||||||||||||
Guotai Junan International Holdings Ltd. | (17,000 | ) | (1,436 | ) | 0.2 | |||||||
Jardine Matheson Holdings Ltd. | (3,000 | ) | (145,025 | ) | 19.7 | |||||||
Prudential PLC | (9,508 | ) | (143,698 | ) | 19.6 | |||||||
|
|
|
| |||||||||
| (290,159 | ) | |||||||||||
| Ireland | ||||||||||||
Bank of Ireland Group PLC | (18,168 | ) | (187,059 | ) | 25.4 | |||||||
|
|
|
| |||||||||
| Israel | ||||||||||||
Ashtrom Group Ltd. | (4,262 | ) | (66,881 | ) | 9.1 | |||||||
Bezeq The Israeli Telecommunication Corp. Ltd. | (10,779 | ) | (14,609 | ) | 2.0 | |||||||
First International Bank Of Israel Ltd. | (609 | ) | (22,029 | ) | 3.0 | |||||||
Global-e Online Ltd. | (999 | ) | (27,852 | ) | 3.8 | |||||||
ICL Group Ltd. | (118,622 | ) | (733,531 | ) | 99.7 | |||||||
Teva Pharmaceutical Industries Ltd., ADR | (10,717 | ) | (93,560 | ) | 12.7 | |||||||
|
|
|
| |||||||||
| (958,462 | ) | |||||||||||
| Italy | ||||||||||||
Amplifon SpA | (601 | ) | (21,965 | ) | 3.0 | |||||||
Assicurazioni Generali SpA | (7,206 | ) | (149,419 | ) | 20.3 | |||||||
Banca Mediolanum SpA | (23,581 | ) | (212,245 | ) | 28.9 | |||||||
Coca-Cola HBC AG | (788 | ) | (23,742 | ) | 3.2 | |||||||
DiaSorin SpA | (1,636 | ) | (176,902 | ) | 24.0 | |||||||
Eni SpA | (62,601 | ) | (941,544 | ) | 128.0 | |||||||
Interpump Group SpA | (5,385 | ) | (299,233 | ) | 40.7 | |||||||
Iveco Group NV | (4,578 | ) | (41,006 | ) | 5.6 | |||||||
Leonardo SpA | (45,977 | ) | (545,429 | ) | 74.2 | |||||||
Nexi SpA | (12,878 | ) | (106,304 | ) | 14.5 | |||||||
Pirelli & C SpA | (21,716 | ) | (113,261 | ) | 15.4 | |||||||
Poste Italiane SpA | (21,235 | ) | (220,000 | ) | 29.9 | |||||||
|
|
|
| |||||||||
| (2,851,050 | ) | |||||||||||
| Japan | ||||||||||||
Activia Properties, Inc. | (74 | ) | (219,908 | ) | 29.9 | |||||||
Advance Residence Investment Corp. | (221 | ) | (584,639 | ) | 79.5 | |||||||
Air Water, Inc. | (7,200 | ) | (92,778 | ) | 12.6 | |||||||
Allegro MicroSystems, Inc. | (10,742 | ) | (384,241 | ) | 52.2 | |||||||
Ariake Japan Co. Ltd. | (4,700 | ) | (194,347 | ) | 26.4 | |||||||
Asahi Group Holdings Ltd. | (18,200 | ) | (716,874 | ) | 97.5 | |||||||
ASKUL Corp. | (15,900 | ) | (216,186 | ) | 29.4 | |||||||
Bandai Namco Holdings, Inc. | (8,500 | ) | (196,874 | ) | 26.8 | |||||||
Bank of Kyoto Ltd. | (1,600 | ) | (80,260 | ) | 10.9 | |||||||
SCHEDULE OF INVESTMENTS | 47 |
Schedule of Investments (continued) April 30, 2023 | BlackRock Global Equity Market Neutral Fund |
| Security | Shares | Value | % of Basket Value | |||||||||
| Japan (continued) | ||||||||||||
BayCurrent Consulting, Inc. | (900 | ) | $ | (31,925 | ) | 4.3 | % | |||||
Benefit One, Inc. | (12,200 | ) | (171,226 | ) | 23.3 | |||||||
BIPROGY, Inc. | (7,000 | ) | (172,143 | ) | 23.4 | |||||||
Bridgestone Corp. | (3,100 | ) | (126,952 | ) | 17.3 | |||||||
Calbee, Inc. | (6,200 | ) | (136,706 | ) | 18.6 | |||||||
Capcom Co. Ltd. | (4,600 | ) | (176,209 | ) | 24.0 | |||||||
Chiba Bank Ltd. | (64,200 | ) | (427,592 | ) | 58.1 | |||||||
Chubu Electric Power Co., Inc. | (18,100 | ) | (205,817 | ) | 28.0 | |||||||
Chugai Pharmaceutical Co. Ltd. | (22,900 | ) | (602,493 | ) | 81.9 | |||||||
Chugin Financial Group, Inc. | (5,400 | ) | (36,963 | ) | 5.0 | |||||||
Cosmo Energy Holdings Co. Ltd. | (700 | ) | (22,830 | ) | 3.1 | |||||||
Credit Saison Co. Ltd. | (12,500 | ) | (176,651 | ) | 24.0 | |||||||
Dai Nippon Printing Co. Ltd. | (19,400 | ) | (568,686 | ) | 77.3 | |||||||
Daido Steel Co. Ltd. | (12,800 | ) | (502,959 | ) | 68.4 | |||||||
Daiwa Office Investment Corp. | (89 | ) | (394,698 | ) | 53.7 | |||||||
Daiwa Securities Group, Inc. | (10,900 | ) | (51,641 | ) | 7.0 | |||||||
Daiwa Securities Living Investments Corp. | (226 | ) | (195,984 | ) | 26.6 | |||||||
Descente Ltd. | (4,300 | ) | (139,407 | ) | 19.0 | |||||||
East Japan Railway Co. | (3,400 | ) | (198,466 | ) | 27.0 | |||||||
ENEOS Holdings, Inc. | (5,200 | ) | (18,865 | ) | 2.6 | |||||||
Food & Life Cos. Ltd. | (2,300 | ) | (56,531 | ) | 7.7 | |||||||
FP Corp. | (8,800 | ) | (223,243 | ) | 30.4 | |||||||
Fuji Kyuko Co. Ltd. | (3,400 | ) | (133,163 | ) | 18.1 | |||||||
Fukuoka Financial Group, Inc. | (19,200 | ) | (368,890 | ) | 50.2 | |||||||
Fuyo General Lease Co. Ltd. | (4,900 | ) | (365,610 | ) | 49.7 | |||||||
GLP J-Reit | (145 | ) | (168,899 | ) | 23.0 | |||||||
Goldwin, Inc. | (2,200 | ) | (203,857 | ) | 27.7 | |||||||
GS Yuasa Corp. | (47,400 | ) | (850,195 | ) | 115.6 | |||||||
GungHo Online Entertainment, Inc. | (51,600 | ) | (1,010,313 | ) | 137.4 | |||||||
Hakuhodo DY Holdings, Inc. | (43,200 | ) | (518,996 | ) | 70.6 | |||||||
Hankyu Hanshin Holdings, Inc. | (6,400 | ) | (203,815 | ) | 27.7 | |||||||
Harmonic Drive Systems, Inc. | (11,600 | ) | (361,675 | ) | 49.2 | |||||||
Haseko Corp. | (69,600 | ) | (866,225 | ) | 117.8 | |||||||
Heiwa Corp. | (26,200 | ) | (527,649 | ) | 71.8 | |||||||
Hikari Tsushin, Inc. | (4,600 | ) | (640,050 | ) | 87.0 | |||||||
Hino Motors Ltd. | (4,500 | ) | (18,100 | ) | 2.5 | |||||||
Hirogin Holdings, Inc. | (37,400 | ) | (189,182 | ) | 25.7 | |||||||
Hisamitsu Pharmaceutical Co., Inc. | (7,600 | ) | (214,363 | ) | 29.1 | |||||||
Hitachi Construction Machinery Co. Ltd. | (4,500 | ) | (112,979 | ) | 15.4 | |||||||
Horiba Ltd. | (800 | ) | (44,965 | ) | 6.1 | |||||||
Hoshizaki Corp. | (9,100 | ) | (326,914 | ) | 44.5 | |||||||
Industrial & Infrastructure Fund Investment Corp. | (406 | ) | (474,483 | ) | 64.5 | |||||||
Itoham Yonekyu Holdings, Inc. | (49,200 | ) | (274,984 | ) | 37.4 | |||||||
Iyogin Holdings, Inc. | (32,500 | ) | (194,063 | ) | 26.4 | |||||||
Japan Aviation Electronics Industry Ltd. | (25,100 | ) | (449,387 | ) | 61.1 | |||||||
Japan Exchange Group, Inc. | (28,800 | ) | (476,796 | ) | 64.8 | |||||||
Japan Hotel REIT Investment Corp. | (559 | ) | (321,945 | ) | 43.8 | |||||||
Japan Logistics Fund, Inc. | (74 | ) | (179,153 | ) | 24.4 | |||||||
Japan Metropolitan Fund Invest | (909 | ) | (678,668 | ) | 92.3 | |||||||
Japan Prime Realty Investment Corp. | (47 | ) | (124,635 | ) | 16.9 | |||||||
Japan Real Estate Investment Corp. | (342 | ) | (1,382,038 | ) | 187.9 | |||||||
JCR Pharmaceuticals Co. Ltd. | (8,600 | ) | (94,898 | ) | 12.9 | |||||||
Jeol Ltd. | (1,900 | ) | (56,574 | ) | 7.7 | |||||||
JMDC, Inc. | (19,300 | ) | (705,870 | ) | 96.0 | |||||||
Justsystems Corp. | (5,700 | ) | (153,663 | ) | 20.9 | |||||||
Kagome Co. Ltd. | (17,400 | ) | (430,928 | ) | 58.6 | |||||||
Kansai Electric Power Co., Inc. | (22,200 | ) | (244,080 | ) | 33.2 | |||||||
Kansai Paint Co. Ltd. | (23,200 | ) | (333,504 | ) | 45.4 | |||||||
Kawasaki Heavy Industries Ltd. | (12,200 | ) | (270,706 | ) | 36.8 | |||||||
Keihan Holdings Co. Ltd. | (6,800 | ) | (190,958 | ) | 26.0 | |||||||
Keio Corp. | (5,800 | ) | (219,749 | ) | 29.9 | |||||||
Keisei Electric Railway Co. Ltd. | (2,600 | ) | (93,568 | ) | 12.7 | |||||||
| Security | Shares | Value | % of Basket Value | |||||||||
| Japan (continued) | ||||||||||||
Kintetsu Group Holdings Co. Ltd. | (8,200 | ) | $ | (281,755 | ) | 38.3 | % | |||||
Kobayashi Pharmaceutical Co. Ltd. | (1,800 | ) | (114,583 | ) | 15.6 | |||||||
Kobe Steel Ltd. | (29,300 | ) | (222,797 | ) | 30.3 | |||||||
Kotobuki Spirits Co. Ltd. | (7,600 | ) | (572,599 | ) | 77.9 | |||||||
Kurita Water Industries Ltd. | (2,600 | ) | (111,290 | ) | 15.1 | |||||||
Kyudenko Corp. | (14,600 | ) | (396,741 | ) | 53.9 | |||||||
Kyushu Electric Power Co., Inc. | (54,800 | ) | (325,649 | ) | 44.3 | |||||||
Kyushu Financial Group, Inc. | (84,400 | ) | (310,340 | ) | 42.2 | |||||||
Kyushu Railway Co. | (27,900 | ) | (646,326 | ) | 87.9 | |||||||
LaSalle Logiport REIT | (244 | ) | (295,575 | ) | 40.2 | |||||||
Matsui Securities Co. Ltd. | (41,200 | ) | (240,542 | ) | 32.7 | |||||||
MatsukiyoCocokara & Co. | (15,000 | ) | (819,496 | ) | 111.4 | |||||||
Mazda Motor Corp. | (11,900 | ) | (109,778 | ) | 14.9 | |||||||
McDonald’s Holdings Co. Japan Ltd. | (7,100 | ) | (301,698 | ) | 41.0 | |||||||
Mebuki Financial Group, Inc. | (49,700 | ) | (129,829 | ) | 17.7 | |||||||
Menicon Co. Ltd. | (6,600 | ) | (142,938 | ) | 19.4 | |||||||
Mitsui Fudosan Logistics Park, Inc. | (95 | ) | (364,075 | ) | 49.5 | |||||||
Mitsui High-Tec, Inc. | (21,800 | ) | (1,340,584 | ) | 182.3 | |||||||
Miura Co. Ltd. | (20,100 | ) | (545,878 | ) | 74.2 | |||||||
Money Forward, Inc. | (11,300 | ) | (480,172 | ) | 65.3 | |||||||
MonotaRO Co. Ltd. | (8,800 | ) | (135,685 | ) | 18.5 | |||||||
Mori Hills REIT Investment Corp. | (611 | ) | (704,458 | ) | 95.8 | |||||||
Morinaga & Co. Ltd. | (18,700 | ) | (564,811 | ) | 76.8 | |||||||
Morinaga Milk Industry Co. Ltd. | (5,300 | ) | (203,144 | ) | 27.6 | |||||||
Nankai Electric Railway Co. Ltd. | (1,000 | ) | (23,788 | ) | 3.2 | |||||||
Nextage Co. Ltd. | (9,900 | ) | (183,100 | ) | 24.9 | |||||||
NHK Spring Co. Ltd. | (108,200 | ) | (817,702 | ) | 111.2 | |||||||
Nifco, Inc. | (8,400 | ) | (246,312 | ) | 33.5 | |||||||
Nihon Kohden Corp. | (25,800 | ) | (728,054 | ) | 99.0 | |||||||
Nippon Accommodations Fund, Inc. | (50 | ) | (247,814 | ) | 33.7 | |||||||
Nippon Building Fund, Inc. | (180 | ) | (769,497 | ) | 104.6 | |||||||
Nippon Electric Glass Co. Ltd. | (51,400 | ) | (1,000,946 | ) | 136.1 | |||||||
Nippon Sanso Holdings Corp. | (400 | ) | (7,360 | ) | 1.0 | |||||||
Nippon Shokubai Co. Ltd. | (4,200 | ) | (171,782 | ) | 23.4 | |||||||
Nishi-Nippon Railroad Co. Ltd. | (21,400 | ) | (400,343 | ) | 54.4 | |||||||
Nisshin Seifun Group, Inc. | (50,400 | ) | (623,045 | ) | 84.7 | |||||||
Nissin Foods Holdings Co. Ltd. | (3,300 | ) | (324,428 | ) | 44.1 | |||||||
Noevir Holdings Co. Ltd. | (5,900 | ) | (245,528 | ) | 33.4 | |||||||
NOF Corp. | (4,600 | ) | (214,413 | ) | 29.2 | |||||||
NOK Corp. | (34,900 | ) | (479,445 | ) | 65.2 | |||||||
NTT Data Corp. | (6,700 | ) | (92,846 | ) | 12.6 | |||||||
Odakyu Electric Railway Co. Ltd. | (4,600 | ) | (65,542 | ) | 8.9 | |||||||
OKUMA Corp. | (6,400 | ) | (289,863 | ) | 39.4 | |||||||
Open House Group Co. Ltd. | (12,100 | ) | (492,899 | ) | 67.0 | |||||||
Oriental Land Co. Ltd/Japan | (5,500 | ) | (198,552 | ) | 27.0 | |||||||
Orix JREIT, Inc. | (70 | ) | (92,276 | ) | 12.5 | |||||||
Osaka Gas Co. Ltd. | (33,100 | ) | (558,300 | ) | 75.9 | |||||||
OSG Corp. | (7,300 | ) | (104,623 | ) | 14.2 | |||||||
PALTAC Corp. | (2,100 | ) | (82,200 | ) | 11.2 | |||||||
Pan Pacific International Holdings Corp. | (27,900 | ) | (531,836 | ) | 72.3 | |||||||
Park24 Co. Ltd. | (52,400 | ) | (826,288 | ) | 112.4 | |||||||
PeptiDream, Inc. | (4,700 | ) | (64,812 | ) | 8.8 | |||||||
Rakus Co. Ltd. | (7,200 | ) | (111,636 | ) | 15.2 | |||||||
Relo Group, Inc. | (11,500 | ) | (182,214 | ) | 24.8 | |||||||
Renesas Electronics Corp. | (67,500 | ) | (897,946 | ) | 122.1 | |||||||
Rengo Co. Ltd. | (87,200 | ) | (579,918 | ) | 78.9 | |||||||
Resonac Holdings Corp. | (72,400 | ) | (1,169,624 | ) | 159.0 | |||||||
Rinnai Corp. | (3,000 | ) | (73,957 | ) | 10.1 | |||||||
Rohto Pharmaceutical Co. Ltd. | (3,200 | ) | (67,726 | ) | 9.2 | |||||||
Sanwa Holdings Corp. | (7,600 | ) | (84,858 | ) | 11.5 | |||||||
SBI Shinsei Bank Ltd. | (21,800 | ) | (399,074 | ) | 54.3 | |||||||
Seino Holdings Co. Ltd. | (7,000 | ) | (79,257 | ) | 10.8 | |||||||
| 48 | 2 0 2 3 BLACK ROCK ANNUAL REPORT TO SHAREHOLDERS |
Schedule of Investments (continued) April 30, 2023 | BlackRock Global Equity Market Neutral Fund |
| Security | Shares | Value | % of Basket Value | |||||||||
| Japan (continued) | ||||||||||||
Sekisui House Reit, Inc. | (540 | ) | $ | (312,279 | ) | 42.5 | % | |||||
SG Holdings Co. Ltd. | (17,800 | ) | (260,745 | ) | 35.5 | |||||||
Shikoku Electric Power Co., Inc. | (4,200 | ) | (25,313 | ) | 3.4 | |||||||
Shizuoka Financial Group, Inc. | (44,200 | ) | (339,743 | ) | 46.2 | |||||||
Shochiku Co. Ltd. | (1,100 | ) | (100,733 | ) | 13.7 | |||||||
Socionext, Inc. | (1,200 | ) | (101,447 | ) | 13.8 | |||||||
SoftBank Corp. | (25,100 | ) | (288,246 | ) | 39.2 | |||||||
Sony Group Corp. | (23,700 | ) | (2,187,432 | ) | 297.4 | |||||||
Sotetsu Holdings, Inc. | (22,500 | ) | (436,445 | ) | 59.3 | |||||||
Square Enix Holdings Co. Ltd. | (5,100 | ) | (255,825 | ) | 34.8 | |||||||
Stanley Electric Co. Ltd. | (14,500 | ) | (333,499 | ) | 45.3 | |||||||
Suzuken Co. Ltd. | (3,800 | ) | (110,288 | ) | 15.0 | |||||||
Sysmex Corp. | (1,300 | ) | (85,348 | ) | 11.6 | |||||||
Taiyo Yuden Co. Ltd. | (13,500 | ) | (421,605 | ) | 57.3 | |||||||
Takara Holdings, Inc. | (22,400 | ) | (180,004 | ) | 24.5 | |||||||
Takashimaya Co. Ltd. | (5,800 | ) | (87,470 | ) | 11.9 | |||||||
TechnoPro Holdings, Inc. | (12,200 | ) | (339,469 | ) | 46.2 | |||||||
Tobu Railway Co. Ltd. | (700 | ) | (18,225 | ) | 2.5 | |||||||
Toho Gas Co. Ltd. | (11,100 | ) | (211,833 | ) | 28.8 | |||||||
Tohoku Electric Power Co, Inc. | (6,300 | ) | (33,054 | ) | 4.5 | |||||||
Tokyu Corp. | (42,400 | ) | (609,794 | ) | 82.9 | |||||||
Tokyu Fudosan Holdings Corp. | (23,400 | ) | (121,028 | ) | 16.5 | |||||||
TOPPAN, Inc. | (18,600 | ) | (403,080 | ) | 54.8 | |||||||
Toshiba TEC Corp. | (1,900 | ) | (56,278 | ) | 7.7 | |||||||
Toyo Seikan Group Holdings Ltd. | (2,000 | ) | (28,815 | ) | 3.9 | |||||||
Toyo Tire Corp. | (43,500 | ) | (528,484 | ) | 71.9 | |||||||
United Urban Investment Corp. | (212 | ) | (240,037 | ) | 32.6 | |||||||
USS Co. Ltd. | (1,800 | ) | (30,844 | ) | 4.2 | |||||||
Visional, Inc. | (300 | ) | (16,053 | ) | 2.2 | |||||||
West Japan Railway Co. | (4,100 | ) | (181,319 | ) | 24.7 | |||||||
Yamato Holdings Co. Ltd. | (5,000 | ) | (87,610 | ) | 11.9 | |||||||
Yokohama Rubber Co. Ltd. | (11,900 | ) | (263,861 | ) | 35.9 | |||||||
Z Holdings Corp. | (97,400 | ) | (271,753 | ) | 37.0 | |||||||
Zensho Holdings Co. Ltd. | (1,100 | ) | (35,655 | ) | 4.8 | |||||||
|
|
|
| |||||||||
| (53,694,745 | ) | |||||||||||
| Luxembourg | ||||||||||||
Aperam SA | (2,612 | ) | (96,444 | ) | 13.1 | |||||||
Eurofins Scientific SE | (5,698 | ) | (396,319 | ) | 53.9 | |||||||
|
|
|
| |||||||||
| (492,763 | ) | |||||||||||
| Netherlands | ||||||||||||
Akzo Nobel NV | (245 | ) | (20,234 | ) | 2.7 | |||||||
Argenx SE | (700 | ) | (268,826 | ) | 36.6 | |||||||
Euronext NV | (2,265 | ) | (179,344 | ) | 24.4 | |||||||
Heineken NV | (391 | ) | (44,701 | ) | 6.1 | |||||||
JDE Peet’s NV | (13,126 | ) | (397,427 | ) | 54.0 | |||||||
Koninklijke Ahold Delhaize NV | (3,155 | ) | (108,000 | ) | 14.7 | |||||||
OCI NV | (1,125 | ) | (29,503 | ) | 4.0 | |||||||
SBM Offshore NV | (19,848 | ) | (279,298 | ) | 38.0 | |||||||
|
|
|
| |||||||||
| (1,327,333 | ) | |||||||||||
| Nigeria | ||||||||||||
Airtel Africa PLC | (222,546 | ) | (331,913 | ) | 45.1 | |||||||
|
|
|
| |||||||||
| Norway | ||||||||||||
Aker ASA, A Shares | (1,147 | ) | (69,896 | ) | 9.5 | |||||||
DNB Bank ASA | (23,919 | ) | (419,404 | ) | 57.0 | |||||||
Leroy Seafood Group ASA | (13,408 | ) | (70,398 | ) | 9.6 | |||||||
Mowi ASA | (7,050 | ) | (134,119 | ) | 18.2 | |||||||
Orkla ASA | (127,270 | ) | (912,123 | ) | 124.0 | |||||||
| Security | Shares | Value | % of Basket Value | |||||||||
| Norway (continued) | ||||||||||||
Salmar ASA | (15,336 | ) | $ | (679,358 | ) | 92.4 | % | |||||
Schibsted ASA | (11,135 | ) | (197,136 | ) | 26.8 | |||||||
Telenor ASA | (2,047 | ) | (25,469 | ) | 3.5 | |||||||
|
|
|
| |||||||||
| (2,507,903 | ) | |||||||||||
| Portugal | ||||||||||||
Jeronimo Martins SGPS SA | (4,002 | ) | (100,567 | ) | 13.7 | |||||||
|
|
|
| |||||||||
| Singapore | ||||||||||||
CapitaLand Ascendas REIT | (226,600 | ) | (486,102 | ) | 66.1 | |||||||
Grab Holdings Ltd. | (61,267 | ) | (178,287 | ) | 24.2 | |||||||
Kenon Holdings Ltd. | (5,846 | ) | (154,808 | ) | 21.0 | |||||||
Oversea-Chinese Banking Corp. Ltd. | (114,600 | ) | (1,080,763 | ) | 147.0 | |||||||
Sea Ltd., ADR | (642 | ) | (48,901 | ) | 6.6 | |||||||
Singapore Exchange Ltd. | (13,200 | ) | (94,698 | ) | 12.9 | |||||||
Singapore Technologies Engineering Ltd. | (21,300 | ) | (57,800 | ) | 7.9 | |||||||
Singapore Telecommunications Ltd. | (188,500 | ) | (360,106 | ) | 49.0 | |||||||
STMicroelectronics NV | (9,271 | ) | (394,680 | ) | 53.7 | |||||||
UOL Group Ltd. | (78,100 | ) | (406,130 | ) | 55.2 | |||||||
|
|
|
| |||||||||
| (3,262,275 | ) | |||||||||||
| South Korea | ||||||||||||
Delivery Hero SE | (2,375 | ) | (94,547 | ) | 12.9 | |||||||
|
|
|
| |||||||||
| Spain | ||||||||||||
Amadeus IT Group SA | (2,730 | ) | (191,237 | ) | 26.0 | |||||||
Cellnex Telecom SA | (5,303 | ) | (222,303 | ) | 30.2 | |||||||
Corp ACCIONA Energias Renovables SA | (14,948 | ) | (534,372 | ) | 72.7 | |||||||
Endesa SA | (26,505 | ) | (592,047 | ) | 80.5 | |||||||
Inmobiliaria Colonial Socimi SA | (17,944 | ) | (114,216 | ) | 15.5 | |||||||
|
|
|
| |||||||||
| (1,654,175 | ) | |||||||||||
| Sweden | ||||||||||||
Autoliv, Inc | (1,934 | ) | (165,957 | ) | 22.6 | |||||||
Electrolux AB | (16,496 | ) | (247,518 | ) | 33.7 | |||||||
Embracer Group AB | (35,818 | ) | (185,990 | ) | 25.3 | |||||||
Evolution AB | (56 | ) | (7,435 | ) | 1.0 | |||||||
H & M Hennes & Mauritz AB, B Shares | (3,051 | ) | (44,448 | ) | 6.0 | |||||||
Hexagon AB, B Shares | (8,326 | ) | (94,750 | ) | 12.9 | |||||||
Hexatronic Group AB | (13,583 | ) | (114,122 | ) | 15.5 | |||||||
Husqvarna AB, B Shares | (56,652 | ) | (485,978 | ) | 66.1 | |||||||
Investment AB Latour, B Shares | (6,287 | ) | (135,338 | ) | 18.4 | |||||||
Kinnevik AB | (11,258 | ) | (183,844 | ) | 25.0 | |||||||
Lifco AB, B Shares | (6,385 | ) | (144,725 | ) | 19.7 | |||||||
Skandinaviska Enskilda Banken AB | (17,872 | ) | (201,987 | ) | 27.5 | |||||||
SSAB AB, A Shares | (2,703 | ) | (19,087 | ) | 2.6 | |||||||
Svenska Cellulosa AB SCA, Class B | (5,826 | ) | (79,477 | ) | 10.8 | |||||||
Swedish Orphan Biovitrum AB | (18,818 | ) | (454,987 | ) | 61.9 | |||||||
Telia Co. AB | (17,150 | ) | (47,475 | ) | 6.4 | |||||||
Volvo AB, B Shares | (25,898 | ) | (529,169 | ) | 71.9 | |||||||
|
|
|
| |||||||||
| (3,142,287 | ) | |||||||||||
| Switzerland | ||||||||||||
Adecco Group AG, Registered Shares | (18,879 | ) | (650,569 | ) | 88.5 | |||||||
Bachem Holding AG | (6,543 | ) | (716,064 | ) | 97.4 | |||||||
Baloise Holding AG, Registered Shares | (3,360 | ) | (563,479 | ) | 76.6 | |||||||
EMS-Chemie Holding AG, Registered Shares | (1,223 | ) | (1,006,478 | ) | 136.9 | |||||||
Julius Baer Group Ltd. | (2,531 | ) | (181,698 | ) | 24.7 | |||||||
Lonza Group AG, Registered Shares | (1,031 | ) | (644,207 | ) | 87.6 | |||||||
Mediclinic International PLC | (53,121 | ) | (328,645 | ) | 44.7 | |||||||
Meyer Burger Technology AG | (819,106 | ) | (528,591 | ) | 71.9 | |||||||
On Holding AG | (626 | ) | (20,314 | ) | 2.8 | |||||||
SCHEDULE OF INVESTMENTS | 49 |
Schedule of Investments (continued) April 30, 2023 | BlackRock Global Equity Market Neutral Fund |
| Security | Shares | Value | % of Basket Value | |||||||||
| Switzerland (continued) | ||||||||||||
Schindler Holding AG, Registered Shares | (2,878 | ) | $ | (615,956 | ) | 83.7 | % | |||||
SIG Group AG | (9,635 | ) | (258,377 | ) | 35.1 | |||||||
Sonova Holding AG, Registered Shares | (1,426 | ) | (453,079 | ) | 61.6 | |||||||
Swiss Life Holding AG, Registered Shares | (880 | ) | (581,932 | ) | 79.1 | |||||||
UBS Group AG, Registered Shares | (14,827 | ) | (302,261 | ) | 41.1 | |||||||
|
|
|
| |||||||||
| (6,851,650 | ) | |||||||||||
| United Kingdom | ||||||||||||
3i Group PLC | (43,546 | ) | (956,555 | ) | 130.1 | |||||||
abrdn PLC | (42,689 | ) | (112,951 | ) | 15.4 | |||||||
Associated British Foods PLC | (2,233 | ) | (54,260 | ) | 7.4 | |||||||
Aviva PLC | (1,541 | ) | (8,098 | ) | 1.1 | |||||||
Barratt Developments PLC | (23,295 | ) | (144,730 | ) | 19.7 | |||||||
Berkeley Group Holdings PLC | (5,349 | ) | (295,532 | ) | 40.2 | |||||||
CNH Industrial NV | (37,031 | ) | (518,787 | ) | 70.5 | |||||||
Compass Group PLC | (4,594 | ) | (119,632 | ) | 16.3 | |||||||
Dechra Pharmaceuticals PLC | (11,605 | ) | (537,606 | ) | 73.1 | |||||||
Derwent London PLC | (694 | ) | (20,680 | ) | 2.8 | |||||||
Farfetch Ltd. | (46,104 | ) | (185,799 | ) | 25.3 | |||||||
Future PLC | (34,017 | ) | (476,447 | ) | 64.8 | |||||||
Harbour Energy PLC | (33,587 | ) | (103,127 | ) | 14.0 | |||||||
HSBC Holdings PLC | (96,798 | ) | (688,555 | ) | 93.6 | |||||||
Informa PLC | (168,727 | ) | (1,514,533 | ) | 205.9 | |||||||
International Consolidated Airlines Group SA | (120,157 | ) | (227,567 | ) | 30.9 | |||||||
International Distributions Services PLC | (104,666 | ) | (328,852 | ) | 44.7 | |||||||
JD Sports Fashion PLC | (301,776 | ) | (604,177 | ) | 82.2 | |||||||
JET2 PLC | (2,969 | ) | (45,243 | ) | 6.1 | |||||||
Just Eat Takeaway.com NV | (19,943 | ) | (348,238 | ) | 47.3 | |||||||
Lloyds Banking Group PLC | (621,832 | ) | (372,788 | ) | 50.7 | |||||||
Manchester United PLC, Class A | (3,970 | ) | (79,598 | ) | 10.8 | |||||||
National Grid PLC | (41,356 | ) | (585,234 | ) | 79.6 | |||||||
Persimmon PLC | (2,777 | ) | (45,389 | ) | 6.2 | |||||||
Smith & Nephew PLC | (31,640 | ) | (514,490 | ) | 70.0 | |||||||
St James’s Place PLC | (8,277 | ) | (124,214 | ) | 16.9 | |||||||
Vistry Group PLC | (11,724 | ) | (114,084 | ) | 15.5 | |||||||
Watches of Switzerland Group PLC | (16,355 | ) | (168,865 | ) | 23.0 | |||||||
WPP PLC | (1,111 | ) | (12,774 | ) | 1.7 | |||||||
|
|
|
| |||||||||
| (9,308,805 | ) | |||||||||||
| United States | ||||||||||||
Adient PLC | (6,758 | ) | (249,640 | ) | 33.9 | |||||||
ADT, Inc. | (258,630 | ) | (1,732,821 | ) | 235.6 | |||||||
AES Corp. | (3,492 | ) | (82,621 | ) | 11.2 | |||||||
Affirm Holdings, Inc. | (16,504 | ) | (162,729 | ) | 22.1 | |||||||
Aflac, Inc. | (1,304 | ) | (91,084 | ) | 12.4 | |||||||
Airbnb, Inc., Class A | (4,146 | ) | (496,152 | ) | 67.5 | |||||||
Alexandria Real Estate Equities, Inc. | (1,701 | ) | (211,230 | ) | 28.7 | |||||||
Alteryx, Inc., Class A | (8,152 | ) | (335,292 | ) | 45.6 | |||||||
Amcor PLC | (37,275 | ) | (408,907 | ) | 55.6 | |||||||
American Equity Investment Life Holding Co. | (13,952 | ) | (537,710 | ) | 73.1 | |||||||
Ameriprise Financial, Inc. | (1,165 | ) | (355,465 | ) | 48.3 | |||||||
AmerisourceBergen Corp. | (2,291 | ) | (382,253 | ) | 52.0 | |||||||
Amkor Technology, Inc. | (2,366 | ) | (52,927 | ) | 7.2 | |||||||
Analog Devices, Inc. | (4,725 | ) | (849,933 | ) | 115.6 | |||||||
Annaly Capital Management, Inc. | (2,507 | ) | (50,090 | ) | 6.8 | |||||||
Ansys, Inc. | (137 | ) | (43,007 | ) | 5.8 | |||||||
Antero Midstream Corp. | (29,642 | ) | (318,948 | ) | 43.4 | |||||||
Antero Resources Corp. | (16,946 | ) | (389,589 | ) | 53.0 | |||||||
Apartment Income REIT Corp. | (6,424 | ) | (237,559 | ) | 32.3 | |||||||
Apollo Global Management, Inc. | (12,427 | ) | (787,748 | ) | 107.1 | |||||||
Apple Hospitality REIT, Inc. | (14,001 | ) | (208,475 | ) | 28.3 | |||||||
| Security | Shares | Value | % of Basket Value | |||||||||
| United States (continued) | ||||||||||||
Aramark | (3,275 | ) | $ | (113,642 | ) | 15.5 | % | |||||
Arista Networks, Inc. | (3,529 | ) | (565,205 | ) | 76.9 | |||||||
Aspen Technology, Inc. | (727 | ) | (128,679 | ) | 17.5 | |||||||
Atmos Energy Corp. | (382 | ) | (43,601 | ) | 5.9 | |||||||
Avantor, Inc. | (2,612 | ) | (50,882 | ) | 6.9 | |||||||
Avnet, Inc. | (6,184 | ) | (255,152 | ) | 34.7 | |||||||
Axalta Coating Systems Ltd. | (13,263 | ) | (418,713 | ) | 56.9 | |||||||
Ball Corp. | (5,788 | ) | (307,806 | ) | 41.9 | |||||||
Bentley Systems, Inc., Class B | (1,285 | ) | (54,690 | ) | 7.4 | |||||||
BJ’s Wholesale Club Holdings, Inc. | (585 | ) | (44,676 | ) | 6.1 | |||||||
Black Hills Corp. | (3,840 | ) | (250,714 | ) | 34.1 | |||||||
Bloom Energy Corp., Class A | (5,701 | ) | (94,922 | ) | 12.9 | |||||||
Blue Owl Capital, Inc. | (16,156 | ) | (181,917 | ) | 24.7 | |||||||
Boston Properties, Inc. | (1,366 | ) | (72,890 | ) | 9.9 | |||||||
Broadcom, Inc. | (52 | ) | (32,578 | ) | 4.4 | |||||||
Broadridge Financial Solutions, Inc. | (235 | ) | (34,171 | ) | 4.6 | |||||||
Cadence Bank | (600 | ) | (12,132 | ) | 1.6 | |||||||
Calix, Inc. | (1,384 | ) | (63,249 | ) | 8.6 | |||||||
CarMax, Inc. | (1,851 | ) | (129,626 | ) | 17.6 | |||||||
Catalent, Inc. | (5,303 | ) | (265,786 | ) | 36.1 | |||||||
Celanese Corp. | (5,807 | ) | (616,936 | ) | 83.9 | |||||||
Ceridian HCM Holding, Inc. | (2,727 | ) | (173,110 | ) | 23.5 | |||||||
Chesapeake Energy Corp. | (2,097 | ) | (173,380 | ) | 23.6 | |||||||
Churchill Downs, Inc. | (811 | ) | (237,242 | ) | 32.3 | |||||||
Civitas Resources, Inc. | (2,814 | ) | (194,307 | ) | 26.4 | |||||||
Clean Harbors, Inc. | (2,141 | ) | (310,788 | ) | 42.3 | |||||||
Clear Secure, Inc. | (13,394 | ) | (324,001 | ) | 44.1 | |||||||
Clorox Co. | (1,337 | ) | (221,434 | ) | 30.1 | |||||||
CME Group, Inc. | (1,308 | ) | (242,987 | ) | 33.0 | |||||||
Comfort Systems USA, Inc. | (1,174 | ) | (175,501 | ) | 23.9 | |||||||
Commerce Bancshares, Inc. | (1,184 | ) | (66,126 | ) | 9.0 | |||||||
Comstock Resources, Inc. | (7,211 | ) | (82,926 | ) | 11.3 | |||||||
Confluent, Inc. | (4,848 | ) | (106,656 | ) | 14.5 | |||||||
Consolidated Edison, Inc. | (574 | ) | (56,522 | ) | 7.7 | |||||||
Constellium SE | (6,278 | ) | (93,228 | ) | 12.7 | |||||||
Cooper Cos., Inc. | (1,352 | ) | (515,720 | ) | 70.1 | |||||||
Coterra Energy, Inc. | (4,079 | ) | (104,422 | ) | 14.2 | |||||||
Coty, Inc., Class A | (113,490 | ) | (1,347,126 | ) | 183.2 | |||||||
Cullen/Frost Bankers, Inc. | (328 | ) | (36,162 | ) | 4.9 | |||||||
Diodes, Inc. | (4,091 | ) | (326,053 | ) | 44.3 | |||||||
Dominion Energy, Inc. | (1,604 | ) | (91,653 | ) | 12.5 | |||||||
DoorDash, Inc. | (295 | ) | (18,051 | ) | 2.5 | |||||||
Dun & Bradstreet Holdings, Inc. | (1,299 | ) | (14,510 | ) | 2.0 | |||||||
Dynatrace, Inc. | (2,064 | ) | (87,266 | ) | 11.9 | |||||||
Eagle Materials, Inc. | (169 | ) | (25,047 | ) | 3.4 | |||||||
Edison International | (2,806 | ) | (206,522 | ) | 28.1 | |||||||
Elanco Animal Health, Inc. | (7,592 | ) | (71,896 | ) | 9.8 | |||||||
Entegris, Inc. | (6,132 | ) | (459,409 | ) | 62.5 | |||||||
Erie Indemnity Co., Class A | (968 | ) | (210,375 | ) | 28.6 | |||||||
Euronet Worldwide, Inc. | (1,273 | ) | (140,972 | ) | 19.2 | |||||||
Evergy, Inc. | (4,116 | ) | (255,645 | ) | 34.8 | |||||||
Exelon Corp. | (8,261 | ) | (350,597 | ) | 47.7 | |||||||
ExlService Holdings, Inc. | (559 | ) | (99,714 | ) | 13.6 | |||||||
Federal Realty Investment Trust | (1,307 | ) | (129,249 | ) | 17.6 | |||||||
Ferguson PLC | (4,630 | ) | (645,804 | ) | 87.8 | |||||||
Fifth Third Bancorp | (8,449 | ) | (221,364 | ) | 30.1 | |||||||
First American Financial Corp. | (637 | ) | (36,698 | ) | 5.0 | |||||||
First Citizens BancShares, Inc. | (65 | ) | (65,467 | ) | 8.9 | |||||||
First Industrial Realty Trust, Inc. | (3,381 | ) | (177,401 | ) | 24.1 | |||||||
First Solar, Inc. | (971 | ) | (177,285 | ) | 24.1 | |||||||
Fiserv, Inc. | (1,894 | ) | (231,295 | ) | 31.4 | |||||||
| 50 | 2 0 2 3 BLACK ROCK ANNUAL REPORT TO SHAREHOLDERS |
Schedule of Investments (continued) April 30, 2023 | BlackRock Global Equity Market Neutral Fund |
| Security | Shares | Value | % of Basket Value | |||||||||
| United States (continued) | ||||||||||||
FleetCor Technologies, Inc. | (95 | ) | $ | (20,322 | ) | 2.8 | % | |||||
Fluence Energy, Inc. | (26,529 | ) | (479,114 | ) | 65.1 | |||||||
Foot Locker, Inc. | (14,060 | ) | (590,379 | ) | 80.3 | |||||||
Fox Factory Holding Corp. | (1,017 | ) | (112,755 | ) | 15.3 | |||||||
GE Healthcare, Inc. | (3,860 | ) | (313,972 | ) | 42.7 | |||||||
Gen Digital, Inc. | (7,191 | ) | (127,065 | ) | 17.3 | |||||||
Gitlab, Inc. | (2,129 | ) | (64,636 | ) | 8.8 | |||||||
Graphic Packaging Holding Co. | (7,029 | ) | (173,335 | ) | 23.6 | |||||||
Grocery Outlet Holding Corp. | (5,158 | ) | (153,605 | ) | 20.9 | |||||||
HashiCorp., Inc. | (23,614 | ) | (633,091 | ) | 86.1 | |||||||
HB Fuller Co. | (1,899 | ) | (125,657 | ) | 17.1 | |||||||
Hilton Grand Vacations, Inc. | (2,382 | ) | (101,950 | ) | 13.9 | |||||||
Host Hotels & Resorts, Inc. | (15,621 | ) | (252,592 | ) | 34.3 | |||||||
ICON PLC | (3,517 | ) | (677,691 | ) | 92.2 | |||||||
Insight Enterprises, Inc. | (1,589 | ) | (192,190 | ) | 26.1 | |||||||
Inspire Medical Systems, Inc. | (2,653 | ) | (710,022 | ) | 96.5 | |||||||
International Business Machines Corp. | (2,031 | ) | (256,739 | ) | 34.9 | |||||||
Interpublic Group of Cos., Inc. | (6,773 | ) | (241,999 | ) | 32.9 | |||||||
Iridium Communications, Inc. | (4,527 | ) | (287,329 | ) | 39.1 | |||||||
Jazz Pharmaceuticals PLC | (1,785 | ) | (250,739 | ) | 34.1 | |||||||
Karuna Therapeutics, Inc. | (117 | ) | (23,217 | ) | 3.2 | |||||||
Kinder Morgan, Inc. | (7,793 | ) | (133,650 | ) | 18.2 | |||||||
Kinsale Capital Group, Inc. | (903 | ) | (295,019 | ) | 40.1 | |||||||
Lamb Weston Holdings, Inc. | (639 | ) | (71,447 | ) | 9.7 | |||||||
Lantheus Holdings, Inc. | (8,284 | ) | (707,868 | ) | 96.3 | |||||||
Las Vegas Sands Corp. | (1,640 | ) | (104,714 | ) | 14.2 | |||||||
Levi Strauss & Co. | (29,636 | ) | (428,537 | ) | 58.3 | |||||||
Littelfuse, Inc. | (239 | ) | (57,895 | ) | 7.9 | |||||||
Live Nation Entertainment, Inc. | (1,157 | ) | (78,421 | ) | 10.7 | |||||||
Loews Corp. | (1,582 | ) | (91,076 | ) | 12.4 | |||||||
Madison Square Garden Sports Corp. | (5,413 | ) | (1,085,306 | ) | 147.6 | |||||||
Marriott International, Inc. | (1,844 | ) | (312,263 | ) | 42.5 | |||||||
Maximus, Inc. | (4,323 | ) | (361,619 | ) | 49.2 | |||||||
Meritage Homes Corp. | (2,341 | ) | (299,765 | ) | 40.8 | |||||||
MKS Instruments, Inc. | (272 | ) | (22,813 | ) | 3.1 | |||||||
Mondelez International, Inc. | (697 | ) | (53,474 | ) | 7.3 | |||||||
MongoDB, Inc. | (699 | ) | (167,732 | ) | 22.8 | |||||||
Mosaic Co. | (1,352 | ) | (57,933 | ) | 7.9 | |||||||
Motorola Solutions, Inc. | (927 | ) | (270,128 | ) | 36.7 | |||||||
Natera, Inc. | (1,030 | ) | (52,242 | ) | 7.1 | |||||||
National Retail Properties, Inc. | (678 | ) | (29,493 | ) | 4.0 | |||||||
National Storage Affiliates Trust | (12,913 | ) | (497,796 | ) | 67.7 | |||||||
NCR Corp. | (10,853 | ) | (241,913 | ) | 32.9 | |||||||
Neogen Corp. | (11,029 | ) | (189,919 | ) | 25.8 | |||||||
Netflix, Inc. | (778 | ) | (256,686 | ) | 34.9 | |||||||
New Fortress Energy, Inc. | (3,105 | ) | (94,050 | ) | 12.8 | |||||||
New Jersey Resources Corp. | (4,226 | ) | (218,231 | ) | 29.7 | |||||||
New Relic, Inc. | (3,774 | ) | (269,728 | ) | 36.7 | |||||||
New York Times Co. | (10,995 | ) | (437,051 | ) | 59.4 | |||||||
Newell Brands, Inc. | (61,858 | ) | (751,575 | ) | 102.2 | |||||||
Noble Corp. PLC | (5,785 | ) | (222,433 | ) | 30.2 | |||||||
Okta, Inc. | (686 | ) | (47,012 | ) | 6.4 | |||||||
Old Republic International Corp. | (740 | ) | (18,700 | ) | 2.5 | |||||||
Ollie’s Bargain Outlet Holdings, Inc. | (2,192 | ) | (143,028 | ) | 19.4 | |||||||
Omega Healthcare Investors, Inc. | (973 | ) | (26,037 | ) | 3.5 | |||||||
Omnicom Group, Inc. | (1,442 | ) | (130,602 | ) | 17.8 | |||||||
ONE Gas, Inc. | (6,956 | ) | (535,264 | ) | 72.8 | |||||||
Option Care Health, Inc. | (3,324 | ) | (106,867 | ) | 14.5 | |||||||
Oracle Corp. | (4,770 | ) | (451,814 | ) | 61.4 | |||||||
Ormat Technologies, Inc. | (1,508 | ) | (129,401 | ) | 17.6 | |||||||
PACCAR, Inc. | (4,585 | ) | (342,454 | ) | 46.6 | |||||||
| Security | Shares | Value | % of Basket Value | |||||||||
| United States (continued) | ||||||||||||
Paychex, Inc. | (330 | ) | $ | (36,254 | ) | 4.9 | % | |||||
Paylocity Holding Corp. | (497 | ) | (96,065 | ) | 13.1 | |||||||
PayPal Holdings, Inc. | (6,025 | ) | (457,900 | ) | 62.3 | |||||||
Pentair PLC | (1,974 | ) | (114,650 | ) | 15.6 | |||||||
Performance Food Group Co. | (2,769 | ) | (173,589 | ) | 23.6 | |||||||
Permian Resources Corp. | (33,655 | ) | (351,695 | ) | 47.8 | |||||||
Pinnacle West Capital Corp. | (1,624 | ) | (127,419 | ) | 17.3 | |||||||
PPG Industries, Inc. | (713 | ) | (100,005 | ) | 13.6 | |||||||
Primerica, Inc. | (1,082 | ) | (197,476 | ) | 26.8 | |||||||
Privia Health Group, Inc. | (7,584 | ) | (209,546 | ) | 28.5 | |||||||
PTC, Inc. | (264 | ) | (33,209 | ) | 4.5 | |||||||
PulteGroup, Inc. | (11,149 | ) | (748,655 | ) | 101.8 | |||||||
QuidelOrtho Corp. | (470 | ) | (42,276 | ) | 5.7 | |||||||
R1 RCM, Inc. | (44,934 | ) | (700,521 | ) | 95.3 | |||||||
Radian Group, Inc. | (13,573 | ) | (329,417 | ) | 44.8 | |||||||
RBC Bearings, Inc. | (80 | ) | (18,161 | ) | 2.5 | |||||||
Rivian Automotive, Inc. | (7,159 | ) | (91,778 | ) | 12.5 | |||||||
Robinhood Markets, Inc. | (55,896 | ) | (494,680 | ) | 67.3 | |||||||
Ryan Specialty Holdings, Inc. | (619 | ) | (25,292 | ) | 3.4 | |||||||
Ryman Hospitality Properties, Inc. | (3,913 | ) | (350,840 | ) | 47.7 | |||||||
Sanofi | (1,543 | ) | (165,517 | ) | 22.5 | |||||||
Sealed Air Corp. | (8,176 | ) | (392,366 | ) | 53.4 | |||||||
Selective Insurance Group, Inc. | (7,140 | ) | (687,796 | ) | 93.5 | |||||||
Shift4 Payments, Inc., Class A | (1,535 | ) | (104,027 | ) | 14.1 | |||||||
Shoals Technologies Group, Inc., Class A | (2,472 | ) | (51,640 | ) | 7.0 | |||||||
Skyline Champion Corp. | (6,343 | ) | (470,460 | ) | 64.0 | |||||||
Skyworks Solutions, Inc. | (41 | ) | (4,342 | ) | 0.6 | |||||||
Smartsheet, Inc., Class A | (381 | ) | (15,571 | ) | 2.1 | |||||||
SolarEdge Technologies, Inc. | (1,388 | ) | (396,454 | ) | 53.9 | |||||||
Southern Co. | (28,132 | ) | (2,069,109 | ) | 281.4 | |||||||
SouthState Corp. | (3,907 | ) | (269,505 | ) | 36.6 | |||||||
Southwest Gas Holdings, Inc. | (6,409 | ) | (358,904 | ) | 48.8 | |||||||
Spirit Realty Capital, Inc. | (903 | ) | (34,729 | ) | 4.7 | |||||||
SPS Commerce, Inc. | (386 | ) | (56,858 | ) | 7.7 | |||||||
SS&C Technologies Holdings, Inc. | (4,851 | ) | (283,978 | ) | 38.6 | |||||||
STAG Industrial, Inc. | (899 | ) | (30,449 | ) | 4.1 | |||||||
Surgery Partners, Inc. | (1,323 | ) | (52,470 | ) | 7.1 | |||||||
Synaptics, Inc. | (2,598 | ) | (230,079 | ) | 31.3 | |||||||
Take-Two Interactive Software, Inc. | (6,085 | ) | (756,305 | ) | 102.8 | |||||||
Tenable Holdings, Inc. | (912 | ) | (33,735 | ) | 4.6 | |||||||
Tenaris SA | (20,739 | ) | (295,336 | ) | 40.2 | |||||||
Tenet Healthcare Corp. | (5,496 | ) | (402,967 | ) | 54.8 | |||||||
Terreno Realty Corp. | (2,628 | ) | (161,859 | ) | 22.0 | |||||||
Tetra Tech, Inc. | (886 | ) | (122,596 | ) | 16.7 | |||||||
T-Mobile US, Inc. | (1,696 | ) | (244,054 | ) | 33.2 | |||||||
Trade Desk, Inc., Class A | (1,342 | ) | (86,344 | ) | 11.7 | |||||||
TriNet Group, Inc. | (8,685 | ) | (805,794 | ) | 109.6 | |||||||
Twilio, Inc., Class A | (6,797 | ) | (357,590 | ) | 48.6 | |||||||
Tyler Technologies, Inc. | (718 | ) | (272,144 | ) | 37.0 | |||||||
Uber Technologies, Inc. | (4,422 | ) | (137,303 | ) | 18.7 | |||||||
Under Armour, Inc., Class A | (2,028 | ) | (17,988 | ) | 2.4 | |||||||
Universal Health Services, Inc. | (4,151 | ) | (624,103 | ) | 84.9 | |||||||
Valvoline, Inc. | (4,036 | ) | (139,444 | ) | 19.0 | |||||||
Verizon Communications, Inc. | (4,330 | ) | (168,134 | ) | 22.9 | |||||||
Vir Biotechnology, Inc. | (11,238 | ) | (282,636 | ) | 38.4 | |||||||
Vontier Corp. | (12,967 | ) | (351,795 | ) | 47.8 | |||||||
Vornado Realty Trust | (5,911 | ) | (88,724 | ) | 12.1 | |||||||
Walt Disney Co. | (3,420 | ) | (350,550 | ) | 47.7 | |||||||
Welltower, Inc. | (7,368 | ) | (583,693 | ) | 79.4 | |||||||
WESCO International, Inc. | (680 | ) | (97,920 | ) | 13.3 | |||||||
Whirlpool Corp. | (5,141 | ) | (717,632 | ) | 97.6 | |||||||
SCHEDULE OF INVESTMENTS | 51 |
Schedule of Investments (continued) April 30, 2023 | BlackRock Global Equity Market Neutral Fund |
| Security | Shares | Value | % of Basket Value | |||||||||
| United States (continued) | ||||||||||||
Xcel Energy, Inc. | (350 | ) | $ | (24,468 | ) | 3.3 | % | |||||
Zebra Technologies Corp. | (529 | ) | (152,368 | ) | 20.7 | |||||||
ZoomInfo Technologies, Inc. | (25,537 | ) | (559,516 | ) | 76.1 | |||||||
|
|
|
| |||||||||
| (54,015,093 | ) | |||||||||||
| Preferred Stocks | ||||||||||||
| Germany | ||||||||||||
Henkel AG & Co. KGaA | (419 | ) | (33,725 | ) | 4.6 | |||||||
|
|
|
| |||||||||
Total Reference Entity — Short | (171,979,363 | ) | ||||||||||
|
| |||||||||||
Net Value of Reference Entity — Bank of America N.A. |
| $ | (735,397 | ) | ||||||||
|
| |||||||||||
The following table represents the individual long and short positions and related values of the equity securities underlying the total return swap with BNP Paribas SA as of period end, termination dates 03/21/25-04/14/25:
| Security | Shares | Value | % of Basket Value | |||||||||
Reference Entity — Long | ||||||||||||
| Common Stocks | ||||||||||||
| Australia | ||||||||||||
AGL Energy Ltd. | 94,009 | $ | 515,888 | (486.8 | )% | |||||||
Allkem Ltd. | 30,120 | 246,662 | (232.7 | ) | ||||||||
AMP Ltd. | 757,881 | 571,341 | (539.1 | ) | ||||||||
Aristocrat Leisure Ltd. | 11,049 | 278,656 | (262.9 | ) | ||||||||
Aurizon Holdings Ltd. | 159,521 | 361,613 | (341.2 | ) | ||||||||
Bank of Queensland Ltd. | 149,987 | 577,290 | (544.7 | ) | ||||||||
Beach Energy Ltd. | 140,509 | 137,880 | (130.1 | ) | ||||||||
Bendigo & Adelaide Bank Ltd. | 10,820 | 62,102 | (58.6 | ) | ||||||||
BHP Group Ltd. | 10,144 | 300,103 | (283.2 | ) | ||||||||
Boral Ltd. | 60,126 | 164,570 | (155.3 | ) | ||||||||
Challenger Ltd. | 100,387 | 402,655 | (379.9 | ) | ||||||||
Charter Hall Group | 20,295 | 150,522 | (142.0 | ) | ||||||||
CSR Ltd. | 153,496 | 535,747 | (505.5 | ) | ||||||||
Deterra Royalties Ltd. | 51,398 | 157,112 | (148.3 | ) | ||||||||
Domain Holdings Australia Ltd. | 70,601 | 156,967 | (148.1 | ) | ||||||||
Downer EDI Ltd. | 232,018 | 547,269 | (516.4 | ) | ||||||||
Flight Centre Travel Group Ltd. | 34,052 | 445,885 | (420.7 | ) | ||||||||
Fortescue Metals Group Ltd. | 3,890 | 54,252 | (51.2 | ) | ||||||||
GPT Group | 102,742 | 301,223 | (284.2 | ) | ||||||||
IDP Education Ltd. | 8,181 | 153,240 | (144.6 | ) | ||||||||
Iluka Resources Ltd. | 51,607 | 378,009 | (356.7 | ) | ||||||||
Insignia Financial Ltd. | 40,401 | 79,949 | (75.4 | ) | ||||||||
Lynas Rare Earths Ltd. | 9,171 | 39,265 | (37.1 | ) | ||||||||
Macquarie Group Ltd. | 4,163 | 506,720 | (478.1 | ) | ||||||||
Magellan Financial Group Ltd. | 4,695 | 25,371 | (23.9 | ) | ||||||||
Mineral Resources Ltd. | 3,902 | 191,860 | (181.0 | ) | ||||||||
Mirvac Group | 32,783 | 52,482 | (49.5 | ) | ||||||||
National Australia Bank Ltd. | 43,744 | 839,614 | (792.2 | ) | ||||||||
Orora Ltd. | 134,626 | 306,761 | (289.4 | ) | ||||||||
Pilbara Minerals Ltd. | 87,587 | 248,625 | (234.6 | ) | ||||||||
Pro Medicus Ltd. | 8,827 | 361,200 | (340.8 | ) | ||||||||
Region RE Ltd., Registered Shares | 158,236 | 258,184 | (243.6 | ) | ||||||||
Rio Tinto Ltd. | 1,063 | 79,653 | (75.2 | ) | ||||||||
Rio Tinto PLC | 4,488 | 282,799 | (266.8 | ) | ||||||||
Scentre Group | 13,669 | 26,155 | (24.7 | ) | ||||||||
SEEK Ltd. | 26,510 | 431,207 | (406.9 | ) | ||||||||
Star Entertainment Grp Ltd. | 44,201 | 37,345 | (35.2 | ) | ||||||||
| Security | Shares | Value | % of Basket Value | |||||||||
| Australia (continued) | ||||||||||||
Steadfast Group Ltd. | 96,471 | $ | 379,184 | (357.8 | )% | |||||||
Treasury Wine Estates Ltd. | 23,096 | 213,281 | (201.2 | ) | ||||||||
Westpac Banking Corp. | 40,446 | 603,643 | (569.6 | ) | ||||||||
WiseTech Global Ltd. | 7,278 | 332,386 | (313.6 | ) | ||||||||
Worley Ltd. | 34,043 | 340,992 | (321.7 | ) | ||||||||
|
|
|
| |||||||||
| 12,135,662 | ||||||||||||
| Austria | ||||||||||||
ams-OSRAM AG | 22,965 | 159,039 | (150.1 | ) | ||||||||
ANDRITZ AG | 6,757 | 439,519 | (414.7 | ) | ||||||||
BAWAG Group AG | 434 | 21,199 | (20.0 | ) | ||||||||
Raiffeisen Bank International AG | 55,877 | 859,682 | (811.1 | ) | ||||||||
|
|
|
| |||||||||
| 1,479,439 | ||||||||||||
| Belgium | ||||||||||||
Elia Group SA/NV | 316 | 43,394 | (40.9 | ) | ||||||||
Euronav NV | 19,860 | 341,592 | (322.3 | ) | ||||||||
Sofina SA | 2,175 | 500,105 | (471.9 | ) | ||||||||
Solvay SA | 3,674 | 441,615 | (416.7 | ) | ||||||||
|
|
|
| |||||||||
| 1,326,706 | ||||||||||||
| Bermuda | ||||||||||||
RenaissanceRe Holdings Ltd. | 888 | 191,284 | (180.5 | ) | ||||||||
|
|
|
| |||||||||
| Brazil | ||||||||||||
Wheaton Precious Metals Corp. | 1,297 | 63,552 | (60.0 | ) | ||||||||
|
|
|
| |||||||||
| Canada | ||||||||||||
AbCellera Biologics, Inc. | 2,972 | 20,150 | (19.0 | ) | ||||||||
Alamos Gold, Inc., Class B | 53,621 | 688,155 | (649.3 | ) | ||||||||
ARC Resources Ltd. | 5,865 | 72,358 | (68.3 | ) | ||||||||
Ballard Power Systems, Inc. | 191,849 | 841,558 | (794.0 | ) | ||||||||
Baytex Energy Corp. | 23,656 | 88,395 | (83.4 | ) | ||||||||
Birchcliff Energy Ltd. | 127,496 | 767,216 | (723.9 | ) | ||||||||
Boralex, Inc. | 1,929 | 55,827 | (52.7 | ) | ||||||||
Canada Goose Holdings, Inc. | 14,145 | 277,525 | (261.9 | ) | ||||||||
Canadian Imperial Bank of Commerce | 1,098 | 45,877 | (43.3 | ) | ||||||||
Canadian National Railway Co. | 3,312 | 392,005 | (369.9 | ) | ||||||||
Element Fleet Management Corp. | 65,967 | 856,845 | (808.5 | ) | ||||||||
Emera, Inc. | 31,914 | 1,348,481 | (1,272.3 | ) | ||||||||
Enerplus Corp. | 47,592 | 706,693 | (666.8 | ) | ||||||||
First Capital Real Estate Investment Trust | 1,057 | 12,325 | (11.6 | ) | ||||||||
First Majestic Silver Corp. | 45,527 | 319,290 | (301.3 | ) | ||||||||
FirstService Corp. | 2,332 | 348,442 | (328.8 | ) | ||||||||
Franco-Nevada Corp. | 3,011 | 453,667 | (428.0 | ) | ||||||||
GFL Environmental, Inc. | 17,417 | 628,462 | (593.0 | ) | ||||||||
Gildan Activewear, Inc. | 9,802 | 317,055 | (299.1 | ) | ||||||||
Ivanhoe Mines Ltd. | 26,161 | 225,199 | (212.5 | ) | ||||||||
Lithium Americas Corp. | 27,583 | 547,420 | (516.5 | ) | ||||||||
MEG Energy Corp. | 7,955 | 131,520 | (124.1 | ) | ||||||||
Methanex Corp. | 11,516 | 511,839 | (482.9 | ) | ||||||||
NuVista Energy Ltd. | 23,299 | 200,815 | (189.5 | ) | ||||||||
Pan American Silver Corp. | 3,949 | 69,819 | (65.9 | ) | ||||||||
Parex Resources, Inc. | 15,248 | 307,469 | (290.1 | ) | ||||||||
Restaurant Brands International, Inc. | 2,082 | 144,980 | (136.8 | ) | ||||||||
RioCan Real Estate Investment Trust | 5,320 | 81,789 | (77.2 | ) | ||||||||
Ritchie Bros Auctioneers, Inc. | 9,029 | 512,955 | (484.0 | ) | ||||||||
Royal Bank of Canada | 11,708 | 1,156,237 | (1,090.9 | ) | ||||||||
Stantec, Inc. | 7,278 | 434,493 | (410.0 | ) | ||||||||
TC Energy Corp. | 23,171 | 956,279 | (902.3 | ) | ||||||||
Teck Resources Ltd. | 10,469 | 484,164 | (456.8 | ) | ||||||||
TELUS Corp. | 69,734 | 1,468,059 | (1,385.2 | ) | ||||||||
Tourmaline Oil Corp. | 10,617 | 473,661 | (446.9 | ) | ||||||||
| 52 | 2 0 2 3 BLACK ROCK ANNUAL REPORT TO SHAREHOLDERS |
Schedule of Investments (continued) April 30, 2023 | BlackRock Global Equity Market Neutral Fund |
| Security | Shares | Value | % of Basket Value | |||||||||
| Canada (continued) | ||||||||||||
TransAlta Corp. | 15,658 | $ | 138,630 | (130.8 | )% | |||||||
Vermilion Energy, Inc. | 7,878 | 98,985 | (93.4 | ) | ||||||||
West Fraser Timber Co. Ltd. | 634 | 45,521 | (42.9 | ) | ||||||||
Whitecap Resources, Inc. | 2,056 | 16,091 | (15.2 | ) | ||||||||
|
|
|
| |||||||||
| 16,246,251 | ||||||||||||
| Chile | ||||||||||||
Lundin Mining Corp. | 17,282 | 131,069 | (123.7 | ) | ||||||||
|
|
|
| |||||||||
| China | ||||||||||||
Shangri-La Asia Ltd. | 38,000 | 35,055 | (33.1 | ) | ||||||||
Wharf Holdings Ltd. | 207,000 | 473,073 | (446.3 | ) | ||||||||
|
|
|
| |||||||||
| 508,128 | ||||||||||||
| Comoros | ||||||||||||
Golar LNG Ltd. | 3,014 | 68,418 | (64.6 | ) | ||||||||
|
|
|
| |||||||||
| Denmark | ||||||||||||
D/S Norden A/S | 1,529 | 96,241 | (90.8 | ) | ||||||||
Genmab A/S | 160 | 65,856 | (62.1 | ) | ||||||||
GN Store Nord A/S | 176 | 4,704 | (4.4 | ) | ||||||||
H Lundbeck A/S | 64,431 | 341,633 | (322.4 | ) | ||||||||
Jyske Bank A/S, Registered Shares | 475 | 34,782 | (32.8 | ) | ||||||||
Novozymes A/S, B Shares | 17,265 | 900,169 | (849.4 | ) | ||||||||
Orsted A/S | 2,275 | 204,481 | (192.9 | ) | ||||||||
Tryg A/S | 2,083 | 49,296 | (46.5 | ) | ||||||||
|
|
|
| |||||||||
| 1,697,162 | ||||||||||||
| Finland | ||||||||||||
Kone OYJ, Class B | 2,177 | 124,378 | (117.3 | ) | ||||||||
Metso Outotec OYJ | 32,032 | 354,226 | (334.2 | ) | ||||||||
Outokumpu OYJ | 23,041 | 125,805 | (118.7 | ) | ||||||||
Wartsila OYJ ABP | 160,043 | 1,858,185 | (1,753.3 | ) | ||||||||
|
|
|
| |||||||||
| 2,462,594 | ||||||||||||
| Germany | ||||||||||||
Carl Zeiss Meditec AG | 421 | 56,713 | (53.5 | ) | ||||||||
Commerzbank AG | 3,509 | 39,058 | (36.9 | ) | ||||||||
Covestro AG | 4,970 | 218,341 | (206.0 | ) | ||||||||
Deutsche Bank AG, Registered Shares | 16,163 | 177,934 | (167.9 | ) | ||||||||
Deutsche Lufthansa AG, Registered Shares | 3,766 | 40,544 | (38.3 | ) | ||||||||
E.ON SE | 8,221 | 108,905 | (102.8 | ) | ||||||||
Encavis AG | 9,504 | 164,591 | (155.3 | ) | ||||||||
Fraport AG Frankfurt Airport Services Worldwide | 20,769 | 1,120,159 | (1,056.9 | ) | ||||||||
Freenet AG | 29,231 | 834,564 | (787.4 | ) | ||||||||
HUGO BOSS AG | 621 | 46,887 | (44.2 | ) | ||||||||
Knorr-Bremse AG | 6,851 | 480,899 | (453.8 | ) | ||||||||
LEG Immobilien SE | 806 | 50,241 | (47.4 | ) | ||||||||
Mercedes-Benz Group AG | 15,075 | 1,177,362 | (1,110.9 | ) | ||||||||
Merck KGaA | 600 | 107,785 | (101.7 | ) | ||||||||
METRO AG | 11,901 | 101,370 | (95.6 | ) | ||||||||
Nemetschek SE | 3,874 | 303,224 | (286.1 | ) | ||||||||
ProSiebenSat.1 Media SE | 22,744 | 204,618 | (193.1 | ) | ||||||||
SMA Solar Technology AG | 443 | 47,994 | (45.3 | ) | ||||||||
Solarworld AG | 10 | 2 | (0.0 | ) | ||||||||
SUSE SA | 8,891 | 168,335 | (158.8 | ) | ||||||||
Talanx AG | 14,646 | 737,689 | (696.0 | ) | ||||||||
United Internet AG, Registered Shares | 24,787 | 426,209 | (402.1 | ) | ||||||||
|
|
|
| |||||||||
| 6,613,424 | ||||||||||||
| Hong Kong | ||||||||||||
AIA Group Ltd. | 39,400 | 428,937 | (404.7 | ) | ||||||||
ASMPT Ltd. | 35,800 | 281,454 | (265.6 | ) | ||||||||
| Security | Shares | Value | % of Basket Value | |||||||||
| Hong Kong (continued) | ||||||||||||
Bank of East Asia Ltd. | 38,200 | $ | 50,343 | (47.5 | )% | |||||||
Cafe de Coral Holdings Ltd. | 10,000 | 14,006 | (13.2 | ) | ||||||||
Cathay Pacific Airways Ltd. | 724,000 | 700,543 | (661.0 | ) | ||||||||
Dah Sing Banking Group Ltd. | 103,600 | 83,094 | (78.4 | ) | ||||||||
Dah Sing Financial Holdings Ltd. | 86,800 | 222,368 | (209.8 | ) | ||||||||
Haitong International Securities Group Ltd. | 113,300 | 9,563 | (9.0 | ) | ||||||||
Hang Lung Group Ltd. | 40,000 | 70,319 | (66.3 | ) | ||||||||
Hang Lung Properties Ltd. | 136,000 | 248,590 | (234.6 | ) | ||||||||
Hongkong Land Holdings Ltd. | 90,100 | 400,984 | (378.3 | ) | ||||||||
Hysan Development Co. Ltd. | 79,000 | 223,250 | (210.6 | ) | ||||||||
Kerry Properties Ltd. | 8,500 | 21,930 | (20.7 | ) | ||||||||
Melco International Development Ltd. | 16,000 | 18,621 | (17.6 | ) | ||||||||
New World Development Co. Ltd. | 112,000 | 298,681 | (281.8 | ) | ||||||||
Pacific Basin Shipping Ltd. | 388,000 | 135,002 | (127.4 | ) | ||||||||
Swire Pacific Ltd. | 94,500 | 750,130 | (707.8 | ) | ||||||||
Swire Properties Ltd. | 431,000 | 1,158,377 | (1,093.0 | ) | ||||||||
United Energy Group Ltd. | 1,470,000 | 221,513 | (209.0 | ) | ||||||||
Yue Yuen Industrial Holdings Ltd. | 391,500 | 589,161 | (555.9 | ) | ||||||||
|
|
|
| |||||||||
| 5,926,866 | ||||||||||||
| Indonesia | ||||||||||||
First Pacific Co. Ltd. | 146,000 | 48,889 | (46.1 | ) | ||||||||
|
|
|
| |||||||||
| Ireland | ||||||||||||
Kingspan Group PLC | 4,398 | 305,222 | (288.0 | ) | ||||||||
Ryanair Holdings PLC | 11,646 | 191,258 | (180.5 | ) | ||||||||
Smurfit Kappa Group PLC | 9,015 | 334,512 | (315.6 | ) | ||||||||
|
|
|
| |||||||||
| 830,992 | ||||||||||||
| Israel | ||||||||||||
Alony Hetz Properties & Investments Ltd. | 54,835 | 432,018 | (407.6 | ) | ||||||||
Check Point Software Technologies Ltd. | 5,603 | 713,598 | (673.3 | ) | ||||||||
Elbit Systems Ltd. | 735 | 135,758 | (128.1 | ) | ||||||||
Gav-Yam Lands Corp. Ltd. | 10,950 | 78,843 | (74.4 | ) | ||||||||
Harel Insurance Investments & Financial Services Ltd. | 4,563 | 40,868 | (38.5 | ) | ||||||||
Nice Ltd. | 676 | 138,207 | (130.4 | ) | ||||||||
Nova Ltd. | 5,224 | 477,735 | (450.8 | ) | ||||||||
Phoenix Holdings Ltd. | 5,674 | 60,740 | (57.3 | ) | ||||||||
|
|
|
| |||||||||
| 2,077,767 | ||||||||||||
| Italy | ||||||||||||
A2A SpA | 1,063,087 | 1,878,387 | (1,772.3 | ) | ||||||||
Banco BPM SpA | 90,580 | 368,894 | (348.1 | ) | ||||||||
BPER Banca | 163,123 | 458,842 | (432.9 | ) | ||||||||
Buzzi Unicem SpA | 5,929 | 147,643 | (139.3 | ) | ||||||||
De’ Longhi SpA | 616 | 14,335 | (13.5 | ) | ||||||||
Ferrari NV | 568 | 158,512 | (149.6 | ) | ||||||||
FinecoBank Banca Fineco SpA | 17,859 | 271,119 | (255.8 | ) | ||||||||
Hera SpA | 22,121 | 68,965 | (65.1 | ) | ||||||||
Infrastrutture Wireless Italiane SpA | 19,578 | 272,131 | (256.8 | ) | ||||||||
Intesa Sanpaolo SpA | 65,663 | 172,918 | (163.1 | ) | ||||||||
Italgas SpA | 7,937 | 51,903 | (49.0 | ) | ||||||||
Mediobanca Banca di Credito Finanziario SpA | 114,451 | 1,230,915 | (1,161.4 | ) | ||||||||
Moncler SpA | 13,834 | 1,027,698 | (969.7 | ) | ||||||||
Prysmian SpA | 7,136 | 292,489 | (276.0 | ) | ||||||||
Recordati Industria Chimica e Farmaceutica SpA | 549 | 25,309 | (23.9 | ) | ||||||||
Reply SpA | 2,284 | 266,505 | (251.4 | ) | ||||||||
Snam SpA | 42,407 | 236,036 | (222.7 | ) | ||||||||
UnipolSai Assicurazioni SpA | 96,374 | 259,650 | (245.0 | ) | ||||||||
|
|
|
| |||||||||
| 7,202,251 | ||||||||||||
SCHEDULE OF INVESTMENTS | 53 |
Schedule of Investments (continued) April 30, 2023 | BlackRock Global Equity Market Neutral Fund |
| Security | Shares | Value | % of Basket Value | |||||||||
| Japan | ||||||||||||
Acom Co. Ltd. | 189,200 | $ | 472,354 | (445.7 | )% | |||||||
Aeon Co. Ltd. | 17,600 | 365,425 | (344.8 | ) | ||||||||
AEON Financial Service Co. Ltd. | 82,800 | 752,008 | (709.6 | ) | ||||||||
Ain Holdings, Inc. | 3,800 | 161,112 | (152.0 | ) | ||||||||
Aisin Corp. | 9,800 | 292,780 | (276.3 | ) | ||||||||
Alfresa Holdings Corp. | 37,800 | 557,447 | (526.0 | ) | ||||||||
Amano Corp. | 5,600 | 116,111 | (109.6 | ) | ||||||||
ANA Holdings, Inc. | 36,000 | 799,803 | (754.6 | ) | ||||||||
Anritsu Corp. | 56,900 | 531,022 | (501.0 | ) | ||||||||
Asahi Kasei Corp. | 11,400 | 82,053 | (77.4 | ) | ||||||||
Astellas Pharma, Inc. | 59,900 | 919,536 | (867.6 | ) | ||||||||
AZ-COM MARUWA Holdings, Inc. | 20,300 | 304,966 | (287.8 | ) | ||||||||
Benesse Holdings, Inc. | 61,100 | 893,762 | (843.3 | ) | ||||||||
Brother Industries Ltd. | 51,200 | 819,142 | (772.9 | ) | ||||||||
Canon Marketing Japan, Inc. | 3,300 | 83,986 | (79.2 | ) | ||||||||
Casio Computer Co. Ltd. | 16,100 | 156,159 | (147.3 | ) | ||||||||
COMSYS Holdings Corp. | 50,500 | 984,314 | (928.7 | ) | ||||||||
Concordia Financial Group Ltd. | 19,400 | 75,001 | (70.8 | ) | ||||||||
Cosmos Pharmaceutical Corp. | 3,000 | 300,553 | (283.6 | ) | ||||||||
CyberAgent, Inc. | 66,300 | 589,503 | (556.2 | ) | ||||||||
Daicel Corp. | 41,100 | 330,019 | (311.4 | ) | ||||||||
Dai-ichi Life Holdings, Inc. | 18,700 | 354,440 | (334.4 | ) | ||||||||
Daiwa House Industry Co. Ltd. | 44,200 | 1,146,860 | (1,082.1 | ) | ||||||||
DeNA Co. Ltd. | 19,000 | 271,859 | (256.5 | ) | ||||||||
Denka Co. Ltd. | 27,700 | 565,605 | (533.7 | ) | ||||||||
DIC Corp. | 1,600 | 30,116 | (28.4 | ) | ||||||||
DMG Mori Co. Ltd. | 44,200 | 722,550 | (681.8 | ) | ||||||||
Dowa Holdings Co. Ltd. | 44,000 | 1,464,844 | (1,382.1 | ) | ||||||||
Ebara Corp. | 7,100 | 316,772 | (298.9 | ) | ||||||||
EXEO Group, Inc. | 16,700 | 315,709 | (297.9 | ) | ||||||||
Fuji Electric Co. Ltd. | 2,000 | 82,205 | (77.6 | ) | ||||||||
Fuji Media Holdings, Inc. | 126,900 | 1,211,733 | (1,143.3 | ) | ||||||||
FUJIFILM Holdings Corp. | 19,500 | 1,035,453 | (977.0 | ) | ||||||||
Fujikura Ltd. | 200 | 1,389 | (1.3 | ) | ||||||||
GMO internet group, Inc. | 6,200 | 127,095 | (119.9 | ) | ||||||||
Hamamatsu Photonics KK | 4,300 | 232,416 | (219.3 | ) | ||||||||
Hitachi Ltd. | 12,800 | 721,789 | (681.0 | ) | ||||||||
House Foods Group, Inc. | 8,800 | 197,065 | (185.9 | ) | ||||||||
Hoya Corp. | 2,700 | 288,672 | (272.4 | ) | ||||||||
IHI Corp. | 15,000 | 385,186 | (363.4 | ) | ||||||||
Information Services International-Dentsu Ltd. | 2,800 | 100,754 | (95.1 | ) | ||||||||
INFRONEER Holdings, Inc. | 68,800 | 553,552 | (522.3 | ) | ||||||||
Internet Initiative Japan, Inc. | 36,400 | 767,630 | (724.3 | ) | ||||||||
Itochu Techno-Solutions Corp. | 24,200 | 638,138 | (602.1 | ) | ||||||||
J Front Retailing Co. Ltd. | 178,500 | 1,911,848 | (1,803.9 | ) | ||||||||
Japan Steel Works Ltd. | 5,300 | 98,147 | (92.6 | ) | ||||||||
JTEKT Corp. | 29,100 | 244,575 | (230.8 | ) | ||||||||
Kadokawa Corp. | 18,800 | 408,678 | (385.6 | ) | ||||||||
Kakaku.com, Inc. | 36,300 | 509,188 | (480.4 | ) | ||||||||
Kamigumi Co. Ltd. | 7,600 | 169,635 | (160.1 | ) | ||||||||
Kandenko Co. Ltd. | 64,100 | 491,651 | (463.9 | ) | ||||||||
Kaneka Corp. | 12,500 | 338,800 | (319.7 | ) | ||||||||
Kao Corp. | 18,200 | 749,353 | (707.0 | ) | ||||||||
Kawasaki Kisen Kaisha Ltd. | 200 | 4,863 | (4.6 | ) | ||||||||
KDDI Corp. | 3,700 | 117,662 | (111.0 | ) | ||||||||
Kewpie Corp. | 23,800 | 407,135 | (384.2 | ) | ||||||||
Kinden Corp. | 27,900 | 387,003 | (365.2 | ) | ||||||||
Kirin Holdings Co. Ltd. | 18,000 | 297,877 | (281.1 | ) | ||||||||
Koei Tecmo Holdings Co. Ltd. | 17,500 | 327,649 | (309.2 | ) | ||||||||
Kokuyo Co. Ltd. | 31,400 | 457,069 | (431.3 | ) | ||||||||
Kose Corp. | 3,500 | 416,396 | (392.9 | ) | ||||||||
K’s Holdings Corp. | 27,800 | 251,056 | (236.9 | ) | ||||||||
| Security | Shares | Value | % of Basket Value | |||||||||
| Japan (continued) | ||||||||||||
Kusuri no Aoki Holdings Co. Ltd. | 4,000 | $ | 195,600 | (184.6 | )% | |||||||
Kyocera Corp. | 12,800 | 684,576 | (645.9 | ) | ||||||||
Kyowa Kirin Co. Ltd. | 14,400 | 326,809 | (308.4 | ) | ||||||||
Lawson, Inc. | 14,800 | 684,546 | (645.9 | ) | ||||||||
Lintec Corp. | 25,300 | 431,024 | (406.7 | ) | ||||||||
Lion Corp. | 72,900 | 809,613 | (763.9 | ) | ||||||||
Lixil Corp. | 17,400 | 279,252 | (263.5 | ) | ||||||||
M3, Inc. | 14,500 | 362,919 | (342.4 | ) | ||||||||
Mani, Inc. | 36,300 | 484,171 | (456.8 | ) | ||||||||
MISUMI Group, Inc. | 5,100 | 131,071 | (123.7 | ) | ||||||||
Mitsubishi Chemical Group Corp. | 40,600 | 242,808 | (229.1 | ) | ||||||||
Mitsubishi Corp. | 12,700 | 479,997 | (452.9 | ) | ||||||||
Mitsubishi Electric Corp. | 23,700 | 299,227 | (282.3 | ) | ||||||||
Mitsubishi Estate Co. Ltd. | 56,500 | 708,855 | (668.8 | ) | ||||||||
Mitsubishi Gas Chemical Co., Inc. | 39,100 | 580,239 | (547.5 | ) | ||||||||
Mitsubishi Heavy Industries Ltd. | 700 | 27,055 | (25.5 | ) | ||||||||
Mitsubishi Motors Corp. | 32,200 | 126,138 | (119.0 | ) | ||||||||
Mitsui & Co. Ltd. | 10,100 | 321,438 | (303.3 | ) | ||||||||
Mitsui Chemicals, Inc. | 2,700 | 69,629 | (65.7 | ) | ||||||||
Mitsui Fudosan Co. Ltd. | 65,800 | 1,329,818 | (1,254.7 | ) | ||||||||
Mizuho Financial Group, Inc. | 55,700 | 823,231 | (776.8 | ) | ||||||||
MS&AD Insurance Group Holdings, Inc. | 5,400 | 180,580 | (170.4 | ) | ||||||||
Nabtesco Corp. | 2,900 | 71,218 | (67.2 | ) | ||||||||
NEC Corp. | 6,400 | 250,857 | (236.7 | ) | ||||||||
NEC Networks & System Integration Corp. | 37,300 | 473,706 | (447.0 | ) | ||||||||
NET One Systems Co. Ltd. | 25,900 | 622,431 | (587.3 | ) | ||||||||
NGK Insulators Ltd. | 1,800 | 23,048 | (21.8 | ) | ||||||||
Nidec Corp. | 11,700 | 590,278 | (557.0 | ) | ||||||||
Nihon M&A Center Holdings, Inc. | 51,900 | 404,185 | (381.4 | ) | ||||||||
Nikon Corp. | 87,000 | 915,416 | (863.7 | ) | ||||||||
Nippon Express Holdings, Inc. | 4,100 | 245,139 | (231.3 | ) | ||||||||
Nippon Shinyaku Co. Ltd. | 700 | 32,620 | (30.8 | ) | ||||||||
Nipro Corp. | 30,100 | 231,069 | (218.0 | ) | ||||||||
Nissan Motor Co. Ltd. | 49,500 | 183,748 | (173.4 | ) | ||||||||
Niterra Co. Ltd. | 18,600 | 397,127 | (374.7 | ) | ||||||||
Nitto Denko Corp. | 2,600 | 171,268 | (161.6 | ) | ||||||||
Nomura Real Estate Holdings, Inc. | 9,800 | 248,597 | (234.6 | ) | ||||||||
Nomura Research Institute Ltd. | 17,200 | 440,622 | (415.7 | ) | ||||||||
NS Solutions Corp. | 11,900 | 329,940 | (311.3 | ) | ||||||||
Obayashi Corp. | 27,700 | 235,018 | (221.8 | ) | ||||||||
OBIC Business Consultants Co. Ltd. | 24,400 | 944,185 | (890.9 | ) | ||||||||
Oji Holdings Corp. | 5,900 | 23,628 | (22.3 | ) | ||||||||
Olympus Corp. | 23,000 | 410,816 | (387.6 | ) | ||||||||
Ono Pharmaceutical Co. Ltd. | 3,300 | 67,747 | (63.9 | ) | ||||||||
Orient Corp. | 1,800 | 15,306 | (14.4 | ) | ||||||||
Otsuka Corp. | 31,200 | 1,157,208 | (1,091.9 | ) | ||||||||
Otsuka Holdings Co. Ltd. | 12,000 | 415,818 | (392.3 | ) | ||||||||
Panasonic Holdings Corp. | 300 | 2,881 | (2.7 | ) | ||||||||
Penta-Ocean Construction Co. Ltd. | 56,200 | 278,310 | (262.6 | ) | ||||||||
Pigeon Corp. | 9,100 | 144,355 | (136.2 | ) | ||||||||
Pola Orbis Holdings, Inc. | 85,800 | 1,214,808 | (1,146.2 | ) | ||||||||
Recruit Holdings Co. Ltd. | 19,300 | 551,895 | (520.7 | ) | ||||||||
Resorttrust, Inc. | 1,800 | 30,284 | (28.6 | ) | ||||||||
Ricoh Co. Ltd. | 103,200 | 869,602 | (820.5 | ) | ||||||||
Rohm Co. Ltd. | 5,200 | 399,474 | (376.9 | ) | ||||||||
Ryohin Keikaku Co. Ltd. | 47,600 | 510,634 | (481.8 | ) | ||||||||
Sanrio Co. Ltd. | 3,200 | 150,886 | (142.4 | ) | ||||||||
Santen Pharmaceutical Co. Ltd. | 4,800 | 41,139 | (38.8 | ) | ||||||||
Sapporo Holdings Ltd. | 7,600 | 215,828 | (203.6 | ) | ||||||||
Sawai Group Holdings Co. Ltd. | 13,600 | 401,029 | (378.4 | ) | ||||||||
SCSK Corp. | 15,900 | 244,602 | (230.8 | ) | ||||||||
Seiko Epson Corp. | 5,400 | 84,086 | (79.3 | ) | ||||||||
| 54 | 2 0 2 3 BLACK ROCK ANNUAL REPORT TO SHAREHOLDERS |
Schedule of Investments (continued) April 30, 2023 | BlackRock Global Equity Market Neutral Fund |
| Security | Shares | Value | % of Basket Value | |||||||||
| Japan (continued) | ||||||||||||
Sharp Corp. | 22,000 | $ | 159,856 | (150.8 | )% | |||||||
Shimizu Corp. | 35,200 | 218,902 | (206.5 | ) | ||||||||
SoftBank Group Corp. | 53,000 | 2,026,930 | (1,912.5 | ) | ||||||||
Sohgo Security Services Co. Ltd. | 18,100 | 515,107 | (486.0 | ) | ||||||||
Sompo Holdings, Inc. | 20,100 | 854,300 | (806.1 | ) | ||||||||
Subaru Corp. | 35,100 | 583,360 | (550.4 | ) | ||||||||
Sugi Holdings Co. Ltd. | 1,300 | 56,246 | (53.1 | ) | ||||||||
Sumitomo Bakelite Co. Ltd. | 5,700 | 222,169 | (209.6 | ) | ||||||||
Sumitomo Chemical Co. Ltd. | 12,100 | 41,681 | (39.3 | ) | ||||||||
Sumitomo Corp. | 8,000 | 146,175 | (137.9 | ) | ||||||||
Sumitomo Electric Industries Ltd. | 14,300 | 185,942 | (175.4 | ) | ||||||||
Sumitomo Mitsui Trust Holdings, Inc. | 11,100 | 407,710 | (384.7 | ) | ||||||||
Sumitomo Pharma Co. Ltd. | 56,500 | 361,199 | (340.8 | ) | ||||||||
Sumitomo Realty & Development Co. Ltd. | 36,300 | 863,445 | (814.7 | ) | ||||||||
T&D Holdings, Inc. | 61,500 | 767,644 | (724.3 | ) | ||||||||
Taisei Corp. | 7,100 | 245,802 | (231.9 | ) | ||||||||
Taisho Pharmaceutical Holdings Co. Ltd. | 14,200 | 624,883 | (589.6 | ) | ||||||||
Takara Bio, Inc. | 4,900 | 63,053 | (59.5 | ) | ||||||||
TBS Holdings, Inc. | 13,600 | 208,825 | (197.0 | ) | ||||||||
Terumo Corp. | 22,000 | 671,018 | (633.1 | ) | ||||||||
Toda Corp. | 49,900 | 296,994 | (280.2 | ) | ||||||||
Toho Co. Ltd. | 12,400 | 501,870 | (473.5 | ) | ||||||||
Tokio Marine Holdings, Inc. | 1,100 | 22,530 | (21.3 | ) | ||||||||
Tokyo Ohka Kogyo Co. Ltd. | 6,400 | 340,605 | (321.4 | ) | ||||||||
Tokyo Tatemono Co. Ltd. | 55,900 | 721,115 | (680.4 | ) | ||||||||
Toray Industries, Inc. | 139,700 | 806,685 | (761.1 | ) | ||||||||
TOTO Ltd. | 5,700 | 198,717 | (187.5 | ) | ||||||||
Toyoda Gosei Co. Ltd. | 16,600 | 289,992 | (273.6 | ) | ||||||||
Toyota Boshoku Corp. | 20,100 | 324,226 | (305.9 | ) | ||||||||
Toyota Industries Corp. | 1,200 | 71,008 | (67.0 | ) | ||||||||
Trend Micro, Inc. | 800 | 39,841 | (37.6 | ) | ||||||||
TS Tech Co. Ltd. | 33,700 | 462,446 | (436.3 | ) | ||||||||
Tsuruha Holdings, Inc. | 15,500 | 1,034,648 | (976.2 | ) | ||||||||
UBE Corp. | 15,900 | 257,138 | (242.6 | ) | ||||||||
Ulvac, Inc. | 1,500 | 60,747 | (57.3 | ) | ||||||||
Ushio, Inc. | 15,400 | 195,172 | (184.2 | ) | ||||||||
Welcia Holdings Co. Ltd. | 10,700 | 228,375 | (215.5 | ) | ||||||||
Yakult Honsha Co. Ltd. | 3,100 | 237,505 | (224.1 | ) | ||||||||
Yamaha Corp. | 7,600 | 305,265 | (288.0 | ) | ||||||||
Yamato Kogyo Co. Ltd. | 8,200 | 328,443 | (309.9 | ) | ||||||||
Yaskawa Electric Corp. | 6,400 | 265,791 | (250.8 | ) | ||||||||
Zeon Corp. | 3,900 | 41,020 | (38.7 | ) | ||||||||
ZOZO, Inc. | 31,900 | 685,513 | (646.8 | ) | ||||||||
|
|
|
| |||||||||
| 69,266,770 | ||||||||||||
| Luxembourg | ||||||||||||
ArcelorMittal SA | 7,748 | 220,466 | (208.0 | ) | ||||||||
L’Occitane International SA | 12,750 | 32,436 | (30.6 | ) | ||||||||
|
|
|
| |||||||||
| 252,902 | ||||||||||||
| Macau | ||||||||||||
Galaxy Entertainment Group Ltd. | 30,000 | 213,512 | (201.4 | ) | ||||||||
MGM China Holdings Ltd. | 104,800 | 143,139 | (135.1 | ) | ||||||||
SJM Holdings Ltd. | 29,000 | 15,100 | (14.2 | ) | ||||||||
Wynn Macau Ltd. | 249,600 | 270,031 | (254.8 | ) | ||||||||
|
|
|
| |||||||||
| 641,782 | ||||||||||||
| Mexico | ||||||||||||
Fresnillo PLC | 20,047 | 177,802 | (167.8 | ) | ||||||||
|
|
|
| |||||||||
| Netherlands | ||||||||||||
ABN AMRO Bank NV, CVA | 49,059 | 787,520 | (743.1 | ) | ||||||||
| Security | Shares | Value | % of Basket Value | |||||||||
| Netherlands (continued) | ||||||||||||
Aegon NV | 17,004 | $ | 77,699 | (73.3 | )% | |||||||
ASML Holding NV | 317 | 201,477 | (190.1 | ) | ||||||||
ASR Nederland NV | 19,843 | 874,019 | (824.7 | ) | ||||||||
Koninklijke KPN NV | 157,018 | 573,466 | (541.1 | ) | ||||||||
Koninklijke Vopak NV | 4,624 | 176,945 | (166.9 | ) | ||||||||
Wolters Kluwer NV | 5,144 | 682,554 | (644.0 | ) | ||||||||
|
|
|
| |||||||||
| 3,373,680 | ||||||||||||
| New Zealand | ||||||||||||
a2 Milk Co. Ltd. | 77,043 | 277,207 | (261.6 | ) | ||||||||
Contact Energy Ltd. | 73,730 | 353,780 | (333.8 | ) | ||||||||
Infratil Ltd. | 113,960 | 666,790 | (629.1 | ) | ||||||||
|
|
|
| |||||||||
| 1,297,777 | ||||||||||||
| Norway | ||||||||||||
Aker BP ASA | 7,589 | 181,538 | (171.3 | ) | ||||||||
AutoStore Holdings Ltd. | 7,572 | 16,317 | (15.4 | ) | ||||||||
Equinor ASA | 19,161 | 551,998 | (520.8 | ) | ||||||||
Gjensidige Forsikring ASA | 18,552 | 323,357 | (305.1 | ) | ||||||||
Golden Ocean Group Ltd. | 22,855 | 210,663 | (198.8 | ) | ||||||||
Kongsberg Gruppen ASA | 21,870 | 982,870 | (927.4 | ) | ||||||||
NEL ASA | 89,150 | 122,580 | (115.7 | ) | ||||||||
Nordic Semiconductor ASA | 38,105 | 412,925 | (389.6 | ) | ||||||||
TOMRA Systems ASA | 41,991 | 644,306 | (607.9 | ) | ||||||||
Var Energi ASA | 92,041 | 241,676 | (228.0 | ) | ||||||||
|
|
|
| |||||||||
| 3,688,230 | ||||||||||||
| Poland | ||||||||||||
InPost SA | 16,458 | 176,889 | (166.9 | ) | ||||||||
|
|
|
| |||||||||
| Singapore | ||||||||||||
City Developments Ltd. | 81,300 | 424,765 | (400.8 | ) | ||||||||
ComfortDelGro Corp. Ltd. | 260,700 | 233,086 | (219.9 | ) | ||||||||
Mapletree Pan Asia Commercial Trust | 64,300 | 85,069 | (80.3 | ) | ||||||||
NetLink NBN Trust | 736,400 | 482,836 | (455.6 | ) | ||||||||
SATS Ltd. | 166,300 | 317,273 | (299.3 | ) | ||||||||
Sembcorp Industries Ltd. | 509,600 | 1,637,742 | (1,545.3 | ) | ||||||||
Singapore Post Ltd. | 691,100 | 264,428 | (249.5 | ) | ||||||||
StarHub Ltd. | 158,800 | 119,095 | (112.4 | ) | ||||||||
Suntec Real Estate Investment Trust | 37,600 | 38,066 | (35.9 | ) | ||||||||
|
|
|
| |||||||||
| 3,602,360 | ||||||||||||
| Spain | ||||||||||||
Atlantica Sustainable Infrastructure PLC | 21,321 | 567,565 | (535.5 | ) | ||||||||
Banco Bilbao Vizcaya Argentaria SA | 54,348 | 398,483 | (376.0 | ) | ||||||||
Banco de Sabadell SA | 389,952 | 407,076 | (384.1 | ) | ||||||||
Bankinter SA | 24,516 | 145,198 | (137.0 | ) | ||||||||
EDP Renovaveis SA | 20,519 | 456,787 | (431.0 | ) | ||||||||
Mapfre SA | 341,497 | 685,141 | (646.5 | ) | ||||||||
Merlin Properties Socimi SA | 98,576 | 872,918 | (823.6 | ) | ||||||||
Sacyr SA | 11,787 | 39,059 | (36.8 | ) | ||||||||
|
|
|
| |||||||||
| 3,572,227 | ||||||||||||
| Sweden | ||||||||||||
Assa Abloy AB | 1,393 | 32,948 | (31.1 | ) | ||||||||
Atlas Copco AB, A Shares | 59,162 | 850,080 | (802.1 | ) | ||||||||
Atlas Copco AB, B Shares | 17,890 | 227,932 | (215.1 | ) | ||||||||
Avanza Bank Holding AB | 11,308 | 238,563 | (225.1 | ) | ||||||||
Beijer Ref AB | 10,478 | 169,999 | (160.4 | ) | ||||||||
Castellum AB | 9,854 | 118,848 | (112.1 | ) | ||||||||
Elekta AB, B Shares | 65,017 | 542,891 | (512.2 | ) | ||||||||
Epiroc AB, Class A | 14,026 | 278,761 | (263.0 | ) | ||||||||
Epiroc AB, Class B | 21,929 | 374,552 | (353.4 | ) | ||||||||
SCHEDULE OF INVESTMENTS | 55 |
Schedule of Investments (continued) April 30, 2023 | BlackRock Global Equity Market Neutral Fund |
| Security | Shares | Value | % of Basket Value | |||||||||
| Sweden (continued) | ||||||||||||
Getinge AB, B Shares | 8,569 | $ | 215,859 | (203.7 | )% | |||||||
Industrivarden AB, A Shares | 857 | 24,333 | (23.0 | ) | ||||||||
Industrivarden AB, C Shares | 13,695 | 388,059 | (366.1 | ) | ||||||||
Indutrade AB | 4,664 | 111,182 | (104.9 | ) | ||||||||
Investor AB, A Shares | 12,728 | 277,095 | (261.5 | ) | ||||||||
L E Lundbergforetagen AB, B Shares | 1,465 | 69,774 | (65.8 | ) | ||||||||
Nibe Industrier AB, B Shares | 48,194 | 535,279 | (505.1 | ) | ||||||||
Sagax AB | 8,595 | 209,202 | (197.4 | ) | ||||||||
Sweco AB, B Shares | 6,158 | 81,943 | (77.3 | ) | ||||||||
Volvo Car AB | 12,190 | 49,938 | (47.1 | ) | ||||||||
|
|
|
| |||||||||
| 4,797,238 | ||||||||||||
| Switzerland | ||||||||||||
ABB Ltd., Registered Shares | 4,550 | 164,587 | (155.3 | ) | ||||||||
Accelleron Industries AG | 14,414 | 356,494 | (336.4 | ) | ||||||||
Banque Cantonale Vaudoise, Registered Shares | 2,671 | 281,801 | (265.9 | ) | ||||||||
Belimo Holding AG, Registered Shares | 1,119 | 541,595 | (511.0 | ) | ||||||||
Chocoladefabriken Lindt & Spruengli AG, Participation Certificates | 63 | 780,049 | (736.0 | ) | ||||||||
Chocoladefabriken Lindt & Spruengli AG, Registered Shares | 1 | 123,608 | (116.6 | ) | ||||||||
Cie Financiere Richemont SA, Registered Shares | 1,486 | 246,325 | (232.4 | ) | ||||||||
Clariant AG, Registered Shares | 12,447 | 208,195 | (196.4 | ) | ||||||||
Dufry AG, Registered Shares | 41,899 | 1,942,130 | (1,832.5 | ) | ||||||||
Geberit AG, Registered Shares | 159 | 90,806 | (85.7 | ) | ||||||||
Georg Fischer AG, Registered Shares | 952 | 69,626 | (65.7 | ) | ||||||||
Givaudan SA, Registered Shares | 317 | 1,111,920 | (1,049.1 | ) | ||||||||
Helvetia Holding AG, Registered Shares | 1,904 | 285,626 | (269.5 | ) | ||||||||
Idorsia Ltd. | 31,239 | 302,870 | (285.8 | ) | ||||||||
Partners Group Holding AG | 515 | 501,292 | (473.0 | ) | ||||||||
Sika AG, Registered Shares | 3,885 | 1,076,065 | (1,015.3 | ) | ||||||||
Swiss Prime Site AG, Registered Shares | 403 | 36,580 | (34.5 | ) | ||||||||
Tecan Group AG, Registered Shares | 753 | 329,091 | (310.5 | ) | ||||||||
VAT Group AG | 1,044 | 369,314 | (348.5 | ) | ||||||||
|
|
|
| |||||||||
| 8,817,974 | ||||||||||||
| United Kingdom | ||||||||||||
Auto Trader Group PLC | 39,136 | 310,477 | (292.9 | ) | ||||||||
B&M European Value Retail SA | 10,135 | 60,666 | (57.2 | ) | ||||||||
Beazley PLC | 126,155 | 939,047 | (886.0 | ) | ||||||||
Bellway PLC | 3,890 | 117,005 | (110.4 | ) | ||||||||
British American Tobacco PLC | 494 | 18,098 | (17.1 | ) | ||||||||
British Land Co. PLC | 105,126 | 525,394 | (495.7 | ) | ||||||||
Bunzl PLC | 4,404 | 173,885 | (164.1 | ) | ||||||||
Burberry Group PLC | 11,865 | 384,143 | (362.5 | ) | ||||||||
Centrica PLC | 709,521 | 1,011,179 | (954.1 | ) | ||||||||
ConvaTec Group PLC | 127,138 | 348,586 | (328.9 | ) | ||||||||
Croda International PLC | 4,618 | 402,473 | (379.7 | ) | ||||||||
Diploma PLC | 2,088 | 70,179 | (66.2 | ) | ||||||||
Direct Line Insurance Group PLC | 71,704 | 153,793 | (145.1 | ) | ||||||||
Hammerson PLC | 40 | 14 | (0.0 | ) | ||||||||
Hargreaves Lansdown PLC | 47,293 | 474,963 | (448.1 | ) | ||||||||
Hiscox Ltd. | 47,646 | 703,730 | (664.0 | ) | ||||||||
IG Group Holdings PLC | 11,145 | 102,060 | (96.3 | ) | ||||||||
IMI PLC | 22,767 | 453,246 | (427.7 | ) | ||||||||
Inchcape PLC | 33,591 | 339,335 | (320.2 | ) | ||||||||
Intermediate Capital Group PLC | 63,615 | 1,036,228 | (977.7 | ) | ||||||||
Intertek Group PLC | 4,963 | 257,541 | (243.0 | ) | ||||||||
ITV PLC | 461,896 | 466,254 | (439.9 | ) | ||||||||
| Security | Shares | Value | % of Basket Value | |||||||||
| United Kingdom (continued) | ||||||||||||
Land Securities Group PLC | 11,405 | $ | 96,016 | (90.6 | )% | |||||||
Liberty Global PLC | 51,824 | 1,054,100 | (994.6 | ) | ||||||||
Liberty Global PLC | 48,131 | 939,036 | (886.0 | ) | ||||||||
London Stock Exchange Group PLC | 6,041 | 629,319 | (593.8 | ) | ||||||||
Nomad Foods Ltd. | 24,829 | 466,785 | (440.4 | ) | ||||||||
OSB Group PLC | 12,093 | 75,115 | (70.9 | ) | ||||||||
Pennon Group PLC | 60,092 | 644,576 | (608.2 | ) | ||||||||
Phoenix Group Holdings PLC | 20,308 | 150,124 | (141.6 | ) | ||||||||
Renishaw PLC | 1,960 | 88,144 | (83.2 | ) | ||||||||
Rightmove PLC | 80,893 | 580,652 | (547.9 | ) | ||||||||
Rotork PLC | 137,571 | 562,381 | (530.6 | ) | ||||||||
RS GROUP PLC | 4,565 | 52,551 | (49.6 | ) | ||||||||
Segro PLC | 159,155 | 1,662,845 | (1,569.0 | ) | ||||||||
Severn Trent PLC | 5,033 | 183,873 | (173.5 | ) | ||||||||
Smiths Group PLC | 7,234 | 151,711 | (143.1 | ) | ||||||||
Spectris PLC | 61,255 | 2,876,739 | (2,714.3 | ) | ||||||||
Spirax-Sarco Engineering PLC | 2,240 | 310,341 | (292.8 | ) | ||||||||
Standard Chartered PLC | 52,536 | 412,776 | (389.5 | ) | ||||||||
Taylor Wimpey PLC | 29,384 | 47,049 | (44.4 | ) | ||||||||
Tesco PLC | 121,126 | 424,841 | (400.9 | ) | ||||||||
Travis Perkins PLC | 34,637 | 414,609 | (391.2 | ) | ||||||||
Tritax Big Box REIT PLC | 309,687 | 600,310 | (566.4 | ) | ||||||||
United Utilities Group PLC | 59,890 | 806,927 | (761.4 | ) | ||||||||
|
|
|
| |||||||||
| 21,579,116 | ||||||||||||
| United States | ||||||||||||
Acadia Healthcare Co., Inc. | 1,050 | 75,904 | (71.6 | ) | ||||||||
Accenture PLC, Class B | 1,414 | 396,330 | (374.0 | ) | ||||||||
Acuity Brands, Inc. | 623 | 98,048 | (92.5 | ) | ||||||||
Adobe, Inc. | 6,429 | 2,427,333 | (2,290.3 | ) | ||||||||
AECOM | 1,665 | 138,278 | (130.5 | ) | ||||||||
Affiliated Managers Group, Inc. | 1,592 | 229,853 | (216.9 | ) | ||||||||
Agilent Technologies, Inc. | 11,384 | 1,541,735 | (1,454.7 | ) | ||||||||
Akamai Technologies, Inc. | 5,586 | 457,884 | (432.0 | ) | ||||||||
Alaska Air Group, Inc. | 1,051 | 45,676 | (43.1 | ) | ||||||||
Alcoa Corp. | 17,200 | 638,808 | (602.7 | ) | ||||||||
Alkermes PLC | 14,037 | 400,756 | (378.1 | ) | ||||||||
Allstate Corp. | 3,503 | 405,507 | (382.6 | ) | ||||||||
Ally Financial, Inc. | 6,502 | 171,523 | (161.8 | ) | ||||||||
Alnylam Pharmaceuticals, Inc. | 1,315 | 261,948 | (247.2 | ) | ||||||||
Alphabet, Inc., Class A | 289 | 31,021 | (29.3 | ) | ||||||||
Altria Group, Inc. | 75,443 | 3,584,297 | (3,381.9 | ) | ||||||||
Amazon.com, Inc. | 10,254 | 1,081,284 | (1,020.2 | ) | ||||||||
American Airlines Group, Inc. | 26,420 | 360,369 | (340.0 | ) | ||||||||
American Financial Group, Inc. | 5,292 | 649,487 | (612.8 | ) | ||||||||
American Tower Corp. | 12 | 2,453 | (2.3 | ) | ||||||||
AMETEK, Inc. | 2,698 | 372,135 | (351.1 | ) | ||||||||
Amgen, Inc. | 1,166 | 279,537 | (263.8 | ) | ||||||||
Aon PLC | 4,102 | 1,333,888 | (1,258.6 | ) | ||||||||
Apple, Inc. | 9,117 | 1,546,973 | (1,459.6 | ) | ||||||||
Arthur J Gallagher & Co. | 1,289 | 268,189 | (253.0 | ) | ||||||||
Autodesk, Inc. | 327 | 63,696 | (60.1 | ) | ||||||||
AutoNation, Inc. | 2,820 | 371,394 | (350.4 | ) | ||||||||
AutoZone, Inc. | 204 | 543,315 | (512.6 | ) | ||||||||
Avis Budget Group, Inc. | 290 | 51,234 | (48.3 | ) | ||||||||
Axcelis Technologies, Inc. | 1,736 | 205,369 | (193.8 | ) | ||||||||
Azenta, Inc. | 1,648 | 71,672 | (67.6 | ) | ||||||||
Bank of America Corp. | 4,475 | 131,028 | (123.6 | ) | ||||||||
Bath & Body Works, Inc. | 898 | 31,520 | (29.7 | ) | ||||||||
Bausch Health Cos., Inc. | 3,023 | 22,086 | (20.8 | ) | ||||||||
Beacon Roofing Supply, Inc. | 7,343 | 441,902 | (417.0 | ) | ||||||||
| 56 | 2 0 2 3 BLACK ROCK ANNUAL REPORT TO SHAREHOLDERS |
Schedule of Investments (continued) April 30, 2023 | BlackRock Global Equity Market Neutral Fund |
| Security | Shares | Value | % of Basket Value | |||||||||
| United States (continued) | ||||||||||||
BioMarin Pharmaceutical, Inc. | 2,538 | $ | 243,750 | (230.0 | )% | |||||||
Bio-Techne Corp. | 670 | 53,520 | (50.5 | ) | ||||||||
Block, Inc. | 1,475 | 89,665 | (84.6 | ) | ||||||||
Boeing Co. | 3,629 | 750,405 | (708.0 | ) | ||||||||
Booz Allen Hamilton Holding Corp. | 7,160 | 685,355 | (646.7 | ) | ||||||||
Boston Beer Co., Inc. | 1,224 | 388,632 | (366.7 | ) | ||||||||
Box, Inc. | 2,109 | 55,804 | (52.7 | ) | ||||||||
Boyd Gaming Corp. | 6,463 | 448,532 | (423.2 | ) | ||||||||
Brighthouse Financial, Inc. | 3,625 | 160,225 | (151.2 | ) | ||||||||
Bristol-Myers Squibb Co. | 18,049 | 1,205,132 | (1,137.1 | ) | ||||||||
Bruker Corp. | 18,732 | 1,482,263 | (1,398.6 | ) | ||||||||
CACI International, Inc., Class A | 4,290 | 1,344,143 | (1,268.3 | ) | ||||||||
Camden Property Trust | 2,251 | 247,723 | (233.7 | ) | ||||||||
Capri Holdings Ltd. | 5,182 | 215,053 | (202.9 | ) | ||||||||
Carlisle Cos., Inc. | 2,898 | 625,533 | (590.2 | ) | ||||||||
Carnival Corp. | 89,739 | 826,496 | (779.8 | ) | ||||||||
Carnival PLC | 26,769 | 219,196 | (206.8 | ) | ||||||||
Charles River Laboratories International, Inc. | 1,356 | 257,803 | (243.2 | ) | ||||||||
Charter Communications, Inc. | 459 | 169,233 | (159.7 | ) | ||||||||
Chemed Corp. | 896 | 493,920 | (466.0 | ) | ||||||||
Cheniere Energy, Inc. | 7,629 | 1,167,237 | (1,101.3 | ) | ||||||||
Chevron Corp. | 14,073 | 2,372,426 | (2,238.5 | ) | ||||||||
Chewy, Inc., Class A | 6,939 | 215,178 | (203.0 | ) | ||||||||
Church & Dwight Co., Inc. | 4,832 | 469,284 | (442.8 | ) | ||||||||
Cigna Group | 1,027 | 260,129 | (245.4 | ) | ||||||||
Cincinnati Financial Corp. | 443 | 47,153 | (44.5 | ) | ||||||||
Cintas Corp. | 3,543 | 1,614,793 | (1,523.6 | ) | ||||||||
Cirrus Logic, Inc. | 4,011 | 344,104 | (324.7 | ) | ||||||||
Citizens Financial Group, Inc. | 244 | 7,549 | (7.1 | ) | ||||||||
Cleveland-Cliffs, Inc. | 2,296 | 35,312 | (33.3 | ) | ||||||||
Coca-Cola Co. | 4,024 | 258,140 | (243.6 | ) | ||||||||
Cognizant Technology Solutions Corp. | 2,454 | 146,528 | (138.3 | ) | ||||||||
Columbia Banking System, Inc. | 23 | 491 | (0.5 | ) | ||||||||
Columbia Sportswear Co. | 11,042 | 922,449 | (870.4 | ) | ||||||||
Comerica, Inc. | 14,148 | 613,599 | (579.0 | ) | ||||||||
Commercial Metals Co. | 11,274 | 526,383 | (496.7 | ) | ||||||||
ConocoPhillips | 1,451 | 149,293 | (140.9 | ) | ||||||||
Credit Acceptance Corp. | 1,058 | 517,891 | (488.7 | ) | ||||||||
Crocs, Inc. | 4,214 | 521,145 | (491.7 | ) | ||||||||
Crowdstrike Holdings, Inc. | 212 | 25,451 | (24.0 | ) | ||||||||
CubeSmart | 6,643 | 302,190 | (285.1 | ) | ||||||||
Curtiss-Wright Corp. | 909 | 154,375 | (145.7 | ) | ||||||||
CVS Health Corp. | 18,335 | 1,344,139 | (1,268.2 | ) | ||||||||
Danaher Corp. | 595 | 140,961 | (133.0 | ) | ||||||||
DaVita, Inc. | 2,183 | 197,256 | (186.1 | ) | ||||||||
Deckers Outdoor Corp. | 2,043 | 979,292 | (924.0 | ) | ||||||||
Devon Energy Corp. | 2,844 | 151,955 | (143.4 | ) | ||||||||
Diamondback Energy, Inc. | 1,930 | 274,446 | (259.0 | ) | ||||||||
DocuSign, Inc. | 489 | 24,176 | (22.8 | ) | ||||||||
Domino’s Pizza, Inc. | 4,381 | 1,390,836 | (1,312.3 | ) | ||||||||
Donaldson Co., Inc. | 3,656 | 232,339 | (219.2 | ) | ||||||||
Dover Corp. | 3,613 | 528,076 | (498.3 | ) | ||||||||
Dropbox, Inc. | 18,787 | 382,128 | (360.6 | ) | ||||||||
DTE Energy Co. | 325 | 36,533 | (34.5 | ) | ||||||||
DuPont de Nemours, Inc. | 24,506 | 1,708,558 | (1,612.1 | ) | ||||||||
Eastman Chemical Co. | 7,406 | 624,104 | (588.9 | ) | ||||||||
eBay, Inc. | 73,917 | 3,431,966 | (3,238.2 | ) | ||||||||
Ecolab, Inc. | 2,757 | 462,735 | (436.6 | ) | ||||||||
Edwards Lifesciences Corp. | 1,069 | 94,051 | (88.7 | ) | ||||||||
Electronic Arts, Inc. | 14,760 | 1,878,653 | (1,772.6 | ) | ||||||||
Elevance Health, Inc. | 625 | 292,906 | (276.4 | ) | ||||||||
Enovis Corp. | 14,788 | 861,401 | (812.8 | ) | ||||||||
| Security | Shares | Value | % of Basket Value | |||||||||
| United States (continued) | ||||||||||||
EOG Resources, Inc. | 5,644 | $ | 674,289 | (636.2 | )% | |||||||
EPAM Systems, Inc. | 515 | 145,457 | (137.2 | ) | ||||||||
Equinix, Inc. | 1,173 | 849,346 | (801.4 | ) | ||||||||
Equity LifeStyle Properties, Inc. | 6,724 | 463,284 | (437.1 | ) | ||||||||
Equity Residential | 4,587 | 290,128 | (273.7 | ) | ||||||||
Etsy, Inc. | 2,258 | 228,126 | (215.2 | ) | ||||||||
Evercore, Inc., Class A | 501 | 57,149 | (53.9 | ) | ||||||||
Exelixis, Inc. | 34,633 | 633,784 | (598.0 | ) | ||||||||
Expedia Group, Inc. | 5,183 | 486,995 | (459.5 | ) | ||||||||
Experian PLC | 17,057 | 599,117 | (565.3 | ) | ||||||||
Exxon Mobil Corp. | 11,812 | 1,397,832 | (1,318.9 | ) | ||||||||
FactSet Research Systems, Inc. | 1,098 | 452,036 | (426.5 | ) | ||||||||
Fair Isaac Corp. | 1,166 | 848,790 | (800.9 | ) | ||||||||
Fidelity National Information Services, Inc. | 17,830 | 1,046,978 | (987.9 | ) | ||||||||
Flowserve Corp. | 7,061 | 235,767 | (222.5 | ) | ||||||||
Fluor Corp. | 10,891 | 316,492 | (298.6 | ) | ||||||||
Ford Motor Co. | 46,542 | 552,919 | (521.7 | ) | ||||||||
Fox Corp., Class A | 31,976 | 1,063,522 | (1,003.5 | ) | ||||||||
Fox Corp., Class B | 41,769 | 1,275,625 | (1,203.6 | ) | ||||||||
Freeport-McMoRan, Inc. | 21,705 | 822,837 | (776.4 | ) | ||||||||
Gap, Inc. | 4,300 | 41,280 | (39.0 | ) | ||||||||
Garmin Ltd. | 27,734 | 2,722,647 | (2,568.9 | ) | ||||||||
Gartner, Inc. | 4,219 | 1,276,079 | (1,204.0 | ) | ||||||||
General Dynamics Corp. | 10,443 | 2,280,125 | (2,151.4 | ) | ||||||||
General Electric Co. | 11,187 | 1,107,177 | (1,044.7 | ) | ||||||||
Gentex Corp. | 14,024 | 386,922 | (365.1 | ) | ||||||||
Globant SA | 271 | 42,512 | (40.1 | ) | ||||||||
Globus Medical, Inc. | 11,377 | 661,459 | (624.1 | ) | ||||||||
GoDaddy, Inc., Class A | 1,560 | 118,061 | (111.4 | ) | ||||||||
Graco, Inc. | 768 | 60,895 | (57.5 | ) | ||||||||
Guidewire Software, Inc. | 8,064 | 614,396 | (579.7 | ) | ||||||||
Halliburton Co. | 14,454 | 473,368 | (446.6 | ) | ||||||||
Halozyme Therapeutics, Inc. | 3,576 | 114,897 | (108.4 | ) | ||||||||
Hanover Insurance Group, Inc. | 1,808 | 216,164 | (204.0 | ) | ||||||||
HCA Healthcare, Inc. | 537 | 154,296 | (145.6 | ) | ||||||||
HealthEquity, Inc. | 3,289 | 175,797 | (165.9 | ) | ||||||||
HEICO Corp. | 91 | 15,346 | (14.5 | ) | ||||||||
Helmerich & Payne, Inc. | 16,311 | 540,873 | (510.3 | ) | ||||||||
Henry Schein, Inc. | 1,919 | 155,074 | (146.3 | ) | ||||||||
Herc Holdings, Inc. | 7,853 | 785,457 | (741.1 | ) | ||||||||
Holcim AG | 14,928 | 989,074 | (933.2 | ) | ||||||||
Hologic, Inc. | 3,627 | 311,958 | (294.3 | ) | ||||||||
Home Depot, Inc. | 1,272 | 382,287 | (360.7 | ) | ||||||||
Honeywell International, Inc. | 3,041 | 607,713 | (573.4 | ) | ||||||||
Hormel Foods Corp. | 11,007 | 445,123 | (420.0 | ) | ||||||||
Howard Hughes Corp. | 1,181 | 91,374 | (86.2 | ) | ||||||||
Huntsman Corp. | 89,493 | 2,397,517 | (2,262.2 | ) | ||||||||
ICU Medical, Inc. | 1,014 | 191,788 | (181.0 | ) | ||||||||
IDACORP, Inc. | 209 | 23,224 | (21.9 | ) | ||||||||
Incyte Corp. | 5,577 | 414,985 | (391.6 | ) | ||||||||
Ingersoll Rand, Inc. | 393 | 22,409 | (21.1 | ) | ||||||||
Insperity, Inc. | 295 | 36,126 | (34.1 | ) | ||||||||
Integra LifeSciences Holdings Corp. | 1,265 | 69,980 | (66.0 | ) | ||||||||
Intuitive Surgical, Inc. | 222 | 66,871 | (63.1 | ) | ||||||||
Invesco Ltd. | 81,454 | 1,395,307 | (1,316.5 | ) | ||||||||
Ionis Pharmaceuticals, Inc. | 1,766 | 62,463 | (58.9 | ) | ||||||||
IQVIA Holdings, Inc. | 387 | 72,845 | (68.7 | ) | ||||||||
ITT, Inc. | 2,706 | 228,495 | (215.6 | ) | ||||||||
J M Smucker Co. | 1,772 | 273,615 | (258.2 | ) | ||||||||
Jack Henry & Associates, Inc. | 2,751 | 449,348 | (424.0 | ) | ||||||||
Johnson Controls International PLC | 18,051 | 1,080,172 | (1,019.2 | ) | ||||||||
Jones Lang LaSalle, Inc. | 5,557 | 772,645 | (729.0 | ) | ||||||||
SCHEDULE OF INVESTMENTS | 57 |
Schedule of Investments (continued) April 30, 2023 | BlackRock Global Equity Market Neutral Fund |
| Security | Shares | Value | % of Basket Value | |||||||||
| United States (continued) | ||||||||||||
KeyCorp | 6,725 | $ | 75,723 | (71.5 | )% | |||||||
Keysight Technologies, Inc. | 1,366 | 197,578 | (186.4 | ) | ||||||||
KLA Corp. | 184 | 71,123 | (67.1 | ) | ||||||||
Knight-Swift Transportation Holdings, Inc. | 11,766 | 662,661 | (625.2 | ) | ||||||||
Laboratory Corp. of America Holdings | 3,123 | 708,015 | (668.0 | ) | ||||||||
Lam Research Corp. | 268 | 140,453 | (132.5 | ) | ||||||||
Landstar System, Inc. | 148 | 26,052 | (24.6 | ) | ||||||||
Lattice Semiconductor Corp. | 390 | 31,083 | (29.3 | ) | ||||||||
Lear Corp. | 109 | 13,915 | (13.1 | ) | ||||||||
Lennox International, Inc. | 5,378 | 1,516,112 | (1,430.5 | ) | ||||||||
Liberty Broadband Corp. | 7,953 | 674,255 | (636.2 | ) | ||||||||
Light & Wonder, Inc. | 278 | 16,761 | (15.8 | ) | ||||||||
Lowe’s Cos., Inc. | 316 | 65,674 | (62.0 | ) | ||||||||
Lyft, Inc. | 13,071 | 133,978 | (126.4 | ) | ||||||||
MACOM Technology Solutions Holdings, Inc. | 517 | 30,162 | (28.5 | ) | ||||||||
Macy’s, Inc. | 20,313 | 331,914 | (313.2 | ) | ||||||||
Manhattan Associates, Inc. | 17,903 | 2,966,169 | (2,798.7 | ) | ||||||||
Marathon Oil Corp. | 32,989 | 797,014 | (752.0 | ) | ||||||||
Marriott Vacations Worldwide Corp. | 497 | 66,876 | (63.1 | ) | ||||||||
Martin Marietta Materials, Inc. | 53 | 19,250 | (18.2 | ) | ||||||||
Marvell Technology, Inc. | 962 | 37,980 | (35.8 | ) | ||||||||
Masco Corp. | 11,920 | 637,839 | (601.8 | ) | ||||||||
Match Group, Inc. | 14,403 | 531,471 | (501.5 | ) | ||||||||
Medical Properties Trust, Inc. | 40,879 | 358,509 | (338.3 | ) | ||||||||
Merck & Co., Inc. | 455 | 52,539 | (49.6 | ) | ||||||||
Meta Platforms, Inc., Class A | 4,773 | 1,147,047 | (1,082.3 | ) | ||||||||
MetLife, Inc. | 31,127 | 1,909,019 | (1,801.2 | ) | ||||||||
Mettler-Toledo International, Inc. | 395 | 589,142 | (555.9 | ) | ||||||||
MGIC Investment Corp. | 20,245 | 301,043 | (284.0 | ) | ||||||||
MGM Resorts International | 9,209 | 413,668 | (390.3 | ) | ||||||||
Micron Technology, Inc. | 32,203 | 2,072,585 | (1,955.6 | ) | ||||||||
Microsoft Corp. | 23,689 | 7,278,682 | (6,867.7 | ) | ||||||||
Mid-America Apartment Communities, Inc. | 923 | 141,957 | (133.9 | ) | ||||||||
Mohawk Industries, Inc. | 360 | 38,124 | (36.0 | ) | ||||||||
Molson Coors Beverage Co., Class B | 17,292 | 1,028,528 | (970.5 | ) | ||||||||
Moody’s Corp. | 4,090 | 1,280,661 | (1,208.4 | ) | ||||||||
MSCI, Inc. | 991 | 478,108 | (451.1 | ) | ||||||||
Nasdaq, Inc. | 8,149 | 451,210 | (425.7 | ) | ||||||||
NetApp, Inc. | 8,659 | 544,565 | (513.8 | ) | ||||||||
Neurocrine Biosciences, Inc. | 2,909 | 293,925 | (277.3 | ) | ||||||||
Newmont Corp. | 21,637 | 1,025,594 | (967.7 | ) | ||||||||
Nexstar Media Group, Inc. | 904 | 156,799 | (147.9 | ) | ||||||||
Nordson Corp. | 1,257 | 271,902 | (256.6 | ) | ||||||||
Norfolk Southern Corp. | 6,639 | 1,347,916 | (1,271.8 | ) | ||||||||
Northern Trust Corp. | 1,235 | 96,528 | (91.1 | ) | ||||||||
Northrop Grumman Corp. | 1,216 | 560,904 | (529.2 | ) | ||||||||
Novocure Ltd. | 845 | 55,686 | (52.5 | ) | ||||||||
NVIDIA Corp. | 8,377 | 2,324,534 | (2,193.3 | ) | ||||||||
OneMain Holdings, Inc. | 12,128 | 465,351 | (439.1 | ) | ||||||||
O’Reilly Automotive, Inc. | 2,491 | 2,285,019 | (2,156.0 | ) | ||||||||
Oshkosh Corp. | 8,127 | 621,878 | (586.8 | ) | ||||||||
Otis Worldwide Corp. | 17,780 | 1,516,634 | (1,431.0 | ) | ||||||||
Ovintiv, Inc. | 9,072 | 327,318 | (308.8 | ) | ||||||||
Ovintiv, Inc. | 5,761 | 206,681 | (195.0 | ) | ||||||||
Palo Alto Networks, Inc. | 740 | 135,020 | (127.4 | ) | ||||||||
Paycom Software, Inc. | 718 | 208,486 | (196.7 | ) | ||||||||
PDC Energy, Inc. | 7,017 | 456,456 | (430.7 | ) | ||||||||
Penn Entertainment, Inc. | 12,461 | 371,213 | (350.3 | ) | ||||||||
Penske Automotive Group, Inc. | 4,741 | 657,008 | (619.9 | ) | ||||||||
PepsiCo., Inc. | 3,775 | 720,610 | (679.9 | ) | ||||||||
Philip Morris International, Inc. | 22,801 | 2,279,416 | (2,150.7 | ) | ||||||||
Pinnacle Financial Partners, Inc. | 1,456 | 78,959 | (74.5 | ) | ||||||||
| Security | Shares | Value | % of Basket Value | |||||||||
| United States (continued) | ||||||||||||
Pinterest, Inc. | 9,930 | $ | 228,390 | (215.5 | )% | |||||||
Planet Fitness, Inc., Class A | 2,612 | 217,162 | (204.9 | ) | ||||||||
Power Integrations, Inc. | 4,798 | 349,198 | (329.5 | ) | ||||||||
PPL Corp. | 721 | 20,707 | (19.5 | ) | ||||||||
Primo Water Corp. | 23,666 | 356,999 | (336.8 | ) | ||||||||
Prudential Financial, Inc. | 4,611 | 401,157 | (378.5 | ) | ||||||||
PTC Therapeutics, Inc. | 11,900 | 656,166 | (619.1 | ) | ||||||||
PVH Corp. | 2,773 | 237,951 | (224.5 | ) | ||||||||
Qorvo, Inc. | 197 | 18,140 | (17.1 | ) | ||||||||
Qualys, Inc. | 3,172 | 358,246 | (338.0 | ) | ||||||||
Quest Diagnostics, Inc. | 5,997 | 832,444 | (785.4 | ) | ||||||||
Ralph Lauren Corp. | 14,233 | 1,633,806 | (1,541.6 | ) | ||||||||
Rambus, Inc. | 7,105 | 315,036 | (297.3 | ) | ||||||||
Regeneron Pharmaceuticals, Inc., Registered Shares | 170 | 136,304 | (128.6 | ) | ||||||||
Repligen Corp. | 974 | 147,688 | (139.4 | ) | ||||||||
ResMed, Inc. | 853 | 205,539 | (193.9 | ) | ||||||||
RingCentral, Inc., Class A | 12,627 | 348,000 | (328.4 | ) | ||||||||
ROBLOX Corp. | 13,359 | 475,580 | (448.7 | ) | ||||||||
Roche Holding AG | 1,821 | 617,916 | (583.0 | ) | ||||||||
Rollins, Inc. | 6,713 | 283,624 | (267.6 | ) | ||||||||
Royal Gold, Inc. | 1,590 | 210,580 | (198.7 | ) | ||||||||
S&P Global, Inc. | 10,240 | 3,712,819 | (3,503.2 | ) | ||||||||
Saia, Inc. | 28 | 8,338 | (7.9 | ) | ||||||||
SBA Communications Corp. | 1,971 | 514,214 | (485.2 | ) | ||||||||
Scotts Miracle-Gro Co. | 15,491 | 1,034,954 | (976.5 | ) | ||||||||
SEI Investments Co. | 2,807 | 165,360 | (156.0 | ) | ||||||||
Signify NV | 13,132 | 439,194 | (414.4 | ) | ||||||||
Sims Ltd. | 2,238 | 23,380 | (22.1 | ) | ||||||||
Sirius XM Holdings, Inc. | 41,264 | 156,803 | (148.0 | ) | ||||||||
SiteOne Landscape Supply, Inc. | 600 | 88,644 | (83.6 | ) | ||||||||
Snap-on, Inc. | 4,524 | 1,173,571 | (1,107.3 | ) | ||||||||
Southwestern Energy Co. | 10,274 | 53,322 | (50.3 | ) | ||||||||
Steel Dynamics, Inc. | 3,737 | 388,461 | (366.5 | ) | ||||||||
Stifel Financial Corp. | 1,047 | 62,789 | (59.2 | ) | ||||||||
Sun Communities, Inc. | 636 | 88,359 | (83.4 | ) | ||||||||
Synopsys, Inc. | 2,263 | 840,297 | (792.9 | ) | ||||||||
Synovus Financial Corp. | 9,857 | 303,596 | (286.5 | ) | ||||||||
T Rowe Price Group, Inc. | 2,426 | 272,513 | (257.1 | ) | ||||||||
Tapestry, Inc. | 7,919 | 323,174 | (304.9 | ) | ||||||||
Teradata Corp. | 28,481 | 1,102,500 | (1,040.3 | ) | ||||||||
Teradyne, Inc. | 1,617 | 147,761 | (139.4 | ) | ||||||||
Texas Pacific Land Corp. | 91 | 134,466 | (126.9 | ) | ||||||||
Texas Roadhouse, Inc. | 395 | 43,695 | (41.2 | ) | ||||||||
Textron, Inc. | 17,427 | 1,166,563 | (1,100.7 | ) | ||||||||
Thor Industries, Inc. | 1,399 | 110,549 | (104.3 | ) | ||||||||
TJX Cos., Inc. | 1,992 | 157,009 | (148.1 | ) | ||||||||
Transocean Ltd. | 14,233 | 83,975 | (79.2 | ) | ||||||||
Travel & Leisure Co. | 9,328 | 356,983 | (336.8 | ) | ||||||||
Travelers Cos., Inc. | 1,547 | 280,224 | (264.4 | ) | ||||||||
Trimble, Inc. | 3,908 | 184,067 | (173.7 | ) | ||||||||
UGI Corp. | 6,174 | 209,175 | (197.4 | ) | ||||||||
United Parcel Service, Inc., Class B | 8,259 | 1,485,051 | (1,401.2 | ) | ||||||||
United States Steel Corp. | 52,826 | 1,208,659 | (1,140.4 | ) | ||||||||
United Therapeutics Corp. | 1,283 | 295,257 | (278.6 | ) | ||||||||
UnitedHealth Group, Inc. | 510 | 250,966 | (236.8 | ) | ||||||||
US Bancorp | 20,956 | 718,372 | (677.8 | ) | ||||||||
Vail Resorts, Inc. | 1,077 | 259,040 | (244.4 | ) | ||||||||
Valero Energy Corp. | 1,353 | 155,149 | (146.4 | ) | ||||||||
Veeva Systems, Inc., Class A | 455 | 81,481 | (76.9 | ) | ||||||||
Ventas, Inc. | 2,073 | 99,608 | (94.0 | ) | ||||||||
VeriSign, Inc. | 12,684 | 2,813,311 | (2,654.5 | ) | ||||||||
| 58 | 2 0 2 3 BLACK ROCK ANNUAL REPORT TO SHAREHOLDERS |
Schedule of Investments (continued) April 30, 2023 | BlackRock Global Equity Market Neutral Fund |
| Security | Shares | Value | % of Basket Value | |||||||||
| United States (continued) | ||||||||||||
Vertex Pharmaceuticals, Inc. | 1,924 | $ | 655,565 | (618.6 | )% | |||||||
Virtu Financial, Inc., Class A | 23,424 | 469,651 | (443.1 | ) | ||||||||
Visteon Corp. | 2,988 | 419,485 | (395.8 | ) | ||||||||
Vistra Corp. | 58,295 | 1,390,919 | (1,312.4 | ) | ||||||||
Vulcan Materials Co. | 3,802 | 665,806 | (628.2 | ) | ||||||||
W R Berkley Corp. | 3,777 | 222,541 | (210.0 | ) | ||||||||
Walgreens Boots Alliance, Inc. | 2,309 | 81,392 | (76.8 | ) | ||||||||
Walmart, Inc. | 7,557 | 1,140,880 | (1,076.5 | ) | ||||||||
Waste Connections, Inc. | 212 | 29,500 | (27.8 | ) | ||||||||
Waters Corp. | 1,937 | 581,797 | (549.0 | ) | ||||||||
Watsco, Inc. | 3,569 | 1,236,230 | (1,166.4 | ) | ||||||||
Westlake Corp. | 1,134 | 129,027 | (121.7 | ) | ||||||||
Westrock Co. | 12,843 | 384,391 | (362.7 | ) | ||||||||
WEX, Inc. | 1,192 | 211,401 | (199.5 | ) | ||||||||
Willis Towers Watson PLC | 2,901 | 671,872 | (633.9 | ) | ||||||||
WillScot Mobile Mini Holdings Corp. | 2,829 | 128,437 | (121.2 | ) | ||||||||
Woodward, Inc. | 818 | 78,544 | (74.1 | ) | ||||||||
Workiva, Inc. | 1,084 | 101,267 | (95.6 | ) | ||||||||
World Wrestling Entertainment, Inc., Class A | 6,551 | 702,071 | (662.4 | ) | ||||||||
WP Carey, Inc. | 4,729 | 350,892 | (331.1 | ) | ||||||||
WW Grainger, Inc. | 173 | 120,334 | (113.5 | ) | ||||||||
Xylem, Inc. | 12,949 | 1,344,624 | (1,268.7 | ) | ||||||||
YETI Holdings, Inc. | 1,843 | 72,706 | (68.6 | ) | ||||||||
Yum! Brands, Inc. | 1,048 | 147,328 | (139.0 | ) | ||||||||
Ziff Davis, Inc. | 2,895 | 211,740 | (199.8 | ) | ||||||||
Zillow Group, Inc., Class C | 10,507 | 457,475 | (431.6 | ) | ||||||||
Zions Bancorp NA | 6,303 | 175,602 | (165.7 | ) | ||||||||
Zurn Elkay Water Solutions Corp. | 11,900 | 256,445 | (242.0 | ) | ||||||||
|
|
|
| |||||||||
| 174,954,529 | ||||||||||||
| Zambia | ||||||||||||
First Quantum Minerals Ltd. | 4,290 | 103,469 | (97.6) | |||||||||
| Preferred Stocks | ||||||||||||
| Germany | ||||||||||||
Bayerische Motoren Werke AG | 1,354 | 144,139 | (136.0 | ) | ||||||||
Fuchs Petrolub SE, Preference Shares | 17,467 | 691,138 | (652.1 | ) | ||||||||
Sartorius AG | 1,324 | 515,478 | (486.4 | ) | ||||||||
Volkswagen AG | 1,230 | 168,214 | (158.7 | ) | ||||||||
|
|
|
| |||||||||
| 1,518,969 | ||||||||||||
| Warrants | ||||||||||||
| Australia | ||||||||||||
Magellan Financial Group Ltd., (Issued/Exercisable 04/14/22, 1 Share for 1 Warrant, Expires 04/16/27, Strike Price AUD 35.00) | 464 | 63 | (0.1 | ) | ||||||||
|
|
|
| |||||||||
Total Reference Entity — Long | 356,832,231 | |||||||||||
|
| |||||||||||
Reference Entity — Short |
| |||||||||||
| Common Stocks | ||||||||||||
| Australia | ||||||||||||
ALS Ltd. | (61,920 | ) | (538,816 | ) | 508.4 | |||||||
Ampol Ltd. | (46,028 | ) | (915,528 | ) | 863.8 | |||||||
ASX Ltd. | (8,121 | ) | (368,441 | ) | 347.6 | |||||||
BlueScope Steel Ltd. | (3,841 | ) | (50,899 | ) | 48.0 | |||||||
carsales.com Ltd. | (79,824 | ) | (1,262,169 | ) | 1,190.9 | |||||||
Cleanaway Waste Management Ltd. | (746,085 | ) | (1,197,837 | ) | 1,130.2 | |||||||
Cochlear Ltd. | (1,414 | ) | (231,147 | ) | 218.1 | |||||||
Coles Group Ltd. | (93,870 | ) | (1,130,545 | ) | 1,066.7 | |||||||
Computershare Ltd. | (17,036 | ) | (252,818 | ) | 238.5 | |||||||
| Security | Shares | Value | % of Basket Value | |||||||||
| Australia (continued) | ||||||||||||
EBOS Group Ltd. | (22,374 | ) | $ | (607,296 | ) | 573.0 | % | |||||
Endeavour Group Ltd. | (65,898 | ) | (296,103 | ) | 279.4 | |||||||
Flutter Entertainment PLC | (3,781 | ) | (756,578 | ) | 713.9 | |||||||
Glencore PLC | (43,332 | ) | (254,734 | ) | 240.3 | |||||||
IGO Ltd. | (21,313 | ) | (195,692 | ) | 184.6 | |||||||
Incitec Pivot Ltd. | (63,648 | ) | (135,199 | ) | 127.6 | |||||||
Insurance Australia Group Ltd. | (13,813 | ) | (45,628 | ) | 43.1 | |||||||
JB Hi-Fi Ltd. | (13,683 | ) | (403,707 | ) | 380.9 | |||||||
Lendlease Corp. Ltd. | (122,674 | ) | (607,271 | ) | 573.0 | |||||||
Lottery Corp. Ltd. | (25,318 | ) | (84,637 | ) | 79.9 | |||||||
Medibank Pvt Ltd. | (15,537 | ) | (36,660 | ) | 34.6 | |||||||
Newcrest Mining Ltd. | (13,589 | ) | (256,460 | ) | 242.0 | |||||||
Newcrest Mining Ltd. | (19,736 | ) | (375,700 | ) | 354.5 | |||||||
NEXTDC Ltd. | (82,672 | ) | (632,861 | ) | 597.1 | |||||||
Northern Star Resources Ltd. | (18,697 | ) | (166,249 | ) | 156.9 | |||||||
Nufarm Ltd. | (4,571 | ) | (16,943 | ) | 16.0 | |||||||
Orica Ltd. | (4,721 | ) | (50,806 | ) | 47.9 | |||||||
Ramsay Health Care Ltd. | (25,164 | ) | (1,078,688 | ) | 1,017.8 | |||||||
REA Group Ltd. | (2,536 | ) | (237,780 | ) | 224.4 | |||||||
Reece Ltd. | (139,782 | ) | (1,697,692 | ) | 1,601.8 | |||||||
Santos Ltd. | (23,809 | ) | (112,672 | ) | 106.3 | |||||||
Seven Group Holdings Ltd. | (103,167 | ) | (1,624,732 | ) | 1,533.0 | |||||||
Tabcorp Holdings Ltd. | (1,868,812 | ) | (1,299,524 | ) | 1,226.1 | |||||||
Telstra Group Ltd. | (117,205 | ) | (339,241 | ) | 320.1 | |||||||
Vicinity Ltd. | (137,217 | ) | (191,279 | ) | 180.5 | |||||||
Woodside Energy Group Ltd. | (85,406 | ) | (1,931,957 | ) | 1,822.9 | |||||||
|
|
|
| |||||||||
| (19,384,289 | ) | |||||||||||
| Austria | ||||||||||||
Erste Group Bank AG | (14,223 | ) | (517,885 | ) | 488.6 | |||||||
Mondi PLC | (15,012 | ) | (237,197 | ) | 223.8 | |||||||
OMV AG | (17,475 | ) | (828,235 | ) | 781.5 | |||||||
|
|
|
| |||||||||
| (1,583,317 | ) | |||||||||||
| Belgium | ||||||||||||
Ackermans & van Haaren NV | (398 | ) | (70,109 | ) | 66.2 | |||||||
Anheuser-Busch InBev SA | (12,209 | ) | (795,019 | ) | 750.1 | |||||||
KBC Group NV | (13,872 | ) | (993,174 | ) | 937.1 | |||||||
|
|
|
| |||||||||
| (1,858,302 | ) | |||||||||||
| Brazil | ||||||||||||
Yara International ASA | (5,746 | ) | (231,535 | ) | 218.5 | |||||||
|
|
|
| |||||||||
| Canada | ||||||||||||
Air Canada | (74,508 | ) | (1,035,417 | ) | 977.0 | |||||||
Atco Ltd. | (26,189 | ) | (859,382 | ) | 810.9 | |||||||
Boyd Group Services, Inc. | (1,587 | ) | (262,924 | ) | 248.1 | |||||||
Brookfield Corp. | (35,979 | ) | (1,159,279 | ) | 1,093.8 | |||||||
Cameco Corp. | (4,294 | ) | (117,289 | ) | 110.7 | |||||||
Canadian Apartment Properties REIT | (26,111 | ) | (950,055 | ) | 896.4 | |||||||
Canadian Tire Corp Ltd. | (16,208 | ) | (2,109,648 | ) | 1,990.5 | |||||||
Canadian Utilities Ltd. | (19,238 | ) | (552,375 | ) | 521.2 | |||||||
CCL Industries, Inc., Class B | (14,166 | ) | (661,363 | ) | 624.0 | |||||||
Fairfax Financial Holdings Ltd. | (1,727 | ) | (1,199,101 | ) | 1,131.4 | |||||||
Finning International, Inc. | (17,600 | ) | (452,926 | ) | 427.3 | |||||||
George Weston Ltd. | (4,079 | ) | (543,968 | ) | 513.2 | |||||||
iA Financial Corp., Inc. | (18,823 | ) | (1,254,569 | ) | 1,183.7 | |||||||
IGM Financial, Inc.. | (2,572 | ) | (78,393 | ) | 74.0 | |||||||
Intact Financial Corp. | (10,611 | ) | (1,594,288 | ) | 1,504.3 | |||||||
Kinaxis, Inc. | (205 | ) | (27,960 | ) | 26.4 | |||||||
Loblaw Cos. Ltd. | (6,761 | ) | (631,590 | ) | 595.9 | |||||||
National Bank of Canada | (4,846 | ) | (358,902 | ) | 338.6 | |||||||
Nutrien Ltd. | (3,061 | ) | (210,773 | ) | 198.9 | |||||||
SCHEDULE OF INVESTMENTS | 59 |
Schedule of Investments (continued) April 30, 2023 | BlackRock Global Equity Market Neutral Fund |
| Security | Shares | Value | % of Basket Value | |||||||||
| Canada (continued) | ||||||||||||
Nuvei Corp. | (26,999 | ) | $ | (1,088,533 | ) | 1,027.1 | % | |||||
Onex Corp. | (21,558 | ) | (985,651 | ) | 930.0 | |||||||
Open Text Corp. | (778 | ) | (29,255 | ) | 27.6 | |||||||
Paramount Resources Ltd., Class A | (2,745 | ) | (64,531 | ) | 60.9 | |||||||
Parkland Corp. | (69,326 | ) | (1,623,523 | ) | 1,531.9 | |||||||
Peyto Exploration & Development Corp. | (1,712 | ) | (15,479 | ) | 14.6 | |||||||
Power Corp. of Canada | (33,953 | ) | (903,275 | ) | 852.3 | |||||||
Rogers Communications, Inc. | (3,657 | ) | (179,456 | ) | 169.3 | |||||||
Saputo, Inc. | (32,878 | ) | (845,301 | ) | 797.6 | |||||||
SNC-Lavalin Group, Inc. | (15,324 | ) | (350,385 | ) | 330.6 | |||||||
Tamarack Valley Energy Ltd. | (677,810 | ) | (1,856,955 | ) | 1,752.1 | |||||||
Toromont Industries Ltd. | (18,333 | ) | (1,471,276 | ) | 1,388.2 | |||||||
WSP Global, Inc. | (3,659 | ) | (479,596 | ) | 452.5 | |||||||
|
|
|
| |||||||||
| (23,953,418 | ) | |||||||||||
| China | ||||||||||||
NXP Semiconductors NV | (3,940 | ) | (645,136 | ) | 608.7 | |||||||
Prosus NV | (6,743 | ) | (505,385 | ) | 476.9 | |||||||
Wilmar International Ltd. | (7,300 | ) | (21,535 | ) | 20.3 | |||||||
|
|
|
| |||||||||
| (1,172,056 | ) | |||||||||||
| Denmark | ||||||||||||
AP Moller - Maersk A/S, Class A | (55 | ) | (98,458 | ) | 92.9 | |||||||
Carlsberg A/S | (967 | ) | (160,226 | ) | 151.2 | |||||||
Danske Bank A/S | (74,194 | ) | (1,570,455 | ) | 1,481.8 | |||||||
DSV A/S | (1,585 | ) | (298,747 | ) | 281.9 | |||||||
ISS A/S | (6,845 | ) | (143,328 | ) | 135.2 | |||||||
Royal Unibrew A/S | (1,168 | ) | (104,562 | ) | 98.6 | |||||||
Vestas Wind Systems A/S | (28,387 | ) | (786,682 | ) | 742.3 | |||||||
|
|
|
| |||||||||
| (3,162,458 | ) | |||||||||||
| Finland | ||||||||||||
Elisa OYJ | (10,773 | ) | (669,990 | ) | 632.2 | |||||||
Fortum OYJ | (23,158 | ) | (346,417 | ) | 326.9 | |||||||
Huhtamaki OYJ | (870 | ) | (31,409 | ) | 29.6 | |||||||
Kesko OYJ, B Shares | (30,324 | ) | (633,205 | ) | 597.5 | |||||||
Kojamo OYJ | (5,159 | ) | (64,158 | ) | 60.5 | |||||||
Nordea Bank Abp | (93,090 | ) | (1,026,252 | ) | 968.3 | |||||||
Stora Enso OYJ, R Shares | (4,513 | ) | (57,343 | ) | 54.1 | |||||||
Valmet OYJ | (595 | ) | (20,158 | ) | 19.0 | |||||||
|
|
|
| |||||||||
| (2,848,932 | ) | |||||||||||
| France | ||||||||||||
Adevinta ASA | (62,261 | ) | (479,882 | ) | 452.8 | |||||||
Unibail-Rodamco-Westfield | (4,472 | ) | (239,936 | ) | 226.4 | |||||||
|
|
|
| |||||||||
| (719,818 | ) | |||||||||||
| Germany | ||||||||||||
adidas AG | (1,055 | ) | (186,072 | ) | 175.6 | |||||||
Aixtron SE | (1,854 | ) | (52,578 | ) | 49.6 | |||||||
Aroundtown SA | (111,083 | ) | (151,588 | ) | 143.0 | |||||||
BASF SE | (10,979 | ) | (568,786 | ) | 536.7 | |||||||
Bechtle AG | (14,272 | ) | (664,803 | ) | 627.3 | |||||||
Continental AG | (1,215 | ) | (85,392 | ) | 80.6 | |||||||
Deutsche Boerse AG | (9,390 | ) | (1,793,523 | ) | 1,692.2 | |||||||
Deutsche Post AG, Registered Shares | (7,071 | ) | (340,612 | ) | 321.4 | |||||||
Deutsche Wohnen SE | (4,341 | ) | (98,440 | ) | 92.9 | |||||||
Evotec SE | (9,608 | ) | (176,766 | ) | 166.8 | |||||||
Hannover Rueck SE | (1,313 | ) | (280,923 | ) | 265.1 | |||||||
HeidelbergCement AG | (1,094 | ) | (82,988 | ) | 78.3 | |||||||
Hella GmbH & Co. KGaA | (3,254 | ) | (275,609 | ) | 260.0 | |||||||
HelloFresh SE | (2,636 | ) | (70,885 | ) | 66.9 | |||||||
HOCHTIEF AG | (3,514 | ) | (294,621 | ) | 278.0 | |||||||
| Security | Shares | Value | % of Basket Value | |||||||||
| Germany (continued) | ||||||||||||
Infineon Technologies AG | (11,714 | ) | $ | (427,234 | ) | 403.1 | % | |||||
KION Group AG | (3,590 | ) | (149,098 | ) | 140.7 | |||||||
Rational AG | (381 | ) | (276,360 | ) | 260.7 | |||||||
SAP SE | (1,265 | ) | (171,418 | ) | 161.7 | |||||||
Siemens Healthineers AG | (7,345 | ) | (458,433 | ) | 432.5 | |||||||
Vonovia SE | (19,781 | ) | (429,647 | ) | 405.4 | |||||||
|
|
|
| |||||||||
| (7,035,776 | ) | |||||||||||
| Hong Kong | ||||||||||||
DFI Retail Group Holdings Ltd. | (5,800 | ) | (17,456 | ) | 16.4 | |||||||
Jardine Matheson Holdings Ltd. | (500 | ) | (24,171 | ) | 22.8 | |||||||
Prudential PLC | (69,299 | ) | (1,052,497 | ) | 993.1 | |||||||
Vitasoy International Holdings Ltd. | (68,000 | ) | (120,276 | ) | 113.5 | |||||||
|
|
|
| |||||||||
| (1,214,400 | ) | |||||||||||
| Israel | ||||||||||||
Ashtrom Group Ltd. | (40,084 | ) | (630,366 | ) | 594.8 | |||||||
Delek Group Ltd. | (1,619 | ) | (175,951 | ) | 166.0 | |||||||
Shufersal Ltd. | (2,467 | ) | (12,548 | ) | 11.8 | |||||||
Teva Pharmaceutical Industries Ltd., ADR | (1,784 | ) | (15,574 | ) | 14.7 | |||||||
|
|
|
| |||||||||
| (834,439 | ) | |||||||||||
| Italy | ||||||||||||
Assicurazioni Generali SpA | (69,294 | ) | (1,445,411 | ) | 1,363.8 | |||||||
Banca Mediolanum SpA | (33,885 | ) | (306,843 | ) | 289.5 | |||||||
Coca-Cola HBC AG | (3,731 | ) | (112,998 | ) | 106.6 | |||||||
DiaSorin SpA | (2,440 | ) | (265,405 | ) | 250.4 | |||||||
Eni SpA | (80,671 | ) | (1,220,578 | ) | 1,151.7 | |||||||
Interpump Group SpA | (9,722 | ) | (543,373 | ) | 512.7 | |||||||
Iveco Group NV | (1,472 | ) | (13,265 | ) | 12.5 | |||||||
Leonardo SpA | (31,854 | ) | (380,220 | ) | 358.7 | |||||||
Nexi SpA | (6,427 | ) | (53,372 | ) | 50.4 | |||||||
Poste Italiane SpA | (13,941 | ) | (145,299 | ) | 137.1 | |||||||
|
|
|
| |||||||||
| (4,486,764 | ) | |||||||||||
| Japan | ||||||||||||
Activia Properties, Inc. | (102 | ) | (302,894 | ) | 285.8 | |||||||
Advance Residence Investment Corp. | (63 | ) | (166,445 | ) | 157.0 | |||||||
Advantest Corp. | (1,300 | ) | (103,456 | ) | 97.6 | |||||||
Aeon Mall Co. Ltd. | (2,900 | ) | (39,846 | ) | 37.6 | |||||||
Ajinomoto Co., Inc. | (4,700 | ) | (172,269 | ) | 162.5 | |||||||
Allegro MicroSystems, Inc. | (5,193 | ) | (185,754 | ) | 175.3 | |||||||
Asahi Group Holdings Ltd. | (4,700 | ) | (184,872 | ) | 174.4 | |||||||
ASKUL Corp. | (1,300 | ) | (17,655 | ) | 16.7 | |||||||
Bandai Namco Holdings, Inc. | (30,200 | ) | (698,824 | ) | 659.4 | |||||||
Bank of Kyoto Ltd. | (500 | ) | (25,056 | ) | 23.6 | |||||||
BayCurrent Consulting, Inc. | (3,900 | ) | (138,449 | ) | 130.6 | |||||||
Benefit One, Inc. | (15,800 | ) | (221,679 | ) | 209.2 | |||||||
BIPROGY, Inc. | (7,000 | ) | (171,993 | ) | 162.3 | |||||||
Calbee, Inc. | (9,900 | ) | (218,080 | ) | 205.8 | |||||||
Capcom Co. Ltd. | (5,500 | ) | (210,394 | ) | 198.5 | |||||||
Chiba Bank Ltd. | (15,700 | ) | (104,452 | ) | 98.6 | |||||||
Chubu Electric Power Co., Inc. | (13,400 | ) | (152,212 | ) | 143.6 | |||||||
Chugai Pharmaceutical Co. Ltd. | (17,500 | ) | (459,922 | ) | 434.0 | |||||||
Credit Saison Co. Ltd. | (24,400 | ) | (344,282 | ) | 324.8 | |||||||
Dai Nippon Printing Co. Ltd. | (7,300 | ) | (213,807 | ) | 201.7 | |||||||
Daido Steel Co. Ltd. | (5,600 | ) | (219,815 | ) | 207.4 | |||||||
Daiwa House REIT Investment Corp. | (97 | ) | (210,194 | ) | 198.3 | |||||||
Daiwa Office Investment Corp. | (16 | ) | (70,900 | ) | 66.9 | |||||||
Daiwa Securities Group, Inc. | (3,500 | ) | (16,570 | ) | 15.6 | |||||||
Daiwa Securities Living Investments Corp. | (137 | ) | (118,688 | ) | 112.0 | |||||||
Descente Ltd. | (8,900 | ) | (287,920 | ) | 271.7 | |||||||
East Japan Railway Co. | (25,600 | ) | (1,492,455 | ) | 1,408.2 | |||||||
| 60 | 2 0 2 3 BLACK ROCK ANNUAL REPORT TO SHAREHOLDERS |
Schedule of Investments (continued) April 30, 2023 | BlackRock Global Equity Market Neutral Fund |
| Security | Shares | Value | % of Basket Value | |||||||||
| Japan (continued) | ||||||||||||
ENEOS Holdings, Inc. | (81,400 | ) | $ | (295,134 | ) | 278.5 | % | |||||
Food & Life Cos. Ltd. | (1,800 | ) | (44,258 | ) | 41.8 | |||||||
FP Corp. | (9,300 | ) | (235,671 | ) | 222.4 | |||||||
Fuji Kyuko Co. Ltd. | (24,900 | ) | (973,874 | ) | 918.9 | |||||||
Fujitsu General Ltd. | (1,500 | ) | (39,425 | ) | 37.2 | |||||||
Fukuoka Financial Group, Inc. | (11,100 | ) | (213,098 | ) | 201.1 | |||||||
Furukawa Electric Co. Ltd. | (14,000 | ) | (261,222 | ) | 246.5 | |||||||
Fuyo General Lease Co. Ltd. | (6,400 | ) | (477,064 | ) | 450.1 | |||||||
Goldwin, Inc. | (5,200 | ) | (481,845 | ) | 454.6 | |||||||
GS Yuasa Corp. | (7,100 | ) | (127,281 | ) | 120.1 | |||||||
GungHo Online Entertainment, Inc. | (1,900 | ) | (37,154 | ) | 35.1 | |||||||
Hachijuni Bank Ltd. | (15,100 | ) | (68,896 | ) | 65.0 | |||||||
Hakuhodo DY Holdings, Inc. | (19,300 | ) | (231,651 | ) | 218.6 | |||||||
Hankyu Hanshin Holdings, Inc. | (11,500 | ) | (365,351 | ) | 344.7 | |||||||
Haseko Corp. | (29,200 | ) | (363,109 | ) | 342.6 | |||||||
Heiwa Corp. | (19,600 | ) | (394,284 | ) | 372.0 | |||||||
Hikari Tsushin, Inc. | (1,100 | ) | (152,958 | ) | 144.3 | |||||||
Hino Motors Ltd. | (4,100 | ) | (16,481 | ) | 15.6 | |||||||
Hitachi Construction Machinery Co. Ltd. | (1,700 | ) | (42,650 | ) | 40.2 | |||||||
Honda Motor Co. Ltd. | (13,500 | ) | (364,869 | ) | 344.3 | |||||||
Ibiden Co. Ltd. | (16,300 | ) | (653,681 | ) | 616.8 | |||||||
Iida Group Holdings Co. Ltd. | (23,100 | ) | (418,166 | ) | 394.6 | |||||||
Industrial & Infrastructure Fund Investment Corp. | (126 | ) | (147,138 | ) | 138.8 | |||||||
Inpex Corp. | (35,400 | ) | (395,011 | ) | 372.7 | |||||||
Isuzu Motors Ltd. | (41,900 | ) | (504,150 | ) | 475.7 | |||||||
Itoham Yonekyu Holdings, Inc. | (25,400 | ) | (141,779 | ) | 133.8 | |||||||
Iwatani Corp. | (30,800 | ) | (1,486,238 | ) | 1,402.3 | |||||||
Iyogin Holdings, Inc. | (22,300 | ) | (133,038 | ) | 125.5 | |||||||
Izumi Co. Ltd. | (8,300 | ) | (198,936 | ) | 187.7 | |||||||
Japan Aviation Electronics Industry Ltd. | (33,200 | ) | (593,558 | ) | 560.0 | |||||||
Japan Exchange Group, Inc. | (17,400 | ) | (287,324 | ) | 271.1 | |||||||
Japan Hotel REIT Investment Corp. | (621 | ) | (357,475 | ) | 337.3 | |||||||
Japan Logistics Fund, Inc. | (36 | ) | (87,089 | ) | 82.2 | |||||||
Japan Metropolitan Fund Invest | (51 | ) | (37,370 | ) | 35.3 | |||||||
Japan Post Bank Co. Ltd. | (74,000 | ) | (602,551 | ) | 568.5 | |||||||
Japan Post Insurance Co. Ltd. | (47,100 | ) | (779,451 | ) | 735.4 | |||||||
Japan Real Estate Investment Corp. | (97 | ) | (391,653 | ) | 369.5 | |||||||
JCR Pharmaceuticals Co. Ltd. | (5,500 | ) | (60,661 | ) | 57.2 | |||||||
Jeol Ltd. | (500 | ) | (14,891 | ) | 14.1 | |||||||
Justsystems Corp. | (24,000 | ) | (646,723 | ) | 610.2 | |||||||
Kagome Co. Ltd. | (6,200 | ) | (153,386 | ) | 144.7 | |||||||
Kansai Paint Co. Ltd. | (27,800 | ) | (399,224 | ) | 376.7 | |||||||
Keio Corp. | (1,500 | ) | (56,764 | ) | 53.6 | |||||||
Keisei Electric Railway Co. Ltd. | (600 | ) | (21,562 | ) | 20.3 | |||||||
Keyence Corp. | (1,000 | ) | (459,867 | ) | 433.9 | |||||||
Kikkoman Corp. | (52,200 | ) | (3,146,325 | ) | 2,968.7 | |||||||
Kintetsu Group Holdings Co. Ltd. | (11,600 | ) | (398,947 | ) | 376.4 | |||||||
Kobayashi Pharmaceutical Co. Ltd. | (7,000 | ) | (445,113 | ) | 420.0 | |||||||
Kobe Steel Ltd. | (101,600 | ) | (771,978 | ) | 728.4 | |||||||
Kotobuki Spirits Co. Ltd. | (7,900 | ) | (594,222 | ) | 560.7 | |||||||
Kurita Water Industries Ltd. | (4,900 | ) | (209,589 | ) | 197.8 | |||||||
Kyudenko Corp. | (13,300 | ) | (361,052 | ) | 340.7 | |||||||
Kyushu Financial Group, Inc. | (8,900 | ) | (32,692 | ) | 30.8 | |||||||
Kyushu Railway Co. | (5,300 | ) | (122,622 | ) | 115.7 | |||||||
LaSalle Logiport REIT | (35 | ) | (42,359 | ) | 40.0 | |||||||
Makita Corp. | (31,400 | ) | (900,467 | ) | 849.6 | |||||||
Marubeni Corp. | (4,700 | ) | (68,011 | ) | 64.2 | |||||||
Marui Group Co. Ltd. | (5,100 | ) | (82,783 | ) | 78.1 | |||||||
Matsui Securities Co. Ltd. | (31,500 | ) | (183,799 | ) | 173.4 | |||||||
MatsukiyoCocokara & Co. | (9,300 | ) | (507,412 | ) | 478.8 | |||||||
Mazda Motor Corp. | (4,900 | ) | (45,168 | ) | 42.6 | |||||||
| Security | Shares | Value | % of Basket Value | |||||||||
| Japan (continued) | ||||||||||||
McDonald’s Holdings Co. Japan Ltd. | (10,200 | ) | $ | (433,079 | ) | 408.6 | % | |||||
Mebuki Financial Group, Inc. | (106,600 | ) | (278,115 | ) | 262.4 | |||||||
Menicon Co. Ltd. | (2,300 | ) | (49,787 | ) | 47.0 | |||||||
Mitsui Fudosan Logistics Park, Inc. | (161 | ) | (616,428 | ) | 581.6 | |||||||
Miura Co. Ltd. | (6,300 | ) | (170,863 | ) | 161.2 | |||||||
MonotaRO Co. Ltd. | (23,400 | ) | (360,151 | ) | 339.8 | |||||||
Mori Hills REIT Investment Corp. | (56 | ) | (64,511 | ) | 60.9 | |||||||
Morinaga & Co. Ltd. | (6,000 | ) | (181,064 | ) | 170.8 | |||||||
Morinaga Milk Industry Co. Ltd. | (2,000 | ) | (76,572 | ) | 72.2 | |||||||
Murata Manufacturing Co. Ltd. | (2,800 | ) | (162,045 | ) | 152.9 | |||||||
Nagase & Co. Ltd. | (9,200 | ) | (147,677 | ) | 139.3 | |||||||
Nankai Electric Railway Co. Ltd. | (2,100 | ) | (49,896 | ) | 47.1 | |||||||
NHK Spring Co. Ltd. | (9,400 | ) | (70,958 | ) | 67.0 | |||||||
Nifco, Inc. | (7,200 | ) | (210,899 | ) | 199.0 | |||||||
Nihon Kohden Corp. | (4,100 | ) | (115,631 | ) | 109.1 | |||||||
Nippon Accommodations Fund, Inc. | (2 | ) | (9,899 | ) | 9.3 | |||||||
Nippon Building Fund, Inc. | (166 | ) | (709,231 | ) | 669.2 | |||||||
Nippon Kayaku Co. Ltd. | (98,600 | ) | (911,758 | ) | 860.3 | |||||||
Nippon Sanso Holdings Corp. | (21,100 | ) | (387,827 | ) | 365.9 | |||||||
Nippon Yusen KK | (17,000 | ) | (410,337 | ) | 387.2 | |||||||
Nishi-Nippon Railroad Co. Ltd. | (3,300 | ) | (61,667 | ) | 58.2 | |||||||
Nisshin Seifun Group, Inc. | (10,900 | ) | (134,613 | ) | 127.0 | |||||||
Nissin Foods Holdings Co. Ltd. | (2,000 | ) | (196,307 | ) | 185.2 | |||||||
NOF Corp. | (1,100 | ) | (51,243 | ) | 48.4 | |||||||
NOK Corp. | (23,200 | ) | (317,786 | ) | 299.8 | |||||||
Nomura Holdings, Inc. | (175,100 | ) | (640,620 | ) | 604.5 | |||||||
NTT Data Corp. | (8,400 | ) | (116,280 | ) | 109.7 | |||||||
Odakyu Electric Railway Co. Ltd. | (14,900 | ) | (212,075 | ) | 200.1 | |||||||
OKUMA Corp. | (5,200 | ) | (235,283 | ) | 222.0 | |||||||
Open House Group Co. Ltd. | (13,500 | ) | (549,656 | ) | 518.6 | |||||||
Osaka Gas Co. Ltd. | (21,300 | ) | (359,127 | ) | 338.9 | |||||||
OSG Corp. | (13,100 | ) | (187,563 | ) | 177.0 | |||||||
PALTAC Corp. | (2,200 | ) | (85,984 | ) | 81.1 | |||||||
Pan Pacific International Holdings Corp. | (61,400 | ) | (1,169,862 | ) | 1,103.8 | |||||||
Park24 Co. Ltd. | (27,400 | ) | (431,603 | ) | 407.2 | |||||||
PeptiDream, Inc. | (1,800 | ) | (24,814 | ) | 23.4 | |||||||
Persol Holdings Co. Ltd. | (4,600 | ) | (96,639 | ) | 91.2 | |||||||
Rakus Co. Ltd. | (17,200 | ) | (266,501 | ) | 251.5 | |||||||
Relo Group, Inc. | (37,700 | ) | (597,091 | ) | 563.4 | |||||||
Renesas Electronics Corp. | (35,100 | ) | (466,841 | ) | 440.5 | |||||||
Resonac Holdings Corp. | (40,000 | ) | (646,168 | ) | 609.7 | |||||||
Rinnai Corp. | (4,500 | ) | (110,875 | ) | 104.6 | |||||||
Rohto Pharmaceutical Co. Ltd. | (14,700 | ) | (310,806 | ) | 293.3 | |||||||
Sanwa Holdings Corp. | (18,100 | ) | (201,939 | ) | 190.5 | |||||||
SCREEN Holdings Co. Ltd. | (400 | ) | (33,158 | ) | 31.3 | |||||||
Seino Holdings Co. Ltd. | (9,700 | ) | (109,692 | ) | 103.5 | |||||||
Sekisui House Reit, Inc. | (818 | ) | (472,504 | ) | 445.8 | |||||||
SG Holdings Co. Ltd. | (9,600 | ) | (140,802 | ) | 132.9 | |||||||
SHIFT, Inc. | (300 | ) | (57,005 | ) | 53.8 | |||||||
Shikoku Electric Power Co., Inc. | (13,800 | ) | (83,071 | ) | 78.4 | |||||||
Shinko Electric Industries Co. Ltd. | (20,600 | ) | (623,591 | ) | 588.4 | |||||||
SoftBank Corp. | (37,000 | ) | (424,671 | ) | 400.7 | |||||||
Sony Group Corp. | (500 | ) | (46,117 | ) | 43.5 | |||||||
Sotetsu Holdings, Inc. | (9,300 | ) | (180,169 | ) | 170.0 | |||||||
Square Enix Holdings Co. Ltd. | (7,300 | ) | (365,861 | ) | 345.2 | |||||||
SUMCO Corp. | (44,500 | ) | (625,106 | ) | 589.8 | |||||||
Suzuken Co. Ltd. | (5,100 | ) | (147,792 | ) | 139.4 | |||||||
Sysmex Corp. | (900 | ) | (59,029 | ) | 55.7 | |||||||
Taiheiyo Cement Corp. | (51,700 | ) | (944,982 | ) | 891.6 | |||||||
Taiyo Yuden Co. Ltd. | (27,300 | ) | (853,108 | ) | 804.9 | |||||||
Takara Holdings, Inc. | (39,400 | ) | (316,304 | ) | 298.4 | |||||||
TechnoPro Holdings, Inc. | (600 | ) | (16,682 | ) | 15.7 | |||||||
SCHEDULE OF INVESTMENTS | 61 |
Schedule of Investments (continued) April 30, 2023 | BlackRock Global Equity Market Neutral Fund |
| Security | Shares | Value | % of Basket Value | |||||||||
| Japan (continued) | ||||||||||||
Tohoku Electric Power Co., Inc. | (4,100 | ) | $ | (21,479 | ) | 20.3 | % | |||||
Tokai Carbon Co. Ltd. | (12,100 | ) | (112,086 | ) | 105.8 | |||||||
Tokyo Electric Power Co., Holdings, Inc. | (167,600 | ) | (612,664 | ) | 578.1 | |||||||
Tokyu Corp. | (71,100 | ) | (1,022,243 | ) | 964.5 | |||||||
Tokyu Fudosan Holdings Corp. | (32,200 | ) | (166,441 | ) | 157.0 | |||||||
TOPPAN, Inc. | (20,400 | ) | (441,697 | ) | 416.8 | |||||||
Toshiba TEC Corp. | (1,200 | ) | (35,525 | ) | 33.5 | |||||||
Toyo Suisan Kaisha Ltd. | (3,500 | ) | (159,124 | ) | 150.1 | |||||||
Toyo Tire Corp. | (7,300 | ) | (88,597 | ) | 83.6 | |||||||
Toyota Tsusho Corp. | (5,200 | ) | (220,391 | ) | 207.9 | |||||||
Unicharm Corp. | (13,300 | ) | (547,175 | ) | 516.3 | |||||||
United Urban Investment Corp. | (217 | ) | (245,472 | ) | 231.6 | |||||||
USS Co. Ltd. | (5,000 | ) | (85,620 | ) | 80.8 | |||||||
Visional, Inc. | (2,800 | ) | (149,612 | ) | 141.2 | |||||||
West Japan Railway Co. | (11,400 | ) | (503,475 | ) | 475.0 | |||||||
Yamato Holdings Co. Ltd. | (63,100 | ) | (1,104,656 | ) | 1,042.3 | |||||||
Yokohama Rubber Co. Ltd. | (12,000 | ) | (265,848 | ) | 250.8 | |||||||
Z Holdings Corp. | (183,800 | ) | (513,403 | ) | 484.4 | |||||||
Zensho Holdings Co. Ltd. | (1,000 | ) | (32,364 | ) | 30.5 | |||||||
|
|
|
| |||||||||
| (53,390,970 | ) | |||||||||||
| Luxembourg | �� | |||||||||||
Aperam SA | (4,237 | ) | (157,327 | ) | 148.4 | |||||||
|
|
|
| |||||||||
| Netherlands | ||||||||||||
Akzo Nobel NV | (5,490 | ) | (456,111 | ) | 430.4 | |||||||
Alfen N.V. | (4,182 | ) | (338,856 | ) | 319.7 | |||||||
Argenx SE | (130 | ) | (50,223 | ) | 47.4 | |||||||
ASM International NV | (1,487 | ) | (540,711 | ) | 510.2 | |||||||
Heineken NV | (568 | ) | (65,314 | ) | 61.6 | |||||||
JDE Peet’s NV | (10,242 | ) | (311,951 | ) | 294.3 | |||||||
OCI NV | (2,996 | ) | (79,098 | ) | 74.6 | |||||||
SBM Offshore NV | (24,677 | ) | (349,337 | ) | 329.6 | |||||||
Universal Music Group NV | (15,013 | ) | (328,512 | ) | 310.0 | |||||||
|
|
|
| |||||||||
| (2,520,113 | ) | |||||||||||
| New Zealand | ||||||||||||
Auckland International Airport Ltd. | (270,734 | ) | (1,466,656 | ) | 1,383.9 | |||||||
Fisher & Paykel Healthcare Corp. Ltd. | (152,324 | ) | (2,585,294 | ) | 2,439.3 | |||||||
Mainfreight Ltd. | (28,722 | ) | (1,261,948 | ) | 1,190.7 | |||||||
Mercury NZ Ltd. | (134,850 | ) | (524,033 | ) | 494.4 | |||||||
Meridian Energy Ltd. | (119,359 | ) | (400,033 | ) | 377.5 | |||||||
Spark New Zealand Ltd. | (520,982 | ) | (1,670,189 | ) | 1,575.9 | |||||||
|
|
|
| |||||||||
| (7,908,153 | ) | |||||||||||
| Nigeria | ||||||||||||
Airtel Africa PLC | (32,781 | ) | (49,106 | ) | 46.3 | |||||||
|
|
|
| |||||||||
| Norway | ||||||||||||
Aker ASA, A Shares | (796 | ) | (48,685 | ) | 45.9 | |||||||
DNB Bank ASA | (35,108 | ) | (617,939 | ) | 583.1 | |||||||
Leroy Seafood Group ASA | (3,726 | ) | (19,632 | ) | 18.5 | |||||||
Mowi ASA | (15,386 | ) | (293,727 | ) | 277.1 | |||||||
Norsk Hydro ASA | (48,109 | ) | (354,253 | ) | 334.3 | |||||||
Orkla ASA | (28,210 | ) | (202,885 | ) | 191.4 | |||||||
Salmar ASA | (13,700 | ) | (609,031 | ) | 574.7 | |||||||
Schibsted ASA | (14,433 | ) | (256,406 | ) | 241.9 | |||||||
Telenor ASA | (32,483 | ) | (405,562 | ) | 382.7 | |||||||
|
|
|
| |||||||||
| (2,808,120 | ) | |||||||||||
| Security | Shares | Value | % of Basket Value | |||||||||
| Portugal | ||||||||||||
Banco Comercial Portugues SA | (156,506 | ) | $ | (40,287 | ) | 38.0 | % | |||||
Jeronimo Martins SGPS SA | (1,461 | ) | (36,921 | ) | 34.9 | |||||||
|
|
|
| |||||||||
| (77,208 | ) | |||||||||||
| Puerto Rico | ||||||||||||
Popular, Inc. | (1,005 | ) | (60,310 | ) | 56.9 | |||||||
|
|
|
| |||||||||
| Singapore | ||||||||||||
CapitaLand Ascendas REIT | (583,100 | ) | (1,253,279 | ) | 1,182.5 | |||||||
CapitaLand Integrated Commercial Trust | (10,300 | ) | (15,709 | ) | 14.8 | |||||||
DBS Group Holdings Ltd. | (10,200 | ) | (251,741 | ) | 237.5 | |||||||
Genting Singapore Ltd. | (841,000 | ) | (714,577 | ) | 674.2 | |||||||
Grab Holdings Ltd. | (261,873 | ) | (762,050 | ) | 719.0 | |||||||
Jardine Cycle & Carriage Ltd. | (13,600 | ) | (345,972 | ) | 326.4 | |||||||
Kenon Holdings Ltd. | (1,997 | ) | (52,997 | ) | 50.0 | |||||||
Keppel DC REIT | (379,300 | ) | (612,567 | ) | 578.0 | |||||||
Oversea-Chinese Banking Corp. Ltd. | (11,400 | ) | (107,774 | ) | 101.7 | |||||||
Sea Ltd., ADR | (3,008 | ) | (229,119 | ) | 216.2 | |||||||
Singapore Exchange Ltd. | (34,600 | ) | (248,708 | ) | 234.7 | |||||||
Singapore Technologies Engineering Ltd. | (154,300 | ) | (419,549 | ) | 395.9 | |||||||
Singapore Telecommunications Ltd. | (423,000 | ) | (809,656 | ) | 763.9 | |||||||
UOL Group Ltd. | (86,200 | ) | (449,145 | ) | 423.8 | |||||||
Venture Corp Ltd. | (14,300 | ) | (182,469 | ) | 172.2 | |||||||
|
|
|
| |||||||||
| (6,455,312 | ) | |||||||||||
| Spain | ||||||||||||
Amadeus IT Group SA | (9,160 | ) | (644,750 | ) | 608.3 | |||||||
Banco Santander SA | (157,816 | ) | (555,341 | ) | 524.0 | |||||||
Cellnex Telecom SA | (2,634 | ) | (111,068 | ) | 104.8 | |||||||
Corp ACCIONA Energias Renovables SA | (4,002 | ) | (143,926 | ) | 135.8 | |||||||
Endesa SA | (30,065 | ) | (675,422 | ) | 637.3 | |||||||
Inmobiliaria Colonial Socimi SA | (53,634 | ) | (343,377 | ) | 324.0 | |||||||
Red Electrica Corp. SA | (11,367 | ) | (206,973 | ) | 195.3 | |||||||
|
|
|
| |||||||||
| (2,680,857 | ) | |||||||||||
| Sweden | ||||||||||||
Autoliv, Inc. | (416 | ) | (35,697 | ) | 33.7 | |||||||
Evolution AB | (4,741 | ) | (628,724 | ) | 593.2 | |||||||
Hexagon AB, B Shares | (58,641 | ) | (666,362 | ) | 628.7 | |||||||
Husqvarna AB, B Shares | (68,040 | ) | (582,627 | ) | 549.7 | |||||||
Investor AB, B Shares | (11,066 | ) | (236,031 | ) | 222.7 | |||||||
Kinnevik AB | (23,087 | ) | (376,538 | ) | 355.3 | |||||||
Lifco AB, B Shares | (13,218 | ) | (299,158 | ) | 282.3 | |||||||
Securitas AB, B Shares | (84,378 | ) | (750,418 | ) | 708.1 | |||||||
Skandinaviska Enskilda Banken AB | (4,845 | ) | (54,693 | ) | 51.6 | |||||||
Skanska AB, B Shares | (27,214 | ) | (441,724 | ) | 416.8 | |||||||
SSAB AB, A Shares | (4,410 | ) | (31,063 | ) | 29.3 | |||||||
Swedish Orphan Biovitrum AB | (7,115 | ) | (171,728 | ) | 162.0 | |||||||
Telia Co. AB | (161,045 | ) | (445,192 | ) | 420.1 | |||||||
|
|
|
| |||||||||
| (4,719,955 | ) | |||||||||||
| Switzerland | ||||||||||||
Adecco Group AG, Registered Shares | (194 | ) | (6,693 | ) | 6.3 | |||||||
Alcon, Inc. | (140 | ) | (10,222 | ) | 9.7 | |||||||
Bachem Holding AG | (5,229 | ) | (572,775 | ) | 540.4 | |||||||
Baloise Holding AG, Registered Shares | (3,194 | ) | (536,111 | ) | 505.8 | |||||||
Barry Callebaut AG, Registered Shares | (556 | ) | (1,190,344 | ) | 1,123.1 | |||||||
Emmi AG, Registered Shares | (389 | ) | (405,986 | ) | 383.1 | |||||||
EMS-Chemie Holding AG, Registered Shares | (781 | ) | (643,330 | ) | 607.0 | |||||||
Galenica AG | (509 | ) | (45,742 | ) | 43.2 | |||||||
Julius Baer Group Ltd. | (1,388 | ) | (99,724 | ) | 94.1 | |||||||
Lonza Group AG, Registered Shares | (377 | ) | (235,811 | ) | 222.5 | |||||||
Mediclinic International PLC | (78,886 | ) | (490,456 | ) | 462.8 | |||||||
| 62 | 2 0 2 3 BLACK ROCK ANNUAL REPORT TO SHAREHOLDERS |
Schedule of Investments (continued) April 30, 2023 | BlackRock Global Equity Market Neutral Fund |
| Security | Shares | Value | % of Basket Value | |||||||||
| Switzerland (continued) | ||||||||||||
On Holding AG | (26,456 | ) | $ | (858,497 | ) | 810.0 | % | |||||
Schindler Holding AG, Registered Shares | (838 | ) | (179,513 | ) | 169.4 | |||||||
SIG Group AG | (4,414 | ) | (118,481 | ) | 111.8 | |||||||
Sonova Holding AG, Registered Shares | (232 | ) | (73,777 | ) | 69.6 | |||||||
Swiss Life Holding AG, Registered Shares | (1,420 | ) | (939,897 | ) | 886.8 | |||||||
Swisscom AG, Registered Shares | (1,120 | ) | (771,053 | ) | 727.5 | |||||||
Zurich Insurance Group AG | (420 | ) | (204,229 | ) | 192.7 | |||||||
|
|
|
| |||||||||
| (7,382,641 | ) | |||||||||||
| United Kingdom | ||||||||||||
abrdn PLC | (115,686 | ) | (307,593 | ) | 290.2 | |||||||
Admiral Group PLC | (12,118 | ) | (349,462 | ) | 329.7 | |||||||
Associated British Foods PLC | (894 | ) | (21,840 | ) | 20.6 | |||||||
AstraZeneca PLC | (1,334 | ) | (194,691 | ) | 183.7 | |||||||
BAE Systems PLC | (18,994 | ) | (239,974 | ) | 226.4 | |||||||
Barratt Developments PLC | (97,690 | ) | (609,704 | ) | 575.3 | |||||||
Berkeley Group Holdings PLC | (14,449 | ) | (802,128 | ) | 756.8 | |||||||
BT Group PLC | (20,156 | ) | (39,939 | ) | 37.7 | |||||||
Coca-Cola Europacific Partners PLC | (12,730 | ) | (820,703 | ) | 774.4 | |||||||
Compass Group PLC | (34,541 | ) | (903,843 | ) | 852.8 | |||||||
DCC PLC | (25,318 | ) | (1,562,493 | ) | 1,474.3 | |||||||
Dechra Pharmaceuticals PLC | (2,755 | ) | (128,264 | ) | 121.0 | |||||||
Derwent London PLC | (1,876 | ) | (56,237 | ) | 53.1 | |||||||
Diageo PLC | (9,908 | ) | (448,205 | ) | 422.9 | |||||||
Entain PLC | (18,861 | ) | (341,164 | ) | 321.9 | |||||||
Farfetch Ltd. | (67,359 | ) | (271,457 | ) | 256.1 | |||||||
Future PLC | (17,407 | ) | (244,980 | ) | 231.2 | |||||||
Greggs PLC, Registered Shares | (13,759 | ) | (484,684 | ) | 457.3 | |||||||
Informa PLC | (28,753 | ) | (259,538 | ) | 244.9 | |||||||
International Consolidated Airlines Group SA | (42,260 | ) | (80,416 | ) | 75.9 | |||||||
International Distributions Services PLC | (60,297 | ) | (190,433 | ) | 179.7 | |||||||
Investec PLC | (57,840 | ) | (319,830 | ) | 301.8 | |||||||
JET2 PLC | (5,203 | ) | (79,651 | ) | 75.2 | |||||||
Johnson Matthey PLC | (10,762 | ) | (263,692 | ) | 248.8 | |||||||
Kingfisher PLC | (120,963 | ) | (388,795 | ) | 366.9 | |||||||
M&G PLC | (150,563 | ) | (386,098 | ) | 364.3 | |||||||
Manchester United PLC, Class A | (598 | ) | (11,990 | ) | 11.3 | |||||||
National Grid PLC | (55,123 | ) | (783,999 | ) | 739.7 | |||||||
Next PLC | (1,502 | ) | (126,431 | ) | 119.3 | |||||||
Persimmon PLC | (15,467 | ) | (253,938 | ) | 239.6 | |||||||
Rentokil Initial PLC | (262,688 | ) | (2,075,071 | ) | 1,957.9 | |||||||
Smith & Nephew PLC | (22,858 | ) | (373,622 | ) | 352.5 | |||||||
Unilever PLC | (5,847 | ) | (322,950 | ) | 304.7 | |||||||
Vistry Group PLC | (56,393 | ) | (551,043 | ) | 519.9 | |||||||
Watches of Switzerland Group PLC | (30,928 | ) | (320,859 | ) | 302.7 | |||||||
WPP PLC | (12,904 | ) | (149,112 | ) | 140.7 | |||||||
|
|
|
| |||||||||
| (14,764,829 | ) | |||||||||||
| United States | ||||||||||||
10X Genomics, Inc., Class A | (2,407 | ) | (126,199 | ) | 119.1 | |||||||
Adient PLC | (7,327 | ) | (270,659 | ) | 255.4 | |||||||
ADT, Inc. | (132,676 | ) | (888,929 | ) | 838.7 | |||||||
AES Corp. | (1,918 | ) | (45,380 | ) | 42.8 | |||||||
Affirm Holdings, Inc. | (36,487 | ) | (359,762 | ) | 339.4 | |||||||
Aflac, Inc. | (146 | ) | (10,198 | ) | 9.6 | |||||||
AGCO Corp. | (8,815 | ) | (1,092,531 | ) | 1,030.8 | |||||||
agilon health, Inc. | (36,685 | ) | (890,345 | ) | 840.1 | |||||||
Airbnb, Inc., Class B | (7,935 | ) | (949,581 | ) | 896.0 | |||||||
Albemarle Corp. | (2,548 | ) | (472,552 | ) | 445.9 | |||||||
Albertsons Cos., Inc., Class A | (38,882 | ) | (812,634 | ) | 766.8 | |||||||
Alexandria Real Estate Equities, Inc. | (2,196 | ) | (272,699 | ) | 257.3 | |||||||
| Security | Shares | Value | % of Basket Value | |||||||||
| United States (continued) | ||||||||||||
Alight, Inc., Class A | (137,468 | ) | $ | (1,271,579 | ) | 1,199.8 | % | |||||
Allegion PLC | (860 | ) | (95,013 | ) | 89.6 | |||||||
Alliant Energy Corp. | (32,012 | ) | (1,765,142 | ) | 1,665.5 | |||||||
Alteryx, Inc., Class A | (10,658 | ) | (438,364 | ) | 413.6 | |||||||
Amcor PLC | (45,309 | ) | (497,040 | ) | 469.0 | |||||||
American Electric Power Co., Inc. | (22,624 | ) | (2,090,910 | ) | 1,972.9 | |||||||
American International Group, Inc. | (2,124 | ) | (112,657 | ) | 106.3 | |||||||
Ameriprise Financial, Inc. | (1,730 | ) | (527,858 | ) | 498.1 | |||||||
AmerisourceBergen Corp. | (4,560 | ) | (760,836 | ) | 717.9 | |||||||
Amkor Technology, Inc. | (11,531 | ) | (257,948 | ) | 243.4 | |||||||
Analog Devices, Inc. | (805 | ) | (144,803 | ) | 136.6 | |||||||
Annaly Capital Management, Inc. | (40,981 | ) | (818,800 | ) | 772.6 | |||||||
Ansys, Inc. | (613 | ) | (192,433 | ) | 181.6 | |||||||
Antero Midstream Corp. | (7,568 | ) | (81,432 | ) | 76.8 | |||||||
Antero Resources Corp. | (6,247 | ) | (143,619 | ) | 135.5 | |||||||
Apartment Income REIT Corp. | (11,633 | ) | (430,188 | ) | 405.9 | |||||||
Apellis Pharmaceuticals, Inc. | (5,875 | ) | (490,151 | ) | 462.5 | |||||||
Apollo Global Management, Inc. | (8,737 | ) | (553,838 | ) | 522.6 | |||||||
Apple Hospitality REIT, Inc. | (5,718 | ) | (85,141 | ) | 80.3 | |||||||
Applied Industrial Technologies, Inc. | (1,736 | ) | (235,506 | ) | 222.2 | |||||||
AppLovin Corp., Class A | (94,922 | ) | (1,613,674 | ) | 1,522.6 | |||||||
AptarGroup, Inc. | (7,818 | ) | (926,511 | ) | 874.2 | |||||||
Aptiv PLC | (5,659 | ) | (582,085 | ) | 549.2 | |||||||
Aramark | (13,274 | ) | (460,608 | ) | 434.6 | |||||||
Arista Networks, Inc. | (1,139 | ) | (182,422 | ) | 172.1 | |||||||
Arrow Electronics, Inc. | (2,329 | ) | (266,507 | ) | 251.5 | |||||||
Arrowhead Pharmaceuticals, Inc. | (513 | ) | (18,165 | ) | 17.1 | |||||||
Asana, Inc. | (1,598 | ) | (25,856 | ) | 24.4 | |||||||
Asbury Automotive Group, Inc. | (532 | ) | (102,921 | ) | 97.1 | |||||||
Aspen Technology, Inc. | (1,029 | ) | (182,133 | ) | 171.8 | |||||||
Atkore, Inc. | (4,389 | ) | (554,462 | ) | 523.2 | |||||||
Atmos Energy Corp. | (10,973 | ) | (1,252,458 | ) | 1,181.7 | |||||||
Avangrid, Inc. | (12,532 | ) | (504,538 | ) | 476.1 | |||||||
Avantor, Inc. | (9,750 | ) | (189,930 | ) | 179.2 | |||||||
Avery Dennison Corp. | (3,599 | ) | (627,954 | ) | 592.5 | |||||||
Axalta Coating Systems Ltd. | (15,350 | ) | (484,599 | ) | 457.2 | |||||||
AZEK Co., Inc. | (7,606 | ) | (206,427 | ) | 194.8 | |||||||
Ball Corp. | (4,887 | ) | (259,891 | ) | 245.2 | |||||||
Bentley Systems, Inc., Class B | (1,925 | ) | (81,928 | ) | 77.3 | |||||||
BJ’s Wholesale Club Holdings, Inc. | (3,090 | ) | (235,983 | ) | 222.7 | |||||||
Black Hills Corp. | (3,484 | ) | (227,470 | ) | 214.6 | |||||||
Blackline, Inc. | (379 | ) | (21,114 | ) | 19.9 | |||||||
Bloom Energy Corp., Class A | (11,681 | ) | (194,489 | ) | 183.5 | |||||||
Blue Owl Capital, Inc. | (64,911 | ) | (730,898 | ) | 689.6 | |||||||
Boston Properties, Inc. | (29,799 | ) | (1,590,075 | ) | 1,500.3 | |||||||
Broadcom, Inc. | (1,415 | ) | (886,497 | ) | 836.4 | |||||||
Brown & Brown, Inc. | (5,871 | ) | (378,034 | ) | 356.7 | |||||||
Brown-Forman Corp. | (8,673 | ) | (564,526 | ) | 532.7 | |||||||
Brunswick Corp. | (5,000 | ) | (423,950 | ) | 400.0 | |||||||
Bumble, Inc., Class A | (3,064 | ) | (55,795 | ) | 52.6 | |||||||
Bunge Ltd. | (1,589 | ) | (148,730 | ) | 140.3 | |||||||
Cactus, Inc., Class A | (7,058 | ) | (285,708 | ) | 269.6 | |||||||
Cadence Bank | (4,000 | ) | (80,880 | ) | 76.3 | |||||||
Caesars Entertainment, Inc. | (2,229 | ) | (100,951 | ) | 95.3 | |||||||
Calix, Inc. | (8,069 | ) | (368,753 | ) | 347.9 | |||||||
Capital One Financial Corp. | (899 | ) | (87,473 | ) | 82.5 | |||||||
Carter’s, Inc. | (5,456 | ) | (380,665 | ) | 359.2 | |||||||
Catalent, Inc. | (3,671 | ) | (183,991 | ) | 173.6 | |||||||
CDW Corp. | (1,764 | ) | (299,157 | ) | 282.3 | |||||||
Celanese Corp. | (9,235 | ) | (981,126 | ) | 925.7 | |||||||
CenterPoint Energy, Inc. | (54,946 | ) | (1,674,205 | ) | 1,579.7 | |||||||
SCHEDULE OF INVESTMENTS | 63 |
Schedule of Investments (continued) April 30, 2023 | BlackRock Global Equity Market Neutral Fund |
| Security | Shares | Value | % of Basket Value | |||||||||
| United States (continued) | ||||||||||||
Ceridian HCM Holding, Inc. | (2,208 | ) | $ | (140,164 | ) | 132.2 | % | |||||
Chemours Co. | (11,391 | ) | (331,136 | ) | 312.4 | |||||||
Chesapeake Energy Corp. | (14,057 | ) | (1,162,233 | ) | 1,096.6 | |||||||
Churchill Downs, Inc. | (4,281 | ) | (1,252,321 | ) | 1,181.6 | |||||||
Civitas Resources, Inc. | (23,920 | ) | (1,651,676 | ) | 1,558.4 | |||||||
Clarivate PLC | (147,625 | ) | (1,307,957 | ) | 1,234.1 | |||||||
Clean Harbors, Inc. | (1,265 | ) | (183,627 | ) | 173.3 | |||||||
Clear Secure, Inc. | (5,420 | ) | (131,110 | ) | 123.7 | |||||||
Clorox Co. | (3,837 | ) | (635,484 | ) | 599.6 | |||||||
Cloudflare, Inc. | (9,843 | ) | (463,113 | ) | 437.0 | |||||||
Coherent Corp. | (21,977 | ) | (750,295 | ) | 707.9 | |||||||
Comcast Corp. | (5,924 | ) | (245,076 | ) | 231.2 | |||||||
Commerce Bancshares, Inc. | (2,180 | ) | (121,753 | ) | 114.9 | |||||||
Concentrix Corp. | (2,697 | ) | (260,287 | ) | 245.6 | |||||||
Confluent, Inc. | (16,640 | ) | (366,080 | ) | 345.4 | |||||||
Consolidated Edison, Inc. | (5,214 | ) | (513,423 | ) | 484.4 | |||||||
Constellation Energy Corp. | (303 | ) | (23,452 | ) | 22.1 | |||||||
Constellium SE | (4,843 | ) | (71,919 | ) | 67.9 | |||||||
Cooper Cos., Inc. | (1,555 | ) | (593,155 | ) | 559.7 | |||||||
Corning, Inc. | (2,296 | ) | (76,273 | ) | 72.0 | |||||||
Corteva, Inc. | (8,427 | ) | (515,058 | ) | 486.0 | |||||||
Coterra Energy, Inc. | (10,920 | ) | (279,552 | ) | 263.8 | |||||||
Coty, Inc., Class A | (61,880 | ) | (734,516 | ) | 693.0 | |||||||
Cousins Properties, Inc. | (2,328 | ) | (50,774 | ) | 47.9 | |||||||
Crane Co. | (4,588 | ) | (330,657 | ) | 312.0 | |||||||
Crane NXT Co. | (4,060 | ) | (192,282 | ) | 181.4 | |||||||
CSL Ltd. | (2,104 | ) | (418,765 | ) | 395.1 | |||||||
Cullen/Frost Bankers, Inc. | (265 | ) | (29,216 | ) | 27.6 | |||||||
Datadog, Inc. | (11,097 | ) | (747,716 | ) | 705.5 | |||||||
Dell Technologies, Inc. | (7,371 | ) | (320,565 | ) | 302.5 | |||||||
Delta Air Lines, Inc. | (4,363 | ) | (149,695 | ) | 141.2 | |||||||
Denbury, Inc. | (1,558 | ) | (145,486 | ) | 137.3 | |||||||
Diodes, Inc. | (7,571 | ) | (603,409 | ) | 569.3 | |||||||
Discover Financial Services | (6,372 | ) | (659,311 | ) | 622.1 | |||||||
Dollar Tree, Inc. | (1,560 | ) | (239,788 | ) | 226.2 | |||||||
Dominion Energy, Inc. | (5,727 | ) | (327,241 | ) | 308.8 | |||||||
DoorDash, Inc. | (6,204 | ) | (379,623 | ) | 358.2 | |||||||
Dow, Inc. | (32,377 | ) | (1,761,309 | ) | 1,661.9 | |||||||
Doximity, Inc. | (34,961 | ) | (1,284,817 | ) | 1,212.3 | |||||||
DR Horton, Inc. | (852 | ) | (93,567 | ) | 88.3 | |||||||
DraftKings, Inc. | (33,464 | ) | (733,196 | ) | 691.8 | |||||||
DTE Midstream LLC | (10,618 | ) | (523,149 | ) | 493.6 | |||||||
Dun & Bradstreet Holdings, Inc. | (55,404 | ) | (618,863 | ) | 583.9 | |||||||
Duolingo, Inc. | (10,207 | ) | (1,389,785 | ) | 1,311.3 | |||||||
DXC Technology Co. | (880 | ) | (20,988 | ) | 19.8 | |||||||
Dynatrace, Inc. | (17,519 | ) | (740,703 | ) | 698.9 | |||||||
Eagle Materials, Inc. | (516 | ) | (76,476 | ) | 72.2 | |||||||
East West Bancorp, Inc. | (9,914 | ) | (512,455 | ) | 483.5 | |||||||
Edison International | (10,669 | ) | (785,238 | ) | 740.9 | |||||||
Elanco Animal Health, Inc. | (14,457 | ) | (136,908 | ) | 129.2 | |||||||
Elastic NV | (7,659 | ) | (438,478 | ) | 413.7 | |||||||
EMCOR Group, Inc. | (5,461 | ) | (933,831 | ) | 881.1 | |||||||
Endeavor Group Holdings, Inc. | (20,514 | ) | (528,851 | ) | 499.0 | |||||||
Entegris, Inc. | (12,370 | ) | (926,760 | ) | 874.4 | |||||||
EQT Corp. | (2,904 | ) | (101,175 | ) | 95.5 | |||||||
Equitable Holdings, Inc. | (29,940 | ) | (778,141 | ) | 734.2 | |||||||
Erie Indemnity Co., Class A | (61 | ) | (13,257 | ) | 12.5 | |||||||
Estee Lauder Cos., Inc., Class A | (269 | ) | (66,368 | ) | 62.6 | |||||||
Euronet Worldwide, Inc. | (2,295 | ) | (254,148 | ) | 239.8 | |||||||
Evergy, Inc. | (833 | ) | (51,738 | ) | 48.8 | |||||||
Exelon Corp. | (34,076 | ) | (1,446,185 | ) | 1,364.5 | |||||||
ExlService Holdings, Inc. | (797 | ) | (142,169 | ) | 134.1 | |||||||
| Security | Shares | Value | % of Basket Value | |||||||||
| United States (continued) | ||||||||||||
Extra Space Storage, Inc. | (308 | ) | $ | (46,828 | ) | 44.2 | % | |||||
F&G Annuities & Life, Inc. | (1 | ) | (18 | ) | 0.0 | |||||||
Federal Realty Investment Trust | (906 | ) | (89,594 | ) | 84.5 | |||||||
Ferguson PLC | (292 | ) | (40,942 | ) | 38.6 | |||||||
Fidelity National Financial, Inc. | (19,762 | ) | (701,353 | ) | 661.8 | |||||||
Fifth Third Bancorp | (4,678 | ) | (122,564 | ) | 115.6 | |||||||
First Citizens BancShares, Inc. | (89 | ) | (89,639 | ) | 84.6 | |||||||
First Industrial Realty Trust, Inc. | (2,722 | ) | (142,823 | ) | 134.8 | |||||||
First Solar, Inc. | (2,155 | ) | (393,460 | ) | 371.2 | |||||||
FirstEnergy Corp. | (36,014 | ) | (1,433,357 | ) | 1,352.4 | |||||||
Fiserv, Inc. | (833 | ) | (101,726 | ) | 96.0 | |||||||
FleetCor Technologies, Inc. | (488 | ) | (104,393 | ) | 98.5 | |||||||
Floor & Decor Holdings, Inc., Class A | (7,333 | ) | (728,460 | ) | 687.3 | |||||||
Fluence Energy, Inc. | (2,302 | ) | (41,574 | ) | 39.2 | |||||||
FNB Corp. | (51,650 | ) | (592,942 | ) | 559.5 | |||||||
Fox Factory Holding Corp. | (2,013 | ) | (223,181 | ) | 210.6 | |||||||
Freshworks, Inc. | (41,294 | ) | (551,688 | ) | 520.5 | |||||||
Frontier Communications Parent, Inc. | (12,253 | ) | (276,183 | ) | 260.6 | |||||||
Gaming and Leisure Properties, Inc. | (9,078 | ) | (472,056 | ) | 445.4 | |||||||
Gen Digital, Inc. | (57,019 | ) | (1,007,526 | ) | 950.6 | |||||||
Gitlab, Inc. | (34,723 | ) | (1,054,190 | ) | 994.7 | |||||||
Goldman Sachs Group, Inc. | (1,213 | ) | (416,593 | ) | 393.1 | |||||||
Graphic Packaging Holding Co. | (29,883 | ) | (736,915 | ) | 695.3 | |||||||
Grocery Outlet Holding Corp. | (1,590 | ) | (47,350 | ) | 44.7 | |||||||
GSK PLC | (5,311 | ) | (94,947 | ) | 89.6 | |||||||
Haleon PLC | (268,425 | ) | (1,170,658 | ) | 1,104.6 | |||||||
HashiCorp., Inc. | (26,336 | ) | (706,068 | ) | 666.2 | |||||||
Healthcare Realty Trust, Inc. | (102,327 | ) | (2,024,028 | ) | 1,909.7 | |||||||
Hertz Global Holdings, Inc. | (71,188 | ) | (1,187,416 | ) | 1,120.4 | |||||||
HF Sinclair Corp. | (3,611 | ) | (159,281 | ) | 150.3 | |||||||
Hilton Grand Vacations, Inc. | (20,161 | ) | (862,891 | ) | 814.2 | |||||||
Houlihan Lokey, Inc. | (6,014 | ) | (549,559 | ) | 518.5 | |||||||
Huntington Bancshares, Inc. | (10,159 | ) | (113,781 | ) | 107.4 | |||||||
Hyatt Hotels Corp., Class A | (2,822 | ) | (322,555 | ) | 304.3 | |||||||
ICON PLC | (2,659 | ) | (512,363 | ) | 483.4 | |||||||
Independence Realty Trust, Inc. | (12,335 | ) | (205,378 | ) | 193.8 | |||||||
Inspire Medical Systems, Inc. | (430 | ) | (115,081 | ) | 108.6 | |||||||
Interactive Brokers Group, Inc. | (950 | ) | (73,958 | ) | 69.8 | |||||||
International Business Machines Corp. | (12,588 | ) | (1,591,249 | ) | 1,501.4 | |||||||
International Flavors & Fragrances, Inc. | (12,719 | ) | (1,233,234 | ) | 1,163.6 | |||||||
International Game Technology PLC | (19,103 | ) | (537,558 | ) | 507.2 | |||||||
Interpublic Group of Cos., Inc. | (39,044 | ) | (1,395,042 | ) | 1,316.3 | |||||||
Intra-Cellular Therapies, Inc. | (10,968 | ) | (681,661 | ) | 643.2 | |||||||
iRhythm Technologies, Inc. | (7,403 | ) | (972,754 | ) | 917.8 | |||||||
James Hardie Industries PLC, CDI | (889 | ) | (19,778 | ) | 18.7 | |||||||
Janus Henderson Group PLC | (14,827 | ) | (384,761 | ) | 363.0 | |||||||
Jazz Pharmaceuticals PLC | (630 | ) | (88,496 | ) | 83.5 | |||||||
Karuna Therapeutics, Inc. | (3,582 | ) | (710,812 | ) | 670.7 | |||||||
Kinder Morgan, Inc. | (12,656 | ) | (217,050 | ) | 204.8 | |||||||
Kinsale Capital Group, Inc. | (3,814 | ) | (1,246,072 | ) | 1,175.7 | |||||||
Kite Realty Group Trust | (103,812 | ) | (2,150,985 | ) | 2,029.5 | |||||||
Lantheus Holdings, Inc. | (3,484 | ) | (297,708 | ) | 280.9 | |||||||
Las Vegas Sands Corp. | (1,275 | ) | (81,409 | ) | 76.8 | |||||||
Lennar Corp. | (14,515 | ) | (1,637,437 | ) | 1,545.0 | |||||||
Levi Strauss & Co. | (38,092 | ) | (550,810 | ) | 519.7 | |||||||
Lincoln Electric Holdings, Inc. | (864 | ) | (144,979 | ) | 136.8 | |||||||
Lithia Motors, Inc. | (361 | ) | (79,741 | ) | 75.2 | |||||||
Littelfuse, Inc. | (681 | ) | (164,965 | ) | 155.7 | |||||||
Live Nation Entertainment, Inc. | (581 | ) | (39,380 | ) | 37.2 | |||||||
Loews Corp. | (9,611 | ) | (553,305 | ) | 522.1 | |||||||
Madison Square Garden Sports Corp. | (260 | ) | (52,130 | ) | 49.2 | |||||||
Maravai LifeSciences Holdings, Inc., Class A | (2,374 | ) | (32,737 | ) | 30.9 | |||||||
| 64 | 2 0 2 3 BLACK ROCK ANNUAL REPORT TO SHAREHOLDERS |
Schedule of Investments (continued) April 30, 2023 | BlackRock Global Equity Market Neutral Fund |
| Security | Shares | Value | % of Basket Value | |||||||||
| United States (continued) | ||||||||||||
Markel Corp. | (445 | ) | $ | (608,996 | ) | 574.6 | % | |||||
MarketAxess Holdings, Inc. | (1,040 | ) | (331,105 | ) | 312.4 | |||||||
MasTec, Inc. | (5,795 | ) | (514,654 | ) | 485.6 | |||||||
Maximus, Inc. | (14,335 | ) | (1,199,123 | ) | 1,131.4 | |||||||
McKesson Corp. | (2,076 | ) | (756,162 | ) | 713.5 | |||||||
MDU Resources Group, Inc. | (11,438 | ) | (334,218 | ) | 315.3 | |||||||
Medpace Holdings, Inc. | (1,673 | ) | (334,834 | ) | 315.9 | |||||||
Meritage Homes Corp. | (4,500 | ) | (576,225 | ) | 543.7 | |||||||
MKS Instruments, Inc. | (12,530 | ) | (1,050,891 | ) | 991.6 | |||||||
Moderna, Inc. | (2,512 | ) | (333,820 | ) | 315.0 | |||||||
Monday.com Ltd. | (150 | ) | (18,288 | ) | 17.3 | |||||||
Mondelez International, Inc. | (1,193 | ) | (91,527 | ) | 86.4 | |||||||
MongoDB, Inc. | (5,908 | ) | (1,417,684 | ) | 1,337.6 | |||||||
Morgan Stanley | (33,424 | ) | (3,007,157 | ) | 2,837.4 | |||||||
Mosaic Co. | (13,545 | ) | (580,403 | ) | 547.6 | |||||||
Motorola Solutions, Inc. | (5,733 | ) | (1,670,596 | ) | 1,576.3 | |||||||
Natera, Inc. | (618 | ) | (31,345 | ) | 29.6 | |||||||
National Retail Properties, Inc. | (4,990 | ) | (217,065 | ) | 204.8 | |||||||
National Storage Affiliates Trust | (26,980 | ) | (1,040,079 | ) | 981.4 | |||||||
NCR Corp. | (3,684 | ) | (82,116 | ) | 77.5 | |||||||
Neogen Corp. | (10,093 | ) | (173,801 | ) | 164.0 | |||||||
Netflix, Inc. | (2,623 | ) | (865,406 | ) | 816.5 | |||||||
New Fortress Energy, Inc. | (622 | ) | (18,840 | ) | 17.8 | |||||||
New Jersey Resources Corp. | (17,324 | ) | (894,611 | ) | 844.1 | |||||||
New Relic, Inc. | (2,268 | ) | (162,094 | ) | 152.9 | |||||||
New York Times Co. | (2,334 | ) | (92,777 | ) | 87.5 | |||||||
Newell Brands, Inc. | (56,405 | ) | (685,321 | ) | 646.6 | |||||||
News Corp. | (61,613 | ) | (1,085,005 | ) | 1,023.7 | |||||||
NextEra Energy, Inc. | (7,774 | ) | (595,722 | ) | 562.1 | |||||||
NEXTracker, Inc. | (9,638 | ) | (303,501 | ) | 286.4 | |||||||
Noble Corp. PLC | (15,471 | ) | (594,860 | ) | 561.3 | |||||||
Novanta, Inc. | (5,961 | ) | (911,079 | ) | 859.6 | |||||||
Nutanix, Inc. | (6,250 | ) | (149,875 | ) | 141.4 | |||||||
nVent Electric PLC | (38,852 | ) | (1,629,064 | ) | 1,537.1 | |||||||
OGE Energy Corp. | (25,879 | ) | (971,498 | ) | 916.6 | |||||||
Okta, Inc. | (13,579 | ) | (930,569 | ) | 878.0 | |||||||
Old Republic International Corp. | (67,923 | ) | (1,716,414 | ) | 1,619.5 | |||||||
Ollie’s Bargain Outlet Holdings, Inc. | (1,948 | ) | (127,107 | ) | 119.9 | |||||||
Omega Healthcare Investors, Inc. | (1,053 | ) | (28,178 | ) | 26.6 | |||||||
Omnicom Group, Inc. | (12,413 | ) | (1,124,245 | ) | 1,060.8 | |||||||
ONE Gas, Inc. | (1,565 | ) | (120,427 | ) | 113.6 | |||||||
ONEOK, Inc. | (4,941 | ) | (323,191 | ) | 304.9 | |||||||
Onto Innovation, Inc. | (3,275 | ) | (265,210 | ) | 250.2 | |||||||
Option Care Health, Inc. | (3,414 | ) | (109,760 | ) | 103.6 | |||||||
Oracle Corp. | (2,737 | ) | (259,249 | ) | 244.6 | |||||||
Organon & Co. | (26,607 | ) | (655,330 | ) | 618.3 | |||||||
Ormat Technologies, Inc. | (758 | ) | (65,044 | ) | 61.4 | |||||||
PACCAR, Inc. | (19,990 | ) | (1,493,053 | ) | 1,408.8 | |||||||
Palantir Technologies, Inc. | (94,909 | ) | (735,545 | ) | 694.0 | |||||||
Paramount Global, Class B | (2,182 | ) | (50,906 | ) | 48.0 | |||||||
Parker-Hannifin Corp. | (4,879 | ) | (1,585,090 | ) | 1,495.6 | |||||||
PayPal Holdings, Inc. | (22,745 | ) | (1,728,620 | ) | 1,631.0 | |||||||
Peloton Interactive, Inc., Class A | (39,740 | ) | (352,891 | ) | 333.0 | |||||||
Pentair PLC | (9,000 | ) | (522,720 | ) | 493.2 | |||||||
Performance Food Group Co. | (51,146 | ) | (3,206,343 | ) | 3,025.3 | |||||||
Permian Resources Corp. | (37,200 | ) | (388,740 | ) | 366.8 | |||||||
Pfizer, Inc. | (16,758 | ) | (651,719 | ) | 614.9 | |||||||
PG&E Corp. | (17,493 | ) | (299,305 | ) | 282.4 | |||||||
Phillips 66 | (3,147 | ) | (311,553 | ) | 294.0 | |||||||
PNC Financial Services Group, Inc. | (388 | ) | (50,537 | ) | 47.7 | |||||||
PPG Industries, Inc. | (911 | ) | (127,777 | ) | 120.6 | |||||||
Primerica, Inc. | (705 | ) | (128,670 | ) | 121.4 | |||||||
| Security | Shares | Value | % of Basket Value | |||||||||
| United States (continued) | ||||||||||||
Privia Health Group, Inc. | (18,281 | ) | $ | (505,104 | ) | 476.6 | % | |||||
Progressive Corp. | (3,288 | ) | (448,483 | ) | 423.2 | |||||||
Progyny, Inc. | (5,822 | ) | (193,523 | ) | 182.6 | |||||||
PTC, Inc. | (5,492 | ) | (690,839 | ) | 651.8 | |||||||
Public Service Enterprise Group, Inc. | (3,644 | ) | (230,301 | ) | 217.3 | |||||||
PulteGroup, Inc. | (7,880 | ) | (529,142 | ) | 499.3 | |||||||
Qualcomm, Inc. | (4,760 | ) | (555,968 | ) | 524.6 | |||||||
Quanta Services, Inc. | (1,429 | ) | (242,416 | ) | 228.7 | |||||||
QuidelOrtho Corp. | (1,842 | ) | (165,688 | ) | 156.3 | |||||||
R1 RCM, Inc. | (12,686 | ) | (197,775 | ) | 186.6 | |||||||
Radian Group, Inc. | (2,508 | ) | (60,869 | ) | 57.4 | |||||||
Range Resources Corp. | (9,254 | ) | (244,768 | ) | 230.9 | |||||||
Raymond James Financial, Inc. | (2,494 | ) | (225,782 | ) | 213.0 | |||||||
RBC Bearings, Inc. | (4,519 | ) | (1,025,858 | ) | 967.9 | |||||||
Realty Income Corp. | (6,586 | ) | (413,864 | ) | 390.5 | |||||||
Regal Rexnord Corp., Registered Shares | (441 | ) | (57,401 | ) | 54.2 | |||||||
Rexford Industrial Realty, Inc. | (4,867 | ) | (271,433 | ) | 256.1 | |||||||
RH | (1,975 | ) | (503,882 | ) | 475.4 | |||||||
Rithm Capital Corp. | (211,150 | ) | (1,722,984 | ) | 1,625.7 | |||||||
Rivian Automotive, Inc. | (28,025 | ) | (359,280 | ) | 339.0 | |||||||
RLI Corp. | (239 | ) | (33,233 | ) | 31.4 | |||||||
Robinhood Markets, Inc. | (67,288 | ) | (595,499 | ) | 561.9 | |||||||
Rockwell Automation, Inc. | (912 | ) | (258,470 | ) | 243.9 | |||||||
Ryan Specialty Holdings, Inc. | (6,974 | ) | (284,958 | ) | 268.9 | |||||||
Ryman Hospitality Properties, Inc. | (6,333 | ) | (567,817 | ) | 535.8 | |||||||
Science Applications International Corp. | (4,498 | ) | (458,931 | ) | 433.0 | |||||||
Sealed Air Corp. | (6,993 | ) | (335,594 | ) | 316.6 | |||||||
Selective Insurance Group, Inc. | (4,994 | ) | (481,072 | ) | 453.9 | |||||||
SentinelOne, Inc. | (9,678 | ) | (155,525 | ) | 146.7 | |||||||
Shift4 Payments, Inc., Class A | (12,964 | ) | (878,570 | ) | 829.0 | |||||||
Shoals Technologies Group, Inc., Class A | (20,945 | ) | (437,541 | ) | 412.8 | |||||||
Shockwave Medical, Inc. | (1,030 | ) | (298,865 | ) | 282.0 | |||||||
Sitio Royalties Corp. | (11,415 | ) | (289,827 | ) | 273.5 | |||||||
Skyline Champion Corp. | (3,744 | ) | (277,692 | ) | 262.0 | |||||||
Skyworks Solutions, Inc. | (6,005 | ) | (635,929 | ) | 600.0 | |||||||
SLM Corp. | (20,935 | ) | (314,444 | ) | 296.7 | |||||||
Smartsheet, Inc., Class A | (1,074 | ) | (43,894 | ) | 41.4 | |||||||
Snowflake, Inc. | (3,762 | ) | (557,077 | ) | 525.6 | |||||||
SoFi Technologies, Inc. | (117,187 | ) | (730,075 | ) | 688.9 | |||||||
SolarEdge Technologies, Inc. | (3,155 | ) | (901,163 | ) | 850.3 | |||||||
Sonoco Products Co. | (4,925 | ) | (298,553 | ) | 281.7 | |||||||
Southern Co. | (20,980 | ) | (1,543,079 | ) | 1,456.0 | |||||||
SouthState Corp. | (4,655 | ) | (321,102 | ) | 303.0 | |||||||
Southwest Gas Holdings, Inc. | (1,066 | ) | (59,696 | ) | 56.3 | |||||||
Spirit Realty Capital, Inc. | (2,115 | ) | (81,343 | ) | 76.8 | |||||||
SPS Commerce, Inc. | (220 | ) | (32,406 | ) | 30.6 | |||||||
SS&C Technologies Holdings, Inc. | (52,819 | ) | (3,092,024 | ) | 2,917.4 | |||||||
STAG Industrial, Inc. | (32,248 | ) | (1,092,240 | ) | 1,030.6 | |||||||
Stanley Black & Decker, Inc. | (7,373 | ) | (636,585 | ) | 600.6 | |||||||
Starbucks Corp. | (1,831 | ) | (209,265 | ) | 197.4 | |||||||
Starwood Property Trust, Inc. | (48,345 | ) | (864,892 | ) | 816.1 | |||||||
State Street Corp. | (1,832 | ) | (132,380 | ) | 124.9 | |||||||
Stellantis NV | (80,690 | ) | (1,340,631 | ) | 1,264.9 | |||||||
Super Micro Computer, Inc. | (205 | ) | (21,613 | ) | 20.4 | |||||||
Surgery Partners, Inc. | (612 | ) | (24,272 | ) | 22.9 | |||||||
Synaptics, Inc. | (2,542 | ) | (225,120 | ) | 212.4 | |||||||
Sysco Corp. | (7,320 | ) | (561,737 | ) | 530.0 | |||||||
Take-Two Interactive Software, Inc. | (1,858 | ) | (230,931 | ) | 217.9 | |||||||
Teledyne Technologies, Inc. | (590 | ) | (244,496 | ) | 230.7 | |||||||
Tenable Holdings, Inc. | (1,908 | ) | (70,577 | ) | 66.6 | |||||||
Tenaris SA | (58,098 | ) | (832,386 | ) | 785.4 | |||||||
Tenet Healthcare Corp. | (2,742 | ) | (201,043 | ) | 189.7 | |||||||
SCHEDULE OF INVESTMENTS | 65 |
Schedule of Investments (continued) April 30, 2023 | BlackRock Global Equity Market Neutral Fund |
| Security | Shares | Value | % of Basket Value | |||||||||
United States (continued) | ||||||||||||
Terreno Realty Corp. | (7,253 | ) | $ | (446,712 | ) | 421.5 | % | |||||
Tesla, Inc. | (653 | ) | (107,294 | ) | 101.2 | |||||||
Tetra Tech, Inc. | (1,999 | ) | (276,602 | ) | 261.0 | |||||||
T-Mobile US, Inc. | (9,231 | ) | (1,328,341 | ) | 1,253.3 | |||||||
Toast, Inc. | (30,437 | ) | (553,953 | ) | 522.7 | |||||||
TopBuild Corp. | (155 | ) | (34,949 | ) | 33.0 | |||||||
Trade Desk, Inc., Class A | (10,754 | ) | (691,912 | ) | 652.8 | |||||||
TriNet Group, Inc. | (674 | ) | (62,534 | ) | 59.0 | |||||||
Twilio, Inc., Class A | (6,798 | ) | (357,643 | ) | 337.4 | |||||||
Tyler Technologies, Inc. | (1,582 | ) | (599,625 | ) | 565.8 | |||||||
Uber Technologies, Inc. | (18,869 | ) | (585,882 | ) | 552.8 | |||||||
U-Haul Holding Co. | (9,197 | ) | (497,558 | ) | 469.5 | |||||||
UiPath, Inc. | (20,785 | ) | (292,653 | ) | 276.1 | |||||||
Under Armour, Inc., Class A | (15,903 | ) | (141,060 | ) | 133.1 | |||||||
United Rentals, Inc. | (697 | ) | (251,694 | ) | 237.5 | |||||||
Unity Software, Inc. | (18,874 | ) | (509,032 | ) | 480.3 | |||||||
Universal Health Services, Inc. | (1,722 | ) | (258,903 | ) | 244.3 | |||||||
Valley National Bancorp | (60,890 | ) | (571,148 | ) | 538.9 | |||||||
Valvoline, Inc. | (6,776 | ) | (234,111 | ) | 220.9 | |||||||
Verizon Communications, Inc. | (22,023 | ) | (855,153 | ) | 806.9 | |||||||
Vertiv Holdings Co., Class A | (59,017 | ) | (880,534 | ) | 830.8 | |||||||
Viatris, Inc. | (8,619 | ) | (80,415 | ) | 75.9 | |||||||
Vir Biotechnology, Inc. | (7,692 | ) | (193,454 | ) | 182.5 | |||||||
Vontier Corp. | (77,871 | ) | (2,112,640 | ) | 1,993.4 | |||||||
Warner Music Group Corp., Class A | (18,429 | ) | (561,532 | ) | 529.8 | |||||||
Webster Financial Corp. | (2,083 | ) | (77,696 | ) | 73.3 | |||||||
Wells Fargo & Co. | (10,330 | ) | (410,617 | ) | 387.4 | |||||||
Welltower, Inc. | (15,292 | ) | (1,211,432 | ) | 1,143.0 | |||||||
WESCO International, Inc. | (169 | ) | (24,336 | ) | 23.0 | |||||||
Western Alliance Bancorp | (2,650 | ) | (98,368 | ) | 92.8 | |||||||
Western Union Co. | (25,170 | ) | (275,108 | ) | 259.6 | |||||||
Whirlpool Corp. | (2,203 | ) | (307,517 | ) | 290.2 | |||||||
Wingstop, Inc. | (1,780 | ) | (356,196 | ) | 336.1 | |||||||
Wolfspeed, Inc. | (1,334 | ) | (62,098 | ) | 58.6 | |||||||
Xcel Energy, Inc. | (5,999 | ) | (419,390 | ) | 395.7 | |||||||
XPO, Inc. | (413 | ) | (18,246 | ) | 17.2 | |||||||
Zebra Technologies Corp. | (405 | ) | (116,652 | ) | 110.1 | |||||||
Zimmer Biomet Holdings, Inc. | (317 | ) | (43,885 | ) | 41.4 | |||||||
Zoom Video Communications, Inc., Class A | (4,068 | ) | (249,897 | ) | 235.8 | |||||||
ZoomInfo Technologies, Inc. | (2,337 | ) | (51,204 | ) | 48.3 | |||||||
Zscaler, Inc. | (2,925 | ) | (263,543 | ) | 248.7 | |||||||
|
|
|
| |||||||||
| (185,205,742 | ) | |||||||||||
| Security | Shares | Value | % of Basket Value | |||||||||
United States (continued) | ||||||||||||
Preferred Stocks | ||||||||||||
Germany | ||||||||||||
Henkel AG & Co. KGaA | (3,360 | ) | $ | (272,068 | ) | 256.7 | % | |||||
|
|
|
| |||||||||
Total Reference Entity — Short | (356,938,215 | ) | ||||||||||
|
| |||||||||||
Net Value of Reference Entity — BNP Paribas SA | $ | (105,984 | ) | |||||||||
|
| |||||||||||
The following table represents the individual long and short positions and related values of the equity securities underlying the total return swap with BNP Paribas SA as of period end, termination dates 03/17/25-04/17/25:
| Security | Shares | Value | % of Basket Value | |||||||||
Reference Entity — Long | ||||||||||||
Common Stocks | ||||||||||||
Australia | ||||||||||||
Charter Hall Long Wale REIT | 5,491 | $ | 15,925 | 11.3 | % | |||||||
Charter Hall Retail REIT | 20,586 | 53,001 | 37.5 | |||||||||
GrainCorp Ltd. | 2,990 | 13,547 | 9.6 | |||||||||
oOh!media Ltd. | 23,095 | 25,266 | 17.9 | |||||||||
Premier Investments Ltd. | 6,461 | 112,329 | 79.4 | |||||||||
Regis Resources Ltd., Registered Shares | 8,982 | 12,733 | 9.0 | |||||||||
Silver Lake Resources Ltd. | 15,666 | 13,167 | 9.3 | |||||||||
Technology One Ltd. | 5,481 | 55,328 | 39.1 | |||||||||
West African Resources Ltd. | 24,232 | 15,708 | 11.1 | |||||||||
|
|
|
| |||||||||
| 317,004 | ||||||||||||
Belgium | ||||||||||||
Barco NV | 1,016 | 29,717 | 21.0 | |||||||||
Melexis NV | 184 | 17,569 | 12.5 | |||||||||
Telenet Group Holding NV | 853 | 19,816 | 14.0 | |||||||||
|
|
|
| |||||||||
| 67,102 | ||||||||||||
Canada | ||||||||||||
Artis Real Estate Investment Trust | 5,411 | 27,918 | 19.7 | |||||||||
Boyd Group Services, Inc. | 469 | 77,692 | 55.0 | |||||||||
Dream Unlimited Corp. | 1,037 | 17,167 | 12.1 | |||||||||
Dundee Precious Metals, Inc. | 1,632 | 11,887 | 8.4 | |||||||||
Laurentian Bank of Canada | 1,155 | 27,270 | 19.3 | |||||||||
|
|
|
| |||||||||
| 161,934 | ||||||||||||
Denmark | ||||||||||||
Scandinavian Tobacco Group A/S | 983 | 19,228 | 13.6 | |||||||||
|
|
|
| |||||||||
Finland | ||||||||||||
F-Secure OYJ | 5,128 | 16,550 | 11.7 | |||||||||
|
|
|
| |||||||||
| 66 | 2 0 2 3 BLACK ROCK ANNUAL REPORT TO SHAREHOLDERS |
Schedule of Investments (continued) April 30, 2023 | BlackRock Global Equity Market Neutral Fund |
| Security | Shares | Value | % of Basket Value | |||||||||
Germany | ||||||||||||
Grand City Properties SA | 2,073 | $ | 17,339 | 12.3 | % | |||||||
Krones AG | 340 | 44,739 | 31.6 | |||||||||
Salzgitter AG | 1,079 | 42,829 | 30.3 | |||||||||
|
|
|
| |||||||||
| 104,907 | ||||||||||||
Ireland | ||||||||||||
Cimpress PLC | 345 | 17,923 | 12.7 | |||||||||
|
|
|
| |||||||||
Israel | ||||||||||||
Kornit Digital Ltd. | 1,251 | 22,843 | 16.2 | |||||||||
|
|
|
| |||||||||
Italy | ||||||||||||
Banca Popolare di Sondrio SPA | 18,722 | 85,181 | 60.2 | |||||||||
Sesa SpA | 224 | 27,494 | 19.5 | |||||||||
|
|
|
| |||||||||
| 112,675 | ||||||||||||
Japan | ||||||||||||
Central Glass Co. Ltd. | 2,200 | 48,395 | 34.2 | |||||||||
Create SD Holdings Co. Ltd. | 600 | 14,554 | 10.3 | |||||||||
Digital Arts, Inc. | 1,600 | 60,663 | 42.9 | |||||||||
dip Corp. | 600 | 15,110 | 10.7 | |||||||||
eGuarantee, Inc. | 2,100 | 33,242 | 23.5 | |||||||||
Eiken Chemical Co. Ltd. | 1,100 | 13,036 | 9.2 | |||||||||
Elan Corp. | 1,800 | 13,708 | 9.7 | |||||||||
Financial Partners Group Co. Ltd. | 1,800 | 14,655 | 10.4 | |||||||||
Gree, Inc. | 2,500 | 13,172 | 9.3 | |||||||||
Gunma Bank Ltd. | 5,600 | 19,505 | 13.8 | |||||||||
JAFCO Group Co. ltd. | 3,300 | 42,779 | 30.3 | |||||||||
Japan Elevator Service Holdings Co. Ltd. | 1,500 | 22,701 | 16.1 | |||||||||
Kaga Electronics Co. Ltd. | 1,100 | 39,726 | 28.1 | |||||||||
Kanematsu Corp. | 2,200 | 29,130 | 20.6 | |||||||||
KOMEDA Holdings Co. Ltd. | 700 | 13,440 | 9.5 | |||||||||
Kureha Corp. | 600 | 37,971 | 26.9 | |||||||||
Kyorin Pharmaceutical Co. Ltd. | 1,800 | 23,566 | 16.7 | |||||||||
Kyoritsu Maintenance Co. Ltd. | 400 | 16,457 | 11.6 | |||||||||
Life Corp. | 800 | 16,970 | 12.0 | |||||||||
Meitec Corp. | 1,800 | 31,016 | 21.9 | |||||||||
Mitsubishi Shokuhin Co. Ltd. | 600 | 15,763 | 11.1 | |||||||||
Mizuho Leasing Co. Ltd. | 500 | 14,251 | 10.1 | |||||||||
Modec, Inc. | 1,400 | 15,452 | 10.9 | |||||||||
Nichias Corp. | 1,100 | 22,664 | 16.0 | |||||||||
Nippon Ceramic Co. Ltd. | 700 | 14,250 | 10.1 | |||||||||
Nippon Gas Co. Ltd. | 15,100 | 215,953 | 152.7 | |||||||||
Nippon REIT Investment Corp. | 10 | 23,883 | 16.9 | |||||||||
Okinawa Electric Power Co., Inc. | 1,900 | 15,496 | 11.0 | |||||||||
Okumura Corp. | 1,000 | 24,955 | 17.7 | |||||||||
Outsourcing, Inc. | 4,900 | 50,874 | 36.0 | |||||||||
PHC Holdings Corp. | 1,300 | 13,624 | 9.6 | |||||||||
Plus Alpha Consulting Co. Ltd. | 600 | 13,086 | 9.3 | |||||||||
Raito Kogyo Co. Ltd. | 900 | 13,527 | 9.6 | |||||||||
Seiren Co. Ltd. | 3,300 | 55,605 | 39.3 | |||||||||
Shin-Etsu Polymer Co. Ltd. | 1,200 | 12,056 | 8.5 | |||||||||
Starts Corp., Inc. | 3,800 | 72,741 | 51.4 | |||||||||
Sumitomo Mitsui Construction Co. Ltd. | 4,400 | 12,721 | 9.0 | |||||||||
Systena Corp. | 12,800 | 26,931 | 19.0 | |||||||||
Takeuchi Manufacturing Co. Ltd. | 1,600 | 44,658 | 31.6 | |||||||||
Tokyu Construction Co. Ltd. | 2,800 | 15,102 | 10.7 | |||||||||
Towa Pharmaceutical Co. Ltd. | 1,400 | 20,325 | 14.4 | |||||||||
Toyo Ink SC Holdings Co. Ltd. | 900 | 14,774 | 10.4 | |||||||||
Toyo Tanso Co. Ltd. | 500 | 14,831 | 10.5 | |||||||||
| Security | Shares | Value | % of Basket Value | |||||||||
Japan (continued) | ||||||||||||
TRE Holdings Corp. | 2,900 | $ | 25,914 | 18.3 | % | |||||||
Usen-Next Holdings Co. Ltd. | 600 | 13,708 | 9.7 | |||||||||
|
|
|
| |||||||||
| 1,302,940 | ||||||||||||
Jersey | ||||||||||||
JTC PLC | 1,713 | 16,951 | 12.0 | |||||||||
|
|
|
| |||||||||
Norway | ||||||||||||
SpareBank 1 SR-Bank ASA | 1,111 | 13,022 | 9.2 | |||||||||
|
|
|
| |||||||||
Portugal | ||||||||||||
REN - Redes Energeticas Nacionais SGPS SA | 6,214 | 18,074 | 12.8 | |||||||||
|
|
|
| |||||||||
Singapore | ||||||||||||
BW LPG Ltd. | 1,662 | 13,436 | 9.5 | |||||||||
|
|
|
| |||||||||
Spain | ||||||||||||
Pharma Mar SA | 320 | 13,306 | 9.4 | |||||||||
|
|
|
| |||||||||
Sweden | ||||||||||||
AddTech AB, B Shares | 3,934 | 78,264 | 55.4 | |||||||||
Alleima AB | 9,167 | 46,701 | 33.0 | |||||||||
Betsson AB | 2,175 | 23,308 | 16.5 | |||||||||
Fortnox AB | 1,865 | 12,759 | 9.0 | |||||||||
Mycronic AB | 1,179 | 24,842 | 17.6 | |||||||||
Nyfosa AB | 2,186 | 14,870 | 10.5 | |||||||||
|
|
|
| |||||||||
| 200,744 | ||||||||||||
Switzerland | ||||||||||||
Bucher Industries AG, Registered Shares | 39 | 17,612 | 12.4 | |||||||||
Orior AG | 220 | 20,595 | 14.6 | |||||||||
Sulzer AG, Registered Shares | 319 | 26,805 | 19.0 | |||||||||
Vetropack Holding AG, Registered Shares | 248 | 12,840 | 9.1 | |||||||||
|
|
|
| |||||||||
| 77,852 | ||||||||||||
United Kingdom | ||||||||||||
Bytes Technology Group PLC | 6,347 | 32,897 | 23.3 | |||||||||
Cranswick PLC | 325 | 13,064 | 9.2 | |||||||||
Dunelm Group PLC | 1,293 | 18,466 | 13.1 | |||||||||
Grainger PLC | 22,349 | 72,050 | 50.9 | |||||||||
Ibstock PLC | 6,258 | 13,239 | 9.4 | |||||||||
Kainos Group PLC | 1,004 | 15,543 | 11.0 | |||||||||
Lancashire Holdings Ltd. | 2,537 | 19,413 | 13.7 | |||||||||
Moneysupermarket.com Group PLC | 7,571 | 25,938 | 18.3 | |||||||||
Spire Healthcare Group PLC | 4,557 | 12,982 | 9.2 | |||||||||
Virgin Money UK PLC | 9,146 | 17,829 | 12.6 | |||||||||
|
|
|
| |||||||||
| 241,421 | ||||||||||||
United States | ||||||||||||
Advanced Energy Industries, Inc. | 359 | 31,054 | 22.0 | |||||||||
Air Transport Services Group, Inc. | 1,091 | 22,158 | 15.7 | |||||||||
Albany International Corp., Class A | 896 | 81,724 | 57.8 | |||||||||
Amicus Therapeutics, Inc. | 6,455 | 74,491 | 52.7 | |||||||||
Apogee Enterprises, Inc. | 332 | 14,130 | 10.0 | |||||||||
Arbor Realty Trust, Inc. | 1,712 | 19,637 | 13.9 | |||||||||
ASGN, Inc. | 3,063 | 219,280 | 155.1 | |||||||||
Bank of Hawaii Corp. | 666 | 32,254 | 22.8 | |||||||||
BJ’s Restaurants, Inc. | 734 | 23,884 | 16.9 | |||||||||
BOK Financial Corp. | 790 | 66,257 | 46.9 | |||||||||
Buckle, Inc. | 626 | 20,990 | 14.8 | |||||||||
California Resources Corp. | 685 | 27,743 | 19.6 | |||||||||
Carpenter Technology Corp. | 414 | 21,834 | 15.4 | |||||||||
Catalyst Pharmaceuticals, Inc. | 1,523 | 24,246 | 17.1 | |||||||||
CNO Financial Group, Inc. | 1,069 | 23,988 | 17.0 | |||||||||
CommScope Holding Co., Inc. | 2,796 | 13,784 | 9.7 | |||||||||
SCHEDULE OF INVESTMENTS | 67 |
Schedule of Investments (continued) April 30, 2023 | BlackRock Global Equity Market Neutral Fund |
| Security | Shares | Value | % of Basket Value | |||||||||
United States (continued) | ||||||||||||
Core & Main, Inc., Class A | 688 | $ | 17,929 | 12.7 | % | |||||||
Cracker Barrel Old Country Store, Inc. | 709 | 75,267 | 53.2 | |||||||||
CSG Systems International, Inc. | 351 | 18,491 | 13.1 | |||||||||
CSW Industrials, Inc. | 133 | 17,911 | 12.7 | |||||||||
Dave & Buster’s Entertainment, Inc. | 510 | 18,085 | 12.8 | |||||||||
Duckhorn Portfolio, Inc. | 854 | 12,895 | 9.1 | |||||||||
Ducommun, Inc. | 333 | 16,650 | 11.8 | |||||||||
Dycom Industries, Inc. | 463 | 42,883 | 30.3 | |||||||||
EchoStar Corp. | 1,750 | 29,873 | 21.1 | |||||||||
Energy Recovery, Inc. | 1,256 | 28,298 | 20.0 | |||||||||
Enova International, Inc. | 1,439 | 63,201 | 44.7 | |||||||||
Essent Group Ltd. | 975 | 41,408 | 29.3 | |||||||||
Everi Holdings, Inc. | 970 | 14,744 | 10.4 | |||||||||
Extreme Networks, Inc. | 812 | 14,437 | 10.2 | |||||||||
Fiverr International Ltd. | 443 | 16,178 | 11.4 | |||||||||
Gibraltar Industries, Inc. | 569 | 28,473 | 20.1 | |||||||||
Gorman-Rupp Co. | 640 | 15,712 | 11.1 | |||||||||
Gray Television, Inc. | 2,553 | 19,684 | 13.9 | |||||||||
Group 1 Automotive, Inc. | 85 | 19,081 | 13.5 | |||||||||
Guardant Health, Inc. | 3,251 | 73,343 | 51.9 | |||||||||
Hancock Whitney Corp. | 403 | 14,718 | 10.4 | |||||||||
Hub Group, Inc., Class A | 246 | 18,548 | 13.1 | |||||||||
IDT Corp. | 563 | 18,697 | 13.2 | |||||||||
Independent Bank Group, Inc. | 802 | 29,177 | 20.6 | |||||||||
JetBlue Airways Corp. | 2,160 | 15,422 | 10.9 | |||||||||
John Bean Technologies Corp. | 575 | 62,508 | 44.2 | |||||||||
Kadant, Inc. | 113 | 20,999 | 14.9 | |||||||||
Kennametal, Inc. | 541 | 14,044 | 9.9 | |||||||||
Kohl’s Corp. | 592 | 13,042 | 9.2 | |||||||||
LendingTree, Inc. | 561 | 13,369 | 9.5 | |||||||||
LSB Industries, Inc. | 1,805 | 16,119 | 11.4 | |||||||||
MaxLinear, Inc. | 2,302 | 55,547 | 39.3 | |||||||||
Medifast, Inc. | 140 | 12,831 | 9.1 | |||||||||
Morningstar, Inc. | 157 | 27,995 | 19.8 | |||||||||
MSA Safety, Inc. | 315 | 40,871 | 28.9 | |||||||||
Nabors Industries Ltd. | 274 | 27,329 | 19.3 | |||||||||
National Beverage Corp. | 667 | 33,150 | 23.4 | |||||||||
NextEra Energy Partners LP | 946 | 54,404 | 38.5 | |||||||||
Oceaneering International, Inc. | 891 | 15,797 | 11.2 | |||||||||
Oxford Industries, Inc. | 132 | 13,621 | 9.6 | |||||||||
Red Rock Resorts, Inc. | 4,230 | 206,424 | 146.0 | |||||||||
Rush Enterprises, Inc., Class A | 502 | 26,661 | 18.9 | |||||||||
Ruth’s Hospitality Group, Inc. | 4,128 | 66,709 | 47.2 | |||||||||
Sanmina Corp. | 280 | 14,633 | 10.4 | |||||||||
Simpson Manufacturing Co., Inc. | 103 | 12,955 | 9.2 | |||||||||
Six Flags Entertainment Corp. | 995 | 24,149 | 17.1 | |||||||||
SpartanNash Co. | 537 | 13,167 | 9.3 | |||||||||
Sprinklr, Inc. | 2,881 | 34,457 | 24.4 | |||||||||
Steven Madden Ltd. | 980 | 34,339 | 24.3 | |||||||||
TechTarget, Inc. | 372 | 12,682 | 9.0 | |||||||||
Trinity Industries, Inc. | 952 | 22,800 | 16.1 | |||||||||
TripAdvisor, Inc. | 4,602 | 81,594 | 57.7 | |||||||||
United States Cellular Corp. | 1,918 | 40,738 | 28.8 | |||||||||
US Silica Holdings, Inc. | 1,029 | 13,428 | 9.5 | |||||||||
| Security | Shares | Value | % of Basket Value | |||||||||
United States (continued) | ||||||||||||
USANA Health Sciences, Inc. | 204 | $ | 13,540 | 9.6 | % | |||||||
Veradigm, Inc. | 5,313 | 66,359 | 46.9 | |||||||||
|
|
|
| |||||||||
| 2,504,820 | ||||||||||||
Preferred Stocks | ||||||||||||
Germany | ||||||||||||
Kloeckner & Co. SE | 2,343 | 26,033 | 18.4 | |||||||||
|
|
|
| |||||||||
Total Reference Entity — Long | 5,268,765 | |||||||||||
|
| |||||||||||
Reference Entity — Short | ||||||||||||
Common Stocks | ||||||||||||
Australia | ||||||||||||
AUB Group Ltd. | (1,594 | ) | (29,244 | ) | (20.7 | ) | ||||||
Corporate Travel Management Ltd. | (3,771 | ) | (52,756 | ) | (37.3 | ) | ||||||
Ingenia Communities Group | (18,113 | ) | (51,623 | ) | (36.5 | ) | ||||||
IPH Ltd. | (2,437 | ) | (13,208 | ) | (9.3 | ) | ||||||
IRESS Ltd. | (4,343 | ) | (29,896 | ) | (21.2 | ) | ||||||
Neuren Pharmaceuticals Ltd. | (3,307 | ) | (31,073 | ) | (22.0 | ) | ||||||
Nine Entertainment Co. Holdings Ltd. | (19,212 | ) | (26,550 | ) | (18.8 | ) | ||||||
Tietto Minerals Ltd. | (40,515 | ) | (16,038 | ) | (11.3 | ) | ||||||
United Malt Grp Ltd. | (5,445 | ) | (15,983 | ) | (11.3 | ) | ||||||
Webjet Ltd. | (2,583 | ) | (12,736 | ) | (9.0 | ) | ||||||
|
|
|
| |||||||||
| (279,107 | ) | |||||||||||
Bahamas | ||||||||||||
OneSpaWorld Holdings Ltd. | (1,159 | ) | (13,908 | ) | (9.8 | ) | ||||||
|
|
|
| |||||||||
Belgium | ||||||||||||
Bekaert SA | (537 | ) | (25,036 | ) | (17.7 | ) | ||||||
|
|
|
| |||||||||
Canada | ||||||||||||
Aurinia Pharmaceuticals, Inc. | (1,409 | ) | (15,851 | ) | (11.2 | ) | ||||||
Canadian Western Bank | (711 | ) | (12,664 | ) | (9.0 | ) | ||||||
Choice Properties Real Estate Investment Trust | (1,214 | ) | (13,026 | ) | (9.2 | ) | ||||||
EQB, Inc. | (381 | ) | (16,785 | ) | (11.9 | ) | ||||||
Maple Leaf Foods, Inc. | (631 | ) | (12,840 | ) | (9.1 | ) | ||||||
North West Co., Inc. | (478 | ) | (13,923 | ) | (9.8 | ) | ||||||
Spartan Delta Corp. | (1,991 | ) | (22,436 | ) | (15.9 | ) | ||||||
Triple Flag Precious Metals Corp. | (759 | ) | (12,189 | ) | (8.6 | ) | ||||||
Westshore Terminals Investment Corp. | (1,066 | ) | (21,581 | ) | (15.3 | ) | ||||||
Winpak Ltd. | (511 | ) | (16,934 | ) | (12.0 | ) | ||||||
Xenon Pharmaceuticals, Inc. | (321 | ) | (12,930 | ) | (9.1 | ) | ||||||
|
|
|
| |||||||||
| (171,159 | ) | |||||||||||
Costa Rica | ||||||||||||
Establishment Labs Holdings, Inc. | (187 | ) | (13,032 | ) | (9.2 | ) | ||||||
|
|
|
| |||||||||
Denmark | ||||||||||||
Alm Brand A/S | (13,773 | ) | (25,518 | ) | (18.1 | ) | ||||||
Ringkjoebing Landbobank A/S | (230 | ) | (32,399 | ) | (22.9 | ) | ||||||
|
|
|
| |||||||||
| (57,917 | ) | |||||||||||
Egypt | ||||||||||||
Energean PLC | (4,341 | ) | (66,993 | ) | (47.4 | ) | ||||||
|
|
|
| |||||||||
| 68 | 2 0 2 3 BLACK ROCK ANNUAL REPORT TO SHAREHOLDERS |
Schedule of Investments (continued) April 30, 2023 | BlackRock Global Equity Market Neutral Fund |
| Security | Shares | Value | % of Basket Value | |||||||||
Finland | ||||||||||||
Konecranes OYJ | (727 | ) | $ | (28,516 | ) | (20.2 | )% | |||||
Tokmanni Group Corp. | (1,231 | ) | (16,887 | ) | (11.9 | ) | ||||||
|
|
|
| |||||||||
| (45,403 | ) | |||||||||||
Germany | ||||||||||||
Auto1 Group SE | (2,884 | ) | (22,790 | ) | (16.1 | ) | ||||||
CANCOM SE | (403 | ) | (14,531 | ) | (10.3 | ) | ||||||
Dermapharm Holding SE | (383 | ) | (19,237 | ) | (13.6 | ) | ||||||
|
|
|
| |||||||||
| (56,558 | ) | |||||||||||
Japan | ||||||||||||
Aichi Financial Group, Inc. | (900 | ) | (14,399 | ) | (10.2 | ) | ||||||
Change Holdings, Inc. | (1,100 | ) | (19,000 | ) | (13.4 | ) | ||||||
Colowide Co. Ltd. | (1,300 | ) | (20,295 | ) | (14.3 | ) | ||||||
Comforia Residential REIT, Inc. | (17 | ) | (43,262 | ) | (30.6 | ) | ||||||
Cybozu, Inc. | (800 | ) | (16,239 | ) | (11.5 | ) | ||||||
Fuji Soft, Inc. | (800 | ) | (48,612 | ) | (34.4 | ) | ||||||
Fujio Food Group, Inc. | (2,000 | ) | (21,079 | ) | (14.9 | ) | ||||||
Hokuhoku Financial Group, Inc. | (3,100 | ) | (22,723 | ) | (16.1 | ) | ||||||
Joshin Denki Co. Ltd. | (900 | ) | (13,652 | ) | (9.6 | ) | ||||||
Ki-Star Real Estate Co. Ltd. | (1,600 | ) | (48,713 | ) | (34.4 | ) | ||||||
Komeri Co. Ltd. | (700 | ) | (16,565 | ) | (11.7 | ) | ||||||
M&A Research Institute Holdings, Inc. | (2,000 | ) | (150,998 | ) | (106.8 | ) | ||||||
Musashi Seimitsu Industry Co. Ltd. | (3,000 | ) | (41,138 | ) | (29.1 | ) | ||||||
Musashino Bank Ltd. | (800 | ) | (13,211 | ) | (9.3 | ) | ||||||
NS United Kaiun Kaisha Ltd. | (500 | ) | (14,963 | ) | (10.6 | ) | ||||||
Rorze Corp. | (500 | ) | (37,714 | ) | (26.7 | ) | ||||||
Sanyo Denki Co. Ltd. | (300 | ) | (15,243 | ) | (10.8 | ) | ||||||
SB Technology Corp. | (1,000 | ) | (17,366 | ) | (12.3 | ) | ||||||
SBS Holdings, Inc. | (1,400 | ) | (34,734 | ) | (24.6 | ) | ||||||
Seiko Group Corp. | (700 | ) | (15,622 | ) | (11.0 | ) | ||||||
Shiga Bank Ltd. | (700 | ) | (14,866 | ) | (10.5 | ) | ||||||
Shin Nippon Biomedical Laboratories Ltd. | (5,500 | ) | (102,338 | ) | (72.4 | ) | ||||||
Sumitomo Densetsu Co. Ltd. | (1,600 | ) | (33,597 | ) | (23.8 | ) | ||||||
Tokyo Electron Device Ltd. | (300 | ) | (17,545 | ) | (12.4 | ) | ||||||
Wacoal Holdings Corp. | (2,000 | ) | (39,192 | ) | (27.7 | ) | ||||||
Yodogawa Steel Works Ltd. | (1,100 | ) | (23,446 | ) | (16.6 | ) | ||||||
Yoshinoya Holdings Co. Ltd. | (800 | ) | (15,076 | ) | (10.7 | ) | ||||||
|
|
|
| |||||||||
| (871,588 | ) | |||||||||||
Netherlands | ||||||||||||
Fugro NV | (948 | ) | (13,462 | ) | (9.5 | ) | ||||||
|
|
|
| |||||||||
Norway | ||||||||||||
Aker Carbon Capture ASA | (12,073 | ) | (12,393 | ) | (8.8 | ) | ||||||
FREYR Battery SA | (3,885 | ) | (27,467 | ) | (19.4 | ) | ||||||
|
|
|
| |||||||||
| (39,860 | ) | |||||||||||
Singapore | ||||||||||||
AEM Holdings Ltd. | (46,300 | ) | (117,889 | ) | (83.4 | ) | ||||||
|
|
|
| |||||||||
Spain | ||||||||||||
Ence Energia y Celulosa SA | (10,320 | ) | (40,486 | ) | (28.7 | ) | ||||||
Faes Farma SA | (8,055 | ) | (28,437 | ) | (20.1 | ) | ||||||
|
|
|
| |||||||||
| (68,923 | ) | |||||||||||
Sweden | ||||||||||||
Cint Group AB | (9,741 | ) | (15,209 | ) | (10.8 | ) | ||||||
Dometic Group AB | (5,888 | ) | (42,001 | ) | (29.7 | ) | ||||||
Peab AB | (5,192 | ) | (27,272 | ) | (19.3 | ) | ||||||
Wallenstam AB, B Shares | (3,747 | ) | (14,761 | ) | (10.4 | ) | ||||||
|
|
|
| |||||||||
| (99,243 | ) | |||||||||||
| Security | Shares | Value | % of Basket Value | |||||||||
Switzerland | ||||||||||||
ALSO Holding AG, Registered Shares | (77 | ) | $ | (16,551 | ) | (11.7 | )% | |||||
Bystronic AG | (25 | ) | (18,097 | ) | (12.8 | ) | ||||||
Forbo Holding AG, Registered Shares | (10 | ) | (14,761 | ) | (10.4 | ) | ||||||
OC Oerlikon Corp. AG, Registered Shares | (4,023 | ) | (22,588 | ) | (16.0 | ) | ||||||
|
|
|
| |||||||||
| (71,997 | ) | |||||||||||
United Kingdom | ||||||||||||
Ascential PLC | (9,577 | ) | (30,460 | ) | (21.5 | ) | ||||||
Domino’s Pizza Group PLC | (12,754 | ) | (46,812 | ) | (33.1 | ) | ||||||
Great Portland Estates PLC | (2,002 | ) | (13,316 | ) | (9.4 | ) | ||||||
Redrow PLC | (2,213 | ) | (14,311 | ) | (10.1 | ) | ||||||
Spirent Communications PLC | (9,733 | ) | (21,952 | ) | (15.5 | ) | ||||||
THG PLC | (31,032 | ) | (38,857 | ) | (27.5 | ) | ||||||
Yellow Cake PLC | (8,085 | ) | (37,958 | ) | (26.9 | ) | ||||||
|
|
|
| |||||||||
| (203,666 | ) | |||||||||||
United States | ||||||||||||
Acadia Realty Trust | (1,491 | ) | (20,143 | ) | (14.2 | ) | ||||||
Adtalem Global Education, Inc. | (545 | ) | (22,111 | ) | (15.6 | ) | ||||||
AeroVironment, Inc. | (219 | ) | (22,051 | ) | (15.6 | ) | ||||||
Ameresco, Inc., Class A | (423 | ) | (17,597 | ) | (12.4 | ) | ||||||
Anterix, Inc. | (533 | ) | (16,832 | ) | (11.9 | ) | ||||||
Apollo Commercial Real Estate Finance, Inc. | (2,095 | ) | (21,201 | ) | (15.0 | ) | ||||||
Arcosa, Inc. | (336 | ) | (22,693 | ) | (16.1 | ) | ||||||
Atlantic Union Bankshares Corp. | (434 | ) | (12,421 | ) | (8.8 | ) | ||||||
Big Lots, Inc. | (1,371 | ) | (12,325 | ) | (8.7 | ) | ||||||
Bionano Genomics, Inc. | (19,880 | ) | (13,675 | ) | (9.7 | ) | ||||||
Calavo Growers, Inc. | (439 | ) | (14,030 | ) | (9.9 | ) | ||||||
Camping World Holdings, Inc., Class A | (2,734 | ) | (61,214 | ) | (43.3 | ) | ||||||
Cass Information Systems, Inc. | (299 | ) | (10,937 | ) | (7.7 | ) | ||||||
Children’s Place, Inc. | (764 | ) | (22,645 | ) | (16.0 | ) | ||||||
Claros Mortgage Trust, Inc. | (3,619 | ) | (43,283 | ) | (30.6 | ) | ||||||
Clearfield, Inc. | (399 | ) | (17,428 | ) | (12.3 | ) | ||||||
ContextLogic, Inc. | (23,917 | ) | (172,442 | ) | (122.0 | ) | ||||||
Delek US Holdings, Inc. | (961 | ) | (20,902 | ) | (14.8 | ) | ||||||
DICE Therapeutics, Inc. | (388 | ) | (12,610 | ) | (8.9 | ) | ||||||
Dynex Capital, Inc. | (6,473 | ) | (76,770 | ) | (54.3 | ) | ||||||
Easterly Government Properties, Inc. | (6,877 | ) | (96,759 | ) | (68.4 | ) | ||||||
Ebix, Inc. | (2,177 | ) | (35,398 | ) | (25.0 | ) | ||||||
Enterprise Financial Services Corp. | (540 | ) | (23,090 | ) | (16.3 | ) | ||||||
Farmland Partners, Inc. | (1,758 | ) | (18,354 | ) | (13.0 | ) | ||||||
Federal Signal Corp. | (610 | ) | (31,342 | ) | (22.2 | ) | ||||||
Figs, Inc., Class A | (2,804 | ) | (20,189 | ) | (14.3 | ) | ||||||
First Bancorp/Southern Pines NC | (470 | ) | (14,467 | ) | (10.2 | ) | ||||||
FirstCash Holdings, Inc. | (839 | ) | (86,442 | ) | (61.1 | ) | ||||||
Forward Air Corp. | (187 | ) | (19,730 | ) | (14.0 | ) | ||||||
Four Corners Property Trust, Inc. | (566 | ) | (14,439 | ) | (10.2 | ) | ||||||
Freshpet, Inc. | (1,111 | ) | (76,626 | ) | (54.2 | ) | ||||||
FuelCell Energy, Inc. | (31,658 | ) | (59,517 | ) | (42.1 | ) | ||||||
Home BancShares, Inc. | (602 | ) | (13,106 | ) | (9.3 | ) | ||||||
ICF International, Inc. | (330 | ) | (37,620 | ) | (26.6 | ) | ||||||
InvenTrust Properties Corp. | (590 | ) | (13,305 | ) | (9.4 | ) | ||||||
IonQ, Inc. | (3,174 | ) | (17,489 | ) | (12.4 | ) | ||||||
Lemonade, Inc. | (4,957 | ) | (53,734 | ) | (38.0 | ) | ||||||
Leonardo DRS, Inc. | (1,287 | ) | (19,369 | ) | (13.7 | ) | ||||||
LTC Properties, Inc. | (377 | ) | (12,611 | ) | (8.9 | ) | ||||||
Luminar Technologies, Inc. | (4,256 | ) | (25,621 | ) | (18.1 | ) | ||||||
nCino, Inc. | (3,185 | ) | (78,765 | ) | (55.7 | ) | ||||||
NewMarket Corp. | (43 | ) | (17,183 | ) | (12.2 | ) | ||||||
NexTier Oilfield Solutions, Inc. | (11,794 | ) | (95,296 | ) | (67.4 | ) | ||||||
Northern Oil and Gas, Inc. | (1,932 | ) | (64,084 | ) | (45.3 | ) | ||||||
Office Properties Income Trust | (2,247 | ) | (14,650 | ) | (10.4 | ) | ||||||
SCHEDULE OF INVESTMENTS | 69 |
Schedule of Investments (continued) April 30, 2023 | BlackRock Global Equity Market Neutral Fund |
| Security | Shares | Value | % of Basket Value | |||||||||
United States (continued) | ||||||||||||
O-I Glass, Inc. | (545 | ) | $ | (12,246 | ) | (8.7 | )% | |||||
Otter Tail Corp. | (210 | ) | (15,110 | ) | (10.7 | ) | ||||||
PennyMac Mortgage Investment Trust | (4,945 | ) | (61,466 | ) | (43.5 | ) | ||||||
Perimeter Solutions SA | (2,263 | ) | (16,927 | ) | (12.0 | ) | ||||||
Physicians Realty Trust | (1,941 | ) | (27,989 | ) | (19.8 | ) | ||||||
Piedmont Lithium, Inc. | (256 | ) | (14,720 | ) | (10.4 | ) | ||||||
PolyPeptide Group AG | (662 | ) | (16,653 | ) | (11.8 | ) | ||||||
PotlatchDeltic Corp. | (307 | ) | (14,193 | ) | (10.0 | ) | ||||||
ProFrac Holding Corp. | (9,931 | ) | (111,227 | ) | (78.7 | ) | ||||||
Reliance Worldwide Corp. Ltd. | (20,237 | ) | (55,198 | ) | (39.0 | ) | ||||||
Renasant Corp. | (1,112 | ) | (31,269 | ) | (22.1 | ) | ||||||
Rocket Lab USA, Inc. | (4,370 | ) | (17,130 | ) | (12.1 | ) | ||||||
S&T Bancorp, Inc. | (1,490 | ) | (41,020 | ) | (29.0 | ) | ||||||
Select Energy Services, Inc. | (2,211 | ) | (16,428 | ) | (11.6 | ) | ||||||
SiTime Corp. | (116 | ) | (12,583 | ) | (8.9 | ) | ||||||
Sotera Health Co. | (1,172 | ) | (19,654 | ) | (13.9 | ) | ||||||
Spectrum Brands Holdings, Inc. | (817 | ) | (54,331 | ) | (38.4 | ) | ||||||
Spire, Inc. | (1,464 | ) | (99,157 | ) | (70.1 | ) | ||||||
Sprouts Farmers Market, Inc. | (1,114 | ) | (38,611 | ) | (27.3 | ) | ||||||
Stem, Inc. | (27,687 | ) | (117,116 | ) | (82.8 | ) | ||||||
Stock Yards Bancorp, Inc. | (502 | ) | (24,397 | ) | (17.3 | ) | ||||||
Strategic Education, Inc. | (139 | ) | (12,232 | ) | (8.7 | ) | ||||||
Stride, Inc. | (1,455 | ) | (62,507 | ) | (44.2 | ) | ||||||
Tidewater, Inc. | (277 | ) | (12,473 | ) | (8.8 | ) | ||||||
Tootsie Roll Industries, Inc. | (519 | ) | (21,217 | ) | (15.0 | ) | ||||||
TPI Composites, Inc. | (3,724 | ) | (46,029 | ) | (32.6 | ) | ||||||
UFP Technologies, Inc. | (248 | ) | (34,184 | ) | (24.2 | ) | ||||||
United Bankshares, Inc. | (1,184 | ) | (39,226 | ) | (27.7 | ) | ||||||
Universal Corp. | (301 | ) | (16,522 | ) | (11.7 | ) | ||||||
Veris Residential, Inc. | (890 | ) | (14,552 | ) | (10.3 | ) | ||||||
Vertex Energy, Inc. | (1,633 | ) | (12,901 | ) | (9.1 | ) | ||||||
Viking Therapeutics, Inc. | (3,289 | ) | (70,089 | ) | (49.6 | ) | ||||||
Vishay Intertechnology, Inc. | (954 | ) | (20,311 | ) | (14.4 | ) | ||||||
Vital Energy, Inc. | (436 | ) | (20,287 | ) | (14.4 | ) | ||||||
Washington Federal, Inc. | (3,207 | ) | (89,924 | ) | (63.6 | ) | ||||||
Xenia Hotels & Resorts, Inc. | (2,311 | ) | (29,257 | ) | (20.7 | ) | ||||||
|
|
|
| |||||||||
| (2,911,632 | ) | |||||||||||
|
| |||||||||||
Total Reference Entity — Short | (5,127,373 | ) | ||||||||||
|
| |||||||||||
Net Value of Reference Entity — BNP Paribas SA | $ | 141,392 | ||||||||||
|
| |||||||||||
The following table represents the individual long and short positions and related values of the equity securities underlying the total return swap with Goldman Sachs Bank USA as of period end, termination dates 06/12/23-08/19/26:
| Security | Shares | Value | % of Basket Value | |||||||||
Reference Entity — Long | ||||||||||||
Common Stocks | ||||||||||||
Australia | ||||||||||||
Abacus Property Group | 58,673 | $ | 105,282 | (9.1 | )% | |||||||
Accent Group Ltd. | 62,024 | 106,361 | (9.2 | ) | ||||||||
Arena REIT | 61,457 | 154,844 | (13.3 | ) | ||||||||
Austal Ltd. | 6,377 | 7,094 | (0.6 | ) | ||||||||
Australian Ethical Investment Ltd. | 42,877 | 93,711 | (8.1 | ) | ||||||||
Centuria Capital Group | 35,176 | 40,831 | (3.5 | ) | ||||||||
Charter Hall Long Wale REIT | 111,413 | 326,776 | (28.2 | ) | ||||||||
| Security | Shares | Value | % of Basket Value | |||||||||
Australia (continued) | ||||||||||||
Charter Hall Retail REIT | 300,719 | $ | 783,473 | (67.6 | )% | |||||||
Charter Hall Social Infrastructure REIT | 67,042 | 136,686 | (11.8 | ) | ||||||||
Clinuvel Pharmaceuticals Ltd. | 8,690 | 118,515 | (10.2 | ) | ||||||||
Codan Ltd. | 2,460 | 12,088 | (1.0 | ) | ||||||||
Credit Corp. Group Ltd. | 26,101 | 318,298 | (27.5 | ) | ||||||||
Eagers Automotive Ltd. | 17,097 | 163,617 | (14.1 | ) | ||||||||
Elders Ltd. | 46,217 | 252,183 | (21.7 | ) | ||||||||
GrainCorp Ltd. | 44,208 | 202,866 | (17.5 | ) | ||||||||
Growthpoint Properties Australia Ltd. | 95,779 | 210,303 | (18.1 | ) | ||||||||
GWA Group Ltd. | 86,996 | 102,997 | (8.9 | ) | ||||||||
Imdex Ltd. | 143,562 | 201,238 | (17.4 | ) | ||||||||
Johns Lyng Group Ltd. | 56,315 | 257,255 | (22.2 | ) | ||||||||
Jumbo Interactive Ltd. | 32,341 | 285,247 | (24.6 | ) | ||||||||
Karoon Energy Ltd. | 69,902 | 101,342 | (8.7 | ) | ||||||||
Lifestyle Communities Ltd. | 3,762 | 43,160 | (3.7 | ) | ||||||||
Lovisa Holdings Ltd. | 20,560 | 369,462 | (31.9 | ) | ||||||||
McMillan Shakespeare Ltd. | 4,867 | 50,380 | (4.3 | ) | ||||||||
Monadelphous Group Ltd. | 29,282 | 244,629 | (21.1 | ) | ||||||||
Nanosonics Ltd. | 137,323 | 529,495 | (45.7 | ) | ||||||||
National Storage REIT | 269,732 | 455,276 | (39.3 | ) | ||||||||
Netwealth Group Ltd. | 30,073 | 276,759 | (23.9 | ) | ||||||||
Nick Scali Ltd. | 34,772 | 228,055 | (19.7 | ) | ||||||||
Objective Corp. Ltd. | 4,574 | 39,667 | (3.4 | ) | ||||||||
oOh!media Ltd. | 272,793 | 302,602 | (26.1 | ) | ||||||||
Perenti Ltd. | 392,578 | 305,078 | (26.3 | ) | ||||||||
Perseus Mining Ltd. | 365,568 | 547,367 | (47.2 | ) | ||||||||
Pinnacle Investment Management Group Ltd. | 36,812 | 205,313 | (17.7 | ) | ||||||||
PolyNovo Ltd. | 18,039 | 19,871 | (1.7 | ) | ||||||||
Premier Investments Ltd. | 17,894 | 315,042 | (27.2 | ) | ||||||||
PWR Holdings Ltd. | 12,513 | 84,713 | (7.3 | ) | ||||||||
Ramelius Resources Ltd. | 235,528 | 208,591 | (18.0 | ) | ||||||||
Regis Resources Ltd., Registered Shares | 241,770 | 346,689 | (29.9 | ) | ||||||||
Rural Funds Group | 8,496 | 11,220 | (1.0 | ) | ||||||||
Silver Lake Resources Ltd. | 112,781 | 96,340 | (8.3 | ) | ||||||||
SolGold PLC | 209,423 | 49,359 | (4.3 | ) | ||||||||
Technology One Ltd. | 61,950 | 632,556 | (54.6 | ) | ||||||||
Ventia Services Group Pty Ltd. | 167,956 | 296,401 | (25.6 | ) | ||||||||
Viva Energy Group Ltd. | 104,093 | 218,090 | (18.8 | ) | ||||||||
Waypoint REIT Ltd. | 312,400 | 549,658 | (47.4 | ) | ||||||||
|
|
|
| |||||||||
| 10,406,780 | ||||||||||||
Austria | ||||||||||||
Immofinanz AG | 15,909 | 257,904 | (22.2 | ) | ||||||||
Kontron AG | 15,557 | 298,625 | (25.8 | ) | ||||||||
Palfinger AG | 1,833 | 59,777 | (5.2 | ) | ||||||||
Porr AG | 6,646 | 100,691 | (8.7 | ) | ||||||||
Schoeller-Bleckmann Oilfield Equipment AG | 1,104 | 68,753 | (5.9 | ) | ||||||||
UNIQA Insurance Group AG | 16,496 | 146,979 | (12.7 | ) | ||||||||
Vienna Insurance Group AG Wiener Versicherung Gruppe | 12,200 | 356,115 | (30.7 | ) | ||||||||
|
|
|
| |||||||||
| 1,288,844 | ||||||||||||
Belgium | ||||||||||||
Barco NV | 24,160 | 699,742 | (60.4 | ) | ||||||||
Econocom Group SA/NV | 4,224 | 14,383 | (1.2 | ) | ||||||||
Etablissements Franz Colruyt NV | 5,093 | 140,325 | (12.1 | ) | ||||||||
Euronav NV | 11,952 | 203,019 | (17.5 | ) | ||||||||
Exmar NV | 23,167 | 300,891 | (26.0 | ) | ||||||||
Fagron | 19,193 | 353,800 | (30.5 | ) | ||||||||
Ion Beam Applications | 2,651 | 48,180 | (4.2 | ) | ||||||||
Melexis NV | 10,572 | 998,560 | (86.1 | ) | ||||||||
| 70 | 2 0 2 3 BLACK ROCK ANNUAL REPORT TO SHAREHOLDERS |
Schedule of Investments (continued) April 30, 2023 | BlackRock Global Equity Market Neutral Fund |
| Security | Shares | Value | % of Basket Value | |||||||||
Belgium (continued) | ||||||||||||
Montea NV | 1,865 | $ | 162,108 | (14.0 | )% | |||||||
Shurgard Self Storage Ltd. | 6,812 | 349,353 | (30.1 | ) | ||||||||
X-Fab Silicon Foundries SE | 1,254 | 10,588 | (0.9 | ) | ||||||||
|
|
|
| |||||||||
| 3,280,949 | ||||||||||||
Canada | ||||||||||||
Advantage Energy Ltd. | 4,251 | 24,192 | (2.1 | ) | ||||||||
Aecon Group, Inc. | 40,981 | 388,028 | (33.5 | ) | ||||||||
Altius Minerals Corp. | 22,013 | 349,388 | (30.1 | ) | ||||||||
Artis Real Estate Investment Trust | 20,057 | 105,500 | (9.1 | ) | ||||||||
Boardwalk Real Estate Investment Trust | 7,523 | 325,843 | (28.1 | ) | ||||||||
Boyd Group Services, Inc. | 248 | 41,108 | (3.5 | ) | ||||||||
Canaccord Genuity Group, Inc. | 31,892 | 257,402 | (22.2 | ) | ||||||||
Canada Goose Holdings, Inc. | 24,198 | 479,508 | (41.4 | ) | ||||||||
Cardinal Energy Ltd. | 7,986 | 43,549 | (3.8 | ) | ||||||||
Cargojet, Inc. | 1,616 | 123,063 | (10.6 | ) | ||||||||
Celestica, Inc. | 9,235 | 101,529 | (8.8 | ) | ||||||||
Centerra Gold, Inc. | 10,542 | 72,154 | (6.2 | ) | ||||||||
Cogeco Communications, Inc. | 5,766 | 282,637 | (24.4 | ) | ||||||||
Crew Energy, Inc. | 10,055 | 34,555 | (3.0 | ) | ||||||||
Crombie Real Estate Investment Trust | 8,186 | 94,268 | (8.1 | ) | ||||||||
CT Real Estate Investment Trust | 952 | 11,439 | (1.0 | ) | ||||||||
Dream Unlimited Corp. | 5,138 | 86,713 | (7.5 | ) | ||||||||
Dundee Precious Metals, Inc. | 50,686 | 376,311 | (32.5 | ) | ||||||||
ECN Capital Corp. | 31,387 | 74,026 | (6.4 | ) | ||||||||
Evertz Technologies Ltd. | 6,500 | 57,529 | (5.0 | ) | ||||||||
Fortuna Silver Mines, Inc. | 92,149 | 349,579 | (30.2 | ) | ||||||||
H&R Real Estate Investment Trust | 17,536 | 153,951 | (13.3 | ) | ||||||||
Hudbay Minerals, Inc. | 117,465 | 595,697 | (51.4 | ) | ||||||||
IAMGOLD Corp. | 19,394 | 56,217 | (4.8 | ) | ||||||||
Innergex Renewable Energy, Inc. | 69,267 | 719,443 | (62.1 | ) | ||||||||
Interfor Corp. | 7,767 | 123,469 | (10.6 | ) | ||||||||
Kelt Exploration Ltd. | 28,300 | 104,627 | (9.0 | ) | ||||||||
Knight Therapeutics, Inc. | 1,933 | 6,500 | (0.6 | ) | ||||||||
Laurentian Bank of Canada | 4,584 | 110,038 | (9.5 | ) | ||||||||
Lundin Gold, Inc. | 16,428 | 210,692 | (18.2 | ) | ||||||||
Major Drilling Group International, Inc. | 2,260 | 17,641 | (1.5 | ) | ||||||||
Morguard Corp. | 1,515 | 116,855 | (10.1 | ) | ||||||||
Mullen Group Ltd. | 11,815 | 132,403 | (11.4 | ) | ||||||||
New Gold, Inc. | 104,153 | 135,332 | (11.7 | ) | ||||||||
NFI Group, Inc. | 5,984 | 35,331 | (3.0 | ) | ||||||||
Novagold Resources, Inc. | 8,192 | 44,933 | (3.9 | ) | ||||||||
Pason Systems, Inc. | 28,881 | 254,510 | (22.0 | ) | ||||||||
PrairieSky Royalty Ltd. | 66,288 | 1,058,414 | (91.3 | ) | ||||||||
Precision Drilling Corp. | 7,808 | 393,448 | (33.9 | ) | ||||||||
Richelieu Hardware Ltd. | 14,913 | 453,238 | (39.1 | ) | ||||||||
Rogers Sugar, Inc. | 6,717 | 31,439 | (2.7 | ) | ||||||||
Russel Metals, Inc. | 19,093 | 491,575 | (42.4 | ) | ||||||||
Sandstorm Gold Ltd. | 57,333 | 333,515 | (28.8 | ) | ||||||||
Savaria Corp. | 22,204 | 275,372 | (23.7 | ) | ||||||||
Secure Energy Services, Inc. | 22,203 | 104,714 | (9.0 | ) | ||||||||
Silvercorp Metals, Inc. | 91,526 | 339,179 | (29.3 | ) | ||||||||
Slate Grocery REIT | 34,293 | 339,348 | (29.3 | ) | ||||||||
Sleep Country Canada Holdings, Inc. | 15,040 | 264,005 | (22.8 | ) | ||||||||
SmartCentres Real Estate Investment Trust | 2,253 | 44,054 | (3.8 | ) | ||||||||
SunOpta, Inc. | 20,361 | 174,295 | (15.0 | ) | ||||||||
Superior Plus Corp. | 10,720 | 80,490 | (6.9 | ) | ||||||||
Taseko Mines Ltd. | 161,944 | 269,742 | (23.3 | ) | ||||||||
Topaz Energy Corp. | 23,767 | 344,388 | (29.7 | ) | ||||||||
| Security | Shares | Value | % of Basket Value | |||||||||
Canada (continued) | ||||||||||||
Torex Gold Resources, Inc. | 17,768 | $ | 294,893 | (25.4 | )% | |||||||
TransAlta Renewables, Inc. | 38,318 | 361,909 | (31.2 | ) | ||||||||
Trican Well Service Ltd. | 4,124 | 9,762 | (0.8 | ) | ||||||||
|
|
|
| |||||||||
| 12,159,740 | ||||||||||||
China | ||||||||||||
Health & Happiness H&H International Holdings Ltd. | 172,500 | 295,397 | (25.5 | ) | ||||||||
indie Semiconductor, Inc. | 2,400 | 18,168 | (1.6 | ) | ||||||||
|
|
|
| |||||||||
| 313,565 | ||||||||||||
Denmark | ||||||||||||
Dfds A/S | 1,856 | 74,167 | (6.4 | ) | ||||||||
NKT A/S | 5,938 | 309,747 | (26.7 | ) | ||||||||
Scandinavian Tobacco Group A/S | 21,870 | 423,904 | (36.6 | ) | ||||||||
Schouw & Co. A/S | 617 | 52,130 | (4.5 | ) | ||||||||
SimCorp A/S | 1,693 | 182,516 | (15.7 | ) | ||||||||
Sydbank AS | 11,858 | 525,019 | (45.3 | ) | ||||||||
|
|
|
| |||||||||
| 1,567,483 | ||||||||||||
Egypt | ||||||||||||
Centamin PLC | 620,689 | 793,179 | (68.4 | ) | ||||||||
|
|
|
| |||||||||
Faeroe Islands | ||||||||||||
Bakkafrost P/F | 1,101 | 81,498 | (7.0 | ) | ||||||||
|
|
|
| |||||||||
Finland | ||||||||||||
Cargotec OYJ, B Shares | 1,749 | 95,929 | (8.3 | ) | ||||||||
Citycon OYJ | 87,426 | 655,571 | (56.5 | ) | ||||||||
Finnair OYJ | 51,326 | 29,822 | (2.6 | ) | ||||||||
Kemira OYJ | 28,369 | 493,409 | (42.6 | ) | ||||||||
Nokian Renkaat OYJ | 60,391 | 583,655 | (50.3 | ) | ||||||||
Revenio Group OYJ | 2,667 | 99,334 | (8.6 | ) | ||||||||
YIT OYJ | 15,605 | 40,047 | (3.4 | ) | ||||||||
|
|
|
| |||||||||
| 1,997,767 | ||||||||||||
France | ||||||||||||
Atos SE | 40,497 | 557,427 | (48.1 | ) | ||||||||
Believe SA | 4,833 | 57,127 | (4.9 | ) | ||||||||
Cie des Alpes | 4,845 | 76,270 | (6.6 | ) | ||||||||
Cie Plastic Omnium SA | 9,341 | 164,002 | (14.2 | ) | ||||||||
Esker SA | 1,013 | 153,109 | (13.2 | ) | ||||||||
Etablissements Maurel et Prom SA | 16,295 | 61,655 | (5.3 | ) | ||||||||
Eutelsat Communications SA | 49,883 | 329,484 | (28.4 | ) | ||||||||
Guerbet | 1 | 18 | (0.0 | ) | ||||||||
Interparfums SA | 4,952 | 390,302 | (33.7 | ) | ||||||||
IPSOS | 2,859 | 153,617 | (13.3 | ) | ||||||||
Kaufman & Broad SA | 2,786 | 89,905 | (7.8 | ) | ||||||||
Korian SA | 13,074 | 112,576 | (9.7 | ) | ||||||||
Manitou BF SA | 3,609 | 88,436 | (7.6 | ) | ||||||||
Mercialys SA | 27,814 | 277,455 | (23.9 | ) | ||||||||
Mersen SA | 4,577 | 183,039 | (15.8 | ) | ||||||||
Nexity SA | 9,068 | 235,956 | (20.4 | ) | ||||||||
Rubis SCA | 1,591 | 46,647 | (4.0 | ) | ||||||||
SES-imagotag SA | 1,227 | 195,034 | (16.8 | ) | ||||||||
SMCP SA | 41,322 | 362,775 | (31.3 | ) | ||||||||
Television Francaise 1 | 55,903 | 446,304 | (38.5 | ) | ||||||||
Verallia SA | 7,985 | 321,425 | (27.7 | ) | ||||||||
Vicat SA | 14,286 | 413,125 | (35.6 | ) | ||||||||
Vilmorin & Cie SA | 522 | 24,476 | (2.1 | ) | ||||||||
|
|
|
| |||||||||
| 4,740,164 | ||||||||||||
SCHEDULE OF INVESTMENTS | 71 |
Schedule of Investments (continued) April 30, 2023 | BlackRock Global Equity Market Neutral Fund |
| Security | Shares | Value | % of Basket Value | |||||||||
Germany | ||||||||||||
1&1 AG | 10,250 | $ | 118,645 | (10.2 | )% | |||||||
Adesso SE | 837 | 124,426 | (10.7 | ) | ||||||||
Atoss Software AG | 3,238 | 644,607 | (55.6 | ) | ||||||||
AURELIUS Equity Opportunities SE & Co. KGaA | 3,149 | 57,828 | (5.0 | ) | ||||||||
Bank of Georgia Group PLC | 19,555 | 717,392 | (61.9 | ) | ||||||||
CropEnergies AG | 858 | 9,856 | (0.9 | ) | ||||||||
Datagroup SE | 720 | 52,489 | (4.5 | ) | ||||||||
Deutsche Pfandbriefbank AG | 46,296 | 423,722 | (36.6 | ) | ||||||||
Deutz AG | 57,913 | 381,895 | (33.0 | ) | ||||||||
Duerr AG | 16,137 | 555,363 | (47.9 | ) | ||||||||
Eckert & Ziegler Strahlen- und Medizintechnik AG | 4,526 | 232,340 | (20.0 | ) | ||||||||
Elmos Semiconductor SE | 1,722 | 128,816 | (11.1 | ) | ||||||||
ElringKlinger AG | 13,242 | 147,722 | (12.8 | ) | ||||||||
flatexDEGIRO AG | 23,225 | 248,421 | (21.4 | ) | ||||||||
GFT Technologies SE | 3,346 | 131,061 | (11.3 | ) | ||||||||
Grand City Properties SA | 29,044 | 240,625 | (20.8 | ) | ||||||||
Heidelberger Druckmaschinen AG | 89,668 | 184,543 | (15.9 | ) | ||||||||
Hornbach Holding AG & Co. KGaA | 445 | 37,513 | (3.2 | ) | ||||||||
Krones AG | 2,531 | 330,283 | (28.5 | ) | ||||||||
Nagarro SE | 1,056 | 112,707 | (9.7 | ) | ||||||||
Orion Engineered Carbons SA | 729 | 17,649 | (1.5 | ) | ||||||||
Pfeiffer Vacuum Technology AG | 755 | 125,173 | (10.8 | ) | ||||||||
Siltronic AG | 626 | 44,728 | (3.9 | ) | ||||||||
Stabilus SE | 539 | 34,925 | (3.0 | ) | ||||||||
Steico SE | 904 | 44,621 | (3.9 | ) | ||||||||
TAG Immobilien AG | 55,429 | 470,841 | (40.6 | ) | ||||||||
TBC Bank Group PLC | 16,353 | 477,161 | (41.2 | ) | ||||||||
TUI AG | 15,339 | 97,337 | (8.4 | ) | ||||||||
Vitesco Technologies Group AG | 6,764 | 459,322 | (39.6 | ) | ||||||||
Wacker Neuson SE | 496 | 12,003 | (1.0 | ) | ||||||||
|
|
|
| |||||||||
| 6,664,014 | ||||||||||||
Guatemala | ||||||||||||
Millicom International Cellular SA, SDR | 9,020 | 160,072 | (13.8 | ) | ||||||||
|
|
|
| |||||||||
Hong Kong | ||||||||||||
Cowell e Holdings, Inc. | 6,000 | 11,605 | (1.0 | ) | ||||||||
Melco Resorts & Entertainment Ltd., ADR | 39,584 | 539,926 | (46.6 | ) | ||||||||
Nissin Foods Co. Ltd. | 21,000 | 18,760 | (1.6 | ) | ||||||||
PAX Global Technology Ltd. | 51,000 | 42,010 | (3.6 | ) | ||||||||
Sa Sa International Holdings Ltd. | 640,000 | 150,471 | (13.0 | ) | ||||||||
SmarTone Telecommunications Holdings Ltd. | 16,000 | 9,738 | (0.9 | ) | ||||||||
United Laboratories International Holdings Ltd. | 72,000 | 58,297 | (5.0 | ) | ||||||||
|
|
|
| |||||||||
| 830,807 | ||||||||||||
Indonesia | ||||||||||||
Bumitama Agri Ltd. | 157,900 | 68,272 | (5.9 | ) | ||||||||
First Resources Ltd. | 144,200 | 166,289 | (14.3 | ) | ||||||||
Golden Agri-Resources Ltd. | 202,100 | 41,807 | (3.6 | ) | ||||||||
|
|
|
| |||||||||
| 276,368 | ||||||||||||
Iraq | ||||||||||||
Gulf Keystone Petroleum Ltd. | 14,471 | 24,244 | (2.1 | ) | ||||||||
|
|
|
| |||||||||
Ireland | ||||||||||||
Cimpress PLC | 5,911 | 307,077 | (26.5 | ) | ||||||||
Dalata Hotel Group PLC | 47,883 | 238,855 | (20.6 | ) | ||||||||
|
|
|
| |||||||||
| 545,932 | ||||||||||||
Israel | ||||||||||||
Cellcom Israel Ltd. | 9,245 | 32,970 | (2.8 | ) | ||||||||
| Security | Shares | Value | % of Basket Value | |||||||||
Israel (continued) | ||||||||||||
Kornit Digital Ltd. | 19,213 | $ | 350,829 | (30.3 | )% | |||||||
Plus500 Ltd. | 20,133 | 414,865 | (35.8 | ) | ||||||||
Taboola.com Ltd. | 14,151 | 32,689 | (2.8 | ) | ||||||||
|
|
|
| |||||||||
| 831,353 | ||||||||||||
Italy | ||||||||||||
Banca Popolare di Sondrio SPA | 73,717 | 332,258 | (28.7 | ) | ||||||||
Biesse SpA | 7,104 | 107,660 | (9.3 | ) | ||||||||
Brembo SpA | 1,364 | 19,879 | (1.7 | ) | ||||||||
Brunello Cucinelli SpA | 15,580 | 1,479,392 | (127.6 | ) | ||||||||
CIR SpA-Compagnie Industriali | 40,806 | 17,072 | (1.5 | ) | ||||||||
Credito Emiliano SpA | 1,271 | 9,679 | (0.8 | ) | ||||||||
Danieli & C Officine Meccaniche SpA | 6,173 | 159,278 | (13.7 | ) | ||||||||
Datalogic SpA | 5,819 | 47,931 | (4.1 | ) | ||||||||
ERG SpA | 28,422 | 851,235 | (73.4 | ) | ||||||||
Iren SpA | 176,630 | 378,782 | (32.7 | ) | ||||||||
Maire Tecnimont SpA | 78,653 | 334,787 | (28.9 | ) | ||||||||
MFE-MediaForEurope NV | 137,520 | 100,444 | (8.7 | ) | ||||||||
OVS SpA | 96,576 | 288,187 | (24.9 | ) | ||||||||
Pharmanutra SpA | 536 | 29,494 | (2.5 | ) | ||||||||
Piaggio & C SpA | 24,123 | 98,396 | (8.5 | ) | ||||||||
RAI Way SpA | 13,510 | 85,851 | (7.4 | ) | ||||||||
Sanlorenzo SpA/Ameglia | 2,976 | 132,469 | (11.4 | ) | ||||||||
Sesa SpA | 7,113 | 864,579 | (74.6 | ) | ||||||||
Tinexta Spa | 6,007 | 121,419 | (10.5 | ) | ||||||||
Tod’s SpA | 3,801 | 159,352 | (13.7 | ) | ||||||||
Unipol Gruppo SpA | 67,443 | 376,169 | (32.5 | ) | ||||||||
Webuild SpA | 207,073 | 441,630 | (38.1 | ) | ||||||||
Wiit SpA | 2,657 | 57,356 | (4.9 | ) | ||||||||
|
|
|
| |||||||||
| 6,493,299 | ||||||||||||
Japan | ||||||||||||
77 Bank Ltd. | 18,300 | 301,416 | (26.0 | ) | ||||||||
Adastria Co. Ltd. | 31,400 | 600,301 | (51.8 | ) | ||||||||
Aeon Delight Co. Ltd. | 22,800 | 512,040 | (44.2 | ) | ||||||||
Aichi Corp. | 19,800 | 124,251 | (10.7 | ) | ||||||||
Aida Engineering Ltd. | 1,800 | 11,489 | (1.0 | ) | ||||||||
Alpen Co. Ltd. | 11,400 | 176,590 | (15.2 | ) | ||||||||
Anicom Holdings, Inc. | 66,200 | 261,226 | (22.5 | ) | ||||||||
AOKI Holdings, Inc. | 72,600 | 512,082 | (44.2 | ) | ||||||||
Arata Corp. | 2,700 | 88,895 | (7.7 | ) | ||||||||
Autobacs Seven Co. Ltd. | 5,100 | 58,746 | (5.1 | ) | ||||||||
Avex, Inc. | 17,600 | 204,229 | (17.6 | ) | ||||||||
Bell System24 Holdings, Inc. | 27,100 | 282,290 | (24.3 | ) | ||||||||
Belluna Co. Ltd. | 41,100 | 228,388 | (19.7 | ) | ||||||||
Bunka Shutter Co. Ltd. | 70,500 | 608,408 | (52.5 | ) | ||||||||
Central Glass Co. Ltd. | 34,600 | 757,110 | (65.3 | ) | ||||||||
Chugoku Marine Paints Ltd. | 8,000 | 70,789 | (6.1 | ) | ||||||||
Citizen Watch Co. Ltd. | 59,100 | 331,508 | (28.6 | ) | ||||||||
CKD Corp. | 14,300 | 220,753 | (19.0 | ) | ||||||||
Comture Corp. | 9,600 | 143,542 | (12.4 | ) | ||||||||
Create SD Holdings Co. Ltd. | 16,000 | 393,444 | (33.9 | ) | ||||||||
Curves Holdings Co. Ltd. | 12,600 | 74,479 | (6.4 | ) | ||||||||
Daihen Corp. | 6,000 | 200,176 | (17.3 | ) | ||||||||
Daiken Corp. | 19,200 | 334,339 | (28.8 | ) | ||||||||
Daiseki Co. Ltd. | 9,300 | 269,473 | (23.2 | ) | ||||||||
Digital Arts, Inc. | 22,300 | 841,826 | (72.6 | ) | ||||||||
Digital Garage, Inc. | 13,900 | 496,675 | (42.8 | ) | ||||||||
dip Corp. | 16,900 | 423,078 | (36.5 | ) | ||||||||
Doshisha Co. Ltd. | 25,900 | 413,001 | (35.6 | ) | ||||||||
| 72 | 2 0 2 3 BLACK ROCK ANNUAL REPORT TO SHAREHOLDERS |
Schedule of Investments (continued) April 30, 2023 | BlackRock Global Equity Market Neutral Fund |
| Security | Shares | Value | % of Basket Value | |||||||||
Japan (continued) | ||||||||||||
Doutor Nichires Holdings Co. Ltd. | 34,400 | $ | 549,630 | (47.4 | )% | |||||||
DTS Corp. | 2,000 | 48,163 | (4.2 | ) | ||||||||
DyDo Group Holdings, Inc. | 4,400 | 166,615 | (14.4 | ) | ||||||||
eGuarantee, Inc. | 13,600 | 214,256 | (18.5 | ) | ||||||||
Eiken Chemical Co. Ltd. | 38,200 | 450,185 | (38.8 | ) | ||||||||
Eizo Corp. | 900 | 29,884 | (2.6 | ) | ||||||||
Elan Corp. | 18,400 | 139,632 | (12.0 | ) | ||||||||
Elecom Co. Ltd. | 79,600 | 765,448 | (66.0 | ) | ||||||||
en Japan, Inc. | 23,000 | 418,303 | (36.1 | ) | ||||||||
euglena Co. Ltd. | 28,600 | 189,956 | (16.4 | ) | ||||||||
FCC Co. Ltd. | 68,100 | 888,611 | (76.7 | ) | ||||||||
Financial Partners Group Co. Ltd. | 46,400 | 383,242 | (33.1 | ) | ||||||||
Fuji Co. Ltd. | 5,000 | 66,161 | (5.7 | ) | ||||||||
Fuji Corp. | 6,500 | 110,450 | (9.5 | ) | ||||||||
Fujimi, Inc. | 6,900 | 362,245 | (31.2 | ) | ||||||||
Fujimori Kogyo Co. Ltd. | 3,800 | 89,474 | (7.7 | ) | ||||||||
Fukuoka REIT Corp. | 386 | 469,826 | (40.5 | ) | ||||||||
Fullcast Holdings Co., Ltd. | 4,200 | 77,271 | (6.7 | ) | ||||||||
Funai Soken Holdings, Inc. | 32,400 | 629,574 | (54.3 | ) | ||||||||
Future Corp. | 15,800 | 205,022 | (17.7 | ) | ||||||||
Geo Holdings Corp. | 17,100 | 209,668 | (18.1 | ) | ||||||||
Giken Ltd. | 23,600 | 375,970 | (32.4 | ) | ||||||||
GNI Group Ltd. | 14,900 | 113,913 | (9.8 | ) | ||||||||
Goldcrest Co. Ltd. | 32,700 | 443,969 | (38.3 | ) | ||||||||
Gree, Inc. | 38,200 | 200,540 | (17.3 | ) | ||||||||
G-Tekt Corp. | 33,500 | 371,747 | (32.1 | ) | ||||||||
Gunma Bank Ltd. | 75,500 | 261,898 | (22.6 | ) | ||||||||
H2O Retailing Corp. | 44,600 | 535,181 | (46.2 | ) | ||||||||
Halows Co. Ltd. | 5,100 | 122,549 | (10.6 | ) | ||||||||
Hamakyorex Co. Ltd. | 800 | 20,735 | (1.8 | ) | ||||||||
Hankyu Hanshin REIT, Inc. | 57 | 61,896 | (5.3 | ) | ||||||||
Hanwa Co. Ltd. | 8,300 | 260,427 | (22.5 | ) | ||||||||
Heiwa Real Estate Co. Ltd. | 13,400 | 388,601 | (33.5 | ) | ||||||||
Hiday Hidaka Corp. | 12,800 | 218,218 | (18.8 | ) | ||||||||
Hioki EE Corp. | 900 | 60,739 | (5.2 | ) | ||||||||
Hitachi Zosen Corp. | 11,800 | 74,186 | (6.4 | ) | ||||||||
Hogy Medical Co. Ltd. | 6,800 | 172,519 | (14.9 | ) | ||||||||
Hokkoku Financial Holdings, Inc. | 2,100 | 74,337 | (6.4 | ) | ||||||||
Hosiden Corp. | 8,100 | 105,052 | (9.1 | ) | ||||||||
Ichigo, Inc. | 282,000 | 547,396 | (47.2 | ) | ||||||||
IDOM, Inc. | 19,100 | 119,650 | (10.3 | ) | ||||||||
Inaba Denki Sangyo Co. Ltd. | 4,700 | 106,356 | (9.2 | ) | ||||||||
Infocom Corp. | 9,500 | 160,083 | (13.8 | ) | ||||||||
Infomart Corp. | 198,200 | 431,665 | (37.2 | ) | ||||||||
JAC Recruitment Co. Ltd. | 37,000 | 700,788 | (60.5 | ) | ||||||||
JAFCO Group Co. ltd. | 38,500 | 497,530 | (42.9 | ) | ||||||||
Japan Elevator Service Holdings Co. Ltd. | 11,200 | 168,834 | (14.6 | ) | ||||||||
Japan Lifeline Co. Ltd. | 10,600 | 73,882 | (6.4 | ) | ||||||||
Japan Material Co. Ltd. | 5,500 | 83,611 | (7.2 | ) | ||||||||
Japan Securities Finance Co. Ltd. | 14,800 | 113,150 | (9.8 | ) | ||||||||
JCU Corp. | 21,600 | 517,126 | (44.6 | ) | ||||||||
JINS Holdings, Inc. | 24,600 | 537,417 | (46.4 | ) | ||||||||
Kaga Electronics Co. Ltd. | 9,200 | 330,881 | (28.5 | ) | ||||||||
Kanematsu Corp. | 22,800 | 300,704 | (25.9 | ) | ||||||||
Kato Sangyo Co. Ltd. | 4,300 | 115,687 | (10.0 | ) | ||||||||
KeePer Technical Laboratory Co. Ltd. | 4,000 | 150,627 | (13.0 | ) | ||||||||
Keihanshin Building Co. Ltd. | 28,500 | 272,536 | (23.5 | ) | ||||||||
KFC Holdings Japan Ltd. | 6,200 | 133,669 | (11.5 | ) | ||||||||
Kintetsu Department Store Co. Ltd. | 2,200 | 40,671 | (3.5 | ) | ||||||||
Kissei Pharmaceutical Co. Ltd. | 7,100 | 145,737 | (12.6 | ) | ||||||||
Kitz Corp. | 7,300 | 50,574 | (4.4 | ) | ||||||||
KOMEDA Holdings Co. Ltd. | 12,000 | 229,628 | (19.8 | ) | ||||||||
| Security | Shares | Value | % of Basket Value | |||||||||
Japan (continued) | ||||||||||||
Konoike Transport Co. Ltd. | 21,900 | $ | 261,064 | (22.5 | )% | |||||||
Koshidaka Holdings Co. Ltd. | 31,700 | 271,845 | (23.4 | ) | ||||||||
Kumiai Chemical Industry Co. Ltd. | 31,000 | 209,001 | (18.0 | ) | ||||||||
Kureha Corp. | 6,400 | 403,141 | (34.8 | ) | ||||||||
Kyokuto Kaihatsu Kogyo Co. Ltd. | 16,600 | 212,008 | (18.3 | ) | ||||||||
Kyorin Pharmaceutical Co. Ltd. | 14,200 | 185,192 | (16.0 | ) | ||||||||
Kyoritsu Maintenance Co. Ltd. | 19,800 | 809,816 | (69.9 | ) | ||||||||
Life Corp. | 34,700 | 746,017 | (64.4 | ) | ||||||||
Link And Motivation, Inc. | 53,200 | 193,668 | (16.7 | ) | ||||||||
M&A Capital Partners Co. Ltd. | 2,900 | 83,027 | (7.2 | ) | ||||||||
Maeda Kosen Co. Ltd. | 6,700 | 162,522 | (14.0 | ) | ||||||||
Mandom Corp. | 39,100 | 470,879 | (40.6 | ) | ||||||||
Maruzen Showa Unyu Co. Ltd. | 800 | 20,285 | (1.7 | ) | ||||||||
Max Co. Ltd. | 2,900 | 46,927 | (4.0 | ) | ||||||||
MCJ Co. Ltd. | 4,400 | 30,849 | (2.7 | ) | ||||||||
Megmilk Snow Brand Co. Ltd. | 12,000 | 174,339 | (15.0 | ) | ||||||||
Meidensha Corp. | 13,700 | 188,402 | (16.2 | ) | ||||||||
Meitec Corp. | 51,400 | 880,665 | (76.0 | ) | ||||||||
Melco Holdings, Inc. | 400 | 9,994 | (0.9 | ) | ||||||||
METAWATER Co. Ltd. | 14,400 | 192,345 | (16.6 | ) | ||||||||
Mie Kotsu Group Holdings, Inc. | 5,500 | 24,082 | (2.1 | ) | ||||||||
Milbon Co. Ltd. | 6,500 | 277,673 | (24.0 | ) | ||||||||
Mimasu Semiconductor Industry Co. Ltd. | 16,400 | 321,282 | (27.7 | ) | ||||||||
Mitsubishi Pencil Co. Ltd. | 13,800 | 182,822 | (15.8 | ) | ||||||||
Mitsubishi Shokuhin Co. Ltd. | 27,300 | 714,173 | (61.6 | ) | ||||||||
Mitsui DM Sugar Holdings Co. Ltd. | 16,600 | 281,880 | (24.3 | ) | ||||||||
Mitsui-Soko Holdings Co. Ltd. | 5,700 | 169,551 | (14.6 | ) | ||||||||
MIXI, Inc. | 20,400 | 436,820 | (37.7 | ) | ||||||||
Mizuho Leasing Co. Ltd. | 15,200 | 431,512 | (37.2 | ) | ||||||||
Mizuno Corp. | 5,900 | 149,132 | (12.9 | ) | ||||||||
Mochida Pharmaceutical Co. Ltd. | 8,400 | 218,759 | (18.9 | ) | ||||||||
Modec, Inc. | 5,700 | 62,689 | (5.4 | ) | ||||||||
Monogatari Corp. | 17,800 | �� | 379,199 | (32.7 | ) | |||||||
Morita Holdings Corp. | 21,100 | 225,169 | (19.4 | ) | ||||||||
MOS Food Services, Inc. | 30,400 | 707,863 | (61.1 | ) | ||||||||
Nakanishi, Inc. | 41,200 | 791,328 | (68.3 | ) | ||||||||
Nichias Corp. | 8,300 | 170,034 | (14.7 | ) | ||||||||
Nichicon Corp. | 34,200 | 328,670 | (28.4 | ) | ||||||||
Nichiden Corp. | 1,800 | 27,034 | (2.3 | ) | ||||||||
Nippn Corp. | 8,100 | 106,660 | (9.2 | ) | ||||||||
Nippon Ceramic Co. Ltd. | 19,500 | 395,376 | (34.1 | ) | ||||||||
Nippon Gas Co. Ltd. | 36,400 | 518,842 | (44.8 | ) | ||||||||
Nippon Light Metal Holdings Co. Ltd. | 49,500 | 525,670 | (45.3 | ) | ||||||||
Nippon Paper Industries Co. Ltd. | 57,600 | 467,422 | (40.3 | ) | ||||||||
Nippon Parking Development Co. Ltd. | 77,300 | 135,013 | (11.6 | ) | ||||||||
Nippon REIT Investment Corp. | 287 | 682,877 | (58.9 | ) | ||||||||
Nippon Road Co. Ltd. | 3,700 | 222,126 | (19.2 | ) | ||||||||
Nippon Seiki Co. Ltd. | 19,800 | 127,681 | (11.0 | ) | ||||||||
Nippon Soda Co. Ltd. | 10,000 | 349,553 | (30.2 | ) | ||||||||
Nishi-Nippon Financial Holdings, Inc. | 61,600 | 519,952 | (44.9 | ) | ||||||||
Nissan Shatai Co. Ltd. | 1,500 | 10,441 | (0.9 | ) | ||||||||
Nisshin Oillio Group Ltd. | 8,000 | 202,508 | (17.5 | ) | ||||||||
Nisshinbo Holdings, Inc. | 22,600 | 176,315 | (15.2 | ) | ||||||||
Nissin Electric Co. Ltd. | 1,800 | 22,763 | (2.0 | ) | ||||||||
Nissui Corp. | 134,900 | 597,435 | (51.5 | ) | ||||||||
Nittetsu Mining Co. Ltd. | 8,800 | 241,189 | (20.8 | ) | ||||||||
Nitto Boseki Co. Ltd. | 15,800 | 223,785 | (19.3 | ) | ||||||||
Nohmi Bosai Ltd. | 3,500 | 45,729 | (3.9 | ) | ||||||||
Nomura Co. Ltd. | 45,400 | 318,459 | (27.5 | ) | ||||||||
Noritsu Koki Co. Ltd. | 11,900 | 198,222 | (17.1 | ) | ||||||||
NSD Co. Ltd. | 18,900 | 352,316 | (30.4 | ) | ||||||||
NTN Corp. | 187,600 | 469,460 | (40.5 | ) | ||||||||
SCHEDULE OF INVESTMENTS | 73 |
Schedule of Investments (continued) April 30, 2023 | BlackRock Global Equity Market Neutral Fund |
| Security | Shares | Value | % of Basket Value | |||||||||
Japan (continued) | ||||||||||||
Obara Group, Inc. | 14,600 | $ | 464,662 | (40.1 | )% | |||||||
Oiles Corp. | 22,700 | 290,684 | (25.1 | ) | ||||||||
Okamoto Industries, Inc. | 1,500 | 45,269 | (3.9 | ) | ||||||||
Okamura Corp. | 19,100 | 206,500 | (17.8 | ) | ||||||||
Oki Electric Industry Co. Ltd. | 87,600 | 481,426 | (41.5 | ) | ||||||||
Okinawa Cellular Telephone Co. | 10,000 | 226,383 | (19.5 | ) | ||||||||
Okinawa Electric Power Co., Inc. | 55,300 | 456,986 | (39.4 | ) | ||||||||
Okumura Corp. | 11,000 | 273,378 | (23.6 | ) | ||||||||
Open Up Group, Inc. | 11,100 | 166,538 | (14.4 | ) | ||||||||
Optex Group Co. Ltd. | 6,500 | 99,116 | (8.5 | ) | ||||||||
Osaka Organic Chemical Industry Ltd. | 8,900 | 136,676 | (11.8 | ) | ||||||||
Outsourcing, Inc. | 20,500 | 211,956 | (18.3 | ) | ||||||||
Pacific Metals Co. Ltd. | 14,600 | 205,940 | (17.8 | ) | ||||||||
Pasona Group, Inc. | 6,800 | 94,823 | (8.2 | ) | ||||||||
PHC Holdings Corp. | 3,400 | 35,427 | (3.1 | ) | ||||||||
Pilot Corp. | 6,500 | 219,411 | (18.9 | ) | ||||||||
Plus Alpha Consulting Co. Ltd. | 13,000 | 282,185 | (24.3 | ) | ||||||||
Prestige International, Inc. | 132,900 | 587,746 | (50.7 | ) | ||||||||
Raito Kogyo Co. Ltd. | 29,300 | 437,708 | (37.8 | ) | ||||||||
Riso Kyoiku Co. Ltd. | 52,200 | 115,642 | (10.0 | ) | ||||||||
Round One Corp. | 93,500 | 409,439 | (35.3 | ) | ||||||||
Royal Holdings Co. Ltd. | 11,500 | 247,052 | (21.3 | ) | ||||||||
RS Technologies Co. Ltd. | 8,800 | 200,508 | (17.3 | ) | ||||||||
S Foods, Inc. | 3,800 | 85,659 | (7.4 | ) | ||||||||
Saizeriya Co. Ltd. | 4,400 | 112,040 | (9.7 | ) | ||||||||
Sakata Seed Corp. | 25,900 | 767,836 | (66.2 | ) | ||||||||
Sangetsu Corp. | 5,100 | 86,157 | (7.4 | ) | ||||||||
Sanken Electric Co. Ltd. | 3,100 | 236,305 | (20.4 | ) | ||||||||
Sanyo Chemical Industries Ltd. | 1,800 | 57,276 | (4.9 | ) | ||||||||
Sanyo Special Steel Co. Ltd. | 2,200 | 39,451 | (3.4 | ) | ||||||||
Sato Holdings Corp. | 10,600 | 181,732 | (15.7 | ) | ||||||||
Seiren Co. Ltd. | 48,600 | 819,246 | (70.7 | ) | ||||||||
Septeni Holdings Co. Ltd. | 39,800 | 111,054 | (9.6 | ) | ||||||||
Seria Co. Ltd. | 19,600 | 353,230 | (30.5 | ) | ||||||||
Shima Seiki Manufacturing Ltd. | 800 | 11,091 | (1.0 | ) | ||||||||
Shin-Etsu Polymer Co. Ltd. | 34,600 | 345,430 | (29.8 | ) | ||||||||
Shoei Co. Ltd. | 30,600 | 575,439 | (49.6 | ) | ||||||||
Solasto Corp. | 10,300 | 48,649 | (4.2 | ) | ||||||||
S-Pool, Inc. | 33,700 | 158,439 | (13.7 | ) | ||||||||
Star Asia Investment Corp. | 1,260 | 522,806 | (45.1 | ) | ||||||||
Starts Corp., Inc. | 10,400 | 199,213 | (17.2 | ) | ||||||||
Starts Proceed Investment Corp. | 20 | 34,310 | (3.0 | ) | ||||||||
Strike Co. Ltd. | 12,000 | 326,574 | (28.2 | ) | ||||||||
Sumitomo Mitsui Construction Co. Ltd. | 122,100 | 350,743 | (30.3 | ) | ||||||||
Sumitomo Warehouse Co. Ltd. | 13,700 | 230,649 | (19.9 | ) | ||||||||
Sun Frontier Fudousan Co. Ltd. | 8,900 | 87,545 | (7.5 | ) | ||||||||
Systena Corp. | 352,100 | 738,189 | (63.7 | ) | ||||||||
Tadano Ltd. | 9,800 | 77,719 | (6.7 | ) | ||||||||
Taikisha Ltd. | 2,400 | 65,899 | (5.7 | ) | ||||||||
Taiyo Holdings Co. Ltd. | 12,200 | 223,474 | (19.3 | ) | ||||||||
Takamatsu Construction Group Co. Ltd. | 3,800 | 62,450 | (5.4 | ) | ||||||||
Takara Standard Co. Ltd. | 6,700 | 82,067 | (7.1 | ) | ||||||||
Takeuchi Manufacturing Co. Ltd. | 1,000 | 27,948 | (2.4 | ) | ||||||||
Takuma Co. Ltd. | 95,600 | 1,012,622 | (87.4 | ) | ||||||||
Tamron Co. Ltd. | 5,700 | 140,784 | (12.1 | ) | ||||||||
TechMatrix Corp. | 14,900 | 180,035 | (15.5 | ) | ||||||||
T-Gaia Corp. | 20,000 | 248,714 | (21.5 | ) | ||||||||
TKC Corp. | 2,000 | 54,781 | (4.7 | ) | ||||||||
Tocalo Co. Ltd. | 23,600 | 224,580 | (19.4 | ) | ||||||||
Toho Titanium Co. Ltd. | 13,200 | 199,836 | (17.2 | ) | ||||||||
TOKAI Corp. | 16,300 | 249,426 | (21.5 | ) | ||||||||
| Security | Shares | Value | % of Basket Value | |||||||||
Japan (continued) | ||||||||||||
Tokai Rika Co. Ltd. | 13,100 | $ | 183,083 | (15.8 | )% | |||||||
Token Corp. | 4,000 | 235,882 | (20.3 | ) | ||||||||
Tokyo Seimitsu Co. Ltd. | 3,600 | 134,604 | (11.6 | ) | ||||||||
Tokyo Steel Manufacturing Co. Ltd. | 36,800 | 375,403 | (32.4 | ) | ||||||||
Tokyotokeiba Co. Ltd. | 18,400 | 588,669 | (50.8 | ) | ||||||||
Tokyu Construction Co. Ltd. | 96,900 | 520,212 | (44.9 | ) | ||||||||
Tokyu REIT, Inc. | 198 | 268,005 | (23.1 | ) | ||||||||
Topcon Corp. | 13,800 | 199,153 | (17.2 | ) | ||||||||
Toridoll Holdings Corp. | 34,100 | 737,206 | (63.6 | ) | ||||||||
Torii Pharmaceutical Co. Ltd. | 500 | 12,856 | (1.1 | ) | ||||||||
Tosei Corp. | 53,500 | 644,747 | (55.6 | ) | ||||||||
Towa Pharmaceutical Co. Ltd. | 26,000 | 376,096 | (32.4 | ) | ||||||||
Toyo Ink SC Holdings Co. Ltd. | 9,700 | 158,559 | (13.7 | ) | ||||||||
Toyo Tanso Co. Ltd. | 3,500 | 103,186 | (8.9 | ) | ||||||||
TRE Holdings Corp. | 8,800 | 78,434 | (6.8 | ) | ||||||||
Tri Chemical Laboratories, Inc. | 20,700 | 339,540 | (29.3 | ) | ||||||||
Trusco Nakayama Corp. | 29,200 | 513,717 | (44.3 | ) | ||||||||
Tsubakimoto Chain Co. | 3,800 | 95,345 | (8.2 | ) | ||||||||
United Arrows Ltd. | 44,100 | 651,998 | (56.2 | ) | ||||||||
Universal Entertainment Corp. | 8,800 | 187,895 | (16.2 | ) | ||||||||
Usen-Next Holdings Co. Ltd. | 4,300 | 97,787 | (8.4 | ) | ||||||||
UT Group Co. Ltd. | 15,600 | 302,646 | (26.1 | ) | ||||||||
Valor Holdings Co. Ltd. | 20,700 | 320,967 | (27.7 | ) | ||||||||
ValueCommerce Co. Ltd. | 56,700 | 559,190 | (48.2 | ) | ||||||||
Vision, Inc. | 5,600 | 71,221 | (6.1 | ) | ||||||||
VT Holdings Co. Ltd. | 50,900 | 202,615 | (17.5 | ) | ||||||||
Wakita & Co. Ltd. | 32,700 | 337,048 | (29.1 | ) | ||||||||
WDB Holdings Co. Ltd. | 5,100 | 77,195 | (6.7 | ) | ||||||||
Yamazen Corp. | 600 | 4,716 | (0.4 | ) | ||||||||
Yellow Hat Ltd. | 13,700 | 197,189 | (17.0 | ) | ||||||||
Yurtec Corp. | 43,200 | 266,015 | (22.9 | ) | ||||||||
Zenrin Co. Ltd. | 18,300 | 119,922 | (10.3 | ) | ||||||||
Zuken, Inc. | 17,700 | 455,600 | (39.3 | ) | ||||||||
|
|
|
| |||||||||
| 68,097,845 | ||||||||||||
Jersey | ||||||||||||
JTC PLC | 26,579 | 261,457 | (22.6 | ) | ||||||||
|
|
|
| |||||||||
Luxembourg | ||||||||||||
SES SA | 89,897 | 552,614 | (47.7 | ) | ||||||||
|
|
|
| |||||||||
Malta | ||||||||||||
Kambi Group PLC | 14,458 | 239,293 | (20.6 | ) | ||||||||
|
|
|
| |||||||||
Netherlands | ||||||||||||
PostNL NV | 128,705 | 230,185 | (19.9 | ) | ||||||||
Shop Apotheke Europe NV | 3,881 | 384,359 | (33.1 | ) | ||||||||
TomTom NV | 49,573 | 421,557 | (36.4 | ) | ||||||||
uniQure NV | 16,371 | 317,761 | (27.4 | ) | ||||||||
Vastned Retail NV | 415 | 9,372 | (0.8 | ) | ||||||||
Wereldhave NV | 13,150 | 200,194 | (17.3 | ) | ||||||||
|
|
|
| |||||||||
| 1,563,428 | ||||||||||||
New Zealand | ||||||||||||
a2 Milk Co. Ltd. | 28,360 | 103,626 | (8.9 | ) | ||||||||
Chorus Ltd. | 9,524 | 50,945 | (4.4 | ) | ||||||||
|
|
|
| |||||||||
| 154,571 | ||||||||||||
Norway | ||||||||||||
Aker Solutions ASA | 38,922 | 141,264 | (12.2 | ) | ||||||||
Austevoll Seafood ASA | 29,169 | 279,289 | (24.1 | ) | ||||||||
Borregaard ASA, Registered Shares | 7,428 | 126,378 | (10.9 | ) | ||||||||
DNO ASA | 220,061 | 224,230 | (19.3 | ) | ||||||||
Elkem ASA | 54,512 | 187,688 | (16.2 | ) | ||||||||
| 74 | 2 0 2 3 BLACK ROCK ANNUAL REPORT TO SHAREHOLDERS |
Schedule of Investments (continued) April 30, 2023 | BlackRock Global Equity Market Neutral Fund |
| Security | Shares | Value | % of Basket Value | |||||||||
Norway (continued) | ||||||||||||
Frontline PLC | 2,723 | $ | 42,987 | (3.7 | )% | |||||||
Grieg Seafood ASA | 4,638 | 39,520 | (3.4 | ) | ||||||||
Odfjell Drilling Ltd. | 196,903 | 468,021 | (40.4 | ) | ||||||||
Protector Forsikring ASA | 12,172 | 179,520 | (15.5 | ) | ||||||||
Schibsted ASA, B Shares | 3,367 | 55,444 | (4.8 | ) | ||||||||
SpareBank 1 Nord Norge | 3,594 | 33,063 | (2.9 | ) | ||||||||
SpareBank 1 SMN | 8,329 | 109,167 | (9.4 | ) | ||||||||
SpareBank 1 SR-Bank ASA | 3,637 | 43,295 | (3.7 | ) | ||||||||
Stolt-Nielsen Ltd. | 6,731 | 197,739 | (17.1 | ) | ||||||||
Storebrand ASA | 25,220 | 197,816 | (17.1 | ) | ||||||||
TGS ASA | 10,756 | 171,674 | (14.8 | ) | ||||||||
Veidekke ASA | 1,399 | 16,353 | (1.4 | ) | ||||||||
Wallenius Wilhelmsen ASA | 4,780 | 36,370 | (3.1 | ) | ||||||||
|
|
|
| |||||||||
| 2,549,818 | ||||||||||||
Peru | ||||||||||||
Hochschild Mining PLC | 171,924 | 152,333 | (13.1 | ) | ||||||||
|
|
|
| |||||||||
Portugal | ||||||||||||
REN - Redes Energeticas Nacionais SGPS SA | 330,506 | 951,966 | (82.1 | ) | ||||||||
Semapa-Sociedade de Investimento e Gestao | 909 | 13,620 | (1.2 | ) | ||||||||
Sonae SGPS SA | 109,413 | 123,781 | (10.7 | ) | ||||||||
|
|
|
| |||||||||
| 1,089,367 | ||||||||||||
Puerto Rico | ||||||||||||
Evertec, Inc. | 29,698 | 1,030,224 | (88.9 | ) | ||||||||
Liberty Latin America Ltd. | 11,907 | 105,615 | (9.1 | ) | ||||||||
|
|
|
| |||||||||
| 1,135,839 | ||||||||||||
Singapore | ||||||||||||
BW LPG Ltd. | 40,672 | 333,342 | (28.8 | ) | ||||||||
Capitaland India Trust | 435,800 | 356,964 | (30.8 | ) | ||||||||
Far East Hospitality Trust | 145,000 | 67,547 | (5.8 | ) | ||||||||
Frasers Centrepoint Trust | 63,500 | 105,545 | (9.1 | ) | ||||||||
Hour Glass Ltd. | 42,100 | 65,826 | (5.7 | ) | ||||||||
IGG, Inc. | 1,192,000 | 985,354 | (85.0 | ) | ||||||||
Sheng Siong Group Ltd. | 243,900 | 324,011 | (27.9 | ) | ||||||||
|
|
|
| |||||||||
| 2,238,589 | ||||||||||||
South Africa | ||||||||||||
Scatec ASA | 86,798 | 577,987 | (49.9 | ) | ||||||||
|
|
|
| |||||||||
South Korea | ||||||||||||
Magnachip Semiconductor Corp. | 10,165 | 90,265 | (7.8 | ) | ||||||||
|
|
|
| |||||||||
Spain | ||||||||||||
Almirall SA | 20,487 | 208,100 | (18.0 | ) | ||||||||
Applus Services SA | 2,284 | 19,017 | (1.6 | ) | ||||||||
Cia de Distribucion Integral Logista Holdings SA | 28,456 | 766,913 | (66.2 | ) | ||||||||
Ebro Foods SA | 8,676 | 159,747 | (13.8 | ) | ||||||||
Laboratorios Farmaceuticos Rovi SA | 5,427 | 238,115 | (20.5 | ) | ||||||||
Mediaset Espana Comunicacion SA | 29,392 | 96,904 | (8.4 | ) | ||||||||
Melia Hotels International SA | 14,165 | 90,713 | (7.8 | ) | ||||||||
Pharma Mar SA | 3,211 | 132,209 | (11.4 | ) | ||||||||
Tecnicas Reunidas SA | 1,049 | 9,661 | (0.8 | ) | ||||||||
Unicaja Banco SA | 219,247 | 220,519 | (19.0 | ) | ||||||||
Viscofan SA | 1,816 | 123,398 | (10.7 | ) | ||||||||
|
|
|
| |||||||||
| 2,065,296 | ||||||||||||
Sweden | ||||||||||||
AAK AB | 8,999 | 179,667 | (15.5 | ) | ||||||||
AddLife AB, Class A | 6,657 | 78,295 | (6.8 | ) | ||||||||
AddTech AB, B Shares | 49,862 | 990,090 | (85.4 | ) | ||||||||
Alleima AB | 31,589 | 160,815 | (13.9 | ) | ||||||||
| Security | Shares | Value | % of Basket Value | |||||||||
Sweden (continued) | ||||||||||||
Ambea AB | 2,817 | $ | 10,616 | (0.9 | )% | |||||||
Arjo AB, B Shares | 39,847 | 175,199 | (15.1 | ) | ||||||||
Atrium Ljungberg AB, B Shares | 552 | 10,167 | (0.9 | ) | ||||||||
Betsson AB | 30,052 | 321,484 | (27.7 | ) | ||||||||
BioGaia AB, B Shares | 41,259 | 406,022 | (35.0 | ) | ||||||||
Biotage AB | 24,323 | 299,634 | (25.9 | ) | ||||||||
Boozt AB | 2,556 | 29,282 | (2.5 | ) | ||||||||
Bravida Holding AB | 18,398 | 221,847 | (19.1 | ) | ||||||||
Bure Equity AB | 1,749 | 44,289 | (3.8 | ) | ||||||||
Camurus AB | 4,112 | 92,757 | (8.0 | ) | ||||||||
Cellavision AB | 238 | 4,023 | (0.4 | ) | ||||||||
Corem Property Group AB, B Shares | 144,640 | 113,573 | (9.8 | ) | ||||||||
Fortnox AB | 66,213 | 452,304 | (39.0 | ) | ||||||||
HMS Networks AB | 6,472 | 298,620 | (25.8 | ) | ||||||||
Intrum AB | 17,518 | 156,757 | (13.5 | ) | ||||||||
INVISIO AB | 1,107 | 22,506 | (1.9 | ) | ||||||||
MIPS AB | 4,032 | 215,905 | (18.6 | ) | ||||||||
Mycronic AB | 28,997 | 609,630 | (52.6 | ) | ||||||||
Nolato AB, B Shares | 27,624 | 151,883 | (13.1 | ) | ||||||||
NP3 Fastigheter AB | 442 | 8,422 | (0.7 | ) | ||||||||
Nyfosa AB | 39,582 | 268,320 | (23.1 | ) | ||||||||
Orron Energy ab | 145,050 | 167,479 | (14.5 | ) | ||||||||
Paradox Interactive AB | 2,665 | 64,819 | (5.6 | ) | ||||||||
Resurs Holding AB | 8,541 | 16,120 | (1.4 | ) | ||||||||
Samhallsbyggnadsbolaget i Norden AB | 55,003 | 82,476 | (7.1 | ) | ||||||||
Scandic Hotels Group AB | 55,694 | 197,332 | (17.0 | ) | ||||||||
Sdiptech AB, Class B | 981 | 22,453 | (1.9 | ) | ||||||||
Sectra AB, B Shares | 19,993 | 312,470 | (27.0 | ) | ||||||||
Storskogen Group AB | 43,645 | 39,419 | (3.4 | ) | ||||||||
Svolder AB | 1,891 | 11,316 | (1.0 | ) | ||||||||
Thule Group AB | 3,470 | 99,503 | (8.6 | ) | ||||||||
Troax Group AB | 8,286 | 186,043 | (16.1 | ) | ||||||||
Vitrolife AB | 3,398 | 75,829 | (6.5 | ) | ||||||||
Xvivo Perfusion AB | 2,081 | 61,645 | (5.3 | ) | ||||||||
|
|
|
| |||||||||
| 6,659,011 | ||||||||||||
Switzerland | ||||||||||||
Allreal Holding AG, Registered Shares | 1,326 | 234,044 | (20.2 | ) | ||||||||
Aryzta AG | 770,484 | 1,362,064 | (117.5 | ) | ||||||||
Basilea Pharmaceutica AG, Registered Shares | 8,287 | 399,379 | (34.5 | ) | ||||||||
Bossard Holding AG, Registered Shares | 59 | 14,388 | (1.2 | ) | ||||||||
Bucher Industries AG, Registered Shares | 922 | 412,960 | (35.6 | ) | ||||||||
Burkhalter Holding AG | 770 | 82,316 | (7.1 | ) | ||||||||
Cembra Money Bank AG | 1,256 | 100,315 | (8.7 | ) | ||||||||
Comet Holding AG, Registered Shares | 500 | 120,265 | (10.4 | ) | ||||||||
Gurit Holding AG | 1,220 | 122,363 | (10.6 | ) | ||||||||
Huber & Suhner AG, Registered Shares | 2,042 | 167,273 | (14.4 | ) | ||||||||
Implenia AG, Registered Shares | 2,234 | 100,282 | (8.6 | ) | ||||||||
Inficon Holding AG, Registered Shares | 317 | 343,461 | (29.6 | ) | ||||||||
Kardex Holding AG, Registered Shares | 922 | 209,588 | (18.1 | ) | ||||||||
LEM Holding SA, Registered Shares | 6 | 13,166 | (1.1 | ) | ||||||||
Medacta Group SA | 247 | 33,039 | (2.8 | ) | ||||||||
Medartis Holding AG | 550 | 45,864 | (4.0 | ) | ||||||||
Orior AG | 2,267 | 210,630 | (18.2 | ) | ||||||||
Sensirion Holding AG | 1,926 | 207,883 | (17.9 | ) | ||||||||
Sulzer AG, Registered Shares | 2,977 | 248,239 | (21.4 | ) | ||||||||
Swissquote Group Holding SA, Registered Shares | 1,748 | 372,291 | (32.1 | ) | ||||||||
SCHEDULE OF INVESTMENTS | 75 |
Schedule of Investments (continued) April 30, 2023 | BlackRock Global Equity Market Neutral Fund |
| Security | Shares | Value | % of Basket Value | |||||||||
| Switzerland (continued) | ||||||||||||
Vetropack Holding AG, Registered Shares | 4,143 | $ | 214,044 | (18.5 | )% | |||||||
Ypsomed Holding AG, Registered Shares | 2,475 | 572,455 | (49.4 | ) | ||||||||
|
|
|
| |||||||||
| 5,586,309 | ||||||||||||
| Turkey | ||||||||||||
Eldorado Gold Corp. | 19,825 | 221,595 | (19.1 | ) | ||||||||
|
|
|
| |||||||||
| United Kingdom | ||||||||||||
Advanced Medical Solutions Group PLC | 2,398 | 7,277 | (0.6 | ) | ||||||||
AG Barr PLC | 40,203 | 250,304 | (21.6 | ) | ||||||||
AJ Bell PLC | 96,188 | 388,147 | (33.5 | ) | ||||||||
Alpha Group International PLC | 1,555 | 41,793 | (3.6 | ) | ||||||||
Ashmore Group PLC | 98,219 | 296,476 | (25.6 | ) | ||||||||
ASOS PLC | 7,462 | 68,401 | (5.9 | ) | ||||||||
Babcock International Group PLC | 11,719 | 46,303 | (4.0 | ) | ||||||||
Balanced Commercial Property Trust Ltd. | 232,244 | 236,461 | (20.4 | ) | ||||||||
Big Yellow Group PLC | 28,884 | 437,916 | (37.8 | ) | ||||||||
Bodycote PLC | 38,171 | 326,420 | (28.2 | ) | ||||||||
boohoo Group PLC | 555,104 | 338,608 | (29.2 | ) | ||||||||
Bytes Technology Group PLC | 174,799 | 899,952 | (77.6 | ) | ||||||||
Chemring Group PLC | 149,377 | 526,387 | (45.4 | ) | ||||||||
Clarkson PLC | 5,385 | 206,646 | (17.8 | ) | ||||||||
Cranswick PLC | 7,208 | 287,545 | (24.8 | ) | ||||||||
CVS Group PLC | 43,642 | 1,146,837 | (98.9 | ) | ||||||||
Deliveroo PLC | 32,082 | 43,497 | (3.7 | ) | ||||||||
DiscoverIE Group PLC | 31,401 | 328,995 | (28.4 | ) | ||||||||
Dr Martens PLC | 17,139 | 35,197 | (3.0 | ) | ||||||||
Dunelm Group PLC | 63,585 | 902,103 | (77.8 | ) | ||||||||
Essentra PLC | 116,792 | 299,350 | (25.8 | ) | ||||||||
FD Technologies PLC | 3,610 | 84,299 | (7.3 | ) | ||||||||
Fevertree Drinks PLC | 18,757 | 315,100 | (27.2 | ) | ||||||||
Forterra PLC | 9,387 | 22,475 | (1.9 | ) | ||||||||
Frasers Group PLC | 40,773 | 387,882 | (33.5 | ) | ||||||||
Gamma Communications PLC | 12,415 | 179,417 | (15.5 | ) | ||||||||
Genuit Group PLC | 25,779 | 95,969 | (8.3 | ) | ||||||||
Genus PLC | 4,045 | 134,627 | (11.6 | ) | ||||||||
Grafton Group PLC, CDI | 8,715 | 94,137 | (8.1 | ) | ||||||||
Grainger PLC | 124,402 | 398,354 | (34.4 | ) | ||||||||
Hammerson PLC | 76,096 | 26,445 | (2.3 | ) | ||||||||
Helios Towers PLC | 70,194 | 90,395 | (7.8 | ) | ||||||||
Hill & Smith PLC | 2,162 | 36,826 | (3.2 | ) | ||||||||
Hunting PLC | 53,825 | 155,725 | (13.4 | ) | ||||||||
Ibstock PLC | 75,425 | 158,396 | (13.7 | ) | ||||||||
Impax Asset Management Group PLC | 24,469 | 238,335 | (20.6 | ) | ||||||||
IntegraFin Holdings PLC | 21,793 | 73,494 | (6.3 | ) | ||||||||
Johnson Service Group PLC | 75,340 | 113,424 | (9.8 | ) | ||||||||
Judges Scientific PLC | 1,559 | 191,961 | (16.6 | ) | ||||||||
Jupiter Fund Management PLC | 94,019 | 151,506 | (13.1 | ) | ||||||||
Just Group PLC | 164,633 | 179,979 | (15.5 | ) | ||||||||
Kainos Group PLC | 41,258 | 633,936 | (54.7 | ) | ||||||||
Lancashire Holdings Ltd. | 95,472 | 726,210 | (62.6 | ) | ||||||||
Learning Technologies Group PLC | 86,955 | 120,786 | (10.4 | ) | ||||||||
Luxfer Holdings PLC | 6,486 | 98,912 | (8.5 | ) | ||||||||
Marshalls PLC | 37,682 | 140,037 | (12.1 | ) | ||||||||
Mitchells & Butlers PLC | 29,466 | 63,869 | (5.5 | ) | ||||||||
Moneysupermarket.com Group PLC | 63,586 | 216,615 | (18.7 | ) | ||||||||
Morgan Advanced Materials PLC | 51,830 | 197,523 | (17.0 | ) | ||||||||
Morgan Sindall Group PLC | 9,120 | 191,434 | (16.5 | ) | ||||||||
National Express Group PLC | 374,799 | 564,576 | (48.7 | ) | ||||||||
OSB Group PLC | 4,021 | 25,025 | (2.2 | ) | ||||||||
Oxford Instruments PLC | 2,078 | 71,028 | (6.1 | ) | ||||||||
| Security | Shares | Value | % of Basket Value | |||||||||
| United Kingdom (continued) | ||||||||||||
Oxford Nanopore Technologies PLC | 33,320 | $ | 94,698 | (8.2 | )% | |||||||
Paragon Banking Group PLC | 33,568 | 208,869 | (18.0 | ) | ||||||||
Premier Foods PLC | 33,432 | 51,913 | (4.5 | ) | ||||||||
QinetiQ Group PLC | 152,007 | 700,002 | (60.4 | ) | ||||||||
Quilter PLC | 515,609 | 544,013 | (46.9 | ) | ||||||||
Redde Northgate PLC | 81,745 | 380,877 | (32.9 | ) | ||||||||
RWS Holdings PLC | 19,265 | 60,623 | (5.2 | ) | ||||||||
Safestore Holdings PLC | 26,535 | 325,727 | (28.1 | ) | ||||||||
Savills PLC | 9,834 | 117,275 | (10.1 | ) | ||||||||
Shaftesbury Capital PLC | 212,319 | 309,585 | (26.7 | ) | ||||||||
SIG PLC | 159,924 | 88,333 | (7.6 | ) | ||||||||
Smart Metering Systems PLC | 43,655 | 428,615 | (37.0 | ) | ||||||||
Softcat PLC | 28,717 | 476,617 | (41.1 | ) | ||||||||
SThree PLC | 55,819 | 291,270 | (25.1 | ) | ||||||||
Telecom Plus PLC | 16,204 | 361,729 | (31.2 | ) | ||||||||
TP ICAP Group PLC | 197,076 | 415,099 | (35.8 | ) | ||||||||
Trainline PLC | 53,122 | 164,077 | (14.2 | ) | ||||||||
Trustpilot Group PLC | 81,675 | 89,315 | (7.7 | ) | ||||||||
UK Commercial Property REIT Ltd. | 987,320 | 656,510 | (56.6 | ) | ||||||||
Vesuvius PLC | 106,243 | 533,869 | (46.1 | ) | ||||||||
Victrex PLC | 11,983 | 250,725 | (21.6 | ) | ||||||||
Virgin Money UK PLC | 341,672 | 662,249 | (57.1 | ) | ||||||||
Volution Group PLC | 65,994 | 354,250 | (30.6 | ) | ||||||||
Wickes Group PLC | 1,864 | 3,107 | (0.3 | ) | ||||||||
YouGov PLC | 10,210 | 107,357 | (9.3 | ) | ||||||||
|
|
|
| |||||||||
| 20,970,016 | ||||||||||||
| United States | ||||||||||||
1-800-Flowers.com, Inc., Class A | 6,548 | 60,307 | (5.2 | ) | ||||||||
1st Source Corp. | 2,441 | 101,741 | (8.8 | ) | ||||||||
2seventy bio, Inc. | 3,553 | 33,789 | (2.9 | ) | ||||||||
2U, Inc. | 27,782 | 153,912 | (13.3 | ) | ||||||||
8x8, Inc. | 99,944 | 286,839 | (24.7 | ) | ||||||||
A10 Networks, Inc. | 47,494 | 671,565 | (57.9 | ) | ||||||||
Aaron’s Co., Inc. | 6,152 | 82,129 | (7.1 | ) | ||||||||
Abercrombie & Fitch Co., Class A | 20,898 | 491,939 | (42.4 | ) | ||||||||
ACADIA Pharmaceuticals, Inc. | 14,079 | 300,305 | (25.9 | ) | ||||||||
Accel Entertainment, Inc. | 19,275 | 170,584 | (14.7 | ) | ||||||||
ACI Worldwide, Inc. | 10,994 | 278,478 | (24.0 | ) | ||||||||
Acushnet Holdings Corp. | 8,813 | 441,796 | (38.1 | ) | ||||||||
Adaptive Biotechnologies Corp. | 2,593 | 18,514 | (1.6 | ) | ||||||||
Advanced Energy Industries, Inc. | 8,534 | 738,191 | (63.7 | ) | ||||||||
AdvanSix, Inc. | 4,267 | 160,781 | (13.9 | ) | ||||||||
Agenus, Inc. | 4,948 | 7,471 | (0.6 | ) | ||||||||
Agios Pharmaceuticals, Inc. | 9,043 | 206,813 | (17.8 | ) | ||||||||
Air Transport Services Group, Inc. | 10,546 | 214,189 | (18.5 | ) | ||||||||
Alarm.com Holdings, Inc. | 5,715 | 272,548 | (23.5 | ) | ||||||||
Albany International Corp., Class A | 2,300 | 209,783 | (18.1 | ) | ||||||||
Alector, Inc. | 41,956 | 276,910 | (23.9 | ) | ||||||||
Alexander & Baldwin, Inc. | 5,005 | 96,246 | (8.3 | ) | ||||||||
Alignment Healthcare, Inc. | 10,884 | 68,460 | (5.9 | ) | ||||||||
Allegiant Travel Co. | 4,591 | 477,051 | (41.2 | ) | ||||||||
ALLETE, Inc. | 8,087 | 504,467 | (43.5 | ) | ||||||||
Allogene Therapeutics, Inc. | 40,811 | 221,604 | (19.1 | ) | ||||||||
Alpha Metallurgical Resources, Inc. | 534 | 78,263 | (6.8 | ) | ||||||||
Amalgamated Financial Corp. | 10,693 | 174,082 | (15.0 | ) | ||||||||
Ambac Financial Group, Inc. | 10,291 | 164,141 | (14.2 | ) | ||||||||
Ambarella, Inc. | 3,054 | 189,287 | (16.3 | ) | ||||||||
Amedisys, Inc. | 4,023 | 323,047 | (27.9 | ) | ||||||||
American Assets Trust, Inc. | 82,421 | 1,500,062 | (129.4 | ) | ||||||||
American Axle & Manufacturing Holdings, Inc. | 22,152 | 158,387 | (13.7 | ) | ||||||||
| 76 | 2 0 2 3 BLACK ROCK ANNUAL REPORT TO SHAREHOLDERS |
Schedule of Investments (continued) April 30, 2023 | BlackRock Global Equity Market Neutral Fund |
| Security | Shares | Value | % of Basket Value | |||||||||
| United States (continued) | ||||||||||||
American Software, Inc. | 5,400 | $ | 64,476 | (5.6 | )% | |||||||
American Vanguard Corp. | 7,773 | 149,630 | (12.9 | ) | ||||||||
American Woodmark Corp. | 9,667 | 488,377 | (42.1 | ) | ||||||||
AMERISAFE, Inc. | 4,252 | 236,624 | (20.4 | ) | ||||||||
Amicus Therapeutics, Inc. | 12,789 | 147,585 | (12.7 | ) | ||||||||
Amneal Pharmaceuticals, Inc. | 9,382 | 18,107 | (1.6 | ) | ||||||||
Amphastar Pharmaceuticals, Inc. | 7,057 | 252,429 | (21.8 | ) | ||||||||
AnaptysBio, Inc. | 5,904 | 122,921 | (10.6 | ) | ||||||||
AngioDynamics, Inc. | 12,608 | 104,899 | (9.0 | ) | ||||||||
Anika Therapeutics, Inc. | 3,627 | 93,069 | (8.0 | ) | ||||||||
Apogee Enterprises, Inc. | 16,737 | 712,327 | (61.4 | ) | ||||||||
Appfolio, Inc. | 625 | 87,263 | (7.5 | ) | ||||||||
Arbor Realty Trust, Inc. | 72,736 | 834,282 | (72.0 | ) | ||||||||
Archrock, Inc. | 23,526 | 242,083 | (20.9 | ) | ||||||||
Arcus Biosciences, Inc. | 19,416 | 346,576 | (29.9 | ) | ||||||||
Arhaus, Inc. | 5,508 | 44,174 | (3.8 | ) | ||||||||
Armada Hoffler Properties, Inc. | 15,601 | 182,844 | (15.8 | ) | ||||||||
Arrow Financial Corp. | 404 | 8,722 | (0.8 | ) | ||||||||
Artisan Partners Asset Management, Inc., Class A | 15,635 | 542,065 | (46.8 | ) | ||||||||
Artivion, Inc. | 2,792 | 38,725 | (3.3 | ) | ||||||||
Arvinas, Inc. | 9,485 | 248,602 | (21.4 | ) | ||||||||
ASGN, Inc. | 2,347 | 168,022 | (14.5 | ) | ||||||||
AssetMark Financial Holdings, Inc. | 10,327 | 316,832 | (27.3 | ) | ||||||||
Associated Banc-Corp. | 10,506 | 187,322 | (16.2 | ) | ||||||||
Assured Guaranty Ltd. | 22,591 | 1,216,977 | (105.0 | ) | ||||||||
Astec Industries, Inc. | 6,110 | 252,221 | (21.8 | ) | ||||||||
AtriCure, Inc. | 14,925 | 656,551 | (56.6 | ) | ||||||||
Avantax, Inc. | 17,652 | 447,831 | (38.6 | ) | ||||||||
Avid Bioservices, Inc. | 4,020 | 72,561 | (6.3 | ) | ||||||||
Avid Technology, Inc. | 6,316 | 186,385 | (16.1 | ) | ||||||||
AvidXchange Holdings, Inc. | 22,199 | 164,939 | (14.2 | ) | ||||||||
Avient Corp. | 11,878 | 457,422 | (39.5 | ) | ||||||||
Axogen, Inc. | 2,158 | 19,465 | (1.7 | ) | ||||||||
Axonics, Inc. | 1,456 | 83,662 | (7.2 | ) | ||||||||
Axos Financial, Inc. | 9,869 | 401,372 | (34.6 | ) | ||||||||
Badger Meter, Inc. | 6,697 | 886,214 | (76.4 | ) | ||||||||
Bally’s Corp. | 1,676 | 28,827 | (2.5 | ) | ||||||||
BancFirst Corp. | 1,953 | 156,025 | (13.5 | ) | ||||||||
Bandwidth, Inc., Class A | 25,815 | 314,169 | (27.1 | ) | ||||||||
Bank of Hawaii Corp. | 1,954 | 94,632 | (8.2 | ) | ||||||||
Bar Harbor Bankshares | 1,313 | 32,562 | (2.8 | ) | ||||||||
Beam Therapeutics, Inc. | 6,902 | 211,960 | (18.3 | ) | ||||||||
Belden, Inc. | 10,206 | 805,151 | (69.5 | ) | ||||||||
Benchmark Electronics, Inc. | 7,261 | 155,022 | (13.4 | ) | ||||||||
Berry Corp. | 34,572 | 264,130 | (22.8 | ) | ||||||||
BGC Partners, Inc., Class A | 4,066 | 18,419 | (1.6 | ) | ||||||||
BJ’s Restaurants, Inc. | 3,848 | 125,214 | (10.8 | ) | ||||||||
Blackbaud, Inc. | 4,984 | 345,665 | (29.8 | ) | ||||||||
Bluebird Bio, Inc. | 8,486 | 36,914 | (3.2 | ) | ||||||||
Bluegreen Vacations Holding Corp. | 1,035 | 29,798 | (2.6 | ) | ||||||||
BlueLinx Holdings, Inc. | 676 | 47,361 | (4.1 | ) | ||||||||
Blueprint Medicines Corp. | 6,111 | 311,967 | (26.9 | ) | ||||||||
Boise Cascade Co. | 4,278 | 292,230 | (25.2 | ) | ||||||||
BOK Financial Corp. | 4,385 | 367,770 | (31.7 | ) | ||||||||
Bread Financial Holdings, Inc. | 5,438 | 150,089 | (12.9 | ) | ||||||||
BrightView Holdings, Inc. | 3,518 | 19,455 | (1.7 | ) | ||||||||
Brink’s Co. | 6,066 | 381,248 | (32.9 | ) | ||||||||
Broadstone Net Lease, Inc. | 15,771 | 255,017 | (22.0 | ) | ||||||||
Brookdale Senior Living, Inc. | 132,728 | 569,403 | (49.1 | ) | ||||||||
Buckle, Inc. | 24,878 | 834,159 | (72.0 | ) | ||||||||
Burford Capital Ltd. | 7,809 | 101,200 | (8.7 | ) | ||||||||
| Security | Shares | Value | % of Basket Value | |||||||||
| United States (continued) | ||||||||||||
Business First Bancshares, Inc. | 3,483 | $ | 53,708 | (4.6 | )% | |||||||
Byline Bancorp, Inc. | 16,794 | 324,964 | (28.0 | ) | ||||||||
Caleres, Inc. | 5,277 | 120,316 | (10.4 | ) | ||||||||
California Resources Corp. | 10,821 | 438,250 | (37.8 | ) | ||||||||
Cal-Maine Foods, Inc. | 9,547 | 453,482 | (39.1 | ) | ||||||||
Cambridge Bancorp | 992 | 51,237 | (4.4 | ) | ||||||||
Camden National Corp. | 2,307 | 73,709 | (6.4 | ) | ||||||||
Cannae Holdings, Inc. | 17,758 | 323,906 | (27.9 | ) | ||||||||
Capital City Bank Group, Inc. | 13,919 | 423,973 | (36.6 | ) | ||||||||
Cara Therapeutics, Inc. | 4,177 | 17,543 | (1.5 | ) | ||||||||
CareDx, Inc. | 17,633 | 142,651 | (12.3 | ) | ||||||||
Cargurus, Inc. | 20,972 | 344,780 | (29.7 | ) | ||||||||
Castle Biosciences, Inc. | 294 | 6,653 | (0.6 | ) | ||||||||
Catalyst Pharmaceuticals, Inc. | 10,795 | 171,856 | (14.8 | ) | ||||||||
Century Aluminum Co. | 30,636 | 263,163 | (22.7 | ) | ||||||||
Century Communities, Inc. | 2,222 | 149,629 | (12.9 | ) | ||||||||
Cerence, Inc. | 10,127 | 258,745 | (22.3 | ) | ||||||||
Cerus Corp. | 34,589 | 79,901 | (6.9 | ) | ||||||||
CEVA, Inc. | 4,207 | 105,722 | (9.1 | ) | ||||||||
Chatham Lodging Trust | 31,090 | 318,362 | (27.5 | ) | ||||||||
Chefs’ Warehouse, Inc. | 2,009 | 66,819 | (5.8 | ) | ||||||||
Chegg, Inc. | 43,901 | 789,340 | (68.1 | ) | ||||||||
Chico’s FAS, Inc. | 58,841 | 296,559 | (25.6 | ) | ||||||||
Chimera Investment Corp. | 51,167 | 290,629 | (25.1 | ) | ||||||||
Cinemark Holdings, Inc. | 26,677 | 450,308 | (38.8 | ) | ||||||||
CIRCOR International, Inc. | 13,318 | 370,773 | (32.0 | ) | ||||||||
Clean Energy Fuels Corp. | 22,168 | 94,657 | (8.2 | ) | ||||||||
Clear Channel Outdoor Holdings, Inc. | 46,740 | 59,360 | (5.1 | ) | ||||||||
Clearwater Analytics Holdings, Inc., Class A | 7,705 | 118,734 | (10.2 | ) | ||||||||
Clearwater Paper Corp. | 6,234 | 225,047 | (19.4 | ) | ||||||||
Clearway Energy, Inc., Class A | 21,315 | 617,709 | (53.3 | ) | ||||||||
CNO Financial Group, Inc. | 50,920 | 1,142,645 | (98.6 | ) | ||||||||
Codexis, Inc. | 67,912 | 266,215 | (23.0 | ) | ||||||||
Coeur Mining, Inc. | 64,669 | 219,875 | (19.0 | ) | ||||||||
Cohen & Steers, Inc. | 582 | 34,955 | (3.0 | ) | ||||||||
Coherus Biosciences, Inc. | 39,155 | 283,091 | (24.4 | ) | ||||||||
Collegium Pharmaceutical, Inc. | 1,121 | 26,086 | (2.2 | ) | ||||||||
CommScope Holding Co., Inc. | 3,003 | 14,805 | (1.3 | ) | ||||||||
Community Health Systems, Inc. | 56,981 | 361,260 | (31.2 | ) | ||||||||
CommVault Systems, Inc. | 33,177 | 1,933,224 | (166.8 | ) | ||||||||
Compass Minerals International, Inc. | 11,323 | 370,602 | (32.0 | ) | ||||||||
ConnectOne Bancorp, Inc. | 8,046 | 126,966 | (11.0 | ) | ||||||||
Corcept Therapeutics, Inc. | 45,218 | 1,018,762 | (87.9 | ) | ||||||||
Core & Main, Inc., Class A | 11,197 | 291,794 | (25.2 | ) | ||||||||
CoreCivic, Inc. | 5,590 | 49,136 | (4.2 | ) | ||||||||
CorVel Corp. | 38 | 7,677 | (0.7 | ) | ||||||||
Covenant Logistics Group, Inc. | 2,722 | 107,220 | (9.2 | ) | ||||||||
Cracker Barrel Old Country Store, Inc. | 1,951 | 207,118 | (17.9 | ) | ||||||||
CrossFirst Bankshares, Inc. | 7,012 | 70,330 | (6.1 | ) | ||||||||
CSG Systems International, Inc. | 6,174 | 325,246 | (28.1 | ) | ||||||||
CSW Industrials, Inc. | 1,603 | 215,876 | (18.6 | ) | ||||||||
Dana, Inc. | 25,134 | 371,732 | (32.1 | ) | ||||||||
Dave & Buster’s Entertainment, Inc. | 8,606 | 305,169 | (26.3 | ) | ||||||||
Deciphera Pharmaceuticals, Inc. | 9,416 | 133,801 | (11.5 | ) | ||||||||
Denny’s Corp. | 11,519 | 129,128 | (11.1 | ) | ||||||||
DiamondRock Hospitality Co. | 53,129 | 430,876 | (37.2 | ) | ||||||||
Digi International, Inc. | 10,413 | 314,056 | (27.1 | ) | ||||||||
DigitalBridge Group, Inc. | 3,162 | 39,304 | (3.4 | ) | ||||||||
DigitalOcean Holdings, Inc. | 12,940 | 408,128 | (35.2 | ) | ||||||||
Dime Community Bancshares, Inc. | 7,365 | 151,719 | (13.1 | ) | ||||||||
Diversified Energy Co. PLC | 127,114 | 149,133 | (12.9 | ) | ||||||||
Domo, Inc. | 7,171 | 113,875 | (9.8 | ) | ||||||||
SCHEDULE OF INVESTMENTS | 77 |
Schedule of Investments (continued) April 30, 2023 | BlackRock Global Equity Market Neutral Fund |
| Security | Shares | Value | % of Basket Value | |||||||||
| United States (continued) | ||||||||||||
Donegal Group, Inc., Class A | 20,077 | $ | 282,684 | (24.4 | )% | |||||||
Dorian LPG Ltd. | 31,073 | 690,442 | (59.6 | ) | ||||||||
Duckhorn Portfolio, Inc. | 79,427 | 1,199,348 | (103.5 | ) | ||||||||
Ducommun, Inc. | 4,144 | 207,200 | (17.9 | ) | ||||||||
DXP Enterprises, Inc. | 8,361 | 210,697 | (18.2 | ) | ||||||||
Dycom Industries, Inc. | 1,812 | 167,827 | (14.5 | ) | ||||||||
Dyne Therapeutics, Inc. | 10,229 | 105,972 | (9.1 | ) | ||||||||
Eagle Pharmaceuticals, Inc. | 13,689 | 384,387 | (33.2 | ) | ||||||||
Earthstone Energy, Inc., Class A | 2,998 | 40,653 | (3.5 | ) | ||||||||
EchoStar Corp. | 46,651 | 796,333 | (68.7 | ) | ||||||||
Ecovyst, Inc. | 73,082 | 829,481 | (71.6 | ) | ||||||||
Editas Medicine, Inc. | 37,288 | 304,270 | (26.2 | ) | ||||||||
Elme Communities | 42,117 | 725,676 | (62.6 | ) | ||||||||
Embecta Corp. | 11,742 | 325,840 | (28.1 | ) | ||||||||
Emergent BioSolutions, Inc. | 22,502 | 198,693 | (17.1 | ) | ||||||||
Enanta Pharmaceuticals, Inc. | 5,400 | 191,970 | (16.6 | ) | ||||||||
Encore Wire Corp. | 1,378 | 215,423 | (18.6 | ) | ||||||||
Energy Recovery, Inc. | 14,637 | 329,772 | (28.4 | ) | ||||||||
Enerpac Tool Group Corp. | 4,446 | 105,637 | (9.1 | ) | ||||||||
Enfusion, Inc. | 2,754 | 23,079 | (2.0 | ) | ||||||||
Ennis, Inc. | 3,808 | 73,989 | (6.4 | ) | ||||||||
Enova International, Inc. | 11,022 | 484,086 | (41.8 | ) | ||||||||
EnPro Industries, Inc. | 642 | 60,521 | (5.2 | ) | ||||||||
Enstar Group Ltd. | 546 | 131,368 | (11.3 | ) | ||||||||
EPR Properties | 21,823 | 915,693 | (79.0 | ) | ||||||||
Equitrans Midstream Corp. | 17,109 | 88,111 | (7.6 | ) | ||||||||
Equity Bancshares, Inc. | 300 | 7,065 | (0.6 | ) | ||||||||
ESCO Technologies, Inc. | 4,071 | 380,923 | (32.9 | ) | ||||||||
Essent Group Ltd. | 21,142 | 897,901 | (77.5 | ) | ||||||||
Ethan Allen Interiors, Inc. | 27,590 | 770,589 | (66.5 | ) | ||||||||
Eventbrite, Inc. | 16,071 | 116,836 | (10.1 | ) | ||||||||
Everbridge, Inc. | 8,712 | 228,951 | (19.8 | ) | ||||||||
Everi Holdings, Inc. | 31,710 | 481,992 | (41.6 | ) | ||||||||
EW Scripps Co., Class A | 16,721 | 140,958 | (12.2 | ) | ||||||||
eXp World Holdings, Inc. | 45,256 | 529,043 | (45.6 | ) | ||||||||
Exponent, Inc. | 18,431 | 1,696,574 | (146.4 | ) | ||||||||
Extreme Networks, Inc. | 23,336 | 414,914 | (35.8 | ) | ||||||||
EZCORP, Inc. | 8,301 | 71,472 | (6.2 | ) | ||||||||
Fate Therapeutics, Inc. | 58,749 | 356,606 | (30.8 | ) | ||||||||
FibroGen, Inc. | 21,543 | 368,816 | (31.8 | ) | ||||||||
First Bancshares, Inc. | 12,294 | 308,579 | (26.6 | ) | ||||||||
First Busey Corp. | 13,192 | 239,831 | (20.7 | ) | ||||||||
First Financial Corp. | 1,131 | 39,076 | (3.4 | ) | ||||||||
First Foundation, Inc. | 26,393 | 166,012 | (14.3 | ) | ||||||||
First Hawaiian, Inc. | 5,963 | 113,953 | (9.8 | ) | ||||||||
First Interstate BancSystem, Inc. | 6,042 | 154,615 | (13.3 | ) | ||||||||
First Mid Bancshares, Inc. | 325 | 8,567 | (0.7 | ) | ||||||||
First of Long Island Corp. | 13,250 | 155,025 | (13.4 | ) | ||||||||
Fiverr International Ltd. | 12,426 | 453,798 | (39.1 | ) | ||||||||
Flushing Financial Corp. | 8,741 | 105,154 | (9.1 | ) | ||||||||
Forrester Research, Inc. | 11,089 | 343,094 | (29.6 | ) | ||||||||
Franklin BSP Realty Trust, Inc. | 14,817 | 187,139 | (16.1 | ) | ||||||||
Franklin Covey Co. | 10,681 | 392,206 | (33.8 | ) | ||||||||
Franklin Electric Co., Inc. | 4,999 | 447,261 | (38.6 | ) | ||||||||
Frontier Group Holdings, Inc. | 18,954 | 179,873 | (15.5 | ) | ||||||||
FRP Holdings, Inc. | 3,217 | 186,586 | (16.1 | ) | ||||||||
FTAI Aviation Ltd. | 6,109 | 173,801 | (15.0 | ) | ||||||||
Fulton Financial Corp. | 15,836 | 188,923 | (16.3 | ) | ||||||||
FutureFuel Corp. | 10,725 | 80,438 | (6.9 | ) | ||||||||
GATX Corp. | 8,707 | 991,814 | (85.6 | ) | ||||||||
Genco Shipping & Trading Ltd. | 22,420 | 345,492 | (29.8 | ) | ||||||||
Genesco, Inc. | 6,306 | 218,566 | (18.9 | ) | ||||||||
| Security | Shares | Value | % of Basket Value | |||||||||
| United States (continued) | ||||||||||||
Gentherm, Inc. | 2,104 | $ | 125,504 | (10.8 | )% | |||||||
GEO Group, Inc. | 15,433 | 116,210 | (10.0 | ) | ||||||||
Gibraltar Industries, Inc. | 2,800 | 140,112 | (12.1 | ) | ||||||||
Gladstone Land Corp. | 5,104 | 82,225 | (7.1 | ) | ||||||||
Global Industrial Co. | 7,585 | 202,140 | (17.4 | ) | ||||||||
GMS, Inc. | 7,655 | 444,449 | (38.3 | ) | ||||||||
Golden Entertainment, Inc. | 7,212 | 304,058 | (26.2 | ) | ||||||||
GoodRx Holdings, Inc. | 54,117 | 252,726 | (21.8 | ) | ||||||||
Goosehead Insurance, Inc. | 2,048 | 117,760 | (10.2 | ) | ||||||||
GoPro, Inc., Class A | 127,522 | 545,794 | (47.1 | ) | ||||||||
Gorman-Rupp Co. | 533 | 13,085 | (1.1 | ) | ||||||||
Grand Canyon Education, Inc. | 4,336 | 514,683 | (44.4 | ) | ||||||||
Granite Point Mortgage Trust, Inc. | 9,893 | 44,222 | (3.8 | ) | ||||||||
Gray Television, Inc. | 23,074 | 177,901 | (15.3 | ) | ||||||||
Great Lakes Dredge & Dock Corp. | 10,755 | 61,626 | (5.3 | ) | ||||||||
Greif, Inc. | 585 | 46,063 | (4.0 | ) | ||||||||
Griffon Corp. | 8,140 | 231,583 | (20.0 | ) | ||||||||
Group 1 Automotive, Inc. | 5,296 | 1,188,846 | (102.6 | ) | ||||||||
Guardant Health, Inc. | 6,080 | 137,165 | (11.8 | ) | ||||||||
Gulfport Energy Corp. | 3,728 | 337,235 | (29.1 | ) | ||||||||
H&E Equipment Services, Inc. | 12,611 | 460,301 | (39.7 | ) | ||||||||
Hackett Group, Inc. | 6,552 | 121,605 | (10.5 | ) | ||||||||
Hain Celestial Group, Inc. | 17,298 | 310,153 | (26.8 | ) | ||||||||
Hamilton Lane, Inc., Class A | 2,502 | 184,347 | (15.9 | ) | ||||||||
Hancock Whitney Corp. | 19,868 | 725,579 | (62.6 | ) | ||||||||
Hanesbrands, Inc. | 5,186 | 27,175 | (2.3 | ) | ||||||||
Hannon Armstrong Sustainable Infrastructure | ||||||||||||
Capital, Inc. | 17,133 | 486,235 | (41.9 | ) | ||||||||
HarborOne Bancorp, Inc. | 8,670 | 93,203 | (8.0 | ) | ||||||||
Harmony Biosciences Holdings, Inc. | 12,987 | 418,701 | (36.1 | ) | ||||||||
Harsco Corp. | 15,382 | 105,674 | (9.1 | ) | ||||||||
Haverty Furniture Cos., Inc. | 11,554 | 348,238 | (30.0 | ) | ||||||||
Hawaiian Holdings, Inc. | 54,661 | 455,326 | (39.3 | ) | ||||||||
HBT Financial, Inc. | 6,023 | 106,246 | (9.2 | ) | ||||||||
Healthcare Services Group, Inc. | 11,914 | 185,978 | (16.0 | ) | ||||||||
Heartland Financial USA, Inc. | 13,329 | 433,992 | (37.4 | ) | ||||||||
Heidrick & Struggles International, Inc. | 9,809 | 246,304 | (21.2 | ) | ||||||||
Helen of Troy Ltd. | 2,795 | 280,450 | (24.2 | ) | ||||||||
Helix Energy Solutions Group, Inc. | 64,918 | 470,655 | (40.6 | ) | ||||||||
Herbalife Ltd. | 27,293 | 405,574 | (35.0 | ) | ||||||||
Heron Therapeutics, Inc. | 35,996 | 86,030 | (7.4 | ) | ||||||||
Hingham Institution For Savings The | 47 | 9,144 | (0.8 | ) | ||||||||
Horizon Bancorp, Inc. | 34,451 | 362,769 | (31.3 | ) | ||||||||
Hub Group, Inc., Class A | 5,617 | 423,522 | (36.5 | ) | ||||||||
Huron Consulting Group, Inc. | 3,737 | 316,860 | (27.3 | ) | ||||||||
I3 Verticals, Inc., Class A | 7,072 | 164,424 | (14.2 | ) | ||||||||
IDT Corp. | 14,709 | 488,486 | (42.1 | ) | ||||||||
IGM Biosciences, Inc. | 5,050 | 54,692 | (4.7 | ) | ||||||||
ImmunoGen, Inc. | 21,951 | 118,316 | (10.2 | ) | ||||||||
Independent Bank Corp. | 14,445 | 257,410 | (22.2 | ) | ||||||||
Independent Bank Group, Inc. | 6,281 | 228,503 | (19.7 | ) | ||||||||
Innoviva, Inc. | 34,790 | 408,087 | (35.2 | ) | ||||||||
Installed Building Products, Inc. | 2,324 | 288,803 | (24.9 | ) | ||||||||
Integer Holdings Corp. | 3,350 | 275,872 | (23.8 | ) | ||||||||
Inter Parfums, Inc. | 1,386 | 210,381 | (18.1 | ) | ||||||||
Intercept Pharmaceuticals, Inc. | 31,586 | 547,070 | (47.2 | ) | ||||||||
Interface, Inc. | 13,954 | 109,399 | (9.4 | ) | ||||||||
International Bancshares Corp. | 3,974 | 169,571 | (14.6 | ) | ||||||||
International Seaways, Inc. | 26,000 | 1,035,320 | (89.3 | ) | ||||||||
Invesco Mortgage Capital, Inc. | 13,121 | 139,214 | (12.0 | ) | ||||||||
Iovance Biotherapeutics, Inc. | 8,745 | 49,322 | (4.3 | ) | ||||||||
Ironwood Pharmaceuticals, Inc. | 79,053 | 822,942 | (71.0 | ) | ||||||||
| 78 | 2 0 2 3 BLACK ROCK ANNUAL REPORT TO SHAREHOLDERS |
Schedule of Investments (continued) April 30, 2023 | BlackRock Global Equity Market Neutral Fund |
| Security | Shares | Value | % of Basket Value | |||||||||
| United States (continued) | ||||||||||||
J & J Snack Foods Corp. | 1,215 | $ | 186,138 | (16.1 | )% | |||||||
Jamf Holding Corp. | 12,750 | 241,230 | (20.8 | ) | ||||||||
Janus International Group, Inc. | 44,410 | 399,690 | (34.5 | ) | ||||||||
JELD-WEN Holding, Inc. | 6,057 | 77,408 | (6.7 | ) | ||||||||
JetBlue Airways Corp. | 139,592 | 996,687 | (86.0 | ) | ||||||||
Johnson Outdoors, Inc. | 140 | 8,120 | (0.7 | ) | ||||||||
Kadant, Inc. | 3,952 | 734,400 | (63.4 | ) | ||||||||
Kaiser Aluminum Corp. | 1,872 | 123,028 | (10.6 | ) | ||||||||
KAR Auction Services, Inc. | 18,659 | 252,643 | (21.8 | ) | ||||||||
Karyopharm Therapeutics, Inc. | 18,567 | 66,470 | (5.7 | ) | ||||||||
Kearny Financial Corp. | 15,891 | 123,791 | (10.7 | ) | ||||||||
Kennametal, Inc. | 15,472 | 401,653 | (34.6 | ) | ||||||||
Kforce, Inc. | 5,513 | 326,039 | (28.1 | ) | ||||||||
Knowles Corp. | 18,402 | 310,626 | (26.8 | ) | ||||||||
Kodiak Sciences, Inc. | 6,267 | 27,449 | (2.4 | ) | ||||||||
Kohl’s Corp. | 6,770 | 149,143 | (12.9 | ) | ||||||||
Kontoor Brands, Inc. | 10,337 | 466,922 | (40.3 | ) | ||||||||
Korn Ferry | 8,619 | 413,884 | (35.7 | ) | ||||||||
Kratos Defense & Security Solutions, Inc. | 6,827 | 88,068 | (7.6 | ) | ||||||||
Kura Oncology, Inc. | 16,398 | 159,717 | (13.8 | ) | ||||||||
Kymera Therapeutics, Inc. | 779 | 24,570 | (2.1 | ) | ||||||||
Ladder Capital Corp. | 11,186 | 104,589 | (9.0 | ) | ||||||||
Laureate Education, Inc. | 71,464 | 885,439 | (76.4 | ) | ||||||||
La-Z-Boy, Inc. | 11,170 | 320,914 | (27.7 | ) | ||||||||
LeMaitre Vascular, Inc. | 7,449 | 402,246 | (34.7 | ) | ||||||||
LendingTree, Inc. | 29,043 | 692,095 | (59.7 | ) | ||||||||
Liberty Media Corp.-Liberty Braves | 2,823 | 110,577 | (9.5 | ) | ||||||||
Ligand Pharmaceuticals, Inc. | 4,104 | 313,340 | (27.0 | ) | ||||||||
Lindsay Corp. | 6,538 | 789,398 | (68.1 | ) | ||||||||
Lions Gate Entertainment Corp. | 6,449 | 74,164 | (6.4 | ) | ||||||||
LivaNova PLC | 11,777 | 564,118 | (48.7 | ) | ||||||||
Live Oak Bancshares, Inc. | 7,128 | 167,936 | (14.5 | ) | ||||||||
LivePerson, Inc. | 38,840 | 179,829 | (15.5 | ) | ||||||||
LiveRamp Holdings, Inc. | 15,814 | 380,959 | (32.9 | ) | ||||||||
LSB Industries, Inc. | 20,967 | 187,235 | (16.2 | ) | ||||||||
LXP Industrial Trust | 20,946 | 196,892 | (17.0 | ) | ||||||||
Macerich Co. | 15,764 | 157,482 | (13.6 | ) | ||||||||
Malibu Boats, Inc., Class A | 24,674 | 1,400,249 | (120.8 | ) | ||||||||
Manitowoc Co., Inc. | 4,806 | 73,484 | (6.3 | ) | ||||||||
Marcus Corp. | 39,976 | 700,380 | (60.4 | ) | ||||||||
MarineMax, Inc. | 14,011 | 408,000 | (35.2 | ) | ||||||||
Marqeta, Inc. | 2,873 | 11,636 | (1.0 | ) | ||||||||
Marten Transport Ltd. | 15,496 | 312,864 | (27.0 | ) | ||||||||
Masonite International Corp. | 2,591 | 236,843 | (20.4 | ) | ||||||||
Matson, Inc. | 9,192 | 625,332 | (53.9 | ) | ||||||||
MaxLinear, Inc. | 7,755 | 187,128 | (16.1 | ) | ||||||||
McGrath RentCorp | 873 | 77,592 | (6.7 | ) | ||||||||
MDC Holdings, Inc. | 7,376 | 302,195 | (26.1 | ) | ||||||||
Medifast, Inc. | 5,002 | 458,433 | (39.5 | ) | ||||||||
Mercantile Bank Corp. | 1,544 | 43,325 | (3.7 | ) | ||||||||
Merchants Bancorp/IN | 2,933 | 68,046 | (5.9 | ) | ||||||||
Mercury General Corp. | 24,317 | 739,480 | (63.8 | ) | ||||||||
MFA Financial, Inc. | 63,125 | 674,806 | (58.2 | ) | ||||||||
MGE Energy, Inc. | 1,176 | 90,093 | (7.8 | ) | ||||||||
MGP Ingredients, Inc. | 3,569 | 352,189 | (30.4 | ) | ||||||||
Midland States Bancorp, Inc. | 10,244 | 204,880 | (17.7 | ) | ||||||||
MidWestOne Financial Group, Inc. | 5,633 | 116,603 | (10.1 | ) | ||||||||
MiMedx Group, Inc. | 2,267 | 8,683 | (0.7 | ) | ||||||||
MiNK Therapeutics, Inc. | 72 | 129 | (0.0 | ) | ||||||||
Mister Car Wash, Inc. | 46,303 | 408,392 | (35.2 | ) | ||||||||
Mitek Systems, Inc. | 15,294 | 137,952 | (11.9 | ) | ||||||||
Model N, Inc. | 23,403 | 720,812 | (62.2 | ) | ||||||||
| Security | Shares | Value | % of Basket Value | |||||||||
| United States (continued) | ||||||||||||
ModivCare, Inc. | 1,883 | $ | 119,759 | (10.3 | )% | |||||||
Momentive Global, Inc. | 6,383 | 59,936 | (5.2 | ) | ||||||||
Monarch Casino & Resort, Inc. | 8,748 | 606,761 | (52.3 | ) | ||||||||
Moog, Inc., Class A | 971 | 87,497 | (7.5 | ) | ||||||||
Morningstar, Inc. | 3,778 | 673,655 | (58.1 | ) | ||||||||
Movado Group, Inc. | 4,868 | 124,718 | (10.8 | ) | ||||||||
Mr Cooper Group, Inc. | 15,923 | 737,235 | (63.6 | ) | ||||||||
MRC Global, Inc. | 65,706 | 639,976 | (55.2 | ) | ||||||||
MSA Safety, Inc. | 3,346 | 434,143 | (37.5 | ) | ||||||||
Myers Industries, Inc. | 4,804 | 91,036 | (7.9 | ) | ||||||||
MYR Group, Inc. | 6,434 | 823,488 | (71.0 | ) | ||||||||
Myriad Genetics, Inc. | 5,951 | 126,697 | (10.9 | ) | ||||||||
Nabors Industries Ltd. | 4,489 | 447,733 | (38.6 | ) | ||||||||
Napco Security Technologies, Inc. | 15,860 | 491,660 | (42.4 | ) | ||||||||
National Beverage Corp. | 10,770 | 535,269 | (46.2 | ) | ||||||||
National HealthCare Corp. | 7,419 | 429,634 | (37.1 | ) | ||||||||
National Research Corp. | 1,100 | 47,883 | (4.1 | ) | ||||||||
National Vision Holdings, Inc. | 16,544 | 348,086 | (30.0 | ) | ||||||||
Navient Corp. | 14,033 | 232,106 | (20.0 | ) | ||||||||
Nektar Therapeutics | 83,775 | 63,024 | (5.4 | ) | ||||||||
NeoGenomics, Inc. | 7,436 | 108,714 | (9.4 | ) | ||||||||
NETGEAR, Inc. | 8,167 | 115,400 | (10.0 | ) | ||||||||
Nevro Corp. | 13,880 | 406,268 | (35.0 | ) | ||||||||
New York Mortgage Trust, Inc. | 6,114 | 62,852 | (5.4 | ) | ||||||||
Newmark Group, Inc. | 32,872 | 208,408 | (18.0 | ) | ||||||||
NexPoint Residential Trust, Inc. | 36,088 | 1,549,258 | (133.6 | ) | ||||||||
NextEra Energy Partners LP | 14,205 | 816,930 | (70.5 | ) | ||||||||
NextGen Healthcare, Inc. | 31,675 | 530,239 | (45.7 | ) | ||||||||
Nordstrom, Inc. | 9,486 | 146,654 | (12.7 | ) | ||||||||
NOW, Inc. | 20,378 | 217,433 | (18.8 | ) | ||||||||
Nurix Therapeutics, Inc. | 2,851 | 27,455 | (2.4 | ) | ||||||||
NV5 Global, Inc. | 1,254 | 118,791 | (10.2 | ) | ||||||||
Oceaneering International, Inc. | 20,006 | 354,706 | (30.6 | ) | ||||||||
Oil States International, Inc. | 14,155 | 99,651 | (8.6 | ) | ||||||||
Old Second Bancorp, Inc. | 32,636 | 401,096 | (34.6 | ) | ||||||||
Omega Flex, Inc. | 236 | 25,962 | (2.2 | ) | ||||||||
Omnicell, Inc. | 3,895 | 236,699 | (20.4 | ) | ||||||||
OPKO Health, Inc. | 6,326 | 9,299 | (0.8 | ) | ||||||||
Organogenesis Holdings, Inc. | 7,774 | 15,937 | (1.4 | ) | ||||||||
Oscar Health, Inc. | 12,809 | 86,205 | (7.4 | ) | ||||||||
OSI Systems, Inc. | 2,246 | 253,708 | (21.9 | ) | ||||||||
Outfront Media, Inc. | 32,314 | 538,351 | (46.4 | ) | ||||||||
Oxford Industries, Inc. | 3,504 | 361,578 | (31.2 | ) | ||||||||
Pacira BioSciences, Inc. | 15,807 | 716,215 | (61.8 | ) | ||||||||
Pactiv Evergreen, Inc. | 3,262 | 25,770 | (2.2 | ) | ||||||||
PacWest Bancorp | 7,391 | 75,019 | (6.5 | ) | ||||||||
PagerDuty, Inc. | 8,818 | 265,069 | (22.9 | ) | ||||||||
Palomar Holdings, Inc. | 3,764 | 189,179 | (16.3 | ) | ||||||||
Papa John’s International, Inc. | 4,247 | 317,633 | (27.4 | ) | ||||||||
Par Pacific Holdings, Inc. | 5,054 | 118,415 | (10.2 | ) | ||||||||
Park Hotels & Resorts, Inc. | 124,057 | 1,494,887 | (129.0 | ) | ||||||||
Parsons Corp. | 7,720 | 335,820 | (29.0 | ) | ||||||||
Patterson-UTI Energy, Inc. | 21,977 | 245,923 | (21.2 | ) | ||||||||
Payoneer Global, Inc. | 10,871 | 59,356 | (5.1 | ) | ||||||||
Pebblebrook Hotel Trust | 52,300 | 744,229 | (64.2 | ) | ||||||||
Pennant Group, Inc. | 1,553 | 21,540 | (1.9 | ) | ||||||||
PennyMac Financial Services, Inc. | 2,651 | 165,661 | (14.3 | ) | ||||||||
Peoples Bancorp, Inc. | 16,657 | 434,081 | (37.4 | ) | ||||||||
Perdoceo Education Corp. | 12,154 | 157,759 | (13.6 | ) | ||||||||
Petco Health & Wellness Co., Inc. | 69,683 | 694,043 | (59.9 | ) | ||||||||
PGT Innovations, Inc. | 10,474 | 268,763 | (23.2 | ) | ||||||||
Photronics, Inc. | 11,435 | 165,350 | (14.3 | ) | ||||||||
SCHEDULE OF INVESTMENTS | 79 |
Schedule of Investments (continued) April 30, 2023 | BlackRock Global Equity Market Neutral Fund |
| Security | Shares | Value | % of Basket Value | |||||||||
| United States (continued) | ||||||||||||
Pilgrim’s Pride Corp. | 7,931 | $ | 180,906 | (15.6 | )% | |||||||
PJT Partners, Inc. | 9,278 | 638,048 | (55.0 | ) | ||||||||
Plains GP Holdings LP, Class A | 66,534 | 891,556 | (76.9 | ) | ||||||||
PMV Pharmaceuticals, Inc. | 10,371 | 47,810 | (4.1 | ) | ||||||||
Poseida Therapeutics, Inc. | 7,705 | 20,341 | (1.8 | ) | ||||||||
PowerSchool Holdings, Inc., Class A | 15,713 | 328,087 | (28.3 | ) | ||||||||
Premier Financial Corp. | 14,126 | 234,633 | (20.2 | ) | ||||||||
Prestige Consumer Healthcare, Inc. | 11,556 | 711,041 | (61.3 | ) | ||||||||
PriceSmart, Inc. | 3,711 | 273,426 | (23.6 | ) | ||||||||
Primoris Services Corp. | 4,689 | 118,632 | (10.2 | ) | ||||||||
PROS Holdings, Inc. | 22,672 | 643,205 | (55.5 | ) | ||||||||
Q2 Holdings, Inc. | 22,635 | 557,274 | (48.1 | ) | ||||||||
QCR Holdings, Inc. | 1,195 | 49,473 | (4.3 | ) | ||||||||
Quaker Chemical Corp. | 3,203 | 597,776 | (51.6 | ) | ||||||||
Quanex Building Products Corp. | 4,666 | 89,121 | (7.7 | ) | ||||||||
QuinStreet, Inc. | 4,911 | 54,561 | (4.7 | ) | ||||||||
RadNet, Inc. | 6,623 | 183,192 | (15.8 | ) | ||||||||
Rapid7, Inc. | 4,305 | 209,266 | (18.1 | ) | ||||||||
Rayonier, Inc. | 9,799 | 307,297 | (26.5 | ) | ||||||||
RCI Hospitality Holdings, Inc. | 285 | 21,347 | (1.8 | ) | ||||||||
RE/MAX Holdings, Inc., Class A | 7,416 | 143,203 | (12.4 | ) | ||||||||
Red Rock Resorts, Inc. | 5,998 | 292,702 | (25.2 | ) | ||||||||
REGENXBIO, Inc., Registered Shares | 12,864 | 249,047 | (21.5 | ) | ||||||||
Repay Holdings Corp. | 13,968 | 87,579 | (7.6 | ) | ||||||||
Retail Opportunity Investments Corp. | 45,921 | 598,351 | (51.6 | ) | ||||||||
Revolve Group, Inc. | 14,647 | 302,461 | (26.1 | ) | ||||||||
REX American Resources Corp. | 6,865 | 194,211 | (16.8 | ) | ||||||||
RLJ Lodging Trust | 95,218 | 961,702 | (83.0 | ) | ||||||||
RMR Group, Inc., Class A | 20,507 | 487,041 | (42.0 | ) | ||||||||
RPC, Inc. | 20,595 | 152,197 | (13.1 | ) | ||||||||
RPT Realty | 13,772 | 128,080 | (11.0 | ) | ||||||||
Rush Enterprises, Inc. | 6,678 | 391,197 | (33.7 | ) | ||||||||
Rush Enterprises, Inc., Class A | 18,255 | 969,523 | (83.6 | ) | ||||||||
Ruth’s Hospitality Group, Inc. | 23,819 | 384,915 | (33.2 | ) | ||||||||
Safehold, Inc. | 16,551 | 458,794 | (39.6 | ) | ||||||||
Sangamo Therapeutics, Inc. | 34,132 | 50,174 | (4.3 | ) | ||||||||
Sanmina Corp. | 16,868 | 881,522 | (76.0 | ) | ||||||||
ScanSource, Inc. | 5,364 | 146,705 | (12.7 | ) | ||||||||
Schneider National, Inc. | 25,082 | 656,396 | (56.6 | ) | ||||||||
Schnitzer Steel Industries, Inc. | 11,033 | 318,743 | (27.5 | ) | ||||||||
SEMrush Holdings, Inc., Class A | 16,462 | 159,023 | (13.7 | ) | ||||||||
Semtech Corp. | 14,137 | 275,530 | (23.8 | ) | ||||||||
Sensient Technologies Corp. | 4,842 | 360,535 | (31.1 | ) | ||||||||
Seres Therapeutics, Inc. | 3,971 | 19,359 | (1.7 | ) | ||||||||
Seritage Growth Properties | 9,355 | 70,069 | (6.0 | ) | ||||||||
Service Properties Trust | 23,027 | 201,947 | (17.4 | ) | ||||||||
ServisFirst Bancshares, Inc. | 3,667 | 185,183 | (16.0 | ) | ||||||||
Shoe Carnival, Inc. | 2,854 | 66,356 | (5.7 | ) | ||||||||
Shutterstock, Inc. | 8,098 | 542,566 | (46.8 | ) | ||||||||
Shyft Group, Inc. | 2,731 | 68,493 | (5.9 | ) | ||||||||
Silk Road Medical, Inc. | 7,672 | 337,721 | (29.1 | ) | ||||||||
Simpson Manufacturing Co., Inc. | 4,252 | 534,817 | (46.1 | ) | ||||||||
Simulations Plus, Inc. | 2,812 | 117,401 | (10.1 | ) | ||||||||
Sinclair Broadcast Group, Inc., Class A | 11,439 | 227,522 | (19.6 | ) | ||||||||
Six Flags Entertainment Corp. | 27,809 | 674,924 | (58.2 | ) | ||||||||
SkyWest, Inc. | 9,314 | 263,586 | (22.7 | ) | ||||||||
Sleep Number Corp. | 2,849 | 64,245 | (5.5 | ) | ||||||||
SmartFinancial, Inc. | 1,650 | 35,541 | (3.1 | ) | ||||||||
SolarWinds Corp. | 6,165 | 53,142 | (4.6 | ) | ||||||||
Sonic Automotive, Inc., Class A | 2,448 | 108,985 | (9.4 | ) | ||||||||
Sovos Brands, Inc. | 9,508 | 163,062 | (14.1 | ) | ||||||||
SpartanNash Co. | 18,621 | 456,587 | (39.4 | ) | ||||||||
| Security | Shares | Value | % of Basket Value | |||||||||
| United States (continued) | ||||||||||||
Sportsman’s Warehouse Holdings, Inc. | 9,099 | $ | 56,596 | (4.9 | )% | |||||||
Sprinklr, Inc. | 1,343 | 16,062 | (1.4 | ) | ||||||||
Sprout Social, Inc., Class A | 1,503 | 74,038 | (6.4 | ) | ||||||||
SPX Technologies, Inc. | 18,399 | 1,171,648 | (101.1 | ) | ||||||||
STAAR Surgical Co. | 7,605 | 535,924 | (46.2 | ) | ||||||||
Standard Motor Products, Inc. | 3,990 | 143,680 | (12.4 | ) | ||||||||
Standex International Corp. | 2,624 | 322,253 | (27.8 | ) | ||||||||
Steelcase, Inc. | 16,704 | 133,632 | (11.5 | ) | ||||||||
Stepan Co. | 1,476 | 136,087 | (11.7 | ) | ||||||||
Sterling Infrastructure, Inc. | 13,030 | 481,068 | (41.5 | ) | ||||||||
Steven Madden Ltd. | 10,253 | 359,265 | (31.0 | ) | ||||||||
Stitch Fix, Inc. | 38,682 | 131,906 | (11.4 | ) | ||||||||
Stoke Therapeutics, Inc. | 10,440 | 92,812 | (8.0 | ) | ||||||||
StoneX Group, Inc. | 603 | 59,136 | (5.1 | ) | ||||||||
Summit Hotel Properties, Inc. | 13,992 | 90,108 | (7.8 | ) | ||||||||
SunCoke Energy, Inc. | 6,343 | 49,349 | (4.3 | ) | ||||||||
Sunnova Energy International, Inc. | 12,598 | 226,260 | (19.5 | ) | ||||||||
SunPower Corp. | 6,543 | 86,498 | (7.5 | ) | ||||||||
Supernus Pharmaceuticals, Inc. | 34,375 | 1,267,062 | (109.3 | ) | ||||||||
Sylvamo Corp. | 3,027 | 138,697 | (12.0 | ) | ||||||||
Talos Energy, Inc. | 12,370 | 168,603 | (14.5 | ) | ||||||||
Tandem Diabetes Care, Inc. | 3,941 | 155,985 | (13.5 | ) | ||||||||
Target Hospitality Corp. | 5,357 | 67,552 | (5.8 | ) | ||||||||
TechTarget, Inc. | 12,597 | 429,432 | (37.0 | ) | ||||||||
Theravance Biopharma, Inc. | 14,719 | 159,407 | (13.8 | ) | ||||||||
Thermon Group Holdings, Inc. | 3,153 | 65,519 | (5.7 | ) | ||||||||
Thryv Holdings, Inc. | 4,834 | 108,572 | (9.4 | ) | ||||||||
Tiptree, Inc. | 1,066 | 14,679 | (1.3 | ) | ||||||||
Titan International, Inc. | 2,246 | 21,921 | (1.9 | ) | ||||||||
Titan Machinery, Inc. | 5,075 | 159,101 | (13.7 | ) | ||||||||
Tompkins Financial Corp. | 255 | 14,948 | (1.3 | ) | ||||||||
Transcat, Inc. | 691 | 52,716 | (4.5 | ) | ||||||||
Travere Therapeutics, Inc. | 15,025 | 324,089 | (28.0 | ) | ||||||||
Treace Medical Concepts, Inc. | 2,675 | 65,511 | (5.7 | ) | ||||||||
Tri Pointe Homes, Inc. | 15,003 | 430,286 | (37.1 | ) | ||||||||
Trinity Industries, Inc. | 9,802 | 234,758 | (20.3 | ) | ||||||||
Trinseo PLC | 4,693 | 85,037 | (7.3 | ) | ||||||||
TripAdvisor, Inc. | 3,192 | 56,594 | (4.9 | ) | ||||||||
Triumph Group, Inc. | 10,823 | 116,997 | (10.1 | ) | ||||||||
TrueBlue, Inc. | 7,633 | 115,640 | (10.0 | ) | ||||||||
TTM Technologies, Inc. | 6,811 | 80,438 | (6.9 | ) | ||||||||
Turning Point Brands, Inc. | 38,710 | 920,911 | (79.4 | ) | ||||||||
Tutor Perini Corp. | 46,483 | 246,360 | (21.3 | ) | ||||||||
Twist Bioscience Corp. | 10,345 | 129,106 | (11.1 | ) | ||||||||
Ultragenyx Pharmaceutical, Inc. | 12,443 | 543,386 | (46.9 | ) | ||||||||
UMB Financial Corp. | 5,229 | 332,617 | (28.7 | ) | ||||||||
Under Armour, Inc. | 21,488 | 172,764 | (14.9 | ) | ||||||||
United Fire Group, Inc. | 16,594 | 446,379 | (38.5 | ) | ||||||||
United States Cellular Corp. | 10,952 | 232,620 | (20.1 | ) | ||||||||
Uniti Group, Inc. | 27,364 | 93,585 | (8.1 | ) | ||||||||
Unitil Corp. | 10,081 | 560,403 | (48.3 | ) | ||||||||
Univest Financial Corp. | 8,929 | 179,651 | (15.5 | ) | ||||||||
Urban Edge Properties | 4,859 | 71,282 | (6.1 | ) | ||||||||
US Physical Therapy, Inc. | 664 | 70,689 | (6.1 | ) | ||||||||
US Silica Holdings, Inc. | 71,556 | 933,806 | (80.6 | ) | ||||||||
USANA Health Sciences, Inc. | 10,060 | 667,682 | (57.6 | ) | ||||||||
Utz Brands, Inc. | 4,967 | 93,926 | (8.1 | ) | ||||||||
UWM Holdings Corp. | 10,229 | 61,374 | (5.3 | ) | ||||||||
Vanda Pharmaceuticals, Inc. | 37,363 | 229,409 | (19.8 | ) | ||||||||
Varex Imaging Corp. | 10,442 | 185,241 | (16.0 | ) | ||||||||
Varonis Systems, Inc. | 3,509 | 81,268 | (7.0 | ) | ||||||||
Vector Group Ltd. | 93,504 | 1,191,241 | (102.8 | ) | ||||||||
| 80 | 2 0 2 3 BLACK ROCK ANNUAL REPORT TO SHAREHOLDERS |
Schedule of Investments (continued) April 30, 2023 | BlackRock Global Equity Market Neutral Fund |
| Security | Shares | Value | % of Basket Value | |||||||||
United States (continued) | ||||||||||||
Veeco Instruments, Inc. | 23,644 | $ | 435,522 | (37.6 | )% | |||||||
Veracyte, Inc. | 8,411 | 190,425 | (16.4 | ) | ||||||||
Vericel Corp. | 6,780 | 213,638 | (18.4 | ) | ||||||||
Verint Systems, Inc. | 15,954 | 582,161 | (50.2 | ) | ||||||||
Veritex Holdings, Inc. | 6,134 | 105,566 | (9.1 | ) | ||||||||
Veritiv Corp. | 1,027 | 117,971 | (10.2 | ) | ||||||||
Vertex, Inc., Class A | 1,101 | 22,736 | (2.0 | ) | ||||||||
Vicor Corp. | 8,418 | 361,721 | (31.2 | ) | ||||||||
Victory Capital Holdings, Inc., Class A | 32,883 | 1,004,247 | (86.6 | ) | ||||||||
Vimeo, Inc. | 26,077 | 85,793 | (7.4 | ) | ||||||||
Virtus Investment Partners, Inc. | 102 | 18,585 | (1.6 | ) | ||||||||
Vishay Precision Group, Inc. | 1,843 | 69,186 | (6.0 | ) | ||||||||
Vital Farms, Inc. | 14,312 | 184,339 | (15.9 | ) | ||||||||
Wabash National Corp. | 7,610 | 195,349 | (16.9 | ) | ||||||||
Walker & Dunlop, Inc. | 6,273 | 422,236 | (36.4 | ) | ||||||||
Warby Parker, Inc. | 9,473 | 99,751 | (8.6 | ) | ||||||||
Warrior Met Coal, Inc. | 6,136 | 212,122 | (18.3 | ) | ||||||||
Washington Trust Bancorp, Inc. | 19,145 | 538,166 | (46.4 | ) | ||||||||
Watts Water Technologies, Inc., Class A | 1,824 | 294,996 | (25.4 | ) | ||||||||
Weis Markets, Inc. | 3,204 | 264,298 | (22.8 | ) | ||||||||
Whitestone REIT | 32,177 | 287,984 | (24.8 | ) | ||||||||
Winmark Corp. | 3,305 | 1,103,606 | (95.2 | ) | ||||||||
World Acceptance Corp. | 1,337 | 134,903 | (11.6 | ) | ||||||||
World Fuel Services Corp. | 23,956 | 566,320 | (48.9 | ) | ||||||||
Xencor, Inc. | 7,964 | 210,568 | (18.2 | ) | ||||||||
Xerox Holdings Corp. | 44,555 | 698,177 | (60.2 | ) | ||||||||
Yelp, Inc. | 30,274 | 905,798 | (78.1 | ) | ||||||||
Yext, Inc. | 51,251 | 449,984 | (38.8 | ) | ||||||||
Zeta Global Holdings Corp. | 25,599 | 248,566 | (21.4 | ) | ||||||||
ZipRecruiter, Inc. | 24,088 | 408,051 | (35.2 | ) | ||||||||
Zumiez, Inc. | 19,596 | 342,636 | (29.6 | ) | ||||||||
|
|
|
| |||||||||
| 166,722,881 | ||||||||||||
Preferred Stocks | ||||||||||||
Germany | ||||||||||||
Schaeffler AG | 93,085 | 670,241 | (57.8 | ) | ||||||||
|
|
|
| |||||||||
Total Reference Entity — Long | 334,054,813 | |||||||||||
|
| |||||||||||
| Reference Entity — Short | ||||||||||||
| Common Stocks | ||||||||||||
Australia | ||||||||||||
ARB Corp. Ltd. | (17,362 | ) | (375,914 | ) | 32.4 | |||||||
AUB Group Ltd. | (3,185 | ) | (59,122 | ) | 5.1 | |||||||
Australian Clinical Labs Ltd. | (10,194 | ) | (24,233 | ) | 2.1 | |||||||
Bapcor Ltd. | (35,786 | ) | (158,297 | ) | 13.7 | |||||||
Bega Cheese Ltd. | (43,856 | ) | (111,914 | ) | 9.7 | |||||||
Bellevue Gold Ltd. | (176,183 | ) | (167,614 | ) | 14.5 | |||||||
Boss Energy Ltd. | (40,542 | ) | (72,269 | ) | 6.2 | |||||||
Breville Group Ltd. | (34,565 | ) | (480,977 | ) | 41.5 | |||||||
Brickworks Ltd. | (10,000 | ) | (168,503 | ) | 14.5 | |||||||
BWP Trust | (44,790 | ) | (117,006 | ) | 10.1 | |||||||
Capricorn Metals Ltd. | (172,884 | ) | (516,133 | ) | 44.5 | |||||||
Centuria Industrial REIT | (74,501 | ) | (156,937 | ) | 13.5 | |||||||
Collins Foods Ltd. | (10,640 | ) | (62,120 | ) | 5.4 | |||||||
Coronado Global Resources, Inc., CDI | (296,295 | ) | (330,932 | ) | 28.5 | |||||||
Corporate Travel Management Ltd. | (44,140 | ) | (625,965 | ) | 54.0 | |||||||
Costa Group Holdings Ltd. | (14,982 | ) | (25,198 | ) | 2.2 | |||||||
De Grey Mining Ltd. | (198,387 | ) | (215,767 | ) | 18.6 | |||||||
Dicker Data Ltd. | (34,561 | ) | (189,597 | ) | 16.4 | |||||||
G8 Education Ltd. | (158,906 | ) | (130,433 | ) | 11.2 | |||||||
| Security | Shares | Value | % of Basket Value | |||||||||
Australia (continued) | ||||||||||||
Gold Road Resources Ltd. | (64,400 | ) | $ | (81,152 | ) | 7.0 | % | |||||
GUD Holdings Ltd. | (40,239 | ) | (260,073 | ) | 22.4 | |||||||
Hansen Technologies Ltd. | (23,497 | ) | (71,336 | ) | 6.2 | |||||||
Healius Ltd. | (121,571 | ) | (244,900 | ) | 21.1 | |||||||
HomeCo Daily Needs REIT | (277,332 | ) | (224,604 | ) | 19.4 | |||||||
Imugene Ltd. | (1,689,376 | ) | (143,119 | ) | 12.3 | |||||||
Ingenia Communities Group | (290,996 | ) | (839,463 | ) | 72.4 | |||||||
Inghams Group Ltd. | (470,451 | ) | (890,302 | ) | 76.8 | |||||||
Integral Diagnostics Ltd. | (20,640 | ) | (43,808 | ) | 3.8 | |||||||
IRESS Ltd. | (85,899 | ) | (598,026 | ) | 51.6 | |||||||
Kelsian Group Ltd. | (61,945 | ) | (255,721 | ) | 22.1 | |||||||
Leo Lithium Ltd. | (291,767 | ) | (103,816 | ) | 9.0 | |||||||
Link Administration Holdings Ltd. | (199,877 | ) | (285,707 | ) | 24.6 | |||||||
Megaport Ltd. | (33,125 | ) | (126,544 | ) | 10.9 | |||||||
Mincor Resources NL | (43,849 | ) | (41,532 | ) | 3.6 | |||||||
nib holdings Ltd. | (34,410 | ) | (178,830 | ) | 15.4 | |||||||
Nine Entertainment Co. Holdings Ltd. | (261,775 | ) | (365,937 | ) | 31.6 | |||||||
NRW Holdings Ltd. | (46,590 | ) | (75,884 | ) | 6.5 | |||||||
OceanaGold Corp. | (105,249 | ) | (243,722 | ) | 21.0 | |||||||
Omni Bridgeway Ltd. | (116,046 | ) | (179,450 | ) | 15.5 | |||||||
Paladin Energy Ltd. | (491,111 | ) | (218,870 | ) | 18.9 | |||||||
PEXA Group Ltd. | (46,591 | ) | (418,828 | ) | 36.1 | |||||||
PointsBet Holdings Ltd. | (323,085 | ) | (340,381 | ) | 29.4 | |||||||
Sayona Mining Ltd. | (3,080,410 | ) | (421,953 | ) | 36.4 | |||||||
Select Harvests Ltd. | (19,123 | ) | (56,871 | ) | 4.9 | |||||||
Sigma Healthcare Ltd. | (274,831 | ) | (129,256 | ) | 11.1 | |||||||
Super Retail Group Ltd. | (45,202 | ) | (413,286 | ) | 35.7 | |||||||
Telix Pharmaceuticals Ltd. | (34,174 | ) | (233,706 | ) | 20.2 | |||||||
Tietto Minerals Ltd. | (371,011 | ) | (148,883 | ) | 12.8 | |||||||
United Malt Grp Ltd. | (156,886 | ) | (466,084 | ) | 40.2 | |||||||
Webjet Ltd. | (150,394 | ) | (753,058 | ) | 65.0 | |||||||
|
|
|
| |||||||||
| (12,844,033 | ) | |||||||||||
Austria | ||||||||||||
CA Immobilien Anlagen AG | (4,622 | ) | (133,055 | ) | 11.5 | |||||||
EVN AG | (5,869 | ) | (140,346 | ) | 12.1 | |||||||
Semperit AG Holding | (2,018 | ) | (52,550 | ) | 4.5 | |||||||
|
|
|
| |||||||||
| (325,951 | ) | |||||||||||
Bahamas | ||||||||||||
OneSpaWorld Holdings Ltd. | (12,254 | ) | (147,048 | ) | 12.7 | |||||||
|
|
|
| |||||||||
Belgium | ||||||||||||
Aedifica SA | (9,581 | ) | (793,938 | ) | 68.5 | |||||||
Bekaert SA | (14,637 | ) | (675,907 | ) | 58.3 | |||||||
Biocartis Group NV | (30 | ) | (20 | ) | 0.0 | |||||||
bpost SA | (65,006 | ) | (316,824 | ) | 27.3 | |||||||
Cofinimmo SA | (11,561 | ) | (1,096,091 | ) | 94.6 | |||||||
Deme Group NV | (2,307 | ) | (302,847 | ) | 26.1 | |||||||
Intervest Offices & Warehouses NV | (4,159 | ) | (85,219 | ) | 7.4 | |||||||
KBC Ancora | (6,580 | ) | (314,125 | ) | 27.1 | |||||||
Kinepolis Group NV | (11,728 | ) | (588,960 | ) | 50.8 | |||||||
Recticel SA | (7,091 | ) | (100,183 | ) | 8.6 | |||||||
Tessenderlo Group SA | (19,360 | ) | (636,348 | ) | 54.9 | |||||||
VGP NV | (3,505 | ) | (364,152 | ) | 31.4 | |||||||
Xior Student Housing NV | (4,422 | ) | (139,392 | ) | 12.0 | |||||||
|
|
|
| |||||||||
| (5,414,006 | ) | |||||||||||
Bermuda | ||||||||||||
Cool Co. Ltd. | (31,842 | ) | (398,098 | ) | 34.3 | |||||||
|
|
|
| |||||||||
Canada | ||||||||||||
Absolute Software Corp. | (23,284 | ) | (183,981 | ) | 15.9 | |||||||
SCHEDULE OF INVESTMENTS | 81 |
Schedule of Investments (continued) April 30, 2023 | BlackRock Global Equity Market Neutral Fund |
| Security | Shares | Value | % of Basket Value | |||||||||
Canada (continued) | ||||||||||||
ADENTRA, Inc. | (11,090 | ) | $ | (215,322 | ) | 18.6 | % | |||||
Ag Growth International, Inc. | (3,001 | ) | (132,801 | ) | 11.5 | |||||||
Algoma Steel Group, Inc. | (11,739 | ) | (87,443 | ) | 7.5 | |||||||
Allied Properties Real Estate Investment Trust | (33,508 | ) | (569,694 | ) | 49.2 | |||||||
Altus Group Ltd. | (4,932 | ) | (198,295 | ) | 17.1 | |||||||
Andlauer Healthcare Group, Inc. | (1,335 | ) | (51,337 | ) | 4.4 | |||||||
ATS Corp. | (15,093 | ) | (653,829 | ) | 56.4 | |||||||
Brookfield Reinsurance Ltd. | (3,651 | ) | (119,780 | ) | 10.3 | |||||||
Calian Group Ltd. | (174 | ) | (8,160 | ) | 0.7 | |||||||
Canadian Western Bank | (33,103 | ) | (600,620 | ) | 51.8 | |||||||
Cascades, Inc. | (36,708 | ) | (302,550 | ) | 26.1 | |||||||
Choice Properties Real Estate Investment Trust | (52,141 | ) | (570,020 | ) | 49.2 | |||||||
Cogeco, Inc. | (4,231 | ) | (182,176 | ) | 15.7 | |||||||
Converge Technology Solutions Corp. | (135,673 | ) | (334,992 | ) | 28.9 | |||||||
Corby Spirit and Wine Ltd. | (490 | ) | (5,691 | ) | 0.5 | |||||||
Definity Financial Corp. | (10,685 | ) | (292,725 | ) | 25.3 | |||||||
Denison Mines Corp. | (88,191 | ) | (98,031 | ) | 8.5 | |||||||
Docebo, Inc. | (2,478 | ) | (97,297 | ) | 8.4 | |||||||
Dye & Durham Ltd. | (16,383 | ) | (176,636 | ) | 15.2 | |||||||
Enerflex Ltd. | (44,454 | ) | (272,811 | ) | 23.5 | |||||||
Enghouse Systems Ltd. | (1,739 | ) | (48,452 | ) | 4.2 | |||||||
EQB, Inc. | (356 | ) | (15,974 | ) | 1.4 | |||||||
Equinox Gold Corp. | (2,939 | ) | (14,505 | ) | 1.3 | |||||||
Fiera Capital Corp. | (3,316 | ) | (18,403 | ) | 1.6 | |||||||
Filo Mining Corp. | (26,321 | ) | (443,391 | ) | 38.3 | |||||||
Headwater Exploration, Inc. | (52,759 | ) | (245,110 | ) | 21.1 | |||||||
i-80 Gold Corp. | (37,120 | ) | (94,241 | ) | 8.1 | |||||||
InterRent Real Estate Investment Trust | (105,068 | ) | (1,016,828 | ) | 87.7 | |||||||
Jamieson Wellness, Inc. | (2,269 | ) | (56,662 | ) | 4.9 | |||||||
K92 Mining, Inc. | (3,432 | ) | (16,526 | ) | 1.4 | |||||||
Killam Apartment Real Estate Investment Trust | (29,109 | ) | (365,844 | ) | 31.6 | |||||||
Labrador Iron Ore Royalty Corp. | (11,115 | ) | (253,686 | ) | 21.9 | |||||||
Lassonde Industries, Inc. | (323 | ) | (23,405 | ) | 2.0 | |||||||
MAG Silver Corp. | (30,536 | ) | (401,529 | ) | 34.6 | |||||||
Maple Leaf Foods, Inc. | (38,017 | ) | (787,445 | ) | 67.9 | |||||||
Minto Apartment Real Estate Investment Trust | (42,337 | ) | (447,586 | ) | 38.6 | |||||||
North West Co., Inc. | (16,532 | ) | (490,459 | ) | 42.3 | |||||||
NorthWest Healthcare Properties Real Estate Investment Trust | (62,977 | ) | (383,334 | ) | 33.1 | |||||||
Orla Mining Ltd. | (44,373 | ) | (202,848 | ) | 17.5 | |||||||
Osisko Mining, Inc. | (13,111 | ) | (37,818 | ) | 3.3 | |||||||
Park Lawn Corp. | (5,386 | ) | (106,124 | ) | 9.2 | |||||||
Pipestone Energy Corp. | (204,177 | ) | (381,564 | ) | 32.9 | |||||||
Pollard Banknote Ltd. | (7,921 | ) | (141,631 | ) | 12.2 | |||||||
Premium Brands Holdings Corp. | (7,102 | ) | (539,330 | ) | 46.5 | |||||||
Primaris Real Estate Investment Trust | (6,328 | ) | (63,151 | ) | 5.5 | |||||||
Seabridge Gold, Inc. | (971 | ) | (13,515 | ) | 1.2 | |||||||
Sienna Senior Living, Inc. | (37,311 | ) | (303,665 | ) | 26.2 | |||||||
SilverCrest Metals, Inc. | (68,318 | ) | (452,595 | ) | 39.0 | |||||||
Skeena Resources Ltd. | (126,404 | ) | (860,535 | ) | 74.2 | |||||||
Spartan Delta Corp. | (57,424 | ) | (656,944 | ) | 56.7 | |||||||
Stella-Jones, Inc. | (1,500 | ) | (59,378 | ) | 5.1 | |||||||
StorageVault Canada, Inc. | (131,377 | ) | (568,267 | ) | 49.0 | |||||||
Trisura Group Ltd. | (6,707 | ) | (156,554 | ) | 13.5 | |||||||
Victoria Gold Corp. | (20,558 | ) | (149,937 | ) | 12.9 | |||||||
Westshore Terminals Investment Corp. | (615 | ) | (12,687 | ) | 1.1 | |||||||
Winpak Ltd. | (12,057 | ) | (406,210 | ) | 35.0 | |||||||
Xenon Pharmaceuticals, Inc. | (18,544 | ) | (746,952 | ) | 64.4 | |||||||
|
|
|
| |||||||||
| (16,137,276 | ) | |||||||||||
| Security | Shares | Value | % of Basket Value | |||||||||
China | ||||||||||||
AustAsia Group Ltd. | (13,597 | ) | $ | (5,543 | ) | 0.5 | % | |||||
E-Commodities Holdings Ltd. | (118,000 | ) | (19,594 | ) | 1.7 | |||||||
Fosun Tourism Group | (187,800 | ) | (218,915 | ) | 18.9 | |||||||
TI Fluid Systems PLC | (166,621 | ) | (218,208 | ) | 18.8 | |||||||
Vesync Co. Ltd. | (42,000 | ) | (16,373 | ) | 1.4 | |||||||
Yanlord Land Group Ltd. | (414,500 | ) | (265,010 | ) | 22.8 | |||||||
|
|
|
| |||||||||
| (743,643 | ) | |||||||||||
Colombia | ||||||||||||
Frontera Energy Corp. | (8,851 | ) | (84,775 | ) | 7.3 | |||||||
|
|
|
| |||||||||
Cyprus | ||||||||||||
Atalaya Mining PLC | (7,193 | ) | (29,439 | ) | 2.5 | |||||||
|
|
|
| |||||||||
Denmark | ||||||||||||
NTG Nordic Transport Group A/S | (6,158 | ) | (324,728 | ) | 28.0 | |||||||
Solar A/S, B Shares | (551 | ) | (44,730 | ) | 3.9 | |||||||
Trifork Holding AG | (733 | ) | (17,291 | ) | 1.5 | |||||||
|
|
|
| |||||||||
| (386,749 | ) | |||||||||||
Egypt | ||||||||||||
Energean PLC | (43,374 | ) | (664,455 | ) | 57.3 | |||||||
|
|
|
| |||||||||
Finland | ||||||||||||
Aktia Bank OYJ | (20,417 | ) | (203,744 | ) | 17.6 | |||||||
Anora Group OYJ | (24,503 | ) | (141,994 | ) | 12.3 | |||||||
Jervois Global Ltd. | (659,199 | ) | (39,369 | ) | 3.4 | |||||||
Konecranes OYJ | (14,993 | ) | (582,890 | ) | 50.3 | |||||||
Metsa Board OYJ | (51,604 | ) | (369,103 | ) | 31.9 | |||||||
Musti Group OYJ | (2,158 | ) | (44,385 | ) | 3.8 | |||||||
Oriola OYJ | (13,980 | ) | (22,219 | ) | 1.9 | |||||||
Puuilo OYJ | (17,825 | ) | (136,705 | ) | 11.8 | |||||||
Sanoma OYJ | (15,268 | ) | (131,318 | ) | 11.3 | |||||||
Talenom OYJ | (5,694 | ) | (47,997 | ) | 4.1 | |||||||
TietoEVRY OYJ | (9,324 | ) | (295,780 | ) | 25.5 | |||||||
Tokmanni Group Corp. | (48,161 | ) | (653,682 | ) | 56.4 | |||||||
|
|
|
| |||||||||
| (2,669,186 | ) | |||||||||||
France | ||||||||||||
ABC arbitrage | (7,452 | ) | (49,351 | ) | 4.3 | |||||||
Altarea SCA | (2,389 | ) | (310,190 | ) | 26.8 | |||||||
Alten SA | (4,919 | ) | (829,935 | ) | 71.6 | |||||||
Antin Infrastructure Partners SA | (20,052 | ) | (335,612 | ) | 28.9 | |||||||
Carmila SA | (4,145 | ) | (69,691 | ) | 6.0 | |||||||
CGG SA | (541,861 | ) | (402,057 | ) | 34.7 | |||||||
Chargeurs SA | (2,693 | ) | (43,877 | ) | 3.8 | |||||||
Coface SA | (24,655 | ) | (374,604 | ) | 32.3 | |||||||
Derichebourg SA | (4,156 | ) | (25,505 | ) | 2.2 | |||||||
Euroapi SA | (24,220 | ) | (288,669 | ) | 24.9 | |||||||
Fnac Darty SA | (5,962 | ) | (222,929 | ) | 19.2 | |||||||
ID Logistics Group | (37 | ) | (10,783 | ) | 0.9 | |||||||
Imerys SA | (29,579 | ) | (1,206,655 | ) | 104.1 | |||||||
LISI | (5,491 | ) | (154,409 | ) | 13.3 | |||||||
Maisons du Monde SA | (5,549 | ) | (58,039 | ) | 5.0 | |||||||
Metropole Television SA | (6,816 | ) | (109,112 | ) | 9.4 | |||||||
Societe BIC SA | (3,919 | ) | (239,798 | ) | 20.7 | |||||||
Sopra Steria Group SACA | (2,006 | ) | (430,856 | ) | 37.2 | |||||||
Trigano SA | (2,611 | ) | (337,298 | ) | 29.1 | |||||||
Voltalia SA, Registered Shares | (34,642 | ) | (522,564 | ) | 45.1 | |||||||
|
|
|
| |||||||||
| (6,021,934 | ) | |||||||||||
Gambia | ||||||||||||
BW Energy Ltd. | (14,253 | ) | (39,019 | ) | 3.4 | |||||||
|
|
|
| |||||||||
| 82 | 2 0 2 3 BLACK ROCK ANNUAL REPORT TO SHAREHOLDERS |
Schedule of Investments (continued) April 30, 2023 | BlackRock Global Equity Market Neutral Fund |
| Security | Shares | Value | % of Basket Value | |||||||||
Germany | ||||||||||||
About You Holding SE | (2,018 | ) | $ | (12,328 | ) | 1.1 | % | |||||
ADVA Optical Networking SE | (4,000 | ) | (87,444 | ) | 7.6 | |||||||
Auto1 Group SE | (14,866 | ) | (116,402 | ) | 10.0 | |||||||
BayWa AG | (6,734 | ) | (286,138 | ) | 24.7 | |||||||
CANCOM SE | (7,811 | ) | (279,380 | ) | 24.1 | |||||||
Ceconomy AG | (21,772 | ) | (65,949 | ) | 5.7 | |||||||
Cewe Stiftung & Co. KGAA | (2,708 | ) | (276,622 | ) | 23.9 | |||||||
CompuGroup Medical SE & Co. KgaA | (2,729 | ) | (148,854 | ) | 12.8 | |||||||
Dermapharm Holding SE | (2,463 | ) | (122,988 | ) | 10.6 | |||||||
DIC Asset AG | (21,669 | ) | (163,601 | ) | 14.1 | |||||||
Energiekontor AG | (3,536 | ) | (280,897 | ) | 24.2 | |||||||
Hamborner REIT AG | (18,729 | ) | (146,549 | ) | 12.6 | |||||||
Hamburger Hafen und Logistik AG | (5,760 | ) | (78,839 | ) | 6.8 | |||||||
Hypoport SE | (880 | ) | (140,011 | ) | 12.1 | |||||||
Indus Holding AG | (2,821 | ) | (82,893 | ) | 7.2 | |||||||
Instone Real Estate Group SE | (6,345 | ) | (50,316 | ) | 4.3 | |||||||
Jenoptik AG | (17,251 | ) | (546,264 | ) | 47.1 | |||||||
JOST Werke SE | (2,262 | ) | (123,969 | ) | 10.7 | |||||||
KWS Saat SE & Co. KGaA | (153 | ) | (9,840 | ) | 0.9 | |||||||
MBB SE | (184 | ) | (16,643 | ) | 1.4 | |||||||
Medios AG | (7,683 | ) | (152,838 | ) | 13.2 | |||||||
Mercer International, Inc. | (6,204 | ) | (60,365 | ) | 5.2 | |||||||
Norma Group SE | (15,580 | ) | (367,430 | ) | 31.7 | |||||||
PNE AG | (22,424 | ) | (363,608 | ) | 31.4 | |||||||
SGL Carbon SE | (18,608 | ) | (170,231 | ) | 14.7 | |||||||
Sirius Real Estate Ltd. | (315,455 | ) | (314,560 | ) | 27.1 | |||||||
Software AG | (4,985 | ) | (170,489 | ) | 14.7 | |||||||
Softwareone Holding AG | (18,536 | ) | (278,109 | ) | 24.0 | |||||||
STRATEC SE | (434 | ) | (29,624 | ) | 2.6 | |||||||
Stroeer SE & Co. KGaA | (16,775 | ) | (912,741 | ) | 78.7 | |||||||
Synlab AG | (1,236 | ) | (12,949 | ) | 1.1 | |||||||
Takkt AG | (7,529 | ) | (119,612 | ) | 10.3 | |||||||
Vossloh AG | (200 | ) | (9,097 | ) | 0.8 | |||||||
Wuestenrot & Wuerttembergische AG | (5,937 | ) | (107,135 | ) | 9.2 | |||||||
|
|
|
| |||||||||
| (6,104,715 | ) | |||||||||||
Ghana | ||||||||||||
Kosmos Energy Ltd. | (50,160 | ) | (321,024 | ) | 27.7 | |||||||
Tullow Oil PLC | (2,707,728 | ) | (935,081 | ) | 80.7 | |||||||
|
|
|
| |||||||||
| (1,256,105 | ) | |||||||||||
Hong Kong | ||||||||||||
Cadeler A/S | (52,199 | ) | (230,719 | ) | 19.9 | |||||||
CK Life Sciences Int’l Holdings, Inc. | (486,000 | ) | (49,059 | ) | 4.2 | |||||||
C-Mer Eye Care Holdings Ltd. | (12,000 | ) | (6,874 | ) | 0.6 | |||||||
EC Healthcare | (63,000 | ) | (42,421 | ) | 3.7 | |||||||
Pacific Textiles Holdings Ltd. | (40,000 | ) | (12,870 | ) | 1.1 | |||||||
Prosperity REIT | (462,000 | ) | (112,065 | ) | 9.7 | |||||||
SUNeVision Holdings Ltd. | (160,000 | ) | (90,909 | ) | 7.8 | |||||||
Viva China Holdings Ltd. | (128,000 | ) | (21,730 | ) | 1.9 | |||||||
|
|
|
| |||||||||
| (566,647 | ) | |||||||||||
Indonesia | ||||||||||||
Nickel Industries Ltd. | (135,380 | ) | (87,313 | ) | 7.5 | |||||||
|
|
|
| |||||||||
Ireland | ||||||||||||
C&C Group PLC | (493,928 | ) | (957,705 | ) | 82.6 | |||||||
Cairn Homes PLC | (80,431 | ) | (90,028 | ) | 7.8 | |||||||
Cosmo Pharmaceuticals NV | (1,488 | ) | (89,252 | ) | 7.7 | |||||||
| Security | Shares | Value | % of Basket Value | |||||||||
Ireland (continued) | ||||||||||||
Keywords Studios PLC | (4,228 | ) | $ | (141,676 | ) | 12.2 | % | |||||
Prothena Corp. PLC | (8,994 | ) | (473,264 | ) | 40.8 | |||||||
|
|
|
| |||||||||
| (1,751,925 | ) | |||||||||||
Israel | ||||||||||||
Camtek Ltd. | (3,382 | ) | (87,181 | ) | 7.5 | |||||||
Innoviz Technologies Ltd. | (3,424 | ) | (8,560 | ) | 0.8 | |||||||
Isracard Ltd. | (6,057 | ) | (24,519 | ) | 2.1 | |||||||
JFrog Ltd. | (1,141 | ) | (21,188 | ) | 1.8 | |||||||
Maytronics Ltd. | (1,726 | ) | (18,056 | ) | 1.6 | |||||||
Nano Dimension Ltd., ADR | (14,727 | ) | (36,376 | ) | 3.1 | |||||||
Nova Ltd. | (4,776 | ) | (441,501 | ) | 38.1 | |||||||
Paz Oil Co. Ltd. | (478 | ) | (44,761 | ) | 3.9 | |||||||
Perion Network Ltd. | (4,089 | ) | (146,355 | ) | 12.6 | |||||||
Rami Levy Chain Stores Hashikma Marketing 2006 Ltd. | (166 | ) | (9,427 | ) | 0.8 | |||||||
|
|
|
| |||||||||
| (837,924 | ) | |||||||||||
Italy | ||||||||||||
ACEA SpA | (6,719 | ) | (97,743 | ) | 8.4 | |||||||
Anima Holding SpA | (2,215 | ) | (9,129 | ) | 0.8 | |||||||
Antares Vision SpA | (15,769 | ) | (114,871 | ) | 9.9 | |||||||
Ariston Holding NV | (2,749 | ) | (31,155 | ) | 2.7 | |||||||
BFF Bank SpA | (28,555 | ) | (272,434 | ) | 23.5 | |||||||
Danieli & C Officine Meccaniche SpA | (1,123 | ) | (22,813 | ) | 2.0 | |||||||
Digital Bros SpA | (14,669 | ) | (330,921 | ) | 28.5 | |||||||
doValue SpA | (5,973 | ) | (41,603 | ) | 3.6 | |||||||
Enav SpA | (6,426 | ) | (29,965 | ) | 2.6 | |||||||
Esprinet SpA | (5,635 | ) | (49,484 | ) | 4.3 | |||||||
Fila SpA | (9,028 | ) | (74,186 | ) | 6.4 | |||||||
Gruppo MutuiOnline SpA | (803 | ) | (24,842 | ) | 2.1 | |||||||
GVS SpA | (10,370 | ) | (70,205 | ) | 6.1 | |||||||
Illimity Bank SpA | (8,037 | ) | (56,236 | ) | 4.8 | |||||||
Industrie De Nora SpA | (8,460 | ) | (167,430 | ) | 14.4 | |||||||
MARR SpA | (5,356 | ) | (83,282 | ) | 7.2 | |||||||
MFE-MediaForEurope NV | (472,901 | ) | (221,627 | ) | 19.1 | |||||||
Safilo Group SpA | (66,245 | ) | (94,637 | ) | 8.2 | |||||||
Salvatore Ferragamo SpA | (1,382 | ) | (24,094 | ) | 2.1 | |||||||
Saras SpA | (126,250 | ) | (161,799 | ) | 14.0 | |||||||
Tamburi Investment Partners SpA | (2,269 | ) | (21,499 | ) | 1.8 | |||||||
Technogym SpA | (40,857 | ) | (369,901 | ) | 31.9 | |||||||
Technoprobe SpA | (22,323 | ) | (157,713 | ) | 13.6 | |||||||
|
|
|
| |||||||||
| (2,527,569 | ) | |||||||||||
Japan | ||||||||||||
ADEKA Corp. | (26,300 | ) | (450,037 | ) | 38.8 | |||||||
Advance Logistics Investment Corp. | (157 | ) | (161,209 | ) | 13.9 | |||||||
Aeon Hokkaido Corp. | (23,800 | ) | (144,757 | ) | 12.5 | |||||||
Aichi Financial Group, Inc. | (17,400 | ) | (276,931 | ) | 23.9 | |||||||
Aiful Corp. | (188,800 | ) | (520,376 | ) | 44.9 | |||||||
Airtrip Corp. | (5,600 | ) | (114,111 | ) | 9.8 | |||||||
Alpha Systems, Inc. | (3,600 | ) | (111,009 | ) | 9.6 | |||||||
Appier Group, Inc. | (31,400 | ) | (361,521 | ) | 31.2 | |||||||
ARCLANDS Corp. | (87,400 | ) | (1,002,340 | ) | 86.5 | |||||||
Arcs Co. Ltd. | (14,100 | ) | (259,679 | ) | 22.4 | |||||||
ARTERIA Networks Corp. | (17,500 | ) | (169,857 | ) | 14.7 | |||||||
Asahi Holdings, Inc. | (75,000 | ) | (1,119,368 | ) | 96.6 | |||||||
Atom Corp. | (160,900 | ) | (1,004,190 | ) | 86.6 | |||||||
Awa Bank Ltd. | (27,600 | ) | (418,308 | ) | 36.1 | |||||||
Axial Retailing, Inc. | (7,700 | ) | (202,496 | ) | 17.5 | |||||||
Belc Co. Ltd. | (5,400 | ) | (247,114 | ) | 21.3 | |||||||
SCHEDULE OF INVESTMENTS | 83 |
Schedule of Investments (continued) April 30, 2023 | BlackRock Global Equity Market Neutral Fund |
| Security | Shares | Value | % of Basket Value | |||||||||
Japan (continued) | ||||||||||||
BML, Inc. | (2,400 | ) | $ | (54,624 | ) | 4.7 | % | |||||
Bushiroad, Inc. | (2,000 | ) | (13,285 | ) | 1.1 | |||||||
Canon Electronics, Inc. | (1,600 | ) | (22,087 | ) | 1.9 | |||||||
Cawachi Ltd. | (2,300 | ) | (39,947 | ) | 3.4 | |||||||
Change Holdings, Inc. | (38,000 | ) | (652,283 | ) | 56.3 | |||||||
Chofu Seisakusho Co. Ltd. | (4,100 | ) | (74,948 | ) | 6.5 | |||||||
Chudenko Corp. | (16,400 | ) | (272,466 | ) | 23.5 | |||||||
CI Takiron Corp. | (16,800 | ) | (62,711 | ) | 5.4 | |||||||
COLOPL, Inc. | (36,100 | ) | (172,000 | ) | 14.8 | |||||||
Colowide Co. Ltd. | (39,500 | ) | (613,137 | ) | 52.9 | |||||||
Comforia Residential REIT, Inc. | (72 | ) | (182,545 | ) | 15.7 | |||||||
CRE Logistics REIT, Inc. | (288 | ) | (401,899 | ) | 34.7 | |||||||
Create Restaurants Holdings, Inc. | (31,600 | ) | (233,730 | ) | 20.2 | |||||||
Cyberdyne, Inc. | (6,500 | ) | (13,622 | ) | 1.2 | |||||||
Daiho Corp. | (8,000 | ) | (232,823 | ) | 20.1 | |||||||
Daiki Aluminium Industry Co. Ltd. | (41,300 | ) | (429,454 | ) | 37.0 | |||||||
Daikokutenbussan Co. Ltd. | (4,200 | ) | (170,437 | ) | 14.7 | |||||||
Daishi Hokuetsu Financial Group, Inc. | (41,000 | ) | (925,595 | ) | 79.8 | |||||||
Daiwabo Holdings Co. Ltd. | (23,800 | ) | (454,804 | ) | 39.2 | |||||||
DCM Holdings Co. Ltd. | (52,300 | ) | (554,394 | ) | 47.8 | |||||||
Dexerials Corp. | (25,500 | ) | (491,677 | ) | 42.4 | |||||||
Duskin Co. Ltd. | (18,900 | ) | (469,677 | ) | 40.5 | |||||||
Earth Corp. | (2,400 | ) | (89,126 | ) | 7.7 | |||||||
EDION Corp. | (29,700 | ) | (296,113 | ) | 25.5 | |||||||
eRex Co. Ltd. | (10,500 | ) | (136,136 | ) | 11.7 | |||||||
ES-Con Japan Ltd. | (59,900 | ) | (387,502 | ) | 33.4 | |||||||
Exedy Corp. | (66,900 | ) | (975,193 | ) | 84.1 | |||||||
Ferrotec Holdings Corp. | (7,700 | ) | (176,496 | ) | 15.2 | |||||||
Fuji Seal International, Inc. | (8,600 | ) | (99,026 | ) | 8.5 | |||||||
Fuji Soft, Inc. | (2,600 | ) | (157,369 | ) | 13.6 | |||||||
Fujicco Co. Ltd. | (17,900 | ) | (256,757 | ) | 22.2 | |||||||
Fujio Food Group, Inc. | (52,500 | ) | (551,276 | ) | 47.6 | |||||||
Fujitec Co. Ltd. | (22,500 | ) | (607,052 | ) | 52.4 | |||||||
Fukushima Galilei Co. Ltd. | (4,300 | ) | (164,209 | ) | 14.2 | |||||||
Fukuyama Transporting Co. Ltd. | (10,000 | ) | (270,770 | ) | 23.4 | |||||||
Furukawa Co. Ltd. | (8,400 | ) | (84,116 | ) | 7.3 | |||||||
Globeride, Inc. | (22,700 | ) | (421,616 | ) | 36.4 | |||||||
Glory Ltd. | (42,100 | ) | (907,108 | ) | 78.3 | |||||||
GMO Financial Holdings, Inc. | (29,300 | ) | (135,570 | ) | 11.7 | |||||||
GMO GlobalSign Holdings KK | (7,600 | ) | (218,647 | ) | 18.9 | |||||||
Gunze Ltd. | (11,100 | ) | (388,956 | ) | 33.6 | |||||||
Hakuto Co. Ltd. | (4,100 | ) | (130,517 | ) | 11.3 | |||||||
Hazama Ando Corp. | (18,800 | ) | (125,702 | ) | 10.8 | |||||||
Heiwa Real Estate REIT, Inc. | (539 | ) | (639,447 | ) | 55.2 | |||||||
Heiwado Co. Ltd. | (13,800 | ) | (212,430 | ) | 18.3 | |||||||
Hirata Corp. | (6,300 | ) | (318,668 | ) | 27.5 | |||||||
HIS Co. Ltd. | (43,000 | ) | (656,518 | ) | 56.6 | |||||||
Hokkaido Electric Power Co., Inc. | (69,200 | ) | (264,150 | ) | 22.8 | |||||||
Hokuetsu Corp. | (77,000 | ) | (516,176 | ) | 44.5 | |||||||
Hokuhoku Financial Group, Inc. | (58,000 | ) | (423,526 | ) | 36.5 | |||||||
Hokuriku Electric Power Co | (17,900 | ) | (84,728 | ) | 7.3 | |||||||
Hokuto Corp. | (29,300 | ) | (407,504 | ) | 35.2 | |||||||
Hoshino Resorts REIT, Inc. | (73 | ) | (385,322 | ) | 33.2 | |||||||
Hyakugo Bank Ltd. | (125,000 | ) | (365,694 | ) | 31.5 | |||||||
Ichibanya Co. Ltd. | (3,100 | ) | (124,758 | ) | 10.8 | |||||||
Idec Corp. | (1,100 | ) | (27,293 | ) | 2.4 | |||||||
Iino Kaiun Kaisha Ltd. | (11,700 | ) | (89,269 | ) | 7.7 | |||||||
Inabata & Co. Ltd. | (25,900 | ) | (535,685 | ) | 46.2 | |||||||
Inageya Co. Ltd. | (7,000 | ) | (85,881 | ) | 7.4 | |||||||
Insource Co. Ltd. | (15,500 | ) | (144,139 | ) | 12.4 | |||||||
Iriso Electronics Co. Ltd. | (5,700 | ) | (197,779 | ) | 17.1 | |||||||
Itochu Enex Co. Ltd. | (12,300 | ) | (106,647 | ) | 9.2 | |||||||
| Security | Shares | Value | % of Basket Value | |||||||||
Japan (continued) | ||||||||||||
Itochu-Shokuhin Co. Ltd. | (2,700 | ) | $ | (109,655 | ) | 9.5 | % | |||||
J Trust Co. Ltd. | (24,100 | ) | (71,274 | ) | 6.1 | |||||||
Jaccs Co. Ltd. | (5,900 | ) | (200,376 | ) | 17.3 | |||||||
Japan Display, Inc. | (317,100 | ) | (97,447 | ) | 8.4 | |||||||
JDC Corp. | (17,700 | ) | (81,148 | ) | 7.0 | |||||||
J-Oil Mills, Inc. | (15,100 | ) | (181,570 | ) | 15.7 | |||||||
Joshin Denki Co. Ltd. | (32,300 | ) | (488,103 | ) | 42.1 | |||||||
JTOWER, Inc. | (7,800 | ) | (340,340 | ) | 29.4 | |||||||
Juroku Financial Group, Inc. | (11,400 | ) | (255,674 | ) | 22.1 | |||||||
Kameda Seika Co. Ltd. | (4,200 | ) | (141,712 | ) | 12.2 | |||||||
Kanamoto Co. Ltd. | (11,900 | ) | (201,987 | ) | 17.4 | |||||||
Kanto Denka Kogyo Co. Ltd. | (14,900 | ) | (114,529 | ) | 9.9 | |||||||
Kappa Create Co. Ltd. | (39,900 | ) | (449,156 | ) | 38.7 | |||||||
Katakura Industries Co. Ltd. | (6,500 | ) | (88,006 | ) | 7.6 | |||||||
Keiyo Bank Ltd. | (41,500 | ) | (174,688 | ) | 15.1 | |||||||
Keiyo Co. Ltd. | (4,600 | ) | (28,823 | ) | 2.5 | |||||||
Kenedix Residential Next Investment Corp. | (76 | ) | (120,794 | ) | 10.4 | |||||||
KH Neochem Co. Ltd. | (14,800 | ) | (258,617 | ) | 22.3 | |||||||
Kisoji Co. Ltd. | (31,000 | ) | (544,749 | ) | 47.0 | |||||||
Ki-Star Real Estate Co. Ltd. | (46,400 | ) | (1,413,505 | ) | 121.9 | |||||||
Kiyo Bank Ltd. | (65,100 | ) | (771,095 | ) | 66.5 | |||||||
Koa Corp. | (22,300 | ) | (283,684 | ) | 24.5 | |||||||
Kohnan Shoji Co. Ltd. | (25,400 | ) | (694,030 | ) | 59.9 | |||||||
Komeri Co. Ltd. | (27,400 | ) | (645,096 | ) | �� | 55.7 | ||||||
Konishi Co. Ltd. | (12,600 | ) | (191,615 | ) | 16.5 | |||||||
Kumagai Gumi Co. Ltd. | (12,000 | ) | (258,455 | ) | 22.3 | |||||||
Kura Sushi, Inc. | (16,300 | ) | (395,641 | ) | 34.1 | |||||||
KYB Corp. | (27,600 | ) | (891,904 | ) | 76.9 | |||||||
Kyoei Steel Ltd. | (3,900 | ) | (53,357 | ) | 4.6 | |||||||
Leopalace21 Corp. | (166,500 | ) | (445,511 | ) | 38.4 | |||||||
LITALICO, Inc. | (4,700 | ) | (85,356 | ) | 7.4 | |||||||
Macnica Holdings, Inc. | (9,100 | ) | (253,362 | ) | 21.9 | |||||||
Makino Milling Machine Co. Ltd. | (2,500 | ) | (92,617 | ) | 8.0 | |||||||
Management Solutions Co. Ltd. | (8,900 | ) | (213,779 | ) | 18.4 | |||||||
Maruha Nichiro Corp. | (20,700 | ) | (390,354 | ) | 33.7 | |||||||
Maruwa Co. Ltd. | (1,300 | ) | (168,069 | ) | 14.5 | |||||||
Matsuda Sangyo Co. Ltd. | (8,500 | ) | (143,164 | ) | 12.4 | |||||||
Maxvalu Tokai Co. Ltd. | (1,500 | ) | (30,299 | ) | 2.6 | |||||||
Medley, Inc. | (500 | ) | (13,252 | ) | 1.1 | |||||||
Meiko Electronics Co. Ltd. | (7,800 | ) | (159,556 | ) | 13.8 | |||||||
Micronics Japan Co. Ltd. | (11,400 | ) | (105,331 | ) | 9.1 | |||||||
Mirai Corp. | (87 | ) | (29,455 | ) | 2.5 | |||||||
MIRAIT ONE corp | (16,100 | ) | (202,652 | ) | 17.5 | |||||||
Mitani Sekisan Co. Ltd. | (4,400 | ) | (157,530 | ) | 13.6 | |||||||
Mitsubishi Estate Logistics REIT Investment Corp. | (106 | ) | (329,283 | ) | 28.4 | |||||||
Mitsubishi Logisnext Co. Ltd. | (1,900 | ) | (14,012 | ) | 1.2 | |||||||
Mitsubishi Research Institute, Inc. | (1,900 | ) | (69,850 | ) | 6.0 | |||||||
Mitsuboshi Belting Ltd. | (8,100 | ) | (235,161 | ) | 20.3 | |||||||
Mitsuuroko Group Holdings Co. Ltd. | (11,900 | ) | (118,299 | ) | 10.2 | |||||||
Musashi Seimitsu Industry Co. Ltd. | (45,800 | ) | (625,610 | ) | 54.0 | |||||||
Musashino Bank Ltd. | (1,600 | ) | (26,327 | ) | 2.3 | |||||||
Nachi-Fujikoshi Corp. | (19,300 | ) | (552,782 | ) | 47.7 | |||||||
Nafco Co. Ltd. | (1,900 | ) | (26,293 | ) | 2.3 | |||||||
Nagawa Co. Ltd. | (8,300 | ) | (392,787 | ) | 33.9 | |||||||
Nanto Bank Ltd. | (21,400 | ) | (395,032 | ) | 34.1 | |||||||
Nichiha Corp. | (8,700 | ) | (186,230 | ) | 16.1 | |||||||
Nihon Parkerizing Co. Ltd. | (13,600 | ) | (107,843 | ) | 9.3 | |||||||
Nikkiso Co. Ltd. | (9,500 | ) | (67,611 | ) | 5.8 | |||||||
Nikkon Holdings Co. Ltd. | (6,000 | ) | (117,760 | ) | 10.2 | |||||||
Nippon Carbon Co. Ltd. | (27,200 | ) | (844,651 | ) | 72.9 | |||||||
Nippon Pillar Packing Co. Ltd. | (2,700 | ) | (76,043 | ) | 6.6 | |||||||
| 84 | 2 0 2 3 BLACK ROCK ANNUAL REPORT TO SHAREHOLDERS |
Schedule of Investments (continued) April 30, 2023 | BlackRock Global Equity Market Neutral Fund |
| Security | Shares | Value | % of Basket Value | |||||||||
Japan (continued) | ||||||||||||
Nippon Signal Company Ltd. | (9,800 | ) | $ | (81,102 | ) | 7.0 | % | |||||
Nippon Television Holdings, Inc. | (16,900 | ) | (154,018 | ) | 13.3 | |||||||
Nishimatsu Construction Co. Ltd. | (11,200 | ) | (298,215 | ) | 25.7 | |||||||
Nishimatsuya Chain Co. Ltd. | (29,000 | ) | (348,672 | ) | 30.1 | |||||||
Nishio Holdings Co. Ltd. | (6,600 | ) | (158,887 | ) | 13.7 | |||||||
Nissha Co. Ltd. | (37,100 | ) | (513,029 | ) | 44.3 | |||||||
Nitta Corp. | (3,700 | ) | (85,278 | ) | 7.4 | |||||||
Nitto Kogyo Corp. | (10,100 | ) | (202,595 | ) | 17.5 | |||||||
Nojima Corp. | (23,600 | ) | (256,480 | ) | 22.1 | |||||||
Noritake Co. Ltd. | (3,200 | ) | (111,341 | ) | 9.6 | |||||||
Noritz Corp. | (10,300 | ) | (141,488 | ) | 12.2 | |||||||
North Pacific Bank Ltd. | (16,200 | ) | (35,116 | ) | 3.0 | |||||||
NS United Kaiun Kaisha Ltd. | (22,800 | ) | (677,811 | ) | 58.5 | |||||||
NTT UD REIT Investment Corp. | (315 | ) | (307,729 | ) | 26.5 | |||||||
Ogaki Kyoritsu Bank Ltd. | (42,800 | ) | (590,624 | ) | 51.0 | |||||||
Ohsho Food Service Corp. | (3,600 | ) | (166,142 | ) | 14.3 | |||||||
Oisix ra daichi, Inc. | (31,800 | ) | (602,821 | ) | 52.0 | |||||||
Okasan Securities Group, Inc. | (60,300 | ) | (192,490 | ) | 16.6 | |||||||
One REIT, Inc. | (222 | ) | (397,970 | ) | 34.3 | |||||||
Open Door, Inc. | (44,800 | ) | (489,586 | ) | 42.2 | |||||||
Optorun Co. Ltd. | (4,100 | ) | (63,360 | ) | 5.5 | |||||||
Organo Corp. | (18,500 | ) | (452,613 | ) | 39.0 | |||||||
Osaka Soda Co. Ltd. | (8,700 | ) | (285,280 | ) | 24.6 | |||||||
OSAKA Titanium Technologies Co. Ltd. | (4,200 | ) | (90,503 | ) | 7.8 | |||||||
Pacific Industrial Co. Ltd. | (28,900 | ) | (264,359 | ) | 22.8 | |||||||
PAL GROUP Holdings Co. Ltd. | (7,800 | ) | (181,617 | ) | 15.7 | |||||||
Paramount Bed Holdings Co. Ltd. | (3,500 | ) | (62,879 | ) | 5.4 | |||||||
Pharma Foods International Co. Ltd. | (39,100 | ) | (513,368 | ) | 44.3 | |||||||
Piolax, Inc. | (15,100 | ) | (227,118 | ) | 19.6 | |||||||
Prima Meat Packers Ltd. | (8,200 | ) | (140,680 | ) | 12.1 | |||||||
Raiznext Corp. | (2,700 | ) | (29,282 | ) | 2.5 | |||||||
Raksul, Inc. | (14,100 | ) | (145,495 | ) | 12.6 | |||||||
Retail Partners Co. Ltd. | (4,300 | ) | (48,969 | ) | 4.2 | |||||||
Ricoh Leasing Co. Ltd. | (8,200 | ) | (240,288 | ) | 20.7 | |||||||
Riken Keiki Co. Ltd. | (7,600 | ) | (296,007 | ) | 25.5 | |||||||
Riken Vitamin Co. Ltd. | (7,300 | ) | (110,917 | ) | 9.6 | |||||||
Ringer Hut Co. Ltd. | (22,100 | ) | (397,501 | ) | 34.3 | |||||||
Roland Corp. | (10,300 | ) | (312,882 | ) | 27.0 | |||||||
Rorze Corp. | (11,200 | ) | (840,438 | ) | 72.5 | |||||||
Ryosan Co. Ltd. | (3,700 | ) | (88,565 | ) | 7.6 | |||||||
Ryoyo Electro Corp. | (6,800 | ) | (125,701 | ) | 10.8 | |||||||
Saibu Gas Holdings Co. Ltd. | (14,500 | ) | (204,515 | ) | 17.6 | |||||||
Sakata INX Corp. | (7,500 | ) | (61,975 | ) | 5.3 | |||||||
SAMTY Co. Ltd. | (28,200 | ) | (466,264 | ) | 40.2 | |||||||
Samty Residential Investment Corp. | (218 | ) | (188,068 | ) | 16.2 | |||||||
San-A Co. Ltd. | (2,000 | ) | (68,521 | ) | 5.9 | |||||||
San-Ai Obbli Co. Ltd. | (4,600 | ) | (49,095 | ) | 4.2 | |||||||
SanBio Co. Ltd. | (4,000 | ) | (18,720 | ) | 1.6 | |||||||
Sanki Engineering Co. Ltd. | (23,800 | ) | (266,599 | ) | 23.0 | |||||||
Sansan, Inc. | (19,100 | ) | (259,805 | ) | 22.4 | |||||||
Sanyo Denki Co. Ltd. | (9,900 | ) | (500,587 | ) | 43.2 | |||||||
SB Technology Corp. | (6,400 | ) | (110,684 | ) | 9.5 | |||||||
SBS Holdings, Inc. | (16,800 | ) | (414,810 | ) | 35.8 | |||||||
Seiko Group Corp. | (11,200 | ) | (249,016 | ) | 21.5 | |||||||
Sekisui Jushi Corp. | (18,200 | ) | (296,097 | ) | 25.5 | |||||||
Senko Group Holdings Co. Ltd. | (68,100 | ) | (493,046 | ) | 42.5 | |||||||
Shibaura Machine Co. Ltd. | (6,700 | ) | (158,106 | ) | 13.6 | |||||||
Shibuya Corp. | (4,000 | ) | (74,968 | ) | 6.5 | |||||||
Shiga Bank Ltd. | (13,600 | ) | (287,195 | ) | 24.8 | |||||||
Shikoku Kasei Holdings Corp. | (3,900 | ) | (41,186 | ) | 3.6 | |||||||
Shin Nippon Biomedical Laboratories Ltd. | (23,400 | ) | (433,157 | ) | 37.4 | |||||||
| Security | Shares | Value | % of Basket Value | |||||||||
Japan (continued) | ||||||||||||
Showa Sangyo Co. Ltd. | (13,400 | ) | $ | (267,195 | ) | 23.1 | % | |||||
Simplex Holdings, Inc. | (19,000 | ) | (335,117 | ) | 28.9 | |||||||
SKY Perfect JSAT Holdings, Inc. | (19,300 | ) | (76,263 | ) | 6.6 | |||||||
SOSiLA Logistics REIT, Inc. | (176 | ) | (177,320 | ) | 15.3 | |||||||
Sparx Group Co. Ltd. | (600 | ) | (6,634 | ) | 0.6 | |||||||
Sumitomo Densetsu Co. Ltd. | (6,300 | ) | (132,699 | ) | 11.4 | |||||||
Sumitomo Osaka Cement Co. Ltd. | (11,200 | ) | (319,047 | ) | 27.5 | |||||||
Suruga Bank Ltd. | (39,800 | ) | (152,897 | ) | 13.2 | |||||||
T Hasegawa Co. Ltd. | (16,200 | ) | (390,730 | ) | 33.7 | |||||||
Takara Leben Real Estate Investment Corp. | (273 | ) | (186,031 | ) | 16.0 | |||||||
Tama Home Co. Ltd. | (800 | ) | (22,172 | ) | 1.9 | |||||||
Tenma Corp. | (16,200 | ) | (282,813 | ) | 24.4 | |||||||
Toa Corp. | (18,800 | ) | (413,360 | ) | 35.7 | |||||||
Toagosei Co. Ltd. | (17,300 | ) | (151,682 | ) | 13.1 | |||||||
Toei Co. Ltd. | (2,000 | ) | (272,870 | ) | 23.5 | |||||||
Toho Bank Ltd. | (311,900 | ) | (521,587 | ) | 45.0 | |||||||
Toho Holdings Co. Ltd. | (19,600 | ) | (396,098 | ) | 34.2 | |||||||
TOKAI Holdings Corp. | (51,300 | ) | (337,735 | ) | 29.1 | |||||||
Tokai Tokyo Financial Holdings, Inc. | (286,500 | ) | (752,280 | ) | 64.9 | |||||||
Tokushu Tokai Paper Co. Ltd. | (11,800 | ) | (260,166 | ) | 22.4 | |||||||
Tokuyama Corp. | (28,800 | ) | (475,818 | ) | 41.0 | |||||||
Tokyo Electron Device Ltd. | (10,700 | ) | (622,276 | ) | 53.7 | |||||||
TOMONY Holdings, Inc. | (115,000 | ) | (316,948 | ) | 27.3 | |||||||
Tomy Co. Ltd. | (57,800 | ) | (661,367 | ) | 57.1 | |||||||
Topre Corp. | (6,600 | ) | (67,729 | ) | 5.8 | |||||||
Toyo Construction Co. Ltd. | (26,800 | ) | (194,507 | ) | 16.8 | |||||||
Toyo Gosei Co. Ltd. | (600 | ) | (34,685 | ) | 3.0 | |||||||
Toyobo Co. Ltd. | (64,900 | ) | (496,475 | ) | 42.8 | |||||||
Trancom Co. Ltd. | (3,400 | ) | (173,050 | ) | 14.9 | |||||||
Transcosmos, Inc. | (15,500 | ) | (366,488 | ) | 31.6 | |||||||
Tsuburaya Fields Holdings, Inc. | (21,200 | ) | (292,546 | ) | 25.2 | |||||||
Tsugami Corp. | (6,800 | ) | (71,547 | ) | 6.2 | |||||||
TV Asahi Holdings Corp. | (22,600 | ) | (264,661 | ) | 22.8 | |||||||
United Super Markets Holdings, Inc. | (27,800 | ) | (243,254 | ) | 21.0 | |||||||
Wacoal Holdings Corp. | (17,800 | ) | (350,643 | ) | 30.2 | |||||||
Wacom Co. Ltd. | (36,400 | ) | (187,371 | ) | 16.2 | |||||||
Weathernews, Inc. | (2,300 | ) | (116,766 | ) | 10.1 | |||||||
WingArc1st, Inc. | (3,300 | ) | (54,518 | ) | 4.7 | |||||||
YAMABIKO Corp. | (33,200 | ) | (333,264 | ) | 28.7 | |||||||
Yodogawa Steel Works Ltd. | (16,100 | ) | (341,996 | ) | 29.5 | |||||||
Yokogawa Bridge Holdings Corp. | (12,000 | ) | (198,963 | ) | 17.2 | |||||||
Yokorei Co. Ltd. | (40,300 | ) | (328,499 | ) | 28.3 | |||||||
Yonex Co. Ltd. | (20,300 | ) | (245,376 | ) | 21.2 | |||||||
Yoshinoya Holdings Co. Ltd. | (18,400 | ) | (344,733 | ) | 29.7 | |||||||
Yuasa Trading Co. Ltd. | (500 | ) | (14,713 | ) | 1.3 | |||||||
Zojirushi Corp. | (14,100 | ) | (187,444 | ) | 16.2 | |||||||
|
|
|
| |||||||||
| (69,301,173 | ) | |||||||||||
Liechtenstein | ||||||||||||
Implantica AG, Class A | (7,960 | ) | (14,817 | ) | 1.3 | |||||||
|
|
|
| |||||||||
Macau | ||||||||||||
MECOM Power and Construction Ltd. | (102,000 | ) | (18,617 | ) | 1.6 | |||||||
|
|
|
| |||||||||
Malta | ||||||||||||
Kindred Group PLC | (34,173 | ) | (417,150 | ) | 36.0 | |||||||
|
|
|
| |||||||||
Netherlands | ||||||||||||
AMG Advanced Metallurgical Group NV | (3,847 | ) | (142,478 | ) | 12.3 | |||||||
Arcadis NV | (11,699 | ) | (479,409 | ) | 41.4 | |||||||
Basic-Fit NV | (615 | ) | (25,876 | ) | 2.2 | |||||||
Corbion NV | (594 | ) | (18,543 | ) | 1.6 | |||||||
Flow Traders Ltd. | (11,395 | ) | (279,638 | ) | 24.1 | |||||||
SCHEDULE OF INVESTMENTS | 85 |
Schedule of Investments (continued) April 30, 2023 | BlackRock Global Equity Market Neutral Fund |
| Security | Shares | Value | % of Basket Value | |||||||||
Netherlands (continued) | ||||||||||||
Fugro NV | (13,574 | ) | $ | (190,923 | ) | 16.5 | % | |||||
Meltwater NV | (192,618 | ) | (319,007 | ) | 27.5 | |||||||
NSI NV | (2,312 | ) | (52,619 | ) | 4.6 | |||||||
SIF Holding NV | (9 | ) | (118 | ) | 0.0 | |||||||
Sligro Food Group NV | (1,555 | ) | (26,910 | ) | 2.3 | |||||||
TKH Group NV | (9,105 | ) | (437,021 | ) | 37.7 | |||||||
|
|
|
| |||||||||
| (1,972,542 | ) | |||||||||||
New Zealand | ||||||||||||
Pushpay Holdings Ltd. | (794,546 | ) | (699,125 | ) | 60.3 | |||||||
|
|
|
| |||||||||
Norway | ||||||||||||
Aker Carbon Capture ASA | (76,674 | ) | (80,263 | ) | 6.9 | |||||||
Atea ASA | (1,184 | ) | (16,518 | ) | 1.4 | |||||||
Crayon Group Holding ASA | (28,103 | ) | (220,983 | ) | 19.1 | |||||||
Europris ASA | (28,610 | ) | (208,272 | ) | 18.0 | |||||||
FREYR Battery SA | (5,639 | ) | (39,868 | ) | 3.4 | |||||||
Hexagon Composites ASA | (49,015 | ) | (151,175 | ) | 13.1 | |||||||
Hexagon Purus ASA | (6,508 | ) | (14,069 | ) | 1.2 | |||||||
Kahoot! ASA | (156,765 | ) | (415,036 | ) | 35.8 | |||||||
MPC Container Ships ASA | (50,200 | ) | (83,849 | ) | 7.2 | |||||||
Norske Skog ASA | (12,443 | ) | (56,447 | ) | 4.9 | |||||||
Norwegian Air Shuttle ASA | (117,317 | ) | (115,932 | ) | 10.0 | |||||||
|
|
|
| |||||||||
| (1,402,412 | ) | |||||||||||
Philippines | ||||||||||||
TaskUS, Inc., Class A | (12,513 | ) | (168,425 | ) | 14.5 | |||||||
|
|
|
| |||||||||
Portugal | ||||||||||||
Altri SGPS SA | (37,263 | ) | (192,340 | ) | 16.6 | |||||||
Corticeira Amorim SGPS SA | (26,110 | ) | (292,291 | ) | 25.2 | |||||||
CTT-Correios de Portugal SA | (44,698 | ) | (183,198 | ) | 15.8 | |||||||
Navigator Co. SA | (87,431 | ) | (318,280 | ) | 27.5 | |||||||
NOS SGPS SA | (81,828 | ) | (356,387 | ) | 30.7 | |||||||
|
|
|
| |||||||||
| (1,342,496 | ) | |||||||||||
Puerto Rico | ||||||||||||
Liberty Latin America Ltd. | (3,146 | ) | (27,936 | ) | 2.4 | |||||||
|
|
|
| |||||||||
Singapore | ||||||||||||
AEM Holdings Ltd. | (158,800 | ) | (404,801 | ) | 34.9 | |||||||
CapitaLand China Trust | (15,000 | ) | (12,513 | ) | 1.1 | |||||||
Kulicke & Soffa Industries, Inc. | (2,615 | ) | (124,631 | ) | 10.8 | |||||||
Lendlease Global Commercial REIT | (100,000 | ) | (52,626 | ) | 4.5 | |||||||
OUE Commercial Real Estate Investment Trust | (238,100 | ) | (58,147 | ) | 5.0 | |||||||
PARAGON REIT | (149,300 | ) | (104,823 | ) | 9.0 | |||||||
Parkway Life Real Estate Investment Trust | (27,700 | ) | (80,696 | ) | 7.0 | |||||||
Starhill Global REIT | (394,800 | ) | (155,668 | ) | 13.4 | |||||||
TDCX, Inc. | (5,937 | ) | (41,737 | ) | 3.6 | |||||||
|
|
|
| |||||||||
| (1,035,642 | ) | |||||||||||
Spain | ||||||||||||
Atresmedia Corp. de Medios de Comunicacion SA . | (12,422 | ) | (49,272 | ) | 4.3 | |||||||
Befesa SA | (11,937 | ) | (533,119 | ) | 46.0 | |||||||
CIE Automotive SA | (3,278 | ) | (98,068 | ) | 8.5 | |||||||
Construcciones y Auxiliar de Ferrocarriles SA | (1,893 | ) | (58,293 | ) | 5.0 | |||||||
Ence Energia y Celulosa SA | (5,403 | ) | (21,068 | ) | 1.8 | |||||||
Faes Farma SA | (57,947 | ) | (202,662 | ) | 17.5 | |||||||
Gestamp Automocion SA | (32,293 | ) | (138,439 | ) | 11.9 | |||||||
Grenergy Renovables SA | (9,236 | ) | (268,049 | ) | 23.1 | |||||||
Linea Directa Aseguradora SA Cia de Seguros y Reaseguros | (62,554 | ) | (57,219 | ) | 4.9 | |||||||
| Security | Shares | Value | % of Basket Value | |||||||||
Spain (continued) | ||||||||||||
Opdenergy Holdings SA | (33,903 | ) | $ | (139,939 | ) | 12.1 | % | |||||
Talgo SA | (12,108 | ) | (41,771 | ) | 3.6 | |||||||
Vidrala SA | (1,758 | ) | (183,020 | ) | 15.8 | |||||||
|
|
|
| |||||||||
| (1,790,919 | ) | |||||||||||
Sweden | ||||||||||||
AcadeMedia AB | (131,027 | ) | (658,389 | ) | 56.8 | |||||||
AFRY AB | (8,490 | ) | (158,091 | ) | 13.6 | |||||||
Attendo AB | (16,823 | ) | (59,095 | ) | 5.1 | |||||||
Beijer Alma AB | (13,224 | ) | (298,119 | ) | 25.7 | |||||||
Bilia AB, A Shares | (7,676 | ) | (85,699 | ) | 7.4 | |||||||
Billerud AB | (74,211 | ) | (705,604 | ) | 60.9 | |||||||
BioArctic AB | (14,886 | ) | (381,235 | ) | 32.9 | |||||||
Cibus Nordic Real Estate AB | (9,312 | ) | (98,579 | ) | 8.5 | |||||||
Cint Group AB | (37,077 | ) | (57,846 | ) | 5.0 | |||||||
Clas Ohlson AB, B Shares | (16,619 | ) | (124,269 | ) | 10.7 | |||||||
Cloetta AB, B Shares | (15,267 | ) | (32,010 | ) | 2.8 | |||||||
Coor Service Management Holding AB | (40,880 | ) | (263,310 | ) | 22.7 | |||||||
Creades AB, Class A | (2,210 | ) | (18,180 | ) | 1.6 | |||||||
Dios Fastigheter AB | (4,807 | ) | (33,964 | ) | 2.9 | |||||||
Dometic Group AB | (14,009 | ) | (99,576 | ) | 8.6 | |||||||
Duni AB | (11,762 | ) | (127,410 | ) | 11.0 | |||||||
Dustin Group AB | (66,647 | ) | (227,075 | ) | 19.6 | |||||||
Electrolux Professional AB | (18,557 | ) | (107,208 | ) | 9.2 | |||||||
Fabege AB | (15,334 | ) | (121,728 | ) | 10.5 | |||||||
Granges AB | (19,904 | ) | (196,115 | ) | 16.9 | |||||||
Hemnet Group AB | (20,089 | ) | (325,977 | ) | 28.1 | |||||||
Hexpol AB | (16,657 | ) | (194,338 | ) | 16.8 | |||||||
Hufvudstaden AB, A Shares | (51,072 | ) | (721,314 | ) | 62.2 | |||||||
Instalco AB | (27,173 | ) | (141,509 | ) | 12.2 | |||||||
Investment AB Oresund | (387 | ) | (4,594 | ) | 0.4 | |||||||
JM AB | (10,981 | ) | (174,390 | ) | 15.0 | |||||||
KNOW IT AB | (2,554 | ) | (58,622 | ) | 5.1 | |||||||
Lindab International AB | (16,531 | ) | (262,317 | ) | 22.6 | |||||||
Loomis AB | (8,922 | ) | (282,518 | ) | 24.4 | |||||||
MEKO AB | (5,108 | ) | (62,045 | ) | 5.3 | |||||||
Munters Group AB | (7,941 | ) | (77,248 | ) | 6.7 | |||||||
NCC AB, B Shares | (19,004 | ) | (187,360 | ) | 16.2 | |||||||
New Wave Group AB, B Shares | (3,724 | ) | (74,537 | ) | 6.4 | |||||||
Nordnet AB publ | (7,283 | ) | (113,354 | ) | 9.8 | |||||||
OX2 AB | (1,718 | ) | (13,180 | ) | 1.1 | |||||||
Pandox AB | (7,590 | ) | (89,482 | ) | 7.7 | |||||||
Peab AB | (31,940 | ) | (167,309 | ) | 14.4 | |||||||
PowerCell Sweden AB | (9,269 | ) | (77,840 | ) | 6.7 | |||||||
Ratos AB, B Shares | (23,095 | ) | (79,132 | ) | 6.8 | |||||||
Rvrc Holding AB | (18,287 | ) | (54,101 | ) | 4.7 | |||||||
SkiStar AB | (769 | ) | (9,804 | ) | 0.8 | |||||||
SSAB AB, B Shares | (59,392 | ) | (397,200 | ) | 34.3 | |||||||
Stillfront Group AB | (110,437 | ) | (233,286 | ) | 20.1 | |||||||
Surgical Science Sweden AB | (12,678 | ) | (229,500 | ) | 19.8 | |||||||
Vestum AB | (14,095 | ) | (18,139 | ) | 1.6 | |||||||
Viaplay Group AB | (2,230 | ) | (56,426 | ) | 4.9 | |||||||
Wallenstam AB, B Shares | (60,703 | ) | (238,526 | ) | 20.6 | |||||||
Wihlborgs Fastigheter AB | (47,614 | ) | (380,929 | ) | 32.9 | |||||||
|
|
|
| |||||||||
| (8,578,479 | ) | |||||||||||
Switzerland | ||||||||||||
ALSO Holding AG, Registered Shares | (1,895 | ) | (404,128 | ) | 34.9 | |||||||
Burckhardt Compression Holding AG | (99 | ) | (60,811 | ) | 5.3 | |||||||
Bystronic AG | (232 | ) | (166,555 | ) | 14.4 | |||||||
| 86 | 2 0 2 3 BLACK ROCK ANNUAL REPORT TO SHAREHOLDERS |
Schedule of Investments (continued) April 30, 2023 | BlackRock Global Equity Market Neutral Fund |
| Security | Shares | Value | % of Basket Value | |||||||||
Switzerland (continued) | ||||||||||||
Daetwyler Holding AG | (1,176 | ) | $ | (296,214 | ) | 25.6 | % | |||||
dormakaba Holding AG | (1,793 | ) | (799,149 | ) | 68.9 | |||||||
EFG International AG | (15,838 | ) | (151,565 | ) | 13.1 | |||||||
Forbo Holding AG, Registered Shares | (294 | ) | (430,532 | ) | 37.1 | |||||||
Interroll Holding AG, Registered Shares | (101 | ) | (366,693 | ) | 31.6 | |||||||
Intershop Holding AG | (106 | ) | (74,049 | ) | 6.4 | |||||||
Komax Holding AG, Registered Shares | (1,451 | ) | (382,595 | ) | 33.0 | |||||||
Landis&Gyr Group AG | (5,228 | ) | (431,215 | ) | 37.2 | |||||||
Leonteq AG | (1,007 | ) | (54,354 | ) | 4.7 | |||||||
Mobimo Holding AG, Registered Shares | (1,838 | ) | (490,311 | ) | 42.3 | |||||||
OC Oerlikon Corp. AG, Registered Shares | (30,875 | ) | (171,955 | ) | 14.8 | |||||||
Peach Property Group AG | (7,568 | ) | (117,644 | ) | 10.2 | |||||||
Rieter Holding AG, Registered Shares | (174 | ) | (18,847 | ) | 1.6 | |||||||
SFS Group AG | (4,523 | ) | (587,836 | ) | 50.7 | |||||||
Siegfried Holding AG, Registered Shares | (664 | ) | (509,118 | ) | 43.9 | |||||||
SKAN Group AG | (4,081 | ) | (391,552 | ) | 33.8 | |||||||
St Galler Kantonalbank AG, Registered Shares | (958 | ) | (536,778 | ) | 46.3 | |||||||
Stadler Rail AG | (12,900 | ) | (533,430 | ) | 46.0 | |||||||
TX Group AG | (234 | ) | (27,106 | ) | 2.3 | |||||||
Valiant Holding AG, Registered Shares | (1,739 | ) | (201,091 | ) | 17.4 | |||||||
Vontobel Holding AG, Registered Shares | (4,475 | ) | (298,193 | ) | 25.7 | |||||||
Zehnder Group AG | (783 | ) | (63,621 | ) | 5.5 | |||||||
Zur Rose Group AG | (248 | ) | (10,794 | ) | 0.9 | |||||||
|
|
|
| |||||||||
| (7,576,136 | ) | |||||||||||
United Arab Emirates | ||||||||||||
Network International Holdings PLC | (107,015 | ) | (513,404 | ) | 44.3 | |||||||
|
|
|
| |||||||||
United Kingdom | ||||||||||||
Ascential PLC | (33,300 | ) | (105,254 | ) | 9.1 | |||||||
Assura PLC | (1,121,194 | ) | (706,278 | ) | 60.9 | |||||||
Auction Technology Group PLC | (5,721 | ) | (49,716 | ) | 4.3 | |||||||
Balfour Beatty PLC | (173,504 | ) | (822,793 | ) | 71.0 | |||||||
Bridgepoint Group PLC, Registered Shares | (43,889 | ) | (131,352 | ) | 11.3 | |||||||
Capita PLC | (107,432 | ) | (46,219 | ) | 4.0 | |||||||
Close Brothers Group PLC | (11,592 | ) | (130,527 | ) | 11.3 | |||||||
Coats Group PLC | (699,905 | ) | (677,851 | ) | 58.5 | |||||||
Computacenter PLC | (12,313 | ) | (352,465 | ) | 30.4 | |||||||
Craneware PLC | (487 | ) | (8,161 | ) | 0.7 | |||||||
Crest Nicholson Holdings PLC | (56,054 | ) | (186,761 | ) | 16.1 | |||||||
Currys PLC | (187,553 | ) | (132,817 | ) | 11.5 | |||||||
Domino’s Pizza Group PLC | (78,423 | ) | (286,010 | ) | 24.7 | |||||||
Elementis PLC | (178,398 | ) | (277,647 | ) | 23.9 | |||||||
EMIS Group PLC | (35,376 | ) | (714,616 | ) | 61.6 | |||||||
Finablr PLC | (44,203 | ) | (1 | ) | 0.0 | |||||||
Firstgroup PLC | (84,749 | ) | (117,793 | ) | 10.2 | |||||||
GB Group PLC | (56,035 | ) | (225,974 | ) | 19.5 | |||||||
Great Portland Estates PLC | (60,755 | ) | (401,274 | ) | 34.6 | |||||||
Greatland Gold PLC | (2,139,980 | ) | (212,986 | ) | 18.4 | |||||||
Halfords Group PLC | (116,614 | ) | (304,166 | ) | 26.2 | |||||||
Hays PLC | (706,579 | ) | (998,472 | ) | 86.1 | |||||||
Home Reit PLC | (350,343 | ) | (146,321 | ) | 12.6 | |||||||
Impact Healthcare Reit PLC | (38,501 | ) | (46,702 | ) | 4.0 | |||||||
IP Group PLC | (112,582 | ) | (78,387 | ) | 6.8 | |||||||
J D Wetherspoon PLC | (19,057 | ) | (168,270 | ) | 14.5 | |||||||
John Wood Group PLC | (85,650 | ) | (239,728 | ) | 20.7 | |||||||
Kape Technologies PLC | (78,094 | ) | (277,469 | ) | 23.9 | |||||||
Keller Group PLC | (6,908 | ) | (57,098 | ) | 4.9 | |||||||
Kier Group PLC | (49,834 | ) | (47,371 | ) | 4.1 | |||||||
Liontrust Asset Management PLC | (6,703 | ) | (71,371 | ) | 6.2 | |||||||
LondonMetric Property PLC | (114,667 | ) | (274,087 | ) | 23.6 | |||||||
| Security | Shares | Value | % of Basket Value | |||||||||
United Kingdom (continued) | ||||||||||||
LXI REIT PLC | (1,032,326 | ) | $ | (1,348,837 | ) | 116.4 | % | |||||
Marlowe PLC | (17,409 | ) | (108,430 | ) | 9.4 | |||||||
Mitie Group PLC | (533,727 | ) | (609,693 | ) | 52.6 | |||||||
Molten Ventures PLC | (90,849 | ) | (314,601 | ) | 27.1 | |||||||
Moonpig Group PLC | (7,451 | ) | (12,638 | ) | 1.1 | |||||||
NCC Group PLC | (179,292 | ) | (238,590 | ) | 20.6 | |||||||
Ninety One PLC | (12,698 | ) | (28,453 | ) | 2.5 | |||||||
Pagegroup PLC | (67,180 | ) | (377,874 | ) | 32.6 | |||||||
Petrofac Ltd. | (548,849 | ) | (486,075 | ) | 41.9 | |||||||
Pets at Home Group PLC | (55,997 | ) | (267,693 | ) | 23.1 | |||||||
Playtech PLC | (3,260 | ) | (23,476 | ) | 2.0 | |||||||
PRS REIT PLC | (70,150 | ) | (74,855 | ) | 6.5 | |||||||
PZ Cussons PLC | (35,132 | ) | (87,190 | ) | 7.5 | |||||||
Rathbones Group PLC | (13,408 | ) | (324,693 | ) | 28.0 | |||||||
Reach PLC | (224,465 | ) | (235,149 | ) | 20.3 | |||||||
Redrow PLC | (17,319 | ) | (111,255 | ) | 9.6 | |||||||
Renewi PLC | (63,267 | ) | (470,750 | ) | 40.6 | |||||||
S4 Capital PLC | (83,112 | ) | (150,479 | ) | 13.0 | |||||||
Spirent Communications PLC | (154,676 | ) | (346,294 | ) | 29.9 | |||||||
SSP Group PLC | (131,614 | ) | (420,262 | ) | 36.3 | |||||||
Supermarket Income Reit PLC | (206,756 | ) | (224,089 | ) | 19.3 | |||||||
Synthomer PLC | (88,616 | ) | (131,384 | ) | 11.3 | |||||||
THG PLC | (32,349 | ) | (40,266 | ) | 3.5 | |||||||
Tyman PLC | (29,440 | ) | (89,866 | ) | 7.7 | |||||||
Urban Logistics REIT PLC | (32,267 | ) | (56,486 | ) | 4.9 | |||||||
Volex PLC | (15,179 | ) | (48,136 | ) | 4.1 | |||||||
WH Smith PLC | (22,686 | ) | (443,757 | ) | 38.3 | |||||||
Wincanton PLC | (46,569 | ) | (123,964 | ) | 10.7 | |||||||
Workspace Group PLC | (4,710 | ) | (27,836 | ) | 2.4 | |||||||
Yellow Cake PLC | (278,641 | ) | (1,298,537 | ) | 112.0 | |||||||
|
|
|
| |||||||||
| (16,817,545 | ) | |||||||||||
United States | ||||||||||||
3D Systems Corp. | (26,951 | ) | (246,871 | ) | 21.3 | |||||||
4D Molecular Therapeutics, Inc. | (1,786 | ) | (32,166 | ) | 2.8 | |||||||
AAR Corp. | (2,646 | ) | (139,656 | ) | 12.0 | |||||||
ABM Industries, Inc. | (27,031 | ) | (1,150,980 | ) | 99.3 | |||||||
Acadia Realty Trust | (7,574 | ) | (102,325 | ) | 8.8 | |||||||
ACCO Brands Corp. | (4,135 | ) | (18,938 | ) | 1.6 | |||||||
Accolade, Inc. | (1,074 | ) | (14,531 | ) | 1.3 | |||||||
Aclaris Therapeutics, Inc. | (7,752 | ) | (68,915 | ) | 5.9 | |||||||
ACV Auctions, Inc., Class B | (12,789 | ) | (166,641 | ) | 14.4 | |||||||
AdaptHealth Corp. | (18,955 | ) | (225,185 | ) | 19.4 | |||||||
Addus HomeCare Corp. | (2,162 | ) | (176,722 | ) | 15.2 | |||||||
Adeia, Inc. | (25,217 | ) | (192,658 | ) | 16.6 | |||||||
Adicet Bio, Inc. | (5,006 | ) | (29,235 | ) | 2.5 | |||||||
ADMA Biologics, Inc. | (7,766 | ) | (26,016 | ) | 2.2 | |||||||
Adtalem Global Education, Inc. | (3,002 | ) | (121,791 | ) | 10.5 | |||||||
ADTRAN Holdings, Inc. | (15,761 | ) | (143,740 | ) | 12.4 | |||||||
Advantage Solutions, Inc. | (12,880 | ) | (16,486 | ) | 1.4 | |||||||
Aehr Test Systems | (11,013 | ) | (272,572 | ) | 23.5 | |||||||
Aerovate Therapeutics, Inc. | (3,641 | ) | (76,352 | ) | 6.6 | |||||||
AeroVironment, Inc. | (656 | ) | (66,053 | ) | 5.7 | |||||||
AerSale Corp. | (762 | ) | (12,329 | ) | 1.1 | |||||||
Aeva Technologies, Inc. | (21,530 | ) | (21,356 | ) | 1.8 | |||||||
Agiliti, Inc. | (16,181 | ) | (270,546 | ) | 23.3 | |||||||
Agilysys, Inc. | (1,595 | ) | (124,474 | ) | 10.7 | |||||||
Akero Therapeutics, Inc. | (16,896 | ) | (755,927 | ) | 65.2 | |||||||
Alamo Group, Inc. | (1,117 | ) | (197,407 | ) | 17.0 | |||||||
Alexander’s, Inc. | (2,010 | ) | (374,001 | ) | 32.3 | |||||||
Alkami Technology, Inc. | (28,152 | ) | (337,542 | ) | 29.1 | |||||||
SCHEDULE OF INVESTMENTS | 87 |
Schedule of Investments (continued) April 30, 2023 | BlackRock Global Equity Market Neutral Fund |
| Security | Shares | Value | % of Basket Value | |||||||||
United States (continued) | ||||||||||||
Allbirds, Inc., Class A | (177,009 | ) | $ | (221,261 | ) | 19.1 | % | |||||
Allovir, Inc. | (1,174 | ) | (4,039 | ) | 0.3 | |||||||
Alphatec Holdings, Inc. | (20,836 | ) | (300,872 | ) | 26.0 | |||||||
Altair Engineering, Inc., Class A | (5,283 | ) | (364,791 | ) | 31.5 | |||||||
Altus Power, Inc. | (7,621 | ) | (34,599 | ) | 3.0 | |||||||
A-Mark Precious Metals, Inc. | (9,340 | ) | (334,372 | ) | 28.8 | |||||||
AMC Networks, Inc. | (9,843 | ) | (174,123 | ) | 15.0 | |||||||
Amerant Bancorp, Inc. | (10,660 | ) | (198,276 | ) | 17.1 | |||||||
Ameresco, Inc., Class A | (5,373 | ) | (223,517 | ) | 19.3 | |||||||
American Eagle Outfitters, Inc. | (10,660 | ) | (142,737 | ) | 12.3 | |||||||
American States Water Co. | (5,121 | ) | (454,489 | ) | 39.2 | |||||||
American Well Corp., Class A | (6,523 | ) | (14,285 | ) | 1.2 | |||||||
America’s Car-Mart, Inc. | (5,744 | ) | (461,760 | ) | 39.8 | |||||||
Ameris Bancorp | (486 | ) | (16,281 | ) | 1.4 | |||||||
Amplitude, Inc. | (4,867 | ) | (55,240 | ) | 4.8 | |||||||
Anavex Life Sciences Corp. | (21,460 | ) | (174,684 | ) | 15.1 | |||||||
Andersons, Inc. | (1,305 | ) | (58,334 | ) | 5.0 | |||||||
ANI Pharmaceuticals, Inc. | (565 | ) | (21,312 | ) | 1.8 | |||||||
Anterix, Inc. | (1,330 | ) | (42,001 | ) | 3.6 | |||||||
Apartment Investment and Management Co. | (15,846 | ) | (124,074 | ) | 10.7 | |||||||
API Group Corp. | (14,773 | ) | (336,233 | ) | 29.0 | |||||||
Apollo Commercial Real Estate Finance, Inc. | (21,879 | ) | (221,415 | ) | 19.1 | |||||||
Apollo Medical Holdings, Inc. | (1,595 | ) | (56,607 | ) | 4.9 | |||||||
Appian Corp., Class A | (17,816 | ) | (668,991 | ) | 57.7 | |||||||
ArcBest Corp. | (3,123 | ) | (294,811 | ) | 25.4 | |||||||
Arcellx, Inc. | (1,577 | ) | (67,306 | ) | 5.8 | |||||||
Arcosa, Inc. | (4,670 | ) | (315,412 | ) | 27.2 | |||||||
Arcturus Therapeutics Holdings, Inc. | (12,574 | ) | (334,720 | ) | 28.9 | |||||||
Ares Commercial Real Estate Corp. | (31,900 | ) | (274,659 | ) | 23.7 | |||||||
Argan, Inc. | (8,294 | ) | (333,668 | ) | 28.8 | |||||||
Arko Corp. | (15,643 | ) | (130,775 | ) | 11.3 | |||||||
ARMOUR Residential REIT, Inc. | (62,703 | ) | (319,785 | ) | 27.6 | |||||||
Array Technologies, Inc. | (12,472 | ) | (255,052 | ) | 22.0 | |||||||
Artesian Resources Corp., Class A | (179 | ) | (9,806 | ) | 0.8 | |||||||
Atea Pharmaceuticals, Inc. | (14,196 | ) | (46,421 | ) | 4.0 | |||||||
Atlantic Union Bankshares Corp. | (14,931 | ) | (427,325 | ) | 36.9 | |||||||
Atlanticus Holdings Corp. | (894 | ) | (26,069 | ) | 2.3 | |||||||
Avanos Medical, Inc. | (13,788 | ) | (407,298 | ) | 35.1 | |||||||
AvePoint, Inc. | (32,429 | ) | (140,742 | ) | 12.1 | |||||||
Avidity Biosciences, Inc. | (4,559 | ) | (56,532 | ) | 4.9 | |||||||
Axsome Therapeutics, Inc. | (1,230 | ) | (87,982 | ) | 7.6 | |||||||
AZZ, Inc. | (8,026 | ) | (302,821 | ) | 26.1 | |||||||
Babcock & Wilcox Enterprises, Inc. | (72,972 | ) | (453,886 | ) | 39.2 | |||||||
Balchem Corp. | (6,020 | ) | (791,028 | ) | 68.2 | |||||||
Banc of California, Inc. | (17,638 | ) | (200,191 | ) | 17.3 | |||||||
Bank First Corp. | (167 | ) | (11,421 | ) | 1.0 | |||||||
Banner Corp. | (1,587 | ) | (79,223 | ) | 6.8 | |||||||
Barnes Group, Inc. | (16,828 | ) | (707,281 | ) | 61.0 | |||||||
Barrett Business Services, Inc. | (1,302 | ) | (108,860 | ) | 9.4 | |||||||
Beauty Health Co. | (4,246 | ) | (48,659 | ) | 4.2 | |||||||
Benson Hill, Inc. | (36,984 | ) | (39,203 | ) | 3.4 | |||||||
BioCryst Pharmaceuticals, Inc. | (19,150 | ) | (145,732 | ) | 12.6 | |||||||
Biohaven Ltd. | (1,860 | ) | (24,329 | ) | 2.1 | |||||||
BioLife Solutions, Inc. | (1,513 | ) | (26,568 | ) | 2.3 | |||||||
Bionano Genomics, Inc. | (444,264 | ) | (305,609 | ) | 26.4 | |||||||
Bioxcel Therapeutics, Inc. | (17,298 | ) | (356,685 | ) | 30.8 | |||||||
Blink Charging Co | (12,775 | ) | (91,086 | ) | 7.9 | |||||||
Bloomin’ Brands, Inc. | (23,352 | ) | (578,429 | ) | 49.9 | |||||||
Blue Bird Corp. | (1,468 | ) | (27,452 | ) | 2.4 | |||||||
Boot Barn Holdings, Inc. | (2,588 | ) | (187,552 | ) | 16.2 | |||||||
Boston Omaha Corp., Class A | (9,792 | ) | (200,344 | ) | 17.3 | |||||||
Brady Corp., Class A | (4,119 | ) | (210,193 | ) | 18.1 | |||||||
| Security | Shares | Value | % of Basket Value | |||||||||
United States (continued) | ||||||||||||
Braze, Inc. | (2,984 | ) | $ | (87,730 | ) | 7.6 | % | |||||
Bridgebio Pharma, Inc. | (1,070 | ) | (15,536 | ) | 1.3 | |||||||
Brightsphere Investment Group, Inc. | (16,926 | ) | (382,189 | ) | 33.0 | |||||||
BrightSpire Capital, Inc. | (28,899 | ) | (164,724 | ) | 14.2 | |||||||
Brinker International, Inc. | (12,894 | ) | (514,728 | ) | 44.4 | |||||||
Bristow Group, Inc. | (5,461 | ) | (122,163 | ) | 10.5 | |||||||
Brookline Bancorp, Inc. | (1,181 | ) | (11,267 | ) | 1.0 | |||||||
BRP Group, Inc., Class A | (22,168 | ) | (558,412 | ) | 48.2 | |||||||
Butterfly Network, Inc. | (90,814 | ) | (196,158 | ) | 16.9 | |||||||
Cadre Holdings, Inc. | (611 | ) | (12,868 | ) | 1.1 | |||||||
Calavo Growers, Inc. | (9,191 | ) | (293,744 | ) | 25.3 | |||||||
California Water Service Group | (9,107 | ) | (510,721 | ) | 44.1 | |||||||
Callon Petroleum Co. | (5,165 | ) | (171,168 | ) | 14.8 | |||||||
Camping World Holdings, Inc., Class A | (25,070 | ) | (561,317 | ) | 48.4 | |||||||
Cano Health, Inc. | (116,019 | ) | (134,582 | ) | 11.6 | |||||||
Capitol Federal Financial, Inc. | (27,430 | ) | (170,066 | ) | 14.7 | |||||||
CareMax, Inc. | (27,979 | ) | (70,507 | ) | 6.1 | |||||||
Caribou Biosciences, Inc. | (36,186 | ) | (155,600 | ) | 13.4 | |||||||
CarParts.com, Inc. | (5,085 | ) | (24,103 | ) | 2.1 | |||||||
Carriage Services, Inc. | (4,828 | ) | (138,612 | ) | 12.0 | |||||||
Cars.com, Inc. | (21,012 | ) | (411,205 | ) | 35.5 | |||||||
Casella Waste Systems, Inc., Class A | (17,809 | ) | (1,585,001 | ) | 136.7 | |||||||
Cass Information Systems, Inc. | (9,135 | ) | (334,158 | ) | 28.8 | |||||||
Cathay General Bancorp | (16,874 | ) | (537,774 | ) | 46.4 | |||||||
Cavco Industries, Inc. | (1,355 | ) | (406,798 | ) | 35.1 | |||||||
CBIZ, Inc. | (359 | ) | (18,916 | ) | 1.6 | |||||||
CBL & Associates Properties, Inc. | (794 | ) | (18,365 | ) | 1.6 | |||||||
CCC Intelligent Solutions Holdings, Inc. | (52,790 | ) | (458,217 | ) | 39.5 | |||||||
Celldex Therapeutics, Inc. | (21,806 | ) | (685,581 | ) | 59.1 | |||||||
Centerspace | (5,506 | ) | (310,428 | ) | 26.8 | |||||||
Central Garden & Pet Co. | (6,480 | ) | (238,723 | ) | 20.6 | |||||||
Central Garden & Pet Co., Class A | (2,807 | ) | (99,171 | ) | 8.6 | |||||||
Centrus Energy Corp., Class A | (12,191 | ) | (357,196 | ) | 30.8 | |||||||
Cerevel Therapeutics Holdings, Inc. | (14,077 | ) | (408,796 | ) | 35.3 | |||||||
Certara, Inc. | (12,458 | ) | (301,110 | ) | 26.0 | |||||||
Chase Corp. | (1,833 | ) | (200,402 | ) | 17.3 | |||||||
Chesapeake Utilities Corp. | (808 | ) | (99,788 | ) | 8.6 | |||||||
Children’s Place, Inc. | (9,514 | ) | (281,995 | ) | 24.3 | |||||||
Chuy’s Holdings, Inc. | (2,302 | ) | (80,294 | ) | 6.9 | |||||||
City Holding Co. | (2,886 | ) | (263,174 | ) | 22.7 | |||||||
Claros Mortgage Trust, Inc. | (1,686 | ) | (20,165 | ) | 1.7 | |||||||
Clarus Corp. | (14,825 | ) | (144,247 | ) | 12.4 | |||||||
Clearfield, Inc. | (4,204 | ) | (183,631 | ) | 15.8 | |||||||
Clearway Energy, Inc., Class C | (8,154 | ) | (247,637 | ) | 21.4 | |||||||
Clover Health Investments Corp. | (28,862 | ) | (21,317 | ) | 1.8 | |||||||
Cogent Biosciences, Inc. | (16,650 | ) | (179,154 | ) | 15.5 | |||||||
Cogent Communications Holdings, Inc. | (15,207 | ) | (1,049,891 | ) | 90.6 | |||||||
Cohu, Inc. | (7,141 | ) | (241,651 | ) | 20.8 | |||||||
Columbia Financial, Inc. | (15,769 | ) | (264,604 | ) | 22.8 | |||||||
Columbus McKinnon Corp. | (4,586 | ) | (159,180 | ) | 13.7 | |||||||
Community Bank System, Inc. | (14,772 | ) | (738,009 | ) | 63.7 | |||||||
Community Healthcare Trust, Inc. | (12,077 | ) | (432,236 | ) | 37.3 | |||||||
Community Trust Bancorp, Inc. | (2,852 | ) | (102,701 | ) | 8.9 | |||||||
Compass, Inc. | (2,686 | ) | (6,285 | ) | 0.5 | |||||||
Conduent, Inc. | (69,791 | ) | (244,966 | ) | 21.1 | |||||||
CONMED Corp. | (2,277 | ) | (285,923 | ) | 24.7 | |||||||
Consensus Cloud Solutions, Inc. | (7,218 | ) | (269,448 | ) | 23.2 | |||||||
Core Laboratories NV | (1,378 | ) | (31,019 | ) | 2.7 | |||||||
Corporate Office Properties Trust | (13,392 | ) | (306,543 | ) | 26.4 | |||||||
Couchbase, Inc. | (22,879 | ) | (351,421 | ) | 30.3 | |||||||
Coursera, Inc. | (35,071 | ) | (436,283 | ) | 37.6 | |||||||
CRA International, Inc. | (189 | ) | (19,871 | ) | 1.7 | |||||||
| 88 | 2 0 2 3 BLACK ROCK ANNUAL REPORT TO SHAREHOLDERS |
Schedule of Investments (continued) April 30, 2023 | BlackRock Global Equity Market Neutral Fund |
| Security | Shares | Value | % of Basket Value | |||||||||
United States (continued) | ||||||||||||
Credo Technology Group Holding Ltd. | (61,602 | ) | $ | (499,592 | ) | 43.1 | % | |||||
Crinetics Pharmaceuticals, Inc. | (8,462 | ) | (165,347 | ) | 14.3 | |||||||
Cross Country Healthcare, Inc. | (22,938 | ) | (504,177 | ) | 43.5 | |||||||
CryoPort, Inc. | (2,804 | ) | (58,996 | ) | 5.1 | |||||||
CS Disco, Inc. | (26,742 | ) | (157,243 | ) | 13.6 | |||||||
CTI BioPharma Corp. | (65,921 | ) | (320,376 | ) | 27.6 | |||||||
CTS Corp. | (5,326 | ) | (208,832 | ) | 18.0 | |||||||
Cullinan Oncology, Inc. | (7,603 | ) | (73,977 | ) | 6.4 | |||||||
Cushman & Wakefield PLC | (35,872 | ) | (353,339 | ) | 30.5 | |||||||
CVB Financial Corp. | (9,750 | ) | (145,958 | ) | 12.6 | |||||||
Cymabay Therapeutics, Inc. | (991 | ) | (10,663 | ) | 0.9 | |||||||
Cytek Biosciences, Inc. | (15,279 | ) | (175,403 | ) | 15.1 | |||||||
Definitive Healthcare Corp. | (4,160 | ) | (44,512 | ) | 3.8 | |||||||
Delek US Holdings, Inc. | (7,794 | ) | (169,520 | ) | 14.6 | |||||||
Deluxe Corp. | (5,780 | ) | (87,567 | ) | 7.6 | |||||||
Denali Therapeutics, Inc. | (2,211 | ) | (54,921 | ) | 4.7 | |||||||
DICE Therapeutics, Inc. | (6,061 | ) | (196,983 | ) | 17.0 | |||||||
Digital Turbine, Inc. | (64,121 | ) | (752,139 | ) | 64.9 | |||||||
Dine Brands Global, Inc. | (3,839 | ) | (249,266 | ) | 21.5 | |||||||
DocGo, Inc. | (29,379 | ) | (249,722 | ) | 21.5 | |||||||
Donnelley Financial Solutions, Inc. | (10,681 | ) | (461,953 | ) | 39.9 | |||||||
Dorman Products, Inc. | (4,170 | ) | (359,287 | ) | 31.0 | |||||||
Douglas Dynamics, Inc. | (4,230 | ) | (123,981 | ) | 10.7 | |||||||
Douglas Elliman, Inc. | (29,075 | ) | (92,749 | ) | 8.0 | |||||||
Dril-Quip, Inc. | (2,314 | ) | (63,126 | ) | 5.4 | |||||||
Driven Brands Holdings, Inc. | (2,866 | ) | (87,986 | ) | 7.6 | |||||||
Dynavax Technologies Corp. | (3,640 | ) | (37,892 | ) | 3.3 | |||||||
Dynex Capital, Inc. | (73,450 | ) | (871,117 | ) | 75.1 | |||||||
E2open Parent Holdings, Inc. | (96,484 | ) | (606,884 | ) | 52.4 | |||||||
Eagle Bulk Shipping, Inc. | (5,987 | ) | (267,739 | ) | 23.1 | |||||||
Eastern Bankshares, Inc. | (460 | ) | (5,359 | ) | 0.5 | |||||||
Edgewell Personal Care Co. | (5,308 | ) | (231,800 | ) | 20.0 | |||||||
Ellington Financial, Inc. | (39,686 | ) | (506,790 | ) | 43.7 | |||||||
Empire State Realty Trust, Inc. | (53,738 | ) | (328,339 | ) | 28.3 | |||||||
Enact Holdings, Inc. | (909 | ) | (21,943 | ) | 1.9 | |||||||
Encore Capital Group, Inc. | (12,496 | ) | (642,044 | ) | 55.4 | |||||||
Energizer Holdings, Inc. | (12,527 | ) | (418,778 | ) | 36.1 | |||||||
Energy Fuels, Inc. | (33,572 | ) | (192,830 | ) | 16.6 | |||||||
Energy Vault Holdings, Inc. | (12,140 | ) | (20,517 | ) | 1.8 | |||||||
EnerSys | (9,684 | ) | (803,481 | ) | 69.3 | |||||||
Enhabit, Inc. | (11,907 | ) | (145,861 | ) | 12.6 | |||||||
Enovix Corp. | (51,328 | ) | (555,369 | ) | 47.9 | |||||||
Enterprise Financial Services Corp. | (2,468 | ) | (105,532 | ) | 9.1 | |||||||
ePlus, Inc. | (3,764 | ) | (163,885 | ) | 14.1 | |||||||
EQRx, Inc. | (65,324 | ) | (109,744 | ) | 9.5 | |||||||
Equity Commonwealth | (11,088 | ) | (229,743 | ) | 19.8 | |||||||
Esab Corp. | (7,512 | ) | (438,400 | ) | 37.8 | |||||||
ESS Tech, Inc. | (65,167 | ) | (69,729 | ) | 6.0 | |||||||
Essential Properties Realty Trust, Inc. | (21,691 | ) | (536,852 | ) | 46.3 | |||||||
EverCommerce, Inc. | (4,854 | ) | (58,588 | ) | 5.1 | |||||||
EverQuote, Inc. | (6,096 | ) | (42,489 | ) | 3.7 | |||||||
Evolent Health, Inc., Class A | (14,076 | ) | (512,507 | ) | 44.2 | |||||||
Evolus, Inc. | (20,394 | ) | (178,244 | ) | 15.4 | |||||||
Evolv Technologies Holdings, Inc. | (78,476 | ) | (282,514 | ) | 24.4 | |||||||
Expro Group Holdings NV | (14,727 | ) | (292,920 | ) | 25.3 | |||||||
Farmers National Banc Corp. | (752 | ) | (8,791 | ) | 0.8 | |||||||
Farmland Partners, Inc. | (19,246 | ) | (200,928 | ) | 17.3 | |||||||
Fastly, Inc. | (3,718 | ) | (54,952 | ) | 4.7 | |||||||
FB Financial Corp. | (722 | ) | (21,248 | ) | 1.8 | |||||||
Federal Agricultural Mortgage Corp. | (1,543 | ) | (205,666 | ) | 17.7 | |||||||
Federal Signal Corp. | (7,318 | ) | (375,999 | ) | 32.4 | |||||||
Federated Hermes, Inc. | (17,011 | ) | (704,085 | ) | 60.7 | |||||||
| Security | Shares | Value | % of Basket Value | |||||||||
United States (continued) | ||||||||||||
Figs, Inc., Class A | (9,340 | ) | $ | (67,248 | ) | 5.8 | % | |||||
First Advantage Corp. | (13,028 | ) | (167,540 | ) | 14.5 | |||||||
First Bancorp/Southern Pines NC | (21,612 | ) | (665,217 | ) | 57.4 | |||||||
First Financial Bankshares, Inc. | (9,222 | ) | (269,836 | ) | 23.3 | |||||||
First Merchants Corp. | (14,688 | ) | (428,596 | ) | 37.0 | |||||||
FirstCash Holdings, Inc. | (597 | ) | (61,509 | ) | 5.3 | |||||||
Forestar Group, Inc. | (793 | ) | (15,337 | ) | 1.3 | |||||||
FormFactor, Inc. | (2,525 | ) | (68,958 | ) | 6.0 | |||||||
Forward Air Corp. | (6,633 | ) | (699,848 | ) | 60.4 | |||||||
Four Corners Property Trust, Inc. | (19,270 | ) | (491,578 | ) | 42.4 | |||||||
Franchise Group, Inc. | (7,600 | ) | (222,300 | ) | 19.2 | |||||||
Fresh Del Monte Produce, Inc. | (5,271 | ) | (151,330 | ) | 13.1 | |||||||
Freshpet, Inc. | (7,540 | ) | (520,034 | ) | 44.9 | |||||||
Frontdoor, Inc. | (12,503 | ) | (342,082 | ) | 29.5 | |||||||
fuboTV, Inc. | (108,041 | ) | (123,167 | ) | 10.6 | |||||||
FuelCell Energy, Inc. | (240,223 | ) | (451,619 | ) | 39.0 | |||||||
Fulcrum Therapeutics, Inc. | (62,428 | ) | (156,070 | ) | 13.5 | |||||||
Funko, Inc., Class A | (42,556 | ) | (419,602 | ) | 36.2 | |||||||
Gates Industrial Corp. PLC | (19,083 | ) | (257,048 | ) | 22.2 | |||||||
Genworth Financial, Inc., Class A | (125,037 | ) | (726,465 | ) | 62.7 | |||||||
German American Bancorp, Inc. | (2,208 | ) | (64,187 | ) | 5.5 | |||||||
Geron Corp. | (65,479 | ) | (161,078 | ) | 13.9 | |||||||
Getty Realty Corp. | (7,682 | ) | (256,041 | ) | 22.1 | |||||||
Gevo, Inc. | (89,966 | ) | (104,361 | ) | 9.0 | |||||||
G-III Apparel Group Ltd. | (7,443 | ) | (116,855 | ) | 10.1 | |||||||
Glacier Bancorp, Inc. | (17,399 | ) | (578,169 | ) | 49.9 | |||||||
Gladstone Commercial Corp. | (10,004 | ) | (119,448 | ) | 10.3 | |||||||
Glaukos Corp. | (6,718 | ) | (319,172 | ) | 27.5 | |||||||
Global Medical REIT, Inc. | (8,176 | ) | (75,873 | ) | 6.5 | |||||||
Global Net Lease, Inc. | (64,497 | ) | (726,236 | ) | 62.6 | |||||||
GrafTech International Ltd. | (57,555 | ) | (271,084 | ) | 23.4 | |||||||
Graham Holdings Co. | (1,739 | ) | (1,000,916 | ) | 86.3 | |||||||
Granite Construction, Inc. | (15,118 | ) | (576,449 | ) | 49.7 | |||||||
Great Southern Bancorp, Inc. | (1,846 | ) | (93,924 | ) | 8.1 | |||||||
Green Brick Partners, Inc. | (8,020 | ) | (298,905 | ) | 25.8 | |||||||
Green Dot Corp., Class A | (7,409 | ) | (127,361 | ) | 11.0 | |||||||
Greenbrier Cos., Inc. | (8,036 | ) | (212,552 | ) | 18.3 | |||||||
Greif, Inc. | (5,081 | ) | (319,036 | ) | 27.5 | |||||||
Grid Dynamics Holdings, Inc. | (8,154 | ) | (88,634 | ) | 7.6 | |||||||
Hagerty, Inc. | (10,656 | ) | (106,667 | ) | 9.2 | |||||||
Harmonic, Inc. | (24,331 | ) | (342,824 | ) | 29.6 | |||||||
Hawaiian Electric Industries, Inc. | (40,847 | ) | (1,601,611 | ) | 138.2 | |||||||
Hawkins, Inc. | (581 | ) | (23,438 | ) | 2.0 | |||||||
Hayward Holdings, Inc. | (59,326 | ) | (714,285 | ) | 61.6 | |||||||
HCI Group, Inc. | (3,431 | ) | (173,814 | ) | 15.0 | |||||||
Health Catalyst, Inc. | (1,909 | ) | (24,053 | ) | 2.1 | |||||||
HealthStream, Inc. | (1,443 | ) | (35,556 | ) | 3.1 | |||||||
Heartland Express, Inc. | (6,403 | ) | (92,715 | ) | 8.0 | |||||||
Hecla Mining Co. | (19,986 | ) | (120,915 | ) | 10.4 | |||||||
Helios Technologies, Inc. | (5,189 | ) | (312,066 | ) | 26.9 | |||||||
Heritage Commerce Corp. | (13,616 | ) | (115,736 | ) | 10.0 | |||||||
Heritage-Crystal Clean, Inc. | (7,125 | ) | (249,090 | ) | 21.5 | |||||||
Hibbett, Inc. | (7,666 | ) | (416,494 | ) | 35.9 | |||||||
Highwoods Properties, Inc. | (8,810 | ) | (201,925 | ) | 17.4 | |||||||
Hillenbrand, Inc. | (7,415 | ) | (338,272 | ) | 29.2 | |||||||
Hillman Solutions Corp. | (15,927 | ) | (133,787 | ) | 11.5 | |||||||
Hilltop Holdings, Inc. | (8,511 | ) | (264,011 | ) | 22.8 | |||||||
Hims & Hers Health, Inc. | (8,012 | ) | (92,859 | ) | 8.0 | |||||||
Hippo Holdings, Inc. | (5,210 | ) | (95,030 | ) | 8.2 | |||||||
HireRight Holdings Corp. | (14,756 | ) | (156,414 | ) | 13.5 | |||||||
HNI Corp. | (4,361 | ) | (113,299 | ) | 9.8 | |||||||
Home BancShares, Inc. | (39,466 | ) | (859,175 | ) | 74.1 | |||||||
SCHEDULE OF INVESTMENTS | 89 |
Schedule of Investments (continued) April 30, 2023 | BlackRock Global Equity Market Neutral Fund |
| Security | Shares | Value | % of Basket Value | |||||||||
United States (continued) | ||||||||||||
Hope Bancorp, Inc. | (6,866 | ) | $ | (62,481 | ) | 5.4 | % | |||||
Hostess Brands, Inc. | (4,838 | ) | (124,627 | ) | 10.8 | |||||||
Hyliion Holdings Corp. | (54,078 | ) | (74,087 | ) | 6.4 | |||||||
Hyster-Yale Materials Handling, Inc. | (4,496 | ) | (236,759 | ) | 20.4 | |||||||
Hyzon Motors, Inc. | (3,383 | ) | (2,813 | ) | 0.2 | |||||||
ICF International, Inc. | (256 | ) | (29,184 | ) | 2.5 | |||||||
Ichor Holdings Ltd. | (20,793 | ) | (579,085 | ) | 50.0 | |||||||
Ideaya Biosciences, Inc. | (1,181 | ) | (21,565 | ) | 1.9 | |||||||
IMAX Corp. | (10,931 | ) | (229,004 | ) | 19.8 | |||||||
Immunovant, Inc. | (18,901 | ) | (305,062 | ) | 26.3 | |||||||
Impinj, Inc. | (6,112 | ) | (540,362 | ) | 46.6 | |||||||
Independent Bank Corp. | (8,112 | ) | (454,272 | ) | 39.2 | |||||||
Ingevity Corp. | (2,771 | ) | (198,792 | ) | 17.2 | |||||||
Ingles Markets, Inc. | (256 | ) | (23,562 | ) | 2.0 | |||||||
Inhibrx, Inc. | (7,677 | ) | (161,217 | ) | 13.9 | |||||||
Innospec, Inc. | (1,562 | ) | (158,746 | ) | 13.7 | |||||||
Inogen, Inc. | (2,197 | ) | (29,242 | ) | 2.5 | |||||||
Insmed, Inc. | (14,536 | ) | (283,452 | ) | 24.5 | |||||||
Insteel Industries, Inc. | (4,049 | ) | (111,469 | ) | 9.6 | |||||||
Intapp, Inc. | (2,844 | ) | (114,670 | ) | 9.9 | |||||||
InterDigital, Inc. | (13,097 | ) | (887,191 | ) | 76.5 | |||||||
InvenTrust Properties Corp. | (6,684 | ) | (150,724 | ) | 13.0 | |||||||
IonQ, Inc. | (45,342 | ) | (249,834 | ) | 21.6 | |||||||
Itron, Inc. | (4,039 | ) | (215,683 | ) | 18.6 | |||||||
Ivanhoe Electric, Inc. | (1,831 | ) | (21,807 | ) | 1.9 | |||||||
Jack in the Box, Inc. | (7,086 | ) | (656,801 | ) | 56.7 | |||||||
Jackson Financial, Inc. | (6,341 | ) | (228,339 | ) | 19.7 | |||||||
JBG SMITH Properties | (16,618 | ) | (237,139 | ) | 20.5 | |||||||
Joby Aviation, Inc. | (207,334 | ) | (897,756 | ) | 77.4 | |||||||
John B Sanfilippo & Son, Inc. | (1,734 | ) | (180,249 | ) | 15.6 | |||||||
John Wiley & Sons, Inc. | (37,888 | ) | (1,461,340 | ) | 126.1 | |||||||
KB Home | (16,323 | ) | (715,274 | ) | 61.7 | |||||||
Kelly Services, Inc., Class A | (1,283 | ) | (21,054 | ) | 1.8 | |||||||
Kemper Corp. | (5,303 | ) | (257,991 | ) | 22.3 | |||||||
Kennedy-Wilson Holdings, Inc. | (36,027 | ) | (604,533 | ) | 52.2 | |||||||
Keros Therapeutics, Inc. | (2,799 | ) | (124,150 | ) | 10.7 | |||||||
Kezar Life Sciences, Inc. | (5,879 | ) | (14,286 | ) | 1.2 | |||||||
Kimball Electronics, Inc. | (8,584 | ) | (172,796 | ) | 14.9 | |||||||
Kinetik Holdings, Inc. | (3,918 | ) | (120,674 | ) | 10.4 | |||||||
Kiniksa Pharmaceuticals Ltd., Class A | (1,286 | ) | (13,825 | ) | 1.2 | |||||||
KKR Real Estate Finance Trust, Inc. | (57,413 | ) | (616,616 | ) | 53.2 | |||||||
Koppers Holdings, Inc. | (1,213 | ) | (39,799 | ) | 3.4 | |||||||
Krispy Kreme, Inc. | (9,789 | ) | (150,555 | ) | 13.0 | |||||||
Kronos Worldwide, Inc. | (7,134 | ) | (66,346 | ) | 5.7 | |||||||
Kura Sushi USA, Inc., Class A | (7,938 | ) | (547,087 | ) | 47.2 | |||||||
Kyndryl Holdings, Inc. | (7,461 | ) | (107,886 | ) | 9.3 | |||||||
Lakeland Bancorp, Inc. | (14,804 | ) | (212,289 | ) | 18.3 | |||||||
Latham Group, Inc. | (26,648 | ) | (64,222 | ) | 5.5 | |||||||
LCI Industries | (3,712 | ) | (419,308 | ) | 36.2 | |||||||
Leonardo DRS, Inc. | (25,645 | ) | (385,957 | ) | 33.3 | |||||||
Leslie’s, Inc. | (31,404 | ) | (340,733 | ) | 29.4 | |||||||
Lexicon Pharmaceuticals, Inc. | (69,502 | ) | (166,110 | ) | 14.3 | |||||||
LGI Homes, Inc. | (6,926 | ) | (822,809 | ) | 71.0 | |||||||
Liberty Energy, Inc. | (25,402 | ) | (325,400 | ) | 28.1 | |||||||
Liberty Media Corp.-Liberty Braves | (12,527 | ) | (476,277 | ) | 41.1 | |||||||
Life Time Group Holdings, Inc. | (23,857 | ) | (495,987 | ) | 42.8 | |||||||
Lightwave Logic, Inc. | (16,605 | ) | (74,723 | ) | 6.4 | |||||||
Lindblad Expeditions Holdings, Inc. | (1,574 | ) | (17,802 | ) | 1.5 | |||||||
Lions Gate Entertainment Corp. | (4,225 | ) | (45,081 | ) | 3.9 | |||||||
Lovesac Co | (1,826 | ) | (48,006 | ) | 4.1 | |||||||
LTC Properties, Inc. | (15,611 | ) | (522,188 | ) | 45.0 | |||||||
Luminar Technologies, Inc. | (56,959 | ) | (342,893 | ) | 29.6 | |||||||
| Security | Shares | Value | % of Basket Value | |||||||||
United States (continued) | ||||||||||||
M/I Homes, Inc. | (7,946 | ) | $ | (537,467 | ) | 46.4 | % | |||||
Madison Square Garden Entertainment Corp. | (1,662 | ) | (53,633 | ) | 4.6 | |||||||
Magnite, Inc. | (1,593 | ) | (14,974 | ) | 1.3 | |||||||
Marcus & Millichap, Inc. | (7,421 | ) | (233,539 | ) | 20.1 | |||||||
Masterbrand, Inc. | (54,059 | ) | (436,256 | ) | 37.6 | |||||||
Materion Corp. | (4,583 | ) | (496,385 | ) | 42.8 | |||||||
Mativ Holdings, Inc. | (13,089 | ) | (253,534 | ) | 21.9 | |||||||
Matterport, Inc. | (115,604 | ) | (269,357 | ) | 23.2 | |||||||
Matthews International Corp. | (20,335 | ) | (770,086 | ) | 66.4 | |||||||
MaxCyte, Inc. | (3,944 | ) | (19,720 | ) | 1.7 | |||||||
Maxeon Solar Technologies Ltd. | (5,909 | ) | (166,102 | ) | 14.3 | |||||||
Mercury Systems, Inc. | (14,488 | ) | (690,643 | ) | 59.6 | |||||||
MeridianLink, Inc. | (16,182 | ) | (241,759 | ) | 20.9 | |||||||
Mesa Laboratories, Inc. | (2,172 | ) | (361,660 | ) | 31.2 | |||||||
Methode Electronics, Inc. | (8,790 | ) | (360,302 | ) | 31.1 | |||||||
Microvast Holdings, Inc. | (9,994 | ) | (10,494 | ) | 0.9 | |||||||
MicroVision, Inc. | (52,255 | ) | (104,510 | ) | 9.0 | |||||||
Middlesex Water Co | (162 | ) | (11,823 | ) | 1.0 | |||||||
MillerKnoll, Inc. | (15,689 | ) | (266,870 | ) | 23.0 | |||||||
Minerals Technologies, Inc. | (6,456 | ) | (382,583 | ) | 33.0 | |||||||
Mirati Therapeutics, Inc. | (2,696 | ) | (119,460 | ) | 10.3 | |||||||
Mirum Pharmaceuticals, Inc. | (10,261 | ) | (275,508 | ) | 23.8 | |||||||
Mission Produce, Inc. | (21,161 | ) | (241,024 | ) | 20.8 | |||||||
Modine Manufacturing Co. | (4,236 | ) | (88,575 | ) | 7.6 | |||||||
Moelis & Co., Class A | (14,226 | ) | (538,881 | ) | 46.5 | |||||||
Monro, Inc. | (1,308 | ) | (63,935 | ) | 5.5 | |||||||
Montrose Environmental Group, Inc. | (6,449 | ) | (196,437 | ) | 16.9 | |||||||
Morphic Holding, Inc. | (4,663 | ) | (220,373 | ) | 19.0 | |||||||
Mueller Water Products, Inc., Class A | (73,416 | ) | (983,774 | ) | 84.9 | |||||||
N-able, Inc. | (22,807 | ) | (290,789 | ) | 25.1 | |||||||
NanoString Technologies, Inc. | (8,518 | ) | (83,476 | ) | 7.2 | |||||||
National Bank Holdings Corp. | (3,470 | ) | (110,346 | ) | 9.5 | |||||||
National Health Investors, Inc. | (4,889 | ) | (243,326 | ) | 21.0 | |||||||
National Presto Industries, Inc. | (7,268 | ) | (494,369 | ) | 42.6 | |||||||
Navitas Semiconductor Corp. | (23,713 | ) | (126,390 | ) | 10.9 | |||||||
NBT Bancorp, Inc. | (6,159 | ) | (198,566 | ) | 17.1 | |||||||
nCino, Inc. | (19,337 | ) | (478,204 | ) | 41.3 | |||||||
Necessity Retail REIT, Inc. | (20,601 | ) | (113,512 | ) | 9.8 | |||||||
Nelnet, Inc. | (10,045 | ) | (967,334 | ) | 83.4 | |||||||
NetScout Systems, Inc. | (10,270 | ) | (279,447 | ) | 24.1 | |||||||
NETSTREIT Corp. | (32,490 | ) | (591,968 | ) | 51.1 | |||||||
NewMarket Corp. | (2,769 | ) | (1,106,492 | ) | 95.5 | |||||||
NextDecade Corp. | (32,185 | ) | (200,513 | ) | 17.3 | |||||||
Nextdoor Holdings, Inc. | (166,159 | ) | (350,595 | ) | 30.2 | |||||||
NexTier Oilfield Solutions, Inc. | (62,452 | ) | (504,612 | ) | 43.5 | |||||||
Nicolet Bankshares, Inc. | (1,390 | ) | (79,661 | ) | 6.9 | |||||||
nLight, Inc. | (24,084 | ) | (211,217 | ) | 18.2 | |||||||
NMI Holdings, Inc., Class A | (6,000 | ) | (140,400 | ) | 12.1 | |||||||
Northern Oil and Gas, Inc. | (30,405 | ) | (1,008,534 | ) | 87.0 | |||||||
Northfield Bancorp, Inc. | (15,418 | ) | (160,656 | ) | 13.9 | |||||||
Northwest Bancshares, Inc. | (28,711 | ) | (335,632 | ) | 29.0 | |||||||
Northwest Natural Holding Co. | (2,141 | ) | (100,541 | ) | 8.7 | |||||||
NorthWestern Corp. | (28,714 | ) | (1,683,215 | ) | 145.2 | |||||||
Nu Skin Enterprises, Inc., Class A | (7,636 | ) | (301,317 | ) | 26.0 | |||||||
Nuvalent, Inc., Class A | (6,181 | ) | (218,746 | ) | 18.9 | |||||||
Nuvation Bio, Inc. | (4,406 | ) | (7,094 | ) | 0.6 | |||||||
ODP Corp. | (14,232 | ) | (614,965 | ) | 53.1 | |||||||
Office Properties Income Trust | (1,957 | ) | (12,760 | ) | 1.1 | |||||||
O-I Glass, Inc. | (27,339 | ) | (614,307 | ) | 53.0 | |||||||
Olo, Inc. | (56,803 | ) | (389,101 | ) | 33.6 | |||||||
OmniAb, Inc. | (99,923 | ) | (347,732 | ) | 30.0 | |||||||
ON24, Inc. | (9,271 | ) | (80,658 | ) | 7.0 | |||||||
| 90 | 2 0 2 3 BLACK ROCK ANNUAL REPORT TO SHAREHOLDERS |
Schedule of Investments (continued) April 30, 2023 | BlackRock Global Equity Market Neutral Fund |
| Security | Shares | Value | % of Basket Value | |||||||||
United States (continued) | ||||||||||||
One Liberty Properties, Inc. | (5,652 | ) | $ | (124,457 | ) | 10.7 | % | |||||
OneSpan, Inc. | (13,335 | ) | (196,558 | ) | 17.0 | |||||||
Open Lending Corp. | (24,476 | ) | (172,066 | ) | 14.8 | |||||||
Opendoor Technologies, Inc. | (93,209 | ) | (128,628 | ) | 11.1 | |||||||
OraSure Technologies, Inc. | (15,176 | ) | (103,197 | ) | 8.9 | |||||||
Origin Bancorp, Inc. | (5,373 | ) | (158,127 | ) | 13.6 | |||||||
Orthofix Medical, Inc. | (5,578 | ) | (105,034 | ) | 9.1 | |||||||
OrthoPediatrics Corp. | (3,980 | ) | (200,751 | ) | 17.3 | |||||||
Otter Tail Corp. | (1,583 | ) | (113,897 | ) | 9.8 | |||||||
Outset Medical, Inc. | (28,927 | ) | (520,397 | ) | 44.9 | |||||||
Pacific Biosciences of California, Inc. | (31,350 | ) | (332,310 | ) | 28.7 | |||||||
Paragon 28, Inc. | (4,827 | ) | (88,913 | ) | 7.7 | |||||||
Patrick Industries, Inc. | (2,410 | ) | (165,398 | ) | 14.3 | |||||||
Patterson Cos., Inc. | (21,609 | ) | (585,820 | ) | 50.5 | |||||||
Paycor HCM, Inc. | (1,618 | ) | (38,023 | ) | 3.3 | |||||||
PDF Solutions, Inc. | (1,688 | ) | (60,852 | ) | 5.3 | |||||||
Peapack-Gladstone Financial Corp. | (3,905 | ) | (103,717 | ) | 8.9 | |||||||
Pediatrix Medical Group, Inc. | (8,086 | ) | (115,872 | ) | 10.0 | |||||||
PennyMac Mortgage Investment Trust | (14,077 | ) | (174,977 | ) | 15.1 | |||||||
Perella Weinberg Partners | (18,883 | ) | (149,176 | ) | 12.9 | |||||||
Perficient, Inc. | (1,777 | ) | (115,363 | ) | 10.0 | |||||||
Phathom Pharmaceuticals, Inc. | (20,230 | ) | (216,461 | ) | 18.7 | |||||||
Phillips Edison & Co., Inc. | (32,400 | ) | (1,021,896 | ) | 88.2 | |||||||
Phreesia, Inc. | (474 | ) | (14,997 | ) | 1.3 | |||||||
Physicians Realty Trust | (74,989 | ) | (1,081,341 | ) | 93.3 | |||||||
Piper Sandler Cos | (2,423 | ) | (328,171 | ) | 28.3 | |||||||
Pitney Bowes, Inc. | (72,621 | ) | (254,900 | ) | 22.0 | |||||||
Planet Labs PBC | (63,503 | ) | (259,092 | ) | 22.4 | |||||||
Plexus Corp. | (8,038 | ) | (703,084 | ) | 60.7 | |||||||
Pliant Therapeutics, Inc. | (8,330 | ) | (235,323 | ) | 20.3 | |||||||
Plymouth Industrial REIT, Inc. | (24,793 | ) | (501,810 | ) | 43.3 | |||||||
PolyPeptide Group AG | (11,012 | ) | (275,004 | ) | 23.7 | |||||||
Portillo’s, Inc., Class A | (7,252 | ) | (156,788 | ) | 13.5 | |||||||
PotlatchDeltic Corp. | (16,072 | ) | (743,009 | ) | 64.1 | |||||||
PRA Group, Inc. | (12,587 | ) | (456,531 | ) | 39.4 | |||||||
Premier, Inc., Class A | (25,471 | ) | (848,948 | ) | 73.2 | |||||||
ProAssurance Corp. | (1,688 | ) | (30,316 | ) | 2.6 | |||||||
PROCEPT BioRobotics Corp. | (7,640 | ) | (232,180 | ) | 20.0 | |||||||
ProFrac Holding Corp. | (27,332 | ) | (306,118 | ) | 26.4 | |||||||
PROG Holdings, Inc. | (9,310 | ) | (281,441 | ) | 24.3 | |||||||
Progress Software Corp. | (13,672 | ) | (750,319 | ) | 64.7 | |||||||
Proterra, Inc. | (212,080 | ) | (248,134 | ) | 21.4 | |||||||
Proto Labs, Inc. | (3,392 | ) | (97,588 | ) | 8.4 | |||||||
Provident Financial Services, Inc. | (3,183 | ) | (55,639 | ) | 4.8 | |||||||
PubMatic, Inc. | (14,870 | ) | (203,124 | ) | 17.5 | |||||||
Pulmonx Corp. | (22,833 | ) | (268,288 | ) | 23.1 | |||||||
PureCycle Technologies, Inc. | (48,753 | ) | (320,307 | ) | 27.6 | |||||||
Purple Innovation, Inc. | (108,381 | ) | (321,892 | ) | 27.8 | |||||||
Quanterix Corp. | (2,604 | ) | (32,915 | ) | 2.8 | |||||||
Rackspace Technology, Inc. | (185,518 | ) | (270,856 | ) | 23.4 | |||||||
Ramaco Resources, Inc. | (4,932 | ) | (40,097 | ) | 3.5 | |||||||
RAPT Therapeutics, Inc. | (3,875 | ) | (70,525 | ) | 6.1 | |||||||
Ready Capital Corp. | (76,426 | ) | (820,051 | ) | 70.7 | |||||||
REC Silicon ASA | (77,581 | ) | (118,850 | ) | 10.3 | |||||||
Recursion Pharmaceuticals, Inc. | (36,805 | ) | (175,560 | ) | 15.1 | |||||||
Relay Therapeutics, Inc. | (8,389 | ) | (95,383 | ) | 8.2 | |||||||
Reliance Worldwide Corp. Ltd. | (129,558 | ) | (357,862 | ) | 30.9 | |||||||
Remitly Global, Inc. | (7,640 | ) | (128,352 | ) | 11.1 | |||||||
Renasant Corp. | (2,691 | ) | (75,671 | ) | 6.5 | |||||||
Resideo Technologies, Inc. | (19,705 | ) | (350,749 | ) | 30.3 | |||||||
Resources Connection, Inc. | (6,328 | ) | (92,326 | ) | 8.0 | |||||||
REV Group, Inc. | (29,872 | ) | (320,527 | ) | 27.7 | |||||||
| Security | Shares | Value | % of Basket Value | |||||||||
United States (continued) | ||||||||||||
Revance Therapeutics, Inc. | (8,820 | ) | $ | (280,741 | ) | 24.2 | % | |||||
Revolution Medicines, Inc. | (6,216 | ) | (146,014 | ) | 12.6 | |||||||
Reynolds Consumer Products, Inc. | (22,883 | ) | (641,411 | ) | 55.3 | |||||||
Rimini Street, Inc. | (40,297 | ) | (150,711 | ) | 13.0 | |||||||
Rocket Lab USA, Inc. | (106,371 | ) | (416,974 | ) | 36.0 | |||||||
Rocket Pharmaceuticals, Inc. | (4,878 | ) | (87,414 | ) | 7.5 | |||||||
Rogers Corp. | (4,669 | ) | (751,476 | ) | 64.8 | |||||||
Roivant Sciences Ltd. | (49,449 | ) | (422,789 | ) | 36.5 | |||||||
Rover Group, Inc. | (47,441 | ) | (214,908 | ) | 18.5 | |||||||
RXO, Inc. | (19,796 | ) | (358,110 | ) | 30.9 | |||||||
Ryerson Holding Corp. | (2,386 | ) | (90,119 | ) | 7.8 | |||||||
S&T Bancorp, Inc. | (4,474 | ) | (123,169 | ) | 10.6 | |||||||
Sabra Health Care REIT, Inc. | (7,877 | ) | (89,798 | ) | 7.7 | |||||||
Sabre Corp. | (15,971 | ) | (63,884 | ) | 5.5 | |||||||
Safety Insurance Group, Inc. | (9,415 | ) | (688,142 | ) | 59.4 | |||||||
Sage Therapeutics, Inc. | (4,894 | ) | (239,072 | ) | 20.6 | |||||||
Sally Beauty Holdings, Inc. | (6,977 | ) | (99,283 | ) | 8.6 | |||||||
Sandy Spring Bancorp, Inc. | (2,815 | ) | (63,281 | ) | 5.5 | |||||||
Scholastic Corp. | (5,136 | ) | (197,582 | ) | 17.0 | |||||||
Schrodinger, Inc. | (16,579 | ) | (489,412 | ) | 42.2 | |||||||
Seaboard Corp. | (20 | ) | (78,821 | ) | 6.8 | |||||||
Seacoast Banking Corp. of Florida | (7,713 | ) | (171,151 | ) | 14.8 | |||||||
Seer, Inc. | (31,962 | ) | (106,753 | ) | 9.2 | |||||||
Select Energy Services, Inc. | (30,486 | ) | (226,511 | ) | 19.5 | |||||||
Select Medical Holdings Corp. | (13,713 | ) | (418,247 | ) | 36.1 | |||||||
Senseonics Holdings, Inc. | (116,820 | ) | (69,520 | ) | 6.0 | |||||||
SES AI Corp. | (27,427 | ) | (44,706 | ) | 3.9 | |||||||
Shake Shack, Inc., Class A | (1,215 | ) | (66,594 | ) | 5.7 | |||||||
Shenandoah Telecommunications Co. | (7,683 | ) | (159,883 | ) | 13.8 | |||||||
SI-BONE, Inc. | (11,863 | ) | (262,172 | ) | 22.6 | |||||||
Signet Jewelers Ltd. | (2,578 | ) | (189,689 | ) | 16.4 | |||||||
SilverBow Resources, Inc. | (1,315 | ) | (31,363 | ) | 2.7 | |||||||
Simmons First National Corp., Class A | (17,545 | ) | (293,177 | ) | 25.3 | |||||||
Simply Good Foods Co. | (17,635 | ) | (641,385 | ) | 55.3 | |||||||
SITE Centers Corp. | (51,504 | ) | (635,559 | ) | 54.8 | |||||||
SiTime Corp. | (3,384 | ) | (367,062 | ) | 31.7 | |||||||
SJW Group | (10,302 | ) | (782,128 | ) | 67.5 | |||||||
SMART Global Holdings, Inc. | (7,452 | ) | (114,910 | ) | 9.9 | |||||||
SmartRent, Inc. | (54,026 | ) | (139,387 | ) | 12.0 | |||||||
Snap One Holdings Corp. | (3,402 | ) | (33,204 | ) | 2.9 | |||||||
Solid Power, Inc. | (133,984 | ) | (304,144 | ) | 26.2 | |||||||
SomaLogic, Inc. | (79,406 | ) | (222,337 | ) | 19.2 | |||||||
Sonos, Inc. | (11,076 | ) | (234,147 | ) | 20.2 | |||||||
Sotera Health Co. | (1,183 | ) | (19,839 | ) | 1.7 | |||||||
Southside Bancshares, Inc. | (2,389 | ) | (75,803 | ) | 6.5 | |||||||
Spectrum Brands Holdings, Inc. | (8,482 | ) | (564,053 | ) | 48.7 | |||||||
Sphere Entertainment Co. | (1,662 | ) | (46,769 | ) | 4.0 | |||||||
Spire, Inc. | (1,370 | ) | (92,790 | ) | 8.0 | |||||||
SpringWorks Therapeutics, Inc. | (14,225 | ) | (332,581 | ) | 28.7 | |||||||
Sprouts Farmers Market, Inc. | (8,913 | ) | (308,925 | ) | 26.7 | |||||||
Squarespace, Inc. | (3,644 | ) | (113,328 | ) | 9.8 | |||||||
St Joe Co. | (9,004 | ) | (370,064 | ) | 31.9 | |||||||
Stellar Bancorp, Inc. | (6,913 | ) | (158,584 | ) | 13.7 | |||||||
Stem, Inc. | (63,422 | ) | (268,275 | ) | 23.1 | |||||||
StepStone Group, Inc., Class A | (8,863 | ) | (195,252 | ) | 16.8 | |||||||
Stericycle, Inc. | (4,162 | ) | (189,995 | ) | 16.4 | |||||||
Stock Yards Bancorp, Inc. | (6,476 | ) | (314,734 | ) | 27.2 | |||||||
Strategic Education, Inc. | (6,544 | ) | (575,872 | ) | 49.7 | |||||||
Sun Country Airlines Holdings, Inc. | (9,456 | ) | (186,567 | ) | 16.1 | |||||||
Sunstone Hotel Investors, Inc. | (18,523 | ) | (176,524 | ) | 15.2 | |||||||
Syndax Pharmaceuticals, Inc. | (14,179 | ) | (291,378 | ) | 25.1 | |||||||
Taro Pharmaceutical Industries Ltd. | (2,004 | ) | (50,501 | ) | 4.4 | |||||||
SCHEDULE OF INVESTMENTS | 91 |
Schedule of Investments (continued) April 30, 2023 | BlackRock Global Equity Market Neutral Fund |
| Security | Shares | Value | % of Basket Value | |||||||||
United States (continued) | ||||||||||||
Tejon Ranch Co. | (2,869 | ) | $ | (49,576 | ) | 4.3 | % | |||||
Telephone and Data Systems, Inc. | (12,482 | ) | (124,820 | ) | 10.8 | |||||||
Telos Corp. | (14,332 | ) | (24,364 | ) | 2.1 | |||||||
Tennant Co. | (5,768 | ) | (440,791 | ) | 38.0 | |||||||
Terex Corp. | (4,249 | ) | (189,463 | ) | 16.3 | |||||||
Texas Capital Bancshares, Inc. | (12,148 | ) | (610,437 | ) | 52.7 | |||||||
TFS Financial Corp. | (21,416 | ) | (257,849 | ) | 22.2 | |||||||
TG Therapeutics, Inc. | (13,245 | ) | (328,873 | ) | 28.4 | |||||||
Tidewater, Inc. | (13,958 | ) | (628,529 | ) | 54.2 | |||||||
TimkenSteel Corp. | (4,664 | ) | (78,075 | ) | 6.7 | |||||||
Tootsie Roll Industries, Inc. | (4,916 | ) | (200,966 | ) | 17.3 | |||||||
Towne Bank/Portsmouth VA | (13,378 | ) | (316,925 | ) | 27.3 | |||||||
TPG, Inc. | (5,235 | ) | (151,658 | ) | 13.1 | |||||||
TPI Composites, Inc. | (22,725 | ) | (280,881 | ) | 24.2 | |||||||
Traeger, Inc. | (152,660 | ) | (464,086 | ) | 40.0 | |||||||
TransMedics Group, Inc. | (7,456 | ) | (589,770 | ) | 50.9 | |||||||
Tredegar Corp. | (69,059 | ) | (647,773 | ) | 55.9 | |||||||
TreeHouse Foods, Inc. | (11,155 | ) | (594,004 | ) | 51.2 | |||||||
TriCo Bancshares | (2,893 | ) | (103,598 | ) | 8.9 | |||||||
TriMas Corp. | (1,626 | ) | (41,317 | ) | 3.6 | |||||||
Tronox Holdings PLC | (18,684 | ) | (255,784 | ) | 22.1 | |||||||
TrustCo Bank Corp. NY | (1,767 | ) | (52,727 | ) | 4.6 | |||||||
Trustmark Corp. | (10,298 | ) | (246,019 | ) | 21.2 | |||||||
TTEC Holdings, Inc. | (1,045 | ) | (35,603 | ) | 3.1 | |||||||
Tucows, Inc. | (1,405 | ) | (31,458 | ) | 2.7 | |||||||
Two Harbors Investment Corp. | (17,098 | ) | (238,175 | ) | 20.5 | |||||||
Ultra Clean Holdings, Inc. | (9,541 | ) | (272,300 | ) | 23.5 | |||||||
UMH Properties, Inc. | (22,640 | ) | (344,128 | ) | 29.7 | |||||||
UniFirst Corp. | (5,009 | ) | (819,873 | ) | 70.7 | |||||||
United Bankshares, Inc. | (5,302 | ) | (175,655 | ) | 15.2 | |||||||
United Community Banks, Inc. | (10,441 | ) | (259,981 | ) | 22.4 | |||||||
United Natural Foods, Inc. | (5,239 | ) | (142,868 | ) | 12.3 | |||||||
Universal Corp. | (17,067 | ) | (936,808 | ) | 80.8 | |||||||
Universal Health Realty Income Trust | (9,161 | ) | (398,504 | ) | 34.4 | |||||||
Universal Logistics Holdings, Inc. | (353 | ) | (9,037 | ) | 0.8 | |||||||
Upbound Group, Inc. | (18,071 | ) | (481,773 | ) | 41.6 | |||||||
Urban Outfitters, Inc. | (14,404 | ) | (389,772 | ) | 33.6 | |||||||
Urstadt Biddle Properties, Inc., Class A | (14,816 | ) | (255,132 | ) | 22.0 | |||||||
V2X, Inc. | (2,983 | ) | (128,866 | ) | 11.1 | |||||||
VAALCO Energy, Inc. | (7,497 | ) | (32,087 | ) | 2.8 | |||||||
Vaxcyte, Inc. | (23,215 | ) | (994,298 | ) | 85.8 | |||||||
Velo3D, Inc. | (72,303 | ) | (169,189 | ) | 14.6 | |||||||
Ventyx Biosciences, Inc. | (10,507 | ) | (395,063 | ) | 34.1 | |||||||
Veris Residential, Inc. | (59,908 | ) | (979,496 | ) | 84.5 | |||||||
Verra Mobility Corp. | (61,435 | ) | (1,041,323 | ) | 89.8 | |||||||
Veru, Inc. | (44,133 | ) | (56,049 | ) | 4.8 | |||||||
Viasat, Inc. | (6,264 | ) | (219,428 | ) | 18.9 | |||||||
Viavi Solutions, Inc. | (21,551 | ) | (193,097 | ) | 16.7 | |||||||
Victoria’s Secret & Co. | (13,105 | ) | (406,386 | ) | 35.1 | |||||||
Viking Therapeutics, Inc. | (13,716 | ) | (292,288 | ) | 25.2 | |||||||
Virgin Galactic Holdings, Inc. | (70,259 | ) | (255,743 | ) | 22.1 | |||||||
Viridian Therapeutics, Inc. | (18,355 | ) | (514,491 | ) | 44.4 | |||||||
Vishay Intertechnology, Inc. | (43,224 | ) | (920,239 | ) | 79.4 | |||||||
Vista Outdoor, Inc. | (16,195 | ) | (390,300 | ) | 33.7 | |||||||
Vital Energy, Inc. | (1,753 | ) | (81,567 | ) | 7.0 | |||||||
Vobile Group Ltd. | (525,000 | ) | (204,875 | ) | 17.7 | |||||||
VSE Corp. | (3,138 | ) | (132,706 | ) | 11.4 | |||||||
Vuzix Corp. | (39,136 | ) | (157,327 | ) | 13.6 | |||||||
Washington Federal, Inc. | (6,368 | ) | (178,559 | ) | 15.4 | |||||||
WD-40 Co. | (1,114 | ) | (212,106 | ) | 18.3 | |||||||
Werner Enterprises, Inc. | (5,930 | ) | (267,858 | ) | 23.1 | |||||||
| Security | Shares | Value | % of Basket Value | |||||||||
United States (continued) | ||||||||||||
Westamerica BanCorp | (5,565 | ) | $ | (225,438 | ) | 19.4 | % | |||||
White Mountains Insurance Group Ltd. | (914 | ) | (1,308,976 | ) | 112.9 | |||||||
WideOpenWest, Inc. | (5,356 | ) | (61,219 | ) | 5.3 | |||||||
Winnebago Industries, Inc. | (5,419 | ) | (315,061 | ) | 27.2 | |||||||
Wolverine World Wide, Inc. | (21,631 | ) | (362,103 | ) | 31.2 | |||||||
Workhorse Group, Inc. | (203,696 | ) | (191,922 | ) | 16.6 | |||||||
Worthington Industries, Inc. | (3,184 | ) | (189,098 | ) | 16.3 | |||||||
Xenia Hotels & Resorts, Inc. | (14,777 | ) | (187,077 | ) | 16.1 | |||||||
Xometry, Inc. | (779 | ) | (10,820 | ) | 0.9 | |||||||
XPEL, Inc. | (1,043 | ) | (76,202 | ) | 6.6 | |||||||
Xperi, Inc. | (18,361 | ) | (174,246 | ) | 15.0 | |||||||
Xponential Fitness, Inc., Class A | (6,865 | ) | (227,094 | ) | 19.6 | |||||||
Zentalis Pharmaceuticals, Inc. | (13,047 | ) | (287,425 | ) | 24.8 | |||||||
Zuora, Inc. | (4,676 | ) | (36,426 | ) | 3.1 | |||||||
|
|
|
| |||||||||
| (163,873,809 | ) | |||||||||||
Vietnam | ||||||||||||
XP Power Ltd. | (333 | ) | (9,139 | ) | 0.8 | |||||||
|
|
|
| |||||||||
| Preferred Stocks | ||||||||||||
Germany | ||||||||||||
Einhell Germany AG | (1,170 | ) | (200,735 | ) | 17.3 | |||||||
Jungheinrich AG | (8,805 | ) | (338,929 | ) | 29.2 | |||||||
Sixt SE | (874 | ) | (69,068 | ) | 6.0 | |||||||
|
|
|
| |||||||||
| Rights | ||||||||||||
Spain | ||||||||||||
Faes Farma SA (Expires 05/10/23) | (57,947 | ) | (7,729 | ) | 0.7 | |||||||
|
|
|
| |||||||||
| Warrants | ||||||||||||
Australia | ||||||||||||
Pointsbet Holdings Ltd. | (9,593 | ) | (0 | ) | 0.0 | |||||||
|
|
|
| |||||||||
Total Reference Entity — Short | (335,214,037 | ) | ||||||||||
|
| |||||||||||
Net Value of Reference Entity — Goldman Sachs Bank USA |
| $ | (1,159,224 | ) | ||||||||
|
| |||||||||||
The following table represents the individual long and short positions and related values of the equity securities underlying the total return swap with Goldman Sachs Bank USA as of period end, termination dates 07/03/23-08/19/26:
| Security | Shares | Value | % of Basket Value | |||||||||
Reference Entity — Long | ||||||||||||
| Common Stocks | ||||||||||||
| Australia | ||||||||||||
AGL Energy Ltd. | 12,023 | $ | 67,109 | 132.7 | % | |||||||
Allkem Ltd. | 2,383 | 19,815 | 39.2 | |||||||||
AMP Ltd. | 284,769 | 218,061 | 431.2 | |||||||||
Aristocrat Leisure Ltd. | 9,749 | 249,859 | 494.1 | |||||||||
Aurizon Holdings Ltd. | 49,530 | 114,100 | 225.6 | |||||||||
Bank of Queensland Ltd. | 267,627 | 1,048,106 | 2,072.6 | |||||||||
Beach Energy Ltd. | 125,735 | 125,429 | 248.0 | |||||||||
Bendigo & Adelaide Bank Ltd. | 9,911 | 57,835 | 114.4 | |||||||||
BHP Group Ltd. | 2,291 | 68,936 | 136.3 | |||||||||
Boral Ltd. | 93,623 | 260,205 | 514.5 | |||||||||
Challenger Ltd. | 75,290 | 307,300 | 607.7 | |||||||||
Charter Hall Group | 59,119 | 445,885 | 881.7 | |||||||||
CSR Ltd. | 55,026 | 195,168 | 385.9 | |||||||||
Deterra Royalties Ltd. | 38,109 | 118,475 | 234.3 | |||||||||
| 92 | 2 0 2 3 BLACK ROCK ANNUAL REPORT TO SHAREHOLDERS |
Schedule of Investments (continued) April 30, 2023 | BlackRock Global Equity Market Neutral Fund |
| Security | Shares | Value | % of Basket Value | |||||||||
Australia (continued) | ||||||||||||
Domain Holdings Australia Ltd. | 10,728 | $ | 24,259 | 48.0 | % | |||||||
Downer EDI Ltd. | 345,169 | 827,270 | 1,635.9 | |||||||||
Flight Centre Travel Group Ltd. | 13,716 | 182,391 | 360.7 | |||||||||
Fortescue Metals Group Ltd. | 7,289 | 103,437 | 204.5 | |||||||||
GPT Group | 79,604 | 237,267 | 469.2 | |||||||||
IDP Education Ltd. | 15,144 | 288,233 | 570.0 | |||||||||
Iluka Resources Ltd. | 67,041 | 499,497 | 987.7 | |||||||||
Insignia Financial Ltd. | 217,207 | 436,757 | 863.7 | |||||||||
Lynas Rare Earths Ltd. | 6,353 | 27,663 | 54.7 | |||||||||
Macquarie Group Ltd. | 4,301 | 531,126 | 1,050.3 | |||||||||
Magellan Financial Group Ltd. | 23,750 | 130,351 | 257.8 | |||||||||
Mineral Resources Ltd. | 6,086 | 304,290 | 601.7 | |||||||||
Mirvac Group | 70,204 | 114,111 | 225.6 | |||||||||
National Australia Bank Ltd. | 12,328 | 240,456 | 475.5 | |||||||||
Orora Ltd. | 142,531 | 330,125 | 652.8 | |||||||||
Pilbara Minerals Ltd. | 1,917 | 5,521 | 10.9 | |||||||||
Pro Medicus Ltd. | 13,002 | 540,997 | 1,069.8 | |||||||||
Region RE Ltd., Registered Shares | 42,141 | 69,861 | 138.1 | |||||||||
Rio Tinto PLC | 27,741 | 1,734,457 | 3,429.8 | |||||||||
SEEK Ltd. | 23,114 | 382,296 | 756.0 | |||||||||
Star Entertainment Grp Ltd. | 84,444 | 72,624 | 143.6 | |||||||||
Steadfast Group Ltd. | 57,735 | 230,645 | 456.1 | |||||||||
Treasury Wine Estates Ltd. | 80,964 | 760,210 | 1,503.3 | |||||||||
Westpac Banking Corp. | 83,202 | 1,261,856 | 2,495.3 | |||||||||
WiseTech Global Ltd. | 4,197 | 194,767 | 385.1 | |||||||||
Worley Ltd. | 15,391 | 156,749 | 310.0 | |||||||||
|
|
|
| |||||||||
| 12,983,499 | ||||||||||||
Austria | ||||||||||||
ams-OSRAM AG | 11,278 | 77,482 | 153.2 | |||||||||
ANDRITZ AG | 3,321 | 213,892 | 423.0 | |||||||||
BAWAG Group AG | 411 | 19,888 | 39.3 | |||||||||
Raiffeisen Bank International AG | 23,133 | 352,478 | 697.0 | |||||||||
|
|
|
| |||||||||
| 663,740 | ||||||||||||
Belgium | ||||||||||||
Elia Group SA/NV | 169 | 22,990 | 45.5 | |||||||||
Euronav NV | 60,940 | 1,048,168 | 2,072.7 | |||||||||
Sofina SA | 1,961 | 446,795 | 883.5 | |||||||||
Solvay SA | 9,289 | 1,105,806 | 2,186.7 | |||||||||
|
|
|
| |||||||||
| 2,623,759 | ||||||||||||
Bermuda | ||||||||||||
RenaissanceRe Holdings Ltd. | 731 | 157,465 | 311.4 | |||||||||
|
|
|
| |||||||||
Brazil | ||||||||||||
Wheaton Precious Metals Corp. | 1,291 | 64,436 | 127.4 | |||||||||
|
|
|
| |||||||||
Canada | ||||||||||||
ARC Resources Ltd. | 14,391 | 180,802 | 357.5 | |||||||||
Birchcliff Energy Ltd. | 10,439 | 63,991 | 126.5 | |||||||||
Bombardier, Inc., Class B | 7,732 | 338,525 | 669.4 | |||||||||
Boralex, Inc. | 3,175 | 93,696 | 185.3 | |||||||||
Canada Goose Holdings, Inc. | 24,978 | 490,068 | 969.1 | |||||||||
Canadian Imperial Bank of Commerce | 2,932 | 124,376 | 246.0 | |||||||||
Canadian National Railway Co. | 535 | 64,524 | 127.6 | |||||||||
CGI, Inc. | 11,384 | 1,168,432 | 2,310.5 | |||||||||
Crescent Point Energy Corp. | 47,181 | 353,123 | 698.3 | |||||||||
Element Fleet Management Corp. | 15,630 | 206,768 | 408.9 | |||||||||
Emera, Inc. | 17,584 | 756,930 | 1,496.8 | |||||||||
Enbridge, Inc. | 4,323 | 173,873 | 343.8 | |||||||||
Enerplus Corp. | 46,642 | 705,612 | 1,395.3 | |||||||||
First Majestic Silver Corp. | 36,233 | 258,972 | 512.1 | |||||||||
FirstService Corp. | 2,839 | 431,806 | 853.9 | |||||||||
| Security | Shares | Value | % of Basket Value | |||||||||
Canada (continued) | ||||||||||||
Franco-Nevada Corp. | 4,583 | $ | 703,558 | 1,391.3 | % | |||||||
GFL Environmental, Inc. | 4,957 | 182,013 | 359.9 | |||||||||
Gildan Activewear, Inc. | 49,062 | 1,615,560 | 3,194.7 | |||||||||
Imperial Oil Ltd. | 9,919 | 511,916 | 1,012.3 | |||||||||
Ivanhoe Mines Ltd. | 20,003 | 175,623 | 347.3 | |||||||||
Lithium Americas Corp. | 10,106 | 204,372 | 404.1 | |||||||||
MEG Energy Corp. | 4,544 | 76,560 | 151.4 | |||||||||
Methanex Corp. | 5,846 | 264,808 | 523.7 | |||||||||
NuVista Energy Ltd. | 17,357 | 152,420 | 301.4 | |||||||||
Pan American Silver Corp. | 43,948 | 791,380 | 1,564.9 | |||||||||
RioCan Real Estate Investment Trust | 10,078 | 157,930 | 312.3 | |||||||||
Ritchie Bros Auctioneers, Inc. | 6,031 | 349,144 | 690.4 | |||||||||
Royal Bank of Canada | 3,504 | 347,878 | 687.9 | |||||||||
Stantec, Inc. | 5,374 | 326,710 | 646.1 | |||||||||
TC Energy Corp. | 40,530 | 1,704,186 | 3,370.0 | |||||||||
Teck Resources Ltd. | 3,167 | 149,290 | 295.2 | |||||||||
TELUS Corp. | 56,942 | 1,220,881 | 2,414.2 | |||||||||
Tourmaline Oil Corp. | 6,505 | 295,659 | 584.7 | |||||||||
TransAlta Corp. | 22,891 | 206,484 | 408.3 | |||||||||
Vermilion Energy, Inc. | 5,167 | 66,210 | 130.9 | |||||||||
West Fraser Timber Co. Ltd. | 1,797 | 131,580 | 260.2 | |||||||||
|
|
|
| |||||||||
| 15,045,660 | ||||||||||||
Chile | ||||||||||||
Lundin Mining Corp. | 2,815 | 21,763 | 43.0 | |||||||||
|
|
|
| |||||||||
China | ||||||||||||
Budweiser Brewing Co. APAC Ltd. | 189,400 | 547,209 | 1,082.1 | |||||||||
Shangri-La Asia Ltd. | 18,000 | 16,605 | 32.8 | |||||||||
SITC International Holdings Co. Ltd. | 72,000 | 133,175 | 263.3 | |||||||||
Wharf Holdings Ltd. | 30,000 | 68,562 | 135.6 | |||||||||
|
|
|
| |||||||||
| 765,551 | ||||||||||||
Denmark | ||||||||||||
Coloplast A/S | 1,732 | 247,682 | 489.8 | |||||||||
D/S Norden A/S | 2,809 | 174,945 | 345.9 | |||||||||
Genmab A/S | 223 | 90,907 | 179.8 | |||||||||
GN Store Nord A/S | 8,879 | 235,471 | 465.6 | |||||||||
H Lundbeck A/S | 11,703 | 61,495 | 121.6 | |||||||||
Jyske Bank A/S, Registered Shares | 1,484 | 107,645 | 212.9 | |||||||||
Novozymes A/S, B Shares | 14,968 | 773,626 | 1,529.8 | |||||||||
Orsted A/S | 6,668 | 593,878 | 1,174.4 | |||||||||
Rockwool A/S, B Shares | 335 | 80,511 | 159.2 | |||||||||
|
|
|
| |||||||||
| 2,366,160 | ||||||||||||
Finland | ||||||||||||
Kone OYJ, Class B | 4,496 | 254,520 | 503.3 | |||||||||
Metso Outotec OYJ | 17,289 | 189,234 | 374.2 | |||||||||
Outokumpu OYJ | 17,159 | 92,765 | 183.4 | |||||||||
Wartsila OYJ ABP | 26,049 | 300,069 | 593.4 | |||||||||
|
|
|
| |||||||||
| 836,588 | ||||||||||||
France | ||||||||||||
Accor SA | 49,270 | 1,734,213 | 3,429.3 | |||||||||
Aeroports de Paris | 617 | 97,314 | 192.4 | |||||||||
ALD SA | 21,203 | 253,390 | 501.1 | |||||||||
Bureau Veritas SA | 15,225 | 435,552 | 861.3 | |||||||||
Carrefour SA | 87,270 | 1,800,710 | 3,560.8 | |||||||||
Cie de Saint-Gobain | 2,935 | 168,587 | 333.4 | |||||||||
Danone SA | 17,028 | 1,118,009 | 2,210.8 | |||||||||
Dassault Aviation SA | 596 | 115,501 | 228.4 | |||||||||
Edenred | 3,060 | 197,256 | 390.1 | |||||||||
Engie SA | 97,041 | 1,540,375 | 3,046.0 | |||||||||
EssilorLuxottica SA | 4,642 | 911,961 | 1,803.4 | |||||||||
SCHEDULE OF INVESTMENTS | 93 |
Schedule of Investments (continued) April 30, 2023 | BlackRock Global Equity Market Neutral Fund |
| Security | Shares | Value | % of Basket Value | |||||||||
France (continued) | ||||||||||||
Gaztransport Et Technigaz SA | 1,844 | $ | 195,673 | 386.9 | % | |||||||
Getlink SE | 24,731 | 458,868 | 907.4 | |||||||||
Hermes International | 621 | 1,340,170 | 2,650.1 | |||||||||
ICADE | 11,524 | 536,790 | 1,061.5 | |||||||||
JCDecaux SE | 1,197 | 26,287 | 52.0 | |||||||||
Kering SA | 117 | 74,518 | 147.4 | |||||||||
Klepierre SA | 49,061 | 1,233,190 | 2,438.6 | |||||||||
LVMH Moet Hennessy Louis Vuitton SE | 362 | 345,402 | 683.0 | |||||||||
Neoen SA | 29,071 | 865,670 | 1,711.8 | |||||||||
Pernod Ricard SA | 1,763 | 403,960 | 798.8 | |||||||||
Remy Cointreau SA | 864 | 148,158 | 293.0 | |||||||||
Societe Generale SA | 2,381 | 57,502 | 113.7 | |||||||||
Veolia Environnement SA | 18,063 | 571,851 | 1,130.8 | |||||||||
Wendel SE | 9,330 | 1,038,548 | 2,053.7 | |||||||||
|
|
|
| |||||||||
| 15,669,455 | ||||||||||||
Germany | ||||||||||||
Carl Zeiss Meditec AG | 398 | 53,088 | 105.0 | |||||||||
Covestro AG | 12,218 | 531,993 | 1,052.0 | |||||||||
Deutsche Bank AG, Registered Shares | 3,885 | 42,372 | 83.8 | |||||||||
Deutsche Lufthansa AG, Registered Shares | 1,553 | 16,562 | 32.8 | |||||||||
DWS Group GmbH & Co. KGaA | 12,513 | 412,720 | 816.1 | |||||||||
E.ON SE | 81,807 | 1,073,590 | 2,123.0 | |||||||||
Encavis AG | 4,322 | 74,140 | 146.6 | |||||||||
Evonik Industries AG | 8,323 | 180,211 | 356.4 | |||||||||
Fraport AG Frankfurt Airport Services Worldwide | 19,559 | 1,045,332 | 2,067.1 | |||||||||
Freenet AG | 33,909 | 959,137 | 1,896.7 | |||||||||
HUGO BOSS AG | 3,332 | 249,948 | 494.3 | |||||||||
Knorr-Bremse AG | 4,292 | 298,481 | 590.2 | |||||||||
LEG Immobilien SE | 725 | 44,777 | 88.5 | |||||||||
Mercedes-Benz Group AG | 18,756 | 1,451,736 | 2,870.7 | |||||||||
Merck KGaA | 1,871 | 332,867 | 658.2 | |||||||||
Nemetschek SE | 2,666 | 206,836 | 409.0 | |||||||||
ProSiebenSat.1 Media SE | 5,737 | 51,116 | 101.1 | |||||||||
Scout24 SE | 2,583 | 159,716 | 315.8 | |||||||||
Siemens AG, Registered Shares | 5,603 | 916,263 | 1,811.9 | |||||||||
SMA Solar Technology AG | 1,130 | 121,202 | 239.7 | |||||||||
SUSE SA | 721 | 13,523 | 26.7 | |||||||||
Talanx AG | 7,502 | 374,413 | 740.4 | |||||||||
United Internet AG, Registered Shares | 8,477 | 144,384 | 285.5 | |||||||||
|
|
|
| |||||||||
| 8,754,407 | ||||||||||||
Hong Kong | ||||||||||||
AIA Group Ltd. | 66,400 | 722,892 | 1,429.5 | |||||||||
ASMPT Ltd. | 25,100 | 197,337 | 390.2 | |||||||||
Bank of East Asia Ltd. | 186,800 | 246,182 | 486.8 | |||||||||
Cafe de Coral Holdings Ltd. | 60,000 | 84,040 | 166.2 | |||||||||
Cathay Pacific Airways Ltd. | 752,000 | 727,650 | 1,438.9 | |||||||||
Dah Sing Banking Group Ltd. | 167,200 | 134,108 | 265.2 | |||||||||
Haitong International Securities Group Ltd. | 53,900 | 4,550 | 9.0 | |||||||||
Hang Lung Group Ltd. | 7,000 | 12,306 | 24.3 | |||||||||
Hang Lung Properties Ltd. | 185,000 | 338,162 | 668.7 | |||||||||
Hongkong Land Holdings Ltd. | 44,900 | 199,824 | 395.2 | |||||||||
Hysan Development Co. Ltd. | 6,000 | 16,956 | 33.5 | |||||||||
Link REIT | 61,800 | 404,222 | 799.3 | |||||||||
Swire Pacific Ltd. | 51,000 | 404,840 | 800.6 | |||||||||
Swire Properties Ltd. | 266,000 | 714,928 | 1,413.7 | |||||||||
| Security | Shares | Value | % of Basket Value | |||||||||
Hong Kong (continued) | ||||||||||||
United Energy Group Ltd. | 2,804,000 | $ | 422,541 | 835.6 | % | |||||||
Yue Yuen Industrial Holdings Ltd. | 160,500 | 241,538 | 477.6 | |||||||||
|
|
|
| |||||||||
| 4,872,076 | ||||||||||||
Indonesia | ||||||||||||
First Pacific Co. Ltd. | 310,000 | 103,807 | 205.3 | |||||||||
|
|
|
| |||||||||
Ireland | ||||||||||||
Smurfit Kappa Group PLC | 3,449 | 126,727 | 250.6 | |||||||||
|
|
|
| |||||||||
Israel | ||||||||||||
Alony Hetz Properties & Investments Ltd. | 24,219 | 190,171 | 376.1 | |||||||||
Check Point Software Technologies Ltd. | 3,541 | 450,982 | 891.8 | |||||||||
Elbit Systems Ltd. | 322 | 59,276 | 117.2 | |||||||||
Gav-Yam Lands Corp. Ltd. | 7,600 | 54,533 | 107.8 | |||||||||
Harel Insurance Investments & Financial Services Ltd. | 7,685 | 68,604 | 135.7 | |||||||||
Nice Ltd. | 1,147 | 233,595 | 461.9 | |||||||||
Nova Ltd. | 5,904 | 539,921 | 1,067.7 | |||||||||
Phoenix Holdings Ltd. | 18,261 | 194,848 | 385.3 | |||||||||
Wix.com Ltd. | 10,701 | 933,448 | 1,845.8 | |||||||||
|
|
|
| |||||||||
| 2,725,378 | ||||||||||||
Italy | ||||||||||||
A2A SpA | 946,035 | 1,656,318 | 3,275.3 | |||||||||
Buzzi Unicem SpA | 11,218 | 276,781 | 547.3 | |||||||||
Enel SpA | 109,068 | 739,644 | 1,462.6 | |||||||||
Ferrari NV | 1,357 | 375,057 | 741.7 | |||||||||
FinecoBank Banca Fineco SpA | 5,340 | 80,272 | 158.7 | |||||||||
Hera SpA | 81,314 | 251,244 | 496.8 | |||||||||
Infrastrutture Wireless Italiane SpA | 9,917 | 136,563 | 270.1 | |||||||||
Intesa Sanpaolo SpA | 286,385 | 746,830 | 1,476.8 | |||||||||
Italgas SpA | 45,541 | 294,949 | 583.3 | |||||||||
Mediobanca Banca di Credito Finanziario SpA | 6,662 | 70,981 | 140.4 | |||||||||
Moncler SpA | 15,271 | 1,124,085 | 2,222.8 | |||||||||
PRADA SpA | 176,400 | 1,298,759 | 2,568.2 | |||||||||
Prysmian SpA | 3,527 | 143,169 | 283.1 | |||||||||
Recordati Industria Chimica e Farmaceutica SpA | 3,097 | 141,443 | 279.7 | |||||||||
Reply SpA | 4,107 | 474,488 | 938.3 | |||||||||
Snam SpA | 18,987 | 104,680 | 207.0 | |||||||||
UnipolSai Assicurazioni SpA | 98,560 | 263,035 | 520.1 | |||||||||
|
|
|
| |||||||||
| 8,178,298 | ||||||||||||
Japan | ||||||||||||
Acom Co. Ltd. | 147,100 | 365,151 | 722.1 | |||||||||
Aeon Co. Ltd. | 11,000 | 227,106 | 449.1 | |||||||||
AEON Financial Service Co. Ltd. | 56,800 | 512,828 | 1,014.1 | |||||||||
Ain Holdings, Inc. | 2,400 | 101,156 | 200.0 | |||||||||
Aisin Corp. | 5,900 | 175,317 | 346.7 | |||||||||
Alfresa Holdings Corp. | 48,300 | 708,325 | 1,400.7 | |||||||||
Amano Corp. | 3,800 | 78,355 | 154.9 | |||||||||
ANA Holdings, Inc. | 4,500 | 99,419 | 196.6 | |||||||||
Anritsu Corp. | 80,000 | 742,283 | 1,467.8 | |||||||||
Astellas Pharma, Inc. | 33,500 | 511,319 | 1,011.1 | |||||||||
AZ-COM MARUWA Holdings, Inc. | 13,400 | 200,167 | 395.8 | |||||||||
Benesse Holdings, Inc. | 24,000 | 349,042 | 690.2 | |||||||||
Brother Industries Ltd. | 35,300 | 561,579 | 1,110.5 | |||||||||
Canon Marketing Japan, Inc. | 5,000 | 126,565 | 250.3 | |||||||||
Casio Computer Co. Ltd. | 5,000 | 48,213 | 95.3 | |||||||||
Coca-Cola Bottlers Japan Holdings, Inc. | 89,300 | 974,983 | 1,928.0 | |||||||||
COMSYS Holdings Corp. | 96,100 | 1,862,648 | 3,683.3 | |||||||||
| 94 | 2 0 2 3 BLACK ROCK ANNUAL REPORT TO SHAREHOLDERS |
Schedule of Investments (continued) April 30, 2023 | BlackRock Global Equity Market Neutral Fund |
| Security | Shares | Value | % of Basket Value | |||||||||
Japan (continued) | ||||||||||||
Concordia Financial Group Ltd. | 155,000 | $ | 595,827 | 1,178.2 | % | |||||||
Cosmos Pharmaceutical Corp. | 5,600 | 557,890 | 1,103.2 | |||||||||
CyberAgent, Inc. | 42,100 | 372,201 | 736.0 | |||||||||
Daicel Corp. | 58,600 | 467,917 | 925.3 | |||||||||
Daifuku Co. Ltd. | 8,100 | 151,214 | 299.0 | |||||||||
Dai-ichi Life Holdings, Inc. | 10,300 | 194,110 | 383.8 | |||||||||
Daikin Industries Ltd. | 200 | 36,784 | 72.7 | |||||||||
DeNA Co. Ltd. | 75,600 | 1,075,598 | 2,127.0 | |||||||||
Denka Co. Ltd. | 4,200 | 85,255 | 168.6 | |||||||||
DIC Corp. | 13,400 | 250,787 | 495.9 | |||||||||
DMG Mori Co. Ltd. | 52,300 | 850,075 | 1,681.0 | |||||||||
Dowa Holdings Co. Ltd. | 10,600 | 350,873 | 693.8 | |||||||||
Ebara Corp. | 20,400 | 904,751 | 1,789.1 | |||||||||
EXEO Group, Inc. | 32,500 | 610,918 | 1,208.1 | |||||||||
Fuji Electric Co. Ltd. | 3,400 | 138,979 | 274.8 | |||||||||
Fuji Media Holdings, Inc. | 26,300 | 249,727 | 493.8 | |||||||||
FUJIFILM Holdings Corp. | 8,100 | 427,672 | 845.7 | |||||||||
Fujikura Ltd. | 61,800 | 426,887 | 844.2 | |||||||||
GMO internet group, Inc. | 14,300 | 291,460 | 576.4 | |||||||||
GMO Payment Gateway, Inc. | 13,100 | 1,038,777 | 2,054.1 | |||||||||
Hamamatsu Photonics KK | 4,700 | 252,542 | 499.4 | |||||||||
Hitachi Ltd. | 1,100 | 61,666 | 121.9 | |||||||||
House Foods Group, Inc. | 6,900 | 153,658 | 303.9 | |||||||||
Information Services International-Dentsu Ltd. | 5,600 | 200,251 | 396.0 | |||||||||
INFRONEER Holdings, Inc. | 82,800 | 662,453 | 1,310.0 | |||||||||
Internet Initiative Japan, Inc. | 7,000 | 146,774 | 290.2 | |||||||||
Itochu Techno-Solutions Corp. | 23,300 | 611,019 | 1,208.3 | |||||||||
J Front Retailing Co. Ltd. | 55,200 | 587,952 | 1,162.7 | |||||||||
Japan Steel Works Ltd. | 1,000 | 18,411 | 36.4 | |||||||||
JTEKT Corp. | 8,900 | 74,401 | 147.1 | |||||||||
Kadokawa Corp. | 8,400 | 181,541 | 359.0 | |||||||||
Kakaku.com, Inc. | 27,800 | 387,669 | 766.6 | |||||||||
Kamigumi Co. Ltd. | 8,400 | 186,449 | 368.7 | |||||||||
Kandenko Co. Ltd. | 31,200 | 238,011 | 470.7 | |||||||||
Kaneka Corp. | 18,000 | 485,109 | 959.3 | |||||||||
Kawasaki Kisen Kaisha Ltd. | 15,300 | 369,766 | 731.2 | |||||||||
KDDI Corp. | 8,000 | 252,975 | 500.2 | |||||||||
Kewpie Corp. | 8,100 | 137,770 | 272.4 | |||||||||
Kinden Corp. | 44,500 | 614,036 | 1,214.2 | |||||||||
Koei Tecmo Holdings Co. Ltd. | 10,200 | 189,930 | 375.6 | |||||||||
Kokuyo Co. Ltd. | 31,000 | 448,720 | 887.3 | |||||||||
Kose Corp. | 2,400 | 283,853 | 561.3 | |||||||||
K’s Holdings Corp. | 15,800 | 141,874 | 280.6 | |||||||||
Kuraray Co. Ltd. | 6,100 | 57,619 | 113.9 | |||||||||
Kusuri no Aoki Holdings Co. Ltd. | 7,200 | 350,057 | 692.2 | |||||||||
Kyocera Corp. | 19,400 | 1,031,639 | 2,040.0 | |||||||||
Kyowa Kirin Co. Ltd. | 26,400 | 595,556 | 1,177.7 | |||||||||
Lawson, Inc. | 51,400 | 2,364,298 | 4,675.3 | |||||||||
Lintec Corp. | 15,300 | 259,188 | 512.5 | |||||||||
Lion Corp. | 49,400 | 545,535 | 1,078.8 | |||||||||
Lixil Corp. | 11,900 | 189,858 | 375.4 | |||||||||
M3, Inc. | 12,200 | 303,545 | 600.2 | |||||||||
Mani, Inc. | 28,000 | 371,306 | 734.2 | |||||||||
Maruichi Steel Tube Ltd. | 5,200 | 119,141 | 235.6 | |||||||||
MISUMI Group, Inc. | 3,400 | 86,887 | 171.8 | |||||||||
Mitsubishi Chemical Group Corp. | 74,200 | 441,239 | 872.5 | |||||||||
Mitsubishi Corp. | 900 | 33,817 | 66.9 | |||||||||
Mitsubishi Electric Corp. | 18,800 | 236,054 | 466.8 | |||||||||
Mitsubishi Estate Co. Ltd. | 35,200 | 439,447 | 869.0 | |||||||||
Mitsubishi Gas Chemical Co., Inc. | 72,200 | 1,065,206 | 2,106.4 | |||||||||
Mitsubishi Heavy Industries Ltd. | 6,800 | 261,294 | 516.7 | |||||||||
Mitsubishi Motors Corp. | 35,700 | 139,041 | 274.9 | |||||||||
| Security | Shares | Value | % of Basket Value | |||||||||
Japan (continued) | ||||||||||||
Mitsubishi UFJ Financial Group, Inc. | 148,400 | $ | 941,742 | 1,862.3 | % | |||||||
Mitsui & Co. Ltd. | 16,100 | 509,394 | 1,007.3 | |||||||||
Mitsui Chemicals, Inc. | 13,800 | 353,816 | 699.7 | |||||||||
Mitsui Fudosan Co. Ltd. | 16,800 | 338,087 | 668.6 | |||||||||
Mizuho Financial Group, Inc. | 45,700 | 671,454 | 1,327.8 | |||||||||
MS&AD Insurance Group Holdings, Inc. | 31,800 | 1,057,382 | 2,090.9 | |||||||||
Nabtesco Corp. | 1,500 | 36,628 | 72.4 | |||||||||
Nagoya Railroad Co. Ltd. | 9,900 | 161,783 | 319.9 | |||||||||
NEC Networks & System Integration Corp. | 42,500 | 536,690 | 1,061.3 | |||||||||
NET One Systems Co. Ltd. | 5,300 | 126,632 | 250.4 | |||||||||
NGK Insulators Ltd. | 39,600 | 503,994 | 996.6 | |||||||||
Nidec Corp. | 4,200 | 210,646 | 416.5 | |||||||||
Nihon M&A Center Holdings, Inc. | 30,200 | 233,857 | 462.4 | |||||||||
Nikon Corp. | 65,700 | 687,852 | 1,360.2 | |||||||||
Nippon Express Holdings, Inc. | 7,700 | 457,766 | 905.2 | |||||||||
Nippon Shinyaku Co. Ltd. | 3,100 | 143,632 | 284.0 | |||||||||
Nippon Steel Corp. | 15,800 | 343,255 | 678.8 | |||||||||
Nippon Telegraph & Telephone Corp. | 8,000 | 247,268 | 489.0 | |||||||||
Nipro Corp. | 19,600 | 149,591 | 295.8 | |||||||||
Nissan Chemical Corp. | 900 | 40,540 | 80.2 | |||||||||
Nissan Motor Co. Ltd. | 210,800 | 779,143 | 1,540.7 | |||||||||
Niterra Co. Ltd. | 15,800 | 335,450 | 663.3 | |||||||||
Nitto Denko Corp. | 2,900 | 189,941 | 375.6 | |||||||||
Nomura Research Institute Ltd. | 41,500 | 1,057,297 | 2,090.8 | |||||||||
NS Solutions Corp. | 15,800 | 435,594 | 861.4 | |||||||||
NSK Ltd. | 17,000 | 97,256 | 192.3 | |||||||||
Obayashi Corp. | 112,000 | 945,182 | 1,869.1 | |||||||||
OBIC Business Consultants Co. Ltd. | 4,100 | 157,745 | 311.9 | |||||||||
Obic Co. Ltd. | 200 | 31,239 | 61.8 | |||||||||
Olympus Corp. | 16,100 | 285,817 | 565.2 | |||||||||
Omron Corp. | 17,800 | 1,057,579 | 2,091.3 | |||||||||
Ono Pharmaceutical Co. Ltd. | 4,300 | 87,756 | 173.5 | |||||||||
Orient Corp. | 12,000 | 101,449 | 200.6 | |||||||||
Otsuka Corp. | 30,000 | 1,106,340 | 2,187.7 | |||||||||
Otsuka Holdings Co. Ltd. | 5,800 | 199,856 | 395.2 | |||||||||
Panasonic Holdings Corp. | 46,500 | 443,929 | 877.9 | |||||||||
Penta-Ocean Construction Co. Ltd. | 34,000 | 167,429 | 331.1 | |||||||||
Pigeon Corp. | 12,000 | 189,284 | 374.3 | |||||||||
Pola Orbis Holdings, Inc. | 57,200 | 805,337 | 1,592.5 | |||||||||
Recruit Holdings Co. Ltd. | 28,600 | 813,078 | 1,607.8 | |||||||||
Resorttrust, Inc. | 2,100 | 35,131 | 69.5 | |||||||||
Ricoh Co. Ltd. | 29,800 | 249,765 | 493.9 | |||||||||
Rohm Co. Ltd. | 4,700 | 358,852 | 709.6 | |||||||||
Sanrio Co. Ltd. | 6,600 | 309,441 | 611.9 | |||||||||
Santen Pharmaceutical Co. Ltd. | 75,900 | 646,853 | 1,279.1 | |||||||||
Sapporo Holdings Ltd. | 13,900 | 392,605 | 776.4 | |||||||||
Sawai Group Holdings Co. Ltd. | 21,000 | 615,681 | 1,217.5 | |||||||||
SCSK Corp. | 1,000 | 15,296 | 30.2 | |||||||||
Seiko Epson Corp. | 1,300 | 20,132 | 39.8 | |||||||||
Sharp Corp. | 9,900 | 71,513 | 141.4 | |||||||||
Shimizu Corp. | 69,600 | 430,442 | 851.2 | |||||||||
Shionogi & Co. Ltd. | 3,800 | 172,419 | 341.0 | |||||||||
SoftBank Group Corp. | 17,400 | 661,487 | 1,308.1 | |||||||||
Sohgo Security Services Co. Ltd. | 33,400 | 945,101 | 1,868.9 | |||||||||
Sompo Holdings, Inc. | 9,700 | 409,996 | 810.8 | |||||||||
Subaru Corp. | 48,400 | 800,381 | 1,582.7 | |||||||||
Sugi Holdings Co. Ltd. | 12,400 | 533,301 | 1,054.6 | |||||||||
Sumitomo Bakelite Co. Ltd. | 5,500 | 213,135 | 421.5 | |||||||||
Sumitomo Chemical Co. Ltd. | 32,900 | 112,719 | 222.9 | |||||||||
Sumitomo Corp. | 10,800 | 196,180 | 387.9 | |||||||||
Sumitomo Electric Industries Ltd. | 4,700 | 60,767 | 120.2 | |||||||||
Sumitomo Mitsui Trust Holdings, Inc. | 19,400 | 708,510 | 1,401.1 | |||||||||
SCHEDULE OF INVESTMENTS | 95 |
Schedule of Investments (continued) April 30, 2023 | BlackRock Global Equity Market Neutral Fund |
| Security | Shares | Value | % of Basket Value | |||||||||
Japan (continued) | ||||||||||||
Sumitomo Pharma Co. Ltd. | 47,000 | $ | 298,747 | 590.8 | % | |||||||
Sumitomo Realty & Development Co. Ltd. | 23,200 | 548,734 | 1,085.1 | |||||||||
Sundrug Co. Ltd. | 18,600 | 519,365 | 1,027.0 | |||||||||
Suntory Beverage & Food Ltd. | 3,800 | 144,944 | 286.6 | |||||||||
T&D Holdings, Inc. | 9,200 | 114,169 | 225.8 | |||||||||
Taisei Corp. | 34,200 | 1,177,641 | 2,328.7 | |||||||||
Taisho Pharmaceutical Holdings Co. Ltd. | 12,000 | 525,052 | 1,038.3 | |||||||||
Takara Bio, Inc. | 19,600 | 250,711 | 495.8 | |||||||||
TBS Holdings, Inc. | 22,200 | 338,989 | 670.3 | |||||||||
Teijin Ltd. | 2,300 | 26,021 | 51.5 | |||||||||
Terumo Corp. | 21,600 | 655,140 | 1,295.5 | |||||||||
Toda Corp. | 30,700 | 181,766 | 359.4 | |||||||||
Toho Co. Ltd. | 14,100 | 567,444 | 1,122.1 | |||||||||
Tokyo Ohka Kogyo Co. Ltd. | 13,100 | 693,092 | 1,370.6 | |||||||||
Tokyo Tatemono Co. Ltd. | 102,800 | 1,318,715 | 2,607.7 | |||||||||
Toray Industries, Inc. | 105,100 | 604,207 | 1,194.8 | |||||||||
TOTO Ltd. | 5,200 | 180,231 | 356.4 | |||||||||
Toyoda Gosei Co. Ltd. | 14,200 | 246,674 | 487.8 | |||||||||
Toyota Boshoku Corp. | 4,100 | 65,756 | 130.0 | |||||||||
Trend Micro, Inc. | 17,200 | 851,630 | 1,684.1 | |||||||||
TS Tech Co. Ltd. | 38,800 | 529,597 | 1,047.3 | |||||||||
Tsuruha Holdings, Inc. | 25,200 | 1,672,429 | 3,307.2 | |||||||||
UBE Corp. | 50,800 | 816,735 | 1,615.1 | |||||||||
Ulvac, Inc. | 2,700 | 108,683 | 214.9 | |||||||||
Ushio, Inc. | 8,200 | 103,334 | 204.3 | |||||||||
Welcia Holdings Co. Ltd. | 23,700 | 502,885 | 994.4 | |||||||||
Yakult Honsha Co. Ltd. | 6,100 | 464,727 | 919.0 | |||||||||
Yamaha Corp. | 2,500 | 99,836 | 197.4 | |||||||||
Yamato Kogyo Co. Ltd. | 2,300 | 91,583 | 181.1 | |||||||||
Yaskawa Electric Corp. | 17,800 | 734,839 | 1,453.1 | |||||||||
Zeon Corp. | 17,000 | 177,761 | 351.5 | |||||||||
ZOZO, Inc. | 34,300 | 732,405 | 1,448.3 | |||||||||
|
|
|
| |||||||||
| 72,641,974 | ||||||||||||
Luxembourg | ||||||||||||
ArcelorMittal SA | 6,740 | 190,283 | 376.3 | |||||||||
|
|
|
| |||||||||
Macau | ||||||||||||
Galaxy Entertainment Group Ltd. | 30,000 | 213,516 | 422.2 | |||||||||
SJM Holdings Ltd. | 32,000 | 16,663 | 32.9 | |||||||||
Wynn Macau Ltd. | 158,400 | 171,369 | 338.9 | |||||||||
|
|
|
| |||||||||
| 401,548 | ||||||||||||
Mexico | ||||||||||||
Fresnillo PLC | 7,331 | 64,531 | 127.6 | |||||||||
|
|
|
| |||||||||
Netherlands | ||||||||||||
ABN AMRO Bank NV, CVA | 21,771 | 345,980 | 684.2 | |||||||||
Aegon NV | 17,875 | 80,914 | 160.0 | |||||||||
ASML Holding NV | 2,056 | 1,294,168 | 2,559.2 | |||||||||
ASR Nederland NV | 673 | 29,369 | 58.1 | |||||||||
Koninklijke KPN NV | 43,542 | 157,544 | 311.5 | |||||||||
Koninklijke Vopak NV | 18,275 | 692,565 | 1,369.5 | |||||||||
Wolters Kluwer NV | 1,482 | 194,800 | 385.2 | |||||||||
|
|
|
| |||||||||
| 2,795,340 | ||||||||||||
New Zealand | ||||||||||||
a2 Milk Co. Ltd. | 63,698 | 233,158 | 461.1 | |||||||||
Infratil Ltd. | 72,562 | 429,241 | 848.8 | |||||||||
|
|
|
| |||||||||
| 662,399 | ||||||||||||
Norway | ||||||||||||
Aker BP ASA | 6,549 | 159,408 | 315.2 | |||||||||
| Security | Shares | Value | % of Basket Value | |||||||||
Norway (continued) | ||||||||||||
AutoStore Holdings Ltd. | 72,048 | $ | 157,770 | 312.0 | % | |||||||
Equinor ASA | 38,401 | 1,124,536 | 2,223.7 | |||||||||
Gjensidige Forsikring ASA | 19,520 | 345,589 | 683.4 | |||||||||
Golden Ocean Group Ltd. | 8,713 | 81,648 | 161.5 | |||||||||
Kongsberg Gruppen ASA | 17,524 | 799,881 | 1,581.7 | |||||||||
NEL ASA | 41,977 | 58,580 | 115.8 | |||||||||
Nordic Semiconductor ASA | 8,187 | 90,625 | 179.2 | |||||||||
TOMRA Systems ASA | 22,201 | 346,498 | 685.2 | |||||||||
Var Energi ASA | 114,618 | 305,581 | 604.3 | |||||||||
|
|
|
| |||||||||
| 3,470,116 | ||||||||||||
Poland | ||||||||||||
InPost SA | 27,733 | 295,413 | 584.2 | |||||||||
|
|
|
| |||||||||
Puerto Rico | ||||||||||||
Liberty Latin America Ltd. | 2 | 18 | 0.0 | |||||||||
|
|
|
| |||||||||
Singapore | ||||||||||||
City Developments Ltd. | 27,100 | 141,807 | 280.4 | |||||||||
ComfortDelGro Corp. Ltd. | 139,000 | 124,462 | 246.1 | |||||||||
Mapletree Industrial Trust | 19,300 | 34,510 | 68.3 | |||||||||
NetLink NBN Trust | 141,200 | 92,716 | 183.4 | |||||||||
SATS Ltd. | 203,700 | 389,235 | 769.7 | |||||||||
Sembcorp Industries Ltd. | 139,700 | 449,624 | 889.1 | |||||||||
Singapore Airlines Ltd. | 30,200 | 132,862 | 262.7 | |||||||||
Singapore Post Ltd. | 535,400 | 205,162 | 405.7 | |||||||||
StarHub Ltd. | 83,100 | 62,416 | 123.4 | |||||||||
Suntec Real Estate Investment Trust | 394,300 | 399,807 | 790.6 | |||||||||
|
|
|
| |||||||||
| 2,032,601 | ||||||||||||
Spain | ||||||||||||
ACS Actividades de Construccion y Servicios SA | 985 | 33,598 | 66.4 | |||||||||
Atlantica Sustainable Infrastructure PLC | 9,576 | 254,913 | 504.1 | |||||||||
Banco Bilbao Vizcaya Argentaria SA | 103,128 | 748,872 | 1,480.9 | |||||||||
Banco de Sabadell SA | 105,374 | 109,653 | 216.8 | |||||||||
Bankinter SA | 43,883 | 257,287 | 508.8 | |||||||||
EDP Renovaveis SA | 24,488 | 539,852 | 1,067.5 | |||||||||
Fluidra SA | 427 | 7,257 | 14.4 | |||||||||
Mapfre SA | 28,700 | 57,003 | 112.7 | |||||||||
Merlin Properties Socimi SA | 86,344 | 757,193 | 1,497.3 | |||||||||
Sacyr SA | 20,613 | 67,652 | 133.8 | |||||||||
|
|
|
| |||||||||
| 2,833,280 | ||||||||||||
Sweden | ||||||||||||
Alfa Laval AB | 3,965 | 144,089 | 284.9 | |||||||||
Atlas Copco AB, A Shares | 50,988 | 731,369 | 1,446.3 | |||||||||
Atlas Copco AB, B Shares | 54,371 | 691,513 | 1,367.4 | |||||||||
Avanza Bank Holding AB | 20,522 | 431,988 | 854.2 | |||||||||
Beijer Ref AB | 22,478 | 363,916 | 719.6 | |||||||||
Boliden AB | 1,318 | 46,937 | 92.8 | |||||||||
Castellum AB | 2,522 | 30,355 | 60.0 | |||||||||
Elekta AB, B Shares | 35,407 | 295,114 | 583.6 | |||||||||
Epiroc AB, Class A | 18,728 | 371,443 | 734.5 | |||||||||
Epiroc AB, Class B | 12,981 | 221,254 | 437.5 | |||||||||
Fastighets AB Balder, Class B | 5,012 | 23,107 | 45.7 | |||||||||
Getinge AB, B Shares | 10,474 | 263,331 | 520.7 | |||||||||
Industrivarden AB, A Shares | 18,273 | 517,774 | 1,023.9 | |||||||||
Industrivarden AB, C Shares | 35,527 | 1,004,655 | 1,986.7 | |||||||||
Indutrade AB | 1,203 | 28,623 | 56.6 | |||||||||
Investor AB, A Shares | 6,955 | 151,130 | 298.9 | |||||||||
L E Lundbergforetagen AB, B Shares | 5,306 | 252,223 | 498.8 | |||||||||
| 96 | 2 0 2 3 BLACK ROCK ANNUAL REPORT TO SHAREHOLDERS |
Schedule of Investments (continued) April 30, 2023 | BlackRock Global Equity Market Neutral Fund |
| Security | Shares | Value | % of Basket Value | |||||||||
Sweden (continued) | ||||||||||||
Sagax AB | 3,223 | $ | 78,290 | 154.8 | % | |||||||
Sweco AB, B Shares | 9,890 | 131,350 | 259.7 | |||||||||
Volvo Car AB | 3,802 | 15,545 | 30.8 | |||||||||
|
|
|
| |||||||||
| 5,794,006 | ||||||||||||
Switzerland | ||||||||||||
ABB Ltd., Registered Shares | 3,986 | 143,051 | 282.9 | |||||||||
Accelleron Industries AG | 2,113 | 51,850 | 102.5 | |||||||||
Banque Cantonale Vaudoise, Registered Shares | 5,139 | 538,069 | 1,064.0 | |||||||||
Belimo Holding AG, Registered Shares | 882 | 423,424 | 837.3 | |||||||||
Chocoladefabriken Lindt & Spruengli AG, Participation Certificates | 99 | 1,215,975 | 2,404.5 | |||||||||
Chocoladefabriken Lindt & Spruengli AG, Registered Shares | 1 | 122,617 | 242.5 | |||||||||
Cie Financiere Richemont SA, Registered Shares | 111 | 18,348 | 36.3 | |||||||||
Clariant AG, Registered Shares | 29,163 | 483,924 | 956.9 | |||||||||
Dufry AG, Registered Shares | 3,604 | 165,781 | 327.8 | |||||||||
Geberit AG, Registered Shares | 1,782 | 1,009,779 | 1,996.8 | |||||||||
Georg Fischer AG, Registered Shares | 7,563 | 548,439 | 1,084.5 | |||||||||
Helvetia Holding AG, Registered Shares | 656 | 97,617 | 193.0 | |||||||||
Partners Group Holding AG | 629 | 607,482 | 1,201.3 | |||||||||
Schindler Holding AG | 542 | 120,501 | 238.3 | |||||||||
Sika AG, Registered Shares | 2,882 | 792,008 | 1,566.2 | |||||||||
Swiss Prime Site AG, Registered Shares | 2,395 | 215,680 | 426.5 | |||||||||
Tecan Group AG, Registered Shares | 235 | 101,851 | 201.4 | |||||||||
Temenos AG, Registered Shares | 6,699 | 561,760 | 1,110.9 | |||||||||
VAT Group AG | 2,514 | 882,412 | 1,744.9 | |||||||||
|
|
|
| |||||||||
| 8,100,568 | ||||||||||||
United Kingdom | ||||||||||||
Auto Trader Group PLC | 64,095 | 505,140 | 998.9 | |||||||||
B&M European Value Retail SA | 48,962 | 290,982 | 575.4 | |||||||||
Beazley PLC | 56,200 | 415,568 | 821.8 | |||||||||
Bellway PLC | 5,638 | 168,448 | 333.1 | |||||||||
British Land Co. PLC | 104,823 | 520,901 | 1,030.1 | |||||||||
Burberry Group PLC | 36,895 | 1,186,328 | 2,345.9 | |||||||||
Centrica PLC | 453,358 | 641,642 | 1,268.8 | |||||||||
ConvaTec Group PLC | 199,751 | 543,875 | 1,075.5 | |||||||||
Croda International PLC | 8,200 | 709,819 | 1,403.6 | |||||||||
Diploma PLC | 5,246 | 175,113 | 346.3 | |||||||||
Drax Group PLC | 93,758 | 730,519 | 1,444.6 | |||||||||
easyJet PLC | 41,185 | 254,412 | 503.1 | |||||||||
Halma PLC | 3,873 | 110,986 | 219.5 | |||||||||
Hammerson PLC | 45 | 16 | 0.0 | |||||||||
Hargreaves Lansdown PLC | 57,755 | 576,114 | 1,139.2 | |||||||||
IG Group Holdings PLC | 9,157 | 83,296 | 164.7 | |||||||||
IMI PLC | 76,494 | 1,512,890 | 2,991.7 | |||||||||
Inchcape PLC | 41,868 | 420,206 | 830.9 | |||||||||
Indivior PLC | 25,613 | 484,450 | 958.0 | |||||||||
Intermediate Capital Group PLC | 46,582 | 753,689 | 1,490.4 | |||||||||
Intertek Group PLC | 1,084 | 55,869 | 110.5 | |||||||||
ITV PLC | 769,790 | 771,663 | 1,525.9 | |||||||||
J Sainsbury PLC | 22,436 | 77,309 | 152.9 | |||||||||
Land Securities Group PLC | 2,459 | 20,564 | 40.7 | |||||||||
Liberty Global PLC | 29,611 | 602,288 | 1,191.0 | |||||||||
Liberty Global PLC | 24,729 | 482,463 | 954.0 | |||||||||
London Stock Exchange Group PLC | 2,825 | 295,626 | 584.6 | |||||||||
Moneysupermarket.com Group PLC | 3 | 10 | 0.0 | |||||||||
Nomad Foods Ltd. | 29,337 | 551,536 | 1,090.6 | |||||||||
| Security | Shares | Value | % of Basket Value | |||||||||
United Kingdom (continued) | ||||||||||||
OSB Group PLC | 127,725 | $ | 788,027 | 1,558.3 | % | |||||||
Pennon Group PLC | 17,102 | 182,185 | 360.3 | |||||||||
Phoenix Group Holdings PLC | 26,509 | 194,676 | 385.0 | |||||||||
Renishaw PLC | 2,775 | 123,895 | 245.0 | |||||||||
Rightmove PLC | 49,695 | 354,220 | 700.5 | |||||||||
Rotork PLC | 106,623 | 432,895 | 856.0 | |||||||||
Segro PLC | 25,097 | 260,649 | 515.4 | |||||||||
Severn Trent PLC | 163 | 5,914 | 11.7 | |||||||||
Smiths Group PLC | 8,979 | 187,617 | 371.0 | |||||||||
Spectris PLC | 109 | 5,083 | 10.0 | |||||||||
Spirax-Sarco Engineering PLC | 9,107 | 1,252,646 | 2,477.0 | |||||||||
SSE PLC | 30,633 | 696,231 | 1,376.8 | |||||||||
Standard Chartered PLC | 54,027 | 421,508 | 833.5 | |||||||||
Taylor Wimpey PLC | 12,457 | 19,814 | 39.2 | |||||||||
TechnipFMC PLC | 34,628 | 474,057 | 937.4 | |||||||||
Tesco PLC | 90,253 | 314,444 | 621.8 | |||||||||
Travis Perkins PLC | 76,414 | 908,396 | 1,796.3 | |||||||||
Tritax Big Box REIT PLC | 112,729 | 217,077 | 429.3 | |||||||||
United Utilities Group PLC | 50,172 | 671,342 | 1,327.5 | |||||||||
|
|
|
| |||||||||
| 20,452,398 | ||||||||||||
United States | ||||||||||||
A O Smith Corp. | 2,744 | 187,388 | 370.6 | |||||||||
Acadia Healthcare Co., Inc. | 5,838 | 422,029 | 834.5 | |||||||||
Accenture PLC, Class A | 2,714 | 760,707 | 1,504.3 | |||||||||
Acuity Brands, Inc. | 672 | 105,759 | 209.1 | |||||||||
Adobe, Inc. | 1,949 | 735,864 | 1,455.1 | |||||||||
Advanced Drainage Systems, Inc. | 243 | 20,830 | 41.2 | |||||||||
AECOM | 7,038 | 584,506 | 1,155.8 | |||||||||
Affiliated Managers Group, Inc. | 1,706 | 246,312 | 487.1 | |||||||||
Agilent Technologies, Inc. | 8,290 | 1,122,715 | 2,220.1 | |||||||||
Air Products and Chemicals, Inc. | 1,372 | 403,862 | 798.6 | |||||||||
Akamai Technologies, Inc. | 3,695 | 302,879 | 598.9 | |||||||||
Alaska Air Group, Inc. | 1,042 | 45,285 | 89.5 | |||||||||
Alcoa Corp. | 9,344 | 347,036 | 686.2 | |||||||||
Alkermes PLC | 11,995 | 342,457 | 677.2 | |||||||||
Allstate Corp. | 12,889 | 1,492,031 | 2,950.4 | |||||||||
Alnylam Pharmaceuticals, Inc. | 2,868 | 571,306 | 1,129.7 | |||||||||
Alphabet, Inc., Class A | 6,829 | 733,025 | 1,449.5 | |||||||||
Altria Group, Inc. | 39,967 | 1,898,832 | 3,754.9 | |||||||||
Amazon.com, Inc. | 2,843 | 299,794 | 592.8 | |||||||||
AMC Entertainment Holdings, Inc. | 48,841 | 73,262 | 144.9 | |||||||||
American Airlines Group, Inc. | 41,001 | 559,254 | 1,105.9 | |||||||||
American Financial Group, Inc. | 7,250 | 889,792 | 1,759.5 | |||||||||
American Tower Corp. | 346 | 70,719 | 139.8 | |||||||||
AMETEK, Inc. | 5,262 | 725,788 | 1,435.2 | |||||||||
Amgen, Inc. | 978 | 234,466 | 463.6 | |||||||||
Apple, Inc. | 13,109 | 2,224,335 | 4,398.5 | |||||||||
Applied Materials., Inc. | 3,843 | 434,374 | 859.0 | |||||||||
Armstrong World Industries, Inc. | 3,074 | 211,061 | 417.4 | |||||||||
Arthur J Gallagher & Co | 2,201 | 457,940 | 905.6 | |||||||||
Ashland, Inc. | 181 | 18,391 | 36.4 | |||||||||
Autodesk, Inc. | 3,532 | 687,998 | 1,360.5 | |||||||||
AutoNation, Inc. | 367 | 48,334 | 95.6 | |||||||||
AutoZone, Inc. | 680 | 1,811,051 | 3,581.3 | |||||||||
Avis Budget Group, Inc. | 163 | 28,797 | 56.9 | |||||||||
Azenta, Inc. | 364 | 15,830 | 31.3 | |||||||||
Bank of America Corp. | 18,289 | 535,502 | 1,058.9 | |||||||||
Bank of New York Mellon Corp. | 2,312 | 98,468 | 194.7 | |||||||||
Bath & Body Works, Inc. | 5,005 | 175,675 | 347.4 | |||||||||
Bausch Health Cos., Inc. | 16,448 | 122,480 | 242.2 | |||||||||
SCHEDULE OF INVESTMENTS | 97 |
Schedule of Investments (continued) April 30, 2023 | BlackRock Global Equity Market Neutral Fund |
| Security | Shares | Value | % of Basket Value | |||||||||
United States (continued) | ||||||||||||
Beacon Roofing Supply, Inc. | 3,902 | $ | 234,822 | 464.4 | % | |||||||
Best Buy Co., Inc. | 25,367 | 1,890,349 | 3,738.1 | |||||||||
BioMarin Pharmaceutical, Inc. | 2,948 | 283,126 | 559.9 | |||||||||
Bio-Rad Laboratories, Inc. | 1,189 | 535,989 | 1,059.9 | |||||||||
Bio-Techne Corp. | 1,326 | 105,921 | 209.5 | |||||||||
Boeing Co. | 7,521 | 1,555,192 | 3,075.3 | |||||||||
Booz Allen Hamilton Holding Corp. | 1,716 | 164,256 | 324.8 | |||||||||
Boston Beer Co., Inc. | 671 | 213,049 | 421.3 | |||||||||
Boston Scientific Corp. | 7,535 | 392,724 | 776.6 | |||||||||
Box, Inc. | 28,487 | 753,766 | 1,490.5 | |||||||||
Boyd Gaming Corp. | 4,818 | 334,369 | 661.2 | |||||||||
Brighthouse Financial, Inc. | 24,714 | 1,092,359 | 2,160.1 | |||||||||
Bristol-Myers Squibb Co. | 13,665 | 912,412 | 1,804.3 | |||||||||
Bruker Corp. | 1,276 | 100,970 | 199.7 | |||||||||
CACI International, Inc., Class A | 4,649 | 1,456,625 | 2,880.4 | |||||||||
Camden Property Trust | 1,938 | 213,277 | 421.7 | |||||||||
Capri Holdings Ltd. | 6,088 | 252,652 | 499.6 | |||||||||
Carnival Corp. | 47,924 | 441,380 | 872.8 | |||||||||
Carnival PLC | 43,326 | 352,281 | 696.6 | |||||||||
CH Robinson Worldwide, Inc. | 2,946 | 297,163 | 587.6 | |||||||||
Charles River Laboratories International, Inc. | 4,946 | 940,334 | 1,859.5 | |||||||||
Charles Schwab Corp. | 4,365 | 228,028 | 450.9 | |||||||||
Chart Industries, Inc. | 3,236 | 430,712 | 851.7 | |||||||||
Charter Communications, Inc. | 249 | 91,806 | 181.5 | |||||||||
Chemed Corp. | 1,576 | 868,770 | 1,718.0 | |||||||||
Cheniere Energy, Inc. | 5,733 | 877,149 | 1,734.5 | |||||||||
Chevron Corp. | 7,620 | 1,284,580 | 2,540.2 | |||||||||
Chewy, Inc., Class A | 10,010 | 310,410 | 613.8 | |||||||||
Chipotle Mexican Grill, Inc. | 16 | 33,082 | 65.4 | |||||||||
Cigna Group | 3,917 | 992,137 | 1,961.9 | |||||||||
Cincinnati Financial Corp. | 808 | 86,004 | 170.1 | |||||||||
Cintas Corp. | 299 | 136,275 | 269.5 | |||||||||
Cirrus Logic, Inc. | 13,841 | 1,187,419 | 2,348.1 | |||||||||
Citizens Financial Group, Inc. | 7,445 | 230,348 | 455.5 | |||||||||
Cleveland-Cliffs, Inc. | 2,185 | 33,605 | 66.5 | |||||||||
Coca-Cola Co. | 40,701 | 2,610,969 | 5,163.1 | |||||||||
Cognizant Technology Solutions Corp. | 8,884 | 530,464 | 1,049.0 | |||||||||
Columbia Banking System, Inc. | 428 | 9,142 | 18.1 | |||||||||
Columbia Sportswear Co. | 2,653 | 221,632 | 438.3 | |||||||||
Comerica, Inc. | 2,660 | 115,364 | 228.1 | |||||||||
Commercial Metals Co. | 2,825 | 131,899 | 260.8 | |||||||||
ConocoPhillips | 5,437 | 559,413 | 1,106.2 | |||||||||
CoStar Group, Inc. | 2,270 | 174,676 | 345.4 | |||||||||
Costco Wholesale Corp. | 504 | 253,623 | 501.5 | |||||||||
Credit Acceptance Corp. | 1,547 | 757,256 | 1,497.4 | |||||||||
Crimson Wine Group Ltd. | 1 | 6 | 0.0 | |||||||||
Crowdstrike Holdings, Inc. | 238 | 28,572 | 56.5 | |||||||||
Curtiss-Wright Corp. | 1,138 | 193,267 | 382.2 | |||||||||
CVS Health Corp. | 10,532 | 772,101 | 1,526.8 | |||||||||
Danaher Corp. | 12,291 | 2,911,861 | 5,758.1 | |||||||||
DaVita, Inc. | 1,032 | 93,252 | 184.4 | |||||||||
Deckers Outdoor Corp. | 6,199 | 2,971,429 | 5,875.9 | |||||||||
Devon Energy Corp. | 4,745 | 253,525 | 501.3 | |||||||||
Diamondback Energy, Inc. | 169 | 24,032 | 47.5 | |||||||||
Dick’s Sporting Goods, Inc. | 3,915 | 567,714 | 1,122.6 | |||||||||
DocuSign, Inc. | 1,941 | 95,963 | 189.8 | |||||||||
Domino’s Pizza, Inc. | 2,031 | 644,782 | 1,275.0 | |||||||||
Donaldson Co., Inc. | 2,969 | 188,680 | 373.1 | |||||||||
Dover Corp. | 1,688 | 246,718 | 487.9 | |||||||||
Dropbox, Inc. | 7,008 | 142,543 | 281.9 | |||||||||
DTE Energy Co. | 159 | 17,873 | 35.3 | |||||||||
DuPont de Nemours, Inc. | 22,085 | 1,539,766 | 3,044.8 | |||||||||
| Security | Shares | Value | % of Basket Value | |||||||||
United States (continued) | ||||||||||||
eBay, Inc. | 17,597 | $ | 817,029 | 1,615.6 | % | |||||||
Ecolab, Inc. | 243 | 40,785 | 80.7 | |||||||||
Edwards Lifesciences Corp. | 434 | 38,183 | 75.5 | |||||||||
Electronic Arts, Inc. | 2,934 | 373,440 | 738.5 | |||||||||
Elevance Health, Inc. | 1,481 | 694,071 | 1,372.5 | |||||||||
Eli Lilly & Co. | 2,633 | 1,042,299 | 2,061.1 | |||||||||
Enovis Corp. | 5,510 | 320,957 | 634.7 | |||||||||
Envista Holdings Corp. | 17,838 | 686,585 | 1,357.7 | |||||||||
EOG Resources, Inc. | 12,260 | 1,464,702 | 2,896.4 | |||||||||
EPAM Systems, Inc. | 1,003 | 283,287 | 560.2 | |||||||||
Equinix, Inc. | 1,063 | 769,697 | 1,522.0 | |||||||||
Equity LifeStyle Properties, Inc. | 7,848 | 540,727 | 1,069.3 | |||||||||
Equity Residential | 14,699 | 929,712 | 1,838.5 | |||||||||
Etsy, Inc. | 3,522 | 355,828 | 703.6 | |||||||||
Evercore, Inc., Class A | 261 | 29,772 | 58.9 | |||||||||
Exelixis, Inc. | 12,687 | 232,172 | 459.1 | |||||||||
Expedia Group, Inc. | 994 | 93,396 | 184.7 | |||||||||
Expeditors International of Washington, Inc. | 3,882 | 441,927 | 873.9 | |||||||||
Experian PLC | 13,573 | 473,565 | 936.5 | |||||||||
F5, Inc. | 3,319 | 445,941 | 881.8 | |||||||||
FactSet Research Systems, Inc. | 626 | 257,718 | 509.6 | |||||||||
Fair Isaac Corp. | 540 | 393,093 | 777.3 | |||||||||
Fidelity National Information Services, Inc. | 7,632 | 448,151 | 886.2 | |||||||||
Flowers Foods, Inc. | 5,364 | 147,564 | 291.8 | |||||||||
Flowserve Corp. | 5,259 | 175,598 | 347.2 | |||||||||
Ford Motor Co. | 151,916 | 1,804,762 | 3,568.8 | |||||||||
Fox Corp., Class A | 31,186 | 1,037,246 | 2,051.1 | |||||||||
Fox Corp., Class B | 22,309 | 681,317 | 1,347.3 | |||||||||
Freeport-McMoRan, Inc. | 11,885 | 450,560 | 891.0 | |||||||||
FTI Consulting, Inc. | 3,616 | 652,688 | 1,290.7 | |||||||||
Gap, Inc. | 29,127 | 279,619 | 552.9 | |||||||||
Garmin Ltd. | 7,648 | 750,804 | 1,484.7 | |||||||||
Gartner, Inc. | 1,763 | 533,237 | 1,054.5 | |||||||||
General Dynamics Corp. | 7,909 | 1,726,851 | 3,414.8 | |||||||||
General Electric Co. | 1,869 | 184,975 | 365.8 | |||||||||
General Motors Co. | 14,811 | 489,355 | 967.7 | |||||||||
Gentex Corp. | 19,025 | 524,900 | 1,038.0 | |||||||||
Globant SA | 251 | 39,374 | 77.9 | |||||||||
Globus Medical, Inc. | 7,388 | 429,538 | 849.4 | |||||||||
GoDaddy, Inc., Class A | 3,393 | 256,782 | 507.8 | |||||||||
Graco, Inc. | 10,441 | 827,867 | 1,637.1 | |||||||||
Guidewire Software, Inc. | 7,343 | 559,463 | 1,106.3 | |||||||||
Halliburton Co. | 39,061 | 1,279,248 | 2,529.7 | |||||||||
Halozyme Therapeutics, Inc. | 4,032 | 129,548 | 256.2 | |||||||||
Hanover Insurance Group, Inc. | 6,240 | 746,054 | 1,475.3 | |||||||||
HCA Healthcare, Inc. | 2,507 | 720,336 | 1,424.4 | |||||||||
HealthEquity, Inc. | 2,511 | 134,213 | 265.4 | |||||||||
HEICO Corp. | 2,551 | 430,201 | 850.7 | |||||||||
HEICO Corp., Class A | 9,384 | 1,259,614 | 2,490.8 | |||||||||
Helmerich & Payne, Inc. | 17,705 | 587,098 | 1,161.0 | |||||||||
Henry Schein, Inc. | 12,714 | 1,027,418 | 2,031.7 | |||||||||
Herc Holdings, Inc. | 4,273 | 427,385 | 845.1 | |||||||||
Holcim AG | 3,511 | 230,780 | 456.4 | |||||||||
Hologic, Inc. | 4,509 | 387,819 | 766.9 | |||||||||
Home Depot, Inc. | 1,003 | 301,442 | 596.1 | |||||||||
Honeywell International, Inc. | 8,958 | 1,790,167 | 3,540.0 | |||||||||
Hormel Foods Corp. | 7,328 | 296,344 | 586.0 | |||||||||
Howard Hughes Corp. | 652 | 50,445 | 99.8 | |||||||||
HubSpot, Inc. | 1,634 | 687,832 | 1,360.2 | |||||||||
IDACORP, Inc. | 3,915 | 435,035 | 860.3 | |||||||||
IDEXX Laboratories, Inc. | 368 | 181,115 | 358.1 | |||||||||
Inari Medical, Inc. | 942 | 62,568 | 123.7 | |||||||||
| 98 | 2 0 2 3 BLACK ROCK ANNUAL REPORT TO SHAREHOLDERS |
Schedule of Investments (continued) April 30, 2023 | BlackRock Global Equity Market Neutral Fund |
| Security | Shares | Value | % of Basket Value | |||||||||
United States (continued) | ||||||||||||
Incyte Corp. | 7,738 | $ | 575,785 | 1,138.6 | % | |||||||
Insperity, Inc. | 221 | 27,064 | 53.5 | |||||||||
Integra LifeSciences Holdings Corp. | 6,547 | 362,180 | 716.2 | |||||||||
Invesco Ltd. | 64,804 | 1,110,093 | 2,195.2 | |||||||||
Ionis Pharmaceuticals, Inc. | 20,160 | 713,059 | 1,410.0 | |||||||||
IQVIA Holdings, Inc. | 4,314 | 812,024 | 1,605.7 | |||||||||
ITT, Inc. | 3,574 | 301,789 | 596.8 | |||||||||
Jack Henry & Associates, Inc. | 4,170 | 681,128 | 1,346.9 | |||||||||
Jefferies Financial Group, Inc. | 21,612 | 692,232 | 1,368.9 | |||||||||
Johnson & Johnson | 8,649 | 1,415,841 | 2,799.8 | |||||||||
Johnson Controls International PLC | 5,030 | 300,995 | 595.2 | |||||||||
Jones Lang LaSalle, Inc. | 5,195 | 722,313 | 1,428.3 | |||||||||
KBR, Inc. | 3,298 | 187,096 | 370.0 | |||||||||
KeyCorp | 10,922 | 122,982 | 243.2 | |||||||||
Keysight Technologies, Inc. | 1,928 | 278,866 | 551.4 | |||||||||
KLA Corp. | 1,602 | 619,237 | 1,224.5 | |||||||||
Knight-Swift Transportation Holdings, Inc. | 15,357 | 864,906 | 1,710.3 | |||||||||
Laboratory Corp. of America Holdings | 3,089 | 700,307 | 1,384.8 | |||||||||
Lam Research Corp. | 341 | 178,711 | 353.4 | |||||||||
Landstar System, Inc. | 8,826 | 1,553,641 | 3,072.3 | |||||||||
Lattice Semiconductor Corp. | 2,191 | 174,623 | 345.3 | |||||||||
Lear Corp. | 11,752 | 1,500,260 | 2,966.7 | |||||||||
Lennox International, Inc. | 3,503 | 987,531 | 1,952.8 | |||||||||
Liberty Broadband Corp. | 5,536 | 469,342 | 928.1 | |||||||||
Louisiana-Pacific Corp. | 10,956 | 654,511 | 1,294.3 | |||||||||
Lowe’s Cos., Inc. | 9,326 | 1,938,223 | 3,832.8 | |||||||||
Lumentum Holdings, Inc. | 688 | 33,196 | 65.6 | |||||||||
MACOM Technology Solutions Holdings, Inc. | 10,028 | 585,034 | 1,156.9 | |||||||||
Macy’s, Inc. | 62,722 | 1,024,877 | 2,026.7 | |||||||||
Manhattan Associates, Inc. | 11,591 | 1,920,397 | 3,797.5 | |||||||||
Marathon Oil Corp. | 17,859 | 431,473 | 853.2 | |||||||||
Marathon Petroleum Corp. | 3,281 | 400,282 | 791.5 | |||||||||
Marriott Vacations Worldwide Corp. | 1,480 | 199,149 | 393.8 | |||||||||
Martin Marietta Materials, Inc. | 3,280 | 1,191,296 | 2,355.7 | |||||||||
Masco Corp. | 4,784 | 255,992 | 506.2 | |||||||||
Mastercard, Inc. | 694 | 263,741 | 521.5 | |||||||||
Match Group, Inc. | 5,325 | 196,492 | 388.6 | |||||||||
McCormick & Co., Inc. | 12,200 | 1,071,770 | 2,119.4 | |||||||||
Medical Properties Trust, Inc. | 39,188 | 343,679 | 679.6 | |||||||||
Merck & Co., Inc. | 936 | 108,080 | 213.7 | |||||||||
Meta Platforms, Inc., Class A | 1,459 | 350,627 | 693.3 | |||||||||
MetLife, Inc. | 10,582 | 648,994 | 1,283.4 | |||||||||
Mettler-Toledo International, Inc. | 523 | 780,054 | 1,542.5 | |||||||||
MGM Resorts International | 22,302 | 1,001,806 | 1,981.0 | |||||||||
Micron Technology, Inc. | 6,909 | 444,663 | 879.3 | |||||||||
Microsoft Corp. | 8,279 | 2,543,806 | 5,030.3 | |||||||||
Mid-America Apartment Communities, Inc. | 2,357 | 362,507 | 716.8 | |||||||||
Mohawk Industries, Inc. | 8,713 | 922,707 | 1,824.6 | |||||||||
Molson Coors Beverage Co., Class B | 25,599 | 1,522,629 | 3,010.9 | |||||||||
Moody’s Corp. | 3,189 | 998,540 | 1,974.6 | |||||||||
MSCI, Inc. | 203 | 97,937 | 193.7 | |||||||||
Nasdaq, Inc. | 9,912 | 548,827 | 1,085.3 | |||||||||
Nestle SA, Registered Shares | 6,820 | 872,157 | 1,724.7 | |||||||||
Neurocrine Biosciences, Inc. | 5,801 | 586,133 | 1,159.1 | |||||||||
New York Community Bancorp, Inc. | 30,732 | 328,525 | 649.6 | |||||||||
Newmont Corp. | 13,318 | 631,273 | 1,248.3 | |||||||||
Nexstar Media Group, Inc. | 1,149 | 199,294 | 394.1 | |||||||||
Nordson Corp. | 2,324 | 502,704 | 994.1 | |||||||||
Norfolk Southern Corp. | 1,197 | 243,027 | 480.6 | |||||||||
Northern Trust Corp. | 4,879 | 381,343 | 754.1 | |||||||||
Northrop Grumman Corp. | 253 | 116,701 | 230.8 | |||||||||
NVIDIA Corp. | 22,982 | 6,377,275 | 12,610.8 | |||||||||
| Security | Shares | Value | % of Basket Value | |||||||||
United States (continued) | ||||||||||||
Occidental Petroleum Corp. | 1,087 | $ | 66,883 | 132.3 | % | |||||||
OneMain Holdings, Inc. | 12,557 | 481,812 | 952.8 | |||||||||
O’Reilly Automotive, Inc. | 960 | 880,618 | 1,741.4 | |||||||||
Oshkosh Corp. | 7,894 | 604,049 | 1,194.5 | |||||||||
Otis Worldwide Corp. | 16,563 | 1,412,824 | 2,793.8 | |||||||||
Ovintiv, Inc. | 6,790 | 244,983 | 484.4 | |||||||||
Ovintiv, Inc. | 6,066 | 220,568 | 436.2 | |||||||||
Palo Alto Networks, Inc. | 4,905 | 894,966 | 1,769.8 | |||||||||
Paycom Software, Inc. | 250 | 72,593 | 143.5 | |||||||||
PDC Energy, Inc. | 5,877 | 382,299 | 756.0 | |||||||||
Penske Automotive Group, Inc. | 3,884 | 538,245 | 1,064.4 | |||||||||
PepsiCo., Inc. | 8,973 | 1,712,856 | 3,387.1 | |||||||||
Philip Morris International, Inc. | 14,526 | 1,452,164 | 2,871.6 | |||||||||
Pinnacle Financial Partners, Inc. | 5,872 | 318,439 | 629.7 | |||||||||
Pinterest, Inc. | 27,246 | 626,658 | 1,239.2 | |||||||||
Pioneer Natural Resources Co. | 1,495 | 325,237 | 643.1 | |||||||||
Planet Fitness, Inc., Class A | 52 | 4,323 | 8.5 | |||||||||
Pool Corp. | 280 | 98,370 | 194.5 | |||||||||
Power Integrations, Inc. | 3,368 | 245,123 | 484.7 | |||||||||
PPL Corp. | 1,671 | 47,991 | 94.9 | |||||||||
Primo Water Corp. | 40,963 | 629,394 | 1,244.6 | |||||||||
Prudential Financial, Inc. | 8,283 | 720,621 | 1,425.0 | |||||||||
PTC Therapeutics, Inc. | 4,830 | 266,326 | 526.6 | |||||||||
Qorvo, Inc. | 12,664 | 1,166,101 | 2,305.9 | |||||||||
Qualys, Inc. | 2,684 | 303,131 | 599.4 | |||||||||
Quest Diagnostics, Inc. | 2,166 | 300,662 | 594.5 | |||||||||
Ralph Lauren Corp. | 4,127 | 473,738 | 936.8 | |||||||||
Rambus, Inc. | 3,179 | 140,957 | 278.7 | |||||||||
Regeneron Pharmaceuticals, Inc., Registered Shares | 362 | 290,248 | 574.0 | |||||||||
Reinsurance Group of America, Inc. | 1,186 | 168,792 | 333.8 | |||||||||
Reliance Steel & Aluminum Co. | 6,292 | 1,559,158 | 3,083.2 | |||||||||
Repligen Corp. | 698 | 105,838 | 209.3 | |||||||||
ResMed, Inc. | 4,085 | 984,322 | 1,946.5 | |||||||||
RingCentral, Inc., Class A | 12,360 | 340,642 | 673.6 | |||||||||
Roche Holding AG | 1,689 | 568,642 | 1,124.5 | |||||||||
Rollins, Inc. | 10,877 | 459,553 | 908.7 | |||||||||
Royal Caribbean Cruises Ltd. | 4,447 | 290,967 | 575.4 | |||||||||
Royal Gold, Inc. | 865 | 114,561 | 226.5 | |||||||||
S&P Global, Inc. | 1,769 | 641,404 | 1,268.3 | |||||||||
Saia, Inc. | 639 | 190,275 | 376.3 | |||||||||
SBA Communications Corp. | 283 | 73,832 | 146.0 | |||||||||
Schlumberger NV | 23,108 | 1,140,380 | 2,255.1 | |||||||||
Schneider Electric SE | 1,335 | 231,025 | 456.8 | |||||||||
Scotts Miracle-Gro Co. | 3,720 | 248,533 | 491.5 | |||||||||
SEI Investments Co. | 5,311 | 312,871 | 618.7 | |||||||||
Silicon Laboratories, Inc. | 4,262 | 593,697 | 1,174.0 | |||||||||
Sims Ltd. | 10,536 | 111,953 | 221.4 | |||||||||
Sirius XM Holdings, Inc. | 139,519 | 530,172 | 1,048.4 | |||||||||
SiteOne Landscape Supply, Inc. | 4,641 | 685,661 | 1,355.9 | |||||||||
Snap-on, Inc. | 1,696 | 439,959 | 870.0 | |||||||||
Southwest Airlines Co. | 41,442 | 1,255,278 | 2,482.3 | |||||||||
Spotify Technology SA | 1,611 | 215,230 | 425.6 | |||||||||
Steel Dynamics, Inc. | 1,057 | 109,875 | 217.3 | |||||||||
Stifel Financial Corp. | 17,734 | 1,063,508 | 2,103.0 | |||||||||
Sun Communities, Inc. | 657 | 91,277 | 180.5 | |||||||||
Syneos Health, Inc. | 22,055 | 865,879 | 1,712.2 | |||||||||
Synopsys, Inc. | 2,005 | 744,497 | 1,472.2 | |||||||||
Synovus Financial Corp. | 8,355 | 257,334 | 508.9 | |||||||||
T Rowe Price Group, Inc. | 5,854 | 657,580 | 1,300.3 | |||||||||
Tapestry, Inc. | 7,615 | 310,768 | 614.5 | |||||||||
Teleflex, Inc. | 2,577 | 702,284 | 1,388.7 | |||||||||
SCHEDULE OF INVESTMENTS | 99 |
Schedule of Investments (continued) April 30, 2023 | BlackRock Global Equity Market Neutral Fund |
| Security | Shares | Value | % of Basket Value | |||||||||
United States (continued) | ||||||||||||
Tempur Sealy International, Inc. | 6,528 | $ | 244,604 | 483.7 | % | |||||||
Teradata Corp. | 16,296 | 630,818 | 1,247.4 | |||||||||
Teradyne, Inc. | 22,015 | 2,011,731 | 3,978.1 | |||||||||
Texas Pacific Land Corp. | 582 | 859,992 | 1,700.6 | |||||||||
Textron, Inc. | 5,373 | 359,669 | 711.2 | |||||||||
Thor Industries, Inc. | 1,172 | 92,611 | 183.1 | |||||||||
TJX Cos., Inc. | 5,555 | 437,845 | 865.8 | |||||||||
Transocean Ltd. | 16,141 | 95,232 | 188.3 | |||||||||
Travel & Leisure Co. | 42,962 | 1,644,156 | 3,251.2 | |||||||||
Travelers Cos., Inc. | 891 | 161,396 | 319.2 | |||||||||
Trex Co., Inc. | 16,469 | 900,196 | 1,780.1 | |||||||||
Trimble, Inc. | 19,901 | 937,337 | 1,853.5 | |||||||||
UGI Corp. | 25,244 | 855,267 | 1,691.3 | |||||||||
Ulta Beauty, Inc. | 2,459 | 1,355,966 | 2,681.4 | |||||||||
United Parcel Service, Inc., Class B | 1,407 | 252,993 | 500.3 | |||||||||
United Therapeutics Corp. | 2,739 | 630,326 | 1,246.4 | |||||||||
UnitedHealth Group, Inc. | 1,672 | 822,774 | 1,627.0 | |||||||||
Universal Display Corp. | 5,799 | 773,935 | 1,530.4 | |||||||||
US Bancorp | 17,424 | 597,295 | 1,181.1 | |||||||||
Valero Energy Corp. | 2,948 | 338,047 | 668.5 | |||||||||
Veeva Systems, Inc., Class A | 7,323 | 1,311,403 | 2,593.2 | |||||||||
Ventas, Inc. | 7,872 | 378,250 | 748.0 | |||||||||
VeriSign, Inc. | 18,467 | 4,095,981 | 8,099.6 | |||||||||
Verisk Analytics, Inc. | 6,026 | 1,169,707 | 2,313.0 | |||||||||
Vertex Pharmaceuticals, Inc. | 1,530 | 521,317 | 1,030.9 | |||||||||
Virtu Financial, Inc., Class A | 2,306 | 46,235 | 91.4 | |||||||||
Visa, Inc., Class A | 3,753 | 873,436 | 1,727.2 | |||||||||
Visteon Corp. | 116 | 16,285 | 32.2 | |||||||||
Vulcan Materials Co. | 955 | 167,240 | 330.7 | |||||||||
W R Berkley Corp. | 6,220 | 366,482 | 724.7 | |||||||||
Walgreens Boots Alliance, Inc. | 38,857 | 1,369,709 | 2,708.5 | |||||||||
Walmart, Inc. | 4,842 | 730,997 | 1,445.5 | |||||||||
Waters Corp. | 2,055 | 617,240 | 1,220.6 | |||||||||
Watsco, Inc. | 1,433 | 496,363 | 981.5 | |||||||||
Westlake Corp. | 3,967 | 451,365 | 892.6 | |||||||||
Westrock Co. | 9,084 | 271,884 | 537.6 | |||||||||
WEX, Inc. | 1,935 | 343,172 | 678.6 | |||||||||
Willis Towers Watson PLC | 1,648 | 381,677 | 754.7 | |||||||||
WillScot Mobile Mini Holdings Corp. | 1,123 | 50,984 | 100.8 | |||||||||
Woodward, Inc. | 731 | 70,191 | 138.8 | |||||||||
Workiva, Inc. | 3,340 | 312,023 | 617.0 | |||||||||
World Wrestling Entertainment, Inc., Class A | 5,744 | 615,584 | 1,217.3 | |||||||||
WW Grainger, Inc. | 661 | 459,772 | 909.2 | |||||||||
Xylem, Inc. | 12,560 | 1,304,230 | 2,579.1 | |||||||||
YETI Holdings, Inc. | 9,701 | 382,704 | 756.8 | |||||||||
Yum! Brands, Inc. | 15,872 | 2,231,286 | 4,412.3 | |||||||||
Ziff Davis, Inc. | 697 | 50,979 | 100.8 | |||||||||
Zillow Group, Inc., Class C | 4,725 | 205,726 | 406.8 | |||||||||
Zions Bancorp NA | 8,060 | 224,552 | 444.0 | |||||||||
Zoetis, Inc. | 3,701 | 650,562 | 1,286.5 | |||||||||
|
|
|
| |||||||||
| 200,895,374 | ||||||||||||
Zambia | ||||||||||||
First Quantum Minerals Ltd. | 49,087 | 1,207,371 | 2,387.5 | |||||||||
|
|
|
| |||||||||
| Preferred Stocks | ||||||||||||
Germany | ||||||||||||
Bayerische Motoren Werke AG | 2,838 | 299,237 | 591.7 | |||||||||
Fuchs Petrolub SE, Preference Shares | 4,822 | 188,917 | 373.6 | |||||||||
Sartorius AG | 641 | 246,935 | 488.3 | |||||||||
Volkswagen AG | 876 | 118,634 | 234.6 | |||||||||
|
|
|
| |||||||||
| 853,723 | ||||||||||||
| Security | Shares | Value | % of Basket Value | |||||||||
Germany (continued) | ||||||||||||
| Warrants | ||||||||||||
Australia | ||||||||||||
Magellan Financial Group Ltd., (Issued/Exercisable 04/14/22, 1 Share for 1 Warrant, Expires 04/16/27, Strike Price AUD 35.00) | 1,580 | $ | 218 | 0.4 | % | |||||||
|
|
|
| |||||||||
Total Reference Entity — Long | 398,649,930 | |||||||||||
|
| |||||||||||
| Reference Entity — Short | ||||||||||||
| Common Stocks | ||||||||||||
Australia | ||||||||||||
Ampol Ltd. | (19,910 | ) | (402,725 | ) | (796.4 | ) | ||||||
Atlas Arteria Ltd. | (361,598 | ) | (1,592,711 | ) | (3,149.5 | ) | ||||||
BlueScope Steel Ltd. | (115,993 | ) | (1,562,359 | ) | (3,089.5 | ) | ||||||
Champion Iron Ltd. | (19,465 | ) | (85,765 | ) | (169.6 | ) | ||||||
Cleanaway Waste Management Ltd. | (827,301 | ) | (1,350,491 | ) | (2,670.5 | ) | ||||||
Evolution Mining Ltd. | (221,303 | ) | (528,800 | ) | (1,045.7 | ) | ||||||
Glencore PLC | (3,005 | ) | (17,506 | ) | (34.6 | ) | ||||||
Goodman Group | (118,711 | ) | (1,550,781 | ) | (3,066.6 | ) | ||||||
IGO Ltd. | (35,648 | ) | (332,550 | ) | (657.6 | ) | ||||||
Incitec Pivot Ltd. | (350,608 | ) | (757,002 | ) | (1,496.9 | ) | ||||||
Lendlease Corp. Ltd. | (3,998 | ) | (20,140 | ) | (39.8 | ) | ||||||
Lottery Corp. Ltd. | (237,352 | ) | (806,382 | ) | (1,594.6 | ) | ||||||
Medibank Pvt Ltd. | (7,966 | ) | (19,100 | ) | (37.8 | ) | ||||||
Newcrest Mining Ltd. | (2,318 | ) | (44,570 | ) | (88.1 | ) | ||||||
Newcrest Mining Ltd. | (49,757 | ) | (962,996 | ) | (1,904.3 | ) | ||||||
NEXTDC Ltd. | (62,487 | ) | (485,541 | ) | (960.1 | ) | ||||||
Nufarm Ltd. | (144,608 | ) | (545,082 | ) | (1,077.9 | ) | ||||||
Orica Ltd. | (15,712 | ) | (171,819 | ) | (339.8 | ) | ||||||
Ramsay Health Care Ltd. | (1,374 | ) | (59,904 | ) | (118.5 | ) | ||||||
Reece Ltd. | (17,295 | ) | (213,461 | ) | (422.1 | ) | ||||||
Santos Ltd. | (337,698 | ) | (1,621,584 | ) | (3,206.6 | ) | ||||||
Seven Group Holdings Ltd. | (93,598 | ) | (1,497,889 | ) | (2,962.0 | ) | ||||||
South32 Ltd. | (262,665 | ) | (752,856 | ) | (1,488.7 | ) | ||||||
Transurban Group | (43,771 | ) | (442,271 | ) | (874.6 | ) | ||||||
Woodside Energy Group Ltd. | (1 | ) | (22 | ) | (0.1 | ) | ||||||
|
|
|
| |||||||||
| (15,824,307 | ) | |||||||||||
Austria | ||||||||||||
Erste Group Bank AG | (11,793 | ) | (425,456 | ) | (841.3 | ) | ||||||
Mondi PLC | (15,802 | ) | (247,899 | ) | (490.2 | ) | ||||||
OMV AG | (7,900 | ) | (370,769 | ) | (733.2 | ) | ||||||
|
|
|
| |||||||||
| (1,044,124 | ) | |||||||||||
Belgium | ||||||||||||
Ackermans & van Haaren NV | (97 | ) | (16,927 | ) | (33.5 | ) | ||||||
Ageas SA/NV | (759 | ) | (33,548 | ) | (66.3 | ) | ||||||
Anheuser-Busch InBev SA | (13,391 | ) | (863,633 | ) | (1,707.8 | ) | ||||||
KBC Group NV | (13,843 | ) | (981,658 | ) | (1,941.2 | ) | ||||||
|
|
|
| |||||||||
| (1,895,766 | ) | |||||||||||
Canada | ||||||||||||
Agnico Eagle Mines Ltd. | (15,719 | ) | (902,104 | ) | (1,783.9 | ) | ||||||
Algonquin Power & Utilities Corp. | (44,960 | ) | (386,666 | ) | (764.6 | ) | ||||||
Barrick Gold Corp. | (49,568 | ) | (953,464 | ) | (1,885.4 | ) | ||||||
BlackBerry Ltd. | (26,990 | ) | (106,568 | ) | (210.7 | ) | ||||||
Brookfield Asset Management Ltd. | (29,143 | ) | (988,066 | ) | (1,953.9 | ) | ||||||
CAE, Inc. | (26,532 | ) | (604,372 | ) | (1,195.1 | ) | ||||||
Cameco Corp. | (34,003 | ) | (945,027 | ) | (1,868.8 | ) | ||||||
Canadian Apartment Properties REIT | (20,519 | ) | (760,060 | ) | (1,503.0 | ) | ||||||
Canadian Pacific Kansas City Ltd. | (3,354 | ) | (267,415 | ) | (528.8 | ) | ||||||
Canadian Solar, Inc. | (20,117 | ) | (752,778 | ) | (1,488.6 | ) | ||||||
| 100 | 2 0 2 3 BLACK ROCK ANNUAL REPORT TO SHAREHOLDERS |
Schedule of Investments (continued) April 30, 2023 | BlackRock Global Equity Market Neutral Fund |
| Security | Shares | Value | % of Basket Value | |||||||||
Canada (continued) | ||||||||||||
Canadian Tire Corp. Ltd. | (8,223 | ) | $ | (1,090,736 | ) | (2,156.9 | )% | |||||
Canadian Utilities Ltd. | (14,753 | ) | (431,400 | ) | (853.1 | ) | ||||||
Cenovus Energy, Inc. | (41,814 | ) | (710,305 | ) | (1,404.6 | ) | ||||||
CI Financial Corp. | (52,152 | ) | (519,277 | ) | (1,026.8 | ) | ||||||
Colliers International Group, Inc. | (2,085 | ) | (224,198 | ) | (443.3 | ) | ||||||
Fairfax Financial Holdings Ltd. | (150 | ) | (105,948 | ) | (209.5 | ) | ||||||
Finning International, Inc. | (65,211 | ) | (1,709,457 | ) | (3,380.4 | ) | ||||||
George Weston Ltd. | (1,956 | ) | (265,623 | ) | (525.3 | ) | ||||||
iA Financial Corp., Inc. | (1,994 | ) | (135,289 | ) | (267.5 | ) | ||||||
IGM Financial, Inc. | (8,418 | ) | (261,298 | ) | (516.7 | ) | ||||||
Intact Financial Corp. | (2,846 | ) | (432,026 | ) | (854.3 | ) | ||||||
Lightspeed Commerce, Inc. | (88,209 | ) | (1,173,963 | ) | (2,321.5 | ) | ||||||
Loblaw Cos. Ltd. | (4,281 | ) | (407,202 | ) | (805.2 | ) | ||||||
National Bank of Canada | (527 | ) | (39,185 | ) | (77.5 | ) | ||||||
Nutrien Ltd. | (16,850 | ) | (1,183,418 | ) | (2,340.2 | ) | ||||||
Open Text Corp. | (80,267 | ) | (3,073,951 | ) | (6,078.6 | ) | ||||||
Osisko Gold Royalties Ltd. | (24,418 | ) | (401,379 | ) | (793.7 | ) | ||||||
Paramount Resources Ltd., Class A | (1,871 | ) | (44,830 | ) | (88.7 | ) | ||||||
Parkland Corp. | (33,411 | ) | (796,993 | ) | (1,576.0 | ) | ||||||
Power Corp. of Canada | (6,615 | ) | (179,187 | ) | (354.3 | ) | ||||||
Quebecor, Inc. | (18,445 | ) | (481,480 | ) | (952.1 | ) | ||||||
Rogers Communications, Inc. | (56,095 | ) | (2,802,065 | ) | (5,541.0 | ) | ||||||
Saputo, Inc. | (17,547 | ) | (459,653 | ) | (908.9 | ) | ||||||
Shopify, Inc., Class A | (8,007 | ) | (392,383 | ) | (775.9 | ) | ||||||
SNC-Lavalin Group, Inc. | (16,213 | ) | (377,773 | ) | (747.0 | ) | ||||||
Sun Life Financial, Inc. | (10,189 | ) | (505,441 | ) | (999.5 | ) | ||||||
Thomson Reuters Corp. | (6,350 | ) | (844,482 | ) | (1,669.9 | ) | ||||||
Tricon Residential, Inc. | (35,815 | ) | (290,392 | ) | (574.2 | ) | ||||||
WSP Global, Inc. | (5,973 | ) | (797,313 | ) | (1,576.7 | ) | ||||||
|
|
|
| |||||||||
| (26,803,167 | ) | |||||||||||
China | ||||||||||||
BOC Hong Kong Holdings Ltd. | (125,500 | ) | (396,164 | ) | (783.4 | ) | ||||||
Kerry Logistics Network Ltd. | (80,500 | ) | (114,057 | ) | (225.5 | ) | ||||||
NXP Semiconductors NV | (4,703 | ) | (770,069 | ) | (1,522.8 | ) | ||||||
Prosus NV | (630 | ) | (47,215 | ) | (93.4 | ) | ||||||
Xinyi Glass Holdings Ltd. | (1,366,000 | ) | (2,499,118 | ) | (4,941.9 | ) | ||||||
|
|
|
| |||||||||
| (3,826,623 | ) | |||||||||||
Finland | ||||||||||||
Elisa OYJ | (13,642 | ) | (840,577 | ) | (1,662.2 | ) | ||||||
Huhtamaki OYJ | (3,331 | ) | (119,067 | ) | (235.4 | ) | ||||||
Kesko OYJ, B Shares | (8,759 | ) | (181,034 | ) | (358.0 | ) | ||||||
Kojamo OYJ | (14,954 | ) | (184,116 | ) | (364.1 | ) | ||||||
Stora Enso OYJ, R Shares | (14,975 | ) | (188,437 | ) | (372.6 | ) | ||||||
Valmet OYJ | (3,614 | ) | (121,346 | ) | (240.0 | ) | ||||||
|
|
|
| |||||||||
| (1,634,577 | ) | |||||||||||
France | ||||||||||||
Air France-KLM | (111,507 | ) | (191,642 | ) | (379.0 | ) | ||||||
Alstom SA | (3,119 | ) | (77,787 | ) | (153.8 | ) | ||||||
Amundi SA | (7,671 | ) | (498,586 | ) | (985.9 | ) | ||||||
BioMerieux | (8,210 | ) | (852,554 | ) | (1,685.9 | ) | ||||||
BNP Paribas SA | (11,064 | ) | (709,185 | ) | (1,402.4 | ) | ||||||
Capgemini SE | (8,507 | ) | (1,539,046 | ) | (3,043.4 | ) | ||||||
Cie de L’Odet SE | (132 | ) | (230,626 | ) | (456.0 | ) | ||||||
Covivio SA/France | (402 | ) | (22,661 | ) | (44.8 | ) | ||||||
Credit Agricole SA | (105,973 | ) | (1,285,216 | ) | (2,541.5 | ) | ||||||
Eiffage SA | (8,370 | ) | (988,625 | ) | (1,955.0 | ) | ||||||
Eramet SA | (1,144 | ) | (110,417 | ) | (218.3 | ) | ||||||
Eurazeo SE | (2,569 | ) | (181,931 | ) | (359.8 | ) | ||||||
Faurecia SE | (2,410 | ) | (49,590 | ) | (98.1 | ) | ||||||
| Security | Shares | Value | % of Basket Value | |||||||||
France (continued) | ||||||||||||
Ipsen SA | (6,641 | ) | $ | (799,074 | ) | (1,580.1 | )% | |||||
Orange SA | (68,965 | ) | (890,699 | ) | (1,761.3 | ) | ||||||
Publicis Groupe SA | (1,368 | ) | (110,932 | ) | (219.4 | ) | ||||||
Rexel SA | (8,614 | ) | (197,945 | ) | (391.4 | ) | ||||||
Sodexo SA | (2,569 | ) | (273,050 | ) | (539.9 | ) | ||||||
Technip Energies NV | (4,426 | ) | (97,407 | ) | (192.6 | ) | ||||||
Thales SA | (1,428 | ) | (216,130 | ) | (427.4 | ) | ||||||
TotalEnergies SE | (24,487 | ) | (1,553,097 | ) | (3,071.2 | ) | ||||||
Unibail-Rodamco-Westfield | (9,575 | ) | (513,734 | ) | (1,015.9 | ) | ||||||
Worldline SA/France | (4,837 | ) | (208,747 | ) | (412.8 | ) | ||||||
|
|
|
| |||||||||
| (11,598,681 | ) | |||||||||||
Germany | ||||||||||||
adidas AG | (717 | ) | (125,654 | ) | (248.5 | ) | ||||||
Aixtron SE | (892 | ) | (25,028 | ) | (49.5 | ) | ||||||
Aroundtown SA | (31,223 | ) | (42,163 | ) | (83.4 | ) | ||||||
Aurubis AG | (3,842 | ) | (357,470 | ) | (706.9 | ) | ||||||
BASF SE | (3,515 | ) | (180,253 | ) | (356.4 | ) | ||||||
Bayer AG, Registered Shares | (7,555 | ) | (494,489 | ) | (977.8 | ) | ||||||
Bechtle AG | (4,634 | ) | (213,740 | ) | (422.7 | ) | ||||||
Brenntag SE | (7,489 | ) | (605,717 | ) | (1,197.8 | ) | ||||||
Continental AG | (5,220 | ) | (363,080 | ) | (718.0 | ) | ||||||
CTS Eventim AG & Co. KGaA | (4,851 | ) | (317,198 | ) | (627.2 | ) | ||||||
Deutsche Boerse AG | (4,271 | ) | (807,764 | ) | (1,597.3 | ) | ||||||
Deutsche Post AG, Registered Shares | (12,849 | ) | (613,158 | ) | (1,212.5 | ) | ||||||
Evotec SE | (9,078 | ) | (165,199 | ) | (326.7 | ) | ||||||
Fresenius Medical Care AG & Co. KGaA | (14,640 | ) | (704,994 | ) | (1,394.1 | ) | ||||||
Hannover Rueck SE | (1,419 | ) | (300,927 | ) | (595.1 | ) | ||||||
HeidelbergCement AG | (3,667 | ) | (275,467 | ) | (544.7 | ) | ||||||
Hella GmbH & Co. KGaA | (675 | ) | (56,602 | ) | (111.9 | ) | ||||||
HelloFresh SE | (5,613 | ) | (149,712 | ) | (296.0 | ) | ||||||
HOCHTIEF AG | (7,857 | ) | (652,076 | ) | (1,289.4 | ) | ||||||
Infineon Technologies AG | (20,299 | ) | (736,516 | ) | (1,456.4 | ) | ||||||
KION Group AG | (591 | ) | (24,323 | ) | (48.1 | ) | ||||||
Muenchener Rueckversicherungs-Gesellschaft AG in Muenchen, Registered Shares | (617 | ) | (230,113 | ) | (455.0 | ) | ||||||
Nordex SE | (7,384 | ) | (88,185 | ) | (174.4 | ) | ||||||
Rational AG | (158 | ) | (113,515 | ) | (224.5 | ) | ||||||
SAP SE | (686 | ) | (92,120 | ) | (182.2 | ) | ||||||
Siemens Healthineers AG | (3,632 | ) | (224,641 | ) | (444.2 | ) | ||||||
Sixt SE | (6,393 | ) | (786,516 | ) | (1,555.3 | ) | ||||||
Symrise AG | (2,764 | ) | (331,386 | ) | (655.3 | ) | ||||||
TeamViewer SE | (1,583 | ) | (28,990 | ) | (57.3 | ) | ||||||
Telefonica Deutschland Holding AG | (29,589 | ) | (99,198 | ) | (196.2 | ) | ||||||
Vonovia SE | (14,711 | ) | (316,561 | ) | (626.0 | ) | ||||||
|
|
|
| |||||||||
| (9,522,755 | ) | |||||||||||
Hong Kong | ||||||||||||
CK Asset Holdings Ltd. | (36,500 | ) | (215,826 | ) | (426.8 | ) | ||||||
CK Infrastructure Holdings Ltd. | (73,000 | ) | (415,612 | ) | (821.8 | ) | ||||||
CLP Holdings Ltd. | (203,500 | ) | (1,515,185 | ) | (2,996.2 | ) | ||||||
Guotai Junan International Holdings Ltd. | (259,000 | ) | (21,875 | ) | (43.3 | ) | ||||||
Hang Seng Bank Ltd. | (18,800 | ) | (278,666 | ) | (551.0 | ) | ||||||
Henderson Land Development Co. Ltd. | (130,000 | ) | (462,888 | ) | (915.3 | ) | ||||||
HKT Trust & HKT Ltd. | (2,503,000 | ) | (3,289,579 | ) | (6,505.0 | ) | ||||||
Hong Kong & China Gas Co. Ltd. | (460,000 | ) | (408,443 | ) | (807.7 | ) | ||||||
Jardine Matheson Holdings Ltd. | (1,300 | ) | (62,844 | ) | (124.3 | ) | ||||||
Man Wah Holdings Ltd. | (371,200 | ) | (312,263 | ) | (617.5 | ) | ||||||
NWS Holdings Ltd. | (166,000 | ) | (143,781 | ) | (284.3 | ) | ||||||
PCCW Ltd. | (5,469,000 | ) | (2,852,747 | ) | (5,641.2 | ) | ||||||
Power Assets Holdings Ltd. | (155,500 | ) | (888,562 | ) | (1,757.1 | ) | ||||||
Prudential PLC | (135,671 | ) | (2,048,629 | ) | (4,051.1 | ) | ||||||
SCHEDULE OF INVESTMENTS | 101 |
Schedule of Investments (continued) April 30, 2023 | BlackRock Global Equity Market Neutral Fund |
| Security | Shares | Value | % of Basket Value | |||||||||
Hong Kong (continued) | ||||||||||||
Sino Land Co. Ltd. | (696,703 | ) | $ | (938,845 | ) | (1,856.5 | )% | |||||
VTech Holdings Ltd. | (48,600 | ) | (291,768 | ) | (577.0 | ) | ||||||
Wharf Real Estate Investment Co. Ltd. | (3,000 | ) | (17,300 | ) | (34.2 | ) | ||||||
|
|
|
| |||||||||
| (14,164,813 | ) | |||||||||||
Ireland | ||||||||||||
Bank of Ireland Group PLC | (3,215 | ) | (32,989 | ) | (65.2 | ) | ||||||
|
|
|
| |||||||||
Israel | ||||||||||||
Azrieli Group Ltd. | (16,475 | ) | (955,315 | ) | (1,889.1 | ) | ||||||
Bank Hapoalim BM | (90,729 | ) | (777,364 | ) | (1,537.2 | ) | ||||||
Bank Leumi Le-Israel BM | (282,267 | ) | (2,225,372 | ) | (4,400.6 | ) | ||||||
ICL Group Ltd. | (9,654 | ) | (59,603 | ) | (117.9 | ) | ||||||
Israel Corp. Ltd. | (858 | ) | (249,818 | ) | (494.0 | ) | ||||||
Israel Discount Bank Ltd. | (48,174 | ) | (238,091 | ) | (470.8 | ) | ||||||
Mizrahi Tefahot Bank Ltd. | (7,205 | ) | (235,013 | ) | (464.7 | ) | ||||||
Shufersal Ltd. | (145,809 | ) | (739,307 | ) | (1,461.9 | ) | ||||||
Strauss Group Ltd. | (33,822 | ) | (749,991 | ) | (1,483.1 | ) | ||||||
Teva Pharmaceutical Industries Ltd. | (7,852 | ) | (68,424 | ) | (135.3 | ) | ||||||
Teva Pharmaceutical Industries Ltd., ADR | (1,383 | ) | (12,074 | ) | (23.9 | ) | ||||||
|
|
|
| |||||||||
| (6,310,372 | ) | |||||||||||
Italy | ||||||||||||
Assicurazioni Generali SpA | (39,081 | ) | (807,488 | ) | (1,596.8 | ) | ||||||
Banca Mediolanum SpA | (1,423 | ) | (12,758 | ) | (25.2 | ) | ||||||
DiaSorin SpA | (3,625 | ) | (390,614 | ) | (772.4 | ) | ||||||
Interpump Group SpA | (5,430 | ) | (300,678 | ) | (594.6 | ) | ||||||
Iveco Group NV | (12,547 | ) | (111,980 | ) | (221.4 | ) | ||||||
Leonardo SpA | (20,842 | ) | (246,199 | ) | (486.9 | ) | ||||||
Nexi SpA | (17,272 | ) | (142,049 | ) | (280.9 | ) | ||||||
Pirelli &C SpA | (12,161 | ) | (63,191 | ) | (125.0 | ) | ||||||
Poste Italiane SpA | (31,968 | ) | (330,030 | ) | (652.6 | ) | ||||||
Saipem SpA | (12,567 | ) | (19,065 | ) | (37.7 | ) | ||||||
UniCredit SpA | (31,906 | ) | (626,860 | ) | (1,239.6 | ) | ||||||
|
|
|
| |||||||||
| (3,050,912 | ) | |||||||||||
Japan | ||||||||||||
Activia Properties, Inc. | (20 | ) | (59,049 | ) | (116.8 | ) | ||||||
Advance Residence Investment Corp. | (105 | ) | (275,882 | ) | (545.5 | ) | ||||||
Air Water, Inc. | (8,700 | ) | (111,370 | ) | (220.2 | ) | ||||||
Allegro MicroSystems, Inc. | (7,499 | ) | (268,239 | ) | (530.4 | ) | ||||||
Asahi Group Holdings Ltd. | (15,700 | ) | (614,178 | ) | (1,214.5 | ) | ||||||
Asics Corp. | (10,600 | ) | (300,355 | ) | (593.9 | ) | ||||||
ASKUL Corp. | (8,800 | ) | (118,823 | ) | (235.0 | ) | ||||||
Bank of Kyoto Ltd. | (15,500 | ) | (772,419 | ) | (1,527.4 | ) | ||||||
Benefit One, Inc. | (19,900 | ) | (277,580 | ) | (548.9 | ) | ||||||
BIPROGY, Inc. | (6,600 | ) | (161,232 | ) | (318.8 | ) | ||||||
Capcom Co. Ltd. | (6,700 | ) | (254,909 | ) | (504.1 | ) | ||||||
Chiba Bank Ltd. | (17,600 | ) | (116,429 | ) | (230.2 | ) | ||||||
Chubu Electric Power Co., Inc. | (27,800 | ) | (314,019 | ) | (621.0 | ) | ||||||
Chugai Pharmaceutical Co. Ltd. | (40,000 | ) | (1,045,414 | ) | (2,067.3 | ) | ||||||
Chugin Financial Group, Inc. | (8,100 | ) | (55,080 | ) | (108.9 | ) | ||||||
Cosmo Energy Holdings Co. Ltd. | (600 | ) | (19,442 | ) | (38.4 | ) | ||||||
Credit Saison Co. Ltd. | (12,700 | ) | (178,203 | ) | (352.4 | ) | ||||||
Dai Nippon Printing Co. Ltd. | (18,400 | ) | (535,849 | ) | (1,059.6 | ) | ||||||
Daido Steel Co. Ltd. | (7,200 | ) | (280,980 | ) | (555.6 | ) | ||||||
Daiwa House REIT Investment Corp. | (215 | ) | (462,896 | ) | (915.4 | ) | ||||||
Daiwa Office Investment Corp. | (12 | ) | (52,864 | ) | (104.5 | ) | ||||||
Daiwa Securities Group, Inc. | (3,100 | ) | (14,591 | ) | (28.9 | ) | ||||||
Daiwa Securities Living Investments Corp. | (317 | ) | (273,065 | ) | (540.0 | ) | ||||||
Descente Ltd. | (10,000 | ) | (321,700 | ) | (636.1 | ) | ||||||
Electric Power Development Co. Ltd. | (27,600 | ) | (447,238 | ) | (884.4 | ) | ||||||
| Security | Shares | Value | % of Basket Value | |||||||||
Japan (continued) | ||||||||||||
Food & Life Cos. Ltd. | (2,900 | ) | $ | (70,859 | ) | (140.1 | )% | |||||
FP Corp. | (12,400 | ) | (312,456 | ) | (617.9 | ) | ||||||
Fuji Kyuko Co. Ltd. | (2,800 | ) | (108,911 | ) | (215.4 | ) | ||||||
Fujitsu General Ltd. | (28,400 | ) | (741,576 | ) | (1,466.4 | ) | ||||||
Furukawa Electric Co. Ltd. | (5,000 | ) | (92,756 | ) | (183.4 | ) | ||||||
Fuyo General Lease Co. Ltd. | (8,400 | ) | (622,652 | ) | (1,231.3 | ) | ||||||
GLP J-Reit | (75 | ) | (86,816 | ) | (171.7 | ) | ||||||
Goldwin, Inc. | (8,100 | ) | (746,093 | ) | (1,475.4 | ) | ||||||
GS Yuasa Corp. | (13,400 | ) | (238,875 | ) | (472.4 | ) | ||||||
GungHo Online Entertainment, Inc. | (800 | ) | (15,556 | ) | (30.8 | ) | ||||||
Hachijuni Bank Ltd. | (10,100 | ) | (45,827 | ) | (90.6 | ) | ||||||
Hakuhodo DY Holdings, Inc. | (12,800 | ) | (152,773 | ) | (302.1 | ) | ||||||
Hankyu Hanshin Holdings, Inc. | (5,400 | ) | (170,798 | ) | (337.7 | ) | ||||||
Harmonic Drive Systems, Inc. | (2,600 | ) | (80,564 | ) | (159.3 | ) | ||||||
Haseko Corp. | (41,500 | ) | (513,174 | ) | (1,014.8 | ) | ||||||
Heiwa Corp. | (18,800 | ) | (376,043 | ) | (743.6 | ) | ||||||
Hikari Tsushin, Inc. | (1,900 | ) | (262,680 | ) | (519.4 | ) | ||||||
Hirogin Holdings, Inc. | (9,700 | ) | (48,736 | ) | (96.4 | ) | ||||||
Hitachi Construction Machinery Co. Ltd. | (3,700 | ) | (92,320 | ) | (182.6 | ) | ||||||
Hoshizaki Corp. | (13,000 | ) | (464,037 | ) | (917.6 | ) | ||||||
Ibiden Co. Ltd. | (6,800 | ) | (271,122 | ) | (536.1 | ) | ||||||
Iida Group Holdings Co. Ltd. | (25,600 | ) | (460,884 | ) | (911.4 | ) | ||||||
Industrial & Infrastructure Fund Investment Corp. | (232 | ) | (269,373 | ) | (532.7 | ) | ||||||
Inpex Corp. | (100,800 | ) | (1,118,114 | ) | (2,211.0 | ) | ||||||
Itoham Yonekyu Holdings, Inc. | (35,800 | ) | (198,720 | ) | (393.0 | ) | ||||||
Iwatani Corp. | (16,400 | ) | (786,787 | ) | (1,555.8 | ) | ||||||
Iyogin Holdings, Inc. | (34,900 | ) | (207,023 | ) | (409.4 | ) | ||||||
Izumi Co. Ltd. | (17,700 | ) | (421,782 | ) | (834.1 | ) | ||||||
Japan Airlines Co. Ltd. | (14,000 | ) | (270,617 | ) | (535.1 | ) | ||||||
Japan Aviation Electronics Industry Ltd. | (3,100 | ) | (55,104 | ) | (109.0 | ) | ||||||
Japan Exchange Group, Inc. | (11,100 | ) | (182,698 | ) | (361.3 | ) | ||||||
Japan Hotel REIT Investment Corp. | (458 | ) | (262,148 | ) | (518.4 | ) | ||||||
Japan Logistics Fund, Inc. | (47 | ) | (113,061 | ) | (223.6 | ) | ||||||
Japan Metropolitan Fund Invest | (324 | ) | (240,361 | ) | (475.3 | ) | ||||||
Japan Post Insurance Co. Ltd. | (29,200 | ) | (480,452 | ) | (950.1 | ) | ||||||
Japan Prime Realty Investment Corp. | (53 | ) | (139,634 | ) | (276.1 | ) | ||||||
Japan Real Estate Investment Corp. | (179 | ) | (718,608 | ) | (1,421.0 | ) | ||||||
JMDC, Inc. | (12,900 | ) | (468,800 | ) | (927.0 | ) | ||||||
Justsystems Corp. | (8,600 | ) | (230,366 | ) | (455.5 | ) | ||||||
Kajima Corp. | (23,200 | ) | (310,789 | ) | (614.6 | ) | ||||||
Kansai Paint Co. Ltd. | (18,100 | ) | (258,468 | ) | (511.1 | ) | ||||||
Keihan Holdings Co. Ltd. | (7,800 | ) | (217,561 | ) | (430.2 | ) | ||||||
Keio Corp. | (10,900 | ) | (410,133 | ) | (811.0 | ) | ||||||
Keisei Electric Railway Co. Ltd. | (8,400 | ) | (300,200 | ) | (593.6 | ) | ||||||
Kikkoman Corp. | (12,300 | ) | (737,545 | ) | (1,458.5 | ) | ||||||
Kintetsu Group Holdings Co. Ltd. | (12,400 | ) | (424,317 | ) | (839.1 | ) | ||||||
Kobayashi Pharmaceutical Co. Ltd. | (4,600 | ) | (290,830 | ) | (575.1 | ) | ||||||
Kotobuki Spirits Co. Ltd. | (4,200 | ) | (314,146 | ) | (621.2 | ) | ||||||
Kyudenko Corp. | (11,400 | ) | (307,794 | ) | (608.7 | ) | ||||||
Kyushu Electric Power Co., Inc. | (9,400 | ) | (55,460 | ) | (109.7 | ) | ||||||
Kyushu Financial Group, Inc. | (30,900 | ) | (112,854 | ) | (223.2 | ) | ||||||
Kyushu Railway Co. | (18,800 | ) | (432,496 | ) | (855.2 | ) | ||||||
LaSalle Logiport REIT | (132 | ) | (158,852 | ) | (314.1 | ) | ||||||
Marubeni Corp. | (55,800 | ) | (802,701 | ) | (1,587.3 | ) | ||||||
Marui Group Co. Ltd. | (13,100 | ) | (211,436 | ) | (418.1 | ) | ||||||
Matsui Securities Co. Ltd. | (87,500 | ) | (507,536 | ) | (1,003.6 | ) | ||||||
MatsukiyoCocokara & Co. | (3,200 | ) | (173,887 | ) | (343.9 | ) | ||||||
Mazda Motor Corp. | (2,700 | ) | (24,749 | ) | (48.9 | ) | ||||||
McDonald’s Holdings Co. Japan Ltd. | (6,100 | ) | (257,504 | ) | (509.2 | ) | ||||||
Mebuki Financial Group, Inc. | (104,500 | ) | (271,120 | ) | (536.1 | ) | ||||||
| 102 | 2 0 2 3 BLACK ROCK ANNUAL REPORT TO SHAREHOLDERS |
Schedule of Investments (continued) April 30, 2023 | BlackRock Global Equity Market Neutral Fund |
| Security | Shares | Value | % of Basket Value | |||||||||
Japan (continued) | ||||||||||||
Mitsui Fudosan Logistics Park, Inc. | (294 | ) | $ | (1,119,232 | ) | (2,213.2 | )% | |||||
Miura Co. Ltd. | (10,700 | ) | (288,607 | ) | (570.7 | ) | ||||||
MonotaRO Co. Ltd. | (17,500 | ) | (267,936 | ) | (529.8 | ) | ||||||
Mori Hills REIT Investment Corp. | (179 | ) | (205,009 | ) | (405.4 | ) | ||||||
Morinaga & Co. Ltd. | (10,300 | ) | (309,114 | ) | (611.3 | ) | ||||||
Morinaga Milk Industry Co. Ltd. | (3,600 | ) | (137,084 | ) | (271.1 | ) | ||||||
Murata Manufacturing Co. Ltd. | (3,300 | ) | (189,831 | ) | (375.4 | ) | ||||||
Nagase & Co. Ltd. | (15,000 | ) | (239,413 | ) | (473.4 | ) | ||||||
Nextage Co. Ltd. | (5,800 | ) | (106,561 | ) | (210.7 | ) | ||||||
NHK Spring Co. Ltd. | (47,300 | ) | (355,102 | ) | (702.2 | ) | ||||||
Nifco, Inc. | (10,900 | ) | (317,502 | ) | (627.8 | ) | ||||||
Nihon Kohden Corp. | (14,500 | ) | (406,562 | ) | (804.0 | ) | ||||||
Nippon Building Fund, Inc. | (162 | ) | (688,236 | ) | (1,361.0 | ) | ||||||
Nippon Electric Glass Co. Ltd. | (9,600 | ) | (185,697 | ) | (367.2 | ) | ||||||
Nippon Kayaku Co. Ltd. | (70,600 | ) | (649,043 | ) | (1,283.5 | ) | ||||||
Nippon Sanso Holdings Corp. | (31,400 | ) | (573,892 | ) | (1,134.8 | ) | ||||||
Nippon Shokubai Co. Ltd. | (2,400 | ) | (97,510 | ) | (192.8 | ) | ||||||
Nishi-Nippon Railroad Co. Ltd. | (2,300 | ) | (42,736 | ) | (84.5 | ) | ||||||
Nisshin Seifun Group, Inc. | (22,800 | ) | (279,978 | ) | (553.6 | ) | ||||||
Nissin Foods Holdings Co. Ltd. | (200 | ) | (19,524 | ) | (38.6 | ) | ||||||
Noevir Holdings Co. Ltd. | (2,200 | ) | (90,940 | ) | (179.8 | ) | ||||||
NOF Corp. | (2,600 | ) | (120,407 | ) | (238.1 | ) | ||||||
NOK Corp. | (26,900 | ) | (366,639 | ) | (725.0 | ) | ||||||
Nomura Holdings, Inc. | (137,400 | ) | (499,585 | ) | (987.9 | ) | ||||||
NTT Data Corp. | (35,000 | ) | (481,712 | ) | (952.6 | ) | ||||||
OKUMA Corp. | (1,900 | ) | (85,479 | ) | (169.0 | ) | ||||||
Open House Group Co. Ltd. | (1,700 | ) | (68,829 | ) | (136.1 | ) | ||||||
Orix JREIT, Inc. | (42 | ) | (55,002 | ) | (108.8 | ) | ||||||
Osaka Gas Co. Ltd. | (14,000 | ) | (234,675 | ) | (464.1 | ) | ||||||
OSG Corp. | (16,300 | ) | (232,029 | ) | (458.8 | ) | ||||||
PALTAC Corp. | (2,800 | ) | (108,818 | ) | (215.2 | ) | ||||||
Pan Pacific International Holdings Corp. | (21,800 | ) | (412,908 | ) | (816.5 | ) | ||||||
Park24 Co. Ltd. | (4,900 | ) | (76,741 | ) | (151.8 | ) | ||||||
PeptiDream, Inc. | (2,900 | ) | (39,734 | ) | (78.6 | ) | ||||||
Persol Holdings Co. Ltd. | (27,200 | ) | (568,184 | ) | (1,123.6 | ) | ||||||
Relo Group, Inc. | (13,500 | ) | (212,605 | ) | (420.4 | ) | ||||||
Renesas Electronics Corp. | (1,400 | ) | (18,505 | ) | (36.6 | ) | ||||||
Rohto Pharmaceutical Co. Ltd. | (6,100 | ) | (128,233 | ) | (253.6 | ) | ||||||
Sankyu, Inc. | (5,800 | ) | (207,253 | ) | (409.8 | ) | ||||||
Sanwa Holdings Corp. | (24,200 | ) | (268,484 | ) | (530.9 | ) | ||||||
SBI Shinsei Bank Ltd. | (13,400 | ) | (243,704 | ) | (481.9 | ) | ||||||
SCREEN Holdings Co. Ltd. | (2,900 | ) | (239,013 | ) | (472.6 | ) | ||||||
Seino Holdings Co. Ltd. | (10,900 | ) | (122,572 | ) | (242.4 | ) | ||||||
Sekisui Chemical Co. Ltd. | (22,300 | ) | (321,541 | ) | (635.8 | ) | ||||||
Sekisui House Ltd. | (28,500 | ) | (593,680 | ) | (1,174.0 | ) | ||||||
Sekisui House Reit, Inc. | (637 | ) | (365,843 | ) | (723.4 | ) | ||||||
Seven & i Holdings Co. Ltd. | (33,200 | ) | (1,523,971 | ) | (3,013.6 | ) | ||||||
SG Holdings Co. Ltd. | (14,200 | ) | (207,063 | ) | (409.5 | ) | ||||||
Shikoku Electric Power Co., Inc. | (13,800 | ) | (82,600 | ) | (163.3 | ) | ||||||
Shin-Etsu Chemical Co. Ltd. | (54,500 | ) | (1,577,705 | ) | (3,119.8 | ) | ||||||
Shizuoka Financial Group, Inc. | (11,900 | ) | (90,857 | ) | (179.7 | ) | ||||||
Shochiku Co. Ltd. | (1,300 | ) | (118,296 | ) | (233.9 | ) | ||||||
SoftBank Corp. | (53,000 | ) | (605,495 | ) | (1,197.3 | ) | ||||||
Sony Group Corp. | (4,300 | ) | (394,557 | ) | (780.2 | ) | ||||||
Sotetsu Holdings, Inc. | (19,600 | ) | (377,712 | ) | (746.9 | ) | ||||||
Square Enix Holdings Co. Ltd. | (5,700 | ) | (284,083 | ) | (561.8 | ) | ||||||
Stanley Electric Co. Ltd. | (3,800 | ) | (86,832 | ) | (171.7 | ) | ||||||
Sumitomo Metal Mining Co. Ltd. | (25,900 | ) | (969,517 | ) | (1,917.2 | ) | ||||||
Suzuken Co. Ltd. | (5,900 | ) | (170,038 | ) | (336.2 | ) | ||||||
Taiheiyo Cement Corp. | (24,800 | ) | (450,659 | ) | (891.2 | ) | ||||||
Taiyo Yuden Co. Ltd. | (7,500 | ) | (232,919 | ) | (460.6 | ) | ||||||
| Security | Shares | Value | % of Basket Value | |||||||||
Japan (continued) | ||||||||||||
Takara Holdings, Inc. | (21,900 | ) | $ | (174,821 | ) | (345.7 | )% | |||||
Takashimaya Co. Ltd. | (20,000 | ) | (299,306 | ) | (591.9 | ) | ||||||
Takeda Pharmaceutical Co. Ltd. | (5,500 | ) | (184,814 | ) | (365.5 | ) | ||||||
TDK Corp. | (1,500 | ) | (52,259 | ) | (103.3 | ) | ||||||
TechnoPro Holdings, Inc. | (800 | ) | (22,116 | ) | (43.7 | ) | ||||||
TIS, Inc. | (7,600 | ) | (211,443 | ) | (418.1 | ) | ||||||
Tobu Railway Co. Ltd. | (1,500 | ) | (38,784 | ) | (76.7 | ) | ||||||
Tohoku Electric Power Co., Inc. | (5,000 | ) | (26,045 | ) | (51.5 | ) | ||||||
Tokai Carbon Co. Ltd. | (139,900 | ) | (1,288,400 | ) | (2,547.8 | ) | ||||||
Tokyo Gas Co. Ltd. | (12,700 | ) | (263,314 | ) | (520.7 | ) | ||||||
Tokyu Corp. | (15,300 | ) | (219,152 | ) | (433.4 | ) | ||||||
Tokyu Fudosan Holdings Corp. | (38,300 | ) | (196,865 | ) | (389.3 | ) | ||||||
TOPPAN, Inc. | (8,300 | ) | (178,709 | ) | (353.4 | ) | ||||||
Toshiba TEC Corp. | (3,500 | ) | (103,011 | ) | (203.7 | ) | ||||||
Toyo Seikan Group Holdings Ltd. | (5,300 | ) | (75,850 | ) | (150.0 | ) | ||||||
Toyo Suisan Kaisha Ltd. | (5,300 | ) | (239,631 | ) | (473.9 | ) | ||||||
Toyo Tire Corp. | (26,000 | ) | (313,777 | ) | (620.5 | ) | ||||||
United Urban Investment Corp. | (88 | ) | (98,982 | ) | (195.7 | ) | ||||||
USS Co. Ltd. | (3,400 | ) | (57,888 | ) | (114.5 | ) | ||||||
Visional, Inc. | (5,700 | ) | (302,837 | ) | (598.8 | ) | ||||||
West Japan Railway Co. | (12,000 | ) | (527,342 | ) | (1,042.8 | ) | ||||||
Yamato Holdings Co. Ltd. | (18,600 | ) | (323,743 | ) | (640.2 | ) | ||||||
Yokohama Rubber Co. Ltd. | (14,500 | ) | (319,485 | ) | (631.8 | ) | ||||||
Z Holdings Corp. | (137,000 | ) | (380,545 | ) | (752.5 | ) | ||||||
Zensho Holdings Co. Ltd. | (3,300 | ) | (106,203 | ) | (210.0 | ) | ||||||
|
|
|
| |||||||||
| (51,870,650 | ) | |||||||||||
Luxembourg | ||||||||||||
Aperam SA | (2,935 | ) | (107,966 | ) | (213.5 | ) | ||||||
Eurofins Scientific SE | (4,691 | ) | (325,112 | ) | (642.9 | ) | ||||||
|
|
|
| |||||||||
| (433,078 | ) | |||||||||||
Netherlands | ||||||||||||
Akzo Nobel NV | (4,553 | ) | (374,730 | ) | (741.0 | ) | ||||||
Argenx SE | (767 | ) | (293,857 | ) | (581.1 | ) | ||||||
ASM International NV | (106 | ) | (38,369 | ) | (75.9 | ) | ||||||
Euronext NV | (18,108 | ) | (1,428,681 | ) | (2,825.1 | ) | ||||||
Heineken NV | (1,955 | ) | (222,758 | ) | (440.5 | ) | ||||||
JDE Peet’s NV | (1,575 | ) | (47,514 | ) | (94.0 | ) | ||||||
Koninklijke Ahold Delhaize NV | (17,904 | ) | (610,690 | ) | (1,207.6 | ) | ||||||
OCI NV | (6,991 | ) | (182,311 | ) | (360.5 | ) | ||||||
SBM Offshore NV | (31,499 | ) | (441,547 | ) | (873.1 | ) | ||||||
Universal Music Group NV | (11,975 | ) | (259,411 | ) | (513.0 | ) | ||||||
|
|
|
| |||||||||
| (3,899,868 | ) | |||||||||||
New Zealand | ||||||||||||
Mainfreight Ltd. | (5,262 | ) | (233,794 | ) | (462.3 | ) | ||||||
|
|
|
| |||||||||
Nigeria | ||||||||||||
Airtel Africa PLC | (11,012 | ) | (16,390 | ) | (32.4 | ) | ||||||
|
|
|
| |||||||||
Portugal | ||||||||||||
Banco Comercial Portugues SA | (4,086,067 | ) | (1,042,161 | ) | (2,060.8 | ) | ||||||
Jeronimo Martins SGPS SA | (1,137 | ) | (28,475 | ) | (56.3 | ) | ||||||
|
|
|
| |||||||||
| (1,070,636 | ) | |||||||||||
Singapore | ||||||||||||
CapitaLand Ascendas REIT | (238,000 | ) | (512,292 | ) | (1,013.0 | ) | ||||||
DBS Group Holdings Ltd. | (3,000 | ) | (74,108 | ) | (146.5 | ) | ||||||
Genting Singapore Ltd. | (701,300 | ) | (596,775 | ) | (1,180.1 | ) | ||||||
Jardine Cycle & Carriage Ltd. | (13,500 | ) | (343,916 | ) | (680.1 | ) | ||||||
Oversea-Chinese Banking Corp. Ltd. | (12,800 | ) | (121,102 | ) | (239.5 | ) | ||||||
Sea Ltd., ADR | (20,986 | ) | (1,598,504 | ) | (3,161.0 | ) | ||||||
Singapore Exchange Ltd. | (70,000 | ) | (503,895 | ) | (996.4 | ) | ||||||
SCHEDULE OF INVESTMENTS | 103 |
Schedule of Investments (continued) April 30, 2023 | BlackRock Global Equity Market Neutral Fund |
| Security | Shares | Value | % of Basket Value | |||||||||
Singapore (continued) | ||||||||||||
Singapore Technologies Engineering Ltd. | (156,600 | ) | $ | (426,428 | ) | (843.2 | )% | |||||
Singapore Telecommunications Ltd. | (55,500 | ) | (106,385 | ) | (210.4 | ) | ||||||
STMicroelectronics NV | (30,612 | ) | (1,297,101 | ) | (2,565.0 | ) | ||||||
UOL Group Ltd. | (65,200 | ) | (340,231 | ) | (672.8 | ) | ||||||
Venture Corp. Ltd. | (110,700 | ) | (1,414,656 | ) | (2,797.4 | ) | ||||||
|
|
|
| |||||||||
| (7,335,393 | ) | |||||||||||
South Korea | ||||||||||||
Delivery Hero SE | (6,901 | ) | (273,906 | ) | (541.6 | ) | ||||||
|
|
|
| |||||||||
Spain | ||||||||||||
Aena SME SA | (108 | ) | (18,216 | ) | (36.0 | ) | ||||||
Amadeus IT Group SA | (22,885 | ) | (1,597,175 | ) | (3,158.4 | ) | ||||||
CaixaBank SA | (29,338 | ) | (107,682 | ) | (212.9 | ) | ||||||
Cellnex Telecom SA | (17,777 | ) | (742,713 | ) | (1,468.7 | ) | ||||||
Corp. ACCIONA Energias Renovables SA | (6,681 | ) | (237,877 | ) | (470.4 | ) | ||||||
Endesa SA | (22,555 | ) | (502,018 | ) | (992.7 | ) | ||||||
Inmobiliaria Colonial Socimi SA | (28,472 | ) | (180,517 | ) | (357.0 | ) | ||||||
|
|
|
| |||||||||
| (3,386,198 | ) | |||||||||||
Sweden | ||||||||||||
Autoliv, Inc. | (6,563 | ) | (563,171 | ) | (1,113.7 | ) | ||||||
Electrolux AB | (10,070 | ) | (150,647 | ) | (297.9 | ) | ||||||
|
|
|
| |||||||||
| (713,818 | ) | |||||||||||
Switzerland | ||||||||||||
Adecco Group AG, Registered Shares | (23,104 | ) | (790,155 | ) | (1,562.5 | ) | ||||||
Alcon, Inc. | (10,529 | ) | (762,773 | ) | (1,508.4 | ) | ||||||
Bachem Holding AG | (874 | ) | (94,990 | ) | (187.8 | ) | ||||||
Barry Callebaut AG, Registered Shares | (398 | ) | (845,448 | ) | (1,671.8 | ) | ||||||
Emmi AG, Registered Shares | (735 | ) | (760,857 | ) | (1,504.6 | ) | ||||||
EMS-Chemie Holding AG, Registered Shares | (667 | ) | (544,793 | ) | (1,077.3 | ) | ||||||
Flughafen Zurich AG, Registered Shares | (1,004 | ) | (192,231 | ) | (380.1 | ) | ||||||
Galenica AG | (17,883 | ) | (1,594,370 | ) | (3,152.8 | ) | ||||||
Julius Baer Group Ltd. | (2,322 | ) | (165,558 | ) | (327.4 | ) | ||||||
Lonza Group AG, Registered Shares | (1,782 | ) | (1,105,172 | ) | (2,185.4 | ) | ||||||
Mediclinic International PLC | (125,804 | ) | (776,759 | ) | (1,536.0 | ) | ||||||
On Holding AG | (3,877 | ) | (125,809 | ) | (248.8 | ) | ||||||
Schindler Holding AG, Registered Shares | (3,885 | ) | (825,628 | ) | (1,632.6 | ) | ||||||
SIG Group AG | (13,295 | ) | (353,954 | ) | (699.9 | ) | ||||||
Straumann Holding AG, Registered Shares | (225 | ) | (33,946 | ) | (67.1 | ) | ||||||
Swiss Life Holding AG, Registered Shares | (717 | ) | (470,797 | ) | (931.0 | ) | ||||||
Swisscom AG, Registered Shares | (284 | ) | (194,930 | ) | (385.5 | ) | ||||||
UBS Group AG, Registered Shares | (17,454 | ) | (354,121 | ) | (700.3 | ) | ||||||
Zurich Insurance Group AG | (4,013 | ) | (1,936,332 | ) | (3,829.0 | ) | ||||||
|
|
|
| |||||||||
| (11,928,623 | ) | |||||||||||
United Kingdom | ||||||||||||
abrdn PLC | (112,450 | ) | (297,030 | ) | (587.4 | ) | ||||||
Associated British Foods PLC | (35,492 | ) | (860,828 | ) | (1,702.3 | ) | ||||||
Aviva PLC | (66,402 | ) | (348,309 | ) | (688.8 | ) | ||||||
Barratt Developments PLC | (22,555 | ) | (139,825 | ) | (276.5 | ) | ||||||
Berkeley Group Holdings PLC | (38,274 | ) | (2,110,452 | ) | (4,173.3 | ) | ||||||
BT Group PLC | (36,890 | ) | (73,206 | ) | (144.8 | ) | ||||||
CK Hutchison Holdings Ltd. | (197,500 | ) | (1,320,356 | ) | (2,611.0 | ) | ||||||
CNH Industrial NV | (6,478 | ) | (90,389 | ) | (178.7 | ) | ||||||
Coca-Cola Europacific Partners PLC | (20,622 | ) | (1,329,500 | ) | (2,629.0 | ) | ||||||
Compass Group PLC | (48,613 | ) | (1,263,393 | ) | (2,498.3 | ) | ||||||
Darktrace PLC | (11,820 | ) | (41,087 | ) | (81.3 | ) | ||||||
DCC PLC | (16,349 | ) | (1,002,118 | ) | (1,981.6 | ) | ||||||
Dechra Pharmaceuticals PLC | (4,303 | ) | (198,952 | ) | (393.4 | ) | ||||||
Derwent London PLC | (11,855 | ) | (352,468 | ) | (697.0 | ) | ||||||
Entain PLC | (5,131 | ) | (92,227 | ) | (182.4 | ) | ||||||
| Security | Shares | Value | % of Basket Value | |||||||||
United Kingdom (continued) | ||||||||||||
Farfetch Ltd. | (134,145 | ) | $ | (540,604 | ) | (1,069.0 | )% | |||||
Future PLC | (18,550 | ) | (259,267 | ) | (512.7 | ) | ||||||
Greggs PLC, Registered Shares | (7,276 | ) | (254,552 | ) | (503.4 | ) | ||||||
Harbour Energy PLC | (65,766 | ) | (201,224 | ) | (397.9 | ) | ||||||
HSBC Holdings PLC | (129,687 | ) | (920,530 | ) | (1,820.3 | ) | ||||||
Informa PLC | (17,559 | ) | (157,699 | ) | (311.8 | ) | ||||||
International Consolidated Airlines Group SA | (72,446 | ) | (137,310 | ) | (271.5 | ) | ||||||
International Distributions Services PLC | (113,342 | ) | (355,557 | ) | (703.1 | ) | ||||||
Investec PLC | (74,434 | ) | (408,793 | ) | (808.4 | ) | ||||||
JET2 PLC | (2,439 | ) | (37,062 | ) | (73.3 | ) | ||||||
Johnson Matthey PLC | (3,759 | ) | (91,471 | ) | (180.9 | ) | ||||||
Kingfisher PLC | (80,221 | ) | (256,039 | ) | (506.3 | ) | ||||||
Lloyds Banking Group PLC | (265,288 | ) | (158,739 | ) | (313.9 | ) | ||||||
M&G PLC | (76,805 | ) | (195,662 | ) | (386.9 | ) | ||||||
National Grid PLC | (13,982 | ) | (197,517 | ) | (390.6 | ) | ||||||
Next PLC | (23,331 | ) | (1,950,792 | ) | (3,857.6 | ) | ||||||
Persimmon PLC | (33,729 | ) | (550,058 | ) | (1,087.7 | ) | ||||||
RELX PLC | (4,057 | ) | (133,154 | ) | (263.3 | ) | ||||||
Rentokil Initial PLC | (213,428 | ) | (1,674,920 | ) | (3,312.1 | ) | ||||||
Serco Group PLC | (11,635 | ) | (21,903 | ) | (43.3 | ) | ||||||
Smith & Nephew PLC | (17,118 | ) | (278,229 | ) | (550.2 | ) | ||||||
St James’s Place PLC | (18,641 | ) | (279,268 | ) | (552.2 | ) | ||||||
Vistry Group PLC | (44,104 | ) | (427,819 | ) | (846.0 | ) | ||||||
Watches of Switzerland Group PLC | (43,802 | ) | (451,657 | ) | (893.1 | ) | ||||||
Whitbread PLC | (951 | ) | (38,607 | ) | (76.3 | ) | ||||||
WPP PLC | (6,450 | ) | (74,001 | ) | (146.3 | ) | ||||||
|
|
|
| |||||||||
| (19,572,574 | ) | |||||||||||
United States | ||||||||||||
10X Genomics, Inc., Class A | (2,138 | ) | (112,095 | ) | (221.7 | ) | ||||||
Adient PLC | (3,841 | ) | (141,887 | ) | (280.6 | ) | ||||||
AES Corp. | (15,712 | ) | (371,746 | ) | (735.1 | ) | ||||||
Aflac, Inc. | (8,476 | ) | (592,049 | ) | (1,170.8 | ) | ||||||
agilon health, Inc. | (34,321 | ) | (832,971 | ) | (1,647.2 | ) | ||||||
Albertsons Cos., Inc., Class A | (13,772 | ) | (287,835 | ) | (569.2 | ) | ||||||
Alexandria Real Estate Equities, Inc. | (5,206 | ) | (646,481 | ) | (1,278.4 | ) | ||||||
Alight, Inc., Class A | (186,750 | ) | (1,727,437 | ) | (3,415.9 | ) | ||||||
Alliant Energy Corp. | (24,519 | ) | (1,351,978 | ) | (2,673.5 | ) | ||||||
Allison Transmission Holdings, Inc. | (6,068 | ) | (296,058 | ) | (585.4 | ) | ||||||
Alteryx, Inc., Class A | (6,726 | ) | (276,640 | ) | (547.0 | ) | ||||||
Amcor PLC | (145,119 | ) | (1,591,955 | ) | (3,148.0 | ) | ||||||
American Electric Power Co., Inc. | (4,495 | ) | (415,428 | ) | (821.5 | ) | ||||||
American Equity Investment Life Holding Co. | (2,350 | ) | (90,569 | ) | (179.1 | ) | ||||||
Americold Realty Trust, Inc. | (55,278 | ) | (1,635,676 | ) | (3,234.5 | ) | ||||||
Ameriprise Financial, Inc. | (1,958 | ) | (597,425 | ) | (1,181.4 | ) | ||||||
AmerisourceBergen Corp. | (8,243 | ) | (1,375,345 | ) | (2,719.7 | ) | ||||||
Amkor Technology, Inc. | (46,241 | ) | (1,034,411 | ) | (2,045.5 | ) | ||||||
Amphenol Corp., Class A | (913 | ) | (68,904 | ) | (136.3 | ) | ||||||
Analog Devices, Inc. | (3,360 | ) | (604,397 | ) | (1,195.2 | ) | ||||||
Annaly Capital Management, Inc. | (65,988 | ) | (1,318,440 | ) | (2,607.2 | ) | ||||||
Ansys, Inc. | (2,118 | ) | (664,883 | ) | (1,314.8 | ) | ||||||
Antero Midstream Corp. | (21,615 | ) | (232,577 | ) | (459.9 | ) | ||||||
Antero Resources Corp. | (4,708 | ) | (108,237 | ) | (214.0 | ) | ||||||
Apartment Income REIT Corp. | (17,662 | ) | (653,141 | ) | (1,291.6 | ) | ||||||
Apellis Pharmaceuticals, Inc. | (7,298 | ) | (608,872 | ) | (1,204.0 | ) | ||||||
Apollo Global Management, Inc. | (31,380 | ) | (1,989,178 | ) | (3,933.5 | ) | ||||||
Apple Hospitality REIT, Inc. | (25,096 | ) | (373,679 | ) | (738.9 | ) | ||||||
Applied Industrial Technologies, Inc. | (10,968 | ) | (1,487,919 | ) | (2,942.3 | ) | ||||||
AppLovin Corp., Class A | (26,729 | ) | (454,393 | ) | (898.5 | ) | ||||||
AptarGroup, Inc. | (6,224 | ) | (737,606 | ) | (1,458.6 | ) | ||||||
Aptiv PLC | (2,203 | ) | (226,601 | ) | (448.1 | ) | ||||||
Aramark | (30,775 | ) | (1,067,892 | ) | (2,111.7 | ) | ||||||
| 104 | 2 0 2 3 BLACK ROCK ANNUAL REPORT TO SHAREHOLDERS |
Schedule of Investments (continued) April 30, 2023 | BlackRock Global Equity Market Neutral Fund |
| Security | Shares | Value | % of Basket Value | |||||||||
| United States (continued) | ||||||||||||
Arch Capital Group Ltd. | (457 | ) | $ | (34,307 | ) | (67.8 | )% | |||||
Arista Networks, Inc. | (4,181 | ) | (669,629 | ) | (1,324.2 | ) | ||||||
Arrow Electronics, Inc. | (203 | ) | (23,229 | ) | (45.9 | ) | ||||||
Asana, Inc. | (1,384 | ) | (22,393 | ) | (44.3 | ) | ||||||
Asbury Automotive Group, Inc. | (602 | ) | (116,463 | ) | (230.3 | ) | ||||||
Aspen Technology, Inc. | (4,014 | ) | (710,478 | ) | (1,404.9 | ) | ||||||
Assurant, Inc. | (2,507 | ) | (308,687 | ) | (610.4 | ) | ||||||
Atkore, Inc. | (6,292 | ) | (794,868 | ) | (1,571.8 | ) | ||||||
Atlassian Corp. | (1,331 | ) | (196,535 | ) | (388.6 | ) | ||||||
Avangrid, Inc. | (12,242 | ) | (492,863 | ) | (974.6 | ) | ||||||
Avantor, Inc. | (4,764 | ) | (92,803 | ) | (183.5 | ) | ||||||
Avnet, Inc. | (4,529 | ) | (186,867 | ) | (369.5 | ) | ||||||
Axalta Coating Systems Ltd. | (4,468 | ) | (141,055 | ) | (278.9 | ) | ||||||
Baker Hughes Co., Class A | (7,181 | ) | (209,972 | ) | (415.2 | ) | ||||||
Ball Corp. | (12,025 | ) | (639,490 | ) | (1,264.6 | ) | ||||||
Bentley Systems, Inc., Class B | (37,184 | ) | (1,582,551 | ) | (3,129.4 | ) | ||||||
Black Hills Corp. | (1,332 | ) | (86,966 | ) | (172.0 | ) | ||||||
Bloom Energy Corp., Class A | (28,883 | ) | (480,902 | ) | (951.0 | ) | ||||||
Blue Owl Capital, Inc. | (30,032 | ) | (338,160 | ) | (668.7 | ) | ||||||
Boston Properties, Inc. | (27,568 | ) | (1,471,028 | ) | (2,908.9 | ) | ||||||
Broadcom, Inc. | (906 | ) | (567,609 | ) | (1,122.4 | ) | ||||||
Brown & Brown, Inc. | (6,526 | ) | (420,209 | ) | (830.9 | ) | ||||||
Brown-Forman Corp. | (8,182 | ) | (532,566 | ) | (1,053.1 | ) | ||||||
Bumble, Inc., Class A | (27,107 | ) | (493,618 | ) | (976.1 | ) | ||||||
Bunge Ltd. | (7,723 | ) | (722,873 | ) | (1,429.5 | ) | ||||||
Cactus, Inc., Class A | (9,612 | ) | (389,094 | ) | (769.4 | ) | ||||||
Cadence Bank | (2,659 | ) | (53,765 | ) | (106.3 | ) | ||||||
Caesars Entertainment, Inc. | (16,628 | ) | (753,082 | ) | (1,489.2 | ) | ||||||
Calix, Inc. | (9,858 | ) | (450,511 | ) | (890.9 | ) | ||||||
Capital One Financial Corp. | (1,582 | ) | (153,929 | ) | (304.4 | ) | ||||||
CarMax, Inc. | (357 | ) | (25,001 | ) | (49.4 | ) | ||||||
Carter’s, Inc. | (2,757 | ) | (192,356 | ) | (380.4 | ) | ||||||
Catalent, Inc. | (10,242 | ) | (513,329 | ) | (1,015.1 | ) | ||||||
Celanese Corp. | (12,697 | ) | (1,348,929 | ) | (2,667.5 | ) | ||||||
Ceridian HCM Holding, Inc. | (6,469 | ) | (410,652 | ) | (812.0 | ) | ||||||
Chemours Co. | (7,271 | ) | (211,368 | ) | (418.0 | ) | ||||||
Churchill Downs, Inc. | (621 | ) | (181,661 | ) | (359.2 | ) | ||||||
Cisco Systems, Inc. | (7,181 | ) | (339,302 | ) | (671.0 | ) | ||||||
Civitas Resources, Inc. | (9,789 | ) | (675,930 | ) | (1,336.6 | ) | ||||||
Clarivate PLC | (56,926 | ) | (504,364 | ) | (997.4 | ) | ||||||
Clean Harbors, Inc. | (192 | ) | (27,871 | ) | (55.1 | ) | ||||||
Clear Secure, Inc. | (1,243 | ) | (30,068 | ) | (59.5 | ) | ||||||
Clorox Co. | (5,726 | ) | (948,340 | ) | (1,875.3 | ) | ||||||
Cloudflare, Inc. | (4,040 | ) | (190,082 | ) | (375.9 | ) | ||||||
Coca-Cola Consolidated, Inc. | (28 | ) | (16,505 | ) | (32.6 | ) | ||||||
Coherent Corp. | (13,868 | ) | (473,454 | ) | (936.2 | ) | ||||||
Comfort Systems USA, Inc. | (843 | ) | (126,020 | ) | (249.2 | ) | ||||||
Commerce Bancshares, Inc. | (800 | ) | (44,680 | ) | (88.4 | ) | ||||||
Concentrix Corp. | (5,653 | ) | (545,571 | ) | (1,078.8 | ) | ||||||
Confluent, Inc. | (40,792 | ) | (897,424 | ) | (1,774.6 | ) | ||||||
Consolidated Edison, Inc. | (2,269 | ) | (223,428 | ) | (441.8 | ) | ||||||
Constellation Energy Corp. | (4,223 | ) | (326,860 | ) | (646.4 | ) | ||||||
Constellium SE | (5,625 | ) | (83,531 | ) | (165.2 | ) | ||||||
Cooper Cos., Inc. | (802 | ) | (305,923 | ) | (605.0 | ) | ||||||
Corebridge Financial, Inc. | (176,593 | ) | (2,977,358 | ) | (5,887.6 | ) | ||||||
Corning, Inc. | (22,475 | ) | (746,619 | ) | (1,476.4 | ) | ||||||
Coterra Energy, Inc. | (46,614 | ) | (1,193,318 | ) | (2,359.7 | ) | ||||||
Coty, Inc., Class A | (42,336 | ) | (502,528 | ) | (993.7 | ) | ||||||
Cousins Properties, Inc. | (1,174 | ) | (25,605 | ) | (50.6 | ) | ||||||
Crane Co. | (8,047 | ) | (579,947 | ) | (1,146.8 | ) | ||||||
Crane NXT Co. | (8,047 | ) | (381,106 | ) | (753.6 | ) | ||||||
CSL Ltd. | (3,618 | ) | (731,951 | ) | (1,447.4 | ) | ||||||
| Security | Shares | Value | % of Basket Value | |||||||||
| United States (continued) | ||||||||||||
CSX Corp. | (1,143 | ) | $ | (35,022 | ) | (69.3 | )% | |||||
Cullen/Frost Bankers, Inc. | (6,274 | ) | (691,708 | ) | (1,367.8 | ) | ||||||
Darling Ingredients, Inc. | (1,109 | ) | (66,063 | ) | (130.6 | ) | ||||||
Dell Technologies, Inc. | (910 | ) | (39,576 | ) | (78.3 | ) | ||||||
DENTSPLY SIRONA, Inc. | (1,924 | ) | (80,673 | ) | (159.5 | ) | ||||||
Digital Realty Trust, Inc. | (1,029 | ) | (102,025 | ) | (201.8 | ) | ||||||
Diodes, Inc. | (1,907 | ) | (151,988 | ) | (300.6 | ) | ||||||
Dollar Tree, Inc. | (5,305 | ) | (815,432 | ) | (1,612.5 | ) | ||||||
Dominion Energy, Inc. | (1,670 | ) | (95,424 | ) | (188.7 | ) | ||||||
DoorDash, Inc. | (2,023 | ) | (123,787 | ) | (244.8 | ) | ||||||
DR Horton, Inc. | (608 | ) | (66,771 | ) | (132.0 | ) | ||||||
DraftKings, Inc. | (6,206 | ) | (135,973 | ) | (268.9 | ) | ||||||
DTE Midstream LLC | (8,316 | ) | (409,729 | ) | (810.2 | ) | ||||||
Dun & Bradstreet Holdings, Inc. | (6,184 | ) | (69,075 | ) | (136.6 | ) | ||||||
Dynatrace, Inc. | (11,001 | ) | (465,122 | ) | (919.8 | ) | ||||||
Edison International | (20,244 | ) | (1,489,958 | ) | (2,946.3 | ) | ||||||
Elanco Animal Health, Inc. | (21,311 | ) | (201,815 | ) | (399.1 | ) | ||||||
Elastic NV | (3,906 | ) | (223,619 | ) | (442.2 | ) | ||||||
EMCOR Group, Inc. | (6,768 | ) | (1,157,328 | ) | (2,288.6 | ) | ||||||
Encompass Health Corp. | (8,694 | ) | (557,720 | ) | (1,102.9 | ) | ||||||
Endeavor Group Holdings, Inc. | (21,789 | ) | (561,720 | ) | (1,110.8 | ) | ||||||
Entegris, Inc. | (20,943 | ) | (1,569,050 | ) | (3,102.7 | ) | ||||||
EQT Corp. | (4,593 | ) | (160,020 | ) | (316.4 | ) | ||||||
Equitable Holdings, Inc. | (69,868 | ) | (1,815,869 | ) | (3,590.8 | ) | ||||||
Erie Indemnity Co., Class A | (1,028 | ) | (223,415 | ) | (441.8 | ) | ||||||
Estee Lauder Cos., Inc., Class A | (435 | ) | (107,323 | ) | (212.2 | ) | ||||||
Euronet Worldwide, Inc. | (2,624 | ) | (290,582 | ) | (574.6 | ) | ||||||
Evergy, Inc. | (2,383 | ) | (148,008 | ) | (292.7 | ) | ||||||
Exelon Corp. | (18,022 | ) | (764,854 | ) | (1,512.5 | ) | ||||||
ExlService Holdings, Inc. | (844 | ) | (150,553 | ) | (297.7 | ) | ||||||
Federal Realty Investment Trust | (13,830 | ) | (1,367,649 | ) | (2,704.5 | ) | ||||||
FedEx Corp. | (895 | ) | (203,863 | ) | (403.1 | ) | ||||||
Ferguson PLC | (4,617 | ) | (643,167 | ) | (1,271.8 | ) | ||||||
Ferguson PLC | (5,279 | ) | (743,389 | ) | (1,470.0 | ) | ||||||
Fidelity National Financial, Inc. | (4,129 | ) | (146,538 | ) | (289.8 | ) | ||||||
Fifth Third Bancorp | (8,388 | ) | (219,766 | ) | (434.6 | ) | ||||||
First American Financial Corp. | (775 | ) | (44,648 | ) | (88.3 | ) | ||||||
First Citizens BancShares, Inc. | (812 | ) | (817,830 | ) | (1,617.2 | ) | ||||||
First Industrial Realty Trust, Inc. | (4,189 | ) | (219,797 | ) | (434.6 | ) | ||||||
First Solar, Inc. | (766 | ) | (139,856 | ) | (276.6 | ) | ||||||
FirstEnergy Corp. | (21,143 | ) | (841,491 | ) | (1,664.0 | ) | ||||||
Fiserv, Inc. | (25,870 | ) | (3,159,244 | ) | (6,247.3 | ) | ||||||
FleetCor Technologies, Inc. | (981 | ) | (209,856 | ) | (415.0 | ) | ||||||
Floor & Decor Holdings, Inc., Class A | (7,714 | ) | (766,309 | ) | (1,515.3 | ) | ||||||
FNB Corp. | (8,924 | ) | (102,448 | ) | (202.6 | ) | ||||||
Fortune Brands Innovations, Inc. | (4,710 | ) | (304,690 | ) | (602.5 | ) | ||||||
Frontier Communications Parent, Inc. | (40,718 | ) | (917,784 | ) | (1,814.9 | ) | ||||||
GE Healthcare, Inc. | (12,393 | ) | (1,008,047 | ) | (1,993.4 | ) | ||||||
Gen Digital, Inc. | (30,567 | ) | (540,119 | ) | (1,068.1 | ) | ||||||
Graphic Packaging Holding Co. | (44,262 | ) | (1,091,501 | ) | (2,158.4 | ) | ||||||
Haleon PLC | (67,208 | ) | (291,117 | ) | (575.7 | ) | ||||||
Hasbro, Inc. | (9,490 | ) | (561,998 | ) | (1,111.3 | ) | ||||||
Healthcare Realty Trust, Inc. | (97,512 | ) | (1,928,787 | ) | (3,814.1 | ) | ||||||
Hexcel Corp. | (349 | ) | (25,156 | ) | (49.7 | ) | ||||||
HF Sinclair Corp. | (1,301 | ) | (57,387 | ) | (113.5 | ) | ||||||
Hilton Grand Vacations, Inc. | (14,069 | ) | (602,153 | ) | (1,190.7 | ) | ||||||
Houlihan Lokey, Inc. | (3,789 | ) | (346,239 | ) | (684.7 | ) | ||||||
Howmet Aerospace, Inc. | (11,558 | ) | (511,904 | ) | (1,012.3 | ) | ||||||
Huntington Bancshares, Inc. | (54,101 | ) | (605,931 | ) | (1,198.2 | ) | ||||||
ICON PLC | (2,498 | ) | (481,340 | ) | (951.8 | ) | ||||||
Independence Realty Trust, Inc. | (99,370 | ) | (1,654,510 | ) | (3,271.7 | ) | ||||||
Ingredion, Inc. | (4,036 | ) | (428,502 | ) | (847.3 | ) | ||||||
SCHEDULE OF INVESTMENTS | 105 |
Schedule of Investments (continued) April 30, 2023 | BlackRock Global Equity Market Neutral Fund |
| Security | Shares | Value | % of Basket Value | |||||||||
| United States (continued) | ||||||||||||
Inmode Ltd. | (1,853 | ) | $ | (69,043 | ) | (136.5 | )% | |||||
Insight Enterprises, Inc. | (1,293 | ) | (156,388 | ) | (309.3 | ) | ||||||
Inspire Medical Systems, Inc. | (1,339 | ) | (358,357 | ) | (708.6 | ) | ||||||
Interactive Brokers Group, Inc. | (4,989 | ) | (388,394 | ) | (768.0 | ) | ||||||
International Business Machines Corp. | (13,669 | ) | (1,727,898 | ) | (3,416.8 | ) | ||||||
International Flavors & Fragrances, Inc. | (8,478 | ) | (822,027 | ) | (1,625.5 | ) | ||||||
International Game Technology PLC | (18,268 | ) | (514,062 | ) | (1,016.5 | ) | ||||||
Interpublic Group of Cos., Inc. | (11,449 | ) | (409,073 | ) | (808.9 | ) | ||||||
Intra-Cellular Therapies, Inc. | (7,506 | ) | (466,498 | ) | (922.5 | ) | ||||||
iRhythm Technologies, Inc. | (8,102 | ) | (1,064,603 | ) | (2,105.2 | ) | ||||||
Iridium Communications, Inc. | (6,351 | ) | (403,098 | ) | (797.1 | ) | ||||||
IVERIC bio, Inc. | (2,034 | ) | (66,898 | ) | (132.3 | ) | ||||||
Jazz Pharmaceuticals PLC | (2,754 | ) | (386,854 | ) | (765.0 | ) | ||||||
JPMorgan Chase & Co. | (15,706 | ) | (2,171,197 | ) | (4,293.4 | ) | ||||||
Juniper Networks, Inc. | (16,940 | ) | (510,741 | ) | (1,010.0 | ) | ||||||
Karuna Therapeutics, Inc. | (1,707 | ) | (338,737 | ) | (669.8 | ) | ||||||
Kinder Morgan, Inc. | (3,271 | ) | (56,098 | ) | (110.9 | ) | ||||||
Kinsale Capital Group, Inc. | (2,646 | ) | (864,475 | ) | (1,709.5 | ) | ||||||
Kite Realty Group Trust | (34,832 | ) | (721,719 | ) | (1,427.2 | ) | ||||||
Lamb Weston Holdings, Inc. | (14,039 | ) | (1,569,701 | ) | (3,104.0 | ) | ||||||
Lantheus Holdings, Inc. | (7,190 | ) | (614,386 | ) | (1,214.9 | ) | ||||||
Las Vegas Sands Corp. | (5,048 | ) | (322,315 | ) | (637.4 | ) | ||||||
Leggett & Platt, Inc. | (17,059 | ) | (551,176 | ) | (1,089.9 | ) | ||||||
Lennar Corp. | (18,146 | ) | (2,047,050 | ) | (4,048.0 | ) | ||||||
Levi Strauss & Co. | (29,925 | ) | (432,716 | ) | (855.7 | ) | ||||||
Liberty Media Corp.-Liberty Formula One, Class C | (8,113 | ) | (585,677 | ) | (1,158.2 | ) | ||||||
Lincoln Electric Holdings, Inc. | (2,839 | ) | (476,384 | ) | (942.0 | ) | ||||||
Linde PLC | (1,450 | ) | (535,703 | ) | (1,059.3 | ) | ||||||
Lithia Motors, Inc. | (1,379 | ) | (304,607 | ) | (602.3 | ) | ||||||
Littelfuse, Inc. | (1,259 | ) | (304,980 | ) | (603.1 | ) | ||||||
Live Nation Entertainment, Inc. | (3,561 | ) | (241,365 | ) | (477.3 | ) | ||||||
Loews Corp. | (21,327 | ) | (1,227,795 | ) | (2,427.9 | ) | ||||||
M&T Bank Corp. | (515 | ) | (64,787 | ) | (128.1 | ) | ||||||
Madison Square Garden Sports Corp. | (2,744 | ) | (550,172 | ) | (1,087.9 | ) | ||||||
Maravai LifeSciences Holdings, Inc., Class A | (74,826 | ) | (1,031,851 | ) | (2,040.4 | ) | ||||||
Markel Corp. | (404 | ) | (552,886 | ) | (1,093.3 | ) | ||||||
MarketAxess Holdings, Inc. | (1,961 | ) | (624,324 | ) | (1,234.6 | ) | ||||||
Marriott International, Inc. | (970 | ) | (164,260 | ) | (324.8 | ) | ||||||
MasTec, Inc. | (3,400 | ) | (301,954 | ) | (597.1 | ) | ||||||
Mattel, Inc. | (2,775 | ) | (49,950 | ) | (98.8 | ) | ||||||
Maximus, Inc. | (43,888 | ) | (3,671,231 | ) | (7,259.7 | ) | ||||||
McKesson Corp. | (728 | ) | (265,167 | ) | (524.4 | ) | ||||||
MDU Resources Group, Inc. | (28,584 | ) | (835,224 | ) | (1,651.6 | ) | ||||||
Medpace Holdings, Inc. | (3,129 | ) | (626,238 | ) | (1,238.4 | ) | ||||||
Meritage Homes Corp. | (2,235 | ) | (286,192 | ) | (565.9 | ) | ||||||
MKS Instruments, Inc. | (13,972 | ) | (1,171,832 | ) | (2,317.2 | ) | ||||||
Moderna, Inc. | (2,027 | ) | (269,368 | ) | (532.7 | ) | ||||||
Mondelez International, Inc. | (4,472 | ) | (343,092 | ) | (678.5 | ) | ||||||
MongoDB, Inc. | (2,135 | ) | (512,315 | ) | (1,013.1 | ) | ||||||
Morgan Stanley | (18,027 | ) | (1,621,889 | ) | (3,207.2 | ) | ||||||
Mosaic Co. | (6,346 | ) | (271,926 | ) | (537.7 | ) | ||||||
Motorola Solutions, Inc. | (4,627 | ) | (1,348,308 | ) | (2,666.2 | ) | ||||||
Natera, Inc. | (14,556 | ) | (738,280 | ) | (1,459.9 | ) | ||||||
National Storage Affiliates Trust | (13,355 | ) | (514,835 | ) | (1,018.1 | ) | ||||||
NCR Corp. | (15,502 | ) | (345,540 | ) | (683.3 | ) | ||||||
Neogen Corp. | (1,608 | ) | (27,690 | ) | (54.8 | ) | ||||||
Netflix, Inc. | (2,904 | ) | (958,117 | ) | (1,894.6 | ) | ||||||
New Fortress Energy, Inc. | (2,669 | ) | (80,844 | ) | (159.9 | ) | ||||||
New Jersey Resources Corp. | (4,043 | ) | (208,781 | ) | (412.9 | ) | ||||||
New Relic, Inc. | (1,261 | ) | (90,124 | ) | (178.2 | ) | ||||||
New York Times Co. | (1,887 | ) | (75,008 | ) | (148.3 | ) | ||||||
| Security | Shares | Value | % of Basket Value | |||||||||
| United States (continued) | ||||||||||||
Newell Brands, Inc. | (57,134 | ) | $ | (694,178 | ) | (1,372.7 | )% | |||||
News Corp. | (84,670 | ) | (1,491,039 | ) | (2,948.5 | ) | ||||||
NEXTracker, Inc. | (3,582 | ) | (112,797 | ) | (223.1 | ) | ||||||
Novanta, Inc. | (14,577 | ) | (2,227,949 | ) | (4,405.7 | ) | ||||||
Nutanix, Inc. | (533 | ) | (12,781 | ) | (25.3 | ) | ||||||
nVent Electric PLC | (30,834 | ) | (1,292,870 | ) | (2,556.6 | ) | ||||||
NVR, Inc. | (10 | ) | (58,400 | ) | (115.5 | ) | ||||||
OGE Energy Corp. | (36,502 | ) | (1,370,285 | ) | (2,709.7 | ) | ||||||
Okta, Inc. | (18,658 | ) | (1,278,633 | ) | (2,528.4 | ) | ||||||
Old National Bancorp/IN | (39,918 | ) | (535,300 | ) | (1,058.5 | ) | ||||||
Old Republic International Corp. | (23,333 | ) | (589,625 | ) | (1,166.0 | ) | ||||||
Olin Corp. | (6,499 | ) | (360,045 | ) | (712.0 | ) | ||||||
Ollie’s Bargain Outlet Holdings, Inc. | (1,670 | ) | (108,968 | ) | (215.5 | ) | ||||||
Omega Healthcare Investors, Inc. | (664 | ) | (17,769 | ) | (35.1 | ) | ||||||
Omnicom Group, Inc. | (22,362 | ) | (2,025,326 | ) | (4,005.0 | ) | ||||||
ONE Gas, Inc. | (3,402 | ) | (261,784 | ) | (517.7 | ) | ||||||
ONEOK, Inc. | (12,046 | ) | (787,929 | ) | (1,558.1 | ) | ||||||
Onto Innovation, Inc. | (14,248 | ) | (1,153,803 | ) | (2,281.6 | ) | ||||||
Option Care Health, Inc. | (2,252 | ) | (72,402 | ) | (143.2 | ) | ||||||
Oracle Corp. | (22,143 | ) | (2,097,385 | ) | (4,147.5 | ) | ||||||
Organon & Co. | (12,267 | ) | (302,136 | ) | (597.5 | ) | ||||||
Ormat Technologies, Inc. | (233 | ) | (19,994 | ) | (39.5 | ) | ||||||
PACCAR, Inc. | (24,707 | ) | (1,845,366 | ) | (3,649.1 | ) | ||||||
Palantir Technologies, Inc. | (33,751 | ) | (261,570 | ) | (517.2 | ) | ||||||
Paylocity Holding Corp. | (372 | ) | (71,904 | ) | (142.2 | ) | ||||||
PayPal Holdings, Inc. | (20,788 | ) | (1,579,888 | ) | (3,124.2 | ) | ||||||
Peloton Interactive, Inc., Class A | (20,961 | ) | (186,134 | ) | (368.1 | ) | ||||||
Pentair PLC | (6,136 | ) | (356,379 | ) | (704.7 | ) | ||||||
Performance Food Group Co. | (24,948 | ) | (1,563,990 | ) | (3,092.7 | ) | ||||||
Permian Resources Corp. | (43,136 | ) | (450,771 | ) | (891.4 | ) | ||||||
Pfizer, Inc. | (5,082 | ) | (197,639 | ) | (390.8 | ) | ||||||
PG&E Corp. | (35,320 | ) | (604,325 | ) | (1,195.0 | ) | ||||||
Phillips 66 | (4,509 | ) | (446,391 | ) | (882.7 | ) | ||||||
Pinnacle West Capital Corp. | (380 | ) | (29,815 | ) | (59.0 | ) | ||||||
Plug Power, Inc. | (95,489 | ) | (862,266 | ) | (1,705.1 | ) | ||||||
PPG Industries, Inc. | (445 | ) | (62,416 | ) | (123.4 | ) | ||||||
Primerica, Inc. | (1,982 | ) | (361,735 | ) | (715.3 | ) | ||||||
Procore Technologies, Inc. | (11,310 | ) | (604,067 | ) | (1,194.5 | ) | ||||||
Progressive Corp. | (4,806 | ) | (655,538 | ) | (1,296.3 | ) | ||||||
Progyny, Inc. | (14,066 | ) | (467,554 | ) | (924.6 | ) | ||||||
Prosperity Bancshares, Inc. | (8,683 | ) | (543,729 | ) | (1,075.2 | ) | ||||||
PTC, Inc. | (4,648 | ) | (584,672 | ) | (1,156.2 | ) | ||||||
PulteGroup, Inc. | (6,109 | ) | (410,219 | ) | (811.2 | ) | ||||||
Quanta Services, Inc. | (6,374 | ) | (1,081,285 | ) | (2,138.2 | ) | ||||||
QuidelOrtho Corp. | (9,730 | ) | (875,213 | ) | (1,730.7 | ) | ||||||
R1 RCM, Inc. | (45,859 | ) | (714,942 | ) | (1,413.8 | ) | ||||||
Radian Group, Inc. | (4,681 | ) | (113,608 | ) | (224.7 | ) | ||||||
Range Resources Corp. | (13,541 | ) | (358,159 | ) | (708.2 | ) | ||||||
Raymond James Financial, Inc. | (3,010 | ) | (272,495 | ) | (538.8 | ) | ||||||
RBC Bearings, Inc. | (6,385 | ) | (1,449,459 | ) | (2,866.2 | ) | ||||||
Realty Income Corp. | (10,086 | ) | (633,804 | ) | (1,253.3 | ) | ||||||
Regal Rexnord Corp., Registered Shares | (2,427 | ) | (315,898 | ) | (624.7 | ) | ||||||
Regions Financial Corp., Registered Shares | (8,123 | ) | (148,326 | ) | (293.3 | ) | ||||||
Rexford Industrial Realty, Inc. | (5,395 | ) | (300,879 | ) | (595.0 | ) | ||||||
RH | (4,007 | ) | (1,022,306 | ) | (2,021.6 | ) | ||||||
Rithm Capital Corp. | (155,340 | ) | (1,267,574 | ) | (2,506.6 | ) | ||||||
Rivian Automotive, Inc. | (16,852 | ) | (216,043 | ) | (427.2 | ) | ||||||
RLI Corp. | (389 | ) | (54,090 | ) | (107.0 | ) | ||||||
Robinhood Markets, Inc. | (22,852 | ) | (202,240 | ) | (399.9 | ) | ||||||
Rockwell Automation, Inc. | (2,183 | ) | (618,684 | ) | (1,223.4 | ) | ||||||
Roku, Inc. | (4,468 | ) | (251,146 | ) | (496.6 | ) | ||||||
Roper Technologies, Inc. | (293 | ) | (133,251 | ) | (263.5 | ) | ||||||
| 106 | 2 0 2 3 BLACK ROCK ANNUAL REPORT TO SHAREHOLDERS |
Schedule of Investments (continued) April 30, 2023 | BlackRock Global Equity Market Neutral Fund |
| Security | Shares | Value | % of Basket Value | |||||||||
| United States (continued) | ||||||||||||
Ryan Specialty Holdings, Inc. | (25,104 | ) | $ | (1,025,749 | ) | (2,028.4 | )% | |||||
Ryman Hospitality Properties, Inc. | (2,115 | ) | (189,631 | ) | (375.0 | ) | ||||||
Salesforce, Inc. | (7,534 | ) | (1,494,520 | ) | (2,955.3 | ) | ||||||
Science Applications International Corp. | (5,610 | ) | (572,388 | ) | (1,131.9 | ) | ||||||
Sealed Air Corp. | (13,941 | ) | (669,029 | ) | (1,323.0 | ) | ||||||
SeaWorld Entertainment, Inc. | (2,818 | ) | (151,214 | ) | (299.0 | ) | ||||||
Selective Insurance Group, Inc. | (3,456 | ) | (332,916 | ) | (658.3 | ) | ||||||
SentinelOne, Inc. | (97,465 | ) | (1,566,263 | ) | (3,097.2 | ) | ||||||
Shift4 Payments, Inc., Class A | (2,962 | ) | (200,735 | ) | (396.9 | ) | ||||||
Shoals Technologies Group, Inc., Class A | (12,180 | ) | (254,440 | ) | (503.1 | ) | ||||||
Shockwave Medical, Inc. | (1,385 | ) | (401,872 | ) | (794.7 | ) | ||||||
Sinch AB | (166,212 | ) | (437,159 | ) | (864.5 | ) | ||||||
Sitio Royalties Corp. | (917 | ) | (23,283 | ) | (46.0 | ) | ||||||
Skyline Champion Corp. | (10,255 | ) | (760,613 | ) | (1,504.1 | ) | ||||||
Skyworks Solutions, Inc. | (3,336 | ) | (353,282 | ) | (698.6 | ) | ||||||
SLM Corp. | (34,721 | ) | (521,509 | ) | (1,031.3 | ) | ||||||
Smartsheet, Inc., Class A | (5,605 | ) | (229,076 | ) | (453.0 | ) | ||||||
Snowflake, Inc. | (4,400 | ) | (651,552 | ) | (1,288.4 | ) | ||||||
SolarEdge Technologies, Inc. | (2,473 | ) | (706,363 | ) | (1,396.8 | ) | ||||||
Southern Co. | (20,297 | ) | (1,492,844 | ) | (2,952.0 | ) | ||||||
SouthState Corp. | (11,811 | ) | (814,723 | ) | (1,611.1 | ) | ||||||
Southwest Gas Holdings, Inc. | (5,997 | ) | (335,832 | ) | (664.1 | ) | ||||||
Spirit Realty Capital, Inc. | (1,635 | ) | (62,882 | ) | (124.3 | ) | ||||||
SPS Commerce, Inc. | (283 | ) | (41,686 | ) | (82.4 | ) | ||||||
SS&C Technologies Holdings, Inc. | (34,788 | ) | (2,036,490 | ) | (4,027.1 | ) | ||||||
STAG Industrial, Inc. | (35,851 | ) | (1,214,273 | ) | (2,401.2 | ) | ||||||
Stanley Black & Decker, Inc. | (3,221 | ) | (278,101 | ) | (549.9 | ) | ||||||
Starbucks Corp. | (3,143 | ) | (359,213 | ) | (710.3 | ) | ||||||
Starwood Property Trust, Inc. | (9,077 | ) | (162,388 | ) | (321.1 | ) | ||||||
State Street Corp. | (258 | ) | (18,643 | ) | (36.9 | ) | ||||||
Stellantis NV | (176,106 | ) | (2,894,533 | ) | (5,723.8 | ) | ||||||
Surgery Partners, Inc. | (7,509 | ) | (297,807 | ) | (588.9 | ) | ||||||
Synaptics, Inc. | (1,471 | ) | (130,272 | ) | (257.6 | ) | ||||||
Sysco Corp. | (10,298 | ) | (790,269 | ) | (1,562.7 | ) | ||||||
Take-Two Interactive Software, Inc. | (4,046 | ) | (502,877 | ) | (994.4 | ) | ||||||
Teledyne Technologies, Inc. | (6,568 | ) | (2,721,779 | ) | (5,382.2 | ) | ||||||
Tenable Holdings, Inc. | (1,148 | ) | (42,465 | ) | (84.0 | ) | ||||||
Terreno Realty Corp. | (8,872 | ) | (546,426 | ) | (1,080.5 | ) | ||||||
Tetra Tech, Inc. | (1,110 | ) | (153,591 | ) | (303.7 | ) | ||||||
Toast, Inc. | (12,419 | ) | (226,026 | ) | (447.0 | ) | ||||||
Trade Desk, Inc., Class A | (16,163 | ) | (1,039,927 | ) | (2,056.4 | ) | ||||||
TriNet Group, Inc. | (743 | ) | (68,936 | ) | (136.3 | ) | ||||||
Twilio, Inc., Class A | (9,442 | ) | (496,744 | ) | (982.3 | ) | ||||||
Tyler Technologies, Inc. | (449 | ) | (170,184 | ) | (336.5 | ) | ||||||
Uber Technologies, Inc. | (11,119 | ) | (345,245 | ) | (682.7 | ) | ||||||
UFP Industries, Inc. | (4,809 | ) | (377,603 | ) | (746.7 | ) | ||||||
UiPath, Inc. | (55,379 | ) | (779,736 | ) | (1,541.9 | ) | ||||||
Under Armour, Inc., Class A | (29,961 | ) | (265,754 | ) | (525.5 | ) | ||||||
Universal Health Services, Inc. | (5,484 | ) | (824,519 | ) | (1,630.5 | ) | ||||||
Valvoline, Inc. | (10,509 | ) | (363,086 | ) | (718.0 | ) | ||||||
Vertiv Holdings Co., Class A | (15,849 | ) | (236,467 | ) | (467.6 | ) | ||||||
Viatris, Inc. | �� | (36,788 | ) | (343,232 | ) | (678.7 | ) | |||||
Vir Biotechnology, Inc. | (11,745 | ) | (295,387 | ) | (584.1 | ) | ||||||
Vontier Corp. | (34,494 | ) | (935,822 | ) | (1,850.5 | ) | ||||||
Vornado Realty Trust | (2,078 | ) | (31,191 | ) | (61.7 | ) | ||||||
Warner Music Group Corp., Class A | (572 | ) | (17,429 | ) | (34.5 | ) | ||||||
Webster Financial Corp. | (15,216 | ) | (567,557 | ) | (1,122.3 | ) | ||||||
WEC Energy Group, Inc. | (796 | ) | (76,551 | ) | (151.4 | ) | ||||||
Welltower, Inc. | (6,421 | ) | (508,672 | ) | (1,005.9 | ) | ||||||
WESCO International, Inc. | (3,211 | ) | (462,384 | ) | (914.3 | ) | ||||||
Whirlpool Corp. | (1,516 | ) | (211,618 | ) | (418.5 | )�� | ||||||
| Security | Shares | Value | % of Basket Value | |||||||||
| United States (continued) | ||||||||||||
Wingstop, Inc. | (1,824 | ) | $ | (365,001 | ) | (721.8 | )% | |||||
Wolfspeed, Inc. | (2,721 | ) | (126,663 | ) | (250.5 | ) | ||||||
Xcel Energy, Inc. | (3,695 | ) | (258,317 | ) | (510.8 | ) | ||||||
XPO, Inc. | (1,690 | ) | (74,664 | ) | (147.6 | ) | ||||||
Zimmer Biomet Holdings, Inc. | (7,758 | ) | (1,074,018 | ) | (2,123.8 | ) | ||||||
ZoomInfo Technologies, Inc. | (23,119 | ) | (506,537 | ) | (1,001.7 | ) | ||||||
|
|
|
| |||||||||
| (200,492,832 | ) | |||||||||||
| Preferred Stocks | ||||||||||||
| Germany | ||||||||||||
Henkel AG & Co. KGaA | (20,734 | ) | (1,662,514 | ) | (3,287.6 | ) | ||||||
|
|
|
| |||||||||
Total Reference Entity — Short | (398,599,360 | ) | ||||||||||
|
| |||||||||||
Net Value of Reference Entity — Goldman Sachs Bank USA |
| $ | 50,570 | |||||||||
|
| |||||||||||
The following table represents the individual long and short positions and related values of the equity securities underlying the total return swap with UBS AG as of period end, termination dates 04/03/28-04/24/28:
| Security | Shares | Value | % of Basket Value | |||||||||
Reference Entity — Long | ||||||||||||
| Common Stocks | ||||||||||||
| Australia | ||||||||||||
AMP Ltd. | 359,408 | $ | 274,908 | (59.9 | )% | |||||||
Bank of Queensland Ltd. | 221,309 | 864,572 | (188.3 | ) | ||||||||
Beach Energy Ltd. | 52,356 | 52,124 | (11.4 | ) | ||||||||
Bendigo & Adelaide Bank Ltd. | 16,091 | 93,174 | (20.3 | ) | ||||||||
Challenger Ltd. | 217,674 | 886,520 | (193.1 | ) | ||||||||
Charter Hall Group | 55,819 | 420,212 | (91.5 | ) | ||||||||
CSR Ltd. | 43,998 | 155,795 | (33.9 | ) | ||||||||
Deterra Royalties Ltd. | 9,265 | 28,743 | (6.3 | ) | ||||||||
Domain Holdings Australia Ltd. | 4,516 | 10,188 | (2.2 | ) | ||||||||
Downer EDI Ltd. | 157,282 | 376,378 | (82.0 | ) | ||||||||
Flight Centre Travel Group Ltd. | 45,725 | 607,249 | (132.3 | ) | ||||||||
GPT Group | 26,756 | 79,601 | (17.3 | ) | ||||||||
IDP Education Ltd. | 29,327 | 557,508 | (121.4 | ) | ||||||||
Iluka Resources Ltd. | 16,521 | 122,805 | (26.7 | ) | ||||||||
Lynas Rare Earths Ltd. | 9,915 | 43,100 | (9.4 | ) | ||||||||
Macquarie Group Ltd. | 4,565 | 563,312 | (122.7 | ) | ||||||||
Magellan Financial Group Ltd. | 25,006 | 137,070 | (29.9 | ) | ||||||||
Mineral Resources Ltd. | 24,907 | 1,244,189 | (271.0 | ) | ||||||||
Mirvac Group | 44,759 | 72,652 | (15.8 | ) | ||||||||
National Australia Bank Ltd. | 12,361 | 240,721 | (52.4 | ) | ||||||||
Orora Ltd. | 79,745 | 184,436 | (40.2 | ) | ||||||||
Pilbara Minerals Ltd. | 36,020 | 103,701 | (22.6 | ) | ||||||||
Pro Medicus Ltd. | 27,894 | 1,158,617 | (252.4 | ) | ||||||||
Region RE Ltd., Registered Shares | 263,272 | 435,853 | (94.9 | ) | ||||||||
SEEK Ltd. | 34,155 | 563,726 | (122.8 | ) | ||||||||
Star Entertainment Grp Ltd. | 106,437 | 91,305 | (19.9 | ) | ||||||||
Steadfast Group Ltd. | 70,685 | 281,989 | (61.4 | ) | ||||||||
Treasury Wine Estates Ltd. | 114,331 | 1,071,499 | (233.4 | ) | ||||||||
WiseTech Global Ltd. | 6,936 | 321,438 | (70.0 | ) | ||||||||
|
|
|
| |||||||||
| 11,043,385 | ||||||||||||
| Austria | ||||||||||||
ANDRITZ AG | 2,221 | 144,576 | (31.5 | ) | ||||||||
SCHEDULE OF INVESTMENTS | 107 |
Schedule of Investments (continued) April 30, 2023 | BlackRock Global Equity Market Neutral Fund |
| Security | Shares | Value | % of Basket | |||||||||
| Austria (continued) | ||||||||||||
BAWAG Group AG | 491 | $ | 24,005 | (5.2 | )% | |||||||
Raiffeisen Bank International AG | 63,756 | 981,631 | (213.8 | ) | ||||||||
|
|
|
| |||||||||
| 1,150,212 | ||||||||||||
| Belgium | ||||||||||||
Elia Group SA/NV | 1,923 | 264,276 | (57.6 | ) | ||||||||
Sofina SA | 6,663 | 1,533,187 | (333.9 | ) | ||||||||
Solvay SA | 1,482 | 178,271 | (38.8 | ) | ||||||||
|
|
|
| |||||||||
| 1,975,734 | ||||||||||||
| Bermuda | ||||||||||||
RenaissanceRe Holdings Ltd. | 191 | 41,143 | (9.0 | ) | ||||||||
|
|
|
| |||||||||
| Brazil | ||||||||||||
Wheaton Precious Metals Corp. | 601 | 29,674 | (6.5 | ) | ||||||||
|
|
|
| |||||||||
| Canada | ||||||||||||
Alamos Gold, Inc., Class A | 39,906 | 516,085 | (112.4 | ) | ||||||||
B2Gold Corp. | 101,243 | 398,568 | (86.8 | ) | ||||||||
Ballard Power Systems, Inc. | 80,068 | 354,237 | (77.2 | ) | ||||||||
Baytex Energy Corp. | 73,999 | 278,744 | (60.7 | ) | ||||||||
Birchcliff Energy Ltd. | 28,836 | 174,854 | (38.1 | ) | ||||||||
Bombardier, Inc., Class B | 14,286 | 617,530 | (134.5 | ) | ||||||||
Canada Goose Holdings, Inc. | 12,796 | 251,058 | (54.7 | ) | ||||||||
Canadian Imperial Bank of Commerce | 10,199 | 426,120 | (92.8 | ) | ||||||||
Element Fleet Management Corp. | 93,377 | 1,222,055 | (266.2 | ) | ||||||||
Enerplus Corp. | 81,108 | 1,213,678 | (264.4 | ) | ||||||||
First Majestic Silver Corp. | 136,520 | 964,956 | (210.2 | ) | ||||||||
FirstService Corp. | 2,228 | 335,357 | (73.0 | ) | ||||||||
Franco-Nevada Corp. | 2,108 | 320,073 | (69.7 | ) | ||||||||
GFL Environmental, Inc. | 1,274 | 46,303 | (10.1 | ) | ||||||||
Gildan Activewear, Inc. | 4,267 | 139,045 | (30.3 | ) | ||||||||
Imperial Oil Ltd. | 13,372 | 682,076 | (148.6 | ) | ||||||||
Ivanhoe Mines Ltd. | 28,806 | 249,988 | (54.4 | ) | ||||||||
Kinross Gold Corp. | 59,612 | 300,712 | (65.5 | ) | ||||||||
Lithium Americas Corp. | 3,856 | 77,124 | (16.8 | ) | ||||||||
Methanex Corp. | 18,059 | 808,960 | (176.2 | ) | ||||||||
NuVista Energy Ltd. | 18,891 | 164,082 | (35.7 | ) | ||||||||
Restaurant Brands International, Inc. | 3,398 | 238,370 | (51.9 | ) | ||||||||
RioCan Real Estate Investment Trust | 44,989 | 697,129 | (151.8 | ) | ||||||||
Ritchie Bros Auctioneers, Inc. | 94 | 5,382 | (1.2 | ) | ||||||||
Stantec, Inc. | 47,909 | 2,881,734 | (627.7 | ) | ||||||||
Tourmaline Oil Corp. | 12,625 | 567,587 | (123.6 | ) | ||||||||
TransAlta Corp. | 22,216 | 198,210 | (43.2 | ) | ||||||||
Vermilion Energy, Inc. | 4,049 | 51,289 | (11.2 | ) | ||||||||
West Fraser Timber Co. Ltd. | 2,640 | 191,089 | (41.6 | ) | ||||||||
|
|
|
| |||||||||
| 14,372,395 | ||||||||||||
| Chile | ||||||||||||
Lundin Mining Corp. | 27,877 | 213,101 | (46.4 | ) | ||||||||
|
|
|
| |||||||||
| China | ||||||||||||
Budweiser Brewing Co. APAC Ltd. | 100,900 | 291,531 | (63.5 | ) | ||||||||
Shangri-La Asia Ltd. | 130,000 | 119,931 | (26.1 | ) | ||||||||
Wharf Holdings Ltd. | 377,000 | 861,642 | (187.7 | ) | ||||||||
|
|
|
| |||||||||
| 1,273,104 | ||||||||||||
| Comoros | ||||||||||||
Golar LNG Ltd. | 1,232 | 27,966 | (6.1 | ) | ||||||||
|
|
|
| |||||||||
| Denmark | ||||||||||||
Coloplast A/S | 517 | 74,665 | (16.3 | ) | ||||||||
D/S Norden A/S | 2,013 | 126,808 | (27.6 | ) | ||||||||
H Lundbeck A/S | 75,959 | 403,116 | (87.8 | ) | ||||||||
| Security | Shares | Value | % of Basket Value | |||||||||
| Denmark (continued) | ||||||||||||
Jyske Bank A/S, Registered Shares | 5,410 | $ | 396,505 | (86.4 | )% | |||||||
Novozymes A/S, B Shares | 4,013 | 209,278 | (45.6 | ) | ||||||||
Orsted A/S | 2,063 | 185,587 | (40.4 | ) | ||||||||
Rockwool A/S, B Shares | 3,586 | 870,594 | (189.6 | ) | ||||||||
Tryg A/S | 795 | 18,816 | (4.1 | ) | ||||||||
|
|
|
| |||||||||
| 2,285,369 | ||||||||||||
| Finland | ||||||||||||
Kone OYJ, Class B | 6,219 | 355,564 | (77.4 | ) | ||||||||
Outokumpu OYJ | 6,274 | 34,280 | (7.5 | ) | ||||||||
|
|
|
| |||||||||
| 389,844 | ||||||||||||
| France | ||||||||||||
Accor SA | 4,909 | 174,544 | (38.0 | ) | ||||||||
Aeroports de Paris | 8,613 | 1,371,609 | (298.8 | ) | ||||||||
Arkema SA | 5,278 | 523,405 | (114.0 | ) | ||||||||
Bureau Veritas SA | 20,303 | 586,785 | (127.8 | ) | ||||||||
Carrefour SA | 2,190 | 45,654 | (9.9 | ) | ||||||||
Cie de Saint-Gobain | 1,894 | 109,895 | (23.9 | ) | ||||||||
Danone SA | 887 | 58,838 | (12.8 | ) | ||||||||
Dassault Aviation SA | 269 | 52,687 | (11.5 | ) | ||||||||
Edenred | 4,940 | 321,686 | (70.1 | ) | ||||||||
Engie SA | 19,701 | 315,762 | (68.8 | ) | ||||||||
EssilorLuxottica SA | 1,670 | 331,398 | (72.2 | ) | ||||||||
Gaztransport Et Technigaz SA | 9,695 | 1,039,125 | (226.3 | ) | ||||||||
Getlink SE | 20,108 | 376,634 | (82.0 | ) | ||||||||
Hermes International | 513 | 1,116,344 | (243.2 | ) | ||||||||
ICADE | 33,512 | 1,577,423 | (343.6 | ) | ||||||||
JCDecaux SE | 7,033 | 156,050 | (34.0 | ) | ||||||||
Kering SA | 45 | 28,831 | (6.3 | ) | ||||||||
LVMH Moet Hennessy Louis Vuitton SE | 76 | 73,274 | (16.0 | ) | ||||||||
Neoen SA | 32,305 | 972,077 | (211.7 | ) | ||||||||
Pernod Ricard SA | 1,175 | 272,001 | (59.2 | ) | ||||||||
Societe Generale SA | 1,495 | 36,365 | (7.9 | ) | ||||||||
Teleperformance | 1,034 | 207,184 | (45.1 | ) | ||||||||
Vallourec SA | 1,948 | 22,303 | (4.9 | ) | ||||||||
Veolia Environnement SA | 29,933 | 948,864 | (206.7 | ) | ||||||||
Wendel SE | 3,906 | 439,153 | (95.7 | ) | ||||||||
|
|
|
| |||||||||
| 11,157,891 | ||||||||||||
| Germany | ||||||||||||
Carl Zeiss Meditec AG | 666 | 89,786 | (19.6 | ) | ||||||||
Commerzbank AG | 2,222 | 24,752 | (5.4 | ) | ||||||||
Covestro AG | 3,160 | 138,924 | (30.3 | ) | ||||||||
Deutsche Lufthansa AG, Registered Shares | 15,139 | 163,114 | (35.5 | ) | ||||||||
DWS Group GmbH & Co. KGaA | 16,878 | 562,484 | (122.5 | ) | ||||||||
Encavis AG | 27,822 | 482,171 | (105.0 | ) | ||||||||
Evonik Industries AG | 16,113 | 352,486 | (76.8 | ) | ||||||||
Fraport AG Frankfurt Airport Services Worldwide | 27,571 | 1,488,197 | (324.2 | ) | ||||||||
Freenet AG | 25,167 | 719,093 | (156.6 | ) | ||||||||
HUGO BOSS AG | 1,313 | 99,167 | (21.6 | ) | ||||||||
Knorr-Bremse AG | 29,807 | 2,093,853 | (456.1 | ) | ||||||||
Mercedes-Benz Group AG | 8,601 | 672,260 | (146.4 | ) | ||||||||
Merck KGaA | 605 | 108,768 | (23.7 | ) | ||||||||
METRO AG | 33,523 | 285,741 | (62.2 | ) | ||||||||
Nemetschek SE | 5,160 | 404,152 | (88.0 | ) | ||||||||
ProSiebenSat.1 Media SE | 8,446 | 75,963 | (16.6 | ) | ||||||||
SUSE SA | 9,290 | 176,001 | (38.3 | ) | ||||||||
Talanx AG | 13,991 | 705,280 | (153.6 | ) | ||||||||
| 108 | 2 0 2 3 BLACK ROCK ANNUAL REPORT TO SHAREHOLDERS |
Schedule of Investments (continued) April 30, 2023 | BlackRock Global Equity Market Neutral Fund |
| Security | Shares | Value | % of Basket Value | |||||||||
| Germany (continued) | ||||||||||||
thyssenkrupp AG | 90,935 | $ | 655,831 | (142.9 | )% | |||||||
United Internet AG, Registered Shares | 2,053 | 35,329 | (7.7 | ) | ||||||||
|
|
|
| |||||||||
| 9,333,352 | ||||||||||||
| Hong Kong | ||||||||||||
ASMPT Ltd. | 33,600 | 264,178 | (57.5 | ) | ||||||||
Bank of East Asia Ltd. | 92,400 | 121,779 | (26.5 | ) | ||||||||
Cafe de Coral Holdings Ltd. | 26,000 | 36,419 | (7.9 | ) | ||||||||
Cathay Pacific Airways Ltd. | 683,000 | 660,914 | (144.0 | ) | ||||||||
Dah Sing Financial Holdings Ltd. | 27,200 | 69,687 | (15.2 | ) | ||||||||
Haitong International Securities Group Ltd. | 105,600 | 8,914 | (1.9 | ) | ||||||||
Hang Lung Group Ltd. | 49,000 | 86,146 | (18.8 | ) | ||||||||
Hang Lung Properties Ltd. | 129,000 | 235,810 | (51.4 | ) | ||||||||
Hongkong Land Holdings Ltd. | 85,700 | 381,402 | (83.1 | ) | ||||||||
Hysan Development Co. Ltd. | 85,000 | 240,222 | (52.3 | ) | ||||||||
Kerry Properties Ltd. | 93,500 | 241,247 | (52.6 | ) | ||||||||
Link REIT | 45,300 | 296,311 | (64.5 | ) | ||||||||
New World Development Co. Ltd. | 1,331,000 | 3,549,721 | (773.2 | ) | ||||||||
Super Hi International Holding Ltd. | 7,000 | 14,603 | (3.2 | ) | ||||||||
Swire Pacific Ltd. | 35,000 | 277,843 | (60.5 | ) | ||||||||
Swire Properties Ltd. | 153,600 | 412,848 | (89.9 | ) | ||||||||
|
|
|
| |||||||||
| 6,898,044 | ||||||||||||
| Indonesia | ||||||||||||
First Pacific Co. Ltd. | 216,000 | 72,333 | (15.8 | ) | ||||||||
|
|
|
| |||||||||
| Ireland | ||||||||||||
Ryanair Holdings PLC | 9,096 | 149,499 | (32.6 | ) | ||||||||
|
|
|
| |||||||||
| Israel | ||||||||||||
Alony Hetz Properties & Investments Ltd. | 62,477 | 490,122 | (106.8 | ) | ||||||||
Gav-Yam Lands Corp. Ltd. | 18,706 | 134,111 | (29.2 | ) | ||||||||
Nova Ltd. | 406 | 37,129 | (8.1 | ) | ||||||||
|
|
|
| |||||||||
| 661,362 | ||||||||||||
| Italy | ||||||||||||
A2A SpA | 146,150 | 258,442 | (56.3 | ) | ||||||||
Banco BPM SpA | 22,096 | 90,070 | (19.6 | ) | ||||||||
Buzzi Unicem SpA | 17,670 | 440,363 | (95.9 | ) | ||||||||
Ferrari NV | 308 | 86,020 | (18.7 | ) | ||||||||
FinecoBank Banca Fineco SpA | 13,234 | 201,066 | (43.8 | ) | ||||||||
Hera SpA | 161,527 | 503,961 | (109.8 | ) | ||||||||
Italgas SpA | 12,993 | 85,030 | (18.5 | ) | ||||||||
Mediobanca Banca di Credito Finanziario SpA | 96,887 | 1,042,857 | (227.2 | ) | ||||||||
Moncler SpA | 17,953 | 1,334,812 | (290.7 | ) | ||||||||
Recordati Industria Chimica e Farmaceutica SpA | 2,584 | 119,215 | (26.0 | ) | ||||||||
Reply SpA | 1,063 | 124,125 | (27.0 | ) | ||||||||
Snam SpA | 140,814 | 784,365 | (170.9 | ) | ||||||||
UnipolSai Assicurazioni SpA | 198,848 | 536,152 | (116.8 | ) | ||||||||
|
|
|
| |||||||||
| 5,606,478 | ||||||||||||
| Japan | ||||||||||||
Acom Co. Ltd. | 386,900 | 961,383 | (209.4 | ) | ||||||||
AEON Financial Service Co. Ltd. | 44,100 | 398,449 | (86.8 | ) | ||||||||
Ain Holdings, Inc. | 1,700 | 71,704 | (15.6 | ) | ||||||||
Aisin Corp. | 5,100 | 151,656 | (33.0 | ) | ||||||||
Alfresa Holdings Corp. | 66,600 | 977,757 | (213.0 | ) | ||||||||
Alps Alpine Co. Ltd. | 2,100 | 19,441 | (4.2 | ) | ||||||||
Amano Corp. | 5,700 | 117,685 | (25.6 | ) | ||||||||
Anritsu Corp. | 4,700 | 43,647 | (9.5 | ) | ||||||||
Astellas Pharma, Inc. | 21,700 | 331,614 | (72.2 | ) | ||||||||
AZ-COM MARUWA Holdings, Inc. | 24,900 | 372,406 | (81.1 | ) | ||||||||
Benesse Holdings, Inc. | 100,600 | 1,464,308 | (319.0 | ) | ||||||||
| Security | Shares | Value | % of Basket Value | |||||||||
| Japan (continued) | ||||||||||||
Brother Industries Ltd. | 46,200 | $ | 735,688 | (160.3 | )% | |||||||
Canon Marketing Japan, Inc. | 3,900 | 98,822 | (21.5 | ) | ||||||||
Casio Computer Co. Ltd. | 2,200 | 21,231 | (4.6 | ) | ||||||||
Coca-Cola Bottlers Japan Holdings, Inc. | 29,700 | 324,581 | (70.7 | ) | ||||||||
COMSYS Holdings Corp. | 6,100 | 118,356 | (25.8 | ) | ||||||||
Concordia Financial Group Ltd. | 9,000 | 34,634 | (7.5 | ) | ||||||||
Cosmos Pharmaceutical Corp. | 1,800 | 179,488 | (39.1 | ) | ||||||||
CyberAgent, Inc. | 104,300 | 923,252 | (201.1 | ) | ||||||||
Daicel Corp. | 13,500 | 107,910 | (23.5 | ) | ||||||||
Dai-ichi Life Holdings, Inc. | 2,200 | 41,496 | (9.0 | ) | ||||||||
Daikin Industries Ltd. | 1,100 | 202,523 | (44.1 | ) | ||||||||
Denka Co. Ltd. | 13,700 | 278,295 | (60.6 | ) | ||||||||
DIC Corp. | 300 | 5,620 | (1.2 | ) | ||||||||
Dowa Holdings Co. Ltd. | 9,000 | 298,173 | (65.0 | ) | ||||||||
Ebara Corp. | 3,000 | 133,162 | (29.0 | ) | ||||||||
FUJIFILM Holdings Corp. | 6,000 | 317,300 | (69.1 | ) | ||||||||
Fujikura Ltd. | 10,500 | 72,592 | (15.8 | ) | ||||||||
GMO internet group, Inc. | 22,100 | 450,741 | (98.2 | ) | ||||||||
Hamamatsu Photonics KK | 2,000 | 107,549 | (23.4 | ) | ||||||||
Hitachi Ltd. | 3,400 | 190,858 | (41.6 | ) | ||||||||
House Foods Group, Inc. | 31,400 | 700,080 | (152.5 | ) | ||||||||
Hoya Corp. | 900 | 95,690 | (20.8 | ) | ||||||||
IHI Corp. | 600 | 15,334 | (3.3 | ) | ||||||||
Information Services International-Dentsu Ltd. | 11,400 | 407,960 | (88.9 | ) | ||||||||
INFRONEER Holdings, Inc. | 94,500 | 756,841 | (164.9 | ) | ||||||||
Internet Initiative Japan, Inc. | 1,200 | 25,183 | (5.5 | ) | ||||||||
Itochu Techno-Solutions Corp. | 66,100 | 1,734,912 | (377.9 | ) | ||||||||
J Front Retailing Co. Ltd. | 61,000 | 650,926 | (141.8 | ) | ||||||||
JTEKT Corp. | 34,400 | 287,819 | (62.7 | ) | ||||||||
Kadokawa Corp. | 9,000 | 194,659 | (42.4 | ) | ||||||||
Kakaku.com, Inc. | 11,200 | 156,286 | (34.0 | ) | ||||||||
Kamigumi Co. Ltd. | 1,900 | 42,215 | (9.2 | ) | ||||||||
Kandenko Co. Ltd. | 14,800 | 113,016 | (24.6 | ) | ||||||||
Kaneka Corp. | 14,200 | 383,059 | (83.4 | ) | ||||||||
Kawasaki Kisen Kaisha Ltd. | 24,500 | 592,383 | (129.0 | ) | ||||||||
KDDI Corp. | 1,100 | 34,817 | (7.6 | ) | ||||||||
Kewpie Corp. | 23,700 | 403,515 | (87.9 | ) | ||||||||
Kinden Corp. | 18,200 | 251,401 | (54.8 | ) | ||||||||
Koei Tecmo Holdings Co. Ltd. | 20,400 | 380,119 | (82.8 | ) | ||||||||
Kokuyo Co. Ltd. | 34,200 | 495,595 | (108.0 | ) | ||||||||
K’s Holdings Corp. | 300 | 2,696 | (0.6 | ) | ||||||||
Kuraray Co. Ltd. | 9,800 | 93,079 | (20.3 | ) | ||||||||
Kyocera Corp. | 9,300 | 494,983 | (107.8 | ) | ||||||||
Kyowa Kirin Co. Ltd. | 12,800 | 288,982 | (62.9 | ) | ||||||||
Lintec Corp. | 13,200 | 223,819 | (48.8 | ) | ||||||||
Lion Corp. | 32,300 | 357,099 | (77.8 | ) | ||||||||
Lixil Corp. | 34,500 | 550,565 | (119.9 | ) | ||||||||
M3, Inc. | 600 | 14,944 | (3.3 | ) | ||||||||
Mani, Inc. | 26,400 | 350,529 | (76.4 | ) | ||||||||
Maruichi Steel Tube Ltd. | 5,400 | 123,877 | (27.0 | ) | ||||||||
MISUMI Group, Inc. | 400 | 10,229 | (2.2 | ) | ||||||||
Mitsubishi Chemical Group Corp. | 111,900 | 665,860 | (145.0 | ) | ||||||||
Mitsubishi Corp. | 2,200 | 82,721 | (18.0 | ) | ||||||||
Mitsubishi Electric Corp. | 21,400 | 269,014 | (58.6 | ) | ||||||||
Mitsubishi Estate Co. Ltd. | 29,500 | 368,718 | (80.3 | ) | ||||||||
Mitsubishi Gas Chemical Co., Inc. | 121,600 | 1,795,537 | (391.1 | ) | ||||||||
Mitsubishi Heavy Industries Ltd. | 2,800 | 107,702 | (23.5 | ) | ||||||||
Mitsubishi Motors Corp. | 38,900 | 151,589 | (33.0 | ) | ||||||||
Mitsui & Co. Ltd. | 4,700 | 148,808 | (32.4 | ) | ||||||||
Mitsui Chemicals, Inc. | 52,500 | 1,347,239 | (293.5 | ) | ||||||||
Mitsui Fudosan Co. Ltd. | 6,500 | 130,848 | (28.5 | ) | ||||||||
SCHEDULE OF INVESTMENTS | 109 |
Schedule of Investments (continued) April 30, 2023 | BlackRock Global Equity Market Neutral Fund |
| Security | Shares | Value | % of Basket Value | |||||||||
| Japan (continued) | ||||||||||||
Mizuho Financial Group, Inc. | 26,400 | $ | 388,217 | (84.6 | )% | |||||||
Nabtesco Corp. | 11,100 | 271,289 | (59.1 | ) | ||||||||
Nagoya Railroad Co. Ltd. | 13,300 | 217,590 | (47.4 | ) | ||||||||
NEC Networks & System Integration Corp. | 101,700 | 1,285,290 | (280.0 | ) | ||||||||
NGK Insulators Ltd. | 27,600 | 351,577 | (76.6 | ) | ||||||||
Nidec Corp. | 9,300 | 466,680 | (101.7 | ) | ||||||||
Nihon M&A Center Holdings, Inc. | 88,800 | 688,270 | (149.9 | ) | ||||||||
Nikon Corp. | 32,600 | 341,616 | (74.4 | ) | ||||||||
Nippon Express Holdings, Inc. | 600 | 35,707 | (7.8 | ) | ||||||||
Nippon Shinyaku Co. Ltd. | 6,600 | 306,111 | (66.7 | ) | ||||||||
Nippon Telegraph & Telephone Corp. | 4,200 | 129,948 | (28.3 | ) | ||||||||
Nipro Corp. | 68,700 | 524,849 | (114.3 | ) | ||||||||
Nissan Chemical Corp. | 2,000 | 90,148 | (19.6 | ) | ||||||||
Nissan Motor Co. Ltd. | 19,000 | 70,409 | (15.3 | ) | ||||||||
Niterra Co. Ltd. | 8,700 | 184,903 | (40.3 | ) | ||||||||
Nitto Denko Corp. | 4,800 | 314,599 | (68.5 | ) | ||||||||
NS Solutions Corp. | 14,300 | 394,574 | (85.9 | ) | ||||||||
NSK Ltd. | 263,500 | 1,508,792 | (328.6 | ) | ||||||||
OBIC Business Consultants Co. Ltd. | 33,200 | 1,278,337 | (278.4 | ) | ||||||||
Olympus Corp. | 39,000 | 692,823 | (150.9 | ) | ||||||||
Oracle Corp. Japan | 14,300 | 1,040,335 | (226.6 | ) | ||||||||
Orient Corp. | 8,300 | 70,231 | (15.3 | ) | ||||||||
Otsuka Holdings Co. Ltd. | 7,000 | 241,456 | (52.6 | ) | ||||||||
Panasonic Holdings Corp. | 44,400 | 424,230 | (92.4 | ) | ||||||||
Pigeon Corp. | 20,200 | 318,905 | (69.5 | ) | ||||||||
Pola Orbis Holdings, Inc. | 97,100 | 1,368,506 | (298.1 | ) | ||||||||
Recruit Holdings Co. Ltd. | 46,800 | 1,331,348 | (290.0 | ) | ||||||||
Ricoh Co. Ltd. | 125,300 | 1,051,524 | (229.0 | ) | ||||||||
Rohm Co. Ltd. | 5,100 | 389,714 | (84.9 | ) | ||||||||
Sanrio Co. Ltd. | 16,100 | 755,801 | (164.6 | ) | ||||||||
Sapporo Holdings Ltd. | 6,200 | 175,394 | (38.2 | ) | ||||||||
Sawai Group Holdings Co. Ltd. | 19,900 | 583,950 | (127.2 | ) | ||||||||
SCSK Corp. | 16,500 | 252,559 | (55.0 | ) | ||||||||
Seiko Epson Corp. | 28,400 | 440,312 | (95.9 | ) | ||||||||
Sharp Corp. | 7,600 | 54,934 | (12.0 | ) | ||||||||
Shimizu Corp. | 62,500 | 386,737 | (84.2 | ) | ||||||||
Sohgo Security Services Co. Ltd. | 74,100 | 2,098,824 | (457.2 | ) | ||||||||
Sompo Holdings, Inc. | 8,100 | 342,738 | (74.7 | ) | ||||||||
Subaru Corp. | 77,100 | 1,275,342 | (277.8 | ) | ||||||||
Sugi Holdings Co. Ltd. | 14,900 | 641,323 | (139.7 | ) | ||||||||
Sumitomo Bakelite Co. Ltd. | 100 | 3,878 | (0.8 | ) | ||||||||
Sumitomo Chemical Co. Ltd. | 73,300 | 251,439 | (54.8 | ) | ||||||||
Sumitomo Corp. | 31,500 | 572,681 | (124.7 | ) | ||||||||
Sumitomo Mitsui Trust Holdings, Inc. | 20,700 | 756,690 | (164.8 | ) | ||||||||
Sumitomo Pharma Co. Ltd. | 39,700 | 252,530 | (55.0 | ) | ||||||||
Sundrug Co. Ltd. | 16,200 | 452,827 | (98.6 | ) | ||||||||
T&D Holdings, Inc. | 61,300 | 761,563 | (165.9 | ) | ||||||||
Taisei Corp. | 600 | 20,755 | (4.5 | ) | ||||||||
Taisho Pharmaceutical Holdings Co. Ltd. | 24,300 | 1,064,307 | (231.8 | ) | ||||||||
Takara Bio, Inc. | 27,000 | 345,577 | (75.3 | ) | ||||||||
TBS Holdings, Inc. | 58,400 | 892,991 | (194.5 | ) | ||||||||
Terumo Corp. | 3,300 | 100,212 | (21.8 | ) | ||||||||
Toda Corp. | 53,700 | 318,372 | (69.4 | ) | ||||||||
Toho Co. Ltd. | 10,700 | 431,044 | (93.9 | ) | ||||||||
Tokyo Ohka Kogyo Co. Ltd. | 6,000 | 317,731 | (69.2 | ) | ||||||||
Tokyo Tatemono Co. Ltd. | 9,800 | 125,837 | (27.4 | ) | ||||||||
Toray Industries, Inc. | 31,100 | 178,724 | (38.9 | ) | ||||||||
TOTO Ltd. | 13,700 | 475,196 | (103.5 | ) | ||||||||
Toyoda Gosei Co. Ltd. | 10,400 | 180,785 | (39.4 | ) | ||||||||
Toyota Boshoku Corp. | 18,900 | 303,355 | (66.1 | ) | ||||||||
| Security | Shares | Value | % of Basket Value | |||||||||
| Japan (continued) | ||||||||||||
Toyota Industries Corp. | 1,600 | $ | 94,264 | (20.5 | )% | |||||||
Toyota Motor Corp. | 5,800 | 80,734 | (17.6 | ) | ||||||||
Trend Micro, Inc. | 6,200 | 307,374 | (67.0 | ) | ||||||||
TS Tech Co. Ltd. | 86,900 | 1,187,416 | (258.6 | ) | ||||||||
Tsuruha Holdings, Inc. | 18,500 | 1,228,665 | (267.6 | ) | ||||||||
UBE Corp. | 16,300 | 262,256 | (57.1 | ) | ||||||||
Ulvac, Inc. | 14,300 | 575,982 | (125.5 | ) | ||||||||
Ushio, Inc. | 20,800 | 262,373 | (57.2 | ) | ||||||||
Welcia Holdings Co. Ltd. | 13,400 | 284,516 | (62.0 | ) | ||||||||
Yakult Honsha Co. Ltd. | 9,900 | 755,101 | (164.5 | ) | ||||||||
Yamaha Corp. | 700 | 27,977 | (6.1 | ) | ||||||||
Yamato Kogyo Co. Ltd. | 9,400 | 374,602 | (81.6 | ) | ||||||||
Yaskawa Electric Corp. | 35,900 | 1,482,950 | (323.0 | ) | ||||||||
Zeon Corp. | 23,900 | 250,238 | (54.5 | ) | ||||||||
ZOZO, Inc. | 41,600 | 888,870 | (193.6 | ) | ||||||||
|
|
|
| |||||||||
| 63,508,673 | ||||||||||||
| Luxembourg | ||||||||||||
ArcelorMittal SA | 9,153 | 260,613 | (56.7 | ) | ||||||||
L’Occitane International SA | 19,250 | 48,975 | (10.7 | ) | ||||||||
|
|
|
| |||||||||
| 309,588 | ||||||||||||
| Macau | ||||||||||||
Galaxy Entertainment Group Ltd. | 45,000 | 320,288 | (69.8 | ) | ||||||||
MGM China Holdings Ltd. | 404,800 | 552,922 | (120.4 | ) | ||||||||
Wynn Macau Ltd. | 404,000 | 437,097 | (95.2 | ) | ||||||||
|
|
|
| |||||||||
| 1,310,307 | ||||||||||||
| Netherlands | ||||||||||||
ABN AMRO Bank NV, CVA | 7,906 | 127,003 | (27.7 | ) | ||||||||
Aegon NV | 10,313 | 47,161 | (10.3 | ) | ||||||||
ASML Holding NV | 462 | 293,853 | (64.0 | ) | ||||||||
IMCD NV | 142 | 21,429 | (4.7 | ) | ||||||||
Koninklijke KPN NV | 73,920 | 270,155 | (58.8 | ) | ||||||||
Koninklijke Vopak NV | 13,981 | 535,407 | (116.6 | ) | ||||||||
Wolters Kluwer NV | 577 | 76,625 | (16.7 | ) | ||||||||
|
|
|
| |||||||||
| 1,371,633 | ||||||||||||
| New Zealand | ||||||||||||
a2 Milk Co. Ltd. | 86,566 | 316,296 | (68.9 | ) | ||||||||
Contact Energy Ltd. | 3,736 | 18,066 | (3.9 | ) | ||||||||
Infratil Ltd. | 81,487 | 480,404 | (104.7 | ) | ||||||||
|
|
|
| |||||||||
| 814,766 | ||||||||||||
| Norway | ||||||||||||
Aker BP ASA | 41,769 | 1,009,833 | (220.0 | ) | ||||||||
AutoStore Holdings Ltd. | 12,896 | 28,075 | (6.1 | ) | ||||||||
Gjensidige Forsikring ASA | 28,443 | 501,015 | (109.1 | ) | ||||||||
Golden Ocean Group Ltd. | 16,784 | 156,384 | (34.1 | ) | ||||||||
Kongsberg Gruppen ASA | 20,394 | 926,312 | (201.8 | ) | ||||||||
NEL ASA | 339,185 | 470,782 | (102.5 | ) | ||||||||
Var Energi ASA | 157,213 | 417,085 | (90.8 | ) | ||||||||
|
|
|
| |||||||||
| 3,509,486 | ||||||||||||
| Poland | ||||||||||||
InPost SA | 30,255 | 325,415 | (70.9 | ) | ||||||||
|
|
|
| |||||||||
| Singapore | ||||||||||||
City Developments Ltd. | 160,500 | 840,059 | (183.0 | ) | ||||||||
ComfortDelGro Corp. Ltd. | 78,300 | 70,126 | (15.2 | ) | ||||||||
Mapletree Industrial Trust | 23,300 | 41,672 | (9.1 | ) | ||||||||
Mapletree Pan Asia Commercial Trust | 238,300 | 315,820 | (68.8 | ) | ||||||||
Sembcorp Industries Ltd. | 105,600 | 339,951 | (74.0 | ) | ||||||||
| 110 | 2 0 2 3 BLACK ROCK ANNUAL REPORT TO SHAREHOLDERS |
Schedule of Investments (continued) April 30, 2023 | BlackRock Global Equity Market Neutral Fund |
| Security | Shares | Value | % of Basket Value | |||||||||
| Singapore (continued) | ||||||||||||
Singapore Airlines Ltd. | 58,300 | $ | 256,545 | (55.9 | )% | |||||||
StarHub Ltd. | 129,400 | 97,214 | (21.2 | ) | ||||||||
Suntec Real Estate Investment Trust | 582,600 | 590,879 | (128.7 | ) | ||||||||
|
|
|
| |||||||||
| 2,552,266 | ||||||||||||
| Spain | ||||||||||||
Banco de Sabadell SA | 280,977 | 293,471 | (63.9 | ) | ||||||||
Bankinter SA | 42,746 | 253,363 | (55.2 | ) | ||||||||
EDP Renovaveis SA | 44,616 | 993,968 | (216.5 | ) | ||||||||
Fluidra SA | 36,464 | 625,991 | (136.4 | ) | ||||||||
Mapfre SA | 15,813 | 31,750 | (6.9 | ) | ||||||||
Merlin Properties Socimi SA | 102,131 | 905,022 | (197.1 | ) | ||||||||
Sacyr SA | 22,570 | 74,849 | (16.3 | ) | ||||||||
|
|
|
| |||||||||
| 3,178,414 | ||||||||||||
| Sweden | ||||||||||||
Atlas Copco AB, A Shares | 13,719 | 198,505 | (43.2 | ) | ||||||||
Atlas Copco AB, B Shares | 48,929 | 627,833 | (136.8 | ) | ||||||||
Beijer Ref AB | 40,049 | 655,386 | (142.8 | ) | ||||||||
Boliden AB | 8,148 | 289,605 | (63.1 | ) | ||||||||
Elekta AB, B Shares | 25,331 | 213,075 | (46.4 | ) | ||||||||
Epiroc AB, Class A | 57,844 | 1,159,282 | (252.5 | ) | ||||||||
Epiroc AB, Class B | 5,418 | 93,328 | (20.3 | ) | ||||||||
Getinge AB, B Shares | 16,019 | 406,748 | (88.6 | ) | ||||||||
Industrivarden AB, C Shares | 52,060 | 1,487,262 | (323.9 | ) | ||||||||
Indutrade AB | 1,724 | 41,412 | (9.0 | ) | ||||||||
Investor AB, A Shares | 26,020 | 570,794 | (124.3 | ) | ||||||||
L E Lundbergforetagen AB, B Shares | 16,093 | 772,470 | (168.3 | ) | ||||||||
Nibe Industrier AB, B Shares | 38,255 | 428,525 | (93.3 | ) | ||||||||
Saab AB | 527 | 29,359 | (6.4 | ) | ||||||||
Sagax AB | 5,380 | 132,018 | (28.8 | ) | ||||||||
Sweco AB, B Shares | 2,672 | 35,834 | (7.8 | ) | ||||||||
Volvo Car AB | 10,786 | 44,539 | (9.7 | ) | ||||||||
|
|
|
| |||||||||
| 7,185,975 | ||||||||||||
| United Kingdom | ||||||||||||
Auto Trader Group PLC | 37,473 | 297,674 | (64.8 | ) | ||||||||
B&M European Value Retail SA | 3,010 | 18,047 | (3.9 | ) | ||||||||
Bellway PLC | 3,192 | 96,161 | (20.9 | ) | ||||||||
British Land Co. PLC | 38,703 | 193,731 | (42.2 | ) | ||||||||
Bunzl PLC | 3,608 | 142,646 | (31.1 | ) | ||||||||
Burberry Group PLC | 14,853 | 481,545 | (104.9 | ) | ||||||||
Centrica PLC | 186,000 | 265,250 | (57.8 | ) | ||||||||
Croda International PLC | 2,165 | 188,925 | (41.1 | ) | ||||||||
Diploma PLC | 391 | 13,161 | (2.9 | ) | ||||||||
Drax Group PLC | 59,050 | 464,159 | (101.1 | ) | ||||||||
easyJet PLC | 95,761 | 596,719 | (130.0 | ) | ||||||||
Halma PLC | 2,130 | 61,543 | (13.4 | ) | ||||||||
IG Group Holdings PLC | 10,750 | 98,575 | (21.5 | ) | ||||||||
Inchcape PLC | 47,410 | 479,601 | (104.5 | ) | ||||||||
Indivior PLC | 22,258 | 424,530 | (92.5 | ) | ||||||||
Intermediate Capital Group PLC | 24,133 | 393,691 | (85.7 | ) | ||||||||
ITV PLC | 516,375 | 522,029 | (113.7 | ) | ||||||||
J Sainsbury PLC | 5,144 | 17,767 | (3.9 | ) | ||||||||
Land Securities Group PLC | 5,654 | 47,673 | (10.4 | ) | ||||||||
Liberty Global PLC | 18,444 | 375,151 | (81.7 | ) | ||||||||
Liberty Global PLC | 1,265 | 24,680 | (5.4 | ) | ||||||||
London Stock Exchange Group PLC | 5,168 | 538,866 | (117.4 | ) | ||||||||
Nomad Foods Ltd. | 987 | 18,556 | (4.0 | ) | ||||||||
OSB Group PLC | 47,682 | 296,572 | (64.6 | ) | ||||||||
Pennon Group PLC | 21,365 | 229,506 | (50.0 | ) | ||||||||
Phoenix Group Holdings PLC | 33,287 | 246,396 | (53.7 | ) | ||||||||
| Security | Shares | Value | % of Basket Value | |||||||||
| United Kingdom (continued) | ||||||||||||
Renishaw PLC | 15,938 | $ | 718,029 | (156.4 | )% | |||||||
Rightmove PLC | 14,670 | 105,469 | (23.0 | ) | ||||||||
Rotork PLC | 98,047 | 401,456 | (87.4 | ) | ||||||||
Segro PLC | 2,110 | 22,071 | (4.8 | ) | ||||||||
Smiths Group PLC | 2,557 | 53,708 | (11.7 | ) | ||||||||
Spirax-Sarco Engineering PLC | 1,303 | 180,809 | (39.4 | ) | ||||||||
Standard Chartered PLC | 21,551 | 169,607 | (36.9 | ) | ||||||||
Taylor Wimpey PLC | 235,251 | 377,264 | (82.2 | ) | ||||||||
Tesco PLC | 34,496 | 121,153 | (26.4 | ) | ||||||||
Travis Perkins PLC | 64,290 | 770,713 | (167.9 | ) | ||||||||
Tritax Big Box REIT PLC | 296,204 | 575,025 | (125.2 | ) | ||||||||
United Utilities Group PLC | 55,538 | 749,409 | (163.2 | ) | ||||||||
|
|
|
| |||||||||
| 10,777,867 | ||||||||||||
| United States | ||||||||||||
Acadia Healthcare Co., Inc. | 2,941 | 212,605 | (46.3 | ) | ||||||||
Accenture PLC, Class B | 65 | 18,219 | (4.0 | ) | ||||||||
Adobe, Inc. | 329 | 124,217 | (27.1 | ) | ||||||||
AECOM | 2,094 | 173,907 | (37.9 | ) | ||||||||
Affiliated Managers Group, Inc. | 1,246 | 179,897 | (39.2 | ) | ||||||||
Agilent Technologies, Inc. | 3,605 | 488,225 | (106.3 | ) | ||||||||
Air Products and Chemicals, Inc. | 567 | 166,902 | (36.4 | ) | ||||||||
Akamai Technologies, Inc. | 3,103 | 254,353 | (55.4 | ) | ||||||||
Alaska Air Group, Inc. | 5,783 | 251,329 | (54.7 | ) | ||||||||
Alcoa Corp. | 10,383 | 385,625 | (84.0 | ) | ||||||||
Alkermes PLC | 1,249 | 35,659 | (7.8 | ) | ||||||||
Allstate Corp. | 1,331 | 154,077 | (33.6 | ) | ||||||||
Alphabet, Inc., Class A | 3,164 | 339,624 | (74.0 | ) | ||||||||
Altria Group, Inc. | 17,198 | 817,077 | (178.0 | ) | ||||||||
Amazon.com, Inc. | 15,594 | 1,644,387 | (358.2 | ) | ||||||||
American Airlines Group, Inc. | 3,381 | 46,117 | (10.0 | ) | ||||||||
American Financial Group, Inc. | 1,063 | 130,462 | (28.4 | ) | ||||||||
American Tower Corp. | 622 | 127,131 | (27.7 | ) | ||||||||
AMETEK, Inc. | 1,999 | 275,722 | (60.1 | ) | ||||||||
Amgen, Inc. | 952 | 228,232 | (49.7 | ) | ||||||||
AMN Healthcare Services, Inc. | 753 | 65,022 | (14.2 | ) | ||||||||
Apple, Inc. | 5,813 | 986,350 | (214.8 | ) | ||||||||
Arthur J Gallagher & Co. | 1,547 | 321,869 | (70.1 | ) | ||||||||
Autodesk, Inc. | 270 | 52,593 | (11.5 | ) | ||||||||
Axcelis Technologies, Inc. | 1,581 | 187,032 | (40.7 | ) | ||||||||
Azenta, Inc. | 1,525 | 66,322 | (14.4 | ) | ||||||||
Bath & Body Works, Inc. | 5,384 | 188,978 | (41.2 | ) | ||||||||
Beacon Roofing Supply, Inc. | 5,493 | 330,569 | (72.0 | ) | ||||||||
Best Buy Co., Inc. | 398 | 29,659 | (6.5 | ) | ||||||||
BioMarin Pharmaceutical, Inc. | 563 | 54,071 | (11.8 | ) | ||||||||
Block, Inc. | 351 | 21,337 | (4.6 | ) | ||||||||
Boeing Co. | 444 | 91,810 | (20.0 | ) | ||||||||
Boston Beer Co., Inc. | 47 | 14,923 | (3.2 | ) | ||||||||
Brighthouse Financial, Inc. | 3,837 | 169,595 | (36.9 | ) | ||||||||
Bristol-Myers Squibb Co. | 31,721 | 2,118,011 | (461.3 | ) | ||||||||
Camden Property Trust | 580 | 63,829 | (13.9 | ) | ||||||||
Capri Holdings Ltd. | 3,783 | 156,995 | (34.2 | ) | ||||||||
Carlisle Cos., Inc. | 1,423 | 307,155 | (66.9 | ) | ||||||||
Carnival PLC | 99,345 | 814,878 | (177.5 | ) | ||||||||
Chart Industries, Inc. | 150 | 19,965 | (4.3 | ) | ||||||||
Charter Communications, Inc. | 1,351 | 498,114 | (108.5 | ) | ||||||||
Chemed Corp. | 1,342 | 739,777 | (161.1 | ) | ||||||||
Cheniere Energy, Inc. | 804 | 123,012 | (26.8 | ) | ||||||||
Chevron Corp. | 3,831 | 645,830 | (140.7 | ) | ||||||||
Chewy, Inc., Class A | 364 | 11,288 | (2.5 | ) | ||||||||
Chipotle Mexican Grill, Inc. | 309 | 638,895 | (139.2 | ) | ||||||||
Church & Dwight Co., Inc. | 3,017 | 293,011 | (63.8 | ) | ||||||||
SCHEDULE OF INVESTMENTS | 111 |
Schedule of Investments (continued) April 30, 2023 | BlackRock Global Equity Market Neutral Fund |
| Security | Shares | Value | % of Basket Value | |||||||||
| United States (continued) | ||||||||||||
Cigna Group | 5,689 | $ | 1,440,967 | (313.9 | )% | |||||||
Cincinnati Financial Corp. | 1,606 | 170,943 | (37.2 | ) | ||||||||
Cintas Corp. | 832 | 379,201 | (82.6 | ) | ||||||||
Citizens Financial Group, Inc. | 661 | 20,451 | (4.5 | ) | ||||||||
Cleveland-Cliffs, Inc. | 9,913 | 152,462 | (33.2 | ) | ||||||||
Coca-Cola Co. | 27,751 | 1,780,227 | (387.8 | ) | ||||||||
Columbia Banking System, Inc. | 5,704 | 121,837 | (26.5 | ) | ||||||||
Columbia Sportswear Co. | 10,422 | 870,654 | (189.6 | ) | ||||||||
Comerica, Inc. | 2,430 | 105,389 | (23.0 | ) | ||||||||
CoStar Group, Inc. | 672 | 51,710 | (11.3 | ) | ||||||||
Costco Wholesale Corp. | 1,626 | 818,236 | (178.2 | ) | ||||||||
Curtiss-Wright Corp. | 2,812 | 477,562 | (104.0 | ) | ||||||||
CVS Health Corp. | 4,522 | 331,508 | (72.2 | ) | ||||||||
Danaher Corp. | 2,534 | 600,330 | (130.8 | ) | ||||||||
DaVita, Inc. | 2,285 | 206,473 | (45.0 | ) | ||||||||
Deckers Outdoor Corp. | 671 | 321,637 | (70.1 | ) | ||||||||
Devon Energy Corp. | 3,928 | 209,873 | (45.7 | ) | ||||||||
Diamondback Energy, Inc. | 2,966 | 421,765 | (91.9 | ) | ||||||||
Dick’s Sporting Goods, Inc. | 1,455 | 210,990 | (46.0 | ) | ||||||||
DocuSign, Inc. | 1,341 | 66,299 | (14.4 | ) | ||||||||
Domino’s Pizza, Inc. | 1,625 | 515,889 | (112.4 | ) | ||||||||
DuPont de Nemours, Inc. | 11,024 | 768,593 | (167.4 | ) | ||||||||
eBay, Inc. | 8,484 | 393,912 | (85.8 | ) | ||||||||
Edwards Lifesciences Corp. | 1,101 | 96,866 | (21.1 | ) | ||||||||
Electronic Arts, Inc. | 1,707 | 217,267 | (47.3 | ) | ||||||||
Elevance Health, Inc. | 1,998 | 936,363 | (204.0 | ) | ||||||||
Enovis Corp. | 1,514 | 88,191 | (19.2 | ) | ||||||||
EOG Resources, Inc. | 5,072 | 605,952 | (132.0 | ) | ||||||||
Equity LifeStyle Properties, Inc. | 3,860 | 265,954 | (57.9 | ) | ||||||||
Equity Residential | 558 | 35,294 | (7.7 | ) | ||||||||
Essential Utilities, Inc. | 1,015 | 43,341 | (9.4 | ) | ||||||||
Experian PLC | 1,681 | 59,115 | (12.9 | ) | ||||||||
Exxon Mobil Corp. | 5,380 | 636,669 | (138.7 | ) | ||||||||
Fair Isaac Corp. | 1,097 | 798,561 | (173.9 | ) | ||||||||
Fidelity National Information Services, Inc. | 9,467 | 555,902 | (121.1 | ) | ||||||||
Five Below, Inc. | 589 | 116,245 | (25.3 | ) | ||||||||
Flowers Foods, Inc. | 2,794 | 76,863 | (16.7 | ) | ||||||||
Fortinet, Inc. | 526 | 33,164 | (7.2 | ) | ||||||||
Gap, Inc. | 57,464 | 551,654 | (120.2 | ) | ||||||||
Garmin Ltd. | 4,208 | 413,099 | (90.0 | ) | ||||||||
Gartner, Inc. | 128 | 38,715 | (8.4 | ) | ||||||||
Generac Holdings, Inc. | 770 | 78,709 | (17.1 | ) | ||||||||
General Dynamics Corp. | 2,036 | 444,540 | (96.8 | ) | ||||||||
Globant SA | 362 | 56,787 | (12.4 | ) | ||||||||
Globus Medical, Inc. | 932 | 54,186 | (11.8 | ) | ||||||||
GoDaddy, Inc., Class A | 279 | 21,115 | (4.6 | ) | ||||||||
Guidewire Software, Inc. | 3,671 | 279,693 | (60.9 | ) | ||||||||
Halliburton Co. | 11,896 | 389,594 | (84.9 | ) | ||||||||
Halozyme Therapeutics, Inc. | 3,617 | 116,214 | (25.3 | ) | ||||||||
Hanover Insurance Group, Inc. | 1,217 | 145,505 | (31.7 | ) | ||||||||
HCA Healthcare, Inc. | 392 | 112,633 | (24.5 | ) | ||||||||
Helmerich & Payne, Inc. | 12,850 | 426,106 | (92.8 | ) | ||||||||
Herc Holdings, Inc. | 1,218 | 121,824 | (26.5 | ) | ||||||||
Hologic, Inc. | 1,859 | 159,893 | (34.8 | ) | ||||||||
Honeywell International, Inc. | 1,664 | 332,534 | (72.4 | ) | ||||||||
Hormel Foods Corp. | 4,789 | 193,667 | (42.2 | ) | ||||||||
Howard Hughes Corp. | 1,019 | 78,840 | (17.2 | ) | ||||||||
IDACORP, Inc. | 1,423 | 158,124 | (34.4 | ) | ||||||||
IDEXX Laboratories, Inc. | 1,091 | 536,947 | (117.0 | ) | ||||||||
Inari Medical, Inc. | 692 | 45,963 | (10.0 | ) | ||||||||
Incyte Corp. | 1,176 | 87,506 | (19.1 | ) | ||||||||
Integra LifeSciences Holdings Corp. | 2,484 | 137,415 | (29.9 | ) | ||||||||
| Security | Shares | Value | % of Basket Value | |||||||||
| United States (continued) | ||||||||||||
Invesco Ltd. | 4,771 | $ | 81,727 | (17.8 | )% | |||||||
IQVIA Holdings, Inc. | 102 | 19,199 | (4.2 | ) | ||||||||
ITT, Inc. | 2,025 | 170,991 | (37.2 | ) | ||||||||
J M Smucker Co. | 326 | 50,338 | (11.0 | ) | ||||||||
Jack Henry & Associates, Inc. | 1,280 | 209,075 | (45.5 | ) | ||||||||
Johnson & Johnson | 5,102 | 835,197 | (181.9 | ) | ||||||||
Johnson Controls International PLC | 18,461 | 1,104,706 | (240.6 | ) | ||||||||
KeyCorp | 2,798 | 31,505 | (6.9 | ) | ||||||||
Keysight Technologies, Inc. | 3,069 | 443,900 | (96.7 | ) | ||||||||
KLA Corp. | 726 | 280,628 | (61.1 | ) | ||||||||
Knight-Swift Transportation Holdings, Inc. | 1,445 | 81,382 | (17.7 | ) | ||||||||
Laboratory Corp. of America Holdings | 1,848 | 418,960 | (91.3 | ) | ||||||||
Lam Research Corp. | 193 | 101,147 | (22.0 | ) | ||||||||
Lennox International, Inc. | 2,666 | 751,572 | (163.7 | ) | ||||||||
Liberty Broadband Corp. | 5,934 | 503,085 | (109.6 | ) | ||||||||
Liberty Media Corp.-Liberty SiriusXM | 664 | 18,552 | (4.0 | ) | ||||||||
Light & Wonder, Inc. | 2,896 | 174,600 | (38.0 | ) | ||||||||
Lowe’s Cos., Inc. | 1,894 | 393,630 | (85.7 | ) | ||||||||
Lyft, Inc. | 11,147 | 114,257 | (24.9 | ) | ||||||||
Manhattan Associates, Inc. | 1,821 | 301,703 | (65.7 | ) | ||||||||
Marathon Oil Corp. | 28,480 | 688,077 | (149.9 | ) | ||||||||
Marriott Vacations Worldwide Corp. | 369 | 49,653 | (10.8 | ) | ||||||||
Masco Corp. | 414 | 22,153 | (4.8 | ) | ||||||||
Match Group, Inc. | 14,221 | 524,755 | (114.3 | ) | ||||||||
McDonald’s Corp. | 519 | 153,494 | (33.4 | ) | ||||||||
Meta Platforms, Inc., Class A | 1,214 | 291,748 | (63.5 | ) | ||||||||
MetLife, Inc. | 6,413 | 393,309 | (85.7 | ) | ||||||||
Micron Technology, Inc. | 16,168 | 1,040,572 | (226.7 | ) | ||||||||
Microsoft Corp. | 5,750 | 1,766,745 | (384.8 | ) | ||||||||
Mohawk Industries, Inc. | 540 | 57,186 | (12.5 | ) | ||||||||
Molson Coors Beverage Co., Class B | 2,676 | 159,168 | (34.7 | ) | ||||||||
Moody’s Corp. | 273 | 85,482 | (18.6 | ) | ||||||||
MSCI, Inc. | 569 | 274,514 | (59.8 | ) | ||||||||
Nasdaq, Inc. | 1,351 | 74,805 | (16.3 | ) | ||||||||
NetApp, Inc. | 679 | 42,702 | (9.3 | ) | ||||||||
Neurocrine Biosciences, Inc. | 424 | 42,841 | (9.3 | ) | ||||||||
Newmont Corp. | 20,655 | 979,047 | (213.3 | ) | ||||||||
Nexstar Media Group, Inc. | 534 | 92,622 | (20.2 | ) | ||||||||
Norfolk Southern Corp. | 3,605 | 731,923 | (159.4 | ) | ||||||||
Northrop Grumman Corp. | 74 | 34,134 | (7.4 | ) | ||||||||
Novocure Ltd. | 2,916 | 192,164 | (41.9 | ) | ||||||||
NVIDIA Corp. | 2,847 | 790,014 | (172.1 | ) | ||||||||
Occidental Petroleum Corp. | 4,083 | 251,227 | (54.7 | ) | ||||||||
OneMain Holdings, Inc. | 5,304 | 203,514 | (44.3 | ) | ||||||||
O’Reilly Automotive, Inc. | 1,250 | 1,146,637 | (249.8 | ) | ||||||||
Oshkosh Corp. | 2,653 | 203,008 | (44.2 | ) | ||||||||
Ovintiv, Inc. | 13,586 | 491,170 | (107.0 | ) | ||||||||
Palo Alto Networks, Inc. | 904 | 164,944 | (35.9 | ) | ||||||||
PDC Energy, Inc. | 1,773 | 115,334 | (25.1 | ) | ||||||||
Penn Entertainment, Inc. | 6,943 | 206,832 | (45.1 | ) | ||||||||
Pinnacle Financial Partners, Inc. | 597 | 32,375 | (7.1 | ) | ||||||||
Post Holdings, Inc. | 474 | 42,892 | (9.3 | ) | ||||||||
Power Integrations, Inc. | 5,563 | 404,875 | (88.2 | ) | ||||||||
PPL Corp. | 28,919 | 830,554 | (180.9 | ) | ||||||||
Primo Water Corp. | 3,030 | 46,056 | (10.0 | ) | ||||||||
Qorvo, Inc. | 4,469 | 411,506 | (89.6 | ) | ||||||||
Qualys, Inc. | 5,830 | 658,440 | (143.4 | ) | ||||||||
Quest Diagnostics, Inc. | 5,073 | 704,183 | (153.4 | ) | ||||||||
Ralph Lauren Corp. | 806 | 92,521 | (20.2 | ) | ||||||||
Rambus, Inc. | 1,121 | 49,705 | (10.8 | ) | ||||||||
Regeneron Pharmaceuticals, Inc., Registered Shares | 560 | 449,002 | (97.8 | ) | ||||||||
| 112 | 2 0 2 3 BLACK ROCK ANNUAL REPORT TO SHAREHOLDERS |
Schedule of Investments (continued) April 30, 2023 | BlackRock Global Equity Market Neutral Fund |
| Security | Shares | Value | % of Basket Value | |||||||||
| United States (continued) | ||||||||||||
Repligen Corp. | 327 | $ | 49,583 | (10.8 | )% | |||||||
ResMed, Inc. | 1,166 | 280,959 | (61.2 | ) | ||||||||
RingCentral, Inc., Class A | 11,394 | 314,019 | (68.4 | ) | ||||||||
Rollins, Inc. | 8,969 | 378,940 | (82.5 | ) | ||||||||
Royal Gold, Inc. | 3,891 | 515,324 | (112.2 | ) | ||||||||
S&P Global, Inc. | 4,014 | 1,455,396 | (317.0 | ) | ||||||||
Saia, Inc. | 215 | 64,021 | (13.9 | ) | ||||||||
SBA Communications Corp. | 501 | 130,706 | (28.5 | ) | ||||||||
Schlumberger NV | 10,000 | 493,500 | (107.5 | ) | ||||||||
Schneider Electric SE | 3,223 | 563,299 | (122.7 | ) | ||||||||
Scotts Miracle-Gro Co. | 6,345 | 423,909 | (92.3 | ) | ||||||||
SEI Investments Co. | 250 | 14,728 | (3.2 | ) | ||||||||
Signify NV | 27,947 | 935,338 | (203.7 | ) | ||||||||
Sims Ltd. | 7,343 | 77,867 | (17.0 | ) | ||||||||
SiteOne Landscape Supply, Inc. | 940 | 138,876 | (30.2 | ) | ||||||||
Snap-on, Inc. | 241 | 62,518 | (13.6 | ) | ||||||||
Steel Dynamics, Inc. | 826 | 85,863 | (18.7 | ) | ||||||||
Sun Communities, Inc. | 1,347 | 187,139 | (40.8 | ) | ||||||||
Synchrony Financial | 11,435 | 337,447 | (73.5 | ) | ||||||||
Synopsys, Inc. | 640 | 237,645 | (51.8 | ) | ||||||||
Tempur Sealy International, Inc. | 1,125 | 42,154 | (9.2 | ) | ||||||||
Teradyne, Inc. | 4,483 | 409,657 | (89.2 | ) | ||||||||
Texas Pacific Land Corp. | 263 | 388,622 | (84.6 | ) | ||||||||
Thor Industries, Inc. | 1,335 | 105,492 | (23.0 | ) | ||||||||
TJX Cos., Inc. | 1,507 | 118,782 | (25.9 | ) | ||||||||
Transocean Ltd. | 25,441 | 150,102 | (32.7 | ) | ||||||||
Travelers Cos., Inc. | 4,678 | 847,373 | (184.6 | ) | ||||||||
UGI Corp. | 5,840 | 197,859 | (43.1 | ) | ||||||||
Ulta Beauty, Inc. | 884 | 487,464 | (106.2 | ) | ||||||||
United States Steel Corp. | 1,628 | 37,249 | (8.1 | ) | ||||||||
United Therapeutics Corp. | 556 | 127,952 | (27.9 | ) | ||||||||
UnitedHealth Group, Inc. | 464 | 228,330 | (49.7 | ) | ||||||||
US Bancorp | 20,963 | 718,612 | (156.5 | ) | ||||||||
Veeva Systems, Inc., Class A | 2,787 | 499,096 | (108.7 | ) | ||||||||
VeriSign, Inc. | 12,138 | 2,692,208 | (586.4 | ) | ||||||||
Vertex Pharmaceuticals, Inc. | 1 | 341 | (0.1 | ) | ||||||||
Virtu Financial, Inc., Class A | 5,852 | 117,333 | (25.6 | ) | ||||||||
Visa, Inc., Class A | 307 | 71,448 | (15.6 | ) | ||||||||
Vulcan Materials Co. | 2,446 | 428,344 | (93.3 | ) | ||||||||
Waste Connections, Inc. | 1,105 | 153,761 | (33.5 | ) | ||||||||
Westlake Corp. | 4,220 | 480,152 | (104.6 | ) | ||||||||
WEX, Inc. | 727 | 128,933 | (28.1 | ) | ||||||||
Willis Towers Watson PLC | 2,095 | 485,202 | (105.7 | ) | ||||||||
Woodward, Inc. | 952 | 91,411 | (19.9 | ) | ||||||||
Workiva, Inc. | 1,123 | 104,911 | (22.9 | ) | ||||||||
World Wrestling Entertainment, Inc., Class A | 1,950 | 208,981 | (45.5 | ) | ||||||||
WW Grainger, Inc. | 629 | 437,514 | (95.3 | ) | ||||||||
Xylem, Inc. | 1,743 | 180,993 | (39.4 | ) | ||||||||
YETI Holdings, Inc. | 4,105 | 161,942 | (35.3 | ) | ||||||||
Ziff Davis, Inc. | 2,094 | 153,155 | (33.4 | ) | ||||||||
Zillow Group, Inc., Class C | 7,369 | 320,846 | (69.9 | ) | ||||||||
Zions Bancorp NA | 14,221 | 396,197 | (86.3 | ) | ||||||||
|
|
|
| |||||||||
| 73,846,105 | ||||||||||||
| Zambia | ||||||||||||
First Quantum Minerals Ltd. | 3,641 | 88,526 | (19.3 | ) | ||||||||
|
|
|
| |||||||||
| Preferred Stocks | ||||||||||||
| Germany | ||||||||||||
Bayerische Motoren Werke AG | 891 | 94,921 | (20.7 | ) | ||||||||
| Security | Shares | Value | % of Basket Value | |||||||||
| Germany (continued) | ||||||||||||
Fuchs Petrolub SE, Preference Shares | 1,194 | $ | 47,287 | (10.3 | )% | |||||||
Sartorius AG | 366 | 142,590 | (31.1 | ) | ||||||||
Volkswagen AG | 968 | 132,475 | (28.8 | ) | ||||||||
|
|
|
| |||||||||
| Warrants | ||||||||||||
| Australia | ||||||||||||
Magellan Financial Group Ltd., (Issued/Exercisable 04/14/22, 1 Share for 1 Warrant, Expires 04/16/27, Strike Price AUD 35.00) | 3,393 | 466 | (0.1 | ) | ||||||||
|
|
|
| |||||||||
Total Reference Entity — Long | 235,877,646 | |||||||||||
|
| |||||||||||
Reference Entity — Short | ||||||||||||
| Common Stocks | ||||||||||||
| Australia | ||||||||||||
Ampol Ltd. | (9,328 | ) | (188,320 | ) | 41.0 | |||||||
EBOS Group Ltd. | (16,821 | ) | (460,158 | ) | 100.2 | |||||||
Evolution Mining Ltd. | (5,785 | ) | (13,795 | ) | 3.0 | |||||||
Goodman Group | (20,681 | ) | (269,713 | ) | 58.8 | |||||||
QBE Insurance Group Ltd. | (2,261 | ) | (23,386 | ) | 5.1 | |||||||
|
|
|
| |||||||||
| (955,372 | ) | |||||||||||
| Austria | ||||||||||||
Erste Group Bank AG | (529 | ) | (19,277 | ) | 4.2 | |||||||
OMV AG | (9,327 | ) | (442,377 | ) | 96.3 | |||||||
|
|
|
| |||||||||
| (461,654 | ) | |||||||||||
| Belgium | ||||||||||||
Ackermans & van Haaren NV | (381 | ) | (67,167 | ) | 14.6 | |||||||
Anheuser-Busch InBev SA | (1,768 | ) | (115,219 | ) | 25.1 | |||||||
D’ieteren Group | (4,941 | ) | (932,456 | ) | 203.1 | |||||||
Galapagos NV | (4,996 | ) | (194,277 | ) | 42.3 | |||||||
UCB SA | (9,383 | ) | (874,282 | ) | 190.5 | |||||||
Umicore SA | (1,616 | ) | (53,165 | ) | 11.6 | |||||||
|
|
|
| |||||||||
| (2,236,566 | ) | |||||||||||
| Brazil | ||||||||||||
Yara International ASA | (3,920 | ) | (159,766 | ) | 34.8 | |||||||
|
|
|
| |||||||||
| Canada | ||||||||||||
Canadian Solar, Inc. | (1,420 | ) | (53,137 | ) | 11.6 | |||||||
Paramount Resources Ltd., Class A | (593 | ) | (14,050 | ) | 3.0 | |||||||
Ritchie Bros Auctioneers, Inc. | (1 | ) | (57 | ) | 0.0 | |||||||
|
|
|
| |||||||||
| (67,244 | ) | |||||||||||
| China | ||||||||||||
ESR Group Ltd. | (76,400 | ) | (119,428 | ) | 26.0 | |||||||
Prosus NV | (3,781 | ) | (283,579 | ) | 61.8 | |||||||
Xinyi Glass Holdings Ltd. | (11,000 | ) | (20,126 | ) | 4.4 | |||||||
|
|
|
| |||||||||
| (423,133 | ) | |||||||||||
| Denmark | ||||||||||||
AP Moller - Maersk A/S, Class A | (24 | ) | (42,998 | ) | 9.4 | |||||||
Carlsberg A/S | (626 | ) | (103,526 | ) | 22.5 | |||||||
DSV A/S | (6,830 | ) | (1,288,431 | ) | 280.6 | |||||||
Pandora A/S | (1,316 | ) | (122,108 | ) | 26.6 | |||||||
Royal Unibrew A/S | (1,137 | ) | (101,886 | ) | 22.2 | |||||||
Vestas Wind Systems A/S | (3,870 | ) | (107,340 | ) | 23.4 | |||||||
|
|
|
| |||||||||
| (1,766,289 | ) | |||||||||||
| Finland | ||||||||||||
Elisa OYJ | (2,427 | ) | (151,056 | ) | 32.9 | |||||||
Huhtamaki OYJ | (1,159 | ) | (41,874 | ) | 9.1 | |||||||
SCHEDULE OF INVESTMENTS | 113 |
Schedule of Investments (continued) April 30, 2023 | BlackRock Global Equity Market Neutral Fund |
| Security | Shares | Value | % of Basket Value | |||||||||
| Finland (continued) | ||||||||||||
Kesko OYJ, B Shares | (16,659 | ) | $ | (348,166 | ) | 75.8 | % | |||||
Kojamo OYJ | (17,051 | ) | (212,188 | ) | 46.2 | |||||||
Nordea Bank Abp | (74,088 | ) | (823,415 | ) | 179.4 | |||||||
Stora Enso OYJ, R Shares | (19,742 | ) | (251,018 | ) | 54.7 | |||||||
Valmet OYJ | (5,390 | ) | (182,718 | ) | 39.8 | |||||||
|
|
|
| |||||||||
| (2,010,435 | ) | |||||||||||
| France | ||||||||||||
Adevinta ASA | (77,251 | ) | (601,683 | ) | 131.1 | |||||||
Airbus SE | (10,064 | ) | (1,412,535 | ) | 307.7 | |||||||
Alstom SA | (11,015 | ) | (277,454 | ) | 60.4 | |||||||
Amundi SA | (10,959 | ) | (719,599 | ) | 156.7 | |||||||
BioMerieux | (436 | ) | (45,758 | ) | 10.0 | |||||||
Bollore SE | (57,533 | ) | (389,534 | ) | 84.8 | |||||||
Cie de L’Odet SE | (13 | ) | (22,933 | ) | 5.0 | |||||||
Credit Agricole SA | (168,062 | ) | (2,058,921 | ) | 448.5 | |||||||
Dassault Systemes SE | (2,846 | ) | (115,699 | ) | 25.2 | |||||||
Elis SA | (9,384 | ) | (186,818 | ) | 40.7 | |||||||
Eramet SA | (3,200 | ) | (312,439 | ) | 68.1 | |||||||
Eurazeo SE | (5,306 | ) | (379,751 | ) | 82.7 | |||||||
Faurecia SE | (2,930 | ) | (60,978 | ) | 13.3 | |||||||
Ipsen SA | (10,901 | ) | (1,324,833 | ) | 288.6 | |||||||
La Francaise des Jeux SAEM | (3,901 | ) | (167,115 | ) | 36.4 | |||||||
Publicis Groupe SA | (1,367 | ) | (112,020 | ) | 24.4 | |||||||
Rexel SA | (2,658 | ) | (61,710 | ) | 13.4 | |||||||
Sodexo SA | (2,399 | ) | (257,683 | ) | 56.1 | |||||||
Unibail-Rodamco-Westfield | (22,414 | ) | (1,202,568 | ) | 261.9 | |||||||
Worldline SA/France | (6,921 | ) | (301,716 | ) | 65.7 | |||||||
|
|
|
| |||||||||
| (10,011,747 | ) | |||||||||||
| Germany | ||||||||||||
adidas AG | (859 | ) | (151,621 | ) | 33.0 | |||||||
Aixtron SE | (3,717 | ) | (105,497 | ) | 23.0 | |||||||
Aroundtown SA | (165,828 | ) | (226,418 | ) | 49.3 | |||||||
Aurubis AG | (231 | ) | (21,721 | ) | 4.7 | |||||||
Bechtle AG | (6,493 | ) | (302,660 | ) | 65.9 | |||||||
Continental AG | (8,617 | ) | (606,038 | ) | 132.0 | |||||||
CTS Eventim AG & Co. KGaA | (5,013 | ) | (331,009 | ) | 72.1 | |||||||
Deutsche Wohnen SE | (6,683 | ) | (151,656 | ) | 33.0 | |||||||
Evotec SE | (27,615 | ) | (508,415 | ) | 110.8 | |||||||
Fresenius Medical Care AG & Co. KGaA | (55,361 | ) | (2,692,190 | ) | 586.4 | |||||||
Gerresheimer AG | (668 | ) | (72,941 | ) | 15.9 | |||||||
Hannover Rueck SE | (2,052 | ) | (439,405 | ) | 95.7 | |||||||
HelloFresh SE | (844 | ) | (22,698 | ) | 5.0 | |||||||
HOCHTIEF AG | (2,912 | ) | (244,355 | ) | 53.2 | |||||||
Infineon Technologies AG | (31,715 | ) | (1,157,472 | ) | 252.1 | |||||||
KION Group AG | (5,583 | ) | (232,046 | ) | 50.6 | |||||||
Muenchener Rueckversicherungs-Gesellschaft AG in Muenchen, Registered Shares | (1,972 | ) | (742,798 | ) | 161.8 | |||||||
Nordex SE | (22,739 | ) | (274,485 | ) | 59.8 | |||||||
SAP SE | (174 | ) | (23,597 | ) | 5.1 | |||||||
Siemens Healthineers AG | (13,176 | ) | (823,108 | ) | 179.3 | |||||||
Sixt SE | (2,919 | ) | (362,960 | ) | 79.1 | |||||||
Symrise AG | (269 | ) | (32,574 | ) | 7.1 | |||||||
Telefonica Deutschland Holding AG | (92,763 | ) | (314,144 | ) | 68.4 | |||||||
Vonovia SE | (4,312 | ) | (93,723 | ) | 20.4 | |||||||
|
|
|
| |||||||||
| (9,933,531 | ) | |||||||||||
| Hong Kong | ||||||||||||
Hang Seng Bank Ltd. | (39,100 | ) | (579,591 | ) | 126.2 | |||||||
Henderson Land Development Co. Ltd. | (12,000 | ) | (42,730 | ) | 9.3 | |||||||
HKT Trust & HKT Ltd. | (73,000 | ) | (95,945 | ) | 20.9 | |||||||
| Security | Shares | Value | % of Basket Value | |||||||||
| Hong Kong (continued) | ||||||||||||
Hong Kong & China Gas Co. Ltd. | (376,000 | ) | $ | (333,872 | ) | 72.7 | % | |||||
MTR Corp. Ltd. | (300,500 | ) | (1,501,501 | ) | 327.1 | |||||||
PCCW Ltd. | (40,000 | ) | (20,866 | ) | 4.5 | |||||||
Prudential PLC | (29,900 | ) | (454,627 | ) | 99.0 | |||||||
Techtronic Industries Co. Ltd. | (268,000 | ) | (2,899,444 | ) | 631.6 | |||||||
Wharf Real Estate Investment Co. Ltd. | (19,000 | ) | (109,571 | ) | 23.9 | |||||||
|
|
|
| |||||||||
| (6,038,147 | ) | |||||||||||
| Ireland | ||||||||||||
Bank of Ireland Group PLC | (18,032 | ) | (186,939 | ) | 40.7 | |||||||
|
|
|
| |||||||||
| Israel | ||||||||||||
Teva Pharmaceutical Industries Ltd., ADR | (13,708 | ) | (119,671 | ) | 26.1 | |||||||
|
|
|
| |||||||||
| Italy | ||||||||||||
Assicurazioni Generali SpA | (86,125 | ) | (1,797,941 | ) | 391.6 | |||||||
Coca-Cola HBC AG | (43,998 | ) | (1,334,170 | ) | 290.6 | |||||||
Davide Campari-Milano NV | (3,414 | ) | (44,098 | ) | 9.6 | |||||||
DiaSorin SpA | (601 | ) | (65,426 | ) | 14.3 | |||||||
Eni SpA | (100,752 | ) | (1,525,582 | ) | 332.3 | |||||||
Interpump Group SpA | (29,563 | ) | (1,653,588 | ) | 360.2 | |||||||
Iveco Group NV | (2,912 | ) | (26,262 | ) | 5.7 | |||||||
Leonardo SpA | (63,988 | ) | (764,313 | ) | 166.5 | |||||||
Nexi SpA | (215,452 | ) | (1,790,600 | ) | 390.0 | |||||||
Pirelli & C SpA | (2,931 | ) | (15,387 | ) | 3.4 | |||||||
Poste Italiane SpA | (13,747 | ) | (143,395 | ) | 31.2 | |||||||
|
|
|
| |||||||||
| (9,160,762 | ) | |||||||||||
| Japan | ||||||||||||
Activia Properties, Inc. | (132 | ) | (390,058 | ) | 85.0 | |||||||
Advance Residence Investment Corp. | (384 | ) | (1,010,198 | ) | 220.0 | |||||||
Advantest Corp. | (800 | ) | (63,339 | ) | 13.8 | |||||||
Allegro MicroSystems, Inc. | (13,129 | ) | (469,624 | ) | 102.3 | |||||||
Asahi Group Holdings Ltd. | (6,700 | ) | (262,441 | ) | 57.2 | |||||||
Asics Corp. | (25,200 | ) | (714,712 | ) | 155.7 | |||||||
ASKUL Corp. | (6,100 | ) | (82,463 | ) | 18.0 | |||||||
Benefit One, Inc. | (32,800 | ) | (457,778 | ) | 99.7 | |||||||
BIPROGY, Inc. | (4,400 | ) | (107,590 | ) | 23.4 | |||||||
Bridgestone Corp. | (22,900 | ) | (932,550 | ) | 203.1 | |||||||
Calbee, Inc. | (18,900 | ) | (414,412 | ) | 90.3 | |||||||
Capcom Co. Ltd. | (4,300 | ) | (163,810 | ) | 35.7 | |||||||
Chiba Bank Ltd. | (74,100 | ) | (490,737 | ) | 106.9 | |||||||
Chubu Electric Power Co., Inc. | (64,400 | ) | (728,223 | ) | 158.6 | |||||||
Chugin Financial Group, Inc. | (57,500 | ) | (391,345 | ) | 85.2 | |||||||
Credit Saison Co. Ltd. | (107,600 | ) | (1,511,987 | ) | 329.3 | |||||||
Dai Nippon Printing Co. Ltd. | (72,800 | ) | (2,122,084 | ) | 462.2 | |||||||
Daido Steel Co. Ltd. | (21,800 | ) | (851,661 | ) | 185.5 | |||||||
Daiwa House REIT Investment Corp. | (173 | ) | (373,425 | ) | 81.3 | |||||||
Daiwa Office Investment Corp. | (122 | ) | (537,941 | ) | 117.2 | |||||||
Daiwa Securities Group, Inc. | (12,200 | ) | (57,472 | ) | 12.5 | |||||||
Daiwa Securities Living Investments Corp. | (404 | ) | (348,364 | ) | 75.9 | |||||||
Descente Ltd. | (29,900 | ) | (963,671 | ) | 209.9 | |||||||
Food & Life Cos. Ltd. | (2,500 | ) | (61,091 | ) | 13.3 | |||||||
FP Corp. | (23,100 | ) | (582,716 | ) | 126.9 | |||||||
Fuji Kyuko Co. Ltd. | (5,000 | ) | (194,738 | ) | 42.4 | |||||||
Fukuoka Financial Group, Inc. | (13,400 | ) | (255,990 | ) | 55.8 | |||||||
Furukawa Electric Co. Ltd. | (2,400 | ) | (44,561 | ) | 9.7 | |||||||
Fuyo General Lease Co. Ltd. | (4,100 | ) | (304,223 | ) | 66.3 | |||||||
GLP J-Reit | (579 | ) | (670,704 | ) | 146.1 | |||||||
Goldwin, Inc. | (1,700 | ) | (156,640 | ) | 34.1 | |||||||
GS Yuasa Corp. | (18,700 | ) | (333,592 | ) | 72.7 | |||||||
GungHo Online Entertainment, Inc. | (7,500 | ) | (146,022 | ) | 31.8 | |||||||
Hachijuni Bank Ltd. | (16,900 | ) | (76,778 | ) | 16.7 | |||||||
| 114 | 2 0 2 3 BLACK ROCK ANNUAL REPORT TO SHAREHOLDERS |
Schedule of Investments (continued) April 30, 2023 | BlackRock Global Equity Market Neutral Fund |
| Security | Shares | Value | % of Basket Value | |||||||||
| Japan (continued) | ||||||||||||
Hakuhodo DY Holdings, Inc. | (30,700 | ) | $ | (366,777 | ) | 79.9 | % | |||||
Hankyu Hanshin Holdings, Inc. | (9,500 | ) | (300,916 | ) | 65.5 | |||||||
Harmonic Drive Systems, Inc. | (7,000 | ) | (217,028 | ) | 47.3 | |||||||
Haseko Corp. | (51,200 | ) | (633,706 | ) | 138.0 | |||||||
Heiwa Corp. | (38,200 | ) | (764,954 | ) | 166.6 | |||||||
Hikari Tsushin, Inc. | (3,700 | ) | (511,937 | ) | 111.5 | |||||||
Hino Motors Ltd. | (5,100 | ) | (20,393 | ) | 4.4 | |||||||
Hisamitsu Pharmaceutical Co., Inc. | (1,200 | ) | (33,657 | ) | 7.3 | |||||||
Hitachi Construction Machinery Co. Ltd. | (6,600 | ) | (164,815 | ) | 35.9 | |||||||
Honda Motor Co. Ltd. | (100 | ) | (2,689 | ) | 0.6 | |||||||
Horiba Ltd. | (400 | ) | (22,353 | ) | 4.9 | |||||||
Hoshizaki Corp. | (70,700 | ) | (2,525,481 | ) | 550.1 | |||||||
Ibiden Co. Ltd. | (28,900 | ) | (1,152,589 | ) | 251.1 | |||||||
Iida Group Holdings Co. Ltd. | (11,600 | ) | (209,057 | ) | 45.5 | |||||||
Industrial & Infrastructure Fund Investment Corp. | (790 | ) | (918,076 | ) | 200.0 | |||||||
Inpex Corp. | (55,200 | ) | (612,457 | ) | 133.4 | |||||||
Itoham Yonekyu Holdings, Inc. | (18,300 | ) | (101,707 | ) | 22.2 | |||||||
Iwatani Corp. | (24,700 | ) | (1,186,169 | ) | 258.4 | |||||||
Iyogin Holdings, Inc. | (59,600 | ) | (353,884 | ) | 77.1 | |||||||
Izumi Co. Ltd. | (51,500 | ) | (1,228,318 | ) | 267.6 | |||||||
Japan Aviation Electronics Industry Ltd. | (35,000 | ) | (622,981 | ) | 135.7 | |||||||
Japan Exchange Group, Inc. | (53,000 | ) | (872,567 | ) | 190.1 | |||||||
Japan Logistics Fund, Inc. | (196 | ) | (471,898 | ) | 102.8 | |||||||
Japan Metropolitan Fund Invest | (107 | ) | (79,442 | ) | 17.3 | |||||||
Japan Post Bank Co. Ltd. | (18,800 | ) | (152,437 | ) | 33.2 | |||||||
Japan Prime Realty Investment Corp. | (53 | ) | (139,754 | ) | 30.4 | |||||||
Japan Real Estate Investment Corp. | (419 | ) | (1,683,666 | ) | 366.7 | |||||||
JCR Pharmaceuticals Co. Ltd. | (38,000 | ) | (416,913 | ) | 90.8 | |||||||
JMDC, Inc. | (19,600 | ) | (712,732 | ) | 155.2 | |||||||
Justsystems Corp. | (6,700 | ) | (179,588 | ) | 39.1 | |||||||
Kagome Co. Ltd. | (11,800 | ) | (290,610 | ) | 63.3 | |||||||
Kansai Paint Co. Ltd. | (23,300 | ) | (333,073 | ) | 72.6 | |||||||
Keio Corp. | (6,600 | ) | (248,632 | ) | 54.2 | |||||||
Keisei Electric Railway Co. Ltd. | (14,900 | ) | (533,206 | ) | 116.1 | |||||||
Kikkoman Corp. | (16,500 | ) | (990,024 | ) | 215.6 | |||||||
Kintetsu Group Holdings Co. Ltd. | (17,800 | ) | (609,449 | ) | 132.8 | |||||||
Kobayashi Pharmaceutical Co. Ltd. | (300 | ) | (18,988 | ) | 4.1 | |||||||
Kobe Steel Ltd. | (215,400 | ) | (1,628,355 | ) | 354.7 | |||||||
Kotobuki Spirits Co. Ltd. | (3,000 | ) | (224,727 | ) | 49.0 | |||||||
Kurita Water Industries Ltd. | (18,000 | ) | (765,807 | ) | 166.8 | |||||||
Kyudenko Corp. | (16,400 | ) | (443,247 | ) | 96.6 | |||||||
Kyushu Electric Power Co., Inc. | (78,600 | ) | (464,361 | ) | 101.1 | |||||||
Kyushu Financial Group, Inc. | (14,400 | ) | (52,648 | ) | 11.5 | |||||||
Kyushu Railway Co. | (16,700 | ) | (384,661 | ) | 83.8 | |||||||
LaSalle Logiport REIT | (769 | ) | (926,347 | ) | 201.8 | |||||||
MatsukiyoCocokara & Co. | (2,200 | ) | (119,503 | ) | 26.0 | |||||||
Mazda Motor Corp. | (54,100 | ) | (496,327 | ) | 108.1 | |||||||
McDonald’s Holdings Co. Japan Ltd. | (18,800 | ) | (794,336 | ) | 173.0 | |||||||
Mebuki Financial Group, Inc. | (177,500 | ) | (461,077 | ) | 100.4 | |||||||
Menicon Co. Ltd. | (2,900 | ) | (62,456 | ) | 13.6 | |||||||
Mercari, Inc. | (4,400 | ) | (77,044 | ) | 16.8 | |||||||
Mitsui Fudosan Logistics Park, Inc. | (160 | ) | (609,716 | ) | 132.8 | |||||||
Mitsui High-Tec, Inc. | (5,900 | ) | (360,790 | ) | 78.6 | |||||||
Miura Co. Ltd. | (21,500 | ) | (580,660 | ) | 126.5 | |||||||
Money Forward, Inc. | (24,300 | ) | (1,026,616 | ) | 223.6 | |||||||
MonotaRO Co. Ltd. | (31,800 | ) | (487,649 | ) | 106.2 | |||||||
Mori Hills REIT Investment Corp. | (217 | ) | (248,763 | ) | 54.2 | |||||||
Morinaga & Co. Ltd. | (42,000 | ) | (1,261,655 | ) | 274.8 | |||||||
Morinaga Milk Industry Co. Ltd. | (3,100 | ) | (118,176 | ) | 25.7 | |||||||
Nagase & Co. Ltd. | (22,300 | ) | (356,251 | ) | 77.6 | |||||||
Nextage Co. Ltd. | (16,800 | ) | (308,992 | ) | 67.3 | |||||||
NHK Spring Co. Ltd. | (162,200 | ) | (1,219,079 | ) | 265.5 | |||||||
| Security | Shares | Value | % of Basket Value | |||||||||
| Japan (continued) | ||||||||||||
Nifco, Inc. | (34,100 | ) | $ | (994,362 | ) | 216.6 | % | |||||
Nihon Kohden Corp. | (56,300 | ) | (1,579,771 | ) | 344.1 | |||||||
Nippon Building Fund, Inc. | (476 | ) | (2,023,225 | ) | 440.7 | |||||||
Nippon Electric Glass Co. Ltd. | (71,200 | ) | (1,378,354 | ) | 300.2 | |||||||
Nippon Kayaku Co. Ltd. | (27,100 | ) | (249,385 | ) | 54.3 | |||||||
Nippon Sanso Holdings Corp. | (33,400 | ) | (611,122 | ) | 133.1 | |||||||
Nippon Shokubai Co. Ltd. | (200 | ) | (8,133 | ) | 1.8 | |||||||
Nishi-Nippon Railroad Co. Ltd. | (4,000 | ) | (74,405 | ) | 16.2 | |||||||
Nisshin Seifun Group, Inc. | (64,200 | ) | (789,173 | ) | 171.9 | |||||||
Nissin Foods Holdings Co. Ltd. | (500 | ) | (48,881 | ) | 10.7 | |||||||
Noevir Holdings Co. Ltd. | (2,900 | ) | (119,996 | ) | 26.1 | |||||||
NOF Corp. | (6,800 | ) | (315,148 | ) | 68.6 | |||||||
NOK Corp. | (26,400 | ) | (360,677 | ) | 78.6 | |||||||
NTT Data Corp. | (15,400 | ) | (212,185 | ) | 46.2 | |||||||
Odakyu Electric Railway Co. Ltd. | (10,700 | ) | (151,590 | ) | 33.0 | |||||||
OKUMA Corp. | (18,400 | ) | (828,647 | ) | 180.5 | |||||||
Open House Group Co. Ltd. | (5,500 | ) | (222,832 | ) | 48.5 | |||||||
Osaka Gas Co. Ltd. | (19,100 | ) | (320,360 | ) | 69.8 | |||||||
OSG Corp. | (24,400 | ) | (347,692 | ) | 75.7 | |||||||
PALTAC Corp. | (2,600 | ) | (101,188 | ) | 22.0 | |||||||
Pan Pacific International Holdings Corp. | (1,700 | ) | (32,221 | ) | 7.0 | |||||||
Park24 Co. Ltd. | (10,700 | ) | (167,762 | ) | 36.5 | |||||||
PeptiDream, Inc. | (22,300 | ) | (305,714 | ) | 66.6 | |||||||
Persol Holdings Co. Ltd. | (20,700 | ) | (432,784 | ) | 94.3 | |||||||
Rakus Co. Ltd. | (69,000 | ) | (1,063,746 | ) | 231.7 | |||||||
Relo Group, Inc. | (31,300 | ) | (493,237 | ) | 107.4 | |||||||
Resonac Holdings Corp. | (37,800 | ) | (607,163 | ) | 132.3 | |||||||
Rinnai Corp. | (5,300 | ) | (129,919 | ) | 28.3 | |||||||
Rohto Pharmaceutical Co. Ltd. | (61,800 | ) | (1,300,497 | ) | 283.3 | |||||||
Sankyu, Inc. | (6,000 | ) | (214,618 | ) | 46.8 | |||||||
Sanwa Holdings Corp. | (59,000 | ) | (655,140 | ) | 142.7 | |||||||
SBI Shinsei Bank Ltd. | (54,400 | ) | (990,171 | ) | 215.7 | |||||||
SCREEN Holdings Co. Ltd. | (1,500 | ) | (123,776 | ) | 27.0 | |||||||
Seino Holdings Co. Ltd. | (9,900 | ) | (111,460 | ) | 24.3 | |||||||
Sekisui House Ltd. | (2,200 | ) | (45,868 | ) | 10.0 | |||||||
Sekisui House Reit, Inc. | (728 | ) | (418,586 | ) | 91.2 | |||||||
SG Holdings Co. Ltd. | (83,900 | ) | (1,224,563 | ) | 266.7 | |||||||
SHIFT, Inc. | (3,600 | ) | (679,771 | ) | 148.1 | |||||||
SoftBank Corp. | (42,800 | ) | (488,781 | ) | 106.5 | |||||||
Sony Group Corp. | (4,300 | ) | (394,608 | ) | 86.0 | |||||||
Sotetsu Holdings, Inc. | (37,700 | ) | (727,396 | ) | 158.4 | |||||||
Square Enix Holdings Co. Ltd. | (6,100 | ) | (304,306 | ) | 66.3 | |||||||
SUMCO Corp. | (6,500 | ) | (90,825 | ) | 19.8 | |||||||
Suzuken Co. Ltd. | (5,300 | ) | (152,960 | ) | 33.3 | |||||||
Sysmex Corp. | (6,400 | ) | (417,715 | ) | 91.0 | |||||||
Taiheiyo Cement Corp. | (11,000 | ) | (200,072 | ) | 43.6 | |||||||
Takara Holdings, Inc. | (241,600 | ) | (1,930,590 | ) | 420.5 | |||||||
Takashimaya Co. Ltd. | (21,500 | ) | (322,321 | ) | 70.2 | |||||||
TechnoPro Holdings, Inc. | (7,300 | ) | (201,981 | ) | 44.0 | |||||||
TIS, Inc. | (12,200 | ) | (339,750 | ) | 74.0 | |||||||
Tobu Railway Co. Ltd. | (3,800 | ) | (98,375 | ) | 21.4 | |||||||
Toho Gas Co. Ltd. | (12,300 | ) | (233,404 | ) | 50.8 | |||||||
Tohoku Electric Power Co., Inc. | (3,700 | ) | (19,300 | ) | 4.2 | |||||||
Tokyo Electric Power Co., Holdings, Inc. | (278,300 | ) | (1,012,496 | ) | 220.5 | |||||||
Tokyo Gas Co. Ltd. | (56,700 | ) | (1,177,366 | ) | 256.5 | |||||||
Tokyu Corp. | (46,400 | ) | (664,313 | ) | 144.7 | |||||||
Tokyu Fudosan Holdings Corp. | (13,100 | ) | (67,386 | ) | 14.7 | |||||||
TOPPAN, Inc. | (1,600 | ) | (34,483 | ) | 7.5 | |||||||
Toshiba TEC Corp. | (600 | ) | (17,672 | ) | 3.9 | |||||||
Toyo Suisan Kaisha Ltd. | (20,900 | ) | (945,840 | ) | 206.0 | |||||||
Toyo Tire Corp. | (27,800 | ) | (335,853 | ) | 73.2 | |||||||
Unicharm Corp. | (32,700 | ) | (1,338,933 | ) | 291.6 | |||||||
SCHEDULE OF INVESTMENTS | 115 |
Schedule of Investments (continued) April 30, 2023 | BlackRock Global Equity Market Neutral Fund |
| Security | Shares | Value | % of Basket Value | |||||||||
| Japan (continued) | ||||||||||||
United Urban Investment Corp. | (139 | ) | $ | (156,501 | ) | 34.1 | % | |||||
USS Co. Ltd. | (9,600 | ) | (163,579 | ) | 35.6 | |||||||
Visional, Inc. | (12,300 | ) | (654,385 | ) | 142.5 | |||||||
West Japan Railway Co. | (24,000 | ) | (1,054,072 | ) | 229.6 | |||||||
Workman Co. Ltd. | (2,100 | ) | (86,822 | ) | 18.9 | |||||||
Yokohama Rubber Co. Ltd. | (32,800 | ) | (723,175 | ) | 157.5 | |||||||
Z Holdings Corp. | (77,000 | ) | (214,073 | ) | 46.6 | |||||||
|
|
|
| |||||||||
| (83,738,561 | ) | |||||||||||
| Luxembourg | ||||||||||||
Aperam SA | (1,452 | ) | (53,951 | ) | 11.8 | |||||||
Eurofins Scientific SE | (20,858 | ) | (1,460,108 | ) | 318.0 | |||||||
|
|
|
| |||||||||
| (1,514,059 | ) | |||||||||||
| Netherlands | ||||||||||||
Akzo Nobel NV | (18,974 | ) | (1,577,665 | ) | 343.6 | |||||||
Alfen N.V. | (2,651 | ) | (214,974 | ) | 46.8 | |||||||
Argenx SE | (1,265 | ) | (489,087 | ) | 106.5 | |||||||
ASM International NV | (4,272 | ) | (1,554,679 | ) | 338.6 | |||||||
Euronext NV | (6,352 | ) | (506,312 | ) | 110.3 | |||||||
Heineken NV | (2,811 | ) | (323,499 | ) | 70.5 | |||||||
JDE Peet’s NV | (17,426 | ) | (531,177 | ) | 115.7 | |||||||
OCI NV | (1,557 | ) | (41,128 | ) | 9.0 | |||||||
SBM Offshore NV | (1,913 | ) | (27,101 | ) | 5.9 | |||||||
Universal Music Group NV | (24,778 | ) | (542,630 | ) | 118.2 | |||||||
|
|
|
| |||||||||
| (5,808,252 | ) | |||||||||||
| New Zealand | ||||||||||||
Mainfreight Ltd. | (3,682 | ) | (163,018 | ) | 35.5 | |||||||
Mercury NZ Ltd. | (8,921 | ) | (34,935 | ) | 7.6 | |||||||
Meridian Energy Ltd. | (135,374 | ) | (457,080 | ) | 99.6 | |||||||
|
|
|
| |||||||||
| (655,033 | ) | |||||||||||
| Nigeria | ||||||||||||
Airtel Africa PLC | (171,652 | ) | (257,523 | ) | 56.1 | |||||||
|
|
|
| |||||||||
| Norway | ||||||||||||
Aker ASA, A Shares | (2,859 | ) | (176,768 | ) | 38.5 | |||||||
DNB Bank ASA | (3,848 | ) | (68,514 | ) | 14.9 | |||||||
Leroy Seafood Group ASA | (6,121 | ) | (32,593 | ) | 7.1 | |||||||
Mowi ASA | (8,918 | ) | (172,051 | ) | 37.5 | |||||||
Orkla ASA | (214,061 | ) | (1,555,909 | ) | 338.9 | |||||||
Salmar ASA | (29,048 | ) | (1,305,145 | ) | 284.3 | |||||||
Schibsted ASA | (31,904 | ) | (572,690 | ) | 124.7 | |||||||
Telenor ASA | (12,003 | ) | (151,440 | ) | 33.0 | |||||||
|
|
|
| |||||||||
| (4,035,110 | ) | |||||||||||
| Portugal | ||||||||||||
Banco Comercial Portugues SA | (3,362,260 | ) | (866,181 | ) | 188.7 | |||||||
Jeronimo Martins SGPS SA | (4,230 | ) | (106,976 | ) | 23.3 | |||||||
|
|
|
| |||||||||
| (973,157 | ) | |||||||||||
| Puerto Rico | ||||||||||||
Popular, Inc. | (393 | ) | (23,584 | ) | 5.1 | |||||||
|
|
|
| |||||||||
| Singapore | ||||||||||||
Kenon Holdings Ltd. | (2,320 | ) | (61,299 | ) | 13.4 | |||||||
Sea Ltd., ADR | (3,479 | ) | (264,995 | ) | 57.7 | |||||||
STMicroelectronics NV | (24,275 | ) | (1,040,987 | ) | 226.7 | |||||||
|
|
|
| |||||||||
| (1,367,281 | ) | |||||||||||
| South Korea | ||||||||||||
Delivery Hero SE | (4,561 | ) | (182,533 | ) | 39.8 | |||||||
|
|
|
| |||||||||
| Security | Shares | Value | % of Basket Value | |||||||||
| Spain | ||||||||||||
Aena SME SA | (1,785 | ) | $ | (301,314 | ) | 65.6 | % | |||||
Amadeus IT Group SA | (406 | ) | (28,600 | ) | 6.2 | |||||||
CaixaBank SA | (49,562 | ) | (183,899 | ) | 40.1 | |||||||
Cellnex Telecom SA | (14,147 | ) | (596,985 | ) | 130.1 | |||||||
Endesa SA | (11,257 | ) | (253,079 | ) | 55.1 | |||||||
Inmobiliaria Colonial Socimi SA | (65,645 | ) | (420,559 | ) | 91.6 | |||||||
|
|
|
| |||||||||
| (1,784,436 | ) | |||||||||||
| Sweden | ||||||||||||
Autoliv, Inc. | (3,460 | ) | (296,903 | ) | 64.7 | |||||||
Electrolux AB | (24,542 | ) | (370,350 | ) | 80.7 | |||||||
Embracer Group AB | (37,674 | ) | (196,754 | ) | 42.9 | |||||||
H & M Hennes & Mauritz AB, B Shares | (14,047 | ) | (205,738 | ) | 44.8 | |||||||
Hexagon AB, B Shares | (33,080 | ) | (378,911 | ) | 82.5 | |||||||
Hexatronic Group AB | (17,064 | ) | (144,404 | ) | 31.5 | |||||||
Husqvarna AB, B Shares | (69,943 | ) | (603,942 | ) | 131.6 | |||||||
Investment AB Latour, B Shares | (9,354 | ) | (202,608 | ) | 44.1 | |||||||
Kinnevik AB | (54,114 | ) | (889,338 | ) | 193.7 | |||||||
Lifco AB, B Shares | (6,186 | ) | (141,126 | ) | 30.7 | |||||||
Securitas AB, B Shares | (92,634 | ) | (830,642 | ) | 180.9 | |||||||
Skandinaviska Enskilda Banken AB | (42,288 | ) | (481,043 | ) | 104.8 | |||||||
SSAB AB, B Shares | (19,470 | ) | (138,326 | ) | 30.1 | |||||||
Svenska Cellulosa AB SCA, Class B | (43,434 | ) | (596,129 | ) | 129.8 | |||||||
Swedish Orphan Biovitrum AB | (3,311 | ) | (80,610 | ) | 17.6 | |||||||
Telia Co. AB | (115,387 | ) | (321,380 | ) | 70.0 | |||||||
|
|
|
| |||||||||
| (5,878,204 | ) | |||||||||||
| Switzerland | ||||||||||||
Mediclinic International PLC | (79,228 | ) | (493,329 | ) | 107.4 | |||||||
|
|
|
| |||||||||
| United Kingdom | ||||||||||||
abrdn PLC | (71,034 | ) | (189,122 | ) | 41.2 | |||||||
Associated British Foods PLC | (93,710 | ) | (2,292,587 | ) | 499.4 | |||||||
Aviva PLC | (23,885 | ) | (126,326 | ) | 27.5 | |||||||
Barratt Developments PLC | (119,551 | ) | (747,339 | ) | 162.8 | |||||||
BT Group PLC | (15,683 | ) | (31,122 | ) | 6.8 | |||||||
CNH Industrial NV | (36,365 | ) | (512,890 | ) | 111.7 | |||||||
Coca-Cola Europacific Partners PLC | (8,234 | ) | (530,846 | ) | 115.6 | |||||||
Compass Group PLC | (14,660 | ) | (384,191 | ) | 83.7 | |||||||
Derwent London PLC | (3,653 | ) | (109,493 | ) | 23.9 | |||||||
Entain PLC | (39,226 | ) | (709,987 | ) | 154.7 | |||||||
Future PLC | (10,469 | ) | (147,569 | ) | 32.1 | |||||||
HSBC Holdings PLC | (86,793 | ) | (621,368 | ) | 135.3 | |||||||
International Consolidated Airlines Group SA | (307,636 | ) | (586,284 | ) | 127.7 | |||||||
International Distributions Services PLC | (217,564 | ) | (688,000 | ) | 149.9 | |||||||
Investec PLC | (58,044 | ) | (321,418 | ) | 70.0 | |||||||
JD Sports Fashion PLC | (41,041 | ) | (82,717 | ) | 18.0 | |||||||
JET2 PLC | (4,139 | ) | (63,487 | ) | 13.8 | |||||||
Johnson Matthey PLC | (5,507 | ) | (135,138 | ) | 29.4 | |||||||
Just Eat Takeaway.com NV | (35,847 | ) | (629,987 | ) | 137.2 | |||||||
Kingfisher PLC | (77,145 | ) | (248,367 | ) | 54.1 | |||||||
M&G PLC | (741,270 | ) | (1,903,243 | ) | 414.6 | |||||||
Manchester United PLC, Class A | (5,407 | ) | (108,410 | ) | 23.6 | |||||||
National Grid PLC | (27,589 | ) | (392,930 | ) | 85.6 | |||||||
Ocado Group PLC | (39,254 | ) | (248,159 | ) | 54.1 | |||||||
Persimmon PLC | (16,007 | ) | (263,195 | ) | 57.3 | |||||||
RELX PLC | (46,208 | ) | (1,529,037 | ) | 333.1 | |||||||
Sage Group PLC | (4,471 | ) | (45,740 | ) | 10.0 | |||||||
Serco Group PLC | (7,594 | ) | (14,418 | ) | 3.1 | |||||||
Smith & Nephew PLC | (33,756 | ) | (552,340 | ) | 120.3 | |||||||
St James’s Place PLC | (2,738 | ) | (41,358 | ) | 9.0 | |||||||
Tate & Lyle PLC | (15,029 | ) | (153,077 | ) | 33.3 | |||||||
| 116 | 2 0 2 3 BLACK ROCK ANNUAL REPORT TO SHAREHOLDERS |
Schedule of Investments (continued) April 30, 2023 | BlackRock Global Equity Market Neutral Fund |
| Security | Shares | Value | % of Basket Value | |||||||||
| United Kingdom (continued) | ||||||||||||
Vistry Group PLC | (134,010 | ) | $ | (1,312,260 | ) | 285.8 | % | |||||
Whitbread PLC | (3,096 | ) | (125,942 | ) | 27.4 | |||||||
WPP PLC | (39,534 | ) | (457,564 | ) | 99.7 | |||||||
|
|
|
| |||||||||
| (16,305,911 | ) | |||||||||||
| United States | ||||||||||||
10X Genomics, Inc., Class A | (1,266 | ) | (66,376 | ) | 14.5 | |||||||
Adient PLC | (5,138 | ) | (189,798 | ) | 41.3 | |||||||
ADT, Inc. | (120,048 | ) | (804,322 | ) | 175.2 | |||||||
AES Corp. | (2,059 | ) | (48,716 | ) | 10.6 | |||||||
Aflac, Inc. | (3,564 | ) | (248,945 | ) | 54.2 | |||||||
Airbnb, Inc., Class B | (2,184 | ) | (261,359 | ) | 56.9 | |||||||
Alexandria Real Estate Equities, Inc. | (5,646 | ) | (701,120 | ) | 152.7 | |||||||
Alteryx, Inc., Class A | (1,901 | ) | (78,188 | ) | 17.0 | |||||||
American Electric Power Co., Inc. | (3,395 | ) | (313,766 | ) | 68.3 | |||||||
American International Group, Inc. | (11,044 | ) | (585,774 | ) | 127.6 | |||||||
Ameriprise Financial, Inc. | (390 | ) | (118,997 | ) | 25.9 | |||||||
AmerisourceBergen Corp. | (2,350 | ) | (392,097 | ) | 85.4 | |||||||
Analog Devices, Inc. | (316 | ) | (56,842 | ) | 12.4 | |||||||
Annaly Capital Management, Inc. | (3,531 | ) | (70,549 | ) | 15.4 | |||||||
Ansys, Inc. | (618 | ) | (194,003 | ) | 42.3 | |||||||
Antero Midstream Corp. | (3,422 | ) | (36,821 | ) | 8.0 | |||||||
Antero Resources Corp. | (1,044 | ) | (24,002 | ) | 5.2 | |||||||
Apartment Income REIT Corp. | (6,035 | ) | (223,174 | ) | 48.6 | |||||||
Apollo Global Management, Inc. | (2,869 | ) | (181,866 | ) | 39.6 | |||||||
Applied Industrial Technologies, Inc. | (5,574 | ) | (756,169 | ) | 164.7 | |||||||
AppLovin Corp., Class A | (5,087 | ) | (86,479 | ) | 18.8 | |||||||
AptarGroup, Inc. | (379 | ) | (44,915 | ) | 9.8 | |||||||
Aramark | (3,246 | ) | (112,636 | ) | 24.5 | |||||||
Arista Networks, Inc. | (5,005 | ) | (801,601 | ) | 174.6 | |||||||
Asana, Inc. | (1,186 | ) | (19,189 | ) | 4.2 | |||||||
Asbury Automotive Group, Inc. | (2,091 | ) | (404,525 | ) | 88.1 | |||||||
Aspen Technology, Inc. | (689 | ) | (121,953 | ) | 26.6 | |||||||
Atmos Energy Corp. | (4,291 | ) | (489,775 | ) | 106.7 | |||||||
Avangrid, Inc. | (10,777 | ) | (433,882 | ) | 94.5 | |||||||
Avantor, Inc. | (10,213 | ) | (198,949 | ) | 43.3 | |||||||
Avnet, Inc. | (4,568 | ) | (188,476 | ) | 41.1 | |||||||
Axalta Coating Systems Ltd. | (10,089 | ) | (318,510 | ) | 69.4 | |||||||
AZEK Co., Inc. | (415 | ) | (11,263 | ) | 2.5 | |||||||
Ball Corp. | (2,091 | ) | (111,199 | ) | 24.2 | |||||||
Bentley Systems, Inc., Class B | (4,586 | ) | (195,180 | ) | 42.5 | |||||||
BJ’s Wholesale Club Holdings, Inc. | (5,577 | ) | (425,915 | ) | 92.8 | |||||||
Black Hills Corp. | (3,891 | ) | (254,043 | ) | 55.3 | |||||||
Bloom Energy Corp., Class A | (14,153 | ) | (235,647 | ) | 51.3 | |||||||
Boston Properties, Inc. | (2,851 | ) | (152,129 | ) | 33.1 | |||||||
Broadcom, Inc. | (109 | ) | (68,289 | ) | 14.9 | |||||||
Broadridge Financial Solutions, Inc. | (421 | ) | (61,218 | ) | 13.3 | |||||||
Brown-Forman Corp. | (1,038 | ) | (67,563 | ) | 14.7 | |||||||
Bunge Ltd. | (1,824 | ) | (170,726 | ) | 37.2 | |||||||
Cadence Bank | (3,545 | ) | (71,680 | ) | 15.6 | |||||||
Calix, Inc. | (2,119 | ) | (96,838 | ) | 21.1 | |||||||
Capital One Financial Corp. | (715 | ) | (69,570 | ) | 15.2 | |||||||
CarMax, Inc. | (658 | ) | (46,080 | ) | 10.0 | |||||||
Catalent, Inc. | (4,069 | ) | (203,938 | ) | 44.4 | |||||||
CDW Corp. | (3,243 | ) | (549,980 | ) | 119.8 | |||||||
Celanese Corp. | (2,907 | ) | (308,840 | ) | 67.3 | |||||||
Ceridian HCM Holding, Inc. | (1,520 | ) | (96,490 | ) | 21.0 | |||||||
CF Industries Holdings, Inc. | (781 | ) | (55,904 | ) | 12.2 | |||||||
Chesapeake Energy Corp. | (6,724 | ) | (555,940 | ) | 121.1 | |||||||
Churchill Downs, Inc. | (2,024 | ) | (592,081 | ) | 129.0 | |||||||
Civitas Resources, Inc. | (7,928 | ) | (547,428 | ) | 119.2 | |||||||
| Security | Shares | Value | % of Basket Value | |||||||||
| United States (continued) | ||||||||||||
Clean Harbors, Inc. | (1,317 | ) | $ | (191,176 | ) | 41.6 | % | |||||
Clear Secure, Inc. | (2,875 | ) | (69,546 | ) | 15.2 | |||||||
Clorox Co. | (2,530 | ) | (419,019 | ) | 91.3 | |||||||
CME Group, Inc. | (4,013 | ) | (745,495 | ) | 162.4 | |||||||
Comcast Corp. | (8,060 | ) | (333,442 | ) | 72.6 | |||||||
Comfort Systems USA, Inc. | (542 | ) | (81,024 | ) | 17.7 | |||||||
Commerce Bancshares, Inc. | (9,987 | ) | (557,774 | ) | 121.5 | |||||||
Concentrix Corp. | (1,515 | ) | (146,213 | ) | 31.8 | |||||||
Consolidated Edison, Inc. | (285 | ) | (28,064 | ) | 6.1 | |||||||
Constellation Energy Corp. | (5,375 | ) | (416,025 | ) | 90.6 | |||||||
Constellium SE | (1,267 | ) | (18,815 | ) | 4.1 | |||||||
Cooper Cos., Inc. | (2,738 | ) | (1,044,410 | ) | 227.5 | |||||||
Corning, Inc. | (1,624 | ) | (53,949 | ) | 11.8 | |||||||
Corteva, Inc. | (920 | ) | (56,230 | ) | 12.3 | |||||||
Coterra Energy, Inc. | (16,369 | ) | (419,046 | ) | 91.3 | |||||||
Coty, Inc., Class A | (1,823 | ) | (21,639 | ) | 4.7 | |||||||
Cousins Properties, Inc. | (8,051 | ) | (175,592 | ) | 38.2 | |||||||
Crane Co. | (33 | ) | (2,378 | ) | 0.5 | |||||||
Crown Castle, Inc. | (1,765 | ) | (217,254 | ) | 47.3 | |||||||
Darling Ingredients, Inc. | (6,263 | ) | (373,087 | ) | 81.3 | |||||||
Dell Technologies, Inc. | (4,802 | ) | (208,839 | ) | 45.5 | |||||||
Delta Air Lines, Inc. | (79 | ) | (2,710 | ) | 0.6 | |||||||
Denbury, Inc. | (800 | ) | (74,704 | ) | 16.3 | |||||||
Diodes, Inc. | (436 | ) | (34,749 | ) | 7.6 | |||||||
Dollar Tree, Inc. | (371 | ) | (57,026 | ) | 12.4 | |||||||
Dominion Energy, Inc. | (7,985 | ) | (456,263 | ) | 99.4 | |||||||
DoorDash, Inc. | (23,097 | ) | (1,413,305 | ) | 307.8 | |||||||
DR Horton, Inc. | (2,474 | ) | (271,695 | ) | 59.2 | |||||||
DraftKings, Inc. | (2,125 | ) | (46,559 | ) | 10.1 | |||||||
Dun & Bradstreet Holdings, Inc. | (2,473 | ) | (27,623 | ) | 6.0 | |||||||
Dynatrace, Inc. | (10,586 | ) | (447,576 | ) | 97.5 | |||||||
Eagle Materials, Inc. | (877 | ) | (129,980 | ) | 28.3 | |||||||
Edison International | (8,399 | ) | (618,166 | ) | 134.6 | |||||||
Elanco Animal Health, Inc. | (5,599 | ) | (53,023 | ) | 11.6 | |||||||
Elastic NV | (2,117 | ) | (121,198 | ) | 26.4 | |||||||
Entegris, Inc. | (9,875 | ) | (739,835 | ) | 161.2 | |||||||
EQT Corp. | (3,653 | ) | (127,271 | ) | 27.7 | |||||||
Estee Lauder Cos., Inc., Class A | (279 | ) | (68,835 | ) | 15.0 | |||||||
Euronet Worldwide, Inc. | (1,944 | ) | (215,279 | ) | 46.9 | |||||||
Evergy, Inc. | (1,367 | ) | (84,904 | ) | 18.5 | |||||||
Exelon Corp. | (9,764 | ) | (414,384 | ) | 90.3 | |||||||
ExlService Holdings, Inc. | (204 | ) | (36,390 | ) | 7.9 | |||||||
Extra Space Storage, Inc. | (203 | ) | (30,864 | ) | 6.7 | |||||||
Federal Realty Investment Trust | (216 | ) | (21,360 | ) | 4.7 | |||||||
Ferguson PLC | (239 | ) | (33,656 | ) | 7.3 | |||||||
Ferguson PLC | (13,711 | ) | (1,924,588 | ) | 419.2 | |||||||
Fidelity National Financial, Inc. | (12,728 | ) | (451,717 | ) | 98.4 | |||||||
Fifth Third Bancorp | (10,517 | ) | (275,545 | ) | 60.0 | |||||||
First American Financial Corp. | (1,356 | ) | (78,119 | ) | 17.0 | |||||||
First Citizens BancShares, Inc. | (193 | ) | (194,386 | ) | 42.3 | |||||||
First Industrial Realty Trust, Inc. | (4,120 | ) | (216,176 | ) | 47.1 | |||||||
First Solar, Inc. | (425 | ) | (77,597 | ) | 16.9 | |||||||
Fiserv, Inc. | (2,768 | ) | (338,028 | ) | 73.6 | |||||||
Floor & Decor Holdings, Inc., Class A | (1,772 | ) | (176,030 | ) | 38.3 | |||||||
Fluence Energy, Inc. | (622 | ) | (11,233 | ) | 2.4 | |||||||
Foot Locker, Inc. | (4,141 | ) | (173,881 | ) | 37.9 | |||||||
Fox Factory Holding Corp. | (349 | ) | (38,694 | ) | 8.4 | |||||||
Gaming and Leisure Properties, Inc. | (454 | ) | (23,608 | ) | 5.1 | |||||||
GE Healthcare, Inc. | (20,950 | ) | (1,704,073 | ) | 371.2 | |||||||
Gen Digital, Inc. | (2,515 | ) | (44,440 | ) | 9.7 | |||||||
Goldman Sachs Group, Inc. | (562 | ) | (193,013 | ) | 42.0 | |||||||
SCHEDULE OF INVESTMENTS | 117 |
Schedule of Investments (continued) April 30, 2023 | BlackRock Global Equity Market Neutral Fund |
| Security | Shares | Value | % of Basket Value | |||||||||
| United States (continued) | ||||||||||||
Graphic Packaging Holding Co. | (9,992 | ) | $ | (246,403 | ) | 53.7 | % | |||||
H&R Block, Inc. | (538 | ) | (18,244 | ) | 4.0 | |||||||
Hasbro, Inc. | (594 | ) | (35,177 | ) | 7.7 | |||||||
HashiCorp., Inc. | (2,951 | ) | (79,116 | ) | 17.2 | |||||||
HB Fuller Co. | (554 | ) | (36,658 | ) | 8.0 | |||||||
HF Sinclair Corp. | (1,488 | ) | (65,636 | ) | 14.3 | |||||||
Host Hotels & Resorts, Inc. | (6,189 | ) | (100,076 | ) | 21.8 | |||||||
Hyatt Hotels Corp., Class A | (557 | ) | (63,665 | ) | 13.9 | |||||||
ICON PLC | (640 | ) | (123,322 | ) | 26.9 | |||||||
Inmode Ltd. | (912 | ) | (33,981 | ) | 7.4 | |||||||
Insight Enterprises, Inc. | (1,002 | ) | (121,192 | ) | 26.4 | |||||||
Inspire Medical Systems, Inc. | (806 | ) | (215,710 | ) | 47.0 | |||||||
International Business Machines Corp. | (1,725 | ) | (218,057 | ) | 47.5 | |||||||
International Flavors & Fragrances, Inc. | (208 | ) | (20,168 | ) | 4.4 | |||||||
Interpublic Group of Cos., Inc. | (9,914 | ) | (354,227 | ) | 77.2 | |||||||
Iridium Communications, Inc. | (1,274 | ) | (80,861 | ) | 17.6 | |||||||
Jazz Pharmaceuticals PLC | (3,355 | ) | (471,277 | ) | 102.7 | |||||||
JPMorgan Chase & Co. | (454 | ) | (62,761 | ) | 13.7 | |||||||
Karuna Therapeutics, Inc. | (362 | ) | (71,835 | ) | 15.6 | |||||||
Kinder Morgan, Inc. | (38,774 | ) | (664,974 | ) | 144.8 | |||||||
Kinsale Capital Group, Inc. | (316 | ) | (103,240 | ) | 22.5 | |||||||
Kite Realty Group Trust | (1,515 | ) | (31,391 | ) | 6.8 | |||||||
Lamb Weston Holdings, Inc. | (6,796 | ) | (759,861 | ) | 165.5 | |||||||
Lantheus Holdings, Inc. | (1,086 | ) | (92,799 | ) | 20.2 | |||||||
Lennar Corp. | (2,242 | ) | (252,920 | ) | 55.1 | |||||||
Levi Strauss & Co. | (12,849 | ) | (185,797 | ) | 40.5 | |||||||
Liberty Media Corp.-Liberty Formula One, Class C | (10,388 | ) | (749,910 | ) | 163.3 | |||||||
Lithia Motors, Inc. | (668 | ) | (147,555 | ) | 32.1 | |||||||
Littelfuse, Inc. | (76 | ) | (18,410 | ) | 4.0 | |||||||
Loews Corp. | (2,364 | ) | (136,095 | ) | 29.6 | |||||||
Madison Square Garden Sports Corp. | (2,617 | ) | (524,708 | ) | 114.3 | |||||||
Markel Corp. | (513 | ) | (702,056 | ) | 152.9 | |||||||
MarketAxess Holdings, Inc. | (638 | ) | (203,120 | ) | 44.2 | |||||||
Marriott International, Inc. | (1,475 | ) | (249,776 | ) | 54.4 | |||||||
Mattel, Inc. | (8,416 | ) | (151,488 | ) | 33.0 | |||||||
Maximus, Inc. | (4,412 | ) | (369,064 | ) | 80.4 | |||||||
Meritage Homes Corp. | (7,915 | ) | (1,013,516 | ) | 220.8 | |||||||
MKS Instruments, Inc. | (4,219 | ) | (353,848 | ) | 77.1 | |||||||
Mondelez International, Inc. | (3,445 | ) | (264,300 | ) | 57.6 | |||||||
MongoDB, Inc. | (1,476 | ) | (354,181 | ) | 77.1 | |||||||
Morgan Stanley | (4,742 | ) | (426,638 | ) | 92.9 | |||||||
Mosaic Co. | (2,146 | ) | (91,956 | ) | 20.0 | |||||||
Motorola Solutions, Inc. | (487 | ) | (141,912 | ) | 30.9 | |||||||
National Retail Properties, Inc. | (2,692 | ) | (117,102 | ) | 25.5 | |||||||
National Storage Affiliates Trust | (2,609 | ) | (100,577 | ) | 21.9 | |||||||
NCR Corp. | (8,719 | ) | (194,347 | ) | 42.3 | |||||||
Neogen Corp. | (1,496 | ) | (25,761 | ) | 5.6 | |||||||
Netflix, Inc. | (1,541 | ) | (508,422 | ) | 110.7 | |||||||
New Jersey Resources Corp. | (2,886 | ) | (149,033 | ) | 32.5 | |||||||
New Relic, Inc. | (2,820 | ) | (201,545 | ) | 43.9 | |||||||
New York Times Co. | (8,734 | ) | (347,176 | ) | 75.6 | |||||||
Newell Brands, Inc. | (39,376 | ) | (478,418 | ) | 104.2 | |||||||
NEXTracker, Inc. | (9,416 | ) | (296,510 | ) | 64.6 | |||||||
Noble Corp. PLC | (34,931 | ) | (1,343,097 | ) | 292.6 | |||||||
Nutanix, Inc. | (3,637 | ) | (87,215 | ) | 19.0 | |||||||
Okta, Inc. | (3,612 | ) | (247,530 | ) | 53.9 | |||||||
Ollie’s Bargain Outlet Holdings, Inc. | (1,457 | ) | (95,069 | ) | 20.7 | |||||||
Omega Healthcare Investors, Inc. | (2,963 | ) | (79,290 | ) | 17.3 | |||||||
Omnicom Group, Inc. | (1,522 | ) | (137,848 | ) | 30.0 | |||||||
ONE Gas, Inc. | (8,947 | ) | (688,472 | ) | 150.0 | |||||||
ONEOK, Inc. | (6,650 | ) | (434,976 | ) | 94.7 | |||||||
| Security | Shares | Value | % of Basket Value | |||||||||
| United States (continued) | ||||||||||||
Option Care Health, Inc. | (1,536 | ) | $ | (49,382 | ) | 10.8 | % | |||||
Oracle Corp. | (7,533 | ) | (713,526 | ) | 155.4 | |||||||
Organon & Co. | (3,188 | ) | (78,520 | ) | 17.1 | |||||||
Ormat Technologies, Inc. | (1,092 | ) | (93,705 | ) | 20.4 | |||||||
PACCAR, Inc. | (4,414 | ) | (329,682 | ) | 71.8 | |||||||
PayPal Holdings, Inc. | (4,378 | ) | (332,728 | ) | 72.5 | |||||||
Pentair PLC | (24,219 | ) | (1,406,640 | ) | 306.4 | |||||||
Performance Food Group Co. | (7,217 | ) | (452,434 | ) | 98.6 | |||||||
Permian Resources Corp. | (15,139 | ) | (158,203 | ) | 34.5 | |||||||
Pfizer, Inc. | (3,326 | ) | (129,348 | ) | 28.2 | |||||||
PG&E Corp. | (1,091 | ) | (18,667 | ) | 4.1 | |||||||
Pinnacle West Capital Corp. | (1,834 | ) | (143,896 | ) | 31.3 | |||||||
PPG Industries, Inc. | (2,683 | ) | (376,318 | ) | 82.0 | |||||||
Primerica, Inc. | (1,958 | ) | (357,355 | ) | 77.8 | |||||||
Privia Health Group, Inc. | (9,966 | ) | (275,361 | ) | 60.0 | |||||||
Progressive Corp. | (815 | ) | (111,166 | ) | 24.2 | |||||||
Public Service Enterprise Group, Inc. | (9,660 | ) | (610,512 | ) | 133.0 | |||||||
PulteGroup, Inc. | (11,735 | ) | (788,005 | ) | 171.6 | |||||||
R1 RCM, Inc. | (25,149 | ) | (392,073 | ) | 85.4 | |||||||
Radian Group, Inc. | (2,755 | ) | (66,864 | ) | 14.6 | |||||||
Range Resources Corp. | (1,981 | ) | (52,397 | ) | 11.4 | |||||||
Regions Financial Corp., Registered Shares | (23,864 | ) | (435,757 | ) | 94.9 | |||||||
Republic Services, Inc. | (260 | ) | (37,601 | ) | 8.2 | |||||||
Rexford Industrial Realty, Inc. | (7,661 | ) | (427,254 | ) | 93.1 | |||||||
RH | (1,227 | ) | (313,045 | ) | 68.2 | |||||||
Rivian Automotive, Inc. | (5,553 | ) | (71,189 | ) | 15.5 | |||||||
RLI Corp. | (177 | ) | (24,612 | ) | 5.4 | |||||||
Robinhood Markets, Inc. | (31,302 | ) | (277,023 | ) | 60.3 | |||||||
Rockwell Automation, Inc. | (1,561 | ) | (442,403 | ) | 96.4 | |||||||
Roku, Inc. | (1,800 | ) | (101,178 | ) | 22.0 | |||||||
Roper Technologies, Inc. | (468 | ) | (212,837 | ) | 46.4 | |||||||
Ryan Specialty Holdings, Inc. | (13,995 | ) | (571,836 | ) | 124.6 | |||||||
Ryman Hospitality Properties, Inc. | (8,950 | ) | (802,457 | ) | 174.8 | |||||||
Salesforce, Inc. | (451 | ) | (89,465 | ) | 19.5 | |||||||
Sealed Air Corp. | (4,638 | ) | (222,578 | ) | 48.5 | |||||||
Selective Insurance Group, Inc. | (426 | ) | (41,037 | ) | 8.9 | |||||||
SentinelOne, Inc. | (1,319 | ) | (21,196 | ) | 4.6 | |||||||
Shift4 Payments, Inc., Class A | (2,970 | ) | (201,277 | ) | 43.8 | |||||||
Skyline Champion Corp. | (2,537 | ) | (188,169 | ) | 41.0 | |||||||
Skyworks Solutions, Inc. | (3,665 | ) | (388,123 | ) | 84.5 | |||||||
Snowflake, Inc. | (127 | ) | (18,806 | ) | 4.1 | |||||||
SolarEdge Technologies, Inc. | (1,213 | ) | (346,469 | ) | 75.5 | |||||||
Sonoco Products Co. | (8,520 | ) | (516,482 | ) | 112.5 | |||||||
Southern Co. | (5,663 | ) | (416,514 | ) | 90.7 | |||||||
SouthState Corp. | (2,656 | ) | (183,211 | ) | 39.9 | |||||||
Southwest Gas Holdings, Inc. | (4,385 | ) | (245,560 | ) | 53.5 | |||||||
Spirit Realty Capital, Inc. | (1,414 | ) | (54,382 | ) | 11.8 | |||||||
Splunk, Inc. | (596 | ) | (51,399 | ) | 11.2 | |||||||
SPS Commerce, Inc. | (235 | ) | (34,616 | ) | 7.5 | |||||||
SS&C Technologies Holdings, Inc. | (779 | ) | (45,603 | ) | 9.9 | |||||||
STAG Industrial, Inc. | (666 | ) | (22,557 | ) | 4.9 | |||||||
Stanley Black & Decker, Inc. | (1,915 | ) | (165,341 | ) | 36.0 | |||||||
Starbucks Corp. | (1,470 | ) | (168,006 | ) | 36.6 | |||||||
State Street Corp. | (266 | ) | (19,221 | ) | 4.2 | |||||||
Super Micro Computer, Inc. | (761 | ) | (80,232 | ) | 17.5 | |||||||
Surgery Partners, Inc. | (12,703 | ) | (503,801 | ) | 109.7 | |||||||
SVB Financial Group | (216 | ) | (106 | ) | 0.0 | |||||||
Synaptics, Inc. | (1,155 | ) | (102,287 | ) | 22.3 | |||||||
Take-Two Interactive Software, Inc. | (3,729 | ) | (463,477 | ) | 101.0 | |||||||
Teledyne Technologies, Inc. | (593 | ) | (245,739 | ) | 53.5 | |||||||
Tenet Healthcare Corp. | (6,471 | ) | (474,454 | ) | 103.3 | |||||||
Tetra Tech, Inc. | (357 | ) | (49,398 | ) | 10.8 | |||||||
| 118 | 2 0 2 3 BLACK ROCK ANNUAL REPORT TO SHAREHOLDERS |
Schedule of Investments (continued) April 30, 2023 | BlackRock Global Equity Market Neutral Fund |
| Security | Shares | Value | % of Basket Value | |||||||||
| United States (continued) | ||||||||||||
T-Mobile US, Inc. | (1,648 | ) | $ | (237,147 | ) | 51.7 | % | |||||
Toast, Inc. | (3,932 | ) | (71,562 | ) | 15.6 | |||||||
Trade Desk, Inc., Class A | (4,082 | ) | (262,636 | ) | 57.2 | |||||||
TriNet Group, Inc. | (1,092 | ) | (101,316 | ) | 22.1 | |||||||
Twilio, Inc., Class A | (13,057 | ) | (686,929 | ) | 149.6 | |||||||
Tyler Technologies, Inc. | (490 | ) | (185,725 | ) | 40.5 | |||||||
UFP Industries, Inc. | (607 | ) | (47,662 | ) | 10.4 | |||||||
Under Armour, Inc., Class A | (5,310 | ) | (47,100 | ) | 10.3 | |||||||
United Rentals, Inc. | (460 | ) | (166,111 | ) | 36.2 | |||||||
Universal Health Services, Inc. | (2,611 | ) | (392,564 | ) | 85.5 | |||||||
Valvoline, Inc. | (23,524 | ) | (812,754 | ) | 177.0 | |||||||
Verizon Communications, Inc. | (1,459 | ) | (56,653 | ) | 12.3 | |||||||
Vir Biotechnology, Inc. | (4,685 | ) | (117,828 | ) | 25.7 | |||||||
Vontier Corp. | (11,645 | ) | (315,929 | ) | 68.8 | |||||||
Vornado Realty Trust | (5,203 | ) | (78,097 | ) | 17.0 | |||||||
Webster Financial Corp. | (2,843 | ) | (106,044 | ) | 23.1 | |||||||
Welltower, Inc. | (4,230 | ) | (335,101 | ) | 73.0 | |||||||
WESCO International, Inc. | (1,918 | ) | (276,192 | ) | 60.2 | |||||||
Western Alliance Bancorp | (7,049 | ) | (261,659 | ) | 57.0 | |||||||
Whirlpool Corp. | (2,195 | ) | (306,400 | ) | 66.7 | |||||||
XPO, Inc. | (6,491 | ) | (286,772 | ) | 62.5 | |||||||
Zebra Technologies Corp. | (1,037 | ) | (298,687 | ) | 65.1 | |||||||
ZoomInfo Technologies, Inc. | (20,654 | ) | (452,529 | ) | 98.6 | |||||||
|
|
|
| |||||||||
| (68,406,361 | ) | |||||||||||
| Preferred Stocks | ||||||||||||
| Germany | ||||||||||||
Henkel AG & Co. KGaA | (17,057 | ) | (1,382,157 | ) | 301.1 | |||||||
|
|
|
| |||||||||
Total Reference Entity — Short | (236,336,747 | ) | ||||||||||
|
| |||||||||||
Net Value of Reference Entity — UBS AG | $ | (459,101 | ) | |||||||||
|
| |||||||||||
The following table represents the individual long and short positions and related values of the equity securities underlying the total return swap with UBS AG as of period end, termination dates 04/03/28-04/24/28:
| Security | Shares | Value | % of Basket Value | |||||||||
Reference Entity — Long | ||||||||||||
| Common Stocks | ||||||||||||
| Australia | ||||||||||||
oOh!media Ltd. | 22,138 | $ | 24,303 | 13.9 | % | |||||||
Rural Funds Group | 10,476 | 13,674 | 7.8 | |||||||||
Silver Lake Resources Ltd. | 15,377 | 12,987 | 7.5 | |||||||||
Waypoint REIT Ltd. | 10,114 | 17,599 | 10.1 | |||||||||
|
|
|
| |||||||||
| 68,563 | ||||||||||||
| Belgium | ||||||||||||
Melexis NV | 550 | 52,508 | 30.1 | |||||||||
Telenet Group Holding NV | 10,797 | 250,183 | 143.5 | |||||||||
|
|
|
| |||||||||
| 302,691 | ||||||||||||
| Canada | ||||||||||||
H&R Real Estate Investment Trust | 4,785 | 41,209 | 23.6 | |||||||||
Spin Master Corp. | 574 | 16,232 | 9.3 | |||||||||
|
|
|
| |||||||||
| 57,441 | ||||||||||||
| Security | Shares | Value | % of Basket Value | |||||||||
| Denmark | ||||||||||||
Scandinavian Tobacco Group A/S | 666 | $ | 13,028 | 7.4 | % | |||||||
Sydbank AS | 278 | 12,348 | 7.1 | |||||||||
|
|
|
| |||||||||
| 25,376 | ||||||||||||
| Finland | ||||||||||||
Citycon OYJ | 1,705 | 12,828 | 7.4 | |||||||||
|
|
|
| |||||||||
| France | ||||||||||||
Atos SE | 3,805 | 52,802 | 30.3 | |||||||||
|
|
|
| |||||||||
| Germany | ||||||||||||
Bank of Georgia Group PLC | 1,207 | 44,535 | 25.5 | |||||||||
|
|
|
| |||||||||
| Italy | ||||||||||||
Sesa SpA | 115 | 14,101 | 8.1 | |||||||||
|
|
|
| |||||||||
| Japan | ||||||||||||
Aeon Delight Co. Ltd. | 700 | 15,513 | 8.9 | |||||||||
Citizen Watch Co. Ltd. | 6,000 | 33,772 | 19.4 | |||||||||
euglena Co. Ltd. | 2,000 | 13,351 | 7.6 | |||||||||
Fukuoka REIT Corp. | 29 | 35,439 | 20.3 | |||||||||
Giken Ltd. | 1,100 | 17,585 | 10.1 | |||||||||
Hogy Medical Co. Ltd. | 800 | 20,385 | 11.7 | |||||||||
JAC Recruitment Co. Ltd. | 1,000 | 19,005 | 10.9 | |||||||||
Kaga Electronics Co. Ltd. | 500 | 17,738 | 10.2 | |||||||||
Kanematsu Corp. | 1,000 | 13,017 | 7.5 | |||||||||
Kitz Corp. | 2,100 | 14,605 | 8.4 | |||||||||
Koshidaka Holdings Co. Ltd. | 2,100 | 18,091 | 10.4 | |||||||||
Kyorin Pharmaceutical Co. Ltd. | 1,000 | 12,870 | 7.4 | |||||||||
Life Corp. | 900 | 19,420 | 11.1 | |||||||||
Meidensha Corp. | 1,700 | 23,487 | 13.5 | |||||||||
Milbon Co. Ltd. | 500 | 21,442 | 12.3 | |||||||||
Modec, Inc. | 1,300 | 14,115 | 8.1 | |||||||||
Nakanishi, Inc. | 1,100 | 21,196 | 12.1 | |||||||||
Nichias Corp. | 2,000 | 41,138 | 23.6 | |||||||||
Nichicon Corp. | 2,000 | 19,281 | 11.0 | |||||||||
Nisshin Oillio Group Ltd. | 1,500 | 37,875 | 21.7 | |||||||||
Nitto Boseki Co. Ltd. | 1,900 | 26,995 | 15.5 | |||||||||
NTN Corp. | 5,400 | 13,566 | 7.8 | |||||||||
Okinawa Electric Power Co., Inc. | 2,100 | 17,422 | 10.0 | |||||||||
Pasona Group, Inc. | 1,000 | 13,996 | 8.0 | |||||||||
PHC Holdings Corp. | 1,500 | 15,683 | 9.0 | |||||||||
Raito Kogyo Co. Ltd. | 3,100 | 46,505 | 26.7 | |||||||||
Sakata Seed Corp. | 500 | 14,878 | 8.5 | |||||||||
Shin-Etsu Polymer Co. Ltd. | 2,800 | 28,036 | 16.1 | |||||||||
Sumitomo Mitsui Construction Co. Ltd. | 4,600 | 13,294 | 7.6 | |||||||||
Tadano Ltd. | 1,900 | 15,123 | 8.7 | |||||||||
Tamron Co. Ltd. | 700 | 17,365 | 9.9 | |||||||||
Tokyu REIT, Inc. | 9 | 12,231 | 7.0 | |||||||||
Toridoll Holdings Corp. | 1,000 | 21,697 | 12.4 | |||||||||
Toyo Tanso Co. Ltd. | 500 | 14,789 | 8.5 | |||||||||
TRE Holdings Corp. | 4,300 | 38,328 | 22.0 | |||||||||
ValueCommerce Co. Ltd. | 1,500 | 14,862 | 8.5 | |||||||||
|
|
|
| |||||||||
| 754,095 | ||||||||||||
| Netherlands | ||||||||||||
Wereldhave NV | 1,056 | 16,241 | 9.3 | |||||||||
|
|
|
| |||||||||
| Norway | ||||||||||||
Aker Solutions ASA | 14,568 | 52,024 | 29.8 | |||||||||
SpareBank 1 SR-Bank ASA | 2,043 | 23,947 | 13.7 | |||||||||
Storebrand ASA | 3,816 | 29,460 | 16.9 | |||||||||
TGS ASA | 817 | 12,820 | 7.4 | |||||||||
|
|
|
| |||||||||
| 118,251 | ||||||||||||
SCHEDULE OF INVESTMENTS | 119 |
Schedule of Investments (continued) April 30, 2023 | BlackRock Global Equity Market Neutral Fund |
| Security | Shares | Value | % of Basket Value | |||||||||
| Singapore | ||||||||||||
BW LPG Ltd. | 1,804 | $ | 14,630 | 8.4 | % | |||||||
|
|
|
| |||||||||
| Spain | ||||||||||||
Pharma Mar SA | 464 | 19,294 | 11.1 | |||||||||
|
|
|
| |||||||||
| Sweden | ||||||||||||
Fortnox AB | 6,243 | 42,712 | 24.5 | |||||||||
Resurs Holding AB | 6,561 | 12,441 | 7.1 | |||||||||
Sectra AB, B Shares | 833 | 13,053 | 7.5 | |||||||||
|
|
|
| |||||||||
| 68,206 | ||||||||||||
| United Kingdom | ||||||||||||
Babcock International Group PLC | 11,459 | 45,429 | 26.0 | |||||||||
Frasers Group PLC | 1,341 | 12,850 | 7.4 | |||||||||
Just Group PLC | 11,737 | 12,920 | 7.4 | |||||||||
Luxfer Holdings PLC | 1,186 | 18,087 | 10.4 | |||||||||
Paragon Banking Group PLC | 6,360 | 39,840 | 22.8 | |||||||||
Spire Healthcare Group PLC | 8,775 | 24,996 | 14.3 | |||||||||
TP ICAP Group PLC | 6,087 | 12,842 | 7.4 | |||||||||
|
|
|
| |||||||||
| 166,964 | ||||||||||||
| United States | ||||||||||||
A10 Networks, Inc. | 1,578 | 22,313 | 12.8 | |||||||||
ACI Worldwide, Inc. | 1,082 | 27,407 | 15.7 | |||||||||
Albany International Corp., Class A | 1,235 | 112,644 | 64.6 | |||||||||
Amedisys, Inc. | 295 | 23,689 | 13.6 | |||||||||
American Axle & Manufacturing Holdings, Inc. | 1,754 | 12,541 | 7.2 | |||||||||
Bank of Hawaii Corp. | 607 | 29,397 | 16.9 | |||||||||
Belden, Inc. | 719 | 56,722 | 32.5 | |||||||||
Benchmark Electronics, Inc. | 604 | 12,895 | 7.4 | |||||||||
Boise Cascade Co. | �� | 682 | 46,588 | 26.7 | ||||||||
Brink’s Co. | 1,327 | 83,402 | 47.8 | |||||||||
CommVault Systems, Inc. | 1,386 | 80,762 | 46.3 | |||||||||
CSG Systems International, Inc. | 1,046 | 55,103 | 31.6 | |||||||||
Denny’s Corp. | 1,281 | 14,360 | 8.2 | |||||||||
Duckhorn Portfolio, Inc. | 2,331 | 35,198 | 20.2 | |||||||||
EchoStar Corp. | 1,634 | 27,892 | 16.0 | |||||||||
Energy Recovery, Inc. | 813 | 18,317 | 10.5 | |||||||||
Enerpac Tool Group Corp. | 1,034 | 24,568 | 14.1 | |||||||||
EnPro Industries, Inc. | 657 | 61,935 | 35.5 | |||||||||
Extreme Networks, Inc. | 2,035 | 36,182 | 20.7 | |||||||||
First Busey Corp. | 850 | 15,453 | 8.9 | |||||||||
Fiverr International Ltd. | 378 | 13,805 | 7.9 | |||||||||
GATX Corp. | 190 | 21,643 | 12.4 | |||||||||
Global Industrial Co. | 1,177 | 31,367 | 18.0 | |||||||||
GoPro, Inc., Class A | 15,124 | 64,731 | 37.1 | |||||||||
Gorman-Rupp Co. | 708 | 17,381 | 10.0 | |||||||||
Griffon Corp. | 759 | 21,594 | 12.4 | |||||||||
Hackett Group, Inc. | 1,390 | 25,798 | 14.8 | |||||||||
Helen of Troy Ltd. | 450 | 45,153 | 25.9 | |||||||||
Herbalife Ltd. | 5,426 | 80,630 | 46.2 | |||||||||
IDT Corp. | 625 | 20,756 | 11.9 | |||||||||
Kaiser Aluminum Corp. | 301 | 19,782 | 11.3 | |||||||||
Kontoor Brands, Inc. | 325 | 14,680 | 8.4 | |||||||||
Korn Ferry | 1,655 | 79,473 | 45.6 | |||||||||
La-Z-Boy, Inc. | 1,926 | 55,334 | 31.7 | |||||||||
McGrath RentCorp | 587 | 52,173 | 29.9 | |||||||||
Mercury General Corp. | 508 | 15,448 | 8.9 | |||||||||
MGP Ingredients, Inc. | 419 | 41,347 | 23.7 | |||||||||
Mr Cooper Group, Inc. | 1,675 | 77,553 | 44.5 | |||||||||
NexPoint Residential Trust, Inc. | 356 | 15,283 | 8.8 | |||||||||
NextGen Healthcare, Inc. | 1,937 | 32,425 | 18.6 | |||||||||
| Security | Shares | Value | % of Basket Value | |||||||||
| United States (continued) | ||||||||||||
Owens & Minor, Inc. | 873 | $ | 13,566 | 7.8 | % | |||||||
Petco Health & Wellness Co., Inc. | 5,185 | 51,643 | 29.6 | |||||||||
PJT Partners, Inc. | 193 | 13,273 | 7.6 | |||||||||
Prestige Consumer Healthcare, Inc. | 189 | 11,629 | 6.7 | |||||||||
RadNet, Inc. | 467 | 12,917 | 7.4 | |||||||||
REX American Resources Corp. | 570 | 16,125 | 9.2 | |||||||||
Rush Enterprises, Inc., Class A | 627 | 33,300 | 19.1 | |||||||||
Sanmina Corp. | 717 | 37,471 | 21.5 | |||||||||
Silk Road Medical, Inc. | 529 | 23,287 | 13.3 | |||||||||
SPX Technologies, Inc. | 475 | 30,248 | 17.3 | |||||||||
TechTarget, Inc. | 529 | 18,034 | 10.3 | |||||||||
Turning Point Brands, Inc. | 1,252 | 29,785 | 17.1 | |||||||||
Under Armour, Inc. | 1,918 | 15,421 | 8.8 | |||||||||
United States Cellular Corp. | 613 | 13,020 | 7.5 | |||||||||
Unitil Corp. | 227 | 12,619 | 7.2 | |||||||||
US Silica Holdings, Inc. | 1,147 | 14,968 | 8.6 | |||||||||
Vector Group Ltd. | 2,773 | 35,328 | 20.3 | |||||||||
|
|
|
| |||||||||
| 1,926,358 | ||||||||||||
| Preferred Stocks | ||||||||||||
| Germany | ||||||||||||
Kloeckner & Co. SE | 2,271 | 25,246 | 14.5 | |||||||||
|
|
|
| |||||||||
Total Reference Entity — Long | 3,687,622 | |||||||||||
|
| |||||||||||
Reference Entity — Short | ||||||||||||
| Common Stocks | ||||||||||||
| Australia | ||||||||||||
Breville Group Ltd. | (938 | ) | (12,848 | ) | (7.3 | ) | ||||||
Chalice Mining Ltd. | (5,823 | ) | (30,987 | ) | (17.8 | ) | ||||||
|
|
|
| |||||||||
| (43,835 | ) | |||||||||||
| Bahamas | ||||||||||||
OneSpaWorld Holdings Ltd. | (1,455 | ) | (17,460 | ) | (10.0 | ) | ||||||
|
|
|
| |||||||||
| Belgium | ||||||||||||
Aedifica SA | (168 | ) | (14,054 | ) | (8.1 | ) | ||||||
|
|
|
| |||||||||
| Canada | ||||||||||||
BELLUS Health, Inc. | (1,027 | ) | (14,746 | ) | (8.5 | ) | ||||||
Sienna Senior Living, Inc. | (1,665 | ) | (13,302 | ) | (7.6 | ) | ||||||
|
|
|
| |||||||||
| (28,048 | ) | |||||||||||
| Denmark | ||||||||||||
ALK-Abello A/S | (1,026 | ) | (13,007 | ) | (7.5 | ) | ||||||
Topdanmark AS | (230 | ) | (12,161 | ) | (7.0 | ) | ||||||
Zealand Pharma A/S | (450 | ) | (15,242 | ) | (8.7 | ) | ||||||
|
|
|
| |||||||||
| (40,410 | ) | |||||||||||
| Egypt | ||||||||||||
Energean PLC | (943 | ) | (14,483 | ) | (8.3 | ) | ||||||
|
|
|
| |||||||||
| France | ||||||||||||
Alten SA | (282 | ) | (48,011 | ) | (27.6 | ) | ||||||
Metropole Television SA | (1,286 | ) | (20,794 | ) | (11.9 | ) | ||||||
|
|
|
| |||||||||
| (68,805 | ) | |||||||||||
| Germany | ||||||||||||
Dermapharm Holding SE | (280 | ) | (13,994 | ) | (8.0 | ) | ||||||
|
|
|
| |||||||||
| Ireland | ||||||||||||
Prothena Corp. PLC | (235 | ) | (12,366 | ) | (7.1 | ) | ||||||
|
|
|
| |||||||||
| Italy | ||||||||||||
Saras SpA | (17,049 | ) | (22,076 | ) | (12.7 | ) | ||||||
|
|
|
| |||||||||
| 120 | 2 0 2 3 BLACK ROCK ANNUAL REPORT TO SHAREHOLDERS |
Schedule of Investments (continued) April 30, 2023 | BlackRock Global Equity Market Neutral Fund
|
| Security | Shares | Value | % of Basket Value | |||||||||
| Japan | ||||||||||||
CRE Logistics REIT, Inc. | (31 | ) | $ | (43,415 | ) | (24.9 | )% | |||||
DCM Holdings Co. Ltd. | (4,500 | ) | (47,951 | ) | (27.5 | ) | ||||||
Fujitec Co. Ltd. | (1,100 | ) | (29,529 | ) | (16.9 | ) | ||||||
Fukushima Galilei Co. Ltd. | (400 | ) | (15,338 | ) | (8.8 | ) | ||||||
Heiwa Real Estate REIT, Inc. | (12 | ) | (14,297 | ) | (8.2 | ) | ||||||
Hokuhoku Financial Group, Inc. | (1,800 | ) | (13,220 | ) | (7.6 | ) | ||||||
Kappa Create Co. Ltd. | (1,200 | ) | (13,563 | ) | (7.8 | ) | ||||||
Kisoji Co. Ltd. | (1,300 | ) | (22,934 | ) | (13.2 | ) | ||||||
Koa Corp. | (1,300 | ) | (16,586 | ) | (9.5 | ) | ||||||
Kura Sushi, Inc. | (2,400 | ) | (58,443 | ) | (33.5 | ) | ||||||
Musashi Seimitsu Industry Co. Ltd. | (1,000 | ) | (13,479 | ) | (7.7 | ) | ||||||
Nippon Carbon Co. Ltd. | (700 | ) | (21,820 | ) | (12.5 | ) | ||||||
Nishimatsuya Chain Co. Ltd. | (1,400 | ) | (16,892 | ) | (9.7 | ) | ||||||
NS United Kaiun Kaisha Ltd. | (700 | ) | (20,877 | ) | (12.0 | ) | ||||||
Okasan Securities Group, Inc. | (2,300 | ) | (7,364 | ) | (4.2 | ) | ||||||
Osaka Soda Co. Ltd. | (400 | ) | (13,185 | ) | (7.6 | ) | ||||||
OSAKA Titanium Technologies Co. Ltd. | (2,500 | ) | (54,144 | ) | (31.0 | ) | ||||||
Rorze Corp. | (600 | ) | (44,835 | ) | (25.7 | ) | ||||||
SAMTY Co. Ltd. | (1,200 | ) | (19,922 | ) | (11.4 | ) | ||||||
Samty Residential Investment Corp. | (17 | ) | (14,725 | ) | (8.4 | ) | ||||||
Shiga Bank Ltd. | (700 | ) | (14,842 | ) | (8.5 | ) | ||||||
Shin Nippon Biomedical Laboratories Ltd. | (4,300 | ) | (79,933 | ) | (45.8 | ) | ||||||
Toho Bank Ltd. | (17,000 | ) | (28,574 | ) | (16.4 | ) | ||||||
Tokyo Electron Device Ltd. | (1,100 | ) | (63,848 | ) | (36.6 | ) | ||||||
Wacoal Holdings Corp. | (2,000 | ) | (39,558 | ) | (22.7 | ) | ||||||
W-Scope Corp. | (2,800 | ) | (23,655 | ) | (13.6 | ) | ||||||
|
|
|
| |||||||||
| (752,929 | ) | |||||||||||
| Netherlands | ||||||||||||
Fugro NV | (2,504 | ) | (35,559 | ) | (20.4 | ) | ||||||
|
|
|
| |||||||||
| Norway | ||||||||||||
PGS ASA | (16,951 | ) | (12,292 | ) | (7.0 | ) | ||||||
|
|
|
| |||||||||
| Singapore | ||||||||||||
AEM Holdings Ltd. | (5,300 | ) | (13,507 | ) | (7.7 | ) | ||||||
|
|
|
| |||||||||
| Spain | ||||||||||||
Ence Energia y Celulosa SA | (4,137 | ) | (16,213 | ) | (9.3 | ) | ||||||
Faes Farma SA | (7,414 | ) | (26,085 | ) | (15.0 | ) | ||||||
|
|
|
| |||||||||
| (42,298 | ) | |||||||||||
| Sweden | ||||||||||||
Billerud AB | (4,452 | ) | (42,442 | ) | (24.3 | ) | ||||||
Dometic Group AB | (4,504 | ) | (32,065 | ) | (18.4 | ) | ||||||
|
|
|
| |||||||||
| (74,507 | ) | |||||||||||
| United Kingdom | ||||||||||||
Ascential PLC | (6,369 | ) | (20,302 | ) | (11.6 | ) | ||||||
Computacenter PLC | (695 | ) | (20,026 | ) | (11.5 | ) | ||||||
GB Group PLC | (6,808 | ) | (27,610 | ) | (15.8 | ) | ||||||
LXI REIT PLC | (15,071 | ) | (19,830 | ) | (11.4 | ) | ||||||
|
|
|
| |||||||||
| (87,768 | ) | |||||||||||
| United States | ||||||||||||
4D Molecular Therapeutics, Inc. | (768 | ) | (13,832 | ) | (7.9 | ) | ||||||
Adtalem Global Education, Inc. | (884 | ) | (35,864 | ) | (20.6 | ) | ||||||
Akero Therapeutics, Inc. | (379 | ) | (16,956 | ) | (9.7 | ) | ||||||
A-Mark Precious Metals, Inc. | (378 | ) | (13,532 | ) | (7.8 | ) | ||||||
ARMOUR Residential REIT, Inc. | (22,318 | ) | (113,822 | ) | (65.3 | ) | ||||||
Atlantic Union Bankshares Corp. | (1,337 | ) | (38,265 | ) | (21.9 | ) | ||||||
AZZ, Inc. | (542 | ) | (20,450 | ) | (11.7 | ) | ||||||
Big Lots, Inc. | (2,970 | ) | (26,700 | ) | (15.3 | ) | ||||||
Calavo Growers, Inc. | (2,028 | ) | (64,815 | ) | (37.2 | ) | ||||||
| Security | Shares | Value | % of Basket Value | |||||||||
| United States (continued) | ||||||||||||
Casella Waste Systems, Inc., Class A | (301 | ) | $ | (26,789 | ) | (15.4 | )% | |||||
Cathay General Bancorp | (565 | ) | (18,006 | ) | (10.3 | ) | ||||||
CBIZ, Inc. | (1,634 | ) | (86,095 | ) | (49.4 | ) | ||||||
Cerevel Therapeutics Holdings, Inc. | (749 | ) | (21,751 | ) | (12.5 | ) | ||||||
Children’s Place, Inc. | (952 | ) | (28,217 | ) | (16.2 | ) | ||||||
Clearfield, Inc. | (1,072 | ) | (46,825 | ) | (26.9 | ) | ||||||
Community Bank System, Inc. | (336 | ) | (16,787 | ) | (9.6 | ) | ||||||
Community Healthcare Trust, Inc. | (426 | ) | (15,246 | ) | (8.7 | ) | ||||||
Core Laboratories NV | (1,045 | ) | (23,523 | ) | (13.5 | ) | ||||||
Corporate Office Properties Trust | (727 | ) | (16,641 | ) | (9.5 | ) | ||||||
Driven Brands Holdings, Inc. | (1,051 | ) | (32,266 | ) | (18.5 | ) | ||||||
Ebix, Inc. | (1,265 | ) | (20,569 | ) | (11.8 | ) | ||||||
Ellington Financial, Inc. | (1,895 | ) | (24,199 | ) | (13.9 | ) | ||||||
Encore Capital Group, Inc. | (352 | ) | (18,086 | ) | (10.4 | ) | ||||||
EnerSys | (231 | ) | (19,166 | ) | (11.0 | ) | ||||||
Enterprise Financial Services Corp. | (470 | ) | (20,097 | ) | (11.5 | ) | ||||||
FARO Technologies, Inc. | (560 | ) | (13,076 | ) | (7.5 | ) | ||||||
Fastly, Inc. | (2,986 | ) | (44,133 | ) | (25.3 | ) | ||||||
Glacier Bancorp, Inc. | (931 | ) | (30,937 | ) | (17.7 | ) | ||||||
Granite Construction, Inc. | (413 | ) | (15,748 | ) | (9.0 | ) | ||||||
Harmonic, Inc. | (1,078 | ) | (15,189 | ) | (8.7 | ) | ||||||
HealthStream, Inc. | (569 | ) | (14,020 | ) | (8.0 | ) | ||||||
Highwoods Properties, Inc. | (624 | ) | (14,302 | ) | (8.2 | ) | ||||||
Hilltop Holdings, Inc. | (428 | ) | (13,277 | ) | (7.6 | ) | ||||||
Independent Bank Corp. | (524 | ) | (29,344 | ) | (16.8 | ) | ||||||
John Wiley & Sons, Inc. | (1,003 | ) | (38,686 | ) | (22.2 | ) | ||||||
Leonardo DRS, Inc. | (2,742 | ) | (41,267 | ) | (23.7 | ) | ||||||
Life Time Group Holdings, Inc. | (2,669 | ) | (55,488 | ) | (31.8 | ) | ||||||
M/I Homes, Inc. | (22 | ) | (1,488 | ) | (0.9 | ) | ||||||
Mirati Therapeutics, Inc. | (2,218 | ) | (98,280 | ) | (56.4 | ) | ||||||
National Presto Industries, Inc. | (129 | ) | (8,775 | ) | (5.0 | ) | ||||||
Northern Oil and Gas, Inc. | (591 | ) | (19,603 | ) | (11.2 | ) | ||||||
Northwest Bancshares, Inc. | (1,220 | ) | (14,262 | ) | (8.2 | ) | ||||||
Nu Skin Enterprises, Inc., Class A | (617 | ) | (24,347 | ) | (14.0 | ) | ||||||
OneSpan, Inc. | (1,012 | ) | (14,917 | ) | (8.6 | ) | ||||||
Otter Tail Corp. | (173 | ) | (12,447 | ) | (7.1 | ) | ||||||
Pacific Biosciences of California, Inc. | (3,265 | ) | (34,609 | ) | (19.8 | ) | ||||||
Phillips Edison & Co., Inc. | (703 | ) | (22,173 | ) | (12.7 | ) | ||||||
Piedmont Lithium, Inc. | (238 | ) | (13,685 | ) | (7.8 | ) | ||||||
PotlatchDeltic Corp. | (1,982 | ) | (91,628 | ) | (52.5 | ) | ||||||
PROCEPT BioRobotics Corp. | (576 | ) | (17,505 | ) | (10.0 | ) | ||||||
Ranger Oil Corp. | (1,076 | ) | (44,331 | ) | (25.4 | ) | ||||||
Renasant Corp. | (535 | ) | (15,044 | ) | (8.6 | ) | ||||||
Resideo Technologies, Inc. | (1,433 | ) | (25,507 | ) | (14.6 | ) | ||||||
Rocket Pharmaceuticals, Inc. | (1,137 | ) | (20,375 | ) | (11.7 | ) | ||||||
Roivant Sciences Ltd. | (1,475 | ) | (12,611 | ) | (7.2 | ) | ||||||
Ryerson Holding Corp. | (515 | ) | (19,451 | ) | (11.2 | ) | ||||||
Sage Therapeutics, Inc. | (716 | ) | (34,977 | ) | (20.1 | ) | ||||||
Scholastic Corp. | (2,283 | ) | (87,827 | ) | (50.4 | ) | ||||||
Select Energy Services, Inc. | (7,540 | ) | (56,022 | ) | (32.1 | ) | ||||||
Select Medical Holdings Corp. | (864 | ) | (26,352 | ) | (15.1 | ) | ||||||
Shake Shack, Inc., Class A | (237 | ) | (12,990 | ) | (7.4 | ) | ||||||
SITE Centers Corp. | (1,067 | ) | (13,167 | ) | (7.6 | ) | ||||||
Sotera Health Co. | (1,001 | ) | (16,787 | ) | (9.6 | ) | ||||||
SpringWorks Therapeutics, Inc. | (530 | ) | (12,391 | ) | (7.1 | ) | ||||||
Stericycle, Inc. | (337 | ) | (15,384 | ) | (8.8 | ) | ||||||
Stock Yards Bancorp, Inc. | (721 | ) | (35,041 | ) | (20.1 | ) | ||||||
Strategic Education, Inc. | (640 | ) | (56,320 | ) | (32.3 | ) | ||||||
Stride, Inc. | (298 | ) | (12,802 | ) | (7.3 | ) | ||||||
TFS Financial Corp. | (1,037 | ) | (12,485 | ) | (7.2 | ) | ||||||
TreeHouse Foods, Inc. | (524 | ) | (27,903 | ) | (16.0 | ) | ||||||
SCHEDULE OF INVESTMENTS | 121 |
Schedule of Investments (continued) April 30, 2023 | BlackRock Global Equity Market Neutral Fund |
| Security | Shares | Value | % of Basket Value | |||||||||
| United States (continued) | ||||||||||||
Trustmark Corp. | (576 | ) | $ | (13,761 | ) | (7.9 | )% | |||||
Ultra Clean Holdings, Inc. | (807 | ) | (23,032 | ) | (13.2 | ) | ||||||
Veris Residential, Inc. | (2,760 | ) | (45,126 | ) | (25.9 | ) | ||||||
Vishay Intertechnology, Inc. | (2,675 | ) | (56,951 | ) | (32.7 | ) | ||||||
WD-40 Co. | (162 | ) | (30,845 | ) | (17.7 | ) | ||||||
Xponential Fitness, Inc., Class A | (413 | ) | (13,662 | ) | (7.8 | ) | ||||||
|
|
|
| |||||||||
| (2,218,829 | ) | |||||||||||
|
| |||||||||||
Total Reference Entity — Short | (3,513,220) | |||||||||||
|
| |||||||||||
Net Value of Reference Entity — UBS AG |
| $ | 174,402 | |||||||||
|
| |||||||||||
Balances Reported in the Statements of Assets and Liabilities for OTC Swaps
| Description | Swap Premiums Paid | Swap Premiums Received | Unrealized Appreciation | Unrealized Depreciation | ||||||||||||
OTC Swaps | $ | — | $ | — | $ | 3,908,318 | $ | (3,091,901 | ) | |||||||
Derivative Financial Instruments Categorized by Risk Exposure
As of period end, the fair values of derivative financial instruments located in the Statements of Assets and Liabilities were as follows:
| Commodity Contracts | Credit Contracts | Equity Contracts | Foreign Currency Exchange Contracts | Interest Rate Contracts | Other Contracts | Total | ||||||||||||||||||||||
Assets — Derivative Financial Instruments |
| |||||||||||||||||||||||||||
Futures contracts | ||||||||||||||||||||||||||||
Unrealized appreciation on futures contracts(a) | $ | — | $ | — | $ | 247 | $ | — | $ | — | $ | — | $ | 247 | ||||||||||||||
Swaps — OTC | ||||||||||||||||||||||||||||
Unrealized appreciation on OTC swaps; Swap premiums paid | — | — | 3,908,318 | — | — | — | 3,908,318 | |||||||||||||||||||||
|
|
|
|
|
|
|
|
|
|
|
|
|
| |||||||||||||||
| $ | — | $ | — | $ | 3,908,565 | $ | — | $ | — | $ | — | $ | 3,908,565 | |||||||||||||||
|
|
|
|
|
|
|
|
|
|
|
|
|
| |||||||||||||||
Liabilities — Derivative Financial Instruments |
| |||||||||||||||||||||||||||
Swaps — OTC | ||||||||||||||||||||||||||||
Unrealized depreciation on OTC swaps; Swap premiums received | $ | — | $ | — | $ | 3,091,901 | $ | — | $ | — | $ | — | $ | 3,091,901 | ||||||||||||||
|
|
|
|
|
|
|
|
|
|
|
|
|
| |||||||||||||||
| (a) | Net cumulative unrealized appreciation (depreciation) on futures contracts and centrally cleared swaps, if any, are reported in the Schedule of Investments. In the Statements of Assets and Liabilities, only current day’s variation margin is reported in receivables or payables and the net cumulative unrealized appreciation (depreciation) is included in accumulated earnings (loss). |
For the period ended April 30, 2023, the effect of derivative financial instruments in the Statements of Operations was as follows:
| Commodity Contracts | Credit Contracts | Equity Contracts | Foreign Currency Exchange Contracts | Interest Rate Contracts | Other Contracts | Total | ||||||||||||||||||||||
Net Realized Gain (Loss) from: | ||||||||||||||||||||||||||||
Futures contracts | $ | — | $ | — | $ | 499,192 | $ | — | $ | — | $ | — | $ | 499,192 | ||||||||||||||
Options purchased(a) | — | — | 3,391,908 | — | — | — | 3,391,908 | |||||||||||||||||||||
Options written | — | — | (1,722,995 | ) | — | — | — | (1,722,995 | ) | |||||||||||||||||||
Swaps | — | — | 66,580,777 | — | — | — | 66,580,777 | |||||||||||||||||||||
|
|
|
|
|
|
|
|
|
|
|
|
|
| |||||||||||||||
| $ | — | $ | — | $ | 68,748,882 | $ | — | $ | — | $ | — | $ | 68,748,882 | |||||||||||||||
|
|
|
|
|
|
|
|
|
|
|
|
|
| |||||||||||||||
| Net Change in Unrealized Appreciation (Depreciation) on: | ||||||||||||||||||||||||||||
Futures contracts | $ | — | $ | — | $ | 611,587 | $ | — | $ | — | $ | — | $ | 611,587 | ||||||||||||||
Swaps | — | — | (36,800,950 | ) | — | — | — | (36,800,950 | ) | |||||||||||||||||||
|
|
|
|
|
|
|
|
|
|
|
|
|
| |||||||||||||||
| $ | — | $ | — | $ | (36,189,363 | ) | $ | — | $ | — | $ | — | $ | (36,189,363 | ) | |||||||||||||
|
|
|
|
|
|
|
|
|
|
|
|
|
| |||||||||||||||
| (a) | Options purchased are included in net realized gain (loss) from investments — unaffiliated. |
| 122 | 2 0 2 3 BLACK ROCK ANNUAL REPORT TO SHAREHOLDERS |
Schedule of Investments (continued) April 30, 2023 | BlackRock Global Equity Market Neutral Fund |
Average Quarterly Balances of Outstanding Derivative Financial Instruments
Futures contracts: | ||||
Average notional value of contracts — long | $ | 21,139,500 | ||
Average notional value of contracts — short | $ | 20,004,364 | ||
Options: | ||||
Average value of option contracts purchased | $ | 557,755 | ||
Average value of option contracts written | $ | 118,445 | ||
Total return swaps: | ||||
Average notional value | $ | (42,615,728 | ) |
For more information about the Fund’s investment risks regarding derivative financial instruments, refer to the Notes to Financial Statements.
Derivative Financial Instruments — Offsetting as of Period End
The Fund’s derivative assets and liabilities (by type) were as follows:
| Assets | Liabilities | |||||||
Derivative Financial Instruments | ||||||||
Futures contracts | $ | 168,086 | $ | — | ||||
Swaps — OTC(a) | 3,908,318 | 3,091,901 | ||||||
|
|
|
| |||||
Total derivative assets and liabilities in the Statements of Assets and Liabilities | 4,076,404 | 3,091,901 | ||||||
|
|
|
| |||||
Derivatives not subject to a Master Netting Agreement or similar agreement (“MNA”) | (168,086 | ) | — | |||||
|
|
|
| |||||
Total derivative assets and liabilities subject to an MNA | $ | 3,908,318 | $ | 3,091,901 | ||||
|
|
|
| |||||
| (a) | Includes unrealized appreciation (depreciation) on OTC swaps and swap premiums (paid/received) in the Statements of Assets and Liabilities. |
The following table presents the Fund’s derivative assets and liabilities by counterparty net of amounts available for offset under an MNA and net of the related collateral received (and pledged) by the Fund:
| Counterparty | | Derivative Assets Subject to an MNA by Counterparty | | | Derivatives Available for Offset | (a) | | Non-Cash Collateral Received | | | Cash Collateral Received | (b) | | Net Amount of Derivative Assets(c) | | |||||
BNP Paribas SA | $ | 2,183,099 | $ | (34,626 | ) | $ | — | $ | (2,148,473 | ) | $ | — | ||||||||
Goldman Sachs Bank USA | 1,724,502 | (1,432,026 | ) | — | — | 292,476 | ||||||||||||||
UBS AG | 717 | (717 | ) | — | — | — | ||||||||||||||
|
|
|
|
|
|
|
|
|
| |||||||||||
| $ | 3,908,318 | $ | (1,467,369 | ) | $ | — | $ | (2,148,473 | ) | $ | 292,476 | |||||||||
|
|
|
|
|
|
|
|
|
| |||||||||||
| ||||||||||||||||||||
| Counterparty | | Derivative Liabilities Subject to an MNA by Counterparty | | | Derivatives Available for Offset | (a) | | Non-Cash Collateral Pledged | (b) | | Cash Collateral Pledged(b) | | | Net Amount of Derivative Liabilities(d) | | |||||
Bank of America N.A | $ | 1,581,515 | $ | — | $ | — | $ | (1,581,515 | ) | $ | — | |||||||||
BNP Paribas SA | 34,626 | (34,626 | ) | — | — | — | ||||||||||||||
Goldman Sachs Bank USA | 1,432,026 | (1,432,026 | ) | — | — | — | ||||||||||||||
UBS AG | 43,734 | (717 | ) | — | (43,017 | ) | — | |||||||||||||
|
|
|
|
|
|
|
|
|
| |||||||||||
| $ | 3,091,901 | $ | (1,467,369 | ) | $ | — | $ | (1,624,532 | ) | $ | — | |||||||||
|
|
|
|
|
|
|
|
|
| |||||||||||
| (a) | The amount of derivatives available for offset is limited to the amount of derivative asset and/or liabilities that are subject to an MNA. |
| (b) | Excess of collateral received/pledged, if any, from the individual counterparty is not shown for financial reporting purposes. |
| (c) | Net amount represents the net amount receivable from the counterparty in the event of default. |
| (d) | Net amount represents the net amount payable due to counterparty in the event of default. |
SCHEDULE OF INVESTMENTS | 123 |
Schedule of Investments (continued) April 30, 2023 | BlackRock Global Equity Market Neutral Fund |
Fair Value Hierarchy as of Period End
Various inputs are used in determining the fair value of financial instruments. For a description of the input levels and information about the Fund’s policy regarding valuation of financial instruments, refer to the Notes to Financial Statements.
The following table summarizes the Fund’s financial instruments categorized in the fair value hierarchy. The breakdown of the Fund’s financial instruments into major categories is disclosed in the Schedule of Investments above.
| Level 1 | Level 2 | Level 3 | Total | |||||||||||||
Assets | ||||||||||||||||
Investments | ||||||||||||||||
Long-Term Investments | ||||||||||||||||
Common Stocks | $ | 31 | $ | — | $ | — | $ | 31 | ||||||||
Preferred Securities | ||||||||||||||||
Preferred Stocks | — | — | 3,467,812 | 3,467,812 | ||||||||||||
U.S. Treasury Obligations | — | 54,793,722 | — | 54,793,722 | ||||||||||||
Short-Term Securities | ||||||||||||||||
Money Market Funds | 1,420,426 | — | — | 1,420,426 | ||||||||||||
U.S. Treasury Obligations | — | 614,207,616 | — | 614,207,616 | ||||||||||||
|
|
|
|
|
|
|
| |||||||||
| $ | 1,420,457 | $ | 669,001,338 | $ | 3,467,812 | $ | 673,889,607 | |||||||||
|
|
|
|
|
|
|
| |||||||||
Derivative Financial Instruments(a) | ||||||||||||||||
Assets | ||||||||||||||||
Equity Contracts | $ | 247 | $ | 3,908,318 | $ | — | $ | 3,908,565 | ||||||||
Liabilities | ||||||||||||||||
Equity Contracts | — | (3,091,901 | ) | — | (3,091,901 | ) | ||||||||||
|
|
|
|
|
|
|
| |||||||||
| $ | 247 | $ | 816,417 | $ | — | $ | 816,664 | |||||||||
|
|
|
|
|
|
|
| |||||||||
| (a) | Derivative financial instruments are swaps and futures contracts. Swaps and futures contracts are valued at the unrealized appreciation (depreciation) on the instrument. |
See notes to financial statements.
| 124 | 2 0 2 3 BLACK ROCK ANNUAL REPORT TO SHAREHOLDERS |
Statements of Assets and Liabilities
April 30, 2023
| BlackRock Advantage Emerging Markets Fund | BlackRock Global Equity Market Neutral Fund | |||||||
ASSETS | ||||||||
Investments, at value — unaffiliated(a)(b) | $ | 79,719,875 | $ | 672,469,181 | ||||
Investments, at value — affiliated(c) | 4,601,926 | 1,420,426 | ||||||
Cash | — | 42,970,626 | ||||||
Cash pledged: | ||||||||
Collateral — OTC derivatives | — | 15,680,000 | ||||||
Futures contracts | 136,000 | 4,752,000 | ||||||
Foreign currency, at value(d) | 620,751 | 12,770,786 | ||||||
Receivables: | ||||||||
Investments sold | 2,097,455 | 660,000 | ||||||
Securities lending income — affiliated | 2 | — | ||||||
Swaps | — | 10,523,206 | ||||||
Capital shares sold | 30,278 | 1,525,023 | ||||||
Dividends — unaffiliated | 154,155 | — | ||||||
Dividends — affiliated | 17,247 | 265,461 | ||||||
Interest — unaffiliated | — | 763,573 | ||||||
From the Manager | 2,302 | — | ||||||
Due from broker | — | 710,000 | ||||||
Variation margin on futures contracts | 22,710 | 168,086 | ||||||
Unrealized appreciation on OTC swaps | — | 3,908,318 | ||||||
Prepaid expenses | 35,917 | 74,119 | ||||||
Other assets | — | 6,099,209 | ||||||
|
|
|
| |||||
Total assets | 87,438,618 | 774,760,014 | ||||||
|
|
|
| |||||
LIABILITIES | ||||||||
Cash received as collateral for OTC derivatives | — | 2,350,001 | ||||||
Collateral on securities loaned | 8,904 | — | ||||||
Payables: | ||||||||
Investments purchased | 2,572,207 | 27,392,003 | ||||||
Swaps | — | 8,632,653 | ||||||
Accounting services fees | 7,393 | 36,663 | ||||||
Administration fees | — | 50,059 | ||||||
Capital shares redeemed | 4,080 | 15,426,530 | ||||||
Custodian fees | 70,264 | 93,716 | ||||||
Deferred foreign capital gain tax | 30,650 | — | ||||||
Investment advisory fees | — | 1,259,706 | ||||||
Trustees’ and Officer’s fees | 1,744 | 2,032 | ||||||
Other accrued expenses | 20,085 | 72,598 | ||||||
Professional fees | 82,658 | 127,810 | ||||||
Service and distribution fees | 1,211 | 8,626 | ||||||
Transfer agent fees | 3,382 | 47,120 | ||||||
Unrealized depreciation on OTC swaps | — | 3,091,901 | ||||||
|
|
|
| |||||
Total liabilities | 2,802,578 | 58,591,418 | ||||||
|
|
|
| |||||
NET ASSETS | $ | 84,636,040 | $ | 716,168,596 | ||||
|
|
|
| |||||
NET ASSETS CONSIST OF | ||||||||
Paid-in capital | $ | 125,712,756 | $ | 725,484,554 | ||||
Accumulated loss | (41,076,716 | ) | (9,315,958 | ) | ||||
|
|
|
| |||||
NET ASSETS | $ | 84,636,040 | $ | 716,168,596 | ||||
|
|
|
| |||||
(a) Investments, at cost — unaffiliated | $ | 79,356,980 | $ | 672,001,137 | ||||
(b) Securities loaned, at value | $ | 8,725 | $ | — | ||||
(c) Investments, at cost — affiliated | $ | 4,601,920 | $ | 1,420,426 | ||||
(d) Foreign currency, at cost | $ | 619,009 | $ | 12,645,268 | ||||
FINANCIAL STATEMENTS | 125 |
Statements of Assets and Liabilities (continued)
April 30, 2023
| BlackRock Advantage Emerging Markets Fund | BlackRock Global Equity Market Neutral Fund | |||||||
NET ASSET VALUE | ||||||||
| Institutional | ||||||||
Net assets | $ | 6,362,335 | $ | 565,026,692 | ||||
|
|
|
| |||||
Shares outstanding | 684,518 | 46,363,467 | ||||||
|
|
|
| |||||
Net asset value | $ | 9.29 | $ | 12.19 | ||||
|
|
|
| |||||
Shares authorized | Unlimited | Unlimited | ||||||
|
|
|
| |||||
Par value | $ | 0.001 | $ | 0.001 | ||||
|
|
|
| |||||
| Investor A | ||||||||
Net assets | $ | 4,428,305 | $ | 22,462,232 | ||||
|
|
|
| |||||
Shares outstanding | 485,960 | 1,877,569 | ||||||
|
|
|
| |||||
Net asset value | $ | 9.11 | $ | 11.96 | ||||
|
|
|
| |||||
Shares authorized | Unlimited | Unlimited | ||||||
|
|
|
| |||||
Par value | $ | 0.001 | $ | 0.001 | ||||
|
|
|
| |||||
| Investor C | ||||||||
Net assets | $ | 429,877 | $ | 5,280,599 | ||||
|
|
|
| |||||
Shares outstanding | 49,701 | 472,400 | ||||||
|
|
|
| |||||
Net asset value | $ | 8.65 | $ | 11.18 | ||||
|
|
|
| |||||
Shares authorized | Unlimited | Unlimited | ||||||
|
|
|
| |||||
Par value | $ | 0.001 | $ | 0.001 | ||||
|
|
|
| |||||
| Class K | ||||||||
Net assets | $ | 73,415,523 | $ | 123,399,073 | ||||
|
|
|
| |||||
Shares outstanding | 7,898,772 | 10,092,396 | ||||||
|
|
|
| |||||
Net asset value | $ | 9.29 | $ | 12.23 | ||||
|
|
|
| |||||
Shares authorized | Unlimited | Unlimited | ||||||
|
|
|
| |||||
Par value | $ | 0.001 | $ | 0.001 | ||||
|
|
|
| |||||
See notes to financial statements.
| 126 | 2 0 2 3 BLACK ROCK ANNUAL REPORT TO SHAREHOLDERS |
Year Ended April 30, 2023
| BlackRock Advantage Emerging Markets Fund | BlackRock Global Equity Market Neutral Fund | |||||||
INVESTMENT INCOME | ||||||||
Dividends — unaffiliated | $ | 4,366,194 | $ | — | ||||
Dividends — affiliated | 131,469 | 440,621 | ||||||
Interest — unaffiliated | 5,167 | 16,862,606 | ||||||
Securities lending income — affiliated — net | 5,000 | — | ||||||
Foreign taxes withheld | (425,078 | ) | — | |||||
|
|
|
| |||||
Total investment income | 4,082,752 | 17,303,227 | ||||||
|
|
|
| |||||
EXPENSES | ||||||||
Investment advisory | 845,665 | 8,240,598 | ||||||
Custodian | 219,509 | 437,595 | ||||||
Professional | 156,223 | 174,857 | ||||||
Registration | 64,827 | 129,495 | ||||||
Printing and postage | 48,619 | 56,803 | ||||||
Administration | 44,926 | 276,198 | ||||||
Accounting services | 31,371 | 161,836 | ||||||
Administration — class specific | 21,142 | 131,849 | ||||||
Transfer agent — class specific | 17,642 | 486,887 | ||||||
Service and distribution — class specific | 14,546 | 97,535 | ||||||
Trustees and Officer | 7,369 | 12,566 | ||||||
Miscellaneous | 19,543 | 132,716 | ||||||
|
|
|
| |||||
Total expenses | 1,491,382 | 10,338,935 | ||||||
Less: | ||||||||
Administration fees waived | (44,925 | ) | — | |||||
Administration fees waived by the Manager — class specific | (21,142 | ) | (131,847 | ) | ||||
Fees waived and/or reimbursed by the Manager | (540,425 | ) | (1,117,768 | ) | ||||
Transfer agent fees waived and/or reimbursed by the Manager — class specific | (10,364 | ) | (205,380 | ) | ||||
|
|
|
| |||||
Total expenses after fees waived and/or reimbursed | 874,526 | 8,883,940 | ||||||
|
|
|
| |||||
Net investment income | 3,208,226 | 8,419,287 | ||||||
|
|
|
| |||||
REALIZED AND UNREALIZED GAIN (LOSS) | ||||||||
Net realized gain (loss) from: | ||||||||
Investments — unaffiliated(a) | (17,989,306 | ) | 3,326,470 | |||||
Investments — affiliated | 81 | — | ||||||
Foreign currency transactions | (287,564 | ) | (992,658 | ) | ||||
Futures contracts | (1,796,119 | ) | 499,192 | |||||
Options written | — | (1,722,995 | ) | |||||
Swaps | — | 66,580,777 | ||||||
|
|
|
| |||||
| (20,072,908 | ) | 67,690,786 | ||||||
|
|
|
| |||||
Net change in unrealized appreciation (depreciation) on: | ||||||||
Investments — unaffiliated(b) | 3,549,626 | 465,700 | ||||||
Investments — affiliated | 6 | — | ||||||
Foreign currency translations | 12,129 | 684,859 | ||||||
Futures contracts | 468,819 | 611,587 | ||||||
Swaps | — | (36,800,950 | ) | |||||
|
|
|
| |||||
| 4,030,580 | (35,038,804 | ) | ||||||
|
|
|
| |||||
Net realized and unrealized gain (loss) | (16,042,328 | ) | 32,651,982 | |||||
|
|
|
| |||||
NET INCREASE (DECREASE) IN NET ASSETS RESULTING FROM OPERATIONS | $ | (12,834,102 | ) | $ | 41,071,269 | |||
|
|
|
| |||||
(a) Net of foreign capital gain tax and capital gain tax refund, if applicable of | $ | 10,683 | $ | — | ||||
(b) Net of increase in deferred foreign capital gain tax of | $ | (30,650 | ) | $ | — | |||
See notes to financial statements.
FINANCIAL STATEMENTS | 127 |
Statements of Changes in Net Assets
| BlackRock Advantage Emerging Markets Fund | BlackRock Global Equity Market Neutral Fund | |||||||||||||||||||
| Year Ended 04/30/23 | Year Ended 04/30/22 | Year Ended 04/30/23 | Year Ended 04/30/22 | |||||||||||||||||
INCREASE (DECREASE) IN NET ASSETS |
| |||||||||||||||||||
OPERATIONS | ||||||||||||||||||||
Net investment income (loss) | $ | 3,208,226 | $ | 2,683,808 | $ | 8,419,287 | $ | (7,192,302 | ) | |||||||||||
Net realized gain (loss) | (20,072,908 | ) | (10,303,637 | ) | 67,690,786 | (40,824,333 | ) | |||||||||||||
Net change in unrealized appreciation (depreciation) | 4,030,580 | (32,996,826 | ) | (35,038,804 | ) | 31,625,594 | ||||||||||||||
|
|
|
|
|
|
|
| |||||||||||||
Net increase (decrease) in net assets resulting from operations | (12,834,102 | ) | (40,616,655 | ) | 41,071,269 | (16,391,041 | ) | |||||||||||||
|
|
|
|
|
|
|
| |||||||||||||
DISTRIBUTIONS TO SHAREHOLDERS(a) | ||||||||||||||||||||
Institutional | (219,347 | ) | (211,822 | ) | — | (5,694,760 | ) | |||||||||||||
Investor A | (165,363 | ) | (69,700 | ) | — | (289,045 | ) | |||||||||||||
Investor C | (8,701 | ) | (451 | ) | — | (83,551 | ) | |||||||||||||
Class K | (2,617,795 | ) | (2,045,863 | ) | — | (64,174 | ) | |||||||||||||
|
|
|
|
|
|
|
| |||||||||||||
Decrease in net assets resulting from distributions to shareholders | (3,011,206 | ) | (2,327,836 | ) | — | (6,131,530 | ) | |||||||||||||
|
|
|
|
|
|
|
| |||||||||||||
CAPITAL SHARE TRANSACTIONS | ||||||||||||||||||||
Net increase (decrease) in net assets derived from capital share transactions | (40,652,940 | ) | 9,079,203 | 72,900,510 | 129,941,298 | |||||||||||||||
|
|
|
|
|
|
|
| |||||||||||||
NET ASSETS | ||||||||||||||||||||
Total increase (decrease) in net assets | (56,498,248 | ) | (33,865,288 | ) | 113,971,779 | 107,418,727 | ||||||||||||||
Beginning of year | 141,134,288 | 174,999,576 | 602,196,817 | 494,778,090 | ||||||||||||||||
|
|
|
|
|
|
|
| |||||||||||||
End of year | $ | 84,636,040 | $ | 141,134,288 | $ | 716,168,596 | $ | 602,196,817 | ||||||||||||
|
|
|
|
|
|
|
| |||||||||||||
| (a) | Distributions for annual periods determined in accordance with U.S. federal income tax regulations. |
See notes to financial statements.
| 128 | 2 0 2 3 BLACK ROCK ANNUAL REPORT TO SHAREHOLDERS |
(For a share outstanding throughout each period)
| BlackRock Advantage Emerging Markets Fund | ||||||||||||||||||||||||
| Institutional | ||||||||||||||||||||||||
| Year Ended 04/30/23 | Year Ended 04/30/22 | Year Ended 04/30/21 | Period from 08/01/19 to 04/30/20 | Year Ended 07/31/19 | Year Ended 07/31/18 | |||||||||||||||||||
Net asset value, beginning of period | $ | 10.11 | $ | 13.24 | $ | 8.85 | $ | 10.25 | $ | 10.59 | $ | 10.10 | ||||||||||||
|
|
|
|
|
|
|
|
|
|
|
| |||||||||||||
Net investment income(a) | 0.28 | 0.20 | 0.15 | 0.10 | 0.18 | 0.07 | ||||||||||||||||||
Net realized and unrealized gain (loss) | (0.75 | ) | (3.17 | ) | 4.43 | (1.27 | ) | (0.52 | ) | 0.42 | ||||||||||||||
|
|
|
|
|
|
|
|
|
|
|
| |||||||||||||
Net increase (decrease) from investment operations | (0.47 | ) | (2.97 | ) | 4.58 | (1.17 | ) | (0.34 | ) | 0.49 | ||||||||||||||
|
|
|
|
|
|
|
|
|
|
|
| |||||||||||||
Distributions from net investment income(b) | (0.35 | ) | (0.16 | ) | (0.19 | ) | (0.23 | ) | — | — | ||||||||||||||
|
|
|
|
|
|
|
|
|
|
|
| |||||||||||||
Net asset value, end of period | $ | 9.29 | $ | 10.11 | $ | 13.24 | $ | 8.85 | $ | 10.25 | $ | 10.59 | ||||||||||||
|
|
|
|
|
|
|
|
|
|
|
| |||||||||||||
Total Return(c) | ||||||||||||||||||||||||
Based on net asset value | (4.57 | )% | (22.62 | )% | 52.00 | % | (11.78 | )%(d) | (3.21 | )%(e) | 4.85 | % | ||||||||||||
|
|
|
|
|
|
|
|
|
|
|
| |||||||||||||
Ratios to Average Net Assets(f) | ||||||||||||||||||||||||
Total expenses | 1.48 | % | 1.19 | % | 1.40 | % | 1.38 | %(g)(h) | 1.42 | %(i)(j) | 1.28 | %(i) | ||||||||||||
|
|
|
|
|
|
|
|
|
|
|
| |||||||||||||
Total expenses after fees waived and/or reimbursed | 0.85 | % | 0.85 | % | 0.85 | % | 0.81 | %(g) | 0.92 | %(j) | 0.94 | % | ||||||||||||
|
|
|
|
|
|
|
|
|
|
|
| |||||||||||||
Net investment income | 3.00 | % | 1.62 | % | 1.29 | % | 1.38 | %(g) | 1.83 | % | 0.67 | % | ||||||||||||
|
|
|
|
|
|
|
|
|
|
|
| |||||||||||||
Supplemental Data | ||||||||||||||||||||||||
Net assets, end of period (000) | $ | 6,362 | $ | 9,583 | $ | 17,216 | $ | 9,689 | $ | 15,904 | $ | 32,775 | ||||||||||||
|
|
|
|
|
|
|
|
|
|
|
| |||||||||||||
Portfolio turnover rate | 159 | % | 183 | % | 180 | %(k) | 141 | %(k) | 128 | %(k) | 111 | %(k) | ||||||||||||
|
|
|
|
|
|
|
|
|
|
|
| |||||||||||||
| (a) | Based on average shares outstanding. |
| (b) | Distributions for annual periods determined in accordance with U.S. federal income tax regulations. |
| (c) | Where applicable, assumes the reinvestment of distributions. |
| (d) | Not annualized. |
| (e) | Includes payment from an affiliate, which had no impact on the Fund’s total return. |
| (f) | Excludes fees and expenses incurred indirectly as a result of investments in underlying funds. |
| (g) | Annualized. |
| (h) | Audit, printing and tax costs were not annualized in the calculation of the expense ratios. If these expenses were annualized, total expenses would have been 1.42%. |
| (i) | Includes recoupment of past waived and/or reimbursed fees. Excluding the recoupment of past waived and/or reimbursed fees, the expense ratios were as follows: |
| Year Ended 04/30/23 | Year Ended 04/30/22 | Year Ended 04/30/21 | Period from 08/01/19 to 04/30/20 | Year Ended 07/31/19 | Year Ended 07/31/18 | |||||||||||||||||||
Expense ratios | N/A | N/A | N/A | N/A | 1.39 | % | 1.28 | % | ||||||||||||||||
|
|
|
|
|
|
|
|
|
|
|
| |||||||||||||
| (j) | Includes non-recurring expenses of offering costs. Without these costs, total expenses and total expenses after fees waived and/or reimbursed would have been 1.40% and 0.90%, respectively. |
| (k) | Excludes underlying investments in total return swaps. |
See notes to financial statements.
FINANCIAL HIGHLIGHTS | 129 |
Financial Highlights (continued)
(For a share outstanding throughout each period)
| BlackRock Advantage Emerging Markets Fund (continued) | ||||||||||||||||||||||||
| Investor A | ||||||||||||||||||||||||
| Year Ended 04/30/23 | Year Ended 04/30/22 | Year Ended 04/30/21 | Period from 08/01/19 to 04/30/20 | Year Ended 07/31/19 | �� | Year Ended 07/31/18 | ||||||||||||||||||
Net asset value, beginning of period | $ | 9.93 | $ | 13.00 | $ | 8.69 | $ | 10.07 | $ | 10.43 | $ | 9.97 | ||||||||||||
|
|
|
|
|
|
|
|
|
|
|
| |||||||||||||
Net investment income(a) | 0.23 | 0.15 | 0.11 | 0.07 | 0.17 | 0.14 | ||||||||||||||||||
Net realized and unrealized gain (loss) | (0.72 | ) | (3.09 | ) | 4.36 | (1.25 | ) | (0.53 | ) | 0.32 | ||||||||||||||
|
|
|
|
|
|
|
|
|
|
|
| |||||||||||||
Net increase (decrease) from investment operations | (0.49 | ) | (2.94 | ) | 4.47 | (1.18 | ) | (0.36 | ) | 0.46 | ||||||||||||||
|
|
|
|
|
|
|
|
|
|
|
| |||||||||||||
Distributions from net investment income(b) | (0.33 | ) | (0.13 | ) | (0.16 | ) | (0.20 | ) | — | — | ||||||||||||||
|
|
|
|
|
|
|
|
|
|
|
| |||||||||||||
Net asset value, end of period | $ | 9.11 | $ | 9.93 | $ | 13.00 | $ | 8.69 | $ | 10.07 | $ | 10.43 | ||||||||||||
|
|
|
|
|
|
|
|
|
|
|
| |||||||||||||
Total Return(c) | ||||||||||||||||||||||||
Based on net asset value | (4.84 | )% | (22.83 | )% | 51.62 | % | (12.05 | )%(d) | (3.45 | )%(e) | 4.61 | % | ||||||||||||
|
|
|
|
|
|
|
|
|
|
|
| |||||||||||||
Ratios to Average Net Assets(f) | ||||||||||||||||||||||||
Total expenses | 1.87 | % | 1.52 | % | 1.74 | % | 1.70 | %(g)(h) | 1.69 | %(i)(j) | 1.57 | %(i) | ||||||||||||
|
|
|
|
|
|
|
|
|
|
|
| |||||||||||||
Total expenses after fees waived and/or reimbursed | 1.15 | % | 1.15 | % | 1.14 | % | 1.12 | %(g) | 1.17 | %(j) | 1.19 | % | ||||||||||||
|
|
|
|
|
|
|
|
|
|
|
| |||||||||||||
Net investment income | 2.54 | % | 1.29 | % | 0.98 | % | 1.02 | %(g) | 1.74 | % | 1.32 | % | ||||||||||||
|
|
|
|
|
|
|
|
|
|
|
| |||||||||||||
Supplemental Data | ||||||||||||||||||||||||
Net assets, end of period (000) | $ | 4,428 | $ | 5,246 | $ | 7,125 | $ | 5,224 | $ | 3,817 | $ | 5,454 | ||||||||||||
|
|
|
|
|
|
|
|
|
|
|
| |||||||||||||
Portfolio turnover rate | 159 | % | 183 | % | 180 | %(k) | 141 | %(k) | 128 | %(k) | 111 | %(k) | ||||||||||||
|
|
|
|
|
|
|
|
|
|
|
| |||||||||||||
| (a) | Based on average shares outstanding. |
| (b) | Distributions for annual periods determined in accordance with U.S. federal income tax regulations. |
| (c) | Where applicable, excludes the effects of any sales charges and assumes the reinvestment of distributions. |
| (d) | Not annualized. |
| (e) | Includes payment from an affiliate, which had no impact on the Fund’s total return. |
| (f) | Excludes fees and expenses incurred indirectly as a result of investments in underlying funds. |
| (g) | Annualized. |
| (h) | Audit, printing and tax costs were not annualized in the calculation of the expense ratios. If these expenses were annualized, total expenses would have been 1.74%. |
| (i) | Includes recoupment of past waived and/or reimbursed fees. Excluding the recoupment of past waived and/or reimbursed fees, the expense ratios were as follows: |
| Year Ended 04/30/23 | Year Ended 04/30/22 | Year Ended 04/30/21 | Period from 08/01/19 to 04/30/20 | Year Ended 07/31/19 | Year Ended 07/31/18 | |||||||||||||||||||
Expense ratios | N/A | N/A | N/A | N/A | 1.67 | % | 1.55 | % | ||||||||||||||||
|
|
|
|
|
|
|
|
|
|
|
| |||||||||||||
| (j) | Includes non-recurring expenses of offering costs. Without these costs, total expenses and total expenses after fees waived and/or reimbursed would have been 1.67% and 1.15%, respectively. |
| (k) | Excludes underlying investments in total return swaps. |
See notes to financial statements.
| 130 | 2 0 2 3 BLACK ROCK ANNUAL REPORT TO SHAREHOLDERS |
Financial Highlights (continued)
(For a share outstanding throughout each period)
| BlackRock Advantage Emerging Markets Fund (continued) | ||||||||||||||||||||||||
| Investor C | ||||||||||||||||||||||||
| Year Ended 04/30/23 | Year Ended 04/30/22 | Year Ended 04/30/21 | Period from 08/01/19 to 04/30/20 | Year Ended 07/31/19 | Year Ended 07/31/18 | |||||||||||||||||||
Net asset value, beginning of period | $ | 9.46 | $ | 12.36 | $ | 8.29 | $ | 9.53 | $ | 9.95 | $ | 9.58 | ||||||||||||
|
|
|
|
|
|
|
|
|
|
|
| |||||||||||||
Net investment income(a) | 0.15 | 0.07 | 0.04 | 0.02 | 0.08 | 0.03 | ||||||||||||||||||
Net realized and unrealized gain (loss) | (0.68 | ) | (2.96 | ) | 4.14 | (1.21 | ) | (0.50 | ) | 0.34 | ||||||||||||||
|
|
|
|
|
|
|
|
|
|
|
| |||||||||||||
Net increase (decrease) from investment operations | (0.53 | ) | (2.89 | ) | 4.18 | (1.19 | ) | (0.42 | ) | 0.37 | ||||||||||||||
|
|
|
|
|
|
|
|
|
|
|
| |||||||||||||
Distributions from net investment income(b) | (0.28 | ) | (0.01 | ) | (0.11 | ) | (0.05 | ) | — | — | ||||||||||||||
|
|
|
|
|
|
|
|
|
|
|
| |||||||||||||
Net asset value, end of period | $ | 8.65 | $ | 9.46 | $ | 12.36 | $ | 8.29 | $ | 9.53 | $ | 9.95 | ||||||||||||
|
|
|
|
|
|
|
|
|
|
|
| |||||||||||||
Total Return(c) | ||||||||||||||||||||||||
Based on net asset value | (5.51 | )% | (23.40 | )% | 50.49 | % | (12.57 | )%(d) | (4.22 | )%(e) | 3.86 | % | ||||||||||||
|
|
|
|
|
|
|
|
|
|
|
| |||||||||||||
Ratios to Average Net Assets(f) | ||||||||||||||||||||||||
Total expenses | 2.75 | % | 2.43 | % | 2.56 | % | 2.53 | %(g)(h) | 2.53 | %(i) | 2.38 | % | ||||||||||||
|
|
|
|
|
|
|
|
|
|
|
| |||||||||||||
Total expenses after fees waived and/or reimbursed | 1.90 | % | 1.90 | % | 1.90 | % | 1.90 | %(g) | 1.92 | %(i) | 1.94 | % | ||||||||||||
|
|
|
|
|
|
|
|
|
|
|
| |||||||||||||
Net investment income | 1.72 | % | 0.61 | % | 0.43 | % | 0.26 | %(g) | 0.81 | % | 0.25 | % | ||||||||||||
|
|
|
|
|
|
|
|
|
|
|
| |||||||||||||
Supplemental Data | ||||||||||||||||||||||||
Net assets, end of period (000) | $ | 430 | $ | 282 | $ | 550 | $ | 1,164 | $ | 2,280 | $ | 3,240 | ||||||||||||
|
|
|
|
|
|
|
|
|
|
|
| |||||||||||||
Portfolio turnover rate | 159 | % | 183 | % | 180 | %(j) | 141 | %(j) | 128 | %(j) | 111 | %(j) | ||||||||||||
|
|
|
|
|
|
|
|
|
|
|
| |||||||||||||
| (a) | Based on average shares outstanding. |
| (b) | Distributions for annual periods determined in accordance with U.S. federal income tax regulations. |
| (c) | Where applicable, excludes the effects of any sales charges and assumes the reinvestment of distributions. |
| (d) | Not annualized. |
| (e) | Includes payment from an affiliate, which had no impact on the Fund’s total return. |
| (f) | Excludes fees and expenses incurred indirectly as a result of investments in underlying funds. |
| (g) | Annualized. |
| (h) | Audit, printing and tax costs were not annualized in the calculation of the expense ratios. If these expenses were annualized, total expenses would have been 2.57%. |
| (i) | Includes non-recurring expenses of offering costs. Without these costs, total expenses and total expenses after fees waived and/or reimbursed would have been 2.51% and 1.90%, respectively. |
| (j) | Excludes underlying investments in total return swaps. |
See notes to financial statements.
FINANCIAL HIGHLIGHTS | 131 |
Financial Highlights (continued)
(For a share outstanding throughout each period)
| BlackRock Advantage Emerging Markets Fund (continued) | ||||||||||||||||||||||||||||||||||||||||||||
| Class K | ||||||||||||||||||||||||||||||||||||||||||||
| | Year Ended 04/30/23 | | | Year Ended 04/30/22 | | | Year Ended 04/30/21 | | | Period from 08/01/19 to 04/30/20 | | | Year Ended 07/31/19 | | | Period from 01/25/18 to 07/31/18 | (a)
| |||||||||||||||||||||||||||
Net asset value, beginning of period | $ | 10.11 | $ | 13.24 | $ | 8.84 | $ | 10.26 | $ | 10.59 | $ | 12.14 | ||||||||||||||||||||||||||||||||
|
|
|
|
|
|
|
|
|
|
|
| |||||||||||||||||||||||||||||||||
Net investment income(b) | 0.29 | 0.20 | 0.16 | 0.10 | 0.19 | 0.13 | ||||||||||||||||||||||||||||||||||||||
Net realized and unrealized gain (loss) | (0.76 | ) | (3.16 | ) | 4.43 | (1.28 | ) | (0.52 | ) | (1.68 | ) | |||||||||||||||||||||||||||||||||
|
|
|
|
|
|
|
|
|
|
|
| |||||||||||||||||||||||||||||||||
Net increase (decrease) from investment operations | (0.47 | ) | (2.96 | ) | 4.59 | (1.18 | ) | (0.33 | ) | (1.55 | ) | |||||||||||||||||||||||||||||||||
|
|
|
|
|
|
|
|
|
|
|
| |||||||||||||||||||||||||||||||||
Distributions from net investment income(c) | (0.35 | ) | (0.17 | ) | (0.19 | ) | (0.24 | ) | — | — | ||||||||||||||||||||||||||||||||||
|
|
|
|
|
|
|
|
|
|
|
| |||||||||||||||||||||||||||||||||
Net asset value, end of period | $ | 9.29 | $ | 10.11 | $ | 13.24 | $ | 8.84 | $ | 10.26 | $ | 10.59 | ||||||||||||||||||||||||||||||||
|
|
|
|
|
|
|
|
|
|
|
| |||||||||||||||||||||||||||||||||
Total Return(d) | ||||||||||||||||||||||||||||||||||||||||||||
Based on net asset value | (4.53 | )% | (22.59 | )% | 52.19 | % | (11.87 | )%(e) | (3.12 | )%(f) | (12.77 | )%(e) | ||||||||||||||||||||||||||||||||
|
|
|
|
|
|
|
|
|
|
|
| |||||||||||||||||||||||||||||||||
Ratios to Average Net Assets(g) | ||||||||||||||||||||||||||||||||||||||||||||
Total expenses | 1.38 | % | 1.13 | % | 1.36 | % | 1.41 | %(h)(i) | 1.37 | %(j) | 1.32 | %(h)(k) | ||||||||||||||||||||||||||||||||
|
|
|
|
|
|
|
|
|
|
|
| |||||||||||||||||||||||||||||||||
Total expenses after fees waived and/or reimbursed | 0.81 | % | 0.81 | % | 0.81 | % | 0.81 | %(h) | 0.87 | %(j) | 0.89 | %(h) | ||||||||||||||||||||||||||||||||
|
|
|
|
|
|
|
|
|
|
|
| |||||||||||||||||||||||||||||||||
Net investment income | 3.07 | % | 1.63 | % | 1.36 | % | 1.33 | %(h) | 1.93 | % | 2.33 | %(h) | ||||||||||||||||||||||||||||||||
|
|
|
|
|
|
|
|
|
|
|
| |||||||||||||||||||||||||||||||||
Supplemental Data | ||||||||||||||||||||||||||||||||||||||||||||
Net assets, end of period (000) | $ | 73,416 | $ | 126,023 | $ | 150,108 | $ | 85,164 | $ | 80,529 | $ | 145,476 | ||||||||||||||||||||||||||||||||
|
|
|
|
|
|
|
|
|
|
|
| |||||||||||||||||||||||||||||||||
Portfolio turnover rate | 159 | % | 183 | % | 180 | %(l) | 141 | %(l) | 128 | %(l) | 111 | %(l)(m) | ||||||||||||||||||||||||||||||||
|
|
|
|
|
|
|
|
|
|
|
| |||||||||||||||||||||||||||||||||
| (a) | Commencement of operations. |
| (b) | Based on average shares outstanding. |
| (c) | Distributions for annual periods determined in accordance with U.S. federal income tax regulations. |
| (d) | Where applicable, assumes the reinvestment of distributions. |
| (e) | Not annualized. |
| (f) | Includes payment from an affiliate, which had no impact on the Fund’s total return. |
| (g) | Excludes fees and expenses incurred indirectly as a result of investments in underlying funds. |
| (h) | Annualized. |
| (i) | Audit, printing and tax costs were not annualized in the calculation of the expense ratios. If these expenses were annualized, the total expenses would have been 1.45%. |
| (j) | Includes non-recurring expenses of offering costs. Without these costs, total expenses and total expenses after fees waived and/or reimbursed would have been 1.34% and 0.84%, respectively. |
| (k) | Offering costs were not annualized in the calculation of the expense ratios. If these expenses were annualized, the total expenses would have been 1.31%. |
| (l) | Excludes underlying investments in total return swaps. |
| (m) | Portfolio turnover rate is representative of the Fund for the entire year. |
See notes to financial statements.
| 132 | 2 0 2 3 BLACK ROCK ANNUAL REPORT TO SHAREHOLDERS |
Financial Highlights (continued)
(For a share outstanding throughout each period)
| BlackRock Global Equity Market Neutral Fund | ||||||||||||||||||||||||||||||||||||||||||||
| Institutional | ||||||||||||||||||||||||||||||||||||||||||||
| Year Ended 04/30/23 | Year Ended 04/30/22 | Year Ended 04/30/21 | Period from 08/01/19 to 04/30/20 | Year Ended 07/31/19 | Year Ended 07/31/18 | |||||||||||||||||||||||||||||||||||||||
Net asset value, beginning of period | $ | 11.49 | $ | 11.98 | $ | 11.42 | $ | 12.67 | $ | 12.17 | $ | 11.62 | ||||||||||||||||||||||||||||||||
|
|
|
|
|
|
|
|
|
|
|
| |||||||||||||||||||||||||||||||||
Net investment income (loss)(a) | 0.14 | (0.15 | ) | (0.17 | ) | (0.01 | ) | 0.05 | (0.06 | ) | ||||||||||||||||||||||||||||||||||
Net realized and unrealized gain (loss) | 0.56 | (0.20 | ) | 0.76 | (0.46 | ) | 0.57 | 0.61 | ||||||||||||||||||||||||||||||||||||
|
|
|
|
|
|
|
|
|
|
|
| |||||||||||||||||||||||||||||||||
Net increase (decrease) from investment operations | 0.70 | (0.35 | ) | 0.59 | (0.47 | ) | 0.62 | 0.55 | ||||||||||||||||||||||||||||||||||||
|
|
|
|
|
|
|
|
|
|
|
| |||||||||||||||||||||||||||||||||
Distributions(b) | ||||||||||||||||||||||||||||||||||||||||||||
From net investment income | — | — | — | (0.04 | ) | — | — | |||||||||||||||||||||||||||||||||||||
From net realized gain | — | (0.14 | ) | (0.03 | ) | (0.74 | ) | (0.12 | ) | — | ||||||||||||||||||||||||||||||||||
|
|
|
|
|
|
|
|
|
|
|
| |||||||||||||||||||||||||||||||||
Total distributions | — | (0.14 | ) | (0.03 | ) | (0.78 | ) | (0.12 | ) | — | ||||||||||||||||||||||||||||||||||
|
|
|
|
|
|
|
|
|
|
|
| |||||||||||||||||||||||||||||||||
Net asset value, end of period | $ | 12.19 | $ | 11.49 | $ | 11.98 | $ | 11.42 | $ | 12.67 | $ | 12.17 | ||||||||||||||||||||||||||||||||
|
|
|
|
|
|
|
|
|
|
|
| |||||||||||||||||||||||||||||||||
Total Return(c) | ||||||||||||||||||||||||||||||||||||||||||||
Based on net asset value | 6.09 | % | (2.94 | )%(d) | 5.21 | %(e) | (3.80 | )%(f) | 5.09 | % | 4.73 | % | ||||||||||||||||||||||||||||||||
|
|
|
|
|
|
|
|
|
|
|
| |||||||||||||||||||||||||||||||||
Ratios to Average Net Assets(g) | ||||||||||||||||||||||||||||||||||||||||||||
Total expenses | 1.57 | % | 1.58 | % | 1.82 | % | 1.80 | %(h) | 1.76 | % | 1.73 | %(i) | ||||||||||||||||||||||||||||||||
|
|
|
|
|
|
|
|
|
|
|
| |||||||||||||||||||||||||||||||||
Total expenses after fees waived and/or reimbursed | 1.34 | % | 1.36 | % | 1.57 | % | 1.57 | %(h) | 1.63 | % | 1.66 | % | ||||||||||||||||||||||||||||||||
|
|
|
|
|
|
|
|
|
|
|
| |||||||||||||||||||||||||||||||||
Net investment income (loss) | 1.24 | % | (1.29 | )% | (1.49 | )% | (0.09 | )%(h) | 0.36 | % | (0.51 | )% | ||||||||||||||||||||||||||||||||
|
|
|
|
|
|
|
|
|
|
|
| |||||||||||||||||||||||||||||||||
Supplemental Data | ||||||||||||||||||||||||||||||||||||||||||||
Net assets, end of period (000) | $ | 565,027 | $ | 565,502 | $ | 459,420 | $ | 492,021 | $ | 546,561 | $ | 559,028 | ||||||||||||||||||||||||||||||||
|
|
|
|
|
|
|
|
|
|
|
| |||||||||||||||||||||||||||||||||
Portfolio turnover rate | 79 | %(j) | 31 | %(j) | 43 | %(j) | 53 | %(j) | 7 | %(j) | 20 | %(j) | ||||||||||||||||||||||||||||||||
|
|
|
|
|
|
|
|
|
|
|
| |||||||||||||||||||||||||||||||||
| (a) | Based on average shares outstanding. |
| (b) | Distributions for annual periods determined in accordance with U.S. federal income tax regulations. |
| (c) | Where applicable, assumes the reinvestment of distributions. |
| (d) | Includes payment from an affiliate, which had no impact on the Fund’s total return. |
| (e) | Includes payments from an affiliate, which impacted the Fund’s total return. Excluding the payments, the Fund’s total return would have been 5.12%. |
| (f) | Not annualized. |
| (g) | Excludes fees and expenses incurred indirectly as a result of investments in underlying funds. |
| (h) | Annualized. |
| (i) | Includes recoupment of past waived and/or reimbursed fees. Excluding the recoupment of past waived and/or reimbursed fees, the expense ratios were as follows: |
| Year Ended 04/30/23 | Year Ended 04/30/22 | Year Ended 04/30/21 | Period from 08/01/19 to 04/30/20 | Year Ended 07/31/19 | Year Ended 07/31/18 | |||||||||||||||||||
Expense ratios | N/A | N/A | N/A | N/A | N/A | 1.71 | % | |||||||||||||||||
|
|
|
|
|
|
|
|
|
|
|
| |||||||||||||
| (j) | Excludes underlying investments in total return swaps. |
See notes to financial statements.
FINANCIAL HIGHLIGHTS | 133 |
Financial Highlights (continued)
(For a share outstanding throughout each period)
| BlackRock Global Equity Market Neutral Fund (continued) | ||||||||||||||||||||||||||||||||||||||||||||
| Investor A | ||||||||||||||||||||||||||||||||||||||||||||
| Year Ended 04/30/23 | Year Ended 04/30/22 | Year Ended 04/30/21 | Period from 08/01/19 to 04/30/20 | Year Ended 07/31/19 | Year Ended 07/31/18 | |||||||||||||||||||||||||||||||||||||||
Net asset value, beginning of period | $ | 11.30 | $ | 11.82 | $ | 11.27 | $ | 12.50 | $ | 12.03 | $ | 11.52 | ||||||||||||||||||||||||||||||||
|
|
|
|
|
|
|
|
|
|
|
| |||||||||||||||||||||||||||||||||
Net investment income (loss)(a) | 0.11 | (0.18 | ) | (0.20 | ) | (0.02 | ) | 0.01 | (0.10 | ) | ||||||||||||||||||||||||||||||||||
Net realized and unrealized gain (loss) | 0.55 | (0.20 | ) | 0.75 | (0.46 | ) | 0.56 | 0.61 | ||||||||||||||||||||||||||||||||||||
|
|
|
|
|
|
|
|
|
|
|
| |||||||||||||||||||||||||||||||||
Net increase (decrease) from investment operations | 0.66 | (0.38 | ) | 0.55 | (0.48 | ) | 0.57 | 0.51 | ||||||||||||||||||||||||||||||||||||
|
|
|
|
|
|
|
|
|
|
|
| |||||||||||||||||||||||||||||||||
Distributions(b) | ||||||||||||||||||||||||||||||||||||||||||||
From net investment income | — | — | — | (0.01 | ) | — | — | |||||||||||||||||||||||||||||||||||||
From net realized gain | — | (0.14 | ) | (0.00 | )(c) | (0.74 | ) | (0.10 | ) | — | ||||||||||||||||||||||||||||||||||
|
|
|
|
|
|
|
|
|
|
|
| |||||||||||||||||||||||||||||||||
Total distributions | — | (0.14 | ) | (0.00 | ) | (0.75 | ) | (0.10 | ) | — | ||||||||||||||||||||||||||||||||||
|
|
|
|
|
|
|
|
|
|
|
| |||||||||||||||||||||||||||||||||
Net asset value, end of period | $ | 11.96 | $ | 11.30 | $ | 11.82 | $ | 11.27 | $ | 12.50 | $ | 12.03 | ||||||||||||||||||||||||||||||||
|
|
|
|
|
|
|
|
|
|
|
| |||||||||||||||||||||||||||||||||
Total Return(d) | ||||||||||||||||||||||||||||||||||||||||||||
Based on net asset value | 5.84 | % | (3.23 | )%(e) | 4.92 | %(f) | (3.94 | )%(g) | 4.79 | % | 4.43 | % | ||||||||||||||||||||||||||||||||
|
|
|
|
|
|
|
|
|
|
|
| |||||||||||||||||||||||||||||||||
Ratios to Average Net Assets(h) | ||||||||||||||||||||||||||||||||||||||||||||
Total expenses | 1.83 | % | 1.86 | % | 2.07 | % | 2.07 | %(i) | 2.04 | % | 2.03 | %(j) | ||||||||||||||||||||||||||||||||
|
|
|
|
|
|
|
|
|
|
|
| |||||||||||||||||||||||||||||||||
Total expenses after fees waived and/or reimbursed | 1.59 | % | 1.61 | % | 1.82 | % | 1.82 | %(i) | 1.88 | % | 1.96 | % | ||||||||||||||||||||||||||||||||
|
|
|
|
|
|
|
|
|
|
|
| |||||||||||||||||||||||||||||||||
Net investment income (loss) | 1.00 | % | (1.54 | )% | (1.75 | )% | (0.28 | )%(i) | 0.12 | % | (0.84 | )% | ||||||||||||||||||||||||||||||||
|
|
|
|
|
|
|
|
|
|
|
| |||||||||||||||||||||||||||||||||
Supplemental Data | ||||||||||||||||||||||||||||||||||||||||||||
Net assets, end of period (000) | $ | 22,462 | $ | 25,229 | $ | 23,390 | $ | 23,509 | $ | 49,514 | $ | 49,180 | ||||||||||||||||||||||||||||||||
|
|
|
|
|
|
|
|
|
|
|
| |||||||||||||||||||||||||||||||||
Portfolio turnover rate | 79 | %(k) | 31 | %(k) | 43 | %(k) | 53 | %(k) | 7 | %(k) | 20 | %(k) | ||||||||||||||||||||||||||||||||
|
|
|
|
|
|
|
|
|
|
|
| |||||||||||||||||||||||||||||||||
| (a) | Based on average shares outstanding. |
| (b) | Distributions for annual periods determined in accordance with U.S. federal income tax regulations. |
| (c) | Amount is greater than $(0.005) per share. |
| (d) | Where applicable, excludes the effects of any sales charges and assumes the reinvestment of distributions. |
| (e) | Includes payment from an affiliate, which had no impact on the Fund’s total return. |
| (f) | Includes payments received from an affiliate, which impacted the Fund’s total return. Excluding the payments, the Fund’s total return would have been 4.83%. |
| (g) | Not annualized. |
| (h) | Excludes fees and expenses incurred indirectly as a result of investments in underlying funds. |
| (i) | Annualized. |
| (j) | Includes recoupment of past waived and/or reimbursed fees. Excluding the recoupment of past waived and/or reimbursed fees, the expense ratios were as follows: |
| Year Ended 04/30/23 | Year Ended 04/30/22 | Year Ended 04/30/21 | Period from 08/01/19 to 04/30/20 | Year Ended 07/31/19 | Year Ended 07/31/18 | |||||||||||||||||||
Expense ratios | N/A | N/A | N/A | N/A | N/A | 1.95 | % | |||||||||||||||||
|
|
|
|
|
|
|
|
|
|
|
| |||||||||||||
| (k) | Excludes underlying investments in total return swaps. |
See notes to financial statements.
| 134 | 2 0 2 3 BLACK ROCK ANNUAL REPORT TO SHAREHOLDERS |
Financial Highlights (continued)
(For a share outstanding throughout each period)
| BlackRock Global Equity Market Neutral Fund (continued) | ||||||||||||||||||||||||||||||||||||||||||||
| Investor C | ||||||||||||||||||||||||||||||||||||||||||||
| | Year Ended 04/30/23 | | | Year Ended 04/30/22 | | | Year Ended 04/30/21 | | | Period from 08/01/19 to 04/30/20 | | | Year Ended 07/31/19 | | | Year Ended 07/31/18 | | |||||||||||||||||||||||||||
Net asset value, beginning of period | $ | 10.64 | $ | 11.22 | $ | 10.77 | $ | 11.99 | $ | 11.59 | $ | 11.18 | ||||||||||||||||||||||||||||||||
|
|
|
|
|
|
|
|
|
|
|
| |||||||||||||||||||||||||||||||||
Net investment income (loss)(a) | 0.03 | (0.25 | ) | (0.27 | ) | (0.09 | ) | (0.08 | ) | (0.18 | ) | |||||||||||||||||||||||||||||||||
Net realized and unrealized gain (loss) | 0.51 | (0.19 | ) | 0.72 | (0.44 | ) | 0.54 | 0.59 | ||||||||||||||||||||||||||||||||||||
|
|
|
|
|
|
|
|
|
|
|
| |||||||||||||||||||||||||||||||||
Net increase (decrease) from investment operations | 0.54 | (0.44 | ) | 0.45 | (0.53 | ) | 0.46 | 0.41 | ||||||||||||||||||||||||||||||||||||
|
|
|
|
|
|
|
|
|
|
|
| |||||||||||||||||||||||||||||||||
Distributions from net realized gain(b) | — | (0.14 | ) | — | (0.69 | ) | (0.06 | ) | — | |||||||||||||||||||||||||||||||||||
|
|
|
|
|
|
|
|
|
|
|
| |||||||||||||||||||||||||||||||||
Net asset value, end of period | $ | 11.18 | $ | 10.64 | $ | 11.22 | $ | 10.77 | $ | 11.99 | $ | 11.59 | ||||||||||||||||||||||||||||||||
|
|
|
|
|
|
|
|
|
|
|
| |||||||||||||||||||||||||||||||||
Total Return(c) | ||||||||||||||||||||||||||||||||||||||||||||
Based on net asset value | 5.08 | % | (3.95 | )%(d) | 4.18 | %(e) | (4.51 | )%(f) | 4.02 | % | 3.67 | % | ||||||||||||||||||||||||||||||||
|
|
|
|
|
|
|
|
|
|
|
| |||||||||||||||||||||||||||||||||
Ratios to Average Net Assets(g) | ||||||||||||||||||||||||||||||||||||||||||||
Total expenses | 2.63 | % | 2.64 | % | 2.86 | % | 2.83 | %(h) | 2.79 | % | 2.76 | %(i) | ||||||||||||||||||||||||||||||||
|
|
|
|
|
|
|
|
|
|
|
| |||||||||||||||||||||||||||||||||
Total expenses after fees waived and/or reimbursed | 2.34 | % | 2.36 | % | 2.57 | % | 2.57 | %(h) | 2.63 | % | 2.69 | % | ||||||||||||||||||||||||||||||||
|
|
|
|
|
|
|
|
|
|
|
| |||||||||||||||||||||||||||||||||
Net investment income (loss) | 0.25 | % | (2.30 | )% | (2.44 | )% | (1.04 | )%(h) | (0.64 | )% | (1.58 | )% | ||||||||||||||||||||||||||||||||
|
|
|
|
|
|
|
|
|
|
|
| |||||||||||||||||||||||||||||||||
Supplemental Data | ||||||||||||||||||||||||||||||||||||||||||||
Net assets, end of period (000) | $ | 5,281 | $ | 4,386 | $ | 6,817 | $ | 11,539 | $ | 17,282 | $ | 21,168 | ||||||||||||||||||||||||||||||||
|
|
|
|
|
|
|
|
|
|
|
| |||||||||||||||||||||||||||||||||
Portfolio turnover rate | 79 | %(j) | 31 | %(j) | 43 | %(j) | 53 | %(j) | 7 | %(j) | 20 | %(j) | ||||||||||||||||||||||||||||||||
|
|
|
|
|
|
|
|
|
|
|
| |||||||||||||||||||||||||||||||||
| (a) | Based on average shares outstanding. |
| (b) | Distributions for annual periods determined in accordance with U.S. federal income tax regulations. |
| (c) | Where applicable, excludes the effects of any sales charges and assumes the reinvestment of distributions. |
| (d) | Includes payment from an affiliate, which had no impact on the Fund’s total return. |
| (e) | Includes payments received from an affiliate, which impacted the Fund’s total return. Excluding the payments, the Fund’s total return would have been 4.09%. |
| (f) | Not annualized. |
| (g) | Excludes fees and expenses incurred indirectly as a result of investments in underlying funds. |
| (h) | Annualized. |
| (i) | Includes recoupment of past waived and/or reimbursed fees. Excluding the recoupment of past waived and/or reimbursed fees, the expense ratios were as follows: |
| Year Ended 04/30/23 | Year Ended 04/30/22 | Year Ended 04/30/21 | Period from 08/01/19 to 04/30/20 | Year Ended 07/31/19 | Year Ended 07/31/18 | |||||||||||||||||||
Expense ratios | N/A | N/A | N/A | N/A | N/A | 2.72 | % | |||||||||||||||||
|
|
|
|
|
|
|
|
|
|
|
| |||||||||||||
| (j) | Excludes underlying investments in total return swaps. |
See notes to financial statements.
FINANCIAL HIGHLIGHTS | 135 |
Financial Highlights (continued)
(For a share outstanding throughout each period)
| BlackRock Global Equity Market Neutral Fund (continued) | ||||||||||||||||||||||||||||||||||||||||||||
| Class K | ||||||||||||||||||||||||||||||||||||||||||||
| Year Ended 04/30/23 | Year Ended 04/30/22 | Year Ended 04/30/21 | Period from 08/01/19 to 04/30/20 | Year Ended 07/31/19 | Year Ended 07/31/18 | |||||||||||||||||||||||||||||||||||||||
Net asset value, beginning of period | $ | 11.52 | $ | 12.00 | $ | 11.44 | $ | 12.69 | $ | 12.19 | $ | 11.63 | ||||||||||||||||||||||||||||||||
|
|
|
|
|
|
|
|
|
|
|
| |||||||||||||||||||||||||||||||||
Net investment income (loss)(a) | 0.19 | (0.14 | ) | (0.25 | ) | (0.01 | ) | 0.06 | (0.01 | ) | ||||||||||||||||||||||||||||||||||
Net realized and unrealized gain (loss) | 0.52 | (0.20 | ) | 0.85 | (0.46 | ) | 0.56 | 0.57 | ||||||||||||||||||||||||||||||||||||
|
|
|
|
|
|
|
|
|
|
|
| |||||||||||||||||||||||||||||||||
Net increase (decrease) from investment operations | 0.71 | (0.34 | ) | 0.60 | (0.47 | ) | 0.62 | 0.56 | ||||||||||||||||||||||||||||||||||||
|
|
|
|
|
|
|
|
|
|
|
| |||||||||||||||||||||||||||||||||
Distributions(b) | ||||||||||||||||||||||||||||||||||||||||||||
From net investment income | — | — | — | (0.04 | ) | — | — | |||||||||||||||||||||||||||||||||||||
From net realized gain | — | (0.14 | ) | (0.04 | ) | (0.74 | ) | (0.12 | ) | — | ||||||||||||||||||||||||||||||||||
|
|
|
|
|
|
|
|
|
|
|
| |||||||||||||||||||||||||||||||||
Total distributions | — | (0.14 | ) | (0.04 | ) | (0.78 | ) | (0.12 | ) | — | ||||||||||||||||||||||||||||||||||
|
|
|
|
|
|
|
|
|
|
|
| |||||||||||||||||||||||||||||||||
Net asset value, end of period | $ | 12.23 | $ | 11.52 | $ | 12.00 | $ | 11.44 | $ | 12.69 | $ | 12.19 | ||||||||||||||||||||||||||||||||
|
|
|
|
|
|
|
|
|
|
|
| |||||||||||||||||||||||||||||||||
Total Return(c) | ||||||||||||||||||||||||||||||||||||||||||||
Based on net asset value | 6.16 | % | (2.85 | )%(d) | 5.24 | %(d) | (3.77 | )%(e) | 5.11 | % | 4.82 | % | ||||||||||||||||||||||||||||||||
|
|
|
|
|
|
|
|
|
|
|
| |||||||||||||||||||||||||||||||||
Ratios to Average Net Assets(f) | ||||||||||||||||||||||||||||||||||||||||||||
Total expenses | 1.48 | % | 1.51 | % | 1.77 | % | 1.76 | %(g) | 1.72 | % | 1.65 | %(h) | ||||||||||||||||||||||||||||||||
|
|
|
|
|
|
|
|
|
|
|
| |||||||||||||||||||||||||||||||||
Total expenses after fees waived and/or reimbursed | 1.29 | % | 1.31 | % | 1.52 | % | 1.52 | %(g) | 1.57 | % | 1.58 | % | ||||||||||||||||||||||||||||||||
|
|
|
|
|
|
|
|
|
|
|
| |||||||||||||||||||||||||||||||||
Net investment income (loss) | 1.59 | % | (1.24 | )% | (2.07 | )% | (0.07 | )%(g) | 0.45 | % | (0.04 | )% | ||||||||||||||||||||||||||||||||
|
|
|
|
|
|
|
|
|
|
|
| |||||||||||||||||||||||||||||||||
Supplemental Data | ||||||||||||||||||||||||||||||||||||||||||||
Net assets, end of period (000) | $ | 123,399 | $ | 7,080 | $ | 5,151 | $ | 325 | $ | 453 | $ | 217 | ||||||||||||||||||||||||||||||||
|
|
|
|
|
|
|
|
|
|
|
| |||||||||||||||||||||||||||||||||
Portfolio turnover rate | 79 | %(i) | 31 | %(i) | 43 | %(i) | 53 | %(i) | 7 | %(i) | 20 | %(i) | ||||||||||||||||||||||||||||||||
|
|
|
|
|
|
|
|
|
|
|
| |||||||||||||||||||||||||||||||||
| (a) | Based on average shares outstanding. |
| (b) | Distributions for annual periods determined in accordance with U.S. federal income tax regulations. |
| (c) | Where applicable, assumes the reinvestment of distributions. |
| (d) | Includes payment from an affiliate, which had no impact on the Fund’s total return. |
| (e) | Not annualized. |
| (f) | Excludes fees and expenses incurred indirectly as a result of investments in underlying funds. |
| (g) | Annualized. |
| (h) | Includes recoupment of past waived and/or reimbursed fees. Excluding the recoupment of past waived and/or reimbursed fees for the year ended July 31, 2018, the expense ratio would have been 1.64%. |
| (i) | Excludes underlying investments in total return swaps. |
See notes to financial statements.
| 136 | 2 0 2 3 BLACK ROCK ANNUAL REPORT TO SHAREHOLDERS |
1. ORGANIZATION
BlackRock FundsSM (the “Trust”) is registered under the Investment Company Act of 1940, as amended (the “1940 Act”), as an open-end management investment company. The Trust is organized as a Massachusetts business trust. The following, each of which is a series of the Trust, are referred to herein collectively as the “Funds” or individually as a “Fund”:
| Fund Name | Herein Referred To As | Diversification Classification | ||
BlackRock Advantage Emerging Markets Fund | Advantage Emerging Markets | Diversified | ||
BlackRock Global Equity Market Neutral Fund | Global Equity Market Neutral | Diversified | ||
Each Fund offers multiple classes of shares. All classes of shares have identical voting, dividend, liquidation and other rights and are subject to the same terms and conditions, except that certain classes bear expenses related to the shareholder servicing and distribution of such shares. Institutional and Class K Shares are sold without a sales charge and only to certain eligible investors. Investor A and Investor C Shares bear certain expenses related to shareholder servicing of such shares, and Investor C Shares also bear certain expenses related to the distribution of such shares. Investor A and Investor C Shares are generally available through financial intermediaries. Each class has exclusive voting rights with respect to matters relating to its shareholder servicing and distribution expenditures (except that Investor C shareholders may vote on material changes to the Investor A Shares distribution and service plan).
| Share Class | Initial Sales Charge | CDSC | Conversion Privilege | |||
Institutional and Class K Shares | No | No | None | |||
Investor A Shares | Yes | No(a) | None | |||
Investor C Shares | No | Yes(b) | To Investor A Shares after approximately 8 years | |||
| (a) | Investor A Shares may be subject to a contingent deferred sales charge (“CDSC”) for certain redemptions where no initial sales charge was paid at the time of purchase. |
| (b) | A CDSC of 1.00% is assessed on certain redemptions of Investor C Shares made within one year after purchase. |
The Funds, together with certain other registered investment companies advised by BlackRock Advisors, LLC (the “Manager”) or its affiliates, are included in a complex of funds referred to as the BlackRock Multi-Asset Complex.
On May 10, 2022, the Board of Trustees of the Trust (the “Board”), approved a change in the name of BlackRock Global Long/Short Equity Fund to BlackRock Global Equity Market Neutral Fund. While the Fund’s investment process and investment strategy were not changed in connection with the name change, certain updates were made to the Fund’s investment process and investment strategy disclosure in order to align the disclosure with the Fund’s new name. These changes were effective as of September 1, 2022.
2. SIGNIFICANT ACCOUNTING POLICIES
The financial statements are prepared in conformity with accounting principles generally accepted in the United States of America (“U.S. GAAP”), which may require management to make estimates and assumptions that affect the reported amounts of assets and liabilities in the financial statements, disclosure of contingent assets and liabilities at the date of the financial statements and the reported amounts of increases and decreases in net assets from operations during the reporting period. Actual results could differ from those estimates. Each Fund is considered an investment company under U.S. GAAP and follows the accounting and reporting guidance applicable to investment companies. Below is a summary of significant accounting policies:
Investment Transactions and Income Recognition: For financial reporting purposes, investment transactions are recorded on the dates the transactions are executed. Realized gains and losses on investment transactions are determined using the specific identification method. Dividend income and capital gain distributions, if any, are recorded on the ex-dividend dates. Non-cash dividends, if any, are recorded on the ex-dividend dates at fair value. Dividends from foreign securities where the ex-dividend dates may have passed are subsequently recorded when the Funds are informed of the ex-dividend dates. Under the applicable foreign tax laws, a withholding tax at various rates may be imposed on capital gains, dividends and interest. Upon notification from issuers, a portion of the dividend income received from a real estate investment trust may be redesignated as a reduction of cost of the related investment and/or realized gain. Interest income, including amortization and accretion of premiums and discounts on debt securities, is recognized daily on an accrual basis. Income, expenses and realized and unrealized gains and losses are allocated daily to each class based on its relative net assets.
Foreign Currency Translation: Each Fund’s books and records are maintained in U.S. dollars. Securities and other assets and liabilities denominated in foreign currencies are translated into U.S. dollars using exchange rates determined as of the close of trading on the New York Stock Exchange (“NYSE”). Purchases and sales of investments are recorded at the rates of exchange prevailing on the respective dates of such transactions. Generally, when the U.S. dollar rises in value against a foreign currency, the investments denominated in that currency will lose value; the opposite effect occurs if the U.S. dollar falls in relative value.
Each Fund does not isolate the effect of fluctuations in foreign exchange rates from the effect of fluctuations in the market prices of investments for financial reporting purposes. Accordingly, the effects of changes in exchange rates on investments are not segregated in the Statements of Operations from the effects of changes in market prices of those investments, but are included as a component of net realized and unrealized gain (loss) from investments. Each Fund reports realized currency gains (losses) on foreign currency related transactions as components of net realized gain (loss) for financial reporting purposes, whereas such components are generally treated as ordinary income for U.S. federal income tax purposes.
Foreign Taxes: The Funds may be subject to foreign taxes (a portion of which may be reclaimable) on income, stock dividends, capital gains on investments, or certain foreign currency transactions. All foreign taxes are recorded in accordance with the applicable foreign tax regulations and rates that exist in the foreign jurisdictions in which each Fund invests. These foreign taxes, if any, are paid by each Fund and are reflected in its Statements of Operations as follows: foreign taxes withheld at source are presented as a
NOTES TO FINANCIAL STATEMENTS | 137 |
Notes to Financial Statements (continued)
reduction of income, foreign taxes on securities lending income are presented as a reduction of securities lending income, foreign taxes on stock dividends are presented as “Foreign taxes withheld”, and foreign taxes on capital gains from sales of investments and foreign taxes on foreign currency transactions are included in their respective net realized gain (loss) categories. Foreign taxes payable or deferred as of April 30, 2023, if any, are disclosed in the Statements of Assets and Liabilities.
The Funds file withholding tax reclaims in certain jurisdictions to recover a portion of amounts previously withheld. The Funds may record a reclaim receivable based on collectability, which includes factors such as the jurisdiction’s applicable laws, payment history and market convention. The Statements of Operations include tax reclaims recorded as well as professional and other fees, if any, associated with recovery of foreign withholding taxes.
Collateralization: If required by an exchange or counterparty agreement, the Funds may be required to deliver/deposit cash and/or securities to/with an exchange, or broker-dealer or custodian as collateral for certain investments.
Distributions: Distributions paid by the Funds are recorded on the ex-dividend dates. Distributions of capital gains are recorded on the ex-dividend dates and made at least annually. The character and timing of distributions are determined in accordance with U.S. federal income tax regulations, which may differ from U.S. GAAP.
Indemnifications: In the normal course of business, a Fund enters into contracts that contain a variety of representations that provide general indemnification. A Fund’s maximum exposure under these arrangements is unknown because it involves future potential claims against a Fund, which cannot be predicted with any certainty.
Other: Expenses directly related to a Fund or its classes are charged to that Fund or the applicable class. Expenses directly related to the Funds and other shared expenses prorated to the Funds are allocated daily to each class based on their relative net assets or other appropriate methods. Other operating expenses shared by several funds, including other funds managed by the Manager, are prorated among those funds on the basis of relative net assets or other appropriate methods.
3. INVESTMENT VALUATION AND FAIR VALUE MEASUREMENTS
Investment Valuation Policies: Each Fund’s investments are valued at fair value (also referred to as “market value” within the financial statements) each day that the Fund is open for business and, for financial reporting purposes, as of the report date. U.S. GAAP defines fair value as the price a fund would receive to sell an asset or pay to transfer a liability in an orderly transaction between market participants at the measurement date. The Board has approved the designation of each Fund’s Manager as the valuation designee for each Fund. Each Fund determines the fair values of its financial instruments using various independent dealers or pricing services under the Manager’s policies. If a security’s market price is not readily available or does not otherwise accurately represent the fair value of the security, the security will be valued in accordance with the Manager’s policies and procedures as reflecting fair value. The Manager has formed a committee (the “Valuation Committee”) to develop pricing policies and procedures and to oversee the pricing function for all financial instruments, with assistance from other BlackRock pricing committees.
Fair Value Inputs and Methodologies: The following methods and inputs are used to establish the fair value of each Fund’s assets and liabilities:
| · | Equity investments traded on a recognized securities exchange are valued at that day’s official closing price, as applicable, on the exchange where the stock is primarily traded. Equity investments traded on a recognized exchange for which there were no sales on that day may be valued at the last available bid (long positions) or ask (short positions) price. |
| · | Fixed-income investments for which market quotations are readily available are generally valued using the last available bid price or current market quotations provided by independent dealers or third-party pricing services. Pricing services generally value fixed-income securities assuming orderly transactions of an institutional round lot size, but a fund may hold or transact in such securities in smaller, odd lot sizes. Odd lots may trade at lower prices than institutional round lots. The pricing services may use matrix pricing or valuation models that utilize certain inputs and assumptions to derive values, including transaction data (e.g., recent representative bids and offers), market data, credit quality information, perceived market movements, news, and other relevant information. Certain fixed-income securities, including asset- backed and mortgage related securities may be valued based on valuation models that consider the estimated cash flows of each tranche of the entity, establish a benchmark yield and develop an estimated tranche specific spread to the benchmark yield based on the unique attributes of the tranche. The amortized cost method of valuation may be used with respect to debt obligations with sixty days or less remaining to maturity unless the Manager determines such method does not represent fair value. |
| · | Investments in open-end U.S. mutual funds (including money market funds) are valued at that day’s published net asset value (“NAV”). |
| · | The Funds value their investment in SL Liquidity Series, LLC, Money Market Series (the “Money Market Series”) at fair value, which is ordinarily based upon their pro rata ownership in the underlying fund’s net assets. |
| · | Futures contracts are valued based on that day’s last reported settlement or trade price on the exchange where the contract is traded. |
| · | Exchange-traded options are valued at the mean between the last bid and ask prices at the close of the options market in which the options trade. An exchange-traded option for which there is no mean price is valued at the last bid (long positions) or ask (short positions) price. If no bid or ask price is available, the prior day’s price will be used, unless it is determined that the prior day’s price no longer reflects the fair value of the option. Over-the-counter (“OTC”) options and options on swaps (“swaptions”) are valued by an independent pricing service using a mathematical model, which incorporates a number of market data factors, such as the trades and prices of the underlying instruments. |
| · | Swap agreements are valued utilizing quotes received daily by independent pricing services or through brokers, which are derived using daily swap curves and models that incorporate a number of market data factors, such as discounted cash flows, trades and values of the underlying reference instruments. |
| 138 | 2 0 2 3 BLACK ROCK ANNUAL REPORT TO SHAREHOLDERS |
Notes to Financial Statements (continued)
Generally, trading in foreign instruments is substantially completed each day at various times prior to the close of trading on the NYSE. Each business day, the Funds use current market factors supplied by independent pricing services to value certain foreign instruments (“Systematic Fair Value Price”). The Systematic Fair Value Price is designed to value such foreign securities at fair value as of the close of trading on the NYSE, which follows the close of the local markets.
If events (e.g., market volatility, company announcement or a natural disaster) occur that are expected to materially affect the value of such investment, or in the event that application of these methods of valuation results in a price for an investment that is deemed not to be representative of the market value of such investment, or if a price is not available, the investment will be valued by the Valuation Committee in accordance with the Manager’s policies and procedures as reflecting fair value (“Fair Valued Investments”). The fair valuation approaches that may be used by the Valuation Committee include market approach, income approach and cost approach. Valuation techniques such as discounted cash flow, use of market comparables and matrix pricing are types of valuation approaches and are typically used in determining fair value. When determining the price for Fair Valued Investments, the Valuation Committee seeks to determine the price that each Fund might reasonably expect to receive or pay from the current sale or purchase of that asset or liability in an arm’s-length transaction. Fair value determinations shall be based upon all available factors that the Valuation Committee deems relevant and consistent with the principles of fair value measurement.
For investments in equity or debt issued by privately held companies or funds (“Private Company” or collectively, the “Private Companies”) and other Fair Valued Investments, the fair valuation approaches that are used by the Valuation Committee and third-party pricing services utilized by the Valuation Committee include one or a combination of, but not limited to, the following inputs.
| Standard Inputs Generally Considered By The Valuation Committee And Third-Party Pricing Services | ||
Market approach | (i) recent market transactions, including subsequent rounds of financing, in the underlying investment or comparable issuers; (ii) recapitalizations and other transactions across the capital structure; and (iii) market multiples of comparable issuers. | |
Income approach | (i) future cash flows discounted to present and adjusted as appropriate for liquidity, credit, and/or market risks; (ii) quoted prices for similar investments or assets in active markets; and (iii) other risk factors, such as interest rates, yield curves, volatilities, prepayment speeds, loss severities, credit risks, recovery rates, liquidation amounts and/or default rates. | |
Cost approach | (i) audited or unaudited financial statements, investor communications and financial or operational metrics issued by the Private Company; (ii) changes in the valuation of relevant indices or publicly traded companies comparable to the Private Company; (iii) relevant news and other public sources; and (iv) known secondary market transactions in the Private Company’s interests and merger or acquisition activity in companies comparable to the Private Company. |
Investments in series of preferred stock issued by Private Companies are typically valued utilizing market approach in determining the enterprise value of the company. Such investments often contain rights and preferences that differ from other series of preferred and common stock of the same issuer. Enterprise valuation techniques such as an option pricing model (“OPM”), a probability weighted expected return model (“PWERM”), current value method or a hybrid of those techniques are used as deemed appropriate under the circumstances. The use of these valuation techniques involve a determination of the exit scenarios of the investment in order to appropriately allocate the enterprise value of the company among the various parts of its capital structure.
The Private Companies are not subject to the public company disclosure, timing, and reporting standards applicable to other investments held by a Fund. Typically, the most recently available information by a Private Company is as of a date that is earlier than the date a Fund is calculating its NAV. This factor may result in a difference between the value of the investment and the price a Fund could receive upon the sale of the investment.
Fair Value Hierarchy: Various inputs are used in determining the fair value of financial instruments. These inputs to valuation techniques are categorized into a fair value hierarchy consisting of three broad levels for financial reporting purposes as follows:
| · | Level 1 – Unadjusted price quotations in active markets/exchanges for identical assets or liabilities that each Fund has the ability to access; |
| · | Level 2 – Other observable inputs (including, but not limited to, quoted prices for similar assets or liabilities in markets that are active, quoted prices for identical or similar assets or liabilities in markets that are not active, inputs other than quoted prices that are observable for the assets or liabilities (such as interest rates, yield curves, volatilities, prepayment speeds, loss severities, credit risks and default rates) or other market–corroborated inputs); and |
| · | Level 3 – Unobservable inputs based on the best information available in the circumstances, to the extent observable inputs are not available (including the Valuation Committee’s assumptions used in determining the fair value of financial instruments). |
The hierarchy gives the highest priority to unadjusted quoted prices in active markets for identical assets or liabilities (Level 1 measurements) and the lowest priority to unobservable inputs (Level 3 measurements). Accordingly, the degree of judgment exercised in determining fair value is greatest for instruments categorized in Level 3. The inputs used to measure fair value may fall into different levels of the fair value hierarchy. In such cases, for disclosure purposes, the fair value hierarchy classification is determined based on the lowest level input that is significant to the fair value measurement in its entirety. Investments classified within Level 3 have significant unobservable inputs used by the Valuation Committee in determining the price for Fair Valued Investments. Level 3 investments include equity or debt issued by Private Companies that may not have a secondary market and/or may have a limited number of investors. The categorization of a value determined for financial instruments is based on the pricing transparency of the financial instruments and is not necessarily an indication of the risks associated with investing in those securities.
As of April 30, 2023, certain investments of Advantage Emerging Markets were fair valued using NAV as a practical expedient as no quoted market value is available and therefore have been excluded from the fair value hierarchy.
NOTES TO FINANCIAL STATEMENTS | 139 |
Notes to Financial Statements (continued)
4. SECURITIES AND OTHER INVESTMENTS
Preferred Stocks: Preferred stock has a preference over common stock in liquidation (and generally in receiving dividends as well), but is subordinated to the liabilities of the issuer in all respects. As a general rule, the market value of preferred stock with a fixed dividend rate and no conversion element varies inversely with interest rates and perceived credit risk, while the market price of convertible preferred stock generally also reflects some element of conversion value. Because preferred stock is junior to debt securities and other obligations of the issuer, deterioration in the credit quality of the issuer will cause greater changes in the value of a preferred stock than in a more senior debt security with similar stated yield characteristics. Unlike interest payments on debt securities, preferred stock dividends are payable only if declared by the issuer’s board of directors. Preferred stock also may be subject to optional or mandatory redemption provisions.
Warrants: Warrants entitle a fund to purchase a specified number of shares of common stock and are non-income producing. The purchase price and number of shares are subject to adjustment under certain conditions until the expiration date of the warrants, if any. If the price of the underlying stock does not rise above the strike price before the warrant expires, the warrant generally expires without any value and a fund will lose any amount it paid for the warrant. Thus, investments in warrants may involve more risk than investments in common stock. Warrants may trade in the same markets as their underlying stock; however, the price of the warrant does not necessarily move with the price of the underlying stock.
Forward Commitments, When-Issued and Delayed Delivery Securities: The Funds may purchase securities on a when-issued basis and may purchase or sell securities on a forward commitment basis. Settlement of such transactions normally occurs within a month or more after the purchase or sale commitment is made. The Funds may purchase securities under such conditions with the intention of actually acquiring them but may enter into a separate agreement to sell the securities before the settlement date. Since the value of securities purchased may fluctuate prior to settlement, the Funds may be required to pay more at settlement than the security is worth. In addition, a fund is not entitled to any of the interest earned prior to settlement. When purchasing a security on a delayed delivery basis, the Funds assume the rights and risks of ownership of the security, including the risk of price and yield fluctuations. In the event of default by the counterparty, the Funds’ maximum amount of loss is the unrealized appreciation of unsettled when-issued transactions.
Securities Lending: Certain Funds may lend their securities to approved borrowers, such as brokers, dealers and other financial institutions. The borrower pledges and maintains with the Funds collateral consisting of cash, an irrevocable letter of credit issued by a bank, or securities issued or guaranteed by the U.S. Government. The initial collateral received by each Fund is required to have a value of at least 102% of the current value of the loaned securities for securities traded on U.S. exchanges and a value of at least 105% for all other securities. The collateral is maintained thereafter at a value equal to at least 100% of the current market value of the securities on loan. The market value of the loaned securities is determined at the close of each business day of the Fund and any additional required collateral is delivered to the Fund, or excess collateral returned by the Fund, on the next business day. During the term of the loan, the Funds are entitled to all distributions made on or in respect of the loaned securities, but do not receive interest income on securities received as collateral. Loans of securities are terminable at any time and the borrower, after notice, is required to return borrowed securities within the standard time period for settlement of securities transactions.
As of period end, any securities on loan were collateralized by cash and/or U.S. Government obligations. Cash collateral invested by the securities lending agent, BlackRock Investment Management, LLC (“BIM”), if any, is disclosed in the Schedules of Investments. Any non-cash collateral received cannot be sold, re-invested or pledged by the Fund, except in the event of borrower default. The securities on loan, if any, are disclosed in the Funds’ Schedules of Investments. The market value of any securities on loan and the value of related collateral, if any, are shown separately in the Statements of Assets and Liabilities as a component of investments at value – unaffiliated, and collateral on securities loaned, respectively.
Securities lending transactions are entered into by the Funds under Master Securities Lending Agreements (each, an “MSLA”), which provide the right, in the event of default (including bankruptcy or insolvency), for the non-defaulting party to liquidate the collateral and calculate a net exposure to the defaulting party or request additional collateral. In the event that a borrower defaults, the Funds, as lender, would offset the market value of the collateral received against the market value of the securities loaned. When the value of the collateral is greater than that of the market value of the securities loaned, the lender is left with a net amount payable to the defaulting party. However, bankruptcy or insolvency laws of a particular jurisdiction may impose restrictions on or prohibitions against such a right of offset in the event of an MSLA counterparty’s bankruptcy or insolvency. Under the MSLA, absent an event of default, the borrower can resell or re-pledge the loaned securities, and the Funds can reinvest cash collateral received in connection with loaned securities. Upon an event of default, the parties’ obligations to return the securities or collateral to the other party are extinguished, and the parties can resell or re-pledge the loaned securities or the collateral received in connection with the loaned securities in order to satisfy the defaulting party’s net payment obligation for all transactions under the MSLA. The defaulting party remains liable for any deficiency.
As of period end, the following table is a summary of the Advantage Emerging Markets’s securities on loan by counterparty which are subject to offset under an MSLA:
Fund Name/Counterparty | | Securities Loaned at Value | | | Cash Collateral Received | (a) | | Non-Cash Collateral Received, at Fair Value | (a) | | Net Amount | | ||||
Advantage Emerging Markets Barclays Capital, Inc. | $ | 8,725 | $ | (8,725 | ) | $ | — | $ | — | |||||||
|
|
|
|
|
|
|
| |||||||||
| (a) | Collateral received, if any, in excess of the market value of securities on loan is not presented in this table. The total cash collateral received by each Fund is disclosed in the Fund’s Statements of Assets and Liabilities. |
The risks of securities lending include the risk that the borrower may not provide additional collateral when required or may not return the securities when due. To mitigate these risks, the Funds benefit from a borrower default indemnity provided by BIM. BIM’s indemnity allows for full replacement of the securities loaned to the extent the collateral received does not cover the value on the securities loaned in the event of borrower default. Each Fund could incur a loss if the value of an investment purchased with cash collateral falls below the market value of loaned securities or if the value of an investment purchased with cash collateral falls below the value of the original cash collateral received. Such losses are borne entirely by the Funds.
| 140 | 2 0 2 3 BLACK ROCK ANNUAL REPORT TO SHAREHOLDERS |
Notes to Financial Statements (continued)
5. DERIVATIVE FINANCIAL INSTRUMENTS
The Funds engage in various portfolio investment strategies using derivative contracts both to increase the returns of the Funds and/or to manage their exposure to certain risks such as credit risk, equity risk, interest rate risk, foreign currency exchange rate risk, commodity price risk or other risks (e.g., inflation risk). Derivative financial instruments categorized by risk exposure are included in the Schedules of Investments. These contracts may be transacted on an exchange or OTC.
Futures Contracts: Futures contracts are purchased or sold to gain exposure to, or manage exposure to, changes in interest rates (interest rate risk) and changes in the value of equity securities (equity risk) or foreign currencies (foreign currency exchange rate risk).
Futures contracts are exchange-traded agreements between the Funds and a counterparty to buy or sell a specific quantity of an underlying instrument at a specified price and on a specified date. Depending on the terms of a contract, it is settled either through physical delivery of the underlying instrument on the settlement date or by payment of a cash amount on the settlement date. Upon entering into a futures contract, the Funds are required to deposit initial margin with the broker in the form of cash or securities in an amount that varies depending on a contract’s size and risk profile. The initial margin deposit must then be maintained at an established level over the life of the contract. Amounts pledged, which are considered restricted, are included in cash pledged for futures contracts in the Statements of Assets and Liabilities.
Securities deposited as initial margin are designated in the Schedules of Investments and cash deposited, if any, are shown as cash pledged for futures contracts in the Statements of Assets and Liabilities. Pursuant to the contract, the Funds agree to receive from or pay to the broker an amount of cash equal to the daily fluctuation in market value of the contract (“variation margin”). Variation margin is recorded as unrealized appreciation (depreciation) and, if any, shown as variation margin receivable (or payable) on futures contracts in the Statements of Assets and Liabilities. When the contract is closed, a realized gain or loss is recorded in the Statements of Operations equal to the difference between the notional amount of the contract at the time it was opened and the notional amount at the time it was closed. The use of futures contracts involves the risk of an imperfect correlation in the movements in the price of futures contracts and interest rates, foreign currency exchange rates or underlying assets.
Options: The Funds may purchase and write call and put options to increase or decrease their exposure to the risks of underlying instruments, including equity risk, interest rate risk and/or commodity price risk and/or, in the case of options written, to generate gains from options premiums.
A call option gives the purchaser (holder) of the option the right (but not the obligation) to buy, and obligates the seller (writer) to sell (when the option is exercised) the underlying instrument at the exercise or strike price at any time or at a specified time during the option period. A put option gives the holder the right to sell and obligates the writer to buy the underlying instrument at the exercise or strike price at any time or at a specified time during the option period.
Premiums paid on options purchased and premiums received on options written, as well as the daily fluctuation in market value, are included in investments at value –unaffiliated and options written at value, respectively, in the Statements of Assets and Liabilities. When an instrument is purchased or sold through the exercise of an option, the premium is offset against the cost or proceeds of the underlying instrument. When an option expires, a realized gain or loss is recorded in the Statements of Operations to the extent of the premiums received or paid. When an option is closed or sold, a gain or loss is recorded in the Statements of Operations to the extent the cost of the closing transaction exceeds the premiums received or paid. When the Funds write a call option, such option is typically “covered,” meaning that they hold the underlying instrument subject to being called by the option counterparty. When the Funds write a put option, cash is segregated in an amount sufficient to cover the obligation. These amounts, which are considered restricted, are included in cash pledged as collateral for options written in the Statements of Assets and Liabilities.
In purchasing and writing options, the Funds bear the risk of an unfavorable change in the value of the underlying instrument or the risk that they may not be able to enter into a closing transaction due to an illiquid market. Exercise of a written option could result in the Funds purchasing or selling a security when they otherwise would not, or at a price different from the current market value.
Swaps: Swap contracts are entered into to manage exposure to issuers, markets and securities. Such contracts are agreements between the Funds and a counterparty to make periodic net payments on a specified notional amount or a net payment upon termination. Swap agreements are privately negotiated in the OTC market and may be entered into as a bilateral contract (“OTC swaps”) or centrally cleared (“centrally cleared swaps”).
For OTC swaps, any upfront premiums paid and any upfront fees received are shown as swap premiums paid and swap premiums received, respectively, in the Statements of Assets and Liabilities and amortized over the term of the contract. The daily fluctuation in market value is recorded as unrealized appreciation (depreciation) on OTC Swaps in the Statements of Assets and Liabilities. Payments received or paid are recorded in the Statements of Operations as realized gains or losses, respectively. When an OTC swap is terminated, a realized gain or loss is recorded in the Statements of Operations equal to the difference between the proceeds from (or cost of) the closing transaction and the Funds’ basis in the contract, if any. Generally, the basis of the contract is the premium received or paid.
In a centrally cleared swap, immediately following execution of the swap contract, the swap contract is novated to a central counterparty (the “CCP”) and the CCP becomes the Funds’ counterparty on the swap. Each Fund is required to interface with the CCP through the broker. Upon entering into a centrally cleared swap, each Fund is required to deposit initial margin with the broker in the form of cash or securities in an amount that varies depending on the size and risk profile of the particular swap. Securities deposited as initial margin are designated in the Schedules of Investments and cash deposited is shown as cash pledged for centrally cleared swaps in the Statements of Assets and Liabilities. Amounts pledged, which are considered restricted cash, are included in cash pledged for centrally cleared swaps in the Statements of Assets and Liabilities. Pursuant to the contract, each Fund agrees to receive from or pay to the broker an amount of cash equal to the daily fluctuation in market value of the contract (“variation margin”). Variation margin is recorded as unrealized appreciation (depreciation) and shown as variation margin receivable (or payable) on centrally cleared swaps in the Statements of Assets and Liabilities. Payments received from (paid to) the counterparty are amortized over the term of the contract and recorded as realized gains (losses) in the Statements of Operations, including those at termination.
NOTES TO FINANCIAL STATEMENTS | 141 |
Notes to Financial Statements (continued)
| · | Total return swaps — Total return swaps are entered into to obtain exposure to a security or market without owning such security or investing directly in such market or to exchange the risk/return of one security or market (e.g., fixed-income) with another security or market (e.g., equity or commodity prices) (equity risk, commodity price risk and/or interest rate risk). |
Total return swaps are agreements in which there is an exchange of cash flows whereby one party commits to make payments based on the total return (distributions plus capital gains/losses) of an underlying instrument, or basket of underlying instruments, in exchange for fixed or floating rate interest payments. If the total return of the instrument(s) or index underlying the transaction exceeds or falls short of the offsetting fixed or floating interest rate obligation, the Funds receive payment from or make a payment to the counterparty.
Certain total return swaps are designed to function as a portfolio of direct investments in long and short equity positions. This means that the Fund has the ability to trade in and out of these long and short positions within the swap and will receive the economic benefits and risks equivalent to direct investment in these positions, subject to certain adjustments due to events related to the counterparty. Benefits and risks include capital appreciation (depreciation), corporate actions and dividends received and paid, all of which are reflected in the swap’s market value. The market value also includes interest charges and credits (“financing fees”) related to the notional values of the long and short positions and cash balances within the swap. These interest charges and credits are based on a specified benchmark rate plus or minus a specified spread determined based upon the country and/or currency of the positions in the portfolio.
Positions within the swap and financing fees are reset periodically. During a reset, any unrealized appreciation (depreciation) on positions and accrued financing fees become available for cash settlement between the Funds and the counterparty. The amounts that are available for cash settlement are recorded as realized gains or losses in the Statements of Operations. Cash settlement in and out of the swap may occur at a reset date or any other date, at the discretion of the Funds and the counterparty, over the life of the agreement. Certain swaps have no stated expiration and can be terminated by either party at any time.
Swap transactions involve, to varying degrees, elements of interest rate, credit and market risks in excess of the amounts recognized in the Statements of Assets and Liabilities. Such risks involve the possibility that there will be no liquid market for these agreements, that the counterparty to the agreements may default on its obligation to perform or disagree as to the meaning of the contractual terms in the agreements, and that there may be unfavorable changes in interest rates and/or market values associated with these transactions.
Master Netting Arrangements: In order to define its contractual rights and to secure rights that will help it mitigate its counterparty risk, a Fund may enter into an International Swaps and Derivatives Association, Inc. Master Agreement (“ISDA Master Agreement”) or similar agreement with its counterparties. An ISDA Master Agreement is a bilateral agreement between a Fund and a counterparty that governs certain OTC derivatives and typically contains, among other things, collateral posting terms and netting provisions in the event of a default and/or termination event. Under an ISDA Master Agreement, a Fund may, under certain circumstances, offset with the counterparty certain derivative financial instruments’ payables and/or receivables with collateral held and/or posted and create one single net payment. The provisions of the ISDA Master Agreement typically permit a single net payment in the event of default including the bankruptcy or insolvency of the counterparty. However, bankruptcy or insolvency laws of a particular jurisdiction may impose restrictions on or prohibitions against the right of offset in bankruptcy, insolvency or other events.
Collateral Requirements: For derivatives traded under an ISDA Master Agreement, the collateral requirements are typically calculated by netting the mark-to-market amount for each transaction under such agreement and comparing that amount to the value of any collateral currently pledged by the Funds and the counterparty.
Cash collateral that has been pledged to cover obligations of the Funds and cash collateral received from the counterparty, if any, is reported separately in the Statements of Assets and Liabilities as cash pledged as collateral and cash received as collateral, respectively. Non-cash collateral pledged by the Funds, if any, is noted in the Schedules of Investments. Generally, the amount of collateral due from or to a counterparty is subject to a certain minimum transfer amount threshold before a transfer is required, which is determined at the close of business of the Funds. Any additional required collateral is delivered to/pledged by the Funds on the next business day. Typically, the counterparty is not permitted to sell, re-pledge or use cash and non-cash collateral it receives. A Fund generally agrees not to use non-cash collateral that it receives but may, absent default or certain other circumstances defined in the underlying ISDA Master Agreement, be permitted to use cash collateral received. In such cases, interest may be paid pursuant to the collateral arrangement with the counterparty. To the extent amounts due to the Funds from the counterparties are not fully collateralized, each Fund bears the risk of loss from counterparty non-performance. Likewise, to the extent the Funds have delivered collateral to a counterparty and stand ready to perform under the terms of their agreement with such counterparty, each Fund bears the risk of loss from a counterparty in the amount of the value of the collateral in the event the counterparty fails to return such collateral. Based on the terms of agreements, collateral may not be required for all derivative contracts.
For financial reporting purposes, the Funds do not offset derivative assets and derivative liabilities that are subject to netting arrangements, if any, in the Statements of Assets and Liabilities.
6. INVESTMENT ADVISORY AGREEMENT AND OTHER TRANSACTIONS WITH AFFILIATES
Investment Advisory: The Trust, on behalf of each Fund, entered into an Investment Advisory Agreement with the Manager, the Funds’ investment adviser and an indirect, wholly-owned subsidiary of BlackRock, Inc. (“BlackRock”), to provide investment advisory services. The Manager is responsible for the management of each Fund’s portfolio and provides the personnel, facilities, equipment and certain other services necessary to the operations of each Fund.
For such services, each Fund pays the Manager a monthly fee at an annual rate equal to the following percentages of the average daily value of each Fund’s net assets:
Investment Advisory Fees | ||||||||
| Average Daily Net Assets | Advantage Emerging Markets | Global Equity Market Neutral | ||||||
First $1 billion | 0.80 | % | 1.25 | % | ||||
$1 billion — $3 billion | 0.75 | 1.18 | ||||||
| 142 | 2 0 2 3 BLACK ROCK ANNUAL REPORT TO SHAREHOLDERS |
Notes to Financial Statements (continued)
| Investment Advisory Fees | ||||||||
| Average Daily Net Assets | Advantage Emerging Markets | Global Equity Market Neutral | ||||||
$3 billion — $5 billion | 0.72 | % | 1.13 | % | ||||
$5 billion — $10 billion | 0.70 | 1.09 | ||||||
Greater than $10 billion | 0.68 | 1.06 | ||||||
With respect to Global Equity Market Neutral, the Manager entered into a sub-advisory agreement with BlackRock International Limited (“BIL”), an affiliate of the Manager. The Manager pays BIL for services it provides for that portion of the Fund for which BIL acts as sub-adviser, a monthly fee that is equal to a percentage of the investment advisory fees paid by Global Equity Market Neutral to the Manager.
Service and Distribution Fees: The Trust, on behalf of each Fund, entered into a Distribution Agreement and a Distribution and Service Plan with BlackRock Investments, LLC (“BRIL”), an affiliate of the Manager. Pursuant to the Distribution and Service Plan and in accordance with Rule 12b-1 under the 1940 Act, each Fund pays BRIL ongoing service and distribution fees. The fees are accrued daily and paid monthly at annual rates based upon the average daily net assets of the relevant share class of each Fund as follows:
| Share Class | Service Fees | Distribution Fees | ||||||
Investor A | 0.25 | % | N/A | |||||
Investor C | 0.25 | 0.75 | % | |||||
BRIL and broker-dealers, pursuant to sub-agreements with BRIL, provide shareholder servicing and distribution services to the Funds. The ongoing service and/or distribution fee compensates/reimburses BRIL and each broker-dealer for providing shareholder servicing and/or distribution related services to shareholders.
For the year ended April 30, 2023, the following table shows the class specific service and distribution fees borne directly by each share class of each Fund:
| Fund Name | Investor A | Investor C | Total | |||||||||
Advantage Emerging Markets | $ | 11,562 | $ | 2,984 | $ | 14,546 | ||||||
Global Equity Market Neutral | 61,056 | 36,479 | 97,535 | |||||||||
Administration: The Trust, on behalf of each Fund, entered into an Administration Agreement with the Manager, an indirect, wholly-owned subsidiary of BlackRock, to provide administrative services. For these services, the Manager receives an administration fee computed daily and payable monthly, based on a percentage of the average daily net assets of each Fund. The administration fee, which is shown as administration in the Statements of Operations, is paid at the annual rates below.
| Average Daily Net Assets | Administration Fees | |||
First $500 million | 0.0425 | % | ||
$500 million — $1 billion | 0.0400 | |||
$1 billion — $2 billion | 0.0375 | |||
$2 billion — $4 billion | 0.0350 | |||
$4 billion — $13 billion | 0.0325 | |||
Greater than $13 billion | 0.0300 | |||
In addition, the Manager charges each of the share classes an administration fee, which is shown as administration – class specific in the Statements of Operations, at an annual rate of 0.02% of the average daily net assets of each respective class.
For the year ended April 30, 2023, the following table shows the class specific administration fees borne directly by each share class of each Fund:
| Fund Name | Institutional | Investor A | Investor C | Class K | Total | |||||||||||||||
Advantage Emerging Markets | $ | 1,422 | $ | 925 | $ | 60 | $ | 18,735 | $ | 21,142 | ||||||||||
Global Equity Market Neutral | 106,990 | 4,884 | 730 | 19,245 | 131,849 | |||||||||||||||
Transfer Agent: Pursuant to written agreements, certain financial intermediaries, some of which may be affiliates, provide the Funds with sub-accounting, recordkeeping, sub-transfer agency and other administrative services with respect to servicing of underlying investor accounts. For these services, these entities receive an asset-based fee or an annual fee per shareholder account, which will vary depending on share class and/or net assets. For the year ended April 30, 2023, the Funds did not pay any amounts to affiliates in return for these services.
The Manager maintains a call center that is responsible for providing certain shareholder services to the Funds. Shareholder services include responding to inquiries and processing purchases and sales based upon instructions from shareholders. For the year ended April 30, 2023, each Fund reimbursed the Manager the following amounts for costs incurred in running the call center, which are included in transfer agent — class specific in the Statements of Operations:
| Fund Name | Institutional | Investor A | Investor C | Class K | Total | |||||||||||||||
Advantage Emerging Markets | $ | 244 | $ | 1,296 | $ | 133 | $ | 368 | $ | 2,041 | ||||||||||
Global Equity Market Neutral | 1,208 | 424 | 351 | — | 1,983 | |||||||||||||||
NOTES TO FINANCIAL STATEMENTS | 143 |
Notes to Financial Statements (continued)
For the year ended April 30, 2023, the following table shows the class specific transfer agent fees borne directly by each share class of each Fund:
| Fund Name | Institutional | Investor A | Investor C | Class K | Total | |||||||||||||||
Advantage Emerging Markets | $ | 6,374 | $ | 9,320 | $ | 953 | $ | 995 | $ | 17,642 | ||||||||||
Global Equity Market Neutral | 456,531 | 24,423 | 5,220 | 713 | 486,887 | |||||||||||||||
Other Fees: For the year ended April 30, 2023, affiliates earned underwriting discounts, direct commissions and dealer concessions on sales of each Fund’s Investor A Shares as follows:
| Fund Name | Investor A | |||
Advantage Emerging Markets | $ | 72 | ||
Global Equity Market Neutral | 351 | |||
For the year ended April 30, 2023, affiliates received CDSCs as follows:
| Fund Name | Investor A | Investor C | ||||||
Advantage Emerging Markets | $ | 9 | $ | — | ||||
Global Equity Market Neutral | 982 | 645 | ||||||
Expense Limitations, Waivers and Reimbursements: With respect to each Fund, the Manager contractually agreed to waive its investment advisory fees by the amount of investment advisory fees each Fund pays to the Manager indirectly through its investment in affiliated money market funds (the “affiliated money market fund waiver”) through June 30, 2024. The contractual agreement may be terminated upon 90 days’ notice by a majority of the trustees who are not “interested persons” of the Trust, as defined in the 1940 Act (“Independent Trustees”), or by a vote of a majority of the outstanding voting securities of a Fund. The amount of waivers and/or reimbursements of fees and expenses made pursuant to the expense limitation described below will be reduced by the amount of the affiliated money market fund waiver. This amount is included in fees waived and/or reimbursed by the Manager in the Statements of Operations. For the year ended April 30, 2023, the amounts waived were as follows:
| Fund Name | Fees Waived and/or Reimbursed by the Manager | |||
Advantage Emerging Markets | $ | 3,568 | ||
Global Equity Market Neutral | 14,843 | |||
The Manager has contractually agreed to waive its investment advisory fee with respect to any portion of each Fund’s assets invested in affiliated equity and fixed-income mutual funds and affiliated exchange-traded funds that have a contractual management fee through June 30, 2024. The contractual agreement may be terminated upon 90 days’ notice by a majority of the Independent Trustees, or by a vote of a majority of the outstanding voting securities of a Fund. For the year ended April 30, 2023, there were no fees waived by the Manager pursuant to this arrangement.
With respect to Advantage Emerging Markets, the Manager contractually agreed to waive and/or reimburse fees or expenses in order to limit other expenses (“expense limitation”) through June 30, 2024. Other expenses include accounting, administration, transfer agency, custody, professional and registration fees and exclude dividend expense, interest expense, and certain other fund expenses that constitute extraordinary expenses not incurred in the ordinary course of the Fund’s business. The expense limitations as a percentage of average daily net assets are as follows:
| Fund Name/Share Class | Expense Limitation | |||
Advantage Emerging Markets | ||||
Institutional | 0.05 | % | ||
Investor A | 0.10 | |||
Investor C | 0.10 | |||
Class K | 0.01 | |||
With respect to Global Equity Market Neutral, the Manager contractually agreed to waive and/or reimburse fees or expenses in order to limit expenses, excluding interest expense, dividend expense, tax expense, acquired fund fees and expenses, and certain other fund expenses, which constitute extraordinary expenses not incurred in the ordinary course of the Fund’s business (“expense limitation”). The expense limitations as a percentage of average daily net assets are as follows:
| Fund Name/Share Class | Expense Limitation | |||
Global Equity Market Neutral | ||||
Institutional | 1.34 | % | ||
Investor A | 1.59 | |||
Investor C | 2.34 | |||
Class K | 1.29 | |||
The Manager has agreed not to reduce or discontinue the contractual expense limitations through June 30, 2024, unless approved by the Board, including a majority of the Independent Trustees, or by a vote of a majority of the outstanding voting securities of a Fund. For the year ended April 30, 2023, amounts included in the Statements of Operations were as follows:
| Fund Name | Fees Waived and/or Reimbursed by the Manager | |||
Advantage Emerging Markets | $ | 536,857 | ||
| 144 | 2 0 2 3 BLACK ROCK ANNUAL REPORT TO SHAREHOLDERS |
Notes to Financial Statements (continued)
| Fund Name | Fees Waived and/or Reimbursed by the Manager | |||
Global Equity Market Neutral | $ | 1,102,925 | ||
| Fund Name | Administration Fees Waived | |||
Advantage Emerging Markets | $ | 44,925 | ||
In addition, these amounts waived and/or reimbursed by the Manager are included in Administration fees waived — class specific and transfer agent fees waived and/or reimbursed — class specific, respectively, in the Statements of Operations. For the year ended April 30, 2023, class specific expense waivers and/or reimbursements were as follows:
| Administration Fees Waived by the Manager - Class Specific | ||||||||||||||||||||
| Fund Name | Institutional | Investor A | Investor C | Class K | Total | |||||||||||||||
Advantage Emerging Markets | $ | 1,422 | $ | 925 | $ | 60 | $ | 18,735 | $ | 21,142 | ||||||||||
Global Equity Market Neutral | 106,989 | 4,884 | 730 | 19,244 | 131,847 | |||||||||||||||
| Transfer Agent Fees Waived and/or Reimbursed by the Manager - Class Specific | ||||||||||||||||||||
| Fund Name | Institutional | Investor A | Investor C | Class K | Total | |||||||||||||||
Advantage Emerging Markets | $ | 3,529 | $ | 5,158 | $ | 684 | $ | 993 | $ | 10,364 | ||||||||||
Global Equity Market Neutral | 189,059 | 12,212 | 3,397 | 712 | 205,380 | |||||||||||||||
Securities Lending: The U.S. Securities and Exchange Commission (“SEC”) has issued an exemptive order which permits BIM, an affiliate of the Manager, to serve as securities lending agent for the Funds, subject to applicable conditions. As securities lending agent, BIM bears all operational costs directly related to securities lending. The Funds are responsible for expenses in connection with the investment of cash collateral received for securities on loan (the “collateral investment expenses”). The cash collateral is invested in a private investment company, Money Market Series, managed by the Manager or its affiliates. However, BIM has agreed to cap the collateral investment expenses of the Money Market Series to an annual rate of 0.04%. The investment adviser to the Money Market Series will not charge any advisory fees with respect to shares purchased by the Funds. The Money Market Series may, under certain circumstances, impose a liquidity fee of up to 2% of the value withdrawn or temporarily restrict withdrawals for up to 10 business days during a 90 day period, in the event that the private investment company’s weekly liquid assets fall below certain thresholds. The Money Market Series seeks current income consistent with maintaining liquidity and preserving capital. Although the Money Market Series is not registered under the 1940 Act, its investments may follow the parameters of investments by a money market fund that is subject to Rule 2a-7 under the 1940 Act.
Securities lending income is equal to the total of income earned from the reinvestment of cash collateral, net of fees and other payments to and from borrowers of securities, and less the collateral investment expenses. Each Fund retains a portion of securities lending income and remits a remaining portion to BIM as compensation for its services as securities lending agent.
Pursuant to the current securities lending agreement, Advantage Emerging Markets retains 82% of securities lending income (which excludes collateral investment expenses), and this amount retained can never be less than 70% of the total of securities lending income plus the collateral investment expenses.
In addition, commencing the business day following the date that the aggregate securities lending income earned across the BlackRock Multi-Asset Complex in a calendar year exceeds a specified threshold, Advantage Emerging Markets, pursuant to the securities lending agreement, will retain for the remainder of that calendar year securities lending income in an amount equal to 85% of securities lending income (which excludes collateral investment expenses), and this amount retained can never be less than 70% of the total of securities lending income plus the collateral investment expenses.
Pursuant to the current securities lending agreement, Global Equity Market Neutral retains 81% of securities lending income (which excludes collateral investment expenses), and this amount retained can never be less than 70% of the total of securities lending income plus the collateral investment expenses.
In addition, commencing the business day following the date that the aggregate securities lending income earned across the BlackRock Multi-Asset Complex in a calendar year exceeds a specified threshold, Global Equity Market Neutral, pursuant to the securities lending agreement, will retain for the remainder of that calendar year securities lending income in an amount equal to 81% of securities lending income (which excludes collateral investment expenses), and this amount retained can never be less than 70% of the total of securities lending income plus the collateral investment expenses.
The share of securities lending income earned by each Fund is shown as securities lending income — affiliated — net in the Statements of Operations. For the year ended April 30, 2023, each Fund paid BIM the following amounts for securities lending agent services:
| Fund Name | Amounts | |||
Advantage Emerging Markets | $ | 1,044 | ||
Interfund Lending: In accordance with an exemptive order (the “Order”) from the SEC, each Fund may participate in a joint lending and borrowing facility for temporary purposes (the “Interfund Lending Program”), subject to compliance with the terms and conditions of the Order, and to the extent permitted by each Fund’s investment policies and restrictions. Each Fund is currently permitted to borrow and lend under the Interfund Lending Program.
A lending BlackRock fund may lend in aggregate up to 15% of its net assets but may not lend more than 5% of its net assets to any one borrowing fund through the Interfund Lending Program. A borrowing BlackRock fund may not borrow through the Interfund Lending Program or from any other source more than 33 1/3% of its total assets (or any
NOTES TO FINANCIAL STATEMENTS | 145 |
Notes to Financial Statements (continued)
lower threshold provided for by the fund’s investment restrictions). If a borrowing BlackRock fund’s total outstanding borrowings exceed 10% of its total assets, each of its outstanding interfund loans will be subject to collateralization of at least 102% of the outstanding principal value of the loan. All interfund loans are for temporary or emergency purposes and the interest rate to be charged will be the average of the highest current overnight repurchase agreement rate available to a lending fund and the bank loan rate, as calculated according to a formula established by the Board.
During the year ended April 30, 2023, the Funds did not participate in the Interfund Lending Program.
Trustees and Officers: Certain trustees and/or officers of the Trust are directors and/or officers of BlackRock or its affiliates. The Funds reimburse the Manager for a portion of the compensation paid to the Trust’s Chief Compliance Officer, which is included in Trustees and Officer in the Statements of Operations.
Other Transactions: The Funds may purchase securities from, or sell securities to, an affiliated fund provided the affiliation is due solely to having a common investment adviser, common officers, or common trustees. For the year ended April 30, 2023, the purchase and sale transactions and any net realized gains (losses) with affiliated funds in compliance with Rule 17a-7 under the 1940 Act were as follows:
| Fund Name | Purchases | Sales | Net Realized Gain (Loss) | |||||||||
Advantage Emerging Markets | $ | 2,923,178 | $ | 3,589,933 | $ | (138,216 | ) | |||||
| 7. | PURCHASES AND SALES |
For the year ended April 30, 2023, purchases and sales of investments, excluding short-term securities, were as follows:
| U.S. Government Securities | Other Securities | |||||||||||||||
| Fund Name | Purchases | Sales | Purchases | Sales | ||||||||||||
Advantage Emerging Markets | $ | — | $ | — | $ | 159,435,235 | $ | 196,262,899 | ||||||||
Global Equity Market Neutral | 59,575,493 | 41,689,497 | 718,812 | 1,077,080 | ||||||||||||
| 8. | INCOME TAX INFORMATION |
It is each Fund’s policy to comply with the requirements of the Internal Revenue Code of 1986, as amended, applicable to regulated investment companies, and to distribute substantially all of its taxable income to its shareholders. Therefore, no U.S. federal income tax provision is required.
Each Fund files U.S. federal and various state and local tax returns. No income tax returns are currently under examination. The statute of limitations on each Fund’s U.S. federal tax returns generally remains open for a period of three years after they are filed. The statutes of limitations on each Fund’s state and local tax returns may remain open for an additional year depending upon the jurisdiction.
Management has analyzed tax laws and regulations and their application to the Funds as of April 30, 2023, inclusive of the open tax return years, and does not believe that there are any uncertain tax positions that require recognition of a tax liability in the Funds’ financial statements.
The tax character of distributions paid was as follows:
| Fund Name | Year Ended 04/30/23 | Year Ended 04/30/22 | ||||||
Advantage Emerging Markets | ||||||||
Ordinary income | $ | 3,011,206 | $ | 2,327,836 | ||||
|
|
|
| |||||
Global Equity Market Neutral | ||||||||
Long-term capital gains | $ | — | $ | 6,131,530 | ||||
|
|
|
| |||||
As of April 30, 2023, the tax components of accumulated earnings (loss) were as follows:
| Fund Name | Undistributed Ordinary Income | Non-Expiring Capital Loss Carryforwards(a) | Net Unrealized Gains (Losses)(b) | Total | ||||||||||||
Advantage Emerging Markets | $ | 360,778 | $ | (38,746,286 | ) | $ | (2,691,208 | ) | $ | (41,076,716 | ) | |||||
Global Equity Market Neutral | 6,760,313 | (16,669,223 | ) | 592,952 | (9,315,958 | ) | ||||||||||
| (a) | Amounts available to offset future realized capital gains. |
| (b) | The difference between book-basis and tax-basis net unrealized gains (losses) was attributable primarily to the tax deferral of losses on wash sales, the realization for tax purposes of unrealized gains (losses) on certain futures contracts, the realization for tax purposes of unrealized gains on investments in passive foreign investment companies, the timing and recognition of partnership income, the accounting for swap agreements, the characterization of corporate actions and the realization for tax purposes of unrealized gains on constructive sales. |
| 146 | 2 0 2 3 BLACK ROCK ANNUAL REPORT TO SHAREHOLDERS |
Notes to Financial Statements (continued)
As of April 30, 2023, gross unrealized appreciation and depreciation based on cost of investments (including short positions and derivatives, if any) for U.S. federal income tax purposes were as follows:
| Fund Name | Tax Cost | Gross Unrealized Appreciation | Gross Unrealized Depreciation | Net Unrealized Appreciation (Depreciation) | ||||||||||||
Advantage Emerging Markets | $ | 86,987,468 | $ | 7,453,050 | $ | (10,118,707) | $ | (2,665,657 | ) | |||||||
Global Equity Market Neutral | 673,421,631 | 62,690,250 | (62,222,274 | ) | 467,976 | |||||||||||
| 9. | BANK BORROWINGS |
The Trust, on behalf of each Fund, along with certain other funds managed by the Manager and its affiliates (“Participating Funds”), is party to a 364-day, $2.50 billion credit agreement with a group of lenders. Under this agreement, the Funds may borrow to fund shareholder redemptions. Excluding commitments designated for certain individual funds, the Participating Funds, including the Funds, can borrow up to an aggregate commitment amount of $1.75 billion at any time outstanding, subject to asset coverage and other limitations as specified in the agreement. The credit agreement has the following terms: a fee of 0.10% per annum on unused commitment amounts and interest at a rate equal to the higher of (a) Overnight Bank Funding Rate (“OBFR”) (but, in any event, not less than 0.00%) on the date the loan is made plus 0.80% per annum, (b) the Fed Funds rate (but, in any event, not less than 0.00%) in effect from time to time plus 0.80% per annum on amounts borrowed or (c) the sum of (x) Daily Simple Secured Overnight Financing Rate (“SOFR”) (but, in any event, not less than 0.00%) on the date the loan is made plus 0.10% and (y) 0.80% per annum. The agreement expires in April 2024 unless extended or renewed. These fees were allocated among such funds based upon portions of the aggregate commitment available to them and relative net assets of Participating Funds. During the year ended April 30, 2023, the Funds did not borrow under the credit agreement.
| 10. | PRINCIPAL RISKS |
In the normal course of business, the Funds invest in securities or other instruments and may enter into certain transactions, and such activities subject each Fund to various risks, including among others, fluctuations in the market (market risk) or failure of an issuer to meet all of its obligations. The value of securities or other instruments may also be affected by various factors, including, without limitation: (i) the general economy; (ii) the overall market as well as local, regional or global political and/or social instability; (iii) regulation, taxation or international tax treaties between various countries; or (iv) currency, interest rate and price fluctuations. Local, regional or global events such as war, acts of terrorism, the spread of infectious illness or other public health issues, recessions, or other events could have a significant impact on the Funds and their investments. Each Fund’s prospectus provides details of the risks to which each Fund is subject.
The Funds may be exposed to additional risks when reinvesting cash collateral in money market funds that do not seek to maintain a stable NAV per share of $1.00, which may be subject to redemption gates or liquidity fees under certain circumstances.
Market Risk: Investments in the securities of issuers domiciled in countries with emerging capital markets involve certain additional risks that do not generally apply to investments in securities of issuers in more developed capital markets, such as (i) low or nonexistent trading volume, resulting in a lack of liquidity and increased volatility in prices for such securities; (ii) uncertain national policies and social, political and economic instability, increasing the potential for expropriation of assets, confiscatory taxation, high rates of inflation or unfavorable diplomatic developments; (iii) lack of publicly available or reliable information about issuers as a result of not being subject to the same degree of regulatory requirements and accounting, auditing and financial reporting standards; and (iv) possible fluctuations in exchange rates, differing legal systems and the existence or possible imposition of exchange controls, custodial restrictions or other foreign or U.S. governmental laws or restrictions applicable to such investments.
Infectious Illness Risk: An outbreak of an infectious illness, such as the COVID-19 pandemic, may adversely impact the economies of many nations and the global economy, and may impact individual issuers and capital markets in ways that cannot be foreseen. An infectious illness outbreak may result in, among other things, closed international borders, prolonged quarantines, supply chain disruptions, market volatility or disruptions and other significant economic, social and political impacts.
Valuation Risk: The market values of equities, such as common stocks and preferred securities or equity related investments, such as futures and options, may decline due to general market conditions which are not specifically related to a particular company. They may also decline due to factors which affect a particular industry or industries. A Fund may invest in illiquid investments. An illiquid investment is any investment that a Fund reasonably expects cannot be sold or disposed of in current market conditions in seven calendar days or less without the sale or disposition significantly changing the market value of the investment. A Fund may experience difficulty in selling illiquid investments in a timely manner at the price that it believes the investments are worth. Prices may fluctuate widely over short or extended periods in response to company, market or economic news. Markets also tend to move in cycles, with periods of rising and falling prices. This volatility may cause each Fund’s NAV to experience significant increases or decreases over short periods of time. If there is a general decline in the securities and other markets, the NAV of a Fund may lose value, regardless of the individual results of the securities and other instruments in which a Fund invests.
The price a Fund could receive upon the sale of any particular portfolio investment may differ from a Fund’s valuation of the investment, particularly for securities that trade in thin or volatile markets or that are valued using a fair valuation technique or a price provided by an independent pricing service. Changes to significant unobservable inputs and assumptions (i.e., publicly traded company multiples, growth rate, time to exit) due to the lack of observable inputs may significantly impact the resulting fair value and therefore a Fund’s results of operations. As a result, the price received upon the sale of an investment may be less than the value ascribed by a Fund, and a Fund could realize a greater than expected loss or lesser than expected gain upon the sale of the investment. A Fund’s ability to value its investments may also be impacted by technological issues and/or errors by pricing services or other third-party service providers.
Counterparty Credit Risk: The Funds may be exposed to counterparty credit risk, or the risk that an entity may fail to or be unable to perform on its commitments related to unsettled or open transactions, including making timely interest and/or principal payments or otherwise honoring its obligations. The Funds manage counterparty credit risk by entering into transactions only with counterparties that the Manager believes have the financial resources to honor their obligations and by monitoring the financial stability of
NOTES TO FINANCIAL STATEMENTS | 147 |
Notes to Financial Statements (continued)
those counterparties. Financial assets, which potentially expose the Funds to market, issuer and counterparty credit risks, consist principally of financial instruments and receivables due from counterparties. The extent of the Funds’ exposure to market, issuer and counterparty credit risks with respect to these financial assets is approximately their value recorded in the Statements of Assets and Liabilities, less any collateral held by the Funds.
A derivative contract may suffer a mark-to-market loss if the value of the contract decreases due to an unfavorable change in the market rates or values of the underlying instrument. Losses can also occur if the counterparty does not perform under the contract.
For OTC options purchased, each Fund bears the risk of loss in the amount of the premiums paid plus the positive change in market values net of any collateral held by the Funds should the counterparty fail to perform under the contracts. Options written by the Funds do not typically give rise to counterparty credit risk, as options written generally obligate the Funds, and not the counterparty, to perform. The Funds may be exposed to counterparty credit risk with respect to options written to the extent each Fund deposits collateral with its counterparty to a written option.
With exchange-traded options purchased and exchange-traded futures, there is less counterparty credit risk to the Funds since the exchange or clearinghouse, as counterparty to such instruments, guarantees against a possible default. The clearinghouse stands between the buyer and the seller of the contract; therefore, credit risk is limited to failure of the clearinghouse. While offset rights may exist under applicable law, a Fund does not have a contractual right of offset against a clearing broker or clearinghouse in the event of a default (including the bankruptcy or insolvency). Additionally, credit risk exists in exchange-traded futures with respect to initial and variation margin that is held in a clearing broker’s customer accounts. While clearing brokers are required to segregate customer margin from their own assets, in the event that a clearing broker becomes insolvent or goes into bankruptcy and at that time there is a shortfall in the aggregate amount of margin held by the clearing broker for all its clients, typically the shortfall would be allocated on a pro rata basis across all the clearing broker’s customers, potentially resulting in losses to the Funds.
Concentration Risk: A diversified portfolio, where this is appropriate and consistent with a fund’s objectives, minimizes the risk that a price change of a particular investment will have a material impact on the NAV of a fund. The investment concentrations within each Fund’s portfolio are disclosed in its Schedule of Investments.
Certain Funds invest a significant portion of their assets in securities of issuers located in the United States. A decrease in imports or exports, changes in trade regulations, inflation and/or an economic recession in the United States may have a material adverse effect on the U.S. economy and the securities listed on U.S. exchanges. Proposed and adopted policy and legislative changes in the United States may also have a significant effect on U.S. markets generally, as well as on the value of certain securities. Governmental agencies project that the United States will continue to maintain elevated public debt levels for the foreseeable future which may constrain future economic growth. Circumstances could arise that could prevent the timely payment of interest or principal on U.S. government debt, such as reaching the legislative “debt ceiling.” Such non-payment would result in substantial negative consequences for the U.S. economy and the global financial system. If U.S. relations with certain countries deteriorate, it could adversely affect issuers that rely on the United States for trade. The United States has also experienced increased internal unrest and discord. If these trends were to continue, they may have an adverse impact on the U.S. economy and the issuers in which the Funds invest.
Certain Funds invest a substantial amount of their assets in issuers located in a single country or a limited number of countries. When a fund concentrates its investments in this manner, it assumes the risk that economic, regulatory, political and social conditions in those countries may have a significant impact on their investment performance and could affect the income from, or the value or liquidity of, the Fund’s portfolio. Unanticipated or sudden political or social developments may cause uncertainty in the markets and as a result adversely affect the Fund’s investments. Foreign issuers may not be subject to the same uniform accounting, auditing and financial reporting standards and practices as used in the United States. Foreign securities markets may also be more volatile and less liquid than U.S. securities and may be less subject to governmental supervision not typically associated with investing in U.S. securities. Investment percentages in specific countries are presented in the Schedules of Investments.
Certain Funds invest a significant portion of their assets in securities of issuers located in Europe or with significant exposure to European issuers or countries. The European financial markets have recently experienced volatility and adverse trends due to concerns about economic downturns in, or rising government debt levels of, several European countries as well as acts of war in the region. These events may spread to other countries in Europe and may affect the value and liquidity of certain of the Funds’ investments.
Responses to the financial problems by European governments, central banks and others, including austerity measures and reforms, may not work, may result in social unrest and may limit future growth and economic recovery or have other unintended consequences. Further defaults or restructurings by governments and others of their debt could have additional adverse effects on economies, financial markets and asset valuations around the world. The United Kingdom has withdrawn from the European Union, and one or more other countries may withdraw from the European Union and/or abandon the Euro, the common currency of the European Union. These events and actions have adversely affected, and may in the future adversely affect, the value and exchange rate of the Euro and may continue to significantly affect the economies of every country in Europe, including countries that do not use the Euro and non-European Union member states. The impact of these actions, especially if they occur in a disorderly fashion, is not clear but could be significant and far reaching. In addition, Russia launched a large-scale invasion of Ukraine on February 24, 2022. The extent and duration of the military action, resulting sanctions and resulting future market disruptions in the region are impossible to predict, but have been, and may continue to be, significant and have a severe adverse effect on the region, including significant negative impacts on the economy and the markets for certain securities and commodities, such as oil and natural gas, as well as other sectors.
Certain Funds invest a significant portion of their assets in securities of issuers located in Asia or with significant exposure to Asian issuers or countries. The Asian financial markets have recently experienced volatility and adverse trends due to concerns in several Asian countries regarding monetary policy, government intervention in the markets, rising government debt levels or economic downturns. These events may spread to other countries in Asia and may affect the value and liquidity of certain of the Funds’ investments.
Certain Funds invest a significant portion of their assets in securities of issuers located in China or with significant exposure to Chinese issuers. Investments in Chinese securities, including certain Hong Kong-listed securities, involve risks specific to China. China may be subject to considerable degrees of economic, political and social instability and demonstrates significantly higher volatility from time to time in comparison to developed markets. Chinese markets generally continue to experience inefficiency, volatility and pricing anomalies resulting from governmental influence, a lack of publicly available information and/or political and social instability. Internal social unrest or confrontations with other neighboring countries may disrupt economic development in China and result in a greater risk of currency fluctuations, currency non-convertibility,
| 148 | 2 0 2 3 BLACK ROCK ANNUAL REPORT TO SHAREHOLDERS |
Notes to Financial Statements (continued)
interest rate fluctuations and higher rates of inflation. Incidents involving China’s or the region’s security may cause uncertainty in Chinese markets and may adversely affect the Chinese economy and the Fund’s investments. Reduction in spending on Chinese products and services, institution of tariffs or other trade barriers, or a downturn in any of the economies of China’s key trading partners may have an adverse impact on the Chinese economy. In addition, measures may be taken to limit the flow of capital and/or sanctions may be imposed, which could prohibit or restrict the ability to own or transfer fund assets and may also include retaliatory actions, such as seizure of fund assets.
| 11. | CAPITAL SHARE TRANSACTIONS |
Transactions in capital shares for each class were as follows:
| Year Ended 04/30/23 | Year Ended 04/30/22 | |||||||||||||||
| Fund Name / Share Class | Shares | Amounts | Shares | Amounts | ||||||||||||
Advantage Emerging Markets | ||||||||||||||||
Institutional | ||||||||||||||||
Shares sold | 208,272 | $ | 1,946,147 | 172,173 | $ | 2,149,062 | ||||||||||
Shares issued in reinvestment of distributions | 24,118 | 217,789 | 15,307 | 189,748 | ||||||||||||
Shares redeemed | (495,776 | ) | (4,500,312 | ) | (540,197 | ) | (6,345,580 | ) | ||||||||
|
|
|
|
|
|
|
| |||||||||
| (263,386 | ) | $ | (2,336,376 | ) | (352,717 | ) | $ | (4,006,770 | ) | |||||||
|
|
|
|
|
|
|
| |||||||||
Investor A | ||||||||||||||||
Shares sold | 47,347 | $ | 440,441 | 60,578 | $ | 730,563 | ||||||||||
Shares issued in reinvestment of distributions | 18,434 | 163,319 | 5,633 | 68,598 | ||||||||||||
Shares redeemed | (108,134 | ) | (984,054 | ) | (85,864 | ) | (1,000,083 | ) | ||||||||
|
|
|
|
|
|
|
| |||||||||
| (42,353 | ) | $ | (380,294 | ) | (19,653 | ) | $ | (200,922 | ) | |||||||
|
|
|
|
|
|
|
| |||||||||
Investor C | ||||||||||||||||
Shares sold | 42,971 | $ | 382,997 | 494 | $ | 5,613 | ||||||||||
Shares issued in reinvestment of distributions | 1,032 | 8,701 | 36 | 450 | ||||||||||||
Shares redeemed | (24,088 | ) | (212,434 | ) | (15,259 | ) | (175,008 | ) | ||||||||
|
|
|
|
|
|
|
| |||||||||
| 19,915 | $ | 179,264 | (14,729 | ) | $ | (168,945 | ) | |||||||||
|
|
|
|
|
|
|
| |||||||||
Class K | ||||||||||||||||
Shares sold | 1,450,230 | $ | 13,775,721 | 2,518,212 | $ | 29,836,376 | ||||||||||
Shares issued in reinvestment of distributions | 290,217 | 2,617,795 | 165,545 | 2,045,863 | ||||||||||||
Shares redeemed | (6,306,984 | ) | (54,509,050 | ) | (1,558,201 | ) | (18,426,399 | ) | ||||||||
|
|
|
|
|
|
|
| |||||||||
| (4,566,537 | ) | $ | (38,115,534 | ) | 1,125,556 | $ | 13,455,840 | |||||||||
|
|
|
|
|
|
|
| |||||||||
| (4,852,361 | ) | $ | (40,652,940 | ) | 738,457 | $ | 9,079,203 | |||||||||
|
|
|
|
|
|
|
| |||||||||
| Year Ended 04/30/23 | Year Ended 04/30/22 | |||||||||||||||
| Fund Name / Share Class | Shares | Amounts | Shares | Amounts | ||||||||||||
Global Equity Market Neutral | ||||||||||||||||
Institutional | ||||||||||||||||
Shares sold | 26,358,802 | $ | 306,911,089 | 21,428,123 | $ | 249,500,008 | ||||||||||
Shares issued in reinvestment of distributions | — | — | 338,212 | 4,007,822 | ||||||||||||
Shares redeemed | (29,231,157 | ) | (338,909,422) | (10,894,979 | ) | (126,513,641) | ||||||||||
|
|
|
|
|
|
|
| |||||||||
| (2,872,355 | ) | $ | (31,998,333 | ) | 10,871,356 | $ | 126,994,189 | |||||||||
|
|
|
|
|
|
|
| |||||||||
Investor A | ||||||||||||||||
Shares sold | 896,505 | $ | 10,257,468 | 798,505 | $ | 9,148,217 | ||||||||||
Shares issued in reinvestment of distributions | — | — | 23,726 | 277,350 | ||||||||||||
Shares redeemed | (1,250,914 | ) | (14,421,836 | ) | (569,722 | ) | (6,530,854 | ) | ||||||||
|
|
|
|
|
|
|
| |||||||||
| (354,409 | ) | $ | (4,164,368 | ) | 252,509 | $ | 2,894,713 | |||||||||
|
|
|
|
|
|
|
| |||||||||
Investor C | ||||||||||||||||
Shares sold | 287,251 | $ | 3,165,458 | 70,815 | $ | 760,368 | ||||||||||
Shares issued in reinvestment of distributions | — | — | 7,514 | 83,179 | ||||||||||||
Shares redeemed | (227,007 | ) | (2,413,505 | ) | (274,027 | ) | (2,959,803 | ) | ||||||||
|
|
|
|
|
|
|
| |||||||||
| 60,244 | $ | 751,953 | (195,698 | ) | $ | (2,116,256 | ) | |||||||||
|
|
|
|
|
|
|
| |||||||||
NOTES TO FINANCIAL STATEMENTS | 149 |
Notes to Financial Statements (continued)
| Year Ended 04/30/23 | Year Ended 04/30/22 | |||||||||||||||
| Fund Name / Share Class (continued) | Shares | Amounts | Shares | Amounts | ||||||||||||
Global Equity Market Neutral (continued) | ||||||||||||||||
Class K | ||||||||||||||||
Shares sold | 12,848,228 | $ | 148,024,891 | 215,060 | $ | 2,517,495 | ||||||||||
Shares issued in reinvestment of distributions | — | — | 5,402 | 64,174 | ||||||||||||
Shares redeemed | (3,370,538 | ) | (39,713,633 | ) | (34,941 | ) | (413,017 | ) | ||||||||
|
|
|
|
|
|
|
| |||||||||
| 9,477,690 | $ | 108,311,258 | 185,521 | $ | 2,168,652 | |||||||||||
|
|
|
|
|
|
|
| |||||||||
| 6,311,170 | $ | 72,900,510 | 11,113,688 | $ | 129,941,298 | |||||||||||
|
|
|
|
|
|
|
| |||||||||
| 12. | SUBSEQUENT EVENTS |
Management has evaluated the impact of all subsequent events on the Funds through the date the financial statements were issued and has determined that there were no subsequent events requiring adjustment or additional disclosure in the financial statements.
| 150 | 2 0 2 3 BLACK ROCK ANNUAL REPORT TO SHAREHOLDERS |
Report of Independent Registered Public Accounting Firm
To the Shareholders of BlackRock Advantage Emerging Markets Fund and BlackRock Global Equity Market Neutral Fund and the Board of Trustees of BlackRock FundsSM:
Opinion on the Financial Statements and Financial Highlights
We have audited the accompanying statements of assets and liabilities of BlackRock Advantage Emerging Markets Fund and BlackRock Global Equity Market Neutral Fund (formerly, BlackRock Global Long/Short Equity Fund) of BlackRock FundsSM (the “Funds”), including the schedules of investments, as of April 30, 2023, the related statements of operations for the year then ended, the statements of changes in net assets for each of the two years in the period then ended, and the financial highlights for each of the three years in the period then ended and for the period from August 1, 2019 through April 30, 2020, and the related notes. In our opinion, the financial statements and financial highlights present fairly, in all material respects, the financial position of the Funds as of April 30, 2023, and the results of their operations for the year then ended, the changes in their net assets for each of the two years in the period then ended, and the financial highlights for each of the three years in the period then ended and for the period from August 1, 2019 through April 30, 2020, in conformity with accounting principles generally accepted in the United States of America.
The financial highlights for each of the two years in the period ended July 31, 2019 of the Funds were audited by other auditors whose report dated September 24, 2019, expressed an unqualified opinion on those financial highlights.
Basis for Opinion
These financial statements and financial highlights are the responsibility of the Funds’ management. Our responsibility is to express an opinion on the Funds’ financial statements and financial highlights based on our audits. We are a public accounting firm registered with the Public Company Accounting Oversight Board (United States) (PCAOB) and are required to be independent with respect to the Funds in accordance with the U.S. federal securities laws and the applicable rules and regulations of the Securities and Exchange Commission and the PCAOB.
We conducted our audits in accordance with the standards of the PCAOB. Those standards require that we plan and perform the audit to obtain reasonable assurance about whether the financial statements and financial highlights are free of material misstatement, whether due to error or fraud. The Funds are not required to have, nor were we engaged to perform, an audit of their internal control over financial reporting. As part of our audits we are required to obtain an understanding of internal control over financial reporting but not for the purpose of expressing an opinion on the effectiveness of the Funds’ internal control over financial reporting. Accordingly, we express no such opinion.
Our audits included performing procedures to assess the risks of material misstatement of the financial statements and financial highlights, whether due to error or fraud, and performing procedures that respond to those risks. Such procedures included examining, on a test basis, evidence regarding the amounts and disclosures in the financial statements and financial highlights. Our audits also included evaluating the accounting principles used and significant estimates made by management, as well as evaluating the overall presentation of the financial statements and financial highlights. Our procedures included confirmation of securities owned as of April 30, 2023, by correspondence with custodians or counterparties; when replies were not received, we performed other auditing procedures. We believe that our audits provide a reasonable basis for our opinion.
Deloitte & Touche LLP
Boston, Massachusetts
June 22, 2023
We have served as the auditor of one or more BlackRock investment companies since 1992.
REPORT OF INDEPENDENT REGISTERED PUBLIC ACCOUNTING FIRM | 151 |
Important Tax Information (unaudited)
The following amounts, or maximum amounts allowable by law, are hereby designated as qualified dividend income for individuals for the fiscal year ended April 30, 2023:
| ||||
| Fund Name | Qualified Dividend Income | |||
| ||||
Advantage Emerging Markets | $ | 2,060,638 | ||
| ||||
The Funds intend to pass through to their shareholders the following amounts, or maximum amounts allowable by law, of foreign source income earned and foreign taxes paid for the fiscal year ended April 30, 2023:
| ||||||||
| Fund Name | Foreign Source Income Earned | Foreign Taxes Paid | ||||||
| ||||||||
Advantage Emerging Markets | $ | 3,119,537 | $ | 597,701 | ||||
| ||||||||
The Fund hereby designates the following amount, or maximum amount allowable by law, of distributions from direct federal obligation interest for the fiscal year ended April 30, 2023:
| ||||
| Fund Name | Federal Obligation Interest | |||
| ||||
Global Equity Market Neutral | $ | 8,241,641 | ||
| ||||
The law varies in each state as to whether and what percent of ordinary income dividends attributable to federal obligations is exempt from state income tax. Shareholders are advised to check with their tax advisers to determine if any portion of the dividends received is exempt from state income tax.
The Funds hereby designate the following amounts, or maximum amounts allowable by law, as interest income eligible to be treated as a Section 163(j) interest dividend for the fiscal year ended April 30, 2023:
| ||||
| Fund Name | Interest Dividends | |||
| ||||
Advantage Emerging Markets | $ | 89,975 | ||
Global Equity Market Neutral | 8,578,770 | |||
| ||||
The Funds hereby designate the following amounts, or maximum amounts allowable by law, as interest-related dividends eligible for exemption from U.S. withholding tax for nonresident aliens and foreign corporations for the fiscal year ended April 30, 2023:
| ||||
| Fund Name | Interest Related Dividends | |||
| ||||
Advantage Emerging Markets | $ | 89,975 | ||
Global Equity Market Neutral | 8,578,770 | |||
| ||||
| 152 | 2 0 2 3 BLACK ROCK ANNUAL REPORT TO SHAREHOLDERS |
Statement Regarding Liquidity Risk Management Program
In compliance with Rule 22e-4 under the Investment Company Act of 1940, as amended (the “Liquidity Rule”), BlackRock FundsSM (the “Trust”) has adopted and implemented a liquidity risk management program (the “Program”) for BlackRock Advantage Emerging Markets Fund and BlackRock Global Equity Market Neutral Fund (the “Funds”), each a series of the Trust, which is reasonably designed to assess and manage each Fund’s liquidity risk.
The Board of Trustees (the “Board”) of the Trust, on behalf of the Funds, met on November 8-9, 2022 (the “Meeting”) to review the Program. The Board previously appointed BlackRock Advisors, LLC or BlackRock Fund Advisors (“BlackRock”), each an investment adviser to certain BlackRock funds, as the program administrator for each Fund’s Program, as applicable. BlackRock also previously delegated oversight of the Program to the 40 Act Liquidity Risk Management Committee (the “Committee”). At the Meeting, the Committee, on behalf of BlackRock, provided the Board with a report that addressed the operation of the Program and assessed its adequacy and effectiveness of implementation, including the management of each Fund’s Highly Liquid Investment Minimum (“HLIM”) where applicable, and any material changes to the Program (the “Report”). The Report covered the period from October 1, 2021 through September 30, 2022 (the “Program Reporting Period”).
The Report described the Program’s liquidity classification methodology for categorizing each Fund’s investments (including derivative transactions) into one of four liquidity buckets. It also referenced the methodology used by BlackRock to establish each Fund’s HLIM and noted that the Committee reviews and ratifies the HLIM assigned to each Fund no less frequently than annually. The Report also discussed notable events affecting liquidity over the Program Reporting Period, including the imposition of capital controls in certain countries.
The Report noted that the Program complied with the key factors for consideration under the Liquidity Rule for assessing, managing and periodically reviewing each Fund’s liquidity risk, as follows:
| a) | The Fund’s investment strategy and liquidity of portfolio investments during both normal and reasonably foreseeable stressed conditions. During the Program Reporting Period, the Committee reviewed whether each Fund’s strategy is appropriate for an open-end fund structure with a focus on funds with more significant and consistent holdings of less liquid and illiquid assets. The Committee also factored a fund’s concentration in an issuer into the liquidity classification methodology by taking issuer position sizes into account. Where a fund participated in borrowings for investment purposes (such as tender option bonds or reverse repurchase agreements), such borrowings were factored into the Program’s calculation of a fund’s liquidity bucketing. A fund’s derivative exposure was also considered in such calculation. |
| b) | Short-term and long-term cash flow projections during both normal and reasonably foreseeable stressed conditions. During the Program Reporting Period, the Committee reviewed historical redemption activity and used this information as a component to establish each Fund’s reasonably anticipated trading size utilized for liquidity classifications. Each Fund has adopted an in-kind redemption policy which may be utilized to meet larger redemption requests. The Committee may also take into consideration a fund’s shareholder ownership concentration (which, depending on product type and distribution channel, may or may not be available), a fund’s distribution channels, and the degree of certainty associated with a fund’s short-term and long-term cash flow projections. |
| c) | Holdings of cash and cash equivalents, as well as borrowing arrangements. The Committee considered the terms of the credit facility committed to each Fund, the financial health of the institution providing the facility and the fact that the credit facility is shared among multiple funds (including that a portion of the aggregate commitment amount is specifically designated for BlackRock Floating Rate Income Portfolio, a series of BlackRock Funds V, and BlackRock Floating Rate Loan ETF, a series of BlackRock ETF Trust II). The Committee also considered other types of borrowing available to the Funds, such as the ability to use reverse repurchase agreements and interfund lending, as applicable. |
There were no material changes to the Program during the Program Reporting Period other than the enhancement of certain model components in the Program’s classification methodology. The Report provided to the Board stated that the Committee concluded that based on the operation of the functions, as described in the Report, the Program is operating as intended and is effective in implementing the requirements of the Liquidity Rule.
STATEMENT REGARDING LIQUIDITY RISK MANAGEMENT PROGRAM | 153 |
Trustee and Officer Information
| Independent Trustees(a) | ||||||||
Name Year of Birth(b) | Position(s) Held (Length of Service)(c) | Principal Occupation(s) During Past 5 Years | Number of BlackRock-Advised Registered Investment Companies (“RICs”) Consisting of Investment Portfolios (“Portfolios”) Overseen | Public Company and Other Investment Company Directorships Held Past 5 Years | ||||
Mark Stalnecker 1951 | Chair of the Board (Since 2019) and Trustee (Since 2015) | Chief Investment Officer, University of Delaware from 1999 to 2013; Trustee and Chair of the Finance and Investment Committees, Winterthur Museum and Country Estate from 2005 to 2016; Member of the Investment Committee, Delaware Public Employees’ Retirement System since 2002; Member of the Investment Committee, Christiana Care Health System from 2009 to 2017; Member of the Investment Committee, Delaware Community Foundation from 2013 to 2014; Director and Chair of the Audit Committee, SEI Private Trust Co. from 2001 to 2014. | 28 RICs consisting of 166 Portfolios | None | ||||
Susan J. Carter 1956 | Trustee (Since 2016) | Trustee, Financial Accounting Foundation from 2017 to 2021; Advisory Board Member, Center for Private Equity and Entrepreneurship at Tuck School of Business from 1997 to 2021; Director, Pacific Pension Institute from 2014 to 2018; Senior Advisor, Commonfund Capital, Inc. (“CCI”) (investment adviser) in 2015; Chief Executive Officer, CCI from 2013 to 2014; President & Chief Executive Officer, CCI from 1997 to 2013; Advisory Board Member, Girls Who Invest from 2015 to 2018 and Board Member thereof from 2018 to 2022; Advisory Board Member, Bridges Fund Management since 2016; Practitioner Advisory Board Member, Private Capital Research Institute (“PCRI”) since 2017; Lecturer in the Practice of Management, Yale School of Management since 2019; Advisor to Finance Committee, Altman Foundation since 2020; Investment Committee Member, Tostan since 2021; Member of the President’s Counsel, Commonfund since 2023. | 28 RICs consisting of 166 Portfolios | None | ||||
Collette Chilton 1958 | Trustee (Since 2015) | Chief Investment Officer, Williams College since 2006; Chief Investment Officer, Lucent Asset Management Corporation from 1998 to 2006; Director, Boys and Girls Club of Boston since 2017; Director, B1 Capital since 2018; Director, David and Lucile Packard Foundation since 2020. | 28 RICs consisting of 166 Portfolios | None | ||||
Neil A. Cotty 1954 | Trustee (Since 2016) | Bank of America Corporation from 1996 to 2015, serving in various senior finance leadership roles, including Chief Accounting Officer from 2009 to 2015, Chief Financial Officer of Global Banking, Markets and Wealth Management from 2008 to 2009, Chief Accounting Officer from 2004 to 2008, Chief Financial Officer of Consumer Bank from 2003 to 2004, Chief Financial Officer of Global Corporate Investment Bank from 1999 to 2002. | 28 RICs consisting of 166 Portfolios | None | ||||
Lena G. Goldberg 1949 | Trustee (Since 2019) | Director, Pioneer Legal Institute since 2023; Director, Charles Stark Draper Laboratory, Inc. from 2013 to 2021; Senior Lecturer, Harvard Business School from 2008 to 2021; FMR LLC/Fidelity Investments (financial services) from 1996 to 2008, serving in various senior roles including Executive Vice President - Strategic Corporate Initiatives and Executive Vice President and General Counsel; Partner, Sullivan & Worcester LLP from 1985 to 1996 and Associate thereof from 1979 to 1985. | 28 RICs consisting of 166 Portfolios | None | ||||
| 154 | 2 0 2 3 BLACK ROCK ANNUAL REPORT TO SHAREHOLDERS |
Trustee and Officer Information (continued)
| Independent Trustees(a) (continued) | ||||||||
Name Year of Birth(b) | Position(s) Held (Length of Service)(c) | Principal Occupation(s) During Past 5 Years | Number of BlackRock-Advised Registered Investment Companies (“RICs”) Consisting of Investment | Public Company and Other Investment Company Directorships Held Past 5 Years | ||||
Henry R. Keizer 1956 | Trustee (Since 2019) | Director, Park Indemnity Ltd. (captive insurer) from 2010 to 2022. | 28 RICs consisting of 166 Portfolios | GrafTech International Ltd. (materials manufacturing); Sealed Air Corp. (packaging); WABCO (commercial vehicle safety systems) from 2015 to 2020; Hertz Global Holdings (car rental) from 2015 to 2021 | ||||
Cynthia A. Montgomery 1952 | Trustee (Since 2007) | Professor, Harvard Business School since 1989. | 28 RICs consisting of 166 Portfolios | None | ||||
Donald C. Opatrny 1952 | Trustee (Since 2019) | Chair of the Board of Phoenix Art Museum since 2022 and Trustee thereof since 2018; Chair of the Investment Committee of The Arizona Community Foundation since 2022 and trustee thereof since 2020; Director, Athena Capital Advisors LLC (investment management firm) from 2013 to 2020; Trustee, Vice Chair, Member of the Executive Committee and Chair of the Investment Committee, Cornell University from 2004 to 2019; President and Trustee, the Center for the Arts, Jackson Hole from 2011 to 2018; Member of the Board and Investment Committee, University School from 2007 to 2018; Member of Affordable Housing Supply Board of Jackson, Wyoming since 2017; Member, Investment Funds Committee, State of Wyoming since 2017; Trustee, Artstor (a Mellon Foundation affiliate) from 2010 to 2015; Member of the Investment Committee, Mellon Foundation from 2009 to 2015; President, Trustee and Member of the Investment Committee, The Aldrich Contemporary Art Museum from 2007 to 2014; Trustee and Chair of the Investment Committee, Community Foundation of Jackson Hole since 2014. | 28 RICs consisting of 166 Portfolios | None | ||||
Kenneth L. Urish 1951 | Trustee (Since 2007) | Managing Partner, Urish Popeck & Co., LLC (certified public accountants and consultants) since 1976; Past- Chairman of the Professional Ethics Committee of the Pennsylvania Institute of Certified Public Accountants and Committee Member thereof since 2007; Member of External Advisory Board, The Pennsylvania State University Accounting Department since 2001, Emeritus since 2022; Principal, UP Strategic Wealth Investment Advisors, LLC since 2013; Trustee, The Holy Family Institute from 2001 to 2010; President and Trustee, Pittsburgh Catholic Publishing Associates from 2003 to 2008; Director, Inter-Tel from 2006 to 2007; Member, Advisory Board, ESG Competent Boards since 2020. | 28 RICs consisting of 166 Portfolios | None | ||||
TRUSTEE AND OFFICER INFORMATION | 155 |
Trustee and Officer Information (continued)
| Independent Trustees(a) (continued) | ||||||||
Name Year of Birth(b) | Position(s) Held (Length of Service)(c) | Principal Occupation(s) During Past 5 Years | Number of BlackRock-Advised Registered Investment Companies (“RICs”) Consisting of Investment | Public Company and Other Investment Company Directorships Held During | ||||
Claire A. Walton 1957 | Trustee (Since 2016) | Advisory Board Member, Grossman School of Business at the University of Vermont since 2023; Advisory Board Member, Scientific Financial Systems since 2022; General Partner of Neon Liberty Capital Management, LLC since 2003; Chief Operating Officer and Chief Financial Officer of Liberty Square Asset Management, LP from 1998 to 2015; Director, Boston Hedge Fund Group from 2009 to 2018; Director, Massachusetts Council on Economic Education from 2013 to 2015; Director, Woodstock Ski Runners from 2013 to 2022. | 28 RICs consisting of 166 Portfolios | None | ||||
| Interested Trustees(a)(d) | ||||||||
Name Year of Birth(b) | Position(s) Held (Length of Service)(c) | Principal Occupation(s) During Past 5 Years | Number of BlackRock-Advised (“RICs”) Consisting of Investment | Public Company and Other Investment Company Directorships Held During Past 5 Years | ||||
Robert Fairbairn 1965 | Trustee (Since 2018) | Vice Chairman of BlackRock, Inc. since 2019; Member of BlackRock’s Global Executive and Global Operating Committees; Co-Chair of BlackRock’s Human Capital Committee; Senior Managing Director of BlackRock, Inc. from 2010 to 2019; oversaw BlackRock’s Strategic Partner Program and Strategic Product Management Group from 2012 to 2019; Member of the Board of Managers of BlackRock Investments, LLC from 2011 to 2018; Global Head of BlackRock’s Retail and iShares® businesses from 2012 to 2016. | 98 RICs consisting of 266 Portfolios | None | ||||
John M. Perlowski(e) 1964 | Trustee (Since 2015) President and Chief Executive Officer (Since 2010) | Managing Director of BlackRock, Inc. since 2009; Head of BlackRock Global Accounting and Product Services since 2009; Advisory Director of Family Resource Network (charitable foundation) since 2009. | 100 RICs consisting of 268 Portfolios | None | ||||
| (a) | The address of each Trustee is c/o BlackRock, Inc., 50 Hudson Yards, New York, NY 10001. |
| (b) | Independent Trustees serve until their resignation, retirement, removal or death, or until December 31 of the year in which they turn 75. The Board may determine to extend the terms of Independent Trustees on a case-by-case basis, as appropriate. |
| (c) | Following the combination of Merrill Lynch Investment Managers, L.P. (“MLIM”) and BlackRock, Inc. in September 2006, the various legacy MLIM and legacy BlackRock fund boards were realigned and consolidated into three new fund boards in 2007. Furthermore, effective January 1, 2019, three BlackRock Fund Complexes were realigned and consolidated into two BlackRock Fund Complexes. As a result, although the chart shows the year that each Independent Trustee joined the Board, certain Independent Trustees first became members of the boards of other BlackRock-advised Funds, legacy MLIM funds or legacy BlackRock funds as follows: Cynthia A. Montgomery, 1994; Kenneth L. Urish, 1999; Lena G. Goldberg, 2016; Henry R. Keizer, 2016; Donald C. Opatrny, 2015. |
| (d) | Mr. Fairbairn and Mr. Perlowski are both “interested persons,” as defined in the 1940 Act, of the Trust based on their positions with BlackRock, Inc. and its affiliates. Mr. Fairbairn and Mr. Perlowski are also board members of the BlackRock Fixed-Income Complex. |
| (e) | Mr. Perlowski is also a trustee of the BlackRock Credit Strategies Fund and BlackRock Private Investments Fund. |
| 156 | 2 0 2 3 BLACK ROCK ANNUAL REPORT TO SHAREHOLDERS |
Trustee and Officer Information (continued)
| Officers Who Are Not Trustees(a) | ||||
Name Year of Birth(b) | Position(s) Held (Length of Service) | Principal Occupation(s) During Past 5 Years | ||
Roland Villacorta 1971 | Vice President (Since 2022) | Managing Director of BlackRock, Inc. since 2022; Head of Global Cash Management and Head of Securities Lending within BlackRock’s Portfolio Management Group since 2022; Member of BlackRock’s Global Operating Committee since 2022; Head of Portfolio Management in BlackRock’s Financial Markets Advisory Group within BlackRock Solutions from 2008 to 2015; Co-Head of BlackRock Solutions’ Portfolio Analytics Group; previously Mr. Villacorta was Co-Head of Fixed Income within BlackRock’s Risk & Quantitative Analysis Group. | ||
Jennifer McGovern 1977 | Vice President (Since 2014) | Managing Director of BlackRock, Inc. since 2016; Director of BlackRock, Inc. from 2011 to 2015; Head of Americas Product Development and Governance for BlackRock’s Global Product Group since 2019; Head of Product Structure and Oversight for BlackRock’s U.S. Wealth Advisory Group from 2013 to 2019. | ||
Trent Walker 1974 | Chief Financial Officer (Since 2021) | Managing Director of BlackRock, Inc. since September 2019; Executive Vice President of PIMCO from 2016 to 2019; Senior Vice President of PIMCO from 2008 to 2015; Treasurer from 2013 to 2019 and Assistant Treasurer from 2007 to 2017 of PIMCO Funds, PIMCO Variable Insurance Trust, PIMCO ETF Trust, PIMCO Equity Series, PIMCO Equity Series VIT, PIMCO Managed Accounts Trust, 2 PIMCO-sponsored interval funds and 21 PIMCO-sponsored closed-end funds. | ||
Jay M. Fife 1970 | Treasurer (Since 2007) | Managing Director of BlackRock, Inc. since 2007. | ||
Charles Park 1967 | Chief Compliance Officer (Since 2014) | Anti-Money Laundering Compliance Officer for certain BlackRock-advised Funds from 2014 to 2015; Chief Compliance Officer of BlackRock Advisors, LLC and the BlackRock-advised Funds in the BlackRock Multi-Asset Complex and the BlackRock Fixed-Income Complex since 2014; Principal of and Chief Compliance Officer for iShares® Delaware Trust Sponsor LLC since 2012 and BlackRock Fund Advisors (“BFA”) since 2006; Chief Compliance Officer for the BFA-advised iShares® exchange traded funds since 2006; Chief Compliance Officer for BlackRock Asset Management International Inc. since 2012. | ||
Lisa Belle 1968 | Anti-Money Laundering Compliance Officer (Since 2019) | Managing Director of BlackRock, Inc. since 2019; Global Financial Crime Head for Asset and Wealth Management of JP Morgan from 2013 to 2019; Managing Director of RBS Securities from 2012 to 2013; Head of Financial Crimes for Barclays Wealth Americas from 2010 to 2012. | ||
Janey Ahn 1975 | Secretary (Since 2019) | Managing Director of BlackRock, Inc. since 2018; Director of BlackRock, Inc. from 2009 to 2017. | ||
| (a) | The address of each Officer is c/o BlackRock, Inc., 50 Hudson Yards, New York, NY 10001. |
| (b) | Officers of the Trust serve at the pleasure of the Board. |
Further information about the Trust’s Trustees and Officers is available in the Trust’s Statement of Additional Information, which can be obtained without charge by calling (800) 441-7762.
Effective December 31, 2022, Joseph P. Platt retired as a Trustee of the Funds.
TRUSTEE AND OFFICER INFORMATION | 157 |
General Information
Quarterly performance, semi-annual and annual reports, current net asset value and other information regarding the Funds may be found on BlackRock’s website, which can be accessed at blackrock.com. Any reference to BlackRock’s website in this report is intended to allow investors public access to information regarding the Funds and does not, and is not intended to, incorporate BlackRock’s website in this report.
Householding
The Funds will mail only one copy of shareholder documents, including prospectuses, annual and semi-annual reports, Rule 30e-3 notices and proxy statements, to shareholders with multiple accounts at the same address. This practice is commonly called “householding” and is intended to reduce expenses and eliminate duplicate mailings of shareholder documents. Mailings of your shareholder documents may be householded indefinitely unless you instruct us otherwise. If you do not want the mailing of these documents to be combined with those for other members of your household, please call the Funds at (800) 441-7762.
Availability of Quarterly Schedule of Investments
The Funds file their complete schedules of portfolio holdings with the SEC for the first and third quarters of each fiscal year as an exhibit to their reports on Form N-PORT. The Funds’ Forms N-PORT are available on the SEC’s website at sec.gov. Additionally, each Fund makes its portfolio holdings for the first and third quarters of each fiscal year available at blackrock.com/fundreports.
Availability of Proxy Voting Policies, Procedures and Voting Records
A description of the policies and procedures that the Funds use to determine how to vote proxies relating to portfolio securities and information about how the Funds voted proxies relating to securities held in the Funds’ portfolios during the most recent 12-month period ended June 30 is available without charge, upon request (1) by calling (800) 441-7762; (2) on the BlackRock website at blackrock.com; and (3) on the SEC’s website at sec.gov.
BlackRock’s Mutual Fund Family
BlackRock offers a diverse lineup of open-end mutual funds crossing all investment styles and managed by experts in equity, fixed-income and tax-exempt investing. Visit blackrock.com for more information.
Shareholder Privileges
Account Information
Call us at (800) 441-7762 from 8:00 AM to 6:00 PM ET on any business day to get information about your account balances, recent transactions and share prices. You can also visit blackrock.com for more information.
Automatic Investment Plans
Investor class shareholders who want to invest regularly can arrange to have $50 or more automatically deducted from their checking or savings account and invested in any of the BlackRock funds.
Systematic Withdrawal Plans
Investor class shareholders can establish a systematic withdrawal plan and receive periodic payments of $50 or more from their BlackRock funds, as long as their account balance is at least $10,000.
Retirement Plans
Shareholders may make investments in conjunction with Traditional, Rollover, Roth, Coverdell, Simple IRAs, SEP IRAs and 403(b) Plans.
BlackRock Privacy Principles
BlackRock is committed to maintaining the privacy of its current and former fund investors and individual clients (collectively, “Clients”) and to safeguarding their non-public personal information. The following information is provided to help you understand what personal information BlackRock collects, how we protect that information and why in certain cases we share such information with select parties.
If you are located in a jurisdiction where specific laws, rules or regulations require BlackRock to provide you with additional or different privacy-related rights beyond what is set forth below, then BlackRock will comply with those specific laws, rules or regulations.
BlackRock obtains or verifies personal non-public information from and about you from different sources, including the following: (i) information we receive from you or, if applicable, your financial intermediary, on applications, forms or other documents; (ii) information about your transactions with us, our affiliates, or others; (iii) information we receive from a consumer reporting agency; and (iv) from visits to our websites.
| 158 | 2 0 2 3 BLACK ROCK ANNUAL REPORT TO SHAREHOLDERS |
Additional Information (continued)
BlackRock Privacy Principles (continued)
BlackRock does not sell or disclose to non-affiliated third parties any non-public personal information about its Clients, except as permitted by law or as is necessary to respond to regulatory requests or to service Client accounts. These non-affiliated third parties are required to protect the confidentiality and security of this information and to use it only for its intended purpose.
We may share information with our affiliates to service your account or to provide you with information about other BlackRock products or services that may be of interest to you. In addition, BlackRock restricts access to non-public personal information about its Clients to those BlackRock employees with a legitimate business need for the information. BlackRock maintains physical, electronic and procedural safeguards that are designed to protect the non-public personal information of its Clients, including procedures relating to the proper storage and disposal of such information.
Fund and Service Providers
| Investment Adviser and Administrator | Distributor | |
| BlackRock Advisors, LLC | BlackRock Investments, LLC | |
| Wilmington, DE 19809 | New York, NY 10001 | |
| Sub-Adviser | Independent Registered Public Accounting Firm | |
| BlackRock International Limited(a) | Deloitte & Touche LLP | |
| Edinburgh, EH3 8BL | Boston, MA 02116 | |
| United Kingdom | ||
| Legal Counsel | ||
| Accounting Agent and Custodian | Sidley Austin LLP | |
| State Street Bank and Trust Company | New York, NY 10019 | |
| Boston, MA 02114 | ||
| Address of the Funds | ||
| Transfer Agent | 100 Bellevue Parkway | |
| BNY Mellon Investment Servicing (US) Inc. | Wilmington, DE 19809 | |
| Wilmington, DE 19809 | ||
(a) For Global Equity Market Neutral. | ||
ADDITIONAL INFORMATION | 159 |
Glossary of Terms Used in this Report
Currency Abbreviation
| USD | United States Dollar | |
| Portfolio Abbreviation | ||
| ADR | American Depositary Receipt | |
| AMBAC | AMBAC Assurance Corp. | |
| ARB | Airport Revenue Bonds | |
| CDI | CREST Depository Interest | |
| CVA | Certificaten Van Aandelen (Dutch Certificate) | |
| DIP | Debtor-In-Possession | |
| LP | Limited Partnership | |
| MSCI | Morgan Stanley Capital International | |
| NVDR | Non-Voting Depositary Receipt | |
| PCL | Public Company Limited | |
| PILOT | Payment in Lieu of Taxes | |
| PJSC | Public Joint Stock Company | |
| REIT | Real Estate Investment Trust | |
| S&P | Standard & Poor’s | |
| SAB | Special Assessment Bonds | |
| SAP | Subject to Appropriations | |
| SCA | Societe en Commandite par Actions | |
| SDR | Swedish Depositary Receipt | |
| SG | Syncora Guarantee | |
| ST | Special Tax | |
| THOR | Thai Overnight Repurchase Rate | |
| UT | Unlimited Tax | |
| 160 | 2 0 2 3 BLACK ROCK ANNUAL REPORT TO SHAREHOLDERS |
Want to know more?
blackrock.com | 800-441-7762
This report is intended for current holders. It is not authorized for use as an offer of sale or a solicitation of an offer to buy shares of the Funds unless preceded or accompanied by the Funds’ current prospectus. Past performance results shown in this report should not be considered a representation of future performance. Investment returns and principal value of shares will fluctuate so that shares, when redeemed, may be worth more or less than their original cost. Statements and other information herein are as dated and are subject to change.
EMLSGLS-04/23-AR
|  |
(b) Not Applicable
| Item 3 – | Audit Committee Financial Expert – The registrant’s board of directors (the “board of directors”), has determined that (i) the registrant has the following audit committee financial experts serving on its audit committee and (ii) each audit committee financial expert is independent: |
Neil A. Cotty
Henry R. Keizer
Kenneth L. Urish
Under applicable securities laws, a person determined to be an audit committee financial expert will not be deemed an “expert” for any purpose, including without limitation for the purposes of Section 11 of the Securities Act of 1933, as a result of being designated or identified as an audit committee financial expert. The designation or identification of a person as an audit committee financial expert does not impose on such person any duties, obligations, or liabilities greater than the duties, obligations, and liabilities imposed on such person as a member of the audit committee and board of directors in the absence of such designation or identification. The designation or identification of a person as an audit committee financial expert does not affect the duties, obligations, or liability of any other member of the audit committee or board of directors.
| Item 4 – | Principal Accountant Fees and Services |
The following table presents fees billed by Deloitte & Touche LLP (“D&T”) in each of the last two fiscal years for the services rendered to the Fund:
| (a) Audit Fees | (b) Audit-Related Fees1 | (c) Tax Fees2 | (d) All Other Fees | |||||||||||||
| Entity Name | Current Year End | Previous Fiscal Year End | Current Fiscal Year End | Previous Fiscal Year End | Current Fiscal Year End | Previous Fiscal Year End | Current Fiscal Year End | Previous Fiscal Year End | ||||||||
| BlackRock Advantage Emerging Markets Fund | $47,838 | $46,002 | $44 | $0 | $25,900 | $18,100 | $218 | $420 | ||||||||
| BlackRock Global Equity Market Neutral Fund (Formerly BlackRock Global Long/Short Equity Fund) | $64,464 | $62,016 | $44 | $0 | $33,800 | $24,000 | $218 | $420 | ||||||||
The following table presents fees billed by D&T that were required to be approved by the registrant’s audit committee (the “Committee”) for services that relate directly to the operations or financial reporting of the Fund and that are rendered on behalf of BlackRock Advisors, LLC (the “Investment Adviser” or “BlackRock”) and entities controlling, controlled by, or under common control with BlackRock (not including any sub-adviser whose role is primarily portfolio management and is subcontracted with or
2
overseen by another investment adviser) that provide ongoing services to the Fund (“Affiliated Service Providers”):
| Current Fiscal Year End | Previous Fiscal Year End | |||
(b) Audit-Related Fees1 | $0 | $0 | ||
(c) Tax Fees2 | $0 | $0 | ||
(d) All Other Fees3 | $2,154,000 | $2,098,000 |
1 The nature of the services includes assurance and related services reasonably related to the performance of the audit or review of financial statements not included in Audit Fees, including accounting consultations, agreed-upon procedure reports, attestation reports, comfort letters, out-of-pocket expenses and internal control reviews not required by regulators.
2 The nature of the services includes tax compliance and/or tax preparation, including services relating to the filing or amendment of federal, state or local income tax returns, regulated investment company qualification reviews, taxable income and tax distribution calculations.
3 Non-audit fees of $2,154,000 and $2,098,000 for the current fiscal year and previous fiscal year, respectively, were paid to the Fund’s principal accountant in their entirety by BlackRock, in connection with services provided to the Affiliated Service Providers of the Fund and of certain other funds sponsored and advised by BlackRock or its affiliates for a service organization review and an accounting research tool subscription. These amounts represent aggregate fees paid by BlackRock and were not allocated on a per fund basis.
(e)(1) Audit Committee Pre-Approval Policies and Procedures:
The Committee has adopted policies and procedures with regard to the pre-approval of services. Audit, audit-related and tax compliance services provided to the registrant on an annual basis require specific pre-approval by the Committee. The Committee also must approve other non-audit services provided to the registrant and those non-audit services provided to the Investment Adviser and Affiliated Service Providers that relate directly to the operations and the financial reporting of the registrant. Certain of these non-audit services that the Committee believes are (a) consistent with the SEC’s auditor independence rules and (b) routine and recurring services that will not impair the independence of the independent accountants may be approved by the Committee without consideration on a specific case-by-case basis (“general pre-approval”). The term of any general pre-approval is 12 months from the date of the pre-approval, unless the Committee provides for a different period. Tax or other non-audit services provided to the registrant which have a direct impact on the operations or financial reporting of the registrant will only be deemed pre-approved provided that any individual project does not exceed $10,000 attributable to the registrant or $50,000 per project. For this purpose, multiple projects will be aggregated to determine if they exceed the previously mentioned cost levels.
Any proposed services exceeding the pre-approved cost levels will require specific pre-approval by the Committee, as will any other services not subject to general pre-approval (e.g., unanticipated but permissible services). The Committee is informed of each service approved subject to general pre-approval at the next regularly scheduled in-person board meeting. At this meeting, an analysis of such services is presented to the Committee for ratification. The Committee may delegate to the Committee Chairman the authority to approve the provision of and fees for any specific engagement of permitted non-audit services, including services exceeding pre-approved cost levels.
(e)(2) None of the services described in each of Items 4(b) through (d) were approved by the Committee pursuant to the de minimis exception in paragraph (c)(7)(i)(C) of Rule 2-01 of Regulation S-X.
(f) Not Applicable
(g) The aggregate non-audit fees, defined as the sum of the fees shown under “Audit-Related Fees,” “Tax
3
Fees” and “All Other Fees,” paid to the accountant for services rendered by the accountant to the registrant, the Investment Adviser and the Affiliated Service Providers were:
| Entity Name | Current Fiscal Year End | Previous Fiscal Year End | ||||||
| BlackRock Advantage Emerging Markets Fund | $26,162 | $18,520 | ||||||
| BlackRock Global Equity Market Neutral Fund (Formerly BlackRock Global Long/Short Equity Fund) | $34,062 | $24,420 |
Additionally, the amounts billed by D&T in connection with services provided to the Affiliated Service Providers of the Fund and of other funds sponsored and advised by BlackRock or its affiliates during the current and previous fiscal years for a service organization review and an accounting research tool subscription were:
Current Fiscal Year End | Previous Fiscal Year End | |
$2,154,000 | $2,098,000 |
These amounts represent aggregate fees paid by BlackRock and were not allocated on a per fund basis.
(h) The Committee has considered and determined that the provision of non-audit services that were rendered to the Investment Adviser and the Affiliated Service Providers that were not pre-approved pursuant to paragraph (c)(7)(ii) of Rule 2-01 of Regulation S-X is compatible with maintaining the principal accountant’s independence.
(i) – Not Applicable
(j) – Not Applicable
| Item 5 – | Audit Committee of Listed Registrant – Not Applicable |
| Item 6 – | Investments |
(a) The registrant’s Schedule of Investments is included as part of the Report to Stockholders filed under Item 1(a) of this Form.
(b) Not Applicable due to no such divestments during the semi-annual period covered since the previous Form N-CSR filing.
| Item 7 – | Disclosure of Proxy Voting Policies and Procedures for Closed-End Management Investment Companies – Not Applicable |
| Item 8 – | Portfolio Managers of Closed-End Management Investment Companies – Not Applicable |
4
| Item 9 – | Purchases of Equity Securities by Closed-End Management Investment Company and Affiliated Purchasers – Not Applicable |
| Item 10 – | Submission of Matters to a Vote of Security Holders – There have been no material changes to these procedures. |
| Item 11 – | Controls and Procedures |
(a) The registrant’s principal executive and principal financial officers, or persons performing similar functions, have concluded that the registrant’s disclosure controls and procedures (as defined in Rule 30a-3(c) under the Investment Company Act of 1940, as amended (the “1940 Act”)) are effective as of a date within 90 days of the filing of this report based on the evaluation of these controls and procedures required by Rule 30a-3(b) under the 1940 Act and Rule 15d-15(b) under the Securities Exchange Act of 1934, as amended.
(b) There were no changes in the registrant’s internal control over financial reporting (as defined in Rule 30a-3(d) under the 1940 Act) that occurred during the period covered by this report that have materially affected, or are reasonably likely to materially affect, the registrant’s internal control over financial reporting.
| Item 12 – | Disclosure of Securities Lending Activities for Closed-End Management Investment Companies – Not Applicable |
| Item 13 – | Exhibits attached hereto |
(a)(1) Code of Ethics – See Item 2
(a)(2) Section 302 Certifications are attached
(a)(3) Any written solicitation to purchase securities under Rule 23c-1 – Not Applicable
(a)(4) Change in Registrant’s independent public accountant – Not Applicable
(b) Section 906 Certifications are attached
5
Pursuant to the requirements of the Securities Exchange Act of 1934 and the Investment Company Act of 1940, the registrant has duly caused this report to be signed on its behalf by the undersigned, thereunto duly authorized.
BlackRock Funds
| By: | /s/ John M. Perlowski | |||
| John M. Perlowski | ||||
| Chief Executive Officer (principal executive officer) of | ||||
| BlackRock Funds |
Date: July 18, 2023
Pursuant to the requirements of the Securities Exchange Act of 1934 and the Investment Company Act of 1940, this report has been signed below by the following persons on behalf of the registrant and in the capacities and on the dates indicated.
| By: | /s/ John M. Perlowski | |||
| John M. Perlowski | ||||
| Chief Executive Officer (principal executive officer) of | ||||
| BlackRock Funds |
Date: July 18, 2023
| By: | /s/ Trent Walker | |||
| Trent Walker | ||||
| Chief Financial Officer (principal financial officer) of | ||||
| BlackRock Funds |
Date: July 18, 2023
6