UNITED STATES
SECURITIES AND EXCHANGE COMMISSION
Washington, D.C. 20549
FORM N-CSR
CERTIFIED SHAREHOLDER REPORT OF REGISTERED MANAGEMENT
INVESTMENT COMPANIES
Investment Company Act file number: 811-05742
| Name of Fund: | BlackRock FundsSM |
| BlackRock Advantage International Fund |
| BlackRock Advantage Large Cap Growth Fund |
| BlackRock Advantage Small Cap Core Fund |
| BlackRock Commodity Strategies Fund |
| BlackRock Energy Opportunities Fund |
| BlackRock Health Sciences Opportunities Portfolio |
| BlackRock High Equity Income Fund |
| BlackRock Infrastructure Sustainable Opportunities Fund |
| BlackRock International Dividend Fund |
| BlackRock Mid-Cap Growth Equity Portfolio |
| BlackRock SMID-Cap Growth Equity Fund |
| BlackRock Technology Opportunities Fund |
| Fund Address: | 100 Bellevue Parkway, Wilmington, DE 19809 |
Name and address of agent for service: John M. Perlowski, Chief Executive Officer, BlackRock FundsSM,
50 Hudson Yards, New York, NY 10001
Registrant’s telephone number, including area code: (800) 441-7762
Date of fiscal year end: 05/31/2023
Date of reporting period: 05/31/2023
Item 1 – Report to Stockholders
(a) The Report to Shareholders is attached herewith.
| MAY 31, 2023 |

| 2023 Annual Report | ||
BlackRock FundsSM
| · | BlackRock Advantage International Fund |
| · | BlackRock Advantage Large Cap Growth Fund |
| · | BlackRock Advantage Small Cap Core Fund |
BlackRock Large Cap Series Funds, Inc.
| · | BlackRock Advantage Large Cap Core Fund |
| · | BlackRock Advantage Large Cap Value Fund |
| Not FDIC Insured • May Lose Value • No Bank Guarantee |
Dear Shareholder,
Investors faced an uncertain economic landscape during the 12-month reporting period ended May 31, 2023, amid mixed indicators and rapidly changing market conditions. The U.S. economy returned to modest growth beginning in the third quarter of 2022, although the pace of growth slowed thereafter. Inflation was elevated, reaching a 40-year high as labor costs grew rapidly and unemployment rates reached the lowest levels in decades. However, inflation moderated as the period continued, while continued strength in consumer spending backstopped the economy.
Equity returns varied substantially, as large-capitalization U.S. stocks gained for the period amid a rebound in big tech stocks, whereas small-capitalization U.S. stocks declined. International equities from developed markets advanced, while emerging market stocks declined substantially, pressured by higher interest rates and falling commodities prices.
The 10-year U.S. Treasury yield rose during the reporting period, driving its price down, as investors reacted to elevated inflation and attempted to anticipate future interest rate changes. The corporate bond market also faced inflationary headwinds, although high-yield corporate bond prices fared better than investment-grade bonds as demand from yield-seeking investors remained strong.
The U.S. Federal Reserve (the “Fed”), acknowledging that inflation has been more persistent than expected, raised interest rates eight times. Furthermore, the Fed wound down its bond-buying programs and incrementally reduced its balance sheet by not replacing securities that reach maturity. In addition, the Fed added liquidity to markets amid the failure of prominent regional banks.
Restricted labor supply kept inflation elevated even as other inflation drivers, such as goods prices and energy costs, moderated. While economic growth was modest in the last year, we believe that stickiness in services inflation and continued wage growth will keep inflation above central bank targets for some time. Although the Fed has decelerated the pace of interest rate hikes and most recently opted for a pause, we believe that the Fed is likely to keep rates high for an extended period to get inflation under control. With this in mind, we believe the possibility of a U.S. recession in the near term is high, but the dimming economic outlook has not yet been fully reflected in current market prices. We believe investors should expect a period of higher volatility as markets adjust to the new economic reality and policymakers attempt to adapt. Resolution of the debt ceiling standoff late in the period eliminated one source of uncertainty, but the relatively modest spending cuts won’t move the needle on the government’s substantial debt burden.
While we favor an overweight to equities in the long term, we prefer an underweight stance on equities overall in the near term. Expectations for corporate earnings remain elevated, which seems inconsistent with the possibility of a recession. Nevertheless, we are overweight on emerging market stocks as we believe a weakening U.S. dollar could provide a supportive backdrop. While we are neutral on credit overall amid tightening credit and financial conditions, there are selective opportunities in the near term. For fixed income investing with a six- to twelve-month horizon, we see the most attractive investments in short-term U.S. Treasuries, global inflation-linked bonds, and emerging market bonds denominated in local currency.
Overall, our view is that investors need to think globally, position themselves to be prepared for a decarbonizing economy, and be nimble as market conditions change. We encourage you to talk with your financial advisor and visit blackrock.com for further insight about investing in today’s markets.
Sincerely,

Rob Kapito
President, BlackRock Advisors, LLC

Rob Kapito
President, BlackRock Advisors, LLC
| Total Returns as of May 31, 2023 | ||||||||
| 6-Month | 12-Month | |||||||
U.S. large cap equities (S&P 500® Index) | 3.33 | % | 2.92 | % | ||||
U.S. small cap equities (Russell 2000® Index) | (6.53 | ) | (4.68 | ) | ||||
International equities (MSCI Europe, Australasia, Far East Index) | 6.89 | 3.06 | ||||||
Emerging market equities (MSCI Emerging Markets Index) | (0.37 | ) | (8.49 | ) | ||||
3-month Treasury bills (ICE BofA 3-Month U.S. Treasury Bill Index) | 2.16 | 3.16 | ||||||
U.S. Treasury securities (ICE BofA 10-Year U.S. Treasury Index) | 1.78 | (3.65 | ) | |||||
U.S. investment grade bonds (Bloomberg U.S. Aggregate Bond Index) | 2.00 | (2.14 | ) | |||||
Tax-exempt municipal bonds (Bloomberg Municipal Bond Index) | 1.94 | 0.49 | ||||||
U.S. high yield bonds (Bloomberg U.S. Corporate High Yield 2% Issuer Capped Index) | 3.01 | 0.05 | ||||||
Past performance is not an indication of future results. Index performance is shown for illustrative purposes only. You cannot invest directly in an index. | ||||
| 2 | THIS PAGE IS NOT PART OF YOUR FUND REPORT |
| Page | ||||
| 2 | ||||
Annual Report: | ||||
| 4 | ||||
| 19 | ||||
| 19 | ||||
| 20 | ||||
Financial Statements: | ||||
| 21 | ||||
| 53 | ||||
| 55 | ||||
| 57 | ||||
| 60 | ||||
| 84 | ||||
| 99 | ||||
| 100 | ||||
| 101 | ||||
| 105 | ||||
| 109 | ||||
| 111 | ||||

| 3 |
| Fund Summary as of May 31, 2023 | BlackRock Advantage International Fund |
Investment Objective
BlackRock Advantage International Fund’s (the “Fund”) investment objective is to provide long-term capital appreciation.
Portfolio Management Commentary
How did the Fund perform?
For the 12-month period ended May 31, 2023, the Fund outperformed its benchmark, the MSCI EAFE® Index.
What factors influenced performance?
The period was highlighted by market volatility as investors weighed the trajectory of monetary policy amid stubbornly high inflation and an evolving economic backdrop. While goods inflation moderated, services inflation remained well above expectations, leading to aggressive policy tightening by the Fed. This resulted in a persistently inverted yield curve, often a precursor to an imminent recession. Despite the headwinds and volatility seen during the period, large-cap equities ended the 12 months in positive territory. This was highlighted by the strong recovery seen in 2023 despite cracks appearing in financial stability as the banking sector came under pressure. What began in March accelerated into April 2023 with the second largest U.S. bank failure in history. While the turmoil took a toll on consumer confidence, with spending data demonstrating signs of weakness, the market focused on the measures taken to support banks and depositors, which appeared to have prevented a widespread crisis. While traditional measures of economic activity slowed, online job postings continued to point to labor market strength and stubbornly high inflation, corroborated by a rising Employment Cost Index. Equity markets struggled late in the period despite the rally seen across technology stocks on hopes that the latest evolution in Artificial Intelligence (“AI”) could drive a new paradigm in profitability.
Stock selection sentiment-based measures provided persistent gains during the period. These faster moving insights were able to correctly capture the emerging and evolving market trends. In particular, insights evaluating informed investor sentiment proved additive within industrial companies. Additionally, insights capturing both management and analyst views drove gains as the market’s focus shifted towards growth and the outlook for earnings. These, alongside other consumer sentiment measures, helped position the Fund around the China consumer reopening theme by motivating a successful overweight to luxury names.
Elsewhere, defensive positioning was rewarded later in the period. Fundamental quality insights evaluating accruals as a measure of company overspending drove gains, most notably through overweights to healthcare and defense stocks.
On the downside, select fundamental valuation measures were challenged during the period, given the rapidly shifting market style preferences. Traditional metrics evaluating sales, research expenditures, and other financial statement metrics all detracted from performance. Measures that look toward informed investor positioning and avoid highly shorted stocks detracted as well amid the market volatility. Broader macro positioning also detracted from performance, most notably an overweight to Italian equities and an underweight to the financials sector.
Describe recent portfolio activity.
Over the course of the period, the portfolio maintained a balanced allocation of risk across all major return drivers. There were, however, several new signals added within the stock selection group of insights. The Fund built upon its alternative data capabilities with enhanced data sets that capture informed investor positioning as well as news flow. Additionally, the Fund added to its complex of consumer intent insights with a measure that looks towards social media activity as a measure of potential revenue growth. Finally, the Fund built upon its company employee-related measures by adding an insight that identifies organizations at risk for emerging labor disputes.
Given the dynamism of the current environment, the Fund built upon its alternative data capabilities and instituted enhanced signal constructs to best identify emerging trends, such as sentiment around supply chain disruptions and wage inflation. Additionally, the Fund developed a new bank quality insight to better identify firms with less exposure to uninsured deposits and commercial real estate amid the emerging industry crisis in March 2023. Finally, an insight identifying companies likely to benefit from the emerging theme related to the AI revolution was also implemented.
Describe portfolio positioning at period end.
At period-end, the Fund’s positioning with respect to sector allocation was essentially neutral relative to the MSCI EAFE® Index. The Fund had slight overweights to the industrials and consumer staples sectors and slight underweights to the financials and consumer discretionary sectors.
The views expressed reflect the opinions of BlackRock as of the date of this report and are subject to change based on changes in market, economic or other conditions. These views are not intended to be a forecast of future events and are no guarantee of future results.
| 4 | 2 0 2 3 BLACK ROCK ANNUAL REPORT TO SHAREHOLDERS |
| Fund Summary as of May 31, 2023 (continued) | BlackRock Advantage International Fund |
GROWTH OF $10,000 INVESTMENT
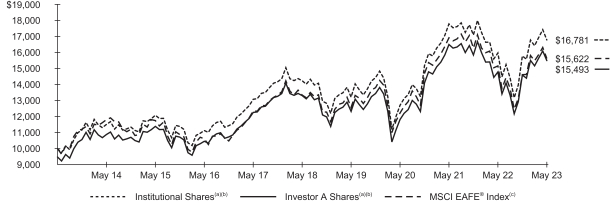
| (a) | Assuming maximum sales charges, if any, transaction costs and other operating expenses, including investment advisory fees and administration fees, if any. Institutional Shares do not have a sales charge. |
| (b) | Under normal circumstances, the Fund seeks to invest at least 80% of its net assets plus the amount of any borrowings for investment purposes in non-U.S. equity securities and equity-like instruments of companies that are components of, or have characteristics similar to, the companies included in the MSCI EAFE® Index and derivatives that are tied economically to securities of the MSCI EAFE® Index. The Fund’s total returns prior to June 12, 2017 are the returns of the Fund when it followed different investments strategies under the name BlackRock Global Opportunities Portfolio. |
| (c) | An equity index which captures large- and mid-cap representation across certain developed markets countries around the world, excluding the United States and Canada. The index covers approximately 85% of the free float adjusted market capitalization in each country. |
Performance
| Average Annual Total Returns(a)(b) | ||||||||||||||||||||||||||||||||
| 1 Year | 5 Years | 10 Years | ||||||||||||||||||||||||||||||
| Without Sales Charge | With Sales Charge | Without Sales Charge | With Sales Charge | Without Sales Charge | With Sales Charge | |||||||||||||||||||||||||||
Institutional | 5.10 | % | N/A | 3.35 | % | N/A | 5.31 | % | N/A | |||||||||||||||||||||||
Investor A | 4.82 | (0.69 | )% | 3.09 | 1.98 | % | 5.04 | 4.48 | % | |||||||||||||||||||||||
Investor C | 4.04 | 3.04 | 2.32 | 2.32 | 4.38 | 4.38 | ||||||||||||||||||||||||||
Class K | 5.16 | N/A | 3.39 | N/A | 5.34 | N/A | ||||||||||||||||||||||||||
Class R | 4.54 | N/A | 2.82 | N/A | 4.71 | N/A | ||||||||||||||||||||||||||
MSCI EAFE® Index | 3.06 | N/A | 3.21 | N/A | 4.56 | N/A | ||||||||||||||||||||||||||
| (a) | Assuming maximum sales charges, if any. Average annual total returns with and without sales charges reflect reductions for distribution and service fees. See “About Fund Performance” for a detailed description of share classes, including any related sales charges and fees, and how performance was calculated for certain share classes. |
| (b) | Under normal circumstances, the Fund seeks to invest at least 80% of its net assets plus the amount of any borrowings for investment purposes in non-U.S. equity securities and equity-like instruments of companies that are components of, or have characteristics similar to, the companies included in the MSCI EAFE® Index and derivatives that are tied economically to securities of the MSCI EAFE® Index. The Fund’s total returns prior to June 12, 2017 are the returns of the Fund when it followed different investments strategies under the name BlackRock Global Opportunities Portfolio. |
N/A - Not applicable as share class and index do not have a sales charge.
Past performance is not an indication of future results.
Performance results may include adjustments made for financial reporting purposes in accordance with U.S. generally accepted accounting principles.
Expense Example
| Actual | Hypothetical 5% Return | |||||||||||||||||||||||||||||||
| | Beginning Account Value (12/01/22) | | | Ending Account Value (05/31/23) | | | Expenses Paid During the Period | (a) | | Beginning Account Value (12/01/22) | | | Ending Account Value (05/31/23) | | | Expenses Paid During the Period | (a) | | Annualized Expense Ratio | | ||||||||||||
Institutional | $ | 1,000.00 | $ | 1,063.30 | $ | 2.57 | $ | 1,000.00 | $ | 1,022.44 | $ | 2.52 | 0.50 | % | ||||||||||||||||||
Investor A | 1,000.00 | 1,062.00 | 3.86 | 1,000.00 | 1,021.19 | 3.78 | 0.75 | |||||||||||||||||||||||||
Investor C | 1,000.00 | 1,057.80 | 7.70 | 1,000.00 | 1,017.45 | 7.54 | 1.50 | |||||||||||||||||||||||||
Class K | 1,000.00 | 1,063.60 | 2.32 | 1,000.00 | 1,022.69 | 2.27 | 0.45 | |||||||||||||||||||||||||
Class R | 1,000.00 | 1,060.50 | 5.14 | 1,000.00 | 1,019.95 | 5.04 | 1.00 | |||||||||||||||||||||||||
| (a) | For each class of the Fund, expenses are equal to the annualized expense ratio for the class, multiplied by the average account value over the period, multiplied by 182/365 (to reflect the one-half year period shown). |
See “Disclosure of Expenses” for further information on how expenses were calculated.
FUND SUMMARY | 5 |
| Fund Summary as of May 31, 2023 (continued) | BlackRock Advantage International Fund |
Portfolio Information
TEN LARGEST HOLDINGS
| Security(a) | Percent of Net Assets | |||
Nestlé SA, Registered Shares | 3.0 | % | ||
ASML Holding NV | 2.7 | |||
Novartis AG, Registered Shares | 2.2 | |||
Novo Nordisk A/S, Class B | 2.0 | |||
SAP SE | 1.8 | |||
Shell PLC | 1.7 | |||
Siemens AG, Registered Shares | 1.7 | |||
BHP Group Ltd. | 1.6 | |||
LVMH Moet Hennessy Louis Vuitton SE | 1.6 | |||
AstraZeneca PLC | 1.4 | |||
| (a) | Excludes short-term securities. |
GEOGRAPHIC ALLOCATION
| Country | Percent of Net Assets | |||
Japan | 20.0 | % | ||
France | 11.5 | |||
United Kingdom | 10.2 | |||
Switzerland | 10.1 | |||
Germany | 9.8 | |||
Australia | 8.6 | |||
Netherlands | 7.1 | |||
United States | 3.5 | |||
Spain | 3.0 | |||
Denmark | 2.8 | |||
Sweden | 2.6 | |||
Hong Kong | 2.2 | |||
Italy | 2.0 | |||
Norway | 1.6 | |||
Belgium | 1.5 | |||
Singapore | 1.0 | |||
Luxembourg | 1.0 | |||
Other (each representing less than 1%) | 1.4 | |||
Other Assets Less Liabilities | 0.1 | |||
| 6 | 2 0 2 3 BLACK ROCK ANNUAL REPORT TO SHAREHOLDERS |
| Fund Summary as of May 31, 2023 | BlackRock Advantage Large Cap Growth Fund |
Investment Objective
BlackRock Advantage Large Cap Growth Fund’s (the “Fund”) investment objective is to seek long-term capital appreciation.
Portfolio Management Commentary
How did the Fund perform?
For the 12-month period ended May 31, 2023, all of the Fund’s share classes underperformed its benchmark, the Russell 1000® Growth Index.
What factors influenced performance?
The period was highlighted by market volatility as investors weighed the trajectory of monetary policy amid stubbornly high inflation and an evolving economic backdrop. While goods inflation moderated, services inflation remained well above expectations, leading to aggressive policy tightening by the Fed. This resulted in a persistently inverted yield curve, often a precursor to an imminent recession. Despite the headwinds and volatility seen during the period, large-cap equities ended the 12 months in positive territory. This was highlighted by the strong recovery seen in 2023 despite cracks appearing in financial stability as the banking sector came under pressure. What began in March accelerated into April 2023 with the second largest U.S. bank failure in history. While the turmoil took a toll on consumer confidence, with spending data demonstrating signs of weakness, the market focused on the measures taken to support banks and depositors, which appeared to have prevented a widespread crisis. While traditional measures of economic activity slowed, online job postings continued to point to labor market strength and stubbornly high inflation, corroborated by a rising Employment Cost Index. Equity markets struggled late in the period despite the rally seen across technology stocks on hopes that the latest evolution in Artificial Intelligence (“AI”) could drive a new paradigm in profitability.
The Fund’s macro-related insights struggled as performance leadership oscillated between defensive and growth stocks during the period. Insights that identify industries likely to benefit from central bank policy normalization performed poorly. Specifically, these insights motivated positioning within information technology and industrial companies that ran against the broader investor shift to pro-growth exposures during the third quarter of 2022. Later, industry insights motivated positioning that ultimately ran against the market’s “peak inflation” narrative during the fourth quarter of 2022. Inflation data ultimately moved the Fund to a “higher for longer” posture with respect to interest rates in March 2023 which constrained performance as bond yields plummeted in anticipation of a more dovish Fed in the wake of the banking crisis.
Elsewhere, non-traditional quality measures, such as those looking at employee benefits, detracted as they ran against the market’s style preferences for the period.
On the positive side, certain sentiment and fundamental valuation measures provided ballast to the Fund’s performance. An insight capturing bond market sentiment and analyzing company credit data proved additive as it correctly positioned the portfolio during a period of high volatility in interest rate markets. Earlier in the period, valuation measures were aligned with the market’s cyclical tone, most notably measures evaluating levels of research spending and revenue.
Describe recent portfolio activity.
Over the course of the period, the portfolio maintained a balanced allocation of risk across all major return drivers. There were, however, several new signals added within the stock selection group of insights. The Fund built upon its alternative data capabilities with enhanced data sets that capture informed investor positioning as well as news flow. Additionally, the Fund developed a new bank quality insight to better identify firms with less exposure to uninsured deposits and commercial real estate amid the emerging industry crisis in March 2023. Finally, an insight identifying companies likely to benefit from the emerging theme related to the AI revolution was also implemented.
Describe portfolio positioning at period end.
Relative to the Russell 1000® Growth Index, the Fund was positioned essentially neutrally from a sector perspective. The Fund had slight overweight positions in the information technology and industrials sectors and slight underweight positions in the financials and energy sectors.
The views expressed reflect the opinions of BlackRock as of the date of this report and are subject to change based on changes in market, economic or other conditions. These views are not intended to be a forecast of future events and are no guarantee of future results.
FUND SUMMARY | 7 |
| Fund Summary as of May 31, 2023 (continued) | BlackRock Advantage Large Cap Growth Fund |
GROWTH OF $10,000 INVESTMENT
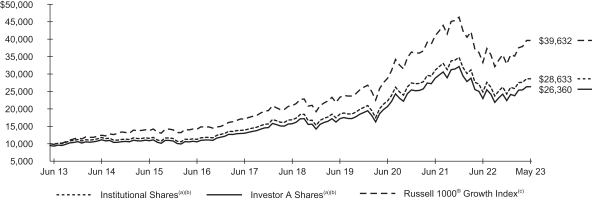
| (a) | Assuming maximum sales charges, if any, transaction costs and other operating expenses, including investment advisory fees and administration fees, if any. Institutional Shares do not have a sales charge. |
| (b) | Under normal circumstances, the Fund seeks to invest at least 80% of its net assets plus the amount of any borrowings for investment purposes in large cap equity securities of U.S. issuers and derivatives that have similar economic characteristics to such securities. The Fund’s total returns prior to June 12, 2017 are the returns of the Fund when it followed different investment strategies under the name BlackRock Flexible Equity Fund. |
| (c) | An index that measures the performance of the large-cap growth segment of the U.S. equity universe. It includes those Russell 1000 companies with higher price-to-book ratios and higher forecasted growth values. |
Performance
| Average Annual Total Returns(a)(b) | ||||||||||||||||||||||||||||||||
| 1 Year | 5 Years | 10 Years | ||||||||||||||||||||||||||||||
| Without Sales Charge | With Sales Charge | Without Sales Charge | With Sales Charge | Without Sales Charge | With Sales Charge | |||||||||||||||||||||||||||
Institutional | 5.62 | % | N/A | 11.26 | % | N/A | 11.09 | % | N/A | |||||||||||||||||||||||
Investor A | 5.28 | (0.24 | )% | 10.98 | 9.79 | % | 10.77 | 10.18 | % | |||||||||||||||||||||||
Investor C | 4.50 | 3.50 | 10.15 | 10.15 | 10.10 | 10.10 | ||||||||||||||||||||||||||
Class K | 5.63 | N/A | 11.31 | N/A | 10.95 | N/A | ||||||||||||||||||||||||||
Class R | 5.03 | N/A | 10.70 | N/A | 10.45 | N/A | ||||||||||||||||||||||||||
Russell 1000® Growth Index | 9.55 | N/A | 13.84 | N/A | 14.76 | N/A | ||||||||||||||||||||||||||
| (a) | Assuming maximum sales charges, if any. Average annual total returns with and without sales charges reflect reductions for distribution and service fees. See “About Fund Performance” for a detailed description of share classes, including any related sales charges and fees, and how performance was calculated for certain share classes. |
| (b) | Under normal circumstances, the Fund seeks to invest at least 80% of its net assets plus the amount of any borrowings for investment purposes in large cap equity securities of U.S. issuers and derivatives that have similar economic characteristics to such securities. The Fund’s total returns prior to June 12, 2017 are the returns of the Fund when it followed different investment strategies under the name BlackRock Flexible Equity Fund. |
N/A - Not applicable as share class and index do not have a sales charge.
Past performance is not an indication of future results.
Performance results may include adjustments made for financial reporting purposes in accordance with U.S. generally accepted accounting principles.
Expense Example
| Actual | Hypothetical 5% Return | |||||||||||||||||||||||||||||||
| | Beginning Account Value (12/01/22) | | | Ending Account Value (05/31/23) | | | Expenses Paid During the Period | (a) | | Beginning Account Value (12/01/22) | | | Ending Account Value (05/31/23) | | | Expenses Paid During the Period | (a) | | Annualized Expense Ratio | | ||||||||||||
Institutional | $ | 1,000.00 | $ | 1,089.80 | $ | 3.20 | $ | 1,000.00 | $ | 1,021.87 | $ | 3.07 | 0.61 | % | ||||||||||||||||||
Investor A | 1,000.00 | 1,087.90 | 4.53 | 1,000.00 | 1,020.59 | 4.38 | 0.87 | |||||||||||||||||||||||||
Investor C | 1,000.00 | 1,083.80 | 8.42 | 1,000.00 | 1,016.85 | 8.15 | 1.62 | |||||||||||||||||||||||||
Class K | 1,000.00 | 1,090.00 | 2.97 | 1,000.00 | 1,022.09 | 2.87 | 0.57 | |||||||||||||||||||||||||
Class R | 1,000.00 | 1,087.00 | 5.83 | 1,000.00 | 1,019.35 | 5.64 | 1.12 | |||||||||||||||||||||||||
| (a) | For each class of the Fund, expenses are equal to the annualized expense ratio for the class, multiplied by the average account value over the period, multiplied by 182/365 (to reflect the one-half year period shown). |
See “Disclosure of Expenses” for further information on how expenses were calculated.
| 8 | 2 0 2 3 BLACK ROCK ANNUAL REPORT TO SHAREHOLDERS |
| Fund Summary as of May 31, 2023 (continued) | BlackRock Advantage Large Cap Growth Fund |
Portfolio Information
TEN LARGEST HOLDINGS
| Security(a) | Percent of Net Assets | |||
Apple Inc. | 11.2 | % | ||
Microsoft Corp. | 10.7 | |||
NVIDIA Corp. | 5.6 | |||
Amazon.com, Inc. | 4.9 | |||
Alphabet, Inc., Class C, NVS | 2.7 | |||
UnitedHealth Group, Inc. | 2.4 | |||
Alphabet, Inc., Class A | 2.2 | |||
PepsiCo, Inc. | 2.2 | |||
Tesla, Inc. | 1.9 | |||
Adobe, Inc. | 1.9 | |||
| (a) | Excludes short-term securities. |
SECTOR ALLOCATION
| Sector(a) | Percent of Net Assets | |||
Information Technology | 44.8 | % | ||
Consumer Discretionary | 14.2 | |||
Health Care | 11.6 | |||
Industrials | 8.8 | |||
Communication Services | 6.9 | |||
Consumer Staples | 6.3 | |||
Financials | 4.7 | |||
Materials | 1.2 | |||
Other (each representing less than 1%) | 0.6 | |||
Short-Term Securities | 1.9 | |||
Liabilities in Excess of Other Assets | (1.0 | ) | ||
| (a) | For Fund compliance purposes, the Fund’s sector classifications refer to one or more of the sector sub-classifications used by one or more widely recognized market indexes or ratings group indexes, and/or as defined by the investment adviser. These definitions may not apply for purposes of this report, which may combine such sector sub-classifications for reporting ease. |
FUND SUMMARY | 9 |
| Fund Summary as of May 31, 2023 | BlackRock Advantage Small Cap Core Fund |
Investment Objective
BlackRock Advantage Small Cap Core Fund’s (the “Fund”) investment objective is to seek capital appreciation over the long term.
Portfolio Management Commentary
How did the Fund perform?
For the 12-month period ended May 31, 2023, the Fund underperformed the benchmark Russell 2000® Index.
What factors influenced performance?
The period was highlighted by market volatility as investors weighed the trajectory of monetary policy amid stubbornly high inflation and an evolving economic backdrop. While goods inflation moderated, services inflation remained well above expectations, leading to aggressive policy tightening by the Fed. This resulted in a persistently inverted yield curve, often a precursor to an imminent recession. Despite the headwinds and volatility seen during the period, large-cap equities ended the 12 months in positive territory. This was highlighted by the strong recovery seen in 2023 despite cracks appearing in financial stability as the banking sector came under pressure. What began in March accelerated into April 2023 with the second largest U.S. bank failure in history. While the turmoil took a toll on consumer confidence, with spending data demonstrating signs of weakness, the market focused on the measures taken to support banks and depositors, which appeared to have prevented a widespread crisis. While traditional measures of economic activity slowed, online job postings continued to point to labor market strength and stubbornly high inflation, corroborated by a rising Employment Cost Index. Equity markets struggled late in the period despite the rally seen across technology stocks on hopes that the latest evolution in Artificial Intelligence (“AI”) could drive a new paradigm in profitability.
The Fund’s non-traditional quality measures, which tend to have a growth orientation, weighed most heavily on performance for the period. These included a measure evaluating corporate culture which struggled within biotechnology companies, especially during the final months of the period. In addition, a measure evaluating company benefits struggled within healthcare.
Elsewhere, macro thematic measures were challenged to navigate the market’s shifting preferences between defensive and growth stocks during the period. In particular, insights that identify industries likely to benefit from central bank policy normalization weighed on performance within the information technology sector.
In the final months of the period, trending sentiment measures struggled to find their footing. These included measures that analyze informed investor positioning and company conference calls, which performed poorly across information technology and industrial companies, respectively.
Certain trend-based sentiment measures proved additive as they correctly captured the evolving economic backdrop, before becoming a source of underperformance toward period-end. Most notably strong performance was seen across insights that analyze text from market participants and measures that look at retail investor flows. Elsewhere, a notable performer was a stability insight that preferred lower-risk securities that performed well against the backdrop of elevated market volatility.
Finally, traditional valuation measures, such as those looking at sales relative to enterprise value and book value relative to stock price were additive earlier in the period as they were aligned with the cyclical tone of the market in motivating an overweight to industrial companies.
Describe recent portfolio activity.
Over the course of the period, the portfolio maintained a balanced allocation of risk across all major return drivers. There were, however, several new signals added within the stock selection group of insights. The Fund built upon its alternative data capabilities with enhanced data sets that capture informed investor positioning as well as news flow. Additionally, the Fund developed a new bank quality insight to better identify firms with less exposure to uninsured deposits and commercial real estate amid the emerging industry crisis in March 2023. Finally, an insight identifying companies likely to benefit from the emerging theme related to the AI revolution was also implemented.
Describe portfolio positioning at period end.
Relative to the Russell 2000® Index, the Fund remained largely sector-neutral at period end. The Fund ended the period with slight overweight allocations to the industrials and healthcare sectors, and slight underweights to the financials and materials sectors.
The views expressed reflect the opinions of BlackRock as of the date of this report and are subject to change based on changes in market, economic or other conditions. These views are not intended to be a forecast of future events and are no guarantee of future results.
| 10 | 2 0 2 3 BLACK ROCK ANNUAL REPORT TO SHAREHOLDERS |
| Fund Summary as of May 31, 2023 (continued) | BlackRock Advantage Small Cap Core Fund |
GROWTH OF $10,000 INVESTMENT
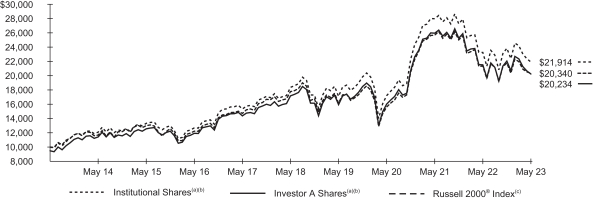
| (a) | Assuming maximum sales charges, if any, transaction costs and other operating expenses, including investment advisory fees and administration fees, if any. Institutional Shares do not have a sales charge. |
| (b) | Under normal circumstances, the Fund seeks to invest at least 80% of its net assets plus any borrowings for investment purposes in equity securities or other financial instruments that are components of, or have market capitalizations similar to, the securities included in the Russell 2000® Index. |
| (c) | An index that measures the performance of the small-cap segment of the U.S. equity universe. It is a subset of the Russell 3000® Index representing approximately 10% of the total market capitalization of that index. It includes approximately 2,000 of the smallest securities based on a combination of their market cap and current index membership. |
Performance
| Average Annual Total Returns(a) | ||||||||||||||||||||||||||||||||
| 1 Year | 5 Years | 10 Years | ||||||||||||||||||||||||||||||
| Without Sales Charge | With Sales Charge | Without Sales Charge | With Sales Charge | Without Sales Charge | With Sales Charge | |||||||||||||||||||||||||||
Institutional | (5.75 | )% | N/A | 3.60 | % | N/A | 8.16 | % | N/A | |||||||||||||||||||||||
Investor A | (5.98 | ) | (10.91 | )% | 3.34 | 2.23 | % | 7.88 | 7.30 | % | ||||||||||||||||||||||
Investor C | (6.70 | ) | (7.61 | ) | 2.56 | 2.56 | 7.24 | 7.24 | ||||||||||||||||||||||||
Class K | (5.70 | ) | N/A | 3.64 | N/A | 8.19 | N/A | |||||||||||||||||||||||||
Russell 2000® Index | (4.68 | ) | N/A | 2.74 | N/A | 7.36 | N/A | |||||||||||||||||||||||||
| (a) | Assuming maximum sales charges, if any. Average annual total returns with and without sales charges reflect reductions for distribution and service fees. See “About Fund Performance” for a detailed description of share classes, including any related sales charges and fees, and how performance was calculated for certain share classes. |
N/A - Not applicable as share class and index do not have a sales charge.
Past performance is not an indication of future results.
Performance results may include adjustments made for financial reporting purposes in accordance with U.S. generally accepted accounting principles.
Expense Example
| Actual | Hypothetical 5% Return | |||||||||||||||||||||||||||||||
| | Beginning Account Value (12/01/22) | | | Ending Account Value (05/31/23) | | | Expenses Paid During the Period | (a) | | Beginning Account Value (12/01/22) | | | Ending Account Value (05/31/23) | | | Expenses Paid During the Period | (a) | | Annualized Expense Ratio | | ||||||||||||
Institutional | $ | 1,000.00 | $ | 919.30 | $ | 2.39 | $ | 1,000.00 | $ | 1,022.44 | $ | 2.52 | 0.50 | % | ||||||||||||||||||
Investor A | 1,000.00 | 918.00 | 3.59 | 1,000.00 | 1,021.19 | 3.78 | 0.75 | |||||||||||||||||||||||||
Investor C | 1,000.00 | 914.50 | 7.16 | 1,000.00 | 1,017.45 | 7.54 | 1.50 | |||||||||||||||||||||||||
Class K | 1,000.00 | 919.60 | 2.15 | 1,000.00 | 1,022.69 | 2.27 | 0.45 | |||||||||||||||||||||||||
| (a) | For each class of the Fund, expenses are equal to the annualized expense ratio for the class, multiplied by the average account value over the period, multiplied by 182/365 (to reflect the one-half year period shown). |
See “Disclosure of Expenses” for further information on how expenses were calculated.
FUND SUMMARY | 11 |
| Fund Summary as of May 31, 2023 (continued) | BlackRock Advantage Small Cap Core Fund |
Portfolio Information
TEN LARGEST HOLDINGS
| Security(a) | Percent of Net Assets | |||
Insperity, Inc. | 1.4 | % | ||
EMCOR Group, Inc. | 1.1 | |||
Merit Medical Systems, Inc. | 0.9 | |||
Commercial Metals Co. | 0.8 | |||
Sanmina Corp. | 0.8 | |||
Heartland Financial U.S.A., Inc. | 0.8 | |||
Franklin Electric Co., Inc. | 0.8 | |||
Rush Enterprises, Inc., Class A | 0.8 | |||
UFP Industries, Inc. | 0.8 | |||
Hancock Whitney Corp. | 0.8 | |||
| (a) | Excludes short-term securities. |
SECTOR ALLOCATION
| Sector(a) | Percent of Net Assets | |||
Health Care | 18.8 | % | ||
Industrials | 17.6 | |||
Financials | 13.6 | |||
Information Technology | 13.4 | |||
Consumer Discretionary | 11.7 | |||
Real Estate | 6.0 | |||
Energy | 5.7 | |||
Consumer Staples | 3.6 | |||
Materials | 3.1 | |||
Communication Services | 2.9 | |||
Utilities | 2.7 | |||
Short-Term Securities | 3.8 | |||
Liabilities in Excess of Other Assets | (2.9 | ) | ||
| (a) | For Fund compliance purposes, the Fund’s sector classifications refer to one or more of the sector sub-classifications used by one or more widely recognized market indexes or ratings group indexes, and/or as defined by the investment adviser. These definitions may not apply for purposes of this report, which may combine such sector sub-classifications for reporting ease. |
| 12 | 2 0 2 3 BLACK ROCK ANNUAL REPORT TO SHAREHOLDERS |
| Fund Summary as of May 31, 2023 | BlackRock Advantage Large Cap Core Fund |
Investment Objective
BlackRock Advantage Large Cap Core Fund’s (the “Fund”) investment objective is to seek long-term capital growth. In other words, the Fund tries to choose investments that will increase in value.
Portfolio Management Commentary
How did the Fund perform?
For the 12-month period ended May 31, 2023, the Fund underperformed its benchmark, the Russell 1000® Index.
What factors influenced performance?
The period was highlighted by market volatility as investors weighed the trajectory of monetary policy amid stubbornly high inflation and an evolving economic backdrop. While goods inflation moderated, services inflation remained well above expectations, leading to aggressive policy tightening by the Fed. This resulted in a persistently inverted yield curve, often a precursor to an imminent recession. Despite the headwinds and volatility seen during the period, large-cap equities ended the 12 months in positive territory. This was highlighted by the strong recovery seen in 2023 despite cracks appearing in financial stability as the banking sector came under pressure. What began in March accelerated into April 2023 with the second largest U.S. bank failure in history. While the turmoil took a toll on consumer confidence, with spending data demonstrating signs of weakness, the market focused on the measures taken to support banks and depositors, which appeared to have prevented a widespread crisis. While traditional measures of economic activity slowed, online job postings continued to point to labor market strength and stubbornly high inflation, corroborated by a rising Employment Cost Index. Equity markets struggled late in the period despite the rally seen across technology stocks on hopes that the latest evolution in Artificial Intelligence (“AI”) could drive a new paradigm in profitability.
The Fund’s macro-related insights struggled as performance leadership oscillated between defensive and growth stocks during the period. Insights that identify industries likely to benefit from central bank policy normalization performed poorly. Specifically, these insights motivated positioning within information technology and industrial companies that ran against the broader investor shift to pro-growth exposures during the third quarter of 2022. Later, industry insights motivated positioning that ultimately ran against the market’s “peak inflation” narrative during the fourth quarter of 2022. Inflation data ultimately moved the Fund to a “higher for longer” posture with respect to interest rates in March 2023 which constrained performance as bond yields plummeted in anticipation of a more dovish Fed in the wake of the banking crisis.
Elsewhere, non-traditional quality measures, such as those looking at employee benefits and company news controversies, detracted as they ran against the market’s style preferences for the period. The Fund’s use of derivatives marginally detracted from performance.
On the positive side, certain sentiment and fundamental valuation measures provided ballast to the Fund’s performance. Within sentiment measures, a bond market insight proved additive as it correctly positioned the portfolio within the financials sector during a period of high volatility in interest rate markets driven by the banking crisis. Earlier in the period, contrarian quality and valuation measures were aligned with the market’s cyclical tone, most notably measures evaluating levels of external financing and research spending.
Describe recent portfolio activity.
Over the course of the period, the portfolio maintained a balanced allocation of risk across all major return drivers. There were, however, several new signals added within the stock selection group of insights. The Fund built upon its alternative data capabilities with enhanced data sets that capture informed investor positioning as well as news flow. Additionally, the Fund developed a new bank quality insight to better identify firms with less exposure to uninsured deposits and commercial real estate amid the emerging industry crisis in March 2023. Finally, an insight identifying companies likely to benefit from the emerging theme related to the AI revolution was also implemented.
Describe portfolio positioning at period end.
Relative to the Russell 1000® Index, the Fund was positioned essentially neutrally from a sector perspective. The Fund had slight overweight positions in the information technology and consumer staples sectors and slight underweight positions in the financials and utilities sectors.
The views expressed reflect the opinions of BlackRock as of the date of this report and are subject to change based on changes in market, economic or other conditions. These views are not intended to be a forecast of future events and are no guarantee of future results.
FUND SUMMARY | 13 |
| Fund Summary as of May 31, 2023 (continued) | BlackRock Advantage Large Cap Core Fund |
GROWTH OF $10,000 INVESTMENT
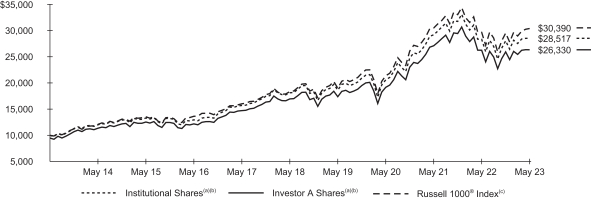
| (a) | Assuming maximum sales charges, if any, transaction costs and other operating expenses, including investment advisory fees and administration fees, if any. Institutional Shares do not have a sales charge. |
| (b) | The Fund invests primarily in a diversified portfolio consisting primarily of common stock of U.S. companies that Fund management believes have exhibited above-average growth rates in earnings over the long term. |
| (c) | An index that measures the performance of the large-cap segment of the U.S. equity universe. It is a subset of the Russell 3000® Index and includes approximately 1,000 of the largest securities based on a combination of their market capitalization and current index membership. The index represents approximately 93% of the U.S. market. |
Performance
| Average Annual Total Returns(a) | ||||||||||||||||||||||||||||||||
| 1 Year | 5 Years | 10 Years | ||||||||||||||||||||||||||||||
| Without Sales Charge | With Sales Charge | Without Sales Charge | With Sales Charge | Without Sales Charge | With Sales Charge | |||||||||||||||||||||||||||
Institutional | 0.63 | % | N/A | 9.49 | % | N/A | 11.05 | % | N/A | |||||||||||||||||||||||
Investor A | 0.34 | (4.93 | )% | 9.21 | 8.04 | % | 10.76 | 10.17 | % | |||||||||||||||||||||||
Investor C | (0.42 | ) | (1.34 | ) | 8.39 | 8.39 | 10.06 | 10.06 | ||||||||||||||||||||||||
Class K | 0.63 | N/A | 9.53 | N/A | 11.07 | N/A | ||||||||||||||||||||||||||
Class R | 0.14 | N/A | 8.94 | N/A | 10.47 | N/A | ||||||||||||||||||||||||||
Russell 1000® Index | 2.45 | N/A | 10.61 | N/A | 11.76 | N/A | ||||||||||||||||||||||||||
| (a) | Assuming maximum sales charges, if any. Average annual total returns with and without sales charges reflect reductions for distribution and service fees. See “About Fund Performance” for a detailed description of share classes, including any related sales charges and fees, and how performance was calculated for certain share classes. |
N/A - Not applicable as share class and index do not have a sales charge.
Past performance is not an indication of future results.
Performance results may include adjustments made for financial reporting purposes in accordance with U.S. generally accepted accounting principles.
Expense Example
| Actual | Hypothetical 5% Return | |||||||||||||||||||||||||||||||
| | Beginning Account Value (12/01/22) | | | Ending Account Value (05/31/23) | | | Expenses Paid During the Period | (a) | | Beginning Account Value (12/01/22) | | | Ending Account Value (05/31/23) | | | Expenses Paid During the Period | (a) | | Annualized Expense Ratio | | ||||||||||||
Institutional | $ | 1,000.00 | $ | 1,017.00 | $ | 2.41 | $ | 1,000.00 | $ | 1,022.54 | $ | 2.42 | 0.48 | % | ||||||||||||||||||
Investor A | 1,000.00 | 1,015.50 | 3.67 | 1,000.00 | 1,021.29 | 3.68 | 0.73 | |||||||||||||||||||||||||
Investor C | 1,000.00 | 1,011.70 | 7.42 | 1,000.00 | 1,017.55 | 7.44 | 1.48 | |||||||||||||||||||||||||
Class K | 1,000.00 | 1,017.00 | 2.16 | 1,000.00 | 1,022.79 | 2.17 | 0.43 | |||||||||||||||||||||||||
Class R | 1,000.00 | 1,014.40 | 4.92 | 1,000.00 | 1,020.05 | 4.94 | 0.98 | |||||||||||||||||||||||||
| (a) | For each class of the Fund, expenses are equal to the annualized expense ratio for the class, multiplied by the average account value over the period, multiplied by 182/365 (to reflect the one-half year period shown). |
See “Disclosure of Expenses” for further information on how expenses were calculated.
| 14 | 2 0 2 3 BLACK ROCK ANNUAL REPORT TO SHAREHOLDERS |
| Fund Summary as of May 31, 2023 (continued) | BlackRock Advantage Large Cap Core Fund |
Portfolio Information
TEN LARGEST HOLDINGS
| Security(a) | Percent of Net Assets | |||
Microsoft Corp. | 7.3 | % | ||
Apple Inc. | 7.0 | |||
NVIDIA Corp. | 3.5 | |||
Alphabet, Inc., Class A | 2.6 | |||
Amazon.com, Inc. | 2.4 | |||
PepsiCo, Inc. | 1.8 | |||
Chevron Corp. | 1.8 | |||
Walmart, Inc. | 1.7 | |||
Meta Platforms, Inc., Class A | 1.7 | |||
Alphabet, Inc., Class C, NVS | 1.7 | |||
| (a) | Excludes short-term investments. |
SECTOR ALLOCATION
| Sector(a) | Percent of Net Assets | |||
Information Technology | 28.5 | % | ||
Health Care | 14.4 | |||
Financials | 11.2 | |||
Consumer Discretionary | 10.9 | |||
Industrials | 10.5 | |||
Consumer Staples | 7.9 | |||
Communication Services | 7.7 | |||
Energy | 3.1 | |||
Real Estate | 2.2 | |||
Materials | 1.4 | |||
Utilities | 1.2 | |||
Short-Term Securities | 0.9 | |||
Other Assets Less Liabilities | 0.1 | |||
| (a) | For Fund compliance purposes, the Fund’s sector classifications refer to one or more of the sector sub-classifications used by one or more widely recognized market indexes or ratings group indexes, and/or as defined by the investment adviser. These definitions may not apply for purposes of this report, which may combine such sector sub-classifications for reporting ease. |
FUND SUMMARY | 15 |
| Fund Summary as of May 31, 2023 | BlackRock Advantage Large Cap Value Fund |
Investment Objective
BlackRock Advantage Large Cap Value Fund’s (the “Fund”) investment objective is to seek long-term capital growth. In other words, the Fund tries to choose investments that will increase in value.
Portfolio Management Commentary
How did the Fund perform?
For the 12-month period ended May 31, 2023, the Fund underperformed its benchmark, the Russell 1000® Value Index.
What factors influenced performance?
The period was highlighted by market volatility as investors weighed the trajectory of monetary policy amid stubbornly high inflation and an evolving economic backdrop. While goods inflation moderated, services inflation remained well above expectations, leading to aggressive policy tightening by the Fed. This resulted in a persistently inverted yield curve, often a precursor to an imminent recession. Despite the headwinds and volatility seen during the period, large-cap equities ended the 12 months in positive territory. This was highlighted by the strong recovery seen in 2023 despite cracks appearing in financial stability as the banking sector came under pressure. What began in March accelerated into April 2023 with the second largest U.S. bank failure in history. While the turmoil took a toll on consumer confidence, with spending data demonstrating signs of weakness, the market focused on the measures taken to support banks and depositors, which appeared to have prevented a widespread crisis. While traditional measures of economic activity slowed, online job postings continued to point to labor market strength and stubbornly high inflation, corroborated by a rising Employment Cost Index. Equity markets struggled late in the period despite the rally seen across technology stocks on hopes that the latest evolution in Artificial Intelligence (“AI”) could drive a new paradigm in profitability.
The Fund’s macro-related insights struggled as performance leadership oscillated between defensive and growth stocks during the period. Insights that identify industries likely to benefit from central bank policy normalization performed poorly. Specifically, these insights motivated an unsuccessful underweight to consumer discretionary, most notably hotel and leisure companies. Later, industry insights motivated positioning that ultimately ran against the market’s “peak inflation” narrative during the fourth quarter of 2022. Inflation data ultimately moved the Fund to a “higher for longer” posture with respect to interest rates in March 2023 which constrained performance as bond yields plummeted in anticipation of a more dovish Fed in the wake of the banking crisis.
Elsewhere, non-traditional quality measures which tend to have a growth orientation, such as those looking at employee benefits, detracted as they ran against the market’s style preferences for the period.
On the positive side, certain sentiment and fundamental measures provided ballast to the Fund’s performance. An insight capturing bond market sentiment and informed investor flows proved additive as it correctly positioned the portfolio during a period of high volatility in interest rate markets. Traditional fundamental measures evaluating research spending, alongside quality related insights with a preference for lower volatility names and looking at equity issuance, were also among the top performers.
Describe recent portfolio activity.
Over the course of the period, the portfolio maintained a balanced allocation of risk across all major return drivers. There were, however, several new signals added within the stock selection group of insights. The Fund built upon its alternative data capabilities with enhanced data sets that capture informed investor positioning as well as news flow. Additionally, the Fund developed a new bank quality insight to better identify firms with less exposure to uninsured deposits and commercial real estate amid the emerging industry crisis in March 2023. Finally, an insight identifying companies likely to benefit from the emerging theme related to the AI revolution was also implemented.
Describe portfolio positioning at period end.
Relative to the Russell 1000® Value Index, the Fund was positioned essentially neutrally from a sector perspective. The Fund had slight overweight positions in the information technology and consumer staples sectors and slight underweight positions in the materials and utilities sectors.
The views expressed reflect the opinions of BlackRock as of the date of this report and are subject to change based on changes in market, economic or other conditions. These views are not intended to be a forecast of future events and are no guarantee of future results.
| 16 | 2 0 2 3 BLACK ROCK ANNUAL REPORT TO SHAREHOLDERS |
| Fund Summary as of May 31, 2023 (continued) | BlackRock Advantage Large Cap Value Fund |
GROWTH OF $10,000 INVESTMENT

| (a) | Assuming maximum sales charges, if any, transaction costs and other operating expenses, including investment advisory fees and administration fees, if any. Institutional Shares do not have a sales charge. |
| (b) | Under normal circumstances, the Fund seeks to invest at least 80% of its net assets plus the amount of any borrowings for investment purposes in large cap equity securities of U.S. issuers and derivatives that have similar economic characteristics to such securities. The Fund’s total returns prior to June 12, 2017 are the returns of the Fund when it followed different investment strategies under the name BlackRock Large Cap Value Fund. |
| (c) | An index that measures the performance of the large-cap value segment of the U.S. equity universe. It includes those Russell 1000® companies with lower price-to-book ratios and lower expected growth values. |
Performance
| Average Annual Total Returns(a)(b) | ||||||||||||||||||||||||||||||||
| 1 Year | 5 Years | 10 Years | ||||||||||||||||||||||||||||||
| Without Sales Charge | With Sales Charge | Without Sales Charge | With Sales Charge | Without Sales Charge | With Sales Charge | |||||||||||||||||||||||||||
Institutional | (4.97 | )% | N/A | 6.47 | % | N/A | 8.59 | % | N/A | |||||||||||||||||||||||
Investor A | (5.22 | ) | (10.19 | )% | 6.21 | 5.07 | % | 8.29 | 7.71 | % | ||||||||||||||||||||||
Investor C | (5.89 | ) | (6.78 | ) | 5.42 | 5.42 | 7.64 | 7.64 | ||||||||||||||||||||||||
Class K | (4.91 | ) | N/A | 6.53 | N/A | 8.62 | N/A | |||||||||||||||||||||||||
Class R | (5.43 | ) | N/A | 5.94 | N/A | 8.01 | N/A | |||||||||||||||||||||||||
Russell 1000® Value Index | (4.55 | ) | N/A | 6.78 | N/A | 8.42 | N/A | |||||||||||||||||||||||||
| (a) | Assuming maximum sales charges, if any. Average annual total returns with and without sales charges reflect reductions for distribution and service fees. See “About Fund Performance” for a detailed description of share classes, including any related sales charges and fees, and how performance was calculated for certain share classes. |
| (b) | Under normal circumstances, the Fund seeks to invest at least 80% of its net assets plus the amount of any borrowings for investment purposes in large cap equity securities of U.S. issuers and derivatives that have similar economic characteristics to such securities. The Fund’s total returns prior to June 12, 2017 are the returns of the Fund when it followed different investment strategies under the name BlackRock Large Cap Value Fund. |
N/A - Not applicable as share class and index do not have a sales charge.
Past performance is not an indication of future results.
Performance results may include adjustments made for financial reporting purposes in accordance with U.S. generally accepted accounting principles.
Expense Example
| Actual | Hypothetical 5% Return | |||||||||||||||||||||||||||||||
| | Beginning Account Value (12/01/22) | | | Ending Account Value (05/31/23) | | | Expenses Paid During the Period | (a) | | Beginning Account Value (12/01/22) | | | Ending Account Value (05/31/23) | | | Expenses Paid During the Period | (a) | | Annualized Expense Ratio | | ||||||||||||
Institutional | $ | 1,000.00 | $ | 946.00 | $ | 2.62 | $ | 1,000.00 | $ | 1,022.24 | $ | 2.72 | 0.54 | % | ||||||||||||||||||
Investor A | 1,000.00 | 944.50 | 3.83 | 1,000.00 | 1,020.99 | 3.98 | 0.79 | |||||||||||||||||||||||||
Investor C | 1,000.00 | 941.30 | 7.45 | 1,000.00 | 1,017.25 | 7.75 | 1.54 | |||||||||||||||||||||||||
Class K | 1,000.00 | 946.40 | 2.38 | 1,000.00 | 1,022.49 | 2.47 | 0.49 | |||||||||||||||||||||||||
Class R | 1,000.00 | 943.80 | 5.04 | 1,000.00 | 1,019.75 | 5.24 | 1.04 | |||||||||||||||||||||||||
| (a) | For each class of the Fund, expenses are equal to the annualized expense ratio for the class, multiplied by the average account value over the period, multiplied by 182/365 (to reflect the one-half year period shown). |
See “Disclosure of Expenses” for further information on how expenses were calculated.
FUND SUMMARY | 17 |
| Fund Summary as of May 31, 2023 (continued) | BlackRock Advantage Large Cap Value Fund |
Portfolio Information
TEN LARGEST HOLDINGS
| Security(a) | Percent of Net Assets | |||
Chevron Corp. | 2.7 | % | ||
Meta Platforms, Inc., Class A | 2.6 | |||
Walmart, Inc. | 2.4 | |||
Berkshire Hathaway, Inc., Class B | 2.1 | |||
Bristol-Myers Squibb Co. | 1.8 | |||
CVS Health Corp. | 1.7 | |||
Johnson & Johnson | 1.6 | |||
Boston Scientific Corp. | 1.6 | |||
Honeywell International, Inc. | 1.6 | |||
JPMorgan Chase & Co. | 1.6 | |||
| (a) | Excludes short-term securities. |
SECTOR ALLOCATION
| Sector(a) | Percent of Net Assets | |||
Financials | 18.8 | % | ||
Health Care | 17.3 | |||
Industrials | 12.3 | |||
Information Technology | 9.1 | |||
Consumer Staples | 9.0 | |||
Communication Services | 7.8 | |||
Consumer Discretionary | 6.9 | |||
Energy | 6.5 | |||
Real Estate | 4.6 | |||
Utilities | 4.0 | |||
Materials | 2.7 | |||
Short-Term Securities | 1.1 | |||
Liabilities in Excess of Other Assets | (0.1 | ) | ||
| (a) | For Fund compliance purposes, the Fund’s sector classifications refer to one or more of the sector sub-classifications used by one or more widely recognized market indexes or ratings group indexes, and/or as defined by the investment adviser. These definitions may not apply for purposes of this report, which may combine such sector sub-classifications for reporting ease. |
| 18 | 2 0 2 3 BLACK ROCK ANNUAL REPORT TO SHAREHOLDERS |
Institutional and Class K Shares are not subject to any sales charge. These shares bear no ongoing distribution or service fees and are available only to certain eligible investors. BlackRock Advantage International Fund’s, BlackRock Advantage Large Cap Core Fund’s and BlackRock Advantage Large Cap Value Fund’s Class K Shares performance shown prior to the Class K Shares inception date of January 25, 2018 is that of Institutional Shares. BlackRock Advantage Large Cap Growth Fund’s Class K Shares performance shown prior to the Class K Shares inception date of January 25, 2018 is that of Investor A Shares. BlackRock Advantage Small Cap Core Fund’s Class K Shares performance shown prior to the Class K Shares inception date of March 28, 2016 is that of Institutional Shares. The performance of each Fund’s Class K Shares would be substantially similar to Investor A Shares or Institutional Shares, as applicable, because Investor A Shares or Institutional Shares, as applicable, of a Fund invest in the same portfolio of securities and performance would only differ to the extent that Class K Shares and Investor A Shares or Institutional Shares, as applicable, have different expenses. The actual returns of Class K Shares would have been higher than those of Investor A Shares or Institutional Shares, as applicable, because Class K Shares have lower expenses than Investor A Shares and Institutional Shares.
Investor A Shares are subject to a maximum initial sales charge (front-end load) of 5.25% and a service fee of 0.25% per year (but no distribution fee). Certain redemptions of these shares may be subject to a contingent deferred sales charge (“CDSC”) where no initial sales charge was paid at the time of purchase. These shares are generally available through financial intermediaries. On July 6, 2021, BlackRock Advantage Large Cap Growth Fund’s issued and outstanding Service Shares converted into Investor A Shares with the same relative aggregate net asset value (“NAV”).
Investor C Shares are subject to a 1.00% CDSC if redeemed within one year of purchase. In addition, these shares are subject to a distribution fee of 0.75% per year and a service fee of 0.25% per year. These shares are generally available through financial intermediaries. These shares automatically convert to Investor A Shares after approximately eight years.
Class R Shares (available only in BlackRock Advantage International Fund, BlackRock Advantage Large Cap Growth Fund, BlackRock Advantage Large Cap Core Fund and BlackRock Advantage Large Cap Value Fund) are not subject to any sales charge. These shares are subject to a distribution fee of 0.25% per year and a service fee of 0.25% per year. These shares are available only to certain employer-sponsored retirement plans.
Past performance is not an indication of future results. Financial markets have experienced extreme volatility and trading in many instruments has been disrupted. These circumstances may continue for an extended period of time and may continue to affect adversely the value and liquidity of each Fund’s investments. As a result, current performance may be lower or higher than the performance data quoted. Refer to blackrock.com to obtain performance data current to the most recent month-end. Performance results do not reflect the deduction of taxes that a shareholder would pay on Fund distributions or the redemption of Fund shares. Figures shown in the performance tables assume reinvestment of all distributions, if any, at NAV on the ex-dividend date or payable date, as applicable. Investment return and principal value of shares will fluctuate so that shares, when redeemed, may be worth more or less than their original cost. Distributions paid to each class of shares will vary because of the different levels of service, distribution and transfer agency fees applicable to each class, which are deducted from the income available to be paid to shareholders.
BlackRock Advisors, LLC (the “Manager”), each Fund’s investment adviser, has contractually and/or voluntarily agreed to waive and/or reimburse a portion of each Fund’s expenses. Without such waiver(s) and/or reimbursement(s), each Fund’s performance would have been lower. With respect to each Fund’s voluntary waiver(s), if any, the Manager is under no obligation to waive and/or reimburse or to continue waiving and/or reimbursing its fees and such voluntary waiver(s) may be reduced or discontinued at any time. With respect to each Fund’s contractual waiver(s), if any, the Manager is under no obligation to continue waiving and/or reimbursing its fees after the applicable termination date of such agreement. See the Notes to Financial Statements for additional information on waivers and/or reimbursements.
Shareholders of each Fund may incur the following charges: (a) transactional expenses, such as sales charges; and (b) operating expenses, including investment advisory fees, administration fees, service and distribution fees, including 12b-1 fees, acquired fund fees and expenses, and other fund expenses. The expense examples shown (which are based on a hypothetical investment of $1,000 invested at the beginning of the period and held through the end of the period) are intended to assist shareholders both in calculating expenses based on an investment in each Fund and in comparing these expenses with similar costs of investing in other mutual funds.
The expense examples provide information about actual account values and actual expenses. Annualized expense ratios reflect contractual and voluntary fee waivers, if any. In order to estimate the expenses a shareholder paid during the period covered by this report, shareholders can divide their account value by $1,000 and then multiply the result by the number corresponding to their Fund and share class under the heading entitled “Expenses Paid During the Period.”
The expense examples also provide information about hypothetical account values and hypothetical expenses based on a Fund’s actual expense ratio and an assumed rate of return of 5% per year before expenses. In order to assist shareholders in comparing the ongoing expenses of investing in these Funds and other funds, compare the 5% hypothetical examples with the 5% hypothetical examples that appear in shareholder reports of other funds.
The expenses shown in the expense examples are intended to highlight shareholders’ ongoing costs only and do not reflect transactional expenses, such as sales charges, if any. Therefore, the hypothetical examples are useful in comparing ongoing expenses only and will not help shareholders determine the relative total expenses of owning different funds. If these transactional expenses were included, shareholder expenses would have been higher.
ABOUT FUND PERFORMANCE / DISCLOSURE OF EXPENSES | 19 |
Derivative Financial Instruments
The Funds may invest in various derivative financial instruments. These instruments are used to obtain exposure to a security, commodity, index, market, and/or other assets without owning or taking physical custody of securities, commodities and/or other referenced assets or to manage market, equity, credit, interest rate, foreign currency exchange rate, commodity and/or other risks. Derivative financial instruments may give rise to a form of economic leverage and involve risks, including the imperfect correlation between the value of a derivative financial instrument and the underlying asset, possible default of the counterparty to the transaction or illiquidity of the instrument. Pursuant to Rule 18f-4 under the 1940 Act, among other things, the Fund must either use derivative financial instruments with embedded leverage in a limited manner or comply with an outer limit on fund leverage risk based on value-at-risk. The Funds’ successful use of a derivative financial instrument depends on the investment adviser’s ability to predict pertinent market movements accurately, which cannot be assured. The use of these instruments may result in losses greater than if they had not been used, may limit the amount of appreciation a Fund can realize on an investment and/or may result in lower distributions paid to shareholders. The Funds’ investments in these instruments, if any, are discussed in detail in the Notes to Financial Statements.
| 20 | 2 0 2 3 BLACK ROCK ANNUAL REPORT TO SHAREHOLDERS |
May 31, 2023 | BlackRock Advantage International Fund (Percentages shown are based on Net Assets) |
| Security | Shares | Value | ||||||
Common Stocks | ||||||||
| Australia — 8.6% | ||||||||
Ampol Ltd. | 14,616 | $ | 298,580 | |||||
ANZ Group Holdings Ltd. | 170,455 | 2,535,445 | ||||||
Aristocrat Leisure Ltd. | 480,369 | 11,601,546 | ||||||
Bank of Queensland Ltd. | 347,005 | 1,233,401 | ||||||
Beach Energy Ltd. | 234,298 | 211,610 | ||||||
BHP Group Ltd. | 722,349 | 19,765,714 | ||||||
Brambles Ltd. | 11,195 | 99,954 | ||||||
Charter Hall Group | 23,032 | 167,666 | ||||||
Cochlear Ltd. | 352 | 55,708 | ||||||
Commonwealth Bank of Australia | 22,631 | 1,422,648 | ||||||
CSL Ltd. | 34,461 | 6,863,130 | ||||||
Flight Centre Travel Group Ltd.(a) | 134,440 | 1,846,315 | ||||||
Fortescue Metals Group Ltd. | 625,501 | 7,832,193 | ||||||
GPT Group | 36,235 | 98,704 | ||||||
Lottery Corp. Ltd. | 217,698 | 704,470 | ||||||
Macquarie Group Ltd. | 107,188 | 11,888,950 | ||||||
National Australia Bank Ltd. | 273,041 | 4,598,787 | ||||||
Newcrest Mining Ltd. | 12,128 | 204,588 | ||||||
Rio Tinto Ltd. | 48,583 | 3,385,460 | ||||||
Rio Tinto PLC | 165,608 | 9,786,036 | ||||||
Rocketboots Ltd.(a)(b) | 1,389 | 72 | ||||||
Santos Ltd. | 119,155 | 564,047 | ||||||
Sonic Healthcare Ltd. | 106,166 | 2,428,142 | ||||||
Steadfast Group Ltd. | 52,925 | 204,027 | ||||||
Telstra Group Ltd. | 863,838 | 2,449,712 | ||||||
Transurban Group | 21,640 | 208,739 | ||||||
Westpac Banking Corp. | 600,165 | 8,056,403 | ||||||
Woodside Energy Group Ltd. | 85,202 | 1,885,268 | ||||||
Worley Ltd. | 409,925 | 4,338,597 | ||||||
|
| |||||||
| 104,735,912 | ||||||||
| Austria — 0.5% | ||||||||
ams-OSRAM AG(a)(b) | 156,391 | 1,152,394 | ||||||
ANDRITZ AG | 42,564 | 2,287,320 | ||||||
BAWAG Group AG(c) | 21,926 | 957,257 | ||||||
Raiffeisen Bank International AG(a) | 147,154 | 2,163,782 | ||||||
|
| |||||||
| 6,560,753 | ||||||||
| Belgium — 1.5% | ||||||||
Anheuser-Busch InBev SA/NV | 153,741 | 8,201,313 | ||||||
Elia Group SA/NV | 2,757 | 333,660 | ||||||
Groupe Bruxelles Lambert NV | 6,280 | 484,597 | ||||||
KBC Group NV | 31,423 | 2,064,465 | ||||||
Sofina SA | 355 | 73,467 | ||||||
Solvay SA | 69,537 | 7,275,307 | ||||||
|
| |||||||
| 18,432,809 | ||||||||
| Denmark — 2.8% | ||||||||
DSV A/S | 294 | 56,848 | ||||||
Genmab A/S(a) | 6,630 | 2,609,946 | ||||||
H Lundbeck A/S, Class B | 66,737 | 351,280 | ||||||
Jyske Bank A/S, Registered Shares(a) | 987 | 68,065 | ||||||
Novo Nordisk A/S, Class B | 153,031 | 24,627,438 | ||||||
Novozymes A/S, B Shares | 118,396 | 5,722,167 | ||||||
Pandora A/S | 584 | 46,613 | ||||||
Tryg A/S | 24,269 | 552,411 | ||||||
|
| |||||||
| 34,034,768 | ||||||||
| Finland — 0.0% | ||||||||
Metso Oyj | 23,102 | 253,268 | ||||||
|
| |||||||
| France — 11.5% | ||||||||
Aeroports de Paris(a) | 221 | 33,684 | ||||||
Air Liquide SA | 2,174 | 364,260 | ||||||
| Security | Shares | Value | ||||||
| France (continued) | ||||||||
Airbus SE | 3,084 | $ | 405,007 | |||||
ALD SA(c) | 19 | 205 | ||||||
Amundi SA(c) | 8,803 | 496,791 | ||||||
Arkema SA | 25,634 | 2,239,115 | ||||||
BNP Paribas SA | 28,454 | 1,654,267 | ||||||
Bureau Veritas SA | 79,405 | 2,017,901 | ||||||
Capgemini SE | 33,019 | 5,760,369 | ||||||
Carrefour SA | 216,373 | 3,982,213 | ||||||
Danone SA | 4,570 | 270,493 | ||||||
Dassault Aviation SA | 30,660 | 5,200,586 | ||||||
Dassault Systemes SE | 243,809 | 10,748,892 | ||||||
Edenred | 719 | 46,281 | ||||||
Engie SA | 359,697 | 5,408,625 | ||||||
EssilorLuxottica SA | 2,810 | 508,900 | ||||||
Eurazeo SE | 886 | 60,602 | ||||||
Hermes International | 7,771 | 15,851,465 | ||||||
Kering SA | 808 | 432,007 | ||||||
La Francaise des Jeux SAEM, Class A(c) | 3,246 | 125,494 | ||||||
Legrand SA | 711 | 67,397 | ||||||
L’Oreal SA | 27,820 | 11,911,029 | ||||||
LVMH Moet Hennessy Louis Vuitton SE | 21,790 | 19,051,612 | ||||||
Pernod Ricard SA | 23,723 | 5,138,849 | ||||||
Rexel SA | 109,484 | 2,247,571 | ||||||
Safran SA | 72,065 | 10,467,057 | ||||||
Sanofi | 110,996 | 11,324,594 | ||||||
Schneider Electric SE | 81,568 | 14,111,171 | ||||||
Société Générale SA | 11,960 | 278,435 | ||||||
Thales SA | 19,462 | 2,712,681 | ||||||
TotalEnergies SE | 27,803 | 1,568,946 | ||||||
Ubisoft Entertainment SA(a) | 132,245 | 3,761,427 | ||||||
Vallourec SA(a) | 13,138 | 137,817 | ||||||
Veolia Environnement SA | 51,743 | 1,527,615 | ||||||
Vinci SA | 1,906 | 217,126 | ||||||
Wendel SE | 359 | 37,875 | ||||||
|
| |||||||
| 140,168,359 | ||||||||
| Germany — 9.4% | ||||||||
Allianz SE, Registered Shares | 2,994 | 641,161 | ||||||
BASF SE | 6,423 | 305,466 | ||||||
Bayer AG, Registered Shares | 33,831 | 1,888,120 | ||||||
Bayerische Motoren Werke AG | 47,338 | 5,162,461 | ||||||
Beiersdorf AG | 22,531 | 2,875,173 | ||||||
Covestro AG(a)(c) | 23,025 | 889,175 | ||||||
Deutsche Post AG, Registered Shares | 204,155 | 9,206,136 | ||||||
Deutsche Telekom AG, Registered Shares | 179,728 | 3,987,365 | ||||||
DWS Group GmbH & Co. KGaA(c) | 2,650 | 85,697 | ||||||
E.ON SE, Class N | 118,435 | 1,435,824 | ||||||
Evonik Industries AG | 217,875 | 4,376,171 | ||||||
Freenet AG, Class N | 127,319 | 3,129,772 | ||||||
Fresenius SE & Co. KGaA | 11,997 | 328,983 | ||||||
GEA Group AG | 61,115 | 2,575,746 | ||||||
HUGO BOSS AG | 3,521 | 239,829 | ||||||
Infineon Technologies AG, Class N | 151,445 | 5,638,148 | ||||||
Knorr-Bremse AG | 11,215 | 769,446 | ||||||
Mercedes-Benz Group AG, Class N | 207,128 | 15,483,558 | ||||||
Merck KGaA | 7,282 | 1,271,888 | ||||||
Muenchener Rueckversicherungs-Gesellschaft AG, Registered Shares | 4,982 | 1,782,023 | ||||||
Nemetschek SE | 31,705 | 2,488,408 | ||||||
SAP SE | 163,465 | 21,434,471 | ||||||
Scout24 SE(c) | 84,691 | 5,440,558 | ||||||
Siemens AG, Registered Shares | 124,671 | 20,516,221 | ||||||
Siemens Energy AG(a) | 58,981 | 1,500,331 | ||||||
SCHEDULES OF INVESTMENTS | 21 |
Schedule of Investments (continued) May 31, 2023 | BlackRock Advantage International Fund (Percentages shown are based on Net Assets) |
| Security | Shares | Value | ||||||
| Germany (continued) | ||||||||
TeamViewer SE(a)(c) | 42,856 | $ | 672,588 | |||||
Zalando SE(a)(c) | 19,476 | 566,358 | ||||||
|
| |||||||
| 114,691,077 | ||||||||
| Hong Kong — 2.2% | ||||||||
AIA Group Ltd. | 1,556,000 | 14,958,139 | ||||||
CK Asset Holdings Ltd. | 143,000 | 770,793 | ||||||
CK Infrastructure Holdings Ltd. | 62,000 | 342,891 | ||||||
Henderson Land Development Co. Ltd. | 21,000 | 66,630 | ||||||
Jardine Matheson Holdings Ltd. | 103,500 | 4,962,937 | ||||||
Kerry Properties Ltd.(b) | 263,000 | 574,304 | ||||||
New World Development Co. Ltd. | 1,132,000 | 2,704,404 | ||||||
Sino Land Co. Ltd. | 362,000 | 470,866 | ||||||
Sun Hung Kai Properties Ltd. | 62,000 | 789,918 | ||||||
Swire Properties Ltd.(b) | 366,800 | 874,395 | ||||||
|
| |||||||
| 26,515,277 | ||||||||
| India — 0.0% | ||||||||
AceVector Ltd. (Acquired 05/07/14, | 172,800 | 127,493 | ||||||
|
| |||||||
| Ireland — 0.1% | ||||||||
CRH PLC | 3,199 | 151,385 | ||||||
Kingspan Group PLC | 9,472 | 630,567 | ||||||
|
| |||||||
| 781,952 | ||||||||
| Israel — 0.2% | ||||||||
Bank Hapoalim BM | 97,693 | 786,424 | ||||||
Bank Leumi Le-Israel BM | 41,496 | 291,004 | ||||||
Bezeq The Israeli Telecommunication Corp. Ltd. | 409,716 | 512,317 | ||||||
Elbit Systems Ltd. | 977 | 199,840 | ||||||
Israel Discount Bank Ltd., Class A | 19,891 | 95,827 | ||||||
Nice Ltd.(a) | 665 | 136,364 | ||||||
Teva Pharmaceutical Industries Ltd.(a)(b) | 86,375 | 618,364 | ||||||
|
| |||||||
| 2,640,140 | ||||||||
| Italy — 2.0% | ||||||||
Assicurazioni Generali SpA | 86,537 | 1,643,943 | ||||||
Banca Generali SpA | 16,209 | 501,586 | ||||||
Banca Monte dei Paschi di Siena SpA(a) | 17,886 | 40,542 | ||||||
Buzzi SpA | 89,917 | 2,059,907 | ||||||
Enel SpA | 268,341 | 1,688,939 | ||||||
Ferrari NV | 1,535 | 439,382 | ||||||
Intesa Sanpaolo SpA | 1,276,129 | 2,963,752 | ||||||
Italgas SpA | 40,279 | 229,926 | ||||||
Mediobanca Banca di Credito Finanziario SpA | 199,831 | 2,208,862 | ||||||
MFE-MediaForEurope NV, Class A | 119 | 56 | ||||||
MFE-MediaForEurope NV, Class B | 11 | 8 | ||||||
Moncler SpA | 8,683 | 590,940 | ||||||
Poste Italiane SpA(c) | 187,064 | 1,944,494 | ||||||
Recordati Industria Chimica e Farmaceutica SpA | 24,260 | 1,058,041 | ||||||
Snam SpA | 1,295,709 | 6,792,053 | ||||||
Terna - Rete Elettrica Nazionale | 12,342 | 103,701 | ||||||
UniCredit SpA | 92,080 | 1,775,512 | ||||||
|
| |||||||
| 24,041,644 | ||||||||
| Japan — 20.0% | ||||||||
Acom Co. Ltd. | 66,000 | 148,914 | ||||||
Aeon Co. Ltd. | 1,900 | 37,578 | ||||||
Aisin Corp. | 3,300 | 94,691 | ||||||
Amada Co. Ltd. | 149,400 | 1,425,017 | ||||||
ANA Holdings, Inc.(a) | 1,100 | 24,400 | ||||||
Asahi Kasei Corp. | 79,500 | 539,164 | ||||||
Astellas Pharma, Inc. | 678,500 | 10,735,332 | ||||||
Benesse Holdings, Inc. | 115,800 | 1,462,613 | ||||||
Bridgestone Corp. | 4,900 | 199,204 | ||||||
| Security | Shares | Value | ||||||
| Japan (continued) | ||||||||
Canon, Inc. | 9,000 | $ | 223,082 | |||||
Central Japan Railway Co. | 51,200 | 6,227,407 | ||||||
Coca-Cola Bottlers Japan Holdings, Inc. | 1,600 | 17,750 | ||||||
Concordia Financial Group Ltd. | 23,400 | 90,465 | ||||||
Cosmos Pharmaceutical Corp. | 600 | 57,012 | ||||||
Dai-ichi Life Holdings, Inc. | 149,500 | 2,557,009 | ||||||
Daito Trust Construction Co. Ltd. | 20,700 | 1,966,000 | ||||||
Daiwa House Industry Co. Ltd. | 183,000 | 4,772,462 | ||||||
DMG Mori Co. Ltd. | 114,000 | 1,903,412 | ||||||
East Japan Railway Co. | 700 | 38,589 | ||||||
ENEOS Holdings, Inc. | 24,300 | 80,707 | ||||||
FANUC Corp. | 23,900 | 817,472 | ||||||
Fast Retailing Co. Ltd. | 27,100 | 6,335,405 | ||||||
Fuji Electric Co. Ltd. | 5,600 | 234,902 | ||||||
FUJIFILM Holdings Corp. | 64,900 | 3,966,314 | ||||||
Fukuoka Financial Group, Inc. | 1,800 | 33,362 | ||||||
Hino Motors Ltd.(a) | 30,700 | 136,211 | ||||||
Hitachi Ltd. | 143,800 | 8,276,051 | ||||||
Honda Motor Co. Ltd. | 182,000 | 5,178,761 | ||||||
Hoya Corp. | 500 | 62,685 | ||||||
ITOCHU Corp. | 37,500 | 1,265,925 | ||||||
Itochu Techno-Solutions Corp. | 6,700 | 174,239 | ||||||
J Front Retailing Co. Ltd. | 19,500 | 190,722 | ||||||
Japan Airport Terminal Co. Ltd. | 1,900 | 88,611 | ||||||
Japan Exchange Group, Inc. | 39,200 | 640,112 | ||||||
Japan Post Bank Co. Ltd. | 160,100 | 1,195,240 | ||||||
Japan Post Holdings Co. Ltd. | 59,500 | 419,543 | ||||||
Japan Tobacco, Inc. | 578,800 | 12,620,464 | ||||||
JGC Holdings Corp. | 36,300 | 441,004 | ||||||
Kakaku.com, Inc. | 64,500 | 936,567 | ||||||
Kandenko Co. Ltd. | 1,800 | 13,001 | ||||||
Kao Corp. | 45,800 | 1,596,070 | ||||||
KDDI Corp. | 328,300 | 10,121,992 | ||||||
Kirin Holdings Co. Ltd. | 34,200 | 510,437 | ||||||
Kobayashi Pharmaceutical Co. Ltd. | 19,700 | 1,115,054 | ||||||
Kose Corp. | 700 | 70,162 | ||||||
Kubota Corp. | 46,900 | 644,822 | ||||||
Kyocera Corp. | 3,900 | 221,248 | ||||||
Lawson, Inc. | 244,500 | 10,665,592 | ||||||
Mitsubishi Chemical Group Corp. | 145,500 | 815,510 | ||||||
Mitsubishi Corp. | 363,600 | 14,536,735 | ||||||
Mitsubishi Electric Corp. | 61,000 | 794,009 | ||||||
Mitsubishi Gas Chemical Co., Inc. | 308,800 | 4,304,013 | ||||||
Mitsubishi HC Capital, Inc. | 11,300 | 61,297 | ||||||
Mitsubishi UFJ Financial Group, Inc. | 931,300 | 6,192,948 | ||||||
Mitsui & Co. Ltd. | 82,900 | 2,612,181 | ||||||
Mitsui Fudosan Co. Ltd. | 123,900 | 2,362,450 | ||||||
Mizuho Financial Group, Inc. | 35,900 | 527,726 | ||||||
MS&AD Insurance Group Holdings, Inc. | 178,200 | 6,106,226 | ||||||
Murata Manufacturing Co. Ltd. | 800 | 46,757 | ||||||
Nabtesco Corp. | 2,700 | 60,020 | ||||||
NEC Corp. | 20,300 | 952,694 | ||||||
Nexon Co. Ltd. | 29,800 | 607,329 | ||||||
Nidec Corp. | 74,400 | 3,686,896 | ||||||
Nikon Corp. | 58,700 | 650,308 | ||||||
Nippon Express Holdings, Inc. | 36,600 | 2,052,169 | ||||||
Nippon Paint Holdings Co. Ltd. | 5,000 | 38,288 | ||||||
Nippon Steel Corp. | 31,200 | 607,444 | ||||||
Nippon Telegraph & Telephone Corp. | 6,800 | 193,193 | ||||||
Nisshin Seifun Group, Inc. | 2,500 | 31,368 | ||||||
Nissin Foods Holdings Co. Ltd. | 1,500 | 127,994 | ||||||
Nitto Denko Corp. | 45,700 | 3,249,513 | ||||||
| 22 | 2 0 2 3 BLACK ROCK ANNUAL REPORT TO SHAREHOLDERS |
Schedule of Investments (continued) May 31, 2023 | BlackRock Advantage International Fund (Percentages shown are based on Net Assets) |
| Security | Shares | Value | ||||||
| Japan (continued) | ||||||||
Nomura Holdings, Inc. | 73,200 | $ | 257,259 | |||||
Nomura Research Institute Ltd. | 7,600 | 191,207 | ||||||
Obic Co. Ltd. | 6,600 | 1,067,593 | ||||||
Olympus Corp. | 19,000 | 287,742 | ||||||
Omron Corp. | 60,500 | 3,645,814 | ||||||
Ono Pharmaceutical Co. Ltd. | 7,100 | 132,764 | ||||||
Oracle Corp. Japan(a) | 13,400 | 1,025,216 | ||||||
Oriental Land Co. Ltd. | 20,800 | 779,017 | ||||||
ORIX Corp. | 73,200 | 1,244,273 | ||||||
Otsuka Holdings Co. Ltd. | 156,800 | 5,817,555 | ||||||
Pola Orbis Holdings, Inc. | 12,100 | 163,727 | ||||||
Recruit Holdings Co. Ltd. | 379,100 | 11,597,535 | ||||||
Resona Holdings, Inc. | 103,000 | 467,231 | ||||||
Ricoh Co. Ltd. | 66,200 | 552,252 | ||||||
Santen Pharmaceutical Co. Ltd. | 163,100 | 1,484,009 | ||||||
SBI Holdings, Inc. | 2,000 | 37,388 | ||||||
SCSK Corp. | 5,500 | 86,982 | ||||||
Sega Sammy Holdings, Inc. | 55,500 | 1,077,562 | ||||||
Sekisui House Ltd. | 36,900 | 720,169 | ||||||
Seven & i Holdings Co. Ltd. | 22,900 | 958,644 | ||||||
Shimadzu Corp. | 4,100 | 126,796 | ||||||
Shimamura Co. Ltd. | 2,000 | 180,803 | ||||||
Shionogi & Co. Ltd. | 92,500 | 4,155,666 | ||||||
Shiseido Co. Ltd. | 3,400 | 154,398 | ||||||
Skylark Holdings Co. Ltd.(a) | 2,900 | 38,325 | ||||||
SoftBank Corp. | 222,300 | 2,368,888 | ||||||
SoftBank Group Corp. | 94,100 | 3,702,646 | ||||||
Sompo Holdings, Inc. | 55,600 | 2,260,265 | ||||||
Subaru Corp. | 113,400 | 1,945,058 | ||||||
Sumitomo Chemical Co. Ltd. | 760,900 | 2,265,761 | ||||||
Sumitomo Mitsui Financial Group, Inc. | 40,200 | 1,631,383 | ||||||
Sumitomo Mitsui Trust Holdings, Inc. | 17,300 | 609,554 | ||||||
Sumitomo Realty & Development Co. Ltd. | 42,100 | 1,015,330 | ||||||
Suzuki Motor Corp. | 46,300 | 1,524,611 | ||||||
T&D Holdings, Inc. | 207,100 | 2,812,191 | ||||||
Takeda Pharmaceutical Co. Ltd. | 113,500 | 3,612,261 | ||||||
Terumo Corp. | 114,700 | 3,489,396 | ||||||
Toho Co. Ltd. | 1,500 | 58,993 | ||||||
Tokio Marine Holdings, Inc. | 305,200 | 6,832,457 | ||||||
Tokyo Electron Ltd. | 700 | 95,204 | ||||||
Toshiba Corp. | 30,200 | 974,207 | ||||||
Toyota Motor Corp. | 525,300 | 7,155,535 | ||||||
Trend Micro, Inc. | 36,200 | 1,721,460 | ||||||
Tsuruha Holdings, Inc. | 68,500 | 4,731,093 | ||||||
Unicharm Corp. | 29,900 | 1,135,546 | ||||||
Yakult Honsha Co. Ltd. | 1,500 | 97,439 | ||||||
Yamada Holdings Co. Ltd. | 848,900 | 2,515,390 | ||||||
Yamato Holdings Co. Ltd. | 1,700 | 31,099 | ||||||
ZOZO, Inc. | 174,100 | 3,543,918 | ||||||
|
| |||||||
| 243,569,456 | ||||||||
| Luxembourg — 1.0% | ||||||||
ArcelorMittal SA | 459,444 | 11,460,236 | ||||||
SES SA | 9 | 53 | ||||||
|
| |||||||
| 11,460,289 | ||||||||
| Macau — 0.0% | ||||||||
Galaxy Entertainment Group Ltd.(a) | 27,000 | 167,523 | ||||||
|
| |||||||
| Netherlands — 7.1% | ||||||||
ABN AMRO Bank NV, CVA(c) | 29,346 | 428,736 | ||||||
Argenx SE(a) | 2,852 | 1,110,858 | ||||||
ASML Holding NV | 45,945 | 33,233,237 | ||||||
ASR Nederland NV | 60,527 | 2,579,464 | ||||||
| Security | Shares | Value | ||||||
| Netherlands (continued) | ||||||||
ING Groep NV | 561,402 | $ | 6,917,083 | |||||
Koninklijke KPN NV | 568,113 | 1,954,449 | ||||||
Koninklijke Philips NV | 194,797 | 3,680,222 | ||||||
Koninklijke Vopak NV | 16,003 | 562,473 | ||||||
NN Group NV | 3,635 | 131,141 | ||||||
QIAGEN NV(a) | 3,958 | 179,266 | ||||||
Shell PLC | 749,321 | 20,601,075 | ||||||
Signify NV(c) | 69,086 | 1,762,977 | ||||||
Wolters Kluwer NV, Class C | 113,006 | 12,908,027 | ||||||
|
| |||||||
| 86,049,008 | ||||||||
| New Zealand — 0.0% | ||||||||
Xero Ltd.(a) | 5,002 | 357,108 | ||||||
|
| |||||||
| Norway — 1.6% | ||||||||
Aker BP ASA | 64,485 | 1,398,087 | ||||||
DNB Bank ASA | 395,255 | 6,621,287 | ||||||
Equinor ASA | 239,047 | 6,067,746 | ||||||
Gjensidige Forsikring ASA | 148,776 | 2,500,925 | ||||||
Kongsberg Gruppen ASA | 23,575 | 944,907 | ||||||
Telenor ASA | 91,246 | 938,268 | ||||||
Var Energi ASA | 312,039 | 698,791 | ||||||
|
| |||||||
| 19,170,011 | ||||||||
| Portugal — 0.5% | ||||||||
EDP - Energias de Portugal SA | 979,758 | �� | 4,786,015 | |||||
Jeronimo Martins SGPS SA | 31,873 | 770,256 | ||||||
|
| |||||||
| 5,556,271 | ||||||||
| Singapore — 1.0% | ||||||||
Jardine Cycle & Carriage Ltd. | 227,800 | 5,445,083 | ||||||
Singapore Airlines Ltd. | 690,800 | 3,273,170 | ||||||
Singapore Telecommunications Ltd. | 12,800 | 23,545 | ||||||
STMicroelectronics NV | 61,567 | 2,679,801 | ||||||
United Overseas Bank Ltd. | 53,400 | 1,103,291 | ||||||
|
| |||||||
| 12,524,890 | ||||||||
| South Africa — 0.1% | ||||||||
Anglo American PLC | 57,570 | 1,585,955 | ||||||
|
| |||||||
| Spain — 3.0% | ||||||||
Acciona SA | 25,539 | 4,139,270 | ||||||
ACS Actividades de Construccion y Servicios SA | 29,941 | 999,160 | ||||||
Amadeus IT Group SA(a) | 64,283 | 4,613,272 | ||||||
Banco Bilbao Vizcaya Argentaria SA | 1,011,851 | 6,652,605 | ||||||
Banco Santander SA | 1,518,480 | 4,960,919 | ||||||
Bankinter SA | 288,530 | 1,653,896 | ||||||
CaixaBank SA | 792,853 | 2,913,998 | ||||||
EDP Renovaveis SA | 16,670 | 331,468 | ||||||
Ferrovial SA | 22,632 | 702,216 | ||||||
Grifols SA, Class A(a) | 51,246 | 596,291 | ||||||
Indra Sistemas SA | 8,317 | 102,170 | ||||||
Industria de Diseno Textil SA | 70,448 | 2,356,892 | ||||||
Mapfre SA | 425,388 | 837,567 | ||||||
Repsol SA | 74,965 | 1,015,958 | ||||||
Telefonica SA | 1,002,487 | 4,269,355 | ||||||
|
| |||||||
| 36,145,037 | ||||||||
| Sweden — 2.6% | ||||||||
Assa Abloy AB, Class B | 326,962 | 7,271,296 | ||||||
Boliden AB | 21,961 | 670,947 | ||||||
Elekta AB, B Shares | 71,910 | 528,082 | ||||||
Evolution AB(c) | 17,808 | 2,350,808 | ||||||
Industrivarden AB, A Shares | 45,301 | 1,221,164 | ||||||
Industrivarden AB, C Shares | 191,333 | 5,125,366 | ||||||
Investor AB, A Shares | 41,110 | 847,793 | ||||||
SCHEDULES OF INVESTMENTS | 23 |
Schedule of Investments (continued) May 31, 2023 | BlackRock Advantage International Fund (Percentages shown are based on Net Assets) |
| Security | Shares | Value | ||||||
| Sweden (continued) | ||||||||
Investor AB, B Shares | 429,278 | $ | 8,751,565 | |||||
L E Lundbergforetagen AB, B Shares | 11,672 | 487,012 | ||||||
Saab AB, Class B | 75,921 | 4,139,624 | ||||||
Swedish Orphan Biovitrum AB(a) | 22,523 | 453,132 | ||||||
|
| |||||||
| 31,846,789 | ||||||||
| Switzerland — 10.1% | ||||||||
ABB Ltd., Registered Shares | 419,603 | 15,326,898 | ||||||
Chocoladefabriken Lindt & Spruengli AG, NVS | 506 | 6,063,601 | ||||||
Chocoladefabriken Lindt & Spruengli AG, Registered Shares | 14 | 1,694,228 | ||||||
Cie Financiere Richemont SA, Registered Shares | 36,548 | 5,819,007 | ||||||
Clariant AG, Registered Shares | 74,001 | 1,066,733 | ||||||
Flughafen Zurich AG, Registered Shares | 739 | 142,870 | ||||||
Givaudan SA, Registered Shares | 1,847 | 6,087,680 | ||||||
Helvetia Holding AG, Registered Shares | 9,150 | 1,301,954 | ||||||
Holcim AG | 3,844 | 237,497 | ||||||
Kuehne + Nagel International AG, Registered Shares | 122 | 34,781 | ||||||
Logitech International SA, Registered Shares | 5,340 | 341,567 | ||||||
Medmix AG(c) | 2 | 44 | ||||||
Nestlé SA, Registered Shares | 303,130 | 35,931,910 | ||||||
Novartis AG, Registered Shares | 279,204 | 26,760,789 | ||||||
Roche Holding AG | 3,822 | 1,293,821 | ||||||
Roche Holding AG, NVS | 53,483 | 17,034,811 | ||||||
Sika AG, Registered Shares | 2,792 | 763,951 | ||||||
Sonova Holding AG, Registered Shares | 167 | 42,890 | ||||||
Swatch Group AG | 3,963 | 1,181,073 | ||||||
Temenos AG, Registered Shares | 23,256 | 1,966,984 | ||||||
|
| |||||||
| 123,093,089 | ||||||||
| United Kingdom — 10.2% | ||||||||
AstraZeneca PLC | 119,284 | 17,373,789 | ||||||
Auto Trader Group PLC(c) | 244,924 | 1,922,169 | ||||||
Aviva PLC | 68,551 | 336,535 | ||||||
BAE Systems PLC | 55,743 | 644,252 | ||||||
Barclays PLC | 1,177,687 | 2,224,150 | ||||||
Bellway PLC | 17,527 | 493,742 | ||||||
BP PLC | 2,389,735 | 13,425,592 | ||||||
British American Tobacco PLC | 454,737 | 14,394,515 | ||||||
Bunzl PLC | 1,597 | 62,520 | ||||||
Burberry Group PLC | 1,043 | 27,972 | ||||||
Centrica PLC | 2,272,326 | 3,331,301 | ||||||
Close Brothers Group PLC | 15 | 169 | ||||||
ConvaTec Group PLC(c) | 110,413 | 279,731 | ||||||
Croda International PLC | 4,559 | 346,050 | ||||||
Diageo PLC | 48,429 | 2,013,317 | ||||||
Diploma PLC | 2,612 | 98,617 | ||||||
Direct Line Insurance Group PLC | 219,470 | 454,381 | ||||||
DS Smith PLC | 6,826 | 25,817 | ||||||
Dunelm Group PLC | 24 | 325 | ||||||
Experian PLC | 199,350 | 7,033,568 | ||||||
GSK PLC | 393,091 | 6,597,726 | ||||||
Halma PLC | 14,955 | 448,840 | ||||||
HSBC Holdings PLC | 866,149 | 6,348,271 | ||||||
IG Group Holdings PLC | 50,796 | 424,982 | ||||||
IMI PLC | 34,631 | 688,230 | ||||||
Intertek Group PLC | 88,963 | 4,600,631 | ||||||
Just Eat Takeaway.com NV(a)(c) | 10,210 | 154,418 | ||||||
Lloyds Banking Group PLC | 4,450,690 | 2,452,193 | ||||||
London Stock Exchange Group PLC | 30,568 | 3,258,691 | ||||||
Ocado Group PLC(a) | 8,659 | 39,862 | ||||||
Pearson PLC | 2,556 | 25,361 | ||||||
Pennon Group PLC | 13,010 | 125,276 | ||||||
| Security | Shares | Value | ||||||
| United Kingdom (continued) | ||||||||
Reckitt Benckiser Group PLC | 53,374 | $ | 4,150,447 | |||||
RELX PLC | 72,854 | 2,278,484 | ||||||
Rightmove PLC | 310,825 | 2,029,998 | ||||||
Rotork PLC | 8,681 | 34,710 | ||||||
Sage Group PLC | 46,017 | 498,682 | ||||||
Smiths Group PLC | 256,049 | 5,123,199 | ||||||
Spectris PLC | 45,022 | 2,061,004 | ||||||
Spirax-Sarco Engineering PLC | 2,695 | 367,347 | ||||||
SSE PLC | 129,457 | 3,036,399 | ||||||
Standard Chartered PLC | 398,068 | 3,137,067 | ||||||
Subsea 7 SA | 63,028 | 638,895 | ||||||
Tesco PLC | 1,013,152 | 3,292,148 | ||||||
Travis Perkins PLC | 11,624 | 126,436 | ||||||
Unilever PLC | 119,965 | 6,002,454 | ||||||
United Utilities Group PLC | 1,725 | 21,754 | ||||||
Vodafone Group PLC | 2,338,292 | 2,223,555 | ||||||
|
| |||||||
| 124,675,572 | ||||||||
| United States — 0.1% | ||||||||
Tenaris SA | 90,382 | 1,121,967 | ||||||
|
| |||||||
Total Common Stocks — 96.1% |
| 1,170,306,417 | ||||||
|
| |||||||
| Preferred Securities | ||||||||
Preferred Stocks — 0.4% |
| |||||||
| Germany — 0.4% | ||||||||
Bayerische Motoren Werke AG, , 8.52% | 236 | 24,297 | ||||||
FUCHS PETROLUB SE, , NVS, , 1.07% | 637 | 22,639 | ||||||
Volkswagen AG, , Preference Shares, , NVS | 32,273 | 4,043,217 | ||||||
|
| |||||||
| 4,090,153 | ||||||||
|
| |||||||
Total Preferred Securities — 0.4% |
| 4,090,153 | ||||||
|
| |||||||
| Rights | ||||||||
Spain — 0.0% |
| |||||||
EDP Renovaveis SA I-2023 Shares(a) | 222 | 4,414 | ||||||
|
| |||||||
Total Rights — 0.0% |
| 4,414 | ||||||
|
| |||||||
Total Long-Term Investments — 96.5% |
| 1,174,400,984 | ||||||
|
| |||||||
Short-Term Securities |
| |||||||
| Money Market Funds — 3.4% | ||||||||
BlackRock Liquidity Funds, T-Fund, Institutional Class, 5.00%(f)(g) | 39,104,394 | 39,104,394 | ||||||
SL Liquidity Series, LLC, Money Market Series, 5.32%(f)(g)(h) | 2,613,380 | 2,613,380 | ||||||
|
| |||||||
Total Short-Term Securities — 3.4% |
| 41,717,774 | ||||||
|
| |||||||
Total Investments — 99.9% |
| 1,216,118,758 | ||||||
Other Assets Less Liabilities — 0.1% |
| 1,728,298 | ||||||
|
| |||||||
Net Assets — 100.0% |
| $ | 1,217,847,056 | |||||
|
| |||||||
| (a) | Non-income producing security. |
| (b) | All or a portion of this security is on loan. |
| (c) | Security exempt from registration pursuant to Rule 144A under the Securities Act of 1933, as amended. These securities may be resold in transactions exempt from registration to qualified institutional investors. |
| 24 | 2 0 2 3 BLACK ROCK ANNUAL REPORT TO SHAREHOLDERS |
Schedule of Investments (continued) May 31, 2023 | BlackRock Advantage International Fund |
| (d) | Security is valued using significant unobservable inputs and is classified as Level 3 in the fair value hierarchy. |
| (e) | Restricted security as to resale, excluding 144A securities. The Fund held restricted securities with a current value of $127,493, representing 0.0% of its net assets as of period end, and an original cost of $804,375. |
| (f) | Affiliate of the Fund. |
| (g) | Annualized 7-day yield as of period end. |
| (h) | All or a portion of this security was purchased with the cash collateral from loaned securities. |
Affiliates
Investments in issuers considered to be affiliate(s) of the Fund during the year ended May 31, 2023 for purposes of Section 2(a)(3) of the Investment Company Act of 1940, as amended, were as follows:
| Affiliated Issuer | Value at 05/31/22 | Purchases at Cost | Proceeds from Sale | Net Realized Gain (Loss) | Change in Unrealized Appreciation (Depreciation) | Value at 05/31/23 | Shares Held at 05/31/23 | Income | Capital Gain Distributions from Underlying Funds | |||||||||||||||||||||||||||
BlackRock Liquidity Funds, T-Fund, Institutional Class | $ | 20,534,364 | $ | 18,570,030 | (a) | $ | — | $ | — | $ | — | $ | 39,104,394 | 39,104,394 | $ | 756,782 | $ | — | ||||||||||||||||||
SL Liquidity Series, LLC, Money Market Series | 6,246,194 | — | (3,632,146 | ) | 19 | (687 | ) | 2,613,380 | 2,613,380 | 59,267 | (b) | — | ||||||||||||||||||||||||
|
|
|
|
|
|
|
|
|
| |||||||||||||||||||||||||||
| $ | 19 | $ | (687 | ) | $ | 41,717,774 | $ | 816,049 | $ | — | ||||||||||||||||||||||||||
|
|
|
|
|
|
|
|
|
| |||||||||||||||||||||||||||
| (a) | Represents net amount purchased (sold). |
| (b) | All or a portion represents securities lending income earned from the reinvestment of cash collateral from loaned securities, net of fees and collateral investment expenses, and other payments to and from borrowers of securities. |
Derivative Financial Instruments Outstanding as of Period End
Futures Contracts
| Description | Number of Contracts | Expiration Date | Notional Amount (000) | Value/ Unrealized Appreciation (Depreciation) | ||||||||||||
Long Contracts | ||||||||||||||||
MSCI EAFE Index | 405 | 06/16/23 | $ | 41,581 | $ | (1,276,343 | ) | |||||||||
|
| |||||||||||||||
Derivative Financial Instruments Categorized by Risk Exposure
As of period end, the fair values of derivative financial instruments located in the Statements of Assets and Liabilities were as follows:
| Commodity Contracts | Credit Contracts | Equity Contracts | Foreign Currency Exchange Contracts | Interest Rate Contracts | Other Contracts | Total | ||||||||||||||||||||||
Liabilities — Derivative Financial Instruments | ||||||||||||||||||||||||||||
Futures contracts | ||||||||||||||||||||||||||||
Unrealized depreciation on futures contracts(a) | $ | — | $ | — | $ | 1,276,343 | $ | — | $ | — | $ | — | $ | 1,276,343 | ||||||||||||||
|
|
|
|
|
|
|
|
|
|
|
|
|
| |||||||||||||||
| (a) | Net cumulative unrealized appreciation (depreciation) on futures contracts and centrally cleared swaps, if any, are reported in the Schedule of Investments. In the Statements of Assets and Liabilities, only current day’s variation margin is reported in receivables or payables and the net cumulative unrealized appreciation (depreciation) is included in accumulated earnings (loss). |
SCHEDULES OF INVESTMENTS | 25 |
Schedule of Investments (continued) May 31, 2023 | BlackRock Advantage International Fund |
For the period ended May 31, 2023, the effect of derivative financial instruments in the Statements of Operations was as follows:
| Commodity Contracts | Credit Contracts | Equity Contracts | Foreign Currency Exchange Contracts | Interest Rate Contracts | Other Contracts | Total | ||||||||||||||||||||||
Net Realized Gain (Loss) from | ||||||||||||||||||||||||||||
Futures contracts | $ | — | $ | — | $ | 735,413 | $ | — | $ | — | $ | — | $ | 735,413 | ||||||||||||||
|
|
|
|
|
|
|
|
|
|
|
|
|
| |||||||||||||||
| Net Change in Unrealized Appreciation (Depreciation) on | ||||||||||||||||||||||||||||
Futures contracts | $ | — | $ | — | $ | (1,491,530 | ) | $ | — | $ | — | $ | — | $ | (1,491,530 | ) | ||||||||||||
|
|
|
|
|
|
|
|
|
|
|
|
|
| |||||||||||||||
Average Quarterly Balances of Outstanding Derivative Financial Instruments
Futures contracts | ||||
Average notional value of contracts — long | $ | 27,166,610 |
For more information about the Fund’s investment risks regarding derivative financial instruments, refer to the Notes to Financial Statements.
Fair Value Hierarchy as of Period End
Various inputs are used in determining the fair value of financial instruments. For a description of the input levels and information about the Fund’s policy regarding valuation of financial instruments, refer to the Notes to Financial Statements.
The following table summarizes the Fund’s financial instruments categorized in the fair value hierarchy. The breakdown of the Fund’s financial instruments into major categories is disclosed in the Schedule of Investments above.
| Level 1 | Level 2 | Level 3 | Total | |||||||||||||
Assets | ||||||||||||||||
Investments | ||||||||||||||||
Long-Term Investments | ||||||||||||||||
Common Stocks | ||||||||||||||||
Australia | $ | 72 | $ | 104,735,840 | $ | — | $ | 104,735,912 | ||||||||
Austria | — | 6,560,753 | — | 6,560,753 | ||||||||||||
Belgium | — | 18,432,809 | — | 18,432,809 | ||||||||||||
Denmark | — | 34,034,768 | — | 34,034,768 | ||||||||||||
Finland | — | 253,268 | — | 253,268 | ||||||||||||
France | — | 140,168,359 | — | 140,168,359 | ||||||||||||
Germany | — | 114,691,077 | — | 114,691,077 | ||||||||||||
Hong Kong | — | 26,515,277 | — | 26,515,277 | ||||||||||||
India | — | — | 127,493 | 127,493 | ||||||||||||
Ireland | — | 781,952 | — | 781,952 | ||||||||||||
Israel | — | 2,640,140 | — | 2,640,140 | ||||||||||||
Italy | — | 24,041,644 | — | 24,041,644 | ||||||||||||
Japan | — | 243,569,456 | — | 243,569,456 | ||||||||||||
Luxembourg | — | 11,460,289 | — | 11,460,289 | ||||||||||||
Macau | — | 167,523 | — | 167,523 | ||||||||||||
Netherlands | — | 86,049,008 | — | 86,049,008 | ||||||||||||
New Zealand | — | 357,108 | — | 357,108 | ||||||||||||
Norway | — | 19,170,011 | — | 19,170,011 | ||||||||||||
Portugal | — | 5,556,271 | — | 5,556,271 | ||||||||||||
Singapore | — | 12,524,890 | — | 12,524,890 | ||||||||||||
South Africa | — | 1,585,955 | — | 1,585,955 | ||||||||||||
Spain | — | 36,145,037 | — | 36,145,037 | ||||||||||||
Sweden | — | 31,846,789 | — | 31,846,789 | ||||||||||||
Switzerland | — | 123,093,089 | — | 123,093,089 | ||||||||||||
United Kingdom | 325 | 124,675,247 | — | 124,675,572 | ||||||||||||
United States | — | 1,121,967 | — | 1,121,967 | ||||||||||||
Preferred Securities | — | 4,090,153 | — | 4,090,153 | ||||||||||||
Rights | — | 4,414 | — | 4,414 | ||||||||||||
Short-Term Securities | ||||||||||||||||
Money Market Funds | 39,104,394 | — | — | 39,104,394 | ||||||||||||
|
|
|
|
|
|
|
| |||||||||
| $ | 39,104,791 | $ | 1,174,273,094 | $ | 127,493 | 1,213,505,378 | ||||||||||
|
|
|
|
|
|
|
| |||||||||
Investments valued at NAV(a) | 2,613,380 | |||||||||||||||
|
| |||||||||||||||
| $ | 1,216,118,758 | |||||||||||||||
|
| |||||||||||||||
| 26 | 2 0 2 3 BLACK ROCK ANNUAL REPORT TO SHAREHOLDERS |
Schedule of Investments (continued) May 31, 2023 | BlackRock Advantage International Fund |
Fair Value Hierarchy as of Period End (continued)
| Level 1 | Level 2 | Level 3 | Total | |||||||||||||
Derivative Financial Instruments(b) | ||||||||||||||||
Liabilities | ||||||||||||||||
Equity Contracts | $ | (1,276,343 | ) | $ | — | $ | — | $ | (1,276,343 | ) | ||||||
|
|
|
|
|
|
|
| |||||||||
| (a) | Certain investments of the Fund were fair valued using NAV as a practical expedient as no quoted market value is available and therefore have been excluded from the fair value hierarchy. |
| (b) | Derivative financial instruments are futures contracts. Futures contracts are valued at the unrealized appreciation (depreciation) on the instrument. |
See notes to financial statements.
SCHEDULES OF INVESTMENTS | 27 |
Schedule of Investments May 31, 2023 | BlackRock Advantage Large Cap Growth Fund (Percentages shown are based on Net Assets) |
| Security | Shares | Value | ||||||
Common Stocks |
| |||||||
| Aerospace & Defense — 0.4% | ||||||||
Axon Enterprise, Inc.(a) | 17,441 | $ | 3,364,543 | |||||
Lockheed Martin Corp. | 633 | 281,059 | ||||||
|
| |||||||
| 3,645,602 | ||||||||
| Automobiles — 1.9% | ||||||||
Tesla, Inc.(a) | 89,222 | 18,195,042 | ||||||
|
| |||||||
| Beverages — 2.6% | ||||||||
Coca-Cola Co. | 51,928 | 3,098,024 | ||||||
PepsiCo, Inc. | 116,054 | 21,162,447 | ||||||
|
| |||||||
| 24,260,471 | ||||||||
| Biotechnology — 2.0% | ||||||||
AbbVie, Inc. | 20,585 | 2,839,906 | ||||||
Amgen, Inc. | 26,331 | 5,809,935 | ||||||
Horizon Therapeutics PLC(a) | 9,466 | 946,884 | ||||||
Incyte Corp.(a) | 63,660 | 3,918,273 | ||||||
Neurocrine Biosciences, Inc.(a) | 5,748 | 514,618 | ||||||
Regeneron Pharmaceuticals, Inc.(a) | 3,219 | 2,367,768 | ||||||
Seagen, Inc.(a) | 4,464 | 873,605 | ||||||
Ultragenyx Pharmaceutical, Inc.(a) | 31,391 | 1,549,460 | ||||||
|
| |||||||
| 18,820,449 | ||||||||
| Broadline Retail — 6.0% | ||||||||
Amazon.com, Inc.(a) | 390,088 | 47,036,811 | ||||||
Coupang, Inc., Class A(a) | 53,129 | 828,813 | ||||||
eBay, Inc. | 135,567 | 5,767,020 | ||||||
Etsy, Inc.(a) | 23,562 | 1,909,700 | ||||||
MercadoLibre, Inc.(a) | 1,060 | 1,313,340 | ||||||
|
| |||||||
| 56,855,684 | ||||||||
| Building Products — 0.9% | ||||||||
Allegion PLC | 51,610 | 5,405,632 | ||||||
Trane Technologies PLC | 21,145 | 3,451,498 | ||||||
|
| |||||||
| 8,857,130 | ||||||||
| Chemicals — 1.2% | ||||||||
Cabot Corp. | 1 | 69 | ||||||
Ecolab, Inc. | 68,227 | 11,260,866 | ||||||
|
| |||||||
| 11,260,935 | ||||||||
| Commercial Services & Supplies — 0.7% | ||||||||
Cintas Corp. | 14,412 | 6,804,482 | ||||||
|
| |||||||
| Communications Equipment — 0.0% | ||||||||
Arista Networks, Inc.(a) | 651 | 108,287 | ||||||
|
| |||||||
| Construction & Engineering — 0.3% | ||||||||
AECOM | 34,898 | 2,723,789 | ||||||
|
| |||||||
| Consumer Finance — 0.6% | ||||||||
American Express Co. | 36,315 | 5,758,106 | ||||||
|
| |||||||
| Consumer Staples Distribution & Retail — 1.2% | ||||||||
Walmart, Inc. | 78,588 | 11,542,220 | ||||||
|
| |||||||
| Electrical Equipment — 0.1% | ||||||||
AMETEK, Inc. | 4,883 | 708,377 | ||||||
|
| |||||||
| Electronic Equipment, Instruments & Components — 1.0% | ||||||||
Flex Ltd.(a) | 380,456 | 9,659,778 | ||||||
|
| |||||||
| Entertainment — 0.1% | ||||||||
Electronic Arts, Inc. | 827 | 105,856 | ||||||
ROBLOX Corp., Class A(a) | 16,963 | 710,071 | ||||||
Spotify Technology SA(a) | 3,046 | 453,550 | ||||||
|
| |||||||
| 1,269,477 | ||||||||
| Security | Shares | Value | ||||||
| Financial Services — 3.6% | ||||||||
Block, Inc., Class A(a) | 19,912 | $ | 1,202,486 | |||||
Mastercard, Inc., Class A | 40,418 | 14,753,378 | ||||||
PayPal Holdings, Inc.(a) | 65,544 | 4,063,072 | ||||||
Visa, Inc., Class A | 64,462 | 14,248,036 | ||||||
|
| |||||||
| 34,266,972 | ||||||||
| Food Products — 1.2% | ||||||||
Archer-Daniels-Midland Co. | 5,535 | 391,048 | ||||||
Hershey Co. | 41,658 | 10,818,582 | ||||||
|
| |||||||
| 11,209,630 | ||||||||
| Ground Transportation — 0.3% | ||||||||
Lyft, Inc., Class A(a) | 113,199 | 1,021,055 | ||||||
Uber Technologies, Inc.(a) | 47,850 | 1,814,950 | ||||||
|
| |||||||
| 2,836,005 | ||||||||
| Health Care Equipment & Supplies — 2.2% | ||||||||
Abbott Laboratories | 48,622 | 4,959,444 | ||||||
Boston Scientific Corp.(a) | 232,625 | 11,975,535 | ||||||
IDEXX Laboratories, Inc.(a) | 7,556 | 3,511,802 | ||||||
Stryker Corp. | 1,208 | 332,901 | ||||||
|
| |||||||
| 20,779,682 | ||||||||
| Health Care Providers & Services — 4.6% | ||||||||
Cigna Group | 32,155 | 7,955,469 | ||||||
CVS Health Corp. | 88,342 | 6,009,906 | ||||||
Elevance Health, Inc. | 14,233 | 6,373,822 | ||||||
UnitedHealth Group, Inc. | 47,112 | 22,954,851 | ||||||
|
| |||||||
| 43,294,048 | ||||||||
| Health Care Technology — 0.0% | ||||||||
Teladoc Health, Inc.(a) | 11,046 | 255,715 | ||||||
|
| |||||||
| Hotels, Restaurants & Leisure — 1.3% | ||||||||
Caesars Entertainment, Inc.(a) | 60,514 | 2,481,679 | ||||||
Darden Restaurants, Inc. | 10,841 | 1,718,515 | ||||||
DraftKings, Inc., Class A(a) | 10,099 | 235,711 | ||||||
MGM Resorts International | 12,858 | 505,191 | ||||||
Starbucks Corp. | 13,905 | 1,357,684 | ||||||
Travel + Leisure Co. | 91,289 | 3,329,310 | ||||||
Wingstop, Inc. | 997 | 198,762 | ||||||
Yum! Brands, Inc. | 22,777 | 2,931,172 | ||||||
|
| |||||||
| 12,758,024 | ||||||||
| Household Durables — 0.2% | ||||||||
TopBuild Corp.(a) | 10,019 | 2,020,431 | ||||||
|
| |||||||
| Household Products — 1.4% | ||||||||
Kimberly-Clark Corp. | 60,781 | 8,161,673 | ||||||
Procter & Gamble Co. | 35,074 | 4,998,045 | ||||||
|
| |||||||
| 13,159,718 | ||||||||
| Industrial Conglomerates — 1.0% | ||||||||
Honeywell International, Inc. | 51,530 | 9,873,148 | ||||||
|
| |||||||
| Insurance — 0.5% | ||||||||
Marsh & McLennan Cos., Inc. | 15,222 | 2,636,146 | ||||||
MetLife, Inc. | 50,287 | 2,491,721 | ||||||
|
| |||||||
| 5,127,867 | ||||||||
| Interactive Media & Services — 6.6% | ||||||||
Alphabet, Inc., Class A(a)(b) | 172,628 | 21,210,802 | ||||||
Alphabet, Inc., Class C, NVS(a) | 209,477 | 25,843,177 | ||||||
Match Group, Inc.(a) | 62,474 | 2,155,353 | ||||||
Meta Platforms, Inc., Class A(a) | 38,646 | 10,230,369 | ||||||
Pinterest, Inc., Class A(a) | 73,034 | 1,748,434 | ||||||
Snap, Inc., Class A, NVS(a) | 153,783 | 1,568,587 | ||||||
|
| |||||||
| 62,756,722 | ||||||||
| 28 | 2 0 2 3 BLACK ROCK ANNUAL REPORT TO SHAREHOLDERS |
Schedule of Investments (continued) May 31, 2023 | BlackRock Advantage Large Cap Growth Fund (Percentages shown are based on Net Assets) |
| Security | Shares | Value | ||||||
| IT Services — 2.3% | ||||||||
Accenture PLC, Class A | 25,068 | $ | 7,668,803 | |||||
Gartner, Inc.(a) | 17,840 | 6,116,622 | ||||||
VeriSign, Inc.(a) | 36,461 | 8,142,470 | ||||||
Wix.com Ltd.(a) | 4,686 | 357,167 | ||||||
|
| |||||||
| 22,285,062 | ||||||||
| Life Sciences Tools & Services — 1.8% | ||||||||
Agilent Technologies, Inc. | 96,891 | 11,207,382 | ||||||
Danaher Corp. | 23,806 | 5,466,334 | ||||||
Mettler-Toledo International, Inc.(a) | 347 | 458,689 | ||||||
|
| |||||||
| 17,132,405 | ||||||||
| Machinery — 3.1% | ||||||||
Caterpillar, Inc. | 6,130 | 1,261,248 | ||||||
Cummins, Inc. | 5,413 | 1,106,471 | ||||||
Deere & Co. | 38,916 | 13,464,158 | ||||||
Illinois Tool Works, Inc. | 40,147 | 8,781,353 | ||||||
Xylem, Inc. | 46,746 | 4,683,949 | ||||||
|
| |||||||
| 29,297,179 | ||||||||
| Media — 0.2% | ||||||||
Fox Corp., Class A, NVS | 68,835 | 2,147,652 | ||||||
|
| |||||||
| Oil, Gas & Consumable Fuels — 0.0% | ||||||||
ConocoPhillips | 1,592 | 158,086 | ||||||
|
| |||||||
| Pharmaceuticals — 1.1% | ||||||||
Bristol-Myers Squibb Co. | 159,956 | 10,307,565 | ||||||
|
| |||||||
| Professional Services — 0.8% | ||||||||
Automatic Data Processing, Inc. | 19,674 | 4,111,669 | ||||||
Insperity, Inc. | 7,320 | 810,471 | ||||||
Paychex, Inc. | 7,071 | 741,960 | ||||||
Paycom Software, Inc. | 7,903 | 2,213,867 | ||||||
|
| |||||||
| 7,877,967 | ||||||||
| Real Estate Management & Development — 0.0% | ||||||||
Zillow Group, Inc., Class A(a) | 163 | 7,301 | ||||||
|
| |||||||
| Retail REITs — 0.1% | ||||||||
Simon Property Group, Inc. | 10,989 | 1,155,493 | ||||||
|
| |||||||
| Semiconductors & Semiconductor Equipment — 9.7% | ||||||||
Advanced Micro Devices, Inc.(a) | 8,034 | 949,699 | ||||||
Analog Devices, Inc. | 35,148 | 6,245,448 | ||||||
Applied Materials, Inc. | 126,167 | 16,818,061 | ||||||
Intel Corp. | 122,107 | 3,839,044 | ||||||
Lattice Semiconductor Corp.(a) | 64,926 | 5,279,133 | ||||||
MaxLinear, Inc.(a) | 18,206 | 531,798 | ||||||
NVIDIA Corp. | 140,136 | 53,019,054 | ||||||
NXP Semiconductors NV | 9,732 | 1,743,001 | ||||||
QUALCOMM, Inc. | 35,553 | 4,032,066 | ||||||
|
| |||||||
| 92,457,304 | ||||||||
| Software — 19.5% | ||||||||
Adobe, Inc.(a) | 42,750 | 17,860,523 | ||||||
Autodesk, Inc.(a) | 13,991 | 2,789,666 | ||||||
Box, Inc., Class A(a) | 14,325 | 403,535 | ||||||
Cadence Design Systems, Inc.(a) | 6,897 | 1,592,586 | ||||||
Fortinet, Inc.(a) | 115,354 | 7,882,139 | ||||||
FreedomPay, Inc.(a)(c) | 43,051 | — | ||||||
Intuit, Inc. | 15,040 | 6,303,565 | ||||||
Manhattan Associates, Inc.(a) | 35,760 | 6,487,579 | ||||||
Microsoft Corp. | 311,518 | 102,299,396 | ||||||
Palo Alto Networks, Inc.(a) | 4,410 | 941,050 | ||||||
RingCentral, Inc., Class A(a) | 70,439 | 2,444,233 | ||||||
Salesforce, Inc.(a) | 40,766 | 9,106,309 | ||||||
| Security | Shares | Value | ||||||
| Software (continued) | ||||||||
ServiceNow, Inc.(a) | 23,253 | $ | 12,667,769 | |||||
Splunk, Inc.(a) | 47,477 | 4,713,991 | ||||||
Synopsys, Inc.(a) | 5,307 | 2,414,473 | ||||||
Teradata Corp.(a) | 52,159 | 2,444,171 | ||||||
VMware, Inc., Class A(a) | 4,788 | 652,557 | ||||||
Workday, Inc., Class A(a) | 15,519 | 3,289,873 | ||||||
Zoom Video Communications, Inc., Class A(a) | 21,657 | 1,453,834 | ||||||
|
| |||||||
| 185,747,249 | ||||||||
| Specialized REITs — 0.4% | ||||||||
SBA Communications Corp. | 18,736 | 4,155,270 | ||||||
|
| |||||||
| Specialty Retail — 3.1% | ||||||||
AutoZone, Inc.(a) | 74 | 176,626 | ||||||
Best Buy Co., Inc. | 12,897 | 937,225 | ||||||
Dick’s Sporting Goods, Inc. | 19,339 | 2,465,916 | ||||||
Five Below, Inc.(a) | 13,241 | 2,284,337 | ||||||
Home Depot, Inc. | 2,147 | 608,567 | ||||||
Lowe’s Cos., Inc. | 26,924 | 5,415,224 | ||||||
Penske Automotive Group, Inc. | 11,799 | 1,630,858 | ||||||
TJX Cos., Inc. | 191,863 | 14,733,160 | ||||||
Wayfair, Inc., Class A(a) | 31,515 | 1,270,685 | ||||||
|
| |||||||
| 29,522,598 | ||||||||
| Technology Hardware, Storage & Peripherals — 12.3% | ||||||||
Apple Inc. | 599,959 | 106,342,733 | ||||||
Dell Technologies, Inc., Class C | 12,667 | 567,608 | ||||||
Hewlett Packard Enterprise Co. | 558,760 | 8,057,319 | ||||||
HP, Inc. | 69,414 | 2,017,171 | ||||||
|
| |||||||
| 116,984,831 | ||||||||
| Textiles, Apparel & Luxury Goods — 1.7% | ||||||||
Crocs, Inc.(a) | 13,189 | 1,480,861 | ||||||
Lululemon Athletica, Inc.(a) | 30,684 | 10,184,940 | ||||||
NIKE, Inc., Class B | 40,785 | 4,293,029 | ||||||
|
| |||||||
| 15,958,830 | ||||||||
| Trading Companies & Distributors — 1.1% | ||||||||
WW Grainger, Inc. | 16,622 | 10,788,010 | ||||||
|
| |||||||
Total Long-Term Investments — 99.1% | 944,790,593 | |||||||
|
| |||||||
Short-Term Securities |
| |||||||
| Money Market Funds — 1.9% | ||||||||
BlackRock Liquidity Funds, T-Fund, Institutional Class, 5.00%(d)(e) | 6,109,397 | 6,109,397 | ||||||
SL Liquidity Series, LLC, Money Market Series, 5.32%(d)(e)(f) | 12,171,918 | 12,171,918 | ||||||
|
| |||||||
Total Short-Term Securities — 1.9% |
| 18,281,315 | ||||||
|
| |||||||
Total Investments — 101.0% |
| 963,071,908 | ||||||
Liabilities in Excess of Other Assets — (1.0)% |
| (9,956,619 | ) | |||||
|
| |||||||
Net Assets — 100.0% |
| $ | 953,115,289 | |||||
|
| |||||||
| (a) | Non-income producing security. |
| (b) | All or a portion of this security is on loan. |
| (c) | Security is valued using significant unobservable inputs and is classified as Level 3 in the fair value hierarchy. |
| (d) | Affiliate of the Fund. |
| (e) | Annualized 7-day yield as of period end. |
| (f) | All or a portion of this security was purchased with the cash collateral from loaned securities. |
SCHEDULES OF INVESTMENTS | 29 |
Schedule of Investments (continued) May 31, 2023 | BlackRock Advantage Large Cap Growth Fund |
Affiliates
Investments in issuers considered to be affiliate(s) of the Fund during the year ended May 31, 2023 for purposes of Section 2(a)(3) of the Investment Company Act of 1940, as amended, were as follows:
| Affiliated Issuer | Value at 05/31/22 | Purchases at Cost | Proceeds from Sale | Net Realized Gain (Loss) | Change in Unrealized Appreciation (Depreciation) | Value at 05/31/23 | Shares Held at 05/31/23 | Income | Capital Gain Distributions from Underlying Funds | |||||||||||||||||||||||||||
BlackRock Liquidity Funds, T-Fund, Institutional Class | $ | 8,039,456 | $ | — | $ | (1,930,059 | )(a) | $ | — | $ | — | $ | 6,109,397 | 6,109,397 | $ | 294,631 | $ | — | ||||||||||||||||||
SL Liquidity Series, LLC, Money Market Series | 1,498,897 | 10,670,948 | (a) | — | 3,300 | (1,227 | ) | 12,171,918 | 12,171,918 | 7,555 | (b) | — | ||||||||||||||||||||||||
|
|
|
|
|
|
|
|
|
| |||||||||||||||||||||||||||
| $ | 3,300 | $ | (1,227 | ) | $ | 18,281,315 | $ | 302,186 | $ | — | ||||||||||||||||||||||||||
|
|
|
|
|
|
|
|
|
| |||||||||||||||||||||||||||
| (a) | Represents net amount purchased (sold). |
| (b) | All or a portion represents securities lending income earned from the reinvestment of cash collateral from loaned securities, net of fees and collateral investment expenses, and other payments to and from borrowers of securities. |
For Fund compliance purposes, the Fund’s industry classifications refer to one or more of the industry sub-classifications used by one or more widely recognized market indexes or rating group indexes, and/or as defined by the investment adviser. These definitions may not apply for purposes of this report, which may combine such industry sub-classifications for reporting ease.
Derivative Financial Instruments Outstanding as of Period End
Futures Contracts
| Description | Number of Contracts | Expiration Date | Notional Amount (000) | Value/ Unrealized Appreciation (Depreciation) | ||||||||||||
Long Contracts | ||||||||||||||||
NASDAQ 100 E-Mini Index | 33 | 06/16/23 | $ | 9,438 | $ | 407,128 | ||||||||||
|
| |||||||||||||||
Derivative Financial Instruments Categorized by Risk Exposure
As of period end, the fair values of derivative financial instruments located in the Statements of Assets and Liabilities were as follows:
| Commodity Contracts | Credit Contracts | Equity Contracts | Foreign Currency Exchange Contracts | Interest Rate Contracts | Other Contracts | Total | ||||||||||||||||||||||
Assets — Derivative Financial Instruments | ||||||||||||||||||||||||||||
Futures contracts | ||||||||||||||||||||||||||||
Unrealized appreciation on futures contracts(a) | $ | — | $ | — | $ | 407,128 | $ | — | $ | — | $ | — | $ | 407,128 | ||||||||||||||
|
|
|
|
|
|
|
|
|
|
|
|
|
| |||||||||||||||
| (a) | Net cumulative unrealized appreciation (depreciation) on futures contracts, if any, are reported in the Schedule of Investments. In the Statements of Assets and Liabilities, only current day’s variation margin is reported in receivables or payables and the net cumulative unrealized appreciation (depreciation) is included in accumulated earnings (loss). |
For the period ended May 31, 2023, the effect of derivative financial instruments in the Statements of Operations was as follows:
| Commodity Contracts | Credit Contracts | Equity Contracts | Foreign Currency Exchange Contracts | Interest Rate Contracts | Other Contracts | Total | ||||||||||||||||||||||
Net Realized Gain (Loss) from | ||||||||||||||||||||||||||||
Futures contracts | $ | — | $ | — | $ | 222,696 | $ | — | $ | — | $ | — | $ | 222,696 | ||||||||||||||
|
|
|
|
|
|
|
|
|
|
|
|
|
| |||||||||||||||
| Net Change in Unrealized Appreciation (Depreciation) on | ||||||||||||||||||||||||||||
Futures contracts | $ | — | $ | — | $ | 727,458 | $ | — | $ | — | $ | — | $ | 727,458 | ||||||||||||||
|
|
|
|
|
|
|
|
|
|
|
|
|
| |||||||||||||||
| 30 | 2 0 2 3 BLACK ROCK ANNUAL REPORT TO SHAREHOLDERS |
Schedule of Investments (continued) May 31, 2023 | BlackRock Advantage Large Cap Growth Fund |
Average Quarterly Balances of Outstanding Derivative Financial Instruments
Futures contracts | ||||
Average notional value of contracts — long | $ | 9,819,101 |
For more information about the Fund’s investment risks regarding derivative financial instruments, refer to the Notes to Financial Statements.
Fair Value Hierarchy as of Period End
Various inputs are used in determining the fair value of financial instruments. For a description of the input levels and information about the Fund’s policy regarding valuation of financial instruments, refer to the Notes to Financial Statements.
The following table summarizes the Fund’s financial instruments categorized in the fair value hierarchy. The breakdown of the Fund’s financial instruments into major categories is disclosed in the Schedule of Investments above.
| Level 1 | Level 2 | Level 3 | Total | |||||||||||||
Assets | ||||||||||||||||
Investments | ||||||||||||||||
Long-Term Investments | ||||||||||||||||
Common Stocks | $ | 944,790,593 | $ | — | $ | — | $ | 944,790,593 | ||||||||
Short-Term Securities | ||||||||||||||||
Money Market Funds | 6,109,397 | — | — | 6,109,397 | ||||||||||||
|
|
|
|
|
|
|
| |||||||||
| $ | 950,899,990 | $ | — | $ | — | 950,899,990 | ||||||||||
|
|
|
|
|
|
|
| |||||||||
Investments valued at NAV(a) | 12,171,918 | |||||||||||||||
|
| |||||||||||||||
| $ | 963,071,908 | |||||||||||||||
|
| |||||||||||||||
Derivative Financial Instruments(b) | ||||||||||||||||
Assets | ||||||||||||||||
Equity Contracts | $ | 407,128 | $ | — | $ | — | $ | 407,128 | ||||||||
|
|
|
|
|
|
|
| |||||||||
| (a) | Certain investments of the Fund were fair valued using NAV as a practical expedient as no quoted market value is available and therefore have been excluded from the fair value hierarchy. |
| (b) | Derivative financial instruments are futures contracts. Futures contracts are valued at the unrealized appreciation (depreciation) on the instrument. |
See notes to financial statements.
SCHEDULES OF INVESTMENTS | 31 |
Schedule of Investments May 31, 2023 | BlackRock Advantage Small Cap Core Fund (Percentages shown are based on Net Assets) |
| Security | Shares | Value | ||||||
Common Stocks | ||||||||
| Aerospace & Defense — 0.9% | ||||||||
Ducommun, Inc.(a) | 12,607 | $ | 516,383 | |||||
HEICO Corp., Class A | 7,477 | 911,073 | ||||||
Kratos Defense & Security Solutions, Inc.(a) | 130,030 | 1,708,594 | ||||||
Moog, Inc., Class A | 179,080 | 17,408,367 | ||||||
Parsons Corp.(a) | 212,364 | 9,490,547 | ||||||
V2X, Inc.(a)(b) | 42,269 | 1,743,596 | ||||||
|
| |||||||
| 31,778,560 | ||||||||
| Air Freight & Logistics — 0.4% | ||||||||
Hub Group, Inc., Class A(a) | 175,760 | 12,928,906 | ||||||
|
| |||||||
| Automobile Components — 1.9% | ||||||||
Adient PLC(a) | 349,344 | 11,769,399 | ||||||
Cooper-Standard Holdings, Inc.(a)(b) | 87,633 | 952,571 | ||||||
Dana, Inc. | 311,556 | 4,009,726 | ||||||
Fox Factory Holding Corp.(a)(b) | 31,817 | 2,829,168 | ||||||
Gentherm, Inc.(a) | 889 | 48,859 | ||||||
Goodyear Tire & Rubber Co.(a) | 329,461 | 4,523,499 | ||||||
Modine Manufacturing Co.(a) | 448,813 | 12,248,107 | ||||||
Patrick Industries, Inc. | 57,331 | 3,756,900 | ||||||
Standard Motor Products, Inc. | 29,740 | 1,050,417 | ||||||
Stoneridge, Inc.(a) | 23,646 | 386,849 | ||||||
Visteon Corp.(a) | 182,159 | 24,332,799 | ||||||
|
| |||||||
| 65,908,294 | ||||||||
| Automobiles — 0.2% | ||||||||
Winnebago Industries, Inc. | 148,732 | 8,275,448 | ||||||
|
| |||||||
| Banks — 6.2% | ||||||||
Amalgamated Financial Corp. | 179,252 | 2,548,963 | ||||||
Ameris Bancorp | 3,934 | 124,157 | ||||||
Bank of Marin Bancorp | 26,500 | 428,505 | ||||||
BankFinancial Corp. | 46,408 | 343,419 | ||||||
Bar Harbor Bankshares | 7,222 | 170,656 | ||||||
Business First Bancshares, Inc. | 81,282 | 1,184,279 | ||||||
Capital Bancorp, Inc. | 416 | 7,068 | ||||||
Capital City Bank Group, Inc. | 190,044 | 5,714,623 | ||||||
Capstar Financial Holdings, Inc. | 88,382 | 1,065,003 | ||||||
Carter Bankshares, Inc.(a) | 32,813 | 462,663 | ||||||
Central Valley Community Bancorp | 2,206 | 31,833 | ||||||
Colony Bankcorp, Inc. | 2,188 | 20,348 | ||||||
Community Trust Bancorp, Inc. | 47,201 | 1,590,674 | ||||||
ConnectOne Bancorp, Inc. | 103,963 | 1,411,818 | ||||||
Enterprise Bancorp, Inc. | 5,658 | 150,390 | ||||||
Enterprise Financial Services Corp. | 163,614 | 6,646,001 | ||||||
FB Financial Corp. | 223,642 | 5,962,296 | ||||||
Financial Institutions, Inc. | 74,698 | 1,173,506 | ||||||
First Bancshares, Inc. | 121,896 | 3,174,172 | ||||||
First Bank | 23,460 | 240,700 | ||||||
First Busey Corp. | 94,248 | 1,762,438 | ||||||
First Business Financial Services, Inc. | 45,180 | 1,209,469 | ||||||
First Community Bankshares, Inc. | 70,421 | 1,877,424 | ||||||
First Financial Corp. | 62,192 | 2,017,508 | ||||||
First Financial Northwest, Inc. | 119,721 | 1,215,168 | ||||||
First Foundation, Inc. | 79,525 | 308,557 | ||||||
First Internet Bancorp | 18,541 | 227,683 | ||||||
First Interstate BancSystem, Inc., Class A | 109,587 | 2,416,393 | ||||||
First Merchants Corp. | 2,472 | 65,384 | ||||||
First United Corp. | 31,812 | 414,192 | ||||||
FS Bancorp, Inc. | 1,488 | 42,259 | ||||||
Fulton Financial Corp. | 676,673 | 7,551,671 | ||||||
Great Southern Bancorp, Inc. | 2,297 | 111,703 | ||||||
Hancock Whitney Corp. | 707,847 | 25,857,651 | ||||||
| Security | Shares | Value | ||||||
| Banks (continued) | ||||||||
HBT Financial, Inc. | 166,056 | $ | 2,922,586 | |||||
Heartland Financial U.S.A., Inc. | 1,008,255 | 27,817,755 | ||||||
Heritage Commerce Corp. | 323,494 | 2,355,036 | ||||||
Heritage Financial Corp. | 15,039 | 245,888 | ||||||
HomeTrust Bancshares, Inc. | 129,741 | 2,541,626 | ||||||
Horizon Bancorp, Inc. | 588,054 | 5,227,800 | ||||||
Independent Bank Corp. | 123,859 | 2,025,095 | ||||||
Independent Bank Group, Inc. | 4,264 | 142,290 | ||||||
Lakeland Bancorp, Inc. | 318,353 | 4,141,773 | ||||||
Mercantile Bank Corp. | 59,438 | 1,547,171 | ||||||
Meridian Corp. | 440 | 4,242 | ||||||
Mid Penn Bancorp, Inc. | 67,390 | 1,494,710 | ||||||
Midland States Bancorp, Inc. | 315,119 | 6,094,401 | ||||||
MidWestOne Financial Group, Inc. | 18,659 | 352,282 | ||||||
National Bank Holdings Corp., Class A | 44,769 | 1,339,936 | ||||||
Northrim BanCorp, Inc. | 121,150 | 4,592,796 | ||||||
OceanFirst Financial Corp. | 1,023,190 | 14,529,298 | ||||||
Old National Bancorp | 191,523 | 2,378,716 | ||||||
Origin Bancorp, Inc. | 120,680 | 3,433,346 | ||||||
PacWest Bancorp | 153,403 | 989,449 | ||||||
Peapack-Gladstone Financial Corp. | 70,467 | 1,859,624 | ||||||
Ponce Financial Group, Inc.(a) | 3,824 | 28,986 | ||||||
Premier Financial Corp. | 265,726 | 3,704,220 | ||||||
Primis Financial Corp. | 5,858 | 43,173 | ||||||
Republic Bancorp, Inc., Class A | 34,469 | 1,452,524 | ||||||
Republic First Bancorp, Inc.(a)(b) | 1,239,066 | 1,635,567 | ||||||
Riverview Bancorp, Inc. | 220,282 | 1,030,920 | ||||||
Sandy Spring Bancorp, Inc. | 205,830 | 4,310,080 | ||||||
Seacoast Banking Corp. of Florida | 30,580 | 632,394 | ||||||
Shore Bancshares, Inc. | 95,427 | 1,074,508 | ||||||
Sierra Bancorp | 89,351 | 1,428,722 | ||||||
SmartFinancial, Inc. | 45,577 | 961,675 | ||||||
South Plains Financial, Inc. | 80,440 | 1,782,550 | ||||||
Southern First Bancshares, Inc.(a) | 30,541 | 701,527 | ||||||
Summit Financial Group, Inc. | 17,069 | 325,335 | ||||||
Timberland Bancorp, Inc. | 1,505 | 35,458 | ||||||
Towne Bank | 209,236 | 4,862,645 | ||||||
UMB Financial Corp. | 89,755 | 5,083,723 | ||||||
United Bankshares, Inc. | 46,720 | 1,374,502 | ||||||
Univest Financial Corp. | 193,368 | 3,428,415 | ||||||
Veritex Holdings, Inc. | 70,210 | 1,212,527 | ||||||
Washington Trust Bancorp, Inc. | 105,662 | 2,690,155 | ||||||
WesBanco, Inc. | 420,631 | 10,154,032 | ||||||
Western New England Bancorp, Inc. | 6,620 | 37,469 | ||||||
Wintrust Financial Corp. | 25,468 | 1,619,001 | ||||||
|
| |||||||
| 213,174,502 | ||||||||
| Beverages — 1.2% | ||||||||
Celsius Holdings, Inc.(a) | 8,749 | 1,098,262 | ||||||
Coca-Cola Consolidated, Inc. | 6,349 | 4,201,387 | ||||||
Duckhorn Portfolio, Inc.(a) | 21,147 | 275,545 | ||||||
MGP Ingredients, Inc. | 178,811 | 16,997,774 | ||||||
Primo Water Corp. | 1,475,149 | 18,985,168 | ||||||
Vita Coco Co., Inc.(a) | 5,762 | 153,730 | ||||||
|
| |||||||
| 41,711,866 | ||||||||
| Biotechnology — 8.6% | ||||||||
2seventy bio, Inc.(a) | 61,019 | 726,736 | ||||||
4D Molecular Therapeutics, Inc.(a) | 84,325 | 1,548,207 | ||||||
ACADIA Pharmaceuticals, Inc.(a) | 90,534 | 2,127,549 | ||||||
ACELYRIN, Inc.(a) | 58,888 | 1,065,873 | ||||||
Agenus, Inc.(a) | 829,374 | 1,293,823 | ||||||
Agios Pharmaceuticals, Inc.(a) | 128,322 | 3,243,980 | ||||||
Alector, Inc.(a)(b) | 705,447 | 5,248,526 | ||||||
| 32 | 2 0 2 3 BLACK ROCK ANNUAL REPORT TO SHAREHOLDERS |
Schedule of Investments (continued) May 31, 2023 | BlackRock Advantage Small Cap Core Fund (Percentages shown are based on Net Assets) |
| Security | Shares | Value | ||||||
| Biotechnology (continued) | ||||||||
Alkermes PLC(a) | 544,977 | $ | 15,766,185 | |||||
Allakos, Inc.(a)(b) | 222,789 | 1,109,489 | ||||||
Allogene Therapeutics, Inc.(a)(b) | 370,992 | 1,947,708 | ||||||
ALX Oncology Holdings, Inc.(a) | 15,983 | 106,607 | ||||||
Amicus Therapeutics, Inc.(a) | 113,806 | 1,281,456 | ||||||
Anika Therapeutics, Inc.(a) | 27,066 | 733,218 | ||||||
Annexon, Inc.(a)(b) | 41,893 | 125,260 | ||||||
Apellis Pharmaceuticals, Inc.(a) | 123,286 | 10,584,103 | ||||||
Applied Molecular Transport, Inc.(a) | 65,272 | 17,375 | ||||||
Arcus Biosciences, Inc.(a) | 225,984 | 4,641,711 | ||||||
Arrowhead Pharmaceuticals, Inc.(a) | 67,961 | 2,338,538 | ||||||
ARS Pharmaceuticals, Inc.(a) | 65 | 452 | ||||||
Atara Biotherapeutics, Inc.(a) | 356,845 | 545,973 | ||||||
Atossa Therapeutics, Inc.(a) | 340,502 | 316,667 | ||||||
Avidity Biosciences, Inc.(a) | 74,332 | 789,406 | ||||||
Beam Therapeutics, Inc.(a) | 239,376 | 7,636,094 | ||||||
BioAtla, Inc.(a) | 109,863 | 346,068 | ||||||
Blueprint Medicines Corp.(a)(b) | 249,406 | 14,096,427 | ||||||
Bridgebio Pharma, Inc.(a) | 159,905 | 2,193,897 | ||||||
C4 Therapeutics, Inc.(a) | 90,727 | 307,565 | ||||||
CareDx, Inc.(a) | 107,164 | 855,169 | ||||||
Catalyst Pharmaceuticals, Inc.(a) | 343,351 | 3,965,704 | ||||||
Coherus Biosciences, Inc.(a) | 819,930 | 3,353,514 | ||||||
Crinetics Pharmaceuticals, Inc.(a) | 55,834 | 1,218,856 | ||||||
Cyteir Therapeutics, Inc.(a) | 2,314 | 5,322 | ||||||
Cytokinetics, Inc.(a) | 58,196 | 2,193,407 | ||||||
Day One Biopharmaceuticals, Inc.(a) | 32,601 | 433,593 | ||||||
Deciphera Pharmaceuticals, Inc.(a) | 385,321 | 5,201,834 | ||||||
Denali Therapeutics, Inc.(a)(b) | 410,368 | 12,401,321 | ||||||
Dyne Therapeutics, Inc.(a) | 123,535 | 1,609,661 | ||||||
Editas Medicine, Inc.(a) | 463,285 | 4,252,956 | ||||||
Emergent BioSolutions, Inc.(a)(b) | 400,790 | 3,418,739 | ||||||
Enanta Pharmaceuticals, Inc.(a) | 87,409 | 2,052,363 | ||||||
Fate Therapeutics, Inc.(a)(b) | 1,222,317 | 6,172,701 | ||||||
FibroGen, Inc.(a)(b) | 247,931 | 4,276,810 | ||||||
Foghorn Therapeutics, Inc.(a) | 601 | 3,780 | ||||||
G1 Therapeutics, Inc.(a) | 5,173 | 13,139 | ||||||
Halozyme Therapeutics, Inc.(a) | 283,790 | 9,203,310 | ||||||
Heron Therapeutics, Inc.(a)(b) | 631,869 | 720,331 | ||||||
Homology Medicines, Inc.(a) | 191,198 | 186,743 | ||||||
Ideaya Biosciences, Inc.(a) | 37,320 | 852,389 | ||||||
ImmunoGen, Inc.(a) | 127,306 | 1,736,454 | ||||||
Insmed, Inc.(a) | 49,950 | 950,549 | ||||||
Intellia Therapeutics, Inc.(a)(b) | 324,844 | 12,103,687 | ||||||
Intercept Pharmaceuticals, Inc.(a) | 268,150 | 2,826,301 | ||||||
Iovance Biotherapeutics, Inc.(a) | 14,192 | 124,038 | ||||||
Ironwood Pharmaceuticals, Inc., Class A(a) | 1,059,529 | 11,527,676 | ||||||
iTeos Therapeutics, Inc.(a) | 105,814 | 1,722,652 | ||||||
IVERIC bio, Inc.(a) | 118,095 | 4,458,086 | ||||||
Jounce Therapeutics, Inc., CVR(a)(c) | 10,334 | 310 | ||||||
Karuna Therapeutics, Inc.(a) | 33,535 | 7,597,354 | ||||||
Karyopharm Therapeutics, Inc.(a) | 660,486 | 1,492,698 | ||||||
Kiniksa Pharmaceuticals Ltd., Class A(a) | 368,603 | 5,108,838 | ||||||
Kinnate Biopharma, Inc.(a) | 9,740 | 41,882 | ||||||
Kodiak Sciences, Inc.(a) | 478,909 | 2,839,930 | ||||||
Kronos Bio, Inc.(a)(b) | 43,065 | 71,919 | ||||||
Krystal Biotech, Inc.(a) | 2,778 | 327,387 | ||||||
Kura Oncology, Inc.(a) | 112,091 | 1,493,052 | ||||||
Kymera Therapeutics, Inc.(a)(b) | 77,727 | 2,288,283 | ||||||
MacroGenics, Inc.(a) | 382,803 | 1,787,690 | ||||||
Madrigal Pharmaceuticals, Inc.(a) | 6,840 | 1,904,324 | ||||||
MeiraGTx Holdings PLC(a) | 31,227 | 214,842 | ||||||
| Security | Shares | Value | ||||||
| Biotechnology (continued) | ||||||||
MiMedx Group, Inc.(a)(b) | 9,827 | $ | 57,586 | |||||
Mirum Pharmaceuticals, Inc.(a) | 39,602 | 1,038,760 | ||||||
Myriad Genetics, Inc.(a)(b) | 180,956 | 3,991,889 | ||||||
NextCure, Inc.(a) | 169,789 | 292,037 | ||||||
Nkarta, Inc.(a) | 128,764 | 594,890 | ||||||
Nurix Therapeutics, Inc.(a) | 124,287 | 1,257,784 | ||||||
Olema Pharmaceuticals, Inc.(a)(b) | 159,827 | 826,306 | ||||||
Passage Bio, Inc.(a) | 143,703 | 136,662 | ||||||
PMV Pharmaceuticals, Inc.(a)(b) | 266,837 | 1,427,578 | ||||||
Poseida Therapeutics, Inc.(a) | 82,181 | 186,551 | ||||||
Precigen, Inc.(a) | 121,854 | 145,006 | ||||||
Prometheus Biosciences, Inc.(a) | 35,634 | 7,080,476 | ||||||
Protagonist Therapeutics, Inc.(a) | 4,610 | 120,183 | ||||||
Prothena Corp. PLC(a) | 10,875 | 722,426 | ||||||
PTC Therapeutics, Inc.(a)(b) | 234,413 | 9,838,314 | ||||||
Puma Biotechnology, Inc.(a) | 228,047 | 763,957 | ||||||
Recursion Pharmaceuticals, Inc., Class A(a) | 167,395 | 1,468,054 | ||||||
REGENXBIO, Inc.(a) | 491,474 | 8,468,097 | ||||||
Relay Therapeutics, Inc.(a) | 435,024 | 4,846,167 | ||||||
Replimune Group, Inc.(a) | 61,004 | 1,158,466 | ||||||
Rigel Pharmaceuticals, Inc.(a) | 800,655 | 1,120,917 | ||||||
Sage Therapeutics, Inc.(a)(b) | 13,112 | 649,044 | ||||||
Sana Biotechnology, Inc.(a)(b) | 132,361 | 796,813 | ||||||
Sangamo Therapeutics, Inc.(a) | 1,413,433 | 1,583,045 | ||||||
Scholar Rock Holding Corp.(a) | 87,436 | 508,878 | ||||||
Seres Therapeutics, Inc.(a)(b) | 89,697 | 444,000 | ||||||
Shattuck Labs, Inc.(a) | 4,414 | 11,521 | ||||||
Surface Oncology, Inc.(a) | 58,721 | 46,102 | ||||||
Sutro Biopharma, Inc.(a)(b) | 372,079 | 1,670,635 | ||||||
TG Therapeutics, Inc.(a) | 75,160 | 2,001,511 | ||||||
Travere Therapeutics, Inc.(a) | 349,741 | 6,256,866 | ||||||
Twist Bioscience Corp.(a)(b) | 584,044 | 8,848,267 | ||||||
Ultragenyx Pharmaceutical, Inc.(a) | 53,540 | 2,642,734 | ||||||
UroGen Pharma Ltd.(a) | 20,705 | 204,980 | ||||||
Vaxcyte, Inc.(a) | 53,247 | 2,636,791 | ||||||
Veracyte, Inc.(a)(b) | 365,566 | 9,460,848 | ||||||
Vericel Corp.(a) | 59,888 | 1,923,603 | ||||||
Vir Biotechnology, Inc.(a) | 217,682 | 5,805,579 | ||||||
Vor BioPharma, Inc.(a)(b) | 2,295 | 10,787 | ||||||
Voyager Therapeutics, Inc.(a)(b) | 52,831 | 601,745 | ||||||
Xencor, Inc.(a)(b) | 74,904 | 2,029,898 | ||||||
|
| |||||||
| 296,824,240 | ||||||||
| Building Products — 1.3% | ||||||||
AAON, Inc. | 25,656 | 2,222,066 | ||||||
Apogee Enterprises, Inc. | 63,446 | 2,341,792 | ||||||
Builders FirstSource, Inc.(a) | 6,138 | 711,701 | ||||||
Caesarstone Ltd. | 37,444 | 173,740 | ||||||
Gibraltar Industries, Inc.(a) | 115,933 | 6,063,296 | ||||||
Janus International Group, Inc.(a) | 390,457 | 3,447,735 | ||||||
JELD-WEN Holding, Inc.(a) | 187,127 | 2,449,493 | ||||||
PGT Innovations, Inc.(a)(b) | 86,136 | 2,142,202 | ||||||
UFP Industries, Inc. | 338,765 | 26,457,547 | ||||||
|
| |||||||
| 46,009,572 | ||||||||
| Capital Markets — 1.9% | ||||||||
Artisan Partners Asset Management, Inc., Class A | 116,923 | 3,741,536 | ||||||
AssetMark Financial Holdings, Inc.(a) | 109,215 | 3,066,757 | ||||||
Avantax, Inc.(a) | 33,186 | 702,216 | ||||||
Cohen & Steers, Inc. | 52,866 | 2,876,439 | ||||||
Federated Hermes, Inc., Class B | 79,064 | 2,722,174 | ||||||
GCM Grosvenor, Inc., Class A | 4,323 | 29,829 | ||||||
Greenhill & Co., Inc. | 4,987 | 72,212 | ||||||
Hamilton Lane, Inc., Class A | 116,686 | 7,924,146 | ||||||
SCHEDULES OF INVESTMENTS | 33 |
Schedule of Investments (continued) May 31, 2023 | BlackRock Advantage Small Cap Core Fund (Percentages shown are based on Net Assets) |
| Security | Shares | Value | ||||||
| Capital Markets (continued) | ||||||||
Houlihan Lokey, Inc., Class A | 281,837 | $ | 24,607,188 | |||||
Moelis & Co., Class A | 104,676 | 3,964,080 | ||||||
StepStone Group, Inc., Class A | 87,777 | 1,888,083 | ||||||
Stifel Financial Corp. | 138,500 | 7,696,445 | ||||||
Victory Capital Holdings, Inc., Class A | 236,654 | 7,329,174 | ||||||
|
| |||||||
| 66,620,279 | ||||||||
| Chemicals — 1.2% | ||||||||
Alto Ingredients, Inc.(a) | 20,776 | 41,760 | ||||||
Cabot Corp. | 127,343 | 8,720,449 | ||||||
Ecovyst, Inc.(a) | 75,394 | 756,956 | ||||||
HB Fuller Co. | 51,656 | 3,251,229 | ||||||
Ingevity Corp.(a)(b) | 55,616 | 2,624,519 | ||||||
Innospec, Inc. | 46,332 | 4,279,223 | ||||||
Livent Corp.(a) | 99,286 | 2,288,542 | ||||||
Quaker Chemical Corp. | 38,824 | 7,369,183 | ||||||
Sensient Technologies Corp. | 79,670 | 5,738,630 | ||||||
Stepan Co. | 60,617 | 5,573,733 | ||||||
|
| |||||||
| 40,644,224 | ||||||||
| Commercial Services & Supplies — 0.4% | ||||||||
ACCO Brands Corp. | 129,287 | 625,749 | ||||||
BrightView Holdings, Inc.(a) | 529,298 | 3,493,367 | ||||||
CECO Environmental Corp.(a) | 64,924 | 698,582 | ||||||
CoreCivic, Inc.(a) | 225,721 | 1,945,715 | ||||||
Healthcare Services Group, Inc. | 278,266 | 3,759,374 | ||||||
Interface, Inc., Class A | 66,937 | 463,873 | ||||||
Li-Cycle Holdings Corp.(a)(b) | 38,087 | 179,771 | ||||||
Steelcase, Inc., Class A | 500,171 | 3,246,110 | ||||||
|
| |||||||
| 14,412,541 | ||||||||
| Communications Equipment — 0.5% | ||||||||
Calix, Inc.(a) | 209,487 | 9,764,189 | ||||||
Digi International, Inc.(a) | 23,183 | 833,429 | ||||||
Extreme Networks, Inc.(a) | 305,467 | 6,292,620 | ||||||
NETGEAR, Inc.(a) | 68,837 | 965,783 | ||||||
|
| |||||||
| 17,856,021 | ||||||||
| Construction & Engineering — 2.9% | ||||||||
API Group Corp.(a)(b) | 324,473 | 7,333,090 | ||||||
Comfort Systems U.S.A., Inc.(b) | 114,541 | 16,949,777 | ||||||
Concrete Pumping Holdings, Inc.(a) | 14,948 | 103,739 | ||||||
Dycom Industries, Inc.(a)(b) | 94,693 | 9,604,711 | ||||||
EMCOR Group, Inc. | 221,894 | 36,577,007 | ||||||
Fluor Corp.(a) | 55,753 | 1,480,799 | ||||||
Matrix Service Co.(a) | 86,768 | 469,415 | ||||||
MYR Group, Inc.(a) | 102,404 | 13,056,510 | ||||||
Primoris Services Corp. | 230,116 | 6,167,109 | ||||||
Sterling Infrastructure, Inc.(a) | 162,886 | 7,504,158 | ||||||
Tutor Perini Corp.(a)(b) | 230,142 | 1,242,767 | ||||||
|
| |||||||
| 100,489,082 | ||||||||
| Construction Materials — 0.1% | ||||||||
Summit Materials, Inc., Class A(a) | 119,761 | 3,788,040 | ||||||
|
| |||||||
| Consumer Finance — 0.9% | ||||||||
Enova International, Inc.(a) | 241,153 | 11,218,438 | ||||||
EZCORP, Inc., Class A, NVS(a) | 102,164 | 852,048 | ||||||
FirstCash Holdings, Inc. | 89,155 | 8,785,334 | ||||||
LendingClub Corp.(a) | 162,385 | 1,331,557 | ||||||
LendingTree, Inc.(a) | 170,831 | 3,124,499 | ||||||
Oportun Financial Corp.(a) | 49,135 | 281,543 | ||||||
PROG Holdings, Inc.(a)(b) | 101,127 | 3,299,774 | ||||||
Regional Management Corp. | 102,343 | 2,676,269 | ||||||
|
| |||||||
| 31,569,462 | ||||||||
| Security | Shares | Value | ||||||
| Consumer Staples Distribution & Retail — 0.0% | ||||||||
SpartanNash Co. | 23,694 | $ | 542,593 | |||||
|
| |||||||
| Containers & Packaging — 0.0% | ||||||||
Pactiv Evergreen, Inc. | 6,382 | 44,802 | ||||||
|
| |||||||
| Diversified Consumer Services — 1.1% | ||||||||
2U, Inc.(a) | 34,561 | 138,244 | ||||||
American Public Education, Inc.(a) | 75,029 | 375,895 | ||||||
Chegg, Inc.(a) | 335,632 | 3,013,975 | ||||||
Duolingo, Inc., Class A(a) | 35,350 | 5,287,300 | ||||||
Frontdoor, Inc.(a) | 293,470 | 9,047,680 | ||||||
Laureate Education, Inc., Class A | 1,365,427 | 16,521,667 | ||||||
OneSpaWorld Holdings Ltd.(a) | 168,791 | 1,760,490 | ||||||
|
| |||||||
| 36,145,251 | ||||||||
| Diversified REITs — 0.4% | ||||||||
Alexander & Baldwin, Inc. | 100,108 | 1,833,979 | ||||||
American Assets Trust, Inc. | 493,757 | 9,406,071 | ||||||
Armada Hoffler Properties, Inc. | 150,856 | 1,665,450 | ||||||
Empire State Realty Trust, Inc., Class A | 208,150 | 1,284,285 | ||||||
|
| |||||||
| 14,189,785 | ||||||||
| Diversified Telecommunication Services — 0.5% | ||||||||
Bandwidth, Inc., Class A(a)(b) | 237,914 | 2,831,177 | ||||||
EchoStar Corp., Class A(a) | 271,141 | 4,275,894 | ||||||
IDT Corp., Class B(a) | 36,501 | 1,109,265 | ||||||
Iridium Communications, Inc. | 50,621 | 3,039,285 | ||||||
Liberty Latin America Ltd., Class A(a) | 41,610 | 304,585 | ||||||
Liberty Latin America Ltd., Class C, NVS(a) | 69,012 | 503,788 | ||||||
Ooma, Inc.(a) | 427,083 | 5,688,745 | ||||||
|
| |||||||
| 17,752,739 | ||||||||
| Electric Utilities — 0.3% | ||||||||
Portland General Electric Co. | 201,945 | 9,840,780 | ||||||
|
| |||||||
| Electrical Equipment — 1.0% | ||||||||
Allied Motion Technologies, Inc. | 349 | 11,842 | ||||||
Atkore, Inc.(a)(b) | 210,068 | 24,529,640 | ||||||
Bloom Energy Corp., Class A(a)(b) | 493,890 | 6,776,171 | ||||||
EnerSys | 1,690 | 164,386 | ||||||
LSI Industries, Inc. | 69,858 | 812,449 | ||||||
Shoals Technologies Group, Inc., Class A(a) | 40,524 | 951,909 | ||||||
SunPower Corp.(a)(b) | 99,378 | 1,053,407 | ||||||
Sunrun, Inc.(a) | 39,732 | 700,872 | ||||||
Thermon Group Holdings, Inc.(a) | 14,667 | 336,461 | ||||||
|
| |||||||
| 35,337,137 | ||||||||
| Electronic Equipment, Instruments & Components — 3.0% | ||||||||
Advanced Energy Industries, Inc. | 5,144 | 504,884 | ||||||
Badger Meter, Inc. | 654 | 90,167 | ||||||
Belden, Inc. | 146,091 | 12,781,501 | ||||||
Benchmark Electronics, Inc. | 197,688 | 4,667,414 | ||||||
ePlus, Inc.(a) | 187,006 | 9,236,226 | ||||||
Fabrinet(a) | 74,931 | 8,483,688 | ||||||
Insight Enterprises, Inc.(a) | 135,149 | 18,274,848 | ||||||
Itron, Inc.(a) | 3,927 | 265,976 | ||||||
Napco Security Technologies, Inc. | 26,185 | 973,820 | ||||||
OSI Systems, Inc.(a) | 51,405 | 6,117,709 | ||||||
PC Connection, Inc. | 196,486 | 8,835,975 | ||||||
Plexus Corp.(a) | 6,985 | 633,400 | ||||||
Sanmina Corp.(a) | 546,905 | 29,007,841 | ||||||
ScanSource, Inc.(a) | 134,514 | 3,868,623 | ||||||
|
| |||||||
| 103,742,072 | ||||||||
| Energy Equipment & Services — 1.9% | ||||||||
Archrock, Inc. | 512,848 | 4,615,632 | ||||||
Borr Drilling Ltd.(a)(b) | 982,945 | 6,733,173 | ||||||
| 34 | 2 0 2 3 BLACK ROCK ANNUAL REPORT TO SHAREHOLDERS |
Schedule of Investments (continued) May 31, 2023 | BlackRock Advantage Small Cap Core Fund (Percentages shown are based on Net Assets) |
| Security | Shares | Value | ||||||
| Energy Equipment & Services (continued) | ||||||||
ChampionX Corp. | 146,860 | $ | 3,709,684 | |||||
Forum Energy Technologies, Inc.(a) | 1,255 | 26,769 | ||||||
Helix Energy Solutions Group, Inc.(a) | 279,762 | 1,756,905 | ||||||
Helmerich & Payne, Inc. | 243,149 | 7,508,441 | ||||||
Liberty Energy, Inc., Class A | 1,296,447 | 15,220,288 | ||||||
Nabors Industries Ltd.(a) | 21,936 | 1,836,043 | ||||||
Newpark Resources, Inc.(a) | 2,233 | 7,726 | ||||||
Oil States International, Inc.(a) | 349,620 | 2,223,583 | ||||||
Patterson-UTI Energy, Inc. | 926,728 | 9,026,331 | ||||||
ProPetro Holding Corp.(a) | 1,361,507 | 9,081,252 | ||||||
Solaris Oilfield Infrastructure, Inc., Class A | 147,456 | 1,080,852 | ||||||
U.S. Silica Holdings, Inc.(a) | 283,923 | 3,216,848 | ||||||
|
| |||||||
| 66,043,527 | ||||||||
| Entertainment — 0.1% | ||||||||
Cinemark Holdings, Inc.(a) | 107,196 | 1,716,208 | ||||||
Eros Media World PLC, Class A(a) | 23,977 | 5,035 | ||||||
IMAX Corp.(a) | 6,824 | 118,328 | ||||||
Lions Gate Entertainment Corp., Class A(a)(b) | 93,518 | 963,236 | ||||||
Marcus Corp. | 32,975 | 503,858 | ||||||
Sciplay Corp., Class A(a) | 62,608 | 1,213,969 | ||||||
|
| |||||||
| 4,520,634 | ||||||||
| Financial Services — 2.2% | ||||||||
Burford Capital Ltd. | 35,022 | 464,392 | ||||||
Essent Group Ltd. | 453,541 | 20,032,906 | ||||||
Federal Agricultural Mortgage Corp., Class C, NVS | 116,025 | 15,525,305 | ||||||
Marqeta, Inc., Class A(a) | 774,455 | 3,709,640 | ||||||
Merchants Bancorp | 40,606 | 928,253 | ||||||
MoneyGram International, Inc.(a) | 87,484 | 961,449 | ||||||
NMI Holdings, Inc., Class A(a) | 378,542 | 9,520,331 | ||||||
Paysafe Ltd.(a) | 185,991 | 1,796,673 | ||||||
Radian Group, Inc. | 75,658 | 1,932,305 | ||||||
Repay Holdings Corp., Class A(a) | 328,432 | 2,078,975 | ||||||
Star Holdings(a) | 18,592 | 288,176 | ||||||
StoneCo Ltd., Class A(a) | 1,345,061 | 16,853,614 | ||||||
|
| |||||||
| 74,092,019 | ||||||||
| Food Products — 1.2% | ||||||||
Cal-Maine Foods, Inc. | 126,749 | 6,026,915 | ||||||
Hostess Brands, Inc., Class A(a)(b) | 447,114 | 11,124,196 | ||||||
Lancaster Colony Corp. | 55,358 | 10,882,276 | ||||||
Seneca Foods Corp., Class A(a) | 12,659 | 585,352 | ||||||
Sovos Brands, Inc.(a)(b) | 271,642 | 5,158,482 | ||||||
SunOpta, Inc.(a) | 493,670 | 3,322,399 | ||||||
Vital Farms, Inc.(a)(b) | 399,684 | 5,791,421 | ||||||
Whole Earth Brands, Inc., Class A(a) | 21,862 | 63,181 | ||||||
|
| |||||||
| 42,954,222 | ||||||||
| Gas Utilities — 0.9% | ||||||||
Brookfield Infrastructure Corp., Class A | 249,351 | 11,495,081 | ||||||
New Jersey Resources Corp. | 342,984 | 16,617,575 | ||||||
Spire, Inc. | 70,261 | 4,536,753 | ||||||
|
| |||||||
| 32,649,409 | ||||||||
| Ground Transportation — 0.3% | ||||||||
Covenant Logistics Group, Inc., Class A | 141,404 | 5,397,391 | ||||||
Saia, Inc.(a) | 14,799 | 4,205,284 | ||||||
Universal Logistics Holdings, Inc. | 42 | 1,115 | ||||||
|
| |||||||
| 9,603,790 | ||||||||
| Health Care Equipment & Supplies — 3.7% | ||||||||
Accuray, Inc.(a) | 351,839 | 1,298,286 | ||||||
Alphatec Holdings, Inc.(a) | 3,610 | 54,728 | ||||||
AngioDynamics, Inc.(a) | 166,150 | 1,571,779 | ||||||
Artivion, Inc.(a)(b) | 122,441 | 1,834,166 | ||||||
| Security | Shares | Value | ||||||
| Health Care Equipment & Supplies (continued) | ||||||||
AtriCure, Inc.(a) | 78,329 | $ | 3,522,455 | |||||
Atrion Corp. | 4,256 | 2,214,652 | ||||||
Axogen, Inc.(a)(b) | 14,860 | 126,310 | ||||||
Axonics, Inc.(a) | 3,241 | 156,832 | ||||||
Cerus Corp.(a) | 258,159 | 552,460 | ||||||
Glaukos Corp.(a) | 19,401 | 1,106,245 | ||||||
Haemonetics Corp.(a) | 44,866 | 3,795,664 | ||||||
Heska Corp.(a) | 14,997 | 1,795,591 | ||||||
Inari Medical, Inc.(a) | 4,595 | 277,538 | ||||||
Inogen, Inc.(a) | 20,646 | 217,402 | ||||||
Inspire Medical Systems, Inc.(a) | 49,715 | 14,541,140 | ||||||
iRadimed Corp. | 1,215 | 57,141 | ||||||
Lantheus Holdings, Inc.(a) | 54,152 | 4,689,022 | ||||||
LeMaitre Vascular, Inc. | 30,240 | 1,900,282 | ||||||
LivaNova PLC(a) | 227,087 | 10,055,412 | ||||||
Merit Medical Systems, Inc.(a)(b) | 394,709 | 32,524,022 | ||||||
Neogen Corp.(a) | 51,379 | 898,619 | ||||||
NeuroPace, Inc.(a) | 911 | 4,054 | ||||||
Nevro Corp.(a) | 125,592 | 3,461,315 | ||||||
NuVasive, Inc.(a) | 133,971 | 5,112,333 | ||||||
Omnicell, Inc.(a) | 65,699 | 4,823,621 | ||||||
OraSure Technologies, Inc.(a) | 567,337 | 2,853,705 | ||||||
Orthofix Medical, Inc.(a) | 20,496 | 383,070 | ||||||
Paragon 28, Inc.(a) | 21,469 | 386,013 | ||||||
Shockwave Medical, Inc.(a) | 50,449 | 13,878,015 | ||||||
SI-BONE, Inc.(a) | 28,215 | 710,454 | ||||||
STAAR Surgical Co.(a) | 59,696 | 3,463,562 | ||||||
Tactile Systems Technology, Inc.(a) | 269,889 | 5,673,067 | ||||||
Varex Imaging Corp.(a) | 214,678 | 4,731,503 | ||||||
|
| |||||||
| 128,670,458 | ||||||||
| Health Care Providers & Services — 2.3% | ||||||||
23andMe Holding Co., Class A(a) | 37,161 | 71,349 | ||||||
Accolade, Inc.(a)(b) | 92,820 | 1,117,553 | ||||||
Addus HomeCare Corp.(a) | 11,427 | 1,030,144 | ||||||
Alignment Healthcare, Inc.(a) | 83,916 | 492,587 | ||||||
Aveanna Healthcare Holdings, Inc.(a) | 142,707 | 168,394 | ||||||
Brookdale Senior Living, Inc.(a) | 280,102 | 966,352 | ||||||
CorVel Corp.(a) | 10,005 | 1,955,377 | ||||||
Cross Country Healthcare, Inc.(a)(b) | 32,718 | 834,309 | ||||||
Ensign Group, Inc. | 190,832 | 16,909,624 | ||||||
HealthEquity, Inc.(a) | 216,778 | 11,879,434 | ||||||
Hims & Hers Health, Inc., Class A(a) | 54,817 | 490,064 | ||||||
Joint Corp.(a) | 29,560 | 419,161 | ||||||
National HealthCare Corp. | 7,356 | 446,509 | ||||||
NeoGenomics, Inc.(a) | 174,819 | 3,003,390 | ||||||
OPKO Health, Inc.(a)(b) | 771,912 | 1,072,958 | ||||||
Option Care Health, Inc.(a) | 617,172 | 17,003,089 | ||||||
Pediatrix Medical Group, Inc.(a) | 1,990 | 26,467 | ||||||
PetIQ, Inc., Class A(a)(b) | 49,355 | 628,289 | ||||||
Privia Health Group, Inc.(a)(b) | 286,121 | 7,138,719 | ||||||
Progyny, Inc.(a)(b) | 307,060 | 11,437,985 | ||||||
Viemed Healthcare, Inc.(a) | 191,743 | 1,827,311 | ||||||
|
| |||||||
| 78,919,065 | ||||||||
| Health Care REITs — 0.0% | ||||||||
Diversified Healthcare Trust | 321,411 | 437,119 | ||||||
|
| |||||||
| Health Care Technology — 0.9% | ||||||||
American Well Corp., Class A(a) | 1,209,527 | 2,673,055 | ||||||
Evolent Health, Inc., Class A(a) | 276,208 | 8,048,701 | ||||||
Health Catalyst, Inc.(a) | 236,147 | 2,659,015 | ||||||
HealthStream, Inc. | 31,481 | 724,693 | ||||||
NextGen Healthcare, Inc.(a) | 115,752 | 1,802,259 | ||||||
SCHEDULES OF INVESTMENTS | 35 |
Schedule of Investments (continued) May 31, 2023 | BlackRock Advantage Small Cap Core Fund (Percentages shown are based on Net Assets) |
| Security | Shares | Value | ||||||
| Health Care Technology (continued) | ||||||||
Phreesia, Inc.(a) | 113,839 | $ | 3,417,447 | |||||
Sharecare, Inc., Class A(a) | 71,693 | 106,822 | ||||||
Veradigm, Inc.(a) | 868,772 | 10,234,134 | ||||||
|
| |||||||
| 29,666,126 | ||||||||
| Hotel & Resort REITs — 1.1% | ||||||||
Apple Hospitality REIT, Inc. | 444,991 | 6,465,719 | ||||||
Braemar Hotels & Resorts, Inc. | 2,078,595 | 8,501,454 | ||||||
Chatham Lodging Trust | 147,940 | 1,389,157 | ||||||
Hersha Hospitality Trust, Class A | 198,072 | 1,146,837 | ||||||
RLJ Lodging Trust | 994,253 | 10,220,921 | ||||||
Ryman Hospitality Properties, Inc. | 121,028 | 11,101,898 | ||||||
Summit Hotel Properties, Inc. | 24,848 | 162,754 | ||||||
|
| |||||||
| 38,988,740 | ||||||||
| Hotels, Restaurants & Leisure — 2.9% | ||||||||
Accel Entertainment, Inc., Class A(a) | 225,297 | 2,102,021 | ||||||
Bally’s Corp.(a)(b) | 217,542 | 2,956,396 | ||||||
BJ’s Restaurants, Inc.(a) | 150,735 | 4,488,888 | ||||||
Carrols Restaurant Group, Inc.(a) | 133,550 | 734,525 | ||||||
Chuy’s Holdings, Inc.(a) | 963 | 35,477 | ||||||
Dave & Buster’s Entertainment, Inc.(a)(b) | 219,154 | 7,045,801 | ||||||
El Pollo Loco Holdings, Inc. | 145,520 | 1,330,053 | ||||||
Everi Holdings, Inc.(a)(b) | 110,074 | 1,530,029 | ||||||
Fiesta Restaurant Group, Inc.(a) | 710 | 5,105 | ||||||
Hilton Grand Vacations, Inc.(a)(b) | 400,987 | 17,142,194 | ||||||
Monarch Casino & Resort, Inc. | 78,987 | 5,125,467 | ||||||
Noodles & Co., Class A(a) | 5,195 | 17,403 | ||||||
Papa John’s International, Inc. | 90,358 | 6,334,999 | ||||||
PlayAGS, Inc.(a) | 117,959 | �� | 629,901 | |||||
Red Rock Resorts, Inc., Class A | 4,677 | 213,224 | ||||||
Ruth’s Hospitality Group, Inc. | 4,749 | 101,771 | ||||||
Shake Shack, Inc., Class A(a) | 43,746 | 2,894,673 | ||||||
Texas Roadhouse, Inc. | 199,299 | 21,504,362 | ||||||
Wingstop, Inc. | 123,663 | 24,653,456 | ||||||
|
| |||||||
| 98,845,745 | ||||||||
| Household Durables — 1.6% | ||||||||
Century Communities, Inc. | 49,545 | 3,152,548 | ||||||
Ethan Allen Interiors, Inc. | 167,391 | 4,189,797 | ||||||
GoPro, Inc., Class A(a) | 235,993 | 991,171 | ||||||
Hooker Furnishings Corp. | 29,218 | 433,887 | ||||||
Installed Building Products, Inc. | 184,075 | 19,243,201 | ||||||
iRobot Corp.(a) | 40,925 | 1,450,791 | ||||||
La-Z-Boy, Inc. | 90,532 | 2,419,015 | ||||||
Skyline Champion Corp.(a) | 21,737 | 1,263,572 | ||||||
Taylor Morrison Home Corp., Class A(a) | 378,338 | 16,052,881 | ||||||
Tri Pointe Homes, Inc.(a)(b) | 155,491 | 4,541,892 | ||||||
Universal Electronics, Inc.(a) | 2,657 | 21,442 | ||||||
|
| |||||||
| 53,760,197 | ||||||||
| Household Products — 0.3% | ||||||||
Central Garden & Pet Co.(a) | 15,079 | 547,368 | ||||||
Central Garden & Pet Co., Class A, NVS(a) | 240,842 | 8,272,923 | ||||||
Oil-Dri Corp. of America | 1,758 | 66,751 | ||||||
|
| |||||||
| 8,887,042 | ||||||||
| Independent Power and Renewable Electricity Producers — 1.3% | ||||||||
Brookfield Renewable Corp., Class A | 161,541 | 5,424,547 | ||||||
Clearway Energy, Inc., Class A | 605,422 | 16,636,996 | ||||||
Clearway Energy, Inc., Class C | 800,102 | 22,986,930 | ||||||
Spruce Power Holding Corp.(a) | 883 | 663 | ||||||
Sunnova Energy International, Inc.(a) | 30,509 | 538,789 | ||||||
|
| |||||||
| 45,587,925 | ||||||||
| Security | Shares | Value | ||||||
| Industrial REITs — 0.8% | ||||||||
First Industrial Realty Trust, Inc. | 115,739 | $ | 6,016,113 | |||||
Industrial Logistics Properties Trust | 199,166 | 360,491 | ||||||
Terreno Realty Corp. | 350,055 | 21,468,873 | ||||||
|
| |||||||
| 27,845,477 | ||||||||
| Insurance — 2.0% | ||||||||
Ambac Financial Group, Inc.(a) | 209,580 | 2,919,449 | ||||||
Argo Group International Holdings Ltd. | 48,496 | 1,421,418 | ||||||
CNO Financial Group, Inc. | 387,564 | 8,414,014 | ||||||
Crawford & Co., Class A, NVS | 2,074 | 20,491 | ||||||
Donegal Group, Inc., Class A | 115,034 | 1,654,189 | ||||||
eHealth, Inc.(a) | 165,028 | 1,104,037 | ||||||
Enstar Group Ltd.(a) | 548 | 128,988 | ||||||
Genworth Financial, Inc., Class A(a)(b) | 537,380 | 2,874,983 | ||||||
Goosehead Insurance, Inc., Class A(a) | 31,069 | 1,714,387 | ||||||
Heritage Insurance Holdings, Inc. | 132,072 | 583,758 | ||||||
Kinsale Capital Group, Inc. | 84,571 | 25,623,322 | ||||||
MBIA, Inc.(a) | 68,505 | 545,300 | ||||||
Mercury General Corp. | 403,020 | 12,094,630 | ||||||
NI Holdings, Inc.(a) | 208 | 2,850 | ||||||
Oscar Health, Inc., Class A(a) | 794,337 | 5,830,434 | ||||||
Selective Insurance Group, Inc. | 10,763 | 1,041,105 | ||||||
Selectquote, Inc.(a) | 228,116 | 364,986 | ||||||
Tiptree, Inc. | 11,778 | 155,352 | ||||||
United Fire Group, Inc. | 33,775 | 725,487 | ||||||
Universal Insurance Holdings, Inc. | 20,547 | 294,849 | ||||||
|
| |||||||
| 67,514,029 | ||||||||
| Interactive Media & Services — 1.8% | ||||||||
Bumble, Inc., Class A(a) | 676,724 | 10,353,877 | ||||||
Cargurus, Inc., Class A(a) | 147,447 | 2,770,529 | ||||||
DHI Group, Inc.(a) | 13,808 | 50,537 | ||||||
Eventbrite, Inc., Class A(a) | 692,160 | 5,025,082 | ||||||
EverQuote, Inc., Class A(a)(b) | 97,431 | 887,596 | ||||||
Shutterstock, Inc. | 419,001 | 20,853,680 | ||||||
TrueCar, Inc.(a) | 239,959 | 542,307 | ||||||
Vimeo, Inc.(a) | 1,100,723 | 4,039,653 | ||||||
Yelp, Inc.(a) | 440,899 | 14,770,117 | ||||||
ZipRecruiter, Inc., Class A(a)(b) | 152,597 | 2,360,676 | ||||||
|
| |||||||
| 61,654,054 | ||||||||
| IT Services — 0.5% | ||||||||
Backblaze, Inc., Class A(a) | 3,087 | 12,935 | ||||||
Brightcove, Inc.(a) | 31,017 | 129,651 | ||||||
DigitalOcean Holdings, Inc.(a) | 98,837 | 3,869,469 | ||||||
Fastly, Inc., Class A(a) | 338,122 | 5,504,626 | ||||||
Grid Dynamics Holdings, Inc., Class A(a) | 59,385 | 570,096 | ||||||
Hackett Group, Inc. | 260,848 | 5,057,843 | ||||||
Information Services Group, Inc. | 7,597 | 38,745 | ||||||
Perficient, Inc.(a)(b) | 16,054 | 1,227,649 | ||||||
PFSweb, Inc. | 2,866 | 12,381 | ||||||
Rackspace Technology, Inc.(a) | 62,574 | 97,615 | ||||||
Squarespace, Inc., Class A(a) | 48,810 | 1,434,526 | ||||||
Unisys Corp.(a) | 41,411 | 162,745 | ||||||
|
| |||||||
| 18,118,281 | ||||||||
| Leisure Products — 0.1% | ||||||||
Escalade, Inc. | 103 | 1,197 | ||||||
MasterCraft Boat Holdings, Inc.(a) | 58,247 | 1,543,546 | ||||||
Topgolf Callaway Brands Corp.(a) | 131,563 | 2,245,780 | ||||||
|
| |||||||
| 3,790,523 | ||||||||
| Life Sciences Tools & Services — 0.8% | ||||||||
AbCellera Biologics, Inc.(a)(b) | 482,297 | 3,361,610 | ||||||
Adaptive Biotechnologies Corp.(a) | 1,019,513 | 7,095,810 | ||||||
| 36 | 2 0 2 3 BLACK ROCK ANNUAL REPORT TO SHAREHOLDERS |
Schedule of Investments (continued) May 31, 2023 | BlackRock Advantage Small Cap Core Fund (Percentages shown are based on Net Assets) |
| Security | Shares | Value | ||||||
| Life Sciences Tools & Services (continued) | ||||||||
Alpha Teknova, Inc.(a) | 665 | $ | 2,553 | |||||
BioLife Solutions, Inc.(a) | 2,845 | 66,431 | ||||||
Codexis, Inc.(a) | 408,209 | 902,142 | ||||||
CryoPort, Inc.(a) | 25,348 | 466,657 | ||||||
Medpace Holdings, Inc.(a) | 21,888 | 4,530,159 | ||||||
NanoString Technologies, Inc.(a) | 315,312 | 1,857,188 | ||||||
Pacific Biosciences of California, Inc.(a)(b) | 298,615 | 3,696,854 | ||||||
Personalis, Inc.(a)(b) | 719,541 | 1,295,174 | ||||||
PhenomeX, Inc.(a) | 270,366 | 189,256 | ||||||
Quanterix Corp.(a) | 34,175 | 670,172 | ||||||
Quantum-Si, Inc., Class A(a) | 94,983 | 143,424 | ||||||
Seer, Inc., Class A(a) | 290,598 | 1,069,401 | ||||||
Singular Genomics Systems, Inc.(a) | 130,459 | 137,634 | ||||||
SomaLogic, Inc., Class A(a) | 165,038 | 500,065 | ||||||
|
| |||||||
| 25,984,530 | ||||||||
| Machinery — 3.4% | ||||||||
Albany International Corp., Class A | 1,410 | 119,737 | ||||||
Astec Industries, Inc. | 114,588 | 4,223,714 | ||||||
CIRCOR International, Inc.(a) | 18,407 | 533,435 | ||||||
Columbus McKinnon Corp. | 17,243 | 629,025 | ||||||
Energy Recovery, Inc.(a) | 44,194 | 1,052,259 | ||||||
EnPro Industries, Inc. | 4,496 | 454,456 | ||||||
Federal Signal Corp. | 2,760 | 146,252 | ||||||
Franklin Electric Co., Inc. | 305,101 | 27,751,987 | ||||||
Gorman-Rupp Co. | 1,130 | 27,041 | ||||||
John Bean Technologies Corp. | 40,101 | 4,275,168 | ||||||
Kadant, Inc. | 11,557 | 2,192,594 | ||||||
Kennametal, Inc. | 298,847 | 7,447,267 | ||||||
Lindsay Corp. | 20,590 | 2,425,502 | ||||||
Luxfer Holdings PLC | 3,143 | 45,133 | ||||||
Manitowoc Co., Inc.(a) | 490,002 | 7,031,529 | ||||||
Mueller Industries, Inc. | 1,514 | 112,430 | ||||||
NN, Inc.(a) | 1,027 | 1,807 | ||||||
SPX Technologies, Inc.(a) | 136,757 | 10,442,764 | ||||||
Tennant Co. | 1,592 | 116,375 | ||||||
Terex Corp. | 316,042 | 14,654,868 | ||||||
Trinity Industries, Inc. | 86,567 | 1,830,892 | ||||||
Wabash National Corp. | 73,557 | 1,724,912 | ||||||
Watts Water Technologies, Inc., Class A | 147,369 | 23,350,618 | ||||||
Xylem, Inc. | 49,606 | 4,970,521 | ||||||
|
| |||||||
| 115,560,286 | ||||||||
| Marine Transportation — 0.4% | ||||||||
Matson, Inc. | 185,304 | 12,661,822 | ||||||
|
| |||||||
| Media — 0.4% | ||||||||
Cardlytics, Inc.(a) | 134,047 | 693,023 | ||||||
Clear Channel Outdoor Holdings, Inc.(a) | 21,414 | 26,339 | ||||||
Entravision Communications Corp., Class A | 330,956 | 1,366,848 | ||||||
EW Scripps Co., Class A, NVS(a) | 198,653 | 1,565,386 | ||||||
Gray Television, Inc. | 48,110 | 338,213 | ||||||
iHeartMedia, Inc., Class A(a)(b) | 134,263 | 318,203 | ||||||
PubMatic, Inc., Class A(a) | 4,708 | 82,625 | ||||||
TEGNA, Inc. | 339,947 | 5,265,779 | ||||||
Thryv Holdings, Inc.(a) | 141,725 | 3,302,193 | ||||||
Townsquare Media, Inc., Class A | 77 | 742 | ||||||
WideOpenWest, Inc.(a) | 21,344 | 162,215 | ||||||
|
| |||||||
| 13,121,566 | ||||||||
| Metals & Mining — 1.8% | ||||||||
Arconic Corp.(a) | 37,868 | 1,094,764 | ||||||
ATI, Inc.(a) | 3,572 | 123,520 | ||||||
Atlas Lithium Corp.(a)(b) | 5,904 | 125,991 | ||||||
Coeur Mining, Inc.(a) | 1,752,026 | 5,256,078 | ||||||
| Security | Shares | Value | ||||||
| Metals & Mining (continued) | ||||||||
Commercial Metals Co. | 679,945 | $ | 29,067,649 | |||||
Constellium SE, Class A(a) | 540,048 | 8,046,715 | ||||||
Hecla Mining Co.(b) | 179,071 | 954,448 | ||||||
Kaiser Aluminum Corp. | 15,159 | 915,603 | ||||||
Materion Corp. | 7,615 | 764,089 | ||||||
Novagold Resources, Inc.(a)(b) | 692,220 | 3,564,933 | ||||||
Olympic Steel, Inc. | 18,702 | 782,118 | ||||||
Perpetua Resources Corp.(a) | 2,158 | 9,862 | ||||||
PolyMet Mining Corp.(a) | 25,026 | 34,286 | ||||||
Ryerson Holding Corp. | 28,083 | 954,541 | ||||||
Schnitzer Steel Industries, Inc., Class A | 271,081 | 7,457,438 | ||||||
SunCoke Energy, Inc. | 80,059 | 543,601 | ||||||
Warrior Met Coal, Inc. | 68,992 | 2,261,558 | ||||||
|
| |||||||
| 61,957,194 | ||||||||
| Mortgage Real Estate Investment Trusts (REITs) — 0.5% | ||||||||
Arbor Realty Trust, Inc.(b) | 1,037,928 | 13,088,272 | ||||||
BrightSpire Capital, Inc., Class A | 12,653 | 74,906 | ||||||
Great Ajax Corp. | 186,759 | 1,027,174 | ||||||
Hannon Armstrong Sustainable Infrastructure Capital, Inc. | 5,879 | 138,333 | ||||||
Ladder Capital Corp., Class A | 194,856 | 1,856,978 | ||||||
Nexpoint Real Estate Finance, Inc. | 3,180 | 42,262 | ||||||
|
| |||||||
| 16,227,925 | ||||||||
| Multi-Utilities — 0.1% | ||||||||
Black Hills Corp. | 20,053 | 1,222,230 | ||||||
Unitil Corp. | 27,840 | 1,466,890 | ||||||
|
| |||||||
| 2,689,120 | ||||||||
| Office REITs — 1.0% | ||||||||
Brandywine Realty Trust | 272,474 | 1,062,649 | ||||||
Corporate Office Properties Trust | 732,043 | 16,705,221 | ||||||
Hudson Pacific Properties, Inc. | 289,324 | 1,351,143 | ||||||
Orion Office REIT, Inc. | 106,198 | 589,399 | ||||||
Paramount Group, Inc. | 2,524,005 | 10,954,182 | ||||||
Piedmont Office Realty Trust, Inc., Class A | 389,631 | 2,427,401 | ||||||
|
| |||||||
| 33,089,995 | ||||||||
| Oil, Gas & Consumable Fuels — 3.8% | ||||||||
Ardmore Shipping Corp. | 389,893 | 4,565,647 | ||||||
California Resources Corp. | 83,345 | 3,128,771 | ||||||
Callon Petroleum Co.(a)(b) | 29,569 | 905,698 | ||||||
Chord Energy Corp. | 36,087 | 5,161,885 | ||||||
Civitas Resources, Inc. | 145,247 | 9,702,500 | ||||||
CVR Energy, Inc. | 12,001 | 280,943 | ||||||
DHT Holdings, Inc. | 616,165 | 4,738,309 | ||||||
Energy Fuels, Inc.(a) | 122,348 | 719,406 | ||||||
Equitrans Midstream Corp. | 6,811 | 58,098 | ||||||
Evolution Petroleum Corp. | 225,547 | 1,768,289 | ||||||
International Seaways, Inc. | 53,086 | 1,913,750 | ||||||
Magnolia Oil & Gas Corp., Class A | 1,131,345 | 21,868,899 | ||||||
Matador Resources Co. | 196,741 | 8,650,702 | ||||||
Murphy Oil Corp. | 546,059 | 19,002,853 | ||||||
Navigator Holdings Ltd.(a)(b) | 4,014 | 51,459 | ||||||
Nordic American Tankers Ltd. | 580,694 | 2,038,236 | ||||||
Ovintiv, Inc. | 92,935 | 3,073,360 | ||||||
PBF Energy, Inc., Class A | 118,058 | 4,345,715 | ||||||
Scorpio Tankers, Inc. | 85,130 | 3,896,400 | ||||||
SFL Corp. Ltd. | 34,956 | 299,923 | ||||||
SM Energy Co. | 793,309 | 20,856,094 | ||||||
Teekay Tankers Ltd., Class A | 66,402 | 2,399,104 | ||||||
World Fuel Services Corp. | 480,172 | 10,981,534 | ||||||
|
| |||||||
| 130,407,575 | ||||||||
SCHEDULES OF INVESTMENTS | 37 |
Schedule of Investments (continued) May 31, 2023 | BlackRock Advantage Small Cap Core Fund (Percentages shown are based on Net Assets) |
| Security | Shares | Value | ||||||
| Passenger Airlines — 0.2% | ||||||||
Allegiant Travel Co.(a)(b) | 10,902 | $ | 1,062,836 | |||||
Hawaiian Holdings, Inc.(a) | 146,006 | 1,169,508 | ||||||
SkyWest, Inc.(a) | 100,238 | 2,998,119 | ||||||
Spirit Airlines, Inc. | 167,053 | 2,540,876 | ||||||
|
| |||||||
| 7,771,339 | ||||||||
| Personal Care Products — 0.8% | ||||||||
BellRing Brands, Inc.(a) | 49,614 | 1,816,865 | ||||||
elf Beauty, Inc.(a) | 227,854 | 23,701,373 | ||||||
Nature’s Sunshine Products, Inc.(a) | 1,259 | 14,076 | ||||||
USANA Health Sciences, Inc.(a) | 19,817 | 1,202,297 | ||||||
|
| |||||||
| 26,734,611 | ||||||||
| Pharmaceuticals — 2.6% | ||||||||
Aclaris Therapeutics, Inc.(a) | 70,403 | 587,865 | ||||||
Amphastar Pharmaceuticals, Inc.(a)(b) | 111,639 | 4,953,422 | ||||||
Arvinas, Inc.(a)(b) | 164,039 | 3,580,971 | ||||||
Atea Pharmaceuticals, Inc.(a) | 572,478 | 2,284,187 | ||||||
Collegium Pharmaceutical, Inc.(a) | 123,836 | 2,733,061 | ||||||
Corcept Therapeutics, Inc.(a)(b) | 497,240 | 11,680,168 | ||||||
Edgewise Therapeutics, Inc.(a) | 46,540 | 470,985 | ||||||
Endo International PLC(a) | 724,513 | 25,358 | ||||||
Harmony Biosciences Holdings, Inc.(a) | 253,885 | 8,779,343 | ||||||
Intra-Cellular Therapies, Inc.(a) | 115,545 | 6,861,062 | ||||||
Ligand Pharmaceuticals, Inc.(a) | 15,740 | 1,103,059 | ||||||
Marinus Pharmaceuticals, Inc.(a) | 22,422 | 159,420 | ||||||
Mind Medicine MindMed, Inc.(a) | 16,675 | 59,030 | ||||||
Nektar Therapeutics(a)(b) | 1,114,105 | 646,292 | ||||||
NGM Biopharmaceuticals, Inc.(a) | 269,818 | 817,549 | �� | |||||
Nuvation Bio, Inc., Class A(a) | 520,442 | 843,116 | ||||||
Pacira BioSciences, Inc.(a)(b) | 130,291 | 4,954,967 | ||||||
Prestige Consumer Healthcare, Inc.(a) | 351,003 | 20,087,902 | ||||||
Revance Therapeutics, Inc.(a) | 41,242 | 1,260,356 | ||||||
Scilex Holding Co. (Acquired 03/05/21 - 01/09/23, cost $9,826,744), NVS(a)(b)(d) | 430,177 | 2,493,431 | ||||||
Supernus Pharmaceuticals, Inc.(a)(b) | 382,387 | 12,672,305 | ||||||
Tarsus Pharmaceuticals, Inc.(a) | 46,878 | 785,207 | ||||||
Xeris Biopharma Holdings, Inc.(a)(b) | 201,668 | 516,270 | ||||||
|
| |||||||
| 88,355,326 | ||||||||
| Professional Services — 3.4% | ||||||||
ASGN, Inc.(a) | 19,545 | 1,278,829 | ||||||
Conduent, Inc.(a) | 1,042,091 | 3,157,536 | ||||||
CSG Systems International, Inc. | 122,883 | 5,895,926 | ||||||
ExlService Holdings, Inc.(a) | 164,534 | 24,834,762 | ||||||
Exponent, Inc. | 139,300 | 12,720,876 | ||||||
Franklin Covey Co.(a) | 85,261 | 3,147,836 | ||||||
Insperity, Inc. | 421,834 | 46,705,461 | ||||||
KBR, Inc. | 126,380 | 7,458,948 | ||||||
Kelly Services, Inc., Class A, NVS | 158,609 | 2,772,485 | ||||||
Kforce, Inc. | 152,159 | 8,762,837 | ||||||
Paylocity Holding Corp.(a)(b) | 6,091 | 1,052,220 | ||||||
ShiftPixy, Inc.(a) | 56 | 115 | ||||||
|
| |||||||
| 117,787,831 | ||||||||
| Real Estate Management & Development — 0.4% | ||||||||
Compass, Inc., Class A(a) | 236,904 | 876,545 | ||||||
eXp World Holdings, Inc. | 38,744 | 596,270 | ||||||
FRP Holdings, Inc.(a) | 30,057 | 1,587,310 | ||||||
Marcus & Millichap, Inc. | 247,795 | 7,272,783 | ||||||
RMR Group, Inc., Class A | 212,921 | 4,584,189 | ||||||
|
| |||||||
| 14,917,097 | ||||||||
| Residential REITs — 0.4% | ||||||||
Bluerock Homes Trust, Inc., Class A(a) | 4,196 | 67,136 | ||||||
| Security | Shares | Value | ||||||
| Residential REITs (continued) | ||||||||
Elme Communities | 136,486 | $ | 2,062,303 | |||||
Independence Realty Trust, Inc. | 329,522 | 5,690,845 | ||||||
NexPoint Residential Trust, Inc. | 115,916 | 4,757,193 | ||||||
|
| |||||||
| 12,577,477 | ||||||||
| Retail REITs — 1.3% | ||||||||
Acadia Realty Trust | 722,377 | 9,296,992 | ||||||
Kite Realty Group Trust | 1,283,719 | 24,955,497 | ||||||
Macerich Co. | 323,282 | 3,116,438 | ||||||
Phillips Edison & Co., Inc. | 132,261 | 3,836,892 | ||||||
RPT Realty | 208,486 | 1,943,090 | ||||||
|
| |||||||
| 43,148,909 | ||||||||
| Semiconductors & Semiconductor Equipment — 3.1% | ||||||||
Ambarella, Inc.(a) | 114,830 | 8,304,506 | ||||||
Amkor Technology, Inc. | 486,028 | 12,043,774 | ||||||
Axcelis Technologies, Inc.(a) | 117,586 | 18,525,674 | ||||||
FormFactor, Inc.(a) | 114,712 | 3,589,338 | ||||||
Ichor Holdings Ltd.(a) | 66,431 | �� | 2,012,859 | |||||
inTEST Corp.(a) | 2,850 | 58,710 | ||||||
Lattice Semiconductor Corp.(a)(b) | 212,642 | 17,289,921 | ||||||
MaxLinear, Inc.(a) | 272,472 | 7,958,907 | ||||||
Photronics, Inc.(a) | 144,013 | 3,057,396 | ||||||
Power Integrations, Inc. | 50,353 | 4,350,499 | ||||||
Rambus, Inc.(a) | 42,918 | 2,745,035 | ||||||
Semtech Corp.(a)(b) | 433,632 | 9,427,160 | ||||||
Silicon Laboratories, Inc.(a) | 93,733 | 13,185,421 | ||||||
Synaptics, Inc.(a) | 40,816 | 3,511,809 | ||||||
|
| |||||||
| 106,061,009 | ||||||||
| Software — 5.7% | ||||||||
8x8, Inc.(a) | 356,485 | 1,454,459 | ||||||
ACI Worldwide, Inc.(a) | 494,123 | 11,270,946 | ||||||
Alarm.com Holdings, Inc.(a) | 74,128 | 3,722,708 | ||||||
Appfolio, Inc., Class A(a) | 48,137 | 6,890,812 | ||||||
Asana, Inc., Class A(a)(b) | 241,201 | 5,759,880 | ||||||
BlackLine, Inc.(a) | 105,192 | 5,477,347 | ||||||
Box, Inc., Class A(a)(b) | 409,694 | 11,541,080 | ||||||
Cerence, Inc.(a) | 37,444 | 1,067,903 | ||||||
Cleanspark, Inc.(a) | 3,805 | 16,323 | ||||||
Clear Secure, Inc., Class A | 72,224 | 1,784,655 | ||||||
CommVault Systems, Inc.(a) | 9,827 | 684,844 | ||||||
Domo, Inc., Class B(a) | 303,396 | 4,080,676 | ||||||
eGain Corp.(a) | 1,996 | 14,471 | ||||||
EngageSmart, Inc.(a) | 331,238 | 6,286,897 | ||||||
Everbridge, Inc.(a) | 245,021 | 5,885,404 | ||||||
Expensify, Inc., Class A(a) | 71,449 | 494,427 | ||||||
Intapp, Inc.(a) | 44,021 | 1,860,768 | ||||||
Kaleyra, Inc.(a)(b) | 5,344 | 14,856 | ||||||
LivePerson, Inc.(a)(b) | 630,275 | 2,319,412 | ||||||
LiveRamp Holdings, Inc.(a) | 249,139 | 6,064,043 | ||||||
MicroStrategy, Inc., Class A(a) | 7,672 | 2,314,105 | ||||||
Model N, Inc.(a) | 253,541 | 8,093,029 | ||||||
PagerDuty, Inc.(a) | 455,043 | 12,381,720 | ||||||
PowerSchool Holdings, Inc., Class A(a) | 49,534 | 938,174 | ||||||
PROS Holdings, Inc.(a) | 216,103 | 6,552,243 | ||||||
Q2 Holdings, Inc.(a) | 514,583 | 14,984,657 | ||||||
Rapid7, Inc.(a) | 284,609 | 13,581,541 | ||||||
SEMrush Holdings, Inc., Class A(a)(b) | 179,547 | 1,366,353 | ||||||
Sprout Social, Inc., Class A(a)(b) | 106,523 | 4,613,511 | ||||||
SPS Commerce, Inc.(a)(b) | 27,161 | 4,231,684 | ||||||
Stronghold Digital Mining, Inc., Class A(a) | 3,728 | 23,337 | ||||||
Telos Corp.(a) | 15,975 | 51,280 | ||||||
Tenable Holdings, Inc.(a)(b) | 387,245 | 15,873,173 | ||||||
| 38 | 2 0 2 3 BLACK ROCK ANNUAL REPORT TO SHAREHOLDERS |
Schedule of Investments (continued) May 31, 2023 | BlackRock Advantage Small Cap Core Fund (Percentages shown are based on Net Assets) |
| Security | Shares | Value | ||||||
| Software (continued) | ||||||||
Upland Software, Inc.(a) | 73,172 | $ | 205,613 | |||||
Varonis Systems, Inc.(a) | 546,898 | 14,372,479 | ||||||
Verint Systems, Inc.(a)(b) | 190,601 | 6,838,764 | ||||||
Vertex, Inc., Class A(a) | 9,368 | 205,909 | ||||||
Workiva, Inc., Class A(a) | 32,454 | 3,143,494 | ||||||
Yext, Inc.(a) | 648,608 | 5,960,708 | ||||||
Zeta Global Holdings Corp., Class A(a) | 116,036 | 1,046,645 | ||||||
Zuora, Inc., Class A(a) | 299,575 | 3,232,414 | ||||||
|
| |||||||
| 196,702,744 | ||||||||
| Specialized REITs — 0.6% | ||||||||
Outfront Media, Inc. | 1,525,757 | 21,848,840 | ||||||
|
| |||||||
| Specialty Retail — 3.4% | ||||||||
1-800-Flowers.com, Inc., Class A(a) | 384,080 | 3,118,730 | ||||||
Aaron’s Co., Inc. | 185,251 | 2,267,472 | ||||||
Abercrombie & Fitch Co., Class A(a) | 102,372 | 3,176,603 | ||||||
Academy Sports & Outdoors, Inc. | 88,812 | 4,348,235 | ||||||
American Eagle Outfitters, Inc. | 763,984 | 7,769,717 | ||||||
Arko Corp., Class A | 9,398 | 68,135 | ||||||
Chico’s FAS, Inc.(a)(b) | 843,619 | 3,830,030 | ||||||
Conn’s, Inc.(a)(b) | 363,327 | 1,475,108 | ||||||
Container Store Group, Inc.(a) | 88,112 | 216,756 | ||||||
Foot Locker, Inc. | 229,119 | 5,801,293 | ||||||
Group 1 Automotive, Inc. | 90,948 | 20,327,787 | ||||||
Haverty Furniture Cos., Inc. | 86,417 | 2,280,545 | ||||||
Lulu’s Fashion Lounge Holdings, Inc.(a) | 163 | 396 | ||||||
Murphy U.S.A., Inc.(b) | 64,835 | 17,921,691 | ||||||
Overstock.com, Inc.(a) | 421,153 | 7,888,196 | ||||||
Signet Jewelers Ltd. | 112,328 | 7,131,705 | ||||||
Sonic Automotive, Inc., Class A | 87,607 | 3,630,434 | ||||||
Stitch Fix, Inc., Class A(a)(b) | 747,600 | 2,683,884 | ||||||
Urban Outfitters, Inc.(a)(b) | 690,124 | 21,269,622 | ||||||
Warby Parker, Inc., Class A(a)(b) | 87,759 | 966,227 | ||||||
Winmark Corp. | 654 | 213,197 | ||||||
|
| |||||||
| 116,385,763 | ||||||||
| Technology Hardware, Storage & Peripherals — 0.5% | ||||||||
Avid Technology, Inc.(a) | 69,345 | 1,664,280 | ||||||
Super Micro Computer, Inc.(a)(b) | 45,452 | 10,178,975 | ||||||
Xerox Holdings Corp. | 381,369 | 5,365,862 | ||||||
|
| |||||||
| 17,209,117 | ||||||||
| Textiles, Apparel & Luxury Goods — 0.5% | ||||||||
Crocs, Inc.(a) | 141,684 | 15,908,280 | ||||||
Ermenegildo Zegna NV | 75,128 | 854,957 | ||||||
Fossil Group, Inc.(a) | 2,105 | 4,273 | ||||||
Oxford Industries, Inc. | 20,925 | 2,091,244 | ||||||
|
| |||||||
| 18,858,754 | ||||||||
| Tobacco — 0.1% | ||||||||
Turning Point Brands, Inc. | 105,255 | 2,204,040 | ||||||
|
| |||||||
| Trading Companies & Distributors — 2.9% | ||||||||
Applied Industrial Technologies, Inc. | 121,266 | 14,910,867 | ||||||
Boise Cascade Co. | 76,714 | 5,509,600 | ||||||
GATX Corp. | 110,984 | 13,197,107 | ||||||
Global Industrial Co. | 16,918 | 420,920 | ||||||
GMS, Inc.(a) | 60,125 | 3,807,716 | ||||||
H&E Equipment Services, Inc. | 70,594 | 2,538,560 | ||||||
Herc Holdings, Inc. | 152,703 | 15,487,138 | ||||||
McGrath RentCorp. | 152,109 | 13,508,800 | ||||||
| Security | Shares | Value | ||||||
| Trading Companies & Distributors (continued) | ||||||||
MRC Global, Inc.(a) | 145,117 | $ | 1,261,066 | |||||
NOW, Inc.(a) | 134,730 | 1,197,750 | ||||||
Rush Enterprises, Inc., Class A | 529,029 | 27,652,346 | ||||||
Rush Enterprises, Inc., Class B | 188 | 10,940 | ||||||
Titan Machinery, Inc.(a) | 73,299 | 1,850,800 | ||||||
|
| |||||||
| 101,353,610 | ||||||||
| Water Utilities — 0.1% | ||||||||
California Water Service Group | 31,929 | 1,817,079 | ||||||
|
| |||||||
| Wireless Telecommunication Services — 0.1% | ||||||||
Telephone & Data Systems, Inc. | 232,082 | 1,550,308 | ||||||
United States Cellular Corp.(a)(b) | 20,334 | 290,776 | ||||||
|
| |||||||
| 1,841,084 | ||||||||
|
| |||||||
Total Common Stocks — 99.1% |
| 3,409,409,221 | ||||||
|
| |||||||
| Rights | ||||||||
Biotechnology — 0.0% |
| |||||||
Flexion Therapeutics, Inc., CVR(a)(c) | 73,745 | 38,347 | ||||||
Radius Health, Inc., CVR(a)(c) | 72,193 | 5,776 | ||||||
|
| |||||||
| 44,123 | ||||||||
| Paper & Forest Products — 0.0% | ||||||||
Resolute Forest Products, Inc.,, CVR(a)(c) | 72,036 | 102,291 | ||||||
|
| |||||||
| Pharmaceuticals — 0.0% | ||||||||
Ipsen SA, CVR(a)(b)(c) | 28,456 | 88,498 | ||||||
|
| |||||||
Total Rights — 0.0% |
| 234,912 | ||||||
|
| |||||||
Total Long-Term Investments — 99.1% |
| 3,409,644,133 | ||||||
|
| |||||||
Short-Term Securities |
| |||||||
| Money Market Funds — 3.8% | ||||||||
BlackRock Liquidity Funds, T-Fund, Institutional Class, 5.00%(e)(f) | 32,705,335 | 32,705,335 | ||||||
SL Liquidity Series, LLC, Money Market Series, 5.32%(e)(f)(g) | 99,134,034 | 99,134,034 | ||||||
|
| |||||||
Total Short-Term Securities — 3.8% |
| 131,839,369 | ||||||
|
| |||||||
Total Investments — 102.9% |
| 3,541,483,502 | ||||||
Liabilities in Excess of Other Assets — (2.9)% |
| (99,307,719 | ) | |||||
|
| |||||||
Net Assets — 100.0% |
| $ | 3,442,175,783 | |||||
|
| |||||||
| (a) | Non-income producing security. |
| (b) | All or a portion of this security is on loan. |
| (c) | Security is valued using significant unobservable inputs and is classified as Level 3 in the fair value hierarchy. |
| (d) | Restricted security as to resale, excluding 144A securities. The Fund held restricted securities with a current value of $2,493,431, representing 0.1% of its net assets as of period end, and an original cost of $9,826,744. |
| (e) | Affiliate of the Fund. |
| (f) | Annualized 7-day yield as of period end. |
| (g) | All or a portion of this security was purchased with the cash collateral from loaned securities. |
SCHEDULES OF INVESTMENTS | 39 |
Schedule of Investments (continued) May 31, 2023 | BlackRock Advantage Small Cap Core Fund |
Affiliates
Investments in issuers considered to be affiliate(s) of the Fund during the year ended May 31, 2023 for purposes of Section 2(a)(3) of the Investment Company Act of 1940, as amended, were as follows:
| Affiliated Issuer | Value at 05/31/22 | Purchases at Cost | Proceeds from Sale | Net Realized Gain (Loss) | Change in Unrealized Appreciation (Depreciation) | Value at 05/31/23 | Shares Held at 05/31/23 | Income | Capital Gain Distributions from Underlying Funds | |||||||||||||||||||||||||||
BlackRock Liquidity Funds, | $ | 80,626,304 | $ | — | $ | (47,920,969 | )(a) | $ | — | $ | — | $ | 32,705,335 | 32,705,335 | $ | 1,202,928 | $ | — | ||||||||||||||||||
SL Liquidity Series, LLC, Money Market Series | 161,949,528 | — | (62,822,974 | )(a) | (2,082 | ) | 9,562 | 99,134,034 | 99,134,034 | 1,158,211 | (b) | — | ||||||||||||||||||||||||
|
|
|
|
|
|
|
|
|
| |||||||||||||||||||||||||||
| $ | (2,082 | ) | $ | 9,562 | $ | 131,839,369 | $ | 2,361,139 | $ | — | ||||||||||||||||||||||||||
|
|
|
|
|
|
|
|
|
| |||||||||||||||||||||||||||
| (a) | Represents net amount purchased (sold). |
| (b) | All or a portion represents securities lending income earned from the reinvestment of cash collateral from loaned securities, net of fees and collateral investment expenses, and other payments to and from borrowers of securities. |
For Fund compliance purposes, the Fund’s industry classifications refer to one or more of the industry sub-classifications used by one or more widely recognized market indexes or rating group indexes, and/or as defined by the investment adviser. These definitions may not apply for purposes of this report, which may combine such industry sub-classifications for reporting ease.
Futures Contracts
| Description | Number of Contracts | Expiration Date | Notional Amount (000) | Value/ Unrealized Appreciation (Depreciation) | ||||||||||||
Long Contracts | ||||||||||||||||
Russell 2000 E-Mini Index | 430 | 06/16/23 | $ | 37,664 | $ | (271,500 | ) | |||||||||
|
| |||||||||||||||
Derivative Financial Instruments Categorized by Risk Exposure
As of period end, the fair values of derivative financial instruments located in the Statements of Assets and Liabilities were as follows:
| Commodity Contracts | Credit Contracts | Equity Contracts | Foreign Currency Exchange Contracts | Interest Rate Contracts | Other Contracts | Total | ||||||||||||||||||||||
Liabilities — Derivative Financial Instruments | ||||||||||||||||||||||||||||
Futures contracts | ||||||||||||||||||||||||||||
Unrealized depreciation on futures contracts(a) | $ | — | $ | — | $ | 271,500 | $ | — | $ | — | $ | — | $ | 271,500 | ||||||||||||||
|
|
|
|
|
|
|
|
|
|
|
|
|
| |||||||||||||||
| (a) | Net cumulative unrealized appreciation (depreciation) on futures contracts, if any, are reported in the Schedule of Investments. In the Statements of Assets and Liabilities, only current day’s variation margin is reported in receivables or payables and the net cumulative unrealized appreciation (depreciation) is included in accumulated earnings (loss). |
For the period ended May 31, 2023, the effect of derivative financial instruments in the Statements of Operations was as follows:
| Commodity Contracts | Credit Contracts | Equity Contracts | Foreign Currency Exchange Contracts | Interest Rate Contracts | Other Contracts | Total | ||||||||||||||||||||||
Net Realized Gain (Loss) from | ||||||||||||||||||||||||||||
Futures contracts | $ | — | $ | — | $ | (4,805,742 | ) | $ | — | $ | — | $ | — | $ | (4,805,742 | ) | ||||||||||||
|
|
|
|
|
|
|
|
|
|
|
|
|
| |||||||||||||||
| Net Change in Unrealized Appreciation (Depreciation) on | ||||||||||||||||||||||||||||
Futures contracts | $ | — | $ | — | $ | (3,130,512 | ) | $ | — | $ | — | $ | — | $ | (3,130,512 | ) | ||||||||||||
|
|
|
|
|
|
|
|
|
|
|
|
|
| |||||||||||||||
| 40 | 2 0 2 3 BLACK ROCK ANNUAL REPORT TO SHAREHOLDERS |
Schedule of Investments (continued) May 31, 2023 | BlackRock Advantage Small Cap Core Fund |
Average Quarterly Balances of Outstanding Derivative Financial Instruments
Futures contracts | ||||
Average notional value of contracts — long | $ | 40,870,778 |
For more information about the Fund’s investment risks regarding derivative financial instruments, refer to the Notes to Financial Statements.
Fair Value Hierarchy as of Period End
Various inputs are used in determining the fair value of financial instruments. For a description of the input levels and information about the Fund’s policy regarding valuation of financial instruments, refer to the Notes to Financial Statements.
The following table summarizes the Fund’s financial instruments categorized in the fair value hierarchy. The breakdown of the Fund’s financial instruments into major categories is disclosed in the Schedule of Investments above.
| Level 1 | Level 2 | Level 3 | Total | |||||||||||||
Assets | ||||||||||||||||
Investments | ||||||||||||||||
Long-Term Investments | ||||||||||||||||
Common Stocks | ||||||||||||||||
Aerospace & Defense | $ | 31,778,560 | $ | — | $ | — | $ | 31,778,560 | ||||||||
Air Freight & Logistics | 12,928,906 | — | — | 12,928,906 | ||||||||||||
Automobile Components | 65,908,294 | — | — | 65,908,294 | ||||||||||||
Automobiles | 8,275,448 | — | — | 8,275,448 | ||||||||||||
Banks | 213,174,502 | — | — | 213,174,502 | ||||||||||||
Beverages | 41,711,866 | — | — | 41,711,866 | ||||||||||||
Biotechnology | 296,823,930 | 310 | — | 296,824,240 | ||||||||||||
Building Products | 46,009,572 | — | — | 46,009,572 | ||||||||||||
Capital Markets | 66,620,279 | — | — | 66,620,279 | ||||||||||||
Chemicals | 40,644,224 | — | — | 40,644,224 | ||||||||||||
Commercial Services & Supplies | 14,412,541 | — | — | 14,412,541 | ||||||||||||
Communications Equipment | 17,856,021 | — | — | 17,856,021 | ||||||||||||
Construction & Engineering | 100,489,082 | — | — | 100,489,082 | ||||||||||||
Construction Materials | 3,788,040 | — | — | 3,788,040 | ||||||||||||
Consumer Finance | 31,569,462 | — | — | 31,569,462 | ||||||||||||
Consumer Staples Distribution & Retail | 542,593 | — | — | 542,593 | ||||||||||||
Containers & Packaging | 44,802 | — | — | 44,802 | ||||||||||||
Diversified Consumer Services | 36,145,251 | — | — | 36,145,251 | ||||||||||||
Diversified REITs | 14,189,785 | — | — | 14,189,785 | ||||||||||||
Diversified Telecommunication Services | 17,752,739 | — | — | 17,752,739 | ||||||||||||
Electric Utilities | 9,840,780 | — | — | 9,840,780 | ||||||||||||
Electrical Equipment | 35,337,137 | — | — | 35,337,137 | ||||||||||||
Electronic Equipment, Instruments & Components | 103,742,072 | — | — | 103,742,072 | ||||||||||||
Energy Equipment & Services | 66,043,527 | — | — | 66,043,527 | ||||||||||||
Entertainment | 4,520,634 | — | — | 4,520,634 | ||||||||||||
Financial Services | 74,092,019 | — | — | 74,092,019 | ||||||||||||
Food Products | 42,954,222 | — | — | 42,954,222 | ||||||||||||
Gas Utilities | 32,649,409 | — | — | 32,649,409 | ||||||||||||
Ground Transportation | 9,603,790 | — | — | 9,603,790 | ||||||||||||
Health Care Equipment & Supplies | 128,670,458 | — | — | 128,670,458 | ||||||||||||
Health Care Providers & Services | 78,919,065 | — | — | 78,919,065 | ||||||||||||
Health Care REITs | 437,119 | — | — | 437,119 | ||||||||||||
Health Care Technology | 29,666,126 | — | — | 29,666,126 | ||||||||||||
Hotel & Resort REITs | 38,988,740 | — | — | 38,988,740 | ||||||||||||
Hotels, Restaurants & Leisure | 98,845,745 | — | — | 98,845,745 | ||||||||||||
Household Durables | 53,760,197 | — | — | 53,760,197 | ||||||||||||
Household Products | 8,887,042 | — | — | 8,887,042 | ||||||||||||
Independent Power and Renewable Electricity Producers | 45,587,925 | — | — | 45,587,925 | ||||||||||||
Industrial REITs | 27,845,477 | — | — | 27,845,477 | ||||||||||||
Insurance | 67,514,029 | — | — | 67,514,029 | ||||||||||||
Interactive Media & Services | 61,654,054 | — | — | 61,654,054 | ||||||||||||
IT Services | 18,118,281 | — | — | 18,118,281 | ||||||||||||
Leisure Products | 3,790,523 | — | — | 3,790,523 | ||||||||||||
Life Sciences Tools & Services | 25,984,530 | — | — | 25,984,530 | ||||||||||||
Machinery | 115,560,286 | — | — | 115,560,286 | ||||||||||||
Marine Transportation | 12,661,822 | — | — | 12,661,822 | ||||||||||||
Media | 13,121,566 | — | — | 13,121,566 | ||||||||||||
Metals & Mining | 61,957,194 | — | — | 61,957,194 | ||||||||||||
SCHEDULES OF INVESTMENTS | 41 |
Schedule of Investments (continued) May 31, 2023 | BlackRock Advantage Small Cap Core Fund |
Fair Value Hierarchy as of Period End (continued)
| Level 1 | Level 2 | Level 3 | Total | |||||||||||||
Common Stocks (continued) | ||||||||||||||||
Mortgage Real Estate Investment Trusts (REITs) | $ | 16,227,925 | $ | — | $ | — | $ | 16,227,925 | ||||||||
Multi-Utilities | 2,689,120 | — | — | 2,689,120 | ||||||||||||
Office REITs | 33,089,995 | — | — | 33,089,995 | ||||||||||||
Oil, Gas & Consumable Fuels | 130,407,575 | — | — | 130,407,575 | ||||||||||||
Passenger Airlines | 7,771,339 | — | — | 7,771,339 | ||||||||||||
Personal Care Products | 26,734,611 | — | — | 26,734,611 | ||||||||||||
Pharmaceuticals | 85,861,895 | 2,493,431 | — | 88,355,326 | ||||||||||||
Professional Services | 117,787,831 | — | — | 117,787,831 | ||||||||||||
Real Estate Management & Development | 14,917,097 | — | — | 14,917,097 | ||||||||||||
Residential REITs | 12,577,477 | — | — | 12,577,477 | ||||||||||||
Retail REITs | 43,148,909 | — | — | 43,148,909 | ||||||||||||
Semiconductors & Semiconductor Equipment | 106,061,009 | — | — | 106,061,009 | ||||||||||||
Software | 196,702,744 | — | — | 196,702,744 | ||||||||||||
Specialized REITs | 21,848,840 | — | — | 21,848,840 | ||||||||||||
Specialty Retail | 116,385,763 | — | — | 116,385,763 | ||||||||||||
Technology Hardware, Storage & Peripherals | 17,209,117 | — | — | 17,209,117 | ||||||||||||
Textiles, Apparel & Luxury Goods | 18,858,754 | — | — | 18,858,754 | ||||||||||||
Tobacco | 2,204,040 | — | — | 2,204,040 | ||||||||||||
Trading Companies & Distributors | 101,353,610 | — | — | 101,353,610 | ||||||||||||
Water Utilities | 1,817,079 | — | — | 1,817,079 | ||||||||||||
Wireless Telecommunication Services | 1,841,084 | — | — | 1,841,084 | ||||||||||||
Rights | — | 5,776 | 229,136 | 234,912 | ||||||||||||
Short-Term Securities | ||||||||||||||||
Money Market Funds | 32,705,335 | — | — | 32,705,335 | ||||||||||||
|
|
|
|
|
|
|
| |||||||||
| $ | 3,439,620,815 | $ | 2,499,517 | $ | 229,136 | 3,442,349,468 | ||||||||||
|
|
|
|
|
|
|
| |||||||||
Investments valued at NAV(a) | 99,134,034 | |||||||||||||||
|
| |||||||||||||||
| $ | 3,541,483,502 | |||||||||||||||
|
| |||||||||||||||
Derivative Financial Instruments(b) | ||||||||||||||||
Liabilities | ||||||||||||||||
Equity Contracts | $ | (271,500 | ) | $ | — | $ | — | $ | (271,500 | ) | ||||||
|
|
|
|
|
|
|
| |||||||||
| (a) | Certain investments of the Fund were fair valued using NAV as a practical expedient or its equivalent as no quoted market value is available and therefore have been excluded from the fair value hierarchy. |
| (b) | Derivative financial instruments are futures contracts. Futures contracts are valued at the unrealized appreciation (depreciation) on the instrument. |
See notes to financial statements.
| 42 | 2 0 2 3 BLACK ROCK ANNUAL REPORT TO SHAREHOLDERS |
Schedule of Investments May 31, 2023 | BlackRock Advantage Large Cap Core Fund (Percentages shown are based on Net Assets) |
| Security | Shares | Value | ||||||
Common Stocks |
| |||||||
Aerospace & Defense — 1.2% |
| |||||||
Axon Enterprise, Inc.(a) | 42,262 | $ | 8,152,763 | |||||
General Dynamics Corp. | 78,668 | 16,062,432 | ||||||
HEICO Corp., Class A | 18,580 | 2,263,973 | ||||||
Lockheed Martin Corp. | 15,415 | 6,844,414 | ||||||
|
| |||||||
| 33,323,582 | ||||||||
| Automobile Components — 0.2% | ||||||||
Lear Corp. | 34,526 | 4,234,959 | ||||||
|
| |||||||
| Automobiles — 1.3% | ||||||||
General Motors Co. | 526,737 | 17,071,546 | ||||||
Tesla, Inc.(a) | 97,813 | 19,947,005 | ||||||
|
| |||||||
| 37,018,551 | ||||||||
| Banks — 2.0% | ||||||||
Bank of America Corp. | 997,952 | 27,733,086 | ||||||
Citigroup, Inc. | 394,285 | 17,474,711 | ||||||
JPMorgan Chase & Co. | 54,101 | 7,342,047 | ||||||
U.S. Bancorp | 44,413 | 1,327,949 | ||||||
Wells Fargo & Co. | 28,369 | 1,129,370 | ||||||
|
| |||||||
| 55,007,163 | ||||||||
| Beverages — 2.2% | ||||||||
Coca-Cola Co. | 145,945 | 8,707,079 | ||||||
PepsiCo, Inc. | 284,789 | 51,931,274 | ||||||
|
| |||||||
| 60,638,353 | ||||||||
| Biotechnology — 2.0% | ||||||||
AbbVie, Inc. | 14,419 | 1,989,245 | ||||||
Amgen, Inc. | 95,989 | 21,179,973 | ||||||
Gilead Sciences, Inc. | 72,519 | 5,579,612 | ||||||
Horizon Therapeutics PLC(a) | 16,087 | 1,609,183 | ||||||
Incyte Corp.(a) | 109,594 | 6,745,511 | ||||||
Neurocrine Biosciences, Inc.(a) | 15,395 | 1,378,314 | ||||||
Regeneron Pharmaceuticals, Inc.(a) | 13,742 | 10,108,065 | ||||||
Seagen, Inc.(a) | 5,392 | 1,055,214 | ||||||
Ultragenyx Pharmaceutical, Inc.(a) | 141,377 | 6,978,369 | ||||||
|
| |||||||
| 56,623,486 | ||||||||
| Broadline Retail — 3.3% | ||||||||
Amazon.com, Inc.(a) | 566,891 | 68,355,717 | ||||||
Coupang, Inc., Class A(a) | 22,992 | 358,675 | ||||||
eBay, Inc. | 484,090 | 20,593,188 | ||||||
Etsy, Inc.(a) | 64,293 | 5,210,948 | ||||||
|
| |||||||
| 94,518,528 | ||||||||
| Building Products — 0.8% | ||||||||
Allegion PLC | 120,107 | 12,580,007 | ||||||
Trane Technologies PLC | 53,925 | 8,802,178 | ||||||
|
| |||||||
| 21,382,185 | ||||||||
| Capital Markets — 1.8% | ||||||||
Bank of New York Mellon Corp. | 460,488 | 18,511,618 | ||||||
Cboe Global Markets, Inc. | 15,429 | 2,043,108 | ||||||
Intercontinental Exchange, Inc. | 24,817 | 2,629,361 | ||||||
Nasdaq, Inc. | 71,327 | 3,947,950 | ||||||
S&P Global, Inc. | 62,087 | 22,812,626 | ||||||
Tradeweb Markets, Inc., Class A | 13,512 | 904,628 | ||||||
|
| |||||||
| 50,849,291 | ||||||||
| Chemicals — 1.2% | ||||||||
Ecolab, Inc. | 208,868 | 34,473,663 | ||||||
LyondellBasell Industries NV, Class A | 2,989 | 255,679 | ||||||
|
| |||||||
| 34,729,342 | ||||||||
| Security | Shares | Value | ||||||
Commercial Services & Supplies — 0.5% |
| |||||||
Cintas Corp. | 32,178 | $ | 15,192,521 | |||||
|
| |||||||
| Communications Equipment — 0.1% | ||||||||
Juniper Networks, Inc. | 75,802 | 2,302,107 | ||||||
|
| |||||||
| Construction & Engineering — 0.7% | ||||||||
AECOM | 231,121 | 18,038,994 | ||||||
Valmont Industries, Inc. | 10,687 | 2,802,879 | ||||||
|
| |||||||
| 20,841,873 | ||||||||
| Construction Materials — 0.0% | ||||||||
Vulcan Materials Co. | 3,452 | 674,866 | ||||||
|
| |||||||
| Consumer Finance — 1.4% | ||||||||
American Express Co. | 222,917 | 35,345,719 | ||||||
Synchrony Financial | 160,653 | 4,973,817 | ||||||
|
| |||||||
| 40,319,536 | ||||||||
| Consumer Staples Distribution & Retail — 1.7% | ||||||||
Walmart, Inc. | 334,172 | 49,079,842 | ||||||
|
| |||||||
| Electric Utilities — 0.3% | ||||||||
IDACORP, Inc. | 10,705 | 1,114,069 | ||||||
PPL Corp. | 82,894 | 2,171,823 | ||||||
Xcel Energy, Inc. | 73,773 | 4,816,639 | ||||||
|
| |||||||
| 8,102,531 | ||||||||
| Electrical Equipment — 0.8% | ||||||||
AMETEK, Inc. | 46,801 | 6,789,421 | ||||||
Eaton Corp. PLC | 95,194 | 16,744,625 | ||||||
|
| |||||||
| 23,534,046 | ||||||||
| Electronic Equipment, Instruments & Components — 0.8% | ||||||||
Flex Ltd.(a) | 864,365 | 21,946,227 | ||||||
|
| |||||||
| Energy Equipment & Services — 0.0% | ||||||||
Halliburton Co. | 28,307 | 810,996 | ||||||
|
| |||||||
| Entertainment — 0.1% | ||||||||
Electronic Arts, Inc. | 10,021 | 1,282,688 | ||||||
Warner Bros Discovery, Inc., Class A(a) | 67,202 | 758,039 | ||||||
|
| |||||||
| 2,040,727 | ||||||||
| Financial Services — 2.6% | ||||||||
Berkshire Hathaway, Inc., Class B(a) | 28,068 | 9,012,073 | ||||||
Block, Inc., Class A(a) | 81,694 | 4,933,501 | ||||||
Mastercard, Inc., Class A | 50,395 | 18,395,183 | ||||||
PayPal Holdings, Inc.(a) | 300,511 | 18,628,677 | ||||||
Visa, Inc., Class A | 101,566 | 22,449,133 | ||||||
WEX, Inc.(a) | 2,771 | 459,570 | ||||||
|
| |||||||
| 73,878,137 | ||||||||
| Food Products — 2.2% | ||||||||
Archer-Daniels-Midland Co. | 293,027 | 20,702,357 | ||||||
Hershey Co. | 128,268 | 33,311,200 | ||||||
J M Smucker Co. | 63,718 | 9,340,422 | ||||||
|
| |||||||
| 63,353,979 | ||||||||
| Ground Transportation — 0.1% | ||||||||
Lyft, Inc., Class A(a) | 181,949 | 1,641,180 | ||||||
Ryder System, Inc. | 3,538 | 278,900 | ||||||
Schneider National, Inc., Class B | 50,703 | 1,314,222 | ||||||
Uber Technologies, Inc.(a) | 17,615 | 668,137 | ||||||
|
| |||||||
| 3,902,439 | ||||||||
| Health Care Equipment & Supplies — 2.6% | ||||||||
Abbott Laboratories | 204,702 | 20,879,604 | ||||||
Boston Scientific Corp.(a) | 772,237 | 39,754,761 | ||||||
SCHEDULES OF INVESTMENTS | 43 |
Schedule of Investments (continued) May 31, 2023 | BlackRock Advantage Large Cap Core Fund (Percentages shown are based on Net Assets) |
| Security | Shares | Value | ||||||
Health Care Equipment & Supplies (continued) |
| |||||||
IDEXX Laboratories, Inc.(a) | 15,399 | $ | 7,156,993 | |||||
Stryker Corp. | 21,406 | 5,899,065 | ||||||
|
| |||||||
| 73,690,423 | ||||||||
| Health Care Providers & Services — 4.9% | ||||||||
Cigna Group | 129,262 | 31,980,711 | ||||||
CVS Health Corp. | 548,127 | 37,289,080 | ||||||
Elevance Health, Inc. | 69,662 | 31,196,037 | ||||||
UnitedHealth Group, Inc. | 79,275 | 38,625,951 | ||||||
|
| |||||||
| 139,091,779 | ||||||||
| Health Care Technology — 0.3% | ||||||||
Teladoc Health, Inc.(a) | 374,958 | 8,680,278 | ||||||
|
| |||||||
| Hotel & Resort REITs — 0.0% | ||||||||
RLJ Lodging Trust | 56 | 576 | ||||||
|
| |||||||
| Hotels, Restaurants & Leisure — 1.7% | ||||||||
Caesars Entertainment, Inc.(a) | 256,681 | 10,526,488 | ||||||
Darden Restaurants, Inc. | 53,117 | 8,420,107 | ||||||
McDonald’s Corp. | 22,803 | 6,501,363 | ||||||
MGM Resorts International | 61,616 | 2,420,893 | ||||||
Starbucks Corp. | 11,095 | 1,083,316 | ||||||
Travel + Leisure Co. | 379,512 | 13,840,802 | ||||||
Yum! Brands, Inc. | 37,378 | 4,810,175 | ||||||
|
| |||||||
| 47,603,144 | ||||||||
| Household Durables — 0.2% | ||||||||
Taylor Morrison Home Corp., Class A(a) | 20,061 | 851,188 | ||||||
TopBuild Corp.(a) | 10,339 | 2,084,963 | ||||||
Whirlpool Corp. | 17,454 | 2,256,628 | ||||||
|
| |||||||
| 5,192,779 | ||||||||
| Household Products — 1.8% | ||||||||
Kimberly-Clark Corp. | 226,591 | 30,426,639 | ||||||
Procter & Gamble Co. | 144,186 | 20,546,505 | ||||||
|
| |||||||
| 50,973,144 | ||||||||
| Industrial Conglomerates — 1.3% | ||||||||
Honeywell International, Inc. | 186,202 | 35,676,303 | ||||||
|
| |||||||
| Industrial REITs — 0.2% | ||||||||
Prologis, Inc. | 35,309 | 4,397,736 | ||||||
|
| |||||||
| Insurance — 3.4% | ||||||||
Allstate Corp. | 40,919 | 4,437,666 | ||||||
American Financial Group, Inc. | 4,404 | 494,437 | ||||||
Everest Re Group Ltd. | 9,099 | 3,093,842 | ||||||
Marsh & McLennan Cos., Inc. | 175,456 | 30,385,470 | ||||||
MetLife, Inc. | 721,142 | 35,732,586 | ||||||
Travelers Cos., Inc. | 129,474 | 21,912,180 | ||||||
|
| |||||||
| 96,056,181 | ||||||||
| Interactive Media & Services — 6.3% | ||||||||
Alphabet, Inc., Class A(a) | 593,184 | 72,884,518 | ||||||
Alphabet, Inc., Class C, NVS(a) | 380,440 | 46,934,883 | ||||||
Match Group, Inc.(a) | 85,467 | 2,948,611 | ||||||
Meta Platforms, Inc., Class A(a) | 178,436 | 47,235,578 | ||||||
Pinterest, Inc., Class A(a) | 160,203 | 3,835,260 | ||||||
Snap, Inc., Class A, NVS(a) | 423,063 | 4,315,243 | ||||||
|
| |||||||
| 178,154,093 | ||||||||
| IT Services — 0.6% | ||||||||
Accenture PLC, Class A | 26,221 | 8,021,528 | ||||||
Gartner, Inc.(a) | 12,528 | 4,295,350 | ||||||
VeriSign, Inc.(a) | 25,633 | 5,724,362 | ||||||
|
| |||||||
| 18,041,240 | ||||||||
| Security | Shares | Value | ||||||
Life Sciences Tools & Services — 2.3% |
| |||||||
Agilent Technologies, Inc. | 264,748 | $ | 30,623,401 | |||||
Bruker Corp. | 9,843 | 680,151 | ||||||
Danaher Corp. | 126,775 | 29,110,076 | ||||||
Thermo Fisher Scientific, Inc. | 6,761 | 3,437,698 | ||||||
|
| |||||||
| 63,851,326 | ||||||||
| Machinery — 3.8% | ||||||||
Cummins, Inc. | 19,292 | 3,943,478 | ||||||
Deere & Co. | 100,717 | 34,846,068 | ||||||
Illinois Tool Works, Inc. | 161,653 | 35,358,361 | ||||||
Snap-on, Inc. | 22,753 | 5,662,311 | ||||||
Timken Co. | 108,872 | 7,789,791 | ||||||
Xylem, Inc. | 201,227 | 20,162,946 | ||||||
|
| |||||||
| 107,762,955 | ||||||||
| Media — 1.3% | ||||||||
Comcast Corp., Class A | 215,061 | 8,462,650 | ||||||
Fox Corp., Class A, NVS | 906,851 | 28,293,751 | ||||||
Fox Corp., Class B | 11,766 | 343,685 | ||||||
|
| |||||||
| 37,100,086 | ||||||||
| Metals & Mining — 0.2% | ||||||||
Commercial Metals Co. | 6,468 | 276,507 | ||||||
Steel Dynamics, Inc. | 47,501 | 4,365,342 | ||||||
|
| |||||||
| 4,641,849 | ||||||||
| Multi-Utilities — 1.0% | ||||||||
DTE Energy Co. | 250,833 | 26,989,631 | ||||||
|
| |||||||
| Oil, Gas & Consumable Fuels — 3.0% | ||||||||
Cheniere Energy, Inc. | 8,739 | 1,221,450 | ||||||
Chevron Corp. | 342,954 | 51,655,732 | ||||||
ConocoPhillips | 137,130 | 13,617,009 | ||||||
EOG Resources, Inc. | 78,993 | 8,475,159 | ||||||
Phillips 66 | 25,063 | 2,296,021 | ||||||
Pioneer Natural Resources Co. | 11,235 | 2,240,708 | ||||||
Targa Resources Corp. | 3,659 | 248,995 | ||||||
Valero Energy Corp. | 28,463 | 3,046,680 | ||||||
Williams Cos., Inc. | 111,621 | 3,199,058 | ||||||
|
| |||||||
| 86,000,812 | ||||||||
| Pharmaceuticals — 2.3% | ||||||||
Bristol-Myers Squibb Co. | 639,833 | 41,230,839 | ||||||
Johnson & Johnson | 49,666 | 7,701,210 | ||||||
Merck & Co., Inc. | 34,152 | 3,770,722 | ||||||
Pfizer, Inc. | 289,611 | 11,011,010 | ||||||
|
| |||||||
| 63,713,781 | ||||||||
| Professional Services — 0.3% | ||||||||
Automatic Data Processing, Inc. | 23,998 | 5,015,342 | ||||||
Insperity, Inc. | 27,097 | 3,000,180 | ||||||
Paycom Software, Inc. | 3,625 | 1,015,471 | ||||||
|
| |||||||
| 9,030,993 | ||||||||
| Residential REITs — 0.4% | ||||||||
Equity Residential | 199,209 | 12,111,907 | ||||||
|
| |||||||
| Retail REITs — 1.0% | ||||||||
Brixmor Property Group, Inc. | 196,730 | 3,940,502 | ||||||
Simon Property Group, Inc. | 220,296 | 23,164,124 | ||||||
|
| |||||||
| 27,104,626 | ||||||||
| Semiconductors & Semiconductor Equipment — 6.3% | ||||||||
Analog Devices, Inc. | 159,802 | 28,395,217 | ||||||
Applied Materials, Inc. | 180,951 | 24,120,768 | ||||||
Intel Corp. | 676,562 | 21,271,109 | ||||||
Lattice Semiconductor Corp.(a) | 41,834 | 3,401,523 | ||||||
MaxLinear, Inc.(a) | 16,605 | 485,032 | ||||||
| 44 | 2 0 2 3 BLACK ROCK ANNUAL REPORT TO SHAREHOLDERS |
Schedule of Investments (continued) May 31, 2023 | BlackRock Advantage Large Cap Core Fund (Percentages shown are based on Net Assets) |
| Security | Shares | Value | ||||||
Semiconductors & Semiconductor Equipment (continued) |
| |||||||
NVIDIA Corp. | 260,443 | $ | 98,536,005 | |||||
NXP Semiconductors NV | 4,586 | 821,353 | ||||||
QUALCOMM, Inc. | 17,312 | 1,963,354 | ||||||
|
| |||||||
| 178,994,361 | ||||||||
| Software — 12.4% | ||||||||
Adobe, Inc.(a) | 86,204 | 36,015,169 | ||||||
Autodesk, Inc.(a) | 11,772 | 2,347,219 | ||||||
Fortinet, Inc.(a) | 90,224 | 6,165,006 | ||||||
InterDigital, Inc. | 7 | 581 | ||||||
Intuit, Inc. | 10,734 | 4,498,834 | ||||||
Manhattan Associates, Inc.(a) | 75,814 | 13,754,176 | ||||||
Microsoft Corp. | 626,218 | 205,643,729 | ||||||
RingCentral, Inc., Class A(a) | 213,566 | 7,410,740 | ||||||
Salesforce, Inc.(a) | 143,073 | 31,959,647 | ||||||
ServiceNow, Inc.(a) | 23,467 | 12,784,352 | ||||||
Splunk, Inc.(a) | 111,552 | �� | 11,075,998 | |||||
Synopsys, Inc.(a) | 2,414 | 1,098,273 | ||||||
Teradata Corp.(a) | 7,724 | 361,947 | ||||||
VMware, Inc., Class A(a) | 15,527 | 2,116,175 | ||||||
Workday, Inc., Class A(a) | 42,435 | 8,995,796 | ||||||
Zoom Video Communications, Inc., Class A(a) | 83,960 | 5,636,235 | ||||||
|
| |||||||
| 349,863,877 | ||||||||
| Specialized REITs — 0.7% | ||||||||
SBA Communications Corp. | 89,351 | 19,816,265 | ||||||
|
| |||||||
| Specialty Retail — 3.2% | ||||||||
Best Buy Co., Inc. | 93,811 | 6,817,245 | ||||||
Dick’s Sporting Goods, Inc. | 69,209 | 8,824,840 | ||||||
Five Below, Inc.(a) | 30,191 | 5,208,551 | ||||||
Home Depot, Inc. | 17,670 | 5,008,561 | ||||||
Lowe’s Cos., Inc. | 86,281 | 17,353,698 | ||||||
Penske Automotive Group, Inc.(b) | 43,203 | 5,971,519 | ||||||
TJX Cos., Inc. | 521,258 | 40,027,402 | ||||||
Wayfair, Inc., Class A(a) | 28,392 | 1,144,765 | ||||||
|
| |||||||
| 90,356,581 | ||||||||
| Technology Hardware, Storage & Peripherals — 8.3% | ||||||||
Apple Inc. | 1,108,887 | 196,550,221 | ||||||
| Security | Shares | Value | ||||||
Technology Hardware, Storage & Peripherals (continued) |
| |||||||
Hewlett Packard Enterprise Co. | 2,267,764 | $ | 32,701,157 | |||||
HP, Inc. | 127,991 | 3,719,418 | ||||||
|
| |||||||
| 232,970,796 | ||||||||
| Textiles, Apparel & Luxury Goods — 1.0% | ||||||||
Crocs, Inc.(a) | 35,494 | 3,985,266 | ||||||
Lululemon Athletica, Inc.(a) | 57,050 | 18,936,607 | ||||||
NIKE, Inc., Class B | 2,918 | 307,149 | ||||||
Ralph Lauren Corp., Class A | 44,688 | 4,750,781 | ||||||
|
| |||||||
| 27,979,803 | ||||||||
| Trading Companies & Distributors — 0.9% | ||||||||
Univar Solutions, Inc.(a) | 32,755 | 1,166,733 | ||||||
WW Grainger, Inc. | 38,024 | 24,678,337 | ||||||
|
| |||||||
| 25,845,070 | ||||||||
Total Long-Term Investments — 99.0% |
| 2,795,997,662 | ||||||
|
| |||||||
Short-Term Securities |
| |||||||
| Money Market Funds — 0.9% | ||||||||
BlackRock Liquidity Funds, T-Fund, Institutional Class, 5.00%(c)(d) | 25,513,614 | 25,513,614 | ||||||
SL Liquidity Series, LLC, Money Market Series, 5.32%(c)(d)(e) | 1,007,234 | 1,007,234 | ||||||
|
| |||||||
Total Short-Term Securities — 0.9% |
| 26,520,848 | ||||||
|
| |||||||
Total Investments — 99.9% |
| 2,822,518,510 | ||||||
Other Assets Less Liabilities — 0.1% |
| 2,740,131 | ||||||
|
| |||||||
Net Assets — 100.0% |
| $ | 2,825,258,641 | |||||
|
| |||||||
| (a) | Non-income producing security. |
| (b) | All or a portion of this security is on loan. |
| (c) | Affiliate of the Fund. |
| (d) | Annualized 7-day yield as of period end. |
| (e) | All or a portion of this security was purchased with the cash collateral from loaned securities. |
Affiliates
Investments in issuers considered to be affiliate(s) of the Fund during the year ended May 31, 2023 for purposes of Section 2(a)(3) of the Investment Company Act of 1940, as amended, were as follows:
| Affiliated Issuer | Value at 05/31/22 | Purchases at Cost | Proceeds from Sale | Net Realized Gain (Loss) | Change in Unrealized Appreciation (Depreciation) | Value at 05/31/23 | Shares Held at 05/31/23 | Income | Capital Gain Distributions | |||||||||||||||||||||||||||
BlackRock Liquidity Funds, T-Fund, Institutional Class | $ | 27,372,151 | $ | — | $ | (1,858,537 | )(a) | $ | — | $ | — | $ | 25,513,614 | 25,513,614 | $ | 776,979 | $ | — | ||||||||||||||||||
SL Liquidity Series, LLC, Money Market Series | 3,496,621 | — | (2,484,952 | )(a) | (5,159 | ) | 724 | 1,007,234 | 1,007,234 | 37,536 | (b) | — | ||||||||||||||||||||||||
|
|
|
|
|
|
|
|
|
| |||||||||||||||||||||||||||
| $ | (5,159 | ) | $ | 724 | $ | 26,520,848 | $ | 814,515 | $ | — | ||||||||||||||||||||||||||
|
|
|
|
|
|
|
|
|
| |||||||||||||||||||||||||||
| (a) | Represents net amount purchased (sold). |
| (b) | All or a portion represents securities lending income earned from the reinvestment of cash collateral from loaned securities, net of fees and collateral investment expenses, and other payments to and from borrowers of securities. |
SCHEDULES OF INVESTMENTS | 45 |
Schedule of Investments (continued) May 31, 2023 | BlackRock Advantage Large Cap Core Fund |
For Fund compliance purposes, the Fund’s industry classifications refer to one or more of the industry sub-classifications used by one or more widely recognized market indexes or rating group indexes, and/or as defined by the investment adviser. These definitions may not apply for purposes of this report, which may combine such industry sub-classifications for reporting ease.
Derivative Financial Instruments Outstanding as of Period End
Futures Contracts
| Description | Number of Contracts | Expiration Date | Notional Amount (000) | Value/ Unrealized Appreciation (Depreciation) | ||||||||||||
Long Contracts | ||||||||||||||||
S&P 500 E-Mini Index | 157 | 06/16/23 | $ | 32,895 | $ | 2,128,463 | ||||||||||
|
| |||||||||||||||
Derivative Financial Instruments Categorized by Risk Exposure
As of period end, the fair values of derivative financial instruments located in the Statements of Assets and Liabilities were as follows:
| Commodity Contracts | Credit Contracts | Equity Contracts | Foreign Currency Exchange Contracts | Interest Rate Contracts | Other Contracts | Total | ||||||||||||||||||||||
Assets — Derivative Financial Instruments | ||||||||||||||||||||||||||||
Futures contracts | ||||||||||||||||||||||||||||
Unrealized appreciation on futures contracts(a) | $ | — | $ | — | $ | 2,128,463 | $ | — | $ | — | $ | — | $ | 2,128,463 | ||||||||||||||
|
|
|
|
|
|
|
|
|
|
|
|
|
| |||||||||||||||
| (a) | Net cumulative unrealized appreciation (depreciation) on futures contracts, if any, are reported in the Schedule of Investments. In the Statements of Assets and Liabilities, only current day’s variation margin is reported in receivables or payables and the net cumulative unrealized appreciation (depreciation) is included in accumulated earnings (loss). |
For the period ended May 31, 2023, the effect of derivative financial instruments in the Statements of Operations was as follows:
| Commodity Contracts | Credit Contracts | Equity Contracts | Foreign Currency Exchange Contracts | Interest Rate Contracts | Other Contracts | Total | ||||||||||||||||||||||
Net Realized Gain (Loss) from | ||||||||||||||||||||||||||||
Futures contracts | $ | — | $ | — | $ | (3,745,547 | ) | $ | — | $ | — | $ | — | $ | (3,745,547 | ) | ||||||||||||
|
|
|
|
|
|
|
|
|
|
|
|
|
| |||||||||||||||
| Net Change in Unrealized Appreciation (Depreciation) on | ||||||||||||||||||||||||||||
Futures contracts | $ | — | $ | — | $ | 2,082,322 | $ | — | $ | — | $ | — | $ | 2,082,322 | ||||||||||||||
|
|
|
|
|
|
|
|
|
|
|
|
|
| |||||||||||||||
Average Quarterly Balances of Outstanding Derivative Financial Instruments
Futures contracts | ||||
Average notional value of contracts — long | $ | 32,105,106 |
For more information about the Fund’s investment risks regarding derivative financial instruments, refer to the Notes to Financial Statements.
| 46 | 2 0 2 3 BLACK ROCK ANNUAL REPORT TO SHAREHOLDERS |
Schedule of Investments (continued) May 31, 2023 | BlackRock Advantage Large Cap Core Fund |
Fair Value Hierarchy as of Period End
Various inputs are used in determining the fair value of financial instruments. For a description of the input levels and information about the Fund’s policy regarding valuation of financial instruments, refer to the Notes to Financial Statements.
The following table summarizes the Fund’s financial instruments categorized in the fair value hierarchy. The breakdown of the Fund’s financial instruments into major categories is disclosed in the Schedule of Investments above.
| Level 1 | Level 2 | Level 3 | Total | |||||||||||||
Assets | ||||||||||||||||
Investments | ||||||||||||||||
Long-Term Investments | ||||||||||||||||
Common Stocks | $ | 2,795,997,662 | $ | — | $ | — | $ | 2,795,997,662 | ||||||||
Short-Term Securities | ||||||||||||||||
Money Market Funds | 25,513,614 | — | — | 25,513,614 | ||||||||||||
|
|
|
|
|
|
|
| |||||||||
| $ | 2,821,511,276 | �� | $ | — | $ | — | 2,821,511,276 | |||||||||
|
|
|
|
|
|
|
| |||||||||
Investments valued at NAV(a) | 1,007,234 | |||||||||||||||
|
| |||||||||||||||
| $ | 2,822,518,510 | |||||||||||||||
|
| |||||||||||||||
Derivative Financial Instruments(b) | ||||||||||||||||
Assets | ||||||||||||||||
Equity Contracts | $ | 2,128,463 | $ | — | $ | — | $ | 2,128,463 | ||||||||
|
|
|
|
|
|
|
| |||||||||
| (a) | Certain investments of the Fund were fair valued using NAV as a practical expedient or its equivalent as no quoted market value is available and therefore have been excluded from the fair value hierarchy. |
| (b) | Derivative financial instruments are futures contracts. Futures contracts are valued at the unrealized appreciation (depreciation) on the instrument. |
See notes to financial statements.
SCHEDULES OF INVESTMENTS | 47 |
Schedule of Investments May 31, 2023 | BlackRock Advantage Large Cap Value Fund (Percentages shown are based on Net Assets) |
| Security | Shares | Value | ||||||
Common Stocks | ||||||||
Aerospace & Defense — 1.8% | ||||||||
Axon Enterprise, Inc.(a) | 4,015 | $ | 774,534 | |||||
Curtiss-Wright Corp. | 4,379 | 692,145 | ||||||
General Dynamics Corp. | 21,791 | 4,449,286 | ||||||
Lockheed Martin Corp. | 5,087 | 2,258,679 | ||||||
Northrop Grumman Corp. | 2,530 | 1,101,790 | ||||||
Textron, Inc. | 8,850 | 547,549 | ||||||
|
| |||||||
| 9,823,983 | ||||||||
| Automobile Components — 0.4% | ||||||||
Lear Corp. | 17,977 | 2,205,059 | ||||||
|
| |||||||
| Automobiles — 0.1% | ||||||||
Ford Motor Co. | 50,495 | 605,940 | ||||||
|
| |||||||
| Banks — 5.1% | ||||||||
Citigroup, Inc. | 187,221 | 8,297,635 | ||||||
Citizens Financial Group, Inc. | 4,720 | 121,682 | ||||||
JPMorgan Chase & Co. | 62,736 | 8,513,903 | ||||||
KeyCorp. | 57,751 | 539,394 | ||||||
PNC Financial Services Group, Inc. | 1,806 | 209,189 | ||||||
Truist Financial Corp. | 36,405 | 1,109,260 | ||||||
U.S. Bancorp | 69,513 | 2,078,439 | ||||||
Wells Fargo & Co. | 171,334 | 6,820,806 | ||||||
|
| |||||||
| 27,690,308 | ||||||||
| Beverages — 1.8% | ||||||||
Coca-Cola Co. | 14,758 | 880,462 | ||||||
Keurig Dr Pepper, Inc. | 34,458 | 1,072,333 | ||||||
PepsiCo, Inc. | 41,458 | 7,559,867 | ||||||
|
| |||||||
| 9,512,662 | ||||||||
| Biotechnology — 1.2% | ||||||||
ACELYRIN, Inc.(a) | 9,526 | 172,421 | ||||||
Amgen, Inc. | 5,940 | 1,310,661 | ||||||
Exelixis, Inc.(a) | 11,198 | 215,897 | ||||||
Gilead Sciences, Inc. | 27,015 | 2,078,534 | ||||||
Horizon Therapeutics PLC(a) | 465 | 46,514 | ||||||
Incyte Corp.(a) | 8,133 | 500,586 | ||||||
Regeneron Pharmaceuticals, Inc.(a) | 2,275 | 1,673,399 | ||||||
Ultragenyx Pharmaceutical, Inc.(a) | 7,844 | 387,180 | ||||||
United Therapeutics Corp.(a) | 634 | 132,975 | ||||||
|
| |||||||
| 6,518,167 | ||||||||
| Broadline Retail — 0.9% | ||||||||
Coupang, Inc., Class A(a) | 5,167 | 80,605 | ||||||
eBay, Inc. | 108,221 | 4,603,721 | ||||||
Etsy, Inc.(a) | 3,956 | 320,634 | ||||||
|
| |||||||
| 5,004,960 | ||||||||
| Building Products — 0.9% | ||||||||
Allegion PLC | 21,538 | 2,255,890 | ||||||
Johnson Controls International PLC | 14,070 | 839,979 | ||||||
Owens Corning | 3,307 | 351,633 | ||||||
Trane Technologies PLC | 8,695 | 1,419,285 | ||||||
|
| |||||||
| 4,866,787 | ||||||||
| Capital Markets — 3.7% | ||||||||
Bank of New York Mellon Corp. | 159,087 | 6,395,298 | ||||||
Cboe Global Markets, Inc. | 11,031 | 1,460,725 | ||||||
Intercontinental Exchange, Inc. | 17,194 | 1,821,704 | ||||||
Invesco Ltd. | 123,230 | 1,772,047 | ||||||
Nasdaq, Inc. | 26,632 | 1,474,081 | ||||||
S&P Global, Inc. | 19,958 | 7,333,168 | ||||||
|
| |||||||
| 20,257,023 | ||||||||
| Security | Shares | Value | ||||||
| Chemicals — 1.3% | ||||||||
DuPont de Nemours, Inc. | 2,895 | $ | 194,515 | |||||
Eastman Chemical Co. | 5,914 | 455,910 | ||||||
FMC Corp. | 26,337 | 2,741,155 | ||||||
Huntsman Corp. | 13,592 | 322,810 | ||||||
LyondellBasell Industries NV, Class A | 29,807 | 2,549,691 | ||||||
Sherwin-Williams Co. | 2,917 | 664,434 | ||||||
|
| |||||||
| 6,928,515 | ||||||||
| Commercial Services & Supplies — 0.2% | ||||||||
Cintas Corp. | 2,529 | 1,194,042 | ||||||
|
| |||||||
| Communications Equipment — 0.8% | ||||||||
Cisco Systems, Inc. | 12,017 | 596,884 | ||||||
Juniper Networks, Inc. | 117,939 | 3,581,808 | ||||||
|
| |||||||
| 4,178,692 | ||||||||
| Construction & Engineering — 0.8% | ||||||||
AECOM | 51,507 | 4,020,121 | ||||||
Valmont Industries, Inc. | 1,321 | 346,459 | ||||||
|
| |||||||
| 4,366,580 | ||||||||
| Construction Materials — 0.4% | ||||||||
Vulcan Materials Co. | 9,808 | 1,917,464 | ||||||
|
| |||||||
| Consumer Finance — 1.9% | ||||||||
American Express Co. | 49,503 | 7,849,196 | ||||||
Synchrony Financial | 73,640 | 2,279,894 | ||||||
|
| |||||||
| 10,129,090 | ||||||||
| Consumer Staples Distribution & Retail — 2.4% | ||||||||
Walmart, Inc. | 88,833 | 13,046,903 | ||||||
|
| |||||||
| Diversified Telecommunication Services — 0.5% | ||||||||
AT&T Inc. | 50,778 | 798,738 | ||||||
Verizon Communications, Inc. | 46,743 | 1,665,453 | ||||||
|
| |||||||
| 2,464,191 | ||||||||
| Electric Utilities — 2.1% | ||||||||
Evergy, Inc. | 72,624 | 4,201,298 | ||||||
IDACORP, Inc. | 2,300 | 239,361 | ||||||
Portland General Electric Co. | 13,828 | 673,839 | ||||||
PPL Corp. | 133,059 | 3,486,146 | ||||||
Xcel Energy, Inc. | 40,349 | 2,634,386 | ||||||
|
| |||||||
| 11,235,030 | ||||||||
| Electrical Equipment — 1.4% | ||||||||
AMETEK, Inc. | 19,219 | 2,788,100 | ||||||
Eaton Corp. PLC | 26,314 | 4,628,633 | ||||||
|
| |||||||
| 7,416,733 | ||||||||
| Electronic Equipment, Instruments & Components — 0.9% | ||||||||
Flex Ltd.(a) | 137,274 | 3,485,387 | ||||||
TD SYNNEX Corp. | 12,701 | 1,135,215 | ||||||
|
| |||||||
| 4,620,602 | ||||||||
| Energy Equipment & Services — 0.1% | ||||||||
Halliburton Co. | 12,496 | 358,010 | ||||||
Patterson-UTI Energy, Inc. | 24,155 | 235,270 | ||||||
|
| |||||||
| 593,280 | ||||||||
| Entertainment — 0.4% | ||||||||
Activision Blizzard, Inc. | 12,702 | 1,018,700 | ||||||
Electronic Arts, Inc. | 8,217 | 1,051,776 | ||||||
Warner Bros Discovery, Inc., Class A(a) | 18,782 | 211,861 | ||||||
|
| |||||||
| 2,282,337 | ||||||||
| Financial Services — 3.3% | ||||||||
Berkshire Hathaway, Inc., Class B(a) | 34,900 | 11,205,692 | ||||||
Block, Inc., Class A(a) | 17,007 | 1,027,053 | ||||||
Fidelity National Information Services, Inc. | 16,053 | 876,012 | ||||||
| 48 | 2 0 2 3 BLACK ROCK ANNUAL REPORT TO SHAREHOLDERS |
Schedule of Investments (continued) May 31, 2023 | BlackRock Advantage Large Cap Value Fund (Percentages shown are based on Net Assets) |
| Security | Shares | Value | ||||||
| Financial Services (continued) | ||||||||
Mastercard, Inc., Class A | 675 | $ | 246,388 | |||||
PayPal Holdings, Inc.(a) | 74,618 | 4,625,570 | ||||||
StoneCo Ltd., Class A(a) | 7,484 | 93,774 | ||||||
WEX, Inc.(a) | 349 | 57,882 | ||||||
|
| |||||||
| 18,132,371 | ||||||||
| Food Products — 3.1% | ||||||||
Archer-Daniels-Midland Co. | 96,209 | 6,797,166 | ||||||
General Mills, Inc. | 1,151 | 96,868 | ||||||
Hershey Co. | 23,607 | 6,130,738 | ||||||
J M Smucker Co. | 23,355 | 3,423,609 | ||||||
Kellogg Co. | 1,782 | 118,984 | ||||||
|
| |||||||
| 16,567,365 | ||||||||
| Gas Utilities — 0.0% | ||||||||
Spire, Inc. | 1,722 | 111,190 | ||||||
|
| |||||||
| Ground Transportation — 0.4% | ||||||||
Lyft, Inc., Class A(a) | 15,983 | 144,167 | ||||||
Norfolk Southern Corp. | 7,564 | 1,574,673 | ||||||
Ryder System, Inc. | 1,453 | 114,540 | ||||||
Schneider National, Inc., Class B | 9,403 | 243,726 | ||||||
|
| |||||||
| 2,077,106 | ||||||||
| Health Care Equipment & Supplies — 3.3% | ||||||||
Abbott Laboratories | 62,879 | 6,413,658 | ||||||
Boston Scientific Corp.(a) | 172,771 | 8,894,251 | ||||||
Enovis Corp.(a) | 3,517 | 185,452 | ||||||
Medtronic PLC | 11,736 | 971,271 | ||||||
Stryker Corp. | 6,145 | 1,693,439 | ||||||
|
| |||||||
| 18,158,071 | ||||||||
| Health Care Providers & Services — 4.6% | ||||||||
Cigna Group | 28,714 | 7,104,131 | ||||||
CVS Health Corp. | 134,976 | 9,182,417 | ||||||
Elevance Health, Inc. | 18,708 | 8,377,817 | ||||||
UnitedHealth Group, Inc. | 292 | 142,274 | ||||||
|
| |||||||
| 24,806,639 | ||||||||
| Health Care Technology — 0.4% | ||||||||
Teladoc Health, Inc.(a)(b) | 94,316 | 2,183,415 | ||||||
|
| |||||||
| Hotel & Resort REITs — 0.2% | ||||||||
Park Hotels & Resorts, Inc. | 99,963 | 1,293,521 | ||||||
|
| |||||||
| Hotels, Restaurants & Leisure — 1.6% | ||||||||
Caesars Entertainment, Inc.(a) | 49,331 | 2,023,064 | ||||||
Darden Restaurants, Inc. | 14,101 | 2,235,291 | ||||||
McDonald’s Corp. | 8,036 | 2,291,144 | ||||||
MGM Resorts International | 10,411 | 409,048 | ||||||
Penn Entertainment, Inc.(a) | 2,180 | 54,587 | ||||||
Travel + Leisure Co. | 45,077 | 1,643,958 | ||||||
Yum! Brands, Inc. | 537 | 69,107 | ||||||
|
| |||||||
| 8,726,199 | ||||||||
| Household Durables — 1.1% | ||||||||
Taylor Morrison Home Corp., Class A(a) | 64,237 | 2,725,576 | ||||||
Toll Brothers, Inc. | 25,397 | 1,719,377 | ||||||
TopBuild Corp.(a) | 3,557 | 717,304 | ||||||
Whirlpool Corp. | 7,303 | 944,205 | ||||||
|
| |||||||
| 6,106,462 | ||||||||
| Household Products — 1.8% | ||||||||
Kimberly-Clark Corp. | 24,597 | 3,302,885 | ||||||
Procter & Gamble Co. | 45,191 | 6,439,718 | ||||||
|
| |||||||
| 9,742,603 | ||||||||
| Independent Power and Renewable Electricity Producers — 0.0% | ||||||||
Brookfield Renewable Corp., Class A | 5,551 | 186,403 | ||||||
|
| |||||||
| Security | Shares | Value | ||||||
| Industrial Conglomerates — 1.6% | ||||||||
General Electric Co. | 1,236 | $ | 125,491 | |||||
Honeywell International, Inc. | 45,232 | 8,666,451 | ||||||
|
| |||||||
| 8,791,942 | ||||||||
| Industrial REITs — 1.0% | ||||||||
Prologis, Inc. | 43,111 | 5,369,475 | ||||||
|
| |||||||
| Insurance — 4.8% | ||||||||
Allstate Corp. | 16,315 | 1,769,362 | ||||||
American Financial Group, Inc. | 2,060 | 231,276 | ||||||
Everest Re Group Ltd. | 3,851 | 1,309,417 | ||||||
Hartford Financial Services Group, Inc. | 35,687 | 2,445,273 | ||||||
Marsh & McLennan Cos., Inc. | 17,762 | 3,076,023 | ||||||
MetLife, Inc. | 151,536 | 7,508,609 | ||||||
Prudential Financial, Inc. | 11,073 | 871,334 | ||||||
Travelers Cos., Inc. | 43,224 | 7,315,230 | ||||||
Unum Group | 28,697 | 1,246,885 | ||||||
|
| |||||||
| 25,773,409 | ||||||||
| Interactive Media & Services — 4.4% | ||||||||
Alphabet, Inc., Class A(a) | 48,979 | 6,018,050 | ||||||
Alphabet, Inc., Class C, NVS(a) | 20,450 | 2,522,916 | ||||||
Bumble, Inc., Class A(a) | 10,850 | 166,005 | ||||||
Meta Platforms, Inc., Class A(a) | 52,891 | 14,001,306 | ||||||
Pinterest, Inc., Class A(a) | 33,313 | 797,513 | ||||||
Snap, Inc., Class A, NVS(a) | 38,989 | 397,688 | ||||||
|
| |||||||
| 23,903,478 | ||||||||
| IT Services — 0.1% | ||||||||
Gartner, Inc.(a) | 541 | 185,487 | ||||||
VeriSign, Inc.(a) | 1,498 | 334,534 | ||||||
|
| |||||||
| 520,021 | ||||||||
| Life Sciences Tools & Services — 3.0% | ||||||||
Agilent Technologies, Inc. | 37,032 | 4,283,492 | ||||||
Danaher Corp. | 33,944 | 7,794,221 | ||||||
Thermo Fisher Scientific, Inc. | 8,416 | 4,279,199 | ||||||
|
| |||||||
| 16,356,912 | ||||||||
| Machinery — 4.3% | ||||||||
Cummins, Inc. | 9,423 | 1,926,155 | ||||||
Deere & Co. | 16,174 | 5,595,881 | ||||||
Illinois Tool Works, Inc. | 25,889 | 5,662,701 | ||||||
Oshkosh Corp. | 984 | 72,649 | ||||||
Snap-on, Inc. | 12,913 | 3,213,529 | ||||||
Timken Co. | 41,076 | 2,938,988 | ||||||
Xylem, Inc. | 38,757 | 3,883,451 | ||||||
|
| |||||||
| 23,293,354 | ||||||||
| Media — 2.4% | ||||||||
Comcast Corp., Class A | 174,283 | 6,858,036 | ||||||
Fox Corp., Class A, NVS | 200,377 | 6,251,762 | ||||||
Fox Corp., Class B | 4,487 | 131,065 | ||||||
Liberty Media Corp. - Liberty SiriusXM, Class A(a) | 1,625 | 45,468 | ||||||
|
| |||||||
| 13,286,331 | ||||||||
| Metals & Mining — 1.0% | ||||||||
Commercial Metals Co. | 19,104 | 816,696 | ||||||
Newmont Corp. | 11,206 | 454,403 | ||||||
Reliance Steel & Aluminum Co. | 2,643 | 620,259 | ||||||
Steel Dynamics, Inc. | 17,467 | 1,605,218 | ||||||
United States Steel Corp. | 105,191 | 2,200,596 | ||||||
|
| |||||||
| 5,697,172 | ||||||||
| Multi-Utilities — 1.8% | ||||||||
CMS Energy Corp. | 52,817 | 3,062,330 | ||||||
SCHEDULES OF INVESTMENTS | 49 |
Schedule of Investments (continued) May 31, 2023 | BlackRock Advantage Large Cap Value Fund (Percentages shown are based on Net Assets) |
| Security | Shares | Value | ||||||
| Multi-Utilities (continued) | ||||||||
DTE Energy Co. | 62,412 | $ | 6,715,531 | |||||
NiSource, Inc. | 5,061 | 136,090 | ||||||
|
| |||||||
| 9,913,951 | ||||||||
| Office REITs — 0.3% | ||||||||
Alexandria Real Estate Equities, Inc. | 12,259 | 1,390,906 | ||||||
Kilroy Realty Corp. | 11,755 | 319,031 | ||||||
|
| |||||||
| 1,709,937 | ||||||||
| Oil, Gas & Consumable Fuels — 6.4% | ||||||||
Chevron Corp. | 98,900 | 14,896,318 | ||||||
ConocoPhillips | 40,323 | 4,004,074 | ||||||
EOG Resources, Inc. | 15,148 | 1,625,229 | ||||||
Exxon Mobil Corp. | 67,541 | 6,901,339 | ||||||
Marathon Oil Corp. | 18,187 | 403,024 | ||||||
Phillips 66 | 16,890 | 1,547,293 | ||||||
Pioneer Natural Resources Co. | 8,039 | 1,603,298 | ||||||
Targa Resources Corp. | 2,826 | 192,309 | ||||||
Valero Energy Corp. | 11,631 | 1,244,982 | ||||||
Williams Cos., Inc. | 85,090 | 2,438,680 | ||||||
|
| |||||||
| 34,856,546 | ||||||||
| Passenger Airlines — 0.1% | ||||||||
JetBlue Airways Corp.(a) | 47,217 | 322,492 | ||||||
|
| |||||||
| Pharmaceuticals — 4.7% | ||||||||
Bristol-Myers Squibb Co. | 150,265 | 9,683,077 | ||||||
Johnson & Johnson | 57,636 | 8,937,038 | ||||||
Merck & Co., Inc. | 5,584 | 616,530 | ||||||
Pfizer, Inc. | 166,118 | 6,315,806 | ||||||
|
| |||||||
| 25,552,451 | ||||||||
| Professional Services — 0.2% | ||||||||
Automatic Data Processing, Inc. | 2,054 | 429,266 | ||||||
Insperity, Inc. | 5,163 | 571,647 | ||||||
Paycom Software, Inc. | 153 | 42,860 | ||||||
|
| |||||||
| 1,043,773 | ||||||||
| Real Estate Management & Development — 0.0% | ||||||||
Zillow Group, Inc., Class A(a) | 1,616 | 72,381 | ||||||
|
| |||||||
| Residential REITs — 1.1% | ||||||||
Equity Residential | 95,106 | 5,782,445 | ||||||
|
| |||||||
| Retail REITs — 1.6% | ||||||||
Brixmor Property Group, Inc. | 41,467 | 830,584 | ||||||
Kimco Realty Corp. | 135,012 | 2,481,521 | ||||||
Regency Centers Corp. | 3,400 | 191,318 | ||||||
Simon Property Group, Inc. | 50,141 | 5,272,326 | ||||||
|
| |||||||
| 8,775,749 | ||||||||
| Semiconductors & Semiconductor Equipment — 3.1% | ||||||||
Analog Devices, Inc. | 26,707 | 4,745,567 | ||||||
Applied Materials, Inc. | 1,286 | 171,424 | ||||||
Intel Corp. | 196,266 | 6,170,603 | ||||||
NVIDIA Corp. | 14,727 | 5,571,813 | ||||||
|
| |||||||
| 16,659,407 | ||||||||
| Software — 3.1% | ||||||||
Adobe, Inc.(a) | 9,893 | 4,133,196 | ||||||
Autodesk, Inc.(a) | 600 | 119,634 | ||||||
Manhattan Associates, Inc.(a) | 21,249 | 3,854,994 | ||||||
Microsoft Corp. | 12,953 | 4,253,636 | ||||||
RingCentral, Inc., Class A(a) | 7,908 | 274,408 | ||||||
ServiceNow, Inc.(a) | 508 | 276,748 | ||||||
| Security | Shares | Value | ||||||
| Software (continued) | ||||||||
Splunk, Inc.(a) | 20,352 | $ | 2,020,750 | |||||
Teradata Corp.(a) | 1,554 | 72,820 | ||||||
VMware, Inc., Class A(a) | 3,327 | 453,437 | ||||||
Zoom Video Communications, Inc., Class A(a) | 17,991 | 1,207,736 | ||||||
|
| |||||||
| 16,667,359 | ||||||||
| Specialized REITs — 0.3% | ||||||||
SBA Communications Corp. | 6,656 | 1,476,168 | ||||||
VICI Properties, Inc. | 7,291 | 225,510 | ||||||
|
| |||||||
| 1,701,678 | ||||||||
| Specialty Retail — 2.2% | ||||||||
Best Buy Co., Inc. | 16,616 | 1,207,485 | ||||||
Dick’s Sporting Goods, Inc. | 11,670 | 1,488,042 | ||||||
Five Below, Inc.(a) | 1,640 | 282,933 | ||||||
Home Depot, Inc. | 3,092 | 876,427 | ||||||
Penske Automotive Group, Inc.(b) | 12,775 | 1,765,760 | ||||||
TJX Cos., Inc. | 78,719 | 6,044,832 | ||||||
|
| |||||||
| 11,665,479 | ||||||||
| Technology Hardware, Storage & Peripherals — 1.3% | ||||||||
Apple Inc. | 1,412 | 250,277 | ||||||
Hewlett Packard Enterprise Co. | 461,702 | 6,657,743 | ||||||
|
| |||||||
| 6,908,020 | ||||||||
| Textiles, Apparel & Luxury Goods — 0.6% | ||||||||
Crocs, Inc.(a) | 1,850 | 207,718 | ||||||
Lululemon Athletica, Inc.(a) | 8,462 | 2,808,791 | ||||||
Ralph Lauren Corp., Class A | 2,164 | 230,055 | ||||||
Under Armour, Inc., Class C, NVS(a) | 5,681 | 37,381 | ||||||
|
| |||||||
| 3,283,945 | ||||||||
| Trading Companies & Distributors — 0.6% | ||||||||
Univar Solutions, Inc.(a) | 10,383 | 369,843 | ||||||
WW Grainger, Inc. | 4,571 | 2,966,670 | ||||||
|
| |||||||
| 3,336,513 | ||||||||
| Wireless Telecommunication Services — 0.1% | ||||||||
United States Cellular Corp.(a)(b) | 40,504 | 579,207 | ||||||
|
| |||||||
Total Long-Term Investments — 99.0% |
| 536,773,120 | ||||||
|
| |||||||
| Short-Term Securities | ||||||||
| Money Market Funds — 1.1% | ||||||||
BlackRock Liquidity Funds, T-Fund, Institutional Class, 5.00%(c)(d) | 4,925,122 | 4,925,122 | ||||||
SL Liquidity Series, LLC, Money Market Series, 5.32%(c)(d)(e) | 973,342 | 973,342 | ||||||
|
| |||||||
Total Short-Term Securities — 1.1% |
| 5,898,464 | ||||||
|
| |||||||
Total Investments — 100.1% |
| 542,671,584 | ||||||
Liabilities in Excess of Other Assets — (0.1)% |
| (295,368 | ) | |||||
|
| |||||||
Net Assets — 100.0% |
| $ | 542,376,216 | |||||
|
| |||||||
| (a) | Non-income producing security. |
| (b) | All or a portion of this security is on loan. |
| (c) | Affiliate of the Fund. |
| (d) | Annualized 7-day yield as of period end. |
| (e) | All or a portion of this security was purchased with the cash collateral from loaned securities. |
| 50 | 2 0 2 3 BLACK ROCK ANNUAL REPORT TO SHAREHOLDERS |
Schedule of Investments (continued) May 31, 2023 | BlackRock Advantage Large Cap Value Fund |
Affiliates
Investments in issuers considered to be affiliate(s) of the Fund during the year ended May 31, 2023 for purposes of Section 2(a)(3) of the Investment Company Act of 1940, as amended, were as follows:
| Affiliated Issuer | Value at 05/31/22 | Purchases at Cost | Proceeds from Sale | Net Realized Gain (Loss) | Change in Unrealized Appreciation (Depreciation) | Value at 05/31/23 | Shares Held at 05/31/23 | Income | Capital Gain Distributions from Underlying Funds | |||||||||||||||||||||||||||
BlackRock Liquidity Funds, T-Fund, Institutional Class | $ | 6,051,649 | $ | — | $ | (1,126,527 | )(a) | $ | — | $ | — | $ | 4,925,122 | 4,925,122 | $ | 172,727 | $ | — | ||||||||||||||||||
SL Liquidity Series, LLC, Money Market Series | 1,202,047 | — | (231,547 | )(a) | 2,148 | 694 | 973,342 | 973,342 | 38,573 | (b) | — | |||||||||||||||||||||||||
|
|
|
|
|
|
|
|
|
| |||||||||||||||||||||||||||
| $ | 2,148 | $ | 694 | $ | 5,898,464 | $ | 211,300 | $ | — | |||||||||||||||||||||||||||
|
|
|
|
|
|
|
|
|
| |||||||||||||||||||||||||||
| (a) | Represents net amount purchased (sold). |
| (b) | All or a portion represents securities lending income earned from the reinvestment of cash collateral from loaned securities, net of fees and collateral investment expenses, and other payments to and from borrowers of securities. |
For Fund compliance purposes, the Fund’s industry classifications refer to one or more of the industry sub-classifications used by one or more widely recognized market indexes or rating group indexes, and/or as defined by the investment adviser. These definitions may not apply for purposes of this report, which may combine such industry sub-classifications for reporting ease.
Derivative Financial Instruments Outstanding as of Period End
Futures Contracts
| Description | Number of Contracts | Expiration Date | Notional Amount (000) | Value/ Unrealized Appreciation (Depreciation) | ||||||||||||
Long Contracts | ||||||||||||||||
S&P 500 E-Mini Index | 31 | 06/16/23 | $ | 6,495 | $ | 353,384 | ||||||||||
|
| |||||||||||||||
Derivative Financial Instruments Categorized by Risk Exposure
As of period end, the fair values of derivative financial instruments located in the Statements of Assets and Liabilities were as follows:
| Commodity Contracts | Credit Contracts | Equity Contracts | Foreign Currency Exchange Contracts | Interest Rate Contracts | Other Contracts | Total | ||||||||||||||||||||||
Assets — Derivative Financial Instruments | ||||||||||||||||||||||||||||
Futures contracts | ||||||||||||||||||||||||||||
Unrealized appreciation on futures contracts(a) | $ | — | $ | — | $ | 353,384 | $ | — | $ | — | $ | — | $ | 353,384 | ||||||||||||||
|
|
|
|
|
|
|
|
|
|
|
|
|
| |||||||||||||||
| (a) | Net cumulative unrealized appreciation (depreciation) on futures contracts, if any, are reported in the Schedule of Investments. In the Statements of Assets and Liabilities, only current day’s variation margin is reported in receivables or payables and the net cumulative unrealized appreciation (depreciation) is included in accumulated earnings (loss). |
For the period ended May 31, 2023, the effect of derivative financial instruments in the Statements of Operations was as follows:
| Commodity Contracts | Credit Contracts | Equity Contracts | Foreign Currency Exchange Contracts | Interest Rate Contracts | Other Contracts | Total | ||||||||||||||||||||||
Net Realized Gain (Loss) from | ||||||||||||||||||||||||||||
Futures contracts | $ | — | $ | — | $ | (873,650 | ) | $ | — | $ | — | $ | — | $ | (873,650 | ) | ||||||||||||
|
|
|
|
|
|
|
|
|
|
|
|
|
| |||||||||||||||
Net Change in Unrealized Appreciation (Depreciation) on | ||||||||||||||||||||||||||||
Futures contracts | $ | — | $ | — | $ | 242,350 | $ | — | $ | — | $ | — | $ | 242,350 | ||||||||||||||
|
|
|
|
|
|
|
|
|
|
|
|
|
| |||||||||||||||
SCHEDULES OF INVESTMENTS | 51 |
Schedule of Investments (continued) May 31, 2023 | BlackRock Advantage Large Cap Value Fund |
Average Quarterly Balances of Outstanding Derivative Financial Instruments
Futures contracts | ||||
Average notional value of contracts — long | $ | 6,780,466 |
For more information about the Fund’s investment risks regarding derivative financial instruments, refer to the Notes to Financial Statements.
Fair Value Hierarchy as of Period End
Various inputs are used in determining the fair value of financial instruments. For a description of the input levels and information about the Fund’s policy regarding valuation of financial instruments, refer to the Notes to Financial Statements.
The following table summarizes the Fund’s financial instruments categorized in the fair value hierarchy. The breakdown of the Fund’s financial instruments into major categories is disclosed in the Schedule of Investments above.
| Level 1 | Level 2 | Level 3 | Total | |||||||||||||
Assets | ||||||||||||||||
Investments | ||||||||||||||||
Long-Term Investments | ||||||||||||||||
Common Stocks | $ | 536,773,120 | $ | — | $ | — | $ | 536,773,120 | ||||||||
Short-Term Securities | ||||||||||||||||
Money Market Funds | 4,925,122 | — | — | 4,925,122 | ||||||||||||
|
|
|
|
|
|
|
| |||||||||
| $ | 541,698,242 | $ | — | $ | — | 541,698,242 | ||||||||||
|
|
|
|
|
|
|
| |||||||||
Investments valued at NAV(a) | 973,342 | |||||||||||||||
|
| |||||||||||||||
| $ | 542,671,584 | |||||||||||||||
|
| |||||||||||||||
Derivative Financial Instruments(b) | ||||||||||||||||
Assets | ||||||||||||||||
Equity Contracts | $ | 353,384 | $ | — | $ | — | $ | 353,384 | ||||||||
|
|
|
|
|
|
|
| |||||||||
| (a) | Certain investments of the Fund were fair valued using NAV as a practical expedient or its equivalent as no quoted market value is available and therefore have been excluded from the fair value hierarchy. |
| (b) | Derivative financial instruments futures contracts. Futures contracts are valued at the unrealized appreciation (depreciation) on the instrument. |
See notes to financial statements.
��
| 52 | 2 0 2 3 BLACK ROCK ANNUAL REPORT TO SHAREHOLDERS |
Statements of Assets and Liabilities
May 31, 2023
| BlackRock Advantage International Fund | BlackRock Advantage Large Cap Growth Fund | BlackRock Advantage Small Cap Core Fund | BlackRock Advantage Large Cap Core Fund | BlackRock Advantage Large Cap Value Fund | ||||||||||||||||
ASSETS | ||||||||||||||||||||
Investments, at value — unaffiliated(a)(b) | $ | 1,174,400,984 | $ | 944,790,593 | $ | 3,409,644,133 | $ | 2,795,997,662 | $ | 536,773,120 | ||||||||||
Investments, at value — affiliated(c) | 41,717,774 | 18,281,315 | 131,839,369 | 26,520,848 | 5,898,464 | |||||||||||||||
Cash | — | — | — | 2,411,547 | 7,532 | |||||||||||||||
Cash pledged: | ||||||||||||||||||||
Futures contracts | 1,410,000 | 560,000 | 2,787,000 | 1,720,000 | 351,006 | |||||||||||||||
Foreign currency, at value(d) | 3,348,215 | 77,725 | — | — | — | |||||||||||||||
Receivables: | ||||||||||||||||||||
Investments sold | 22,076,252 | 10,528,339 | 27,737,668 | 26,631,248 | 5,315,749 | |||||||||||||||
Securities lending income — affiliated | 274 | 911 | 187,123 | 1,740 | 344 | |||||||||||||||
Capital shares sold | 1,553,387 | 137,939 | 2,790,787 | 840,017 | 59,663 | |||||||||||||||
Dividends — unaffiliated | 8,424,167 | 677,018 | 3,220,999 | 3,392,772 | 1,140,292 | |||||||||||||||
Dividends — affiliated | 123,528 | 34,016 | 128,540 | 99,870 | 20,757 | |||||||||||||||
Interest — unaffiliated | — | — | 255 | — | — | |||||||||||||||
From the Manager | 143,651 | 104,918 | 229,935 | 338,855 | 45,842 | |||||||||||||||
Prepaid expenses | 58,357 | 55,356 | 63,882 | 57,337 | 48,808 | |||||||||||||||
|
|
|
|
|
|
|
|
|
| |||||||||||
Total assets | 1,253,256,589 | 975,248,130 | 3,578,629,691 | 2,858,011,896 | 549,661,577 | |||||||||||||||
|
|
|
|
|
|
|
|
|
| |||||||||||
LIABILITIES | ||||||||||||||||||||
Collateral on securities loaned | 2,619,531 | 12,172,035 | 99,154,486 | 1,010,154 | 971,663 | |||||||||||||||
Payables: | ||||||||||||||||||||
Investments purchased | 30,248,534 | 8,285,186 | 28,351,926 | 26,326,134 | 5,164,839 | |||||||||||||||
Administration fees | 82,596 | 68,506 | 221,912 | 179,538 | 39,545 | |||||||||||||||
Capital shares redeemed | 488,498 | 457,619 | 4,654,165 | 1,770,139 | 350,961 | |||||||||||||||
Investment advisory fees | 743,295 | 757,077 | 2,292,695 | 1,733,298 | 361,643 | |||||||||||||||
Directors’ and Officer’s fees | 2,802 | 2,709 | 7,071 | 5,212 | 2,168 | |||||||||||||||
Other accrued expenses | 605,242 | 111,102 | 1,046,299 | 1,128,962 | 168,306 | |||||||||||||||
Other affiliate fees | 34,060 | 53,442 | — | 112,033 | 4,982 | |||||||||||||||
Professional fees | 46,092 | 65,980 | 70,108 | 5,570 | 92,449 | |||||||||||||||
Registration fees | — | — | 159,188 | — | — | |||||||||||||||
Service and distribution fees | 55,480 | 99,419 | 77,012 | 296,026 | 90,830 | |||||||||||||||
Variation margin on futures contracts | 483,403 | 59,766 | 419,046 | 186,189 | 37,975 | |||||||||||||||
|
|
|
|
|
|
|
|
|
| |||||||||||
Total liabilities | 35,409,533 | 22,132,841 | 136,453,908 | 32,753,255 | 7,285,361 | |||||||||||||||
|
|
|
|
|
|
|
|
|
| |||||||||||
NET ASSETS | $ | 1,217,847,056 | $ | 953,115,289 | $ | 3,442,175,783 | $ | 2,825,258,641 | $ | 542,376,216 | ||||||||||
|
|
|
|
|
|
|
|
|
| |||||||||||
NET ASSETS CONSIST OF: | ||||||||||||||||||||
Paid-in capital | $ | 1,192,431,814 | $ | 671,288,029 | $ | 4,068,777,979 | $ | 2,427,250,634 | $ | 530,264,442 | ||||||||||
Accumulated earnings (loss) | 25,415,242 | 281,827,260 | (626,602,196 | ) | 398,008,007 | 12,111,774 | ||||||||||||||
|
|
|
|
|
|
|
|
|
| |||||||||||
NET ASSETS | $ | 1,217,847,056 | $ | 953,115,289 | $ | 3,442,175,783 | $ | 2,825,258,641 | $ | 542,376,216 | ||||||||||
|
|
|
|
|
|
|
|
|
| |||||||||||
(a) Investments, at cost — unaffiliated | $ | 1,053,176,042 | $ | 632,033,704 | $ | 3,661,998,796 | $ | 2,284,628,593 | $ | 511,418,070 | ||||||||||
(b) Securities loaned, at value | $ | 2,396,012 | $ | 11,857,692 | $ | 93,581,953 | $ | 939,896 | $ | 856,547 | ||||||||||
(c) Investments, at cost — affiliated | $ | 41,717,581 | $ | 18,282,497 | $ | 131,787,718 | $ | 26,520,124 | $ | 5,897,770 | ||||||||||
(d) Foreign currency, at cost | $ | 3,342,619 | $ | 84,408 | $ | — | $ | — | $ | — | ||||||||||
FINANCIAL STATEMENTS | 53 |
Statements of Assets and Liabilities (continued)
May 31, 2023
| BlackRock Advantage International Fund | BlackRock Advantage Large Cap Growth Fund | BlackRock Advantage Small Cap Core Fund | BlackRock Advantage Large Cap Core Fund | BlackRock Advantage Large Cap Value Fund | ||||||||||||||||
NET ASSET VALUE | ||||||||||||||||||||
Institutional | ||||||||||||||||||||
Net assets | $ | 771,697,700 | $ | 499,741,624 | $ | 2,152,756,549 | $ | 1,479,014,435 | $ | 164,433,700 | ||||||||||
|
|
|
|
|
|
|
|
|
| |||||||||||
Shares outstanding | 46,133,436 | 25,294,418 | 153,148,326 | 85,217,648 | 6,174,247 | |||||||||||||||
|
|
|
|
|
|
|
|
|
| |||||||||||
Net asset value | $ | 16.73 | $ | 19.76 | $ | 14.06 | $ | 17.36 | $ | 26.63 | ||||||||||
|
|
|
|
|
|
|
|
|
| |||||||||||
Shares authorized | Unlimited | Unlimited | Unlimited | 400 million | 400 million | |||||||||||||||
|
|
|
|
|
|
|
|
|
| |||||||||||
Par value | $ | 0.001 | $ | 0.001 | $ | 0.001 | $ | 0.10 | $ | 0.10 | ||||||||||
|
|
|
|
|
|
|
|
|
| |||||||||||
Investor A | ||||||||||||||||||||
Net assets | $ | 230,878,656 | $ | 441,982,995 | $ | 315,693,970 | $ | 1,271,383,763 | $ | 345,671,372 | ||||||||||
|
|
|
|
|
|
|
|
|
| |||||||||||
Shares outstanding | 13,977,360 | 23,796,109 | 22,620,092 | 77,516,829 | 13,364,994 | |||||||||||||||
|
|
|
|
|
|
|
|
|
| |||||||||||
Net asset value | $ | 16.52 | $ | 18.57 | $ | 13.96 | $ | 16.40 | $ | 25.86 | ||||||||||
|
|
|
|
|
|
|
|
|
| |||||||||||
Shares authorized | Unlimited | Unlimited | Unlimited | 300 million | 400 million | |||||||||||||||
|
|
|
|
|
|
|
|
|
| |||||||||||
Par value | $ | 0.001 | $ | 0.001 | $ | 0.001 | $ | 0.10 | $ | 0.10 | ||||||||||
|
|
|
|
|
|
|
|
|
| |||||||||||
Investor C | ||||||||||||||||||||
Net assets | $ | 2,598,082 | $ | 8,371,587 | $ | 9,275,980 | $ | 31,813,264 | $ | 14,894,339 | ||||||||||
|
|
|
|
|
|
|
|
|
| |||||||||||
Shares outstanding | 162,077 | 562,455 | 686,987 | 2,445,134 | 635,731 | |||||||||||||||
|
|
|
|
|
|
|
|
|
| |||||||||||
Net asset value | $ | 16.03 | $ | 14.88 | $ | 13.50 | $ | 13.01 | $ | 23.43 | ||||||||||
|
|
|
|
|
|
|
|
|
| |||||||||||
Shares authorized | Unlimited | Unlimited | Unlimited | 400 million | 400 million | |||||||||||||||
|
|
|
|
|
|
|
|
|
| |||||||||||
Par value | $ | 0.001 | $ | 0.001 | $ | 0.001 | $ | 0.10 | $ | 0.10 | ||||||||||
|
|
|
|
|
|
|
|
|
| |||||||||||
Class K | ||||||||||||||||||||
Net assets | $ | 193,748,064 | $ | 2,489,004 | $ | 964,449,284 | $ | 31,567,986 | $ | 10,451,371 | ||||||||||
|
|
|
|
|
|
|
|
|
| |||||||||||
Shares outstanding | 11,580,950 | 125,961 | 68,547,331 | 1,818,023 | 392,381 | |||||||||||||||
|
|
|
|
|
|
|
|
|
| |||||||||||
Net asset value | $ | 16.73 | $ | 19.76 | $ | 14.07 | $ | 17.36 | $ | 26.64 | ||||||||||
|
|
|
|
|
|
|
|
|
| |||||||||||
Shares authorized | Unlimited | Unlimited | Unlimited | 2 billion | 2 billion | |||||||||||||||
|
|
|
|
|
|
|
|
|
| |||||||||||
Par value | $ | 0.001 | $ | 0.001 | $ | 0.001 | $ | 0.10 | $ | 0.10 | ||||||||||
|
|
|
|
|
|
|
|
|
| |||||||||||
Class R | ||||||||||||||||||||
Net assets | $ | 18,924,554 | $ | 530,079 | N/A | $ | 11,479,193 | $ | 6,925,434 | |||||||||||
|
|
|
|
|
|
|
|
|
| |||||||||||
Shares outstanding | 1,144,638 | 27,084 | N/A | 775,761 | 282,470 | |||||||||||||||
|
|
|
|
|
|
|
|
|
| |||||||||||
Net asset value | $ | 16.53 | $ | 19.57 | N/A | $ | 14.80 | $ | 24.52 | |||||||||||
|
|
|
|
|
|
|
|
|
| |||||||||||
Shares authorized | Unlimited | Unlimited | N/A | 200 million | 200 million | |||||||||||||||
|
|
|
|
|
|
|
|
|
| |||||||||||
Par value | $ | 0.001 | $ | 0.001 | N/A | $ | 0.10 | $ | 0.10 | |||||||||||
|
|
|
|
|
|
|
|
|
| |||||||||||
See notes to financial statements.
| 54 | 2 0 2 3 BLACK ROCK ANNUAL REPORT TO SHAREHOLDERS |
Year Ended May 31, 2023
BlackRock Fund | BlackRock Large Cap Growth Fund | BlackRock Small Cap Core Fund | ||||||||||
INVESTMENT INCOME | ||||||||||||
Dividends — unaffiliated | $ | 41,509,706 | $ | 9,434,138 | $ | 50,844,989 | ||||||
Dividends — affiliated | 756,782 | 294,631 | 1,202,928 | |||||||||
Securities lending income — affiliated — net | 59,267 | 7,555 | 1,158,211 | |||||||||
Foreign taxes withheld | (3,868,233 | ) | (1,773 | ) | (152,542 | ) | ||||||
|
|
|
|
|
| |||||||
Total investment income | 38,457,522 | 9,734,551 | 53,053,586 | |||||||||
|
|
|
|
|
| |||||||
EXPENSES | ||||||||||||
Investment advisory | 4,780,691 | 5,027,585 | 15,841,692 | |||||||||
Transfer agent — class specific | 1,159,713 | 902,378 | 2,568,152 | |||||||||
Service and distribution — class specific | 592,584 | 1,137,145 | 942,484 | |||||||||
Administration | 437,592 | 365,313 | 1,388,551 | |||||||||
Custodian | 302,580 | 41,443 | 109,207 | |||||||||
Administration — class specific | 213,586 | 176,434 | 743,567 | |||||||||
Professional | 133,816 | 115,625 | 110,873 | |||||||||
Registration | 96,784 | 88,184 | 352,702 | |||||||||
Accounting services | 94,453 | 84,344 | 238,118 | |||||||||
Printing and postage | 46,850 | 36,737 | 47,243 | |||||||||
Directors and Officer | 15,415 | 13,966 | 41,353 | |||||||||
Miscellaneous | 3,252 | 26,552 | 68,026 | |||||||||
|
|
|
|
|
| |||||||
Total expenses | 7,877,316 | 8,015,706 | 22,451,968 | |||||||||
Less: | ||||||||||||
Administration fees waived by the Manager — class specific | (213,586 | ) | (112,691 | ) | (743,567 | ) | ||||||
Fees waived and/or reimbursed by the Manager | (1,105,198 | ) | (771,768 | ) | (1,468,837 | ) | ||||||
Transfer agent fees waived and/or reimbursed by the Manager — class specific | (698,818 | ) | (588,897 | ) | (1,210,231 | ) | ||||||
|
|
|
|
|
| |||||||
Total expenses after fees waived and/or reimbursed | 5,859,714 | 6,542,350 | 19,029,333 | |||||||||
|
|
|
|
|
| |||||||
Net investment income | 32,597,808 | 3,192,201 | 34,024,253 | |||||||||
|
|
|
|
|
| |||||||
REALIZED AND UNREALIZED GAIN (LOSS) | ||||||||||||
Net realized gain (loss) from: | ||||||||||||
Investments — unaffiliated | (66,424,794 | ) | (14,485,903 | ) | (238,825,437 | ) | ||||||
Investments — affiliated | 19 | 3,300 | (2,082 | ) | ||||||||
Futures contracts | 735,413 | 222,696 | (4,805,742 | ) | ||||||||
Foreign currency transactions | (293,253 | ) | — | — | ||||||||
|
|
|
|
|
| |||||||
| (65,982,615 | ) | (14,259,907 | ) | (243,633,261 | ) | |||||||
|
|
|
|
|
| |||||||
Net change in unrealized appreciation (depreciation) on: | ||||||||||||
Investments — unaffiliated | 92,255,979 | 66,545,633 | 884,917 | |||||||||
Investments — affiliated | (687 | ) | (1,227 | ) | 9,562 | |||||||
Futures contracts | (1,491,530 | ) | 727,458 | (3,130,512 | ) | |||||||
Foreign currency translations | (21,182 | ) | (340 | ) | — | |||||||
|
|
|
|
|
| |||||||
| 90,742,580 | 67,271,524 | (2,236,033 | ) | |||||||||
|
|
|
|
|
| |||||||
Net realized and unrealized gain (loss) | 24,759,965 | 53,011,617 | (245,869,294 | ) | ||||||||
|
|
|
|
|
| |||||||
NET INCREASE (DECREASE) IN NET ASSETS RESULTING FROM OPERATIONS | $ | 57,357,773 | $ | 56,203,818 | $ | (211,845,041 | ) | |||||
|
|
|
|
|
| |||||||
See notes to financial statements.
FINANCIAL STATEMENTS | 55 |
Statements of Operations (continued)
Year Ended May 31, 2023
| BlackRock Advantage Large Cap Core Fund | BlackRock Advantage Large Cap Value Fund | |||||||
INVESTMENT INCOME | ||||||||
Dividends — unaffiliated | $ | 45,224,036 | $ | 12,631,234 | ||||
Dividends — affiliated | 776,979 | 172,727 | ||||||
Securities lending income — affiliated — net | 37,536 | 38,573 | ||||||
Foreign taxes withheld | (7,270 | ) | (910 | ) | ||||
|
|
|
| |||||
Total investment income | 46,031,281 | 12,841,624 | ||||||
|
|
|
| |||||
EXPENSES | ||||||||
Investment advisory | 12,011,415 | 2,786,381 | ||||||
Service and distribution — class specific | 3,562,766 | 1,109,383 | ||||||
Transfer agent — class specific | 3,492,679 | 572,600 | ||||||
Administration | 1,063,468 | 239,960 | ||||||
Administration — class specific | 557,888 | 113,776 | ||||||
Accounting services | 187,746 | 67,342 | ||||||
Professional | 119,138 | 144,254 | ||||||
Registration | 113,047 | 86,342 | ||||||
Custodian | 95,903 | 29 | ||||||
Printing and postage | 41,010 | 37,024 | ||||||
Directors and Officer | 32,603 | 11,606 | ||||||
Miscellaneous | 69,101 | 24,622 | ||||||
|
|
|
| |||||
Total expenses | 21,346,764 | 5,193,319 | ||||||
Less: | ||||||||
Administration fees waived by the Manager — class specific | (557,888 | ) | (113,776 | ) | ||||
Fees waived and/or reimbursed by the Manager | (1,743,102 | ) | (611,138 | ) | ||||
Transfer agent fees waived and/or reimbursed — class specific | (2,113,888 | ) | (293,537 | ) | ||||
|
|
|
| |||||
Total expenses after fees waived and/or reimbursed | 16,931,886 | 4,174,868 | ||||||
|
|
|
| |||||
Net investment income | 29,099,395 | 8,666,756 | ||||||
|
|
|
| |||||
REALIZED AND UNREALIZED GAIN (LOSS) | ||||||||
Net realized gain (loss) from: | ||||||||
Investments — unaffiliated | (54,201,159 | ) | (858,507 | ) | ||||
Investments — affiliated | (5,159 | ) | 2,148 | |||||
Futures contracts | (3,745,547 | ) | (873,650 | ) | ||||
Payment by affiliate | 16,519 | — | ||||||
|
|
|
| |||||
| (57,935,346 | ) | (1,730,009 | ) | |||||
|
|
|
| |||||
Net change in unrealized appreciation (depreciation) on: | ||||||||
Investments — unaffiliated | 28,017,299 | (38,951,084 | ) | |||||
Investments — affiliated | 724 | 694 | ||||||
Futures contracts | 2,082,322 | 242,350 | ||||||
|
|
|
| |||||
| 30,100,345 | (38,708,040 | ) | ||||||
|
|
|
| |||||
Net realized and unrealized loss | (27,835,001 | ) | (40,438,049 | ) | ||||
|
|
|
| |||||
NET INCREASE (DECREASE) IN NET ASSETS RESULTING FROM OPERATIONS | $ | 1,264,394 | $ | (31,771,293 | ) | |||
|
|
|
| |||||
See notes to financial statements.
| 56 | 2 0 2 3 BLACK ROCK ANNUAL REPORT TO SHAREHOLDERS |
Statements of Changes in Net Assets
| BlackRock Advantage International Fund | BlackRock Advantage Large Cap Growth Fund | |||||||||||||||
| Year Ended 05/31/23 | Year Ended 05/31/22 | Year Ended 05/31/23 | Year Ended 05/31/22 | |||||||||||||
INCREASE (DECREASE) IN NET ASSETS | ||||||||||||||||
OPERATIONS | ||||||||||||||||
Net investment income (loss) | $ | 32,597,808 | $ | 26,775,669 | $ | 3,192,201 | $ | (569,120 | ) | |||||||
Net realized gain (loss) | (65,982,615 | ) | 13,815,739 | (14,259,907 | ) | 61,322,883 | ||||||||||
Net change in unrealized appreciation (depreciation) | 90,742,580 | (158,114,198 | ) | 67,271,524 | (132,089,230 | ) | ||||||||||
|
|
|
|
|
|
|
| |||||||||
Net increase (decrease) in net assets resulting from operations | 57,357,773 | (117,522,790 | ) | 56,203,818 | (71,335,467 | ) | ||||||||||
|
|
|
|
|
|
|
| |||||||||
DISTRIBUTIONS TO SHAREHOLDERS(a) | ||||||||||||||||
Institutional | (23,002,049 | ) | (56,532,048 | ) | (1,487,169 | ) | (44,257,293 | ) | ||||||||
Investor A | (6,936,172 | ) | (29,302,058 | ) | (734,722 | ) | (108,743,677 | ) | ||||||||
Investor C | (57,995 | ) | (240,559 | ) | — | (2,223,605 | ) | |||||||||
Class K | (3,878,150 | ) | (8,265,311 | ) | (6,578 | ) | (260,167 | ) | ||||||||
Class R | (73,700 | ) | (255,950 | ) | (147 | ) | (58,102 | ) | ||||||||
|
|
|
|
|
|
|
| |||||||||
Decrease in net assets resulting from distributions to shareholders | (33,948,066 | ) | (94,595,926 | ) | (2,228,616 | ) | (155,542,844 | ) | ||||||||
|
|
|
|
|
|
|
| |||||||||
CAPITAL SHARE TRANSACTIONS | ||||||||||||||||
Net increase in net assets derived from capital share transactions | 135,628,015 | 87,661,542 | 1,585,172 | 75,061,115 | ||||||||||||
|
|
|
|
|
|
|
| |||||||||
NET ASSETS | ||||||||||||||||
Total increase (decrease) in net assets | 159,037,722 | (124,457,174 | ) | 55,560,374 | (151,817,196 | ) | ||||||||||
Beginning of year | 1,058,809,334 | 1,183,266,508 | 897,554,915 | 1,049,372,111 | ||||||||||||
|
|
|
|
|
|
|
| |||||||||
End of year | $ | 1,217,847,056 | $ | 1,058,809,334 | $ | 953,115,289 | $ | 897,554,915 | ||||||||
|
|
|
|
|
|
|
| |||||||||
| (a) | Distributions for annual periods determined in accordance with U.S. federal income tax regulations. |
See notes to financial statements.
FINANCIAL STATEMENTS | 57 |
Statements of Changes in Net Assets (continued)
| BlackRock Advantage Small Cap Core Fund | BlackRock Advantage Large Cap Core Fund | |||||||||||||||||||
| Year Ended 05/31/23 | Year Ended 05/31/22 | Year Ended 05/31/23 | Period from 10/01/21 to 05/31/22 | Year Ended 09/30/21 | ||||||||||||||||
INCREASE (DECREASE) IN NET ASSETS | ||||||||||||||||||||
OPERATIONS | ||||||||||||||||||||
Net investment income | $ | 34,024,253 | $ | 29,215,493 | $ | 29,099,395 | $ | 17,849,810 | $ | 23,635,633 | ||||||||||
Net realized gain (loss) | (243,633,261 | ) | 250,713,459 | (57,935,346 | ) | 105,141,301 | 591,709,028 | |||||||||||||
Net change in unrealized appreciation (depreciation) | (2,236,033 | ) | (1,069,259,136 | ) | 30,100,345 | (286,927,386 | ) | 202,950,778 | ||||||||||||
|
|
|
|
|
|
|
|
|
| |||||||||||
Net increase (decrease) in net assets resulting from operations | (211,845,041 | ) | (789,330,184 | ) | 1,264,394 | (163,936,275 | ) | 818,295,439 | ||||||||||||
|
|
|
|
|
|
|
|
|
| |||||||||||
DISTRIBUTIONS TO SHAREHOLDERS(a) | ||||||||||||||||||||
Institutional | (65,785,212 | ) | (329,368,119 | ) | (87,947,101 | ) | (308,814,770 | ) | (70,259,334 | ) | ||||||||||
Service | — | — | — | — | (15,503 | ) | ||||||||||||||
Investor A | (8,392,738 | ) | (54,143,568 | ) | (78,931,541 | ) | (280,110,173 | ) | (66,523,425 | ) | ||||||||||
Investor C | (218,628 | ) | (1,508,629 | ) | (2,397,702 | ) | (8,989,662 | ) | (1,882,579 | ) | ||||||||||
Class K | (26,282,902 | ) | (113,826,903 | ) | (1,924,102 | ) | (11,248,178 | ) | (1,855,510 | ) | ||||||||||
Class R | — | — | (849,067 | ) | (2,790,705 | ) | (595,042 | ) | ||||||||||||
|
|
|
|
|
|
|
|
|
| |||||||||||
Decrease in net assets resulting from distributions to shareholders | (100,679,480 | ) | (498,847,219 | ) | (172,049,513 | ) | (611,953,488 | ) | (141,131,393 | ) | ||||||||||
|
|
|
|
|
|
|
|
|
| |||||||||||
CAPITAL SHARE TRANSACTIONS | ||||||||||||||||||||
Net increase (decrease) in net assets derived from capital share transactions . | (84,503,292 | ) | 860,940,149 | (48,914,390 | ) | 466,117,456 | (125,973,220 | ) | ||||||||||||
|
|
|
|
|
|
|
|
|
| |||||||||||
NET ASSETS | ||||||||||||||||||||
Total increase (decrease) in net assets | (397,027,813 | ) | (427,237,254 | ) | (219,699,509 | ) | (309,772,307 | ) | 551,190,826 | |||||||||||
Beginning of period | 3,839,203,596 | 4,266,440,850 | 3,044,958,150 | 3,354,730,457 | 2,803,539,631 | |||||||||||||||
|
|
|
|
|
|
|
|
|
| |||||||||||
End of period | $ | 3,442,175,783 | $ | 3,839,203,596 | $ | 2,825,258,641 | $ | 3,044,958,150 | $ | 3,354,730,457 | ||||||||||
|
|
|
|
|
|
|
|
|
| |||||||||||
| (a) | Distributions for annual periods determined in accordance with U.S. federal income tax regulations. |
See notes to financial statements.
| 58 | 2 0 2 3 BLACK ROCK ANNUAL REPORT TO SHAREHOLDERS |
Statements of Changes in Net Assets (continued)
| BlackRock Advantage Large Cap Value Fund | ||||||||
| Year Ended 05/31/23 | Year Ended 05/31/22 | |||||||
INCREASE (DECREASE) IN NET ASSETS | ||||||||
OPERATIONS | ||||||||
Net investment income | $ | 8,666,756 | $ | 7,845,046 | ||||
Net realized gain (loss) | (1,730,009 | ) | 73,721,702 | |||||
Net change in unrealized appreciation (depreciation) | (38,708,040 | ) | (78,673,932 | ) | ||||
|
|
|
| |||||
Net increase (decrease) in net assets resulting from operations | (31,771,293 | ) | 2,892,816 | |||||
|
|
|
| |||||
DISTRIBUTIONS TO SHAREHOLDERS(a) | ||||||||
Institutional | (9,937,889 | ) | (31,826,031 | ) | ||||
Investor A | (20,893,090 | ) | (68,214,081 | ) | ||||
Investor C | (893,218 | ) | (3,358,960 | ) | ||||
Class K | (574,235 | ) | (1,517,442 | ) | ||||
Class R | (460,361 | ) | (1,494,991 | ) | ||||
|
|
|
| |||||
Decrease in net assets resulting from distributions to shareholders | (32,758,793 | ) | (106,411,505 | ) | ||||
|
|
|
| |||||
CAPITAL SHARE TRANSACTIONS | ||||||||
Net increase (decrease) in net assets derived from capital share transactions | (11,079,734 | ) | 67,596,123 | |||||
|
|
|
| |||||
NET ASSETS | ||||||||
Total decrease in net assets | (75,609,820 | ) | (35,922,566 | ) | ||||
Beginning of year | 617,986,036 | 653,908,602 | ||||||
|
|
|
| |||||
End of year | $ | 542,376,216 | $ | 617,986,036 | ||||
|
|
|
| |||||
| (a) | Distributions for annual periods determined in accordance with U.S. federal income tax regulations. |
See notes to financial statements.
FINANCIAL STATEMENTS | 59 |
(For a share outstanding throughout each period)
| BlackRock Advantage International Fund | ||||||||||||||||||||||||
| Institutional | ||||||||||||||||||||||||
| Year Ended 05/31/23 | Year Ended 05/31/22 | Year Ended 05/31/21 | Period from to 05/31/20 | Year Ended 09/30/19 | Year Ended 09/30/18 | |||||||||||||||||||
Net asset value, beginning of period | $ | 16.48 | $ | 19.89 | $ | 14.52 | $ | 16.12 | $ | 16.97 | $ | 16.77 | ||||||||||||
|
|
|
|
|
|
|
|
|
|
|
| |||||||||||||
Net investment income(a) | 0.48 | 0.46 | 0.38 | 0.22 | 0.44 | 0.45 | ||||||||||||||||||
Net realized and unrealized gain (loss) | 0.29 | (2.28 | ) | 5.30 | (1.37 | ) | (0.90 | ) | (0.12 | ) | ||||||||||||||
|
|
|
|
|
|
|
|
|
|
|
| |||||||||||||
Net increase (decrease) from investment operations | 0.77 | (1.82 | ) | 5.68 | (1.15 | ) | (0.46 | ) | 0.33 | |||||||||||||||
|
|
|
|
|
|
|
|
|
|
|
| |||||||||||||
Distributions(b) | ||||||||||||||||||||||||
From net investment income | (0.52 | ) | (0.62 | ) | (0.31 | ) | (0.45 | ) | (0.39 | ) | (0.13 | ) | ||||||||||||
From net realized gain | — | (0.97 | ) | — | — | — | — | |||||||||||||||||
|
|
|
|
|
|
|
|
|
|
|
| |||||||||||||
Total distributions | (0.52 | ) | (1.59 | ) | (0.31 | ) | (0.45 | ) | (0.39 | ) | (0.13 | ) | ||||||||||||
|
|
|
|
|
|
|
|
|
|
|
| |||||||||||||
Net asset value, end of period | $ | 16.73 | $ | 16.48 | $ | 19.89 | $ | 14.52 | $ | 16.12 | $ | 16.97 | ||||||||||||
|
|
|
|
|
|
|
|
|
|
|
| |||||||||||||
Total Return(c) | ||||||||||||||||||||||||
Based on net asset value | 5.10 | % | (9.93 | )% | 39.57 | % | (7.45 | )%(d) | (2.52 | )% | 1.94 | %(e) | ||||||||||||
|
|
|
|
|
|
|
|
|
|
|
| |||||||||||||
Ratios to Average Net Assets(f) | ||||||||||||||||||||||||
Total expenses | 0.68 | % | 0.73 | % | 0.78 | % | 0.82 | %(g) | 0.88 | % | 0.86 | % | ||||||||||||
|
|
|
|
|
|
|
|
|
|
|
| |||||||||||||
Total expenses after fees waived and/or reimbursed | 0.50 | % | 0.50 | % | 0.50 | % | 0.50 | %(g) | 0.59 | % | 0.64 | % | ||||||||||||
|
|
|
|
|
|
|
|
|
|
|
| |||||||||||||
Net investment income | 3.08 | % | 2.51 | % | 2.21 | % | 2.17 | %(g) | 2.78 | % | 2.61 | % | ||||||||||||
|
|
|
|
|
|
|
|
|
|
|
| |||||||||||||
Supplemental Data | ||||||||||||||||||||||||
Net assets, end of period (000) | $ | 771,698 | $ | 710,116 | $ | 616,649 | $ | 477,944 | $ | 446,831 | $ | 403,149 | ||||||||||||
|
|
|
|
|
|
|
|
|
|
|
| |||||||||||||
Portfolio turnover rate | 128 | % | 132 | % | 247 | % | 131 | % | 140 | % | 106 | % | ||||||||||||
|
|
|
|
|
|
|
|
|
|
|
| |||||||||||||
| (a) | Based on average shares outstanding. |
| (b) | Distributions for annual periods determined in accordance with U.S. federal income tax regulations. |
| (c) | Where applicable, assumes the reinvestment of distributions. |
| (d) | Not annualized. |
| (e) | Includes the litigation settlement amount. Excluding this amount, the Fund’s total return is 1.82% |
| (f) | Excludes fees and expenses incurred indirectly as a result of investments in underlying funds. |
| (g) | Annualized. |
See notes to financial statements.
| 60 | 2 0 2 3 BLACK ROCK ANNUAL REPORT TO SHAREHOLDERS |
Financial Highlights (continued)
(For a share outstanding throughout each period)
| BlackRock Advantage International Fund (continued) | ||||||||||||||||||||||||
| Investor A | ||||||||||||||||||||||||
| Year Ended 05/31/23 | Year Ended 05/31/22 | Year Ended 05/31/21 | Period from 10/01/19 to 05/31/20 | Year Ended 09/30/19 | Year Ended 09/30/18 | |||||||||||||||||||
Net asset value, beginning of period | $ | 16.28 | $ | 19.65 | $ | 14.35 | $ | 15.93 | $ | 16.78 | $ | 16.60 | ||||||||||||
|
|
|
|
|
|
|
|
|
|
|
| |||||||||||||
Net investment income(a) | 0.44 | 0.35 | 0.33 | 0.19 | 0.40 | 0.38 | ||||||||||||||||||
Net realized and unrealized gain (loss) | 0.28 | (2.19 | ) | 5.24 | (1.35 | ) | (0.90 | ) | (0.10 | ) | ||||||||||||||
|
|
|
|
|
|
|
|
|
|
|
| |||||||||||||
Net increase (decrease) from investment operations | 0.72 | (1.84 | ) | 5.57 | (1.16 | ) | (0.50 | ) | 0.28 | |||||||||||||||
|
|
|
|
|
|
|
|
|
|
|
| |||||||||||||
Distributions(b) | ||||||||||||||||||||||||
From net investment income | (0.48 | ) | (0.56 | ) | (0.27 | ) | (0.42 | ) | (0.35 | ) | (0.10 | ) | ||||||||||||
From net realized gain | — | (0.97 | ) | — | — | — | — | |||||||||||||||||
|
|
|
|
|
|
|
|
|
|
|
| |||||||||||||
Total distributions | (0.48 | ) | (1.53 | ) | (0.27 | ) | (0.42 | ) | (0.35 | ) | (0.10 | ) | ||||||||||||
|
|
|
|
|
|
|
|
|
|
|
| |||||||||||||
Net asset value, end of period | $ | 16.52 | $ | 16.28 | $ | 19.65 | $ | 14.35 | $ | 15.93 | $ | 16.78 | ||||||||||||
|
|
|
|
|
|
|
|
|
|
|
| |||||||||||||
Total Return(c) | ||||||||||||||||||||||||
Based on net asset value | 4.82 | % | (10.13 | )% | 39.21 | % | (7.61 | )%(d) | (2.77 | )% | 1.68 | %(e) | ||||||||||||
|
|
|
|
|
|
|
|
|
|
|
| |||||||||||||
Ratios to Average Net Assets(f) | ||||||||||||||||||||||||
Total expenses | 1.00 | % | 1.02 | % | 1.05 | % | 1.08 | %(g) | 1.16 | % | 1.15 | % | ||||||||||||
|
|
|
|
|
|
|
|
|
|
|
| |||||||||||||
Total expenses after fees waived and/or reimbursed | 0.75 | % | 0.75 | % | 0.75 | % | 0.75 | %(g) | 0.84 | % | 0.89 | % | ||||||||||||
|
|
|
|
|
|
|
|
|
|
|
| |||||||||||||
Net investment income | 2.82 | % | 1.93 | % | 1.95 | % | 1.85 | %(g) | 2.56 | % | 2.20 | % | ||||||||||||
|
|
|
|
|
|
|
|
|
|
|
| |||||||||||||
Supplemental Data | ||||||||||||||||||||||||
Net assets, end of period (000) | $ | 230,879 | $ | 240,255 | $ | 456,083 | $ | 366,411 | $ | 404,739 | $ | 302,725 | ||||||||||||
|
|
|
|
|
|
|
|
|
|
|
| |||||||||||||
Portfolio turnover rate | 128 | % | 132 | % | 247 | % | 131 | % | 140 | % | 106 | % | ||||||||||||
|
|
|
|
|
|
|
|
|
|
|
| |||||||||||||
| (a) | Based on average shares outstanding. |
| (b) | Distributions for annual periods determined in accordance with U.S. federal income tax regulations. |
| (c) | Where applicable, excludes the effects of any sales charges and assumes the reinvestment of distributions. |
| (d) | Not annualized. |
| (e) | Includes the litigation settlement amount. Excluding this amount, the Fund’s total return is 1.56% |
| (f) | Excludes fees and expenses incurred indirectly as a result of investments in underlying funds. |
| (g) | Annualized. |
See notes to financial statements.
FINANCIAL HIGHLIGHTS | 61 |
Financial Highlights (continued)
(For a share outstanding throughout each period)
| BlackRock Advantage International Fund (continued) | ||||||||||||||||||||||||
| Investor C | ||||||||||||||||||||||||
| Year Ended 05/31/23 | Year Ended 05/31/22 | Year Ended 05/31/21 | Period from 10/01/19 to 05/31/20 | Year Ended 09/30/19 | Year Ended 09/30/18 | |||||||||||||||||||
Net asset value, beginning of period | $ | 15.81 | $ | 19.12 | $ | 13.95 | $ | 15.43 | $ | 16.11 | $ | 15.96 | ||||||||||||
|
|
|
|
|
|
|
|
|
|
|
| |||||||||||||
Net investment income(a) | 0.32 | 0.22 | 0.16 | 0.10 | 0.23 | 0.23 | ||||||||||||||||||
Net realized and unrealized gain (loss) | 0.27 | (2.15 | ) | 5.14 | (1.31 | ) | (0.80 | ) | (0.08 | ) | ||||||||||||||
|
|
|
|
|
|
|
|
|
|
|
| |||||||||||||
Net increase (decrease) from investment operations | 0.59 | (1.93 | ) | 5.30 | (1.21 | ) | (0.57 | ) | 0.15 | |||||||||||||||
|
|
|
|
|
|
|
|
|
|
|
| |||||||||||||
Distributions(b) | ||||||||||||||||||||||||
From net investment income | (0.37 | ) | (0.41 | ) | (0.13 | ) | (0.27 | ) | (0.11 | ) | — | |||||||||||||
From net realized gain | — | (0.97 | ) | — | — | — | — | |||||||||||||||||
|
|
|
|
|
|
|
|
|
|
|
| |||||||||||||
Total distributions | (0.37 | ) | (1.38 | ) | (0.13 | ) | (0.27 | ) | (0.11 | ) | — | |||||||||||||
|
|
|
|
|
|
|
|
|
|
|
| |||||||||||||
Net asset value, end of period | $ | 16.03 | $ | 15.81 | $ | 19.12 | $ | 13.95 | $ | 15.43 | $ | 16.11 | ||||||||||||
|
|
|
|
|
|
|
|
|
|
|
| |||||||||||||
Total Return(c) | ||||||||||||||||||||||||
Based on net asset value | 4.04 | % | (10.83 | )% | 38.21 | % | (8.05 | )%(d) | (3.51 | )% | 0.94 | %(e) | ||||||||||||
|
|
|
|
|
|
|
|
|
|
|
| |||||||||||||
Ratios to Average Net Assets(f) | ||||||||||||||||||||||||
Total expenses | 1.78 | % | 1.83 | % | 1.88 | % | 1.84 | %(g) | 1.88 | % | 1.89 | % | ||||||||||||
|
|
|
|
|
|
|
|
|
|
|
| |||||||||||||
Total expenses after fees waived and/or reimbursed | 1.50 | % | 1.50 | % | 1.50 | % | 1.50 | %(g) | 1.59 | % | 1.64 | % | ||||||||||||
|
|
|
|
|
|
|
|
|
|
|
| |||||||||||||
Net investment income | 2.10 | % | 1.27 | % | 0.98 | % | 1.04 | %(g) | 1.52 | % | 1.39 | % | ||||||||||||
|
|
|
|
|
|
|
|
|
|
|
| |||||||||||||
Supplemental Data | ||||||||||||||||||||||||
Net assets, end of period (000) | $ | 2,598 | $ | 2,356 | $ | 3,664 | $ | 6,193 | $ | 9,448 | $ | 23,111 | ||||||||||||
|
|
|
|
|
|
|
|
|
|
|
| |||||||||||||
Portfolio turnover rate | 128 | % | 132 | % | 247 | % | 131 | % | 140 | % | 106 | % | ||||||||||||
|
|
|
|
|
|
|
|
|
|
|
| |||||||||||||
| (a) | Based on average shares outstanding. |
| (b) | Distributions for annual periods determined in accordance with U.S. federal income tax regulations. |
| (c) | Where applicable, excludes the effects of any sales charges and assumes the reinvestment of distributions. |
| (d) | Not annualized. |
| (e) | Includes the litigation settlement amount. Excluding this amount, the Fund’s total return is 0.81% |
| (f) | Excludes fees and expenses incurred indirectly as a result of investments in underlying funds. |
| (g) | Annualized. |
See notes to financial statements.
| 62 | 2 0 2 3 BLACK ROCK ANNUAL REPORT TO SHAREHOLDERS |
Financial Highlights (continued)
(For a share outstanding throughout each period)
| BlackRock Advantage International Fund (continued) | ||||||||||||||||||||||||
| Class K | ||||||||||||||||||||||||
| Year Ended 05/31/23 | Year Ended 05/31/22 | Year Ended 05/31/21 | Period from 10/01/19 to 05/31/20 | Year Ended 09/30/19 | Period from 01/25/18(a) to 09/30/18 | |||||||||||||||||||
Net asset value, beginning of period | $ | 16.48 | $ | 19.89 | $ | 14.52 | $ | 16.12 | $ | 16.98 | $ | 18.33 | ||||||||||||
|
|
|
|
|
|
|
|
|
|
|
| |||||||||||||
Net investment income(b) | 0.52 | 0.46 | 0.46 | 0.23 | 0.56 | 0.39 | ||||||||||||||||||
Net realized and unrealized gain (loss) | 0.26 | (2.28 | ) | 5.23 | (1.37 | ) | (1.03 | ) | (1.74 | ) | ||||||||||||||
|
|
|
|
|
|
|
|
|
|
|
| |||||||||||||
Net increase (decrease) from investment operations | 0.78 | (1.82 | ) | 5.69 | (1.14 | ) | (0.47 | ) | (1.35 | ) | ||||||||||||||
|
|
|
|
|
|
|
|
|
|
|
| |||||||||||||
Distributions(c) | ||||||||||||||||||||||||
From net investment income | (0.53 | ) | (0.62 | ) | (0.32 | ) | (0.46 | ) | (0.39 | ) | — | |||||||||||||
From net realized gain | — | (0.97 | ) | — | — | — | — | |||||||||||||||||
|
|
|
|
|
|
|
|
|
|
|
| |||||||||||||
Total distributions | (0.53 | ) | (1.59 | ) | (0.32 | ) | (0.46 | ) | (0.39 | ) | — | |||||||||||||
|
|
|
|
|
|
|
|
|
|
|
| |||||||||||||
Net asset value, end of period | $ | 16.73 | $ | 16.48 | $ | 19.89 | $ | 14.52 | $ | 16.12 | $ | 16.98 | ||||||||||||
|
|
|
|
|
|
|
|
|
|
|
| |||||||||||||
Total Return(d) | ||||||||||||||||||||||||
Based on net asset value | 5.16 | % | (9.89 | )% | 39.64 | % | (7.40 | )%(e) | (2.53 | )% | (7.37 | )%(f) | ||||||||||||
|
|
|
|
|
|
|
|
|
|
|
| |||||||||||||
Ratios to Average Net Assets(g) | ||||||||||||||||||||||||
Total expenses | 0.57 | % | 0.61 | % | 0.63 | % | 0.65 | %(h) | 0.75 | % | 0.80 | %(h) | ||||||||||||
|
|
|
|
|
|
|
|
|
|
|
| |||||||||||||
Total expenses after fees waived and/or reimbursed | 0.45 | % | 0.45 | % | 0.45 | % | 0.45 | %(h) | 0.54 | % | 0.59 | %(h) | ||||||||||||
|
|
|
|
|
|
|
|
|
|
|
| |||||||||||||
Net investment income | 3.28 | % | 2.55 | % | 2.65 | % | 2.20 | %(h) | 3.59 | % | 3.33 | %(h) | ||||||||||||
|
|
|
|
|
|
|
|
|
|
|
| |||||||||||||
Supplemental Data | ||||||||||||||||||||||||
Net assets, end of period (000) | $ | 193,748 | $ | 103,329 | $ | 103,454 | $ | 43,073 | $ | 43,721 | $ | 8,175 | ||||||||||||
|
|
|
|
|
|
|
|
|
|
|
| |||||||||||||
Portfolio turnover rate | 128 | % | 132 | % | 247 | % | 131 | % | 140 | % | 106 | %(i) | ||||||||||||
|
|
|
|
|
|
|
|
|
|
|
| |||||||||||||
| (a) | Commencement of operations. |
| (b) | Based on average shares outstanding. |
| (c) | Distributions for annual periods determined in accordance with U.S. federal income tax regulations. |
| (d) | Where applicable, assumes the reinvestment of distributions. |
| (e) | Not annualized. |
| (f) | Includes the litigation settlement amount. Excluding this amount, the Fund’s total return is (7.42)% |
| (g) | Excludes fees and expenses incurred indirectly as a result of investments in underlying funds. |
| (h) | Annualized. |
| (i) | Portfolio turnover is representative of the Fund for the entire year. |
See notes to financial statements.
FINANCIAL HIGHLIGHTS | 63 |
Financial Highlights (continued)
(For a share outstanding throughout each period)
BlackRock Advantage International Fund (continued) | ||||||||||||||||||||||||
| Class R | ||||||||||||||||||||||||
| Year Ended 05/31/23 | Year Ended 05/31/22 | Year Ended 05/31/21 | Period from to 05/31/20 | Year Ended 09/30/19 | Year Ended 09/30/18 | |||||||||||||||||||
Net asset value, beginning of period | $ | 16.29 | $ | 19.68 | $ | 14.36 | $ | 15.91 | $ | 16.74 | $ | 16.53 | ||||||||||||
|
|
|
|
|
|
|
|
|
|
|
| |||||||||||||
Net investment income(a) | 0.45 | 0.33 | 0.28 | 0.15 | 0.34 | 0.32 | ||||||||||||||||||
Net realized and unrealized gain (loss) | 0.23 | (2.23 | ) | 5.26 | (1.34 | ) | (0.88 | ) | (0.08 | ) | ||||||||||||||
|
|
|
|
|
|
|
|
|
|
|
| |||||||||||||
Net increase (decrease) from investment operations | 0.68 | (1.90 | ) | 5.54 | (1.19 | ) | (0.54 | ) | 0.24 | |||||||||||||||
|
|
|
|
|
|
|
|
|
|
|
| |||||||||||||
Distributions(b) | ||||||||||||||||||||||||
From net investment income | (0.44 | ) | (0.52 | ) | (0.22 | ) | (0.36 | ) | (0.29 | ) | (0.03 | ) | ||||||||||||
From net realized gain | — | (0.97 | ) | — | — | — | — | |||||||||||||||||
|
|
|
|
|
|
|
|
|
|
|
| |||||||||||||
Total distributions | (0.44 | ) | (1.49 | ) | (0.22 | ) | (0.36 | ) | (0.29 | ) | (0.03 | ) | ||||||||||||
|
|
|
|
|
|
|
|
|
|
|
| |||||||||||||
Net asset value, end of period | $ | 16.53 | $ | 16.29 | $ | 19.68 | $ | 14.36 | $ | 15.91 | $ | 16.74 | ||||||||||||
|
|
|
|
|
|
|
|
|
|
|
| |||||||||||||
Total Return(c) | ||||||||||||||||||||||||
Based on net asset value | 4.54 | % | (10.42 | )% | 38.91 | % | (7.75 | )%(d) | (3.04 | )% | 1.44 | %(e) | ||||||||||||
|
|
|
|
|
|
|
|
|
|
|
| |||||||||||||
Ratios to Average Net Assets(f) | ||||||||||||||||||||||||
Total expenses | 1.33 | % | 1.35 | % | 1.36 | % | 1.37 | %(g) | 1.44 | % | 1.45 | % | ||||||||||||
|
|
|
|
|
|
|
|
|
|
|
| |||||||||||||
Total expenses after fees waived and/or reimbursed | 1.00 | % | 1.00 | % | 1.00 | % | 1.00 | %(g) | 1.09 | % | 1.14 | % | ||||||||||||
|
|
|
|
|
|
|
|
|
|
|
| |||||||||||||
Net investment income | 2.75 | % | 1.81 | % | 1.67 | % | 1.47 | %(g) | 2.20 | % | 1.91 | % | ||||||||||||
|
|
|
|
|
|
|
|
|
|
|
| |||||||||||||
Supplemental Data | ||||||||||||||||||||||||
Net assets, end of period (000) | $ | 18,925 | $ | 2,753 | $ | 3,416 | $ | 3,310 | $ | 5,244 | $ | 7,572 | ||||||||||||
|
|
|
|
|
|
|
|
|
|
|
| |||||||||||||
Portfolio turnover rate | 128 | % | 132 | % | 247 | % | 131 | % | 140 | % | 106 | % | ||||||||||||
|
|
|
|
|
|
|
|
|
|
|
| |||||||||||||
| (a) | Based on average shares outstanding. |
| (b) | Distributions for annual periods determined in accordance with U.S. federal income tax regulations. |
| (c) | Where applicable, assumes the reinvestment of distributions. |
| (d) | Not annualized. |
| (e) | Includes the litigation settlement amount. Excluding this amount, the Fund’s total return is 1.26% |
| (f) | Excludes fees and expenses incurred indirectly as a result of investments in underlying funds. |
| (g) | Annualized. |
See notes to financial statements.
| 64 | 2 0 2 3 BLACK ROCK ANNUAL REPORT TO SHAREHOLDERS |
Financial Highlights
(For a share outstanding throughout each period)
BlackRock Advantage Large Cap Growth Fund | ||||||||||||||||||||||||
| Institutional | ||||||||||||||||||||||||
| | Year Ended 05/31/23 | | | Year Ended 05/31/22 | | | Year Ended 05/31/21 | | | Period from 10/01/19 to 05/31/20 |
| | Year Ended 09/30/19 | | | Year Ended 09/30/18 | | |||||||
Net asset value, beginning of period | $ | 18.77 | $ | 23.33 | $ | 18.23 | $ | 16.49 | $ | 17.89 | $ | 15.20 | ||||||||||||
|
|
|
|
|
|
|
|
|
|
|
| |||||||||||||
Net investment income(a) | 0.09 | 0.03 | 0.04 | 0.07 | 0.13 | 0.13 | ||||||||||||||||||
Net realized and unrealized gain (loss) | 0.96 | (1.25 | ) | 6.59 | 2.40 | (0.22 | ) | 3.52 | ||||||||||||||||
|
|
|
|
|
|
|
|
|
|
|
| |||||||||||||
Net increase (decrease) from investment operations | 1.05 | (1.22 | ) | 6.63 | 2.47 | (0.09 | ) | 3.65 | ||||||||||||||||
|
|
|
|
|
|
|
|
|
|
|
| |||||||||||||
Distributions(b) | ||||||||||||||||||||||||
From net investment income | (0.06 | ) | — | (0.07 | ) | (0.14 | ) | (0.13 | ) | (0.08 | ) | |||||||||||||
From net realized gain | — | (3.34 | ) | (1.46 | ) | (0.59 | ) | (1.18 | ) | (0.88 | ) | |||||||||||||
|
|
|
|
|
|
|
|
|
|
|
| |||||||||||||
Total distributions | (0.06 | ) | (3.34 | ) | (1.53 | ) | (0.73 | ) | (1.31 | ) | (0.96 | ) | ||||||||||||
|
|
|
|
|
|
|
|
|
|
|
| |||||||||||||
Net asset value, end of period | $ | 19.76 | $ | 18.77 | $ | 23.33 | $ | 18.23 | $ | 16.49 | $ | 17.89 | ||||||||||||
|
|
|
|
|
|
|
|
|
|
|
| |||||||||||||
Total Return(c) | ||||||||||||||||||||||||
Based on net asset value | 5.62 | % | (7.80 | )% | 37.54 | % | 15.34 | %(d) | 0.41 | % | 25.31 | % | ||||||||||||
|
|
|
|
|
|
|
|
|
|
|
| |||||||||||||
Ratios to Average Net Assets(e) | ||||||||||||||||||||||||
Total expenses | 0.75 | % | 0.75 | % | 0.83 | % | 0.86 | %(f) | 0.87 | % | 0.86 | % | ||||||||||||
|
|
|
|
|
|
|
|
|
|
|
| |||||||||||||
Total expenses after fees waived and/or reimbursed | 0.61 | % | 0.61 | % | 0.62 | % | 0.62 | %(f) | 0.62 | % | 0.62 | % | ||||||||||||
|
|
|
|
|
|
|
|
|
|
|
| |||||||||||||
Net investment income | 0.50 | % | 0.15 | % | 0.21 | % | 0.65 | %(f) | 0.82 | % | 0.83 | % | ||||||||||||
|
|
|
|
|
|
|
|
|
|
|
| |||||||||||||
Supplemental Data | ||||||||||||||||||||||||
Net assets, end of period (000) | $ | 499,742 | $ | 432,076 | $ | 125,061 | $ | 89,737 | $ | 79,564 | $ | 74,886 | ||||||||||||
|
|
|
|
|
|
|
|
|
|
|
| |||||||||||||
Portfolio turnover rate | 130 | % | 130 | % | 134 | % | 70 | % | 154 | % | 162 | % | ||||||||||||
|
|
|
|
|
|
|
|
|
|
|
| |||||||||||||
| (a) | Based on average shares outstanding. |
| (b) | Distributions for annual periods determined in accordance with U.S. federal income tax regulations. |
| (c) | Where applicable, assumes the reinvestment of distributions. |
| (d) | Not annualized. |
| (e) | Excludes fees and expenses incurred indirectly as a result of investments in underlying funds. |
| (f) | Annualized. |
See notes to financial statements.
FINANCIAL HIGHLIGHTS | 65 |
Financial Highlights (continued)
(For a share outstanding throughout each period)
BlackRock Advantage Large Cap Growth Fund (continued) | ||||||||||||||||||||||||
| Investor A | ||||||||||||||||||||||||
| | Year Ended 05/31/23 | | | Year Ended 05/31/22 | | | Year Ended 05/31/21 | | | Period from 10/01/19 to 05/31/20 |
| | Year Ended 09/30/19 | | | Year Ended 09/30/18 | | |||||||
Net asset value, beginning of period | $ | 17.67 | $ | 22.13 | $ | 17.35 | $ | 15.71 | $ | 17.11 | $ | 14.59 | ||||||||||||
|
|
|
|
|
|
|
|
|
|
|
| |||||||||||||
Net investment income (loss)(a) | 0.04 | (0.03 | ) | (0.01 | ) | 0.04 | 0.09 | 0.09 | ||||||||||||||||
Net realized and unrealized gain (loss) | 0.89 | (1.16 | ) | 6.27 | 2.28 | (0.22 | ) | 3.37 | ||||||||||||||||
|
|
|
|
|
|
|
|
|
|
|
| |||||||||||||
Net increase (decrease) from investment operations | 0.93 | (1.19 | ) | 6.26 | 2.32 | (0.13 | ) | 3.46 | ||||||||||||||||
|
|
|
|
|
|
|
|
|
|
|
| |||||||||||||
Distributions(b) | ||||||||||||||||||||||||
From net investment income | (0.03 | ) | — | (0.02 | ) | (0.09 | ) | (0.09 | ) | (0.06 | ) | |||||||||||||
From net realized gain | — | (3.27 | ) | (1.46 | ) | (0.59 | ) | (1.18 | ) | (0.88 | ) | |||||||||||||
|
|
|
|
|
|
|
|
|
|
|
| |||||||||||||
Total distributions | (0.03 | ) | (3.27 | ) | (1.48 | ) | (0.68 | ) | (1.27 | ) | (0.94 | ) | ||||||||||||
|
|
|
|
|
|
|
|
|
|
|
| |||||||||||||
Net asset value, end of period | $ | 18.57 | $ | 17.67 | $ | 22.13 | $ | 17.35 | $ | 15.71 | $ | 17.11 | ||||||||||||
|
|
|
|
|
|
|
|
|
|
|
| |||||||||||||
Total Return(c) | ||||||||||||||||||||||||
Based on net asset value | 5.28 | % | (8.05 | )% | 37.28 | % | 15.16 | %(d) | 0.15 | % | 24.98 | % | ||||||||||||
|
|
|
|
|
|
|
|
|
|
|
| |||||||||||||
Ratios to Average Net Assets(e) | ||||||||||||||||||||||||
Total expenses | 1.06 | % | 1.07 | % | 1.08 | % | 1.12 | %(f) | 1.12 | % | 1.12 | % | ||||||||||||
|
|
|
|
|
|
|
|
|
|
|
| |||||||||||||
Total expenses after fees waived and/or reimbursed | 0.87 | % | 0.87 | % | 0.87 | % | 0.87 | %(f) | 0.87 | % | 0.87 | % | ||||||||||||
|
|
|
|
|
|
|
|
|
|
|
| |||||||||||||
Net investment income (loss) | 0.24 | % | (0.16 | )% | (0.04 | )% | 0.40 | %(f) | 0.57 | % | 0.58 | % | ||||||||||||
|
|
|
|
|
|
|
|
|
|
|
| |||||||||||||
Supplemental Data | ||||||||||||||||||||||||
Net assets, end of period (000) | $ | 441,983 | $ | 452,791 | $ | 909,344 | $ | 713,162 | $ | 699,247 | $ | 730,996 | ||||||||||||
|
|
|
|
|
|
|
|
|
|
|
| |||||||||||||
Portfolio turnover rate | 130 | % | 130 | % | 134 | % | 70 | % | 154 | % | 162 | % | ||||||||||||
|
|
|
|
|
|
|
|
|
|
|
| |||||||||||||
| (a) | Based on average shares outstanding. |
| (b) | Distributions for annual periods determined in accordance with U.S. federal income tax regulations. |
| (c) | Where applicable, excludes the effects of any sales charges and assumes the reinvestment of distributions. |
| (d) | Not annualized. |
| (e) | Excludes fees and expenses incurred indirectly as a result of investments in underlying funds. |
| (f) | Annualized. |
See notes to financial statements.
| 66 | 2 0 2 3 BLACK ROCK ANNUAL REPORT TO SHAREHOLDERS |
Financial Highlights (continued)
(For a share outstanding throughout each period)
| BlackRock Advantage Large Cap Growth Fund (continued) | ||||||||||||||||||||||||
| Investor C | ||||||||||||||||||||||||
| Year Ended 05/31/23 | Year Ended 05/31/22 | Year Ended 05/31/21 | Period from 10/01/19 to 05/31/20 | Year Ended 09/30/19 | Year Ended 09/30/18 | |||||||||||||||||||
Net asset value, beginning of period | $ | 14.24 | $ | 18.42 | $ | 14.67 | $ | 13.35 | $ | 14.55 | $ | 12.53 | ||||||||||||
|
|
|
|
|
|
|
|
|
|
|
| |||||||||||||
Net investment loss(a) | (0.07 | ) | (0.16 | ) | (0.13 | ) | (0.03 | ) | (0.03 | ) | (0.03 | ) | ||||||||||||
Net realized and unrealized gain (loss) | 0.71 | (0.87 | ) | 5.27 | 1.93 | (0.17 | ) | 2.89 | ||||||||||||||||
|
|
|
|
|
|
|
|
|
|
|
| |||||||||||||
Net increase (decrease) from investment operations | 0.64 | (1.03 | ) | 5.14 | 1.90 | (0.20 | ) | 2.86 | ||||||||||||||||
|
|
|
|
|
|
|
|
|
|
|
| |||||||||||||
Distributions from net realized gain(b) | — | (3.15 | ) | (1.39 | ) | (0.58 | ) | (1.00 | ) | (0.84 | ) | |||||||||||||
|
|
|
|
|
|
|
|
|
|
|
| |||||||||||||
Net asset value, end of period | $ | 14.88 | $ | 14.24 | $ | 18.42 | $ | 14.67 | $ | 13.35 | $ | 14.55 | ||||||||||||
|
|
|
|
|
|
|
|
|
|
|
| |||||||||||||
Total Return(c) | ||||||||||||||||||||||||
Based on net asset value | 4.50 | % | (8.74 | )% | 36.25 | % | 14.56 | %(d) | (0.59 | )% | 24.09 | % | ||||||||||||
|
|
|
|
|
|
|
|
|
|
|
| |||||||||||||
Ratios to Average Net Assets(e) | ||||||||||||||||||||||||
Total expenses | 1.87 | % | 1.83 | % | 1.84 | % | 1.83 | %(f) | 1.85 | % | 1.87 | % | ||||||||||||
|
|
|
|
|
|
|
|
|
|
|
| |||||||||||||
Total expenses after fees waived and/or reimbursed | 1.62 | % | 1.62 | % | 1.62 | % | 1.62 | %(f) | 1.62 | % | 1.62 | % | ||||||||||||
|
|
|
|
|
|
|
|
|
|
|
| |||||||||||||
Net investment loss | (0.51 | )% | (0.89 | )% | (0.78 | )% | (0.35 | )%(f) | (0.22 | )% | (0.19 | )% | ||||||||||||
|
|
|
|
|
|
|
|
|
|
|
| |||||||||||||
Supplemental Data | ||||||||||||||||||||||||
Net assets, end of period (000) | $ | 8,372 | $ | 10,162 | $ | 12,989 | $ | 14,728 | $ | 15,277 | $ | 48,702 | ||||||||||||
|
|
|
|
|
|
|
|
|
|
|
| |||||||||||||
Portfolio turnover rate | 130 | % | 130 | % | 134 | % | 70 | % | 154 | % | 162 | % | ||||||||||||
|
|
|
|
|
|
|
|
|
|
|
| |||||||||||||
| (a) | Based on average shares outstanding. |
| (b) | Distributions for annual periods determined in accordance with U.S. federal income tax regulations. |
| (c) | Where applicable, excludes the effects of any sales charges and assumes the reinvestment of distributions. |
| (d) | Not annualized. |
| (e) | Excludes fees and expenses incurred indirectly as a result of investments in underlying funds. |
| (f) | Annualized. |
See notes to financial statements.
FINANCIAL HIGHLIGHTS | 67 |
Financial Highlights (continued)
(For a share outstanding throughout each period)
| BlackRock Advantage Large Cap Growth Fund (continued) | ||||||||||||||||||||||||
| Class K | ||||||||||||||||||||||||
| Year Ended 05/31/23 | Year Ended 05/31/22 | Year Ended 05/31/21 | Period from 10/01/19 to 05/31/20 | Year Ended 09/30/19 | Period from 01/25/18(a) to 09/30/18 | |||||||||||||||||||
Net asset value, beginning of period | $ | 18.77 | $ | 23.33 | $ | 18.23 | $ | 16.49 | $ | 17.89 | $ | 16.37 | ||||||||||||
|
|
|
|
|
|
|
|
|
|
|
| |||||||||||||
Net investment income(b) | 0.10 | 0.04 | 0.05 | 0.08 | 0.14 | 0.11 | ||||||||||||||||||
Net realized and unrealized gain (loss) | 0.95 | (1.25 | ) | 6.59 | 2.40 | (0.23 | ) | 1.41 | ||||||||||||||||
|
|
|
|
|
|
|
|
|
|
|
| |||||||||||||
Net increase (decrease) from investment operations | 1.05 | (1.21 | ) | 6.64 | 2.48 | (0.09 | ) | 1.52 | ||||||||||||||||
|
|
|
|
|
|
|
|
|
|
|
| |||||||||||||
Distributions(c) | ||||||||||||||||||||||||
From net investment income | (0.06 | ) | — | (0.08 | ) | (0.15 | ) | (0.13 | ) | — | ||||||||||||||
From net realized gain | — | (3.35 | ) | (1.46 | ) | (0.59 | ) | (1.18 | ) | — | ||||||||||||||
|
|
|
|
|
|
|
|
|
|
|
| |||||||||||||
Total distributions | (0.06 | ) | (3.35 | ) | (1.54 | ) | (0.74 | ) | (1.31 | ) | — | |||||||||||||
|
|
|
|
|
|
|
|
|
|
|
| |||||||||||||
Net asset value, end of period | $ | 19.76 | $ | 18.77 | $ | 23.33 | $ | 18.23 | $ | 16.49 | $ | 17.89 | ||||||||||||
|
|
|
|
|
|
|
|
|
|
|
| |||||||||||||
Total Return(d) | ||||||||||||||||||||||||
Based on net asset value | 5.63 | % | (7.76 | )% | 37.60 | % | 15.40 | %(e) | 0.47 | % | 9.29 | %(e) | ||||||||||||
|
|
|
|
|
|
|
|
|
|
|
| |||||||||||||
Ratios to Average Net Assets(f) | ||||||||||||||||||||||||
Total expenses | 0.69 | % | 0.69 | % | 0.69 | % | 0.70 | %(g) | 0.71 | % | 0.72 | %(g) | ||||||||||||
|
|
|
|
|
|
|
|
|
|
|
| |||||||||||||
Total expenses after fees waived and/or reimbursed | 0.57 | % | 0.57 | % | 0.57 | % | 0.57 | %(g) | 0.57 | % | 0.57 | %(g) | ||||||||||||
|
|
|
|
|
|
|
|
|
|
|
| |||||||||||||
Net investment income | 0.53 | % | 0.18 | % | 0.25 | % | 0.72 | %(g) | 0.85 | % | 0.93 | %(g) | ||||||||||||
|
|
|
|
|
|
|
|
|
|
|
| |||||||||||||
Supplemental Data | ||||||||||||||||||||||||
Net assets, end of period (000) | $ | 2,489 | $ | 2,177 | $ | 1,152 | $ | 715 | $ | 973 | $ | 609 | ||||||||||||
|
|
|
|
|
|
|
|
|
|
|
| |||||||||||||
Portfolio turnover rate | 130 | % | 130 | % | 134 | % | 70 | % | 154 | % | 162 | %(h) | ||||||||||||
|
|
|
|
|
|
|
|
|
|
|
| |||||||||||||
| (a) | Commencement of operations. |
| (b) | Based on average shares outstanding. |
| (c) | Distributions for annual periods determined in accordance with U.S. federal income tax regulations. |
| (d) | Where applicable, assumes the reinvestment of distributions. |
| (e) | Not annualized. |
| (f) | Excludes fees and expenses incurred indirectly as a result of investments in underlying funds. |
| (g) | Annualized. |
| (h) | Portfolio turnover is representative of the Fund for the entire year. |
See notes to financial statements.
| 68 | 2 0 2 3 BLACK ROCK ANNUAL REPORT TO SHAREHOLDERS |
Financial Highlights (continued)
(For a share outstanding throughout each period)
| BlackRock Advantage Large Cap Growth Fund (continued) | ||||||||||||||||||||||||
| Class R | ||||||||||||||||||||||||
| Year Ended 05/31/23 | Year Ended 05/31/22 | Year Ended 05/31/21 | Period from 10/01/19 to 05/31/20 | Year Ended 09/30/19 | Year Ended 09/30/18 | |||||||||||||||||||
Net asset value, beginning of period | $ | 18.64 | $ | 23.17 | $ | 18.10 | $ | 16.32 | $ | 17.69 | $ | 15.01 | ||||||||||||
|
|
|
|
|
|
|
|
|
|
|
| |||||||||||||
Net investment income (loss)(a) | (0.00 | )(b) | (0.09 | ) | (0.06 | ) | 0.02 | 0.05 | 0.05 | |||||||||||||||
Net realized and unrealized gain (loss) | 0.94 | (1.25 | ) | 6.55 | 2.38 | (0.23 | ) | 3.49 | ||||||||||||||||
|
|
|
|
|
|
|
|
|
|
|
| |||||||||||||
Net increase (decrease) from investment operations | 0.94 | (1.34 | ) | 6.49 | 2.40 | (0.18 | ) | 3.54 | ||||||||||||||||
|
|
|
|
|
|
|
|
|
|
|
| |||||||||||||
Distributions(c) | ||||||||||||||||||||||||
From net investment income | (0.01 | ) | — | — | (0.03 | ) | (0.01 | ) | — | |||||||||||||||
From net realized gain | — | (3.19 | ) | (1.42 | ) | (0.59 | ) | (1.18 | ) | (0.86 | ) | |||||||||||||
|
|
|
|
|
|
|
|
|
|
|
| |||||||||||||
Total distributions | (0.01 | ) | (3.19 | ) | (1.42 | ) | (0.62 | ) | (1.19 | ) | (0.86 | ) | ||||||||||||
|
|
|
|
|
|
|
|
|
|
|
| |||||||||||||
Net asset value, end of period | $ | 19.57 | $ | 18.64 | $ | 23.17 | $ | 18.10 | $ | 16.32 | $ | 17.69 | ||||||||||||
|
|
|
|
|
|
|
|
|
|
|
| |||||||||||||
Total Return(d) | ||||||||||||||||||||||||
Based on net asset value | 5.03 | % | (8.28 | )% | 36.93 | % | 14.99 | %(e) | (0.15 | )% | 24.68 | % | ||||||||||||
|
|
|
|
|
|
|
|
|
|
|
| |||||||||||||
Ratios to Average Net Assets(f) | ||||||||||||||||||||||||
Total expenses | 1.42 | % | 1.50 | % | 1.36 | % | 1.46 | %(g) | 1.42 | % | 1.40 | % | ||||||||||||
|
|
|
|
|
|
|
|
|
|
|
| |||||||||||||
Total expenses after fees waived and/or reimbursed | 1.12 | % | 1.12 | % | 1.12 | % | 1.12 | %(g) | 1.12 | % | 1.12 | % | ||||||||||||
|
|
|
|
|
|
|
|
|
|
|
| |||||||||||||
Net investment income (loss) | (0.03 | )% | (0.39 | )% | (0.30 | )% | 0.16 | %(g) | 0.33 | % | 0.30 | % | ||||||||||||
|
|
|
|
|
|
|
|
|
|
|
| |||||||||||||
Supplemental Data | ||||||||||||||||||||||||
Net assets, end of period (000) | $ | 530 | $ | 349 | $ | 577 | $ | 536 | $ | 867 | $ | 1,864 | ||||||||||||
|
|
|
|
|
|
|
|
|
|
|
| |||||||||||||
Portfolio turnover rate | 130 | % | 130 | % | 134 | % | 70 | % | 154 | % | 162 | % | ||||||||||||
|
|
|
|
|
|
|
|
|
|
|
| |||||||||||||
| (a) | Based on average shares outstanding. |
| (b) | Amount is less than $0.005 per share. |
| (c) | Distributions for annual periods determined in accordance with U.S. federal income tax regulations. |
| (d) | Where applicable, assumes the reinvestment of distributions. |
| (e) | Not annualized. |
| (f) | Excludes fees and expenses incurred indirectly as a result of investments in underlying funds. |
| (g) | Annualized. |
See notes to financial statements.
FINANCIAL HIGHLIGHTS | 69 |
Financial Highlights
(For a share outstanding throughout each period)
| BlackRock Advantage Small Cap Core Fund | ||||||||||||||||||||||||
| Institutional | ||||||||||||||||||||||||
| Year Ended 05/31/23 | Year Ended 05/31/22 | Year Ended 05/31/21 | Year Ended 05/31/20 | Year Ended 05/31/19 | ||||||||||||||||||||
Net asset value, beginning of year | $ | 15.35 | $ | 20.72 | $ | 13.09 | $ | 13.13 | $ | 14.80 | ||||||||||||||
|
|
|
|
|
|
|
|
|
| |||||||||||||||
Net investment income(a) | 0.14 | 0.13 | 0.12 | 0.14 | 0.13 | |||||||||||||||||||
Net realized and unrealized gain (loss) | (1.02 | ) | (3.28 | ) | 7.97 | (0.05 | ) | (1.13 | ) | |||||||||||||||
|
|
|
|
|
|
|
|
|
| |||||||||||||||
Net increase (decrease) from investment operations | (0.88 | ) | (3.15 | ) | 8.09 | 0.09 | (1.00 | ) | ||||||||||||||||
|
|
|
|
|
|
|
|
|
| |||||||||||||||
Distributions(b) | ||||||||||||||||||||||||
From net investment income | (0.12 | ) | (0.14 | ) | (0.10 | ) | (0.13 | ) | (0.11 | ) | ||||||||||||||
From net realized gain | (0.29 | ) | (2.08 | ) | (0.36 | ) | (0.00 | )(c) | (0.56 | ) | ||||||||||||||
|
|
|
|
|
|
|
|
|
| |||||||||||||||
Total distributions | (0.41 | ) | (2.22 | ) | (0.46 | ) | (0.13 | ) | (0.67 | ) | ||||||||||||||
|
|
|
|
|
|
|
|
|
| |||||||||||||||
Net asset value, end of year | $ | 14.06 | $ | 15.35 | $ | 20.72 | $ | 13.09 | $ | 13.13 | ||||||||||||||
|
|
|
|
|
|
|
|
|
| |||||||||||||||
Total Return(d) | ||||||||||||||||||||||||
Based on net asset value | (5.75 | )% | (16.89 | )% | 62.61 | % | 0.61 | % | (6.89 | )% | ||||||||||||||
|
|
|
|
|
|
|
|
|
| |||||||||||||||
Ratios to Average Net Assets(e) | ||||||||||||||||||||||||
Total expenses | 0.59 | % | 0.59 | % | 0.60 | % | 0.64 | % | 0.70 | % | ||||||||||||||
|
|
|
|
|
|
|
|
|
| |||||||||||||||
Total expenses after fees waived and/or reimbursed | 0.50 | % | 0.50 | % | 0.50 | % | 0.50 | % | 0.49 | % | ||||||||||||||
|
|
|
|
|
|
|
|
|
| |||||||||||||||
Net investment income | 0.93 | % | 0.69 | % | 0.65 | % | 0.99 | % | 0.95 | % | ||||||||||||||
|
|
|
|
|
|
|
|
|
| |||||||||||||||
Supplemental Data | ||||||||||||||||||||||||
Net assets, end of year (000) | $ | 2,152,757 | $ | 2,501,959 | $ | 2,802,145 | $ | 847,753 | $ | 551,833 | ||||||||||||||
|
|
|
|
|
|
|
|
|
| |||||||||||||||
Portfolio turnover rate | 93 | % | 81 | % | 63 | % | 101 | % | 100 | % | ||||||||||||||
|
|
|
|
|
|
|
|
|
| |||||||||||||||
| (a) | Based on average shares outstanding. |
| (b) | Distributions for annual periods determined in accordance with U.S. federal income tax regulations. |
| (c) | Amount is greater than $(0.005) per share. |
| (d) | Where applicable, assumes the reinvestment of distributions. |
| (e) | Excludes fees and expenses incurred indirectly as a result of investments in underlying funds. |
See notes to financial statements.
| 70 | 2 0 2 3 BLACK ROCK ANNUAL REPORT TO SHAREHOLDERS |
Financial Highlights (continued)
(For a share outstanding throughout each period)
| BlackRock Advantage Small Cap Core Fund (continued) | ||||||||||||||||||||||||
| Investor A | ||||||||||||||||||||||||
| Year Ended 05/31/23 | Year Ended 05/31/22 | Year Ended 05/31/21 | Year Ended 05/31/20 | Year Ended 05/31/19 | ||||||||||||||||||||
Net asset value, beginning of year | $ | 15.24 | $ | 20.58 | $ | 13.02 | $ | 13.05 | $ | 14.73 | ||||||||||||||
|
|
|
|
|
|
|
|
|
| |||||||||||||||
Net investment income(a) | 0.10 | 0.08 | 0.08 | 0.10 | 0.09 | |||||||||||||||||||
Net realized and unrealized gain (loss) | (1.01 | ) | (3.25 | ) | 7.91 | (0.03 | ) | (1.13 | ) | |||||||||||||||
|
|
|
|
|
|
|
|
|
| |||||||||||||||
Net increase (decrease) from investment operations | (0.91 | ) | (3.17 | ) | 7.99 | 0.07 | (1.04 | ) | ||||||||||||||||
|
|
|
|
|
|
|
|
|
| |||||||||||||||
Distributions(b) | ||||||||||||||||||||||||
From net investment income | (0.08 | ) | (0.09 | ) | (0.07 | ) | (0.10 | ) | (0.08 | ) | ||||||||||||||
From net realized gain | (0.29 | ) | (2.08 | ) | (0.36 | ) | (0.00 | )(c) | (0.56 | ) | ||||||||||||||
|
|
|
|
|
|
|
|
|
| |||||||||||||||
Total distributions | (0.37 | ) | (2.17 | ) | (0.43 | ) | (0.10 | ) | (0.64 | ) | ||||||||||||||
|
|
|
|
|
|
|
|
|
| |||||||||||||||
Net asset value, end of year | $ | 13.96 | $ | 15.24 | $ | 20.58 | $ | 13.02 | $ | 13.05 | ||||||||||||||
|
|
|
|
|
|
|
|
|
| |||||||||||||||
Total Return(d) | ||||||||||||||||||||||||
Based on net asset value | (5.98 | )% | (17.08 | )% | 62.05 | % | 0.45 | % | (7.16 | )% | ||||||||||||||
|
|
|
|
|
|
|
|
|
| |||||||||||||||
Ratios to Average Net Assets(e) | ||||||||||||||||||||||||
Total expenses | 0.93 | % | 0.92 | % | 0.95 | % | 1.01 | % | 1.03 | % | ||||||||||||||
|
|
|
|
|
|
|
|
|
| |||||||||||||||
Total expenses after fees waived and/or reimbursed | 0.75 | % | 0.75 | % | 0.75 | % | 0.75 | % | 0.75 | % | ||||||||||||||
|
|
|
|
|
|
|
|
|
| |||||||||||||||
Net investment income | 0.67 | % | 0.44 | % | 0.45 | % | 0.75 | % | 0.69 | % | ||||||||||||||
|
|
|
|
|
|
|
|
|
| |||||||||||||||
Supplemental Data | ||||||||||||||||||||||||
Net assets, end of year (000) | $ | 315,694 | $ | 358,594 | $ | 530,664 | $ | 277,926 | $ | 248,574 | ||||||||||||||
|
|
|
|
|
|
|
|
|
| |||||||||||||||
Portfolio turnover rate | 93 | % | 81 | % | 63 | % | 101 | % | 100 | % | ||||||||||||||
|
|
|
|
|
|
|
|
|
| |||||||||||||||
| (a) | Based on average shares outstanding. |
| (b) | Distributions for annual periods determined in accordance with U.S. federal income tax regulations. |
| (c) | Amount is greater than $(0.005) per share. |
| (d) | Where applicable, excludes the effects of any sales charges and assumes the reinvestment of distributions. |
| (e) | Excludes fees and expenses incurred indirectly as a result of investments in underlying funds. |
See notes to financial statements.
FINANCIAL HIGHLIGHTS | 71 |
Financial Highlights (continued)
(For a share outstanding throughout each period)
| BlackRock Advantage Small Cap Core Fund (continued) | ||||||||||||||||||||||||
| Investor C | ||||||||||||||||||||||||
| Year Ended 05/31/23 | Year Ended 05/31/22 | Year Ended 05/31/21 | Year Ended 05/31/20 | Year Ended 05/31/19 | ||||||||||||||||||||
Net asset value, beginning of year | $ | 14.80 | $ | 20.08 | $ | 12.74 | $ | 12.80 | $ | 14.48 | ||||||||||||||
|
|
|
|
|
|
|
|
|
| |||||||||||||||
Net investment income (loss)(a) | (0.01 | ) | (0.05 | ) | (0.05 | ) | 0.00 | (b) | (0.01 | ) | ||||||||||||||
Net realized and unrealized gain (loss) | (0.98 | ) | (3.18 | ) | 7.74 | (0.04 | ) | (1.10 | ) | |||||||||||||||
|
|
|
|
|
|
|
|
|
| |||||||||||||||
Net increase (decrease) from investment operations | (0.99 | ) | (3.23 | ) | 7.69 | (0.04 | ) | (1.11 | ) | |||||||||||||||
|
|
|
|
|
|
|
|
|
| |||||||||||||||
Distributions(c) | ||||||||||||||||||||||||
From net investment income | (0.02 | ) | — | — | (0.02 | ) | (0.01 | ) | ||||||||||||||||
From net realized gain | (0.29 | ) | (2.05 | ) | (0.35 | ) | (0.00 | )(d) | (0.56 | ) | ||||||||||||||
|
|
|
|
|
|
|
|
|
| |||||||||||||||
Total distributions | (0.31 | ) | (2.05 | ) | (0.35 | ) | (0.02 | ) | (0.57 | ) | ||||||||||||||
|
|
|
|
|
|
|
|
|
| |||||||||||||||
Net asset value, end of year | $ | 13.50 | $ | 14.80 | $ | 20.08 | $ | 12.74 | $ | 12.80 | ||||||||||||||
|
|
|
|
|
|
|
|
|
| |||||||||||||||
Total Return(e) | ||||||||||||||||||||||||
Based on net asset value | (6.70 | )% | (17.74 | )% | 60.90 | % | (0.33 | )% | (7.83 | )% | ||||||||||||||
|
|
|
|
|
|
|
|
|
| |||||||||||||||
Ratios to Average Net Assets(f) | ||||||||||||||||||||||||
Total expenses | 1.69 | % | 1.64 | % | 1.70 | % | 1.71 | % | 1.81 | % | ||||||||||||||
|
|
|
|
|
|
|
|
|
| |||||||||||||||
Total expenses after fees waived and/or reimbursed | 1.50 | % | 1.50 | % | 1.50 | % | 1.50 | % | 1.50 | % | ||||||||||||||
|
|
|
|
|
|
|
|
|
| |||||||||||||||
Net investment income (loss) | (0.07 | )% | (0.30 | )% | (0.32 | )% | 0.01 | % | (0.06 | )% | ||||||||||||||
|
|
|
|
|
|
|
|
|
| |||||||||||||||
Supplemental Data | ||||||||||||||||||||||||
Net assets, end of year (000) | $ | 9,276 | $ | 10,969 | $ | 12,880 | $ | 4,955 | $ | 4,363 | ||||||||||||||
|
|
|
|
|
|
|
|
|
| |||||||||||||||
Portfolio turnover rate | 93 | % | 81 | % | 63 | % | 101 | % | 100 | % | ||||||||||||||
|
|
|
|
|
|
|
|
|
| |||||||||||||||
| (a) | Based on average shares outstanding. |
| (b) | Amount is less than $0.005 per share. |
| (c) | Distributions for annual periods determined in accordance with U.S. federal income tax regulations. |
| (d) | Amount is greater than $(0.005) per share. |
| (e) | Where applicable, excludes the effects of any sales charges and assumes the reinvestment of distributions. |
| (f) | Excludes fees and expenses incurred indirectly as a result of investments in underlying funds. |
See notes to financial statements.
| 72 | 2 0 2 3 BLACK ROCK ANNUAL REPORT TO SHAREHOLDERS |
Financial Highlights (continued)
(For a share outstanding throughout each period)
BlackRock Advantage Small Cap Core Fund (continued) | ||||||||||||||||||||||||
| Class K | ||||||||||||||||||||||||
| Year Ended 05/31/23 | Year Ended 05/31/22 | Year Ended 05/31/21 | Year Ended 05/31/20 | Year Ended 05/31/19 | ||||||||||||||||||||
Net asset value, beginning of year | $ | 15.36 | $ | 20.73 | $ | 13.10 | $ | 13.13 | $ | 14.81 | ||||||||||||||
|
|
|
|
|
|
|
|
|
| |||||||||||||||
Net investment income(a) | 0.14 | 0.13 | 0.13 | 0.14 | 0.14 | |||||||||||||||||||
Net realized and unrealized gain (loss) | (1.02 | ) | (3.27 | ) | 7.97 | (0.03 | ) | (1.15 | ) | |||||||||||||||
|
|
|
|
|
|
|
|
|
| |||||||||||||||
Net increase (decrease) from investment operations | (0.88 | ) | (3.14 | ) | 8.10 | 0.11 | (1.01 | ) | ||||||||||||||||
|
|
|
|
|
|
|
|
|
| |||||||||||||||
Distributions(b) | ||||||||||||||||||||||||
From net investment income | (0.12 | ) | (0.15 | ) | (0.11 | ) | (0.14 | ) | (0.11 | ) | ||||||||||||||
From net realized gain | (0.29 | ) | (2.08 | ) | (0.36 | ) | (0.00 | )(c) | (0.56 | ) | ||||||||||||||
|
|
|
|
|
|
|
|
|
| |||||||||||||||
Total distributions | (0.41 | ) | (2.23 | ) | (0.47 | ) | (0.14 | ) | (0.67 | ) | ||||||||||||||
|
|
|
|
|
|
|
|
|
| |||||||||||||||
Net asset value, end of year | $ | 14.07 | $ | 15.36 | $ | 20.73 | $ | 13.10 | $ | 13.13 | ||||||||||||||
|
|
|
|
|
|
|
|
|
| |||||||||||||||
Total Return(d) | ||||||||||||||||||||||||
Based on net asset value | (5.70 | )% | (16.84 | )% | 62.63 | % | 0.73 | % | (6.93 | )% | ||||||||||||||
|
|
|
|
|
|
|
|
|
| |||||||||||||||
Ratios to Average Net Assets(e) | ||||||||||||||||||||||||
Total expenses | 0.51 | % | 0.51 | % | 0.52 | % | 0.56 | % | 0.61 | % | ||||||||||||||
|
|
|
|
|
|
|
|
|
| |||||||||||||||
Total expenses after fees waived and/or reimbursed | 0.45 | % | 0.45 | % | 0.45 | % | 0.45 | % | 0.45 | % | ||||||||||||||
|
|
|
|
|
|
|
|
|
| |||||||||||||||
Net investment income | 0.97 | % | 0.73 | % | 0.71 | % | 0.99 | % | 1.00 | % | ||||||||||||||
|
|
|
|
|
|
|
|
|
| |||||||||||||||
Supplemental Data | ||||||||||||||||||||||||
Net assets, end of year (000) | $ | 964,449 | $ | 967,682 | $ | 920,752 | $ | 188,885 | $ | 56,316 | ||||||||||||||
|
|
|
|
|
|
|
|
|
| |||||||||||||||
Portfolio turnover rate | 93 | % | 81 | % | 63 | % | 101 | % | 100 | % | ||||||||||||||
|
|
|
|
|
|
|
|
|
| |||||||||||||||
| (a) | Based on average shares outstanding. |
| (b) | Distributions for annual periods determined in accordance with U.S. federal income tax regulations. |
| (c) | Amount is greater than $(0.005) per share. |
| (d) | Where applicable, assumes the reinvestment of distributions. |
| (e) | Excludes fees and expenses incurred indirectly as a result of investments in underlying funds. |
See notes to financial statements.
FINANCIAL HIGHLIGHTS | 73 |
Financial Highlights
(For a share outstanding throughout each period)
| BlackRock Advantage Large Cap Core Fund | ||||||||||||||||||||||||
| Institutional | ||||||||||||||||||||||||
| Year Ended 05/31/23 | Period from 10/01/21 | Year Ended 09/30/21 | Year Ended 09/30/20 | Year Ended 09/30/19 | Year Ended 09/30/18 | |||||||||||||||||||
Net asset value, beginning of period | $ | 18.39 | $ | 23.32 | $ | 18.78 | $ | 16.87 | $ | 18.18 | $ | 21.42 | ||||||||||||
|
|
|
|
|
|
|
|
|
|
|
| |||||||||||||
Net investment income(a) | 0.20 | 0.13 | 0.19 | 0.22 | 0.25 | 0.25 | ||||||||||||||||||
Net realized and unrealized gain (loss) | (0.18 | ) | (0.87 | ) | 5.31 | 2.41 | (0.13 | ) | 2.71 | |||||||||||||||
|
|
|
|
|
|
|
|
|
|
|
| |||||||||||||
Net increase (decrease) from investment operations | 0.02 | (0.74 | ) | 5.50 | 2.63 | 0.12 | 2.96 | |||||||||||||||||
|
|
|
|
|
|
|
|
|
|
|
| |||||||||||||
Distributions(b) | ||||||||||||||||||||||||
From net investment income | (0.20 | ) | (0.19 | ) | (0.22 | ) | (0.29 | ) | (0.20 | ) | (0.23 | ) | ||||||||||||
From net realized gain | (0.85 | ) | (4.00 | ) | (0.74 | ) | (0.43 | ) | (1.23 | ) | (5.97 | ) | ||||||||||||
|
|
|
|
|
|
|
|
|
|
|
| |||||||||||||
Total distributions | (1.05 | ) | (4.19 | ) | (0.96 | ) | (0.72 | ) | (1.43 | ) | (6.20 | ) | ||||||||||||
|
|
|
|
|
|
|
|
|
|
|
| |||||||||||||
Net asset value, end of period | $ | 17.36 | $ | 18.39 | $ | 23.32 | $ | 18.78 | $ | 16.87 | $ | 18.18 | ||||||||||||
|
|
|
|
|
|
|
|
|
|
|
| |||||||||||||
Total Return(c) | ||||||||||||||||||||||||
Based on net asset value | 0.63 | % | (5.20 | )%(d) | 30.31 | % | 15.96 | % | 1.41 | % | 17.36 | % | ||||||||||||
|
|
|
|
|
|
|
|
|
|
|
| |||||||||||||
Ratios to Average Net Assets(e) | ||||||||||||||||||||||||
Total expenses | 0.63 | % | 0.61 | %(f)(g) | 0.68 | %(h) | 0.84 | %(i) | 0.82 | %(i) | 0.79 | %(h) | ||||||||||||
|
|
|
|
|
|
|
|
|
|
|
| |||||||||||||
Total expenses after fees waived and/or reimbursed | 0.48 | % | 0.48 | %(f)(g) | 0.48 | %(h) | 0.48 | %(i) | 0.47 | %(i) | 0.48 | %(h) | ||||||||||||
|
|
|
|
|
|
|
|
|
|
|
| |||||||||||||
Net investment income | 1.17 | % | 0.92 | %(f)(g) | 0.87 | %(h) | 1.29 | %(i) | 1.54 | %(i) | 1.44 | %(h) | ||||||||||||
|
|
|
|
|
|
|
|
|
|
|
| |||||||||||||
Supplemental Data | ||||||||||||||||||||||||
Net assets, end of period (000) | $ | 1,479,014 | $ | 1,547,621 | $ | 1,721,850 | $ | 1,399,612 | $ | 1,325,232 | $ | 1,197,729 | ||||||||||||
|
|
|
|
|
|
|
|
|
|
|
| |||||||||||||
Portfolio turnover rate(j) | 105 | % | 73 | % | 111 | % | 99 | % | 151 | % | 148 | % | ||||||||||||
|
|
|
|
|
|
|
|
|
|
|
| |||||||||||||
| (a) | Based on average shares outstanding. |
| (b) | Distributions for annual periods determined in accordance with U.S. federal income tax regulations. |
| (c) | Where applicable, assumes the reinvestment of distributions. |
| (d) | Not annualized. |
| (e) | Excludes fees and expenses incurred indirectly as a result of investments in underlying funds. |
| (f) | Annualized. |
| (g) | From October 1, 2021 through April 25, 2022, the Fund invested in the Master Portfolio as part of a master-feeder structure and received its corresponding allocated fees waived and expenses and/or net investment income from the Master Portfolio. Includes the Fund’s share of the Master Portfolio’s allocated fees waived of 0.01%. |
| (h) | Includes the Fund’s share of the Master Portfolio’s allocated expenses and/or net investment income. Includes the Fund’s share of the Master Portfolio’s allocated fees waived of less than 0.01%. |
| (i) | Includes the Fund’s share of the Master Portfolio’s allocated expenses and/or net investment income. Includes the Fund’s share of the Master Portfolio’s allocated fees waived of 0.01%. |
| (j) | Portfolio turnover rate includes transactions from the Master Portfolio prior to April 25, 2022. |
See notes to financial statements.
| 74 | 2 0 2 3 BLACK ROCK ANNUAL REPORT TO SHAREHOLDERS |
Financial Highlights (continued)
(For a share outstanding throughout each period)
| BlackRock Advantage Large Cap Core Fund (continued) | ||||||||||||||||||||||||
| Investor A | ||||||||||||||||||||||||
| Year Ended 05/31/23 | Period from 10/01/21 | Year Ended 09/30/21 | Year Ended 09/30/20 | Year Ended 09/30/19 | Year Ended 09/30/18 | |||||||||||||||||||
Net asset value, beginning of period | $ | 17.44 | $ | 22.30 | $ | 18.00 | $ | 16.20 | $ | 17.52 | $ | 20.84 | ||||||||||||
|
|
|
|
|
|
|
|
|
|
|
| |||||||||||||
Net investment income(a) | 0.15 | 0.09 | 0.13 | 0.17 | 0.20 | 0.20 | ||||||||||||||||||
Net realized and unrealized gain (loss) | (0.19 | ) | (0.82 | ) | 5.08 | 2.31 | (0.12 | ) | 2.63 | |||||||||||||||
|
|
|
|
|
|
|
|
|
|
|
| |||||||||||||
Net increase (decrease) from investment operations | (0.04 | ) | (0.73 | ) | 5.21 | 2.48 | 0.08 | 2.83 | ||||||||||||||||
|
|
|
|
|
|
|
|
|
|
|
| |||||||||||||
Distributions(b) | ||||||||||||||||||||||||
From net investment income | (0.15 | ) | (0.13 | ) | (0.17 | ) | (0.25 | ) | (0.17 | ) | (0.18 | ) | ||||||||||||
From net realized gain | (0.85 | ) | (4.00 | ) | (0.74 | ) | (0.43 | ) | (1.23 | ) | (5.97 | ) | ||||||||||||
|
|
|
|
|
|
|
|
|
|
|
| |||||||||||||
Total distributions | (1.00 | ) | (4.13 | ) | (0.91 | ) | (0.68 | ) | (1.40 | ) | (6.15 | ) | ||||||||||||
|
|
|
|
|
|
|
|
|
|
|
| |||||||||||||
Net asset value, end of period | $ | 16.40 | $ | 17.44 | $ | 22.30 | $ | 18.00 | $ | 16.20 | $ | 17.52 | ||||||||||||
|
|
|
|
|
|
|
|
|
|
|
| |||||||||||||
Total Return(c) | ||||||||||||||||||||||||
Based on net asset value | 0.34 | % | (5.37 | )%(d) | 30.01 | % | 15.66 | % | 1.18 | % | 17.10 | % | ||||||||||||
|
|
|
|
|
|
|
|
|
|
|
| |||||||||||||
Ratios to Average Net Assets(e) | ||||||||||||||||||||||||
Total expenses | 0.90 | % | 0.86 | %(f)(g) | 0.93 | %(h) | 1.09 | %(i) | 1.10 | %(i) | 1.14 | %(h) | ||||||||||||
|
|
|
|
|
|
|
|
|
|
|
| |||||||||||||
Total expenses after fees waived and/or reimbursed | 0.73 | % | 0.73 | %(f)(g) | 0.73 | %(h) | 0.73 | %(i) | 0.73 | %(i) | 0.73 | %(h) | ||||||||||||
|
|
|
|
|
|
|
|
|
|
|
| |||||||||||||
Net investment income | 0.92 | % | 0.67 | %(f)(g) | 0.62 | %(h) | 1.04 | %(i) | 1.30 | %(i) | 1.19 | %(h) | ||||||||||||
|
|
|
|
|
|
|
|
|
|
|
| |||||||||||||
Supplemental Data | ||||||||||||||||||||||||
Net assets, end of period (000) | $ | 1,271,384 | $ | 1,382,899 | $ | 1,519,185 | $ | 1,325,195 | $ | 1,202,715 | $ | 929,540 | ||||||||||||
|
|
|
|
|
|
|
|
|
|
|
| |||||||||||||
Portfolio turnover rate(j) | 105 | % | 73 | % | 111 | % | 99 | % | 151 | % | 148 | % | ||||||||||||
|
|
|
|
|
|
|
|
|
|
|
| |||||||||||||
| (a) | Based on average shares outstanding. |
| (b) | Distributions for annual periods determined in accordance with U.S. federal income tax regulations. |
| (c) | Where applicable, assumes the reinvestment of distributions. |
| (d) | Not annualized. |
| (e) | Excludes fees and expenses incurred indirectly as a result of investments in underlying funds. |
| (f) | Annualized. |
| (g) | From October 1, 2021 through April 25, 2022, the Fund invested in the Master Portfolio as part of a master-feeder structure and received its corresponding allocated fees waived and expenses and/or net investment income from the Master Portfolio. Includes the Fund’s share of the Master Portfolio’s allocated fees waived of 0.01%. |
| (h) | Includes the Fund’s share of the Master Portfolio’s allocated expenses and/or net investment income. Includes the Fund’s share of the Master Portfolio’s allocated fees waived of less than 0.01%. |
| (i) | Includes the Fund’s share of the Master Portfolio’s allocated expenses and/or net investment income. Includes the Fund’s share of the Master Portfolio’s allocated fees waived of 0.01%. |
| (j) | Portfolio turnover rate includes transactions from the Master Portfolio prior to April 25, 2022. |
See notes to financial statements.
FINANCIAL HIGHLIGHTS | 75 |
Financial Highlights (continued)
(For a share outstanding throughout each period)
| BlackRock Advantage Large Cap Core Fund (continued) | ||||||||||||||||||||||||
| Investor C | ||||||||||||||||||||||||
| Year Ended 05/31/23 | Period from to 05/31/22 | Year Ended 09/30/21 | Year Ended 09/30/20 | Year Ended 09/30/19 | Year Ended 09/30/18 | |||||||||||||||||||
Net asset value, beginning of period | $ | 14.06 | $ | 18.68 | $ | 15.14 | $ | 13.72 | $ | 15.03 | $ | 18.61 | ||||||||||||
|
|
|
|
|
|
|
|
|
|
|
| |||||||||||||
Net investment income (loss)(a) | 0.02 | (0.01 | ) | (0.02 | ) | 0.04 | 0.07 | 0.06 | ||||||||||||||||
Net realized and unrealized gain (loss) | (0.16 | ) | (0.61 | ) | 4.28 | 1.95 | (0.12 | ) | 2.29 | |||||||||||||||
|
|
|
|
|
|
|
|
|
|
|
| |||||||||||||
Net increase (decrease) from investment operations | (0.14 | ) | (0.62 | ) | 4.26 | 1.99 | (0.05 | ) | 2.35 | |||||||||||||||
|
|
|
|
|
|
|
|
|
|
|
| |||||||||||||
Distributions(b) | ||||||||||||||||||||||||
From net investment income | (0.06 | ) | (0.00 | )(c) | — | (0.14 | ) | (0.03 | ) | — | ||||||||||||||
From net realized gain | (0.85 | ) | (4.00 | ) | (0.72 | ) | (0.43 | ) | (1.23 | ) | (5.93 | ) | ||||||||||||
|
|
|
|
|
|
|
|
|
|
|
| |||||||||||||
Total distributions | (0.91 | ) | (4.00 | ) | (0.72 | ) | (0.57 | ) | (1.26 | ) | (5.93 | ) | ||||||||||||
|
|
|
|
|
|
|
|
|
|
|
| |||||||||||||
Net asset value, end of period | $ | 13.01 | $ | 14.06 | $ | 18.68 | $ | 15.14 | $ | 13.72 | $ | 15.03 | ||||||||||||
|
|
|
|
|
|
|
|
|
|
|
| |||||||||||||
Total Return(d) | ||||||||||||||||||||||||
Based on net asset value | (0.42 | )% | (5.81 | )%(e) | 29.03 | % | 14.80 | % | 0.37 | % | 16.24 | % | ||||||||||||
|
|
|
|
|
|
|
|
|
|
|
| |||||||||||||
Ratios to Average Net Assets(f) | ||||||||||||||||||||||||
Total expenses | 1.72 | % | 1.69 | %(g)(h) | 1.69 | %(i) | 1.87 | %(j) | 1.89 | %(j) | 1.92 | %(i) | ||||||||||||
|
|
|
|
|
|
|
|
|
|
|
| |||||||||||||
Total expenses after fees waived and/or reimbursed | 1.48 | % | 1.48 | %(g)(h) | 1.48 | %(i) | 1.48 | %(j) | 1.48 | %(j) | 1.48 | %(i) | ||||||||||||
|
|
|
|
|
|
|
|
|
|
|
| |||||||||||||
Net investment income (loss) | 0.17 | % | (0.08 | )%(g)(h) | (0.13 | )%(i) | 0.32 | %(j) | 0.52 | %(j) | 0.44 | %(i) | ||||||||||||
|
|
|
|
|
|
|
|
|
|
|
| |||||||||||||
Supplemental Data | ||||||||||||||||||||||||
Net assets, end of period (000) | $ | 31,813 | $ | 38,506 | $ | 42,561 | $ | 31,921 | $ | 95,571 | $ | 159,351 | ||||||||||||
|
|
|
|
|
|
|
|
|
|
|
| |||||||||||||
Portfolio turnover rate(k) | 105 | % | 73 | % | 111 | % | 99 | % | 151 | % | 148 | % | ||||||||||||
|
|
|
|
|
|
|
|
|
|
|
| |||||||||||||
| (a) | Based on average shares outstanding. |
| (b) | Distributions for annual periods determined in accordance with U.S. federal income tax regulations. |
| (c) | Amount is greater than $(0.005) per share. |
| (d) | Where applicable, assumes the reinvestment of distributions. |
| (e) | Not annualized. |
| (f) | Excludes fees and expenses incurred indirectly as a result of investments in underlying funds. |
| (g) | Annualized. |
| (h) | From October 1, 2021 through April 25, 2022, the Fund invested in the Master Portfolio as part of a master-feeder structure and received its corresponding allocated fees waived and expenses and/or net investment income from the Master Portfolio. Includes the Fund’s share of the Master Portfolio’s allocated fees waived of 0.01%. |
| (i) | Includes the Fund’s share of the Master Portfolio’s allocated expenses and/or net investment income. Includes the Fund’s share of the Master Portfolio’s allocated fees waived of less than 0.01%. |
| (j) | Includes the Fund’s share of the Master Portfolio’s allocated expenses and/or net investment income. Includes the Fund’s share of the Master Portfolio’s allocated fees waived of 0.01%. |
| (k) | Portfolio turnover rate includes transactions from the Master Portfolio prior to April 25, 2022. |
See notes to financial statements.
| 76 | 2 0 2 3 BLACK ROCK ANNUAL REPORT TO SHAREHOLDERS |
Financial Highlights (continued)
(For a share outstanding throughout each period)
| BlackRock Advantage Large Cap Core Fund (continued) | ||||||||||||||||||||||||
| Class K | ||||||||||||||||||||||||
| | Year Ended 05/31/23 | | | Period from 10/01/21 to 05/31/22 | | Year Ended 09/30/21 | | | Year Ended 09/30/20 | | | Year Ended 09/30/19 | | | Period from 01/25/18 to 09/30/18 | (a)
| ||||||||
Net asset value, beginning of period | $ | 18.40 | $ | 23.34 | $ | 18.79 | $ | 16.88 | $ | 18.19 | $ | 17.48 | ||||||||||||
|
|
|
|
|
|
|
|
|
|
|
| |||||||||||||
Net investment income(b) | 0.21 | 0.13 | 0.20 | 0.22 | 0.31 | 0.18 | ||||||||||||||||||
Net realized and unrealized gain (loss) | (0.19 | ) | (0.87 | ) | 5.32 | 2.42 | (0.18 | ) | 0.53 | |||||||||||||||
|
|
|
|
|
|
|
|
|
|
|
| |||||||||||||
Net increase (decrease) from investment operations | 0.02 | (0.74 | ) | 5.52 | 2.64 | 0.13 | 0.71 | |||||||||||||||||
|
|
|
|
|
|
|
|
|
|
|
| |||||||||||||
Distributions(c) | ||||||||||||||||||||||||
From net investment income | (0.21 | ) | (0.20 | ) | (0.23 | ) | (0.30 | ) | (0.21 | ) | — | |||||||||||||
From net realized gain | (0.85 | ) | (4.00 | ) | (0.74 | ) | (0.43 | ) | (1.23 | ) | — | |||||||||||||
|
|
|
|
|
|
|
|
|
|
|
| |||||||||||||
Total distributions | (1.06 | ) | (4.20 | ) | (0.97 | ) | (0.73 | ) | (1.44 | ) | — | |||||||||||||
|
|
|
|
|
|
|
|
|
|
|
| |||||||||||||
Net asset value, end of period | $ | 17.36 | $ | 18.40 | $ | 23.34 | $ | 18.79 | $ | 16.88 | $ | 18.19 | ||||||||||||
|
|
|
|
|
|
|
|
|
|
|
| |||||||||||||
Total Return(d) | ||||||||||||||||||||||||
Based on net asset value | 0.63 | % | (5.18 | )%(e) | 30.42 | % | 16.01 | % | 1.45 | % | 4.06 | %(e) | ||||||||||||
|
|
|
|
|
|
|
|
|
|
|
| |||||||||||||
Ratios to Average Net Assets(f) | ||||||||||||||||||||||||
Total expenses | 0.54 | % | 0.51 | %(g)(h) | 0.55 | %(i) | 0.70 | %(j) | 0.72 | %(j) | 0.72 | %(g)(i) | ||||||||||||
|
|
|
|
|
|
|
|
|
|
|
| |||||||||||||
Total expenses after fees waived and/or reimbursed | 0.43 | % | 0.43 | %(g)(h) | 0.43 | %(i) | 0.43 | %(j) | 0.43 | %(j) | 0.43 | %(g)(i) | ||||||||||||
|
|
|
|
|
|
|
|
|
|
|
| |||||||||||||
Net investment income | 1.22 | % | 0.98 | %(g)(h) | 0.91 | %(i) | 1.30 | %(j) | 1.87 | %(j) | 1.55 | %(g)(i) | ||||||||||||
|
|
|
|
|
|
|
|
|
|
|
| |||||||||||||
Supplemental Data | ||||||||||||||||||||||||
Net assets, end of period (000) | $ | 31,568 | $ | 61,965 | $ | 56,736 | $ | 34,078 | $ | 3,079 | $ | 2,458 | ||||||||||||
|
|
|
|
|
|
|
|
|
|
|
| |||||||||||||
Portfolio turnover rate(k) | 105 | % | 73 | % | 111 | % | 99 | % | 151 | % | 148 | % | ||||||||||||
|
|
|
|
|
|
|
|
|
|
|
| |||||||||||||
| (a) | Commencement of operations. |
| (b) | Based on average shares outstanding. |
| (c) | Distributions for annual periods determined in accordance with U.S. federal income tax regulations. |
| (d) | Where applicable, assumes the reinvestment of distributions. |
| (e) | Not annualized. |
| (f) | Excludes fees and expenses incurred indirectly as a result of investments in underlying funds. |
| (g) | Annualized. |
| (h) | From October 1, 2021 through April 25, 2022, the Fund invested in the Master Portfolio as part of a master-feeder structure and received its corresponding allocated fees waived and expenses and/or net investment income from the Master Portfolio. Includes the Fund’s share of the Master Portfolio’s allocated fees waived of 0.01%. |
| (i) | Includes the Fund’s share of the Master Portfolio’s allocated expenses and/or net investment income. Includes the Fund’s share of the Master Portfolio’s allocated fees waived of less than 0.01%. |
| (j) | Includes the Fund’s share of the Master Portfolio’s allocated expenses and/or net investment income. Includes the Fund’s share of the Master Portfolio’s allocated fees waived of 0.01%. |
| (k) | Portfolio turnover rate includes transactions from the Master Portfolio prior to April 25, 2022. |
See notes to financial statements.
FINANCIAL HIGHLIGHTS | 77 |
Financial Highlights (continued)
(For a share outstanding throughout each period)
| BlackRock Advantage Large Cap Core Fund (continued) | ||||||||||||||||||||||||
| Class R | ||||||||||||||||||||||||
| Year Ended 05/31/23 | Period from 10/01/21 to 05/31/22 | Year Ended 09/30/21 | Year Ended 09/30/20 | Year Ended 09/30/19 | Year Ended 09/30/18 | |||||||||||||||||||
Net asset value, beginning of period | $ | 15.84 | $ | 20.60 | $ | 16.66 | $ | 15.03 | $ | 16.38 | $ | 19.85 | ||||||||||||
|
|
|
|
|
|
|
|
|
|
|
| |||||||||||||
Net investment income(a) | 0.10 | 0.05 | 0.07 | 0.13 | 0.15 | 0.15 | ||||||||||||||||||
Net realized and unrealized gain (loss) | (0.17 | ) | (0.72 | ) | 4.70 | 2.13 | (0.13 | ) | 2.47 | |||||||||||||||
|
|
|
|
|
|
|
|
|
|
|
| |||||||||||||
Net increase (decrease) from investment operations | (0.07 | ) | (0.67 | ) | 4.77 | 2.26 | 0.02 | 2.62 | ||||||||||||||||
|
|
|
|
|
|
|
|
|
|
|
| |||||||||||||
Distributions(b) | ||||||||||||||||||||||||
From net investment income | (0.12 | ) | (0.09 | ) | (0.09 | ) | (0.20 | ) | (0.14 | ) | (0.12 | ) | ||||||||||||
From net realized gain | (0.85 | ) | (4.00 | ) | (0.74 | ) | (0.43 | ) | (1.23 | ) | (5.97 | ) | ||||||||||||
|
|
|
|
|
|
|
|
|
|
|
| |||||||||||||
Total distributions | (0.97 | ) | (4.09 | ) | (0.83 | ) | (0.63 | ) | (1.37 | ) | (6.09 | ) | ||||||||||||
|
|
|
|
|
|
|
|
|
|
|
| |||||||||||||
Net asset value, end of period | $ | 14.80 | $ | 15.84 | $ | 20.60 | $ | 16.66 | $ | 15.03 | $ | 16.38 | ||||||||||||
|
|
|
|
|
|
|
|
|
|
|
| |||||||||||||
Total Return(c) | ||||||||||||||||||||||||
Based on net asset value | 0.14 | % | (5.55 | )%(d) | 29.67 | % | 15.38 | % | 0.88 | % | 16.83 | % | ||||||||||||
|
|
|
|
|
|
|
|
|
|
|
| |||||||||||||
Ratios to Average Net Assets(e) | ||||||||||||||||||||||||
Total expenses | 1.24 | % | 1.23 | %(f)(g) | 1.26 | %(h) | 1.37 | %(i) | 1.32 | %(i) | 1.38 | %(h) | ||||||||||||
|
|
|
|
|
|
|
|
|
|
|
| |||||||||||||
Total expenses after fees waived and/or reimbursed | 0.98 | % | 0.98 | %(f)(g) | 0.98 | %(h) | 0.98 | %(i) | 0.98 | %(i) | 0.98 | %(h) | ||||||||||||
|
|
|
|
|
|
|
|
|
|
|
| |||||||||||||
Net investment income | 0.68 | % | 0.42 | %(f)(g) | 0.37 | %(h) | 0.83 | %(i) | 1.04 | %(i) | 0.94 | %(h) | ||||||||||||
|
|
|
|
|
|
|
|
|
|
|
| |||||||||||||
Supplemental Data | ||||||||||||||||||||||||
Net assets, end of period (000) | $ | 11,479 | $ | 13,967 | $ | 14,399 | $ | 12,416 | $ | 27,003 | $ | 41,488 | ||||||||||||
|
|
|
|
|
|
|
|
|
|
|
| |||||||||||||
Portfolio turnover rate(j) | 105 | % | 73 | % | 111 | % | 99 | % | 151 | % | 148 | % | ||||||||||||
|
|
|
|
|
|
|
|
|
|
|
| |||||||||||||
| (a) | Based on average shares outstanding. |
| (b) | Distributions for annual periods determined in accordance with U.S. federal income tax regulations. |
| (c) | Where applicable, assumes the reinvestment of distributions. |
| (d) | Not annualized. |
| (e) | Excludes fees and expenses incurred indirectly as a result of investments in underlying funds. |
| (f) | Annualized. |
| (g) | From October 1, 2021 through April 25, 2022, the Fund invested in the Master Portfolio as part of a master-feeder structure and received its corresponding allocated fees waived and expenses and/or net investment income from the Master Portfolio. Includes the Fund’s share of the Master Portfolio’s allocated fees waived of 0.01%. |
| (h) | Includes the Fund’s share of the Master Portfolio’s allocated expenses and/or net investment income. Includes the Fund’s share of the Master Portfolio’s allocated fees waived of less than 0.01%. |
| (i) | Includes the Fund’s share of the Master Portfolio’s allocated expenses and/or net investment income. Includes the Fund’s share of the Master Portfolio’s allocated fees waived of 0.01%. |
| (j) | Portfolio turnover rate includes transactions from the Master Portfolio prior to April 25, 2022. |
See notes to financial statements.
| 78 | 2 0 2 3 BLACK ROCK ANNUAL REPORT TO SHAREHOLDERS |
Financial Highlights
(For a share outstanding throughout each period)
| BlackRock Advantage Large Cap Value Fund | ||||||||||||||||||||||||
| Institutional | ||||||||||||||||||||||||
| Year Ended 05/31/23 | Year Ended 05/31/22 | Year Ended 05/31/21 | Period from 10/01/19 to 05/31/20 | Year Ended 09/30/19 | Year Ended 09/30/18 | |||||||||||||||||||
Net asset value, beginning of period | $ | 29.79 | $ | 35.07 | $ | 24.74 | $ | 28.08 | $ | 30.89 | $ | 28.32 | ||||||||||||
|
|
|
|
|
|
|
|
|
|
|
| |||||||||||||
Net investment income(a) | 0.47 | 0.45 | 0.46 | 0.39 | 0.57 | 0.55 | ||||||||||||||||||
Net realized and unrealized gain (loss) | (2.02 | ) | (0.21 | ) | 10.36 | (2.60 | ) | (0.26 | ) | 2.57 | ||||||||||||||
|
|
|
|
|
|
|
|
|
|
|
| |||||||||||||
Net increase (decrease) from investment operations | (1.55 | ) | 0.24 | 10.82 | (2.21 | ) | 0.31 | 3.12 | ||||||||||||||||
|
|
|
|
|
|
|
|
|
|
|
| |||||||||||||
Distributions(b) | ||||||||||||||||||||||||
From net investment income | (0.47 | ) | (0.47 | ) | (0.49 | ) | (0.58 | ) | (0.59 | ) | (0.43 | ) | ||||||||||||
From net realized gain | (1.14 | ) | (5.05 | ) | — | (0.55 | ) | (2.53 | ) | (0.12 | ) | |||||||||||||
|
|
|
|
|
|
|
|
|
|
|
| |||||||||||||
Total distributions | (1.61 | ) | (5.52 | ) | (0.49 | ) | (1.13 | ) | (3.12 | ) | (0.55 | ) | ||||||||||||
|
|
|
|
|
|
|
|
|
|
|
| |||||||||||||
Net asset value, end of period | $ | 26.63 | $ | 29.79 | $ | 35.07 | $ | 24.74 | $ | 28.08 | $ | 30.89 | ||||||||||||
|
|
|
|
|
|
|
|
|
|
|
| |||||||||||||
Total Return(c) | ||||||||||||||||||||||||
Based on net asset value | (4.97 | )% | 0.63 | % | 44.37 | % | (8.36 | )%(d) | 1.80 | % | 11.16 | %(d) | ||||||||||||
|
|
|
|
|
|
|
|
|
|
|
| |||||||||||||
Ratios to Average Net Assets(e) | ||||||||||||||||||||||||
Total expenses | 0.70 | % | 0.70 | % | 0.84 | %(f) | 0.89 | %(g)(h) | 0.87 | %(h) | 0.92 | %(i) | ||||||||||||
|
|
|
|
|
|
|
|
|
|
|
| |||||||||||||
Total expenses after fees waived and/or reimbursed | 0.54 | % | 0.54 | % | 0.54 | %(f) | 0.54 | %(g)(h) | 0.54 | %(h) | 0.54 | %(i) | ||||||||||||
|
|
|
|
|
|
|
|
|
|
|
| |||||||||||||
Net investment income | 1.72 | % | 1.41 | % | 1.58 | %(f) | 2.20 | %(g)(h) | 2.09 | %(h) | 1.87 | %(i) | ||||||||||||
|
|
|
|
|
|
|
|
|
|
|
| |||||||||||||
Supplemental Data | ||||||||||||||||||||||||
Net assets, end of period (000) | $ | 164,434 | $ | 186,903 | $ | 194,452 | $ | 146,365 | $ | 192,744 | $ | 169,089 | ||||||||||||
|
|
|
|
|
|
|
|
|
|
|
| |||||||||||||
Portfolio turnover rate | 116 | % | 136 | % | 126 | %(j) | 70 | % | 161 | % | 143 | % | ||||||||||||
|
|
|
|
|
|
|
|
|
|
|
| |||||||||||||
| (a) | Based on average shares outstanding. |
| (b) | Distributions for annual periods determined in accordance with U.S. federal income tax regulations. |
| (c) | Where applicable, assumes the reinvestment of distributions. |
| (d) | Not annualized. |
| (e) | Excludes fees and expenses incurred indirectly as a result of investments in underlying funds. |
| (f) | From June 1, 2020 through February 28, 2021, the Fund invested in the Master Portfolio as part of a master-feeder structure and received its corresponding allocated fees waived and expenses and/or net investment income from the Master Portfolio. Includes the Fund’s share of the Master Portfolio’s allocated fees waived of 0.03%. |
| (g) | Annualized. |
| (h) | Includes the Fund’s share of the Master Portfolio’s allocated expenses and/or net investment income. Includes the Fund’s share of the Master Portfolio’s allocated fees waived of 0.05% and 0.03% for the period October 1, 2019 to May 31, 2020 and September 30, 2019, respectively. |
| (i) | Includes the Fund’s share of the Master Portfolio’s allocated expenses and/or net investment income. Includes the Fund’s share of the Master Portfolio’s allocated fees waived of less than 0.01%. |
| (j) | Portfolio turnover rate includes transactions from the Master Portfolio prior to March 1, 2021. |
See notes to financial statements.
FINANCIAL HIGHLIGHTS | 79 |
Financial Highlights (continued)
(For a share outstanding throughout each period)
| BlackRock Advantage Large Cap Value Fund (continued) | ||||||||||||||||||||||||
| Investor A | ||||||||||||||||||||||||
| Year Ended 05/31/23 | Year Ended 05/31/22 | Year Ended 05/31/21 | Period from 10/01/19 to 05/31/20 | Year Ended 09/30/19 | Year Ended 09/30/18 | |||||||||||||||||||
Net asset value, beginning of period | $ | 28.98 | $ | 34.26 | $ | 24.18 | $ | 27.45 | $ | 30.26 | $ | 27.76 | ||||||||||||
|
|
|
|
|
|
|
|
|
|
|
| |||||||||||||
Net investment income(a) | 0.39 | 0.36 | 0.38 | 0.34 | 0.49 | 0.47 | ||||||||||||||||||
Net realized and unrealized gain (loss) | (1.97 | ) | (0.20 | ) | 10.13 | (2.55 | ) | (0.25 | ) | 2.51 | ||||||||||||||
|
|
|
|
|
|
|
|
|
|
|
| |||||||||||||
Net increase (decrease) from investment operations | (1.58 | ) | 0.16 | 10.51 | (2.21 | ) | 0.24 | 2.98 | ||||||||||||||||
|
|
|
|
|
|
|
|
|
|
|
| |||||||||||||
Distributions(b) | ||||||||||||||||||||||||
From net investment income | (0.40 | ) | (0.39 | ) | (0.43 | ) | (0.51 | ) | (0.52 | ) | (0.36 | ) | ||||||||||||
From net realized gain | (1.14 | ) | (5.05 | ) | — | (0.55 | ) | (2.53 | ) | (0.12 | ) | |||||||||||||
|
|
|
|
|
|
|
|
|
|
|
| |||||||||||||
Total distributions | (1.54 | ) | (5.44 | ) | (0.43 | ) | (1.06 | ) | (3.05 | ) | (0.48 | ) | ||||||||||||
|
|
|
|
|
|
|
|
|
|
|
| |||||||||||||
Net asset value, end of period | $ | 25.86 | $ | 28.98 | $ | 34.26 | $ | 24.18 | $ | 27.45 | $ | 30.26 | ||||||||||||
|
|
|
|
|
|
|
|
|
|
|
| |||||||||||||
Total Return(c) | ||||||||||||||||||||||||
Based on net asset value | (5.22 | )% | 0.40 | % | 44.01 | % | (8.53 | )%(d) | 1.56 | % | 10.86 | %(d) | ||||||||||||
|
|
|
|
|
|
|
|
|
|
|
| |||||||||||||
Ratios to Average Net Assets(e) | ||||||||||||||||||||||||
Total expenses | 0.97 | % | 0.97 | % | 1.10 | %(f) | 1.15 | %(g)(h) | 1.14 | %(h) | 1.20 | %(i) | ||||||||||||
|
|
|
|
|
|
|
|
|
|
|
| |||||||||||||
Total expenses after fees waived and/or reimbursed | 0.79 | % | 0.79 | % | 0.79 | %(f) | 0.79 | %(g)(h) | 0.79 | %(h) | 0.79 | %(i) | ||||||||||||
|
|
|
|
|
|
|
|
|
|
|
| |||||||||||||
Net investment income | 1.47 | % | 1.16 | % | 1.33 | %(f) | 1.95 | %(g)(h) | 1.84 | %(h) | 1.61 | %(i) | ||||||||||||
|
|
|
|
|
|
|
|
|
|
|
| |||||||||||||
Supplemental Data | ||||||||||||||||||||||||
Net assets, end of period (000) | $ | 345,671 | $ | 394,334 | $ | 405,607 | $ | 280,449 | $ | 336,565 | $ | 337,798 | ||||||||||||
|
|
|
|
|
|
|
|
|
|
|
| |||||||||||||
Portfolio turnover rate | 116 | % | 136 | % | 126 | %(j) | 70 | % | 161 | % | 143 | % | ||||||||||||
|
|
|
|
|
|
|
|
|
|
|
| |||||||||||||
| (a) | Based on average shares outstanding. |
| (b) | Distributions for annual periods determined in accordance with U.S. federal income tax regulations. |
| (c) | Where applicable, excludes the effects of any sales charges and assumes the reinvestment of distributions. |
| (d) | Not annualized. |
| (e) | Excludes fees and expenses incurred indirectly as a result of investments in underlying funds. |
| (f) | From June 1, 2020 through February 28, 2021, the Fund invested in the Master Portfolio as part of a master-feeder structure and received its corresponding allocated fees waived and expenses and/or net investment income from the Master Portfolio. Includes the Fund’s share of the Master Portfolio’s allocated fees waived of 0.03%. |
| (g) | Annualized. |
| (h) | Includes the Fund’s share of the Master Portfolio’s allocated expenses and/or net investment income. Includes the Fund’s share of the Master Portfolio’s allocated fees waived of 0.05% and 0.03% for the period October 1, 2019 to May 31, 2020 and September 30, 2019, respectively. |
| (i) | Includes the Fund’s share of the Master Portfolio’s allocated expenses and/or net investment income. Includes the Fund’s share of the Master Portfolio’s allocated fees waived of less than 0.01%. |
| (j) | Portfolio turnover rate includes transactions from the Master Portfolio prior to March 1, 2021. |
See notes to financial statements.
| 80 | 2 0 2 3 BLACK ROCK ANNUAL REPORT TO SHAREHOLDERS |
Financial Highlights (continued)
(For a share outstanding throughout each period)
| BlackRock Advantage Large Cap Value Fund (continued) | ||||||||||||||||||||||||
| Investor C | ||||||||||||||||||||||||
| Year Ended 05/31/23 | Year Ended 05/31/22 | Year Ended 05/31/21 | Period from 10/01/19 to 05/31/20 | Year Ended 09/30/19 | Year Ended 09/30/18 | |||||||||||||||||||
Net asset value, beginning of period | $ | 26.40 | $ | 31.69 | $ | 22.31 | $ | 25.32 | $ | 28.06 | $ | 25.71 | ||||||||||||
|
|
|
|
|
|
|
|
|
|
|
| |||||||||||||
Net investment income(a) | 0.17 | 0.12 | 0.16 | 0.19 | 0.27 | 0.23 | ||||||||||||||||||
Net realized and unrealized gain (loss) | (1.78 | ) | (0.19 | ) | 9.37 | (2.36 | ) | (0.24 | ) | 2.33 | ||||||||||||||
|
|
|
|
|
|
|
|
|
|
|
| |||||||||||||
Net increase (decrease) from investment operations | (1.61 | ) | (0.07 | ) | 9.53 | (2.17 | ) | 0.03 | 2.56 | |||||||||||||||
|
|
|
|
|
|
|
|
|
|
|
| |||||||||||||
Distributions(b) | ||||||||||||||||||||||||
From net investment income | (0.22 | ) | (0.17 | ) | (0.15 | ) | (0.29 | ) | (0.24 | ) | (0.09 | ) | ||||||||||||
From net realized gain | (1.14 | ) | (5.05 | ) | — | (0.55 | ) | (2.53 | ) | (0.12 | ) | |||||||||||||
|
|
|
|
|
|
|
|
|
|
|
| |||||||||||||
Total distributions | (1.36 | ) | (5.22 | ) | (0.15 | ) | (0.84 | ) | (2.77 | ) | (0.21 | ) | ||||||||||||
|
|
|
|
|
|
|
|
|
|
|
| |||||||||||||
Net asset value, end of period | $ | 23.43 | $ | 26.40 | $ | 31.69 | $ | 22.31 | $ | 25.32 | $ | 28.06 | ||||||||||||
|
|
|
|
|
|
|
|
|
|
|
| |||||||||||||
Total Return(c) | ||||||||||||||||||||||||
Based on net asset value | (5.89 | )% | (0.38 | )% | 42.99 | % | (9.00 | )%(d) | 0.79 | % | 10.03 | %(d) | ||||||||||||
|
|
|
|
|
|
|
|
|
|
|
| |||||||||||||
Ratios to Average Net Assets(e) | ||||||||||||||||||||||||
Total expenses | 1.74 | % | 1.73 | % | 1.85 | %(f) | 1.91 | %(g)(h) | 1.94 | %(h) | 1.97 | %(i) | ||||||||||||
|
|
|
|
|
|
|
|
|
|
|
| |||||||||||||
Total expenses after fees waived and/or reimbursed | 1.54 | % | 1.54 | % | 1.54 | %(f) | 1.54 | %(g)(h) | 1.54 | %(h) | 1.54 | %(i) | ||||||||||||
|
|
|
|
|
|
|
|
|
|
|
| |||||||||||||
Net investment income | 0.72 | % | 0.41 | % | 0.63 | %(f) | 1.20 | %(g)(h) | 1.08 | %(h) | 0.87 | %(i) | ||||||||||||
|
|
|
|
|
|
|
|
|
|
|
| |||||||||||||
Supplemental Data | ||||||||||||||||||||||||
Net assets, end of period (000) | $ | 14,894 | $ | 18,099 | $ | 20,880 | $ | 43,395 | $ | 63,659 | $ | 94,919 | ||||||||||||
|
|
|
|
|
|
|
|
|
|
|
| |||||||||||||
Portfolio turnover rate | 116 | % | 136 | % | 126 | %(j) | 70 | % | 161 | % | 143 | % | ||||||||||||
|
|
|
|
|
|
|
|
|
|
|
| |||||||||||||
| (a) | Based on average shares outstanding. |
| (b) | Distributions for annual periods determined in accordance with U.S. federal income tax regulations. |
| (c) | Where applicable, excludes the effects of any sales charges and assumes the reinvestment of distributions. |
| (d) | Not annualized. |
| (e) | Excludes fees and expenses incurred indirectly as a result of investments in underlying funds. |
| (f) | From June 1, 2020 through February 28, 2021, the Fund invested in the Master Portfolio as part of a master-feeder structure and received its corresponding allocated fees waived and expenses and/or net investment income from the Master Portfolio. Includes the Fund’s share of the Master Portfolio’s allocated fees waived of 0.03%. |
| (g) | Annualized. |
| (h) | Includes the Fund’s share of the Master Portfolio’s allocated expenses and/or net investment income. Includes the Fund’s share of the Master Portfolio’s allocated fees waived of 0.05% and 0.03% for the period October 1, 2019 to May 31, 2020 and September 30, 2019, respectively. |
| (i) | Includes the Fund’s share of the Master Portfolio’s allocated expenses and/or net investment income. Includes the Fund’s share of the Master Portfolio’s allocated fees waived of less than 0.01%. |
| (j) | Portfolio turnover rate includes transactions from the Master Portfolio prior to March 1, 2021. |
See notes to financial statements.
FINANCIAL HIGHLIGHTS | 81 |
Financial Highlights (continued)
(For a share outstanding throughout each period)
| BlackRock Advantage Large Cap Value Fund (continued) | ||||||||||||||||||||||||
| Class K | ||||||||||||||||||||||||
| | Year Ended 05/31/23 | | | Year Ended 05/31/22 | | | Year Ended 05/31/21 | | | Period from 10/01/19 to 05/31/20 | | Year Ended 09/30/19 | | | Period from 01/25/18 to 09/30/18 | (a)
| ||||||||
Net asset value, beginning of period | $ | 29.80 | $ | 35.08 | $ | 24.74 | $ | 28.09 | $ | 30.90 | $ | 30.90 | ||||||||||||
|
|
|
|
|
|
|
|
|
|
|
| |||||||||||||
Net investment income(b) | 0.48 | 0.47 | 0.47 | 0.40 | 0.58 | 0.39 | ||||||||||||||||||
Net realized and unrealized gain (loss) | (2.01 | ) | (0.22 | ) | 10.38 | (2.60 | ) | (0.26 | ) | (0.39 | ) | |||||||||||||
|
|
|
|
|
|
|
|
|
|
|
| |||||||||||||
Net increase (decrease) from investment operations | (1.53 | ) | 0.25 | 10.85 | (2.20 | ) | 0.32 | — | ||||||||||||||||
|
|
|
|
|
|
|
|
|
|
|
| |||||||||||||
Distributions(c) | ||||||||||||||||||||||||
From net investment income | (0.49 | ) | (0.48 | ) | (0.51 | ) | (0.60 | ) | (0.60 | ) | — | |||||||||||||
From net realized gain | (1.14 | ) | (5.05 | ) | — | (0.55 | ) | (2.53 | ) | — | ||||||||||||||
|
|
|
|
|
|
|
|
|
|
|
| |||||||||||||
Total distributions | (1.63 | ) | (5.53 | ) | (0.51 | ) | (1.15 | ) | (3.13 | ) | — | |||||||||||||
|
|
|
|
|
|
|
|
|
|
|
| |||||||||||||
Net asset value, end of period | $ | 26.64 | $ | 29.80 | $ | 35.08 | $ | 24.74 | $ | 28.09 | $ | 30.90 | ||||||||||||
|
|
|
|
|
|
|
|
|
|
|
| |||||||||||||
Total Return(d) | ||||||||||||||||||||||||
Based on net asset value | (4.91 | )% | 0.69 | % | 44.48 | % | (8.35 | )%(e) | 1.85 | % | 0.00 | %(e) | ||||||||||||
|
|
|
|
|
|
|
|
|
|
|
| |||||||||||||
Ratios to Average Net Assets(f) | ||||||||||||||||||||||||
Total expenses | 0.63 | % | 0.63 | % | 0.74 | %(g) | 0.80 | %(h)(i) | 0.79 | %(i) | 0.83 | %(h)(j) | ||||||||||||
|
|
|
|
|
|
|
|
|
|
|
| |||||||||||||
Total expenses after fees waived and/or reimbursed | 0.49 | % | 0.49 | % | 0.49 | %(g) | 0.49 | %(h)(i) | 0.49 | %(i) | 0.49 | %(h)(j) | ||||||||||||
|
|
|
|
|
|
|
|
|
|
|
| |||||||||||||
Net investment income | 1.77 | % | 1.47 | % | 1.62 | %(g) | 2.24 | %(h)(i) | 2.14 | %(i) | 1.88 | %(h)(j) | ||||||||||||
|
|
|
|
|
|
|
|
|
|
|
| |||||||||||||
Supplemental Data | ||||||||||||||||||||||||
Net assets, end of period (000) | $ | 10,451 | $ | 10,210 | $ | 8,258 | $ | 4,971 | $ | 5,699 | $ | 5,459 | ||||||||||||
|
|
|
|
|
|
|
|
|
|
|
| |||||||||||||
Portfolio turnover rate | 116 | % | 136 | % | 126 | %(k) | 70 | % | 161 | % | 143 | % | ||||||||||||
|
|
|
|
|
|
|
|
|
|
|
| |||||||||||||
| (a) | Commencement of operations. |
| (b) | Based on average shares outstanding. |
| (c) | Distributions for annual periods determined in accordance with U.S. federal income tax regulations. |
| (d) | Where applicable, assumes the reinvestment of distributions. |
| (e) | Not annualized. |
| (f) | Excludes fees and expenses incurred indirectly as a result of investments in underlying funds. |
| (g) | From June 1, 2020 through February 28, 2021, the Fund invested in the Master Portfolio as part of a master-feeder structure and received its corresponding allocated fees waived and expenses and/or net investment income from the Master Portfolio. Includes the Fund’s share of the Master Portfolio’s allocated fees waived of 0.03%. |
| (h) | Annualized. |
| (i) | Includes the Fund’s share of the Master Portfolio’s allocated expenses and/or net investment income. Includes the Fund’s share of the Master Portfolio’s allocated fees waived of 0.05% and 0.03% for the period October 1, 2019 to May 31, 2020 and September 30, 2019, respectively. |
| (j) | Includes the Fund’s share of the Master Portfolio’s allocated expenses and/or net investment income. Includes the Fund’s share of the Master Portfolio’s allocated fees waived of less than 0.01%. |
| (k) | Portfolio turnover rate includes transactions from the Master Portfolio prior to March 1, 2021. |
See notes to financial statements.
| 82 | 2 0 2 3 BLACK ROCK ANNUAL REPORT TO SHAREHOLDERS |
Financial Highlights (continued)
(For a share outstanding throughout each period)
| BlackRock Advantage Large Cap Value Fund (continued) | ||||||||||||||||||||||||
| Class R | ||||||||||||||||||||||||
| Year Ended 05/31/23 | Year Ended 05/31/22 | Year Ended 05/31/21 | Period from 10/01/19 to 05/31/20 | Year Ended 09/30/19 | Year Ended 09/30/18 | |||||||||||||||||||
Net asset value, beginning of period | $ | 27.56 | $ | 32.84 | $ | 23.18 | $ | 26.29 | $ | 29.10 | $ | 26.70 | ||||||||||||
|
|
|
|
|
|
|
|
|
|
|
| |||||||||||||
Net investment income(a) | 0.31 | 0.27 | 0.29 | 0.28 | 0.41 | 0.38 | ||||||||||||||||||
Net realized and unrealized gain (loss) | (1.87 | ) | (0.19 | ) | 9.71 | (2.43 | ) | (0.26 | ) | 2.42 | ||||||||||||||
|
|
|
|
|
|
|
|
|
|
|
| |||||||||||||
Net increase (decrease) from investment operations | (1.56 | ) | 0.08 | 10.00 | (2.15 | ) | 0.15 | 2.80 | ||||||||||||||||
|
|
|
|
|
|
|
|
|
|
|
| |||||||||||||
Distributions(b) | ||||||||||||||||||||||||
From net investment income | (0.34 | ) | (0.31 | ) | (0.34 | ) | (0.41 | ) | (0.43 | ) | (0.28 | ) | ||||||||||||
From net realized gain | (1.14 | ) | (5.05 | ) | — | (0.55 | ) | (2.53 | ) | (0.12 | ) | |||||||||||||
|
|
|
|
|
|
|
|
|
|
|
| |||||||||||||
Total distributions | (1.48 | ) | (5.36 | ) | (0.34 | ) | (0.96 | ) | (2.96 | ) | (0.40 | ) | ||||||||||||
|
|
|
|
|
|
|
|
|
|
|
| |||||||||||||
Net asset value, end of period | $ | 24.52 | $ | 27.56 | $ | 32.84 | $ | 23.18 | $ | 26.29 | $ | 29.10 | ||||||||||||
|
|
|
|
|
|
|
|
|
|
|
| |||||||||||||
Total Return(c) | ||||||||||||||||||||||||
Based on net asset value | (5.43 | )% | 0.14 | % | 43.63 | % | (8.65 | )%(d) | 1.29 | % | 10.60 | %(d) | ||||||||||||
|
|
|
|
|
|
|
|
|
|
|
| |||||||||||||
Ratios to Average Net Assets(e) | ||||||||||||||||||||||||
Total expenses | 1.36 | % | 1.35 | % | 1.41 | %(f) | 1.43 | %(g)(h) | 1.44 | %(h) | 1.47 | %(i) | ||||||||||||
|
|
|
|
|
|
|
|
|
|
|
| |||||||||||||
Total expenses after fees waived and/or reimbursed | 1.04 | % | 1.04 | % | 1.04 | %(f) | 1.04 | %(g)(h) | 1.04 | %(h) | 1.04 | %(i) | ||||||||||||
|
|
|
|
|
|
|
|
|
|
|
| |||||||||||||
Net investment income | 1.22 | % | 0.91 | % | 1.11 | %(f) | 1.69 | %(g)(h) | 1.59 | %(h) | 1.37 | %(i) | ||||||||||||
|
|
|
|
|
|
|
|
|
|
|
| |||||||||||||
Supplemental Data | ||||||||||||||||||||||||
Net assets, end of period (000) | $ | 6,925 | $ | 8,440 | $ | 9,015 | $ | 10,820 | $ | 18,321 | $ | 29,497 | ||||||||||||
|
|
|
|
|
|
|
|
|
|
|
| |||||||||||||
Portfolio turnover rate | 116 | % | 136 | % | 126 | %(j) | 70 | % | 161 | % | 143 | % | ||||||||||||
|
|
|
|
|
|
|
|
|
|
|
| |||||||||||||
| (a) | Based on average shares outstanding. |
| (b) | Distributions for annual periods determined in accordance with U.S. federal income tax regulations. |
| (c) | Where applicable, assumes the reinvestment of distributions. |
| (d) | Not annualized. |
| (e) | Excludes fees and expenses incurred indirectly as a result of investments in underlying funds. |
| (f) | From June 1, 2020 through February 28, 2021, the Fund invested in the Master Portfolio as part of a master-feeder structure and received its corresponding allocated fees waived and expenses and/or net investment income from the Master Portfolio. Includes the Fund’s share of the Master Portfolio’s allocated fees waived of 0.03%. |
| (g) | Annualized. |
| (h) | Includes the Fund’s share of the Master Portfolio’s allocated expenses and/or net investment income. Includes the Fund’s share of the Master Portfolio’s allocated fees waived of 0.05% and 0.03% for the period October 1, 2019 to May 31, 2020 and September 30, 2019, respectively. |
| (i) | Includes the Fund’s share of the Master Portfolio’s allocated expenses and/or net investment income. Includes the Fund’s share of the Master Portfolio’s allocated fees waived of less than 0.01%. |
| (j) | Portfolio turnover rate includes transactions from the Master Portfolio prior to March 1, 2021. |
See notes to financial statements.
FINANCIAL HIGHLIGHTS | 83 |
| 1. | ORGANIZATION |
BlackRock FundsSM (the “Trust”) and BlackRock Large Cap Series Funds, Inc. (the “Corporation”) are each registered under the Investment Company Act of 1940, as amended (the “1940 Act”), as open-end management investment companies. The Trust is organized as a Massachusetts business trust. The Corporation is organized as a Maryland corporation. BlackRock Advantage International Fund, BlackRock Advantage Large Cap Growth Fund and BlackRock Small Cap Core Fund are series of the Trust. BlackRock Advantage Large Cap Core Fund and BlackRock Advantage Large Cap Value Fund are series of the Corporation. The following are referred to herein collectively as the “Funds” or individually as a “Fund”:
| ||||||||
| Fund Name | Herein Referred To As | Diversification Classification | ||||||
| ||||||||
BlackRock Advantage International Fund | Advantage International | Diversified | ||||||
BlackRock Advantage Large Cap Growth Fund | Advantage Large Cap Growth | Diversified | ||||||
BlackRock Advantage Small Cap Core Fund | Advantage Small Cap Core | Diversified | ||||||
BlackRock Advantage Large Cap Core Fund | Advantage Large Cap Core | Diversified | ||||||
BlackRock Advantage Large Cap Value Fund | Advantage Large Cap Value | Diversified | ||||||
| ||||||||
Each Fund offers multiple classes of shares. All classes of shares have identical voting, dividend, liquidation and other rights and are subject to the same terms and conditions, except that certain classes bear expenses related to the shareholder servicing and distribution of such shares. Institutional and Class K Shares are sold only to certain eligible investors. Investor A, Investor C and Class R Shares bear certain expenses related to shareholder servicing of such shares, and Investor C and Class R Shares also bear certain expenses related to the distribution of such shares. Investor A and Investor C Shares are generally available through financial intermediaries. Class R Shares are sold only to certain employer-sponsored retirement plans. Each class has exclusive voting rights with respect to matters relating to its shareholder servicing and distribution expenditures (except that Investor C shareholders may vote on material changes to the Investor A Shares distribution and service plan).
| ||||||||||||
| Share Class | Initial Sales Charge | CDSC | Conversion Privilege | |||||||||
| ||||||||||||
Institutional, Class K and Class R Shares | No | No | None | |||||||||
Investor A Shares | Yes | No | (a) | None | ||||||||
Investor C Shares | No | Yes | (b) | To Investor A Shares after approximately 8 years | ||||||||
| ||||||||||||
| (a) | Investor A Shares may be subject to a contingent deferred sales charge (“CDSC”) for certain redemptions where no initial sales charge was paid at the time of purchase. |
| (b) | A CDSC of 1.00% is assessed on certain redemptions of Investor C Shares made within one year after purchase. |
The Board of Directors of the Corporation and the Board of Trustees of the Trust are collectively referred to throughout this report as the “Board”, and the directors/trustees thereof are collectively referred to throughout this report as “Directors”.
The Funds, together with certain other registered investment companies advised by BlackRock Advisors, LLC (the “Manager”) or its affiliates, are included in a complex of funds referred to as the BlackRock Multi-Asset Complex.
| 2. | SIGNIFICANT ACCOUNTING POLICIES |
The financial statements are prepared in conformity with accounting principles generally accepted in the United States of America (“U.S. GAAP”), which may require management to make estimates and assumptions that affect the reported amounts of assets and liabilities in the financial statements, disclosure of contingent assets and liabilities at the date of the financial statements and the reported amounts of increases and decreases in net assets from operations during the reporting period. Actual results could differ from those estimates. Each Fund is considered an investment company under U.S. GAAP and follows the accounting and reporting guidance applicable to investment companies. Below is a summary of significant accounting policies:
Investment Transactions and Income Recognition: For financial reporting purposes, investment transactions are recorded on the dates the transactions are executed. Realized gains and losses on investment transactions are determined using the specific identification method. Dividend income and capital gain distributions, if any, are recorded on the ex-dividend dates. Non-cash dividends, if any, are recorded on the ex-dividend dates at fair value. Dividends from foreign securities where the ex-dividend dates may have passed are subsequently recorded when the Funds are informed of the ex-dividend dates. Under the applicable foreign tax laws, a withholding tax at various rates may be imposed on capital gains, dividends and interest. Upon notification from issuers, a portion of the dividend income received from a real estate investment trust may be redesignated as a reduction of cost of the related investment and/or realized gain. Income, expenses and realized and unrealized gains and losses are allocated daily to each class based on its relative net assets.
Foreign Currency Translation: Each Fund’s books and records are maintained in U.S. dollars. Securities and other assets and liabilities denominated in foreign currencies are translated into U.S. dollars using exchange rates determined as of the close of trading on the New York Stock Exchange (“NYSE”). Purchases and sales of investments are recorded at the rates of exchange prevailing on the respective dates of such transactions. Generally, when the U.S. dollar rises in value against a foreign currency, the investments denominated in that currency will lose value; the opposite effect occurs if the U.S. dollar falls in relative value.
Each Fund does not isolate the effect of fluctuations in foreign exchange rates from the effect of fluctuations in the market prices of investments for financial reporting purposes. Accordingly, the effects of changes in exchange rates on investments are not segregated in the Statements of Operations from the effects of changes in market prices of those investments, but are included as a component of net realized and unrealized gain (loss) from investments. Each Fund reports realized currency gains (losses) on foreign currency related transactions as components of net realized gain (loss) for financial reporting purposes, whereas such components are generally treated as ordinary income for U.S. federal income tax purposes.
Foreign Taxes: The Funds may be subject to foreign taxes (a portion of which may be reclaimable) on income, stock dividends, capital gains on investments, or certain foreign currency transactions. All foreign taxes are recorded in accordance with the applicable foreign tax regulations and rates that exist in the foreign jurisdictions in which each Fund
| 84 | 2 0 2 3 BLACK ROCK ANNUAL REPORT TO SHAREHOLDERS |
Notes to Financial Statements (continued)
invests. These foreign taxes, if any, are paid by each Fund and are reflected in its Statements of Operations as follows: foreign taxes withheld at source are presented as a reduction of income, foreign taxes on securities lending income are presented as a reduction of securities lending income, foreign taxes on stock dividends are presented as “Foreign taxes withheld”, and foreign taxes on capital gains from sales of investments and foreign taxes on foreign currency transactions are included in their respective net realized gain (loss) categories. Foreign taxes payable or deferred as of May 31, 2023, if any, are disclosed in the Statements of Assets and Liabilities.
The Funds file withholding tax reclaims in certain jurisdictions to recover a portion of amounts previously withheld. Certain Funds may record a reclaim receivable based on collectability, which includes factors such as the jurisdiction’s applicable laws, payment history and market convention. The Statements of Operations include tax reclaims recorded as well as professional and other fees, if any, associated with recovery of foreign withholding taxes.
Collateralization: If required by an exchange or counterparty agreement, the Funds may be required to deliver/deposit cash and/or securities to/with an exchange, or broker-dealer or custodian as collateral for certain investments.
Distributions: Distributions paid by the Funds are recorded on the ex-dividend dates. The character and timing of distributions are determined in accordance with U.S. federal income tax regulations, which may differ from U.S. GAAP.
Indemnifications: In the normal course of business, a Fund enters into contracts that contain a variety of representations that provide general indemnification. A Fund’s maximum exposure under these arrangements is unknown because it involves future potential claims against a Fund, which cannot be predicted with any certainty.
Other: Expenses directly related to a Fund or its classes are charged to that Fund or the applicable class. Expenses directly related to the Funds and other shared expenses prorated to the Funds are allocated daily to each class based on their relative net assets or other appropriate methods. Other operating expenses shared by several funds, including other funds managed by the Manager, are prorated among those funds on the basis of relative net assets or other appropriate methods.
The Funds have an arrangement with their custodian whereby credits are earned on uninvested cash balances, which could be used to reduce custody fees and/or overdraft charges. The Funds may incur charges on overdrafts, subject to certain conditions.
| 3. | INVESTMENT VALUATION AND FAIR VALUE MEASUREMENTS |
Investment Valuation Policies: The Funds’ investments are valued at fair value (also referred to as “market value” within the financial statements) each day that the Funds are open for business and, for financial reporting purposes, as of the report date. U.S. GAAP defines fair value as the price a fund would receive to sell an asset or pay to transfer a liability in an orderly transaction between market participants at the measurement date. The Board of each Fund has approved the designation of the Fund’s Manager as the valuation designee for the Fund. Each Fund determines the fair values of its financial instruments using various independent dealers or pricing services under the Manager’s policies. If a security’s market price is not readily available or does not otherwise accurately represent the fair value of the security, the security will be valued in accordance with the Manager’s policies and procedures as reflecting fair value. The Manager has formed a committee (the “Valuation Committee”) to develop pricing policies and procedures and to oversee the pricing function for all financial instruments, with assistance from other BlackRock pricing committees.
Fair Value Inputs and Methodologies: The following methods and inputs are used to establish the fair value of each Funds’ assets and liabilities:
| • | Equity investments traded on a recognized securities exchange are valued at that day’s official closing price, as applicable, on the exchange where the stock is primarily traded. Equity investments traded on a recognized exchange for which there were no sales on that day may be valued at the last available bid (long positions) or ask (short positions) price. |
| • | Investments in open-end U.S. mutual funds (including money market funds) are valued at that day’s published NAV. |
| • | The Funds value their investment in SL Liquidity Series, LLC, Money Market Series (the “Money Market Series”) at fair value, which is ordinarily based upon their pro rata ownership in the underlying fund’s net assets. |
| • | Futures contracts are valued based on that day’s last reported settlement or trade price on the exchange where the contract is traded. |
Generally, trading in foreign instruments is substantially completed each day at various times prior to the close of trading on the New York Stock Exchange (“NYSE”). Each business day, the Funds use current market factors supplied by independent pricing services to value certain foreign instruments (“Systematic Fair Value Price”). The Systematic Fair Value Price is designed to value such foreign securities at fair value as of the close of trading on the NYSE, which follows the close of the local markets.
If events (e.g., market volatility, company announcement or a natural disaster) occur that are expected to materially affect the value of such investment, or in the event that application of these methods of valuation results in a price for an investment that is deemed not to be representative of the market value of such investment, or if a price is not available, the investment will be valued by the Valuation Committee, in accordance with the Manager’s policies and procedures as reflecting fair value (“Fair Valued Investments”). The fair valuation approaches that may be used by the Valuation Committee include market approach, income approach and cost approach. Valuation techniques such as discounted cash flow, use of market comparables and matrix pricing are types of valuation approaches and are typically used in determining fair value. When determining the price for Fair Valued Investments, the Valuation Committee seeks to determine the price that each Fund might reasonably expect to receive or pay from the current sale or purchase of that asset or liability in an arm’s-length transaction. Fair value determinations shall be based upon all available factors that the Valuation Committee deems relevant and consistent with the principles of fair value measurement.
NOTES TO FINANCIAL STATEMENTS | 85 |
Notes to Financial Statements (continued)
For investments in equity or debt issued by privately held companies or funds (“Private Company” or collectively, the “Private Companies”) and other Fair Valued Investments, the fair valuation approaches that are used by the Valuation Committee and third-party pricing services utilized by the Valuation Committee include one or a combination of, but not limited to, the following inputs.
| Standard Inputs Generally Considered By The Valuation Committee And Third-Party Pricing Services | ||
Market approach | (i) recent market transactions, including subsequent rounds of financing, in the underlying investment or comparable issuers; | |
(ii) recapitalizations and other transactions across the capital structure; and | ||
(iii) market multiples of comparable issuers. | ||
Income approach | (i) future cash flows discounted to present and adjusted as appropriate for liquidity, credit, and/or market risks; | |
(ii) quoted prices for similar investments or assets in active markets; and | ||
(iii) other risk factors, such as interest rates, yield curves, volatilities, prepayment speeds, loss severities, credit risks, recovery rates, liquidation amounts and/or default rates. | ||
Cost approach | (i) audited or unaudited financial statements, investor communications and financial or operational metrics issued by the Private Company; | |
(ii) changes in the valuation of relevant indices or publicly traded companies comparable to the Private Company; | ||
(iii) relevant news and other public sources; and | ||
(iv) known secondary market transactions in the Private Company’s interests and merger or acquisition activity in companies comparable to the Private Company. | ||
Investments in series of preferred stock issued by Private Companies are typically valued utilizing market approach in determining the enterprise value of the company. Such investments often contain rights and preferences that differ from other series of preferred and common stock of the same issuer. Enterprise valuation techniques such as an option pricing model (“OPM”), a probability weighted expected return model (“PWERM”), current value method or a hybrid of those techniques are used as deemed appropriate under the circumstances. The use of these valuation techniques involve a determination of the exit scenarios of the investment in order to appropriately allocate the enterprise value of the company among the various parts of its capital structure.
The Private Companies are not subject to the public company disclosure, timing, and reporting standards applicable to other investments held by a Fund. Typically, the most recently available information by a Private Company is as of a date that is earlier than the date a Fund is calculating its NAV. This factor may result in a difference between the value of the investment and the price a Fund could receive upon the sale of the investment.
Fair Value Hierarchy: Various inputs are used in determining the fair value of financial instruments. These inputs to valuation techniques are categorized into a fair value hierarchy consisting of three broad levels for financial reporting purposes as follows:
| • | Level 1 – Unadjusted price quotations in active markets/exchanges for identical assets or liabilities that each Fund has the ability to access; |
| • | Level 2 – Other observable inputs (including, but not limited to, quoted prices for similar assets or liabilities in markets that are active, quoted prices for identical or similar assets or liabilities in markets that are not active, inputs other than quoted prices that are observable for the assets or liabilities (such as interest rates, yield curves, volatilities, prepayment speeds, loss severities, credit risks and default rates) or other market–corroborated inputs); and |
| • | Level 3 – Unobservable inputs based on the best information available in the circumstances, to the extent observable inputs are not available (including the Valuation Committee’s assumptions used in determining the fair value of financial instruments). |
The hierarchy gives the highest priority to unadjusted quoted prices in active markets for identical assets or liabilities (Level 1 measurements) and the lowest priority to unobservable inputs (Level 3 measurements). Accordingly, the degree of judgment exercised in determining fair value is greatest for instruments categorized in Level 3. The inputs used to measure fair value may fall into different levels of the fair value hierarchy. In such cases, for disclosure purposes, the fair value hierarchy classification is determined based on the lowest level input that is significant to the fair value measurement in its entirety. Investments classified within Level 3 have significant unobservable inputs used by the Valuation Committee in determining the price for Fair Valued Investments. Level 3 investments include equity or debt issued by Private Companies that may not have a secondary market and/or may have a limited number of investors. The categorization of a value determined for financial instruments is based on the pricing transparency of the financial instruments and is not necessarily an indication of the risks associated with investing in those securities.
As of May 31, 2023, certain investments of the Funds were fair valued using NAV as a practical expedient as no quoted market value is available and therefore have been excluded from the fair value hierarchy.
| 4. | SECURITIES AND OTHER INVESTMENTS |
Securities Lending: Certain Funds may lend their securities to approved borrowers, such as brokers, dealers and other financial institutions. The borrower pledges and maintains with the Fund collateral consisting of cash, an irrevocable letter of credit issued by a bank, or securities issued or guaranteed by the U.S. Government. The initial collateral received by each Fund is required to have a value of at least 102% of the current value of the loaned securities for securities traded on U.S. exchanges and a value of at least 105% for all other securities. The collateral is maintained thereafter at a value equal to at least 100% of the current market value of the securities on loan. The market value of the loaned securities is determined at the close of each business day of the Fund and any additional required collateral is delivered to the Fund, or excess collateral returned by the Fund, on the next business day. During the term of the loan, the Fund is entitled to all distributions made on or in respect of the loaned securities, but do not receive interest income on securities received as collateral. Loans of securities are terminable at any time and the borrower, after notice, is required to return borrowed securities within the standard time period for settlement of securities transactions.
As of period end, any securities on loan were collateralized by cash and/or U.S. Government obligations. Cash collateral invested by the securities lending agent, BlackRock Investment Management, LLC (“BIM”), if any, is disclosed in the Schedules of Investments. Any non-cash collateral received cannot be sold, re-invested or pledged by the
| 86 | 2 0 2 3 BLACK ROCK ANNUAL REPORT TO SHAREHOLDERS |
Notes to Financial Statements (continued)
Fund, except in the event of borrower default. The securities on loan, if any, are disclosed in the Fund’s Schedules of Investments. The market value of any securities on loan and the value of related collateral, if any, are shown separately in the Statements of Assets and Liabilities as a component of investments at value – unaffiliated and collateral on securities loaned, respectively.
Securities lending transactions are entered into by the Funds under Master Securities Lending Agreements (each, an “MSLA”), which provide the right, in the event of default (including bankruptcy or insolvency), for the non-defaulting party to liquidate the collateral and calculate a net exposure to the defaulting party or request additional collateral. In the event that a borrower defaults, the Fund, as lender, would offset the market value of the collateral received against the market value of the securities loaned. When the value of the collateral is greater than that of the market value of the securities loaned, the lender is left with a net amount payable to the defaulting party. However, bankruptcy or insolvency laws of a particular jurisdiction may impose restrictions on or prohibitions against such a right of offset in the event of an MSLA counterparty’s bankruptcy or insolvency. Under the MSLA, absent an event of default, the borrower can resell or re-pledge the loaned securities, and a Fund can reinvest cash collateral received in connection with loaned securities. Upon an event of default, the parties’ obligations to return the securities or collateral to the other party are extinguished, and the parties can resell or re-pledge the loaned securities or the collateral received in connection with the loaned securities in order to satisfy the defaulting party’s net payment obligation for all transactions under the MSLA. The defaulting party remains liable for any deficiency.
As of period end, the following table is a summary of the Funds’ securities on loan by counterparty which are subject to offset under an MSLA:
| ||||
| Fund Name/Counterparty | Securities Loaned at Value | Cash Collateral Received(a) | Non-Cash Collateral Received(a) | Net Amount(b) | ||||||||||||
Advantage International | ||||||||||||||||
BofA Securities, Inc. | $ | 719,644 | $ | (719,644 | ) | $ | — | $ | — | |||||||
Goldman Sachs & Co. LLC | 833,966 | (833,966 | ) | — | — | |||||||||||
Morgan Stanley | 842,402 | (842,402 | ) | — | — | |||||||||||
|
|
|
|
|
|
|
| |||||||||
| $ | 2,396,012 | $ | (2,396,012 | ) | $ | — | $ | — | ||||||||
|
|
|
|
|
|
|
| |||||||||
Advantage Large Cap Growth | ||||||||||||||||
Citigroup Global Markets, Inc. | $ | 11,857,692 | $ | (11,857,692 | ) | $ | — | $ | — | |||||||
|
|
|
|
|
|
|
| |||||||||
Advantage Small Cap Core | ||||||||||||||||
Barclays Capital, Inc. | $ | 2,847,057 | $ | (2,847,057 | ) | $ | — | $ | — | |||||||
BNP Paribas SA | 2,105,796 | (2,105,796 | ) | — | — | |||||||||||
BofA Securities, Inc. | 3,635,947 | (3,635,947 | ) | — | — | |||||||||||
Citigroup Global Markets, Inc. | 6,882,419 | (6,882,419 | ) | — | — | |||||||||||
Credit Suisse Securities (USA) LLC | 607,233 | (607,233 | ) | — | — | |||||||||||
J.P. Morgan Securities LLC | 33,304,654 | (33,304,654 | ) | — | — | |||||||||||
Jefferies LLC | 7,321,021 | (7,321,021 | ) | — | — | |||||||||||
Morgan Stanley | 23,693,325 | (23,693,325 | ) | — | — | |||||||||||
National Financial Services LLC | 2,936,885 | (2,936,885 | ) | — | — | |||||||||||
SG Americas Securities LLC | 156,342 | (156,342 | ) | — | — | |||||||||||
State Street Bank & Trust Co. | 1,385,608 | (1,385,608 | ) | — | — | |||||||||||
TD Prime Services LLC | 8,705,666 | (8,705,666 | ) | — | — | |||||||||||
|
|
|
|
|
|
|
| |||||||||
| $ | 93,581,953 | $ | (93,581,953 | ) | $ | — | $ | — | ||||||||
|
|
|
|
|
|
|
| |||||||||
Advantage Large Cap Core | ||||||||||||||||
Goldman Sachs & Co. LLC | $ | 939,896 | $ | (939,896 | ) | $ | — | $ | — | |||||||
|
|
|
|
|
|
|
| |||||||||
Advantage Large Cap Value | ||||||||||||||||
Goldman Sachs & Co. LLC | $ | 856,547 | $ | (856,547 | ) | $ | — | $ | — | |||||||
|
|
|
|
|
|
|
| |||||||||
| (a) | Collateral received, if any, in excess of the market value of securities on loan is not presented in this table. The total cash collateral received by each Fund is disclosed in the Funds’ Statements of Assets and Liabilities. |
| (b) | The market value of the loaned securities is determined as of May 31, 2023. Additional collateral is delivered to the Fund on the next business day in accordance with the MSLA. The net amount would be subject to the borrower default indemnity in the event of default by the counterparty. |
The risks of securities lending include the risk that the borrower may not provide additional collateral when required or may not return the securities when due. To mitigate these risks, the Funds benefit from a borrower default indemnity provided by BIM. BIM’s indemnity allows for full replacement of the securities loaned to the extent the collateral received does not cover the value on the securities loaned in the event of borrower default. Each Fund could incur a loss if the value of an investment purchased with cash collateral falls below the market value of loaned securities or if the value of an investment purchased with cash collateral falls below the value of the original cash collateral received. Such losses are borne entirely by the Funds.
| 5. | DERIVATIVE FINANCIAL INSTRUMENTS |
The Funds engage in various portfolio investment strategies using derivative contracts both to increase the returns of the Funds and/or to manage their exposure to certain risks such as credit risk, equity risk, interest rate risk, foreign currency exchange rate risk, commodity price risk or other risks (e.g., inflation risk). Derivative financial instruments categorized by risk exposure are included in the Schedules of Investments. These contracts may be transacted on an exchange or over-the-counter (“OTC”).
Futures Contracts: Futures contracts are purchased or sold to gain exposure to, or manage exposure to, changes in interest rates (interest rate risk) and changes in the value of equity securities (equity risk) or foreign currencies (foreign currency exchange rate risk).
NOTES TO FINANCIAL STATEMENTS | 87 |
Notes to Financial Statements (continued)
Futures contracts are exchange-traded agreements between the Funds and a counterparty to buy or sell a specific quantity of an underlying instrument at a specified price and on a specified date. Depending on the terms of a contract, it is settled either through physical delivery of the underlying instrument on the settlement date or by payment of a cash amount on the settlement date. Upon entering into a futures contract, the Funds are required to deposit initial margin with the broker in the form of cash or securities in an amount that varies depending on a contract’s size and risk profile. The initial margin deposit must then be maintained at an established level over the life of the contract. Amounts pledged, which are considered restricted, are included in cash pledged for futures contracts in the Statements of Assets and Liabilities.
Securities deposited as initial margin are designated in the Schedules of Investments and cash deposited, if any, are shown as cash pledged for futures contracts in the Statements of Assets and Liabilities. Pursuant to the contract, the Funds agree to receive from or pay to the broker an amount of cash equal to the daily fluctuation in market value of the contract (“variation margin”). Variation margin is recorded as unrealized appreciation (depreciation) and, if any, shown as variation margin receivable (or payable) on futures contracts in the Statements of Assets and Liabilities. When the contract is closed, a realized gain or loss is recorded in the Statements of Operations equal to the difference between the notional amount of the contract at the time it was opened and the notional amount at the time it was closed. The use of futures contracts involves the risk of an imperfect correlation in the movements in the price of futures contracts and interest rates, foreign currency exchange rates or underlying assets.
| 6. | INVESTMENT ADVISORY AGREEMENT AND OTHER TRANSACTIONS WITH AFFILIATES |
Investment Advisory: The Trust, on behalf of Advantage International, Advantage Large Cap Growth and Advantage Small Cap Core, and the Corporation, on behalf of Advantage Large Cap Core and Advantage Large Cap Value, entered into an Investment Advisory Agreement with the Manager, the Funds’ investment adviser and an indirect, wholly-owned subsidiary of BlackRock, Inc. (“BlackRock”), to provide investment advisory services. The Manager is responsible for the management of each Fund’s portfolio and provides the personnel, facilities, equipment and certain other services necessary to the operations of each Fund.
For such services, each Fund pays the Manager a monthly fee at an annual rate equal to the following percentages of the average daily value of each Fund’s net assets:
| Investment Advisory Fees | ||||||||||||||||||||
| Average Daily Net Assets | Advantage International | Advantage Large Cap Growth | Advantage Small Cap Core | Advantage Large Cap Core | Advantage Large Cap Value | |||||||||||||||
First $1 billion | 0.45% | 0.57% | 0.45% | 0.45% | 0.49% | |||||||||||||||
$1 billion - $3 billion | 0.42 | 0.54 | 0.42 | 0.42 | 0.46 | |||||||||||||||
$3 billion - $5 billion | 0.41 | 0.51 | 0.41 | 0.41 | 0.44 | |||||||||||||||
$5 billion - $10 billion | 0.39 | 0.50 | 0.39 | 0.39 | 0.43 | |||||||||||||||
Greater than $10 billion | 0.38 | 0.48 | 0.38 | 0.38 | 0.42 | |||||||||||||||
Service and Distribution Fees: The Trust, on behalf of Advantage International, Advantage Large Cap Growth and Advantage Small Cap Core, and the Corporation, on behalf of Advantage Large Cap Core and Advantage Large Cap Value, entered into a Distribution Agreement and a Distribution and Service Plan with BlackRock Investments, LLC (“BRIL”), an affiliate of the Manager. Pursuant to the Distribution and Service Plan and in accordance with Rule 12b-1 under the 1940 Act, each Fund pays BRIL ongoing service and distribution fees. The fees are accrued daily and paid monthly at annual rates based upon the average daily net assets of the relevant share class of each Fund as follows:
Advantage International | Advantage Large Cap Growth | Advantage Small Cap Core | ||||||||||||||||||||||
| Share Class | Service Fees | Distribution Fees | Service Fees | Distribution Fees | Service Fees | Distribution Fees | ||||||||||||||||||
Investor A | 0.25% | N/A | 0.25% | N/A | 0.25% | N/A | ||||||||||||||||||
Investor C | 0.25 | 0.75% | 0.25 | 0.75% | 0.25% | 0.75% | ||||||||||||||||||
Class R | 0.25 | 0.25 | 0.25 | 0.25 | N/A | N/A | ||||||||||||||||||
Advantage Large Cap Core | Advantage Large Cap Value | |||||||||||||||||||||||
| Share Class | Service Fees | Distribution Fees | Service Fees | Distribution Fees | ||||||||||||||||||||
Investor A | 0.25% | N/A | 0.25% | N/A | ||||||||||||||||||||
Investor C | 0.25 | 0.75% | 0.25 | 0.75% | ||||||||||||||||||||
Class R | 0.25 | 0.25 | 0.25 | 0.25 | ||||||||||||||||||||
BRIL and broker-dealers, pursuant to sub-agreements with BRIL, provide shareholder servicing and distribution services to the Funds. The ongoing service and/or distribution fee compensates BRIL and each broker-dealer for providing shareholder servicing and/or distribution related services to shareholders.
For the year ended May 31, 2023, the following table shows the class specific service and distribution fees borne directly by each share class of each Fund:
| Fund Name | Investor A | Investor C | Class R | Total | ||||||||||||
Advantage International | $ | 554,730 | $ | 24,001 | $ | 13,853 | $ | 592,584 | ||||||||
Advantage Large Cap Growth | 1,046,890 | 88,244 | 2,011 | 1,137,145 | ||||||||||||
Advantage Small Cap Core | 841,190 | 101,294 | — | 942,484 | ||||||||||||
Advantage Large Cap Core | 3,169,273 | 331,773 | 61,720 | 3,562,766 | ||||||||||||
Advantage Large Cap Value | 909,864 | 162,001 | 37,518 | 1,109,383 | ||||||||||||
Administration: The Trust, on behalf of Advantage International, Advantage Large Cap Growth and Advantage Small Cap Core, and the Corporation, on behalf of Advantage Large Cap Core and Advantage Large Cap Value, entered into an Administration Agreement with the Manager, an indirect, wholly-owned subsidiary of BlackRock, to provide
| 88 | 2 0 2 3 BLACK ROCK ANNUAL REPORT TO SHAREHOLDERS |
Notes to Financial Statements (continued)
administrative services. For these services, the Manager receives an administration fee computed daily and payable monthly, based on a percentage of the average daily net assets of each Fund. The administration fee, which is shown as administration in the Statements of Operations, is paid at the annual rates below.
| Average Daily Net Assets | Administration Fees | |||||||
First $500 million | 0.0425% | |||||||
$500 million - $1 billion | 0.0400 | |||||||
$1 billion - $2 billion | 0.0375 | |||||||
$2 billion - $4 billion | 0.0350 | |||||||
$4 billion - $13 billion | 0.0325 | |||||||
Greater than $13 billion | 0.0300 | |||||||
In addition, the Manager charges each of the share classes an administration fee, which is shown as administration — class specific in the Statements of Operations, at an annual rate of 0.02% of the average daily net assets of each respective class.
For the year ended May 31, 2023, the following table shows the class specific administration fees borne directly by each share class of each Fund:
| Fund Name | Institutional | Investor A | Investor C | Class K | Class R | Total | ||||||||||||||||||
Advantage International | $ | 139,003 | $ | 44,378 | $ | 481 | $ | 29,170 | $ | 554 | $ | 213,586 | ||||||||||||
Advantage Large Cap Growth | 90,404 | 83,776 | 1,770 | 404 | 80 | 176,434 | ||||||||||||||||||
Advantage Small Cap Core | 473,932 | 67,320 | 2,027 | 200,288 | — | 743,567 | ||||||||||||||||||
Advantage Large Cap Core | 288,723 | 253,613 | 6,668 | 6,426 | 2,458 | 557,888 | ||||||||||||||||||
Advantage Large Cap Value | 34,210 | 72,805 | 3,241 | 2,018 | 1,502 | 113,776 | ||||||||||||||||||
Transfer Agent: Pursuant to written agreements, certain financial intermediaries, some of which may be affiliates, provide the Funds with sub-accounting, recordkeeping, sub-transfer agency and other administrative services with respect to servicing of underlying investor accounts. For these services, these entities receive an asset-based fee or an annual fee per shareholder account, which will vary depending on share class and/or net assets. For the year ended May 31, 2023, the Funds paid the following amounts to affiliates of BlackRock in return for these services, which are included in transfer agent — class specific in the Statements of Operations:
| Fund Name | Institutional | Total | ||||||
Advantage International | $ | 463,310 | $ | 463,310 | ||||
Advantage Large Cap Growth | 403,876 | 403,876 | ||||||
Advantage Small Cap Core | 169,255 | 169,255 | ||||||
Advantage Large Cap Core | 740,241 | 740,241 | ||||||
The Manager maintains a call center that is responsible for providing certain shareholder services to the Funds. Shareholder services include responding to inquiries and processing purchases and sales based upon instructions from shareholders. For the year ended May 31, 2023, each Fund reimbursed the Manager the following amounts for costs incurred in running the call center, which are included in transfer agent — class specific in the Statements of Operations:
| Fund Name | Institutional | Investor A | Investor C | Class K | Class R | Total | ||||||||||||||||||
Advantage International | $ | 4,454 | $ | 9,602 | $ | 609 | $ | 357 | $ | 62 | $ | 15,084 | ||||||||||||
Advantage Large Cap Growth | 3,371 | 46,428 | 1,840 | 21 | 18 | 51,678 | ||||||||||||||||||
Advantage Small Cap Core | 13,853 | 19,247 | 267 | 5,323 | — | 38,690 | ||||||||||||||||||
Advantage Large Cap Core | 35,315 | 244,842 | 4,835 | 171 | 215 | 285,378 | ||||||||||||||||||
Advantage Large Cap Value | 1,321 | 35,282 | 1,565 | 68 | 163 | 38,399 | ||||||||||||||||||
For the year ended May 31, 2023, the following table shows the class specific transfer agent fees borne directly by each share class of each Fund:
| Fund Name | Institutional | Investor A | Investor C | Class K | Class R | Total | ||||||||||||||||||
Advantage International | $ | 757,984 | $ | 388,444 | $ | 4,982 | $ | 1,250 | $ | 7,053 | $ | 1,159,713 | ||||||||||||
Advantage Large Cap Growth | 322,859 | 561,454 | 16,850 | 234 | 981 | 902,378 | ||||||||||||||||||
Advantage Small Cap Core | 1,939,710 | 561,334 | 18,733 | 48,375 | — | 2,568,152 | ||||||||||||||||||
Advantage Large Cap Core | 1,687,750 | 1,698,801 | 70,538 | 7,546 | 28,044 | 3,492,679 | ||||||||||||||||||
Advantage Large Cap Value | 149,562 | 383,100 | 20,578 | 1,369 | 17,991 | 572,600 | ||||||||||||||||||
Other Fees: For the year ended May 31, 2023, affiliates earned underwriting discounts, direct commissions and dealer concessions on sales of each Fund’s Investor A Shares as follows:
| Fund Name | Amounts | |||
Advantage International | $ | 3,532 | ||
Advantage Large Cap Growth | 7,936 | |||
Advantage Small Cap Core | 16,061 | |||
Advantage Large Cap Core | 25,103 | |||
Advantage Large Cap Value | 5,640 | |||
NOTES TO FINANCIAL STATEMENTS | 89 |
Notes to Financial Statements (continued)
For the year ended May 31, 2023, affiliates received CDSCs as follows:
| Share Class | Advantage International | Advantage Large Cap Growth | Advantage Small Cap Core | Advantage Large Cap Core | Advantage Large Cap Value | |||||||||||||||
Investor A | $ | 1,503 | $ | — | $ | 8,835 | $ | 11,637 | $ | 1,840 | ||||||||||
Investor C | 71 | 157 | 1,229 | 2,421 | 266 | |||||||||||||||
Expense Limitations, Waivers and Reimbursements: With respect to each Fund, the Manager contractually agreed to waive its investment advisory fees by the amount of investment advisory fees each Fund pays to the Manager indirectly through its investment in affiliated money market funds (the “affiliated money market fund waiver”) through June 30, 2024. The contractual agreement may be terminated upon 90 days’ notice by a majority of the directors who are not “interested persons” of the Trust or the Corporation, as defined in the 1940 Act (“Independent Directors”), or by a vote of a majority of the outstanding voting securities of a Fund. The amount of waivers and/or reimbursements of fees and expenses made pursuant to the expense limitation described below will be reduced by the amount of the affiliated money market fund waiver. These amounts are included in fees waived and/or reimbursed by the Manager in the Statements of Operations. For the year ended May 31, 2023, the amounts waived were as follows.
| Fund Name | Amounts Waived | |||
Advantage International | $ | 16,154 | ||
Advantage Large Cap Growth | 6,570 | |||
Advantage Small Cap Core | 27,283 | |||
Advantage Large Cap Core | 17,078 | |||
Advantage Large Cap Value | 3,797 | |||
The Manager has contractually agreed to waive its investment advisory fee with respect to any portion of each Fund’s assets invested in affiliated equity and fixed-income mutual funds and affiliated exchange-traded funds that have a contractual management fee through June 30, 2024. The contractual agreement may be terminated upon 90 days’ notice by a majority of the Independent Directors, or by a vote of a majority of the outstanding voting securities of a Fund. For the year ended May 31, 2023, there were no fees waived by the Manager pursuant to this arrangement.
With respect to each Fund, the Manager contractually agreed to waive and/or reimburse fees or expenses in order to limit expenses, excluding interest expense, dividend expense, tax expense, acquired fund fees and expenses, and certain other fund expenses, which constitute extraordinary expenses not incurred in the ordinary course of each Fund’s business (“expense limitation”). The expense limitations as a percentage of average daily net assets are as follows:
| Fund Name | Institutional | Investor A | Investor C | Class K | Class R | |||||||||||||||
Advantage International | 0.50 | % | 0.75 | % | 1.50 | % | 0.45 | % | 1.00 | % | ||||||||||
Advantage Large Cap Growth | 0.62 | 0.87 | 1.62 | 0.57 | 1.12 | |||||||||||||||
Advantage Small Cap Core’ | 0.50 | 0.75 | 1.50 | 0.45 | N/A | |||||||||||||||
Advantage Large Cap Core | 0.48 | 0.73 | 1.48 | 0.43 | 0.98 | |||||||||||||||
Advantage Large Cap Value | 0.54 | 0.79 | 1.54 | 0.49 | 1.04 | |||||||||||||||
The Manager has agreed not to reduce or discontinue the contractual expense limitations through June 30, 2024 (June 30, 2033 with respect to Advantage Large Cap Growth Class R Shares), unless approved by the Board, including a majority of the Independent Directors, or by a vote of a majority of the outstanding voting securities of a Fund.
For the year ended May 31, 2023, the Manager waived and/or reimbursed investment advisory fees, which is included in fees waived and/or reimbursed by the Manager in the Statements of Operations, as follows:
| Fund Name | Amounts Waived | |||
Advantage International | $ | 1,089,044 | ||
Advantage Large Cap Growth | 765,198 | |||
Advantage Small Cap Core | 1,441,554 | |||
Advantage Large Cap Core | 1,726,024 | |||
Advantage Large Cap Value | 607,341 | |||
In addition, these amounts waived and/or reimbursed by the Manager are included in administration fees waived by the Manager — class specific and transfer agent fees waived and/or reimbursed by the Manager — class specific, service and distribution fees waived and service distribution fees reimbursed respectively, in the Statements of Operations. For the year ended May 31, 2023, class specific expense waivers and/or reimbursements were as follows:
Administration Fees Waived by the Manager - Class Specific | ||||||||||||||||||||||||
| Fund Name | Institutional | Investor A | Investor C | Class K | Class R | Total | ||||||||||||||||||
Advantage International | $ | 139,003 | $ | 44,378 | $ | 481 | $ | 29,170 | $ | 554 | $ | 213,586 | ||||||||||||
Advantage Large Cap Growth | 33,951 | 76,486 | 1,770 | 404 | 80 | 112,691 | ||||||||||||||||||
Advantage Small Cap Core | 473,932 | 67,320 | 2,027 | 200,288 | — | 743,567 | ||||||||||||||||||
Advantage Large Cap Core | 288,723 | 253,613 | 6,668 | 6,426 | 2,458 | 557,888 | ||||||||||||||||||
Advantage Large Cap Value | 34,210 | 72,805 | 3,241 | 2,018 | 1,502 | 113,776 | ||||||||||||||||||
| 90 | 2 0 2 3 BLACK ROCK ANNUAL REPORT TO SHAREHOLDERS |
Notes to Financial Statements (continued)
Transfer Agent Fees Waived and/or Reimbursed by the Manager - Class Specific | ||||||||||||||||||||||||
| Fund Name | Institutional | Investor A | Investor C | Class K | Class R | Total | ||||||||||||||||||
Advantage International | $ | 410,363 | $ | 277,824 | $ | 3,708 | $ | 1,250 | $ | 5,673 | $ | 698,818 | ||||||||||||
Advantage Large Cap Growth | 216,150 | 359,527 | 12,205 | 234 | 781 | 588,897 | ||||||||||||||||||
Advantage Small Cap Core | 754,936 | 393,265 | 13,655 | 48,375 | — | 1,210,231 | ||||||||||||||||||
Advantage Large Cap Core | 966,072 | 1,065,739 | 52,344 | 7,546 | 22,187 | 2,113,888 | ||||||||||||||||||
Advantage Large Cap Value | 64,072 | 201,403 | 12,475 | 1,370 | 14,217 | 293,537 | ||||||||||||||||||
Securities Lending: The U.S. Securities and Exchange Commission (“SEC”) has issued an exemptive order which permits BIM, an affiliate of the Manager, to serve as securities lending agent for the Funds, subject to applicable conditions. As securities lending agent, BIM bears all operational costs directly related to securities lending. The Funds are responsible for expenses in connection with the investment of cash collateral received for securities on loan (the “collateral investment expenses”). The cash collateral is invested in a private investment company, Money Market Series, managed by the Manager or its affiliates. However, BIM has agreed to cap the collateral investment expenses of the Money Market Series to an annual rate of 0.04%. The investment adviser to the Money Market Series will not charge any advisory fees with respect to shares purchased by the Funds. The Money Market Series may, under certain circumstances, impose a liquidity fee of up to 2% of the value withdrawn or temporarily restrict withdrawals for up to 10 business days during a 90 day period, in the event that the private investment company’s weekly liquid assets fall below certain thresholds. The Money Market Series seeks current income consistent with maintaining liquidity and preserving capital. Although the Money Market Series is not registered under the 1940 Act, its investments may follow the parameters of investments by a money market fund that is subject to Rule 2a-7 under the 1940 Act.
Securities lending income is equal to the total of income earned from the reinvestment of cash collateral, net of fees and other payments to and from borrowers of securities, and less the collateral investment expenses. Each Fund retains a portion of securities lending income and remits a remaining portion to BIM as compensation for its services as securities lending agent.
Pursuant to the current securities lending agreement, each Fund (except Advantage International) retains 81% of securities lending income (which excludes collateral investment expenses), and this amount retained can never be less than 70% of the total of securities lending income plus the collateral investment expenses. Pursuant to the current securities lending agreement, Advantage International retains 82% of securities lending income (which excludes collateral investment expenses), and this amount retained can never be less than 70% of the total of securities lending income plus the collateral investment expenses.
In addition, commencing the business day following the date that the aggregate securities lending income earned across the BlackRock Multi-Asset Complex in a calendar year exceeds a specified threshold, each Fund (except Advantage International), pursuant to the securities lending agreement, will retain for the remainder of that calendar year securities lending income in an amount equal to 81% of securities lending income (which excludes collateral investment expenses), and this amount retained can never be less than 70% of the total of securities lending income plus the collateral investment expenses. Advantage International, pursuant to the securities lending agreement, will retain for the remainder of that calendar year securities lending income in an amount equal to 85% of securities lending income (which excludes collateral investment expenses), and this amount retained can never be less than 70% of the total of securities lending income plus the collateral investment expenses.
The share of securities lending income earned by each Fund is shown as securities lending income — affiliated — net in the Statements of Operations. For the year ended May 31, 2023, each Fund paid BIM the following amounts for securities lending agent services:
| Fund Name | Amounts | |||
Advantage International | $ | 12,515 | ||
Advantage Large Cap Growth | 412 | |||
Advantage Small Cap Core | 271,001 | |||
Advantage Large Cap Core | 8,308 | |||
Advantage Large Cap Value | 8,739 | |||
Interfund Lending: In accordance with an exemptive order (the “Order”) from the SEC, each Fund other than Advantage Large Cap Growth may participate in a joint lending and borrowing facility for temporary purposes (the “Interfund Lending Program”), subject to compliance with the terms and conditions of the Order, and to the extent permitted by each Fund’s investment policies and restrictions. Advantage International, Advantage Large Cap Core and Advantage Large Cap Value are currently permitted to borrow under the Interfund Lending Program. Advantage Small Cap Core is currently permitted to borrow and lend under the Interfund Lending Program.
A lending BlackRock fund may lend in aggregate up to 15% of its net assets but may not lend more than 5% of its net assets to any one borrowing fund through the Interfund Lending Program. A borrowing BlackRock fund may not borrow through the Interfund Lending Program or from any other source more than 33 1/3% of its total assets (or any lower threshold provided for by the fund’s investment restrictions). If a borrowing BlackRock fund’s total outstanding borrowings exceed 10% of its total assets, each of its outstanding interfund loans will be subject to collateralization of at least 102% of the outstanding principal value of the loan. All interfund loans are for temporary or emergency purposes and the interest rate to be charged will be the average of the highest current overnight repurchase agreement rate available to a lending fund and the bank loan rate, as calculated according to a formula established by the Board.
During the year ended May 31, 2023, the Funds did not participate in the Interfund Lending Program.
Directors and Officers: Certain Directors and/or officers of the Corporation and the Trust are directors and/or officers of BlackRock or its affiliates. The Funds reimburse the Manager for a portion of the compensation paid to the Corporation’s/Trust’s Chief Compliance Officer, which is included in Directors and Officer in the Statements of Operations.
Other Transactions: During the year ended May 31, 2023, Advantage Large Cap Core recorded a reimbursement of $16,519 from an affiliate, which is included in payments by affiliates in the Statements of Operations, related to operating events.
NOTES TO FINANCIAL STATEMENTS | 91 |
Notes to Financial Statements (continued)
The Funds may purchase securities from, or sell securities to, an affiliated fund provided the affiliation is due solely to having a common investment adviser, common officers, or common directors or trustees. For the year ended May 31, 2023, the purchase and sale transactions and any net realized gains (losses) with an affiliated fund in compliance with Rule 17a-7 under the 1940 Act were as follows:
| ||||||||||||
| Fund Name | Purchases | Sales | Net Realized Loss | |||||||||
| ||||||||||||
Advantage International | $ | 180,889,569 | $ 167,360,330 | $ | (6,535,565) | |||||||
Advantage Large Cap Growth | 192,913,491 | 193,078,257 | (2,881,776) | |||||||||
Advantage Small Cap Core | 44,475,586 | 65,446,487 | (4,061,357) | |||||||||
Advantage Large Cap Core | 314,532,775 | 295,431,269 | (5,463,341) | |||||||||
Advantage Large Cap Value | 66,440,485 | 61,562,655 | 532,101 | |||||||||
| ||||||||||||
| 7. | PURCHASES AND SALES |
For the year ended May 31, 2023, purchases and sales of investments, excluding short-term investments, were as follows:
| ||||||||
| Fund Name | Purchases | Sales | ||||||
| ||||||||
Advantage International | $ | 1,454,962,359 | $ | 1,336,416,377 | ||||
Advantage Large Cap Growth | 1,144,290,928 | 1,140,450,035 | ||||||
Advantage Small Cap Core | 3,402,506,526 | 3,504,180,067 | ||||||
Advantage Large Cap Core | 2,914,073,629 | 3,105,367,923 | ||||||
Advantage Large Cap Value | 657,352,062 | 692,880,943 | ||||||
| ||||||||
| 8. | INCOME TAX INFORMATION |
It is each Fund’s policy to comply with the requirements of the Internal Revenue Code of 1986, as amended, applicable to regulated investment companies, and to distribute substantially all of its taxable income to its shareholders. Therefore, no U.S. federal income tax provision is required.
Each Fund files U.S. federal and various state and local tax returns. No income tax returns are currently under examination. The statute of limitations on each Fund’s U.S. federal tax returns generally remains open for a period of three years after they are filed. The statutes of limitations on each Fund’s state and local tax returns may remain open for an additional year depending upon the jurisdiction.
Management has analyzed tax laws and regulations and their application to the Funds as of May 31, 2023, inclusive of the open tax return years, and does not believe that there are any uncertain tax positions that require recognition of a tax liability in the Funds’ financial statements.
The tax character of distributions paid was as follows:
| Period | Advantage International | Advantage Large Cap Growth | Advantage Small Cap Core(a) | Advantage Large Cap Core(a) | Advantage Large Cap Value | |||||||||||||||||||
Ordinary income | 05/31/23 | $ | 33,948,066 | $ | 2,228,616 | $ | 29,229,941 | $ | 29,688,180 | $ | 8,879,547 | |||||||||||||
| 05/31/22 | 75,379,392 | 80,241,896 | 267,924,397 | 300,626,296 | 62,455,146 | |||||||||||||||||||
| 09/30/21 | — | — | — | 74,893,922 | — | |||||||||||||||||||
| 05/31/21 | 17,234,394 | 18,919,073 | 68,728,891 | — | 8,535,339 | |||||||||||||||||||
Long-term capital gains | 05/31/23 | — | — | 71,449,539 | 142,361,333 | 23,879,246 | ||||||||||||||||||
| 05/31/22 | 19,216,534 | 75,300,948 | 230,922,822 | 311,327,192 | 43,956,359 | |||||||||||||||||||
| 09/30/21 | — | — | — | 66,237,471 | — | |||||||||||||||||||
| 05/31/21 | — | 48,567,710 | 9,400,294 | — | — | |||||||||||||||||||
|
|
|
|
|
|
|
|
|
| |||||||||||||||
Total | 05/31/23 | $ | 33,948,066 | $ | 2,228,616 | $ | 100,679,480 | $ | 172,049,513 | $ | 32,758,793 | |||||||||||||
|
|
|
|
|
|
|
|
|
| |||||||||||||||
| 05/31/22 | $ | 94,595,926 | $ | 155,542,844 | $ | 498,847,219 | $ | 611,953,488 | $ | 106,411,505 | ||||||||||||||
|
|
|
|
|
|
|
|
|
| |||||||||||||||
| 09/30/21 | $ | — | $ | — | $ | — | $ | 141,131,393 | $ | — | ||||||||||||||
|
|
|
|
|
|
|
|
|
| |||||||||||||||
| 05/31/21 | $ | 17,234,394 | $ | 67,486,783 | $ | 78,129,185 | $ | — | $ | 8,535,339 | ||||||||||||||
|
|
|
|
|
|
|
|
|
| |||||||||||||||
| (a) | Distribution amounts may include a portion of the proceeds from redeemed shares. |
| 92 | 2 0 2 3 BLACK ROCK ANNUAL REPORT TO SHAREHOLDERS |
Notes to Financial Statements (continued)
As of May 31, 2023, the tax components of accumulated earnings (loss) were as follows:
|
|
| ||||||||||||||||||
| Advantage International | Advantage Large Cap Growth | Advantage Small Cap Core | Advantage Large Cap Core | Advantage Large Cap Value | ||||||||||||||||
|
|
| ||||||||||||||||||
Undistributed ordinary income | $ | 19,829,056 | $ | 867,519 | $ | 9,437,677 | $ | 10,578,065 | $ | 3,224,919 | ||||||||||
Non-expiring capital loss carryforwards | (90,015,175 | ) | (25,713,241 | ) | (320,410,727 | ) | (84,219,781 | ) | (10,898,011 | ) | ||||||||||
Net unrealized gains (losses)(a) | 95,601,361 | 306,672,982 | (315,629,146 | ) | 471,649,723 | 19,784,866 | ||||||||||||||
|
|
|
|
|
|
|
|
|
| |||||||||||
| $ | 25,415,242 | $ | 281,827,260 | $ | (626,602,196 | ) | $ | 398,008,007 | $ | 12,111,774 | ||||||||||
|
|
|
|
|
|
|
|
|
| |||||||||||
|
|
| ||||||||||||||||||
| (a) | The difference between book-basis and tax-basis net unrealized gains (losses) was attributable primarily to the tax deferral of losses on wash sales, the realization for tax purposes of unrealized gains (losses) on certain foreign currency contracts and futures contracts, the realization for tax purposes of unrealized gains on investments in passive foreign investment companies, characterization of corporate actions and the timing and recognition of partnership income. |
As of May 31, 2023, gross unrealized appreciation and depreciation based on cost of investments (including short positions and derivatives, if any) for U.S. federal income tax purposes were as follows:
| ||||||||||||||||
| Fund Name | Tax Cost | Gross Unrealized Appreciation | Gross Unrealized Depreciation | Net Unrealized Appreciation (Depreciation) | ||||||||||||
| ||||||||||||||||
Advantage International | $ | 1,120,446,423 | $ | 127,084,390 | $ | (31,412,055 | ) | $ | 95,672,335 | |||||||
Advantage Large Cap Growth | 656,474,021 | 329,779,244 | (23,181,357 | ) | 306,597,887 | |||||||||||
Advantage Small Cap Core | 3,860,339,860 | 328,536,004 | (647,392,362 | ) | (318,856,358 | ) | ||||||||||
Advantage Large Cap Core | 2,351,271,901 | 599,475,314 | (128,228,705 | ) | 471,246,609 | |||||||||||
Advantage Large Cap Value | 522,996,869 | 47,720,861 | (28,046,146 | ) | 19,674,715 | |||||||||||
| ||||||||||||||||
| 9. | BANK BORROWINGS |
The Trust, on behalf of Advantage International, Advantage Large Cap Growth and Advantage Small Cap Core, and the Corporation, on behalf of Advantage Large Cap Core and Advantage Large Cap Value, along with certain other funds managed by the Manager and its affiliates (“Participating Funds”), are parties to a 364-day, $2.50 billion credit agreement with a group of lenders. Under this agreement, the Funds may borrow to fund shareholder redemptions. Excluding commitments designated for certain individual funds, the Participating Funds, including the Funds, can borrow up to an aggregate commitment amount of $1.75 billion at any time outstanding, subject to asset coverage and other limitations as specified in the agreement. The credit agreement has the following terms: a fee of 0.10% per annum on unused commitment amounts and interest at a rate equal to the higher of (a) Overnight Bank Funding Rate (“OBFR”) (but, in any event, not less than 0.00%) on the date the loan is made plus 0.80% per annum, (b) the Fed Funds rate (but, in any event, not less than 0.00%) in effect from time to time plus 0.80% per annum on amounts borrowed or (c) the sum of (x) Daily Simple Secured Overnight Financing Rate (“SOFR”) (but, in any event, not less than 0.00%) on the date the loan is made plus 0.10% and (y) 0.80% per annum. The agreement expires in April 2024 unless extended or renewed. These fees were allocated among such funds based upon portions of the aggregate commitment available to them and relative net assets of Participating Funds. During the year ended April 30, 2024, the Funds did not borrow under the credit agreement.
| 10. | PRINCIPAL RISKS |
In the normal course of business, the Funds invest in securities or other instruments and may enter into certain transactions, and such activities subject each Fund to various risks, including among others, fluctuations in the market (market risk) or failure of an issuer to meet all of its obligations. The value of securities or other instruments may also be affected by various factors, including, without limitation: (i) the general economy; (ii) the overall market as well as local, regional or global political and/or social instability; (iii) regulation, taxation or international tax treaties between various countries; or (iv) currency, interest rate and price fluctuations. Local, regional or global events such as war, acts of terrorism, the spread of infectious illness or other public health issues, recessions, or other events could have a significant impact on the Funds and their investments. Each Fund’s prospectus provides details of the risks to which each Fund is subject.
The Funds may be exposed to additional risks when reinvesting cash collateral in money market funds that do not seek to maintain a stable NAV per share of $1.00, which may be subject to redemption gates or liquidity fees under certain circumstances.
Infectious Illness Risk: An outbreak of an infectious illness, such as the COVID-19 pandemic, may adversely impact the economies of many nations and the global economy, and may impact individual issuers and capital markets in ways that cannot be foreseen. An infectious illness outbreak may result in, among other things, closed international borders, prolonged quarantines, supply chain disruptions, market volatility or disruptions and other significant economic, social and political impacts.
Valuation Risk: The market values of equities, such as common stocks and preferred securities or equity related investments, such as futures and options, may decline due to general market conditions which are not specifically related to a particular company. They may also decline due to factors which affect a particular industry or industries. A Fund may invest in illiquid investments. An illiquid investment is any investment that a Fund reasonably expects cannot be sold or disposed of in current market conditions in seven calendar days or less without the sale or disposition significantly changing the market value of the investment. A Fund may experience difficulty in selling illiquid investments in a timely manner at the price that it believes the investments are worth. Prices may fluctuate widely over short or extended periods in response to company, market or economic news. Markets also tend to move in cycles, with periods of rising and falling prices. This volatility may cause each Fund’s NAV to experience significant increases or decreases over short periods of time. If there is a general decline in the securities and other markets, the NAV of a Fund may lose value, regardless of the individual results of the securities and other instruments in which a Fund invests.
NOTES TO FINANCIAL STATEMENTS | 93 |
Notes to Financial Statements (continued)
The price a Fund could receive upon the sale of any particular portfolio investment may differ from a Fund’s valuation of the investment, particularly for securities that trade in thin or volatile markets or that are valued using a fair valuation technique or a price provided by an independent pricing service. Changes to significant unobservable inputs and assumptions (i.e., publicly traded company multiples, growth rate, time to exit) due to the lack of observable inputs may significantly impact the resulting fair value and therefore a Fund’s results of operations. As a result, the price received upon the sale of an investment may be less than the value ascribed by a Fund, and a Fund could realize a greater than expected loss or lesser than expected gain upon the sale of the investment. A Fund’s ability to value its investments may also be impacted by technological issues and/or errors by pricing services or other third-party service providers.
Counterparty Credit Risk: The Funds may be exposed to counterparty credit risk, or the risk that an entity may fail to or be unable to perform on its commitments related to unsettled or open transactions, including making timely interest and/or principal payments or otherwise honoring its obligations. The Funds manage counterparty credit risk by entering into transactions only with counterparties that the Manager believes have the financial resources to honor their obligations and by monitoring the financial stability of those counterparties. Financial assets, which potentially expose the Funds to market, issuer and counterparty credit risks, consist principally of financial instruments and receivables due from counterparties. The extent of the Funds’ exposure to market, issuer and counterparty credit risks with respect to these financial assets is approximately their value recorded in the Statements of Assets and Liabilities, less any collateral held by the Funds.
A derivative contract may suffer a mark-to-market loss if the value of the contract decreases due to an unfavorable change in the market rates or values of the underlying instrument. Losses can also occur if the counterparty does not perform under the contract.
With exchange-traded futures, there is less counterparty credit risk to the Funds since the exchange or clearinghouse, as counterparty to such instruments, guarantees against a possible default. The clearinghouse stands between the buyer and the seller of the contract; therefore, credit risk is limited to failure of the clearinghouse. While offset rights may exist under applicable law, a Fund does not have a contractual right of offset against a clearing broker or clearinghouse in the event of a default (including the bankruptcy or insolvency). Additionally, credit risk exists in exchange-traded futures and centrally cleared swaps with respect to initial and variation margin that is held in a clearing broker’s customer accounts. While clearing brokers are required to segregate customer margin from their own assets, in the event that a clearing broker becomes insolvent or goes into bankruptcy and at that time there is a shortfall in the aggregate amount of margin held by the clearing broker for all its clients, typically the shortfall would be allocated on a pro rata basis across all the clearing broker’s customers, potentially resulting in losses to the Funds.
Concentration Risk: A diversified portfolio, where this is appropriate and consistent with each fund’s objectives, minimizes the risk that a price change of a particular investment will have a material impact on the NAV of a fund. The investment concentrations within each Fund’s portfolio are disclosed in its Schedule of Investments.
Certain Funds invest a significant portion of their assets in securities within a single or limited number of market sectors. When a fund concentrates its investments in this manner, it assumes the risk that economic, regulatory, political and social conditions affecting such sectors may have a significant impact on the Fund and could affect the income from, or the value or liquidity of, the Fund’s portfolio. Investment percentages in specific sectors are presented in the Schedules of Investments.
Certain Funds invest a significant portion of their assets in securities of issuers located in the United States. A decrease in imports or exports, changes in trade regulations, inflation and/or an economic recession in the United States may have a material adverse effect on the U.S. economy and the securities listed on U.S. exchanges. Proposed and adopted policy and legislative changes in the United States may also have a significant effect on U.S. markets generally, as well as on the value of certain securities. Governmental agencies project that the United States will continue to maintain elevated public debt levels for the foreseeable future which may constrain future economic growth. Circumstances could arise that could prevent the timely payment of interest or principal on U.S. government debt, such as reaching the legislative “debt ceiling.” Such non-payment would result in substantial negative consequences for the U.S. economy and the global financial system. If U.S. relations with certain countries deteriorate, it could adversely affect issuers that rely on the United States for trade. The United States has also experienced increased internal unrest and discord. If these trends were to continue, they may have an adverse impact on the U.S. economy and the issuers in which the Funds invest
Advantage International invests a significant portion of its assets in securities of issuers located in Europe or with significant exposure to European issuers or countries. The European financial markets have recently experienced volatility and adverse trends due to concerns about economic downturns in, or rising government debt levels of, several European countries as well as acts of war in the region. These events may spread to other countries in Europe and may affect the value and liquidity of certain of the Fund’s investments.
Responses to the financial problems by European governments, central banks and others, including austerity measures and reforms, may not work, may result in social unrest and may limit future growth and economic recovery or have other unintended consequences. Further defaults or restructurings by governments and others of their debt could have additional adverse effects on economies, financial markets and asset valuations around the world. The United Kingdom has withdrawn from the European Union, and one or more other countries may withdraw from the European Union and/or abandon the Euro, the common currency of the European Union. The impact of these actions, especially if they occur in a disorderly fashion, is not clear but could be significant and far reaching. In addition, Russia launched a large-scale invasion of Ukraine on February 24, 2022. The extent and duration of the military action, resulting sanctions and resulting future market disruptions in the region are impossible to predict, but could be significant and have a severe adverse effect on the region, including significant negative impacts on the economy and the markets for certain securities and commodities, such as oil and natural gas, as well as other sectors.
Advantage International invests a significant portion of its assets in securities of issuers located in Asia or with significant exposure to Asian issuers or countries. The Asian financial markets have recently experienced volatility and adverse trends due to concerns in several Asian countries regarding monetary policy, government intervention in the markets, rising government debt levels or economic downturns. These events may spread to other countries in Asia and may affect the value and liquidity of certain of the Fund’s investments.
Significant Shareholder Redemption Risk: Certain shareholders may own or manage a substantial amount of fund shares and/or hold their fund investments for a limited period of time. Large redemptions of fund shares by these shareholders may force a fund to sell portfolio securities, which may negatively impact the fund’s NAV, increase the fund’s brokerage costs, and/or accelerate the realization of taxable income/gains and cause the fund to make additional taxable distributions to shareholders.
| 94 | 2 0 2 3 BLACK ROCK ANNUAL REPORT TO SHAREHOLDERS |
Notes to Financial Statements (continued)
| 11. | CAPITAL SHARE TRANSACTIONS |
Transactions in capital shares for each class were as follows:
| Year Ended 05/31/23 | Year Ended 05/31/22 | |||||||||||||||
| Fund Name/Share Class | Shares | Amount | Shares | Amount | ||||||||||||
Advantage International | ||||||||||||||||
Institutional | ||||||||||||||||
Shares sold | 11,508,058 | $ | 175,708,419 | 13,777,161 | $ | 261,293,357 | ||||||||||
Shares issued in reinvestment of distributions | 1,525,765 | 22,800,749 | 2,994,510 | 55,505,073 | ||||||||||||
Shares redeemed | (9,987,110 | ) | (150,703,357 | ) | (4,683,986 | ) | (84,719,670 | ) | ||||||||
|
|
|
|
|
|
|
| |||||||||
| 3,046,713 | $ | 47,805,811 | 12,087,685 | $ | 232,078,760 | |||||||||||
|
|
|
|
|
|
|
| |||||||||
Investor A | ||||||||||||||||
Shares sold and automatic conversion of shares | 1,491,738 | $ | 22,573,584 | 1,609,445 | $ | 29,061,798 | ||||||||||
Shares issued in reinvestment of distributions | 426,965 | 6,301,933 | 1,366,649 | 25,210,535 | ||||||||||||
Shares redeemed | (2,700,529 | ) | (41,155,670 | ) | (11,421,414 | ) | (216,904,290 | ) | ||||||||
|
|
|
|
|
|
|
| |||||||||
| (781,826 | ) | $ | (12,280,153 | ) | (8,445,320 | ) | $ | (162,631,957 | ) | |||||||
|
|
|
|
|
|
|
| |||||||||
Investor C | ||||||||||||||||
Shares sold | 51,816 | $ | 776,986 | 15,572 | $ | 276,617 | ||||||||||
Shares issued in reinvestment of distributions | 4,022 | 57,985 | 13,423 | 240,443 | ||||||||||||
Shares redeemed and automatic conversion of shares | (42,803 | ) | (646,954 | ) | (71,622 | ) | (1,273,660 | ) | ||||||||
|
|
|
|
|
|
|
| |||||||||
| 13,035 | $ | 188,017 | (42,627 | ) | $ | (756,600 | ) | |||||||||
|
|
|
|
|
|
|
| |||||||||
Class K | ||||||||||||||||
Shares sold | 6,766,930 | $ | 106,688,626 | 1,559,416 | $ | 28,044,701 | ||||||||||
Shares issued in reinvestment of distributions | 259,872 | 3,878,150 | 445,197 | 8,265,311 | ||||||||||||
Shares redeemed | (1,714,155 | ) | (27,125,496 | ) | (936,345 | ) | (17,250,139 | ) | ||||||||
|
|
|
|
|
|
|
| |||||||||
| 5,312,647 | $ | 83,441,280 | 1,068,268 | $ | 19,059,873 | |||||||||||
|
|
|
|
|
|
|
| |||||||||
Class R | ||||||||||||||||
Shares sold | 1,023,690 | $ | 17,224,244 | 52,932 | $ | 965,685 | ||||||||||
Shares issued in reinvestment of distributions | 4,989 | 73,701 | 13,774 | 253,477 | ||||||||||||
Shares redeemed | (53,022 | ) | (824,885 | ) | (71,361 | ) | (1,307,696 | ) | ||||||||
|
|
|
|
|
|
|
| |||||||||
| 975,657 | $ | 16,473,060 | (4,655 | ) | $ | (88,534 | ) | |||||||||
|
|
|
|
|
|
|
| |||||||||
| 8,566,226 | $ | 135,628,015 | 4,663,351 | $ | 87,661,542 | |||||||||||
|
|
|
|
|
|
|
| |||||||||
Advantage Large Cap Growth | ||||||||||||||||
Institutional | ||||||||||||||||
Shares sold | 6,868,840 | $ | 118,137,284 | 18,866,857 | $ | 451,445,651 | ||||||||||
Shares issued in reinvestment of distributions | 84,195 | 1,481,839 | 1,817,498 | 43,395,960 | ||||||||||||
Shares redeemed | (4,676,497 | ) | (85,552,119 | ) | (3,026,155 | ) | (68,987,252 | ) | ||||||||
|
|
|
|
|
|
|
| |||||||||
| 2,276,538 | $ | 34,067,004 | 17,658,200 | $ | 425,854,359 | |||||||||||
|
|
|
|
|
|
|
| |||||||||
Service(a) | ||||||||||||||||
Shares sold | — | $ | — | 7 | $ | 150 | ||||||||||
Shares redeemed and automatic conversion of shares | — | — | (10,889 | ) | (267,829 | ) | ||||||||||
|
|
|
|
|
|
|
| |||||||||
| — | $ | — | (10,882 | ) | $ | (267,679 | ) | |||||||||
|
|
|
|
|
|
|
| |||||||||
Investor A | ||||||||||||||||
Shares sold | 783,596 | $ | 13,193,623 | — | $ | — | ||||||||||
Shares sold and automatic conversion of shares | — | — | 1,431,877 | 31,127,446 | ||||||||||||
Shares issued in reinvestment of distributions | 43,075 | 713,736 | 4,697,926 | 104,584,323 | ||||||||||||
Shares redeemed | (2,657,309 | ) | (44,721,957 | ) | (21,602,520 | ) | (487,976,651 | ) | ||||||||
|
|
|
|
|
|
|
| |||||||||
| (1,830,638 | ) | $ | (30,814,598 | ) | (15,472,717 | ) | $ | (352,264,882 | ) | |||||||
|
|
|
|
|
|
|
| |||||||||
NOTES TO FINANCIAL STATEMENTS | 95 |
Notes to Financial Statements (continued)
| Year Ended 05/31/23 | Year Ended 05/31/22 | |||||||||||||||
| Fund Name/Share Class | Shares | Amount | Shares | Amount | ||||||||||||
Advantage Large Cap Growth (continued) | ||||||||||||||||
Investor C | ||||||||||||||||
Shares sold | 63,364 | $ | 871,927 | 86,912 | $ | 1,498,005 | ||||||||||
Shares issued in reinvestment of distributions | — | — | 121,002 | 2,203,502 | ||||||||||||
Shares redeemed and automatic conversion of shares | (214,528 | ) | (2,877,817 | ) | (199,549 | ) | (3,453,157 | ) | ||||||||
|
|
|
|
|
|
|
| |||||||||
| (151,164 | ) | $ | (2,005,890 | ) | 8,365 | $ | 248,350 | |||||||||
|
|
|
|
|
|
|
| |||||||||
Class K | ||||||||||||||||
Shares sold | 33,825 | $ | 619,234 | 69,002 | $ | 1,702,198 | ||||||||||
Shares issued in reinvestment of distributions | 331 | 5,828 | 9,209 | 219,275 | ||||||||||||
Shares redeemed | (24,166 | ) | (435,384 | ) | (11,600 | ) | (275,935 | ) | ||||||||
|
|
|
|
|
|
|
| |||||||||
| 9,990 | $ | 189,678 | 66,611 | $ | 1,645,538 | |||||||||||
|
|
|
|
|
|
|
| |||||||||
Class R | ||||||||||||||||
Shares sold | 10,387 | $ | 185,989 | 3,124 | $ | 69,959 | ||||||||||
Shares issued in reinvestment of distributions | 8 | 147 | 2,242 | 52,719 | ||||||||||||
Shares redeemed | (2,056 | ) | (37,158 | ) | (11,539 | ) | (277,249 | ) | ||||||||
|
|
|
|
|
|
|
| |||||||||
| 8,339 | $ | 148,978 | (6,173 | ) | $ | (154,571 | ) | |||||||||
|
|
|
|
|
|
|
| |||||||||
| 313,065 | $ | 1,585,172 | 2,243,404 | $ | 75,061,115 | |||||||||||
|
|
|
|
|
|
|
| |||||||||
Advantage Small Cap Core | ||||||||||||||||
Institutional | ||||||||||||||||
Shares sold | 47,919,449 | $ | 701,900,107 | 69,055,122 | $ | 1,263,123,865 | ||||||||||
Shares issued in reinvestment of distributions | 4,704,458 | 65,751,152 | 17,566,446 | 329,082,359 | ||||||||||||
Shares redeemed | (62,510,640 | ) | (917,764,827 | ) | (58,854,243 | ) | (1,047,621,729 | ) | ||||||||
|
|
|
|
|
|
|
| |||||||||
| (9,886,733 | ) | $ | (150,113,568 | ) | 27,767,325 | $ | 544,584,495 | |||||||||
|
|
|
|
|
|
|
| |||||||||
Investor A | ||||||||||||||||
Shares sold and automatic conversion of shares | 3,601,657 | $ | 52,810,767 | 6,829,398 | $ | 128,844,710 | ||||||||||
Shares issued in reinvestment of distributions | 605,080 | 8,387,411 | 2,896,706 | 54,040,890 | ||||||||||||
Shares redeemed | (5,120,440 | ) | (74,615,130 | ) | (11,975,936 | ) | (222,210,668 | ) | ||||||||
|
|
|
|
|
|
|
| |||||||||
| (913,703 | ) | $ | (13,416,952 | ) | (2,249,832 | ) | $ | (39,325,068 | ) | |||||||
|
|
|
|
|
|
|
| |||||||||
Investor C | ||||||||||||||||
Shares sold | 125,566 | $ | 1,786,554 | 204,917 | $ | 3,763,393 | ||||||||||
Shares issued in reinvestment of distributions | 16,415 | 218,327 | 82,849 | 1,504,284 | ||||||||||||
Shares redeemed and automatic conversion of shares | (196,132 | ) | (2,747,776 | ) | (188,194 | ) | (3,180,500 | ) | ||||||||
|
|
|
|
|
|
|
| |||||||||
| (54,151 | ) | $ | (742,895 | ) | 99,572 | $ | 2,087,177 | |||||||||
|
|
|
|
|
|
|
| |||||||||
Class K | ||||||||||||||||
Shares sold | 19,864,648 | $ | 291,931,230 | 23,648,944 | $ | 446,279,930 | ||||||||||
Shares issued in reinvestment of distributions | 1,873,351 | 26,253,904 | 6,037,283 | 113,137,247 | ||||||||||||
Shares redeemed | (16,189,057 | ) | (238,415,011 | ) | (11,100,191 | ) | (205,823,632 | ) | ||||||||
|
|
|
|
|
|
|
| |||||||||
| 5,548,942 | $ | 79,770,123 | 18,586,036 | $ | 353,593,545 | |||||||||||
|
|
|
|
|
|
|
| |||||||||
| (5,305,645 | ) | $ | (84,503,292 | ) | 44,203,101 | $ | 860,940,149 | |||||||||
|
|
|
|
|
|
|
| |||||||||
| (a) | On July 6, 2021, the Fund’s issued and outstanding Service Shares converted into Investor A Shares. |
| 96 | 2 0 2 3 BLACK ROCK ANNUAL REPORT TO SHAREHOLDERS |
Notes to Financial Statements (continued)
| Year Ended 05/31/23 | Period from 10/01/21 to 05/31/22 | Year Ended 09/30/21 | ||||||||||||||||||||||
| Fund Name/Share Class | Shares | Amount | Shares | Amount | Shares | Amount | ||||||||||||||||||
Advantage Large Cap Core | ||||||||||||||||||||||||
Institutional | ||||||||||||||||||||||||
Shares sold | 7,232,763 | $ | 117,472,203 | 4,675,752 | $ | 96,402,525 | 11,122,519 | $ | 251,323,550 | |||||||||||||||
Shares issued in reinvestment of distributions | 5,176,989 | 82,730,713 | 13,928,034 | 288,867,428 | 3,302,822 | 63,900,785 | ||||||||||||||||||
Shares redeemed | (11,342,719 | ) | (183,436,037 | ) | (8,280,673 | ) | (170,654,461 | ) | (15,124,464 | ) | (321,784,632 | ) | ||||||||||||
|
|
|
|
|
|
|
|
|
|
|
| |||||||||||||
| 1,067,033 | $ | 16,766,879 | 10,323,113 | $ | 214,615,492 | (699,123 | ) | $ | (6,560,297 | ) | ||||||||||||||
|
|
|
|
|
|
|
|
|
|
|
| |||||||||||||
Service(a) | ||||||||||||||||||||||||
Shares sold | — | $ | — | — | $ | — | 548 | $ | 11,010 | |||||||||||||||
Shares issued in reinvestment of distributions | — | — | — | — | 804 | 15,503 | ||||||||||||||||||
Shares redeemed | — | — | — | — | (18,313 | ) | (426,166 | ) | ||||||||||||||||
|
|
|
|
|
|
|
|
|
|
|
| |||||||||||||
| — | $ | — | — | $ | — | (16,961 | ) | $ | (399,653 | ) | ||||||||||||||
|
|
|
|
|
|
|
|
|
|
|
| |||||||||||||
Investor A | ||||||||||||||||||||||||
Shares sold and automatic conversion of shares | 4,614,359 | $ | 72,748,020 | 4,220,054 | $ | 83,106,936 | 5,247,188 | $ | 107,401,444 | |||||||||||||||
Shares issued in reinvestment of distributions | 4,932,185 | 74,491,359 | 13,306,804 | 262,010,951 | 3,379,506 | 62,612,624 | ||||||||||||||||||
Shares redeemed | (11,328,154 | ) | (178,943,679 | ) | (6,366,773 | ) | (124,698,000 | ) | (14,126,753 | ) | (303,828,770 | ) | ||||||||||||
|
|
|
|
|
|
|
|
|
|
|
| |||||||||||||
| (1,781,610 | ) | $ | (31,704,300 | ) | 11,160,085 | $ | 220,419,887 | (5,500,059 | ) | $ | (133,814,702 | ) | ||||||||||||
|
|
|
|
|
|
|
|
|
|
|
| |||||||||||||
Investor C | ||||||||||||||||||||||||
Shares sold | 492,228 | $ | 6,204,724 | 400,679 | $ | 6,350,905 | 1,269,667 | $ | 21,139,842 | |||||||||||||||
Shares issued in reinvestment of distributions | 196,124 | 2,351,728 | 554,976 | 8,840,764 | 118,023 | 1,844,502 | ||||||||||||||||||
Shares redeemed and automatic conversion of shares | (982,251 | ) | (12,432,749 | ) | (494,580 | ) | (7,852,572 | ) | (1,217,765 | ) | (20,462,871 | ) | ||||||||||||
|
|
|
|
|
|
|
|
|
|
|
| |||||||||||||
| (293,899 | ) | $ | (3,876,297 | ) | 461,075 | $ | 7,339,097 | 169,925 | $ | 2,521,473 | ||||||||||||||
|
|
|
|
|
|
|
|
|
|
|
| |||||||||||||
Class K | ||||||||||||||||||||||||
Shares sold | 645,071 | $ | 10,729,466 | 1,076,338 | $ | 23,074,817 | 924,918 | $ | 19,893,604 | |||||||||||||||
Shares issued in reinvestment of distributions | 120,270 | 1,924,102 | 542,342 | 11,248,178 | 95,892 | 1,855,510 | ||||||||||||||||||
Shares redeemed | (2,315,017 | ) | (41,205,381 | ) | (682,182 | ) | (13,799,154 | ) | (403,241 | ) | (8,643,340 | ) | ||||||||||||
|
|
|
|
|
|
|
|
|
|
|
| |||||||||||||
| (1,549,676 | ) | $ | (28,551,813 | ) | 936,498 | $ | 20,523,841 | 617,569 | $ | 13,105,774 | ||||||||||||||
|
|
|
|
|
|
|
|
|
|
|
| |||||||||||||
Class R | ||||||||||||||||||||||||
Shares sold | 81,548 | $ | 1,163,716 | 207,005 | $ | 3,605,109 | 195,034 | $ | 3,743,255 | |||||||||||||||
Shares issued in reinvestment of distributions | 62,298 | 849,067 | 155,818 | 2,790,704 | 34,683 | 595,042 | ||||||||||||||||||
Shares redeemed | (249,611 | ) | (3,561,642 | ) | (180,329 | ) | (3,176,674 | ) | (276,127 | ) | (5,164,112 | ) | ||||||||||||
|
|
|
|
|
|
|
|
|
|
|
| |||||||||||||
| (105,765 | ) | $ | (1,548,859 | ) | 182,494 | $ | 3,219,139 | (46,410 | ) | $ | (825,815 | ) | ||||||||||||
|
|
|
|
|
|
|
|
|
|
|
| |||||||||||||
| (2,663,917 | ) | $ | (48,914,390 | ) | 23,063,265 | $ | 466,117,456 | (5,475,059 | ) | $ | (125,973,220 | ) | ||||||||||||
|
|
|
|
|
|
|
|
|
|
|
| |||||||||||||
| (a) | On July 6, 2021, the Fund’s issued and outstanding Service Shares converted into Investor A Shares. |
| Year Ended 05/31/23 | Year Ended 05/31/22 | |||||||||||||||
| Shares | Amount | Shares | Amount | |||||||||||||
Advantage Large Cap Value | ||||||||||||||||
Institutional | ||||||||||||||||
Shares sold | 881,237 | $ | 24,019,416 | 915,940 | $ | 28,986,414 | ||||||||||
Shares issued in reinvestment of distributions | 344,992 | 8,902,293 | 917,328 | 28,547,837 | ||||||||||||
Shares redeemed | (1,325,202 | ) | (36,046,939 | ) | (1,104,695 | ) | (34,353,481) | |||||||||
|
|
|
|
|
|
|
| |||||||||
| (98,973 | ) | $ | (3,125,230 | ) | 728,573 | $ | 23,180,770 | |||||||||
|
|
|
|
|
|
|
| |||||||||
Service(a) | ||||||||||||||||
Shares sold | — | $ | — | 2,088 | $ | 71,736 | ||||||||||
Shares redeemed and automatic conversion of shares | — | — | (453,246 | ) | (15,610,547 | ) | ||||||||||
|
|
|
|
|
|
|
| |||||||||
| — | $ | — | (451,158 | ) | $ | (15,538,811 | ) | |||||||||
|
|
|
|
|
|
|
| |||||||||
NOTES TO FINANCIAL STATEMENTS | 97 |
Notes to Financial Statements (continued)
| Year Ended 05/31/23 | Year Ended 05/31/22 | |||||||||||||||
| Fund Name/Share Class | Shares | Amount | Shares | Amount | ||||||||||||
Advantage Large Cap Value (continued) | ||||||||||||||||
Investor A | ||||||||||||||||
Shares sold and automatic conversion of shares | 1,375,001 | $ | 36,028,089 | 1,527,485 | $ | 48,539,900 | ||||||||||
Shares issued in reinvestment of distributions | 759,779 | 19,035,751 | 2,044,253 | 62,034,841 | ||||||||||||
Shares redeemed | (2,376,037 | ) | (62,562,160) | (1,803,689 | ) | (55,590,938) | ||||||||||
|
|
|
|
|
|
|
| |||||||||
| (241,257 | ) | $ | (7,498,320 | ) | 1,768,049 | $ | 54,983,803 | |||||||||
|
|
|
|
|
|
|
| |||||||||
Investor C | ||||||||||||||||
Shares sold | 135,087 | $ | 3,243,871 | 172,422 | $ | 4,896,841 | ||||||||||
Shares issued in reinvestment of distributions | 38,671 | 875,749 | 118,748 | 3,308,545 | ||||||||||||
Shares redeemed and automatic conversion of shares | (223,496 | ) | (5,340,361 | ) | (264,687 | ) | (7,567,062 | ) | ||||||||
|
|
|
|
|
|
|
| |||||||||
| (49,738 | ) | $ | (1,220,741 | ) | 26,483 | $ | 638,324 | |||||||||
|
|
|
|
|
|
|
| |||||||||
Class K | ||||||||||||||||
Shares sold | 128,817 | $ | 3,493,709 | 163,719 | $ | 5,160,955 | ||||||||||
Shares issued in reinvestment of distributions | 22,234 | 574,235 | 48,756 | 1,514,064 | ||||||||||||
Shares redeemed | (101,295 | ) | (2,693,778 | ) | (105,279 | ) | (3,245,112 | ) | ||||||||
|
|
|
|
|
|
|
| |||||||||
| 49,756 | $ | 1,374,166 | 107,196 | $ | 3,429,907 | |||||||||||
|
|
|
|
|
|
|
| |||||||||
Class R | ||||||||||||||||
Shares sold | 46,745 | $ | 1,166,823 | 45,560 | $ | 1,349,808 | ||||||||||
Shares issued in reinvestment of distributions | 19,382 | 459,713 | 51,590 | 1,492,653 | ||||||||||||
Shares redeemed | (89,884 | ) | (2,236,145 | ) | (65,423 | ) | (1,940,331 | ) | ||||||||
|
|
|
|
|
|
|
| |||||||||
| (23,757 | ) | $ | (609,609 | ) | 31,727 | $ | 902,130 | |||||||||
|
|
|
|
|
|
|
| |||||||||
| (363,969 | ) | $ | (11,079,734 | ) | 2,210,870 | $ | 67,596,123 | |||||||||
|
|
|
|
|
|
|
| |||||||||
| (a) | On July 6, 2021, the Fund’s issued and outstanding Service Shares converted into Investor A Shares. |
As of May 31, 2023, shares owned by BlackRock Financial Management, Inc., an affiliate of the Funds, were as follows:
| Share Class | Advantage Large Cap Growth | |||
Class K | 12,217 | |||
| 12. | SUBSEQUENT EVENTS |
Management has evaluated the impact of all subsequent events on the Funds through the date the financial statements were issued and has determined that there were no subsequent events requiring adjustment or additional disclosure in the financial statements.
| 98 | 2 0 2 3 BLACK ROCK ANNUAL REPORT TO SHAREHOLDERS |
Report of Independent Registered Public Accounting Firm
To the Shareholders of BlackRock Advantage International Fund, BlackRock Advantage Large Cap Growth Fund and BlackRock Advantage Small Cap Core Fund and the Board of Trustees of BlackRock FundsSM, and to the Shareholders of BlackRock Advantage Large Cap Core Fund and BlackRock Advantage Large Cap Value Fund and the Board of Directors of BlackRock Large Cap Series Funds, Inc.:
Opinion on the Financial Statements and Financial Highlights
We have audited the accompanying statements of assets and liabilities of BlackRock Advantage International Fund, BlackRock Advantage Large Cap Growth Fund, and BlackRock Advantage Small Cap Core Fund of BlackRock FundsSM, and BlackRock Advantage Large Cap Core Fund and BlackRock Advantage Large Cap Value Fund of BlackRock Large Cap Series Funds, Inc. (the “Funds”), including the schedules of investments, as of May 31, 2023, the related statements of operations for the year then ended, and the statements of changes in net assets and the financial highlights for the periods indicated in the table below, and the related notes. In our opinion, the financial statements and financial highlights present fairly, in all material respects, the financial position of the Funds as of May 31, 2023, and the results of their operations for the year then ended, and the changes in their net assets and the financial highlights for the periods indicated in the table below, in conformity with accounting principles generally accepted in the United States of America.
Fund | Statements of Changes in Net Assets | Financial Highlights | ||
| BlackRock Advantage International Fund, BlackRock Advantage Large Cap Growth Fund, BlackRock Advantage Large Cap Value Fund | For each of the two years in the period ended May 31, 2023 | For each of the three years in the period ended May 31, 2023, for the period from October 1, 2019 through May 31, 2020, and for each of the two years in the period ended September 30, 2019 | ||
| BlackRock Advantage Small Cap Core Fund | For each of the two years in the period ended May 31, 2023 | For each of the five years in the period ended May 31, 2023 | ||
| BlackRock Advantage Large Cap Core Fund | For the year ended May 31, 2023, for the period from October 1, 2021 through May 31, 2022, and for the year ended September 30, 2021 | For the year ended May 31, 2023, for the period from October 1, 2021 through May 31, 2022, and for each of the four years in the period ended September 30, 2021 |
Basis for Opinion
These financial statements and financial highlights are the responsibility of the Funds’ management. Our responsibility is to express an opinion on the Funds’ financial statements and financial highlights based on our audits. We are a public accounting firm registered with the Public Company Accounting Oversight Board (United States) (PCAOB) and are required to be independent with respect to the Funds in accordance with the U.S. federal securities laws and the applicable rules and regulations of the Securities and Exchange Commission and the PCAOB.
We conducted our audits in accordance with the standards of the PCAOB. Those standards require that we plan and perform the audit to obtain reasonable assurance about whether the financial statements and financial highlights are free of material misstatement, whether due to error or fraud. The Funds are not required to have, nor were we engaged to perform, an audit of their internal control over financial reporting. As part of our audits we are required to obtain an understanding of internal control over financial reporting but not for the purpose of expressing an opinion on the effectiveness of the Funds’ internal control over financial reporting. Accordingly, we express no such opinion.
Our audits included performing procedures to assess the risks of material misstatement of the financial statements and financial highlights, whether due to error or fraud, and performing procedures that respond to those risks. Such procedures included examining, on a test basis, evidence regarding the amounts and disclosures in the financial statements and financial highlights. Our audits also included evaluating the accounting principles used and significant estimates made by management, as well as evaluating the overall presentation of the financial statements and financial highlights. Our procedures included confirmation of securities owned as of May 31, 2023, by correspondence with custodians or counterparties; when replies were not received, we performed other auditing procedures. We believe that our audits provide a reasonable basis for our opinion.
Deloitte & Touche LLP
Boston, Massachusetts
July 21, 2023
We have served as the auditor of one or more BlackRock investment companies since 1992.
REPORT OF INDEPENDENT REGISTERED PUBLIC ACCOUNTING FIRM | 99 |
Important Tax Information (unaudited)
The following amounts, or maximum amounts allowable by law, are hereby designated as qualified dividend income for individuals for the fiscal year ended May 31, 2023:
| Fund Name | Qualified Dividend Income | |
Advantage International | $ 31,828,295 | |
Advantage Large Cap Growth | 8,719,852 | |
Advantage Small Cap Core | 46,372,480 | |
Advantage Large Cap Core | 45,085,137 | |
Advantage Large Cap Value | 12,000,904 |
The Funds hereby designates the following amounts, or maximum amounts allowable by law, as capital gain dividends, subject to a long-term capital gains tax rate as noted below, for the fiscal year ended May 31, 2023:
| Fund Name | 20% Rate Long-Term | |
Advantage Small Cap Core | $ 71,449,539 | |
Advantage Large Cap Core | 142,361,341 | |
Advantage Large Cap Value | 23,879,258 |
The Fund intends to pass through to its shareholders the following amount, or maximum amount allowable by law, of the foreign source income earned and foreign taxes paid for the fiscal year ended May 31, 2023:
| Fund Name | Foreign Source Income Earned | Foreign Taxes Paid | ||
Advantage International | $ 34,358,215 | $ 3,861,016 |
The following percentages, or maximum percentages allowable by law, of ordinary income distributions paid during the fiscal year ended May 31, 2023 qualified for the dividends-received deduction for corporate shareholders:
| Fund Name | Dividends-Received Deduction | |
Advantage Large Cap Growth | 100.00% | |
Advantage Small Cap Core | 100.00 | |
Advantage Large Cap Core | 100.00 | |
Advantage Large Cap Value | 100.00 |
The Funds hereby designate the following amounts, or maximum amounts allowable by law, as interest income eligible to be treated as a Section 163(j) interest dividend for the fiscal year ended May 31, 2023:
| Fund Name | Interest Dividends | |
Advantage International | $ 615,182 | |
Advantage Large Cap Growth | 94,640 | |
Advantage Small Cap Core | 778,600 | |
Advantage Large Cap Core | 488,724 | |
Advantage Large Cap Value | 116,154 |
The Funds hereby designate the following amounts, or maximum amounts allowable by law, as interest-related dividends eligible for exemption from U.S. withholding tax for nonresident aliens and foreign corporations for the fiscal year ended May 31, 2023:
| Fund Name | Interest-Related Dividends | |
Advantage International | $ 615,182 | |
Advantage Large Cap Growth | 94,640 | |
Advantage Small Cap Core | 778,600 | |
Advantage Large Cap Core | 488,724 | |
Advantage Large Cap Value | 116,152 |
| 100 | 2 0 2 3 BLACK ROCK ANNUAL REPORT TO SHAREHOLDERS |
Disclosure of Investment Advisory Agreement
The Board of Trustees of BlackRock Funds (the “Trust”) met on April 18, 2023 and May 23-24, 2023 to consider the approval to continue the investment advisory agreement (the “Trust Advisory Agreement”) between the Trust, on behalf of BlackRock Advantage International Fund (“Advantage International Fund”), BlackRock Advantage Large Cap Growth Fund (“Advantage Large Cap Growth Fund”) and BlackRock Advantage Small Cap Core Fund (“Advantage Small Cap Core Fund”), and BlackRock Advisors, LLC (the “Manager” or “BlackRock”), each Fund’s investment advisor.
The Board of Directors of BlackRock Large Cap Series Funds, Inc. (the “Corporation”) met on April 18, 2023 and May 23-24, 2023 to consider the approval to continue the investment advisory agreement (the “Corporation Advisory Agreement”) between the Corporation, on behalf of BlackRock Advantage Large Cap Value Fund (“Advantage Large Cap Value Fund”) and BlackRock Advantage Large Cap Core Fund (“Advantage Large Cap Core Fund”), and the Manager, each Fund’s investment advisor.
Advantage International Fund, Advantage Large Cap Growth Fund, Advantage Small Cap Core Fund, Advantage Large Cap Value Fund and Advantage Large Cap Core Fund are referred to herein individually as a “Fund” or collectively as the “Funds.” The Trust Advisory Agreement and the Corporation Advisory Agreement are referred to herein individually as an “Agreement” or collectively as the “Agreements.” For simplicity: (a) the Board of Trustees of the Trust and the Board of Directors of the Corporation are referred to herein individually as the “Board” and collectively as the “Boards” and the members are referred to as “Board Members”; and (b) the meetings held on April 18, 2023 are referred to as the “April Meeting” and the meetings held on May 23-24, 2023 are referred to as the “May Meeting.”
The Approval Process
Consistent with the requirements of the Investment Company Act of 1940 (the “1940 Act”), the Boards consider the approval of the continuation of the pertinent Agreement for each Fund on an annual basis. The Board members who are not “interested persons” of the Trust or the Corporation, as defined in the 1940 Act, are considered independent Board members (the “Independent Board Members”). Each Board’s consideration entailed a year-long deliberative process during which the Board and its committees assessed BlackRock’s various services to pertinent Fund, including through the review of written materials and oral presentations, and the review of additional information provided in response to requests from the Independent Board Members. The Boards had four quarterly meetings per year, each of which extended over a two-day period, as well as additional ad hoc meetings and executive sessions throughout the year, as needed. The committees of each Board similarly met throughout the year. The Boards also had an additional one-day meeting to consider specific information regarding the renewal of the Agreements. In considering the renewal of the Agreements, the Boards assessed, among other things, the nature, extent and quality of the services provided to the Fund by BlackRock, BlackRock’s personnel and affiliates, including (as applicable): investment management services; accounting oversight; administrative and shareholder services; oversight of the Fund’s service providers; risk management and oversight; and legal, regulatory and compliance services. Throughout the year, including during the contract renewal process, the Independent Board Members were advised by independent legal counsel, and met with independent legal counsel in various executive sessions outside of the presence of BlackRock’s management.
During the year, the Boards, acting directly and through their committees, considered information that was relevant to their annual consideration of the renewal of the pertinent Agreement, including the services and support provided by BlackRock to the Funds and their shareholders. BlackRock also furnished additional information to the Boards in response to specific questions from the Boards. Among the matters the Boards considered were: (a) investment performance for one-year, three-year, five-year, and/or since inception periods, as applicable, against peer funds, an applicable benchmark, and other performance metrics, as applicable, as well as BlackRock senior management’s and portfolio managers’ analyses of the reasons for any outperformance or underperformance relative to its peers, benchmarks, and other performance metrics, as applicable; (b) fees, including advisory, administration, if applicable, and other amounts paid to BlackRock and its affiliates by the Fund for services; (c) Fund operating expenses and how BlackRock allocates expenses to the Fund; (d) the resources devoted to risk oversight of, and compliance reports relating to, implementation of the Fund’s investment objective, policies and restrictions, and meeting regulatory requirements; (e) BlackRock’s and each Fund’s adherence to applicable compliance policies and procedures; (f) the nature, character and scope of non-investment management services provided by BlackRock and its affiliates and the estimated cost of such services, as available; (g) BlackRock’s and other service providers’ internal controls and risk and compliance oversight mechanisms; (h) BlackRock’s implementation of the proxy voting policies approved by the Board; (i) the use of brokerage commissions and execution quality of portfolio transactions; (j) BlackRock’s implementation of each Fund’s valuation and liquidity procedures; (k) an analysis of management fees paid to BlackRock for products with similar investment mandates across the open-end fund, exchange-traded fund (“ETF”), closed-end fund, sub-advised mutual fund, separately managed account, collective investment trust, and institutional separate account product channels, as applicable, and the similarities and differences between these products and the services provided as compared to the Fund; (l) BlackRock’s compensation methodology for its investment professionals and the incentives and accountability it creates, along with investment professionals’ investments in the fund(s) they manage; and (m) periodic updates on BlackRock’s business.
Prior to and in preparation for the April Meeting, the Boards received and reviewed materials specifically relating to the renewal of the pertinent Agreement. The Independent Board Members are continuously engaged in a process with their independent legal counsel and BlackRock to review the nature and scope of the information provided to the Board to better assist their deliberations. The materials provided in connection with the April Meeting included, among other things: (a) information independently compiled and prepared by Broadridge Financial Solutions, Inc. (“Broadridge”), based on either a Lipper classification or Morningstar category, regarding each Fund’s fees and expenses as compared with a peer group of funds as determined by Broadridge (“Expense Peers”) and the investment performance of each Fund as compared with a peer group of funds (“Performance Peers”); (b) information on the composition of the Expense Peers and Performance Peers, and a description of Broadridge’s methodology; (c) information on the estimated profits realized by BlackRock and its affiliates pursuant to the Agreements and a discussion of fall-out benefits to BlackRock and its affiliates; (d) a general analysis provided by BlackRock concerning investment management fees received in connection with other types of investment products, such as institutional accounts, sub-advised mutual funds, ETFs, closed-end funds, open-end funds, and separately managed accounts under similar investment mandates, as well as the performance of such other products, as applicable; (e) a review of non-management fees; (f) the existence, impact and sharing of potential economies of scale, if any, with the Funds; (g) a summary of aggregate amounts paid by each Fund to BlackRock; (h) sales and redemption data regarding each Fund’s shares; and (i) various additional information requested by the Boards as appropriate regarding BlackRock’s and the Funds’ operations.
At the April Meeting, each Board reviewed materials relating to its consideration of the pertinent Agreement and the Independent Board Members presented BlackRock with questions and requests for additional information. BlackRock responded to these questions and requests with additional written information in advance of the May Meeting.
At the May Meeting, each Board concluded its assessment of, among other things: (a) the nature, extent and quality of the services provided by BlackRock; (b) the investment performance of each Fund as compared to its Performance Peers and to other metrics, as applicable; (c) the advisory fee and the estimated cost of the services and estimated
DISCLOSURE OF INVESTMENT ADVISORY AGREEMENT | 101 |
Disclosure of Investment Advisory Agreement (continued)
profits realized by BlackRock and its affiliates from their relationship with the Funds; (d) each Fund’s fees and expenses compared to its Expense Peers; (e) the existence and sharing of potential economies of scale; (f) any fall-out benefits to BlackRock and its affiliates as a result of BlackRock’s relationship with the Funds; and (g) other factors deemed relevant by the Board Members.
Each Board also considered other matters it deemed important to the approval process, such as other payments made to BlackRock or its affiliates relating to securities lending and cash management, and BlackRock’s services related to the valuation and pricing of Fund portfolio holdings. Each Board noted the willingness of BlackRock’s personnel to engage in open, candid discussions with the Board. The Board Members evaluated the information available to it on a fund-by-fund basis. The following paragraphs provide more information about some of the primary factors that were relevant to each Board’s decision. The Board Members did not identify any particular information, or any single factor as determinative, and each Board Member may have attributed different weights to the various items and factors considered.
A. Nature, Extent and Quality of the Services Provided by BlackRock
Each Board, including the Independent Board Members, reviewed the nature, extent and quality of services provided by BlackRock, including the investment advisory services and the resulting performance of the applicable Fund. Throughout the year, each Board compared each Fund’s performance to the performance of a comparable group of mutual funds, relevant benchmarks, and performance metrics, as applicable. The Boards met with BlackRock’s senior management personnel responsible for investment activities, including the senior investment officers. Each Board also reviewed the materials provided by each Fund’s portfolio management team discussing the Fund’s performance, investment strategies and outlook.
Each Board considered, among other factors, with respect to BlackRock: the experience of investment personnel generally and each Fund’s portfolio management team; research capabilities; investments by portfolio managers in the funds they manage; portfolio trading capabilities; use of technology; commitment to compliance; credit analysis capabilities; risk analysis and oversight capabilities; and the approach to training and retaining portfolio managers and other research, advisory and management personnel. The Boards also considered BlackRock’s overall risk management program, including the continued efforts of BlackRock and its affiliates to address cybersecurity risks and the role of BlackRock’s Risk & Quantitative Analysis Group. Each Board engaged in a review of BlackRock’s compensation structure with respect to each Fund’s portfolio management team and BlackRock’s ability to attract and retain high-quality talent and create performance incentives.
In addition to investment advisory services, the Boards considered the nature and quality of the administrative and other non-investment advisory services provided to each Fund. BlackRock and its affiliates provide the Funds with certain administrative, shareholder and other services (in addition to any such services provided to the Funds by third-parties) and officers and other personnel as are necessary for the operations of the Funds. In particular, BlackRock and its affiliates provide the Funds with administrative services including, among others: (i) responsibility for disclosure documents, such as the prospectus, the summary prospectus (as applicable), the statement of additional information and periodic shareholder reports; (ii) oversight of daily accounting and pricing; (iii) responsibility for periodic filings with regulators; (iv) overseeing and coordinating the activities of third-party service providers including, among others, each Fund’s custodian, fund accountant, transfer agent, and auditor; (v) organizing Board meetings and preparing the materials for such Board meetings; (vi) providing legal and compliance support; (vii) furnishing analytical and other support to assist the Board in its consideration of strategic issues such as the merger, consolidation or repurposing of certain open-end funds; and (viii) performing or managing administrative functions necessary for the operation of the Funds, such as tax reporting, expense management, fulfilling regulatory filing requirements, overseeing each Fund’s distribution partners, and shareholder call center and other services. The Boards reviewed the structure and duties of BlackRock’s fund administration, shareholder services, and legal and compliance departments and considered BlackRock’s policies and procedures for assuring compliance with applicable laws and regulations. Each Board considered the operation of BlackRock’s business continuity plans.
B. The Investment Performance of the Funds and BlackRock
Each Board, including the Independent Board Members, reviewed and considered the performance history of each Fund throughout the year and at the April Meeting. In preparation for the April Meeting, the Boards was provided with reports independently prepared by Broadridge, which included an analysis of each Fund’s performance as of December 31, 2022, as compared to its Performance Peers. Broadridge ranks funds in quartiles, ranging from first to fourth, where first is the most desirable quartile position and fourth is the least desirable. In connection with its review, with respect to each Fund, the applicable Board received and reviewed information regarding the investment performance of the Fund as compared to its Performance Peers and the respective Morningstar Category (“Morningstar Category”). Each Board and its Performance Oversight Committee regularly review and meet with Fund management to discuss the performance of each Fund throughout the year.
In evaluating performance, the Boards focused particular attention on funds with less favorable performance records. The Board also noted that while it found the data provided by Broadridge generally useful, it recognized the limitations of such data, including in particular, that notable differences may exist between a fund and its Performance Peers (for example, the investment objectives and strategies). Further, the Boards recognized that the performance data reflects a snapshot of a period as of a particular date and that selecting a different performance period could produce significantly different results. The Board also acknowledged that long-term performance could be impacted by even one period of significant outperformance or underperformance, and that a single investment theme could have the ability to disproportionately affect long-term performance.
The Board of the Trust noted that for the one-, three- and five-year periods reported, Advantage International Fund ranked in the first, first and second quartiles, respectively, against its Morningstar Category. The Board noted that BlackRock believes that the Morningstar Category is an appropriate performance metric for the Fund, and that BlackRock has explained its rationale for this belief to the Board.
The Board of the Trust noted that for the one-, three- and five-year periods reported, Advantage Large Cap Growth Fund ranked in the third, second and second quartiles, respectively, against its Morningstar Category. The Board noted that BlackRock believes that the Morningstar Category is an appropriate performance metric for the Fund, and that BlackRock has explained its rationale for this belief to the Board. The Board and BlackRock reviewed the Fund’s underperformance relative to its Morningstar Category during the applicable period.
| 102 | 2 0 2 3 BLACK ROCK ANNUAL REPORT TO SHAREHOLDERS |
Disclosure of Investment Advisory Agreement (continued)
The Board of the Corporation noted that for the one-, three- and five-year periods reported, Advantage Large Cap Core Fund ranked in the fourth, second and third quartiles, respectively, against its Morningstar Category. The Board noted that BlackRock believes that the Morningstar Category is an appropriate performance metric for the Fund, and that BlackRock has explained its rationale for this belief to the Board. The Board and BlackRock reviewed the Fund’s underperformance relative to its Morningstar Category during the applicable periods.
The Board of the Trust noted that for the one-, three- and five-year periods reported, Advantage Small Cap Core Fund ranked in the fourth, fourth and second quartiles, respectively, against its Morningstar Category. The Board noted that BlackRock believes that the Morningstar Category is an appropriate performance metric for the Fund, and that BlackRock has explained its rationale for this belief to the Board. The Board and BlackRock reviewed the Fund’s underperformance relative to its Morningstar Category during the applicable periods.
The Board of the Corporation noted that for the one-, three- and five-year periods reported, Advantage Large Cap Value Fund ranked in fourth, third and third quartiles, respectively, against its Morningstar Category. The Board noted that BlackRock believes that the Morningstar Category is an appropriate performance metric for the Fund, and that BlackRock has explained its rationale for this belief to the Board. The Board and BlackRock reviewed the Fund’s underperformance relative to its Morningstar Category during the applicable periods.
C. Consideration of the Advisory/Management Fees and the Estimated Cost of the Services and Estimated Profits Realized by BlackRock and its Affiliates from their Relationship with the Funds
Each Board, including the Independent Board Members, reviewed each Fund’s contractual management fee rate compared with those of its Expense Peers. The contractual management fee rate represents a combination of the advisory fee and any administrative fees, before taking into account any reimbursements or fee waivers. Each Board also compared each Fund’s total expense ratio, as well as its actual management fee rate, to those of its Expense Peers. The total expense ratio represents a fund’s total net operating expenses, including any 12b-1 or non-12b-1 service fees. The total expense ratio gives effect to any expense reimbursements or fee waivers, and the actual management fee rate gives effect to any management fee reimbursements or waivers. The Boards considered that the fee and expense information in the Broadridge report for the Fund reflected information for a specific period and that historical asset levels and expenses may differ from current levels, particularly in a period of market volatility. The Board considered the services provided and the fees charged by BlackRock and its affiliates to other types of clients with similar investment mandates, as applicable, including institutional accounts and sub-advised mutual funds (including mutual funds sponsored by third parties).
The Boards received and reviewed statements relating to BlackRock’s financial condition. The Boards reviewed BlackRock’s profitability methodology and were also provided with an estimated profitability analysis that detailed the revenues earned and the expenses incurred by BlackRock for services provided to each Fund. The Boards reviewed BlackRock’s estimated profitability with respect to each Fund and other funds the Boards currently oversee for the year ended December 31, 2022 compared to available aggregate estimated profitability data provided for the prior two years. The Boards reviewed BlackRock’s estimated profitability with respect to certain other U.S. fund complexes managed by the Manager and/or its affiliates. The Boards reviewed BlackRock’s assumptions and methodology of allocating expenses in the estimated profitability analysis, noting the inherent limitations in allocating costs among various advisory products. The Boards recognized that profitability may be affected by numerous factors including, among other things, fee waivers and expense reimbursements by the Manager, the types of funds managed, precision of expense allocations and business mix. The Boards thus recognized that calculating and comparing profitability at the individual fund level is difficult.
The Boards noted that, in general, individual fund or product line profitability of other advisors is not publicly available. The Boards reviewed BlackRock’s overall operating margin, in general, compared to that of certain other publicly traded asset management firms. The Boards considered the differences between BlackRock and these other firms, including the contribution of technology at BlackRock, BlackRock’s expense management, and the relative product mix.
Each Board considered whether BlackRock has the financial resources necessary to attract and retain high quality investment management personnel to perform its obligations under the Agreements and to continue to provide the high quality of services that is expected by the Board. The Boards further considered factors including but not limited to BlackRock’s commitment of time and resources, assumption of risk, and liability profile in servicing the Funds, including in contrast to what is required of BlackRock with respect to other products with similar investment mandates across the open-end fund, ETF, closed-end fund, sub-advised mutual fund, separately managed account, collective investment trust, and institutional separate account product channels, as applicable.
The applicable Board noted that each of Advantage Large Cap Core Fund’s, Advantage Large Cap Growth Fund’s, Advantage Small Cap Core Fund’s, and Advantage International Fund’s contractual management fee rate ranked in the first quartile, and that the actual management fee rate and total expense ratio each ranked in the first quartile relative to the Fund’s Expense Peers.
The Board of the Corporation noted that Advantage Large Cap Value Fund’s contractual management fee rate ranked in the second quartile, and that the actual management fee rate and total expense ratio each ranked in the first quartile relative to the Fund’s Expense Peers.
The Boards also noted that each Fund has an advisory fee arrangement that includes breakpoints that adjust the fee rate downward as the size of the pertinent Fund increases above certain contractually specified levels. The Boards additionally noted that the breakpoints can, conversely, adjust the advisory fee rate upward as the size of the pertinent Fund decreases below certain contractually specified levels. The Boards further noted that BlackRock and the applicable Board have contractually agreed to a cap on each Fund’s total expenses as a percentage of the Fund’s average daily net assets on a class-by-class basis.
D. Economies of Scale
Each Board, including the Independent Board Members, considered the extent to which economies of scale might be realized as the assets of the Funds increase, including the existence of fee waivers and/or expense caps, as applicable, noting that any contractual fee waivers and contractual expense caps had been approved by the Board. In its consideration, the Board further considered the continuation and/or implementation of fee waivers and/or expense caps, as applicable. Each Board also considered the extent to which the Funds benefit from such economies of scale in a variety of ways, and whether there should be changes in the advisory fee rate or breakpoint structure in order to enable the Funds to more fully participate in these economies of scale. Each Board considered each Fund’s asset levels and whether the current fee schedule was appropriate.
DISCLOSURE OF INVESTMENT ADVISORY AGREEMENT | 103 |
Disclosure of Investment Advisory Agreement (continued)
E. Other Factors Deemed Relevant by the Board Members
Each Board, including the Independent Board Members, also took into account other ancillary or “fall-out” benefits that BlackRock or its affiliates may derive from BlackRock’s respective relationships with the applicable Fund, both tangible and intangible, such as BlackRock’s ability to leverage its investment professionals who manage other portfolios and its risk management personnel, an increase in BlackRock’s profile in the investment advisory community, and the engagement of BlackRock’s affiliates as service providers to the Funds, including for administrative, distribution, securities lending and cash management services. With respect to securities lending, during the year the Board also considered information provided by independent third-party consultants related to the performance of each BlackRock affiliate as securities lending agent. The Board also considered BlackRock’s overall operations and its efforts to expand the scale of, and improve the quality of, its operations. The Board also noted that, subject to applicable law, BlackRock may use and benefit from third-party research obtained by soft dollars generated by certain registered fund transactions to assist in managing all or a number of its other client accounts.
In connection with its consideration of the pertinent Agreements, the Boards also received information regarding BlackRock’s brokerage and soft dollar practices. The Boards received reports from BlackRock which included information on brokerage commissions and trade execution practices throughout the year.
The Boards noted the competitive nature of the open-end fund marketplace, and that shareholders are able to redeem their Fund shares if they believe that the pertinent Fund’s fees and expenses are too high or if they are dissatisfied with the performance of the Fund.
Conclusion
At the May Meeting, in a continuation of the discussions that occurred during the April Meeting, and as a culmination of the Board of the Trust’s year-long deliberative process, the Board of the Trust, including the Independent Board Members, unanimously approved the continuation of the Trust Advisory Agreement between the Manager and the Trust, on behalf of each of Advantage International Fund, Advantage Large Cap Growth Fund and Advantage Small Cap Core Fund, for a one-year term ending June 30, 2024.
At the May Meeting, as a result of the discussions that occurred during the April Meeting, and as a culmination of the Board of the Corporation’s year-long deliberative process, the Board of the Corporation, including the Independent Board Members, unanimously approved the continuation of the Corporation Advisory Agreement between the Manager and the Corporation, on behalf of each of Advantage Large Cap Value Fund and Advantage Large Cap Core Fund, for a one-year term ending June 30, 2024.
Based upon its evaluation of all of the aforementioned factors in their totality, as well as other information, the Boards, including the Independent Board Members, was satisfied that the terms of the Agreements were fair and reasonable and, in the best interest of each Fund and its shareholders. In arriving at its decision to approve the Agreements, the Boards did not identify any single factor or group of factors as all-important or controlling, but considered all factors together, and different Board Members may have attributed different weights to the various factors considered. The Independent Board Members were advised by independent legal counsel throughout the deliberative process.
| 104 | 2 0 2 3 BLACK ROCK ANNUAL REPORT TO SHAREHOLDERS |
Director and Officer Information
| Independent Directors(a) | ||||||||
Name Year of Birth(b) | Position(s) Held (Length of Service)(c) | Principal Occupation(s) During Past 5 Years | Number of BlackRock-Advised Registered Investment Companies (“RICs”) Consisting of Investment Portfolios (“Portfolios”) Overseen | Public Company and Other Investment Company Directorships Held During Past 5 Years | ||||
Mark Stalnecker 1951 | Chair of the Board and Director (Since 2019) | Chief Investment Officer, University of Delaware from 1999 to 2013; Trustee and Chair of the Finance and Investment Committees, Winterthur Museum and Country Estate from 2005 to 2016; Member of the Investment Committee, Delaware Public Employees’ Retirement System since 2002; Member of the Investment Committee, Christiana Care Health System from 2009 to 2017; Member of the Investment Committee, Delaware Community Foundation from 2013 to 2014; Director and Chair of the Audit Committee, SEI Private Trust Co. from 2001 to 2014. | 28 RICs consisting of 167 Portfolios | None | ||||
Susan J. Carter 1956 | Director (Since 2019) | Trustee, Financial Accounting Foundation from 2017 to 2021; Advisory Board Member, Center for Private Equity and Entrepreneurship at Tuck School of Business from 1997 to 2021; Director, Pacific Pension Institute from 2014 to 2018; Senior Advisor, Commonfund Capital, Inc. (“CCI”) (investment adviser) in 2015; Chief Executive Officer, CCI from 2013 to 2014; President & Chief Executive Officer, CCI from 1997 to 2013; Advisory Board Member, Girls Who Invest from 2015 to 2018 and Board Member thereof from 2018 to 2022; Advisory Board Member, Bridges Fund Management since 2016; Practitioner Advisory Board Member, Private Capital Research Institute (“PCRI”) since 2017; Lecturer in the Practice of Management, Yale School of Management since 2019; Advisor to Finance Committee, Altman Foundation since 2020; Investment Committee Member, Tostan since 2021; Member of the President’s Counsel, Commonfund since 2023. | 28 RICs consisting of 167 Portfolios | None | ||||
| Collette Chilton 1958 | Director (Since 2019) | Chief Investment Officer, Williams College since 2006; Chief Investment Officer, Lucent Asset Management Corporation from 1998 to 2006; Director, Boys and Girls Club of Boston since 2017; Director, B1 Capital since 2018; Director, David and Lucile Packard Foundation since 2020. | 28 RICs consisting of 167 Portfolios | None | ||||
Neil A. Cotty 1954 | Director (Since 2019) | Bank of America Corporation from 1996 to 2015, serving in various senior finance leadership roles, including Chief Accounting Officer from 2009 to 2015, Chief Financial Officer of Global Banking, Markets and Wealth Management from 2008 to 2009, Chief Accounting Officer from 2004 to 2008, Chief Financial Officer of Consumer Bank from 2003 to 2004, Chief Financial Officer of Global Corporate Investment Bank from 1999 to 2002. | 28 RICs consisting of 167 Portfolios | None | ||||
Lena G. Goldberg 1949 | Director (Since 2016) | Director, Pioneer Legal Institute since 2023; Director, Charles Stark Draper Laboratory, Inc. since 2013; Senior Lecturer, Harvard Business School, from 2008 to 2021; FMR LLC/Fidelity Investments (financial services) from 1996 to 2008, serving in various senior roles including Executive Vice President - Strategic Corporate Initiatives and Executive Vice President and General Counsel; Partner, Sullivan & Worcester LLP from 1985 to 1996 and Associate thereof from 1979 to 1985. | 28 RICs consisting of 167 Portfolios | None | ||||
DIRECTOR AND OFFICER INFORMATION | 105 |
Director and Officer Information (continued)
| Independent Directors(a) | ||||||||
Name Year of Birth(b) | Position(s) Held (Length of Service)(c) | Principal Occupation(s) During Past 5 Years | Number of BlackRock-Advised Registered Investment Companies (“RICs”) Consisting of Investment Portfolios (“Portfolios”) Overseen | Public Company and Other Investment Company Directorships Held During Past 5 Years | ||||
| Henry R. Keizer 1956 | Director (Since 2016) | Director, Park Indemnity Ltd. (captive insurer) from 2010 to 2022. | 28 RICs consisting of 167 Portfolios | GrafTech International Ltd. (materials manufacturing); Sealed Air Corp. (packaging); WABCO (commercial vehicle safety systems) from 2015 to 2020; Hertz Global Holdings (car rental) from 2015 to 2021. | ||||
Cynthia A. Montgomery 1952 | Director (Since 2019) | Professor, Harvard Business School since 1989. | 28 RICs consisting of 167 Portfolios | None | ||||
| Donald C. Opatrny 1952 | Director (Since 2015) | Chair of the Board of Phoenix Art Museum since 2022 and Trustee thereof since 2018; Chair of the Investment Committee of The Arizona Community Foundation since 2022 and trustee thereof since 2020; Director, Athena Capital Advisors LLC (investment management firm) from 2013 to 2020; Trustee, Vice Chair, Member of the Executive Committee and Chair of the Investment Committee, Cornell University from 2004 to 2019; President and Trustee, the Center for the Arts, Jackson Hole from 2011 to 2018; Member of the Board and Investment Committee, University School from 2007 to 2018; Member of Affordable Housing Supply Board of Jackson, Wyoming since 2017; Member, Investment Funds Committee, State of Wyoming since 2017; Trustee, Artstor (a Mellon Foundation affiliate) from 2010 to 2015; Member of the Investment Committee, Mellon Foundation from 2009 to 2015; President, Trustee and Member of the Investment Committee, The Aldrich Contemporary Art Museum from 2007 to 2014; Trustee and Chair of the Investment Committee, Community Foundation of Jackson Hole since 2014. | 28 RICs consisting of 167 Portfolios | None | ||||
| Kenneth L. Urish 1951 | Director (Since 2019) | Managing Partner, Urish Popeck & Co., LLC (certified public accountants and consultants) since 1976; Past-Chairman of the Professional Ethics Committee of the Pennsylvania Institute of Certified Public Accountants and Committee Member thereof since 2007; Member of External Advisory Board, The Pennsylvania State University Accounting Department since 2001, Emeritus since 2022; Principal, UP Strategic Wealth Investment Advisors, LLC since 2013; Trustee, The Holy Family Institute from 2001 to 2010; President and Trustee, Pittsburgh Catholic Publishing Associates from 2003 to 2008; Director, Inter-Tel from 2006 to 2007; Member, Advisory Board, ESG Competent Boards since 2020. | 28 RICs consisting of 167 Portfolios | None | ||||
| 106 | 2 0 2 3 BLACK ROCK ANNUAL REPORT TO SHAREHOLDERS |
Director and Officer Information (continued)
| Independent Directors(a) | ||||||||
Name Year of Birth(b) | Position(s) Held (Length of Service)(c) | Principal Occupation(s) During Past 5 Years | Number of BlackRock-Advised Registered Investment Companies (“RICs”) Consisting of Investment Portfolios (“Portfolios”) Overseen | Public Company Past 5 Years | ||||
| Claire A. Walton 1957 | Director (Since 2019) | Advisory Board Member, Grossman School of Business at the University of Vermont since 2023; Advisory Board Member, Scientific Financial Systems since 2022; General Partner of Neon Liberty Capital Management, LLC since 2003; Chief Operating Officer and Chief Financial Officer of Liberty Square Asset Management, LP from 1998 to 2015; Director, Boston Hedge Fund Group from 2009 to 2018; Director, Massachusetts Council on Economic Education from 2013 to 2015; Director, Woodstock Ski Runners from 2013 to 2022. | 28 RICs consisting of 167 Portfolios | None | ||||
| Interested Directors(a)(d) | ||||||||
Name Year of Birth(b) | Position(s) Held (Length of Service)(c) | Principal Occupation(s) During Past 5 Years | Number of BlackRock-Advised Registered Investment Companies (“RICs”) Consisting of Investment Portfolios (“Portfolios”) Overseen | Public Company and Other Investment Company Directorships Held During Past 5 Years | ||||
| Robert Fairbairn 1965 | Director (Since 2018) | Vice Chairman of BlackRock, Inc. since 2019; Member of BlackRock’s Global Executive and Global Operating Committees; Co-Chair of BlackRock’s Human Capital Committee; Senior Managing Director of BlackRock, Inc. from 2010 to 2019; oversaw BlackRock’s Strategic Partner Program and Strategic Product Management Group from 2012 to 2019; Member of the Board of Managers of BlackRock Investments, LLC from 2011 to 2018; Global Head of BlackRock’s Retail and iShares® businesses from 2012 to 2016. | 98 RICs consisting of 268 Portfolios | None | ||||
John M. Perlowski(e) 1964 | Director (Since 2015), President and Chief Executive Officer (Since 2010) | Managing Director of BlackRock, Inc. since 2009; Head of BlackRock Global Accounting and Product Services since 2009; Advisory Director of Family Resource Network (charitable foundation) since 2009. | 100 RICs consisting of 270 Portfolios | None | ||||
| (a) | The address of each Director is c/o BlackRock, Inc., 50 Hudson Yards, New York, NY 10001. |
| (b) | Independent Directors serve until their resignation, retirement, removal or death, or until December 31 of the year in which they turn 75. The Board may determine to extend the terms of Independent Directors on a case-by-case basis, as appropriate. |
| (c) | Following the combination of Merrill Lynch Investment Managers, L.P. (“MLIM”) and BlackRock, Inc. in September 2006, the various legacy MLIM and legacy BlackRock fund boards were realigned and consolidated into three new fund boards in 2007. Furthermore, effective January 1, 2019, three BlackRock Fund Complexes were realigned and consolidated into two BlackRock Fund Complexes. As a result, although the chart shows the year that each Independent Director joined the Board, certain Independent Directors first became members of the boards of other BlackRock-advised Funds, legacy MLIM funds or legacy BlackRock funds as follows: Cynthia A. Montgomery, 1994; Kenneth L. Urish, 1999; Lena G. Goldberg, 2016; Henry R. Keizer, 2016; Donald C. Opatrny, 2015. |
| (d) | Mr. Fairbairn and Mr. Perlowski are both “interested persons,” as defined in the 1940 Act, of the Trust and the Corporation based on their positions with BlackRock, Inc. and its affiliates. Mr. Fairbairn and Mr. Perlowski are also board members of the BlackRock Fixed-Income Complex. |
DIRECTOR AND OFFICER INFORMATION | 107 |
Director and Officer Information (continued)
| (e) | Mr. Perlowski is also a trustee of the BlackRock Credit Strategies Fund and BlackRock Private Investments Fund. |
| Officers Who Are Not Directors(a) | ||||
Name Year of Birth(b) | Position(s) Held (Length of Service) | Principal Occupation(s) During Past 5 Years | ||
Roland Villacorta 1971 | Vice President (Since 2022) | Managing Director of BlackRock, Inc. since 2022; Head of Global Cash Management and Head of Securities Lending within BlackRock’s Portfolio Management Group since 2022; Member of BlackRock’s Global Operating Committee since 2022; Head of Portfolio Management in BlackRock’s Financial Markets Advisory Group within BlackRock Solutions from 2008 to 2015; Co-Head of BlackRock Solutions’ Portfolio Analytics Group; previously Mr. Villacorta was Co-Head of Fixed Income within BlackRock’s Risk & Quantitative Analysis Group. | ||
| Jennifer McGovern 1977 | Vice President (Since 2014) | Managing Director of BlackRock, Inc. since 2016; Director of BlackRock, Inc. from 2011 to 2015; Head of Americas Product Development and Governance for BlackRock’s Global Product Group since 2019; Head of Product Structure and Oversight for BlackRock’s U.S. Wealth Advisory Group from 2013 to 2019. | ||
Trent Walker 1974 | Chief Financial Officer (Since 2021) | Managing Director of BlackRock, Inc. since September 2019; Executive Vice President of PIMCO from 2016 to 2019; Senior Vice President of PIMCO from 2008 to 2015; Treasurer from 2013 to 2019 and Assistant Treasurer from 2007 to 2017 of PIMCO Funds, PIMCO Variable Insurance Trust, PIMCO ETF Trust, PIMCO Equity Series, PIMCO Equity Series VIT, PIMCO Managed Accounts Trust, 2 PIMCO-sponsored interval funds and 21 PIMCO-sponsored closed-end funds. | ||
Jay M. Fife 1970 | Treasurer (Since 2007) | Managing Director of BlackRock, Inc. since 2007. | ||
Charles Park 1967 | Chief Compliance Officer (Since 2014) | Anti-Money Laundering Compliance Officer for certain BlackRock-advised Funds from 2014 to 2015; Chief Compliance Officer of BlackRock Advisors, LLC and the BlackRock-advised Funds in the BlackRock Multi-Asset Complex and the BlackRock Fixed-Income Complex since 2014; Principal of and Chief Compliance Officer for iShares® Delaware Trust Sponsor LLC since 2012 and BlackRock Fund Advisors (“BFA”) since 2006; Chief Compliance Officer for the BFA-advised iShares® exchange traded funds since 2006; Chief Compliance Officer for BlackRock Asset Management International Inc. since 2012. | ||
Lisa Belle 1968 | Anti-Money Laundering Compliance Officer (Since 2019) | Managing Director of BlackRock, Inc. since 2019; Global Financial Crime Head for Asset and Wealth Management of JP Morgan from 2013 to 2019; Managing Director of RBS Securities from 2012 to 2013; Head of Financial Crimes for Barclays Wealth Americas from 2010 to 2012. | ||
Janey Ahn 1975 | Secretary (Since 2019) | Managing Director of BlackRock, Inc. since 2018; Director of BlackRock, Inc. from 2009 to 2017. | ||
(a) The address of each Officer is c/o BlackRock, Inc., 50 Hudson Yards, New York, NY 10001.
(b) Officers of the Turst and the Corporation serve at the pleasure of the Board.
Further information about the Trust’s Directors and Officers is available in the Trust’s Statement of Additional Information, which can be obtained without charge by calling (800) 441-7762.
Effective December 31, 2022, Joseph P. Platt retired as a Director of the Trust.
Effective July 1, 2023, Aaron Wasserman replaced Charles Park as Chief Compliance Officer of the Trust.
|
| 108 | 2 0 2 3 BLACK ROCK ANNUAL REPORT TO SHAREHOLDERS |
Tailored Shareholder Reports for Mutual Funds and ETFs
Effective January 24, 2023, the SEC adopted rule and form amendments to require mutual funds and ETFs to transmit concise and visually engaging streamlined annual and semiannual reports to shareholders that highlight key information. Other information, including financial statements, will no longer appear in a streamlined shareholder report but must be available online, delivered free of charge upon request, and filed on a semiannual basis on Form N-CSR. The rule and form amendments have a compliance date of July 24, 2024. At this time, management is evaluating the impact of these amendments on the shareholder reports for the Funds.
General Information
Quarterly performance, semi-annual and annual reports, current net asset value and other information regarding the Funds may be found on BlackRock’s website, which can be accessed at blackrock.com. Any reference to BlackRock’s website in this report is intended to allow investors public access to information regarding the Funds and does not, and is not intended to, incorporate BlackRock’s website in this report.
Householding
The Funds will mail only one copy of shareholder documents, including prospectuses, annual and semi-annual reports, Rule 30e-3 notices and proxy statements, to shareholders with multiple accounts at the same address. This practice is commonly called “householding” and is intended to reduce expenses and eliminate duplicate mailings of shareholder documents. Mailings of your shareholder documents may be householded indefinitely unless you instruct us otherwise. If you do not want the mailing of these documents to be combined with those for other members of your household, please call the Funds at (800) 441-7762.
Availability of Quarterly Schedule of Investments
The Funds file their complete schedules of portfolio holdings with the SEC for the first and third quarters of each fiscal year as an exhibit to their reports on Form N-PORT. The Funds’ Forms N-PORT are available on the SEC’s website at sec.gov. Additionally, each Fund makes its portfolio holdings for the first and third quarters of each fiscal year available at blackrock.com/fundreports.
Availability of Proxy Voting Policies, Procedures and Voting Records
A description of the policies and procedures that the Funds use to determine how to vote proxies relating to portfolio securities and information about how the Funds voted proxies relating to securities held in the Funds’ portfolios during the most recent 12-month period ended June 30 is available without charge, upon request (1) by calling (800) 441-7762; (2) on the BlackRock website at blackrock.com; and (3) on the SEC’s website at sec.gov.
BlackRock’s Mutual Fund Family
BlackRock offers a diverse lineup of open-end mutual funds crossing all investment styles and managed by experts in equity, fixed-income and tax-exempt investing. Visit blackrock.com for more information.
Shareholder Privileges
Account Information
Call us at (800) 441-7762 from 8:00 AM to 6:00 PM ET on any business day to get information about your account balances, recent transactions and share prices. You can also visit blackrock.com for more information.
Automatic Investment Plans
Investor class shareholders who want to invest regularly can arrange to have $50 or more automatically deducted from their checking or savings account and invested in any of the BlackRock funds.
Systematic Withdrawal Plans
Investor class shareholders can establish a systematic withdrawal plan and receive periodic payments of $50 or more from their BlackRock funds, as long as their account balance is at least $10,000.
Retirement Plans
Shareholders may make investments in conjunction with Traditional, Rollover, Roth, Coverdell, Simple IRAs, SEP IRAs and 403(b) Plans.
BlackRock Privacy Principles
BlackRock is committed to maintaining the privacy of its current and former fund investors and individual clients (collectively, “Clients”) and to safeguarding their non-public personal information. The following information is provided to help you understand what personal information BlackRock collects, how we protect that information and why in certain cases we share such information with select parties.
ADDITIONAL INFORMATION | 109 |
Additional Information (continued)
If you are located in a jurisdiction where specific laws, rules or regulations require BlackRock to provide you with additional or different privacy-related rights beyond what is set forth below, then BlackRock will comply with those specific laws, rules or regulations.
BlackRock obtains or verifies personal non-public information from and about you from different sources, including the following: (i) information we receive from you or, if applicable, your financial intermediary, on applications, forms or other documents; (ii) information about your transactions with us, our affiliates, or others; (iii) information we receive from a consumer reporting agency; and (iv) from visits to our websites.
BlackRock does not sell or disclose to non-affiliated third parties any non-public personal information about its Clients, except as permitted by law or as is necessary to respond to regulatory requests or to service Client accounts. These non-affiliated third parties are required to protect the confidentiality and security of this information and to use it only for its intended purpose.
We may share information with our affiliates to service your account or to provide you with information about other BlackRock products or services that may be of interest to you. In addition, BlackRock restricts access to non-public personal information about its Clients to those BlackRock employees with a legitimate business need for the information. BlackRock maintains physical, electronic and procedural safeguards that are designed to protect the non-public personal information of its Clients, including procedures relating to the proper storage and disposal of such information.
Fund and Service Providers | ||
Investment Adviser and Administrator | Independent Registered Public Accounting Firm | |
BlackRock Advisors, LLC | Deloitte & Touche LLP | |
Wilmington, DE 19809 | Boston, MA 02116 | |
Accounting Agent and Transfer Agent | Distributor | |
BNY Mellon Investment Servicing (US) Inc. | BlackRock Investments, LLC | |
Wilmington, DE 19809 | New York, NY 10001 | |
Custodian | Legal Counsel | |
The Bank of New York Mellon | Sidley Austin LLP | |
New York, NY 10286 | New York, NY 10019 | |
Address of the Trust and the Corporation | ||
100 Bellevue Parkway | ||
Wilmington, DE 19809 | ||
| 110 | 2 0 2 3 BLACK ROCK ANNUAL REPORT TO SHAREHOLDERS |
Glossary of Terms Used in this Report
| Portfolio Abbreviation | ||
| NVS | Non-Voting Shares | |
GLOSSARY OF TERMS USED IN THIS REPORT | 111 |
Want to know more?
blackrock.com | 800-441-7762
This report is intended for current holders. It is not authorized for use as an offer of sale or a solicitation of an offer to buy shares of the Funds unless preceded or accompanied by the Funds’ current prospectus. Past performance results shown in this report should not be considered a representation of future performance. Investment returns and principal value of shares will fluctuate so that shares, when redeemed, may be worth more or less than their original cost. Statements and other information herein are as dated and are subject to change.
SC2-5/23-AR
|  |
| MAY 31, 2023 |

2023 Annual Report
| ||
BlackRock FundsSM
| · | BlackRock Energy Opportunities Fund |
| · | BlackRock High Equity Income Fund |
| · | BlackRock International Dividend Fund |
| Not FDIC Insured • May Lose Value • No Bank Guarantee |
Dear Shareholder,
Investors faced an uncertain economic landscape during the 12-month reporting period ended May 31, 2023, amid mixed indicators and rapidly changing market conditions. The U.S. economy returned to modest growth beginning in the third quarter of 2022, although the pace of growth slowed thereafter. Inflation was elevated, reaching a 40-year high as labor costs grew rapidly and unemployment rates reached the lowest levels in decades. However, inflation moderated as the period continued, while continued strength in consumer spending backstopped the economy.
Equity returns varied substantially, as large-capitalization U.S. stocks gained for the period amid a rebound in big tech stocks, whereas small-capitalization U.S. stocks declined. International equities from developed markets advanced, while emerging market stocks declined substantially, pressured by higher interest rates and falling commodities prices.
The 10-year U.S. Treasury yield rose during the reporting period, driving its price down, as investors reacted to elevated inflation and attempted to anticipate future interest rate changes. The corporate bond market also faced inflationary headwinds, although high-yield corporate bond prices fared better than investment-grade bonds as demand from yield-seeking investors remained strong.
The U.S. Federal Reserve (the “Fed”), acknowledging that inflation has been more persistent than expected, raised interest rates eight times. Furthermore, the Fed wound down its bond-buying programs and incrementally reduced its balance sheet by not replacing securities that reach maturity. In addition, the Fed added liquidity to markets amid the failure of prominent regional banks.
Restricted labor supply kept inflation elevated even as other inflation drivers, such as goods prices and energy costs, moderated. While economic growth was modest in the last year, we believe that stickiness in services inflation and continued wage growth will keep inflation above central bank targets for some time. Although the Fed has decelerated the pace of interest rate hikes and most recently opted for a pause, we believe that the Fed is likely to keep rates high for an extended period to get inflation under control. With this in mind, we believe the possibility of a U.S. recession in the near term is high, but the dimming economic outlook has not yet been fully reflected in current market prices. We believe investors should expect a period of higher volatility as markets adjust to the new economic reality and policymakers attempt to adapt. Resolution of the debt ceiling standoff late in the period eliminated one source of uncertainty, but the relatively modest spending cuts won’t move the needle on the government’s substantial debt burden.
While we favor an overweight to equities in the long term, we prefer an underweight stance on equities overall in the near term. Expectations for corporate earnings remain elevated, which seems inconsistent with the possibility of a recession. Nevertheless, we are overweight on emerging market stocks as we believe a weakening U.S. dollar could provide a supportive backdrop. While we are neutral on credit overall amid tightening credit and financial conditions, there are selective opportunities in the near term. For fixed income investing with a six- to twelve-month horizon, we see the most attractive investments in short-term U.S. Treasuries, global inflation-linked bonds, and emerging market bonds denominated in local currency.
Overall, our view is that investors need to think globally, position themselves to be prepared for a decarbonizing economy, and be nimble as market conditions change. We encourage you to talk with your financial advisor and visit blackrock.com for further insight about investing in today’s markets.
Sincerely,

Rob Kapito
President, BlackRock Advisors, LLC
|
Rob Kapito |
President, BlackRock Advisors, LLC |

| Total Returns as of May 31, 2023 | ||||
| 6-Month | 12-Month | |||
U.S. large cap equities (S&P 500® Index) | 3.33% | 2.92% | ||
U.S. small cap equities (Russell 2000® Index) | (6.53) | (4.68) | ||
International equities (MSCI Europe, Australasia, Far East Index) | 6.89 | 3.06 | ||
Emerging market equities (MSCI Emerging Markets Index) | (0.37) | (8.49) | ||
3-month Treasury bills (ICE BofA 3-Month U.S. Treasury Bill Index) | 2.16 | 3.16 | ||
U.S. Treasury securities (ICE BofA 10-Year U.S. Treasury Index) | 1.78 | (3.65) | ||
U.S. investment grade bonds (Bloomberg U.S. Aggregate Bond Index) | 2.00 | (2.14) | ||
Tax-exempt municipal bonds (Bloomberg Municipal Bond Index) | 1.94 | 0.49 | ||
U.S. high yield bonds (Bloomberg U.S. Corporate High Yield 2% Issuer Capped Index) | 3.01 | 0.05 | ||
Past performance is not an indication of future results. Index performance is shown for illustrative purposes only. You cannot invest directly in an index. | ||||
| 2 | T H I S P A G E I S N O T P A R T O F Y O U R F U N D R E P O R T |
| Page | ||||
| 2 | ||||
Annual Report: | ||||
| 4 | ||||
| 13 | ||||
| 13 | ||||
Financial Statements: | ||||
| 14 | ||||
| 23 | ||||
| 25 | ||||
| 26 | ||||
| 29 | ||||
| 40 | ||||
| 52 | ||||
| 53 | ||||
Disclosure of Investment Advisory Agreements and Sub-Advisory Agreements | 54 | |||
| 58 | ||||
| 63 | ||||
| 65 | ||||

| 3 |
Fund Summary as of May 31, 2023
| BlackRock Energy Opportunities Fund |
Investment Objective
BlackRock Energy Opportunities Fund’s (the “Fund”) investment objective is to provide long-term growth of capital.
Portfolio Management Commentary
How did the Fund perform?
For the 12-month period ended May 31, 2023, all of the Fund’s share classes underperformed its benchmark, the MSCI World Energy Index.
What factors influenced performance?
Stock selection within the exploration and production (“E&P”) subsector contributed to performance. On the other hand, selection in the distribution subsector detracted. An underweight in oil services was the largest detractor.
BP PLC (“BP”) was a key detractor at the individual stock level. BP, which was added to late in the period, lost ground due in part to its announcement of a reduced share buy-back. In the oilfield services sector, overweight positions in Tenaris SA and Patterson UTI-Energy, Inc. detracted. An underweight in Schlumberger Ltd. also hurt results given the stock’s outperformance.
In the E&P subsector, the shale producers Devon Energy Corp. and Pioneer Natural Resources Co. made positive contributions to relative performance. An overweight in Hess Corp. was also a key contributor, as the company beat first quarter earnings estimates and raised its forward guidance. Overweights in the integrated oil companies TotalEnergies SE and Shell PLC contributed, as well.
Overweights in the integrated oil companies TotalEnergies SE and Shell PLC contributed to outperformance, as well.
Describe recent portfolio activity.
The investment adviser increased the Fund’s allocation to the oilfield services subsector. It also added to European integrated oil stocks and midstream distribution companies, while it reduced its weighting in natural gas producers.
Describe portfolio positioning at period end.
The investment adviser maintained a bias towards higher-quality international oil producers and selective positions in U.S. shale companies. The Fund was overweight in the E&P and distribution sub-sectors, and it remained underweight in the integrated, refining and marketing and oil services sub-sectors.
The views expressed reflect the opinions of BlackRock as of the date of this report and are subject to change based on changes in market, economic or other conditions. These views are not intended to be a forecast of future events and are no guarantee of future results.
| 4 | 2 0 2 3 B L A C K R O C K A N N U A L R E P O R T T O S H A R E H O L D E R S |
Fund Summary as of May 31, 2023 (continued)
| BlackRock Energy Opportunities Fund |
GROWTH OF $10,000 INVESTMENT
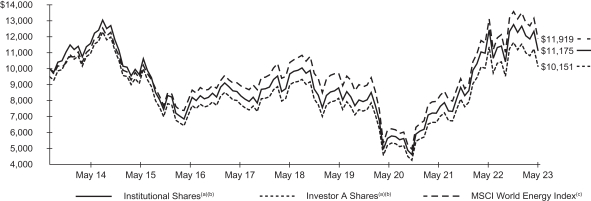
| (a) | Assuming maximum sales charges, if any, transaction costs and other operating expenses, including investment advisory fees and administration fees, if any. Institutional Shares do not have a sales charge. |
| (b) | Under normal market conditions, the Fund invests at least 80% of its total assets in equity securities of global energy and natural resources companies and companies in associated businesses, as well as utilities (such as gas, water, cable, electrical and telecommunications utilities). |
| (c) | An index that is designed to capture the large- and mid-cap segments across developed markets countries. All securities in the index are classified in the energy sector as per the Global Industry Classification Standard. |
Performance
| Average Annual Total Returns(a) | ||||||||||||||||||||||||
|
| |||||||||||||||||||||||
| 1 Year | 5 Years | 10 Years | ||||||||||||||||||||||
|
|
|
|
|
| |||||||||||||||||||
| Without Sales Charge | With Sales Charge | Without Sales Charge | With Sales Charge | Without Sales Charge | With Sales Charge | |||||||||||||||||||
Institutional | (10.59 | )% | N/A | 2.59 | % | N/A | 1.12 | % | N/A | |||||||||||||||
Investor A | (10.97 | ) | (15.64 | )% | 2.16 | 1.07 | % | 0.69 | 0.15 | % | ||||||||||||||
Investor C | (11.57 | ) | (12.43 | ) | 1.45 | 1.45 | 0.12 | 0.12 | ||||||||||||||||
MSCI World Energy Index | (9.68 | ) | N/A | 2.42 | N/A | 1.77 | N/A | |||||||||||||||||
| (a) | Assuming maximum sales charges, if any. Average annual total returns with and without sales charges reflect reductions for distribution and service fees. See “About Fund Performance” for a detailed description of share classes, including any related sales charges and fees. |
N/A - Not applicable as share class and index do not have a sales charge.
Past performance is not an indication of future results.
Performance results may include adjustments made for financial reporting purposes in accordance with U.S. generally accepted accounting principles.
Expense Example
| Actual | Hypothetical 5% Return | |||||||||||||||||||||||||||||||
|
|
|
| |||||||||||||||||||||||||||||
| | Beginning Account Value (12/01/22) | | | Ending Account Value (05/31/23) | | | Expenses Paid During the Period | (a) | | Beginning Account Value (12/01/22) | | | Ending Account Value (05/31/23) | | | Expenses Paid During the Period | (a) | | Annualized Expense Ratio | | ||||||||||||
Institutional | $ | 1,000.00 | $ | 870.40 | $ | 4.24 | $ | 1,000.00 | $ | 1,020.40 | $ | 4.58 | 0.91 | % | ||||||||||||||||||
Investor A | 1,000.00 | 868.70 | 6.13 | 1,000.00 | 1,018.37 | 6.64 | 1.32 | |||||||||||||||||||||||||
Investor C | 1,000.00 | 866.00 | 9.46 | 1,000.00 | 1,014.79 | 10.20 | 2.03 | |||||||||||||||||||||||||
| (a) | For each class of the Fund, expenses are equal to the annualized expense ratio for the class, multiplied by the average account value over the period, multiplied by 182/365 (to reflect the one-half year period shown). |
See “Disclosure of Expenses” for further information on how expenses were calculated.
F U N D S U M M A R Y | 5 |
Fund Summary as of May 31, 2023 (continued)
| BlackRock Energy Opportunities Fund |
Portfolio Information
TEN LARGEST HOLDINGS
| Security(a) | Percent of Net Assets | |||
Exxon Mobil Corp. | 18.4 | % | ||
Shell PLC | 9.9 | |||
TotalEnergies SE | 7.0 | |||
BP PLC | 6.7 | |||
ConocoPhillips | 6.6 | |||
Chevron Corp. | 4.9 | |||
Canadian Natural Resources Ltd. | 4.4 | |||
EOG Resources, Inc. | 4.1 | |||
Williams Cos., Inc. | 4.0 | |||
Hess Corp. | 3.5 | |||
INDUSTRY ALLOCATION
| Industry(b) | Percent of Net Assets | |||
Oil, Gas & Consumable Fuels | 93.7 | % | ||
Energy Equipment & Services | 4.6 | |||
Other (each representing less than 1%) | 0.6 | |||
Short-Term Securities | 0.6 | |||
Other Assets | 0.5 | |||
| (a) | Excludes short-term securities. |
| (b) | For Fund compliance purposes, the Fund’s industry classifications refer to one or more of the industry sub-classifications used by one or more widely recognized market indexes or ratings group indexes, and/or as defined by the investment adviser. These definitions may not apply for purposes of this report, which may combine such industry sub-classifications for reporting ease. |
| 6 | 2 0 2 3 B L A C K R O C K A N N U A L R E P O R T T O S H A R E H O L D E R S |
Fund Summary as of May 31, 2023
| BlackRock High Equity Income Fund |
Investment Objective
BlackRock High Equity Income Fund’s (the “Fund”) investment objective is to seek high current income while maintaining prospects for capital appreciation.
Portfolio Management Commentary
How did the Fund perform?
For the 12-month period ended May 31, 2023, all of the Fund’s share classes underperformed its benchmark, the Russell 1000 Value® Index.
What factors influenced performance?
The largest contribution to the Fund’s relative performance came from allocation decisions in the health care sector. Within the sector, selection decisions in the pharmaceuticals and health care providers and services industries boosted relative return. Investment decisions in the financial sector also proved beneficial. Other modest contributors included allocation decisions within the energy sector and stock selection among utilities, as well as the use of equity-linked notes that enhanced portfolio yield.
Conversely, the largest detractor from the Fund’s relative performance was stock selection in the industrials sector. Notably, stock selection within the professional services industry hurt relative return, as did an underweight allocation to the electrical equipment industry. In communication services, stock selection weighed on results, as did investment decisions within the wireless telecommunication services industry. Investment decisions within the information technology (“IT”) sector also hampered relative performance. Other meaningful detractors included stock selection within the consumer discretionary sector.
Describe recent portfolio activity.
As a result of portfolio activity and market price movements during the period, the largest increases in the Fund’s sector exposure were in IT and healthcare. Conversely, the Fund reduced its exposure to the energy and consumer discretionary sectors.
Describe portfolio positioning at period end.
The Fund ended the period with its largest absolute allocations in the healthcare, financials, and IT sectors. Relative to the benchmark, the Fund’s largest overweight positions were in the health care, IT, and consumer discretionary sectors, while the largest relative underweights were in the real estate, materials, and utilities sectors.
The views expressed reflect the opinions of BlackRock as of the date of this report and are subject to change based on changes in market, economic or other conditions. These views are not intended to be a forecast of future events and are no guarantee of future results.
F U N D S U M M A R Y | 7 |
Fund Summary as of May 31, 2023 (continued)
| BlackRock High Equity Income Fund |
GROWTH OF $10,000 INVESTMENT
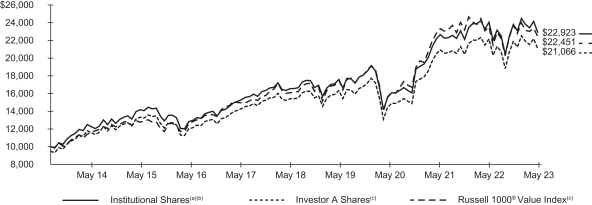
| (a) | Assuming maximum sales charges, if any, transaction costs and other operating expenses, including investment advisory fees and administration fees, if any. Institutional Shares do not have a sales charge. |
| (b) | Under normal circumstances, the Fund will invest at least 80% of its net assets, plus the amount of any borrowings for investment purposes, in equity securities and equity-related instruments, including equity-linked notes. The Fund may invest in securities of companies with any market capitalization, but will generally focus on large cap securities. The Fund’s total returns prior to June 12, 2017, are the returns of the Fund when it followed different investment strategies under the name BlackRock U.S. Opportunities Portfolio. |
| (c) | An index that measures the performance of the large-cap value segment of the U.S. equity universe. It includes those Russell 1000® companies with lower price-to-book ratios and lower expected growth values. |
Performance
| Average Annual Total Returns(a)(b) | ||||||||||||||||||||||||
|
| |||||||||||||||||||||||
| 1 Year | 5 Years | 10 Years | ||||||||||||||||||||||
|
|
|
|
|
| |||||||||||||||||||
| Without Sales Charge | With Sales Charge | Without Sales Charge | With Sales Charge | Without Sales Charge | With Sales Charge | |||||||||||||||||||
Institutional | (4.70 | )% | N/A | 6.72 | % | N/A | 8.65 | % | N/A | |||||||||||||||
Investor A | (4.96 | ) | (9.96 | )% | 6.45 | 5.30 | % | 8.32 | 7.74 | % | ||||||||||||||
Investor C | (5.63 | ) | (6.52 | ) | 5.66 | 5.66 | 7.67 | 7.67 | ||||||||||||||||
Class K | (4.68 | ) | N/A | 6.74 | N/A | 8.66 | N/A | |||||||||||||||||
Russell 1000® Value Index | (4.55 | ) | N/A | 6.78 | N/A | 8.42 | N/A | |||||||||||||||||
| (a) | Assuming maximum sales charges, if any. Average annual total returns with and without sales charges reflect reductions for distribution and service fees. See “About Fund Performance” for a detailed description of share classes, including any related sales charges and fees. |
| (b) | Under normal circumstances, the Fund will invest at least 80% of its net assets, plus the amount of any borrowings for investment purposes, in equity securities and equity-related instruments, including equity-linked notes. The Fund may invest in securities of companies with any market capitalization, but will generally focus on large cap securities. The Fund’s total returns prior to June 12, 2017, are the returns of the Fund when it followed different investment strategies under the name BlackRock U.S. Opportunities Portfolio. |
N/A - Not applicable as share class and index do not have a sales charge.
Past performance is not an indication of future results.
Performance results may include adjustments made for financial reporting purposes in accordance with U.S. generally accepted accounting principles.
Expense Example
| Actual | Hypothetical 5% Return | |||||||||||||||||||||||||||||||
|
|
|
| |||||||||||||||||||||||||||||
| | Beginning Account Value (12/01/22) | | | Ending Account Value (05/31/23) | | | Expenses Paid During the Period | (a) | | Beginning Account Value (12/01/22) | | | Ending Account Value (05/31/23) | | | Expenses Paid During the Period | (a) | | Annualized Expense Ratio | | ||||||||||||
Institutional | $ | 1,000.00 | $ | 963.60 | $ | 4.16 | $ | 1,000.00 | $ | 1,020.69 | $ | 4.28 | 0.85 | % | ||||||||||||||||||
Investor A | 1,000.00 | 962.30 | 5.38 | 1,000.00 | 1,019.45 | 5.54 | 1.10 | |||||||||||||||||||||||||
Investor C | 1,000.00 | 958.70 | 9.03 | 1,000.00 | 1,015.71 | 9.30 | 1.85 | |||||||||||||||||||||||||
Class K | 1,000.00 | 963.70 | 3.92 | 1,000.00 | 1,020.94 | 4.03 | 0.80 | |||||||||||||||||||||||||
| (a) | For each class of the Fund, expenses are equal to the annualized expense ratio for the class, multiplied by the average account value over the period, multiplied by 182/365 (to reflect the one-half year period shown). |
See “Disclosure of Expenses” for further information on how expenses were calculated.
| 8 | 2 0 2 3 B L A C K R O C K A N N U A L R E P O R T T O S H A R E H O L D E R S |
Fund Summary as of May 31, 2023 (continued)
| BlackRock High Equity Income Fund |
Portfolio Information
TEN LARGEST HOLDINGS
| Security | Percent of Net Assets | |||
Wells Fargo & Co. | 2.1 | % | ||
Cognizant Technology Solutions Corp., Class A | 2.0 | |||
Laboratory Corp. of America Holdings | 1.9 | |||
Baxter International, Inc. | 1.7 | |||
Medtronic PLC | 1.7 | |||
Kraft Heinz Co. | 1.7 | |||
Citigroup, Inc. | 1.6 | |||
Komatsu Ltd. | 1.6 | |||
Samsung Electronics Co. Ltd., Registered Shares, GDR | 1.5 | |||
BP PLC | 1.5 | |||
SECTOR ALLOCATION
| Sector(a) | Percent of Net Assets | |||
Health Care | 22.9 | % | ||
Financials | 21.6 | |||
Industrials | 11.9 | |||
Information Technology | 9.5 | |||
Communication Services | 8.5 | |||
Consumer Staples | 8.3 | |||
Energy | 6.9 | |||
Consumer Discretionary | 5.8 | |||
Utilities | 4.4 | |||
Materials | 2.9 | |||
Liabilities in Excess of Other Assets | (2.7 | ) | ||
| (a) | For Fund compliance purposes, the Fund’s sector classifications refer to one or more of the sector sub-classifications used by one or more widely recognized market indexes or ratings group indexes, and/or as defined by the investment adviser. These definitions may not apply for purposes of this report, which may combine such sector sub-classifications for reporting ease. |
F U N D S U M M A R Y | 9 |
Fund Summary as of May 31, 2023
| BlackRock International Dividend Fund |
Investment Objective
BlackRock International Dividend Fund’s (the “Fund”) investment objective is to seek long-term total return and current income.
Portfolio Management Commentary
How did the Fund perform?
For the 12-month period ended May 31, 2023, all of the Fund’s classes outperformed its benchmark, the MSCI All Country World ex-U.S. Index.
What factors influenced performance?
The largest contributors to relative performance at the sector level were stock selection decisions in healthcare, financials, and consumer discretionary stocks. The largest individual contributors to relative performance were Danish pharmaceutical stock Novo Nordisk, French luxury goods company LVMH, and Spanish clothing retailer Inditex.
Novo Nordisk was the most significant contributor to performance, as it announced that a higher dose of its popular drug Semaglutide showed better control of blood sugar levels and greater weight loss without any apparent worsening of side effects. In addition, sales volume growth for Novo Nordisk’s diabetes drug Ozempic topped 90% and returned to normal supply conditions in the US after months of shortages. In addition, incremental data on the oral version of obesity drug Wegovy potentially increased its addressable market. LVMH contributed as discretionary spending remained strong overall among affluent consumers, which led to continued growth in margins in the luxury retail industry. Inditex continued to execute well, leading to substantial top-line growth as the company retained its strong capital allocation in terms of disciplined space management and cash deployment. In addition, the current economics of Inditex’s online business were better than expected.
Conversely, the largest detractors from relative performance were stock selection decisions and an underweight allocation to information technology (“IT”), as well as stock selection in communication services. Stock selection in consumer staples also detracted from returns. Among individual stocks, the largest detractors were Canadian telecom Telus, US oilfield equipment and services company Baker Hughes, and Dutch brewer Heineken.
Telus detracted the most from relative returns, as the telecom underperformed alongside its big three Canadian telecom peers and other traditionally defensive stocks as investors rotated into growth stocks later in the period. Baker Hughes struggled as supply chain issues adversely affected its business execution, causing the shares to trade at a discount that reflected its energy conglomerate status. Lastly, Heineken lagged along with other consumer stocks. A large investor’s decision to sell its entire stake in the brewer also weighed on its share price.
Describe recent portfolio activity.
The Fund increased its weightings in the healthcare, energy, and consumer staples sectors, with newly added positions in Lonza, Shell, and Heineken. Conversely, the Fund reduced positions in financials and IT, mostly through sales of Bankinter and Amadeus. The Fund also sold its only position in the utilities sector, Energias de Portugal (EDP).
Describe portfolio positioning at period end.
The Fund focuses on high-quality dividend-paying companies, leading to portfolio composition that differs substantially from the benchmark. From a sector perspective, the Fund had significant absolute and relative exposure to the healthcare and consumer staples sectors. Conversely, it had zero-weight exposure in real estate and utilities, and limited exposure in materials. Regionally, the Fund had the most significant exposure to the United Kingdom and France.
The views expressed reflect the opinions of BlackRock as of the date of this report and are subject to change based on changes in market, economic or other conditions. These views are not intended to be a forecast of future events and are no guarantee of future results.
| 10 | 2 0 2 3 B L A C K R O C K A N N U A L R E P O R T T O S H A R E H O L D E R S |
Fund Summary as of May 31, 2023 (continued)
| BlackRock International Dividend Fund |
GROWTH OF $10,000 INVESTMENT
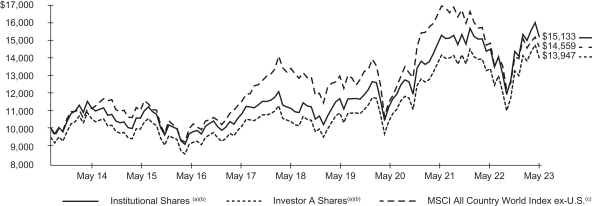
| (a) | Assuming maximum sales charges, if any, transaction costs and other operating expenses, including investment advisory fees and administration fees, if any. Institutional Shares do not have a sales charge. |
| (b) | Under normal circumstances, the Fund will invest at least 80% of its net assets, plus the amount of any borrowings for investment purposes, in dividend-paying equity securities issued by foreign companies of any market capitalization and derivatives that have similar economic characteristics to such securities. The Fund’s total returns prior to June 12, 2017 are the returns of the Fund when it followed different investment strategies under the name BlackRock International Opportunities Portfolio. |
| (c) | An index that captures large- and mid-cap representation across certain developed markets countries (excluding the U.S.) and certain emerging markets countries. |
Performance
| Average Annual Total Returns(a)(b) | ||||||||||||||||||||||||
|
| |||||||||||||||||||||||
| 1 Year | 5 Years | 10 Years | ||||||||||||||||||||||
|
|
|
|
|
| |||||||||||||||||||
| Without Sales Charge | With Sales Charge | Without Sales Charge | With Sales Charge | Without Sales Charge | With Sales Charge | |||||||||||||||||||
Institutional | 4.81 | % | N/A | 6.75 | % | N/A | 4.23 | % | N/A | |||||||||||||||
Investor A | 4.56 | (0.93 | )% | 6.49 | 5.35 | % | 3.94 | 3.38 | % | |||||||||||||||
Investor C | 3.77 | 2.77 | 5.70 | 5.70 | 3.32 | 3.32 | ||||||||||||||||||
Class K | 4.89 | N/A | 6.81 | N/A | 4.26 | N/A | ||||||||||||||||||
MSCI All Country World Index ex-U.S. | (1.41 | ) | N/A | 2.22 | N/A | 3.83 | N/A | |||||||||||||||||
| (a) | Assuming maximum sales charges, if any. Average annual total returns with and without sales charges reflect reductions for distribution and service fees. See “About Fund Performance” for a detailed description of share classes, including any related sales charges and fees. |
| (b) | Under normal circumstances, the Fund will invest at least 80% of its net assets, plus the amount of any borrowings for investment purposes, in dividend-paying equity securities issued by foreign companies of any market capitalization and derivatives that have similar economic characteristics to such securities. The Fund’s total returns prior to June 12, 2017 are the returns of the Fund when it followed different investment strategies under the name BlackRock International Opportunities Portfolio. |
N/A - Not applicable as share class and index do not have a sales charge.
Past performance is not an indication of future results.
Performance results may include adjustments made for financial reporting purposes in accordance with U.S. generally accepted accounting principles.
Expense Example
| Actual | Hypothetical 5% Return | |||||||||||||||||||||||||||
| | Beginning Account Value (12/01/22) | | | Ending Account Value (05/31/23) | | | Expenses Paid During the Period | (a) | | Beginning Account Value (12/01/22) | | | Ending Account Value (05/31/23) | | | Expenses Paid During the Period | (a) | | Annualized Expense Ratio | | ||||||||
Institutional | $ | 1,000.00 | $ | 1,057.70 | $ | 4.29 | $ | 1,000.00 | $ | 1,020.76 | $ | 4.23 | 0.84 | % | ||||||||||||||
Investor A | 1,000.00 | 1,056.40 | 5.77 | 1,000.00 | 1,019.32 | 5.64 | 1.12 | |||||||||||||||||||||
Investor C | 1,000.00 | 1,052.90 | 9.57 | 1,000.00 | 1,015.60 | 9.40 | 1.87 | |||||||||||||||||||||
Class K | 1,000.00 | 1,058.20 | 4.10 | 1,000.00 | 1,020.95 | 4.03 | 0.80 | |||||||||||||||||||||
| (a) | For each class of the Fund, expenses are equal to the annualized expense ratio for the class, multiplied by the average account value over the period, multiplied by 182/365 (to reflect the one-half year period shown). |
See “Disclosure of Expenses” for further information on how expenses were calculated.
F U N D S U M M A R Y | 11 |
Fund Summary as of May 31, 2023 (continued)
| BlackRock International Dividend Fund |
Portfolio Information
TEN LARGEST HOLDINGS
| Security(a) | Percent of Net Assets | |
Sanofi | 4.1% | |
Novo Nordisk A/S, Class B | 4.1 | |
Reckitt Benckiser Group PLC | 4.0 | |
Taiwan Semiconductor Manufacturing Co. Ltd. | 4.0 | |
Lonza Group AG, Registered Shares | 3.7 | |
Diageo PLC | 3.5 | |
TELUS Corp. | 3.5 | |
LVMH Moet Hennessy Louis Vuitton SE | 3.4 | |
Kering SA | 3.4 | |
AstraZeneca PLC | 3.1 | |
GEOGRAPHIC ALLOCATION
| Country | Percent of Net Assets | |||
United Kingdom | 22.4 | % | ||
France | 14.9 | |||
United States | 12.7 | |||
Netherlands | 8.3 | |||
Taiwan | 6.9 | |||
Switzerland | 5.7 | |||
Denmark | 4.1 | |||
Japan | 3.5 | |||
Canada | 3.5 | |||
India | 3.2 | |||
China | 3.0 | |||
Spain | 3.0 | |||
Mexico | 2.7 | |||
Indonesia | 2.1 | |||
Singapore | 2.1 | |||
Germany | 2.0 | |||
Sweden | 1.7 | |||
Liabilities in Excess of Other Assets | (1.8 | ) | ||
| (a) | Excludes short-term securities. |
| 12 | 2 0 2 3 B L A C K R O C K A N N U A L R E P O R T T O S H A R E H O L D E R S |
Institutional and Class K Shares (Class K Shares are available only for BlackRock High Equity Income Fund and BlackRock International Dividend Fund) are not subject to any sales charge. These shares bear no ongoing distribution or service fees and are available only to certain eligible investors. BlackRock High Equity Income Fund’s Class K Shares performance shown prior to the Class K Shares inception date of April 21, 2020 is that of Institutional Shares. BlackRock International Dividend Fund’s Class K Shares performance shown prior to the Class K Shares inception date of January 25, 2018 is that of Institutional Shares. The performance of each Fund’s Class K Shares would be substantially similar to Institutional Shares, because the share classes of a Fund invest in the same portfolio of securities and performance would only differ to the extent that Class K Shares and Institutional Shares have different expenses. The actual returns of Class K Shares would have been higher than those of Institutional Shares because Class K Shares have lower expenses than Institutional Shares.
Investor A Shares are subject to a maximum initial sales charge (front-end load) of 5.25% and a service fee of 0.25% per year (but no distribution fee). Certain redemptions of these shares may be subject to a contingent deferred sales charge (“CDSC”) where no initial sales charge was paid at the time of purchase. These shares are generally available through financial intermediaries. On July 6, 2021, BlackRock Energy Opportunities Fund and BlackRock International Dividend Fund’s and on August 18, 2021, BlackRock High Equity Income Fund’s issued and outstanding Service Shares converted into Investor A Shares with the same relative aggregate net asset value (“NAV”), respectively.
Investor C Shares are subject to a 1.00% CDSC if redeemed within one year of purchase. In addition, these shares are subject to a distribution fee of 0.75% per year and a service fee of 0.25% per year. These shares are generally available through financial intermediaries. These shares automatically convert to Investor A Shares after approximately eight years.
Past performance is not an indication of future results. Financial markets have experienced extreme volatility and trading in many instruments has been disrupted. These circumstances may continue for an extended period of time and may continue to affect adversely the value and liquidity of each Fund’s investments. As a result, current performance may be lower or higher than the performance data quoted. Refer to blackrock.com to obtain performance data current to the most recent month-end. Performance results do not reflect the deduction of taxes that a shareholder would pay on Fund distributions or the redemption of Fund shares. Figures shown in the performance tables assume reinvestment of all distributions, if any, at NAV on the ex-dividend date or payable date, as applicable. Investment return and principal value of shares will fluctuate so that shares, when redeemed, may be worth more or less than their original cost. Distributions paid to each class of shares will vary because of the different levels of service, distribution and transfer agency fees applicable to each class, which are deducted from the income available to be paid to shareholders.
BlackRock Advisors, LLC (the “Manager”), each Fund’s investment adviser, has contractually and/or voluntarily agreed to waive and/or reimburse a portion of each Fund’s expenses. Without such waivers and/or reimbursements, each Fund’s performance would have been lower. With respect to each Fund’s voluntary waivers, if any, the Manager is under no obligation to waive and/or reimburse or to continue waiving and/or reimbursing its fees and such voluntary waivers may be reduced or discontinued at any time. With respect to each Fund’s contractual waivers, if any, the Manager is under no obligation to continue waiving and/or reimbursing its fees after the applicable termination date of such agreement. See the Notes to Financial Statements for additional information on waivers and/or reimbursements.
Shareholders of each Fund may incur the following charges: (a) transactional expenses, such as sales charges; and (b) operating expenses, including investment advisory fees, administration fees, service and distribution fees, including 12b-1 fees, acquired fund fees and expenses, and other fund expenses. The expense examples shown (which are based on a hypothetical investment of $1,000 invested at the beginning of the period and held through the end of the period) are intended to assist shareholders both in calculating expenses based on an investment in each Fund and in comparing these expenses with similar costs of investing in other mutual funds.
The expense examples provide information about actual account values and actual expenses. Annualized expense ratios reflect contractual and voluntary fee waivers, if any. In order to estimate the expenses a shareholder paid during the period covered by this report, shareholders can divide their account value by $1,000 and then multiply the result by the number corresponding to their Fund and share class under the heading entitled “Expenses Paid During the Period.”
The expense examples also provide information about hypothetical account values and hypothetical expenses based on a Fund’s actual expense ratio and an assumed rate of return of 5% per year before expenses. In order to assist shareholders in comparing the ongoing expenses of investing in these Funds and other funds, compare the 5% hypothetical examples with the 5% hypothetical examples that appear in shareholder reports of other funds.
The expenses shown in the expense examples are intended to highlight shareholders’ ongoing costs only and do not reflect transactional expenses, such as sales charges, if any. Therefore, the hypothetical examples are useful in comparing ongoing expenses only and will not help shareholders determine the relative total expenses of owning different funds. If these transactional expenses were included, shareholder expenses would have been higher.
A B O U T F U N D P E R F O R M A N C E / D I S C L O S U R E O F E X P E N S E S | 13 |
May 31, 2023 | BlackRock Energy Opportunities Fund (Percentages shown are based on Net Assets) |
| Security | Shares | Value | ||||||
Common Stocks |
| |||||||
Energy Equipment & Services — 4.6% | ||||||||
Patterson-UTI Energy, Inc. | 182,616 | $ | 1,778,680 | |||||
Poseidon Concepts Corp.(a) | 35,081 | — | ||||||
Schlumberger NV | 280,074 | 11,995,569 | ||||||
Tenaris SA | 272,069 | 3,377,360 | ||||||
|
| |||||||
| 17,151,609 | ||||||||
| Food Products — 0.6% | ||||||||
Darling Ingredients, Inc.(a) | 34,331 | 2,175,899 | ||||||
|
| |||||||
| Oil, Gas & Consumable Fuels — 93.7% | ||||||||
ARC Resources Ltd. | 375,427 | 4,524,483 | ||||||
BP PLC | 4,524,720 | 25,419,991 | ||||||
Canadian Natural Resources Ltd. | 307,492 | 16,564,928 | ||||||
Cenovus Energy, Inc. | 589,721 | 9,422,504 | ||||||
Cheniere Energy, Inc. | 82,569 | 11,540,669 | ||||||
Chevron Corp. | 122,136 | 18,396,124 | ||||||
ConocoPhillips | 250,144 | 24,839,299 | ||||||
Diamondback Energy, Inc. | 61,342 | 7,799,635 | ||||||
Eni SpA | 562,234 | 7,481,509 | ||||||
EOG Resources, Inc. | 143,489 | 15,394,935 | ||||||
Exxon Mobil Corp. | 678,915 | 69,371,535 | ||||||
Gazprom PJSC(b) | 639,500 | 79 | ||||||
Hess Corp. | 105,314 | 13,340,124 | ||||||
Kinder Morgan, Inc. | 605,327 | 9,751,818 | ||||||
Kosmos Energy Ltd.(a) | 505,891 | 3,015,110 | ||||||
Marathon Petroleum Corp. | 100,721 | 10,566,640 | ||||||
Santos Ltd. | 817,386 | 3,869,282 | ||||||
| Security | Shares | Value | ||||||
| Oil, Gas & Consumable Fuels (continued) | ||||||||
Shell PLC | 1,356,506 | $ | 37,294,407 | |||||
TC Energy Corp. | 166,268 | 6,471,898 | ||||||
TotalEnergies SE | 469,555 | 26,497,373 | ||||||
Tourmaline Oil Corp. | 156,409 | 6,538,645 | ||||||
Valero Energy Corp. | 92,215 | 9,870,694 | ||||||
Williams Cos., Inc. | 520,806 | 14,926,300 | ||||||
|
| |||||||
| 352,897,982 | ||||||||
|
| |||||||
Total Long-Term Investments — 98.9% |
| 372,225,490 | ||||||
|
| |||||||
Short-Term Securities |
| |||||||
| Money Market Funds — 0.6% | ||||||||
BlackRock Liquidity Funds, T-Fund, Institutional Class, 5.00%(c)(d) | 2,370,913 | 2,370,913 | ||||||
|
| |||||||
Total Short-Term Securities — 0.6% |
| 2,370,913 | ||||||
|
| |||||||
Total Investments — 99.5% |
| 374,596,403 | ||||||
Other Assets Less Liabilities — 0.5% |
| 2,022,796 | ||||||
|
| |||||||
Net Assets — 100.0% |
| $ | 376,619,199 | |||||
|
| |||||||
| (a) | Non-income producing security. |
| (b) | Security is valued using significant unobservable inputs and is classified as Level 3 in the fair value hierarchy. |
| (c) | Affiliate of the Fund. |
| (d) | Annualized 7-day yield as of period end. |
Affiliates
Investments in issuers considered to be affiliate(s) of the Fund during the year ended May 31, 2023 for purposes of Section 2(a)(3) of the Investment Company Act of 1940, as amended, were as follows:
| Affiliated Issuer | Value at 05/31/22 | Purchases at Cost | Proceeds from Sale | Net Realized Gain (Loss) | Change in Unrealized Appreciation (Depreciation) | Value at 05/31/23 | Shares Held at 05/31/23 | Income | Capital Gain | |||||||||||||||||||||||||||
BlackRock Liquidity Funds, T-Fund, Institutional Class | $ | 6,186,102 | $ | — | $ | (3,815,189 | )(a) | $ | — | $ | — | $ | 2,370,913 | 2,370,913 | $ | 211,959 | $ | — | ||||||||||||||||||
SL Liquidity Series, LLC, Money Market Series(b) | — | — | (613 | )(a) | 613 | — | — | — | 479 | (c) | — | |||||||||||||||||||||||||
|
|
|
|
|
|
|
|
|
| |||||||||||||||||||||||||||
| $ | 613 | $ | — | $ | 2,370,913 | $ | 212,438 | $ | — | |||||||||||||||||||||||||||
|
|
|
|
|
|
|
|
|
| |||||||||||||||||||||||||||
| (a) | Represents net amount purchased (sold). |
| (b) | As of period end, the entity is no longer held. |
| (c) | All or a portion represents securities lending income earned from the reinvestment of cash collateral from loaned securities, net of fees and collateral investment expenses, and other payments to and from borrowers of securities. |
For Fund compliance purposes, the Fund’s industry classifications refer to one or more of the industry sub-classifications used by one or more widely recognized market indexes or rating group indexes, and/or as defined by the investment adviser. These definitions may not apply for purposes of this report, which may combine such industry sub-classifications for reporting ease.
| 14 | 2 0 2 3 B L A C K R O C K A N N U A L R E P O R T T O S H A R E H O L D E R S |
Schedule of Investments (continued) May 31, 2023 | BlackRock Energy Opportunities Fund |
Fair Value Hierarchy as of Period End
Various inputs are used in determining the fair value of financial instruments. For a description of the input levels and information about the Fund’s policy regarding valuation of financial instruments, refer to the Notes to Financial Statements.
The following table summarizes the Fund’s financial instruments categorized in the fair value hierarchy. The breakdown of the Fund’s financial instruments into major categories is disclosed in the Schedule of Investments above.
| Level 1 | Level 2 | Level 3 | Total | |||||||||||||
Assets | ||||||||||||||||
Investments | ||||||||||||||||
Long-Term Investments | ||||||||||||||||
Common Stocks | ||||||||||||||||
Energy Equipment & Services | $ | 13,774,249 | $ | 3,377,360 | $ | — | $ | 17,151,609 | ||||||||
Food Products | 2,175,899 | — | — | 2,175,899 | ||||||||||||
Oil, Gas & Consumable Fuels | 252,335,341 | 100,562,562 | 79 | 352,897,982 | ||||||||||||
Short-Term Securities | ||||||||||||||||
Money Market Funds | 2,370,913 | — | — | 2,370,913 | ||||||||||||
|
|
|
|
|
|
|
| |||||||||
| $ | 270,656,402 | $ | 103,939,922 | $ | 79 | $ | 374,596,403 | |||||||||
|
|
|
|
|
|
|
| |||||||||
See notes to financial statements.
S C H E D U L E S O F I N V E S T M E N T S | 15 |
Schedule of Investments May 31, 2023
| BlackRock High Equity Income Fund (Percentages shown are based on Net Assets) |
| Security | Shares | Value | ||||||
Common Stocks | ||||||||
| Aerospace & Defense — 2.4% | ||||||||
BAE Systems PLC | 74,881 | $ | 865,441 | |||||
L3Harris Technologies, Inc. | 155,480 | 27,352,041 | ||||||
Raytheon Technologies Corp. | 199,913 | 18,419,984 | ||||||
|
| |||||||
| 46,637,466 | ||||||||
| Automobile Components — 0.9% | ||||||||
Lear Corp. | 150,049 | 18,405,010 | ||||||
|
| |||||||
| Automobiles — 1.0% | ||||||||
General Motors Co. | 606,233 | 19,648,012 | ||||||
|
| |||||||
| Banks — 5.8% | ||||||||
Citigroup, Inc. | 721,736 | 31,987,340 | ||||||
Citizens Financial Group, Inc. | 636,760 | 16,415,673 | ||||||
First Citizens BancShares, Inc., Class A | 19,287 | 24,054,746 | ||||||
Wells Fargo & Co. | 1,048,863 | 41,755,236 | ||||||
|
| |||||||
| 114,212,995 | ||||||||
| Capital Markets — 1.7% | ||||||||
Carlyle Group, Inc. | 541,860 | 14,852,383 | ||||||
Invesco Ltd. | 312,369 | 4,491,866 | ||||||
Raymond James Financial, Inc. | 167,090 | 15,096,581 | ||||||
|
| |||||||
| 34,440,830 | ||||||||
| Chemicals — 0.6% | ||||||||
PPG Industries, Inc. | 86,590 | 11,368,401 | ||||||
|
| |||||||
| Communications Equipment — 1.4% | ||||||||
Cisco Systems, Inc. | 437,740 | 21,742,546 | ||||||
Nokia Oyj, NVS, ADR | 1,410,672 | 5,656,795 | ||||||
|
| |||||||
| 27,399,341 | ||||||||
| Consumer Staples Distribution & Retail — 0.9% | ||||||||
Dollar General Corp. | 88,993 | 17,895,602 | ||||||
|
| |||||||
| Containers & Packaging — 1.2% | ||||||||
Sealed Air Corp. | 648,180 | 24,533,613 | ||||||
|
| |||||||
| Diversified Telecommunication Services — 1.7% | ||||||||
AT&T Inc. | 572,876 | 9,011,339 | ||||||
Verizon Communications, Inc. | 680,952 | 24,262,320 | ||||||
|
| |||||||
| 33,273,659 | ||||||||
| Electric Utilities — 2.0% | ||||||||
American Electric Power Co., Inc. | 133,692 | 11,112,479 | ||||||
Edison International | 66,298 | 4,476,441 | ||||||
Exelon Corp. | 309,712 | 12,280,081 | ||||||
PG&E Corp.(a) | 625,873 | 10,602,288 | ||||||
|
| |||||||
| 38,471,289 | ||||||||
| Financial Services — 2.5% | ||||||||
Equitable Holdings, Inc. | 508,599 | 12,481,020 | ||||||
Fidelity National Information Services, Inc. | 511,610 | 27,918,558 | ||||||
Visa, Inc., Class A | 41,180 | 9,102,015 | ||||||
|
| |||||||
| 49,501,593 | ||||||||
| Food Products — 2.0% | ||||||||
Danone SA | 101,095 | 5,983,704 | ||||||
Kraft Heinz Co. | 861,177 | 32,914,185 | ||||||
|
| |||||||
| 38,897,889 | ||||||||
| Health Care Equipment & Supplies — 5.1% | ||||||||
Baxter International, Inc. | 830,760 | 33,828,547 | ||||||
Koninklijke Philips NV | 551,076 | 10,411,259 | ||||||
Medtronic PLC | 404,901 | 33,509,607 | ||||||
Zimmer Biomet Holdings, Inc. | 178,525 | 22,733,374 | ||||||
|
| |||||||
| 100,482,787 | ||||||||
| Security | Shares | Value | ||||||
| Health Care Providers & Services — 4.8% | ||||||||
Cardinal Health, Inc. | 250,876 | $ | 20,647,095 | |||||
Cigna Group | 80,491 | 19,914,278 | ||||||
Elevance Health, Inc. | 33,895 | 15,178,859 | ||||||
Humana, Inc. | 3,038 | 1,524,681 | ||||||
Laboratory Corp. of America Holdings | 171,774 | 36,507,128 | ||||||
|
| |||||||
| 93,772,041 | ||||||||
| Household Durables — 1.1% | ||||||||
Newell Brands, Inc. | 986,238 | 8,195,638 | ||||||
Sony Group Corp., ADR | 140,230 | 13,139,551 | ||||||
|
| |||||||
| 21,335,189 | ||||||||
| Household Products — 0.4% | ||||||||
Reckitt Benckiser Group PLC | 89,202 | 6,936,489 | ||||||
|
| |||||||
| Industrial Conglomerates — 0.3% | ||||||||
Siemens AG, Registered Shares | 40,202 | 6,615,757 | ||||||
|
| |||||||
| Insurance — 3.9% | ||||||||
American International Group, Inc. | 420,448 | 22,212,268 | ||||||
Fidelity National Financial, Inc., Class A | 789,084 | 26,939,328 | ||||||
Prudential PLC | 1,033,361 | 13,578,150 | ||||||
Willis Towers Watson PLC | 68,017 | 14,885,520 | ||||||
|
| |||||||
| 77,615,266 | ||||||||
| Interactive Media & Services — 0.4% | ||||||||
Alphabet, Inc., Class C, NVS(a) | 41,192 | 5,081,857 | ||||||
Meta Platforms, Inc., Class A(a) | 11,521 | 3,049,839 | ||||||
|
| |||||||
| 8,131,696 | ||||||||
| IT Services — 2.0% | ||||||||
Cognizant Technology Solutions Corp., Class A | 620,422 | 38,770,171 | ||||||
|
| |||||||
| Machinery — 1.6% | ||||||||
Komatsu Ltd. | 1,358,700 | 31,882,910 | ||||||
|
| |||||||
| Media — 2.0% | ||||||||
Comcast Corp., Class A | 714,553 | 28,117,660 | ||||||
Fox Corp., Class A, NVS | 384,273 | 11,989,318 | ||||||
|
| |||||||
| 40,106,978 | ||||||||
| Multi-Utilities — 0.7% | ||||||||
Public Service Enterprise Group, Inc. | 97,448 | 5,822,518 | ||||||
Sempra Energy | 55,283 | 7,934,769 | ||||||
|
| |||||||
| 13,757,287 | ||||||||
| Oil, Gas & Consumable Fuels — 4.2% | ||||||||
BP PLC | 5,164,783 | 29,015,881 | ||||||
ConocoPhillips | 92,087 | 9,144,239 | ||||||
EQT Corp. | 26,734 | 929,541 | ||||||
Kosmos Energy Ltd.(a) | 1,779,590 | 10,606,357 | ||||||
Shell PLC | 957,082 | 26,313,046 | ||||||
Williams Cos., Inc. | 203,527 | 5,833,084 | ||||||
|
| |||||||
| 81,842,148 | ||||||||
| Personal Care Products — 0.7% | ||||||||
Unilever PLC, ADR | 285,969 | 14,281,292 | ||||||
|
| |||||||
| Pharmaceuticals — 3.4% | ||||||||
AstraZeneca PLC | 98,709 | 14,377,027 | ||||||
Bayer AG, Registered Shares | 346,168 | 19,319,759 | ||||||
Eli Lilly & Co. | 15,847 | 6,805,652 | ||||||
Novo Nordisk A/S, ADR | 25,858 | 4,149,175 | ||||||
Sanofi | 224,845 | 22,940,271 | ||||||
|
| |||||||
| 67,591,884 | ||||||||
| Professional Services — 3.3% | ||||||||
Dun & Bradstreet Holdings, Inc. | 1,607,310 | 16,073,100 | ||||||
Leidos Holdings, Inc. | 267,316 | 20,866,687 | ||||||
| 16 | 2 0 2 3 B L A C K R O C K A N N U A L R E P O R T T O S H A R E H O L D E R S |
Schedule of Investments (continued) May 31, 2023
| BlackRock High Equity Income Fund (Percentages shown are based on Net Assets) |
| Security |
Shares | Value | ||||||||||
| Professional Services (continued) | ||||||||||||
Robert Half International, Inc. | 47,810 | $ | 3,108,606 | |||||||||
SS&C Technologies Holdings, Inc. | 444,216 | 24,414,112 | ||||||||||
|
| |||||||||||
| 64,462,505 | ||||||||||||
| Semiconductors & Semiconductor Equipment — 0.5% | ||||||||||||
Intel Corp. | 314,020 | 9,872,789 | ||||||||||
|
| |||||||||||
| Software — 0.9% | ||||||||||||
Microsoft Corp. | 50,924 | 16,722,932 | ||||||||||
|
| |||||||||||
| Technology Hardware, Storage & Peripherals — 1.8% | ||||||||||||
HP, Inc. | 212,580 | 6,177,575 | ||||||||||
Samsung Electronics Co. Ltd., Registered Shares, GDR | 22,346 | 30,227,987 | ||||||||||
|
| |||||||||||
| 36,405,562 | ||||||||||||
| Textiles, Apparel & Luxury Goods — 0.3% | ||||||||||||
Ralph Lauren Corp., Class A | 57,417 | 6,104,001 | ||||||||||
|
| |||||||||||
| Tobacco — 1.2% | ||||||||||||
British American Tobacco PLC | 729,414 | 23,089,304 | ||||||||||
|
| |||||||||||
| Trading Companies & Distributors — 0.3% | ||||||||||||
MSC Industrial Direct Co., Inc., Class A | 72,990 | 6,563,261 | ||||||||||
|
| |||||||||||
| Wireless Telecommunication Services — 1.1% | ||||||||||||
Rogers Communications, Inc., Class B, NVS | 148,830 | 6,561,676 | ||||||||||
Vodafone Group PLC | 14,892,032 | 14,161,300 | ||||||||||
|
| |||||||||||
| 20,722,976 | ||||||||||||
|
| |||||||||||
Total Common Stocks — 64.1% | 1,261,750,925 | |||||||||||
|
| |||||||||||
| Par (000) | ||||||||||||
Equity-Linked Notes | ||||||||||||
| Aerospace & Defense — 2.1% | ||||||||||||
Barclays Capital, Inc. (Airbus SE) 18.13% 07/10/23 | EUR | 59,400 | 7,805,323 | |||||||||
Barclays Capital, Inc. (BAE Systems PLC) | GBP | 616,600 | 7,208,628 | |||||||||
Goldman Sachs & Co. LLC (L3Harris Technologies, Inc.) 13.12% 07/17/23 | USD | 80,300 | 14,234,753 | |||||||||
Goldman Sachs & Co. LLC (Raytheon Technologies Corp.) 13.13% 06/22/23 | 124,200 | 11,539,644 | ||||||||||
|
| |||||||||||
| 40,788,348 | ||||||||||||
| Automobile Components — 0.6% | ||||||||||||
BMO Capital Markets Corp. (Lear Corp.) | 93,200 | 11,428,237 | ||||||||||
|
| |||||||||||
| Automobiles — 0.4% | ||||||||||||
SG Americas Securities LLC (General Motors Co.) 25.41% 06/12/23 | 230,300 | 7,502,204 | ||||||||||
|
| |||||||||||
| Banks — 2.3% | ||||||||||||
BNP Paribas Securities Corporation (First Citizens BancShares, Inc.) 20.08% 06/14/23 | 7,200 | 7,807,073 | ||||||||||
Citigroup Global Markets, Inc. (Citizens Financial Group, Inc.) 17.68% 06/29/23 | 198,200 | 5,194,110 | ||||||||||
JP Morgan Securities LLC (Wells Fargo & Co.) 16.45% 06/29/23 | 465,500 | 18,708,560 | ||||||||||
Nomura Securities International, Inc. (Citigroup, Inc.) 20.86% 06/14/23 | 320,300 | 14,179,640 | ||||||||||
|
| |||||||||||
| 45,889,383 | ||||||||||||
| Beverages — 0.1% | ||||||||||||
RBC Capital Markets LLC (Molson Coors Beverage Co.) 18.80% 07/03/23 | 35,500 | 2,212,862 | ||||||||||
|
| |||||||||||
| Security | Par (000) | Value | ||||||||||
| Capital Markets — 1.2% | ||||||||||||
Citigroup Global Markets, Inc. (Raymond James Financial, Inc.) 19.50% 06/29/23 | USD | 47,800 | $ | 4,378,014 | ||||||||
JP Morgan Securities LLC (Carlyle Group, Inc.) 24.86% 08/03/23 | 325,000 | 8,908,250 | ||||||||||
SG Americas Securities LLC (Carlyle Group, Inc.) 24.11% 06/02/23 | 307,000 | 8,418,507 | ||||||||||
SG Americas Securities LLC (Invesco Ltd.) | 194,000 | 2,822,315 | ||||||||||
|
| |||||||||||
| 24,527,086 | ||||||||||||
| Chemicals — 0.4% | ||||||||||||
BNP Paribas Securities Corporation (PPG Industries, Inc.) 21.68% 06/26/23 | 53,800 | 7,111,759 | ||||||||||
|
| |||||||||||
| Communications Equipment — 1.0% | ||||||||||||
Barclays Capital, Inc. (Nokia Oyj) 21.51% 08/03/23 | 846,300 | 3,393,663 | ||||||||||
BMO Capital Markets Corp. (Cisco Systems, Inc.) | 271,900 | 13,502,956 | ||||||||||
Nomura Securities International, Inc. (Nokia Oyj) | 865,000 | 3,467,673 | ||||||||||
|
| |||||||||||
| 20,364,292 | ||||||||||||
| Consumer Staples Distribution & Retail — 0.5% | ||||||||||||
BMO Capital Markets Corp. (Dollar General Corp.) 14.38% 06/26/23 | 43,700 | 8,801,838 | ||||||||||
|
| |||||||||||
| Containers & Packaging — 0.7% | ||||||||||||
Citigroup Global Markets, Inc. (Sealed Air Corp.) | 373,600 | 14,308,303 | ||||||||||
|
| |||||||||||
| Diversified Telecommunication Services — 1.1% | ||||||||||||
Citigroup Global Markets, Inc. (Verizon Communications, Inc.) 15.06% 06/29/23 | 423,100 | 15,266,623 | ||||||||||
Goldman Sachs & Co. LLC (AT&T Inc.) 10.56% 07/03/23 | 358,700 | 5,695,311 | ||||||||||
|
| |||||||||||
| 20,961,934 | ||||||||||||
| Electric Utilities — 1.1% | ||||||||||||
Barclays Capital, Inc. (Exelon Corp.) 16.57% 07/03/23 | 193,800 | 7,776,077 | ||||||||||
RBC Capital Markets LLC (American Electric Power Co., Inc.) 13.71% 06/07/23 | 78,900 | 6,573,085 | ||||||||||
RBC Capital Markets LLC (PG&E Corp.) 11.11% 07/17/23 | 391,800 | 6,655,255 | ||||||||||
|
| |||||||||||
| 21,004,417 | ||||||||||||
| Financial Services — 1.8% | ||||||||||||
Barclays Capital, Inc. (Equitable Holdings, Inc.) | 316,000 | 7,754,640 | ||||||||||
BMO Capital Markets Corp. (Apollo Global Management, Inc.) 27.57% 07/03/23 | 58,900 | 3,833,731 | ||||||||||
BMO Capital Markets Corp. (Visa, Inc.) 9.64% 07/17/23 | 17,400 | 3,875,517 | ||||||||||
Goldman Sachs & Co. LLC (Fidelity National Information Services, Inc.) 24.19% 06/22/23 | 212,300 | 11,603,229 | ||||||||||
Nomura Securities International, Inc. (Equitable Holdings, Inc.) 21.97% 06/02/23 | 316,000 | 7,752,454 | ||||||||||
|
| |||||||||||
| 34,819,571 | ||||||||||||
| Food Products — 1.1% | ||||||||||||
BNP Paribas Arbitrage (Danone SA) 20.41% 07/10/23 | EUR | 62,700 | 3,780,030 | |||||||||
JP Morgan Securities LLC (Kraft Heinz Co.) | USD | 489,600 | 18,802,108 | |||||||||
|
| |||||||||||
| 22,582,138 | ||||||||||||
S C H E D U L E S O F I N V E S T M E N T S | 17 |
Schedule of Investments (continued) May 31, 2023
| BlackRock High Equity Income Fund (Percentages shown are based on Net Assets) |
| Security | Par (000) | Value | ||||||||||
| Health Care Equipment & Supplies — 4.2% | ||||||||||||
Nomura Securities International, Inc. (Baxter International, Inc.) 21.47% 08/03/23 | USD | 498,300 | $ | 20,290,776 | ||||||||
Nomura Securities International, Inc. (Zimmer Biomet Holdings, Inc.) 15.66% 06/12/23 | 110,900 | 14,118,743 | ||||||||||
RBC Capital Markets LLC (Koninklijke Philips NV) 20.00% 07/27/23(b) | EUR | 309,500 | 5,945,458 | |||||||||
SG Americas Securities LLC (Baxter International, Inc.) 20.91% 06/02/23 | USD | 509,300 | 20,744,802 | |||||||||
SG Americas Securities LLC (Medtronic PLC) 16.21% 06/12/23 | 251,600 | 20,792,011 | ||||||||||
|
| |||||||||||
| 81,891,790 | ||||||||||||
| Health Care Providers & Services — 3.1% | ||||||||||||
Barclays Capital, Inc. (Cardinal Health, Inc.) 15.44% 08/03/23 | 150,400 | 12,377,920 | ||||||||||
BMO Capital Markets Corp. (Humana, Inc.) 17.61% 07/13/23 | 7,600 | 3,860,782 | ||||||||||
Goldman Sachs & Co. LLC (Laboratory Corp. of America Holdings) 12.90% 07/03/23 | 66,600 | 14,286,221 | ||||||||||
Nomura Securities International, Inc. (Cardinal Health, Inc.) 19.71% 06/02/23 | 156,000 | 12,314,259 | ||||||||||
RBC Capital Markets LLC (Cigna Group) 13.76% 07/03/23 | 42,700 | 10,626,479 | ||||||||||
SG Americas Securities LLC (Elevance Health, Inc.) 17.53% 06/12/23 | 18,200 | 8,172,134 | ||||||||||
|
| |||||||||||
| 61,637,795 | ||||||||||||
| Household Durables — 0.8% | ||||||||||||
BOFA Securities, Inc. (Newell Brands, Inc.) 34.97% 08/03/23 | 422,600 | 3,511,806 | ||||||||||
Citigroup Global Markets, Inc. (Sony Group Corp.) 16.08% 06/29/23 | 87,100 | 8,055,777 | ||||||||||
Nomura Securities International, Inc. (Newell Brands, Inc.) 32.68% 06/02/23 | 509,300 | 4,231,083 | ||||||||||
|
| |||||||||||
| 15,798,666 | ||||||||||||
| Household Products — 0.2% | ||||||||||||
BNP Paribas Arbitrage (Reckitt Benckiser Group PLC) 12.90% 07/10/23 | GBP | 55,300 | 4,330,692 | |||||||||
|
| |||||||||||
| Industrial Conglomerates — 0.2% | ||||||||||||
BNP Paribas Arbitrage (Siemens AG) 18.97% 07/20/23 | EUR | 25,100 | 4,051,903 | |||||||||
|
| |||||||||||
| Insurance — 2.2% | ||||||||||||
BNP Paribas Arbitrage (Prudential PLC) 19.94% 07/10/23 | GBP | 646,900 | 8,603,446 | |||||||||
JP Morgan Securities LLC (American International Group, Inc.) 14.84% 06/26/23 | USD | 263,200 | 13,859,805 | |||||||||
JP Morgan Securities LLC (Fidelity National Financial, Inc.) 26.89% 06/26/23 | 352,900 | 12,059,212 | ||||||||||
Mizuho Securities USA LLC (Willis Towers Watson PLC) 12.80% 07/13/23 | 42,200 | 9,240,962 | ||||||||||
|
| |||||||||||
| 43,763,425 | ||||||||||||
| Interactive Media & Services — 0.5% | ||||||||||||
Goldman Sachs & Co. LLC (Meta Platforms, Inc.) 21.28% 06/22/23 | 26,500 | 6,261,482 | ||||||||||
JP Morgan Securities LLC (Alphabet, Inc.) 16.85% 06/22/23 | 35,500 | 4,037,875 | ||||||||||
|
| |||||||||||
| 10,299,357 | ||||||||||||
| IT Services — 1.0% | ||||||||||||
RBC Capital Markets LLC (Cognizant Technology Solutions Corp.) 15.07% 06/07/23 | 319,900 | 20,006,279 | ||||||||||
|
| |||||||||||
| Security | Par (000) | Value | ||||||||||
| Media — 1.1% | ||||||||||||
BNP Paribas Securities Corporation (Comcast Corp.) 16.77% 06/14/23 | USD | 444,000 | $ | 17,003,214 | ||||||||
Goldman Sachs & Co. LLC (Fox Corp.) 17.81% 06/22/23 | 138,600 | 4,372,302 | ||||||||||
|
| |||||||||||
| 21,375,516 | ||||||||||||
| Multi-Utilities — 0.7% | ||||||||||||
BMO Capital Markets Corp. (Sempra Energy) 15.38% 06/26/23 | 34,200 | 4,939,201 | ||||||||||
SG Americas Securities LLC (Public Service Enterprise Group, Inc.) 19.88% 06/12/23 | 141,000 | 8,398,016 | ||||||||||
|
| |||||||||||
| 13,337,217 | ||||||||||||
| Oil, Gas & Consumable Fuels — 2.8% | ||||||||||||
BMO Capital Markets Corp. (EQT Corp.) 22.01% 06/07/23 | 197,800 | 6,849,454 | ||||||||||
BMO Capital Markets Corp. (Williams Cos., Inc.) 18.17% 07/13/23 | 233,000 | 6,634,559 | ||||||||||
BNP Paribas Arbitrage (Shell PLC) 20.14% 07/20/23 | GBP | 529,000 | 14,945,354 | |||||||||
BNP Paribas Securities Corporation (Kosmos Energy Ltd.) 32.44% 06/26/23 | USD | 551,700 | 3,328,346 | |||||||||
Nomura Securities International, Inc. (ConocoPhillips) 17.51% 06/14/23 | 39,800 | 3,949,773 | ||||||||||
RBC Capital Markets LLC (BP PLC) 19.32% 07/20/23 | GBP | 3,234,100 | 18,481,919 | |||||||||
|
| |||||||||||
| 54,189,405 | ||||||||||||
| Personal Care Products — 0.5% | ||||||||||||
BNP Paribas Securities Corporation (Unilever PLC) 15.57% 06/26/23 | USD | 177,700 | 8,932,813 | |||||||||
|
| |||||||||||
| Pharmaceuticals — 2.3% | ||||||||||||
Barclays Capital, Inc. (Sanofi) 23.92% 07/27/23 | EUR | 137,500 | 14,332,389 | |||||||||
BMO Capital Markets Corp. (Novo Nordisk A/S) | USD | 24,700 | 3,989,878 | |||||||||
BNP Paribas Arbitrage (AstraZeneca PLC) 16.77% 07/20/23 | GBP | 74,900 | 10,955,370 | |||||||||
BNP Paribas Securities Corporation (Eli Lilly & Co.) 16.98% 06/14/23 | USD | 11,600 | 4,473,981 | |||||||||
RBC Capital Markets LLC (Bayer AG) | EUR | 211,800 | 11,969,208 | |||||||||
|
| |||||||||||
| 45,720,826 | ||||||||||||
| Professional Services — 1.3% | ||||||||||||
Goldman Sachs & Co. LLC (SS&C Technologies Holdings, Inc.) 16.43% 06/22/23 | USD | 275,900 | 15,276,515 | |||||||||
RBC Capital Markets LLC (Robert Half International, Inc.) 18.55% 07/17/23 | 29,800 | 1,961,022 | ||||||||||
SG Americas Securities LLC (Leidos Holdings, Inc.) 14.25% 06/22/23 | 102,400 | 8,037,868 | ||||||||||
|
| |||||||||||
| 25,275,405 | ||||||||||||
| Software — 0.6% | ||||||||||||
Nomura Securities International, Inc. (Microsoft Corp.) 19.39% 06/14/23 | 42,100 | 12,722,844 | ||||||||||
|
| |||||||||||
| Specialty Retail — 0.2% | ||||||||||||
BMO Capital Markets Corp. (Ross Stores, Inc.) 13.41% 06/29/23 | 39,200 | 4,053,461 | ||||||||||
|
| |||||||||||
| Technology Hardware, Storage & Peripherals — 0.2% | ||||||||||||
RBC Capital Markets LLC (HP, Inc.) 22.84% 07/03/23 | 133,100 | 3,885,650 | ||||||||||
|
| |||||||||||
| 18 | 2 0 2 3 B L A C K R O C K A N N U A L R E P O R T T O S H A R E H O L D E R S |
Schedule of Investments (continued) May 31, 2023
| BlackRock High Equity Income Fund (Percentages shown are based on Net Assets) |
| Security | Par (000) | Value | ||||||||||
| Textiles, Apparel & Luxury Goods — 0.5% | ||||||||||||
JP Morgan Securities LLC (Ralph Lauren Corp.) | USD | 34,300 | $ | 3,646,433 | ||||||||
Nomura Securities International, Inc. (Ralph Lauren Corp.) 22.38% 06/02/23 | 57,900 | 6,153,613 | ||||||||||
|
| |||||||||||
| 9,800,046 | ||||||||||||
| Tobacco — 0.8% | ||||||||||||
Barclays Capital, Inc. (British American Tobacco PLC) 19.52% 07/27/23 | GBP | 340,800 | 10,833,798 | |||||||||
BOFA Securities, Inc. (Altria Group, Inc.) 16.65% 06/02/23 | USD | 102,300 | 4,542,891 | |||||||||
|
| |||||||||||
| 15,376,689 | ||||||||||||
| Trading Companies & Distributors — 0.4% | ||||||||||||
Barclays Capital, Inc. (MSC Industrial Direct Co., Inc.) 15.82% 08/03/23 | 43,700 | 3,929,504 | ||||||||||
BOFA Securities, Inc. (MSC Industrial Direct Co., Inc.) 22.44% 06/02/23 | 55,000 | 4,690,888 | ||||||||||
|
| |||||||||||
| 8,620,392 | ||||||||||||
| Security | Par (000) | Value | ||||||||||
| Wireless Telecommunication Services — 0.6% | ||||||||||||
Barclays Capital, Inc. (Vodafone Group PLC) | GBP | 9,114,900 | $ | 8,603,228 | ||||||||
RBC Capital Markets LLC (Rogers Communications, Inc.) 13.20% 06/07/23 | CAD | 92,400 | 4,082,359 | |||||||||
|
| |||||||||||
| 12,685,587 | ||||||||||||
|
| |||||||||||
Total Equity-Linked Notes — 38.6% | 760,058,130 | |||||||||||
|
| |||||||||||
Total Investments — 102.7% | 2,021,809,055 | |||||||||||
Liabilities in Excess of Other Assets — (2.7)% |
| (52,896,959 | ) | |||||||||
|
| |||||||||||
Net Assets — 100.0% | $ | 1,968,912,096 | ||||||||||
|
| |||||||||||
| (a) | Non-income producing security. |
| (b) | Security is valued using significant unobservable inputs and is classified as Level 3 in the fair value hierarchy. |
Affiliates
Investments in issuers considered to be affiliate(s) of the Fund during the year ended May 31, 2023 for purposes of Section 2(a)(3) of the Investment Company Act of 1940, as amended, were as follows:
| Affiliated Issuer | Value at 05/31/22 | Purchases at Cost | Proceeds from Sale | Net Realized | Change in Unrealized Appreciation (Depreciation) | Value at 05/31/23 | Shares Held at 05/31/23 | Income | Capital Gain | |||||||||||||||||||||||||||
BlackRock Liquidity Funds, T-Fund, Institutional Class(a) | $ | 25,886,024 | $ | — | $ (25,886,024) | (b) | $ | — | $ | — | $ | — | — | $ | 2,000,304 | $ — | ||||||||||||||||||||
SL Liquidity Series, LLC, Money Market Series(a) | — | 4,794 | (b) | — | (4,794) | — | — | — | 3,960 | (c) | — | |||||||||||||||||||||||||
|
|
|
|
|
|
|
|
|
| |||||||||||||||||||||||||||
| $ | (4,794) | $ | — | $ | — | $ | 2,004,264 | $ — | ||||||||||||||||||||||||||||
|
|
|
|
|
|
|
|
|
| |||||||||||||||||||||||||||
| (a) | As of period end, the entity is no longer held. |
| (b) | Represents net amount purchased (sold). |
| (c) | All or a portion represents securities lending income earned from the reinvestment of cash collateral from loaned securities, net of fees and collateral investment expenses, and other payments to and from borrowers of securities. |
For Fund compliance purposes, the Fund’s industry classifications refer to one or more of the industry sub-classifications used by one or more widely recognized market indexes or rating group indexes, and/or as defined by the investment adviser. These definitions may not apply for purposes of this report, which may combine such industry sub-classifications for reporting ease.
Fair Value Hierarchy as of Period End
Various inputs are used in determining the fair value of financial instruments. For a description of the input levels and information about the Fund’s policy regarding valuation of financial instruments, refer to the Notes to Financial Statements.
The following table summarizes the Fund’s financial instruments categorized in the fair value hierarchy. The breakdown of the Fund’s financial instruments into major categories is disclosed in the Schedule of Investments above.
| Level 1 | Level 2 | Level 3 | Total | |||||||||||||
Assets | ||||||||||||||||
Investments | ||||||||||||||||
Long-Term Investments | ||||||||||||||||
Common Stocks | ||||||||||||||||
Aerospace & Defense | $ | 45,772,025 | $ | 865,441 | $ | — | $ | 46,637,466 | ||||||||
Automobile Components | 18,405,010 | — | — | 18,405,010 | ||||||||||||
Automobiles | 19,648,012 | — | — | 19,648,012 | ||||||||||||
Banks | 114,212,995 | — | — | 114,212,995 | ||||||||||||
S C H E D U L E S O F I N V E S T M E N T S | 19 |
Schedule of Investments (continued) May 31, 2023
| BlackRock High Equity Income Fund |
Fair Value Hierarchy as of Period End (continued)
| Level 1 | Level 2 | Level 3 | Total | |||||||||||||
Common Stocks (continued) | ||||||||||||||||
Capital Markets | $ | 34,440,830 | $ | — | $ | — | $ | 34,440,830 | ||||||||
Chemicals | 11,368,401 | — | — | 11,368,401 | ||||||||||||
Communications Equipment | 27,399,341 | — | — | 27,399,341 | ||||||||||||
Consumer Staples Distribution & Retail | 17,895,602 | — | — | 17,895,602 | ||||||||||||
Containers & Packaging | 24,533,613 | — | — | 24,533,613 | ||||||||||||
Diversified Telecommunication Services | 33,273,659 | — | — | 33,273,659 | ||||||||||||
Electric Utilities | 38,471,289 | — | — | 38,471,289 | ||||||||||||
Financial Services | 49,501,593 | — | — | 49,501,593 | ||||||||||||
Food Products | 32,914,185 | 5,983,704 | — | 38,897,889 | ||||||||||||
Health Care Equipment & Supplies | 90,071,528 | 10,411,259 | — | 100,482,787 | ||||||||||||
Health Care Providers & Services | 93,772,041 | — | — | 93,772,041 | ||||||||||||
Household Durables | 21,335,189 | — | — | 21,335,189 | ||||||||||||
Household Products | — | 6,936,489 | — | 6,936,489 | ||||||||||||
Industrial Conglomerates | — | 6,615,757 | — | 6,615,757 | ||||||||||||
Insurance | 64,037,116 | 13,578,150 | — | 77,615,266 | ||||||||||||
Interactive Media & Services | 8,131,696 | — | — | 8,131,696 | ||||||||||||
IT Services | 38,770,171 | — | — | 38,770,171 | ||||||||||||
Machinery | — | 31,882,910 | — | 31,882,910 | ||||||||||||
Media | 40,106,978 | — | — | 40,106,978 | ||||||||||||
Multi-Utilities | 13,757,287 | — | — | 13,757,287 | ||||||||||||
Oil, Gas & Consumable Fuels | 26,513,221 | 55,328,927 | — | 81,842,148 | ||||||||||||
Personal Care Products | 14,281,292 | — | — | 14,281,292 | ||||||||||||
Pharmaceuticals | 10,954,827 | 56,637,057 | — | 67,591,884 | ||||||||||||
Professional Services | 64,462,505 | — | — | 64,462,505 | ||||||||||||
Semiconductors & Semiconductor Equipment | 9,872,789 | — | — | 9,872,789 | ||||||||||||
Software | 16,722,932 | — | — | 16,722,932 | ||||||||||||
Technology Hardware, Storage & Peripherals | 6,177,575 | 30,227,987 | — | 36,405,562 | ||||||||||||
Textiles, Apparel & Luxury Goods | 6,104,001 | — | — | 6,104,001 | ||||||||||||
Tobacco | — | 23,089,304 | — | 23,089,304 | ||||||||||||
Trading Companies & Distributors | 6,563,261 | — | — | 6,563,261 | ||||||||||||
Wireless Telecommunication Services | 6,561,676 | 14,161,300 | — | 20,722,976 | ||||||||||||
Equity-Linked Notes | — | 742,143,464 | 17,914,666 | 760,058,130 | ||||||||||||
|
|
|
|
|
|
|
| |||||||||
| $ | 1,006,032,640 | $ | 997,861,749 | $ | 17,914,666 | $ | 2,021,809,055 | |||||||||
|
|
|
|
|
|
|
| |||||||||
A reconciliation of Level 3 investments is presented when the Fund had a significant amount of Level 3 investments at the beginning and/or end of the period in relation to net assets. The following table is a reconciliation of Level 3 investments for which significant unobservable inputs were used in determining fair value:
| Equity-Linked Notes | ||||
| Assets | ||||
Opening Balance, as of May 31, 2022 | $ | 25,492,266 | ||
Transfers into Level 3 | — | |||
Transfers out of Level 3 | — | |||
Net realized gain (loss) | (349,210 | ) | ||
Net change in unrealized appreciation (depreciation)(a)(b) | (1,277,616 | ) | ||
Purchases | 18,558,098 | |||
Sales | (24,508,872 | ) | ||
|
| |||
Closing Balance, as of May 31, 2023 | $ | 17,914,666 | ||
|
| |||
Net change in unrealized appreciation (depreciation) on investments still held at May 31, 2023(b) | $ | (643,432 | ) | |
|
| |||
| (a) | Included in the related net change in unrealized appreciation (depreciation) in the Statements of Operations. |
| (b) | Any difference between net change in unrealized appreciation (depreciation) and net change in unrealized appreciation (depreciation) on investments still held at May 31, 2023, is generally due to investments no longer held or categorized as Level 3 at period end. |
See notes to financial statements.
| 20 | 2 0 2 3 B L A C K R O C K A N N U A L R E P O R T T O S H A R E H O L D E R S |
Schedule of Investments May 31, 2023
| BlackRock International Dividend Fund (Percentages shown are based on Net Assets) |
| Security | Shares | Value | ||||||
Common Stocks | ||||||||
| Canada — 3.5% | ||||||||
TELUS Corp. | 1,144,704 | $ | 21,688,241 | |||||
|
| |||||||
| China — 3.0% | ||||||||
Budweiser Brewing Co. APAC Ltd.(a) | 4,939,800 | 12,429,725 | ||||||
Yum China Holdings, Inc. | 113,522 | 6,409,452 | ||||||
|
| |||||||
| 18,839,177 | ||||||||
| Denmark — 4.1% | ||||||||
Novo Nordisk A/S, Class B | 156,511 | 25,187,478 | ||||||
|
| |||||||
| France — 14.9% | ||||||||
Air Liquide SA | 73,994 | 12,397,898 | ||||||
EssilorLuxottica SA | 66,731 | 12,085,194 | ||||||
Kering SA | 39,787 | 21,272,590 | ||||||
LVMH Moet Hennessy Louis Vuitton SE | 24,345 | 21,285,520 | ||||||
Sanofi | 249,062 | 25,411,060 | ||||||
|
| |||||||
| 92,452,262 | ||||||||
| Germany — 2.0% | ||||||||
MTU Aero Engines AG, Class N | 53,908 | 12,470,727 | ||||||
|
| |||||||
| India — 3.2% | ||||||||
AceVector Ltd. (Acquired 05/07/14 - 10/29/14, cost $7,423,816)(b)(c)(d) | 1,595,200 | 1,176,947 | ||||||
HDFC Bank Ltd. | 948,926 | 18,426,392 | ||||||
|
| |||||||
| 19,603,339 | ||||||||
| Indonesia — 2.2% | ||||||||
Bank Rakyat Indonesia Persero Tbk PT | 35,729,900 | 13,276,807 | ||||||
|
| |||||||
| Japan — 3.5% | ||||||||
Daiichi Sankyo Co. Ltd. | 290,200 | 9,437,071 | ||||||
KDDI Corp. | 403,500 | 12,440,523 | ||||||
|
| |||||||
| 21,877,594 | ||||||||
| Mexico — 2.7% | ||||||||
Wal-Mart de Mexico SAB de CV | 4,401,684 | 16,744,266 | ||||||
|
| |||||||
| Netherlands — 8.3% | ||||||||
Heineken NV | 152,300 | 15,409,480 | ||||||
Koninklijke KPN NV | 5,417,562 | 18,637,752 | ||||||
Shell PLC | 49,081 | 1,349,384 | ||||||
Shell PLC | 570,306 | 15,943,818 | ||||||
|
| |||||||
| 51,340,434 | ||||||||
| Singapore — 2.1% | ||||||||
DBS Group Holdings Ltd. | 309,800 | 6,936,447 | ||||||
United Overseas Bank Ltd. | 287,500 | 5,940,002 | ||||||
|
| |||||||
| 12,876,449 | ||||||||
| Spain — 3.0% | ||||||||
Industria de Diseno Textil SA | 560,262 | 18,743,997 | ||||||
|
| |||||||
| Sweden — 1.7% | ||||||||
Epiroc AB, Class A | 605,798 | 10,640,859 | ||||||
|
| |||||||
| Security | Shares | Value | ||||||
| Switzerland — 5.7% | ||||||||
Lonza Group AG, Registered Shares | 36,158 | $ | 22,678,509 | |||||
Zurich Insurance Group AG, Class N | 26,669 | 12,485,947 | ||||||
|
| |||||||
| 35,164,456 | ||||||||
| Taiwan — 6.9% | ||||||||
MediaTek, Inc. | 740,000 | 18,184,464 | ||||||
Taiwan Semiconductor Manufacturing Co. Ltd. | 1,359,000 | 24,594,954 | ||||||
|
| |||||||
| 42,779,418 | ||||||||
| United Kingdom — 22.4% | ||||||||
AstraZeneca PLC | 132,642 | 19,319,390 | ||||||
BAE Systems PLC | 1,094,086 | 12,644,950 | ||||||
Diageo PLC | 522,347 | 21,715,297 | ||||||
Ferguson PLC | 113,344 | 16,427,178 | ||||||
Prudential PLC | 1,352,611 | 17,773,028 | ||||||
Reckitt Benckiser Group PLC | 322,140 | 25,050,116 | ||||||
RELX PLC | 616,536 | 19,271,679 | ||||||
Smith & Nephew PLC | 426,312 | 6,387,101 | ||||||
|
| |||||||
| 138,588,739 | ||||||||
| United States — 8.5% | ||||||||
Baker Hughes Co., Class A | 673,984 | 18,366,064 | ||||||
Otis Worldwide Corp. | 240,373 | 19,112,057 | ||||||
Visa, Inc., Class A | 68,248 | 15,084,856 | ||||||
|
| |||||||
| 52,562,977 | ||||||||
|
| |||||||
Total Long-Term Investments — 97.7% | 604,837,220 | |||||||
|
| |||||||
Short-Term Securities | ||||||||
| Money Market Funds — 4.1% | ||||||||
BlackRock Liquidity Funds, T-Fund, Institutional Class, 5.00%(e)(f) | 25,743,453 | 25,743,453 | ||||||
|
| |||||||
Total Short-Term Securities — 4.1% | 25,743,453 | |||||||
|
| |||||||
Total Investments — 101.8% | 630,580,673 | |||||||
Liabilities in Excess of Other Assets — (1.8)% | (11,447,558 | ) | ||||||
|
| |||||||
Net Assets — 100.0% | $ | 619,133,115 | ||||||
|
| |||||||
| (a) | Security exempt from registration pursuant to Rule 144A under the Securities Act of 1933, as amended. These securities may be resold in transactions exempt from registration to qualified institutional investors. |
| (b) | Security is valued using significant unobservable inputs and is classified as Level 3 in the fair value hierarchy. |
| (c) | Non-income producing security. |
| (d) | Restricted security as to resale, excluding 144A securities. The Fund held restricted securities with a current value of $1,176,947, representing 0.2% of its net assets as of period end, and an original cost of $7,423,816. |
| (e) | Affiliate of the Fund. |
| (f) | Annualized 7-day yield as of period end. |
S C H E D U L E S O F I N V E S T M E N T S | 21 |
Schedule of Investments (continued) May 31, 2023
| BlackRock International Dividend Fund |
Affiliates
Investments in issuers considered to be affiliate(s) of the Fund during the year ended May 31, 2023 for purposes of Section 2(a)(3) of the Investment Company Act of 1940, as amended, were as follows:
| Affiliated Issuer | Value at 05/31/22 | Purchases at Cost | Proceeds from Sale | Net Realized Gain (Loss) | Change in Unrealized Appreciation (Depreciation) | Value at 05/31/23 | Shares Held at 05/31/23 | Income | Capital Gain | |||||||||||||||||||||||||||
BlackRock Liquidity Funds, T-Fund, Institutional Class | $ | 4,283,734 | $ | 21,459,719 | (a) | $ — | $ | — | $ | — | $ | 25,743,453 | 25,743,453 | $ | 423,023 | $ | — | |||||||||||||||||||
SL Liquidity Series, LLC, Money Market Series(b) | — | 1,655 | (a) | — | (1,655 | ) | — | — | — | 1,477 | (c) | — | ||||||||||||||||||||||||
|
|
|
|
|
|
|
|
|
| |||||||||||||||||||||||||||
| $ | (1,655 | ) | $ | — | $ | 25,743,453 | $ | 424,500 | $ | — | ||||||||||||||||||||||||||
|
|
|
|
|
|
|
|
|
| |||||||||||||||||||||||||||
| (a) | Represents net amount purchased (sold). |
| (b) | As of period end, the entity is no longer held. |
| (c) | All or a portion represents securities lending income earned from the reinvestment of cash collateral from loaned securities, net of fees and collateral investment expenses, and other payments to and from borrowers of securities. |
Fair Value Hierarchy as of Period End
Various inputs are used in determining the fair value of financial instruments. For a description of the input levels and information about the Fund’s policy regarding valuation of financial instruments, refer to the Notes to Financial Statements.
The following table summarizes the Fund’s financial instruments categorized in the fair value hierarchy. The breakdown of the Fund’s financial instruments into major categories is disclosed in the Schedule of Investments above.
| ||||||||||||||||
| Level 1 | Level 2 | Level 3 | Total | |||||||||||||
| ||||||||||||||||
Assets | ||||||||||||||||
Investments | ||||||||||||||||
Long-Term Investments | ||||||||||||||||
Common Stocks | ||||||||||||||||
Canada | $ | 21,688,241 | $ | — | $ | — | $ | 21,688,241 | ||||||||
China | 6,409,452 | 12,429,725 | — | 18,839,177 | ||||||||||||
Denmark | — | 25,187,478 | — | 25,187,478 | ||||||||||||
France | — | 92,452,262 | — | 92,452,262 | ||||||||||||
Germany | — | 12,470,727 | — | 12,470,727 | ||||||||||||
India | — | 18,426,392 | 1,176,947 | 19,603,339 | ||||||||||||
Indonesia | — | 13,276,807 | — | 13,276,807 | ||||||||||||
Japan | — | 21,877,594 | — | 21,877,594 | ||||||||||||
Mexico | 16,744,266 | — | — | 16,744,266 | ||||||||||||
Netherlands | — | 51,340,434 | — | 51,340,434 | ||||||||||||
Singapore | — | 12,876,449 | — | 12,876,449 | ||||||||||||
Spain | — | 18,743,997 | — | 18,743,997 | ||||||||||||
Sweden | — | 10,640,859 | — | 10,640,859 | ||||||||||||
Switzerland | — | 35,164,456 | — | 35,164,456 | ||||||||||||
Taiwan | — | 42,779,418 | — | 42,779,418 | ||||||||||||
United Kingdom | — | 138,588,739 | — | 138,588,739 | ||||||||||||
United States | 52,562,977 | — | — | 52,562,977 | ||||||||||||
Short-Term Securities | ||||||||||||||||
Money Market Funds | 25,743,453 | — | — | 25,743,453 | ||||||||||||
|
|
|
|
|
|
|
| |||||||||
| $ | 123,148,389 | $ | 506,255,337 | $ | 1,176,947 | $ | 630,580,673 | |||||||||
|
|
|
|
|
|
|
| |||||||||
See notes to financial statements.
| 22 | 2 0 2 3 B L A C K R O C K A N N U A L R E P O R T T O S H A R E H O L D E R S |
Statements of Assets and Liabilities
May 31, 2023
| BlackRock Energy Opportunities Fund | BlackRock | BlackRock International Dividend Fund | ||||||||||
ASSETS | ||||||||||||
Investments, at value — unaffiliated(a) | $ | 372,225,490 | $ | 2,021,809,055 | $ | 604,837,220 | ||||||
Investments, at value — affiliated(b) | 2,370,913 | — | 25,743,453 | |||||||||
Cash | 31,997 | — | — | |||||||||
Foreign currency, at value(c) | 760 | 152,664 | 81,272 | |||||||||
Receivables: | ||||||||||||
Investments sold | 2,382,712 | 26,709,204 | 29,622 | |||||||||
Securities lending income — affiliated | — | 311 | — | |||||||||
Capital shares sold | 262,373 | 3,810,516 | 2,119,623 | |||||||||
Dividends — unaffiliated | 2,056,679 | 4,049,072 | 2,798,876 | |||||||||
Dividends — affiliated | 13,750 | 128,623 | 87,695 | |||||||||
Interest — unaffiliated | — | 4,925,608 | — | |||||||||
From the Manager | 28,001 | 214,113 | 72,551 | |||||||||
Prepaid expenses | 57,790 | 131,470 | 119,021 | |||||||||
|
|
|
|
|
| |||||||
Total assets | 379,430,465 | 2,061,930,636 | 635,889,333 | |||||||||
|
|
|
|
|
| |||||||
LIABILITIES | ||||||||||||
Bank overdraft | — | 1,038,259 | — | |||||||||
Payables: | ||||||||||||
Investments purchased | — | 80,119,518 | 13,714,331 | |||||||||
Administration fees | 37,667 | 136,807 | 41,617 | |||||||||
Capital shares redeemed | 1,862,132 | 8,033,819 | 1,237,550 | |||||||||
Deferred foreign capital gain tax | — | — | 26,396 | |||||||||
Income dividend distributions | — | 441,537 | — | |||||||||
Investment advisory fees | 535,784 | 2,470,615 | 533,903 | |||||||||
IRS compliance fee for foreign withholding tax claims | — | — | 757,020 | |||||||||
Trustees’ and Officer’s fees | 2,039 | 3,616 | 1,598 | |||||||||
Other accrued expenses | 44,675 | 84,376 | 48,318 | |||||||||
Other affiliate fees | 2,111 | — | 2,705 | |||||||||
Professional fees | 55,414 | 94,803 | 209,544 | |||||||||
Service and distribution fees | 64,211 | 116,337 | 31,539 | |||||||||
Transfer agent fees | 207,233 | 478,853 | 151,697 | |||||||||
|
|
|
|
|
| |||||||
| Total liabilities | 2,811,266 | 93,018,540 | 16,756,218 | |||||||||
|
|
|
|
|
| |||||||
NET ASSETS | $ | 376,619,199 | $ | 1,968,912,096 | $ | 619,133,115 | ||||||
|
|
|
|
|
| |||||||
NET ASSETS CONSIST OF: | ||||||||||||
Paid-in capital | $ | 625,854,445 | $ | 2,112,392,478 | $ | 589,957,352 | ||||||
Accumulated earnings (loss) | (249,235,246 | ) | (143,480,382 | ) | 29,175,763 | |||||||
|
|
|
|
|
| |||||||
NET ASSETS | $ | 376,619,199 | $ | 1,968,912,096 | $ | 619,133,115 | ||||||
|
|
|
|
|
| |||||||
(a) Investments, at cost — unaffiliated | $ | 303,188,285 | $ | 2,037,930,070 | $ | 577,045,671 | ||||||
(b) Investments, at cost — affiliated | $ | 2,370,913 | $ | — | $ | 25,743,453 | ||||||
(c) Foreign currency, at cost | $ | 758 | $ | 152,475 | $ | 81,612 | ||||||
F I N A N C I A L S T A T E M E N T S | 23 |
Statements of Assets and Liabilities (continued)
May 31, 2023
| BlackRock Energy Opportunities Fund | BlackRock High Equity Income Fund | BlackRock International Dividend Fund | ||||||||||
NET ASSET VALUE | ||||||||||||
| Institutional | ||||||||||||
Net assets | $ | 153,530,485 | $ | 1,475,683,009 | $ | 432,855,321 | ||||||
|
|
|
|
|
| |||||||
Shares outstanding | 12,860,683 | 56,267,659 | 13,187,559 | |||||||||
|
|
|
|
|
| |||||||
Net asset value | $ | 11.94 | $ | 26.23 | $ | 32.82 | ||||||
|
|
|
|
|
| |||||||
Shares authorized | Unlimited | Unlimited | Unlimited | |||||||||
|
|
|
|
|
| |||||||
Par value | $ | 0.001 | $ | 0.001 | $ | 0.001 | ||||||
|
|
|
|
|
| |||||||
| Investor A | ||||||||||||
Net assets | $ | 204,035,026 | $ | 296,253,794 | $ | 121,410,888 | ||||||
|
|
|
|
|
| |||||||
Shares outstanding | 17,624,037 | 13,502,818 | 4,012,385 | |||||||||
|
|
|
|
|
| |||||||
Net asset value | $ | 11.58 | $ | 21.94 | $ | 30.26 | ||||||
|
|
|
|
|
| |||||||
Shares authorized | Unlimited | Unlimited | Unlimited | |||||||||
|
|
|
|
|
| |||||||
Par value | $ | 0.001 | $ | 0.001 | $ | 0.001 | ||||||
|
|
|
|
|
| |||||||
| Investor C | ||||||||||||
Net assets | $ | 19,053,688 | $ | 59,275,778 | $ | 4,517,341 | ||||||
|
|
|
|
|
| |||||||
Shares outstanding | 1,711,081 | 4,353,431 | 174,779 | |||||||||
|
|
|
|
|
| |||||||
Net asset value | $ | 11.14 | $ | 13.62 | $ | 25.85 | ||||||
|
|
|
|
|
| |||||||
Shares authorized | Unlimited | Unlimited | Unlimited | |||||||||
|
|
|
|
|
| |||||||
Par value | $ | 0.001 | $ | 0.001 | $ | 0.001 | ||||||
|
|
|
|
|
| |||||||
| Class K | ||||||||||||
Net assets | N/A | $ | 137,699,515 | $ | 60,349,565 | |||||||
|
|
|
|
|
| |||||||
Shares outstanding | N/A | 5,253,578 | 1,838,276 | |||||||||
|
|
|
|
|
| |||||||
Net asset value | N/A | $ | 26.21 | $ | 32.83 | |||||||
|
|
|
|
|
| |||||||
Shares authorized | N/A | Unlimited | Unlimited | |||||||||
|
|
|
|
|
| |||||||
Par value | N/A | $ | 0.001 | $ | 0.001 | |||||||
|
|
|
|
|
| |||||||
See notes to financial statements.
| 24 | 2 0 2 3 B L A C K R O C K A N N U A L R E P O R T T O S H A R E H O L D E R S |
Year Ended May 31, 2023
| BlackRock Energy Opportunities Fund | BlackRock High Equity Income Fund | BlackRock International Dividend Fund | ||||||||||
INVESTMENT INCOME | ||||||||||||
Dividends — unaffiliated | $ | 17,481,471 | $ | 34,448,978 | $ | 11,485,500 | ||||||
Dividends — affiliated | 211,959 | 2,000,304 | 423,023 | |||||||||
Interest — unaffiliated | — | 99,359,905 | — | |||||||||
Securities lending income — affiliated — net | 479 | 3,960 | 1,477 | |||||||||
Other income | — | — | 399,625 | |||||||||
Foreign taxes withheld | (890,676 | ) | (687,095 | ) | (993,403 | ) | ||||||
Foreign withholding tax claims | — | — | 1,136,533 | |||||||||
IRS compliance fee for foreign withholding tax claims | — | — | (757,020 | ) | ||||||||
|
|
|
|
|
| |||||||
Total investment income | 16,803,233 | 135,126,052 | 11,695,735 | |||||||||
|
|
|
|
|
| |||||||
EXPENSES | ||||||||||||
Investment advisory | 2,979,519 | 13,909,586 | 2,668,916 | |||||||||
Service and distribution — class specific | 781,393 | 1,250,134 | 318,346 | |||||||||
Transfer agent — class specific | 631,971 | 1,815,141 | 429,697 | |||||||||
Administration | 168,840 | 698,639 | 150,515 | |||||||||
Professional | 101,064 | 152,704 | 280,718 | |||||||||
Registration | 82,509 | 222,157 | 81,300 | |||||||||
Administration — class specific | 79,448 | 352,313 | 70,785 | |||||||||
Accounting services | 58,063 | 132,294 | 55,791 | |||||||||
Custodian | 49,331 | 152,151 | 43,855 | |||||||||
Printing and postage | 32,583 | 37,575 | 41,866 | |||||||||
Trustees and Officer | 9,849 | 22,142 | 8,602 | |||||||||
Miscellaneous | 12,343 | 44,833 | 19,683 | |||||||||
|
|
|
|
|
| |||||||
Total expenses | 4,986,913 | 18,789,669 | 4,170,074 | |||||||||
Less: | ||||||||||||
Administration fees waived — class specific | (50,729 | ) | (352,313 | ) | (70,785 | ) | ||||||
Fees waived and/or reimbursed by the Manager | (4,608 | ) | (1,282,324 | ) | (528,714 | ) | ||||||
Transfer agent fees waived and/or reimbursed — class specific | (163,021 | ) | (946,890 | ) | (270,168 | ) | ||||||
|
|
|
|
|
| |||||||
Total expenses after fees waived and/or reimbursed | 4,768,555 | 16,208,142 | 3,300,407 | |||||||||
|
|
|
|
|
| |||||||
Net investment income | 12,034,678 | 118,917,910 | 8,395,328 | |||||||||
|
|
|
|
|
| |||||||
REALIZED AND UNREALIZED GAIN (LOSS) | ||||||||||||
Net realized gain (loss) from: | ||||||||||||
Investments — unaffiliated | 3,440,523 | (92,492,318 | ) | (249,089 | ) | |||||||
Investments — affiliated | 613 | (4,794 | ) | (1,655 | ) | |||||||
Foreign currency transactions | (7,742 | ) | (494,015 | ) | (39,576 | ) | ||||||
|
|
|
|
|
| |||||||
| 3,433,394 | (92,991,127 | ) | (290,320 | ) | ||||||||
|
|
|
|
|
| |||||||
Net change in unrealized appreciation (depreciation) on: | ||||||||||||
Investments — unaffiliated(a) | (68,194,665 | ) | (89,990,428 | ) | 8,823,723 | |||||||
Foreign currency translations | 2,307 | 30,304 | 35,327 | |||||||||
|
|
|
|
|
| |||||||
| (68,192,358 | ) | (89,960,124 | ) | 8,859,050 | ||||||||
|
|
|
|
|
| |||||||
Net realized and unrealized gain (loss) | (64,758,964 | ) | (182,951,251 | ) | 8,568,730 | |||||||
|
|
|
|
|
| |||||||
NET INCREASE (DECREASE) IN NET ASSETS RESULTING FROM OPERATIONS | $ | (52,724,286 | ) | $ | (64,033,341 | ) | $ | 16,964,058 | ||||
|
|
|
|
|
| |||||||
(a) Net of increase in deferred foreign capital gain tax of | — | — | (26,396 | ) | ||||||||
See notes to financial statements.
F I N A N C I A L S T A T E M E N T S | 25 |
Statements of Changes in Net Assets
| BlackRock Energy Opportunities Fund | ||||||||
| Year Ended 05/31/23 | Year Ended 05/31/22 | |||||||
INCREASE (DECREASE) IN NET ASSETS | ||||||||
OPERATIONS | ||||||||
Net investment income | $ | 12,034,678 | $ | 6,185,142 | ||||
Net realized gain | 3,433,394 | 11,495,831 | ||||||
Net change in unrealized appreciation (depreciation) | (68,192,358 | ) | 105,851,479 | |||||
|
|
|
| |||||
Net increase (decrease) in net assets resulting from operations | (52,724,286 | ) | 123,532,452 | |||||
|
|
|
| |||||
DISTRIBUTIONS TO SHAREHOLDERS(a) | ||||||||
Institutional | (4,153,602 | ) | (1,685,666 | ) | ||||
Investor A | (4,979,465 | ) | (2,822,736 | ) | ||||
Investor C | (385,896 | ) | (228,017 | ) | ||||
|
|
|
| |||||
Decrease in net assets resulting from distributions to shareholders | (9,518,963 | ) | (4,736,419 | ) | ||||
|
|
|
| |||||
CAPITAL SHARE TRANSACTIONS | ||||||||
Net increase in net assets derived from capital share transactions | 50,744,840 | 101,858,896 | ||||||
|
|
|
| |||||
NET ASSETS | ||||||||
Total increase (decrease) in net assets | (11,498,409 | ) | 220,654,929 | |||||
Beginning of year | 388,117,608 | 167,462,679 | ||||||
|
|
|
| |||||
End of year | $ | 376,619,199 | $ | 388,117,608 | ||||
|
|
|
| |||||
| (a) | Distributions for annual periods determined in accordance with U.S. federal income tax regulations. |
See notes to financial statements.
| 26 | 2 0 2 3 B L A C K R O C K A N N U A L R E P O R T T O S H A R E H O L D E R S |
Statements of Changes in Net Assets (continued)
| BlackRock High Equity Income Fund | ||||||||
| Year Ended 05/31/23 | Year Ended 05/31/22 | |||||||
| ||||||||
INCREASE (DECREASE) IN NET ASSETS | ||||||||
OPERATIONS | ||||||||
Net investment income | $ | 118,917,910 | $ | 48,052,004 | ||||
Net realized loss | (92,991,127 | ) | (12,998,968 | ) | ||||
Net change in unrealized appreciation (depreciation) | (89,960,124 | ) | 7,823,061 | |||||
|
|
|
| |||||
Net increase (decrease) in net assets resulting from operations | (64,033,341 | ) | 42,876,097 | |||||
|
|
|
| |||||
DISTRIBUTIONS TO SHAREHOLDERS(a) | ||||||||
Institutional | (94,841,361 | ) | (34,570,316 | ) | ||||
Service | — | (143,733 | ) | |||||
Investor A | (20,115,999 | ) | (17,750,469 | ) | ||||
Investor C | (3,255,218 | ) | (2,190,275 | ) | ||||
Class K | (5,726,980 | ) | (33,372 | ) | ||||
|
|
|
| |||||
Decrease in net assets resulting from distributions to shareholders | (123,939,558 | ) | (54,688,165 | ) | ||||
|
|
|
| |||||
CAPITAL SHARE TRANSACTIONS | ||||||||
Net increase in net assets derived from capital share transactions | 867,175,165 | 783,325,619 | ||||||
|
|
|
| |||||
Capital contribution from affiliate | — | 154,683 | ||||||
|
|
|
| |||||
NET ASSETS | ||||||||
Total increase in net assets | 679,202,266 | 771,668,234 | ||||||
Beginning of year | 1,289,709,830 | 518,041,596 | ||||||
|
|
|
| |||||
End of year | $ | 1,968,912,096 | $ | 1,289,709,830 | ||||
|
|
|
| |||||
| (a) | Distributions for annual periods determined in accordance with U.S. federal income tax regulations. |
See notes to financial statements.
F I N A N C I A L S T A T E M E N T S | 27 |
Statements of Changes in Net Assets (continued)
| BlackRock International Dividend Fund | ||||||||
| Year Ended 05/31/23 | Year Ended 05/31/22 | |||||||
INCREASE (DECREASE) IN NET ASSETS | ||||||||
OPERATIONS | ||||||||
Net investment income | $ | 8,395,328 | $ | 3,891,300 | ||||
Net realized gain (loss) | (290,320 | ) | 7,499,714 | |||||
Net change in unrealized appreciation (depreciation) | 8,859,050 | (25,439,461 | ) | |||||
|
|
|
| |||||
Net increase (decrease) in net assets resulting from operations | 16,964,058 | (14,048,447 | ) | |||||
|
|
|
| |||||
DISTRIBUTIONS TO SHAREHOLDERS(a) | ||||||||
Institutional | (4,254,124 | ) | (6,131,550 | ) | ||||
Investor A | (3,455,327 | ) | (8,109,355 | ) | ||||
Investor C | (111,861 | ) | (346,707 | ) | ||||
Class K | (679,380 | ) | (453,060 | ) | ||||
|
|
|
| |||||
Decrease in net assets resulting from distributions to shareholders | (8,500,692 | ) | (15,040,672 | ) | ||||
|
|
|
| |||||
CAPITAL SHARE TRANSACTIONS | ||||||||
Net increase in net assets derived from capital share transactions | 357,362,077 | 37,095,166 | ||||||
|
|
|
| |||||
NET ASSETS | ||||||||
Total increase in net assets | 365,825,443 | 8,006,047 | ||||||
Beginning of year | 253,307,672 | 245,301,625 | ||||||
|
|
|
| |||||
End of year | $ | 619,133,115 | $ | 253,307,672 | ||||
|
|
|
| |||||
| (a) | Distributions for annual periods determined in accordance with U.S. federal income tax regulations. |
See notes to financial statements.
| 28 | 2 0 2 3 B L A C K R O C K A N N U A L R E P O R T T O S H A R E H O L D E R S |
(For a share outstanding throughout each period)
| BlackRock Energy Opportunities Fund | ||||||||||||||||||||||||||||
| Institutional | ||||||||||||||||||||||||||||
| Year Ended 05/31/23 | Year Ended 05/31/22 | Year Ended 05/31/21 | Period from to 05/31/20 | Year Ended 09/30/19 | Year Ended 09/30/18 | |||||||||||||||||||||||
Net asset value, beginning of period | $ | 13.73 | $ | 8.55 | $ | 6.64 | $ | 9.66 | $ | 12.34 | $ | 11.13 | ||||||||||||||||
|
|
|
|
|
|
|
|
|
|
|
| |||||||||||||||||
Net investment income(a) | 0.42 | 0.32 | 0.26 | 0.21 | 0.29 | 0.23 | ||||||||||||||||||||||
Net realized and unrealized gain (loss) | (1.88 | ) | 5.11 | 1.90 | (2.93 | ) | (2.66 | ) | 1.30 | |||||||||||||||||||
|
|
|
|
|
|
|
|
|
|
|
| |||||||||||||||||
Net increase (decrease) from investment operations | (1.46 | ) | 5.43 | 2.16 | (2.72 | ) | (2.37 | ) | 1.53 | |||||||||||||||||||
|
|
|
|
|
|
|
|
|
|
|
| |||||||||||||||||
Distributions from net investment income(b) | (0.33 | ) | (0.25 | ) | (0.25 | ) | (0.30 | ) | (0.31 | ) | (0.32 | ) | ||||||||||||||||
|
|
|
|
|
|
|
|
|
|
|
| |||||||||||||||||
Net asset value, end of period | $ | 11.94 | $ | 13.73 | $ | 8.55 | $ | 6.64 | $ | 9.66 | $ | 12.34 | ||||||||||||||||
|
|
|
|
|
|
|
|
|
|
|
| |||||||||||||||||
Total Return(c) | ||||||||||||||||||||||||||||
Based on net asset value | (10.59 | )% | 65.17 | % | 33.50 | % | (29.02 | )%(d) | (19.24 | )% | 14.08 | % | ||||||||||||||||
|
|
|
|
|
|
|
|
|
|
|
| |||||||||||||||||
Ratios to Average Net Assets(e) | ||||||||||||||||||||||||||||
Total expenses | 1.03 | % | 1.11 | % | 1.33 | % | 1.40 | %(f)(g) | 1.30 | % | 1.29 | % | ||||||||||||||||
|
|
|
|
|
|
|
|
|
|
|
| |||||||||||||||||
Total expenses after fees waived and/or reimbursed | 0.91 | % | 0.91 | % | 0.91 | % | 0.91 | %(f)(g) | 0.91 | % | 0.92 | % | ||||||||||||||||
|
|
|
|
|
|
|
|
|
|
|
| |||||||||||||||||
Net investment income | 3.28 | % | 3.05 | % | 3.75 | % | 3.89 | %(f) | 2.91 | % | 1.97 | % | ||||||||||||||||
|
|
|
|
|
|
|
|
|
|
|
| |||||||||||||||||
Supplemental Data | ||||||||||||||||||||||||||||
Net assets, end of period (000) | $ | 153,530 | $ | 128,580 | $ | 52,377 | $ | 38,779 | $ | 23,579 | $ | 22,255 | ||||||||||||||||
|
|
|
|
|
|
|
|
|
|
|
| |||||||||||||||||
Portfolio turnover rate | 77 | % | 75 | % | 79 | % | 39 | % | 37 | % | 37 | % | ||||||||||||||||
|
|
|
|
|
|
|
|
|
|
|
| |||||||||||||||||
| (a) | Based on average shares outstanding. |
| (b) | Distributions for annual periods determined in accordance with U.S. federal income tax regulations. |
| (c) | Where applicable, assumes the reinvestment of distributions. |
| (d) | Not annualized. |
| (e) | Excludes fees and expenses incurred indirectly as a result of investments in underlying funds. |
| (f) | Annualized. |
| (g) | Reorganization, Audit and Printing costs were not annualized in the calculation of the expense ratios. If these expenses were annualized, the total expenses and total expenses after fees waived and/or reimbursed would have been 1.47% and 0.91%, respectively. |
See notes to financial statements.
F I N A N C I A L H I G H L I G H T S | 29 |
Financial Highlights (continued)
(For a share outstanding throughout each period)
| BlackRock Energy Opportunities Fund (continued) | ||||||||||||||||||||||||
| Investor A | ||||||||||||||||||||||||
| Year Ended 05/31/23 | Year Ended 05/31/22 | Year Ended 05/31/21 | Period from to 05/31/20 | Year Ended 09/30/19 | Year Ended 09/30/18 | |||||||||||||||||||
Net asset value, beginning of period | $ | 13.33 | $ | 8.31 | $ | 6.46 | $ | 9.39 | $ | 11.99 | $ | 10.83 | ||||||||||||
|
|
|
|
|
|
|
|
|
|
|
| |||||||||||||
Net investment income(a) | 0.37 | 0.27 | 0.23 | 0.18 | 0.24 | 0.17 | ||||||||||||||||||
Net realized and unrealized gain (loss) | (1.84 | ) | 4.97 | 1.84 | (2.85 | ) | (2.59 | ) | 1.27 | |||||||||||||||
|
|
|
|
|
|
|
|
|
|
|
| |||||||||||||
Net increase (decrease) from investment operations | (1.47 | ) | 5.24 | 2.07 | (2.67 | ) | (2.35 | ) | 1.44 | |||||||||||||||
|
|
|
|
|
|
|
|
|
|
|
| |||||||||||||
Distributions from net investment income(b) | (0.28 | ) | (0.22 | ) | (0.22 | ) | (0.26 | ) | (0.25 | ) | (0.28 | ) | ||||||||||||
|
|
|
|
|
|
|
|
|
|
|
| |||||||||||||
Net asset value, end of period | $ | 11.58 | $ | 13.33 | $ | 8.31 | $ | 6.46 | $ | 9.39 | $ | 11.99 | ||||||||||||
|
|
|
|
|
|
|
|
|
|
|
| |||||||||||||
Total Return(c) | ||||||||||||||||||||||||
Based on net asset value | (10.97 | )% | 64.51 | % | 33.00 | % | (29.23 | )%(d) | (19.61 | )% | 13.59 | % | ||||||||||||
|
|
|
|
|
|
|
|
|
|
|
| |||||||||||||
Ratios to Average Net Assets(e) | ||||||||||||||||||||||||
Total expenses | 1.33 | % | 1.43 | % | 1.73 | % | 1.94 | %(f)(g) | 1.66 | % | 1.65 | % | ||||||||||||
|
|
|
|
|
|
|
|
|
|
|
| |||||||||||||
Total expenses after fees waived and/or reimbursed | 1.32 | % | 1.32 | % | 1.32 | % | 1.32 | %(f)(g) | 1.33 | % | 1.34 | % | ||||||||||||
|
|
|
|
|
|
|
|
|
|
|
| |||||||||||||
Net investment income | 2.94 | % | 2.66 | % | 3.30 | % | 3.65 | %(f) | 2.44 | % | 1.52 | % | ||||||||||||
|
|
|
|
|
|
|
|
|
|
|
| |||||||||||||
Supplemental Data | ||||||||||||||||||||||||
Net assets, end of period (000) | $ | 204,035 | $ | 232,979 | $ | 103,858 | $ | 72,733 | $ | 34,574 | $ | 41,644 | ||||||||||||
|
|
|
|
|
|
|
|
|
|
|
| |||||||||||||
Portfolio turnover rate | 77 | % | 75 | % | 79 | % | 39 | % | 37 | % | 37 | % | ||||||||||||
|
|
|
|
|
|
|
|
|
|
|
| |||||||||||||
| (a) | Based on average shares outstanding. |
| (b) | Distributions for annual periods determined in accordance with U.S. federal income tax regulations. |
| (c) | Where applicable, excludes the effects of any sales charges and assumes the reinvestment of distributions. |
| (d) | Not annualized. |
| (e) | Excludes fees and expenses incurred indirectly as a result of investments in underlying funds. |
| (f) | Annualized. |
| (g) | Reorganization, Audit and Printing costs were not annualized in the calculation of the expense ratios. If these expenses were annualized, the total expenses and total expenses after fees waived and/or reimbursed would have been 2.00% and 1.32%, respectively. |
See notes to financial statements.
| 30 | 2 0 2 3 B L A C K R O C K A N N U A L R E P O R T T O S H A R E H O L D E R S |
Financial Highlights (continued)
(For a share outstanding throughout each period)
| BlackRock Energy Opportunities Fund (continued) | ||||||||||||||||||||||||
| Investor C | ||||||||||||||||||||||||
| Year Ended 05/31/23 | Year Ended 05/31/22 | Year Ended 05/31/21 | Period from 10/01/19 to 05/31/20 | Year Ended 09/30/19 | Year Ended 09/30/18 | |||||||||||||||||||
Net asset value, beginning of period | $ | 12.83 | $ | 8.01 | $ | 6.24 | $ | 9.03 | $ | 11.39 | $ | 10.30 | ||||||||||||
|
|
|
|
|
|
|
|
|
|
|
| |||||||||||||
Net investment income(a) | 0.27 | 0.19 | 0.17 | 0.14 | 0.14 | 0.09 | ||||||||||||||||||
Net realized and unrealized gain (loss) | (1.76 | ) | 4.79 | 1.77 | (2.75 | ) | (2.44 | ) | 1.22 | |||||||||||||||
|
|
|
|
|
|
|
|
|
|
|
| |||||||||||||
Net increase (decrease) from investment operations | (1.49 | ) | 4.98 | 1.94 | (2.61 | ) | (2.30 | ) | 1.31 | |||||||||||||||
|
|
|
|
|
|
|
|
|
|
|
| |||||||||||||
Distributions from net investment income(b) | (0.20 | ) | (0.16 | ) | (0.17 | ) | (0.18 | ) | (0.06 | ) | (0.22 | ) | ||||||||||||
|
|
|
|
|
|
|
|
|
|
|
| |||||||||||||
Net asset value, end of period | $ | 11.14 | $ | 12.83 | $ | 8.01 | $ | 6.24 | $ | 9.03 | $ | 11.39 | ||||||||||||
|
|
|
|
|
|
|
|
|
|
|
| |||||||||||||
Total Return(c) | ||||||||||||||||||||||||
Based on net asset value | (11.57 | )% | 63.37 | % | 31.89 | % | (29.51 | )%(d) | (20.21 | )% | 12.90 | % | ||||||||||||
|
|
|
|
|
|
|
|
|
|
|
| |||||||||||||
Ratios to Average Net Assets(e) | ||||||||||||||||||||||||
Total expenses(f) | 2.05 | % | 2.16 | % | 2.53 | % | 2.61 | %(g)(h) | 2.35 | % | 2.36 | % | ||||||||||||
|
|
|
|
|
|
|
|
|
|
|
| |||||||||||||
Total expenses after fees waived and/or reimbursed | 2.03 | % | 2.04 | % | 2.04 | % | 2.04 | %(g)(h) | 2.05 | % | 2.06 | % | ||||||||||||
|
|
|
|
|
|
|
|
|
|
|
| |||||||||||||
Net investment income | 2.22 | % | 1.92 | % | 2.60 | % | 2.77 | %(g) | 1.48 | % | 0.80 | % | ||||||||||||
|
|
|
|
|
|
|
|
|
|
|
| |||||||||||||
Supplemental Data | ||||||||||||||||||||||||
Net assets, end of period (000) | $ | 19,054 | $ | 26,559 | $ | 10,699 | $ | 11,152 | $ | 7,554 | $ | 21,878 | ||||||||||||
|
|
|
|
|
|
|
|
|
|
|
| |||||||||||||
Portfolio turnover rate | 77 | % | 75 | % | 79 | % | 39 | % | 37 | % | 37 | % | ||||||||||||
|
|
|
|
|
|
|
|
|
|
|
| |||||||||||||
| (a) | Based on average shares outstanding. |
| (b) | Distributions for annual periods determined in accordance with U.S. federal income tax regulations. |
| (c) | Where applicable, excludes the effects of any sales charges and assumes the reinvestment of distributions. |
| (d) | Not annualized. |
| (e) | Excludes fees and expenses incurred indirectly as a result of investments in underlying funds. |
| (f) | Includes recoupment of past waived and/or reimbursed fees. Excluding the recoupment of past waived and/or reimbursed fees, the ratios were as follows: |
| Year Ended 05/31/23 | Year Ended 05/31/22 | Year Ended 05/31/21 | Period from to 5/31/20 | Year Ended 09/30/19 | Year Ended 09/30/18 | |||||||||||||||||||
Expense ratios | N/A | N/A | N/A | 2.61 | % | 2.35 | % | N/A | ||||||||||||||||
|
|
|
|
|
|
|
|
|
|
|
| |||||||||||||
| (g) | Annualized. |
| (h) | Reorganization, Audit and Printing costs were not annualized in the calculation of the expense ratios. If these expenses were annualized, the total expenses and total expenses after fees waived and/or reimbursed would have been 2.67% and 2.04%, respectively. |
See notes to financial statements.
F I N A N C I A L H I G H L I G H T S | 31 |
Financial Highlights
(For a share outstanding throughout each period)
| BlackRock High Equity Income Fund | ||||||||||||||||||||||||
| Institutional | ||||||||||||||||||||||||
| Year Ended 05/31/23 | Year Ended 05/31/22 | Year Ended 05/31/21 | Period from to 05/31/20 | Year Ended 09/30/19 | Year Ended 09/30/18 | |||||||||||||||||||
Net asset value, beginning of period | $ | 29.54 | $ | 29.99 | $ | 22.81 | $ | 26.57 | $ | 28.16 | $ | 27.33 | ||||||||||||
|
|
|
|
|
|
|
|
|
|
|
| |||||||||||||
Net investment income(a) | 1.86 | 1.99 | 1.81 | 0.94 | 1.24 | 1.32 | ||||||||||||||||||
Net realized and unrealized gain (loss) | (3.25 | ) | (0.20 | ) | 7.13 | (3.54 | ) | (0.73 | ) | 0.75 | ||||||||||||||
|
|
|
|
|
|
|
|
|
|
|
| |||||||||||||
Net increase (decrease) from investment operations | (1.39 | ) | 1.79 | 8.94 | (2.60 | ) | 0.51 | 2.07 | ||||||||||||||||
|
|
|
|
|
|
|
|
|
|
|
| |||||||||||||
Distributions(b) | ||||||||||||||||||||||||
From net investment income | (1.86 | ) | (1.95 | ) | (1.76 | ) | (1.16 | ) | (1.05 | ) | (1.05 | ) | ||||||||||||
From net realized gain | (0.06 | ) | (0.29 | ) | — | — | (1.05 | ) | (0.19 | ) | ||||||||||||||
|
|
|
|
|
|
|
|
|
|
|
| |||||||||||||
Total distributions | (1.92 | ) | (2.24 | ) | (1.76 | ) | (1.16 | ) | (2.10 | ) | (1.24 | ) | ||||||||||||
|
|
|
|
|
|
|
|
|
|
|
| |||||||||||||
Net asset value, end of period | $ | 26.23 | $ | 29.54 | $ | 29.99 | $ | 22.81 | $ | 26.57 | $ | 28.16 | ||||||||||||
|
|
|
|
|
|
|
|
|
|
|
| |||||||||||||
Total Return(c) | ||||||||||||||||||||||||
Based on net asset value | (4.70 | )% | 6.28 | %(d) | 40.81 | % | (9.94 | )%(e) | 2.27 | % | 7.81 | % | ||||||||||||
|
|
|
|
|
|
|
|
|
|
|
| |||||||||||||
Ratios to Average Net Assets(f) | ||||||||||||||||||||||||
Total expenses | 1.00 | % | 1.02 | % | 1.12 | % | 1.12 | %(g) | 1.12 | % | 1.09 | % | ||||||||||||
|
|
|
|
|
|
|
|
|
|
|
| |||||||||||||
Total expenses after fees waived and/or reimbursed | 0.85 | % | 0.85 | % | 0.85 | % | 0.85 | %(g) | 0.85 | % | 0.85 | % | ||||||||||||
|
|
|
|
|
|
|
|
|
|
|
| |||||||||||||
Net investment income | 6.81 | % | 6.76 | % | 6.93 | % | 5.63 | %(g) | 4.80 | % | 4.79 | % | ||||||||||||
|
|
|
|
|
|
|
|
|
|
|
| |||||||||||||
Supplemental Data | ||||||||||||||||||||||||
Net assets, end of period (000) | $ | 1,475,683 | $ | 953,582 | $ | 277,653 | $ | 128,474 | $ | 151,747 | $ | 248,847 | ||||||||||||
|
|
|
|
|
|
|
|
|
|
|
| |||||||||||||
Portfolio turnover rate | 126 | % | 140 | % | 146 | % | 76 | % | 79 | % | 75 | % | ||||||||||||
|
|
|
|
|
|
|
|
|
|
|
| |||||||||||||
| (a) | Based on average shares outstanding. |
| (b) | Distributions for annual periods determined in accordance with U.S. federal income tax regulations. |
| (c) | Where applicable, assumes the reinvestment of distributions. |
| (d) | Includes a capital contribution from affiliate, which had no impact on the Fund’s total return. |
| (e) | Not annualized. |
| (f) | Excludes fees and expenses incurred indirectly as a result of investments in underlying funds. |
| (g) | Annualized. |
See notes to financial statements.
| 32 | 2 0 2 3 B L A C K R O C K A N N U A L R E P O R T T O S H A R E H O L D E R S |
Financial Highlights (continued)
(For a share outstanding throughout each period)
| BlackRock High Equity Income Fund (continued) | ||||||||||||||||||||||||
| Investor A | ||||||||||||||||||||||||
| Year Ended 05/31/23 | Year Ended 05/31/22 | Year Ended 05/31/21 | Period from 10/01/19 to 05/31/20 | Year Ended 09/30/19 | Year Ended 09/30/18 | |||||||||||||||||||
Net asset value, beginning of period | $ | 24.73 | $ | 25.16 | $ | 19.14 | $ | 22.43 | $ | 24.12 | $ | 23.53 | ||||||||||||
|
|
|
|
|
|
|
|
|
|
|
| |||||||||||||
Net investment income(a) | 1.49 | 1.58 | 1.42 | 0.75 | 1.00 | 1.08 | ||||||||||||||||||
Net realized and unrealized gain (loss) | (2.72 | ) | (0.14 | ) | 6.03 | (2.98 | ) | (0.64 | ) | 0.65 | ||||||||||||||
|
|
|
|
|
|
|
|
|
|
|
| |||||||||||||
Net increase (decrease) from investment operations | (1.23 | ) | 1.44 | 7.45 | (2.23 | ) | 0.36 | 1.73 | ||||||||||||||||
|
|
|
|
|
|
|
|
|
|
|
| |||||||||||||
Distributions(b) | ||||||||||||||||||||||||
From net investment income | (1.50 | ) | (1.58 | ) | (1.43 | ) | (1.06 | ) | (1.00 | ) | (0.95 | ) | ||||||||||||
From net realized gain | (0.06 | ) | (0.29 | ) | — | — | (1.05 | ) | (0.19 | ) | ||||||||||||||
|
|
|
|
|
|
|
|
|
|
|
| |||||||||||||
Total distributions | (1.56 | ) | (1.87 | ) | (1.43 | ) | (1.06 | ) | (2.05 | ) | (1.14 | ) | ||||||||||||
|
|
|
|
|
|
|
|
|
|
|
| |||||||||||||
Net asset value, end of period | $ | 21.94 | $ | 24.73 | $ | 25.16 | $ | 19.14 | $ | 22.43 | $ | 24.12 | ||||||||||||
|
|
|
|
|
|
|
|
|
|
|
| |||||||||||||
Total Return(c) | ||||||||||||||||||||||||
Based on net asset value | (4.96 | )% | 5.99 | %(d) | 40.44 | % | (10.09 | )%(e) | 2.02 | % | 7.58 | % | ||||||||||||
|
|
|
|
|
|
|
|
|
|
|
| |||||||||||||
Ratios to Average Net Assets(f) | ||||||||||||||||||||||||
Total expenses | 1.24 | % | 1.31 | % | 1.40 | % | 1.40 | %(g) | 1.37 | % | 1.38 | % | ||||||||||||
|
|
|
|
|
|
|
|
|
|
|
| |||||||||||||
Total expenses after fees waived and/or reimbursed | 1.10 | % | 1.10 | % | 1.10 | % | 1.10 | %(g) | 1.10 | % | 1.10 | % | ||||||||||||
|
|
|
|
|
|
|
|
|
|
|
| |||||||||||||
Net investment income | 6.54 | % | 6.41 | % | 6.64 | % | 5.35 | %(g) | 4.55 | % | 4.57 | % | ||||||||||||
|
|
|
|
|
|
|
|
|
|
|
| |||||||||||||
Supplemental Data | ||||||||||||||||||||||||
Net assets, end of period (000) | $ | 296,254 | $ | 293,050 | $ | 208,207 | $ | 172,696 | $ | 215,121 | $ | 214,095 | ||||||||||||
|
|
|
|
|
|
|
|
|
|
|
| |||||||||||||
Portfolio turnover rate | 126 | % | 140 | % | 146 | % | 76 | % | 79 | % | 75 | % | ||||||||||||
|
|
|
|
|
|
|
|
|
|
|
| |||||||||||||
| (a) | Based on average shares outstanding. |
| (b) | Distributions for annual periods determined in accordance with U.S. federal income tax regulations. |
| (c) | Where applicable, excludes the effects of any sales charges and assumes the reinvestment of distributions. |
| (d) | Includes a capital contribution from affiliate, which had no impact on the Fund’s total return. |
| (e) | Not annualized. |
| (f) | Excludes fees and expenses incurred indirectly as a result of investments in underlying funds. |
| (g) | Annualized. |
See notes to financial statements.
F I N A N C I A L H I G H L I G H T S | 33 |
Financial Highlights (continued)
(For a share outstanding throughout each period)
| BlackRock High Equity Income Fund (continued) | ||||||||||||||||||||||||
| Investor C | ||||||||||||||||||||||||
| Year Ended 05/31/23 | Year Ended 05/31/22 | Year Ended 05/31/21 | Period from to 05/31/20 | Year Ended 09/30/19 | Year Ended 09/30/18 | |||||||||||||||||||
Net asset value, beginning of period | $ | 15.37 | $ | 15.75 | $ | 11.98 | $ | 14.35 | $ | 16.19 | $ | 16.13 | ||||||||||||
|
|
|
|
|
|
|
|
|
|
|
| |||||||||||||
Net investment income(a) | 0.82 | 0.87 | 0.78 | 0.41 | 0.55 | 0.61 | ||||||||||||||||||
Net realized and unrealized gain (loss) | (1.68 | ) | (0.09 | ) | 3.78 | (1.88 | ) | (0.45 | ) | 0.44 | ||||||||||||||
|
|
|
|
|
|
|
|
|
|
|
| |||||||||||||
Net increase (decrease) from investment operations | (0.86 | ) | 0.78 | 4.56 | (1.47 | ) | 0.10 | 1.05 | ||||||||||||||||
|
|
|
|
|
|
|
|
|
|
|
| |||||||||||||
Distributions(b) | ||||||||||||||||||||||||
From net investment income | (0.83 | ) | (0.87 | ) | (0.79 | ) | (0.90 | ) | (0.89 | ) | (0.80 | ) | ||||||||||||
From net realized gain | (0.06 | ) | (0.29 | ) | — | — | (1.05 | ) | (0.19 | ) | ||||||||||||||
|
|
|
|
|
|
|
|
|
|
|
| |||||||||||||
Total distributions | (0.89 | ) | (1.16 | ) | (0.79 | ) | (0.90 | ) | (1.94 | ) | (0.99 | ) | ||||||||||||
|
|
|
|
|
|
|
|
|
|
|
| |||||||||||||
Net asset value, end of period | $ | 13.62 | $ | 15.37 | $ | 15.75 | $ | 11.98 | $ | 14.35 | $ | 16.19 | ||||||||||||
|
|
|
|
|
|
|
|
|
|
|
| |||||||||||||
Total Return(c) | ||||||||||||||||||||||||
Based on net asset value | (5.63 | )% | 5.17 | %(d) | 39.41 | % | (10.52 | )%(e) | 1.30 | % | 6.75 | % | ||||||||||||
|
|
|
|
|
|
|
|
|
|
|
| |||||||||||||
Ratios to Average Net Assets(f) | ||||||||||||||||||||||||
Total expenses | 1.98 | % | 2.04 | % | 2.18 | % | 2.16 | %(g) | 2.12 | % | 2.10 | % | ||||||||||||
|
|
|
|
|
|
|
|
|
|
|
| |||||||||||||
Total expenses after fees waived and/or reimbursed | 1.85 | % | 1.85 | % | 1.85 | % | 1.85 | %(g) | 1.85 | % | 1.85 | % | ||||||||||||
|
|
|
|
|
|
|
|
|
|
|
| |||||||||||||
Net investment income | 5.80 | % | 5.67 | % | 5.85 | % | 4.57 | %(g) | 3.84 | % | 3.82 | % | ||||||||||||
|
|
|
|
|
|
|
|
|
|
|
| |||||||||||||
Supplemental Data | ||||||||||||||||||||||||
Net assets, end of period (000) | $ | 59,276 | $ | 42,543 | $ | 22,379 | $ | 24,163 | $ | 36,132 | $ | 93,399 | ||||||||||||
|
|
|
|
|
|
|
|
|
|
|
| |||||||||||||
Portfolio turnover rate | 126 | % | 140 | % | 146 | % | 76 | % | 79 | % | 75 | % | ||||||||||||
|
|
|
|
|
|
|
|
|
|
|
| |||||||||||||
| (a) | Based on average shares outstanding. |
| (b) | Distributions for annual periods determined in accordance with U.S. federal income tax regulations. |
| (c) | Where applicable, excludes the effects of any sales charges and assumes the reinvestment of distributions. |
| (d) | Includes a capital contribution from affiliate, which had no impact on the Fund’s total return. |
| (e) | Not annualized. |
| (f) | Excludes fees and expenses incurred indirectly as a result of investments in underlying funds. |
| (g) | Annualized. |
See notes to financial statements.
| 34 | 2 0 2 3 B L A C K R O C K A N N U A L R E P O R T T O S H A R E H O L D E R S |
Financial Highlights (continued)
(For a share outstanding throughout each period)
| BlackRock High Equity Income Fund (continued) | ||||||||||||||||
| Class K | ||||||||||||||||
| | Year Ended 05/31/23 | | | Year Ended 05/31/22 | | | Year Ended 05/31/21 | | | Period from 04/21/20 to 05/31/20 | (a)
| |||||
Net asset value, beginning of period | $ | 29.53 | $ | 30.00 | $ | 22.81 | $ | 21.04 | ||||||||
|
|
|
|
|
|
|
| |||||||||
Net investment income(b) | 1.87 | 2.00 | 1.78 | 0.20 | ||||||||||||
Net realized and unrealized gain (loss) | (3.25 | ) | (0.21 | ) | 7.19 | 1.77 | ||||||||||
|
|
|
|
|
|
|
| |||||||||
Net increase (decrease) from investment operations | (1.38 | ) | 1.79 | 8.97 | 1.97 | |||||||||||
|
|
|
|
|
|
|
| |||||||||
Distributions(c) | ||||||||||||||||
From net investment income | (1.88 | ) | (1.97 | ) | (1.78 | ) | (0.20 | ) | ||||||||
From net realized gain | (0.06 | ) | (0.29 | ) | — | — | ||||||||||
|
|
|
|
|
|
|
| |||||||||
Total distributions | (1.94 | ) | (2.26 | ) | (1.78 | ) | (0.20 | ) | ||||||||
|
|
|
|
|
|
|
| |||||||||
Net asset value, end of period | $ | 26.21 | $ | 29.53 | $ | 30.00 | $ | 22.81 | ||||||||
|
|
|
|
|
|
|
| |||||||||
Total Return(d) | ||||||||||||||||
Based on net asset value | (4.68 | )% | 6.27 | %(e) | 40.93 | % | 9.35 | %(f) | ||||||||
|
|
|
|
|
|
|
| |||||||||
Ratios to Average Net Assets(g) | ||||||||||||||||
Total expenses | 0.89 | % | 0.98 | % | 1.01 | % | 0.99 | %(h) | ||||||||
|
|
|
|
|
|
|
| |||||||||
Total expenses after fees waived and/or reimbursed | 0.80 | % | 0.80 | % | 0.80 | % | 0.80 | %(h) | ||||||||
|
|
|
|
|
|
|
| |||||||||
Net investment income | 6.88 | % | 6.76 | % | 6.94 | % | 8.28 | %(h) | ||||||||
|
|
|
|
|
|
|
| |||||||||
Supplemental Data | ||||||||||||||||
Net assets, end of period (000) | $ | 137,700 | $ | 535 | $ | 359 | $ | 288 | ||||||||
|
|
|
|
|
|
|
| |||||||||
Portfolio turnover rate | 126 | % | 140 | % | 146 | % | 76 | %(i) | ||||||||
|
|
|
|
|
|
|
| |||||||||
| (a) | Commencement of operations. |
| (b) | Based on average shares outstanding. |
| (c) | Distributions for annual periods determined in accordance with U.S. federal income tax regulations. |
| (d) | Where applicable, assumes the reinvestment of distributions. |
| (e) | Includes a capital contribution from affiliate, which had no impact on the Fund’s total return. |
| (f) | Not annualized. |
| (g) | Excludes fees and expenses incurred indirectly as a result of investments in underlying funds. |
| (h) | Annualized. |
| (i) | Portfolio turnover is representative of the Fund for the entire year. |
See notes to financial statements.
F I N A N C I A L H I G H L I G H T S | 35 |
Financial Highlights
(For a share outstanding throughout each period)
| BlackRock International Dividend Fund | ||||||||||||||||||||||||
| Institutional | ||||||||||||||||||||||||
| Year Ended 05/31/23 | Year Ended 05/31/22 | Year Ended 05/31/21 | Period from to 05/31/20 | Year Ended 09/30/19 | Year Ended 09/30/18 | |||||||||||||||||||
Net asset value, beginning of period | $ | 32.36 | $ | 36.36 | $ | 28.23 | $ | 28.67 | $ | 29.16 | $ | 31.36 | ||||||||||||
|
|
|
|
|
|
|
|
|
|
|
| |||||||||||||
Net investment income(a) | 0.86 | 0.64 | 0.85 | 0.42 | 0.70 | 0.76 | ||||||||||||||||||
Net realized and unrealized gain (loss) | 0.56 | (2.45 | ) | 7.81 | (0.40 | ) | 0.32 | (1.57 | ) | |||||||||||||||
|
|
|
|
|
|
|
|
|
|
|
| |||||||||||||
Net increase (decrease) from investment operations | 1.42 | (1.81 | ) | 8.66 | 0.02 | 1.02 | (0.81 | ) | ||||||||||||||||
|
|
|
|
|
|
|
|
|
|
|
| |||||||||||||
Distributions(b) | ||||||||||||||||||||||||
From net investment income | (0.43 | ) | (0.79 | ) | (0.53 | ) | (0.39 | ) | (0.66 | ) | (0.98 | ) | ||||||||||||
From net realized gain | (0.53 | ) | (1.40 | ) | — | (0.07 | ) | (0.85 | ) | (0.41 | ) | |||||||||||||
|
|
|
|
|
|
|
|
|
|
|
| |||||||||||||
Total distributions | (0.96 | ) | (2.19 | ) | (0.53 | ) | (0.46 | ) | (1.51 | ) | (1.39 | ) | ||||||||||||
|
|
|
|
|
|
|
|
|
|
|
| |||||||||||||
Net asset value, end of period | $ | 32.82 | $ | 32.36 | $ | 36.36 | $ | 28.23 | $ | 28.67 | $ | 29.16 | ||||||||||||
|
|
|
|
|
|
|
|
|
|
|
| |||||||||||||
Total Return(c) | ||||||||||||||||||||||||
Based on net asset value | 4.81 | % | (5.23 | )% | 30.98 | % | 0.08 | %(d) | 3.86 | % | (2.67 | )%(e) | ||||||||||||
|
|
|
|
|
|
|
|
|
|
|
| |||||||||||||
Ratios to Average Net Assets(f) | ||||||||||||||||||||||||
Total expenses | 1.07 | % | 1.18 | % | 1.13 | % | 1.17 | %(g)(h) | 1.15 | % | 1.14 | % | ||||||||||||
|
|
|
|
|
|
|
|
|
|
|
| |||||||||||||
Total expenses after fees waived and/or reimbursed | 0.84 | % | 0.87 | % | 0.84 | % | 0.84 | %(g)(h) | 0.84 | % | 0.84 | % | ||||||||||||
|
|
|
|
|
|
|
|
|
|
|
| |||||||||||||
Net investment income | 2.71 | % | 1.85 | % | 2.63 | % | 2.23 | %(g) | 2.52 | % | 2.50 | % | ||||||||||||
|
|
|
|
|
|
|
|
|
|
|
| |||||||||||||
Supplemental Data | ||||||||||||||||||||||||
Net assets, end of period (000) | $ | 432,855 | $ | 118,637 | $ | 101,899 | $ | 74,681 | $ | 83,814 | $ | 102,541 | ||||||||||||
|
|
|
|
|
|
|
|
|
|
|
| |||||||||||||
Portfolio turnover rate | 34 | % | 50 | % | 83 | % | 29 | % | 22 | % | 25 | % | ||||||||||||
|
|
|
|
|
|
|
|
|
|
|
| |||||||||||||
| (a) | Based on average shares outstanding. |
| (b) | Distributions for annual periods determined in accordance with U.S. federal income tax regulations. |
| (c) | Where applicable, assumes the reinvestment of distributions. |
| (d) | Not annualized. |
| (e) | Includes the litigation settlement amount. Excluding this amount, the Fund’s total return is (2.81)%. |
| (f) | Excludes fees and expenses incurred indirectly as a result of investments in underlying funds. |
| (g) | Annualized. |
| (h) | Audit and Printing costs were not annualized in the calculation of the expense ratios. If these expenses were annualized, the total expenses and total expenses after fees waived and/or reimbursed would have been 1.19% and 0.84%, respectively. |
See notes to financial statements.
| 36 | 2 0 2 3 B L A C K R O C K A N N U A L R E P O R T T O S H A R E H O L D E R S |
Financial Highlights (continued)
(For a share outstanding throughout each period)
| BlackRock International Dividend Fund (continued) | ||||||||||||||||||||||||
| Investor A | ||||||||||||||||||||||||
| Year Ended 05/31/23 | Year Ended 05/31/22 | Year Ended 05/31/21 | Period from to 05/31/20 | Year Ended 09/30/19 | Year Ended 09/30/18 | |||||||||||||||||||
Net asset value, beginning of period | $ | 29.91 | $ | 33.78 | $ | 26.26 | $ | 26.69 | $ | 27.26 | $ | 29.30 | ||||||||||||
|
|
|
|
|
|
|
|
|
|
|
| |||||||||||||
Net investment income(a) | 0.50 | 0.45 | 0.70 | 0.34 | 0.60 | 0.61 | ||||||||||||||||||
Net realized and unrealized gain (loss) | 0.74 | (2.21 | ) | 7.28 | (0.37 | ) | 0.27 | (1.43 | ) | |||||||||||||||
|
|
|
|
|
|
|
|
|
|
|
| |||||||||||||
Net increase (decrease) from investment operations | 1.24 | (1.76 | ) | 7.98 | (0.03 | ) | 0.87 | (0.82 | ) | |||||||||||||||
|
|
|
|
|
|
|
|
|
|
|
| |||||||||||||
Distributions(b) | ||||||||||||||||||||||||
From net investment income | (0.36 | ) | (0.71 | ) | (0.46 | ) | (0.33 | ) | (0.59 | ) | (0.81 | ) | ||||||||||||
From net realized gain | (0.53 | ) | (1.40 | ) | — | (0.07 | ) | (0.85 | ) | (0.41 | ) | |||||||||||||
|
|
|
|
|
|
|
|
|
|
|
| |||||||||||||
Total distributions | (0.89 | ) | (2.11 | ) | (0.46 | ) | (0.40 | ) | (1.44 | ) | (1.22 | ) | ||||||||||||
|
|
|
|
|
|
|
|
|
|
|
| |||||||||||||
Net asset value, end of period | $ | 30.26 | $ | 29.91 | $ | 33.78 | $ | 26.26 | $ | 26.69 | $ | 27.26 | ||||||||||||
|
|
|
|
|
|
|
|
|
|
|
| |||||||||||||
Total Return(c) | ||||||||||||||||||||||||
Based on net asset value | 4.56 | % | (5.48 | )% | 30.67 | % | (0.08 | )%(d) | 3.57 | % | (2.89 | )%(e) | ||||||||||||
|
|
|
|
|
|
|
|
|
|
|
| |||||||||||||
Ratios to Average Net Assets(f) | ||||||||||||||||||||||||
Total expenses | 1.39 | % | 1.46 | % | 1.45 | % | 1.48 | %(g)(h) | 1.43 | % | 1.44 | % | ||||||||||||
|
|
|
|
|
|
|
|
|
|
|
| |||||||||||||
Total expenses after fees waived and/or reimbursed | 1.11 | % | 1.12 | % | 1.09 | % | 1.09 | %(g)(h) | 1.09 | % | 1.09 | % | ||||||||||||
|
|
|
|
|
|
|
|
|
|
|
| |||||||||||||
Net investment income | 1.76 | % | 1.42 | % | 2.34 | % | 1.92 | %(g) | 2.30 | % | 2.14 | % | ||||||||||||
|
|
|
|
|
|
|
|
|
|
|
| |||||||||||||
Supplemental Data | ||||||||||||||||||||||||
Net assets, end of period (000) | $ | 121,411 | $ | 113,512 | $ | 128,077 | $ | 100,753 | $ | 125,196 | $ | 140,473 | ||||||||||||
|
|
|
|
|
|
|
|
|
|
|
| |||||||||||||
Portfolio turnover rate | 34 | % | 50 | % | 83 | % | 29 | % | 22 | % | 25 | % | ||||||||||||
|
|
|
|
|
|
|
|
|
|
|
| |||||||||||||
| (a) | Based on average shares outstanding. |
| (b) | Distributions for annual periods determined in accordance with U.S. federal income tax regulations. |
| (c) | Where applicable, excludes the effects of any sales charges and assumes the reinvestment of distributions. |
| (d) | Not annualized. |
| (e) | Includes the litigation settlement amount. Excluding this amount, the Fund’s total return is (3.03)%. |
| (f) | Excludes fees and expenses incurred indirectly as a result of investments in underlying funds. |
| (g) | Annualized. |
| (h) | Audit and Printing costs were not annualized in the calculation of the expense ratios. If these expenses were annualized, the total expenses and total expenses after fees waived and/or reimbursed would have been 1.51% and 1.09%, respectively. |
See notes to financial statements.
F I N A N C I A L H I G H L I G H T S | 37 |
Financial Highlights (continued)
(For a share outstanding throughout each period)
| BlackRock International Dividend Fund (continued) | ||||||||||||||||||||||||
| Investor C | ||||||||||||||||||||||||
| Year Ended 05/31/23 | Year Ended 05/31/22 | Year Ended 05/31/21 | Period from 10/01/19 to 05/31/20 | Year Ended 09/30/19 | Year Ended 09/30/18 | |||||||||||||||||||
Net asset value, beginning of period | $ | 25.71 | $ | 29.33 | $ | 22.85 | $ | 23.25 | $ | 23.94 | $ | 25.81 | ||||||||||||
|
|
|
|
|
|
|
|
|
|
|
| |||||||||||||
Net investment income(a) | 0.26 | 0.16 | 0.33 | 0.18 | 0.32 | 0.39 | ||||||||||||||||||
Net realized and unrealized gain (loss) | 0.61 | (1.87 | ) | 6.41 | (0.32 | ) | 0.26 | (1.30 | ) | |||||||||||||||
|
|
|
|
|
|
|
|
|
|
|
| |||||||||||||
Net increase (decrease) from investment operations | 0.87 | (1.71 | ) | 6.74 | (0.14 | ) | 0.58 | (0.91 | ) | |||||||||||||||
|
|
|
|
|
|
|
|
|
|
|
| |||||||||||||
Distributions(b) | ||||||||||||||||||||||||
From net investment income | (0.20 | ) | (0.51 | ) | (0.26 | ) | (0.19 | ) | (0.42 | ) | (0.55 | ) | ||||||||||||
From net realized gain | (0.53 | ) | (1.40 | ) | — | (0.07 | ) | (0.85 | ) | (0.41 | ) | |||||||||||||
|
|
|
|
|
|
|
|
|
|
|
| |||||||||||||
Total distributions | (0.73 | ) | (1.91 | ) | (0.26 | ) | (0.26 | ) | (1.27 | ) | (0.96 | ) | ||||||||||||
|
|
|
|
|
|
|
|
|
|
|
| |||||||||||||
Net asset value, end of period | $ | 25.85 | $ | 25.71 | $ | 29.33 | $ | 22.85 | $ | 23.25 | $ | 23.94 | ||||||||||||
|
|
|
|
|
|
|
|
|
|
|
| |||||||||||||
Total Return(c) | ||||||||||||||||||||||||
Based on net asset value | 3.77 | % | (6.17 | )% | 29.70 | % | (0.58 | )%(d) | 2.80 | % | (3.63 | )%(e) | ||||||||||||
|
|
|
|
|
|
|
|
|
|
|
| |||||||||||||
Ratios to Average Net Assets(f) | ||||||||||||||||||||||||
Total expenses | 2.19 | % | 2.30 | % | 2.28 | % | 2.27 | %(g)(h) | 2.20 | % | 2.19 | % | ||||||||||||
|
|
|
|
|
|
|
|
|
|
|
| |||||||||||||
Total expenses after fees waived and/or reimbursed | 1.86 | % | 1.86 | % | 1.84 | % | 1.84 | %(g)(h) | 1.84 | % | 1.84 | % | ||||||||||||
|
|
|
|
|
|
|
|
|
|
|
| |||||||||||||
Net investment income | 1.06 | % | 0.60 | % | 1.31 | % | 1.15 | %(g) | 1.39 | % | 1.57 | % | ||||||||||||
|
|
|
|
|
|
|
|
|
|
|
| |||||||||||||
Supplemental Data | ||||||||||||||||||||||||
Net assets, end of period (000) | $ | 4,517 | $ | 4,067 | $ | 5,607 | $ | 9,906 | $ | 14,805 | $ | 36,239 | ||||||||||||
|
|
|
|
|
|
|
|
|
|
|
| |||||||||||||
Portfolio turnover rate | 34 | % | 50 | % | 83 | % | 29 | % | 22 | % | 25 | % | ||||||||||||
|
|
|
|
|
|
|
|
|
|
|
| |||||||||||||
| (a) | Based on average shares outstanding. |
| (b) | Distributions for annual periods determined in accordance with U.S. federal income tax regulations. |
| (c) | Where applicable, excludes the effects of any sales charges and assumes the reinvestment of distributions. |
| (d) | Not annualized. |
| (e) | Includes the litigation settlement amount. Excluding this amount, the Fund’s total return is (3.79)%. |
| (f) | Excludes fees and expenses incurred indirectly as a result of investments in underlying funds. |
| (g) | Annualized. |
| (h) | Audit and Printing costs were not annualized in the calculation of the expense ratios. If these expenses were annualized, the total expenses and total expenses after fees waived and/or reimbursed would have been 2.29% and 1.84%, respectively. |
See notes to financial statements.
| 38 | 2 0 2 3 B L A C K R O C K A N N U A L R E P O R T T O S H A R E H O L D E R S |
Financial Highlights (continued)
(For a share outstanding throughout each period)
| BlackRock International Dividend Fund (continued) | ||||||||||||||||||||||||
| Class K | ||||||||||||||||||||||||
| | Year Ended 05/31/23 | | | Year Ended 05/31/22 | | | Year Ended 05/31/21 | | | Period from 10/01/19 to 05/31/20 | | | Year Ended 09/30/19 | | | Period from 01/25/18 to 09/30/18 | (a)
| |||||||
Net asset value, beginning of period | $ | 32.36 | $ | 36.36 | $ | 28.23 | $ | 28.68 | $ | 29.17 | $ | 32.08 | ||||||||||||
|
|
|
|
|
|
|
|
|
|
|
| |||||||||||||
Net investment income(b) | 0.76 | 0.76 | 0.87 | 0.44 | 0.73 | 0.56 | ||||||||||||||||||
Net realized and unrealized gain (loss) | 0.69 | (2.55 | ) | 7.80 | (0.42 | ) | 0.30 | (2.91 | ) | |||||||||||||||
|
|
|
|
|
|
|
|
|
|
|
| |||||||||||||
Net increase (decrease) from investment operations | 1.45 | (1.79 | ) | 8.67 | 0.02 | 1.03 | (2.35 | ) | ||||||||||||||||
|
|
|
|
|
|
|
|
|
|
|
| |||||||||||||
Distributions(c) | ||||||||||||||||||||||||
From net investment income | (0.45 | ) | (0.81 | ) | (0.54 | ) | (0.40 | ) | (0.67 | ) | (0.56 | ) | ||||||||||||
From net realized gain | (0.53 | ) | (1.40 | ) | — | (0.07 | ) | (0.85 | ) | — | ||||||||||||||
|
|
|
|
|
|
|
|
|
|
|
| |||||||||||||
Total distributions | (0.98 | ) | (2.21 | ) | (0.54 | ) | (0.47 | ) | (1.52 | ) | (0.56 | ) | ||||||||||||
|
|
|
|
|
|
|
|
|
|
|
| |||||||||||||
Net asset value, end of period | $ | 32.83 | $ | 32.36 | $ | 36.36 | $ | 28.23 | $ | 28.68 | $ | 29.17 | ||||||||||||
|
|
|
|
|
|
|
|
|
|
|
| |||||||||||||
Total Return(d) | ||||||||||||||||||||||||
Based on net asset value | 4.89 | % | (5.18 | )% | 31.04 | % | 0.09 | %(e) | 3.92 | % | (7.33 | )%(e)(f) | ||||||||||||
|
|
|
|
|
|
|
|
|
|
|
| |||||||||||||
Ratios to Average Net Assets(g) | ||||||||||||||||||||||||
Total expenses | 0.97 | % | 1.09 | % | 1.03 | % | 1.08 | %(h)(i) | 1.04 | % | 1.02 | %(h)(j) | ||||||||||||
|
|
|
|
|
|
|
|
|
|
|
| |||||||||||||
Total expenses after fees waived and/or reimbursed | 0.80 | % | 0.82 | % | 0.79 | % | 0.79 | %(h)(i) | 0.79 | % | 0.79 | %(h) | ||||||||||||
|
|
|
|
|
|
|
|
|
|
|
| |||||||||||||
Net investment income | 2.42 | % | 2.23 | % | 2.68 | % | 2.28 | %(h) | 2.63 | % | 2.81 | %(h) | ||||||||||||
|
|
|
|
|
|
|
|
|
|
|
| |||||||||||||
Supplemental Data | ||||||||||||||||||||||||
Net assets, end of period (000) | $ | 60,350 | $ | 17,092 | $ | 5,936 | $ | 3,266 | $ | 3,847 | $ | 3,659 | ||||||||||||
|
|
|
|
|
|
|
|
|
|
|
| |||||||||||||
Portfolio turnover rate | 34 | % | 50 | % | 83 | % | 29 | % | 22 | % | 25 | %(k) | ||||||||||||
|
|
|
|
|
|
|
|
|
|
|
| |||||||||||||
| (a) | Commencement of operations. |
| (b) | Based on average shares outstanding. |
| (c) | Distributions for annual periods determined in accordance with U.S. federal income tax regulations. |
| (d) | Where applicable, assumes the reinvestment of distributions. |
| (e) | Not annualized. |
| (f) | Includes the litigation settlement amount. Excluding this amount, the Fund’s total return is (7.45)%. |
| (g) | Excludes fees and expenses incurred indirectly as a result of investments in underlying funds. |
| (h) | Annualized. |
| (i) | Audit and Printing costs were not annualized in the calculation of the expense ratios. If these expenses were annualized, the total expenses and total expenses after fees waived and/or reimbursed would have been 1.10% and 0.79%, respectively. |
| (j) | Offering and board realignment consolidation costs were not annualized in the calculation of the expense ratio. If these expenses were annualized, the total expense ratio would have been 1.03%. |
| (k) | Portfolio turnover is representative of the Fund for the entire year. |
See notes to financial statements.
F I N A N C I A L H I G H L I G H T S | 39 |
| 1. | ORGANIZATION |
BlackRock FundsSM (the “Trust”) is registered under the Investment Company Act of 1940, as amended (the “1940 Act”), as an open-end management investment company. The Trust is organized as a Massachusetts business trust. The following, each of which is a series of the Trust, are referred to herein collectively as the “Funds” or individually as a “Fund”:
| ||||||||
| Fund Name | Herein Referred To As | Diversification Classification | ||||||
| ||||||||
BlackRock Energy Opportunities Fund | Energy Opportunities | Non-Diversified | ||||||
BlackRock High Equity Income Fund | High Equity Income | Diversified | ||||||
BlackRock International Dividend Fund | International Dividend | Diversified | ||||||
| ||||||||
Each Fund offers multiple classes of shares. All classes of shares have identical voting, dividend, liquidation and other rights and are subject to the same terms and conditions, except that certain classes bear expenses related to the shareholder servicing and distribution of such shares. Institutional and Class K Shares are sold only to certain eligible investors. Investor A and Investor C Shares bear certain expenses related to shareholder servicing of such shares, and Investor C Shares also bear certain expenses related to the distribution of such shares. Investor A and Investor C Shares are generally available through financial intermediaries. Each class has exclusive voting rights with respect to matters relating to its shareholder servicing and distribution expenditures (except that Investor C shareholders may vote on material changes to the Investor A Shares distribution and service plan).
| ||||||||||||
| Share Class | Initial Sales Charge | CDSC | Conversion Privilege | |||||||||
| ||||||||||||
Institutional and Class K Shares | No | No | None | |||||||||
Investor A Shares | Yes | No | (a) | None | ||||||||
Investor C Shares | No | Yes | (b) | To Investor A Shares after approximately 8 years | ||||||||
| ||||||||||||
| (a) | Investor A Shares may be subject to a contingent deferred sales charge (“CDSC”) for certain redemptions where no initial sales charge was paid at the time of purchase. |
| (b) | A CDSC of 1.00% is assessed on certain redemptions of Investor C Shares made within one year after purchase. |
The Funds, together with certain other registered investment companies advised by BlackRock Advisors, LLC (the “Manager”) or its affiliates, are included in a complex of funds referred to as the BlackRock Multi-Asset Complex.
| 2. | SIGNIFICANT ACCOUNTING POLICIES |
The financial statements are prepared in conformity with accounting principles generally accepted in the United States of America (“U.S. GAAP”), which may require management to make estimates and assumptions that affect the reported amounts of assets and liabilities in the financial statements, disclosure of contingent assets and liabilities at the date of the financial statements and the reported amounts of increases and decreases in net assets from operations during the reporting period. Actual results could differ from those estimates. Each Fund is considered an investment company under U.S. GAAP and follows the accounting and reporting guidance applicable to investment companies. Below is a summary of significant accounting policies:
Investment Transactions and Income Recognition: For financial reporting purposes, investment transactions are recorded on the dates the transactions are executed. Realized gains and losses on investment transactions are determined using the specific identification method. Dividend income and capital gain distributions, if any, are recorded on the ex-dividend dates. Non-cash dividends, if any, are recorded on the ex-dividend dates at fair value. Dividends from foreign securities where the ex-dividend dates may have passed are subsequently recorded when the Funds are informed of the ex-dividend dates. Under the applicable foreign tax laws, a withholding tax at various rates may be imposed on capital gains, dividends and interest. Upon notification from issuers, a portion of the dividend income received from a real estate investment trust may be redesignated as a reduction of cost of the related investment and/or realized gain. Interest income, including amortization and accretion of premiums and discounts on debt securities, is recognized daily on an accrual basis. Income, expenses and realized and unrealized gains and losses are allocated daily to each class based on its relative net assets.
Foreign Currency Translation: Each Fund’s books and records are maintained in U.S. dollars. Securities and other assets and liabilities denominated in foreign currencies are translated into U.S. dollars using exchange rates determined as of the close of trading on the New York Stock Exchange (“NYSE”). Purchases and sales of investments are recorded at the rates of exchange prevailing on the respective dates of such transactions. Generally, when the U.S. dollar rises in value against a foreign currency, the investments denominated in that currency will lose value; the opposite effect occurs if the U.S. dollar falls in relative value.
Each Fund does not isolate the effect of fluctuations in foreign exchange rates from the effect of fluctuations in the market prices of investments for financial reporting purposes. Accordingly, the effects of changes in exchange rates on investments are not segregated in the Statements of Operations from the effects of changes in market prices of those investments, but are included as a component of net realized and unrealized gain (loss) from investments. Each Fund reports realized currency gains (losses) on foreign currency related transactions as components of net realized gain (loss) for financial reporting purposes, whereas such components are generally treated as ordinary income for U.S. federal income tax purposes.
Foreign Taxes: The Funds may be subject to foreign taxes (a portion of which may be reclaimable) on income, stock dividends, capital gains on investments, or certain foreign currency transactions. All foreign taxes are recorded in accordance with the applicable foreign tax regulations and rates that exist in the foreign jurisdictions in which each Fund invests. These foreign taxes, if any, are paid by each Fund and are reflected in its Statements of Operations as follows: foreign taxes withheld at source are presented as a reduction of income, foreign taxes on securities lending income are presented as a reduction of securities lending income, foreign taxes on stock dividends are presented as “Foreign taxes withheld”, and foreign taxes on capital gains from sales of investments and foreign taxes on foreign currency transactions are included in their respective net realized gain (loss) categories. Foreign taxes payable or deferred as of May 31, 2023, if any, are disclosed in the Statements of Assets and Liabilities.
| 40 | 2 0 2 3 B L A C K R O C K A N N U A L R E P O R T T O S H A R E H O L D E R S |
Notes to Financial Statements (continued)
The Funds file withholding tax reclaims in certain jurisdictions to recover a portion of amounts previously withheld. The Funds may record a reclaim receivable based on collectability, which includes factors such as the jurisdiction’s applicable laws, payment history and market convention. The Statements of Operations include tax reclaims recorded as well as professional and other fees, if any, associated with recovery of foreign withholding taxes.
Collateralization: If required by an exchange or counterparty agreement, the Funds may be required to deliver/deposit cash and/or securities to/with an exchange, or broker-dealer or custodian as collateral for certain investments.
Distributions: Distributions paid by each Fund are recorded on the ex-dividend dates. The character and timing of distributions are determined in accordance with U.S. federal income tax regulations, which may differ from U.S. GAAP.
Indemnifications: In the normal course of business, a Fund enters into contracts that contain a variety of representations that provide general indemnification. A Fund’s maximum exposure under these arrangements is unknown because it involves future potential claims against a Fund, which cannot be predicted with any certainty.
Other: Expenses directly related to a Fund or its classes are charged to that Fund or the applicable class. Expenses directly related to the Funds and other shared expenses prorated to the Funds are allocated daily to each class based on their relative net assets or other appropriate methods. Other operating expenses shared by several funds, including other funds managed by the Manager, are prorated among those funds on the basis of relative net assets or other appropriate methods.
The Funds have an arrangement with their custodian whereby credits are earned on uninvested cash balances, which could be used to reduce custody fees and/or overdraft charges. The Funds may incur charges on overdrafts, subject to certain conditions.
| 3. | INVESTMENT VALUATION AND FAIR VALUE MEASUREMENTS |
Investment Valuation Policies: Each Fund’s investments are valued at fair value (also referred to as “market value” within the financial statements) each day that the Fund is open for business and, for financial reporting purposes, as of the report date. U.S. GAAP defines fair value as the price a fund would receive to sell an asset or pay to transfer a liability in an orderly transaction between market participants at the measurement date. The Board of Trustees of the Trust (the “Board”) has approved the designation of each Fund’s Manager as the valuation designee for each Fund. Each Fund determines the fair values of its financial instruments using various independent dealers or pricing services under the Manager’s policies. If a security’s market price is not readily available or does not otherwise accurately represent the fair value of the security, the security will be valued in accordance with the Manager’s policies and procedures as reflecting fair value. The Manager has formed a committee (the “Valuation Committee”) to develop pricing policies and procedures and to oversee the pricing function for all financial instruments, with assistance from other BlackRock pricing committees.
Fair Value Inputs and Methodologies: The following methods and inputs are used to establish the fair value of each Fund’s assets and liabilities:
| • | Equity investments traded on a recognized securities exchange are valued at that day’s official closing price, as applicable, on the exchange where the stock is primarily traded. Equity investments traded on a recognized exchange for which there were no sales on that day may be valued at the last available bid (long positions) or ask (short positions) price. |
| • | Fixed-income investments for which market quotations are readily available are generally valued using the last available bid price or current market quotations provided by independent dealers or third-party pricing services. Pricing services generally value fixed-income securities assuming orderly transactions of an institutional round lot size, but a fund may hold or transact in such securities in smaller, odd lot sizes. Odd lots may trade at lower prices than institutional round lots. The pricing services may use matrix pricing or valuation models that utilize certain inputs and assumptions to derive values, including transaction data (e.g., recent representative bids and offers), market data, credit quality information, perceived market movements, news, and other relevant information. Certain fixed-income securities, including asset-backed and mortgage related securities may be valued based on valuation models that consider the estimated cash flows of each tranche of the entity, establish a benchmark yield and develop an estimated tranche specific spread to the benchmark yield based on the unique attributes of the tranche. The amortized cost method of valuation may be used with respect to debt obligations with sixty days or less remaining to maturity unless the Manager determines such method does not represent fair value. |
| • | Investments in open-end U.S. mutual funds (including money market funds) are valued at that day’s published net asset value (“NAV”). |
Generally, trading in foreign instruments is substantially completed each day at various times prior to the close of trading on the NYSE. Each business day, the Funds use current market factors supplied by independent pricing services to value certain foreign instruments (“Systematic Fair Value Price”). The Systematic Fair Value Price is designed to value such foreign securities at fair value as of the close of trading on the NYSE, which follows the close of the local markets.
If events (e.g., market volatility, company announcement or a natural disaster) occur that are expected to materially affect the value of such investment, or in the event that application of these methods of valuation results in a price for an investment that is deemed not to be representative of the market value of such investment, or if a price is not available, the investment will be valued by the Valuation Committee in accordance with the Manager’s policies and procedures as reflecting fair value (“Fair Valued Investments”). The fair valuation approaches that may be used by the Valuation Committee include market approach, income approach and cost approach. Valuation techniques such as discounted cash flow, use of market comparables and matrix pricing are types of valuation approaches and are typically used in determining fair value. When determining the price for Fair Valued Investments, the Valuation Committee seeks to determine the price that each Fund might reasonably expect to receive or pay from the current sale or purchase of that asset or liability in an arm’s-length transaction. Fair value determinations shall be based upon all available factors that the Valuation Committee deems relevant and consistent with the principles of fair value measurement.
N O T E S T O F I N A N C I A L S T A T E M E N T S | 41 |
Notes to Financial Statements (continued)
For investments in equity or debt issued by privately held companies or funds (“Private Company” or collectively, the “Private Companies”) and other Fair Valued Investments, the fair valuation approaches that are used by the Valuation Committee and third-party pricing services utilized by the Valuation Committee include one or a combination of, but not limited to, the following inputs.
| Standard Inputs Generally Considered By The Valuation Committee And Third-Party Pricing Services | ||
Market approach | (i) recent market transactions, including subsequent rounds of financing, in the underlying investment or comparable issuers; | |
(ii) recapitalizations and other transactions across the capital structure; and | ||
(iii) market multiples of comparable issuers. | ||
Income approach | (i) future cash flows discounted to present and adjusted as appropriate for liquidity, credit, and/or market | |
(ii) quoted prices for similar investments or assets in active markets; and | ||
(iii) other risk factors, such as interest rates, yield curves, volatilities, prepayment speeds, loss severities, credit risks, recovery rates, liquidation amounts and/or default rates. | ||
Cost approach | (i) audited or unaudited financial statements, investor communications and financial or operational metrics issued by the Private Company; | |
(ii) changes in the valuation of relevant indices or publicly traded companies comparable to the Private Company; | ||
(iii) relevant news and other public sources; and | ||
(iv) known secondary market transactions in the Private Company’s interests and merger or acquisition activity in companies comparable to the Private Company. | ||
Investments in series of preferred stock issued by Private Companies are typically valued utilizing market approach in determining the enterprise value of the company. Such investments often contain rights and preferences that differ from other series of preferred and common stock of the same issuer. Enterprise valuation techniques such as an option pricing model (“OPM”), a probability weighted expected return model (“PWERM”), current value method or a hybrid of those techniques are used as deemed appropriate under the circumstances. The use of these valuation techniques involve a determination of the exit scenarios of the investment in order to appropriately allocate the enterprise value of the company among the various parts of its capital structure.
The Private Companies are not subject to the public company disclosure, timing, and reporting standards applicable to other investments held by a Fund. Typically, the most recently available information by a Private Company is as of a date that is earlier than the date a Fund is calculating its NAV. This factor may result in a difference between the value of the investment and the price a Fund could receive upon the sale of the investment.
Fair Value Hierarchy: Various inputs are used in determining the fair value of financial instruments. These inputs to valuation techniques are categorized into a fair value hierarchy consisting of three broad levels for financial reporting purposes as follows:
| • | Level 1 – Unadjusted price quotations in active markets/exchanges for identical assets or liabilities that each Fund has the ability to access; |
| • | Level 2 – Other observable inputs (including, but not limited to, quoted prices for similar assets or liabilities in markets that are active, quoted prices for identical or similar assets or liabilities in markets that are not active, inputs other than quoted prices that are observable for the assets or liabilities (such as interest rates, yield curves, volatilities, prepayment speeds, loss severities, credit risks and default rates) or other market–corroborated inputs); and |
| • | Level 3 – Unobservable inputs based on the best information available in the circumstances, to the extent observable inputs are not available (including the Valuation Committee’s assumptions used in determining the fair value of financial instruments). |
The hierarchy gives the highest priority to unadjusted quoted prices in active markets for identical assets or liabilities (Level 1 measurements) and the lowest priority to unobservable inputs (Level 3 measurements). Accordingly, the degree of judgment exercised in determining fair value is greatest for instruments categorized in Level 3. The inputs used to measure fair value may fall into different levels of the fair value hierarchy. In such cases, for disclosure purposes, the fair value hierarchy classification is determined based on the lowest level input that is significant to the fair value measurement in its entirety. Investments classified within Level 3 have significant unobservable inputs used by the Valuation Committee in determining the price for Fair Valued Investments. Level 3 investments include equity or debt issued by Private Companies that may not have a secondary market and/or may have a limited number of investors. The categorization of a value determined for financial instruments is based on the pricing transparency of the financial instruments and is not necessarily an indication of the risks associated with investing in those securities.
| 4. | SECURITIES AND OTHER INVESTMENTS |
Equity-Linked Notes: Equity-linked notes seek to generate income and provide exposure to the performance of an underlying security, group of securities or exchange-traded funds (the “underlying reference instrument”). In an equity-linked note, a fund purchases a note from a bank or broker-dealer and in return, the issuer provides for interest payments during the term of the note. At maturity or when the security is sold, a fund will either settle by taking physical delivery of the underlying reference instrument or by receipt of a cash settlement amount equal to the value of the note at termination or maturity. The use of equity-linked notes involves the risk that the value of the note changes unfavorably due to movements in the value of the underlying reference instrument. Equity-linked notes are considered general unsecured contractual obligations of the bank or broker-dealer. A fund must rely on the creditworthiness of the issuer for its investment returns.
Preferred Stocks: Preferred stock has a preference over common stock in liquidation (and generally in receiving dividends as well), but is subordinated to the liabilities of the issuer in all respects. As a general rule, the market value of preferred stock with a fixed dividend rate and no conversion element varies inversely with interest rates and perceived credit risk, while the market price of convertible preferred stock generally also reflects some element of conversion value. Because preferred stock is junior to debt securities and other obligations of the issuer, deterioration in the credit quality of the issuer will cause greater changes in the value of a preferred stock than in a more senior debt security with similar stated yield characteristics. Unlike interest payments on debt securities, preferred stock dividends are payable only if declared by the issuer’s board of directors. Preferred stock also may be subject to optional or mandatory redemption provisions.
| 42 | 2 0 2 3 B L A C K R O C K A N N U A L R E P O R T T O S H A R E H O L D E R S |
Notes to Financial Statements (continued)
| 5. | INVESTMENT ADVISORY AGREEMENT AND OTHER TRANSACTIONS WITH AFFILIATES |
Investment Advisory: The Trust, on behalf of each Fund, entered into an Investment Advisory Agreement with the Manager, the Fund’s investment adviser and an indirect, wholly-owned subsidiary of BlackRock, Inc. (“BlackRock”), to provide investment advisory services. The Manager is responsible for the management of each Fund’s portfolio and provides the personnel, facilities, equipment and certain other services necessary to the operations of each Fund.
For such services, each Fund pays the Manager a monthly fee at an annual rate equal to the following percentages of the average daily value of each Fund’s net assets:
| Investment Advisory Fees | ||||||
| Average Daily Net Assets | Energy Opportunities | |||||
First $1 billion | 0.750% | |||||
$1 billion - $2 billion | 0.700 | |||||
$2 billion - $3 billion | 0.675 | |||||
Greater than $3 billion | 0.650 | |||||
| Investment Advisory Fees | ||||||||||
| Average Daily Net Assets | High Equity Income | International Dividend | ||||||||
First $1 billion | 0.810% | 0.600% | ||||||||
$1 billion - $3 billion | 0.760 | 0.560 | ||||||||
$3 billion - $5 billion | 0.730 | 0.540 | ||||||||
$5 billion - $10 billion | 0.700 | 0.520 | ||||||||
Greater than $10 billion | 0.680 | 0.510 | ||||||||
Prior to April 19, 2023, the annual rates as a percentage of average daily net assets, for the Fund were as follows:
| Investment Advisory Fees | ||||||
| Average Daily Net Assets | International Dividend | |||||
First $1 billion | 0.790% | |||||
$1 billion - $3 billion | 0.740 | |||||
$3 billion - $5 billion | 0.710 | |||||
$5 billion - $10 billion | 0.690 | |||||
Greater than $10 billion | 0.670 | |||||
With respect to Energy Opportunities and International Dividend, the Manager entered into separate sub-advisory agreements with BlackRock International Limited (“BIL”), an affiliate of the Manager. The Manager pays BIL, for services it provides for that portion of each applicable Fund for which BIL acts as sub-adviser, a monthly fee that is equal to a percentage of the investment advisory fees paid by each Fund to the Manager.
Service and Distribution Fees: The Trust, on behalf of each Fund, entered into a Distribution Agreement and a Distribution and Service Plan with BlackRock Investments, LLC (“BRIL”), an affiliate of the Manager. Pursuant to the Distribution and Service Plan and in accordance with Rule 12b-1 under the 1940 Act, each Fund pays BRIL ongoing service and distribution fees. The fees are accrued daily and paid monthly at annual rates based upon the average daily net assets of the relevant share class of each Fund as follows:
| Share Class | Service Fees | Distribution Fees | ||
Investor A | 0.25 | N/A | ||
Investor C | 0.25 | 0.75 % | ||
BRIL and broker-dealers, pursuant to sub-agreements with BRIL, provide shareholder servicing and distribution services to the Funds. The ongoing service and/or distribution fee compensates BRIL and each broker-dealer for providing shareholder servicing and/or distribution related services to shareholders.
For the year ended May 31, 2023, the following table shows the class specific service and distribution fees borne directly by each share class of each Fund:
| Fund Name | Investor A | Investor C | Total | |||||||||
BlackRock Energy Opportunities Fund | $ | 557,987 | $ | 223,406 | $ | 781,393 | ||||||
BlackRock High Equity Income Fund | 732,800 | 517,334 | 1,250,134 | |||||||||
BlackRock International Dividend Fund | 279,626 | 38,720 | 318,346 | |||||||||
N O T E S T O F I N A N C I A L S T A T E M E N T S | 43 |
Notes to Financial Statements (continued)
Administration: The Trust, on behalf of each Fund, entered into an Administration Agreement with the Manager, an indirect, wholly-owned subsidiary of BlackRock, to provide administrative services. For these services, the Manager receives an administration fee computed daily and payable monthly, based on a percentage of the average daily net assets of each Fund. The administration fee, which is shown as administration in the Statements of Operations, is paid at the annual rates below.
| Average Daily Net Assets | Administration Fees | |||||||
First $500 million | 0.0425% | |||||||
$500 million - $1 billion | 0.0400 | |||||||
$1 billion - $2 billion | 0.0375 | |||||||
$2 billion - $4 billion | 0.0350 | |||||||
$4 billion - $13 billion | 0.0325 | |||||||
Greater than $13 billion | 0.0300 | |||||||
In addition, the Manager charges each of the share classes an administration fee, which is shown as administration — class specific in the Statements of Operations, at an annual rate of 0.02% of the average daily net assets of each respective class.
For the year ended May 31, 2023, the following table shows the class specific administration fees borne directly by each share class of each Fund:
| Fund Name | Institutional | Investor A | Investor C | Class K | Total | |||||||||||||||
Energy Opportunities | $ | 30,356 | $ | 44,613 | $ | 4,479 | $ | — | $ | 79,448 | ||||||||||
High Equity Income | 267,258 | 58,562 | 10,322 | 16,171 | 352,313 | |||||||||||||||
International Dividend | 40,501 | 22,364 | 776 | 7,144 | 70,785 | |||||||||||||||
Transfer Agent: Pursuant to written agreements, certain financial intermediaries, some of which may be affiliates, provide the Funds with sub-accounting, recordkeeping, sub-transfer agency and other administrative services with respect to servicing of underlying investor accounts. For these services, these entities receive an asset-based fee or an annual fee per shareholder account, which will vary depending on share class and/or net assets. For the year ended May 31, 2023, the Funds did not pay any amounts to affiliates in return for these services.
The Manager maintains a call center that is responsible for providing certain shareholder services to the Funds. Shareholder services include responding to inquiries and processing purchases and sales based upon instructions from shareholders. For the year ended May 31, 2023, each Fund reimbursed the Manager the following amounts for costs incurred in running the call center, which are included in transfer agent — class specific in the Statements of Operations:
| Fund Name | Institutional | Investor A | Investor C | Class K | Total | |||||||||||||||
Energy Opportunities | $ | 1,596 | $ | 28,106 | $ | 2,825 | $ | — | $ | 32,527 | ||||||||||
High Equity Income | 1,100 | 8,691 | 1,785 | 39 | 11,615 | |||||||||||||||
International Dividend | 736 | 5,942 | 729 | 54 | 7,461 | |||||||||||||||
For the year ended May 31, 2023, the following table shows the class specific transfer agent fees borne directly by each share class of each Fund:
| Fund Name | Institutional | Investor A | Investor C | Class K | Total | |||||||||||||||
Energy Opportunities | $ | 197,107 | $ | 401,409 | $ | 33,455 | $ | — | $ | 631,971 | ||||||||||
High Equity Income | 1,470,415 | 295,836 | 46,876 | 2,014 | 1,815,141 | |||||||||||||||
International Dividend | 246,756 | 173,540 | 8,080 | 1,321 | 429,697 | |||||||||||||||
Other Fees: For the year ended May 31, 2023, affiliates earned underwriting discounts, direct commissions and dealer concessions on sales of each Fund’s Investor A Shares as follows:
| Fund Name | Amounts | |||
Energy Opportunities | $ | 31,687 | ||
High Equity Income | 76,096 | |||
International Dividend | 3,228 | |||
For the year ended May 31, 2023, affiliates received CDSCs as follows:
| Share Class | Energy Opportunities | High Equity Income | International Dividend | |||||||||
Investor A | $ | 5,019 | $ | 4,174 | $ | 724 | ||||||
Investor C | 5,052 | 13,141 | 4 | |||||||||
Expense Limitations, Waivers and Reimbursements: With respect to each Fund, the Manager contractually agreed to waive its investment advisory fees by the amount of investment advisory fees each Fund pays to the Manager indirectly through its investment in affiliated money market funds (the “affiliated money market fund waiver”) through June 30, 2024. The contractual agreement may be terminated upon 90 days’ notice by a majority of the trustees who are not “interested persons” of the Trust, as defined in the 1940 Act (“Independent Trustees”), or by a vote of a majority of the outstanding voting securities of a Fund. The amount of waivers and/or reimbursements of fees and
| 44 | 2 0 2 3 B L A C K R O C K A N N U A L R E P O R T T O S H A R E H O L D E R S |
Notes to Financial Statements (continued)
expenses made pursuant to the expense limitation described below will be reduced by the amount of the affiliated money market fund waiver. This amount is included in fees waived and/or reimbursed by the Manager in the Statements of Operations. For the year ended May 31, 2023, the amounts waived were as follows:
| Fund Name | Amounts Waived | |||
Energy Opportunities | $ | 4,608 | ||
High Equity Income | 40,619 | |||
International Dividend | 7,916 | |||
The Manager has contractually agreed to waive its investment advisory fee with respect to any portion of each Fund’s assets invested in affiliated equity and fixed-income mutual funds and affiliated exchange-traded funds that have a contractual management fee through June 30, 2024. The contractual agreement may be terminated upon 90 days’ notice by a majority of the Independent Trustees, or by a vote of a majority of the outstanding voting securities of a Fund. For the year ended May 31, 2023, there were no fees waived by the Manager pursuant to this arrangement.
With respect to each Fund, the Manager contractually agreed to waive and/or reimburse fees or expenses in order to limit expenses, excluding interest expense, dividend expense, tax expense, acquired fund fees and expenses, and certain other fund expenses, which constitute extraordinary expenses not incurred in the ordinary course of each Fund’s business (“expense limitation”). The expense limitations as a percentage of average daily net assets are as follows:
| ||||||||||||||||
| Fund Name | Institutional | Investor A | Investor C | Class K | ||||||||||||
| ||||||||||||||||
Energy Opportunities | 0.91 | % | 1.32 | % | 2.04 | % | 0.91%(a) | |||||||||
High Equity Income | 0.85 | 1.10 | 1.85 | 0.80% | ||||||||||||
International Dividend | 0.65 | 0.90 | 1.65 | 0.60 | ||||||||||||
| ||||||||||||||||
| (a) | There were no shares outstanding as of May 31, 2023. |
Prior to April 19, 2023, the expense limitations as a percentage of average daily net assets for classes were as follows:
| ||||||||||||||||
| Fund Name | Institutional | Investor A | Investor C | Class K | ||||||||||||
| ||||||||||||||||
International Dividend | 0.84 | % | 1.09 | % | 1.84 | % | 0.79 | % | ||||||||
| ||||||||||||||||
The Manager has agreed not to reduce or discontinue the contractual expense limitations through June 30, 2024, unless approved by the Board, including a majority of the Independent Trustees or by a vote of a majority of the outstanding voting securities of a Fund. For the year ended May 31, 2023, the amounts included in the Statements of Operations were as follows:
| ||||
| Fund Name | Amounts Waived | |||
| ||||
High Equity Income | $ | 1,241,705 | ||
International Dividend | 520,798 | |||
| ||||
In addition, these amounts waived and/or reimbursed by the Manager are included in administration fees waived by the Manager — class specific and transfer agent fees waived and/or reimbursed by the Manager — class specific, respectively, in the Statements of Operations. For the year ended May 31, 2023, class specific expense waivers and/or reimbursements were as follows:
| ||||||||||||||||||||
| Administration Fees Waived by the Manager - Class Specific | ||||||||||||||||||||
|
| |||||||||||||||||||
| Fund Name | Institutional | Investor A | Investor C | Class K | Total | |||||||||||||||
| ||||||||||||||||||||
Energy Opportunities | $ | 30,355 | $ | 18,716 | $ | 1,658 | $ | — | $ | 50,729 | ||||||||||
High Equity Income | 267,258 | 58,562 | 10,322 | 16,171 | 352,313 | |||||||||||||||
International Dividend | 40,501 | 22,364 | 776 | 7,144 | 70,785 | |||||||||||||||
| ||||||||||||||||||||
| ||||||||||||||||||||
| Transfer Agent Fees Waived and/or Reimbursed by the Manager - Class Specific | ||||||||||||||||||||
|
| |||||||||||||||||||
| Fund Name | Institutional | Investor A | Investor C | Class K | Total | |||||||||||||||
| ||||||||||||||||||||
Energy Opportunities | $ | 150,934 | $ | 10,917 | $ | 1,170 | $ | — | $ | 163,021 | ||||||||||
High Equity Income | 777,178 | 147,880 | 19,818 | 2,014 | 946,890 | |||||||||||||||
International Dividend | 145,007 | 117,838 | 6,002 | 1,321 | 270,168 | |||||||||||||||
| ||||||||||||||||||||
Securities Lending: The U.S. Securities and Exchange Commission (“SEC”) has issued an exemptive order which permits BlackRock Investment Management, LLC (“BIM”), an affiliate of the Manager, to serve as securities lending agent for the Funds, subject to applicable conditions. As securities lending agent, BIM bears all operational costs directly related to securities lending. The Funds are responsible for expenses in connection with the investment of cash collateral received for securities on loan (the “collateral investment expenses”). The cash collateral is invested in a private investment company, SL Liquidity Series, LLC, Money Market Series (the “Money Market Series”), managed by the Manager or its affiliates. However, BIM has agreed to cap the collateral investment expenses of the Money Market Series to an annual rate of 0.04%. The investment adviser to the Money Market Series will not charge any advisory fees with respect to shares purchased by the Funds. The Money Market Series may, under certain circumstances, impose a liquidity fee of up to 2% of the value withdrawn or temporarily restrict withdrawals for up to 10 business days during a 90 day period, in the event that the private investment company’s weekly liquid assets fall below certain thresholds. The Money Market Series seeks current income consistent with maintaining liquidity and preserving capital. Although the Money Market Series is not registered under the 1940 Act, its investments may follow the parameters of investments by a money market fund that is subject to Rule 2a-7 under the 1940 Act.
N O T E S T O F I N A N C I A L S T A T E M E N T S | 45 |
Notes to Financial Statements (continued)
Securities lending income is equal to the total of income earned from the reinvestment of cash collateral, net of fees and other payments to and from borrowers of securities, and less the collateral investment expenses. Each Fund retains a portion of securities lending income and remits a remaining portion to BIM as compensation for its services as securities lending agent.
Pursuant to the current securities lending agreement, Energy Opportunities and International Dividend retain 82% of securities lending income (which excludes collateral investment expenses), and this amount retained can never be less than 70% of the total of securities lending income plus the collateral investment expenses. Pursuant to the current securities lending agreement, High Equity Income retains 81% of securities lending income (which excludes collateral investment expenses), and this amount retained can never be less than 70% of the total of securities lending income plus the collateral investment expenses.
In addition, commencing the business day following the date that the aggregate securities lending income earned across the BlackRock Multi-Asset Complex in a calendar year exceeds a specified threshold, Energy Opportunities and International Dividend, pursuant to the securities lending agreement, will retain for the remainder of that calendar year securities lending income in an amount equal to 85% of securities lending income (which excludes collateral investment expenses), and this amount retained can never be less than 70% of the total of securities lending income plus the collateral investment expenses. High Equity Income, pursuant to the securities lending agreement, will retain for the remainder of that calendar year securities lending income in an amount equal to 81% of securities lending income (which excludes collateral investment expenses), and this amount retained can never be less than 70% of the total of securities lending income plus the collateral investment expenses.
The share of securities lending income earned by each Fund is shown as securities lending income — affiliated — net in the Statements of Operations. For the year ended May 31, 2023, each Fund paid BIM the following amounts for securities lending agent services:
| ||||
| Fund Name | Amounts | |||
| ||||
Energy Opportunities | $ | 90 | ||
High Equity Income | 884 | |||
International Dividend | 269 | |||
| ||||
Trustees and Officers: Certain trustees and/or officers of the Trust are directors and/or officers of BlackRock or its affiliates. The Funds reimburse the Manager for a portion of the compensation paid to the Trust’s Chief Compliance Officer, which is included in Trustees and Officer in the Statements of Operations.
Other Transactions: The Funds may purchase securities from, or sell securities to, an affiliated fund provided the affiliation is due solely to having a common investment adviser, common officers, or common trustees. For the year ended May 31, 2023, the purchase and sale transactions and any net realized gains (losses) with an affiliated fund in compliance with Rule 17a-7 under the 1940 Act were as follows:
| ||||||||||||
| Fund Name | Purchases | Sales | Net Realized Gain (Loss) | |||||||||
| ||||||||||||
International Dividend | $ | — | $ 2,713,256 | $ | (125,883) | |||||||
| ||||||||||||
| 6. | PURCHASES AND SALES |
For the year ended May 31, 2023, purchases and sales of investments, excluding short-term investments and equity-linked notes, were as follows:
| ||||||||
| Fund Name | Purchases | Sales | ||||||
| ||||||||
Energy Opportunities | $ | 352,260,892 | $ | 299,366,415 | ||||
High Equity Income | 1,952,230,230 | 1,504,020,115 | ||||||
International Dividend | 468,618,213 | 117,377,643 | ||||||
| ||||||||
| 7. | INCOME TAX INFORMATION |
It is each Fund’s policy to comply with the requirements of the Internal Revenue Code of 1986, as amended, applicable to regulated investment companies, and to distribute substantially all of its taxable income to its shareholders. Therefore, no U.S. federal income tax provision is required.
Each Fund files U.S. federal and various state and local tax returns. No income tax returns are currently under examination. The statute of limitations on each Fund’s U.S. federal tax returns generally remains open for a period of three years after they are filed. The statutes of limitations on each Fund’s state and local tax returns may remain open for an additional year depending upon the jurisdiction.
Management has analyzed tax laws and regulations and their application to the Funds as of May 31, 2023, inclusive of the open tax return years, and does not believe that there are any uncertain tax positions that require recognition of a tax liability in the Funds’ financial statements.
| 46 | 2 0 2 3 B L A C K R O C K A N N U A L R E P O R T T O S H A R E H O L D E R S |
Notes to Financial Statements (continued)
The tax character of distributions paid was as follows:
| ||||||||||||||||
| Period | Energy Opportunities | High Equity Income | International Dividend | |||||||||||||
| ||||||||||||||||
Ordinary income | 05/31/23 | $ | 9,518,963 | $ | 123,218,102 | $ | 4,123,182 | |||||||||
| 05/31/22 | 4,736,419 | 48,052,529 | 11,797,446 | |||||||||||||
Long-term capital gains | 05/31/23 | — | 721,456 | 4,377,510 | ||||||||||||
| 05/31/22 | — | 6,635,636 | 3,243,226 | |||||||||||||
|
|
|
|
|
| |||||||||||
Total | 05/31/23 | $ | 9,518,963 | $ | 123,939,558 | $ | 8,500,692 | |||||||||
|
|
|
|
|
| |||||||||||
| 05/31/22 | $ | 4,736,419 | $ | 54,688,165 | $ | 15,040,672 | ||||||||||
|
|
|
|
|
| |||||||||||
As of May 31, 2023, the tax components of accumulated earnings (loss) were as follows:
| ||||||||||||||||||||
| Fund Name | Undistributed Ordinary Income | Non-expiring Capital Loss Carryforwards(a) | Net Unrealized Gains (Losses)(b) | Qualified late-year losses(c) | Total | |||||||||||||||
| ||||||||||||||||||||
Energy Opportunities | $ | 6,027,434 | $ | (308,043,616 | ) | $ | 52,780,936 | $ | — | $ | (249,235,246 | ) | ||||||||
High Equity Income | — | (35,547,927 | ) | (106,005,489 | ) | (1,926,966 | ) | (143,480,382 | ) | |||||||||||
International Dividend | 6,075,249 | (1,535,989 | ) | 24,636,503 | — | 29,175,763 | ||||||||||||||
| ||||||||||||||||||||
| (a) | Amounts available to offset future realized capital gains. |
| (b) | The difference between book-basis and tax-basis net unrealized gains (losses) was attributable primarily to the tax deferral of losses on wash sales, the realization for tax purposes of unrealized gains(losses) on certain foreign currency contracts. the timing and recognition of partnership income and characterization of corporate actions. |
| (c) | The Funds have elected to defer certain qualified late-year losses and recognize such losses in the next taxable year. |
During the year ended May 31, 2023, the Energy Opportunities Fund utilized $3,924,114 of its respective capital loss carryforward.
As of May 31, 2023, gross unrealized appreciation and depreciation based on cost of investments (including short positions and derivatives, if any) for U.S. federal income tax purposes were as follows:
| ||||||||||||||||
| Fund Name | Tax Cost | Gross Unrealized Appreciation | Gross Unrealized Depreciation | Net Unrealized Appreciation (Depreciation) | ||||||||||||
| ||||||||||||||||
Energy Opportunities | $ | 321,811,230 | $ | 62,042,059 | $ | (9,257,718 | ) | $ | 52,784,341 | |||||||
High Equity Income | 2,127,779,642 | 88,784,244 | (194,778,524 | ) | (105,994,280 | ) | ||||||||||
International Dividend | 605,904,670 | 47,872,863 | (23,225,545 | ) | 24,647,318 | |||||||||||
| ||||||||||||||||
| 8. | BANK BORROWINGS |
The Trust, on behalf of each Fund, along with certain other funds managed by the Manager and its affiliates (“Participating Funds”), is party to a 364-day, $2.50 billion credit agreement with a group of lenders. Under this agreement, the Funds may borrow to fund shareholder redemptions. Excluding commitments designated for certain individual funds, the Participating Funds, including the Funds, can borrow up to an aggregate commitment amount of $1.75 billion at any time outstanding, subject to asset coverage and other limitations as specified in the agreement. The credit agreement has the following terms: a fee of 0.10% per annum on unused commitment amounts and interest at a rate equal to the higher of (a) Overnight Bank Funding Rate (“OBFR”) (but, in any event, not less than 0.00%) on the date the loan is made plus 0.80% per annum, (b) the Fed Funds rate (but, in any event, not less than 0.00%) in effect from time to time plus 0.80% per annum on amounts borrowed or (c) the sum of (x) Daily Simple Secured Overnight Financing Rate (“SOFR”) (but, in any event, not less than 0.00%) on the date the loan is made plus 0.10% and (y) 0.80% per annum. The agreement expires in April 2024 unless extended or renewed. These fees were allocated among such funds based upon portions of the aggregate commitment available to them and relative net assets of Participating Funds. During the year ended May 31, 2023, the Funds did not borrow under the credit agreement.
| 9. | PRINCIPAL RISKS |
In the normal course of business, the Funds invest in securities or other instruments and may enter into certain transactions, and such activities subject each Fund to various risks, including among others, fluctuations in the market (market risk) or failure of an issuer to meet all of its obligations. The value of securities or other instruments may also be affected by various factors, including, without limitation: (i) the general economy; (ii) the overall market as well as local, regional or global political and/or social instability; (iii) regulation, taxation or international tax treaties between various countries; or (iv) currency, interest rate and price fluctuations. Local, regional or global events such as war, acts of terrorism, the spread of infectious illness or other public health issues, recessions, or other events could have a significant impact on the Funds and their investments. Each Fund’s prospectus provides details of the risks to which each Fund is subject.
Infectious Illness Risk: An outbreak of an infectious illness, such as the COVID-19 pandemic, may adversely impact the economies of many nations and the global economy and may impact individual issuers and capital markets in ways that cannot be foreseen. An infectious illness outbreak may result in, among other things, closed international borders, prolonged quarantines, supply chain disruptions, market volatility or disruptions and other significant economic, social and political impacts.
N O T E S T O F I N A N C I A L S T A T E M E N T S | 47 |
Notes to Financial Statements (continued)
Valuation Risk: The market values of equities, such as common stocks and preferred securities or equity related investments, such as futures and options, may decline due to general market conditions which are not specifically related to a particular company. They may also decline due to factors which affect a particular industry or industries. A Fund may invest in illiquid investments. An illiquid investment is any investment that a Fund reasonably expects cannot be sold or disposed of in current market conditions in seven calendar days or less without the sale or disposition significantly changing the market value of the investment. A Fund may experience difficulty in selling illiquid investments in a timely manner at the price that it believes the investments are worth. Prices may fluctuate widely over short or extended periods in response to company, market or economic news. Markets also tend to move in cycles, with periods of rising and falling prices. This volatility may cause each Fund’s NAV to experience significant increases or decreases over short periods of time. If there is a general decline in the securities and other markets, the NAV of a Fund may lose value, regardless of the individual results of the securities and other instruments in which a Fund invests.
The price a Fund could receive upon the sale of any particular portfolio investment may differ from a Fund’s valuation of the investment, particularly for securities that trade in thin or volatile markets or that are valued using a fair valuation technique or a price provided by an independent pricing service. Changes to significant unobservable inputs and assumptions (i.e., publicly traded company multiples, growth rate, time to exit) due to the lack of observable inputs may significantly impact the resulting fair value and therefore a Fund’s results of operations. As a result, the price received upon the sale of an investment may be less than the value ascribed by a Fund, and a Fund could realize a greater than expected loss or lesser than expected gain upon the sale of the investment. A Fund’s ability to value its investments may also be impacted by technological issues and/or errors by pricing services or other third-party service providers.
Counterparty Credit Risk: The Funds may be exposed to counterparty credit risk, or the risk that an entity may fail to or be unable to perform on its commitments related to unsettled or open transactions, including making timely interest and/or principal payments or otherwise honoring its obligations. The Funds manage counterparty credit risk by entering into transactions only with counterparties that the Manager believes have the financial resources to honor their obligations and by monitoring the financial stability of those counterparties. Financial assets, which potentially expose the Funds to market, issuer and counterparty credit risks, consist principally of financial instruments and receivables due from counterparties. The extent of the Funds’ exposure to market, issuer and counterparty credit risks with respect to these financial assets is approximately their value recorded in the Statements of Assets and Liabilities, less any collateral held by the Funds.
Concentration Risk: A diversified portfolio, where this is appropriate and consistent with a fund’s objectives, minimizes the risk that a price change of a particular investment will have a material impact on the NAV of a fund. The investment concentrations within each Fund’s portfolio are disclosed in its Schedule of Investments.
Certain Funds invest a significant portion of their assets in securities within a single or limited number of market sectors. When a Fund concentrates its investments in this manner, it assumes the risk that economic, regulatory, political and social conditions affecting such sectors may have a significant impact on the Fund and could affect the income from, or the value or liquidity of, the Fund’s portfolio. Investment percentages in specific sectors are presented in the Schedules of Investments.
International Dividend invests a substantial amount of its assets in issuers located in a single country or a limited number of countries. When a Fund concentrates its investments in this manner, it assumes the risk that economic, regulatory, political and social conditions in those countries may have a significant impact on its investment performance and could affect the income from, or the value or liquidity of, the Fund’s portfolio. Unanticipated or sudden political or social developments may cause uncertainty in the markets and as a result adversely affect the Fund’s investments. Foreign issuers may not be subject to the same uniform accounting, auditing and financial reporting standards and practices as used in the United States. Foreign securities markets may also be more volatile and less liquid than U.S. securities and may be less subject to governmental supervision not typically associated with investing in U.S. securities. Investment percentages in specific countries are presented in the Schedule of Investments.
Certain Funds invest a significant portion of their assets in securities of issuers located in the United States. A decrease in imports or exports, changes in trade regulations, inflation and/or an economic recession in the United States may have a material adverse effect on the U.S. economy and the securities listed on U.S. exchanges. Proposed and adopted policy and legislative changes in the United States may also have a significant effect on U.S. markets generally, as well as on the value of certain securities. Governmental agencies project that the United States will continue to maintain elevated public debt levels for the foreseeable future which may constrain future economic growth. Circumstances could arise that could prevent the timely payment of interest or principal on U.S. government debt, such as reaching the legislative “debt ceiling.” Such non-payment would result in substantial negative consequences for the U.S. economy and the global financial system. If U.S. relations with certain countries deteriorate, it could adversely affect issuers that rely on the United States for trade. The United States has also experienced increased internal unrest and discord. If these trends were to continue, they may have an adverse impact on the U.S. economy and the issuers in which the certain Funds invest.
International Dividend invests a significant portion of its assets in securities of issuers located in Europe or with significant exposure to European issuers or countries. The European financial markets have recently experienced volatility and adverse trends due to concerns about economic downturns in, or rising government debt levels of, several European countries as well as acts of war in the region. These events may spread to other countries in Europe and may affect the value and liquidity of certain of International Dividend’s investments.
Responses to the financial problems by European governments, central banks and others, including austerity measures and reforms, may not work, may result in social unrest and may limit future growth and economic recovery or have other unintended consequences. Further defaults or restructurings by governments and others of their debt could have additional adverse effects on economies, financial markets and asset valuations around the world. The United Kingdom has withdrawn from the European Union, and one or more other countries may withdraw from the European Union and/or abandon the Euro, the common currency of the European Union. These events and actions have adversely affected, and may in the future adversely affect, the value and exchange rate of the Euro and may continue to significantly affect the economies of every country in Europe, including countries that do not use the Euro and non-European Union member states. The impact of these actions, especially if they occur in a disorderly fashion, is not clear but could be significant and far reaching. In addition, Russia launched a large-scale invasion of Ukraine on February 24, 2022. The extent and duration of the military action, resulting sanctions and resulting future market disruptions in the region are impossible to predict, but have been, and may continue to be, significant and have a severe adverse effect on the region, including significant negative impacts on the economy and the markets for certain securities and commodities, such as oil and natural gas, as well as other sectors.
| 48 | 2 0 2 3 B L A C K R O C K A N N U A L R E P O R T T O S H A R E H O L D E R S |
Notes to Financial Statements (continued)
Significant Shareholder Redemption Risk: Certain shareholders may own or manage a substantial amount of fund shares and/or hold their fund investments for a limited period of time. Large redemptions of fund shares by these shareholders may force a fund to sell portfolio securities, which may negatively impact the fund’s NAV, increase the fund’s brokerage costs, and/or accelerate the realization of taxable income/gains and cause the fund to make additional taxable distributions to shareholders.
| 10. | CAPITAL SHARE TRANSACTIONS |
Transactions in capital shares for each class were as follows:
| Year Ended 05/31/23 | Year Ended 05/31/22 | |||||||||||||||
| Fund Name/Share Class | Shares | Amount | Shares | Amount | ||||||||||||
Energy Opportunities | ||||||||||||||||
Institutional | ||||||||||||||||
Shares sold | 12,067,659 | $ | 156,474,280 | 9,364,009 | $ | 100,913,152 | ||||||||||
Shares issued in reinvestment of distributions | 344,414 | 4,146,262 | 187,332 | 1,664,461 | ||||||||||||
Shares redeemed | (8,916,366 | ) | (111,402,349 | ) | (6,311,684 | ) | (64,759,770 | ) | ||||||||
|
|
|
|
|
|
|
| |||||||||
| 3,495,707 | $ | 49,218,193 | 3,239,657 | $ | 37,817,843 | |||||||||||
|
|
|
|
|
|
|
| |||||||||
Service(a) | ||||||||||||||||
Shares sold | — | $ | — | 71,823 | $ | 628,502 | ||||||||||
Shares redeemed and automatic conversions of shares | — | — | (135,066 | ) | (1,154,444 | ) | ||||||||||
|
|
|
|
|
|
|
| |||||||||
| — | $ | — | (63,243 | ) | $ | (525,942 | ) | |||||||||
|
|
|
|
|
|
|
| |||||||||
Investor A | ||||||||||||||||
Shares sold and automatic conversion of shares | 10,055,914 | $ | 125,839,735 | 13,429,808 | $ | 137,459,277 | ||||||||||
Shares issued in reinvestment of distributions | 428,848 | 4,913,297 | 316,331 | 2,724,067 | ||||||||||||
Shares redeemed | (10,342,732 | ) | (125,289,679 | ) | (8,761,288 | ) | (83,474,340 | ) | ||||||||
|
|
|
|
|
|
|
| |||||||||
| 142,030 | $ | 5,463,353 | 4,984,851 | $ | 56,709,004 | |||||||||||
|
|
|
|
|
|
|
| |||||||||
Investor C | ||||||||||||||||
Shares sold | 524,342 | $ | 6,358,068 | 1,177,179 | $ | 12,085,205 | ||||||||||
Shares issued in reinvestment of distributions | 34,611 | 378,968 | 26,785 | 223,073 | ||||||||||||
Shares redeemed and automatic conversion of shares | (917,902 | ) | (10,673,742 | ) | (469,040 | ) | (4,450,287 | ) | ||||||||
|
|
|
|
|
|
|
| |||||||||
| (358,949 | ) | $ | (3,936,706 | ) | 734,924 | $ | 7,857,991 | |||||||||
|
|
|
|
|
|
|
| |||||||||
| 3,278,788 | $ | 50,744,840 | 8,896,189 | $ | 101,858,896 | |||||||||||
|
|
|
|
|
|
|
| |||||||||
High Equity Income | ||||||||||||||||
Institutional | ||||||||||||||||
Shares sold | 43,564,325 | $ | 1,195,222,978 | 26,437,419 | $ | 783,049,854 | ||||||||||
Shares issued in reinvestment of distributions | 3,437,184 | 93,276,417 | 1,119,199 | 32,929,847 | ||||||||||||
Shares redeemed | (23,014,916 | ) | (624,903,631 | ) | (4,532,198 | ) | (133,442,436 | ) | ||||||||
|
|
|
|
|
|
|
| |||||||||
| 23,986,593 | $ | 663,595,764 | 23,024,420 | $ | 682,537,265 | |||||||||||
|
|
|
|
|
|
|
| |||||||||
Service(b) | ||||||||||||||||
Shares sold | — | $ | — | 13,128 | $ | 345,715 | ||||||||||
Shares issued in reinvestment of distributions | — | — | 4,384 | 114,738 | ||||||||||||
Shares redeemed | — | — | (368,626 | ) | (9,679,545 | ) | ||||||||||
|
|
|
|
|
|
|
| |||||||||
| — | $ | — | (351,114 | ) | $ | (9,219,092 | ) | |||||||||
|
|
|
|
|
|
|
| |||||||||
Investor A | ||||||||||||||||
Shares sold and automatic conversion of shares | 3,945,697 | $ | 90,206,380 | 4,829,225 | $ | 120,149,339 | ||||||||||
Shares issued in reinvestment of distributions | 867,585 | 19,692,071 | 700,286 | 17,251,506 | ||||||||||||
Shares redeemed | (3,160,034 | ) | (71,467,053 | ) | (1,954,222 | ) | (48,316,023 | ) | ||||||||
|
|
|
|
|
|
|
| |||||||||
| 1,653,248 | $ | 38,431,398 | 3,575,289 | $ | 89,084,822 | |||||||||||
|
|
|
|
|
|
|
| |||||||||
N O T E S T O F I N A N C I A L S T A T E M E N T S | 49 |
Notes to Financial Statements (continued)
| Year Ended 05/31/23 | Year Ended 05/31/22 | |||||||||||||||
| Fund Name/Share Class | Shares | Amount | Shares | Amount | ||||||||||||
High Equity Income (continued) | ||||||||||||||||
Investor C | ||||||||||||||||
Shares sold | 2,116,697 | $ | 30,073,990 | 1,596,565 | $ | 24,625,842 | ||||||||||
Shares issued in reinvestment of distributions | 230,643 | 3,252,346 | 142,478 | 2,187,470 | ||||||||||||
Shares redeemed and automatic conversions of shares | (761,451 | ) | (10,735,623 | ) | (392,582 | ) | (6,081,549 | ) | ||||||||
|
|
|
|
|
|
|
| |||||||||
| 1,585,889 | $ | 22,590,713 | 1,346,461 | $ | 20,731,763 | |||||||||||
|
|
|
|
|
|
|
| |||||||||
Class K | ||||||||||||||||
Shares sold | 5,616,247 | $ | 152,879,817 | 15,549 | $ | 472,528 | ||||||||||
Shares issued in reinvestment of distributions | 209,416 | 5,701,757 | 222 | 6,572 | ||||||||||||
Shares redeemed | (590,210 | ) | (16,024,284 | ) | (9,613 | ) | (288,239 | ) | ||||||||
|
|
|
|
|
|
|
| |||||||||
| 5,235,453 | $ | 142,557,290 | 6,158 | $ | 190,861 | |||||||||||
|
|
|
|
|
|
|
| |||||||||
| 32,461,183 | $ | 867,175,165 | 27,601,214 | $ | 783,325,619 | |||||||||||
|
|
|
|
|
|
|
| |||||||||
International Dividend | ||||||||||||||||
Institutional | ||||||||||||||||
Shares sold | 11,844,319 | $ | 384,760,335 | 1,452,672 | $ | 48,865,767 | ||||||||||
Shares issued in reinvestment of distributions | 125,517 | 3,705,818 | 164,543 | 5,679,268 | ||||||||||||
Shares redeemed | (2,448,728 | ) | (77,994,091 | ) | (753,594 | ) | (25,800,170 | ) | ||||||||
|
|
|
|
|
|
|
| |||||||||
| 9,521,108 | $ | 310,472,062 | 863,621 | $ | 28,744,865 | |||||||||||
|
|
|
|
|
|
|
| |||||||||
Service(a) | ||||||||||||||||
Shares sold | — | $ | — | 574 | $ | 19,595 | ||||||||||
Shares redeemed and automatic conversion of shares | — | — | (110,673 | ) | (3,741,628 | ) | ||||||||||
|
|
|
|
|
|
|
| |||||||||
| — | $ | — | (110,099 | ) | $ | (3,722,033 | ) | |||||||||
|
|
|
|
|
|
|
| |||||||||
Investor A | ||||||||||||||||
Shares sold and automatic conversion of shares | 880,305 | $ | 25,436,596 | 503,815 | $ | 16,104,422 | ||||||||||
Shares issued in reinvestment of distributions | 124,210 | 3,304,279 | 235,424 | 7,531,807 | ||||||||||||
Shares redeemed | (787,096 | ) | (22,191,435 | ) | (736,146 | ) | (23,338,236 | ) | ||||||||
|
|
|
|
|
|
|
| |||||||||
| 217,419 | $ | 6,549,440 | 3,093 | $ | 297,993 | |||||||||||
|
|
|
|
|
|
|
| |||||||||
Investor C | ||||||||||||||||
Shares sold | 63,048 | $ | 1,552,610 | 19,452 | $ | 540,652 | ||||||||||
Shares issued in reinvestment of distributions | 4,936 | 111,585 | 12,351 | 341,290 | ||||||||||||
Shares redeemed and automatic conversion of shares | (51,428 | ) | (1,239,376 | ) | (64,752 | ) | (1,776,778 | ) | ||||||||
|
|
|
|
|
|
|
| |||||||||
| 16,556 | $ | 424,819 | (32,949 | ) | $ | (894,836 | ) | |||||||||
|
|
|
|
|
|
|
| |||||||||
Class K | ||||||||||||||||
Shares sold | 1,571,774 | $ | 48,180,217 | 472,471 | $ | 16,295,722 | ||||||||||
Shares issued in reinvestment of distributions | 23,059 | 679,380 | 13,158 | 452,872 | ||||||||||||
Shares redeemed | (284,694 | ) | (8,943,841 | ) | (120,735 | ) | (4,079,417 | ) | ||||||||
|
|
|
|
|
|
|
| |||||||||
| 1,310,139 | $ | 39,915,756 | 364,894 | $ | 12,669,177 | |||||||||||
|
|
|
|
|
|
|
| |||||||||
| 11,065,222 | $ | 357,362,077 | 1,088,560 | $ | 37,095,166 | |||||||||||
|
|
|
|
|
|
|
| |||||||||
| (a) | On July 6, 2021, the Fund’s issued and outstanding Service Shares converted into Investor A Shares. |
| (b) | On August 18, 2021, the Fund’s issued and outstanding Service Shares converted into Investor A Shares |
As of May 31, 2023, BlackRock Financial Management, Inc., an affiliate of the Fund, owned 11,882 Class K Shares of High Equity Income.
| 11. | FOREIGN TAX WITHHOLDING CLAIMS |
International Dividend is expected to seek a closing agreement with the Internal Revenue Service (“IRS”) to address any prior years’ U.S. income tax liabilities attributable to International Dividend shareholders resulting from the recovery of foreign taxes. The closing agreement would result in International Dividend paying a compliance fee to the IRS, on behalf of its shareholders, representing the estimated tax savings generated from foreign tax credits claimed by International Dividend shareholders on their tax returns in prior years.
| 50 | 2 0 2 3 B L A C K R O C K A N N U A L R E P O R T T O S H A R E H O L D E R S |
Notes to Financial Statements (continued)
12. SUBSEQUENT EVENTS
Management has evaluated the impact of all subsequent events on the Funds through the date the financial statements were issued and has determined that there were no subsequent events requiring adjustment or additional disclosure in the financial statements.
N O T E S T O F I N A N C I A L S T A T E M E N T S | 51 |
Report of Independent Registered Public Accounting Firm
To the Shareholders of BlackRock Energy Opportunities Fund, BlackRock High Equity Income Fund, and BlackRock International Dividend Fund and the Board of Trustees of BlackRock FundsSM:
Opinion on the Financial Statements and Financial Highlights
We have audited the accompanying statements of assets and liabilities of BlackRock Energy Opportunities Fund, BlackRock High Equity Income Fund, and BlackRock International Dividend Fund of BlackRock FundsSM (the “Funds”), including the schedules of investments, as of May 31, 2023, the related statements of operations for the year then ended, the statements of changes in net assets for each of the two years in the period then ended, the financial highlights for each of the three years in the period then ended, for the period from October 1, 2019 through May 31, 2020, and for each of the two years in the period ended September 30, 2019, and the related notes. In our opinion, the financial statements and financial highlights present fairly, in all material respects, the financial position of the Funds as of May 31, 2023, and the results of their operations for the year then ended, the changes in their net assets for each of the two years in the period then ended, and the financial highlights for each of the three years in the period then ended, for the period from October 1, 2019 through May 31, 2020, and for each of the two years in the period ended September 30, 2019, in conformity with accounting principles generally accepted in the United States of America.
Basis for Opinion
These financial statements and financial highlights are the responsibility of the Funds’ management. Our responsibility is to express an opinion on the Funds’ financial statements and financial highlights based on our audits. We are a public accounting firm registered with the Public Company Accounting Oversight Board (United States) (PCAOB) and are required to be independent with respect to the Funds in accordance with the U.S. federal securities laws and the applicable rules and regulations of the Securities and Exchange Commission and the PCAOB.
We conducted our audits in accordance with the standards of the PCAOB. Those standards require that we plan and perform the audit to obtain reasonable assurance about whether the financial statements and financial highlights are free of material misstatement, whether due to error or fraud. The Funds are not required to have, nor were we engaged to perform, an audit of their internal control over financial reporting. As part of our audits we are required to obtain an understanding of internal control over financial reporting but not for the purpose of expressing an opinion on the effectiveness of the Funds’ internal control over financial reporting. Accordingly, we express no such opinion.
Our audits included performing procedures to assess the risks of material misstatement of the financial statements and financial highlights, whether due to error or fraud, and performing procedures that respond to those risks. Such procedures included examining, on a test basis, evidence regarding the amounts and disclosures in the financial statements and financial highlights. Our audits also included evaluating the accounting principles used and significant estimates made by management, as well as evaluating the overall presentation of the financial statements and financial highlights. Our procedures included confirmation of securities owned as of May 31, 2023, by correspondence with custodians or counterparties; when replies were not received, we performed other auditing procedures. We believe that our audits provide a reasonable basis for our opinion.
Deloitte & Touche LLP
Boston, Massachusetts
July 21, 2023
We have served as the auditor of one or more BlackRock investment companies since 1992.
| 52 | 2 0 2 3 B L A C K R O C K A N N U A L R E P O R T T O S H A R E H O L D E R S |
| Important Tax Information (unaudited) |
The following amounts, or maximum amounts allowable by law, are hereby designated as qualified dividend income for individuals for the fiscal year ended May 31, 2023:
| ||||
| Fund Name | Qualified Dividend Income | |||
| ||||
Energy Opportunities | $ | 16,964,351 | ||
High Equity Income | 33,346,899 | |||
International Dividend | 9,081,204 | |||
| ||||
The Funds hereby designate the following amounts, or maximum amounts allowable by law, as capital gain dividends, subject to a long-term capital gains tax rate as noted below, for the fiscal year ended May 31, 2023:
| ||||
| Fund Name | 20% Rate Long-Term Capital Gain Dividends | |||
| ||||
High Equity Income | $ | 721,456 | ||
International Dividend | 4,377,510 | |||
| ||||
The Funds intend to pass through to its shareholders the following amounts, or maximum amounts allowable by law, of foreign source income earned for the fiscal year ended May 31, 2023:
| ||||
| Fund Name | Foreign Source Income Earned | |||
| ||||
International Dividend | $ | 7,932,427 | ||
| ||||
The Funds hereby designate the following amounts, or maximum amounts allowable by law, of distributions from direct federal obligation interest for the fiscal year ended May 31, 2023:
| ||||
| Fund Name | Federal Obligation Interest | |||
| ||||
International Dividend | $ | 72,407 | ||
| ||||
The law varies in each state as to whether and what percent of ordinary income dividends attributable to federal obligations is exempt from state income tax. Shareholders are advised to check with their tax advisers to determine if any portion of the dividends received is exempt from state income tax.
The following percentages, or maximum percentages allowable by law, of ordinary income distributions paid during the fiscal year ended May 31, 2023 qualified for the dividends-received deduction for corporate shareholders:
| Fund Name | Dividends-Received Deduction | |||
Energy Opportunities | 72.79 | % | ||
High Equity Income | 17.53 | |||
International Dividend | 6.73 | |||
The Funds hereby designate the following amounts, or maximum amounts allowable by law, as interest income eligible to be treated as a Section 163(j) interest dividend for the fiscal year ended May 31, 2023:
| Fund Name | Interest Dividends | |||
Energy Opportunities | $ | 151,780 | ||
High Equity Income | 1,764,486 | |||
International Dividend | 269,504 | |||
The Funds hereby designate the following amounts, or maximum amounts allowable by law, as interest-related dividends eligible for exemption from U.S. withholding tax for nonresident aliens and foreign corporations for the fiscal year ended May 31, 2023:
| Fund Name | Interest-Related Dividends | |||
Energy Opportunities | $ | 151,780 | ||
High Equity Income | 1,764,486 | |||
International Dividend | 308,276 | |||
IMPORTANT TAX INFORMATION | 53 |
Disclosure of Investment Advisory Agreement and Sub-Advisory Agreements
The Board of Trustees (the “Board,” the members of which are referred to as “Board Members”) of BlackRock Funds (the “Trust”) met on April 18, 2023 (the “April Meeting”) and May 23-24, 2023 (the “May Meeting”) to consider the approval to continue the investment advisory agreement (the “Advisory Agreement”) between the Trust, on behalf of BlackRock Energy Opportunities Fund (“Energy Opportunities Fund”), BlackRock High Equity Income Fund (“High Equity Income Fund”) and BlackRock International Dividend Fund (“International Dividend Fund” and, together with Energy Opportunities Fund and High Equity Income Fund, the “Funds” and, each individually a “Fund”), and BlackRock Advisors, LLC (the “Manager”), each Fund’s investment advisor. The Board also considered the approval to continue the sub-advisory agreement between the Manager and BlackRock International Limited (the “Sub-Advisor”) with respect to Energy Opportunities Fund (the “Energy Opportunities Fund Sub-Advisory Agreement”) and the sub-advisory agreement between the Manager and the Sub-Advisor with respect to International Dividend Fund (the “International Dividend Fund Sub-Advisory Agreement” and, together with the Energy Opportunities Agreement, the “Sub-Advisory Agreements”). The Manager and the Sub-Advisor are referred to herein as “BlackRock.” The Advisory Agreement and the Sub-Advisory Agreements are referred to herein as the “Agreements.”
The Approval Process
Consistent with the requirements of the Investment Company Act of 1940 (the “1940 Act”), the Board considers the approval of the continuation of the Agreements for each Fund on an annual basis. The Board members who are not “interested persons” of the Trust, as defined in the 1940 Act, are considered independent Board members (the “Independent Board Members”). The Board’s consideration entailed a year-long deliberative process during which the Board and its committees assessed BlackRock’s various services to each Fund, including through the review of written materials and oral presentations, and the review of additional information provided in response to requests from the Independent Board Members. The Board had four quarterly meetings per year, each of which extended over a two-day period, as well as additional ad hoc meetings and executive sessions throughout the year, as needed. The committees of the Board similarly met throughout the year. The Board also had an additional one-day meeting to consider specific information regarding the renewal of the Agreements. In considering the renewal of the Agreements, the Board assessed, among other things, the nature, extent and quality of the services provided to the Fund by BlackRock, BlackRock’s personnel and affiliates, including (as applicable): investment management services; accounting oversight; administrative and shareholder services; oversight of the Fund’s service providers; risk management and oversight; and legal, regulatory and compliance services. Throughout the year, including during the contract renewal process, the Independent Board Members were advised by independent legal counsel, and met with independent legal counsel in various executive sessions outside of the presence of BlackRock’s management.
During the year, the Board, acting directly and through its committees, considered information that was relevant to its annual consideration of the renewal of the Agreements, including the services and support provided by BlackRock to the Fund and its shareholders. BlackRock also furnished additional information to the Board in response to specific questions from the Board. Among the matters the Board considered were: (a) investment performance for one-year, three-year, five-year, and/or since inception periods, as applicable, against peer funds, an applicable benchmark, and other performance metrics, as applicable, as well as BlackRock senior management’s and portfolio managers’ analyses of the reasons for any outperformance or underperformance relative to its peers, benchmarks, and other performance metrics, as applicable; (b) fees, including advisory, administration, if applicable, and other amounts paid to BlackRock and its affiliates by the Fund for services; (c) Fund operating expenses and how BlackRock allocates expenses to the Fund; (d) the resources devoted to, risk oversight of, and compliance reports relating to, implementation of the Fund’s investment objective, policies and restrictions, and meeting regulatory requirements; (e) BlackRock’s and the Fund’s adherence to applicable compliance policies and procedures; (f) the nature, character and scope of non-investment management services provided by BlackRock and its affiliates and the estimated cost of such services, as available; (g) BlackRock’s and other service providers’ internal controls and risk and compliance oversight mechanisms; (h) BlackRock’s implementation of the proxy voting policies approved by the Board; (i) the use of brokerage commissions and execution quality of portfolio transactions; (j) BlackRock’s implementation of the Fund’s valuation and liquidity procedures; (k) an analysis of management fees paid to BlackRock for products with similar investment mandates across the open-end fund, exchange-traded fund (“ETF”), closed-end fund, sub-advised mutual fund, separately managed account, collective investment trust, and institutional separate account product channels, as applicable, and the similarities and differences between these products and the services provided as compared to the Fund; (l) BlackRock’s compensation methodology for its investment professionals and the incentives and accountability it creates, along with investment professionals’ investments in the fund(s) they manage; and (m) periodic updates on BlackRock’s business.
Prior to and in preparation for the April Meeting, the Board received and reviewed materials specifically relating to the renewal of the Agreements. The Independent Board Members are continuously engaged in a process with their independent legal counsel and BlackRock to review the nature and scope of the information provided to the Board to better assist its deliberations. The materials provided in connection with the April Meeting included, among other things: (a) information independently compiled and prepared by Broadridge Financial Solutions, Inc. (“Broadridge”), based on either a Lipper classification or Morningstar category, regarding each Fund’s fees and expenses as compared with a peer group of funds as determined by Broadridge (“Expense Peers”) and the investment performance of each Fund as compared with a peer group of funds (“Performance Peers”); (b) information on the composition of the Expense Peers and Performance Peers and a description of Broadridge’s methodology; (c) information on the estimated profits realized by BlackRock and its affiliates pursuant to the Agreements and a discussion of fall-out benefits to BlackRock and its affiliates; (d) a general analysis provided by BlackRock concerning investment management fees received in connection with other types of investment products, such as institutional accounts, sub-advised mutual funds, ETFs, closed-end funds, open-end funds, and separately managed accounts under similar investment mandates, as well as the performance of such other products, as applicable; (e) a review of non-management fees; (f) the existence, impact and sharing of potential economies of scale, if any, with the Funds; (g) a summary of aggregate amounts paid by each Fund to BlackRock; (h) sales and redemption data regarding each Fund’s shares; and (i) various additional information requested by the Board as appropriate regarding BlackRock’s and the Funds’ operations.
At the April Meeting, the Board reviewed materials relating to its consideration of the Agreements and the Independent Board Members presented BlackRock with questions and requests for additional information. BlackRock responded to these questions and requests with additional written information in advance of the May Meeting.
At the May Meeting, the Board concluded its assessment of, among other things: (a) the nature, extent and quality of the services provided by BlackRock; (b) the investment performance of each Fund as compared to its Performance Peers and to other metrics, as applicable; (c) the advisory fee and the estimated cost of the services and estimated profits realized by BlackRock and its affiliates from their relationship with the Funds; (d) each Fund’s fees and expenses compared to its Expense Peers; (e) the existence and sharing of potential economies of scale; (f) any fall-out benefits to BlackRock and its affiliates as a result of BlackRock’s relationship with the Funds; and (g) other factors deemed relevant by the Board Members.
| 54 | 2 0 2 3 B L A C K R O C K A N N U A L R E P O R T T O S H A R E H O L D E R S |
Disclosure of Investment Advisory Agreement and Sub-Advisory Agreements (continued)
The Board also considered other matters it deemed important to the approval process, such as other payments made to BlackRock or its affiliates relating to securities lending and cash management, and BlackRock’s services related to the valuation and pricing of Fund portfolio holdings. The Board noted the willingness of BlackRock’s personnel to engage in open, candid discussions with the Board. The Board Members evaluated the information available to it on a fund-by-fund basis. The following paragraphs provide more information about some of the primary factors that were relevant to the Board’s decision. The Board Members did not identify any particular information, or any single factor as determinative, and each Board Member may have attributed different weights to the various items and factors considered.
A: Nature, Extent and Quality of the Services Provided by BlackRock
The Board, including the Independent Board Members, reviewed the nature, extent and quality of services provided by BlackRock, including the investment advisory services and the resulting performance of each Fund. Throughout the year, the Board compared each Fund’s performance to the performance of a comparable group of mutual funds, relevant benchmark, and performance metrics, as applicable. The Board met with BlackRock’s senior management personnel responsible for investment activities, including the senior investment officers. The Board also reviewed the materials provided by each Fund’s portfolio management team discussing the Fund’s performance, investment strategies and outlook.
The Board considered, among other factors, with respect to BlackRock: the experience of investment personnel generally and each Fund’s portfolio management team; research capabilities; investments by portfolio managers in the funds they manage; portfolio trading capabilities; use of technology; commitment to compliance; credit analysis capabilities; risk analysis and oversight capabilities; and the approach to training and retaining portfolio managers and other research, advisory and management personnel. The Board also considered BlackRock’s overall risk management program, including the continued efforts of BlackRock and its affiliates to address cybersecurity risks and the role of BlackRock’s Risk & Quantitative Analysis Group. The Board engaged in a review of BlackRock’s compensation structure with respect to each Fund’s portfolio management team and BlackRock’s ability to attract and retain high-quality talent and create performance incentives.
In addition to investment advisory services, the Board considered the nature and quality of the administrative and other non-investment advisory services provided to each Fund. BlackRock and its affiliates provide the Funds with certain administrative, shareholder and other services (in addition to any such services provided to the Funds by third-parties) and officers and other personnel as are necessary for the operations of the Funds. In particular, BlackRock and its affiliates provide the Funds with administrative services including, among others: (i) responsibility for disclosure documents, such as the prospectus, the summary prospectus (as applicable), the statement of additional information and periodic shareholder reports; (ii) oversight of daily accounting and pricing; (iii) responsibility for periodic filings with regulators; (iv) overseeing and coordinating the activities of third-party service providers, including, among others, each Fund’s custodian, fund accountant, transfer agent, and auditor; (v) organizing Board meetings and preparing the materials for such Board meetings; (vi) providing legal and compliance support; (vii) furnishing analytical and other support to assist the Board in its consideration of strategic issues such as the merger, consolidation or repurposing of certain open-end funds; and (viii) performing or managing administrative functions necessary for the operation of the Funds, such as tax reporting, expense management, fulfilling regulatory filing requirements, overseeing each Fund’s distribution partners, and shareholder call center and other services. The Board reviewed the structure and duties of BlackRock’s fund administration, shareholder services, and legal and compliance departments and considered BlackRock’s policies and procedures for assuring compliance with applicable laws and regulations. The Board considered the operation of BlackRock’s business continuity plans.
The Board noted that the engagement of the Sub-Advisor with respect to the Energy Opportunities Fund and International Dividend Fund facilitates the provision of investment advice and trading by investment personnel out of non-U.S. jurisdictions. The Board considered that this arrangement provides additional flexibility to the portfolio management team, which may benefit Energy Opportunities Fund and International Dividend Fund and their shareholders.
| B: | The Investment Performance of the Funds and BlackRock |
The Board, including the Independent Board Members, reviewed and considered the performance history of each Fund throughout the year and at the April Meeting. In preparation for the April Meeting, the Board was provided with reports independently prepared by Broadridge, which included an analysis of each Fund’s performance as of December 31, 2022, as compared to its Performance Peers. Broadridge ranks funds in quartiles, ranging from first to fourth, where first is the most desirable quartile position and fourth is the least desirable. In connection with its review, with respect to each Fund, the Board received and reviewed information regarding the investment performance of the Fund as compared to its Performance Peers and, with respect to Energy Opportunities Fund and High Equity Income Fund, the respective Morningstar Category (“Morningstar Category”) and, with respect to International Dividend Fund, the respective Lipper Classification (“Lipper Classification”). The Board and its Performance Oversight Committee regularly review and meet with Fund management to discuss the performance of each Fund throughout the year.
In evaluating performance, the Board focused particular attention on funds with less favorable performance records. The Board also noted that while it found the data provided by Broadridge generally useful, it recognized the limitations of such data, including in particular, that notable differences may exist between a fund and its Performance Peers (for example, the investment objectives and strategies). Further, the Board recognized that the performance data reflects a snapshot of a period as of a particular date and that selecting a different performance period could produce significantly different results. The Board also acknowledged that long-term performance could be impacted by even one period of significant outperformance or underperformance, and that a single investment theme could have the ability to disproportionately affect long-term performance.
The Board noted that for each of the one-, three- and five-year periods reported, High Equity Income Fund ranked in the first quartile against its Morningstar Category. The Board noted that BlackRock believes that the Morningstar Category is an appropriate performance metric for the Fund, and that BlackRock has explained its rationale for this belief to the Board.
The Board noted that for the one-, three- and five-year periods reported, International Dividend Fund ranked in the second, first and first quartiles, respectively, against its Lipper Classification. The Board noted that BlackRock believes that the Lipper Classification is an appropriate performance metric for the Fund, and that BlackRock has explained its rationale for this belief to the Board.
DISCLOSURE OF INVESTMENT ADVISORY AGREEMENT AND SUB - ADVISORY AGREEMENTS | 55 |
Disclosure of Investment Advisory Agreement and Sub-Advisory Agreements (continued)
The Board noted that for the one-, three- and five-year periods reported, Energy Opportunities Fund ranked in the third, third and second quartiles, respectively, against its Morningstar Category. The Board noted that BlackRock believes that the Morningstar Category is an appropriate performance metric for the Fund, and that BlackRock has explained its rationale for this belief to the Board. The Board and BlackRock reviewed the Fund’s underperformance relative to its Morningstar Category during the applicable periods.
C: Consideration of the Advisory/Management Fees and the Estimated Cost of the Services and Estimated Profits Realized by BlackRock and its Affiliates from their Relationship with the Funds
The Board, including the Independent Board Members, reviewed each Fund’s contractual management fee rate compared with those of its Expense Peers. The contractual management fee rate represents a combination of the advisory fee and any administrative fees, before taking into account any reimbursements or fee waivers. The Board also compared each Fund’s total expense ratio, as well as its actual management fee rate, to those of its Expense Peers. The total expense ratio represents a fund’s total net operating expenses, including any 12b-1 or non-12b-1 service fees. The total expense ratio gives effect to any expense reimbursements or fee waivers, and the actual management fee rate gives effect to any management fee reimbursements or waivers. The Board considered that the fee and expense information in the Broadridge report for the Fund reflected information for a specific period and that historical asset levels and expenses may differ from current levels, particularly in a period of market volatility. The Board considered the services provided and the fees charged by BlackRock and its affiliates to other types of clients with similar investment mandates, as applicable, including institutional accounts and sub-advised mutual funds (including mutual funds sponsored by third parties).
The Board received and reviewed statements relating to BlackRock’s financial condition. The Board reviewed BlackRock’s profitability methodology and was also provided with an estimated profitability analysis that detailed the revenues earned and the expenses incurred by BlackRock for services provided to each Fund. The Board reviewed BlackRock’s estimated profitability with respect to each Fund and other funds the Board currently oversees for the year ended December 31, 2022 compared to available aggregate estimated profitability data provided for the prior two years. The Board reviewed BlackRock’s estimated profitability with respect to certain other U.S. fund complexes managed by the Manager and/or its affiliates. The Board reviewed BlackRock’s assumptions and methodology of allocating expenses in the estimated profitability analysis, noting the inherent limitations in allocating costs among various advisory products. The Board recognized that profitability may be affected by numerous factors including, among other things, fee waivers and expense reimbursements by the Manager, the types of funds managed, precision of expense allocations and business mix. The Board thus recognized that calculating and comparing profitability at the individual fund level is difficult.
The Board noted that, in general, individual fund or product line profitability of other advisors is not publicly available. The Board reviewed BlackRock’s overall operating margin, in general, compared to that of certain other publicly traded asset management firms. The Board considered the differences between BlackRock and these other firms, including the contribution of technology at BlackRock, BlackRock’s expense management, and the relative product mix.
The Board considered whether BlackRock has the financial resources necessary to attract and retain high quality investment management personnel to perform its obligations under the Agreements and to continue to provide the high quality of services that is expected by the Board. The Board further considered factors including but not limited to BlackRock’s commitment of time and resources, assumption of risk, and liability profile in servicing the Funds, including in contrast to what is required of BlackRock with respect to other products with similar investment mandates across the open-end fund, ETF, closed-end fund, sub-advised mutual fund, separately managed account, collective investment trust, and institutional separate account product channels, as applicable.
The Board noted that Energy Opportunities Fund’s contractual management fee rate ranked in the fourth quartile, and that the actual management fee rate and total expense ratio ranked in the fourth and second quartiles, respectively, relative to the Fund’s Expense Peers. The Board further noted that BlackRock and the Board have contractually agreed to a cap on the Fund’s total expenses as a percentage of the Fund’s average daily net assets on a class-by-class basis.
The Board noted that International Dividend Fund’s contractual management fee rate ranked in the third quartile, and that the actual management fee rate and total expense ratio each ranked in the first quartile relative to the Fund’s Expense Peers. After discussion between the Board, including the Independent Board Members, and BlackRock, the Board and BlackRock agreed to a contractual adjustment to reduce specified levels within the breakpoint schedule. This adjustment was implemented on April 19, 2023. The Board further noted that BlackRock and the Board have contractually agreed to a cap on the Fund’s total operating expenses as a percentage of the Fund’s average daily net assets on a class-by-class basis. After discussions between the Board, including the Independent Board Members, and BlackRock, the Board and BlackRock agreed to a lower contractual expense cap, on a class-by-class basis. The contractual expense cap reduction was implemented on April 19, 2023.
The Board noted that High Equity Income Fund’s contractual management fee rate ranked in the third quartile, and that the actual management fee rate and total expense ratio ranked in the third and first quartiles, respectively, relative to the Fund’s Expense Peers. The Board further noted that BlackRock and the Board have contractually agreed to a cap on the Fund’s total expenses as a percentage of the Fund’s average daily net assets on a class-by-class basis.
The Board also noted that each Fund has an advisory fee arrangement that includes breakpoints that adjust the fee rate downward as the size of the Fund increases above certain contractually specified levels. The Board additionally noted that the breakpoints can, conversely, adjust the advisory fee rate upward as the size of a Fund decreases below certain contractually specified levels.
D: Economies of Scale
The Board, including the Independent Board Members, considered the extent to which economies of scale might be realized as the assets of the Funds increase, including the existence of fee waivers and/or expense caps, as applicable, noting that any contractual fee waivers and contractual expense caps had been approved by the Board. In its consideration, the Board further considered the continuation and/or implementation of fee waivers and/or expense caps, as applicable. The Board also considered the extent to which the Funds benefit from such economies of scale in a variety of ways, and whether there should be changes in the advisory fee rate or breakpoint structure in order to enable the Funds to more fully participate in these economies of scale. The Board considered each Fund’s asset levels and whether the current fee schedule was appropriate.
| 56 | 2 0 2 3 B L A C K R O C K A N N U A L R E P O R T T O S H A R E H O L D E R S |
Disclosure of Investment Advisory Agreement and Sub-Advisory Agreements (continued)
E: Other Factors Deemed Relevant by the Board Members
The Board, including the Independent Board Members, also took into account other ancillary or “fall-out” benefits that BlackRock or its affiliates may derive from BlackRock’s respective relationships with the Funds, both tangible and intangible, such as BlackRock’s ability to leverage its investment professionals who manage other portfolios and its risk management personnel, an increase in BlackRock’s profile in the investment advisory community, and the engagement of BlackRock’s affiliates as service providers to the Funds, including for administrative, distribution, securities lending and cash management services. With respect to securities lending, during the year the Board also considered information provided by independent third-party consultants related to the performance of each BlackRock affiliate as securities lending agent. The Board also considered BlackRock’s overall operations and its efforts to expand the scale of, and improve the quality of, its operations. The Board also noted that, subject to applicable law, BlackRock may use and benefit from third-party research obtained by soft dollars generated by certain registered fund transactions to assist in managing all or a number of its other client accounts.
In connection with its consideration of the Agreements, the Board also received information regarding BlackRock’s brokerage and soft dollar practices. The Board received reports from BlackRock which included information on brokerage commissions and trade execution practices throughout the year.
The Board noted the competitive nature of the open-end fund marketplace, and that shareholders are able to redeem their Fund shares if they believe that the pertinent Fund’s fees and expenses are too high or if they are dissatisfied with the performance of the Fund.
Conclusion
At the May Meeting, in a continuation of the discussions that occurred during the April Meeting, and as a culmination of the Board’s year-long deliberative process, the Board, including the Independent Board Members, unanimously approved the continuation of (i) the Advisory Agreement between the Manager and the Trust, on behalf of each Fund; (ii) the International Dividend Fund Sub-Advisory Agreement between the Manager and the Sub-Advisor with respect to International Dividend Fund; and (iii) the Energy Opportunities Fund Sub-Advisory Agreement between the Manager and the Sub-Advisor with respect to Energy Opportunities Fund, each for a one-year term ending June 30, 2024. Based upon its evaluation of all of the aforementioned factors in their totality, as well as other information, the Board, including the Independent Board Members, was satisfied that the terms of the Agreements were fair and reasonable and, in the best interest of each Fund and its shareholders. In arriving at its decision to approve the Agreements, the Board did not identify any single factor or group of factors as all-important or controlling, but considered all factors together, and different Board Members may have attributed different weights to the various factors considered. The Independent Board Members were advised by independent legal counsel throughout the deliberative process.
DISCLOSURE OF INVESTMENT ADVISORY AGREEMENT AND SUB - ADVISORY AGREEMENTS | 57 |
Trustee and Officer Information
| Independent Trustees(a) | ||||||||
Name Year of Birth(b) | Position(s) Held (Length of Service)(c) | Principal Occupation(s) During Past 5 Years | Number of BlackRock-Advised Registered Investment Companies (“RICs”) Consisting of Investment | Public Company and Other Investment Company Directorships Held During Past 5 Years | ||||
Mark Stalnecker 1951 | Chair of the Board (Since 2019) and Trustee (Since 2015) | Chief Investment Officer, University of Delaware from 1999 to 2013; Trustee and Chair of the Finance and Investment Committees, Winterthur Museum and Country Estate from 2005 to 2016; Member of the Investment Committee, Delaware Public Employees’ Retirement System since 2002; Member of the Investment Committee, Christiana Care Health System from 2009 to 2017; Member of the Investment Committee, Delaware Community Foundation from 2013 to 2014; Director and Chair of the Audit Committee, SEI Private Trust Co. from 2001 to 2014. | 28 RICs consisting of 167 Portfolios | None | ||||
Susan J. Carter 1956 | Trustee (Since 2016) | Trustee, Financial Accounting Foundation from 2017 to 2021; Advisory Board Member, Center for Private Equity and Entrepreneurship at Tuck School of Business from 1997 to 2021; Director, Pacific Pension Institute from 2014 to 2018; Senior Advisor, Commonfund Capital, Inc. (“CCI”) (investment adviser) in 2015; Chief Executive Officer, CCI from 2013 to 2014; President & Chief Executive Officer, CCI from 1997 to 2013; Advisory Board Member, Girls Who Invest from 2015 to 2018 and Board Member thereof from 2018 to 2022; Advisory Board Member, Bridges Fund Management since 2016; Practitioner Advisory Board Member, Private Capital Research Institute (“PCRI”) since 2017; Lecturer in the Practice of Management, Yale School of Management since 2019; Advisor to Finance Committee, Altman Foundation since 2020; Investment Committee Member, Tostan since 2021; Member of the President’s Counsel, Commonfund since 2023. | 28 RICs consisting of 167 Portfolios | None | ||||
Collette Chilton 1958 | Trustee (Since 2015) | Chief Investment Officer, Williams College since 2006; Chief Investment Officer, Lucent Asset Management Corporation from 1998 to 2006; Director, Boys and Girls Club of Boston since 2017; Director, B1 Capital since 2018; Director, David and Lucile Packard Foundation since 2020. | 28 RICs consisting of 167 Portfolios | None | ||||
Neil A. Cotty 1954 | Trustee (Since 2016) | Bank of America Corporation from 1996 to 2015, serving in various senior finance leadership roles, including Chief Accounting Officer from 2009 to 2015, Chief Financial Officer of Global Banking, Markets and Wealth Management from 2008 to 2009, Chief Accounting Officer from 2004 to 2008, Chief Financial Officer of Consumer Bank from 2003 to 2004, Chief Financial Officer of Global Corporate Investment Bank from 1999 to 2002. | 28 RICs consisting of 167 Portfolios | None | ||||
Lena G. Goldberg 1949 | Trustee (Since 2019) | Director, Pioneer Legal Institute since 2023; Director, Charles Stark Draper Laboratory, Inc. from 2013 to 2021; Senior Lecturer, Harvard Business School from 2008 to 2021; FMR LLC/Fidelity Investments (financial services) from 1996 to 2008, serving in various senior roles including Executive Vice President - Strategic Corporate Initiatives and Executive Vice President and General Counsel; Partner, Sullivan & Worcester LLP from 1985 to 1996 and Associate thereof from 1979 to 1985. | 28 RICs consisting of 167 Portfolios | None | ||||
| 58 | 2 0 2 3 B L A C K R O C K A N N U A L R E P O R T T O S H A R E H O L D E R S |
Trustee and Officer Information (continued)
| Independent Trustees(a) | ||||||||
Name Year of Birth(b) | Position(s) Held (Length of Service)(c) | Principal Occupation(s) During Past 5 Years | Number of BlackRock-Advised Registered Investment Companies (“RICs”) Consisting of Investment | Public Company and Other Investment Company Directorships Held During Past 5 Years | ||||
Henry R. Keizer 1956 | Trustee (Since 2019) | Director, Park Indemnity Ltd. (captive insurer) from 2010 to 2022. | 28 RICs consisting of 167 Portfolios | GrafTech International Ltd. (materials manufacturing); Sealed Air Corp. (packaging); WABCO (commercial vehicle safety systems) from 2015 to 2020; Hertz Global Holdings (car rental) from 2015 to 2021. | ||||
Cynthia A. Montgomery 1952 | Trustee (Since 2007) | Professor, Harvard Business School since 1989. | 28 RICs consisting of 167 Portfolios | None | ||||
Donald C. Opatrny 1952 | Trustee (Since 2019) | Chair of the Board of Phoenix Art Museum since 2022 and Trustee thereof since 2018; Chair of the Investment Committee of The Arizona Community Foundation since 2022 and trustee thereof since 2020; Director, Athena Capital Advisors LLC (investment management firm) from 2013 to 2020; Trustee, Vice Chair, Member of the Executive Committee and Chair of the Investment Committee, Cornell University from 2004 to 2019; President and Trustee, the Center for the Arts, Jackson Hole from 2011 to 2018; Member of the Board and Investment Committee, University School from 2007 to 2018; Member of Affordable Housing Supply Board of Jackson, Wyoming since 2017; Member, Investment Funds Committee, State of Wyoming since 2017; Trustee, Artstor (a Mellon Foundation affiliate) from 2010 to 2015; Member of the Investment Committee, Mellon Foundation from 2009 to 2015; President, Trustee and Member of the Investment Committee, The Aldrich Contemporary Art Museum from 2007 to 2014; Trustee and Chair of the Investment Committee, Community Foundation of Jackson Hole since 2014. | 28 RICs consisting of 167 Portfolios | None | ||||
Kenneth L. Urish 1951 | Trustee (Since 2007) | Managing Partner, Urish Popeck & Co., LLC (certified public accountants and consultants) since 1976; Past-Chairman of the Professional Ethics Committee of the Pennsylvania Institute of Certified Public Accountants and Committee Member thereof since 2007; Member of External Advisory Board, The Pennsylvania State University Accounting Department since 2001, Emeritus since 2022; Principal, UP Strategic Wealth Investment Advisors, LLC since 2013; Trustee, The Holy Family Institute from 2001 to 2010; President and Trustee, Pittsburgh Catholic Publishing Associates from 2003 to 2008; Director, Inter-Tel from 2006 to 2007; Member, Advisory Board, ESG Competent Boards since 2020. | 28 RICs consisting of 167 Portfolios | None | ||||
��
TRUSTEE AND OFFICER INFORMATION | 59 |
Trustee and Officer Information (continued)
| Independent Trustees(a) | ||||||||
Name Year of Birth(b) | Position(s) Held (Length of Service)(c) | Principal Occupation(s) During Past 5 Years | Number of BlackRock-Advised Registered Investment Companies (“RICs”) Consisting of Investment | Public Company and Other Investment Company Directorships Held During Past 5 Years | ||||
Claire A. Walton 1957 | Trustee (Since 2016) | Advisory Board Member, Grossman School of Business at the University of Vermont since 2023; Advisory Board Member, Scientific Financial Systems since 2022; General Partner of Neon Liberty Capital Management, LLC since 2003; Chief Operating Officer and Chief Financial Officer of Liberty Square Asset Management, LP from 1998 to 2015; Director, Boston Hedge Fund Group from 2009 to 2018; Director, Massachusetts Council on Economic Education from 2013 to 2015.; Director, Woodstock Ski Runners from 2013 to 2022. | 28 RICs consisting of 167 Portfolios | None | ||||
| 60 | 2 0 2 3 B L A C K R O C K A N N U A L R E P O R T T O S H A R E H O L D E R S |
Trustee and Officer Information (continued)
| Interested Trustees(a)(d) | ||||||||
Name Year of Birth(b) | Position(s) Held (Length of Service)(c) | Principal Occupation(s) During Past 5 Years | Number of BlackRock-Advised Registered Investment Companies (“RICs”) Consisting of Investment | Public Company and Other Investment Company Directorships Held During Past 5 Years | ||||
Robert Fairbairn 1965 | Trustee (Since 2018) | Vice Chairman of BlackRock, Inc. since 2019; Member of BlackRock’s Global Executive and Global Operating Committees; Co-Chair of BlackRock’s Human Capital Committee; Senior Managing Director of BlackRock, Inc. from 2010 to 2019; oversaw BlackRock’s Strategic Partner Program and Strategic Product Management Group from 2012 to 2019; Member of the Board of Managers of BlackRock Investments, LLC from 2011 to 2018; Global Head of BlackRock’s Retail and iShares® businesses from 2012 to 2016. | 98 RICs consisting of 268 Portfolios | None | ||||
John M. Perlowski(e) 1964 | Trustee (Since 2015), President and Chief Executive Officer (Since 2010) | Managing Director of BlackRock, Inc. since 2009; Head of BlackRock Global Accounting and Product Services since 2009; Advisory Director of Family Resource Network (charitable foundation) since 2009. | 100 RICs consisting of 270 Portfolios | None | ||||
| (a) | The address of each Trustee is c/o BlackRock, Inc., 50 Hudson Yards, New York, NY 10001. |
| (b) | Independent Trustees serve until their resignation, retirement, removal or death, or until December 31 of the year in which they turn 75. The Board may determine to extend the terms of Independent Trustees on a case-by-case basis, as appropriate. |
| (c) | Following the combination of Merrill Lynch Investment Managers, L.P. (“MLIM”) and BlackRock, Inc. in September 2006, the various legacy MLIM and legacy BlackRock fund boards were realigned and consolidated into three new fund boards in 2007. Furthermore, effective January 1, 2019, three BlackRock Fund Complexes were realigned and consolidated into two BlackRock Fund Complexes. As a result, although the chart shows the year that each Independent Trustee joined the Board, certain Independent Trustees first became members of the boards of other BlackRock-advised Funds, legacy MLIM funds or legacy BlackRock funds as follows: Cynthia A. Montgomery, 1994; Kenneth L. Urish, 1999; Lena G. Goldberg, 2016; Henry R. Keizer, 2016; Donald C. Opatrny, 2015. |
| (d) | Mr. Fairbairn and Mr. Perlowski are both “interested persons,” as defined in the 1940 Act, of the Trust based on their positions with BlackRock, Inc. and its affiliates. Mr. Fairbairn and Mr. Perlowski are also board members of the BlackRock Fixed-Income Complex. |
| (e) | Mr. Perlowski is also a trustee of the BlackRock Credit Strategies Fund and BlackRock Private Investments Fund. |
T R U S T E E A N D O F F I C E R I N F O R M A T I O N | 61 |
Trustee and Officer Information (continued)
| Officers Who Are Not Trustees(a) | ||||
Name Year of Birth(b) | Position(s) Held (Length of Service) | Principal Occupation(s) During Past 5 Years | ||
Roland Villacorta 1971 | Vice President (Since 2022) | Managing Director of BlackRock, Inc. since 2022; Head of Global Cash Management and Head of Securities Lending within BlackRock’s Portfolio Management Group since 2022; Member of BlackRock’s Global Operating Committee since 2022; Head of Portfolio Management in BlackRock’s Financial Markets Advisory Group within BlackRock Solutions from 2008 to 2015; Co-Head of BlackRock Solutions’ Portfolio Analytics Group; previously Mr. Villacorta was Co-Head of Fixed Income within BlackRock’s Risk & Quantitative Analysis Group. | ||
Jennifer McGovern 1977 | Vice President (Since 2014) | Managing Director of BlackRock, Inc. since 2016; Director of BlackRock, Inc. from 2011 to 2015; Head of Americas Product Development and Governance for BlackRock’s Global Product Group since 2019; Head of Product Structure and Oversight for BlackRock’s U.S. Wealth Advisory Group from 2013 to 2019. | ||
Trent Walker 1974 | Chief Financial Officer (Since 2021) | Managing Director of BlackRock, Inc. since September 2019; Executive Vice President of PIMCO from 2016 to 2019; Senior Vice President of PIMCO from 2008 to 2015; Treasurer from 2013 to 2019 and Assistant Treasurer from 2007 to 2017 of PIMCO Funds, PIMCO Variable Insurance Trust, PIMCO ETF Trust, PIMCO Equity Series, PIMCO Equity Series VIT, PIMCO Managed Accounts Trust, 2 PIMCO-sponsored interval funds and 21 PIMCO-sponsored closed-end funds. | ||
Jay M. Fife 1970 | Treasurer (Since 2007) | Managing Director of BlackRock, Inc. since 2007. | ||
Charles Park 1967 | Chief Compliance Officer (Since 2014) | Anti-Money Laundering Compliance Officer for certain BlackRock-advised Funds from 2014 to 2015; Chief Compliance Officer of BlackRock Advisors, LLC and the BlackRock-advised Funds in the BlackRock Multi-Asset Complex and the BlackRock Fixed-Income Complex since 2014; Principal of and Chief Compliance Officer for iShares® Delaware Trust Sponsor LLC since 2012 and BlackRock Fund Advisors (“BFA”) since 2006; Chief Compliance Officer for the BFA-advised iShares® exchange traded funds since 2006; Chief Compliance Officer for BlackRock Asset Management International Inc. since 2012. | ||
Lisa Belle 1968 | Anti-Money Laundering Compliance Officer (Since 2019) | Managing Director of BlackRock, Inc. since 2019; Global Financial Crime Head for Asset and Wealth Management of JP Morgan from 2013 to 2019; Managing Director of RBS Securities from 2012 to 2013; Head of Financial Crimes for Barclays Wealth Americas from 2010 to 2012. | ||
Janey Ahn 1975 | Secretary (Since 2019) | Managing Director of BlackRock, Inc. since 2018; Director of BlackRock, Inc. from 2009 to 2017. | ||
| (a) | The address of each Officer is c/o BlackRock, Inc., 50 Hudson Yards, New York, NY 10001. |
| (b) | Officers of the Trust serve at the pleasure of the Board. |
Further information about the Trust’s Trustees and Officers is available in the Trust’s Statement of Additional Information, which can be obtained without charge by calling (800) 441-7762.
Effective December 31, 2022, Joseph P. Platt retired as a Trustee of the Trust.
Effective July 1, 2023, Aaron Wasserman replaced Charles Park as Chief Compliance Officer of the Trust.
| 62 | 2 0 2 3 B L A C K R O C K A N N U A L R E P O R T T O S H A R E H O L D E R S |
Tailored Shareholder Reports for Mutual Funds and ETFs
Effective January 24, 2023, the SEC adopted rule and form amendments to require mutual funds and ETFs to transmit concise and visually engaging streamlined annual and semiannual reports to shareholders that highlight key information. Other information, including financial statements, will no longer appear in a streamlined shareholder report but must be available online, delivered free of charge upon request, and filed on a semiannual basis on Form N-CSR. The rule and form amendments have a compliance date of July 24, 2024. At this time, management is evaluating the impact of these amendments on the shareholder reports for the Funds.
General Information
Quarterly performance, semi-annual and annual reports, current net asset value and other information regarding the Funds may be found on BlackRock’s website, which can be accessed at blackrock.com. Any reference to BlackRock’s website in this report is intended to allow investors public access to information regarding the Funds and does not, and is not intended to, incorporate BlackRock’s website in this report.
Householding
The Funds will mail only one copy of shareholder documents, including prospectuses, annual and semi-annual reports, Rule 30e-3 notices and proxy statements, to shareholders with multiple accounts at the same address. This practice is commonly called “householding” and is intended to reduce expenses and eliminate duplicate mailings of shareholder documents. Mailings of your shareholder documents may be householded indefinitely unless you instruct us otherwise. If you do not want the mailing of these documents to be combined with those for other members of your household, please call the Funds at (800) 441-7762.
Availability of Quarterly Schedule of Investments
The Funds file their complete schedules of portfolio holdings with the SEC for the first and third quarters of each fiscal year as an exhibit to their reports on Form N-PORT. The Funds’ Forms N-PORT are available on the SEC’s website at sec.gov. Additionally, each Fund makes its portfolio holdings for the first and third quarters of each fiscal year available at blackrock.com/fundreports.
Availability of Proxy Voting Policies, Procedures and Voting Records
A description of the policies and procedures that the Funds use to determine how to vote proxies relating to portfolio securities and information about how the Funds voted proxies relating to securities held in the Funds’ portfolios during the most recent 12-month period ended June 30 is available without charge, upon request (1) by calling (800) 441-7762; (2) on the BlackRock website at blackrock.com; and (3) on the SEC’s website at sec.gov.
BlackRock’s Mutual Fund Family
BlackRock offers a diverse lineup of open-end mutual funds crossing all investment styles and managed by experts in equity, fixed-income and tax-exempt investing. Visit blackrock.com for more information.
Shareholder Privileges
Account Information
Call us at (800) 441-7762 from 8:00 AM to 6:00 PM ET on any business day to get information about your account balances, recent transactions and share prices. You can also visit blackrock.com for more information.
Automatic Investment Plans
Investor class shareholders who want to invest regularly can arrange to have $50 or more automatically deducted from their checking or savings account and invested in any of the BlackRock funds.
Systematic Withdrawal Plans
Investor class shareholders can establish a systematic withdrawal plan and receive periodic payments of $50 or more from their BlackRock funds, as long as their account balance is at least $10,000.
Retirement Plans
Shareholders may make investments in conjunction with Traditional, Rollover, Roth, Coverdell, Simple IRAs, SEP IRAs and 403(b) Plans.
BlackRock Privacy Principles
BlackRock is committed to maintaining the privacy of its current and former fund investors and individual clients (collectively, “Clients”) and to safeguarding their non-public personal information. The following information is provided to help you understand what personal information BlackRock collects, how we protect that information and why in certain cases we share such information with select parties.
ADDITIONAL INFORMATION | 63 |
Additional Information (continued)
If you are located in a jurisdiction where specific laws, rules or regulations require BlackRock to provide you with additional or different privacy-related rights beyond what is set forth below, then BlackRock will comply with those specific laws, rules or regulations.
BlackRock obtains or verifies personal non-public information from and about you from different sources, including the following: (i) information we receive from you or, if applicable, your financial intermediary, on applications, forms or other documents; (ii) information about your transactions with us, our affiliates, or others; (iii) information we receive from a consumer reporting agency; and (iv) from visits to our websites.
BlackRock does not sell or disclose to non-affiliated third parties any non-public personal information about its Clients, except as permitted by law or as is necessary to respond to regulatory requests or to service Client accounts. These non-affiliated third parties are required to protect the confidentiality and security of this information and to use it only for its intended purpose.
We may share information with our affiliates to service your account or to provide you with information about other BlackRock products or services that may be of interest to you. In addition, BlackRock restricts access to non-public personal information about its Clients to those BlackRock employees with a legitimate business need for the information. BlackRock maintains physical, electronic and procedural safeguards that are designed to protect the non-public personal information of its Clients, including procedures relating to the proper storage and disposal of such information.
Fund and Service Providers
| Investment Adviser and Administrator | Independent Registered Public Accounting Firm | |
| BlackRock Advisors, LLC | Deloitte & Touche LLP | |
| Wilmington, DE 19809 | Boston, MA 02116 | |
| Sub-Adviser(a) | Distributor | |
| BlackRock International Limited | BlackRock Investments, LLC | |
| Edinburgh, EH3 8BL | New York, NY 10022 | |
| United Kingdom | ||
| Legal Counsel | ||
| Accounting Agent and Transfer Agent | Sidley Austin LLP | |
| BNY Mellon Investment Servicing (US) Inc. | New York, NY 10019 | |
| Wilmington, DE 19809 | ||
| Address of the Trust | ||
| Custodian | 100 Bellevue Parkway | |
| The Bank of New York Mellon | Wilmington, DE 19809 | |
| New York, NY 10286 | ||
(a) BlackRock Energy Opportunities Fund and BlackRock International Dividend Fund.
| 64 | 2 0 2 3 B L A C K R O C K A N N U A L R E P O R T T O S H A R E H O L D E R S |
Glossary of Terms Used in this Report
Currency Abbreviation
| CAD | Canadian Dollar | |
| EUR | Euro | |
| GBP | British Pound | |
| USD | United States Dollar | |
| Portfolio Abbreviation | ||
| ADR | American Depositary Receipt | |
| GDR | Global Depositary Receipt | |
| NVS | Non-Voting Shares | |
GLOSSARY OF TERMS USED IN THIS REPORT | 65 |
Want to know more?
blackrock.com | 800-441-7762
This report is intended for current holders. It is not authorized for use as an offer of sale or a solicitation of an offer to buy shares of the Funds unless preceded or accompanied by the Funds’ current prospectus. Past performance results shown in this report should not be considered a representation of future performance. Investment returns and principal value of shares will fluctuate so that shares, when redeemed, may be worth more or less than their original cost. Statements and other information herein are as dated and are subject to change.
EHI-5/23-AR
|  |

| MAY 31, 2023 |

| 2023 Annual Report
| |
BlackRock FundsSM
| · | BlackRock Commodity Strategies Fund |
| Not FDIC Insured • May Lose Value • No Bank Guarantee |
Dear Shareholder,
Investors faced an uncertain economic landscape during the 12-month reporting period ended May 31, 2023, amid mixed indicators and rapidly changing market conditions. The U.S. economy returned to modest growth beginning in the third quarter of 2022, although the pace of growth slowed thereafter. Inflation was elevated, reaching a 40-year high as labor costs grew rapidly and unemployment rates reached the lowest levels in decades. However, inflation moderated as the period continued, while continued strength in consumer spending backstopped the economy.
Equity returns varied substantially, as large-capitalization U.S. stocks gained for the period amid a rebound in big tech stocks, whereas small-capitalization U.S. stocks declined. International equities from developed markets advanced, while emerging market stocks declined substantially, pressured by higher interest rates and falling commodities prices.
The 10-year U.S. Treasury yield rose during the reporting period, driving its price down, as investors reacted to elevated inflation and attempted to anticipate future interest rate changes. The corporate bond market also faced inflationary headwinds, although high-yield corporate bond prices fared better than investment-grade bonds as demand from yield-seeking investors remained strong.
The U.S. Federal Reserve (the “Fed”), acknowledging that inflation has been more persistent than expected, raised interest rates eight times. Furthermore, the Fed wound down its bond-buying programs and incrementally reduced its balance sheet by not replacing securities that reach maturity. In addition, the Fed added liquidity to markets amid the failure of prominent regional banks.
Restricted labor supply kept inflation elevated even as other inflation drivers, such as goods prices and energy costs, moderated. While economic growth was modest in the last year, we believe that stickiness in services inflation and continued wage growth will keep inflation above central bank targets for some time. Although the Fed has decelerated the pace of interest rate hikes and most recently opted for a pause, we believe that the Fed is likely to keep rates high for an extended period to get inflation under control. With this in mind, we believe the possibility of a U.S. recession in the near term is high, but the dimming economic outlook has not yet been fully reflected in current market prices. We believe investors should expect a period of higher volatility as markets adjust to the new economic reality and policymakers attempt to adapt. Resolution of the debt ceiling standoff late in the period eliminated one source of uncertainty, but the relatively modest spending cuts won’t move the needle on the government’s substantial debt burden.
While we favor an overweight to equities in the long term, we prefer an underweight stance on equities overall in the near term. Expectations for corporate earnings remain elevated, which seems inconsistent with the possibility of a recession. Nevertheless, we are overweight on emerging market stocks as we believe a weakening U.S. dollar could provide a supportive backdrop. While we are neutral on credit overall amid tightening credit and financial conditions, there are selective opportunities in the near term. For fixed income investing with a six- to twelve-month horizon, we see the most attractive investments in short-term U.S. Treasuries, global inflation-linked bonds, and emerging market bonds denominated in local currency.
Overall, our view is that investors need to think globally, position themselves to be prepared for a decarbonizing economy, and be nimble as market conditions change. We encourage you to talk with your financial advisor and visit blackrock.com for further insight about investing in today’s markets.
Sincerely,

Rob Kapito
President, BlackRock Advisors, LLC

Rob Kapito
President, BlackRock Advisors, LLC
| Total Returns as of May 31, 2023 | ||||
| 6-Month | 12-Month | |||
U.S. large cap equities | 3.33% | 2.92% | ||
U.S. small cap equities | (6.53) | (4.68) | ||
International equities (MSCI Europe, Australasia, Far East Index) | 6.89 | 3.06 | ||
Emerging market equities (MSCI Emerging Markets Index) | (0.37) | (8.49) | ||
3-month Treasury bills | 2.16 | 3.16 | ||
U.S. Treasury securities | 1.78 | (3.65) | ||
U.S. investment grade bonds (Bloomberg U.S. Aggregate Bond Index) | 2.00 | (2.14) | ||
Tax-exempt municipal bonds (Bloomberg Municipal Bond Index) | 1.94 | 0.49 | ||
U.S. high yield bonds | 3.01 | 0.05 | ||
| Past performance is not an indication of future results. Index performance is shown for illustrative purposes only. You cannot invest directly in an index. | ||||
| 2 | THIS PAGE IS NOT PART OF YOUR FUND REPORT |
| Page | ||||
| ||||
| 2 | ||||
Annual Report: | ||||
| 4 | ||||
| 7 | ||||
| 7 | ||||
| 7 | ||||
Consolidated Financial Statements: | ||||
| 8 | ||||
| 16 | ||||
| 18 | ||||
| 19 | ||||
| 20 | ||||
| 24 | ||||
| 35 | ||||
| 36 | ||||
| 37 | ||||
| 40 | ||||
| 45 | ||||
| 47 | ||||

| 3 |
| Fund Summary as of May 31, 2023 | BlackRock Commodity Strategies Fund |
Investment Objective
BlackRock Commodity Strategies Fund’s (the “Fund”) investment objective is to seek total return.
Portfolio Management Commentary
How did the Fund perform?
For the 12-month reporting period that ended on May 31, 2023, the Fund outperformed its benchmark, the Bloomberg Commodity Index Total ReturnSM.
What factors influenced performance?
The Fund invests in both commodity futures and natural resources stocks, while the benchmark consists entirely of commodity futures. Since resource stocks outpaced physical commodities, holding equities versus futures made a strong contribution to relative performance.
The Fund’s positioning in the energy and mining sectors contributed to performance. In the former, the shale producer Devon Energy Corp. was a leading contributor to returns. Hess Corp. also contributed to returns, the company beat first quarter 2023 earnings estimates and raised its forward guidance. In the mining sector, the Fund’s position in Sigma Lithium Corp. was the largest contributor behind takeover speculation and surging electric vehicle demand.
Positioning in the oilfield services sector detracted, led by positions in Schlumberger NV and Patterson UTI-Energy, Inc. The Fund’s position in SalMar ASA detracted from returns. The company saw its share price decline after the government of Norway proposed a 40% resource rent tax on salmon farmers.
The Fund achieved its allocation to commodity futures through the use of total return swaps, a form of derivative. The Fund maintained a position in cash and cash equivalents, predominantly comprised of U.S. Treasury bills, as collateral against its position in commodity total return swaps. The cash balance did not have a material impact on results.
Describe recent portfolio activity.
The Fund increased its total allocations to industrial metals and precious metals, reduced its positions in energy, and maintained its agriculture exposure.
Describe portfolio positioning at period end.
When combining the equity and commodity positions, the Fund was overweight in the industrial metals and energy sectors, and it was underweight in precious metals and agriculture. The industrial metals sector represented the largest overweight within the equity portfolio.
The views expressed reflect the opinions of BlackRock as of the date of this report and are subject to change based on changes in market, economic or other conditions. These views are not intended to be a forecast of future events and are no guarantee of future results.
| 4 | 2 0 2 3 BLACK ROCK ANNUAL REPORT TO SHAREHOLDERS |
| Fund Summary as of May 31, 2023 (continued) | BlackRock Commodity Strategies Fund |
GROWTH OF $10,000 INVESTMENT
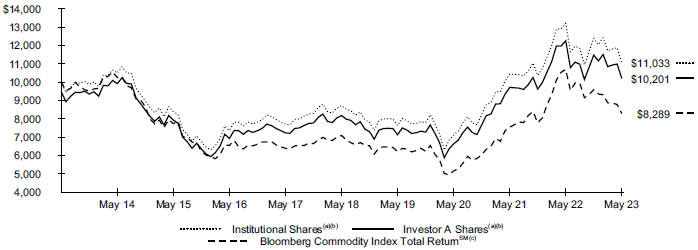
| (a) | Assuming maximum sales charges, if any, transaction costs and other operating expenses, including investment advisory fees and administration fees, if any. Institutional Shares do not have a sales charge. |
| (b) | The Fund utilizes two strategies and under normal circumstances expects to invest approximately 50% of its total assets in each strategy; provided, however, that from time to time, Fund management may alter the weightings if it deems it prudent to do so based on market conditions, trends or movements or other similar factors. One strategy focuses on investments in commodity-linked derivatives. The other strategy focuses on equity investments in commodity-related companies, including, but not limited to, companies operating in the mining, energy and agricultural sectors. |
| (c) | An index composed of futures contracts and reflects the returns on a fully collateralized investment in the Bloomberg Commodity Index (“BCOM”). This combines the returns of the BCOM with the returns on cash collateral invested in 13-week (3-Month) U.S. Treasury Bills. |
Performance
| Average Annual Total Returns(a) | ||||||||||||||||||||||||
| 1 Year | 5 Years | 10 Years | ||||||||||||||||||||||
Without Sales Charge | With Sales Charge | Without Sales Charge | With Sales Charge | Without Sales Charge | With Sales Charge | |||||||||||||||||||
Institutional | (16.46 | )% | N/A | 4.82 | % | N/A | 0.99 | % | N/A | |||||||||||||||
Investor A | (16.76 | ) | (21.13 | )% | 4.53 | 3.41 | % | 0.74 | 0.20 | % | ||||||||||||||
Investor C | (17.34 | ) | (18.10 | ) | 3.77 | 3.77 | 0.15 | 0.15 | ||||||||||||||||
Class K | (16.48 | ) | N/A | 4.84 | N/A | 1.01 | N/A | |||||||||||||||||
Bloomberg Commodity Index Total ReturnSM | (22.48 | ) | N/A | 3.17 | N/A | (1.86 | ) | N/A | ||||||||||||||||
| (a) | Assuming maximum sales charges, if any. Average annual total returns with and without sales charges reflect reductions for distribution and service fees. See “About Fund Performance” for a detailed description of share classes, including any related sales charges and fees, and how performance was calculated for certain share classes. |
N/A - Not applicable as share class and index do not have a sales charge.
Past performance is not an indication of future results.
Performance results may include adjustments made for financial reporting purposes in accordance with U.S. generally accepted accounting principles.
Expense Example
| Actual | Hypothetical 5% Return | |||||||||||||||||||||||||||
| | Beginning Account Value (12/01/22) |
| | Ending Account Value (05/31/23) |
| | Expenses Paid During the Period |
(a) | | Beginning Account Value (12/01/22) |
| | Ending Account Value (05/31/23) |
| | Expenses Paid During the Period |
(a) | | Annualized Expense Ratio |
| ||||||||
Institutional | $ 1,000.00 | $ 890.60 | $ 3.39 | $ 1,000.00 | $ 1,021.34 | $ 3.63 | 0.72 | % | ||||||||||||||||||||
Investor A | 1,000.00 | 889.00 | 4.57 | 1,000.00 | 1,020.09 | 4.89 | 0.97 | |||||||||||||||||||||
Investor C | 1,000.00 | 886.20 | 8.09 | 1,000.00 | 1,016.36 | 8.65 | 1.72 | |||||||||||||||||||||
| Class K | 1,000.00 | 890.90 | 3.16 | 1,000.00 | 1,021.59 | 3.38 | 0.67 | |||||||||||||||||||||
| (a) | For each class of the Fund, expenses are equal to the annualized expense ratio for the class, multiplied by the average account value over the period, multiplied by 182/365 (to reflect the one-half year period shown). |
See “Disclosure of Expenses” for further information on how expenses were calculated.
FUND SUMMARY | 5 |
| Fund Summary as of May 31, 2023 (continued) | BlackRock Commodity Strategies Fund |
Portfolio Information
| TEN LARGEST HOLDINGS | ||||
| Security(a) | Percent of Net Assets | |||
Exxon Mobil Corp. | 3.2 | % | ||
Shell PLC | 1.7 | |||
BHP Group Ltd. | 1.5 | |||
Franco-Nevada Corp. | 1.4 | |||
Wheaton Precious Metals Corp. | 1.3 | |||
TotalEnergies SE | 1.2 | |||
BP PLC | 1.2 | |||
ConocoPhillips | 1.2 | |||
Barrick Gold Corp. | 1.1 | |||
Vale SA, ADR | 1.0 | |||
| SECTOR ALLOCATION | ||||
| Sector(b) | Percent of Net Assets | |||
Materials | 23.7 | % | ||
Energy | 17.7 | |||
Consumer Staples | 4.6 | |||
Industrials | 1.3 | |||
Other (each representing less than 1%) | 1.4 | |||
Short-Term Securities | 53.6 | |||
Liabilities in Excess of Other Assets | (2.3 | ) | ||
| (a) | Excludes short-term securities. |
| (b) | For Fund compliance purposes, the Fund’s sector classifications refer to one or more of the sector sub-classifications used by one or more widely recognized market indexes or ratings group indexes, and/or as defined by the investment adviser. These definitions may not apply for purposes of this report, which may combine such sector sub-classifications for reporting ease. |
| 6 | 2 0 2 3 BLACK ROCK ANNUAL REPORT TO SHAREHOLDERS |
Institutional and Class K Shares are not subject to any sales charge. These shares bear no ongoing distribution or service fees and are available only to certain eligible investors. Class K Shares performance shown prior to the Class K Shares inception date of January 25, 2018 is that of Institutional Shares. The performance of the Fund’s Class K Shares would be substantially similar to Institutional Shares because Class K Shares and Institutional Shares invest in the same portfolio of securities and performance would only differ to the extent that Class K Shares and Institutional Shares have different expenses. The actual returns of Class K Shares would have been higher than those of the Institutional Shares because Class K Shares have lower expenses than the Institutional Shares.
Investor A Shares are subject to a maximum initial sales charge (front-end load) of 5.25% and a service fee of 0.25% per year (but no distribution fee). Certain redemptions of these shares may be subject to a contingent deferred sales charge (“CDSC”) where no initial sales charge was paid at the time of purchase. These shares are generally available through financial intermediaries.
Investor C Shares are subject to a 1.00% CDSC if redeemed within one year of purchase. In addition, these shares are subject to a distribution fee of 0.75% per year and a service fee of 0.25% per year. These shares are generally available through financial intermediaries. These shares automatically convert to Investor A Shares after approximately eight years.
Past performance is not an indication of future results. Financial markets have experienced extreme volatility and trading in many instruments has been disrupted. These circumstances may continue for an extended period of time and may continue to affect adversely the value and liquidity of the Fund’s investments. As a result, current performance may be lower or higher than the performance data quoted. Refer to blackrock.com to obtain performance data current to the most recent month-end. Performance results do not reflect the deduction of taxes that a shareholder would pay on Fund distributions or the redemption of Fund shares. Figures shown in the performance table(s) assume reinvestment of all distributions, if any, at net asset value (“NAV”) on the ex-dividend date or payable date, as applicable. Investment return and principal value of shares will fluctuate so that shares, when redeemed, may be worth more or less than their original cost. Distributions paid to each class of shares will vary because of the different levels of service, distribution and transfer agency fees applicable to each class, which are deducted from the income available to be paid to shareholders.
BlackRock Advisors, LLC (the “Manager”), the Fund’s investment adviser, has contractually and/or voluntarily agreed to waive and/or reimburse a portion of the Fund’s expenses. Without such waiver(s) and/or reimbursement(s), the Fund’s performance would have been lower. With respect to the Fund’s voluntary waiver(s), if any, the Manager is under no obligation to waive and/or reimburse or to continue waiving and/or reimbursing its fees and such voluntary waiver(s) may be reduced or discontinued at any time. With respect to the Fund’s contractual waiver(s), if any, the Manager is under no obligation to continue waiving and/or reimbursing its fees after the applicable termination date of such agreement. See the Notes to Consolidated Financial Statements for additional information on waivers and/or reimbursements.
Shareholders of the Fund may incur the following charges: (a) transactional expenses, such as sales charges; and (b) operating expenses, including investment advisory fees, administration fees, service and distribution fees, including 12b-1 fees, acquired fund fees and expenses, and other fund expenses. The expense example shown (which is based on a hypothetical investment of $1,000 invested at the beginning of the period and held through the end of the period) is intended to assist shareholders both in calculating expenses based on an investment in the Fund and in comparing these expenses with similar costs of investing in other mutual funds.
The expense example provides information about actual account values and actual expenses. Annualized expense ratios reflect contractual and voluntary fee waivers, if any. In order to estimate the expenses a shareholder paid during the period covered by this report, shareholders can divide their account value by $1,000 and then multiply the result by the number corresponding to their share class under the heading entitled “Expenses Paid During the Period.”
The expense example also provides information about hypothetical account values and hypothetical expenses based on the Fund’s actual expense ratio and an assumed rate of return of 5% per year before expenses. In order to assist shareholders in comparing the ongoing expenses of investing in the Fund and other funds, compare the 5% hypothetical example with the 5% hypothetical examples that appear in shareholder reports of other funds.
The expenses shown in the expense example are intended to highlight shareholders’ ongoing costs only and do not reflect transactional expenses, such as sales charges, if any. Therefore, the hypothetical example is useful in comparing ongoing expenses only and will not help shareholders determine the relative total expenses of owning different funds. If these transactional expenses were included, shareholder expenses would have been higher.
Derivative Financial Instruments
The Fund may invest in various derivative financial instruments. These instruments are used to obtain exposure to a security, commodity, index, market, and/or other assets without owning or taking physical custody of securities, commodities and/or other referenced assets or to manage market, equity, credit, interest rate, foreign currency exchange rate, commodity and/or other risks. Derivative financial instruments may give rise to a form of economic leverage and involve risks, including the imperfect correlation between the value of a derivative financial instrument and the underlying asset, possible default of the counterparty to the transaction or illiquidity of the instrument. Pursuant to Rule 18f-4 under the 1940 Act, among other things, the Fund must either use derivative financial instruments with embedded leverage in a limited manner or comply with an outer limit on fund leverage risk based on value-at-risk. The Fund’s successful use of a derivative financial instrument depends on the investment adviser’s ability to predict pertinent market movements accurately, which cannot be assured. The use of these instruments may result in losses greater than if they had not been used, may limit the amount of appreciation the Fund can realize on an investment and/or may result in lower distributions paid to shareholders. The Fund’s investments in these instruments, if any, are discussed in detail in the Notes to Consolidated Financial Statements.
ABOUT FUND PERFORMANCE / DISCLOSURE OF EXPENSES / DERIVATIVE FINANCIAL INSTRUMENTS | 7 |
Consolidated Schedule of Investments May 31, 2023 | BlackRock Commodity Strategies Fund (Percentages shown are based on Net Assets) |
| Security | Shares | Value | ||||||
Common Stocks |
| |||||||
Biotechnology — 0.0% |
| |||||||
Hofseth BioCare ASA(a) | 1,911,352 | $ | 540,679 | |||||
|
| |||||||
Capital Markets — 0.2% | ||||||||
Agronomics Ltd.(a) | 16,673,979 | 2,126,014 | ||||||
|
| |||||||
Chemicals — 1.8% | ||||||||
Albemarle Corp. | 14,605 | 2,826,506 | ||||||
CF Industries Holdings, Inc. | 30,909 | 1,901,212 | ||||||
DSM-Firmenich AG(a) | 35,052 | 3,898,075 | ||||||
FMC Corp. | 37,046 | 3,855,748 | ||||||
Nutrien Ltd. | 30,373 | 1,600,657 | ||||||
Robertet SA(b) | 3,182 | 2,884,251 | ||||||
Sociedad Quimica y Minera de Chile SA, ADR | 31,163 | 1,999,730 | ||||||
Symrise AG | 15,767 | 1,688,530 | ||||||
|
| |||||||
| 20,654,709 | ||||||||
| Consumer Staples Distribution & Retail — 0.7% | ||||||||
Grocery Outlet Holding Corp.(a)(b) | 137,300 | 3,943,256 | ||||||
HelloFresh SE(a) | 41,133 | 982,901 | ||||||
Koninklijke Ahold Delhaize NV | 95,728 | 3,034,803 | ||||||
|
| |||||||
| 7,960,960 | ||||||||
| Containers & Packaging — 1.0% | ||||||||
Crown Holdings, Inc. | 29,438 | 2,244,059 | ||||||
FP Corp. | 90,000 | 1,842,239 | ||||||
Graphic Packaging Holding Co. | 179,385 | 4,287,302 | ||||||
Smurfit Kappa Group PLC | 67,475 | 2,404,146 | ||||||
|
| |||||||
| 10,777,746 | ||||||||
| Energy Equipment & Services — 0.8% | ||||||||
Patterson-UTI Energy, Inc. | 96,384 | 938,780 | ||||||
Schlumberger NV | 149,535 | 6,404,584 | ||||||
Tenaris SA | 145,396 | 1,804,890 | ||||||
|
| |||||||
| 9,148,254 | ||||||||
| Food Products — 3.6% | ||||||||
Archer-Daniels-Midland Co. | 49,906 | 3,525,859 | ||||||
Barry Callebaut AG, Registered Shares | 2,311 | 4,677,334 | ||||||
Bunge Ltd. | 41,019 | 3,800,000 | ||||||
China Mengniu Dairy Co. Ltd. | 1,086,000 | 4,220,898 | ||||||
Darling Ingredients, Inc.(a) | 35,937 | 2,277,687 | ||||||
Kerry Group PLC, Class A | 46,323 | 4,518,122 | ||||||
Maple Leaf Foods, Inc.(b) | 151,675 | 2,791,043 | ||||||
Nestlé SA, Registered Shares | 37,499 | 4,444,993 | ||||||
Salmar ASA | 84,204 | 3,715,218 | ||||||
SunOpta, Inc.(a)(b) | 401,499 | 2,702,088 | ||||||
Tate & Lyle PLC | 342,923 | 3,352,911 | ||||||
|
| |||||||
| 40,026,153 | ||||||||
| Hotels, Restaurants & Leisure — 0.3% | ||||||||
Compass Group PLC | 132,203 | 3,622,919 | ||||||
|
| |||||||
Machinery — 1.3% | ||||||||
Ag Growth International, Inc. | 75,754 | 2,798,015 | ||||||
AGCO Corp. | 22,321 | 2,461,560 | ||||||
Deere & Co. | 10,145 | 3,509,967 | ||||||
Epiroc AB, Class A | 53,338 | 936,883 | ||||||
John Bean Technologies Corp. | 34,690 | 3,698,301 | ||||||
Marel HF(c) | 563,514 | 1,843,161 | ||||||
|
| |||||||
| 15,247,887 | ||||||||
| Metals & Mining — 21.4% | ||||||||
Agnico Eagle Mines Ltd. | 121,688 | 6,192,418 | ||||||
Alamos Gold, Inc., Class A | 241,484 | 2,981,416 | ||||||
Alcoa Corp. | 35,145 | 1,114,799 | ||||||
Anglo American PLC | 135,164 | 3,723,537 | ||||||
| Security | Shares | Value | ||||||
Metals & Mining (continued) | ||||||||
AngloGold Ashanti Ltd., ADR | 58,439 | $ | 1,414,224 | |||||
Antofagasta PLC | 39,851 | 663,087 | ||||||
ArcelorMittal SA | 199,111 | 4,966,566 | ||||||
Artemis Gold, Inc.(a) | 117,513 | 390,412 | ||||||
Aurubis AG | 12,794 | 981,547 | ||||||
Auteco Minerals Ltd.(a) | 4,451,296 | 87,112 | ||||||
B2Gold Corp. | 1,175,383 | 4,355,194 | ||||||
Barrick Gold Corp. | 734,562 | 12,399,407 | ||||||
Bellevue Gold Ltd.(a) | 1,947,640 | 1,634,979 | ||||||
BHP Group Ltd. | 634,768 | 17,369,226 | ||||||
Blackstone Minerals Ltd.(a)(b) | 1,592,935 | 145,099 | ||||||
BlueScope Steel Ltd. | 58,276 | 702,817 | ||||||
Centerra Gold, Inc. | 445,047 | 2,681,757 | ||||||
Chalice Mining Ltd.(a) | 347,829 | 1,586,947 | ||||||
Challenger Gold Ltd.(a)(b) | 1,731,433 | 174,470 | ||||||
Champion Iron Ltd. | 338,643 | 1,323,276 | ||||||
Develop Global Ltd.(a)(b) | 1,193,818 | 2,719,573 | ||||||
Dundee Precious Metals, Inc. | 173,680 | 1,196,249 | ||||||
Eldorado Gold Corp.(a) | 49,920 | 470,746 | ||||||
Emerald Resources NL(a) | 536,194 | 657,833 | ||||||
Endeavour Mining PLC | 219,397 | 5,782,707 | ||||||
ERO Copper Corp.(a) | 130,611 | 2,161,937 | ||||||
First Quantum Minerals Ltd. | 206,075 | 4,317,328 | ||||||
Foran Mining Corp.(a) | 280,973 | 685,098 | ||||||
Foran Mining Corp. (Acquired 03/20/23, cost $243,769)(a)(d) | 90,000 | 215,914 | ||||||
Franco-Nevada Corp. | 107,108 | 15,565,574 | ||||||
Freeport-McMoRan, Inc. | 195,919 | 6,727,858 | ||||||
Fresnillo PLC | 89,260 | 717,929 | ||||||
Glencore PLC | 2,194,463 | 11,222,820 | ||||||
Gold Fields Ltd. | 170,392 | 2,583,396 | ||||||
Gold Fields Ltd., ADR | 272,240 | 4,116,269 | ||||||
Iluka Resources Ltd. | 117,468 | 858,970 | ||||||
Impala Platinum Holdings Ltd. | 76,088 | 610,912 | ||||||
Kinross Gold Corp. | 798,426 | 3,764,218 | ||||||
Lithium Royalty Corp.(a) | 87,378 | 984,169 | ||||||
Lundin Gold, Inc. | 150,771 | 1,910,321 | ||||||
Lundin Mining Corp. | 248,335 | 1,736,058 | ||||||
Lynas Rare Earths Ltd.(a) | 347,969 | 1,698,410 | ||||||
MAG Silver Corp.(a) | 125,240 | 1,521,332 | ||||||
Marathon Gold Corp.(a) | 424,656 | 256,514 | ||||||
Mineral Resources Ltd. | 64,474 | 2,969,889 | ||||||
Newcrest Mining Ltd. | 456,681 | 7,703,788 | ||||||
Newmont Corp. | 180,678 | 7,326,493 | ||||||
Nickel Industries Ltd. | 4,373,063 | 2,545,964 | ||||||
Norsk Hydro ASA | 759,080 | 4,594,200 | ||||||
Northam Platinum Holdings Ltd.(a) | 103,026 | 848,085 | ||||||
Northern Star Resources Ltd. | 593,879 | 5,022,315 | ||||||
Nucor Corp. | 30,035 | 3,966,422 | ||||||
Osisko Gold Royalties Ltd. | 121,353 | 1,926,451 | ||||||
Osisko Mining, Inc.(a) | 649,406 | 1,549,963 | ||||||
Pan American Silver Corp.(b) | 157,483 | 2,398,466 | ||||||
Polymetal International PLC(a) | 381,486 | 879,338 | ||||||
Polyus PJSC(a)(e) | 46,252 | 6 | ||||||
Predictive Discovery Ltd.(a) | 3,273,423 | 330,975 | ||||||
Rio Tinto PLC | 106,463 | 6,291,065 | ||||||
Rupert Resources Ltd.(a) | 7,770 | 20,892 | ||||||
Rupert Resources Ltd. (Acquired 02/24/23, cost $315,608)(a)(d) | 91,372 | 243,904 | ||||||
Sibanye Stillwater Ltd. | 360,486 | 636,934 | ||||||
Sigma Lithium Corp.(a)(b) | 143,455 | 5,401,094 | ||||||
Skeena Resources Ltd.(a) | 164,060 | 874,987 | ||||||
| 8 | 2 0 2 3 BLACK ROCK ANNUAL REPORT TO SHAREHOLDERS |
Consolidated Schedule of Investments (continued) May 31, 2023 | BlackRock Commodity Strategies Fund (Percentages shown are based on Net Assets) |
| Security | Shares | Value | ||||||
Metals & Mining (continued) | ||||||||
Sociedad Minera Cerro Verde SAA | 36,219 | $ | 1,068,461 | |||||
Solaris Resources, Inc.(a) | 145,905 | 597,592 | ||||||
Solaris Resources, Inc.(a) | 39,000 | 159,735 | ||||||
SSR Mining, Inc. | 189,439 | 2,798,014 | ||||||
Steel Dynamics, Inc. | 41,170 | 3,783,523 | ||||||
Stelco Holdings, Inc. | 62,555 | 1,957,522 | ||||||
Teck Resources Ltd., Class B | 204,396 | 7,978,596 | ||||||
Titan Mining Corp. | 131,486 | 43,587 | ||||||
Titan Mining Corp.(a) | 20,773 | 6,886 | ||||||
Torex Gold Resources, Inc.(a) | 116,889 | 1,827,171 | ||||||
Trident Royalties PLC(a) | 1,140,298 | 718,341 | ||||||
Vale SA, ADR | 923,365 | 11,708,268 | ||||||
Wheaton Precious Metals Corp. | 332,604 | 15,073,148 | ||||||
|
| |||||||
| 240,622,500 | ||||||||
| Oil, Gas & Consumable Fuels — 16.9% | ||||||||
ARC Resources Ltd. | 196,614 | 2,369,506 | ||||||
BP PLC | 2,441,385 | 13,715,763 | ||||||
Cameco Corp.(b) | 98,429 | 2,740,263 | ||||||
Canadian Natural Resources Ltd. | 158,166 | 8,520,574 | ||||||
Cenovus Energy, Inc. | 306,902 | 4,903,650 | ||||||
Cheniere Energy, Inc. | 42,118 | 5,886,833 | ||||||
Chevron Corp. | 64,812 | 9,761,983 | ||||||
ConocoPhillips | 132,225 | 13,129,943 | ||||||
Diamondback Energy, Inc. | 31,884 | 4,054,051 | ||||||
Eni SpA | 292,903 | 3,897,588 | ||||||
EOG Resources, Inc. | 76,284 | 8,184,510 | ||||||
Exxon Mobil Corp. | 355,863 | 36,362,081 | ||||||
Gazprom PJSC(e) | 712,200 | 87 | ||||||
Hess Corp. | 56,183 | 7,116,701 | ||||||
Kinder Morgan, Inc. | 316,354 | 5,096,463 | ||||||
Kosmos Energy Ltd.(a) | 280,904 | 1,674,188 | ||||||
Marathon Petroleum Corp. | 52,659 | 5,524,456 | ||||||
Santos Ltd. | 451,683 | 2,138,144 | ||||||
Shell PLC | 715,554 | 19,672,719 | ||||||
TC Energy Corp. | 84,204 | 3,277,598 | ||||||
TotalEnergies SE | 247,567 | 13,970,409 | ||||||
Tourmaline Oil Corp. | 81,601 | 3,411,313 | ||||||
Valero Energy Corp. | 47,274 | 5,060,209 | ||||||
Williams Cos., Inc. | 273,017 | 7,824,667 | ||||||
Woodside Energy Group Ltd. | 78,943 | 1,746,774 | ||||||
|
| |||||||
| 190,040,473 | ||||||||
| Personal Care Products — 0.3% | ||||||||
Jamieson Wellness, Inc.(c) | 147,806 | 3,320,871 | ||||||
|
| |||||||
Pharmaceuticals — 0.4% | ||||||||
Zoetis, Inc., Class A | 25,506 | 4,157,733 | ||||||
|
| |||||||
Total Common Stocks — 48.7% | 548,246,898 | |||||||
|
| |||||||
Rights | ||||||||
| Metals & Mining — 0.0% | ||||||||
Kincross Gold Corp., CVR(a)(e) | 11,812 | — | ||||||
|
| |||||||
Total Rights — 0.0% | — | |||||||
|
| |||||||
Warrants(a) | ||||||||
| Beverages — 0.0% | ||||||||
Flow Beverage Corp. (Issued/Exercisable, 1 Share for 1 Warrant, Expires 06/29/23, Strike Price CAD 10.00) | 306,414 | 1,129 | ||||||
|
| |||||||
| Security | Shares | Value | ||||||||||
Capital Markets — 0.0% |
| |||||||||||
Agronomics Ltd. (Issued/Exercisable, 1 Share for 1 Warrant, Expires 06/01/23, Strike Price GBP 0.28) | 3,014,355 | $ | 37 | |||||||||
Agronomics Ltd. (Issued/Exercisable, 1 Share for 1 Warrant, Expires 12/08/23, Strike Price GBP 0.30) | 3,909,350 | 49 | ||||||||||
|
| |||||||||||
| 86 | ||||||||||||
| Metals & Mining — 0.0% | ||||||||||||
Titan Mining Corp. (Issued/Exercisable, 1 Share for 1 Warrant, Expires 09/23/23, Strike Price CAD 0.75) | 10,387 | — | ||||||||||
|
| |||||||||||
Total Warrants — 0.0% |
| 1,215 | ||||||||||
|
| |||||||||||
Total Long-Term Investments — 48.7% |
| 548,248,113 | ||||||||||
|
| |||||||||||
Short-Term Securities |
| |||||||||||
| Money Market Funds — 1.9% | ||||||||||||
BlackRock Liquidity Funds, T-Fund, Institutional Class, 5.00%(f)(g) | 7,558,334 | 7,558,334 | ||||||||||
SL Liquidity Series, LLC, Money Market Series, 5.32%(f)(g)(h) | 13,698,222 | 13,698,222 | ||||||||||
|
| |||||||||||
| 21,256,556 | ||||||||||||
|
| |||||||||||
Par (000) | ||||||||||||
| ||||||||||||
| U.S. Treasury Obligations(i) — 51.7% | ||||||||||||
U.S. Treasury Bills | ||||||||||||
4.61%, 06/08/23 | USD | 92,000 | 91,906,084 | |||||||||
4.74%, 07/06/23 | 92,000 | 91,567,760 | ||||||||||
4.83%, 08/10/23 | 99,000 | 98,011,392 | ||||||||||
5.06%, 08/31/23 | 103,000 | 101,632,193 | ||||||||||
4.84%, 10/12/23 | 103,000 | 101,008,888 | ||||||||||
5.20%, 11/16/23 | 100,000 | 97,566,217 | ||||||||||
|
| |||||||||||
| 581,692,534 | ||||||||||||
|
| |||||||||||
Total Short-Term Securities — 53.6% |
| 602,949,090 | ||||||||||
|
| |||||||||||
Total Investments — 102.3% |
| 1,151,197,203 | ||||||||||
Liabilities in Excess of Other Assets — (2.3)% |
| (25,351,493 | ) | |||||||||
|
| |||||||||||
Net Assets — 100.0% | $ | 1,125,845,710 | ||||||||||
|
| |||||||||||
| (a) | Non-income producing security. |
| (b) | All or a portion of this security is on loan. |
| (c) | Security exempt from registration pursuant to Rule 144A under the Securities Act of 1933, as amended. These securities may be resold in transactions exempt from registration to qualified institutional investors. |
| (d) | Restricted security as to resale, excluding 144A securities. The Fund held restricted securities with a current value of $459,818, representing 0.0% of its net assets as of period end, and an original cost of $559,377. |
| (e) | Security is valued using significant unobservable inputs and is classified as Level 3 in the fair value hierarchy. |
| (f) | Affiliate of the Fund. |
| (g) | Annualized 7-day yield as of period end. |
| (h) | All or a portion of this security was purchased with the cash collateral from loaned securities. |
| (i) | Rates are discount rates or a range of discount rates as of period end. |
CONSOLIDATED SCHEDULE OF INVESTMENTS | 9 |
Consolidated Schedule of Investments (continued) May 31, 2023 | BlackRock Commodity Strategies Fund |
Affiliates
Investments in issuers considered to be affiliate(s) of the Fund during the year ended May 31, 2023 for purposes of Section 2(a)(3) of the Investment Company Act of 1940, as amended, were as follows:
| Affiliated Issuer | Value at 05/31/22 | Purchases at Cost | Proceeds from Sale | Net Realized Gain (Loss) | Change in Unrealized Appreciation (Depreciation) | Value at 05/31/23 | Shares Held at 05/31/23 | Income | Capital Gain Distributions from Underlying Funds | |||||||||||||||||||||||||||
BlackRock Liquidity Funds, T-Fund, Institutional Class | $ | 56,583,646 | $ | — | $ | (49,025,312 | )(a) | $ | — | $ | — | $ | 7,558,334 | 7,558,334 | $ | 472,423 | $ | — | ||||||||||||||||||
SL Liquidity Series, LLC, Money Market Series | 12,237,871 | 1,457,265 | (a) | — | (2,888 | ) | 5,974 | 13,698,222 | 13,698,222 | 548,475 | (b) | — | ||||||||||||||||||||||||
|
|
|
|
|
|
|
|
|
| |||||||||||||||||||||||||||
| $ | (2,888 | ) | $ | 5,974 | $ | 21,256,556 | $ | 1,020,898 | $ | — | ||||||||||||||||||||||||||
|
|
|
|
|
|
|
|
|
| |||||||||||||||||||||||||||
| (a) | Represents net amount purchased (sold). |
| (b) | All or a portion represents securities lending income earned from the reinvestment of cash collateral from loaned securities, net of fees and collateral investment expenses, and other payments to and from borrowers of securities. |
For Fund compliance purposes, the Fund’s industry classifications refer to one or more of the industry sub-classifications used by one or more widely recognized market indexes or rating group indexes, and/or as defined by the investment adviser. These definitions may not apply for purposes of this report, which may combine such industry sub-classifications for reporting ease.
Derivative Financial Instruments Outstanding as of Period End
OTC Total Return Swaps
Paid by the Fund | Received by the Fund | Counterparty | Termination Date | Notional Amount | Value | Upfront Premium Paid (Received) | Unrealized Appreciation (Depreciation) | |||||||||||||||||||||||||||||||||||||||
| Rate | Frequency | Reference | Frequency | |||||||||||||||||||||||||||||||||||||||||||
3-month U.S. Treasury Bill, 5.42%(a) | At Termination | BCOMLITR | At Termination | Merrill Lynch International | 06/08/23 | USD | 2,459 | $ | (30,841 | ) | $ | — | $ | (30,841 | ) | |||||||||||||||||||||||||||||||
3-month U.S. Treasury Bill, 5.42%(a) | At Termination | BCOMAGTR | At Termination | Merrill Lynch International | 06/08/23 | USD | 16,226 | (2,835,373 | ) | — | (2,835,373 | ) | ||||||||||||||||||||||||||||||||||
3-month U.S. Treasury Bill, 5.42%(a) | At Termination | BCOMPRTR | At Termination | Societe Generale SA | 06/08/23 | USD | 4,824 | 112,741 | — | 112,741 | ||||||||||||||||||||||||||||||||||||
3-month U.S. Treasury Bill, 5.42%(a) | At Termination | BCOMPRTR | At Termination | Societe Generale SA | 06/30/23 | USD | 8,875 | 595,173 | — | 595,173 | ||||||||||||||||||||||||||||||||||||
3-month U.S. Treasury Bill, 5.42%(a) | At Termination | BCOMRENT | At Termination | JPMorgan Chase Bank N.A. | 07/19/23 | USD | 149,052 | (62,558,613 | ) | — | (62,558,613 | ) | ||||||||||||||||||||||||||||||||||
3-month U.S. Treasury Bill, 5.42%(a) | At Termination | BCOMRLIT | At Termination | Morgan Stanley & Co. International PLC | 07/19/23 | USD | 8,939 | 27,920 | — | 27,920 | ||||||||||||||||||||||||||||||||||||
3-month U.S. Treasury Bill, 5.42%(a) | At Termination | BCOMRPRT | At Termination | Societe Generale SA | 07/19/23 | USD | 44,274 | 6,117,446 | — | 6,117,446 | ||||||||||||||||||||||||||||||||||||
3-month U.S. Treasury Bill, 5.42%(a) | At Termination | BCOMINTR | At Termination | Morgan Stanley & Co. International PLC | 08/02/23 | USD | 2,566 | (239,253 | ) | — | (239,253 | ) | ||||||||||||||||||||||||||||||||||
3-month U.S. Treasury Bill, 5.42%(a) | At Termination | BCOMPRTR | At Termination | Morgan Stanley & Co. International PLC | 08/02/23 | USD | 34,824 | 3,046,553 | — | 3,046,553 | ||||||||||||||||||||||||||||||||||||
3-month U.S. Treasury Bill, 5.42%(a) | At Termination | BCOMAGTR | At Termination | Morgan Stanley & Co. International PLC | 09/13/23 | USD | 993 | (94,797 | ) | — | (94,797 | ) | ||||||||||||||||||||||||||||||||||
3-month U.S. Treasury Bill, 5.42%(a) | At Termination | BCOMINTR | At Termination | Societe Generale SA | 09/13/23 | USD | 1,996 | (195,882 | ) | — | (195,882 | ) | ||||||||||||||||||||||||||||||||||
| 10 | 2 0 2 3 BLACK ROCK ANNUAL REPORT TO SHAREHOLDERS |
Consolidated Schedule of Investments (continued) May 31, 2023 | BlackRock Commodity Strategies Fund |
OTC Total Return Swaps (continued)
Paid by the Fund | Received by the Fund | Counterparty | Termination Date | Notional Amount | Value | Upfront Premium Paid (Received) | Unrealized Appreciation (Depreciation) | |||||||||||||||||||||||||||||||||||||||
| Rate | Frequency | Reference | Frequency | |||||||||||||||||||||||||||||||||||||||||||
3-month U.S. Treasury Bill, 5.42%(a) | At Termination | BCOMPRTR | At Termination | Societe Generale SA | 09/13/23 | USD | 2,957 | $ | 397,040 | $ | — | $ | 397,040 | |||||||||||||||||||||||||||||||||
3-month U.S. Treasury Bill, 5.42%(a) | At Termination | BCOMRLIT | At Termination | Morgan Stanley & Co. International PLC | 09/30/23 | USD | 811 | 39,764 | — | 39,764 | ||||||||||||||||||||||||||||||||||||
3-month U.S. Treasury Bill, 5.42%(a) | At Termination | BCOMRINT | At Termination | Morgan Stanley & Co. International PLC | 09/30/23 | USD | 328 | (12,827 | ) | — | (12,827 | ) | ||||||||||||||||||||||||||||||||||
3-month U.S. Treasury Bill, 5.42%(a) | At Termination | BCOMRPRT | At Termination | Goldman Sachs International | 10/02/23 | USD | 7,871 | 1,302,229 | — | 1,302,229 | ||||||||||||||||||||||||||||||||||||
3-month U.S. Treasury Bill, 5.42%(a) | At Termination | BCOMRENT | At Termination | JPMorgan Chase Bank N.A. | 10/02/23 | USD | 3,430 | (1,165,640 | ) | — | (1,165,640 | ) | ||||||||||||||||||||||||||||||||||
3-month U.S. Treasury Bill, 5.42%(a) | At Termination | BCOMENTR | At Termination | JPMorgan Chase Bank N.A. | 10/10/23 | USD | 10,484 | (4,305,472 | ) | — | (4,305,472 | ) | ||||||||||||||||||||||||||||||||||
3-month U.S. Treasury Bill, 5.42%(a) | At Termination | BCOMLITR | At Termination | Morgan Stanley & Co. International PLC | 10/10/23 | USD | 1,012 | (7,312 | ) | — | (7,312 | ) | ||||||||||||||||||||||||||||||||||
3-month U.S. Treasury Bill, 5.42%(a) | At Termination | BCOMAGTR | At Termination | Morgan Stanley & Co. International PLC | 10/10/23 | USD | 2,526 | (226,643 | ) | — | (226,643 | ) | ||||||||||||||||||||||||||||||||||
3-month U.S. Treasury Bill, 5.42%(a) | At Termination | BCOMPRTR | At Termination | Societe Generale SA | 10/10/23 | USD | 1,437 | 221,421 | — | 221,421 | ||||||||||||||||||||||||||||||||||||
3-month U.S. Treasury Bill, 5.42%(a) | At Termination | BCOMRPRT | At Termination | Goldman Sachs International | 10/31/23 | USD | 4,388 | 794,406 | — | 794,406 | ||||||||||||||||||||||||||||||||||||
3-month U.S. Treasury Bill, 5.42%(a) | At Termination | BCOMRLIT | At Termination | Morgan Stanley & Co. International PLC | 10/31/23 | USD | 1,100 | (9,999 | ) | — | (9,999 | ) | ||||||||||||||||||||||||||||||||||
3-month U.S. Treasury Bill, 5.42%(a) | At Termination | BCOMPRTR | At Termination | Merrill Lynch International | 11/03/23 | USD | 1,768 | 321,714 | — | 321,714 | ||||||||||||||||||||||||||||||||||||
3-month U.S. Treasury Bill, 5.42%(a) | At Termination | BCOMAGTR | At Termination | Morgan Stanley & Co. International PLC | 11/03/23 | USD | 33,592 | (2,389,530 | ) | — | (2,389,530 | ) | ||||||||||||||||||||||||||||||||||
3-month U.S. Treasury Bill, 5.42%(a) | At Termination | BCOMINTR | At Termination | Morgan Stanley & Co. International PLC | 11/03/23 | USD | 3,437 | (116,887 | ) | — | (116,887 | ) | ||||||||||||||||||||||||||||||||||
3-month U.S. Treasury Bill, 5.42%(a) | At Termination | BCOMRAGT | At Termination | Goldman Sachs International | 11/30/23 | USD | 74,614 | (6,579,598 | ) | — | (6,579,598 | ) | ||||||||||||||||||||||||||||||||||
3-month U.S. Treasury Bill, 5.42%(a) | At Termination | BCOMRENT | At Termination | JPMorgan Chase Bank N.A. | 11/30/23 | USD | 7,078 | (2,647,734 | ) | — | (2,647,734 | ) | ||||||||||||||||||||||||||||||||||
3-month U.S. Treasury Bill, 5.42%(a) | At Termination | BCOMRLIT | At Termination | Morgan Stanley & Co. International PLC | 11/30/23 | USD | 4,192 | (36,382 | ) | — | (36,382 | ) | ||||||||||||||||||||||||||||||||||
3-month U.S. Treasury Bill, 5.42%(a) | At Termination | BCOMRINT | At Termination | Morgan Stanley & Co. International PLC | 11/30/23 | USD | 10,263 | (1,381,754 | ) | — | (1,381,754 | ) | ||||||||||||||||||||||||||||||||||
3-month U.S. Treasury Bill, 5.42%(a) | At Termination | BCOMRPRT | At Termination | Societe Generale SA | 11/30/23 | USD | 3,007 | 277,977 | — | 277,977 | ||||||||||||||||||||||||||||||||||||
3-month U.S. Treasury Bill, 5.42%(a) | At Termination | BCOMRAGT | At Termination | Morgan Stanley & Co. International PLC | 01/04/24 | USD | 492 | (33,944 | ) | — | (33,944 | ) | ||||||||||||||||||||||||||||||||||
CONSOLIDATED SCHEDULE OF INVESTMENTS | | 11 | |
Consolidated Schedule of Investments (continued) May 31, 2023 | BlackRock Commodity Strategies Fund |
OTC Total Return Swaps (continued)
Paid by the Fund | Received by the Fund | Counterparty | Termination Date | Notional Amount | Value | Upfront Premium Paid (Received) | Unrealized Appreciation (Depreciation) | |||||||||||||||||||||||||||||||||||||||
| Rate | Frequency | Reference | Frequency | |||||||||||||||||||||||||||||||||||||||||||
3-month U.S. Treasury Bill, 5.42%(a) | At Termination | BCOMRINT | At Termination | Morgan Stanley & Co. International PLC | 01/04/24 | USD | 11,772 | $ | (1,590,093 | ) | $ | — | $ | (1,590,093 | ) | |||||||||||||||||||||||||||||||
3-month U.S. Treasury Bill, 5.42%(a) | At Termination | BCOMRLIT | At Termination | Morgan Stanley & Co. International PLC | 01/08/24 | USD | 863 | (17,467 | ) | — | (17,467 | ) | ||||||||||||||||||||||||||||||||||
3-month U.S. Treasury Bill, 5.42%(a) | At Termination | BCOMRPRT | At Termination | Societe Generale SA | 01/08/24 | USD | 4,395 | 80,559 | — | 80,559 | ||||||||||||||||||||||||||||||||||||
3-month U.S. Treasury Bill, 5.42%(a) | At Termination | BCOMRENT | At Termination | JPMorgan Chase Bank N.A. | 01/31/24 | USD | 18,477 | (3,429,892 | ) | — | (3,429,892 | ) | ||||||||||||||||||||||||||||||||||
3-month U.S. Treasury Bill, 5.42%(a) | At Termination | BCOMRAGT | At Termination | Morgan Stanley & Co. International PLC | 01/31/24 | USD | 3,037 | (331,039 | ) | — | (331,039 | ) | ||||||||||||||||||||||||||||||||||
3-month U.S. Treasury Bill, 5.42%(a) | At Termination | BCOMRINT | At Termination | Morgan Stanley & Co. International PLC | 01/31/24 | USD | 10,404 | (2,204,537 | ) | — | (2,204,537 | ) | ||||||||||||||||||||||||||||||||||
3-month U.S. Treasury Bill, 5.42%(a) | At Termination | BCOMRLIT | At Termination | Morgan Stanley & Co. International PLC | 02/02/24 | USD | 4,658 | (121,880 | ) | — | (121,880 | ) | ||||||||||||||||||||||||||||||||||
3-month U.S. Treasury Bill, 5.42%(a) | At Termination | BCOMRPRT | At Termination | Societe Generale SA | 02/08/24 | USD | 1,723 | 54,759 | — | 54,759 | ||||||||||||||||||||||||||||||||||||
3-month U.S. Treasury Bill, 5.42%(a) | At Termination | BCOMRENT | At Termination | JPMorgan Chase Bank N.A. | 02/26/24 | USD | 7,355 | (1,036,016 | ) | — | (1,036,016 | ) | ||||||||||||||||||||||||||||||||||
3-month U.S. Treasury Bill, 5.42%(a) | At Termination | BCOMRAGT | At Termination | Morgan Stanley & Co. International PLC | 02/26/24 | USD | 35,885 | (3,354,907 | ) | — | (3,354,907 | ) | ||||||||||||||||||||||||||||||||||
3-month U.S. Treasury Bill, 5.42%(a) | At Termination | BCOMRLIT | At Termination | Morgan Stanley & Co. International PLC | 02/26/24 | USD | 1,914 | (67,333 | ) | — | (67,333 | ) | ||||||||||||||||||||||||||||||||||
3-month U.S. Treasury Bill, 5.42%(a) | At Termination | BCOMRINT | At Termination | Morgan Stanley & Co. International PLC | 02/28/24 | USD | 22,581 | (2,919,366 | ) | — | (2,919,366 | ) | ||||||||||||||||||||||||||||||||||
3-month U.S. Treasury Bill, 5.42%(a) | At Termination | BCOMINTR | At Termination | Morgan Stanley & Co. International PLC | 03/11/24 | USD | 4,957 | (508,467 | ) | — | (508,467 | ) | ||||||||||||||||||||||||||||||||||
3-month U.S. Treasury Bill, 5.42%(a) | At Termination | BCOMRAGT | At Termination | Merrill Lynch International | 03/14/24 | USD | 15,095 | (1,039,706 | ) | — | (1,039,706 | ) | ||||||||||||||||||||||||||||||||||
3-month U.S. Treasury Bill, 5.42%(a) | At Termination | BCOMRLIT | At Termination | Merrill Lynch International | 03/14/24 | USD | 1,795 | (30,457 | ) | — | (30,457 | ) | ||||||||||||||||||||||||||||||||||
3-month U.S. Treasury Bill, 5.42%(a) | At Termination | BCOMRPRT | At Termination | JPMorgan Chase Bank N.A. | 04/01/24 | USD | 6,019 | (89,405 | ) | — | (89,405 | ) | ||||||||||||||||||||||||||||||||||
3-month U.S. Treasury Bill, 5.42%(a) | At Termination | BCOMRAGT | At Termination | Morgan Stanley & Co. International PLC | 04/01/24 | USD | 19,937 | (1,453,213 | ) | — | (1,453,213 | ) | ||||||||||||||||||||||||||||||||||
3-month U.S. Treasury Bill, 5.42%(a) | At Termination | BCOMRLIT | At Termination | Morgan Stanley & Co. International PLC | 04/01/24 | USD | 3,250 | (26,773 | ) | — | (26,773 | ) | ||||||||||||||||||||||||||||||||||
3-month U.S. Treasury Bill, 5.42%(a) | At Termination | BCOMRPRT | At Termination | Goldman Sachs International | 04/03/24 | USD | 1,607 | (31,081 | ) | — | (31,081 | ) | ||||||||||||||||||||||||||||||||||
3-month U.S. Treasury Bill, 5.42%(a) | At Termination | BCOMRENT | At Termination | JPMorgan Chase Bank N.A. | 04/29/24 | USD | 6,021 | (407,452 | ) | — | (407,452 | ) | ||||||||||||||||||||||||||||||||||
| 12 | 2 0 2 3 BLACK ROCK ANNUAL REPORT TO SHAREHOLDERS |
Consolidated Schedule of Investments (continued) May 31, 2023 | BlackRock Commodity Strategies Fund |
OTC Total Return Swaps (continued)
Paid by the Fund | Received by the Fund | Counterparty | Termination Date | Notional Amount | Value | Upfront Premium Paid (Received) | Unrealized Appreciation (Depreciation) | |||||||||||||||||||||||||||||||||||||||
| Rate | Frequency | Reference | Frequency | |||||||||||||||||||||||||||||||||||||||||||
3-month U.S. Treasury Bill, 5.42%(a) | At Termination | BCOMRLIT | At Termination | JPMorgan Chase Bank N.A. | 05/02/24 | USD | 991 | $ | (2,589 | ) | $ | — | $ | (2,589 | ) | |||||||||||||||||||||||||||||||
3-month U.S. Treasury Bill, 5.42%(a) | At Termination | BCOMRAGT | At Termination | JPMorgan Chase Bank N.A. | 05/02/24 | USD | 1,984 | (80,665 | ) | — | (80,665 | ) | ||||||||||||||||||||||||||||||||||
3-month U.S. Treasury Bill, 5.42%(a) | At Termination | BCOMRPRT | At Termination | JPMorgan Chase Bank N.A. | 05/02/24 | USD | 2,032 | (81,685 | ) | — | (81,685 | ) | ||||||||||||||||||||||||||||||||||
3-month U.S. Treasury Bill, 5.42%(a) | At Termination | BCOMRINT | At Termination | JPMorgan Chase Bank N.A. | 05/02/24 | USD | 1,996 | (180,312 | ) | — | (180,312 | ) | ||||||||||||||||||||||||||||||||||
|
|
|
|
|
| |||||||||||||||||||||||||||||||||||||||||
| $ | (90,483,114 | ) | $ | — | $ | (90,483,114 | ) | |||||||||||||||||||||||||||||||||||||||
|
|
|
|
|
| |||||||||||||||||||||||||||||||||||||||||
| (a) | All or a portion of the security is held by a wholly-owned subsidiary. See Note 1 of the Notes to Consolidated Financial Statements for details on the wholly-owned subsidiary. |
Balances Reported in the Consolidated Statement of Assets and Liabilities for OTC Swaps
| ||||||||||||||||
Swap Premiums Paid | Swap Premiums Received | Unrealized Appreciation | Unrealized Depreciation | |||||||||||||
| ||||||||||||||||
OTC Swaps | $ | — | $ | — | $ | 13,389,702 | $ | (103,872,816 | ) | |||||||
| ||||||||||||||||
Derivative Financial Instruments Categorized by Risk Exposure
As of period end, the fair values of derivative financial instruments located in the Consolidated Statement of Assets and Liabilities were as follows:
| ||||||||||||||||||||||||||||
Commodity Contracts | Credit Contracts | Equity Contracts | Foreign Currency Exchange Contracts | Interest Rate Contracts | Other Contracts | Total | ||||||||||||||||||||||
| ||||||||||||||||||||||||||||
Assets — Derivative Financial Instruments | ||||||||||||||||||||||||||||
Swaps — OTC | ||||||||||||||||||||||||||||
Unrealized appreciation on OTC swaps; | $ | 13,389,702 | $ | — | $ | — | $ | — | $ | — | $ | — | $ | 13,389,702 | ||||||||||||||
|
|
|
|
|
|
|
|
|
|
|
|
|
| |||||||||||||||
Liabilities — Derivative Financial Instruments | ||||||||||||||||||||||||||||
Swaps — OTC | ||||||||||||||||||||||||||||
Unrealized depreciation on OTC swaps; | $ | 103,872,816 | $ | — | $ | — | $ | — | $ | — | $ | — | $ | 103,872,816 | ||||||||||||||
|
|
|
|
|
|
|
|
|
|
|
|
|
| |||||||||||||||
For the period ended May 31, 2023, the effect of derivative financial instruments in the Consolidated Statement of Operations was as follows:
| ||||||||||||||||||||||||||||
Commodity Contracts | Credit Contracts | Equity Contracts | Foreign Currency Exchange Contracts | Interest Rate Contracts | Other Contracts | Total | ||||||||||||||||||||||
| ||||||||||||||||||||||||||||
Net Realized Gain (Loss) from | ||||||||||||||||||||||||||||
Swaps | $ | 49,746,357 | $ | — | $ | — | $ | — | $ | — | $ | — | $ | 49,746,357 | ||||||||||||||
|
|
|
|
|
|
|
|
|
|
|
|
|
| |||||||||||||||
| Net Change in Unrealized Appreciation (Depreciation) on | ||||||||||||||||||||||||||||
Swaps | $ | (323,423,860 | ) | $ | — | $ | — | $ | — | $ | — | $ | — | $ | (323,423,860 | ) | ||||||||||||
|
|
|
|
|
|
|
|
|
|
|
|
|
| |||||||||||||||
Average Quarterly Balances of Outstanding Derivative Financial Instruments
Total return swaps | ||||
Average notional amount | $ | 830,112,596 | ||
For more information about the Fund’s investment risks regarding derivative financial instruments, refer to the Notes to Consolidated Financial Statements.
CONSOLIDATED SCHEDULE OF INVESTMENTS | 13 |
Consolidated Schedule of Investments (continued) May 31, 2023 | BlackRock Commodity Strategies Fund |
Derivative Financial Instruments – Offsetting as of Period End
The Fund’s derivative assets and liabilities (by type) were as follows:
| Assets | Liabilities | |||||||
Derivative Financial Instruments | ||||||||
Swaps — OTC(a) | $ | 13,389,702 | $ | 103,872,816 | ||||
|
|
|
| |||||
Total derivative assets and liabilities in the Consolidated Statement of Assets and Liabilities | $ | 13,389,702 | $ | 103,872,816 | ||||
|
|
|
| |||||
Derivatives not subject to a Master Netting Agreement or similar agreement (“MNA”) | — | — | ||||||
|
|
|
| |||||
Total derivative assets and liabilities subject to an MNA | $ | 13,389,702 | $ | 103,872,816 | ||||
|
|
|
| |||||
| (a) | Includes unrealized appreciation (depreciation) on OTC swaps and swap premiums (paid/received) in the Consolidated Statement of Assets and Liabilities. |
The following tables present the Fund’s derivative assets and liabilities by counterparty net of amounts available for offset under an MNA and net of the related collateral received and pledged by the Fund:
| Counterparty | Derivative Assets Subject to an MNA by Counterparty | Derivatives Available for Offset(a) | Non- Cash Collateral Received(b) | Cash Collateral Received(b) | Net Amount of Derivative Assets(c) | |||||||||||||||
Goldman Sachs International(d) | $ | 2,096,635 | $ | (2,096,635 | ) | $ | — | $ | — | $ | — | |||||||||
Merrill Lynch International(d) | 321,714 | (321,714 | ) | — | — | — | ||||||||||||||
Morgan Stanley & Co. International PLC(d) | 3,114,237 | (3,114,237 | ) | — | — | — | ||||||||||||||
Societe Generale SA(d) | 7,857,116 | (195,882 | ) | — | (6,900,000 | ) | 761,234 | |||||||||||||
|
|
|
|
|
|
|
|
|
| |||||||||||
| $ | 13,389,702 | $ | (5,728,468 | ) | $ | — | $ | (6,900,000 | ) | $ | 761,234 | |||||||||
|
|
|
|
|
|
|
|
|
| |||||||||||
| Counterparty | Derivative Liabilities Subject to an MNA by Counterparty | Derivatives Available for Offset(a) | Non- Cash Collateral | Cash Collateral Pledged(b) | Net Amount of Derivative Liabilities(e) | |||||||||||||||
Goldman Sachs International(d) | $ | 6,610,679 | $ | (2,096,635 | ) | $ | — | $ | (4,430,000 | ) | $ | 84,044 | ||||||||
JPMorgan Chase Bank N.A.(d) | 75,985,475 | — | — | (75,985,475 | ) | — | ||||||||||||||
Merrill Lynch International(d) | 3,936,377 | (321,714 | ) | — | (3,614,663 | ) | — | |||||||||||||
Morgan Stanley & Co. International PLC(d) | 17,144,403 | (3,114,237 | ) | — | (14,030,166 | ) | — | |||||||||||||
Societe Generale SA(d) | 195,882 | (195,882 | ) | — | — | — | ||||||||||||||
|
|
|
|
|
|
|
|
|
| |||||||||||
| $ | 103,872,816 | $ | (5,728,468 | ) | $ | — | $ | (98,060,304 | ) | $ | 84,044 | |||||||||
|
|
|
|
|
|
|
|
|
| |||||||||||
| (a) | The amount of derivatives available for offset is limited to the amount of derivative assets and/or liabilities that are subject to an MNA. |
| (b) | Excess of collateral received/pledged, if any, from the individual counterparty is not shown for financial reporting purposes. |
| (c) | Net amount represents the net amount receivable from the counterparty in the event of default. |
| (d) | Represents derivatives owned by the BlackRock Cayman Commodity Strategies Fund, Ltd., a wholly-owed subsidiary of the Fund. See Note 1 of the Notes to Consolidated Financial Statements. |
| (e) | Net amount represents the net amount payable due to the counterparty in the event of default. |
Fair Value Hierarchy as of Period End
Various inputs are used in determining the fair value of financial instruments. For a description of the input levels and information about the Fund’s policy regarding valuation of financial instruments, refer to the Notes to Consolidated Financial Statements.
The following table summarizes the Fund’s financial instruments categorized in the fair value hierarchy. The breakdown of the Fund’s financial instruments into major categories is disclosed in the Consolidated Schedule of Investments above.
| Level 1 | Level 2 | Level 3 | Total | |||||||||||||
Assets | ||||||||||||||||
Investments | ||||||||||||||||
Long-Term Investments | ||||||||||||||||
Common Stocks | ||||||||||||||||
Biotechnology | $ | 540,679 | $ | — | $ | — | $ | 540,679 | ||||||||
Capital Markets | 2,126,014 | — | — | 2,126,014 | ||||||||||||
Chemicals | 18,966,179 | 1,688,530 | — | 20,654,709 | ||||||||||||
Consumer Staples Distribution & Retail | 3,943,256 | 4,017,704 | — | 7,960,960 | ||||||||||||
| 14 | 2 0 2 3 BLACK ROCK ANNUAL REPORT TO SHAREHOLDERS |
Consolidated Schedule of Investments (continued) May 31, 2023 | BlackRock Commodity Strategies Fund |
Fair Value Hierarchy as of Period End (continued)
| Level 1 | Level 2 | Level 3 | Total | |||||||||||||
Common Stocks (continued) | ||||||||||||||||
Containers & Packaging | $ | 6,531,361 | $ | 4,246,385 | $ | — | $ | 10,777,746 | ||||||||
Energy Equipment & Services | 7,343,364 | 1,804,890 | — | 9,148,254 | ||||||||||||
Food Products | 18,449,588 | 21,576,565 | — | 40,026,153 | ||||||||||||
Hotels, Restaurants & Leisure | — | 3,622,919 | — | 3,622,919 | ||||||||||||
Machinery | 14,311,004 | 936,883 | — | 15,247,887 | ||||||||||||
Metals & Mining | 153,874,740 | 86,747,754 | 6 | 240,622,500 | ||||||||||||
Oil, Gas & Consumable Fuels | 134,898,989 | 55,141,397 | 87 | 190,040,473 | ||||||||||||
Personal Care Products | 3,320,871 | — | — | 3,320,871 | ||||||||||||
Pharmaceuticals | 4,157,733 | — | — | 4,157,733 | ||||||||||||
Rights | — | — | — | — | ||||||||||||
Warrants | ||||||||||||||||
Beverages | 1,129 | — | — | 1,129 | ||||||||||||
Capital Markets | — | 86 | — | 86 | ||||||||||||
Metals & Mining | — | — | — | — | ||||||||||||
Short-Term Securities | ||||||||||||||||
Money Market Funds | 7,558,334 | — | — | 7,558,334 | ||||||||||||
U.S. Treasury Obligations | — | 581,692,534 | — | 581,692,534 | ||||||||||||
Unfunded SPAC PIPE Commitments(a) | — | — | — | — | ||||||||||||
|
|
|
|
|
|
|
| |||||||||
| $ | 376,023,241 | $ | 761,475,647 | $ | 93 | 1,137,498,981 | ||||||||||
|
|
|
|
|
|
|
| |||||||||
Investments valued at NAV(b) | 13,698,222 | |||||||||||||||
|
| |||||||||||||||
| $ | 1,151,197,203 | |||||||||||||||
|
| |||||||||||||||
Derivative Financial Instruments(c) | ||||||||||||||||
Assets | ||||||||||||||||
Commodity Contracts | $ | — | $ | 13,389,702 | $ | — | $ | 13,389,702 | ||||||||
Liabilities | ||||||||||||||||
Commodity Contracts | — | (103,872,816) | — | (103,872,816) | ||||||||||||
|
|
|
|
|
|
|
| |||||||||
| $ | — | $ | (90,483,114) | $ | — | $ | (90,483,114) | |||||||||
|
|
|
|
|
|
|
| |||||||||
| (a) | Unfunded SPAC PIPE commitments are valued at the unrealized appreciation (depreciation) on the commitment. |
| (b) | Certain investments of the Fund were fair valued using NAV as a practical expedient as no quoted market value is available and therefore have been excluded from the fair value hierarchy. |
| (c) | Derivative financial instruments are swaps. Swaps are valued at the unrealized appreciation (depreciation) on the instrument. |
See notes to consolidated financial statements.
CONSOLIDATED SCHEDULE OF INVESTMENTS | 15 |
Consolidated Statement of Assets and Liabilities
May 31, 2023
BlackRock Commodity Strategies Fund | ||||
ASSETS | ||||
Investments, at value — unaffiliated(a)(b) | $ | 1,129,940,647 | ||
Investments, at value — affiliated(c) | 21,256,556 | |||
Cash pledged: | ||||
Collateral — OTC derivatives | 100,150,000 | |||
Receivables: | ||||
Investments sold | 4,735,183 | |||
Securities lending income — affiliated | 34,386 | |||
Capital shares sold | 1,762,943 | |||
Dividends — unaffiliated | 2,318,626 | |||
Dividends — affiliated | 31,864 | |||
From the Manager | 194,349 | |||
Unrealized appreciation on OTC swaps | 13,389,702 | |||
Prepaid expenses | 63,819 | |||
|
| |||
Total assets | 1,273,878,075 | |||
|
| |||
LIABILITIES | ||||
Bank overdraft | 6,435,342 | |||
Foreign bank overdraft(d) | 71,013 | |||
Cash received: | ||||
Collateral — OTC derivatives | 6,900,000 | |||
Collateral on securities loaned | 13,697,546 | |||
Payables: | ||||
Investments purchased | 8,282,425 | |||
Swaps | 3,287,024 | |||
Administration fees | 86,349 | |||
Capital shares redeemed | 3,553,239 | |||
Deferred foreign capital gain tax | 14,090 | |||
Investment advisory fees | 1,211,142 | |||
Trustees’ and Officer’s fees | 4,679 | |||
Other accrued expenses | 511,975 | |||
Professional fees | 49,850 | |||
Service and distribution fees | 54,875 | |||
Unrealized depreciation on OTC swaps | 103,872,816 | |||
|
| |||
Total liabilities | 148,032,365 | |||
|
| |||
NET ASSETS | $ | 1,125,845,710 | ||
|
| |||
NET ASSETS CONSIST OF: | ||||
Paid-in capital | $ | 1,344,079,632 | ||
Accumulated loss | (218,233,922 | ) | ||
|
| |||
NET ASSETS | $ | 1,125,845,710 | ||
|
| |||
(a) Investments, at cost — unaffiliated | $ | 1,055,579,636 | ||
(b) Securities loaned, at value | $ | 13,101,509 | ||
(c) Investments, at cost — affiliated | $ | 21,248,454 | ||
(d) Foreign bank overdraft, at cost | $ | 70,449 | ||
| 16 | 2 0 2 3 BLACK ROCK ANNUAL REPORT TO SHAREHOLDERS |
Consolidated Statement of Assets and Liabilities (continued)
May 31, 2023
BlackRock Commodity Strategies Fund | ||||
NET ASSET VALUE | ||||
| Institutional | ||||
Net assets | $ | 837,334,363 | ||
|
| |||
Shares outstanding | 97,176,351 | |||
|
| |||
Net asset value | $ | 8.62 | ||
|
| |||
Shares authorized | Unlimited | |||
|
| |||
Par value | $ | 0.001 | ||
|
| |||
| Investor A | ||||
Net assets | $ | 120,674,203 | ||
|
| |||
Shares outstanding | 14,144,034 | |||
|
| |||
Net asset value | $ | 8.53 | ||
|
| |||
Shares authorized | Unlimited | |||
|
| |||
Par value | $ | 0.001 | ||
|
| |||
| Investor C | ||||
Net assets | $ | 29,757,732 | ||
|
| |||
Shares outstanding | 3,659,198 | |||
|
| |||
Net asset value | $ | 8.13 | ||
|
| |||
Shares authorized | Unlimited | |||
|
| |||
Par value | $ | 0.001 | ||
|
| |||
| Class K | ||||
Net assets | $ | 138,079,412 | ||
|
| |||
Shares outstanding | 16,013,066 | |||
|
| |||
Net asset value | $ | 8.62 | ||
|
| |||
Shares authorized | Unlimited | |||
|
| |||
Par value | $ | 0.001 | ||
|
| |||
See notes to consolidated financial statements.
CONSOLIDATED FINANCIAL STATEMENTS | 17 |
Consolidated Statement of Operations
Year Ended May 31, 2023
BlackRock Commodity Strategies Fund | ||||
INVESTMENT INCOME | ||||
Dividends — unaffiliated | $ | 30,790,298 | ||
Dividends — affiliated | 472,423 | |||
Interest — unaffiliated | 24,235,310 | |||
Securities lending income — affiliated — net | 548,475 | |||
Foreign taxes withheld | (1,957,300 | ) | ||
|
| |||
Total investment income | 54,089,206 | |||
|
| |||
EXPENSES | ||||
Investment advisory | 10,546,866 | |||
Transfer agent — class specific | 1,885,618 | |||
Service and distribution — class specific | 769,685 | |||
Administration | 691,877 | |||
Administration — class specific | 350,795 | |||
Registration | 252,313 | |||
Custodian | 160,344 | |||
Accounting services | 131,291 | |||
Professional | 126,336 | |||
Printing and postage | 50,635 | |||
Trustees and Officer | 25,703 | |||
Miscellaneous | 51,729 | |||
|
| |||
Total expenses | 15,043,192 | |||
Less: | ||||
Administration fees waived by the Manager — class specific | (350,335 | ) | ||
Fees waived and/or reimbursed by the Manager | (329,049 | ) | ||
Transfer agent fees waived and/or reimbursed by the Manager — class specific | (1,120,069 | ) | ||
|
| |||
Total expenses after fees waived and/or reimbursed | 13,243,739 | |||
|
| |||
Net investment income | 40,845,467 | |||
|
| |||
REALIZED AND UNREALIZED GAIN (LOSS) | ||||
Net realized gain (loss) from: | ||||
Investments — unaffiliated(a) | (52,971,816 | ) | ||
Investments — affiliated | (2,888 | ) | ||
Foreign currency transactions | (270,995 | ) | ||
Swaps | 49,746,357 | |||
|
| |||
| (3,499,342 | ) | |||
|
| |||
Net change in unrealized appreciation (depreciation) on: | ||||
Investments — unaffiliated(b) | (98,445,067 | ) | ||
Investments — affiliated | 5,974 | |||
Foreign currency translations | 2,721 | |||
Swaps | (323,423,860 | ) | ||
|
| |||
| (421,860,232 | ) | |||
|
| |||
Net realized and unrealized loss | (425,359,574 | ) | ||
|
| |||
NET DECREASE IN NET ASSETS RESULTING FROM OPERATIONS | $ | (384,514,107 | ) | |
|
| |||
(a) Net of foreign capital gain tax of | $(320 | ) | ||
(b) Net of increase in deferred foreign capital gain tax of | (14,090 | ) | ||
See notes to consolidated financial statements.
| 18 | 2 0 2 3 BLACK ROCK ANNUAL REPORT TO SHAREHOLDERS |
Consolidated Statements of Changes in Net Assets
| BlackRock Commodity Strategies Fund | ||||||||
Year Ended 05/31/23 | Year Ended 05/31/22 | |||||||
INCREASE (DECREASE) IN NET ASSETS | ||||||||
OPERATIONS | ||||||||
Net investment income | $ | 40,845,467 | $ | 15,534,503 | ||||
Net realized gain (loss) | (3,499,342 | ) | 143,115,453 | |||||
Net change in unrealized appreciation (depreciation) | (421,860,232 | ) | 270,269,565 | |||||
|
|
|
| |||||
Net increase (decrease) in net assets resulting from operations | (384,514,107 | ) | 428,919,521 | |||||
|
|
|
| |||||
DISTRIBUTIONS TO SHAREHOLDERS(a) | ||||||||
Institutional | (140,578,102 | ) | (29,088,688 | ) | ||||
Investor A | (16,226,823 | ) | (3,302,095 | ) | ||||
Investor C | (3,106,978 | ) | (383,038 | ) | ||||
Class K | (24,906,279 | ) | (2,408,554 | ) | ||||
|
|
|
| |||||
Decrease in net assets resulting from distributions to shareholders | (184,818,182 | ) | (35,182,375 | ) | ||||
|
|
|
| |||||
CAPITAL SHARE TRANSACTIONS | ||||||||
Net increase (decrease) in net assets derived from capital share transactions | (957,833,933 | ) | 1,055,217,138 | |||||
|
|
|
| |||||
NET ASSETS | ||||||||
Total increase (decrease) in net assets | (1,527,166,222 | ) | 1,448,954,284 | |||||
Beginning of year | 2,653,011,932 | 1,204,057,648 | ||||||
|
|
|
| |||||
End of year | $ | 1,125,845,710 | $ | 2,653,011,932 | ||||
|
|
|
| |||||
| (a) | Distributions for annual periods determined in accordance with U.S. federal income tax regulations. |
See notes to consolidated financial statements.
CONSOLIDATED FINANCIAL STATEMENTS | 19 |
Consolidated Financial Highlights
(For a share outstanding throughout each period)
| BlackRock Commodity Strategies Fund | ||||||||||||||||||||||||
Institutional
| ||||||||||||||||||||||||
Year Ended 05/31/23 | Year Ended 05/31/22 | Year Ended 05/31/21 | Period from 08/01/19 to 05/31/20 | Year Ended 07/31/19 | Year Ended 07/31/18 | |||||||||||||||||||
Net asset value, beginning of period | $ | 11.33 | $ | 9.22 | $ | 6.33 | $ | 7.18 | $ | 7.82 | $ | 7.43 | ||||||||||||
|
|
|
|
|
|
|
|
|
|
|
| |||||||||||||
Net investment income(a) | 0.22 | 0.09 | 0.07 | 0.09 | 0.14 | (b) | 0.07 | |||||||||||||||||
Net realized and unrealized gain (loss) | (2.08 | ) | 2.27 | 2.88 | (0.79 | ) | (0.64 | ) | 0.37 | |||||||||||||||
|
|
|
|
|
|
|
|
|
|
|
| |||||||||||||
Net increase (decrease) from investment operations | (1.86 | ) | 2.36 | 2.95 | (0.70 | ) | (0.50 | ) | 0.44 | |||||||||||||||
|
|
|
|
|
|
|
|
|
|
|
| |||||||||||||
Distributions from net investment income(c) | (0.85 | ) | (0.25 | ) | (0.06 | ) | (0.15 | ) | (0.14 | ) | (0.05 | ) | ||||||||||||
|
|
|
|
|
|
|
|
|
|
|
| |||||||||||||
Net asset value, end of period | $ | 8.62 | $ | 11.33 | $ | 9.22 | $ | 6.33 | $ | 7.18 | $ | 7.82 | ||||||||||||
|
|
|
|
|
|
|
|
|
|
|
| |||||||||||||
Total Return(d) | ||||||||||||||||||||||||
Based on net asset value | (16.46 | )% | 26.31 | % | 46.93 | % | (9.96 | )%(e) | (6.34 | )% | 5.97 | % | ||||||||||||
|
|
|
|
|
|
|
|
|
|
|
| |||||||||||||
Ratios to Average Net Assets(f) | ||||||||||||||||||||||||
Total expenses | 0.83 | % | 0.82 | % | 0.90 | % | 1.04 | %(g) | 1.01 | % | 1.14 | % | ||||||||||||
|
|
|
|
|
|
|
|
|
|
|
| |||||||||||||
Total expenses after fees waived and/or reimbursed | 0.72 | % | 0.72 | % | 0.72 | % | 0.72 | %(g) | 0.72 | % | 0.88 | % | ||||||||||||
|
|
|
|
|
|
|
|
|
|
|
| |||||||||||||
Net investment income | 2.37 | % | 0.95 | % | 0.90 | % | 1.61 | %(g) | 1.90 | %(b) | 0.90 | % | ||||||||||||
|
|
|
|
|
|
|
|
|
|
|
| |||||||||||||
Supplemental Data | ||||||||||||||||||||||||
Net assets, end of period (000) | $ | 837,334 | $ | 2,061,348 | $ | 862,528 | $ | 104,275 | $ | 145,239 | $ | 200,786 | ||||||||||||
|
|
|
|
|
|
|
|
|
|
|
| |||||||||||||
Portfolio turnover rate | 78 | % | 91 | %(h) | 58 | % | 72 | % | 76 | % | 110 | % | ||||||||||||
|
|
|
|
|
|
|
|
|
|
|
| |||||||||||||
| (a) | Based on average shares outstanding. |
| (b) | Net investment income per share and the ratio of net investment income to average net assets includes $0.01 per share and 0.13%, respectively, resulting from a special dividend. |
| (c) | Distributions for annual periods determined in accordance with U.S. federal income tax regulations. |
| (d) | Where applicable, assumes the reinvestment of distributions. |
| (e) | Not annualized. |
| (f) | Excludes fees and expenses incurred indirectly as a result of investments in underlying funds. |
| (g) | Annualized. |
| (h) | Portfolio turnover rate excludes in-kind transactions. |
See notes to consolidated financial statements.
| 20 | 2 0 2 3 BLACK ROCK ANNUAL REPORT TO SHAREHOLDERS |
Consolidated Financial Highlights (continued)
(For a share outstanding throughout each period)
| BlackRock Commodity Strategies Fund (continued) | ||||||||||||||||||||||||
Investor A
| ||||||||||||||||||||||||
Year Ended 05/31/23 | Year Ended 05/31/22 | Year Ended 05/31/21 | Period from 08/01/19 to 05/31/20 | Year Ended 07/31/19 | Year Ended 07/31/18 | |||||||||||||||||||
Net asset value, beginning of period | $ | 11.23 | $ | 9.14 | $ | 6.28 | $ | 7.12 | $ | 7.74 | $ | 7.36 | ||||||||||||
|
|
|
|
|
|
|
|
|
|
|
| |||||||||||||
Net investment income(a) | 0.20 | 0.07 | 0.05 | 0.08 | 0.12 | (b) | 0.06 | |||||||||||||||||
Net realized and unrealized gain (loss) | (2.07 | ) | 2.25 | 2.86 | (0.79 | ) | (0.63 | ) | 0.36 | |||||||||||||||
|
|
|
|
|
|
|
|
|
|
|
| |||||||||||||
Net increase (decrease) from investment operations | (1.87 | ) | 2.32 | 2.91 | (0.71 | ) | (0.51 | ) | 0.42 | |||||||||||||||
|
|
|
|
|
|
|
|
|
|
|
| |||||||||||||
Distributions from net investment income(c) | (0.83 | ) | (0.23 | ) | (0.05 | ) | (0.13 | ) | (0.11 | ) | (0.04 | ) | ||||||||||||
|
|
|
|
|
|
|
|
|
|
|
| |||||||||||||
Net asset value, end of period | $ | 8.53 | $ | 11.23 | $ | 9.14 | $ | 6.28 | $ | 7.12 | $ | 7.74 | ||||||||||||
|
|
|
|
|
|
|
|
|
|
|
| |||||||||||||
Total Return(d) | ||||||||||||||||||||||||
Based on net asset value | (16.76 | )% | 26.06 | % | 46.53 | % | (10.18 | )%(e) | (6.50 | )% | 5.69 | % | ||||||||||||
|
|
|
|
|
|
|
|
|
|
|
| |||||||||||||
Ratios to Average Net Assets(f) | ||||||||||||||||||||||||
Total expenses | 1.07 | % | 1.13 | % | 1.18 | % | 1.40 | %(g) | 1.38 | % | 1.55 | % | ||||||||||||
|
|
|
|
|
|
|
|
|
|
|
| |||||||||||||
Total expenses after fees waived and/or reimbursed | 0.97 | % | 0.97 | % | 0.97 | % | 0.97 | %(g) | 0.97 | % | 1.11 | % | ||||||||||||
|
|
|
|
|
|
|
|
|
|
|
| |||||||||||||
Net investment income | 2.15 | % | 0.68 | % | 0.62 | % | 1.38 | %(g) | 1.68 | %(b) | 0.73 | % | ||||||||||||
|
|
|
|
|
|
|
|
|
|
|
| |||||||||||||
Supplemental Data | ||||||||||||||||||||||||
Net assets, end of period (000) | $ | 120,674 | $ | 236,887 | $ | 127,923 | $ | 23,628 | $ | 33,853 | $ | 56,622 | ||||||||||||
|
|
|
|
|
|
|
|
|
|
|
| |||||||||||||
Portfolio turnover rate | 78 | % | 91 | %(h) | 58 | % | 72 | % | 76 | % | 110 | % | ||||||||||||
|
|
|
|
|
|
|
|
|
|
|
| |||||||||||||
| (a) | Based on average shares outstanding. |
| (b) | Net investment income per share and the ratio of net investment income to average net assets includes $0.01 per share and 0.13%, respectively, resulting from a special dividend. |
| (c) | Distributions for annual periods determined in accordance with U.S. federal income tax regulations. |
| (d) | Where applicable, excludes the effects of any sales charges and assumes the reinvestment of distributions. |
| (e) | Not annualized. |
| (f) | Excludes fees and expenses incurred indirectly as a result of investments in underlying funds. |
| (g) | Annualized. |
| (h) | Portfolio turnover rate excludes in-kind transactions. |
See notes to consolidated financial statements.
CONSOLIDATED FINANCIAL HIGHLIGHTS | 21 |
Consolidated Financial Highlights (continued)
(For a share outstanding throughout each period)
| BlackRock Commodity Strategies Fund (continued) | ||||||||||||||||||||||||
Investor C
| ||||||||||||||||||||||||
Year Ended 05/31/23 | Year Ended 05/31/22 | Year Ended 05/31/21 | Period from 08/01/19 to 05/31/20 | Year Ended 07/31/19 | Year Ended 07/31/18 | |||||||||||||||||||
Net asset value, beginning of period | $ | 10.75 | $ | 8.78 | $ | 6.04 | $ | 6.84 | $ | 7.45 | $ | 7.10 | ||||||||||||
|
|
|
|
|
|
|
|
|
|
|
| |||||||||||||
Net investment income (loss)(a) | 0.13 | (0.00 | )(b) | (0.01 | ) | 0.03 | 0.06 | (c) | (0.00 | )(b) | ||||||||||||||
Net realized and unrealized gain (loss) | (1.98 | ) | 2.15 | 2.75 | (0.76 | ) | (0.60 | ) | 0.35 | |||||||||||||||
|
|
|
|
|
|
|
|
|
|
|
| |||||||||||||
Net increase (decrease) from investment operations | (1.85 | ) | 2.15 | 2.74 | (0.73 | ) | (0.54 | ) | 0.35 | |||||||||||||||
|
|
|
|
|
|
|
|
|
|
|
| |||||||||||||
Distributions from net investment income(d) | (0.77 | ) | (0.18 | ) | (0.00 | )(b) | (0.07 | ) | (0.07 | ) | — | |||||||||||||
|
|
|
|
|
|
|
|
|
|
|
| |||||||||||||
Net asset value, end of period | $ | 8.13 | $ | 10.75 | $ | 8.78 | $ | 6.04 | $ | 6.84 | $ | 7.45 | ||||||||||||
|
|
|
|
|
|
|
|
|
|
|
| |||||||||||||
Total Return(e) | ||||||||||||||||||||||||
Based on net asset value | (17.34 | )% | 25.06 | % | 45.48 | % | (10.80 | )%(f) | (7.19 | )% | 4.93 | % | ||||||||||||
|
|
|
|
|
|
|
|
|
|
|
| |||||||||||||
Ratios to Average Net Assets(g) | ||||||||||||||||||||||||
Total expenses | 1.80 | % | 1.81 | % | 1.96 | % | 2.07 | %(h) | 2.11 | % | 2.20 | % | ||||||||||||
|
|
|
|
|
|
|
|
|
|
|
| |||||||||||||
Total expenses after fees waived and/or reimbursed | 1.72 | % | 1.72 | % | 1.72 | % | 1.72 | %(h) | 1.72 | % | 1.87 | % | ||||||||||||
|
|
|
|
|
|
|
|
|
|
|
| |||||||||||||
Net investment income (loss) | 1.49 | % | (0.04 | )% | (0.15 | )% | 0.63 | %(h) | 0.92 | %(c) | (0.05 | )% | ||||||||||||
|
|
|
|
|
|
|
|
|
|
|
| |||||||||||||
Supplemental Data | ||||||||||||||||||||||||
Net assets, end of period (000) | $ | 29,758 | $ | 42,138 | $ | 16,246 | $ | 4,255 | $ | 5,832 | $ | 7,562 | ||||||||||||
|
|
|
|
|
|
|
|
|
|
|
| |||||||||||||
Portfolio turnover rate | 78 | % | 91 | %(i) | 58 | % | 72 | % | 76 | % | 110 | % | ||||||||||||
|
|
|
|
|
|
|
|
|
|
|
| |||||||||||||
| (a) | Based on average shares outstanding. |
| (b) | Amount is greater than $(0.005) per share. |
| (c) | Net investment income per share and the ratio of net investment income to average net assets includes $0.01 per share and 0.13%, respectively, resulting from a special dividend. |
| (d) | Distributions for annual periods determined in accordance with U.S. federal income tax regulations. |
| (e) | Where applicable, excludes the effects of any sales charges and assumes the reinvestment of distributions. |
| (f) | Not annualized. |
| (g) | Excludes fees and expenses incurred indirectly as a result of investments in underlying funds. |
| (h) | Annualized. |
| (i) | Portfolio turnover rate excludes in-kind transactions. |
See notes to consolidated financial statements.
| 22 | 2 0 2 3 BLACK ROCK ANNUAL REPORT TO SHAREHOLDERS |
Consolidated Financial Highlights (continued)
(For a share outstanding throughout each period)
| BlackRock Commodity Strategies Fund (continued) | ||||||||||||||||||||||||
Class K
| ||||||||||||||||||||||||
| | Year Ended 05/31/23 |
| | Year Ended 05/31/22 |
| | Year Ended 05/31/21 |
| | Period from 08/01/19 to 05/31/20 |
| | Year Ended 07/31/19 |
| | Period from 01/25/18 to 7/31/18 | (a)
| |||||||
Net asset value, beginning of period | $ | 11.34 | $ | 9.22 | $ | 6.34 | $ | 7.19 | $ | 7.83 | $ | 8.27 | ||||||||||||
|
|
|
|
|
|
|
|
|
|
|
| |||||||||||||
Net investment income(b) | 0.23 | 0.10 | 0.06 | 0.09 | 0.14 | (c) | 0.07 | |||||||||||||||||
Net realized and unrealized gain (loss) | (2.09 | ) | 2.27 | 2.89 | (0.79 | ) | (0.63 | ) | (0.51 | ) | ||||||||||||||
|
|
|
|
|
|
|
|
|
|
|
| |||||||||||||
Net increase (decrease) from investment operations | (1.86 | ) | 2.37 | 2.95 | (0.70 | ) | (0.49 | ) | (0.44 | ) | ||||||||||||||
|
|
|
|
|
|
|
|
|
|
|
| |||||||||||||
Distributions from net investment income(d) | (0.86 | ) | (0.25 | ) | (0.07 | ) | (0.15 | ) | (0.15 | ) | — | |||||||||||||
|
|
|
|
|
|
|
|
|
|
|
| |||||||||||||
Net asset value, end of period | $ | 8.62 | $ | 11.34 | $ | 9.22 | $ | 6.34 | $ | 7.19 | $ | 7.83 | ||||||||||||
|
|
|
|
|
|
|
|
|
|
|
| |||||||||||||
Total Return(e) | ||||||||||||||||||||||||
Based on net asset value | (16.48 | )% | 26.47 | % | 46.76 | % | (9.90 | )%(f) | (6.28 | )% | (5.32 | )%(f) | ||||||||||||
|
|
|
|
|
|
|
|
|
|
|
| |||||||||||||
Ratios to Average Net Assets(g) | ||||||||||||||||||||||||
Total expenses | 0.72 | % | 0.72 | % | 0.80 | % | 0.95 | %(h) | 0.96 | % | 0.92 | %(h)(i) | ||||||||||||
|
|
|
|
|
|
|
|
|
|
|
| |||||||||||||
Total expenses after fees waived and/or reimbursed | 0.67 | % | 0.67 | % | 0.67 | % | 0.67 | %(h) | 0.67 | % | 0.74 | %(h)(i) | ||||||||||||
|
|
|
|
|
|
|
|
|
|
|
| |||||||||||||
Net investment income | 2.42 | % | 1.02 | % | 0.76 | % | 1.60 | %(h) | 1.97 | %(c) | 1.80 | %(h) | ||||||||||||
|
|
|
|
|
|
|
|
|
|
|
| |||||||||||||
Supplemental Data | ||||||||||||||||||||||||
Net assets, end of period (000) | $ | 138,079 | $ | 312,639 | $ | 197,360 | $ | 25,283 | $ | 22,520 | $ | 22,750 | ||||||||||||
|
|
|
|
|
|
|
|
|
|
|
| |||||||||||||
Portfolio turnover rate | 78 | % | 91 | %(j) | 58 | % | 72 | % | 76 | % | 110 | % | ||||||||||||
|
|
|
|
|
|
|
|
|
|
|
| |||||||||||||
| (a) | Commencement of operations. |
| (b) | Based on average shares outstanding. |
| (c) | Net investment income per share and the ratio of net investment income to average net assets includes $0.01 per share and 0.13%, respectively, resulting from a special dividend. |
| (d) | Distributions for annual periods determined in accordance with U.S. federal income tax regulations. |
| (e) | Where applicable, assumes the reinvestment of distributions. |
| (f) | Not annualized. |
| (g) | Excludes fees and expenses incurred indirectly as a result of investments in underlying funds. |
| (h) | Annualized. |
| (i) | Offering and board realignment and consolidation costs were not annualized in the calculation of the expense ratios. If these expenses were annualized, the total expenses and total expenses after fees waived and/or reimbursed would have been 0.93% and 0.76%, respectively. |
| (j) | Portfolio turnover rate excludes in-kind transactions. |
See notes to consolidated financial statements.
CONSOLIDATED FINANCIAL HIGHLIGHTS | 23 |
Notes to Consolidated Financial Statements
| 1. | ORGANIZATION |
BlackRock FundsSM (the “Trust”) is registered under the Investment Company Act of 1940, as amended (the “1940 Act”), as an open-end management investment company. The Trust is organized as a Massachusetts business trust. BlackRock Commodity Strategies Fund (the “Fund”) is a series of the Trust. The Fund is classified as diversified.
The Fund offers multiple classes of shares. All classes of shares have identical voting, dividend, liquidation and other rights and are subject to the same terms and conditions, except that certain classes bear expenses related to the shareholder servicing and distribution of such shares. Institutional and Class K Shares are sold only to certain eligible investors. Investor A and Investor C Shares bear certain expenses related to shareholder servicing of such shares, and Investor C Shares also bear certain expenses related to the distribution of such shares. Investor A and Investor C Shares are generally available through financial intermediaries. Each class has exclusive voting rights with respect to matters relating to its shareholder servicing and distribution expenditures (except that Investor C shareholders may vote on material changes to the Investor A Shares distribution and service plan).
| Share Class | Initial Sales Charge | CDSC | Conversion Privilege | |||||
Institutional and Class K Shares | No | No | None | |||||
Investor A Shares | Yes | No | (a) | None | ||||
Investor C Shares | No | Yes | (b) | To Investor A Shares after approximately 8 years | ||||
| (a) | Investor A Shares may be subject to a contingent deferred sales charge (“CDSC”) for certain redemptions where no initial sales charge was paid at the time of purchase. |
| (b) | A CDSC of 1.00% is assessed on certain redemptions of Investor C Shares made within one year after purchase. |
The Fund, together with certain other registered investment companies advised by BlackRock Advisors, LLC (the “Manager”) or its affiliates, is included in a complex of funds referred to as the BlackRock Multi-Asset Complex.
Basis of Consolidation: The accompanying consolidated financial statements of the Fund include the accounts of BlackRock Cayman Commodity Strategies Fund, Ltd. (the “Subsidiary”), which is a wholly-owned subsidiary of the Fund and primarily invests in commodity-related instruments and other derivatives. The Subsidiary enables the Fund to hold these commodity-related instruments and satisfy regulated investment company tax requirements. The Fund may invest up to 25% of its total assets in the Subsidiary. The net assets of the Subsidiary as of period end were $84,479,516, which is 7.5% of the Fund’s consolidated net assets. Intercompany accounts and transactions, if any, have been eliminated. The Subsidiary is subject to the same investment policies and restrictions that apply to the Fund, except that the Subsidiary may invest without limitation in commodity-related instruments.
| 2. | SIGNIFICANT ACCOUNTING POLICIES |
The consolidated financial statements are prepared in conformity with accounting principles generally accepted in the United States of America (“U.S. GAAP”), which may require management to make estimates and assumptions that affect the reported amounts of assets and liabilities in the consolidated financial statements, disclosure of contingent assets and liabilities at the date of the consolidated financial statements and the reported amounts of increases and decreases in net assets from operations during the reporting period. Actual results could differ from those estimates. The Fund is considered an investment company under U.S. GAAP and follows the accounting and reporting guidance applicable to investment companies. Below is a summary of significant accounting policies:
Investment Transactions and Income Recognition: For financial reporting purposes, investment transactions are recorded on the dates the transactions are executed. Realized gains and losses on investment transactions are determined using the specific identification method. Dividend income and capital gain distributions, if any, are recorded on the ex-dividend dates. Non-cash dividends, if any, are recorded on the ex-dividend dates at fair value. Dividends from foreign securities where the ex-dividend dates may have passed are subsequently recorded when the Fund is informed of the ex-dividend dates. Under the applicable foreign tax laws, a withholding tax at various rates may be imposed on capital gains, dividends and interest. Interest income, including amortization and accretion of premiums and discounts on debt securities, is recognized daily on an accrual basis. Income, expenses and realized and unrealized gains and losses are allocated daily to each class based on its relative net assets.
Foreign Currency Translation: The Fund’s books and records are maintained in U.S. dollars. Securities and other assets and liabilities denominated in foreign currencies are translated into U.S. dollars using exchange rates determined as of the close of trading on the New York Stock Exchange (“NYSE”). Purchases and sales of investments are recorded at the rates of exchange prevailing on the respective dates of such transactions. Generally, when the U.S. dollar rises in value against a foreign currency, the investments denominated in that currency will lose value; the opposite effect occurs if the U.S. dollar falls in relative value.
The Fund does not isolate the effect of fluctuations in foreign exchange rates from the effect of fluctuations in the market prices of investments for financial reporting purposes. Accordingly, the effects of changes in exchange rates on investments are not segregated in the Consolidated Statement of Operations from the effects of changes in market prices of those investments, but are included as a component of net realized and unrealized gain (loss) from investments. The Fund reports realized currency gains (losses) on foreign currency related transactions as components of net realized gain (loss) for financial reporting purposes, whereas such components are generally treated as ordinary income for U.S. federal income tax purposes.
Foreign Taxes: The Fund may be subject to foreign taxes (a portion of which may be reclaimable) on income, stock dividends, capital gains on investments, or certain foreign currency transactions. All foreign taxes are recorded in accordance with the applicable foreign tax regulations and rates that exist in the foreign jurisdictions in which the Fund invests. These foreign taxes, if any, are paid by the Fund and are reflected in its Consolidated Statement of Operations as follows: foreign taxes withheld at source are presented as a reduction of income, foreign taxes on securities lending income are presented as a reduction of securities lending income, foreign taxes on stock dividends are presented as “Foreign taxes withheld”, and foreign taxes on capital gains from sales of investments and foreign taxes on foreign currency transactions are included in their respective net realized gain (loss) categories. Foreign taxes payable or deferred as of May 31, 2023, if any, are disclosed in the Consolidated Statement of Assets and Liabilities.
| 24 | 2 0 2 3 BLACK ROCK ANNUAL REPORT TO SHAREHOLDERS |
Notes to Consolidated Financial Statements (continued)
The Fund files withholding tax reclaims in certain jurisdictions to recover a portion of amounts previously withheld. The Fund may record a reclaim receivable based on collectability, which includes factors such as the jurisdiction’s applicable laws, payment history and market convention. The Consolidated Statement of Operations includes tax reclaims recorded as well as professional and other fees, if any, associated with recovery of foreign withholding taxes.
Collateralization: If required by an exchange or counterparty agreement, the Fund may be required to deliver/deposit cash and/or securities to/with an exchange, or broker-dealer or custodian as collateral for certain investments.
Distributions: Distributions paid by the Fund are recorded on the ex-dividend dates. The character and timing of distributions are determined in accordance with U.S. federal income tax regulations, which may differ from U.S. GAAP.
Net income and realized gains from investments held by the Subsidiary are treated as ordinary income for tax purposes. If a net loss is realized by the Subsidiary in any taxable year, the loss will generally not be available to offset the Fund’s ordinary income and/or capital gains for that year.
Indemnifications: In the normal course of business, the Fund enters into contracts that contain a variety of representations that provide general indemnification. The Fund’s maximum exposure under these arrangements is unknown because it involves future potential claims against the Fund, which cannot be predicted with any certainty.
Other: Expenses directly related to the Fund or its classes are charged to the Fund or the applicable class. Expenses directly related to the Fund and other shared expenses prorated to the Fund are allocated daily to each class based on its relative net assets or other appropriate methods. Other operating expenses shared by several funds, including other funds managed by the Manager, are prorated among those funds on the basis of relative net assets or other appropriate methods.
The Fund has an arrangement with its custodian whereby credits are earned on uninvested cash balances, which could be used to reduce custody fees and/or overdraft charges. The Fund may incur charges on overdrafts, subject to certain conditions.
| 3. | INVESTMENT VALUATION AND FAIR VALUE MEASUREMENTS |
Investment Valuation Policies: The Fund’s investments are valued at fair value (also referred to as “market value” within the consolidated financial statements) each day that the Fund is open for business and, for financial reporting purposes, as of the report date. U.S. GAAP defines fair value as the price a fund would receive to sell an asset or pay to transfer a liability in an orderly transaction between market participants at the measurement date. The Board of Trustees of the Trust (the “Board”) has approved the designation of the Fund’s Manager as the valuation designee for the Fund. The Fund determines the fair values of its financial instruments using various independent dealers or pricing services under the Manager’s policies. If a security’s market price is not readily available or does not otherwise accurately represent the fair value of the security, the security will be valued in accordance with the Manager’s policies and procedures as reflecting fair value. The Manager has formed a committee (the “Valuation Committee”) to develop pricing policies and procedures and to oversee the pricing function for all financial instruments, with assistance from other BlackRock pricing committees.
Fair Value Inputs and Methodologies: The following methods and inputs are used to establish the fair value of the Fund’s assets and liabilities:
| • | Equity investments traded on a recognized securities exchange are valued at that day’s official closing price, as applicable, on the exchange where the stock is primarily traded. Equity investments traded on a recognized exchange for which there were no sales on that day may be valued at the last available bid (long positions) or ask (short positions) price. |
| • | Fixed-income investments for which market quotations are readily available are generally valued using the last available bid price or current market quotations provided by independent dealers or third-party pricing services. Pricing services generally value fixed-income securities assuming orderly transactions of an institutional round lot size, but a fund may hold or transact in such securities in smaller, odd lot sizes. Odd lots may trade at lower prices than institutional round lots. The pricing services may use matrix pricing or valuation models that utilize certain inputs and assumptions to derive values, including transaction data (e.g., recent representative bids and offers), market data, credit quality information, perceived market movements, news, and other relevant information. Certain fixed-income securities, including asset-backed and mortgage related securities may be valued based on valuation models that consider the estimated cash flows of each tranche of the entity, establish a benchmark yield and develop an estimated tranche specific spread to the benchmark yield based on the unique attributes of the tranche. The amortized cost method of valuation may be used with respect to debt obligations with sixty days or less remaining to maturity unless the Manager determines such method does not represent fair value. |
| • | Investments in open-end U.S. mutual funds (including money market funds) are valued at that day’s published net asset value (“NAV”). |
| • | The Fund values its investment in SL Liquidity Series, LLC, Money Market Series (the “Money Market Series”) at fair value, which is ordinarily based upon its pro rata ownership in the underlying fund’s net assets. |
| • | Swap agreements are valued utilizing quotes received daily by independent pricing services or through brokers, which are derived using daily swap curves and models that incorporate a number of market data factors, such as discounted cash flows, trades and values of the underlying reference instruments. |
Generally, trading in foreign instruments is substantially completed each day at various times prior to the close of trading on the NYSE. Each business day, the Fund uses current market factors supplied by independent pricing services to value certain foreign instruments (“Systematic Fair Value Price”). The Systematic Fair Value Price is designed to value such foreign securities at fair value as of the close of trading on the NYSE, which follows the close of the local markets.
If events (e.g., market volatility, company announcement or a natural disaster) occur that are expected to materially affect the value of such investment, or in the event that application of these methods of valuation results in a price for an investment that is deemed not to be representative of the market value of such investment, or if a price is not available, the investment will be valued by the Valuation Committee in accordance with the Manager’s policies and procedures as reflecting fair value (“Fair Valued Investments”). The fair valuation approaches that may be used by the Valuation Committee include market approach, income approach and cost approach. Valuation techniques such as discounted cash flow, use of market comparables and matrix pricing are types of valuation approaches and are typically used in determining fair value. When determining the price for Fair Valued Investments, the Valuation Committee seeks to determine the price that the Fund might reasonably expect to receive or pay from
NOTES TO CONSOLIDATED FINANCIAL STATEMENTS | 25 |
Notes to Consolidated Financial Statements (continued)
the current sale or purchase of that asset or liability in an arm’s-length transaction. Fair value determinations shall be based upon all available factors that the Valuation Committee deems relevant and consistent with the principles of fair value measurement.
For investments in equity or debt issued by privately held companies or funds (“Private Company” or collectively, the “Private Companies”) and other Fair Valued Investments, the fair valuation approaches that are used by the Valuation Committee and third-party pricing services utilized by the Valuation Committee include one or a combination of, but not limited to, the following inputs.
| Standard Inputs Generally Considered By The Valuation Committee And Third-Party Pricing Services | ||
Market approach | (i) recent market transactions, including subsequent rounds of financing, in the underlying investment or comparable issuers; (ii) recapitalizations and other transactions across the capital structure; and (iii) market multiples of comparable issuers. | |
Income approach | (i) future cash flows discounted to present and adjusted as appropriate for liquidity, credit, and/or market risks; (ii) quoted prices for similar investments or assets in active markets; and (iii) other risk factors, such as interest rates, yield curves, volatilities, prepayment speeds, loss severities, credit risks, recovery rates, liquidation amounts and/or default rates. | |
Cost approach | (i) audited or unaudited financial statements, investor communications and financial or operational metrics issued by the Private Company; (ii) changes in the valuation of relevant indices or publicly traded companies comparable to the Private Company; (iii) relevant news and other public sources; and (iv) known secondary market transactions in the Private Company’s interests and merger or acquisition activity in companies comparable to the Private Company. | |
Investments in series of preferred stock issued by Private Companies are typically valued utilizing market approach in determining the enterprise value of the company. Such investments often contain rights and preferences that differ from other series of preferred and common stock of the same issuer. Enterprise valuation techniques such as an option pricing model (“OPM”), a probability weighted expected return model (“PWERM”), current value method or a hybrid of those techniques are used as deemed appropriate under the circumstances. The use of these valuation techniques involve a determination of the exit scenarios of the investment in order to appropriately allocate the enterprise value of the company among the various parts of its capital structure.
The Private Companies are not subject to the public company disclosure, timing, and reporting standards applicable to other investments held by the Fund. Typically, the most recently available information by a Private Company is as of a date that is earlier than the date the Fund is calculating its NAV. This factor may result in a difference between the value of the investment and the price the Fund could receive upon the sale of the investment.
Fair Value Hierarchy: Various inputs are used in determining the fair value of financial instruments. These inputs to valuation techniques are categorized into a fair value hierarchy consisting of three broad levels for financial reporting purposes as follows:
| • | Level 1 – Unadjusted price quotations in active markets/exchanges for identical assets or liabilities that the Fund has the ability to access; |
| • | Level 2 – Other observable inputs (including, but not limited to, quoted prices for similar assets or liabilities in markets that are active, quoted prices for identical or similar assets or liabilities in markets that are not active, inputs other than quoted prices that are observable for the assets or liabilities (such as interest rates, yield curves, volatilities, prepayment speeds, loss severities, credit risks and default rates) or other market–corroborated inputs); and |
| • | Level 3 – Unobservable inputs based on the best information available in the circumstances, to the extent observable inputs are not available (including the Valuation Committee’s assumptions used in determining the fair value of financial instruments). |
The hierarchy gives the highest priority to unadjusted quoted prices in active markets for identical assets or liabilities (Level 1 measurements) and the lowest priority to unobservable inputs (Level 3 measurements). Accordingly, the degree of judgment exercised in determining fair value is greatest for instruments categorized in Level 3. The inputs used to measure fair value may fall into different levels of the fair value hierarchy. In such cases, for disclosure purposes, the fair value hierarchy classification is determined based on the lowest level input that is significant to the fair value measurement in its entirety. Investments classified within Level 3 have significant unobservable inputs used by the Valuation Committee in determining the price for Fair Valued Investments. Level 3 investments include equity or debt issued by Private Companies that may not have a secondary market and/or may have a limited number of investors. The categorization of a value determined for financial instruments is based on the pricing transparency of the financial instruments and is not necessarily an indication of the risks associated with investing in those securities.
As of May 31, 2023, certain investments of the Fund were fair valued using NAV as a practical expedient as no quoted market value is available and therefore have been excluded from the fair value hierarchy.
| 4. | SECURITIES AND OTHER INVESTMENTS |
Preferred Stocks: Preferred stock has a preference over common stock in liquidation (and generally in receiving dividends as well), but is subordinated to the liabilities of the issuer in all respects. As a general rule, the market value of preferred stock with a fixed dividend rate and no conversion element varies inversely with interest rates and perceived credit risk, while the market price of convertible preferred stock generally also reflects some element of conversion value. Because preferred stock is junior to debt securities and other obligations of the issuer, deterioration in the credit quality of the issuer will cause greater changes in the value of a preferred stock than in a more senior debt security with similar stated yield characteristics. Unlike interest payments on debt securities, preferred stock dividends are payable only if declared by the issuer’s board of directors. Preferred stock also may be subject to optional or mandatory redemption provisions.
Warrants: Warrants entitle a fund to purchase a specified number of shares of common stock and are non-income producing. The purchase price and number of shares are subject to adjustment under certain conditions until the expiration date of the warrants, if any. If the price of the underlying stock does not rise above the strike price before the
| 26 | 2 0 2 3 BLACK ROCK ANNUAL REPORT TO SHAREHOLDERS |
Notes to Consolidated Financial Statements (continued)
warrant expires, the warrant generally expires without any value and a fund will lose any amount it paid for the warrant. Thus, investments in warrants may involve more risk than investments in common stock. Warrants may trade in the same markets as their underlying stock; however, the price of the warrant does not necessarily move with the price of the underlying stock.
Special Purpose Acquisition Companies: Special purpose acquisition companies (SPACs) are companies that have no operations but go public with the intention of merging with or acquiring a company using the proceeds of the SPAC’s initial public offering. The Fund may enter into a commitment with a SPAC for a private investment in a public equity (PIPE) and will satisfy the commitment if and when the SPAC completes its merger or acquisition. Securities purchased through PIPE transactions will be restricted from trading and considered illiquid until a registration statement for the shares is filed and declared effective. Unfunded SPAC PIPE commitments are marked-to-market and any unrealized appreciation (depreciation) is separately presented in the Statement of Assets and Liabilities and Statement of Operations. As of period end, the Fund had the following unfunded SPAC PIPE commitments:
| Investment Name | Commitment Amount | Value | Unrealized Appreciation (Depreciation) | |||||||||
Metals Acquisition Ltd. | $ | 1,287,000 | $ | 1,287,000 | $ | — | ||||||
|
|
|
|
|
| |||||||
Securities Lending: The Fund may lend its securities to approved borrowers, such as brokers, dealers and other financial institutions. The borrower pledges and maintains with the Fund collateral consisting of cash, an irrevocable letter of credit issued by a bank, or securities issued or guaranteed by the U.S. Government. The initial collateral received by the Fund is required to have a value of at least 102% of the current value of the loaned securities for securities traded on U.S. exchanges and a value of at least 105% for all other securities. The collateral is maintained thereafter at a value equal to at least 100% of the current market value of the securities on loan. The market value of the loaned securities is determined at the close of each business day of the Fund and any additional required collateral is delivered to the Fund, or excess collateral returned by the Fund, on the next business day. During the term of the loan, the Fund is entitled to all distributions made on or in respect of the loaned securities, but does not receive interest income on securities received as collateral. Loans of securities are terminable at any time and the borrower, after notice, is required to return borrowed securities within the standard time period for settlement of securities transactions.
As of period end, any securities on loan were collateralized by cash and/or U.S. Government obligations. Cash collateral invested by the securities lending agent, BlackRock Investment Management, LLC (“BIM”), if any, is disclosed in the Consolidated Schedule of Investments. Any non-cash collateral received cannot be sold, re-invested or pledged by the Fund, except in the event of borrower default. The securities on loan, if any, are disclosed in the Fund’s Consolidated Schedule of Investments. The market value of any securities on loan and the value of related collateral, if any, are shown separately in the Consolidated StatementConsolidated of Assets and Liabilities as a component of investments at value – unaffiliated and collateral on securities loaned, respectively.
Securities lending transactions are entered into by the Fund under Master Securities Lending Agreements (each, an “MSLA”), which provide the right, in the event of default (including bankruptcy or insolvency), for the non-defaulting party to liquidate the collateral and calculate a net exposure to the defaulting party or request additional collateral. In the event that a borrower defaults, the Fund, as lender, would offset the market value of the collateral received against the market value of the securities loaned. When the value of the collateral is greater than that of the market value of the securities loaned, the lender is left with a net amount payable to the defaulting party. However, bankruptcy or insolvency laws of a particular jurisdiction may impose restrictions on or prohibitions against such a right of offset in the event of an MSLA counterparty’s bankruptcy or insolvency. Under the MSLA, absent an event of default, the borrower can resell or re-pledge the loaned securities, and the Fund can reinvest cash collateral received in connection with loaned securities. Upon an event of default, the parties’ obligations to return the securities or collateral to the other party are extinguished, and the parties can resell or re-pledge the loaned securities or the collateral received in connection with the loaned securities in order to satisfy the defaulting party’s net payment obligation for all transactions under the MSLA. The defaulting party remains liable for any deficiency.
As of period end, the following table is a summary of the Fund’s securities on loan by counterparty which are subject to offset under an MSLA:
| Counterparty | | Securities Loaned at Value | | | Cash Collateral Received | (a) | | Non-Cash Collateral Received | (a) | | Net Amount | | ||||
Barclays Capital, Inc. | $ | 65,357 | $ | (65,357 | ) | $ | — | $ | — | |||||||
BofA Securities, Inc. | 37,232 | (37,232 | ) | — | — | |||||||||||
J.P. Morgan Securities LLC | 9,993,061 | (9,993,061 | ) | — | — | |||||||||||
Morgan Stanley | 2,863,845 | (2,863,845 | ) | — | — | |||||||||||
National Financial Services LLC | 11,488 | (11,488 | ) | — | — | |||||||||||
SG Americas Securities LLC | 130,526 | (130,526 | ) | — | — | |||||||||||
|
|
|
|
|
|
|
| |||||||||
| $ | 13,101,509 | $ | (13,101,509 | ) | $ | — | $ | — | ||||||||
|
|
|
|
|
|
|
| |||||||||
| (a) | Collateral received, if any, in excess of the market value of securities on loan is not presented in this table. The total cash collateral received by the Fund is disclosed in the Fund’s Consolidated Statement of Assets and Liabilities. |
The risks of securities lending include the risk that the borrower may not provide additional collateral when required or may not return the securities when due. To mitigate these risks, the Fund benefits from a borrower default indemnity provided by BIM. BIM’s indemnity allows for full replacement of the securities loaned to the extent the collateral received does not cover the value on the securities loaned in the event of borrower default. The Fund could incur a loss if the value of an investment purchased with cash collateral falls below the market value of loaned securities or if the value of an investment purchased with cash collateral falls below the value of the original cash collateral received. Such losses are borne entirely by the Fund.
NOTES TO CONSOLIDATED FINANCIAL STATEMENTS | 27 |
Notes to Consolidated Financial Statements (continued)
| 5. | DERIVATIVE FINANCIAL INSTRUMENTS |
The Fund engages in various portfolio investment strategies using derivative contracts both to increase the returns of the Fund and/or to manage its exposure to certain risks such as credit risk, equity risk, interest rate risk, foreign currency exchange rate risk, commodity price risk or other risks (e.g., inflation risk). Derivative financial instruments categorized by risk exposure are included in the Consolidated Schedule of Investments. These contracts may be transacted on an exchange or over-the-counter (“OTC”).
Swaps: Swap contracts are entered into to manage exposure to issuers, markets and securities. Such contracts are agreements between the Fund and a counterparty to make periodic net payments on a specified notional amount or a net payment upon termination. Swap agreements are privately negotiated in the OTC market and may be entered into as a bilateral contract (“OTC swaps”) or centrally cleared (“centrally cleared swaps”).
For OTC swaps, any upfront premiums paid and any upfront fees received are shown as swap premiums paid and swap premiums received, respectively, in the Consolidated Statement of Assets and Liabilities and amortized over the term of the contract. The daily fluctuation in market value is recorded as unrealized appreciation (depreciation) on OTC Swaps in the Consolidated Statement of Assets and Liabilities. Payments received or paid are recorded in the Consolidated Statement of Operations as realized gains or losses, respectively. When an OTC swap is terminated, a realized gain or loss is recorded in the Consolidated Statement of Operations equal to the difference between the proceeds from (or cost of) the closing transaction and the Fund’s basis in the contract, if any. Generally, the basis of the contract is the premium received or paid.
In a centrally cleared swap, immediately following execution of the swap contract, the swap contract is novated to a central counterparty (the “CCP”) and the CCP becomes the Fund’s counterparty on the swap. The Fund is required to interface with the CCP through the broker. Upon entering into a centrally cleared swap, the Fund is required to deposit initial margin with the broker in the form of cash or securities in an amount that varies depending on the size and risk profile of the particular swap. Securities deposited as initial margin are designated in the Consolidated Schedule of Investments and cash deposited is shown as cash pledged for centrally cleared swaps in the Consolidated Statement of Assets and Liabilities. Amounts pledged, which are considered restricted cash, are included in cash pledged for centrally cleared swaps in the Consolidated Statement of Assets and Liabilities. Pursuant to the contract, the Fund agrees to receive from or pay to the broker an amount of cash equal to the daily fluctuation in market value of the contract (“variation margin”). Variation margin is recorded as unrealized appreciation (depreciation) and shown as variation margin receivable (or payable) on centrally cleared swaps in the Consolidated Statement of Assets and Liabilities. Payments received from (paid to) the counterparty are amortized over the term of the contract and recorded as realized gains (losses) in the Consolidated Statement of Operations, including those at termination.
| • | Total return swaps — Total return swaps are entered into to obtain exposure to a security or market without owning such security or investing directly in such market or to exchange the risk/return of one security or market (e.g., fixed-income) with another security or market (e.g., equity or commodity prices) (equity risk, commodity price risk and/or interest rate risk). |
Total return swaps are agreements in which there is an exchange of cash flows whereby one party commits to make payments based on the total return (distributions plus capital gains/losses) of an underlying instrument, or basket of underlying instruments, in exchange for fixed or floating rate interest payments. If the total return of the instrument(s) or index underlying the transaction exceeds or falls short of the offsetting fixed or floating interest rate obligation, the Fund receives payment from or makes a payment to the counterparty.
Swap transactions involve, to varying degrees, elements of interest rate, credit and market risks in excess of the amounts recognized in the Consolidated Statement of Assets and Liabilities. Such risks involve the possibility that there will be no liquid market for these agreements, that the counterparty to the agreements may default on its obligation to perform or disagree as to the meaning of the contractual terms in the agreements, and that there may be unfavorable changes in interest rates and/or market values associated with these transactions.
Master Netting Arrangements: In order to define its contractual rights and to secure rights that will help it mitigate its counterparty risk, the Fund may enter into an International Swaps and Derivatives Association, Inc. Master Agreement (“ISDA Master Agreement”) or similar agreement with its counterparties. An ISDA Master Agreement is a bilateral agreement between a Fund and a counterparty that governs certain OTC derivatives and typically contains, among other things, collateral posting terms and netting provisions in the event of a default and/or termination event. Under an ISDA Master Agreement, a Fund may, under certain circumstances, offset with the counterparty certain derivative financial instruments’ payables and/or receivables with collateral held and/or posted and create one single net payment. The provisions of the ISDA Master Agreement typically permit a single net payment in the event of default including the bankruptcy or insolvency of the counterparty. However, bankruptcy or insolvency laws of a particular jurisdiction may impose restrictions on or prohibitions against the right of offset in bankruptcy, insolvency or other events.
Collateral Requirements: For derivatives traded under an ISDA Master Agreement, the collateral requirements are typically calculated by netting the mark-to-market amount for each transaction under such agreement and comparing that amount to the value of any collateral currently pledged by the Fund and the counterparty.
Cash collateral that has been pledged to cover obligations of the Fund and cash collateral received from the counterparty, if any, is reported separately in the Consolidated Statement of Assets and Liabilities as cash pledged as collateral and cash received as collateral, respectively. Non-cash collateral pledged by the Fund, if any, is noted in the Consolidated Schedule of Investments. Generally, the amount of collateral due from or to a counterparty is subject to a certain minimum transfer amount threshold before a transfer is required, which is determined at the close of business of the Fund. Any additional required collateral is delivered to/pledged by the Fund on the next business day. Typically, the counterparty is not permitted to sell, re-pledge or use cash and non-cash collateral it receives. The Fund generally agrees not to use non-cash collateral that it receives but may, absent default or certain other circumstances defined in the underlying ISDA Master Agreement, be permitted to use cash collateral received. In such cases, interest may be paid pursuant to the collateral arrangement with the counterparty. To the extent amounts due to the Fund from the counterparties are not fully collateralized, the Fund bears the risk of loss from counterparty non-performance. Likewise, to the extent the Fund has delivered collateral to a counterparty and stands ready to perform under the terms of its agreement with such counterparty, the Fund bears the risk of loss from a counterparty in the amount of the value of the collateral in the event the counterparty fails to return such collateral. Based on the terms of agreements, collateral may not be required for all derivative contracts.
For financial reporting purposes, the Fund does not offset derivative assets and derivative liabilities that are subject to netting arrangements, if any, in the Consolidated Statement of Assets and Liabilities.
| 28 | 2 0 2 3 BLACK ROCK ANNUAL REPORT TO SHAREHOLDERS |
Notes to Consolidated Financial Statements (continued)
| 6. | INVESTMENT ADVISORY AGREEMENT AND OTHER TRANSACTIONS WITH AFFILIATES |
Investment Advisory: The Trust, on behalf of the Fund, entered into an Investment Advisory Agreement with the Manager, the Fund’s investment adviser and an indirect, wholly-owned subsidiary of BlackRock, Inc. (“BlackRock”), to provide investment advisory services. The Manager is responsible for the management of the Fund’s portfolio and provides the personnel, facilities, equipment and certain other services necessary to the operations of the Fund.
For such services, the Fund pays the Manager a monthly fee at an annual rate equal to the following percentages of the average daily value of the Fund’s net assets:
| Average Daily Net Assets | Investment Advisory Fees | |||
First $1 billion | 0.62 | % | ||
$1 billion - $3 billion | 0.58 | |||
$3 billion - $5 billion | 0.56 | |||
$5 billion - $10 billion | 0.54 | |||
Greater than $10 billion | 0.53 | |||
The Manager provides investment management and other services to the Subsidiary. The Manager does not receive separate compensation from the Subsidiary for providing investment management or administrative services. However, the Fund pays the Manager based on the Fund’s net assets, which includes the assets of the Subsidiary.
With respect to the Fund, the Manager entered into a sub-advisory agreement with BlackRock International Limited (“BIL”), an affiliate of the Manager. The Manager pays BIL for services it provides for that portion of the Fund for which BIL acts as sub-adviser, a monthly fee that is equal to a percentage of the investment advisory fees paid by the Fund to the Manager.
Service and Distribution Fees: The Trust, on behalf of the Fund, entered into a Distribution Agreement and a Distribution and Service Plan with BlackRock Investments, LLC (“BRIL”), an affiliate of the Manager. Pursuant to the Distribution and Service Plan and in accordance with Rule 12b-1 under the 1940 Act, the Fund pays BRIL ongoing service and distribution fees. The fees are accrued daily and paid monthly at annual rates based upon the average daily net assets of the relevant share class of the Fund as follows:
| Share Class | Service Fees | Distribution Fees | ||||||
Investor A | 0.25 | % | N/A | |||||
Investor C | 0.25 | 0.75 | % | |||||
BRIL and broker-dealers, pursuant to sub-agreements with BRIL, provide shareholder servicing and distribution services to the Fund. The ongoing service and/or distribution fee compensates BRIL and each broker-dealer for providing shareholder servicing and/or distribution related services to shareholders.
For the year ended May 31, 2023, the following table shows the class specific service and distribution fees borne directly by each share class of the Fund:
| Investor A | Investor C | Total | ||||||||||
Service and distribution — class specific | $ | 403,026 | $ | 366,659 | $ | 769,685 | ||||||
Administration: The Trust, on behalf of the Fund, entered into an Administration Agreement with the Manager, an indirect, wholly-owned subsidiary of BlackRock, to provide administrative services. For these services, the Manager receives an administration fee computed daily and payable monthly, based on a percentage of the average daily net assets of the Fund. The administration fee, which is shown as administration in the Consolidated Statement of Operations, is paid at the annual rates below.
| Average Daily Net Assets | Administration Fees | |||
First $500 million | 0.0425 | % | ||
$500 million - $1 billion | 0.0400 | |||
$1 billion - $2 billion | 0.0375 | |||
$2 billion - $4 billion | 0.0350 | |||
$4 billion - $13 billion | 0.0325 | |||
Greater than $13 billion | 0.0300 | |||
In addition, the Manager charges each of the share classes an administration fee, which is shown as administration — class specific in the Consolidated Statement of Operations, at an annual rate of 0.02% of the average daily net assets of each respective class.
For the year ended May 31, 2023, the Fund paid the following to the Manager in return for these services, which are included in administration — class specific in the Consolidated Statement of Operations:
| Institutional | Investor A | Investor C | Class K | Total | ||||||||||||||||
Administration — class specific | $ | 262,470 | $ | 32,301 | $ | 7,329 | $ | 48,695 | $ | 350,795 | ||||||||||
Transfer Agent: Pursuant to written agreements, certain financial intermediaries, some of which may be affiliates, provide the Fund with sub-accounting, recordkeeping, sub-transfer agency and other administrative services with respect to servicing of underlying investor accounts. For these services, these entities receive an asset-based fee or an annual fee per shareholder account, which will vary depending on share class and/or net assets. For the year ended May 31, 2023, the Fund did not pay any amounts to affiliates in return for these services.
NOTES TO CONSOLIDATED FINANCIAL STATEMENTS | 29 |
Notes to Consolidated Financial Statements (continued)
The Manager maintains a call center that is responsible for providing certain shareholder services to the Fund. Shareholder services include responding to inquiries and processing purchases and sales based upon instructions from shareholders. For the year ended May 31, 2023, the Fund reimbursed the Manager the following amounts for costs incurred in running the call center, which are included in transfer agent — class specific in the Consolidated Statement of Operations:
| Institutional | Investor A | Investor C | Class K | Total | ||||||||||||||||
Reimbursed amounts | $ | 4,679 | $ | 1,815 | $ | 606 | $ | 547 | $ | 7,647 | ||||||||||
For the year ended May 31, 2023, the following table shows the class specific transfer agent fees borne directly by each share class of the Fund:
| Institutional | Investor A | Investor C | Class K | Total | ||||||||||||||||
Transfer agent — class specific | $ | 1,632,355 | $ | 181,885 | $ | 33,414 | $ | 37,964 | $ | 1,885,618 | ||||||||||
Other Fees: For the year ended May 31, 2023, affiliates earned underwriting discounts, direct commissions and dealer concessions on sales of the Fund’s Investor A Shares for a total of $9,489.
For the year ended May 31, 2023, affiliates received CDSCs as follows:
| Share Class | Amounts | |||
Investor A | $ | 28,955 | ||
Investor C | 15,603 | |||
Expense Limitations, Waivers and Reimbursements: The Manager contractually agreed to waive its investment advisory fees by the amount of investment advisory fees the Fund pays to the Manager indirectly through its investment in affiliated money market funds (the “affiliated money market fund waiver”) through June 30, 2024. The contractual agreement may be terminated upon 90 days’ notice by a majority of the trustees who are not “interested persons” of the Trust, as defined in the 1940 Act (“Independent Trustees”), or by a vote of a majority of the outstanding voting securities of the Fund. The amount of waivers and/or reimbursements of fees and expenses made pursuant to the expense limitation described below will be reduced by the amount of the affiliated money market fund waiver. This amount is included in fees waived and/or reimbursed by the Manager in the Statement of Operations. For the year ended May 31, 2023, the amount waived was $12,659.
The Manager has contractually agreed to waive its investment advisory fee with respect to any portion of the Fund’s assets invested in affiliated equity and fixed-income mutual funds and affiliated exchange-traded funds that have a contractual management fee through June 30, 2024. The contractual agreement may be terminated upon 90 days’ notice by a majority of the Independent Trustees, or by a vote of a majority of the outstanding voting securities of the Fund. For the year ended May 31, 2023, there were no fees waived by the Manager pursuant to this arrangement.
The Manager contractually agreed to waive and/or reimburse fees or expenses in order to limit expenses, excluding interest expense, dividend expense, tax expense, acquired fund fees and expenses, and certain other fund expenses, which constitute extraordinary expenses not incurred in the ordinary course of the Fund’s business (“expense limitation”). The expense limitations as a percentage of average daily net assets are as follows:
| Institutional | Investor A | Investor C | Class K | |||
| 0.72% | 0.97% | 1.72% | 0.67% |
The Manager has agreed not to reduce or discontinue the contractual expense limitations through June 30, 2024 unless approved by the Board, including a majority of the Independent Trustees, or by a vote of a majority of the outstanding voting securities of the Fund. For the year ended May 31, 2023, the Manager waived and/or reimbursed investment advisory fees of $316,390, which is included in fees waived and/or reimbursed by the Manager in the Consolidated Statement of Operations.
In addition, these amounts waived and/or reimbursed by the Manager are included in administration fees waived by the Manager — class specific and transfer agent fees waived and/or reimbursed by the Manager — class specific, respectively, in the Consolidated Statement of Operations. For the year ended May 31, 2023, class specific expense waivers and/or reimbursements are as follows:
| Institutional | Investor A | Investor C | Class K | Total | ||||||||||||||||
Administration fees waived by the Manager — class specific | $ | 262,470 | $ | 32,301 | $ | 7,329 | $ | 48,235 | $ | 350,335 | ||||||||||
Transfer agent fees waived and/or reimbursed by the Manager — class specific | 967,769 | 100,161 | 15,380 | 36,759 | 1,120,069 | |||||||||||||||
Securities Lending: The U.S. Securities and Exchange Commission (“SEC”) has issued an exemptive order which permits BIM, an affiliate of the Manager, to serve as securities lending agent for the Fund, subject to applicable conditions. As securities lending agent, BIM bears all operational costs directly related to securities lending. The Fund is responsible for expenses in connection with the investment of cash collateral received for securities on loan (the “collateral investment expenses”). The cash collateral is invested in a private investment company, Money Market Series, managed by the Manager or its affiliates. However, BIM has agreed to cap the collateral investment expenses of the Money Market Series to an annual rate of 0.04%. The investment adviser to the Money Market Series will not charge any advisory fees with respect to shares purchased by the Fund. The Money Market Series may, under certain circumstances, impose a liquidity fee of up to 2% of the value withdrawn or temporarily restrict withdrawals for up to 10 business days during a 90 day period, in the event that the private investment company’s weekly liquid assets fall below certain thresholds. The Money Market Series seeks current income consistent with maintaining liquidity and preserving capital. Although the Money Market Series is not registered under the 1940 Act, its investments may follow the parameters of investments by a money market fund that is subject to Rule 2a-7 under the 1940 Act.
| 30 | 2 0 2 3 BLACK ROCK ANNUAL REPORT TO SHAREHOLDERS |
Notes to Consolidated Financial Statements (continued)
Securities lending income is equal to the total of income earned from the reinvestment of cash collateral, net of fees and other payments to and from borrowers of securities, and less the collateral investment expenses. The Fund retains a portion of securities lending income and remits a remaining portion to BIM as compensation for its services as securities lending agent.
Pursuant to the current securities lending agreement, the Fund retains 82% of securities lending income (which excludes collateral investment expenses), and this amount retained can never be less than 70% of the total of securities lending income plus the collateral investment expenses.
In addition, commencing the business day following the date that the aggregate securities lending income earned across the BlackRock Multi-Asset Complex in a calendar year exceeds a specified threshold, the Fund, pursuant to the securities lending agreement, will retain for the remainder of that calendar year securities lending income in an amount equal to 85% of securities lending income (which excludes collateral investment expenses), and this amount retained can never be less than 70% of the total of securities lending income plus the collateral investment expenses.
The share of securities lending income earned by the Fund is shown as securities lending income — affiliated — net in the Consolidated Statement of Operations. For the year ended May 31, 2023, the Fund paid BIM $109,120 for securities lending agent services.
Interfund Lending: In accordance with an exemptive order (the “Order”) from the SEC, the Fund may participate in a joint lending and borrowing facility for temporary purposes (the “Interfund Lending Program”), subject to compliance with the terms and conditions of the Order, and to the extent permitted by the Fund’s investment policies and restrictions. The Fund is currently permitted to borrow and lend under the Interfund Lending Program.
A lending BlackRock fund may lend in aggregate up to 15% of its net assets but may not lend more than 5% of its net assets to any one borrowing fund through the Interfund Lending Program. A borrowing BlackRock fund may not borrow through the Interfund Lending Program or from any other source more than 33 1/3% of its total assets (or any lower threshold provided for by the fund’s investment restrictions). If a borrowing BlackRock fund’s total outstanding borrowings exceed 10% of its total assets, each of its outstanding interfund loans will be subject to collateralization of at least 102% of the outstanding principal value of the loan. All interfund loans are for temporary or emergency purposes and the interest rate to be charged will be the average of the highest current overnight repurchase agreement rate available to a lending fund and the bank loan rate, as calculated according to a formula established by the Board.
During the year ended May 31, 2023, the Fund did not participate in the Interfund Lending Program.
Trustees and Officers: Certain trustees and/or officers of the Trust are directors and/or officers of BlackRock or its affiliates. The Fund reimburses the Manager for a portion of the compensation paid to the Trust’s Chief Compliance Officer, which is included in Trustees and Officer in the Consolidated Statement of Operations.
Other Transactions: The Fund may purchase securities from, or sell securities to, an affiliated fund provided the affiliation is due solely to having a common investment adviser, common officers, or common trustees. For the year ended May 31, 2023, the purchase and sale transactions and any net realized gains (losses) with an affiliated fund in compliance with Rule 17a-7 under the 1940 Act were as follows:
| Purchases | Sales | Net Realized Loss | ||||||||||||
| $ | 281,484 | $ | 2,903,844 | $ | (1,842,703 | ) | ||||||||
| 7. | PURCHASES AND SALES |
For the year ended May 31, 2023, purchases and sales of investments, excluding short-term securities, were $671,333,840 and $1,233,216,003, respectively.
| 8. | INCOME TAX INFORMATION |
It is the Fund’s policy to comply with the requirements of the Internal Revenue Code of 1986, as amended, applicable to regulated investment companies, and to distribute substantially all of its taxable income to its shareholders. Therefore, no U.S. federal income tax provision is required.
The Fund files U.S. federal and various state and local tax returns. No income tax returns are currently under examination. The statute of limitations on the Fund’s U.S. federal tax returns generally remains open for a period of three years after they are filed. The statutes of limitations on the Fund’s state and local tax returns may remain open for an additional year depending upon the jurisdiction.
Management has analyzed tax laws and regulations and their application to the Fund as of May 31, 2023, inclusive of the open tax return years, and does not believe that there are any uncertain tax positions that require recognition of a tax liability in the Fund’s consolidated financial statements.
U.S. GAAP requires that certain components of net assets be adjusted to reflect permanent differences between financial and tax reporting. These reclassifications have no effect on net assets or per share. As of period end, permanent differences attributable to certain deemed distributions and income recognized from the Fund’s wholly owned subsidiary were reclassified to the following accounts:
| Amounts | ||||
Paid-in capital | $ | (1,423,924 | ) | |
Accumulated earnings (loss) | 1,423,924 | |||
NOTES TO CONSOLIDATED FINANCIAL STATEMENTS | 31 |
Notes to Consolidated Financial Statements (continued)
The tax character of distributions paid was as follows:
Year Ended 05/31/23 | Year Ended 05/31/22 | |||||||
Ordinary income | $ | 184,818,182 | $ | 35,182,375 | ||||
|
|
|
| |||||
As of May 31, 2023, the tax components of accumulated earnings (loss) were as follows:
| Fund Name | Undistributed Ordinary Income | Non-expiring Capital Loss Carryforwards(a) | Net Unrealized Gains (Losses)(b) | Total | ||||||||||||
BlackRock Commodity Strategies Fund | $ | 69,051,424 | $ | (231,406,260 | ) | $ | (55,879,086 | ) | $ | (218,233,922 | ) | |||||
| (a) | Amounts available to offset future realized capital gains. |
| (b) | The difference between book-basis and tax-basis net unrealized gains was attributable primarily to the tax deferral of losses on wash sales, the realization for tax purposes of unrealized gains (losses) on certain foreign currency contracts, the timing and recognition of partnership income, the realization for tax purposes of unrealized gains on investments in passive foreign investment companies and the characterization of corporate actions. |
As of May 31, 2023, gross unrealized appreciation and depreciation based on cost of investments (including short positions and derivatives, if any) for U.S. federal income tax purposes were as follows:
| Fund Name | Tax Cost | Gross Unrealized Appreciation | Gross Unrealized Depreciation | Net Unrealized Appreciation (Depreciation) | ||||||||||||
BlackRock Commodity Strategies Fund | $ | 1,116,724,078 | $ | 121,786,971 | $ | (177,791,802 | ) | $ | (56,004,831 | ) | ||||||
| 9. | BANK BORROWINGS |
The Trust, on behalf of the Fund, along with certain other funds managed by the Manager and its affiliates (“Participating Funds”), is a party to a 364-day, $2.50 billion credit agreement with a group of lenders. Under this agreement, the Fund may borrow to fund shareholder redemptions. Excluding commitments designated for certain individual funds, the Participating Funds, including the Fund, can borrow up to an aggregate commitment amount of $1.75 billion at any time outstanding, subject to asset coverage and other limitations as specified in the agreement. The credit agreement has the following terms: a fee of 0.10% per annum on unused commitment amounts and interest at a rate equal to the higher of (a) Overnight Bank Funding Rate (“OBFR”) (but, in any event, not less than 0.00%) on the date the loan is made plus 0.80% per annum, (b) the Fed Funds rate (but, in any event, not less than 0.00%) in effect from time to time plus 0.80% per annum on amounts borrowed or (c) the sum of (x) Daily Simple Secured Overnight Financing Rate (“SOFR”) (but, in any event, not less than 0.00%) on the date the loan is made plus 0.10% and (y) 0.80% per annum. The agreement expires in April 2024 unless extended or renewed. These fees were allocated among such funds based upon portions of the aggregate commitment available to them and relative net assets of Participating Funds. During the year ended May 31, 2023, the Fund did not borrow under the credit agreement.
| 10. | PRINCIPAL RISKS |
In the normal course of business, the Fund invests in securities or other instruments and may enter into certain transactions, and such activities subject the Fund to various risks, including among others, fluctuations in the market (market risk) or failure of an issuer to meet all of its obligations. The value of securities or other instruments may also be affected by various factors, including, without limitation: (i) the general economy; (ii) the overall market as well as local, regional or global political and/or social instability; (iii) regulation, taxation or international tax treaties between various countries; or (iv) currency, interest rate and price fluctuations. Local, regional or global events such as war, acts of terrorism, the spread of infectious illness or other public health issues, recessions, or other events could have a significant impact on the Fund and its investments. The Fund’s prospectus provides details of the risks to which the Fund is subject.
The Fund may be exposed to additional risks when reinvesting cash collateral in money market funds that do not seek to maintain a stable NAV per share of $1.00, which may be subject to redemption gates or liquidity fees under certain circumstances.
Market Risk: The Fund may be exposed to prepayment risk, which is the risk that borrowers may exercise their option to prepay principal earlier than scheduled during periods of declining interest rates, which would force the Fund to reinvest in lower yielding securities. The Fund may also be exposed to reinvestment risk, which is the risk that income from the Fund’s portfolio will decline if the Fund invests the proceeds from matured, traded or called fixed-income securities at market interest rates that are below the Fund portfolio’s current earnings rate.
Infectious Illness Risk: An outbreak of an infectious illness, such as the COVID-19 pandemic, may adversely impact the economies of many nations and the global economy and may impact individual issuers and capital markets in ways that cannot be foreseen. An infectious illness outbreak may result in, among other things, closed international borders, prolonged quarantines, supply chain disruptions, market volatility or disruptions and other significant economic, social and political impacts.
Valuation Risk: The market values of equities, such as common stocks and preferred securities or equity related investments, such as futures and options, may decline due to general market conditions which are not specifically related to a particular company. They may also decline due to factors which affect a particular industry or industries. The Fund may invest in illiquid investments. An illiquid investment is any investment that the Fund reasonably expects cannot be sold or disposed of in current market conditions in seven calendar days or less without the sale or disposition significantly changing the market value of the investment. The Fund may experience difficulty in selling illiquid
| 32 | 2 0 2 3 BLACK ROCK ANNUAL REPORT TO SHAREHOLDERS |
Notes to Consolidated Financial Statements (continued)
investments in a timely manner at the price that it believes the investments are worth. Prices may fluctuate widely over short or extended periods in response to company, market or economic news. Markets also tend to move in cycles, with periods of rising and falling prices. This volatility may cause the Fund’s NAV to experience significant increases or decreases over short periods of time. If there is a general decline in the securities and other markets, the NAV of the Fund may lose value, regardless of the individual results of the securities and other instruments in which the Fund invests.
The price the Fund could receive upon the sale of any particular portfolio investment may differ from the Fund’s valuation of the investment, particularly for securities that trade in thin or volatile markets or that are valued using a fair valuation technique or a price provided by an independent pricing service. Changes to significant unobservable inputs and assumptions (i.e., publicly traded company multiples, growth rate, time to exit) due to the lack of observable inputs may significantly impact the resulting fair value and therefore the Fund’s results of operations. As a result, the price received upon the sale of an investment may be less than the value ascribed by the Fund, and the Fund could realize a greater than expected loss or lesser than expected gain upon the sale of the investment. The Fund’s ability to value its investments may also be impacted by technological issues and/or errors by pricing services or other third-party service providers.
Counterparty Credit Risk: The Fund may be exposed to counterparty credit risk, or the risk that an entity may fail to or be unable to perform on its commitments related to unsettled or open transactions, including making timely interest and/or principal payments or otherwise honoring its obligations. The Fund manages counterparty credit risk by entering into transactions only with counterparties that the Manager believes have the financial resources to honor their obligations and by monitoring the financial stability of those counterparties. Financial assets, which potentially expose the Fund to market, issuer and counterparty credit risks, consist principally of financial instruments and receivables due from counterparties. The extent of the Fund’s exposure to market, issuer and counterparty credit risks with respect to these financial assets is approximately their value recorded in the Consolidated Statement of Assets and Liabilities, less any collateral held by the Fund.
A derivative contract may suffer a mark-to-market loss if the value of the contract decreases due to an unfavorable change in the market rates or values of the underlying instrument. Losses can also occur if the counterparty does not perform under the contract.
Concentration Risk: A diversified portfolio, where this is appropriate and consistent with a fund’s objectives, minimizes the risk that a price change of a particular investment will have a material impact on the NAV of a fund. The investment concentrations within the Fund’s portfolio are disclosed in its Consolidated Schedule of Investments.
The Fund invests a significant portion of its assets in securities within a single or limited number of market sectors. When a fund concentrates its investments in this manner, it assumes the risk that economic, regulatory, political and social conditions affecting such sectors may have a significant impact on the Fund and could affect the income from, or the value or liquidity of, the Fund’s portfolio. Investment percentages in specific sectors are presented in the Schedule of Investments. The Fund invests a significant portion of its assets in securities of issuers located in the United States. A decrease in imports or exports, changes in trade regulations, inflation and/or an economic recession in the United States may have a material adverse effect on the U.S. economy and the securities listed on U.S. exchanges. Proposed and adopted policy and legislative changes in the United States may also have a significant effect on U.S. markets generally, as well as on the value of certain securities. Governmental agencies project that the United States will continue to maintain elevated public debt levels for the foreseeable future which may constrain future economic growth. Circumstances could arise that could prevent the timely payment of interest or principal on U.S. government debt, such as reaching the legislative “debt ceiling.” Such non-payment would result in substantial negative consequences for the U.S. economy and the global financial system. If U.S. relations with certain countries deteriorate, it could adversely affect issuers that rely on the United States for trade. The United States has also experienced increased internal unrest and discord. If these trends were to continue, they may have an adverse impact on the U.S. economy and the issuers in which the Fund invests.
Significant Shareholder Redemption Risk: Certain shareholders may own or manage a substantial amount of fund shares and/or hold their fund investments for a limited period of time. Large redemptions of fund shares by these shareholders may force a fund to sell portfolio securities, which may negatively impact the fund’s NAV, increase the fund’s brokerage costs, and/or accelerate the realization of taxable income/gains and cause the fund to make additional taxable distributions to shareholders.
| 11. | CAPITAL SHARE TRANSACTIONS |
Transactions in capital shares for each class were as follows:
| Year Ended 05/31/23 | Year Ended 05/31/22 | |||||||||||||||
| Share Class | Shares | Amount | Shares | Amount | ||||||||||||
Institutional | ||||||||||||||||
Shares sold | 48,377,579 | $ | 467,663,752 | 154,044,749 | $ | 1,536,299,947 | ||||||||||
Shares issued in reinvestment of distributions | 15,381,433 | 135,103,945 | 3,205,932 | 28,631,112 | ||||||||||||
Shares redeemed | (148,478,047 | ) | (1,392,777,097 | ) | (68,952,983 | ) | (685,696,069 | ) | ||||||||
|
|
|
|
|
|
|
| |||||||||
| (84,719,035 | ) | $ | (790,009,400 | ) | 88,297,698 | $ | 879,234,990 | |||||||||
|
|
|
|
|
|
|
| |||||||||
Investor A | ||||||||||||||||
Shares sold and automatic conversion of shares | 3,826,409 | $ | 36,751,196 | 14,802,967 | $ | 146,719,128 | ||||||||||
Shares issued in reinvestment of distributions | 1,826,612 | 15,892,675 | 363,990 | 3,219,524 | ||||||||||||
Shares redeemed | (12,608,372 | ) | (117,252,987 | ) | (8,069,674 | ) | (78,996,285 | ) | ||||||||
|
|
|
|
|
|
|
| |||||||||
| (6,955,351 | ) | $ | (64,609,116 | ) | 7,097,283 | $ | 70,942,367 | |||||||||
|
|
|
|
|
|
|
| |||||||||
NOTES TO CONSOLIDATED FINANCIAL STATEMENTS | 33 |
Notes to Consolidated Financial Statements (continued)
| Year Ended 05/31/23 | Year Ended 05/31/22 | |||||||||||||||
| Share Class | Shares | Amount | Shares | Amount | ||||||||||||
Investor C | ||||||||||||||||
Shares sold | 998,622 | $ | 9,407,731 | 2,599,039 | $ | 25,219,121 | ||||||||||
Shares issued in reinvestment of distributions | 373,610 | 3,106,485 | 45,217 | 382,739 | ||||||||||||
Shares redeemed and automatic conversion of shares | (1,631,866 | ) | (14,422,937 | ) | (576,619 | ) | (5,577,417 | ) | ||||||||
|
|
|
|
|
|
|
| |||||||||
| (259,634 | ) | $ | (1,908,721 | ) | 2,067,637 | $ | 20,024,443 | |||||||||
|
|
|
|
|
|
|
| |||||||||
Class K | ||||||||||||||||
Shares sold | 8,292,838 | $ | 85,776,294 | 23,398,781 | $ | 245,214,319 | ||||||||||
Shares issued in reinvestment of distributions | 2,834,330 | 24,904,192 | 269,571 | 2,408,462 | ||||||||||||
Shares redeemed | (22,680,846 | ) | (211,987,182 | ) | (17,506,219 | )(a) | (162,607,443 | ) | ||||||||
|
|
|
|
|
|
|
| |||||||||
| (11,553,678 | ) | $ | (101,306,696 | ) | 6,162,133 | $ | 85,015,338 | |||||||||
|
|
|
|
|
|
|
| |||||||||
| (103,487,698 | ) | $ | (957,833,933 | ) | 103,624,751 | $ | 1,055,217,138 | |||||||||
|
|
|
|
|
|
|
| |||||||||
| (a) | Including (13,609,467) representing in-kind redemptions. |
| 12. | SUBSEQUENT EVENTS |
Management has evaluated the impact of all subsequent events on the Fund through the date the financial statements were issued and has determined that there were no subsequent events requiring adjustment or additional disclosure in the financial statements.
| 34 | 2 0 2 3 BLACK ROCK ANNUAL REPORT TO SHAREHOLDERS |
Report of Independent Registered Public Accounting Firm
To the Shareholders of BlackRock Commodity Strategies Fund and the Board of Trustees of BlackRock FundsSM:
Opinion on the Financial Statements and Financial Highlights
We have audited the accompanying consolidated statement of assets and liabilities of BlackRock Commodity Strategies Fund of BlackRock FundsSM (the “Fund”), including the consolidated schedule of investments, as of May 31, 2023, the related consolidated statement of operations for the year then ended, the consolidated statements of changes in net assets for each of the two years in the period then ended, the consolidated financial highlights for each of the three years in the period then ended and for the period from August 1, 2019 through May 31, 2020, and the related notes. In our opinion, the financial statements and financial highlights present fairly, in all material respects, the financial position of the Fund as of May 31, 2023, and the results of its operations for the year then ended, the changes in its net assets for each of the two years in the period then ended, and the financial highlights for each of the three years in the period then ended and for the period from August 1, 2019 through May 31, 2020, in conformity with accounting principles generally accepted in the United States of America.
The financial highlights for each of the two years in the period ended July 31, 2019 of the Fund were audited by other auditors whose report dated September 24, 2019, expressed an unqualified opinion on those financial highlights.
Basis for Opinion
These financial statements and financial highlights are the responsibility of the Fund’s management. Our responsibility is to express an opinion on the Fund’s financial statements and financial highlights based on our audits. We are a public accounting firm registered with the Public Company Accounting Oversight Board (United States) (PCAOB) and are required to be independent with respect to the Fund in accordance with the U.S. federal securities laws and the applicable rules and regulations of the Securities and Exchange Commission and the PCAOB.
We conducted our audits in accordance with the standards of the PCAOB. Those standards require that we plan and perform the audit to obtain reasonable assurance about whether the financial statements and financial highlights are free of material misstatement, whether due to error or fraud. The Fund is not required to have, nor were we engaged to perform, an audit of its internal control over financial reporting. As part of our audits we are required to obtain an understanding of internal control over financial reporting but not for the purpose of expressing an opinion on the effectiveness of the Fund’s internal control over financial reporting. Accordingly, we express no such opinion.
Our audits included performing procedures to assess the risks of material misstatement of the financial statements and financial highlights, whether due to error or fraud, and performing procedures that respond to those risks. Such procedures included examining, on a test basis, evidence regarding the amounts and disclosures in the financial statements and financial highlights. Our audits also included evaluating the accounting principles used and significant estimates made by management, as well as evaluating the overall presentation of the financial statements and financial highlights. Our procedures included confirmation of securities owned as of May 31, 2023, by correspondence with custodians or counterparties; when replies were not received, we performed other auditing procedures. We believe that our audits provide a reasonable basis for our opinion.
Deloitte & Touche LLP
Boston, Massachusetts
July 21, 2023
We have served as the auditor of one or more BlackRock investment companies since 1992.
REPORT OF INDEPENDENT REGISTERED PUBLIC ACCOUNTING FIRM | 35 |
| Important Tax Information (unaudited) |
The following amount, or maximum amount allowable by law, is hereby designated is qualified dividend income for individuals for the fiscal year ended May 31, 2023:
| ||||
| Fund Name | Qualified Dividend Income | |||
| ||||
BlackRock Commodity Strategies Fund | $ 29,136,558 | |||
| ||||
The Fund hereby designates the following amount, or maximum amount allowable by law, of distributions from direct federal obligation interest for the fiscal year ended May 31, 2023:
| ||||
| Fund Name | Federal Obligation Interest | |||
| ||||
BlackRock Commodity Strategies Fund | $ 21,429,792 | |||
| ||||
The following percentage, or maximum percentage allowable by law, of ordinary income distributions paid during the fiscal year ended May 31, 2023 qualified for the dividends-received deduction for corporate shareholders:
| ||||
| Fund Name | Dividends-Received Deduction | |||
| ||||
BlackRock Commodity Strategies Fund | 6.62% | |||
| ||||
The Fund hereby designates the following amount, or maximum amount allowable by law, as interest income eligible to be treated as a Section 163(j) interest dividend for the fiscal year ended May 31, 2023:
| ||||
| Fund Name | Interest Dividends | |||
| ||||
BlackRock Commodity Strategies Fund | $ 21,748,352 | |||
| ||||
The Fund hereby designates the following amount, or maximum amount allowable by law, as interest-related dividends eligible for exemption from U.S. withholding tax for nonresident aliens and foreign corporations for the fiscal year ended May 31, 2023:
| ||||
| Fund Name | Interest- Related Dividends | |||
| ||||
BlackRock Commodity Strategies Fund | $ 21,746,681 | |||
| ||||
| 36 | 2 0 2 3 BLACK ROCK ANNUAL REPORT TO SHAREHOLDERS |
Disclosure of Investment Advisory Agreement and Sub-Advisory Agreement
The Board of Trustees (the “Board,” the members of which are referred to as “Board Members”) of BlackRock Funds (the “Trust”) met on April 18, 2023 (the “April Meeting”) and May 23-24, 2023 (the “May Meeting”) to consider the approval to continue the investment advisory agreement (the “Advisory Agreement”) between the Trust, on behalf of BlackRock Commodity Strategies Fund (the “Fund”), and BlackRock Advisors, LLC (the “Manager”), the Fund’s investment advisor. The Board also considered the approval to continue the sub-advisory agreement (the “Sub-Advisory Agreement”) between the Manager and BlackRock International Limited (the “Sub-Advisor”) with respect to the Fund. The Manager and the Sub-Advisor are referred to herein as “BlackRock.” The Advisory Agreement and the Sub-Advisory Agreement are referred to herein as the “Agreements.”
The Approval Process
Consistent with the requirements of the Investment Company Act of 1940 (the “1940 Act”), the Board considers the approval of the continuation of the Agreements for the Fund on an annual basis. The Board members who are not “interested persons” of the Trust, as defined in the 1940 Act, are considered independent Board members (the “Independent Board Members”). The Board’s consideration entailed a year-long deliberative process during which the Board and its committees assessed BlackRock’s various services to the Fund, including through the review of written materials and oral presentations, and the review of additional information provided in response to requests from the Independent Board Members. The Board had four quarterly meetings per year, each of which extended over a two-day period, as well as additional ad hoc meetings and executive sessions throughout the year, as needed. The committees of the Board similarly met throughout the year. The Board also had an additional one-day meeting to consider specific information regarding the renewal of the Agreements. In considering the renewal of the Agreements, the Board assessed, among other things, the nature, extent and quality of the services provided to the Fund by BlackRock, BlackRock’s personnel and affiliates, including (as applicable): investment management services; accounting oversight; administrative and shareholder services; oversight of the Fund’s service providers; risk management and oversight; and legal, regulatory and compliance services. Throughout the year, including during the contract renewal process, the Independent Board Members were advised by independent legal counsel, and met with independent legal counsel in various executive sessions outside of the presence of BlackRock’s management.
During the year, the Board, acting directly and through its committees, considered information that was relevant to its annual consideration of the renewal of the Agreements, including the services and support provided by BlackRock to the Fund and its shareholders. BlackRock also furnished additional information to the Board in response to specific questions from the Board. Among the matters the Board considered were: (a) investment performance for one-year, three-year, five-year, and/or since inception periods, as applicable, against peer funds, relevant benchmarks, and other performance metrics, as applicable, as well as BlackRock senior management’s and portfolio managers’ analyses of the reasons for any outperformance or underperformance relative to its peers, benchmarks, and other performance metrics, as applicable; (b) fees, including advisory, administration, if applicable, and other amounts paid to BlackRock and its affiliates by the Fund for services; (c) Fund operating expenses and how BlackRock allocates expenses to the Fund; (d) the resources devoted to, risk oversight of, and compliance reports relating to, implementation of the Fund’s investment objective, policies and restrictions, and meeting regulatory requirements; (e) BlackRock’s and the Fund’s adherence to applicable compliance policies and procedures; (f) the nature, character and scope of non-investment management services provided by BlackRock and its affiliates and the estimated cost of such services, as available; (g) BlackRock’s and other service providers’ internal controls and risk and compliance oversight mechanisms; (h) BlackRock’s implementation of the proxy voting policies approved by the Board; (i) the use of brokerage commissions and execution quality of portfolio transactions; (j) BlackRock’s implementation of the Fund’s valuation and liquidity procedures; (k) an analysis of management fees paid to BlackRock for products with similar investment mandates across the open-end fund, exchange-traded fund (“ETF”), closed-end fund, sub-advised mutual fund, separately managed account, collective investment trust, and institutional separate account product channels, as applicable, and the similarities and differences between these products and the services provided as compared to the Fund; (l) BlackRock’s compensation methodology for its investment professionals and the incentives and accountability it creates, along with investment professionals’ investments in the fund(s) they manage; and (m) periodic updates on BlackRock’s business.
Prior to and in preparation for the April Meeting, the Board received and reviewed materials specifically relating to the renewal of the Agreements. The Independent Board Members are continuously engaged in a process with their independent legal counsel and BlackRock to review the nature and scope of the information provided to the Board to better assist its deliberations. The materials provided in connection with the April Meeting included, among other things: (a) information independently compiled and prepared by Broadridge Financial Solutions, Inc. (“Broadridge”), based on either a Lipper classification or Morningstar category, regarding the Fund’s fees and expenses as compared with a peer group of funds as determined by Broadridge (“Expense Peers”) and the investment performance of the Fund as compared with a peer group of funds (“Performance Peers”); (b) information on the composition of the Expense Peers and Performance Peers and a description of Broadridge’s methodology; (c) information on the estimated profits realized by BlackRock and its affiliates pursuant to the Agreements and a discussion of fall-out benefits to BlackRock and its affiliates; (d) a general analysis provided by BlackRock concerning investment management fees received in connection with other types of investment products, such as institutional accounts, sub-advised mutual funds, ETFs, closed-end funds, open-end funds, and separately managed accounts, under similar investment mandates, as well as the performance of such other products, as applicable; (e) a review of non-management fees; (f) the existence, impact and sharing of potential economies of scale, if any, with the Fund; (g) a summary of aggregate amounts paid by the Fund to BlackRock; (h) sales and redemption data regarding the Fund’s shares; and (i) various additional information requested by the Board as appropriate regarding BlackRock’s and the Fund’s operations.
At the April Meeting, the Board reviewed materials relating to its consideration of the Agreements and the Independent Board Members presented BlackRock with questions and requests for additional information. BlackRock responded to these questions and requests with additional written information in advance of the May Meeting.
At the May Meeting, the Board concluded its assessment of, among other things: (a) the nature, extent and quality of the services provided by BlackRock; (b) the investment performance of the Fund as compared to its Performance Peers and to other metrics, as applicable; (c) the advisory fee and the estimated cost of the services and estimated profits realized by BlackRock and its affiliates from their relationship with the Fund; (d) the Fund’s fees and expenses compared to its Expense Peers; (e) the existence and sharing of potential economies of scale; (f) any fall-out benefits to BlackRock and its affiliates as a result of BlackRock’s relationship with the Fund; and (g) other factors deemed relevant by the Board Members.
The Board also considered other matters it deemed important to the approval process, such as other payments made to BlackRock or its affiliates relating to securities lending and cash management, and BlackRock’s services related to the valuation and pricing of Fund portfolio holdings. The Board noted the willingness of BlackRock’s personnel to engage in open, candid discussions with the Board. The Board Members evaluated the information available to it on a fund-by-fund basis. The following paragraphs provide
DISCLOSURE OF INVESTMENT ADVISORY AGREEMENT AND SUB - ADVISORY AGREEMENT | 37 |
Disclosure of Investment Advisory Agreement and Sub-Advisory Agreement (continued)
more information about some of the primary factors that were relevant to the Board’s decision. The Board Members did not identify any particular information, or any single factor as determinative, and each Board Member may have attributed different weights to the various items and factors considered.
A: Nature, Extent and Quality of the Services Provided by BlackRock
The Board, including the Independent Board Members, reviewed the nature, extent and quality of services provided by BlackRock, including the investment advisory services, and the resulting performance of the Fund. Throughout the year, the Board compared Fund performance to the performance of a comparable group of mutual funds, relevant benchmarks, and performance metrics, as applicable. The Board met with BlackRock’s senior management personnel responsible for investment activities, including the senior investment officers. The Board also reviewed the materials provided by the Fund’s portfolio management team discussing the Fund’s performance, investment strategies and outlook.
The Board considered, among other factors, with respect to BlackRock: the experience of investment personnel generally and the Fund’s portfolio management team; research capabilities; investments by portfolio managers in the funds they manage; portfolio trading capabilities; use of technology; commitment to compliance; credit analysis capabilities; risk analysis and oversight capabilities; and the approach to training and retaining portfolio managers and other research, advisory and management personnel. The Board also considered BlackRock’s overall risk management program, including the continued efforts of BlackRock and its affiliates to address cybersecurity risks and the role of BlackRock’s Risk & Quantitative Analysis Group. The Board engaged in a review of BlackRock’s compensation structure with respect to the Fund’s portfolio management team and BlackRock’s ability to attract and retain high-quality talent and create performance incentives.
In addition to investment advisory services, the Board considered the nature and quality of the administrative and other non-investment advisory services provided to the Fund. BlackRock and its affiliates provide the Fund with certain administrative, shareholder and other services (in addition to any such services provided to the Fund by third parties) and officers and other personnel as are necessary for the operations of the Fund. In particular, BlackRock and its affiliates provide the Fund with administrative services including, among others: (i) responsibility for disclosure documents, such as the prospectus, the summary prospectus (as applicable), the statement of additional information and periodic shareholder reports; (ii) oversight of daily accounting and pricing; (iii) responsibility for periodic filings with regulators; (iv) overseeing and coordinating the activities of third-party service providers including, among others, the Fund’s custodian, fund accountant, transfer agent, and auditor; (v) organizing Board meetings and preparing the materials for such Board meetings; (vi) providing legal and compliance support; (vii) furnishing analytical and other support to assist the Board in its consideration of strategic issues such as the merger, consolidation or repurposing of certain open-end funds; and (viii) performing or managing administrative functions necessary for the operation of the Fund, such as tax reporting, expense management, fulfilling regulatory filing requirements, overseeing the Fund’s distribution partners, and shareholder call center and other services. The Board reviewed the structure and duties of BlackRock’s fund administration, shareholder services, and legal and compliance departments and considered BlackRock’s policies and procedures for assuring compliance with applicable laws and regulations. The Board considered the operation of BlackRock’s business continuity plans.
The Board noted that the engagement of the Sub-Advisor with respect to the Fund facilitates the provision of investment advice and trading by investment personnel out of non-U.S. jurisdictions. The Board considered that this arrangement provides additional flexibility to the portfolio management team, which may benefit the Fund and its shareholders.
B: The Investment Performance of the Fund and BlackRock
The Board, including the Independent Board Members, reviewed and considered the performance history of the Fund throughout the year and at the April Meeting. In preparation for the April Meeting, the Board was provided with reports independently prepared by Broadridge, which included an analysis of the Fund’s performance as of December 31, 2022, as compared to its Performance Peers. Broadridge ranks funds in quartiles, ranging from first to fourth, where first is the most desirable quartile position and fourth is the least desirable. In connection with its review, the Board received and reviewed information regarding the investment performance of the Fund as compared to its Performance Peers and the respective Morningstar Category (“Morningstar Category”). The Board and its Performance Oversight Committee regularly review and meet with Fund management to discuss the performance of the Fund throughout the year.
In evaluating performance, the Board focused particular attention on funds with less favorable performance records. The Board also noted that while it found the data provided by Broadridge generally useful, it recognized the limitations of such data, including in particular, that notable differences may exist between a fund and its Performance Peers (for example, the investment objectives and strategies). Further, the Board recognized that the performance data reflects a snapshot of a period as of a particular date and that selecting a different performance period could produce significantly different results. The Board also acknowledged that long-term performance could be impacted by even one period of significant outperformance or underperformance, and that a single investment theme could have the ability to disproportionately affect long-term performance.
The Board noted that for the one-, three- and five-year periods reported, the Fund ranked in the fourth, second and second quartiles, respectively, against its Morningstar Category. The Board noted that BlackRock believes that the Morningstar Category is an appropriate performance metric for the Fund, and that BlackRock has explained its rationale for this belief to the Board. The Board and BlackRock reviewed the Fund’s underperformance relative to its Morningstar Category during the applicable period.
C: Consideration of the Advisory/Management Fees and the Estimated Cost of the Services and Estimated Profits Realized by BlackRock and its Affiliates from their Relationship with the Fund
The Board, including the Independent Board Members, reviewed the Fund’s contractual management fee rate compared with those of its Expense Peers. The contractual management fee rate represents a combination of the advisory fee and any administrative fees, before taking into account any reimbursements or fee waivers. The Board also compared the Fund’s total expense ratio, as well as its actual management fee rate, to those of its Expense Peers. The total expense ratio represents a fund’s total net operating expenses, including any 12b-1 or non-12b-1 service fees. The total expense ratio gives effect to any expense reimbursements or fee waivers, and the actual management fee rate gives effect to any management fee reimbursements or waivers. The Board considered that the fee and expense information in the Broadridge report for the Fund reflected information for a specific period and that historical asset levels and expenses may differ from current levels, particularly in a period of market volatility. The
| 38 | 2 0 2 3 BLACK ROCK ANNUAL REPORT TO SHAREHOLDERS |
Disclosure of Investment Advisory Agreement and Sub-Advisory Agreement (continued)
Board considered the services provided and the fees charged by BlackRock and its affiliates to other types of clients with similar investment mandates, as applicable, including institutional accounts and sub-advised mutual funds (including mutual funds sponsored by third parties).
The Board received and reviewed statements relating to BlackRock’s financial condition. The Board reviewed BlackRock’s profitability methodology and was also provided with an estimated profitability analysis that detailed the revenues earned and the expenses incurred by BlackRock for services provided to the Fund. The Board reviewed BlackRock’s estimated profitability with respect to the Fund and other funds the Board currently oversees for the year ended December 31, 2022 compared to available aggregate estimated profitability data provided for the prior two years. The Board reviewed BlackRock’s estimated profitability with respect to certain other U.S. fund complexes managed by the Manager and/or its affiliates. The Board reviewed BlackRock’s assumptions and methodology of allocating expenses in the estimated profitability analysis, noting the inherent limitations in allocating costs among various advisory products. The Board recognized that profitability may be affected by numerous factors including, among other things, fee waivers and expense reimbursements by the Manager, the types of funds managed, precision of expense allocations and business mix. The Board thus recognized that calculating and comparing profitability at the individual fund level is difficult.
The Board noted that, in general, individual fund or product line profitability of other advisors is not publicly available. The Board reviewed BlackRock’s overall operating margin, in general, compared to that of certain other publicly traded asset management firms. The Board considered the differences between BlackRock and these other firms, including the contribution of technology at BlackRock, BlackRock’s expense management, and the relative product mix.
The Board considered whether BlackRock has the financial resources necessary to attract and retain high quality investment management personnel to perform its obligations under the Agreements and to continue to provide the high quality of services that is expected by the Board. The Board further considered factors including but not limited to BlackRock’s commitment of time and resources, assumption of risk, and liability profile in servicing the Fund, including in contrast to what is required of BlackRock with respect to other products with similar investment mandates across the open-end fund, ETF, closed-end fund, sub-advised mutual fund, separately managed account, collective investment trust, and institutional separate account product channels, as applicable.
The Board noted that the Fund’s contractual management fee rate ranked in the second quartile, and that the actual management fee rate and total expense ratio each ranked in the second quartile relative to the Fund’s Expense Peers. The Board further noted that the Fund has an advisory fee arrangement that includes breakpoints that adjust the fee rate downward as the size of the Fund increases above certain contractually specified levels. The Board additionally noted that the breakpoints can, conversely, adjust the advisory fee rate upward as the size of the Fund decreases below certain contractually specified levels. The Board also noted that BlackRock and the Board have contractually agreed to a cap on the Fund’s total expenses as a percentage of the Fund’s average daily net assets on a class-by-class basis.
D: Economies of Scale
The Board, including the Independent Board Members, considered the extent to which economies of scale might be realized as the assets of the Fund increase, including the existence of fee waivers and/or expense caps, as applicable, noting that any contractual fee waivers and contractual expense caps had been approved by the Board. In its consideration, the Board further considered the continuation and/or implementation of fee waivers and/or expense caps, as applicable. The Board also considered the extent to which the Fund benefits from such economies of scale in a variety of ways, and whether there should be changes in the advisory fee rate or breakpoint structure in order to enable the Fund to more fully participate in these economies of scale. The Board considered the Fund’s asset levels and whether the current fee schedule was appropriate.
E: Other Factors Deemed Relevant by the Board Members
The Board, including the Independent Board Members, also took into account other ancillary or “fall-out” benefits that BlackRock or its affiliates may derive from BlackRock’s respective relationships with the Fund, both tangible and intangible, such as BlackRock’s ability to leverage its investment professionals who manage other portfolios and its risk management personnel, an increase in BlackRock’s profile in the investment advisory community, and the engagement of BlackRock’s affiliates as service providers to the Fund, including for administrative, distribution, securities lending and cash management services. With respect to securities lending, during the year the Board also considered information provided by independent third-party consultants related to the performance of each BlackRock affiliate as securities lending agent. The Board also considered BlackRock’s overall operations and its efforts to expand the scale of, and improve the quality of, its operations. The Board also noted that, subject to applicable law, BlackRock may use and benefit from third-party research obtained by soft dollars generated by certain registered fund transactions to assist in managing all or a number of its other client accounts.
In connection with its consideration of the Agreements, the Board also received information regarding BlackRock’s brokerage and soft dollar practices. The Board received reports from BlackRock which included information on brokerage commissions and trade execution practices throughout the year.
The Board noted the competitive nature of the open-end fund marketplace, and that shareholders are able to redeem their Fund shares if they believe that the Fund’s fees and expenses are too high or if they are dissatisfied with the performance of the Fund.
Conclusion
At the May Meeting, in a continuation of the discussions that occurred during the April Meeting, and as a culmination of the Board’s year-long deliberative process, the Board, including the Independent Board Members, unanimously approved the continuation of the Advisory Agreement between the Manager and the Trust, on behalf of the Fund, for a one-year term ending June 30, 2024, and the Sub-Advisory Agreement between the Manager and the Sub-Advisor, with respect to the Fund, for a one-year term ending June 30, 2024. Based upon its evaluation of all of the aforementioned factors in their totality, as well as other information, the Board, including the Independent Board Members, was satisfied that the terms of the Agreements were fair and reasonable and in the best interest of the Fund and its shareholders. In arriving at its decision to approve the Agreements, the Board did not identify any single factor or group of factors as all-important or controlling, but considered all factors together, and different Board Members may have attributed different weights to the various factors considered. The Independent Board Members were advised by independent legal counsel throughout the deliberative process.
DISCLOSURE OF INVESTMENT ADVISORY AGREEMENT AND SUB - ADVISORY AGREEMENT | 39 |
Trustee and Officer Information
| Independent Trustees(a) | ||||||||
Name Year of Birth(b) | Position(s) Held (Length of Service)(c) | Principal Occupation(s) During Past 5 Years | Number of BlackRock-Advised Registered Investment Companies (“RICs”) Consisting of Investment Portfolios (“Portfolios”) Overseen | Public Company and Other Investment Company Directorships Held During Past 5 Years | ||||
Mark Stalnecker 1951 | Chair of the Board (Since 2019) and Trustee (Since 2015) | Chief Investment Officer, University of Delaware from 1999 to 2013; Trustee and Chair of the Finance and Investment Committees, Winterthur Museum and Country Estate from 2005 to 2016; Member of the Investment Committee, Delaware Public Employees’ Retirement System since 2002; Member of the Investment Committee, Christiana Care Health System from 2009 to 2017; Member of the Investment Committee, Delaware Community Foundation from 2013 to 2014; Director and Chair of the Audit Committee, SEI Private Trust Co. from 2001 to 2014. | 28 RICs consisting of 167 Portfolios | None | ||||
Susan J. Carter 1956 | Trustee (Since 2016) | Trustee, Financial Accounting Foundation from 2017 to 2021; Advisory Board Member, Center for Private Equity and Entrepreneurship at Tuck School of Business from 1997 to 2021; Director, Pacific Pension Institute from 2014 to 2018; Senior Advisor, Commonfund Capital, Inc. (“CCI”) (investment adviser) in 2015; Chief Executive Officer, CCI from 2013 to 2014; President & Chief Executive Officer, CCI from 1997 to 2013; Advisory Board Member, Girls Who Invest from 2015 to 2018 and Board Member thereof from 2018 to 2022; Advisory Board Member, Bridges Fund Management since 2016; Practitioner Advisory Board Member, Private Capital Research Institute (“PCRI”) since 2017; Lecturer in the Practice of Management, Yale School of Management since 2019; Advisor to Finance Committee, Altman Foundation since 2020; Investment Committee Member, Tostan since 2021; Member of the President’s Counsel, Commonfund since 2023. | 28 RICs consisting of 167 Portfolios | None | ||||
Collette Chilton 1958 | Trustee (Since 2015) | Chief Investment Officer, Williams College since 2006; Chief Investment Officer, Lucent Asset Management Corporation from 1998 to 2006; Director, Boys and Girls Club of Boston since 2017; Director, B1 Capital since 2018; Director, David and Lucile Packard Foundation since 2020. | 28 RICs consisting of 167 Portfolios | None | ||||
Neil A. Cotty 1954 | Trustee (Since 2016) | Bank of America Corporation from 1996 to 2015, serving in various senior finance leadership roles, including Chief Accounting Officer from 2009 to 2015, Chief Financial Officer of Global Banking, Markets and Wealth Management from 2008 to 2009, Chief Accounting Officer from 2004 to 2008, Chief Financial Officer of Consumer Bank from 2003 to 2004, Chief Financial Officer of Global Corporate Investment Bank from 1999 to 2002. | 28 RICs consisting of 167 Portfolios | None | ||||
Lena G. Goldberg 1949 | Trustee (Since 2019) | Director, Pioneer Legal Institute since 2023; Director, Charles Stark Draper Laboratory, Inc. from 2013 to 2021; Senior Lecturer, Harvard Business School from 2008 to 2021; FMR LLC/Fidelity Investments (financial services) from 1996 to 2008, serving in various senior roles including Executive Vice President - Strategic Corporate Initiatives and Executive Vice President and General Counsel; Partner, Sullivan & Worcester LLP from 1985 to 1996 and Associate thereof from 1979 to 1985. | 28 RICs consisting of 167 Portfolios | None | ||||
| 40 | 2 0 2 3 BLACK ROCK ANNUAL REPORT TO SHAREHOLDERS |
Trustee and Officer Information (continued)
| Independent Trustees(a) | ||||||||
Name Year of Birth(b) | Position(s) Held (Length of Service)(c) | Principal Occupation(s) During Past 5 Years | Number of BlackRock-Advised Registered Investment Companies (“RICs”) Consisting of Investment Portfolios (“Portfolios”) Overseen | Public Company and Other Investment Company Directorships Held During Past 5 Years | ||||
Henry R. Keizer 1956 | Trustee (Since 2019) | Director, Park Indemnity Ltd. (captive insurer) from 2010 to 2022. | 28 RICs consisting of 167 Portfolios | GrafTech International Ltd. (materials manufacturing); Sealed Air Corp. (packaging); WABCO (commercial vehicle safety systems) from 2015 to 2020; Hertz Global Holdings (car rental) from 2015 to 2021. | ||||
Cynthia A. Montgomery 1952 | Trustee (Since 2007) | Professor, Harvard Business School since 1989. | 28 RICs consisting of 167 Portfolios | None | ||||
Donald C. Opatrny 1952 | Trustee (Since 2019) | Chair of the Board of Phoenix Art Museum since 2022 and Trustee thereof since 2018; Chair of the Investment Committee of The Arizona Community Foundation since 2022 and trustee thereof since 2020; Director, Athena Capital Advisors LLC (investment management firm) from 2013 to 2020; Trustee, Vice Chair, Member of the Executive Committee and Chair of the Investment Committee, Cornell University from 2004 to 2019; President and Trustee, the Center for the Arts, Jackson Hole from 2011 to 2018; Member of the Board and Investment Committee, University School from 2007 to 2018; Member of Affordable Housing Supply Board of Jackson, Wyoming since 2017; Member, Investment Funds Committee, State of Wyoming since 2017; Trustee, Artstor (a Mellon Foundation affiliate) from 2010 to 2015; Member of the Investment Committee, Mellon Foundation from 2009 to 2015; President, Trustee and Member of the Investment Committee, The Aldrich Contemporary Art Museum from 2007 to 2014; Trustee and Chair of the Investment Committee, Community Foundation of Jackson Hole since 2014. | 28 RICs consisting of 167 Portfolios | None | ||||
Kenneth L. Urish 1951 | Trustee (Since 2007) | Managing Partner, Urish Popeck & Co., LLC (certified public accountants and consultants) since 1976; Past-Chairman of the Professional Ethics Committee of the Pennsylvania Institute of Certified Public Accountants and Committee Member thereof since 2007; Member of External Advisory Board, The Pennsylvania State University Accounting Department since 2001, Emeritus since 2022; Principal, UP Strategic Wealth Investment Advisors, LLC since 2013; Trustee, The Holy Family Institute from 2001 to 2010; President and Trustee, Pittsburgh Catholic Publishing Associates from 2003 to 2008; Director, Inter-Tel from 2006 to 2007; Member, Advisory Board, ESG Competent Boards since 2020. | 28 RICs consisting of 167 Portfolios | None | ||||
TRUSTEE AND OFFICER INFORMATION | 41 |
Trustee and Officer Information (continued)
| Independent Trustees(a) | ||||||||
Name Year of Birth(b) | Position(s) Held (Length of Service)(c) | Principal Occupation(s) During Past 5 Years | Number of BlackRock-Advised Registered Investment Companies (“RICs”) Consisting of Investment Portfolios (“Portfolios”) Overseen | Public Company and Other Investment Company Directorships Held During Past 5 Years | ||||
Claire A. Walton 1957 | Trustee (Since 2016) | Advisory Board Member, Grossman School of Business at the University of Vermont since 2023; Advisory Board Member, Scientific Financial Systems since 2022; General Partner of Neon Liberty Capital Management, LLC since 2003; Chief Operating Officer and Chief Financial Officer of Liberty Square Asset Management, LP from 1998 to 2015; Director, Boston Hedge Fund Group from 2009 to 2018; Director, Massachusetts Council on Economic Education from 2013 to 2015; Director, Woodstock Ski Runners from 2013 to 2022. | 28 RICs consisting of 167 Portfolios | None | ||||
| 42 | 2 0 2 3 BLACK ROCK ANNUAL REPORT TO SHAREHOLDERS |
Trustee and Officer Information (continued)
Interested Trustees(a)(d) | ||||||||
Name Year of Birth(b) | Position(s) Held (Length of Service)(c) | Principal Occupation(s) During Past 5 Years | Number of BlackRock-Advised Registered Investment Companies (“RICs”) Consisting of Investment Portfolios (“Portfolios”) Overseen | Public Company and Other Investment Company Directorships Held During Past 5 Years | ||||
Robert Fairbairn 1965 | Trustee (Since 2018) | Vice Chairman of BlackRock, Inc. since 2019; Member of BlackRock’s Global Executive and Global Operating Committees; Co-Chair of BlackRock’s Human Capital Committee; Senior Managing Director of BlackRock, Inc. from 2010 to 2019; oversaw BlackRock’s Strategic Partner Program and Strategic Product Management Group from 2012 to 2019; Member of the Board of Managers of BlackRock Investments, LLC from 2011 to 2018; Global Head of BlackRock’s Retail and iShares® businesses from 2012 to 2016. | 98 RICs consisting of 268 Portfolios | None | ||||
John M. Perlowski(e) 1964 | Trustee (Since 2015) President and Chief Executive Officer (Since 2010) | Managing Director of BlackRock, Inc. since 2009; Head of BlackRock Global Accounting and Product Services since 2009; Advisory Director of Family Resource Network (charitable foundation) since 2009. | 100 RICs consisting of 270 Portfolios | None | ||||
| (a) | The address of each Trustee is c/o BlackRock, Inc., 50 Hudson Yards, New York, NY 10001. |
| (b) | Independent Trustees serve until their resignation, retirement, removal or death, or until December 31 of the year in which they turn 75. The Board may determine to extend the terms of Independent Trustees on a case-by-case basis, as appropriate. |
| (c) | Following the combination of Merrill Lynch Investment Managers, L.P. (“MLIM”) and BlackRock, Inc. in September 2006, the various legacy MLIM and legacy BlackRock fund boards were realigned and consolidated into three new fund boards in 2007. Furthermore, effective January 1, 2019, three BlackRock Fund Complexes were realigned and consolidated into two BlackRock Fund Complexes. As a result, although the chart shows the year that each Independent Trustee joined the Board, certain Independent Trustees first became members of the boards of other BlackRock-advised Funds, legacy MLIM funds or legacy BlackRock funds as follows: Cynthia A. Montgomery, 1994; Kenneth L. Urish, 1999; Lena G. Goldberg, 2016; Henry R. Keizer, 2016; Donald C. Opatrny, 2015. |
| (d) | Mr. Fairbairn and Mr. Perlowski are both “interested persons,” as defined in the 1940 Act, of the Trust based on their positions with BlackRock, Inc. and its affiliates. Mr. Fairbairn and Mr. Perlowski are also board members of the BlackRock Fixed-Income Complex. |
| (e) | Mr. Perlowski is also a trustee of the BlackRock Credit Strategies Fund and BlackRock Private Investments Fund. |
TRUSTEE AND OFFICER INFORMATION | 43 |
Trustee and Officer Information (continued)
Officers Who Are Not Trustees(a) | ||||
Name Year of Birth(b) | Position(s) Held (Length of Service) | Principal Occupation(s) During Past 5 Years | ||
Roland Villacorta 1971 | Vice President (Since 2022) | Managing Director of BlackRock, Inc. since 2022; Head of Global Cash Management and Head of Securities Lending within BlackRock’s Portfolio Management Group since 2022; Member of BlackRock’s Global Operating Committee since 2022; Head of Portfolio Management in BlackRock’s Financial Markets Advisory Group within BlackRock Solutions from 2008 to 2015; Co-Head of BlackRock Solutions’ Portfolio Analytics Group; previously Mr. Villacorta was Co-Head of Fixed Income within BlackRock’s Risk & Quantitative Analysis Group. | ||
Jennifer McGovern 1977 | Vice President (Since 2014) | Managing Director of BlackRock, Inc. since 2016; Director of BlackRock, Inc. from 2011 to 2015; Head of Americas Product Development and Governance for BlackRock’s Global Product Group since 2019; Head of Product Structure and Oversight for BlackRock’s U.S. Wealth Advisory Group from 2013 to 2019. | ||
Trent Walker 1974 | Chief Financial Officer (Since 2021) | Managing Director of BlackRock, Inc. since September 2019; Executive Vice President of PIMCO from 2016 to 2019; Senior Vice President of PIMCO from 2008 to 2015; Treasurer from 2013 to 2019 and Assistant Treasurer from 2007 to 2017 of PIMCO Funds, PIMCO Variable Insurance Trust, PIMCO ETF Trust, PIMCO Equity Series, PIMCO Equity Series VIT, PIMCO Managed Accounts Trust, 2 PIMCO-sponsored interval funds and 21 PIMCO-sponsored closed-end funds. | ||
Jay M. Fife 1970 | Treasurer (Since 2007) | Managing Director of BlackRock, Inc. since 2007. | ||
Charles Park 1967 | Chief Compliance Officer (Since 2014) | Anti-Money Laundering Compliance Officer for certain BlackRock-advised Funds from 2014 to 2015; Chief Compliance Officer of BlackRock Advisors, LLC and the BlackRock-advised Funds in the BlackRock Multi-Asset Complex and the BlackRock Fixed-Income Complex since 2014; Principal of and Chief Compliance Officer for iShares® Delaware Trust Sponsor LLC since 2012 and BlackRock Fund Advisors (“BFA”) since 2006; Chief Compliance Officer for the BFA-advised iShares® exchange traded funds since 2006; Chief Compliance Officer for BlackRock Asset Management International Inc. since 2012. | ||
Lisa Belle 1968 | Anti-Money Laundering Compliance Officer (Since 2019) | Managing Director of BlackRock, Inc. since 2019; Global Financial Crime Head for Asset and Wealth Management of JP Morgan from 2013 to 2019; Managing Director of RBS Securities from 2012 to 2013; Head of Financial Crimes for Barclays Wealth Americas from 2010 to 2012. | ||
Janey Ahn 1975 | Secretary (Since 2019) | Managing Director of BlackRock, Inc. since 2018; Director of BlackRock, Inc. from 2009 to 2017. | ||
| (a) | The address of each Officer is c/o BlackRock, Inc., 50 Hudson Yards, New York, NY 10001. |
| (b) | Officers of the Trust serve at the pleasure of the Board. |
Further information about the Trust’s Trustees and Officers is available in the Trust’s Statement of Additional Information, which can be obtained without charge by calling (800) 441-7762.
Effective December 31, 2022, Joseph P. Platt retired as a Trustee of the Trust.
Effective July 1, 2023, Aaron Wasserman replaced Charles Park as Chief Compliance Officer of the Trust.
| 44 | 2 0 2 3 BLACK ROCK ANNUAL REPORT TO SHAREHOLDERS |
Tailored Shareholder Reports for Mutual Funds and ETFs
Effective January 24, 2023, the SEC adopted rule and form amendments to require mutual funds and ETFs to transmit concise and visually engaging streamlined annual and semiannual reports to shareholders that highlight key information. Other information, including financial statements, will no longer appear in a streamlined shareholder report but must be available online, delivered free of charge upon request, and filed on a semiannual basis on Form N-CSR. The rule and form amendments have a compliance date of July 24, 2024. At this time, management is evaluating the impact of these amendments on the shareholder reports for the Fund.
General Information
Quarterly performance, semi-annual and annual reports, current net asset value and other information regarding the Fund may be found on BlackRock’s website, which can be accessed at blackrock.com. Any reference to BlackRock’s website in this report is intended to allow investors public access to information regarding the Fund and does not, and is not intended to, incorporate BlackRock’s website in this report.
Householding
The Fund will mail only one copy of shareholder documents, including prospectuses, annual and semi-annual reports, Rule 30e-3 notices and proxy statements, to shareholders with multiple accounts at the same address. This practice is commonly called “householding” and is intended to reduce expenses and eliminate duplicate mailings of shareholder documents. Mailings of your shareholder documents may be householded indefinitely unless you instruct us otherwise. If you do not want the mailing of these documents to be combined with those for other members of your household, please call the Fund at (800) 441-7762.
Availability of Quarterly Schedule of Investments
The Fund files its complete schedule of portfolio holdings with the SEC for the first and third quarters of each fiscal year as an exhibit to its reports on Form N-PORT. The Fund’s Form N-PORT is available on the SEC’s website at sec.gov. Additionally, the Fund makes its portfolio holdings for the first and third quarters of each fiscal year available at blackrock.com/fundreports.
Availability of Proxy Voting Policies, Procedures and Voting Records
A description of the policies and procedures that the Fund uses to determine how to vote proxies relating to portfolio securities and information about how the Fund voted proxies relating to securities held in the Fund’s portfolio during the most recent 12-month period ended June 30 is available without charge, upon request (1) by calling (800) 441-7762; (2) on the BlackRock website at blackrock.com; and (3) on the SEC’s website at sec.gov.
BlackRock’s Mutual Fund Family
BlackRock offers a diverse lineup of open-end mutual funds crossing all investment styles and managed by experts in equity, fixed-income and tax-exempt investing. Visit blackrock.com for more information.
Shareholder Privileges
Account Information
Call us at (800) 441-7762 from 8:00 AM to 6:00 PM ET on any business day to get information about your account balances, recent transactions and share prices. You can also visit blackrock.com for more information.
Automatic Investment Plans
Investor class shareholders who want to invest regularly can arrange to have $50 or more automatically deducted from their checking or savings account and invested in any of the BlackRock funds.
Systematic Withdrawal Plans
Investor class shareholders can establish a systematic withdrawal plan and receive periodic payments of $50 or more from their BlackRock funds, as long as their account balance is at least $10,000.
Retirement Plans
Shareholders may make investments in conjunction with Traditional, Rollover, Roth, Coverdell, Simple IRAs, SEP IRAs and 403(b) Plans.
BlackRock Privacy Principles
BlackRock is committed to maintaining the privacy of its current and former fund investors and individual clients (collectively, “Clients”) and to safeguarding their non-public personal information. The following information is provided to help you understand what personal information BlackRock collects, how we protect that information and why in certain cases we share such information with select parties.
ADDITIONAL INFORMATION | 45 |
Additional Information (continued)
If you are located in a jurisdiction where specific laws, rules or regulations require BlackRock to provide you with additional or different privacy-related rights beyond what is set forth below, then BlackRock will comply with those specific laws, rules or regulations.
BlackRock obtains or verifies personal non-public information from and about you from different sources, including the following: (i) information we receive from you or, if applicable, your financial intermediary, on applications, forms or other documents; (ii) information about your transactions with us, our affiliates, or others; (iii) information we receive from a consumer reporting agency; and (iv) from visits to our websites.
BlackRock does not sell or disclose to non-affiliated third parties any non-public personal information about its Clients, except as permitted by law or as is necessary to respond to regulatory requests or to service Client accounts. These non-affiliated third parties are required to protect the confidentiality and security of this information and to use it only for its intended purpose.
We may share information with our affiliates to service your account or to provide you with information about other BlackRock products or services that may be of interest to you. In addition, BlackRock restricts access to non-public personal information about its Clients to those BlackRock employees with a legitimate business need for the information. BlackRock maintains physical, electronic and procedural safeguards that are designed to protect the non-public personal information of its Clients, including procedures relating to the proper storage and disposal of such information.
| Fund and Service Providers | ||
| Investment Adviser and Administrator | Distributor | |
BlackRock Advisors, LLC | BlackRock Investments, LLC | |
Wilmington, DE 19809 | New York, NY 10001 | |
| Sub-Adviser | Independent Registered Public Accounting Firm | |
BlackRock International Limited | Deloitte & Touche LLP | |
Edinburgh, EH3 8BL | Boston, MA 02116 | |
United Kingdom | ||
| Legal Counsel | ||
| Accounting Agent and Transfer Agent | Sidley Austin LLP | |
BNY Mellon Investment Servicing (US) Inc. | New York, NY 10019 | |
Wilmington, DE 19809 | ||
| Address of the Trust | ||
| Custodian | 100 Bellevue Parkway | |
The Bank of New York Mellon | Wilmington, DE 19809 | |
New York, NY 10286 | ||
| 46 | 2 0 2 3 BLACK ROCK ANNUAL REPORT TO SHAREHOLDERS |
Glossary of Terms Used in this Report
| Currency Abbreviation | ||
| CAD | Canadian Dollar | |
| GBP | British Pound | |
| USD | United States Dollar | |
| Portfolio Abbreviation | ||
| ADR | American Depositary Receipt | |
| BCOMAGTR | Bloomberg Agriculture SubindexSM | |
| BCOMENTR | Bloomberg Select Energy Subindex Total ReturnSM | |
| BCOMINTR | Bloomberg Industrial Metals SubindexSM | |
| BCOMLITR | Bloomberg Livestock SubindexSM | |
| BCOMPRTR | Bloomberg Precious Metals SubindexSM | |
| BCOMRAGT | Bloomberg Roll Select Agriculture Subindex Total ReturnSM | |
| BCOMRENT | Bloomberg Roll Select Energy Subindex Total Return SM | |
| BCOMRINT | Bloomberg Roll Select Industrial Metals Subindex Total ReturnSM | |
| BCOMRLIT | Bloomberg Roll Select Livestock Subindex Total ReturnSM | |
| BCOMRPRT | Bloomberg Roll Select Precious Metals Subindex Total ReturnSM | |
| CVR | Contingent Value Rights | |
| OTC | Over-the-Counter | |
GLOSSARY OF TERMS USED IN THIS REPORT | 47 |
Want to know more?
blackrock.com | 800-441-7762
This report is intended for current holders. It is not authorized for use as an offer of sale or a solicitation of an offer to buy shares of the Fund unless preceded or accompanied by the Fund’s current prospectus. Past performance results shown in this report should not be considered a representation of future performance. Investment returns and principal value of shares will fluctuate so that shares, when redeemed, may be worth more or less than their original cost. Statements and other information herein are as dated and are subject to change.
CSF-5/23-AR
|  |
| MAY 31, 2023 |

| 2023 Annual Report
| |
BlackRock FundsSM
| · | BlackRock SMID-Cap Growth Equity Fund |
Not FDIC Insured • May Lose Value • No Bank Guarantee
|
Dear Shareholder,
Investors faced an uncertain economic landscape during the 12-month reporting period ended May 31, 2023, amid mixed indicators and rapidly changing market conditions. The U.S. economy returned to modest growth beginning in the third quarter of 2022, although the pace of growth slowed thereafter. Inflation was elevated, reaching a 40-year high as labor costs grew rapidly and unemployment rates reached the lowest levels in decades. However, inflation moderated as the period continued, while continued strength in consumer spending backstopped the economy.
Equity returns varied substantially, as large-capitalization U.S. stocks gained for the period amid a rebound in big tech stocks, whereas small-capitalization U.S. stocks declined. International equities from developed markets advanced, while emerging market stocks declined substantially, pressured by higher interest rates and falling commodities prices.
The 10-year U.S. Treasury yield rose during the reporting period, driving its price down, as investors reacted to elevated inflation and attempted to anticipate future interest rate changes. The corporate bond market also faced inflationary headwinds, although high-yield corporate bond prices fared better than investment-grade bonds as demand from yield-seeking investors remained strong.
The U.S. Federal Reserve (the “Fed”), acknowledging that inflation has been more persistent than expected, raised interest rates eight times. Furthermore, the Fed wound down its bond-buying programs and incrementally reduced its balance sheet by not replacing securities that reach maturity. In addition, the Fed added liquidity to markets amid the failure of prominent regional banks.
Restricted labor supply kept inflation elevated even as other inflation drivers, such as goods prices and energy costs, moderated. While economic growth was modest in the last year, we believe that stickiness in services inflation and continued wage growth will keep inflation above central bank targets for some time. Although the Fed has decelerated the pace of interest rate hikes and most recently opted for a pause, we believe that the Fed is likely to keep rates high for an extended period to get inflation under control. With this in mind, we believe the possibility of a U.S. recession in the near term is high, but the dimming economic outlook has not yet been fully reflected in current market prices. We believe investors should expect a period of higher volatility as markets adjust to the new economic reality and policymakers attempt to adapt. Resolution of the debt ceiling standoff late in the period eliminated one source of uncertainty, but the relatively modest spending cuts won’t move the needle on the government’s substantial debt burden.
While we favor an overweight to equities in the long term, we prefer an underweight stance on equities overall in the near term. Expectations for corporate earnings remain elevated, which seems inconsistent with the possibility of a recession. Nevertheless, we are overweight on emerging market stocks as we believe a weakening U.S. dollar could provide a supportive backdrop. While we are neutral on credit overall amid tightening credit and financial conditions, there are selective opportunities in the near term. For fixed income investing with a six- to twelve-month horizon, we see the most attractive investments in short-term U.S. Treasuries, global inflation-linked bonds, and emerging market bonds denominated in local currency.
Overall, our view is that investors need to think globally, position themselves to be prepared for a decarbonizing economy, and be nimble as market conditions change. We encourage you to talk with your financial advisor and visit blackrock.com for further insight about investing in today’s markets.
Sincerely,

Rob Kapito
President, BlackRock Advisors, LLC

Rob Kapito
President, BlackRock Advisors, LLC
| Total Returns as of May 31, 2023 | ||||
6-Month |
12-Month | |||
U.S. large cap equities (S&P 500® Index)
| 3.33% | 2.92% | ||
U.S. small cap equities
| (6.53) | (4.68) | ||
International equities
| 6.89 | 3.06 | ||
Emerging market equities
| (0.37) | (8.49) | ||
3-month Treasury bills
| 2.16 | 3.16 | ||
U.S. Treasury securities
| 1.78 | (3.65) | ||
U.S. investment grade bonds (Bloomberg U.S. Aggregate Bond Index)
| 2.00 | (2.14) | ||
Tax-exempt municipal bonds (Bloomberg Municipal Bond Index)
| 1.94 | 0.49 | ||
U.S. high yield bonds (Bloomberg U.S. Corporate High Yield 2% Issuer Capped Index)
| 3.01 | 0.05 | ||
Past performance is not an indication of future results. Index performance is shown for illustrative purposes only. You cannot invest directly in an index.
| ||||
| 2 | THIS PAGE IS NOT PART OF YOUR FUND REPORT |
Table of Contents
| Page | ||||
| 2 | ||||
Annual Report: | ||||
| 4 | ||||
| 7 | ||||
| 7 | ||||
Financial Statements: | ||||
| 8 | ||||
| 11 | ||||
| 13 | ||||
| 14 | ||||
| 15 | ||||
| 18 | ||||
| 25 | ||||
| 26 | ||||
| 29 | ||||
| 34 | ||||
| 36 | ||||

| 3 |
Fund Summary as of May 31, 2023
| BlackRock SMID-Cap Growth Equity Fund |
Investment Objective
BlackRock SMID-Cap Growth Equity Fund’s (the “Fund”) investment objective is long-term capital appreciation.
Portfolio Management Commentary
How did the Fund perform?
For the 12-month period ended May 31, 2023, the Fund underperformed its benchmark, the Russell 2500TM Growth Index.
What factors influenced performance?
The largest detractors from the Fund’s performance relative to the benchmark were stock selection in the healthcare, communication services and financials sectors. Within healthcare, positioning among biotechnology names, specifically an overweight position in Halozyme Therapeutics, Inc., detracted the most from performance. Within communication services an off-benchmark position in Match Group, Inc. within the interactive media and services sub-sector weighed most heavily on performance. Lastly, within financials, an overweight position in Morningstar, Inc. within the capital markets industry detracted from relative performance.
The largest contributors to the Fund’s relative performance were security selection in industrials, consumer discretionary and positioning in materials. In industrials, stock selection in the aerospace & defense sub-sector contributed to performance, most notably an overweight in Axon Enterprise, Inc. Within consumer discretionary an overweight position in Duolingo, Inc. within the diversified consumer services industry led positive contributions. Lastly, positioning in materials proved beneficial, most notably a lack of exposure to the chemicals sub-sector.
Describe recent portfolio activity.
During the period, exposure to industrials increased with an allocation to the air freight and logistics sub-sector. Exposure to the energy sector increased as well. Conversely, exposure to communication services decreased the most as the allocation to entertainment companies was trimmed. Exposure to the healthcare sector decreased as well. The Fund’s cash position slightly decreased as well during the period.
Describe portfolio positioning at period end.
Relative to the Russell 2500TM Growth Index, at the end of the reporting period the Fund’s largest overweight was in the information technology sector, followed by industrials and consumer discretionary. Conversely, the materials sector was the largest underweight, followed by consumer staples and healthcare.
The views expressed reflect the opinions of BlackRock as of the date of this report and are subject to change based on changes in market, economic or other conditions. These views are not intended to be a forecast of future events and are no guarantee of future results.
| 4 | 2 0 2 3 BLACK ROCK ANNUAL REPORT TO SHAREHOLDERS |
| Fund Summary as of May 31, 2023 (continued) | BlackRock SMID-Cap Growth Equity Fund |
GROWTH OF $10,000 INVESTMENT
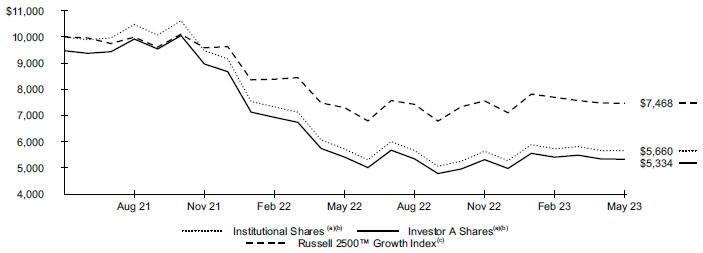
The Fund commenced operations on June 29, 2021.
| (a) | Assuming maximum sales charges, if any, transaction costs and other operating expenses, including investment advisory fees and administration fees, if any. Institutional Shares do not have a sales charge. |
| (b) | Under normal circumstances, the Fund invests at least 80% of its net assets, plus the amount of any borrowings for investment purposes, in equity securities issued by U.S. small- and mid-capitalization companies which Fund management believes have above-average earnings growth potential, and derivatives that have similar economic characteristics to such equity securities. |
| (c) | An index that measures the performance of the small to mid-cap growth segment of the U.S. equity universe. It includes those Russell 2500™ companies with higher growth earning potential as defined by FTSE Russell’s leading style methodology. |
Performance
| Average Annual Total Returns(a) | ||||||||||||||||||||||
| 1 Year | Since Inception(b) | |||||||||||||||||||||
| Without Sales Charge | With Sales Charge | Without Sales Charge | With Sales Charge | |||||||||||||||||||
Institutional | (1.14 | )% | N/A | (25.65 | )% | N/A | ||||||||||||||||
Investor A | (1.49 | ) | (6.66 | )% | (25.85 | ) | (27.91 | )% | ||||||||||||||
Class K | (1.05 | ) | N/A | (25.58 | ) | N/A | ||||||||||||||||
Russell 2500™ Growth Index | 2.30 | N/A | (14.11 | ) | N/A | |||||||||||||||||
| (a) | Assuming maximum sales charges, if any. Average annual total returns with and without sales charges reflect reductions for distribution and service fees. See “About Fund Performance” for a detailed description of share classes, including any related sales charges and fees. |
| (b) | The Fund commenced operations on June 29, 2021. |
N/A - Not applicable as share class and index do not have a sales charge.
Past performance is not an indication of future results.
Performance results may include adjustments made for financial reporting purposes in accordance with U.S. generally accepted accounting principles.
Expense Example
| Actual | Hypothetical 5% Return | |||||||||||||||||||||||||||||||
|
|
|
| |||||||||||||||||||||||||||||
| | Beginning Account Value (06/01/22) | | | Ending Account Value (05/31/23) | | | Expenses Paid During the Period | (a) | | Beginning Account Value (06/01/22) | | | Ending Account Value (05/31/23) | | | Expenses Paid During the Period | (a) | | Annualized Expense Ratio | | ||||||||||||
Institutional | $ 1,000.00 | $ 1,004.40 | $ 4.25 | $ 1,000.00 | $ 1,020.69 | $ 4.28 | 0.85 | % | ||||||||||||||||||||||||
Investor A | 1,000.00 | 1,003.60 | 5.48 | 1,000.00 | 1,019.46 | 5.54 | 1.10 | |||||||||||||||||||||||||
Class K | 1,000.00 | 1,005.30 | 3.75 | 1,000.00 | 1,021.20 | 3.78 | 0.75 | |||||||||||||||||||||||||
| (a) | For each class of the Fund, expenses are equal to the annualized expense ratio for the class, multiplied by the average account value over the period, multiplied by 182/365 (to reflect the one-half year period shown). |
See “Disclosure of Expenses” for further information on how expenses were calculated.
FUND SUMMARY | 5 |
| Fund Summary as of May 31, 2023 (continued) | BlackRock SMID-Cap Growth Equity Fund |
Portfolio Information
TEN LARGEST HOLDINGS
| Security(a) |
Percent of Net Assets | |||
Entegris, Inc. | 3.6 | % | ||
Axon Enterprise, Inc. | 3.2 | |||
Saia, Inc. | 2.5 | |||
Lattice Semiconductor Corp. | 2.4 | |||
Monolithic Power Systems, Inc. | 2.4 | |||
Bio-Techne Corp. | 2.3 | |||
Tradeweb Markets, Inc., Class A | 2.3 | |||
Confluent, Inc., Class A | 2.2 | |||
Liberty Media Corp. - Liberty Formula One, Class C, NVS | 2.2 | |||
Zscaler, Inc. | 2.2 | |||
SECTOR ALLOCATION
| Sector(b) |
Percent of Net Assets | |||
Information Technology | 26.4 | % | ||
Industrials | 24.5 | |||
Consumer Discretionary | 17.7 | |||
Health Care | 16.6 | |||
Financials | 7.2 | |||
Communication Services | 4.0 | |||
Energy | 2.2 | |||
Other (each representing less than 1%) | 0.7 | |||
Short-Term Securities | 7.8 | |||
Liabilities in Excess of Other Assets | (7.1 | ) | ||
| (a) | Excludes short-term securities. |
| (b) | For Fund compliance purposes, the Fund’s sector classifications refer to one or more of the sector sub-classifications used by one or more widely recognized market indexes or ratings group indexes, and/or as defined by the investment adviser. These definitions may not apply for purposes of this report, which may combine such sector sub-classifications for reporting ease. |
| 6 | 2 0 2 3 BLACK ROCK ANNUAL REPORT TO SHAREHOLDERS |
Institutional and Class K Shares are not subject to any sales charge. These shares bear no ongoing distribution or service fees and are available only to certain eligible investors.
Investor A Shares are subject to a maximum initial sales charge (front-end load) of 5.25% and a service fee of 0.25% per year (but no distribution fee). Certain redemptions of these shares may be subject to a contingent deferred sales charge (“CDSC”) where no initial sales charge was paid at the time of purchase. These shares are generally available through financial intermediaries.
Past performance is not an indication of future results. Financial markets have experienced extreme volatility and trading in many instruments has been disrupted. These circumstances may continue for an extended period of time and may continue to affect adversely the value and liquidity of the Fund’s investments. As a result, current performance may be lower or higher than the performance data quoted. Refer to blackrock.com to obtain performance data current to the most recent month-end. Performance results do not reflect the deduction of taxes that a shareholder would pay on Fund distributions or the redemption of Fund shares. Figures shown in the performance table(s) assume reinvestment of all distributions, if any, at net asset value (“NAV”) on the ex-dividend date or payable date, as applicable. Investment return and principal value of shares will fluctuate so that shares, when redeemed, may be worth more or less than their original cost. Distributions paid to each class of shares will vary because of the different levels of service, distribution and transfer agency fees applicable to each class, which are deducted from the income available to be paid to shareholders.
BlackRock Advisors, LLC (the “Manager”), the Fund’s investment adviser, has contractually and/or voluntarily agreed to waive and/or reimburse a portion of the Fund’s expenses. Without such waiver(s) and/or reimbursement(s), the Fund’s performance would have been lower. With respect to the Fund’s voluntary waiver(s), if any, the Manager is under no obligation to waive and/or reimburse or to continue waiving and/or reimbursing its fees and such voluntary waiver(s) may be reduced or discontinued at any time. With respect to the Fund’s contractual waiver(s), if any, the Manager is under no obligation to continue waiving and/or reimbursing its fees after the applicable termination date of such agreement. See the Notes to Financial Statements for additional information on waivers and/or reimbursements.
Shareholders of the Fund may incur the following charges: (a) transactional expenses, such as sales charges; and (b) operating expenses, including investment advisory fees, administration fees, service and distribution fees, including 12b-1 fees, acquired fund fees and expenses, and other fund expenses. The expense example shown (which is based on a hypothetical investment of $1,000 invested at the beginning of the period and held through the end of the period) is intended to assist shareholders both in calculating expenses based on an investment in the Fund and in comparing these expenses with similar costs of investing in other mutual funds.
The expense example provides information about actual account values and actual expenses. Annualized expense ratios reflect contractual and voluntary fee waivers, if any. In order to estimate the expenses a shareholder paid during the period covered by this report, shareholders can divide their account value by $1,000 and then multiply the result by the number corresponding to their share class under the heading entitled “Expenses Paid During the Period.”
The expense example also provides information about hypothetical account values and hypothetical expenses based on the Fund’s actual expense ratio and an assumed rate of return of 5% per year before expenses. In order to assist shareholders in comparing the ongoing expenses of investing in the Fund and other funds, compare the 5% hypothetical example with the 5% hypothetical examples that appear in shareholder reports of other funds.
The expenses shown in the expense example are intended to highlight shareholders’ ongoing costs only and do not reflect transactional expenses, such as sales charges, if any. Therefore, the hypothetical example is useful in comparing ongoing expenses only and will not help shareholders determine the relative total expenses of owning different funds. If these transactional expenses were included, shareholder expenses would have been higher.
ABOUT FUND PERFORMANCE / DISCLOSURE OF EXPENSES | 7 |
May 31, 2023 | BlackRock SMID-Cap Growth Equity Fund (Percentages shown are based on Net Assets) |
| Security | Shares | Value | ||||||
Common Stocks |
| |||||||
| Aerospace & Defense — 5.1% | ||||||||
Axon Enterprise, Inc.(a) | 1,407 | $ | 271,424 | |||||
HEICO Corp. | 1,070 | 165,401 | ||||||
|
| |||||||
| 436,825 | ||||||||
| Air Freight & Logistics — 1.7% | ||||||||
GXO Logistics, Inc.(a) | 2,619 | 146,455 | ||||||
|
| |||||||
| Automobile Components — 1.6% | ||||||||
Fox Factory Holding Corp.(a) | 1,507 | 134,002 | ||||||
|
| |||||||
| Biotechnology — 1.2% | ||||||||
Halozyme Therapeutics, Inc.(a) | 3,112 | 100,922 | ||||||
|
| |||||||
| Broadline Retail — 0.2% | ||||||||
Etsy, Inc.(a) | 188 | 15,237 | ||||||
|
| |||||||
| Building Products — 0.9% | ||||||||
AZEK Co., Inc., Class A(a) | 3,263 | 75,865 | ||||||
|
| |||||||
| Capital Markets — 7.1% | ||||||||
Carlyle Group, Inc. | 663 | 18,173 | ||||||
MarketAxess Holdings, Inc. | 418 | 113,867 | ||||||
Morningstar, Inc. | 759 | 155,367 | ||||||
TPG, Inc., Class A | 4,714 | 121,621 | ||||||
Tradeweb Markets, Inc., Class A | 2,910 | 194,825 | ||||||
|
| |||||||
| 603,853 | ||||||||
| Commercial Services & Supplies — 3.4% | ||||||||
Casella Waste Systems, Inc., Class A(a) | 1,671 | 150,657 | ||||||
GFL Environmental, Inc. | 3,914 | 141,452 | ||||||
|
| |||||||
| 292,109 | ||||||||
| Construction & Engineering — 3.4% | ||||||||
Comfort Systems U.S.A., Inc.(b) | 1,147 | 169,733 | ||||||
WillScot Mobile Mini Holdings Corp.(a) | 2,717 | 117,048 | ||||||
|
| |||||||
| 286,781 | ||||||||
| Distributors — 1.4% | ||||||||
Pool Corp. | 389 | 123,013 | ||||||
|
| |||||||
| Diversified Consumer Services — 3.4% | ||||||||
Bright Horizons Family Solutions, Inc.(a) | 442 | 37,835 | ||||||
Duolingo, Inc., Class A(a) | 1,114 | 166,621 | ||||||
European Wax Center, Inc., Class A(a) | 1,746 | 30,258 | ||||||
Mister Car Wash, Inc.(a) | 6,530 | 53,873 | ||||||
|
| |||||||
| 288,587 | ||||||||
| Entertainment — 2.2% | ||||||||
Liberty Media Corp. - Liberty Formula One, Class C, NVS(a) | 2,686 | 189,094 | ||||||
|
| |||||||
| Financial Services — 0.2% | ||||||||
Jack Henry & Associates, Inc. | 92 | 14,066 | ||||||
|
| |||||||
| Food Products — 0.3% | ||||||||
Freshpet, Inc.(a)(b) | 377 | 22,530 | ||||||
|
| |||||||
| Ground Transportation — 2.5% | ||||||||
Saia, Inc.(a) | 737 | 209,426 | ||||||
|
| |||||||
| Health Care Equipment & Supplies — 4.2% | ||||||||
Figs, Inc., Class A(a) | 7,795 | 64,231 | ||||||
Inmode Ltd.(a) | 785 | 24,783 | ||||||
Inspire Medical Systems, Inc.(a) | 368 | 107,636 | ||||||
Insulet Corp.(a)(b) | 236 | 64,723 | ||||||
Teleflex, Inc. | 420 | 98,595 | ||||||
|
| |||||||
| 359,968 | ||||||||
| Health Care Technology — 1.9% | ||||||||
Certara, Inc.(a) | 2,046 | 42,516 | ||||||
| Security | Shares | Value | ||||||
| Health Care Technology (continued) | ||||||||
Doximity, Inc., Class A(a)(b) | 2,039 | $ | 62,536 | |||||
Phreesia, Inc.(a) | 1,901 | 57,068 | ||||||
|
| |||||||
| 162,120 | ||||||||
| Hotels, Restaurants & Leisure — 8.2% | ||||||||
Churchill Downs, Inc. | 1,278 | 173,578 | ||||||
Domino’s Pizza, Inc. | 86 | 24,927 | ||||||
Evolution AB(c) | 1,259 | 166,199 | ||||||
Penn Entertainment, Inc.(a) | 922 | 23,087 | ||||||
Planet Fitness, Inc., Class A(a)(b) | 2,546 | 162,791 | ||||||
Vail Resorts, Inc. | 629 | 152,973 | ||||||
|
| |||||||
| 703,555 | ||||||||
| Industrial REITs — 0.3% | ||||||||
Rexford Industrial Realty, Inc. | 543 | 29,561 | ||||||
|
| |||||||
| Interactive Media & Services — 1.7% | ||||||||
Match Group, Inc.(a) | 4,142 | 142,899 | ||||||
|
| |||||||
| IT Services — 4.3% | ||||||||
DigitalOcean Holdings, Inc.(a) | 2,011 | 78,731 | ||||||
Globant SA(a) | 936 | 172,046 | ||||||
MongoDB, Inc., Class A(a)(b) | 405 | 118,985 | ||||||
|
| |||||||
| 369,762 | ||||||||
| Life Sciences Tools & Services — 9.3% | ||||||||
Azenta, Inc.(a) | 1,378 | 59,598 | ||||||
Bio-Techne Corp. | 2,408 | 196,950 | ||||||
Charles River Laboratories International, Inc.(a) | 952 | 184,098 | ||||||
Olink Holding AB, ADR(a) | 668 | 13,013 | ||||||
Repligen Corp.(a) | 1,071 | 179,842 | ||||||
West Pharmaceutical Services, Inc. | 482 | 161,292 | ||||||
|
| |||||||
| 794,793 | ||||||||
| Machinery — 3.7% | ||||||||
AutoStore Holdings Ltd.(a)(c) | 43,420 | 92,054 | ||||||
Chart Industries, Inc.(a) | 829 | 90,966 | ||||||
Graco, Inc. | 1,763 | 134,852 | ||||||
|
| |||||||
| 317,872 | ||||||||
| Media — 0.1% | ||||||||
Cable One, Inc. | 18 | 11,013 | ||||||
|
| |||||||
| Oil, Gas & Consumable Fuels — 2.2% | ||||||||
Diamondback Energy, Inc. | 449 | 57,090 | ||||||
EQT Corp. | 1,757 | 61,091 | ||||||
Texas Pacific Land Corp. | 54 | 70,400 | ||||||
|
| |||||||
| 188,581 | ||||||||
| Professional Services — 3.4% | ||||||||
Booz Allen Hamilton Holding Corp., Class A | 1,658 | 166,762 | ||||||
Fiverr International Ltd.(a) | 1,594 | 41,747 | ||||||
Paylocity Holding Corp.(a)(b) | 446 | 77,046 | ||||||
|
| |||||||
| 285,555 | ||||||||
| Semiconductors & Semiconductor Equipment — 10.0% | ||||||||
Ambarella, Inc.(a) | 1,501 | 108,552 | ||||||
Entegris, Inc. | 2,921 | 307,435 | ||||||
Lattice Semiconductor Corp.(a) | 2,550 | 207,341 | ||||||
Monolithic Power Systems, Inc. | 413 | 202,333 | ||||||
SolarEdge Technologies, Inc.(a) | 100 | 28,483 | ||||||
|
| |||||||
| 854,144 | ||||||||
| Software — 12.1% | ||||||||
Aspen Technology, Inc.(a) | 667 | 109,335 | ||||||
Bentley Systems, Inc., Class B | 3,536 | 172,486 | ||||||
BILL Holdings, Inc.(a) | 489 | 50,650 | ||||||
Confluent, Inc., Class A(a) | 6,013 | 190,852 | ||||||
Five9, Inc.(a) | 553 | 36,559 | ||||||
| 8 | 2 0 2 3 BLACK ROCK ANNUAL REPORT TO SHAREHOLDERS |
Schedule of Investments (continued) May 31, 2023 | BlackRock SMID-Cap Growth Equity Fund (Percentages shown are based on Net Assets) |
| Security | Shares | Value | ||||||
| Software (continued) | ||||||||
HubSpot, Inc.(a) | 312 | $ | 161,613 | |||||
JFrog Ltd.(a) | 3,399 | 82,800 | ||||||
PagerDuty, Inc.(a) | 1,410 | 38,366 | ||||||
Zscaler, Inc.(a) | 1,391 | 188,453 | ||||||
|
| |||||||
| 1,031,114 | ||||||||
| Specialty Retail — 2.8% | ||||||||
Burlington Stores, Inc.(a) | 527 | 79,293 | ||||||
Floor & Decor Holdings, Inc., Class A(a) | 1,778 | 162,349 | ||||||
|
| |||||||
| 241,642 | ||||||||
| Trading Companies & Distributors — 0.5% | ||||||||
SiteOne Landscape Supply, Inc.(a) | 299 | 41,229 | ||||||
|
| |||||||
Total Long-Term Investments — 99.3% | 8,472,573 | |||||||
|
| |||||||
Short-Term Securities | ||||||||
| Money Market Funds — 7.8% | ||||||||
BlackRock Liquidity Funds, T-Fund, Institutional Class, 5.00%(d)(e) | 7,120 | 7,120 | ||||||
SL Liquidity Series, LLC, Money Market Series, 5.32%(d)(e)(f) | 660,597 | 660,597 | ||||||
|
| |||||||
Total Short-Term Securities — 7.8% | 667,717 | |||||||
|
| |||||||
Total Investments — 107.1% | 9,140,290 | |||||||
Liabilities in Excess of Other Assets — (7.1)% | (607,203 | ) | ||||||
|
| |||||||
Net Assets — 100.0% | $ | 8,533,087 | ||||||
|
| |||||||
| (a) | Non-income producing security. |
| (b) | All or a portion of this security is on loan. |
| (c) | Security exempt from registration pursuant to Rule 144A under the Securities Act of 1933, as amended. These securities may be resold in transactions exempt from registration to qualified institutional investors. |
| (d) | Affiliate of the Fund. |
| (e) | Annualized 7-day yield as of period end. |
| (f) | All or a portion of this security was purchased with the cash collateral from loaned securities. |
Affiliates
Investments in issuers considered to be affiliate(s) of the Fund during the year ended May 31, 2023 for purposes of Section 2(a)(3) of the Investment Company Act of 1940, as amended, were as follows:
| Affiliated Issuer | Value at 05/31/22 | Purchases at Cost | Proceeds from Sale | Net Realized Gain (Loss) | Change in Unrealized Appreciation (Depreciation) | Value at 05/31/23 | Shares Held at 05/31/23 | Income | Capital Gain | |||||||||||||||||||||||||||
BlackRock Liquidity Funds, T-Fund, Institutional Class | $ | 190,657 | $ | — | $ | (183,537 | )(a) | $ | — | $ | — | $ | 7,120 | 7,120 | $ | 4,889 | $ | — | ||||||||||||||||||
SL Liquidity Series, LLC, Money Market Series | 430,483 | 230,292 | (a) | — | (130 | ) | (48 | ) | 660,597 | 660,597 | 1,409 | (b) | — | |||||||||||||||||||||||
|
|
|
|
|
|
|
|
|
| |||||||||||||||||||||||||||
| $ | (130 | ) | $ | (48 | ) | $ | 667,717 | $ | 6,298 | $ | — | |||||||||||||||||||||||||
|
|
|
|
|
|
|
|
|
| |||||||||||||||||||||||||||
| (a) | Represents net amount purchased (sold). |
| (b) | All or a portion represents securities lending income earned from the reinvestment of cash collateral from loaned securities, net of fees and collateral investment expenses, and other payments to and from borrowers of securities. |
For Fund compliance purposes, the Fund’s industry classifications refer to one or more of the industry sub-classifications used by one or more widely recognized market indexes or rating group indexes, and/or as defined by the investment adviser. These definitions may not apply for purposes of this report, which may combine such industry sub-classifications for reporting ease.
SCHEDULE OF INVESTMENTS | 9 |
Schedule of Investments (continued) May 31, 2023
| BlackRock SMID-Cap Growth Equity Fund |
Fair Value Hierarchy as of Period End
Various inputs are used in determining the fair value of financial instruments. For a description of the input levels and information about the Fund’s policy regarding valuation of financial instruments, refer to the Notes to Financial Statements.
The following table summarizes the Fund’s financial instruments categorized in the fair value hierarchy. The breakdown of the Fund’s financial instruments into major categories is disclosed in the Schedule of Investments above.
| Level 1 | Level 2 | Level 3 | Total | |||||||||||
Assets | ||||||||||||||
Investments | ||||||||||||||
Long-Term Investments | ||||||||||||||
Common Stocks | ||||||||||||||
Aerospace & Defense | $ | 436,825 | $ | — | $ | — | $436,825 | |||||||
Air Freight & Logistics | 146,455 | — | — | 146,455 | ||||||||||
Automobile Components | 134,002 | — | — | 134,002 | ||||||||||
Biotechnology | 100,922 | — | — | 100,922 | ||||||||||
Broadline Retail | 15,237 | — | — | 15,237 | ||||||||||
Building Products | 75,865 | — | — | 75,865 | ||||||||||
Capital Markets | 603,853 | — | — | 603,853 | ||||||||||
Commercial Services & Supplies | 292,109 | — | — | 292,109 | ||||||||||
Construction & Engineering | 286,781 | — | — | 286,781 | ||||||||||
Distributors | 123,013 | — | — | 123,013 | ||||||||||
Diversified Consumer Services | 288,587 | — | — | 288,587 | ||||||||||
Entertainment | 189,094 | — | — | 189,094 | ||||||||||
Financial Services | 14,066 | — | — | 14,066 | ||||||||||
Food Products | 22,530 | — | — | 22,530 | ||||||||||
Ground Transportation | 209,426 | — | — | 209,426 | ||||||||||
Health Care Equipment & Supplies | 359,968 | — | — | 359,968 | ||||||||||
Health Care Technology | 162,120 | — | — | 162,120 | ||||||||||
Hotels, Restaurants & Leisure | 537,356 | 166,199 | — | 703,555 | ||||||||||
Industrial REITs | 29,561 | — | — | 29,561 | ||||||||||
Interactive Media & Services | 142,899 | — | — | 142,899 | ||||||||||
IT Services | 369,762 | — | — | 369,762 | ||||||||||
Life Sciences Tools & Services | 794,793 | — | — | 794,793 | ||||||||||
Machinery | 225,818 | 92,054 | — | 317,872 | ||||||||||
Media | 11,013 | — | — | 11,013 | ||||||||||
Oil, Gas & Consumable Fuels | 188,581 | — | — | 188,581 | ||||||||||
Professional Services | 285,555 | — | — | 285,555 | ||||||||||
Semiconductors & Semiconductor Equipment | 854,144 | — | — | 854,144 | ||||||||||
Software | 1,031,114 | — | — | 1,031,114 | ||||||||||
Specialty Retail | 241,642 | — | — | 241,642 | ||||||||||
Trading Companies & Distributors | 41,229 | — | — | 41,229 | ||||||||||
Short-Term Securities | ||||||||||||||
Money Market Funds | 7,120 | — | — | 7,120 | ||||||||||
|
|
|
|
|
|
| ||||||||
| $ | 8,221,440 | $ | 258,253 | $ | — | 8,479,693 | ||||||||
|
|
|
|
|
|
| ||||||||
Investments valued at NAV(a) | 660,597 | |||||||||||||
| ||||||||||||||
| $9,140,290 | ||||||||||||||
| ||||||||||||||
| (a) | Certain investments of the Fund were fair valued using NAV as a practical expedient as no quoted market value is available and therefore have been excluded from the fair value hierarchy. |
See notes to financial statements.
| 10 | 2 0 2 3 BLACK ROCK ANNUAL REPORT TO SHAREHOLDERS |
Statement of Assets and Liabilities
May 31, 2023
BlackRock SMID-Cap Growth Equity Fund | ||||
ASSETS | ||||
Investments, at value — unaffiliated(a)(b) | $ | 8,472,573 | ||
Investments, at value — affiliated(c) | 667,717 | |||
Foreign currency, at value(d) | 1,002 | |||
Receivables: | ||||
Securities lending income — affiliated | 94 | |||
Capital shares sold | 1,753 | |||
Dividends — unaffiliated | 1,821 | |||
Dividends — affiliated | 223 | |||
From the Manager | 61,188 | |||
|
| |||
Total assets | 9,206,371 | |||
|
| |||
LIABILITIES | ||||
Collateral on securities loaned | 660,883 | |||
Payables: | ||||
Administration fees | 736 | |||
Investment advisory fees | 9,969 | |||
Trustees’ and Officer’s fees | 1,501 | |||
Professional fees | 178 | |||
Service fees | 17 | |||
|
| |||
Total liabilities | 673,284 | |||
|
| |||
NET ASSETS | $ | 8,533,087 | ||
|
| |||
NET ASSETS CONSIST OF: | ||||
Paid-in capital | $ | 14,984,370 | ||
Accumulated loss | (6,451,283 | ) | ||
|
| |||
NET ASSETS | $ | 8,533,087 | ||
|
| |||
(a) Investments, at cost — unaffiliated | $ | 9,384,685 | ||
(b) Securities loaned, at value | $ | 517,612 | ||
(c) Investments, at cost — affiliated | $ | 667,717 | ||
(d) Foreign currency, at cost | $ | 1,084 | ||
FINANCIAL STATEMENTS | 11 |
Statement of Assets and Liabilities (continued)
May 31, 2023
BlackRock SMID-Cap Growth Equity Fund | ||||
| NET ASSET VALUE | ||||
| Institutional | ||||
Net assets | $ | 58,927 | ||
|
| |||
Shares outstanding | 5,207 | |||
|
| |||
Net asset value | $ | 11.32 | ||
|
| |||
Shares authorized | Unlimited | |||
|
| |||
Par value | $ | 0.001 | ||
|
| |||
| Investor A | ||||
Net assets | $ | 82,360 | ||
|
| |||
Shares outstanding | 7,312 | |||
|
| |||
Net asset value | $ | 11.26 | ||
|
| |||
Shares authorized | Unlimited | |||
|
| |||
Par value | $ | 0.001 | ||
|
| |||
| Class K | ||||
Net assets | $ | 8,391,800 | ||
|
| |||
Shares outstanding | 740,011 | |||
|
| |||
Net asset value | $ | 11.34 | ||
|
| |||
Shares authorized | Unlimited | |||
|
| |||
Par value | $ | 0.001 | ||
|
| |||
See notes to financial statements.
| 12 | 2 0 2 3 BLACK ROCK ANNUAL REPORT TO SHAREHOLDERS |
Year Ended May 31, 2023
BlackRock Growth Equity Fund | ||||
INVESTMENT INCOME | ||||
Dividends — unaffiliated | $ | 35,329 | ||
Dividends — affiliated | 4,889 | |||
Securities lending income — affiliated — net | 1,409 | |||
Foreign taxes withheld | (457 | ) | ||
|
| |||
Total investment income | 41,170 | |||
|
| |||
EXPENSES | ||||
Investment advisory | 58,853 | |||
Professional | 26,111 | |||
Trustees and Officer | 6,001 | |||
Administration — class specific | 4,340 | |||
Service — class specific | 197 | |||
Miscellaneous | 58 | |||
|
| |||
Total expenses | 95,560 | |||
Less: | ||||
Fees waived and/or reimbursed by the Manager | (32,236 | ) | ||
|
| |||
Total expenses after fees waived and/or reimbursed | 63,324 | |||
|
| |||
Net investment loss | (22,154 | ) | ||
|
| |||
REALIZED AND UNREALIZED GAIN (LOSS) | ||||
Net realized gain (loss) from: | ||||
Investments — unaffiliated | (2,544,960 | ) | ||
Investments — affiliated | (130 | ) | ||
Foreign currency transactions | 424 | |||
|
| |||
| (2,544,666 | ) | |||
|
| |||
Net change in unrealized appreciation (depreciation) on: | ||||
Investments — unaffiliated | 2,465,221 | |||
Investments — affiliated | (48 | ) | ||
Foreign currency translations | (133 | ) | ||
|
| |||
| 2,465,040 | ||||
|
| |||
Net realized and unrealized loss | (79,626 | ) | ||
|
| |||
NET DECREASE IN NET ASSETS RESULTING FROM OPERATIONS | $ | (101,780 | ) | |
|
| |||
See notes to financial statements.
FINANCIAL STATEMENTS | 13 |
Statements of Changes in Net Assets
| BlackRock SMID-Cap Growth Equity Fund | ||||||||
Year Ended 05/31/23 | Period from 06/29/21(a) to 05/31/22 | |||||||
INCREASE (DECREASE) IN NET ASSETS | ||||||||
OPERATIONS | ||||||||
Net investment loss | $ | (22,154 | ) | $ | (55,152 | ) | ||
Net realized loss | (2,544,666 | ) | (2,987,010 | ) | ||||
Net change in unrealized appreciation (depreciation) | 2,465,040 | (3,377,231 | ) | |||||
|
|
|
| |||||
Net decrease in net assets resulting from operations | (101,780 | ) | (6,419,393 | ) | ||||
|
|
|
| |||||
CAPITAL SHARE TRANSACTIONS | ||||||||
Net increase (decrease) in net assets derived from capital share transactions | (17,247 | ) | 15,071,507 | |||||
|
|
|
| |||||
NET ASSETS | ||||||||
Total increase (decrease) in net assets | (119,027 | ) | 8,652,114 | |||||
Beginning of period | 8,652,114 | — | ||||||
|
|
|
| |||||
End of period | $ | 8,533,087 | $ | 8,652,114 | ||||
|
|
|
| |||||
| (a) | Commencement of operations. |
See notes to financial statements.
| 14 | 2 0 2 3 BLACK ROCK ANNUAL REPORT TO SHAREHOLDERS |
(For a share outstanding throughout each period)
| BlackRock SMID-Cap Growth Equity Fund | ||||||||
| Institutional | ||||||||
| | Year Ended 05/31/23 | | | Period from 06/29/21 to 05/31/22 | (a)
| |||
Net asset value, beginning of period | $ | 11.45 | $ | 20.00 | ||||
|
|
|
| |||||
Net investment loss(b) | (0.04 | ) | (0.09 | ) | ||||
Net realized and unrealized loss | (0.09 | ) | (8.46 | ) | ||||
|
|
|
| |||||
Net decrease from investment operations | (0.13 | ) | (8.55 | ) | ||||
|
|
|
| |||||
Net asset value, end of period | $ | 11.32 | $ | 11.45 | ||||
|
|
|
| |||||
Total Return(c) | ||||||||
Based on net asset value | (1.14 | )% | (42.75 | )%(d) | ||||
|
|
|
| |||||
Ratios to Average Net Assets(e) | ||||||||
Total expenses | 1.23 | % | 1.06 | %(f)(g) | ||||
|
|
|
| |||||
Total expenses after fees waived and/or reimbursed | 0.85 | % | 0.85 | %(f) | ||||
|
|
|
| |||||
Net investment loss | (0.36 | )% | (0.56 | )%(f) | ||||
|
|
|
| |||||
Supplemental Data | ||||||||
Net assets, end of period (000) | $ | 59 | $ | 59 | ||||
|
|
|
| |||||
Portfolio turnover rate | 53 | % | 54 | % | ||||
|
|
|
| |||||
| (a) | Commencement of operations. |
| (b) | Based on average shares outstanding. |
| (c) | Where applicable, assumes the reinvestment of distributions. |
| (d) | Not annualized. |
| (e) | Excludes fees and expenses incurred indirectly as a result of investments in underlying funds. |
| (f) | Annualized. |
| (g) | Audit costs were not annualized in the calculation of the expense ratios. If these expenses were annualized, the total expenses would have been 1.07%. |
See notes to financial statements.
FINANCIAL HIGHLIGHTS | 15 |
Financial Highlights (continued)
(For a share outstanding throughout each period)
| BlackRock SMID-Cap Growth Equity Fund (continued) | ||||||||
| Investor A | ||||||||
| | Year Ended 05/31/23 |
| | Period from 06/29/21 to 05/31/22 | (a)
| |||
Net asset value, beginning of period | $ | 11.43 | $ | 20.00 | ||||
|
|
|
| |||||
Net investment loss(b) | (0.07 | ) | (0.13 | ) | ||||
Net realized and unrealized loss | (0.10 | ) | (8.44 | ) | ||||
|
|
|
| |||||
Net decrease from investment operations | (0.17 | ) | (8.57 | ) | ||||
|
|
|
| |||||
Net asset value, end of period | $ | 11.26 | $ | 11.43 | ||||
|
|
|
| |||||
Total Return(c) | ||||||||
Based on net asset value | (1.49 | )% | (42.85 | )%(d) | ||||
|
|
|
| |||||
Ratios to Average Net Assets(e) | ||||||||
Total expenses | 1.48 | % | 1.31 | %(f)(g) | ||||
|
|
|
| |||||
Total expenses after fees waived and/or reimbursed | 1.10 | % | 1.10 | %(f) | ||||
|
|
|
| |||||
Net investment loss | (0.61 | )% | (0.80 | )%(f) | ||||
|
|
|
| |||||
Supplemental Data | ||||||||
Net assets, end of period (000) | $ | 82 | $ | 66 | ||||
|
|
|
| |||||
Portfolio turnover rate | 53 | % | 54 | % | ||||
|
|
|
| |||||
(a) Commencement of operations.
(b) Based on average shares outstanding.
(c) Where applicable, excludes the effects of any sales charges and assumes the reinvestment of distributions.
(d) Not annualized.
(e) Excludes fees and expenses incurred indirectly as a result of investments in underlying funds.
(f) Annualized.
(g) Audit costs were not annualized in the calculation of the expense ratios. If these expenses were annualized, the total expenses would have been 1.32%.
See notes to financial statements.
| 16 | 2 0 2 3 BLACK ROCK ANNUAL REPORT TO SHAREHOLDERS |
Financial Highlights (continued)
(For a share outstanding throughout each period)
| BlackRock SMID-Cap Growth Equity Fund (continued) | ||||||||
| Class K | ||||||||
| | Year Ended 05/31/23 | | | Period from 06/29/21 to 05/31/22 | (a)
| |||
Net asset value, beginning of period | $ | 11.46 | $ | 20.00 | ||||
|
|
|
| |||||
Net investment loss(b) | (0.03 | ) | (0.07 | ) | ||||
Net realized and unrealized loss | (0.09 | ) | (8.47 | ) | ||||
|
|
|
| |||||
Net decrease from investment operations | (0.12 | ) | (8.54 | ) | ||||
|
|
|
| |||||
Net asset value, end of period | $ | 11.34 | $ | 11.46 | ||||
|
|
|
| |||||
Total Return(c) | ||||||||
Based on net asset value | (1.05 | )% | (42.70 | )%(d) | ||||
|
|
|
| |||||
Ratios to Average Net Assets(e) | ||||||||
Total expenses | 1.13 | % | 0.96 | %(f)(g) | ||||
|
|
|
| |||||
Total expenses after fees waived and/or reimbursed | 0.75 | % | 0.75 | %(f) | ||||
|
|
|
| |||||
Net investment loss | (0.26 | )% | (0.46 | )%(f) | ||||
|
|
|
| |||||
Supplemental Data | ||||||||
Net assets, end of period (000) | $ | 8,392 | $ | 8,528 | ||||
|
|
|
| |||||
Portfolio turnover rate | 53 | % | 54 | % | ||||
|
|
|
| |||||
| (a) | Commencement of operations. |
| (b) | Based on average shares outstanding. |
| (c) | Where applicable, assumes the reinvestment of distributions. |
| (d) | Not annualized. |
| (e) | Excludes fees and expenses incurred indirectly as a result of investments in underlying funds. |
| (f) | Annualized. |
| (g) | Audit costs were not annualized in the calculation of the expense ratios. If these expenses were annualized, the total expenses would have been 0.97%. |
See notes to financial statements.
FINANCIAL HIGHLIGHTS | 17 |
| 1. | ORGANIZATION |
BlackRock FundsSM (the “Trust”) is registered under the Investment Company Act of 1940, as amended (the “1940 Act”), as an open-end management investment company. The Trust is organized as a Massachusetts business trust. BlackRock SMID-Cap Growth Equity Fund (the “Fund”) is a series of the Trust. The Fund is classified as diversified.
The Fund offers multiple classes of shares. All classes of shares have identical voting, dividend, liquidation and other rights and are subject to the same terms and conditions, except that certain classes bear expenses related to the shareholder servicing and distribution of such shares. Institutional and Class K Shares are sold only to certain eligible investors. Investor A Shares bear certain expenses related to shareholder servicing of such shares. Investor A Shares are generally available through financial intermediaries. Each class has exclusive voting rights with respect to matters relating to its shareholder servicing and distribution expenditures.
| Share Class | Initial Sales Charge | CDSC | Conversion Privilege | |||
Institutional and Class K Shares | No | No | None | |||
| Investor A Shares | Yes | No(a) | None |
| (a) | Investor A Shares may be subject to a contingent deferred sales charge (“CDSC”) for certain redemptions where no initial sales charge was paid at the time of purchase. |
The Fund, together with certain other registered investment companies advised by BlackRock Advisors, LLC (the “Manager” or “BAL”) or its affiliates, is included in a complex of funds referred to as the BlackRock Multi-Asset Complex.
| 2. | SIGNIFICANT ACCOUNTING POLICIES |
The financial statements are prepared in conformity with accounting principles generally accepted in the United States of America (“U.S. GAAP”), which may require management to make estimates and assumptions that affect the reported amounts of assets and liabilities in the financial statements, disclosure of contingent assets and liabilities at the date of the financial statements and the reported amounts of increases and decreases in net assets from operations during the reporting period. Actual results could differ from those estimates. The Fund is considered an investment company under U.S. GAAP and follows the accounting and reporting guidance applicable to investment companies. Below is a summary of significant accounting policies:
Investment Transactions and Income Recognition: For financial reporting purposes, investment transactions are recorded on the dates the transactions are executed. Realized gains and losses on investment transactions are determined using the specific identification method. Dividend income and capital gain distributions, if any, are recorded on the ex-dividend dates. Non-cash dividends, if any, are recorded on the ex-dividend dates at fair value. Dividends from foreign securities where the ex-dividend dates may have passed are subsequently recorded when the Fund is informed of the ex-dividend dates. Under the applicable foreign tax laws, a withholding tax at various rates may be imposed on capital gains, dividends and interest. Upon notification from issuers, a portion of the dividend income received from a real estate investment trust may be redesignated as a reduction of cost of the related investment and/or realized gain. Income, expenses and realized and unrealized gains and losses are allocated daily to each class based on its relative net assets.
Foreign Currency Translation: The Fund’s books and records are maintained in U.S. dollars. Securities and other assets and liabilities denominated in foreign currencies are translated into U.S. dollars using exchange rates determined as of the close of trading on the New York Stock Exchange (“NYSE”). Purchases and sales of investments are recorded at the rates of exchange prevailing on the respective dates of such transactions. Generally, when the U.S. dollar rises in value against a foreign currency, the investments denominated in that currency will lose value; the opposite effect occurs if the U.S. dollar falls in relative value.
The Fund does not isolate the effect of fluctuations in foreign exchange rates from the effect of fluctuations in the market prices of investments for financial reporting purposes. Accordingly, the effects of changes in exchange rates on investments are not segregated in the Statement of Operations from the effects of changes in market prices of those investments, but are included as a component of net realized and unrealized gain (loss) from investments. The Fund reports realized currency gains (losses) on foreign currency related transactions as components of net realized gain (loss) for financial reporting purposes, whereas such components are generally treated as ordinary income for U.S. federal income tax purposes.
Foreign Taxes: The Fund may be subject to foreign taxes (a portion of which may be reclaimable) on income, stock dividends, capital gains on investments, or certain foreign currency transactions. All foreign taxes are recorded in accordance with the applicable foreign tax regulations and rates that exist in the foreign jurisdictions in which the Fund invests. These foreign taxes, if any, are paid by the Fund and are reflected in its Statement of Operations as follows: foreign taxes withheld at source are presented as a reduction of income, foreign taxes on securities lending income are presented as a reduction of securities lending income, foreign taxes on stock dividends are presented as “Foreign taxes withheld”, and foreign taxes on capital gains from sales of investments and foreign taxes on foreign currency transactions are included in their respective net realized gain (loss) categories. Foreign taxes payable or deferred as of May 31, 2023, if any, are disclosed in the Statement of Assets and Liabilities.
The Fund files withholding tax reclaims in certain jurisdictions to recover a portion of amounts previously withheld. The Fund may record a reclaim receivable based on collectability, which includes factors such as the jurisdiction’s applicable laws, payment history and market convention. The Statement of Operations includes tax reclaims recorded as well as professional and other fees, if any, associated with recovery of foreign withholding taxes.
Collateralization: If required by an exchange or counterparty agreement, the Fund may be required to deliver/deposit cash and/or securities to/with an exchange, or broker-dealer or custodian as collateral for certain investments.
Distributions: Distributions paid by the Fund are recorded on the ex-dividend dates. The character and timing of distributions are determined in accordance with U.S. federal income tax regulations, which may differ from U.S. GAAP.
Indemnifications: In the normal course of business, the Fund enters into contracts that contain a variety of representations that provide general indemnification. The Fund’s maximum exposure under these arrangements is unknown because it involves future potential claims against the Fund, which cannot be predicted with any certainty.
| 18 | 2 0 2 3 BLACK ROCK ANNUAL REPORT TO SHAREHOLDERS |
Notes to Financial Statements (continued)
Other: Expenses directly related to the Fund or its classes are charged to the Fund or the applicable class. Expenses directly related to the Fund and other shared expenses prorated to the Fund are allocated daily to each class based on its relative net assets or other appropriate methods. Other operating expenses shared by several funds, including other funds managed by the Manager, are prorated among those funds on the basis of relative net assets or other appropriate methods.
The Fund has an arrangement with its custodian whereby credits are earned on uninvested cash balances, which could be used to reduce custody fees and/or overdraft charges. The Fund may incur charges on overdrafts, subject to certain conditions.
| 3. | INVESTMENT VALUATION AND FAIR VALUE MEASUREMENTS |
Investment Valuation Policies: The Fund’s investments are valued at fair value (also referred to as “market value” within the financial statements) each day that the Fund is open for business and, for financial reporting purposes, as of the report date. U.S. GAAP defines fair value as the price a fund would receive to sell an asset or pay to transfer a liability in an orderly transaction between market participants at the measurement date. The Board of Trustees of the Trust (the “Board”) has approved the designation of the Fund’s Manager as the valuation designee for the Fund. The Fund determines the fair values of its financial instruments using various independent dealers or pricing services under the Manager’s policies. If a security’s market price is not readily available or does not otherwise accurately represent the fair value of the security, the security will be valued in accordance with the Manager’s policies and procedures as reflecting fair value. The Manager has formed a committee (the “Valuation Committee”) to develop pricing policies and procedures and to oversee the pricing function for all financial instruments, with assistance from other BlackRock pricing committees.
Fair Value Inputs and Methodologies: The following methods and inputs are used to establish the fair value of the Fund’s assets and liabilities:
| · | Equity investments traded on a recognized securities exchange are valued at that day’s official closing price, as applicable, on the exchange where the stock is primarily traded. Equity investments traded on a recognized exchange for which there were no sales on that day may be valued at the last available bid (long positions) or ask (short positions) price. |
| · | Investments in open-end U.S. mutual funds (including money market funds) are valued at that day’s published net asset value (“NAV”). |
| · | The Fund values its investment in SL Liquidity Series, LLC, Money Market Series (the “Money Market Series”) at fair value, which is ordinarily based upon its pro rata ownership in the underlying fund’s net assets. |
Generally, trading in foreign instruments is substantially completed each day at various times prior to the close of trading on the NYSE. Each business day, the Fund uses current market factors supplied by independent pricing services to value certain foreign instruments (“Systematic Fair Value Price”). The Systematic Fair Value Price is designed to value such foreign securities at fair value as of the close of trading on the NYSE, which follows the close of the local markets.
If events (e.g., market volatility, company announcement or a natural disaster) occur that are expected to materially affect the value of such investment, or in the event that application of these methods of valuation results in a price for an investment that is deemed not to be representative of the market value of such investment, or if a price is not available, the investment will be valued by the Valuation Committee in accordance with the Manager’s policies and procedures as reflecting fair value (“Fair Valued Investments”). The fair valuation approaches that may be used by the Valuation Committee include market approach, income approach and cost approach. Valuation techniques such as discounted cash flow, use of market comparables and matrix pricing are types of valuation approaches and are typically used in determining fair value. When determining the price for Fair Valued Investments, the Valuation Committee seeks to determine the price that the Fund might reasonably expect to receive or pay from the current sale or purchase of that asset or liability in an arm’s-length transaction. Fair value determinations shall be based upon all available factors that the Valuation Committee deems relevant and consistent with the principles of fair value measurement.
Fair Value Hierarchy: Various inputs are used in determining the fair value of financial instruments. These inputs to valuation techniques are categorized into a fair value hierarchy consisting of three broad levels for financial reporting purposes as follows:
| · | Level 1 – Unadjusted price quotations in active markets/exchanges for identical assets or liabilities that the Fund has the ability to access; |
| · | Level 2 – Other observable inputs (including, but not limited to, quoted prices for similar assets or liabilities in markets that are active, quoted prices for identical or similar assets or liabilities in markets that are not active, inputs other than quoted prices that are observable for the assets or liabilities (such as interest rates, yield curves, volatilities, prepayment speeds, loss severities, credit risks and default rates) or other market–corroborated inputs); and |
| · | Level 3 – Unobservable inputs based on the best information available in the circumstances, to the extent observable inputs are not available (including the Valuation Committee’s assumptions used in determining the fair value of financial instruments). |
The hierarchy gives the highest priority to unadjusted quoted prices in active markets for identical assets or liabilities (Level 1 measurements) and the lowest priority to unobservable inputs (Level 3 measurements). Accordingly, the degree of judgment exercised in determining fair value is greatest for instruments categorized in Level 3. The inputs used to measure fair value may fall into different levels of the fair value hierarchy. In such cases, for disclosure purposes, the fair value hierarchy classification is determined based on the lowest level input that is significant to the fair value measurement in its entirety. Investments classified within Level 3 have significant unobservable inputs used by the Valuation Committee in determining the price for Fair Valued Investments. Level 3 investments include equity or debt issued by privately held companies or funds that may not have a secondary market and/or may have a limited number of investors. The categorization of a value determined for financial instruments is based on the pricing transparency of the financial instruments and is not necessarily an indication of the risks associated with investing in those securities.
As of May 31, 2023, certain investments of the Fund were fair valued using NAV as a practical expedient as no quoted market value is available and therefore have been excluded from the fair value hierarchy.
NOTES TO FINANCIAL STATEMENTS | 19 |
Notes to Financial Statements (continued)
| 4. | SECURITIES AND OTHER INVESTMENTS |
Securities Lending: The Fund may lend its securities to approved borrowers, such as brokers, dealers and other financial institutions. The borrower pledges and maintains with the Fund collateral consisting of cash, an irrevocable letter of credit issued by a bank, or securities issued or guaranteed by the U.S. Government. The initial collateral received by the Fund is required to have a value of at least 102% of the current value of the loaned securities for securities traded on U.S. exchanges and a value of at least 105% for all other securities. The collateral is maintained thereafter at a value equal to at least 100% of the current market value of the securities on loan. The market value of the loaned securities is determined at the close of each business day of the Fund and any additional required collateral is delivered to the Fund, or excess collateral returned by the Fund, on the next business day. During the term of the loan, the Fund is entitled to all distributions made on or in respect of the loaned securities, but does not receive interest income on securities received as collateral. Loans of securities are terminable at any time and the borrower, after notice, is required to return borrowed securities within the standard time period for settlement of securities transactions.
As of period end, any securities on loan were collateralized by cash and/or U.S. Government obligations. Cash collateral invested by the securities lending agent, BlackRock Investment Management, LLC (“BIM”), if any, is disclosed in the Schedule of Investments. Any non-cash collateral received cannot be sold, re-invested or pledged by the Fund, except in the event of borrower default. The securities on loan, if any, are disclosed in the Fund’s Schedule of Investments. The market value of any securities on loan and the value of related collateral, if any, are shown separately in the Statement of Assets and Liabilities as a component of investments at value – unaffiliated and collateral on securities loaned, respectively.
Securities lending transactions are entered into by the Fund under Master Securities Lending Agreements (each, an “MSLA”), which provide the right, in the event of default (including bankruptcy or insolvency), for the non-defaulting party to liquidate the collateral and calculate a net exposure to the defaulting party or request additional collateral. In the event that a borrower defaults, the Fund, as lender, would offset the market value of the collateral received against the market value of the securities loaned. When the value of the collateral is greater than that of the market value of the securities loaned, the lender is left with a net amount payable to the defaulting party. However, bankruptcy or insolvency laws of a particular jurisdiction may impose restrictions on or prohibitions against such a right of offset in the event of an MSLA counterparty’s bankruptcy or insolvency. Under the MSLA, absent an event of default, the borrower can resell or re-pledge the loaned securities, and the Fund can reinvest cash collateral received in connection with loaned securities. Upon an event of default, the parties’ obligations to return the securities or collateral to the other party are extinguished, and the parties can resell or re-pledge the loaned securities or the collateral received in connection with the loaned securities in order to satisfy the defaulting party’s net payment obligation for all transactions under the MSLA. The defaulting party remains liable for any deficiency.
As of period end, the following table is a summary of the Fund’s securities on loan by counterparty which are subject to offset under an MSLA:
| Counterparty | | Securities Loaned at Value | | | Cash Collateral Received | (a) | | Non-Cash Collateral Received | (a) | Net Amount | ||||
J.P. Morgan Securities LLC | $ | 81,828 | $ | (81,828 | ) | $ | — | $ — | ||||||
Morgan Stanley | 229,297 | (229,297 | ) | — | — | |||||||||
TD Prime Services LLC | 206,487 | (206,487 | ) | — | — | |||||||||
|
|
|
|
|
|
| ||||||||
| $ | 517,612 | $ | (517,612 | ) | $ | — | $ — | |||||||
|
|
|
|
|
|
| ||||||||
| (a) | Collateral received in excess of the market value of securities on loan is not presented in this table. The total cash collateral received by the Fund is disclosed in the Fund’s Statement of Assets and Liabilities. |
The risks of securities lending include the risk that the borrower may not provide additional collateral when required or may not return the securities when due. To mitigate these risks, the Fund benefits from a borrower default indemnity provided by BIM. BIM’s indemnity allows for full replacement of the securities loaned to the extent the collateral received does not cover the value on the securities loaned in the event of borrower default. The Fund could incur a loss if the value of an investment purchased with cash collateral falls below the market value of loaned securities or if the value of an investment purchased with cash collateral falls below the value of the original cash collateral received. Such losses are borne entirely by the Fund.
| 5. | INVESTMENT ADVISORY AGREEMENT AND OTHER TRANSACTIONS WITH AFFILIATES |
Investment Advisory: The Trust, on behalf of the Fund, entered into an Investment Advisory Agreement with the Manager, the Fund’s investment adviser and an indirect, wholly-owned subsidiary of BlackRock, Inc. (“BlackRock”), to provide investment advisory services. The Manager is responsible for the management of the Fund’s portfolio and provides the personnel, facilities, equipment and certain other services necessary to the operations of the Fund.
For such services, the Fund pays the Manager a monthly fee at an annual rate equal to the following percentages of the average daily value of the Fund’s net assets:
| Average Daily Net Assets | Investment Advisory Fees | |||
First $1 billion | 0.70 | % | ||
$1 billion - $3 billion | 0.66 | |||
$3 billion - $5 billion | 0.63 | |||
$5 billion - $10 billion | 0.61 | |||
Greater than $10 billion | 0.60 | |||
| 20 | 2 0 2 3 BLACK ROCK ANNUAL REPORT TO SHAREHOLDERS |
Notes to Financial Statements (continued)
Service and Distribution Fees: The Trust, on behalf of the Fund, entered into a Distribution Agreement and a Distribution and Service Plan with BlackRock Investments, LLC (“BRIL”), an affiliate of the Manager. Pursuant to the Distribution and Service Plan and in accordance with Rule 12b-1 under the 1940 Act, the Fund pays BRIL ongoing service and distribution fees. The fees are accrued daily and paid monthly at annual rates based upon the average daily net assets of the relevant share class of the Fund as follows:
| Share Class | Service Fees | Distribution Fees | ||||||
Investor A | 0.25 | % | N/A | |||||
BRIL and broker-dealers, pursuant to sub-agreements with BRIL, provide shareholder servicing and distribution services to the Fund. The ongoing service and/or distribution fee compensates BRIL and each broker-dealer for providing shareholder servicing and/or distribution related services to shareholders.
For the year ended May 31, 2023, the following table shows the class specific service and distribution fees borne directly by each share class of the Fund:
| Investor A | ||||
Service and distribution — class specific | $ 197 | |||
Administration: The Trust, on behalf of the Fund, entered into an Administration Agreement with BAL, which has agreed to provide general administrative services (other than investment advice and related portfolio activities). BAL has agreed to bear all of the Fund’s ordinary operating expenses, excluding, generally, investment advisory fees, distribution fees, brokerage and other expenses related to the execution of portfolio transactions, extraordinary expenses and certain other expenses which are borne by the Fund. BAL is entitled to receive for these administrative services an annual fee based on the average daily net assets of the Fund as follows:
| Average Daily Net Assets | Administration Fees | |
Institutional | 0.15% | |
Investor A | 0.15 | |
Class K | 0.05 |
From time to time, BAL may waive such fees in whole or in part. Any such waiver will reduce the expenses of the Fund and, accordingly, have a favorable impact on its performance. BAL may delegate certain of its administration duties to sub-administrators. For the year ended May 31, 2023, there were no fees waived/reimbursed by the BAL pursuant to this arrangement.
For the year ended May 31, 2023, the following table shows the class specific administration fees borne directly by each share class of the Fund:
| Institutional | Investor A | Class K | Total | |||||||||||||
Administration — class specific | $ | 87 | $ | 118 | $ 4,135 | $ 4,340 | ||||||||||
Other Fees: For the year ended May 31, 2023, affiliates earned underwriting discounts, direct commissions and dealer concessions on sales of the Fund’s Investor A Shares for a total of $36.
Expense Limitations, Waivers and Reimbursements: The Manager contractually agreed to waive its investment advisory fees by the amount of investment advisory fees the Fund pays to the Manager indirectly through its investment in affiliated money market funds (the “affiliated money market fund waiver”) through June 30, 2024. The contractual agreement may be terminated upon 90 days’ notice by a majority of the trustees who are not “interested persons” of the Trust, as defined in the 1940 Act (“Independent Trustees”), or by a vote of a majority of the outstanding voting securities of the Fund. The amount of waivers and/or reimbursements of fees and expenses made pursuant to the expense limitation described below will be reduced by the amount of the affiliated money market fund waiver. This amount is included in fees waived and/or reimbursed by the Manager in the Statement of Operations. For the year ended May 31, 2023, the amount waived was $124.
The Manager has contractually agreed to waive its investment advisory fee with respect to any portion of the Fund’s assets invested in affiliated equity and fixed-income mutual funds and affiliated exchange-traded funds that have a contractual management fee through June 30, 2024. The contractual agreement may be terminated upon 90 days’ notice by a majority of the Independent Trustees, or by a vote of a majority of the outstanding voting securities of the Fund. For the year ended May 31, 2023, there were no fees waived by the Manager pursuant to this arrangement.
The fees and expenses of the Fund’s Independent Trustees, counsel to the Independent Trustees and the Fund’s independent registered public accounting firm (together, the “independent expenses”) are paid directly by the Fund. BAL has contractually agreed to reimburse the Fund or provide an offsetting credit for such independent expenses through June 30, 2024. The amount waived is included in fees waived and/or reimbursed by the Manager in the Statement of Operations. For the year ended May 31, 2023, the amount waived was $32,112.
Securities Lending: The U.S. Securities and Exchange Commission (“SEC”) has issued an exemptive order which permits BIM, an affiliate of the Manager, to serve as securities lending agent for the Fund, subject to applicable conditions. As securities lending agent, BIM bears all operational costs directly related to securities lending. The Fund is responsible for expenses in connection with the investment of cash collateral received for securities on loan (the “collateral investment expenses”). The cash collateral is invested in a private investment company, Money Market Series, managed by the Manager or its affiliates. However, BIM has agreed to cap the collateral investment expenses of the Money Market Series to an annual rate of 0.04%. The investment adviser to the Money Market Series will not charge any advisory fees with respect to shares purchased by the Fund. The Money Market Series may, under certain circumstances, impose a liquidity fee of up to 2% of the value withdrawn or temporarily restrict withdrawals for up to 10 business days during a 90 day period, in the event that the private investment company’s weekly liquid assets fall below certain thresholds. The Money Market Series seeks current income consistent with maintaining liquidity and preserving capital. Although the Money Market Series is not registered under the 1940 Act, its investments may follow the parameters of investments by a money market fund that is subject to Rule 2a-7 under the 1940 Act.
NOTES TO FINANCIAL STATEMENTS | 21 |
Notes to Financial Statements (continued)
Securities lending income is equal to the total of income earned from the reinvestment of cash collateral, net of fees and other payments to and from borrowers of securities, and less the collateral investment expenses. The Fund retains a portion of securities lending income and remits a remaining portion to BIM as compensation for its services as securities lending agent.
Pursuant to the current securities lending agreement, the Fund retains 81% of securities lending income (which excludes collateral investment expenses), and this amount retained can never be less than 70% of the total of securities lending income plus the collateral investment expenses.
In addition, commencing the business day following the date that the aggregate securities lending income earned across the BlackRock Multi-Asset Complex in a calendar year exceeds a specified threshold, the Fund, pursuant to the securities lending agreement, will retain for the remainder of that calendar year securities lending income in an amount equal to 81% of securities lending income (which excludes collateral investment expenses), and this amount retained can never be less than 70% of the total of securities lending income plus the collateral investment expenses.
The share of securities lending income earned by the Fund is shown as securities lending income — affiliated — net in the Statement of Operations. For the year ended May 31, 2023, the Fund paid BIM $265 for securities lending agent services.
Interfund Lending: In accordance with an exemptive order (the “Order”) from the SEC, the Fund may participate in a joint lending and borrowing facility for temporary purposes (the “Interfund Lending Program”), subject to compliance with the terms and conditions of the Order, and to the extent permitted by the Fund’s investment policies and restrictions. The Fund is currently permitted to borrow and lend under the Interfund Lending Program.
A lending BlackRock fund may lend in aggregate up to 15% of its net assets but may not lend more than 5% of its net assets to any one borrowing fund through the Interfund Lending Program. A borrowing BlackRock fund may not borrow through the Interfund Lending Program or from any other source more than 33 1/3% of its total assets (or any lower threshold provided for by the fund’s investment restrictions). If a borrowing BlackRock fund’s total outstanding borrowings exceed 10% of its total assets, each of its outstanding interfund loans will be subject to collateralization of at least 102% of the outstanding principal value of the loan. All interfund loans are for temporary or emergency purposes and the interest rate to be charged will be the average of the highest current overnight repurchase agreement rate available to a lending fund and the bank loan rate, as calculated according to a formula established by the Board.
During the year ended May 31, 2023, the Fund did not participate in the Interfund Lending Program.
Trustees and Officers: Certain trustees and/or officers of the Trust are directors and/or officers of BlackRock or its affiliates. The Fund reimburses the Manager for a portion of the compensation paid to the Trust’s Chief Compliance Officer, which is included in Trustees and Officer in the Statement of Operations.
| 6. | PURCHASES AND SALES |
For the year ended May 31, 2023, purchases and sales of investments, excluding short-term securities, were $4,386,097 and $4,342,511, respectively.
| 7. | INCOME TAX INFORMATION |
It is the Fund’s policy to comply with the requirements of the Internal Revenue Code of 1986, as amended, applicable to regulated investment companies, and to distribute substantially all of its taxable income to its shareholders. Therefore, no U.S. federal income tax provision is required.
The Fund files U.S. federal and various state and local tax returns. No income tax returns are currently under examination. The statute of limitations on the Fund’s U.S. federal tax returns generally remains open for a period of three years after they are filed. The statutes of limitations on the Fund’s state and local tax returns may remain open for an additional year depending upon the jurisdiction.
Management has analyzed tax laws and regulations and their application to the Fund as of May 31, 2023, inclusive of the open tax return years, and does not believe that there are any uncertain tax positions that require recognition of a tax liability in the Fund’s financial statements.
U.S. GAAP requires that certain components of net assets be adjusted to reflect permanent differences between financial and tax reporting. These reclassifications have no effect on net assets or NAVs per share. As of period end, permanent differences attributable to net operating loss were reclassified to the following accounts:
| Amounts | ||
Paid-in capital | $ (27,210) | |
Accumulated earnings (loss) | 27,210 |
As of May 31, 2023, the tax components of accumulated earnings (loss) were as follows:
| Fund Name | Non-expiring Capital Loss Carryforwards(a) | Net Unrealized Gains (Losses)(b) | Qualified late-year losses(c) | Total | ||||||||||
BlackRock SMID-Cap Growth Equity Fund | $ | (5,507,684 | ) | $ | (926,031) | $ | (17,568) | $ (6,451,283) | ||||||
| (a) | Amounts available to offset future realized capital gains. |
| (b) | The difference between book-basis and tax-basis net accumulated losses was attributable primarily to the tax deferral of losses on wash sales and the timing and recognition of partnership income. |
| (c) | The Fund has elected to defer certain qualified late-year losses and recognize such losses in the next taxable year. |
| 22 | 2 0 2 3 BLACK ROCK ANNUAL REPORT TO SHAREHOLDERS |
Notes to Financial Statements (continued)
As of May 31, 2023, gross unrealized appreciation and depreciation based on cost of investments (including short positions and derivatives, if any) for U.S. federal income tax purposes were as follows:
| Fund Name | Tax Cost | Gross Unrealized Appreciation | Gross Unrealized Depreciation | Net Unrealized Appreciation (Depreciation) | ||||||||||
BlackRock SMID-Cap Growth Equity Fund | $ | 10,077,702 | $ | 839,805 | $ | (1,777,217) | $ (937,412) | |||||||
| 8. | BANK BORROWINGS |
The Trust, on behalf of the Fund, along with certain other funds managed by the Manager and its affiliates (“Participating Funds”), is party to a 364-day, $2.50 billion credit agreement with a group of lenders. Under this agreement, the Fund may borrow to fund shareholder redemptions. Excluding commitments designated for certain individual funds, the Participating Funds, including the Fund, can borrow up to an aggregate commitment amount of $1.75 billion at any time outstanding, subject to asset coverage and other limitations as specified in the agreement. The credit agreement has the following terms: a fee of 0.10% per annum on unused commitment amounts and interest at a rate equal to the higher of (a) Overnight Bank Funding Rate (“OBFR”) (but, in any event, not less than 0.00%) on the date the loan is made plus 0.80% per annum, (b) the Fed Funds rate (but, in any event, not less than 0.00%) in effect from time to time plus 0.80% per annum on amounts borrowed or (c) the sum of (x) Daily Simple Secured Overnight Financing Rate (“SOFR”) (but, in any event, not less than 0.00%) on the date the loan is made plus 0.10% and (y) 0.80% per annum. The agreement expires in April 2024 unless extended or renewed. These fees were allocated among such funds based upon portions of the aggregate commitment available to them and relative net assets of Participating Funds. During the year ended May 31, 2023, the Fund did not borrow under the credit agreement.
| 9. | PRINCIPAL RISKS |
In the normal course of business, the Fund invests in securities or other instruments and may enter into certain transactions, and such activities subject the Fund to various risks, including among others, fluctuations in the market (market risk) or failure of an issuer to meet all of its obligations. The value of securities or other instruments may also be affected by various factors, including, without limitation: (i) the general economy; (ii) the overall market as well as local, regional or global political and/or social instability; (iii) regulation, taxation or international tax treaties between various countries; or (iv) currency, interest rate and price fluctuations. Local, regional or global events such as war, acts of terrorism, the spread of infectious illness or other public health issues, recessions, or other events could have a significant impact on the Fund and its investments. The Fund’s prospectus provides details of the risks to which the Fund is subject.
The Fund may be exposed to additional risks when reinvesting cash collateral in money market funds that do not seek to maintain a stable NAV per share of $1.00, which may be subject to redemption gates or liquidity fees under certain circumstances.
Infectious Illness Risk: An outbreak of an infectious illness, such as the COVID-19 pandemic, may adversely impact the economies of many nations and the global economy and may impact individual issuers and capital markets in ways that cannot be foreseen. An infectious illness outbreak may result in, among other things, closed international borders, prolonged quarantines, supply chain disruptions, market volatility or disruptions and other significant economic, social and political impacts.
Valuation Risk: The market values of equities, such as common stocks and preferred securities or equity related investments, such as futures and options, may decline due to general market conditions which are not specifically related to a particular company. They may also decline due to factors which affect a particular industry or industries. The Fund may invest in illiquid investments. An illiquid investment is any investment that the Fund reasonably expects cannot be sold or disposed of in current market conditions in seven calendar days or less without the sale or disposition significantly changing the market value of the investment. The Fund may experience difficulty in selling illiquid investments in a timely manner at the price that it believes the investments are worth. Prices may fluctuate widely over short or extended periods in response to company, market or economic news. Markets also tend to move in cycles, with periods of rising and falling prices. This volatility may cause the Fund’s NAV to experience significant increases or decreases over short periods of time. If there is a general decline in the securities and other markets, the NAV of the Fund may lose value, regardless of the individual results of the securities and other instruments in which the Fund invests.
Counterparty Credit Risk: The Fund may be exposed to counterparty credit risk, or the risk that an entity may fail to or be unable to perform on its commitments related to unsettled or open transactions, including making timely interest and/or principal payments or otherwise honoring its obligations. The Fund manages counterparty credit risk by entering into transactions only with counterparties that the Manager believes have the financial resources to honor their obligations and by monitoring the financial stability of those counterparties. Financial assets, which potentially expose the Fund to market, issuer and counterparty credit risks, consist principally of financial instruments and receivables due from counterparties. The extent of the Fund’s exposure to market, issuer and counterparty credit risks with respect to these financial assets is approximately their value recorded in the Statement of Assets and Liabilities, less any collateral held by the Fund.
Concentration Risk: A diversified portfolio, where this is appropriate and consistent with a fund’s objectives, minimizes the risk that a price change of a particular investment will have a material impact on the NAV of a fund. The investment concentrations within the Fund’s portfolio are disclosed in its Schedule of Investments.
The Fund invests a significant portion of its assets in securities within a single or limited number of market sectors. When a fund concentrates its investments in this manner, it assumes the risk that economic, regulatory, political and social conditions affecting such sectors may have a significant impact on the Fund and could affect the income from, or the value or liquidity of, the Fund’s portfolio. Investment percentages in specific sectors are presented in the Schedule of Investments.
The Fund invests a significant portion of its assets in securities of issuers located in the United States. A decrease in imports or exports, changes in trade regulations, inflation and/or an economic recession in the United States may have a material adverse effect on the U.S. economy and the securities listed on U.S. exchanges. Proposed and adopted policy and legislative changes in the United States may also have a significant effect on U.S. markets generally, as well as on the value of certain securities. Governmental agencies project that the United States will continue to maintain elevated public debt levels for the foreseeable future which may constrain future economic
NOTES TO FINANCIAL STATEMENTS | 23 |
Notes to Financial Statements (continued)
growth. Circumstances could arise that could prevent the timely payment of interest or principal on U.S. government debt, such as reaching the legislative “debt ceiling.” Such non-payment would result in substantial negative consequences for the U.S. economy and the global financial system. If U.S. relations with certain countries deteriorate, it could adversely affect issuers that rely on the United States for trade. The United States has also experienced increased internal unrest and discord. If these trends were to continue, they may have an adverse impact on the U.S. economy and the issuers in which the Fund invests.
Significant Shareholder Redemption Risk: Certain shareholders may own or manage a substantial amount of fund shares and/or hold their fund investments for a limited period of time. Large redemptions of fund shares by these shareholders may force a fund to sell portfolio securities, which may negatively impact the fund’s NAV, increase the fund’s brokerage costs, and/or accelerate the realization of taxable income/gains and cause the fund to make additional taxable distributions to shareholders.
| 10. | CAPITAL SHARE TRANSACTIONS |
Transactions in capital shares for each class were as follows:
| Year Ended 05/31/23 | Period from 06/29/21(a) to 05/31/22 | |||||||||||||||
| Share Class | Shares | Amount | Shares | Amount | ||||||||||||
Institutional | ||||||||||||||||
Shares sold | 87 | $ | 973 | 5,120 | $ | 101,500 | ||||||||||
|
|
|
|
|
|
|
| |||||||||
Investor A | ||||||||||||||||
Shares sold | 8,702 | $ | 97,672 | 5,854 | $ | 113,435 | ||||||||||
Shares redeemed | (7,124 | ) | (73,826 | ) | (120 | ) | (1,495 | ) | ||||||||
|
|
|
|
|
|
|
| |||||||||
| 1,578 | $ | 23,846 | 5,734 | $ | 111,940 | |||||||||||
|
|
|
|
|
|
|
| |||||||||
Class K | ||||||||||||||||
Shares sold | 82 | $ | 912 | 745,986 | $ | 14,882,531 | ||||||||||
Shares redeemed | (3,998 | ) | (42,978 | ) | (2,059 | ) | (24,464 | ) | ||||||||
|
|
|
|
|
|
|
| |||||||||
| (3,916 | ) | $ | (42,066) | 743,927 | $ | 14,858,067 | ||||||||||
|
|
|
|
|
|
|
| |||||||||
| (2,251 | ) | $ | (17,247) | 754,781 | $ | 15,071,507 | ||||||||||
|
|
|
|
|
|
|
| |||||||||
| (a) | Commencement of operations. |
As of May 31, 2023, shares owned by BlackRock Financial Management, Inc., an affiliate of the Fund, were as follows:
| Share Class | ||
Institutional | 5,000 | |
Investor A | 5,000 | |
Class K | 740,000 | |
| 11. | SUBSEQUENT EVENTS |
Management has evaluated the impact of all subsequent events on the Fund through the date the financial statements were issued and has determined that there were no subsequent events requiring adjustment or additional disclosure in the financial statements.
| 24 | 2 0 2 3 BLACK ROCK ANNUAL REPORT TO SHAREHOLDERS |
Report of Independent Registered Public Accounting Firm
To the Shareholders of BlackRock SMID-Cap Growth Equity Fund and the Board of Trustees of BlackRock FundsSM:
Opinion on the Financial Statements and Financial Highlights
We have audited the accompanying statement of assets and liabilities of BlackRock SMID-Cap Growth Equity Fund of BlackRock FundsSM (the “Fund”), including the schedule of investments, as of May 31, 2023, the related statement of operations for the year then ended, the statements of changes in net assets and the financial highlights for the year then ended and for the period from June 29, 2021 (commencement of operations) through May 31, 2022, and the related notes. In our opinion, the financial statements and financial highlights present fairly, in all material respects, the financial position of the Fund as of May 31, 2022, and the results of its operations for the year then ended, the changes in its net assets and the financial highlights for the year then ended and for the period from June 29, 2021 (commencement of operations) through May 31, 2022, in conformity with accounting principles generally accepted in the United States of America.
Basis for Opinion
These financial statements and financial highlights are the responsibility of the Fund’s management. Our responsibility is to express an opinion on the Fund’s financial statements and financial highlights based on our audit. We are a public accounting firm registered with the Public Company Accounting Oversight Board (United States) (PCAOB) and are required to be independent with respect to the Fund in accordance with the U.S. federal securities laws and the applicable rules and regulations of the Securities and Exchange Commission and the PCAOB.
We conducted our audit in accordance with the standards of the PCAOB. Those standards require that we plan and perform the audit to obtain reasonable assurance about whether the financial statements and financial highlights are free of material misstatement, whether due to error or fraud. The Fund is not required to have, nor were we engaged to perform, an audit of its internal control over financial reporting. As part of our audit we are required to obtain an understanding of internal control over financial reporting but not for the purpose of expressing an opinion on the effectiveness of the Fund’s internal control over financial reporting. Accordingly, we express no such opinion.
Our audit included performing procedures to assess the risks of material misstatement of the financial statements and financial highlights, whether due to error or fraud, and performing procedures that respond to those risks. Such procedures included examining, on a test basis, evidence regarding the amounts and disclosures in the financial statements and financial highlights. Our audit also included evaluating the accounting principles used and significant estimates made by management, as well as evaluating the overall presentation of the financial statements and financial highlights. Our procedures included confirmation of securities owned as of May 31, 2023, by correspondence with custodians or counterparties; when replies were not received, we performed other auditing procedures. We believe that our audit provides a reasonable basis for our opinion.
Deloitte & Touche LLP
Boston, Massachusetts
July 21, 2023
We have served as the auditor of one or more BlackRock investment companies since 1992.
R E P O R T O F I N D E P E N D E N T R E G I S T E R E D P U B L I C A C C O U N T I N G F I R M | 25 |
Disclosure of Investment Advisory Agreement
The Board of Trustees (the “Board,” the members of which are referred to as “Board Members”) of BlackRock Funds (the “Trust”) met on April 18, 2023 (the “April Meeting”) and May 23-24, 2023 (the “May Meeting”) to consider the approval to continue the investment advisory agreement (the “Agreement”) between the Trust, on behalf of BlackRock SMID-Cap Growth Equity Fund (the “Fund”), and BlackRock Advisors, LLC (the “Manager” or “BlackRock”), the Fund’s investment advisor.
The Approval Process
Consistent with the requirements of the Investment Company Act of 1940 (the “1940 Act”), the Board considers the approval of the continuation of the Agreement for the Fund on an annual basis. The Board members who are not “interested persons” of the Trust, as defined in the 1940 Act, are considered independent Board members (the “Independent Board Members”). The Board’s consideration entailed a year-long deliberative process during which the Board and its committees assessed BlackRock’s various services to the Fund, including through the review of written materials and oral presentations, and the review of additional information provided in response to requests from the Independent Board Members. The Board had four quarterly meetings per year, each of which extended over a two-day period, as well as additional ad hoc meetings and executive sessions throughout the year, as needed. The committees of the Board similarly met throughout the year. The Board also had an additional one-day meeting to consider specific information regarding the renewal of the Agreement. In considering the renewal of the Agreement, the Board assessed, among other things, the nature, extent and quality of the services provided to the Fund by BlackRock, BlackRock’s personnel and affiliates, including (as applicable): investment management services; accounting oversight; administrative and shareholder services; oversight of the Fund’s service providers; risk management and oversight; and legal, regulatory and compliance services. Throughout the year, including during the contract renewal process, the Independent Board Members were advised by independent legal counsel, and met with independent legal counsel in various executive sessions outside of the presence of BlackRock’s management.
During the year, the Board, acting directly and through its committees, considered information that was relevant to its annual consideration of the renewal of the Agreement, including the services and support provided by BlackRock to the Fund and its shareholders. BlackRock also furnished additional information to the Board in response to specific questions from the Board. Among the matters the Board considered were: (a) investment performance for one-year, three-year, five-year, and/or since inception periods, as applicable, against peer funds, relevant benchmarks, and other performance metrics, as applicable, as well as BlackRock senior management’s and portfolio managers’ analyses of the reasons for any outperformance or underperformance relative to its peers, benchmarks, and other performance metrics, as applicable; (b) fees, including advisory, administration, if applicable, and other amounts paid to BlackRock and its affiliates by the Fund for services; (c) Fund operating expenses and how BlackRock allocates expenses to the Fund; (d) the resources devoted to, risk oversight of, and compliance reports relating to, implementation of the Fund’s investment objective, policies and restrictions, and meeting regulatory requirements; (e) BlackRock’s and the Fund’s adherence to applicable compliance policies and procedures; (f) the nature, character and scope of non-investment management services provided by BlackRock and its affiliates and the estimated cost of such services, as available; (g) BlackRock’s and other service providers’ internal controls and risk and compliance oversight mechanisms; (h) BlackRock’s implementation of the proxy voting policies approved by the Board; (i) the use of brokerage commissions and execution quality of portfolio transactions; (j) BlackRock’s implementation of the Fund’s valuation and liquidity procedures; (k) an analysis of management fees paid to BlackRock for products with similar investment mandates across the open-end fund, exchange-traded fund (“ETF”), closed-end fund, sub-advised mutual fund, separately managed account, collective investment trust, and institutional separate account product channels, as applicable, and the similarities and differences between these products and the services provided as compared to the Fund; (l) BlackRock’s compensation methodology for its investment professionals and the incentives and accountability it creates, along with investment professionals’ investments in the fund(s) they manage; and (m) periodic updates on BlackRock’s business.
Prior to and in preparation for the April Meeting, the Board received and reviewed materials specifically relating to the renewal of the Agreement. The Independent Board Members are continuously engaged in a process with their independent legal counsel and BlackRock to review the nature and scope of the information provided to the Board to better assist its deliberations. The materials provided in connection with the April Meeting included, among other things: (a) information independently compiled and prepared by Broadridge Financial Solutions, Inc. (“Broadridge”), based on either a Lipper classification or Morningstar category, regarding the Fund’s fees and expenses as compared with a peer group of funds as determined by Broadridge (“Expense Peers”) and the investment performance of the Fund as compared with a peer group of funds (“Performance Peers”); (b) information on the composition of the Expense Peers and Performance Peers and a description of Broadridge’s methodology; (c) information on the estimated profits realized by BlackRock and its affiliates pursuant to the Agreement and a discussion of fall-out benefits to BlackRock and its affiliates; (d) a general analysis provided by BlackRock concerning investment management fees received in connection with other types of investment products, such as institutional accounts, sub-advised mutual funds, ETFs, closed-end funds, open-end funds, and separately managed accounts, under similar investment mandates, as well as the performance of such other products, as applicable; (e) a review of non-management fees; (f) the existence, impact and sharing of potential economies of scale, if any, with the Fund; (g) a summary of aggregate amounts paid by the Fund to BlackRock;(h) sales and redemption data regarding the Fund’s shares; and (i) various additional information requested by the Board as appropriate regarding BlackRock’s and the Fund’s operations.
At the April Meeting, the Board reviewed materials relating to its consideration of the Agreement and the Independent Board Members presented BlackRock with questions and requests for additional information. BlackRock responded to these questions and requests with additional written information in advance of the May Meeting.
At the May Meeting, the Board concluded its assessment of, among other things: (a) the nature, extent and quality of the services provided by BlackRock; (b) the investment performance of the Fund as compared to its Performance Peers and to other metrics, as applicable; (c) the advisory fee and the estimated cost of the services and estimated profits realized by BlackRock and its affiliates from their relationship with the Fund; (d) the Fund’s fees and expenses compared to its Expense Peers; (e) the existence and sharing of potential economies of scale; (f) any fall-out benefits to BlackRock and its affiliates as a result of BlackRock’s relationship with the Fund; and (g) other factors deemed relevant by the Board Members.
The Board also considered other matters it deemed important to the approval process, such as other payments made to BlackRock or its affiliates relating to securities lending and cash management, and BlackRock’s services related to the valuation and pricing of Fund portfolio holdings. The Board noted the willingness of BlackRock’s personnel to engage in open, candid discussions with the Board. The Board Members evaluated the information available to it on a fund-by-fund basis. The following paragraphs provide more information about some of the primary factors that were relevant to the Board’s decision. The Board Members did not identify any particular information, or any single factor as determinative, and each Board Member may have attributed different weights to the various items and factors considered.
| 26 | 2 0 2 3 B L A C K R O C K A N N U A L R E P O R T T O S H A R E H O L D E R S |
Disclosure of Investment Advisory Agreement (continued)
A. Nature, Extent and Quality of the Services Provided by BlackRock
The Board, including the Independent Board Members, reviewed the nature, extent and quality of services provided by BlackRock, including the investment advisory services, and the resulting performance of the Fund. Throughout the year, the Board compared Fund performance to the performance of a comparable group of mutual funds, relevant benchmarks, and performance metrics, as applicable. The Board met with BlackRock’s senior management personnel responsible for investment activities, including the senior investment officers. The Board also reviewed the materials provided by the Fund’s portfolio management team discussing the Fund’s performance, investment strategies and outlook.
The Board considered, among other factors, with respect to BlackRock: the experience of investment personnel generally and the Fund’s portfolio management team; research capabilities; investments by portfolio managers in the funds they manage; portfolio trading capabilities; use of technology; commitment to compliance; credit analysis capabilities; risk analysis and oversight capabilities; and the approach to training and retaining portfolio managers and other research, advisory and management personnel. The Board also considered BlackRock’s overall risk management program, including the continued efforts of BlackRock and its affiliates to address cybersecurity risks and the role of BlackRock’s Risk & Quantitative Analysis Group. The Board engaged in a review of BlackRock’s compensation structure with respect to the Fund’s portfolio management team and BlackRock’s ability to attract and retain high-quality talent and create performance incentives.
In addition to investment advisory services, the Board considered the nature and quality of the administrative and other non-investment advisory services provided to the Fund. BlackRock and its affiliates provide the Fund with certain administrative, shareholder and other services (in addition to any such services provided to the Fund by third parties) and officers and other personnel as are necessary for the operations of the Fund. In particular, BlackRock and its affiliates provide the Fund with administrative services including, among others: (i) responsibility for disclosure documents, such as the prospectus, the summary prospectus (as applicable), the statement of additional information and periodic shareholder reports; (ii) oversight of daily accounting and pricing; (iii) responsibility for periodic filings with regulators; (iv) overseeing and coordinating the activities of third-party service providers including, among others, the Fund’s custodian, fund accountant, transfer agent, and auditor; (v) organizing Board meetings and preparing the materials for such Board meetings; (vi) providing legal and compliance support; (vii) furnishing analytical and other support to assist the Board in its consideration of strategic issues such as the merger, consolidation or repurposing of certain open-end funds; and (viii) performing or managing administrative functions necessary for the operation of the Fund, such as tax reporting, expense management, fulfilling regulatory filing requirements, overseeing the Fund’s distribution partners, and shareholder call center and other services. The Board reviewed the structure and duties of BlackRock’s fund administration, shareholder services, and legal and compliance departments and considered BlackRock’s policies and procedures for assuring compliance with applicable laws and regulations. The Board considered the operation of BlackRock’s business continuity plans.
B. The Investment Performance of the Fund and BlackRock
The Board, including the Independent Board Members, reviewed and considered the performance history of the Fund throughout the year and at the April Meeting. In preparation for the April Meeting, the Board was provided with reports independently prepared by Broadridge, which included an analysis of the Fund’s performance as of December 31, 2022, as compared to its Performance Peers. Broadridge ranks funds in quartiles, ranging from first to fourth, where first is the most desirable quartile position and fourth is the least desirable. In connection with its review, the Board received and reviewed information regarding the investment performance of the Fund as compared to its Performance Peers and the respective Morningstar Category (“Morningstar Category”). The Board and its Performance Oversight Committee regularly review and meet with Fund management to discuss the performance of the Fund throughout the year.
In evaluating performance, the Board focused particular attention on funds with less favorable performance records. The Board also noted that while it found the data provided by Broadridge generally useful, it recognized the limitations of such data, including in particular, that notable differences may exist between a fund and its Performance Peers (for example, the investment objectives and strategies). Further, the Board recognized that the performance data reflects a snapshot of a period as of a particular date and that selecting a different performance period could produce significantly different results. The Board also acknowledged that long-term performance could be impacted by even one period of significant outperformance or underperformance, and that a single investment theme could have the ability to disproportionately affect long-term performance.
The Board noted that for each of the one-year and since-inception periods reported, the Fund ranked in the fourth quartile against its Morningstar Category. The Board noted that BlackRock believes that the Morningstar Category is an appropriate performance metric for the Fund, and that BlackRock has explained its rationale for this belief to the Board. The Board and BlackRock reviewed the Fund’s underperformance relative to its Morningstar Category during the applicable periods. The Board was informed that, among other things, underperformance was driven by unfavorable style rotations and stock selection in health care, information technology and communication services sectors.
The Board and BlackRock discussed BlackRock’s strategy for improving the Fund’s investment performance. Discussions covered topics such as performance attribution, the Fund’s investment personnel, and the resources appropriate to support the Fund’s investment processes.
C. Consideration of the Advisory/Management Fees and the Estimated Cost of the Services and Estimated Profits Realized by BlackRock and its Affiliates from their Relationship with the Fund
The Board, including the Independent Board Members, reviewed the Fund’s contractual management fee rate compared with those of its Expense Peers. The contractual management fee rate represents a combination of the advisory fee and any administrative fees, before taking into account any reimbursements or fee waivers. The Board also compared the Fund’s total expense ratio, as well as its actual management fee rate, to those of its Expense Peers. The total expense ratio represents a fund’s total net operating expenses, including any 12b-1 or non-12b-1 service fees. The total expense ratio gives effect to any expense reimbursements or fee waivers, and the actual management fee rate gives effect to any management fee reimbursements or waivers. The Board considered that the fee and expense information in the Broadridge report for the Fund reflected information for a specific period and that historical asset levels and expenses may differ from current levels, particularly in a period of market volatility. The Board considered the services provided and the fees charged by BlackRock and its affiliates to other types of clients with similar investment mandates, as applicable, including institutional accounts and sub-advised mutual funds (including mutual funds sponsored by third parties).
D I S C L O S U R E O F I N V E S T M E N T A D V I S O R Y A G R E E M E N T | 27 |
Disclosure of Investment Advisory Agreement (continued)
The Board received and reviewed statements relating to BlackRock’s financial condition. The Board reviewed BlackRock’s profitability methodology and was also provided with an estimated profitability analysis that detailed the revenues earned and the expenses incurred by BlackRock for services provided to the Fund. The Board reviewed BlackRock’s estimated profitability with respect to the Fund and other funds the Board currently oversees for the year ended December 31, 2022 compared to available aggregate estimated profitability data provided for the prior two years. The Board reviewed BlackRock’s estimated profitability with respect to certain other U.S. fund complexes managed by the Manager and/or its affiliates. The Board reviewed BlackRock’s assumptions and methodology of allocating expenses in the estimated profitability analysis, noting the inherent limitations in allocating costs among various advisory products. The Board recognized that profitability may be affected by numerous factors including, among other things, fee waivers and expense reimbursements by the Manager, the types of funds managed, precision of expense allocations and business mix. The Board thus recognized that calculating and comparing profitability at the individual fund level is difficult.
The Board noted that, in general, individual fund or product line profitability of other advisors is not publicly available. The Board reviewed BlackRock’s overall operating margin, in general, compared to that of certain other publicly traded asset management firms. The Board considered the differences between BlackRock and these other firms, including the contribution of technology at BlackRock, BlackRock’s expense management, and the relative product mix.
The Board considered whether BlackRock has the financial resources necessary to attract and retain high quality investment management personnel to perform its obligations under the Agreement and to continue to provide the high quality of services that is expected by the Board. The Board further considered factors including but not limited to BlackRock’s commitment of time and resources, assumption of risk, and liability profile in servicing the Fund, including in contrast to what is required of BlackRock with respect to other products with similar investment mandates across the open-end fund, ETF, closed-end fund, sub-advised mutual fund, separately managed account, collective investment trust, and institutional separate account product channels, as applicable.
The Board noted that the Fund’s contractual management fee rate ranked in the second quartile, and that the actual management fee rate and total expense ratio ranked in the third and first quartiles, respectively, relative to the Fund’s Expense Peers. The Board also noted that the Fund has an advisory fee arrangement that includes breakpoints that adjust the fee rate downward as the size of the Fund increases above certain contractually specified levels. The Board additionally noted that the breakpoints can, conversely, adjust the advisory fee rate upward as the size of the Fund decreases below certain contractually specified levels.
D. Economies of Scale
The Board, including the Independent Board Members, considered the extent to which economies of scale might be realized as the assets of the Fund increase, including the existence of fee waivers and/or expense caps, as applicable, noting that any contractual fee waivers and contractual expense caps had been approved by the Board. In its consideration, the Board further considered the continuation and/or implementation of fee waivers and/or expense caps, as applicable. The Board also considered the extent to which the Fund benefits from such economies of scale in a variety of ways, and whether there should be changes in the advisory fee rate or breakpoint structure in order to enable the Fund to more fully participate in these economies of scale. The Board considered the Fund’s asset levels and whether the current fee schedule was appropriate.
E. Other Factors Deemed Relevant by the Board Members
The Board, including the Independent Board Members, also took into account other ancillary or “fall-out” benefits that BlackRock or its affiliates may derive from BlackRock’s respective relationships with the Fund, both tangible and intangible, such as BlackRock’s ability to leverage its investment professionals who manage other portfolios and its risk management personnel, an increase in BlackRock’s profile in the investment advisory community, and the engagement of BlackRock’s affiliates as service providers to the Fund, including for administrative, distribution, securities lending and cash management services. With respect to securities lending, during the year the Board also considered information provided by independent third-party consultants related to the performance of each BlackRock affiliate as securities lending agent. The Board also considered BlackRock’s overall operations and its efforts to expand the scale of, and improve the quality of, its operations. The Board also noted that, subject to applicable law, BlackRock may use and benefit from third-party research obtained by soft dollars generated by certain registered fund transactions to assist in managing all or a number of its other client accounts.
In connection with its consideration of the Agreement, the Board also received information regarding BlackRock’s brokerage and soft dollar practices. The Board received reports from BlackRock which included information on brokerage commissions and trade execution practices throughout the year.
The Board noted the competitive nature of the open-end fund marketplace, and that shareholders are able to redeem their Fund shares if they believe that the Fund’s fees and expenses are too high or if they are dissatisfied with the performance of the Fund.
Conclusion
At the May Meeting, in a continuation of the discussions that occurred during the April Meeting, and as a culmination of the Board’s year-long deliberative process, the Board, including the Independent Board Members, unanimously approved the continuation of the Agreement between the Manager and the Trust, on behalf of the Fund, for a one-year term ending June 30, 2024. Based upon its evaluation of all of the aforementioned factors in their totality, as well as other information, the Board, including the Independent Board Members, was satisfied that the terms of the Agreement were fair and reasonable and in the best interest of the Fund and its shareholders. In arriving at its decision to approve the Agreement, the Board did not identify any single factor or group of factors as all-important or controlling, but considered all factors together, and different Board Members may have attributed different weights to the various factors considered. The Independent Board Members were advised by independent legal counsel throughout the deliberative process.
| 28 | 2 0 2 3 B L A C K R O C K A N N U A L R E P O R T T O S H A R E H O L D E R S |
Trustee and Officer Information
Independent Trustees(a)
Name Year of Birth(b)
| Position(s) Held (Length of Service)(c)
| Principal Occupation(s) During Past 5 Years
| Number of BlackRock-Advised Registered Investment Companies (“RICs”) Consisting of Investment Portfolios (“Portfolios”) Overseen
| Public Company
| ||||
Mark Stalnecker 1951 | Chair of the Board (Since 2019) and Trustee (Since 2015) | Chief Investment Officer, University of Delaware from 1999 to 2013; Trustee and Chair of the Finance and Investment Committees, Winterthur Museum and Country Estate from 2005 to 2016; Member of the Investment Committee, Delaware Public Employees’ Retirement System since 2002; Member of the Investment Committee, Christiana Care Health System from 2009 to 2017; Member of the Investment Committee, Delaware Community Foundation from 2013 to 2014; Director and Chair of the Audit Committee, SEI Private Trust Co. from 2001 to 2014.
| 28 RICs consisting of 167 Portfolios | None | ||||
Susan J. Carter 1956 | Trustee (Since 2016) | Trustee, Financial Accounting Foundation from 2017 to 2021; Advisory Board Member, Center for Private Equity and Entrepreneurship at Tuck School of Business from 1997 to 2021; Director, Pacific Pension Institute from 2014 to 2018; Senior Advisor, Commonfund Capital, Inc. (“CCI”) (investment adviser) in 2015; Chief Executive Officer, CCI from 2013 to 2014; President & Chief Executive Officer, CCI from 1997 to 2013; Advisory Board Member, Girls Who Invest from 2015 to 2018 and Board Member thereof from 2018 to 2022; Advisory Board Member, Bridges Fund Management since 2016; Practitioner Advisory Board Member, Private Capital Research Institute (“PCRI”) since 2017; Lecturer in the Practice of Management, Yale School of Management since 2019; Advisor to Finance Committee, Altman Foundation since 2020; Investment Committee Member, Tostan since 2021; Member of the President’s Counsel, Commonfund since 2023.
| 28 RICs consisting of 167 Portfolios | None | ||||
Collette Chilton 1958 | Trustee (Since 2015) | Chief Investment Officer, Williams College since 2006; Chief Investment Officer, Lucent Asset Management Corporation from 1998 to 2006; Director, Boys and Girls Club of Boston since 2017; Director, B1 Capital since 2018; Director, David and Lucile Packard Foundation since 2020.
| 28 RICs consisting of 167 Portfolios | None | ||||
Neil A. Cotty 1954 | Trustee (Since 2016) | Bank of America Corporation from 1996 to 2015, serving in various senior finance leadership roles, including Chief Accounting Officer from 2009 to 2015, Chief Financial Officer of Global Banking, Markets and Wealth Management from 2008 to 2009, Chief Accounting Officer from 2004 to 2008, Chief Financial Officer of Consumer Bank from 2003 to 2004, Chief Financial Officer of Global Corporate Investment Bank from 1999 to 2002.
| 28 RICs consisting of 167 Portfolios | None | ||||
Lena G. Goldberg 1949 | Trustee (Since 2019) | Director, Pioneer Legal Institute since 2023; Director, Charles Stark Draper Laboratory, Inc. from 2013 to 2021; Senior Lecturer, Harvard Business School from 2008 to 2021; FMR LLC/Fidelity Investments (financial services) from 1996 to 2008, serving in various senior roles including Executive Vice President - Strategic Corporate Initiatives and Executive Vice President and General Counsel; Partner, Sullivan & Worcester LLP from 1985 to 1996 and Associate thereof from 1979 to 1985.
| 28 RICs consisting of 167 Portfolios | None | ||||
T R U S T E E A N D O F F I C E R I N F O R M A T I O N | 29 |
Trustee and Officer Information (continued)
| Independent Trustees(a) | ||||||||
Name Year of Birth(b)
| Position(s) Held (Length of Service)(c)
| Principal Occupation(s) During Past 5 Years
| Number of BlackRock-Advised Registered Investment Companies (“RICs”) Consisting of Investment Portfolios (“Portfolios”) Overseen
| Public Company Held During Past
| ||||
Henry R. Keizer 1956 | Trustee (Since 2019) | Director, Park Indemnity Ltd. (captive insurer) from 2010 to 2022. | 28 RICs consisting of 167 Portfolios | GrafTech International Ltd. (materials manufacturing); Sealed Air Corp. (packaging); WABCO (commercial vehicle safety systems) from 2015 to 2020; Hertz Global Holdings (car rental) from 2015 to 2021.
| ||||
Cynthia A. Montgomery 1952 | Trustee (Since 2007) | Professor, Harvard Business School since 1989. | 28 RICs consisting of 167 Portfolios | None | ||||
Donald C. Opatrny 1952 | Trustee (Since 2019) | Chair of the Board of Phoenix Art Museum since 2022 and Trustee thereof since 2018; Chair of the Investment Committee of The Arizona Community Foundation since 2022 and trustee thereof since 2020; Director, Athena Capital Advisors LLC (investment management firm) from 2013 to 2020; Trustee, Vice Chair, Member of the Executive Committee and Chair of the Investment Committee, Cornell University from 2004 to 2019; President and Trustee, the Center for the Arts, Jackson Hole from 2011 to 2018; Member of the Board and Investment Committee, University School from 2007 to 2018; Member of Affordable Housing Supply Board of Jackson, Wyoming since 2017; Member, Investment Funds Committee, State of Wyoming since 2017; Trustee, Artstor (a Mellon Foundation affiliate) from 2010 to 2015; Member of the Investment Committee, Mellon Foundation from 2009 to 2015; President, Trustee and Member of the Investment Committee, The Aldrich Contemporary Art Museum from 2007 to 2014; Trustee and Chair of the Investment Committee, Community Foundation of Jackson Hole since 2014.
| 28 RICs consisting of 167 Portfolios | None | ||||
Kenneth L. Urish 1951 | Trustee (Since 2007) | Managing Partner, Urish Popeck & Co., LLC (certified public accountants and consultants) since 1976; Past-Chairman of the Professional Ethics Committee of the Pennsylvania Institute of Certified Public Accountants and Committee Member thereof since 2007;Member of External Advisory Board, The Pennsylvania State University Accounting Department since 2001, Emeritus since 2022; Principal, UP Strategic Wealth Investment Advisors, LLC since 2013; Trustee, The Holy Family Institute from 2001 to 2010; President and Trustee, Pittsburgh Catholic Publishing Associates from 2003 to 2008; Director, Inter-Tel from 2006 to 2007; Member, Advisory Board, ESG Competent Boards since 2020.
| 28 RICs consisting of 167 Portfolios | None | ||||
| 30 | 2 0 2 3 B L A C K R O C K A N N U A L R E P O R T T O S H A R E H O L D E R S |
Trustee and Officer Information (continued)
| Independent Trustees(a) | ||||||||
Name Year of Birth(b)
| Position(s) Held (Length of Service)(c)
| Principal Occupation(s) During Past 5 Years
| Number of BlackRock-Advised Registered Investment Companies (“RICs”) Consisting of Investment Portfolios (“Portfolios”) Overseen
| Public Company and Other
| ||||
Claire A. Walton 1957 | Trustee (Since 2016) | Advisory Board Member, Grossman School of Business at the University of Vermont since 2023; Advisory Board Member, Scientific Financial Systems since 2022; General Partner of Neon Liberty Capital Management, LLC since 2003; Chief Operating Officer and Chief Financial Officer of Liberty Square Asset Management, LP from 1998 to 2015; Director, Boston Hedge Fund Group from 2009 to 2018; Director, Massachusetts Council on Economic Education from 2013 to 2015; Director, Woodstock Ski Runners from 2013 to 2022.
| 28 RICs consisting of 167 Portfolios | None | ||||
T R U S T E E A N D O F F I C E R I N F O R M A T I O N | 31 |
Trustee and Officer Information (continued)
| Interested Trustees(a)(d) | ||||||||
Name Year of Birth(b)
| Position(s) Held (Length of Service)(c)
| Principal Occupation(s) During Past 5 Years
| Number of BlackRock-Advised Registered Investment Companies (“RICs”) Consisting of Investment Portfolios (“Portfolios”) Overseen
| Public Company and Other
| ||||
Robert Fairbairn 1965 | Trustee (Since 2018) | Vice Chairman of BlackRock, Inc. since 2019; Member of BlackRock’s Global Executive and Global Operating Committees; Co-Chair of BlackRock’s Human Capital Committee; Senior Managing Director of BlackRock, Inc. from 2010 to 2019; oversaw BlackRock’s Strategic Partner Program and Strategic Product Management Group from 2012 to 2019; Member of the Board of Managers of BlackRock Investments, LLC from 2011 to 2018; Global Head of BlackRock’s Retail and iShares® businesses from 2012 to 2016.
| 98 RICs consisting of 268 Portfolios | None | ||||
John M. Perlowski(e) 1964 | Trustee (Since 2015) President and Chief Executive Officer (Since 2010) | Managing Director of BlackRock, Inc. since 2009; Head of BlackRock Global Accounting and Product Services since 2009; Advisory Director of Family Resource Network (charitable foundation) since 2009.
| 100 RICs consisting of 270 Portfolios | None | ||||
| (a) | The address of each Trustee is c/o BlackRock, Inc., 50 Hudson Yards, New York, NY 10001. |
| (b) | Independent Trustees serve until their resignation, retirement, removal or death, or until December 31 of the year in which they turn 75. The Board may determine to extend the terms of Independent Trustees on a case-by-case basis, as appropriate. |
| (c) | Following the combination of Merrill Lynch Investment Managers, L.P. (“MLIM”) and BlackRock, Inc. in September 2006, the various legacy MLIM and legacy BlackRock fund boards were realigned and consolidated into three new fund boards in 2007. Furthermore, effective January 1, 2019, three BlackRock Fund Complexes were realigned and consolidated into two BlackRock Fund Complexes. As a result, although the chart shows the year that each Independent Trustee joined the Board, certain Independent Trustees first became members of the boards of other BlackRock-advised Funds, legacy MLIM funds or legacy BlackRock funds as follows: Cynthia A. Montgomery, 1994; Kenneth L. Urish, 1999; Lena G. Goldberg, 2016; Henry R. Keizer, 2016; Donald C. Opatrny, 2015. |
| (d) | Mr. Fairbairn and Mr. Perlowski are both “interested persons,” as defined in the 1940 Act, of the Trust based on their positions with BlackRock, Inc. and its affiliates. Mr. Fairbairn and Mr. Perlowski are also board members of the BlackRock Fixed-Income Complex. |
| (e) | Mr. Perlowski is also a trustee of the BlackRock Credit Strategies Fund and BlackRock Private Investments Fund. |
| 32 | 2 0 2 3 B L A C K R O C K A N N U A L R E P O R T T O S H A R E H O L D E R S |
Trustee and Officer Information (continued)
| Officers Who Are Not Trustees(a) | ||||
Name Year of Birth(b)
| Position(s) Held (Length of Service)
| Principal Occupation(s) During Past 5 Years
| ||
Roland Villacorta 1971 | Vice President (Since 2022)
| Managing Director of BlackRock, Inc. since 2022; Head of Global Cash Management and Head of Securities Lending within BlackRock’s Portfolio Management Group since 2022; Member of BlackRock’s Global Operating Committee since 2022; Head of Portfolio Management in BlackRock’s Financial Markets Advisory Group within BlackRock Solutions from 2008 to 2015; Co-Head of BlackRock Solutions’ Portfolio Analytics Group; previously Mr. Villacorta was Co-Head of Fixed Income within BlackRock’s Risk & Quantitative Analysis Group.
| ||
Jennifer McGovern 1977 | Vice President (Since 2014)
| Managing Director of BlackRock, Inc. since 2016; Director of BlackRock, Inc. from 2011 to 2015; Head of Americas Product Development and Governance for BlackRock’s Global Product Group since 2019; Head of Product Structure and Oversight for BlackRock’s U.S. Wealth Advisory Group from 2013 to 2019.
| ||
Trent Walker 1974 | Chief Financial Officer (Since 2021)
| Managing Director of BlackRock, Inc. since September 2019; Executive Vice President of PIMCO from 2016 to 2019; Senior Vice President of PIMCO from 2008 to 2015; Treasurer from 2013 to 2019 and Assistant Treasurer from 2007 to 2017 of PIMCO Funds, PIMCO Variable Insurance Trust, PIMCO ETF Trust, PIMCO Equity Series, PIMCO Equity Series VIT, PIMCO Managed Accounts Trust, 2 PIMCO-sponsored interval funds and 21 PIMCO-sponsored closed-end funds.
| ||
Jay M. Fife 1970 | Treasurer (Since 2007)
| Managing Director of BlackRock, Inc. since 2007.
| ||
Charles Park 1967 | Chief Compliance Officer (Since 2014)
| Anti-Money Laundering Compliance Officer for certain BlackRock-advised Funds from 2014 to 2015; Chief Compliance Officer of BlackRock Advisors, LLC and the BlackRock-advised Funds in the BlackRock Multi-Asset Complex and the BlackRock Fixed-Income Complex since 2014; Principal of and Chief Compliance Officer for iShares® Delaware Trust Sponsor LLC since 2012 and BlackRock Fund Advisors (“BFA”) since 2006; Chief Compliance Officer for the BFA-advised iShares® exchange traded funds since 2006; Chief Compliance Officer for BlackRock Asset Management International Inc. since 2012.
| ||
Lisa Belle 1968 | Anti-Money Laundering Compliance Officer (Since 2019)
| Managing Director of BlackRock, Inc. since 2019; Global Financial Crime Head for Asset and Wealth Management of JP Morgan from 2013 to 2019; Managing Director of RBS Securities from 2012 to 2013; Head of Financial Crimes for Barclays Wealth Americas from 2010 to 2012. | ||
Janey Ahn 1975 | Secretary (Since 2019)
| Managing Director of BlackRock, Inc. since 2018; Director of BlackRock, Inc. from 2009 to 2017.
| ||
| (a) | The address of each Officer is c/o BlackRock, Inc., 50 Hudson Yards, New York, NY 10001. |
(b) Officers of the Trust serve at the pleasure of the Board.
Further information about the Trust’s Trustees and Officers is available in the Trust’s Statement of Additional Information, which can be obtained without charge by calling (800) 441-7762.
Effective December 31, 2022, Joseph P. Platt retired as a Trustee of the Trust.
Effective July 1, 2023, Aaron Wasserman replaced Charles Park as Chief Compliance Officer of the Trust.
T R U S T E E A N D O F F I C E R I N F O R M A T I O N | 33 |
Tailored Shareholder Reports for Mutual Funds and ETFs
Effective January 24, 2023, the SEC adopted rule and form amendments to require mutual funds and ETFs to transmit concise and visually engaging streamlined annual and semiannual reports to shareholders that highlight key information. Other information, including financial statements, will no longer appear in a streamlined shareholder report but must be available online, delivered free of charge upon request, and filed on a semiannual basis on Form N-CSR. The rule and form amendments have a compliance date of July 24, 2024. At this time, management is evaluating the impact of these amendments on the shareholder reports for the Fund.
General Information
Quarterly performance, semi-annual and annual reports, current net asset value and other information regarding the Fund may be found on BlackRock’s website, which can be accessed at blackrock.com. Any reference to BlackRock’s website in this report is intended to allow investors public access to information regarding the Fund and does not, and is not intended to, incorporate BlackRock’s website in this report.
Householding
The Fund will mail only one copy of shareholder documents, including prospectuses, annual and semi-annual reports, Rule 30e-3 notices and proxy statements, to shareholders with multiple accounts at the same address. This practice is commonly called “householding” and is intended to reduce expenses and eliminate duplicate mailings of shareholder documents. Mailings of your shareholder documents may be householded indefinitely unless you instruct us otherwise. If you do not want the mailing of these documents to be combined with those for other members of your household, please call the Fund at (800) 441-7762.
Availability of Quarterly Schedule of Investments
The Fund files its complete schedule of portfolio holdings with the SEC for the first and third quarters of each fiscal year as an exhibit to its reports on Form N-PORT. The Fund’s Form N-PORT is available on the SEC’s website at sec.gov. Additionally, the Fund makes its portfolio holdings for the first and third quarters of each fiscal year available at blackrock.com/fundreports.
Availability of Proxy Voting Policies, Procedures and Voting Records
A description of the policies and procedures that the Fund uses to determine how to vote proxies relating to portfolio securities and information about how the Fund voted proxies relating to securities held in the Fund’s portfolio during the most recent 12-month period ended June 30 is available without charge, upon request (1) by calling (800) 441-7762; (2) on the BlackRock website at blackrock.com; and (3) on the SEC’s website at sec.gov.
BlackRock’s Mutual Fund Family
BlackRock offers a diverse lineup of open-end mutual funds crossing all investment styles and managed by experts in equity, fixed-income and tax-exempt investing. Visit blackrock.com for more information.
Shareholder Privileges
Account Information
Call us at (800) 441-7762 from 8:00 AM to 6:00 PM ET on any business day to get information about your account balances, recent transactions and share prices. You can also visit blackrock.com for more information.
Automatic Investment Plans
Investor class shareholders who want to invest regularly can arrange to have $50 or more automatically deducted from their checking or savings account and invested in any of the BlackRock funds.
Systematic Withdrawal Plans
Investor class shareholders can establish a systematic withdrawal plan and receive periodic payments of $50 or more from their BlackRock funds, as long as their account balance is at least $10,000.
Retirement Plans
Shareholders may make investments in conjunction with Traditional, Rollover, Roth, Coverdell, Simple IRAs, SEP IRAs and 403(b) Plans.
BlackRock Privacy Principles
BlackRock is committed to maintaining the privacy of its current and former fund investors and individual clients (collectively, “Clients”) and to safeguarding their non-public personal information. The following information is provided to help you understand what personal information BlackRock collects, how we protect that information and why in certain cases we share such information with select parties.
| 34 | 2 0 2 3 B L A C K R O C K A N N U A L R E P O R T T O S H A R E H O L D E R S |
Additional Information (continued)
If you are located in a jurisdiction where specific laws, rules or regulations require BlackRock to provide you with additional or different privacy-related rights beyond what is set forth below, then BlackRock will comply with those specific laws, rules or regulations.
BlackRock obtains or verifies personal non-public information from and about you from different sources, including the following: (i) information we receive from you or, if applicable, your financial intermediary, on applications, forms or other documents; (ii) information about your transactions with us, our affiliates, or others; (iii) information we receive from a consumer reporting agency; and (iv) from visits to our websites.
BlackRock does not sell or disclose to non-affiliated third parties any non-public personal information about its Clients, except as permitted by law or as is necessary to respond to regulatory requests or to service Client accounts. These non-affiliated third parties are required to protect the confidentiality and security of this information and to use it only for its intended purpose.
We may share information with our affiliates to service your account or to provide you with information about other BlackRock products or services that may be of interest to you. In addition, BlackRock restricts access to non-public personal information about its Clients to those BlackRock employees with a legitimate business need for the information. BlackRock maintains physical, electronic and procedural safeguards that are designed to protect the non-public personal information of its Clients, including procedures relating to the proper storage and disposal of such information.
Fund and Service Providers
| Investment Adviser and Administrator | Distributor | |
| BlackRock Advisors, LLC | BlackRock Investments, LLC | |
| Wilmington, DE 19809 | New York, NY 10001 | |
| Accounting Agent and Transfer Agent | Independent Registered Public Accounting Firm | |
| BNY Mellon Investment Servicing (US) Inc. | Deloitte & Touche LLP | |
| Wilmington, DE 19809 | Boston, MA 02116 | |
| Custodian | Legal Counsel | |
| The Bank of New York Mellon | Sidley Austin LLP | |
| New York, NY 10286 | New York, NY 10019 | |
| Address of the Trust | ||
| 100 Bellevue Parkway | ||
| Wilmington, DE 19809 | ||
A D D I T I O N A L I N F O R M A T I O N | 35 |
Glossary of Terms Used in this Report
| Portfolio Abbreviation | ||
| ADR | American Depositary Receipt | |
| NVS | Non-Voting Shares | |
| 36 | 2 0 2 3 B L A C K R O C K A N N U A L R E P O R T T O S H A R E H O L D E R S |
Want to know more?
blackrock.com | 800-441-7762
This report is intended for current holders. It is not authorized for use as an offer of sale or a solicitation of an offer to buy shares of the Fund unless preceded or accompanied by the Fund’s current prospectus. Past performance results shown in this report should not be considered a representation of future performance. Investment returns and principal value of shares will fluctuate so that shares, when redeemed, may be worth more or less than their original cost. Statements and other information herein are as dated and are subject to change.
SMID-5/23-AR
|  |
| MAY 31, 2023 |

| 2023 Annual Report | ||
BlackRock Capital Appreciation Fund, Inc.
BlackRock FundsSM
| · | BlackRock Health Sciences Opportunities Portfolio |
| · | BlackRock Infrastructure Sustainable Opportunities Fund |
| · | BlackRock Mid-Cap Growth Equity Portfolio |
| · | BlackRock Technology Opportunities Fund |
| Not FDIC Insured • May Lose Value • No Bank Guarantee |
Dear Shareholder,
Investors faced an uncertain economic landscape during the 12-month reporting period ended May 31, 2023, amid mixed indicators and rapidly changing market conditions. The U.S. economy returned to modest growth beginning in the third quarter of 2022, although the pace of growth slowed thereafter. Inflation was elevated, reaching a 40-year high as labor costs grew rapidly and unemployment rates reached the lowest levels in decades. However, inflation moderated as the period continued, while continued strength in consumer spending backstopped the economy.
Equity returns varied substantially, as large-capitalization U.S. stocks gained for the period amid a rebound in big tech stocks, whereas small-capitalization U.S. stocks declined. International equities from developed markets advanced, while emerging market stocks declined substantially, pressured by higher interest rates and falling commodities prices.
The 10-year U.S. Treasury yield rose during the reporting period, driving its price down, as investors reacted to elevated inflation and attempted to anticipate future interest rate changes. The corporate bond market also faced inflationary headwinds, although high-yield corporate bond prices fared better than investment-grade bonds as demand from yield-seeking investors remained strong.
The U.S. Federal Reserve (the “Fed”), acknowledging that inflation has been more persistent than expected, raised interest rates eight times. Furthermore, the Fed wound down its bond-buying programs and incrementally reduced its balance sheet by not replacing securities that reach maturity. In addition, the Fed added liquidity to markets amid the failure of prominent regional banks.
Restricted labor supply kept inflation elevated even as other inflation drivers, such as goods prices and energy costs, moderated. While economic growth was modest in the last year, we believe that stickiness in services inflation and continued wage growth will keep inflation above central bank targets for some time. Although the Fed has decelerated the pace of interest rate hikes and most recently opted for a pause, we believe that the Fed is likely to keep rates high for an extended period to get inflation under control. With this in mind, we believe the possibility of a U.S. recession in the near term is high, but the dimming economic outlook has not yet been fully reflected in current market prices. We believe investors should expect a period of higher volatility as markets adjust to the new economic reality and policymakers attempt to adapt. Resolution of the debt ceiling standoff late in the period eliminated one source of uncertainty, but the relatively modest spending cuts won’t move the needle on the government’s substantial debt burden.
While we favor an overweight to equities in the long term, we prefer an underweight stance on equities overall in the near term. Expectations for corporate earnings remain elevated, which seems inconsistent with the possibility of a recession. Nevertheless, we are overweight on emerging market stocks as we believe a weakening U.S. dollar could provide a supportive backdrop. While we are neutral on credit overall amid tightening credit and financial conditions, there are selective opportunities in the near term. For fixed income investing with a six- to twelve-month horizon, we see the most attractive investments in short-term U.S. Treasuries, global inflation-linked bonds, and emerging market bonds denominated in local currency.
Overall, our view is that investors need to think globally, position themselves to be prepared for a decarbonizing economy, and be nimble as market conditions change. We encourage you to talk with your financial advisor and visit blackrock.com for further insight about investing in today’s markets.
Sincerely,

Rob Kapito
President, BlackRock Advisors, LLC

Rob Kapito
President, BlackRock Advisors, LLC
| Total Returns as of May 31, 2023 | ||||
| 6-Month | 12-Month | |||
U.S. large cap equities | 3.33% | 2.92% | ||
U.S. small cap equities | (6.53) | (4.68) | ||
International equities | 6.89 | 3.06 | ||
Emerging market equities | (0.37) | (8.49) | ||
3-month Treasury bills | 2.16 | 3.16 | ||
U.S. Treasury securities | 1.78 | (3.65) | ||
U.S. investment grade bonds | 2.00 | (2.14) | ||
Tax-exempt municipal bonds | 1.94 | 0.49 | ||
U.S. high yield bonds (Bloomberg U.S. Corporate High Yield 2% Issuer Capped Index) | 3.01 | 0.05 | ||
Past performance is not an indication of future results. Index performance is shown for illustrative purposes only. You cannot invest directly in an index. | ||||
| 2 | T H I S P A G E I S N O T P A R T O F Y O U R F U N D R E P O R T |
| Page | ||||
| 2 | ||||
Annual Report: | ||||
| 4 | ||||
| 19 | ||||
| 19 | ||||
| 20 | ||||
Financial Statements: | ||||
| 21 | ||||
| 41 | ||||
| 45 | ||||
| 48 | ||||
| 51 | ||||
| 77 | ||||
| 94 | ||||
| 95 | ||||
| 96 | ||||
| 100 | ||||
| 105 | ||||
| 107 | ||||

| 3 |
| Fund Summary as of May 31, 2023 | BlackRock Capital Appreciation Fund, Inc. |
Investment Objective
BlackRock Capital Appreciation Fund, Inc.’s (the “Fund”) investment objective is to seek long-term growth of capital.
Portfolio Management Commentary
How did the Fund perform?
For the 12-month period ending May 31, 2023, all of the Fund’s share classes underperformed its benchmark, the Russell 1000® Growth Index. For the same period, all of the Fund’s share classes outperformed the broad-market S&P 500® Index. The following discussion of relative performance pertains to the Russell 1000® Growth Index.
What factors influenced performance?
The largest detractors from the Fund’s performance relative to the benchmark were stock selection in the communication services, information technology and energy sectors. Within communication services, overweight positioning in interactive media and services, specifically Match Group, Inc., detracted the most from performance. Within information technology, an underweight position in Apple, Inc. detracted the most from performance. Lastly, within energy, an off-benchmark position in EQT Corp. and an overweight position in Cheniere Energy, Inc. within the oil, gas and consumable fuels sub-sector detracted from relative performance.
The largest contributors to the Fund’s relative performance were security selection in the consumer discretionary and industrials sectors, along with positioning in real estate. Within consumer discretionary, overweight positioning in the hotels, restaurants and leisure sub-sector contributed to performance, most notably positions in Chipotle Mexican Grill, Inc. and Evolution AB. An overweight to TransDigm Group, Inc. led positive contributions within industrials. Lastly, an underweight allocation to the real estate sector proved additive.
Describe recent portfolio activity.
During the period, exposure to information technology increased with an allocation to the technology hardware, storage and peripherals industry. Exposure to the industrials sector increased as well. Conversely, exposure to energy decreased the most as the allocation to oil, gas and consumable fuels was reduced. Exposure to the materials sector decreased as well. The Fund’s cash position slightly decreased as well during the period.
Describe portfolio positioning at period end.
As of period end, the Fund’s largest overweight position relative to the Russell 1000® Growth Index was in the financials sector, followed by consumer discretionary and healthcare. Conversely, the consumer staples sector was the largest underweight, followed by industrials and information technology.
The views expressed reflect the opinions of BlackRock as of the date of this report and are subject to change based on changes in market, economic or other conditions. These views are not intended to be a forecast of future events and are no guarantee of future results.
| 4 | 2 0 2 3 B L A C K R O C K A N N U A L R E P O R T T O S H A R E H O L D E R S |
| Fund Summary as of May 31, 2023 (continued) | BlackRock Capital Appreciation Fund, Inc. |
GROWTH OF $10,000 INVESTMENT
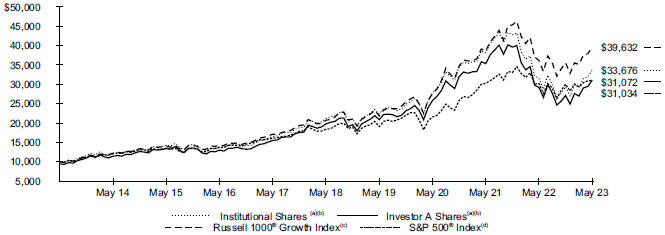
| (a) | Assuming maximum sales charges, if any, transaction costs and other operating expenses, including investment advisory fees and administration fees, if any. Institutional Shares do not have a sales charge. |
| (b) | The Fund invests primarily in a diversified portfolio consisting primarily of common stock of U.S. companies that Fund management believes have exhibited above-average growth rates in earnings over the long term. |
| (c) | An index that measures the performance of the large-cap growth segment of the U.S. equity universe. It includes those Russell 1000® companies with higher price-to-book ratios and higher forecasted growth values. |
| (d) | An unmanaged index that covers 500 leading companies and captures approximately 80% coverage of available market capitalization. |
Performance
| Average Annual Total Returns(a) | ||||||||||||||||||||||||||||||||
| 1 Year | 5 Years | 10 Years | ||||||||||||||||||||||||||||||
| Without Sales Charge | With Sales Charge | Without Sales Charge | With Sales Charge | Without Sales Charge | With Sales Charge | |||||||||||||||||||||||||||
Institutional | 6.81 | % | N/A | 9.74 | % | N/A | 12.91 | % | N/A | |||||||||||||||||||||||
Investor A | 6.53 | 0.94 | % | 9.45 | 8.28 | % | 12.61 | 12.01 | % | |||||||||||||||||||||||
Investor C | 5.62 | 4.70 | 8.57 | 8.57 | 11.89 | 11.89 | ||||||||||||||||||||||||||
Class K | 6.90 | N/A | 9.84 | N/A | 13.03 | N/A | ||||||||||||||||||||||||||
Class R | 6.17 | N/A | 9.11 | N/A | 12.28 | N/A | ||||||||||||||||||||||||||
Russell 1000® Growth Index | 9.55 | N/A | 13.84 | N/A | 14.76 | N/A | ||||||||||||||||||||||||||
S&P 500® Index | 2.92 | N/A | 11.01 | N/A | 11.99 | N/A | ||||||||||||||||||||||||||
| (a) | Assuming maximum sales charges, if any. Average annual total returns with and without sales charges reflect reductions for distribution and service fees. See “About Fund Performance” for a detailed description of share classes, including any related sales charges and fees, and how performance was calculated for certain share classes. |
N/A - Not applicable as share class and index do not have a sales charge.
Past performance is not an indication of future results.
Performance results may include adjustments made for financial reporting purposes in accordance with U.S. generally accepted accounting principles.
Expense Example
| Actual | Hypothetical 5% Return | |||||||||||||||||||||||||||||||
| | Beginning Account Value (12/01/22) | | | Ending Account Value (05/31/23) | | | Expenses Paid During the Period | (a) | | Beginning Account Value (12/01/22) | | | Ending Account Value (05/31/23) | | | Expenses Paid During the Period | (a) | | Annualized Expense Ratio | | ||||||||||||
Institutional | $ | 1,000.00 | $ | 1,146.90 | $ | 3.98 | $ | 1,000.00 | $ | 1,021.22 | $ | 3.73 | 0.74 | % | ||||||||||||||||||
Investor A | 1,000.00 | 1,145.60 | 5.39 | 1,000.00 | 1,019.90 | 5.09 | 1.01 | |||||||||||||||||||||||||
Investor C | 1,000.00 | 1,140.30 | 9.80 | 1,000.00 | 1,015.77 | 9.25 | 1.84 | |||||||||||||||||||||||||
Class K | 1,000.00 | 1,147.70 | 3.48 | 1,000.00 | 1,021.70 | 3.28 | 0.65 | |||||||||||||||||||||||||
Class R | 1,000.00 | 1,144.00 | 7.29 | 1,000.00 | 1,018.13 | 6.84 | 1.36 | |||||||||||||||||||||||||
| (a) | For each class of the Fund, expenses are equal to the annualized expense ratio for the class, multiplied by the average account value over the period, multiplied by 182/365 (to reflect the one-half year period shown). |
| See | “Disclosure of Expenses” for further information on how expenses were calculated. |
F U N D S U M M A R Y | 5 |
| Fund Summary as of May 31, 2023 (continued) | BlackRock Capital Appreciation Fund, Inc. |
Portfolio Information
TEN LARGEST HOLDINGS
| Security(a) | Percent of Net Assets | |||
Microsoft Corp. | 9.5 | % | ||
Apple Inc. | 9.0 | |||
Amazon.com, Inc. | 7.8 | |||
NVIDIA Corp. | 5.5 | |||
Alphabet, Inc., Class A | 5.3 | |||
Visa, Inc., Class A | 4.1 | |||
Intuit, Inc. | 3.6 | |||
ASML Holding NV, Registered Shares | 3.3 | |||
UnitedHealth Group, Inc. | 2.9 | |||
Tesla, Inc. | 2.4 | |||
SECTOR ALLOCATION
| Sector(b) | Percent of Net Assets | |||
Information Technology | 42.2 | % | ||
Consumer Discretionary | 17.7 | |||
Health Care | 13.9 | |||
Financials | 10.7 | |||
Communication Services | 9.1 | |||
Industrials | 4.3 | |||
Energy | 1.2 | |||
Materials | 1.0 | |||
Short-Term Securities | — | (c) | ||
Liabilities in Excess of Other Assets | (0.1 | ) | ||
| (a) | Excludes short-term securities. |
| (b) | For Fund compliance purposes, the Fund’s sector classifications refer to one or more of the sector sub-classifications used by one or more widely recognized market indexes or ratings group indexes, and/or as defined by the investment adviser. These definitions may not apply for purposes of this report, which may combine such sector sub-classifications for reporting ease. |
| (c) | Rounds to less than 0.1%. |
| 6 | 2 0 2 3 B L A C K R O C K A N N U A L R E P O R T T O S H A R E H O L D E R S |
| Fund Summary as of May 31, 2023 | BlackRock Health Sciences Opportunities Portfolio |
Investment Objective
BlackRock Health Sciences Opportunities Portfolio’s (the “Fund”) investment objective is to provide long-term growth of capital.
Portfolio Management Commentary
How did the Fund perform?
For the 12-month period ended May 31, 2023, all of the Fund’s share classes outperformed its benchmark, the Russell 3000® Health Care Index.
What factors influenced performance?
An underweight position in Pfizer, Inc. was the largest contributor to relative performance. Shares of the pharmaceutical giant declined after the company provided weaker guidance for 2023 due to a sharp decrease in COVID-19 linked revenues. Additionally, investors reacted negatively to the company’s $43 billion acquisition of Seagen. An overweight in Boston Scientific Corp. was another large contributor to relative returns. The medical device manufacturer benefited from easing macroeconomic headwinds as elective procedure volume and labor shortages showed signs of recovering. An overweight position in Penumbra, Inc. also contributed to relative performance on anticipation of a positive operating environment for medical device companies.
An out-of-benchmark position in Sanofi SA was the largest detractor. The stock came under legal pressure after allegations that the company’s antihistamine Zantac contained carcinogens. An out-of-benchmark position in Waters Corp., a life sciences tools company that reported consistently weak earnings, also detracted. An underweight position in the healthcare provider HCA Healthcare, Inc. was another key detractor. The company reported strong earnings thanks in part to reduced pressure from labor shortages.
Describe recent portfolio activity.
The Fund’s allocations to the medical devices & supplies (26% to 37%) and biotechnology (18% to 23%) sub-sectors increased. Conversely, its weightings in the healthcare providers and services (25% to 17%) and pharmaceuticals (26% to 20%) sub-sectors decreased.
Describe portfolio positioning at period end.
The investment adviser continued to seek opportunities in stocks with attractive valuations, stable growth and promising product pipelines over the medium-to-long term. It also sought selective growth opportunities in the biotechnology, pharmaceuticals and medical devices industries brought about by innovations and technological developments.
The Fund was overweight in the medical devices and supplies and biotechnology sub-sectors at the end of the period, and it was underweight in pharmaceuticals and healthcare providers and services.
The views expressed reflect the opinions of BlackRock as of the date of this report and are subject to change based on changes in market, economic or other conditions. These views are not intended to be a forecast of future events and are no guarantee of future results.
F U N D S U M M A R Y | 7 |
| Fund Summary as of May 31, 2023 (continued) | BlackRock Health Sciences Opportunities Portfolio |
GROWTH OF $10,000 INVESTMENT
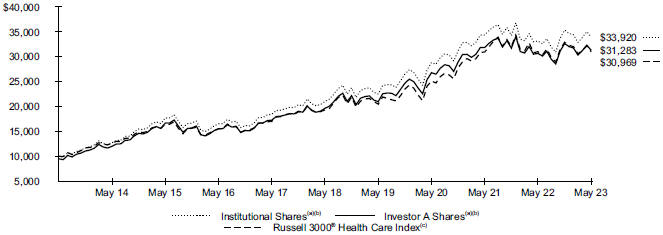
| (a) | Assuming maximum sales charges, if any, transaction costs and other operating expenses, including investment advisory fees and administration fees, if any. Institutional Shares do not have a sales charge. |
| (b) | Under normal market conditions, the Fund invests at least 80% of its total assets in equity securities, primarily common stock, of companies in health sciences and related industries. |
| (c) | An unmanaged index that features companies involved in medical services or health care in the Russell 3000® Index, which includes the largest 3,000 U.S. companies as determined by total market capitalization. |
Performance
| Average Annual Total Returns(a) | ||||||||||||||||||||||||||||||||
| 1 Year | 5 Years | 10 Years | ||||||||||||||||||||||||||||||
| Without Sales Charge | With Sales Charge | Without Sales Charge | With Sales Charge | Without Sales Charge | With Sales Charge | |||||||||||||||||||||||||||
Institutional | 2.25 | % | N/A | 10.06 | % | N/A | 12.99 | % | N/A | |||||||||||||||||||||||
Service | 1.94 | N/A | 9.73 | N/A | 12.66 | N/A | ||||||||||||||||||||||||||
Investor A | 1.99 | (3.37 | )% | 9.77 | 8.59 | % | 12.69 | 12.08 | % | |||||||||||||||||||||||
Investor C | 1.22 | 0.29 | 8.96 | 8.96 | 12.04 | 12.04 | ||||||||||||||||||||||||||
Class K | 2.34 | N/A | 10.17 | N/A | 12.98 | N/A | ||||||||||||||||||||||||||
Class R | 1.62 | N/A | 9.40 | N/A | 12.32 | N/A | ||||||||||||||||||||||||||
Russell 3000® Health Care Index | (0.14 | ) | N/A | 9.91 | N/A | 11.97 | N/A | |||||||||||||||||||||||||
| (a) | Assuming maximum sales charges, if any. Average annual total returns with and without sales charges reflect reductions for distribution and service fees. See “About Fund Performance” for a detailed description of share classes, including any related sales charges and fees, and how performance was calculated for certain share classes. |
N/A - Not applicable as share class and index do not have a sales charge.
Past performance is not an indication of future results.
Performance results may include adjustments made for financial reporting purposes in accordance with U.S. generally accepted accounting principles.
Expense Example
| Actual | Hypothetical 5% Return | |||||||||||||||||||||||||||||||
| | Beginning Account Value (12/01/22) | | | Ending Account Value (05/31/23) | | | Expenses Paid During the Period | (a) | | Beginning Account Value (12/01/22) | | | Ending Account Value (05/31/23) | | | Expenses Paid During the Period | (a) | | Annualized Expense Ratio | | ||||||||||||
Institutional | $ | 1,000.00 | $ | 959.60 | $ | 4.10 | $ | 1,000.00 | $ | 1,020.75 | $ | 4.23 | 0.84 | % | ||||||||||||||||||
Service | 1,000.00 | 958.20 | 5.54 | 1,000.00 | 1,019.28 | 5.69 | 1.13 | |||||||||||||||||||||||||
Investor A | 1,000.00 | 958.40 | 5.29 | 1,000.00 | 1,019.52 | 5.44 | 1.08 | |||||||||||||||||||||||||
Investor C | 1,000.00 | 954.90 | 8.99 | 1,000.00 | 1,015.73 | 9.25 | 1.84 | |||||||||||||||||||||||||
Class K | 1,000.00 | 960.10 | 3.65 | 1,000.00 | 1,021.20 | 3.78 | 0.75 | |||||||||||||||||||||||||
Class R | 1,000.00 | 956.80 | 7.12 | 1,000.00 | 1,017.65 | 7.34 | 1.46 | |||||||||||||||||||||||||
| (a) | For each class of the Fund, expenses are equal to the annualized expense ratio for the class, multiplied by the average account value over the period, multiplied by 182/365 (to reflect the one-half year period shown). |
See “Disclosure of Expenses” for further information on how expenses were calculated.
| 8 | 2 0 2 3 B L A C K R O C K A N N U A L R E P O R T T O S H A R E H O L D E R S |
| Fund Summary as of May 31, 2023 (continued) | BlackRock Health Sciences Opportunities Portfolio |
Portfolio Information
TEN LARGEST HOLDINGS
| Security(a) | Percent of Net Assets | |||
UnitedHealth Group, Inc. | 8.1 | % | ||
Eli Lilly & Co. | 5.9 | |||
Merck & Co., Inc. | 4.7 | |||
Boston Scientific Corp. | 4.0 | |||
Thermo Fisher Scientific, Inc. | 3.8 | |||
Stryker Corp. | 3.3 | |||
Intuitive Surgical, Inc. | 3.2 | |||
AbbVie, Inc. | 2.8 | |||
Vertex Pharmaceuticals, Inc. | 2.7 | |||
Amgen, Inc. | 2.5 | |||
INDUSTRY ALLOCATION
| Industry(b) | Percent of Net Assets | |||
Health Care Equipment & Supplies | 27.2 | % | ||
Biotechnology | 23.1 | |||
Pharmaceuticals | 19.8 | |||
Health Care Providers & Services | 16.9 | |||
Life Sciences Tools & Services | 10.0 | |||
Other (each representing less than 1%) | 0.2 | |||
Short-Term Securities | 3.1 | |||
Liabilities in Excess of Other Assets | (0.3 | ) | ||
| (a) | Excludes short-term securities. |
| (b) | For Fund compliance purposes, the Fund’s industry classifications refer to one or more of the industry sub-classifications used by one or more widely recognized market indexes or ratings group indexes, and/or as defined by the investment adviser. These definitions may not apply for purposes of this report, which may combine such industry sub-classifications for reporting ease. |
F U N D S U M M A R Y | 9 |
| Fund Summary as of May 31, 2023 | BlackRock Infrastructure Sustainable Opportunities Fund |
Investment Objective
BlackRock Infrastructure Sustainable Opportunities Fund’s (the “Fund”) investment objective is to seek to maximize total return while seeking to invest in issuers which are helping to address certain United Nations Sustainable Development Goals (“SDGs”) through their products and services.
Portfolio Management Commentary
How did the Fund perform?
For the 12-month period ended May 31, 2023, all of the Fund’s share classes outperformed its benchmark, the FTSE Developed Core Infrastructure 50/50 Net Tax Index.
What factors influenced performance?
BlackRock Infrastructure Sustainable Opportunities Fund is benchmark agnostic, with a view of infrastructure that looks beyond the traditional benchmarks. The reference benchmark, the FTSE Developed Core Infrastructure 50/50 Net Tax Index, doesn’t incorporate sustainability criteria and has an 11% weighting in the midstream oil and gas sector. In contrast, energy is excluded from the Fund’s sustainable universe.
At the sector level, the U.K. multiutilities, U.S. renewable energy and Australia communications sectors made the largest contributions to absolute performance. Among individual stocks, Constellation Energy Corp., Archaea Energy, Inc. and NextDC Ltd. were the leading contributors. On the other hand, U.S. towers, U.S. healthcare and U.S. life science / medical office were the most notable detractors from absolute performance. SBA Communications Corp., Welltower, Inc. and American Tower Corp. were the largest detractors at the individual stock level.
The Fund used derivatives, including options, futures, swaps and forward contracts in an effort to augment returns or manage the risk of adverse movements in currencies, interest rates and the financial markets. The use of derivatives was a net contributor to performance.
Describe recent portfolio activity.
The Fund’s allocation to healthcare decreased as the investment adviser trimmed positions in the U.S. senior housing company Welltower and the U.S. life science and medical office operator Alexandria Real Estate Equities, Inc. It also sold the Fund’s position in NextEra Energy, Inc. due to fundamental headwinds.
The investment adviser initiated positions in the U.S. data center operator Digital Realty Trust Inc. following the emergence of an upside catalyst, and Boralex, Inc., a leader in Canadian renewables. It also added a position in Clearway Energy, Inc., one of the largest owners of renewable projects in the United States.
Other major changes included the addition of National Grid PLC and SSE PLC, as well as the sales of positions in Public Service Enterprise Group, Inc. and Constellation Energy Corp.
The Fund maintained a large absolute weighting in regulated electric utilities, including renewables, on the belief that the sector offered compelling medium- to long-term structural tailwinds. The energy transition has brought unprecedented support for utilities investment among regulators, governments and consumers. Grid constraints are cited as the leading bottleneck to renewable energy development, ahead of financing and supply chain impediments. The investment adviser believed this could provide an opportunity for growth in capital expenditures and in turn, the earnings power for network utilities.
Describe portfolio positioning at period end.
The Fund’s positioning was balanced across renewable energy development (24%), electricity networks (23%), communications infrastructure (22%), transportation infrastructure (17%), social infrastructure (4%), and water infrastructure (2%). The Fund had an above-average cash position of 9.1% to provide the flexibility to capitalize on stock-specific opportunities.
The views expressed reflect the opinions of BlackRock as of the date of this report and are subject to change based on changes in market, economic or other conditions. These views are not intended to be a forecast of future events and are no guarantee of future results.
| 10 | 2 0 2 3 B L A C K R O C K A N N U A L R E P O R T T O S H A R E H O L D E R S |
| Fund Summary as of May 31, 2023 (continued) | BlackRock Infrastructure Sustainable Opportunities Fund |
GROWTH OF $10,000 INVESTMENT
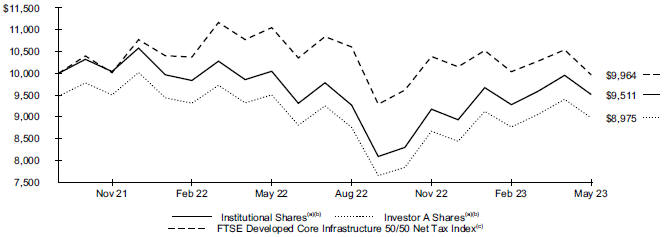
The Fund commenced operations on September 30, 2021.
| (a) | Assuming maximum sales charges, if any, transaction costs and other operating expenses, including investment advisory fees and administration fees, if any. Institutional Shares do not have a sales charge. |
| (b) | Under normal circumstances, the Fund will invest at least 80% of its net assets, plus any borrowings for investment purposes, in the equity securities of infrastructure-related companies or derivatives with similar economic characteristics. |
| (c) | Gives participants an industry-defined interpretation of infrastructure and adjusts the exposure to certain infrastructure sub-sectors. The constituent weights are adjusted as part of the semi-annual review according to three broad industry sectors: 50% utilities; 30% transportation, including capping of 7.5% for railroads/railways; and a 20% mix of other sectors, including pipelines, satellites and telecommunication towers. |
Performance
| Average Annual Total Returns(a) | ||||||||||||||||||
| 1 Year | Since Inception(b) | |||||||||||||||||
| Without Sales Charge | With Sales Charge | Without Sales Charge | With Sales Charge | |||||||||||||||
Institutional | (5.32 | )% | N/A | (2.96 | )% | N/A | ||||||||||||
Investor A | (5.55 | ) | (10.51 | )% | (3.21 | ) | (6.29 | )% | ||||||||||
Class K | (5.27 | ) | N/A | (2.93 | ) | N/A | ||||||||||||
FTSE Developed Core Infrastructure 50/50 Net Tax Index | (9.81 | ) | N/A | (0.22 | ) | N/A | ||||||||||||
| (a) | Assuming maximum sales charges, if any. Average annual total returns with and without sales charges reflect reductions for distribution and service fees. See “About Fund Performance” for a detailed description of share classes, including any related sales charges and fees, and how performance was calculated for certain share classes. |
| (b) | The Fund commenced operations on September 30, 2021. |
N/A - Not applicable as share class and index do not have a sales charge.
Past performance is not an indication of future results.
Performance results may include adjustments made for financial reporting purposes in accordance with U.S. generally accepted accounting principles.
Expense Example
| Actual | Hypothetical 5% Return | |||||||||||||||||||||||||||||||
| | Beginning Account Value (12/01/22) | | | Ending Account Value (05/31/23) | | | Expenses Paid During the Period | (a) | | Beginning Account Value (12/01/22) | | | Ending Account Value (05/31/23) | | | Expenses Paid During the Period | (a) | | Annualized Expense Ratio | | ||||||||||||
Institutional | $ | 1,000.00 | $ | 1,036.70 | $ | 5.07 | $ | 1,000.00 | $ | 1,019.95 | $ | 5.04 | 1.00 | % | ||||||||||||||||||
Investor A | 1,000.00 | 1,035.40 | 6.33 | 1,000.00 | 1,018.71 | 6.29 | 1.25 | |||||||||||||||||||||||||
Class K | 1,000.00 | 1,036.90 | 4.83 | 1,000.00 | 1,020.19 | 4.78 | 0.95 | |||||||||||||||||||||||||
| (a) | For each class of the Fund, expenses are equal to the annualized expense ratio for the class, multiplied by the average account value over the period, multiplied by 182/365 (to reflect the one-half year period shown). |
See “Disclosure of Expenses” for further information on how expenses were calculated.
F U N D S U M M A R Y | 11 |
| Fund Summary as of May 31, 2023 (continued) | BlackRock Infrastructure Sustainable Opportunities Fund |
Portfolio Information
| TEN LARGEST HOLDINGS |
| |||
| Security(a) | Percent of Net Assets | |||
Terna - Rete Elettrica Nazionale | 5.2 | % | ||
SBA Communications Corp. | 4.8 | |||
National Grid PLC | 4.8 | |||
Enel SpA | 4.3 | |||
Clearway Energy, Inc., Class C | 4.2 | |||
Smart Metering Systems PLC | 4.2 | |||
Eversource Energy | 4.0 | |||
Cellnex Telecom SA | 4.0 | |||
SSE PLC | 3.8 | |||
American Tower Corp. | 3.5 | |||
| SECTOR ALLOCATION |
| |||
| Sector(b) | Percent of Net Assets | |||
Utilities | 43.4 | % | ||
Industrials | 20.0 | |||
Real Estate | 17.2 | |||
Communication Services | 7.2 | |||
Information Technology | 1.5 | |||
Short-Term Securities | 8.0 | |||
Other Assets Less Liabilities | 2.7 | |||
| (a) | Excludes short-term securities. |
| (b) | For Fund compliance purposes, the Fund’s sector classifications refer to one or more of the sector sub-classifications used by one or more widely recognized market indexes or ratings group indexes, and/or as defined by the investment adviser. These definitions may not apply for purposes of this report, which may combine such sector sub-classifications for reporting ease. |
| 12 | 2 0 2 3 B L A C K R O C K A N N U A L R E P O R T T O S H A R E H O L D E R S |
| Fund Summary as of May 31, 2023 | BlackRock Mid-Cap Growth Equity Portfolio |
Investment Objective
BlackRock Mid-Cap Growth Equity Portfolio’s (the “Fund”) investment objective is long-term capital appreciation.
Portfolio Management Commentary
How did the Fund perform?
For the 12-month period ending May 31, 2023, all of the Fund’s share classes underperformed its benchmark, the Russell Midcap® Growth Index.
What factors influenced performance?
The largest detractors from the Fund’s performance relative to the benchmark were stock selection in the communication services, healthcare, and consumer discretionary sectors. Within communication services an overweight position in Match Group, Inc. within the interactive media and services sub-sector weighed most heavily on performance. Within healthcare, an overweight position in Catalent, Inc. within the pharmaceuticals industry detracted from performance. Lastly, positioning in consumer discretionary was a slight drag on performance, notably in the hotels, restaurants & leisure industry where an overweight exposure to Expedia Group, Inc. detracted from returns.
The largest contributors to the Fund’s relative performance were selection in industrials and financials, along with positioning in materials. Within industrials, an overweight position in Copart, Inc. led positive contributions. Within materials, having no exposure to the chemicals industry proved beneficial, specifically a lack of holdings in CF Industries Holdings, Inc. and Albemarle Corp., specifically a lack of holdings in CF Industries Holdings, Inc. and Albemarle Corp. Lastly, selection in financials contributed positively, most notably an underweight to SVB Financial Group in the banks sub-sector.
Describe recent portfolio activity.
During the period, exposure to energy increased with additional exposure to the oil, gas & consumable fuels sub-sector. Exposure to the information technology sector increased as well. Conversely, exposure to communication services decreased the most due to a decreased allocation to the media industry. Exposure to the consumer discretionary sector decreased as well.
Describe portfolio positioning at period end.
Relative to the Russell Midcap® Growth Index, at the end of the reporting period the Fund’s largest overweight was in the financials sector, followed by information technology and communication services. Conversely, the consumer staples sector was the largest underweight, followed by energy and materials.
The views expressed reflect the opinions of BlackRock as of the date of this report and are subject to change based on changes in market, economic or other conditions. These views are not intended to be a forecast of future events and are no guarantee of future results.
F U N D S U M M A R Y | 13 |
| Fund Summary as of May 31, 2023 (continued) | BlackRock Mid-Cap Growth Equity Portfolio |
GROWTH OF $10,000 INVESTMENT
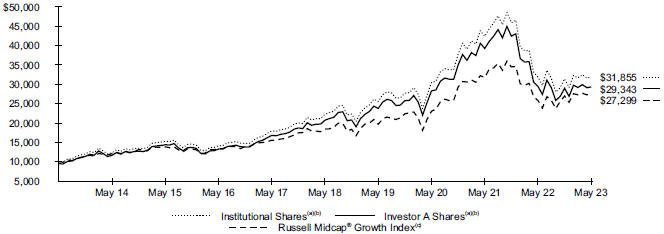
| (a) | Assuming maximum sales charges, if any, transaction costs and other operating expenses, including investment advisory fees and administration fees, if any. Institutional Shares do not have a sales charge. |
| (b) | The Fund normally invests at least 80% of its net assets in equity securities issued by U.S. mid-capitalization companies which Fund management believes have above-average earnings growth potential. |
| (c) | An index that measures the performance of the mid-cap growth segment of the U.S. equity universe. It includes those Russell Midcap® Index companies with higher price-to-book ratios and higher forecasted growth values. |
Performance
| Average Annual Total Returns(a) | ||||||||||||||||||||||||||||||||
| 1 Year | 5 Years | 10 Years | ||||||||||||||||||||||||||||||
| Without Sales Charge | With Sales Charge | Without Sales Charge | With Sales Charge | Without Sales Charge | With Sales Charge | |||||||||||||||||||||||||||
Institutional | (0.12 | )% | N/A | 7.46 | % | N/A | 12.28 | % | N/A | |||||||||||||||||||||||
Service | (0.38 | ) | N/A | 7.19 | N/A | 11.96 | N/A | |||||||||||||||||||||||||
Investor A | (0.39 | ) | (5.62 | )% | 7.19 | 6.04 | % | 11.97 | 11.37 | % | ||||||||||||||||||||||
Investor C | (1.15 | ) | (2.14 | ) | 6.40 | 6.40 | 11.30 | 11.30 | ||||||||||||||||||||||||
Class K | (0.03 | ) | N/A | 7.55 | N/A | 12.35 | N/A | |||||||||||||||||||||||||
Class R | (0.62 | ) | N/A | 6.92 | N/A | 11.69 | N/A | |||||||||||||||||||||||||
Russell Midcap® Growth Index | 5.75 | N/A | 8.18 | N/A | 10.56 | N/A | ||||||||||||||||||||||||||
| (a) | Assuming maximum sales charges, if any. Average annual total returns with and without sales charges reflect reductions for distribution and service fees. See “About Fund Performance” for a detailed description of share classes, including any related sales charges and fees, and how performance was calculated for certain share classes. |
N/A - Not applicable as share class and index do not have a sales charge.
Past performance is not an indication of future results.
Performance results may include adjustments made for financial reporting purposes in accordance with U.S. generally accepted accounting principles.
Expense Example
| Actual | Hypothetical 5% Return | |||||||||||||||||||||||||||||||
| | Beginning Account Value (12/01/22) | | | Ending Account Value (05/31/23) | | | Expenses Paid During the Period | (a) | | Beginning Account Value (12/01/22) | | | Ending Account Value (05/31/23) | | | Expenses Paid During the Period | (a) | | Annualized Expense Ratio | | ||||||||||||
Institutional | $ | 1,000.00 | $ | 1,013.60 | $ | 4.02 | $ | 1,000.00 | $ | 1,020.94 | $ | 4.03 | 0.80 | % | ||||||||||||||||||
Service | 1,000.00 | 1,012.50 | 5.27 | 1,000.00 | 1,019.70 | 5.29 | 1.05 | |||||||||||||||||||||||||
Investor A | 1,000.00 | 1,012.40 | 5.27 | 1,000.00 | 1,019.70 | 5.29 | 1.05 | |||||||||||||||||||||||||
Investor C | 1,000.00 | 1,008.30 | 9.01 | 1,000.00 | 1,015.96 | 9.05 | 1.80 | |||||||||||||||||||||||||
Class K | 1,000.00 | 1,014.20 | 3.56 | 1,000.00 | 1,021.40 | 3.58 | 0.71 | |||||||||||||||||||||||||
Class R | 1,000.00 | 1,011.20 | 6.52 | 1,000.00 | 1,018.45 | 6.54 | 1.30 | |||||||||||||||||||||||||
| (a) | For each class of the Fund, expenses are equal to the annualized expense ratio for the class, multiplied by the average account value over the period, multiplied by 182/365 (to reflect the one-half year period shown). |
See “Disclosure of Expenses” for further information on how expenses were calculated.
| 14 | 2 0 2 3 B L A C K R O C K A N N U A L R E P O R T T O S H A R E H O L D E R S |
| Fund Summary as of May 31, 2023 (continued) | BlackRock Mid-Cap Growth Equity Portfolio |
Portfolio Information
| TEN LARGEST HOLDINGS |
| |||
| Security(a) | Percent of Net Assets | |||
Copart, Inc. | 3.9 | % | ||
Cadence Design Systems, Inc. | 3.4 | |||
Entegris, Inc. | 3.4 | |||
MSCI, Inc., Class A | 3.2 | |||
Monolithic Power Systems, Inc. | 3.1 | |||
West Pharmaceutical Services, Inc. | 2.6 | |||
CoStar Group, Inc. | 2.6 | |||
HubSpot, Inc. | 2.6 | |||
IDEXX Laboratories, Inc. | 2.6 | |||
ANSYS, Inc. | 2.5 | |||
| SECTOR ALLOCATION |
| |||
| Sector(b) | Percent of Net Assets | |||
Information Technology | 28.9 | % | ||
Industrials | 21.6 | |||
Health Care | 15.2 | |||
Consumer Discretionary | 14.3 | |||
Financials | 11.0 | |||
Communication Services | 6.1 | |||
Energy | 1.8 | |||
Materials | 1.1 | |||
Other (each representing less than 1%) | 0.2 | |||
Short-Term Securities | 2.5 | |||
Liabilities in Excess of Other Assets | (2.7 | ) | ||
| (a) | Excludes short-term securities. |
| (b) | For Fund compliance purposes, the Fund’s sector classifications refer to one or more of the sector sub-classifications used by one or more widely recognized market indexes or ratings group indexes, and/or as defined by the investment adviser. These definitions may not apply for purposes of this report, which may combine such sector sub-classifications for reporting ease. |
F U N D S U M M A R Y | 15 |
| Fund Summary as of May 31, 2023 | BlackRock Technology Opportunities Fund |
Investment Objective
BlackRock Technology Opportunities Fund’s (the “Fund”) investment objective is to provide long-term capital appreciation.
Portfolio Management Commentary
How did the Fund perform?
For the 12-month period ended May 31, 2023, all of the Fund’s share classes underperformed its benchmark, the MSCI All-Country World Information Technology Index.
What factors influenced performance?
Stock selection decisions played a key role in detracting from the Fund’s relative performance. Among individual securities, an off-benchmark position in Tesla was the largest detractor from performance, as the electric vehicle (“EV”) manufacturer came under pressure in the second half of 2022 as EV demand appeared muted, although the stock rebounded on news of strong growth plans and effective price cuts. An underweight position in Apple Inc. also detracted from returns, as the mega-cap technology stock traded higher due to investors rotating into high-quality businesses with strong balance sheets. Lastly, an overweight position in silicon carbide wafer company Wolfspeed was one of the largest relative detractors, as investors grew concerned about its ability to scale up supply.
By contrast, the Fund’s off-benchmark position in social media giant Meta Platforms was the largest single-stock contributor to relative performance. The parent company of Facebook announced cuts to operating expenses in order to boost margins, which investors saw as a positive sign. An overweight allocation to credit score provider Fair Isaac was also a top contributor to relatively performance, as the company remained resilient amid an uncertain macroeconomic environment. Lastly, an overweight position in Cadence Design Systems was among the most significant contributors to returns, as the electronic systems design stock traded higher on optimism over the buildout of artificial intelligence over the next several quarters.
Describe recent portfolio activity.
Overall, the Fund increased its exposure to stable, quality stocks, adding more defensive characteristics to the portfolio in the midst of broader market volatility. The Fund took advantage of price dislocation during the market selloff to rotate its exposure within the semiconductor industry, adding to positions with long structural tailwinds and less cyclical sensitivity, including those that stand to benefit from increased capital expenditure on artificial intelligence.
Describe portfolio positioning at period end.
On an absolute basis, the Fund’s largest exposures at period end were to the software and semiconductors sub-sectors, with a structural off-benchmark allocation to the internet sub-sector. This positioning reflected the Fund’s decision to maintain its exposure to long-term secular themes within the portfolio, such as artificial intelligence, renewable energy, and electric vehicles, as well as more nascent themes such as space and quantum computing. Although growth assets have been penalized due to rising rate concerns, the fundamentals of the companies within the portfolio remain compelling. The secular growth trends driving technology are multi-year transformations that are expected to persist regardless of the macroeconomic environment or geopolitical risk.
The views expressed reflect the opinions of BlackRock as of the date of this report and are subject to change based on changes in market, economic or other conditions. These views are not intended to be a forecast of future events and are no guarantee of future results.
| 16 | 2 0 2 3 B L A C K R O C K A N N U A L R E P O R T T O S H A R E H O L D E R S |
| Fund Summary as of May 31, 2023 (continued) | BlackRock Technology Opportunities Fund |
GROWTH OF $10,000 INVESTMENT
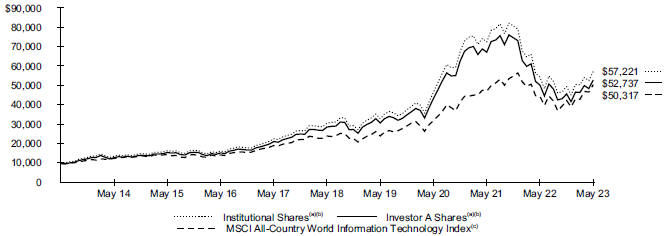
| (a) | Assuming maximum sales charges, if any, transaction costs and other operating expenses, including investment advisory fees and administration fees, if any. Institutional Shares do not have a sales charge. |
| (b) | Under normal market conditions, the Fund invests at least 80% of its net assets, plus the amount of any borrowings for investment purposes, in equity securities issued by U.S. and non-U.S. technology companies in all market capitalization ranges, selected for their rapid and sustainable growth potential from the development, advancement and use of technology. The Fund’s total returns prior to December 30, 2017 are the returns of the Fund when it followed different investment strategies under the name BlackRock Science & Technology Opportunities Portfolio. |
| (c) | An index that includes large- and mid-cap securities across certain Developed Markets countries and certain Emerging Markets countries. All securities in the index are classified in the Information Technology sector as per the Global Industry Classification Standard. |
Performance
| Average Annual Total Returns(a) | ||||||||||||||||||||||||||||||||
| 1 Year | 5 Years | 10 Years | ||||||||||||||||||||||||||||||
| Without Sales Charge | With Sales Charge | Without Sales Charge | With Sales Charge | Without Sales Charge | With Sales Charge | |||||||||||||||||||||||||||
Institutional | 5.36 | % | N/A | 13.43 | % | N/A | 19.06 | % | N/A | |||||||||||||||||||||||
Service | 5.08 | N/A | 13.14 | N/A | 18.77 | N/A | ||||||||||||||||||||||||||
Investor A | 5.09 | (0.43 | )% | 13.15 | 11.93 | % | 18.73 | 18.09 | % | |||||||||||||||||||||||
Investor C | 4.25 | 3.25 | 12.31 | 12.31 | 17.99 | 17.99 | ||||||||||||||||||||||||||
Class K | 5.42 | N/A | 13.49 | N/A | 19.09 | N/A | ||||||||||||||||||||||||||
Class R | 4.83 | N/A | 12.86 | N/A | 18.42 | N/A | ||||||||||||||||||||||||||
MSCI All-Country World Information Technology Index | 13.78 | N/A | 16.12 | N/A | 17.54 | N/A | ||||||||||||||||||||||||||
| (a) | Assuming maximum sales charges, if any. Average annual total returns with and without sales charges reflect reductions for distribution and service fees. See “About Fund Performance” for a detailed description of share classes, including any related sales charges and fees, and how performance was calculated for certain share classes. |
N/A - Not applicable as share class and index do not have a sales charge.
Past performance is not an indication of future results.
Performance results may include adjustments made for financial reporting purposes in accordance with U.S. generally accepted accounting principles.
Expense Example
| Actual | Hypothetical 5% Return | |||||||||||||||||||||||||||||||
| | Beginning Account Value (12/01/22) | | | Ending Account Value (05/31/23) | | | Expenses Paid During the Period | (a) | | Beginning Account Value (12/01/22) | | | Ending Account Value (05/31/23) | | | Expenses Paid During the Period | (a) | | Annualized Expense Ratio | | ||||||||||||
Institutional | $ | 1,000.00 | $ | 1,158.80 | $ | 4.95 | $ | 1,000.00 | $ | 1,020.34 | $ | 4.63 | 0.92 | % | ||||||||||||||||||
Service | 1,000.00 | 1,157.30 | 6.29 | 1,000.00 | 1,019.10 | 5.89 | 1.17 | |||||||||||||||||||||||||
Investor A | 1,000.00 | 1,157.50 | 6.29 | 1,000.00 | 1,019.10 | 5.89 | 1.17 | |||||||||||||||||||||||||
Investor C | 1,000.00 | 1,152.70 | 10.30 | 1,000.00 | 1,015.36 | 9.65 | 1.92 | |||||||||||||||||||||||||
Class K | 1,000.00 | 1,159.00 | 4.68 | 1,000.00 | 1,020.60 | 4.38 | 0.87 | |||||||||||||||||||||||||
Class R | 1,000.00 | 1,155.60 | 7.63 | 1,000.00 | 1,017.85 | 7.14 | 1.42 | |||||||||||||||||||||||||
| (a) | For each class of the Fund, expenses are equal to the annualized expense ratio for the class, multiplied by the average account value over the period, multiplied by 182/365 (to reflect the one-half year period shown). |
See “Disclosure of Expenses” for further information on how expenses were calculated.
F U N D S U M M A R Y | 17 |
| Fund Summary as of May 31, 2023 (continued) | BlackRock Technology Opportunities Fund |
Portfolio Information
| TEN LARGEST HOLDINGS |
| |||
| Security(a) | Percent of Net Assets | |||
Apple Inc. | 9.9 | % | ||
Microsoft Corp. | 9.5 | |||
NVIDIA Corp. | 6.8 | |||
ASML Holding NV | 3.4 | |||
Cadence Design Systems, Inc. | 3.3 | |||
Mastercard, Inc., Class A | 2.7 | |||
Advanced Micro Devices, Inc. | 2.6 | |||
Tesla, Inc. | 2.5 | |||
Broadcom, Inc. | 2.5 | |||
Visa, Inc., Class A | 2.4 | |||
| INDUSTRY ALLOCATION |
| |||
| Industry(b) | Percent of Net Assets | |||
Software | 28.0 | % | ||
Semiconductors & Semiconductor Equipment | 27.8 | |||
Technology Hardware, Storage & Peripherals | 10.4 | |||
Financial Services | 7.2 | |||
Interactive Media & Services | 5.4 | |||
Broadline Retail | 4.6 | |||
IT Services | 2.9 | |||
Entertainment | 2.6 | |||
Automobiles | 2.5 | |||
Communications Equipment | 1.3 | |||
Capital Markets | 1.2 | |||
Electronic Equipment, Instruments & Components | 1.2 | |||
Other (each representing less than 1%) | 4.1 | |||
Short-Term Securities | 4.2 | |||
Liabilities in Excess of Other Assets | (3.4 | ) | ||
| (a) | Excludes short-term securities. |
| (b) | For Fund compliance purposes, the Fund’s industry classifications refer to one or more of the industry sub-classifications used by one or more widely recognized market indexes or ratings group indexes, and/or as defined by the investment adviser. These definitions may not apply for purposes of this report, which may combine such industry sub-classifications for reporting ease. |
| 18 | 2 0 2 3 B L A C K R O C K A N N U A L R E P O R T T O S H A R E H O L D E R S |
Institutional and Class K Shares are not subject to any sales charge. These shares bear no ongoing distribution or service fees and are available only to certain eligible investors. BlackRock Capital Appreciation Fund, Inc.’s Class K Shares performance shown prior to the Class K Shares inception date of August 15, 2016 is that of BlackRock Shares. BlackRock Health Sciences Opportunities Portfolio’s Class K Shares performance shown prior to the Class K Shares inception date of June 8, 2016 is that of Investor A Shares. BlackRock Mid-Cap Growth Equity Portfolio’s Class K Shares performance shown prior to the Class K Shares inception date of March 28, 2016 is that of Institutional Shares. BlackRock Technology Opportunities Fund’s Class K Shares performance shown prior to the Class K Shares inception date of December 10, 2019 is that of Institutional Shares. The performance of each Fund’s Class K Shares would be substantially similar to Investor A Shares or Institutional Shares, as applicable, because the share classes of a Fund invest in the same portfolio of securities and performance would only differ to the extent that Class K Shares and Investor A Shares or Institutional Shares, as applicable, have different expenses. The actual returns of Class K Shares would have been higher than those of the Investor A Shares or Institutional Shares, as applicable, because Class K Shares have lower expenses than the Investor A Shares and Institutional Shares.
Service Shares (not available in BlackRock Capital Appreciation Fund, Inc. and BlackRock Infrastructure Sustainable Opportunities Fund) are not subject to any sales charge. These shares are subject to a service fee of 0.25% per year (but no distribution fee) and are only available to certain eligible investors.
Investor A Shares are subject to a maximum initial sales charge (front-end load) of 5.25% and a service fee of 0.25% per year (but no distribution fee). Certain redemptions of these shares may be subject to a contingent deferred sales charge (“CDSC”) where no initial sales charge was paid at the time of purchase. These shares are generally available through financial intermediaries.
Investor C Shares (not available in BlackRock Infrastructure Sustainable Opportunities Fund) are subject to a 1.00% CDSC if redeemed within one year of purchase. In addition, these shares are subject to a distribution fee of 0.75% per year and a service fee of 0.25% per year. These shares are generally available through financial intermediaries. These shares automatically convert to Investor A Shares after approximately eight years.
Class R Shares (not available in BlackRock Infrastructure Sustainable Opportunities Fund) are not subject to any sales charge. These shares are subject to a distribution fee of 0.25% per year and a service fee of 0.25% per year. These shares are available only to certain employer-sponsored retirement plans.
Past performance is not an indication of future results. Financial markets have experienced extreme volatility and trading in many instruments has been disrupted. These circumstances may continue for an extended period of time and may continue to affect adversely the value and liquidity of each Fund’s investments. As a result, current performance may be lower or higher than the performance data quoted. Refer to blackrock.com to obtain performance data current to the most recent month-end. Performance results do not reflect the deduction of taxes that a shareholder would pay on Fund distributions or the redemption of Fund shares. Figures shown in the performance tables assume reinvestment of all distributions, if any, at net asset value (“NAV”) on the ex-dividend date or payable date, as applicable. Investment return and principal value of shares will fluctuate so that shares, when redeemed, may be worth more or less than their original cost. Distributions paid to each class of shares will vary because of the different levels of service, distribution and transfer agency fees applicable to each class, which are deducted from the income available to be paid to shareholders.
BlackRock Advisors, LLC (the “Manager”), each Fund’s investment adviser, has contractually and/or voluntarily agreed to waive and/or reimburse a portion of each Fund’s expenses. Without such waiver(s) and/or reimbursement(s), each Fund’s performance would have been lower. With respect to each Fund’s voluntary waiver(s), if any, the Manager is under no obligation to waive and/or reimburse or to continue waiving and/or reimbursing its fees and such voluntary waiver(s) may be reduced or discontinued at any time. With respect to each Fund’s contractual waiver(s), if any, the Manager is under no obligation to continue waiving and/or reimbursing its fees after the applicable termination date of such agreement. See the Notes to Financial Statements for additional information on waivers and/or reimbursements.
Shareholders of each Fund may incur the following charges: (a) transactional expenses, such as sales charges; and (b) operating expenses, including investment advisory fees, administration fees, service and distribution fees, including 12b-1 fees, acquired fund fees and expenses, and other fund expenses. The expense examples shown (which are based on a hypothetical investment of $1,000 invested at the beginning of the period and held through the end of the period) are intended to assist shareholders both in calculating expenses based on an investment in each Fund and in comparing these expenses with similar costs of investing in other mutual funds.
The expense examples provide information about actual account values and actual expenses. Annualized expense ratios reflect contractual and voluntary fee waivers, if any. In order to estimate the expenses a shareholder paid during the period covered by this report, shareholders can divide their account value by $1,000 and then multiply the result by the number corresponding to their Fund and share class under the heading entitled “Expenses Paid During the Period.”
The expense examples also provide information about hypothetical account values and hypothetical expenses based on a Fund’s actual expense ratio and an assumed rate of return of 5% per year before expenses. In order to assist shareholders in comparing the ongoing expenses of investing in these Funds and other funds, compare the 5% hypothetical examples with the 5% hypothetical examples that appear in shareholder reports of other funds.
The expenses shown in the expense examples are intended to highlight shareholders’ ongoing costs only and do not reflect transactional expenses, such as sales charges, if any. Therefore, the hypothetical examples are useful in comparing ongoing expenses only and will not help shareholders determine the relative total expenses of owning different funds. If these transactional expenses were included, shareholder expenses would have been higher.
A B O U T F U N D P E R F O R M A N C E / D I S C L O S U R E O F E X P E N S E S | 19 |
Derivative Financial Instruments
The Funds may invest in various derivative financial instruments. These instruments are used to obtain exposure to a security, commodity, index, market, and/or other assets without owning or taking physical custody of securities, commodities and/or other referenced assets or to manage market, equity, credit, interest rate, foreign currency exchange rate, commodity and/or other risks. Derivative financial instruments may give rise to a form of economic leverage and involve risks, including the imperfect correlation between the value of a derivative financial instrument and the underlying asset, possible default of the counterparty to the transaction or illiquidity of the instrument. Pursuant to Rule 18f-4 under the 1940 Act, among other things, the Fund must either use derivative financial instruments with embedded leverage in a limited manner or comply with an outer limit on fund leverage risk based on value-at-risk. The Funds’ successful use of a derivative financial instrument depends on the investment adviser’s ability to predict pertinent market movements accurately, which cannot be assured. The use of these instruments may result in losses greater than if they had not been used, may limit the amount of appreciation a Fund can realize on an investment and/or may result in lower distributions paid to shareholders. The Funds’ investments in these instruments, if any, are discussed in detail in the Notes to Financial Statements.
| 20 | 2 0 2 3 B L A C K R O C K A N N U A L R E P O R T T O S H A R E H O L D E R S |
May 31, 2023 | BlackRock Capital Appreciation Fund, Inc. (Percentages shown are based on Net Assets) |
| Security | Shares | Value | ||||||
| ||||||||
Common Stocks | ||||||||
Aerospace & Defense — 2.4% | ||||||||
TransDigm Group, Inc. | 94,809 | $ | 73,348,983 | |||||
|
| |||||||
| Automobiles — 2.4% | ||||||||
Tesla, Inc.(a) | 372,890 | 76,043,458 | ||||||
|
| |||||||
| Broadline Retail — 7.8% | ||||||||
Amazon.com, Inc.(a) | 2,006,769 | 241,976,206 | ||||||
|
| |||||||
| Capital Markets — 4.3% | ||||||||
Blackstone, Inc., Class A, NVS | 401,246 | 34,362,708 | ||||||
MSCI, Inc., Class A | 83,408 | 39,245,966 | ||||||
S&P Global, Inc. | 163,982 | 60,251,906 | ||||||
|
| |||||||
| 133,860,580 | ||||||||
| Chemicals — 1.0% | ||||||||
Sherwin-Williams Co. | 141,694 | 32,275,059 | ||||||
|
| |||||||
| Commercial Services & Supplies — 2.0% | ||||||||
Cintas Corp. | 72,306 | 34,138,555 | ||||||
Waste Connections, Inc. | 205,524 | 28,084,855 | ||||||
|
| |||||||
| 62,223,410 | ||||||||
| Entertainment — 1.6% | ||||||||
Netflix, Inc.(a) | 125,473 | 49,590,694 | ||||||
|
| |||||||
| Financial Services — 7.0% | ||||||||
Adyen NV(a)(b) | 12,048 | 19,732,723 | ||||||
Mastercard, Inc., Class A | 195,053 | 71,198,246 | ||||||
Visa, Inc., Class A | 573,961 | 126,862,600 | ||||||
|
| |||||||
| 217,793,569 | ||||||||
| Health Care Equipment & Supplies — 4.3% | ||||||||
Boston Scientific Corp.(a) | 674,983 | 34,748,125 | ||||||
IDEXX Laboratories, Inc.(a) | 74,477 | 34,614,675 | ||||||
Intuitive Surgical, Inc.(a) | 205,587 | 63,287,902 | ||||||
|
| |||||||
| 132,650,702 | ||||||||
| Health Care Providers & Services — 2.9% | ||||||||
UnitedHealth Group, Inc. | 183,538 | 89,427,055 | ||||||
|
| |||||||
| Hotels, Restaurants & Leisure — 3.4% | ||||||||
Chipotle Mexican Grill, Inc.(a) | 23,550 | 48,901,339 | ||||||
Evolution AB(b) | 440,795 | 58,188,716 | ||||||
|
| |||||||
| 107,090,055 | ||||||||
| Interactive Media & Services — 6.5% | ||||||||
Alphabet, Inc., Class A(a) | 1,337,249 | 164,307,785 | ||||||
Match Group, Inc.(a) | 1,088,563 | 37,555,423 | ||||||
|
| |||||||
| 201,863,208 | ||||||||
| IT Services — 0.2% | ||||||||
MongoDB, Inc., Class A(a) | 24,285 | 7,134,690 | ||||||
|
| |||||||
| Life Sciences Tools & Services — 3.6% | ||||||||
Danaher Corp. | 231,854 | 53,238,315 | ||||||
Lonza Group AG, Registered Shares | 43,689 | 27,401,996 | ||||||
Thermo Fisher Scientific, Inc. | 59,308 | 30,155,746 | ||||||
|
| |||||||
| 110,796,057 | ||||||||
| Oil, Gas & Consumable Fuels — 1.2% | ||||||||
Cheniere Energy, Inc. | 218,495 | 30,539,046 | ||||||
EQT Corp. | 169,241 | 5,884,510 | ||||||
|
| |||||||
| 36,423,556 | ||||||||
| Pharmaceuticals — 3.2% | ||||||||
Eli Lilly & Co. | 146,515 | 62,922,332 | ||||||
Zoetis, Inc., Class A | 230,121 | 37,512,024 | ||||||
|
| |||||||
| 100,434,356 | ||||||||
| Security | Shares | Value | ||||||
| ||||||||
| Semiconductors & Semiconductor Equipment — 13.2% | ||||||||
ASML Holding NV, Registered Shares | 143,809 | $ | 103,963,840 | |||||
Broadcom, Inc. | 93,937 | 75,897,339 | ||||||
KLA Corp. | 139,298 | 61,707,621 | ||||||
NVIDIA Corp. | 449,445 | 170,043,021 | ||||||
|
| |||||||
| 411,611,821 | ||||||||
| Software — 19.1% | ||||||||
Cadence Design Systems, Inc.(a) | 284,406 | 65,672,190 | ||||||
Intuit, Inc. | 268,914 | 112,707,236 | ||||||
Microsoft Corp. | 900,296 | 295,648,203 | ||||||
Palo Alto Networks, Inc.(a) | 74,060 | 15,803,663 | ||||||
Roper Technologies, Inc. | 96,256 | 43,721,400 | ||||||
ServiceNow, Inc.(a) | 111,309 | 60,638,917 | ||||||
|
| |||||||
| 594,191,609 | ||||||||
| Specialty Retail — 0.4% | ||||||||
Ross Stores, Inc. | 136,035 | 14,095,947 | ||||||
|
| |||||||
| Technology Hardware, Storage & Peripherals — 9.0% | ||||||||
Apple Inc. | 1,577,589 | 279,627,650 | ||||||
|
| |||||||
| Textiles, Apparel & Luxury Goods — 3.6% | ||||||||
LVMH Moet Hennessy Louis Vuitton SE | 62,266 | 54,440,920 | ||||||
NIKE, Inc., Class B | 535,745 | 56,392,519 | ||||||
|
| |||||||
| 110,833,439 | ||||||||
|
| |||||||
| Total Common Stocks — 99.1% (Cost: $1,746,288,212) | 3,083,292,104 | |||||||
|
| |||||||
Preferred Securities | ||||||||
Preferred Stocks — 1.0% | ||||||||
| IT Services — 1.0% | ||||||||
Bytedance Ltd., Series E-1 (Acquired 11/11/20, cost $19,426,516)(a)(c)(d) | 177,291 | 30,763,410 | ||||||
|
| |||||||
| Total Long-Term Investments — 100.1% (Cost: $1,765,714,728) | 3,114,055,514 | |||||||
|
| |||||||
Short-Term Securities | ||||||||
| Money Market Funds — 0.0% | ||||||||
BlackRock Liquidity Funds, T-Fund, Institutional Class, 5.00%(e)(f) | 1,248,701 | 1,248,701 | ||||||
|
| |||||||
Total Short-Term Securities — 0.0% (Cost: $1,248,701) | 1,248,701 | |||||||
|
| |||||||
Total Investments — 100.1% (Cost: $1,766,963,429) | 3,115,304,215 | |||||||
Liabilities in Excess of Other Assets — (0.1)% |
| (3,195,273 | ) | |||||
|
| |||||||
Net Assets — 100.0% | $ | 3,112,108,942 | ||||||
|
| |||||||
| (a) | Non-income producing security. |
| (b) | Security exempt from registration pursuant to Rule 144A under the Securities Act of 1933, as amended. These securities may be resold in transactions exempt from registration to qualified institutional investors. |
| (c) | Security is valued using significant unobservable inputs and is classified as Level 3 in the fair value hierarchy. |
| (d) | Restricted security as to resale, excluding 144A securities. The Fund held restricted securities with a current value of $30,763,410, representing 1.0% of its net assets as of period end, and an original cost of $19,426,516. |
| (e) | Affiliate of the Fund. |
| (f) | Annualized 7-day yield as of period end. |
S C H E D U L E S O F I N V E S T M E N T S | 21 |
Schedule of Investments (continued) May 31, 2023 | BlackRock Capital Appreciation Fund, Inc. |
Affiliates
Investments in issuers considered to be affiliate(s) of the Fund during the year ended May 31, 2023 for purposes of Section 2(a)(3) of the Investment Company Act of 1940, as amended, were as follows:
| Affiliated Issuer | Value at 05/31/22 | Purchases at Cost | Proceeds from Sale | Net Realized Gain (Loss) | Change in Unrealized Appreciation (Depreciation) | Value at 05/31/23 | Shares Held at 05/31/23 | Income | Capital Gain | |||||||||||||||||||||||||||
BlackRock Liquidity Funds, T-Fund, Institutional Class | $ | 95,737,315 | $ | — | $ | (94,488,614 | )(a) | $ | — | $ | — | $ | 1,248,701 | 1,248,701 | $ | 828,727 | $ | — | ||||||||||||||||||
SL Liquidity Series, LLC, Money Market Series(b) | 11,761,599 | — | (11,762,463 | )(a) | 3,022 | (2,158 | ) | — | — | 44,275 | (c) | — | ||||||||||||||||||||||||
|
|
|
|
|
|
|
|
|
| |||||||||||||||||||||||||||
| $ | 3,022 | $ | (2,158 | ) | $ | 1,248,701 | $ | 873,002 | $ | — | ||||||||||||||||||||||||||
|
|
|
|
|
|
|
|
|
| |||||||||||||||||||||||||||
| (a) | Represents net amount purchased (sold). |
| (b) | As of period end, the entity is no longer held. |
| (c) | All or a portion represents securities lending income earned from the reinvestment of cash collateral from loaned securities, net of fees and collateral investment expenses, and other payments to and from borrowers of securities. |
For Fund compliance purposes, the Fund’s industry classifications refer to one or more of the industry sub-classifications used by one or more widely recognized market indexes or rating group indexes, and/or as defined by the investment adviser. These definitions may not apply for purposes of this report, which may combine such industry sub-classifications for reporting ease.
| 22 | 2 0 2 3 B L A C K R O C K A N N U A L R E P O R T T O S H A R E H O L D E R S |
Schedule of Investments (continued) May 31, 2023 | BlackRock Capital Appreciation Fund, Inc. |
Fair Value Hierarchy as of Period End
Various inputs are used in determining the fair value of financial instruments. For a description of the input levels and information about the Fund’s policy regarding valuation of financial instruments, refer to the Notes to Financial Statements.
The following table summarizes the Fund’s financial instruments categorized in the fair value hierarchy. The breakdown of the Fund’s financial instruments into major categories is disclosed in the Schedule of Investments above.
| Level 1 | Level 2 | Level 3 | Total | |||||||||||||
Assets | ||||||||||||||||
Investments | ||||||||||||||||
Long-Term Investments | ||||||||||||||||
Common Stocks | ||||||||||||||||
Aerospace & Defense | $ | 73,348,983 | $ | — | $ | — | $ | 73,348,983 | ||||||||
Automobiles | 76,043,458 | — | — | 76,043,458 | ||||||||||||
Broadline Retail | 241,976,206 | — | — | 241,976,206 | ||||||||||||
Capital Markets | 133,860,580 | — | — | 133,860,580 | ||||||||||||
Chemicals | 32,275,059 | — | — | 32,275,059 | ||||||||||||
Commercial Services & Supplies | 62,223,410 | — | — | 62,223,410 | ||||||||||||
Entertainment | 49,590,694 | — | — | 49,590,694 | ||||||||||||
Financial Services | 198,060,846 | 19,732,723 | — | 217,793,569 | ||||||||||||
Health Care Equipment & Supplies | 132,650,702 | — | — | 132,650,702 | ||||||||||||
Health Care Providers & Services | 89,427,055 | — | — | 89,427,055 | ||||||||||||
Hotels, Restaurants & Leisure | 48,901,339 | 58,188,716 | — | 107,090,055 | ||||||||||||
Interactive Media & Services | 201,863,208 | — | — | 201,863,208 | ||||||||||||
IT Services | 7,134,690 | — | — | 7,134,690 | ||||||||||||
Life Sciences Tools & Services | 83,394,061 | 27,401,996 | — | 110,796,057 | ||||||||||||
Oil, Gas & Consumable Fuels | 36,423,556 | — | — | 36,423,556 | ||||||||||||
Pharmaceuticals | 100,434,356 | — | — | 100,434,356 | ||||||||||||
Semiconductors & Semiconductor Equipment | 411,611,821 | — | — | 411,611,821 | ||||||||||||
Software | 594,191,609 | — | — | 594,191,609 | ||||||||||||
Specialty Retail | 14,095,947 | — | — | 14,095,947 | ||||||||||||
Technology Hardware, Storage & Peripherals | 279,627,650 | — | — | 279,627,650 | ||||||||||||
Textiles, Apparel & Luxury Goods | 56,392,519 | 54,440,920 | — | 110,833,439 | ||||||||||||
Preferred Securities | — | — | 30,763,410 | 30,763,410 | ||||||||||||
Short-Term Securities | ||||||||||||||||
Money Market Funds | 1,248,701 | — | — | 1,248,701 | ||||||||||||
|
|
|
|
|
|
|
| |||||||||
| $ | 2,924,776,450 | $ | 159,764,355 | $ | 30,763,410 | $ | 3,115,304,215 | |||||||||
|
|
|
|
|
|
|
| |||||||||
See notes to financial statements.
S C H E D U L E S O F I N V E S T M E N T S | 23 |
Schedule of Investments May 31, 2023 | BlackRock Health Sciences Opportunities Portfolio (Percentages shown are based on Net Assets) |
| Security | Shares | Value | ||||||
| ||||||||
Common Stocks | ||||||||
Biotechnology — 22.9% | ||||||||
AbbVie, Inc. | 1,695,600 | $ | 233,924,976 | |||||
Abcam PLC, ADR(a) | 853,745 | 13,787,982 | ||||||
Alkermes PLC(a) | 495,139 | 14,324,371 | ||||||
Alnylam Pharmaceuticals, Inc.(a) | 250,177 | 46,285,247 | ||||||
Amgen, Inc. | 949,985 | 209,614,190 | ||||||
Apellis Pharmaceuticals, Inc.(a) | 202,945 | 17,422,828 | ||||||
Argenx SE, ADR(a) | 81,372 | 31,629,296 | ||||||
Biogen, Inc.(a) | 570,173 | 169,004,979 | ||||||
BioMarin Pharmaceutical, Inc.(a) | 484,145 | 42,091,566 | ||||||
Biomea Fusion, Inc.(a) | 260,258 | 8,838,362 | ||||||
Blueprint Medicines Corp.(a) | 400,250 | 22,622,130 | ||||||
Cerevel Therapeutics Holdings, Inc.(a) | 312,854 | 10,199,040 | ||||||
CureVac NV(a) | 310,911 | 3,000,291 | ||||||
Decibel Therapeutics, Inc.(a) | 897,801 | 3,627,116 | ||||||
Design Therapeutics, Inc.(a) | 257,492 | 1,449,680 | ||||||
Exact Sciences Corp.(a)(b) | 280,808 | 22,908,317 | ||||||
Frequency Therapeutics, Inc.(a) | 428,010 | 149,804 | ||||||
Genmab A/S(a) | 42,470 | 16,718,614 | ||||||
Genmab A/S, ADR(a)(b) | 289,405 | 11,347,570 | ||||||
Gilead Sciences, Inc. | 2,723,422 | 209,540,089 | ||||||
Horizon Therapeutics PLC(a) | 115,250 | 11,528,458 | ||||||
Immuneering Corp., Class A(a) | 264,380 | 2,048,945 | ||||||
Immunocore Holdings PLC, ADR(a)(b) | 181,355 | 10,007,169 | ||||||
ImmunoGen, Inc.(a) | 269,116 | 3,670,742 | ||||||
Incyte Corp.(a) | 495,005 | 30,467,558 | ||||||
Ionis Pharmaceuticals, Inc.(a) | 293,400 | 12,000,060 | ||||||
IVERIC bio, Inc.(a) | 183,295 | 6,919,386 | ||||||
Karuna Therapeutics, Inc.(a)(b) | 27,980 | 6,338,869 | ||||||
Legend Biotech Corp., ADR(a) | 227,561 | 14,602,589 | ||||||
Merus NV(a) | 219,255 | 4,762,219 | ||||||
Mirati Therapeutics, Inc.(a) | 228,510 | 8,491,432 | ||||||
Moderna, Inc.(a) | 230,739 | 29,467,678 | ||||||
Monte Rosa Therapeutics, Inc.(a) | 533,603 | 3,937,990 | ||||||
Morphic Holding, Inc.(a) | 187,955 | 10,807,413 | ||||||
Neurocrine Biosciences, Inc.(a) | 297,025 | 26,592,648 | ||||||
Nuvalent, Inc., Class A(a) | 176,992 | 7,451,363 | ||||||
PMV Pharmaceuticals, Inc.(a) | 306,148 | 1,637,892 | ||||||
Prime Medicine, Inc.(a)(b) | 360,982 | 4,952,673 | ||||||
Prometheus Biosciences, Inc.(a) | 107,509 | 21,362,038 | ||||||
Protagonist Therapeutics, Inc.(a) | 403,935 | 10,530,585 | ||||||
Prothena Corp. PLC(a) | 137,132 | 9,109,679 | ||||||
PTC Therapeutics, Inc.(a) | 287,575 | 12,069,523 | ||||||
Regeneron Pharmaceuticals, Inc.(a) | 265,262 | 195,116,117 | ||||||
REVOLUTION Medicines, Inc.(a) | 305,798 | 7,623,544 | ||||||
Rhythm Pharmaceuticals, Inc.(a) | 756,852 | 12,609,154 | ||||||
Rocket Pharmaceuticals, Inc.(a) | 266,176 | 5,571,064 | ||||||
Sage Therapeutics, Inc.(a) | 343,935 | 17,024,783 | ||||||
Sarepta Therapeutics, Inc.(a) | 333,872 | 41,266,579 | ||||||
Seagen, Inc.(a) | 341,700 | 66,870,690 | ||||||
Sigilon Therapeutics, Inc.(a) | 25,586 | 107,461 | ||||||
Tenaya Therapeutics, Inc.(a) | 431,076 | 3,103,747 | ||||||
Ultragenyx Pharmaceutical, Inc.(a) | 99,990 | 4,935,506 | ||||||
Vaxcyte, Inc.(a) | 177,405 | 8,785,096 | ||||||
Vertex Pharmaceuticals, Inc.(a) | 714,739 | 231,268,098 | ||||||
Viking Therapeutics, Inc.(a) | 251,795 | 5,529,418 | ||||||
|
| |||||||
| 1,937,054,614 | ||||||||
| Health Care Equipment & Supplies — 27.1% | ||||||||
Abbott Laboratories | 1,769,403 | 180,479,106 | ||||||
ABIOMED INC, CVR(a)(c) | 243,643 | 687,073 | ||||||
Alcon, Inc. | 1,401,143 | 108,434,457 | ||||||
| Security | Shares | Value | ||||||
| ||||||||
| Health Care Equipment & Supplies (continued) | ||||||||
Align Technology, Inc.(a) | 63,695 | $ | 18,004,029 | |||||
Bausch + Lomb Corp.(a)(b) | 1,268,266 | 22,651,231 | ||||||
Baxter International, Inc. | 1,659,211 | 67,563,072 | ||||||
Becton Dickinson & Co. | 598,615 | 144,721,162 | ||||||
Boston Scientific Corp.(a) | 6,566,903 | 338,064,167 | ||||||
Cooper Cos., Inc. | 197,962 | 73,548,822 | ||||||
Dexcom, Inc.(a) | 832,633 | 97,634,546 | ||||||
Edwards Lifesciences Corp.(a) | 557,149 | 46,928,660 | ||||||
Envista Holdings Corp.(a) | 322,825 | 10,294,889 | ||||||
GE HealthCare Technologies, Inc. | 1,023,465 | 81,375,702 | ||||||
Glaukos Corp.(a) | 77,335 | 4,409,642 | ||||||
Hologic, Inc.(a) | 168,390 | 13,284,287 | ||||||
IDEXX Laboratories, Inc.(a) | 109,065 | 50,690,140 | ||||||
Inspire Medical Systems, Inc.(a) | 83,905 | 24,541,374 | ||||||
Insulet Corp.(a) | 128,592 | 35,266,356 | ||||||
Intuitive Surgical, Inc.(a) | 867,239 | 266,970,854 | ||||||
iRhythm Technologies, Inc.(a) | 36,545 | 4,175,997 | ||||||
Masimo Corp.(a) | 135,405 | 21,913,945 | ||||||
Medtronic PLC | 2,116,567 | 175,167,085 | ||||||
Novocure Ltd.(a)(b) | 425,230 | 30,535,766 | ||||||
Omnicell, Inc.(a) | 124,169 | 9,116,488 | ||||||
Orchestra BioMed Holdings, Inc.(a) | 262,308 | 3,934,620 | ||||||
Penumbra, Inc.(a)(b) | 265,360 | 81,555,742 | ||||||
ResMed, Inc. | 221,867 | 46,767,345 | ||||||
STERIS PLC | 145,075 | 29,010,648 | ||||||
Stryker Corp. | 1,000,590 | 275,742,592 | ||||||
Zimmer Biomet Holdings, Inc. | 239,113 | 30,448,649 | ||||||
|
| |||||||
| 2,293,918,446 | ||||||||
| Health Care Providers & Services — 16.8% | ||||||||
Agiliti, Inc.(a)(b) | 631,112 | 10,331,303 | ||||||
AmerisourceBergen Corp. | 869,425 | 147,932,664 | ||||||
Centene Corp.(a) | 451,070 | 28,151,279 | ||||||
Cigna Group | 251,201 | 62,149,639 | ||||||
Elevance Health, Inc. | 188,957 | 84,618,724 | ||||||
Guardant Health, Inc.(a) | 219,046 | 6,422,429 | ||||||
HCA Healthcare, Inc. | 315,226 | 83,279,557 | ||||||
Humana, Inc. | 170,920 | 85,779,620 | ||||||
McKesson Corp. | 382,710 | 149,578,376 | ||||||
Quest Diagnostics, Inc. | 602,568 | 79,930,645 | ||||||
UnitedHealth Group, Inc. | 1,412,144 | 688,053,043 | ||||||
|
| |||||||
| 1,426,227,279 | ||||||||
| Life Sciences Tools & Services — 10.0% | ||||||||
10X Genomics, Inc., Class A(a) | 147,043 | 7,713,876 | ||||||
Agilent Technologies, Inc. | 383,763 | 44,389,866 | ||||||
Avantor, Inc.(a) | 1,282,066 | 25,564,396 | ||||||
Bio-Techne Corp. | 158,000 | 12,922,820 | ||||||
Danaher Corp. | 665,757 | 152,871,122 | ||||||
ICON PLC(a) | 130,435 | 27,786,568 | ||||||
Illumina, Inc.(a) | 187,905 | 36,951,518 | ||||||
IQVIA Holdings, Inc.(a) | 394,897 | 77,759,168 | ||||||
Mettler-Toledo International, Inc.(a) | 16,425 | 21,711,715 | ||||||
Nautilus Biotechnology, Inc.(a) | 308,716 | 882,928 | ||||||
QIAGEN NV(a) | 481,536 | 21,746,166 | ||||||
Rapid Micro Biosystems, Inc., Class A(a) | 377,456 | 396,329 | ||||||
Repligen Corp.(a) | 130,550 | 21,921,956 | ||||||
Thermo Fisher Scientific, Inc. | 629,682 | 320,168,110 | ||||||
West Pharmaceutical Services, Inc. | 229,380 | 76,757,429 | ||||||
|
| |||||||
| 849,543,967 | ||||||||
| Pharmaceuticals — 19.7% | ||||||||
Arvinas, Inc.(a) | 228,330 | 4,984,444 | ||||||
AstraZeneca PLC | 392,919 | 57,228,897 | ||||||
| 24 | 2 0 2 3 B L A C K R O C K A N N U A L R E P O R T T O S H A R E H O L D E R S |
Schedule of Investments (continued) May 31, 2023 | BlackRock Health Sciences Opportunities Portfolio (Percentages shown are based on Net Assets) |
| Security | Shares | Value | ||||||
| ||||||||
| Pharmaceuticals (continued) | ||||||||
Bristol-Myers Squibb Co. | 615,670 | $ | 39,673,775 | |||||
Daiichi Sankyo Co. Ltd. | 504,500 | 16,405,935 | ||||||
Eli Lilly & Co. | 1,164,636 | 500,164,577 | ||||||
Johnson & Johnson | 1,347,023 | 208,869,386 | ||||||
Merck & Co., Inc. | 3,586,524 | 395,988,115 | ||||||
Novo Nordisk A/S, Class B | 264,360 | 42,543,730 | ||||||
Pfizer, Inc. | 2,641,454 | 100,428,081 | ||||||
Pliant Therapeutics, Inc.(a) | 192,983 | 4,174,222 | ||||||
Reata Pharmaceuticals, Inc., Class A(a) | 97,430 | 8,773,571 | ||||||
Roche Holding AG, NVS | 138,509 | 44,116,348 | ||||||
Sanofi | 388,736 | 39,661,585 | ||||||
Structure Therapeutics, Inc., ADR(a) | 201,473 | 6,447,136 | ||||||
Zoetis, Inc., Class A | 1,215,671 | 198,166,530 | ||||||
|
| |||||||
| 1,667,626,332 | ||||||||
|
| |||||||
Total Common Stocks — 96.5% |
| 8,174,370,638 | ||||||
|
| |||||||
Par (000) | ||||||||
| Other Interests(a)(c)(d) | ||||||||
Afferent Pharmaceuticals, Inc., Series C (Acquired 06/30/15, | USD | 3,421 | 2,736,512 | |||||
Affinivax Inc. (Acquired 08/19/22, | 123 | 1,647,070 | ||||||
|
| |||||||
Total Other Interests — 0.0% | 4,383,582 | |||||||
|
| |||||||
| Shares | ||||||||
| Preferred Securities | ||||||||
Preferred Stocks — 0.7% | ||||||||
| Biotechnology — 0.2% | ||||||||
Cellarity, Inc., Series B (Acquired 01/15/21, cost $5,149,998)(a)(c)(d) | 858,333 | 3,330,332 | ||||||
Goldfinch Bio, Inc., Series B (Acquired 06/26/20 -03/21/22, | 3,518,800 | 1,196,392 | ||||||
Laronde, Inc., Series B (Acquired 07/28/21, cost $10,822,560)(a)(c)(d) | 386,520 | 8,658,048 | ||||||
Neurogene, Inc., Series B (Acquired 12/14/20 -09/22/21, | 2,090,000 | 5,099,600 | ||||||
|
| |||||||
| 18,284,372 | ||||||||
| Health Care Equipment & Supplies — 0.1% | ||||||||
Exo Imaging, Inc., Series C (Acquired 06/24/21, cost $11,178,997)(a)(c)(d) | 1,908,330 | 5,018,908 | ||||||
Swift Health Systems, Inc., Series D (Acquired 08/27/21, | 1,700,345 | 2,244,455 | ||||||
|
| |||||||
| 7,263,363 | ||||||||
| Health Care Providers & Services — 0.1% | ||||||||
Quanta Dialysis Technologies Ltd., Series D (Acquired 06/18/21, | 80,024,425 | 6,570,062 | ||||||
|
| |||||||
| Security | Shares | Value | ||||||
| ||||||||
| Pharmaceuticals — 0.1% | ||||||||
Insitro, Series C (Acquired 03/10/21, | 592,636 | $ | 6,833,093 | |||||
|
| |||||||
| Software — 0.2% | ||||||||
Carbon Health Technologies, Inc. (Acquired 07/09/21, cost $16,855,000)(a)(c)(d) | 1,670,499 | 18,843,229 | ||||||
|
| |||||||
Total Preferred Securities — 0.7% | 57,794,119 | |||||||
|
| |||||||
Warrants(a) | ||||||||
Biotechnology — 0.0% | ||||||||
Nuvation Bio, Inc. (Issued/Exercisable 08/17/20, 1 Share for 1 Warrant, Expires 07/07/27, Strike Price USD 0.00) | 77,354 | 11,797 | ||||||
|
| |||||||
| Health Care Providers & Services — 0.0% | ||||||||
CareMax, Inc. (Issued/Exercisable 09/15/20, 1 Share for 1 Warrant, Expires 07/16/25, Strike Price USD 0.00)(b) | 88,432 | 35,373 | ||||||
|
| |||||||
Total Warrants — 0.0% | 47,170 | |||||||
|
| |||||||
Total Long-Term Investments — 97.2% | 8,236,595,509 | |||||||
|
| |||||||
Short-Term Securities | ||||||||
| Money Market Funds — 3.1% | ||||||||
BlackRock Liquidity Funds, T-Fund, Institutional Class, 5.00%(e)(f) | 211,473,753 | 211,473,753 | ||||||
SL Liquidity Series, LLC, Money Market Series, 5.32%(e)(f)(g) | 47,521,743 | 47,521,743 | ||||||
|
| |||||||
Total Short-Term Securities — 3.1% | 258,995,496 | |||||||
|
| |||||||
Total Investments — 100.3% | 8,495,591,005 | |||||||
Liabilities in Excess of Other Assets — (0.3)% |
| (26,339,999 | ) | |||||
|
| |||||||
Net Assets — 100.0% | $ | 8,469,251,006 | ||||||
|
| |||||||
| (a) | Non-income producing security. |
| (b) | All or a portion of this security is on loan. |
| (c) | Security is valued using significant unobservable inputs and is classified as Level 3 in the fair value hierarchy. |
| (d) | Restricted security as to resale, excluding 144A securities. The Fund held restricted securities with a current value of $62,177,701, representing 0.7% of its net assets as of period end, and an original cost of $79,096,694. |
| (e) | Affiliate of the Fund. |
| (f) | Annualized 7-day yield as of period end. |
| (g) | All or a portion of this security was purchased with the cash collateral from loaned securities. |
S C H E D U L E S O F I N V E S T M E N T S | 25 |
Schedule of Investments (continued) May 31, 2023 | BlackRock Health Sciences Opportunities Portfolio | |
|
Affiliates
Investments in issuers considered to be affiliate(s) of the Fund during the year ended May 31, 2023 for purposes of Section 2(a)(3) of the Investment Company Act of 1940, as amended, were as follows:
| ||||||||||||||||||||||||||||||||||||||
| Affiliated Issuer | Value at 05/31/22 | Purchases at Cost | Proceeds from Sale | Net Realized Gain (Loss) | Change in Unrealized Appreciation (Depreciation) | Value at 05/31/23 | Shares Held at | Income | Capital Gain | |||||||||||||||||||||||||||||
| ||||||||||||||||||||||||||||||||||||||
BlackRock Liquidity Funds, T-Fund, Institutional Class | $ | 371,570,572 | $ | — | $ | (160,096,819 | )(a) | $ | — | $ | — | $ | 211,473,753 | 211,473,753 | $ | 3,744,482 | $ | — | ||||||||||||||||||||
SL Liquidity Series, LLC, Money Market Series | 130,080,903 | — | (82,602,441 | )(a) | 38,791 | 4,490 | 47,521,743 | 47,521,743 | 1,526,277 | (b) | — | |||||||||||||||||||||||||||
|
|
|
|
|
|
|
|
|
| |||||||||||||||||||||||||||||
| $ | 38,791 | $ | 4,490 | $ | 258,995,496 | $ | 5,270,759 | $ | — | |||||||||||||||||||||||||||||
|
|
|
|
|
|
|
|
|
| |||||||||||||||||||||||||||||
| (a) | Represents net amount purchased (sold). |
| (b) | All or a portion represents securities lending income earned from the reinvestment of cash collateral from loaned securities, net of fees and collateral investment expenses, and other payments to and from borrowers of securities. |
For Fund compliance purposes, the Fund’s industry classifications refer to one or more of the industry sub-classifications used by one or more widely recognized market indexes or rating group indexes, and/or as defined by the investment adviser. These definitions may not apply for purposes of this report, which may combine such industry sub-classifications for reporting ease.
Derivative Financial Instruments Outstanding as of Period End
Forward Foreign Currency Exchange Contracts
| ||||||||||||||||||||||
| Currency Purchased | Currency Sold | Counterparty | Settlement Date | Unrealized Appreciation (Depreciation) | ||||||||||||||||||
| ||||||||||||||||||||||
| USD | 41,594,964 | EUR | 38,524,700 | Australia & New Zealand Banking Group Ltd | 06/15/23 | $ | 378,924 | |||||||||||||||
|
| |||||||||||||||||||||
| GBP | 15,391,300 | USD | 19,222,225 | Royal Bank of Canada | 06/15/23 | (69,848 | ) | |||||||||||||||
| USD | 139,983,897 | GBP | 114,686,000 | NatWest Markets PLC | 06/15/23 | (2,727,217 | ) | |||||||||||||||
|
| |||||||||||||||||||||
| $ | (2,797,065 | ) | ||||||||||||||||||||
|
| |||||||||||||||||||||
| $ | (2,418,141 | ) | ||||||||||||||||||||
|
| |||||||||||||||||||||
Derivative Financial Instruments Categorized by Risk Exposure
As of period end, the fair values of derivative financial instruments located in the Statements of Assets and Liabilities were as follows:
| ||||||||||||||||||||||||||||
| Commodity Contracts | Credit Contracts | Equity Contracts | Foreign Currency Exchange Contracts | Interest Rate Contracts | Other Contracts | Total | ||||||||||||||||||||||
| ||||||||||||||||||||||||||||
Assets — Derivative Financial Instruments | ||||||||||||||||||||||||||||
Forward foreign currency exchange contracts | ||||||||||||||||||||||||||||
Unrealized appreciation on forward foreign currency exchange contracts | $ | — | $ | — | $ | — | $ | 378,924 | $ | — | $ | — | $ | 378,924 | ||||||||||||||
|
|
|
|
|
|
|
|
|
|
|
|
|
| |||||||||||||||
Liabilities — Derivative Financial Instruments | ||||||||||||||||||||||||||||
Forward foreign currency exchange contracts | ||||||||||||||||||||||||||||
Unrealized depreciation on forward foreign currency exchange contracts | $ | — | $ | — | $ | — | $ | 2,797,065 | $ | — | $ | — | $ | 2,797,065 | ||||||||||||||
|
|
|
|
|
|
|
|
|
|
|
|
|
| |||||||||||||||
| 26 | 2 0 2 3 B L A C K R O C K A N N U A L R E P O R T T O S H A R E H O L D E R S |
Schedule of Investments (continued) May 31, 2023 | BlackRock Health Sciences Opportunities Portfolio |
For the period ended May 31, 2023, the effect of derivative financial instruments in the Statements of Operations was as follows:
| Commodity Contracts | Credit Contracts | Equity Contracts | Foreign Currency Exchange Contracts | Interest Rate Contracts | Other Contracts | Total | ||||||||||||||||||||||
Net Realized Gain (Loss) from | ||||||||||||||||||||||||||||
Forward foreign currency exchange contracts | $ | — | $ | — | $ | — | $ | 4,341,658 | $ | — | $ | — | $ | 4,341,658 | ||||||||||||||
Options purchased(a) | — | — | (425,702 | ) | — | — | — | (425,702 | ) | |||||||||||||||||||
Options written | — | — | (7,700 | ) | — | — | — | (7,700 | ) | |||||||||||||||||||
|
|
|
|
|
|
|
|
|
|
|
|
|
| |||||||||||||||
| $ | — | $ | — | $ | (433,402 | ) | $ | 4,341,658 | $ | — | $ | — | $ | 3,908,256 | ||||||||||||||
|
|
|
|
|
|
|
|
|
|
|
|
|
| |||||||||||||||
Net Change in Unrealized Appreciation (Depreciation) on | ||||||||||||||||||||||||||||
Forward foreign currency exchange contracts | $ | — | $ | — | $ | — | $ | (7,496,710 | ) | $ | — | $ | — | $ | (7,496,710 | ) | ||||||||||||
|
|
|
|
|
|
|
|
|
|
|
|
|
| |||||||||||||||
| (a) | Options purchased are included in net realized gain (loss) from investments — unaffiliated. |
Average Quarterly Balances of Outstanding Derivative Financial Instruments
Forward foreign currency exchange contracts | ||||
Average amounts purchased — in USD | $ | 168,728,432 | ||
Average amounts sold — in USD | $20,026,385 | |||
Options | ||||
Average value of option contracts purchased | $—(a) | |||
Average value of option contracts written | $—(a) |
| (a) | Derivative not held at any quarter-end. The risk exposure table serves as an indicator of activity during the period. |
For more information about the Fund’s investment risks regarding derivative financial instruments, refer to the Notes to Financial Statements.
Derivative Financial Instruments – Offsetting as of Period End
The Fund’s derivative assets and liabilities (by type) were as follows:
| Assets | Liabilities | |||||||
Derivative Financial Instruments | ||||||||
Forward foreign currency exchange contracts | $ | 378,924 | $ | 2,797,065 | ||||
|
|
|
| |||||
Total derivative assets and liabilities in the Statements of Assets and Liabilities | $ | 378,924 | $ | 2,797,065 | ||||
|
|
|
| |||||
Derivatives not subject to a Master Netting Agreement or similar agreement (“MNA”) | — | — | ||||||
|
|
|
| |||||
Total derivative assets and liabilities subject to an MNA | $ | 378,924 | $ | 2,797,065 | ||||
|
|
|
| |||||
S C H E D U L E S O F I N V E S T M E N T S | 27 |
Schedule of Investments (continued) May 31, 2023 | BlackRock Health Sciences Opportunities Portfolio |
The following table presents the Fund’s derivative assets and liabilities by counterparty net of amounts available for offset under an MNA and net of the related collateral received and pledged by the Fund:
| Counterparty | Derivative Assets Subject to an MNA by Counterparty | Derivatives Available for Offset(a) | Non- Cash | Cash Collateral Received(b) | Net Amount of Derivative Assets(c)(d) | |||||||||||||||
Australia & New Zealand Banking Group Ltd. | $ | 378,924 | $ | — | $ | — | $ | — | $ | 378,924 | ||||||||||
|
|
|
|
|
|
|
|
|
| |||||||||||
| Counterparty | Derivative Liabilities Subject to an MNA by Counterparty | Derivatives Available for Offset(a) | Non- Cash Collateral Pledged(b) | Cash Collateral Pledged(b) | Net Derivative Liabilities(d)(e) | |||||||||||||||
NatWest Markets PLC | $ | 2,727,217 | $ | — | $ | — | $ | — | $ | 2,727,217 | ||||||||||
Royal Bank of Canada | 69,848 | — | — | — | 69,848 | |||||||||||||||
|
|
|
|
|
|
|
|
|
| |||||||||||
| $ | 2,797,065 | $ | — | $ | — | $ | — | $ | 2,797,065 | |||||||||||
|
|
|
|
|
|
|
|
|
| |||||||||||
| (a) | The amount of derivatives available for offset is limited to the amount of derivative assets and/or liabilities that are subject to an MNA. |
| (b) | Excess of collateral received/pledged, if any, from the individual counterparty is not shown for financial reporting purposes. |
| (c) | Net amount represents the net amount receivable from the counterparty in the event of default. |
| (d) | Net amount may also include forward foreign currency exchange contracts that are not required to be collateralized. |
| (e) | Net amount represents the net amount payable due to the counterparty in the event of default. |
Fair Value Hierarchy as of Period End
Various inputs are used in determining the fair value of financial instruments. For a description of the input levels and information about the Fund’s policy regarding valuation of financial instruments, refer to the Notes to Financial Statements.
The following table summarizes the Fund’s financial instruments categorized in the fair value hierarchy. The breakdown of the Fund’s financial instruments into major categories is disclosed in the Schedule of Investments above.
| Level 1 | Level 2 | Level 3 | Total | |||||||||||||
Assets | ||||||||||||||||
Investments | ||||||||||||||||
Long-Term Investments | ||||||||||||||||
Common Stocks | ||||||||||||||||
Biotechnology | $ | 1,920,336,000 | $ | 16,718,614 | $ | — | $ | 1,937,054,614 | ||||||||
Health Care Equipment & Supplies | 2,293,231,373 | — | 687,073 | 2,293,918,446 | ||||||||||||
Health Care Providers & Services | 1,426,227,279 | — | — | 1,426,227,279 | ||||||||||||
Life Sciences Tools & Services | 849,543,967 | — | — | 849,543,967 | ||||||||||||
Pharmaceuticals | 1,467,669,837 | 199,956,495 | — | 1,667,626,332 | ||||||||||||
Other Interests | — | — | 4,383,582 | 4,383,582 | ||||||||||||
Preferred Securities | — | — | 57,794,119 | 57,794,119 | ||||||||||||
Warrants | 47,170 | — | — | 47,170 | ||||||||||||
Short-Term Securities | ||||||||||||||||
Money Market Funds | 211,473,753 | — | — | 211,473,753 | ||||||||||||
|
|
|
|
|
|
|
| |||||||||
| $ | 8,168,529,379 | $ | 216,675,109 | $ | 62,864,774 | 8,448,069,262 | ||||||||||
|
|
|
|
|
|
|
| |||||||||
Investments valued at NAV(a) | 47,521,743 | |||||||||||||||
|
| |||||||||||||||
| $ | 8,495,591,005 | |||||||||||||||
|
| |||||||||||||||
Derivative Financial Instruments(b) | ||||||||||||||||
Assets | ||||||||||||||||
Foreign Currency Exchange Contracts | $ | — | $ | 378,924 | $ | — | $ | 378,924 | ||||||||
| 28 | 2 0 2 3 B L A C K R O C K A N N U A L R E P O R T T O S H A R E H O L D E R S |
Schedule of Investments (continued) May 31, 2023 | BlackRock Health Sciences Opportunities Portfolio |
Fair Value Hierarchy as of Period End (continued)
| Level 1 | Level 2 | Level 3 | Total | |||||||||||||
Liabilities | ||||||||||||||||
Foreign Currency Exchange Contracts | $ | — | $ | (2,797,065 | ) | $ | — | $ | (2,797,065 | ) | ||||||
|
|
|
|
|
|
|
| |||||||||
| $ | — | $ | (2,418,141 | ) | $ | — | $ | (2,418,141 | ) | |||||||
|
|
|
|
|
|
|
| |||||||||
| (a) | Certain investments of the Fund were fair valued using NAV as a practical expedient as no quoted market value is available and therefore have been excluded from the fair value hierarchy. |
| (b) | Derivative financial instruments are forward foreign currency exchange contracts. Forward foreign currency exchange contracts are valued at the unrealized appreciation (depreciation) on the instrument. |
See notes to financial statements.
S C H E D U L E S O F I N V E S T M E N T S | 29 |
Schedule of Investments May 31, 2023 | BlackRock Infrastructure Sustainable Opportunities Fund (Percentages shown are based on Net Assets) |
| Security | Shares | Value | ||||||
| ||||||||
Common Stocks | ||||||||
Commercial Services & Supplies — 4.2% | ||||||||
Smart Metering Systems PLC | 39,010 | $ | 382,389 | |||||
|
| |||||||
| Diversified Telecommunication Services — 7.2% | ||||||||
Cellnex Telecom SA(a) | 8,903 | 360,798 | ||||||
Helios Towers PLC(b) | 75,630 | 85,189 | ||||||
IHS Holding Ltd.(b) | 10,159 | 83,812 | ||||||
Infrastrutture Wireless Italiane SpA(a) | 10,110 | 128,903 | ||||||
|
| |||||||
| 658,702 | ||||||||
| Electric Utilities — 27.5% | ||||||||
EDP - Energias de Portugal SA | 62,830 | 306,918 | ||||||
Enel SpA | 62,688 | 394,559 | ||||||
Eversource Energy | 5,275 | 365,188 | ||||||
Exelon Corp. | 4,664 | 184,928 | ||||||
Hydro One Ltd.(a) | 5,371 | 153,078 | ||||||
Orsted AS(a) | 2,661 | 234,134 | ||||||
SSE PLC | 14,842 | 348,117 | ||||||
Terna - Rete Elettrica Nazionale | 56,410 | 473,972 | ||||||
Xcel Energy, Inc. | 668 | 43,614 | ||||||
|
| |||||||
| 2,504,508 | ||||||||
| Ground Transportation — 5.0% | ||||||||
Canadian Pacific Kansas City Ltd. | 2,290 | 174,495 | ||||||
CSX Corp. | 6,064 | 185,983 | ||||||
West Japan Railway Co. | 2,200 | 92,140 | ||||||
|
| |||||||
| 452,618 | ||||||||
| Health Care REITs — 2.3% | ||||||||
Aedifica SA | 1,226 | 82,366 | ||||||
Physicians Realty Trust | 9,521 | 130,057 | ||||||
|
| |||||||
| 212,423 | ||||||||
| Independent Power and Renewable Electricity Producers — 7.8% | ||||||||
Boralex, Inc., Class A | 7,786 | 215,140 | ||||||
Clearway Energy, Inc., Class C | 13,325 | 382,828 | ||||||
EDP Renovaveis SA | 5,746 | 114,254 | ||||||
|
| |||||||
| 712,222 | ||||||||
| IT Services — 1.5% | ||||||||
NEXTDC Ltd.(b) | 16,197 | 133,701 | ||||||
|
| |||||||
| Multi-Utilities — 6.4% | ||||||||
National Grid PLC | 31,920 | 439,768 | ||||||
REN - Redes Energeticas Nacionais SGPS SA | 52,812 | 141,646 | ||||||
|
| |||||||
| 581,414 | ||||||||
| Office REITs — 1.4% | ||||||||
Alexandria Real Estate Equities, Inc. | 1,138 | 129,117 | ||||||
|
| |||||||
| Specialized REITs — 13.5% | ||||||||
American Tower Corp. | 1,707 | 314,839 | ||||||
| Security | Shares | Value | ||||||
| ||||||||
| Specialized REITs (continued) | ||||||||
Digital Realty Trust, Inc. | 2,242 | $ | 229,715 | |||||
Equinix, Inc. | 332 | 247,523 | ||||||
SBA Communications Corp. | 1,984 | 440,011 | ||||||
|
| |||||||
| 1,232,088 | ||||||||
| Transportation Infrastructure — 10.8% | ||||||||
Aena SME SA(a) | 548 | 85,985 | ||||||
Aeroports de Paris(b) | 1,266 | 192,961 | ||||||
Enav SpA(a) | 10,491 | 44,398 | ||||||
Flughafen Zurich AG, Registered Shares | 736 | 142,289 | ||||||
Fraport AG Frankfurt Airport Services Worldwide(b) | 3,954 | 201,792 | ||||||
Getlink SE | 7,573 | 128,853 | ||||||
Transurban Group | 19,705 | 190,074 | ||||||
|
| |||||||
| 986,352 | ||||||||
| Water Utilities — 1.7% | ||||||||
Severn Trent PLC | 4,528 | 156,428 | ||||||
|
| |||||||
Total Common Stocks — 89.3% | 8,141,962 | |||||||
|
| |||||||
Rights | ||||||||
| Independent Power and Renewable Electricity Producers — 0.0% | ||||||||
EDP Renovaveis SA, Expires 05/31/23(b) | 99 | 1,959 | ||||||
|
| |||||||
Total Rights — 0.0% | 1,959 | |||||||
|
| |||||||
Total Long-Term Investments — 89.3% | 8,143,921 | |||||||
|
| |||||||
Short-Term Securities | ||||||||
| Money Market Funds — 8.0% | ||||||||
BlackRock Liquidity Funds, T-Fund, Institutional Class, 5.00%(c)(d) | 733,814 | 733,814 | ||||||
|
| |||||||
Total Short-Term Securities — 8.0% | 733,814 | |||||||
|
| |||||||
Total Investments — 97.3% | 8,877,735 | |||||||
Other Assets Less Liabilities — 2.7% | 246,647 | |||||||
|
| |||||||
Net Assets — 100.0% | $ | 9,124,382 | ||||||
|
| |||||||
| (a) | Security exempt from registration pursuant to Rule 144A under the Securities Act of 1933, as amended. These securities may be resold in transactions exempt from registration to qualified institutional investors. |
| (b) | Non-income producing security. |
| (c) | Affiliate of the Fund. |
| (d) | Annualized 7-day yield as of period end. |
| 30 | 2 0 2 3 B L A C K R O C K A N N U A L R E P O R T T O S H A R E H O L D E R S |
Schedule of Investments (continued) May 31, 2023
| BlackRock Infrastructure Sustainable Opportunities Fund |
Affiliates
Investments in issuers considered to be affiliate(s) of the Fund during the year ended May 31, 2023 for purposes of Section 2(a)(3) of the Investment Company Act of 1940, as amended, were as follows:
| Affiliated Issuer | Value at 05/31/22 | Purchases at Cost | Proceeds from Sale | Net Realized Gain (Loss) | Change in Unrealized Appreciation (Depreciation) | Value at 05/31/23 | Shares Held at 05/31/23 | Income | Capital Gain Distributions from Underlying Funds | |||||||||||||||||||||||||||
BlackRock Liquidity Funds, T-Fund, Institutional Class | $ | 94,744 | $ | 639,070 | (a) | $ | — | $ | — | $ | — | $ | 733,814 | 733,814 | $ | 12,977 | $ | — | ||||||||||||||||||
SL Liquidity Series, LLC, Money Market Series(b) | — | — | (12 | )(a) | 12 | — | — | — | 699 | (c) | — | |||||||||||||||||||||||||
|
|
|
|
|
|
|
|
|
| |||||||||||||||||||||||||||
| $ | 12 | $ | — | $ | 733,814 | $ | 13,676 | $ | — | |||||||||||||||||||||||||||
|
|
|
|
|
|
|
|
|
| |||||||||||||||||||||||||||
| (a) | Represents net amount purchased (sold). |
| (b) | As of period end, the entity is no longer held. |
| (c) | All or a portion represents securities lending income earned from the reinvestment of cash collateral from loaned securities, net of fees and collateral investment expenses, and other payments to and from borrowers of securities. |
For Fund compliance purposes, the Fund’s industry classifications refer to one or more of the industry sub-classifications used by one or more widely recognized market indexes or rating group indexes, and/or as defined by the investment adviser. These definitions may not apply for purposes of this report, which may combine such industry sub-classifications for reporting ease.
Derivative Financial Instruments Outstanding as of Period End
OTC Total Return Swaps
| Reference Entity | Payment Frequency | Counterparty(a) | Termination Date | Net Notional | Accrued Unrealized Appreciation (Depreciation) | Net Value of Reference Entity | Gross Notional Net Asset Percentage | |||||||||||||||||||
Equity Securities Long/Short | Monthly | Goldman Sachs Bank USA | (c) | 08/19/26 | $ | 107,821 | $ | (6,763 | )(b) | $ | 101,034 | 1.2 | % | |||||||||||||
|
|
|
| |||||||||||||||||||||||
| (a) | The Fund receives the total return on a portfolio of long positions underlying the total return swap. The Fund pays the total return on a portfolio of short positions underlying the total return swap. In addition, the Fund pays or receives a variable rate of interest, based on a specified benchmark. The benchmark and spread are determined based upon the country and/or currency of the individual underlying positions. |
| (b) | Amount includes $24 of net dividends and financing fees. |
The following are the specified benchmarks (plus or minus a range) used in determining the variable rate of interest:
| (c) | |||
Range: | 26 basis points | |||
Benchmarks: | Euro Short-Term Rate: | |||
EUR 1 Day |
The following table represents the individual long positions and related values of equity securities underlying the total return swap with Goldman Sachs Bank USA, as of period end, termination date August 19, 2026:
| ||||||||||||
| Shares | Value | % of Basket Value | ||||||||||
| ||||||||||||
Reference Entity — Long | ||||||||||||
| Common Stocks | ||||||||||||
| Electric Utilities | ||||||||||||
EDP - Energias de Portugal SA | 20,683 | $ | 101,034 | 100.0 | % | |||||||
|
|
|
| |||||||||
Net Value of Reference Entity — | $ | 101,034 | ||||||||||
|
| |||||||||||
S C H E D U L E S O F I N V E S T M E N T S | 31 |
Schedule of Investments (continued) May 31, 2023 | BlackRock Infrastructure Sustainable Opportunities Fund |
Balances Reported in the Statements of Assets and Liabilities for OTC Swaps
| ||||||||||||||
| Swap Premiums Paid | Swap Premiums Received | Unrealized Appreciation | Unrealized Depreciation | |||||||||||
| ||||||||||||||
OTC Swaps | $ | — | $ | — | $ | — | $(6,763) | |||||||
| ||||||||||||||
Derivative Financial Instruments Categorized by Risk Exposure
As of period end, the fair values of derivative financial instruments located in the Statements of Assets and Liabilities were as follows:
| Commodity Contracts | Credit Contracts | Equity Contracts | Foreign Currency Exchange Contracts | Interest Rate Contracts | Other Contracts | Total | ||||||||||||||||||||||
Liabilities — Derivative Financial Instruments | ||||||||||||||||||||||||||||
Swaps — OTC | ||||||||||||||||||||||||||||
Unrealized depreciation on OTC swaps; | ||||||||||||||||||||||||||||
Swap premiums received | $ | — | $ | — | $ | 6,763 | $ | — | $ | — | $ | — | $ | 6,763 | ||||||||||||||
|
|
|
|
|
|
|
|
|
|
|
|
|
| |||||||||||||||
For the period ended May 31, 2023, the effect of derivative financial instruments in the Statements of Operations was as follows:
| Commodity Contracts | Credit Contracts | Equity Contracts | Foreign Currency Exchange Contracts | Interest Rate Contracts | Other Contracts | Total | ||||||||||||||||||||||
Net Realized Gain (Loss) from | ||||||||||||||||||||||||||||
Swaps | $ | — | $ | — | $ | 11,570 | $ | — | $ | — | $ | — | $ | 11,570 | ||||||||||||||
|
|
|
|
|
|
|
|
|
|
|
|
|
| |||||||||||||||
Net Change in Unrealized Appreciation (Depreciation) on | ||||||||||||||||||||||||||||
Swaps | $ | — | $ | — | $ | (10,627 | ) | $ | — | $ | — | $ | — | $ | (10,627 | ) | ||||||||||||
|
|
|
|
|
|
|
|
|
|
|
|
|
| |||||||||||||||
Average Quarterly Balances of Outstanding Derivative Financial Instruments
Total return swaps | ||||
Average notional amount | $ | 121,210 |
For more information about the Fund’s investment risks regarding derivative financial instruments, refer to the Notes to Financial Statements.
Derivative Financial Instruments – Offsetting as of Period End
The Fund’s derivative assets and liabilities (by type) were as follows:
| Assets | Liabilities | |||||||
Derivative Financial Instruments | ||||||||
Swaps — OTC(a) | $ | — | $ | 6,763 | ||||
|
|
|
| |||||
Total derivative assets and liabilities in the Statements of Assets and Liabilities | $ | — | $ | 6,763 | ||||
|
|
|
| |||||
Derivatives not subject to a Master Netting Agreement or similar agreement (“MNA”) | — | — | ||||||
|
|
|
| |||||
Total derivative assets and liabilities subject to an MNA | $ | — | $ | 6,763 | ||||
|
|
|
| |||||
| (a) | Includes unrealized appreciation (depreciation) on OTC swaps and swap premiums (paid/received) in the Statements of Assets and Liabilities. |
| 32 | 2 0 2 3 B L A C K R O C K A N N U A L R E P O R T T O S H A R E H O L D E R S |
Schedule of Investments (continued) May 31, 2023 | BlackRock Infrastructure Sustainable Opportunities Fund |
The following table presents the Fund’s derivative liabilities by counterparty net of amounts available for offset under an MNA and net of the related collateral received by the Fund:
| Counterparty | Derivative Liabilities Subject to an MNA by Counterparty | Derivatives Available for Offset(a) | Non- Cash Collateral Pledged(b) | Cash Collateral Pledged(b) | Net Amount of Derivative Liabilities(c) | |||||||||||||||
Goldman Sachs Bank USA | $ | 6,763 | $ | — | $ | — | $ | — | $ | 6,763 | ||||||||||
|
|
|
|
|
|
|
|
|
| |||||||||||
| (a) | The amount of derivatives available for offset is limited to the amount of derivative assets and/or liabilities that are subject to an MNA. |
| (b) | Excess of collateral received/pledged, if any, from the individual counterparty is not shown for financial reporting purposes. |
| (c) | Net amount represents the net amount payable due to the counterparty in the event of default. |
Fair Value Hierarchy as of Period End
Various inputs are used in determining the fair value of financial instruments. For a description of the input levels and information about the Fund’s policy regarding valuation of financial instruments, refer to the Notes to Financial Statements.
The following table summarizes the Fund’s financial instruments categorized in the fair value hierarchy. The breakdown of the Fund’s financial instruments into major categories is disclosed in the Schedule of Investments above.
| Level 1 | Level 2 | Level 3 | Total | |||||||||||||
Assets | ||||||||||||||||
Investments | ||||||||||||||||
Long-Term Investments | ||||||||||||||||
Common Stocks | ||||||||||||||||
Commercial Services & Supplies | $ | 382,389 | $ | — | $ | — | $ | 382,389 | ||||||||
Diversified Telecommunication Services | 83,812 | 574,890 | — | 658,702 | ||||||||||||
Electric Utilities | 746,808 | 1,757,700 | — | 2,504,508 | ||||||||||||
Ground Transportation | 360,478 | 92,140 | — | 452,618 | ||||||||||||
Health Care REITs | 130,057 | 82,366 | — | 212,423 | ||||||||||||
Independent Power and Renewable Electricity Producers | 597,968 | 114,254 | — | 712,222 | ||||||||||||
IT Services | — | 133,701 | — | 133,701 | ||||||||||||
Multi-Utilities | — | 581,414 | — | 581,414 | ||||||||||||
Office REITs | 129,117 | — | — | 129,117 | ||||||||||||
Specialized REITs | 1,232,088 | — | — | 1,232,088 | ||||||||||||
Transportation Infrastructure | — | 986,352 | — | 986,352 | ||||||||||||
Water Utilities | — | 156,428 | — | 156,428 | ||||||||||||
Rights | — | 1,959 | — | 1,959 | ||||||||||||
Short-Term Securities | ||||||||||||||||
Money Market Funds | 733,814 | — | — | 733,814 | ||||||||||||
|
|
|
|
|
|
|
| |||||||||
| $ | 4,396,531 | $ | 4,481,204 | $ | — | $ | 8,877,735 | |||||||||
|
|
|
|
|
|
|
| |||||||||
Derivative Financial Instruments(a) | ||||||||||||||||
Liabilities | ||||||||||||||||
Equity Contracts | $ | — | $ | (6,763 | ) | $ | — | $ | (6,763 | ) | ||||||
|
|
|
|
|
|
|
| |||||||||
| (a) | Derivative financial instruments are swaps. Swaps are valued at the unrealized appreciation (depreciation) on the instrument. |
See notes to financial statements.
S C H E D U L E S O F I N V E S T M E N T S | 33 |
Schedule of Investments May 31, 2023 | BlackRock Mid-Cap Growth Equity Portfolio (Percentages shown are based on Net Assets) |
| Security | Shares | Value | ||||||
Common Stocks | ||||||||
Aerospace & Defense — 4.1% | ||||||||
HEICO Corp. | 1,348,541 | $ | 208,457,468 | |||||
TransDigm Group, Inc. | 342,941 | 265,316,304 | ||||||
|
| |||||||
| 473,773,772 | ||||||||
| Automobiles — 2.3% | ||||||||
Ferrari NV | 937,538 | 268,764,018 | ||||||
|
| |||||||
| Capital Markets — 11.0% | ||||||||
Ares Management Corp., Class A | 2,727,142 | 237,506,797 | ||||||
KKR & Co., Inc., Class A | 5,202,461 | 267,874,717 | ||||||
MarketAxess Holdings, Inc. | 446,016 | 121,499,218 | ||||||
MSCI, Inc., Class A | 772,305 | 363,392,672 | ||||||
Tradeweb Markets, Inc., Class A | 4,069,609 | 272,460,322 | ||||||
|
| |||||||
| 1,262,733,726 | ||||||||
| Commercial Services & Supplies — 8.7% | ||||||||
Cintas Corp. | 549,728 | 259,548,578 | ||||||
Copart, Inc.(a) | 5,148,523 | 450,959,130 | ||||||
Rollins, Inc. | 3,837,301 | 150,882,675 | ||||||
Waste Connections, Inc. | 1,013,976 | 138,559,820 | ||||||
|
| |||||||
| 999,950,203 | ||||||||
| Communications Equipment — 1.1% | ||||||||
Motorola Solutions, Inc. | 437,446 | 123,324,776 | ||||||
|
| |||||||
| Construction & Engineering — 0.8% | ||||||||
WillScot Mobile Mini Holdings Corp.(a) | 2,238,756 | 96,445,609 | ||||||
|
| |||||||
| Construction Materials — 1.1% | ||||||||
Vulcan Materials Co. | 630,781 | 123,317,686 | ||||||
|
| |||||||
| Distributors — 1.1% | ||||||||
Pool Corp. | 397,312 | 125,641,974 | ||||||
|
| |||||||
| Diversified Telecommunication Services — 0.0% | ||||||||
GCI Liberty, Inc., Class A(a)(b) | 1,528,805 | 15 | ||||||
|
| |||||||
| Electronic Equipment, Instruments & Components — 1.5% | ||||||||
Teledyne Technologies, Inc.(a) | 435,079 | 169,093,453 | ||||||
|
| |||||||
| Entertainment — 4.1% | ||||||||
Liberty Media Corp. - Liberty Formula One, Class C, NVS(a) | 3,701,124 | 260,559,130 | ||||||
Live Nation Entertainment, Inc.(a)(c) | 2,602,799 | 208,067,752 | ||||||
|
| |||||||
| 468,626,882 | ||||||||
| Ground Transportation — 1.9% | ||||||||
Old Dominion Freight Line, Inc. | 718,484 | 223,046,173 | ||||||
|
| |||||||
| Health Care Equipment & Supplies — 6.0% | ||||||||
Alcon, Inc.(c) | 2,496,954 | 193,239,270 | ||||||
IDEXX Laboratories, Inc.(a) | 632,959 | 294,180,354 | ||||||
Insulet Corp.(a)(c) | 238,357 | 65,369,407 | ||||||
Teleflex, Inc.(c) | 588,330 | 138,110,468 | ||||||
|
| |||||||
| 690,899,499 | ||||||||
| Hotels, Restaurants & Leisure — 6.5% | ||||||||
Domino’s Pizza, Inc. | 88,795 | 25,737,231 | ||||||
Evolution AB(d) | 1,667,252 | 220,091,545 | ||||||
Expedia Group, Inc.(a)(c) | 2,157,720 | 206,515,381 | ||||||
Planet Fitness, Inc., Class A(a)(c) | 3,086,037 | 197,321,206 | ||||||
Vail Resorts, Inc. | 392,818 | 95,533,338 | ||||||
|
| |||||||
| 745,198,701 | ||||||||
| Interactive Media & Services — 2.0% | ||||||||
Match Group, Inc.(a) | 6,700,633 | 231,171,839 | ||||||
|
| |||||||
| Security | Shares | Value | ||||||
| IT Services — 3.3% | ||||||||
Globant SA(a)(c) | 1,043,251 | $ | 191,759,966 | |||||
MongoDB, Inc., Class A(a) | 630,103 | 185,117,961 | ||||||
|
| |||||||
| 376,877,927 | ||||||||
| Life Sciences Tools & Services — 9.2% | ||||||||
Agilent Technologies, Inc. | 973,496 | 112,604,282 | ||||||
Bio-Techne Corp.(c) | 2,423,483 | 198,216,675 | ||||||
Charles River Laboratories International, | 861,394 | 166,576,372 | ||||||
Mettler-Toledo International, Inc.(a)(c) | 85,983 | 113,658,348 | ||||||
Repligen Corp.(a)(c) | 989,083 | 166,086,817 | ||||||
West Pharmaceutical Services, Inc.(c) | 909,195 | 304,243,923 | ||||||
|
| |||||||
| 1,061,386,417 | ||||||||
| Machinery — 0.4% | ||||||||
IDEX Corp. | 263,072 | 52,393,420 | ||||||
|
| |||||||
| Oil, Gas & Consumable Fuels — 1.8% | ||||||||
Cheniere Energy, Inc. | 1,382,727 | 193,263,753 | ||||||
EQT Corp. | 271,729 | 9,448,017 | ||||||
|
| |||||||
| 202,711,770 | ||||||||
| Professional Services — 5.6% | ||||||||
CoStar Group, Inc.(a) | 3,806,138 | 302,207,357 | ||||||
Equifax, Inc.(c) | 939,156 | 195,926,725 | ||||||
Paycom Software, Inc. | 513,763 | 143,920,429 | ||||||
|
| |||||||
| 642,054,511 | ||||||||
| Semiconductors & Semiconductor Equipment — 9.2% | ||||||||
Enphase Energy, Inc.(a) | 417,987 | 72,679,579 | ||||||
Entegris, Inc. | 3,708,193 | 390,287,313 | ||||||
Monolithic Power Systems, Inc. | 716,015 | 350,782,909 | ||||||
ON Semiconductor Corp.(a) | 2,858,000 | 238,928,800 | ||||||
|
| |||||||
| 1,052,678,601 | ||||||||
| Software — 13.9% | ||||||||
ANSYS, Inc.(a)(c) | 875,794 | 283,398,180 | ||||||
Aspen Technology, Inc.(a)(c) | 844,163 | 138,375,199 | ||||||
Cadence Design Systems, Inc.(a) | 1,713,948 | 395,767,733 | ||||||
Crowdstrike Holdings, Inc., Class A(a) | 901,168 | 144,304,032 | ||||||
HubSpot, Inc.(a) | 578,408 | 299,609,560 | ||||||
Roper Technologies, Inc. | 351,733 | 159,764,163 | ||||||
Splunk, Inc.(a) | 1,528,570 | 151,771,715 | ||||||
Tyler Technologies, Inc.(a)(c) | 62,010 | 24,615,490 | ||||||
|
| |||||||
| 1,597,606,072 | ||||||||
| Specialized REITs — 0.2% | ||||||||
SBA Communications Corp. | 98,406 | 21,824,483 | ||||||
|
| |||||||
| Specialty Retail — 3.6% | ||||||||
Burlington Stores, Inc.(a) | 806,563 | 121,355,469 | ||||||
Floor & Decor Holdings, Inc., Class A(a)(c) | 1,722,257 | 157,259,287 | ||||||
Tractor Supply Co. | 623,546 | 130,689,006 | ||||||
|
| |||||||
| 409,303,762 | ||||||||
| Textiles, Apparel & Luxury Goods — 0.8% | ||||||||
Lululemon Athletica, Inc.(a) | 272,479 | 90,443,954 | ||||||
|
| |||||||
Total Long-Term Investments — 100.2% | 11,509,269,243 | |||||||
|
| |||||||
| 34 | 2 0 2 3 B L A C K R O C K A N N U A L R E P O R T T O S H A R E H O L D E R S |
Schedule of Investments (continued) May 31, 2023 | BlackRock Mid-Cap Growth Equity Portfolio (Percentages shown are based on Net Assets) |
| Security | Shares | Value | ||||||
Short-Term Securities | ||||||||
Money Market Funds — 2.5% | ||||||||
BlackRock Liquidity Funds, T-Fund, Institutional Class, 5.00%(e)(f) | 34,969,706 | $ | 34,969,706 | |||||
SL Liquidity Series, LLC, Money Market Series, 5.32%(e)(f)(g) | 248,967,968 | 248,967,968 | ||||||
|
| |||||||
Total Short-Term Securities — 2.5% | 283,937,674 | |||||||
|
| |||||||
Total Investments — 102.7% | 11,793,206,917 | |||||||
Liabilities in Excess of Other Assets — (2.7)% |
| (304,628,332 | ) | |||||
|
| |||||||
Net Assets — 100.0% | $ | 11,488,578,585 | ||||||
|
| |||||||
| (a) | Non-income producing security. |
| (b) | Security is valued using significant unobservable inputs and is classified as Level 3 in the fair value hierarchy. |
| (c) | All or a portion of this security is on loan. |
| (d) | Security exempt from registration pursuant to Rule 144A under the Securities Act of 1933, as amended. These securities may be resold in transactions exempt from registration to qualified institutional investors. |
| (e) | Affiliate of the Fund. |
| (f) | Annualized 7-day yield as of period end. |
| (g) | All or a portion of this security was purchased with the cash collateral from loaned securities. |
Affiliates
Investments in issuers considered to be affiliate(s) of the Fund during the year ended May 31, 2023 for purposes of Section 2(a)(3) of the Investment Company Act of 1940, as amended, were as follows:
| Affiliated Issuer | Value at 05/31/22 | Purchases at Cost | Proceeds from Sale | Net Realized Gain (Loss) | Change in Unrealized Appreciation (Depreciation) | Value at 05/31/23 | Shares Held at | Income | Capital Gain | |||||||||||||||||||||||||||
BlackRock Liquidity Funds, T-Fund, Institutional Class | $ | 73,220,432 | $ | — | $ | (38,250,726 | )(a) | $ | — | $ | — | $ | 34,969,706 | 34,969,706 | $ | 2,486,844 | $ | — | ||||||||||||||||||
SL Liquidity Series, LLC, Money Market Series | 194,058,888 | 54,801,246 | (a) | — | 44,087 | 63,747 | 248,967,968 | 248,967,968 | 922,371 | (b) | — | |||||||||||||||||||||||||
|
|
|
|
|
|
|
|
|
| |||||||||||||||||||||||||||
| $ | 44,087 | $ | 63,747 | $ | 283,937,674 | $ | 3,409,215 | $ | — | |||||||||||||||||||||||||||
|
|
|
|
|
|
|
|
|
| |||||||||||||||||||||||||||
| (a) | Represents net amount purchased (sold). |
| (b) | All or a portion represents securities lending income earned from the reinvestment of cash collateral from loaned securities, net of fees and collateral investment expenses, and other payments to and from borrowers of securities. |
For Fund compliance purposes, the Fund’s industry classifications refer to one or more of the industry sub-classifications used by one or more widely recognized market indexes or rating group indexes, and/or as defined by the investment adviser. These definitions may not apply for purposes of this report, which may combine such industry sub-classifications for reporting ease.
S C H E D U L E S O F I N V E S T M E N T S | 35 |
Schedule of Investments (continued) May 31, 2023 | BlackRock Mid-Cap Growth Equity Portfolio |
Fair Value Hierarchy as of Period End
Various inputs are used in determining the fair value of financial instruments. For a description of the input levels and information about the Fund’s policy regarding valuation of financial instruments, refer to the Notes to Financial Statements.
The following table summarizes the Fund’s financial instruments categorized in the fair value hierarchy. The breakdown of the Fund’s financial instruments into major categories is disclosed in the Schedule of Investments above.
| Level 1 | Level 2 | Level 3 | Total | |||||||||||||
Assets | ||||||||||||||||
Investments | ||||||||||||||||
Long-Term Investments | ||||||||||||||||
Common Stocks | ||||||||||||||||
Aerospace & Defense | $ | 473,773,772 | $ | — | $ | — | $ | 473,773,772 | ||||||||
Automobiles | 268,764,018 | — | — | 268,764,018 | ||||||||||||
Capital Markets | 1,262,733,726 | — | — | 1,262,733,726 | ||||||||||||
Commercial Services & Supplies | 999,950,203 | — | — | 999,950,203 | ||||||||||||
Communications Equipment | 123,324,776 | — | — | 123,324,776 | ||||||||||||
Construction & Engineering | 96,445,609 | — | — | 96,445,609 | ||||||||||||
Construction Materials | 123,317,686 | — | — | 123,317,686 | ||||||||||||
Distributors | 125,641,974 | — | — | 125,641,974 | ||||||||||||
Diversified Telecommunication Services | — | — | 15 | 15 | ||||||||||||
Electronic Equipment, Instruments & Components | 169,093,453 | — | — | 169,093,453 | ||||||||||||
Entertainment | 468,626,882 | — | — | 468,626,882 | ||||||||||||
Ground Transportation | 223,046,173 | — | — | 223,046,173 | ||||||||||||
Health Care Equipment & Supplies | 690,899,499 | — | — | 690,899,499 | ||||||||||||
Hotels, Restaurants & Leisure | 525,107,156 | 220,091,545 | — | 745,198,701 | ||||||||||||
Interactive Media & Services | 231,171,839 | — | — | 231,171,839 | ||||||||||||
IT Services | 376,877,927 | — | — | 376,877,927 | ||||||||||||
Life Sciences Tools & Services | 1,061,386,417 | — | — | 1,061,386,417 | ||||||||||||
Machinery | 52,393,420 | — | — | 52,393,420 | ||||||||||||
Oil, Gas & Consumable Fuels | 202,711,770 | — | — | 202,711,770 | ||||||||||||
Professional Services | 642,054,511 | — | — | 642,054,511 | ||||||||||||
Semiconductors & Semiconductor Equipment | 1,052,678,601 | — | — | 1,052,678,601 | ||||||||||||
Software | 1,597,606,072 | — | — | 1,597,606,072 | ||||||||||||
Specialized REITs | 21,824,483 | — | — | 21,824,483 | ||||||||||||
Specialty Retail | 409,303,762 | — | — | 409,303,762 | ||||||||||||
Textiles, Apparel & Luxury Goods | 90,443,954 | — | — | 90,443,954 | ||||||||||||
Short-Term Securities | ||||||||||||||||
Money Market Funds | 34,969,706 | — | — | 34,969,706 | ||||||||||||
|
|
|
|
|
|
|
| |||||||||
| $ | 11,324,147,389 | $ | 220,091,545 | $ | 15 | 11,544,238,949 | ||||||||||
|
|
|
|
|
|
|
| |||||||||
Investments valued at NAV(a) | 248,967,968 | |||||||||||||||
|
| |||||||||||||||
| $ | 11,793,206,917 | |||||||||||||||
|
| |||||||||||||||
| (a) | Certain investments of the Fund were fair valued using NAV as a practical expedient as no quoted market value is available and therefore have been excluded from the fair value hierarchy. |
See notes to financial statements.
| 36 | 2 0 2 3 B L A C K R O C K A N N U A L R E P O R T T O S H A R E H O L D E R S |
Schedule of Investments May 31, 2023 | BlackRock Technology Opportunities Fund (Percentages shown are based on Net Assets) |
| Security | Shares | Value | ||||||
Common Stocks | ||||||||
Aerospace & Defense — 0.1% | ||||||||
Rocket Lab U.S.A., Inc., Class A(a)(b) | 634,507 | $ | 2,906,042 | |||||
|
| |||||||
| Automobiles — 2.5% | ||||||||
Tesla, Inc.(a)(b) | 537,501 | 109,612,579 | ||||||
|
| |||||||
| Broadline Retail — 4.6% | ||||||||
Alibaba Group Holding Ltd., ADR(a)(b) | 359,565 | 28,603,396 | ||||||
Amazon.com, Inc.(a) | 733,381 | 88,431,081 | ||||||
Coupang, Inc., Class A(a) | 1,270,178 | 19,814,777 | ||||||
MercadoLibre, Inc.(a) | 53,906 | 66,789,534 | ||||||
|
| |||||||
| 203,638,788 | ||||||||
| Capital Markets — 1.2% | ||||||||
MSCI, Inc., Class A | 38,189 | 17,969,070 | ||||||
S&P Global, Inc. | 99,924 | 36,715,075 | ||||||
|
| |||||||
| 54,684,145 | ||||||||
| Communications Equipment — 1.3% | ||||||||
Arista Networks, Inc.(a) | 154,118 | 25,635,988 | ||||||
Motorola Solutions, Inc. | 107,210 | 30,224,643 | ||||||
|
| |||||||
| 55,860,631 | ||||||||
| Diversified Consumer Services — 0.1% | ||||||||
Think & Learn Private Ltd. (Acquired 09/30/20, cost $3,427,642)(a)(c)(d) | 2,241 | 3,768,635 | ||||||
|
| |||||||
| Electrical Equipment — 0.6% | ||||||||
NEXTracker, Inc., Class A(a)(b) | 717,031 | 27,426,436 | ||||||
|
| |||||||
| Electronic Equipment, Instruments & Components — 1.2% | ||||||||
Flex Ltd.(a) | 1,307,502 | 33,197,476 | ||||||
Keyence Corp. | 39,200 | 19,003,294 | ||||||
|
| |||||||
| 52,200,770 | ||||||||
| Entertainment — 2.6% | ||||||||
Netflix, Inc.(a) | 87,885 | 34,734,789 | ||||||
ROBLOX Corp., Class A(a) | 499,645 | 20,915,140 | ||||||
Spotify Technology SA(a) | 225,570 | 33,587,373 | ||||||
Warner Music Group Corp., Class A | 1,037,665 | 25,370,909 | ||||||
|
| |||||||
| 114,608,211 | ||||||||
| Financial Services — 7.2% | ||||||||
Adyen NV(a)(e) | 30,939 | 50,673,199 | ||||||
GMO Payment Gateway, Inc. | 412,100 | 32,499,017 | ||||||
Mastercard, Inc., Class A | 327,782 | 119,646,985 | ||||||
Visa, Inc., Class A | 467,656 | 103,366,006 | ||||||
Wise PLC, Class A(a) | 1,566,849 | 11,354,230 | ||||||
|
| |||||||
| 317,539,437 | ||||||||
| Ground Transportation — 0.7% | ||||||||
Uber Technologies, Inc.(a) | 847,184 | 32,133,689 | ||||||
|
| |||||||
| Health Care Technology — 0.5% | ||||||||
M3, Inc. | 917,800 | 20,371,625 | ||||||
|
| |||||||
| Hotels, Restaurants & Leisure — 0.7% | ||||||||
Trip.com Group Ltd.(a) | 934,350 | 29,758,010 | ||||||
|
| |||||||
| Household Durables — 0.6% | ||||||||
Sony Group Corp. | 268,900 | 25,217,545 | ||||||
|
| |||||||
| Interactive Media & Services — 5.4% | ||||||||
Alphabet, Inc., Class A(a) | 823,017 | 101,124,099 | ||||||
Meta Platforms, Inc., Class A(a) | 377,059 | 99,815,059 | ||||||
Tencent Holdings Ltd. | 887,700 | 35,130,143 | ||||||
|
| |||||||
| 236,069,301 | ||||||||
| Security | Shares | Value | ||||||
| IT Services — 1.9% | ||||||||
Klarna Holdings AB (Acquired 09/15/20, cost $11,017,172)(a)(c)(d) | 25,600 | $ | 5,152,437 | |||||
MongoDB, Inc., Class A(a) | 153,671 | 45,147,003 | ||||||
Shopify, Inc., Class A(a)(b) | 418,249 | 23,919,660 | ||||||
Snowflake, Inc., Class A(a) | 50,275 | 8,313,474 | ||||||
|
| |||||||
| 82,532,574 | ||||||||
| Professional Services — 0.6% | ||||||||
RELX PLC | 879,187 | 27,496,277 | ||||||
|
| |||||||
| Real Estate Management & Development — 0.0% | ||||||||
KE Holdings, Inc., ADR(a) | 104,488 | 1,487,909 | ||||||
|
| |||||||
| Semiconductors & Semiconductor Equipment — 27.5% | ||||||||
Advanced Micro Devices, Inc.(a) | 981,786 | 116,056,923 | ||||||
ASM International NV | 102,041 | 44,397,373 | ||||||
ASML Holding NV | 208,685 | 150,947,396 | ||||||
Broadcom, Inc. | 133,674 | 108,003,245 | ||||||
First Solar, Inc.(a) | 127,635 | 25,904,800 | ||||||
Lam Research Corp. | 117,006 | 72,157,600 | ||||||
Marvell Technology, Inc. | 1,137,788 | 66,549,220 | ||||||
Micron Technology, Inc. | 543,492 | 37,066,155 | ||||||
Monolithic Power Systems, Inc. | 141,977 | 69,555,952 | ||||||
NVIDIA Corp. | 793,861 | 300,349,371 | ||||||
Renesas Electronics Corp.(a) | 1,158,400 | 18,748,936 | ||||||
SOITEC(a) | 304,386 | 42,780,586 | ||||||
SolarEdge Technologies, Inc.(a) | 70,523 | 20,087,066 | ||||||
STMicroelectronics NV | 1,283,978 | 55,887,165 | ||||||
Taiwan Semiconductor Manufacturing Co. Ltd., ADR | 351,888 | 34,692,638 | ||||||
Wolfspeed, Inc.(a)(b) | 943,745 | 45,337,510 | ||||||
|
| |||||||
| 1,208,521,936 | ||||||||
| Software — 27.1% | ||||||||
Adobe, Inc.(a) | 55,153 | 23,042,372 | ||||||
Altium Ltd. | 1,532,415 | 38,563,438 | ||||||
ANSYS, Inc.(a) | 129,249 | 41,823,684 | ||||||
Aspen Technology, Inc.(a)(b) | 140,501 | 23,030,924 | ||||||
Atlassian Corp., Class A(a) | 157,761 | 28,521,611 | ||||||
Autodesk, Inc.(a) | 94,780 | 18,898,184 | ||||||
Cadence Design Systems, Inc.(a) | 617,967 | 142,694,760 | ||||||
Constellation Software, Inc. | 22,107 | 45,077,272 | ||||||
Crowdstrike Holdings, Inc., Class A(a)(b) | 143,583 | 22,991,946 | ||||||
Dassault Systemes SE | 721,224 | 31,796,853 | ||||||
Databricks, Inc. (Acquired 07/24/20 - 09/02/20, cost $5,122,891)(a)(c)(d) | 319,983 | 17,775,056 | ||||||
Fair Isaac Corp.(a) | 78,995 | 62,221,992 | ||||||
Intuit, Inc. | 159,667 | 66,919,633 | ||||||
Microsoft Corp. | 1,275,538 | 418,873,924 | ||||||
Oracle Corp. | 817,483 | 86,604,149 | ||||||
Salesforce, Inc.(a) | 246,793 | 55,128,620 | ||||||
ServiceNow, Inc.(a) | 64,781 | 35,291,393 | ||||||
Unqork, Inc. (Acquired 03/05/21, cost $4,093,769)(a)(c)(d) | 149,520 | 880,673 | ||||||
Xero Ltd.(a) | 391,876 | 27,977,232 | ||||||
|
| |||||||
| 1,188,113,716 | ||||||||
| Specialty Retail — 0.0% | ||||||||
AceVector Ltd. (Acquired 05/07/14 - 10/29/14, cost $1,414,399)(a)(c)(d) | 304,000 | 224,293 | ||||||
|
| |||||||
S C H E D U L E S O F I N V E S T M E N T S | 37 |
Schedule of Investments (continued) May 31, 2023 | BlackRock Technology Opportunities Fund (Percentages shown are based on Net Assets) |
| Security | Shares | Value | ||||||
| Technology Hardware, Storage & Peripherals — 10.4% | ||||||||
Apple Inc. | 2,459,346 | $ | 435,919,078 | |||||
Samsung Electronics Co. Ltd. | 382,584 | 20,525,809 | ||||||
|
| |||||||
| 456,444,887 | ||||||||
|
| |||||||
Total Common Stocks — 96.8% | 4,250,617,436 | |||||||
|
| |||||||
Preferred Securities | ||||||||
Preferred Stocks — 2.4% | ||||||||
| Diversified Consumer Services — 0.2% | ||||||||
FlixMobility GmbH, Series F (Acquired 07/26/19, cost $2,490,608)(a)(c)(d) | 125 | 3,140,136 | ||||||
Think & Learn Private Ltd., Series F (Acquired 09/30/20, cost $6,867,746)(a)(c)(d) | 2,371 | 3,987,253 | ||||||
|
| |||||||
| 7,127,389 | ||||||||
| IT Services — 1.0% | ||||||||
Bytedance Ltd., Series E-1 (Acquired 11/11/20, cost $22,196,442)(a)(c)(d) | 202,570 | 35,149,804 | ||||||
Farmer’s Business Network, Inc., Series F (Acquired 07/31/20, cost $6,419,592)(a)(c)(d) | 194,200 | 7,851,506 | ||||||
|
| |||||||
| 43,001,310 | ||||||||
| Semiconductors & Semiconductor Equipment — 0.3% | ||||||||
PsiQuantum Corp., Series C (Acquired 09/09/19, cost $2,698,453)(a)(c)(d) | 581,814 | 11,461,736 | ||||||
|
| |||||||
| Software — 0.9% | ||||||||
Databricks, Inc. | ||||||||
Series F, 0.00% (Acquired 10/22/19, cost $3,700,005)(a)(c)(d) | 258,450 | 14,356,897 | ||||||
Series G, 0.00% (Acquired 02/01/21, cost $12,500,003)(a)(c)(d) | 211,425 | 11,744,659 | ||||||
SambaNova Systems, Inc., Series C (Acquired 02/20/20, cost $9,804,574)(a)(c)(d) | 184,153 | 12,527,929 | ||||||
Unqork, Inc. | ||||||||
Series A, 0.00% (Acquired 03/05/21, cost $194,941)(a)(c)(d) | 7,120 | 44,215 | ||||||
Series B, 0.00% (Acquired 03/05/21, cost $314,316)(a)(c)(d) | 11,480 | 78,408 | ||||||
Series C, 0.00% (Acquired 09/18/20, cost $8,323,340)(a)(c)(d) | 304,000 | 2,580,960 | ||||||
| Security | Shares | Value | ||||||
| Software (continued) | ||||||||
Unqork, Inc. | ||||||||
Series Seed, 0.00% (Acquired 03/05/21, cost $489,544)(a)(c)(d) | 17,880 | $ | 106,565 | |||||
Series Seed A, 0.00% (Acquired 03/05/21, cost $180,704)(a)(c)(d) | 6,600 | 39,270 | ||||||
|
| |||||||
| 41,478,903 | ||||||||
|
| |||||||
Total Preferred Securities — 2.4% (Cost: $76,181,919) | 103,069,338 | |||||||
|
| |||||||
Total Long-Term Investments — 99.2% (Cost: $2,628,321,578) | 4,353,686,774 | |||||||
|
| |||||||
Short-Term Securities | ||||||||
| Money Market Funds — 4.2% | ||||||||
BlackRock Liquidity Funds, T-Fund, Institutional Class, 5.00%(f)(g) | 37,081,328 | 37,081,328 | ||||||
SL Liquidity Series, LLC, Money Market Series, 5.32%(f)(g)(h) | 148,567,014 | 148,567,014 | ||||||
|
| |||||||
Total Short-Term Securities — 4.2% (Cost: $185,620,595) | 185,648,342 | |||||||
|
| |||||||
Total Investments — 103.4% | 4,539,335,116 | |||||||
Liabilities in Excess of Other Assets — (3.4)% |
| (150,274,641 | ) | |||||
|
| |||||||
Net Assets — 100.0% | $ | 4,389,060,475 | ||||||
|
| |||||||
| (a) | Non-income producing security. |
| (b) | All or a portion of this security is on loan. |
| (c) | Security is valued using significant unobservable inputs and is classified as Level 3 in the fair value hierarchy. |
| (d) | Restricted security as to resale, excluding 144A securities. The Fund held restricted securities with a current value of $130,870,432, representing 3.0% of its net assets as of period end, and an original cost of $101,257,792. |
| (e) | Security exempt from registration pursuant to Rule 144A under the Securities Act of 1933, as amended. These securities may be resold in transactions exempt from registration to qualified institutional investors. |
| (f) | Affiliate of the Fund. |
| (g) | Annualized 7-day yield as of period end. |
| (h) | All or a portion of this security was purchased with the cash collateral from loaned securities. |
| 38 | 2 0 2 3 B L A C K R O C K A N N U A L R E P O R T T O S H A R E H O L D E R S |
Schedule of Investments (continued) May 31, 2023 | BlackRock Technology Opportunities Fund |
Affiliates
Investments in issuers considered to be affiliate(s) of the Fund during the year ended May 31, 2023 for purposes of Section 2(a)(3) of the Investment Company Act of 1940, as amended, were as follows:
| Affiliated Issuer | Value at 05/31/22 | Purchases at Cost | Proceeds from Sale | Net Realized Gain (Loss) | Change in Unrealized Appreciation (Depreciation) | Value at 05/31/23 | Shares Held at | Income | Capital Gain | |||||||||||||||||||||||||||
BlackRock Liquidity Funds, T-Fund, Institutional Class | $ | 65,188,334 | $ | — | $ | (28,107,006 | )(a) | $ | — | $ | — | $ | 37,081,328 | 37,081,328 | $ | 1,039,179 | $ | — | ||||||||||||||||||
SL Liquidity Series, LLC, Money Market Series | 104,736,728 | 43,855,814 | (a) | — | (24,547 | ) | (981 | ) | 148,567,014 | 148,567,014 | 887,066 | (b) | — | |||||||||||||||||||||||
|
|
|
|
|
|
|
|
|
| |||||||||||||||||||||||||||
| $ | (24,547 | ) | $ | (981 | ) | $ | 185,648,342 | $ | 1,926,245 | $ | — | |||||||||||||||||||||||||
|
|
|
|
|
|
|
|
|
| |||||||||||||||||||||||||||
| (a) | Represents net amount purchased (sold). |
| (b) | All or a portion represents securities lending income earned from the reinvestment of cash collateral from loaned securities, net of fees and collateral investment expenses, and other payments to and from borrowers of securities. |
For Fund compliance purposes, the Fund’s industry classifications refer to one or more of the industry sub-classifications used by one or more widely recognized market indexes or rating group indexes, and/or as defined by the investment adviser. These definitions may not apply for purposes of this report, which may combine such industry sub-classifications for reporting ease.
Fair Value Hierarchy as of Period End
Various inputs are used in determining the fair value of financial instruments. For a description of the input levels and information about the Fund’s policy regarding valuation of financial instruments, refer to the Notes to Financial Statements.
The following table summarizes the Fund’s financial instruments categorized in the fair value hierarchy. The breakdown of the Fund’s financial instruments into major categories is disclosed in the Schedule of Investments above.
| Level 1 | Level 2 | Level 3 | Total | |||||||||||||
Assets | ||||||||||||||||
Investments | ||||||||||||||||
Long-Term Investments | ||||||||||||||||
Common Stocks | ||||||||||||||||
Aerospace & Defense | $ | 2,906,042 | $ | — | $ | — | $ | 2,906,042 | ||||||||
Automobiles | 109,612,579 | — | — | 109,612,579 | ||||||||||||
Broadline Retail | 203,638,788 | — | — | 203,638,788 | ||||||||||||
Capital Markets | 54,684,145 | — | — | 54,684,145 | ||||||||||||
Communications Equipment | 55,860,631 | — | — | 55,860,631 | ||||||||||||
Diversified Consumer Services | — | — | 3,768,635 | 3,768,635 | ||||||||||||
Electrical Equipment | 27,426,436 | — | — | 27,426,436 | ||||||||||||
Electronic Equipment, Instruments & Components | 33,197,476 | 19,003,294 | — | 52,200,770 | ||||||||||||
Entertainment | 114,608,211 | — | — | 114,608,211 | ||||||||||||
Financial Services | 223,012,991 | 94,526,446 | — | 317,539,437 | ||||||||||||
Ground Transportation | 32,133,689 | — | — | 32,133,689 | ||||||||||||
Health Care Technology | — | 20,371,625 | — | 20,371,625 | ||||||||||||
Hotels, Restaurants & Leisure | — | 29,758,010 | — | 29,758,010 | ||||||||||||
Household Durables | — | 25,217,545 | — | 25,217,545 | ||||||||||||
Interactive Media & Services | 200,939,158 | 35,130,143 | — | 236,069,301 | ||||||||||||
IT Services | 77,380,137 | — | 5,152,437 | 82,532,574 | ||||||||||||
Professional Services | — | 27,496,277 | — | 27,496,277 | ||||||||||||
Real Estate Management & Development | 1,487,909 | — | — | 1,487,909 | ||||||||||||
Semiconductors & Semiconductor Equipment | 895,760,480 | 312,761,456 | — | 1,208,521,936 | ||||||||||||
Software | 1,071,120,464 | 98,337,523 | 18,655,729 | 1,188,113,716 | ||||||||||||
Specialty Retail | — | — | 224,293 | 224,293 | ||||||||||||
Technology Hardware, Storage & Peripherals | 435,919,078 | 20,525,809 | — | 456,444,887 | ||||||||||||
Preferred Securities | — | — | 103,069,338 | 103,069,338 | ||||||||||||
S C H E D U L E S O F I N V E S T M E N T S | 39 |
Schedule of Investments (continued) May 31, 2023 | BlackRock Technology Opportunities Fund |
Fair Value Hierarchy as of Period End (continued)
| Level 1 | Level 2 | Level 3 | Total | |||||||||||||
Short-Term Securities | ||||||||||||||||
Money Market Funds | $ | 37,081,328 | $ | — | $ | — | $ | 37,081,328 | ||||||||
|
|
|
|
|
|
|
| |||||||||
| $ | 3,576,769,542 | $ | 683,128,128 | $ | 130,870,432 | 4,390,768,102 | ||||||||||
|
|
|
|
|
|
|
| |||||||||
Investments valued at NAV(a) | 148,567,014 | |||||||||||||||
|
| |||||||||||||||
| $ | 4,539,335,116 | |||||||||||||||
|
| |||||||||||||||
| (a) | Certain investments of the Fund were fair valued using NAV as a practical expedient as no quoted market value is available and therefore have been excluded from the fair value hierarchy. |
A reconciliation of Level 3 financial instruments is presented when the Fund had a significant amount of Level 3 investments at the beginning and/or end of the year in relation to net assets. The following table is a reconciliation of Level 3 investments for which significant unobservable inputs were used in determining fair value:
Common Stocks | Preferred Stocks | Total | ||||||||||
Assets | ||||||||||||
Opening Balance, as of May 31, 2022 | $ | 65,174,021 | $ | 119,603,445 | $ | 184,777,466 | ||||||
Transfers into Level 3 | — | — | — | |||||||||
Transfers out of Level 3 | — | — | — | |||||||||
Accrued discounts/premiums | — | — | — | |||||||||
Net realized gain (loss) | 388,435 | 388,435 | ||||||||||
Net change in unrealized appreciation (depreciation)(a)(b) | (37,372,927 | ) | (15,730,600 | ) | (53,103,527 | ) | ||||||
Purchases | — | — | — | |||||||||
Sales | — | (1,191,942 | ) | (1,191,942 | ) | |||||||
|
|
|
|
|
| |||||||
Closing Balance, as of May 31, 2023 | $ | 27,801,094 | $ | 103,069,338 | $ | 130,870,432 | ||||||
|
|
|
|
|
| |||||||
Net change in unrealized appreciation (depreciation) on investments still held at May 31, 2023(b) | $ | (37,372,927 | ) | $ | (15,730,600 | ) | $ | (53,103,527 | ) | |||
|
|
|
|
|
| |||||||
| (a) | Included in the related net change in unrealized appreciation (depreciation) in the Statements of Operations. |
| (b) | Any difference between net change in unrealized appreciation (depreciation) and net change in unrealized appreciation (depreciation) on investments still held at May 31, 2023, is generally due to investments no longer held or categorized as Level 3 at period end. |
The following table summarizes the valuation approaches used and unobservable inputs utilized by the BlackRock Valuation Committee (the “Valuation Committee”) to determine the value of certain of the Fund’s Level 3 investments as of period end.
| Value | Valuation Approach | Unobservable Inputs | Range of Unobservable Inputs Utilized(a) | Weighted Average of Unobservable Inputs Based on Fair Value | ||||||||||||||||
Assets | ||||||||||||||||||||
| Market | Revenue Multiple | 2.75x - 28.00x | 19.11x | |||||||||||||||||
| Volatility | 70% | — | ||||||||||||||||||
Common Stocks | $ | 27,801,094 | Time to Exit | 3.0 year | — | |||||||||||||||
| �� | Market | Revenue Multiple | 2.20x - 28.00x | 12.60x | ||||||||||||||||
| Volatility | 50%-70% | 54% | ||||||||||||||||||
| Time to Exit | 3.0 - 4.0 years | 3.8 years | ||||||||||||||||||
Preferred Stocks | 103,069,338 | Market Adjustment Multiple | 1.00x | — | ||||||||||||||||
|
| |||||||||||||||||||
| $ | 130,870,432 | |||||||||||||||||||
|
| |||||||||||||||||||
| (a) | A significant change in unobservable input would have resulted in a correlated (inverse) significant change to value. |
See notes to financial statements.
| 40 | 2 0 2 3 B L A C K R O C K A N N U A L R E P O R T T O S H A R E H O L D E R S |
Statements of Assets and Liabilities
May 31, 2023
BlackRock Capital Appreciation Fund, Inc. | BlackRock Health Sciences Opportunities Portfolio | BlackRock Infrastructure Sustainable Opportunities Fund | ||||||||||
ASSETS | ||||||||||||
Investments, at value — unaffiliated(a)(b) | $ | 3,114,055,514 | $ | 8,236,595,509 | $ | 8,143,921 | ||||||
Investments, at value — affiliated(c) | 1,248,701 | 258,995,496 | 733,814 | |||||||||
Cash | 15,769 | 203,400 | — | |||||||||
Foreign currency, at value(d) | — | 1,443 | 113,909 | |||||||||
Receivables: | ||||||||||||
Investments sold | — | 30,639,804 | 180,029 | |||||||||
Securities lending income — affiliated | 637 | 124,758 | — | |||||||||
Capital shares sold | 1,938,219 | 5,563,949 | 1,753 | |||||||||
Dividends — unaffiliated | 1,740,121 | 11,179,298 | 28,301 | |||||||||
Dividends — affiliated | 33,830 | 865,934 | 2,289 | |||||||||
From the Manager | — | — | 57,974 | |||||||||
Unrealized appreciation on forward foreign currency exchange contracts | — | 378,924 | — | |||||||||
Prepaid expenses | 75,838 | 109,187 | 31,163 | |||||||||
|
|
|
|
|
| |||||||
Total assets | 3,119,108,629 | 8,544,657,702 | 9,293,153 | |||||||||
|
|
|
|
|
| |||||||
LIABILITIES | ||||||||||||
Collateral on securities loaned | — | 47,520,866 | — | |||||||||
Payables: | ||||||||||||
Investments purchased | — | — | 133,107 | |||||||||
Accounting services fees | 96,933 | 261,853 | 18,446 | |||||||||
Administration fees | — | 802,680 | — | |||||||||
Capital shares redeemed | 2,905,217 | 10,164,030 | — | |||||||||
Investment advisory fees | 3,095,217 | 9,821,009 | — | |||||||||
Directors’ and Officer’s fees | 6,032 | 18,079 | 1,362 | |||||||||
Other accrued expenses | 354,812 | 2,584,039 | 8,321 | |||||||||
Other affiliate fees | 70,352 | 77,400 | — | |||||||||
Professional fees | 72,807 | 257,310 | 738 | |||||||||
Service and distribution fees | 398,317 | 1,102,365 | 34 | |||||||||
Unrealized depreciation on: | ||||||||||||
Forward foreign currency exchange contracts | — | 2,797,065 | — | |||||||||
OTC swaps | — | — | 6,763 | |||||||||
|
|
|
|
|
| |||||||
Total liabilities | 6,999,687 | 75,406,696 | 168,771 | |||||||||
|
|
|
|
|
| |||||||
NET ASSETS | $ | 3,112,108,942 | $ | 8,469,251,006 | $ | 9,124,382 | ||||||
|
|
|
|
|
| |||||||
NET ASSETS CONSIST OF: | ||||||||||||
Paid-in capital | $ | 1,719,947,738 | $ | 5,460,834,340 | $ | 10,027,743 | ||||||
Accumulated earnings (loss) | 1,392,161,204 | 3,008,416,666 | (903,361 | ) | ||||||||
|
|
|
|
|
| |||||||
NET ASSETS | $ | 3,112,108,942 | $ | 8,469,251,006 | $ | 9,124,382 | ||||||
|
|
|
|
|
| |||||||
(a) Investments, at cost — unaffiliated | $ | 1,765,714,728 | $ | 5,374,516,904 | $ | 8,375,054 | ||||||
(b) Securities loaned, at value | $ | — | $ | 46,534,836 | $ | — | ||||||
(c) Investments, at cost — affiliated | $ | 1,248,701 | $ | 258,962,231 | $ | 733,814 | ||||||
(d) Foreign currency, at cost | $ | — | $ | 1,511 | $ | 114,372 | ||||||
F I N A N C I A L S T A T E M E N T S | 41 |
Statements of Assets and Liabilities (continued)
May 31, 2023
| BlackRock | BlackRock | BlackRock | ||||||||||
| Capital | Health | Infrastructure | ||||||||||
| Appreciation | Sciences | Sustainable | ||||||||||
| Fund, | Opportunities | Opportunities | ||||||||||
| Inc. | Portfolio | Fund | ||||||||||
NET ASSET VALUE | ||||||||||||
Institutional | ||||||||||||
Net assets | $ | 678,964,542 | $ | 4,436,816,419 | $ | 101,647 | ||||||
|
|
|
|
|
| |||||||
Shares outstanding | 21,423,568 | 64,800,095 | 11,246 | |||||||||
|
|
|
|
|
| |||||||
Net asset value | $ | 31.69 | $ | 68.47 | $ | 9.04 | ||||||
|
|
|
|
|
| |||||||
Shares authorized | 300 million | Unlimited | Unlimited | |||||||||
|
|
|
|
|
| |||||||
Par value | $ | 0.10 | $ | 0.001 | $ | 0.001 | ||||||
|
|
|
|
|
| |||||||
| Service | ||||||||||||
Net assets | N/A | $ | 33,054,854 | N/A | ||||||||
|
|
|
|
|
| |||||||
Shares outstanding | N/A | 512,916 | N/A | |||||||||
|
|
|
|
|
| |||||||
Net asset value | N/A | $ | 64.44 | N/A | ||||||||
|
|
|
|
|
| |||||||
Shares authorized | N/A | Unlimited | N/A | |||||||||
|
|
|
|
|
| |||||||
Par value | N/A | $ | 0.001 | N/A | ||||||||
|
|
|
|
|
| |||||||
| Investor A | ||||||||||||
Net assets | $ | 1,723,972,729 | $ | 2,865,706,353 | $ | 156,280 | ||||||
|
|
|
|
|
| |||||||
Shares outstanding | 62,089,538 | 44,697,499 | 17,304 | |||||||||
|
|
|
|
|
| |||||||
Net asset value | $ | 27.77 | $ | 64.11 | $ | 9.03 | ||||||
|
|
|
|
|
| |||||||
Shares authorized | 300 million | Unlimited | Unlimited | |||||||||
|
|
|
|
|
| |||||||
Par value | $ | 0.10 | $ | 0.001 | $ | 0.001 | ||||||
|
|
|
|
|
| |||||||
| Investor C | ||||||||||||
Net assets | $ | 39,581,427 | $ | 404,306,275 | N/A | |||||||
|
|
|
|
|
| |||||||
Shares outstanding | 2,549,608 | 7,612,300 | N/A | |||||||||
|
|
|
|
|
| |||||||
Net asset value | $ | 15.52 | $ | 53.11 | N/A | |||||||
|
|
|
|
|
| |||||||
Shares authorized | 300 million | Unlimited | N/A | |||||||||
|
|
|
|
|
| |||||||
Par value | $ | 0.10 | $ | 0.001 | N/A | |||||||
|
|
|
|
|
| |||||||
| Class K | ||||||||||||
Net assets | $ | 645,859,575 | $ | 487,286,737 | $ | 8,866,455 | ||||||
|
|
|
|
|
| |||||||
Shares outstanding | 20,134,257 | 7,105,217 | 980,553 | |||||||||
|
|
|
|
|
| |||||||
Net asset value | $ | 32.08 | $ | 68.58 | $ | 9.04 | ||||||
|
|
|
|
|
| |||||||
Shares authorized | 300 million | Unlimited | Unlimited | |||||||||
|
|
|
|
|
| |||||||
Par value | $ | 0.10 | $ | 0.001 | $ | 0.001 | ||||||
|
|
|
|
|
| |||||||
| Class R | ||||||||||||
Net assets | $ | 23,730,669 | $ | 242,080,368 | N/A | |||||||
|
|
|
|
|
| |||||||
Shares outstanding | 1,195,140 | 3,895,670 | N/A | |||||||||
|
|
|
|
|
| |||||||
Net asset value | $ | 19.86 | $ | 62.14 | N/A | |||||||
|
|
|
|
|
| |||||||
Shares authorized | 500 million | Unlimited | N/A | |||||||||
|
|
|
|
|
| |||||||
Par value | $ | 0.10 | $ | 0.001 | N/A | |||||||
|
|
|
|
|
| |||||||
See notes to financial statements.
| 42 | 2 0 2 3 B L A C K R O C K A N N U A L R E P O R T T O S H A R E H O L D E R S |
Statements of Assets and Liabilities (continued)
May 31, 2023
| BlackRock | ||||||||
| Mid-Cap | BlackRock | |||||||
| Growth | Technology | |||||||
| Equity | Opportunities | |||||||
| Portfolio | Fund | |||||||
ASSETS | ||||||||
Investments, at value — unaffiliated(a)(b) | $ | 11,509,269,243 | $ | 4,353,686,774 | ||||
Investments, at value — affiliated(c) | 283,937,674 | 185,648,342 | ||||||
Foreign currency, at value(d) | 1,362 | 142,661 | ||||||
Receivables: | ||||||||
Investments sold | — | 7,740,496 | ||||||
Securities lending income — affiliated | 42,868 | 32,998 | ||||||
Capital shares sold | 11,283,778 | 5,517,828 | ||||||
Dividends — unaffiliated | 5,081,070 | 2,187,506 | ||||||
Dividends — affiliated | 140,565 | 248,733 | ||||||
From the Manager | 339,041 | 72,977 | ||||||
Prepaid expenses | 320,149 | 103,790 | ||||||
|
|
|
| |||||
Total assets | 11,810,415,750 | 4,555,382,105 | ||||||
|
|
|
| |||||
LIABILITIES | ||||||||
Collateral on securities loaned | 249,110,212 | 148,742,881 | ||||||
Payables: | ||||||||
Investments purchased | 31,931,070 | 879,810 | ||||||
Accounting services fees | 341,786 | 128,738 | ||||||
Administration fees | 802,664 | 262,530 | ||||||
Capital shares redeemed | 24,485,885 | 8,838,004 | ||||||
Investment advisory fees | 12,159,620 | 5,360,003 | ||||||
Directors’ and Officer’s fees | 20,767 | 7,824 | ||||||
Other accrued expenses | 2,331,718 | 1,448,281 | ||||||
Professional fees | 85,816 | 101,854 | ||||||
Service and distribution fees | 567,627 | 551,705 | ||||||
|
|
|
| |||||
Total liabilities | 321,837,165 | 166,321,630 | ||||||
|
|
|
| |||||
NET ASSETS | $ | 11,488,578,585 | $ | 4,389,060,475 | ||||
|
|
|
| |||||
NET ASSETS CONSIST OF: | ||||||||
Paid-in capital | $ | 11,635,921,943 | $ | 3,393,343,776 | ||||
Accumulated earnings (loss) | (147,343,358 | ) | 995,716,699 | |||||
|
|
|
| |||||
NET ASSETS | $ | 11,488,578,585 | $ | 4,389,060,475 | ||||
|
|
|
| |||||
(a) Investments, at cost — unaffiliated | $ | 9,336,163,970 | $ | 2,628,321,578 | ||||
(b) Securities loaned, at value | $ | 240,420,753 | $ | 146,110,027 | ||||
(c) Investments, at cost — affiliated | $ | 283,819,202 | $ | 185,620,595 | ||||
(d) Foreign currency, at cost | $ | 1,533 | $ | 143,825 | ||||
F I N A N C I A L S T A T E M E N T S | 43 |
Statements of Assets and Liabilities (continued)
May 31, 2023
| BlackRock | ||||||||
| Mid-Cap | BlackRock | |||||||
| Growth | Technology | |||||||
| Equity | Opportunities | |||||||
| Portfolio | Fund | |||||||
NET ASSET VALUE | ||||||||
Institutional | ||||||||
Net assets | $ | 5,266,832,487 | $ | 2,316,550,134 | ||||
|
|
|
| |||||
Shares outstanding | 160,622,265 | 48,528,618 | ||||||
|
|
|
| |||||
Net asset value | $ | 32.79 | $ | 47.74 | ||||
|
|
|
| |||||
Shares authorized | Unlimited | Unlimited | ||||||
|
|
|
| |||||
Par value | $ | 0.001 | $ | 0.001 | ||||
|
|
|
| |||||
| Service | ||||||||
Net assets | $ | 62,693,160 | $ | 47,331,868 | ||||
|
|
|
| |||||
Shares outstanding | 2,144,598 | 1,064,763 | ||||||
|
|
|
| |||||
Net asset value | $ | 29.23 | $ | 44.45 | ||||
|
|
|
| |||||
Shares authorized | Unlimited | Unlimited | ||||||
|
|
|
| |||||
Par value | $ | 0.001 | $ | 0.001 | ||||
|
|
|
| |||||
| Investor A | ||||||||
Net assets | $ | 1,637,289,028 | $ | 1,572,975,571 | ||||
|
|
|
| |||||
Shares outstanding | 58,782,301 | 36,272,358 | ||||||
|
|
|
| |||||
Net asset value | $ | 27.85 | $ | 43.37 | ||||
|
|
|
| |||||
Shares authorized | Unlimited | Unlimited | ||||||
|
|
|
| |||||
Par value | $ | 0.001 | $ | 0.001 | ||||
|
|
|
| |||||
| Investor C | ||||||||
Net assets | $ | 194,849,227 | $ | 259,247,167 | ||||
|
|
|
| |||||
Shares outstanding | 9,415,385 | 7,496,588 | ||||||
|
|
|
| |||||
Net asset value | $ | 20.69 | $ | 34.58 | ||||
|
|
|
| |||||
Shares authorized | Unlimited | Unlimited | ||||||
|
|
|
| |||||
Par value | $ | 0.001 | $ | 0.001 | ||||
|
|
|
| |||||
| Class K | ||||||||
Net assets | $ | 4,233,487,789 | $ | 157,184,961 | ||||
|
|
|
| |||||
Shares outstanding | 128,470,700 | 3,286,206 | ||||||
|
|
|
| |||||
Net asset value | $ | 32.95 | $ | 47.83 | ||||
|
|
|
| |||||
Shares authorized | Unlimited | Unlimited | ||||||
|
|
|
| |||||
Par value | $ | 0.001 | $ | 0.001 | ||||
|
|
|
| |||||
| Class R | ||||||||
Net assets | $ | 93,426,894 | $ | 35,770,774 | ||||
|
|
|
| |||||
Shares outstanding | 3,446,600 | 823,438 | ||||||
|
|
|
| |||||
Net asset value | $ | 27.11 | $ | 43.44 | ||||
|
|
|
| |||||
Shares authorized | Unlimited | Unlimited | ||||||
|
|
|
| |||||
Par value | $ | 0.001 | $ | 0.001 | ||||
|
|
|
| |||||
See notes to financial statements.
| 44 | 2 0 2 3 B L A C K R O C K A N N U A L R E P O R T T O S H A R E H O L D E R S |
Year Ended May 31, 2023
| BlackRock | BlackRock | BlackRock | ||||||||||
| Capital | Health | Infrastructure | ||||||||||
| Appreciation | Sciences | Sustainable | ||||||||||
| Fund, | Opportunities | Opportunities | ||||||||||
| Inc. | Portfolio | Fund | ||||||||||
INVESTMENT INCOME | ||||||||||||
Dividends — unaffiliated | $ | 21,885,555 | $ | 113,426,725 | $ | 238,497 | ||||||
Dividends — affiliated | 828,727 | 3,744,482 | 12,977 | |||||||||
Securities lending income — affiliated — net | 44,275 | 1,526,277 | 699 | |||||||||
Other income — unaffiliated | — | 284,956 | — | |||||||||
Foreign taxes withheld | (486,196 | ) | (661,289 | ) | (20,311 | ) | ||||||
Foreign withholding tax claims | — | 1,692,134 | — | |||||||||
|
|
|
|
|
| |||||||
Total investment income | 22,272,361 | 120,013,285 | 231,862 | |||||||||
|
|
|
|
|
| |||||||
EXPENSES | ||||||||||||
Investment advisory | 18,895,746 | 60,247,467 | 71,343 | |||||||||
Service and distribution — class specific | 4,599,530 | 13,684,706 | 287 | |||||||||
Transfer agent — class specific | 2,648,497 | 8,764,309 | 374 | |||||||||
Accounting services | 201,580 | 524,611 | 36,984 | |||||||||
Professional | 152,404 | 337,910 | 91,732 | |||||||||
Registration | 141,064 | 228,894 | 42,284 | |||||||||
Custodian | 52,289 | 188,952 | 8,413 | |||||||||
Printing and postage | 35,837 | 50,341 | 49,399 | |||||||||
Directors and Officer | 33,629 | 63,555 | 6,655 | |||||||||
Administration | — | 3,112,373 | 3,790 | |||||||||
Administration — class specific | — | 1,800,920 | 1,784 | |||||||||
Offering | — | — | 61,000 | |||||||||
Miscellaneous | 67,825 | 280,640 | 12,548 | |||||||||
|
|
|
|
|
| |||||||
Total expenses | 26,828,401 | 89,284,678 | 386,593 | |||||||||
Less: | ||||||||||||
Administration fees waived | — | — | (3,772 | ) | ||||||||
Administration fees waived by the Manager — class specific | — | — | (1,755 | ) | ||||||||
Fees waived and/or reimbursed by the Manager | (25,336 | ) | (99,438 | ) | (295,637 | ) | ||||||
Transfer agent fees waived and/or reimbursed by the Manager — class specific | — | — | (313 | ) | ||||||||
|
|
|
|
|
| |||||||
Total expenses after fees waived and/or reimbursed | 26,803,065 | 89,185,240 | 85,116 | |||||||||
|
|
|
|
|
| |||||||
Net investment income (loss) | (4,530,704 | ) | 30,828,045 | 146,746 | ||||||||
|
|
|
|
|
| |||||||
REALIZED AND UNREALIZED GAIN (LOSS) | ||||||||||||
Net realized gain from: | ||||||||||||
Investments — unaffiliated | 110,416,491 | 349,565,967 | (705,411 | ) | ||||||||
Investments — affiliated | 3,022 | 38,791 | 12 | |||||||||
Options written | — | (7,700 | ) | — | ||||||||
Forward foreign currency exchange contracts | — | 4,341,658 | — | |||||||||
Foreign currency transactions | 207,470 | 14,989 | (3,895 | ) | ||||||||
Swaps | — | — | 11,570 | |||||||||
|
|
|
|
|
| |||||||
| 110,626,983 | 353,953,705 | (697,724 | ) | |||||||||
|
|
|
|
|
| |||||||
F I N A N C I A L S T A T E M E N T S | 45 |
Statements of Operations (continued)
Year Ended May 31, 2023
| BlackRock | BlackRock | BlackRock | ||||||||||
| Capital | Health | Infrastructure | ||||||||||
| Appreciation | Sciences | Sustainable | ||||||||||
| Fund, | Opportunities | Opportunities | ||||||||||
| Inc. | Portfolio | Fund | ||||||||||
Net change in unrealized appreciation (depreciation) on: | ||||||||||||
Investments — unaffiliated | $ | 44,750,621 | $ | (196,755,500 | ) | $ | 17,410 | |||||
Investments — affiliated | (2,158 | ) | 4,490 | — | ||||||||
Forward foreign currency exchange contracts | — | (7,496,710 | ) | — | ||||||||
Foreign currency translations | (2,510 | ) | 22,251 | (1,275 | ) | |||||||
Swaps | — | — | (10,627 | ) | ||||||||
|
|
|
|
|
| |||||||
| 44,745,953 | (204,225,469 | ) | 5,508 | |||||||||
|
|
|
|
|
| |||||||
Net realized and unrealized gain (loss) | 155,372,936 | 149,728,236 | (692,216 | ) | ||||||||
|
|
|
|
|
| |||||||
NET INCREASE (DECREASE) IN NET ASSETS RESULTING FROM OPERATIONS | $ | 150,842,232 | $ | 180,556,281 | $ | (545,470 | ) | |||||
|
|
|
|
|
| |||||||
See notes to financial statements.
| 46 | 2 0 2 3 B L A C K R O C K A N N U A L R E P O R T T O S H A R E H O L D E R S |
Statements of Operations (continued)
Year Ended May 31, 2023
| BlackRock | ||||||||
| Mid-Cap | BlackRock | |||||||
| Growth | Technology | |||||||
| Equity | Opportunities | |||||||
| Portfolio | Fund | |||||||
INVESTMENT INCOME | ||||||||
Dividends — unaffiliated | $ | 65,891,017 | $ | 25,638,375 | ||||
Dividends — affiliated | 2,486,844 | 1,039,179 | ||||||
Securities lending income — affiliated — net | 922,371 | 887,066 | ||||||
Foreign taxes withheld | (1,212,041 | ) | (870,769 | ) | ||||
|
|
|
| |||||
Total investment income | 68,088,191 | 26,693,851 | ||||||
|
|
|
| |||||
EXPENSES | ||||||||
Investment advisory | 77,735,522 | 33,073,813 | ||||||
Transfer agent — class specific | 12,963,111 | 5,140,943 | ||||||
Service and distribution — class specific | 7,107,004 | 6,473,376 | ||||||
Administration | 4,214,339 | 1,577,988 | ||||||
Administration — class specific | 2,483,246 | 856,993 | ||||||
Accounting services | 709,057 | 268,543 | ||||||
Registration | 509,921 | 418,307 | ||||||
Custodian | 186,018 | 165,914 | ||||||
Professional | 146,940 | 168,964 | ||||||
Printing and postage | 70,563 | 37,372 | ||||||
Directors and Officer | 52,487 | 34,177 | ||||||
Miscellaneous | 180,944 | 99,558 | ||||||
|
|
|
| |||||
Total expenses | 106,359,152 | 48,315,948 | ||||||
Less: | ||||||||
Administration fees waived by the Manager — class specific | (1,598,012 | ) | (830,678 | ) | ||||
Fees waived and/or reimbursed by the Manager | (80,278 | ) | (22,147 | ) | ||||
Transfer agent fees waived and/or reimbursed by the Manager — class specific | (2,477,330 | ) | (1,672,092 | ) | ||||
|
|
|
| |||||
Total expenses after fees waived and/or reimbursed | 102,203,532 | 45,791,031 | ||||||
|
|
|
| |||||
Net investment loss | (34,115,341 | ) | (19,097,180 | ) | ||||
|
|
|
| |||||
REALIZED AND UNREALIZED GAIN (LOSS) | ||||||||
Net realized gain (loss) from: | ||||||||
Investments — unaffiliated | (1,145,753,265 | ) | (263,300,810 | ) | ||||
Investments — affiliated | 44,087 | (24,547 | ) | |||||
Foreign currency transactions | (125,342 | ) | (730,497 | ) | ||||
|
|
|
| |||||
| (1,145,834,520 | ) | (264,055,854 | ) | |||||
|
|
|
| |||||
Net change in unrealized appreciation (depreciation) on: | ||||||||
Investments — unaffiliated(a) | 1,071,286,355 | 408,218,401 | ||||||
Investments — affiliated | 63,747 | (981 | ) | |||||
Foreign currency translations | (123,224 | ) | 13,880 | |||||
|
|
|
| |||||
| 1,071,226,878 | 408,231,300 | |||||||
|
|
|
| |||||
Net realized and unrealized gain (loss) | (74,607,642 | ) | 144,175,446 | |||||
|
|
|
| |||||
NET INCREASE (DECREASE) IN NET ASSETS RESULTING FROM OPERATIONS | $ | (108,722,983 | ) | $ | 125,078,266 | |||
|
|
|
| |||||
(a) Net of reduction in deferred foreign capital gain tax of | — | 1,249,779 | ||||||
See notes to financial statements.
F I N A N C I A L S T A T E M E N T S | 47 |
Statements of Changes in Net Assets
BlackRock Capital Appreciation Fund, Inc. | BlackRock Health Sciences Opportunities Portfolio | |||||||||||||||||
Year Ended 05/31/23 | Year Ended 05/31/22 | Year Ended 05/31/23 | Year Ended 05/31/22 | |||||||||||||||
INCREASE (DECREASE) IN NET ASSETS |
| |||||||||||||||||
OPERATIONS | ||||||||||||||||||
Net investment income (loss) | $ | (4,530,704 | ) | $ | (16,516,609 | ) | $ | 30,828,045 | $ | 16,788,132 | ||||||||
Net realized gain | 110,626,983 | 368,362,544 | 353,953,705 | 1,099,713,705 | ||||||||||||||
Net change in unrealized appreciation (depreciation) | 44,745,953 | (1,070,518,893 | ) | (204,225,469 | ) | (1,482,036,501 | ) | |||||||||||
|
|
|
|
|
|
|
| |||||||||||
Net increase (decrease) in net assets resulting from operations | 150,842,232 | (718,672,958 | ) | 180,556,281 | (365,534,664 | ) | ||||||||||||
|
|
|
|
|
|
|
| |||||||||||
DISTRIBUTIONS TO SHAREHOLDERS(a) | ||||||||||||||||||
Institutional | (60,013,923 | ) | (130,528,578 | ) | (349,006,342 | ) | (516,524,194 | ) | ||||||||||
Service | — | — | (2,578,561 | ) | (3,833,641 | ) | ||||||||||||
Investor A | (137,177,573 | ) | (328,770,936 | ) | (224,765,771 | ) | (314,788,449 | ) | ||||||||||
Investor C | (5,779,913 | ) | (13,984,071 | ) | (43,035,902 | ) | (65,533,391 | ) | ||||||||||
Class K | (42,620,608 | ) | (101,284,889 | ) | (31,126,901 | ) | (43,731,512 | )�� | ||||||||||
Class R | (2,479,998 | ) | (6,004,941 | ) | (18,314,016 | ) | (25,626,380 | ) | ||||||||||
|
|
|
|
|
|
|
| |||||||||||
Decrease in net assets resulting from distributions to shareholders | (248,072,015 | ) | (580,573,415 | ) | (668,827,493 | ) | (970,037,567 | ) | ||||||||||
|
|
|
|
|
|
|
| |||||||||||
CAPITAL SHARE TRANSACTIONS | ||||||||||||||||||
Net increase (decrease) in net assets derived from capital share transactions | (324,095,316 | ) | 254,523,260 | (536,587,817 | ) | (174,654,649 | ) | |||||||||||
|
|
|
|
|
|
|
| |||||||||||
Capital contribution from affiliate | — | — | — | 183,194 | ||||||||||||||
|
|
|
|
|
|
|
| |||||||||||
NET ASSETS |
| |||||||||||||||||
Total decrease in net assets | (421,325,099 | ) | (1,044,723,113 | ) | (1,024,859,029 | ) | (1,510,043,686 | ) | ||||||||||
Beginning of year | 3,533,434,041 | 4,578,157,154 | 9,494,110,035 | 11,004,153,721 | ||||||||||||||
|
|
|
|
|
|
|
| |||||||||||
End of year | $ | 3,112,108,942 | $ | 3,533,434,041 | $ | 8,469,251,006 | $ | 9,494,110,035 | ||||||||||
|
|
|
|
|
|
|
| |||||||||||
| (a) | Distributions for annual periods determined in accordance with U.S. federal income tax regulations. |
See notes to financial statements.
| 48 | 2 0 2 3 B L A C K R O C K A N N U A L R E P O R T T O S H A R E H O L D E R S |
Statements of Changes in Net Assets (continued)
BlackRock Infrastructure Sustainable Opportunities Fund | BlackRock Mid-Cap Growth Equity Portfolio | |||||||||||||||||
Year Ended 05/31/23 | Period from 09/30/21(a) to 05/31/22 | Year Ended 05/31/23 | Year Ended 05/31/22 | |||||||||||||||
INCREASE (DECREASE) IN NET ASSETS |
| |||||||||||||||||
OPERATIONS | ||||||||||||||||||
Net investment income (loss) | $ | 146,746 | $ | 75,299 | $ | (34,115,341 | ) | $ | (96,337,557 | ) | ||||||||
Net realized gain (loss) | (697,724 | ) | 219,282 | (1,145,834,520 | ) | (861,239,707 | ) | |||||||||||
Net change in unrealized appreciation (depreciation) | 5,508 | (243,994 | ) | 1,071,226,878 | (3,892,585,642 | ) | ||||||||||||
|
|
|
|
|
|
|
| |||||||||||
Net increase (decrease) in net assets resulting from operations | (545,470 | ) | 50,587 | (108,722,983 | ) | (4,850,162,906 | ) | |||||||||||
|
|
|
|
|
|
|
| |||||||||||
DISTRIBUTIONS TO SHAREHOLDERS(b) | ||||||||||||||||||
Institutional | (4,103 | ) | (797 | ) | — | (495,288,827 | ) | |||||||||||
Service | — | — | — | (6,119,263 | ) | |||||||||||||
Investor A | (3,968 | ) | (706 | ) | — | (153,891,201 | ) | |||||||||||
Investor C | — | — | — | (26,348,042 | ) | |||||||||||||
Class K | (378,721 | ) | (76,679 | ) | — | (214,611,593 | ) | |||||||||||
Class R | — | — | — | (6,308,880 | ) | |||||||||||||
|
|
|
|
|
|
|
| |||||||||||
Decrease in net assets resulting from distributions to shareholders | (386,792 | ) | (78,182 | ) | — | (902,567,806 | ) | |||||||||||
|
|
|
|
|
|
|
| |||||||||||
CAPITAL SHARE TRANSACTIONS | ||||||||||||||||||
Net increase (decrease) in net assets derived from capital share transactions | 64,099 | 10,020,140 | (2,206,262,520 | ) | 3,483,893,548 | |||||||||||||
|
|
|
|
|
|
|
| |||||||||||
NET ASSETS |
| |||||||||||||||||
Total increase (decrease) in net assets | (868,163 | ) | 9,992,545 | (2,314,985,503 | ) | (2,268,837,164 | ) | |||||||||||
Beginning of period | 9,992,545 | — | 13,803,564,088 | 16,072,401,252 | ||||||||||||||
|
|
|
|
|
|
|
| |||||||||||
End of period | $ | 9,124,382 | $ | 9,992,545 | $ | 11,488,578,585 | $ | 13,803,564,088 | ||||||||||
|
|
|
|
|
|
|
| |||||||||||
| (a) | Commencement of operations. |
| (b) | Distributions for annual periods determined in accordance with U.S. federal income tax regulations. |
See notes to financial statements.
F I N A N C I A L S T A T E M E N T S | 49 |
Statements of Changes in Net Assets (continued)
BlackRock Technology Opportunities Fund | ||||||||
Year Ended 05/31/23 | Year Ended 05/31/22 | |||||||
INCREASE (DECREASE) IN NET ASSETS | ||||||||
OPERATIONS | ||||||||
Net investment loss | $ | (19,097,180 | ) | $ | (48,945,433 | ) | ||
Net realized loss | (264,055,854 | ) | (141,299,490 | ) | ||||
Net change in unrealized appreciation (depreciation) | 408,231,300 | (1,754,816,313 | ) | |||||
|
|
|
| |||||
Net increase (decrease) in net assets resulting from operations | 125,078,266 | (1,945,061,236 | ) | |||||
|
|
|
| |||||
DISTRIBUTIONS TO SHAREHOLDERS(a) | ||||||||
Institutional | — | (364,665,690 | ) | |||||
Service | — | (6,205,984 | ) | |||||
Investor A | — | (200,086,265 | ) | |||||
Investor C | — | (39,592,660 | ) | |||||
Class K | — | (13,962,671 | ) | |||||
Class R | — | (3,782,264 | ) | |||||
|
|
|
| |||||
Decrease in net assets resulting from distributions to shareholders | — | (628,295,534 | ) | |||||
|
|
|
| |||||
CAPITAL SHARE TRANSACTIONS | ||||||||
Net decrease in net assets derived from capital share transactions | (893,403,112 | ) | (435,571,918 | ) | ||||
|
|
|
| |||||
NET ASSETS | ||||||||
Total decrease in net assets | (768,324,846 | ) | (3,008,928,688 | ) | ||||
Beginning of year | 5,157,385,321 | 8,166,314,009 | ||||||
|
|
|
| |||||
End of year | $ | 4,389,060,475 | $ | 5,157,385,321 | ||||
|
|
|
| |||||
| (a) | Distributions for annual periods determined in accordance with U.S. federal income tax regulations. |
See notes to financial statements.
| 50 | 2 0 2 3 B L A C K R O C K A N N U A L R E P O R T T O S H A R E H O L D E R S |
(For a share outstanding throughout each period)
| BlackRock Capital Appreciation Fund, Inc. | ||||||||||||||||||||||||
| Institutional | ||||||||||||||||||||||||
| Year Ended 05/31/23 | Year Ended 05/31/22 | Period from 10/01/20 to 05/31/21 | Year Ended 09/30/20 | Year Ended 09/30/19 | Year Ended 09/30/18 | |||||||||||||||||||
Net asset value, beginning of period | $ | 31.98 | $ | 43.32 | $ | 38.32 | $ | 30.52 | $ | 33.72 | $ | 29.08 | ||||||||||||
|
|
|
|
|
|
|
|
|
|
|
| |||||||||||||
Net investment income (loss)(a) | 0.00 | (b) | (0.09 | ) | (0.06 | ) | (0.07 | ) | (0.05 | ) | 0.00 | (b)(c) | ||||||||||||
Net realized and unrealized gain (loss) | 1.82 | (6.14 | ) | 7.06 | 10.81 | 0.23 | 7.97 | |||||||||||||||||
|
|
|
|
|
|
|
|
|
|
|
| |||||||||||||
Net increase (decrease) from investment operations | 1.82 | (6.23 | ) | 7.00 | 10.74 | 0.18 | 7.97 | |||||||||||||||||
|
|
|
|
|
|
|
|
|
|
|
| |||||||||||||
Distributions from net realized gain(d) | (2.11 | ) | (5.11 | ) | (2.00 | ) | (2.94 | ) | (3.38 | ) | (3.33 | ) | ||||||||||||
|
|
|
|
|
|
|
|
|
|
|
| |||||||||||||
Net asset value, end of period | $ | 31.69 | $ | 31.98 | $ | 43.32 | $ | 38.32 | $ | 30.52 | $ | 33.72 | ||||||||||||
|
|
|
|
|
|
|
|
|
|
|
| |||||||||||||
Total Return(e) | ||||||||||||||||||||||||
Based on net asset value | 6.81 | % | (17.30 | )% | 18.72 | %(f) | 38.17 | % | 1.77 | % | 30.19 | % | ||||||||||||
|
|
|
|
|
|
|
|
|
|
|
| |||||||||||||
Ratios to Average Net Assets(g) | ||||||||||||||||||||||||
Total expenses | 0.73 | % | 0.70 | % | 0.72 | %(h) | 0.75 | % | 0.75 | % | 0.76 | % | ||||||||||||
|
|
|
|
|
|
|
|
|
|
|
| |||||||||||||
Total expenses after fees waived and/or reimbursed | 0.73 | % | 0.70 | % | 0.72 | %(h) | 0.75 | % | 0.75 | % | 0.76 | % | ||||||||||||
|
|
|
|
|
|
|
|
|
|
|
| |||||||||||||
Net investment income (loss) | 0.01 | % | (0.21 | )% | (0.21 | )%(h) | (0.22 | )% | (0.17 | )% | 0.01 | %(c) | ||||||||||||
|
|
|
|
|
|
|
|
|
|
|
| |||||||||||||
Supplemental Data | ||||||||||||||||||||||||
Net assets, end of period (000) | $ | 678,965 | $ | 943,275 | $ | 1,072,833 | $ | 911,484 | $ | 644,983 | $ | 600,032 | ||||||||||||
|
|
|
|
|
|
|
|
|
|
|
| |||||||||||||
Portfolio turnover rate | 43 | % | 55 | % | 25 | % | 42 | % | 48 | % | 42 | % | ||||||||||||
|
|
|
|
|
|
|
|
|
|
|
| |||||||||||||
| (a) | Based on average shares outstanding. |
| (b) | Amount is less than $0.005 per share. |
| (c) | Net investment income per share and the ratio of net investment income to average net assets includes $0.06 per share and 0.21%, respectively, resulting from a special dividend. |
| (d) | Distributions for annual periods determined in accordance with U.S. federal income tax regulations. |
| (e) | Where applicable, assumes the reinvestment of distributions. |
| (f) | Not annualized. |
| (g) | Excludes fees and expenses incurred indirectly as a result of investments in underlying funds. |
| (h) | Annualized. |
See notes to financial statements.
F I N A N C I A L H I G H L I G H T S | 51 |
Financial Highlights (continued)
(For a share outstanding throughout each period)
| BlackRock Capital Appreciation Fund, Inc. (continued) | ||||||||||||||||||||||||
| Investor A | ||||||||||||||||||||||||
| Year Ended 05/31/23 | Year Ended 05/31/22 | Period from to 05/31/21 | Year Ended 09/30/20 | Year Ended 09/30/19 | Year Ended 09/30/18 | |||||||||||||||||||
Net asset value, beginning of period | $ | 28.38 | $ | 39.00 | $ | 34.74 | $ | 27.99 | $ | 31.25 | $ | 27.16 | ||||||||||||
|
|
|
|
|
|
|
|
|
|
|
| |||||||||||||
Net investment loss(a) | (0.07 | ) | (0.18 | ) | (0.11 | ) | (0.14 | ) | (0.12 | ) | (0.08 | )(b) | ||||||||||||
Net realized and unrealized gain (loss) | 1.57 | (5.39 | ) | 6.37 | 9.83 | 0.18 | 7.41 | |||||||||||||||||
|
|
|
|
|
|
|
|
|
|
|
| |||||||||||||
Net increase (decrease) from investment operations | 1.50 | (5.57 | ) | 6.26 | 9.69 | 0.06 | 7.33 | |||||||||||||||||
|
|
|
|
|
|
|
|
|
|
|
| |||||||||||||
Distributions from net realized gain(c) | (2.11 | ) | (5.05 | ) | (2.00 | ) | (2.94 | ) | (3.32 | ) | (3.24 | ) | ||||||||||||
|
|
|
|
|
|
|
|
|
|
|
| |||||||||||||
Net asset value, end of period | $ | 27.77 | $ | 28.38 | $ | 39.00 | $ | 34.74 | $ | 27.99 | $ | 31.25 | ||||||||||||
|
|
|
|
|
|
|
|
|
|
|
| |||||||||||||
Total Return(d) | ||||||||||||||||||||||||
Based on net asset value | 6.53 | % | (17.51 | )% | 18.51 | %(e) | 37.84 | % | 1.48 | % | 29.85 | % | ||||||||||||
|
|
|
|
|
|
|
|
|
|
|
| |||||||||||||
Ratios to Average Net Assets(f) | ||||||||||||||||||||||||
Total expenses | 1.00 | % | 0.97 | % | 0.97 | %(g) | 1.01 | % | 1.01 | % | 1.04 | % | ||||||||||||
|
|
|
|
|
|
|
|
|
|
|
| |||||||||||||
Total expenses after fees waived and/or reimbursed | 1.00 | % | 0.97 | % | 0.97 | %(g) | 1.01 | % | 1.01 | % | 1.04 | % | ||||||||||||
|
|
|
|
|
|
|
|
|
|
|
| |||||||||||||
Net investment loss | (0.27 | )% | (0.48 | )% | (0.46 | )%(g) | (0.48 | )% | (0.43 | )% | (0.28 | )%(b) | ||||||||||||
|
|
|
|
|
|
|
|
|
|
|
| |||||||||||||
Supplemental Data | ||||||||||||||||||||||||
Net assets, end of period (000) | $ | 1,723,973 | $ | 1,871,340 | $ | 2,551,211 | $ | 2,195,906 | $ | 1,692,630 | $ | 1,751,581 | ||||||||||||
|
|
|
|
|
|
|
|
|
|
|
| |||||||||||||
Portfolio turnover rate | 43 | % | 55 | % | 25 | % | 42 | % | 48 | % | 42 | % | ||||||||||||
|
|
|
|
|
|
|
|
|
|
|
| |||||||||||||
| (a) | Based on average shares outstanding. |
| (b) | Net investment loss per share and the ratio of net investment loss to average net assets includes $0.06 per share and 0.21%, respectively, resulting from a special dividend. |
| (c) | Distributions for annual periods determined in accordance with U.S. federal income tax regulations. |
| (d) | Where applicable, excludes the effects of any sales charges and assumes the reinvestment of distributions. |
| (e) | Not annualized. |
| (f) | Excludes fees and expenses incurred indirectly as a result of investments in underlying funds. |
| (g) | Annualized. |
See notes to financial statements.
| 52 | 2 0 2 3 B L A C K R O C K A N N U A L R E P O R T T O S H A R E H O L D E R S |
Financial Highlights (continued)
(For a share outstanding throughout each period)
| BlackRock Capital Appreciation Fund, Inc. (continued) | ||||||||||||||||||||||||
| Investor C | ||||||||||||||||||||||||
| Year Ended 05/31/23 | Year Ended 05/31/22 | Period from 10/01/20 to 05/31/21 | Year Ended 09/30/20 | Year Ended 09/30/19 | Year Ended 09/30/18 | |||||||||||||||||||
Net asset value, beginning of period | $ | 17.01 | $ | 25.27 | $ | 23.27 | $ | 19.81 | $ | 23.29 | $ | 20.88 | ||||||||||||
|
|
|
|
|
|
|
|
|
|
|
| |||||||||||||
Net investment loss(a) | (0.16 | ) | (0.29 | ) | (0.20 | ) | (0.25 | ) | (0.24 | ) | (0.23 | )(b) | ||||||||||||
Net realized and unrealized gain (loss) | 0.78 | (3.05 | ) | 4.20 | 6.65 | 0.04 | 5.56 | |||||||||||||||||
|
|
|
|
|
|
|
|
|
|
|
| |||||||||||||
Net increase (decrease) from investment operations | 0.62 | (3.34 | ) | 4.00 | 6.40 | (0.20 | ) | 5.33 | ||||||||||||||||
|
|
|
|
|
|
|
|
|
|
|
| |||||||||||||
Distributions from net realized gain(c) | (2.11 | ) | (4.92 | ) | (2.00 | ) | (2.94 | ) | (3.28 | ) | (2.92 | ) | ||||||||||||
|
|
|
|
|
|
|
|
|
|
|
| |||||||||||||
Net asset value, end of period | $ | 15.52 | $ | 17.01 | $ | 25.27 | $ | 23.27 | $ | 19.81 | $ | 23.29 | ||||||||||||
|
|
|
|
|
|
|
|
|
|
|
| |||||||||||||
Total Return(d) | ||||||||||||||||||||||||
Based on net asset value | 5.62 | % | (18.18 | )% | 17.89 | %(e) | 36.73 | % | 0.72 | % | 28.77 | % | ||||||||||||
|
|
|
|
|
|
|
|
|
|
|
| |||||||||||||
Ratios to Average Net Assets(f) | ||||||||||||||||||||||||
Total expenses | 1.84 | % | 1.76 | % | 1.77 | %(g) | 1.79 | % | 1.81 | % | 1.84 | % | ||||||||||||
|
|
|
|
|
|
|
|
|
|
|
| |||||||||||||
Total expenses after fees waived and/or reimbursed | 1.84 | % | 1.76 | % | 1.77 | %(g) | 1.79 | % | 1.81 | % | 1.84 | % | ||||||||||||
|
|
|
|
|
|
|
|
|
|
|
| |||||||||||||
Net investment loss | (1.11 | )% | (1.28 | )% | (1.27 | )%(g) | (1.26 | )% | (1.23 | )% | (1.09 | )%(b) | ||||||||||||
|
|
|
|
|
|
|
|
|
|
|
| |||||||||||||
Supplemental Data | ||||||||||||||||||||||||
Net assets, end of period (000) | $ | 39,581 | $ | 48,332 | $ | 72,075 | $ | 89,336 | $ | 195,908 | $ | 276,097 | ||||||||||||
|
|
|
|
|
|
|
|
|
|
|
| |||||||||||||
Portfolio turnover rate | 43 | % | 55 | % | 25 | % | 42 | % | 48 | % | 42 | % | ||||||||||||
|
|
|
|
|
|
|
|
|
|
|
| |||||||||||||
| (a) | Based on average shares outstanding. |
| (b) | Net investment loss per share and the ratio of net investment loss to average net assets includes $0.06 per share and 0.21%, respectively, resulting from a special dividend. |
| (c) | Distributions for annual periods determined in accordance with U.S. federal income tax regulations. |
| (d) | Where applicable, excludes the effects of any sales charges and assumes the reinvestment of distributions. |
| (e) | Not annualized. |
| (f) | Excludes fees and expenses incurred indirectly as a result of investments in underlying funds. |
| (g) | Annualized. |
See notes to financial statements.
F I N A N C I A L H I G H L I G H T S | 53 |
Financial Highlights (continued)
(For a share outstanding throughout each period)
| BlackRock Capital Appreciation Fund, Inc. (continued) | ||||||||||||||||||||||||
| Class K | ||||||||||||||||||||||||
| Year Ended 05/31/23 | Year Ended 05/31/22 | Period from 10/01/20 to 05/31/21 | Year Ended 09/30/20 | Year Ended 09/30/19 | Year Ended 09/30/18 | |||||||||||||||||||
Net asset value, beginning of period | $ | 32.32 | $ | 43.71 | $ | 38.63 | $ | 30.71 | $ | 33.91 | $ | 29.24 | ||||||||||||
|
|
|
|
|
|
|
|
|
|
|
| |||||||||||||
Net investment income (loss)(a) | 0.02 | (0.06 | ) | (0.03 | ) | (0.04 | ) | (0.02 | ) | 0.04 | (b) | |||||||||||||
Net realized and unrealized gain (loss) | 1.85 | (6.20 | ) | 7.11 | 10.90 | 0.23 | 8.01 | |||||||||||||||||
|
|
|
|
|
|
|
|
|
|
|
| |||||||||||||
Net increase (decrease) from investment operations | 1.87 | (6.26 | ) | 7.08 | 10.86 | 0.21 | 8.05 | |||||||||||||||||
|
|
|
|
|
|
|
|
|
|
|
| |||||||||||||
Distributions from net realized gain(c) | (2.11 | ) | (5.13 | ) | (2.00 | ) | (2.94 | ) | (3.41 | ) | (3.38 | ) | ||||||||||||
|
|
|
|
|
|
|
|
|
|
|
| |||||||||||||
Net asset value, end of period | $ | 32.08 | $ | 32.32 | $ | 43.71 | $ | 38.63 | $ | 30.71 | $ | 33.91 | ||||||||||||
|
|
|
|
|
|
|
|
|
|
|
| |||||||||||||
Total Return(d) | ||||||||||||||||||||||||
Based on net asset value | 6.90 | % | (17.22 | )% | 18.78 | %(e) | 38.33 | % | 1.86 | % | 30.36 | % | ||||||||||||
|
|
|
|
|
|
|
|
|
|
|
| |||||||||||||
Ratios to Average Net Assets(f) | ||||||||||||||||||||||||
Total expenses | 0.65 | % | 0.64 | % | 0.63 | %(g) | 0.64 | % | 0.65 | % | 0.65 | % | ||||||||||||
|
|
|
|
|
|
|
|
|
|
|
| |||||||||||||
Total expenses after fees waived and/or reimbursed | 0.65 | % | 0.63 | % | 0.63 | %(g) | 0.64 | % | 0.64 | % | 0.65 | % | ||||||||||||
|
|
|
|
|
|
|
|
|
|
|
| |||||||||||||
Net investment income (loss) | 0.08 | % | (0.15 | )% | (0.13 | )%(g) | (0.11 | )% | (0.06 | )% | 0.14 | %(b) | ||||||||||||
|
|
|
|
|
|
|
|
|
|
|
| |||||||||||||
Supplemental Data | ||||||||||||||||||||||||
Net assets, end of period (000) | $ | 645,860 | $ | 646,115 | $ | 845,106 | $ | 682,107 | $ | 552,523 | $ | 568,169 | ||||||||||||
|
|
|
|
|
|
|
|
|
|
|
| |||||||||||||
Portfolio turnover rate | 43 | % | 55 | % | 25 | % | 42 | % | 48 | % | 42 | % | ||||||||||||
|
|
|
|
|
|
|
|
|
|
|
| |||||||||||||
| (a) | Based on average shares outstanding. |
| (b) | Net investment income per share and the ratio of net investment income to average net assets includes $0.06 per share and 0.21%, respectively, resulting from a special dividend. |
| (c) | Distributions for annual periods determined in accordance with U.S. federal income tax regulations. |
| (d) | Where applicable, assumes the reinvestment of distributions. |
| (e) | Not annualized. |
| (f) | Excludes fees and expenses incurred indirectly as a result of investments in underlying funds. |
| (g) | Annualized. |
See notes to financial statements.
| 54 | 2 0 2 3 B L A C K R O C K A N N U A L R E P O R T T O S H A R E H O L D E R S |
Financial Highlights (continued)
(For a share outstanding throughout each period)
| BlackRock Capital Appreciation Fund, Inc. (continued) | ||||||||||||||||||||||||
| Class R | ||||||||||||||||||||||||
| Year Ended 05/31/23 | Year Ended 05/31/22 | Period from 10/01/20 to 05/31/21 | Year Ended 09/30/20 | Year Ended 09/30/19 | Year Ended 09/30/18 | |||||||||||||||||||
Net asset value, beginning of period | $ | 21.02 | $ | 30.12 | $ | 27.30 | $ | 22.65 | $ | 26.00 | $ | 23.12 | ||||||||||||
|
|
|
|
|
|
|
|
|
|
|
| |||||||||||||
Net investment loss(a) | (0.11 | ) | (0.23 | ) | (0.15 | ) | (0.17 | ) | (0.16 | ) | (0.13 | )(b) | ||||||||||||
Net realized and unrealized gain (loss) | 1.06 | (3.88 | ) | 4.97 | 7.76 | 0.09 | 6.19 | |||||||||||||||||
|
|
|
|
|
|
|
|
|
|
|
| |||||||||||||
Net increase (decrease) from investment operations | 0.95 | (4.11 | ) | 4.82 | 7.59 | (0.07 | ) | 6.06 | ||||||||||||||||
|
|
|
|
|
|
|
|
|
|
|
| |||||||||||||
Distributions from net realized gain(c) | (2.11 | ) | (4.99 | ) | (2.00 | ) | (2.94 | ) | (3.28 | ) | (3.18 | ) | ||||||||||||
|
|
|
|
|
|
|
|
|
|
|
| |||||||||||||
Net asset value, end of period | $ | 19.86 | $ | 21.02 | $ | 30.12 | $ | 27.30 | $ | 22.65 | $ | 26.00 | ||||||||||||
|
|
|
|
|
|
|
|
|
|
|
| |||||||||||||
Total Return(d) | ||||||||||||||||||||||||
Based on net asset value | 6.17 | % | (17.82 | )% | 18.26 | %(e) | 37.45 | % | 1.19 | % | 29.49 | % | ||||||||||||
|
|
|
|
|
|
|
|
|
|
|
| |||||||||||||
Ratios to Average Net Assets(f) | ||||||||||||||||||||||||
Total expenses | 1.37 | % | 1.33 | % | 1.30 | %(g) | 1.28 | % | 1.29 | % | 1.30 | % | ||||||||||||
|
|
|
|
|
|
|
|
|
|
|
| |||||||||||||
Total expenses after fees waived and/or reimbursed | 1.36 | % | 1.33 | % | 1.30 | %(g) | 1.28 | % | 1.29 | % | 1.30 | % | ||||||||||||
|
|
|
|
|
|
|
|
|
|
|
| |||||||||||||
Net investment loss | (0.63 | )% | (0.85 | )% | (0.80 | )%(g) | (0.75 | )% | (0.71 | )% | (0.54 | )%(b) | ||||||||||||
|
|
|
|
|
|
|
|
|
|
|
| |||||||||||||
Supplemental Data | ||||||||||||||||||||||||
Net assets, end of period (000) | $ | 23,731 | $ | 24,371 | $ | 36,933 | $ | 37,741 | $ | 54,828 | $ | 84,484 | ||||||||||||
|
|
|
|
|
|
|
|
|
|
|
| |||||||||||||
Portfolio turnover rate | 43 | % | 55 | % | 25 | % | 42 | % | 48 | % | 42 | % | ||||||||||||
|
|
|
|
|
|
|
|
|
|
|
| |||||||||||||
| (a) | Based on average shares outstanding. |
| (b) | Net investment loss per share and the ratio of net investment loss to average net assets includes $0.06 per share and 0.21%, respectively, resulting from a special dividend. |
| (c) | Distributions for annual periods determined in accordance with U.S. federal income tax regulations. |
| (d) | Where applicable, assumes the reinvestment of distributions. |
| (e) | Not annualized. |
| (f) | Excludes fees and expenses incurred indirectly as a result of investments in underlying funds. |
| (g) | Annualized. |
See notes to financial statements.
F I N A N C I A L H I G H L I G H T S | 55 |
Financial Highlights
(For a share outstanding throughout each period)
| BlackRock Health Sciences Opportunities Portfolio | ||||||||||||||||||||||||
| Institutional | ||||||||||||||||||||||||
| Year Ended 05/31/23 | Year Ended 05/31/22 | Period from 10/01/20 to 05/31/21 | Year Ended 09/30/20 | Year Ended 09/30/19 | Year Ended 09/30/18 | |||||||||||||||||||
Net asset value, beginning of period | $ | 72.10 | $ | 81.77 | $ | 75.37 | $ | 61.55 | $ | 67.67 | $ | 57.28 | ||||||||||||
|
|
|
|
|
|
|
|
|
|
|
| |||||||||||||
Net investment income(a) | 0.34 | 0.24 | 0.13 | 0.19 | 0.28 | 0.24 | ||||||||||||||||||
Net realized and unrealized gain (loss) | 1.07 | (2.75 | ) | 9.66 | 16.26 | (1.64 | ) | 12.18 | ||||||||||||||||
|
|
|
|
|
|
|
|
|
|
|
| |||||||||||||
Net increase (decrease) from investment operations | 1.41 | (2.51 | ) | 9.79 | 16.45 | (1.36 | ) | 12.42 | ||||||||||||||||
|
|
|
|
|
|
|
|
|
|
|
| |||||||||||||
Distributions(b) | ||||||||||||||||||||||||
From net investment income | (0.38 | ) | (0.16 | ) | (0.13 | ) | (0.32 | ) | (0.23 | ) | (0.02 | ) | ||||||||||||
From net realized gain | (4.66 | ) | (7.00 | ) | (3.26 | ) | (2.31 | ) | (4.53 | ) | (2.01 | ) | ||||||||||||
|
|
|
|
|
|
|
|
|
|
|
| |||||||||||||
Total distributions | (5.04 | ) | (7.16 | ) | (3.39 | ) | (2.63 | ) | (4.76 | ) | (2.03 | ) | ||||||||||||
|
|
|
|
|
|
|
|
|
|
|
| |||||||||||||
Net asset value, end of period | $ | 68.47 | $ | 72.10 | $ | 81.77 | $ | 75.37 | $ | 61.55 | $ | 67.67 | ||||||||||||
|
|
|
|
|
|
|
|
|
|
|
| |||||||||||||
Total Return(c) | ||||||||||||||||||||||||
Based on net asset value | 2.25 | % | (3.55 | )%(d) | 13.37 | %(e) | 27.34 | %(f) | (1.84 | )% | 22.47 | % | ||||||||||||
|
|
|
|
|
|
|
|
|
|
|
| |||||||||||||
Ratios to Average Net Assets(g) | ||||||||||||||||||||||||
Total expenses | 0.84 | % | 0.85 | % | 0.84 | %(h) | 0.85 | % | 0.85 | % | 0.87 | % | ||||||||||||
|
|
|
|
|
|
|
|
|
|
|
| |||||||||||||
Total expenses after fees waived and/or reimbursed | 0.84 | % | 0.85 | % | 0.84 | %(h) | 0.85 | % | 0.84 | % | 0.86 | % | ||||||||||||
|
|
|
|
|
|
|
|
|
|
|
| |||||||||||||
Net investment income | 0.49 | % | 0.31 | % | 0.24 | %(h) | 0.28 | % | 0.45 | % | 0.40 | % | ||||||||||||
|
|
|
|
|
|
|
|
|
|
|
| |||||||||||||
Supplemental Data | ||||||||||||||||||||||||
Net assets, end of period (000) | $ | 4,436,816 | $ | 5,062,514 | $ | 5,990,131 | $ | 5,133,191 | $ | 3,095,352 | $ | 2,944,146 | ||||||||||||
|
|
|
|
|
|
|
|
|
|
|
| |||||||||||||
Portfolio turnover rate | 29 | % | 51 | % | 19 | % | 28 | % | 41 | % | 39 | % | ||||||||||||
|
|
|
|
|
|
|
|
|
|
|
| |||||||||||||
| (a) | Based on average shares outstanding. |
| (b) | Distributions for annual periods determined in accordance with U.S. federal income tax regulations. |
| (c) | Where applicable, assumes the reinvestment of distributions. |
| (d) | Includes a capital contribution from affiliate, which had no impact on the Fund’s total return. |
| (e) | Not annualized. |
| (f) | Includes a payment received from an affiliate, which had no impact on the Fund’s total return. |
| (g) | Excludes fees and expenses incurred indirectly as a result of investments in underlying funds. |
| (h) | Annualized. |
See notes to financial statements.
| 56 | 2 0 2 3 B L A C K R O C K A N N U A L R E P O R T T O S H A R E H O L D E R S |
Financial Highlights (continued)
(For a share outstanding throughout each period)
| BlackRock Health Sciences Opportunities Portfolio (continued) | ||||||||||||||||||||||||
| Service | ||||||||||||||||||||||||
| Year Ended 05/31/23 | Year Ended 05/31/22 | Period from 10/01/20 to 05/31/21 | Year Ended 09/30/20 | Year Ended 09/30/19 | Year Ended 09/30/18 | |||||||||||||||||||
Net asset value, beginning of period | $ | 68.16 | $ | 77.63 | $ | 71.63 | $ | 58.66 | $ | 64.73 | $ | 54.90 | ||||||||||||
|
|
|
|
|
|
|
|
|
|
|
| |||||||||||||
Net investment income (loss)(a) | 0.13 | 0.01 | (0.03 | ) | (0.01 | ) | 0.08 | 0.05 | ||||||||||||||||
Net realized and unrealized gain (loss) | 1.00 | (2.61 | ) | 9.18 | 15.48 | (1.57 | ) | 11.67 | ||||||||||||||||
|
|
|
|
|
|
|
|
|
|
|
| |||||||||||||
Net increase (decrease) from investment operations | 1.13 | (2.60 | ) | 9.15 | 15.47 | (1.49 | ) | 11.72 | ||||||||||||||||
|
|
|
|
|
|
|
|
|
|
|
| |||||||||||||
Distributions(b) | ||||||||||||||||||||||||
From net investment income | (0.19 | ) | — | — | (0.19 | ) | (0.05 | ) | — | |||||||||||||||
From net realized gain | (4.66 | ) | (6.87 | ) | (3.15 | ) | (2.31 | ) | (4.53 | ) | (1.89 | ) | ||||||||||||
|
|
|
|
|
|
|
|
|
|
|
| |||||||||||||
Total distributions | (4.85 | ) | (6.87 | ) | (3.15 | ) | (2.50 | ) | (4.58 | ) | (1.89 | ) | ||||||||||||
|
|
|
|
|
|
|
|
|
|
|
| |||||||||||||
Net asset value, end of period | $ | 64.44 | $ | 68.16 | $ | 77.63 | $ | 71.63 | $ | 58.66 | $ | 64.73 | ||||||||||||
|
|
|
|
|
|
|
|
|
|
|
| |||||||||||||
Total Return(c) | ||||||||||||||||||||||||
Based on net asset value | 1.94 | % | (3.83 | )%(d) | 13.15 | %(e) | 26.96 | %(f) | (2.16 | )% | 22.10 | % | ||||||||||||
|
|
|
|
|
|
|
|
|
|
|
| |||||||||||||
Ratios to Average Net Assets(g) | ||||||||||||||||||||||||
Total expenses | 1.14 | % | 1.14 | % | 1.14 | %(h) | 1.15 | % | 1.15 | % | 1.17 | % | ||||||||||||
|
|
|
|
|
|
|
|
|
|
|
| |||||||||||||
Total expenses after fees waived and/or reimbursed | 1.14 | % | 1.14 | % | 1.14 | %(h) | 1.15 | % | 1.15 | % | 1.16 | % | ||||||||||||
|
|
|
|
|
|
|
|
|
|
|
| |||||||||||||
Net investment income (loss) | 0.19 | % | 0.02 | % | (0.07 | )%(h) | (0.02 | )% | 0.14 | % | 0.10 | % | ||||||||||||
|
|
|
|
|
|
|
|
|
|
|
| |||||||||||||
Supplemental Data | ||||||||||||||||||||||||
Net assets, end of period (000) | $ | 33,055 | $ | 36,625 | $ | 43,825 | $ | 40,252 | $ | 34,708 | $ | 39,325 | ||||||||||||
|
|
|
|
|
|
|
|
|
|
|
| |||||||||||||
Portfolio turnover rate | 29 | % | 51 | % | 19 | % | 28 | % | 41 | % | 39 | % | ||||||||||||
|
|
|
|
|
|
|
|
|
|
|
| |||||||||||||
| (a) | Based on average shares outstanding. |
| (b) | Distributions for annual periods determined in accordance with U.S. federal income tax regulations. |
| (c) | Where applicable, assumes the reinvestment of distributions. |
| (d) | Includes a capital contribution from affiliate, which had no impact on the Fund’s total return. |
| (e) | Not annualized. |
| (f) | Includes a payment received from an affiliate, which had no impact on the Fund’s total return. |
| (g) | Excludes fees and expenses incurred indirectly as a result of investments in underlying funds. |
| (h) | Annualized. |
See notes to financial statements.
F I N A N C I A L H I G H L I G H T S | 57 |
Financial Highlights (continued)
(For a share outstanding throughout each period)
| BlackRock Health Sciences Opportunities Portfolio (continued) | ||||||||||||||||||||||||
| Investor A | ||||||||||||||||||||||||
| Year Ended 05/31/23 | Year Ended 05/31/22 | Period from 10/01/20 to 05/31/21 | Year Ended 09/30/20 | Year Ended 09/30/19 | Year Ended 09/30/18 | |||||||||||||||||||
Net asset value, beginning of period | $ | 67.84 | $ | 77.31 | $ | 71.37 | $ | 58.45 | $ | 64.50 | $ | 54.70 | ||||||||||||
|
|
|
|
|
|
|
|
|
|
|
| |||||||||||||
Net investment income (loss)(a) | 0.16 | 0.05 | (0.01 | ) | 0.01 | 0.10 | 0.06 | |||||||||||||||||
Net realized and unrealized gain (loss) | 0.99 | (2.59 | ) | 9.15 | 15.42 | (1.56 | ) | 11.63 | ||||||||||||||||
|
|
|
|
|
|
|
|
|
|
|
| |||||||||||||
Net increase (decrease) from investment operations | 1.15 | (2.54 | ) | 9.14 | 15.43 | (1.46 | ) | 11.69 | ||||||||||||||||
|
|
|
|
|
|
|
|
|
|
|
| |||||||||||||
Distributions(b) | ||||||||||||||||||||||||
From net investment income | (0.22 | ) | — | — | (0.20 | ) | (0.06 | ) | — | |||||||||||||||
From net realized gain | (4.66 | ) | (6.93 | ) | (3.20 | ) | (2.31 | ) | (4.53 | ) | (1.89 | ) | ||||||||||||
|
|
|
|
|
|
|
|
|
|
|
| |||||||||||||
Total distributions | (4.88 | ) | (6.93 | ) | (3.20 | ) | (2.51 | ) | (4.59 | ) | (1.89 | ) | ||||||||||||
|
|
|
|
|
|
|
|
|
|
|
| |||||||||||||
Net asset value, end of period | $ | 64.11 | $ | 67.84 | $ | 77.31 | $ | 71.37 | $ | 58.45 | $ | 64.50 | ||||||||||||
|
|
|
|
|
|
|
|
|
|
|
| |||||||||||||
Total Return(c) | ||||||||||||||||||||||||
Based on net asset value | 1.99 | % | (3.78 | )%(d) | 13.18 | %(e) | 26.99 | %(f) | (2.11 | )% | 22.13 | % | ||||||||||||
|
|
|
|
|
|
|
|
|
|
|
| |||||||||||||
Ratios to Average Net Assets(g) | ||||||||||||||||||||||||
Total expenses | 1.09 | % | 1.09 | % | 1.10 | %(h) | 1.11 | % | 1.12 | % | 1.15 | % | ||||||||||||
|
|
|
|
|
|
|
|
|
|
|
| |||||||||||||
Total expenses after fees waived and/or reimbursed | 1.09 | % | 1.09 | % | 1.10 | %(h) | 1.11 | % | 1.12 | % | 1.14 | % | ||||||||||||
|
|
|
|
|
|
|
|
|
|
|
| |||||||||||||
Net investment income (loss) | 0.24 | % | 0.07 | % | (0.02 | )%(h) | 0.01 | % | 0.17 | % | 0.11 | % | ||||||||||||
|
|
|
|
|
|
|
|
|
|
|
| |||||||||||||
Supplemental Data | ||||||||||||||||||||||||
Net assets, end of period (000) | $ | 2,865,706 | $ | 3,151,912 | $ | 3,496,818 | $ | 3,135,882 | $ | 2,598,888 | $ | 2,767,303 | ||||||||||||
|
|
|
|
|
|
|
|
|
|
|
| |||||||||||||
Portfolio turnover rate | 29 | % | 51 | % | 19 | % | 28 | % | 41 | % | 39 | % | ||||||||||||
|
|
|
|
|
|
|
|
|
|
|
| |||||||||||||
| (a) | Based on average shares outstanding. |
| (b) | Distributions for annual periods determined in accordance with U.S. federal income tax regulations. |
| (c) | Where applicable, excludes the effects of any sales charges and assumes the reinvestment of distributions. |
| (d) | Includes a capital contribution from affiliate, which had no impact on the Fund’s total return. |
| (e) | Not annualized. |
| (f) | Includes a payment received from an affiliate, which had no impact on the Fund’s total return. |
| (g) | Excludes fees and expenses incurred indirectly as a result of investments in underlying funds. |
| (h) | Annualized. |
See notes to financial statements.
| 58 | 2 0 2 3 B L A C K R O C K A N N U A L R E P O R T T O S H A R E H O L D E R S |
Financial Highlights (continued)
(For a share outstanding throughout each period)
| BlackRock Health Sciences Opportunities Portfolio (continued) | ||||||||||||||||||||||||
| Investor C | ||||||||||||||||||||||||
| Year Ended 05/31/23 | Year Ended 05/31/22 | Period from 10/01/20 to 05/31/21 | Year Ended 09/30/20 | Year Ended 09/30/19 | Year Ended 09/30/18 | |||||||||||||||||||
Net asset value, beginning of period | $ | 57.24 | $ | 66.15 | $ | 61.38 | $ | 50.74 | $ | 56.55 | $ | 48.54 | ||||||||||||
|
|
|
|
|
|
|
|
|
|
|
| |||||||||||||
Net investment loss(a) | (0.27 | ) | (0.43 | ) | (0.33 | ) | (0.40 | ) | (0.28 | ) | (0.30 | ) | ||||||||||||
Net realized and unrealized gain (loss) | 0.80 | (2.17 | ) | 7.85 | 13.34 | (1.38 | ) | 10.20 | ||||||||||||||||
|
|
|
|
|
|
|
|
|
|
|
| |||||||||||||
Net increase (decrease) from investment operations | 0.53 | (2.60 | ) | 7.52 | 12.94 | (1.66 | ) | 9.90 | ||||||||||||||||
|
|
|
|
|
|
|
|
|
|
|
| |||||||||||||
Distributions from net realized gain(b) | (4.66 | ) | (6.31 | ) | (2.75 | ) | (2.30 | ) | (4.15 | ) | (1.89 | ) | ||||||||||||
|
|
|
|
|
|
|
|
|
|
|
| |||||||||||||
Net asset value, end of period | $ | 53.11 | $ | 57.24 | $ | 66.15 | $ | 61.38 | $ | 50.74 | $ | 56.55 | ||||||||||||
|
|
|
|
|
|
|
|
|
|
|
| |||||||||||||
Total Return(c) | ||||||||||||||||||||||||
Based on net asset value | 1.22 | % | (4.50 | )%(d) | 12.61 | %(e) | 26.09 | %(f) | (2.82 | )% | 21.22 | % | ||||||||||||
|
|
|
|
|
|
|
|
|
|
|
| |||||||||||||
Ratios to Average Net Assets(g) | ||||||||||||||||||||||||
Total expenses | 1.85 | % | 1.84 | % | 1.84 | %(h) | 1.85 | % | 1.85 | % | 1.87 | % | ||||||||||||
|
|
|
|
|
|
|
|
|
|
|
| |||||||||||||
Total expenses after fees waived and/or reimbursed | 1.85 | % | 1.84 | % | 1.84 | %(h) | 1.85 | % | 1.85 | % | 1.87 | % | ||||||||||||
|
|
|
|
|
|
|
|
|
|
|
| |||||||||||||
Net investment loss | (0.51 | )% | (0.68 | )% | (0.77 | )%(h) | (0.72 | )% | (0.56 | )% | (0.61 | )% | ||||||||||||
|
|
|
|
|
|
|
|
|
|
|
| |||||||||||||
Supplemental Data | ||||||||||||||||||||||||
Net assets, end of period (000) | $ | 404,306 | $ | 542,880 | $ | 719,525 | $ | 773,522 | $ | 745,636 | $ | 1,017,205 | ||||||||||||
|
|
|
|
|
|
|
|
|
|
|
| |||||||||||||
Portfolio turnover rate | 29 | % | 51 | % | 19 | % | 28 | % | 41 | % | 39 | % | ||||||||||||
|
|
|
|
|
|
|
|
|
|
|
| |||||||||||||
| (a) | Based on average shares outstanding. |
| (b) | Distributions for annual periods determined in accordance with U.S. federal income tax regulations. |
| (c) | Where applicable, excludes the effects of any sales charges and assumes the reinvestment of distributions. |
| (d) | Includes a capital contribution from affiliate, which had no impact on the Fund’s total return. |
| (e) | Not annualized. |
| (f) | Includes a payment received from an affiliate, which had no impact on the Fund’s total return. |
| (g) | Excludes fees and expenses incurred indirectly as a result of investments in underlying funds. |
| (h) | Annualized. |
See notes to financial statements.
F I N A N C I A L H I G H L I G H T S | 59 |
Financial Highlights (continued)
(For a share outstanding throughout each period)
| BlackRock Health Sciences Opportunities Portfolio (continued) | ||||||||||||||||||||||||
| Class K | ||||||||||||||||||||||||
| Year Ended 05/31/23 | Year Ended 05/31/22 | Period from 10/01/20 to 05/31/21 | Year Ended 09/30/20 | Year Ended 09/30/19 | Year Ended 09/30/18 | |||||||||||||||||||
Net asset value, beginning of period | $ | 72.21 | $ | 81.91 | $ | 75.50 | $ | 61.63 | $ | 67.75 | $ | 57.37 | ||||||||||||
|
|
|
|
|
|
|
|
|
|
|
| |||||||||||||
Net investment income(a) | 0.40 | 0.33 | 0.18 | 0.27 | 0.34 | 0.32 | ||||||||||||||||||
Net realized and unrealized gain (loss) | 1.08 | (2.77 | ) | 9.68 | 16.28 | (1.65 | ) | 12.17 | ||||||||||||||||
|
|
|
|
|
|
|
|
|
|
|
| |||||||||||||
Net increase (decrease) from investment operations | 1.48 | (2.44 | ) | 9.86 | 16.55 | (1.31 | ) | 12.49 | ||||||||||||||||
|
|
|
|
|
|
|
|
|
|
|
| |||||||||||||
Distributions(b) | ||||||||||||||||||||||||
From net investment income | (0.45 | ) | (0.26 | ) | (0.19 | ) | (0.37 | ) | (0.28 | ) | (0.10 | ) | ||||||||||||
From net realized gain | (4.66 | ) | (7.00 | ) | (3.26 | ) | (2.31 | ) | (4.53 | ) | (2.01 | ) | ||||||||||||
|
|
|
|
|
|
|
|
|
|
|
| |||||||||||||
Total distributions | (5.11 | ) | (7.26 | ) | (3.45 | ) | (2.68 | ) | (4.81 | ) | (2.11 | ) | ||||||||||||
|
|
|
|
|
|
|
|
|
|
|
| |||||||||||||
Net asset value, end of period | $ | 68.58 | $ | 72.21 | $ | 81.91 | $ | 75.50 | $ | 61.63 | $ | 67.75 | ||||||||||||
|
|
|
|
|
|
|
|
|
|
|
| |||||||||||||
Total Return(c) | ||||||||||||||||||||||||
Based on net asset value | 2.34 | % | (3.44 | )%(d) | 13.45 | %(e) | 27.47 | %(f) | (1.75 | )% | 22.58 | % | ||||||||||||
|
|
|
|
|
|
|
|
|
|
|
| |||||||||||||
Ratios to Average Net Assets(g) | ||||||||||||||||||||||||
Total expenses | 0.75 | % | 0.74 | % | 0.74 | %(h) | 0.75 | % | 0.75 | % | 0.77 | % | ||||||||||||
|
|
|
|
|
|
|
|
|
|
|
| |||||||||||||
Total expenses after fees waived and/or reimbursed | 0.75 | % | 0.74 | % | 0.74 | %(h) | 0.75 | % | 0.75 | % | 0.76 | % | ||||||||||||
|
|
|
|
|
|
|
|
|
|
|
| |||||||||||||
Net investment income | 0.59 | % | 0.42 | % | 0.34 | %(h) | 0.39 | % | 0.55 | % | 0.53 | % | ||||||||||||
|
|
|
|
|
|
|
|
|
|
|
| |||||||||||||
Supplemental Data | ||||||||||||||||||||||||
Net assets, end of period (000) | $ | 487,287 | $ | 436,984 | $ | 464,179 | $ | 344,822 | $ | 171,517 | $ | 130,129 | ||||||||||||
|
|
|
|
|
|
|
|
|
|
|
| |||||||||||||
Portfolio turnover rate | 29 | % | 51 | % | 19 | % | 28 | % | 41 | % | 39 | % | ||||||||||||
|
|
|
|
|
|
|
|
|
|
|
| |||||||||||||
| (a) | Based on average shares outstanding. |
| (b) | Distributions for annual periods determined in accordance with U.S. federal income tax regulations. |
| (c) | Where applicable, assumes the reinvestment of distributions. |
| (d) | Includes a capital contribution from affiliate, which had no impact on the Fund’s total return. |
| (e) | Not annualized. |
| (f) | Includes a payment received from an affiliate, which had no impact on the Fund’s total return. |
| (g) | Excludes fees and expenses incurred indirectly as a result of investments in underlying funds. |
| (h) | Annualized. |
See notes to financial statements.
| 60 | 2 0 2 3 B L A C K R O C K A N N U A L R E P O R T T O S H A R E H O L D E R S |
Financial Highlights (continued)
(For a share outstanding throughout each period)
| BlackRock Health Sciences Opportunities Portfolio (continued) | ||||||||||||||||||||||||
| Class R | ||||||||||||||||||||||||
| Year Ended 05/31/23 | Year Ended 05/31/22 | Period from to 05/31/21 | Year Ended 09/30/20 | Year Ended 09/30/19 | Year Ended 09/30/18 | |||||||||||||||||||
Net asset value, beginning of period | $ | 65.94 | $ | 75.28 | $ | 69.54 | $ | 57.05 | $ | 63.09 | $ | 53.71 | ||||||||||||
|
|
|
|
|
|
|
|
|
|
|
| |||||||||||||
Net investment loss(a) | (0.08 | ) | (0.21 | ) | (0.18 | ) | (0.20 | ) | (0.09 | ) | (0.11 | ) | ||||||||||||
Net realized and unrealized gain (loss) | 0.96 | (2.52 | ) | 8.91 | 15.05 | (1.53 | ) | 11.38 | ||||||||||||||||
|
|
|
|
|
|
|
|
|
|
|
| |||||||||||||
Net increase (decrease) from investment operations | 0.88 | (2.73 | ) | 8.73 | 14.85 | (1.62 | ) | 11.27 | ||||||||||||||||
|
|
|
|
|
|
|
|
|
|
|
| |||||||||||||
Distributions(b) | ||||||||||||||||||||||||
From net investment income | (0.02 | ) | — | — | (0.05 | ) | — | — | ||||||||||||||||
From net realized gain | (4.66 | ) | (6.61 | ) | (2.99 | ) | (2.31 | ) | (4.42 | ) | (1.89 | ) | ||||||||||||
|
|
|
|
|
|
|
|
|
|
|
| |||||||||||||
Total distributions | (4.68 | ) | (6.61 | ) | (2.99 | ) | (2.36 | ) | (4.42 | ) | (1.89 | ) | ||||||||||||
|
|
|
|
|
|
|
|
|
|
|
| |||||||||||||
Net asset value, end of period | $ | 62.14 | $ | 65.94 | $ | 75.28 | $ | 69.54 | $ | 57.05 | $ | 63.09 | ||||||||||||
|
|
|
|
|
|
|
|
|
|
|
| |||||||||||||
Total Return(c) | ||||||||||||||||||||||||
Based on net asset value | 1.62 | % | (4.12 | )%(d) | 12.91 | %(e) | 26.60 | %(f) | (2.44 | )% | 21.75 | % | ||||||||||||
|
|
|
|
|
|
|
|
|
|
|
| |||||||||||||
Ratios to Average Net Assets(g) | ||||||||||||||||||||||||
Total expenses | 1.46 | % | 1.45 | % | 1.44 | %(h) | 1.45 | % | 1.45 | % | 1.46 | % | ||||||||||||
|
|
|
|
|
|
|
|
|
|
|
| |||||||||||||
Total expenses after fees waived and/or reimbursed | 1.46 | % | 1.45 | % | 1.44 | %(h) | 1.45 | % | 1.45 | % | 1.46 | % | ||||||||||||
|
|
|
|
|
|
|
|
|
|
|
| |||||||||||||
Net investment loss | (0.13 | )% | (0.29 | )% | (0.37 | )%(h) | (0.32 | )% | (0.15 | )% | (0.20 | )% | ||||||||||||
|
|
|
|
|
|
|
|
|
|
|
| |||||||||||||
Supplemental Data | ||||||||||||||||||||||||
Net assets, end of period (000) | $ | 242,080 | $ | 263,195 | $ | 289,676 | $ | 260,488 | $ | 224,862 | $ | 241,495 | ||||||||||||
|
|
|
|
|
|
|
|
|
|
|
| |||||||||||||
Portfolio turnover rate | 29 | % | 51 | % | 19 | % | 28 | % | 41 | % | 39 | % | ||||||||||||
|
|
|
|
|
|
|
|
|
|
|
| |||||||||||||
| (a) | Based on average shares outstanding. |
| (b) | Distributions for annual periods determined in accordance with U.S. federal income tax regulations. |
| (c) | Where applicable, assumes the reinvestment of distributions. |
| (d) | Includes a capital contribution from affiliate, which had no impact on the Fund’s total return. |
| (e) | Not annualized. |
| (f) | Includes a payment received from an affiliate, which had no impact on the Fund’s total return. |
| (g) | Excludes fees and expenses incurred indirectly as a result of investments in underlying funds. |
| (h) | Annualized. |
See notes to financial statements.
F I N A N C I A L H I G H L I G H T S | 61 |
Financial Highlights
(For a share outstanding throughout each period)
BlackRock Infrastructure Sustainable Opportunities Fund | ||||||||
| Institutional | ||||||||
| Period from | ||||||||
| Year Ended | 09/30/21 | (a) | ||||||
| 05/31/23 | to 05/31/22 | |||||||
Net asset value, beginning of period | $ | 9.97 | $ | 10.00 | ||||
�� |
|
|
| |||||
Net investment income(b) | 0.14 | 0.07 | ||||||
Net realized and unrealized loss | (0.68 | ) | (0.02 | ) | ||||
|
|
|
| |||||
Net increase (decrease) from investment operations | (0.54 | ) | 0.05 | |||||
|
|
|
| |||||
Distributions(c) | ||||||||
From net investment income | (0.13 | ) | (0.04 | ) | ||||
From net realized gain | (0.26 | ) | (0.04 | ) | ||||
|
|
|
| |||||
Total distributions | (0.39 | ) | (0.08 | ) | ||||
|
|
|
| |||||
Net asset value, end of period | $ | 9.04 | $ | 9.97 | ||||
|
|
|
| |||||
Total Return(d) | ||||||||
Based on net asset value | (5.32 | )% | 0.45 | %(e) | ||||
|
|
|
| |||||
Ratios to Average Net Assets(f) | ||||||||
Total expenses | 4.54 | % | 3.62 | %(g)(h) | ||||
|
|
|
| |||||
Total expenses after fees waived and/or reimbursed | 1.00 | % | 1.00 | %(g) | ||||
|
|
|
| |||||
Net investment income | 1.60 | % | 1.09 | %(g) | ||||
|
|
|
| |||||
Supplemental Data | ||||||||
Net assets, end of period (000) | $ | 102 | $ | 107 | ||||
|
|
|
| |||||
Portfolio turnover rate(i) | 104 | % | 70 | % | ||||
|
|
|
| |||||
| (a) | Commencement of operations. |
| (b) | Based on average shares outstanding. |
| (c) | Distributions for annual periods determined in accordance with U.S. federal income tax regulations. |
| (d) | Where applicable, assumes the reinvestment of distributions. |
| (e) | Not annualized. |
| (f) | Excludes fees and expenses incurred indirectly as a result of investments in underlying funds. |
| (g) | Annualized. |
| (h) | Audit, offering, organization and printing costs were not annualized in the calculation of the expense ratios. If these expenses were annualized, the total expenses would have been 4.45%. |
| (i) | Excludes underlying investments in total return swaps. |
See notes to financial statements.
| 62 | 2 0 2 3 B L A C K R O C K A N N U A L R E P O R T T O S H A R E H O L D E R S |
Financial Highlights (continued)
(For a share outstanding throughout each period)
BlackRock Infrastructure Sustainable Opportunities Fund (continued) | ||||||||
| Investor A | ||||||||
| Period from | ||||||||
| Year Ended | 09/30/21 | (a) | ||||||
| 05/31/23 | to 05/31/22 | |||||||
Net asset value, beginning of period | $ | 9.96 | $ | 10.00 | ||||
|
|
|
| |||||
Net investment income(b) | 0.13 | 0.06 | ||||||
Net realized and unrealized loss | (0.69 | ) | (0.03 | ) | ||||
|
|
|
| |||||
Net increase (decrease) from investment operations | (0.56 | ) | 0.03 | |||||
|
|
|
| |||||
Distributions(c) | ||||||||
From net investment income | (0.11 | ) | (0.03 | ) | ||||
From net realized gain | (0.26 | ) | (0.04 | ) | ||||
|
|
|
| |||||
Total distributions | (0.37 | ) | (0.07 | ) | ||||
|
|
|
| |||||
Net asset value, end of period | $ | 9.03 | $ | 9.96 | ||||
|
|
|
| |||||
Total Return(d) | ||||||||
Based on net asset value | (5.55 | )% | 0.29 | %(e) | ||||
|
|
|
| |||||
Ratios to Average Net Assets(f) | ||||||||
Total expenses | 4.75 | % | 3.88 | %(g)(h) | ||||
|
|
|
| |||||
Total expenses after fees waived and/or reimbursed | 1.25 | % | 1.25 | %(g) | ||||
|
|
|
| |||||
Net investment income | 1.41 | % | 0.84 | %(g) | ||||
|
|
|
| |||||
Supplemental Data | ||||||||
Net assets, end of period (000) | $ | 156 | $ | 109 | ||||
|
|
|
| |||||
Portfolio turnover rate(i) | 104 | % | 70 | % | ||||
|
|
|
| |||||
| (a) | Commencement of operations. |
| (b) | Based on average shares outstanding. |
| (c) | Distributions for annual periods determined in accordance with U.S. federal income tax regulations. |
| (d) | Where applicable, excludes the effects of any sales charges and assumes the reinvestment of distributions. |
| (e) | Not annualized. |
| (f) | Excludes fees and expenses incurred indirectly as a result of investments in underlying funds. |
| (g) | Annualized. |
| (h) | Audit, offering, organization and printing costs were not annualized in the calculation of the expense ratios. If these expenses were annualized, the total expenses would have been 4.71%. |
| (i) | Excludes underlying investments in total return swaps. |
See notes to financial statements.
F I N A N C I A L H I G H L I G H T S | 63 |
Financial Highlights (continued)
(For a share outstanding throughout each period)
BlackRock Infrastructure Sustainable Opportunities Fund (continued) | ||||||||
| Class K | ||||||||
| Period from | ||||||||
| Year Ended | 09/30/21 | (a) | ||||||
| 05/31/23 | to 05/31/22 | |||||||
Net asset value, beginning of period | $ | 9.97 | $ | 10.00 | ||||
|
|
|
| |||||
Net investment income(b) | 0.15 | 0.08 | ||||||
Net realized and unrealized loss | (0.69 | ) | (0.03 | ) | ||||
|
|
|
| |||||
Net increase (decrease) from investment operations | (0.54 | ) | 0.05 | |||||
|
|
|
| |||||
Distributions(c) | ||||||||
From net investment income | (0.13 | ) | (0.04 | ) | ||||
From net realized gain | (0.26 | ) | (0.04 | ) | ||||
|
|
|
| |||||
Total distributions | (0.39 | ) | (0.08 | ) | ||||
|
|
|
| |||||
Net asset value, end of period | $ | 9.04 | $ | 9.97 | ||||
|
|
|
| |||||
Total Return(d) | ||||||||
Based on net asset value | (5.27 | )% | 0.46 | %(e) | ||||
|
|
|
| |||||
Ratios to Average Net Assets(f) | ||||||||
Total expenses | 4.33 | % | 3.36 | %(g)(h) | ||||
|
|
|
| |||||
Total expenses after fees waived and/or reimbursed | 0.95 | % | 0.95 | %(g) | ||||
|
|
|
| |||||
Net investment income | 1.65 | % | 1.13 | %(g) | ||||
|
|
|
| |||||
Supplemental Data | ||||||||
Net assets, end of period (000) | $ | 8,866 | $ | 9,777 | ||||
|
|
|
| |||||
Portfolio turnover rate(i) | 104 | % | 70 | % | ||||
|
|
|
| |||||
| (a) | Commencement of operations. |
| (b) | Based on average shares outstanding. |
| (c) | Distributions for annual periods determined in accordance with U.S. federal income tax regulations. |
| (d) | Where applicable, assumes the reinvestment of distributions. |
| (e) | Not annualized. |
| (f) | Excludes fees and expenses incurred indirectly as a result of investments in underlying funds. |
| (g) | Annualized. |
| (h) | Audit, offering, organization and printing costs were not annualized in the calculation of the expense ratios. If these expenses were annualized, the total expenses would have been 4.21%. |
| (i) | Excludes underlying investments in total return swaps. |
See notes to financial statements.
| 64 | 2 0 2 3 B L A C K R O C K A N N U A L R E P O R T T O S H A R E H O L D E R S |
Financial Highlights
(For a share outstanding throughout each period)
| BlackRock Mid-Cap Growth Equity Portfolio | ||||||||||||||||||||||||
| Institutional | ||||||||||||||||||||||||
| Year Ended 05/31/23 | Year Ended 05/31/22 | Period from 10/01/20 to 05/31/21 | Year Ended 09/30/20 | Year Ended 09/30/19 | Year Ended 09/30/18 | |||||||||||||||||||
Net asset value, beginning of period | $ | 32.83 | $ | 45.95 | $ | 36.56 | $ | 28.68 | $ | 27.87 | $ | 22.10 | ||||||||||||
|
|
|
|
|
|
|
|
|
|
|
| |||||||||||||
Net investment loss(a) | (0.08 | ) | (0.23 | ) | (0.15 | ) | (0.14 | ) | (0.09 | ) | (0.11 | ) | ||||||||||||
Net realized and unrealized gain (loss) | 0.04 | (10.52 | ) | 9.54 | 8.14 | 1.95 | 6.63 | |||||||||||||||||
|
|
|
|
|
|
|
|
|
|
|
| |||||||||||||
Net increase (decrease) from investment operations | (0.04 | ) | (10.75 | ) | 9.39 | 8.00 | 1.86 | 6.52 | ||||||||||||||||
|
|
|
|
|
|
|
|
|
|
|
| |||||||||||||
Distributions from net realized gain(b) | — | (2.37 | ) | — | (0.12 | ) | (1.05 | ) | (0.75 | ) | ||||||||||||||
|
|
|
|
|
|
|
|
|
|
|
| |||||||||||||
Net asset value, end of period | $ | 32.79 | $ | 32.83 | $ | 45.95 | $ | 36.56 | $ | 28.68 | $ | 27.87 | ||||||||||||
|
|
|
|
|
|
|
|
|
|
|
| |||||||||||||
Total Return(c) | ||||||||||||||||||||||||
Based on net asset value | (0.12 | )% | (24.87 | )% | 25.68 | %(d) | 27.98 | % | 7.43 | % | 30.34 | % | ||||||||||||
|
|
|
|
|
|
|
|
|
|
|
| |||||||||||||
Ratios to Average Net Assets(e) | ||||||||||||||||||||||||
Total expenses | 0.84 | % | 0.81 | % | 0.80 | %(f) | 0.85 | % | 0.87 | % | 0.93 | %(g) | ||||||||||||
|
|
|
|
|
|
|
|
|
|
|
| |||||||||||||
Total expenses after fees waived and/or reimbursed | 0.80 | % | 0.80 | % | 0.80 | %(f) | 0.80 | % | 0.80 | % | 0.86 | % | ||||||||||||
|
|
|
|
|
|
|
|
|
|
|
| |||||||||||||
Net investment loss | (0.25 | )% | (0.52 | )% | (0.52 | )%(f) | (0.43 | )% | (0.34 | )% | (0.45 | )% | ||||||||||||
|
|
|
|
|
|
|
|
|
|
|
| |||||||||||||
Supplemental Data | ||||||||||||||||||||||||
Net assets, end of period (000) | $ | 5,266,832 | $ | 7,095,644 | $ | 9,260,191 | $ | 6,003,280 | $ | 2,700,531 | $ | 1,063,328 | ||||||||||||
|
|
|
|
|
|
|
|
|
|
|
| |||||||||||||
Portfolio turnover rate | 46 | % | 28 | % | 22 | % | 35 | % | 38 | % | 43 | % | ||||||||||||
|
|
|
|
|
|
|
|
|
|
|
| |||||||||||||
| (a) | Based on average shares outstanding. |
| (b) | Distributions for annual periods determined in accordance with U.S. federal income tax regulations. |
| (c) | Where applicable, assumes the reinvestment of distributions. |
| (d) | Not annualized. |
| (e) | Excludes fees and expenses incurred indirectly as a result of investments in underlying funds. |
| (f) | Annualized. |
| (g) | Includes recoupment of past waived and/or reimbursed fees. Excluding the recoupment of past waived and/or reimbursed fees for the year ended September 30, 2018, the expense ratio would have been 0.93%. |
See notes to financial statements.
F I N A N C I A L H I G H L I G H T S | 65 |
Financial Highlights (continued)
(For a share outstanding throughout each period)
| BlackRock Mid-Cap Growth Equity Portfolio (continued) | ||||||||||||||||||||||||
| Service | ||||||||||||||||||||||||
| Year Ended 05/31/23 | Year Ended 05/31/22 | Period from to 05/31/21 | Year Ended 09/30/20 | Year Ended 09/30/19 | Year Ended 09/30/18 | |||||||||||||||||||
Net asset value, beginning of period | $ | 29.34 | $ | 41.34 | $ | 32.95 | $ | 25.92 | $ | 25.30 | $ | 20.18 | ||||||||||||
|
|
|
|
|
|
|
|
|
|
|
| |||||||||||||
Net investment loss(a) | (0.14 | ) | (0.31 | ) | (0.20 | ) | (0.19 | ) | (0.15 | ) | (0.17 | ) | ||||||||||||
Net realized and unrealized gain (loss) | 0.03 | (9.39 | ) | 8.59 | 7.34 | 1.76 | 6.04 | |||||||||||||||||
|
|
|
|
|
|
|
|
|
|
|
| |||||||||||||
Net increase (decrease) from investment operations | (0.11 | ) | (9.70 | ) | 8.39 | 7.15 | 1.61 | 5.87 | ||||||||||||||||
|
|
|
|
|
|
|
|
|
|
|
| |||||||||||||
Distributions from net realized gain(b) | — | (2.30 | ) | — | (0.12 | ) | (0.99 | ) | (0.75 | ) | ||||||||||||||
|
|
|
|
|
|
|
|
|
|
|
| |||||||||||||
Net asset value, end of period | $ | 29.23 | $ | 29.34 | $ | 41.34 | $ | 32.95 | $ | 25.92 | $ | 25.30 | ||||||||||||
|
|
|
|
|
|
|
|
|
|
|
| |||||||||||||
Total Return(c) | ||||||||||||||||||||||||
Based on net asset value | (0.38 | )% | (25.06 | )% | 25.46 | %(d) | 27.68 | % | 7.15 | % | 30.03 | % | ||||||||||||
|
|
|
|
|
|
|
|
|
|
|
| |||||||||||||
Ratios to Average Net Assets(e) | ||||||||||||||||||||||||
Total expenses | 1.10 | % | 1.09 | % | 1.10 | %(f) | 1.11 | % | 1.16 | % | 1.25 | %(g) | ||||||||||||
|
|
|
|
|
|
|
|
|
|
|
| |||||||||||||
Total expenses after fees waived and/or reimbursed | 1.05 | % | 1.05 | % | 1.05 | %(f) | 1.05 | % | 1.05 | % | 1.12 | % | ||||||||||||
|
|
|
|
|
|
|
|
|
|
|
| |||||||||||||
Net investment loss | (0.50 | )% | (0.77 | )% | (0.78 | )%(f) | (0.67 | )% | (0.59 | )% | (0.73 | )% | ||||||||||||
|
|
|
|
|
|
|
|
|
|
|
| |||||||||||||
Supplemental Data | ||||||||||||||||||||||||
Net assets, end of period (000) | $ | 62,693 | $ | 81,276 | $ | 104,997 | $ | 83,680 | $ | 61,293 | $ | 33,768 | ||||||||||||
|
|
|
|
|
|
|
|
|
|
|
| |||||||||||||
Portfolio turnover rate | 46 | % | 28 | % | 22 | % | 35 | % | 38 | % | 43 | % | ||||||||||||
|
|
|
|
|
|
|
|
|
|
|
| |||||||||||||
| (a) | Based on average shares outstanding. |
| (b) | Distributions for annual periods determined in accordance with U.S. federal income tax regulations. |
| (c) | Where applicable, assumes the reinvestment of distributions. |
| (d) | Not annualized. |
| (e) | Excludes fees and expenses incurred indirectly as a result of investments in underlying funds. |
| (f) | Annualized. |
| (g) | Includes recoupment of past waived and/or reimbursed fees. Excluding the recoupment of past waived and/or reimbursed fees for the year ended September 30, 2018, the expense ratio would have been 1.25%. |
See notes to financial statements.
| 66 | 2 0 2 3 B L A C K R O C K A N N U A L R E P O R T T O S H A R E H O L D E R S |
Financial Highlights (continued)
(For a share outstanding throughout each period)
| BlackRock Mid-Cap Growth Equity Portfolio (continued) | ||||||||||||||||||||||||
| Investor A | ||||||||||||||||||||||||
| Year Ended 05/31/23 | Year Ended 05/31/22 | Period from to 05/31/21 | Year Ended 09/30/20 | Year Ended 09/30/19 | Year Ended 09/30/18 | |||||||||||||||||||
Net asset value, beginning of period | $ | 27.96 | $ | 39.50 | $ | 31.48 | $ | 24.78 | $ | 24.22 | $ | 19.30 | ||||||||||||
|
|
|
|
|
|
|
|
|
|
|
| |||||||||||||
Net investment loss(a) | (0.14 | ) | (0.29 | ) | (0.19 | ) | (0.18 | ) | (0.14 | ) | (0.18 | ) | ||||||||||||
Net realized and unrealized gain (loss) | 0.03 | (8.94 | ) | 8.21 | 7.00 | 1.68 | 5.79 | |||||||||||||||||
|
|
|
|
|
|
|
|
|
|
|
| |||||||||||||
Net increase (decrease) from investment operations | (0.11 | ) | (9.23 | ) | 8.02 | 6.82 | 1.54 | 5.61 | ||||||||||||||||
|
|
|
|
|
|
|
|
|
|
|
| |||||||||||||
Distributions from net realized gain(b) | — | (2.31 | ) | — | (0.12 | ) | (0.98 | ) | (0.69 | ) | ||||||||||||||
|
|
|
|
|
|
|
|
|
|
|
| |||||||||||||
Net asset value, end of period | $ | 27.85 | $ | 27.96 | $ | 39.50 | $ | 31.48 | $ | 24.78 | $ | 24.22 | ||||||||||||
|
|
|
|
|
|
|
|
|
|
|
| |||||||||||||
Total Return(c) | ||||||||||||||||||||||||
Based on net asset value | (0.39 | )% | (25.05 | )% | 25.48 | %(d) | 27.61 | % | 7.17 | % | 29.98 | % | ||||||||||||
|
|
|
|
|
|
|
|
|
|
|
| |||||||||||||
Ratios to Average Net Assets(e) | ||||||||||||||||||||||||
Total expenses | 1.13 | % | 1.09 | % | 1.09 | %(f) | 1.14 | % | 1.16 | % | 1.29 | %(g) | ||||||||||||
|
|
|
|
|
|
|
|
|
|
|
| |||||||||||||
Total expenses after fees waived and/or reimbursed | 1.05 | % | 1.05 | % | 1.05 | %(f) | 1.05 | % | 1.05 | % | 1.19 | % | ||||||||||||
|
|
|
|
|
|
|
|
|
|
|
| |||||||||||||
Net investment loss | (0.50 | )% | (0.78 | )% | (0.78 | )%(f) | (0.67 | )% | (0.58 | )% | (0.82 | )% | ||||||||||||
|
|
|
|
|
|
|
|
|
|
|
| |||||||||||||
Supplemental Data | ||||||||||||||||||||||||
Net assets, end of period (000) | $ | 1,637,289 | $ | 1,913,190 | $ | 2,577,151 | $ | 1,917,773 | $ | 1,335,467 | $ | 801,263 | ||||||||||||
|
|
|
|
|
|
|
|
|
|
|
| |||||||||||||
Portfolio turnover rate | 46 | % | 28 | % | 22 | % | 35 | % | 38 | % | 43 | % | ||||||||||||
|
|
|
|
|
|
|
|
|
|
|
| |||||||||||||
| (a) | Based on average shares outstanding. |
| (b) | Distributions for annual periods determined in accordance with U.S. federal income tax regulations. |
| (c) | Where applicable, excludes the effects of any sales charges and assumes the reinvestment of distributions. |
| (d) | Not annualized. |
| (e) | Excludes fees and expenses incurred indirectly as a result of investments in underlying funds. |
| (f) | Annualized. |
| (g) | Includes recoupment of past waived and/or reimbursed fees. Excluding the recoupment of past waived and/or reimbursed fees for the year ended September 30, 2018, the expense ratio would have been 1.26%. |
See notes to financial statements.
F I N A N C I A L H I G H L I G H T S | 67 |
Financial Highlights (continued)
(For a share outstanding throughout each period)
| BlackRock Mid-Cap Growth Equity Portfolio (continued) | ||||||||||||||||||||||||
| Investor C | ||||||||||||||||||||||||
| Year Ended 05/31/23 | Year Ended 05/31/22 | Period from to 05/31/21 | Year Ended 09/30/20 | Year Ended 09/30/19 | Year Ended 09/30/18 | |||||||||||||||||||
Net asset value, beginning of period | $ | 20.93 | $ | 30.22 | $ | 24.20 | $ | 19.21 | $ | 19.04 | $ | 15.36 | ||||||||||||
|
|
|
|
|
|
|
|
|
|
|
| |||||||||||||
Net investment loss(a) | (0.25 | ) | (0.43 | ) | (0.29 | ) | (0.30 | ) | (0.24 | ) | (0.26 | ) | ||||||||||||
Net realized and unrealized gain (loss) | 0.01 | (6.67 | ) | 6.31 | 5.41 | 1.28 | 4.57 | |||||||||||||||||
|
|
|
|
|
|
|
|
|
|
|
| |||||||||||||
Net increase (decrease) from investment operations | (0.24 | ) | (7.10 | ) | 6.02 | 5.11 | 1.04 | 4.31 | ||||||||||||||||
|
|
|
|
|
|
|
|
|
|
|
| |||||||||||||
Distributions from net realized gain(b) | — | (2.19 | ) | — | (0.12 | ) | (0.87 | ) | (0.63 | ) | ||||||||||||||
|
|
|
|
|
|
|
|
|
|
|
| |||||||||||||
Net asset value, end of period | $ | 20.69 | $ | 20.93 | $ | 30.22 | $ | 24.20 | $ | 19.21 | $ | 19.04 | ||||||||||||
|
|
|
|
|
|
|
|
|
|
|
| |||||||||||||
Total Return(c) | ||||||||||||||||||||||||
Based on net asset value | (1.15 | )% | (25.61 | )% | 24.88 | %(d) | 26.72 | % | 6.33 | % | 29.05 | % | ||||||||||||
|
|
|
|
|
|
|
|
|
|
|
| |||||||||||||
Ratios to Average Net Assets(e) | ||||||||||||||||||||||||
Total expenses | 1.83 | % | 1.78 | % | 1.80 | %(f) | 1.84 | % | 1.86 | % | 1.94 | %(g) | ||||||||||||
|
|
|
|
|
|
|
|
|
|
|
| |||||||||||||
Total expenses after fees waived and/or reimbursed | 1.80 | % | 1.78 | % | 1.79 | %(f) | 1.80 | % | 1.80 | % | 1.88 | % | ||||||||||||
|
|
|
|
|
|
|
|
|
|
|
| |||||||||||||
Net investment loss | (1.25 | )% | (1.51 | )% | (1.52 | )%(f) | (1.42 | )% | (1.33 | )% | (1.49 | )% | ||||||||||||
|
|
|
|
|
|
|
|
|
|
|
| |||||||||||||
Supplemental Data | ||||||||||||||||||||||||
Net assets, end of period (000) | $ | 194,849 | $ | 243,284 | $ | 357,360 | $ | 280,143 | $ | 209,923 | $ | 164,083 | ||||||||||||
|
|
|
|
|
|
|
|
|
|
|
| |||||||||||||
Portfolio turnover rate | 46 | % | 28 | % | 22 | % | 35 | % | 38 | % | 43 | % | ||||||||||||
|
|
|
|
|
|
|
|
|
|
|
| |||||||||||||
| (a) | Based on average shares outstanding. |
| (b) | Distributions for annual periods determined in accordance with U.S. federal income tax regulations. |
| (c) | Where applicable, excludes the effects of any sales charges and assumes the reinvestment of distributions. |
| (d) | Not annualized. |
| (e) | Excludes fees and expenses incurred indirectly as a result of investments in underlying funds. |
| (f) | Annualized. |
| (g) | Includes recoupment of past waived and/or reimbursed fees. Excluding the recoupment of past waived and/or reimbursed fees for the year ended September 30, 2018, the expense ratio would have been 1.94%. |
See notes to financial statements.
| 68 | 2 0 2 3 B L A C K R O C K A N N U A L R E P O R T T O S H A R E H O L D E R S |
Financial Highlights (continued)
(For a share outstanding throughout each period)
| BlackRock Mid-Cap Growth Equity Portfolio (continued) | ||||||||||||||||||||||||
| Class K | ||||||||||||||||||||||||
| Year Ended 05/31/23 | Year Ended 05/31/22 | Period from to 05/31/21 | Year Ended 09/30/20 | Year Ended 09/30/19 | Year Ended 09/30/18 | |||||||||||||||||||
Net asset value, beginning of period | $ | 32.96 | $ | 46.10 | $ | 36.66 | $ | 28.74 | $ | 27.93 | $ | 22.14 | ||||||||||||
|
|
|
|
|
|
|
|
|
|
|
| |||||||||||||
Net investment loss(a) | (0.05 | ) | (0.17 | ) | (0.12 | ) | (0.12 | ) | (0.09 | ) | (0.07 | ) | ||||||||||||
Net realized and unrealized gain (loss) | 0.04 | (10.58 | ) | 9.56 | 8.16 | 1.96 | 6.62 | |||||||||||||||||
|
|
|
|
|
|
|
|
|
|
|
| |||||||||||||
Net increase (decrease) from investment operations | (0.01 | ) | (10.75 | ) | 9.44 | 8.04 | 1.87 | 6.55 | ||||||||||||||||
|
|
|
|
|
|
|
|
|
|
|
| |||||||||||||
Distributions from net realized gain(b) | — | (2.39 | ) | — | (0.12 | ) | (1.06 | ) | (0.76 | ) | ||||||||||||||
|
|
|
|
|
|
|
|
|
|
|
| |||||||||||||
Net asset value, end of period | $ | 32.95 | $ | 32.96 | $ | 46.10 | $ | 36.66 | $ | 28.74 | $ | 27.93 | ||||||||||||
|
|
|
|
|
|
|
|
|
|
|
| |||||||||||||
Total Return(c) | ||||||||||||||||||||||||
Based on net asset value | (0.03 | )% | (24.79 | )% | 25.75 | %(d) | 28.06 | % | 7.47 | % | 30.46 | % | ||||||||||||
|
|
|
|
|
|
|
|
|
|
|
| |||||||||||||
Ratios to Average Net Assets(e) | ||||||||||||||||||||||||
Total expenses | 0.71 | % | 0.70 | % | 0.70 | %(f) | 0.73 | %(g) | 0.76 | %(h) | 0.80 | %(g) | ||||||||||||
|
|
|
|
|
|
|
|
|
|
|
| |||||||||||||
Total expenses after fees waived and/or reimbursed | 0.71 | % | 0.70 | % | 0.70 | %(f) | 0.73 | % | 0.75 | % | 0.76 | % | ||||||||||||
|
|
|
|
|
|
|
|
|
|
|
| |||||||||||||
Net investment loss | (0.15 | )% | (0.40 | )% | (0.42 | )%(f) | (0.36 | )% | (0.31 | )% | (0.29 | )% | ||||||||||||
|
|
|
|
|
|
|
|
|
|
|
| |||||||||||||
Supplemental Data | ||||||||||||||||||||||||
Net assets, end of period (000) | $ | 4,233,488 | $ | 4,376,642 | $ | 3,674,402 | $ | 2,011,727 | $ | 652,138 | $ | 139,138 | ||||||||||||
|
|
|
|
|
|
|
|
|
|
|
| |||||||||||||
Portfolio turnover rate | 46 | % | 28 | % | 22 | % | 35 | % | 38 | % | 43 | % | ||||||||||||
|
|
|
|
|
|
|
|
|
|
|
| |||||||||||||
| (a) | Based on average shares outstanding. |
| (b) | Distributions for annual periods determined in accordance with U.S. federal income tax regulations. |
| (c) | Where applicable, assumes the reinvestment of distributions. |
| (d) | Not annualized. |
| (e) | Excludes fees and expenses incurred indirectly as a result of investments in underlying funds. |
| (f) | Annualized. |
| (g) | Includes recoupment of past waived and/or reimbursed fees with no financial impact to the expense ratios. |
| (h) | Includes recoupment of past waived and/or reimbursed fees. Excluding the recoupment of past waived and/or reimbursed fees for the year ended September 30, 2019, the expense ratio would have been 0.75%. |
See notes to financial statements.
F I N A N C I A L H I G H L I G H T S | 69 |
Financial Highlights (continued)
(For a share outstanding throughout each period)
| BlackRock Mid-Cap Growth Equity Portfolio (continued) | ||||||||||||||||||||||||
| Class R | ||||||||||||||||||||||||
| Year Ended 05/31/23 | Year Ended 05/31/22 | Period from 10/01/20 to 05/31/21 | Year Ended 09/30/20 | Year Ended 09/30/19 | Year Ended 09/30/18 | |||||||||||||||||||
Net asset value, beginning of period | $ | 27.28 | $ | 38.65 | $ | 30.85 | $ | 24.34 | $ | 23.83 | $ | 19.02 | ||||||||||||
|
|
|
|
|
|
|
|
|
|
|
| |||||||||||||
Net investment loss(a) | (0.20 | ) | (0.37 | ) | (0.25 | ) | (0.24 | ) | (0.19 | ) | (0.22 | ) | ||||||||||||
Net realized and unrealized gain (loss) | 0.03 | (8.73 | ) | 8.05 | 6.87 | 1.65 | 5.69 | |||||||||||||||||
|
|
|
|
|
|
|
|
|
|
|
| |||||||||||||
Net increase (decrease) from investment operations | (0.17 | ) | (9.10 | ) | 7.80 | 6.63 | 1.46 | 5.47 | ||||||||||||||||
|
|
|
|
|
|
|
|
|
|
|
| |||||||||||||
Distributions from net realized gain(b) | — | (2.27 | ) | — | (0.12 | ) | (0.95 | ) | (0.66 | ) | ||||||||||||||
|
|
|
|
|
|
|
|
|
|
|
| |||||||||||||
Net asset value, end of period | $ | 27.11 | $ | 27.28 | $ | 38.65 | $ | 30.85 | $ | 24.34 | $ | 23.83 | ||||||||||||
|
|
|
|
|
|
|
|
|
|
|
| |||||||||||||
Total Return(c) | ||||||||||||||||||||||||
Based on net asset value | (0.62 | )% | (25.24 | )% | 25.28 | %(d) | 27.33 | % | 6.89 | % | 29.63 | % | ||||||||||||
|
|
|
|
|
|
|
|
|
|
|
| |||||||||||||
Ratios to Average Net Assets(e) | ||||||||||||||||||||||||
Total expenses | 1.42 | % | 1.40 | % | 1.39 | %(f) | 1.45 | % | 1.47 | % | 1.59 | %(g) | ||||||||||||
|
|
|
|
|
|
|
|
|
|
|
| |||||||||||||
Total expenses after fees waived and/or reimbursed | 1.30 | % | 1.30 | % | 1.30 | %(f) | 1.30 | % | 1.30 | % | 1.43 | % | ||||||||||||
|
|
|
|
|
|
|
|
|
|
|
| |||||||||||||
Net investment loss | (0.75 | )% | (1.02 | )% | (1.03 | )%(f) | (0.92 | )% | (0.83 | )% | (1.05 | )% | ||||||||||||
|
|
|
|
|
|
|
|
|
|
|
| |||||||||||||
Supplemental Data | ||||||||||||||||||||||||
Net assets, end of period (000) | $ | 93,427 | $ | 93,527 | $ | 98,300 | $ | 59,411 | $ | 40,999 | $ | 22,880 | ||||||||||||
|
|
|
|
|
|
|
|
|
|
|
| |||||||||||||
Portfolio turnover rate | 46 | % | 28 | % | 22 | % | 35 | % | 38 | % | 43 | % | ||||||||||||
|
|
|
|
|
|
|
|
|
|
|
| |||||||||||||
| (a) | Based on average shares outstanding. |
| (b) | Distributions for annual periods determined in accordance with U.S. federal income tax regulations. |
| (c) | Where applicable, assumes the reinvestment of distributions. |
| (d) | Not annualized. |
| (e) | Excludes fees and expenses incurred indirectly as a result of investments in underlying funds. |
| (f) | Annualized. |
| (g) | Includes recoupment of past waived and/or reimbursed fees. Excluding the recoupment of past waived and/or reimbursed fees for the year ended September 30, 2018, the expense ratio would have been 1.58%. |
See notes to financial statements.
| 70 | 2 0 2 3 B L A C K R O C K A N N U A L R E P O R T T O S H A R E H O L D E R S |
Financial Highlights
(For a share outstanding throughout each period)
| BlackRock Technology Opportunities Fund | ||||||||||||||||||||||||
| Institutional | ||||||||||||||||||||||||
| Year Ended 05/31/23 | Year Ended 05/31/22 | Period from 10/01/20 to 05/31/21 | Year Ended 09/30/20 | Year Ended 09/30/19 | Year Ended 09/30/18 | |||||||||||||||||||
Net asset value, beginning of period | $ | 45.31 | $ | 64.81 | $ | 55.33 | $ | 32.63 | $ | 31.83 | $ | 25.64 | ||||||||||||
|
|
|
|
|
|
|
|
|
|
|
| |||||||||||||
Net investment loss(a) | (0.13 | ) | (0.30 | ) | (0.28 | ) | (0.22 | ) | (0.10 | ) | (0.09 | ) | ||||||||||||
Net realized and unrealized gain (loss) | 2.56 | (14.51 | ) | 12.67 | 23.43 | 1.20 | 8.25 | |||||||||||||||||
|
|
|
|
|
|
|
|
|
|
|
| |||||||||||||
Net increase (decrease) from investment operations | 2.43 | (14.81 | ) | 12.39 | 23.21 | 1.10 | 8.16 | |||||||||||||||||
|
|
|
|
|
|
|
|
|
|
|
| |||||||||||||
Distributions from net realized gain(b) | — | (4.69 | ) | (2.91 | ) | (0.51 | ) | (0.30 | ) | (1.97 | ) | |||||||||||||
|
|
|
|
|
|
|
|
|
|
|
| |||||||||||||
Net asset value, end of period | $ | 47.74 | $ | 45.31 | $ | 64.81 | $ | 55.33 | $ | 32.63 | $ | 31.83 | ||||||||||||
|
|
|
|
|
|
|
|
|
|
|
| |||||||||||||
Total Return(c) | ||||||||||||||||||||||||
Based on net asset value | 5.36 | % | (25.09 | )% | 22.68 | %(d) | 72.07 | % | 3.63 | % | 34.02 | % | ||||||||||||
|
|
|
|
|
|
|
|
|
|
|
| |||||||||||||
Ratios to Average Net Assets(e) | ||||||||||||||||||||||||
Total expenses | 0.98 | % | 0.94 | % | 0.92 | %(f) | 0.98 | % | 1.02 | % | 1.10 | % | ||||||||||||
|
|
|
|
|
|
|
|
|
|
|
| |||||||||||||
Total expenses after fees waived and/or reimbursed | 0.92 | % | 0.92 | % | 0.92 | %(f) | 0.92 | % | 0.92 | % | 0.99 | % | ||||||||||||
|
|
|
|
|
|
|
|
|
|
|
| |||||||||||||
Net investment loss | (0.30 | )% | (0.48 | )% | (0.66 | )%(f) | (0.50 | )% | (0.32 | )% | (0.32 | )% | ||||||||||||
|
|
|
|
|
|
|
|
|
|
|
| |||||||||||||
Supplemental Data | ||||||||||||||||||||||||
Net assets, end of period (000) | $ | 2,316,550 | $ | 2,943,616 | $ | 4,958,187 | $ | 3,641,519 | $ | 1,033,286 | $ | 584,654 | ||||||||||||
|
|
|
|
|
|
|
|
|
|
|
| |||||||||||||
Portfolio turnover rate | 39 | % | 29 | % | 25 | % | 27 | % | 33 | % | 49 | % | ||||||||||||
|
|
|
|
|
|
|
|
|
|
|
| |||||||||||||
| (a) | Based on average shares outstanding. |
| (b) | Distributions for annual periods determined in accordance with U.S. federal income tax regulations. |
| (c) | Where applicable, assumes the reinvestment of distributions. |
| (d) | Not annualized. |
| (e) | Excludes fees and expenses incurred indirectly as a result of investments in underlying funds. |
| (f) | Annualized. |
See notes to financial statements.
F I N A N C I A L H I G H L I G H T S | 71 |
Financial Highlights (continued)
(For a share outstanding throughout each period)
| BlackRock Technology Opportunities Fund (continued) | ||||||||||||||||||||||||
| Service | ||||||||||||||||||||||||
| Year Ended 05/31/23 | Year Ended 05/31/22 | Period from 10/01/20 to 05/31/21 | Year Ended 09/30/20 | Year Ended 09/30/19 | Year Ended 09/30/18 | |||||||||||||||||||
Net asset value, beginning of period | $ | 42.30 | $ | 60.86 | $ | 52.20 | $ | 30.88 | $ | 30.22 | $ | 24.44 | ||||||||||||
|
|
|
|
|
|
|
|
|
|
|
| |||||||||||||
Net investment loss(a) | (0.21 | ) | (0.42 | ) | (0.37 | ) | (0.30 | ) | (0.17 | ) | (0.15 | ) | ||||||||||||
Net realized and unrealized gain (loss) | 2.36 | (13.52 | ) | 11.94 | 22.13 | 1.13 | 7.85 | |||||||||||||||||
|
|
|
|
|
|
|
|
|
|
|
| |||||||||||||
Net increase (decrease) from investment operations | 2.15 | (13.94 | ) | 11.57 | 21.83 | 0.96 | 7.70 | |||||||||||||||||
|
|
|
|
|
|
|
|
|
|
|
| |||||||||||||
Distributions from net realized gain(b) | — | (4.62 | ) | (2.91 | ) | (0.51 | ) | (0.30 | ) | (1.92 | ) | |||||||||||||
|
|
|
|
|
|
|
|
|
|
|
| |||||||||||||
Net asset value, end of period | $ | 44.45 | $ | 42.30 | $ | 60.86 | $ | 52.20 | $ | 30.88 | $ | 30.22 | ||||||||||||
|
|
|
|
|
|
|
|
|
|
|
| |||||||||||||
Total Return(c) | ||||||||||||||||||||||||
Based on net asset value | 5.08 | % | (25.28 | )% | 22.46 | %(d) | 71.68 | % | 3.36 | % | 33.74 | % | ||||||||||||
|
|
|
|
|
|
|
|
|
|
|
| |||||||||||||
Ratios to Average Net Assets(e) | ||||||||||||||||||||||||
Total expenses | 1.20 | % | 1.19 | % | 1.17 | %(f) | 1.19 | % | 1.25 | %(g) | 1.37 | % | ||||||||||||
|
|
|
|
|
|
|
|
|
|
|
| |||||||||||||
Total expenses after fees waived and/or reimbursed | 1.17 | % | 1.17 | % | 1.16 | %(f) | 1.17 | % | 1.17 | % | 1.22 | % | ||||||||||||
|
|
|
|
|
|
|
|
|
|
|
| |||||||||||||
Net investment loss | (0.55 | )% | (0.73 | )% | (0.90 | )%(f) | (0.74 | )% | (0.57 | )% | (0.55 | )% | ||||||||||||
|
|
|
|
|
|
|
|
|
|
|
| |||||||||||||
Supplemental Data | ||||||||||||||||||||||||
Net assets, end of period (000) | $ | 47,332 | $ | 55,439 | $ | 83,886 | $ | 50,710 | $ | 20,429 | $ | 15,208 | ||||||||||||
|
|
|
|
|
|
|
|
|
|
|
| |||||||||||||
Portfolio turnover rate | 39 | % | 29 | % | 25 | % | 27 | % | 33 | % | 49 | % | ||||||||||||
|
|
|
|
|
|
|
|
|
|
|
| |||||||||||||
| (a) | Based on average shares outstanding. |
| (b) | Distributions for annual periods determined in accordance with U.S. federal income tax regulations. |
| (c) | Where applicable, assumes the reinvestment of distributions. |
| (d) | Not annualized. |
| (e) | Excludes fees and expenses incurred indirectly as a result of investments in underlying funds. |
| (f) | Annualized. |
| (g) | Includes recoupment of past waived and/or reimbursed fees with no financial impact to the expense ratios. |
See notes to financial statements.
| 72 | 2 0 2 3 B L A C K R O C K A N N U A L R E P O R T T O S H A R E H O L D E R S |
Financial Highlights (continued)
(For a share outstanding throughout each period)
| BlackRock Technology Opportunities Fund (continued) | ||||||||||||||||||||||||
| Investor A | ||||||||||||||||||||||||
| Year Ended 05/31/23 | Year Ended 05/31/22 | Period from 10/01/20 to 05/31/21 | Year Ended 09/30/20 | Year Ended 09/30/19 | Year Ended 09/30/18 | |||||||||||||||||||
Net asset value, beginning of period | $ | 41.27 | $ | 59.47 | $ | 51.06 | $ | 30.22 | $ | 29.58 | $ | 23.95 | ||||||||||||
|
|
|
|
|
|
|
|
|
|
|
| |||||||||||||
Net investment loss(a) | (0.21 | ) | (0.41 | ) | (0.36 | ) | (0.29 | ) | (0.17 | ) | (0.16 | ) | ||||||||||||
Net realized and unrealized gain (loss) | 2.31 | (13.19 | ) | 11.68 | 21.64 | 1.11 | 7.69 | |||||||||||||||||
|
|
|
|
|
|
|
|
|
|
|
| |||||||||||||
Net increase (decrease) from investment operations | 2.10 | (13.60 | ) | 11.32 | 21.35 | 0.94 | 7.53 | |||||||||||||||||
|
|
|
|
|
|
|
|
|
|
|
| |||||||||||||
Distributions from net realized gain(b) | — | (4.60 | ) | (2.91 | ) | (0.51 | ) | (0.30 | ) | (1.90 | ) | |||||||||||||
|
|
|
|
|
|
|
|
|
|
|
| |||||||||||||
Net asset value, end of period | $ | 43.37 | $ | 41.27 | $ | 59.47 | $ | 51.06 | $ | 30.22 | $ | 29.58 | ||||||||||||
|
|
|
|
|
|
|
|
|
|
|
| |||||||||||||
Total Return(c) | ||||||||||||||||||||||||
Based on net asset value | 5.09 | % | (25.28 | )% | 22.48 | %(d) | 71.65 | % | 3.36 | % | 33.70 | % | ||||||||||||
|
|
|
|
|
|
|
|
|
|
|
| |||||||||||||
Ratios to Average Net Assets(e) | ||||||||||||||||||||||||
Total expenses | 1.23 | % | 1.21 | % | 1.19 | %(f) | 1.25 | % | 1.29 | % | 1.38 | %(g) | ||||||||||||
|
|
|
|
|
|
|
|
|
|
|
| |||||||||||||
Total expenses after fees waived and/or reimbursed | 1.17 | % | 1.17 | % | 1.17 | %(f) | 1.17 | % | 1.17 | % | 1.26 | % | ||||||||||||
|
|
|
|
|
|
|
|
|
|
|
| |||||||||||||
Net investment loss | (0.54 | )% | (0.73 | )% | (0.91 | )%(f) | (0.74 | )% | (0.58 | )% | (0.59 | )% | ||||||||||||
|
|
|
|
|
|
|
|
|
|
|
| |||||||||||||
Supplemental Data | ||||||||||||||||||||||||
Net assets, end of period (000) | $ | 1,572,976 | $ | 1,695,648 | $ | 2,524,052 | $ | 1,773,399 | $ | 672,110 | $ | 627,626 | ||||||||||||
|
|
|
|
|
|
|
|
|
|
|
| |||||||||||||
Portfolio turnover rate | 39 | % | 29 | % | 25 | % | 27 | % | 33 | % | 49 | % | ||||||||||||
|
|
|
|
|
|
|
|
|
|
|
| |||||||||||||
| (a) | Based on average shares outstanding. |
| (b) | Distributions for annual periods determined in accordance with U.S. federal income tax regulations. |
| (c) | Where applicable, excludes the effects of any sales charges and assumes the reinvestment of distributions. |
| (d) | Not annualized. |
| (e) | Excludes fees and expenses incurred indirectly as a result of investments in underlying funds. |
| (f) | Annualized. |
| (g) | Includes recoupment of past waived and/or reimbursed fees. Excluding the recoupment of past waived and/or reimbursed fees for the year ended September 30, 2018, the expense ratio would have been 1.37%. |
See notes to financial statements.
F I N A N C I A L H I G H L I G H T S | 73 |
Financial Highlights (continued)
(For a share outstanding throughout each period)
| BlackRock Technology Opportunities Fund (continued) | ||||||||||||||||||||||||
| Investor C | ||||||||||||||||||||||||
| Year Ended 05/31/23 | Year Ended 05/31/22 | Period from 10/01/20 to 05/31/21 | Year Ended 09/30/20 | Year Ended 09/30/19 | Year Ended 09/30/18 | |||||||||||||||||||
Net asset value, beginning of period | $ | 33.17 | $ | 48.77 | $ | 42.52 | $ | 25.43 | $ | 25.13 | $ | 20.72 | ||||||||||||
|
|
|
|
|
|
|
|
|
|
|
| |||||||||||||
Net investment loss(a) | (0.40 | ) | (0.68 | ) | (0.54 | ) | (0.48 | ) | (0.32 | ) | (0.31 | ) | ||||||||||||
Net realized and unrealized gain (loss) | 1.81 | (10.52 | ) | 9.70 | 18.08 | 0.92 | 6.57 | |||||||||||||||||
|
|
|
|
|
|
|
|
|
|
|
| |||||||||||||
Net increase (decrease) from investment operations | 1.41 | (11.20 | ) | 9.16 | 17.60 | 0.60 | 6.26 | |||||||||||||||||
|
|
|
|
|
|
|
|
|
|
|
| |||||||||||||
Distributions from net realized gain(b) | — | (4.40 | ) | (2.91 | ) | (0.51 | ) | (0.30 | ) | (1.85 | ) | |||||||||||||
|
|
|
|
|
|
|
|
|
|
|
| |||||||||||||
Net asset value, end of period | $ | 34.58 | $ | 33.17 | $ | 48.77 | $ | 42.52 | $ | 25.43 | $ | 25.13 | ||||||||||||
|
|
|
|
|
|
|
|
|
|
|
| |||||||||||||
Total Return(c) | ||||||||||||||||||||||||
Based on net asset value | 4.25 | % | (25.81 | )% | 21.89 | %(d) | 70.39 | % | 2.60 | % | 32.68 | % | ||||||||||||
|
|
|
|
|
|
|
|
|
|
|
| |||||||||||||
Ratios to Average Net Assets(e) | ||||||||||||||||||||||||
Total expenses | 1.98 | % | 1.92 | % | 1.91 | %(f) | 1.98 | % | 2.02 | % | 2.10 | %(g) | ||||||||||||
|
|
|
|
|
|
|
|
|
|
|
| |||||||||||||
Total expenses after fees waived and/or reimbursed | 1.92 | % | 1.91 | % | 1.90 | %(f) | 1.92 | % | 1.92 | % | 2.01 | % | ||||||||||||
|
|
|
|
|
|
|
|
|
|
|
| |||||||||||||
Net investment loss | (1.30 | )% | (1.47 | )% | (1.65 | )%(f) | (1.49 | )% | (1.33 | )% | (1.34 | )% | ||||||||||||
|
|
|
|
|
|
|
|
|
|
|
| |||||||||||||
Supplemental Data | ||||||||||||||||||||||||
Net assets, end of period (000) | $ | 259,247 | $ | 291,802 | $ | 427,435 | $ | 317,792 | $ | 152,505 | $ | 142,942 | ||||||||||||
|
|
|
|
|
|
|
|
|
|
|
| |||||||||||||
Portfolio turnover rate | 39 | % | 29 | % | 25 | % | 27 | % | 33 | % | 49 | % | ||||||||||||
|
|
|
|
|
|
|
|
|
|
|
| |||||||||||||
| (a) | Based on average shares outstanding. |
| (b) | Distributions for annual periods determined in accordance with U.S. federal income tax regulations. |
| (c) | Where applicable, excludes the effects of any sales charges and assumes the reinvestment of distributions. |
| (d) | Not annualized. |
| (e) | Excludes fees and expenses incurred indirectly as a result of investments in underlying funds. |
| (f) | Annualized. |
| (g) | Includes recoupment of past waived and/or reimbursed fees. Excluding the recoupment of past waived and/or reimbursed fees for the year ended September 30, 2018, the expense ratio would have been 2.09%. |
See notes to financial statements.
| 74 | 2 0 2 3 B L A C K R O C K A N N U A L R E P O R T T O S H A R E H O L D E R S |
Financial Highlights (continued)
(For a share outstanding throughout each period)
| BlackRock Technology Opportunities Fund (continued) | ||||||||||||||||
| Class K | ||||||||||||||||
| | Year Ended 05/31/23 |
| | Year Ended 05/31/22 |
| | Period from 10/01/20 to 05/31/21 |
| | Period from 12/10/19 to 09/30/20 | (a)
| |||||
Net asset value, beginning of period | $ | 45.37 | $ | 64.89 | $ | 55.36 | $ | 34.59 | ||||||||
|
|
|
|
|
|
|
| |||||||||
Net investment loss(b) | (0.10 | ) | (0.24 | ) | (0.24 | ) | (0.16 | ) | ||||||||
Net realized and unrealized gain (loss) | 2.56 | (14.55 | ) | 12.68 | 20.93 | |||||||||||
|
|
|
|
|
|
|
| |||||||||
Net increase (decrease) from investment operations | 2.46 | (14.79 | ) | 12.44 | 20.77 | |||||||||||
|
|
|
|
|
|
|
| |||||||||
Distributions from net realized gain(c) | — | (4.73 | ) | (2.91 | ) | — | ||||||||||
|
|
|
|
|
|
|
| |||||||||
Net asset value, end of period | $ | 47.83 | $ | 45.37 | $ | 64.89 | $ | 55.36 | ||||||||
|
|
|
|
|
|
|
| |||||||||
Total Return(d) | ||||||||||||||||
Based on net asset value | 5.42 | % | (25.05 | )% | 22.77 | %(e) | 60.05 | %(e) | ||||||||
|
|
|
|
|
|
|
| |||||||||
Ratios to Average Net Assets(f) | ||||||||||||||||
Total expenses | 0.87 | % | 0.84 | % | 0.83 | %(g) | 0.87 | %(g) | ||||||||
|
|
|
|
|
|
|
| |||||||||
Total expenses after fees waived and/or reimbursed | 0.87 | % | 0.83 | % | 0.82 | %(g) | 0.86 | %(g) | ||||||||
|
|
|
|
|
|
|
| |||||||||
Net investment loss | (0.24 | )% | (0.38 | )% | (0.56 | )%(g) | (0.46 | )%(g) | ||||||||
|
|
|
|
|
|
|
| |||||||||
Supplemental Data | ||||||||||||||||
Net assets, end of period (000) | $ | 157,185 | $ | 135,879 | $ | 122,568 | $ | 75,426 | ||||||||
|
|
|
|
|
|
|
| |||||||||
Portfolio turnover rate | 39 | % | 29 | % | 25 | % | 27 | %(h) | ||||||||
|
|
|
|
|
|
|
| |||||||||
| (a) | Commencement of operations. |
| (b) | Based on average shares outstanding. |
| (c) | Distributions for annual periods determined in accordance with U.S. federal income tax regulations. |
| (d) | Where applicable, assumes the reinvestment of distributions. |
| (e) | Not annualized. |
| (f) | Excludes fees and expenses incurred indirectly as a result of investments in underlying funds. |
| (g) | Annualized. |
| (h) | Portfolio turnover is representative of the Fund for the entire year. |
See notes to financial statements.
F I N A N C I A L H I G H L I G H T S | 75 |
Financial Highlights (continued)
(For a share outstanding throughout each period)
BlackRock Technology Opportunities Fund (continued) | ||||||||||||||||||||||||
| Class R | ||||||||||||||||||||||||
| Year Ended 05/31/23 | Year Ended 05/31/22 | Period from to 05/31/21 | Year Ended 09/30/20 | Year Ended 09/30/19 | Year Ended 09/30/18 | |||||||||||||||||||
Net asset value, beginning of period | $ | 41.44 | $ | 59.75 | $ | 51.37 | $ | 30.48 | $ | 29.90 | $ | 24.20 | ||||||||||||
|
|
|
|
|
|
|
|
|
|
|
| |||||||||||||
Net investment loss(a) | (0.30 | ) | (0.56 | ) | (0.46 | ) | (0.38 | ) | (0.24 | ) | (0.23 | ) | ||||||||||||
Net realized and unrealized gain (loss) | 2.30 | (13.25 | ) | 11.75 | 21.78 | 1.12 | 7.78 | |||||||||||||||||
|
|
|
|
|
|
|
|
|
|
|
| |||||||||||||
Net increase (decrease) from investment operations | 2.00 | (13.81 | ) | 11.29 | 21.40 | 0.88 | 7.55 | |||||||||||||||||
|
|
|
|
|
|
|
|
|
|
|
| |||||||||||||
Distributions from net realized gain(b) | — | (4.50 | ) | (2.91 | ) | (0.51 | ) | (0.30 | ) | (1.85 | ) | |||||||||||||
|
|
|
|
|
|
|
|
|
|
|
| |||||||||||||
Net asset value, end of period | $ | 43.44 | $ | 41.44 | $ | 59.75 | $ | 51.37 | $ | 30.48 | $ | 29.90 | ||||||||||||
|
|
|
|
|
|
|
|
|
|
|
| |||||||||||||
Total Return(c) | ||||||||||||||||||||||||
Based on net asset value | 4.83 | % | (25.47 | )% | 22.28 | %(d) | 71.20 | % | 3.12 | % | 33.35 | % | ||||||||||||
|
|
|
|
|
|
|
|
|
|
|
| |||||||||||||
Ratios to Average Net Assets(e) | ||||||||||||||||||||||||
Total expenses | 1.58 | % | 1.54 | % | 1.50 | %(f) | 1.57 | % | 1.60 | % | 1.69 | % | ||||||||||||
|
|
|
|
|
|
|
|
|
|
|
| |||||||||||||
Total expenses after fees waived and/or reimbursed | 1.42 | % | 1.42 | % | 1.42 | %(f) | 1.42 | % | 1.42 | % | 1.53 | % | ||||||||||||
|
|
|
|
|
|
|
|
|
|
|
| |||||||||||||
Net investment loss | (0.79 | )% | (0.98 | )% | (1.17 | )%(f) | (0.99 | )% | (0.83 | )% | (0.87 | )% | ||||||||||||
|
|
|
|
|
|
|
|
|
|
|
| |||||||||||||
Supplemental Data | ||||||||||||||||||||||||
Net assets, end of period (000) | $ | 35,771 | $ | 35,001 | $ | 50,186 | $ | 38,907 | $ | 18,799 | $ | 13,577 | ||||||||||||
|
|
|
|
|
|
|
|
|
|
|
| |||||||||||||
Portfolio turnover rate | 39 | % | 29 | % | 25 | % | 27 | % | 33 | % | 49 | % | ||||||||||||
|
|
|
|
|
|
|
|
|
|
|
| |||||||||||||
| (a) | Based on average shares outstanding. |
| (b) | Distributions for annual periods determined in accordance with U.S. federal income tax regulations. |
| (c) | Where applicable, assumes the reinvestment of distributions. |
| (d) | Not annualized. |
| (e) | Excludes fees and expenses incurred indirectly as a result of investments in underlying funds. |
| (f) | Annualized. |
See notes to financial statements.
| 76 | 2 0 2 3 B L A C K R O C K A N N U A L R E P O R T T O S H A R E H O L D E R S |
| 1. | ORGANIZATION |
BlackRock Capital Appreciation Fund, Inc. (the “Corporation”) and BlackRock FundsSM (the “Trust”) are each registered under the Investment Company Act of 1940, as amended (the “1940 Act”), as open-end management investment companies. The Corporation is organized as a Maryland corporation. The Trust is organized as a Massachusetts business trust. BlackRock Capital Appreciation Fund, Inc. is the only series of the Corporation. BlackRock Health Sciences Opportunities Portfolio, BlackRock Infrastructure Sustainable Opportunities Fund, BlackRock Mid-Cap Growth Equity Portfolio and BlackRock Technology Opportunities Fund are series of the Trust. The following are referred to herein collectively as the “Funds” or individually as a “Fund”:
| Fund Name | Herein Referred To As | Diversification Classification | ||
BlackRock Capital Appreciation Fund, Inc. | Capital Appreciation | Diversified | ||
BlackRock Health Sciences Opportunities Portfolio | Health Sciences Opportunities | Diversified | ||
BlackRock Infrastructure Sustainable Opportunities Fund | Infrastructure Sustainable Opportunities | Non-Diversified | ||
BlackRock Mid-Cap Growth Equity Portfolio | Mid-Cap Growth Equity | Diversified | ||
BlackRock Technology Opportunities Fund | Technology Opportunities | Diversified | ||
Each Fund offers multiple classes of shares. All classes of shares have identical voting, dividend, liquidation and other rights and are subject to the same terms and conditions, except that certain classes bear expenses related to the shareholder servicing and distribution of such shares. Institutional, Service and Class K Shares are sold only to certain eligible investors. Service, Investor A, Investor C and Class R Shares bear certain expenses related to shareholder servicing of such shares, and Investor C and Class R Shares also bear certain expenses related to the distribution of such shares. Investor A and Investor C Shares are generally available through financial intermediaries. Class R Shares are sold only to certain employer-sponsored retirement plans. Each class has exclusive voting rights with respect to matters relating to its shareholder servicing and distribution expenditures (except that Investor C shareholders may vote on material changes to the Investor A Shares distribution and service plan).
| Share Class | Initial Sales Charge | CDSC | Conversion Privilege | |||
Institutional, Service and Class K Shares | No | No | None | |||
Investor A Shares | Yes | No(a) | None | |||
Investor C Shares | No | Yes(b) | To Investor A Shares after approximately 8 years |
| (a) | Investor A Shares may be subject to a contingent deferred sales charge (“CDSC”) for certain redemptions where no initial sales charge was paid at the time of purchase. |
| (b) | A CDSC of 1.00% is assessed on certain redemptions of Investor C Shares made within one year after purchase. |
The Board of Directors of the Corporation and the Board of Trustees of the Trust are collectively referred to throughout this report as the “Board”, and the directors/trustees thereof are collectively referred to throughout this report as “Directors”.
The Funds, together with certain other registered investment companies advised by BlackRock Advisors, LLC (the “Manager”) or its affiliates, are included in a complex of funds referred to as the BlackRock Multi-Asset Complex.
| 2. | SIGNIFICANT ACCOUNTING POLICIES |
The financial statements are prepared in conformity with accounting principles generally accepted in the United States of America (“U.S. GAAP”), which may require management to make estimates and assumptions that affect the reported amounts of assets and liabilities in the financial statements, disclosure of contingent assets and liabilities at the date of the financial statements and the reported amounts of increases and decreases in net assets from operations during the reporting period. Actual results could differ from those estimates. Each Fund is considered an investment company under U.S. GAAP and follows the accounting and reporting guidance applicable to investment companies. Below is a summary of significant accounting policies:
Investment Transactions and Income Recognition: For financial reporting purposes, investment transactions are recorded on the dates the transactions are executed. Realized gains and losses on investment transactions are determined using the specific identification method. Dividend income and capital gain distributions, if any, are recorded on the ex-dividend dates. Non-cash dividends, if any, are recorded on the ex-dividend dates at fair value. Dividends from foreign securities where the ex-dividend dates may have passed are subsequently recorded when the Funds are informed of the ex-dividend dates. Under the applicable foreign tax laws, a withholding tax at various rates may be imposed on capital gains, dividends and interest. Upon notification from issuers, a portion of the dividend income received from a real estate investment trust may be redesignated as a reduction of cost of the related investment and/or realized gain. Income, expenses and realized and unrealized gains and losses are allocated daily to each class based on its relative net assets.
Foreign Currency Translation: Each Fund’s books and records are maintained in U.S. dollars. Securities and other assets and liabilities denominated in foreign currencies are translated into U.S. dollars using exchange rates determined as of the close of trading on the New York Stock Exchange (“NYSE”). Purchases and sales of investments are recorded at the rates of exchange prevailing on the respective dates of such transactions. Generally, when the U.S. dollar rises in value against a foreign currency, the investments denominated in that currency will lose value; the opposite effect occurs if the U.S. dollar falls in relative value.
Each Fund does not isolate the effect of fluctuations in foreign exchange rates from the effect of fluctuations in the market prices of investments for financial reporting purposes. Accordingly, the effects of changes in exchange rates on investments are not segregated in the Statements of Operations from the effects of changes in market prices of those investments, but are included as a component of net realized and unrealized gain (loss) from investments. Each Fund reports realized currency gains (losses) on foreign currency related transactions as components of net realized gain (loss) for financial reporting purposes, whereas such components are generally treated as ordinary income for U.S. federal income tax purposes.
ForeignTaxes: The Funds may be subject to foreign taxes (a portion of which may be reclaimable) on income, stock dividends, capital gains on investments, or certain foreign currency transactions. All foreign taxes are recorded in accordance with the applicable foreign tax regulations and rates that exist in the foreign jurisdictions in which each Fund
N O T E S T O F I N A N C I A L S T A T E M E N T S | 77 |
Notes to Financial Statements (continued)
invests. These foreign taxes, if any, are paid by each Fund and are reflected in its Statements of Operations as follows: foreign taxes withheld at source are presented as a reduction of income, foreign taxes on securities lending income are presented as a reduction of securities lending income, foreign taxes on stock dividends are presented as “Foreign taxes withheld”, and foreign taxes on capital gains from sales of investments and foreign taxes on foreign currency transactions are included in their respective net realized gain (loss) categories. Foreign taxes payable or deferred as of May 31, 2023, if any, are disclosed in the Statements of Assets and Liabilities.
The Funds file withholding tax reclaims in certain jurisdictions to recover a portion of amounts previously withheld. The Funds may record a reclaim receivable based on collectability, which includes factors such as the jurisdiction’s applicable laws, payment history and market convention. The Statements of Operations include tax reclaims recorded as well as professional and other fees, if any, associated with recovery of foreign withholding taxes.
Collateralization: If required by an exchange or counterparty agreement, the Funds may be required to deliver/deposit cash and/or securities to/with an exchange, or broker-dealer or custodian as collateral for certain investments.
Distributions: Distributions paid by the Funds are recorded on the ex-dividend dates. The character and timing of distributions are determined in accordance with U.S. federal income tax regulations, which may differ from U.S. GAAP.
Offering Costs: Offering costs are amortized over a 12-month period beginning with the commencement of operations of a class of shares.
Indemnifications: In the normal course of business, a Fund enters into contracts that contain a variety of representations that provide general indemnification. A Fund’s maximum exposure under these arrangements is unknown because it involves future potential claims against a Fund, which cannot be predicted with any certainty.
Other: Expenses directly related to a Fund or its classes are charged to that Fund or the applicable class. Expenses directly related to the Funds and other shared expenses prorated to the Funds are allocated daily to each class based on their relative net assets or other appropriate methods. Other operating expenses shared by several funds, including other funds managed by the Manager, are prorated among those funds on the basis of relative net assets or other appropriate methods.
The Funds have an arrangement with their custodian whereby credits are earned on uninvested cash balances, which could be used to reduce custody fees and/or overdraft charges. The Funds may incur charges on overdrafts, subject to certain conditions.
| 3. | INVESTMENT VALUATION AND FAIR VALUE MEASUREMENTS |
Investment Valuation Policies: Each Fund’s investments are valued at fair value (also referred to as “market value” within the financial statements) each day that the Fund is open for business and, for financial reporting purposes, as of the report date. U.S. GAAP defines fair value as the price a fund would receive to sell an asset or pay to transfer a liability in an orderly transaction between market participants at the measurement date. The Board of each Fund has approved the designation of each Fund’s Manager as the valuation designee for each Fund. Each Fund determines the fair values of its financial instruments using various independent dealers or pricing services under the Manager’s policies. If a security’s market price is not readily available or does not otherwise accurately represent the fair value of the security, the security will be valued in accordance with the Manager’s policies and procedures as reflecting fair value. The Manager has formed a committee (the “Valuation Committee”) to develop pricing policies and procedures and to oversee the pricing function for all financial instruments, with assistance from other BlackRock pricing committees.
Fair Value Inputs and Methodologies: The following methods and inputs are used to establish the fair value of each Funds’ assets and liabilities:
| • | Equity investments traded on a recognized securities exchange are valued at that day’s official closing price, as applicable, on the exchange where the stock is primarily traded. Equity investments traded on a recognized exchange for which there were no sales on that day may be valued at the last available bid (long positions) or ask (short positions) price. |
| • | Investments in open-end U.S. mutual funds (including money market funds) are valued at that day’s published net asset value (“NAV”). |
| • | The Funds value their investment in SL Liquidity Series, LLC, Money Market Series (the “Money Market Series”) at fair value, which is ordinarily based upon their pro rata ownership in the underlying fund’s net assets. |
| • | Forward foreign currency exchange contracts are valued at the mean between the bid and ask prices and are determined as of the close of trading on the NYSE based on that day’s prevailing forward exchange rate for the underlying currencies. |
| • | Swap agreements are valued utilizing quotes received daily by independent pricing services or through brokers, which are derived using daily swap curves and models that incorporate a number of market data factors, such as discounted cash flows, trades and values of the underlying reference instruments. |
Generally, trading in foreign instruments is substantially completed each day at various times prior to the close of trading on the NYSE. Each business day, the Funds use current market factors supplied by independent pricing services to value certain foreign instruments (“Systematic Fair Value Price”). The Systematic Fair Value Price is designed to value such foreign securities at fair value as of the close of trading on the NYSE, which follows the close of the local markets.
If events (e.g., market volatility, company announcement or a natural disaster) occur that are expected to materially affect the value of such investment, or in the event that application of these methods of valuation results in a price for an investment that is deemed not to be representative of the market value of such investment, or if a price is not available, the investment will be valued by the Valuation Committee in accordance with the Manager’s policies and procedures as reflecting fair value (“Fair Valued Investments”). The fair valuation approaches that may be used by the Valuation Committee include market approach, income approach and cost approach. Valuation techniques such as discounted cash flow, use of market comparables and matrix pricing are types of valuation approaches and are typically used in determining fair value. When determining the price for Fair Valued Investments, the Valuation Committee seeks to determine the price that each Fund might reasonably expect to receive or pay from the current sale or purchase of that asset or liability in an arm’s-length transaction. Fair value determinations shall be based upon all available factors that the Valuation Committee deems relevant and consistent with the principles of fair value measurement.
| 78 | 2 0 2 3 B L A C K R O C K A N N U A L R E P O R T T O S H A R E H O L D E R S |
Notes to Financial Statements (continued)
For investments in equity or debt issued by privately held companies or funds (“Private Company” or collectively, the “Private Companies”) and other Fair Valued Investments, the fair valuation approaches that are used by the Valuation Committee and third-party pricing services utilized by the Valuation Committee include one or a combination of, but not limited to, the following inputs.
| Standard Inputs Generally Considered By The Valuation Committee And Third-Party Pricing Services | ||
Market approach | (i) recent market transactions, including subsequent rounds of financing, in the underlying investment or comparable issuers; (ii) recapitalizations and other transactions across the capital structure; and (iii) market multiples of comparable issuers. | |
Income approach | (i) future cash flows discounted to present and adjusted as appropriate for liquidity, credit, and/or market risks; (ii) quoted prices for similar investments or assets in active markets; and (iii) other risk factors, such as interest rates, yield curves, volatilities, prepayment speeds, loss severities, credit risks, recovery rates, liquidation amounts and/or default rates. | |
Cost approach | (i) audited or unaudited financial statements, investor communications and financial or operational metrics issued by the Private Company; (ii) changes in the valuation of relevant indices or publicly traded companies comparable to the Private Company; (iii) relevant news and other public sources; and (iv) known secondary market transactions in the Private Company’s interests and merger or acquisition activity in companies comparable to the Private Company. | |
Investments in series of preferred stock issued by Private Companies are typically valued utilizing market approach in determining the enterprise value of the company. Such investments often contain rights and preferences that differ from other series of preferred and common stock of the same issuer. Enterprise valuation techniques such as an option pricing model (“OPM”), a probability weighted expected return model (“PWERM”), current value method or a hybrid of those techniques are used as deemed appropriate under the circumstances. The use of these valuation techniques involve a determination of the exit scenarios of the investment in order to appropriately allocate the enterprise value of the company among the various parts of its capital structure.
The Private Companies are not subject to the public company disclosure, timing, and reporting standards applicable to other investments held by a Fund. Typically, the most recently available information by a Private Company is as of a date that is earlier than the date a Fund is calculating its NAV. This factor may result in a difference between the value of the investment and the price a Fund could receive upon the sale of the investment.
Fair Value Hierarchy: Various inputs are used in determining the fair value of financial instruments. These inputs to valuation techniques are categorized into a fair value hierarchy consisting of three broad levels for financial reporting purposes as follows:
| • | Level 1 – Unadjusted price quotations in active markets/exchanges for identical assets or liabilities that each Fund has the ability to access; |
| • | Level 2 – Other observable inputs (including, but not limited to, quoted prices for similar assets or liabilities in markets that are active, quoted prices for identical or similar assets or liabilities in markets that are not active, inputs other than quoted prices that are observable for the assets or liabilities (such as interest rates, yield curves, volatilities, prepayment speeds, loss severities, credit risks and default rates) or other market–corroborated inputs); and |
| • | Level 3 – Unobservable inputs based on the best information available in the circumstances, to the extent observable inputs are not available (including the Valuation Committee’s assumptions used in determining the fair value of financial instruments). |
The hierarchy gives the highest priority to unadjusted quoted prices in active markets for identical assets or liabilities (Level 1 measurements) and the lowest priority to unobservable inputs (Level 3 measurements). Accordingly, the degree of judgment exercised in determining fair value is greatest for instruments categorized in Level 3. The inputs used to measure fair value may fall into different levels of the fair value hierarchy. In such cases, for disclosure purposes, the fair value hierarchy classification is determined based on the lowest level input that is significant to the fair value measurement in its entirety. Investments classified within Level 3 have significant unobservable inputs used by the Valuation Committee in determining the price for Fair Valued Investments. Level 3 investments include equity or debt issued by Private Companies that may not have a secondary market and/or may have a limited number of investors. The categorization of a value determined for financial instruments is based on the pricing transparency of the financial instruments and is not necessarily an indication of the risks associated with investing in those securities.
As of May 31, 2023, certain investments of the Funds were fair valued using NAV as a practical expedient as no quoted market value is available and therefore have been excluded from the fair value hierarchy.
| 4. | SECURITIES AND OTHER INVESTMENTS |
Preferred Stocks: Preferred stock has a preference over common stock in liquidation (and generally in receiving dividends as well), but is subordinated to the liabilities of the issuer in all respects. As a general rule, the market value of preferred stock with a fixed dividend rate and no conversion element varies inversely with interest rates and perceived credit risk, while the market price of convertible preferred stock generally also reflects some element of conversion value. Because preferred stock is junior to debt securities and other obligations of the issuer, deterioration in the credit quality of the issuer will cause greater changes in the value of a preferred stock than in a more senior debt security with similar stated yield characteristics. Unlike interest payments on debt securities, preferred stock dividends are payable only if declared by the issuer’s board of directors. Preferred stock also may be subject to optional or mandatory redemption provisions.
Warrants: Warrants entitle a fund to purchase a specified number of shares of common stock and are non-income producing. The purchase price and number of shares are subject to adjustment under certain conditions until the expiration date of the warrants, if any. If the price of the underlying stock does not rise above the strike price before the
N O T E S T O F I N A N C I A L S T A T E M E N T S | 79 |
Notes to Financial Statements (continued)
warrant expires, the warrant generally expires without any value and a fund will lose any amount it paid for the warrant. Thus, investments in warrants may involve more risk than investments in common stock. Warrants may trade in the same markets as their underlying stock; however, the price of the warrant does not necessarily move with the price of the underlying stock.
Securities Lending: The Funds may lend their securities to approved borrowers, such as brokers, dealers and other financial institutions. The borrower pledges and maintains with the Fund collateral consisting of cash, an irrevocable letter of credit issued by a bank, or securities issued or guaranteed by the U.S. Government. The initial collateral received by each Fund is required to have a value of at least 102% of the current value of the loaned securities for securities traded on U.S. exchanges and a value of at least 105% for all other securities. The collateral is maintained thereafter at a value equal to at least 100% of the current market value of the securities on loan. The market value of the loaned securities is determined at the close of each business day of the Fund and any additional required collateral is delivered to the Fund, or excess collateral returned by the Fund, on the next business day. During the term of the loan, the Fund is entitled to all distributions made on or in respect of the loaned securities, but does not receive interest income on securities received as collateral. Loans of securities are terminable at any time and the borrower, after notice, is required to return borrowed securities within the standard time period for settlement of securities transactions.
As of period end, any securities on loan were collateralized by cash and/or U.S. Government obligations. Cash collateral invested by the securities lending agent, BlackRock Investment Management, LLC (“BIM”), if any, is disclosed in the Schedules of Investments. Any non-cash collateral received cannot be sold, re-invested or pledged by the Fund, except in the event of borrower default. The securities on loan, if any, are disclosed in the Fund’s Schedule of Investments. The market value of any securities on loan and the value of related collateral, if any, are shown separately in the Statements of Assets and Liabilities as a component of investments at value – unaffiliated and collateral on securities loaned, respectively.
Securities lending transactions are entered into by the Funds under Master Securities Lending Agreements (each, an “MSLA”), which provide the right, in the event of default (including bankruptcy or insolvency), for the non-defaulting party to liquidate the collateral and calculate a net exposure to the defaulting party or request additional collateral. In the event that a borrower defaults, the Fund, as lender, would offset the market value of the collateral received against the market value of the securities loaned. When the value of the collateral is greater than that of the market value of the securities loaned, the lender is left with a net amount payable to the defaulting party. However, bankruptcy or insolvency laws of a particular jurisdiction may impose restrictions on or prohibitions against such a right of offset in the event of an MSLA counterparty’s bankruptcy or insolvency. Under the MSLA, absent an event of default, the borrower can resell or re-pledge the loaned securities, and a Fund can reinvest cash collateral received in connection with loaned securities. Upon an event of default, the parties’ obligations to return the securities or collateral to the other party are extinguished, and the parties can resell or re-pledge the loaned securities or the collateral received in connection with the loaned securities in order to satisfy the defaulting party’s net payment obligation for all transactions under the MSLA. The defaulting party remains liable for any deficiency.
As of period end, the following table is a summary of the Funds’ securities on loan by counterparty which are subject to offset under an MSLA:
| Fund Name/Counterparty | | Securities Loaned at Value |
| | Cash Collateral Received | (a) | | Non-Cash Collateral Received | (a) | | Net Amount | (b) | ||||
Health Sciences Opportunities | ||||||||||||||||
BNP Paribas SA | $ | 117,876 | $ | (117,876 | ) | $ | — | $ | — | |||||||
Goldman Sachs & Co. LLC | 28,663,372 | (28,663,372 | ) | — | — | |||||||||||
J.P. Morgan Securities LLC | 7,370,217 | (7,370,217 | ) | — | — | |||||||||||
Jefferies LLC | 6,622,816 | (6,622,816 | ) | — | — | |||||||||||
Morgan Stanley | 3,752,397 | (3,752,397 | ) | — | — | |||||||||||
Toronto-Dominion Bank | 8,158 | (8,158 | ) | — | — | |||||||||||
|
|
|
|
|
|
|
| |||||||||
| $ | 46,534,836 | $ | (46,534,836 | ) | $ | — | $ | — | ||||||||
|
|
|
|
|
|
|
| |||||||||
Mid-Cap Growth Equity | ||||||||||||||||
BofA Securities, Inc. | $ | 12,173,447 | $ | (12,173,447 | ) | $ | — | $ | — | |||||||
Citigroup Global Markets, Inc. | 19,140,008 | (19,140,008 | ) | — | — | |||||||||||
Goldman Sachs & Co. LLC | 57,703,288 | (57,703,288 | ) | — | — | |||||||||||
J.P. Morgan Securities LLC | 140,934,284 | (140,934,284 | ) | — | — | |||||||||||
Morgan Stanley | 9,627,785 | (9,627,785 | ) | — | — | |||||||||||
State Street Bank & Trust Co. | 579,787 | (579,787 | ) | — | — | |||||||||||
Toronto-Dominion Bank | 262,154 | (262,154 | ) | — | — | |||||||||||
|
|
|
|
|
|
|
| |||||||||
| $ | 240,420,753 | $ | (240,420,753 | ) | $ | — | $ | — | ||||||||
|
|
|
|
|
|
|
| |||||||||
Technology Opportunities | ||||||||||||||||
BofA Securities, Inc. | $ | 220,408 | $ | (220,408 | ) | $ | — | $ | — | |||||||
Citigroup Global Markets, Inc. | 101,965,000 | (101,965,000 | ) | — | — | |||||||||||
Goldman Sachs & Co. LLC | 21,861,169 | (21,861,169 | ) | — | — | |||||||||||
J.P. Morgan Securities LLC | 5,176,367 | (5,176,367 | ) | — | — | |||||||||||
Morgan Stanley | 262,515 | (262,515 | ) | — | — | |||||||||||
National Financial Services LLC | 566,100 | (566,100 | ) | — | — | |||||||||||
State Street Bank & Trust Co. | 228,276 | (228,276 | ) | — | — | |||||||||||
Toronto-Dominion Bank | 15,830,192 | (15,830,192 | ) | — | — | |||||||||||
|
|
|
|
|
|
|
| |||||||||
| $ | 146,110,027 | $ | (146,110,027 | ) | $ | — | $ | — | ||||||||
|
|
|
|
|
|
|
| |||||||||
| (a) | Collateral received in excess of the market value of securities on loan is not presented in this table. The total cash collateral received by each Fund is disclosed in the Funds’ Statements of Assets and Liabilities. |
| (b) | The market value of the loaned securities is determined as of May 31, 2023. Additional collateral is delivered to the Fund on the next business day in accordance with the MSLA. The net amount would be subject to the borrower default indemnity in the event of default by the counterparty. |
| 80 | 2 0 2 3 B L A C K R O C K A N N U A L R E P O R T T O S H A R E H O L D E R S |
Notes to Financial Statements (continued)
The risks of securities lending include the risk that the borrower may not provide additional collateral when required or may not return the securities when due. To mitigate these risks, the Funds benefit from a borrower default indemnity provided by BIM. BIM’s indemnity allows for full replacement of the securities loaned to the extent the collateral received does not cover the value on the securities loaned in the event of borrower default. Each Fund could incur a loss if the value of an investment purchased with cash collateral falls below the market value of loaned securities or if the value of an investment purchased with cash collateral falls below the value of the original cash collateral received. Such losses are borne entirely by the Funds.
| 5. | DERIVATIVE FINANCIAL INSTRUMENTS |
The Funds engage in various portfolio investment strategies using derivative contracts both to increase the returns of the Funds and/or to manage their exposure to certain risks such as credit risk, equity risk, interest rate risk, foreign currency exchange rate risk, commodity price risk or other risks (e.g., inflation risk). Derivative financial instruments categorized by risk exposure are included in the Schedules of Investments. These contracts may be transacted on an exchange or over-the-counter (“OTC”).
Forward Foreign Currency Exchange Contracts: Forward foreign currency exchange contracts are entered into to gain or reduce exposure to foreign currencies (foreign currency exchange rate risk).
A forward foreign currency exchange contract is an agreement between two parties to buy and sell a currency at a set exchange rate on a specified date. These contracts help to manage the overall exposure to the currencies in which some of the investments held by the Funds are denominated and in some cases, may be used to obtain exposure to a particular market. The contracts are traded OTC and not on an organized exchange.
The contract is marked-to-market daily and the change in market value is recorded as unrealized appreciation (depreciation) in the Statements of Assets and Liabilities. When a contract is closed, a realized gain or loss is recorded in the Statements of Operations equal to the difference between the value at the time it was opened and the value at the time it was closed. Non-deliverable forward foreign currency exchange contracts are settled with the counterparty in cash without the delivery of foreign currency. The use of forward foreign currency exchange contracts involves the risk that the value of a forward foreign currency exchange contract changes unfavorably due to movements in the value of the referenced foreign currencies, and such value may exceed the amounts reflected in the Statements of Assets and Liabilities. Cash amounts pledged for forward foreign currency exchange contracts are considered restricted and are included in cash pledged as collateral for OTC derivatives in the Statements of Assets and Liabilities. A Fund’s risk of loss from counterparty credit risk on OTC derivatives is generally limited to the aggregate unrealized gain netted against any collateral held by the Fund.
Options: The Funds may purchase and write call and put options to increase or decrease their exposure to the risks of underlying instruments, including equity risk, interest rate risk and/or commodity price risk and/or, in the case of options written, to generate gains from options premiums.
A call option gives the purchaser (holder) of the option the right (but not the obligation) to buy, and obligates the seller (writer) to sell (when the option is exercised) the underlying instrument at the exercise or strike price at any time or at a specified time during the option period. A put option gives the holder the right to sell and obligates the writer to buy the underlying instrument at the exercise or strike price at any time or at a specified time during the option period.
Premiums paid on options purchased and premiums received on options written, as well as the daily fluctuation in market value, are included in investments at value – unaffiliated and options written at value, respectively, in the Statements of Assets and Liabilities. When an instrument is purchased or sold through the exercise of an option, the premium is offset against the cost or proceeds of the underlying instrument. When an option expires, a realized gain or loss is recorded in the Statements of Operations to the extent of the premiums received or paid. When an option is closed or sold, a gain or loss is recorded in the Statements of Operations to the extent the cost of the closing transaction exceeds the premiums received or paid. When the Funds write a call option, such option is typically “covered,” meaning that they hold the underlying instrument subject to being called by the option counterparty. When the Funds write a put option, cash is segregated in an amount sufficient to cover the obligation. These amounts, which are considered restricted, are included in cash pledged as collateral for options written in the Statements of Assets and Liabilities.
In purchasing and writing options, the Funds bear the risk of an unfavorable change in the value of the underlying instrument or the risk that they may not be able to enter into a closing transaction due to an illiquid market. Exercise of a written option could result in the Funds purchasing or selling a security when they otherwise would not, or at a price different from the current market value.
Swaps: Swap contracts are entered into to manage exposure to issuers, markets and securities. Such contracts are agreements between the Funds and a counterparty to make periodic net payments on a specified notional amount or a net payment upon termination. Swap agreements are privately negotiated in the OTC market and may be entered into as a bilateral contract (“OTC swaps”) or centrally cleared (“centrally cleared swaps”).
For OTC swaps, any upfront premiums paid and any upfront fees received are shown as swap premiums paid and swap premiums received, respectively, in the Statements of Assets and Liabilities and amortized over the term of the contract. The daily fluctuation in market value is recorded as unrealized appreciation (depreciation) on OTC Swaps in the Statements of Assets and Liabilities. Payments received or paid are recorded in the Statements of Operations as realized gains or losses, respectively. When an OTC swap is terminated, a realized gain or loss is recorded in the Statements of Operations equal to the difference between the proceeds from (or cost of) the closing transaction and the Funds basis in the contract, if any. Generally, the basis of the contract is the premium received or paid.
| • | Total return swaps — Total return swaps are entered into to obtain exposure to a security or market without owning such security or investing directly in such market or to exchange the risk/return of one security or market (e.g., fixed-income) with another security or market (e.g., equity or commodity prices) (equity risk, commodity price risk and/or interest rate risk). |
Total return swaps are agreements in which there is an exchange of cash flows whereby one party commits to make payments based on the total return (distributions plus capital gains/losses) of an underlying instrument, or basket of underlying instruments, in exchange for fixed or floating rate interest payments. If the total return of the instrument(s) or index underlying the transaction exceeds or falls short of the offsetting fixed or floating interest rate obligation, the Funds receive payment from or make a payment to the counterparty. |
N O T E S T O F I N A N C I A L S T A T E M E N T S | 81 |
Notes to Financial Statements (continued)
Certain total return swaps are designed to function as a portfolio of direct investments in long and short equity positions. This means that the Fund has the ability to trade in and out of these long and short positions within the swap and will receive the economic benefits and risks equivalent to direct investment in these positions, subject to certain adjustments due to events related to the counterparty. Benefits and risks include capital appreciation (depreciation), corporate actions and dividends received and paid, all of which are reflected in the swap’s market value. The market value also includes interest charges and credits (“financing fees”) related to the notional values of the long and short positions and cash balances within the swap. These interest charges and credits are based on a specified benchmark rate plus or minus a specified spread determined based upon the country and/or currency of the positions in the portfolio. |
Positions within the swap and financing fees are reset periodically. During a reset, any unrealized appreciation (depreciation) on positions and accrued financing fees become available for cash settlement between the Funds and the counterparty. The amounts that are available for cash settlement are recorded as realized gains or losses in the Statements of Operations. Cash settlement in and out of the swap may occur at a reset date or any other date, at the discretion of the Funds and the counterparty, over the life of the agreement. Certain swaps have no stated expiration and can be terminated by either party at any time. |
Swap transactions involve, to varying degrees, elements of interest rate, credit and market risks in excess of the amounts recognized in the Statements of Assets and Liabilities. Such risks involve the possibility that there will be no liquid market for these agreements, that the counterparty to the agreements may default on its obligation to perform or disagree as to the meaning of the contractual terms in the agreements, and that there may be unfavorable changes in interest rates and/or market values associated with these transactions.
Master Netting Arrangements: In order to define its contractual rights and to secure rights that will help it mitigate its counterparty risk, a Fund may enter into an International Swaps and Derivatives Association, Inc. Master Agreement (“ISDA Master Agreement”) or similar agreement with its counterparties. An ISDA Master Agreement is a bilateral agreement between a Fund and a counterparty that governs certain OTC derivatives and typically contains, among other things, collateral posting terms and netting provisions in the event of a default and/or termination event. Under an ISDA Master Agreement, a Fund may, under certain circumstances, offset with the counterparty certain derivative financial instruments’ payables and/or receivables with collateral held and/or posted and create one single net payment. The provisions of the ISDA Master Agreement typically permit a single net payment in the event of default including the bankruptcy or insolvency of the counterparty. However, bankruptcy or insolvency laws of a particular jurisdiction may impose restrictions on or prohibitions against the right of offset in bankruptcy, insolvency or other events.
Collateral Requirements: For derivatives traded under an ISDA Master Agreement, the collateral requirements are typically calculated by netting the mark-to-market amount for each transaction under such agreement and comparing that amount to the value of any collateral currently pledged by the Fund and the counterparty.
Cash collateral that has been pledged to cover obligations of the Funds and cash collateral received from the counterparty, if any, is reported separately in the Statements of Assets and Liabilities as cash pledged as collateral and cash received as collateral, respectively. Non-cash collateral pledged by the Funds, if any, is noted in the Schedules of Investments. Generally, the amount of collateral due from or to a counterparty is subject to a certain minimum transfer amount threshold before a transfer is required, which is determined at the close of business of the Funds. Any additional required collateral is delivered to/pledged by the Funds on the next business day. Typically, the counterparty is not permitted to sell, re-pledge or use cash and non-cash collateral it receives. A Fund generally agrees not to use non-cash collateral that it receives but may, absent default or certain other circumstances defined in the underlying ISDA Master Agreement, be permitted to use cash collateral received. In such cases, interest may be paid pursuant to the collateral arrangement with the counterparty. To the extent amounts due to the Funds from a counterparties are not fully collateralized, each Fund bears the risk of loss from counterparty non-performance. Likewise, to the extent the Funds have delivered collateral to a counterparty and stand ready to perform under the terms of their agreement with such counterparty, each Fund bears the risk of loss from a counterparty in the amount of the value of the collateral in the event the counterparty fails to return such collateral. Based on the terms of agreements, collateral may not be required for all derivative contracts.
For financial reporting purposes, the Funds do not offset derivative assets and derivative liabilities that are subject to netting arrangements, if any, in the Statements of Assets and Liabilities.
| 6. | INVESTMENT ADVISORY AGREEMENT AND OTHER TRANSACTIONS WITH AFFILIATES |
Investment Advisory: The Corporation, on behalf of Capital Appreciation, and the Trust, on behalf of Health Sciences Opportunities, Infrastructure Sustainable Opportunities, Mid-Cap Growth Equity and Technology Opportunities, entered into an Investment Advisory Agreement with the Manager, the Funds’ investment adviser and an indirect, wholly-owned subsidiary of BlackRock, Inc. (“BlackRock”), to provide investment advisory services and with respect to Capital Appreciation, administrative services. The Manager is responsible for the management of each Fund’s portfolio and provides the personnel, facilities, equipment and certain other services necessary to the operations of each Fund.
For such services, each Fund pays the Manager a monthly fee at an annual rate equal to the following percentages of the average daily value of each Fund’s net assets:
| Investment Advisory Fees | ||||
| Average Daily Net Assets | Capital Appreciation | |||
First $1 billion | 0.650% | |||
$1 billion - $1.5 billion | 0.625 | |||
$1.5 billion - $5 billion | 0.600 | |||
$5 billion - $7.5 billion | 0.575 | |||
Greater than $7.5 billion | 0.550 | |||
| 82 | 2 0 2 3 B L A C K R O C K A N N U A L R E P O R T T O S H A R E H O L D E R S |
Notes to Financial Statements (continued)
| Investment Advisory Fees | ||||
| Average Daily Net Assets | Health Sciences Opportunities | |||
First $1 billion | 0.750% | |||
$1 billion - $2 billion | 0.700 | |||
$2 billion - $3 billion | 0.675 | |||
$3 billion - $10 billion | 0.650 | |||
Greater than $10 billion | 0.640 | |||
| Investment Advisory Fees | ||||||||
| Average Daily Net Assets | Infrastructure Sustainable Opportunities | Technology Opportunities | ||||||
First $1 billion | 0.800 | % | 0.820 | % | ||||
$1 billion - $3 billion | 0.750 | 0.770 | ||||||
$3 billion - $5 billion | 0.720 | 0.740 | ||||||
$5 billion - $10 billion | 0.700 | 0.710 | ||||||
Greater than $10 billion | 0.680 | 0.700 | ||||||
| Investment Advisory Fees | ||||
| Average Daily Net Assets | Mid-Cap Growth Equity | |||
First $1 billion | 0.700% | |||
$1 billion - $3 billion | 0.660 | |||
$3 billion - $5 billion | 0.630 | |||
$5 billion - $10 billion | 0.610 | |||
$10 billion - $18 billion | 0.600 | |||
Greater than $18 billion | 0.590 | |||
With respect to Infrastructure Sustainable Opportunities, the Manager entered into separate sub-advisory agreements with each of BlackRock International Limited (“BIL”) and BlackRock (Singapore) Limited (“BSL”), each an affiliate of the Manager. The Manager pays BIL and BSL for services they provide, for that portion of the Fund for which BIL and BSL, as applicable, act as sub-adviser, a monthly fee that is equal to a percentage of the investment advisory fees paid by the Fund to the Manager.
Service and Distribution Fees: The Corporation, on behalf of Capital Appreciation, and the Trust, on behalf of Health Sciences Opportunities, Infrastructure Sustainable Opportunities, Mid-Cap Growth Equity and Technology Opportunities, entered into a Distribution Agreement and a Distribution and Service Plan with BlackRock Investments, LLC (“BRIL”), an affiliate of the Manager. Pursuant to the Distribution and Service Plan and in accordance with Rule 12b-1 under the 1940 Act, each Fund pays BRIL ongoing service and distribution fees. The fees are accrued daily and paid monthly at annual rates based upon the average daily net assets of the relevant share class of each Fund as follows:
| Share Class | Service Fees | Distribution Fees | ||||||
Service | 0.25 | % | N/A | |||||
Investor A | 0.25 | N/A | ||||||
Investor C | 0.25 | 0.75 | % | |||||
Class R | 0.25 | 0.25 | ||||||
BRIL and broker-dealers, pursuant to sub-agreements with BRIL, provide shareholder servicing and distribution services to the Funds. The ongoing service and/or distribution fee compensates BRIL and each broker-dealer for providing shareholder servicing and/or distribution related services to shareholders.
For the year ended May 31, 2023, the following table shows the class specific service and distribution fees borne directly by each share class of each Fund:
| Fund Name | Service | Investor A | Investor C | Class R | Total | |||||||||||||||||||||||||||||||
Capital Appreciation | $ | — | $ | 4,094,316 | $ | 395,612 | $ | 109,602 | $ | 4,599,530 | ||||||||||||||||||||||||||
Health Sciences Opportunities | 87,902 | 7,576,046 | 4,762,148 | 1,258,610 | 13,684,706 | |||||||||||||||||||||||||||||||
Infrastructure Sustainable Opportunities | — | 287 | — | — | 287 | |||||||||||||||||||||||||||||||
Mid-Cap Growth Equity | 180,182 | 4,352,069 | 2,116,425 | 458,328 | 7,107,004 | |||||||||||||||||||||||||||||||
Technology Opportunities | 116,560 | 3,700,536 | 2,495,564 | 160,716 | 6,473,376 | |||||||||||||||||||||||||||||||
Administration: The Trust, on behalf of Health Sciences Opportunities, Infrastructure Sustainable Opportunities, Mid-Cap Growth Equity and Technology Opportunities, entered into an Administration Agreement with the Manager, an indirect, wholly-owned subsidiary of BlackRock, to provide administrative services. For these services, the
N O T E S T O F I N A N C I A L S T A T E M E N T S | 83 |
Notes to Financial Statements (continued)
Manager receives an administration fee computed daily and payable monthly, based on a percentage of the average daily net assets of each Fund. The administration fee, which is shown as administration in the Statements of Operations, is paid at the annual rates below.
| Average Daily Net Assets | Administration Fees | |||
First $500 million | 0.0425 | % | ||
$500 million - $1 billion | 0.0400 | |||
$1 billion - $2 billion | 0.0375 | |||
$2 billion - $4 billion | 0.0350 | |||
$4 billion - $13 billion | 0.0325 | |||
Greater than $13 billion | 0.0300 | |||
In addition, the Manager charges each of the share classes an administration fee, which is shown as administration — class specific in the Statements of Operations, at an annual rate of 0.02% of the average daily net assets of each respective class.
For the year ended May 31, 2023, the following table shows the class specific administration fees borne directly by each share class of each Fund:
| Fund Name | Institutional | Service | Investor A | Investor C | Class K | Class R | Total | |||||||||||||||||||||||||||||||||||||||||||||
Health Sciences Opportunities | $ | 953,402 | $ | 7,033 | $ | 606,166 | $ | 95,312 | $ | 88,658 | $ | 50,349 | $ | 1,800,920 | ||||||||||||||||||||||||||||||||||||||
Infrastructure Sustainable Opportunities | 20 | — | 23 | — | 1,741 | — | 1,784 | |||||||||||||||||||||||||||||||||||||||||||||
Mid-Cap Growth Equity | 1,179,241 | 14,426 | 348,412 | 42,378 | 880,452 | 18,337 | 2,483,246 | |||||||||||||||||||||||||||||||||||||||||||||
Technology Opportunities | 468,549 | 9,334 | 296,264 | 49,968 | 26,448 | 6,430 | 856,993 | |||||||||||||||||||||||||||||||||||||||||||||
Transfer Agent: Pursuant to written agreements, certain financial intermediaries, some of which may be affiliates, provide the Funds with sub-accounting, recordkeeping, sub-transfer agency and other administrative services with respect to servicing of underlying investor accounts. For these services, these entities receive an asset-based fee or an annual fee per shareholder account, which will vary depending on share class and/or net assets. For the year ended May 31, 2023, the Funds paid the following amounts to affiliates of BlackRock in return for these services, which are included in transfer agent — class specific in the Statements of Operations:
| Fund Name | Institutional | Total | ||||||||||
Capital Appreciation | $ | 120,129 | $ | 120,129 | ||||||||
The Manager maintains a call center that is responsible for providing certain shareholder services to the Funds. Shareholder services include responding to inquiries and processing purchases and sales based upon instructions from shareholders. For the year ended May 31, 2023, each Fund reimbursed the Manager the following amounts for costs incurred in running the call center, which are included in transfer agent — class specific in the Statements of Operations:
| Fund Name | Institutional | Service | Investor A | Investor C | Class K | Class R | Total | |||||||||||||||||||||||||||||||||||||||||||||
Capital Appreciation | $ | 5,613 | $ | — | $ | 123,062 | $ | 10,468 | $ | 5,211 | $ | 421 | $ | 144,775 | ||||||||||||||||||||||||||||||||||||||
Health Sciences Opportunities | 33,951 | 524 | 165,736 | 31,721 | 3,668 | 2,536 | 238,136 | |||||||||||||||||||||||||||||||||||||||||||||
Infrastructure Sustainable Opportunities | 96 | — | 51 | — | 101 | — | 248 | |||||||||||||||||||||||||||||||||||||||||||||
Mid-Cap Growth Equity | 46,157 | 579 | 109,348 | 14,170 | 22,743 | 1,952 | 194,949 | |||||||||||||||||||||||||||||||||||||||||||||
Technology Opportunities | 41,659 | 627 | 86,727 | 23,306 | 2,090 | 514 | 154,923 | |||||||||||||||||||||||||||||||||||||||||||||
For the year ended May 31, 2023, the following table shows the class specific transfer agent fees borne directly by each share class of each Fund:
| Fund Name | Institutional | Service | Investor A | Investor C | Class K | Class R | Total | |||||||||||||||||||||||||||||||||||||||||||||
Capital Appreciation | $ | 662,626 | $ | — | $ | 1,830,708 | $ | 77,015 | $ | 29,316 | $ | 48,832 | $ | 2,648,497 | ||||||||||||||||||||||||||||||||||||||
Health Sciences Opportunities | 4,686,703 | 51,751 | 2,953,556 | 501,730 | 22,210 | 548,359 | 8,764,309 | |||||||||||||||||||||||||||||||||||||||||||||
Infrastructure Sustainable Opportunities | 199 | — | 54 | — | 121 | — | 374 | |||||||||||||||||||||||||||||||||||||||||||||
Mid-Cap Growth Equity | 8,723,690 | 112,939 | 3,172,356 | 277,674 | 471,610 | 204,842 | 12,963,111 | |||||||||||||||||||||||||||||||||||||||||||||
Technology Opportunities | 2,947,025 | 42,315 | 1,749,432 | 311,339 | 18,248 | 72,584 | 5,140,943 | |||||||||||||||||||||||||||||||||||||||||||||
Other Fees: For the year ended May 31, 2023, affiliates earned underwriting discounts, direct commissions and dealer concessions on sales of each Fund’s Investor A Shares as follows:
| Fund Name | Amounts | |||
Capital Appreciation | $ | 34,608 | ||
Health Sciences Opportunities | 74,660 | |||
Mid-Cap Growth Equity | 49,993 | |||
Technology Opportunities | 80,142 | |||
| 84 | 2 0 2 3 B L A C K R O C K A N N U A L R E P O R T T O S H A R E H O L D E R S |
Notes to Financial Statements (continued)
For the year ended May 31, 2023, affiliates received CDSCs as follows:
| Share Class | Capital Appreciation | Health Sciences Opportunities | Mid-Cap Growth Equity | Technology Opportunities | ||||||||||||
Investor A | $ | 21,054 | $ | 16,706 | $ | 30,408 | $ | 54,895 | ||||||||
Investor C | 1,852 | 17,058 | 20,607 | 23,508 | ||||||||||||
Expense Limitations, Waivers, Reimbursements, and Recoupments: With respect to each Fund, the Manager contractually agreed to waive its investment advisory fees by the amount of investment advisory fees each Fund pays to the Manager indirectly through its investment in affiliated money market funds (the “affiliated money market fund waiver”) through June 30, 2024. The contractual agreement may be terminated upon 90 days’ notice by a majority of the directors who are not “interested persons” of the Corporation or the Trust, as defined in the 1940 Act (“Independent Directors”), or by a vote of a majority of the outstanding voting securities of a Fund. The amount of waivers and/or reimbursements of fees and expenses made pursuant to the expense limitation described below will be reduced by the amount of the affiliated money market fund waiver. These amounts are included in fees waived and/or reimbursed by the Manager in the Statements of Operations. For the year ended May 31, 2023, the amounts waived were as follows:
| Fund Name | Amounts Waived | |||
Capital Appreciation | $ | 25,336 | ||
Health Sciences Opportunities | 99,438 | |||
Infrastructure Sustainable Opportunities | 274 | |||
Mid-Cap Growth Equity | 80,278 | |||
Technology Opportunities | 22,147 | |||
The Manager has contractually agreed to waive its investment advisory fee with respect to any portion of each Fund’s assets invested in affiliated equity and fixed-income mutual funds and affiliated exchange-traded funds that have a contractual management fee through June 30, 2024. The contractual agreement may be terminated upon 90 days’ notice by a majority of the Independent Directors, or by a vote of a majority of the outstanding voting securities of a Fund. For the year ended May 31, 2023, there were no fees waived and/or reimbursed by the Manager pursuant to this arrangement.
With respect to each Fund (except Health Sciences Opportunities), the Manager contractually agreed to waive and/or reimburse fees or expenses in order to limit expenses, excluding interest expense, dividend expense, tax expense, acquired fund fees and expenses, and certain other fund expenses, which constitute extraordinary expenses not incurred in the ordinary course of each Fund’s business (“expense limitation”). The expense limitations as a percentage of average daily net assets are as follows:
| Share Class | Capital Appreciation | Infrastructure Sustainable Opportunities | Mid-Cap Growth Equity | Technology Opportunities | ||||||||||
Institutional | N/A | 1.00 | % | 0.80 | % | 0.92% | ||||||||
Service | N/A | N/A | 1.05 | 1.17 | ||||||||||
Investor A | N/A | 1.25 | 1.05 | 1.17 | ||||||||||
Investor C | 1.94 | % | N/A | 1.80 | 1.92 | |||||||||
Class K | 0.72 | 0.95 | 0.75 | 0.87 | ||||||||||
Class R | N/A | N/A | 1.30 | 1.42 | ||||||||||
The Manager has agreed not to reduce or discontinue the contractual expense limitations through June 30, 2024 (or June 30, 2033 with respect to Capital Appreciation), unless approved by the Board, including a majority of the Independent Directors, or by a vote of a majority of the outstanding voting securities of a Fund.
For the year ended May 31, 2023, Infrastructure Sustainable Opportunities waived and/or reimbursed the Manager investment advisory fees and other expenses of $295,363, which is included in fees waived and/or reimbursed by the Manager in the Statements of Operations.
In addition, these amounts waived and/or reimbursed by the Manager are included in administration fees waived by the Manager — class specific and transfer agent fees waived and/or reimbursed by the Manager — class specific, respectively, in the Statements of Operations. For the year ended May 31, 2023, class specific expense waivers and/or reimbursements are as follows:
| Administration Fees Waived by the Manager - Class Specific | ||||||||||||||||||||||||||||||||||||||||||||||||||||
| Fund Name | Institutional | Service | Investor A | Investor C | Class K | Class R | Total | |||||||||||||||||||||||||||||||||||||||||||||
Infrastructure Sustainable Opportunities | $ 12 | $ — | $ 10 | $ — | $ 1,733 | $ — | $ 1,755 | |||||||||||||||||||||||||||||||||||||||||||||
Mid-Cap Growth Equity | 1,179,241 | 14,426 | 348,412 | 37,596 | — | 18,337 | 1,598,012 | |||||||||||||||||||||||||||||||||||||||||||||
Technology Opportunities | 468,549 | 6,305 | 296,264 | 49,968 | 3,162 | 6,430 | 830,678 | |||||||||||||||||||||||||||||||||||||||||||||
| ||||||||||||||||||||||||||||||||||||||||||||||||||||
| Transfer Agent Fees Waived and/or Reimbursed by the Manager - Class Specific | ||||||||||||||||||||||||||||||||||||||||||||||||||||
| Fund Name | Institutional | Service | Investor A | Investor C | Class K | Class R | Total | |||||||||||||||||||||||||||||||||||||||||||||
Infrastructure Sustainable Opportunities | $ 162 | $ — | $ 30 | �� | $ — | $ 121 | $ — | $ 313 | ||||||||||||||||||||||||||||||||||||||||||||
Mid-Cap Growth Equity | 1,353,292 | 22,638 | 994,509 | 16,816 | — | 90,075 | 2,477,330 | |||||||||||||||||||||||||||||||||||||||||||||
Technology Opportunities | 1,001,170 | 6,522 | 516,817 | 101,795 | — | 45,788 | 1,672,092 | |||||||||||||||||||||||||||||||||||||||||||||
Infrastructure Sustainable Opportunities also had a waiver of administration fees, which are included in Administration fees waived in the Statements of Operations. For the year ended May 31, 2023, the amount was $3,772.
N O T E S T O F I N A N C I A L S T A T E M E N T S | 85 |
Notes to Financial Statements (continued)
With respect to the contractual expense limitation of Infrastructure Sustainable Opportunities, if during the Fund’s fiscal year the operating expenses of a share class, that at any time during the prior two fiscal years received a waiver and/or reimbursement from the Manager, are less than the current expense limitation for that share class, the Manager is entitled to be reimbursed by such share class up to the lesser of: (a) the amount of fees waived and/or expenses reimbursed during those prior two fiscal years under the agreement and (b) an amount not to exceed either the current expense limitation of that share class or the expense limitation of the share class in effect at the time that the share class received the applicable waiver and/or reimbursement, provided that:
| (1) | the Fund, of which the share class is a part, has more than $50 million in assets for the fiscal year, and |
| (2) | the Manager or an affiliate continues to serve as the Fund’s investment adviser or administrator. |
This repayment applies only to the contractual expense limitation on net expenses and does not apply to the contractual investment advisory fee waiver described above or any voluntary waivers that may be in effect from time to time. Effective September 30, 2028 the repayment arrangement between the Fund and the Manager pursuant to which the Fund may be required to repay amounts waived and/or reimbursed under the Fund’s contractual caps on net expenses will be terminated.
As of May 31, 2023, the fund level and class specific waivers and/or reimbursements subject to possible future recoupment under the expense limitation agreement are as follows:
| Expiring May 31, | ||||||||
| Fund Name/Fund Level/Share Class | 2024 | 2025 | ||||||
Infrastructure Sustainable Opportunities | ||||||||
Fund Level | $ | 198,233 | $ | 299,135 | ||||
Institutional | 153 | 174 | ||||||
Investor A | 151 | 40 | ||||||
Class K | 1,479 | 1,854 | ||||||
Securities Lending: The U.S. Securities and Exchange Commission (“SEC”) has issued an exemptive order which permits BIM, an affiliate of the Manager, to serve as securities lending agent for the Funds, subject to applicable conditions. As securities lending agent, BIM bears all operational costs directly related to securities lending. The Funds are responsible for expenses in connection with the investment of cash collateral received for securities on loan (the “collateral investment expenses”). The cash collateral is invested in a private investment company Money Market Series, managed by the Manager or its affiliates. However, BIM has agreed to cap the collateral investment expenses of the Money Market Series to an annual rate of 0.04%. The investment adviser to the Money Market Series will not charge any advisory fees with respect to shares purchased by the Funds. The Money Market Series may, under certain circumstances, impose a liquidity fee of up to 2% of the value withdrawn or temporarily restrict withdrawals for up to 10 business days during a 90 day period, in the event that the private investment company’s weekly liquid assets fall below certain thresholds. The Money Market Series seeks current income consistent with maintaining liquidity and preserving capital. Although the Money Market Series is not registered under the 1940 Act, its investments may follow the parameters of investments by a money market fund that is subject to Rule 2a-7 under the 1940 Act.
Securities lending income is equal to the total of income earned from the reinvestment of cash collateral, net of fees and other payments to and from borrowers of securities, and less the collateral investment expenses. Each Fund retains a portion of securities lending income and remits a remaining portion to BIM as compensation for its services as securities lending agent.
Pursuant to the current securities lending agreement, Capital Appreciation, Health Sciences Opportunities, Mid-Cap Growth Equity and Technology Opportunities retain 81% of securities lending income (which excludes collateral investment expenses), and this amount retained can never be less than 70% of the total of securities lending income plus the collateral investment expenses. Pursuant to the current securities lending agreement, Infrastructure Sustainable Opportunities retains 82% of securities lending income (which excludes collateral investment expenses), and this amount retained can never be less than 70% of the total of securities lending income plus the collateral investment expenses.
In addition, commencing the business day following the date that the aggregate securities lending income earned across the BlackRock Multi-Asset Complex in a calendar year exceeds a specified threshold, Capital Appreciation, Health Sciences Opportunities, Mid-Cap Growth Equity and Technology Opportunities, pursuant to the securities lending agreement, will retain for the remainder of that calendar year securities lending income in an amount equal to 81% of securities lending income (which excludes collateral investment expenses), and this amount retained can never be less than 70% of the total of securities lending income plus the collateral investment expenses. Infrastructure Sustainable Opportunities, pursuant to the securities lending agreement, will retain for the remainder of that calendar year securities lending income in an amount equal to 85% of securities lending income (which excludes collateral investment expenses), and this amount retained can never be less than 70% of the total of securities lending income plus the collateral investment expenses.
The share of securities lending income earned by each Fund is shown as securities lending income — affiliated — net in the Statements of Operations. For the year ended May 31, 2023, each Fund paid BIM the following amounts for securities lending agent services:
| Fund Name | Amounts | |||
Capital Appreciation | $ | 10,079 | ||
Health Sciences Opportunities | 358,016 | |||
Infrastructure Sustainable Opportunities | 137 | |||
Mid-Cap Growth Equity | 212,363 | |||
Technology Opportunities | 207,798 | |||
Interfund Lending: In accordance with an exemptive order (the “Order”) from the SEC, Capital Appreciation and Infrastructure Sustainable Opportunities may participate in a joint lending and borrowing facility for temporary purposes (the “Interfund Lending Program”), subject to compliance with the terms and conditions of the Order, and to the
| 86 | 2 0 2 3 B L A C K R O C K A N N U A L R E P O R T T O S H A R E H O L D E R S |
Notes to Financial Statements (continued)
extent permitted by Capital Appreciation’s and Infrastructure Sustainable Opportunities’s investment policies and restrictions. Capital Appreciation is currently permitted to borrow under the Interfund Lending Program. In addition, Infrastructure Sustainable Opportunities is currently permitted to borrow and lend under the Interfund Lending Program.
A lending BlackRock fund may lend in aggregate up to 15% of its net assets but may not lend more than 5% of its net assets to any one borrowing fund through the Interfund Lending Program. A borrowing BlackRock fund may not borrow through the Interfund Lending Program or from any other source more than 33 1/3% of its total assets (or any lower threshold provided for by the fund’s investment restrictions). If a borrowing BlackRock fund’s total outstanding borrowings exceed 10% of its total assets, each of its outstanding interfund loans will be subject to collateralization of at least 102% of the outstanding principal value of the loan. All interfund loans are for temporary or emergency purposes and the interest rate to be charged will be the average of the highest current overnight repurchase agreement rate available to a lending fund and the bank loan rate, as calculated according to a formula established by the Board.
During the year ended May 31, 2023, Capital Appreciation and Infrastructure Sustainable Opportunities did not participate in the Interfund Lending Program.
Directors and Officers: Certain directors and/or officers of the Corporation and the Trust are directors and/or officers of BlackRock or its affiliates. The Funds reimburse the Manager for a portion of the compensation paid to the Corporation’s/Trust’s Chief Compliance Officer, which is included in Directors and Officer in the Statements of Operations.
| 7. | PURCHASES AND SALES |
For the year ended May 31, 2023, purchases and sales of investments, excluding short-term securities, were as follows:
| Fund Name | Purchases | Sales | ||||||||||
Capital Appreciation | $ | 1,294,400,531 | $ | 1,777,167,092 | ||||||||
Health Sciences Opportunities | 2,582,899,233 | 3,593,646,981 | ||||||||||
Infrastructure Sustainable Opportunities | 8,812,222 | 9,606,641 | ||||||||||
Mid-Cap Growth Equity | 5,624,774,503 | 7,776,643,792 | ||||||||||
Technology Opportunities | 1,660,963,931 | 2,550,886,342 | ||||||||||
| 8. | INCOME TAX INFORMATION |
It is each Fund’s policy to comply with the requirements of the Internal Revenue Code of 1986, as amended, applicable to regulated investment companies, and to distribute substantially all of its taxable income to its shareholders. Therefore, no U.S. federal income tax provision is required.
Each Fund files U.S. federal and various state and local tax returns. No income tax returns are currently under examination. The statute of limitations on each Fund’s U.S. federal tax returns generally remains open for a period of three years after they are filed. The statutes of limitations on each Fund’s state and local tax returns may remain open for an additional year depending upon the jurisdiction.
Management has analyzed tax laws and regulations and their application to the Funds as of May 31, 2023, inclusive of the open tax return years, and does not believe that there are any uncertain tax positions that require recognition of a tax liability in the Funds’ financial statements.
U.S. GAAP requires that certain components of net assets be adjusted to reflect permanent differences between financial and tax reporting. These reclassifications have no effect on net assets or NAVs per share. As of period end, the following permanent differences attributable to net operating losses and non-deductible expenses were reclassified to the following accounts:
| ||||||||||||||||||||||||||||
Capital Appreciation | Infrastructure Sustainable Opportunities | Mid-Cap Growth Equity | Technology Opportunities | |||||||||||||||||||||||||
| ||||||||||||||||||||||||||||
Paid-in capital | $ | (5,038,821 | ) | $ | (16,780 | ) | $ | (67,647,963 | ) | $ | (29,993,093 | ) | ||||||||||||||||
Accumulated earnings (loss) | 5,038,821 | 16,780 | 67,647,963 | 29,993,093 | ||||||||||||||||||||||||
| ||||||||||||||||||||||||||||
The tax character of distributions paid was as follows:
| Period | Capital Appreciation | Health Sciences Opportunities | Infrastructure Sustainable Opportunities | Mid-Cap Growth Equity | Technology Opportunities | |||||||||||||||||||||||||||||||||||||||
Ordinary income | 05/31/23 | $ | — | $ | 40,237,395 | $ | 386,128 | $ | — | $ | — | |||||||||||||||||||||||||||||||||
| 05/31/22 | 57,463,690 | 162,713,719 | 78,182 | 93,002,830 | 47,451,363 | |||||||||||||||||||||||||||||||||||||||
Long-term capital gains | 05/31/23 | 248,072,015 | 628,590,098 | 664 | — | — | ||||||||||||||||||||||||||||||||||||||
| 05/31/22 | 523,109,725 | 807,323,848 | — | 809,564,976 | 580,844,171 | |||||||||||||||||||||||||||||||||||||||
|
|
|
|
|
|
|
|
|
| |||||||||||||||||||||||||||||||||||
Total | 05/31/23 | $ | 248,072,015 | $ | 668,827,493 | $ | 386,792 | $ | — | $ | — | |||||||||||||||||||||||||||||||||
|
|
|
|
|
|
|
|
|
| |||||||||||||||||||||||||||||||||||
| 05/31/22 | $ | 580,573,415 | $ | 970,037,567 | $ | 78,182 | $ | 902,567,806 | $ | 628,295,534 | ||||||||||||||||||||||||||||||||||
|
|
|
|
|
|
|
|
|
| |||||||||||||||||||||||||||||||||||
N O T E S T O F I N A N C I A L S T A T E M E N T S | 87 |
Notes to Financial Statements (continued)
As of May 31, 2023, the tax components of accumulated net earnings were as follows:
| ||||||||||||||||||||||||||||||||||||||||||||||||
| Fund Name | Undistributed Ordinary Income | Undistributed long-term capital gains | Non-expiring Capital Loss Carryforwards(a) | Net Unrealized Gains (Losses)(b) | Qualified late-year losses(c) | Total | ||||||||||||||||||||||||||||||||||||||||||
| ||||||||||||||||||||||||||||||||||||||||||||||||
Capital Appreciation | $ | — | $ | 55,340,065 | $ | — | $ | 1,338,673,363 | $ | (1,852,224 | ) | $ | 1,392,161,204 | |||||||||||||||||||||||||||||||||||
| Health Sciences Opportunities | — | 168,726,898 | — | 2,839,760,704 | (70,936 | ) | 3,008,416,666 |
| |||||||||||||||||||||||||||||||||||||||
Infrastructure Sustainable Opportunities | 98,390 | — | (618,241 | ) | (383,510 | ) | — | (903,361 | ) | |||||||||||||||||||||||||||||||||||||||
Mid-Cap Growth Equity | — | — | (2,288,206,843 | ) | 2,161,394,701 | (20,531,216 | ) | (147,343,358 | ) | |||||||||||||||||||||||||||||||||||||||
Technology Opportunities | — | — | (710,037,033 | ) | 1,713,520,332 | (7,766,600 | ) | 995,716,699 | ||||||||||||||||||||||||||||||||||||||||
| ||||||||||||||||||||||||||||||||||||||||||||||||
| (a) | Amounts available to offset future realized capital gains. |
| (b) | The difference between book-basis and tax-basis net unrealized gains (losses) was attributable primarily to the tax deferral of losses on wash sales and straddles, the realization for tax purposes of unrealized gains (losses) on certain foreign currency contracts, the accounting for swap agreements, characterization of corporate actions, the realization for tax purposes of unrealized gains on investments in passive foreign investment companies and the timing and recognition of partnership income. |
| (c) | The Funds have elected to defer certain qualified late-year losses and recognize such losses in the next taxable year. |
As of May 31, 2023, gross unrealized appreciation and depreciation based on cost of investments (including short positions and derivatives, if any) for U.S. federal income tax purposes were as follows:
| ||||||||||||||||||||||||||||
| Fund Name | Tax Cost | Gross Unrealized Appreciation | Gross Unrealized Depreciation | Net Unrealized Appreciation (Depreciation) | ||||||||||||||||||||||||
| ||||||||||||||||||||||||||||
Capital Appreciation | $ | 1,776,631,680 | $ | 1,452,743,464 | $ | (114,070,929 | ) | $ | 1,338,672,535 | |||||||||||||||||||
Health Sciences Opportunities | 5,658,864,722 | 3,073,789,972 | (237,063,689 | ) | 2,836,726,283 | |||||||||||||||||||||||
Infrastructure Sustainable Opportunities | 9,261,081 | 379,682 | (763,028 | ) | (383,346 | ) | ||||||||||||||||||||||
Mid-Cap Growth Equity | 9,642,643,172 | 3,016,249,961 | (865,686,216 | ) | 2,150,563,745 | |||||||||||||||||||||||
Technology Opportunities | 2,828,995,503 | 1,769,497,434 | (59,157,821 | ) | 1,710,339,613 | |||||||||||||||||||||||
| ||||||||||||||||||||||||||||
| 9. | BANK BORROWINGS |
The Corporation and the Trust, on behalf of the Funds, along with certain other funds managed by the Manager and its affiliates (“Participating Funds”), is party to a 364-day, $2.50 billion credit agreement with a group of lenders. Under this agreement, the Funds may borrow to fund shareholder redemptions. Excluding commitments designated for certain individual funds, the Participating Funds, including the Funds, can borrow up to an aggregate commitment amount of $1.75 billion at any time outstanding, subject to asset coverage and other limitations as specified in the agreement. The credit agreement has the following terms: a fee of 0.10% per annum on unused commitment amounts and interest at a rate equal to the higher of (a) Overnight Bank Funding Rate (“OBFR”) (but, in any event, not less than 0.00%) on the date the loan is made plus 0.80% per annum, (b) the Fed Funds rate (but, in any event, not less than 0.00%) in effect from time to time plus 0.80% per annum on amounts borrowed or (c) the sum of (x) Daily Simple Secured Overnight Financing Rate (“SOFR”) (but, in any event, not less than 0.00%) on the date the loan is made plus 0.10% and (y) 0.80% per annum. The agreement expires in April 2024 unless extended or renewed. These fees were allocated among such funds based upon portions of the aggregate commitment available to them and relative net assets of Participating Funds. During the year ended May 31, 2023, the Funds did not borrow under the credit agreement.
| 10. | PRINCIPAL RISKS |
In the normal course of business, the Funds invest in securities or other instruments and may enter into certain transactions, and such activities subject each Fund to various risks, including among others, fluctuations in the market (market risk) or failure of an issuer to meet all of its obligations. The value of securities or other instruments may also be affected by various factors, including, without limitation: (i) the general economy; (ii) the overall market as well as local, regional or global political and/or social instability; (iii) regulation, taxation or international tax treaties between various countries; or (iv) currency, interest rate and price fluctuations. Local, regional or global events such as war, acts of terrorism, the spread of infectious illness or other public health issues, recessions, or other events could have a significant impact on the Funds and their investments. Each Fund’s prospectus provides details of the risks to which each Fund is subject.
The Funds may be exposed to additional risks when reinvesting cash collateral in money market funds that do not seek to maintain a stable NAV per share of $1.00, which may be subject to redemption gates or liquidity fees under certain circumstances.
Infectious Illness Risk: An outbreak of an infectious illness, such as the COVID-19 pandemic, may adversely impact the economies of many nations and the global economy, and may impact individual issuers and capital markets in ways that cannot be foreseen. An infectious illness outbreak may result in, among other things, closed international borders, prolonged quarantines, supply chain disruptions, market volatility or disruptions and other significant economic, social and political impacts.
Valuation Risk: The market values of equities, such as common stocks and preferred securities or equity related investments, such as futures and options, may decline due to general market conditions which are not specifically related to a particular company. They may also decline due to factors which affect a particular industry or industries. A Fund may invest in illiquid investments. An illiquid investment is any investment that a Fund reasonably expects cannot be sold or disposed of in current market conditions in seven calendar days or less without the sale or disposition significantly changing the market value of the investment. A Fund may experience difficulty in selling illiquid investments in a timely manner at the price that it believes the investments are worth. Prices may fluctuate widely over short or extended periods in response to company, market or economic news. Markets also tend to move in cycles, with periods of rising and falling prices. This volatility may cause each Fund’s NAV to experience significant
| 88 | 2 0 2 3 B L A C K R O C K A N N U A L R E P O R T T O S H A R E H O L D E R S |
Notes to Financial Statements (continued)
increases or decreases over short periods of time. If there is a general decline in the securities and other markets, the NAV of a Fund may lose value, regardless of the individual results of the securities and other instruments in which a Fund invests.
The price a Fund could receive upon the sale of any particular portfolio investment may differ from a Fund’s valuation of the investment, particularly for securities that trade in thin or volatile markets or that are valued using a fair valuation technique or a price provided by an independent pricing service. Changes to significant unobservable inputs and assumptions (i.e., publicly traded company multiples, growth rate, time to exit) due to the lack of observable inputs may significantly impact the resulting fair value and therefore a Fund’s results of operations. As a result, the price received upon the sale of an investment may be less than the value ascribed by a Fund, and a Fund could realize a greater than expected loss or lesser than expected gain upon the sale of the investment. A Fund’s ability to value its investments may also be impacted by technological issues and/or errors by pricing services or other third-party service providers.
Counterparty Credit Risk: The Funds may be exposed to counterparty credit risk, or the risk that an entity may fail to or be unable to perform on its commitments related to unsettled or open transactions, including making timely interest and/or principal payments or otherwise honoring its obligations. The Funds manage counterparty credit risk by entering into transactions only with counterparties that the Manager believes have the financial resources to honor their obligations and by monitoring the financial stability of those counterparties. Financial assets, which potentially expose the Funds to market, issuer and counterparty credit risks, consist principally of financial instruments and receivables due from counterparties. The extent of the Funds’ exposure to market, issuer and counterparty credit risks with respect to these financial assets is approximately their value recorded in the Statements of Assets and Liabilities, less any collateral held by the Funds.
A derivative contract may suffer a mark-to-market loss if the value of the contract decreases due to an unfavorable change in the market rates or values of the underlying instrument. Losses can also occur if the counterparty does not perform under the contract.
With exchange-traded options purchased and exchange-traded futures, there is less counterparty credit risk to the Funds since the exchange or clearinghouse, as counterparty to such instruments, guarantees against a possible default. The clearinghouse stands between the buyer and the seller of the contract; therefore, credit risk is limited to failure of the clearinghouse. While offset rights may exist under applicable law, a Fund does not have a contractual right of offset against a clearing broker or clearinghouse in the event of a default (including the bankruptcy or insolvency). Additionally, credit risk exists in exchange-traded futures with respect to initial and variation margin that is held in a clearing broker’s customer accounts. While clearing brokers are required to segregate customer margin from their own assets, in the event that a clearing broker becomes insolvent or goes into bankruptcy and at that time there is a shortfall in the aggregate amount of margin held by the clearing broker for all its clients, typically the shortfall would be allocated on a pro rata basis across all the clearing broker’s customers, potentially resulting in losses to the Funds.
Concentration Risk: A diversified portfolio, where this is appropriate and consistent with a fund’s objectives, minimizes the risk that a price change of a particular investment will have a material impact on the NAV of a fund. The investment concentrations within the Fund’s portfolio are disclosed in its Schedule of Investments.
Certain Funds invest a significant portion of their assets in securities within a single or limited number of market sectors. When a Fund concentrates its investments in this manner, it assumes the risk that economic, regulatory, political and social conditions affecting such sectors may have a significant impact on the Fund and could affect the income from, or the value or liquidity of, the Fund’s portfolio. Investment percentages in specific sectors are presented in the Schedules of Investments.
The Funds invest a significant portion of their assets in securities of issuers located in the United States. A decrease in imports or exports, changes in trade regulations, inflation and/or an economic recession in the United States may have a material adverse effect on the U.S. economy and the securities listed on U.S. exchanges. Proposed and adopted policy and legislative changes in the United States may also have a significant effect on U.S. markets generally, as well as on the value of certain securities. Governmental agencies project that the United States will continue to maintain elevated public debt levels for the foreseeable future which may constrain future economic growth. Circumstances could arise that could prevent the timely payment of interest or principal on U.S. government debt, such as reaching the legislative “debt ceiling.” Such non-payment would result in substantial negative consequences for the U.S. economy and the global financial system. If U.S. relations with certain countries deteriorate, it could adversely affect issuers that rely on the United States for trade. The United States has also experienced increased internal unrest and discord. If these trends were to continue, they may have an adverse impact on the U.S. economy and the issuers in which the Funds invest.
Significant Shareholder Redemption Risk: Certain shareholders may own or manage a substantial amount of fund shares and/or hold their fund investments for a limited period of time. Large redemptions of fund shares by these shareholders may force a fund to sell portfolio securities, which may negatively impact the fund’s NAV, increase the fund’s brokerage costs, and/or accelerate the realization of taxable income/gains and cause the fund to make additional taxable distributions to shareholders.
| 11. | CAPITAL SHARE TRANSACTIONS |
Transactions in capital shares for each class were as follows:
| Year Ended 05/31/23 | Year Ended 05/31/22 | |||||||||||||||||||||||||||
| Fund Name/Share Class | Shares | Amount | Shares | Amount | ||||||||||||||||||||||||
Capital Appreciation | ||||||||||||||||||||||||||||
Institutional | ||||||||||||||||||||||||||||
Shares sold | 5,716,023 | $ | 157,957,646 | 9,077,631 | $ | 365,178,278 | ||||||||||||||||||||||
Shares issued in reinvestment of distributions | 1,893,570 | 51,954,274 | 2,208,629 | 96,052,412 | ||||||||||||||||||||||||
Shares redeemed | (15,681,629 | ) | (435,307,849 | ) | (6,557,549 | ) | (268,772,260 | ) | ||||||||||||||||||||
|
|
|
|
|
|
|
| |||||||||||||||||||||
| (8,072,036 | ) | $ | (225,395,929 | ) | 4,728,711 | $ | 192,458,430 | |||||||||||||||||||||
|
|
|
|
|
|
|
| |||||||||||||||||||||
N O T E S T O F I N A N C I A L S T A T E M E N T S | 89 |
Notes to Financial Statements (continued)
| Year Ended 05/31/23 | Year Ended 05/31/22 | |||||||||||||||
| Fund Name/Share Class | Shares | Amount | Shares | Amount | ||||||||||||
Capital Appreciation (continued) | ||||||||||||||||
Investor A | ||||||||||||||||
Shares sold and automatic conversion of shares | 3,941,330 | $ | 97,836,995 | 6,420,981 | $ | 239,225,888 | ||||||||||
Shares issued in reinvestment of distributions | 5,278,960 | 127,222,770 | 6,684,788 | 259,138,163 | ||||||||||||
Shares redeemed | (13,077,008 | ) | (322,318,537 | ) | (12,580,937 | ) | (465,390,868 | ) | ||||||||
|
|
|
|
|
|
|
| |||||||||
| (3,856,718 | ) | $ | (97,258,772 | ) | 524,832 | $ | 32,973,183 | |||||||||
|
|
|
|
|
|
|
| |||||||||
Investor C | ||||||||||||||||
Shares sold | 295,401 | $ | 4,190,433 | 417,400 | $ | 9,523,681 | ||||||||||
Shares issued in reinvestment of distributions | 415,970 | 5,707,720 | 559,182 | 13,320,882 | ||||||||||||
Shares redeemed and automatic conversion of shares | (1,003,070 | ) | (14,231,042 | ) | (987,837 | ) | (22,223,382 | ) | ||||||||
|
|
|
|
|
|
|
| |||||||||
| (291,699 | ) | $ | (4,332,889 | ) | (11,255 | ) | $ | 621,181 | ||||||||
|
|
|
|
|
|
|
| |||||||||
Class K | ||||||||||||||||
Shares sold | 2,780,441 | $ | 79,543,996 | 2,650,053 | $ | 110,099,487 | ||||||||||
Shares issued in reinvestment of distributions | 1,501,046 | 41,578,344 | 2,255,335 | 99,168,670 | ||||||||||||
Shares redeemed | (4,141,499 | ) | (118,871,975 | ) | (4,243,421 | ) | (179,618,463 | ) | ||||||||
|
|
|
|
|
|
|
| |||||||||
| 139,988 | $ | 2,250,365 | 661,967 | $ | 29,649,694 | |||||||||||
|
|
|
|
|
|
|
| |||||||||
Class R | ||||||||||||||||
Shares sold | 204,059 | $ | 3,695,774 | 257,323 | $ | 7,134,270 | ||||||||||
Shares issued in reinvestment of distributions | 142,318 | 2,473,411 | 197,158 | 5,739,257 | ||||||||||||
Shares redeemed | (310,598 | ) | (5,527,276 | ) | (521,347 | ) | (14,052,755 | ) | ||||||||
|
|
|
|
|
|
|
| |||||||||
| 35,779 | $ | 641,909 | (66,866 | ) | $ | (1,179,228 | ) | |||||||||
|
|
|
|
|
|
|
| |||||||||
| (12,044,686 | ) | $ | (324,095,316 | ) | 5,837,389 | $ | 254,523,260 | |||||||||
|
|
|
|
|
|
|
| |||||||||
Health Sciences Opportunities | ||||||||||||||||
Institutional | ||||||||||||||||
Shares sold | 11,197,111 | $ | 765,047,695 | 13,550,039 | $ | 1,054,458,394 | ||||||||||
Shares issued in reinvestment of distributions | 5,046,141 | 332,953,033 | 5,984,415 | 466,096,116 | ||||||||||||
Shares redeemed | (21,662,089 | ) | (1,475,511,418 | ) | (22,567,955 | ) | (1,745,432,325 | ) | ||||||||
|
|
|
|
|
|
|
| |||||||||
| (5,418,837 | ) | $ | (377,510,690 | ) | (3,033,501 | ) | $ | (224,877,815 | ) | |||||||
|
|
|
|
|
|
|
| |||||||||
Service | ||||||||||||||||
Shares sold | 57,200 | $ | 3,684,661 | 49,458 | $ | 3,664,984 | ||||||||||
Shares issued in reinvestment of distributions | 40,955 | 2,542,243 | 51,296 | 3,778,993 | ||||||||||||
Shares redeemed | (122,578 | ) | (7,895,488 | ) | (127,959 | ) | (9,488,827 | ) | ||||||||
|
|
|
|
|
|
|
| |||||||||
| (24,423 | ) | $ | (1,668,584 | ) | (27,205 | ) | $ | (2,044,850 | ) | |||||||
|
|
|
|
|
|
|
| |||||||||
Investor A | ||||||||||||||||
Shares sold and automatic conversion of shares | 4,334,203 | $ | 278,606,468 | 5,392,110 | $ | 397,992,758 | ||||||||||
Shares issued in reinvestment of distributions | 3,522,117 | 217,567,391 | 3,792,616 | 278,689,830 | ||||||||||||
Shares redeemed | (9,621,175 | ) | (618,119,887 | ) | (7,954,173 | ) | (581,723,514 | ) | ||||||||
|
|
|
|
|
|
|
| |||||||||
| (1,764,855 | ) | $ | (121,946,028 | ) | 1,230,553 | $ | 94,959,074 | |||||||||
|
|
|
|
|
|
|
| |||||||||
Investor C | ||||||||||||||||
Shares sold | 537,584 | $ | 28,698,873 | 836,719 | $ | 53,237,828 | ||||||||||
Shares issued in reinvestment of distributions | 832,560 | 42,677,038 | 1,004,187 | 62,580,022 | ||||||||||||
Shares redeemed and automatic conversion of shares | (3,241,641 | ) | (172,577,850 | ) | (3,233,983 | ) | (201,419,358 | ) | ||||||||
|
|
|
|
|
|
|
| |||||||||
| (1,871,497 | ) | $ | (101,201,939 | ) | (1,393,077 | ) | $ | (85,601,508 | ) | |||||||
|
|
|
|
|
|
|
| |||||||||
Class K | ||||||||||||||||
Shares sold | 2,134,729 | $ | 147,417,118 | 1,698,513 | $ | 133,270,886 | ||||||||||
Shares issued in reinvestment of distributions | 470,645 | 31,121,552 | 561,988 | 43,729,235 | ||||||||||||
Shares redeemed | (1,551,519 | ) | (105,963,545 | ) | (1,876,019 | ) | (144,869,125 | ) | ||||||||
|
|
|
|
|
|
|
| |||||||||
| 1,053,855 | $ | 72,575,125 | 384,482 | $ | 32,130,996 | |||||||||||
|
|
|
|
|
|
|
| |||||||||
| 90 | 2 0 2 3 B L A C K R O C K A N N U A L R E P O R T T O S H A R E H O L D E R S |
Notes to Financial Statements (continued)
| Year Ended 05/31/23 | Year Ended 05/31/22 | |||||||||||||||
| Fund Name/Share Class | Shares | Amount | Shares | Amount | ||||||||||||
Health Sciences Opportunities (continued) | ||||||||||||||||
Class R | ||||||||||||||||
Shares sold | 260,827 | $ | 16,205,620 | 359,301 | $ | 26,082,993 | ||||||||||
Shares issued in reinvestment of distributions | 305,568 | 18,277,362 | 357,082 | 25,476,530 | ||||||||||||
Shares redeemed | (662,105 | ) | (41,318,683 | ) | (572,860 | ) | (40,780,069 | ) | ||||||||
|
|
|
|
|
|
|
| |||||||||
| (95,710 | ) | $ | (6,835,701 | ) | 143,523 | $ | 10,779,454 | |||||||||
|
|
|
|
|
|
|
| |||||||||
| (8,121,467 | ) | $ | (536,587,817 | ) | (2,695,225 | ) | $ | (174,654,649 | ) | |||||||
|
|
|
|
|
|
|
| |||||||||
Infrastructure Sustainable Opportunities | ||||||||||||||||
Institutional | ||||||||||||||||
Shares sold | 664 | $ | 5,769 | 11,003 | $ | 110,051 | (a) | |||||||||
Shares issued in reinvestment of distributions | 32 | 282 | — | 2 | (a) | |||||||||||
Shares redeemed | (133 | ) | (1,200 | ) | (320 | ) | (3,269 | )(a) | ||||||||
|
|
|
|
|
|
|
| |||||||||
| 563 | $ | 4,851 | 10,683 | $ | 106,784 | |||||||||||
|
|
|
|
|
|
|
| |||||||||
Investor A | ||||||||||||||||
Shares sold | 6,368 | $ | 57,649 | 10,952 | $ | 109,812 | (a) | |||||||||
Shares issued in reinvestment of distributions | 38 | 332 | — | — | ||||||||||||
Shares redeemed | (54 | ) | (495 | ) | — | — | ||||||||||
|
|
|
|
|
|
|
| |||||||||
| 6,352 | $ | 57,486 | 10,952 | $ | 109,812 | |||||||||||
|
|
|
|
|
|
|
| |||||||||
Class K | ||||||||||||||||
Shares sold | 189 | $ | 1,620 | 980,348 | $ | 9,803,544 | (a) | |||||||||
Shares issued in reinvestment of distributions | 16 | 142 | — | — | ||||||||||||
|
|
|
|
|
|
|
| |||||||||
| 205 | $ | 1,762 | 980,348 | $ | 9,803,544 | |||||||||||
|
|
|
|
|
|
|
| |||||||||
| 7,120 | $ | 64,099 | 1,001,983 | $ | 10,020,140 | |||||||||||
|
|
|
|
|
|
|
| |||||||||
Mid-Cap Growth Equity | ||||||||||||||||
Institutional | ||||||||||||||||
Shares sold | 47,917,656 | $ | 1,524,488,005 | 84,092,051 | $ | 3,672,781,183 | ||||||||||
Shares issued in reinvestment of distributions | — | — | 9,954,734 | 462,557,816 | ||||||||||||
Shares redeemed | (103,429,603 | ) | (3,263,321,983 | ) | (79,453,974 | ) | (3,261,438,913 | ) | ||||||||
|
|
|
|
|
|
|
| |||||||||
| (55,511,947 | ) | $ | (1,738,833,978 | ) | 14,592,811 | $ | 873,900,086 | |||||||||
|
|
|
|
|
|
|
| |||||||||
Service | ||||||||||||||||
Shares sold | 350,535 | $ | 9,881,277 | 854,941 | $ | 34,641,736 | ||||||||||
Shares issued in reinvestment of distributions | — | — | 146,401 | 6,102,842 | ||||||||||||
Shares redeemed | (975,944 | ) | (27,755,309 | ) | (771,097 | ) | (29,078,865 | ) | ||||||||
|
|
|
|
|
|
|
| |||||||||
| (625,409 | ) | $ | (17,874,032 | ) | 230,245 | $ | 11,665,713 | |||||||||
|
|
|
|
|
|
|
| |||||||||
Investor A | ||||||||||||||||
Shares sold and automatic conversion of shares | 7,397,275 | $ | 201,630,334 | 16,857,882 | $ | 647,069,791 | ||||||||||
Shares issued in reinvestment of distributions | — | — | 3,734,682 | 148,274,848 | ||||||||||||
Shares redeemed | (17,049,170 | ) | (459,100,473 | ) | (17,401,969 | ) | (628,539,903 | ) | ||||||||
|
|
|
|
|
|
|
| |||||||||
| (9,651,895 | ) | $ | (257,470,139 | ) | 3,190,595 | $ | 166,804,736 | |||||||||
|
|
|
|
|
|
|
| |||||||||
Investor C | ||||||||||||||||
Shares sold | 596,600 | $ | 12,112,431 | 1,829,067 | $ | 53,618,549 | ||||||||||
Shares issued in reinvestment of distributions | — | — | 850,190 | 25,522,539 | ||||||||||||
Shares redeemed and automatic conversion of shares | (2,806,057 | ) | (56,412,228 | ) | (2,880,629 | ) | (78,703,717 | ) | ||||||||
|
|
|
|
|
|
|
| |||||||||
| (2,209,457 | ) | $ | (44,299,797 | ) | (201,372 | ) | $ | 437,371 | ||||||||
|
|
|
|
|
|
|
| |||||||||
N O T E S T O F I N A N C I A L S T A T E M E N T S | 91 |
Notes to Financial Statements (continued)
| Year Ended 05/31/23 | Year Ended 05/31/22 | |||||||||||||||
| Fund Name/Share Class | Shares | Amount | Shares | Amount | ||||||||||||
Mid-Cap Growth Equity (continued) | ||||||||||||||||
Class K | ||||||||||||||||
Shares sold | 43,394,126 | $ | 1,373,927,107 | 75,010,864 | $ | 3,289,871,678 | ||||||||||
Shares issued in reinvestment of distributions | — | — | 4,431,881 | 206,797,826 | ||||||||||||
Shares redeemed | (47,704,012 | ) | (1,522,478,195 | ) | (26,364,924 | ) | (1,103,248,628 | ) | ||||||||
|
|
|
|
|
|
|
| |||||||||
| (4,309,886 | ) | $ | (148,551,088 | ) | 53,077,821 | $ | 2,393,420,876 | |||||||||
|
|
|
|
|
|
|
| |||||||||
Class R | ||||||||||||||||
Shares sold | 880,078 | $ | 23,445,508 | 1,783,479 | $ | 68,929,237 | ||||||||||
Shares issued in reinvestment of distributions | — | — | 161,778 | 6,297,421 | ||||||||||||
Shares redeemed | (862,426 | ) | (22,678,994 | ) | (1,059,950 | ) | (37,561,892 | ) | ||||||||
|
|
|
|
|
|
|
| |||||||||
| 17,652 | $ | 766,514 | 885,307 | $ | 37,664,766 | |||||||||||
|
|
|
|
|
|
|
| |||||||||
| (72,290,942 | ) | $ | (2,206,262,520 | ) | 71,775,407 | $ | 3,483,893,548 | |||||||||
|
|
|
|
|
|
|
| |||||||||
Technology Opportunities | ||||||||||||||||
Institutional | ||||||||||||||||
Shares sold | 16,615,851 | $ | 696,225,151 | 28,834,284 | $ | 1,778,526,131 | ||||||||||
Shares issued in reinvestment of distributions | — | — | 5,074,418 | 339,300,116 | ||||||||||||
Shares redeemed | (33,058,906 | ) | (1,373,686,694 | ) | (45,442,662 | ) | (2,648,038,246 | ) | ||||||||
|
|
|
|
|
|
|
| |||||||||
| (16,443,055 | ) | $ | (677,461,543 | ) | (11,533,960 | ) | $ | (530,211,999 | ) | |||||||
|
|
|
|
|
|
|
| |||||||||
Service | ||||||||||||||||
Shares sold | 171,238 | $ | 6,686,958 | 499,665 | $ | 29,601,143 | ||||||||||
Shares issued in reinvestment of distributions | — | — | 98,949 | 6,194,905 | ||||||||||||
Shares redeemed | (417,065 | ) | (16,352,892 | ) | (666,323 | ) | (39,672,879 | ) | ||||||||
|
|
|
|
|
|
|
| |||||||||
| (245,827 | ) | $ | (9,665,934 | ) | (67,709 | ) | $ | (3,876,831 | ) | |||||||
|
|
|
|
|
|
|
| |||||||||
Investor A | ||||||||||||||||
Shares sold and automatic conversion of shares | 4,850,581 | $ | 188,138,502 | 10,281,016 | $ | 602,060,939 | ||||||||||
Shares issued in reinvestment of distributions | — | — | 3,054,990 | 186,654,164 | ||||||||||||
Shares redeemed | (9,667,118 | ) | (366,443,166 | ) | (14,692,026 | ) | (808,237,783 | ) | ||||||||
|
|
|
|
|
|
|
| |||||||||
| (4,816,537 | ) | $ | (178,304,664 | ) | (1,356,020 | ) | $ | (19,522,680 | ) | |||||||
|
|
|
|
|
|
|
| |||||||||
Investor C | ||||||||||||||||
Shares sold | 705,328 | $ | 21,723,660 | 1,380,731 | $ | 64,636,301 | ||||||||||
Shares issued in reinvestment of distributions | — | — | 764,535 | 37,880,552 | ||||||||||||
Shares redeemed and automatic conversion of shares | (2,005,673 | ) | (60,699,308 | ) | (2,113,452 | ) | (92,040,047 | ) | ||||||||
|
|
|
|
|
|
|
| |||||||||
| (1,300,345 | ) | $ | (38,975,648 | ) | 31,814 | $ | 10,476,806 | |||||||||
|
|
|
|
|
|
|
| |||||||||
Class K | ||||||||||||||||
Shares sold | 1,866,384 | $ | 77,400,205 | 3,720,630 | $ | 244,270,015 | ||||||||||
Shares issued in reinvestment of distributions | — | — | 207,785 | 13,921,146 | ||||||||||||
Shares redeemed | (1,574,873 | ) | (65,635,026 | ) | (2,822,714 | ) | (151,390,233 | ) | ||||||||
|
|
|
|
|
|
|
| |||||||||
| 291,511 | $ | 11,765,179 | 1,105,701 | $ | 106,800,928 | |||||||||||
|
|
|
|
|
|
|
| |||||||||
Class R | ||||||||||||||||
Shares sold | 250,388 | $ | 9,664,993 | 320,513 | $ | 17,676,525 | ||||||||||
Shares issued in reinvestment of distributions | — | — | 61,453 | 3,776,895 | ||||||||||||
Shares redeemed | (271,520 | ) | (10,425,495 | ) | (377,386 | ) | (20,691,562 | ) | ||||||||
|
|
|
|
|
|
|
| |||||||||
| (21,132 | ) | $ | (760,502 | ) | 4,580 | $ | 761,858 | |||||||||
|
|
|
|
|
|
|
| |||||||||
| (22,535,385 | ) | $ | (893,403,112 | ) | (11,815,594 | ) | $ | (435,571,918 | ) | |||||||
|
|
|
|
|
|
|
| |||||||||
| (a) | For the period from September 30, 2021 (commencement of operations) to May 31, 2022. |
| 92 | 2 0 2 3 B L A C K R O C K A N N U A L R E P O R T T O S H A R E H O L D E R S |
Notes to Financial Statements (continued)
As of May 31, 2023, shares owned by BlackRock Financial Management, Inc., an affiliate of the Funds, were as follows:
| Share Class | Infrastructure Sustainable Opportunities | Technology Opportunities | ||||||||||
Institutional | 10,000 | — | ||||||||||
Investor A | 10,000 | — | ||||||||||
Class K | 980,000 | 8,673 | ||||||||||
| 12. | SUBSEQUENT EVENTS |
Management has evaluated the impact of all subsequent events on the Funds through the date the financial statements were issued and has determined that there were no subsequent events requiring adjustment or additional disclosure in the financial statements.
N O T E S T O F I N A N C I A L S T A T E M E N T S | 93 |
Report of Independent Registered Public Accounting Firm
To the Shareholders and the Board of Directors of BlackRock Capital Appreciation Fund, Inc., and the Shareholders of BlackRock Health Sciences Opportunities Portfolio, BlackRock Infrastructure Sustainable Opportunities Fund, BlackRock Mid-Cap Growth Equity Portfolio, and BlackRock Technology Opportunities Fund, and the Board of Trustees of BlackRock FundsSM:
Opinion on the Financial Statements and Financial Highlights
We have audited the accompanying statements of assets and liabilities of BlackRock Capital Appreciation Fund, Inc., BlackRock Health Sciences Opportunities Portfolio, BlackRock Infrastructure Sustainable Opportunities Fund, BlackRock Mid-Cap Growth Equity Portfolio, and BlackRock Technology Opportunities Fund of BlackRock FundsSM (the “Funds”), including the schedules of investments, as of May 31, 2023, the related statements of operations for the year then ended, the statements of changes in net assets and the financial highlights for the periods indicated in the table below, and the related notes. In our opinion, the financial statements and financial highlights present fairly, in all material respects, the financial position of the Funds as of May 31, 2023, and the results of their operations for the year then ended, and the statements of changes in their net assets and the financial highlights for the periods indicated in the table below, in conformity with accounting principles generally accepted in the United States of America.
Fund |
Statements of Changes in Net Assets |
Financial Highlights | ||
| BlackRock Capital Appreciation Fund, Inc., BlackRock Health Sciences Opportunities Portfolio, BlackRock Mid-Cap Growth Equity Portfolio, BlackRock Technology Opportunities Fund | For each of the two years in the period ended May 31, 2023 | For each of the two years in the period ended May 31, 2023, for the period from October 1, 2020 through May 31, 2021, and for each of the three years in the period ended September 30, 2020 | ||
| BlackRock Infrastructure Sustainable Opportunities Fund | For the year ended May 31, 2023, and for the period from September 30, 2021 (commencement of operations) through May 31, 2022 | |||
Basis for Opinion
These financial statements and financial highlights are the responsibility of the Funds’ management. Our responsibility is to express an opinion on the Funds’ financial statements and financial highlights based on our audits. We are a public accounting firm registered with the Public Company Accounting Oversight Board (United States) (PCAOB) and are required to be independent with respect to the Funds in accordance with the U.S. federal securities laws and the applicable rules and regulations of the Securities and Exchange Commission and the PCAOB.
We conducted our audits in accordance with the standards of the PCAOB. Those standards require that we plan and perform the audit to obtain reasonable assurance about whether the financial statements and financial highlights are free of material misstatement, whether due to error or fraud. The Funds are not required to have, nor were we engaged to perform, an audit of their internal control over financial reporting. As part of our audits we are required to obtain an understanding of internal control over financial reporting but not for the purpose of expressing an opinion on the effectiveness of the Funds’ internal control over financial reporting. Accordingly, we express no such opinion.
Our audits included performing procedures to assess the risks of material misstatement of the financial statements and financial highlights, whether due to error or fraud, and performing procedures that respond to those risks. Such procedures included examining, on a test basis, evidence regarding the amounts and disclosures in the financial statements and financial highlights. Our audits also included evaluating the accounting principles used and significant estimates made by management, as well as evaluating the overall presentation of the financial statements and financial highlights. Our procedures included confirmation of securities owned as of May 31, 2023, by correspondence with custodians or counterparties; when replies were not received, we performed other auditing procedures. We believe that our audits provide a reasonable basis for our opinion.
Deloitte & Touche LLP
Boston, Massachusetts
July 21, 2023
We have served as the auditor of one or more BlackRock investment companies since 1992.
| 94 | 2 0 2 3 B L A C K R O C K A N N U A L R E P O R T T O S H A R E H O L D E R S |
| Important Tax Information (unaudited) |
The following amounts, or maximum amounts allowable by law, are hereby designated is qualified dividend income for individuals for the fiscal year ended May 31, 2023:
| ||||||||
| Fund Name |
| Qualified Dividend Income | ||||||
| ||||||||
Health Sciences Opportunities | $ | 112,815,584 | ||||||
Infrastructure Sustainable Opportunities | 192,218 | |||||||
| ||||||||
The Fund hereby designates the following amounts, or maximum amounts allowable by law, as capital gain dividends, subject to a long-term capital gains tax rate as noted below, for the fiscal year ended May 31, 2023:
| ||||||||
| Fund Name |
| 20% Rate Long-Term Capital Gain Dividends | ||||||
| ||||||||
Capital Appreciation | $ | 248,072,015 | ||||||
Health Sciences Opportunities | 628,590,098 | |||||||
Infrastructure Sustainable Opportunities | 664 | |||||||
| ||||||||
The Fund intends to pass through to its shareholders the following amount, or maximum amount allowable by law, of the foreign source income earned and foreign taxes paid for the fiscal year ended May 31, 2023:
| ||||||||
| Fund Name | Foreign Source Income Earned | Foreign Taxes Paid | ||||||
| ||||||||
Infrastructure Sustainable Opportunities | $ | 98,035 | $ 23,027 | |||||
| ||||||||
The Funds hereby designate the following amounts, or maximum amounts allowable by law, of distributions from direct federal obligation interest for the fiscal year ended May 31, 2023:
| ||||||||
| Fund Name | Federal Obligation Interest | |||||||
| ||||||||
Health Sciences Opportunities | $ | 199,257 | ||||||
Infrastructure Sustainable Opportunities | 1,811 | |||||||
| ||||||||
The law varies in each state as to whether and what percent of ordinary income dividends attributable to federal obligations is exempt from state income tax. Shareholders are advised to check with their tax advisers to determine if any portion of the dividends received is exempt from state income tax.
The following percentages, or maximum percentages allowable by law, of ordinary income distributions paid during the fiscal year ended May 31, 2023 qualified for the dividends-received deduction for corporate shareholders:
| ||||||||
| Fund Name | Dividends-Received Deduction | |||||||
| ||||||||
Health Sciences Opportunities | 100.00% | |||||||
Infrastructure Sustainable Opportunities | 28.57 | |||||||
| ||||||||
The Funds hereby designates the following amounts, or maximum amounts allowable by law, as interest income eligible to be treated as a Section 163(j) interest dividend for the fiscal year ended May 31, 2023:
| ||||||||
| Fund Name | Interest Dividends | |||||||
| ||||||||
Health Sciences Opportunities | $ | 848,274 | ||||||
Infrastructure Sustainable Opportunities | 7,712 | |||||||
| ||||||||
The Funds hereby designate the following amounts, or maximum amounts allowable by law, as interest-related dividends and qualified short-term capital gains eligible for exemption from U.S. withholding tax for nonresident aliens and foreign corporations for the fiscal year ended May 31, 2023:
| ||||||||
| Fund Name | Interest-Related Dividends | Qualified Short-Term | ||||||
| ||||||||
Health Sciences Opportunities | $ | 848,274 | $ — | |||||
Infrastructure Sustainable Opportunities | 7,712 | 255,164 | ||||||
| ||||||||
I M P O R T A N T T A X I N F O R M A T I O N | 95 |
Disclosure of Investment Advisory Agreements
The Board of Trustees of BlackRock Funds (the “Trust”) met on April 18, 2023 and May 23-24, 2023 to consider the approval to continue the investment advisory agreement (the “Trust Advisory Agreement”) between the Trust, on behalf of BlackRock Mid-Cap Growth Equity Portfolio (“Mid-Cap Growth Equity Portfolio”), BlackRock Health Sciences Opportunities Portfolio (“Health Sciences Opportunities Portfolio”), BlackRock Technology Opportunities Fund (“Technology Opportunities Fund”) and BlackRock Infrastructure Sustainable Opportunities Fund (“Infrastructure Sustainable Opportunities Fund”), and BlackRock Advisors, LLC (the “Manager” or “BlackRock”), each Fund’s investment advisor. The Board of Directors of the Trust also considered the approval to continue the sub-advisory agreement (the “Infrastructure Sustainable Opportunities Fund BSL Sub-Advisory Agreement”) between the Manager and BlackRock (Singapore) Limited (“BSL”) and the sub-advisory agreement (the “Infrastructure Sustainable Opportunities Fund BIL Sub-Advisory Agreement” and, together with the Infrastructure Sustainable Opportunities Fund BSL Sub-Advisory Agreement, the “Sub-Advisory Agreements”) between the Manager and BlackRock International Limited (“BIL” and, together with BSL, the “Sub-Advisors”), each with respect to Infrastructure Sustainable Opportunities Fund.
The Board of Directors of BlackRock Capital Appreciation Fund, Inc. (the “Corporation” or “Capital Appreciation Fund”) met on April 18, 2023 and May 23-24, 2023 to consider the approval to continue the investment advisory agreement (the “Corporation Advisory Agreement”) between the Corporation and the Manager, its investment advisor.
Mid-Cap Growth Equity Portfolio, Health Sciences Opportunities Portfolio, Technology Opportunity Fund, Infrastructure Sustainable Opportunities Fund and Capital Appreciation Fund are referred to herein individually as a “Fund” or collectively as the “Funds.” The Trust Advisory Agreement, the Sub-Advisory Agreements and the Corporation Advisory Agreement are referred to herein individually as an “Agreement” or collectively as the “Agreements.” For simplicity: (a) the Board of Trustees of the Trust and the Board of Directors of the Corporation are referred to herein individually as the “Board” and collectively as the “Boards” and the members are referred to as “Board Members”; and (b) the meetings held on April 18, 2023 are referred to as the “April Meeting” and the meetings held on May 23-24, 2023 are referred to as the “May Meeting.”
The Approval Process
Consistent with the requirements of the Investment Company Act of 1940 (the “1940 Act”), the Boards consider the approval of the continuation of the pertinent Agreements for each Fund on an annual basis. The Board members who are not “interested persons” of the Trust or the Corporation, as defined in the 1940 Act, are considered independent Board members (the “Independent Board Members”). Each Board’s consideration entailed a year-long deliberative process during which the Board and its committees assessed BlackRock’s various services to the pertinent Fund, including through the review of written materials and oral presentations, and the review of additional information provided in response to requests from the Independent Board Members. The Boards had four quarterly meetings per year, each of which extended over a two-day period, as well as additional ad hoc meetings and executive sessions throughout the year, as needed. The committees of each Board similarly met throughout the year. The Boards also had an additional one-day meeting to consider specific information regarding the renewal of the Agreements. In considering the renewal of the Agreements, the Boards assessed, among other things, the nature, extent and quality of the services provided to the pertinent Fund by BlackRock, BlackRock’s personnel and affiliates, including (as applicable): investment management services; accounting oversight; administrative and shareholder services; oversight of the pertinent Fund’s service providers; risk management and oversight; and legal, regulatory and compliance services. Throughout the year, including during the contract renewal process, the Independent Board Members were advised by independent legal counsel, and met with independent legal counsel in various executive sessions outside of the presence of BlackRock’s management.
During the year, the Boards, acting directly and through their committees, considered information that was relevant to their annual consideration of the renewal of the pertinent Agreement(s), including the services and support provided by BlackRock to the Funds and their shareholders. BlackRock also furnished additional information to the Boards in response to specific questions from the Boards. Among the matters the Boards considered, with respect to each Fund, as pertinent, were: (a) investment performance for one-year, three-year, five-year, and/or since inception periods, as applicable, against peer funds, an applicable benchmark, and other performance metrics, as applicable, as well as BlackRock senior management’s and portfolio managers’ analyses of the reasons for any outperformance or underperformance relative to its peers, benchmarks, and other performance metrics, as applicable; (b) fees, including advisory, administration, if applicable, and other amounts paid to BlackRock and its affiliates by the Fund for services; (c) Fund operating expenses and how BlackRock allocates expenses to the Fund; (d) the resources devoted to, risk oversight of, and compliance reports relating to, implementation of the Fund’s investment objective, policies and restrictions, and meeting regulatory requirements; (e) BlackRock and each Fund’s and the Fund’s adherence to applicable compliance policies and procedures, as applicable; (f) the nature, character and scope of non-investment management services provided by BlackRock and its affiliates and the estimated cost of such services, as available; (g) BlackRock’s and other service providers’ internal controls and risk and compliance oversight mechanisms; (h) BlackRock’s implementation of the proxy voting policies approved by the Board; (i) the use of brokerage commissions and execution quality of portfolio transactions; (j) BlackRock’s implementation of each Fund’s valuation and liquidity procedures; (k) an analysis of management fees paid to BlackRock for products with similar investment mandates across the open-end fund, exchange-traded fund (“ETF”), closed-end fund, sub-advised mutual fund, separately managed account, collective investment trust, and institutional separate account product channels, as applicable, and the similarities and differences between these products and the services provided as compared to the Fund; (l) BlackRock’s compensation methodology for its investment professionals and the incentives and accountability it creates, along with investment professionals’ investments in the fund(s) they manage; and (m) periodic updates on BlackRock’s business.
Prior to and in preparation for the April Meeting, the Boards received and reviewed materials specifically relating to the renewal of the pertinent Agreements. The Independent Board Members are continuously engaged in a process with their independent legal counsel and BlackRock to review the nature and scope of the information provided to the Board to better assist their deliberations. The materials provided in connection with the April Meeting included, among other things: (a) information independently compiled and prepared by Broadridge Financial Solutions, Inc. (“Broadridge”), based on either a Lipper classification or Morningstar category, regarding the fees and expenses of each Fund as compared with a peer group of funds as determined by Broadridge (“Expense Peers”) and the investment performance of each Fund as compared with a peer group of funds (“Performance Peers”); (b) information on the composition of the Expense Peers and Performance Peers, and a description of Broadridge’s methodology; (c) information on the estimated profits realized by BlackRock and its affiliates pursuant to the pertinent Agreements and a discussion of fall-out benefits to BlackRock and its affiliates; (d) a general analysis provided by BlackRock concerning investment management fees received in connection with other types of investment products, such as institutional accounts, sub-advised mutual funds, ETFs, closed-end funds, open-end funds, and separately managed accounts, under similar investment mandates, as well as the performance of such other products, as applicable; (e) a review of non-management fees; (f) the existence, impact and sharing of potential economies of scale, if any, with the Funds; (g) a summary of aggregate amounts paid by each Fund to BlackRock; (h) sales and redemption data regarding each Fund’s shares; and (i) various additional information requested by the Boards as appropriate regarding BlackRock’s and the Funds’ operations.
| 96 | 2 0 2 3 B L A C K R O C K A N N U A L R E P O R T T O S H A R E H O L D E R S |
Disclosure of Investment Advisory Agreements (continued)
At the April Meeting, each Board reviewed materials relating to its consideration of the pertinent Agreements and the Independent Board Members presented BlackRock with questions and requests for additional information. BlackRock responded to these questions and requests with additional written information in advance of the May Meeting.
At the May Meeting, each Board concluded, with respect to the pertinent Fund, its assessment of, among other things: (a) the nature, extent and quality of the services provided by BlackRock; (b) the investment performance of the Fund as compared to its Performance Peers and to other metrics, as applicable; (c) the advisory fee and the estimated cost of the services and estimated profits realized by BlackRock and its affiliates from their relationship with the Fund; (d) the Fund’s fees and expenses compared to its Expense Peers; (e) the existence and sharing of potential economies of scale; (f) any fall-out benefits to BlackRock and its affiliates as a result of BlackRock’s relationship with the Fund; and (g) other factors deemed relevant by the Board Members.
Each Board also considered other matters it deemed important to the approval process, such as other payments made to BlackRock or its affiliates relating to securities lending and cash management, and BlackRock’s services related to the valuation and pricing of the portfolio holdings of the pertinent Fund. Each Board noted the willingness of BlackRock’s personnel to engage in open, candid discussions with the Board. The Board Members evaluated the information available to it on a fund-by-fund basis. The following paragraphs provide more information about some of the primary factors that were relevant each Board’s decision. The Board Members did not identify any particular information, or any single factor as determinative, and each Board Member may have attributed different weights to the various items and factors considered.
A. Nature, Extent and Quality of the Services Provided by BlackRock
Each Board, including the Independent Board Members, reviewed the nature, extent and quality of services provided by BlackRock, including the investment advisory services, and the resulting performance of the applicable Fund. Throughout the year, each Board compared Fund performance to the performance of a comparable group of mutual funds, relevant benchmark, and performance metrics, as applicable. The Boards met with BlackRock’s senior management personnel responsible for investment activities, including the senior investment officers. Each Board also reviewed the materials provided by the applicable Fund’s portfolio management team discussing the Fund’s performance, investment strategies and outlook.
Each Board considered, among other factors, with respect to BlackRock: the experience of investment personnel generally and the applicable Fund’s portfolio management team; research capabilities; investments by portfolio managers in the funds they manage; portfolio trading capabilities; use of technology; commitment to compliance; credit analysis capabilities; risk analysis and oversight capabilities; and the approach to training and retaining portfolio managers and other research, advisory and management personnel. The Boards also considered BlackRock’s overall risk management program, including the continued efforts of BlackRock and its affiliates to address cybersecurity risks and the role of BlackRock’s Risk & Quantitative Analysis Group. Each Board engaged in a review of BlackRock’s compensation structure with respect to the applicable Fund’s portfolio management team and BlackRock’s ability to attract and retain high-quality talent and create performance incentives.
In addition to investment advisory services, the Boards considered the nature and quality of the administrative and other non-investment advisory services provided to the Funds. BlackRock and its affiliates provide the Funds with certain administrative, shareholder and other services (in addition to any such services provided to the Funds by third-parties) and officers and other personnel as are necessary for the operations of the Funds. In particular, BlackRock and its affiliates provide each Fund with administrative services including, among others: (i) responsibility for disclosure documents, such as the prospectus, the summary prospectus (as applicable), the statement of additional information and periodic shareholder reports; (ii) oversight of daily accounting and pricing; (iii) responsibility for periodic filings with regulators; (iv) overseeing and coordinating the activities of third-party service providers, including, among others, the Fund’s custodian, fund accountant, transfer agent, and auditor; (v) organizing Board meetings and preparing the materials for such Board meetings; (vi) providing legal and compliance support; (vii) furnishing analytical and other support to assist the Board in its consideration of strategic issues such as the merger, consolidation or repurposing of certain open-end funds; and (viii) performing or managing administrative functions necessary for the operation of the Fund, such as tax reporting, expense management, fulfilling regulatory filing requirements, overseeing the Fund’s distribution partners, and shareholder call center and other services. The Boards reviewed the structure and duties of BlackRock’s fund administration, shareholder services, and legal and compliance departments and considered BlackRock’s policies and procedures for assuring compliance with applicable laws and regulations. Each Board considered the operation of BlackRock’s business continuity plans.
The Board noted that the engagement of the Sub-Advisors with respect to Infrastructure Sustainable Opportunities Fund facilitates the provision of investment advice and trading by investment personnel out of non-U.S. jurisdictions. The Board considered that this arrangement provides additional flexibility to the portfolio management team, which may benefit Infrastructure Sustainable Opportunities Fund and its shareholders.
B. The Investment Performance of the Funds and BlackRock
Each Board, including the Independent Board Members, reviewed and considered the performance history of the applicable Fund throughout the year and at the April Meeting. In preparation for the April Meeting, the Boards were provided with reports independently prepared by Broadridge, which included an analysis of each Fund’s performance as of December 31, 2022, as compared to its Performance Peers. Broadridge ranks funds in quartiles, ranging from first to fourth, where first is the most desirable quartile position and fourth is the least desirable. In connection with its review, with respect to each Fund, the applicable Board received and reviewed information regarding the investment performance of the Fund as compared to its Performance Peers and the respective Morningstar Category (“Morningstar Category”). Each Board and its Performance Oversight Committee regularly review and meet with Fund management to discuss the performance of each Fund throughout the year.
In evaluating performance, the Boards focused particular attention on funds with less favorable performance records. The Board also noted that while it found the data provided by Broadridge generally useful, it recognized the limitations of such data, including in particular, that notable differences may exist between a fund and its Performance Peers (for example, the investment objectives and strategies). Further, the Boards recognized that the performance data reflects a snapshot of a period as of a particular date and that selecting a different performance period could produce significantly different results. The Board also acknowledged that long-term performance could be impacted by even one period of significant outperformance or underperformance, and that a single investment theme could have the ability to disproportionately affect long-term performance.
The Board of the Trust noted that for the one-, three- and five-year periods reported, Health Sciences Opportunities Portfolio ranked in the second, second and first quartiles, respectively, against its Morningstar Category. The Board noted that BlackRock believes that the Morningstar Category is an appropriate performance metric for the Fund, and that BlackRock has explained its rationale for this belief to the Board.
D I S C L O S U R E O F I N V E S T M E N T A D V I S O R Y A G R E E M E N T S | 97 |
Disclosure of Investment Advisory Agreements (continued)
The Board of the Trust noted that for the one-, three- and five-year periods reported, Technology Opportunities Fund ranked in the third, second and second quartiles, respectively, against its Morningstar Category. The Board noted that BlackRock believes that the Morningstar Category is an appropriate performance metric for the Fund, and that BlackRock has explained its rationale for this belief to the Board. The Board and BlackRock reviewed the Fund’s underperformance relative to its Morningstar Category during the applicable period.
The Board of the Trust noted that for the one-, three- and five-year periods reported, Mid-Cap Growth Equity Portfolio ranked in the fourth, fourth and second quartiles, respectively, against its Morningstar Category. The Board noted that BlackRock believes that the Morningstar Category is an appropriate performance metric for the Fund, and that BlackRock has explained its rationale for this belief to the Board. The Board and BlackRock reviewed the Fund’s underperformance relative to its Morningstar Category during the applicable periods.
The Board of the Trust noted that for each of the one-year and since-inception periods reported, Infrastructure Sustainable Opportunities Fund ranked in the fourth quartile against its Morningstar Category. The Board noted that BlackRock believes that the Morningstar Category is an appropriate performance metric for the Fund, and that BlackRock has explained its rationale for this belief to the Board. The Board and BlackRock reviewed the Fund’s underperformance relative to its Morningstar Category during the applicable periods. The Board was informed that, among other things, underperformance was driven by the absence of traditional fossil fuel energy stocks. These traditional energy stocks do not form part of the Fund’s investment universe. Since the MSCI energy sector was up over 47% over the one-year period, this was significant contributor to positive for strategies which include these as part of their universe and led a performance drag versus peers. The Board and BlackRock discussed BlackRock’s strategy for improving the Fund’s investment performance. Discussions covered topics such as performance attribution, the Fund’s investment personnel, and the resources appropriate to support the Fund’s investment processes.
The Board of the Corporation noted that for the one-, three- and five-year periods reported, Capital Appreciation Fund ranked in the fourth, fourth and third quartiles, respectively, against its Morningstar Category. The Board noted that BlackRock believes that the Morningstar Category is an appropriate performance metric for the Fund, and that BlackRock has explained its rationale for this belief to the Board. The Board and BlackRock reviewed the Fund’s underperformance relative to its Morningstar Category during the applicable periods. The Board was informed that, among other things, underperformance was driven by significant style factor rotation in 2021 and early 2022 out of growth and momentum and into value. The Board and BlackRock discussed BlackRock’s strategy for improving the Fund’s investment performance. Discussions covered topics such as performance attribution, the Fund’s investment personnel, and the resources appropriate to support the Fund’s investment processes.
C. Consideration of the Advisory/Management Fees and the Estimated Cost of the Services and Estimated Profits Realized by BlackRock and its Affiliates from their Relationship with the Funds
Each Board, including the Independent Board Members, reviewed the applicable Fund’s contractual management fee rate compared with those of its Expense Peers. The contractual management fee rate represents a combination of the advisory fee and any administrative fees, before taking into account any reimbursements or fee waivers. Each Board also compared the applicable Fund’s total expense ratio, as well as its actual management fee rate, to those of its Expense Peers. The total expense ratio represents a fund’s total net operating expenses, including any 12b-1 or non-12b-1 service fees. The total expense ratio gives effect to any expense reimbursements or fee waivers, and the actual management fee rate gives effect to any management fee reimbursements or waivers. The Boards considered that the fee and expense information in the Broadridge report for the Fund reflected information for a specific period and that historical asset levels and expenses may differ from current levels, particularly in a period of market volatility. The Board considered the services provided and the fees charged by BlackRock and its affiliates to other types of clients with similar investment mandates, as applicable, including institutional accounts and sub-advised mutual funds (including mutual funds sponsored by third parties).
The Boards received and reviewed statements relating to BlackRock’s financial condition. The Boards reviewed BlackRock’s profitability methodology and were also provided with an estimated profitability analysis that detailed the revenues earned and the expenses incurred by BlackRock for services provided to the Funds. The Boards reviewed BlackRock’s estimated profitability with respect to the Funds and other funds the Boards currently oversee for the year ended December 31, 2022 compared to available aggregate estimated profitability data provided for the prior two years. The Boards reviewed BlackRock’s estimated profitability with respect to certain other U.S. fund complexes managed by BlackRock and/or its affiliates. The Boards reviewed BlackRock’s assumptions and methodology of allocating expenses in the estimated profitability analysis, noting the inherent limitations in allocating costs among various advisory products. The Boards recognized that profitability may be affected by numerous factors including, among other things, fee waivers and expense reimbursements by BlackRock, the types of funds managed, precision of expense allocations and business mix. The Boards thus recognized that calculating and comparing profitability at the individual fund levels is difficult.
The Boards noted that, in general, individual fund or product line profitability of other advisors is not publicly available. The Boards reviewed BlackRock’s overall operating margin, in general, compared to that of certain other publicly traded asset management firms. The Boards considered the differences between BlackRock and these other firms, including the contribution of technology at BlackRock, BlackRock’s expense management, and the relative product mix.
Each Board considered whether BlackRock has the financial resources necessary to attract and retain high quality investment management personnel to perform its obligations under the pertinent Agreement(s) and to continue to provide the high quality of services that is expected by the Board. The Boards further considered factors including but not limited to BlackRock’s commitment of time and resources, assumption of risk, and liability profile in servicing the Funds, including in contrast to what is required of BlackRock with respect to other products with similar investment mandates across the open-end fund, ETF, closed-end fund, sub-advised mutual fund, separately managed account, collective investment trust, and institutional separate account product channels, as applicable.
The Board of the Corporation noted that Capital Appreciation Fund’s contractual management fee rate ranked in the second quartile, and that the actual management fee rate and total expense ratio each ranked in the second quartile relative to the Fund’s Expense Peers. The Board further noted that BlackRock and the Board have contractually agreed to a cap on the Fund’s total expenses as a percentage of the Fund’s average daily net assets on a class-by-class basis, as applicable.
The Board of the Trust noted that Infrastructure Sustainable Opportunities Fund’s contractual management fee rate ranked in the third quartile, and that the actual management fee rate and total expense ratio ranked in the first and third quartiles, respectively, relative to the Fund’s Expense Peers. The Board further noted that BlackRock and the Board have contractually agreed to a cap on the Fund’s total expenses as a percentage of the Fund’s average daily net assets on a class-by-class basis.
| 98 | 2 0 2 3 B L A C K R O C K A N N U A L R E P O R T T O S H A R E H O L D E R S |
Disclosure of Investment Advisory Agreements (continued)
The Board of the Trust noted that Mid-Cap Growth Equity Portfolio’s contractual management fee rate ranked in the third quartile, and that the actual management fee rate and total expense ratio ranked in the second and third quartiles, respectively, relative to the Fund’s Expense Peers. The Board further noted that BlackRock and the Board have contractually agreed to a cap on the Fund’s total expenses as a percentage of the Fund’s average daily net assets on a class-by-class basis.
The Board of the Trust noted that Technology Opportunities Fund’s contractual management fee rate ranked in the third quartile, and that the actual management fee rate and total expense ratio each ranked in the third quartile relative to the Fund’s Expense Peers. The Board further noted that BlackRock and the Board have contractually agreed to a cap on the Fund’s total expenses as a percentage of the Fund’s average daily net assets on a class-by-class basis.
The Board of the Trust noted that Health Sciences Opportunities Portfolio’s contractual management fee rate ranked in the fourth quartile, and that the actual management fee rate and total expense ratio each ranked in the third quartile relative to the Fund’s Expense Peers.
The Boards also noted that each Fund has an advisory fee arrangement that includes breakpoints that adjust the fee rate downward as the size of the Fund increases above certain contractually specified levels. The Board additionally noted that the breakpoints can, conversely, adjust the advisory fee rate upward as the size of the pertinent Fund decreases below certain contractually specified levels.
D. Economies of Scale
Each Board, including the Independent Board Members, considered the extent to which economies of scale might be realized as the assets of the pertinent Fund increase, including the existence of fee waivers and/or expense caps, as applicable, noting that any contractual fee waivers and contractual expense caps had been approved by the Board. In its consideration, each Board further considered the continuation and/or implementation of fee waivers and/or expense caps, as applicable. Each Board also considered the extent to which the applicable Fund benefits from such economies of scale in a variety of ways, and whether there should be changes in the advisory fee rate or breakpoint structure in order to enable the Fund to more fully participate in these economies of scale. Each Board considered the applicable Fund’s asset levels and whether the current fee schedule was appropriate.
E. Other Factors Deemed Relevant by the Board Members
Each Board, including the Independent Board Members, also took into account other ancillary or “fall-out” benefits that BlackRock or its affiliates may derive from BlackRock’s respective relationships with the applicable Fund, both tangible and intangible, such as BlackRock’s ability to leverage its investment professionals who manage other portfolios and its risk management personnel, an increase in BlackRock’s profile in the investment advisory community, and the engagement of BlackRock’s affiliates as service providers to the Fund, including for administrative, distribution, securities lending and cash management services. With respect to securities lending, during the year the Board also considered information provided by independent third-party consultants related to the performance of each BlackRock affiliate as securities lending agent. The Board also considered BlackRock’s overall operations and its efforts to expand the scale of, and improve the quality of, its operations. The Board also noted that, subject to applicable law, BlackRock may use and benefit from third-party research obtained by soft dollars generated by certain registered fund transactions to assist in managing all or a number of its other client accounts.
In connection with their consideration of the pertinent Agreements, the Boards also received information regarding BlackRock’s brokerage and soft dollar practices. The Boards received reports from BlackRock which included information on brokerage commissions and trade execution practices throughout the year.
The Boards noted the competitive nature of the open-end fund marketplace, and that shareholders are able to redeem their Fund shares if they believe that the pertinent Fund’s fees and expenses are too high or if they are dissatisfied with the performance of the Fund.
Conclusion
At the May Meeting, in a continuation of the discussions that occurred during the April Meeting, and as a culmination of the Board of the Trust’s year-long deliberative process, the Board of the Trust, including the Independent Board Members, unanimously approved the continuation of (i) the Trust Advisory Agreement between the Manager and the Trust, on behalf of Mid-Cap Growth Equity Portfolio, Health Sciences Opportunities Portfolio, Technology Opportunity Fund and Infrastructure Sustainable Opportunities Fund; and (ii) the Sub-Advisory Agreements between the Manager and the Sub-Advisors, with respect to Infrastructure Sustainable Opportunities Fund, each for a one-year term ending June 30, 2024.
At the May Meeting, as a result of the discussions that occurred during the April Meeting, and as a culmination of the Board of the Corporation’s year-long deliberative process, the Board of the Corporation, including the Independent Board Members, unanimously approved the continuation of the Corporation Advisory Agreement between the Manager and the Corporation, on behalf of Capital Appreciation Fund, for a one-year term ending June 30, 2024.
Based upon their evaluation of all of the aforementioned factors in their totality, as well as other information, the Boards, including the Independent Board Members, were satisfied that the terms of the Agreements were fair and reasonable and in the best interest of each Fund, as pertinent, and its shareholders. In arriving at its decision to approve the Agreements, the Boards did not identify any single factor or group of factors as all-important or controlling, but considered all factors together, and different Board Members may have attributed different weights to the various factors considered. The Independent Board Members were advised by independent legal counsel throughout the deliberative process.
D I S C L O S U R E O F I N V E S T M E N T A D V I S O R Y A G R E E M E N T S | 99 |
Director and Officer Information
| Independent Directors(a) | ||||||||
Name Year of Birth(b) | Position(s) Held (Length of Service)(c) | Public Company and Other Investment Company Directorships Held During Past 5 Years | Number of BlackRock-Advised Registered Investment Companies (“RICs”) Consisting of Investment Portfolios (“Portfolios”) Overseen | Public Company and Other Investment Directorships Held During Past 5 Years | ||||
Mark Stalnecker 1951 | Chair of the Board (Since 2019) and Director (Since 2015 for the Trust; since 2019 for Capital Appreciation) | Chief Investment Officer, University of Delaware from 1999 to 2013; Trustee and Chair of the Finance and Investment Committees, Winterthur Museum and Country Estate from 2005 to 2016; Member of the Investment Committee, Delaware Public Employees’ Retirement System since 2002; Member of the Investment Committee, Christiana Care Health System from 2009 to 2017; Member of the Investment Committee, Delaware Community Foundation from 2013 to 2014; Director and Chair of the Audit Committee, SEI Private Trust Co. from 2001 to 2014. | 28 RICs consisting of 167 Portfolios | None | ||||
Susan J. Carter 1956 | Director (Since 2016 for the Trust; since 2019 for Capital Appreciation) | Trustee, Financial Accounting Foundation from 2017 to 2021; Advisory Board Member, Center for Private Equity and Entrepreneurship at Tuck School of Business from 1997 to 2021; Director, Pacific Pension Institute from 2014 to 2018; Senior Advisor, Commonfund Capital, Inc. (“CCI”) (investment adviser) in 2015; Chief Executive Officer, CCI from 2013 to 2014; President & Chief Executive Officer, CCI from 1997 to 2013; Advisory Board Member, Girls Who Invest from 2015 to 2018 and Board Member thereof from 2018 to 2022; Advisory Board Member, Bridges Fund Management since 2016; Practitioner Advisory Board Member, Private Capital Research Institute (“PCRI”) since 2017; Lecturer in the Practice of Management, Yale School of Management since 2019; Advisor to Finance Committee, Altman Foundation since 2020; Investment Committee Member, Tostan since 2021; Member of the President’s Counsel, Commonfund since 2023. | 28 RICs consisting of 167 Portfolios | None | ||||
Collette Chilton 1958 | Director (Since 2015 for the Trust; since 2019 for Capital Appreciation) | Chief Investment Officer, Williams College since 2006; Chief Investment Officer, Lucent Asset Management Corporation from 1998 to 2006; Director, Boys and Girls Club of Boston since 2017; Director, B1 Capital since 2018; Director, David and Lucile Packard Foundation since 2020. | 28 RICs consisting of 167 Portfolios | None | ||||
Neil A. Cotty 1954 | Director (Since 2016 for the Trust; since 2019 for Capital Appreciation) | Bank of America Corporation from 1996 to 2015, serving in various senior finance leadership roles, including Chief Accounting Officer from 2009 to 2015, Chief Financial Officer of Global Banking, Markets and Wealth Management from 2008 to 2009, Chief Accounting Officer from 2004 to 2008, Chief Financial Officer of Consumer Bank from 2003 to 2004, Chief Financial Officer of Global Corporate Investment Bank from 1999 to 2002. | 28 RICs consisting of 167 Portfolios | None | ||||
Lena G. Goldberg 1949 | Director (Since 2019 for the Trust; since 2016 for Capital Appreciation) | Director, Pioneer Legal Institute since 2023; Director, Charles Stark Draper Laboratory, Inc. from 2013 to 2021; Senior Lecturer, Harvard Business School from 2008 to 2021; FMR LLC/Fidelity Investments (financial services) from 1996 to 2008, serving in various senior roles including Executive Vice President - Strategic Corporate Initiatives and Executive Vice President and General Counsel; Partner, Sullivan & Worcester LLP from 1985 to 1996 and Associate thereof from 1979 to 1985. | 28 RICs consisting of 167 Portfolios | None | ||||
| 100 | 2 0 2 3 B L A C K R O C K A N N U A L R E P O R T T O S H A R E H O L D E R S |
Director and Officer Information (continued)
| Independent Directors(a) | ||||||||
Name Year of Birth(b) | Position(s) Held (Length of Service)(c) | Public Company and Other Investment Company Directorships Held During Past 5 Years | Number of BlackRock-Advised (“RICs”) Consisting of Investment | Public Company and Other Investment Company Directorships Held During Past 5 Years | ||||
Henry R. Keizer 1956 | Director (Since 2019 for the Trust; since 2016 for Capital Appreciation) | Director, Park Indemnity Ltd. (captive insurer) from 2010 to 2022. | 28 RICs consisting of 167 Portfolios | GrafTech International Ltd. (materials manufacturing); Sealed Air Corp. (packaging); WABCO (commercial vehicle safety systems) from 2015 to 2020; Hertz Global Holdings (car rental) from 2015 to 2021. | ||||
Cynthia A. Montgomery 1952 | Director (Since 2007 for the Trust; since 2019 for Capital Appreciation) | Professor, Harvard Business School since 1989. | 28 RICs consisting of 167 Portfolios | None | ||||
Donald C. Opatrny 1952 | Director (Since 2019 for the Trust; since 2015 for Capital Appreciation) | Chair of the Board of Phoenix Art Museum since 2022 and Trustee thereof since 2018; Chair of the Investment Committee of The Arizona Community Foundation since 2022 and trustee thereof since 2020; Director, Athena Capital Advisors LLC (investment management firm) from 2013 to 2020; Trustee, Vice Chair,Member of the Executive Committee and Chair of the Investment Committee, Cornell University from 2004 to 2019; President and Trustee, the Center for the Arts, Jackson Hole from 2011 to 2018; Member of the Board and Investment Committee, University School from 2007 to 2018; Member of Affordable Housing Supply Board of Jackson, Wyoming since 2017; Member, Investment Funds Committee, State of Wyoming since 2017; Trustee, Artstor (a Mellon Foundation affiliate) from 2010 to 2015; Member of the Investment Committee, Mellon Foundation from 2009 to 2015; President, Trustee and Member of the Investment Committee, The Aldrich Contemporary Art Museum from 2007 to 2014; Trustee and Chair of the Investment Committee, Community Foundation of Jackson Hole since 2014. | 28 RICs consisting of 167 Portfolios | None | ||||
Kenneth L. Urish 1951 | Director (Since 2007 for the Trust; since 2019 for Capital Appreciation) | Managing Partner, Urish Popeck & Co., LLC (certified public accountants and consultants) since 1976; Past-Chairman of the Professional Ethics Committee of the Pennsylvania Institute of Certified Public Accountants and Committee Member thereof since 2007; Member of External Advisory Board, The Pennsylvania State University Accounting Department since 2001; Emeritus since 2022; Principal, UP Strategic Wealth Investment Advisors, LLC since 2013; Trustee, The Holy Family Institute from 2001 to 2010; President and Trustee, Pittsburgh Catholic Publishing Associates from 2003 to 2008; Director, Inter-Tel from 2006 to 2007; Member, Advisory Board, ESG Competent Boards since 2020. | 28 RICs consisting of 167 Portfolios | None | ||||
D I R E C T O R A N D O F F I C E R I N F O R M A T I O N | 101 |
Director and Officer Information (continued)
| Independent Directors(a) | ||||||||
Name Year of Birth(b) | Position(s) Held (Length of Service)(c) | Public Company and Other Investment Company Directorships Held During Past 5 Years | Number of BlackRock-Advised Registered Investment Companies (“RICs”) Consisting of Investment Portfolios (“Portfolios”) Overseen | Public Company and Other | ||||
Claire A. Walton 1957 | Director (Since 2016 for the Trust; since 2019 for Capital Appreciation) | Advisory Board Member, Grossman School of Business at the University of Vermont since 2023; Advisory Board Member, Scientific Financial Systems since 2022; General Partner of Neon Liberty Capital Management, LLC since 2003; Chief Operating Officer and Chief Financial Officer of Liberty Square Asset Management,LP from 1998 to 2015; Director, Boston Hedge Fund Group from 2009 to 2018; Director, Massachusetts Council on Economic Education from 2013 to 2015; Director, Woodstock Ski Runners from 2013 to 2022. | 28 RICs consisting of 167 Portfolios | None | ||||
| 102 | 2 0 2 3 B L A C K R O C K A N N U A L R E P O R T T O S H A R E H O L D E R S |
Director and Officer Information (continued)
| Interested Directors(a)(d) | ||||||||
Name Year of Birth(b) | Position(s) Held (Length of Service)(c) | Principal Occupation(s) During Past 5 Years | Number of BlackRock-Advised Registered Investment Companies (“RICs”) Consisting of Investment Portfolios (“Portfolios”) Overseen | Public Company and Other Investment Company Directorships Held During Past 5 Years | ||||
Robert Fairbairn 1965 | Director (Since 2018 for the Trust; since 2015 for Capital Appreciation) | Vice Chairman of BlackRock, Inc. since 2019; Member of BlackRock’s Global Executive and Global Operating Committees; Co-Chair of BlackRock’s Human Capital Committee; Senior Managing Director of BlackRock, Inc. from 2010 to 2019; oversaw BlackRock’s Strategic Partner Program and Strategic Product Management Group from 2012 to 2019; Member of the Board of Managers of BlackRock Investments, LLC from 2011 to 2018; Global Head of BlackRock’s Retail and iShares® businesses from 2012 to 2016. | 98 RICs consisting of 268 Portfolios | None | ||||
John M. Perlowski(e) 1964 | Director (Since 2015) President and Chief Executive Officer (Since 2010) | Managing Director of BlackRock, Inc. since 2009; Head of BlackRock Global Accounting and Product Services since 2009; Advisory Director of Family Resource Network (charitable foundation) since 2009. | 100 RICs consisting of 270 Portfolios | None | ||||
| (a) | The address of each Director is c/o BlackRock, Inc., 50 Hudson Yards, New York, NY 10001. |
| (b) | With respect to Capital Appreciation, each Independent Director holds office until his or her successor is duly elected and qualifies or until his or her earlier death, resignation, retirement or removalas provided by the Fund’s by-laws or charter or statute, or until December 31 of the year in which he or she turns 75. Directors who are “interested persons,” as defined in the 1940 Act, serve until their successor is duly elected and qualifies or until their earlier death, resignation, retirement or removal as provided by the Fund’s by-laws or statute, or until December 31 of the year in which they turn 72. With respect to Health Sciences Opportunities, Infrastructure Sustainable Opportunities, Mid-Cap Growth Equity and Technology Opportunities, Independent Directors serve until their resignation, retirement, removal or death, or until December 31 of the year in which they turn 75. With respect to all the Funds, the Board may determine to extend the terms of Independent Directors on a case-by-case basis, as appropriate. |
| (c) | With respect to Capital Appreciation, following the combination of Merrill Lynch Investment Managers, L.P. (“MLIM”) and BlackRock, Inc. in September 2006, the various legacy MLIM and legacy BlackRock fund boards were realigned and consolidated into three new fund boards in 2007. In addition, effective January 1, 2019, three BlackRock Fund Complexes were realigned and consolidated into two BlackRock Fund Complexes. As a result, although the chart shows the year that each Independent Director joined the Board, certain Independent Directors first became members of the boards of other BlackRock-advised Funds, legacy MLIM funds or legacy BlackRock funds as follows: Susan J. Carter, 2016; Collette Chilton, 2015; Neil A. Cotty, 2016; Cynthia A. Montgomery, 1994; Mark Stalnecker, 2015; Kenneth L. Urish, 1999; Claire A. Walton, 2016. With respect to Infrastructure Sustainable Opportunities, Health Sciences Opportunities, Mid-Cap Growth Equity and Technology Opportunities, following the combination of MLIM and BlackRock, Inc. in September 2006, the various legacy MLIM and legacy BlackRock fund boards were realigned and consolidated into three new fund boards in 2007. Furthermore, effective January 1, 2019, three BlackRock Fund Complexes were realigned and consolidated into two BlackRock Fund Complexes. As a result, although the chart shows the year that each Independent Director joined the Board, certain Independent Directors first became members of the boards of other BlackRock-advised Funds, legacy MLIM funds or legacy BlackRock funds as follows: Cynthia A. Montgomery, 1994; Kenneth L. Urish, 1999; Lena G. Goldberg, 2016; Henry R. Keizer, 2016; Donald C. Opatrny, 2015. |
| (d) | Mr. Fairbairn and Mr. Perlowski are both “interested persons,” as defined in the 1940 Act, of the Trust and the Corporation based on their positions with BlackRock, Inc. and its affiliates. Mr. Fairbairn and Mr. Perlowski are also board members of the BlackRock Fixed-Income Complex. |
| (e) | Mr. Perlowski is also a trustee of the BlackRock Credit Strategies Fund and BlackRock Private Investments Fund. |
D I R E C T O R A N D O F F I C E R I N F O R M A T I O N | 103 |
Director and Officer Information (continued)
| Officers Who Are Not Directors(a) | ||||
Name Year of Birth(b) | Position(s) Held (Length of Service) | Principal Occupation(s) During Past 5 Years | ||
Roland Villacorta 1971 | Vice President of the Trust (Since 2022) | Managing Director of BlackRock, Inc. since 2022; Head of Global Cash Management and Head of Securities Lending within BlackRock’s Portfolio Management Group since 2022; Member of BlackRock’s Global Operating Committee since 2022; Head of Portfolio Management in BlackRock’s Financial Markets Advisory Group within BlackRock Solutions from 2008 to 2015; Co-Head of BlackRock Solutions’ Portfolio Analytics Group; previously Mr. Villacorta was Co-Head of Fixed Income within BlackRock’s Risk & Quantitative Analysis Group. | ||
Jennifer McGovern 1977 | Vice President (Since 2014) | Managing Director of BlackRock, Inc. since 2016; Director of BlackRock, Inc. from 2011 to 2015; Head of Americas Product Development and Governance for BlackRock’s Global Product Group since 2019; Head of Product Structure and Oversight for BlackRock’s U.S. Wealth Advisory Group from 2013 to 2019. | ||
Trent Walker 1974 | Chief Financial Officer (Since 2021) | Managing Director of BlackRock, Inc. since September 2019; Executive Vice President of PIMCO from 2016 to 2019; Senior Vice President of PIMCO from 2008 to 2015; Treasurer from 2013 to 2019 and Assistant Treasurer from 2007 to 2017 of PIMCO Funds, PIMCO Variable Insurance Trust, PIMCO ETF Trust, PIMCO Equity Series, PIMCO Equity Series VIT, PIMCO Managed Accounts Trust, 2 PIMCO-sponsored interval funds and 21 PIMCO-sponsored closed-end funds. | ||
Jay M. Fife 1970 | Treasurer (Since 2007) | Managing Director of BlackRock, Inc. since 2007. | ||
Charles Park 1967 | Chief Compliance Officer (Since 2014) | Anti-Money Laundering Compliance Officer for certain BlackRock-advised Funds from 2014 to 2015; Chief Compliance Officer of BlackRock Advisors, LLC and the BlackRock-advised Funds in the BlackRock Multi-Asset Complex and the BlackRock Fixed-Income Complex since 2014; Principal of and Chief Compliance Officer for iShares® Delaware Trust Sponsor LLC since 2012 and BlackRock Fund Advisors (“BFA”) since 2006; Chief Compliance Officer for the BFA-advised iShares® exchange traded funds since 2006; Chief Compliance Officer for BlackRock Asset Management International Inc. since 2012. | ||
Lisa Belle 1968 | Anti-Money Laundering Compliance Officer (Since 2019) | Managing Director of BlackRock, Inc. since 2019; Global Financial Crime Head for Asset and Wealth Management of JP Morgan from 2013 to 2019; Managing Director of RBS Securities from 2012 to 2013; Head of Financial Crimes for Barclays Wealth Americas from 2010 to 2012. | ||
Janey Ahn 1975 | Secretary (Since 2019) | Managing Director of BlackRock, Inc. since 2018; Director of BlackRock, Inc. from 2009 to 2017. | ||
| (a) | The address of each Officer is c/o BlackRock, Inc., 50 Hudson Yards, New York, NY 10001. |
| (b) | Officers of the Corporation/Trust serve at the pleasure of the Board. |
Further information about the Corporation’s/Trust’s Directors and Officers is available in each Fund’s Statement of Additional Information, which can be obtained without charge by calling (800) 441-7762.
Effective December 31, 2022, Joseph P. Platt retired as a Director of the Corporation and Trustee of the Trust.
Effective July 1, 2023, Aaron Wasserman replaced Charles Park as Chief Compliance Officer of the Corporation/Trust.
| 104 | 2 0 2 3 B L A C K R O C K A N N U A L R E P O R T T O S H A R E H O L D E R S |
Tailored Shareholder Reports for Mutual Funds and ETFs
Effective January 24, 2023, the SEC adopted rule and form amendments to require mutual funds and ETFs to transmit concise and visually engaging streamlined annual and semiannual reports to shareholders that highlight key information. Other information, including financial statements, will no longer appear in a streamlined shareholder report but must be available online, delivered free of charge upon request, and filed on a semiannual basis on Form N-CSR. The rule and form amendments have a compliance date of July 24, 2024. At this time, management is evaluating the impact of these amendments on the shareholder reports for the Funds.
General Information
Quarterly performance, semi-annual and annual reports, current net asset value and other information regarding the Funds may be found on BlackRock’s website, which can be accessed at blackrock.com. Any reference to BlackRock’s website in this report is intended to allow investors public access to information regarding the Funds and does not, and is not intended to, incorporate BlackRock’s website in this report.
Householding
The Funds will mail only one copy of shareholder documents, including prospectuses, annual and semi-annual reports, Rule 30e-3 notices and proxy statements, to shareholders with multiple accounts at the same address. This practice is commonly called “householding” and is intended to reduce expenses and eliminate duplicate mailings of shareholder documents. Mailings of your shareholder documents may be householded indefinitely unless you instruct us otherwise. If you do not want the mailing of these documents to be combined with those for other members of your household, please call the Funds at (800) 441-7762.
Availability of Quarterly Schedule of Investments
The Funds file their complete schedules of portfolio holdings with the SEC for the first and third quarters of each fiscal year as an exhibit to their reports on Form N-PORT. The Funds’ Forms N-PORT are available on the SEC’s website at sec.gov. Additionally, each Fund makes its portfolio holdings for the first and third quarters of each fiscal year available at blackrock.com/fundreports.
Availability of Proxy Voting Policies, Procedures and Voting Records
A description of the policies and procedures that the Funds use to determine how to vote proxies relating to portfolio securities and information about how the Funds voted proxies relating to securities held in the Funds’ portfolios during the most recent 12-month period ended June 30 is available without charge, upon request (1) by calling (800) 441-7762; (2) on the BlackRock website at blackrock.com; and (3) on the SEC’s website at sec.gov.
BlackRock’s Mutual Fund Family
BlackRock offers a diverse lineup of open-end mutual funds crossing all investment styles and managed by experts in equity, fixed-income and tax-exempt investing. Visit blackrock.com for more information.
Shareholder Privileges
Account Information
Call us at (800) 441-7762 from 8:00 AM to 6:00 PM ET on any business day to get information about your account balances, recent transactions and share prices. You can also visit blackrock.com for more information.
Automatic Investment Plans
Investor class shareholders who want to invest regularly can arrange to have $50 or more automatically deducted from their checking or savings account and invested in any of the BlackRock funds.
Systematic Withdrawal Plans
Investor class shareholders can establish a systematic withdrawal plan and receive periodic payments of $50 or more from their BlackRock funds, as long as their account balance is at least $10,000.
Retirement Plans
Shareholders may make investments in conjunction with Traditional, Rollover, Roth, Coverdell, Simple IRAs, SEP IRAs and 403(b) Plans.
BlackRock Privacy Principles
BlackRock is committed to maintaining the privacy of its current and former fund investors and individual clients (collectively, “Clients”) and to safeguarding their non-public personal information. The following information is provided to help you understand what personal information BlackRock collects, how we protect that information and why in certain cases we share such information with select parties.
A D D I T I O N A L I N F O R M A T I O N | 105 |
Additional Information (continued)
If you are located in a jurisdiction where specific laws, rules or regulations require BlackRock to provide you with additional or different privacy-related rights beyond what is set forth below, then BlackRock will comply with those specific laws, rules or regulations.
BlackRock obtains or verifies personal non-public information from and about you from different sources, including the following: (i) information we receive from you or, if applicable, your financial intermediary, on applications, forms or other documents; (ii) information about your transactions with us, our affiliates, or others; (iii) information we receive from a consumer reporting agency; and (iv) from visits to our websites.
BlackRock does not sell or disclose to non-affiliated third parties any non-public personal information about its Clients, except as permitted by law or as is necessary to respond to regulatory requests or to service Client accounts. These non-affiliated third parties are required to protect the confidentiality and security of this information and to use it only for its intended purpose.
We may share information with our affiliates to service your account or to provide you with information about other BlackRock products or services that may be of interest to you. In addition, BlackRock restricts access to non-public personal information about its Clients to those BlackRock employees with a legitimate business need for the information. BlackRock maintains physical, electronic and procedural safeguards that are designed to protect the non-public personal information of its Clients, including procedures relating to the proper storage and disposal of such information.
Fund and Service Providers | ||
Investment Adviser and Administrator | Independent Registered Public Accounting Firm | |
BlackRock Advisors, LLC | Deloitte & Touche LLP | |
Wilmington, DE 19809 | Boston, MA 02116 | |
Sub-Advisers(a) | Distributor | |
BlackRock International Limited | BlackRock Investments, LLC | |
Edinburgh, EH3 8BL | New York, NY 10001 | |
United Kingdom | ||
Legal Counsel | ||
BlackRock (Singapore) Limited | Sidley Austin LLP | |
079912 Singapore | New York, NY 10019 | |
Accounting Agent and Transfer Agent | Address of the Corporation/Trust | |
BNY Mellon Investment Servicing (US) Inc. | 100 Bellevue Parkway | |
Wilmington, DE 19809 | Wilmington, DE 19809 | |
Custodian | ||
The Bank of New York Mellon | ||
New York, NY 10286 | ||
(a) For BlackRock Infrastructure Sustainable Opportunities Fund.
| 106 | 2 0 2 3 B L A C K R O C K A N N U A L R E P O R T T O S H A R E H O L D E R S |
Glossary of Terms Used in this Report
| Currency Abbreviation | ||
| GBP | British Pound | |
| USD | United States Dollar | |
| Portfolio Abbreviation | ||
| ADR | American Depositary Receipt | |
| CVR | Contingent Value Rights | |
| NVS | Non-Voting Shares | |
G L O S S A R Y O F T E R M S U S E D I N T H I S R E P O R T | 107 |
Want to know more?
blackrock.com | 800-441-7762
This report is intended for current holders. It is not authorized for use as an offer of sale or a solicitation of an offer to buy shares of the Funds unless preceded or accompanied by the Funds’ current prospectus. Past performance results shown in this report should not be considered a representation of future performance. Investment returns and principal value of shares will fluctuate so that shares, when redeemed, may be worth more or less than their original cost. Statements and other information herein are as dated and are subject to change.
GROPPS-5/23-AR
|  |
(b) Not Applicable
| Item 3 – | Audit Committee Financial Expert – The registrant’s board of directors (the “board of directors”), has determined that (i) the registrant has the following audit committee financial experts serving on its audit committee and (ii) each audit committee financial expert is independent: |
Neil A. Cotty
Henry R. Keizer
Kenneth L. Urish
Under applicable securities laws, a person determined to be an audit committee financial expert will not be deemed an “expert” for any purpose, including without limitation for the purposes of Section 11 of the Securities Act of 1933, as a result of being designated or identified as an audit committee financial expert. The designation or identification of a person as an audit committee financial expert does not impose on such person any duties, obligations, or liabilities greater than the duties, obligations, and liabilities imposed on such person as a member of the audit committee and board of directors in the absence of such designation or identification. The designation or identification of a person as an audit committee financial expert does not affect the duties, obligations, or liability of any other member of the audit committee or board of directors.
| Item 4 – | Principal Accountant Fees and Services |
The following table presents fees billed by Deloitte & Touche LLP (“D&T”) in each of the last two fiscal years for the services rendered to the Fund:
| (a) Audit Fees | (b) Audit-Related Fees1 | (c) Tax Fees2 | (d) All Other Fees | |||||||||||||
| Entity Name | Current Fiscal Year End | Previous Fiscal Year End | Current Fiscal Year End | Previous Fiscal Year End | Current Fiscal Year End | Previous Fiscal Year End | Current Fiscal Year End | Previous Fiscal Year End | ||||||||
| BlackRock Advantage International Fund | $33,762 | $32,436 | $44 | $213 | $16,300 | $15,700 | $218 | $0 | ||||||||
| BlackRock Advantage Large Cap Growth Fund | $19,278 | $18,564 | $0 | $213 | $15,300 | $14,700 | $218 | $0 | ||||||||
| BlackRock Advantage Small Cap Core Fund | $31,212 | $29,988 | $44 | $213 | $15,300 | $14,700 | $218 | $0 | ||||||||
| BlackRock Commodity Strategies Fund | $47,838 | $46,002 | $44 | $213 | $22,900 | $22,000 | $218 | $0 | ||||||||
| BlackRock Energy Opportunities Fund | $18,768 | $18,054 | $0 | $213 | $15,300 | $14,700 | $218 | $0 | ||||||||
| BlackRock Health Sciences Opportunities Portfolio | $31,212 | $29,988 | $0 | $213 | $17,300 | $14,700 | $218 | $0 | ||||||||
2
| BlackRock High Equity Income Fund | $22,644 | $21,726 | $0 | $213 | $15,300 | $14,700 | $218 | $0 | ||||||||
BlackRock Infrastructure Sustainable Opportunities Fund | $23,358 | $20,196 | $44 | $0 | $23,150 | $27,550 | $0 | $0 | ||||||||
| BlackRock International Dividend Fund | $25,806 | $24,786 | $0 | $213 | $16,300 | $15,700 | $218 | $0 | ||||||||
| BlackRock Mid-Cap Growth Equity Portfolio | $19,074 | $18,360 | $0 | $213 | $17,300 | $14,700 | $218 | $0 | ||||||||
| BlackRock SMID-Cap Growth Equity Fund | $19,074 | $16,524 | $44 | $0 | $21,650 | $23,050 | $218 | $0 | ||||||||
| BlackRock Technology Opportunities Fund | $37,434 | $36,006 | $0 | $213 | $17,300 | $14,700 | $218 | $0 |
The following table presents fees billed by D&T that were required to be approved by the registrant’s audit committee (the “Committee”) for services that relate directly to the operations or financial reporting of the Fund and that are rendered on behalf of BlackRock Advisors, LLC (the “Investment Adviser” or “BlackRock”) and entities controlling, controlled by, or under common control with BlackRock (not including any sub-adviser whose role is primarily portfolio management and is subcontracted with or overseen by another investment adviser) that provide ongoing services to the Fund (“Affiliated Service Providers”):
| Current Fiscal Year End | Previous Fiscal Year End | |||
| (b) Audit-Related Fees1 | $0 | $0 | ||
| (c) Tax Fees2 | $0 | $0 | ||
| (d) All Other Fees4 | $2,154,000 | $2,098,000 |
1 The nature of the services includes assurance and related services reasonably related to the performance of the audit or review of financial statements not included in Audit Fees, including accounting consultations, agreed-upon procedure reports, attestation reports, comfort letters, out-of-pocket expenses and internal control reviews not required by regulators.
2 The nature of the services includes tax compliance and/or tax preparation, including services relating to the filing or amendment of federal, state or local income tax returns, regulated investment company qualification reviews, taxable income and tax distribution calculations.
3 Non-audit fees of $2,154,000 and $2,098,000 for the current fiscal year and previous fiscal year, respectively, were paid to the Fund’s principal accountant in their entirety by BlackRock, in connection with services provided to the Affiliated Service Providers of the Fund and of certain other funds sponsored and advised by BlackRock or its affiliates for a service organization review and an accounting research tool subscription. These amounts represent aggregate fees paid by BlackRock and were not allocated on a per fund basis.
(e)(1) Audit Committee Pre-Approval Policies and Procedures:
The Committee has adopted policies and procedures with regard to the pre-approval of services. Audit, audit-related and tax compliance services provided to the registrant on an annual basis require specific pre-approval by the Committee. The Committee also must approve other non-audit services provided to the registrant and those non-audit services provided to the Investment Adviser and Affiliated Service Providers that relate directly to the operations and the financial reporting of the registrant. Certain of these non-audit services that the Committee believes are (a) consistent with the SEC’s auditor independence rules and (b) routine and recurring services that will not impair the independence of the
3
independent accountants may be approved by the Committee without consideration on a specific case-by-case basis (“general pre-approval”). The term of any general pre-approval is 12 months from the date of the pre-approval, unless the Committee provides for a different period. Tax or other non-audit services provided to the registrant which have a direct impact on the operations or financial reporting of the registrant will only be deemed pre-approved provided that any individual project does not exceed $10,000 attributable to the registrant or $50,000 per project. For this purpose, multiple projects will be aggregated to determine if they exceed the previously mentioned cost levels.
Any proposed services exceeding the pre-approved cost levels will require specific pre-approval by the Committee, as will any other services not subject to general pre-approval (e.g., unanticipated but permissible services). The Committee is informed of each service approved subject to general pre-approval at the next regularly scheduled in-person board meeting. At this meeting, an analysis of such services is presented to the Committee for ratification. The Committee may delegate to the Committee Chairman the authority to approve the provision of and fees for any specific engagement of permitted non-audit services, including services exceeding pre-approved cost levels.
(e)(2) None of the services described in each of Items 4(b) through (d) were approved by the Committee pursuant to the de minimis exception in paragraph (c)(7)(i)(C) of Rule 2-01 of Regulation S-X.
(f) Not Applicable
(g) The aggregate non-audit fees, defined as the sum of the fees shown under “Audit-Related Fees,” “Tax Fees” and “All Other Fees,” paid to the accountant for services rendered by the accountant to the registrant, the Investment Adviser and the Affiliated Service Providers were:
| Entity Name | Current Fiscal Year End | Previous Fiscal Year End | ||
| BlackRock Advantage International Fund | $16,562 | $15,913 | ||
| BlackRock Advantage Large Cap Growth Fund | $15,518 | $14,913 | ||
| BlackRock Advantage Small Cap Core Fund | $15,562 | $14,913 | ||
| BlackRock Commodity Strategies Fund | $23,162 | $22,213 | ||
| BlackRock Energy Opportunities Fund | $15,518 | $14,913 | ||
| BlackRock Health Sciences Opportunities Portfolio | $17,518 | $14,913 | ||
| BlackRock High Equity Income Fund | $15,518 | $14,913 | ||
| BlackRock Infrastructure Sustainable Opportunities Fund | $23,194 | $27,550 | ||
| BlackRock International Dividend Fund | $16,518 | $15,913 | ||
| BlackRock Mid-Cap Growth Equity Portfolio | $17,518 | $14,913 | ||
| BlackRock SMID-Cap Growth Equity Fund | $21,912 | $23,050 | ||
BlackRock Technology Opportunities Fund | $17,518 | $14,913 |
4
Additionally, the amounts billed by D&T in connection with services provided to the Affiliated Service Providers of the Fund and of other funds sponsored and advised by BlackRock or its affiliates during the current and previous fiscal years for a service organization review and an accounting research tool subscription were:
Current Fiscal Year End | Previous Fiscal Year End | |
| $2,154,000 | $2,098,000 |
These amounts represent aggregate fees paid by BlackRock and were not allocated on a per fund basis.
(h) The Committee has considered and determined that the provision of non-audit services that were rendered to the Investment Adviser and the Affiliated Service Providers that were not pre-approved pursuant to paragraph (c)(7)(ii) of Rule 2-01 of Regulation S-X is compatible with maintaining the principal accountant’s independence.
(i) – Not Applicable
(j) – Not Applicable
| Item 5 – | Audit Committee of Listed Registrant – Not Applicable |
| Item 6 – | Investments |
(a) The registrant’s Schedule of Investments is included as part of the Report to Stockholders filed under Item 1(a) of this Form.
(b) Not Applicable due to no such divestments during the semi-annual period covered since the previous Form N-CSR filing.
| Item 7 – | Disclosure of Proxy Voting Policies and Procedures for Closed-End Management Investment Companies – Not Applicable |
| Item 8 – | Portfolio Managers of Closed-End Management Investment Companies – Not Applicable |
| Item 9 – | Purchases of Equity Securities by Closed-End Management Investment Company and Affiliated Purchasers – Not Applicable |
| Item 10 – | Submission of Matters to a Vote of Security Holders – There have been no material changes to these procedures. |
| Item 11 – | Controls and Procedures |
(a) The registrant’s principal executive and principal financial officers, or persons performing similar functions, have concluded that the registrant’s disclosure controls and procedures (as defined in Rule 30a-3(c) under the Investment Company Act of 1940, as amended (the “1940 Act”)) are effective as of a date within 90 days of the filing of this report based on the evaluation of these controls and procedures required
5
by Rule 30a-3(b) under the 1940 Act and Rule 15d-15(b) under the Securities Exchange Act of 1934, as amended.
(b) There were no changes in the registrant’s internal control over financial reporting (as defined in Rule 30a-3(d) under the 1940 Act) that occurred during the period covered by this report that have materially affected, or are reasonably likely to materially affect, the registrant’s internal control over financial reporting.
| Item 12 – | Disclosure of Securities Lending Activities for Closed-End Management Investment Companies – Not Applicable |
| Item 13 – | Exhibits attached hereto |
(a)(1) Code of Ethics – See Item 2
(a)(2) Section 302 Certifications are attached
(a)(3) Any written solicitation to purchase securities under Rule 23c-1 – Not Applicable
(a)(4) Change in Registrant’s independent public accountant – Not Applicable
(b) Section 906 Certifications are attached
6
Pursuant to the requirements of the Securities Exchange Act of 1934 and the Investment Company Act of 1940, the registrant has duly caused this report to be signed on its behalf by the undersigned, thereunto duly authorized.
BlackRock FundsSM
By: | /s/ John M. Perlowski | |||
John M. Perlowski | ||||
Chief Executive Officer (principal executive officer) of | ||||
BlackRock FundsSM |
Date: July 21, 2023
Pursuant to the requirements of the Securities Exchange Act of 1934 and the Investment Company Act of 1940, this report has been signed below by the following persons on behalf of the registrant and in the capacities and on the dates indicated.
By: | /s/ John M. Perlowski | |||
John M. Perlowski | ||||
Chief Executive Officer (principal executive officer) of | ||||
BlackRock FundsSM |
Date: July 21, 2023
By: | /s/ Trent Walker | |||
Trent Walker | ||||
Chief Financial Officer (principal financial officer) of | ||||
BlackRock FundsSM |
Date: July 21, 2023
7