| | |
| UNITED STATES
SECURITIES AND EXCHANGE COMMISSION |
| | |
| CERTIFIED SHAREHOLDER REPORT OF REGISTERED
MANAGEMENT INVESTMENT COMPANIES
|
| | |
| Investment Company Act file number: | (811-05740) |
| | |
| Exact name of registrant as specified in charter: | Putnam Managed Municipal Income Trust |
| | |
| Address of principal executive offices: | One Post Office Square, Boston, Massachusetts 02109 |
| | |
| Name and address of agent for service: | Robert T. Burns, Vice President
One Post Office Square
Boston, Massachusetts 02109 |
| | |
| Copy to: | Bryan Chegwidden, Esq.
Ropes & Gray LLP
1211 Avenue of the Americas
New York, New York 10036 |
| | |
| Registrant's telephone number, including area code: | (617) 292-1000 |
| | |
| Date of fiscal year end: | October 31, 2017 |
| | |
| Date of reporting period: | November 1, 2016 — April 30, 2017 |
| | |
|
Item 1. Report to Stockholders: | |
| | |
| The following is a copy of the report transmitted to stockholders pursuant to Rule 30e-1 under the Investment Company Act of 1940: | |

Putnam
Managed Municipal
Income Trust
Semiannual report
4 | 30 | 17
Consider these risks before investing: Lower-rated bonds may offer higher yields in return for more risk. Bond investments are subject to interest-rate risk (the risk of bond prices falling if interest rates rise) and credit risk (the risk of an issuer defaulting on interest or principal payments). Interest-rate risk is greater for longer-term bonds, and credit risk is greater for below-investment-grade bonds. Unlike bonds, funds that invest in bonds have fees and expenses. Bond prices may fall or fail to rise over time for several reasons, including general financial market conditions, changing market perceptions (including perceptions about the risk of default and expectations about monetary policy or interest rates), changes in government intervention in the financial markets, and factors related to a specific issuer or industry. These factors may lead to increased volatility and reduced liquidity in the fund’s portfolio holdings. You can lose money by investing in the fund. The fund’s shares trade on a stock exchange at market prices, which may be lower than the fund’s net asset value.
Message from the Trustees
June 15, 2017
Dear Fellow Shareholder:
An impressive level of investor optimism has helped to fuel financial markets through most of 2017’s first half. Global stock and bond markets have generally fared well, with many stock market indexes achieving new record highs with relatively low volatility. At the same time, however, investors worldwide are monitoring a number of macroeconomic and political risks that could disrupt the positive momentum.
While calm markets are generally welcome, we believe investors should continue to remember time-tested strategies: maintain a well-diversified portfolio, keep a long-term view, and do not overreact to short-term market fluctuations. We also believe it is a good idea to speak regularly with your financial advisor to help ensure that your portfolio is aligned with your goals. In the following pages, you will find an overview of your fund’s performance for the reporting period as well as an outlook for the coming months.
We would also like to take this opportunity to announce the arrival of Catharine Bond Hill and Manoj P. Singh to your fund’s Board of Trustees. Dr. Hill and Mr. Singh bring extensive professional and directorship experience to their role as Trustees, and we are pleased to welcome them.
Thank you for investing with Putnam.


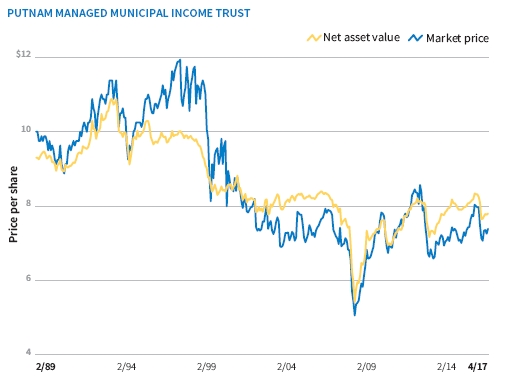
Putnam Managed Municipal Income Trust has the flexibility to invest in municipal bonds issued by any state in the country or U.S. territory. As a closed-end fund, it shares some common characteristics with open-end mutual funds, but there are some key differences that investors should understand as they consider their portfolio.

|
| 2 Managed Municipal Income Trust |
Looking at a closed-end fund’s performance
You will usually see that the NAV and the market price differ. The market price can be influenced by several factors that cause it to vary from the NAV, including fund distributions, changes in supply and demand for the fund’s shares, changing market conditions, and investor perceptions of the fund or its investment manager.
A mix of credit qualities
In addition to its flexible geographical focus, Putnam Managed Municipal Income Trust combines bonds of differing credit quality. The fund invests in high-quality bonds, but also includes an allocation to lower-rated bonds, which may offer higher income in return for more risk.
|
| Managed Municipal Income Trust 3 |
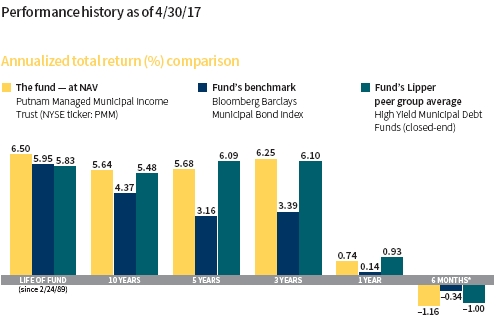
Data are historical. Past performance does not guarantee future results. More recent returns may be less or more than those shown. Investment return and net asset value will fluctuate, and you may have a gain or a loss when you sell your shares. Performance assumes reinvestment of distributions and does not account for taxes. Fund returns in the bar chart are at NAV. See below and pages 10–11 for additional performance information, including fund returns at market price. Index and Lipper results should be compared with fund performance at NAV. Fund results reflect the use of leverage, while index results are unleveraged and Lipper results reflect varying use of, and methods for, leverage.
* Returns for the six-month period are not annualized, but cumulative.
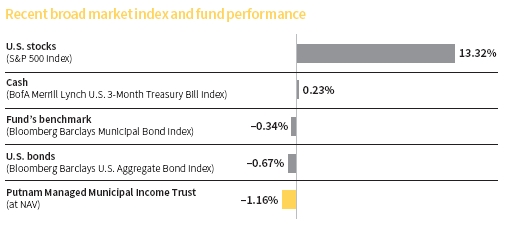
This comparison shows your fund’s performance in the context of broad market indexes for the six months ended 4/30/17. See above and pages 10–11 for additional fund performance information. Index descriptions can be found on page 12.
|
| 4 Managed Municipal Income Trust |


Paul holds a B.A. from Suffolk University. He has been in the investment industry since he joined Putnam in 1989.
In addition to Paul, your fund is managed by Garrett L. Hamilton, CFA.
Paul, how was the market environment for municipal bonds during the reporting period?
Weaker supply/demand dynamics, higher interest rates, and President Trump’s pro-growth agenda weighed on municipal bond performance. From a demand perspective, mutual fund outflows, a measure of investor demand, increased following the presidential election. This was notable as fund flows were strongly positive for most of 2016. In our view, municipal bonds appeared to be pricing in President Trump’s economic stimulus agenda, which many economists believe could lead to improved growth, higher deficits, and possibly an uptick in inflation, as well as improving global growth. We believe the uncertainty around U.S. income tax policy changes for individuals and corporations was an additional headwind for the asset class post-election. The spike in overall new issuance was due in part to the decision by many issuers to come to market with their municipal bond offerings ahead of the U.S. presidential election and a potential year-end interest-rate hike by the Federal Reserve, which occurred on December 14. As a result, 2016 proved to be a record-setting year for municipal bond issuance.
|
| Managed Municipal Income Trust 5 |
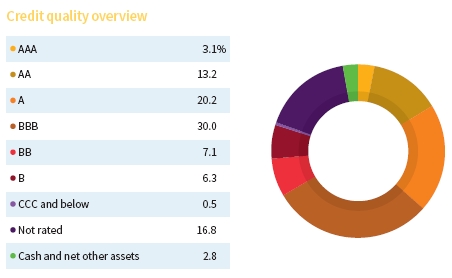
Credit qualities are shown as a percentage of the fund’s net assets (common and preferred shares) as of 4/30/17. A bond rated BBB or higher (SP-3 or higher, for short-term debt) is considered investment grade. This chart reflects the highest security rating provided by one or more of Standard & Poor’s, Moody’s, and Fitch. Ratings may vary over time.
Cash and net other assets, if any, represent the market value weights of cash, derivatives, and short-term securities in the portfolio. The fund itself has not been rated by an independent rating agency.
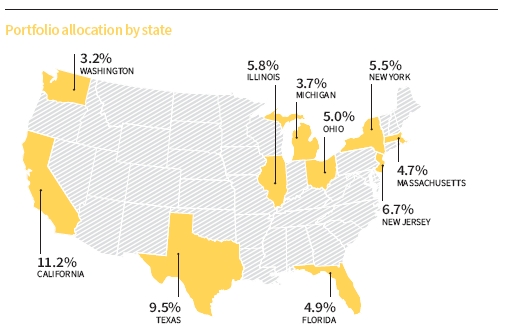
Top 10 state allocations are shown as a percentage of the fund’s net assets (common and preferred shares) as of 4/30/17. Investments in Puerto Rico represented 0.3% of the fund’s net assets. Summary information may differ from the portfolio schedule included in the financial statements due to the differing treatment of interest accruals, the floating rate portion of tender option bonds, derivative securities, if any, and the use of different classifications of securities for presentation purposes. Holdings and allocations may vary over time.
|
| 6 Managed Municipal Income Trust |
From January to April 2017, investor sentiment generally improved, especially for higher-yielding municipal bonds. The pace of new issuance was generally light, and demand slightly outpaced supply — contributing to rising prices and a narrowing of credit spreads of lower-investment- grade as well as high-yield municipal bonds. [Credit spreads reflect the difference in yield between higher- and lower-quality municipal bonds.] Viewed in a longer-term context, the tighter spreads seemed relatively fair to us, especially considering that defaults among municipal issuers remained low and isolated.
With an unemployment rate below 4.5%, consumer and business confidence rising, and the U.S. economic backdrop improving, the Fed announced another interest-rate hike on March 15, 2017. In its assessment of inflation, the Fed was attuned to the pace of growth outside the United States and how it may shape future policy decisions. However, while global growth has improved, foreign central bankers appear committed to more-accommodative monetary policies that allow their recoveries more room to run, in our view.
How did the fund perform?
For the six months ended April 30, 2017, the fund’s performance fell generally in line with its Lipper peer group average but underperformed the return of its benchmark index, the Bloomberg Barclays Municipal Bond Index.
What was your investment approach in this environment?
Given the market backdrop, many of our investment themes remained in place. We maintained overweight exposure, relative to the benchmark index, to municipal bonds rated BBB, and we placed greater focus on higher-education, essential service utilities, and continuing-care retirement community bonds relative to the Lipper group.
However, we moved to a somewhat less defensive duration posture toward the end of the period, thereby slightly increasing the fund’s interest-rate sensitivity. As such, the fund’s duration positioning remained slightly below the median of the Lipper peer group.

During the reporting period, we maintained an underweight position in Puerto Rico-based issuers relative to the fund’s Lipper peers, given Puerto Rico’s weak credit fundamentals. On May 3, 2017, just after the close of the reporting period, the federal control board petitioned for court-supervised debt restructuring under Title III of the Puerto Rico Oversight, Management and Economic Stability Act [PROMESA]. While PROMESA is not a bailout from the federal government, it did provide a way for Puerto Rico to use a bankruptcy-like restructuring tool similar to Chapter 9.
The recent move by Puerto Rico represents the largest bankruptcy in the history of U.S. public finance, exceeding Detroit’s 2013 insolvency. Despite the resulting flurry of headlines, we had anticipated this outcome. The filing does not change our current view on Puerto Rico, which is to maintain an underweight position in these bonds. We are likely to see more headline risk as Congress works with the government of Puerto Rico to come up with a debt repayment plan that creditors can accept and that can help build a foundation for economic recovery in the coming years.
The fund reduced its dividend rate during the reporting period. What led to that decision?
The fund has maintained a stable dividend since July 2014. However, the lower yields on municipal bonds held in the fund translated into less income earned in the portfolio given the low interest-rate environment. Accordingly, the fund’s monthly dividend rate declined from $0.0363 to $0.0337 in November 2016.
|
| Managed Municipal Income Trust 7 |
What is your current assessment of the potential for tax reform, and how might you steer the fund given that possibility?
Just before the close of the reporting period, President Trump presented his tax plan. More details are needed to fully assess the impact of the proposal, and the final plan may be considerably different from the initial tax plan now winding through Congress. However, the proposed plan reduces the overall number of individual tax brackets to three, eliminates targeted tax breaks and special interest, and repeals the alternative minimum tax, among other things. The good news for tax-sensitive investors is that the tax-exempt status of municipal bonds wasn’t addressed in the recently announced tax outline. Treasury Secretary Mnuchin recently stated, “Our preference is strongly to keep the interest deductibility of state and local bonds.” (May 25, 2017). Furthermore, we do not believe the currently proposed lowering of the highest personal income tax bracket from 39.6% to 35% will materially affect demand for municipal bonds.
The new administration has stated that tax reform remains a major policy goal. However, we have not seen major tax reform in over 30 years, and we believe it will continue to be difficult to achieve today given the competing demands on the current administration. As such, we believe it is too early to boldly position the fund in anticipation of potential tax reform. That said, we are taking some limited steps to protect the fund from potential reform by focusing a little more on municipal bonds with 20-year maturities versus 30-year maturities. We continue to closely monitor tax policy developments in Washington to see what form the final tax plan takes, and how it may shape the outlook for municipal bonds.
What are your thoughts about Fed policy in 2017?
We anticipate a continuation of slow, steady improvement in U.S. and global economic growth in the year ahead. The global growth environment continues to be positive, in our view, and we are encouraged by the breadth of the growth. We also believe the market is currently pricing in a 90% probability of an
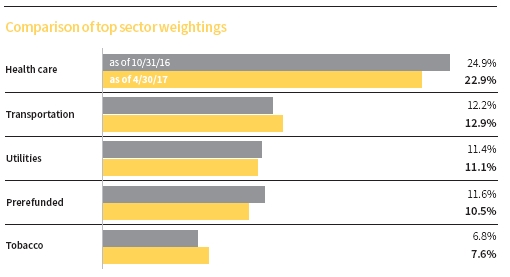
This chart shows how the fund’s top weightings have changed over the past six months. Allocations are shown as a percentage of the fund’s net assets (common and preferred shares). Current period summary information may differ from the information in the portfolio schedule notes included in the financial statements due to the inclusion of derivative securities, any interest accruals, the use of different classifications of securities for presentation purposes, and rounding. Holdings and allocations may vary over time.
|
| 8 Managed Municipal Income Trust |
interest-rate hike from the Fed, which we expect will occur in June.
The market also appears to be focused on how much fiscal stimulus might come from the new administration, and how those initiatives will affect the pulse of the U.S. economy. Should additional stimulus augment U.S. growth, we believe the Fed might be inclined to tighten a little faster, or, conversely, tighten more slowly if fiscal policy proves less stimulative.
Thank you, Paul, for your time and insights today.
The views expressed in this report are exclusively those of Putnam Management and are subject to change. They are not meant as investment advice.
Please note that the holdings discussed in this report may not have been held by the fund for the entire period. Portfolio composition is subject to review in accordance with the fund’s investment strategy and may vary in the future. Current and future portfolio holdings are subject to risk. Statements in the Q&A concerning the fund’s performance or portfolio composition relative to those of the fund’s Lipper peer group may reference information produced by Lipper Inc. or through a third party.
|
| Managed Municipal Income Trust 9 |
Your fund’s performance
This section shows your fund’s performance, price, and distribution information for periods ended April 30, 2017, the end of the first half of its current fiscal year. In accordance with regulatory requirements for mutual funds, we also include performance as of the most recent calendar quarter-end. Performance should always be considered in light of a fund’s investment strategy. Data represent past performance. Past performance does not guarantee future results. More recent returns may be less or more than those shown. Investment return, net asset value, and market price will fluctuate, and you may have a gain or a loss when you sell your shares.
Fund performance Total return and comparative index results for periods ended 4/30/17
| | | | | | | | | |
| | Annual | | | | | | | | |
| | average | | | | | | | | |
| | Life of | | | | | | | | |
| | fund | | | | | | | | |
| | (since | | Annual | | Annual | | Annual | | |
| | 2/24/89) | 10 years | average | 5 years | average | 3 years | average | 1 year | 6 months |
|
| NAV | 6.50% | 73.04% | 5.64% | 31.84% | 5.68% | 19.95% | 6.25% | 0.74% | –1.16% |
|
| Market price | 6.12 | 77.61 | 5.91 | 28.91 | 5.21 | 23.30 | 7.23 | 0.48 | 1.56 |
|
| Bloomberg Barclays | 5.95 | 53.39 | 4.37 | 16.81 | 3.16 | 10.51 | 3.39 | 0.14 | –0.34 |
| Municipal Bond Index | | | | | | | | | |
|
| Lipper High Yield | | | | | | | | | |
| Municipal Debt Funds | 5.83 | 70.92 | 5.48 | 34.48 | 6.09 | 19.45 | 6.10 | 0.93 | –1.00 |
| (closed-end) | | | | | | | | | |
| category average* | | | | | | | | | |
Performance assumes reinvestment of distributions and does not account for taxes.
Index and Lipper results should be compared with fund performance at net asset value. Fund results reflect the use of leverage, while index results are unleveraged and Lipper results reflect varying use of, and methods for, leverage.
* Over the 6-month, 1-year, 3-year, 5-year, 10-year, and life-of-fund periods ended 4/30/17, there were 11, 11, 11, 11, 11, and 6 funds, respectively, in this Lipper category.
Performance includes the deduction of management fees and administrative expenses.
|
| 10 Managed Municipal Income Trust |
Fund price and distribution information For the six-month period ended 4/30/17
| | | | | | |
| Distributions — common shares | | | | | | |
|
| Number | | | | | 6 | |
|
| Income1 | | | | | $0.2022 | |
|
| Capital gains2 | | | | | — | |
|
| Total | | | | | $0.2022 | |
| | | | | Series A | | Series C |
| Distributions — preferred shares | | | | (245 shares) | | (1,980 shares) |
|
| Income1 | | | | $425.78 | | $220.31 |
|
| Capital gains2 | | | | — | | — |
|
| Total | | | | $425.78 | | $220.31 |
|
| Share value — common shares | | | | NAV | | Market price |
|
| 10/31/16 | | | | $8.10 | | $7.48 |
|
| 4/30/17 | | | | 7.80 | | 7.39 |
|
| Current dividend rate (end of period) | | | | NAV | | Market price |
|
| Current dividend rate3 | | | | 5.18% | | 5.47% |
|
| Taxable equivalent4 | | | | 9.15 | | 9.66 |
The classification of distributions, if any, is an estimate. Final distribution information will appear on your year-end tax forms.
1 For some investors, investment income may be subject to the federal alternative minimum tax. Income from federally exempt funds may be subject to state and local taxes.
2 Capital gains, if any, are taxable for federal and, in most cases, state purposes.
3 Most recent distribution, including any return of capital and excluding capital gains, annualized and divided by NAV or market price at end of period.
4 Assumes maximum 43.40% federal tax rate for 2017. Results for investors subject to lower tax rates would not be as advantageous.
Fund performance as of most recent calendar quarter Total return for periods ended 3/31/17
| | | | | | | | | |
| | Annual | | | | | | | | |
| | average | | | | | | | | |
| | Life of | | | | | | | | |
| | fund | | | | | | | | |
| | (since | | Annual | | Annual | | Annual | | |
| | 2/24/89) | 10 years | average | 5 years | average | 3 years | average | 1 year | 6 months |
|
| NAV | 6.49% | 71.93% | 5.57% | 33.46% | 5.94% | 21.17% | 6.61% | 0.86% | –3.31% |
|
| Market price | 6.05 | 76.22 | 5.83 | 27.36 | 4.96 | 24.37 | 7.54 | 0.27 | –6.34 |
See the discussion following the fund performance table on page 10 for information about the calculation of fund performance.
|
| Managed Municipal Income Trust 11 |
Terms and definitions
Important terms
Total return shows how the value of the fund’s shares changed over time, assuming you held the shares through the entire period and reinvested all distributions in the fund.
Net asset value (NAV) is the value of all your fund’s assets, minus any liabilities, divided by the number of outstanding shares.
Market price is the current trading price of one share of the fund. Market prices are set by transactions between buyers and sellers on exchanges such as the New York Stock Exchange.
Fixed-income terms
Current rate is the annual rate of return earned from dividends or interest of an investment. Current rate is expressed as a percentage of the price of a security, fund share, or principal investment.
Yield curve is a graph that plots the yields of bonds with equal credit quality against their differing maturity dates, ranging from shortest to longest. It is used as a benchmark for other debt, such as mortgage or bank lending rates.
Comparative indexes
Bloomberg Barclays Municipal Bond Index is an unmanaged index of long-term fixed-rate investment-grade tax-exempt bonds.
Bloomberg Barclays U.S. Aggregate Bond Index is an unmanaged index of U.S. investment-grade fixed-income securities.
BofA Merrill Lynch U.S. 3-Month Treasury Bill Index is an unmanaged index that seeks to measure the performance of U.S. Treasury bills available in the marketplace.
S&P 500 Index is an unmanaged index of common stock performance.
Indexes assume reinvestment of all distributions and do not account for fees. Securities and performance of a fund and an index will differ. You cannot invest directly in an index.
Lipper is a third-party industry-ranking entity that ranks mutual funds. Its rankings do not reflect sales charges. Lipper rankings are based on total return at net asset value relative to other funds that have similar current investment styles or objectives as determined by Lipper. Lipper may change a fund’s category assignment at its discretion. Lipper category averages reflect performance trends for funds within a category.
|
| 12 Managed Municipal Income Trust |
Other information for shareholders
Important notice regarding share repurchase program
In September 2016, the Trustees of your fund approved the renewal of a share repurchase program that had been in effect since 2005. This renewal allows your fund to repurchase, in the 12 months beginning October 8, 2016, up to 10% of the fund’s common shares outstanding as of October 7, 2016.
Important notice regarding delivery of shareholder documents
In accordance with Securities and Exchange Commission (SEC) regulations, Putnam sends a single copy of annual and semiannual shareholder reports, prospectuses, and proxy statements to Putnam shareholders who share the same address, unless a shareholder requests otherwise. If you prefer to receive your own copy of these documents, please call Putnam at 1-800-225-1581, and Putnam will begin sending individual copies within 30 days.
Proxy voting
Putnam is committed to managing our mutual funds in the best interests of our shareholders. The Putnam funds’ proxy voting guidelines and procedures, as well as information regarding how your fund voted proxies relating to portfolio securities during the 12-month period ended June 30, 2016, are available in the Individual Investors section of putnam.com, and on the SEC’s website, www.sec.gov. If you have questions about finding forms on the SEC’s website, you may call the SEC at 1-800-SEC-0330. You may also obtain the Putnam funds’ proxy voting guidelines and procedures at no charge by calling Putnam’s Shareholder Services at 1-800-225-1581.
Fund portfolio holdings
The fund will file a complete schedule of its portfolio holdings with the SEC for the first and third quarters of each fiscal year on Form N-Q. Shareholders may obtain the fund’s Form N-Q on the SEC’s website at www.sec.gov. In addition, the fund’s Form N-Q may be reviewed and copied at the SEC’s Public Reference Room in Washington, D.C. You may call the SEC at 1-800-SEC-0330 for information about the SEC’s website or the operation of the Public Reference Room.
Trustee and employee fund ownership
Putnam employees and members of the Board of Trustees place their faith, confidence, and, most importantly, investment dollars in Putnam mutual funds. As of April 30, 2017, Putnam employees had approximately $494,000,000 and the Trustees had approximately $139,000,000 invested in Putnam mutual funds. These amounts include investments by the Trustees’ and employees’ immediate family members as well as investments through retirement and deferred compensation plans.
|
| Managed Municipal Income Trust 13 |
Summary of Putnam Closed-End Funds’ Amended and Restated Dividend Reinvestment Plans
Putnam High Income Securities Fund, Putnam Managed Municipal Income Trust, Putnam Master Intermediate Income Trust, Putnam Municipal Opportunities Trust and Putnam Premier Income Trust (each, a “Fund” and collectively, the “Funds”) each offer a dividend reinvestment plan (each, a “Plan” and collectively, the “Plans”). If you participate in a Plan, all income dividends and capital gain distributions are automatically reinvested in Fund shares by the Fund’s agent, Putnam Investor Services, Inc. (the “Agent”). If you are not participating in a Plan, every month you will receive all dividends and other distributions in cash, paid by check and mailed directly to you.
Upon a purchase (or, where applicable, upon registration of transfer on the shareholder records of a Fund) of shares of a Fund by a registered shareholder, each such shareholder will be deemed to have elected to participate in that Fund’s Plan. Each such shareholder will have all distributions by a Fund automatically reinvested in additional shares, unless such shareholder elects to terminate participation in a Plan by instructing the Agent to pay future distributions in cash. Shareholders who were not participants in a Plan as of January 31, 2010, will continue to receive distributions in cash but may enroll in a Plan at any time by contacting the Agent.
If you participate in a Fund’s Plan, the Agent will automatically reinvest subsequent distributions, and the Agent will send you a confirmation in the mail telling you how many additional shares were issued to your account.
To change your enrollment status or to request additional information about the Plans, you may contact the Agent either in writing, at P.O. Box 8383, Boston, MA 02266-8383, or by telephone at 1-800-225-1581 during normal East Coast business hours.
How you acquire additional shares through a Plan If the market price per share for your Fund’s shares (plus estimated brokerage commissions) is greater than or equal to their net asset value per share on the payment date for a distribution, you will be issued shares of the Fund at a value equal to the higher of the net asset value per share on that date or 95% of the market price per share on that date.
If the market price per share for your Fund’s shares (plus estimated brokerage commissions) is less than their net asset value per share on the payment date for a distribution, the Agent will buy Fund shares for participating accounts in the open market. The Agent will aggregate open-market purchases on behalf of all participants, and the average price (including brokerage commissions) of all shares purchased by the Agent will be the price per share allocable to each participant. The Agent will generally complete these open-market purchases within five business days following the payment date. If, before the Agent has completed open-market purchases, the market price per share (plus estimated brokerage commissions) rises to exceed the net asset value per share on the payment date, then the purchase price may exceed the net asset value per share, potentially resulting in the acquisition of fewer shares than if the distribution had been paid in newly issued shares.
How to withdraw from a Plan Participants may withdraw from a Fund’s Plan at any time by notifying the Agent, either in writing or by telephone. Such withdrawal will be effective immediately if notice is received by the Agent with sufficient time prior to any distribution record date; otherwise, such withdrawal will be effective with respect to any subsequent distribution following notice of withdrawal. There is no penalty for withdrawing from or not participating in a Plan.
Plan administration The Agent will credit all shares acquired for a participant under a Plan to the account in which the participant’s common shares are held. Each participant will
|
| 14 Managed Municipal Income Trust |
be sent reasonably promptly a confirmation by the Agent of each acquisition made for his or her account.
About brokerage fees Each participant pays a proportionate share of any brokerage commissions incurred if the Agent purchases additional shares on the open market, in accordance with the Plans. There are no brokerage charges applied to shares issued directly by the Funds under the Plans.
About taxes and Plan amendments
Reinvesting dividend and capital gain distributions in shares of the Funds does not relieve you of tax obligations, which are the same as if you had received cash distributions. The Agent supplies tax information to you and to the IRS annually. Each Fund reserves the right to amend or terminate its Plan upon 30 days’ written notice. However, the Agent may assign its rights, and delegate its duties, to a successor agent with the prior consent of a Fund and without prior notice to Plan participants.
If your shares are held in a broker or nominee name If your shares are held in the name of a broker or nominee offering a dividend reinvestment service, consult your broker or nominee to ensure that an appropriate election is made on your behalf. If the broker or nominee holding your shares does not provide a reinvestment service, you may need to register your shares in your own name in order to participate in a Plan.
In the case of record shareholders such as banks, brokers or nominees that hold shares for others who are the beneficial owners of such shares, the Agent will administer the Plan on the basis of the number of shares certified by the record shareholder as representing the total amount registered in such shareholder’s name and held for the account of beneficial owners who are to participate in the Plan.
|
| Managed Municipal Income Trust 15 |
Financial statements
These sections of the report, as well as the accompanying Notes, constitute the fund’s financial statements.
The fund’s portfolio lists all the fund’s investments and their values as of the last day of the reporting period. Holdings are organized by asset type and industry sector, country, or state to show areas of concentration and diversification.
Statement of assets and liabilities shows how the fund’s net assets and share price are determined. All investment and non-investment assets are added together. Any unpaid expenses and other liabilities are subtracted from this total. The result is divided by the number of shares to determine the net asset value per share. (For funds with preferred shares, the amount subtracted from total assets includes the liquidation preference of preferred shares.)
Statement of operations shows the fund’s net investment gain or loss. This is done by first adding up all the fund’s earnings — from dividends and interest income — and subtracting its operating expenses to determine net investment income (or loss). Then, any net gain or loss the fund realized on the sales of its holdings — as well as any unrealized gains or losses over the period — is added to or subtracted from the net investment result to determine the fund’s net gain or loss for the fiscal period.
Statement of changes in net assets shows how the fund’s net assets were affected by the fund’s net investment gain or loss, by distributions to shareholders, and by changes in the number of the fund’s shares. It lists distributions and their sources (net investment income or realized capital gains) over the current reporting period and the most recent fiscal year-end. The distributions listed here may not match the sources listed in the Statement of operations because the distributions are determined on a tax basis and may be paid in a different period from the one in which they were earned. Dividend sources are estimated at the time of declaration. Actual results may vary. Any non-taxable return of capital cannot be determined until final tax calculations are completed after the end of the fund’s fiscal year.
Financial highlights provide an overview of the fund’s investment results, per-share distributions, expense ratios, net investment income ratios, and portfolio turnover in one summary table, reflecting the five most recent reporting periods. In a semiannual report, the highlights table also includes the current reporting period.
|
| 16 Managed Municipal Income Trust |
The fund’s portfolio 4/30/17 (Unaudited)
Key to holding’s abbreviations
| |
| ABAG Association Of Bay Area Governments | FRN Floating Rate Notes: the rate shown is the current |
| AGM Assured Guaranty Municipal Corporation | interest rate or yield at the close of the reporting period |
| AMBAC AMBAC Indemnity Corporation | G.O. Bonds General Obligation Bonds |
| BAM Build America Mutual | GNMA Coll. Government National Mortgage |
| COP Certificates of Participation | Association Collateralized |
| FGIC Financial Guaranty Insurance Company | NATL National Public Finance Guarantee Corp. |
| FHLMC Coll. Federal Home Loan Mortgage | SGI Syncora Guarantee, Inc. |
| Corporation Collateralized | U.S. Govt. Coll. U.S. Government Collateralized |
| FNMA Coll. Federal National Mortgage | VRDN Variable Rate Demand Notes, which are floating- |
| Association Collateralized | rate securities with long-term maturities that carry |
| FRB Floating Rate Bonds: the rate shown is the current | coupons that reset and are payable upon demand |
| interest rate at the close of the reporting period | either daily, weekly or monthly. The rate shown is the |
| current interest rate at the close of the reporting period. |
| | | |
| MUNICIPAL BONDS AND NOTES (130.1%)* | Rating** | Principal amount | Value |
|
| Alabama (1.8%) | | | |
|
| Cullman Cnty., Hlth. Care Auth. Rev. Bonds | | | |
| (Cullman Regl. Med. Ctr.), Ser. A, 6.75%, 2/1/29 | Ba1 | $1,100,000 | $1,155,517 |
|
| Jefferson Cnty., Swr. Rev. Bonds | | | |
| Ser. D, 6.50%, 10/1/53 | BBB– | 500,000 | 601,255 |
|
| zero %, 10/1/46 | BBB– | 3,950,000 | 3,112,166 |
|
| Lower AL Gas Dist. Rev. Bonds (Gas Project), Ser. A, | | | |
| 5.00%, 9/1/46 | A3 | 1,450,000 | 1,744,379 |
|
| Selma, Indl. Dev. Board Rev. Bonds (Gulf | | | |
| Opportunity Zone Intl. Paper Co.), Ser. A, | | | |
| 6.25%, 11/1/33 | BBB | 1,000,000 | 1,106,260 |
|
| | | | 7,719,577 |
|
| Arizona (3.9%) | | | |
|
| Casa Grande, Indl. Dev. Auth. Rev. Bonds (Casa | | | |
| Grande Regl. Med. Ctr.) | | | |
|
| Ser. A, 7.625%, 12/1/29 (escrow) F | D/P | 1,800,000 | 5,380 |
|
| 7.25%, 12/1/19 (escrow) F | D/P | 1,000,000 | 2,989 |
|
| Maricopa Cnty., Poll. Control Rev. Bonds (El Paso | | | |
| Elec. Co.), Ser. A, 7.25%, 2/1/40 | Baa1 | 2,200,000 | 2,395,360 |
|
| Phoenix, Indl. Dev. Auth. Ed. Rev. Bonds | | | |
|
| (Great Hearts Academies), 6.00%, 7/1/32 | BB+/F | 200,000 | 217,566 |
|
| (Choice Academies, Inc.), 5.625%, 9/1/42 | BB+ | 315,000 | 324,381 |
|
| (Choice Academies, Inc.), 5.375%, 9/1/32 | BB+ | 675,000 | 700,718 |
|
| (Great Hearts Academies), 5.00%, 7/1/44 | BBB– | 1,700,000 | 1,795,098 |
|
| (Choice Academies, Inc.), 4.875%, 9/1/22 | BB+ | 795,000 | 845,292 |
|
| Phoenix, Indl. Dev. Auth. Ed. 144A Rev. Bonds (BASIS | | | |
| Schools, Inc.) | | | |
|
| Ser. A, 5.00%, 7/1/46 | BB | 250,000 | 250,980 |
|
| 5.00%, 7/1/35 | BB | 900,000 | 916,272 |
|
| Ser. A, 5.00%, 7/1/35 | BB | 600,000 | 610,848 |
|
| Salt Verde, Fin. Corp. Gas Rev. Bonds | | | |
|
| 5.50%, 12/1/29 | Baa1 | 2,000,000 | 2,459,180 |
|
| 5.00%, 12/1/37 | Baa1 | 2,000,000 | 2,353,060 |
|
| 5.00%, 12/1/32 | Baa1 | 570,000 | 671,232 |
|
|
| Managed Municipal Income Trust 17 |
| | | |
| MUNICIPAL BONDS AND NOTES (130.1%)* cont. | Rating** | Principal amount | Value |
|
| Arizona cont. | | | |
|
| Tempe, Indl. Dev. Auth. Rev. Bonds (Friendship | | | |
| Village), Ser. A, 6.25%, 12/1/42 | BB–/P | $1,000,000 | $1,045,550 |
|
| Yavapai Cnty., Indl. Dev. Auth. Hosp. Fac. Rev. Bonds | | | |
|
| (Yavapai Regl. Med.), 5.00%, 8/1/36 | Baa1 | 200,000 | 216,442 |
|
| (Yavapai Regl. Med. Ctr.), 5.00%, 8/1/34 | Baa1 | 200,000 | 218,062 |
|
| Yavapai Cnty., Indl. Dev. Ed. Auth. Rev. Bonds | | | |
| (Agribusiness & Equine Ctr.), 5.00%, 3/1/32 | BB+ | 1,000,000 | 1,018,170 |
|
| Yavapai Cnty., Indl. Dev. Ed. Auth. 144A Rev. Bonds, | | | |
| Ser. A, 5.00%, 9/1/34 | BB+ | 500,000 | 505,780 |
|
| | | | 16,552,360 |
|
| California (15.1%) | | | |
|
| ABAG Fin. Auth. for Nonprofit Corps. Rev. Bonds | | | |
|
| (Episcopal Sr. Cmntys.), 6.00%, 7/1/31 | BBB+/F | 660,000 | 737,431 |
|
| (O’Connor Woods), 5.00%, 1/1/33 | AA– | 600,000 | 688,368 |
|
| CA Muni. Fin. Auth. Rev. Bonds | | | |
|
| (U. of La Verne), Ser. A, 6.125%, 6/1/30 | | | |
| (Prerefunded 6/1/20) | A3 | 1,000,000 | 1,150,010 |
|
| (Emerson College), 6.00%, 1/1/42 | BBB+ | 1,000,000 | 1,135,600 |
|
| (Cmnty. Med. Ctrs.), Ser. A, 5.00%, 2/1/40 | A– | 750,000 | 813,518 |
|
| CA School Fin. Auth. Rev. Bonds (2023 Union, LLC), | | | |
| Ser. A, 6.00%, 7/1/33 | BBB | 465,000 | 519,075 |
|
| CA State G.O. Bonds | | | |
|
| 6.50%, 4/1/33 | Aa3 | 4,000,000 | 4,415,360 |
|
| 5.00%, 4/1/42 | Aa3 | 2,000,000 | 2,220,900 |
|
| CA State Muni. Fin. Auth. Charter School Rev. Bonds | | | |
| (Partnerships Uplift Cmnty.), Ser. A, 5.00%, 8/1/32 | BB | 665,000 | 679,085 |
|
| CA State Poll. Control Fin. Auth. Rev. Bonds | | | |
|
| (Wtr. Furnishing), 5.00%, 11/21/45 | Baa3 | 1,000,000 | 1,064,870 |
|
| (San Jose Wtr. Co.), 4.75%, 11/1/46 | A | 1,100,000 | 1,163,745 |
|
| (Pacific Gas & Electric Corp.), Class D, FGIC, | | | |
| 4.75%, 12/1/23 | A3 | 2,500,000 | 2,506,325 |
|
| CA State Pub. Wks. Board Rev. Bonds | | | |
|
| (Dept. of Forestry & Fire), Ser. E, 5.00%, 11/1/32 | A1 | 1,250,000 | 1,272,725 |
|
| (Capital Projects), Ser. A, 5.00%, 4/1/29 | A1 | 2,000,000 | 2,280,300 |
|
| CA State U. Rev. Bonds (Systemwide), Ser. A, | | | |
| 5.00%, 11/1/37 | Aa2 | 2,325,000 | 2,702,162 |
|
| CA Statewide Cmnty. Dev. Auth. COP (The Internext | | | |
| Group), 5.375%, 4/1/30 | BBB+ | 540,000 | 540,621 |
|
| CA Statewide Cmnty. Dev. Auth. Rev. Bonds | | | |
|
| (Terraces at San Joaquin Gardens), Ser. A, | | | |
| 6.00%, 10/1/47 | BB/P | 1,345,000 | 1,444,221 |
|
| (American Baptist Homes West), 5.75%, 10/1/25 | BBB+/F | 3,000,000 | 3,253,860 |
|
| (U. CA Irvine E. Campus Apts. Phase 1), | | | |
| 5.375%, 5/15/38 | Baa1 | 1,000,000 | 1,080,500 |
|
| (899 Charleston, LLC), Ser. A, 5.25%, 11/1/44 | BB/P | 450,000 | 463,478 |
|
| (U. CA Irvine E. Campus Apts. Phase 1), | | | |
| 5.125%, 5/15/31 | Baa1 | 2,250,000 | 2,462,333 |
|
| Corona-Norco, School Dist. Pub. Fin. Auth. Special | | | |
| Tax Bonds (Sr. Lien), Ser. A, 5.00%, 9/1/28 | A– | 380,000 | 425,117 |
|
| Foothill/Eastern Corridor Agcy. Rev. Bonds, Ser. A, | | | |
| 6.00%, 1/15/53 | BBB– | 1,500,000 | 1,720,215 |
|
|
| 18 Managed Municipal Income Trust |
| | | |
| MUNICIPAL BONDS AND NOTES (130.1%)* cont. | Rating** | Principal amount | Value |
|
| California cont. | | | |
|
| Golden State Tobacco Securitization | | | |
| Corp. Rev. Bonds | | | |
|
| Ser. A-1, 5.75%, 6/1/47 | B3 | $2,450,000 | $2,461,834 |
|
| Ser. A-1, 5.75%, 6/1/47 | AAA/P | 150,000 | 150,491 |
|
| Ser. A-2, 5.30%, 6/1/37 | B | 1,000,000 | 1,014,160 |
|
| Ser. A-1, 5.125%, 6/1/47 | B3 | 3,235,000 | 3,234,774 |
|
| Ser. A-1, 5.00%, 6/1/29 | BBB | 1,000,000 | 1,167,120 |
|
| La Verne, COP (Brethren Hillcrest Homes), | | | |
| 5.00%, 5/15/36 | BBB–/F | 325,000 | 338,267 |
|
| Los Angeles, Dept. of Arpt Rev. Bonds (Los Angeles | | | |
| Intl. Arpt.), Ser. B, 5.00%, 5/15/41 | AA– | 1,000,000 | 1,121,060 |
|
| Los Angeles, Dept. of Arpt. Rev. Bonds (Los Angeles | | | |
| Intl. Arpt.), 5.00%, 5/15/30 | AA | 1,000,000 | 1,127,850 |
|
| Los Angeles, Regl. Arpt. Impt. Corp. Lease Rev. | | | |
| Bonds (Laxfuel Corp.), 4.50%, 1/1/27 | A | 400,000 | 431,504 |
|
| M-S-R Energy Auth. Rev. Bonds, Ser. A, | | | |
| 6.50%, 11/1/39 | BBB+ | 750,000 | 1,047,300 |
|
| Oakland, Alameda Cnty. Unified School | | | |
| Dist. G.O. Bonds | | | |
|
| (Election of 2012), 6.625%, 8/1/38 | Aa3 | 800,000 | 961,744 |
|
| (Election of 2006), Ser. A, 5.50%, 8/1/32 | Aa3 | 500,000 | 587,790 |
|
| Poway, Unified School Dist. Pub. Fin. Auth. Special | | | |
| Tax Bonds, 5.00%, 9/15/32 | BBB | 490,000 | 538,642 |
|
| Rancho Cordova, Cmnty. Fac. Dist. Special Tax | | | |
| Bonds (Sunridge Anatolia), Ser. 03-1, 5.00%, 9/1/37 | BBB–/P | 350,000 | 366,744 |
|
| San Francisco City & Cnty. Arpt. Comm. Intl. Arpt. | | | |
| Rev. Bonds, Ser. A, 5.00%, 5/1/30 | A1 | 600,000 | 667,338 |
|
| San Francisco City & Cnty., Redev. Agcy. Cmnty. | | | |
| Successor Special Tax Bonds | | | |
|
| (No. 6 Mission Bay Pub. Impts.), Ser. C, | | | |
| zero %, 8/1/43 | BBB/P | 2,000,000 | 476,280 |
|
| (No. 6 Mission Bay Pub. Impts.), Ser. C, | | | |
| zero %, 8/1/38 | BBB/P | 2,000,000 | 645,860 |
|
| San Francisco, City & Cnty. Redev. Fin. Auth. Tax | | | |
| Alloc. Bonds (Mission Bay South Redev.), Ser. D, | | | |
| 6.625%, 8/1/39 (Prerefunded 8/1/19) | BBB+ | 250,000 | 280,653 |
|
| San Joaquin Hills, Trans. Corridor Agcy. Toll Road | | | |
| Rev. Bonds, Ser. A, 5.00%, 1/15/34 | BBB– | 920,000 | 1,012,396 |
|
| Santaluz, Cmnty. Fac. Dist. No. 2 Special Tax | | | |
| Bonds (Impt. Area No. 1), Ser. A, 5.25%, 9/1/26 | | | |
| (Prerefunded 9/1/21) | BBB+ | 1,620,000 | 1,803,724 |
|
| Sunnyvale, Special Tax Bonds (Cmnty. Fac. Dist. | | | |
| No. 1), 7.75%, 8/1/32 | B+/P | 835,000 | 837,138 |
|
| Univ. of CA Rev. Bonds, Ser. AF, 5.00%, 5/15/36 T | AA | 7,000,000 | 8,058,997 |
|
| Yucaipa Special Tax Bonds (Cmnty. Fac. Dist. No. | | | |
| 98-1 Chapman Heights), 5.375%, 9/1/30 | BBB+ | 375,000 | 411,998 |
|
| | | | 63,483,483 |
|
| Colorado (4.1%) | | | |
|
| Central Platte Valley, Metro. Dist. G.O. Bonds, | | | |
| 5.00%, 12/1/43 | BB+ | 400,000 | 410,576 |
|
| CO Pub. Hwy. Auth. Rev. Bonds (E-470), Ser. C, | | | |
| 5.375%, 9/1/26 | A3 | 500,000 | 538,145 |
|
|
| Managed Municipal Income Trust 19 |
| | | |
| MUNICIPAL BONDS AND NOTES (130.1%)* cont. | Rating** | Principal amount | Value |
|
| Colorado cont. | | | |
|
| CO State Educ. & Cultural Fac. Auth. Rev. Bonds | | | |
| (Skyview Academy), 5.125%, 7/1/34 | BB+ | $755,000 | $795,853 |
|
| CO State Hlth. Fac. Auth. Rev. Bonds | | | |
|
| (Christian Living Cmnty.), 6.375%, 1/1/41 | BB/P | 810,000 | 880,608 |
|
| (Total Longterm Care National), Ser. A, 6.25%, | | | |
| 11/15/40 (Prerefunded 11/15/20) | AAA/P | 300,000 | 350,553 |
|
| (Evangelical Lutheran Good Samaritan Society | | | |
| Oblig. Group (The)), 5.625%, 6/1/43 | BBB+ | 250,000 | 264,120 |
|
| (Valley View Assn.), 5.25%, 5/15/42 | A– | 3,495,000 | 3,500,103 |
|
| (Evangelical Lutheran Good Samaritan Society | | | |
| Oblig. Group (The)), Ser. A, 5.00%, 6/1/45 | Baa1 | 1,500,000 | 1,557,480 |
|
| (Evangelical Lutheran Good Samaritan Society | | | |
| Oblig. Group (The)), 5.00%, 12/1/33 | BBB+ | 1,100,000 | 1,142,889 |
|
| CO State Hlth. Fac. Auth. Hosp. Rev. Bonds | | | |
|
| (Frasier Meadows Retirement Cmnty.), Ser. A, | | | |
| 5.25%, 5/15/37 | BB+/F | 1,000,000 | 1,055,040 |
|
| (Christian Living Neighborhood), 5.00%, 1/1/37 | BB/P | 1,250,000 | 1,280,825 |
|
| (Christian Living Neighborhood), 5.00%, 1/1/31 | BB/P | 500,000 | 520,285 |
|
| E-470 CO Pub. Hwy. Auth. FRN Mandatory Put Bonds | | | |
| (9/1/19) (Sr. Libor Index), Ser. A, 1.567%, 9/1/39 | A3 | 1,900,000 | 1,906,441 |
|
| Eaton, Area Park & Recreation Dist. G.O. Bonds, | | | |
| 5.25%, 12/1/34 | BB/P | 220,000 | 233,281 |
|
| Park Creek, Metro. Dist. Tax Allocation Bonds (Sr. | | | |
| Ltd. Property Tax Supported), Ser. A, 5.00%, 12/1/45 | BBB/F | 225,000 | 239,011 |
|
| Plaza, Tax Alloc. Bonds (Metro. Dist. No. 1), | | | |
| 5.00%, 12/1/40 | BB–/P | 1,650,000 | 1,706,678 |
|
| Regl. Trans. Dist. Rev. Bonds (Denver Trans. | | | |
| Partners), 6.00%, 1/15/41 | Baa3 | 750,000 | 827,295 |
|
| | | | 17,209,183 |
|
| Delaware (1.4%) | | | |
|
| DE State Econ. Dev. Auth. Rev. Bonds | | | |
|
| (Delmarva Pwr.), 5.40%, 2/1/31 | Baa1 | 500,000 | 544,895 |
|
| (Indian River Pwr.), 5.375%, 10/1/45 | Baa3 | 2,600,000 | 2,699,398 |
|
| (ASPIRA Charter School), Ser. A, 5.00%, 6/1/36 | BB+ | 705,000 | 713,700 |
|
| DE State Hlth. Fac. Auth. VRDN (Christiana Care), | | | |
| Ser. A, 0.87%, 10/1/38 | VMIG1 | 1,860,000 | 1,860,000 |
|
| | | | 5,817,993 |
|
| District of Columbia (1.8%) | | | |
|
| DC Rev. Bonds | | | |
|
| (Howard U.), Ser. A, 6.50%, 10/1/41 | BBB | 395,000 | 400,040 |
|
| (Howard U.), Ser. A, U.S. Govt. Coll., 6.50%, 10/1/41 | | | |
| (Prerefunded 4/1/21) | AAA/P | 5,000 | 5,984 |
|
| (Howard U.), Ser. A, 6.25%, 10/1/32 | BBB | 525,000 | 542,194 |
|
| (Howard U.), Ser. A, U.S. Govt. Coll., 6.25%, 10/1/32 | | | |
| (Prerefunded 4/1/21) | AAA/P | 475,000 | 563,972 |
|
| (Kipp Charter School), 6.00%, 7/1/33 | BBB+ | 1,000,000 | 1,157,820 |
|
| DC Tobacco Settlement Fin. Corp. Rev. Bonds, | | | |
| Ser. A, zero %, 6/15/46 | CCC/P | 7,500,000 | 1,049,325 |
|
| DC, Rev. Bonds (Methodist Home of The DC (The)), | | | |
| Ser. A, 5.25%, 1/1/39 | BB–/P | 250,000 | 240,290 |
|
| DC, Wtr. & Swr. Auth. Pub. Util. Rev. Bonds, Ser. C, | | | |
| 5.00%, 10/1/39 | AA+ | 3,000,000 | 3,398,100 |
|
| | | | 7,357,725 |
|
| 20 Managed Municipal Income Trust |
| | | |
| MUNICIPAL BONDS AND NOTES (130.1%)* cont. | Rating** | Principal amount | Value |
|
| Florida (6.2%) | | | |
|
| Double Branch Cmnty. Dev. Dist. Special Assmt. | | | |
| Bonds (Sr. Lien), Ser. A-1, 4.125%, 5/1/31 | A– | $500,000 | $511,060 |
|
| Fishhawk, CCD IV Special Assmt. Bonds, | | | |
| 7.25%, 5/1/43 | B/P | 400,000 | 422,448 |
|
| Florida State Higher Edl. Fac. Rev. Bonds | | | |
| (U. of Tampa), Ser. A, 5.00%, 4/1/32 | A– | 600,000 | 669,786 |
|
| Greater Orlando Aviation Auth. Rev. Bonds (JetBlue | | | |
| Airways Corp.), 5.00%, 11/15/36 | B/P | 1,000,000 | 1,029,340 |
|
| Halifax Hosp. Med. Ctr. Rev. Bonds, 5.00%, 6/1/36 | A– | 1,300,000 | 1,413,581 |
|
| Jacksonville, Econ. Dev. Comm. Indl. Dev. Rev. | | | |
| Bonds (Gerdau Ameristeel US, Inc.), 5.30%, 5/1/37 | BBB– | 1,350,000 | 1,281,420 |
|
| Lakeland, Hosp. Syst. Rev. Bonds | | | |
|
| (Lakeland Regl. Hlth.), 5.00%, 11/15/40 | A2 | 500,000 | 541,020 |
|
| (Lakeland Regl. Hlth. Syst.), 5.00%, 11/15/29 | A2 | 1,000,000 | 1,135,440 |
|
| Lakeland, Retirement Cmnty. 144A Rev. Bonds | | | |
| (1st Mtge. — Carpenters), 6.375%, 1/1/43 | BBB–/F | 840,000 | 872,382 |
|
| Lakewood Ranch, Stewardship Dist. Special | | | |
| Assessment Bonds (Village of Lakewood Ranch | | | |
| South), 5.125%, 5/1/46 | B+/P | 970,000 | 952,045 |
|
| Lakewood Ranch, Stewardship Dist. Special Assmt. | | | |
| Bonds, 4.875%, 5/1/35 | BB–/P | 500,000 | 502,135 |
|
| Lee Cnty., Indl. Dev. Auth. Hlth. Care Fac. Rev. Bonds | | | |
| (Shell Pt./Alliance Oblig. Group), 5.00%, 11/15/22 | BBB | 1,500,000 | 1,503,840 |
|
| Martin Cnty., Rev. Bonds (Indiantown | | | |
| Cogeneration), 4.20%, 12/15/25 | Baa2 | 1,500,000 | 1,538,280 |
|
| Miami Beach, Hlth. Fac. Auth. Hosp. Rev. Bonds | | | |
| (Mount Sinai Med. Ctr.), 5.00%, 11/15/29 | Baa1 | 1,000,000 | 1,088,490 |
|
| Miami-Dade Cnty., Rev. Bonds (Tran. Syst. Sales | | | |
| Surtax), 5.00%, 7/1/42 | AA | 2,000,000 | 2,219,140 |
|
| Miami-Dade Cnty., Indl. Dev. Auth. Rev. Bonds | | | |
| (Pinecrest Academy, Inc.), 5.00%, 9/15/34 | BBB– | 1,240,000 | 1,311,746 |
|
| Midtown Miami Cmnty. Dev. Dist. Special Assmt. | | | |
| Bonds (Garage), Ser. A, 5.00%, 5/1/29 | BB–/P | 570,000 | 603,539 |
|
| Palm Beach Cnty., Hlth. Fac. Auth. Rev. Bonds | | | |
| (Acts Retirement-Life Cmnty.), 5.50%, 11/15/33 | | | |
| (Prerefunded 11/15/20) | A–/F | 2,000,000 | 2,281,720 |
|
| South Lake Hosp. Dist. Rev. Bonds (South Lake | | | |
| Hosp.), Ser. A, 6.00%, 4/1/29 | Baa1 | 1,000,000 | 1,066,250 |
|
| Southeast Overtown Park West Cmnty. Redev. Agcy. | | | |
| 144A Tax Alloc. Bonds, Ser. A-1, 5.00%, 3/1/30 | BBB+ | 480,000 | 516,720 |
|
| Tallahassee, Hlth. Fac. Rev. Bonds (Tallahassee | | | |
| Memorial HealthCare, Inc.), Ser. A, 5.00%, 12/1/55 | Baa1 | 1,000,000 | 1,049,720 |
|
| Tolomato, Cmnty. Dev. Dist. Special Assmt. Bonds, | | | |
| 5.40%, 5/1/37 | B+/P | 700,000 | 700,581 |
|
| Verandah, West Cmnty. Dev. Dist. Special Assmt. | | | |
| Bonds (Cap. Impt.), 5.00%, 5/1/33 | B+/P | 470,000 | 474,113 |
|
| Verano Ctr. Cmnty. Dev. Dist. Special Assmt. Bonds | | | |
| (Cmnty. Infrastructure), Ser. A, 5.375%, 5/1/37 | B/P | 815,000 | 812,522 |
|
| Village Cmnty. Dev. Dist. No. 10 Special Assmt. | | | |
| Bonds, 5.75%, 5/1/31 | BB/P | 765,000 | 857,787 |
|
|
| Managed Municipal Income Trust 21 |
| | | |
| MUNICIPAL BONDS AND NOTES (130.1%)* cont. | Rating** | Principal amount | Value |
|
| Florida cont. | | | |
|
| Village Cmnty. Dev. Dist. No. 8 Special Assmt. Bonds | | | |
| (Phase II), 6.125%, 5/1/39 | BBB–/P | $390,000 | $430,782 |
|
| Village Cmnty. Dev. Dist. No. 9 Special Assmt. Bonds, | | | |
| 5.00%, 5/1/22 | BBB–/P | 325,000 | 338,582 |
|
| | | | 26,124,469 |
|
| Georgia (3.8%) | | | |
|
| Atlanta, Tax Allocation Bonds (Beltline), Ser. B, | | | |
| 5.00%, 1/1/31 | A2 | 1,000,000 | 1,143,170 |
|
| Atlanta, Wtr. & Waste Wtr. Rev. Bonds, Ser. A, 6.25%, | | | |
| 11/1/39 (Prerefunded 11/1/19) | Aa2 | 2,500,000 | 2,814,625 |
|
| Clayton Cnty., Dev. Auth. Special Fac. Rev. Bonds | | | |
| (Delta Airlines), Ser. A, 8.75%, 6/1/29 | Baa3 | 3,000,000 | 3,525,660 |
|
| Cobb Cnty., Dev. Auth. Student Hsg. Rev. Bonds | | | |
| (Kennesaw State U. Real Estate Oblig. Group), Ser. C, | | | |
| 5.00%, 7/15/38 | Baa2 | 750,000 | 800,325 |
|
| Forsyth Cnty., Hosp. Auth. Rev. Bonds (Baptist | | | |
| Hlth. Care Syst.), U.S. Govt. Coll., 6.25%, 10/1/18 | | | |
| (Escrowed to maturity) | AA+ | 505,000 | 526,579�� |
|
| GA State Private College & U. Auth. Rev. Bonds | | | |
| (Mercer U.) | | | |
|
| Ser. C, 5.25%, 10/1/30 | Baa2 | 750,000 | 810,443 |
|
| Ser. A, 5.25%, 10/1/27 | Baa2 | 1,000,000 | 1,089,700 |
|
| Ser. A, 5.00%, 10/1/32 | Baa2 | 1,000,000 | 1,059,960 |
|
| Gainesville & Hall Cnty., Devauth Retirement Cmnty. | | | |
| Rev. Bonds (Acts Retirement-Life Cmnty.), Ser. A-2, | | | |
| 6.375%, 11/15/29 (Prerefunded 11/15/19) | A–/F | 700,000 | 792,561 |
|
| Marietta, Dev. Auth. Rev. Bonds (Fac. of Life U., Inc.), | | | |
| Ser. PJ, 6.25%, 6/15/20 | Ba3 | 675,000 | 697,079 |
|
| Muni. Election Auth. of GA Rev. Bonds (Plant Voltage | | | |
| Units 3 & 4), Ser. A, 5.50%, 7/1/60 | A+ | 2,000,000 | 2,220,260 |
|
| Rockdale Cnty., Dev. Auth. Rev. Bonds (Visy Paper), | | | |
| Ser. A, 6.125%, 1/1/34 | BB/P | 600,000 | 600,990 |
|
| | | | 16,081,352 |
|
| Guam (—%) | | | |
|
| Territory of GU, Pwr. Auth. Rev. Bonds, Ser. A, | | | |
| 5.00%, 10/1/34 | Baa2 | 200,000 | 208,058 |
|
| | | | 208,058 |
|
| Hawaii (1.0%) | | | |
|
| HI State Dept. Budget & Fin. Rev. Bonds | | | |
|
| (Craigside), Ser. A, 9.00%, 11/15/44 | | | |
| (Prerefunded 11/15/19) | B/P | 400,000 | 476,840 |
|
| (Hawaiian Elec. Co. — Subsidiary), 6.50%, 7/1/39 | Baa2 | 3,000,000 | 3,254,100 |
|
| (Kahala Nui), 5.125%, 11/15/32 | BBB+/F | 400,000 | 428,488 |
|
| | | | 4,159,428 |
|
| Illinois (7.4%) | | | |
|
| Chicago, G.O. Bonds | | | |
|
| Ser. A, 6.00%, 1/1/38 | BBB+ | 2,560,000 | 2,680,115 |
|
| Ser. B-2, 5.50%, 1/1/37 | BBB+ | 2,000,000 | 2,004,800 |
|
| Ser. C, 5.00%, 1/1/38 | BBB+ | 1,500,000 | 1,416,810 |
|
| Chicago, Special Assmt. Bonds (Lake Shore East), | | | |
| 6.75%, 12/1/32 | BB/P | 1,605,000 | 1,612,865 |
|
|
| 22 Managed Municipal Income Trust |
| | | |
| MUNICIPAL BONDS AND NOTES (130.1%)* cont. | Rating** | Principal amount | Value |
|
| Illinois cont. | | | |
|
| Chicago, Board of Ed. G.O. Bonds, Ser. C, | | | |
| 5.25%, 12/1/39 | B | $1,500,000 | $1,223,175 |
|
| Chicago, Motor Fuel Tax Rev. Bonds, 5.00%, 1/1/29 | BBB– | 500,000 | 517,130 |
|
| Chicago, O’Hare Intl. Arpt. Rev. Bonds | | | |
|
| Ser. G, 5.00%, 1/1/37 | A | 400,000 | 435,788 |
|
| Ser. C, 5.00%, 1/1/26 | A2 | 2,595,000 | 2,887,560 |
|
| Chicago, Waste Wtr. Transmission Rev. Bonds (2nd | | | |
| Lien), 5.00%, 1/1/39 | A | 1,360,000 | 1,441,219 |
|
| Chicago, Wtr. Wks Rev. Bonds, 5.00%, 11/1/39 | A | 875,000 | 937,029 |
|
| Cicero, G.O. Bonds, Ser. A, AGM, 5.00%, 1/1/20 | AA | 1,250,000 | 1,357,188 |
|
| Du Page Cnty., Special Svc. Area No. 31 Special Tax | | | |
| Bonds (Monarch Landing), 5.625%, 3/1/36 | B/P | 335,000 | 335,405 |
|
| IL Fin. Auth. Rev. Bonds | | | |
|
| (Silver Cross Hosp. & Med. Ctr.), 7.00%, 8/15/44 | | | |
| (Prerefunded 8/15/19) | AAA/P | 2,000,000 | 2,261,420 |
|
| (Rush U. Med. Ctr.), Ser. C, U.S. Govt. Coll., 6.625%, | | | |
| 11/1/39 (Prerefunded 5/1/19) | Aaa | 1,075,000 | 1,192,981 |
|
| (Navistar Intl. Recvy. Zone), 6.50%, 10/15/40 | Caa1 | 500,000 | 520,110 |
|
| (Three Crowns Pk. Plaza), Ser. A, 5.875%, 2/15/26 | BB–/P | 1,000,000 | 1,001,060 |
|
| (American Wtr. Cap. Corp.), 5.25%, 10/1/39 | A | 1,575,000 | 1,656,034 |
|
| IL State G.O. Bonds | | | |
|
| 5.00%, 11/1/34 | Baa2 | 500,000 | 501,875 |
|
| 5.00%, 3/1/34 | Baa2 | 750,000 | 751,545 |
|
| 5.00%, 2/1/29 | Baa2 | 300,000 | 310,989 |
|
| IL State Fin. Auth. Rev. Bonds | | | |
|
| (Provena Hlth.), Ser. A, 7.75%, 8/15/34 | | | |
| (Prerefunded 8/15/19) | AAA/P | 15,000 | 17,213 |
|
| (Provena Hlth.), Ser. A, U.S. Govt. Coll., 7.75%, | | | |
| 8/15/34 (Prerefunded 8/15/19) | BBB– | 1,485,000 | 1,704,127 |
|
| (Presence Hlth. Network), Ser. C, 5.00%, 2/15/36 | Baa3 | 525,000 | 554,925 |
|
| (Riverside Hlth. Syst.), 4.00%, 11/15/35 | A+ | 500,000 | 493,545 |
|
| IL State Fin. Auth. Rev. Bonds (Plymouth Place), | | | |
| 5.25%, 5/15/45 | BB+/F | 1,000,000 | 1,022,330 |
|
| Metro. Wtr. Reclamation Dist. of Greater Chicago | | | |
| G.O. Bonds, Ser. A, 5.00%, 12/1/31 | AA+ | 1,000,000 | 1,147,450 |
|
| Railsplitter, Tobacco Settlement Auth. Rev. Bonds, | | | |
| 6.00%, 6/1/28 | A– | 1,050,000 | 1,199,930 |
|
| | | | 31,184,618 |
|
| Indiana (1.0%) | | | |
|
| IN State Fin. Auth. Econ. Dev. Mandatory Put Bonds | | | |
| (6/1/17) (Republic Svcs., Inc.), Ser. A, 1.20%, 5/1/34 | A–2 | 1,100,000 | 1,099,956 |
|
| IN State Fin. Auth. Edl. Fac. Rev. Bonds (Butler | | | |
| U.), Ser. B | | | |
|
| 5.00%, 2/1/32 | A– | 1,000,000 | 1,112,580 |
|
| 5.00%, 2/1/29 | A– | 500,000 | 562,010 |
|
| Valparaiso, Exempt Facs. Rev. Bonds (Pratt Paper, | | | |
| LLC), 6.75%, 1/1/34 | B+/P | 1,125,000 | 1,317,173 |
|
| | | | 4,091,719 |
|
| Managed Municipal Income Trust 23 |
| | | |
| MUNICIPAL BONDS AND NOTES (130.1%)* cont. | Rating** | Principal amount | Value |
|
| Iowa (0.7%) | | | |
|
| IA State Fin. Auth. Midwestern Disaster Rev. Bonds | | | |
| (IA Fertilizer Co., LLC) | | | |
|
| 5.50%, 12/1/22 | B | $1,000,000 | $1,013,200 |
|
| 5.25%, 12/1/25 | B | 750,000 | 761,633 |
|
| Tobacco Settlement Auth. of IA Rev. Bonds, Ser. C, | | | |
| 5.375%, 6/1/38 | B+ | 1,250,000 | 1,251,600 |
|
| | | | 3,026,433 |
|
| Kansas (0.3%) | | | |
|
| Lenexa, Hlth. Care Fac. Rev. Bonds (LakeView | | | |
| Village), 7.125%, 5/15/29 (Prerefunded 5/15/19) | BB/P | 500,000 | 560,405 |
|
| Wichita, Hlth. Care Fac. Rev. Bonds (KS Masonic | | | |
| Home Oblig. Group), Ser. 2-A, 5.375%, 12/1/46 | B/P | 500,000 | 503,510 |
|
| | | | 1,063,915 |
|
| Kentucky (2.2%) | | | |
|
| KY Econ. Dev. Fin. Auth. Rev. Bonds | | | |
|
| (Masonic Home Indpt. Living II), 7.25%, 5/15/41 | | | |
| (Prerefunded 5/15/21) | BB–/P | 500,000 | 613,430 |
|
| (Masonic Home Indpt. Living II), 7.00%, 5/15/30 | | | |
| (Prerefunded 5/15/21) | BB–/P | 500,000 | 608,550 |
|
| (Masonic Home Indpt. Living), 5.00%, 5/15/46 | BB/P | 1,000,000 | 945,870 |
|
| KY Pub. Trans. Infrastructure Auth. Rev. Bonds (1st | | | |
| Tier Downtown Crossing), Ser. A, 6.00%, 7/1/53 | Baa3 | 1,100,000 | 1,230,471 |
|
| KY State Econ. Dev. Fin. Auth. Hlth. Care Rev. Bonds | | | |
| (Masonic Homes of KY), 5.375%, 11/15/42 | BB–/P | 900,000 | 901,476 |
|
| Louisville & Jefferson Cnty., Metro. Govt. College | | | |
| Rev. Bonds (Bellarmine U.), Ser. A, 6.00%, 5/1/28 | Baa3 | 500,000 | 514,685 |
|
| Louisville & Jefferson Cnty., Metro. Govt. Hlth. | | | |
| Syst. Rev. Bonds (Norton Healthcare Oblig. Group), | | | |
| 5.50%, 10/1/33 | A– | 3,000,000 | 3,477,990 |
|
| Owen Cnty., Wtr. Wks. Syst. Rev. Bonds (American | | | |
| Wtr. Co.), Ser. A, 6.25%, 6/1/39 | A | 700,000 | 756,959 |
|
| | | | 9,049,431 |
|
| Louisiana (1.0%) | | | |
|
| LA State Local Govt. Env. Fac. & Cmnty. Dev. | | | |
| Auth. Rev. Bonds (Westlake Chemical Corp.), | | | |
| 6.75%, 11/1/32 | BBB | 2,200,000 | 2,249,170 |
|
| LA State Pub. Fac. Auth. Rev. Bonds (Ochsner Clinic | | | |
| Foundation), 5.00%, 5/15/47 | A3 | 250,000 | 267,915 |
|
| LA State Pub. Fac. Solid Waste Disp. Auth. Rev. | | | |
| Bonds (LA Pellets, Inc.), Ser. A, 8.375%, 7/1/39 | CCC/P | 500,000 | 175,000 |
|
| Pub. Fac. Auth. Dock & Wharf 144A Rev. Bonds | | | |
| (Impala Warehousing, LLC), 6.50%, 7/1/36 | B+/P | 1,000,000 | 1,079,160 |
|
| St. Tammany, Public Trust Fin. Auth. Rev. Bonds | | | |
| (Christwood), 5.25%, 11/15/37 | BB/P | 385,000 | 389,766 |
|
| | | | 4,161,011 |
|
| Maine (0.6%) | | | |
|
| ME Hlth. & Higher Edl. Fac. Auth. Rev. Bonds | | | |
|
| (ME Gen. Med. Ctr.), 7.50%, 7/1/32 | Ba2 | 1,000,000 | 1,141,510 |
|
| (MaineGeneral Health Oblig. Group), 6.95%, 7/1/41 | Ba2 | 1,000,000 | 1,092,740 |
|
| ME State Fin. Auth. Solid Waste Disp. 144A | | | |
| Mandatory Put Bonds (8/1/25) (Casella Waste Syst.), | | | |
| 5.125%, 8/1/35 | Caa1 | 500,000 | 486,050 |
|
| | | | 2,720,300 |
|
| 24 Managed Municipal Income Trust |
| | | |
| MUNICIPAL BONDS AND NOTES (130.1%)* cont. | Rating** | Principal amount | Value |
|
| Maryland (1.3%) | | | |
|
| Baltimore Cnty., Rev. Bonds (Oak Crest Village, Inc.), | | | |
| 5.00%, 1/1/37 | A/F | $1,585,000 | $1,738,888 |
|
| MD Econ. Dev. Corp. Poll. Control Rev. Bonds | | | |
| (Potomac Electric Power Co.), 6.20%, 9/1/22 | A2 | 550,000 | 599,561 |
|
| Prince Georges Cnty., Rev. Bonds (Collington | | | |
| Episcopal Life Care Cmnty., Inc.), 5.25%, 4/1/37 ## | BB/P | 1,200,000 | 1,275,228 |
|
| Westminster, Rev. Bonds | | | |
|
| (Lutheran Village at Miller’s Grant, Inc. (The)), | | | |
| Ser. A, 6.00%, 7/1/34 | B–/P | 250,000 | 263,643 |
|
| (Carroll Lutheran Village, Inc.), 5.125%, 7/1/34 | BB/P | 1,500,000 | 1,570,785 |
|
| | | | 5,448,105 |
|
| Massachusetts (6.0%) | | | |
|
| MA Bay Trans. Auth. Rev. Bonds, Ser. A, | | | |
| 5.00%, 7/1/25 | AAA | 2,000,000 | 2,444,620 |
|
| MA State G.O. Bonds | | | |
|
| Ser. B, 5.00%, 7/1/33 | Aa1 | 500,000 | 584,800 |
|
| Ser. G, 4.00%, 9/1/42 | Aa1 | 2,700,000 | 2,778,354 |
|
| MA State Dev. Fin. Agcy. Rev. Bonds | | | |
|
| (Sabis Intl.), Ser. A, 8.00%, 4/15/39 | | | |
| (Prerefunded 10/15/19) | BBB | 690,000 | 801,842 |
|
| (Linden Ponds, Inc. Fac.), Ser. A-1, 6.25%, 11/15/46 | B–/P | 450,850 | 464,078 |
|
| (Suffolk U.), Ser. A, 6.25%, 7/1/30 | Baa2 | 360,000 | 386,402 |
|
| (Suffolk U.), Ser. A, U.S. Govt. Coll., 6.25%, 7/1/30 | | | |
| (Prerefunded 7/1/19) | | 640,000 | 709,894 |
|
| (Linden Ponds, Inc. Fac.), Ser. A-1, 6.25%, 11/15/26 | B–/P | 275,400 | 283,480 |
|
| (Boston U.), SGI, 6.00%, 5/15/59 | A1 | 500,000 | 628,075 |
|
| (Loomis Cmntys.), Ser. A, 6.00%, 1/1/33 | BBB– | 200,000 | 222,750 |
|
| (Suffolk U.), Ser. A, 5.75%, 7/1/39 | Baa2 | 345,000 | 371,610 |
|
| (Suffolk U.), Ser. A, U.S. Govt. Coll., 5.75%, 7/1/39 | | | |
| (Prerefunded 7/1/19) | | 605,000 | 664,635 |
|
| (Linden Ponds, Inc.), Ser. B, 5.50%, 11/15/56 | B–/P | 439,022 | 3,345 |
|
| (Linden Ponds, Inc.), Ser. A-2, 5.50%, 11/15/46 | B–/P | 88,265 | 88,261 |
|
| (New England Conservatory of Music), U.S. Govt. | | | |
| Coll., 5.25%, 7/1/38 (Prerefunded 7/1/18) | AAA/P | 805,000 | 843,906 |
|
| (Wheelock College), Ser. C, 5.25%, 10/1/29 | BBB | 1,700,000 | 1,720,485 |
|
| (Dana-Farber Cancer Inst.), Ser. N, 5.00%, 12/1/46 | A1 | 125,000 | 138,214 |
|
| (Dana-Farber Cancer Inst.), Ser. N, 5.00%, 12/1/41 | A1 | 1,275,000 | 1,418,489 |
|
| (Suffolk U.), 5.00%, 7/1/36 | Baa2 | 750,000 | 825,240 |
|
| (Suffolk U.), 5.00%, 7/1/35 | Baa2 | 750,000 | 827,235 |
|
| (First Mtge. — Orchard Cove), 5.00%, 10/1/19 | BB/P | 550,000 | 555,412 |
|
| MA State Dev. Fin. Agcy. Hlth. Care Fac. 144A Rev. | | | |
| Bonds (Adventcare), Ser. A, 6.65%, 10/15/28 | B/P | 1,050,000 | 1,061,057 |
|
| MA State Edl. Fin. Auth. Rev. Bonds, Ser. B, | | | |
| 5.50%, 1/1/23 | AA | 55,000 | 57,988 |
|
| MA State Hlth. & Edl. Fac. Auth. Rev. Bonds | | | |
|
| (Baystate Med. Ctr.), Ser. I, 5.75%, 7/1/36 | A+ | 1,500,000 | 1,637,715 |
|
| (Springfield College), 5.625%, 10/15/40 | | | |
| (Prerefunded 10/15/19) | BBB | 450,000 | 498,969 |
|
| (Springfield College), 5.50%, 10/15/31 | | | |
| (Prerefunded 10/15/19) | BBB | 1,100,000 | 1,216,391 |
|
|
| Managed Municipal Income Trust 25 |
| | | |
| MUNICIPAL BONDS AND NOTES (130.1%)* cont. | Rating** | Principal amount | Value |
|
| Massachusetts cont. | | | |
|
| MA State Hlth. & Edl. Fac. Auth. Rev. Bonds | | | |
|
| (Springfield College), 5.50%, 10/15/26 | | | |
| (Prerefunded 10/15/19) | BBB | $1,500,000 | $1,658,715 |
|
| (Fisher College), Ser. A, 5.125%, 4/1/37 | BBB | 250,000 | 250,475 |
|
| (Milford Regl. Med.), Ser. E, 5.00%, 7/15/22 | Baa3 | 1,000,000 | 1,007,080 |
|
| MA State Port Auth. Special Fac. Rev. Bonds | | | |
| (Conrac), Ser. A, 5.125%, 7/1/41 | A | 750,000 | 815,558 |
|
| | | | 24,965,075 |
|
| Michigan (4.7%) | | | |
|
| Detroit, Wtr. Supply Syst. Rev. Bonds, Ser. B | | | |
|
| AGM, 6.25%, 7/1/36 | AA | 5,000 | 5,485 |
|
| AGM, U.S. Govt. Coll., 6.25%, 7/1/36 | | | |
| (Prerefunded 7/1/19) | AA | 1,655,000 | 1,835,743 |
|
| Flint, Hosp. Bldg. Auth. Rev. Bonds, Ser. A, | | | |
| 5.25%, 7/1/39 | Ba1 | 750,000 | 767,768 |
|
| Genesee Cnty., Wtr. Supply Syst. G.O. Bonds (Wtr. | | | |
| Supply Syst.), Ser. B, BAM, 5.00%, 2/1/46 | AA | 1,500,000 | 1,638,600 |
|
| Great Lakes, Wtr. Auth. Swr. Rev. Bonds (Brazos | | | |
| Presbyterian Homes, Inc.), Ser. C, 5.00%, 7/1/36 | Baa1 | 2,000,000 | 2,193,840 |
|
| Kentwood, Economic Dev. Rev. Bonds (Holland | | | |
| Home), 5.625%, 11/15/32 | BBB–/F | 2,195,000 | 2,361,293 |
|
| MI State Fin. Auth. Rev. Bonds | | | |
|
| (Presbyterian Villages of MI), 5.50%, 11/15/45 | BB+/F | 500,000 | 521,415 |
|
| (Local Govt. Loan Program — Detroit Wtr. & Swr. | | | |
| Dept. (DWSD)), Ser. D-2, 5.00%, 7/1/34 | Baa1 | 400,000 | 435,736 |
|
| (Detroit Wtr. & Swr.), Ser. C-6, 5.00%, 7/1/33 | A3 | 600,000 | 662,946 |
|
| MI State Hosp. Fin. Auth. Rev. Bonds | | | |
|
| Ser. A, 6.125%, 6/1/39 (Prerefunded 6/1/19) | AA+ | 2,000,000 | 2,207,620 |
|
| (Henry Ford Hlth.), 5.75%, 11/15/39 | | | |
| (Prerefunded 11/15/19) | A | 1,600,000 | 1,784,512 |
|
| MI State Strategic Fund Ltd. Rev. Bonds | | | |
| (Worthington Armstrong Venture), 5.75%, 10/1/22 | | | |
| (Escrowed to maturity) | AAA/P | 1,350,000 | 1,611,441 |
|
| MI State Strategic Fund Ltd. Oblig. Rev. Bonds | | | |
| (Cadillac Place Office Bldg.), 5.25%, 10/15/26 | Aa2 | 1,250,000 | 1,433,613 |
|
| Wayne Cnty., Arpt. Auth. Rev. Bonds, Ser. A, | | | |
| 5.00%, 12/1/21 | A2 | 2,000,000 | 2,269,620 |
|
| | | | 19,729,632 |
|
| Minnesota (2.6%) | | | |
|
| Baytown Twp. Lease Rev. Bonds, Ser. A, | | | |
| 4.00%, 8/1/41 | BB+ | 380,000 | 320,321 |
|
| Douglas Cnty., Gross Hlth. Care Fac. Rev. Bonds | | | |
| (Douglas Cnty. Hosp.) | | | |
|
| 6.25%, 7/1/34 (Prerefunded 7/1/18) | AAA/P | 1,940,000 | 2,057,254 |
|
| 6.25%, 7/1/34 (Prerefunded 7/1/18) | AAA/P | 1,060,000 | 1,124,066 |
|
| Ham Lake, Charter School Lease Rev. Bonds | | | |
| (DaVinci Academy of Arts & Science), Ser. A, | | | |
| 5.00%, 7/1/47 | BB–/P | 500,000 | 464,050 |
|
| Inver Grove Heights, Nursing Home Rev. Bonds | | | |
| (Presbyterian Homes Care), 5.375%, 10/1/26 | B/P | 670,000 | 670,141 |
|
|
| 26 Managed Municipal Income Trust |
| | | |
| MUNICIPAL BONDS AND NOTES (130.1%)* cont. | Rating** | Principal amount | Value |
|
| Minnesota cont. | | | |
|
| Minneapolis & St. Paul, Hsg. & Redev. Auth. | | | |
| Hlth. Care VRDN (Allina Hlth. Syst.), Ser. B-2, | | | |
| 0.85%, 11/15/35 | VMIG1 | $850,000 | $850,000 |
|
| Otsego, Charter School Lease Rev. Bonds | | | |
| (Kaleidoscope Charter School), Ser. A, 5.00%, 9/1/34 | BB+ | 800,000 | 820,168 |
|
| Rochester, Hlth. Care Fac. Rev. Bonds (Olmsted Med. | | | |
| Ctr.), 5.875%, 7/1/30 | A/F | 1,000,000 | 1,111,920 |
|
| Rochester, Hlth. Care Fac. VRDN (Mayo Clinic), Ser. A, | | | |
| 0.88%, 11/15/38 | A-1+ | 500,000 | 500,000 |
|
| Sartell, Hlth. Care & Hsg. Facs. Rev. Bonds (Country | | | |
| Manor Campus, LLC) | | | |
|
| 5.25%, 9/1/30 | B–/P | 500,000 | 510,670 |
|
| 5.25%, 9/1/27 | B–/P | 750,000 | 774,540 |
|
| St. Paul, Hsg. & Redev. Auth. Charter School Lease | | | |
| Rev. Bonds (Nova Classical Academy), Ser. A | | | |
|
| 6.625%, 9/1/42 (Prerefunded 9/1/21) | BBB– | 250,000 | 304,073 |
|
| 6.375%, 9/1/31 | BBB– | 250,000 | 282,475 |
|
| St. Paul, Port Auth. Lease Rev. Bonds (Regions Hosp. | | | |
| Pkg. Ramp), Ser. 1, 5.00%, 8/1/36 | A–/P | 1,125,000 | 1,126,620 |
|
| | | | 10,916,298 |
|
| Mississippi (1.5%) | | | |
|
| MS State Bus. Fin. Commission Gulf Opportunity | | | |
| Zone VRDN (Chevron USA, Inc.), Ser. E, | | | |
| 0.89%, 12/1/30 | VMIG1 | 4,500,000 | 4,500,000 |
|
| Warren Cnty., Gulf Opportunity Zone Rev. Bonds | | | |
| (Intl. Paper Co.), Ser. A, 6.50%, 9/1/32 | Baa2 | 1,600,000 | 1,697,952 |
|
| | | | 6,197,952 |
|
| Missouri (0.6%) | | | |
|
| Kirkwood, Indl. Dev. Auth. Retirement Cmnty. Rev. | | | |
| Bonds (Aberdeen Heights), Ser. A, 5.25%, 5/15/42 | BB/F | 500,000 | 522,195 |
|
| MO State Hlth. & Edl. Fac. Auth. VRDN (WA U. (The)), | | | |
| Ser. C, 0.85%, 9/1/30 | VMIG1 | 1,000,000 | 1,000,000 |
|
| St. Louis Arpt. Rev. Bonds (Lambert-St. Louis Intl.), | | | |
| Ser. A-1, 6.625%, 7/1/34 | A3 | 1,000,000 | 1,100,440 |
|
| | | | 2,622,635 |
|
| Nebraska (0.7%) | | | |
|
| Central Plains, Energy Rev. Bonds (NE Gas No. 1), | | | |
| Ser. A, 5.25%, 12/1/18 | A3 | 1,735,000 | 1,835,491 |
|
| Lancaster Cnty., Hosp. Auth. Rev. Bonds (Immanuel | | | |
| Oblig. Group), 5.50%, 1/1/30 | AA/F | 1,000,000 | 1,087,250 |
|
| | | | 2,922,741 |
|
| Nevada (1.1%) | | | |
|
| Clark Cnty., Arpt. Rev. Bonds, Ser. A-2, 5.00%, 7/1/33 | Aa3 | 1,050,000 | 1,183,665 |
|
| Clark Cnty., Impt. Dist. Special Assmt. Bonds | | | |
| (Mountains Edge Local No. 142), 5.00%, 8/1/21 | BBB | 540,000 | 582,493 |
|
| Clark Cnty., Impt. Dist. No. 159 Special Assessment | | | |
| Bonds (Summerlin Village 16A), 5.00%, 8/1/32 | B+/P | 500,000 | 521,930 |
|
| Henderson, Local Impt. Dist. Special Assmt. Bonds | | | |
| (No. T-17), 5.00%, 9/1/18 | BBB–/P | 345,000 | 350,330 |
|
| Las Vegas, Special Assmt. Bonds | | | |
|
| 5.00%, 6/1/31 | B+/P | 435,000 | 448,311 |
|
| (Dist. No. 607 Local Impt.), 5.00%, 6/1/23 | BBB–/P | 380,000 | 412,254 |
|
|
| Managed Municipal Income Trust 27 |
| | | |
| MUNICIPAL BONDS AND NOTES (130.1%)* cont. | Rating** | Principal amount | Value |
|
| Nevada cont. | | | |
|
| Las Vegas, Impt. Dist. No. 812 Special Assessment | | | |
| Bonds (Summerlin Village 24), 5.00%, 12/1/35 | B/P | $250,000 | $239,483 |
|
| Las Vegas, Redev. Agcy. Tax Allocation Bonds (Tax | | | |
| Increment), 5.00%, 6/15/40 | BBB+ | 600,000 | 658,410 |
|
| | | | 4,396,876 |
|
| New Hampshire (1.9%) | | | |
|
| NH State Bus. Fin. Auth. Rev. Bonds (Elliot | | | |
| Hosp. Oblig. Group), Ser. A, 6.00%, 10/1/27 | | | |
| (Prerefunded 10/1/19) | Baa1 | 1,700,000 | 1,895,058 |
|
| NH State Bus. Fin. Auth. Solid Waste Disp. 144A | | | |
| Mandatory Put Bonds (10/1/19) (Casella Waste Syst., | | | |
| Inc.), 4.00%, 4/1/29 | Caa1 | 350,000 | 347,134 |
|
| NH State Hlth. & Ed. Fac. Auth. Rev. Bonds | | | |
|
| (Rivermead), Ser. A, 6.875%, 7/1/41 | BB+/P | 2,000,000 | 2,241,040 |
|
| (Rivermead), Ser. A, 6.625%, 7/1/31 | BB+/P | 1,320,000 | 1,481,621 |
|
| (Kendel at Hanover), 5.00%, 10/1/40 | BBB+/F | 585,000 | 613,624 |
|
| (Elliot Hosp.), 5.00%, 10/1/38 | Baa1 | 250,000 | 271,068 |
|
| (Southern NH Med. Ctr.), 5.00%, 10/1/37 | A– | 1,000,000 | 1,089,210 |
|
| | | | 7,938,755 |
|
| New Jersey (8.5%) | | | |
|
| Burlington Cnty., Bridge Comm. Econ. Dev. Rev. | | | |
| Bonds (The Evergreens), 5.625%, 1/1/38 | BB+/P | 1,500,000 | 1,524,420 |
|
| NJ State Econ. Dev. Auth. Rev. Bonds | | | |
|
| (Ashland School, Inc.), 6.00%, 10/1/33 | BBB | 1,000,000 | 1,127,130 |
|
| (NYNJ Link Borrower, LLC), 5.375%, 1/1/43 | BBB– | 1,000,000 | 1,111,750 |
|
| (MSU Student Hsg. — Provident Group — Montclair | | | |
| LLC), 5.375%, 6/1/25 | Baa3 | 2,000,000 | 2,145,040 |
|
| (Lions Gate), 5.25%, 1/1/44 | BB–/P | 300,000 | 307,428 |
|
| (Continental Airlines, Inc.), 5.25%, 9/15/29 | Ba3 | 3,000,000 | 3,272,850 |
|
| Ser. AAA, 5.00%, 6/15/36 | Baa1 | 350,000 | 349,979 |
|
| (United Methodist Homes), Ser. A, 5.00%, 7/1/29 | BBB–/F | 500,000 | 526,700 |
|
| Ser. B, 5.00%, 11/1/26 | Baa1 | 3,000,000 | 3,155,100 |
|
| 5.00%, 6/15/26 | Baa1 | 500,000 | 531,945 |
|
| NJ State Econ. Dev. Auth. Fac. Rev. Bonds | | | |
| (Continental Airlines, Inc.), 5.625%, 11/15/30 | Ba3 | 1,500,000 | 1,665,450 |
|
| NJ State Econ. Dev. Auth. Wtr. Fac. Rev. Bonds | | | |
| (NJ American Wtr. Co.) | | | |
|
| Ser. A, 5.70%, 10/1/39 | A1 | 2,600,000 | 2,794,714 |
|
| Ser. D, 4.875%, 11/1/29 | A1 | 700,000 | 746,830 |
|
| NJ State Hlth. Care Fac. Fin. Auth. Rev. Bonds | | | |
|
| (St. Peter’s U. Hosp.), 6.25%, 7/1/35 | Ba1 | 2,000,000 | 2,137,580 |
|
| (St. Joseph’s Healthcare Syst. Oblig. Group), | | | |
| 5.00%, 7/1/41 | Baa3 | 835,000 | 897,149 |
|
| (Princeton HealthCare Syst.), Ser. A, 5.00%, 7/1/39 | Baa2 | 1,000,000 | 1,098,550 |
|
| NJ State Trans. Trust Fund Auth. Rev. Bonds (Federal | | | |
| Hwy. Reimbursement Notes) | | | |
|
| 5.00%, 6/15/29 | A+ | 1,050,000 | 1,117,946 |
|
| 5.00%, 6/15/28 | A+ | 600,000 | 643,536 |
|
| North Hudson, Swr. Auth. Rev. Bonds, Ser. A, | | | |
| 5.00%, 6/1/42 | A | 1,000,000 | 1,084,210 |
|
|
| 28 Managed Municipal Income Trust |
| | | |
| MUNICIPAL BONDS AND NOTES (130.1%)* cont. | Rating** | Principal amount | Value |
|
| New Jersey cont. | | | |
|
| Tobacco Settlement Fin. Corp. Rev. Bonds | | | |
|
| Ser. 1A, 5.00%, 6/1/41 | B | $4,500,000 | $4,401,180 |
|
| Ser. 1A, 4.75%, 6/1/34 | BB– | 2,210,000 | 2,169,358 |
|
| zero %, 6/1/41 | A– | 5,000,000 | 1,325,650 |
|
| Union Cnty., Util. Auth. Resource Recvy. Fac. Lease | | | |
| Rev. Bonds (Covanta Union), Ser. A, 5.25%, 12/1/31 | AA+ | 1,450,000 | 1,571,104 |
|
| | | | 35,705,599 |
|
| New Mexico (0.7%) | | | |
|
| Farmington, Poll. Control Rev. Bonds | | | |
|
| (Public Service Co. of San Juan, NM), Ser. D, | | | |
| 5.90%, 6/1/40 | BBB+ | 500,000 | 549,890 |
|
| (AZ Pub. Svc. Co.), Ser. B, 4.70%, 9/1/24 | A2 | 2,000,000 | 2,140,820 |
|
| | | | 2,690,710 |
|
| New York (8.8%) | | | |
|
| Broome Cnty., Indl. Dev. Agcy. Continuing Care | | | |
| Retirement Rev. Bonds (Good Shepard Village), | | | |
| Ser. A, 6.75%, 7/1/28 (Prerefunded 7/1/18) | AAA/P | 600,000 | 639,936 |
|
| Glen Cove, Local Econ. Assistance Corp. Rev. Bonds | | | |
| (Garvies Point Pub. Impt.), Ser. C, stepped-coupon | | | |
| zero% (5.625%, 1/1/24) 1/1/55 †† | B/P | 300,000 | 220,419 |
|
| MTA Hudson Rail Yards Trust Oblig. Rev. Bonds, | | | |
| Ser. A, 5.00%, 11/15/46 | A2 | 3,000,000 | 3,182,220 |
|
| NY City, City Transitional Fin. Auth. VRDN (NYC | | | |
| Recovery), Ser. 3, 0.86%, 11/1/22 | VMIG1 | 435,000 | 435,000 |
|
| NY City, Muni. Wtr. & Swr. Fin. Auth. Rev. Bonds, | | | |
| 5.00%, 6/15/31 T | AA+ | 10,000,000 | 11,189,359 |
|
| NY City, Transitional Fin. Auth. Rev. Bonds (Future | | | |
| Tax), Ser. 99-A, E-1, 5.00%, 2/1/40 | AAA | 4,330,000 | 4,954,429 |
|
| NY Cnty., Tobacco Trust VI Rev. Bonds (Tobacco | | | |
| Settlement Pass-Through), 5.00%, 6/1/51 | BBB | 1,700,000 | 1,780,784 |
|
| NY State Convention Ctr. Dev. Corp. Rev. Bonds | | | |
| (Hotel Unit Fee), zero %, 11/15/50 | Aa3 | 2,500,000 | 598,300 |
|
| NY State Dorm. Auth. Rev. Bonds, Ser. A, | | | |
| 5.00%, 3/15/38 | AAA | 1,500,000 | 1,693,800 |
|
| NY State Dorm. Auth. Non-Supported Debt Rev. | | | |
| Bonds (NYU Hosp. Ctr.), 5.00%, 7/1/34 | A3 | 500,000 | 564,335 |
|
| NY State Dorm. Auth. Revs. bonds, Ser. C, | | | |
| 5.00%, 3/15/31 T | AAA | 5,000,000 | 5,637,292 |
|
| NY State Env. Fac. Corp. Solid Waste Disp. 144A | | | |
| Mandatory Put Bonds (12/2/19) (Casella Waste | | | |
| Syst., Inc.), 3.75%, 12/1/44 | Caa1 | 1,000,000 | 987,140 |
|
| NY State Liberty Dev. Corp. 144A Rev. Bonds (World | | | |
| Trade Ctr.) | | | |
|
| Class 2, 5.375%, 11/15/40 | BB–/P | 750,000 | 820,575 |
|
| Class 1, 5.00%, 11/15/44 | BB–/P | 1,250,000 | 1,329,763 |
|
| Onondaga, Civic Dev. Corp. Rev. Bonds (St. | | | |
| Joseph’s Hosp. Hlth. Ctr.), U.S. Govt. Coll., 5.125%, | | | |
| 7/1/31 (Prerefunded 7/1/19) | AAA/P | 1,620,000 | 1,759,223 |
|
| Port Auth. of NY & NJ Rev. Bonds (Kennedy Intl. | | | |
| Arpt. — 5th Installment), 6.75%, 10/1/19 | BBB–/P | 100,000 | 102,602 |
|
| Port Auth. of NY & NJ Special Oblig. Rev. Bonds (JFK | | | |
| Intl. Air Term.), 6.00%, 12/1/42 | Baa1 | 1,000,000 | 1,121,780 |
|
| | | | 37,016,957 |
|
| Managed Municipal Income Trust 29 |
| | | |
| MUNICIPAL BONDS AND NOTES (130.1%)* cont. | Rating** | Principal amount | Value |
|
| North Carolina (2.1%) | | | |
|
| NC Eastern Muni. Pwr. Agcy. Syst. Rev. Bonds, Ser. C, | | | |
| 6.75%, 1/1/24 (Prerefunded 1/1/19) | AAA/F | $750,000 | $821,378 |
|
| NC State Med. Care Comm. Hlth. Fac. Rev. Bonds | | | |
| (Presbyterian Homes), Ser. C, 5.00%, 10/1/31 | A–/F | 800,000 | 891,200 |
|
| NC State Med. Care Comm. Retirement | | | |
| Fac. Rev. Bonds | | | |
|
| (Carolina Village), 6.00%, 4/1/38 | BB/P | 1,000,000 | 1,014,980 |
|
| (Salemtowne), 5.25%, 10/1/37 | BB/P | 385,000 | 402,822 |
|
| (Forest at Duke, Inc. (The)), 5.125%, 9/1/27 | BBB+/F | 1,000,000 | 1,005,200 |
|
| (Aldersgate United Methodist Church), | | | |
| 5.00%, 7/1/45 | BB/P | 825,000 | 839,883 |
|
| (Southminister, Inc.), 5.00%, 10/1/37 | BB/P | 965,000 | 987,513 |
|
| (United Church Homes & Svcs. Oblig. Group), | | | |
| Ser. A, 5.00%, 9/1/37 | BB/P | 500,000 | 515,430 |
|
| (United Methodist Retirement Homes), Ser. A, | | | |
| 5.00%, 10/1/35 | BBB/F | 500,000 | 547,915 |
|
| NC State Med. Care Comm. Retirement Fac. Rev. | | | |
| Bonds (Salemtowne), 5.375%, 10/1/45 | BB/P | 1,615,000 | 1,680,844 |
|
| | | | 8,707,165 |
|
| Ohio (6.3%) | | | |
|
| American Muni. Pwr., Inc. Rev. Bonds (Hydroelectric | | | |
| Pwr. Plant), Ser. A, 5.00%, 2/15/38 | A2 | 2,035,000 | 2,273,787 |
|
| Buckeye, Tobacco Settlement Fin. Auth. Rev. Bonds | | | |
|
| Ser. A-2, 6.50%, 6/1/47 | B3 | 2,000,000 | 2,006,640 |
|
| Ser. A-3, 6.25%, 6/1/37 | B– | 850,000 | 848,980 |
|
| Ser. A-2, 6.00%, 6/1/42 | B3 | 2,500,000 | 2,433,550 |
|
| Ser. A-2, 5.875%, 6/1/47 | B3 | 6,500,000 | 6,255,960 |
|
| Ser. A-2, 5.875%, 6/1/30 | B– | 1,315,000 | 1,269,028 |
|
| Ser. A-2, 5.75%, 6/1/34 | B– | 5,175,000 | 4,957,754 |
|
| Franklin Cnty., Hlth. Care Fac. Rev. Bonds | | | |
| (OH Presbyterian Retirement Svcs. (OPRS) Cmntys. | | | |
| Oblig. Group), Ser. A, 5.625%, 7/1/26 | BBB– | 1,250,000 | 1,335,725 |
|
| Lake Cnty., Hosp. Fac. Rev. Bonds (Lake Hosp. Syst., | | | |
| Inc.), Ser. C | | | |
|
| 5.625%, 8/15/29 | A3 | 245,000 | 256,733 |
|
| U.S. Govt. Coll., 5.625%, 8/15/29 | | | |
| (Prerefunded 8/15/18) | AAA/P | 1,285,000 | 1,359,556 |
|
| OH State Higher Edl. Fac. Comm. Rev. Bonds | | | |
| (Kenyon College) | | | |
|
| 5.00%, 7/1/44 | A+ | 525,000 | 569,972 |
|
| U.S. Govt. Coll., 5.00%, 7/1/44 | | | |
| (Prerefunded 7/1/20) | AAA/P | 275,000 | 306,771 |
|
| OH State Private Activity Rev. Bonds (Portsmouth | | | |
| Bypass), AGM, 5.00%, 12/31/35 | AA | 750,000 | 825,293 |
|
| Southeastern OH Port Auth. Hosp. Fac. Rev. Bonds | | | |
|
| 5.75%, 12/1/32 | BB/F | 900,000 | 986,490 |
|
| (Memorial Hlth. Syst. Oblig. Group), | | | |
| 5.00%, 12/1/43 | BB/F | 150,000 | 153,411 |
|
| Toledo-Lucas Cnty., Port Auth. Rev. Bonds (CSX | | | |
| Transn, Inc.), 6.45%, 12/15/21 | Baa1 | 500,000 | 590,135 |
|
| | | | 26,429,785 |
|
| 30 Managed Municipal Income Trust |
| | | |
| MUNICIPAL BONDS AND NOTES (130.1%)* cont. | Rating** | Principal amount | Value |
|
| Oklahoma (0.8%) | | | |
|
| OK State Dev. Fin. Auth. Rev. Bonds (Provident | | | |
| OK Ed. Resources, Inc.-Cross Village Student Hsg.), | | | |
| Ser. A, 5.00%, 8/1/47 | BBB– | $500,000 | $533,850 |
|
| Tulsa Cnty., Indl. Auth. Rev. Bonds (Sr. Living | | | |
| Cmnty. Montereau, Inc.), Ser. A, 7.125%, 11/1/30 | | | |
| (Prerefunded 5/1/20) | BB–/P | 1,250,000 | 1,461,550 |
|
| Tulsa, Muni. Arpt. Trust Rev. Bonds (American | | | |
| Airlines, Inc.), Ser. B, 5.50%, 12/1/35 | B+/P | 1,250,000 | 1,307,325 |
|
| | | | 3,302,725 |
|
| Oregon (0.5%) | | | |
|
| Multnomah Cnty., Hosp. Fac. Auth. Rev. Bonds | | | |
|
| (Mirabella at South Waterfront), Ser. A, | | | |
| 5.40%, 10/1/44 | BB–/P | 500,000 | 534,895 |
|
| (Terwilliger Plaza, Inc.), 5.00%, 12/1/29 | BBB/F | 350,000 | 377,118 |
|
| Warm Springs Reservation, Confederated Tribes | | | |
| 144A Rev. Bonds (Pelton Round Butte Tribal), Ser. B, | | | |
| 6.375%, 11/1/33 | A3 | 700,000 | 750,792 |
|
| Yamhill Cnty., Hosp. Auth. Rev. Bonds (Friendsview | | | |
| Retirement Cmnty.), Ser. A, 5.00%, 11/15/36 | BB/P | 325,000 | 330,418 |
|
| | | | 1,993,223 |
|
| Pennsylvania (3.8%) | | | |
|
| Allegheny Cnty., Higher Ed. Bldg. Auth. Rev. Bonds | | | |
| (Robert Morris U.), Ser. A, 5.50%, 10/15/30 | Baa3 | 1,000,000 | 1,085,790 |
|
| Chester Cnty., Indl. Dev. Auth. Rev. Bonds | | | |
|
| (Collegium Charter School), Ser. A, | | | |
| 5.125%, 10/15/37 | BB+ | 750,000 | 749,498 |
|
| (Renaissance Academy Charter School), | | | |
| 5.00%, 10/1/34 | BBB– | 350,000 | 373,632 |
|
| Chester Cnty., Indl. Dev. Auth. Student Hsg. Rev. | | | |
| Bonds (West Chester U. Student Hsg., LLC), Ser. A, | | | |
| 5.00%, 8/1/45 | Baa3 | 1,000,000 | 1,042,920 |
|
| Dauphin Cnty., Gen. Auth. Hlth. Syst. Rev. Bonds | | | |
| (Pinnacle Hlth. Syst.), Ser. A, 5.00%, 6/1/34 | A+ | 250,000 | 281,843 |
|
| Lancaster Cnty., Hosp. Auth. Rev. Bonds (Brethren | | | |
| Village), Ser. A, 6.375%, 7/1/30 | BB–/P | 625,000 | 630,488 |
|
| Lycoming Cnty., Auth. Hlth. Syst. Rev. Bonds | | | |
| (Susquehanna Hlth. Syst.), Ser. A, 5.75%, 7/1/39 | A+ | 3,000,000 | 3,194,610 |
|
| Moon, Indl. Dev. Auth. Rev. Bonds (Baptist Homes | | | |
| Society Oblig. Group), 5.75%, 7/1/35 | B+/P | 1,500,000 | 1,561,260 |
|
| PA State Higher Edl. Fac. Auth. Rev. Bonds | | | |
|
| (Shippensburg U.), 6.25%, 10/1/43 | Baa3 | 500,000 | 546,540 |
|
| (Gwynedd Mercy College), Ser. KK1, | | | |
| 5.375%, 5/1/42 | BBB | 785,000 | 821,134 |
|
| (Indiana U.), Ser. A, 5.00%, 7/1/41 | BBB+ | 500,000 | 526,895 |
|
| PA State Tpk. Comm. Rev. Bonds, Ser. A, | | | |
| 5.00%, 12/1/38 | A1 | 500,000 | 551,980 |
|
| Philadelphia, Auth. for Indl. Dev. Rev. Bonds (Master | | | |
| Charter School), 6.00%, 8/1/35 (Prerefunded 8/1/20) | BBB | 1,055,000 | 1,213,092 |
|
| Philadelphia, Gas Wks. Rev. Bonds, Ser. 9, 5.00%, | | | |
| 8/1/30 (Prerefunded 8/1/20) | A | 1,000,000 | 1,119,870 |
|
|
| Managed Municipal Income Trust 31 |
| | | |
| MUNICIPAL BONDS AND NOTES (130.1%)* cont. | Rating** | Principal amount | Value |
|
| Pennsylvania cont. | | | |
|
| Susquehanna, Area Regl. Arpt. Syst. Auth. Rev. | | | |
| Bonds, Ser. A, 6.50%, 1/1/38 | Baa3 | $1,325,000 | $1,354,190 |
|
| West Shore Area Auth. Rev. Bonds (Lifeways | | | |
| at Messiah Village), Ser. A, 5.00%, 7/1/35 | BBB–/F | 785,000 | 834,102 |
|
| | | | 15,887,844 |
|
| Puerto Rico (0.5%) | | | |
|
| Cmnwlth. of PR, G.O. Bonds | | | |
|
| (Pub. Impt.), Ser. A, NATL, 5.50%, 7/1/20 | AA– | 1,000,000 | 1,072,320 |
|
| Ser. A, FGIC, 1.21%, 7/1/21 | Caa3 | 1,000,000 | 797,500 |
|
| | | | 1,869,820 |
|
| Rhode Island (0.4%) | | | |
|
| RI Hlth. & Edl. Bldg. Corp. Rev. Bonds (Lifespan | | | |
| Oblig. Group-Hosp. Fin.), 5.00%, 5/15/25 | BBB+ | 1,500,000 | 1,719,645 |
|
| | | | 1,719,645 |
|
| South Carolina (1.7%) | | | |
|
| SC State Pub. Svc. Auth. Rev. Bonds | | | |
|
| (Santee Cooper), Ser. A, 5.75%, 12/1/43 | AA– | 3,000,000 | 3,359,790 |
|
| Ser. A, 5.50%, 12/1/54 | AA– | 2,000,000 | 2,175,560 |
|
| SC State Pub. Svcs. Auth. Rev. Bonds, Ser. E, | | | |
| 5.25%, 12/1/55 | AA– | 1,500,000 | 1,625,895 |
|
| | | | 7,161,245 |
|
| South Dakota (0.3%) | | | |
|
| SD State Hlth. & Edl. Fac. Auth. Rev. Bonds (Sanford | | | |
| Oblig Group), 5.00%, 11/1/45 | A1 | 1,250,000 | 1,349,550 |
|
| | | | 1,349,550 |
|
| Tennessee (0.4%) | | | |
|
| Johnson City, Hlth. & Edl. Fac. Board Hosp. | | | |
| Rev. Bonds (Mountain States Hlth. Alliance), | | | |
| 6.00%, 7/1/38 | Baa1 | 1,450,000 | 1,569,248 |
|
| | | | 1,569,248 |
|
| Texas (12.0%) | | | |
|
| Brazos, Harbor Indl. Dev. Corp. Env. Fac. Mandatory | | | |
| Put Bonds (5/1/28) (Dow Chemical), 5.90%, 5/1/38 | BBB | 2,735,000 | 2,829,057 |
|
| Central TX Regl. Mobility Auth. Rev. Bonds | | | |
|
| Ser. A, 5.00%, 1/1/45 | BBB+ | 250,000 | 273,993 |
|
| Ser. A, 5.00%, 1/1/40 | BBB+ | 500,000 | 549,840 |
|
| (Sr. Lien), Ser. A, 5.00%, 1/1/33 | BBB+ | 525,000 | 576,692 |
|
| Clifton, Higher Ed. Fin. Corp. Rev. Bonds (Idea | | | |
| Pub. Schools) | | | |
|
| 6.00%, 8/15/33 | BBB | 500,000 | 569,260 |
|
| 5.00%, 8/15/32 | BBB | 315,000 | 342,506 |
|
| 5.00%, 8/15/28 | BBB | 200,000 | 223,400 |
|
| Dallas-Fort Worth, Intl. Arpt. Rev. Bonds, Ser. A, | | | |
| 5.00%, 11/1/43 | A1 | 2,535,000 | 2,757,320 |
|
| Grand Parkway Trans. Corp. Rev. Bonds, Ser. B, | | | |
| 5.25%, 10/1/51 | AA+ | 2,000,000 | 2,275,620 |
|
| Harris Cnty., Cultural Ed. Fac. Fin. Corp. Rev. Bonds | | | |
|
| (Brazos Presbyterian Homes, Inc.), 5.00%, 1/1/37 | BB+/F | 250,000 | 258,898 |
|
| (YMCA of the Greater Houston Area), Ser. A, | | | |
| 5.00%, 6/1/33 | Baa3 | 1,000,000 | 1,067,350 |
|
|
| 32 Managed Municipal Income Trust |
| | | |
| MUNICIPAL BONDS AND NOTES (130.1%)* cont. | Rating** | Principal amount | Value |
|
| Texas cont. | | | |
|
| Harris Cnty., Cultural Ed. Fac. Fin. Corp. VRDN (The | | | |
| Methodist Hosp.), Ser. C-1, 0.87%, 12/1/24 | A-1+ | $2,000,000 | $2,000,000 |
|
| Houston, Arpt. Syst. Rev. Bonds | | | |
|
| Ser. B-1, 5.00%, 7/15/35 | BB– | 2,500,000 | 2,628,525 |
|
| Ser. B-1, 5.00%, 7/15/30 | BB– | 650,000 | 698,789 |
|
| Ser. A, 5.00%, 7/1/24 | A+ | 1,500,000 | 1,667,355 |
|
| (United Airlines, Inc.), 4.75%, 7/1/24 | Ba3 | 1,300,000 | 1,403,324 |
|
| La Vernia, Higher Ed. Fin. Corp. Rev. Bonds (Kipp, | | | |
| Inc.), Ser. A | | | |
|
| 6.375%, 8/15/44 (Prerefunded 8/15/19) | BBB | 1,100,000 | 1,227,017 |
|
| 6.25%, 8/15/39 (Prerefunded 8/15/19) | BBB | 1,975,000 | 2,197,504 |
|
| La Vernia, Higher Ed. Fin. Corp. 144A Rev. Bonds | | | |
| (Meridian World School, LLC), Ser. A, 5.25%, 8/15/35 | BB+ | 1,000,000 | 1,011,980 |
|
| Love Field, Arpt. Modernization Corp. Special Fac. | | | |
| Rev. Bonds (Southwest Airlines Co.), 5.25%, 11/1/40 | Baa1 | 3,500,000 | 3,780,525 |
|
| Matagorda Cnty., Poll. Control Rev. Bonds | | | |
|
| (Central Pwr. & Light Co.), Ser. A, 6.30%, 11/1/29 | A– | 1,000,000 | 1,080,660 |
|
| (Dist. No. 1), Ser. A, AMBAC, 4.40%, 5/1/30 | A– | 1,250,000 | 1,365,288 |
|
| New Hope, Cultural Ed. Fac. Fin. Corp. Rev. Bonds | | | |
|
| (Wesleyan Homes, Inc.), 5.50%, 1/1/43 | BB–/P | 500,000 | 509,025 |
|
| (NCCD College Station Properties, LLC), Ser. A, | | | |
| 5.00%, 7/1/47 | Baa3 | 500,000 | 527,370 |
|
| (Collegiate Hsg.-Tarleton St.), 5.00%, 4/1/39 | Baa3 | 500,000 | 519,595 |
|
| (MRC Crestview), 5.00%, 11/15/36 | BB+/F | 200,000 | 205,960 |
|
| (TX A&M U. Collegiate & Student Hsg. College | | | |
| Station I, LLC), Ser. A, 5.00%, 4/1/29 | Baa3 | 530,000 | 584,786 |
|
| North Texas Edl. Fin. Co. Rev. Bonds (Uplift Edl.), | | | |
| Ser. A, 5.25%, 12/1/47 | BBB– | 2,000,000 | 2,045,320 |
|
| North TX, Tollway Auth. Rev. Bonds | | | |
|
| (1st Tier), Ser. A, 6.00%, 1/1/25 | A1 | 120,000 | 123,852 |
|
| Ser. A, 5.00%, 1/1/39 | A1 | 1,000,000 | 1,125,510 |
|
| Red River, Hlth. Retirement Fac. Dev. | | | |
| Corp. Rev. Bonds | | | |
|
| (Happy Harbor Methodist Home, Inc.), Ser. A, | | | |
| 7.75%, 11/15/44 | B–/P | 420,000 | 472,672 |
|
| (Sears Methodist Retirement Syst. Oblig. Group), | | | |
| Ser. C, 6.25%, 5/9/53 (In default) † | D/P | 39,000 | 59 |
|
| (Sears Methodist Retirement Syst. Oblig. Group), | | | |
| Ser. B, 6.15%, 11/15/49 (In default) † | D/P | 749,000 | 1,124 |
|
| (Sears Methodist Retirement Syst. Oblig. Group), | | | |
| Ser. A, 6.05%, 11/15/46 (In default) † | D/P | 441,000 | 662 |
|
| (Sears Methodist Retirement Syst. Oblig. Group), | | | |
| Ser. D, 6.05%, 11/15/46 (In default) † | D/P | 76,000 | 114 |
|
| (Sears Methodist Retirement Syst. Oblig. Group), | | | |
| Ser. A, 5.45%, 11/15/38 (In default) † | D/P | 1,124,000 | 1,686 |
|
| (Sears Methodist Retirement Syst. Oblig. Group), | | | |
| Ser. A, 5.15%, 11/15/27 (In default) † | D/P | 593,000 | 890 |
|
| Tarrant Cnty., Cultural Ed. Fac. Fin. Corp. Retirement | | | |
| Fac. Rev. Bonds | | | |
|
| (Sr. Living Ctr.), Ser. A, 8.25%, 11/15/39 | B+/P | 1,500,000 | 1,597,725 |
|
| (Buckingham Sr. Living Cmnty., Inc.), Ser. A, | | | |
| 5.50%, 11/15/45 | BB/F | 1,000,000 | 1,036,480 |
|
|
| Managed Municipal Income Trust 33 |
| | | |
| MUNICIPAL BONDS AND NOTES (130.1%)* cont. | Rating** | Principal amount | Value |
|
| Texas cont. | | | |
|
| Tarrant Cnty., Cultural Ed. Fac. Fin. Corp. Retirement | | | |
| Fac. Rev. Bonds | | | |
|
| (Buckner Retirement Svcs., Inc.), 5.25%, 11/15/37 | A/F | $1,065,000 | $1,073,169 |
|
| (Buckner Retirement Svcs., Inc.), Ser. B, | | | |
| 5.00%, 11/15/46 | A/F | 1,500,000 | 1,598,310 |
|
| TX Private Activity Surface Trans. Corp. Rev. Bonds | | | |
|
| (NTE Mobility), 7.50%, 12/31/31 | Baa2 | 2,000,000 | 2,284,160 |
|
| (LBJ Infrastructure), 7.00%, 6/30/40 | Baa3 | 2,500,000 | 2,837,050 |
|
| TX State Dept. of Hsg. & Cmnty. Affairs Rev. Bonds, | | | |
| Ser. C, GNMA Coll., FNMA Coll., FHLMC Coll., | | | |
| 6.90%, 7/2/24 | AA+ | 100,000 | 99,920 |
|
| TX State Muni. Gas Acquisition & Supply Corp. III Rev. | | | |
| Bonds, 5.00%, 12/15/28 | A3 | 1,500,000 | 1,639,365 |
|
| TX State Private Activity Bond Surface Trans. Corp. | | | |
| Rev. Bonds (Blueridge Trans. Group, LLC (SH 288 | | | |
| Toll Lane)) | | | |
|
| 5.00%, 12/31/55 | Baa3 | 500,000 | 537,405 |
|
| 5.00%, 12/31/50 | Baa3 | 750,000 | 808,965 |
|
| | | | 50,416,077 |
|
| Utah (1.1%) | | | |
|
| Murray City, Hosp. VRDN (IHC Hlth. Svcs., Inc.), | | | |
| Ser. A, 0.84%, 5/15/37 | VMIG1 | 2,800,000 | 2,800,000 |
|
| Salt Lake City, Arpt. Rev. Bonds, Ser. A | | | |
|
| 5.00%, 7/1/37 | A+ | 500,000 | 569,150 |
|
| 5.00%, 7/1/36 | A+ | 1,000,000 | 1,141,990 |
|
| | | | 4,511,140 |
|
| Virginia (2.9%) | | | |
|
| Alexandria, Indl. Dev. Auth. Res. Care Fac. Mtge. Rev. | | | |
| Bonds (Goodwin House, Inc.), 5.00%, 10/1/45 | BBB/F | 1,500,000 | 1,615,065 |
|
| Cherry Hill Cmnty., Dev. Auth. 144A Special Assmt. | | | |
| Bonds (Potomac Shores), 5.40%, 3/1/45 | B/P | 1,000,000 | 1,005,620 |
|
| Chesapeake Bay Bridge & Tunnel Dist. Rev. Bonds | | | |
| (1st Tier Gen. Resolution), 5.00%, 7/1/46 | Baa2 | 1,000,000 | 1,105,910 |
|
| Henrico Cnty., Econ. Dev. Auth. Res. Care Fac. Rev. | | | |
| Bonds (United Methodist Homes), 5.00%, 6/1/22 | BB+/P | 625,000 | 685,306 |
|
| Lexington, Indl. Dev. Auth. Res. Care Fac. Rev. Bonds | | | |
| (Kendal at Lexington), 4.00%, 1/1/31 | BBB–/F | 675,000 | 674,973 |
|
| Lower Magnolia Green Cmnty., Dev. Auth. 144A | | | |
| Special Assmt. Bonds, 5.00%, 3/1/35 | B/P | 490,000 | 498,217 |
|
| Lynchburg, Indl. Dev. Auth. Res. Care Fac. Rev. | | | |
| Bonds (Westminster-Canterbury) | | | |
|
| 5.00%, 7/1/31 | BB+/P | 1,250,000 | 1,258,213 |
|
| 4.875%, 7/1/21 | BB+/P | 1,000,000 | 1,006,370 |
|
| Suffolk, Econ. Dev. Auth. Retirement Fac. Rev. | | | |
| Bonds (United Church Homes & Svcs. Oblig. Group), | | | |
| 5.00%, 9/1/31 | BB/P | 500,000 | 533,765 |
|
| VA State Small Bus. Fin. Auth. Rev. Bonds | | | |
|
| (Elizabeth River Crossings OPCO, LLC), | | | |
| 6.00%, 1/1/37 | BBB | 740,000 | 831,827 |
|
| (Express Lanes, LLC), 5.00%, 7/1/34 | BBB– | 1,150,000 | 1,214,423 |
|
|
| 34 Managed Municipal Income Trust |
| | | |
| MUNICIPAL BONDS AND NOTES (130.1%)* cont. | Rating** | Principal amount | Value |
|
| Virginia cont. | | | |
|
| Washington Cnty., Indl. Dev. Auth. Hosp. Fac. Rev. | | | |
| Bonds (Mountain States Hlth. Alliance), Ser. C, | | | |
| 7.75%, 7/1/38 | Baa1 | $1,700,000 | $1,837,003 |
|
| | | | 12,266,692 |
|
| Washington (4.7%) | | | |
|
| Port of Seattle, Rev. Bonds, Ser. C, 5.00%, 4/1/40 | A1 | 625,000 | 689,144 |
|
| Port Seattle, Port Indl. Dev. Corp. Rev. Bonds (Delta | | | |
| Airlines, Inc.), 5.00%, 4/1/30 | BB+ | 800,000 | 859,352 |
|
| Skagit Cnty., Pub. Hosp. Rev. Bonds (Dist. No. 001), | | | |
| 5.75%, 12/1/35 | Baa2 | 2,500,000 | 2,690,150 |
|
| WA State G.O. Bonds (Sr. 520 Corridor-Motor Vehicle | | | |
| Tax), Ser. C, 5.00%, 6/1/28 T | AA+ | 5,000,000 | 5,705,579 |
|
| Tobacco Settlement Auth. of WA Rev. Bonds, | | | |
| 5.25%, 6/1/32 | A– | 1,275,000 | 1,386,346 |
|
| WA State Hlth. Care Fac. Auth. FRN Mandatory Put | | | |
| Bonds (7/1/22) (Fred Hutchinson Cancer Research | | | |
| Ctr.), Ser. B, 1.765%, 1/1/42 | A | 1,700,000 | 1,709,214 |
|
| WA State Hlth. Care Fac. Auth. Rev. Bonds | | | |
|
| (WA Hlth. Svcs.), 7.00%, 7/1/39 | | | |
| (Prerefunded 7/1/19) | Baa1 | 1,000,000 | 1,122,890 |
|
| (Kadlec Med. Ctr.), 5.50%, 12/1/39 | | | |
| (Prerefunded 12/1/20) | AAA/P | 1,300,000 | 1,489,761 |
|
| (Central WA Hlth. Svcs. Assn.), 4.00%, 7/1/36 | Baa1 | 810,000 | 798,231 |
|
| WA State Hsg. Fin. Comm. Rev. Bonds (Wesley | | | |
| Homes Lea Hill), 5.00%, 7/1/41 | B/P | 500,000 | 484,960 |
|
| WA State Hsg. Fin. Comm. 144A Rev. Bonds | | | |
|
| (Heron’s Key Oblig. Group), Ser. A, 7.00%, 7/1/50 | B–/P | 500,000 | 481,890 |
|
| (Bayview Manor Homes), Ser. A, 5.00%, 7/1/46 | BB+/P | 1,230,000 | 1,236,199 |
|
| (Presbyterian Retirement Cmnty. Northwest), | | | |
| Ser. A, 5.00%, 1/1/36 | BB+/F | 1,175,000 | 1,194,740 |
|
| | | | 19,848,456 |
|
| West Virginia (0.2%) | | | |
|
| WV State Hosp. Fin. Auth. Rev. Bonds (Thomas Hlth. | | | |
| Syst.), 6.75%, 10/1/43 | B+/P | 735,000 | 753,882 |
|
| | | | 753,882 |
|
| Wisconsin (1.7%) | | | |
|
| Pub. Fin. Auth. Arpt. Fac. Rev. Bonds (Sr. Oblig. | | | |
| Group), 5.25%, 7/1/28 | BBB | 350,000 | 373,562 |
|
| Pub. Fin. Auth. Exempt Fac. Rev. Bonds (Celanese | | | |
| U.S. Holdings, LLC), Ser. C, 4.30%, 11/1/30 | Baa3 | 300,000 | 302,226 |
|
| WI State Hlth. & Edl. Fac. Auth. Rev. Bonds | | | |
|
| (St. Johns Cmntys. Inc.), Ser. A, 7.625%, 9/15/39 | | | |
| (Prerefunded 9/15/19) | AAA/F | 1,350,000 | 1,553,486 |
|
| (Prohealth Care, Inc.), 6.625%, 2/15/39 | | | |
| (Prerefunded 2/15/19) | AAA/P | 1,250,000 | 1,372,300 |
|
| (St. John’s Cmnty., Inc.), Ser. B, 5.00%, 9/15/45 | BBB+/F | 250,000 | 260,605 |
|
| WI State Pub. Fin. Auth Sr. Living Rev. Bonds (Rose | | | |
| Villa, Inc.), Ser. A, 5.75%, 11/15/44 | BB–/P | 1,800,000 | 1,884,996 |
|
|
| Managed Municipal Income Trust 35 |
| | | |
| MUNICIPAL BONDS AND NOTES (130.1%)* cont. | Rating** | Principal amount | Value |
|
| Wisconsin cont. | | | |
|
| WI State Pub. Fin. Auth Sr. Living 144A Rev. Bonds | | | |
| (Mary’s Woods at Marylhurst), Ser. A, 5.25%, 5/15/37 | BB/F | $380,000 | $402,488 |
|
| WI State Pub. Fin. Auth. 144A Rev. Bonds (Church | | | |
| Home of Hartford, Inc.), Ser. A, 5.00%, 9/1/30 | BB/F | 945,000 | 976,544 |
|
| | | | 7,126,207 |
|
| Total municipal bonds and notes (cost $514,421,219) | | $545,475,094 |
|
| |
| PREFERRED STOCKS (0.4%)* | | Shares | Value |
|
| MuniMae Tax Exempt Bond Subsidiary, LLC 144A Ser. A-5, 5s cum. pfd. | 1,625,000 | $1,673,750 |
|
| Total preferred stocks (cost $1,625,000) | | | $1,673,750 |
|
| |
| COMMON STOCKS (0.0%)* | | Shares | Value |
|
| Tembec, Inc. (Canada) † | | 1,750 | $3,795 |
|
| Total common stocks (cost $1,273,945) | | | $3,795 |
|
| |
| TOTAL INVESTMENTS | | | |
|
| Total investments (cost $517,320,164) | | | $547,152,639 |
|
Notes to the fund’s portfolio
Unless noted otherwise, the notes to the fund’s portfolio are for the close of the fund’s reporting period, which ran from November 1, 2016 through April 30, 2017 (the reporting period). Within the following notes to the portfolio, references to “ASC 820” represent Accounting Standards Codification 820 Fair Value Measurements and Disclosures and references to “OTC”, if any, represent over-the-counter.
* Percentages indicated are based on net assets of $419,312,543.
** The Moody’s, Standard & Poor’s or Fitch ratings indicated are believed to be the most recent ratings available at the close of the reporting period for the securities listed. Ratings are generally ascribed to securities at the time of issuance. While the agencies may from time to time revise such ratings, they undertake no obligation to do so, and the ratings do not necessarily represent what the agencies would ascribe to these securities at the close of the reporting period. Securities rated by Fitch are indicated by “/F.” Securities rated by Putnam are indicated by “/P.” The Putnam rating categories are comparable to the Standard & Poor’s classifications. If a security is insured, it will usually be rated by the ratings organizations based on the financial strength of the insurer.
† This security is non-income-producing.
†† The interest rate and date shown parenthetically represent the new interest rate to be paid and the date the fund will begin accruing interest at this rate.
## Forward commitment, in part or in entirety (Note 1).
F This security is valued by Putnam Management at fair value following procedures approved by the Trustees. Securities may be classified as Level 2 or Level 3 for ASC 820 based on the securities’ valuation inputs (Note 1).
T Underlying security in a tender option bond transaction. This security has been segregated as collateral for financing transactions.
At the close of the reporting period, the fund maintained liquid assets totaling $17,016,820 to cover tender option bonds.
144A after the name of an issuer represents securities exempt from registration under Rule 144A of the Securities Act of 1933, as amended. These securities may be resold in transactions exempt from registration, normally to qualified institutional buyers.
On Mandatory Put Bonds, the rates shown are the current interest rates at the close of the reporting period and the dates shown represent the next mandatory put dates.
The dates shown parenthetically on prerefunded bonds represent the next prerefunding dates.
The dates shown on debt obligations are the original maturity dates.
|
| 36 Managed Municipal Income Trust |
The fund had the following sector concentrations greater than 10% at the close of the reporting period (as a percentage of net assets):
| | |
| Health care | 31.3% | |
| |
| Transportation | 16.4 | |
| |
| Utilities | 15.4 | |
| |
| Prerefunded | 13.3 | |
| |
ASC 820 establishes a three-level hierarchy for disclosure of fair value measurements. The valuation hierarchy is based upon the transparency of inputs to the valuation of the fund’s investments. The three levels are defined as follows:
Level 1: Valuations based on quoted prices for identical securities in active markets.
Level 2: Valuations based on quoted prices in markets that are not active or for which all significant inputs are observable, either directly or indirectly.
Level 3: Valuations based on inputs that are unobservable and significant to the fair value measurement.
The following is a summary of the inputs used to value the fund’s net assets as of the close of the reporting period:
| | | | |
| | | | | Valuation inputs | |
|
| Investments in securities: | | Level 1 | Level 2 | Level 3 |
|
| Common stocks*: | | | | |
|
| Basic materials | | $3,795 | $— | $— |
|
| Total common stocks | | 3,795 | — | — |
| | | | | |
| Municipal bonds and notes | | — | 545,462,190 | 12,904 |
|
| Preferred stocks | | — | 1,673,750 | — |
|
| Totals by level | | $3,795 | $547,135,940 | $12,904 |
*Common stock classifications are presented at the sector level, which may differ from the fund’s portfolio presentation.
During the reporting period, transfers within the fair value hierarchy, if any, did not represent, in the aggregate, more than 1% of the fund’s net assets measured as of the end of the period. Transfers are accounted for using the end of period pricing valuation method.
At the start and close of the reporting period, Level 3 investments in securities represented less than 1% of the fund’s net assets and were not considered a significant portion of the fund’s portfolio.
The accompanying notes are an integral part of these financial statements.
|
| Managed Municipal Income Trust 37 |
Statement of assets and liabilities 4/30/17 (Unaudited)
| |
| ASSETS | |
|
| Investment in securities, at value (Note 1): | |
| Unaffiliated issuers (identified cost $517,320,164) | $547,152,639 |
|
| Cash | 1,065,129 |
|
| Interest and other receivables | 8,470,765 |
|
| Receivable for investments sold | 13,409,312 |
|
| Receivable for custodian fees (Note 2) | 79 |
|
| Prepaid assets | 50,908 |
|
| Total assets | 570,148,832 |
|
| |
| LIABILITIES | |
|
| Payable for investments purchased | 9,062,246 |
|
| Payable for purchases of delayed delivery securities (Note 1) | 1,252,752 |
|
| Payable for compensation of Manager (Note 2) | 720,916 |
|
| Payable for investor servicing fees (Note 2) | 34,852 |
|
| Payable for Trustee compensation and expenses (Note 2) | 204,581 |
|
| Payable for administrative services (Note 2) | 1,642 |
|
| Payable for floating rate notes issued (Note 1) | 13,574,407 |
|
| Distributions payable to shareholders | 1,809,030 |
|
| Distributions payable to preferred shareholders (Note 1) | 32,897 |
|
| Other accrued expenses | 642,966 |
|
| Total liabilities | 27,336,289 |
| Series A remarketed preferred shares: (245 shares authorized and issued at $245 per | |
| share) (Note 4) | 24,500,000 |
|
| Series C remarketed preferred shares: (1,980 shares authorized and issued at $50,000 per | |
| share) (Note 4) | 99,000,000 |
|
| Net assets | $419,312,543 |
|
| |
| REPRESENTED BY | |
|
| Paid-in capital — common shares (Unlimited shares authorized) (Notes 1 and 5) | $415,803,059 |
|
| Distributions in excess of net investment income (Note 1) | (1,890,607) |
|
| Accumulated net realized loss on investments (Note 1) | (24,432,384) |
|
| Net unrealized appreciation of investments | 29,832,475 |
|
| Total — Representing net assets applicable to common shares outstanding | $419,312,543 |
|
| |
| COMPUTATION OF NET ASSET VALUE | |
|
| Net asset value per common share | |
| ($419,312,543 divided by 53,735,135 shares) | $7.80 |
The accompanying notes are an integral part of these financial statements.
|
| 38 Managed Municipal Income Trust |
Statement of operations Six months ended 4/30/17 (Unaudited)
| |
| INVESTMENT INCOME | |
|
| Interest income | $13,102,823 |
|
| Total investment income | 13,102,823 |
|
| |
| EXPENSES | |
|
| Compensation of Manager (Note 2) | 1,452,041 |
|
| Investor servicing fees (Note 2) | 104,376 |
|
| Custodian fees (Note 2) | 5,640 |
|
| Trustee compensation and expenses (Note 2) | 12,227 |
|
| Administrative services (Note 2) | 7,553 |
|
| Interest and fees expense (Note 2) | 87,914 |
|
| Legal | 235,725 |
|
| Preferred share remarketing agent fees | 93,141 |
|
| Other | 463,967 |
|
| Total expenses | 2,462,584 |
| | |
| Expense reduction (Note 2) | (10,580) |
|
| Net expenses | 2,452,004 |
| |
| Net investment income | 10,650,819 |
|
| |
| Net realized gain on investments (Notes 1 and 3) | 2,683,340 |
|
| Net unrealized depreciation of investments during the period | (18,216,131) |
|
| Net loss on investments | (15,532,791) |
| |
| Net decrease in net assets resulting from operations | $(4,881,972) |
|
| |
| DISTRIBUTIONS TO SERIES A AND C REMARKETED PREFERRED SHAREHOLDERS (NOTE 1): | |
|
| From ordinary income | |
|
| Taxable net investment income | (25,422) |
|
| From tax exempt net investment income | (515,102) |
|
| Net decrease in net assets resulting from operations (applicable to common shareholders) | (5,422,496) |
|
The accompanying notes are an integral part of these financial statements.
|
| Managed Municipal Income Trust 39 |
Statement of changes in net assets
| | |
| INCREASE (DECREASE) IN NET ASSETS | Six months ended 4/30/17* | Year ended 10/31/16 |
|
| Operations | | |
|
| Net investment income | $10,650,819 | $23,046,051 |
|
| Net realized gain on investments | 2,683,340 | 322,266 |
|
| Net unrealized appreciation (depreciation) of investments | (18,216,131) | 7,794,261 |
|
| Net increase (decrease) in net assets resulting | | |
| from operations | (4,881,972) | 31,162,578 |
| |
| DISTRIBUTIONS TO SERIES A AND C REMARKETED | | |
| PREFERRED SHAREHOLDERS (NOTE 1): | | |
|
| From ordinary income | | |
| Taxable net investment income | (25,422) | (8,010) |
|
| From tax exempt net investment income | (515,102) | (638,588) |
|
| Net increase (decrease) in net assets resulting from | | |
| operations (applicable to common shareholders) | (5,422,496) | 30,515,980 |
| |
| DISTRIBUTIONS TO COMMON SHAREHOLDERS: (NOTE 1) | | |
|
| From ordinary income | | |
| Taxable net investment income | (807,686) | (1,112,852) |
|
| From tax exempt net investment income | (10,057,558) | (22,340,413) |
|
| Decrease from shares repurchased (Note 5) | (708,285) | (786,170) |
|
| Total increase (decrease) in net assets | (16,996,025) | 6,276,545 |
|
| |
| NET ASSETS | | |
|
| Beginning of period | 436,308,568 | 430,032,023 |
|
| End of period (including distributions in excess | | |
| of net investment income of $1,890,607 and $1,135,658, | | |
| respectively) | $419,312,543 | $436,308,568 |
| |
| NUMBER OF FUND SHARES | | |
|
| Common shares outstanding at beginning of period | 53,834,820 | 53,943,915 |
|
| Shares repurchased (Note 5) | (99,685) | (109,095) |
|
| Common shares outstanding at end of period | 53,735,135 | 53,834,820 |
|
| Remarketed preferred shares outstanding and | | |
| end of period | 2,225 | 2,225 |
* Unaudited.
The accompanying notes are an integral part of these financial statements.
|
| 40 Managed Municipal Income Trust |
Financial highlights (For a common share outstanding throughout the period)
| | | | | | | |
| PER-SHARE OPERATING PERFORMANCE | | | | | | | |
|
| Six months | | | | | | |
| | ended** | | | | Year ended | | |
| |
|
| | 4/30/17 | | 10/31/16 | 10/31/15 | 10/31/14 | 10/31/13 | 10/31/12 |
| Net asset value, beginning of period | | | | | | | |
| (common shares) | $8.10 | | $7.97 | $7.94 | $7.34 | $8.10 | $7.37 |
| Investment operations: | | | | | | | |
|
| Net investment income a | .20 | | .43 | .45 | .45 | .47 | .48 |
|
| Net realized and unrealized | | | | | | | |
| gain (loss) on investments | (.29) | | .15 | (.02) | .59 | (.76) | .72 |
|
| Total from investment operations | (.09) | | .58 | .43 | 1.04 | (.29) | 1.20 |
| Distributions to preferred shareholders: | | | | | | |
|
| From net investment income | (.01) | | (.01) | — e | — e | — e | — e |
|
| Total from investment operations | | | | | | | |
| (applicable to common shareholders) | (.10) | | .57 | .43 | 1.04 | (.29) | 1.20 |
| Distributions to common shareholders: | | | | | | | |
|
| From net investment income | (.20) | | (.44) | (.43) | (.46) | (.47) | (.47) |
|
| Total distributions | (.20) | | (.44) | (.43) | (.46) | (.47) | (.47) |
|
| Increase from shares repurchased | — e | | — e | .03 | .02 | — e | — |
|
| Net asset value, end of period | | | | | | | |
| (common shares) | $7.80 | | $8.10 | $7.97 | $7.94 | $7.34 | $8.10 |
|
| Market price, end of period | | | | | | | |
| (common shares) | $7.39 | | $7.48 | $7.30 | $7.17 | $6.70 | $8.37 |
|
| Total return at market price (%) | | | | | | | |
| (common shares) b | 1.56* | | 8.38 | 8.11 | 14.18 | (14.78) | 18.52 |
| |
| RATIOS AND SUPPLEMENTAL DATA | | | | | | | |
|
| Net assets, end of period | | | | | | | |
| (common shares) (in thousands) | $419,313 | | $436,309 | $430,032 | $445,877 | $421,307 | $466,728 |
|
| Ratio of expenses to average net assets | | | | | | | |
| (including interest expense) (%) c,d,f | .59*g | | .92 | .90 | .91 | .90 | .89 |
|
| Ratio of net investment income | | | | | | | |
| to average net assets (%) c | 2.42* | | 5.09 | 5.57 | 5.69 | 5.91 | 6.12 |
|
| Portfolio turnover (%) | 12* | | 24 | 13 | 14 | 15 | 15 |
|
* Not annualized.
** Unaudited.
a Per share net investment income has been determined on the basis of the weighted average number of shares outstanding during the period.
b Total return assumes dividend reinvestment.
c Ratios reflect net assets available to common shares only; net investment income ratio also reflects reduction for dividend payments to preferred shareholders.
d Includes amounts paid through expense offset arrangements, if any (Note 2).
e Amount represents less than $0.01 per share.
f Includes interest and fee expense associated with borrowings which amounted to:
| |
| | Percentage of average |
| | net assets |
|
| April 30, 2017 | 0.02% |
|
| October 31, 2016 | 0.03 |
|
| October 31, 2015 | 0.02 |
|
| October 31, 2014 | 0.02 |
|
| October 31, 2013 | 0.02 |
|
| October 31, 2012 | 0.02 |
|
g Includes 0.12% of increased proxy solicitation and legal fees related to the 2017 annual shareholder meeting.
The accompanying notes are an integral part of these financial statements.
|
| Managed Municipal Income Trust 41 |
Notes to financial statements 4/30/17 (Unaudited)
Within the following Notes to financial statements, references to “State Street” represent State Street Bank and Trust Company, references to “the SEC” represent the Securities and Exchange Commission, references to “Putnam Management” represent Putnam Investment Management, LLC, the fund’s manager, an indirect wholly-owned subsidiary of Putnam Investments, LLC and references to “OTC”, if any, represent over-the-counter. Unless otherwise noted, the “reporting period” represents the period from November 1, 2016 through April 30, 2017.
Putnam Managed Municipal Income Trust (the fund) is a Massachusetts business trust, which is registered under the Investment Company Act of 1940, as amended, as a diversified closed-end management investment company. The goal of the fund is to seek a high level of current income exempt from federal income tax. The fund intends to achieve its objective by investing in a diversified portfolio of tax-exempt municipal securities which Putnam Management believes does not involve undue risk to income or principal. Up to 60% of the fund’s assets may consist of high-yield tax-exempt municipal securities that are below investment grade and involve special risk considerations. The fund’s shares trade on a stock exchange at market prices, which may be lower than the fund’s net asset value. The fund also uses leverage, primarily by issuing preferred shares in an effort to enhance the returns for the common shareholders. The fund also uses leverage which involves risk and may increase the volatility of the fund’s net asset value.
In the normal course of business, the fund enters into contracts that may include agreements to indemnify another party under given circumstances. The fund’s maximum exposure under these arrangements is unknown as this would involve future claims that may be, but have not yet been, made against the fund. However, the fund’s management team expects the risk of material loss to be remote.
The fund has entered into contractual arrangements with an investment adviser, administrator, transfer agent and custodian, who each provide services to the fund. Unless expressly stated otherwise, shareholders are not parties to, or intended beneficiaries of these contractual arrangements, and these contractual arrangements are not intended to create any shareholder right to enforce them against the service providers or to seek any remedy under them against the service providers, either directly or on behalf of the fund.
Under the fund’s Declaration of Trust, any claims asserted against or on behalf of the Putnam Funds, including claims against Trustees and Officers, must be brought in state and federal courts located within the Commonwealth of Massachusetts.
Note 1: Significant accounting policies
The following is a summary of significant accounting policies consistently followed by the fund in the preparation of its financial statements. The preparation of financial statements is in conformity with accounting principles generally accepted in the United States of America and requires management to make estimates and assumptions that affect the reported amounts of assets and liabilities in the financial statements and the reported amounts of increases and decreases in net assets from operations. Actual results could differ from those estimates. Subsequent events after the Statement of assets and liabilities date through the date that the financial statements were issued have been evaluated in the preparation of the financial statements.
Security valuation Portfolio securities and other investments are valued using policies and procedures adopted by the Board of Trustees. The Trustees have formed a Pricing Committee to oversee the implementation of these procedures and have delegated responsibility for valuing the fund’s assets in accordance with these procedures to Putnam Management. Putnam Management has established an internal Valuation Committee that is responsible for making fair value determinations, evaluating the effectiveness of the pricing policies of the fund and reporting to the Pricing Committee.
Tax-exempt bonds and notes are generally valued on the basis of valuations provided by an independent pricing service approved by the Trustees. Such services use information with respect to transactions in bonds, quotations from bond dealers, market transactions in comparable securities and various relationships between securities in determining value. These securities will generally be categorized as Level 2.
Certain investments, including certain restricted and illiquid securities and derivatives, are also valued at fair value following procedures approved by the Trustees. To assess the continuing appropriateness of fair valuations, the Valuation Committee reviews and affirms the reasonableness of such valuations on a regular basis after considering all relevant information that is reasonably available. Such valuations and procedures are reviewed periodically by the Trustees. These valuations consider such factors as significant market or specific security events such as interest rate or credit quality changes, various relationships with other securities, discount rates, U.S. Treasury, U.S. swap and credit yields, index levels, convexity exposures, recovery rates, sales and other
|
| 42 Managed Municipal Income Trust |
multiples and resale restrictions. These securities are classified as Level 2 or as Level 3 depending on the priority of the significant inputs. The fair value of securities is generally determined as the amount that the fund could reasonably expect to realize from an orderly disposition of such securities over a reasonable period of time. By its nature, a fair value price is a good faith estimate of the value of a security in a current sale and does not reflect an actual market price, which may be different by a material amount.
Security transactions and related investment income Security transactions are recorded on the trade date (the date the order to buy or sell is executed). Gains or losses on securities sold are determined on the identified cost basis.
Interest income is recorded on the accrual basis. All premiums/discounts are amortized/accreted on a yield-to-maturity basis. The premium in excess of the call price, if any, is amortized to the call date; thereafter, any remaining premium is amortized to maturity.
Securities purchased or sold on a delayed delivery basis may be settled at a future date beyond customary settlement time; interest income is accrued based on the terms of the securities. Losses may arise due to changes in the fair value of the underlying securities or if the counterparty does not perform under the contract.
Tender option bond transactions The fund may participate in transactions whereby a fixed-rate bond is transferred to a tender option bond trust (TOB trust) sponsored by a broker. The TOB trust funds the purchase of the fixed rate bonds by issuing floating-rate bonds to third parties and allowing the fund to retain the residual interest in the TOB trust’s assets and cash flows, which are in the form of inverse floating rate bonds. The inverse floating rate bonds held by the fund give the fund the right to (1) cause the holders of the floating rate bonds to tender their notes at par, and (2) to have the fixed-rate bond held by the TOB trust transferred to the fund, causing the TOB trust to collapse. The fund accounts for the transfer of the fixed-rate bond to the TOB trust as a secured borrowing by including the fixed-rate bond in the fund’s portfolio and including the floating rate bond as a liability in the Statement of assets and liabilities. At the close of the reporting period, the fund’s investments with a value of $30,591,227 were held by the TOB trust and served as collateral for $13,574,407 in floating-rate bonds outstanding. For the reporting period ended, the fund incurred interest expense of $48,539 for these investments based on an average interest rate of 0.54%.
Federal taxes It is the policy of the fund to distribute all of its income within the prescribed time period and otherwise comply with the provisions of the Internal Revenue Code of 1986, as amended (the Code), applicable to regulated investment companies. It is also the intention of the fund to distribute an amount sufficient to avoid imposition of any excise tax under Section 4982 of the Code.
The fund is subject to the provisions of Accounting Standards Codification 740 Income Taxes (ASC 740). ASC 740 sets forth a minimum threshold for financial statement recognition of the benefit of a tax position taken or expected to be taken in a tax return. The fund did not have a liability to record for any unrecognized tax benefits in the accompanying financial statements. No provision has been made for federal taxes on income, capital gains or unrealized appreciation on securities held nor for excise tax on income and capital gains. Each of the fund’s federal tax returns for the prior three fiscal years remains subject to examination by the Internal Revenue Service.
At October 31, 2016, the fund had a capital loss carryover of $27,313,079 available to the extent allowed by the Code to offset future net capital gain, if any. For any carryover, the amount of the carryover and that carryover’s expiration date is:
| | | |
| | Loss carryover | |
|
| Short-term | Long-term | Total | Expiration |
|
| $769,263 | $6,073,917 | $6,843,180 | * |
|
| 12,490,924 | N/A | 12,490,924 | October 31, 2017 |
|
| 3,146,619 | N/A | 3,146,619 | October 31, 2018 |
|
| 4,832,356 | N/A | 4,832,356 | October 31, 2019 |
* Under the Regulated Investment Company Modernization Act of 2010, the fund will be permitted to carry forward capital losses incurred in taxable years beginning after December 22, 2010 for an unlimited period. However, any losses incurred will be required to be utilized prior to the losses incurred in pre-enactment tax years. As a result of this ordering rule, pre-enactment capital loss carryforwards may be more likely to expire unused. Additionally, post-enactment capital losses that are carried forward will retain their character as either short-term or long-term capital losses rather than being considered all short-term as under previous law.
|
| Managed Municipal Income Trust 43 |
The aggregate identified cost on a tax basis is $516,974,153, resulting in gross unrealized appreciation and depreciation of $36,716,624 and $6,538,138, respectively, or net unrealized appreciation of $30,178,486.
Distributions to shareholders Distributions to common and preferred shareholders from net investment income are recorded by the fund on the ex-dividend date. Distributions from capital gains, if any, are recorded on the ex-dividend date and paid at least annually. Dividends on remarketed preferred shares become payable when, as and if declared by the Trustees. Each dividend period for the remarketed preferred shares Series A is generally a 28 day period, and generally a 7 day period for Series C. The applicable dividend rate for the remarketed preferred shares on April 30, 2016 was 1.034% for Series A, and 1.100% for Series C. The amount and character of income and gains to be distributed are determined in accordance with income tax regulations, which may differ from generally accepted accounting principles. Dividend sources are estimated at the time of declaration. Actual results may vary. Any non-taxable return of capital cannot be determined until final tax calculations are completed after the end of the fund’s fiscal year. Reclassifications are made to the fund’s capital accounts to reflect income and gains available for distribution (or available capital loss carryovers) under income tax regulations.
During the reporting period, the fund has experienced unsuccessful remarketings of its remarketed preferred shares. As a result, dividends to the remarketed preferred shares have been paid at the “maximum dividend rate,” pursuant to the fund’s by-laws, which, based on the current credit quality of the remarketed preferred shares, equals 110% of the 60-day “AA” composite commercial paper rate.
Determination of net asset value Net asset value of the common shares is determined by dividing the value of all assets of the fund, less all liabilities and the liquidation preference (redemption value of preferred shares, plus accumulated and unpaid dividends) of any outstanding remarketed preferred shares, by the total number of common shares outstanding as of period end.
Note 2: Management fee, administrative services and other transactions
The fund pays Putnam Management for management and investment advisory services quarterly based on the average net assets of the fund, including assets attributable to preferred shares. Such fee is based on the following annual rates based on the average weekly net assets attributable to common and preferred shares.
The lesser of (i) 0.550% of average net assets attributable to common and preferred shares outstanding, or (ii) the following rates:
| | | | |
| | of the first $500 million of average | | | of the next $5 billion of average weekly |
| 0.650% | weekly net assets, | | 0.425% | net assets. |
| |
|
| | of the next $500 million of average | | | of the next $5 billion of average weekly |
| 0.550% | weekly net assets | | 0.405% | net assets. |
| |
|
| of the next $500 million of average | | | of the next $5 billion of average weekly |
| 0.500% | weekly net assets | | 0.390% | net assets, |
| |
|
| of the next $5 billion of average weekly | | 0.380% | of any excess thereafter. |
| 0.450% | net assets. | | | |
For the reporting period, the management fee represented an effective rate (excluding the impact from any expense waivers in effect) of 0.269% of the fund’s average net assets.
If dividends payable on remarketed preferred shares during any dividend payment period plus any expenses attributable to remarketed preferred shares for that period exceed the fund’s gross income attributable to the proceeds of the remarketed preferred shares during that period, then the fee payable to Putnam Management for that period will be reduced by the amount of the excess (but not more than the effective management fees rate under the contract multiplied by the liquidation preference of the remarketed preferred shares outstanding during the period).
Putnam Investments Limited (PIL), an affiliate of Putnam Management, is authorized by the Trustees to manage a separate portion of the assets of the fund as determined by Putnam Management from time to time. PIL did not manage any portion of the assets of the fund during the reporting period. If Putnam Management were to engage the services of PIL, Putnam Management would pay a quarterly sub-management fee to PIL for its services at an annual rate of 0.40% of the average net assets of the portion of the fund managed by PIL.
|
| 44 Managed Municipal Income Trust |
The fund reimburses Putnam Management an allocated amount for the compensation and related expenses of certain officers of the fund and their staff who provide administrative services to the fund. The aggregate amount of all such reimbursements is determined annually by the Trustees.
Custodial functions for the fund’s assets are provided by State Street. Custody fees are based on the fund’s asset level, the number of its security holdings and transaction volumes.
Putnam Investor Services, Inc., an affiliate of Putnam Management, provides investor servicing agent functions to the fund. Putnam Investor Services, Inc. was paid a monthly fee for investor servicing at an annual rate of 0.05% of the fund’s average daily net assets. The amounts incurred for investor servicing agent functions during the reporting period are included in Investor servicing fees in the Statement of operations.
The fund has entered into expense offset arrangements with Putnam Investor Services, Inc. and State Street whereby Putnam Investor Services, Inc.’s and State Street’s fees are reduced by credits allowed on cash balances. For the reporting period, the fund’s expenses were reduced by $10,580 under the expense offset arrangements.
Each Independent Trustee of the fund receives an annual Trustee fee, of which $317, as a quarterly retainer, has been allocated to the fund, and an additional fee for each Trustees meeting attended. Trustees also are reimbursed for expenses they incur relating to their services as Trustees.
The fund has adopted a Trustee Fee Deferral Plan (the Deferral Plan) which allows the Trustees to defer the receipt of all or a portion of Trustees fees payable on or after July 1, 1995. The deferred fees remain invested in certain Putnam funds until distribution in accordance with the Deferral Plan.
The fund has adopted an unfunded noncontributory defined benefit pension plan (the Pension Plan) covering all Trustees of the fund who have served as a Trustee for at least five years and were first elected prior to 2004. Benefits under the Pension Plan are equal to 50% of the Trustee’s average annual attendance and retainer fees for the three years ended December 31, 2005. The retirement benefit is payable during a Trustee’s lifetime, beginning the year following retirement, for the number of years of service through December 31, 2006. Pension expense for the fund is included in Trustee compensation and expenses in the Statement of operations. Accrued pension liability is included in Payable for Trustee compensation and expenses in the Statement of assets and liabilities. The Trustees have terminated the Pension Plan with respect to any Trustee first elected after 2003.
Note 3: Purchases and sales of securities
During the reporting period, the cost of purchases and the proceeds from sales, excluding short-term investments, were as follows:
| | |
| | Cost of purchases | Proceeds from sales |
|
| Investments in securities (Long-term) | $63,721,867 | $71,433,423 |
|
| U.S. government securities (Long-term) | — | — |
|
| Total | $63,721,867 | $71,433,423 |
The fund may purchase or sell investments from or to other Putnam funds in the ordinary course of business, which can reduce the fund’s transaction costs, at prices determined in accordance with SEC requirements and policies approved by the Trustees. During the reporting period, purchases or sales of long-term securities from or to other Putnam funds, if any, did not represent more than 5% of the fund’s total cost of purchases and/or total proceeds from sales.
Note 4: Preferred shares
The Series A (245) and C (1,980) Remarketed Preferred shares are redeemable at the option of the fund on any dividend payment date at a redemption price of $100,000 per Series A Remarketed Preferred share and $50,000 per Series C Remarketed Preferred share, plus an amount equal to any dividends accumulated on a daily basis but unpaid through the redemption date (whether or not such dividends have been declared) and, in certain circumstances, a call premium.
It is anticipated that dividends paid to holders of remarketed preferred shares will be considered tax-exempt dividends under the Internal Revenue Code of 1986. To the extent that the fund earns taxable income and capital gains by the conclusion of a fiscal year, it may be required to apportion to the holders of the remarketed preferred shares throughout that year additional dividends as necessary to result in an after-tax equivalent to the applicable dividend rate for the period.
|
| Managed Municipal Income Trust 45 |
Under the Investment Company Act of 1940, the fund is required to maintain asset coverage of at least 200% with respect to the remarketed preferred shares. Additionally, the fund’s bylaws impose more stringent asset coverage requirements and restrictions relating to the rating of the remarketed preferred shares by the shares’ rating agencies. Should these requirements not be met, or should dividends accrued on the remarketed preferred shares not be paid, the fund may be restricted in its ability to declare dividends to common shareholders or may be required to redeem certain of the remarketed preferred shares. At period end, no such restrictions have been placed on the fund.
Note 5: Shares repurchased
In September 2016, the Trustees approved the renewal of the repurchase program to allow the fund to repurchase up to 10% of its outstanding common shares over the 12-month period ending October 7, 2017 (based on shares outstanding as of October 7, 2016). Prior to this renewal, the Trustees had approved a repurchase program to allow the fund to repurchase up to 10% of its outstanding common shares over the 12-month period ending October 7, 2016 (based on shares outstanding as of October 7, 2015). Repurchases are made when the fund’s shares are trading at less than net asset value and in accordance with procedures approved by the fund’s Trustees.
For the reporting period, the fund repurchased 99,685 common shares for an aggregate purchase price of $708,285, which reflects a weighted-average discount from net asset value per share of 9.33%. The weighted-average discount reflects the payment of commissions by the fund to execute repurchase trades.
For the previous fiscal year, the fund repurchased 109,095 common shares for an aggregate purchase price of $786,170, which reflected a weighted-average discount from net asset value per share of 9.74%. The weighted-average discount reflected the payment of commissions by the fund to execute repurchase trades.
At the close of the reporting period, Putnam Investments, LLC owned 1,236 shares of the fund (0.002% of shares outstanding), valued at $9,641.
Note 6: Market, credit and other risks
In the normal course of business, the fund trades financial instruments and enters into financial transactions where risk of potential loss exists due to changes in the market (market risk) or failure of the contracting party to the transaction to perform (credit risk). The fund may be exposed to additional credit risk that an institution or other entity with which the fund has unsettled or open transactions will default. The fund may invest in higher-yielding, lower-rated bonds that may have a higher rate of default.
Note 7: New pronouncements
In October 2016, the SEC adopted amendments to rules under the Investment Company Act of 1940 (“final rules”) intended to modernize the reporting and disclosure of information by registered investment companies. The final rules amend Regulation S-X and require funds to provide standardized, enhanced derivative disclosure in fund financial statements in a format designed for individual investors. The amendments to Regulation S-X also update the disclosures for other investments and investments in and advances to affiliates and amend the rules regarding the general form and content of fund financial statements. The compliance date for the amendments to Regulation S-X is August 1, 2017. Putnam Management have evaluated the amendments and their impact, if any, on the fund’s financial statements.
Note 8: Actions by Trustees
On May 25, 2017 Putnam Management announced that Putnam and the Board of Trustees of the Putnam Funds had approved in principle a tender offer by the fund to purchase up to 100% of the outstanding remarketed preferred shares of the fund for cash at a price per share equal to 89.75% of liquidation preference of each series of remarketed preferred shares. The tender offer is subject to final approval by the Trustees and certain other conditions. It is anticipated that the tender offer will be conducted in the third quarter of 2017. The fund expects to seek alternative financing to replace any remarketed preferred shares that are tendered.
|
| 46 Managed Municipal Income Trust |
Shareholder meeting results (Unaudited)
April 28, 2017 annual meeting
At the meeting, a proposal to fix the number of Trustees at 12 was approved as follows:
| | |
| Votes for | Votes against | Abstentions |
|
| 43,969,928 | 1,443,429 | 2,051,114 |
|
At the meeting, the vote by common and preferred shareholders voting together as a single class on the election of 10 nominees as the Fund’s Trustees was as follows:
| | |
| | Votes for | Votes withheld |
|
| Liaquat Ahamed | 45,877,019 | 1,587,452 |
|
| Ravi Akhoury | 45,872,829 | 1,591,642 |
|
| Barbara M. Baumann | 46,065,682 | 1,398,789 |
|
| Jameson A. Baxter | 45,777,670 | 1,686,801 |
|
| Katinka Domotorffy | 46,050,350 | 1,414,121 |
|
| Catharine Bond Hill | 45,991,295 | 1,473,176 |
|
| Paul L. Joskow | 45,974,562 | 1,489,909 |
|
| Kenneth R. Leibler | 45,726,003 | 1,738,468 |
|
| Robert L. Reynolds | 46,048,173 | 1,416,298 |
|
| Manoj P. Singh | 45,848,692 | 1,615,779 |
At the meeting, the vote on a shareholder proposal to request that the Board of Trustees afford the preferred shareholders a means to obtain liquidity for their shares was as follows:
| | |
| Votes for | Votes against | Abstentions |
|
| 1,675 | 47,462,796 | — |
|
The meeting was adjourned with respect to the election of two Trustees to be voted on by the fund’s preferred shareholders voting as a separate class. As a result, the fund’s preferred shareholders will consider election of two Trustees when the annual meeting reconvenes.
All tabulations are rounded to the nearest whole number.
|
| Managed Municipal Income Trust 47 |
Putnam family of funds
The following is a list of Putnam’s open-end mutual funds offered to the public. Investors should carefully consider the investment objective, risks, charges, and expenses of a fund before investing. For a prospectus, or a summary prospectus if available, containing this and other information for any Putnam fund or product, contact your financial advisor or call Putnam Investor Services at 1-800-225-1581. Please read the prospectus carefully before investing.
| |
| Growth | Income |
| Growth Opportunities Fund | American Government Income Fund |
| International Growth Fund | Diversified Income Trust |
| Multi-Cap Growth Fund | Emerging Markets Income Fund |
| Small Cap Growth Fund | Floating Rate Income Fund |
| Global Income Trust |
| Blend | Government Money Market Fund* |
| Capital Opportunities Fund | High Yield Advantage Fund |
| Capital Spectrum Fund | Income Fund |
| Emerging Markets Equity Fund | Money Market Fund† |
| Equity Spectrum Fund | Short Duration Income Fund |
| Europe Equity Fund | U.S. Government Income Trust |
| Global Equity Fund | |
| International Capital Opportunities Fund | Tax-free Income |
| International Equity Fund | AMT-Free Municipal Fund |
| Investors Fund | Intermediate-Term Municipal Income Fund |
| Low Volatility Equity Fund | Short-Term Municipal Income Fund |
| Multi-Cap Core Fund | Tax Exempt Income Fund |
| Research Fund | Tax-Free High Yield Fund |
| | |
| Value | State tax-free income funds‡: |
| Convertible Securities Fund | Arizona, California, Massachusetts, Michigan, |
| Equity Income Fund | Minnesota, New Jersey, New York, Ohio, |
| Global Dividend Fund | and Pennsylvania. |
| International Value Fund | |
| Multi-Cap Value Fund | |
| Small Cap Value Fund | |
|
| 48 Managed Municipal Income Trust |
| |
| Absolute Return | Retirement Income Fund Lifestyle 1 — a portfolio |
| Absolute Return 100 Fund® | with managed allocations to stocks, bonds, |
| Absolute Return 300 Fund® | and money market investments to generate |
| Absolute Return 500 Fund® | retirement income. |
| Absolute Return 700 Fund® | |
| RetirementReady® Funds — portfolios with |
| Global Sector | adjusting allocations to stocks, bonds, and |
| Global Consumer Fund | money market instruments, becoming more |
| Global Energy Fund | conservative over time. |
| Global Financials Fund | |
| Global Health Care Fund | RetirementReady® 2060 Fund |
| Global Industrials Fund | RetirementReady® 2055 Fund |
| Global Natural Resources Fund | RetirementReady® 2050 Fund |
| Global Sector Fund | RetirementReady® 2045 Fund |
| Global Technology Fund | RetirementReady® 2040 Fund |
| Global Telecommunications Fund | RetirementReady® 2035 Fund |
| Global Utilities Fund | RetirementReady® 2030 Fund |
| RetirementReady® 2025 Fund |
| Asset Allocation | RetirementReady® 2020 Fund |
| George Putnam Balanced Fund | |
| | |
| Global Asset Allocation Funds — four | |
| investment portfolios that spread your money | |
| across a variety of stocks, bonds, and money | |
| market instruments. | |
| | |
| Dynamic Asset Allocation Balanced Fund | |
| Dynamic Asset Allocation Conservative Fund | |
| Dynamic Asset Allocation Growth Fund | |
| Dynamic Risk Allocation Fund | |
* You could lose money by investing in the fund. Although the fund seeks to preserve the value of your investment at $1.00 per share, it cannot guarantee it will do so. An investment in the fund is not insured or guaranteed by the Federal Deposit Insurance Corporation or any other government agency. The fund’s sponsor has no legal obligation to provide financial support to the fund, and you should not expect that the sponsor will provide financial support to the fund at any time.
† You could lose money by investing in the fund. Although the fund seeks to preserve the value of your investment at $1.00 per share, it cannot guarantee it will do so. The fund may impose a fee upon sale of your shares or may temporarily suspend your ability to sell shares if the fund’s liquidity falls below required minimums because of market conditions or other factors. An investment in the fund is not insured or guaranteed by the Federal Deposit Insurance Corporation or any other government agency. The fund’s sponsor has no legal obligation to provide financial support to the fund, and you should not expect that the sponsor will provide financial support to the fund at any time.
‡ Not available in all states.
Check your account balances and the most recent month-end performance in the Individual Investors section at putnam.com.
|
| Managed Municipal Income Trust 49 |
Fund information
Founded over 75 years ago, Putnam Investments was built around the concept that a balance between risk and reward is the hallmark of a well-rounded financial program. We manage over 100 funds across income, value, blend, growth, asset allocation, absolute return, and global sector categories.
| | |
| Investment Manager | Trustees | James F. Clark |
| Putnam Investment | Jameson A. Baxter, Chair | Vice President and |
| Management, LLC | Kenneth R. Leibler, Vice Chair | Chief Compliance Officer |
| One Post Office Square | Liaquat Ahamed | |
| Boston, MA 02109 | Ravi Akhoury | Michael J. Higgins |
| | Barbara M. Baumann | Vice President, Treasurer, |
| Investment Sub-Advisor | Katinka Domotorffy | and Clerk |
| Putnam Investments Limited | Catharine Bond Hill | |
| 57–59 St James’s Street | Paul L. Joskow | Janet C. Smith |
| London, England SW1A 1LD | Robert E. Patterson | Vice President, |
| George Putnam, III | Principal Financial Officer, |
| Marketing Services | Robert L. Reynolds | Principal Accounting Officer, |
| Putnam Retail Management | Manoj P. Singh | and Assistant Treasurer |
| One Post Office Square | | |
| Boston, MA 02109 | Officers | Susan G. Malloy |
| Robert L. Reynolds | Vice President and |
| Custodian | President | Assistant Treasurer |
| State Street Bank | | |
| and Trust Company | Jonathan S. Horwitz | Mark C. Trenchard |
| Executive Vice President, | Vice President and |
| Legal Counsel | Principal Executive Officer, | BSA Compliance Officer |
| Ropes & Gray LLP | and Compliance Liaison | |
| | | Nancy E. Florek |
| | Robert T. Burns | Vice President, Director of |
| | Vice President and | Proxy Voting and Corporate |
| | Chief Legal Officer | Governance, Assistant Clerk, |
| | and Associate Treasurer |
|
| 50 Managed Municipal Income Trust |
Call 1-800-225-1581 Monday through Friday between 8:00 a.m. and 8:00 p.m. Eastern Time, or visit putnam.com anytime for up-to-date information about the fund’s NAV.
|
| Managed Municipal Income Trust 51 |
|
| This page left blank intentionally. |
|
| 52 Managed Municipal Income Trust |
| |
| Item 3. Audit Committee Financial Expert: |
| |
| Item 4. Principal Accountant Fees and Services: |
| |
| Item 6. Schedule of Investments: |
| |
| The registrant's schedule of investments in unaffiliated issuers is included in the report to shareholders in Item 1 above. |
| |
| Item 7. Disclosure of Proxy Voting Policies and Procedures For Closed-End Management Investment Companies: |
| |
| Item 8. Portfolio Managers of Closed-End Management Investment Companies |
| |
| (b) During the period, Garret Hamilton was named Portfolio Manager following the departure of Portfolio Manager Thalia Meehan. |
| |
| (a)(1) Portfolio Managers. The officer of Putnam Management identified below, and Paul Drury, are primarily responsible for the day-to-day management of the fund's portfolio as of the filing date of this report. |
| | | | |
| Portfolio Managers | Joined Fund | Employer | Positions Over Past Five Years |
|
|
| Garret Hamilton | 2016 | Putnam Management 2016-Present
BNY Mellon 2010-2016 | Portfolio Manager |
| |
| (a)(2) Other Accounts Managed by the Fund's Portfolio Managers. |
| |
| The following table shows the number and approximate assets of other investment accounts (or portions of investment accounts) that Garret Hamilton managed as of the fund's most recent fiscal period end. Unless noted, none of the other accounts pays a fee based on the account's performance. |
| | | | | | | |
| Portfolio Leader or Member | Other SEC-registered open-end and closed-end funds | Other accounts that pool assets from more than one client | Other accounts (including separate accounts, managed account programs and single-sponsor defined contribution plan offerings) |
|
|
| | Number of accounts | Assets | Number of accounts | Assets | Number of accounts | Assets |
| Garret Hamilton | 15 | $6,303,700,000 | 0 | $ — | 0 | $ — |
| | | | | | | |
| |
| Potential conflicts of interest in managing multiple accounts. Like other investment professionals with multiple clients, the fund's Portfolio Managers may face certain potential conflicts of interest in connection with managing both the fund and the other accounts listed under “Other Accounts Managed by the Fund's Portfolio Managers” at the same time. The paragraphs below describe some of these potential conflicts, which Putnam Management believes are faced by investment professionals at most major financial firms. As described below, Putnam Management and the Trustees of the Putnam funds have adopted compliance policies and procedures that attempt to address certain of these potential conflicts. |
| |
| The management of accounts with different advisory fee rates and/or fee structures, including accounts that pay advisory fees based on account performance (“performance fee accounts”), may raise potential conflicts of interest by creating an incentive to favor higher-fee accounts. These potential conflicts may include, among others: |
| | • | The most attractive investments could be allocated to higher-fee accounts or performance fee accounts. |
| | • | The trading of higher-fee accounts could be favored as to timing and/or execution price. For example, higher-fee accounts could be permitted to sell securities earlier than other accounts when a prompt sale is desirable or to buy securities at an earlier and more opportune time. |
| | • | The trading of other accounts could be used to benefit higher-fee accounts (front- running). |
| | • | The investment management team could focus their time and efforts primarily on higher-fee accounts due to a personal stake in compensation. |
| |
| Putnam Management attempts to address these potential conflicts of interest relating to higher-fee accounts through various compliance policies that are generally intended to place all accounts, regardless of fee structure, on the same footing for investment management purposes. For example, under Putnam Management's policies: |
| | • | Performance fee accounts must be included in all standard trading and allocation procedures with all other accounts. |
| | • | All accounts must be allocated to a specific category of account and trade in parallel with allocations of similar accounts based on the procedures generally applicable to all accounts in those groups (e.g., based on relative risk budgets of accounts). |
| | • | All trading must be effected through Putnam's trading desks and normal queues and procedures must be followed (i.e., no special treatment is permitted for performance fee accounts or higher-fee accounts based on account fee structure). |
| | • | Front running is strictly prohibited. |
| | • | The fund's Portfolio Manager(s) may not be guaranteed or specifically allocated any portion of a performance fee. |
| |
| As part of these policies, Putnam Management has also implemented trade oversight and review procedures in order to monitor whether particular accounts (including higher-fee accounts or performance fee accounts) are being favored over time. |
| |
| Potential conflicts of interest may also arise when the Portfolio Manager(s) have personal investments in other accounts that may create an incentive to favor those accounts. As a general matter and subject to limited exceptions, Putnam Management's investment professionals do not have the opportunity to invest in client accounts, other than the Putnam funds. However, in the ordinary course of business, Putnam Management or related persons may from time to time establish “pilot” or “incubator” funds for the purpose of testing proposed investment strategies and products prior to offering them to clients. These pilot accounts may be in the form of registered investment companies, private funds such as partnerships or separate accounts established by Putnam Management or an affiliate. Putnam Management or an affiliate supplies the funding for these accounts. Putnam employees, including the fund's Portfolio Manager(s), may also invest in certain pilot accounts. Putnam Management, and to the extent applicable, the Portfolio Manager(s) will benefit from the favorable investment performance of those funds and accounts. Pilot funds and accounts may, and frequently do, invest in the same securities as the client accounts. Putnam Management's policy is to treat pilot accounts in the same manner as client accounts for purposes of trading allocation — neither favoring nor disfavoring them except as is legally required. For example, pilot accounts are normally included in Putnam Management's daily block trades to the same extent as client accounts (except that pilot accounts do not participate in initial public offerings). |
| |
| A potential conflict of interest may arise when the fund and other accounts purchase or sell the same securities. On occasions when the Portfolio Manager(s) consider the purchase or sale of a security to be in the best interests of the fund as well as other accounts, Putnam Management's trading desk may, to the extent permitted by applicable laws and regulations, aggregate the securities to be sold or purchased in order to obtain the best execution and lower brokerage commissions, if any. Aggregation of trades may create the potential for unfairness to the fund or another account if one account is favored over another in allocating the securities purchased or sold — for example, by allocating a disproportionate amount of a security that is likely to increase in value to a favored account. Putnam Management's trade allocation policies generally provide that each day's transactions in securities that are purchased or sold by multiple accounts are, insofar as possible, averaged as to price and allocated between such accounts (including the fund) in a manner which in Putnam Management's opinion is equitable to each account and in accordance with the amount being purchased or sold by each account. Certain exceptions exist for specialty, regional or sector accounts. Trade allocations are reviewed on a periodic basis as part of Putnam Management's trade oversight procedures in an attempt to ensure fairness over time across accounts. |
| |
| “Cross trades,” in which one Putnam account sells a particular security to another account (potentially saving transaction costs for both accounts), may also pose a potential conflict of interest. Cross trades may be seen to involve a potential conflict of interest if, for example, one account is permitted to sell a security to another account at a higher price than an independent third party would pay, or if such trades result in more attractive investments being allocated to higher-fee accounts. Putnam Management and the fund's Trustees have adopted compliance procedures that provide that any transactions between the fund and another Putnam-advised account are to be made at an independent current market price, as required by law. |
| |
| Another potential conflict of interest may arise based on the different investment objectives and strategies of the fund and other accounts. For example, another account may have a shorter-term investment horizon or different investment objectives, policies or restrictions than the fund. Depending on another account's objectives or other factors, the Portfolio Manager(s) may give advice and make decisions that may differ from advice given, or the timing or nature of decisions made, with respect to the fund. In addition, investment decisions are the product of many factors in addition to basic suitability for the particular account involved. Thus, a particular security may be bought or sold for certain accounts even though it could have been bought or sold for other accounts at the same time. More rarely, a particular security may be bought for one or more accounts managed by the Portfolio Manager(s) when one or more other accounts are selling the security (including short sales). There may be circumstances when purchases or sales of portfolio securities for one or more accounts may have an adverse effect on other accounts. As noted above, Putnam Management has implemented trade oversight and review procedures to monitor whether any account is systematically favored over time. |
| |
| The fund's Portfolio Manager(s) may also face other potential conflicts of interest in managing the fund, and the description above is not a complete description of every conflict that could be deemed to exist in managing both the fund and other accounts. |
| |
| (a)(3) Compensation of portfolio managers. Putnam's goal for our products and investors is to deliver strong performance versus peers or performance ahead of the applicable benchmark, depending on the product, over a rolling 3-year period. Portfolio managers are evaluated and compensated, in part, based on their performance relative to this goal across the products they manage. In addition to their individual performance, evaluations take into account the performance of their group and a subjective component. |
| |
| Each portfolio manager is assigned an industry competitive incentive compensation target consistent with this goal and evaluation framework. Actual incentive compensation may be higher or lower than the target, based on individual, group, and subjective performance, and may also reflect the performance of Putnam as a firm. Typically, performance is measured over the lesser of three years or the length of time a portfolio manager has managed a product. |
| |
| Incentive compensation includes a cash bonus and may also include grants of deferred cash, stock or options. In addition to incentive compensation, portfolio managers receive fixed annual salaries typically based on level of responsibility and experience. |
| |
| For this fund, the peer group Putnam compares fund performance against is its broad investment category as determined by Lipper Inc. and identified in the shareholder report included in Item 1. |
| |
| (a)(4) Fund ownership. The following table shows the dollar ranges of shares of the fund owned by the professionals listed above at the end of the fund's last two fiscal years, including investments by their immediate family members and amounts invested through retirement and deferred compensation plans. |
| | | | | | | | | | |
| | Year | $0 | $0-$10,000 | $10,001-$50,000 | $50,001-$100,000 | $100,001-$500,000 | $500,001-$1,000,000 | $1,000,001 and over |
| Garret Hamilton | 2017+ | * |
| | 2016 | * |
| |
| +: For the semi-annual period ended 4/30/17 |
| |
| Item 9. Purchases of Equity Securities by Closed-End Management Investment Companies and Affiliated Purchasers: |
| | | | | |
| Registrant Purchase of Equity Securities | | |
| | | | | Maximum |
| | | | Total Number | Number (or |
| | | | of Shares | Approximate |
| | | | Purchased | Dollar Value) |
| | | | as Part | of Shares |
| | | | of Publicly | that May Yet Be |
| | Total Number | Average | Announced | Purchased |
| | of Shares | Price Paid | Plans or | under the Plans |
| Period | Purchased | per Share | Programs* | or Programs** |
| | | | | |
|
|
| | | | | |
| | | | | |
| November 1 — November 30, 2016 | 99,685 | $7.11 | 99,685 | 5,283,797 |
| December 1 — December 31, 2016 | — | — | — | 5,283,797 |
| January 1 — January 31, 2017 | — | — | — | 5,283,797 |
| February 1 — February 28, 2017 | — | — | — | 5,283,797 |
| March 1 — March 31, 2017 | — | — | — | 5,283,797 |
| April 1 — April 30, 2017 | — | — | — | 5,283,797 |
| | | | | |
| * | In October 2005, the Board of Trustees of the Putnam Funds initiated the closed-end fund share repurchase program, which, as subsequently amended, authorized the fund to repurchase of up to 10% of its fund's outstanding common shares over the two-years ending October 5, 2007. The Trustees have subsequently renewed the program on an annual basis. The program renewed by the Board in September 2015, which was in effect between October 8, 2015 and October 7, 2016, allowed the fund to repurchase up to 5,396,529 of its shares. The program renewed by the Board in September 2016, which is in effect between October 8, 2016 and October 7, 2017, allows the fund to repurchase up to 5,383,482 of its shares. |
| | | | |
| ** | Information prior to October 7, 2016 is based on the total number of shares eligible for repurchase under the program, as amended through September 2015. Information from October 8, 2016 forward is based on the total number of shares eligible for repurchase under the program, as amended through September 2016. | | | |
| |
| Item 10. Submission of Matters to a Vote of Security Holders: |
| |
| Item 11. Controls and Procedures: |
| |
| (a) The registrant's principal executive officer and principal financial officer have concluded, based on their evaluation of the effectiveness of the design and operation of the registrant's disclosure controls and procedures as of a date within 90 days of the filing date of this report, that the design and operation of such procedures are generally effective to provide reasonable assurance that information required to be disclosed by the registrant in this report is recorded, processed, summarized and reported within the time periods specified in the Commission's rules and forms. |
| |
| (b) Changes in internal control over financial reporting: Not applicable |
| |
| (a)(2) Separate certifications for the principal executive officer and principal financial officer of the registrant as required by Rule 30a-2(a) under the Investment Company Act of 1940, as amended, are filed herewith. |
| |
| (b) The certifications required by Rule 30a-2(b) under the Investment Company Act of 1940, as amended, are filed herewith. |
| |
| Pursuant to the requirements of the Securities Exchange Act of 1934 and the Investment Company Act of 1940, the registrant has duly caused this report to be signed on its behalf by the undersigned, thereunto duly authorized. |
| |
| Putnam Managed Municipal Income Trust |
| |
| By (Signature and Title): |
| |
| /s/ Janet C. Smith
Janet C. Smith
Principal Accounting Officer
|
| |
| Pursuant to the requirements of the Securities Exchange Act of 1934 and the Investment Company Act of 1940, this report has been signed below by the following persons on behalf of the registrant and in the capacities and on the dates indicated. |
| |
| By (Signature and Title): |
| |
| /s/ Jonathan S. Horwitz
Jonathan S. Horwitz
Principal Executive Officer
|
| |
| By (Signature and Title): |
| |
| /s/ Janet C. Smith
Janet C. Smith
Principal Financial Officer
|