| | |
| UNITED STATES
SECURITIES AND EXCHANGE COMMISSION |
| | |
| CERTIFIED SHAREHOLDER REPORT OF REGISTERED
MANAGEMENT INVESTMENT COMPANIES
|
| | |
| Investment Company Act file number: | (811-05740) |
| | |
| Exact name of registrant as specified in charter: | Putnam Managed Municipal Income Trust |
| | |
| Address of principal executive offices: | 100 Federal Street, Boston, Massachusetts 02110 |
| | |
| Name and address of agent for service: | Robert T. Burns, Vice President
100 Federal Street
Boston, Massachusetts 02110 |
| | |
| Copy to: | Bryan Chegwidden, Esq.
Ropes & Gray LLP
1211 Avenue of the Americas
New York, New York 10036 |
| | |
| Registrant's telephone number, including area code: | (617) 292-1000 |
| | |
| Date of fiscal year end: | October 31, 2019 |
| | |
| Date of reporting period: | November 1, 2018 — April 30, 2019 |
| | |
|
Item 1. Report to Stockholders: | |
| | |
| The following is a copy of the report transmitted to stockholders pursuant to Rule 30e-1 under the Investment Company Act of 1940: | |
Putnam
Managed Municipal
Income Trust
Semiannual report
4|30|19
IMPORTANT NOTICE: Delivery of paper fund reports
In accordance with regulations adopted by the Securities and Exchange Commission, beginning on January 1, 2021, reports like this one will no longer be sent by mail unless you specifically request it. Instead, they will be on Putnam’s website, and you will be notified by mail whenever a new one is available, and provided with a website link to access the report.
If you wish to stop receiving paper reports sooner, or if you wish to continue to receive paper reports free of charge after January 1, 2021, please see the back cover or insert for instructions. If you invest through a bank or broker, your choice will apply to all funds held in your account. If you invest directly with Putnam, your choice will apply to all Putnam funds in your account.
If you already receive these reports electronically, no action is required.
Message from the Trustees
June 10, 2019
Dear Fellow Shareholder:
If there is any lesson to be learned from constantly changing financial markets, it is the importance of positioning your investment portfolio for your long-term goals. We believe that one strategy is to diversify across different asset classes and investment approaches.
We also believe your mutual fund investment offers a number of advantages, including constant monitoring by experienced investment professionals who maintain a long-term perspective. Putnam’s portfolio managers and analysts take a research-intensive approach that includes risk management strategies designed to serve you through changing conditions.
Another key strategy, in our view, is seeking the counsel of a financial advisor. For over 80 years, Putnam has recognized the importance of professional investment advice. Your financial advisor can help in many ways, including defining and planning for goals such as retirement, evaluating the level of risk appropriate for you, and reviewing your investments on a regular basis and making adjustments as necessary.
As always, your fund’s Board of Trustees remains committed to protecting the interests of Putnam shareholders like you, and we thank you for investing with Putnam.


Putnam Managed Municipal Income Trust has the flexibility to invest in municipal bonds issued by any state in the country or U.S. territory. As a closed-end fund, it shares some common characteristics with open-end mutual funds, but there are some key differences that investors should understand as they consider their portfolio.

|
| 2 Managed Municipal Income Trust |
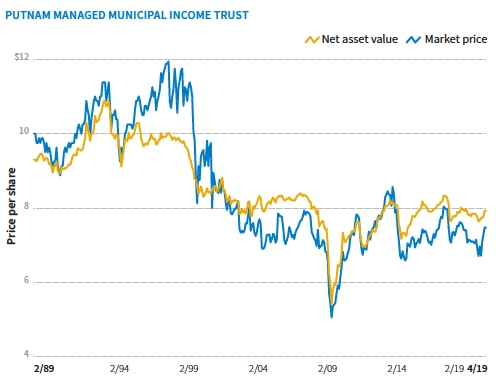
Looking at a closed-end fund’s performance
You will usually see that the NAV and the market price differ. The market price can be influenced by several factors that cause it to vary from the NAV, including fund distributions, changes in supply and demand for the fund’s shares, changing market conditions, and investor perceptions of the fund or its investment manager.
A mix of credit qualities
In addition to its flexible geographical focus, Putnam Managed Municipal Income Trust combines bonds of differing credit quality. The fund invests in high-quality bonds, but also includes an allocation to lower-rated bonds, which may offer higher income in return for more risk.
|
| Managed Municipal Income Trust 3 |

Data are historical. Past performance does not guarantee future results. More recent returns may be less or more than those shown. Investment return and net asset value will fluctuate, and you may have a gain or a loss when you sell your shares. Performance assumes reinvestment of distributions and does not account for taxes. Fund returns in the bar chart are at NAV. See below and pages 10–11 for additional performance information, including fund returns at market price. Index and Lipper results should be compared with fund performance at NAV. Fund results reflect the use of leverage, while index results are unleveraged and Lipper results reflect varying use of, and methods for, leverage.
*Returns for the six-month period are not annualized, but cumulative.

This comparison shows your fund’s performance in the context of broad market indexes for the six months ended 4/30/19. See above and pages 10–11 for additional fund performance information. Index descriptions can be found on page 13.
| |
| 4 Managed Municipal Income Trust |


How was the market for municipal bonds during the period?
Municipal bonds performed well on both an absolute basis and relative to other asset classes for the period, with much of the momentum coming in the second half of the period. During the first three months of the period, which coincided with the fourth quarter of 2018, markets were rattled by several concerns, including rising interest rates, the partial U.S. government shutdown, slowing global growth, and geopolitical tensions. Investors responded by selling higher-risk equity and fixed-income investments and buying more conservative fixed-income investments.
With the prevailing macroeconomic and geopolitical winds presenting some uncertainty about the pace of global growth, the Federal Reserve became quite dovish in its outlook for future interest-rate hikes during the first quarter of 2019. The shift in the Fed’s monetary policy, combined with the end of the federal government shutdown in January 2019 and optimism over a U.S.–China trade agreement, rallied investor sentiment and increased demand for higher-risk assets.
|
| Managed Municipal Income Trust 5 |
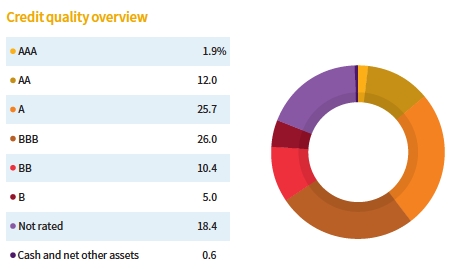
Credit qualities are shown as a percentage of the fund’s net assets (common and preferred shares) as of 4/30/19.A bond rated BBB or higher (SP-3 or higher, for short-term debt) is considered investment grade. This chart reflects the highest security rating provided by one or more of Standard & Poor’s, Moody’s, and Fitch. Ratings may vary over time.
Cash and net other assets, if any, represent the market value weights of cash, derivatives, and short-term securities in the portfolio. The fund itself has not been rated by an independent rating agency.
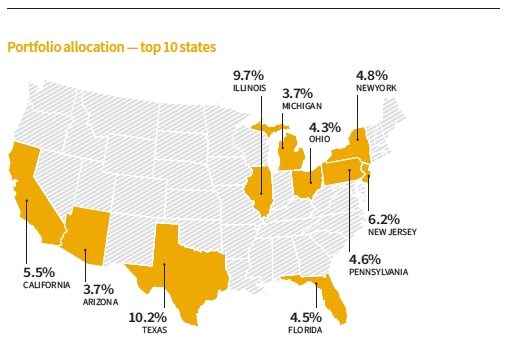
Top ten state allocations are shown as a percentage of the fund’s net assets (common and preferred shares) as of 4/30/19. Investments in Puerto Rico represented 0.2% of the fund’s net assets. Summary information may differ from the portfolio schedule included in the financial statements due to the differing treatment of interest accruals, the floating rate portion of tender option bonds, derivative securities, if any, the timing of matured security transactions, the use of different classifications of securities for presentation purposes, and rounding. Holdings and allocations may vary over time.
| |
| 6 Managed Municipal Income Trust |
Technicals, or supply and demand dynamics, were favorable during the period. With the Tax Cuts and Jobs Act of 2017 capping the deductibility of state and local taxes at $10,000 a year, many Americans faced higher taxes for 2018. As a result, tax-exempt bond funds saw heightened demand and record inflows, which supported prices.
Given their favorable technicals, tax-exempt municipal bonds enjoyed solid returns that outperformed Treasuries and the fixed-income markets for the period.
How did the fund perform during the reporting period?
For the six months ended April 30, 2019, the fund outperformed the Bloomberg Barclays Municipal Bond Index [the municipal benchmark] but underperformed the average return of its Lipper peer group, High Yield Municipal Debt Funds.
What was your investment approach?
We favored an overweight position in bonds with longer intermediate maturities while underweighting shorter intermediate and long maturity holdings as compared with the fund’s municipal benchmark. Consequently, the fund’s yield-curve positioning had more of a bulleted portfolio structure focused on the intermediate portion of the curve at period-end, which resulted in an average maturity of approximately 18 years. Additionally, we used market weakness in October and November 2018 to adjust duration in the portfolio to capture positive seasonal conditions in December and early January. [Duration is a measure of the portfolio’s sensitivity to interest rates.] Consequently, the fund’s duration positioning moved to a generally neutral stance relative to its Lipper peers during the period.
The fund held an overweight exposure to higher-quality bonds rated A and BBB relative to the fund’s Lipper peer group. We continued to look for what we view as attractively priced opportunities to movehigher up the credit-quality spectrum. From a sector positioning perspective, we favored essential service utilities, continuing-care retirement community, and higher-education bonds relative to the fund’s Lipper group. The fund continued to be weighted more toward essential service revenue bonds than toward local general obligation bonds [GOs], which typically rely on the taxing power of state and local governments.

Geographically, the fund held an overweight position in Illinois GOs relative to its benchmark. We believe that the state’s financial profile continues to stabilize, and this is not currently reflected by market spreads. As such, the Illinois GO holdings look attractive from a fundamental and relative value standpoint, in our view.
In February 2019, Puerto Rico reached an important milestone in its financial recovery. Federal bankruptcy Judge Laura Taylor Swain formally approved a major debt restructuring plan for Puerto Rico’s sales tax bonds known as “COFINA.” The agreement swapped out more than $17 billion in COFINA sales tax revenue bonds, including a senior and subordinate lien, for new bonds in a debt exchange. Senior lien bonds recovered roughly 93 cents on the dollar. Subordinate lien bonds recovered roughly 56 cents on the dollar. The restructured bonds were downsized — to about $12 billion — into one new single lien security.
The compromise agreement may help Puerto Rico save more than $400 million annually, which could be available for public services such as health, education, and pension payments. While the ruling brings clarity, and we believe the bond restructuring is a positive
|
| Managed Municipal Income Trust 7 |
step to help resolve Puerto Rico’s debt crisis, the uncertainty of the island’s road to economic recovery causes us to remain cautious.
The fund remained significantly underweight in exposure to Puerto Rico municipal bonds during the period compared with the fund’s Lipper peer group.
Can you discuss changes in the fund’s dividend rate during the reporting period?
In November 2018, the Trustees of the Putnam Funds approved an amendment to the dividend policy for the Putnam closed-end funds to establish targeted distribution rates for common shares, effective with the December 2018 distribution. Under the policy, the fund currently expects to make monthly distributions to common shareholders at a distribution rate of $0.0320 per share, up from $0.0289 per share. The fund’s targeted distribution rate may change from time to time or be discontinued, based on market conditions, among other factors.
What is your outlook for interest rates and the municipal bond market?
We believe slower growth and the absence of inflationary pressures may keep any interest-rate increases by the data-dependent Fed on hold in 2019. This bodes well for municipal bond prices for the foreseeable future, in our view.
Although unfunded pension liabilities remain a concern for some municipalities, defaults for investment-grade municipal bonds have been rare and remain relatively low for non-investment-grade municipal bonds. The asset class also has demonstrated a low correlation to equities in recent years, suggesting that they could help play a defensive role in a diversified investment portfolio during periods of equity market volatility, in our view.
With their competitive tax-adjusted returns and stable credit fundamentals, municipals could perform relatively well in 2019, in our view. We’ll continue to monitor the market on a daily basis to capture opportunities that arise from supply and/or demand imbalances. We’ll also continue

This chart shows how the fund’s top weightings have changed over the past six months. Allocations are shown as a percentage of the fund’s net assets (common and preferred shares). Current period summary information may differ from the information in the portfolio schedule notes included in the financial statements due to the inclusion of derivative securities, any interest accruals, the timing of matured security transactions, the use of different classifications of securities for presentation purposes, and rounding. Holdings and allocations may vary over time.
| |
| 8 Managed Municipal Income Trust |
to adjust the portfolio’s interest-rate sensitivity accordingly as our views change.
Thank you, Paul, for your time and insights today.
The views expressed in this report are exclusively those of Putnam Management and are subject to change. They are not meant as investment advice.
Please note that the holdings discussed in this report may not have been held by the fund for the entire period. Portfolio composition is subject to review in accordance with the fund’s investment strategy and may vary in the future. Current and future portfolio holdings are subject to risk. Statements in the Q&A concerning the fund’s performance or portfolio composition relative to those of the fund’s Lipper peer group may reference information produced by Lipper Inc. or through a third party.
|
| Managed Municipal Income Trust 9 |
Your fund’s performance
This section shows your fund’s performance, price, and distribution information for periods ended April 30, 2019, the end of the first half of its current fiscal year. In accordance with regulatory requirements for mutual funds, we also include performance as of the most recent calendar quarter-end. Performance should always be considered in light of a fund’s investment strategy. Data represent past performance. Past performance does not guarantee future results. More recent returns may be less or more than those shown. Investment return, net asset value, and market price will fluctuate, and you may have a gain or a loss when you sell your shares.
Fund performanceTotal return and comparative index results for periods ended 4/30/19
| | | | | | | | | |
| | Annual | | | | | | | | |
| | average | | | | | | | | |
| | Life of | | | | | | | | |
| | fund (since | | Annual | | Annual | | Annual | | |
| | 2/24/89) | 10 years | average | 5 years | average | 3 years | average | 1 year | 6 months |
| NAV | 6.46% | 133.73% | 8.86% | 34.28% | 6.07% | 12.77% | 4.09% | 6.82% | 6.35% |
| Market price | 6.10 | 142.22 | 9.25 | 38.28 | 6.70 | 12.69 | 4.06 | 10.89 | 14.25 |
| Bloomberg Barclays | | | | | | | | | |
| Municipal Bond Index | 5.81 | 56.03 | 4.55 | 19.14 | 3.56 | 7.97 | 2.59 | 6.16 | 5.68 |
| Lipper High Yield | | | | | | | | | |
| Municipal Debt | | | | | | | | | |
| Funds (closed-end) | 5.80 | 143.05 | 9.22 | 32.55 | 5.79 | 11.97 | 3.84 | 6.63 | 6.98 |
| category average* | | | | | | | | | |
Performance assumes reinvestment of distributions and does not account for taxes.
Index and Lipper results should be compared with fund performance at net asset value. Fund results reflect the use of leverage, while index results are unleveraged and Lipper results reflect varying use of, and methods for, leverage.
*Over the 6-month, 1-year, 3-year, 5-year, 10-year, and life-of-fund periods ended 4/30/19, there were 12, 11, 11, 11, 11, and 6 funds, respectively, in this Lipper category.
Performance includes the deduction of management fees and administrative expenses.
| |
| 10 Managed Municipal Income Trust |
Fund price and distribution informationFor the six-month period ended 4/30/19
| | | |
| Distributions | | | |
| Number | | 6 | |
| Income1 | | $0.1889 | |
| Capital gains2 | | — | |
| Total | | $0.1889 | |
| | Series A | | Series C |
| Distributions — preferred shares | (240 shares) | | (1,507 shares) |
| Income1 | $1,664.03 | | $643.11 |
| Capital gains2 | — | | — |
| Total | $1,664.03 | | $643.11 |
| Share value | NAV | | Market price |
| 10/31/18 | $7.64 | | $6.71 |
| 4/30/19 | 7.93 | | 7.47 |
| Current dividend rate (end of period) | NAV | | Market price |
| Current dividend rate3 | 4.84% | | 5.14% |
| Taxable equivalent4 | 8.18 | | 8.68 |
The classification of distributions, if any, is an estimate. Final distribution information will appear on your year-end tax forms.
1For some investors, investment income may be subject to the federal alternative minimum tax. Income from federally exempt funds may be subject to state and local taxes.
2Capital gains, if any, are taxable for federal and, in most cases, state purposes.
3Most recent distribution, including any return of capital and excluding capital gains, annualized and divided by NAV or market price at end of period.
4Assumes maximum 40.80% federal tax rate for 2019. Results for investors subject to lower tax rates would not be as advantageous.
Fund performance as of most recent calendar quarterTotal return for periods ended 3/31/19
| | | | | | | | | |
| | Annual | | | | | | | | |
| | average | | | | | | | | |
| | Life of | | | | | | | | |
| | fund (since | | Annual | | Annual | | Annual | | |
| | 2/24/89) | 10 years | average | 5 years | average | 3 years | average | 1 year | 6 months |
| NAV | 6.46% | 141.76% | 9.23% | 36.20% | 6.37% | 13.37% | 4.27% | 6.14% | 4.67% |
| Market price | 6.11 | 154.68 | 9.80 | 42.21 | 7.30 | 14.66 | 4.67 | 10.28 | 10.94 |
See the discussion following the fund performance table on page 10 for information about the calculation of fund performance.
|
| Managed Municipal Income Trust 11 |
Consider these risks before investing
Lower-rated bonds may offer higher yields in return for more risk. Bond investments are subject to interest-rate risk (the risk of bond prices falling if interest rates rise) and credit risk (the risk of an issuer defaulting on interest or principal payments). Interest-rate risk is generally greater for longer-term bonds, and credit risk is generally greater for below-investment-grade bonds. Unlike bonds, funds that invest in bonds have fees and expenses. The value of investments in the fund’s portfolio may fall or fail to rise over extended periods of time for a variety of reasons, including general economic, political or financial market conditions, investor sentiment and market perceptions, government actions, geopolitical events or changes, and factors related to a specific issuer, geography, industry or sector. These and other factors may lead to increased volatility and reduced liquidity in the fund’s portfolio holdings. You can lose money by investing in the fund. The fund’s shares trade on a stock exchange at market prices, which may be lower than the fund’s net asset value.
| |
| 12 Managed Municipal Income Trust |
Terms and definitions
Important terms
Total returnshows how the value of the fund’s shares changed over time, assuming you held the shares through the entire period and reinvested all distributions in the fund.
Net asset value (NAV)is the value of all your fund’s assets, minus any liabilities, divided by the number of outstanding shares.
Market priceis the current trading price of one share of the fund. Market prices are set by transactions between buyers and sellers on exchanges such as the New York Stock Exchange.
Fixed-income terms
Current rateis the annual rate of return earned from dividends or interest of an investment. Current rate is expressed as a percentage of the price of a security, fund share, or principal investment.
Yield curveis a graph that plots the yields of bonds with equal credit quality against their differing maturity dates, ranging from shortest to longest. It is used as a benchmark for other debt, such as mortgage or bank lending rates.
Comparative indexes
Bloomberg Barclays Municipal Bond Indexis an unmanaged index of long-term fixed-rate investment-grade tax-exempt bonds.
Bloomberg Barclays U.S. Aggregate Bond Indexis an unmanaged index of U.S. investment-grade fixed-income securities.
ICE BofAML (Intercontinental Exchange Bank of America Merrill Lynch) U.S. 3-Month Treasury Bill Indexis an unmanaged index that seeks to measure the performance of U.S.Treasury bills available in the marketplace.
S&P 500 Indexis an unmanaged index of common stock performance.
Indexes assume reinvestment of all distributions and do not account for fees. Securities and performance of a fund and an index will differ. You cannot invest directly in an index.
ICE Data Indices, LLC (“ICE BofAML”), used with permission. ICE BofAML permits use of the ICE BofAML indices and related data on an “as is” basis; makes no warranties regarding same; does not guarantee the suitability, quality, accuracy, timeliness, and/or completeness of the ICE BofAML indices or any data included in, related to, or derived therefrom; assumes no liability in connection with the use of the foregoing; and does not sponsor, endorse, or recommend Putnam Investments, or any of its products or services.
Lipperis a third-party industry-ranking entity that ranks mutual funds. Its rankings do not reflect sales charges. Lipper rankings are based on total return at net asset value relative to other funds that have similar current investment styles or objectives as determined by Lipper. Lipper may change a fund’s category assignment at its discretion. Lipper category averages reflect performance trends for funds within a category.
|
| Managed Municipal Income Trust 13 |
Other information for shareholders
Important notice regarding share repurchase program
In September 2018, the Trustees of your fund approved the renewal of a share repurchase program that had been in effect since 2005. This renewal allows your fund to repurchase, in the 12 months beginning October 10, 2018, up to 10% of the fund’s common shares outstanding as of October 9, 2018.
Important notice regarding delivery of shareholder documents
In accordance with Securities and Exchange Commission (SEC) regulations, Putnam sends a single copy of annual and semiannual shareholder reports, prospectuses, and proxy statements to Putnam shareholders who share the same address, unless a shareholder requests otherwise. If you prefer to receive your own copy of these documents, please call Putnam at 1-800-225-1581, and Putnam will begin sending individual copies within 30 days.
Proxy voting
Putnam is committed to managing our mutual funds in the best interests of our shareholders. The Putnam funds’ proxy voting guidelines and procedures, as well as information regarding how your fund voted proxies relating to portfolio securities during the 12-month period ended June 30, 2018, are available in the Individual Investors section of putnam.com and on the SEC’s website, www.sec.gov. Ifyou have questions about finding forms on the SEC’s website, you may call the SEC at 1-800-SEC-0330. You may also obtain the Putnam funds’ proxy voting guidelines and procedures at no charge by calling Putnam’s Shareholder Services at 1-800-225-1581.
Fund portfolio holdings
The fund will file a complete schedule of its portfolio holdings with the SEC for the first and third quarters of each fiscal year on Form N-PORT within 60 days of the end of such fiscal quarter. Shareholders may obtain the fund’s Form N-PORT on the SEC’s website at www.sec.gov.
Prior to its use of Form N-PORT, the fund filed its complete schedule of its portfolio holdings with the SEC on Form N-Q, which is available online at www.sec.gov.
Trustee and employee fund ownership
Putnam employees and members of the Board of Trustees place their faith, confidence, and, most importantly, investment dollars in Putnam mutual funds. As of April 30, 2019, Putnam employees had approximately $507,000,000 and the Trustees had approximately $71,000,000 invested in Putnam mutual funds. These amounts include investments by the Trustees’ and employees’ immediate family members as well as investments through retirement and deferred compensation plans.
| |
| 14 Managed Municipal Income Trust |
Summary of Putnam Closed-End Funds’ Amended and Restated Dividend Reinvestment Plans
Putnam Managed Municipal Income Trust, Putnam Master Intermediate Income Trust, Putnam Municipal Opportunities Trust and Putnam Premier Income Trust (each, a “Fund” and collectively, the “Funds”) each offer adividend reinvestment plan(each, a “Plan” and collectively, the “Plans”). If you participate in a Plan, all income dividends and capital gain distributions areautomatically reinvestedin Fund shares by the Fund’s agent, Putnam Investor Services, Inc. (the “Agent”). If you are not participating in a Plan, every month you will receive all dividends and other distributions in cash, paid by check and mailed directly to you.
Upon a purchase (or, where applicable, upon registration of transfer on the shareholder records of a Fund) of shares of a Fund by a registered shareholder, each such shareholderwill be deemed to have elected to participatein that Fund’s Plan. Each such shareholder will have all distributions by a Fund automatically reinvested in additional shares, unless such shareholder elects to terminate participation in a Plan by instructing the Agent to pay future distributions in cash. Shareholders who were not participants in a Plan as of January 31, 2010, will continue to receive distributions in cash but may enroll in a Plan at any time by contacting the Agent.
If you participate in a Fund’s Plan, the Agent will automatically reinvest subsequent distributions, and the Agent will send you a confirmation in the mail telling you how many additional shares were issued to your account.
To change your enrollment status or to request additional information about the Plans, you may contact the Agent either in writing, at P.O. Box 8383, Boston, MA 02266-8383, or by telephone at 1-800-225-1581 during normal East Coast business hours.
How you acquire additional shares through a PlanIf the market price per share for your Fund’s shares (plus estimated brokeragecommissions) is greater than or equal to their net asset value per share on the payment date for a distribution, you will be issued shares of the Fund at a value equal to the higher of the net asset value per share on that date or 95% of the market price per share on that date.
If the market price per share for your Fund’s shares (plus estimated brokerage commissions) is less than their net asset value per share on the payment date for a distribution, the Agent will buy Fund shares for participating accounts in the open market. The Agent will aggregate open-market purchases on behalf of all participants, and the average price (including brokerage commissions) of all shares purchased by the Agent will be the price per share allocable to each participant. The Agent will generally complete these open-market purchases within five business days following the payment date. If, before the Agent has completed open-market purchases, the market price per share (plus estimated brokerage commissions) rises to exceed the net asset value per share on the payment date, then the purchase price may exceed the net asset value per share, potentially resulting in the acquisition of fewer shares than if the distribution had been paid in newly issued shares.
How to withdraw from a PlanParticipants may withdraw from a Fund’s Plan at any time by notifying the Agent, either in writing or by telephone. Such withdrawal will be effective immediately if notice is received by the Agent with sufficient time prior to any distribution record date; otherwise, such withdrawal will be effective with respect to any subsequent distribution following notice of withdrawal. There is no penalty for withdrawing from or not participating in a Plan.
Plan administrationThe Agent will credit all shares acquired for a participant under a Plan to the account in which the participant’s common shares are held. Each participant will
|
| Managed Municipal Income Trust 15 |
be sent reasonably promptly a confirmation by the Agent of each acquisition made for his or her account.
About brokerage feesEach participant pays a proportionate share of any brokerage commissions incurred if the Agent purchases additional shares on the open market, in accordance with the Plans. There are no brokerage charges applied to shares issued directly by the Funds under the Plans.
About taxes and Plan amendments
Reinvesting dividend and capital gain distributions in shares of the Funds does not relieve you of tax obligations, which are the same as if you had received cash distributions. The Agent supplies tax information to you and to the IRS annually. Each Fund reserves the right to amend or terminate its Plan upon 30 days’ written notice. However, the Agent may assign its rights, and delegate its duties, to a successor agent with the priorconsent of a Fund and without prior notice to Plan participants.
If your shares are held in a broker or nominee nameIf your shares are held in the name of a broker or nominee offering a dividend reinvestment service, consult your broker or nominee to ensure that an appropriate election is made on your behalf. If the broker or nominee holding your shares does not provide a reinvestment service, you may need to register your shares in your own name in order to participate in a Plan.
In the case of record shareholders such as banks, brokers or nominees that hold shares for others who are the beneficial owners of such shares, the Agent will administer the Plan on the basis of the number of shares certified by the record shareholder as representing the total amount registered in such shareholder’s name and held for the account of beneficial owners who are to participate in the Plan.
| |
| 16 Managed Municipal Income Trust |
Financial statements
These sections of the report, as well as the accompanying Notes, constitute the fund’s financial statements.
The fund’s portfoliolists all the fund’s investments and their values as of the last day of the reporting period. Holdings are organized by asset type and industry sector, country, or state to show areas of concentration and diversification.
Statement of assets and liabilitiesshows how the fund’s net assets and share price are determined. All investment and non-investment assets are added together. Any unpaid expenses and other liabilities are subtracted from this total. The result is divided by the number of shares to determine the net asset value per share. (For funds with preferred shares, the amount subtracted from total assets includes the liquidation preference of preferred shares.)
Statement of operationsshows the fund’s net investment gain or loss. This is done by first adding up all the fund’s earnings — from dividends and interest income — and subtracting its operating expenses to determine net investment income (or loss). Then, any net gain or loss the fund realized on the sales of its holdings — as well as any unrealized gains or losses over the period — is added toor subtracted from the net investment result to determine the fund’s net gain or loss for the fiscal period.
Statement of changes in net assetsshows how the fund’s net assets were affected by the fund’s net investment gain or loss, by distributions to shareholders, and by changes in the number of the fund’s shares. It lists distributions and their sources (net investment income or realized capital gains) over the current reporting period and the most recent fiscal year-end. The distributions listed here may not match the sources listed in the Statement of operations because the distributions are determined on a tax basis and may be paid in a different period from the one in which they were earned. Dividend sources are estimated at the time of declaration. Actual results may vary. Any non-taxable return of capital cannot be determined until final tax calculations are completed after the end of the fund’s fiscal year.
Financial highlightsprovide an overview of the fund’s investment results, per-share distributions, expense ratios, net investment income ratios, and portfolio turnover in one summary table, reflecting the five most recent reporting periods. In a semiannual report, the highlights table also includes the current reporting period.
|
| Managed Municipal Income Trust 17 |
The fund’s portfolio4/30/19 (Unaudited)
Key to holding’s abbreviations
| |
| ABAGAssociation Of Bay Area Governments | VRDNVariable Rate Demand Notes, which are floating- |
| AGMAssured Guaranty Municipal Corporation | rate securities with long-term maturities that carry |
| AMBACAMBAC Indemnity Corporation | coupons that reset and are payable upon demand |
| COPCertificatesof Participation | either daily, weekly or monthly. The rate shown is the |
| G.O. BondsGeneral Obligation Bonds | current interest rate at the close of the reporting |
| NATLNational Public Finance Guarantee Corp. | period. Rates are set by remarketing agents and may |
| PSFGPermanent School Fund Guaranteed | take into consideration market supply and demand, |
| U.S. Govt. Coll.U.S. Government Collateralized | credit quality and the current SIFMA Municipal Swap |
| Index rate, which was 2.30% as of the close of the |
| reporting period. |
| | | |
| MUNICIPAL BONDS AND NOTES (131.6%)* | Rating** | Principal amount | Value |
| Alabama (1.8%) | | | |
| Jefferson Cnty., Swr. Rev. Bonds | | | |
| Ser. D, 6.50%, 10/1/53 | BBB | $500,000 | $592,630 |
| zero %, 10/1/46 | BBB | 3,950,000 | 3,654,422 |
| Jefferson, Cnty. Rev. Bonds, (Warrants) | | | |
| 5.00%, 9/15/34 | AA | 2,075,000 | 2,407,062 |
| 5.00%, 9/15/33 | AA | 275,000 | 319,913 |
| | | | 6,974,027 |
| Alaska (1.6%) | | | |
| Northern Tobacco Securitization Corp. Rev. Bonds, | | | |
| Ser. A, 5.00%, 6/1/46 | B3 | 6,370,000 | 6,234,701 |
| | | | 6,234,701 |
| Arizona (4.5%) | | | |
| AZ State Indl. Dev. Auth. Ed. 144A Rev. Bonds, | | | |
| (BASIS Schools, Inc.), Ser. G, 5.00%, 7/1/37 | BB | 500,000 | 534,145 |
| Casa Grande, Indl. Dev. Auth. Rev. Bonds, | | | |
| (Casa Grande Regl. Med. Ctr.) | | | |
| Ser. A, 7.625%, 12/1/29 (escrow) F | D/P | 1,800,000 | 5,380 |
| 7.25%, 12/1/19 (escrow) F | D/P | 1,000,000 | 2,989 |
| La Paz Cnty., Indl. Dev. Auth. Ed. Fac. Rev. Bonds, | | | |
| (Harmony Pub. Schools), Ser. A | | | |
| 5.00%, 2/15/48 | BBB | 2,330,000 | 2,533,805 |
| 5.00%, 2/15/38 | BBB | 500,000 | 548,220 |
| Maricopa Cnty., Indl. Dev. Auth. Ed. Rev. Bonds, | | | |
| (Horizon Cmnty. Learning Ctr.), 5.00%, 7/1/35 | BB+ | 500,000 | 522,295 |
| Phoenix, Indl. Dev. Auth. Ed. Rev. Bonds | | | |
| (Great Hearts Academies), 6.00%, 7/1/32 | | | |
| (Prerefunded 7/1/21) | AAA/P | 200,000 | 218,414 |
| (Choice Academies, Inc.), 5.625%, 9/1/42 | BB | 315,000 | 326,614 |
| (Great Hearts Academies), 5.00%, 7/1/44 | BBB– | 1,700,000 | 1,807,865 |
| (Choice Academies, Inc.), 4.875%, 9/1/22 | BB | 555,000 | 569,119 |
| Phoenix, Indl. Dev. Auth. Ed. 144A Rev. Bonds, | | | |
| (BASIS Schools, Inc.) | | | |
| Ser. A, 5.00%, 7/1/46 | BB | 250,000 | 260,198 |
| 5.00%, 7/1/35 | BB | 900,000 | 952,722 |
| Ser. A, 5.00%, 7/1/35 | BB | 600,000 | 635,148 |
| Pinal Cnty., Indl. Dev. Auth. Env. Fac. 144A Rev. | | | |
| Bonds, (Green Bond), 7.25%, 10/1/33 | BB–/P | 1,000,000 | 1,037,160 |
| |
| 18 Managed Municipal Income Trust |
| | | |
| MUNICIPAL BONDS AND NOTES (131.6%)*cont. | Rating** | Principal amount | Value |
| Arizonacont. | | | |
| Salt Verde, Fin. Corp. Gas Rev. Bonds | | | |
| 5.50%, 12/1/29 | A3 | $2,000,000 | $2,516,940 |
| 5.00%, 12/1/37 | A3 | 2,000,000 | 2,522,040 |
| 5.00%, 12/1/32 | A3 | 570,000 | 704,383 |
| Yavapai Cnty., Indl. Dev. Auth. Hosp. Fac. Rev. Bonds | | | |
| (Yavapai Regl. Med.), 5.00%, 8/1/36 | A3 | 200,000 | 226,472 |
| (Yavapai Regl. Med. Ctr.), 5.00%, 8/1/34 | A3 | 200,000 | 227,526 |
| Yavapai Cnty., Indl. Dev. Ed. Auth. Rev. Bonds, | | | |
| (Agribusiness & Equine Ctr.), 5.00%, 3/1/32 | BB+ | 1,000,000 | 1,037,790 |
| Yavapai Cnty., Indl. Dev. Ed. Auth. 144A Rev. Bonds, | | | |
| Ser. A, 5.00%, 9/1/34 | BB+ | 500,000 | 529,210 |
| | | | 17,718,435 |
| California (8.0%) | | | |
| ABAG Fin. Auth. for Nonprofit Corps. Rev. Bonds, | | | |
| (Episcopal Sr. Cmntys.), 6.00%, 7/1/31 | A–/F | 660,000 | 713,255 |
| CA School Fin. Auth. Rev. Bonds, (2023 Union, LLC), | | | |
| Ser. A, 6.00%, 7/1/33 | BBB | 465,000 | 523,585 |
| CA State Muni. Fin. Auth. Charter School Rev. Bonds, | | | |
| (Partnerships Uplift Cmnty.), Ser. A, 5.00%, 8/1/32 | BB | 665,000 | 689,126 |
| CA State Poll. Control Fin. Auth. Rev. Bonds | | | |
| (Wtr. Furnishing), 5.00%, 11/21/45 | Baa3 | 1,000,000 | 1,054,640 |
| (San Jose Wtr. Co.), 4.75%, 11/1/46 | A | 1,100,000 | 1,215,984 |
| CA Statewide Cmnty. Dev. Auth. Rev. Bonds | | | |
| (Terraces at San Joaquin Gardens), Ser. A, | | | |
| 6.00%, 10/1/47 | BB/P | 1,345,000 | 1,436,191 |
| (American Baptist Homes West), 5.75%, 10/1/25 | BBB+/F | 3,000,000 | 3,049,410 |
| (U. CA Irvine E. Campus Apts. Phase 1), | | | |
| 5.375%, 5/15/38 | Baa1 | 1,000,000 | 1,067,990 |
| (899 Charleston, LLC), Ser. A, 5.25%, 11/1/44 | BB/P | 450,000 | 482,558 |
| (U. CA Irvine E. Campus Apts. Phase 1), | | | |
| 5.125%, 5/15/31 | Baa1 | 2,250,000 | 2,404,733 |
| Golden State Tobacco Securitization Corp. Rev. | | | |
| Bonds, Ser. A-2, 5.00%, 6/1/47 | BB/P | 5,000,000 | 4,908,000 |
| La Verne, COP, (Brethren Hillcrest Homes), | | | |
| 5.00%, 5/15/36 | BBB–/F | 325,000 | 338,978 |
| Los Angeles, CA Dept. Wtr & Pwr Rev Bonds Ser | | | |
| C 5.00% 7/1/42 T | Aa2 | 6,460,000 | 7,669,384 |
| Los Angeles, Regl. Arpt. Impt. Corp. Lease Rev. | | | |
| Bonds, (Laxfuel Corp.), 4.50%, 1/1/27 | A | 400,000 | 420,004 |
| Morongo Band of Mission Indians 144A Rev. Bonds, | | | |
| Ser. B, 5.00%, 10/1/42 | BBB–/F | 2,350,000 | 2,559,714 |
| Rancho Cordova, Cmnty. Fac. Dist. Special Tax | | | |
| Bonds, (Sunridge Anatolia), Ser. 03-1, 5.00%, 9/1/37 | BBB–/P | 350,000 | 373,275 |
| San Francisco City & Cnty., Redev. Agcy. Cmnty. | | | |
| Successor Special Tax Bonds, (No. 6 Mission Bay | | | |
| Pub. Impts.), Ser. C | | | |
| zero %, 8/1/43 | BBB/P | 2,000,000 | 539,580 |
| zero %, 8/1/38 | BBB/P | 2,000,000 | 728,800 |
|
| Managed Municipal Income Trust 19 |
| | | |
| MUNICIPAL BONDS AND NOTES (131.6%)*cont. | Rating** | Principal amount | Value |
| Californiacont. | | | |
| Sunnyvale, Special Tax Bonds, (Cmnty. Fac. Dist. | | | |
| No. 1), 7.75%, 8/1/32 | B+/P | $835,000 | $837,346 |
| Yucaipa Special Tax Bonds, (Cmnty. Fac. Dist. | | | |
| No. 98-1 Chapman Heights), 5.375%, 9/1/30 | A | 375,000 | 401,224 |
| | | | 31,413,777 |
| Colorado (3.0%) | | | |
| Broadway Station Metro. Dist. No. 2 Co. G.O. Bonds, | | | |
| Ser. A, 5.125%, 12/1/48 | B/P | 500,000 | 505,750 |
| Central Platte Valley, Metro. Dist. G.O. Bonds, | | | |
| 5.00%, 12/1/43 | BB+ | 400,000 | 422,924 |
| CO Pub. Hwy. Auth. Rev. Bonds, (E-470), Ser. C, | | | |
| 5.375%, 9/1/26 | A2 | 500,000 | 521,065 |
| CO State Educ. & Cultural Fac. Auth. Rev. Bonds, | | | |
| (Skyview Academy), 5.125%, 7/1/34 | BB | 755,000 | 787,790 |
| CO State Hlth. Fac. Auth. Rev. Bonds | | | |
| (Christian Living Cmnty.), 6.375%, 1/1/41 | BB/P | 810,000 | 870,620 |
| (Total Longterm Care National), Ser. A, 6.25%, | | | |
| 11/15/40 (Prerefunded 11/15/20) | AAA/P | 300,000 | 320,607 |
| (Evangelical Lutheran Good Samaritan Society | | | |
| Oblig. Group (The)), 5.625%, 6/1/43 | BBB | 250,000 | 275,650 |
| (Evangelical Lutheran Good Samaritan Society | | | |
| Oblig. Group (The)), 5.00%, 12/1/33 | BBB | 1,100,000 | 1,172,171 |
| CO State Hlth. Fac. Auth. Hosp. Rev. Bonds | | | |
| (Frasier Meadows Retirement Cmnty.), Ser. B, | | | |
| 5.00%, 5/15/48 | BB+/F | 1,500,000 | 1,562,760 |
| (Christian Living Neighborhood), 5.00%, 1/1/37 | BB/P | 1,250,000 | 1,338,363 |
| (Christian Living Neighborhood), 5.00%, 1/1/31 | BB/P | 500,000 | 543,890 |
| Eaton, Area Park & Recreation Dist. G.O. Bonds, | | | |
| 5.25%, 12/1/34 | BB/P | 220,000 | 231,103 |
| Park Creek, Metro. Dist. Tax Allocation Bonds, | | | |
| (Sr. Ltd. Property Tax Supported), Ser. A, | | | |
| 5.00%, 12/1/45 | A/F | 225,000 | 247,757 |
| Plaza, Tax Alloc. Bonds, (Metro. Dist. No. 1), | | | |
| 5.00%, 12/1/40 | BB–/P | 1,650,000 | 1,711,166 |
| Regl. Trans. Dist. Rev. Bonds, (Denver Trans. | | | |
| Partners), 6.00%, 1/15/41 | Baa3 | 750,000 | 778,515 |
| Southlands, Metro. Dist. No. 1 G.O. Bonds, Ser. A-1, | | | |
| 5.00%, 12/1/37 | Ba1 | 500,000 | 539,765 |
| | | | 11,829,896 |
| Connecticut (0.4%) | | | |
| Harbor Point Infrastructure Impt. Dist. 144A Tax | | | |
| Alloc. Bonds, (Harbor Point Ltd.), 5.00%, 4/1/39 | BB/P | 1,500,000 | 1,607,160 |
| | | | 1,607,160 |
| Delaware (2.5%) | | | |
| DE State Econ. Dev. Auth. Rev. Bonds | | | |
| (Delmarva Pwr.), 5.40%, 2/1/31 | A– | 500,000 | 520,585 |
| (Indian River Pwr.), 5.375%, 10/1/45 | Baa3 | 2,600,000 | 2,695,784 |
| (ASPIRA of Delaware Charter Operations, Inc.), | | | |
| Ser. A, 5.00%, 6/1/51 | BB+ | 1,035,000 | 1,085,208 |
| (ASPIRA Charter School), Ser. A, 5.00%, 6/1/36 | BB+ | 705,000 | 752,989 |
|
| 20 Managed Municipal Income Trust |
| | | |
| MUNICIPAL BONDS AND NOTES (131.6%)*cont. | Rating** | Principal amount | Value |
| Delawarecont. | | | |
| DE State Hlth. Fac. Auth. VRDN, (Christiana Care), | | | |
| Ser. A, 2.30%, 10/1/38 | VMIG 1 | $3,000,000 | $3,000,000 |
| Millsboro Special Oblig. 144A Tax Alloc. Bonds, | | | |
| (Plantation Lakes Special Dev. Dist.), 5.125%, 7/1/38 | BB–/P | 1,490,000 | 1,559,211 |
| | | | 9,613,777 |
| District of Columbia (1.5%) | | | |
| DC Rev. Bonds, (Howard U.), Ser. A | | | |
| 6.50%, 10/1/41 | BBB– | 395,000 | 413,225 |
| 6.25%, 10/1/32 | BBB– | 525,000 | 550,289 |
| DC Tobacco Settlement Fin. Corp. Rev. Bonds, | | | |
| Ser. A, zero %, 6/15/46 | CCC/P | 7,500,000 | 1,157,625 |
| DC, Rev. Bonds, (Methodist Home of The DC (The)), | | | |
| Ser. A, 5.25%, 1/1/39 | BB–/P | 250,000 | 245,770 |
| DC, Wtr. & Swr. Auth. Pub. Util. Rev. Bonds, Ser. C, | | | |
| 5.00%, 10/1/39 | AA+ | 3,000,000 | 3,385,170 |
| | | | 5,752,079 |
| Florida (5.5%) | | | |
| Cap. Trust Agcy. Senior Living 144A Rev. Bonds, | | | |
| (H-Bay Ministries, Inc.-Superior Residencies), Ser. C, | | | |
| 7.50%, 7/1/53 | B–/P | 250,000 | 248,438 |
| Celebration Pointe Cmnty. Dev. Dist. No. 1 144A | | | |
| Special Assessment Bonds, (Alachua Cnty.), | | | |
| 5.00%, 5/1/48 | B/P | 250,000 | 256,460 |
| Double Branch Cmnty. Dev. Dist. Special Assmt. | | | |
| Bonds, (Sr. Lien), Ser. A-1, 4.125%, 5/1/31 | A– | 500,000 | 521,750 |
| Fishhawk, CCD IV Special Assmt. Bonds, | | | |
| 7.25%, 5/1/43 | B/P | 380,000 | 413,786 |
| Greater Orlando Aviation Auth. Rev. Bonds, | | | |
| (JetBlue Airways Corp.), 5.00%, 11/15/36 | B/P | 1,000,000 | 1,050,550 |
| Halifax Hosp. Med. Ctr. Rev. Bonds, 5.00%, 6/1/36 | A– | 1,300,000 | 1,443,819 |
| Lakeland, Retirement Cmnty. 144A Rev. Bonds, | | | |
| (1st Mtge. — Carpenters), 6.375%, 1/1/43 | BBB–/F | 840,000 | 841,714 |
| Lakewood Ranch, Stewardship Dist. Special | | | |
| Assessment Bonds, (Village of Lakewood Ranch | | | |
| South), 5.125%, 5/1/46 | B+/P | 905,000 | 928,503 |
| Lakewood Ranch, Stewardship Dist. Special Assmt. | | | |
| Bonds, 4.875%, 5/1/35 | BB–/P | 485,000 | 495,491 |
| Martin Cnty., Rev. Bonds, (Indiantown | | | |
| Cogeneration), 4.20%, 12/15/25 | BBB+ | 1,500,000 | 1,528,950 |
| Miami Beach, Hlth. Fac. Auth. Hosp. Rev. Bonds, | | | |
| (Mount Sinai Med. Ctr.), 5.00%, 11/15/29 | Baa1 | 1,000,000 | 1,094,950 |
| Miami-Dade Cnty., Rev. Bonds, (Tran. Syst. Sales | | | |
| Surtax), 5.00%, 7/1/42 | AA | 2,000,000 | 2,163,200 |
| Miami-Dade Cnty., Indl. Dev. Auth. Rev. Bonds, | | | |
| (Pinecrest Academy, Inc.), 5.00%, 9/15/34 | BBB | 1,240,000 | 1,328,635 |
| Midtown Miami Cmnty. Dev. Dist. Special Assmt. | | | |
| Bonds, (Garage), Ser. A, 5.00%, 5/1/29 | BB–/P | 570,000 | 599,247 |
| Sarasota Cnty., Hlth. Fac. Auth. Rev. Bonds, | | | |
| (Village on the Isle), Ser. A, 5.00%, 1/1/37 | BBB–/F | 1,000,000 | 1,068,800 |
| Sarasota Cnty., Pub. Hosp. Dist. Rev. Bonds, | | | |
| (Sarasota Memorial Hosp.), 4.00%, 7/1/48 | A1 | 1,500,000 | 1,554,360 |
|
| Managed Municipal Income Trust 21 |
| | | |
| MUNICIPAL BONDS AND NOTES (131.6%)*cont. | Rating** | Principal amount | Value |
| Floridacont. | | | |
| South Lake Hosp. Dist. Rev. Bonds, (South Lake | | | |
| Hosp.), Ser. A, 6.00%, 4/1/29 | Baa1 | $1,000,000 | $1,002,740 |
| Southeast Overtown Park West Cmnty. Redev. Agcy. | | | |
| 144A Tax Alloc. Bonds, Ser. A-1, 5.00%, 3/1/30 | BBB+ | 480,000 | 532,848 |
| Tallahassee, Hlth. Fac. Rev. Bonds, (Tallahassee | | | |
| Memorial HealthCare, Inc.), Ser. A, 5.00%, 12/1/55 | Baa1 | 1,000,000 | 1,089,950 |
| Tolomato, Cmnty. Dev. Dist. Special Assmt. Bonds, | | | |
| 5.40%, 5/1/37 | B+/P | 600,000 | 600,696 |
| Verandah, West Cmnty. Dev. Dist. Special Assmt. | | | |
| Bonds, (Cap. Impt.), 5.00%, 5/1/33 | B+/P | 465,000 | 474,272 |
| Village Cmnty. Dev. Dist. No. 10 Special Assmt. | | | |
| Bonds, 5.75%, 5/1/31 | BB/P | 735,000 | 820,458 |
| Village Cmnty. Dev. Dist. No. 12 144A Special | | | |
| Assessment Bonds, 4.00%, 5/1/33 | BB–/P | 750,000 | 771,135 |
| Village Cmnty. Dev. Dist. No. 8 Special Assmt. Bonds, | | | |
| (Phase II), 6.125%, 5/1/39 | BBB–/P | 370,000 | 384,245 |
| Village Cmnty. Dev. Dist. No. 9 Special Assmt. Bonds, | | | |
| 5.00%, 5/1/22 | BBB–/P | 205,000 | 212,378 |
| | | | 21,427,375 |
| Georgia (4.2%) | | | |
| Clayton Cnty., Dev. Auth. Special Fac. Rev. Bonds, | | | |
| (Delta Airlines), Ser. A, 8.75%, 6/1/29 | Baa3 | 3,000,000 | 3,214,920 |
| Cobb Cnty., Dev. Auth. Student Hsg. Rev. Bonds, | | | |
| (Kennesaw State U. Real Estate Oblig. Group), Ser. C, | | | |
| 5.00%, 7/15/38 | Baa2 | 750,000 | 804,075 |
| GA State Private College & U. Auth. Rev. Bonds, | | | |
| (Mercer U.) | | | |
| Ser. C, 5.25%, 10/1/30 | Baa1 | 750,000 | 811,628 |
| Ser. A, 5.25%, 10/1/27 | Baa1 | 1,000,000 | 1,071,820 |
| Ser. A, 5.00%, 10/1/32 | Baa1 | 1,000,000 | 1,047,600 |
| Gainesville & Hall Cnty., Dev. Auth. Edl. Fac. Rev. | | | |
| Bonds, (Riverside Military Academy) | | | |
| 5.00%, 3/1/47 | BBB–/F | 1,000,000 | 1,077,060 |
| 5.00%, 3/1/37 | BBB–/F | 1,450,000 | 1,582,211 |
| Gainesville & Hall Cnty., Devauth Retirement Cmnty. | | | |
| Rev. Bonds, (Acts Retirement-Life Cmnty.), Ser. A-2, | | | |
| 6.375%, 11/15/29 (Prerefunded 11/15/19) | A–/F | 700,000 | 717,535 |
| Main St. Natural Gas, Inc. Gas Supply Rev. Bonds, | | | |
| Ser. A, 5.00%, 5/15/34 | A3 | 3,345,000 | 3,904,217 |
| Muni. Election Auth. of GA Rev. Bonds, (Plant Voltage | | | |
| Units 3 & 4), Ser. A, 5.50%, 7/1/60 | A | 2,000,000 | 2,137,720 |
| | | | 16,368,786 |
| Guam (0.1%) | | | |
| Territory of GU, Pwr. Auth. Rev. Bonds, Ser. A, | | | |
| 5.00%, 10/1/34 | Baa2 | 200,000 | 212,028 |
| | | | 212,028 |
| Hawaii (1.0%) | | | |
| HI State Dept. Budget & Fin. Rev. Bonds | | | |
| (Craigside), Ser. A, 9.00%, 11/15/44 | | | |
| (Prerefunded 11/15/19) | B/P | 400,000 | 415,448 |
| (Hawaiian Elec. Co. — Subsidiary), 6.50%, 7/1/39 | Baa2 | 3,000,000 | 3,028,470 |
| (Kahala Nui), 5.125%, 11/15/32 | A–/F | 400,000 | 439,924 |
| | | | 3,883,842 |
| |
| 22 Managed Municipal Income Trust |
| | | |
| MUNICIPAL BONDS AND NOTES (131.6%)*cont. | Rating** | Principal amount | Value |
| Idaho (0.5%) | | | |
| ID State Hlth. Fac. Auth. Rev. Bonds, (St. Luke’s Hlth. | | | |
| Sys. Oblig. Group), Ser. A, 4.00%, 3/1/38 | A3 | $2,000,000 | $2,073,340 |
| | | | 2,073,340 |
| Illinois (12.0%) | | | |
| Chicago, G.O. Bonds, Ser. A | | | |
| 6.00%, 1/1/38 | BBB+ | 2,560,000 | 2,920,858 |
| 5.50%, 1/1/49 | BBB+ | 1,000,000 | 1,104,840 |
| 5.00%, 1/1/40 | BBB+ | 2,000,000 | 2,135,740 |
| Chicago, Special Assmt. Bonds, (Lake Shore East), | | | |
| 6.75%, 12/1/32 | BB/P | 1,572,000 | 1,580,835 |
| Chicago, Board of Ed. G.O. Bonds | | | |
| Ser. C, 5.25%, 12/1/39 | B+ | 1,500,000 | 1,579,560 |
| Ser. H, 5.00%, 12/1/36 | B+ | 2,100,000 | 2,245,509 |
| Chicago, Motor Fuel Tax Rev. Bonds, 5.00%, 1/1/29 | Ba1 | 500,000 | 528,635 |
| Chicago, O’Hare Intl. Arpt. Rev. Bonds | | | |
| Ser. A, 5.00%, 1/1/38 | A | 700,000 | 816,753 |
| Ser. C, 5.00%, 1/1/26 | A2 | 2,595,000 | 2,860,079 |
| Chicago, Waste Wtr. Transmission Rev. Bonds, | | | |
| (2nd Lien), 5.00%, 1/1/39 | A | 1,360,000 | 1,456,478 |
| Chicago, Wtr. Wks Rev. Bonds | | | |
| 5.00%, 11/1/39 | A | 875,000 | 959,770 |
| 5.00%, 11/1/30 | A | 1,000,000 | 1,142,030 |
| Cicero, G.O. Bonds, Ser. A, AGM, 5.00%, 1/1/20 | AA | 1,250,000 | 1,275,075 |
| Cook Cnty., G.O. Bonds, 5.00%, 11/15/35 | AA– | 500,000 | 556,650 |
| Du Page Cnty., Special Svc. Area No. 31 Special Tax | | | |
| Bonds, (Monarch Landing), 5.625%, 3/1/36 | B/P | 319,000 | 319,632 |
| IL Fin. Auth. Rev. Bonds | | | |
| (Silver Cross Hosp. & Med. Ctr.), 7.00%, 8/15/44 | | | |
| (Prerefunded 8/15/19) | AAA/P | 2,000,000 | 2,030,280 |
| (Navistar Intl. Recvy. Zone), 6.75%, 10/15/40 | BB– | 500,000 | 521,435 |
| (American Wtr. Cap. Corp.), 5.25%, 10/1/39 | A | 1,575,000 | 1,589,144 |
| IL State G.O. Bonds | | | |
| 5.25%, 2/1/30 | Baa3 | 1,000,000 | 1,068,940 |
| 5.00%, 11/1/41 | Baa3 | 1,250,000 | 1,318,838 |
| 5.00%, 1/1/41 | Baa3 | 700,000 | 735,490 |
| 5.00%, 2/1/39 | Baa3 | 200,000 | 207,712 |
| Ser. A, 5.00%, 5/1/38 | Baa3 | 1,000,000 | 1,070,970 |
| 5.00%, 11/1/34 | Baa3 | 500,000 | 534,410 |
| Ser. B, 5.00%, 10/1/31 | Baa3 | 1,000,000 | 1,094,680 |
| Ser. C, 5.00%, 11/1/29 | Baa3 | 1,200,000 | 1,316,484 |
| 5.00%, 1/1/29 | Baa3 | 1,095,000 | 1,186,016 |
| Ser. A, 5.00%, 12/1/28 | Baa3 | 1,760,000 | 1,946,085 |
| Ser. D, 5.00%, 11/1/28 | Baa3 | 1,000,000 | 1,105,420 |
| IL State Fin. Auth. Rev. Bonds | | | |
| (Three Crowns Park), 5.25%, 2/15/47 | BB–/P | 540,000 | 572,503 |
| (Plymouth Place), 5.25%, 5/15/45 | BB+/F | 1,000,000 | 1,045,150 |
| (Three Crowns Park), 5.25%, 2/15/37 | BB–/P | 305,000 | 325,435 |
| (Southern IL Healthcare Enterprises, Inc.), | | | |
| 5.00%, 3/1/33 | A+ | 700,000 | 800,212 |
| (Windy City Portfolio), Ser. A-1, 4.375%, 12/1/42 | BB | 1,000,000 | 755,180 |
| (Riverside Hlth. Syst.), 4.00%, 11/15/35 | A+ | 500,000 | 522,015 |
|
| Managed Municipal Income Trust 23 |
| | | |
| MUNICIPAL BONDS AND NOTES (131.6%)*cont. | Rating** | Principal amount | Value |
| Illinoiscont. | | | |
| IL State Fin. Auth. Student Hsg. & Academic Fac. Rev. | | | |
| Bonds, (U. of IL-CHF-Chicago, LLC), Ser. A | | | |
| 5.00%, 2/15/47 | Baa3 | $500,000 | $546,740 |
| 5.00%, 2/15/37 | Baa3 | 500,000 | 555,415 |
| Metro. Pier & Exposition Auth. Rev. | | | |
| Bonds, (McCormick Place Expansion), | | | |
| Ser. B, stepped-coupon zero % (4.950%, 6/15/31), | | | |
| 12/15/47 †† | BBB | 1,500,000 | 894,945 |
| Metro. Wtr. Reclamation Dist. of Greater Chicago | | | |
| G.O. Bonds, Ser. A, 5.00%, 12/1/31 | AA+ | 1,000,000 | 1,166,190 |
| Sales Tax Securitization Corp. Rev. Bonds, Ser. C, | | | |
| 5.50%, 1/1/36 | AA– | 2,000,000 | 2,379,700 |
| | | | 46,771,833 |
| Indiana (0.5%) | | | |
| IN State Fin. Auth. Edl. Fac. Rev. Bonds, (Butler U.), | | | |
| Ser. B, 5.00%, 2/1/29 | A– | 500,000 | 538,180 |
| Valparaiso, Exempt Facs. Rev. Bonds, (Pratt Paper, | | | |
| LLC), 6.75%, 1/1/34 | B+/P | 1,125,000 | 1,298,981 |
| | | | 1,837,161 |
| Iowa (0.2%) | | | |
| IA State Fin. Auth. Midwestern Disaster Rev. Bonds, | | | |
| (IA Fertilizer Co., LLC), 5.25%, 12/1/25 | B+ | 750,000 | 808,703 |
| | | | 808,703 |
| Kansas (0.4%) | | | |
| Lenexa, Hlth. Care Fac. Rev. Bonds, (LakeView | | | |
| Village), 7.125%, 5/15/29 (Prerefunded 5/15/19) | BB/P | 500,000 | 500,970 |
| Wichita, Hlth. Care Fac. Rev. Bonds, (Presbyterian | | | |
| Manors), Ser. I, 5.00%, 5/15/33 | BB–/P | 500,000 | 532,135 |
| Wyandotte, Cnty./Kansas City, Unified Govt. 144A | | | |
| Rev. Bonds, (Legends Apt. Garage & West Lawn), | | | |
| 4.50%, 6/1/40 | AA | 500,000 | 508,335 |
| | | | 1,541,440 |
| Kentucky (2.5%) | | | |
| KY Econ. Dev. Fin. Auth. Rev. Bonds, (Masonic Home | | | |
| Indpt. Living), 5.00%, 5/15/46 | BB/P | 1,000,000 | 1,029,240 |
| KY Pub. Trans. Infrastructure Auth. Rev. Bonds, | | | |
| (1st Tier Downtown Crossing), Ser. A, 6.00%, 7/1/53 | Baa3 | 1,100,000 | 1,206,524 |
| KY State Econ. Dev. Fin. Auth. Rev. Bonds, | | | |
| (Owensboro Hlth.), Ser. A, 5.25%, 6/1/41 | Baa3 | 125,000 | 139,348 |
| KY State Econ. Dev. Fin. Auth. Hlth. Care Rev. Bonds, | | | |
| (Masonic Homes of KY), 5.375%, 11/15/42 | BB–/P | 900,000 | 934,695 |
| KY State Pub. Energy Auth. Gas Supply Mandatory | | | |
| Put Bonds (6/1/25), Ser. C-1, 4.00%, 12/1/49 | A3 | 2,100,000 | 2,290,470 |
| Louisville & Jefferson Cnty., Metro. Govt. Hlth. Syst. | | | |
| Rev. Bonds, (Norton Healthcare Oblig. Group), | | | |
| 5.50%, 10/1/33 | A– | 3,000,000 | 3,377,280 |
| Owen Cnty., Wtr. Wks. Syst. Rev. Bonds, (American | | | |
| Wtr. Co.), Ser. A, 6.25%, 6/1/39 | A | 700,000 | 702,310 |
| | | | 9,679,867 |
| |
| 24 Managed Municipal Income Trust |
| | | |
| MUNICIPAL BONDS AND NOTES (131.6%)*cont. | Rating** | Principal amount | Value |
| Louisiana (0.6%) | | | |
| LA State Pub. Fac. Solid Waste Disp. Auth. Rev. | | | |
| Bonds, (LA Pellets, Inc.), Ser. A, 8.375%, 7/1/39 | | | |
| (In default) † | D/P | $500,000 | $5 |
| Pub. Fac. Auth. Rev. Bonds, (Tulane U.), Ser. A, | | | |
| 4.00%, 12/15/50 | A2 | 750,000 | 779,648 |
| Pub. Fac. Auth. Dock & Wharf 144A Rev. Bonds, | | | |
| (Impala Warehousing, LLC), 6.50%, 7/1/36 | B+/P | 1,000,000 | 1,094,950 |
| St. Tammany, Public Trust Fin. Auth. Rev. Bonds, | | | |
| (Christwood), 5.25%, 11/15/37 | BB/P | 385,000 | 408,681 |
| | | | 2,283,284 |
| Maine (0.7%) | | | |
| ME Hlth. & Higher Edl. Fac. Auth. Rev. Bonds | | | |
| (ME Gen. Med. Ctr.), 7.50%, 7/1/32 | Ba3 | 1,000,000 | 1,106,400 |
| (MaineGeneral Health Oblig. Group), 6.95%, 7/1/41 | Ba3 | 1,000,000 | 1,086,240 |
| ME State Fin. Auth. Solid Waste Disp. 144A | | | |
| Mandatory Put Bonds (8/1/25), (Casella Waste Syst.), | | | |
| 5.125%, 8/1/35 | B | 500,000 | 525,150 |
| | | | 2,717,790 |
| Maryland (1.4%) | | | |
| Frederick Cnty., Edl. Fac. 144A Rev. Bonds, | | | |
| (Mount St. Mary’s U.), Ser. A, 5.00%, 9/1/37 | BB+ | 500,000 | 539,140 |
| MD Econ. Dev. Corp. Poll. Control Rev. Bonds, | | | |
| (Potomac Electric Power Co.), 6.20%, 9/1/22 | A2 | 550,000 | 560,445 |
| Prince Georges Cnty., Rev. Bonds, (Collington | | | |
| Episcopal Life Care Cmnty., Inc.), 5.25%, 4/1/37 | BB/P | 1,200,000 | 1,281,552 |
| Prince Georges Cnty., Special Oblig. 144A Tax Alloc. | | | |
| Bonds, (Westphalia Town Ctr.), 5.125%, 7/1/39 | B/P | 1,000,000 | 1,047,750 |
| Westminster, Rev. Bonds | | | |
| (Lutheran Village at Miller’s Grant, Inc. (The)), | | | |
| Ser. A, 6.00%, 7/1/34 | B–/P | 250,000 | 266,498 |
| (Carroll Lutheran Village, Inc.), 5.125%, 7/1/34 | BB/P | 1,500,000 | 1,595,205 |
| | | | 5,290,590 |
| Massachusetts (2.0%) | | | |
| MA State Dev. Fin. Agcy. Rev. Bonds | | | |
| (Suffolk U.), Ser. A, 6.25%, 7/1/30 | Baa2 | 360,000 | 362,711 |
| (Loomis Communities), Ser. A, 6.00%, 1/1/33 | BBB/P | 100,000 | 111,026 |
| (Loomis Communities), Ser. A, U.S. Govt. Coll., | | | |
| 6.00%, 1/1/33 (Prerefunded 1/1/23) | AAA/P | 100,000 | 116,686 |
| (Suffolk U.), Ser. A, 5.75%, 7/1/39 | Baa2 | 320,000 | 322,150 |
| (Linden Ponds, Inc.), Ser. B, zero %, 11/15/56 | B–/P | 439,022 | 117,232 |
| MA State Dev. Fin. Agcy. 144A Rev. Bonds, | | | |
| (Linden Ponds, Inc. Fac.) | | | |
| 5.125%, 11/15/46 | BB/F | 1,000,000 | 1,044,070 |
| 5.00%, 11/15/38 | BB/F | 500,000 | 523,150 |
| MA State Dev. Fin. Agcy. Hlth. Care Fac. 144A Rev. | | | |
| Bonds, (Adventcare), Ser. A, 6.65%, 10/15/28 | B/P | 995,000 | 995,259 |
| MA State Port Auth. Rev. Bonds, Ser. A, 5.00%, 7/1/40 | Aa2 | 2,795,000 | 3,327,168 |
| MA State Port Auth. Special Fac. Rev. Bonds, | | | |
| (Conrac), Ser. A, 5.125%, 7/1/41 | A | 750,000 | 796,395 |
| | | | 7,715,847 |
|
| Managed Municipal Income Trust 25 |
| | | |
| MUNICIPAL BONDS AND NOTES (131.6%)*cont. | Rating** | Principal amount | Value |
| Michigan (6.0%) | | | |
| Detroit, G.O. Bonds, 5.00%, 4/1/37 | Ba3 | $750,000 | $802,260 |
| Detroit, Wtr. Supply Syst. Rev. Bonds, Ser. B, AGM, | | | |
| 6.25%, 7/1/36 | AA | 5,000 | 5,035 |
| Flint, Hosp. Bldg. Auth. Rev. Bonds, Ser. A, | | | |
| 5.25%, 7/1/39 | Ba1 | 750,000 | 782,948 |
| Great Lakes, Wtr. Auth. Swr. Rev. Bonds, (Brazos | | | |
| Presbyterian Homes, Inc.), Ser. C, 5.00%, 7/1/36 | A | 2,000,000 | 2,293,140 |
| Kentwood, Economic Dev. Rev. Bonds, | | | |
| (Holland Home), 5.625%, 11/15/32 | BBB–/F | 2,195,000 | 2,355,059 |
| MI State Fin. Auth. Rev. Bonds | | | |
| (Local Govt. Loan Program — Detroit Wtr. & Swr. | | | |
| Dept. (DWSD)), Ser. D-2, 5.00%, 7/1/34 | A+ | 400,000 | 456,828 |
| (Detroit Wtr. & Swr.), Ser. C-6, 5.00%, 7/1/33 | A+ | 600,000 | 673,338 |
| MI State Fin. Auth. Ltd. Oblig. Rev. Bonds | | | |
| (Lawrence Technological U.), 5.00%, 2/1/47 | BB+ | 2,150,000 | 2,303,725 |
| (Kalamazoo College), 4.00%, 12/1/47 | A1 | 1,000,000 | 1,050,770 |
| MI State Hosp. Fin. Auth. Rev. Bonds, (Trinity Hlth. | | | |
| Credit Group), Ser. A, 5.00%, 12/1/47 T | Aa3 | 8,500,000 | 9,186,653 |
| MI State Strategic Fund Ltd. Rev. Bonds, | | | |
| (Worthington Armstrong Venture), 5.75%, 10/1/22 | | | |
| (Escrowed to maturity) | AAA/P | 1,350,000 | 1,517,184 |
| Wayne Cnty., Arpt. Auth. Rev. Bonds, Ser. A, | | | |
| 5.00%, 12/1/21 | A2 | 2,000,000 | 2,154,420 |
| | | | 23,581,360 |
| Minnesota (1.3%) | | | |
| Baytown Twp., Lease Rev. Bonds, Ser. A, | | | |
| 4.00%, 8/1/41 | BB+ | 380,000 | 368,528 |
| Ham Lake, Charter School Lease Rev. Bonds, | | | |
| (DaVinci Academy of Arts & Science), Ser. A, | | | |
| 5.00%, 7/1/47 | BB–/P | 500,000 | 512,670 |
| Rochester, Hlth. Care Fac. Rev. Bonds, | | | |
| (Olmsted Med. Ctr.), 5.875%, 7/1/30 | A/F | 1,000,000 | 1,043,690 |
| Sartell, Hlth. Care & Hsg. Facs. Rev. Bonds, | | | |
| (Country Manor Campus, LLC) | | | |
| 5.25%, 9/1/30 | B–/P | 500,000 | 535,055 |
| 5.25%, 9/1/27 | B–/P | 750,000 | 810,998 |
| St. Paul, Hsg. & Redev. Auth. Charter School Lease | | | |
| Rev. Bonds, (Nova Classical Academy), Ser. A | | | |
| 6.625%, 9/1/42 (Prerefunded 9/1/21) | BBB– | 250,000 | 277,948 |
| 6.375%, 9/1/31 | BBB– | 250,000 | 269,370 |
| St. Paul, Port Auth. Lease Rev. Bonds, | | | |
| (Regions Hosp. Pkg. Ramp), Ser. 1, 5.00%, 8/1/36 | A–/P | 1,125,000 | 1,126,991 |
| | | | 4,945,250 |
| Mississippi (1.4%) | | | |
| MS State Bus. Fin. Corp. Rev. Bonds, (System Energy | | | |
| Resources, Inc.), 2.50%, 4/1/22 | BBB+ | 5,600,000 | 5,619,768 |
| | | | 5,619,768 |
| |
| 26 Managed Municipal Income Trust |
| | | |
| MUNICIPAL BONDS AND NOTES (131.6%)*cont. | Rating** | Principal amount | Value |
| Missouri (1.4%) | | | |
| MO State Hlth. & Edl. Fac. Auth. VRDN, (WA U. (The)), | | | |
| Ser. D, 2.20%, 9/1/30 | VMIG 1 | $1,000,000 | $1,000,000 |
| Saint Louis, Indl. Dev. Auth. Fin. Rev. Bonds, | | | |
| (Ballpark Village Dev.), Ser. A, 4.75%, 11/15/47 | BB–/P | 875,000 | 905,231 |
| St. Louis Arpt. Rev. Bonds, (Lambert-St. Louis Intl.), | | | |
| Ser. A-1, 6.625%, 7/1/34 | A2 | 1,000,000 | 1,007,750 |
| St. Louis Cnty., Indl. Dev. Auth. Sr. Living Fac. Rev. | | | |
| Bonds, (Friendship Village Oblig. Group), Ser. A, | | | |
| 5.00%, 9/1/38 | BB+/F | 2,500,000 | 2,701,050 |
| | | | 5,614,031 |
| Nebraska (1.5%) | | | |
| Central Plains, Energy Mandatory Put Bonds | | | |
| (1/1/24), (No. 4), 5.00%, 3/1/50 | A3 | 4,500,000 | 4,998,690 |
| Lancaster Cnty., Hosp. Auth. Rev. Bonds, | | | |
| (Immanuel Oblig. Group), 5.50%, 1/1/30 | AA/F | 1,000,000 | 1,022,600 |
| | | | 6,021,290 |
| Nevada (1.7%) | | | |
| Clark Cnty., Arpt. Rev. Bonds, Ser. A-2, 5.00%, 7/1/33 | Aa3 | 1,050,000 | 1,184,211 |
| Clark Cnty., Impt. Dist. Special Assmt. Bonds, | | | |
| (Mountains Edge Local No. 142), 5.00%, 8/1/21 | A | 465,000 | 490,487 |
| Clark Cnty., Impt. Dist. No. 159 Special Assessment | | | |
| Bonds, (Summerlin Village 16A), 5.00%, 8/1/32 | B+/P | 480,000 | 500,880 |
| Las Vegas, Special Assmt. Bonds | | | |
| 5.00%, 6/1/31 | B+/P | 410,000 | 422,394 |
| (Dist. No. 607 Local Impt.), 5.00%, 6/1/23 | BBB–/P | 340,000 | 362,960 |
| Las Vegas, Impt. Dist. No. 812 Special Assessment | | | |
| Bonds, (Summerlin Village 24), 5.00%, 12/1/35 | B/P | 250,000 | 256,613 |
| North Las Vegas, G.O. Bonds, AGM, 4.00%, 6/1/33 | AA | 3,095,000 | 3,323,999 |
| | | | 6,541,544 |
| New Hampshire (3.3%) | | | |
| National Fin. Auth. 144A Rev. Bonds, (Covanta | | | |
| Holding Corp.), Ser. C, 4.875%, 11/1/42 | B1 | 1,275,000 | 1,301,635 |
| NH State Bus. Fin. Auth. Solid Waste Disp. 144A | | | |
| Mandatory Put Bonds (10/1/19), (Casella Waste | | | |
| Syst., Inc.), 4.00%, 4/1/29 | B | 350,000 | 351,733 |
| NH State Hlth. & Ed. Fac. Auth. Rev. Bonds | | | |
| (Rivermead), Ser. A, 6.875%, 7/1/41 | BB+/P | 2,000,000 | 2,122,180 |
| (Rivermead), Ser. A, 6.625%, 7/1/31 | BB+/P | 1,320,000 | 1,404,031 |
| (Catholic Med. Ctr.), 5.00%, 7/1/44 | A– | 1,000,000 | 1,120,970 |
| (Concord Hosp. Trust), 5.00%, 10/1/42 | A2 | 3,250,000 | 3,693,398 |
| (Kendel at Hanover), 5.00%, 10/1/40 | BBB+/F | 585,000 | 630,911 |
| (Elliot Hosp.), 5.00%, 10/1/38 | A– | 250,000 | 283,630 |
| (Southern NH Med. Ctr.), 5.00%, 10/1/37 | A– | 1,000,000 | 1,134,210 |
| NH State Hlth. & Ed. Fac. Auth. 144A Rev. Bonds, | | | |
| (Hillside Village), Ser. A, 6.25%, 7/1/42 | B–/P | 750,000 | 803,325 |
| | | | 12,846,023 |
| New Jersey (7.7%) | | | |
| Atlantic City, G.O. Bonds, (Tax Appeal), Ser. B, AGM, | | | |
| 4.00%, 3/1/42 | AA | 1,250,000 | 1,316,550 |
| Burlington Cnty., Bridge Comm. Econ. Dev. Rev. | | | |
| Bonds, (The Evergreens), 5.625%, 1/1/38 | BB+/P | 1,500,000 | 1,499,850 |
|
| Managed Municipal Income Trust 27 |
| | | |
| MUNICIPAL BONDS AND NOTES (131.6%)*cont. | Rating** | Principal amount | Value |
| New Jerseycont. | | | |
| NJ State Econ. Dev. Auth. Rev. Bonds | | | |
| (Ashland School, Inc.), 6.00%, 10/1/33 | BBB | $1,000,000 | $1,120,260 |
| (NYNJ Link Borrower, LLC), 5.375%, 1/1/43 | BBB– | 1,000,000 | 1,104,900 |
| Ser. EEE, 5.00%, 6/15/48 | Baa1 | 3,000,000 | 3,287,010 |
| (North Star Academy Charter School of Newark, | | | |
| Inc.), 5.00%, 7/15/47 | BBB– | 1,000,000 | 1,089,720 |
| Ser. AAA, 5.00%, 6/15/36 | Baa1 | 350,000 | 383,593 |
| (United Methodist Homes), Ser. A, 5.00%, 7/1/29 | BBB–/F | 500,000 | 530,760 |
| Ser. B, 5.00%, 11/1/26 | Baa1 | 3,000,000 | 3,446,940 |
| 5.00%, 6/15/26 | Baa1 | 500,000 | 535,865 |
| NJ State Econ. Dev. Auth. Fac. Rev. Bonds, | | | |
| (Continental Airlines, Inc.), 5.625%, 11/15/30 | BB | 1,500,000 | 1,707,795 |
| NJ State Econ. Dev. Auth. Special Fac. Rev. Bonds, | | | |
| (Port Newark Container Term., LLC), 5.00%, 10/1/37 | Ba1 | 1,500,000 | 1,644,450 |
| NJ State Econ. Dev. Auth. Wtr. Fac. Rev. Bonds, | | | |
| (NJ American Wtr. Co.) | | | |
| Ser. A, 5.70%, 10/1/39 | A1 | 2,600,000 | 2,639,390 |
| Ser. D, 4.875%, 11/1/29 | A1 | 700,000 | 725,431 |
| NJ State Hlth. Care Fac. Fin. Auth. Rev. Bonds, | | | |
| (St. Peter’s U. Hosp.), 6.25%, 7/1/35 | Ba1 | 2,000,000 | 2,133,020 |
| NJ State Trans. Trust Fund Auth. Rev. Bonds, | | | |
| (Federal Hwy. Reimbursement Notes), | | | |
| 5.00%, 6/15/28 | A+ | 600,000 | 691,740 |
| North Hudson, Swr. Auth. Rev. Bonds, Ser. A | | | |
| 5.00%, 6/1/42 | A+ | 945,000 | 1,017,264 |
| 5.00%, 6/1/42 (Prerefunded 6/1/22) | AAA/P | 55,000 | 60,633 |
| Tobacco Settlement Fin. Corp. Rev. Bonds, Ser. B, | | | |
| 5.00%, 6/1/46 | BBB | 3,300,000 | 3,446,784 |
| Union Cnty., Util. Auth. Resource Recvy. Fac. Lease | | | |
| Rev. Bonds, (Covanta Union), Ser. A, 5.25%, 12/1/31 | AA+ | 1,450,000 | 1,566,841 |
| | | | 29,948,796 |
| New Mexico (0.7%) | | | |
| Farmington, Poll. Control Rev. Bonds | | | |
| (Public Service Co. of San Juan, NM), Ser. D, | | | |
| 5.90%, 6/1/40 | BBB+ | 500,000 | 519,855 |
| (AZ Pub. Svc. Co.), Ser. B, 4.70%, 9/1/24 | A2 | 2,000,000 | 2,077,160 |
| | | | 2,597,015 |
| New York (8.0%) | | | |
| Glen Cove, Local Econ. Assistance Corp. Rev. Bonds, | | | |
| (Garvies Point Pub. Impt.), Ser. C, stepped-coupon | | | |
| zero% (5.625%, 1/1/24), 1/1/55 †† | B/P | 300,000 | 266,316 |
| Metro. Trans. Auth. Rev. Bonds, (Green Bonds), | | | |
| Ser. C-1, 4.00%, 11/15/32 | A1 | 3,500,000 | 3,857,665 |
| Metro. Trans. Auth. Dedicated Tax Mandatory Put | | | |
| Bonds (6/1/22), Ser. A-2A, 2.75%, 11/1/26 | AA | 2,910,000 | 2,894,257 |
| NY City, VRDN Ser. I, 2.29%, 4/1/36 | VMIG 1 | 3,000,000 | 3,000,000 |
| NY Counties, Tobacco Trust VI Rev. Bonds, (Tobacco | | | |
| Settlement Pass Through), Ser. A-2B, 5.00%, 6/1/51 | BBB | 1,700,000 | 1,734,459 |
| NY State Convention Ctr. Dev. Corp. Rev. Bonds, | | | |
| (Hotel Unit Fee), zero %, 11/15/50 | Aa3 | 2,500,000 | 785,850 |
| |
| 28 Managed Municipal Income Trust |
| | | |
| MUNICIPAL BONDS AND NOTES (131.6%)*cont. | Rating** | Principal amount | Value |
| New Yorkcont. | | | |
| NY State Dorm. Auth. Non-State Supported Debt | | | |
| Rev. Bonds, (NYU Hosp. Ctr.), 5.00%, 7/1/34 | A3 | $500,000 | $562,875 |
| NY State Dorm. Auth. Rev. Bonds, Ser. A, Group C , | | | |
| 5.00% 3/15/42 T | Aa1 | 10,845,000 | 12,637,798 |
| NY State Env. Fac. Corp. Solid Waste Disp. 144A | | | |
| Mandatory Put Bonds (12/2/19), (Casella Waste | | | |
| Syst., Inc.), 3.75%, 12/1/44 | B | 1,000,000 | 1,005,850 |
| NY State Liberty Dev. Corp. 144A Rev. Bonds | | | |
| (World Trade Ctr.), Class 2, 5.375%, 11/15/40 | BB–/P | 750,000 | 824,475 |
| (3 World Trade Ctr., LLC), Class 1-3, | | | |
| 5.00%, 11/15/44 | BB–/P | 2,350,000 | 2,530,880 |
| Port Auth. of NY & NJ Special Oblig. Rev. Bonds, | | | |
| (KIAC Partners Special Project — 5th Installment), | | | |
| 6.75%, 10/1/19 | BBB–/P | 100,000 | 102,260 |
| Port Auth. of NY & NJ Special Oblig. Rev. Bonds, | | | |
| (John F. Kennedy Intl. Air Term.), 6.00%, 12/1/42 | Baa1 | 1,000,000 | 1,058,480 |
| | | | 31,261,165 |
| North Carolina (1.4%) | | | |
| NC State Med. Care Comm. Hlth. Fac. Rev. Bonds, | | | |
| (Presbyterian Homes), Ser. C, 5.00%, 10/1/31 | A–/F | 800,000 | 910,528 |
| NC State Med. Care Comm. Retirement | | | |
| Fac. Rev. Bonds | | | |
| (Salemtowne), 5.375%, 10/1/45 | BB/P | 1,615,000 | 1,721,606 |
| (Aldersgate United Methodist Retirement Cmnty., | | | |
| Inc.), Ser. A, 5.00%, 7/1/47 | BB/P | 400,000 | 419,644 |
| (Aldersgate United Methodist Church), | | | |
| 5.00%, 7/1/45 | BB/P | 825,000 | 857,744 |
| (Southminister, Inc.), 5.00%, 10/1/37 | BB/P | 965,000 | 1,026,992 |
| (United Church Homes & Svcs. Oblig. Group), | | | |
| Ser. A, 5.00%, 9/1/37 | BB/P | 500,000 | 527,445 |
| | | | 5,463,959 |
| Ohio (5.2%) | | | |
| Buckeye, Tobacco Settlement Fin. Auth. Rev. Bonds | | | |
| Ser. A-2, 6.50%, 6/1/47 | B3 | 4,000,000 | 3,990,480 |
| Ser. A-3, 6.25%, 6/1/37 | B– | 5,850,000 | 5,774,873 |
| Ser. A-2, 6.00%, 6/1/42 | B3 | 4,000,000 | 3,942,000 |
| Ser. B, zero %, 6/1/47 | CCC+/P | 10,000,000 | 572,500 |
| Franklin Cnty., Hlth. Care Fac. Rev. Bonds, | | | |
| (OH Presbyterian Retirement Svcs. (OPRS) Cmntys. | | | |
| Oblig. Group), Ser. A, 5.625%, 7/1/26 | BBB/F | 1,250,000 | 1,287,200 |
| Lake Cnty., Hosp. Fac. Rev. Bonds, (Lake Hosp. Syst., | | | |
| Inc.), Ser. C, 5.625%, 8/15/29 | Baa1 | 245,000 | 245,784 |
| OH State Air Quality Dev. Auth. Exempt Fac. 144A | | | |
| Rev. Bonds, (Pratt Paper, LLC), 4.50%, 1/15/48 | BB+/P | 1,200,000 | 1,253,544 |
| OH State Higher Edl. Fac. Comm. Rev. Bonds, | | | |
| (Kenyon College) | | | |
| 5.00%, 7/1/44 | A | 525,000 | 542,378 |
| U.S. Govt. Coll., 5.00%, 7/1/44 | | | |
| (Prerefunded 7/1/20) | AAA/P | 275,000 | 285,571 |
| OH State Private Activity Rev. Bonds, (Portsmouth | | | |
| Bypass), AGM, 5.00%, 12/31/35 | AA | 750,000 | 841,410 |
|
| Managed Municipal Income Trust 29 |
| | | |
| MUNICIPAL BONDS AND NOTES (131.6%)*cont. | Rating** | Principal amount | Value |
| Ohiocont. | | | |
| Southeastern OH Port Auth. Hosp. Fac. Rev. Bonds | | | |
| 5.75%, 12/1/32 | BB–/F | $900,000 | $971,064 |
| (Memorial Hlth. Syst. Oblig. Group), | | | |
| 5.00%, 12/1/43 | BB–/F | 150,000 | 154,539 |
| Toledo-Lucas Cnty., Port Auth. Rev. Bonds, | | | |
| (CSX Transn, Inc.), 6.45%, 12/15/21 | A3 | 500,000 | 551,515 |
| | | | 20,412,858 |
| Oklahoma (0.7%) | | | |
| Tulsa Cnty., Indl. Auth. Rev. Bonds, (Sr. Living | | | |
| Cmnty. Montereau, Inc.), Ser. A, 7.125%, 11/1/30 | | | |
| (Prerefunded 5/1/20) | BB–/P | 1,250,000 | 1,315,625 |
| Tulsa, Muni. Arpt. Trust Rev. Bonds, (American | | | |
| Airlines, Inc.), Ser. B, 5.50%, 12/1/35 | B+/P | 1,250,000 | 1,351,363 |
| | | | 2,666,988 |
| Oregon (0.4%) | | | |
| Multnomah Cnty., Hosp. Fac. Auth. Rev. Bonds, | | | |
| (Terwilliger Plaza, Inc.), 5.00%, 12/1/29 | BBB/F | 350,000 | 373,856 |
| Warm Springs Reservation, Confederated Tribes | | | |
| 144A Rev. Bonds, (Pelton Round Butte Tribal), Ser. B, | | | |
| 6.375%, 11/1/33 | A3 | 700,000 | 711,116 |
| Yamhill Cnty., Hosp. Auth. Rev. Bonds, (Friendsview | | | |
| Retirement Cmnty.), Ser. A, 5.00%, 11/15/36 | BB/P | 325,000 | 349,749 |
| | | | 1,434,721 |
| Pennsylvania (5.7%) | | | |
| Allegheny Cnty., Higher Ed. Bldg. Auth. Rev. Bonds | | | |
| (Robert Morris U.), Ser. A, 5.50%, 10/15/30 | Baa3 | 1,000,000 | 1,038,890 |
| (Robert Morris U.-UPMC Events Ctr.), | | | |
| 5.00%, 10/15/47 | Baa3 | 1,820,000 | 1,961,596 |
| Allegheny Cnty., Hosp. Dev. Auth. Rev. Bonds, | | | |
| (Allegheny Hlth. Network Oblig. Group), Ser. A | | | |
| 5.00%, 4/1/35 | A | 1,200,000 | 1,392,852 |
| 5.00%, 4/1/32 | A | 1,425,000 | 1,672,052 |
| Cap. Region Wtr. Rev. Bonds, 5.00%, 7/15/30 | A+ | 1,500,000 | 1,809,975 |
| Chester Cnty., Hlth. & Ed. Fac. Auth. Rev. Bonds, | | | |
| (Immaculata U.), 5.00%, 11/1/46 | BB/F | 500,000 | 517,850 |
| Chester Cnty., Indl. Dev. Auth. Rev. Bonds | | | |
| (Collegium Charter School), Ser. A, | | | |
| 5.125%, 10/15/37 | BB+ | 750,000 | 792,323 |
| (Renaissance Academy Charter School), | | | |
| 5.00%, 10/1/34 | BBB– | 350,000 | 376,929 |
| Chester Cnty., Indl. Dev. Auth. Student Hsg. Rev. | | | |
| Bonds, (West Chester U. Student Hsg., LLC), Ser. A, | | | |
| 5.00%, 8/1/45 | Baa3 | 1,000,000 | 1,043,810 |
| Cmnwlth. Fin. Auth. Rev. Bonds, (Tobacco Master | | | |
| Settlement Payment), 5.00%, 6/1/35 | A1 | 1,000,000 | 1,171,430 |
| Dallas, Area Muni. Auth. U. Rev. Bonds, (Misericordia | | | |
| U.), 5.00%, 5/1/48 | Baa3 | 500,000 | 540,870 |
| Lycoming Cnty., Auth. Hlth. Syst. Rev. Bonds, | | | |
| (Susquehanna Hlth. Syst.), Ser. A, 5.75%, 7/1/39 | A+ | 3,000,000 | 3,017,700 |
| Montgomery Cnty., Indl. Auth. Rev. Bonds, | | | |
| (Whitemarsh Continuing Care Retirement Cmnty.), | | | |
| Ser. A, 5.25%, 1/1/48 | BB–/P | 500,000 | 510,395 |
| |
| 30 Managed Municipal Income Trust |
| | | |
| MUNICIPAL BONDS AND NOTES (131.6%)*cont. | Rating** | Principal amount | Value |
| Pennsylvaniacont. | | | |
| Moon, Indl. Dev. Auth. Rev. Bonds, (Baptist Homes | | | |
| Society Oblig. Group), 5.75%, 7/1/35 | B+/P | $1,500,000 | $1,589,085 |
| PA State Higher Edl. Fac. Auth. Rev. Bonds | | | |
| (Shippensburg U.), 6.25%, 10/1/43 | | | |
| (Prerefunded 10/1/21) | BBB– | 500,000 | 554,200 |
| (Gwynedd Mercy College), Ser. KK1, | | | |
| 5.375%, 5/1/42 | BBB | 785,000 | 818,857 |
| PA State Tpk. Comm. Rev. Bonds | | | |
| Ser. B-1, 5.00%, 6/1/42 | A3 | 900,000 | 1,015,983 |
| Ser. A, 5.00%, 12/1/38 | A1 | 500,000 | 560,275 |
| Philadelphia, Auth. for Indl. Dev. Rev. Bonds, | | | |
| (Master Charter School), 6.00%, 8/1/35 | | | |
| (Prerefunded 8/1/20) | BBB– | 1,055,000 | 1,110,039 |
| West Shore Area Auth. Rev. Bonds, (Lifeways | | | |
| at Messiah Village), Ser. A, 5.00%, 7/1/35 | BBB–/F | 785,000 | 830,546 |
| | | | 22,325,657 |
| Puerto Rico (0.3%) | | | |
| Cmnwlth. of PR, G.O. Bonds, (Pub. Impt.), Ser. A, | | | |
| NATL, 5.50%, 7/1/20 | Baa2 | 1,000,000 | 1,024,750 |
| | | | 1,024,750 |
| Rhode Island (0.4%) | | | |
| RI Hlth. & Edl. Bldg. Corp. Rev. Bonds, (Lifespan | | | |
| Oblig. Group-Hosp. Fin.), 5.00%, 5/15/25 | BBB+ | 1,500,000 | 1,722,480 |
| | | | 1,722,480 |
| South Carolina (3.6%) | | | |
| SC State Jobs Econ. Dev. Auth. Edl. Fac. 144A Rev. | | | |
| Bonds, (High Point Academy), Ser. A | | | |
| 5.75%, 6/15/49 | Ba1 | 1,000,000 | 1,091,270 |
| 5.75%, 6/15/39 | Ba1 | 500,000 | 551,435 |
| SC State Jobs-Econ. Dev. Auth. Hosp. Rev. Bonds, | | | |
| (Prisma Hlth. Oblig. Group), Ser. A, 5.00%, 5/1/43 | A2 | 4,500,000 | 5,130,045 |
| SC State Pub. Svcs. Auth. Rev. Bonds | | | |
| Ser. A, 5.50%, 12/1/54 | A+ | 2,000,000 | 2,221,960 |
| Ser. C, 5.00%, 12/1/46 | A+ | 2,500,000 | 2,753,675 |
| (Santee Cooper), Ser. D, 5.00%, 12/1/43 | A+ | 1,000,000 | 1,059,250 |
| Ser. A, 5.00%, 12/1/36 | A+ | 1,000,000 | 1,138,090 |
| | | | 13,945,725 |
| Tennessee (0.3%) | | | |
| Tennergy Corp., Gas Mandatory Put Bonds | | | |
| (10/1/24), Ser. A, 5.00%, 2/1/50 | Aa2 | 1,000,000 | 1,143,810 |
| | | | 1,143,810 |
| Texas (14.1%) | | | |
| Arlington, Higher Ed. Fin. Corp. Rev. Bonds, | | | |
| (Uplift Ed.), Ser. A, PSFG, 4.00%, 12/1/42 | AAA | 1,000,000 | 1,056,310 |
| Central TX Regl. Mobility Auth. Rev. Bonds, (Sr. Lien), | | | |
| Ser. A, 5.00%, 1/1/33 | A– | 525,000 | 571,195 |
| Clifton, Higher Ed. Fin. Corp. Rev. Bonds | | | |
| (Intl. Leadership), Ser. D, 6.125%, 8/15/48 | BB–/P | 2,500,000 | 2,640,175 |
| (Idea Pub. Schools), 5.00%, 8/15/32 | BBB+ | 315,000 | 335,721 |
| (IDEA Pub. Schools), 5.00%, 8/15/28 | BBB+ | 200,000 | 231,316 |
|
| Managed Municipal Income Trust 31 |
| | | |
| MUNICIPAL BONDS AND NOTES (131.6%)*cont. | Rating** | Principal amount | Value |
| Texascont. | | | |
| Dallas-Fort Worth, Intl. Arpt. Rev. Bonds | | | |
| Ser. A, 5.00%, 11/1/43 | A1 | $2,600,000 | $2,692,144 |
| Ser. B, 4.50%, 11/1/45 | A+ | 2,535,000 | 2,670,090 |
| Harris Cnty., Cultural Ed. Fac. Fin. Corp. Rev. Bonds | | | |
| (Brazos Presbyterian Homes, Inc.), 5.00%, 1/1/37 | BBB–/F | 250,000 | 270,388 |
| (YMCA of the Greater Houston Area), Ser. A, | | | |
| 5.00%, 6/1/33 | Baa2 | 1,000,000 | 1,054,980 |
| Houston, Arpt. Syst. Rev. Bonds | | | |
| Ser. B-1, 5.00%, 7/15/35 | BB | 2,500,000 | 2,733,625 |
| Ser. B-1, 5.00%, 7/15/30 | BB | 650,000 | 717,444 |
| Ser. A, 5.00%, 7/1/24 | A+ | 1,500,000 | 1,599,240 |
| La Vernia, Higher Ed. Fin. Corp. Rev. Bonds, (Kipp, | | | |
| Inc.), Ser. A, 6.25%, 8/15/39 (Prerefunded 8/15/19) | AAA/P | 1,975,000 | 2,000,813 |
| La Vernia, Higher Ed. Fin. Corp. 144A Rev. Bonds, | | | |
| (Meridian World School, LLC), Ser. A, 5.25%, 8/15/35 | BB+ | 1,000,000 | 1,056,530 |
| Love Field, Arpt. Modernization Corp. Special Fac. | | | |
| Rev. Bonds, (Southwest Airlines Co.), 5.25%, 11/1/40 | A3 | 3,500,000 | 3,640,700 |
| Matagorda Cnty., Poll. Control Rev. Bonds | | | |
| (Central Pwr. & Light Co.), Ser. A, 6.30%, 11/1/29 | A– | 1,000,000 | 1,026,940 |
| (Dist. No. 1), Ser. A, AMBAC, 4.40%, 5/1/30 | A– | 1,250,000 | 1,369,913 |
| Montgomery Cnty., Toll Road Auth. Rev. Bonds, | | | |
| 5.00%, 9/15/36 | BBB– | 1,110,000 | 1,227,427 |
| New Hope, Cultural Ed. Fac. Fin. Corp. Rev. Bonds | | | |
| (Wesleyan Homes, Inc.), 5.50%, 1/1/43 | BB–/P | 500,000 | 530,880 |
| (Collegiate Student Hsg. Island Campus, LLC), | | | |
| Ser. A, 5.00%, 4/1/42 | Ba1 | 2,830,000 | 2,858,413 |
| (Collegiate Hsg.-Tarleton St.), 5.00%, 4/1/39 | Baa3 | 500,000 | 526,190 |
| (Longhorn Village), 5.00%, 1/1/37 | BB–/P | 500,000 | 514,715 |
| (MRC Crestview), 5.00%, 11/15/36 | BB+/F | 200,000 | 211,964 |
| (Woman’s U.-Collegiate Hsg. Denton, LLC), | | | |
| Ser. A-1, AGM, 4.125%, 7/1/53 | AA | 1,000,000 | 1,031,550 |
| Newark, Higher Ed. Fin. Corp. Rev. Bonds, | | | |
| (Austin Achieve Pub. Schools, Inc.), 5.00%, 6/15/48 | BB–/P | 500,000 | 508,050 |
| North Texas Edl. Fin. Co. Rev. Bonds, (Uplift Edl.), | | | |
| Ser. A, 5.25%, 12/1/47 | BBB– | 2,000,000 | 2,100,120 |
| Red River, Hlth. Retirement Fac. Dev. | | | |
| Corp. Rev. Bonds | | | |
| (Happy Harbor Methodist Home, Inc.), Ser. A, | | | |
| 7.75%, 11/15/44 | B–/P | 420,000 | 486,671 |
| (Sears Methodist Retirement Syst. Oblig. Group), | | | |
| Ser. C, 6.25%, 5/9/53 (In default) † | D/P | 39,000 | 1,170 |
| (Sears Methodist Retirement Syst. Oblig. Group), | | | |
| Ser. B, 6.15%, 11/15/49 (In default) † | D/P | 749,000 | 22,470 |
| (Sears Methodist Retirement Syst. Oblig. Group), | | | |
| Ser. A, 6.05%, 11/15/46 (In default) † | D/P | 441,000 | 13,230 |
| (Sears Methodist Retirement Syst. Oblig. Group), | | | |
| Ser. D, 6.05%, 11/15/46 (In default) † | D/P | 76,000 | 2,280 |
| (Sears Methodist Retirement Syst. Oblig. Group), | | | |
| Ser. A, 5.45%, 11/15/38 (In default) † | D/P | 1,124,000 | 33,720 |
| (Sears Methodist Retirement Syst. Oblig. Group), | | | |
| Ser. A, 5.15%, 11/15/27 (In default) † | D/P | 593,000 | 17,790 |
| |
| 32 Managed Municipal Income Trust |
| | | |
| MUNICIPAL BONDS AND NOTES (131.6%)*cont. | Rating** | Principal amount | Value |
| Texascont. | | | |
| Temple, Tax Increment 144A Tax Alloc. Bonds, | | | |
| (Reinvestment Zone No. 1), Ser. A, 5.00%, 8/1/38 | BB+ | $1,500,000 | $1,605,255 |
| TX Private Activity Surface Trans. Corp. Rev. Bonds | | | |
| (NTE Mobility), 7.50%, 12/31/31 | Baa2 | 2,000,000 | 2,076,180 |
| (LBJ Infrastructure), 7.00%, 6/30/40 | Baa3 | 2,500,000 | 2,642,675 |
| TX State Muni. Gas Acquisition & Supply Corp. III Rev. | | | |
| Bonds, 5.00%, 12/15/28 | A3 | 1,500,000 | 1,637,535 |
| TX State Private Activity Bond Surface Trans. Corp. | | | |
| Rev. Bonds, (Blueridge Trans. Group, LLC | | | |
| (SH 288 Toll Lane)) | | | |
| 5.00%, 12/31/55 | Baa3 | 500,000 | 543,565 |
| 5.00%, 12/31/50 | Baa3 | 750,000 | 817,433 |
| TX State Trans. Comm. Rev. Bonds, | | | |
| (State Hwy. 249 Sys.), Ser. A, zero %, 8/1/39 | Baa3 | 700,000 | 293,692 |
| TX State Transportation Commission G.O. Bonds, | | | |
| Ser. A, 5.00% 10/1/44 T | Aaa | 8,000,000 | 9,038,928 |
| Uptown Dev. Auth. Tax Alloc. Bonds, Ser. A, | | | |
| 5.00%, 9/1/40 | BBB | 700,000 | 770,469 |
| | | | 55,179,896 |
| Virginia (4.1%) | | | |
| Cherry Hill Cmnty., Dev. Auth. 144A Special Assmt. | | | |
| Bonds, (Potomac Shores), 5.40%, 3/1/45 | B/P | 1,000,000 | 1,035,270 |
| Front Royal & Warren Cnty., Indl. Dev. Auth. Rev. | | | |
| Bonds, (Valley Hlth. Oblig. Group), 4.00%, 1/1/50 | A1 | 2,500,000 | 2,597,000 |
| Henrico Cnty., Econ. Dev. Auth. Res. Care Fac. Rev. | | | |
| Bonds, (United Methodist Homes), 5.00%, 6/1/22 | BB+/P | 625,000 | 664,919 |
| King George Cnty., Indl. Dev. Auth. Mandatory | | | |
| Put Bonds (5/1/19), (Waste Mgt., Inc.-King George | | | |
| Landfill, Inc.), Ser. A, 2.50%, 6/1/23 | A– | 4,875,000 | 4,875,000 |
| Lexington, Indl. Dev. Auth. Res. Care Fac. Rev. | | | |
| Bonds, (Kendal at Lexington), 4.00%, 1/1/31 | BBB–/F | 675,000 | 697,950 |
| Lower Magnolia Green Cmnty., Dev. Auth. 144A | | | |
| Special Assmt. Bonds, 5.00%, 3/1/35 | B/P | 485,000 | 494,545 |
| Small Bus. Fin. Auth. Private Activity Rev. Bonds, | | | |
| (Transform 66 P3), 5.00%, 12/31/49 | Baa3 | 1,000,000 | 1,097,450 |
| Suffolk, Econ. Dev. Auth. Retirement Fac. Rev. | | | |
| Bonds, (United Church Homes & Svcs. Oblig. Group), | | | |
| 5.00%, 9/1/31 | BB/P | 500,000 | 543,450 |
| VA State Cmnwlth. U. Hlth. Syst. Auth. Rev. Bonds, | | | |
| Ser. B, 4.00%, 7/1/40 | Aa3 | 2,000,000 | 2,111,020 |
| VA State Small Bus. Fin. Auth. Rev. Bonds | | | |
| (Elizabeth River Crossings OPCO, LLC), | | | |
| 6.00%, 1/1/37 | BBB | 740,000 | 816,864 |
| (Express Lanes, LLC), 5.00%, 7/1/34 | BBB | 1,150,000 | 1,219,207 |
| | | | 16,152,675 |
| Washington (4.8%) | | | |
| Kalispel Tribe of Indians Priority Dist. Rev. Bonds, | | | |
| Ser. A, 5.25%, 1/1/38 | BB+/P | 750,000 | 815,168 |
| Port of Seattle, Rev. Bonds, Ser. C, 5.00%, 4/1/40 | A1 | 625,000 | 690,813 |
| Port Seattle, Port Indl. Dev. Corp. Rev. Bonds, | | | |
| (Delta Airlines, Inc.), 5.00%, 4/1/30 | BBB– | 800,000 | 865,432 |
|
| Managed Municipal Income Trust 33 |
| | | |
| MUNICIPAL BONDS AND NOTES (131.6%)*cont. | Rating** | Principal amount | Value |
| Washingtoncont. | | | |
| Skagit Cnty., Pub. Hosp. Rev. Bonds, (Dist. No. 001), | | | |
| 5.75%, 12/1/35 | Baa2 | $2,500,000 | $2,613,325 |
| Tobacco Settlement Auth. of WA Rev. Bonds, | | | |
| 5.25%, 6/1/32 | A– | 1,275,000 | 1,344,296 |
| WA State G.G. Bonds, Ser. C, 5.00%, 2/1/33 T | Aa1 | 3,400,000 | 4,126,551 |
| WA State Hlth. Care Fac. Auth. Mandatory Put Bonds | | | |
| (7/1/22), (Fred Hutchinson Cancer Research Ctr.), | | | |
| Ser. B, 2.759%, 1/1/42 | A+ | 1,700,000 | 1,717,425 |
| WA State Hlth. Care Fac. Auth. Rev. Bonds | | | |
| (WA Hlth. Svcs.), 7.00%, 7/1/39 | | | |
| (Prerefunded 7/1/19) | Baa1 | 1,000,000 | 1,008,580 |
| (Overlake Hosp. Med. Ctr.), Ser. A, 5.00%, 7/1/36 | A2 | 2,145,000 | 2,473,142 |
| WA State Hsg. Fin. Comm. Rev. Bonds, | | | |
| (Wesley Homes Lea Hill), 5.00%, 7/1/41 | B/P | 500,000 | 519,790 |
| WA State Hsg. Fin. Comm. 144A Rev. Bonds | | | |
| (Bayview Manor Homes), Ser. A, 5.00%, 7/1/46 | BB+/P | 1,230,000 | 1,282,533 |
| (Presbyterian Retirement Cmnty. Northwest), | | | |
| Ser. A, 5.00%, 1/1/36 | BB+/F | 1,175,000 | 1,270,821 |
| | | | 18,727,876 |
| Wisconsin (2.7%) | | | |
| Pub. Fin. Auth. Arpt. Fac. Rev. Bonds, (Sr. Oblig. | | | |
| Group), 5.25%, 7/1/28 | BBB+ | 350,000 | 379,159 |
| Pub. Fin. Auth. Edl. Fac. Rev. Bonds, (Piedmont | | | |
| Cmnty. Charter School), 5.00%, 6/15/53 | Baa3 | 1,150,000 | 1,257,376 |
| Pub. Fin. Auth. Exempt Fac. Rev. Bonds, (Celanese | | | |
| U.S. Holdings, LLC), Ser. C, 4.30%, 11/1/30 | BBB | 300,000 | 311,571 |
| Pub. Fin. Auth. Higher Ed. Fac. Rev. Bonds, | | | |
| (Gannon U.) | | | |
| 5.00%, 5/1/47 | BBB+ | 250,000 | 272,560 |
| 5.00%, 5/1/42 | BBB+ | 1,090,000 | 1,188,274 |
| Pub. Fin. Auth. Ltd. Oblig. Pilot 144A Rev. Bonds, | | | |
| (American Dream at Meadowlands), 7.00%, 12/1/50 | BB/P | 1,000,000 | 1,170,280 |
| Pub. Fin. Auth. Retirement Fac. Rev. Bonds, | | | |
| (Southminster, Inc.), 5.00%, 10/1/43 | BB/F | 750,000 | 798,030 |
| WI State Hlth. & Edl. Fac. Auth. Rev. Bonds | | | |
| (St. Johns Cmntys. Inc.), Ser. A, 7.625%, 9/15/39 | | | |
| (Prerefunded 9/15/19) | AAA/F | 1,350,000 | 1,379,484 |
| (St. John’s Cmnty., Inc.), Ser. B, 5.00%, 9/15/45 | BBB–/F | 250,000 | 257,240 |
| WI State Pub. Fin. Auth Sr. Living Rev. Bonds, | | | |
| (Rose Villa, Inc.), Ser. A, 5.75%, 11/15/44 | BB–/P | 1,800,000 | 1,922,760 |
| WI State Pub. Fin. Auth Sr. Living 144A Rev. Bonds, | | | |
| (Mary’s Woods at Marylhurst), Ser. A, 5.25%, 5/15/37 | BB/F | 380,000 | 405,635 |
| WI State Pub. Fin. Auth. 144A Rev. Bonds, (Church | | | |
| Home of Hartford, Inc.), Ser. A, 5.00%, 9/1/30 | BB/F | 945,000 | 1,003,420 |
| | | | 10,345,789 |
| Total municipal bonds and notes (cost $494,355,635) | | $513,279,164 |
| |
| 34 Managed Municipal Income Trust |
| | |
| SHORT-TERM INVESTMENTS (—%)* | Principal amount | Value |
| U.S. Treasury Bills 2.448%, 7/11/19 # | $45,000 | $44,789 |
| U.S. Treasury Bills 2.464%, 7/18/19 | 46,000 | 45,763 |
| U.S. Treasury Bills 2.441%, 5/14/19 # | 52,000 | 51,955 |
| Total short-term investments (cost $142,503) | | $142,507 |
| |
| TOTAL INVESTMENTS | | |
| Total investments (cost $494,498,138) | | $513,421,671 |
Notes to the fund’s portfolio
Unless noted otherwise, the notes to the fund’s portfolio are for the close of the fund’s reporting period, which ran from November 1, 2018 through April 30, 2019 (the reporting period). Within the following notes to the portfolio, references to “Putnam Management” represent Putnam Investment Management, LLC, the fund’s manager, an indirect wholly-owned subsidiary of Putnam Investments, LLC and references to “ASC 820” represent Accounting Standards Codification 820Fair Value Measurements and Disclosures.
*Percentages indicated are based on net assets of $390,102,520.
**The Moody’s, Standard & Poor’s or Fitch ratings indicated are believed to be the most recent ratings available at the close of the reporting period for the securities listed. Ratings are generally ascribed to securities at the time of issuance. While the agencies may from time to time revise such ratings, they undertake no obligation to do so, and the ratings do not necessarily represent what the agencies would ascribe to these securities at the close of the reporting period. Securities rated by Fitch are indicated by “/F.” Securities rated by Putnam are indicated by “/P.” The Putnam rating categories are comparable to the Standard & Poor’s classifications. If a security is insured, it will usually be rated by the ratings organizations based on the financial strength of the insurer.
†This security is non-income-producing.
††The interest rate and date shown parenthetically represent the new interest rate to be paid and the date the fund will begin accruing interest at this rate.
#This security, in part or in entirety, was pledged and segregated with the broker to cover margin requirements for futures contracts at the close of the reporting period. Collateral at period end totaled $66,881 and is included in Investments in securities on the Statement of assets and liabilities (Notes 1 and 8).
FThis security is valued by Putnam Management at fair value following procedures approved by the Trustees. Securities are classified as Level 3 for ASC 820 based on the securities’ valuation inputs (Note 1).
TUnderlying security in a tender option bond transaction. This security has been segregated as collateral for financing transactions.
At the close of the reporting period, the fund maintained liquid assets totaling $2,491,074 to cover certain derivative contracts, tender option bonds, and the settlement of certain securities.
Unless otherwise noted, the rates quoted in Short-term investments security descriptions represent the weighted average yield to maturity.
144A after the name of an issuer represents securities exempt from registration under Rule 144A of the Securities Act of 1933, as amended. These securities may be resold in transactions exempt from registration, normally to qualified institutional buyers.
On Mandatory Put Bonds, the rates shown are the current interest rates at the close of the reporting period and the dates shown represent the next mandatory put dates. Rates are set by remarketing agents and may take into consideration market supply and demand, credit quality and the current SIFMA Municipal Swap Index, 1 Month US LIBOR or 3 Month US LIBOR rates, which were 2.30%, 2.48% and 2.58%, respectively, as of the close of the reporting period.
The dates shown parenthetically on prerefunded bonds represent the next prerefunding dates.
The dates shown on debt obligations are the original maturity dates.
|
| Managed Municipal Income Trust 35 |
| | |
| The fund had the following sector concentrations greater than 10% at the close of the reporting period (as a percentage of net assets): | |
| |
| Health care | 32.3% | | |
| Utilities | 16.0 | | |
| Education | 15.9 | | |
| Transportation | 15.4 | | |
| | | | | |
| FUTURES CONTRACTS OUTSTANDING at 4/30/19 (Unaudited) | | | |
| | | | | | Unrealized |
| | Number of | Notional | | Expiration | appreciation/ |
| | contracts | amount | Value | date | (depreciation) |
| U.S. Treasury Note Ultra 10 yr (Long) | 47 | $6,193,719 | $6,193,719 | Jun-19 | $27,906 |
| Unrealized appreciation | | | | | 27,906 |
| Unrealized (depreciation) | | | | | — |
| Total | | | | | $27,906 |
| | | | | | |
| OTC TOTAL RETURN SWAP CONTRACTS OUTSTANDING at 4/30/19 (Unaudited) | |
| | | Upfront | | | | |
| | | premium | Termina- | Payments | Total return | Unrealized |
| Swap counterparty/ | | received | tion | received (paid) | received by | appreciation/ |
| Notional amount | Value | (paid) | date | by fund | or paid by fund | (depreciation) |
| Citibank, N.A. | | | | | | |
| $2,200,000 | $58,225 | $— | 7/19/19 | — | 2.805% minus | $58,225 |
| | | | | | Municipal Market | |
| | | | | | Data Index AAA | |
| | | | | | municipal yields | |
| | | | | | 30 Year rate — At | |
| | | | | | maturity | |
| Morgan Stanley & Co. International PLC | | | | |
| 5,000,000 | 32,750 | — | 7/2/19 | — | 2.03% minus | (32,750) |
| | | | | | Municipal Market | |
| | | | | | Data Index AAA | |
| | | | | | municipal yields | |
| | | | | | 10 Year rate — At | |
| | | | | | maturity | |
| Upfront premium received | — | | Unrealized appreciation | 58,225 |
| Upfront premium (paid) | — | | Unrealized (depreciation) | (32,750) |
| Total | | $— | | Total | | $25,475 |
| |
| 36 Managed Municipal Income Trust |
ASC 820 establishes a three-level hierarchy for disclosure of fair value measurements. The valuation hierarchy is based upon the transparency of inputs to the valuation of the fund’s investments. The three levels are defined as follows:
Level 1: Valuations based on quoted prices for identical securities in active markets.
Level 2: Valuations based on quoted prices in markets that are not active or for which all significant inputs are observable, either directly or indirectly.
Level 3: Valuations based on inputs that are unobservable and significant to the fair value measurement.
The following is a summary of the inputs used to value the fund’s net assets as of the close of the reporting period:
| | | |
| | | Valuation inputs |
| Investments in securities: | Level 1 | Level 2 | Level 3 |
| Municipal bonds and notes | $— | $513,180,135 | $99,029 |
| Short-term investments | — | 142,507 | — |
| Totals by level | $— | $513,322,642 | $99,029 |
| | | | |
| | | Valuation inputs |
| Other financial instruments: | Level 1 | Level 2 | Level 3 |
| Futures contracts | $27,906 | $— | $— |
| Total return swap contracts | — | 25,475 | — |
| Totals by level | $27,906 | $25,475 | $— |
At the start and close of the reporting period, Level 3 investments in securities represented less than 1% of the fund’s net assets and were not considered a significant portion of the fund’s portfolio.
The accompanying notes are an integral part of these financial statements.
|
| Managed Municipal Income Trust 37 |
Statement of assets and liabilities4/30/19 (Unaudited)
| |
| ASSETS | |
| Investment in securities, at value (Notes 1 and 8): | |
| Unaffiliated issuers (identified cost $494,498,138) | $513,421,671 |
| Cash | 237,271 |
| Interest and other receivables | 7,460,739 |
| Receivable for investments sold | 135,000 |
| Receivable for variation margin on futures contracts (Note 1) | 13,953 |
| Unrealized appreciation on OTC swap contracts (Note 1) | 58,225 |
| Prepaid assets | 32,242 |
| Total assets | 521,359,101 |
| |
| LIABILITIES | |
| Payable for investments purchased | 1,875,000 |
| Payable for compensation of Manager (Note 2) | 646,786 |
| Payable for custodian fees (Note 2) | 1,499 |
| Payable for investor servicing fees (Note 2) | 32,320 |
| Payable for Trustee compensation and expenses (Note 2) | 171,049 |
| Payable for administrative services (Note 2) | 1,440 |
| Payable for floating rate notes issued (Note 1) | 27,247,757 |
| Distributions payable to shareholders | 1,614,807 |
| Distributions payable to preferred shareholders (Note 1) | 88,648 |
| Unrealized depreciation on OTC swap contracts (Note 1) | 32,750 |
| Other accrued expenses | 194,525 |
| Total liabilities | 31,906,581 |
| Series A remarketed preferred shares: (240 shares authorized and issued at $100,000 per | |
| share) (Note 4) | 24,000,000 |
| Series C remarketed preferred shares: (1,507 shares authorized and issued at $50,000 per | |
| share) (Note 4) | 75,350,000 |
| Net assets | $390,102,520 |
| |
| REPRESENTED BY | |
| Paid-in capital — common shares (Unlimited shares authorized) (Notes 1 and 5) | $373,106,793 |
| Total distributable earnings (Note 1) | 16,995,727 |
| Total — Representing net assets applicable to common shares outstanding | $390,102,520 |
| |
| COMPUTATION OF NET ASSET VALUE | |
| Net asset value per common share | |
| ($390,102,520 divided by 49,204,185 shares) | $7.93 |
The accompanying notes are an integral part of these financial statements.
| |
| 38 Managed Municipal Income Trust |
Statement of operationsSix months ended 4/30/19 (Unaudited)
| |
| INVESTMENT INCOME | |
| Interest income | $11,585,314 |
| Total investment income | 11,585,314 |
| |
| EXPENSES | |
| Compensation of Manager (Note 2) | 1,293,340 |
| Investor servicing fees (Note 2) | 96,253 |
| Custodian fees (Note 2) | 6,244 |
| Trustee compensation and expenses (Note 2) | 8,677 |
| Administrative services (Note 2) | 7,202 |
| Interest and fees expense (Note 2) | 335,833 |
| Preferred share remarketing agent fees | 74,928 |
| Other | 232,534 |
| Total expenses | 2,055,011 |
| | |
| Expense reduction (Note 2) | (36,792) |
| Net expenses | 2,018,219 |
| | |
| Net investment income | 9,567,095 |
| |
| REALIZED AND UNREALIZED GAIN (LOSS) | |
| Net realized gain (loss) on: | |
| Securities from unaffiliated issuers (Notes 1 and 3) | 3,962,626 |
| Futures contracts (Note 1) | 35,578 |
| Total net realized gain | 3,998,204 |
| Change in net unrealized appreciation (depreciation) on: | |
| Securities from unaffiliated issuers | 10,580,101 |
| Futures contracts | 27,906 |
| Swap contracts | 25,475 |
| Total change in net unrealized appreciation | 10,633,482 |
| | |
| Net gain on investments | 14,631,686 |
| | |
| Net increase in net assets resulting from operations | $24,198,781 |
| |
| Distributions to Series A and C remarketed preferred shareholders (Note 1): | |
| From ordinary income | |
| Taxable net investment income | — |
| From tax exempt net investment income | (1,368,527) |
| Net increase in net assets resulting from operations (applicable to common shareholders) | 22,380,254 |
The accompanying notes are an integral part of these financial statements.
|
| Managed Municipal Income Trust 39 |
Statement of changes in net assets
| | |
| INCREASE (DECREASE) IN NET ASSETS | Six months ended 4/30/19* | Year ended 10/31/18 |
| Operations | | |
| Net investment income | $9,567,095 | $20,749,776 |
| Net realized gain on investments | | |
| and foreign currency transactions | 3,998,204 | 4,983,122 |
| Change in net unrealized appreciation (depreciation) | | |
| of investments and assets and liabilities | | |
| in foreign currencies | 10,633,482 | (22,820,843) |
| Net increase in net assets resulting from operations | 24,198,781 | 2,912,055 |
| |
| Distributions to Series A and C remarketed preferred | | |
| shareholders (Note 1): | | |
| From ordinary income | | |
| Taxable net investment income | — | — |
| From tax exempt net investment income | (1,368,527) | (2,062,049) |
| Net increase in net assets resulting from operations | | |
| (applicable to common shareholders) | 22,830,254 | 850,006 |
| |
| Distributions to common shareholders (note 1): | | |
| From ordinary income | | |
| Taxable net investment income | — | — |
| From tax exempt net investment income | (9,350,156) | (19,231,990) |
| Decrease from capital shares repurchased (Note 5) | (8,401,154) | (23,562,130) |
| Total increase (decrease) in net assets | 5,078,944 | (41,944,114) |
| |
| NET ASSETS | | |
| Beginning of period | 385,023,576 | 426,967,690 |
| End of period | $390,102,520 | $385,023,576 |
| |
| NUMBER OF FUND SHARES | | |
| Common shares outstanding at beginning of period | 50,407,625 | 53,735,135 |
| Shares repurchased (Note 4) | (1,203,440) | (3,327,510) |
| Common shares outstanding at end of period | 49,204,185 | 50,407,625 |
| |
| Series A Remarketed preferred shares outstanding at | | |
| beginning and end of period | 240 | 240 |
| |
| Series C Remarketed preferred shares outstanding at | | |
| beginning and end of period | 1,507 | 1,507 |
*Unaudited.
The accompanying notes are an integral part of these financial statements.
| |
| 40 Managed Municipal Income Trust |
Financial highlights(For a common share outstanding throughout the period)
| | | | | | |
| PER-SHARE OPERATING PERFORMANCE | | | | | | |
| Sixmonths | | | Year ended | |
| | ended** | | | | | |
| | 4/30/19 | 10/31/18 | 10/31/17 | 10/31/16 | 10/31/15 | 10/31/14 |
| Net asset value, beginning of period | | | | | | |
| (common shares) | $7.64 | $7.95 | $8.10 | $7.97 | $7.94 | $7.34 |
| Investment operations: | | | | | | |
| Net investment incomea | .19 | .40 | .39 | .43 | .45 | .45 |
| Net realized and unrealized | | | | | | |
| gain (loss) on investments | .30 | (.35) | (.17) | .15 | (.02) | .59 |
| Total from investment operations | .49 | .05 | .22 | .58 | .43 | 1.04 |
| Distributions to preferred shareholders: | | | | | |
| From net investment income | (.03) | (.04) | (.02) | (.01) | —e | —e |
| Total from investment operations | | | | | | |
| (applicable to common shareholders) | .46 | .01 | .20 | .57 | .43 | 1.04 |
| Distributions to common shareholders: | | | | | | |
| From net investment income | (.19) | (.37) | (.39) | (.44) | (.43) | (.46) |
| From return of capital | — | — | (.01) | — | — | — |
| Total distributions | (.19) | (.37) | (.40) | (.44) | (.43) | (.46) |
| Increase from shares repurchased | .02 | .05 | —e | —e | .03 | .02 |
| Increase from Preferred shares | | | | | | |
| tender offer | — | — | .05 | — | — | — |
| Net asset value, end of period | | | | | | |
| (common shares) | $7.93 | $7.64 | $7.95 | $8.10 | $7.97 | $7.94 |
| Market price, end of period | | | | | | |
| (common shares) | $7.47 | $6.71 | $7.43 | $7.48 | $7.30 | $7.17 |
| Total return at market price (%) | | | | | | |
| (common shares)b | 14.25* | (4.91) | 4.84 | 8.38 | 8.11 | 14.18 |
| |
| RATIOS AND SUPPLEMENTAL DATA | | | | | | |
| Net assets, end of period | | | | | | |
| (common shares) (in thousands) | $390,103 | $385,024 | $426,968 | $436,309 | $430,032 | $445,877 |
| Ratio of expenses to average | | | | | | |
| net assets (including interest | | | | | | |
| expense) (%)c,d,f | .53* | 1.03 | 1.13g | .92 | .90 | .91 |
| Ratio of net investment income | | | | | | |
| to average net assets (%)c | 2.13* | 4.54 | 4.73 | 5.09 | 5.57 | 5.69 |
| Portfolio turnover (%) | 20* | 28 | 30 | 24 | 13 | 14 |
(Continued on next page)
|
| Managed Municipal Income Trust 41 |
Financial highlightscont.
*Not annualized.
**Unaudited.
aPer share net investment income has been determined on the basis of the weighted average number of shares outstanding during the period.
bTotal return assumes dividend reinvestment.
cRatios reflect net assets available to common shares only; net investment income ratio also reflects reduction for dividend payments to preferred shareholders.
dIncludes amounts paid through expense offset arrangements, if any (Note 2).
eAmount represents less than $0.01 per share.
fIncludes interest and fee expense associated with borrowings which amounted to:
| |
| | Percentage of average net assets |
| April 30, 2019 | 0.09% |
| October 31, 2018 | 0.17 |
| October 31, 2017 | 0.06 |
| October 31, 2016 | 0.03 |
| October 31, 2015 | 0.02 |
| October 31, 2014 | 0.02 |
gIncludes 0.17% of increased proxy solicitation and legal fees related to the 2017 annual shareholder meeting.
The accompanying notes are an integral part of these financial statements.
|
| 42 Managed Municipal Income Trust |
Notes to financial statements4/30/19 (Unaudited)
Within the following Notes to financial statements, references to “State Street” represent State Street Bank and Trust Company, references to “the SEC” represent the Securities and Exchange Commission, references to “Putnam Management” represent Putnam Investment Management, LLC, the fund’s manager, an indirect wholly-owned subsidiary of Putnam Investments, LLC and references to “OTC”, if any, represent over-the-counter. Unless otherwise noted, the “reporting period” represents the period from November 1, 2018 through April 30, 2019.
Putnam Managed Municipal Income Trust (the fund) is a Massachusetts business trust, which is registered under the Investment Company Act of 1940, as amended, as a diversified closed-end management investment company. The goal of the fund is to seek a high level of current income exempt from federal income tax. The fund intends to achieve its objective by investing in a diversified portfolio of tax-exempt municipal securities which Putnam Management believes does not involve undue risk to income or principal. Up to 60% of the fund’s assets may consist of high-yield tax-exempt municipal securities that are below investment grade and involve special risk considerations. The fund also uses leverage, primarily by issuing preferred shares in an effort to enhance the returns for the common shareholders. The fund’s shares trade on a stock exchange at market prices, which may be lower than the fund’s net asset value. The fund also uses leverage which involves risk and may increase the volatility of the fund’s net asset value.
In the normal course of business, the fund enters into contracts that may include agreements to indemnify another party under given circumstances. The fund’s maximum exposure under these arrangements is unknown as this would involve future claims that may be, but have not yet been, made against the fund. However, the fund’s management team expects the risk of material loss to be remote.
The fund has entered into contractual arrangements with an investment adviser, administrator, transfer agent and custodian, who each provide services to the fund. Unless expressly stated otherwise, shareholders are not parties to, or intended beneficiaries of these contractual arrangements, and these contractual arrangements are not intended to create any shareholder right to enforce them against the service providers or to seek any remedy under them against the service providers, either directly or on behalf of the fund.
Under the fund’s Amended and Restated Agreement and Declaration of Trust, any claims asserted against or on behalf of the Putnam Funds, including claims against Trustees and Officers, must be brought in state and federal courts located within the Commonwealth of Massachusetts.
Note 1: Significant accounting policies
The following is a summary of significant accounting policies consistently followed by the fund in the preparation of its financial statements. The preparation of financial statements is in conformity with accounting principles generally accepted in the United States of America and requires management to make estimates and assumptions that affect the reported amounts of assets and liabilities in the financial statements and the reported amounts of increases and decreases in net assets from operations. Actual results could differ from those estimates. Subsequent events after the Statement of assets and liabilities date through the date that the financial statements were issued have been evaluated in the preparation of the financial statements.
Security valuationPortfolio securities and other investments are valued using policies and procedures adopted by the Board of Trustees. The Trustees have formed a Pricing Committee to oversee the implementation of these procedures and have delegated responsibility for valuing the fund’s assets in accordance with these procedures to Putnam Management. Putnam Management has established an internal Valuation Committee that is responsible for making fair value determinations, evaluating the effectiveness of the pricing policies of the fund and reporting to the Pricing Committee.
Tax-exempt bonds and notes are generally valued on the basis of valuations provided by an independent pricing service approved by the Trustees. Such services use information with respect to transactions in bonds, quotations from bond dealers, market transactions in comparable securities and various relationships between securities in determining value. These securities will generally be categorized as Level 2.
Certain investments, including certain restricted and illiquid securities and derivatives, are also valued at fair value following procedures approved by the Trustees. To assess the continuing appropriateness of fair valuations, the Valuation Committee reviews and affirms the reasonableness of such valuations on a regular basis after considering all relevant information that is reasonably available. Such valuations and procedures are reviewed periodically by the Trustees. These valuations consider such factors as significant market or specific security events such as interest rate or credit quality changes, various relationships with other securities, discount rates, U.S. Treasury, U.S. swap and credit yields, index levels, convexity exposures, recovery rates, sales and other
|
| Managed Municipal Income Trust 43 |
multiples and resale restrictions. These securities are classified as Level 2 or as Level 3 depending on the priority of the significant inputs. The fair value of securities is generally determined as the amount that the fund could reasonably expect to realize from an orderly disposition of such securities over a reasonable period of time. By its nature, a fair value price is a good faith estimate of the value of a security in a current sale and does not reflect an actual market price, which may be different by a material amount.
Security transactions and related investment incomeSecurity transactions are recorded on the trade date (the date the order to buy or sell is executed). Gains or losses on securities sold are determined on the identified cost basis.
Interest income is recorded on the accrual basis. All premiums/discounts are amortized/accreted on a yield-to-maturity basis. The premium in excess of the call price, if any, is amortized to the call date; thereafter, any remaining premium is amortized to maturity.
Futures contractsThe fund uses futures contracts for hedging treasury term structure risk and for yield curve positioning.
The potential risk to the fund is that the change in value of futures contracts may not correspond to the change in value of the hedged instruments. In addition, losses may arise from changes in the value of the underlying instruments, if there is an illiquid secondary market for the contracts, if interest or exchange rates move unexpectedly or if the counterparty to the contract is unable to perform. With futures, there is minimal counterparty credit risk to the fund since futures are exchange traded and the exchange’s clearinghouse, as counterparty to all exchange traded futures, guarantees the futures against default. Risks may exceed amounts recognized on the Statement of assets and liabilities. When the contract is closed, the fund records a realized gain or loss equal to the difference between the value of the contract at the time it was opened and the value at the time it was closed.
Futures contracts are valued at the quoted daily settlement prices established by the exchange on which they trade. The fund and the broker agree to exchange an amount of cash equal to the daily fluctuation in the value of the futures contract. Such receipts or payments are known as “variation margin.”
Futures contracts outstanding at period end, if any, are listed after the fund’s portfolio.
Total return swap contractsThe fund entered into OTC and/or centrally cleared total return swap contracts, which are arrangements to exchange a market-linked return for a periodic payment, both based on a notional principal amount, for hedging sector exposure, for gaining exposure to specific sectors and for hedging inflation.
To the extent that the total return of the security, index or other financial measure underlying the transaction exceeds or falls short of the offsetting interest rate obligation, the fund will receive a payment from or make a payment to the counterparty. OTC and/or centrally cleared total return swap contracts are marked to market daily based upon quotations from an independent pricing service or market maker. Any change is recorded as an unrealized gain or loss on OTC total return swaps. Daily fluctuations in the value of centrally cleared total return swaps are settled through a central clearing agent and are recorded in variation margin on the Statement of assets and liabilities and recorded as unrealized gain or loss. Payments received or made are recorded as realized gains or losses. Certain OTC and/or centrally cleared total return swap contracts may include extended effective dates. Payments related to these swap contracts are accrued based on the terms of the contract. The fund could be exposed to credit or market risk due to unfavorable changes in the fluctuation of interest rates or in the price of the underlying security or index, the possibility that there is no liquid market for these agreements or that the counterparty may default on its obligation to perform. The fund’s maximum risk of loss from counterparty risk or central clearing risk is the fair value of the contract. This risk may be mitigated for OTC total return swap contracts by having a master netting arrangement between the fund and the counterparty and for centrally cleared total return swap contracts through the daily exchange of variation margin. There is minimal counterparty risk with respect to centrally cleared total return swap contracts due to the clearinghouse guarantee fund and other resources that are available in the event of a clearing member default. Risk of loss may exceed amounts recognized on the Statement of assets and liabilities.
OTC and/or centrally cleared total return swap contracts outstanding, including their respective notional amounts at period end, if any, are listed after the fund’s portfolio.
Master agreementsThe fund is a party to ISDA (International Swaps and Derivatives Association, Inc.) Master Agreements (Master Agreements) with certain counterparties that govern OTC derivative and foreign exchange contracts entered into from time to time. The Master Agreements may contain provisions regarding, among other
| |
| 44 Managed Municipal Income Trust |
things, the parties’ general obligations, representations, agreements, collateral requirements, events of default and early termination. With respect to certain counterparties, in accordance with the terms of the Master Agreements, collateral posted to the fund is held in a segregated account by the fund’s custodian and, with respect to those amounts which can be sold or repledged, is presented in the fund’s portfolio.
Collateral pledged by the fund is segregated by the fund’s custodian and identified in the fund’s portfolio. Collateral can be in the form of cash or debt securities issued by the U.S. Government or related agencies or other securities as agreed to by the fund and the applicable counterparty. Collateral requirements are determined based on the fund’s net position with each counterparty.
Termination events applicable to the fund may occur upon a decline in the fund’s net assets below a specified threshold over a certain period of time. Termination events applicable to counterparties may occur upon a decline in the counterparty’s long-term and short-term credit ratings below a specified level. In each case, upon occurrence, the other party may elect to terminate early and cause settlement of all derivative and foreign exchange contracts outstanding, including the payment of any losses and costs resulting from such early termination, as reasonably determined by the terminating party. Any decision by one or more of the fund’s counterparties to elect early termination could impact the fund’s future derivative activity.
At the close of the reporting period, the fund had a net liability position of $32,750 on open derivative contracts subject to the Master Agreements. There was no collateral posted by the fund at period end for these agreements.
Tender option bond transactionsThe fund may participate in transactions whereby a fixed-rate bond is transferred to a tender option bond trust (TOB trust) sponsored by a broker. The TOB trust funds the purchase of the fixed rate bonds by issuing floating-rate bonds to third parties and allowing the fund to retain the residual interest in the TOB trust’s assets and cash flows, which are in the form of inverse floating rate bonds. The inverse floating rate bonds held by the fund give the fund the right to (1) cause the holders of the floating rate bonds to tender their notes at par, and (2) to have the fixed-rate bond held by the TOB trust transferred to the fund, causing the TOB trust to collapse. The fund accounts for the transfer of the fixed-rate bond to the TOB trust as a secured borrowing by including the fixed-rate bond in the fund’s portfolio and including the floating rate bond as a liability in the Statement of assets and liabilities. At the close of the reporting period, the fund’s investments with a value of $42,659,314 were held by the TOB trust and served as collateral for $27,247,757 in floating-rate bonds outstanding. For the reporting period ended, the fund incurred interest expense of $243,224 for these investments based on an average interest rate of 1.65%.
Federal taxesIt is the policy of the fund to distribute all of its income within the prescribed time period and otherwise comply with the provisions of the Internal Revenue Code of 1986, as amended (the Code), applicable to regulated investment companies. It is also the intention of the fund to distribute an amount sufficient to avoid imposition of any excise tax under Section 4982 of the Code.
The fund is subject to the provisions of Accounting Standards Codification 740Income Taxes(ASC 740). ASC 740 sets forth a minimum threshold for financial statement recognition of the benefit of a tax position taken or expected to be taken in a tax return. The fund did not have a liability to record for any unrecognized tax benefits in the accompanying financial statements. No provision has been made for federal taxes on income, capital gains or unrealized appreciation on securities held nor for excise tax on income and capital gains. Each of the fund’s federal tax returns for the prior three fiscal years remains subject to examination by the Internal Revenue Service.
At October 31, 2018, the fund had a capital loss carryover of $3,391,502 available to the extent allowed by the Code to offset future net capital gain, if any. For any carryover, the amount of the carryover and that carryover’s expiration date is:
| | | |
| | Loss carryover | | |
| Short-term | Long-term | Total | Expiration |
| $3,391,502 | N/A | $3,391,502 | October 31, 2019 |
Under the Regulated Investment Company Modernization Act of 2010, the fund will be permitted to carry forward capital losses incurred in taxable years beginning after December 22, 2010 for an unlimited period. However, any losses incurred will be required to be utilized prior to the losses incurred in pre-enactment tax years. As a result of this ordering rule, pre-enactment capital loss carryforwards may be more likely to expire unused. Additionally, post-enactment capital losses that are carried forward will retain their character as either short-term or long-term capital losses rather than being considered all short-term as under previous law.
|
| Managed Municipal Income Trust 45 |
The aggregate identified cost on a tax basis is $494,410,711, resulting in gross unrealized appreciation and depreciation of $22,081,250 and $3,016,909, respectively, or net unrealized appreciation of $19,064,341.
Distributions to shareholdersDistributions to common and preferred shareholders from net investment income are recorded by the fund on the ex-dividend date. Distributions from capital gains, if any, are recorded on the ex-dividend date and paid at least annually. Effective with the December 2018 distributions, the fund established targeted distribution rates to its common shareholders, whose principal source of the distribution is ordinary income. However, the balance of the distribution, if any, comes first from capital gain and then will constitute a return of capital. A return of capital is not taxable; rather it reduces a shareholder’s tax basis in their shares of the fund. The fund may make return of capital distributions to achieve the targeted distribution rates. Dividends on remarketed preferred shares become payable when, as and if declared by the Trustees. Each dividend period for the remarketed preferred Series A shares is generally a 28 day period, and generally a 7 day period for Class C. The applicable dividend rate for the remarketed preferred shares on April 30, 2019 was 2.717% on class A, and 2.717% for Series C.
During the reporting period, the fund has experienced unsuccessful remarketings of its remarketed preferred shares. As a result, dividends to the remarketed preferred shares have been paid at the “maximum dividend rate,” pursuant to the fund’s by-laws, which, based on the current credit quality of the remarketed preferred shares, equals 110% of the 60-day “AA” composite commercial paper rate.
The amount and character of income and gains to be distributed are determined in accordance with income tax regulations, which may differ from generally accepted accounting principles. Dividend sources are estimated at the time of declaration. Actual results may vary. Any non-taxable return of capital cannot be determined until final tax calculations are completed after the end of the fund’s fiscal year. Reclassifications are made to the fund’s capital accounts to reflect income and gains available for distribution (or available capital loss carryovers) under income tax regulations.
Determination of net asset valueNet asset value of the common shares is determined by dividing the value of all assets of the fund, less all liabilities and the liquidation preference (redemption value of preferred shares, plus accumulated and unpaid dividends) of any outstanding remarketed preferred shares, by the total number of common shares outstanding as of period end.
Note 2: Management fee, administrative services and other transactions
The fund pays Putnam Management for management and investment advisory services quarterly based on the average net assets of the fund, including assets attributable to preferred shares. Such fee is based on the following annual rates based on the average weekly net assets attributable to common and preferred shares.
The lesser of (i) 0.550% of average net assets attributable to common and preferred shares outstanding, or (ii) the following rates:
| | | | |
| | of the first $500 million of average | | | of the next $5 billion of average weekly |
| 0.650% | weekly net assets, | | 0.425% | net assets. |
| | of the next $500 million of average | | | of the next $5 billion of average weekly |
| 0.550% | weekly net assets | | 0.405% | net assets. |
| | of the next $500 million of average | | | of the next $5 billion of average weekly |
| 0.500% | weekly net assets | | 0.390% | net assets, |
| | of the next $5 billion of average weekly | | 0.380% | of any excess thereafter. |
| 0.450% | net assets. | | | |
For the reporting period, the management fee represented an effective rate (excluding the impact from any expense waivers in effect) of 0.267% of the fund’s average net assets attributable to common and preferred shares outstanding.
If dividends payable on remarketed preferred shares during any dividend payment period plus any expenses attributable to remarketed preferred shares for that period exceed the fund’s gross income attributable to the proceeds of the remarketed preferred shares during that period, then the fee payable to Putnam Management for that period will be reduced by the amount of the excess (but not more than the effective management fees rate under the contract multiplied by the liquidation preference of the remarketed preferred shares outstanding during the period).
| |
| 46 Managed Municipal Income Trust |
Putnam Investments Limited (PIL), an affiliate of Putnam Management, is authorized by the Trustees to manage a separate portion of the assets of the fund as determined by Putnam Management from time to time. PIL did not manage any portion of the assets of the fund during the reporting period. If Putnam Management were to engage the services of PIL, Putnam Management would pay a quarterly sub-management fee to PIL for its services at an annual rate of 0.40% of the average net assets of the portion of the fund managed by PIL.
The fund reimburses Putnam Management an allocated amount for the compensation and related expenses of certain officers of the fund and their staff who provide administrative services to the fund. The aggregate amount of all such reimbursements is determined annually by the Trustees.
Custodial functions for the fund’s assets are provided by State Street. Custody fees are based on the fund’s asset level, the number of its security holdings and transaction volumes.
Putnam Investor Services, Inc., an affiliate of Putnam Management, provides investor servicing agent functions to the fund. Putnam Investor Services, Inc. was paid a monthly fee for investor servicing at an annual rate of 0.05% of the fund’s average daily net assets. The amounts incurred for investor servicing agent functions during the reporting period are included in Investor servicing fees in the Statement of operations.
The fund has entered into expense offset arrangements with Putnam Investor Services, Inc. and State Street whereby Putnam Investor Services, Inc.’s and State Street’s fees are reduced by credits allowed on cash balances. For the reporting period, the fund’s expenses were reduced by $36,792 under the expense offset arrangements.
Each Independent Trustee of the fund receives an annual Trustee fee, of which $279, as a quarterly retainer, has been allocated to the fund, and an additional fee for each Trustees meeting attended. Trustees also are reimbursed for expenses they incur relating to their services as Trustees.
The fund has adopted a Trustee Fee Deferral Plan (the Deferral Plan) which allows the Trustees to defer the receipt of all or a portion of Trustees fees payable on or after July 1, 1995. The deferred fees remain invested in certain Putnam funds until distribution in accordance with the Deferral Plan.
The fund has adopted an unfunded noncontributory defined benefit pension plan (the Pension Plan) covering all Trustees of the fund who have served as a Trustee for at least five years and were first elected prior to 2004. Benefits under the Pension Plan are equal to 50% of the Trustee’s average annual attendance and retainer fees for the three years ended December 31, 2005. The retirement benefit is payable during a Trustee’s lifetime, beginning the year following retirement, for the number of years of service through December 31, 2006. Pension expense for the fund is included in Trustee compensation and expenses in the Statement of operations. Accrued pension liability is included in Payable for Trustee compensation and expenses in the Statement of assets and liabilities. The Trustees have terminated the Pension Plan with respect to any Trustee first elected after 2003.
Note 3: Purchases and sales of securities
During the reporting period, the cost of purchases and the proceeds from sales, excluding short-term investments, were as follows:
| | |
| | Cost of purchases | Proceeds from sales |
| Investments in securities (Long-term) | $101,580,256 | $119,546,283 |
| U.S. government securities (Long-term) | — | — |
| Total | $101,580,256 | $119,546,283 |
The fund may purchase or sell investments from or to other Putnam funds in the ordinary course of business, which can reduce the fund’s transaction costs, at prices determined in accordance with SEC requirements and policies approved by the Trustees. During the reporting period, purchases or sales of long-term securities from or to other Putnam funds, if any, did not represent more than 5% of the fund’s total cost of purchases and/or total proceeds from sales.
Note 4: Preferred Shares
The Series A (240) and C (1,507) Remarketed Preferred shares are redeemable at the option of the fund on any dividend payment date at a redemption price of $100,000 per Series A Remarketed Preferred share and $50,000 per Series C Remarketed Preferred share, plus an amount equal to any dividends accumulated on a daily basis but unpaid through the redemption date (whether or not such dividends have been declared) and, in certain circumstances, a call premium.
|
| Managed Municipal Income Trust 47 |
It is anticipated that dividends paid to holders of remarketed preferred shares will be considered tax-exempt dividends under the Internal Revenue Code of 1986. To the extent that the fund earns taxable income and capital gains by the conclusion of a fiscal year, it may be required to apportion to the holders of the remarketed preferred shares throughout that year additional dividends as necessary to result in an after-tax equivalent to the applicable dividend rate for the period.
Under the Investment Company Act of 1940, the fund is required to maintain asset coverage of at least 200% with respect to the remarketed preferred shares. Additionally, the fund’s bylaws impose more stringent asset coverage requirements and restrictions relating to the rating of the remarketed preferred shares by the shares’ rating agencies. Should these requirements not be met, or should dividends accrued on the remarketed preferred shares not be paid, the fund may be restricted in its ability to declare dividends to common shareholders or may be required to redeem certain of the remarketed preferred shares. At period end, no such restrictions have been placed on the fund.
Note 5: Shares repurchased
In September 2018, the Trustees approved the renewal of the repurchase program to allow the fund to repurchase up to 10% of its outstanding common shares over the 12-month period ending October 9, 2019 (based on shares outstanding as of October 9, 2018). Prior to this renewal, the Trustees had approved a repurchase program to allow the fund to repurchase up to 10% of its outstanding common shares over the 12-month period ending October 9, 2018 (based on shares outstanding as of October 9, 2017). Repurchases are made when the fund’s shares are trading at less than net asset value and in accordance with procedures approved by the fund’s Trustees.
For the reporting period, the fund repurchased 1,203,440 common shares for an aggregate purchase price of $8,401,154, which reflects a weighted-average discount from net asset value per share of 9.36%. The weighted-average discount reflects the payment of commissions by the fund to execute repurchase trades.
For the previous fiscal year, the fund repurchased 3,327,510 common shares for an aggregate purchase price of $23,562,130 which reflected a weighted-average discount from net asset value per share of 9.37%. The weighted-average discount reflected the payment of commissions by the fund to execute repurchase trades.
At the close of the reporting period, Putnam Investments, LLC owned approximately 1,505 shares of the fund (less than 0.03% of the fund’s shares outstanding), valued at $11,935 based on net asset value.
Note 6: Market, credit and other risks
In the normal course of business, the fund trades financial instruments and enters into financial transactions where risk of potential loss exists due to changes in the market (market risk) or failure of the contracting party to the transaction to perform (credit risk). The fund may be exposed to additional credit risk that an institution or other entity with which the fund has unsettled or open transactions will default. The fund may invest in higher-yielding, lower-rated bonds that may have a higher rate of default.
|
| 48 Managed Municipal Income Trust |
Note 7: Summary of derivative activity
The volume of activity for the reporting period for any derivative type that was held during the period is listed below and was based on an average of the holdings at the end of each fiscal quarter:
| |
| Futures contracts (number of contracts) | 20 |
| OTC total return swap contracts (notional) | $3,100,000 |
The following is a summary of the fair value of derivative instruments as of the close of the reporting period:
| | | | |
| Fair value of derivative instruments as of the close of the reporting period | |
| | ASSET DERIVATIVES | LIABILITY DERIVATIVES |
| Derivatives not | | | | |
| accounted for as | Statement of | | Statement of | |
| hedging instruments | assets and | | assets and | |
| under ASC 815 | liabilities location | Fair value | liabilities location | Fair value |
| Interest rate contracts | Receivables | $86,131* | Payables | $32,750 |
| Total | | $86,131 | | $32,750 |
*Includes cumulative appreciation/depreciation of futures contracts as reported in the fund’s portfolio. Only current day’s variation margin is reported within the Statement of assets and liabilities.
The following is a summary of realized and change in unrealized gains or losses of derivative instruments in the Statement of operations for the reporting period (Note 1):
| | |
| Amount of realized gain or (loss) on derivatives recognized in net gain or (loss) on investments | |
| Derivatives not accounted for as | | |
| hedging instruments under ASC 815 | Futures | Total |
| Interest rate contracts | $35,578 | $35,578 |
| Total | $35,578 | $35,578 |
| | | |
| Change in unrealized appreciation or (depreciation) on derivatives recognized in net gain or (loss) |
| on investments | | | |
| Derivatives not accounted for as hedging | | | |
| instruments under ASC 815 | Futures | Swaps | Total |
| Interest rate contracts | $27,906 | $25,475 | $53,381 |
| Total | $27,906 | $25,475 | $53,381 |
|
| Managed Municipal Income Trust 49 |
Note 8: Offsetting of financial and derivative assets and liabilities
The following table summarizes any derivatives, repurchase agreements and reverse repurchase agreements, at the end of the reporting period, that are subject to an enforceable master netting agreement or similar agreement. For securities lending transactions or borrowing transactions associated with securities sold short, if any, see Note 1. For financial reporting purposes, the fund does not offset financial assets and financial liabilities that are subject to the master netting agreements in the Statement of assets and liabilities.
| | | | |
| | Citibank, N.A. | JPMorgan
Securities LLC | Morgan
Stanley & Co.
International
PLC | Total |
| Assets: | | | | |
| OTC Total return swap contracts*# | $58,225 | $— | $— | $58,225 |
| Futures contracts§ | — | 13,953 | — | 13,953 |
| Total Assets | $58,225 | $13,953 | $— | $72,178 |
| Liabilities: | | | | |
| OTC Total return swap contracts*# | — | — | 32,750 | 32,750 |
| Futures contracts§ | — | — | — | — |
| Total Liabilities | $— | $— | $32,750 | $32,750 |
| Total Financial and Derivative | $58,225 | $13,953 | $(32,750) | $39,428 |
| Net Assets | | | | |
| Total collateral received | $— | $— | $— | |
| (pledged)†## | | | | |
| Net amount | $58,225 | $13,953 | $(32,750) | |
| Controlled collateral received | | | | |
| (including TBA commitments)** | $— | $— | $— | $— |
| Uncontrolled collateral received | $— | $— | $— | $— |
| Collateral (pledged) (including | | | | |
| TBA commitments)** | $— | $— | $— | $— |
*Excludes premiums, if any. Included in unrealized appreciation and depreciation on OTC swap contracts on the Statement of assets and liabilities.
**Included with Investments in securities on the Statement of assets and liabilities.
†Additional collateral may be required from certain brokers based on individual agreements.
#Covered by master netting agreement (Note 1).
##Any over-collateralization of total financial and derivative net assets is not shown. Collateral may include amounts related to unsettled agreements.
§Includes current day’s variation margin only as reported on the Statement of assets and liabilities, which is not collateralized. Cumulative appreciation/(depreciation) for futures contracts and centrally cleared swap contracts is represented in the tables listed after the fund’s portfolio. Collateral pledged for initial margin on futures contracts, which is not included in the table above, amounted to $68,881.
| |
| 50 Managed Municipal Income Trust |
Shareholder meeting results (Unaudited)
April 26, 2019 annual meeting
At the meeting, a proposal to fix the number of Trustees at 11 was approved as follows:
| | |
| Votes for | Votes against | Abstentions |
| 42,290,995 | 1,595,283 | 724,748 |
At the meeting, each of the nominees for Trustees was elected as follows:
| | |
| | Votes for | Votes withheld |
| Liaquat Ahamed | 42,744,032 | 1,991,527 |
| Ravi Akhoury | 42,370,692 | 2,364,867 |
| Barbara M. Baumann | 42,813,074 | 1,922,485 |
| Katinka Domotorffy | 42,668,090 | 2,067,469 |
| Catharine Bond Hill | 43,236,570 | 1,498,989 |
| Paul L. Joskow | 42,695,144 | 2,040,414 |
| Kenneth R. Leibler | 42,699,023 | 2,036,535 |
| Robert L. Reynolds | 43,087,688 | 1,647,871 |
| Manoj P. Singh | 42,524,507 | 2,211,051 |
At the meeting, each of the preferred nominees for Trustees was elected as follows:
| | |
| | Votes for | Votes withheld |
| Robert E. Patterson | 1,661 | — |
| George Putnam, III | 1,661 | — |
At the meeting, a proposal to convert Putnam Managed Municipal Income Trust to an open-end investment company and approve certain related amendments to its Declaration of Trust was not approved as follows:
| | |
| Votes for | Votes against | Abstentions |
| 2,892,288 | 14,324,471 | 865,232 |
All tabulations are rounded to the nearest whole number.
|
| Managed Municipal Income Trust 51 |
Fund information
Founded over 80 years ago, Putnam Investments was built around the concept that a balance between risk and reward is the hallmark of a well-rounded financial program. We manage funds across income, value, blend, growth, sustainable, asset allocation, absolute return, and global sector categories.
| | |
| Investment Manager | Trustees | Michael J. Higgins |
| Putnam Investment | Kenneth R. Leibler,Chair | Vice President, Treasurer, |
| Management, LLC | Liaquat Ahamed | and Clerk |
| 100 Federal Street | Ravi Akhoury | |
| Boston, MA 02110 | Barbara M. Baumann | Janet C. Smith |
| | Katinka Domotorffy | Vice President, |
| Investment Sub-Advisor | Catharine Bond Hill | Principal Financial Officer, |
| Putnam Investments Limited | Paul L. Joskow | Principal Accounting Officer, |
| 16 St James’s Street | Robert E. Patterson | and Assistant Treasurer |
| London, England SW1A 1ER | George Putnam, III | |
| | Robert L. Reynolds | Susan G. Malloy |
| Marketing Services | Manoj P. Singh | Vice President and |
| Putnam Retail Management | | Assistant Treasurer |
| 100 Federal Street | Officers | |
| Boston, MA 02110 | Robert L. Reynolds | Mark C. Trenchard |
| | President | Vice President and |
| Custodian | | BSA Compliance Officer |
| State Street Bank | Jonathan S. Horwitz | |
| and Trust Company | Executive Vice President, | Nancy E. Florek |
| | Principal Executive Officer, | Vice President, Director of |
| Legal Counsel | and Compliance Liaison | Proxy Voting and Corporate |
| Ropes & Gray LLP | | Governance, Assistant Clerk, |
| Robert T. Burns | and Assistant Treasurer |
| Vice President and | |
| | Chief Legal Officer | Denere P. Poulack |
| | | Assistant Vice President, Assistant |
| | James F. Clark | Clerk, and Assistant Treasurer |
| | Vice President and | |
| | Chief Compliance Officer | |
| |
| 52 Managed Municipal Income Trust |
Call 1-800-225-1581 Monday through Friday between 8:00 a.m. and 8:00 p.m. Eastern Time, or visit putnam.com anytime for up-to-date information about the fund’s NAV.
| |
| Item 3. Audit Committee Financial Expert: |
| |
| Item 4. Principal Accountant Fees and Services: |
| |
| Item 6. Schedule of Investments: |
| |
| The registrant's schedule of investments in unaffiliated issuers is included in the report to shareholders in Item 1 above. |
| |
| Item 7. Disclosure of Proxy Voting Policies and Procedures For Closed-End Management Investment Companies: |
| |
| Item 8. Portfolio Managers of Closed-End Management Investment Companies |
| |
| (b) There have been no changes to the list of the registrant's identified portfolio managers included in the registrant's report on Form N-CSR for the most recent completed fiscal year. |
| |
| Item 9. Purchases of Equity Securities by Closed-End Management Investment Companies and Affiliated Purchasers: |
| | | | | |
| Registrant Purchase of Equity Securities | | |
| | | | | Maximum |
| | | | Total Number | Number (or |
| | | | of Shares | Approximate |
| | | | Purchased | Dollar Value) |
| | | | as Part | of Shares |
| | | | of Publicly | that May Yet Be |
| | Total Number | Average | Announced | Purchased |
| | of Shares | Price Paid | Plans or | under the Plans |
| Period | Purchased | per Share | Programs* | or Programs** |
| | | | | |
| November 1 — November 30, 2018 | 356,301 | $6.88 | 356,301 | 4,335,828 |
| December 1 — December 31, 2018 | 429,129 | $6.91 | 429,129 | 3,906,699 |
| January 1 — January 31, 2019 | 418,010 | $7.14 | 418,010 | 3,488,689 |
| February 1 — February 28, 2019 | — | — | — | 3,488,689 |
| March 1 — March 31, 2019 | — | — | — | 3,488,689 |
| April 1 — April 30, 2019 | — | — | — | 3,488,689 |
| * | In October 2005, the Board of Trustees of the Putnam Funds initiated the closed-end fund share repurchase program, which, as subsequently amended, authorized the fund to repurchase of up to 10% of its fund's outstanding common shares over the two-years ending October 5, 2007. The Trustees have subsequently renewed the program on an annual basis. The program renewed by the Board in September 2017, which was in effect between October 10, 2017 and October 9, 2018, allowed the fund to repurchase up to 5,373,513 of its shares. The program renewed by the Board in September 2018, which is in effect between October 10, 2018 and October 9, 2019, allows the fund to repurchase up to 5,056,605 of its shares. |
| | | | |
| ** | Information prior to October 10, 2018 is based on the total number of shares eligible for repurchase under the program, as amended through September 2017. Information from October 10, 2018 forward is based on the total number of shares eligible for repurchase under the program, as amended through September 2018. | |
| |
| Item 10. Submission of Matters to a Vote of Security Holders: |
| |
| Item 11. Controls and Procedures: |
| |
| (a) The registrant's principal executive officer and principal financial officer have concluded, based on their evaluation of the effectiveness of the design and operation of the registrant's disclosure controls and procedures as of a date within 90 days of the filing date of this report, that the design and operation of such procedures are generally effective to provide reasonable assurance that information required to be disclosed by the registrant in this report is recorded, processed, summarized and reported within the time periods specified in the Commission's rules and forms. |
| |
| (b) Changes in internal control over financial reporting: Not applicable |
| |
| Item 12. Disclosures of Securities Lending Activities for Closed-End Investment Companies: |
| |
| (a)(2) Separate certifications for the principal executive officer and principal financial officer of the registrant as required by Rule 30a-2(a) under the Investment Company Act of 1940, as amended, are filed herewith. |
| |
| (b) The certifications required by Rule 30a-2(b) under the Investment Company Act of 1940, as amended, are filed herewith. |
| |
| Pursuant to the requirements of the Securities Exchange Act of 1934 and the Investment Company Act of 1940, the registrant has duly caused this report to be signed on its behalf by the undersigned, thereunto duly authorized. |
| |
| Putnam Managed Municipal Income Trust |
| |
| By (Signature and Title): |
| |
| /s/ Janet C. Smith
Janet C. Smith
Principal Accounting Officer
|
| |
| Pursuant to the requirements of the Securities Exchange Act of 1934 and the Investment Company Act of 1940, this report has been signed below by the following persons on behalf of the registrant and in the capacities and on the dates indicated. |
| |
| By (Signature and Title): |
| |
| /s/ Jonathan S. Horwitz
Jonathan S. Horwitz
Principal Executive Officer
|
| |
| By (Signature and Title): |
| |
| /s/ Janet C. Smith
Janet C. Smith
Principal Financial Officer
|