Filed pursuant to Rule 424(b)(3)
File No. 333-153862
GRANT PARK FUTURES FUND
LIMITED PARTNERSHIP
________________________________________________
Supplement dated May 31, 2011
to
Prospectus and Disclosure Document
dated April 29, 2011
________________________________________________
THIS SUPPLEMENT CONTAINS INFORMATION WHICH AMENDS, SUPPLEMENTS OR MODIFIES CERTAIN INFORMATION CONTAINED IN THE PROSPECTUS AND DISCLOSURE DOCUMENT OF THE GRANT PARK FUTURES FUND LIMITED PARTNERSHIP DATED APRIL 29, 2011, AND SHOULD BE READ TOGETHER THEREWITH.
YOU SHOULD CAREFULLY CONSIDER THE “RISK FACTORS” BEGINNING ON PAGE 19 OF THE PROSPECTUS BEFORE YOU DECIDE TO INVEST.
NEITHER THE SECURITIES AND EXCHANGE COMMISSION NOR ANY STATE SECURITIES COMMISSION HAS APPROVED OR DISAPPROVED OF THESE SECURITIES OR PASSED UPON THE ACCURACY OR ADEQUACY OF THIS PROSPECTUS SUPPLEMENT. ANY REPRESENTATION TO THE CONTRARY IS A CRIMINAL OFFENSE.
THE COMMODITY FUTURES TRADING COMMISSION HAS NOT PASSED UPON THE MERITS OF PARTICIPATING IN THIS POOL NOR HAS THE COMMODITY FUTURES TRADING COMMISSION PASSED ON THE ADEQUACY OR ACCURACY OF THIS DISCLOSURE DOCUMENT SUPPLEMENT.
SUMMARY
This supplement revises and replaces the fourth paragraph on page 2 of the Prospectus under the heading “Summary – Global 1 Class, Global 2 Class and Global 3 Class units” in its entirety as follows:
Through their respective trading companies, each of EMC, ETC, Winton, Transtrend, QIM, Sunrise, Amplitude and effective February 1, 2011, Alder, Denali and Welton, serve as Grant Park’s commodity trading advisors with respect to the Global 1 Class, Global 2 Class and Global 3 Class units. As of February 1, 2011, with respect to the Global 1 Class, Global 2 Class and Global 3 Class units, each of ETC, Winton, Transtrend, QIM and Welton manage between 10% and 20% of Grant Park’s net assets, and Sunrise, EMC, Amplitude, Alder and Denali are allocated less than 10% of Grant Park’s assets to manage. Effective June 1, 2011, with respect to the Global 1 Class, Global 2 Class and Global 3 Class units, Rabar will be allocated less than 10% of Grant Park’s assets to manage.
This supplement revises and replaces the second paragraph on page 4 of the Prospectus under the heading “Summary – What is the difference between the Legacy 1 Class, the Legacy 2 Class, the Global 1 Class, the Global 2 Class and the Global 3 Class units?” in its entirety as follows:
Trading for the Legacy 1 Class and Legacy 2 Class units, on the one hand, and the Global 1 Class, Global 2 Class and Global 3 Class units, on the other hand, will be directed by different trading advisors, and such trading advisors will pursue different trading strategies. Effective February 1, 2011, the trading advisors for the Legacy 1 Class and Legacy 2 Class units are Rabar, EMC , ETC, Winton, Welton, Global Advisors, Transtrend, QIM, Sunrise, Amplitude, Alder and Denali, and such advisors will generally pursue a technical trend trading philosophy. The trading advisors, asset allocations and trading philosophy with respect to the Legacy 1 Class and Legacy 2 Class units are the same as those utilized for Grant Park’s existing Class A and Class B units. Effective February 1, 2011, the trading advisors for the Global 1 Class, Global 2 Class and Global 3 Class units are EMC, ETC, Winton, Transtrend, QIM, Sunrise, Amplitude, Alder, Denali and Welton, and such trading advisors will generally pursue technical trend trading philosophies, as well as pattern recognition philosophies focused on relatively shorter timeframes than the Legacy 1 Class and Legacy 2 Class units. Effective June 1, 2011, Rabar will be allocated less than 10% of Grant Park’s net assets to manage with respect to Global 1 Class, Global 2 Class and Global 3 Class units.
This supplement revises and replaces the text on page 2 of the Prospectus under the heading “Summary - Breakeven Amounts for Each Class of Units” and the Breakeven Analysis tables on pages 14-17 of the Prospectus under the heading “Summary – Breakeven Analysis” in its entirety as follows:
Break-Even Amounts for Each Class of Units
The following summarizes the approximate dollar returns and percentage returns required for the redemption value of a hypothetical $1,000 initial investment in offered units to equal the amount invested 12 months after the investment was made. The breakeven summary for the Global 3 Class units shows the amount required to “break-even” both with and without an early redemption fee which, for purposes of this summary, has been averaged to approximate the effect that payment of an early redemption fee will have on a redemption of such units during the first year of investment.
| · | Legacy 1 Class: 5.27% (or $52.65). |
| · | Legacy 2 Class: 5.57% (or $55.69). |
| · | Global 1 Class: 4.66% (or $46.63). |
| · | Global 2 Class: 4.97% (or $49.66). |
| · | Global 3 Class: 7.15% (or $71.50) without average early redemption fee, or 8.65% (or $86.50) with average early redemption fee. |
See “Summary – Breakeven Analysis” beginning on page 11 for detailed breakeven analysis of the offered units.
Breakeven Analysis
The breakeven analysis below indicates the approximate dollar returns and percentage required for the redemption value of a hypothetical $1,000 initial investment in offered units to equal the amount invested 12 months after the investment was made. The breakeven analysis for Global 3 Class units shows the amount required to “break-even” both with and without an early redemption fee which, for purposes of this analysis, has been averaged to approximate the effect that payment of an early redemption fee will have on a redemption of such units during the first year of investment. The breakeven analysis is an approximation only.
| Global 1 Class Breakeven Analysis | | Global 1 Class Units | |
Assumed initial selling price per unit(1) | | $ | 1,000.00 | |
Trading advisors’ incentive fees(2) | | $ | 4.13 | |
Brokerage charge(3) (4.45%) | | $ | 44.50 | |
Operating expenses(4) (0.25%) | | $ | 2.50 | |
Offering expenses(5) (0.30%) | | $ | 3.00 | |
Interest income(6) (0.75%) | | $ | (7.50 | ) |
| Amount of trading income required for the redemption value at the end of one year to equal the initial selling price of the unit | | $ | 46. 63 | |
| Percentage of initial selling price per Global 1 Class unit | | | 4. 66 | % |
_______________
| (1) | The minimum investment required to invest in the Global 1 Class units is $5,000. For ease of comparability, $1,000 will be deemed to be the assumed selling price per unit of a Global 1 Class unit, and, as described above, a Legacy 1 Class unit and a Legacy 2 Class unit, and, as described below, a Global 2 Class unit and a Global 3 Class unit, for purposes of the breakeven analysis. |
| (2) | Reflects incentive fees payable to Amplitude, EMC, ETC, Winton, Welton, Transtrend, QIM, Rabar, Sunrise, Alder and Denali assuming they manage between 5% and 20% of invested assets and assuming each of the advisors have equivalent performance returns for the 12-month period. Actual incentive fees are calculated quarterly on the basis of each trading advisor’s individual performance, not the overall performance of Grant Park or the Global 1 Class units. Because incentive fees payable to certain of these trading advisors are calculated on the basis of trading profits realized on the assets they manage after deduction for the allocable portion of only certain expenses charged to Grant Park, these advisors would receive an incentive fee before Grant Park has recouped all expenses and reaches the “break-even” level. Incentive fees payable to certain other of these trading advisors are calculated after deduction for the allocable portion of expenses charged to Grant Park. These advisors would not receive an incentive fee before Grant Park has recouped all expenses. |
| (3) | The brokerage charge is paid to the general partner on a monthly basis. Effective the initial closing date, the brokerage charge for the Global 1 Class units equals 0.3708% per month, a rate of 4.45% annually, of such units’ month-end adjusted net assets. Out of this amount, the general partner pays all clearing, execution and give-up, floor brokerage, exchange and NFA fees, any other transaction costs, selling agent compensation, selling agent service fees and consulting fees to the trading advisors. The general partner retains the balance as payment for its services to Grant Park. Bid-ask spreads on Grant Park’s forward and other non-exchange traded contracts are not included in this breakeven table due to the difficulty of determining those spreads. |
| (4) | Grant Park is responsible for ongoing operating expenses, up to an amount not to exceed 0.25% of Grant Park’s average net assets per year. This amount is used for purposes of this breakeven analysis. |
| (5) | Grant Park’s organization and offering expenses are paid by the general partner and then reimbursed to the general partner by Grant Park. To pay this reimbursement, effective the initial closing date, Global 1 Class units are assessed at an annual rate of 30 basis points (0.30%) of adjusted net assets, calculated and payable monthly on the basis of month-end adjusted net assets of the applicable class. |
| (6) | Grant Park earns interest on free cash balances held in its futures trading accounts. Interest is estimated for these purposes at a rate of 0.75% per year. |
| Global 2 Class Breakeven Analysis | | Global 2 Class Units | |
Assumed initial selling price per unit(1) | | $ | 1,000.00 | |
Trading advisors’ incentive fees(2) | | $ | 4.66 | |
Brokerage charge(3) (4.70%) | | $ | 47.00 | |
Operating expenses(4) (0.25%) | | $ | 2.50 | |
Offering expenses(5) (0.30%) | | $ | 3.00 | |
Interest income(6) (0.75%) | | $ | (7.50 | ) |
| Amount of trading income required for the redemption value at the end of one year to equal the initial selling price of the unit | | $ | 49. 66 | |
| Percentage of initial selling price per Global 2 Class unit | | | 4. 97 | % |
_______________
| (1) | The minimum investment required to invest in the Global 2 Class units is $5,000. For ease of comparability, $1,000 will be deemed to be the assumed selling price per unit of a Global 2 Class unit, and, as described above, a Legacy 1 Class unit, a Legacy 2 Class unit and a Global 1 Class unit, and, as described below, a Global 3 Class unit, for purposes of the breakeven analysis. |
| (2) | Reflects incentive fees payable to Amplitude, EMC, ETC, Winton, Welton, Transtrend, QIM, Rabar, Sunrise, Alder and Denali assuming they manage between 5% and 20% of invested assets and assuming each of the advisors have equivalent performance returns for the 12-month period. Actual incentive fees are calculated quarterly on the basis of each trading advisor’s individual performance, not the overall performance of Grant Park or the Global 2 Class units. Because incentive fees payable to certain of these trading advisors are calculated on the basis of trading profits realized on the assets they manage after deduction for the allocable portion of only certain expenses charged to Grant Park, these advisors would receive an incentive fee before Grant Park has recouped all expenses and reaches the “break-even” level. Incentive fees payable to certain other of these trading advisors are calculated after deduction for the allocable portion of expenses charged to Grant Park. These advisors would not receive an incentive fee before Grant Park has recouped all expenses. |
| (3) | The brokerage charge is paid to the general partner on a monthly basis. Effective the initial closing date, the brokerage charge for the Global 2 Class units equals 0.3917% per month, a rate of 4.70% annually, of such units’ month-end adjusted net assets. Out of this amount, the general partner pays all clearing, execution and give-up, floor brokerage, exchange and NFA fees, any other transaction costs, selling agent compensation, selling agent service fees and consulting fees to the trading advisors. The general partner retains the balance as payment for its services to Grant Park. Bid-ask spreads on Grant Park’s forward and other non-exchange traded contracts are not included in this breakeven table due to the difficulty of determining those spreads. |
| (4) | Grant Park is responsible for ongoing operating expenses, up to an amount not to exceed 0.25% of Grant Park’s average net assets per year. This amount is used for purposes of this breakeven analysis. |
| (5) | Grant Park’s organization and offering expenses are paid by the general partner and then reimbursed to the general partner by Grant Park. To pay this reimbursement, effective the initial closing date, Global 2 Class units are assessed at an annual rate of 30 basis points (0.30%) of adjusted net assets, calculated and payable monthly on the basis of month-end adjusted net assets of the applicable class. |
| (6) | Grant Park earns interest on free cash balances held in its futures trading accounts. Interest is estimated for these purposes at a rate of 0.75% per year. |
| Global 3 Class Breakeven Analysis | | Global 3 Class Units | |
Assumed initial selling price per unit(1) | | $ | 1,000.00 | |
Trading advisors’ incentive fees(2) | | $ | 9.00 | |
Brokerage charge(3) (6.45%) | | $ | 64.50 | |
Operating expenses(4) (0.25%) | | $ | 2.50 | |
Offering expenses(5) (0.30%) | | $ | 3.00 | |
Interest income(6) (0.75% | | $ | (7.50 | ) |
| | | | | |
Amount of trading income required for the redemption value at the end of one year to equal the initial selling price of the unit, without early redemption fee | | $ | 71. 50 | |
| | | | | |
| Percentage of initial selling price per unit, without early redemption fee | | | 7. 15 | % |
Early redemption fee(7) ( 1.50%) | | $ | 15.00 | |
| | | | | |
Amount of trading income required for the redemption value at the end of one year toequal the initial selling price per Global 3 Class unit, with average early redemption fee | | $ | 86.50 | |
| | | | | |
| Percentage of initial selling price per Global 3 Class unit, with average early redemption fee | | | 8.65 | % |
_______________
| (1) | The minimum investment required to invest in the Global 3 Class units is $5,000. For ease of comparability, $1,000 will be deemed to be the assumed selling price per unit of a Global 3 Class unit, and, as described above, a Legacy 1 Class unit, a Legacy 2 Class unit and a Global 1 Class unit, and a Global 2 Class unit, for purposes of the breakeven analysis. |
| (2) | Reflects incentive fees payable to Amplitude, EMC, ETC, Winton, Welton, Transtrend, QIM, Rabar, Sunrise, Alder and Denali assuming they manage between 5% and 20% of invested assets and assuming each of the advisors have equivalent performance returns for the 12-month period. Actual incentive fees are calculated quarterly on the basis of each trading advisor’s individual performance, not the overall performance of Grant Park or the Global 3 Class units. Because incentive fees payable to certain of these trading advisors are calculated on the basis of trading profits realized on the assets they manage after deduction for the allocable portion of only certain expenses charged to Grant Park, these advisors would receive an incentive fee before Grant Park has recouped all expenses and reaches the “break-even” level. Incentive fees payable to certain other of these trading advisors are calculated after deduction for the allocable portion of expenses charged to Grant Park. These advisors would not receive an incentive fee before Grant Park has recouped all expenses. |
| (3) | The brokerage charge is paid to the general partner on a monthly basis. Effective the initial closing date, the brokerage charge for the Global 3 Class units equals 0.5375% per month, a rate of 6.45% annually, of such units’ month-end adjusted net assets. Out of this amount, the general partner pays all clearing, execution and give-up, floor brokerage, exchange and NFA fees, any other transaction costs, selling agent compensation, selling agent service fees and consulting fees to the trading advisors. The general partner retains the balance as payment for its services to Grant Park. Bid-ask spreads on Grant Park’s forward and other non-exchange traded contracts are not included in this breakeven table due to the difficulty of determining those spreads. |
| (4) | Grant Park is responsible for ongoing operating expenses, up to an amount not to exceed 0.25% of Grant Park’s average net assets per year. This amount is used for purposes of this breakeven analysis. |
| (5) | Grant Park’s organization and offering expenses are paid by the general partner and then reimbursed to the general partner by Grant Park. To pay this reimbursement, effective the initial closing date, Global 3 Class units are assessed at an annual rate of 30 basis points (0.30%) of adjusted net assets, calculated and payable monthly on the basis of month-end adjusted net assets |
| (6) | Grant Park earns interest on free cash balances held in its futures trading accounts. Interest is estimated for these purposes at a rate of 0.75% per year. |
| (7) | Global 3 Class limited partners are prohibited from redeeming such units for three months following the subscription for units. Thereafter, Global 3 Class limited partners causing redemption of their units on or before the one-year anniversary of their subscription for the redeemed units will pay an early redemption fee of 1.5%, 1.0% or 0.5% of the net asset value of the redeemed units, depending on when the units are redeemed during the first year. For purposes of this breakeven analysis, the early redemption fee has been presented as an average of the three different early redemption fees to approximate the effect a payment of an early redemption fee would have on a redemption of Global 3 Class units at an undetermined point during the first year of investment. Because the early redemption fee has been averaged and the other fees and expenses shown assume an investment in Grant Park for one year, the breakeven analysis does not reflect the actual amount required to “break-even” for Global 3 Class units that are redeemed prior to the one-year anniversary of the investment, which will vary depending on the date of redemption. |
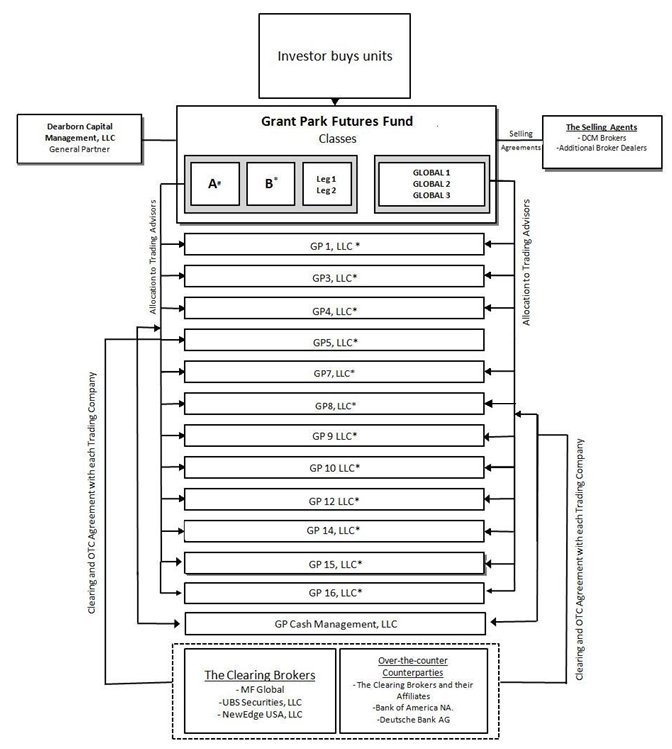
This supplement revises and replaces the chart included on page 18 of the Prospectus under the heading “Summary – Organizational Chart” in its entirety as follow:
Notes:
| # | Classes A and B are closed to new investment. These classes are no longer offered by the Selling Agents. |
| * | Grant Park invests through an individual Trading Company for each Trading Advisor. An Advisory Agreement is entered by each Advisor, its corresponding Trading Company, Grant Park and Dearborn Capital Management LLC, as General Partner and, in the case of some Advisors, Grant Park. |
THE TRADING ADVISORS
This supplement revises and replaces the chart and third paragraph on page 39 of the Prospectus under the heading “The Trading Advisors” in its entirety as follows:
| | | | | | | | | | | | | |
| Class A | X | X | X | X | X | X | X | X | X | X | X | X |
| Class B | X | X | X | X | X | X | X | X | X | X | X | X |
| Legacy 1 | X | X | X | X | X | X | X | X | X | X | X | X |
| Legacy 2 | X | X | X | X | X | X | X | X | X | X | X | X |
| Global 1 | X | X | X | X | X | | X | X | X | X | X | X |
| Global 2 | X | X | X | X | X | | X | X | X | X | X | X |
| Global 3 | X | X | X | X | X | | X | X | X | X | X | X |
Effective February 1, 2011, for the Global 1 Class, Global 2 Class and Global 3 Class units, between 10% and 20% of Grant Park’s assets are allocated to each of ETC, Transtrend, QIM, Welton and Winton, while EMC, Sunrise, Amplitude, Alder and Denali are allocated less than 10% of Grant Park’s net assets. Effective June 1, 2011, Rabar will be allocated less than 10% of Grant Park’s assets. The trading advisors for the Global 1 Class, Global 2 Class and Global 3 Class units will pursue technical trend trading philosophies, as well as pattern recognition philosophies focused on relatively shorter timeframes than the Legacy 1 Class and Legacy 2 Class units.
This supplement revises and replaces the first paragraph on page 54 of the Prospectus under the heading “The Trading Advisors – Sunrise Capital Partners, LLC– Management” in its entirety as follows:
The listed principals for Sunrise are Dr. Gary B. Davis, Dr. John V. Forrest, Richard Slaughter, Martin Klitzner, Martin M. Ehrlich, Marie Laufik, Elissa Davis, Jason Gerlach, Gary Hirschfeld, The Davis Family Trust, Commodity Monitors, Inc., and Sunrise Capital Management, Inc. (Sunrise Capital Management).
This supplement deletes the fifth paragraph on page 54 of the Prospectus under the heading “The Trading Advisors – Sunrise Capital Partners, LLC– Management” in its entirety as follows:
Thomas R. Cardello became a listed principal of Sunrise in December 2004 and was also registered as an associated person in December 2004. Dr. Cardello is responsible for new strategy development and is a senior member of the research and management teams. He holds Ph.D. and M. Phil. Degrees in mathematics and physics from The Cooper Union.
This supplement inserts the following paragraph after the tenth paragraph on page 55 of the Prospectus under the heading “The Trading Advisors – Sunrise Capital Partners, LLC– Management” as follows:
Gary S. Hirschfeld became a listed principal with Sunrise in April 2011 and was registered as an associated person in December 1999. Mr. Hirschfeld joined Sunrise in July 1989 and is Sunrise’s Director of Administration and in his role oversees Sunrise’s operations, accounting and compliance functions. Mr. Hirschfeld earned a B.A. in Biology from University California, San Diego in 1981 and an M.P.H/M.B.A. from Tulane University in 1985. Mr. Hirschfeld is a longtime investor of the Advisor.
This supplement deletes the thirteenth paragraph on page 55 of the Prospectus under the heading “The Trading Advisors – Sunrise Capital Partners, LLC– Management” in its entirety as follows:
TRC Greenwich, Inc. (“TRCG”) became a listed principal of Sunrise in November 2007. TRCG is a Connecticut Corporation organized in 1992 and solely owned by Thomas Cardello.
This supplement revises and replaces the table on page 61 of the Prospectus captioned “Performance of Grant Park – Class A Units” in its entirety as follows:
PERFORMANCE OF GRANT PARK - CLASS A UNITS
(Unaudited)
As required by CFTC regulations, the past performance record of Grant Park’s Class A units for the last five full calendar years and the first three months of 2011 is presented below. While the performance record set forth in the table below has not been independently audited, the General Partner believes that the information presented is accurate. All performance information is shown net of fees and expenses.
| | |
| Name | Grant Park Futures Fund Limited Partnership (Class A units) |
| Type | Privately offered (through February 2003); Publicly offered beginning June 30, 2003; Multi-advisor |
| Inception of Trading | January 1989 |
| Aggregate Gross Subscriptions at 3/31/11 | $147,153,661 |
| Net Asset Value at 3/31/11 | $63,262,159 |
Worst Monthly Percentage Draw-Down (Since 1/06)(1) | -7.95% 01/10 |
Worst Peak-to-Valley Draw-Down (Since 1/06)(2) | -17.08% (Continuing from 02/04 - End of 02/06) |
| | | Rate of Return(3) | |
| | | 2011 | | | 2010 | | | 2009 | | | 2008 | | | 2007 | | | 2006 | |
| January | | | -0.52 | % | | | -7.95 | % | | | -0.91 | % | | | 2.49 | % | | | 1.25 | % | | | 3.49 | % |
| February | | | 2.26 | % | | | 0.63 | % | | | -0.80 | % | | | 9.66 | % | | | -4.18 | % | | | -3.28 | % |
| March | | | -2.48 | % | | | 4.08 | % | | | -3.26 | % | | | -0.63 | % | | | -4.55 | % | | | 4.06 | % |
| April | | | | | | | 1.80 | % | | | -1.73 | % | | | -0.13 | % | | | 5.23 | % | | | 9.46 | % |
| May | | | | | | | -3.83 | % | | | 1.64 | % | | | 2.11 | % | | | 4.60 | % | | | -0.81 | % |
| June | | | | | | | -0.21 | % | | | -3.41 | % | | | 3.06 | % | | | 4.16 | % | | | -2.85 | % |
| July | | | | | | | -1.66 | % | | | -1.26 | % | | | -5.06 | % | | | -3.72 | % | | | -3.66 | % |
| August | | | | | | | 2.77 | % | | | 1.15 | % | | | -2.41 | % | | | -3.71 | % | | | 2.20 | % |
| September | | | | | | | 3.24 | % | | | 1.17 | % | | | 1.31 | % | | | 8.78 | % | | | -1.10 | % |
| October | | | | | | | 4.33 | % | | | -2.59 | % | | | 4.76 | % | | | 5.23 | % | | | -0.64 | % |
| November | | | | | | | -2.58 | % | | | 4.24 | % | | | 2.76 | % | | | -0.66 | % | | | 3.59 | % |
| December | | | | | | | 4.57 | % | | | -3.57 | % | | | 1.08 | % | | | 0.63 | % | | | -0.92 | % |
| Year | | | -0.80 | % | | | 4.45 | % | | | -9.23 | % | | | 19.91 | % | | | 12.63 | % | | | 9.11 | % |
| (1) | Worst Monthly Percentage Draw-Down is the largest monthly loss experienced by Grant Park in any calendar month expressed as a percentage of total equity in Grant Park and includes the month and year of that draw-down. |
| (2) | Worst Peak-to-Valley Draw-Down is the greatest cumulative percentage decline in month-end net asset value of Grant Park due to losses sustained by Grant Park during a period in which the initial month-end net asset value of Grant Park is not equaled or |
| | exceeded by a subsequent month-end net asset value of Grant Park and includes the time period in which the draw-down occurred. |
| (3) | The monthly rate of return is computed by dividing monthly performance by beginning monthly equity plus additions less redemptions. The monthly rates are then compounded to arrive at the annual rate of return. |
This supplement revises and replaces the table on page 62 of the Prospectus captioned “Performance of Grant Park – Class B Units” in its entirety as follows:
PERFORMANCE OF GRANT PARK - CLASS B UNITS
(Unaudited)
As required by CFTC regulations, the past performance record of Grant Park’s Class B units for the last five full calendar years and the first three months of 2011 is presented below. While the performance record set forth in the table below has not been independently audited, the General Partner believes that the information presented is accurate. All performance information is shown net of fees and expenses.
| Name | Grant Park Futures Fund Limited Partnership (Class B units) |
| Type | Public; Multi-advisor |
| Inception of Trading | August 2003 |
| Aggregate Gross Subscriptions at 3/31/11 | $872,734,726 |
| Net Asset Value at 3/31/11 | $611,342,434 |
Worst Monthly Percentage Draw-Down(1) (Since 1/06) | -8.00% 01/10 |
Worst Peak-to-Valley Draw-Down(2) (Since 1/06) | -18.51% (Continuing from 02/04 - End of 02/06) |
| | | Rate of Return(3) | |
| | | 2011 | | | 2010 | | | 2009 | | | 2008 | | | 2007 | | | 2006 | |
| January | | | -0.58 | % | | | -8.00 | % | | | -0.98 | % | | | 2.42 | % | | | 1.18 | % | | | 3.41 | % |
| February | | | 2.20 | % | | | 0.57 | % | | | -0.88 | % | | | 9.58 | % | | | -4.25 | % | | | -3.35 | % |
| March | | | -2.53 | % | | | 4.03 | % | | | -3.33 | % | | | -0.70 | % | | | -4.62 | % | | | 3.98 | % |
| April | | | | | | | 1.74 | % | | | -1.78 | % | | | -0.20 | % | | | 5.15 | % | | | 9.38 | % |
| May | | | | | | | -3.88 | % | | | 1.58 | % | | | 2.03 | % | | | 4.52 | % | | | -0.88 | % |
| June | | | | | | | -0.27 | % | | | -3.46 | % | | | 2.99 | % | | | 4.09 | % | | | -2.92 | % |
| July | | | | | | | -1.71 | % | | | -1.32 | % | | | -5.12 | % | | | -3.79 | % | | | -3.73 | % |
| August | | | | | | | 2.71 | % | | | 1.09 | % | | | -2.48 | % | | | -3.78 | % | | | 2.12 | % |
| September | | | | | | | 3.21 | % | | | 1.12 | % | | | 1.24 | % | | | 8.70 | % | | | -1.17 | % |
| October | | | | | | | 4.27 | % | | | -2.64 | % | | | 4.69 | % | | | 5.16 | % | | | -0.71 | % |
| November | | | | | | | -2.63 | % | | | 4.19 | % | | | 2.69 | % | | | -0.73 | % | | | 3.51 | % |
| December | | | | | | | 4.52 | % | | | -3.63 | % | | | 1.01 | % | | | 0.64 | % | | | -0.90 | % |
| Year | | | -0.96 | % | | | 3.80 | % | | | -9.87 | % | | | 18.88 | % | | | 11.76 | % | | | 8.28 | % |
| (1) | Worst Monthly Percentage Draw-Down is the largest monthly loss experienced by Grant Park in any calendar month expressed as a percentage of total equity in Grant Park and includes the month and year of that draw-down. |
| (2) | Worst Peak-to-Valley Draw-Down is the greatest cumulative percentage decline in month-end net asset value of Grant Park due to losses sustained by Grant Park during a period in which the initial month-end net asset value of Grant Park is not equaled or exceeded by a subsequent month-end net asset value of Grant Park and includes the time period in which the draw-down occurred. |
| (3) | The monthly rate of return is computed by dividing monthly performance by beginning monthly equity plus additions less redemptions. The monthly rates are then compounded to arrive at the annual rate of return. |
This supplement revises and replaces the table on page 63 of the Prospectus captioned “Performance of Grant Park - Legacy 1 Units” in its entirety as follows:
PERFORMANCE OF GRANT PARK - Legacy 1 Units
(Unaudited)
As required by CFTC regulations, the past performance record of Grant Park’s Legacy 1 Class units from April 1, 2009 through March 31, 2011, is presented below. While the performance record set forth in the table below has not been independently audited, the general partner believes that the information presented is accurate. All performance information is shown net of fees and expenses.
| | |
| Name | Grant Park Futures Fund Limited Partnership (Legacy 1 Class) |
| Type | Public |
| Inception of Trading | April 2009 |
| Aggregate Gross Subscriptions at 3/31/11 | $7,396,103 |
| Net Asset Value at 3/31/11 | $6,714,707 |
Worst Monthly Percentage Draw-Down (Since April 2009)(1) | -7.77% 01/10 |
Worst Peak-to-Valley Draw-Down (Since April 2009)(2) | -10.93% (Start of 05/09 - End of 01/10) |
| | | Rate of Return(3) | |
| | | 2011 | | | 2010 | | | 2009 | |
| January | | | -0.35 | % | | | -7.77 | % | | | --- | |
| February | | | 2.37 | % | | | 0.82 | % | | | --- | |
| March | | | -2.21 | % | | | 4.15 | % | | | --- | |
| April | | | | | | | 1.77 | % | | | -1.59 | % |
| May | | | | | | | -3.53 | % | | | 1.66 | % |
| June | | | | | | | -0.03 | % | | | -3.10 | % |
| July | | | | | | | -1.50 | % | | | -1.08 | % |
| August | | | | | | | 2.86 | % | | | 1.27 | % |
| September | | | | | | | 3.24 | % | | | 1.21 | % |
| October | | | | | | | 4.35 | % | | | -2.42 | % |
| November | | | | | | | -2.32 | % | | | 4.04 | % |
| December | | | | | | | 4.67 | % | | | -3.19 | % |
| Year | | | -0.24 | % | | | 6.09 | % | | | -3.39 | % |
| (1) | Worst Monthly Percentage Draw-Down is the largest monthly loss experienced by Grant Park in any calendar month expressed as a percentage of total equity in Grant Park and includes the month and year of that draw-down. |
| (2) | Worst Peak-to-Valley Draw-Down is the greatest cumulative percentage decline in month-end net asset value of Grant Park due to losses sustained by Grant Park during a period in which the initial month-end net asset value of Grant Park is not equaled or exceeded by a subsequent month-end net asset value of Grant Park and includes the time period in which the draw-down occurred. |
| (3) | The monthly rate of return is computed by dividing monthly performance by beginning monthly equity plus additions less redemptions. The monthly rates are then compounded to arrive at the annual rate of return. |
This supplement revises and replaces the table on page 64 of the Prospectus captioned “Performance of Grant Park - Legacy 2 Units” in its entirety as follows:
PERFORMANCE OF GRANT PARK - Legacy 2 Units
(Unaudited)
As required by CFTC regulations, the past performance record of Grant Park’s Legacy 2 Class units from April 1, 2009 through March 31, 2011, is presented below. While the performance record set forth in the table below has not been independently audited, the general partner believes that the information presented is accurate. All performance information is shown net of fees and expenses.
| | |
| Name | Grant Park Futures Fund Limited Partnership (Legacy 2 Class) |
| Type | Public |
| Inception of Trading | April 2009 |
| Aggregate Gross Subscriptions at 3/31/11 | $9,591,250 |
| Net Asset Value at 3/31/11 | $9,467,295 |
Worst Monthly Percentage Draw-Down (Since April 2009)(1) | -7.79% 01/10 |
Worst Peak-to-Valley Draw-Down (Since April 2009)(2) | -11.06% (Start of 03/09 - End of 01/10) |
| | | Rate of Return(3) | |
| | | 2011 | | | 2010 | | | 2009 | |
| January | | | -0.37 | % | | | -7.79 | % | | | --- | |
| February | | | 2.33 | % | | | 0.80 | % | | | --- | |
| March | | | -2.22 | % | | | 4.13 | % | | | --- | |
| April | | | | | | | 1.72 | % | | | -1.61 | % |
| May | | | | | | | -3.53 | % | | | 1.62 | % |
| June | | | | | | | -0.05 | % | | | -3.12 | % |
| July | | | | | | | -1.52 | % | | | -1.09 | % |
| August | | | | | | | 2.82 | % | | | 1.26 | % |
| September | | | | | | | 3.20 | % | | | 1.21 | % |
| October | | | | | | | 4.31 | % | | | -2.44 | % |
| November | | | | | | | -2.34 | % | | | 4.04 | % |
| December | | | | | | | 4.62 | % | | | -3.22 | % |
| Year | | | -0.31 | % | | | 5.73 | % | | | -3.55 | % |
| (1) | Worst Monthly Percentage Draw-Down is the largest monthly loss experienced by Grant Park in any calendar month expressed as a percentage of total equity in Grant Park and includes the month and year of that draw-down. |
| (2) | Worst Peak-to-Valley Draw-Down is the greatest cumulative percentage decline in month-end net asset value of Grant Park due to losses sustained by Grant Park during a period in which the initial month-end net asset value of Grant Park is not equaled or exceeded by a subsequent month-end net asset value of Grant Park and includes the time period in which the draw-down occurred. |
| (3) | The monthly rate of return is computed by dividing monthly performance by beginning monthly equity plus additions less redemptions. The monthly rates are then compounded to arrive at the annual rate of return. |
This supplement revises and replaces the table on page 65 of the Prospectus captioned “Performance of Grant Park - Global 1 Units” in its entirety as follows:
PERFORMANCE OF GRANT PARK - Global 1 Units
(Unaudited)
As required by CFTC regulations, the past performance record of Grant Park’s Global 1 Class units from April 1, 2009 through March 31, 2011 is presented below. While the performance record set forth in the table below has not been independently audited, the general partner believes that the information presented is accurate. All performance information is shown net of fees and expenses.
| Name | | Grant Park Futures Fund Limited Partnership (Global 1 Class) |
| Type | | Public |
| Inception of Trading | | April 2009 |
| Aggregate Gross Subscriptions at 3/31/2011 | | $12,824,920 |
| Net Asset Value at 3/31/2011 | | $12,047,199 |
Worst Monthly Percentage Draw-Down (Since April 2009)(1) | | -7.80% 01/10 |
Worst Peak-to-Valley Draw-Down (Since April 2009)(2) | | -13.28% (Start of 05/09 - End of 01/10 ) |
| | | Rate of Return(3) | |
| | | 2011 | | | 2010 | | | 2009 | |
| January | | | -0.74 | % | | | -7.80 | % | | | --- | |
| February | | | 2.00 | % | | | 0.71 | % | | | --- | |
| March | | | -1.85 | % | | | 3.65 | % | | | --- | |
| April | | | | | | | 1.52 | % | | | -0.28 | % |
| May | | | | | | | -2.21 | % | | | 2.02 | % |
| June | | | | | | | 0.29 | % | | | -3.21 | % |
| July | | | | | | | -2.51 | % | | | -1.26 | % |
| August | | | | | | | 2.71 | % | | | 1.11 | % |
| September | | | | | | | 1.97 | % | | | 1.18 | % |
| October | | | | | | | 3.70 | % | | | -3.22 | % |
| November | | | | | | | -2.13 | % | | | 3.75 | % |
| December | | | | | | | 3.59 | % | | | -4.21 | % |
| Year | | | -0.64 | % | | | 2.88 | % | | | -4.32 | % |
| (1) | Worst Monthly Percentage Draw-Down is the largest monthly loss experienced by Grant Park in any calendar month expressed as a percentage of total equity in Grant Park and includes the month and year of that draw-down. |
| (2) | Worst Peak-to-Valley Draw-Down is the greatest cumulative percentage decline in month-end net asset value of Grant Park due to losses sustained by Grant Park during a period in which the initial month-end net asset value of Grant Park is not equaled or exceeded by a subsequent month-end net asset value of Grant Park and includes the time period in which the draw-down occurred. |
| (3) | The monthly rate of return is computed by dividing monthly performance by beginning monthly equity plus additions less redemptions. The monthly rates are then compounded to arrive at the annual rate of return. |
This supplement revises and replaces the table on page 66 of the Prospectus captioned “Performance of Grant Park - Global 2 Units” in its entirety as follows:
PERFORMANCE OF GRANT PARK - Global 2 Units
(Unaudited)
As required by CFTC regulations, the past performance record of Grant Park’s Global 2 Class units from April 1, 2009 through March 31, 2011, is presented below. While the performance record set forth in the table below has not been independently audited, the general partner believes that the information presented is accurate. All performance information is shown net of fees and expenses.
| | |
| Name | Grant Park Futures Fund Limited Partnership (Global 2 Class) |
| Type | Public |
| Inception of Trading | April 2009 |
| Aggregate Gross Subscriptions at 3/31/2011 | $21,893,406 |
| Net Asset Value at 3/31/2011 | $20,940,583 |
Worst Monthly Percentage Draw-Down (Since April 2009)(1) | -7.82% 01/10 |
Worst Peak-to-Valley Draw-Down (Since April 2009)(2) | -13.53% (Start of 05/09 - End of 01/10) |
| | | Rate of Return(3) | |
| | | 2011 | | | 2010 | | | 2009 | |
| January | | | -0.76 | % | | | -7.82 | % | | | --- | |
| February | | | 1.99 | % | | | 0.69 | % | | | --- | |
| March | | | -1.89 | % | | | 3.56 | % | | | --- | |
| April | | | | | | | 1.50 | % | | | -0.30 | % |
| May | | | | | | | -2.24 | % | | | 1.97 | % |
| June | | | | | | | 0.29 | % | | | -3.24 | % |
| July | | | | | | | -2.53 | % | | | -1.28 | % |
| August | | | | | | | 2.70 | % | | | 1.09 | % |
| September | | | | | | | 1.94 | % | | | 1.10 | % |
| October | | | | | | | 3.68 | % | | | -3.24 | % |
| November | | | | | | | -2.15 | % | | | 3.61 | % |
| December | | | | | | | 3.56 | % | | | -4.17 | % |
| Year | | | -0.70 | % | | | 2.56 | % | | | -4.64 | % |
| (1) | Worst Monthly Percentage Draw-Down is the largest monthly loss experienced by Grant Park in any calendar month expressed as a percentage of total equity in Grant Park and includes the month and year of that draw-down. |
| (2) | Worst Peak-to-Valley Draw-Down is the greatest cumulative percentage decline in month-end net asset value of Grant Park due to losses sustained by Grant Park during a period in which the initial month-end net asset value of Grant Park is not equaled or exceeded by a subsequent month-end net asset value of Grant Park and includes the time period in which the draw-down occurred. |
| (3) | The monthly rate of return is computed by dividing monthly performance by beginning monthly equity plus additions less redemptions. The monthly rates are then compounded to arrive at the annual rate of return. |
This supplement revises and replaces the table on page 67 of the Prospectus captioned “Performance of Grant Park - Global 3 Units” in its entirety as follows:
PERFORMANCE OF GRANT PARK - Global 3 Units
(Unaudited)
As required by CFTC regulations, the past performance record of Grant Park’s Global 3 Class units from April 1, 2009 through March 31, 2011 is presented below. While the performance record set forth in the table below has not been independently audited, the general partner believes that the information presented is accurate. All performance information is shown net of fees and expenses.
| | |
| Name | Grant Park Futures Fund Limited Partnership (Global 3 Class) |
| Type | Public |
| Inception of Trading | April 2009 |
| Aggregate Gross Subscriptions at 3/31/2011 | $179,703,344 |
| Net Asset Value at 3/31/2011 | $173,611,787 |
Worst Monthly Percentage Draw-Down (Since April 2009)(1) | -7.95% 01/10 |
Worst Peak-to-Valley Draw-Down (Since April
2009)(2) | -14.63% (Start of 05/09 - End of 01/10) |
| | | Rate of Return(3) | |
| | | 2011 | | | 2010 | | | 2009 | |
| January | | | -0.91 | % | | | -7.95 | % | | | --- | |
| February | | | 1.76 | % | | | 0.54 | % | | | --- | |
| March | | | -2.01 | % | | | 3.40 | % | | | --- | |
| April | | | | | | | 1.33 | % | | | -0.44 | % |
| May | | | | | | | -2.38 | % | | | 1.77 | % |
| June | | | | | | | 0.10 | % | | | -3.49 | % |
| July | | | | | | | -2.67 | % | | | -1.43 | % |
| August | | | | | | | 2.54 | % | | | 0.94 | % |
| September | | | | | | | 1.79 | % | | | 0.96 | % |
| October | | | | | | | 3.51 | % | | | -3.38 | % |
| November | | | | | | | -2.28 | % | | | 3.52 | % |
| December | | | | | | | 3.40 | % | | | -4.36 | % |
| Year | | | -1.20 | % | | | 0.68 | % | | | -6.04 | % |
| (1) | Worst Monthly Percentage Draw-Down is the largest monthly loss experienced by Grant Park in any calendar month expressed as a percentage of total equity in Grant Park and includes the month and year of that draw-down. |
| (2) | Worst Peak-to-Valley Draw-Down is the greatest cumulative percentage decline in month-end net asset value of Grant Park due to losses sustained by Grant Park during a period in which the initial month-end net asset value of Grant Park is not equaled or exceeded by a subsequent month-end net asset value of Grant Park and includes the time period in which the draw-down occurred. |
| (3) | The monthly rate of return is computed by dividing monthly performance by beginning monthly equity plus additions less redemptions. The monthly rates are then compounded to arrive at the annual rate of return. |
This supplement revises and replaces the paragraph on page 135 of the Prospectus under the heading “Fees and Expenses – Fees and Expenses Paid by the General Partner – Trading Advisor Consulting Fees” in its entirety as follows:
Each trading advisor receives a consulting fee, payable by the General Partner not Grant Park, ranging from 0% to 2% per year, computed and accrued monthly on the basis of the trading advisor’s allocated net assets either at the beginning of the month or at month-end and paid monthly or quarterly. The consulting fees payable to each of Grant Park’s trading advisors that are allocated 10% or more of the fund’s assets are as follows: 1.5% to EMC, 1% to ETC, 1% to Winton and 1% to Welton for the GDP program, and 0% to Welton for both the AES and GNP programs. Grant Park pays consulting fees ranging between 0% and 3% to each of Rabar, Global Advisors, Transtrend, QIM, Sunrise, Amplitude, and effective February 1, 2011, Alder and Denali. No advisor fees are payable with respect to certain advisors.