Grant Park Futures Fund Limited Partnership
Filed: 29 Apr 11, 12:00am
Filed Pursuant to Rule 424(b)(3)
Registration No. 333-153862
PART ONE: DISCLOSURE DOCUMENT
GRANT PARK FUTURES FUND LIMITED PARTNERSHIP
$200,000,000 Legacy 1 Class Units
$200,000,000 Legacy 2 Class Units
$200,000,000 Global Alternative Markets 1 Class Units
$200,000,000 Global Alternative Markets 2 Class Units
$350,000,000 Global Alternative Markets 3 Class Units
The Offering
Grant Park Futures Fund Limited Partnership, which is referred to in this prospectus as Grant Park, is a multi-advisor commodity pool organized to pool assets of investors for the purpose of trading in the U.S. and international spot and derivatives markets for currencies, interest rates, stock indices, agricultural and energy products, precious and base metals and other commodities and underliers. Grant Park, which is not registered as a mutual fund under the Investment Company Act of 1940, has been in continuous operation since January 1989. It is managed by its general partner, Dearborn Capital Management, L.L.C., and invests through independent professional commodity trading advisors.
This offering consists of five classes of limited partnership units: Legacy 1 Class units, Legacy 2 Class units, Global Alternative Markets 1 (“Global 1”) Class units, Global Alternative Markets 2 (“Global 2”) Class units and Global Alternative Markets 3 (“Global 3”) Class units, each of which are being offered to new and existing investors of Grant Park. Grant Park previously publicly offered two additional classes of units: Class A units and Class B units. Although we are no longer offering Class A Units or Class B Units, existing holders of Class A and Class B Units may continue to own such units.
The offered units have different fee arrangements and restrictions on redemptions. Additionally, investments in the offered units will be
allocated to different commodity trading advisors who will apply different investment strategies with respect to each class of units. The Legacy 1 Class and Legacy 2 Class units and Global 1 Class and Global 2 Class units are initially being offered only to investors who are represented by approved selling agents who are directly compensated by the investor for services rendered in connection with an investment in Grant Park (such arrangements commonly referred to as “wrap-accounts”).
The selling agents will offer the units at a price equal to the net asset value per unit of each of the units at the close of business on each closing date, which is the last business day of each month.
The selling agents are not required to sell any specific quantity or dollar amount of units, but have agreed to use their best efforts to sell the units offered. Subscriptions approved for investment will be effective as of each closing date and will be held in Grant Park’s subscription account until invested. The offering is not contingent on a minimum aggregate level of investment and is expected to continue until all registered units are sold. The general partner may, however, in its discretion, suspend or terminate the offering at any time, or it may elect to register and offer additional units.
Summary of Risks
Before you decide whether to invest, you should read this entire prospectus carefully and consider therisk factors beginning on page 19. Several risk factors include, but are not limited to
| • | An investment in Grant Park is speculative and leveraged; as a result of this leverage, small movements in the price of a commodity interest may cause you to incur significant losses. |
| • | Performance can be volatile; rapid and substantial fluctuations in commodity interest prices could cause Grant Park’s trading positions to suddenly turn unprofitable and cause you to lose all or substantially all of your investment in Grant Park. |
| • | Trading in the futures markets, from a macro perspective, results in a zero-sum economic outcome, in that every gain is offset by an equal and opposite loss. Grant Park therefore bears the risk that, on every trade, it will incur the loss. |
| • | Grant Park’s past performance is not necessarily indicative of future performance. |
| • | Grant Park’s use of multiple trading advisors may result in Grant Park taking offsetting trading positions, thereby incurring additional expenses with no net change in holdings. |
| • | No secondary market exists for the units; redemptions of the units are prohibited during the first three months following an initial and each subsequent investment and, in the case of the Global 3 Class units, redemptions prior to the first anniversary date of an investment will result in early redemption fees. |
| • | Grant Park pays substantial fees and expenses, including fees paid to its trading advisors, that must be offset by trading profits and interest income. |
| • | A substantial portion of the trades executed for Grant Park takes place outside of the U.S., much of which exposes Grant Park to substantial credit, regulatory and foreign exchange risk. |
| • | You will have no right to participate in the management of Grant Park. |
| • | The structure and operation of Grant Park involve several conflicts of interest. |
| • | The commodity interest markets are the subject of regulatory scrutiny, from both a national and international perspective, and certain proposals could adversely impact Grant Park’s ability to trade speculatively and implement its trading strategies. |
Minimum Investment
There is a $10,000 minimum investment required to invest in the Legacy 1 Class and Legacy 2 Class units, except that, in the case of investors that are employee benefit plans and/or individual retirement accounts, the minimum investment is $1,000. The minimum investment in the Global 1 Class, Global 2 Class and Global 3 Class units is $5,000,
respectively, except that in the case of investors that are employee benefit plans and/or individual retirement accounts, the minimum investment is $1,000. Any minimum initial investment amounts or wrap-account requirements may be waived in the sole discretion of the general partner.
Neither the Securities and Exchange Commission nor any state securities commission has approved or disapproved of these securities or passed upon the accuracy or adequacy of this prospectus. Any representation to the contrary is a criminal offense.
THE COMMODITY FUTURES TRADING COMMISSION HAS NOT PASSED UPON THE MERITS OF PARTICIPATING IN THIS POOL NOR HAS THE COMMODITY FUTURES TRADING COMMISSION PASSED ON THE ADEQUACY OR ACCURACY OF THIS PROSPECTUS.
This prospectus is in two parts: a disclosure document and a statement of additional information. These parts are bound together, and both parts contain important information.
The date of this prospectus is April 29, 2011
COMMODITY FUTURES TRADING COMMISSION
RISK DISCLOSURE STATEMENT
YOU SHOULD CAREFULLY CONSIDER WHETHER YOUR FINANCIAL CONDITION PERMITS YOU TO PARTICIPATE IN A COMMODITY POOL. IN SO DOING, YOU SHOULD BE AWARE THAT COMMODITY INTEREST TRADING CAN QUICKLY LEAD TO LARGE LOSSES AS WELL AS GAINS. SUCH TRADING LOSSES CAN SHARPLY REDUCE THE NET ASSET VALUE OF THE POOL AND CONSEQUENTLY THE VALUE OF YOUR INTEREST IN THE POOL. IN ADDITION, RESTRICTIONS ON REDEMPTIONS MAY AFFECT YOUR ABILITY TO WITHDRAW YOUR PARTICIPATION IN THE POOL.
FURTHER, COMMODITY POOLS MAY BE SUBJECT TO SUBSTANTIAL CHARGES FOR MANAGEMENT AND ADVISORY AND BROKERAGE FEES. IT MAY BE NECESSARY FOR THOSE POOLS THAT ARE SUBJECT TO THESE CHARGES TO MAKE SUBSTANTIAL TRADING PROFITS TO AVOID DEPLETION OR EXHAUSTION OF THEIR ASSETS. THIS DISCLOSURE DOCUMENT CONTAINS A COMPLETE DESCRIPTION OF EACH EXPENSE TO BE CHARGED THIS POOL AT PAGE 9 AND A STATEMENT OF THE PERCENTAGE RETURN NECESSARY TO BREAK EVEN, THAT IS, TO RECOVER THE AMOUNT OF YOUR INITIAL INVESTMENT, AT PAGE 11.
THIS BRIEF STATEMENT CANNOT DISCLOSE ALL THE RISKS AND OTHER FACTORS NECESSARY TO EVALUATE YOUR PARTICIPATION IN THIS COMMODITY POOL. THEREFORE, BEFORE YOU DECIDE TO PARTICIPATE IN THIS COMMODITY POOL, YOU SHOULD CAREFULLY STUDY THIS DISCLOSURE DOCUMENT, INCLUDING A DESCRIPTION OF THE PRINCIPAL RISK FACTORS OF THIS INVESTMENT, AT PAGE 19.
YOU SHOULD ALSO BE AWARE THAT THIS COMMODITY POOL MAY TRADE FOREIGN FUTURES OR OPTIONS CONTRACTS. TRANSACTIONS ON MARKETS LOCATED OUTSIDE THE UNITED STATES, INCLUDING MARKETS FORMALLY LINKED TO A UNITED STATES MARKET, MAY BE SUBJECT TO REGULATIONS WHICH OFFER DIFFERENT OR DIMINISHED PROTECTION TO THE POOL AND ITS PARTICIPANTS. FURTHER, UNITED STATES REGULATORY AUTHORITIES MAY BE UNABLE TO COMPEL THE ENFORCEMENT OF THE RULES OF REGULATORY AUTHORITIES OR MARKETS IN NON-UNITED STATES JURISDICTIONS WHERE TRANSACTIONS FOR THE POOL MAY BE EFFECTED.
YOU SHOULD ALSO BE AWARE THAT THIS COMMODITY POOL MAY ENGAGE IN OFF-EXCHANGE FOREIGN CURRENCY TRADING. SUCH TRADING IS NOT CONDUCTED IN THE INTERBANK MARKET. THE FUNDS THAT THE POOL USES FOR OFF-EXCHANGE FOREIGN CURRENCY TRADING WILL NOT RECEIVE THE SAME PROTECTIONS AS FUNDS USED TO MARGIN OR GUARANTEE EXCHANGE-TRADED FUTURES AND OPTION CONTRACTS. IF THE POOL DEPOSITS SUCH FUNDS WITH A COUNTERPARTY AND THAT COUNTERPARTY BECOMES INSOLVENT, THE POOL’S CLAIM FOR AMOUNTS DEPOSITED OR PROFITS EARNED ON TRANSACTIONS WITH THE COUNTERPARTY MAY NOT BE TREATED AS A COMMODITY CUSTOMER CLAIM FOR PURPOSES OF SUBCHAPTER IV OF CHAPTER 7 OF THE BANKRUPTCY CODE AND THE REGULATIONS THEREUNDER. THE POOL MAY BE A GENERAL CREDITOR AND ITS CLAIM MAY BE PAID, ALONG WITH THE CLAIMS OF OTHER GENERAL CREDITORS, FROM ANY MONIES STILL AVAILABLE AFTER PRIORITY CLAIMS ARE PAID. EVEN POOL FUNDS THAT THE COUNTERPARTY KEEPS SEPARATE FROM ITS OWN FUNDS MAY NOT BE SAFE FROM THE CLAIMS OF PRIORITY AND OTHER GENERAL CREDITORS.
NATIONAL FUTURES ASSOCIATION HAS NEITHER PASSED UPON THE MERITS OF PARTICIPATING IN THIS POOL NOR THE ADEQUACY OR ACCURACY OF THIS DISCLOSURE DOCUMENT.
i
A NUMBER OF JURISDICTIONS IN WHICH THE UNITS ARE OFFERED IMPOSE ON THEIR RESIDENTS HIGHER MINIMUM SUITABILITY REQUIREMENTS, WHICH ARE DESCRIBED IN APPENDIX C TO THIS PROSPECTUS. PLEASE SEE PAGES C-3 AND C-4 OF APPENDIX C FOR A DETAILED DESCRIPTION OF THE MINIMUM SUITABILITY REQUIREMENTS IN THE STATE IN WHICH YOU RESIDE. YOU WILL BE REQUIRED TO REPRESENT THAT YOU MEET THE REQUIREMENTS SET FORTH IN YOUR STATE OF RESIDENCE BEFORE YOUR SUBSCRIPTION TO PURCHASE UNITS WILL BE ACCEPTED. THESE SUITABILITY REQUIREMENTS ARE, IN EACH CASE, REGULATORY MINIMUMS ONLY, AND JUST BECAUSE YOU MEET SUCH REQUIREMENTS DOES NOT MEAN THAT AN INVESTMENT IN THE UNITS IS SUITABLE FOR YOU. IN NO EVENT MAY YOU INVEST MORE THAN 10% OF YOUR NET WORTH, EXCLUSIVE OF HOME, FURNISHINGS AND AUTOMOBILES, IN GRANT PARK.
Dearborn Capital Management, L.L.C.
General Partner
626 West Jackson Boulevard, Suite 600
Chicago, IL 60661
(312) 756-4450
ii
REGULATORY NOTICES
NO DEALER, SALESMAN OR ANY OTHER PERSON HAS BEEN AUTHORIZED TO GIVE ANY INFORMATION OR TO MAKE ANY REPRESENTATION NOT CONTAINED IN THIS PROSPECTUS, AND, IF GIVEN OR MADE, SUCH OTHER INFORMATION OR REPRESENTATION MUST NOT BE RELIED UPON AS HAVING BEEN AUTHORIZED BY THE FUND, THE GENERAL PARTNER, THE AUTHORIZED PARTICIPANTS OR ANY OTHER PERSON.
THIS PROSPECTUS DOES NOT CONSTITUTE AN OFFER TO SELL OR A SOLICITATION OF AN OFFER TO BUY THE SECURITIES OFFERED HEREBY TO ANY PERSON OR BY ANYONE IN ANY JURISDICTION IN WHICH SUCH OFFER OR SOLICITATION MAY NOT LAWFULLY BE MADE.
THE BOOKS AND RECORDS OF THE FUND WILL BE MAINTAINED AT ITS PRINCIPAL OFFICE, 626 WEST JACKSON BOULEVARD, SUITE 600, CHICAGO, IL 60661. LIMITED PARTNERS WILL HAVE THE RIGHT, DURING NORMAL BUSINESS HOURS, TO HAVE ACCESS TO AND COPY (UPON PAYMENT OF REASONABLE REPRODUCTION COSTS) SUCH BOOKS AND RECORDS IN PERSON OR BY THEIR AUTHORIZED ATTORNEY OR AGENT. EACH MONTH, THE GENERAL PARTNER WILL DISTRIBUTE REPORTS TO ALL LIMITED PARTNERS SETTING FORTH SUCH INFORMATION AS THE COMMODITY FUTURES TRADING COMMISSION (THE “CFTC”) AND THE NATIONAL FUTURES ASSOCIATION (THE “NFA”) MAY REQUIRE BE GIVEN TO THE PARTICIPANTS IN COMMODITY POOLS WITH RESPECT TO THE FUND AND ANY SUCH OTHER INFORMATION AS THE GENERAL PARTNER MAY DEEM APPROPRIATE. THERE WILL SIMILARLY BE DISTRIBUTED TO LIMITED PARTNERS, NOT MORE THAN 90 DAYS AFTER THE CLOSE OF EACH OF THE FUND’S FISCAL YEARS, CERTIFIED AUDITED FINANCIAL STATEMENTS AND (IN NO EVENT LATER THAN MARCH 15 OF THE IMMEDIATELY FOLLOWING YEAR) THE TAX INFORMATION RELATING TO SHARES OF THE FUND NECESSARY FOR THE PREPARATION OF LIMITED PARTNERS’ ANNUAL FEDERAL INCOME TAX RETURNS.
THE DIVISION OF INVESTMENT MANAGEMENT OF THE SECURITIES AND EXCHANGE COMMISSION REQUIRES THAT THE FOLLOWING STATEMENT BE PROMINENTLY SET FORTH HEREIN: “GRANT PARK FUTURES FUND LIMITED PARTNERSHIP IS NOT A MUTUAL FUND OR ANY OTHER TYPE OF INVESTMENT COMPANY WITHIN THE MEANING OF THE INVESTMENT COMPANY ACT OF 1940, AS AMENDED, AND IS NOT SUBJECT TO REGULATION THEREUNDER.”
iii
| Page | ||||
| 1 | ||||
| 19 | ||||
| 33 | ||||
| 34 | ||||
| 35 | ||||
| 37 | ||||
| 37 | ||||
| 39 | ||||
| 61 | ||||
| 62 | ||||
| 63 | ||||
| 64 | ||||
| 65 | ||||
| 66 | ||||
| 67 | ||||
Management’s Discussion and Analysis of Financial Condition and Results of Operations | 108 | |||
| 116 | ||||
| 120 | ||||
| 127 | ||||
| 129 | ||||
| 129 | ||||
| 135 | ||||
| 135 | ||||
| Page | ||||
| 140 | ||||
| 144 | ||||
| 146 | ||||
| 151 | ||||
| 152 | ||||
| 152 | ||||
| 152 | ||||
| 153 | ||||
| Part Two: Statement of Additional Information | 206 | |||
| 208 | ||||
| 217 | ||||
| 218 | ||||
| SAI-E-1 | ||||
| SAI-E-22 | ||||
| Appendices | ||||
| A-1 | ||||
| B-1 | ||||
| C-1 | ||||
| D-1 | ||||
| E-1 | ||||
You should rely only on the information contained in this prospectus. Grant Park, the general partner and the selling agents have not authorized anyone to provide you with different information, and if you receive any unauthorized information, you should not rely on it. We are not making an offer of these securities in any place where the offer is not permitted. You should assume that the information in this prospectus or any prospectus supplement is accurate only as of the date of the front cover of that document, regardless of the time you receive this prospectus.
iv
This summary highlights information contained elsewhere in this prospectus. This summary does not contain all of the information that you should consider before investing in the units. You should read this entire prospectus carefully, including the risk factors beginning on page 19, the Statement of Additional Information and all exhibits to the prospectus, before deciding to invest. See the glossary in Appendix E for definitions of certain key terms relating to Grant Park’s trading activities that are used in this prospectus.
Grant Park
Grant Park is a multi-advisor commodity pool organized to pool assets of investors for the purpose of trading in the U.S. and international spot and derivatives markets for currencies, interest rates, stock indices, agricultural and energy products, precious and base metals and other commodities and underliers. In trading on these markets, Grant Park may enter into: exchange-traded derivatives, such as futures contracts, options on futures contracts, security futures contracts and listed option contracts (collectively, “exchange-traded derivatives”); over-the-counter, or OTC, derivatives, such as forwards, swaps, options and structured financial products (collectively, “OTC derivatives”); and contracts on cash, or spot, commodities (collectively, “cash commodities”) (collectively, “exchange-traded derivatives,” “OTC derivatives” and “cash commodities” are referred to as “commodity interests”).
Grant Park invests the assets of each class of the fund in various trading companies, each of which allocates those assets to one of the independent professional commodity trading advisors retained by the general partner, or to its cash management trading company. Grant Park’s general partner, commodity pool operator and sponsor is Dearborn Capital Management, L.L.C., an Illinois limited liability company. The managing member of Dearborn Capital Management, L.L.C. is Dearborn Capital Management, Ltd., an Illinois corporation whose majority shareholder is David M. Kavanagh.
Grant Park has been trading continuously since January 1989 and, as of December 31, 2010, had a net asset value of approximately $891.9 million and 24,502 limited partners. Since its inception and through February 28, 2003, Grant Park offered its beneficial interests exclusively to qualified investors
on a private placement basis. Effective June 30, 2003, Grant Park began offering units for sale to the public.
Grant Park’s main office is located at 626 West Jackson Boulevard, Suite 600, Chicago, Illinois 60661, and its telephone number is (312) 756-4450.
The Offered Units
Grant Park’s limited partnership units are being offered in five separate and distinct classes: the Legacy 1 Class units, the Legacy 2 Class units, the Global 1 Class units, the Global 2 Class units and the Global 3 Class units. In addition to the offered units, Grant Park has two outstanding classes of limited partnership units, the Class A and Class B units, which are no longer being offered for sale and are not offered hereunder.
Investments in the offered units will be invested through different commodity trading advisors retained by the general partner with respect to each class of units. Each of the trading advisors employs technical and trend-following trading strategies through proprietary trading programs in an effort to achieve capital appreciation while controlling risk and volatility. The general partner may, in its sole discretion, reallocate assets among the trading advisors upon termination of a trading advisor or retention of any new trading advisors, or at the commencement of any month. Consequently, the current apportionments are subject to change.
The offered units are subject to a three-month lock-up period.
Legacy 1 Class and Legacy 2 Class units
The Legacy 1 Class and Legacy 2 Class units will be allocated to the same trading advisors and are being offered only to investors who are represented by approved selling agents who are directly compensated by the investor for services rendered in connection with an investment in Grant Park (such arrangements commonly referred to as “wrap-accounts”). Selling agents who sell Legacy 1 Class or Legacy 2 Class units do not receive any upfront sales compensation. Each selling agent who sells Legacy 2 Class units does, however, receive ongoing compensation for continuing administrative services at an annual rate of 25 basis points (0.25%) of the month-end net asset value of the unit. See “FEES AND EXPENSES — Fees and Expenses Paid by the General Partner — Selling Agent Compensation.”
1
Through their respective trading companies, each of Rabar Market Research, Inc., EMC Capital Management, Inc., Eckhardt Trading Company, or ETC, Winton Capital Management Limited, Welton Investment Corporation, Global Advisors Jersey Limited, Transtrend B.V., Sunrise Partners, LLC, Amplitude Capital International Limited, Quantitative Investment Management, LLC, or QIM, and effective February 1, 2011, Alder Capital Limited and Denali Asset Management, LLLP, serve as Grant Park’s commodity trading advisors with respect to the Legacy 1 Class and Legacy 2 Class units. The trading advisors and their respective asset allocations with respect to the Legacy 1 Class and Legacy 2 Class units are the same as with respect to the fund’s Class A and Class B units. Effective February 1, 2011, with respect to the Class A and Class B units and the Legacy 1 Class and Legacy 2 Class, each of EMC, Winton and Welton manage between 10% to 20% of Grant Park’s net assets, and each of Rabar, ETC, Global Advisors, Transtrend, QIM, Sunrise, Amplitude, Alder and Denali are allocated less than 10% of Grant Park’s net assets to manage.
The trading advisors for the Legacy 1 Class and Legacy 2 Class units will pursue a technical trend trading philosophy, which is the same trading philosophy the trading advisors have historically used for the Class A and Class B units.
Global 1 Class, Global 2 Class and Global 3 Class units
Investments in the Global 1 Class, Global 2 Class and Global 3 Class units will be allocated to the same trading advisors. However, Global 1 Class and Global 2 Class units are being offered only to investors purchasing such units through wrap-accounts. Selling agents who sell Global 1 Class or Global 2 Class units do not receive any upfront sales compensation. Each selling agent who sells Global 2 Class units does, however, receive ongoing compensation for continuing administrative services at an annual rate of 25 basis points (0.25%) of the month-end net asset value of the unit. See “FEES AND EXPENSES — Fees and Expenses Paid by the General Partner — Selling Agent Compensation.”
Selling agents who sell Global 3 Class units receive an upfront sales commission of up to 2.0% of the subscription amount. Beginning with the thirteenth month after the subscription proceeds of a Global 3 Class unit are invested in Grant Park, each selling agent who sells Global 3 Class units will receive
ongoing compensation for continuing administrative services at an annual rate of 2.0% of the month-end net asset value of the unit. In the event that the total underwriting compensation paid to a selling agent per a Global 3 Class unit meets certain limits, such Global 3 Class unit will be automatically exchanged for an equal net asset amount of Global 1 Class units at no additional cost. See “FEES AND EXPENSES — Fees and Expenses Paid by the General Partner — Selling Agent Compensation.”
Global 3 Class units redeemed after the three month lock-up period, but on or before the one-year anniversary of the subscription are subject to a fee of up to 1.50% of the net asset value of the redeemed units; the Global 1 Class and Global 2 Class units are not subject to an early redemption fee.
Through their respective trading companies, each of EMC, ETC, Welton, Winton, Transtrend, QIM, Sunrise, Amplitude, and effective February 1, 2011, Alder and Denali, serve as Grant Park’s commodity trading advisors with respect to the Global 1 Class, Global 2 Class and Global 3 Class units. Effective February 1, 2011, with respect to the Global 1 Class, Global 2 Class and Global 3 Class units, each of ETC, Winton, Transtrend, QIM and Welton manage between 10% and 20% of Grant Park’s net assets, and Sunrise, EMC, Amplitude, Alder and Denali are allocated less than 10% of Grant Park’s assets to manage.
The trading advisors for the Global 1 Class, Global 2 Class and Global 3 Class units pursue technical trend trading philosophies, as well as pattern recognition philosophies focused on relatively shorter timeframes than the Legacy 1 Class and Legacy 2 Class units.
Break-even Amounts for Each Class of Units
The following summarizes the approximate dollar returns and percentage returns required for the redemption value of a hypothetical $1,000 initial investment in offered units to equal the amount invested 12 months after the investment was made. The break-even summary for the Global 3 Class units shows the amount required to “break-even” both with and without an early redemption fee which, for purposes of this summary, has been averaged to approximate the effect that payment of an early redemption fee will have on a redemption of such units during the first year of investment.
| • | Legacy 1 Class: 5.27% (or $52.65). |
2
| • | Legacy 2 Class: 5.57% (or $55.69). |
| • | Global 1 Class: 4.67% (or $46.71). |
| • | Global 2 Class: 4.98% (or $49.76). |
| • | Global 3 Class: 7.18% (or $71.76) without average early redemption fee, or 8.68% (or $86.76) with average early redemption fee. |
See “SUMMARY — Break-even Analysis” beginning on page 11 for detailed breakeven analysis of the offered units.
Continuous Offering Period
Grant Park offers the offered units on a continuous basis and will continue to offer such units until the maximum amount of Legacy 1 Class, Legacy 2 Class, Global 1 Class, Global 2 Class and Global 3 Class units, respectively, which are registered are sold. We refer to this period as the continuous offering period. The general partner may terminate the continuous offering period at any time.
Commodity Interests
Grant Park trades in the U.S. and international spot and derivatives markets for currencies, interest rates, stock indices, agricultural and energy products, precious and base metals and other commodities and underliers. In trading on these markets, Grant Park may enter into exchange-traded derivatives, OTC derivatives and cash commodities. A brief description of Grant Park’s main types of investments is set forth below.
| • | A futures contract is a standardized, exchanged traded contract to buy or sell a commodity for a specified price in the future. |
| • | A forward contract is a bilaterally negotiated contract to buy or sell something (i.e., the underlier) at a specified price in the future. |
| • | An option on a futures contract, forward contract, swap or a commodity gives the buyer of the option the right, but not the obligation, to buy or sell a futures contract, forward contract or a commodity, as applicable, at a specified price on or before a specified date. Options on futures contracts are standardized contracts traded on an exchange, while options on forward |
contracts and commodities, referred to collectively in this prospectus as over-the-counter, or OTC, options, generally are bilaterally negotiated, principal-to-principal contracts not traded on an exchange. |
| • | A swap is a bilaterally negotiated agreement between two parties to exchange cash flows based upon an asset, rate or something else (i.e., the underlier). |
| • | A commodity spot contract is a cash market transaction in which the buyer and seller agree to the immediate purchase and sale of a commodity, usually with a two-day settlement. Spot contracts are not uniform and not exchange-traded. |
| • | A security futures contract is a futures contract on a single equity security or a narrow-based security index. Security futures contracts are exchange-traded. |
For more detailed descriptions of futures contracts, forward contracts, options contracts, other commodity interest contracts and other aspects of the commodity interest markets, see Part Two: Statement of Additional Information.
Plan of Distribution
What is the minimum investment?
| • | The minimum investment required to invest in the Legacy 1 Class and Legacy 2 Class units is $10,000, except in the case of investors that are employee benefit plans and/or individual retirement accounts for which the minimum investment is $1,000; subsequent investment in the Legacy 1 Class and Legacy 2 Class units must be at least $1,000. The selling agents will offer the Legacy 1 Class and Legacy 2 Class units at a price equal to the net asset value per unit of each of the units at the close of business on each closing date, which is the last business day of each month. The Legacy 1 Class and Legacy 2 Class units are being offered only to investors purchasing such units through wrap-accounts. |
| • | The minimum investment in the Global 1 Class, Global 2 Class and Global 3 Class units is $5,000, except in the case of |
3
investors in such units that are employee benefit plans and/or individual retirement accounts for which the minimum investment is $1,000; subsequent investment in the Global 1 Class, Global 2 Class and Global 3 Class units must be at least $1,000. The selling agents will offer the Global 1 Class, Global 2 Class and Global 3 Class units at a price equal to the net asset value per unit of each of the units at the close of business on each closing date, which is the last business day of each month. The Global 1 Class and Global 2 Class units are being offered only to investors purchasing such units through wrap-accounts. |
| • | Any of these minimum investment requirements, including the requirement to invest in certain classes of units through wrap-accounts, may be waived by the general partner in its sole discretion. Units will be sold in fractions calculated to three decimal places. |
How do I invest in Grant Park?
| • | You may buy units at the close of business on the last business day of each month, each a closing date, by submitting a subscription at least five business days before the applicable closing date, or at an earlier date if required by your selling agent. The number of units that you receive will be based on the net asset value per unit of the applicable class of units at the close of business on the closing date. Approved subscriptions will be accepted once payments are received and cleared, and each investor will receive written confirmation of the purchase following acceptance. |
| • | The general partner will accept or reject your subscription, in whole or in part, in its sole discretion. The general partner will deposit your subscription funds in Grant Park’s non-interest bearing subscription account. If the general partner accepts your subscription, your subscription funds will be invested in Grant Park on the next applicable closing date. There is no minimum aggregate subscription amount that must be received before new investors’ funds can be invested. If the general partner does not accept your subscription, your subscription funds will be returned to you without interest. |
| • | The selling agents, which are the registered broker-dealers who are offering the units, will use their best efforts to sell the units being offered, without any firm underwriting commitment. You will not directly pay sales commissions to the selling agents. All sales commissions and other compensation to the selling agents are paid by the general partner out of the brokerage charge paid by Grant Park to the general partner. |
| • | Carefully read the prospectus, along with all appendices, including the limited partnership agreement and the subscription agreement and power of attorney and discuss with your financial advisor any questions you have about Grant Park. Investors will be required to make the representations and warranties set forth in Appendix C relating to their suitability to purchase the offered units in the subscription agreement and power of attorney. If you decide to invest, please complete and sign the subscription agreement and power of attorney and deliver to your selling agent a check made payable to “Grant Park Futures Fund Limited Partnership — Subscription Account,” or authorize a wire transfer in the amount of your subscription in accordance with the instructions set forth in the subscription agreement and power of attorney. Alternatively, if available, you may authorize your selling agent to debit your customer securities brokerage account in the amount of your subscription. |
What is the difference between the Legacy 1 Class, the Legacy 2 Class, the Global 1 Class, the Global 2 Class and the Global 3 Class units?
The Legacy 1 Class, Legacy 2 Class, Global 1 Class and Global 2 Class units are being offered only to investors who purchase such units through wrap-accounts, provided that they meet the suitability criteria described below and in Appendix C. The Global 3 Class units are reserved for investments by new investors generally, provided they meet the same suitability criteria.
Trading for the Legacy 1 Class and Legacy 2 Class units, on the one hand, and the Global 1 Class, Global 2 Class and Global 3 Class units, on the other hand, are directed by different trading advisors, and such trading advisors will pursue different trading
4
strategies. Effective February 1, 2011, the trading advisors for the Legacy 1 Class and Legacy 2 Class units are Rabar, EMC, ETC, Winton, Welton, Global Advisors, Transtrend, QIM, Sunrise, Amplitude, Alder and Denali and such advisors generally pursue a technical trend trading philosophy. The trading advisors, asset allocations and trading philosophy with respect to the Legacy 1 Class and Legacy 2 Class units are the same as those utilized for Grant Park’s Class A and Class B units. Effective February 1, 2011, the trading advisors for the Global 1 Class, Global 2 Class and Global 3 Class units are EMC, ETC, Winton, Transtrend, QIM, Sunrise, Amplitude, Alder, Denali and Welton and such trading advisors generally pursue technical trend trading philosophies, as well as pattern recognition philosophies focused on relatively shorter timeframes than the Legacy 1 Class and Legacy 2 Class units.
The Legacy 1 Class units bear organization and offering expenses at an annual rate of 30 basis points (0.30%) of the adjusted net assets of the Legacy 1 Class units, calculated and payable monthly on the basis of month-end adjusted assets (before accruals for fees and expenses and redemptions). With respect to the monthly brokerage charge payable by Grant Park to the general partner, Legacy 1 Class units are charged 0.4167% of month-end adjusted net assets of the Legacy 1 Class units, a rate of 5.00% annually.
The Legacy 2 Class units bear organization and offering expenses at an annual rate of 30 basis points (0.30%) of the adjusted net assets of the Legacy 2 Class units, calculated and payable monthly on the basis of month-end adjusted assets (before accruals for fees and expenses and redemptions). With respect to the monthly brokerage charge payable by Grant Park to the general partner, Legacy 2 Class units are charged 0.4375% of month-end adjusted net assets of the Legacy 2 Class units, a rate of 5.25% annually.
The Global 1 Class units bear organization and offering expenses at an annual rate of 30 basis points (0.30%) of the adjusted net assets of the Global 1 Class units, calculated and payable monthly on the basis of month-end adjusted assets (before accruals for fees and expenses and redemptions). With respect to the monthly brokerage charge payable by Grant Park to the general partner, Global 1 Class units are charged 0.3708% of month-end adjusted net assets of the Global 1 Class units, a rate of 4.45% annually.
The Global 2 Class units bear organization and offering expenses at an annual rate of 30 basis points
(0.30%) of the adjusted net assets of the Global 2 Class units, calculated and payable monthly on the basis of month-end adjusted assets (before accruals for fees and expenses and redemptions). With respect to the monthly brokerage charge payable by Grant Park to the general partner, Global 2 Class units are charged 0.3917% of month-end adjusted net assets of the Global 2 Class units, a rate of 4.70% annually.
The Global 3 Class units bear organization and offering expenses at an annual rate of 30 basis points (0.30%) of the adjusted net assets of the Global 3 Class units, calculated and payable monthly on the basis of month-end adjusted assets (before accruals for fees and expenses and redemptions). With respect to the monthly brokerage charge payable by Grant Park to the general partner, Global 3 Class units are charged 0.5375% of month-end adjusted net assets of the Global 3 Class units, a rate of 6.45% annually.
Investors in the offered units are prohibited from redeeming such units for three months following the subscription date. This lock-up period may be waived by the general partner at its sole discretion. Global 3 Class units that are redeemed before the one-year anniversary of the subscription date will pay an early redemption fee of up to 1.5% of the net asset value at which such units are redeemed. The general partner has discretion to waive the redemption fee. The Legacy 1 Class, Legacy 2 Class, Global 1 Class and Global 2 Class units are not subject to an early redemption fee. After termination of the lock-up period, you may cause Grant Park to redeem your units at the net asset value per applicable unit as of the last business day of each month with at least 10 days advance written notice to the general partner, or at an earlier date if required by your selling agent.
Is Grant Park a suitable investment for you?
An investment in Grant Park is speculative and involves a high degree of risk. Grant Park is not suitable for all investors. The general partner offers Grant Park as a diversification opportunity for an investor’s entire investment portfolio, and therefore an investment in Grant Park should only represent a limited portion of an investor’s overall portfolio.
To invest in Grant Park, you must have at a minimum:
| (1) | a net worth of at least $250,000, exclusive of home, furnishings and automobiles; or |
5
| (2) | a net worth, similarly calculated, of at least $70,000 and an annual gross income of $70,000. |
A number of jurisdictions in which the units are offered impose on their residents higher minimum suitability requirements, which are described in Appendix C to this prospectus. Please see Appendix C for a detailed description of the minimum suitability requirements in the state in which you reside. You will be required to represent that you meet the requirements set forth in your state of residence before your subscription to purchase units will be accepted.These suitability requirements are, in each case, regulatory minimums only, and just because you meet such requirements does not mean that an investment in the units is suitable for you. In no event may you invest more than 10% of your net worth, exclusive of home, furnishings and automobiles, in Grant Park. Employee benefit plans and individual retirement accounts are subject to special suitability requirements. See “INVESTMENT BY ERISA AND OTHER PLAN ACCOUNTS.”In addition, individual selling agents may impose even higher minimum suitability requirements on their clients investing in Grant Park than those described above or required by an individual state. You should consult with your financial advisor to confirm that you meet these requirements before deciding to invest in Grant Park.
Summary of Risk Factors You Should Consider Before Investing in Grant Park
An investment in Grant Park is highly speculative and involves a high degree of risk. Some of the risks you may face are summarized below. A comprehensive discussion of risks begins on page 19.
| • | The prices of commodity interest contracts are highly volatile and subject to rapid and substantial fluctuations. You could therefore lose all or substantially all of your investment if Grant Park’s trading positions suddenly turn unprofitable. These movements in price are often the result of factors outside of Grant Park’s and its trading advisors’ control and may not be anticipated by Grant Park’s trading advisors. |
| • | Because Grant Park’s trading positions are typically secured by the deposit of margin funds that represent only a small percentage of a contract’s entire face value, Grant Park |
is highly leveraged. As a result of this leverage, relatively small movements in the price of a contract can cause significant losses to Grant Park. |
| • | Grant Park trades in the futures markets. From a macro perspective, gain and losses in the futures markets result in a zero-sum economic outcome, in that every gain is offset by an equal and opposite loss. As a result, Grant Park bears the risk on every trade it makes that it will be the party that incurs a loss. |
| • | Grant Park’s use of multiple independent trading advisors may result in Grant Park taking offsetting positions on the same commodity interest contract thereby possibly incurring additional expenses but without any net change in Grant Park’s holdings. In addition, the trading programs used by each trading advisor bear some similarities to the trading programs used by other trading advisors, which may negate the benefits of having multiple trading advisors. |
| • | Past performance of Grant Park is not necessarily indicative of future performance, and you should not rely on the performance record to date of Grant Park and/or the trading advisors in deciding whether to invest. The general partner has increased Grant Park’s fee and expense structure in certain respects to accommodate the public offering of units, and the fees and expenses have an impact on Grant Park’s net performance. |
| • | A substantial portion of Grant Park’s trades takes place on markets and exchanges outside the United States. Some non-U.S. markets present risks because they are not subject to the same degree of regulation as their U.S. counterparts. In some of these non-U.S. markets, the performance on a contract is the responsibility of the counterparty and the contract is not backed by or novated to a centralized clearing house and therefore exposes Grant Park to credit risk in the form of a counterparty default or payment risk. Trading in non-U.S. markets also leaves Grant Park susceptible to swings in the value of the local currency against the U.S. dollar. |
6
| • | Grant Park pays substantial amounts in fees and expenses that are incurred regardless of whether it is profitable. In addition, Grant Park pays each of its trading advisors an incentive fee that is based only on that trading advisor’s trading profits, which means that Grant Park could pay incentive fees to one or more of its trading advisors even if Grant Park as a whole is not profitable. |
| • | You will have no rights to participate in the management of Grant Park and will have to rely on the fiduciary duty and judgment of the general partner to manage Grant Park in the best interest of the limited partners. |
| • | The structure and operation of Grant Park involves several conflicts of interest. For example, DCM Brokers, LLC, an affiliate of Grant Park’s general partner, serves as Grant Park’s lead selling agent. Additionally, an entity controlled by the general partner’s president occasionally does business, which is unrelated to that of Grant Park, with one of Grant Park’s clearing brokers, MF Global. These and other conflicts may cause the parties involved to act in a manner that is other than in Grant Park’s best interests. |
| • | The commodity interest markets are the subject of regulatory scrutiny, from both a national and international perspective and certain proposals could adversely impact Grant Park’s ability to trade speculatively and implement its trading strategies. |
Investment Factors to Consider Before Investing in Grant Park
| • | Grant Park is an alternative investment fund managed by experienced, professional trading advisors that trade in commodity interests. |
| • | The trading programs that the trading advisors use for Grant Park are comprised of a variety of proprietary trading strategies and systems. |
| • | An investment in Grant Park may diversify a traditional securities portfolio. A diverse portfolio consisting of assets that perform in an unrelated manner, or non-correlated assets, may increase overall return and |
reduce the volatility of a portfolio. As a risk transfer activity, trading in commodity interests has no inherent correlation with any other investment. However, non-correlation will not provide any diversification advantages unless the non-correlated assets are outperforming other portfolio assets, and there is no guarantee that Grant Park will outperform other sectors of an investor’s portfolio or not produce losses. Grant Park’s profitability also depends on the success of the trading advisors’ trading techniques. If Grant Park is unprofitable, then it will not increase the return on an investor’s portfolio or achieve its diversification objectives. |
| • | Investors in Grant Park obtain the advantage of limited liability in highly leveraged trading. |
The General Partner
Dearborn Capital Management, L.L.C., an Illinois limited liability company, is Grant Park’s general partner and commodity pool operator and has sole authority and responsibility for administering Grant Park. Along with its managing member and predecessor as Grant Park’s general partner and commodity pool operator, Dearborn Capital Management, Ltd., the general partner has had management responsibility for Grant Park since Grant Park’s inception. The general partner is registered as a commodity pool operator and as a commodity trading advisor under the Commodity Exchange Act and is a member of the National Futures Association, or NFA.
The office of the general partner is located at 626 West Jackson Boulevard, Suite 600, Chicago, Illinois 60661; telephone: (312) 756-4450; facsimile: (312) 756-4452; e-mail: funds@dearborncapital.com. The general partner’s website address is:www.grantparkfunds.com. The information on this website is not a part of this prospectus. The books and records of the general partner and Grant Park are kept and made available for inspection at the general partner’s office.
The Trading Advisors
Effective February 1, 2011, Grant Park trades through its twelve independent professional commodity trading advisors: Rabar Market Research, Inc., EMC Capital Management, Inc., Eckhardt Trading Company (or ETC), Winton Capital Management Limited, Welton Investment Corporation,
7
Global Advisors Jersey Limited, Transtrend B.V., Quantitative Investment Management LLC (or QIM), Sunrise Capital Partners, LLC, Amplitude Capital International Limited, Alder Capital Limited and Denali Asset Management, LLLP. Each of the trading advisors is registered as a commodity trading advisor under the Commodity Exchange Act and is a member of the NFA. The general partner may terminate or replace any or all of the trading advisors, or add additional trading advisors, at any time in its sole discretion.
Rabar Market Research, Inc. is located at 10 Bank Street, Suite 830, White Plains, New York 10606, and its telephone number is (914) 682-8363. EMC Capital Management, Inc. is located at 2201 Waukegan Road, Suite 240 West, Bannockburn, Illinois 60015, and its telephone number is (847) 267-8700. ETC is located at 1314 North Dearborn Parkway, Carriage House, Chicago, Illinois 60610, and its telephone number is (312) 787-1107. Winton Capital Management Limited is located at 1-5 St. Mary Abbott’s Place, London, W8 6LS, United Kingdom, and its telephone number is +44-20-7610-5350. Welton Investment Corporation is located at the Eastwood Building, San Carlos between 5th and 6th, Carmel, California 93921, and its telephone number is (831) 626-5190. Global Advisors Jersey Limited’s offices are located at Spectrum, Gloucester Street, St. Helier, JE2 3DE, Channel Islands, and its telephone number is +44-153-451-3100. The business office of Transtrend B.V. is located at Weena 723, Unit C5.070, 3013 AM Rotterdam, The Netherlands and its telephone number is +31-10-453-6500. QIM is located at 401 East Market Street, Suite 104, Charlottesville, Virginia 22902, and its telephone number is (434) 817-4800. Sunrise Capital Partners, LLC is located at 12544 High Bluff Drive, Suite 400, San Diego, California 92130, and its telephone number is (858) 259-8911. Amplitude Capital International Limited is located at Grand Pavilion Commercial Centre, 1st Floor, 802 West Bay Road, P.O. Box 31855, KY1 1207 Cayman Islands, and its telephone number is (345) 943-2295. Alder Capital Limited is located at 61 Merrion Square, Dublin 2, Ireland, and its telephone number is +353-1-614-7232. Denali Asset Management, LLLP is located at 5020 Anchor Way, 2nd Floor, Christiansted, Virgin Islands 00826-4633, and its telephone number is (340) 778-7744.
The Clearing Brokers
MF Global Inc. (“MF Global”) acts as a clearing broker for Grant Park in addition to acting as one of
Grant Park’s additional selling agents. MF Global provides brokerage and clearing services to Grant Park with respect to commodity interests. MF Global is not a sponsor or general partner of Grant Park, and does not act in any supervisory capacity with respect to the general partner or participate in the management of either the general partner or Grant Park. Nevertheless, it should be noted that a brokerage entity owned by David M. Kavanagh, who indirectly controls and is president of the general partner, receives compensation from MF Global in exchange for transactions introduced to and cleared through MF Global. This compensation is unrelated to the trading activities of Grant Park. MF Global’s principal office is located at 717 Fifth Avenue, 9th Floor, New York, New York 10022-8101, and its telephone number is (212) 589-6200. It is registered as a futures commission merchant and a commodity pool operator under the Commodity Exchange Act and is a member of the NFA. MF Global also is a member of all major U.S. futures exchanges.
UBS Securities LLC (“UBS Securities”) acts as a clearing broker for Grant Park. UBS Securities has not sponsored or organized Grant Park, and is not responsible for the activities of the general partner or the trading advisors. UBS Securities is a wholly-owned indirect subsidiary of UBS AG. It is registered as a futures commission merchant under the Commodity Exchange Act and is a member of the NFA. UBS Securities’ principal office is located at 677 Washington Blvd., Stamford, Connecticut 06901, and its telephone number is (203) 719-4066.
Newedge USA, LLC (“Newedge USA”) became one of Grant Park’s clearing brokers effective July 1, 2008 to execute and clear Grant Park’s futures transactions and provide other brokerage-related services. Newedge Financial Inc. (“NFI”) is a wholly-owned subsidiary of Newedge USA which merged into Newedge USA effective September 1, 2008. Newedge Alternative Strategies, Inc. (“NAST”) may execute foreign exchange or other over-the-counter, or OTC, transactions with Grant Park, as principal. Newedge USA and NAST are subsidiaries of Newedge Group. Newedge USA and NAST are headquartered at 630 Fifth Avenue, Suite 500, New York, NY 10111 with branch offices in San Francisco, California; Chicago, Illinois; Philadelphia, Pennsylvania; Kansas City, Missouri; and Houston, Texas. Newedge USA is a futures commission merchant and broker-dealer registered with the Commodity Futures Trading Commission, or CFTC, and the SEC, and is a member of FINRA. Newedge USA is a clearing member of all
8
principal futures exchanges located in the United States as well as a member of the Chicago Board Options Exchange, International Securities Exchange, New York Stock Exchange, Options Clearing Corporation, and Government Securities Clearing Corporation. NAST is an eligible swap participant that is not registered or required to be registered with the CFTC or the SEC, and is not a member of any exchange. Prior to January 2, 2008, Newedge USA was known as Fimat USA, LLC, while NAST was known as Fimat Alternative Strategies Inc. On September 1, 2008, Newedge USA merged with futures commission merchant and broker dealer NFI — formerly known as Calyon Financial, Inc. Newedge USA was the surviving entity.
The clearing brokers or their affiliates also may act as dealers through which Grant Park’s OTC derivatives will be effected. The trading advisors also may utilize other dealers in engaging in such transactions, with the general partner’s consent.
The general partner may retain additional or substitute clearing brokers for Grant Park in its sole discretion.
Fees and Expenses
The following fees and expenses include all compensation, fees, profits and other benefits that the general partner, the trading advisors, the selling agents, the clearing brokers, any executing brokers and other dealers used by Grant Park, and the affiliates of those parties may earn or receive in connection with the offering of units in, and the operation of, Grant Park. Net asset value as of a specified time with respect to any class of units or of Grant Park as a whole equals the value of the net assets attributable to such class or of Grant Park, as applicable, as of that time. Net assets is defined as the total assets attributable to any class of units or of Grant Park, as applicable, including all cash, plus Treasury securities at accrued interest and the market value of all open commodity interest positions attributable to such class or of Grant Park, less all liabilities attributable to such class or of Grant Park, determined in accordance with generally accepted accounting principles (GAAP).
| • | Brokerage Charge — The following units are assessed monthly brokerage charges: |
Legacy 1 Class units pay the general partner a monthly brokerage charge equal to 0.4167%, a rate of 5.00% annually, of the month-end adjusted net assets of the Legacy 1 Class units.
Legacy 2 Class units pay the general partner a monthly brokerage charge equal to 0.4375%, a rate of 5.25% annually, of the month-end adjusted net assets of the Legacy 2 Class units.
Global 1 Class units pay the general partner a monthly brokerage charge equal to 0.3708%, a rate of 4.45% annually, of the month-end adjusted net assets of the Global 1 Class units.
Global 2 Class units pay the general partner a monthly brokerage charge equal to 0.3917%, a rate of 4.70% annually, of the month-end adjusted net assets of the Global 2 Class units.
Global 3 Class units pay the general partner a monthly brokerage charge equal to 0.5375%, a rate of 6.45% annually, of the month-end adjusted net assets of the Global 3 Class units.
The general partner pays from the brokerage charge all clearing, execution and give-up, floor brokerage, exchange, and NFA fees, any other transaction costs, selling agent compensation, selling agent administration fees, and consulting fees to the trading advisors. The payments to the clearing brokers will be based upon a specified amount per round-turn for each futures transaction executed on behalf of Grant Park. A round-turn is both the purchase and sale of a futures contract. The all-inclusive payments to the clearing brokers are expected to be between $5.00 and $10.00 per round-turn transaction. The amounts paid to selling agents, trading advisors or others may be based upon a specified percentage of net asset value or round-turn transactions of the units. The balance of the brokerage charge not paid out to other parties shall be retained by the general partner as payment for its services to Grant Park. The amount retained by the general partner varies based on allocations to the trading advisors and has ranged from approximately 1.68% to 2.30% in the past.
| • | Dealer Spreads — Grant Park will trade OTC derivatives. These contracts are traded among dealers, which act as principals or counterparties to each trade. The execution costs are included in the price of the contract |
9
purchased or sold and accordingly these costs to Grant Park cannot necessarily be determined. However, the general partner believes the bid-ask spreads (i.e., compensation) paid by Grant Park will be competitive with the spreads paid by other institutional customers that are comparable in size and trading activity to Grant Park. Any commissions or other transaction fees that may be incurred by Grant Park in trading OTC derivatives, other than the associated bid-ask spreads, will be paid by the general partner out of the brokerage charge. |
| • | Incentive Fees — Grant Park currently pays each trading advisor a quarterly incentive fee based on any new trading profits achieved on the trading advisor’s allocated net assets at the end of each calendar quarter. Generally, new trading profits means the net increase in trading profits, realized and unrealized, experienced by the trading advisor on its allocated net assets from the most recent prior quarter in which an incentive fee was paid to the trading advisor, or if an incentive fee has yet to be paid to that trading advisor, the trading advisor’s initial allocation of net assets. Currently, the incentive fees payable to each of Grant Park’s trading advisors that are allocated 10% or more of the fund’s assets are as follows: 22.5% to EMC, 24% to ETC, 20% to Winton and 20% to Welton. Grant Park pays incentive fees ranging between 20% and 26% to each of Rabar, Global Advisors, Transtrend, QIM, Sunrise, Amplitude and, effective February 1, 2011, Alder and Denali. The method of calculating new trading profits on the allocated net assets of each trading advisor is described in “FEES AND EXPENSES — Incentive Fees.” |
| • | Organization and Offering Expenses — All expenses incurred in connection with the organization and ongoing offering of the units are paid by the general partner and then reimbursed to the general partner by Grant Park. This reimbursement is made monthly. Each class of offered units will bear organization and offering expenses at an annual rate of 30 basis points (0.30%) of the adjusted net assets of each such class, calculated and payable monthly on the basis |
of month-end adjusted net assets. “Adjusted net assets” is defined as the month-end net assets of the particular class before accruals for fees and expenses and redemptions. In its discretion, the general partner may require Grant Park to reimburse the general partner in any subsequent calendar year for amounts that exceed these limits in any calendar year, provided that the maximum amount reimbursed by Grant Park will not exceed the overall limit set forth above. Amounts reimbursed by Grant Park with respect to the ongoing public offering expenses are charged against partners’ capital at the time of reimbursement or accrual. Any amounts reimbursed by Grant Park with respect to organization expenses are expensed at the time the reimbursement is incurred or accrued. If Grant Park terminates prior to completion of payment of the calculated amounts to the general partner, the general partner will not be entitled to any additional payments, and Grant Park will have no further obligation to the general partner. |
| • | Operating Expenses — Grant Park has borne, and will continue to bear, all ongoing operating expenses subject to a maximum charge for such expenses of 0.25% of the average net assets of Grant Park per year, including legal, auditing, administration, transfer agent, printing and postage expenses and the costs and expenses associated with preparing and filing required periodic reports with the SEC. To the extent operating expenses are less than 0.25% of Grant Park’s average net assets during the year, the difference may be reimbursed pro rata to recordholders as of December 31 of each year. The general partner estimates that the legal and audit fee portion of the operating expense chargeable to Grant Park during 2010 will be approximately $500,000. Grant Park is also responsible for any federal, state and local taxes payable by it, which amounts are not included in this estimate. The general partner, not Grant Park, is responsible for paying any operating expenses during any year that exceed 0.25% of the average net assets of Grant Park per year. |
| • | Early Redemption Fee — Investors in the offered units are prohibited from redeeming such units for the first three months |
10
following the subscription for units. Additionally, Global 3 Class limited partners that cause Grant Park to redeem their units before the one-year anniversary of their subscription for units will pay the general partner an early redemption fee. The early redemption fee with respect to the Global 3 Class units is based on the net asset value of the redeemed units and will differ depending on when the units are redeemed during the first year of investment as follows: |
| • | units redeemed after the third month-end and on or before the sixth month-end after the subscription are subject to a fee of 1.50% of the net asset value of the redeemed units; |
| • | units redeemed after the sixth month-end and on or before the ninth month-end after the subscription are subject to a fee of 1.0% of the net asset value of the redeemed units; and |
| • | units redeemed after the ninth month-end and before the one-year anniversary of the subscription are subject to a fee of 0.5% of the net asset value of the redeemed units. |
Legacy 1 Class, Legacy 2 Class, Global 1 and Global 2 Class limited partners, generally, and Global 3 Class limited partners causing redemption of their units on or after the one-year anniversary of their subscription for the redeemed Global 3 Class, units do not pay any redemption fees.
| • | Extraordinary Expenses — Grant Park is required to pay all of its extraordinary expenses, such as litigation expenses or IRS audit expenses, if any. |
Break-Even Analysis
The break-even analysis below indicates the approximate dollar returns and percentage returns required for the redemption value of a hypothetical $1,000 initial investment in offered units to equal the amount invested 12 months after the investment was made. The break-even analysis for Global 3 Class units shows the amount required to “break-even” both with and without an early redemption fee which, for purposes of this analysis, has been averaged to approximate the effect that payment of an early redemption fee will have on a redemption of such units during the first year of investment. The break-even analysis is an approximation only.
11
Legacy 1 Class Break-Even Analysis
| Legacy 1 Class Units | ||||
Assumed initial selling price per unit(1) | $ | 1,000.00 | ||
Trading advisors’ incentive fees(2) | 4.65 | |||
Brokerage charge(3) (5.00%) | 50.00 | |||
Operating expenses(4) (0.25%) | 2.50 | |||
Offering expenses(5) (0.30%) | 3.00 | |||
Interest income(6) (0.75%) | (7.50 | ) | ||
Amount of trading income required for the redemption value at the end of one year to equal the initial selling price of the unit | $ | 52.65 | ||
Percentage of initial selling price per Legacy 1 Class unit | 5.27 | % | ||
| (1) | The minimum investment required to invest in the Legacy 1 Class units is $10,000. For ease of comparability, $1,000 will be deemed to be the assumed selling price per unit of a Legacy 1 Class unit, and, as described below, a Legacy 2 Class unit, a Global 1 Class unit, a Global 2 Class unit and a Global 3 Class unit, for purposes of the break-even analysis. |
| (2) | Reflects incentive fees payable to Amplitude, EMC, ETC, Rabar, Winton, Welton, Global Advisors, Transtrend, QIM, Sunrise, Alder and Denali assuming they manage between 5% and 20% of invested assets and assuming each of the advisors have equivalent performance returns for the 12-month period. Actual incentive fees are calculated quarterly on the basis of each trading advisor’s individual performance, not the overall performance of Grant Park or the Legacy 1 Class units. Because incentive fees payable to certain of these trading advisors are calculated on the basis of trading profits realized on the assets they manage after deduction for the allocable portion of only certain expenses charged to Grant Park, these advisors would receive an incentive fee before Grant Park has recouped all expenses and reaches the “break-even” level. Incentive fees payable to certain other of these trading advisors are calculated after deduction for the allocable portion of expenses charged to Grant Park. These advisors would not receive an incentive fee before Grant Park has recouped all expenses. |
| (3) | The brokerage charge is paid to the general partner on a monthly basis. Effective the initial closing date, the brokerage charge for the Legacy 1 Class units equals 0.4167% per month, a rate of 5.00% annually, of such units’ month-end adjusted net assets. Out of this amount, the general partner pays all clearing, execution and give-up, floor brokerage, exchange and NFA fees, any other transaction costs, selling agent compensation, selling agent service fees and consulting fees to the trading advisors. The general partner retains the balance as payment for its services to Grant Park. Bid-ask spreads on Grant Park’s forward and other non-exchange traded contracts are not included in this break-even table due to the difficulty of determining those spreads. |
| (4) | Grant Park is responsible for ongoing operating expenses, up to an amount not to exceed 0.25% of Grant Park’s average net assets per year. This amount is used for purposes of this break-even analysis. |
| (5) | Grant Park’s organization and offering expenses are paid by the general partner and then reimbursed to the general partner by Grant Park. To pay this reimbursement, effective the initial closing date, Legacy 1 Class units are assessed at an annual rate of 30 basis points (0.30%) of adjusted net assets, calculated and payable monthly on the basis of month-end adjusted net assets of the applicable class. |
| (6) | Grant Park earns interest on free cash balances held in its futures trading accounts. Interest is estimated for these purposes at a rate of 0.75% per year. |
12
Legacy 2 Class Break-Even Analysis
| Legacy 2 Class Units | ||||
Assumed initial selling price per unit(1) | $ | 1,000.00 | ||
Trading advisors’ incentive fees(2) | 5.19 | |||
Brokerage charge(3) (5.25%) | 52.50 | |||
Operating expenses(4) (0.25%) | 2.50 | |||
Offering expenses(5) (0.30%) | 3.00 | |||
Interest income(6) (0.75%) | (7.50 | ) | ||
Amount of trading income required for the redemption value at the end of one year to equal the initial selling price of the unit | $ | 55.69 | ||
Percentage of initial selling price per Legacy 2 Class unit | 5.57 | % | ||
| (1) | The minimum investment required to invest in the Legacy 2 Class units is $10,000. For ease of comparability, $1,000 will be deemed to be the assumed selling price per unit of a Legacy 2 Class unit, and, as described above, a Legacy 1 Class unit, and, as described below, a Global 1 Class unit, a Global 2 Class unit and a Global 3 Class unit, for purposes of the break-even analysis. |
| (2) | Reflects incentive fees payable to Amplitude, EMC, ETC, Rabar, Winton, Welton, Global Advisors, Transtrend, QIM, Sunrise, Alder and Denali assuming they manage between 5% and 20% of invested assets and assuming each of the advisors have equivalent performance returns for the 12-month period. Actual incentive fees are calculated quarterly on the basis of each trading advisor’s individual performance, not the overall performance of Grant Park or the Legacy 2 Class units. Because incentive fees payable to certain of these trading advisors are calculated on the basis of trading profits realized on the assets they manage after deduction for the allocable portion of only certain expenses charged to Grant Park, these advisors would receive an incentive fee before Grant Park has recouped all expenses and reaches the “break-even” level. Incentive fees payable to certain other of these trading advisors are calculated after deduction for the allocable portion of expenses charged to Grant Park. These advisors would not receive an incentive fee before Grant Park has recouped all expenses. |
| (3) | The brokerage charge is paid to the general partner on a monthly basis. Effective the initial closing date, the brokerage charge for the Legacy 2 Class units equals 0.4375% per month, a rate of 5.25% annually, of such units’ month-end adjusted net assets. Out of this amount, the general partner pays all clearing, execution and give-up, floor brokerage, exchange and NFA fees, any other transaction costs, selling agent compensation, selling agent service fees and consulting fees to the trading advisors. The general partner retains the balance as payment for its services to Grant Park. Bid-ask spreads on Grant Park’s forward and other non-exchange traded contracts are not included in this break-even table due to the difficulty of determining those spreads. |
| (4) | Grant Park is responsible for ongoing operating expenses, up to an amount not to exceed 0.25% of Grant Park’s average net assets per year. This amount is used for purposes of this break-even analysis. |
| (5) | Grant Park’s organization and offering expenses are paid by the general partner and then reimbursed to the general partner by Grant Park. To pay this reimbursement, effective the initial closing date, Legacy 2 Class units are assessed at an annual rate of 30 basis points (0.30%) of adjusted net assets, calculated and payable monthly on the basis of month-end adjusted net assets of the applicable class. |
| (6) | Grant Park earns interest on free cash balances held in its futures trading accounts. Interest is estimated for these purposes at a rate of 0.75% per year. |
13
Global 1 Class Break-Even Analysis
| Global 1 Class Units | ||||
Assumed initial selling price per unit(1) | $ | 1,000.00 | ||
Trading advisors’ incentive fees(2) | 4.21 | |||
Brokerage charge(3) (4.45%) | 44.50 | |||
Operating expenses(4) (0.25%) | 2.50 | |||
Offering expenses(5) (0.30%) | 3.00 | |||
Interest income(6) (0.75%) | (7.50 | ) | ||
Amount of trading income required for the redemption value at the end of one year to equal the initial selling price of the unit | $ | 46.71 | ||
Percentage of initial selling price per Global 1 Class unit | 4.67 | % | ||
| (1) | The minimum investment required to invest in the Global 1 Class units is $5,000. For ease of comparability, $1,000 will be deemed to be the assumed selling price per unit of a Global 1 Class unit, and, as described above, a Legacy 1 Class unit and a Legacy 2 Class unit, and, as described below, a Global 2 Class unit and a Global 3 Class unit, for purposes of the break-even analysis. |
| (2) | Reflects incentive fees payable to Amplitude, EMC, ETC, Winton, Transtrend, QIM, Sunrise, Alder and Denali assuming they manage between 5% and 20% of invested assets and assuming each of the advisors have equivalent performance returns for the 12-month period. Actual incentive fees are calculated quarterly on the basis of each trading advisor’s individual performance, not the overall performance of Grant Park or the Global 1 Class units. Because incentive fees payable to certain of these trading advisors are calculated on the basis of trading profits realized on the assets they manage after deduction for the allocable portion of only certain expenses charged to Grant Park, these advisors would receive an incentive fee before Grant Park has recouped all expenses and reaches the “break-even” level. Incentive fees payable to certain other of these trading advisors are calculated after deduction for the allocable portion of expenses charged to Grant Park. These advisors would not receive an incentive fee before Grant Park has recouped all expenses. |
| (3) | The brokerage charge is paid to the general partner on a monthly basis. Effective the initial closing date, the brokerage charge for the Global 1 Class units equals 0.3708% per month, a rate of 4.45% annually, of such units’ month-end adjusted net assets. Out of this amount, the general partner pays all clearing, execution and give-up, floor brokerage, exchange and NFA fees, any other transaction costs, selling agent compensation, selling agent service fees and consulting fees to the trading advisors. The general partner retains the balance as payment for its services to Grant Park. Bid-ask spreads on Grant Park’s forward and other non-exchange traded contracts are not included in this break-even table due to the difficulty of determining those spreads. |
| (4) | Grant Park is responsible for ongoing operating expenses, up to an amount not to exceed 0.25% of Grant Park’s average net assets per year. This amount is used for purposes of this break-even analysis. |
| (5) | Grant Park’s organization and offering expenses are paid by the general partner and then reimbursed to the general partner by Grant Park. To pay this reimbursement, effective the initial closing date, Global 1 Class units are assessed at an annual rate of 30 basis points (0.30%) of adjusted net assets, calculated and payable monthly on the basis of month-end adjusted net assets of the applicable class. |
| (6) | Grant Park earns interest on free cash balances held in its futures trading accounts. Interest is estimated for these purposes at a rate of 0.75% per year. |
14
Global 2 Class Break-Even Analysis
| Global 2 Class Units | ||||
Assumed initial selling price per unit(1) | $ | 1,000.00 | ||
Trading advisors’ incentive fees(2) | 4.76 | |||
Brokerage charge(3) (4.70%) | 47.00 | |||
Operating expenses(4) (0.25%) | 2.50 | |||
Offering expenses(5) (0.30%) | 3.00 | |||
Interest income(6) (0.75%) | (7.50 | ) | ||
Amount of trading income required for the redemption value at the end of one year to equal the initial selling price of the unit | $ | 49.76 | ||
Percentage of initial selling price per Global 2 Class unit | 4.98 | % | ||
| (1) | The minimum investment required to invest in the Global 2 Class units is $5,000. For ease of comparability, $1,000 will be deemed to be the assumed selling price per unit of a Global 2 Class unit, and, as described above, a Legacy 1 Class unit, a Legacy 2 Class unit and a Global 1 Class unit, and, as described below, a Global 3 Class unit, for purposes of the break-even analysis. |
| (2) | Reflects incentive fees payable to Amplitude, EMC, ETC, Winton, Welton, Transtrend, QIM, Sunrise, Alder and Denali assuming they manage between 5% and 20% of invested assets and assuming each of the advisors have equivalent performance returns for the 12-month period. Actual incentive fees are calculated quarterly on the basis of each trading advisor’s individual performance, not the overall performance of Grant Park or the Global 2 Class units. Because incentive fees payable to certain of these trading advisors are calculated on the basis of trading profits realized on the assets they manage after deduction for the allocable portion of only certain expenses charged to Grant Park, these advisors would receive an incentive fee before Grant Park has recouped all expenses and reaches the “break-even” level. Incentive fees payable to certain other of these trading advisors are calculated after deduction for the allocable portion of expenses charged to Grant Park. These advisors would not receive an incentive fee before Grant Park has recouped all expenses. |
| (3) | The brokerage charge is paid to the general partner on a monthly basis. Effective the initial closing date, the brokerage charge for the Global 2 Class units equals 0.3917% per month, a rate of 4.70% annually, of such units’ month-end adjusted net assets. Out of this amount, the general partner pays all clearing, execution and give-up, floor brokerage, exchange and NFA fees, any other transaction costs, selling agent compensation, selling agent service fees and consulting fees to the trading advisors. The general partner retains the balance as payment for its services to Grant Park. Bid-ask spreads on Grant Park’s forward and other non-exchange traded contracts are not included in this break-even table due to the difficulty of determining those spreads. |
| (4) | Grant Park is responsible for ongoing operating expenses, up to an amount not to exceed 0.25% of Grant Park’s average net assets per year. This amount is used for purposes of this break-even analysis. |
| (5) | Grant Park’s organization and offering expenses are paid by the general partner and then reimbursed to the general partner by Grant Park. To pay this reimbursement, effective the initial closing date, Global 2 Class units are assessed at an annual rate of 30 basis points (0.30%) of adjusted net assets, calculated and payable monthly on the basis of month-end adjusted net assets of the applicable class. |
| (6) | Grant Park earns interest on free cash balances held in its futures trading accounts. Interest is estimated for these purposes at a rate of 0.75% per year. |
15
Global 3 Class Break-Even Analysis
| Global 3 Class Units | ||||
Assumed initial selling price per unit(1) | $ | 1,000.00 | ||
Trading advisors’ incentive fees(2) | 9.26 | |||
Brokerage charge(3) (6.45%) | 64.50 | |||
Operating expenses(4) (0.25%) | 2.50 | |||
Offering expenses(5) (0.30%) | 3.00 | |||
Interest income(6) (0.75%) | (7.50 | ) | ||
Amount of trading income required for the redemption value at the end of one year to equal the initial selling price of the unit, without early redemption fee | $ | 71.76 | ||
Percentage of initial selling price per unit, without early redemption fee | 7.18 | % | ||
Early redemption fee(7) (1.50%) | $ | 15.00 | ||
Amount of trading income required for the redemption value at the end of one year to equal the initial selling price per Global 3 Class unit, with highest early redemption fee | $ | 86.76 | ||
Percentage of initial selling price per Global 3 Class unit, with highest early redemption fee | 8.68 | % | ||
| (1) | The minimum investment required to invest in the Global 3 Class units is $5,000. For ease of comparability, $1,000 will be deemed to be the assumed selling price per unit of a Global 3 Class unit, and, as described above, a Legacy 1 Class unit, a Legacy 2 Class unit and a Global 1 Class unit, and a Global 2 Class unit, for purposes of the break-even analysis. |
| (2) | Reflects incentive fees payable to Amplitude, EMC, ETC, Winton, Welton, Transtrend, QIM, Sunrise, Alder and Denali assuming they manage between 5% and 20% of invested assets and assuming each of the advisors have equivalent performance returns for the 12-month period. Actual incentive fees are calculated quarterly on the basis of each trading advisor’s individual performance, not the overall performance of Grant Park or the Global 3 Class units. Because incentive fees payable to certain of these trading advisors are calculated on the basis of trading profits realized on the assets they manage after deduction for the allocable portion of only certain expenses charged to Grant Park, these advisors would receive an incentive fee before Grant Park has recouped all expenses and reaches the “break-even” level. Incentive fees payable to certain other of these trading advisors are calculated after deduction for the allocable portion of expenses charged to Grant Park. These advisors would not receive an incentive fee before Grant Park has recouped all expenses. |
| (3) | The brokerage charge is paid to the general partner on a monthly basis. Effective the initial closing date, the brokerage charge for the Global 3 Class units equals 0.5375% per month, a rate of 6.45% annually, of such units’ month-end adjusted net assets. Out of this amount, the general partner pays all clearing, execution and give-up, floor brokerage, exchange and NFA fees, any other transaction costs, selling agent compensation, selling agent service fees and consulting fees to the trading advisors. The general partner retains the balance as payment for its services to Grant Park. Bid-ask spreads on Grant Park’s forward and other non-exchange traded contracts are not included in this break-even table due to the difficulty of determining those spreads. |
| (4) | Grant Park is responsible for ongoing operating expenses, up to an amount not to exceed 0.25% of Grant Park’s average net assets per year. This amount is used for purposes of this break-even analysis. |
| (5) | Grant Park’s organization and offering expenses are paid by the general partner and then reimbursed to the general partner by Grant Park. To pay this reimbursement, effective the initial closing date, Global 3 Class units are assessed at an annual rate of 30 basis points (0.30%) of adjusted net assets, calculated and payable monthly on the basis of month-end adjusted net assets of the applicable class. |
| (6) | Grant Park earns interest on free cash balances held in its futures trading accounts. Interest is estimated for these purposes at a rate of 0.75% per year. |
16
| (7) | Global 3 Class limited partners are prohibited from redeeming such units for three months following the subscription for units. Thereafter, Global 3 Class limited partners causing redemption of their units on or before the one-year anniversary of their subscription for the redeemed units will pay an early redemption fee of 1.5%, 1.0% or 0.5% of the net asset value of the redeemed units, depending on when the units are redeemed during the first year. For purposes of this breakeven analysis, the highest early redemption fee has been presented to approximate the effect a payment of an early redemption fee would have on a redemption of Global 3 Class units at an undetermined point during the first year of investment. Because the highest early redemption fee has been used and the other fees and expenses shown assume an investment in Grant Park for one year, the breakeven analysis does not reflect the actual amount required to “break-even” for Global 3 Class units that are redeemed prior to the one-year anniversary of the investment, which will vary depending on the date of redemption. |
Transfers, Redemptions and Distributions
You may transfer your units subject to conditions described in the limited partnership agreement, which is attached to this prospectus as Appendix A; however, no secondary market for the units exists or is likely to develop. You may cause Grant Park to redeem your units at the net asset value per applicable unit as of the last business day of each month with at least 10 days advance written notice to the general partner, or at an earlier date if required by your selling agent. The offered units may not be redeemed until after the third-month end after the subscription for the redeemed units. Global 3 Class units redeemed after the three month lock-up period, but on or before the one-year anniversary of the subscription are subject to a fee of up to 1.50% of the net asset value of the redeemed units. There are no redemption fees applicable to Legacy 1 Class, Legacy 2 Class, Global 1 Class and Global 2 Class limited partners or to Global 3 Class limited partners who cause Grant Park to redeem their units on or after the one-year anniversary of their subscription for the redeemed units. The general partner does not intend to make any distributions of Grant Park’s assets.
Federal Income Tax Aspects
Grant Park has received an opinion of counsel to the effect that Grant Park will be treated as a partnership and not as an association or publicly traded partnership taxable as a corporation for federal income tax purposes, so long as Grant Park has previously satisfied and currently satisfies an annual gross income test, which the general partner anticipates that Grant Park will satisfy, and is organized and operated in accordance with its governing agreements and
applicable law. Accordingly, as a partner in a partnership, whether or not Grant Park makes any distributions to you, you will be required to report your share of income, gain, loss and deduction of Grant Park and will be individually liable for federal and state income tax on that share. The gain or loss on Grant Park’s investment in commodity interest contracts, depending on the contracts traded, will constitute a mixture of ordinary income or loss and capital gain or loss. Trading losses of Grant Park, which will generally constitute capital losses, may only be used by non-corporate taxpayers to offset a limited amount of the ordinary income allocated to you, and could be subject to various limitations. In addition, the deductibility of Grant Park expenses may be subject to specified limitations.
Reports to Limited Partners
Grant Park furnishes limited partners with annual reports as required by the rules and regulations of the SEC as well as with those reports required by the CFTC and the NFA, including, but not limited to, a certified annual report containing financial statements audited by Grant Park’s independent accountants and monthly statements setting forth the value of your units and other information relating to Grant Park’s performance. No later than March 15th of each year, limited partners will be provided with appropriate information necessary to file their United States federal and state income tax return on a timely basis.
Glossary
The meanings of certain commodity interest industry terms used in this prospectus are provided in the glossary set forth as Appendix E.
17
Organizational Chart
The organizational chart below illustrates the relationship among the various service providers for Grant Park.
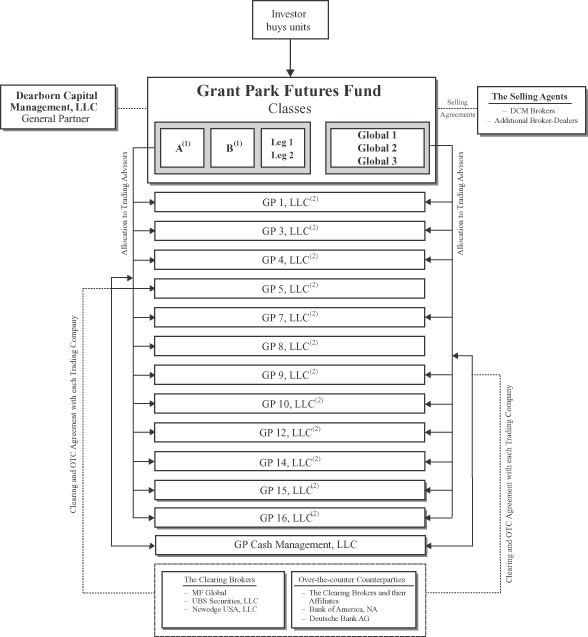
Notes:
| (1) | Classes A and B are closed to new investment. These classes are no longer offered by the Selling Agents. |
| (2) | Grant Park invests through an individual trading company for each trading advisor. An Advisory Agreement is entered by each trading advisor, its corresponding trading company, Dearborn Capital Management, L.L.C., as general partner, and, in the case of some trading advisors, Grant Park. |
18
You should carefully consider the risks and uncertainties described below, as well as all of the other information included in the prospectus, before you decide whether to purchase any units. Any of the following risks and uncertainties could materially adversely affect Grant Park, its trading activities, operating results, financial condition and net asset value and therefore could negatively impact the value of your investment. You should not invest in the units unless you can afford to lose all of your investment.
Market Risks
The commodity interest markets in which Grant Park trades are highly volatile, which could cause substantial losses to Grant Park and may cause you to lose your entire investment.
Commodity interest contracts are highly volatile and are subject to occasional rapid and substantial fluctuations. Consequently, you could lose all or substantially all of your investment in Grant Park should Grant Park’s trading positions suddenly turn unprofitable. The profitability of Grant Park depends primarily on the ability of Grant Park’s trading advisors to predict these fluctuations accurately. Price movements for commodity interests are influenced by, among other things:
| • | changes in interest rates; |
| • | governmental, agricultural, trade, fiscal, monetary and exchange control programs and policies; |
| • | weather and climate conditions; |
| • | changing supply and demand relationships; |
| • | money supply policies and available liquidity; |
| • | changes in balances of payments and trade; |
| • | U.S. and international rates of inflation or deflation; |
| • | currency devaluations and revaluations; |
| • | U.S. and international political and economic events; and |
| • | changes in philosophies and emotions of market participants. |
The trading advisors’ trading methods (regardless of the nature of the method) may not take account of these factors except as they may be reflected in the technical input data analyzed by the trading advisors.
In addition, governments from time to time intervene, directly and by regulation, in certain markets, often with the intent to influence prices directly. The effects of governmental intervention may be particularly significant at certain times in the financial instrument and currency markets, and this intervention may cause these markets to move rapidly.
For a more detailed discussion of the quantitative and qualitative market risks to which Grant Park is exposed, please read the section entitled, “QUANTITATIVE AND QUALITATIVE DISCLOSURES ABOUT MARKET RISK.”
Options are volatile and inherently leveraged, and sharp movements in prices could cause Grant Park to incur large losses.
Grant Park may use options on other commodity interests to generate premium income or speculative gains. Options involve risks similar to other commodity interests, in that options are subject to sudden price movements and are highly leveraged and payment of a relatively small purchase price, called a premium, gives the buyer the right to acquire an underlying commodity interest that may have a face value greater than the premium paid. The buyer of an option risks losing the entire purchase price of the option. The writer, or seller, of an option risks losing the difference between the purchase price received for the option and the price of the commodity interest underlying the option that the writer must purchase or deliver upon exercise of the option. There is no limit on the potential loss. Specific market movements of the commodity interests underlying options cannot accurately be predicted. In addition, OTC options present risks in addition to those associated with exchange-traded options, as discussed immediately below.
OTC transactions are subject to little, if any, regulation, which could expose Grant Park to significant losses.
A portion of Grant Park’s assets may be used to trade OTC derivatives, such as forwards, swaps, and OTC option contracts on foreign currencies or other commodities or underlyings. OTC derivatives are typically traded on a principal-to-principal basis through relatively opaque dealer markets that are
19
dominated by major money center and investment banks and other institutions. OTC derivatives are generally not subject to regulation under the Commodity Exchange Act, and thus are not subject to the jurisdiction of the CFTC. As a general matter, regulation under the Commodity Exchange Act prescribes requirements with respect to, for example, trading practices, the segregation of customer funds, minimum capital requirements, antifraud practices and trade reporting (which promotes transparency in pricing). With respect to OTC derivatives, you therefore do not receive the protection of the Commodity Exchange Act or the CFTC in connection with this trading activity by Grant Park. The markets for OTC contracts rely upon the integrity and sophistication of market participants in lieu of the additional regulation imposed by the CFTC on participants in the futures markets. The absence of regulation in these markets could expose Grant Park in certain circumstances to significant losses in the event of trading abuses or financial failure by participants.
OTC transactions may be subject to the risk of counterparty default, which could cause substantial losses.
Grant Park also faces the risk of non-performance by the counterparties to OTC derivatives contracts. Unlike transactions in futures contracts, the counterparty to an OTC derivatives contract is generally a single bank or other financial institution, rather than a centralized clearing house. As a result, there is significant counterparty credit risk in these transactions. Such credit risk may take the form of a payment default by a counterparty or the filing of bankruptcy, insolvency or similar action by a counterparty. Counterparty risk has recently intensified, as evidenced by the failure of Bear Stearns, the bankruptcy of Lehman Brothers and the federal bail-out of AIG. The risk of a counterparty default is substantial and could cause significant losses to Grant Park in the event that such a default were to occur.
Historically, the only OTC derivatives in which Grant Park has invested are in the forward, option and spot foreign currency markets. Grant Park’s investment in these transactions historically has ranged from approximately 0% to 20% of its assets. It is anticipated, however, that as assets allocated to the trading advisors increase, the percentage invested in the OTC foreign currency markets may also increase. See “MANAGEMENT’S DISCUSSION AND ANALYSIS OF FINANCIAL CONDITION AND RESULTS OF OPERATIONS — Off-Balance Sheet
Risk” and “QUANTITATIVE AND QUALITATIVE DISCLOSURES ABOUT MARKET RISK.”
Exchanges-of-physicals are subject to risks, which could adversely affect the performance of Grant Park.
Grant Park, through its trading advisors, may engage in exchanges of futures for physicals (“EFPs”). An EFP is a transaction permitted under the rules of many futures exchanges in which two parties holding futures positions may close out their positions without making an open, competitive trade on the exchange. Generally, the holder of a short futures position buys the physical commodity, while the holder of a long futures position sells the physical commodity. The prices at which these transactions are executed are negotiated between the parties, and thus may not be consistent with quoted market prices. Regulatory changes, such as limitations on price or types of underlying interests subject to an EFP, may in the future prevent EFPs, which could adversely affect the performance of Grant Park.
Trading forex contracts is subject to substantial and unique risks, and the risk of loss is substantial.
The prices of forex contracts can be highly volatile and the risk of loss in forex trading can be substantial. Forex transactions are not traded on an exchange and the funds deposited with the counterparty for forex transactions will not receive the same protections as funds used to margin or guarantee exchange-traded derivatives. If the counterparty becomes insolvent and a client has a claim for amounts deposited or profits earned on transactions with the counterparty, the client’s claim may not receive a priority. Without a priority, the client is a general creditor and the client’s claim will be paid, along with the claims of other general creditors, from any monies still available after priority claims are paid. Even customer funds that the counterparty keeps from its own operating funds may not be safe from the claims of other general and priority claims. The high degree of leverage that is often obtainable in forex trading can work against clients as well as for clients. The use of leverage can lead to large losses as well as gains, including losses in excess of the amount invested. Because forex transactions do not occur on an exchange and such contracts may be illiquid, it may be difficult or costly to execute a transaction, and the prices of forex contracts may thus be volatile.
20
Certain of Grant Park’s investments are or could be illiquid, which may increase the risk of loss.
Grant Park may not always be able to liquidate its commodity interest positions at the desired price, particularly with respect to its OTC derivatives. In particular, it may be difficult to execute a trade at a specific price when there is a relatively small volume of buy and sell orders in a market. A market disruption, such as the financial market turmoil of 2007 – 2009 or a foreign government taking political actions that disrupt the market in its currency or in a major export, can also make it difficult and costly to liquidate a position. Alternatively, limits imposed by futures exchanges or other regulatory organizations, such as speculative position limits and daily price fluctuation limits, may contribute to a lack of liquidity with respect to some commodity interests. Moreover, in the OTC derivatives markets, liquidation may only occur upon contract maturation or when the contract is assigned to another party, which is likely to present additional costs.
Unexpected market illiquidity may cause substantial losses to investors at any time or from time to time. The large face value of the positions that the trading advisors will acquire for Grant Park increases the risk of illiquidity by both making its positions more difficult to liquidate at favorable prices and increasing the losses incurred while trying to do so. See “QUANTITATIVE AND QUALITATIVE DISCLOSURES ABOUT MARKET RISK.”
Cash flow needs may cause positions to be closed which may cause substantial losses.
Certain trading advisors may trade options on futures. Futures contract gains and losses are marked-to-market daily for purposes of determining margin requirements. Option positions generally are not marked-to-market daily, although short option positions will require additional margin if the market moves against the position. Due to these differences in margin treatment between futures and options, there may be periods in which positions on both sides must be closed down prematurely due to short term cash flow needs. If this occurs during an adverse move in a spread or straddle relationship, then a substantial loss could occur.
The units are subject to restrictions on redemption and transfer, which may prevent you from redeeming or transferring your units when you desire to do so and may increase your risk of loss.
There is not likely to be a secondary market for the units. While the units have redemption rights, there are restrictions. For example, investors in the offered units are prohibited from redeeming such units for three months following the subscription for units. Global 3 Class units that are redeemed after the three-month lock-up period, but before the one-year anniversary of the subscription for the units will be subject to an early redemption fee of up to 1.5% of the net asset value at which such units are redeemed. Additionally, redemptions can occur only monthly. Transfers of units are permitted only with the prior written consent of the general partner, provided that conditions specified in the limited partnership agreement are satisfied. Such restrictions may prevent you from redeeming or transferring your units when you desire to do so. In the event that Grant Park is subject to rapid and substantial losses, the inability to immediately redeem or transfer your units may increase your risk of loss.
An investment in Grant Park may not diversify an overall portfolio.
Historically, managed futures have been generally non-correlated to the performance of other asset classes such as stocks and bonds. Non-correlation means that there is no statistically valid relationship between the performance of futures and other commodity interest transactions, on the one hand, and stocks or bonds, on the other hand. Non-correlation should not be confused with negative correlation, where the performance of two asset classes would be opposite of each other. Because of this non-correlation, Grant Park cannot be expected to be automatically profitable during unfavorable periods for the stock market, or vice versa. If, however, during a particular period of time, Grant Park’s performance moves in the same general direction as the general financial markets or Grant Park does not perform successfully, you will obtain little or no diversification benefits during that period from an investment in the units. In such a case, Grant Park may have no gains to offset your losses from other investments, and you may suffer losses on your investment in Grant Park at the same time as losses on your other investments are increasing. This was the case, for example, during the first quarter of 1994, when Grant Park yielded a loss of approximately 3.66% while the Standard & Poor’s 500 Index yielded a loss of approximately 3.79%. You should therefore
21
not consider Grant Park to be a hedge against losses in your core stock and bond portfolios.
Trading in international markets exposes Grant Park to credit and regulatory risk.
A substantial portion of Grant Park’s trades have in the past and are expected in the future to continue to take place on markets or exchanges outside of the United States. There is no limit to the amount of Grant Park assets that may be committed to trading on non-U.S. markets, and historically, as much as approximately 30% to 60% of Grant Park’s overall market exposure has involved positions taken on non-U.S. markets. The risk of loss in trading non-U.S. commodity interests contracts can be substantial. Participation in non-U.S. commodity interests involves the execution and clearing of trades on, or subject to the rules of, a foreign board of trade. Some of these non-U.S. markets, in contrast to U.S. markets, are so-called principals’ markets in which performance is the responsibility only of the individual counterparty with whom the trader has entered into a commodity interest transaction, not of the exchange or clearing house. In these kinds of markets, Grant Park will be subject to the risk of bankruptcy, insolvency, payment failure or other failures or refusals to perform by the counterparty. Moreover, many of these non-U.S. markets are unregulated, which means that Grant Park may have no or limited recourse in the event of such failures or refusals.
Some non-U.S. markets present additional risk, because they are not subject to the same degree of regulation as their U.S. counterparts. None of the CFTC, NFA or any domestic exchange regulates activities of any foreign boards of trade or exchanges outside of the United States, including the execution, delivery and clearing of transactions, nor has the power to compel enforcement of the rules of a foreign board of trade or exchange or of any applicable non-U.S. laws. Similarly, the rights of market participants, such as Grant Park, in the event of the insolvency or bankruptcy of a non-U.S. market or broker or principal are also likely to be substantially more limited than in the case of U.S. markets or brokers. As a result, Grant Park has less legal and regulatory protection than it does when it trades domestically.
Additionally, trading on non-U.S. exchanges is subject to the risks presented by exchange controls, expropriation, increased tax burdens and exposure to local economic declines and political instability. An adverse development with respect to any of these
variables could reduce the profit or increase the loss earned on trades in the affected international markets.
Grant Park’s international trading may expose it to losses resulting from non-U.S. exchanges that are less developed or less reliable than U.S. exchanges.
Some non-U.S. exchanges also may be in a more developmental stage so that prior price histories may not be indicative of current price dynamics. In addition, Grant Park may not have the same access to certain positions on foreign trading exchanges as do local traders, and the historical market data on which the trading advisors base their strategies may not be as reliable or accessible as it is in the United States.
Grant Park’s international trading activities subject it to foreign exchange risk.
The price of any non-U.S. commodity interests and, therefore, the potential profit and loss on such contract, may be affected by any variance in the foreign exchange rate between the time the order is placed and the time it is liquidated, offset or exercised. As a result, changes in the value of the local currency relative to the U.S. dollar may cause losses to Grant Park even if the contract traded is profitable.
Trading in exchange-traded derivatives is a zero sum economic activity, unlike stocks and bonds.
Trading in exchange-traded derivatives is a zero-sum economic activity in which for every gain there is an equal and offsetting loss, disregarding transaction costs. This distinguishes the market in exchange-traded derivatives from a typical stock or bond investment, where there is an expectation of, in the case of bonds, constant yields, or, in the case of equity, participation over time in general economic growth. Grant Park may incur major losses while stock and bond prices rise substantially in a prospering economy.
Recent and ongoing market disruptions and government intervention could have a material impact on Grant Park’s ability to implement trading strategies.
World financial markets have experienced widespread and systemic disruptions since the fourth quarter of 2007 which have produced unprecedented government reaction and intervention. Such intervention has in certain instances occurred on an “emergency” basis without giving market participants an opportunity to adapt their trading strategies or undertake risk management for their existing positions.
22
Given the breadth of impact and the speed with which such government action has sometimes occurred, these interventions have also tended to increase uncertainty in various markets and, although perhaps, unintentionally, contributed to overall market instability. This situation has been compounded by the sometimes apparent inconsistency with which government action has been formulated and applied. Such inconsistency has had a further destabilizing effect on world financial markets, all of which have tended to reduce liquidity in many of these markets.
Several countries have imposed limitations or complete prohibitions on selected types of trading strategies, making such trading either increasingly difficult or impossible. Any continuing regulatory limitations on selected trading strategies which result as a response to market disruptions could have a materially adverse impact on Grant Park’s ability to implement certain trading methods or allocate to trading advisors who employ such methods. To date, none of the aforementioned risks have impacted Grant Park. It is impossible to predict what impact such disruptions and interventions may have on Grant Park’s future efforts. However, the general partner believes that there is a strong likelihood of increased regulation of the financial markets occurring in the future.
Trading Risks
Grant Park will be highly leveraged, which means that sharp declines in price could lead to large losses.
Because the amount of margin funds necessary to be deposited with a clearing broker to enter into a futures or forward contract position is typically about 2% to 10% of the total value of the contract, the general partner can hold positions in Grant Park’s account with face values equal to several times Grant Park’s net assets. The ratio of margin to equity is typically 8% to 15%, but can range from 5% to 35%. As a result of this leveraging, even a small movement in the price of a contract can cause major losses. Any purchase or sale of a futures or forward contract may result in losses that substantially exceed the amount invested in the contract. For example, if $2,200 in margin is required to hold one U.S. Treasury bond futures contract with a face value of $100,000, a $2,200 decrease in the value of that contract could, if the contract is then closed out, result in a complete loss of the margin deposit, not even taking into account deductions of fees and/or commissions. Severe short-term price declines could, therefore, force the liquidation of open positions with large losses.
There are disadvantages to making trading decisions based on technical analysis.
The trading advisors base their trading decisions primarily on trading strategies that use mathematical analyses of technical factors relating to past market performance. The buy and sell signals generated by a technical, trend-following trading strategy are derived from a study of actual daily, weekly and monthly price fluctuations, volume variations and changes in open interest in the markets. The profitability of any technical, trend-following trading strategy depends upon the occurrence in the future of significant, sustained price moves in some of the markets traded. A danger for trend-following traders is whip-saw markets, that is, markets in which a potential price trend may start to develop but reverses before an actual trend is realized. A pattern of false starts may generate repeated entry and exit signals in technical systems, resulting in unprofitable transactions. In the past, there have been prolonged periods without sustained price moves. Presumably these periods will continue to occur. Periods without sustained price moves may produce substantial losses for trend-following trading strategies. Further, any factor that may lessen the prospect of these types of moves in the future, such as increased governmental control of, or participation in, the relevant markets, may reduce the prospect that any trend-following trading strategy will be profitable in the future.
The risk management approaches of one or all of the trading advisors may not be effective.
The mechanisms employed by each trading advisor to monitor and manage the risks associated with its trading activities on behalf of Grant Park may not succeed in mitigating all identified risks. For example, even if a trading advisor utilizes predetermined stop-loss levels for a position as part of its risk management approach, such stop-loss orders may not necessarily limit losses, since they become market orders upon execution. As a result, the order may not be executed at the stop-loss price, resulting in a loss in excess of the loss that would have been incurred if the order had been executed at the stop-loss price. Even if a trading advisor’s risk management approaches are fully effective, it cannot anticipate all risks that it may face. To the extent one or more of the trading advisors fails to identify and adequately monitor and manage all of the risks associated with its trading activities, Grant Park may suffer losses.
23
Increased competition from other systematic and technical trading systems could reduce the trading advisors’ profitability.
There has been a dramatic increase over the past quarter century in the amount of assets managed by systematic and technical trading systems like that of the trading advisors. Assets in managed futures, for example, have grown from approximately $300 million in 1980 to over $266 billion in December 2010. This means increased trading competition among a larger number of market participants for transactions at favorable prices, which could operate to the detriment of Grant Park by preventing Grant Park from affecting transactions at its desired price. It may become more difficult for Grant Park to implement its trading strategy if other commodity trading advisors using technical systems are, at the same time, also attempting to initiate or liquidate commodity interest positions.
Speculative position limits and daily price fluctuation limits may alter trading decisions for Grant Park.
The CFTC and U.S. exchanges have established limits or position accountability limits, known as speculative position limits, on the maximum net long or net short positions that any person may hold or control in certain exchange-traded derivatives. All accounts controlled by a particular trading advisor are combined for speculative position limit purposes. If positions in those accounts were to approach the level of the particular speculative position limit, or if prices were to approach the level of the daily limit, these limits could cause a modification of the particular trading advisor’s trading decisions or force liquidation of certain futures or options on futures positions. If one or more of Grant Park’s trading advisors must take either of these actions, Grant Park may be required to forego profitable trades or strategies.
Increases in assets under management of any of the trading advisors may affect trading decisions, which could have a detrimental effect on your investment.
In general, with the exception of QIM, none of the trading advisors intends to limit the amount of additional equity of Grant Park that it may manage, and each will continue to seek major new accounts. The more equity a trading advisor manages, the more difficult it may be for it to trade profitably because of the difficulty of trading larger positions without adversely affecting prices and performance and of managing risk associated with larger positions. QIM, for example, recently informed the general partner that
it may limit the amount of additional assets that it manages. Accordingly, future increases in equity under management may require a trading advisor to modify its trading decisions for Grant Park or may cause the general partner to add additional trading advisors, either of which could have a detrimental effect on your investment.
The use of multiple trading advisors may result in offsetting or opposing trading positions and may also require one trading advisor to fund the margin requirements of another trading advisor.
The use of multiple trading advisors may result in developments or positions that adversely affect Grant Park’s net asset value. For example, because the trading advisors will be acting independently, Grant Park could buy and sell the same futures contract, thereby incurring additional expenses but with no net change in its holdings. The trading advisors also may compete, from time to time, for the same trades or other transactions, increasing the cost to Grant Park of making trades or transactions or causing some of them to be foregone altogether. Moreover, even though each trading advisor’s margin requirements ordinarily will be met from that trading advisor’s allocated net assets, one trading advisor may incur losses of such magnitude that Grant Park is unable to meet margin calls from the allocated net assets of that trading advisor. In this event, Grant Park’s clearing brokers may require liquidations and contributions from the allocated net assets of another trading advisor.
The trading advisors’ trading programs bear some similarities and, therefore, may lessen the benefits of having multiple trading advisors.
Some of the trading advisors initially received their trading experience under the guidance of the same individual. However, each trading advisor has, over time, developed and modified the program it will use for Grant Park. Nevertheless, the trading advisors’ trading programs have some similarities. These similarities may, in fact, mitigate the positive effect of having multiple trading advisors. For example, in periods where one trading advisor experiences a draw-down, it is possible that these similarities will cause the other trading advisors to also experience a draw-down.
Each trading advisor advises other clients and may achieve more favorable results for its other accounts.
Each trading advisor manages other trading accounts and each will remain free to manage
24
additional accounts, including its own accounts, in the future. A trading advisor may vary the trading strategies applicable to Grant Park from those used for its other managed accounts, or its other managed accounts may impose a different cost structure than that of the Series for which it trades. Consequently, the results any trading advisor achieves for Grant Park may not be similar to those achieved for other accounts managed by the trading advisor or its affiliates at the same time. Moreover, it is possible that those other accounts managed by the trading advisor or its affiliates may compete with Grant Park for which it trades for the same or similar positions in the commodity interest markets and that those other accounts may make trades at better prices than Grant Park.
A trading advisor may also have a financial incentive to favor other accounts because the compensation received from those other accounts exceeds, or may in the future exceed, the compensation that it receives from managing the account of Grant Park. Because records with respect to other accounts are not accessible to investors of Grant Park, investors will not be able to determine if any trading advisor is favoring other accounts.
Turnover may be high, which could result in higher brokerage commissions and transaction fees and expenses.
Each trading advisor will make certain trading decisions on the basis of short-term market considerations. The portfolio turnover rate may be substantial at times, either due to such decisions or to “whip-saw” market conditions, and could result in Grant Park incurring substantial brokerage commissions and other transaction fees and expenses.
Grant Park’s positions may be concentrated from time to time, which may render Grant Park susceptible to larger losses than if Grant Park were more diversified.
One or more of the trading advisors may from time to time cause Grant Park to hold a few, relatively large positions in relation to its assets. Consequently, a loss in any such position could result in a proportionately greater loss to Grant Park than if Grant Park’s assets had been spread among a wider number of instruments.
Trend following and pattern recognition can be risky.
Grant Park is a multiple-manager fund which employs several trading advisors, all employing
proprietary, systematic trend following and pattern recognition systems in various forms. Grant Park’s trading advisors aim to exploit the tendency of markets to either trend or exhibit repeated patterns over time through the use of their proprietary systematic trading systems. These systems are strictly adhered to in all market scenarios. Since trend following is a reactive trading strategy rather than a predictive one, positions are entered into or exited from in reaction to price movement; there is no prediction of future price. Pattern recognition looks to predict price movement based on historic repeatable price patterns. If the trend or patterns are not confirmed, the position will be exited on a stop. However, if the trend or patterns are confirmed, positions may be increased depending on the momentum of the trend. Trends or patterns are not generally discovered until they are well established and not exited from until they are over. Because we do not know which markets will trend or when the trend will begin or whether patterns will reoccur, the mechanisms are there to identify and capture the developing trends or patterns as they occur. It is this willingness to allow a trend or pattern to run its course and eventually reverse that can lead to gains in any particular market.
The inability of Grant Park to access, or the failure of, electronic trading and order routing systems may adversely affect Grant Park’s trading.
Grant Park may, from time to time, trade on electronic trading and order routing systems, which differ from traditional open outcry pit trading and manual order routing methods. Transactions using an electronic system are subject to the rules and regulations of the exchanges offering the system or listing the contract. Characteristics of electronic trading and order routing systems vary widely among the different electronic systems with respect to order matching procedures, opening and closing procedures and prices, error trade policies and trading limitations or requirements. There are also differences regarding qualifications for access and grounds for termination and limitations on the types of orders that may be entered into the system. Each of these matters may present different risk factors with respect to trading on or using a particular system. Each system may also present risks related to system access, varying response times and security. In the case of internet-based systems, there may be additional risks related to service providers and the receipt and monitoring of electronic mail.
Trading through an electronic trading or order routing system is also subject to risks associated with
25
system or component failure. In the event of system or component failure, it is possible that for a certain time period, it might not be possible to enter new orders, execute existing orders or modify or cancel orders that were previously entered. System or component failure may also result in loss of orders or order priority. Some contracts offered on an electronic trading system may be traded electronically and through open outcry during the same trading hours. Exchanges offering an electronic trading or order routing system and listing the contract may have adopted rules to limit their liability, the liability of futures brokers and software and communication system vendors and the amount that may be collected for system failures and delays. These limitations of liability provisions vary among the exchanges.
Operating Risks
Past performance is not necessarily indicative of future performance.
You should not rely for predictive purposes on the record to date of Grant Park, the general partner or any of the trading advisors. Likewise, you should not assume that any trading advisor’s future trading decisions will create profit, avoid substantial losses or result in performance comparable to that trading advisor’s past performance. Trading advisors may alter their strategies from time to time, and their performance results in the future may materially differ from their prior trading records. Moreover, the technical analysis employed by the trading advisors may not take into account the effect of economic or market forces or events that may cause losses to Grant Park. Furthermore, the general partner, in its discretion, may terminate any of the trading advisors or change the allocation of assets among the trading advisors, which could cause a substantial change in Grant Park’s future performance.
Grant Park pays substantial fees and expenses regardless of profitability.
Grant Park pays brokerage charges, organization and offering expenses, ongoing operating expenses and OTC dealer spreads, in all cases regardless of whether Grant Park’s activities are profitable. In addition, Grant Park pays its trading advisors an incentive fee based on a percentage of Grant Park’s trading profits earned on Grant Park’s net assets allocated to that trading advisor. It is possible that Grant Park could pay substantial incentive fees to one or more trading advisors in a year in which Grant Park has no net trading profits or in which it actually loses money.
Accordingly, Grant Park must earn trading gains sufficient to compensate for these fees and expenses before it can earn any profit.
Grant Park may incur higher fees and expenses upon renewing existing or entering into new contractual relationships.
The clearing arrangements between the clearing brokers and Grant Park generally are terminable by the clearing brokers once the clearing broker has given Grant Park notice. Upon termination, the general partner may be required to renegotiate or make other arrangements for obtaining similar services if Grant Park intends to continue trading in commodity interest contracts at its present level of capacity. The services of MF Global, Newedge USA, UBS Securities or an additional or substitute clearing broker may not be available, or even if available, these services may not be available on terms as favorable as those of the expired or terminated clearing arrangements.
Likewise, upon termination of any of the advisory contracts entered into between Grant Park and each trading advisor, the general partner may be required to renegotiate the contracts or make other arrangements for obtaining commodity trading advisory services. The services of the particular trading advisor may not be available, or these services may not be available on terms as favorable as those contained in the expired or terminated advisory contract. There is severe competition for the services of qualified commodity trading advisors, and the general partner may not be able to retain replacement or additional trading advisors on acceptable terms. This could result in losses to Grant Park and/or the inability of Grant Park to achieve its investment objectives. Moreover, if an advisory contract is renegotiated or additional or substitute trading advisors are retained by the general partner on behalf of Grant Park, the fee structures of the new or additional arrangements may not be as favorable to Grant Park as are those currently in place.
The incentive fees could be an incentive to the trading advisors to make riskier investments.
Each trading advisor employs a speculative strategy for Grant Park and certain trading advisors receive incentive fees based on the trading profits earned by it for Grant Park. Accordingly, these trading advisors have a financial incentive to make investments that are riskier than might be made if Grant Park’s assets were managed by a trading advisor that did not receive performance-based compensation.
26
You will not participate in the management of Grant Park.
You will only have limited voting rights with respect to Grant Park’s affairs, which rights will not permit you to participate in the management or control of Grant Park or the conduct of its business. You must therefore rely upon the fiduciary responsibility and judgment of the general partner to manage Grant Park’s affairs in the best interests of the limited partners.
An unanticipated number of redemption requests during a short period of time could have an adverse effect on the net asset value of Grant Park.
If a substantial number of requests for redemption are received by Grant Park during a relatively short period of time, Grant Park may not be able to satisfy the requests from funds not committed to trading. As a consequence, it could be necessary to liquidate positions in Grant Park’s trading positions before the time that the trading advisors’ trading strategies would dictate liquidation. If this were to occur, it could affect adversely the net asset value per unit of each class, not only for limited partners redeeming units but also for nonredeeming limited partners.
Conflicts of interest exist in the structure and operation of Grant Park.
Mr. Kavanagh, who indirectly controls and is president of the general partner, has a conflict of interest with Grant Park, because an entity controlled by him occasionally receives from MF Global, one of Grant Park’s clearing brokers and additional selling agents, compensation for trades introduced to and cleared through MF Global. This compensation is unrelated to the trading activities of Grant Park. He therefore may have a disincentive to cause the general partner to terminate or replace MF Global even if such replacement is in Grant Park’s best interest.
MF Global and an affiliate of one of Grant Park’s other clearing broker, UBS Securities, also serve as Grant Park’s selling agents, so the general partner may be inclined not to replace or terminate MF Global or UBS Securities as clearing broker if it believes that this will adversely affect MF Global’s or UBS’ efforts as selling agent. MF Global’s and UBS’ dual roles may also give rise to a conflict in that as a selling agent it may have a disincentive to advise potential investors against investing in Grant Park or to advise existing investors to cause Grant Park to redeem their units, in either case in the best interests of the investors,
because to do so would reduce Grant Park’s assets and in turn the compensation paid to MF Global and UBS Securities as clearing broker.
The general partner, the trading advisors and their respective principals, all of which are engaged in other investment activities, are not required to devote substantially all of their time to Grant Park’s business, which also presents the potential for numerous conflicts of interest with Grant Park. In the case of the trading advisors, for example, it is possible that other accounts managed by the trading advisor or its affiliates may compete with Grant Park for the same or similar trading positions, which may cause Grant Park to obtain prices that are less favorable than those obtained for the other accounts. The trading advisors may also take positions in their proprietary accounts that are opposite to or ahead of Grant Park’s account. Trading ahead presents a conflict because the trade executed first may receive a more favorable price than the later trade.
As a result of these and other relationships, parties involved with Grant Park have a financial incentive to act in a manner other than in the best interests of Grant Park and its limited partners. The general partner has not established, and has no plans to establish, any formal procedures to resolve these and other conflicts of interest. Consequently, there is no independent control over how the general partner will resolve these conflicts on which investors can rely in ensuring that Grant Park is treated equitably, except that the general partner will resolve each conflict in light of its fiduciary responsibility for the safekeeping and use of all funds and assets of Grant Park. See “CONFLICTS OF INTEREST.”
Certain of Grant Park’s investments may have no readily available market value, and there is a risk that the value attributed to such investments will not be realized upon disposition.
The general partner will determine the fair market value of Grant Park’s investments if a readily available market value does not exist. The value determined by the general partner may not necessarily reflect the liquidation value of such investments. Accordingly, if Grant Park is required to liquidate any such investment in order to meet redemption requests or margin calls, there is no assurance that the fair market value, as determined by the general partner, or any other value attributed to the investment, will be realized upon disposition. Thus, if you withdraw all of your capital at a time when Grant Park holds such investments, the amount received by you will depend on the value of
27
Grant Park’s investments as determined by the general partner. In valuing Grant Park’s assets, the general partner may rely on valuations and other reports received from third parties, including advisors to Grant Park. The general partner shall not be responsible for verifying the accuracy of such reports. In no event shall the general partner incur any liability for any determination made, or other action taken or omitted, in good faith. All determinations of values by the general partner shall be final and conclusive as to all limited partners.
The failure or bankruptcy of one of its clearing brokers could result in a substantial loss of Grant Park’s assets.
Under CFTC regulations, a clearing broker maintains customers’ assets in a bulk segregated account. If a clearing broker fails to do so, or is unable to satisfy a substantial deficit in a customer account, its other customers may be subject to risk of loss of their funds in the event of that clearing broker’s bankruptcy. In that event, the clearing broker’s customers, such as Grant Park, are entitled to recover, even in respect of property specifically traceable to them, only a proportional share of all property available for distribution to all of that clearing broker’s customers. Grant Park also may be subject to the risk of the failure of, or delay in performance by, any exchanges and markets and their clearing organizations, if any, on which commodity interest contracts are traded.
From time to time, the clearing brokers may be subject to legal or regulatory proceedings in the ordinary course of their business. A clearing broker’s involvement in costly or time-consuming legal proceedings may divert financial resources or personnel away from the clearing broker’s trading operations, which could impair the clearing broker’s ability to successfully execute and clear Grant Park’s trades. Material legal proceedings involving the clearing brokers within the last five years are summarized under the heading “THE CLEARING BROKERS.”
You will only be able to review Grant Park’s holdings on a monthly basis, which makes Grant Park less transparent than certain other investments.
Although Grant Park calculates net asset value daily and will, upon request, provide such information to limited partners, you will only be able to review Grant Park’s holdings on a monthly basis. The trading advisors make Grant Park’s trading decisions. While the trading advisors receive daily trade confirmations
from the clearing brokers of each transaction entered into by Grant Park, Grant Park’s trading results are only reported to investors monthly in summary fashion. Accordingly, an investment in Grant Park does not offer investors the same transparency that a personal trading account offers.
Grant Park’s brokers, futures commission merchants, and trading advisors may cause or be subject to trading errors, which could adversely affect Grant Park’s performance.
While trading advisors will attempt to correct trading errors as soon as they are discovered, none of Grant Park, the general partner, the trading advisors or their service providers will be responsible for poor executions or trading errors committed by brokers, futures commission merchants or the trading advisors themselves. Such trading errors could adversely affect Grant Park’s performance.
Grant Park may terminate before you achieve your investment objective.
Grant Park may terminate, regardless of whether Grant Park has incurred losses, before its stated termination date of December 31, 2027. In particular, Grant Park will terminate if the general partner withdraws and the limited partners fail to elect a substitute general partner, if the general partner is subject to bankruptcy, or upon the occurrence of certain other events as described in the limited partnership agreement. However, no level of losses will require the general partner to terminate Grant Park. Grant Park’s termination would cause the liquidation and potential loss of your investment and could upset the overall maturity and timing of your investment portfolio.
Grant Park is not a regulated investment company.
Grant Park is not an investment company subject to the Investment Company Act of 1940. Accordingly, you do not have the protections afforded by that statute which, for example, requires investment companies to have a majority of disinterested directors and regulates the relationship between the investment company and its investment manager.
Litigation could result in substantial additional expenses.
Grant Park could be named as a defendant in a lawsuit or regulatory action arising out of the activities of the general partner or the trading advisors. If this were to occur, Grant Park will bear the costs of
28
defending such suit or action and will be at further risk if its defense is unsuccessful which could result in losses to your investment.
The general partner relies heavily on its key personnel to manage Grant Park’s trading activities.
In managing and directing the day-to-day activities and affairs of Grant Park, the general partner relies heavily on Mr. Kavanagh, Patrick Meehan, the general partner’s chief operating officer, and Maureen O’Rourke, the general partner’s chief financial officer. In the event of the loss of the services of any of these persons, or if any of these individuals is unable to carry out his or her present responsibilities, it may have an adverse effect on the management of Grant Park.
The general partner places significant reliance on the trading advisors and their key personnel.
The general partner relies on the trading advisors to achieve trading gains for Grant Park, allocating to each of them responsibility for, and discretion over, trading of their allocated portions of Grant Park’s assets. The trading advisors, in turn, are dependent on the services of a limited number of persons to develop and refine their trading approaches and strategies and execute Grant Park’s transactions. The loss of the services of any trading advisor’s principals or key employees, or the failure of those principals or key employees to function effectively as a team, may have an adverse effect on that trading advisor’s ability to manage its trading activities successfully or may cause the trading advisor to cease operations entirely, either of which, in turn, could negatively impact Grant Park’s performance. Each of Grant Park’s trading advisors is controlled, directly or indirectly, by one or more individuals, or, in the case of Transtrend, of which 100% of the voting interest is owned by Robeco Netherlands BV, by its managing directors. These individuals are: Paul Rabar at Rabar, Elizabeth Cheval at EMC, William Eckhardt at ETC, David Winton Harding at Winton, Patrick Welton at Welton, Russell Newton at Global Advisors, Johannes P.A. van den Broek and Harold M. De Boer at Transtrend, Jaffrey Woodriff, Michael Geismar and Ryan Vaughan at QIM, Dr. Gary B. Davis at Sunrise, Karsten Schroeder at Amplitude, Mark Caslin at Alder and Scott T. Ramsey at Denali. The death, incapacity or other prolonged unavailability of such individuals likely would greatly hinder these trading advisors’ operations, and could result in their ceasing operations entirely, which could adversely affect the value of your investment in Grant Park.
The general partner may terminate, replace and/or add trading advisors in its sole discretion, which may have an adverse effect on Grant Park’s net asset value.
The general partner may terminate, substitute or retain trading advisors on behalf of Grant Park in its sole discretion. The addition of a new trading advisor and/or the removal of one or more of the current trading advisors may cause disruptions in Grant Park’s trading as assets are reallocated and new trading advisors transition over to Grant Park, which may have an adverse effect on the net asset value of Grant Park.
The general partner’s allocation of the assets of each class of Grant Park among trading advisors may result in less than optimal performance by Grant Park.
The general partner may reallocate assets among the trading advisors upon termination of a trading advisor, retention of a new trading advisor or at the commencement of any month. Consequently, the net assets of Grant Park may be apportioned among the trading advisors in a different manner than the current apportionment. The general partner’s allocation of assets will directly affect the profitability of Grant Park’s trading, possibly in an adverse manner. For example, a trading advisor may experience a high rate of return but may be managing only a small percentage of Grant Park’s net assets. In this case, the trading advisor’s performance could have a minimal effect on the net asset value of Grant Park.
In particular, QIM has recently informed the general partner that it may limit the amount of additional assets that it manages. Accordingly, in the future, the general partner will be limited in its ability to allocate additional Grant Park assets to QIM.
Third parties may infringe or otherwise violate a trading advisor’s intellectual property rights or assert that a trading advisor has infringed or otherwise violated their intellectual property rights, which may result in significant costs and diverted attention.
Third parties may obtain and use a trading advisor’s intellectual property or technology, including its trade secrets and trading program software, without permission. Any unauthorized use or misappropriation of a trading advisor’s proprietary trades secrets, software and other technology could adversely affect its competitive advantage. Proprietary software and other technology are becoming increasingly easy to duplicate, particularly as employees with proprietary
29
knowledge leave the owner or licensed user of that software or other technology. Each trading advisor may have difficulty monitoring unauthorized uses of its proprietary software and other technology. The precautions it has taken may not prevent misappropriation or infringement of its proprietary software and other technology. Also, third parties may independently develop proprietary software and other technology similar to that of a trading advisor or claim that the trading advisor has violated their intellectual property rights, including their copyrights, trademark rights, trade names, trade secrets and patent rights. As a result, a trading advisor may have to litigate in the future to protect its trade secrets, determine the validity and scope of other parties’ proprietary rights, defend itself against claims that it has infringed or otherwise violated other parties’ rights, or defend itself against claims that its rights are invalid. Any litigation of this type, even if the trading advisor is successful and regardless of the merits, may result in significant costs, divert its resources from Grant Park, or require it to change its proprietary software and other technology or enter into royalty or licensing agreements.
The success of Grant Park depends on the ability of each of the trading advisors’ personnel to accurately implement their trading systems, and any failure to do so could subject Grant Park to losses on such transactions.
The trading advisors’ computerized trading systems rely on the trading advisors’ personnel to accurately process the systems’ outputs and execute the transactions called for by the systems. In addition, each trading advisor relies on its staff to properly operate and maintain its computer and communications systems upon which the trading systems rely. Execution and operation of each trading advisor’s systems is therefore subject to human errors. Any failure, inaccuracy or delay in implementing any of the trading advisors’ systems and executing Grant Park’s transactions could impair its ability to identify profit opportunities and benefit from them. It could also result in decisions to undertake transactions based on inaccurate or incomplete information. This could cause substantial losses on transactions.
Grant Park may experience substantial losses on transactions if a trading advisor’s computer or communications systems fail.
Each trading advisor’s trading activities, including its risk management, depends on the integrity and performance of the computer and communications systems supporting it. Extraordinary
transaction volume, hardware or software failure, power or telecommunications failure, a natural disaster or other catastrophe could cause any trading advisor’s computer systems to operate at an unacceptably slow speed or even fail. Any significant degradation or failure of the systems that a trading advisor uses to gather and analyze information, enter orders, process data, monitor risk levels and otherwise engage in trading activities may result in substantial losses on transactions, liability to other parties, lost profit opportunities, damages to the trading advisors’, the general partner’s and Grant Park’s reputations, increased operational expenses and diversion of technical resources.
If a trading advisor, or third parties on which a trading advisor depends, fail to upgrade computer and communications systems, Grant Park’s financial condition could be harmed.
The development of complex communications and new technologies may render the existing computer and communication systems supporting the trading advisors’ trading activities obsolete. In addition, these computer and communications systems must be compatible with those of third parties, such as the systems of exchanges, clearing brokers and the executing brokers used by the trading advisors. As a result, if these third parties upgrade their systems, the trading advisors will need to make corresponding upgrades to continue effectively its trading activities. Grant Park’s future success will depend on each trading advisor’s and third parties’ ability to respond to changing technologies on a timely and cost-effective basis.
Each trading advisor depends on the reliable performance of the computer or communications systems of third parties, such as brokers and futures exchanges, and may experience substantial losses on transactions if they fail.
Each trading advisor depends on the proper and timely function of complex computer and communications systems maintained and operated by the futures exchanges, brokers and other data providers that the trading advisor uses to conduct its trading activities. Failure or inadequate performance of any of these systems could adversely affect the trading advisor’s ability to complete transactions, including its ability to close out positions, and result in lost profit opportunities and significant losses on commodity interest transactions. This could have a material adverse effect on revenues and materially reduce Grant Park’s available capital. For example, unavailability of
30
price quotations from third parties may make it difficult or impossible for a trading advisor to use its proprietary software that it relies upon to conduct its trading activities. Unavailability of records from brokerage firms can make it difficult or impossible for the trading advisor to accurately determine which transactions have been executed or the details, including price and time, of any transaction executed. This unavailability of information also may make it difficult or impossible for the trading advisor to reconcile its records of transactions with those of another party or to accomplish settlement of executed transactions.
The occurrence of a terrorist attack, or the outbreak, continuation or expansion of war or other hostilities could disrupt Grant Park’s trading activity and materially affect Grant Park’s profitability.
The operations of the general partner, the trading advisors, Grant Park, the exchanges, brokers and counterparties with which the general partner, the trading advisors and Grant Park do business, and the markets in which the general partner, the trading advisors and Grant Park do business could be severely disrupted in the event of a major terrorist attack or the outbreak, continuation or expansion of war or other hostilities. The aftermath of the war and continuing reconstruction process in Iraq, global anti-terrorism initiatives and political unrest in the Middle East and Southeast Asia continue to fuel this concern.
Regulation of the commodity interest markets is extensive and constantly changing; future regulatory developments are impossible to predict, but may significantly and adversely affect Grant Park.
The regulation of commodity interest transactions in the United States is a rapidly changing area of law and is subject to ongoing modification by government and judicial action. In addition, various governments have expressed concern regarding the disruptive effects of speculative trading in the derivatives’ markets and the need to regulate such markets in a comprehensive and prescriptive fashion.
There is a possibility of future regulatory changes altering, perhaps to a material extent, the nature of an investment in Grant Park or the ability of the trading advisors to continue to implement their respective investment strategies. The effect of any future regulatory change on Grant Park is impossible to predict, but could be substantial and adverse.
Largely in light of the general turmoil that has engulfed the financial markets since late 2007,
Congress, the Treasury Department, the CFTC and the SEC, among others, have considered or are considering numerous measures, including but not limited to:
| • | Prohibiting or limiting speculative trading generally and with respect to certain products, such as energy derivatives; |
| • | Imposing reduced speculative position limits; |
| • | Limiting the ability of market participants to obtain hedge exemptions; |
| • | Mandating margin requirements with respect to certain products, such as trading in retail forex, and generally seeking to reduce the use of leverage in financial instruments; |
| • | Imposing substantial regulation upon the OTC derivatives markets, both with respect to products and participants; |
| • | Abolishing preemption with respect to the regulation of commodity interests, which would allow states to regulate all or certain products; |
| • | Increasing regulation with respect to futures contracts and possibly subjecting any futures contract based upon a security to regulation by the SEC; |
| • | Repealing “60/40” tax treatment (i.e., where 60% of gain or loss is long-term capital gain or loss and 40% is short-term capital gain or loss) associated with Internal Revenue Code Section 1256 contracts (e.g., regulated futures contracts, foreign currency contracts, nonequity options, dealer equity options, and dealer securities futures contracts); |
| • | Consolidating regulatory agencies into a sole regulatory agency with oversight over all commodity interests; and |
| • | Imposing a “transaction tax” on the purchase or sale of certain commodity interests, including futures and securities. |
Foreign market regulators have considered or are considering similar initiatives. Any of these proposals, if enacted, could materially change the structure of the commodity interest markets and adversely impact the ability of Grant Park to trade profitably.
31
Grant Park is subject to regulatory risk associated with position limits that could adversely affect Grant Park’s operations and profitability.
The CFTC has proposed and is soliciting public comment regarding new rules to implement position limits on energy, metals and agricultural futures contracts. Although Grant Park does not anticipate these limits, if adopted, will affect Grant Park’s current ability to trade, it is possible that the imposition of such limits may in the future have such an effect if the amount of assets Grant Park trades in these instruments increases.
The failure to comply with the USA Patriot Act may subject Grant Park to substantial negative consequences.
Grant Park is subject to the USA Patriot Act of 2001, as amended (the “Patriot Act”). The Patriot Act contains, among other things, provisions intended to safeguard against the laundering of money in the United States by individuals involved in illicit or illegal activities. The Patriot Act places a focus on individuals wishing to invest their money in U.S. ventures, and provides that domestic investment entities (such as Grant Park) that accept money from said individuals must conduct a substantial investigation to ascertain whether prospective investors are, or may be, engaged in illicit or illegal activities. Grant Park and the general partner will be governed by the substantial provisions of the Patriot Act. If the general partner inadvertently admits a prohibited person or entity as an investor in Grant Park, substantial negative consequences to Grant Park could result, including but not limited to the freezing and/or forfeiture of all of the Grant Park’s assets. Grant Park will utilize reasonable efforts to safeguard itself from being used by individuals to disguise their illegal or illicit activities. Despite these efforts, however, there is no guarantee that dishonest individuals will successfully be screened from participating as investors in Grant Park.
Grant Park has multiple classes which present the possible risk of contagion between them.
Although Grant Park has several classes which allocate assets differently among trading advisors, Grant Park is a single legal entity. Limited partners invested in one or more classes may be compelled to bear the liabilities incurred in respect of another class which such limited partners do not themselves own if there are insufficient assets in that other class to satisfy those liabilities. Accordingly, there is a risk that
liabilities of one class may not be limited to that particular class and may be required to be paid out of one or more other class. Moreover, in a bankruptcy or insolvency proceeding, Grant Park’s assets may be aggregated without regard to class. In addition, third party service providers who provide services to one or more class, and/or other creditors of one or more class, may have valid claims against the class to which they have provided services, or against the Fund as a whole without regard to class.
Tax Risks
Your tax liability may exceed your cash distributions.
Cash is distributed to limited partners at the sole discretion of the general partner, and the general partner does not currently intend to distribute cash to limited partners. Limited partners nevertheless will be subject to federal income tax on their share of Grant Park’s net income and gain each year, regardless of whether they redeem any units or receive any cash distributions from Grant Park.
You could owe taxes on your share of Grant Park’s ordinary income despite overall losses.
Gain or loss on domestic futures and options on futures as well as on most foreign currency contracts will generally be taxed as capital gains or losses for U.S. federal income tax purposes. Interest income and other ordinary income earned by Grant Park generally cannot be offset by capital losses. Consequently, you could owe taxes on your allocable share of Grant Park’s ordinary income for a calendar year even if Grant Park reports a net trading loss for that year. Also, your ability to deduct particular operating expenses of Grant Park, such as trading advisor consulting and incentive fees, may be subject to limitations for purposes of calculating your federal and/or state and local income tax liability.
Partnership treatment is not assured.
Grant Park has received an opinion of counsel to the effect that, under current U.S. federal income tax law, Grant Park will be treated as a partnership for U.S. federal income tax purposes, provided that (a) at least 90% of Grant Park’s annual gross income has previously consisted of and currently consists of “qualifying income” as defined in the Internal Revenue Code and (b) Grant Park is organized and operated in accordance with its governing agreements and applicable law. The general partner believes it is likely, but not certain, that Grant Park will continue to
32
meet the income test. An opinion of counsel is subject to any changes in applicable tax laws and is not binding on the Internal Revenue Service, any other taxing authority or any court.
If Grant Park were to be treated as an association or publicly traded partnership taxable as a corporation instead of as a partnership for U.S. federal income tax purposes, (1) its net income would be taxed at corporate income tax rates, thereby substantially reducing its profitability, (2) you would not be allowed to deduct your share of losses of Grant Park and (3) distributions to you, other than liquidating distributions, would constitute dividends to the extent of Grant Park’s current or accumulated earnings and profits and would be taxable as such.
There is the possibility of a tax audit.
We cannot assure you that Grant Park’s tax returns will not be audited by a taxing authority or that an audit will not result in adjustments to Grant Park’s returns. Any adjustments resulting from an audit may require each limited partner to file an amended tax return and to pay additional taxes plus interest, which generally is not deductible, and might result in an audit of the limited partner’s own return. Any audit of a limited partner’s return could result in adjustments of non-Grant Park, as well as Grant Park, income and deductions.
Non-U.S. investors may face exchange rate risk and local tax consequences.
Non-U.S. investors should note that the units are denominated in U.S. dollars and that changes in the rates of exchange between currencies may cause the value of their investment to decrease. Non-U.S. investors should consult their own tax advisors concerning the applicable U.S. and foreign tax implications of this investment.
THE FOREGOING LIST OF RISK FACTORS IS NOT A COMPLETE EXPLANATION OF THE RISKS INVOLVED. PROSPECTIVE INVESTORS SHOULD READ THE ENTIRE PROSPECTUS AND ARE STRONGLY URGED TO CONSULT WITH THEIR PROFESSIONAL ADVISORS BEFORE INVESTING IN GRANT PARK.
CAUTIONARY NOTE REGARDING FORWARD-LOOKING STATEMENTS
This prospectus includes “forward-looking statements” within the meaning of Section 27A of the Securities Act of 1933, as amended, and Section 21E of the Securities Exchange Act of 1934, as amended, that reflect the general partner’s current expectations about the future results, performance, prospects and opportunities of Grant Park. The general partner has tried to identify these forward-looking statements by using words such as “may,” “will,” “expect,” “anticipate,” “believe,” “intend,” “should,” “estimate,” “continue,” or the negative of those terms or similar expressions. These forward-looking statements are based on information currently available to the general partner and are subject to a number of risks, uncertainties and other factors, both known, such as those described in “RISK FACTORS” and elsewhere in this prospectus, and unknown, that could cause Grant Park’s actual results, performance, prospects or opportunities to differ materially from those expressed in, or implied by, these forward-looking statements.
You should not place undue reliance on any forward-looking statements. Except as expressly required by the federal securities laws, the general partner undertakes no obligation to publicly update or revise any forward-looking statements or the risks, uncertainties or other factors described in this prospectus, as a result of new information, future events or changed circumstances or for any other reason after the date of this prospectus.
33
The following selected consolidated financial data of Grant Park as of and for the years ended December 31, 2010, 2009, 2008, 2007 and 2006 is derived from the consolidated financial statements that have been audited by McGladrey & Pullen, LLP, independent auditors. The financial data should be read in conjunction with “MANAGEMENT’S DISCUSSION AND ANALYSIS OF FINANCIAL CONDITION AND RESULTS OF OPERATIONS,” and with Grant Park’s consolidated financial statements and the notes thereto included elsewhere in this prospectus. Results from past periods are not necessarily indicative of results that may be expected for any future period.
| For the Year Ended December 31, | ||||||||||||||||||||
| 2010 | 2009 | 2008 | 2007 | 2006 | ||||||||||||||||
Total assets | $ | 926,818,164 | $ | 857,602,108 | $ | 684,995,026 | $ | 467,212,443 | $ | 407,930,032 | ||||||||||
Total partners’ capital | 891,912,770 | 831,270,498 | 643,595,209 | 455,685,796 | 382,252,995 | |||||||||||||||
Net gains (losses) from trading | 95,986,575 | (29,071,663 | ) | 127,520,875 | 57,385,145 | 37,071,404 | ||||||||||||||
Income allocated from Dearborn Select Master Fund, SPC – Winton Segregated Portfolio | — | — | 16,714,939 | 9,417,448 | — | |||||||||||||||
Loss allocated from GP 1, LLC* | — | (2,740,621 | ) | — | — | — | ||||||||||||||
Interest income | 4,324,858 | 6,395,208 | 12,681,834 | 17,475,172 | 16,093,168 | |||||||||||||||
Total expenses | 69,789,098 | 61,253,534 | 60,900,881 | 33,855,319 | 26,850,877 | |||||||||||||||
Net income (loss) | 30,522,335 | (86,670,610 | ) | 96,016,767 | 50,422,446 | 26,313,695 | ||||||||||||||
Net income (loss) per General Partner & Limited Partner: | ||||||||||||||||||||
Class A Unit | 63.46 | (145.00 | ) | 263.77 | 148.80 | 98.75 | ||||||||||||||
Class B Unit | 46.51 | (134.12 | ) | 223.70 | 125.29 | 82.71 | ||||||||||||||
Legacy 1 Class Unit** | 58.80 | (33.88 | ) | N/A | N/A | N/A | ||||||||||||||
Legacy 2 Class Unit** | 55.25 | (35.46 | ) | N/A | N/A | N/A | ||||||||||||||
Global 1 Class Unit** | 27.56 | (43.18 | ) | N/A | N/A | N/A | ||||||||||||||
Global 2 Class Unit** | 24.41 | (46.40 | ) | N/A | N/A | N/A | ||||||||||||||
Global 3 Class Unit** | 6.38 | (60.36 | ) | N/A | N/A | N/A | ||||||||||||||
Increase (decrease) in net asset value per General Partner & Limited Partner: | ||||||||||||||||||||
Class A Unit | 63.46 | (145.00 | ) | 260.73 | 146.87 | 97.03 | ||||||||||||||
Class B Unit | 46.51 | (134.12 | ) | 215.79 | 120.26 | 78.14 | ||||||||||||||
Legacy 1 Class Unit | 58.80 | (33.88 | ) | N/A | N/A | N/A | ||||||||||||||
Legacy 2 Class Unit | 55.25 | (35.46 | ) | N/A | N/A | N/A | ||||||||||||||
Global 1 Class Unit | 27.56 | (43.18 | ) | N/A | N/A | N/A | ||||||||||||||
Global 2 Class Unit | 24.41 | (46.40 | ) | N/A | N/A | N/A | ||||||||||||||
Global 3 Class Unit | 6.38 | (60.36 | ) | N/A | N/A | N/A | ||||||||||||||
The financial results are based on weighted average number of units outstanding during the period.
| * | Loss allocated from GP 1, LLC is only for first quarter of 2009. |
| ** | Legacy 1 Class, Legacy 2 Class, Global 1 Class, Global 2 Class and Global 3 Class units began trading on April 1, 2009. |
34
SUPPLEMENTARY QUARTERLY FINANCIAL INFORMATION
The following summarized quarterly financial information presents Grant Park’s results of operations for the three-month periods ended March 31, June 30, September 30, and December 31, 2010 and 2009. Grant Park’s quarterly financial information for the three-month periods ended March 31, June 30, September 30 and December 31, 2010 and 2009 is unaudited. However, in the opinion of Grant Park, all adjustments, consisting of normal recurring adjustments, necessary for a fair presentation have been made.
| 1st Quarter 2010 | 2nd Quarter 2010 | 3rd Quarter 2010 | 4th Quarter 2010 | |||||||||||||
| (unaudited) | (unaudited) | (unaudited) | (unaudited) | |||||||||||||
Gains (losses) from trading | $ | (18,955,723 | ) | $ | (4,825,945 | ) | $ | 46,966,833 | $ | 72,801,410 | ||||||
Net income (loss) | (31,589,409 | ) | (18,428,019 | ) | 30,848,206 | 49,691,557 | ||||||||||
Net income (loss) per General Partner & Limited Partner: | ||||||||||||||||
Class A Unit** | (51.12 | ) | (31.74 | ) | 58.30 | 88.02 | ||||||||||
Class B Unit** | (45.84 | ) | (29.09 | ) | 48.19 | 73.25 | ||||||||||
Legacy 1 Class Unit** | (30.46 | ) | (17.28 | ) | 42.29 | 64.25 | ||||||||||
Legacy 2 Class Unit** | (30.98 | ) | (17.91 | ) | 41.19 | 62.95 | ||||||||||
Global 1 Class Unit** | (35.84 | ) | (4.03 | ) | 19.31 | 48.12 | ||||||||||
Global 2 Class Unit** | (36.93 | ) | (4.41 | ) | 18.66 | 47.09 | ||||||||||
Global 3 Class Unit** | (40.43 | ) | (8.81 | ) | 14.11 | 41.51 | ||||||||||
Increase (decrease) in net asset value per General Partner & Limited Partner: | ||||||||||||||||
Class A Unit | (51.12 | ) | (31.74 | ) | 58.30 | 88.02 | ||||||||||
Class B Unit | (45.84 | ) | (29.09 | ) | 48.19 | 73.25 | ||||||||||
Legacy 1 Class Unit | (30.46 | ) | (17.28 | ) | 42.29 | 64.25 | ||||||||||
Legacy 2 Class Unit | (30.98 | ) | (17.91 | ) | 41.19 | 62.95 | ||||||||||
Global 1 Class Unit | (35.84 | ) | (4.03 | ) | 19.31 | 48.12 | ||||||||||
Global 2 Class Unit | (36.93 | ) | (4.41 | ) | 18.66 | 47.09 | ||||||||||
Global 3 Class Unit | (40.43 | ) | (8.81 | ) | 14.11 | 41.51 | ||||||||||
Net asset value per General Partner & Limited Partner: | ||||||||||||||||
Class A Unit | 1,374.08 | 1,342.34 | 1,400.64 | 1,488.66 | ||||||||||||
Class B Unit | 1,178.51 | 1,149.42 | 1,197.61 | 1,270.86 | ||||||||||||
Legacy 1 Class Unit | 935.66 | 918.38 | 960.67 | 1,024.92 | ||||||||||||
Legacy 2 Class Unit | 933.56 | 915.65 | 956.84 | 1,019.79 | ||||||||||||
Global 1 Class Unit | 920.98 | 916.95 | 936.26 | 984.38 | ||||||||||||
Global 2 Class Unit | 916.67 | 912.26 | 930.92 | 978.01 | ||||||||||||
Global 3 Class Unit | 899.21 | 890.40 | 904.51 | 946.02 | ||||||||||||
For the quarters ended June 30, 2009 and September 30, 2009, classes of Grant Park which had a controlling or majority equity interest in a trading company were consolidated by two groups of classes (A, B and Legacy class units (“LAB”) and Global class units). At that time, management believed that such presentation was the most meaningful presentation to an investor in Grant Park. Subsequent to filing its September 30, 2009 Form 10-Q, Grant Park considered published guidance, including the then recently issued final ruling released by the Commodity Futures Trading Commission effective December 9, 2010, 17 CFTC Part 4 Commodity Pool Operator Periodic Account Statements and Annual Financial Reports, which distinguished between series and multi-class funds with a limitation on liability among such different series or classes of a fund compared to series and multi-class funds that are not structured with a limitation on liability among the different series or classes. The ruling states that the periodic account statements and annual report of a fund structured without a limitation on liability among its different series or classes should include information for the fund as a whole as well as for each series or class. Grant Park’s two groups of classes of units (LAB and Global units) were not intended to separate or segregate the assets and liabilities of one class from another. Accordingly, pursuant to this ruling Grant Park has presented consolidated financial statements for the fund as a whole as of and for the quarter ended December 31, 2009 and for the year then ended, as well as for each period in 2010 and for the year then ended.
35
| 1st Quarter 2009 | 2nd Quarter 2009 | 3rd Quarter 2009 | 4th Quarter 2009 | |||||||||||||
| (unaudited) | (unaudited) | (unaudited) | (unaudited) | |||||||||||||
Gains (losses) from trading | $ | (28,802,751 | ) | $ | (16,390,322 | ) | $ | 22,589,266 | $ | (6,467,856 | ) | |||||
Net income (loss) | (42,783,464 | ) | (31,491,967 | ) | 7,473,826 | (19,869,005 | ) | |||||||||
Net income (loss) per General Partner & Limited Partner: | ||||||||||||||||
Class A Unit** | (77.13 | ) | (52.58 | ) | 15.03 | (30.32 | ) | |||||||||
Class B Unit** | (69.49 | ) | (47.43 | ) | 10.91 | (28.11 | ) | |||||||||
Legacy 1 Class Unit** | N/A | (30.54 | ) | 13.49 | (16.83 | ) | ||||||||||
Legacy 2 Class Unit** | N/A | (31.36 | ) | 13.31 | (17.41 | ) | ||||||||||
Global 1 Class Unit** | N/A | (15.31 | ) | 10.05 | (37.92 | ) | ||||||||||
Global 2 Class Unit** | N/A | (16.27 | ) | 8.81 | (38.94 | ) | ||||||||||
Global 3 Class Unit** | N/A | (22.25 | ) | 4.47 | (42.58 | ) | ||||||||||
Increase (decrease) in net asset value per General Partner & Limited Partner: | ||||||||||||||||
Class A Unit | (77.13 | ) | (52.58 | ) | 15.03 | (30.32 | ) | |||||||||
Class B Unit | (69.49 | ) | (47.43 | ) | 10.91 | (28.11 | ) | |||||||||
Legacy 1 Class Unit | N/A | (30.54 | ) | 13.49 | (16.83 | ) | ||||||||||
Legacy 2 Class Unit | N/A | (31.36 | ) | 13.31 | (17.41 | ) | ||||||||||
Global 1 Class Unit | N/A | (15.31 | ) | 10.05 | (37.92 | ) | ||||||||||
Global 2 Class Unit | N/A | (16.27 | ) | 8.81 | (38.94 | ) | ||||||||||
Global 3 Class Unit | N/A | (22.25 | ) | 4.47 | (42.58 | ) | ||||||||||
Net asset value per General Partner & Limited Partner: | ||||||||||||||||
Class A Unit | 1,493.07 | 1,440.49 | 1,455.52 | 1,425.20 | ||||||||||||
Class B Unit | 1,288.98 | 1,241.55 | 1,252.46 | 1,224.35 | ||||||||||||
Legacy 1 Class Unit | N/A | 969.46 | 982.95 | 966.12 | ||||||||||||
Legacy 2 Class Unit | N/A | 968.64 | 981.95 | 964.54 | ||||||||||||
Global 1 Class Unit | N/A | 984.69 | 994.74 | 956.82 | ||||||||||||
Global 2 Class Unit | N/A | 983.73 | 992.54 | 953.60 | ||||||||||||
Global 3 Class Unit | N/A | 977.75 | 982.22 | 939.64 | ||||||||||||
| ** | Based on weighted average number of units outstanding during the period. |
36
Grant Park is a multi-advisor commodity pool organized to pool assets of investors for the purpose of trading in the U.S. and international spot and derivatives markets for currencies, interest rates, stock indices, agricultural and energy products, precious and base metals and other commodities and underliers. In trading on these markets, Grant Park may enter into: exchange-traded derivatives, such as futures contracts, options on futures contracts, security futures contracts and listed option contracts (collectively, “exchange-traded derivatives”); over-the-counter, or OTC, derivatives, such as forwards, swaps, options and structured financial products (collectively, “OTC derivatives”); and contracts on cash, or spot, commodities (collectively, “cash commodities”) (collectively, “exchange-traded derivatives,” OTC derivatives” and “cash commodities” are referred to as “commodity interests”). Grant Park invests the assets of each class of the fund in various trading companies, each of which allocates those assets to one of the independent professional commodity trading advisors retained by the general partner or to the cash management trading company. Grant Park’s general partner, commodity pool operator and sponsor is Dearborn Capital Management, L.L.C., an Illinois limited liability company. The managing member of Dearborn Capital Management, L.L.C. is Dearborn Capital Management, Ltd., an Illinois corporation whose majority shareholder is David M. Kavanagh.
Grant Park has been trading continuously since January 1989 and, as of December 31, 2010, had a net asset value of approximately $891.9 million and 24,502 limited partners. Since its inception and through February 28, 2003, Grant Park offered its beneficial interests exclusively to qualified investors on a private placement basis. Effective June 30, 2003, Grant Park began offering units for sale to the public.
Grant Park’s main office is located at 626 West Jackson Boulevard, Suite 600, Chicago, Illinois 60661, and its telephone number is (312) 756-4450.
Grant Park has no directors or executive officers and also does not have any employees. Grant Park is managed solely by Dearborn Capital Management, L.L.C. in its capacity as general partner. Dearborn Capital Management, L.L.C. has been registered as a commodity pool operator and a commodity trading advisor under the Commodity Exchange Act and has been a member of the NFA since December 1995.
Background
Dearborn Capital Management, L.L.C., an Illinois limited liability company, is Grant Park’s general partner, commodity pool operator and sponsor. Along with its managing member and predecessor as general partner and commodity pool operator, Dearborn Capital Management Ltd., the general partner has had management responsibility for Grant Park since its inception. The general partner has been registered as a commodity pool operator and a commodity trading advisor under the Commodity Exchange Act and has been a member of the NFA since December 1995. Dearborn Capital Management Ltd., which served as Grant Park’s general partner, commodity pool operator and sponsor from 1989 through 1995, was registered as a commodity pool operator between August 1988 and March 1996 and as a commodity trading advisor between September 1991 and March 1996, an introducing broker between January 1991 and March 1996 and January 1997 and December 1998 and was a member of the NFA between August 1988 and March 1996 and January 1997 and December 1998.
General management responsibility for Grant Park is vested solely in the general partner under the limited partnership agreement. The general partner has full responsibility for this offering, the selection, monitoring and replacement of the trading advisors, the ongoing operation of Grant Park, the preparation and mailing of monthly and annual reports, the filing with the SEC, CFTC and other regulatory or self-regulatory authorities of all required reports, the preparation of all Grant Park and limited partner tax information, the handling of redemption requests, the investment of Grant Park’s funds not committed to trading in U.S. government obligations or bank depositories and the admission of additional limited partners. The general partner utilizes the services of third parties to assist in the provision of some of these services.
Dearborn Capital Management Ltd. and Centum Prata (USA) Holdings, Inc., a Delaware corporation, own the general partner. David Kavanagh is the majority shareholder of Dearborn Capital Management Ltd. and, indirectly through his ownership of Dearborn Capital Management Ltd., which is the managing member of the general partner, has a majority and controlling interest in the general partner.
There have been no material administrative, civil or criminal actions within the past five years against the general partner or its principals and no such actions currently are pending.
37
The limited partnership agreement requires the general partner to own units in Grant Park in an amount at least equal to the greater of (1) 1% of the aggregate capital contributions of all limited partners or (2) $25,000, during any time that units in Grant Park are publicly offered for sale.
The past performance record of Grant Park’s Class A, Class B units, Legacy 1 units, Legacy 2 units, Global 1 units, Global 2 units and Global 3 units is found on pages 61 through 67.
Principals of the General Partner
The principals of the general partner are Dearborn Capital Management Ltd., Centum Prata (USA) Holdings, Inc., David M. Kavanagh, Patrick Meehan, Maureen O’Rourke and Abdullah Mohammed Al Rayes. Only the officers of the general partner, Mr. Kavanagh, Mr. Meehan and Ms. O’Rourke, have management responsibility and control over the general partner.
David M. Kavanagh, president of the general partner, 55, has been responsible for overseeing all operations and activities of the general partner since its formation and has been registered as an AP with the CFTC and listed as a principal of the general partner since December 1995. Commencing in October 1998, Mr. Kavanagh also became president, a principal and an associated person of Dearborn Capital Brokers Ltd., an independent introducing broker. It became registered as an independent introducing broker in October 1998 and was formerly also registered as a commodity pool operator from September 1999 until October 2009. Since October 1998, Dearborn Capital Brokers Ltd. has continued to perform introducing brokerage services for MF Global Inc., formerly known as Man Financial, Inc., a futures commission merchant. From November 2005 through March 2006, Mr. Kavanagh was registered with the CFTC as an AP of MF Global Inc. Neither Dearborn Capital Brokers nor Mr. Kavanagh provide brokerage services to Grant Park’s trading account. Mr. Kavanagh has served as the president of DCM Brokers, LLC, since October 2007, which serves as Grant Park’s lead selling agent. Since December 2010, Mr. Kavanagh has also served as the president of Knollwood Investment Advisors, LLC, a registered investment adviser. In 1980, Mr. Kavanagh received an M.B.A. from the University of Notre Dame, and in 1978, graduated with a B.S. in business administration from John Carroll University.
Patrick J. Meehan, chief operating officer of the general partner, 55, is primarily responsible for the day
to day operations of the general partner. Mr. Meehan became listed as a principal of the general partner effective January 2009. Prior to joining the general partner in April 2008, Mr. Meehan was a member of the senior executive team at Houghton Mifflin Company, an education company, in Boston, MA, beginning in March 1999. His assignments focused on leading technology and operational organizations. He also served as the Chief Information/Technology Officer of the company for three years. Since December 2010, Mr. Meehan also serves as chief operating officer of Knollwood Investment Advisors, LLC, a registered investment adviser. He received a B.A. degree from John Carroll University, an M.B.A. from Webster University and holds Series 22, 31, and 63 licenses.
Maureen O’Rourke, chief financial officer of the general partner, 45, is responsible for financial reporting and compliance issues. Ms. O’Rourke became listed as a principal and registered as an associated person of Dearborn effective September 2003. Since October 2007, Ms. O’Rourke has served as the chief financial officer and financial and operations principal of DCM Brokers, LLC, which serves as Grant Park’s lead selling agent. Since December 2010, Ms. O’Rourke has also served as the chief compliance officer of Knollwood Investment Advisors, LLC, a registered investment adviser. Ms. O’Rourke is a certified public accountant. She received a B.B.A. in accounting from the University of Notre Dame in 1987 and received a M.S. in taxation from DePaul University in 1996.
38
Security Ownership of Certain Beneficial Owners and Management
Grant Park has no directors or officers. Grant Park’s affairs are managed by the general partner. Set
forth in the table below is information regarding the beneficial ownership of the principals of the general partner in Grant Park as of January 31, 2011.
| Number of | ||||||||||||||||||||||||||||||||
Name | Class A Units | Class B Units | Legacy 1 Class Units | Legacy 2 Class Units | Global 1 Class Units | Global 2 Class Units | Global 3 Class Units | General Partnership Units | ||||||||||||||||||||||||
Dearborn Capital Management, LLC | 2,707.791 | 384.311 | 922.500 | 900.000 | 940.193 | 1,108.970 | 450.000 | 823.752 | ||||||||||||||||||||||||
David M. Kavanagh | 2,707.791 | (1) | 384.311 | (1) | 922.500 | (1) | 900.000 | (1) | 940.193 | (1) | 1,108.970 | (1) | 450.000 | (1) | 823.752 | (1) | ||||||||||||||||
Patrick J. Meehan | — | — | 185.117 | — | 50.000 | — | — | — | ||||||||||||||||||||||||
Maureen O’Rourke | — | — | 41.067 | — | 41.359 | — | — | — | ||||||||||||||||||||||||
| Percentage of Outstanding | ||||||||||||||||||||||||||||||||
Name | Class A Units | Class B Units | Legacy 1 Class Units | Legacy 2 Class Units | Global 1 Class Units | Global 2 Class Units | Global 3 Class Units | General Partnership Units | ||||||||||||||||||||||||
Dearborn Capital Management, LLC | 6.29 | % | 0.08 | % | 13.86 | % | 11.35 | % | 8.09 | % | 5.34 | % | 0.27 | % | 100.00 | % | ||||||||||||||||
David M. Kavanagh | 6.29 | % | 0.08 | % | 13.86 | % | 11.35 | % | 8.09 | % | 5.34 | % | 0.27 | % | 100.00 | % | ||||||||||||||||
Patrick J. Meehan | — | — | 2.78 | % | — | 0.43 | % | — | — | — | ||||||||||||||||||||||
Maureen O’Rourke | — | — | 0.62 | % | — | 0.36 | % | — | — | — | ||||||||||||||||||||||
| (1) | Represents units directly held by Dearborn Capital Management, L.L.C., the general partner of Grant Park. The managing member of Dearborn Capital Management, L.L.C. is Dearborn Capital Management Ltd. Mr. Kavanagh is the majority shareholder of Dearborn Capital Management Ltd. |
Grant Park has no securities authorized for issuance under equity compensation plans.
Miscellaneous
The general partner shall have fiduciary responsibility for the safekeeping and use of all funds and assets of Grant Park, whether or not in its immediate possession or control, and the general partner shall not employ, or permit another to employ such funds or assets in any manner except for the exclusive benefit of Grant Park.
The general partner has retained Rabar Market Research, Inc., EMC Capital Management, Inc., Eckhardt Trading Company, or ETC, Global Advisors Jersey Limited, Transtrend B.V., Quantitative Investment Management LLC, or QIM, Winton Capital Management Limited, Welton Investment Corporation, Sunrise Capital Partners, LLC, Amplitude Capital International Limited, and effective February 1, 2011, Alder Capital Limited and Denali Asset Management, LLLP, as Grant Park’s trading advisors. The table below illustrates the trading advisors for each class of Grant Park’s outstanding limited partnership units:
| Alder* | Amplitude | Denali* | EMC | ETC | Global Advisors | QIM | Rabar | Sunrise | Transtrend | Welton | Winton | |||||||||||||||||||||||||||||||||||||
Class A | X | X | X | X | X | X | X | X | X | X | X | X | ||||||||||||||||||||||||||||||||||||
Class B | X | X | X | X | X | X | X | X | X | X | X | X | ||||||||||||||||||||||||||||||||||||
Legacy 1 | X | X | X | X | X | X | X | X | X | X | X | X | ||||||||||||||||||||||||||||||||||||
Legacy 2 | X | X | X | X | X | X | X | X | X | X | X | X | ||||||||||||||||||||||||||||||||||||
Global 1 | X | X | X | X | X | X | X | X | X | X | ||||||||||||||||||||||||||||||||||||||
Global 2 | X | X | X | X | X | X | X | X | X | X | ||||||||||||||||||||||||||||||||||||||
Global 3 | X | X | X | X | X | X | X | X | X | X | ||||||||||||||||||||||||||||||||||||||
| * | Effective February 1, 2011. |
39
The trading advisors and their respective asset allocations with respect to the Legacy 1 Class and the Legacy 2 Class units are the same as with respect to the Class A and Class B units. Effective February 1, 2011, the general partner allocates Grant Park’s net assets among the trading advisors with respect to the Class A, Class B, Legacy 1 Class and Legacy 2 Class units as follows: EMC, Winton and Welton manage between 10% to 20% of Grant Park’s net assets and Rabar, ETC, Global Advisors, Transtrend, QIM, Sunrise, Amplitude, Alder and Denali manage less than 10% of Grant Park’s net assets. The trading advisors for the Legacy 1 Class and Legacy 2 Class units pursue a technical trend trading philosophy, which is the same trading philosophy the trading advisors have historically used for the Class A and Class B units.
Effective February 1, 2011, for the Global 1 Class, Global 2 Class and Global 3 Class units, between 10% and 20% of Grant Park’s assets are allocated to each of ETC, Transtrend, QIM, Welton and Winton, while EMC, Sunrise, Amplitude, Alder and Denali are allocated less than 10% of Grant Park’s net assets. The trading advisors for the Global 1 Class, Global 2 Class and Global 3 Class units pursue technical trend trading philosophies, as well as pattern recognition philosophies focused on relatively shorter timeframes than the Legacy 1 Class and Legacy 2 Class units.
The general partner may, in its sole discretion, reallocate assets among the trading advisors upon termination of a trading advisor or retention of any new trading advisors, or at the commencement of any month. Consequently, the allocation for all classes of units is subject to change.
Rabar and EMC have been trading on behalf of Grant Park since January 1989 and ETC has been trading on behalf of Grant Park since April 1998. Winton began trading for Grant Park on August 1, 2004. Welton began trading for Grant Park on March 1, 2006. Transtrend and Global Advisors each began trading on July 1, 2008, QIM began trading for Grant Park on October 1, 2008. As of January 1, 2010, Sunrise began trading for Grant Park and as of February 1, 2010, Amplitude began trading on behalf of Grant Park as well. Effective February 1, 2011, Alder and Denali began trading for Grant Park and are each allocated less than 10% of Grant Park’s assets to manage. The general partner may, in its sole discretion, reallocate assets among the trading advisors upon termination of a trading advisor or retention of
any new trading advisors, or at the commencement of any month. Consequently, the current apportionment is subject to change.
The advisory contracts authorize the general partner to reallocate assets among the trading advisors monthly as it determines in its sole discretion upon 10 days’ prior written notice to the affected trading advisors. However, no reallocation of assets will be made to a trading advisor if the trading advisor determines that the amount of the reallocated assets, together with other assets that are already under the trading advisor’s management or which, pursuant to firm written commitments, will be placed under the trading advisor’s discretion, would exceed the total amount of funds the trading advisor could manage without detriment to the accounts it manages.
Because the advisory contracts also provide for reallocation upon termination of a trading advisor’s advisory contract, it is possible that, during the terms of the advisory contracts, the percentage of assets managed by the trading advisors may vary, perhaps substantially, from the current allocations. The advisory contracts are generally for a term of one year and are generally automatically renewable for successive one-year terms until terminated or in the case of Transtrend, in force until terminated by either party. The advisory contracts generally provide that either party may terminate the advisory contract at any time for any or no reason upon no less than 60 days’ written notice, or, in the case of Transtrend, may be terminated at any time with at least one business day prior written notice. The advisory contracts also generally provide that either party may terminate the advisory contract immediately upon written notice of the occurrence of enumerated events including the withdrawal of the general partner, the suspension, revocation or withdrawal of either party’s CFTC registration or NFA membership or a material breach of the advisory contract by a trading advisor.
From time to time, the general partner allocates funds in excess of actual funds, referred to as notional funds, to one or more of the trading advisors. Because of the leverage available from the use of notional funds, performance of a notionally funded account expressed as a percentage of nominal account size, which is the sum of notional funds and actual funds, will be different than the performance of the account expressed as a percentage of actual funds only. The rates of return on the actual funds allocated to the trading advisors who have been allocated notional funds by the general partner will be a higher percentage amount, both positive in the case of gains
40
and negative in the case of losses, than if the trading advisor had been allocated actual funds only. The general partner also may “de-leverage” a trading advisor by allocating more of Grant Park’s assets to it than is necessary to maintain the portfolio’s positions. The general partner may pay consulting fees with respect to notional funds allocated to the trading advisors. Incentive fees only are paid to a trading advisor if the trading advisor has new trading profits on its allocated net assets, which includes any notional funds and actual funds.
No trading advisor has authority or responsibility for the selection of any clearing broker for Grant Park or for negotiating the terms, including the commission rates, upon which a clearing broker or brokers are engaged. For ease of administration, however, the trading advisors have discretion to direct all or a portion of their trades on behalf of Grant Park to one or more executing brokers or floor brokers of their choice for execution with instruction to give-up the executed trade to the clearing broker, which will clear and settle the trade and carry the resulting position in Grant Park’s account. The trading advisors also may from time to time execute Grant Park’s OTC options, forward and spot contracts with dealers other than the clearing brokers or their affiliates, but only with the prior written consent of the general partner.
The trading advisors and their principals may currently, or may in the future, trade for their own accounts and/or invest in other commodity pools for which they serve as advisor. In doing so, these trading advisors and/or principals may make trades that are different from, opposite to or similar to, trades entered into by Grant Park and they may even be the other party to a trade entered into by Grant Park. Investors should note that any orders for other accounts might not be part of a block order but might be placed before or after orders for Grant Park, and might or might not obtain more favorable order execution. If the trading advisors or their principals engage in personal account trading, or trading for commodity pools in which they invest, limited partners will not be permitted to inspect records of this trading or any written policies related to this trading.
The advisory contracts with each trading advisor generally provide that the general partner and Grant Park shall indemnify and hold harmless the trading advisor and its affiliates against any losses, liabilities, expenses (including reasonable attorneys’ and accountants’ fees), judgments or settlements if the trading advisor or its affiliates acted in good faith and in a manner it reasonably believed to be in or not
opposed to the best interests of Grant Park, and provided that the trading advisor’s or its affiliates’ conduct does not constitute negligence (or, in the case of certain trading advisors, gross negligence) or a breach of its or their fiduciary obligations.
The following descriptions include background information on each trading advisor and its principals, as well as information concerning each trading advisor’s strategy applicable to the class or classes of Grant Park that it trades. You should note that the descriptions were prepared by each trading advisor and may emphasize different aspects of each. Because each trading advisor’s strategies and programs are proprietary and confidential, their descriptions here are general in nature. Each of the trading advisors has advised the general partner that there have been no material administrative, civil or criminal actions within the past five years against that trading advisor or its principals and no such actions are currently pending.
Rabar Market Research, Inc.
Rabar is an Illinois corporation and was registered as a commodity trading advisor and commodity pool operator in June 1988. Rabar has been a member of the NFA since June 1998. The business address of Rabar is 10 Bank Street, Suite 830, White Plains, New York 10606-1933, and its telephone number is (914) 682-8363. Rabar was originally named Rainbow Market Research, Inc. when it was incorporated in November 1986. Its name was changed to Rabar Market Research, Inc. in January 1989. It has managed accounts continuously since July 1988.
Management
The principals of Rabar are Paul Rabar and Jeffrey Izenman.
Paul Rabar is the president and founder of Rabar. Since founding the firm in 1988, Mr. Rabar has focused his full business time and attention on the operation of Rabar with a particular focus on trading and research. Mr. Rabar is a graduate of the New England Conservatory of Music. As of February 2005, Mr. Rabar was a principal of Vaca Capital Management, LLC, a registered commodity trading advisor and commodity pool operator, as well as a hedge management company. Mr. Rabar became registered as an associated person and listed principal of Rabar in June 1988.
Jeffrey Izenman is the executive vice president of Rabar, having joined Rabar in that capacity in
41
November 1998. Also, he has been a managing member of BRI Partners LLC, a venture capital firm for emerging and developing hedge fund managers, since June 2001. He became a registered associated person and listed principal of BRI in June 2001. Mr. Izenman received his J.D. degree from the University of Michigan Law School in May 1982 and a B.S. in accountancy from the University of Illinois in May 1979. He has also passed the Uniform Certified Public Accountants exam. Mr. Izenman became a listed principal and associated person of Rabar in November 1998.
Rabar’s Trading Program
Strategy. Rabar currently uses a trading program known as the Diversified Program in trading for Grant Park. Rabar has been trading the Diversified Program since January 1989. The objective of Rabar’s investment strategy is to generate capital appreciation over the long run by investing exclusively in exchange-traded futures contracts, options on futures contracts, foreign currency forward contracts and, to a very limited extent, cash commodities. Rabar may also engage in exchange for physical transactions, more commonly referred to as EFPs. An EFP transaction involves the exchange of a futures position for the underlying commodity without making an open competitive trade on an exchange, as permitted by exchange rules.
Rabar’s strategy employs a diversified, systematic, technical, trend-following approach, utilizing a blend of several separate and distinct quantitative models. Each of these elements is described more fully below.
| • | The approach is diversified in that it can be invested in more than 90 markets, covering more than 20 different exchanges in 25 different countries. The portfolio includes futures contracts on currencies, financial instruments, precious and base metals, stock indices, energies, and agricultural and soft commodities. The specific markets have been chosen for, among other reasons, their historical performance and customary liquidity. |
| • | The approach is systematic in that Rabar utilizes multiple quantitative investment models that generate signals directing Rabar to initiate or liquidate positions in each market at specific, predetermined price points. In the vast majority of circumstances, |
Rabar will follow the specific signals generated by the models. The approach does, however, incorporate a small discretionary element. In this regard, Rabar may, from time to time, analyze certain key fundamental factors affecting supply and demand, such as a regional or global financial crisis, extreme weather conditions, or major political events. As a result of the analysis Rabar may make adjustments to the size of positions or the timing of trades in the portfolio in an effort to control risk or to take advantage of potential profit opportunities. |
| • | The approach is technical, meaning that the signals generated by the models are based upon an analysis of objective technical factors rather than fundamental factors. Although the technical indicators analyzed are varied, they are all based primarily on daily, weekly, and monthly price movement. |
| • | The approach is trend-following and, in some cases, trend-identifying. In this regard, Rabar seeks to invest in markets exhibiting directional price movement over time. Since the portfolio will maintain both long and short positions, it is not necessarily relevant whether a particular market is rising or falling. It is merely the case that Rabar’s best opportunity for profit will come from markets moving continuously in one direction while Rabar will have a difficult time profiting from, and may incur losses in, markets that are not exhibiting sustained directional movement. |
| • | The approach incorporates a blend of quantitative models. Specifically, the methodology employs several totally separate and distinct investment models in its overall approach, and several additional variations of those models, all of which are blended together in Rabar’s program. |
Risk Management. Rabar employs a number of risk management techniques in the strategy with a view toward reducing and controlling risk in the portfolio. For example, Rabar’s portfolio is broadly diversified thereby spreading the risk across multiple markets. Rabar’s portfolio is also diversified across multiple quantitative models, limiting the risk exposure in the portfolio to any one such model. Rabar also employs predetermined stop loss levels or exit points for each position. These stop losses can have the
42
effect of limiting the exposure to each position, system, market and market sector, and in the portfolio as a whole. In addition, Rabar utilizes a proprietary quantitative methodology to determine the size of each position with a view toward equalizing risk in the portfolio across all markets.
It should be noted that the risk management techniques described above may not have the desired effects of controlling or even reducing risk in the portfolio, as investing in commodity interests involves a high degree of risk.
Research & Development. Rabar believes that the development of quantitative models for use in investing in commodity interests is a continual process. To this end, Rabar conducts an ongoing research and development effort led by Paul Rabar and including a team of professionals working on research related matters. The goal of the research effort is to evaluate the continued viability of the existing models, to enhance the existing models, and to develop new models. Although these goals may not be achieved, through its research effort Rabar has modified its models over time and it is likely that modifications will be made in the future. Thus, the models that might be used by Rabar in the future may differ from those presently used or those used in the past. Clients such as Grant Park will not be informed about non-material modifications, including generally, markets or commodity interest contracts traded.
Miscellaneous. As stated above, some investment decisions involve the exercise of judgment by Rabar. For example, the decision not to trade particular commodity interests or to reduce or eliminate exposure in particular markets may result at times in missing price moves and hence profits of great magnitude, which other managers who are willing to trade these commodity interests or have not reduced exposure may be able to capture. For these and other reasons, the performance of Rabar may not result in profitable trading.
EMC Capital Management, Inc.
EMC is an Illinois corporation formed and organized in January 1988. It has been registered as a commodity trading advisor since May 1988 and as a commodity pool operator since February 1991. EMC filed a 4.7 Exemption in September 2007. EMC also is a member of the NFA. The business address and telephone number of EMC are 2201 Waukegan Road, Suite 240 West, Bannockburn, Illinois 60015, and (847) 267-8700.
Management
The principals of EMC Capital Management, Inc. are Elizabeth A. Cheval, John C. Krautsack, David F. Polli, Brian D. Proctor and the Elizabeth A. Cheval Revocable Trust.
Elizabeth A. Cheval is the Chairman of EMC, and through the Elizabeth A. Cheval Revocable Trust, of which she is the sole beneficiary and trustee, its sole shareholder. In May of 1988, Ms. Cheval established EMC and began trading capital on behalf of the firm. Ms. Cheval is responsible for the overall supervision of all of EMC’s functions. Ms. Cheval holds a B.A. in mathematics from Lawrence University. Ms. Cheval became registered as an associated person and listed as a principal of EMC effective May 1988.
John C. Krautsack joined EMC in April 1995 and has served as Managing Director, Trading since July 2008, Vice President, Director of Trading since February 2003, and Senior Trader since April 1995. Mr. Krautsack supervises the active management of EMC’s portfolio and is responsible for all trading operations. Mr. Krautsack became registered as an associated person and listed as a principal of EMC effective June 1995 and August 2008, respectively.
David F. Polli joined EMC in October 2002 and has served as Managing Director, Research since July 2008, Director of Research since May 2007, and Director of IT and Senior Trader since October 2002. Mr. Polli directs research at EMC and is responsible for the design and integration of all trading and research platforms employed by EMC. Mr. Polli graduated with honors from the Illinois Institute of Technology with a B.S. in computer and electrical engineering. Mr. Polli became registered as an associated person and listed as a principal of EMC effective April 2003 and July 2008, respectively.
Brian D. Proctor joined EMC in August 2005 and has served as Managing Director since July 2008, and Vice President, Director of Marketing since August 2005. Mr. Proctor is active in trading, research, and business development for EMC. Mr. Proctor holds a B.A. in economics from Miami of Ohio, University and J.D. from John Marshall Law School. Mr. Proctor became registered as an associated person and listed as a principal of EMC effective December 2005 and July 2008, respectively.
The Elizabeth A. Cheval Revocable Trust became a listed principal of EMC effective May 1991.
43
EMC’s Trading Program
EMC’s objective in providing management services to Grant Park is the appreciation of Grant Park’s assets through speculative trading of commodity interests.
EMC currently trades its Classic Program on behalf of Grant Park. EMC has been trading the Classic Program since January 1985. The investment strategy employed in the Classic Program is technical rather than fundamental in nature in that it is developed from analyses of patterns of actual monthly, weekly and daily price movements and is not based on analysis of fundamental factors such as supply and demand, general economic conditions or anticipated world events. EMC relies on historical analyses of these price patterns to interpret current market behavior and to evaluate technical indicators for trade initiations and liquidations. EMC’s investment strategy in the Classic Program is trend-following in that initiations and liquidations of positions in a particular market are generally in the direction of the price trend in that market.
EMC employs an investment strategy that uses a number of trading systems simultaneously. Also, the strategies are diversified in that EMC actively invests in a portfolio of over 80 markets.
Although the specific commodity interests, including futures contracts, options on futures contracts, forward contracts and cash commodities, to be invested in through the Classic Program will vary from time to time, at the present time, EMC principally invests in futures contracts and forward currency contracts for its clients. EMC currently trades futures contracts in a number of sectors including precious and base metals, U.S. and foreign fixed income instruments, stock indices, foreign exchange, grains and agricultural products, energy products such as crude oil, and soft commodities such as orange juice, sugar and coffee. EMC may invest in other commodity interests in the future. EMC also may invest in foreign currency forward contracts and, to a lesser extent, may engage in EFP transactions.
The commodity interests typically chosen for the Classic Program have been selected for, among other things, their historical performance and for their customary liquidity. EMC may frequently invest, however, in less liquid markets. If an open position cannot be liquidated, Grant Park may be required to accept delivery of the underlying commodity. In these circumstances, it may be necessary for Grant Park to borrow funds.
If possible within existing market conditions, EMC adheres to the requirements of a money management system that determines and limits the equity committed to each position, each commodity and each group of commodities, and sets optimal stop-losses for each position and each account. The level of liquidation determined by this money management system can override liquidations determined by technical indicators.
EMC continues to develop investment strategies and programs, as well as risk and money management systems. As a result of EMC’s ongoing research and development, enhancements and modifications have been made from time to time in the specifics of EMC’s methods, and it is likely that similar enhancements and modifications will be made in the future. Accordingly, the methods that may be used by EMC in the future might differ from those presently being used. The general partner will be informed of changes in EMC’s trading methods if strategy changes are deemed material by EMC.
Eckhardt Trading Company (ETC)
ETC is an Illinois corporation formed in May 1992 that became registered as a commodity trading advisor and commodity pool operator and a member of the NFA in June 1992. ETC succeeded to the business formerly conducted by William Eckhardt, who was individually registered as a commodity trading advisor and commodity pool operator and a member of the NFA from June 1991 until his registration was changed over to ETC in June 1992. William Eckhardt is the chairman, chief executive officer and sole shareholder of ETC; John D. Fornengo is president. The address and telephone number of ETC’s business office is 1314 North Dearborn Parkway, Carriage House, Chicago, IL 60610 and (312) 787-1107.
Management
The listed principals of ETC are William Eckhardt, John D. Fornengo and William Eckhardt as Trustee of William Eckhardt Revocable Trust.
William R. Eckhardt was the original founding partner of ETC and has been employed by the firm since its inception in June 1991. Mr. Eckhardt directs ETC’s system development and ongoing research, and along with John D. Fornengo, ETC’s president, is responsible for the overall activities of ETC. Mr. Eckhardt received a B.A. in mathematics from DePaul University in 1969 and a M.S. in mathematics
44
from the University of Chicago in 1970. Mr. Eckhardt became a listed principal of ETC in June 1991. Mr. Eckhardt was registered as a floor broker in November 1982.
In January 1993, John Fornengo began working with ETC to assist Mr. Eckhardt in the implementation and execution of ETC’s trading program. In June 1995, Mr. Fornengo became Vice President of ETC, and in August 1999, he became President. Mr. Fornengo is registered in his individual capacity as a sole proprietor commodity trading advisor; currently, he has no accounts under management. Mr. Fornengo was registered as a listed principal and an associated person of ETC in June 1995 and February 1993 respectively. Mr. Fornengo was registered as a Branch Manager for ETC in July 1997. Mr. Fornengo registered in his individual capacity as a sole proprietor commodity trading advisor, John Domenic Fornengo, in December 1991. He became an approved principal of the sole proprietor commodity trading advisor, John Domenic Fornengo, in December 1991.
William Eckhardt as Trustee of William Eckhardt Revocable Trust became a listed principal of ETC in March 2008.
ETC’s Trading Program
Effective June 1, 2007, ETC trades its Standard Plus Program (formerly called Standard Program Higher Leverage) on behalf of Grant Park. Prior to June 1, 2007, ETC’s Global Financial Program was included in Grant Park. Both trading programs are based on the same trading approach. The primary difference between the two programs relates to position sizes and the markets that may be traded in the programs. The Standard Plus Program (Standard Plus) positions are approximately 20% larger than those in the Standard Program. Due to increased leverage, the Standard Plus entails a greater degree of risk. ETC began managing accounts according to the Standard Plus in October 1991. ETC primarily engages in trading futures contracts on U.S. and non-U.S. exchanges. Currently the market groups or contracts traded for the Standard Plus include U.S. and international interest rates and stock indices, currencies and cross-rates, metals, energy products, grains and soft markets.
ETC’s objective is to achieve appreciation of its clients’ assets through speculative trading of futures contracts and related investments. In addition, ETC may trade options on futures, forward contracts on commodities and currencies, and cash currencies, and may engage in
transactions in physical commodities, including EFPs (in addition to EFPs in currencies). The exact nature of ETC’s methods are proprietary and confidential. The following description is, of necessity, general and not exhaustive.
ETC’s trading approach is the product of over 30 years of intensive research on futures price action, risk management and trading system development. Diversified systems are melded in accordance with the modern mathematical theory of risk. The systems are technical in origin and trend following in thrust. They are not based on the analysis of fundamental supply and demand factors.
ETC’s trading approach is predominantly applied in an algorithmic or mechanical manner. Occasionally, discretion and judgment may be used; discretion is nonetheless informed by investigations into historical price action and is often employed for risk management purposes. Discretion also may be utilized in connection with the timing of the entry of orders in the markets traded.
ETC believes that research is a crucial component of the trading enterprise; time and resources are devoted to it accordingly. The systems used have undergone an evolutionary development, some for protracted periods. Many of the current systems bear little resemblance to their prototypes. The systems are subject to change if ETC’s methodological principles indicate that it is warranted. Additionally, trading decisions may require the exercise of judgment of ETC. The decision not to trade certain futures, not to make certain trades or to reduce position sizes may result at times in missing price moves and profits of great magnitude that other trading advisors who are willing to trade such positions, or trade larger positions, may be able to capture. The past performance of ETC is not indicative of profitable trading in the future.
The markets traded have been chosen for historical performance, and for customary liquidity; however, there can be no assurance of liquidity. From time to time ETC may trade in less liquid markets. In cases involving futures contracts, ETC may determine to accept or to make delivery, or market conditions may be such that an open position cannot be liquidated to avoid delivery. In the event of delivery, it may be necessary for Grant Park to borrow funds. Such borrowing may, but is not required to, be arranged by ETC from independent third parties, generally banks, at market rates for short-term loans; any borrowing will be at Grant Park’s expense.
45
Winton Capital Management Limited
Winton Capital Management Limited, a United Kingdom company, became registered as a commodity trading advisor in January 1998, and as a commodity pool operator in December 1998. Winton is a member of the NFA. Winton is also authorized and regulated by the United Kingdom’s Financial Services Authority (“FSA”). Winton’s principal office is located at 1-5 St. Mary Abbot’s Place, London W8 6LS, United Kingdom, and its telephone number is 011-44-20-7610-5350.
Management
The listed principals for Winton are David Winton Harding, Osman Murgian, Martin John Hunt, Anthony Daniell, David Beddall, Rajeev Patel, Andrew Bastow, Amur Jersey Limited and Samur Jersey Limited.
David Winton Harding founded Winton Capital Management Limited in February 1997, and is the firm’s managing director. Mr. Harding ultimately oversees all critical functions performed at Winton. Mr. Harding graduated from Cambridge University with a first class honors degree in 1982. Mr. Harding became a listed principal and associated person of Winton in January 1998.
Osman Murgian is a founding director of Winton. Mr. Murgian does not take part in any trading or operational activities of Winton nor does he actively market Winton’s services. Mr. Murgian has a beneficial interest of more than 10% of Winton’s share capital. This interest is held by Samur Jersey Ltd. and Amur Jersey Ltd., both of which are investment holding companies ultimately owned by Mr. Murgian’s family foundation. Mr. Murgian was educated at Brighton College in England. Mr. Murgian became a listed principal of Winton in January 1998.
Martin John Hunt is a founding director of the firm. Mr. Hunt supervises the trading operations and has responsibility for the firm’s regulatory compliance and finance. Mr. Hunt became a listed principal and associated person of Winton in January 1998.
Anthony Hamilton Daniell joined Winton in October 2004 and became a director in October 2006. Mr. Daniell is responsible for supervising Winton’s sales and marketing team. Mr. Daniell became an associated person and listed principal of Winton in April 2005 and October 2006, respectively.
Matthew Beddall was appointed to the main Board of Directors at Winton in December 2008. He was appointed Chief Investment Officer in December 2008. Mr. Beddall joined Winton as a researcher in July 2001. As CIO, Mr. Beddall’s responsibilities are principally focused on managing the investment process behind the Winton Futures Fund and overseeing a large section of the research department. Mr. Beddall is extensively involved in all aspects of Winton’s research process and has led the development of much of the software that underlies the design and running of Winton’s trading strategy. Mr. Beddall received a first class honors degree in mathematics and computer science from Southampton University. Mr. Beddall also has an M.Sc. in applied statistics from Birkbeck College, University of London. Mr. Beddall became a listed principal of Winton in January 2009. He became registered as an associated person of Winton in February 2009.
Rajeev Patel joined Winton in April 1997 as a trader and became Director of Trading and Operations in June 2009 and Winton’s Chief Operating Officer in November 2010. Mr. Patel is responsible for overseeing all aspects of trading and is responsible for operations software development, fund accounting and settlements. Mr. Patel holds a degree in economics and business administration from Trinity and All Saints College, Leeds. Mr. Patel became registered as an associated person and listed principal of Winton effective May 1998 and June 2009, respectively.
Andrew Bastow currently serves as Winton’s General Counsel and Director of Government and Regulatory Affairs. Mr. Bastow joined Winton as General Counsel in October 2005 and was appointed to the firm’s main Board of Directors in November 2010. Mr. Bastow holds a first class master of laws degree from the London School of Economics and Political Science. He was listed as a principal in November 2010.
Amur Jersey Limited became a listed principal of Winton in February 2007.
Samur Jersey Limited became a listed principal of Winton in February 2007.
Winton’s Trading Methods
Winton’s investment philosophy is directed towards long-term capital appreciation through compound growth. This is achieved by pursuing a diversified trading scheme without reliance on favorable conditions in any particular market, nor does
46
it depend on the general direction of market prices. The investment technique of Winton’s Diversified Program, which Winton has been trading since October 1997, trades a portfolio of more than 100 commodity interests on major commodity exchanges and forward markets worldwide, employing a totally computerized, technical, principally trend-following trading system developed by its principals. This system tracks the daily price movements from these markets around the world, and carries out certain computations to determine each day how long or short the portfolio should be to maximize profit within a certain range of risk. A trend-following system is one that attempts to take advantage of the observable tendency of the markets to trend, and to tend to make exaggerated movements in both upward and downward directions as a result of such trends. These exaggerated movements are largely explained as a result of the influence of crowd psychology or the herd instinct, amongst market participants. The Winton trading system has been developed by relating the probability of the size and direction of future price movements with certain indicators derived from past price movements which characterize the degree of trending of each market at any time.
Trade selection is not subject to intervention by Winton’s principals and therefore, is not subject to the influences of individual judgment. As a mechanical trading system, the Winton model embodies all the expert knowledge required to analyze market data and direct trades, thus eliminating the risk of basing a trading program on one indispensable person. Equally as important is the fact that mechanical systems can be tested in simulation for long periods of time and the model’s empirical characteristics can be measured. The system’s output is rigorously adhered to in trading the portfolio and intentionally no importance is given to any external or fundamental factors.
The Winton system trades in all the easily accessible and liquid commodity interests that it practically can. As at the date of this document, Winton’s portfolio mainly consists of commodity interests which are futures, options and forward contracts in the following areas: stock indices; bonds; short term interest rates; currencies; precious and base metals; grains; livestock; energy and agricultural products. Winton is constantly looking for new opportunities to add additional markets to the portfolio, thus further increasing the portfolio’s diversification.
The trading strategy and account management principles described here are factors upon which
Winton will base its trading decisions. Such principles may be revised from time to time by Winton as it deems advisable or necessary. Accordingly, no assurance is given that all of these factors will be considered with respect to every trade or recommendation made on behalf of a Program account or that consideration of any of these factors in a particular situation will lessen a client’s risk of loss or increase the potential for profits.
Welton Investment Corporation
Welton Investment Corporation is a Delaware corporation and is the successor to a California corporation originally formed in November 1988. In January 1989, Welton became a registered commodity trading advisor and commodity pool operator. The firm has been a member of the NFA since January 1989 and is also a member of the Managed Funds Association, and the Alternative Investment Management Association. Welton’s offices are located at the Eastwood Building, San Carlos between 5th and 6th, Carmel, California 93921-6147. The firm’s telephone number is (831) 626-5190.
Management
The listed principals of Welton are Patrick Welton, Annette Welton, Brent Hankins, David Nowlin, Gullaume Detrait, Justin Balas, Christopher Keenan, Justin Dew and the Welton Family Trust.
Patrick Welton co-founded the firm in 1988, and serves as Chief Executive Officer and Chairman. Dr. Welton oversees the firm’s trading and research efforts, and is the senior management reviewer of all risk management reporting. Dr. Welton is also a principal of Welton Global Funds Management Corporation, which acts as the statutory commodity pool operator for Welton’s offshore funds. This entity was registered as a commodity pool operator and commodity trading advisor in February 1996. As president and CEO of this entity, Dr. Welton oversees all core functions of the entity. Dr. Welton became a listed principal and associated person of Welton in January 1989. Dr. Welton also became an associated person and listed principal of Welton Global Funds Management Corporation in February 1996.
Annette Welton co-founded Welton in 1988, and serves as the Chief Operating Officer. Ms. Welton oversees all corporate finance and operations for the firm. She leads Welton’s executive team in addition to developing strategic corporate planning policy. She holds a B.S. from UCLA. Ms. Welton has been a listed
47
principal and associated person of Welton since January 1989. Ms. Welton also became an associated person and listed principal of Welton Global Funds Management Corporation in February 1996. As corporate secretary and CFO of Welton Global Funds Management Corporation, Ms. Welton assists with all core functions of the entity.
Brent Hankins is the firm’s Senior Portfolio Manager. Mr. Hankins’ primary responsibilities include portfolio management, research and development of trading strategies, and oversight of the firm’s trading operations. Mr. Hankins has been with Welton since January 1993. Mr. Hankins earned a B.S. from California Polytechnic University at San Luis Obispo. Mr. Hankins became a listed principal and associated person of Welton in February 2000 and March 1993, respectively.
David Nowlin is Welton’s Chief Compliance Officer. Mr. Nowlin oversees all aspects of the firm’s corporate and regulatory compliance along with the administrative operations. Mr. Nowlin has been with Welton since June 1993. Mr. Nowlin earned an M.B.A. from Santa Clara University and a B.A. from Westmont College. Mr. Nowlin became a listed principal and associated person of Welton in February 2000 and June 1994, respectively.
Gullaume Detrait oversees the overall operations of the firm and the enterprise risk management function, both partnering with internal departments to consolidate sound business practices and ensuring that all major risk categories are properly mitigated. Prior to joining the firm, Mr. Detrait was a Vice President at HSBC, a banking and financial services organization, where he participated in strategic development for the U.S. credit card division from December 2005 until July 2008. He holds an M.B.A. from Columbia Business School and a B.S. in economics from ESC Reims in France. Mr. Detrait has been registered as an Associated Person with Welton since September 2008 and listed as a Principal with Welton since February 2011.
Justin Balas oversees the firm’s proprietary research directives and the development of new products, managing groups of specialists within Information Technology, Trading and Applied Sciences. Mr. Balas joined Welton in September 2004. Mr. Balas holds the CAIA designation and earned a BA from the University of California, Santa Cruz. Mr. Balas has been registered as an associated person with Welton since October 2004 and listed as a principal with Welton since February 2011.
Christopher Keenan manages all strategic marketing initiatives on behalf of Welton. Mr. Keenan has been employed by Welton since September 2002. He holds an M.B.A. from Northwestern’s Kellogg School of Business and a B.A. from UCLA. Mr. Keenan has been registered as an associated person with Welton since March 2003 and listed as a principal with Welton since February 2011.
Justin Dew is responsible for business development, expanding the firm’s East Coast presence and identifying, evaluating and executing strategic growth opportunities. Prior to joining Welton in December 2008, Mr. Dew was formerly the Managing Director and Head of Strategic Development for the Clinton Group, an SEC registered investment advisor, from October 2006 to November 2008. Prior to that, he was a Senior Director and Global Head of Alternative Strategies at Standard & Poor’s, a financial services firm providing financial market intelligence, from August 2002 to October 2006. Mr. Dew holds an M.B.A. from Cornell University and a B.S. from Ithaca College. He has been registered as an associated person with Welton since January 2009 and listed as a principal with Welton since February 2011.
As the sole shareholder of Welton, the Welton Family Trust dated January 28, 1992 is a listed principal. The trustees and beneficiaries of the Trust are Patrick and Annette Welton.
Welton’s Trading Program
Since its inception, Welton has offered managed futures advisory services to trading manager, institutional and high net worth clients. Welton will use its Alternative Equity Strategies Program (AES), Global Non-Correlated Portfolio (GNP) and Global Directional Portfolio program (GDP), described below, in managing assets for Grant Park.
Welton’s three investment programs combine various elements of the firm’s proprietary research and trading. All programs are intended to generate investment performance with a low correlation to traditional investments such as equities and hedge funds. Each program also exhibits a low performance correlation to each other. By so doing, Welton strives to make each of its offered programs distinctive in their approach, but uniformly consistent in their ability to diversify and complement the vast majority of investors’ portfolios.
AES Program. The Welton Alternative Equity Strategies portfolio (AES) is a multi-strategy
48
investment program implemented across equity securities, listed options and broad based ETFs. AES trades a complementary and diverse group of strategies each with a different underlying basis of return. AES utilizes mean reversionary, relative value and variance-driven strategies. The strategies are typically best applied within a diverse yet like-kind instrument universe. These strategies were developed within the broader Welton research pipeline, with the specific purpose of diversifying the market breadth and strategic core momentum strategies within Welton’s flagship portfolio, the Global Directional Portfolio (GDP). The program’s overarching goal is to provide investors with a reliable source of returns non-correlated to global equity markets and equity-based hedge funds. Welton’s AES program has been trading as a stand alone product since January 2009. The AES program trades exchange-traded equities and equity options.
GNP Program. The Welton Global Non-Correlated Portfolio (GNP) is a multi-strategy investment program implemented across global exchange-traded futures and foreign exchange. GNP trades a complementary and diverse group of strategies each with a different underlying basis of return. GNP utilizes mean reversion, fundamental and short-term driven strategies. These strategies were developed within the Welton Global Directional Portfolio’s broader research pipeline and are currently strategies all utilized at various allocation levels to diversify GDP’s momentum strategy suite. The program’s overarching goal is to provide investors with a reliable source of returns non-correlated to both global equity markets, hedge funds, and managed futures programs. Welton’s GNP program has been trading as a stand alone product since February 2011. The GNP program trades futures in the equity, fixed income, currency, metals, energy and agricultural markets.
GDP Program. The Welton Global Directional Portfolio (GDP) is a multi-strategy investment program implemented across global exchange-traded futures and foreign exchange. GDP trades a complementary and diverse group of strategies each with a different underlying basis of return. GDP utilizes momentum, mean reversion, and fundamental driven strategies. GDP began trading in June 2004, and is the firm’s flagship investment program today. The program’s overarching goal is to provide investors with a reliable source of returns non-correlated to both global equity markets and hedge funds, while generally mirroring, but outperforming, the performance path of broad based managed futures and global macro indices.
Global Advisors Jersey Limited (Global Advisors)
Global Advisors was formed as a company incorporated in Jersey, Channel Islands as a private company under the Companies (Jersey) Law 1991.
Global Advisors was registered as a commodity trading advisor and has been a member of the NFA since January 2009. Prior to January 2009, Global Advisors operated under the name Global Advisors, L.P. Global Advisors L.P. was registered as a commodity trading advisor and NFA member in June 2001. All registrations for Global Advisors, L.P. were withdrawn in July 2009. Global Advisors’ offices are located at Spectrum, Gloucester Street, St. Helier, JE2 3DE, Channel Islands and its phone number is +44-15-3451-3100.
Management
The listed principals of Global Advisors are Russell Newton, Daniel Masters, Dwayne Drexler, Paul Russell and Global Advisors Holding Limited.
Russell Newton co-founded Global Advisors in February 1999 and serves as Head of Research and a limited partner of Global Advisors. Mr. Newton, supported by his team of quantitative analysts, is solely responsible for the risk management, research and portfolio management of the Global Commodity Systematic Program. Together with Mr. Masters, Mr. Newton co-manages the discretionary client accounts of Global Advisors. Mr. Newton received a B.A. (honors) in natural sciences (experimental psychology) from Cambridge University, U.K., in 1986. He has been registered as a principal of Global Advisors since December 2008 and an associated person of Global Advisors since January 2009 with the NFA, and as an approved person of Global Advisors with the FSA.
Daniel Masters co-founded Global Advisors in February 1999 and serves as a Head of Trading and limited partner of Global Advisors. Mr. Masters is responsible for trade execution for the Global Commodity Systematic Program. Together with Mr. Newton, Mr. Masters co-manages the discretionary client accounts of Global Advisors. Mr. Masters earned a B.S. (honors) in physics from Exeter University, U.K., in 1984, and a masters in management science and operational research from Imperial College, London, U.K. in 1985. Mr. Masters became a listed principal in December 2008 and an associated person of and NFA associate member in January 2009.
49
Dwayne Drexler is a director and shareholder of Global Advisors. Mr. Drexler was initially employed by Global Advisors’ predecessor Global Advisors L.P. in April 1999. Mr. Drexler is responsible for all back-office and administration functions for Global Advisors. Mr. Drexler graduated with a triple major from Georgetown University in 1995, with a B.S./B.A. in accounting, finance, and international business. Mr. Drexler became an associated person of Global Advisors and an NFA associate member in January 2009 and a listed principal of Global Advisors in December 2009.
Paul Russell is a director and shareholder of Global Advisors. He was registered with the NFA as a principal in October 2010 and is approved as a Principal Person of the Trading Advisor by the Jersey Financial Services Commission. Prior to joining Global Advisors in June 2010, Mr. Russell was the Chief Financial Officer, Chief Compliance Officer and a partner at Clive Capital LLP, a London based commodity hedge fund, where he was responsible for all financial, human resources, compliance and legal aspects from October 2007 to June 2010. From October 2001 to September 2007, Mr. Russell was employed by Global Advisors Limited as an associated person from June 2002 until September 2007. Global Advisors Limited is a limited liability company incorporated under the laws of England and Wales which was general partner to Global Advisors L.P., an investment management firm specializing in energy and metals commodities in the United States and United Kingdom, and which was organized as a limited partnership under the laws of England and Wales and Global Operations Services Inc., a Delaware corporation and wholly owned subsidiary of Global Advisors Limited, to which Global Advisors L.P. delegated certain portfolio management and administrative services, and for which Mr. Russell was responsible for all financial, human resources, compliance and legal aspects of the firm. Mr. Russell was the compliance director and a limited partner of Global Advisors LP. Mr. Russell was an associated person of Global Advisors LP from May 2002 to September 2007 and a principal from March 2004 to September 2007. He was also an associated person of Global Operations Services Inc. from July 2002 to September 2007. From July 2002 to September 2007, Mr. Russell also conducted compliance activities for and was authorized signatory to Global Advisors International Limited, an exempt commodity pool operator based in the Cayman Islands. He was an associated person for Global Advisors International Limited from July 2002 to September 2007. He
obtained an M.B.A. from the Open University Business School in 2000, specializing in knowledge management, performance measurement and evaluation, and creative management.
Global Advisors Holdings Limited became a listed principal of Global Advisors in December 2008.
Global Advisors’ Trading Program
Global Advisors uses a program known as the Global Commodity Systematic Program in trading for Grant Park.
Global Advisors operates a fully automated and systematic quantitative trade and portfolio management tool that has been developed for the commodity futures markets. This tool has been designed to run as a low volatility, low draw-down system that provides diversification across a wide range of instruments, including inter- and intra-commodity spreads. It trades infrequently and incrementally with the aim of reducing the effects of transaction costs and to increase capacity within its markets. Global Advisors uses the systematic tool described above to manage Grant Park’s relative exposure to the commodity markets.
The system is comprised of three parts:
| • | The first part processes the data and then extracts those features relevant to the trading system, discarding noise in an adaptive and novel manner. |
| • | The second part then takes this feature set and applies the trade models, outputting a set of positions and stops across the commodity portfolio. |
| • | The third and final part of the system comprises the portfolio overlay. |
Transtrend B.V.
Transtrend is a Dutch limited liability company formed in November 1991 to provide commodity trading advisory services to selected clients. Transtrend has been registered as a commodity trading advisor and commodity pool operator since September 1994, and has been a member of the NFA since September 1994. Transtrend is also licensed as a portfolio manager, and subject to, among others, regulation by the Netherlands Authority for the Financial Markets (“AFM”). The business office of Transtrend, where its books and records are kept, is located at Weena 723, Unit C5.070, 3013 AM Rotterdam, The Netherlands and its telephone number is +31-10-453-6500.
50
Management
The listed principals of Transtrend are Johannes P.A. van den Broek, Harold M. De Boer, Mark H.A. van Dongen, Andre P. Honig and Robeco Nederland B.V.
Johannes “Joep” P.A. van den Broek joined Transtrend as a trader in December of 1995. In October 1997, he was appointed Deputy Director (for Trading) thereby becoming a member of Transtrend’s management team. Effective as of January 1999, Mr. Van den Broek was appointed a Managing Director of Transtrend. Mr. Van den Broek graduated in August 1995 with a masters degree in business economics from Erasmus University Rotterdam. Mr. Van den Broek has been registered as an associated person of Transtrend since October 1998, and as a listed principal of Transtrend since January 1999, and has been a member of the NFA since July 1998.
Harold M. De Boer worked in conjunction with the predecessor of Transtrend for his thesis titled “Cointegration in Commodity Futures Markets” beginning in December 1989. In April of 1990, he joined the predecessor of Transtrend as a research analyst. In 1992 he became responsible for Transtrend’s research department, and as of October 1997, he became a member of Transtrend’s management team with the title of Deputy Director. Effective August 1999, he was appointed a Director of Transtrend, and effective March 2007 he assumed the role of a Managing Director of Transtrend. Mr. De Boer’s primary responsibility remains research and product development. Mr. De Boer graduated in 1990 with a masters degree in applied mathematics from Universiteit Twente in The Netherlands. Mr. De Boer has been listed as a principal of Transtrend since November 1999.
Mark H.A. Van Dongen joined Transtrend as a research analyst in July 1992 and was appointed Deputy Director (research and operations) in October 1997. Effective as of March 2007, Mr. Van Dongen was appointed an Executive Director of Transtrend. Mr. Van Dongen graduated in 1991 with a master degree in econometrics from the Catholic University of Brabant. Mr. van Dongen has been registered as an associated person of Transtrend since August 1998, and has been a member of the NFA since July 1998. In addition, Mr. van Dongen has been listed as a principal of Transtrend since March 2007.
Andre P. Honig joined Transtrend as Deputy Director Investor Relations In May 2004. Effective as of March 2007, Mr. Honig was appointed an Executive
Director of Transtrend. Mr. Honig is responsible for overseeing Transtrend’s client relations and marketing functions. Mr. Honig graduated in 1991 with a masters degree in business econometrics from Erasmus University Rotterdam. Mr. Honig has been registered as an associated person of Transtrend since October 2004, and has been a member of the NFA since October 2004. In addition, Mr. Honig has been listed as a principal of Transtrend since March 2007.
Robeco Nederland B.V. has been a listed principal of Transtrend since July 2002.
Shareholder
100% of the voting interest in Transtrend is owned by Robeco Nederland B.V., which is a wholly-owned subsidiary of Robeco Groep N.V., which in its turn is 100% owned by Coöperatieve Centrale Raiffeissen-Boerenleenbank B.A. (Rabobank Nederland).
Transtrend’s Trading Program
Transtrend trades its Diversified Trend Program, subset Enhanced Risk for Grant Park. Transtrend has offered its Diversified Trend Program to third parties since October 1993. Transtrend’s Diversified Trend Program can at any time be (net) long, short, or neutral in any given market, and the program may include any known futures market, including OTC currency positions. Transtrend applies its strategies to a diversified portfolio spanning the equity, fixed income, currency, metals, energy and agricultural markets.
The applied principles of risk management play a dominant role in Transtrend’s trading program, which is designed to pursue capital growth within the limits of a defined risk tolerance. The program is entirely based on quantitative analysis of signaled price behavior of outright futures and of intra-market and/or inter-market combinations of futures concerned and therefore not on fundamental analysis.
The program may enter into both long and short positions in any of the futures involved, or they may have no position. Long and short positions are likely to be leveraged and unhedged and/or uncovered. The degree of leverage is implicitly determined by the risk/reward profile selected by the client. The degree of leverage can be expressed as the number of contracts traded or held in position per million U.S. dollar under management. A higher degree of leverage represents a higher degree of risk as it goes hand in hand with a higher number of contracts held in a position for each U.S. dollar under management. As such, a selected risk
51
profile has a consequence for the number of contracts traded and/or held in a position for each U.S. dollar under management.
The program is systematic by nature and requires a consistent application. Therefore, discretionary inputs are not essential to the effectiveness of the program. Exceptional market circumstances of the observed past, both favorable and unfavorable, are integrally reflected in the presented performance profile of the program. While Transtrend generally will not use discretionary inputs in trading client accounts, in the event of exceptional market circumstances, Transtrend may use discretion in an attempt to limit risk to a position or account. The use of discretion by Transtrend may have a positive or negative impact on performance.
Transtrend defines the portfolio composition and the relative weighting of futures within each portfolio irrespective of the outcome of historical trades. The guiding principle is a strategic diversification in pursuit of a maximum attainable risk spreading, taking correlation analysis and degrees of profit expectancy into account. As the applied strategies require particular transaction sizes to allow for multiple entry and exit points and because certain minimum transaction sizes may be required or recommendable, the attainable degree of diversification is among others a function of the amount under management. Generally, larger accounts have a higher degree of diversification.
Specific risk provisions are computed for each market exposure. The risk provisions are designed to have a pre-defined reliability. In all trading systems the assessment of price volatility plays a prominent role. Risk assessments are determined on the basis of a regular or continuous evaluation of daily price behavior, possibly leading to regular adjustments during the lifetime of exposures. In most trading systems there are elements which identify and respect the dominant market direction. The trading systems are designed to exploit recurring, non-random characteristics of price behavior in all markets. The totality of the advised trades has thus far represented an ‘elevated collective profit expectancy’ over the course of time and is expected to provide the basis for future profitability as long as past and future market behavior remain generally compatible over time. The applied market approach does not forecast markets or price levels but participates in a systematic and dynamic way in signaled price patterns. The trading systems exploit directional price movement of outright
prices, of time spreads in one or more time frames and of inter-market and -product combinations.
One of the strengths of Transtrend’s Diversified Trend Program is the disciplined, systematic and dynamic nature of market participation. The overall performance is determined by the entirety of all markets and all trades. The results of individual trades deserve only limited attention in a portfolio strategy. Transtrend believes that in a systematic market approach, the consistent (i.e. disciplined) application by Transtrend and a consistent (i.e., prolonged) participation by the client are both essential in attempting to realize the pursued returns over the course of time.
Quantitative Investment Management LLC (QIM)
Quantitative Investment Management, LLC (QIM) is a Virginia limited liability company. QIM has been registered as a commodity trading advisor with the CFTC and has been a member of the NFA since January 2004. QIM was registered as a commodity pool operator effective April 2005. QIM’s address is 401 East Market Street, Suite 104, Charlottesville, VA 22902. The firm’s telephone number is (434) 817-4800.
Management
The listed principals for QIM are Jaffray Woodriff, Michael Geismar, Greyson Williams, Ryan Vaughan, Paul McKee, and Molly Dunnington.
In April 2003, Mr. Woodriff co-founded QIM to offer the Global Program to outside clients. He guides all aspects of QIM’s business and is chiefly responsible for the innovation and improvement of the models and techniques that underlie QIM’s predictions, trading, and risk management. Mr. Woodriff graduated from the University of Virginia with a B.S. in commerce in 1991. Mr. Woodriff became an associated person and a listed principal of QIM in January 2004.
Michael Geismar co-founded QIM in April 2003 with Mr. Woodriff after 18 months of trading their proprietary accounts. As the head of trading for QIM, he implements the firm’s investment models and oversees its portfolio management. Mr. Geismar also manages investor relations and QIM’s general business affairs. Mr. Geismar graduated from the University of Virginia in 1994 with a B.A. in mathematics and a minor in statistics. Mr. Geismar became an associated person of QIM in November 2005, and a listed principal of QIM in January 2004.
52
Greyson Williams co-founded QIM after joining Mr. Woodriff and Mr. Geismar in April 2003. He serves as an analyst, assists in statistical analysis and the development of predictive and risk models, and manages the internal databases and in-house software development. Mr. Williams became an associated person of QIM in November 2005, and a listed principal of QIM in January 2004. Mr. Williams graduated from the University of Virginia in 1995 with a B.A. in English and a minor in art history. Williams became an associated person of QIM in November 2005, and a listed principal of QIM in January 2004.
Ryan Vaughan is the Ryan serves as QIM’s Chief Compliance Officer in addition to coordinating the accounting and legal affairs of the company. Mr. Vaughan began his career at QIM in September 2005. Mr. Vaughan earned a B.S. in commerce from the University of Virginia in May 1993, an M.B.A. from the University of Georgia in June 1995, and spent two years as a Ph.D. student in the University of North Carolina — Chapel Hill Finance Department. Mr. Vaughan became registered as an associated person of QIM in June 2006. He became a listed principal of QIM in October 2006.
Paul McKee is the Head of Trading Systems and Analysis at QIM. Mr. McKee serves as an analyst, a programmer and a researcher, focusing mainly on trading algorithms, predictive models and new mathematical techniques. Mr. McKee joined QIM in January 2005. Mr. McKee graduated from Georgetown University in 1990 with a B.S. in physics and a minor in computer science, from the University of Virginia in 1995 with an M.A. in physics, and from the University of Virginia in 2000 with a Ph.D. in nuclear physics. Mr. McKee became an associated person and listed principal of QIM in February 2009 and March 2009, respectively.
Molly Dunnington joined in May 2009. Her responsibilities currently include assisting with the accounting for QIM’s various funds. From May 2002 until April 2009, Ms. Dunnington was the Vice President, Finance of The Community Foundation Serving Richmond & Central Virginia, a foundation which provides stewardship for permanent endowments, where she served on the management team. Ms. Dunnington received a B.S. in commerce in 1998 from the University of Virginia. Ms. Dunnington became an associated person and listed principal of QIM in January 2011.
Trading Methodology
Predictive Modeling. Numerous small inefficiencies exist in financial markets which can be exploited. QIM’s Global Program looks to take advantage of these inefficiencies through the prudent use of robust quantitative analysis and predictive technologies.
Since the inception of the Global Program in October 2003, QIM has employed numerous quantitative trading models that utilize pattern recognition to predict price movements. All models are tested across massive data sets that expose them to a wide range of market, economic, and political environments, as well as a wide range of time frames and interactions. Only those models that prove to be the most robust, statistically significant, and conceptually diverse are used in actual trading. The resultant system of models creates predictions on a daily basis that have resulted in outperformance versus most benchmarks over the past six and a half years.
Risk Management. QIM applies highly complex risk management procedures that take into account the price, size, volatility, liquidity, and inter-relationships of the markets traded. On the portfolio level, account risk is monitored on a daily basis to target a specific standard deviation or daily returns. For the standard version of the Global Program, annualized volatility is targeted at 12%. During significant drawdowns in equity, QIM reduces market exposure by scaling back the overall leverage.
Execution. The execution of QIM’s trading strategies is systematic. All facets of the predictive models, risk management, and trade allocation are fully automated. However, discretion plays a role in the evolution of the trading system over time as QIM does seek improvements to the trading strategy.
QIM applies its strategies to exchange-trade futures in the equity, fixed-income, currency, energy, metals and agricultural markets.
In addition to the numerous technologies driving the daily trading, QIM’s staff monitors every market in which it trades on a daily basis and monitors numerous other factors, including, but not limited to: volume and open interest, news, correlation pairings, cash prices, opening calls, slippage and volatility.
The trading is discretionary in that final decisions are made, and systems can be overridden, based on the full set of information that has been compiled. That being said, the trading system has never been overridden.
53
Sunrise Capital Partners, LLC
Sunrise is a California limited liability company formed and organized in January 1995. It has been registered as a commodity trading advisor since February 1995 and as a commodity pool operator since February 1995. Sunrise also is a member of the NFA (effective February 1995). The business address and telephone number of Sunrise are 12544 High Bluff Drive, Suite 400, San Diego, California 92130 and (858) 259-8911.
Management
The listed principals for Sunrise are Dr. Gary B. Davis, Dr. John V. Forrest, Richard Slaughter, Dr. Thomas R. Cardello, Martin Klitzner, Martin M. Ehrlich, Marie Laufik, Elissa Davis, Jason Gerlach, The Davis Family Trust, Commodity Monitors, Inc., TRC Greenwich, Inc., and Sunrise Capital Management, Inc. (Sunrise Capital Management).
Dr. Gary B. Davis became a listed principal of Sunrise in February 1995 and was also registered as an associated person in February 1995. In addition, he is a principal, effective July 1983, and registered as an associated person, effective October 1985, of Sunrise Capital Management. Dr. Davis concentrates his efforts in research and trading systems development activities. In 1968 and 1970, Dr. Davis received a B.S. and a medical degree, respectively, from the University of Michigan.
Dr. John V. Forrest became a listed principal of Sunrise in February 1995 and was registered as an associated person in March 1996. Dr. Forrest is also a principal, effective March 1996, and associated person, effective March 1996, of Sunrise Capital Management. Dr. Forrest engages in research and trading systems development on behalf of Sunrise. Dr. Forrest received a B.A. from Notre Dame in 1996 and received a medical degree from the State University of New York – Downstate Medical Center.
Richard C. Slaughter became a listed principal of Sunrise in February 1995 and was also registered as an associated person in February 1995. In addition, effective March 1996, Mr. Slaughter is a principal and associated person of Sunrise Capital Management. Currently, Mr. Slaughter is responsible for research and trading systems development. Mr. Slaughter, a co-founder of Commodity Monitors, Inc. in 1977, serves as its President. In 1974, he received a B.S. in finance from San Diego State University and Mr. Slaughter has pursued graduate studies in finance
at San Diego State University and in systems management at the University of Southern California.
Thomas R. Cardello became a listed principal of Sunrise in December 2004 and was also registered as an associated person in December 2004. Dr. Cardello is responsible for new strategy development and is a senior member of the research and management teams. He holds Ph.D. and M.Phil. degrees in physics from Yale University and B.S. degrees in mathematics and physics from The Cooper Union.
Martin P. Klitzner became a listed principal of Sunrise in February 1995 and was also registered as an associated person in February 1995. He is currently the firm’s Managing Director. Mr. Klitzner joined Sunrise Capital Management in December 1982 and is President, Secretary, Director, principal, effective October 1985, and associated person, effective June 1983. Mr. Klitzner is responsible for Sunrise’s day-to-day business and administrative operations. In 1967 and 1968, Mr. Klitzner received a B.A. and an M.B.A., respectively, from the University of Michigan. He did post-graduate work in economics at the University of California, Los Angeles, from 1968 to 1971.
Martin M. Ehrlich became a listed principal of Sunrise in February 1995 and was also registered as an associated person in February 1995. He currently serves as the Vice President of Marketing. In addition, Mr. Ehrlich is a Vice President, Director, principal, effective October 1991, and associated person, effective November 1986, of Sunrise Capital Management. Mr. Ehrlich joined Sunrise Capital Management in November 1986 after having been a long-time investor with the company.
Marie Laufik became a listed principal of Sunrise in February 1995 and was also registered as an associated person in February 1995. She is currently Vice President — Trading for Sunrise, as well as Vice President, Director, principal, effective November 1991, and associated person, effective January 1992, of Sunrise Capital Management. Ms. Laufik is Sunrise’s head trader. Ms. Laufik received a master’s degree in economics from the University of Prague in 1973.
Elissa Davis became a listed principal of Sunrise in February 1995. She is also a principal of Sunrise Capital Management, effective January 1991, by virtue of her role as a trustee of the Davis Family Trust. Mrs. Davis is not active in the management of either the Sunrise Capital Partners or of Sunrise Capital Management and has not been involved in any other business activities during the past five years.
54
Jason S. Gerlach became a listed principal with Sunrise in March 2010 and was also registered as an associated person in September 2008. He is currently the director of operations for the firm. Mr. Gerlach joined Sunrise in May 2008 and oversees the company’s day-to-day business operations including strategy, administration, and regulatory compliance. Before joining Sunrise, Mr. Gerlach was an attorney with Howard Rice Nemerovski Canady Falk & Rabkin in San Francisco from August 2000 to March 2005. From March 2005 to May 2008, Mr. Gerlach served as the owner, President and Chief Operating Officer of Allie’s Edibles LLC in San Francisco and then Carlsbad, California. Allie’s Edibles manufactures and sells artisan confections. Mr. Gerlach holds a J.D. (cum laude) and M.A. in public policy analysis and public administration from the University of Wisconsin (1996) and a B.A. in government from Cornell University (1993).
The Davis Family Trust, dated October 12, 1989, became a listed principal of Sunrise in February 1995. The Davis Family Trust is also director, the sole shareholder and principal of Sunrise Capital Management; Dr. Gary B. Davis and his wife, Elissa Davis, are trustees and the sole beneficiaries of the Davis Family Trust.
Commodity Monitors, Inc. became a listed principal of Sunrise in February 1995. CMI is a California corporation organized in 1977. CMI was registered in June 1982 as a CTA with the CFTC and withdrew its registration in June 2005. CMI is majority owned by Richard C. Slaughter and John V. Forrest and its only function is to serve as owner of Sunrise Capital Partners, LLC and is not engaged in any other business or venture. CMI’s systems, along with systems developed by Sunrise, are being used exclusively by Sunrise.
TRC Greenwich, Inc. (“TRCG”) became a listed principal of Sunrise in November 2007. TRCG is a Connecticut Corporation organized in 1992 and solely owned by Thomas Cardello.
Sunrise Capital Management, Inc. became a listed principal of Sunrise in February 1995. Sunrise Capital Management is a California corporation (formerly named Sunrise Commodities, Inc.) that continues the business of Sunrise Commodities, a California sole proprietorship organized in 1982, and its predecessor firms. Sunrise Capital Management, Inc. was registered in February 1983 as a CTA and in April 1990 as a CPO with the CFTC and is a member of the NFA in both such capacities.
Sunrise’s Trading Methods
The trading methodologies employed by Sunrise are based on programs analyzing a large number of interrelated mathematical and statistical formulas and techniques which are quantitative, proprietary in nature and which have been either learned or developed by Dr. Davis, Dr. Forrest or Mr. Slaughter. The profitability of programs traded pursuant to technical analysis emphasizing mathematical and charting approaches will depend upon the occurrence in the future, as in the past, of major trends and relationships in some markets. In the absence of these trends and relationships, the trading programs are likely to be unprofitable.
Sunrise’s long-term, trend-following program attempts to detect a trend, or lack of a trend, with respect to a particular commodity interest by analyzing price movement and volatility over time. This program consists of multiple, independent and parallel systems, each designed and tested to seek out and extract different market inefficiencies on different time horizons. These systems will generate a signal to sell a “short” contract or purchase a “long” contract based upon their identification of a price trend in the particular commodity interest. If the systems do not detect a price trend, a “neutral” trading signal will be generated. While this neutral signal is designed to filter out high-risk “whipsaw” markets, it is successful on only a limited basis. Successful speculative commodity trading employing trend-following techniques, such as Sunrise’s system, depends to a large degree upon not trading non-directional markets. Accordingly, to the extent that this “neutral” trading signal is not generated during a nontrending market, trading would likely be unprofitable.
With this strategy, Sunrise utilizes technical trend-following systems trading a wide continuum of time windows. Most of these time frames are decidedly long term by industry standards. Pro-active money management strategies are designed to protect open profits and to minimize exposure to non-directional markets.
Long-term trend-following trading systems, such as those employed by Sunrise, will seldom effect market entry or exit at the most favorable price in the particular market trend. Rather, this type of trading system seeks to close out losing positions quickly and to hold portions of profitable positions for as long as the trading system determines that the particular market trend continues to offer reasonable profit potential. The number of losing transactions may
55
exceed substantially the number of profitable transactions. In using this trading methodology, it is anticipated that Sunrise will commit to margin between 5% and 30% of assets managed. Margin requirements may from time to time exceed this range. While Sunrise relies on mechanical technical trading systems in making investment decisions using the methodology listed above, the overall strategy does include the latitude to depart from this approach if market conditions are such that, in the opinion of Sunrise, execution of trades recommended by the mechanical systems would be difficult or unusually risky to an account.
There may occur the rare instance in which Sunrise will override the system to decrease market exposure. Any modification of trading instructions could adversely affect the profitability of an account. Among the possible consequences of such a modification would be (1) the entrance of a trade at a price significantly worse than a system’s signal price, (2) the complete negation of a signal which subsequently would have produced a profitable trade or (3) the premature termination of an existing trade. Sunrise is under no obligation to notify Grant Park of this type of deviation from its mechanical systems, since it is an integral part of its overall trading method.
A technical trading system consists of a series of fixed rules applied systematically; however, the system still requires that Sunrise make certain subjective judgments. For example, Sunrise will select the markets it will follow and commodity interests it will actively trade, along with the contract months in which it will maintain positions. Sunrise will also subjectively determine when to liquidate positions in a contract month which is about to expire and initiate a position in a more distant contract month.
All trades which Sunrise initiates with Grant Park’s Futures Commission Merchants will be done without any prior consultation with Grant Park and the trades will be in such amounts and at such prices as Sunrise, in its sole discretion, may determine.
Sunrise engages in ongoing research which may lead to significant modifications from time to time. Sunrise will notify its Clients if modifications to its trading systems or portfolio structure are material. Changes to commodity markets and/or commodity interests traded are not considered material and Grant Park will not generally receive notice of such changes.
Sunrise’s Trading Program
Sunrise trades the Sunrise Expanded Diversified Program for Grant Park. The Sunrise Expanded Diversified Program may follow approximately fifty-five different markets. These markets may include, but are not limited to, precious and industrial metals, grains, energy products, soft commodities, domestic and foreign interest rate futures, domestic and foreign stock indices, minor currencies, and major currencies and their crossrates.
Amplitude Capital International Limited
Amplitude Capital International Limited (Amplitude) is a Cayman Islands domiciled limited company established in August 2004. Amplitude became an NFA member and became registered as a commodity trading advisor in January 2010. Prior to its NFA registration in 2010 and currently, under the management of its then and current Chairman, Karsten Schroeder, Amplitude operates several trading programs which are exempt under CFTC regulation Section 4.13(a)(4) and are open to foreign investors. Mr. Schroeder is responsible for product development, trading and strategy for these programs. The business address for Amplitude is Grand Pavilion Commercial Centre, 1st Floor, 802 West Bay Road, P.O. Box 31855, KY1-1207 Cayman Islands. The telephone number for Amplitude is (345) 943-2295.
Management
The listed principals of Amplitude Capital International Limited are Karsten Schroeder, Shamil Chandaria, Steffen Bendel, John D. Harrison, Peter Voss, Heiko Zuehlke, Mathias Ackermand, Gary Linford, Scott P. Lennon, Nicola Harrison, K13 Capital Limited, Star Bird Holdings Limited, and Wakaluba Investments, Limited.
Karsten Schroeder is the Executive Chairman of Amplitude and the portfolio manager for all of Amplitude’s programs. He oversees all the key decisions related to product development, trading ideas and strategy for Amplitude’s range of funds. Together with his partners he founded Amplitude Capital in September 2004. Mr. Schroeder became registered as a listed principal of Amplitude effective December 2009 and an associated person of the firm effective January 2010.
Dr. Shamil Chandaria is the non-executive Chairman of Amplitude. He was appointed to this position in September 2004. Dr. Chandaria does not
56
take part in any trading or operational activities of Amplitude nor does he actively market Amplitude’s services. Dr. Chandaria became registered as a listed principal of Amplitude effective December 2009.
Steffen Bendel has been the Chief Technical Officer of Amplitude since September 2004. He is in charge of research and all the technical solutions of the Amplitude group. Mr. Bendel has extensive experience in programming in different projects in the games industry that include physical simulation and graphics programming. Mr. Bendel became registered as a listed principal of Amplitude effective December 2009.
John Harrison is the Chief Financial Officer of Amplitude and is responsible for budgetary, regulatory and financial reporting within the Amplitude group of companies and oversees all the financial affairs of the group. He is also responsible for the Amplitude group’s corporate transactions as well as its legal and secretariat functions. Mr. Harrison joined the firm in March 2005. Mr. Harrison became registered as a listed principal of Amplitude effective December 2009.
Peter Voss is Head of Operations and the Compliance Officer of the group. In addition, he holds responsibility for all back-office functions of Amplitude. Mr. Voss was a co-founder of Amplitude and has held the position of Chief Operating Officer since the firm’s inception in September 2004. Mr. Voss became registered as a listed principal of Amplitude effective December 2009.
Heiko Zuehlke is the Head of Investor Relations of Amplitude Capital. He joined Amplitude in May 2009. From July 2003 until joining Amplitude Mr. Zuehlke served as a Director in the Equity Derivatives Department of Credit Suisse, a financial services firm, responsible for equity derivatives sales to Scandinavian and UK hedge funds. Mr. Zuehlke became registered as a listed principal of Amplitude effective December 2009 and an associated person of the firm in January 2010.
Mathias Ackermand is a director of the Amplitude Dynamic Trading Fund, the Klassik Fund and the Sinfonie Fund, which are commodity pools operated by Amplitude, and a director and beneficiary shareholder of Amplitude. He was appointed to this position in October 2004. Dr. Ackermand does not take part in any trading or operational activities of Amplitude nor does he actively market Amplitude’s services. Dr. Ackermand became registered as a listed principal of Amplitude effective December 2009.
Gary Linford is a director of the Amplitude Dynamic Trading Fund, the Klassik Fund and the Sinfonie Fund, and a director and beneficiary shareholder of Amplitude Capital International Limited. He was appointed to this position in August 2009. Mr. Linford does not take part in any trading or operational activities of Amplitude nor does he actively market Amplitude’s services. Mr. Linford became registered as a listed principal of Amplitude effective January 2010.
Scott P. Lennon is a director of the Amplitude Dynamic Trading Fund, the Klassik Fund and the Sinfonie Fund, and a director and beneficiary shareholder of Amplitude. He was appointed to this position in October 2004. Mr. Lennon does not take part in any trading or operational activities of Amplitude nor does he actively market Amplitude’s services. Mr. Lennon has been registered as a listed principal of Amplitude effective January 2010.
Nicola Harrison is a partial of owner of Amplitude. Ms. Harrison does not take part in any trading or operational activities of Amplitude nor does he actively market Amplitude’s services. Ms. Harrison became registered as a listed principal of Amplitude effective December 2009.
K13 Capital Limited is a partial owner of Amplitude. Through his ownership in K13 Capital Limited, Dr. Ackermand indirectly has an ownership stake in Amplitude. K13 Capital Limited became registered as a listed principal of Amplitude effective December 2009.
Star Bird Holdings Limited is a partial owner of Amplitude. Through his ownership in Star Bird Holdings, Dr. Chandaria indirectly has an ownership stake in Amplitude. Star Bird Holdings Limited became registered as a listed principal of Amplitude effective December 2009.
Wakaluba Investments, Ltd. is a partial owner of Amplitude. Through his ownership in Wakaluba Investments, Mr. Schroeder indirectly has an ownership stake in Amplitude. Wakaluba Investments Limited became registered as a listed principal of Amplitude effective December 2009.
Alder Capital Limited
Alder Capital Limited is a limited liability company which was incorporated in Ireland on December 7, 1999. Alder is regulated by the Central Bank of Ireland and received its Financial Regulator
57
authorization in May 2000. In May of 2001, Alder became a member of the NFA and was registered as a commodity trading advisor with the CFTC. Since March 2002, Alder has been registered with the Financial Services Authority in the UK and since October 2003, Alder has been registered with the L’Autorité des Marchés Financiers in France. Alder’s offices are located at 61 Merrion Square, Dublin 2, Ireland and its phone number is +353-1-614-7232.
Management
The listed principals of Alder Limited are Mark Caslin, Brian McCarthy, John Caslin, Richard Spring and Ceall O’Dunlaing.
Mark Caslin is the managing director of Alder. He has been registered as an associated person and approved as a principal of Alder by the NFA since May 2001. In May 2000, Mr. Caslin founded Alder with Brian McCarthy. Mr. Caslin is both an entrance exhibitor and a scholar of Trinity College Dublin from which he holds a B.A. Mod in mathematical sciences.
Brian McCarthy is an executive director of Alder. Mr. McCarthy founded Alder with Mark Caslin in May 2000. Brian McCarthy was registered as an associated person and was approved as a principal of Alder by the NFA in May 2001. Mr. McCarthy graduated from the University College Dublin with a masters degree in economic science in 1991.
John Caslin is an executive director of Alder having joined the firm in September 2003 from Eagle Star Life Assurance Company of Ireland (ultimate parent Zurich Financial Services) where he held the position of General Manager Investment & Financial Solutions, was a member of the senior management team and a member of the Investment Committee of the board of Eagle Star Life Assurance Company of Ireland. John joined Eagle Star Life Assurance Company of Ireland in January 1991. John Caslin was registered as an associated person of Alder in March 2005 by the NFA. He was approved as a principal of Alder by the NFA in May 2005. From March 2004 to June 2008, Mr. Caslin served as a non-executive director of iShares plc a Dublin-domiciled exchange traded fund which, as of February 2008, had approximately $20 billion in assets under management. Mr. Caslin was awarded a degree in mathematics and a first class honors degree and gold medal in engineering from Trinity College Dublin in 1991.
Richard Spring is a non-executive director of Alder. He was appointed to this position in May 2000.
Mr. Spring does not take part in any trading or operational activities of Alder nor does he actively market Alder’s services. Mr. Spring was approved as a principal of Alder by the NFA in May 2001. Mr. Spring is a graduate of Trinity College Dublin and King’s Inns.
Ceall O’Dunlaing, F.I.A. F.S.A.I., does not take part in any trading or operational activities of Alder nor does he actively market Alder’s services. Mr. O’Dunlaing was approved as a principal of Alder by the NFA in June 2008. He is currently the director of Financial Risk Solutions Limited, for which he was the founding director in November 1999. Financial Risk Solutions Limited is one of the leading providers of investment administration software to the life and pensions industry in Europe. Mr. O’Dunlaing is a Fellow of the Institute of Actuaries, London and a Fellow of the Society of Actuaries in Ireland.
Trading Method
Alder uses a program known as Alder Global 20 in trading for Grant Park. Alder’s trading system is grounded in the following philosophies:
| • | Trends in the value of some currency pairs or combinations of currency pairs tend to persist for periods of three weeks and upwards. |
| • | Movements in the value of some other currency pairs or combinations of currency pairs tend to self correct. |
| • | Currencies with higher interest rates tend to attract capital relative to currencies with lower interest rates. |
| • | All customers have a limited tolerance for risk. |
Remaining consistent with these philosophies, Alder believes that in order to take advantage of trends, self-correcting movements and interest rate differentials currency risk must be taken. Since currency risk is constantly changing Alder makes a reasonable effort to measure these changes and to limit a client’s maximum portfolio ‘Forecast Risk’ at each time of trading to an agreed level in light of whatever market risk can be forecasted using its ‘CALM’ risk management system.
Alder trades over-the-counter spot and forward contracts in the following currencies: euro, U.S. dollar,
58
Japanese yen, British pound, Swiss franc, Swedish krona, Australian dollar, and Canadian dollar. Their trading system is 100% systematic and at no point does it rely on discretionary trading. At least once in each trading day Alder calculates the expected trend, the interest rate differential and the “forecast risk”, as applicable, for each currency pair or combination of currency pairs. The expected trend for a currency pair or portfolio of currencies is calculated using historical prices; the interest rate differentials are sourced from the market; and the “forecast risk” is calculated using Alder’s risk forecasting system, CALM. These parameters are the inputs to Alder’s proprietary optimization process which determines the ‘quality of the opportunity set’, the currency trades and their size with the objective of maximizing the long-term Sharpe Ratio of the portfolio subject to certain constraints including those that apply at the time of trading.
Denali Asset Management, LLLP
Denali Asset Management, LLLP, is a U.S. Virgin Islands Limited Liability Limited Partnership organized in 1994. It has been registered as a commodity trading advisor since February 1994 and as a commodity pool operator since April 2000. Denali was approved as a member of the NFA in February 1994. Denali was also approved as a forex firm by the NFA in October 2010. Denali’s offices are located at 5020 Anchor Way, 2nd Floor, Christiansted, Virgin Islands, 00820-4633 and its telephone number is (340) 778-7744.
Management
The principals of Denali Asset Management are Scott T. Ramsey, Brad Lenhart and Ascent Capital LLC.
Scott T. Ramsey is Chief Executive Officer of Denali and is the chief trader. Mr. Ramsey launched Denali in 1994 to manage money for institutional investors. He was registered as an associated person and approved as a principal of Denali by the NFA in February 1994. Mr. Ramsey studied mechanical engineering at the University of Missouri.
Brad E. Lenhart is Chief Operating Officer of Denali and is responsible for all of Denali’s operations including accounting, compliance, risk, and personnel. Mr. Lenhart initially joined Denali in this capacity in January 1997 and left the firm for several years beginning in September 1998. From September 1998 through November 2002, Mr. Lenhart was a Director for H2O Plus, a privately held manufacturer and
retailer for skincare products based in Chicago. Mr. Lenhart rejoined Denali in December 2002 and assumed his current responsibilities in December 2002. He became a principal of Denali in April 2003, an associated person in June 2005 and a forex associated person in October 2010. Mr. Lenhart holds a B.A. from the University of Kansas and has studied at Imperial College, London.
Ascent Capital, LLC, a U.S. Virgin Islands limited liability company, became the general partner to Denali Asset Management, LLLP in June 2000 and is owned and controlled by Scott T. Ramsey. It was registered as a principal of Denali in April 2003.
Denali’s Trading Program
Denali’s trading strategy is a discretionary global macro strategy that trades financial futures, foreign currencies, individual equities and commodities using a flexible, opportunistic trading approach. The strategy seeks to capitalize on market volatility that results in significant price movements consistent with its overall macro-economic outlook, while actively adjusting position size on a short-term basis depending on market developments. The strategy utilizes macroeconomic fundamental research, technical analysis and disciplined money management to identify trading opportunities. The vast majority of the trades are directional, with a limited amount of options used to capture directional moves.
Trading Policies of Grant Park
The objective of Grant Park is to achieve appreciation of its assets through trading in futures contracts, forward contracts, options contracts and other interests in commodities. The general partner and the trading advisors follow the operating policies described below in attempting to achieve this objective.
Liquidity
Grant Park invests primarily in futures contracts and other commodity interests that are traded in sufficient volume to permit, in the opinion of the trading advisors, ease of taking and liquidating positions.
Spot Commodities
Although Grant Park does not expect to make or take delivery of commodities, it is authorized to do so. In addition, Grant Park may from time to time trade in spot, or cash, commodities.
59
Leverage
Grant Park normally will not be as highly leveraged as permitted in the case of an investment by an individual investor, and the trading advisors may use less than the otherwise available amount of leverage in the application of certain money management techniques on behalf of Grant Park. Historically, Grant Park’s ratio of margin to equity has typically been between 8% to 15%, but it can range from 5% to 35%.
Borrowings
Grant Park does not currently trade in cash commodities. Also, since inception, Grant Park has not been required to take physical delivery, and does not anticipate being required to do so in the future. However, in the unlikely event that physical delivery is required, the general partner believes that it would be able to borrow sufficient funds from U.S. banks at current market rates to provide the funds necessary to accept such delivery.
Spreads and Straddles
Grant Park may employ spreads or straddles in its trading. Spreads and straddles are futures trading transactions involving the simultaneous buying and selling of a particular futures contract in the same or a related commodity but involving different delivery dates. The purpose of these trades is to earn profits from a widening or narrowing movement of the two prices of the futures contracts.
Pyramiding
Grant Park does not employ the technique, commonly known as pyramiding, in which the speculator uses unrealized profits on existing positions as margin for the purchase or sale of additional positions in the same or another commodity interest.
Modifications in Trading Policies
The advisory contracts require the trading advisors to notify the general partner of any material modification in trading policies promptly and in any event no less than 10 business days prior to institution of the modification. The general partner will not be notified of non-material changes in the nature or types of commodity interests traded.
60
PERFORMANCE OF GRANT PARK — CLASS A UNITS
(Unaudited)
As required by CFTC regulations, the past performance record of Grant Park’s Class A units for the last five full calendar years and first month of 2011 is presented below.The past performance record of Grant Park’s Class A units since inception January 1989 appears in Part Two: Statement of Additional Information.
While the performance record set forth in the table below has not been independently audited, the general partner believes that the information presented is accurate.All performance information is shown net of fees and expenses.
Name | Grant Park Futures Fund Limited Partnership (Class A units) |
Type | Privately offered (through February 2003); Publicly offered beginning June 30, 2003; Multi-advisor |
Inception of trading | January 1989 |
Aggregate gross subscriptions at January 31, 2011 | $147,153,661 |
Net asset value at January 31, 2011 | $64,207,990 |
Worst monthly percentage draw-down (Since January 2006)(1) | (7.95%) 01/10 |
Worst peak-to-valley draw-down (Since January 2006)(2) | (17.08%) (Continuing from 02/04 – End of 02/06) |
| Rate of Return(3) | ||||||||||||||||||||||||
| 2011 | 2010 | 2009 | 2008 | 2007 | 2006 | |||||||||||||||||||
January | (0.52 | )% | (7.95 | )% | (0.91 | )% | 2.49 | % | 1.25 | % | 3.49 | % | ||||||||||||
February | 0.63 | (0.80 | ) | 9.66 | (4.18 | ) | (3.28 | ) | ||||||||||||||||
March | 4.08 | (3.26 | ) | (0.63 | ) | (4.55 | ) | 4.06 | ||||||||||||||||
April | 1.80 | (1.73 | ) | (0.13 | ) | 5.23 | 9.46 | |||||||||||||||||
May | (3.83 | ) | 1.64 | 2.11 | 4.60 | (0.81 | ) | |||||||||||||||||
June | (0.21 | ) | (3.41 | ) | 3.06 | 4.16 | (2.85 | ) | ||||||||||||||||
July | (1.66 | ) | (1.26 | ) | (5.06 | ) | (3.72 | ) | (3.66 | ) | ||||||||||||||
August | 2.77 | 1.15 | (2.41 | ) | (3.71 | ) | 2.20 | |||||||||||||||||
September | 3.24 | 1.17 | 1.31 | 8.78 | (1.10 | ) | ||||||||||||||||||
October | 4.33 | (2.59 | ) | 4.76 | 5.23 | (0.64 | ) | |||||||||||||||||
November | (2.58 | ) | 4.24 | 2.76 | (0.66 | ) | 3.59 | |||||||||||||||||
December | 4.57 | (3.57 | ) | 1.08 | 0.63 | (0.92 | ) | |||||||||||||||||
Year | (0.52 | )% | 4.45 | % | (9.23 | )% | 19.91 | % | 12.63 | % | 9.11 | % | ||||||||||||
| (1) | Worst monthly percentage draw-down is the largest monthly loss experienced by Grant Park in any calendar month expressed as a percentage of total equity in Grant Park and includes the month and year of that draw-down. |
| (2) | Worst peak-to-valley draw-down is the greatest cumulative percentage decline in month-end net asset value of Grant Park due to losses sustained by Grant Park during a period in which the initial month-end net asset value of Grant Park is not equaled or exceeded by a subsequent month-end net asset value of Grant Park and includes the time period in which the draw-down occurred. |
| (3) | The monthly rate of return is computed by dividing monthly performance by beginning monthly equity plus additions less redemptions. The monthly rates are then compounded to arrive at the annual rate of return. |
PAST PERFORMANCE IS NOT NECESSARILY INDICATIVE OF FUTURE RESULTS
61
PERFORMANCE OF GRANT PARK — CLASS B UNITS
(Unaudited)
As required by CFTC regulations, the past performance record of Grant Park’s Class B units for the last five full calendar years and first month of 2011 is presented below.The past performance record of Grant Park Class B units since Grant Park’s inception in of the class in April 2003 appears in Part Two: Statement of Additional Information.
While the performance record set forth in the table below has not been independently audited, the general partner believes that the information presented is accurate.All performance information is shown net of fees and expenses.
Name | Grant Park Futures Fund Limited Partnership (Class B units) |
Type | Public; Multi-advisor |
Inception of trading | August 2003 |
Aggregate gross subscriptions at January 31, 2011 | $872,734,726 |
Net asset value at January 31, 2011 | $625,712,475 |
Worst monthly percentage draw-down (Since January 2006)(1) | (8.00%) 01/10 |
Worst peak-to-valley draw-down (Since January 2006)(2) | (18.51%) (Continuing from 02/04 – End of 02/06) |
| Rate of Return(3) | ||||||||||||||||||||||||
| 2011 | 2010 | 2009 | 2008 | 2007 | 2006 | |||||||||||||||||||
January | (0.58 | )% | (8.00 | )% | (0.98 | )% | 2.42 | % | 1.18 | % | 3.41 | % | ||||||||||||
February | 0.57 | (0.88 | ) | 9.58 | (4.25 | ) | (3.35 | ) | ||||||||||||||||
March | 4.03 | (3.33 | ) | (0.70 | ) | (4.62 | ) | 3.98 | ||||||||||||||||
April | 1.74 | (1.78 | ) | (0.20 | ) | 5.15 | 9.38 | |||||||||||||||||
May | (3.88 | ) | 1.58 | 2.03 | 4.52 | (0.88 | ) | |||||||||||||||||
June | (0.27 | ) | (3.46 | ) | 2.99 | 4.09 | (2.92 | ) | ||||||||||||||||
July | (1.71 | ) | (1.32 | ) | (5.12 | ) | (3.79 | ) | (3.73 | ) | ||||||||||||||
August | 2.71 | 1.09 | (2.48 | ) | (3.78 | ) | 2.12 | |||||||||||||||||
September | 3.21 | 1.12 | 1.24 | 8.70 | (1.17 | ) | ||||||||||||||||||
October | 4.27 | (2.64 | ) | 4.69 | 5.16 | (0.71 | ) | |||||||||||||||||
November | (2.63 | ) | 4.19 | 2.69 | (0.73 | ) | 3.51 | |||||||||||||||||
December | 4.52 | (3.63 | ) | 1.01 | 0.64 | (0.90 | ) | |||||||||||||||||
Year | (0.58 | )% | 3.80 | % | (9.87 | )% | 18.88 | % | 11.76 | % | 8.28 | % | ||||||||||||
| (1) | Worst monthly percentage draw-down is the largest monthly loss experienced by Grant Park in any calendar month expressed as a percentage of total equity in Grant Park and includes the month and year of that draw-down. |
| (2) | Worst peak-to-valley draw-down is the greatest cumulative percentage decline in month-end net asset value of Grant Park due to losses sustained by Grant Park during a period in which the initial month-end net asset value of Grant Park is not equaled or exceeded by a subsequent month-end net asset value of Grant Park and includes the time period in which the draw-down occurred. |
| (3) | The monthly rate of return is computed by dividing monthly performance by beginning monthly equity plus additions less redemptions. The monthly rates are then compounded to arrive at the annual rate of return. |
PAST PERFORMANCE IS NOT NECESSARILY INDICATIVE OF FUTURE RESULTS
62
PERFORMANCE OF GRANT PARK — LEGACY 1 UNITS
(Unaudited)
As required by CFTC regulations, the past performance record of Grant Park’s Legacy 1 Class units from April 1, 2009 through January 31, 2011, is presented below. While the performance record set forth in the table below has not been independently audited, the general partner believes that the information presented is accurate.All performance information is shown net of fees and expenses.
Name | Grant Park Futures Fund Limited Partnership (Legacy 1 Class) |
Type | Public |
Inception of trading | April 2009 |
Aggregate gross subscriptions at January 31, 2011 | $7,307,303 |
Net asset value at January 31, 2011 | $6,903,688 |
Worst monthly percentage draw-down (Since April 2009)(1) | (7.77%) 01/10 |
Worst peak-to-valley draw-down (Since April 2009)(2) | (10.93%) (Start of 05/09 – End of 01/10) |
| Rate of Return(3) | ||||||||||||
| 2011 | 2010 | 2009 | ||||||||||
January | (0.35 | )% | (7.77 | )% | — | |||||||
February | 0.82 | — | ||||||||||
March | 4.15 | — | ||||||||||
April | 1.77 | (1.59 | )% | |||||||||
May | (3.53 | ) | 1.66 | |||||||||
June | (0.03 | ) | (3.10 | ) | ||||||||
July | (1.50 | ) | (1.08 | ) | ||||||||
August | 2.86 | 1.27 | ||||||||||
September | 3.24 | 1.21 | ||||||||||
October | 4.35 | (2.42 | ) | |||||||||
November | (2.32 | ) | 4.04 | |||||||||
December | 4.67 | (3.19 | ) | |||||||||
Year | (0.35 | )% | 6.09 | % | (3.39 | )% | ||||||
| (1) | Worst monthly percentage draw-down is the largest monthly loss experienced by Grant Park in any calendar month expressed as a percentage of total equity in Grant Park and includes the month and year of that draw-down. |
| (2) | Worst peak-to-valley draw-down is the greatest cumulative percentage decline in month-end net asset value of Grant Park due to losses sustained by Grant Park during a period in which the initial month-end net asset value of Grant Park is not equaled or exceeded by a subsequent month-end net asset value of Grant Park and includes the time period in which the draw-down occurred. |
| (3) | The monthly rate of return is computed by dividing monthly performance by beginning monthly equity plus additions less redemptions. The monthly rates are then compounded to arrive at the annual rate of return. |
PAST PERFORMANCE IS NOT NECESSARILY INDICATIVE OF FUTURE RESULTS
63
PERFORMANCE OF GRANT PARK — LEGACY 2 UNITS
(Unaudited)
As required by CFTC regulations, the past performance record of Grant Park’s Legacy 2 Class units from April 1, 2009 through January 31, 2011, is presented below. While the performance record set forth in the table below has not been independently audited, the general partner believes that the information presented is accurate.All performance information is shown net of fees and expenses.
Name | Grant Park Futures Fund Limited Partnership (Legacy 2 Class) |
Type | Public |
Inception of trading | April 2009 |
Aggregate gross subscriptions at January 31, 2011 | $8,235,551 |
Net asset value at January 31, 2011 | $8,161,251 |
Worst monthly percentage draw-down (Since April 2009)(1) | (7.79%) 01/10 |
Worst peak-to-valley draw-down (Since April 2009)(2) | (11.06%) (Start of 03/09 – End of 01/10) |
| Rate of Return(3) | ||||||||||||
| 2011 | 2010 | 2009 | ||||||||||
January | (0.37 | )% | (7.79 | )% | — | |||||||
February | 0.80 | — | ||||||||||
March | 4.13 | — | ||||||||||
April | 1.72 | (1.61 | )% | |||||||||
May | (3.53 | ) | 1.62 | |||||||||
June | (0.05 | ) | (3.12 | ) | ||||||||
July | (1.52 | ) | (1.09 | ) | ||||||||
August | 2.82 | 1.26 | ||||||||||
September | 3.20 | 1.21 | ||||||||||
October | 4.31 | (2.44 | ) | |||||||||
November | (2.34 | ) | 4.04 | |||||||||
December | 4.62 | (3.22 | ) | |||||||||
Year | (0.37 | )% | 5.73 | % | (3.55 | )% | ||||||
| (1) | Worst monthly percentage draw-down is the largest monthly loss experienced by Grant Park in any calendar month expressed as a percentage of total equity in Grant Park and includes the month and year of that draw-down. |
| (2) | Worst peak-to-valley draw-down is the greatest cumulative percentage decline in month-end net asset value of Grant Park due to losses sustained by Grant Park during a period in which the initial month-end net asset value of Grant Park is not equaled or exceeded by a subsequent month-end net asset value of Grant Park and includes the time period in which the draw-down occurred. |
| (3) | The monthly rate of return is computed by dividing monthly performance by beginning monthly equity plus additions less redemptions. The monthly rates are then compounded to arrive at the annual rate of return. |
PAST PERFORMANCE IS NOT NECESSARILY INDICATIVE OF FUTURE RESULTS
64
PERFORMANCE OF GRANT PARK — GLOBAL 1 UNITS
(Unaudited)
As required by CFTC regulations, the past performance record of Grant Park’s Global 1 Class units from April 1, 2009 through January 31, 2011, is presented below. While the performance record set forth in the table below has not been independently audited, the general partner believes that the information presented is accurate.All performance information is shown net of fees and expenses.
Name | Grant Park Futures Fund Limited Partnership (Global 1 Class) |
Type | Public |
Inception of trading | April 2009 |
Aggregate gross subscriptions at January 31, 2011 | $12,121,120 |
Net asset value at January 31, 2011 | $11,458,326 |
Worst monthly percentage draw-down (Since April 2009)(1) | (7.80%) 01/10 |
Worst peak-to-valley draw-down (Since April 2009)(2) | (13.28%) (Start of 05/09 – End of 01/10) |
| Rate of Return(3) | ||||||||||||
| 2011 | 2010 | 2009 | ||||||||||
January | (0.74 | )% | (7.80 | )% | — | |||||||
February | 0.71 | — | ||||||||||
March | 3.65 | — | ||||||||||
April | 1.52 | (0.28 | )% | |||||||||
May | (2.21 | ) | 2.02 | |||||||||
June | 0.29 | (3.21 | ) | |||||||||
July | (2.51 | ) | (1.26 | ) | ||||||||
August | 2.71 | 1.11 | ||||||||||
September | 1.97 | 1.18 | ||||||||||
October | 3.70 | (3.22 | ) | |||||||||
November | (2.13 | ) | 3.75 | |||||||||
December | 3.59 | (4.21 | ) | |||||||||
Year | (0.74 | )% | 2.88 | % | (4.32 | )% | ||||||
| (1) | Worst monthly percentage draw-down is the largest monthly loss experienced by Grant Park in any calendar month expressed as a percentage of total equity in Grant Park and includes the month and year of that draw-down. |
| (2) | Worst peak-to-valley draw-down is the greatest cumulative percentage decline in month-end net asset value of Grant Park due to losses sustained by Grant Park during a period in which the initial month-end net asset value of Grant Park is not equaled or exceeded by a subsequent month-end net asset value of Grant Park and includes the time period in which the draw-down occurred. |
| (3) | The monthly rate of return is computed by dividing monthly performance by beginning monthly equity plus additions less redemptions. The monthly rates are then compounded to arrive at the annual rate of return. |
PAST PERFORMANCE IS NOT NECESSARILY INDICATIVE OF FUTURE RESULTS
65
PERFORMANCE OF GRANT PARK — GLOBAL 2 UNITS
(Unaudited)
As required by CFTC regulations, the past performance record of Grant Park’s Global 2 Class units from April 1, 2009 through January 31, 2011, is presented below. While the performance record set forth in the table below has not been independently audited, the general partner believes that the information presented is accurate.All performance information is shown net of fees and expenses.
Name | Grant Park Futures Fund Limited Partnership (Global 2 Class) |
Type | Public |
Inception of trading | April 2009 |
Aggregate gross subscriptions at January 31, 2011 | $20,692,286 |
Net asset value at January 31, 2011 | $20,256,791 |
Worst monthly percentage draw-down (Since April 2009)(1) | (7.82%) 01/10 |
Worst peak-to-valley draw-down (Since April 2009)(2) | (13.53%) (Start of 05/09 – End of 01/10) |
| Rate of Return(3) | ||||||||||||
| 2011 | 2010 | 2009 | ||||||||||
January | (0.76 | )% | (7.82 | )% | — | |||||||
February | 0.69 | — | ||||||||||
March | 3.56 | — | ||||||||||
April | 1.50 | (0.30 | )% | |||||||||
May | (2.24 | ) | 1.97 | |||||||||
June | 0.29 | (3.24 | ) | |||||||||
July | (2.53 | ) | (1.28 | ) | ||||||||
August | 2.70 | 1.09 | ||||||||||
September | 1.94 | 1.10 | ||||||||||
October | 3.68 | (3.24 | ) | |||||||||
November | (2.15 | ) | 3.61 | |||||||||
December | 3.56 | (4.17 | ) | |||||||||
Year | (0.76 | )% | 2.56 | % | (4.64 | )% | ||||||
| (1) | Worst monthly percentage draw-down is the largest monthly loss experienced by Grant Park in any calendar month expressed as a percentage of total equity in Grant Park and includes the month and year of that draw-down. |
| (2) | Worst peak-to-valley draw-down is the greatest cumulative percentage decline in month-end net asset value of Grant Park due to losses sustained by Grant Park during a period in which the initial month-end net asset value of Grant Park is not equaled or exceeded by a subsequent month-end net asset value of Grant Park and includes the time period in which the draw-down occurred. |
| (3) | The monthly rate of return is computed by dividing monthly performance by beginning monthly equity plus additions less redemptions. The monthly rates are then compounded to arrive at the annual rate of return. |
PAST PERFORMANCE IS NOT NECESSARILY INDICATIVE OF FUTURE RESULTS
66
PERFORMANCE OF GRANT PARK — GLOBAL 3 UNITS
(Unaudited)
As required by CFTC regulations, the past performance record of Grant Park’s Global 3 Class units from April 1, 2009 through January 31, 2011, is presented below. While the performance record set forth in the table below has not been independently audited, the general partner believes that the information presented is accurate.All performance information is shown net of fees and expenses.
Name | Grant Park Futures Fund Limited Partnership (Global 3 Class) |
Type | Public |
Inception of trading | April 2009 |
Aggregate gross subscriptions at January 31, 2011 | $158,111,471 |
Net asset value at January 31, 2011 | $155,022,505 |
Worst monthly percentage draw-down (Since April 2009)(1) | (7.95%) 01/10 |
Worst peak-to-valley draw-down (Since April 2009)(2) | (14.63%) (Start of 05/09 – End of 01/10) |
| Rate of Return(3) | ||||||||||||
| 2011 | 2010 | 2009 | ||||||||||
January | (0.91 | )% | (7.95 | )% | — | |||||||
February | 0.54 | — | ||||||||||
March | 3.40 | — | ||||||||||
April | 1.33 | (0.44 | )% | |||||||||
May | (2.38 | ) | 1.77 | |||||||||
June | 0.10 | (3.49 | ) | |||||||||
July | (2.67 | ) | (1.43 | ) | ||||||||
August | 2.54 | 0.94 | ||||||||||
September | 1.79 | 0.96 | ||||||||||
October | 3.51 | (3.38 | ) | |||||||||
November | (2.28 | ) | 3.52 | |||||||||
December | 3.40 | (4.36 | ) | |||||||||
Year | (0.91 | )% | 0.68 | % | (6.04 | )% | ||||||
| (1) | Worst monthly percentage draw-down is the largest monthly loss experienced by Grant Park in any calendar month expressed as a percentage of total equity in Grant Park and includes the month and year of that draw-down. |
| (2) | Worst peak-to-valley draw-down is the greatest cumulative percentage decline in month-end net asset value of Grant Park due to losses sustained by Grant Park during a period in which the initial month-end net asset value of Grant Park is not equaled or exceeded by a subsequent month-end net asset value of Grant Park and includes the time period in which the draw-down occurred. |
| (3) | The monthly rate of return is computed by dividing monthly performance by beginning monthly equity plus additions less redemptions. The monthly rates are then compounded to arrive at the annual rate of return. |
PAST PERFORMANCE IS NOT NECESSARILY INDICATIVE OF FUTURE RESULTS
67
PERFORMANCE INFORMATION
ECKHARDT TRADING COMPANY
CAPSULE PERFORMANCE RECORD
(Unaudited)
The following represents the trading results of one client account managed by Eckhardt Trading Company in the Standard Plus Program as of January 31, 2011, for the period January 2006 through January 2011, on a monthly and annual basis. Rate of Return (ROR) is calculated by dividing net performance by nominal account size. Management fee is charged at a monthly rate of 1/6 of 1% (2% annually) of Net Assets, as defined. Incentive fee is charged at a quarterly rate of 20% of New Net Profits, as defined.
The following information is as of January 31, 2011:
Name of CTA: | Eckhardt Trading Company |
Name of program: | Standard Plus Program |
Inception of trading by CTA: | August 1991 |
Inception of trading in program: | October 1991 |
Worst monthly drawdown (Since 1/2006): | (8.11%), 1/10 |
Worst peak-to-valley drawdown (Since 1/2006): | (18.54%), 6/08 – 2/10 |
Total Assets under management this account: | $204,671,242 |
Total Assets under management in all programs – Client: | $577,991,613 |
Rates of Return
Month | 2011 | 2010 | 2009 | 2008 | 2007 | 2006 | ||||||||||||||||||
January | (3.85 | )% | (8.11 | )% | (1.60 | )% | 2.16 | % | 0.35 | % | 0.68 | % | ||||||||||||
February | (1.27 | )% | (0.28 | )% | 11.42 | % | 0.84 | % | (2.64 | )% | ||||||||||||||
March | 0.50 | % | 1.01 | % | 0.30 | % | (4.54 | )% | (5.29 | )% | ||||||||||||||
April | 2.83 | % | (2.19 | )% | 0.23 | % | 3.71 | % | 5.63 | % | ||||||||||||||
May | 3.41 | % | 4.02 | % | 1.96 | % | 2.10 | % | 1.29 | % | ||||||||||||||
June | 6.41 | % | (5.85 | )% | 3.48 | % | 5.81 | % | 2.06 | % | ||||||||||||||
July | (2.37 | )% | 1.23 | % | (6.54 | )% | 1.48 | % | (4.21 | )% | ||||||||||||||
August | 4.31 | % | 0.47 | % | (2.98 | )% | (2.00 | )% | 2.09 | % | ||||||||||||||
September | 5.97 | % | 2.63 | % | 3.09 | % | 13.33 | % | (2.22 | )% | ||||||||||||||
October | 4.37 | % | (5.43 | )% | 0.12 | % | 6.04 | % | 0.71 | % | ||||||||||||||
November | (2.92 | )% | 8.14 | % | 1.38 | % | 3.36 | % | 7.09 | % | ||||||||||||||
December | 10.15 | % | (6.78 | )% | 0.18 | % | 4.18 | % | (3.10 | )% | ||||||||||||||
Year | (3.85 | )% | 24.27 | % | (5.54 | )% | 14.76 | % | 39.28 | % | 1.30 | % | ||||||||||||
| 1. | “Draw-down” means losses experienced by the account over a specified period. |
| 2. | “Worst Peak-to-Valley Draw-down” means the greatest cumulative percentage decline in month-end net asset value due to losses sustained by the account during any period in which the initial month-end net asset value is not equaled or exceeded by a subsequent month-end net asset value. |
PAST PERFORMANCE IS NOT NECESSARILY INDICATIVE OF FUTURE RESULTS
68
PERFORMANCE INFORMATION
ECKHARDT TRADING COMPANY
CAPSULE PERFORMANCE RECORD
(Unaudited)
The following represents the trading results of one client account managed by Eckhardt Trading Company in the Standard Program as of January 31, 2011, for the period January 2006 through January 2011, on a monthly and annual basis. Rate of Return (ROR) is calculated by dividing net performance by nominal account size. Management fee is charged at a monthly rate of 1/6 of 1% (2% annually) of Net Assets, as defined. Incentive fee is charged at a quarterly rate of 20% of New Net Profits, as defined.
The following information is as of January 31, 2011: |
Name of CTA: | Eckhardt Trading Company |
Name of program: | Standard Program |
Inception of trading by CTA: | August 1991 |
Inception of trading in program: | August 1991 |
Worst monthly drawdown (Since 1/2006): | (6.92%), 1/10 |
Worst peak-to-valley drawdown (Since 1/2006): | (15.62%), 6/08 – 2/10 |
Total Assets under management this account: | $373,320,613 |
Total Assets under management in all programs – Client: | $577,991,613 |
Rates of Return
Month | 2011 | 2010 | 2009 | 2008 | 2007 | 2006 | ||||||||||||||||||
January | (3.24 | )% | (6.92 | )% | (1.38 | )% | 1.85 | % | 0.37 | % | 0.67 | % | ||||||||||||
February | (1.12 | )% | (0.23 | )% | 10.01 | % | 0.67 | % | (2.13 | )% | ||||||||||||||
March | 0.52 | % | 0.86 | % | 0.21 | % | (4.07 | )% | (4.36 | )% | ||||||||||||||
April | 2.55 | % | (1.79 | )% | 0.14 | % | 3.19 | % | 4.92 | % | ||||||||||||||
May | 2.73 | % | 3.41 | % | 1.70 | % | 1.70 | % | 1.34 | % | ||||||||||||||
June | 5.53 | % | (5.06 | )% | 3.10 | % | 5.21 | % | 1.83 | % | ||||||||||||||
July | (1.87 | )% | 1.26 | % | (5.47 | )% | 1.23 | % | (3.54 | )% | ||||||||||||||
August | 3.63 | % | 0.48 | % | (2.71 | )% | (1.76 | )% | 1.86 | % | ||||||||||||||
September | 5.09 | % | 2.35 | % | 2.69 | % | 11.81 | % | (1.79 | )% | ||||||||||||||
October | 3.62 | % | (4.85 | )% | 0.17 | % | 5.39 | % | 0.67 | % | ||||||||||||||
November | (2.35 | )% | 6.74 | % | 1.20 | % | 3.06 | % | 5.95 | % | ||||||||||||||
December | 8.45 | % | (5.64 | )% | 0.26 | % | 3.76 | % | (2.33 | )% | ||||||||||||||
Year | (3.24 | )% | 20.60 | % | (4.49 | )% | 13.15 | % | 34.12 | % | 2.54 | % | ||||||||||||
| 1. | “Draw-down” means losses experienced by the account over a specified period. |
| 2. | “Worst Peak-to-Valley Draw-down” means the greatest cumulative percentage decline in month-end net asset value due to losses sustained by the account during any period in which the initial month-end net asset value is not equaled or exceeded by a subsequent month-end net asset value. |
PAST PERFORMANCE IS NOT NECESSARILY INDICATIVE OF FUTURE RESULTS
69
PERFORMANCE INFORMATION
ECKHARDT TRADING COMPANY
CAPSULE PERFORMANCE RECORD
(Unaudited)
The following represents the trading results of one client account managed by Eckhardt Trading Company in the Eckhardt Futures Limited Partnership as of January 31, 2011, for the period January 2006 through January 2011, on a monthly and annual basis. Rate of Return (ROR) is calculated by dividing net performance by nominal account size. Management fee is charged at a quarterly rate of 0.5% (2% annually) of Net Assets, as defined. Incentive fee is charged at a quarterly rate of 25% of New Net Profits, as defined.
The following information is as of January 31, 2011: |
Name of CTA: | Eckhardt Trading Company |
Name of account: | Eckhardt Futures Limited Partnership |
Name of program: | Standard Program |
Inception of trading by CTA: | August 1991 |
Inception of trading in program: | June 1993 |
Worst monthly drawdown (Since 1/2006): | (7.09%), 1/10 |
Worst peak-to-valley drawdown (Since 1/2006): | (16.55%), 6/08 – 2/10 |
Aggregate gross subscriptions at 1/2011: | $212,872,664 |
Net asset value at 1/2011: | $217,892,878 |
Total Assets under management this account: | $217,892,878 |
Total Assets under management in all programs – Client: | $577,991,613 |
Rates of Return
Month | 2011 | 2010 | 2009 | 2008 | 2007 | 2006 | ||||||||||||||||||
January | (3.32 | )% | (7.09 | )% | (1.46 | )% | 1.77 | % | 0.39 | % | 0.71 | % | ||||||||||||
February | (1.19 | )% | (0.29 | )% | 9.65 | % | 0.73 | % | (2.19 | )% | ||||||||||||||
March | 0.45 | % | 0.82 | % | 0.16 | % | (4.21 | )% | (4.52 | )% | ||||||||||||||
April | 2.50 | % | (1.89 | )% | 0.12 | % | 3.28 | % | 4.94 | % | ||||||||||||||
May | 2.65 | % | 3.32 | % | 1.59 | % | 1.83 | % | 1.29 | % | ||||||||||||||
June | 5.52 | % | (5.11 | )% | 2.97 | % | 5.18 | % | 1.94 | % | ||||||||||||||
July | (2.01 | )% | 1.15 | % | (5.54 | )% | 1.23 | % | (3.64 | )% | ||||||||||||||
August | 3.78 | % | 0.39 | % | (2.61 | )% | (1.82 | )% | 1.83 | % | ||||||||||||||
September | 5.44 | % | 2.30 | % | 2.78 | % | 11.56 | % | (1.84 | )% | ||||||||||||||
October | 3.60 | % | (4.71 | )% | 0.15 | % | 5.21 | % | 0.65 | % | ||||||||||||||
November | (2.33 | )% | 6.98 | % | 1.15 | % | 2.91 | % | 6.03 | % | ||||||||||||||
December | 8.20 | % | (6.09 | )% | 0.13 | % | 3.57 | % | (2.26 | )% | ||||||||||||||
Year | (3.32 | )% | 20.19 | % | (5.23 | )% | 12.27 | % | 33.22 | % | 2.38 | % | ||||||||||||
| 1. | “Draw-down” means losses experienced by the account over a specified period. |
| 2. | “Worst Peak-to-Valley Draw-down” means the greatest cumulative percentage decline in month-end net asset value due to losses sustained by the account during any period in which the initial month-end net asset value is not equaled or exceeded by a subsequent month-end net asset value. |
PAST PERFORMANCE IS NOT NECESSARILY INDICATIVE OF FUTURE RESULTS
70
PERFORMANCE INFORMATION
ECKHARDT TRADING COMPANY
CAPSULE PERFORMANCE RECORD
(Unaudited)
The following represents the trading results of one client account managed by Eckhardt Trading Company in the Eckhardt Futures Limited Partnership as of January 31, 2011, for the period January 2006 through January 2011, on a monthly and annual basis. Rate of Return (ROR) is calculated by dividing net performance by nominal account size. Management fee is charged at a quarterly rate of 0.5% (2% annually) of Net Assets, as defined. Incentive fee is charged at a quarterly rate of 20% of New Net Profits, as defined.
The following information is as of January 31, 2011: |
Name of CTA: | Eckhardt Trading Company |
Name of account: | Eckhardt Futures Limited Partnership |
Name of program: | Standard Program |
Inception of trading by CTA: | August 1991 |
Inception of trading in program: | June 1993 |
Worst monthly drawdown (Since 1/2006): | (7.09%), 1/10 |
Worst peak-to-valley drawdown (Since 1/2006): | (16.55%), 6/08 – 2/10 |
Aggregate gross subscriptions at 1/2011: | $212,872,664 |
Net asset value at 1/2011: | $217,892,878 |
Total Assets under management this account: | $217,892,878 |
Total Assets under management in all programs – Client: | $577,991,613 |
Rates of Return
Month | 2011 | 2010 | 2009 | 2008 | 2007 | 2006 | ||||||||||||||||||
January | (3.32 | )% | (7.09 | )% | (1.46 | )% | 1.87 | % | 0.39 | % | 0.73 | % | ||||||||||||
February | (1.19 | )% | (0.29 | )% | 10.27 | % | 0.73 | % | (2.22 | )% | ||||||||||||||
March | 0.45 | % | 0.82 | % | 0.16 | % | (4.21 | )% | (4.52 | )% | ||||||||||||||
April | 2.50 | % | (1.89 | )% | 0.12 | % | 3.28 | % | 4.94 | % | ||||||||||||||
May | 2.65 | % | 3.32 | % | 1.69 | % | 1.83 | % | 1.29 | % | ||||||||||||||
June | 5.52 | % | (5.11 | )% | 3.16 | % | 5.42 | % | 1.95 | % | ||||||||||||||
July | (2.01 | )% | 1.15 | % | (5.54 | )% | 1.29 | % | (3.64 | )% | ||||||||||||||
August | 3.78 | % | 0.39 | % | (2.61 | )% | (1.87 | )% | 1.83 | % | ||||||||||||||
September | 5.52 | % | 2.30 | % | 2.78 | % | 12.21 | % | (1.84 | )% | ||||||||||||||
October | 3.83 | % | (4.71 | )% | 0.15 | % | 5.54 | % | 0.65 | % | ||||||||||||||
November | (2.48 | )% | 6.98 | % | 1.15 | % | 3.08 | % | 6.13 | % | ||||||||||||||
December | 8.75 | % | (6.09 | )% | 0.13 | % | 3.80 | % | (2.36 | )% | ||||||||||||||
Year | (3.32 | )% | 20.97 | % | (5.23 | )% | 13.35 | % | 35.25 | % | 2.38 | %�� | ||||||||||||
| 1. | “Draw-down” means losses experienced by the account over a specified period. |
| 2. | “Worst Peak-to-Valley Draw-down” means the greatest cumulative percentage decline in month-end net asset value due to losses sustained by the account during any period in which the initial month-end net asset value is not equaled or exceeded by a subsequent month-end net asset value. |
PAST PERFORMANCE IS NOT NECESSARILY INDICATIVE OF FUTURE RESULTS
71
PERFORMANCE INFORMATION
ECKHARDT TRADING COMPANY
CAPSULE PERFORMANCE RECORD
(Unaudited)
The following represents the trading results of one client account managed by Eckhardt Trading Company in the Eckhardt Futures (Cayman) Limited Standard Program – Class A as of January 31, 2011, for the period January 2006 through January 2011, on a monthly and annual basis. Rate of Return (ROR) is calculated by dividing net performance by nominal account size. Management fee is charged at a quarterly rate of 0.5% (2% annually) of Net Assets, as defined. Incentive fee is charged at a quarterly rate of 25% of New Net Profits, as defined.
The following information is as of January 31, 2011: |
Name of CTA: | Eckhardt Trading Company |
Name of account: | Eckhardt Futures (Cayman) |
Limited Standard Program – Class A
Name of program: | Standard Program |
Inception of trading by CTA: | August 1991 |
Inception of trading in program: | July 2001 |
Worst monthly drawdown (Since 1/2006): | (7.10%), 1/10 |
Worst peak-to-valley drawdown (Since 1/2006): | (16.73%), 6/08 – 2/10 |
Aggregate gross subscriptions at 1/2011: | $229,879,470 |
Net asset value at 1/2011: | $29,835,296 |
Total Assets under management this account: | $29,835,296 |
Total Assets under management in all programs – Client: | $577,991,613 |
Rates of Return
Month | 2011 | 2010 | 2009 | 2008 | 2007 | 2006 | ||||||||||||||||||
January | (3.33 | )% | (7.10 | )% | (1.46 | )% | 1.77 | % | 0.41 | % | 0.74 | % | ||||||||||||
February | (1.21 | )% | (0.30 | )% | 9.64 | % | 0.75 | % | (2.21 | )% | ||||||||||||||
March | 0.44 | % | 0.80 | % | 0.16 | % | (4.06 | )% | (4.34 | )% | ||||||||||||||
April | 2.48 | % | (1.91 | )% | 0.12 | % | 3.28 | % | 4.94 | % | ||||||||||||||
May | 2.63 | % | 3.31 | % | 1.59 | % | 1.83 | % | 1.34 | % | ||||||||||||||
June | 5.50 | % | (5.13 | )% | 2.97 | % | 5.29 | % | 1.93 | % | ||||||||||||||
July | (2.03 | )% | 1.14 | % | (5.54 | )% | 1.23 | % | (3.62 | )% | ||||||||||||||
August | 3.73 | % | 0.38 | % | (2.62 | )% | (1.82 | )% | 1.90 | % | ||||||||||||||
September | 5.35 | % | 2.29 | % | 2.78 | % | 11.62 | % | (1.77 | )% | ||||||||||||||
October | 3.60 | % | (4.72 | )% | 0.15 | % | 5.21 | % | 0.70 | % | ||||||||||||||
November | (2.33 | )% | 6.96 | % | 1.12 | % | 2.91 | % | 6.03 | % | ||||||||||||||
December | 8.20 | % | (6.09 | )% | 0.13 | % | 3.63 | % | (2.44 | )% | ||||||||||||||
Year | (3.33 | )% | 19.90 | % | (5.37 | )% | 12.21 | % | 33.77 | % | 2.65 | % | ||||||||||||
| 1. | “Draw-down” means losses experienced by the account over a specified period. |
| 2. | “Worst Peak-to-Valley Draw-down” means the greatest cumulative percentage decline in month-end net asset value due to losses sustained by the account during any period in which the initial month-end net asset value is not equaled or exceeded by a subsequent month-end net asset value. |
PAST PERFORMANCE IS NOT NECESSARILY INDICATIVE OF FUTURE RESULTS
72
PERFORMANCE INFORMATION
ECKHARDT TRADING COMPANY
CAPSULE PERFORMANCE RECORD
(Unaudited)
The following represents the trading results of one client account managed by Eckhardt Trading Company in the Eckhardt Futures (Cayman) Limited Standard Program – Class A as of January 31, 2011, for the period January 2006 through January 2011, on a monthly and annual basis. Rate of Return (ROR) is calculated by dividing net performance by nominal account size. Management fee is charged at a quarterly rate of 0.5% (2% annually) of Net Assets, as defined. Incentive fee is charged at a quarterly rate of 20% of New Net Profits, as defined.
The following information is as of January 31, 2011:
Name of CTA: | Eckhardt Trading Company |
Name of account: | Eckhardt Futures (Cayman) |
Limited Standard Program – Class A
Name of program: | Standard Program |
Inception of trading by CTA: | August 1991 |
Inception of trading in program: | July 2001 |
Worst monthly drawdown (Since 1/2006): | (7.10%), 1/10 |
Worst peak-to-valley drawdown (Since 1/2006): | (16.73%), 6/08 – 2/10 |
Aggregate gross subscriptions at 1/2011: | $229,879,470 |
Net asset value at 1/2011: | $29,835,296 |
Total Assets under management this account: | $29,835,296 |
Total Assets under management in all programs – Client: | $577,991,613 |
Rates of Return
Month | 2011 | 2010 | 2009 | 2008 | 2007 | 2006 | ||||||||||||||||||
January | (3.33 | )% | (7.10 | )% | (1.46 | )% | 1.87 | % | 0.41 | % | 0.77 | % | ||||||||||||
February | (1.21 | )% | (0.30 | )% | 10.27 | % | 0.75 | % | (2.23 | )% | ||||||||||||||
March | 0.44 | % | 0.80 | % | 0.16 | % | (4.06 | )% | (4.34 | )% | ||||||||||||||
April | 2.48 | % | (1.91 | )% | 0.12 | % | 3.28 | % | 4.94 | % | ||||||||||||||
May | 2.63 | % | 3.31 | % | 1.69 | % | 1.83 | % | 1.34 | % | ||||||||||||||
June | 5.50 | % | (5.13 | )% | 3.15 | % | 5.52 | % | 1.93 | % | ||||||||||||||
July | (2.03 | )% | 1.14 | % | (5.54 | )% | 1.29 | % | (3.62 | )% | ||||||||||||||
August | 3.73 | % | 0.38 | % | (2.62 | )% | (1.88 | )% | 1.90 | % | ||||||||||||||
September | 5.45 | % | 2.29 | % | 2.78 | % | 12.28 | % | (1.77 | )% | ||||||||||||||
October | 3.84 | % | (4.72 | )% | 0.15 | % | 5.53 | % | 0.70 | % | ||||||||||||||
November | (2.49 | )% | 6.96 | % | 1.12 | % | 3.09 | % | 6.14 | % | ||||||||||||||
December | 8.74 | % | (6.09 | )% | 0.13 | % | 3.86 | % | (2.51 | )% | ||||||||||||||
Year | (3.33 | )% | 20.71 | % | (5.37 | )% | 13.29 | % | 35.80 | % | 2.69 | % | ||||||||||||
| 1. | “Draw-down” means losses experienced by the account over a specified period. |
| 2. | “Worst Peak-to-Valley Draw-down” means the greatest cumulative percentage decline in month-end net asset value due to losses sustained by the account during any period in which the initial month-end net asset value is not equaled or exceeded by a subsequent month-end net asset value. |
PAST PERFORMANCE IS NOT NECESSARILY INDICATIVE OF FUTURE RESULTS
73
PERFORMANCE INFORMATION
ECKHARDT TRADING COMPANY
CAPSULE PERFORMANCE RECORD
(Unaudited)
The following represents the trading results of one client account managed by Eckhardt Trading Company in the Eckhardt Standard Master Fund, LP as of January 31, 2011, for the period January 2006 through January 2011, on a monthly and annual basis. Rate of Return (ROR) is calculated by dividing net performance by nominal account size. Management fee is charged at a quarterly rate of 0.5% (2% annually) of Net Assets, as defined. Incentive fee is charged at a quarterly rate of 20% of New Net Profits, as defined.
The following information is as of January 31, 2011: |
Name of CTA: | Eckhardt Trading Company |
Name of account: | Eckhardt Standard Master Fund, LP |
Name of program: | Standard Program |
Inception of trading by CTA: | August 1991 |
Inception of trading in program: | August 2005 |
Worst monthly drawdown (Since 1/2006): | (7.09%), 1/10 |
Worst peak-to-valley drawdown (Since 1/2006): | (16.59%), 6/08 – 2/10 |
Aggregate gross subscriptions at 1/2011: | $434,462,379 |
Net asset value at 1/2011: | $253,918,141 |
Total Assets under management this account: | $253,918,141 |
Total Assets under management in all programs – Client: | $577,991,613 |
Rates of Return
Month | 2011 | 2010 | 2009 | 2008 | 2007 | 2006 | ||||||||||||||||||
January | (3.32 | )% | (7.09 | )% | (1.46 | )% | 1.87 | % | 0.40 | % | 0.77 | % | ||||||||||||
February | (1.19 | )% | (0.29 | )% | 10.27 | % | 0.74 | % | (2.23 | )% | ||||||||||||||
March | 0.45 | % | 0.82 | % | 0.16 | % | (4.06 | )% | (4.34 | )% | ||||||||||||||
April | 2.50 | % | (1.89 | )% | 0.12 | % | 3.28 | % | 4.94 | % | ||||||||||||||
May | 2.64 | % | 3.32 | % | 1.69 | % | 1.84 | % | 1.34 | % | ||||||||||||||
June | 5.52 | % | (5.11 | )% | 3.15 | % | 5.61 | % | 1.93 | % | ||||||||||||||
July | (2.01 | )% | 1.15 | % | (5.54 | )% | 1.29 | % | (3.62 | )% | ||||||||||||||
August | 3.77 | % | 0.39 | % | (2.61 | )% | (1.88 | )% | 1.90 | % | ||||||||||||||
September | 5.46 | % | 2.30 | % | 2.78 | % | 12.28 | % | (1.77 | )% | ||||||||||||||
October | 3.84 | % | (4.71 | )% | 0.15 | % | 5.54 | % | 0.70 | % | ||||||||||||||
November | (2.48 | )% | 6.98 | % | 1.15 | % | 3.09 | % | 6.14 | % | ||||||||||||||
December | 8.75 | % | (6.09 | )% | 0.13 | % | 3.85 | % | (2.51 | )% | ||||||||||||||
Year | (3.32 | )% | 20.88 | % | (5.25 | )% | 13.33 | % | 35.89 | % | 2.69 | % | ||||||||||||
| 1. | “Draw-down” means losses experienced by the account over a specified period. |
| 2. | “Worst Peak-to-Valley Draw-down” means the greatest cumulative percentage decline in month-end net asset value due to losses sustained by the account during any period in which the initial month-end net asset value is not equaled or exceeded by a subsequent month-end net asset value. |
PAST PERFORMANCE IS NOT NECESSARILY INDICATIVE OF FUTURE RESULTS
74
PERFORMANCE INFORMATION
EMC CAPITAL MANAGEMENT, INC.
CAPSULE PERFORMANCE RECORD
(Unaudited)
The Performance Record which follows shows the composite performance record on a monthly basis of all accounts managed by Ms. Cheval and EMC as of January 31, 2011, for the period January 2006 through January 2011 utilizing the Classic Program on a monthly and annual basis.
The following information is as of January 31, 2011:
Name of CTA: | EMC Capital Management, Inc. |
Name of program: | Classic Program |
Inception of trading by CTA: | January 1985 |
Inception of trading in program: | January 1985 |
Worst monthly drawdown (Since 1/2006): | (11.01%), 1/10 |
Worst peak-to-valley drawdown (Since 1/2006): | (24.52%), 12/08 – 02/10 |
Total Assets under management this account: | $175,852,188 |
Total Assets under management in all programs – Client: | $173,827,149 |
Total Assets under management in all programs – Proprietary: | $2,025,039 |
Rates of Return
Month | 2011 | 2010 | 2009 | 2008 | 2007 | 2006 | ||||||||||||||||||
January | 0.67 | % | (11.01 | )% | (1.95 | )% | 3.50 | % | 3.77 | % | 4.59 | % | ||||||||||||
February | (1.08 | )% | 0.41 | % | 14.90 | % | (5.22 | )% | (5.85 | )% | ||||||||||||||
March | 6.02 | % | (6.65 | )% | (1.40 | )% | (3.25 | )% | 7.57 | % | ||||||||||||||
April | 0.48 | % | (2.66 | )% | 0.16 | % | 4.24 | % | 16.06 | % | ||||||||||||||
May | (3.64 | )% | 0.50 | % | 1.72 | % | 3.63 | % | 1.23 | % | ||||||||||||||
June | (1.69 | )% | (6.01 | )% | 5.35 | % | 4.74 | % | (2.39 | )% | ||||||||||||||
July | (0.61 | )% | (1.25 | )% | (6.05 | )% | (7.35 | )% | (4.15 | )% | ||||||||||||||
August | 0.76 | % | 2.54 | % | 1.20 | % | (1.06 | )% | 1.31 | % | ||||||||||||||
September | 6.25 | % | 0.34 | % | 5.80 | % | 10.38 | % | (2.03 | )% | ||||||||||||||
October | 6.84 | % | (1.91 | )% | 11.89 | % | 6.62 | % | 0.71 | % | ||||||||||||||
November | (0.20 | )% | 3.88 | % | 2.79 | % | (0.33 | )% | 1.35 | % | ||||||||||||||
December | 5.74 | % | (1.99 | )% | 0.45 | % | 1.30 | % | 0.05 | % | ||||||||||||||
Year | 0.67 | % | 6.57 | % | (14.26 | )% | 46.26 | % | 17.26 | % | 18.02 | % | ||||||||||||
| 1. | “Draw-down” means losses experienced by the account over a specified period. |
| 2. | “Worst Peak-to-Valley Draw-down” means the greatest cumulative percentage decline in month-end net asset value due to losses sustained by the account during any period in which the initial month-end net asset value is not equaled or exceeded by a subsequent month-end net asset value. |
| 3. | The monthly rate of return is computed by dividing the net income by the beginning nominal equity. The monthly rates are then compounded to arrive at the annual rate of return. |
PAST PERFORMANCE IS NOT NECESSARILY INDICATIVE OF FUTURE RESULTS
75
PERFORMANCE INFORMATION
EMC CAPITAL MANAGEMENT, INC.
CAPSULE PERFORMANCE RECORD
(Unaudited)
The Performance Record which follows shows the composite performance record on a monthly basis of all accounts managed by EMC utilizing the New Program as of February 28, 2007, for the period January 2006 through February 2007 on a monthly and annual basis. The New Program ceased trading in February 2007.
The following information is as of January 31, 2011:
Name of CTA: | EMC Capital Management, Inc. |
Name of program: | The New Program |
Inception of trading by CTA: | January 1985 |
Inception of trading in program: | August 1996 |
Worst monthly drawdown (Since 1/2006): | (3.70%), 2/07 |
Worst peak-to-valley drawdown (Since 1/2006): | (3.70%), 1/07 – 2/07 |
Total Assets under management this account: | $0 |
Total Assets under management in all programs – Client: | $173,827,149 |
Total Assets under management in all programs – Proprietary: | $2,025,039 |
Rates of Return
Month | 2007 | 2006 | ||||||
January | 1.53 | % | 1.09 | % | ||||
February | (3.70 | )% | (2.51 | )% | ||||
March | 2.59 | % | ||||||
April | 4.25 | % | ||||||
May | 0.62 | % | ||||||
June | (0.40 | )% | ||||||
July | (1.28 | )% | ||||||
August | 0.46 | % | ||||||
September | (0.92 | )% | ||||||
October | 1.21 | % | ||||||
November | 1.37 | % | ||||||
December | (0.38 | )% | ||||||
Year | (2.20 | )% | 6.07 | % | ||||
| 1. | “Draw-down” means losses experienced by the account over a specified period. |
| 2. | “Worst Peak-to-Valley Draw-down” means the greatest cumulative percentage decline in month-end net asset value due to losses sustained by the account during any period in which the initial month-end net asset value is not equaled or exceeded by a subsequent month-end net asset value. |
| 3. | The monthly rate of return is computed by dividing the net income by the beginning nominal equity. The monthly rates are then compounded to arrive at the annual rate of return. |
PAST PERFORMANCE IS NOT NECESSARILY INDICATIVE OF FUTURE RESULTS
76
PERFORMANCE INFORMATION
EMC CAPITAL MANAGEMENT, INC.
CAPSULE PERFORMANCE RECORD
(Unaudited)
The following represents the trading results of one client account managed by EMC Capital Management, Inc. in the New Program 2XL as of February 28, 2007, for the period January 2006 through February 2007 on a monthly and annual basis. The New Program 2XL ceased trading February 2007.
The following information is as of January 31, 2011:
Name of CTA: | EMC Capital Management, Inc. |
Name of program: | The New Program 2XL |
Inception of trading by CTA: | January 1985 |
Inception of trading in program: | September 1999 |
Worst monthly drawdown (Since 1/2006): | (4.00%), 2/07 |
Worst peak-to-valley drawdown (Since 1/2006): | (4.22%), 5/06 – 9/06 |
Total Assets under management this account: | $0 |
Total Assets under management in all programs – Client: | $173,827,149 |
Total Assets under management in all programs – Proprietary: | $2,025,039 |
Rates of Return
Month | 2007 | 2006 | ||||||
January | 2.00 | % | 2.09 | % | ||||
February | (4.00 | )% | (3.08 | )% | ||||
March | 3.41 | % | ||||||
April | 9.50 | % | ||||||
May | 1.34 | % | ||||||
June | (1.20 | )% | ||||||
July | (2.30 | )% | ||||||
August | 1.07 | % | ||||||
September | (1.82 | )% | ||||||
October | 1.92 | % | ||||||
November | 3.07 | % | ||||||
December | (1.33 | )% | ||||||
Year | (2.10 | )% | 12.73 | % | ||||
| 1. | “Draw-down” means losses experienced by the account over a specified period. |
| 2. | “Worst Peak-to-Valley Draw-down” means the greatest cumulative percentage decline in month-end net asset value due to losses sustained by the account during any period in which the initial month-end net asset value is not equaled or exceeded by a subsequent month-end net asset value. |
| 3. | The monthly rate of return is computed by dividing the net income by the beginning nominal equity. The monthly rates are then compounded to arrive at the annual rate of return. |
PAST PERFORMANCE IS NOT NECESSARILY INDICATIVE OF FUTURE RESULTS
77
PERFORMANCE INFORMATION
EMC CAPITAL MANAGEMENT, INC.
CAPSULE PERFORMANCE RECORD
(Unaudited)
The following represents the trading results of one client account managed by EMC Capital Management, Inc. in the Currency Program as of January 31, 2011, for the period January 2006 through January 2011, on a monthly and annual basis. The Currency Program ceased trading January 2011.
The following information is as of January 31, 2011:
Name of CTA: | EMC Capital Management, Inc. |
Name of program: | Currency Program |
Inception of trading by CTA: | January 1985 |
Inception of trading in program: | October 2006 |
Worst monthly drawdown (Since 1/2006): | (4.84%), 12/09 |
Worst peak-to-valley drawdown (Since 1/2006): | (17.69%), 2/09 – 1/10 |
Total Assets under management this account: | $0 |
Total Assets under management in all programs – Client: | $173,827,149 |
Total Assets under management in all programs – Proprietary: | $2,025,039 |
Rates of Return
Month | 2010 | 2009 | 2008 | 2007 | 2006 | |||||||||||||||
January | (3.31 | )% | 0.39 | % | (2.59 | )% | (4.58 | )% | ||||||||||||
February | 2.07 | % | 2.46 | % | 0.00 | % | ||||||||||||||
March | (1.63 | )% | 0.63 | % | (0.32 | )% | ||||||||||||||
April | (3.34 | )% | 0.18 | % | 3.90 | % | ||||||||||||||
May | 0.01 | % | 0.16 | % | 1.42 | % | ||||||||||||||
June | (3.14 | )% | 0.27 | % | 0.70 | % | ||||||||||||||
July | (2.14 | )% | 0.33 | % | 1.62 | % | ||||||||||||||
August | (2.30 | )% | 0.69 | % | (2.63 | )% | ||||||||||||||
September | 4.78 | % | (0.69 | )% | 1.95 | % | ||||||||||||||
October | (2.31 | )% | 0.76 | % | 2.22 | % | 1.55 | % | ||||||||||||
November | (0.74 | )% | 0.25 | % | (3.10 | )% | 3.55 | % | ||||||||||||
December | (4.84 | )% | 0.78 | % | (0.26 | )% | (0.30 | )% | ||||||||||||
Year | (3.31 | )% | (12.77 | )% | 3.19 | % | 0.59 | % | 4.84 | % | ||||||||||
| 1. | “Draw-down” means losses experienced by the account over a specified period. |
| 2. | “Worst Peak-to-Valley Draw-down” means the greatest cumulative percentage decline in month-end net asset value due to losses sustained by the account during any period in which the initial month-end net asset value is not equaled or exceeded by a subsequent month-end net asset value. |
| 3. | The monthly rate of return is computed by dividing the net income by the beginning nominal equity. The monthly rates are then compounded to arrive at the annual rate of return. |
PAST PERFORMANCE IS NOT NECESSARILY INDICATIVE OF FUTURE RESULTS
78
PERFORMANCE INFORMATION
WELTON INVESTMENT CORPORATION
CAPSULE PERFORMANCE RECORD
(Unaudited)
The following represents the trading results of Welton Investment Corporation’s Global Directional Portfolio as of January 31, 2011, for the period January 2006 through January 2011, on a monthly and annual basis.
The following information is as of January 31, 2011: |
Name of CTA: | Welton Investment Corporation |
Name of program: | Global Directional Portfolio |
Inception of trading by CTA: | February 1989 |
Inception of trading in program: | June 2004 |
Worst monthly drawdown (Since 1/2006): | (9.15%), 8/07 |
Worst peak-to-valley drawdown (Since 1/2006): | (11.95%), 1/09 – 1/10 |
Total Assets traded pursuant to the program: | $583,000,000 |
Total Assets under management in all programs: | $583,000,000 |
Composite Rates of Return of Global Directional Portfolio
Month | 2011 | 2010 | 2009 | 2008 | 2007 | 2006 | ||||||||||||||||||
January | 1.55 | % | (6.76 | )% | (2.30 | )% | 3.46 | % | 2.87 | % | 4.02 | % | ||||||||||||
February | 2.48 | % | (2.29 | )% | 6.20 | % | (1.24 | )% | (2.33 | )% | ||||||||||||||
March | 4.42 | % | (0.87 | )% | 0.82 | % | (7.24 | )% | 7.30 | % | ||||||||||||||
April | 4.59 | % | (2.99 | )% | 0.69 | % | 6.62 | % | 10.77 | % | ||||||||||||||
May | (4.06 | )% | 3.34 | % | 4.02 | % | 3.53 | % | (0.83 | )% | ||||||||||||||
June | 1.32 | % | (0.89 | )% | 2.57 | % | 5.21 | % | (5.76 | )% | ||||||||||||||
July | 1.07 | % | (1.51 | )% | (4.95 | )% | (2.84 | )% | (4.64 | )% | ||||||||||||||
August | 2.46 | % | 1.27 | % | (3.72 | )% | (9.15 | )% | 4.90 | % | ||||||||||||||
September | 3.86 | % | 0.34 | % | 1.05 | % | 9.28 | % | 0.11 | % | ||||||||||||||
October | 4.58 | % | (1.82 | )% | 4.27 | % | 7.23 | % | (2.52 | )% | ||||||||||||||
November | (3.21 | )% | 5.06 | % | 6.27 | % | (1.43 | )% | 5.47 | % | ||||||||||||||
December | 7.51 | % | (2.71 | )% | 2.76 | % | (0.52 | )% | (0.85 | )% | ||||||||||||||
Year | 1.55 | % | 18.73 | % | (5.57 | )% | 25.31 | % | 11.00 | % | 15.21 | % | ||||||||||||
| 8. | “Draw-down” means losses experienced by the trading program over a specified period. “Worst Monthly Draw-down” means greatest percentage decline in net asset value due to losses sustained by the trading program from the beginning to the end of a calendar month. |
| 9. | “Worst Peak-to-Valley Draw-down” means greatest cumulative percentage decline in month-end net asset value of the trading program due to losses sustained during a period in which the initial month-end net asset value of the trading program is not equaled or exceeded by a subsequent month-end net asset value of the trading program. |
| 10. | Performance results displayed in the above capsule are not necessarily indicative of the results that may be achieved by Welton in the future. Results among accounts in any investment product offered by Welton will vary depending on such factors as size of the account, commission rate and advisory fees charged to the account, the date the account started and the order in which trades for the various accounts are entered. The size of an account may affect the relative size of positions taken, the degree of diversification and the markets traded. The rates of return in the above capsule should not be taken as representative of any rate of return actually achieved by any specific account represented in the capsule. No representation is being made that any account in the future will or is likely to achieve profits or losses similar to those shown. |
PAST PERFORMANCE IS NOT NECESSARILY INDICATIVE OF FUTURE RESULTS
79
PERFORMANCE INFORMATION
WELTON INVESTMENT CORPORATION
CAPSULE PERFORMANCE RECORD
(Unaudited)
The following represents the trading results of all client accounts managed by Welton Investment Corporation in the Alternative Equity Strategies (AES) Program as of January 31, 2011, for the period January 2009 through January 2011, on a monthly and annual basis. Rate of Return (ROR) is calculated by dividing net performance by nominal account size. Management fee is charged at a monthly rate of 1/12 of 0% (0% annually) of Net Assets, as defined. Incentive fee is charged at a quarterly rate of 30% of New Net Profits, as defined.
The following information is as of January 31, 2011: |
Name of CTA: | Welton Investment Corporation |
Name of program: | Alternative Equity Strategies |
(AES) Program
Inception of trading by CTA: | February 1989 |
Inception of trading in program: | January 2009 |
Worst monthly drawdown (Since 1/2009): | (4.01%), 04/09 |
Worst peak-to-valley drawdown (Since 1/2009): | (8.26%), 07/09-10/09 |
Total Assets under management this program: | $34,000,000 |
Total Assets under management in all programs – Client: | $617,000,000 |
Total Assets under management in all programs – Proprietary: | $0 |
Rates of Return
Month | 2011 | 2010 | 2009 | 2008 | 2007 | 2006 | ||||||||||||||||||
January | 0.67 | % | (0.40 | )% | 1.51 | % | — | — | — | |||||||||||||||
February | 3.41 | % | 4.08 | % | — | — | — | |||||||||||||||||
March | 1.25 | % | (0.81 | )% | — | — | — | |||||||||||||||||
April | 0.20 | % | (4.01 | )% | — | — | — | |||||||||||||||||
May | 0.93 | % | 4.20 | % | — | — | — | |||||||||||||||||
June | (0.14 | )% | 3.21 | % | — | — | — | |||||||||||||||||
July | 1.76 | % | (3.97 | )% | — | — | — | |||||||||||||||||
August | (1.01 | )% | 0.08 | % | — | — | — | |||||||||||||||||
September | (0.46 | )% | (2.36 | )% | — | — | — | |||||||||||||||||
October | 0.42 | % | (2.24 | )% | — | — | — | |||||||||||||||||
November | 0.69 | % | 3.33 | % | — | — | — | |||||||||||||||||
December | 1.18 | % | 4.54 | % | — | — | — | |||||||||||||||||
Year | 0.67 | % | 8.03 | % | 7.20 | % | — | — | — | |||||||||||||||
| 1. | “Draw-down” means losses experienced by the account over a specified period. |
| 2. | “Worst Peak-to-Valley Draw-down” means the greatest cumulative percentage decline in month-end net asset value due to losses sustained by the account during any period in which the initial month-end net asset value is not equaled or exceeded by a subsequent month-end net asset value. |
| 3. | Performance shown is that of all accounts managed by Welton pursuant to the AES strategy, reflects reinvestment of income, and is less commissions and after pro forma 0% management fee and 30% incentive fee terms. |
PAST PERFORMANCE IS NOT NECESSARILY INDICATIVE OF FUTURE RESULTS
80
PERFORMANCE INFORMATION
WINTON CAPITAL MANAGEMENT
CAPSULE PERFORMANCE RECORD
(Unaudited)
The following represents the trading results of one client account managed Winton Capital Management in the Winton Diversified Trading Program as of January 31, 2011, for the period January 2006 through January 2011, on a monthly and annual basis. Rate of Return (ROR) is calculated by dividing net performance by nominal account size. Management fee is charged at a rate of 1/12 of 1% (1% annually) of Net Assets, as defined. Incentive fee is charge at a rate of 20% of New Net Profits, as defined.
The following information is as of January 31, 2011: |
Name of CTA: | Winton Capital Management |
Name of program: | Winton Diversified Trading Program |
Trading account: | Winton Futures Fund |
Inception of trading by CTA: | October 1997 |
Inception of trading in program: | October 1997 |
Worst monthly drawdown (Since 1/2006): | (6.28%), 2/07 |
Worst peak-to-valley drawdown (Since 1/2006): | (9.99%), 2/07 – 3/07 |
Total Assets under management this account: | $5,902,978,000 |
Total Assets under management in all programs – Client: | $15,425,041,000 |
Total Assets under management in all programs – Proprietary: | $22,098,000 |
Rates of Return
Month | 2011 | 2010 | 2009 | 2008 | 2007 | 2006 | ||||||||||||||||||
January | 0.11 | % | (2.54 | )% | 1.04 | % | 4.16 | % | 4.04 | % | 4.36 | % | ||||||||||||
February | 2.35 | % | (0.20 | )% | 8.52 | % | (6.28 | )% | (2.61 | )% | ||||||||||||||
March | 4.66 | % | (1.64 | )% | (0.71 | )% | (3.96 | )% | 4.10 | % | ||||||||||||||
April | 1.73 | % | (3.00 | )% | (0.94 | )% | 6.51 | % | 5.96 | % | ||||||||||||||
May | (0.98 | )% | (2.01 | )% | 2.04 | % | 5.30 | % | (3.12 | )% | ||||||||||||||
June | 1.49 | % | (1.27 | )% | 5.48 | % | 2.05 | % | (1.23 | )% | ||||||||||||||
July | (2.76 | )% | (1.49 | )% | (4.54 | )% | (1.17 | )% | (0.46 | )% | ||||||||||||||
August | 5.06 | % | 0.36 | % | (3.18 | )% | (0.85 | )% | 4.77 | % | ||||||||||||||
September | 1.03 | % | 2.85 | % | (0.38 | )% | 7.02 | % | (1.24 | )% | ||||||||||||||
October | 2.76 | % | (1.58 | )% | 3.67 | % | 2.66 | % | 1.58 | % | ||||||||||||||
November | (2.16 | )% | 5.11 | % | 4.63 | % | 2.63 | % | 3.46 | % | ||||||||||||||
December | 4.13 | % | (2.39 | )% | 2.10 | % | 0.27 | % | 2.24 | % | ||||||||||||||
Year | 0.11 | % | 15.33 | % | (4.43 | )% | 22.02 | % | 18.74 | % | 18.72 | % | ||||||||||||
| 11. | “Draw-down” means losses experienced by the account over a specified period. |
| 12. | “Worst Peak-to-Valley Draw-down” means the greatest cumulative percentage decline in month-end net asset value due to losses sustained by the account during any period in which the initial month-end net asset value is not equaled or exceeded by a subsequent month-end net asset value. |
PAST PERFORMANCE IS NOT NECESSARILY INDICATIVE OF FUTURE RESULTS
81
PERFORMANCE INFORMATION
WINTON CAPITAL MANAGEMENT
CAPSULE PERFORMANCE RECORD
(Unaudited)
The following represents the trading results of client accounts managed Winton Capital Management in the Winton Diversified Trading Program as of January 31, 2011, for the period January 2006 through January 2011, on a monthly and annual basis. Management fees are charged at rates ranging from 0% to 1/12 of 2.25% (2.25% annually) of Net Assets, as defined. Incentive fees charged at rates ranging from 14% to 30% of New Net Profits, as defined. Rate of Return (ROR) is calculated by dividing net performance by nominal account size. Additions and withdrawals are accounted for in accordance with the modified OAT (Only Accounts Traded) method as described in NFA Rule 2-34.
The following information is as of January 31, 2011: |
Name of CTA: | Winton Capital Management |
Name of program: | Winton Diversified Trading Program |
Inception of trading by CTA: | October 1997 |
Inception of trading in program: | October 1997 |
Worst monthly drawdown (Since 1/2006): | (6.39%), 2/07 |
Worst peak-to-valley drawdown (Since 1/2006): | (10.25%), 2/07 – 3/07 |
Total Assets under management this program: | $15,266,413,000 |
Total Assets under management in all programs – Client: | $15,425,041,000 |
Total Assets under management in all programs – Proprietary: | $22,098,000 |
Rates of Return
Month | 2011 | 2010 | 2009 | 2008 | 2007 | 2006 | ||||||||||||||||||
January | 0.11 | % | (2.51 | )% | 0.92 | % | 3.92 | % | 4.03 | % | 3.93 | % | ||||||||||||
February | 2.29 | % | (0.32 | )% | 8.21 | % | (6.39 | )% | (2.74 | )% | ||||||||||||||
March | 4.64 | % | (1.78 | )% | (0.92 | )% | (4.13 | )% | 3.88 | % | ||||||||||||||
April | 1.58 | % | (3.08 | )% | (0.97 | )% | 6.13 | % | 5.68 | % | ||||||||||||||
May | (0.85 | )% | (2.08 | )% | 1.95 | % | 5.04 | % | (3.21 | )% | ||||||||||||||
June | 1.46 | % | (1.31 | )% | 5.22 | % | 1.83 | % | (1.34 | )% | ||||||||||||||
July | (2.83 | )% | (1.55 | )% | (4.66 | )% | (1.38 | )% | (0.62 | )% | ||||||||||||||
August | 4.92 | % | 0.31 | % | (3.09 | )% | (0.96 | )% | 4.58 | % | ||||||||||||||
September | 0.84 | % | 2.73 | % | (0.38 | )% | 6.83 | % | (1.43 | )% | ||||||||||||||
October | 2.62 | % | (1.54 | )% | 3.65 | % | 2.38 | % | 1.43 | % | ||||||||||||||
November | (2.23 | )% | 5.01 | % | 4.48 | % | 2.45 | % | 3.10 | % | ||||||||||||||
December | 3.89 | % | (2.53 | )% | 1.93 | % | 0.12 | % | 2.03 | % | ||||||||||||||
Year | 0.11 | % | 14.27 | % | (5.39 | )% | 20.25 | % | 16.13 | % | 15.83 | % | ||||||||||||
| 1. | “Draw-down” means losses experienced by the account over a specified period. |
| 2. | “Worst Peak-to-Valley Draw-down” means the greatest cumulative percentage decline in month-end net asset value due to losses sustained by the account during any period in which the initial month-end net asset value is not equaled or exceeded by a subsequent month-end net asset value. |
PAST PERFORMANCE IS NOT NECESSARILY INDICATIVE OF FUTURE RESULTS
82
PERFORMANCE INFORMATION
WINTON CAPITAL MANAGEMENT
CAPSULE PERFORMANCE RECORD
(Unaudited)
The following represents the trading results of Winton OCTO Fund Limited, a client account managed by Winton Capital Management as of January 31, 2011, for the period November 2009 through January 2011, on a monthly and annual basis (year-to-date for partial years). Management fee is charged at a rate of 1/12 of 1% (1% annually) of Net Assets, as defined. Incentive fee is charge at a rate of 20% of New Net Profits, as defined. Rate of Return (ROR) is calculated by dividing net performance by nominal account size.
The following information is as of January 31, 2011: |
Name of CTA: | Winton Capital Management |
Name of program: | Winton OCTO Fund Limited |
Inception of trading by CTA: | October 1997 |
Inception of trading in program: | November 2009 |
Worst monthly drawdown (Since 11/2009): | (4.03%), 1/10 |
Worst peak-to-valley drawdown (Since 11/2009): | (7.39%), 12/09 – 1/10 |
Total Assets under management this account: | $49,244,000 |
Total Assets under management in all programs – Client: | $15,425,041,000 |
Total Assets under management in all programs – Proprietary: | $22,098,000 |
Rates of Return
Month | 2011 | 2010 | 2009 | |||||||||
January | 1.16 | % | (4.03 | )% | ||||||||
February | 2.40 | % | ||||||||||
March | 3.77 | % | ||||||||||
April | (0.57 | )% | ||||||||||
May | 1.00 | % | ||||||||||
June | 2.71 | % | ||||||||||
July | 3.34 | % | ||||||||||
August | 3.43 | % | ||||||||||
September | 0.14 | % | ||||||||||
October | 2.40 | % | ||||||||||
November | (1.24 | )% | 0.16 | % | ||||||||
December | (0.50 | )% | (3.42 | )% | ||||||||
Year | 1.16 | % | 13.29 | % | (3.27 | )% | ||||||
| 1. | “Draw-down” means losses experienced by the account over a specified period. |
| 2. | “Worst Peak-to-Valley Draw-down” means the greatest cumulative percentage decline in month-end net asset value due to losses sustained by the account during any period in which the initial month-end net asset value is not equaled or exceeded by a subsequent month-end net asset value. |
PAST PERFORMANCE IS NOT NECESSARILY INDICATIVE OF FUTURE RESULTS
83
PERFORMANCE INFORMATION
WINTON CAPITAL MANAGEMENT
CAPSULE PERFORMANCE RECORD
(Unaudited)
The following represents the trading results of Winton Evolution Fund, a client account managed by Winton Capital Management as of January 31, 2011, for the period January 2006 through January 2011, on a monthly and annual basis. Management fee is charged at a rate of 1/12 of 1% (1% annually) of Net Assets, as defined. Incentive fee is charge at a rate of 20% of New Net Profits, as defined. Rate of Return (ROR) is calculated by dividing net performance by nominal account
The following information is as of January 31, 2011: |
Name of CTA: | Winton Capital Management |
Name of program: | Winton Evolution Fund |
Inception of trading by CTA: | October 1997 |
Inception of trading in program: | September 2005 |
Worst monthly drawdown (Since 1/2006): | (6.28%), 2/07 |
Worst peak-to-valley drawdown (Since 1/2006): | (13.25%), 7/08 – 7/09 |
Total Assets under management this account: | $109,384,000 |
Total Assets under management in all programs – Client: | $15,425,041,000 |
Total Assets under management in all programs – Proprietary: | $22,098,000 |
Rates of Return
Month | 2011 | 2010 | 2009 | 2008 | 2007 | 2006 | ||||||||||||||||||
January | 1.18 | % | (2.33 | )% | 0.15 | % | (0.32 | )% | 3.53 | % | 6.19 | % | ||||||||||||
February | 2.75 | % | (0.18 | )% | 5.39 | % | (6.28 | )% | (3.82 | )% | ||||||||||||||
March | 4.30 | % | (2.41 | )% | 0.20 | % | (2.74 | )% | 3.87 | % | ||||||||||||||
April | (0.22 | )% | (1.76 | )% | 0.83 | % | 5.45 | % | 4.50 | % | ||||||||||||||
May | (0.33 | )% | (1.25 | )% | 1.95 | % | 4.45 | % | (3.66 | )% | ||||||||||||||
June | 1.58 | % | (1.79 | )% | 2.73 | % | 2.24 | % | (0.84 | )% | ||||||||||||||
July | 0.25 | % | (1.27 | )% | (3.39 | )% | (1.03 | )% | (0.77 | )% | ||||||||||||||
August | 2.98 | % | 1.88 | % | (2.31 | )% | (0.79 | )% | 4.46 | % | ||||||||||||||
September | 1.54 | % | 4.02 | % | (5.53 | )% | 5.19 | % | (2.21 | )% | ||||||||||||||
October | 3.19 | % | (1.22 | )% | 2.09 | % | 2.21 | % | 0.77 | % | ||||||||||||||
November | (2.89 | )% | 3.75 | % | 2.88 | % | 2.51 | % | 3.35 | % | ||||||||||||||
December | 3.23 | % | (2.70 | )% | 0.95 | % | 0.46 | % | 2.14 | % | ||||||||||||||
Year | 1.18 | % | 14.66 | % | (3.02 | )% | 5.08 | % | 15.53 | % | 14.20 | % | ||||||||||||
| 1. | “Draw-down” means losses experienced by the account over a specified period. |
| 2. | “Worst Peak-to-Valley Draw-down” means the greatest cumulative percentage decline in month-end net asset value due to losses sustained by the account during any period in which the initial month-end net asset value is not equaled or exceeded by a subsequent month-end net asset value. |
PAST PERFORMANCE IS NOT NECESSARILY INDICATIVE OF FUTURE RESULTS
84
PERFORMANCE INFORMATION
ALDER CAPITAL LIMITED CAPSULE PERFORMANCE RECORD
(Unaudited)
The following presents the trading results of the Alder 20 Global Program for the last five full calendar years, on a monthly and annual basis. In reviewing the table, prospective investors should note that Alder Capital is engaged in continuous research on its trading systems and as a result makes changes and adjustment to the trading program. Consequently, the prior track record may not be fully representative of the performance of the current Trading System.
The rates of return reported are based on the returns on nominal account sizes, have been prepared from the records of Alder Capital and are consistent with the trading records for each client’s account. The returns shown are net of management fees/agency fees, incentive fees/agency incentive fees and bid/ask spreads and any fees for FX Execution Arrangements incurred in trading.
Name of CTA | Alder Capital Limited |
Name of Program | Alder Global 20 |
Inception of trading | October 2000 |
Total assets traded pursuant to all programs operated by Alder Capital at January 31, 2011 | $575,000,000 |
Total assets traded pursuant to this program at January 31, 2011 | $549,000,000 |
Worst monthly drawdown (Since January 2006)* | (8.5)% 02/07 |
Worst peak-to-valley drawdown (Since January 2006)** | (15.8)% 04/08 – 08/08 |
| Pro - Forma Rate of Return*** | ||||||||||||||||||||||||
Month | 2011 | 2010 | 2009 | 2008 | 2007 | 2006 | ||||||||||||||||||
January | (3.1 | )% | 1.9 | % | 5.2 | % | 2.2 | % | 3.4 | % | 4.6 | % | ||||||||||||
February | 0.6 | % | 0.7 | % | 6.8 | % | (8.5 | )% | (3.0 | )% | ||||||||||||||
March | 2.7 | % | 2.5 | % | 6.9 | % | 1.4 | % | (7.2 | )% | ||||||||||||||
April | (0.6 | )% | 3.4 | % | 0.1 | % | 0.2 | % | 1.2 | % | ||||||||||||||
May | 0.7 | % | 0.6 | % | (4.2 | )% | 4.0 | % | 1.8 | % | ||||||||||||||
June | 0.2 | % | (4.8 | )% | 0.0 | % | (0.3 | )% | 3.1 | % | ||||||||||||||
July | 1.7 | % | 5.2 | % | (6.2 | )% | (0.1 | )% | (2.7 | )% | ||||||||||||||
August | (1.3 | )% | (4.2 | )% | (6.5 | )% | 1.0 | % | 7.8 | % | ||||||||||||||
September | 0.9 | % | (2.8 | )% | 2.2 | % | 4.6 | % | (6.1 | )% | ||||||||||||||
October | (0.3 | )% | 0.5 | % | 3.7 | % | 1.2 | % | (2.5 | )% | ||||||||||||||
November | 2.0 | % | 1.7 | % | (1.1 | )% | 1.4 | % | 10.0 | % | ||||||||||||||
December | (0.4 | )% | 4.0 | % | 0.7 | % | (2.5 | )% | 5.4 | % | ||||||||||||||
Year | (3.1 | )% | 8.1 | % | 12.0 | % | 3.8 | % | 5.1 | % | 11.3 | % | ||||||||||||
| * | Worst monthly drawdown within the past five years is the largest monthly loss experienced by the Alder Global 20 Program in the past five years. |
| ** | Worst peak-to-valley drawdown within the past five years is the largest percentage decline by the Alder Global 20 program during the period covered from any month-end value –added-monthly index (VAMI), without such month-end VAMI being equaled or exceeded as of a subsequent month end using the compounded ROR method. It is expressed as a percentage of the initial month-end VAMI. |
PAST PERFORMANCE IS NOT NECESSARILY INDICATIVE OF FUTURE RESULTS
85
PERFORMANCE INFORMATION
ALDER CAPITAL LIMITED CAPSULE PERFORMANCE RECORD
(Unaudited)
| *** | Rates of return for individual months have been calculated using the CFTC’s ‘Compounded ROR’ method. The annual rate of return has been calculated by compounding the monthly rates of return for the year and not by adding the monthly rates of return. Source: Alder Capital. The percentage returns shown for the Alder Global 20 program are pro forma returns. They are derived from the actual trading returns for the constituent accounts of the Alder Global 20 program, are net of trading costs, include interest income based on the rate of interest available on a fully-funded account denominated in €, are adjusted for an annual management charge of 2%, performance fees of 20% above the relevant high-water mark and include the reinvestment of profits and losses but take no account of taxation. If a trading account is not fully-funded, interest income will be lower than that available on a fully-funded account and returns will be lower than those shown in the table. On request, figures are available for the returns of the program before adjustment for fees and interest income. The value of investments managed by Alder Capital can go down as well as up and income from such investments may fluctuate in accordance with market conditions and taxation arrangements. Changes in exchange rates may have an adverse effect on the value of or income from investments managed by Alder Capital. Returns for a month are calculated from the close of business on the last trading day of the previous month to the close of business on the last trading day of the relevant month. Returns are not necessarily audited or independently verified. Please read Alder Capital’s disclosure document which is available at http://aldercapital.com/assets/components/downloads/Alder_Capital_Disclosure_Document.pdf for full details of the basis upon which returns have been calculated. |
PAST PERFORMANCE IS NOT NECESSARILY INDICATIVE OF FUTURE RESULTS
86
PERFORMANCE INFORMATION
AMPLITUDE CAPITAL INTERNATIONAL LIMITED
SUMMARY CAPSULE PERFORMANCE RECORD
(Unaudited)
The summary past performance of Amplitude Capital International Limited is presented below as of January 31, 2011.
Name of CTA: | Amplitude Capital International Ltd. |
Name of Trading Program: | Amplitude Sinfonie Fund |
Inception of Trading by CTA: | June 2005 |
Inception of Trading in Program: | September 2009 |
Total Number of Accounts in Program as of 1/31/2011: | 1 |
Total Assets Managed as of 1/31/2011: | $952,600,000 |
Total Assets Managed in this Program as of 1/31/2011: | $69,700,000 |
Worst Monthly Percentage Draw-Down: | (5.46)%(2/10) |
Worst Peak-to-Valley Draw-Down (Since January 2006)*: | (11.63)% (10/09 – 12/10) |
Number of Accounts in Program Closed with a Profit as of 1/31/2011: | 0 |
Number of Accounts in Program Closed with a Loss as of 1/31/2011: | 0 |
Year | YTD through January 31, 2011 | 2010 | 2009 | 2008 | 2007 | 2006 | ||||||||||||||||||
Rate of Return** | (0.96 | )% | 2.11 | % | (5.02 | )% | — | — | — | |||||||||||||||
| * | Draw-down means losses experienced by the program over the specified period. |
| ** | The annual rate of return is calculated by compounding the monthly rates of return which are calculated by dividing monthly performance by beginning equity plus additions. |
PAST PERFORMANCE IS NOT NECESSARILY INDICATIVE OF FUTURE RESULTS
87
PERFORMANCE INFORMATION
DENALI ASSET MANAGEMENT, LLLP
CAPSULE PERFORMANCE RECORD
(Unaudited)
The following represents the trading results of the Denali Partners, LP Fund as of January 31, 2011, for the period January 2006 through January 2011 on a monthly and annual basis.
The following information is as of January 31, 2011:
Name of CTA: | Denali Asset Management, LLLP |
Name of program: | Denali Partners, LP |
Inception of trading by CTA: | June 2000 |
Inception of trading in program: | June 2000 |
Worst monthly drawdown (Since 1/2006): | (5.50%) (8/07) |
Worst peak-to-valley drawdown (Since 1/2006): | (5.51%) (7/07 – 8/07) |
Total Assets under management this account: | $52,840,000 |
Total Assets under management in all programs – Client: | $183,000,000 |
Total Assets under management in all programs – Proprietary: | $107,058,000 |
Rates of Return
Month | 2011 | 2010 | 2009 | 2008 | 2007 | 2006 | ||||||||||||||||||
January | 0.05 | % | 1.39 | % | 1.15 | % | 0.56 | % | 2.74 | % | 2.50 | % | ||||||||||||
February | 0.53 | % | (2.26 | )% | 4.22 | % | (2.16 | )% | (0.90 | )% | ||||||||||||||
March | 1.44 | % | (2.11 | )% | (3.33 | )% | (0.23 | )% | 1.48 | % | ||||||||||||||
April | 0.74 | % | 0.66 | % | 6.61 | % | 2.75 | % | (0.33 | )% | ||||||||||||||
May | 5.20 | % | 3.86 | % | 2.71 | % | 3.72 | % | (1.35 | )% | ||||||||||||||
June | 0.11 | % | (0.53 | )% | (0.63 | )% | 3.55 | % | 1.77 | % | ||||||||||||||
July | 0.56 | % | 1.86 | % | 0.41 | % | (0.01 | )% | (1.92 | )% | ||||||||||||||
August | 1.11 | % | 0.18 | % | 0.05 | % | (5.50 | )% | 0.13 | % | ||||||||||||||
September | 2.08 | % | 0.41 | % | (0.99 | )% | 3.61 | % | (1.08 | )% | ||||||||||||||
October | 0.22 | % | 0.42 | % | 5.70 | % | 1.26 | % | 0.54 | % | ||||||||||||||
November | (0.90 | )% | 0.49 | % | 1.87 | % | (4.07 | )% | (1.40 | )% | ||||||||||||||
December | 1.22 | % | 0.14 | % | 0.92 | % | 1.40 | % | 1.71 | % | ||||||||||||||
Year | 0.05 | % | 14.46 | % | 4.21 | % | 19.16 | % | 6.72 | % | 1.03 | % | ||||||||||||
| 1. | “Draw-down” means losses experienced by the account over a specified period. |
| 2. | “Worst Peak-to-Valley Draw-down” means the greatest cumulative percentage decline in month-end net asset value due to losses sustained by the account during any period in which the initial month-end net asset value is not equaled or exceeded by a subsequent month-end net asset value. |
| 3. | The monthly rate of return is computed by dividing the net income by the beginning nominal equity. The monthly rates are then compounded to arrive at the annual rate of return. |
PAST PERFORMANCE IS NOT NECESSARILY INDICATIVE OF FUTURE RESULTS
88
PERFORMANCE INFORMATION
DENALI ASSET MANAGEMENT, LLLP
CAPSULE PERFORMANCE RECORD
(Unaudited)
The following represents the trading results of the Denali Master Fund, LP Fund as of January 31, 2011, for the period January 2006 through January 2011 on a monthly and annual basis.
The following information is as of January 31, 2011:
Name of CTA: | Denali Asset Management, LLLP |
Name of program: | Denali Master Fund, LP |
Inception of trading by CTA: | June 2000 |
Inception of trading in program: | November 2002 |
Worst monthly drawdown (Since 1/2006): | (5.50%) (8/07) |
Worst peak-to-valley drawdown (Since 1/2006): | (5.51%) (7/07 – 8/07) |
Total Assets under management this account: | $78,800,000 |
Total Assets under management in all programs – Client: | $183,000,000 |
Total Assets under management in all programs – Proprietary: | $107,058,000 |
Rates of Return
Month | 2011 | 2010 | 2009 | 2008 | 2007 | 2006 | ||||||||||||||||||
January | 0.05 | % | 1.39 | % | 1.15 | % | 0.56 | % | 2.74 | % | 2.50 | % | ||||||||||||
February | 0.53 | % | (2.26 | )% | 4.22 | % | (2.16 | )% | (0.90 | )% | ||||||||||||||
March | 1.44 | % | (2.11 | )% | (3.33 | )% | (0.23 | )% | 1.48 | % | ||||||||||||||
April | 0.74 | % | 0.66 | % | 6.61 | % | 2.75 | % | (0.33 | )% | ||||||||||||||
May | 5.20 | % | 3.86 | % | 2.71 | % | 3.72 | % | (1.35 | )% | ||||||||||||||
June | 0.11 | % | (0.53 | )% | (0.63 | )% | 3.55 | % | 1.77 | % | ||||||||||||||
July | 0.56 | % | 1.86 | % | 0.41 | % | (0.01 | )% | (1.92 | )% | ||||||||||||||
August | 1.11 | % | 0.18 | % | 0.05 | % | (5.50 | )% | 0.13 | % | ||||||||||||||
September | 2.08 | % | 0.41 | % | (0.99 | )% | 3.61 | % | (1.08 | )% | ||||||||||||||
October | 0.22 | % | 0.42 | % | 5.70 | % | 1.26 | % | 0.54 | % | ||||||||||||||
November | (0.90 | )% | 0.49 | % | 1.87 | % | (4.07 | )% | (1.40 | )% | ||||||||||||||
December | 1.22 | % | 0.14 | % | 0.92 | % | 1.40 | % | 1.71 | % | ||||||||||||||
Year | 0.05 | % | 14.46 | % | 4.21 | % | 19.16 | % | 6.72 | % | 1.04 | % | ||||||||||||
| 1. | “Draw-down” means losses experienced by the account over a specified period. |
| 2. | “Worst Peak-to-Valley Draw-down” means the greatest cumulative percentage decline in month-end net asset value due to losses sustained by the account during any period in which the initial month-end net asset value is not equaled or exceeded by a subsequent month-end net asset value. |
| 3. | The monthly rate of return is computed by dividing the net income by the beginning nominal equity. The monthly rates are then compounded to arrive at the annual rate of return. |
PAST PERFORMANCE IS NOT NECESSARILY INDICATIVE OF FUTURE RESULTS
89
PERFORMANCE INFORMATION
QUANTITATIVE INVESTMENT MANAGEMENT LLC
CAPSULE PERFORMANCE RECORD
(Unaudited)
The following represents the trading results of client accounts managed by Quantitative Investment Management LLC in the Global Program as of January 31, 2011, for the period January 2006 through January 2011, on a monthly and annual basis.
The following information is as of January 31, 2011: |
Name of CTA: | Quantitative Investment Management LLC |
Name of program: | Global Program |
Inception of trading by CTA: | October 2003 |
Inception of trading in program: | October 2003 |
Worst monthly drawdown (Since 1/2006): | (7.77)%, 1/08 |
Worst peak-to-valley drawdown (Since 1/2006): | (11.15)%, 9/09 – 7/10 |
Strategy: | $4,461,940,000 |
Total Assets in the Fund: | $4,961,935,144 |
Global Program
Month | 2011 | 2010 | 2009 | 2008 | 2007 | 2006 | ||||||||||||||||||
January | 0.30 | % | (4.33 | )% | 6.29 | % | (7.77 | )% | 1.65 | % | 1.04 | % | ||||||||||||
February | (0.46 | )% | (0.17 | )% | 5.17 | % | 1.37 | % | 1.46 | % | ||||||||||||||
March | (1.02 | )% | (2.32 | )% | 3.62 | % | 5.50 | % | 0.92 | % | ||||||||||||||
April | 0.06 | % | 4.38 | % | 2.08 | % | 1.32 | % | (2.17 | )% | ||||||||||||||
May | (1.39 | )% | 3.69 | % | 5.70 | % | (4.03 | )% | 5.12 | % | ||||||||||||||
June | 0.42 | % | (0.75 | )% | (1.63 | )% | 0.94 | % | (2.57 | )% | ||||||||||||||
July | (0.77 | )% | 1.82 | % | (1.92 | )% | 2.05 | % | 2.05 | % | ||||||||||||||
August | 1.38 | % | 0.78 | % | 3.41 | % | 7.66 | % | (0.26 | )% | ||||||||||||||
September | 0.38 | % | 1.40 | % | 3.02 | % | 1.09 | % | (1.52 | )% | ||||||||||||||
October | 2.45 | % | (2.51 | )% | (2.53 | )% | 3.98 | % | 2.37 | % | ||||||||||||||
November | (1.89 | )% | 2.12 | % | 2.33 | % | 3.02 | % | 0.21 | % | ||||||||||||||
December | 1.90 | % | (3.70 | )% | 0.68 | % | 1.15 | % | (1.28 | )% | ||||||||||||||
Year | 0.30 | % | (3.40 | )% | 11.07 | % | 11.94 | % | 28.40 | % | 5.23 | % | ||||||||||||
| 1. | Worst monthly percentage draw-down is the largest monthly loss experienced by the program on a composite basis in any calendar month expressed as a percentage of the total equity in the program and includes the month and year of such draw-own. |
| 2. | Worst peak-to-valley draw-down is largest cumulative percentage decline in month-end net asset value of the program due to losses sustained by the program during a period in which the initial month-end net asset value of the program is not equaled or exceeded by a subsequent month-end net asset value of the Program and includes the time period in which it occurred. |
| 3. | The monthly rate of return is computed by dividing the net income by the beginning nominal equity. Accounts that have middle of the month additions or withdrawals are excluded from the computation. The monthly rates are then compounded to arrive at the annual rate of return. |
PAST PERFORMANCE IS NOT NECESSARILY INDICATIVE OF FUTURE RESULTS
90
Investors are cautioned that the information set forth in the historical performance summaries is not necessarily indicative of, and may have no bearing on, any trading results that may be attained by any of the trading advisors in the future, since past performance is not indicative of future results. There can be no assurance that the trading advisors will make any profits at all, or will be able to avoid incurring substantial losses. Investors should also note that interest income may constitute a significant portion of a commodity pool’s total income and, in certain instances, may generate profits where there have been realized or unrealized losses from commodity trading.
PAST PERFORMANCE IS NOT NECESSARILY INDICATIVE OF FUTURE RESULTS
91
PERFORMANCE INFORMATION
QUANTITATIVE INVESTMENT MANAGEMENT LLC
CAPSULE PERFORMANCE RECORD
(Unaudited)
The following represents the trading results of client accounts managed by Quantitative Investment Management LLC in the Tactical Aggressive Program as of January 31, 2011, for the period May 2008 through January 2011, on a monthly and annual basis.
The following information is as of January 31, 2011:
Name of CTA: | Quantitative Investment Management LLC |
Name of program: | Tactical Aggressive Program |
Inception of trading by CTA: | October 2003 |
Inception of trading in program: | May 2008 |
Worst monthly drawdown (Since 5/2008): | (7.97)%, 9/10 |
Worst peak-to-valley drawdown (Since 5/2008): | (11.49)%, 6/09 – 1/10 |
Strategy: | $499,995,144 |
Total Assets in the Fund: | $4,961,935,144 |
Tactical Aggressive Program
Month | 2011 | 2010 | 2009 | 2008 | 2007 | 2006 | ||||||||||||||||||
January | 6.21 | % | (6.52 | )% | 3.14 | % | — | — | — | |||||||||||||||
February | 11.06 | % | 4.61 | % | — | — | — | |||||||||||||||||
March | 1.17 | % | 0.71 | % | — | — | — | |||||||||||||||||
April | 9.37 | % | 4.70 | % | — | — | — | |||||||||||||||||
May | 0.01 | % | 10.15 | % | 5.43 | % | — | — | ||||||||||||||||
June | 1.69 | % | 8.09 | % | 4.14 | % | — | — | ||||||||||||||||
July | (2.33 | )% | (3.06 | )% | 7.63 | % | — | — | ||||||||||||||||
August | 3.98 | % | (3.17 | )% | 3.26 | % | — | — | ||||||||||||||||
September | (7.97 | )% | 5.31 | % | 12.05 | % | — | — | ||||||||||||||||
October | 0.86 | % | (4.72 | )% | (0.13 | )% | — | — | ||||||||||||||||
November | 1.01 | % | (1.61 | )% | 1.39 | % | — | — | ||||||||||||||||
December | 3.52 | % | 2.17 | % | 1.49 | % | — | — | ||||||||||||||||
Year | 6.21 | % | 15.16 | % | 28.25 | % | 40.50 | % | — | — | ||||||||||||||
| 1. | Worst monthly percentage draw-down is the largest monthly loss experienced by the program on a composite basis in any calendar month expressed as a percentage of the total equity in the program and includes the month and year of such draw-own. |
| 2. | Worst peak-to-valley draw-down is largest cumulative percentage decline in month-end net asset value of the program due to losses sustained by the program during a period in which the initial month-end net asset value of the program is not equaled or exceeded by a subsequent month-end net asset value of the Program and includes the time period in which it occurred. |
| 3. | The monthly rate of return is computed by dividing the net income by the beginning nominal equity. Accounts that have middle of the month additions or withdrawals are excluded from the computation. The monthly rates are then compounded to arrive at the annual rate of return. |
PAST PERFORMANCE IS NOT NECESSARILY INDICATIVE OF FUTURE RESULTS
92
Investors are cautioned that the information set forth in the historical performance summaries is not necessarily indicative of, and may have no bearing on, any trading results that may be attained by any of the trading advisors in the future, since past performance is not indicative of future results. There can be no assurance that the trading advisors will make any profits at all, or will be able to avoid incurring substantial losses. Investors should also note that interest income may constitute a significant portion of a commodity pool’s total income and, in certain instances, may generate profits where there have been realized or unrealized losses from commodity trading.
PAST PERFORMANCE IS NOT NECESSARILY INDICATIVE OF FUTURE RESULTS
93
PERFORMANCE INFORMATION
QUANTITATIVE INVESTMENT MANAGEMENT LLC
CAPSULE PERFORMANCE RECORD
(Unaudited)
The following represents the trading results of client accounts managed by Quantitative Investment Management LLC in the Global 1x Program as of January 31, 2011, for the period May 2006 through January 2011, on a monthly and annual basis.
The following information is as of January 31, 2011: |
Name of CTA: | Quantitative Investment Management LLC |
Name of program: | Global 1x Program |
Inception of trading by CTA: | October 2003 |
Inception of trading in program: | May 2006 |
Worst monthly drawdown (Since 5/2006): | (7.45)%, 1/08 |
Worst peak-to-valley drawdown (Since 5/2006): | (10.98)%, 9/09 – 7/10 |
Strategy: | $325,575,441 |
Total Assets in the Fund: | $4,961,935,144 |
Global 1x Program
Month | 2011 | 2010 | 2009 | 2008 | 2007 | 2006 | ||||||||||||||||||
January | 0.31 | % | (4.35 | )% | 5.75 | % | (7.45 | )% | 1.69 | % | — | |||||||||||||
February | (0.47 | )% | (0.20 | )% | 5.21 | % | 1.36 | % | — | |||||||||||||||
March | (1.03 | )% | (2.28 | )% | 3.49 | % | 5.43 | % | — | |||||||||||||||
April | 0.07 | % | 4.43 | % | 1.80 | % | 1.25 | % | — | |||||||||||||||
May | (1.30 | )% | 3.16 | % | 5.66 | % | (3.76 | )% | 4.52 | % | ||||||||||||||
June | 0.44 | % | (0.35 | )% | (1.55 | )% | 1.31 | % | (2.72 | )% | ||||||||||||||
July | (0.78 | )% | 1.90 | % | (1.86 | )% | 1.95 | % | 2.91 | % | ||||||||||||||
August | 1.37 | % | 0.78 | % | 3.38 | % | 8.09 | % | (0.02 | )% | ||||||||||||||
September | 0.37 | % | 1.43 | % | 3.05 | % | 1.05 | % | (1.47 | )% | ||||||||||||||
October | 2.48 | % | (2.42 | )% | (2.51 | )% | 4.16 | % | 2.71 | % | ||||||||||||||
November | (1.91 | )% | 2.16 | % | 2.30 | % | 3.46 | % | 0.15 | % | ||||||||||||||
December | 1.94 | % | (3.71 | )% | 0.87 | % | 1.18 | % | (1.16 | )% | ||||||||||||||
Year | 0.31 | % | (3.31 | )% | 10.70 | % | 12.23 | % | 30.25 | % | 4.81 | % | ||||||||||||
| 1. | Worst monthly percentage draw-down is the largest monthly loss experienced by the program on a composite basis in any calendar month expressed as a percentage of the total equity in the program and includes the month and year of such draw-own. |
| 2. | Worst peak-to-valley draw-down is largest cumulative percentage decline in month-end net asset value of the program due to losses sustained by the program during a period in which the initial month-end net asset value of the program is not equaled or exceeded by a subsequent month-end net asset value of the Program and includes the time period in which it occurred. |
| 3. | The monthly rate of return is computed by dividing the net income by the beginning nominal equity. Accounts that have middle of the month additions or withdrawals are excluded from the computation. The monthly rates are then compounded to arrive at the annual rate of return. |
PAST PERFORMANCE IS NOT NECESSARILY INDICATIVE OF FUTURE RESULTS
94
Investors are cautioned that the information set forth in the historical performance summaries is not necessarily indicative of, and may have no bearing on, any trading results that may be attained by any of the trading advisors in the future, since past performance is not indicative of future results. There can be no assurance that the trading advisors will make any profits at all, or will be able to avoid incurring substantial losses. Investors should also note that interest income may constitute a significant portion of a commodity pool’s total income and, in certain instances, may generate profits where there have been realized or unrealized losses from commodity trading.
PAST PERFORMANCE IS NOT NECESSARILY INDICATIVE OF FUTURE RESULTS
95
PERFORMANCE INFORMATION
QUANTITATIVE INVESTMENT MANAGEMENT LLC
CAPSULE PERFORMANCE RECORD
(Unaudited)
The following represents the trading results of client accounts managed by Quantitative Investment Management LLC in the Global 3x Program as of January 31, 2011, for the period January 2006 through January 2011, on a monthly and annual basis.
The following information is as of January 31, 2011: |
Name of CTA: | Quantitative Investment Management LLC |
Name of program: | Global 3x Program |
Inception of trading by CTA: | October 2003 |
Inception of trading in program: | June 2005 |
Worst monthly drawdown (Since 1/2006): | (22.36)%, 1/08 |
Worst peak-to-valley drawdown (Since 1/2006): | (30.22)%, 9/09 – 7/10 |
Strategy: | $292,964,253 |
Total Assets in the Fund: | $4,961,935,144 |
Global 3x Program
Month | 2011 | 2010 | 2009 | 2008 | 2007 | 2006 | ||||||||||||||||||
January | 0.98 | % | (12.93 | )% | 18.11 | % | (22.36 | )% | 5.07 | % | 1.76 | % | ||||||||||||
February | (1.37 | )% | (0.31 | )% | 15.62 | % | 4.13 | % | 4.77 | % | ||||||||||||||
March | (3.03 | )% | (7.24 | )% | 11.45 | % | 16.74 | % | 4.59 | % | ||||||||||||||
April | 0.24 | % | 12.75 | % | 5.40 | % | 3.74 | % | (6.57 | )% | ||||||||||||||
May | (3.86 | )% | 10.79 | % | 17.23 | % | (11.44 | )% | 15.28 | % | ||||||||||||||
June | 1.33 | % | (1.86 | )% | (4.89 | )% | 3.92 | % | (6.88 | )% | ||||||||||||||
July | (2.32 | )% | 5.30 | % | (5.58 | )% | 6.11 | % | 6.78 | % | ||||||||||||||
August | 4.14 | % | 1.98 | % | 10.22 | % | 24.34 | % | (0.05 | )% | ||||||||||||||
September | 1.19 | % | 4.41 | % | 9.24 | % | 3.29 | % | (3.60 | )% | ||||||||||||||
October | 7.48 | % | (7.14 | )% | (7.54 | )% | 12.48 | % | 7.73 | % | ||||||||||||||
November | (5.76 | )% | 6.45 | % | 6.91 | % | 10.68 | % | 0.47 | % | ||||||||||||||
December | 5.91 | % | (11.13 | )% | 2.73 | % | 3.73 | % | (3.57 | )% | ||||||||||||||
Year | 0.98 | % | (10.20 | )% | 31.88 | % | 35.73 | % | 114.60 | % | 20.08 | % | ||||||||||||
| 1. | Worst monthly percentage draw-down is the largest monthly loss experienced by the program on a composite basis in any calendar month expressed as a percentage of the total equity in the program and includes the month and year of such draw-own. |
| 2. | Worst peak-to-valley draw-down is largest cumulative percentage decline in month-end net asset value of the program due to losses sustained by the program during a period in which the initial month-end net asset value of the program is not equaled or exceeded by a subsequent month-end net asset value of the Program and includes the time period in which it occurred. |
| 3. | The monthly rate of return is computed by dividing the net income by the beginning nominal equity. Accounts that have middle of the month additions or withdrawals are excluded from the computation. The monthly rates are then compounded to arrive at the annual rate of return. |
PAST PERFORMANCE IS NOT NECESSARILY INDICATIVE OF FUTURE RESULTS
96
Investors are cautioned that the information set forth in the historical performance summaries is not necessarily indicative of, and may have no bearing on, any trading results that may be attained by any of the trading advisors in the future, since past performance is not indicative of future results. There can be no assurance that the trading advisors will make any profits at all, or will be able to avoid incurring substantial losses. Investors should also note that interest income may constitute a significant portion of a commodity pool’s total income and, in certain instances, may generate profits where there have been realized or unrealized losses from commodity trading.
PAST PERFORMANCE IS NOT NECESSARILY INDICATIVE OF FUTURE RESULTS
97
PERFORMANCE INFORMATION
QUANTITATIVE INVESTMENT MANAGEMENT LLC
CAPSULE PERFORMANCE RECORD
(Unaudited)
The following represents the trading results of client accounts managed by Quantitative Investment Management LLC in the Ultra Program as of September 30, 2009, for the period September 2007 through September 2009, on a monthly and annual basis. This program ceased trading in September 2009.
The following information is as of January 31, 2011:
Name of CTA: | Quantitative Investment Management LLC |
Name of program: | Ultra Program |
Inception of trading by CTA: | October 2003 |
Inception of trading in program: | September 2007 |
Worst monthly drawdown: | (6.37%), 7/08 |
Worst peak-to-valley drawdown: | (18.06%), 6/08 – 8/09 |
Strategy: | $0 |
Total Assets in the Fund: | $4,961,935,144 |
Ultra Program
Month | 2009 | 2008 | 2007 | |||||||||
January | 0.08 | % | (4.93 | )% | ||||||||
February | 0.56 | % | 4.60 | % | ||||||||
March | (1.49 | )% | 0.79 | % | ||||||||
April | (1.08 | )% | 2.74 | % | ||||||||
May | (1.61 | )% | 2.62 | % | ||||||||
June | (0.49 | )% | 3.24 | % | ||||||||
July | (0.56 | )% | (6.37 | )% | ||||||||
August | (0.12 | )% | (5.69 | )% | ||||||||
September | 0.41 | % | (0.72 | )% | 2.56 | % | ||||||
October | (0.40 | )% | 2.67 | % | ||||||||
November | (0.24 | )% | (2.38 | )% | ||||||||
December | (1.27 | )% | 0.70 | % | ||||||||
Year | (4.23 | )% | (6.18 | )% | 3.52 | % | ||||||
| 1. | Worst monthly percentage draw-downis the largest monthly loss experienced by the program on a composite basis in any calendar month expressed as a percentage of the total equity in the program and includes the month and year of such draw-own. |
| 2. | Worst peak-to-valley draw-downis largest cumulative percentage decline in month-end net asset value of the program due to losses sustained by the program during a period in which the initial month-end net asset value of the program is not equaled or exceeded by a subsequent month-end net asset value of the Program and includes the time period in which it occurred. |
| 3. | The monthly rate of returnis computed by dividing the net income by the beginning nominal equity. Accounts that have middle of the month additions or withdrawals are excluded from the computation. The monthly rates are then compounded to arrive at the annual rate of return. |
PAST PERFORMANCE IS NOT NECESSARILY INDICATIVE OF FUTURE RESULTS
98
Investors are cautioned that the information set forth in the following historical performance summaries is not necessarily indicative of, and may have no bearing on, any trading results that may be attained by any of the trading advisors in the future, since past performance is not indicative of future results. There can be no assurance that the trading advisors will make any profits at all, or will be able to avoid incurring substantial losses. Investors should also note that interest income may constitute a significant portion of a commodity pool’s total income and, in certain instances, may generate profits where there have been realized or unrealized losses from commodity trading.
PAST PERFORMANCE IS NOT NECESSARILY INDICATIVE OF FUTURE RESULTS
99
PERFORMANCE INFORMATION
TRANSTREND BV
CAPSULE PERFORMANCE RECORD
(Unaudited)
The following represents the trading results of one client account managed by Transtrend BV in the Diversified Trend Program (Enhanced Risk US Dollar) as of January 31, 2011, for the period January 2006 through January 2011, on a monthly and annual basis. Rate of Return (ROR) is calculated by dividing net performance by nominal account size. Management fee is charged at a monthly rate of 0.25% (3% annually) of Net Assets, as defined. Incentive fee is charged at a quarterly rate of 25% of New Net Profits, as defined.
The following information is as of January 31, 2011: |
Name of CTA: | Transtrend BV |
Name of program: | Diversified Trend Program |
(Enhanced Risk US Dollar)
Inception of trading by CTA: | October 1993 |
Inception of trading in program: | January 1995 |
Worst monthly drawdown (Since 1/2006): | (4.79%), 12/09 |
Worst peak-to-valley drawdown (Since 1/2006): | (15.15%), 2/09 – 1/10 |
Total Assets under management this account: | $2,339,893,580 |
Total Assets under management in all programs – Client: | $3,692,432,169 |
Total Assets under management in all programs – Proprietary: | $0 |
Rates of Return
Month | 2011 | 2010 | 2009 | 2008 | 2007 | 2006 | ||||||||||||||||||
January | (0.77 | )% | (3.90 | )% | (0.27 | )% | (0.48 | )% | 1.64 | % | 1.78 | % | ||||||||||||
February | 1.18 | % | 0.76 | % | 5.55 | % | (4.07 | )% | (2.26 | )% | ||||||||||||||
March | 8.18 | % | (3.34 | )% | 1.33 | % | (3.24 | )% | 0.89 | % | ||||||||||||||
April | 1.82 | % | 0.18 | % | 0.59 | % | 5.69 | % | 1.94 | % | ||||||||||||||
May | (4.58 | )% | 1.28 | % | 3.28 | % | 6.84 | % | (3.78 | )% | ||||||||||||||
June | (0.22 | )% | (1.10 | )% | 3.03 | % | 3.65 | % | (1.26 | )% | ||||||||||||||
July | (0.86 | )% | (2.30 | )% | (2.38 | )% | (2.50 | )% | (3.69 | )% | ||||||||||||||
August | 2.75 | % | 0.23 | % | (1.38 | )% | (2.44 | )% | 4.72 | % | ||||||||||||||
September | 3.59 | % | (0.93 | )% | 4.95 | % | 7.81 | % | 0.12 | % | ||||||||||||||
October | 3.91 | % | (3.48 | )% | 7.12 | % | 9.02 | % | 4.56 | % | ||||||||||||||
November | (0.82 | )% | 2.11 | % | 2.57 | % | (2.16 | )% | 3.68 | % | ||||||||||||||
December | 3.60 | % | (4.79 | )% | 2.29 | % | 1.32 | % | 5.29 | % | ||||||||||||||
Year | (0.77 | )% | 14.88 | % | (11.28 | )% | 29.38 | % | 22.39 | % | 12.03 | % | ||||||||||||
| 1. | “Draw-down” means losses experienced by the account over a specified period. |
| 2. | “Worst Peak-to-Valley Draw-down” means the greatest cumulative percentage decline in month-end net asset value due to losses sustained by the account during any period in which the initial month-end net asset value is not equaled or exceeded by a subsequent month-end net asset value. |
PAST PERFORMANCE IS NOT NECESSARILY INDICATIVE OF FUTURE RESULTS
100
PERFORMANCE INFORMATION
TRANSTREND BV
CAPSULE PERFORMANCE RECORD
(Unaudited)
The following represents the trading results of one client account managed by Transtrend BV in the Diversified Trend Program (Enhanced Risk Euro) as of January 31, 2011, for the period January 2006 through January 2011, on a monthly and annual basis. Rate of Return (ROR) is calculated by dividing net performance by nominal account size. Management fee is charged at a monthly rate of 0.25% (3% annually) of Net Assets, as defined. Incentive fee is charged at a quarterly rate of 25% of New Net Profits, as defined.
The following information is as of January 31, 2011: |
Name of CTA: | Transtrend BV |
Name of program: | Diversified Trend Program |
(Enhanced Risk Euro)
Inception of trading by CTA: | October 1993 |
Inception of trading in program: | August 1999 |
Worst monthly drawdown (Since 1/2006): | (4.90%), 12/09 |
Worst peak-to-valley drawdown (Since 1/2006): | (14.97%), 2/09 – 1/10 |
Total Assets under management this account: | $758,081,085 |
Total Assets under management in all programs – Client: | $3,692,432,169 |
Total Assets under management in all programs – Proprietary: | $0 |
Rates of Return
Month | 2011 | 2010 | 2009 | 2008 | 2007 | 2006 | ||||||||||||||||||
January | (0.94 | )% | (3.98 | )% | (0.24 | )% | (0.63 | )% | 1.75 | % | 1.67 | % | ||||||||||||
February | 1.35 | % | 0.91 | % | 5.24 | % | (4.32 | )% | (2.30 | )% | ||||||||||||||
March | 8.14 | % | (3.41 | )% | 0.99 | % | (3.59 | )% | 0.76 | % | ||||||||||||||
April | 1.93 | % | 0.14 | % | 0.73 | % | 5.73 | % | 1.74 | % | ||||||||||||||
May | (4.41 | )% | 1.20 | % | 3.54 | % | 7.42 | % | (3.92 | )% | ||||||||||||||
June | (0.18 | )% | (0.95 | )% | 2.88 | % | 3.62 | % | (1.37 | )% | ||||||||||||||
July | (0.86 | )% | (2.25 | )% | (2.09 | )% | (2.70 | )% | (3.66 | )% | ||||||||||||||
August | 2.85 | % | 0.21 | % | (1.15 | )% | (2.77 | )% | 4.86 | % | ||||||||||||||
September | 3.34 | % | (0.77 | )% | 5.35 | % | 7.97 | % | 0.17 | % | ||||||||||||||
October | 3.65 | % | (3.36 | )% | 7.90 | % | 8.75 | % | 4.87 | % | ||||||||||||||
November | (0.81 | )% | 2.25 | % | 2.60 | % | (2.39 | )% | 3.32 | % | ||||||||||||||
December | 3.73 | % | (4.90 | )% | 2.04 | % | 1.36 | % | 5.46 | % | ||||||||||||||
Year | (0.94 | )% | 15.01 | % | (10.85 | )% | 30.54 | % | 21.40 | % | 11.57 | % | ||||||||||||
| 1. | “Draw-down” means losses experienced by the account over a specified period. |
| 2. | “Worst Peak-to-Valley Draw-down” means the greatest cumulative percentage decline in month-end net asset value due to losses sustained by the account during any period in which the initial month-end net asset value is not equaled or exceeded by a subsequent month-end net asset value. |
PAST PERFORMANCE IS NOT NECESSARILY INDICATIVE OF FUTURE RESULTS
101
PERFORMANCE INFORMATION
TRANSTREND BV
CAPSULE PERFORMANCE RECORD
(Unaudited)
The following represents the trading results of one client account managed by Transtrend BV in the Diversified Trend Program (Enhanced Risk Japanese Yen) as of January 31, 2011, for the period January 2006 through January 2011, on a monthly and annual basis. Rate of Return (ROR) is calculated by dividing net performance by nominal account size. Management fee is charged at a monthly rate of 0.25% (3% annually) of Net Assets, as defined. Incentive fee is charged at a quarterly rate of 25% of New Net Profits, as defined.
The following information is as of January 31, 2011: |
Name of CTA: | Transtrend BV |
Name of program: | Diversified Trend Program |
(Enhanced Risk Japanese Yen)
Inception of trading by CTA: | October 1993 |
Inception of trading in program: | August 2004 |
Worst monthly drawdown (Since 1/2006): | (4.97%), 12/09 |
Worst peak-to-valley drawdown (Since 1/2006): | (15.30%), 2/09 – 1/10 |
Total Assets under management this account: | $250,676,611 |
Total Assets under management in all programs – Client: | $3,692,432,169 |
Total Assets under management in all programs – Proprietary: | $0 |
Rates of Return
Month | 2011 | 2010 | 2009 | 2008 | 2007 | 2006 | ||||||||||||||||||
January | (0.93 | )% | (3.76 | )% | (0.18 | )% | (0.75 | )% | 1.82 | % | 1.51 | % | ||||||||||||
February | 1.21 | % | 0.93 | % | 5.11 | % | (4.46 | )% | (2.34 | )% | ||||||||||||||
March | 8.37 | % | (3.50 | )% | 0.64 | % | (3.75 | )% | 0.66 | % | ||||||||||||||
April | 1.84 | % | 0.08 | % | 0.73 | % | 5.85 | % | 1.77 | % | ||||||||||||||
May | (4.71 | )% | 1.09 | % | 3.41 | % | 7.25 | % | (3.96 | )% | ||||||||||||||
June | (0.25 | )% | (1.06 | )% | 2.79 | % | 3.38 | % | (1.56 | )% | ||||||||||||||
July | (0.74 | )% | (2.37 | )% | (2.10 | )% | (2.75 | )% | (3.75 | )% | ||||||||||||||
August | 2.66 | % | 0.23 | % | (1.19 | )% | (2.90 | )% | 4.86 | % | ||||||||||||||
September | 3.73 | % | (0.87 | )% | 4.77 | % | 8.42 | % | (0.00 | )% | ||||||||||||||
October | 3.80 | % | (3.28 | )% | 6.77 | % | 8.45 | % | 4.87 | % | ||||||||||||||
November | (0.89 | )% | 2.18 | % | 2.21 | % | (2.86 | )% | 3.45 | % | ||||||||||||||
December | 3.58 | % | (4.97 | )% | 1.95 | % | 1.14 | % | 5.53 | % | ||||||||||||||
Year | (0.93 | )% | 15.07 | % | (11.34 | )% | 26.75 | % | 19.88 | % | 10.94 | % | ||||||||||||
| 1. | “Draw-down” means losses experienced by the account over a specified period. |
| 2. | “Worst Peak-to-Valley Draw-down” means the greatest cumulative percentage decline in month-end net asset value due to losses sustained by the account during any period in which the initial month-end net asset value is not equaled or exceeded by a subsequent month-end net asset value. |
PAST PERFORMANCE IS NOT NECESSARILY INDICATIVE OF FUTURE RESULTS
102
PERFORMANCE INFORMATION
TRANSTREND BV
CAPSULE PERFORMANCE RECORD
(Unaudited)
The following represents the trading results of one client account managed by Transtrend BV in the Diversified Trend Program (Standard Risk Euro) as of January 31, 2011, for the period January 2006 through January 2011, on a monthly and annual basis. Rate of Return (ROR) is calculated by dividing net performance by nominal account size. Management fee is charged at a monthly rate of 0.25% (3% annually) of Net Assets, as defined. Incentive fee is charged at a quarterly rate of 25% of New Net Profits, as defined.
The following information is as of January 31, 2011: |
Name of CTA: | Transtrend BV |
Name of program: | Diversified Trend Program |
(Standard Risk Euro)
Inception of trading by CTA: | October 1993 |
Inception of trading in program: | February 1999 |
Worst monthly drawdown (Since 1/2006): | (3.16%), 12/09 |
Worst peak-to-valley drawdown (Since 1/2006): | (10.59%), 2/09 – 1/10 |
Total Assets under management this account: | $313,269,500 |
Total Assets under management in all programs – Client: | $3,692,432,169 |
Total Assets under management in all programs – Proprietary: | $0 |
Rates of Return
Month | 2011 | 2010 | 2009 | 2008 | 2007 | 2006 | ||||||||||||||||||
January | (0.72 | )% | (2.77 | )% | (0.21 | )% | (0.46 | )% | 0.73 | % | 1.04 | % | ||||||||||||
February | 0.73 | % | 0.43 | % | 3.51 | % | (2.92 | )% | (1.67 | )% | ||||||||||||||
March | 5.30 | % | (2.32 | )% | 0.71 | % | (2.20 | )% | 0.72 | % | ||||||||||||||
April | 1.17 | % | 0.16 | % | 0.30 | % | 3.51 | % | 1.06 | % | ||||||||||||||
May | (2.99 | )% | 0.78 | % | 2.05 | % | 4.32 | % | (2.62 | )% | ||||||||||||||
June | (0.17 | )% | (0.65 | )% | 2.05 | % | 2.47 | % | (0.90 | )% | ||||||||||||||
July | (0.65 | )% | (1.47 | )% | (1.94 | )% | (1.67 | )% | (2.62 | )% | ||||||||||||||
August | 1.73 | % | 0.09 | % | (0.93 | )% | (1.59 | )% | 2.88 | % | ||||||||||||||
September | 2.01 | % | (0.57 | )% | 3.82 | % | 4.48 | % | 0.07 | % | ||||||||||||||
October | 2.41 | % | (2.49 | )% | 5.49 | % | 5.66 | % | 2.57 | % | ||||||||||||||
November | (0.63 | )% | 1.38 | % | 1.73 | % | (1.53 | )% | 2.06 | % | ||||||||||||||
December | 2.34 | % | (3.16 | )% | 1.28 | % | 0.82 | % | 3.09 | % | ||||||||||||||
Year | (0.72 | )% | 8.51 | % | (7.84 | )% | 18.82 | % | 12.23 | % | 5.58 | % | ||||||||||||
| 1. | “Draw-down” means losses experienced by the account over a specified period. |
| 2. | “Worst Peak-to-Valley Draw-down” means the greatest cumulative percentage decline in month-end net asset value due to losses sustained by the account during any period in which the initial month-end net asset value is not equaled or exceeded by a subsequent month-end net asset value. |
PAST PERFORMANCE IS NOT NECESSARILY INDICATIVE OF FUTURE RESULTS
103
PERFORMANCE INFORMATION
TRANSTREND BV
CAPSULE PERFORMANCE RECORD
(Unaudited)
The following represents the trading results of one client account managed by Transtrend BV in the Diversified Trend Program (Standard Risk JapaneseYen) as of January 31, 2011, for the period March 2009 through January 2011, on a monthly and annual basis. Rate of Return (ROR) is calculated by dividing net performance by nominal account size. Management fee is charged at a monthly rate of 0.25% (3% annually) of Net Assets, as defined. Incentive fee is charged at a quarterly rate of 25% of New Net Profits, as defined.
The following information is as of January 31, 2011: |
Name of CTA: | Transtrend BV |
Name of program: | Diversified Trend Program |
(Standard Risk Japanese Yen)
Inception of trading by CTA: | October 1993 |
Inception of trading in program: | March 2009 |
Worst monthly drawdown (Since 3/2009): | (4.45%), 12/09 |
Worst peak-to-valley drawdown (Since 3/2009): | (15.47%), 3/09 – 1/10 |
Total Assets under management this account: | $3,482,037 |
Total Assets under management in all programs – Client: | $3,692,432,169 |
Total Assets under management in all programs – Proprietary: | $0 |
Rates of Return
Month | 2011 | 2010 | 2009 | 2008 | 2007 | 2006 | ||||||||||||||||||
January | (0.82 | )% | (3.82 | )% | — | — | — | — | ||||||||||||||||
February | 0.96 | % | — | — | — | — | ||||||||||||||||||
March | 7.47 | % | (4.29 | )% | — | — | — | |||||||||||||||||
April | 1.76 | % | 0.08 | % | — | — | — | |||||||||||||||||
May | (4.38 | )% | 0.87 | % | — | — | — | |||||||||||||||||
June | (0.31 | )% | (0.92 | )% | — | — | — | |||||||||||||||||
July | (0.68 | )% | (2.45 | )% | — | — | — | |||||||||||||||||
August | 1.61 | % | 0.34 | % | — | — | — | |||||||||||||||||
September | 3.17 | % | (0.72 | )% | — | — | — | |||||||||||||||||
October | 3.53 | % | (3.08 | )% | — | — | — | |||||||||||||||||
November | (1.16 | )% | 2.01 | % | — | — | — | |||||||||||||||||
December | 3.68 | % | (4.45 | )% | — | — | — | |||||||||||||||||
Year | (0.82 | )% | 11.81 | % | (12.11 | )% | — | — | — | |||||||||||||||
| 1. | “Draw-down” means losses experienced by the account over a specified period. |
| 2. | “Worst Peak-to-Valley Draw-down” means the greatest cumulative percentage decline in month-end net asset value due to losses sustained by the account during any period in which the initial month-end net asset value is not equaled or exceeded by a subsequent month-end net asset value. |
PAST PERFORMANCE IS NOT NECESSARILY INDICATIVE OF FUTURE RESULTS
104
PERFORMANCE INFORMATION
TRANSTREND BV
CAPSULE PERFORMANCE RECORD
(Unaudited)
The following represents the trading results of one client account managed by Transtrend BV in the Diversified Trend Program (Standard Risk US Dollar) as of January 31, 2011, for the period January 2006 through January 2011, on a monthly and annual basis. Rate of Return (ROR) is calculated by dividing net performance by nominal account size. Management fee is charged at a monthly rate of 0.25% (3% annually) of Net Assets, as defined. Incentive fee is charged at a quarterly rate of 25% of New Net Profits, as defined.
The following information is as of January 31, 2011: |
Name of CTA: | Transtrend BV |
Name of program: | Diversified Trend Program |
(Standard Risk US Dollar)
Inception of trading by CTA: | October 1993 |
Inception of trading in program: | October 1993 |
Worst monthly drawdown (Since 1/2006): | (3.21%), 12/09 |
Worst peak-to-valley drawdown (Since 1/2006): | (10.92%), 2/09 – 1/10 |
Total Assets under management this account: | $27,029,356 |
Total Assets under management in all programs – Client: | $3,692,432,169 |
Total Assets under management in all programs – Proprietary: | $0 |
Rates of Return
Month | 2011 | 2010 | 2009 | 2008 | 2007 | 2006 | ||||||||||||||||||
January | (0.50 | )% | (2.63 | )% | (0.24 | )% | (0.32 | )% | 1.02 | % | 1.08 | % | ||||||||||||
February | 0.73 | % | 0.40 | % | 3.97 | % | (2.61 | )% | (1.65 | )% | ||||||||||||||
March | 5.50 | % | (2.39 | )% | 0.74 | % | (1.95 | )% | 0.79 | % | ||||||||||||||
April | 0.95 | % | (0.11 | )% | 0.43 | % | 3.80 | % | 1.33 | % | ||||||||||||||
May | (2.97 | )% | 0.85 | % | 2.14 | % | 4.21 | % | (1.94 | )% | ||||||||||||||
June | (0.18 | )% | (0.73 | )% | 2.00 | % | 2.48 | % | (0.71 | )% | ||||||||||||||
July | (0.75 | )% | (1.71 | )% | (1.97 | )% | (1.59 | )% | (2.40 | )% | ||||||||||||||
August | 1.82 | % | 0.36 | % | (0.92 | )% | (1.59 | )% | 3.35 | % | ||||||||||||||
September | 2.07 | % | (0.68 | )% | 3.65 | % | 4.91 | % | 0.41 | % | ||||||||||||||
October | 2.72 | % | (2.51 | )% | 4.93 | % | 5.82 | % | 3.08 | % | ||||||||||||||
November | (0.66 | )% | 1.38 | % | 1.67 | % | (1.40 | )% | 2.40 | % | ||||||||||||||
December | 2.21 | % | (3.21 | )% | 1.41 | % | 0.97 | % | 3.52 | % | ||||||||||||||
Year | (0.50 | )% | 8.84 | % | (8.36 | )% | 18.98 | % | 14.46 | % | 9.41 | % | ||||||||||||
| 1. | “Draw-down” means losses experienced by the account over a specified period. |
| 2. | “Worst Peak-to-Valley Draw-down” means the greatest cumulative percentage decline in month-end net asset value due to losses sustained by the account during any period in which the initial month-end net asset value is not equaled or exceeded by a subsequent month-end net asset value. |
PAST PERFORMANCE IS NOT NECESSARILY INDICATIVE OF FUTURE RESULTS
105
PERFORMANCE INFORMATION
TRANSTREND BV
CAPSULE PERFORMANCE RECORD
(Unaudited)
The following represents the trading results of one client account managed by Transtrend BV in the Diversified Trend Program (Enhanced Risk Swiss Franc) as of July 31, 2008, for the period January 2006 through July 2008, on a monthly and annual basis. This program ceased trading in July 2008. Rate of Return (ROR) is calculated by dividing net performance by nominal account size. Management fee is charged at a monthly rate of 0.25% (3% annually) of Net Assets, as defined. Incentive fee is charged at a quarterly rate of 25% of New Net Profits, as defined.
The following information is as of January 31, 2011:
Name of CTA: | Transtrend BV |
Name of program: | Diversified Trend Program (Enhanced Risk Swiss Franc) |
Inception of trading by CTA: | October 1993 |
Inception of trading in program: | October 2002 |
Worst monthly drawdown (Since 1/2006): | (4.05%), 5/06 |
Worst peak-to-valley drawdown (Since 1/2006): | (10.49%), Continuing from 11/05 – 7/06 |
Total Assets under management this account: | $0 |
Total Assets under management in all programs – Client: | $3,692,432,169 |
Total Assets under management in all programs – Proprietary: | $0 |
Rates of Return
Month | 2008 | 2007 | 2006 | |||||||||
January | (1.09 | )% | 1.80 | % | 1.50 | % | ||||||
February | 4.68 | % | (4.03 | )% | (2.25 | )% | ||||||
March | 0.37 | % | (2.96 | )% | 0.43 | % | ||||||
April | 0.70 | % | 5.71 | % | 1.59 | % | ||||||
May | 3.54 | % | 7.33 | % | (4.05 | )% | ||||||
June | 2.88 | % | 3.87 | % | (1.24 | )% | ||||||
July | (1.87 | )% | (2.54 | )% | (3.74 | )% | ||||||
August | (2.38 | )% | 4.35 | % | ||||||||
September | 7.56 | % | 0.38 | % | ||||||||
October | 9.07 | % | 4.17 | % | ||||||||
November | (2.18 | )% | 3.04 | % | ||||||||
December | 1.47 | % | 5.30 | % | ||||||||
Year | 9.40 | % | 23.80 | % | 9.31 | % | ||||||
| 1. | “Draw-down” means losses experienced by the account over a specified period. |
| 2. | “Worst Peak-to-Valley Draw-down” means the greatest cumulative percentage decline in month-end net asset value due to losses sustained by the account during any period in which the initial month-end net asset value is not equaled or exceeded by a subsequent month-end net asset value. |
PAST PERFORMANCE IS NOT NECESSARILY INDICATIVE OF FUTURE RESULTS
106
PERFORMANCE INFORMATION
SUNRISE CAPITAL PARTNERS LLC
SUMMARY CAPSULE PERFORMANCE RECORD
(Unaudited)
The summary past performance record of Sunrise Capital Partners, LLC is presented below as of January 31, 2011.
Name of CTA: | Sunrise Capital Partners LLC |
Name of Trading Program: | Expanded Diversified Program |
Inception of Trading by CTA: | January 1995 |
Inception of Trading in Program: | January 1989 |
Total Number of Accounts in Program as of 1/31/2011: | 7 |
Total Assets Managed as of 1/31/2011: | $727,100,000 |
Total Assets Managed in this Program as of 1/31/2011: | $655,100,000 |
Worst Monthly Percentage Draw-Down: | (13.9)%(08/07) |
Worst Peak-to-Valley Draw-Down (Since January 2006)*: | (20.7)% (12/1/09 – 7/31/10) |
Number of Accounts in Program Closed with a Profit as of 1/31/2011: | 19 |
Number of Accounts in Program Closed with a Loss as of 1/31/2011: | 10 |
Year | YTD through January 31, 2011 | 2010 | 2009 | 2008 | 2007 | 2006 | ||||||||||||||||||
Rate of Return** | 0.60 | % | (7.2 | )% | 4.30 | % | 29.90 | % | 3.90 | % | 9.00 | % | ||||||||||||
| * | Draw-down means losses experienced by the program over the specified period. |
| ** | The annual rate of return is calculated by compounding the monthly rates of return which are calculated by dividing monthly performance by beginning equity plus additions. |
PAST PERFORMANCE IS NOT NECESSARILY INDICATIVE OF FUTURE RESULTS
107
MANAGEMENT’S DISCUSSION AND ANALYSIS OF FINANCIAL CONDITION AND RESULTS OF OPERATIONS
Introduction
Grant Park is a multi-advisor commodity pool organized to pool assets of its investors for the purpose of trading in the U.S. and international spot and derivatives markets for currencies, interest rates, stock indices, agricultural and energy products, precious and base metals and other commodities and underliers. Grant Park has been in continuous operation since it commenced trading on January 1, 1989. Grant Park’s general partner, commodity pool operator and sponsor is Dearborn Capital Management, L.L.C., an Illinois limited liability company. The managing member of Dearborn Capital Management, L.L.C. is Dearborn Capital Management, Ltd., an Illinois corporation whose majority shareholder is David M. Kavanagh.
Organization of Grant Park
Grant Park invests through different commodity trading advisors retained by the general partner. However, instead of each trading advisor maintaining a separate account in the name of Grant Park, the assets of Grant Park are invested in various trading companies, each of which is organized as a limited liability company. Each trading company allocates those assets to one of the commodity trading advisors retained by the general partner.
The following is a list of the trading companies, for which Grant Park is the sole member and all of which were organized as Delaware limited liability companies:
GP 1, LLC (“GP 1”) | GP 7, LLC (“GP 7”) | GP 12, LLC (“GP 12”) | ||
GP 3, LLC (“GP 3”) | GP 8, LLC (“GP 8”) | GP 14, LLC (“GP 14”) | ||
GP 4, LLC (“GP 4”) | GP 9, LLC (“GP 9”) | GP 15, LLC (“GP 15”) | ||
GP 5, LLC (“GP 5”) | GP 10, LLC (“GP 10”) | GP 16, LLC (“GP 16”) | ||
GP 6, LLC (“GP 6”) | GP 11, LLC (“GP 11”) |
Grant Park invests through the trading companies with independent professional commodity trading advisors retained by the general partner. As of December 31, 2010 Rabar, EMC, ETC, Graham Capital Management, L.P., Winton, Welton, Global Advisors, Transtrend, QIM, Revolution Capital Management, LLC (“RCM”), Sunrise and Amplitude served as Grant Park’s commodity trading advisors. Each of the trading advisors is registered as a commodity trading advisor under the Commodity Exchange Act and is a member of the NFA. As of December 31, 2010, the general partner allocated
Grant Park’s net assets through the respective trading companies among its core trading advisors EMC, Winton and Welton and non-core trading advisors Rabar, ETC, Graham, Global Advisors, Transtrend, QIM, RCM, Sunrise and Amplitude. Effective February 1, 2011, the general partner allocated a portion of Grant Park’s net assets through the respective trading companies to non-core trading advisors Alder Capital Limited and Denali Asset Management and ceased allocating assets to Graham and RCM. No more than twenty percent of Grant Park’s assets are allocated to any one trading company and, in turn, any one trading advisor. The general partner may terminate or replace the trading advisors or retain additional trading advisors in its sole discretion.
Critical Accounting Policies
Grant Park’s most significant accounting policy is the valuation of its assets invested in other commodity investment pools and in U.S. and international futures and forward contracts, options contracts, other interests in commodities, and fixed income products. The majority of these investments are exchange-traded contracts, valued based upon exchange settlement prices. The remainder of its investments are non-exchange-traded contracts with valuation of those investments based on third-party quoted dealer values on the Interbank market and fixed income products including U.S. Government-sponsored enterprises and commercial paper, which are stated at cost plus accrued interest, which approximates fair value based on quoted prices in an active market. With the valuation of the investments easily obtained, there is little or no judgment or uncertainty involved in the valuation of investments, and accordingly, it is unlikely that materially different amounts would be reported under different conditions using different but reasonably plausible assumptions.
The preparation of financial statements in conformity with generally accepted accounting principles requires management to make estimates and assumptions that affect the reported amounts of assets and liabilities and disclosure of contingent assets and liabilities at the date of the financial statements and the reported amounts of revenue and expenses during the reporting period. Actual results could differ from those estimates. Grant Park’s significant accounting policies are described in detail in Note 1 of the consolidated financial statements.
Grant Park is the sole member of each of the trading companies. The trading companies, in turn, are
108
the only members of GP Cash Management, LLC. Grant Park presents consolidated financial statements which include the accounts of the trading companies and GP Cash Management, LLC. All material inter-company accounts and transactions are eliminated in consolidation. Recent FASB guidance under FASB ASC 810 establishes accounting and reporting requirements for noncontrolling interests, which Grant Park previously referred to as minority interests. This guidance requires noncontrolling interests to be reported as a component of partners’ capital on the consolidated statement of financial condition and the amount of net income (loss) attributable to noncontrolling interests to be identified on the consolidated statement of operations.
Valuation of Financial Instruments
Grant Park follows the provisions of FASB ASC 820,Fair Value Measurements and Disclosures. FASB ASC 820 defines fair value, establishes a framework for measuring fair value and expands disclosures about fair value measurement and also emphasizes that fair value is a market-based measurement, not an entity-specific measurement.
FASB ASC 820 defines fair value as the price that would be received to sell an asset or paid to transfer a liability in an orderly transaction between market participants at the measurement date and sets out a fair value hierarchy. The fair value hierarchy gives the highest priority to quoted prices in active markets for identical assets or liabilities (Level 1) and the lowest priority to unobservable inputs (Level 3). Inputs are broadly defined under FASB ASC 820 as assumptions market participants would use in pricing an asset or liability. The three levels of the fair value hierarchy under FASB ASC 820 are described below:
Level 1. Unadjusted quoted prices in active markets for identical assets or liabilities that the reporting entity has the ability to access at the measurement date.
Level 2. Inputs other than quoted prices within Level 1 that are observable for the asset or liability, either directly or indirectly. A significant adjustment to a Level 2 input could result in the Level 2 measurement becoming a Level 3 measurement.
Level 3. Inputs are unobservable for the asset or liability.
The following section describes the valuation techniques used by Grant Park to measure different
financial instruments at fair value and includes the level within the fair value hierarchy in which the financial instrument is categorized.
Fair value of exchange-traded contracts is based upon exchange settlement prices. Fair value of non-exchange-traded contracts is based on third party quoted dealer values on the Interbank market. U.S. Government securities, U.S. Government-sponsored enterprises and commercial paper are stated at cost plus accrued interest, which approximates fair value based on quoted market prices in an active market. These financial instruments are classified in Level 1 of the fair value hierarchy.
Grant Park values certificates of deposit at face value plus accrued interest, which approximates fair value, and these financial instruments are classified in Level 2 of the fair value hierarchy. Grant Park values forward contracts based on third-party quoted dealer values on the Interbank market and forward contracts are classified in Level 2.
The following table presents Grant Park’s fair value hierarchy for those assets and liabilities measured at fair value on a recurring basis as of December 31, 2010:
Assets | Level 1 | Level 2 | Level 3 | Total | ||||||||||||
Equity in brokers’ trading accounts | ||||||||||||||||
U.S. Government securities | $ | 98,441,357 | $ | — | $ | — | $ | 98,441,357 | ||||||||
Futures contracts* | 32,922,417 | — | — | 32,922,417 | ||||||||||||
Forward contracts* | — | 3,038,422 | — | 3,038,422 | ||||||||||||
Options on futures contracts* | (4,625 | ) | — | — | (4,625 | ) | ||||||||||
Cash and cash equivalents | ||||||||||||||||
Certificates of deposit | — | 28,202,983 | — | 28,202,983 | ||||||||||||
Commercial paper | 297,810,795 | — | — | 297,810,795 | ||||||||||||
Certificates of deposit | — | 20,009,468 | — | 20,009,468 | ||||||||||||
Commercial paper | 14,996,133 | — | — | 14,996,133 | ||||||||||||
U.S. Government-sponsored enterprises | 292,555,595 | — | — | 292,555,595 | ||||||||||||
U.S. Government securities | 119,865,174 | — | — | 119,865,174 | ||||||||||||
| * | See the consolidated condensed schedule of investments in the financial statements for further description. |
109
The following table presents Grant Park’s fair value hierarchy for those assets and liabilities measured at fair value on a recurring basis as of December 31, 2009:
Assets | Level 1 | Level 2 | Level 3 | Total | ||||||||||||
Equity in brokers’ trading accounts | ||||||||||||||||
U.S. Government securities | $ | 89,970,252 | $ | — | $ | — | $ | 89,970,252 | ||||||||
Futures contracts* | 13,472,467 | — | — | 13,472,467 | ||||||||||||
Forward contracts* | 542,054 | — | — | 542,054 | ||||||||||||
Options on futures contracts* | (5,130 | ) | — | — | (5,130 | ) | ||||||||||
Cash and cash equivalents | ||||||||||||||||
Certificates of deposit | — | 20,042,688 | — | 20,042,688 | ||||||||||||
Commercial paper | 6,761,718 | — | — | 6,761,718 | ||||||||||||
Certificates of deposit | — | 15,755,711 | — | 15,755,711 | ||||||||||||
U.S. Government-sponsored enterprises | 596,671,609 | — | — | 596,671,609 | ||||||||||||
U.S. Government securities | 74,755,744 | — | — | 74,755,744 | ||||||||||||
| * | See the consolidated condensed schedule of investments in the financial statements for further description. |
Results of Operations
Grant Park’s returns, which are Grant Park’s trading gains plus interest income less brokerage fees, performance fees, operating costs and offering costs borne by Grant Park, for the years ended December 31, 2010, 2009 and 2008 are set forth in the table below:
| 2010 | 2009 | 2008 | ||||||||||
Total return – Class A units | 4.5 | % | (9.2 | )% | 19.9 | % | ||||||
Total return – Class B units | 3.8 | % | (9.9 | )% | 18.9 | % | ||||||
Total return – Legacy 1 Class units* | 6.1 | % | (3.4 | )% | — | |||||||
Total return – Legacy 2 Class units* | 5.7 | % | (3.6 | )% | — | |||||||
Total return – Global 1 Class units* | 2.9 | % | (4.3 | )% | — | |||||||
Total return – Global 2 Class units* | 2.6 | % | (4.6 | )% | — | |||||||
Total return – Global 3 Class units* | 0.7 | % | (6.0 | )% | — | |||||||
| * | Legacy 1 Class, Legacy 2 Class, Global 1 Class, Global 2 Class and Global 3 Class units began trading April 1, 2009, and accordingly, the 2009 total return represents the return from April 1, 2009 through December 31, 2009. |
Grant Park’s total net asset value at December 31, 2010, 2009 and 2008 was $891.9 million, $831.3 million and $643.6 million, respectively. Results from past periods are not indicative of results that may be expected for any future period.
The table below sets forth Grant Park’s trading gains or losses by sector for each of the years ended December 31, 2010, 2009 and 2008.
| % Gain (Loss) | ||||||||||||
| Year Ended December 31, | ||||||||||||
Sector | 2010 | 2009 | 2008 | |||||||||
Agriculturals | — | % | — | % | 3.0 | % | ||||||
Currencies | 3.0 | (0.7 | ) | 0.1 | ||||||||
Energy | (2.5 | ) | (3.2 | ) | 8.4 | |||||||
Interest rates | 8.0 | (4.1 | ) | 8.6 | ||||||||
Meats | — | — | 0.3 | |||||||||
Metals | 2.5 | 2.5 | 3.0 | |||||||||
Soft commodities | 4.3 | (0.1 | ) | 1.5 | ||||||||
Stock indices | (1.9 | ) | 3.6 | 5.6 | ||||||||
Total | 13.4 | % | (2.0 | )% | 30.5 | % | ||||||
Year ended December 31, 2010
Economic stability in the early part of 2010 hindered Grant Park’s performance in the first quarter. In January, uptrends in the global equity markets were met with swift reversals to the downside, resulting in losses for Grant Park’s long positions. The sharp price declines were predominantly attributed to concerns surrounding tighter monetary policy in China and financial instability in several small European nations. Falling equity markets also put pressure on the industrial goods markets, moving energy and metals prices lower against Grant Park’s long positions. As the quarter progressed, the financial markets began to stabilize providing profit opportunities for Grant Park. Long positions in the fixed-income markets made gains as ongoing uncertainty in Europe weighed on demand for Eurozone debt, driving U.S. Treasuries higher alongside long positions. In March, global equity markets turned in favor of Grant Park’s long position. Positive U.S. economic data, strong export data from Japan, and a boost in Eurozone investor sentiment all played a role in pushing equities higher. Rallying equity markets supported beliefs that global industrial demand was on the rise, which resulted in profits for Grant Park’s long energy and metals exposure.
Performance began to taper off in the second quarter as the portfolio finished nearly flat in April. The portfolio made minor gains as short positions in the natural gas markets benefitted from larger-than-expected U.S. inventories. Short euro positions also added to performance because of ongoing uncertainty surrounding the Eurozone economy. In May, reports announcing the establishment of an emergency financing facility for ailing European nations, an indicator that the outlook for Europe may be worse than expected, sent investors to the sidelines amid
110
renewed risk-aversion for the remainder of the second quarter. With Grant Park predominantly positioned to benefit from increased risk-appetite, the portfolio endured setbacks in several key sectors. Long equity, base metals, and crude oil positions resulted in losses as investors liquidated positions for safer assets. Helping to offset losses were long positions in the U.S. Treasury markets, which made strong gains following increased demand for safe-haven debt. Long positions in the gold markets also earned profits as investors sought to hedge euro-based assets in light of steadily worsening forecasts.
Market movements in the third quarter were primarily driven by expectations that the U.S. Federal Reserve would be adopting its Quantitative Easing II (QE2) initiative in order to stimulate the ailing economy. By buying debt, the Federal Reserve would be able to inject capital into the economy, improving the opportunity for businesses to obtain credit and potentially grow. In anticipation of Federal Reserve buying, speculators drove U.S. fixed-income markets sharply higher alongside Grant Park’s long debt exposure, resulting in strong gains for the portfolio. Another major impact of shifting monetary policy was a further weakening of the U.S. dollar, which bode well for Grant Park’s currency positions. Foreign currency positions performed well as the U.S. dollar slid lower throughout the quarter. The effects of a weaker U.S. dollar were seen across the commodities markets as well. Grant Park’s long exposure in the grains and metals markets earned profits following strong rallies spurred by U.S. dollar weakness. The portfolio experienced minor losses in the energy markets as warmer temperature forecasts moved natural gas prices higher against short positions.
Strong trends continued into the fourth quarter providing Grant Park with ample trading opportunities. Anticipating a positive result for QE2, optimistic investors drove equity markets steadily higher alongside Grant Park’s long positions. Strong third-quarter earnings reports from key North American and European firms added to the rally in equities. Ongoing declines in the U.S. dollar made U.S. grains products more attractive to international buyers, moving price upwards in the direction of positions. In November, news that China would be raising interest rates, a sign that the global economic recovery may slow, caused a sharp reversal in the financial markets. Investors shifted risk appetites towards risk aversion and as a result liquidated positions in the equity markets, driving prices lower. Grant Park’s long equity exposure experienced setbacks as market prices moved
against positions. Adding to increased risk aversion were renewed fears that the Irish and Spanish governments may default on debt obligations. Fears that the economic instability in Europe may have a dramatic impact on the global economy fostered elevated demand for the safe-haven U.S. dollar, resulting in losses for short U.S. dollar positions. November’s market reversal was short-lived, however, as prices turned back in Grant Park’s favor in December. Alleviated concerns surrounding the Eurozone economy and strong U.S. economic data prompted a surge in risk appetite supporting the equity markets and other riskier assets. Grant Park’s positions in the base metals markets benefitted as optimism supported beliefs that global industrial demand would improve. In the grains markets, flooding in Australia and poor weather conditions in South America led to strong price rallies, which bode well for the portfolio’s long positions. Positioned on the long side in the grains, energy, metals, and equity markets Grant Park was able to take advantage of the increased investor risk appetite, making strong gains throughout the fourth quarter.
For the year ended December 31, 2010, Grant Park had a positive return of 4.5% for the Class A units, a positive return of 3.8% for the Class B units, a positive return of 6.1% for the Legacy 1 Class units, a positive return of 5.7% for the Legacy 2 Class units, a positive return of 2.9% for the Global 1 Class units, a positive return of 2.6% for the Global 2 Class units, and a positive return of 0.7% for the Global 3 Class units. On a combined basis prior to expenses, Grant Park had trading gains of approximately 13.4% which were further increased by gains of approximately 0.5% from interest income. These trading gains were offset by approximately 10.5% in combined total brokerage fees, performance fees and offering costs borne by Grant Park. An analysis of the 13.4% trading gains by sector is as follows:
Sector | % Gain (Loss) | |||
Agriculturals | — | % | ||
Currencies | 3.0 | |||
Energy | (2.5 | ) | ||
Interest rates | 8.0 | |||
Meats | — | |||
Metals | 2.5 | |||
Soft commodities | 4.3 | |||
Stock indices | (1.9 | ) | ||
Total | 13.4 | % | ||
The general partner has agreed to rebate back to Grant Park a portion of Grant Park’s operating expenses to the extent actual expenses were less than
111
the actual amount Grant Park paid the general partner. For 2010, the general partner reimbursed Grant Park a total of $50,000, all of which related to operating expenses.
Year ended December 31, 2009
Throughout 2009, opportunities for profitable trading in the futures markets were difficult to identify. Investors constantly shifted their risk appetite, thereby preventing the development of sustainable price trends throughout the year.
During the first quarter of 2009, Grant Park’s traders incurred trading losses across various sectors. Prices in grains markets rose following better-than-expected economic indicators for increased future demand for grains. Additionally, conflicts between soybean farmers and the Argentine government added to the market rally. These factors moved prices against Grant Park’s short grains positions. The U.S. government’s attempts to use quantitative easing to prompt a recovery in the financial markets caused an oversupply of debt which moved the market against Grant Park’s long debt positions. This governmental action coincided with a rally in the equity markets and created losses against Grant Park’s short positions. The rising equity prices, in turn, served as a bullish indicator for the metals markets and drove prices in the base metals sector up and contrary to Grant Park’s short positions. The energy sector was profitable for Grant Park in the first quarter. Increased natural gas inventories caused by low industrial demand in 2008 pushed prices lower which benefitted Grant Park’s short positions.
During the second quarter of 2009, the downtrend in the fixed-income markets continued again moving against Grant Park’s long positions. The European Central Bank cut interest rates by 25 basis points. This move sparked risk appetite amongst investors and prompted liquidations in the debt markets. Renewed hopes of economic recovery caused share prices to rise across the equity markets and were supported by better-than-expected earnings reports from key European financial firms. Consequently, Grant Park’s long positions were profitable. In the currency markets, strong earnings results from Credit Suisse strengthened the Swiss franc and moved prices against Grant Park’s short Swiss franc positions. In Japan, an unexpected trade surplus bode well for the Japanese yen, moving it against short positions. During May, performance turned positive as Grant Park posted profits for the month. International investors showed increased risk appetite and drove greater demand for
higher-yielding currencies, benefitting short dollar positions. Investors who had remained on the investing sidelines reentered the equity markets based on confidence the global markets were beginning to recover. This activity drove equity prices up, alongside Grant Park’s long positions. Conversely, Grant Park experienced minor setbacks in the fixed-income markets as investors liquidated debt to establish positions in riskier assets. Optimism towards the economy continued into June and Grant Park’s short debt positions met with setbacks. In effect, the positive sentiment in the equity sector caused liquidations in the fixed-income sector and Grant Park’s fixed-income positions lost value. This was evident in the losses incurred in the long positions Grant Park held in the short-term interest rates markets.
During the third quarter of 2009, the majority of losses early in the quarter came predominantly from the crude oil markets. The intra month volatility moved against Grant Park’s long positions. The release of an Energy Information Administration report showing large U.S. crude oil inventories was a major factor that drove prices lower. Grant Park’s short positions in the natural gas markets were able to partially offset losses in the energy sector during the quarter. Natural gas prices fell during this period because of news of increased U.S. energy supplies. In August, Grant Park profited on another round of renewed investor appetite as global equity markets rallied alongside long positions. Firm economic data, including strong housing starts and durable goods orders, lifted share prices in North America and Europe. Grant Park’s long positions in the sugar markets were another major contributor to performance in August. Weak sugar supply from Brazil coupled with strong demand from Southeast Asia was a consistent theme throughout 2009. Optimism concerning the global economy continued throughout August and helped Grant Park finish the quarter on a positive note. Grant Park’s short U.S. dollar positions earned profits as investors sought higher-yielding currencies, including the Australian and New Zealand dollars, in a shift away from risk-aversion. In the energy markets, forecasts for cold weather in the U.S. and improving industrial production data caused prices to rise in the natural gas markets. This information reversed the downward price trend and moved the markets against Grant Park’s short positions.
During the fourth quarter of 2009, falling prices in the debt markets moved against Grant Park’s long positions in the fixed-income markets. U.S. Federal
112
Reserve Chairman Ben Bernanke’s statement that any interest rate changes would come after 2009 weighed heavily on debt prices. A sharp reversal in the equities markets occurred during the last week in October and weighed on Grant Park’s performance. In November, the bulk of Grant Park’s profits came from long positions in the gold markets. Speculators drove gold prices to all-time highs in reaction to a weakening U.S. dollar and in pursuit of a hedge against inflation concerns. The gold rally was further supported when several nations announced they would increase gold holdings in order to hedge their U.S. dollar-based assets. Grant Park also profited from its long positions in the fixed-income markets. Concerns the U.S. government might halt stimulus initiatives increased demand for more risk-averse debt instruments. At year-end, the fixed-income markets underwent another sharp price reversal and moved against Grant Park’s long positions. Rallies in the equity markets, coupled with optimistic unemployment reports, improved investor confidence and prompted liquidations in the U.S. and European fixed-income markets. Concerns over potential defaults in the Dubai debt markets also had an adverse affect on global fixed-income products. Partially offsetting setbacks were positions in the equity and the base metals markets. The portfolio profited from strong up-trends in major U.S. and European benchmark indices. Strong share prices directly led to gains on Grant Park’s long base metals positions as strength in the equity markets improved industrial demand forecasts.
For the year ended December 31, 2009, Grant Park had a negative return of 9.2% for the Class A units, a negative return of 9.9% for the Class B units, a negative return of 3.4% for the Legacy 1 Class units, a negative return of 3.6% for the Legacy 2 Class units, a negative return of 4.3% for the Global 1 Class units, a negative return of 4.6% for the Global 2 Class units, and a negative return of 6.0% for the Global 3 Class units. On a combined basis prior to expenses, Grant Park had trading losses of approximately 2.0% which were offset by gains of approximately 0.8% from interest income. These losses were further increased by approximately 8.7% in combined total brokerage fees, performance fees and offering costs borne by Grant Park. An analysis of the 2.0% trading losses by sector is as follows:
Sector | % Gain (Loss) | |||
Agriculturals | — | % | ||
Currencies | (0.7 | ) | ||
Energy | (3.2 | ) | ||
Interest rates | (4.1 | ) | ||
Meats | — | |||
Metals | 2.5 | |||
Soft commodities | (0.1 | ) | ||
Stock indices | 3.6 | |||
Total | (2.0 | )% | ||
Year ended December 31, 2008
Grant Park began 2008 on a positive note. The ongoing effect of the 2007 credit crisis played a large role in the portfolio’s positive performance in the first quarter. Fueled by uncertainty surrounding the future of the U.S. economy and a 150 basis point interest rate cut, the U.S. dollar weakened steadily against many of its major counterparts. Short dollar positions directly benefited from the decline as the euro, British pound, and New Zealand dollar all rose steadily against the U.S. dollar. A weak U.S. dollar also served Grant Park’s commodity positions well, as the devalued currency drove metals prices upwards alongside long positions. Speculators bid up the gold markets as a hedge against expected inflation increases resulting in profits for long positions. Long grains positions were among the top performers throughout the quarter. U.S. Department of Agriculture (“USDA”) reports announcing lower than expected grain inventory levels, combined with news from China that weather conditions had hurt the farming regions, propelled a strong uptrend in the grains markets. An abundance of poor economic data put steady pressure on the equity markets benefiting the portfolio’s short positions. The effects of slumping home sales, reduced industrial production, and weak consumer confidence pushed
113
global share prices lower. In attempts to shore up the faltering global economy the U.S. Federal Reserve, as well as other major central banks, began commenting on the continued need to ease interest rates in the near future. Speculation of interest rate cuts sent prices on fixed income products upwards, resulting in profits for long positions.
The portfolio started out the second quarter quietly with a slight loss in April. Gains in the energy markets were overcome by setbacks in the fixed income and equity indices markets. After reaping the benefits of declining stock prices early in 2008, a shift in investor sentiment resulted in losses for Grant Park’s short stock indices positions. Capital infusions into major financial institutions like Lehman Brothers and UBS ignited a spark in the equity markets resulting in a steady rally across the sector. A firming in the U.S. equity markets drove up the U.S. dollar which put pressure on the metals and agricultural markets adding to setbacks. Long positions in the copper and corn markets were negatively impacted as technical selling in response to a strong dollar drove down prices. As April ended, performance for the portfolio began to change for the better. The bulk of gains came from long positions in the crude oil markets where supply constraints stemming from violence in Nigeria and a hawkish OPEC sent prices steadily upwards. In the fixed income sector, strong economic data out of the Eurozone supported a bullish outlook for the economy, causing investors to liquidate more risk-averse fixed income positions. The reduced demand for fixed income products pushed prices lower resulting in profits for the portfolio’s short positions. Long grains positions further added to gains, as bad weather swept across the Midwestern U.S. rallied prices. Vicious rainstorms left America’s key farming regions under as much as 6 inches of water fueling a bearish forecast for 2008’s corn and soybean crop. Positioned on the short side of the equity indices markets, Grant Park benefited from weak share prices. Poor earnings reports from leading financial institutions coupled with waning consumer confidence put pressure on the major indices forcing them sharply lower.
Market shifts in the third quarter of 2008 proved to be trying for performance. A reversal in the commodities markets, headlined by a sharp decline in the price of crude oil, moved against Grant Park’s long positions. Contrary to forecasts, Hurricane Bertha narrowly missed key energy producing facilities in the Gulf of Mexico resulting in a massive unwinding of speculative long positions pushing prices lower
resulting in losses for the portfolio. After reaching all-time highs early in the year, prices across the agricultural sector slid sharply due to improved weather patterns in the Midwest. Speculation of possible government intervention in the futures markets also weighed on commodity prices. Fearing that intervention would adversely affect commodities holdings, major institutions began massive liquidations, especially in the gold markets, driving prices lower against positions. September marked a positive shift in performance for the portfolio. Short positions in the equity markets posted gains as the failure and government takeover of mortgage giants Fannie Mae and Freddie Mac put substantial pressure on the share markets. The announcement of the creation of the $700 billion Troubled Asset Relief Program (TARP) and the failure of Washington Mutual and Lehman Brothers drove the equity markets sharply downwards. By the end of the third quarter the majority of Grant Park’s commodity positions reversed to the short side to take advantage of the downward trending markets. Positions in the metals markets were among the strongest source of profits due to price declines stemming from reduced demand from emerging nations such as Brazil, Russia, India, and China. Improved harvesting conditions across U.S. farmlands negated prior supply constraints driving prices in the grains markets lower. Forecasted supply concerns in Nigeria resulted in losses for Grant Park’s short energy positions. Renewed threats of violence on major Nigerian crude oil refineries by rebel group MEND (Movement for the Emancipation of the Niger Delta) called into question the region’s production capabilities driving prices higher.
Turmoil in the financial markets continued into the start of the fourth quarter boding well for performance. Tight credit markets and rapidly decreasing consumer confidence caused investors to flee equity positions driving prices lower. Major indices falling in excess of 20% caused an increase in demand for safer fixed income markets driving up prices across the sector in line with long positions. Falling share prices spurred mass liquidations in the commodities markets driving prices downwards. Positioned on the short side of the metals and agriculturals markets, the portfolio was able to capitalize on the downtrend through most of October. Reduced production due to lack of capital in the credit markets furthered declines in the commodities markets. With global manufacturing nearing all-time lows, demand for energy and base metals declined resulting in profits for Grant Park’s short positions. The bulk of the portfolio’s gains throughout
114
November came from long fixed income positions. Speculators responding to monetary policy shifts from a number of central banks and turbulence in the equity markets fueled strong uptrends in the debt markets resulting in profits for long positions. Positions in the equity indices sector also proved to be a strong source of profits. In the equity markets, a revision to the TARP, which moved the focus of the program away from buying toxic financial assets, weighed heavily on the share prices of financial firms driving most major North American equity indices lower. Commodities markets continued their steady decline into year-end. Slowing production and reduced demand for industrial commodities weighed heavily on prices. One of the rare exceptions was prices on gold which experienced a near 15% increase for the month of November. Short positions in gold markets endured losses as speculators bid up the gold markets in attempts to hedge positions in the financial markets. Grant Park finished 2008 with a strong December. As occurred during the month before, the bulk of gains came from long fixed income positions. Yields on U.S. Treasuries breached all-time lows as the U.S. Federal Reserve brought interest rates to near 0% driving prices upwards. Although gains were made in the fixed income sector, the Federal Reserve’s decision to slash rates weighed heavily on the U.S. dollar. Long U.S. dollar positions against a number of emerging currencies posted losses as the U.S. dollar weakened.
For the year ended December 31, 2008, Grant Park had a positive return of 19.9% for the Class A units and a positive return of 18.9% for the Class B units. On a combined basis prior to expenses, Grant Park had trading gains of approximately 30.5% which were increased by gains of approximately 2.9% from interest income. These gains were offset by approximately 14.3% in combined total brokerage fees, performance fees and offering costs borne by Grant Park. An analysis of the 30.5% trading gains by sector is as follows:
Sector | % Gain (Loss) | |||
Agriculturals | 3.0 | % | ||
Currencies | 0.1 | |||
Energy | 8.4 | |||
Interest rates | 8.6 | |||
Meats | 0.3 | |||
Metals | 3.0 | |||
Soft commodities | 1.5 | |||
Stock indices | 5.6 | |||
Total | 30.5 | % | ||
Capital Resources
Grant Park plans to raise additional capital only through the sale of units pursuant to the continuous offering and does not intend to raise any capital through borrowing. Due to the nature of Grant Park’s business, it does not make any capital expenditures and does not have any capital assets that are not operating capital or assets.
Grant Park maintains 65% to 95% of its net asset value in cash, cash equivalents or other liquid positions over and above that needed to post as collateral for trading. These funds are available to meet redemptions each month.
Liquidity
Most U.S. futures exchanges limit fluctuations in some futures and options contract prices during a single day by regulations referred to as daily price fluctuation limits or daily limits. During a single trading day, no trades may be executed at prices beyond the daily limit. Once the price of a contract has reached the daily limit for that day, positions in that contract can neither be taken nor liquidated. Futures prices have occasionally moved to the daily limit for several consecutive days with little or no trading. Similar occurrences could prevent Grant Park from promptly liquidating unfavorable positions and subject Grant Park to substantial losses that could exceed the margin initially committed to those trades. In addition, even if futures or options prices do not move to the daily limit, Grant Park may not be able to execute trades at favorable prices, if little trading in the contracts is taking place. Other than these limitations on liquidity, which are inherent in Grant Park’s futures and options trading operations, Grant Park’s assets are expected to be highly liquid.
A portion of each trading company’s assets is used as margin to support its trading. Margin requirements are satisfied by the deposit of U.S. Treasury bills, obligations of U.S. Government-sponsored enterprises and cash with brokers subject to CFTC regulations and various exchange and broker requirements.
Grant Park maintains a portion of its assets at its clearing brokers as well as at Lake Forest Bank & Trust Company. These assets, which may range from 5% to 35% of Grant Park’s value, are held in U.S. Treasury securities, commercial paper and/or U.S. Government-sponsored enterprises. The balance of Grant Park’s assets, which range from 65% to 95%,
115
are invested in investment grade money market instruments purchased and managed at Middleton Dickinson Capital Management, LLC which are held in a separate, segregated account at State Street Bank and Trust Company. Violent fluctuations in prevailing interest rates or changes in other economic conditions could cause mark-to-market losses on Grant Park’s cash management income.
Off-Balance Sheet Risk
Off-balance sheet risk refers to an unrecorded potential liability that, even though it does not appear on the balance sheet, may result in future obligation or loss. Grant Park trades in futures and other commodity interest contracts and is therefore a party to financial instruments with elements of off-balance sheet market and credit risk. In entering into these contracts, Grant Park faces the market risk that these contracts may be significantly influenced by market conditions, such as interest rate volatility, resulting in such contracts being less valuable. If the markets should move against all of the commodity interest positions of Grant Park at the same time, and if Grant Park were unable to offset positions, Grant Park could lose all of its assets and the limited partners would realize a 100% loss. Grant Park minimizes market risk through real-time monitoring of open positions, diversification of the portfolio and maintenance of a margin-to-equity ratio that rarely exceeds 25%. All positions of Grant Park are valued each day on a mark-to-market basis.
In addition to market risk, when entering into commodity interest contracts there is a credit risk that a counterparty will not be able to meet its obligations to Grant Park. The counterparty for futures and options on futures contracts traded in the United States and on most non-U.S. futures exchanges is the clearing organization associated with such exchange. In general, clearing organizations are backed by the corporate members of the clearing organization who are required to share any financial burden resulting from the non-performance by one of their members and, as such, should significantly reduce this credit risk.
In cases where the clearing organization is not backed by the clearing members, like some non-U.S. exchanges, it is normally backed by a consortium of banks or other financial institutions.
In the case of forward contracts, over-the-counter options contracts or swap contracts, which are traded on the interbank or other institutional market rather than on exchanges, the counterparty is generally a
single bank or other financial institution, rather than a central clearing organization backed by a group of financial institutions. As a result, there likely will be greater counterparty credit risk in these transactions. Grant Park trades only with those counterparties that it believes to be creditworthy. Nonetheless, the clearing member, clearing organization or other counterparty to these transactions may not be able to meet its obligations to Grant Park, in which case Grant Park could suffer significant losses on these contracts.
In the normal course of business, Grant Park enters into contracts and agreements that contain a variety of representations and warranties and which provide general indemnifications. Grant Park’s maximum exposure under these arrangements is unknown, as this would involve future claims that may be made against Grant Park that have not yet occurred. Grant Park expects the risk of any future obligation under these indemnifications to be remote.
Contractual Obligations
None.
QUANTITATIVE AND QUALITATIVE DISCLOSURES ABOUT MARKET RISK
Introduction
Grant Park is a speculative commodity pool. The market sensitive instruments held by it are acquired for speculative trading purposes, and all or a substantial amount of Grant Park’s assets are subject to the risk of trading loss. Unlike an operating company, the risk of market sensitive instruments is integral, not incidental, to Grant Park’s business.
Market movements result in frequent changes in the fair market value of Grant Park’s open positions and, consequently, in its earnings and cash flow. Grant Park’s market risk is influenced by a wide variety of factors, including the level and volatility of exchange rates, interest rates, equity price levels, the market value of financial instruments and contracts, market prices for base and precious metals, energy complexes and other commodities, the diversification effects among Grant Park’s open positions and the liquidity of the markets in which it trades.
Grant Park rapidly acquires and liquidates both long and short positions in a wide range of different markets. Consequently, it is not possible to predict how a particular future market scenario will affect performance. Grant Park’s current trading advisors all
116
employ trend-following strategies that rely on sustained movements in price. Erratic, choppy, sideways trading markets and sharp reversals in movements can materially and adversely affect Grant Park’s results. Grant Park’s past performance is not necessarily indicative of its future results.
Value at risk is a measure of the maximum amount that Grant Park could reasonably be expected to lose in a given market sector in a given day. However, the inherent uncertainty of Grant Park’s speculative trading and the recurrence in the markets traded by Grant Park of market movements far exceeding expectations could result in actual trading or non-trading losses far beyond the indicated value at risk or Grant Park’s experience to date. This risk is often referred to as the risk of ruin. In light of the foregoing, as well as the risks and uncertainties intrinsic to all future projections, the inclusion of the quantification included in this section should not be considered to constitute any assurance or representation that Grant Park’s losses in any market sector will be limited to value at risk or by Grant Park’s attempts to manage its market risk. Moreover, value at risk may be defined differently as used by other commodity pools or in other contexts.
Materiality, as used in this section, is based on an assessment of reasonably possible market movements and the potential losses caused by such movements, taking into account the leverage, and multiplier features of Grant Park’s market sensitive instruments.
The following quantitative and qualitative disclosures regarding Grant Park’s market risk exposures contain forward-looking statements. All quantitative and qualitative disclosures in this section are deemed to be forward-looking statements, except for statements of historical fact and descriptions of how Grant Park manages its risk exposure. Grant Park’s primary market risk exposures, as well as the strategies used and to be used by its trading advisors for managing such exposures, are subject to numerous uncertainties, contingencies and risks, any one of which could cause the actual results of Grant Park’s risk controls to differ materially from the objectives of such strategies. Government interventions, defaults and expropriations, illiquid markets, the emergence of dominant fundamental factors, political upheavals, changes in historical price relationships, an influx of new market participants, increased regulation and many other factors could result in material losses as well as in material changes to the risk exposures and the risk management strategies of Grant Park. Grant Park’s current market exposure and/or risk
management strategies may not be effective in either the short- or long-term and may change materially.
Quantitative Market Risk
Trading Risk
Grant Park’s approximate risk exposure in the various market sectors traded by its trading advisors is quantified below in terms of value at risk. Due to Grant Park’s mark-to-market accounting, any loss in the fair value of Grant Park’s open positions is directly reflected in Grant Park’s earnings, realized or unrealized.
Exchange maintenance margin requirements have been used by Grant Park as the measure of its value at risk. Maintenance margin requirements are set by exchanges to equal or exceed the maximum losses reasonably expected to be incurred in the fair value of any given contract in 95% to 99% of any one-day interval. The maintenance margin levels are established by brokers, dealers and exchanges using historical price studies, as well as an assessment of current market volatility and economic fundamentals to provide a probabilistic estimate of the maximum expected near-term one-day price fluctuation. Maintenance margin has been used rather than the more generally available initial margin, because such initial margin includes a credit risk component that is not relevant to value at risk.
In the case of market sensitive instruments that are not exchange-traded, including currencies and some energy products and metals in the case of Grant Park, the margin requirements for the equivalent futures positions have been used as value at risk. In those cases in which a futures-equivalent margin is not available, dealers’ margins have been used.
In the case of contracts denominated in foreign currencies, the value at risk figures include foreign currency margin amounts converted into U.S. dollars with an incremental adjustment to reflect the exchange rate risk inherent to Grant Park, which is valued in U.S. dollars, in expressing value at risk in a functional currency other than U.S. dollars.
In quantifying Grant Park’s value at risk, 100% positive correlation in the different positions held in each market risk category has been assumed. Consequently, the margin requirements applicable to the open contracts have simply been aggregated to determine each trading category’s aggregate value at risk. The diversification effects resulting from the fact that Grant Park’s positions are rarely, if ever, 100% positively correlated have not been reflected.
117
Value at Risk by Market Sectors
The following tables indicate the trading value at risk associated with Grant Park’s open positions by market category as of December 31, 2010 and December 31, 2009 and the trading gains/losses by market category for the years ended December 31, 2010 and 2009. All open position trading risk exposures of Grant Park have been included in calculating the figures set forth below. As of December 31, 2010, Grant Park’s net asset value was approximately $891.9 million. As of December 31, 2009, Grant Park’s net asset value was approximately $831.3 million.
| December 31, 2010 | ||||||||||||
Market Sector | Value at Risk | % of Total Capitalization | Trading Gain/(Loss) | |||||||||
Currencies | $ | 22,356,337 | 2.5 | % | 3.0 | % | ||||||
Stock indices | 19,031,638 | 2.1 | (1.9 | ) | ||||||||
Interest rates | 9,028,539 | 1.0 | 8.0 | |||||||||
Metals | 7,319,088 | 0.8 | 2.5 | |||||||||
Energy | 7,029,012 | 0.8 | (2.5 | ) | ||||||||
Agriculturals | 6,389,026 | 0.7 | — | |||||||||
Soft commodities | 3,372,690 | 0.4 | 4.3 | |||||||||
Meats | 968,000 | 0.1 | — | |||||||||
Total | $ | 75,494,330 | 8.4 | % | 13.4 | % | ||||||
| December 31, 2009 | ||||||||||||
Market Sector | Value at Risk | % of Total Capitalization | Trading Gain/(Loss) | |||||||||
Stock indices | $ | 25,520,439 | 3.1 | % | 3.6 | % | ||||||
Interest rates | 17,130,191 | 2.0 | (4.1 | ) | ||||||||
Currencies | 16,432,426 | 2.0 | (0.7 | ) | ||||||||
Metals | 12,236,815 | 1.5 | 2.5 | |||||||||
Energy | 7,154,450 | 0.9 | (3.2 | ) | ||||||||
Soft commodities | 5,200,402 | 0.6 | (0.1 | ) | ||||||||
Agriculturals | 4,119,283 | 0.5 | — | |||||||||
Meats | 742,017 | 0.1 | — | |||||||||
Total | $ | 88,536,023 | 10.7 | % | (2.0 | )% | ||||||
Material Limitations on Value at Risk as an Assessment of Market Risk
The face value of the market sector instruments held by Grant Park is typically many times the applicable maintenance margin requirement, which generally ranges between approximately 1% and 10% of contract face value, as well as many times the capitalization of Grant Park. The magnitude of Grant Park’s open positions creates a risk of ruin not typically found in most other investment vehicles. Because of the size of its positions, certain market conditions — unusual, but historically recurring from time to time — could cause Grant Park to incur severe losses over a short period of time. The value at risk
table above, as well as the past performance of Grant Park, gives no indication of this risk of ruin.
Non-Trading Risk
Grant Park has non-trading market risk on its foreign cash balances not needed for margin. However, these balances, as well as the market risk they represent, are immaterial. Grant Park also has non-trading market risk as a result of investing a substantial portion of its available assets in U.S. Treasury bills and Treasury repurchase agreements. The market risk represented by these investments is also immaterial.
Qualitative Market Risk
Trading Risk
The following were the primary trading risk exposures of Grant Park as of December 31, 2010, by market sector.
Currencies
Exchange rate risk is a significant market exposure of Grant Park. Grant Park’s currency exposure is due to exchange rate fluctuations, primarily fluctuations that disrupt the historical pricing relationships between different currencies and currency pairs. These fluctuations are influenced by interest rate changes as well as political and general economic conditions. Grant Park trades in a large number of currencies, including cross-rates, which are positions between two currencies other than the U.S. dollar. The general partner anticipates that the currency sector will remain one of the primary market exposures for Grant Park for the foreseeable future. As of December 31, 2010, Grant Park was short the U.S. dollar against various major currencies including the Australian dollar, Canadian dollar, Mexican peso, Japanese yen, British pound, euro, Swiss franc, and New Zealand dollar. In general, a weaker U.S. dollar against most major currencies would benefit Grant Park.
Stock Indices
Grant Park’s primary equity exposure is due to equity price risk in the G-7 countries as well as other jurisdictions including Hong Kong, Taiwan, South Africa, India, Singapore, South Korea, and Australia. The stock index futures contracts currently traded by Grant Park are generally futures on broadly based indices, although Grant Park also trades narrow-based stock index or single-stock futures contracts. As of
118
December 31, 2010, Grant Park was predominantly long indices in the U.S., the Eurozone, United Kingdom, Hong Kong, Australia, South Africa, Japan, South Korea, Mexico, India, Canada, and Taiwan. The portfolio does maintain a few short positions in several select European and U.S. equity markets. Grant Park is primarily exposed to the risk of adverse price trends or static markets in the major North American, European, and Asian indices. Static markets would not cause major market changes but would make it difficult for Grant Park to avoid being “whipsawed” into numerous small losses.
Interest Rates
Interest rate risk is a principal market exposure of Grant Park. Interest rate movements directly affect the price of the futures positions held by Grant Park and indirectly the value of its stock index and currency positions. Interest rate movements in one country as well as relative interest rate movements between countries materially impact Grant Park’s profitability. Grant Park’s primary interest rate exposure is due to interest rate fluctuations in the United States and the other G-7 countries. Grant Park also takes futures positions on the government debt of smaller nations, such as Australia, New Zealand, and Mexico. The general partner anticipates that G-7 interest rates will remain the primary market exposure of Grant Park for the foreseeable future. As of December 31, 2010, Grant Park was predominantly long interest rate instruments in the United Kingdom, the Eurozone, and New Zealand. The portfolio had short positions in several U.S., Australian, Japanese, Swiss, Canadian, and Mexican markets.
Metals
Grant Park’s metals market exposure is due to fluctuations in the price of both precious metals, including gold and silver, as well as base metals including aluminum, lead, copper, tin, nickel and zinc. As of December 31, 2010, in the precious metals sector Grant Park had long positions in gold, silver, palladium and platinum. In the base metals markets, Grant Park was long aluminum, copper, lead, nickel, tin, and zinc.
Energy
Grant Park’s primary energy market exposure is due to gas and oil price movements, often resulting from political developments in the Middle East, Nigeria, Russia, and South America. As of December 31, 2010, the energy market exposure of
Grant Park was predominantly long in the Brent crude oil, crude oil, gas oil, unleaded gasoline heating oil and kerosene markets and short natural gas. Oil and gas prices can be volatile and substantial profits and losses have been and are expected to continue to be experienced in this market.
Agricultural/Meat/Soft commodities
Grant Park’s primary commodities exposure is due to agricultural price movements, which are often directly affected by severe or unexpected weather conditions, as well as other factors. As of December 31, 2010, in the grains markets, Grant Park had long positions in the corn, wheat, oats, rough rice, soybean meal, soybean oil, soybean and canola markets. In the livestock markets, Grant Park was long lean hogs, live cattle and feeder cattle. In the softs/industrials sectors, Grant Park was long cocoa, coffee, orange juice, sugar, cotton, lumber and rubber.
Non-Trading Risk Exposure
The following were the only non-trading risk exposures of Grant Park as of December 31, 2010.
Foreign Currency Balances. Grant Park’s primary foreign currency balances are in Japanese yen, British pounds, euros and Australian dollars. The trading advisors regularly convert foreign currency balances to U.S. dollars in an attempt to control Grant Park’s non-trading risk.
Cash Management. Grant Park maintains a portion of its assets at its clearing brokers, as well as at Lake Forest Bank & Trust Company. These assets, which may range from 5% to 35% of Grant Park’s value, are held in U.S. Treasury securities and/or U.S. Government-sponsored enterprises. The balance of Grant Park’s assets, which range from 65% to 95%, are invested in investment grade money market investments purchased by Middleton Dickinson Capital Management, LLC which are held in a separate, segregated account at State Street Bank and Trust Company. Violent fluctuations in prevailing interest rates or changes in other economic conditions could cause mark-to-market losses on Grant Park’s cash management income.
Managing Risk Exposure
The general partner monitors and controls Grant Park’s risk exposure on a daily basis through financial, credit and risk management monitoring systems and, accordingly, believes that it has effective procedures for evaluating and limiting the credit and market risks to which Grant Park is subject.
119
The general partner monitors Grant Park’s performance and the concentration of its open positions, and consults with the trading advisors concerning Grant Park’s overall risk profile. If the general partner felt it necessary to do so, the general partner could require the trading advisors to close out individual positions as well as enter positions traded on behalf of Grant Park. However, any intervention would be a highly unusual event. The general partner primarily relies on the trading advisors’ own risk control policies while maintaining a general supervisory overview of Grant Park’s market risk exposures. The trading advisors apply their own risk management policies to their trading. The trading advisors often follow diversification guidelines, margin limits and stop loss points to exit a position. The trading advisors’ research of risk management often suggests ongoing modifications to their trading programs.
As part of the general partner’s risk management, the general partner periodically meets with the trading advisors to discuss their risk management and to look for any material changes to the trading advisors’ portfolio balance and trading techniques. The trading advisors are required to notify the general partner of any material changes to their programs.
From time to time, certain regulatory or self-regulatory organizations have proposed increased margin requirements on futures contracts. Because Grant Park generally will use a small percentage of assets as margin, Grant Park does not believe that any increase in margin requirements, as proposed, will have a material effect on Grant Park’s operations.
MF Global, Newedge USA, LLC and UBS Securities LLC serve as Grant Park’s clearing brokers. The following descriptions for each clearing broker provide background information and information regarding material legal proceedings involving the clearing broker.
For ease of administration, the trading advisors may direct all or a portion of their trades on behalf of Grant Park to executing brokers or floor brokers for execution with instructions to give-up the executed trade to the clearing broker for clearing and settlement. The cost of any give-up fees to brokers will be included in Grant Park’s brokerage charge. Grant Park’s OTC derivatives transactions generally will be transacted through the clearing brokers or their affiliates. The trading advisors also from time to time
may select other dealers through which such contracts will be traded, but only with the prior written consent of the general partner.
MF Global Inc.
General
MF Global, formerly known as Man Financial Inc. (“MFI”), has served as Grant Park’s clearing broker since November 1, 2005, when it replaced Refco, Inc. as one of Grant Park’s clearing brokers. The address of MF Global’s main office is 717 Fifth Avenue, 9th Floor, New York, New York 10022-8101, and its telephone number is (212) 589-6200. MF Global is registered under the Commodity Exchange Act as a futures commission merchant and a commodity pool operator and is a member of the NFA. It also is a member of all major U.S. futures exchanges.
MF Global provides commodity interest brokerage and clearing services to Grant Park, and also acts as one of Grant Park’s additional selling agents. MF Global is not a sponsor or general partner of Grant Park, and will not act in any supervisory capacity with respect to the general partner or participate in the management of either the general partner of Grant Park. MF Global does not have or accept any discretionary authority with respect to transactions or investments in Grant Park’s trading account. MF Global may use the services of other clearing brokers and brokers who are members of exchanges of which MF Global is not a member. MF Global maintains the trading account of Grant Park on its books and records as a separate account.
Conflicts of Interest
MF Global is presently acting as clearing broker for other commodity pools, providing services similar to those provided Grant Park, and expects to continue to serve in this capacity for commodity pools in the future. MF Global also serves a number of other non-commodity pool customers. Its responsibilities to Grant Park and the responsibilities that it has or may undertake in the future may cause a conflict of interest. These conflicts may result in competition among commodity pools and other customers for services provided to them by the clearing broker. In addition, MF Global may in the future charge other customers, including public and private commodity pools, a lower brokerage rate than is being charged to Grant Park.
MF Global also acts as an additional selling agent for Grant Park. Because MF Global’s compensation as
120
clearing broker is based, at least in part, on the net asset value of Grant Park, it may have a conflict of interest between acting in the best interest of its clients when advising them to purchase or redeem units and assuring continued compensation to itself.
MF Global and its principals, employees and agents may trade commodity interest contracts for their own accounts. These trades may be different from, opposite to or entered ahead of trades entered into by Grant Park, and these persons may even be the other party to a trade entered into by Grant Park. The records of any of these trades will not be available to limited partners.
Legal Proceedings
At any given time, MF Global is involved in numerous legal actions and administrative proceedings, which, in the aggregate, MF Global has advised the general partner are not expected to have a material effect upon its condition, financial or otherwise, or to the services it will render to Grant Park. MF Global has advised the general partner, as of the date of this prospectus, that there have been no administrative, civil or criminal proceedings pending, on appeal or concluded against MF Global or its principals within the five years preceding the date of this prospectus that MF Global would deem material for purposes of Part 4 of the Regulations of the Commodity Futures Trading Commission (the “CFTC”), except as follows:
In May 2006, MF Global was sued by the Receiver for Philadelphia Alternate Asset Fund (“PAAF”) and associated entities for common law negligence, common law fraud, violations of the Commodity Exchange Act and RICO violations (the “Litigation”). In December 2007, without admitting any liability of any party to the Litigation to any other party to the Litigation, the Litigation was settled with MF Global agreeing to pay $69 million, plus $6 million of legal expenses, to the Receiver, in exchange for releases from all applicable parties and the dismissal of the Litigation with prejudice. In a related action, MF Global settled a CFTC administrative proceeding (In the Matter of MF Global, f/k/a Man Financial Inc., and Thomas Gilmartin) brought by the CFTC against MF Global and one of its employees for failure to supervise and recordkeeping violations. Without admitting or denying the allegations, MF Global agreed to pay a civil monetary penalty of $2 million and accepted a cease and desist order.
On February 20, 2007, MF Global settled a CFTC administrative proceeding (In the Matter of Steven M.
Camp and Man Financial Inc., CFTC Docket No. 07-04) in which MF Global was alleged to have failed to supervise one of its former associated persons (“AP”) who was charged with fraudulently soliciting customers to open accounts at MF Global. The CFTC alleged that the former AP misrepresented the profitability of a web-based trading system and of a purported trading system to be traded by a commodity trading advisor. Without admitting or denying the allegation, MF Global agreed to pay restitution to customers amounting to $196,900.44 and a civil monetary penalty of $120,000. MF Global also agreed to a cease and desist order and to strengthen its supervisory system for overseeing sales solicitations by employees in connection with accounts to be traded under letters of direction in favor of third party system providers.
On March 6, 2008, and thereafter, five virtually identical proposed class action securities suits were filed against MF Global’s parent, MF Global Ltd., (now, MF Global Holdings Ltd.) certain of its officers and directors, and Man Group plc. These suits have now been consolidated into a single action. The complaints seek to hold defendants liable under Sections 11, 12, and 15 of the Securities Act of 1933 by alleging that the registration statement and prospectus issued in connection with MF Global Ltd.’s initial public offering in July 2007, were materially false and misleading to the extent that representations were made regarding MF Global Ltd.’s risk management policies, procedures and systems. The allegations are based upon MF Global Ltd.’s disclosure of $141.5 million in trading losses incurred in a single day by an associated person in his personal trading account (“Trading Incident”), which losses MF Global Ltd. was responsible to pay as an exchange clearing member. The consolidated cases have been dismissed on a motion to dismiss by defendants. Plaintiffs have appealed. In January 2011, the parties reached a preliminary agreement to settle whereby MF Global Ltd. will contribute $2.5 million to an overall settlement amount of $90 million. The preliminary settlement will be subject to Court review and final approval.
On December 17, 2009, MF Global settled a CFTC administrative proceeding in connection with the Trading Incident and three other matters without admitting or denying any allegations and accepting a charge of failing to supervise (In the Matter of MF Global Inc. CFTC Docket No. 10-03). The three additional matters that were settled involved allegations that MF Global failed to implement
procedures to ensure proper transmissions of price
121
information for certain options that were sent to a customer, specifically that the price indications reflected a consensus taken on a particular time and date and were derived from different sources in the market place; failed to diligently supervise the proper and accurate preparation of trading cards and failed to maintain appropriate written authorization to conduct trades for a certain customer. Under the CFTC’s order, MF Global agreed to pay an aggregate civil monetary penalty of $10 million (which it had previously accrued) and agreed to a cease and desist order. In addition, MF Global agreed to specific undertakings related to its supervisory practices and procedures and MF Global agreed that it would engage an independent outside firm to review and assess the implementation of the undertakings and certain recommendations that MF Global previously accepted. At the same time, MF Global, without admitting or denying the allegations made by the CME, settled a CME disciplinary action relating to the Trading Incident by paying a fine of $495,000.
On August 28, 2009, Bank of Montreal (“BMO”) instituted suit against MF Global and its former broker, Joseph Saab (“Saab”) (as well as a firm named Optionable, Inc. and five of its principals or employees), in the United States District Court for the Southern District of New York. In its complaint, BMO asserts various claims against all defendants for their alleged misrepresentation of price quotes to BMO’s Market Risk Department (“MRD”) as independent quotes when defendants knew, or should have known, that David Lee (“Lee”), BMO’s trader, created the quotes which, in circular fashion, were passed on to BMO through MF Global’s broker, thereby enabling Lee substantially to overvalue his book at BMO. BMO further alleges that MF Global and Saab knew that Lee was fraudulently misrepresenting prices in his options natural gas book and aided and abetted his ability to do so by MF Global’s actions in sending price indications to the BMO MRD, and substantially assisted Lee’s breach of his fiduciary duties to BMO as its employee. The complaint seeks to hold all defendants jointly and severally liable and, although it does not specify an exact damage claim, it claims CAD 680.0 million (approximately $635.9 million) as a pre-tax loss for BMO in its natural gas trading, claims that it would not have paid brokerage commissions to MF Global (and Optionable), would not have continued Lee and his supervisor as employees at substantial salaries and bonuses, and would not have incurred substantial legal costs and expenses to deal with the Lee mispricing. MF Global has made a motion to dismiss, which was denied.
In or about October 2003, MF Global uncovered an apparent fraudulent scheme conducted by third parties unrelated to MF Global that may have victimized a number of its clients. CCPM, a German Introducing Broker, introduced to MF Global all the clients that may have been victimized. An agent of CCPM, Michael Woertche (and his associates), apparently engaged in a Ponzi scheme in which allegedly unauthorized transfers from and trading in accounts maintained at MF Global were utilized to siphon money out of these accounts, on some occasions shortly after they were established. MF Global was involved in two arbitration proceedings relating to these CCPM introduced accounts. The first arbitration involved claims made by two claimants before a NFA panel. The second arbitration involves claims made by four claimants before a FINRA panel. The claims in both arbitrations are based on allegations that MF Global and an employee assisted CCPM in engaging in, or recklessly or negligently failed to prevent, unauthorized transfers from, and trading in, accounts maintained by MF Global. Damages sought in the NFA arbitration proceeding were approximately $1.7 million in compensatory damages, unspecified punitive damages and attorney’s fees in addition to the rescission of certain deposit agreements. The NFA arbitration was settled for $200,000 as to one claimant and a net of $240,000 as to the second claimant during fiscal 2008. Damages sought in the FINRA proceeding were approximately $6 million in compensatory damages and $12 million in punitive damages. During the year ended March 31, 2009, the FINRA arbitration was settled for an aggregate of $800,000.
The Liquidation Trustee (“Trustee”) for Sentinel Management Group, Inc. (“Sentinel”) sued MF Global in June 2009 on the theory that MF Global’s withdrawal of $50.2 million within 90 days of the filing of Sentinel’s bankruptcy petition on August 17, 2007 is a voidable preference under Section 547 of the Bankruptcy Code and, therefore, recoverable by the Trustee, along with interest and costs.
In May 2009, investors in a venture set up by Nicholas Cosmo (“Cosmo”) sued Bank of America and MF Global, among others, in the United States District Court for the Eastern District of New York, alleging that MF Global, among others, aided and abetted Cosmo and related entities in a Ponzi scheme in which investors lost $400 million. MF Global has made a motion to dismiss which was granted and cannot be appealed by plaintiffs until the conclusion of the case against Bank of America.
122
In December 2010, the Court-appointed receiver for Joseph Forte, L.P., (“Forte Partnership”) filed a complaint in the United States District Court for the Eastern District of Pennsylvania, alleging that MF Global was negligent in the handling of a futures account the Forte Partnership maintained at MF Global. The Complaint alleges that as a result of MF Global’s negligence, Joseph Forte (“Forte”) was able to operate a Ponzi scheme in which he misappropriated at least $25,000,000 from limited partners in the Forte Partnership. The Complaint seeks damages “in excess of $150,000.” MF Global has not been served with the complaint.
In the late spring of 2009, MF Global was sued in Oklahoma State Court by customers who were substantial investors with Mark Trimble (“Trimble”) and/or Phidippides Capital Management (“Phidippides”). Trimble and Phidippides may have been engaged in a Ponzi scheme. Plaintiffs allege that MF Global “materially aided and abetted” Trimble’s and Phidippides’ violations of the anti-fraud provisions of the Oklahoma securities laws and they are seeking damages “in excess of” $10,000 each. MF Global made a motion to dismiss which was granted by the court. Plaintiffs have appealed.
On August 4, 2010, MF Global was added as a defendant to a consolidated class action complaint filed against Moore Capital Management and related entities in the United States District Court for the Southern District of New York alleging claims of manipulation and aiding and abetting manipulation, in violation of the Commodity Exchange Act. Specifically, the complaint alleges that, between October 25, 2007 and June 6, 2008, Moore Capital directed MF Global, as its executing broker, to enter “large” market on close orders (at or near the time of the close) for platinum and palladium futures contracts, which allegedly caused artificially inflated prices. On August 10, 2010, MF Global was added as a defendant to a related class action complaint filed against the Moore-related entities on behalf of a class of plaintiffs who traded the physical platinum and palladium in the relevant time frame, which alleges price fixing under the Sherman Act and violations of the civil Racketeer Influenced and Corrupt Organizations Act. On September 30, 2010 plaintiffs filed an amended consolidated class action complaint that includes all of the allegations and claims identified above on behalf of subclasses of traders of futures contracts of platinum and palladium and physical platinum and palladium. Plaintiffs’ claimed damages have not been quantified. This matter is in its earliest stages.
MF Global and an affiliate, MF Global Market Services LLC (“Market Services”) are currently involved in litigation with a former customer of Market Services, Morgan Fuel & Heating Co., Inc. (“Morgan Fuel”) and its principals, Anthony Bottini, Jr., Brian Bottini and Mark Bottini (the “Bottinis”). The litigations arise out of trading losses incurred by Morgan Fuel in over-the-counter derivative swap transactions, which were unconditionally guaranteed by the Bottinis.
On October 6, 2008, Market Services commenced an arbitration against the Bottinis to recover $8.3 million, which is the amount of the debt owed to Market Services by Morgan Fuel after the liquidation of the swap transactions. MF Global Market Services LLC v. Anthony Bottini, Jr., Brian Bottini and Mark Bottini, FINRA No. 08-03673. Each of the Bottinis executed a guaranty in favor of Market Services personally and unconditionally guaranteeing payment of the obligations of Morgan Fuel upon written demand by Market Services. Market Services asserted a claim of breach of contract based upon the Bottinis’ failure to honor the guarantees.
On October 21, 2008, Morgan Fuel commenced a separate arbitration proceeding before FINRA against MF Global and Market Services. Morgan Fuel claims that MF Global and Market Services caused Morgan Fuel to incur approximately $14.2 million in trading losses. Morgan Fuel v. MF Global and Market Services, FINRA No. 08-03879. Morgan Fuel seeks recovery of $5.9 million in margin payments that it allegedly made to Market Services and a declaration that it has no responsibility to pay Market Services for the remaining $8.3 million in trading losses because Market Services should not have allowed Morgan Fuel to enter into, or maintain, the swap transactions. On MF Global’s motion, the Supreme Court of the State of New York determined that there was no agreement to arbitrate such claims. Morgan Fuel appealed and all appeals were denied.
The Bottinis also asserted a third-party claim against Morgan Fuel, which in turn asserted a fourth-party claim against MF Global, Market Services and Steven Bellino (an MF Global employee) in the arbitration proceeding commenced by Market Services. The Supreme Court of the State of New York denied a motion to stay the fourth party claim but the denial to stay was reversed. Morgan Fuel filed a motion to appeal with the New York Court of Appeals which was denied.
123
On December 12, 2008, MF Global settled three CME Group disciplinary actions involving allegations that on a number of occasions in 2006 and 2007, MF Global employees engaged in impermissible pre-execution communications in connection with trades executed on the e-cbot electronic trading platform, withheld customer orders that were executable in the market for the purpose of soliciting, and brokering contra-orders and crossed orders on the e-cbot trading platform without allowing for the minimum required exposure period between the entry of the orders. MF Global was also charged with failing to properly supervise its employees in connection with these trades. Without admitting or denying any wrongdoing, MF Global consented to an order of a CME Business Conduct Committee Panel which found that MF Global violated legacy CBOT Rule 504.00 and Regulations 480.10 and 9B.13 and 9B.13(c) and ordered MF Global to pay a $400,000 fine, cease and desist from similar conduct and, in consultation with CME Market regulation Staff, enhance its training practices and supervisory procedures regarding electronic trading practices.
MF Global acts only as clearing broker for the futures accounts to be traded by Grant Park and as such is paid commissions for executing and clearing trades. The cases and settlements referenced above will not materially affect MF Global or its ability to perform as a clearing broker. MF Global has not passed upon the adequacy or accuracy of this prospectus and will not act in any supervisory capacity with respect to the general partner of the commodity pool or to the trading advisors, as the case may be, nor participate in the management of the general partner, Grant Park or the trading advisors. Therefore, prospective investors should not rely on MF Global in deciding whether or not to invest in Grant Park.
Newedge USA, LLC
General
Newedge USA, LLC (“Newedge USA”) became one of Grant Park’s clearing brokers effective July 1, 2008 to execute and clear Grant Park’s futures transactions and provide other brokerage-related services. Newedge Financial Inc. (“NFI”) is a wholly-owned subsidiary of Newedge USA which merged into Newedge USA effective September 1, 2008. Newedge Alternative Strategies, Inc. (“NAST”) may execute foreign exchange or other OTC transactions with Grant Park, as principal. Newedge USA and NAST are subsidiaries of Newedge Group. Newedge USA and NAST are headquartered at 630 Fifth Avenue, Suite
500, New York, NY 10111 with branch offices in San Francisco, California; Chicago, Illinois; Philadelphia, Pennsylvania; Kansas City, Missouri and Houston, Texas. Newedge USA is a futures commission merchant and broker-dealer registered with the CFTC and the SEC, and is a member of FINRA. Newedge USA is a clearing member of all principal futures exchanges located in the United States as well as a member of the Chicago Board Options Exchange, International Securities Exchange, New York Stock Exchange, Options Clearing Corporation, and Government Securities Clearing Corporation. NAST is an eligible swap participant that is not registered or required to be registered with the CFTC or the SEC, and is not a member of any exchange. Prior to January 2, 2008 Newedge USA, LLC was known as Fimat USA, LLC, while NAST was known as Fimat Alternative Strategies Inc. On September 1, 2008, Newedge USA merged with future commission merchant and broker-dealer NFI — formerly known as Calyon Financial Inc. Newedge USA was the surviving entity.
Newedge USA provides commodity interest brokerage and clearing services to Grant Park. The foreign futures trades made on behalf of Grant Park are cleared and carried through an affiliate of the Newedge Group, Newedge Group (UK Branch) (“Newedge UK”). Grant Park has entered into a prime brokerage relationship with Newedge UK for the clearing of its OTC foreign currency transactions. Newedge USA is not a sponsor or general partner of Grant Park, and will not act in any supervisory capacity with respect to the general partner or participate in the management of either the general partner of Grant Park. NFI does not have or accept any discretionary authority with respect to transactions or investments in Grant Park’s trading account. NFI may use the services of other clearing brokers, including its affiliates, and brokers who are members of exchanges of which NFI is not a member. NFI maintains the trading account of Grant Park on its books and records as a separate account.
Conflicts of Interest
Newedge USA is presently acting as clearing broker for other commodity pools, providing services similar to those provided Grant Park, and expects to continue to serve in this capacity for commodity pools in the future. Newedge USA also serves a number of other non-commodity pool customers. Its responsibilities to Grant Park and the responsibilities that it has or may undertake in the future may cause a conflict of interest. These conflicts may result in
124
competition among commodity pools and other customers for services provided to them by the clearing broker. In addition, Newedge USA may in the future charge other customers, including public and private commodity pools, a lower brokerage rate than is being charged to Grant Park.
Newedge USA and its principals, employees and agents may trade commodity interests for their own accounts. These trades may be different from, opposite to or entered ahead of trades entered into by Grant Park, and these persons may even be the other party to a trade entered into by Grant Park. The records of any of these trades will not be available to limited partners.
Legal Proceedings
At any given time, Newedge USA is involved in numerous legal actions and administrative proceedings, which Newedge USA has advised the general partner are not, in the aggregate, as of the date of this prospectus, expected to have a material effect upon its condition, financial or otherwise, or to the services it renders to Grant Park. Newedge USA has also advised the general partner that, as of the date of this prospectus, there have been no material, administrative, civil or criminal proceedings pending, on appeal or concluded against Newedge USA, NAST or its principals within the last five years, except as follows:
In March 2008, Newedge USA settled, without admitting or denying the allegations, a disciplinary action brought by the New York Mercantile Exchange (“NYMEX”) alleging that Newedge USA violated NYMEX rules related to: numbering and time stamping orders by failing properly to record a floor order ticket; wash trading; failure to adequately supervise employees; and violation of a prior NYMEX cease and desist order, effective as of December 5, 2006, related to numbering and time stamping orders and block trades. Newedge USA paid a $100,000 fine to NYMEX in connection with this settlement.
In February 2011, Newedge USA settled, without admitting or denying the allegations, a disciplinary action brought by the CFTC alleging that Newedge USA exceeded speculative limits in the October 2009 live cattle futures contract on the Chicago Mercantile Exchange and failed to provide accurate and timely reports to the CFTC regarding their larger trader positions. Newedge USA paid a $140,000 civil penalty and disgorgement value of $80,910 to settle this matter. In addition, the CFTC Order required Newedge USA to implement and maintain a program designed to
prevent and detect reporting violations of the Commodity Exchange Act and CFTC regulations.
Neither Newedge USA, NAST nor any affiliate, officer, director or employee thereof have passed on the merits of this prospectus, or give any guarantee as to the performance or any other aspect of Grant Park.
UBS Securities LLC
General
UBS Securities’ principal office is located at 677 Washington Blvd., Stamford, Connecticut 06901, telephone: (203) 719-4066. It is registered as a broker-dealer with FINRA and as a futures commission merchant with the CFTC. It is a member of various U.S. futures and securities exchanges. UBS Securities is a wholly-owned indirect subsidiary of UBS AG.
UBS Securities did not sponsor or organize Grant Park and is not responsible for the activities of the general partner or the trading advisors. UBS Financial Services, Inc., an affiliate of UBS Securities, acts as one of the selling agents for Grant Park.
UBS Securities clears all foreign futures trades made on behalf of Grant Park and carried by UBS Securities through its parent UBS AG. Grant Park has entered into a prime brokerage relationship with UBS AG’s Stamford, Connecticut office for the clearing of its OTC foreign currency transactions.
Legal Proceedings
UBS Securities has advised the general partner that, except as set forth below, neither UBS Securities nor any of its principals have been involved in any administrative, civil or criminal proceeding, whether pending, on appeal or concluded, within the past five years that is in UBS Securities’ determination material to a decision whether to invest in Grant Park in light of all the circumstances. UBS Securities is and has been a defendant in numerous legal actions relating to its securities and commodities business that allege various violations of federal and state securities laws.
On June 27, 2007, the Securities Division of the Secretary of the Commonwealth of Massachusetts (“Massachusetts Securities Division”) filed an administrative complaint (the “Complaint”) and notice of adjudicatory proceeding against UBS Securities, captioned In The Matter of UBS Securities, LLC, Docket No. E-2007-0049, which alleged that UBS Securities violated the Massachusetts Uniform
125
Securities Act (the “Act”) and related regulations by providing the advisers for certain hedge funds with gifts and gratuities in the form of below market office rents, personal loans with below market interest rates, event tickets, and other perks, in order to induce those hedge fund advisers to increase or retain their level of prime brokerage fees paid to UBS Securities. The Complaint seeks a cease and desist order from conduct that violates the Act and regulations, to censure UBS Securities, to require UBS Securities to pay an administrative fine of an unspecified amount, and to find as fact the allegations of the Complaint. The matter is still pending.
In the summer of 2008, the Massachusetts Securities Division, the Texas State Securities Board, and the New York Attorney General (“NYAG”) all brought actions against UBS Securities and UBS Financial Services, Inc. (“UBS Financial”), alleging violations of various state anti-fraud provisions in connection with the marketing and sale of auction rate securities.
On August 8, 2008, UBS Securities and UBS Financial reached agreements in principle with the SEC, the NYAG, the Massachusetts Securities Division and other state regulatory agencies represented by the North American Securities Administrators Association (“NASAA”) to restore liquidity to all remaining client’s holdings of auction rate securities by June 30, 2012. On October 2, 2008, UBS Securities and UBS Financial entered into a final consent agreement with the Massachusetts Securities Division settling all allegations in the Massachusetts Securities Division’s administrative proceeding against UBS Securities and UBS Financial with regards to the auction rate securities matter. On December 11, 2008, UBS Securities and UBS Financial executed an Assurance of Discontinuance in the auction rate securities settlement with the NYAG. On the same day, UBS Securities and UBS Financial finalized settlements with the SEC. UBS paid penalties of $75 million to NYAG and an additional $75 million to be apportioned among the participating NASAA states. In March 2010, UBS and NASAA agreed on final settlement terms, pursuant to which, UBS agreed to provide client liquidity up to an additional $200 million.
On August 14, 2008, the New Hampshire Bureau of Securities Regulation filed an administrative action against UBS Securities relating to a student loan issuer, the New Hampshire Higher Education Loan Corp. (NHHELCO). On April 14, 2010, UBS Securities entered into a Consent Order resolving all of
the Bureau’s Claims. UBS paid $750,000 to the Bureau for all costs associated with the Bureau’s investigation. UBS entered into a separate civil settlement with NHHELCO and provided a total financial benefit of $20 million to NHHELCO.
On April 29, 2010, the CFTC issued an order with respect to UBS Securities and levied a fine of $200,000. The order stated that on February 6, 2009, UBS Securities’ employee broker aided and abetted UBS Securities’ customer’s concealment of material facts from the New York Mercantile Exchange (“NYMEX”) in violation of Section 9(a)(4) of the CEA, 7 U.S.C. Section 13(a)(4) (2006). Pursuant to NYMEX Rules, a block trade must be reported to NYMEX “within five minutes of the time of execution” consistent with the requirements of NYMEX Rule 6.21C(A)(6). Although the block trade in question was executed earlier in the day, UBS Securities’ employee broker aided and abetted its customer’s concealment of facts when, in response to the customer’s request to delay reporting the trade until after the close of trading, UBS Securities’ employee did not report the trade until after the close. Because the employee broker undertook his actions within the scope of his employment, pursuant to Section 2(a)(1)(B) of the CEA, 7 U.S.C. Section 2(a)(1)(B) (2006), and CFTC Regulation 1.2, 17 C.F.R. Section 1.2 (2009), UBS Securities is liable for the employee broker’s aiding and abetting of its customer’s violation of Section 9(a)(4) of the CEA. The fine has been paid and the matter is now closed.
UBS Securities will act only as clearing broker for Grant Park and as such will be paid commissions for executing and clearing trades on behalf of Grant Park. UBS Securities has not passed upon the adequacy or accuracy of this prospectus. UBS Securities neither will act in any supervisory capacity with respect to the general partner nor participate in the management of Grant Park.
Other Clearing Brokers
The general partner may, in its sole discretion, appoint additional or substitute clearing brokers for Grant Park. These clearing brokers may be compensated at a level higher or lower than Grant Park currently pays to its current clearing brokers.
Other Brokers
Grant Park has also entered into relationships with Bank of America N.A. and Deutsche Bank AG for engaging in a portion of Grant Park’s OTC foreign currency transactions.
126
Some of the parties involved with the operation and/or management of Grant Park, including the general partner, have other relationships that may create disincentives to act in the best interests of Grant Park and its limited partners. The general partner has not established, and has no plans to establish, any procedures or controls to prevent, address or resolve these conflicts. As a result, these conflicts may inhibit or interfere with the sound and profitable operation of Grant Park.
In evaluating these conflicts of interest, you should be aware that the general partner has a responsibility to investors to exercise good faith and fairness in all dealings affecting Grant Park. The fiduciary responsibility of a general partner to investors is a developing and changing area of the law and if you have questions concerning the duties of the general partner, you should consult with your counsel.
Relationship of the General Partner and MF Global
Mr. Kavanagh, who indirectly controls and is president of the general partner, receives, through Dearborn Capital Brokers LTD, compensation from MF Global, Grant Park’s current clearing broker, in exchange for transactions that Dearborn Capital Brokers LTD introduces to MF Global for clearing. Therefore, he may have a disincentive to cause the general partner to terminate or replace MF Global even if termination or replacement may be in the best interest of Grant Park. Mr. Kavanagh does not share in any commissions paid by Grant Park to MF Global.
Other Activities of the General Partner
Because the general partner may engage from time to time in other activities in the normal course of business, including acting as general partner to other similar partnerships and acting as sponsor and investment manager of the Dearborn Alternative Investment Fund Series 2, and the Dearborn Select Winton Series, LP, the general partner’s full efforts will not be devoted to the activities of Grant Park. This may create a conflict of interest with respect to the general partner’s commitment to Grant Park of its resources. The general partner, however, intends to devote sufficient time Grant Park activities to properly manage Grant Park consistent with its fiduciary duties.
Other Trading Activities of the Trading Advisors
Each of the trading advisors and some of their principals currently manage other trading accounts
including their own accounts, and each will remain free to manage additional accounts in the future. These other trading activities present various conflict of interest, some of which are described below.
The trading advisors or their principals may sometimes take positions in their proprietary accounts that are opposite to or ahead of Grant Park’s account. Trading ahead of Grant Park presents a conflict because the trade first executed may receive a more favorable price than the same trade later executed for Grant Park. In addition, the trading advisors may have financial incentives to favor other accounts over Grant Park’s account. The trading advisors may trade other customer accounts that pay higher advisory fees than does Grant Park, which may cause the trading advisors to devote more attention to these other accounts or trade these other accounts in a different manner. Finally, accounts traded by the trading advisors will compete with Grant Park and the trading advisors may compete with each other, in buying and selling commodity interest contracts for Grant Park’s account. When similar orders are entered at the same time, the prices at which Grant Park’s trades are filled may be less favorable than the prices allocated to other accounts. Some orders may be difficult or impossible to execute in markets with limited liquidity where prices may rise or fall sharply in response to orders entered. However, each trading advisor is required to use an allocation methodology that is fair to all of its customers. Because records with respect to other accounts are not accessible to investors in Grant Park, investors will not be able to determine if any other accounts are being favored over Grant Park’s account.
Commodity Interest Trading by General Partner and its Principals
Mr. Kavanagh currently trades futures contracts for his own account and may do so in the future. These trades may be different from, opposite to or entered ahead of trades entered into by Grant Park, and Mr. Kavanagh may even be the other party to a trade entered into by Grant Park. The general partner does not intend to trade for its own account, but may do so in the future. Records of trading of the general partner or its principals would not be made available to limited partners for inspection, so you would not be aware of the nature or details of any such trading.
General Partner and Trading Advisor Ownership Interest in Grant Park
As of December 31, 2010, Grant Park had net assets of approximately $891.9 million, and has issued
127
limited partnership interests in transactions registered under the Securities Act of 1933 for net aggregate capital contributions equal to $1.19 billion. The general partner has made and is required to maintain a cash general partnership investment in Grant Park equal to 1% of such amount from time to time. The general partner may make withdrawals of any investment in excess of this amount. As of December 31, 2010, the sole principal of EMC beneficially owned approximately 0.03% of the interests in Grant Park as a limited partner, and a principal of Rabar, Paul Rabar, owned approximately 0.17% of the interests in Grant Park as a limited partner. As of December 31, 2010, Ms. O’Rourke and Mr. Meehan, principals of the general partner, owned less than 0.07% of the interests in Grant Park as limited partners. Other principals of or persons affiliated with the general partner or the trading advisors may, from time to time, own interests in Grant Park. However, at December 31, 2010, no other persons affiliated with any of the trading advisors, other than as detailed above, own an interest in Grant Park.
The general partner is subject to these and other potential conflicts of interest. The general partner, however, intends to treat Grant Park fairly, acting in accordance with its fiduciary duty.
General Partner Acts as Transfer Agent for Grant Park
Currently, the general partner acts as Grant Park’s transfer agent. The fees and expenses associated in its role as transfer agent for Grant Park are operating expenses of Grant Park and will be reimbursed to the general partner by Grant Park. The total ongoing operating expenses of Grant Park are estimated to be approximately 0.25% of the average net assets of Grant Park per year. This amount may include certain overhead expenses and a portion of the salaries of those employees of the general partner attributable to acting in the capacity as transfer agent of Grant Park.
DCM Brokers, LLC Acts as Lead Selling Agent for Grant Park
DCM Brokers, LLC, or DCM, will act as lead selling agent for Grant Park with respect to the offered units. DCM is a registered broker-dealer and an affiliate of Grant Park’s general partner, Dearborn Capital Management, L.L.C. As lead selling agent, DCM will be entitled to receive selling commissions and other related compensation that will be paid directly by the general partner. See “PLAN OF DISTRIBUTION — Selling Agent Compensation.”
Incentive Compensation
The trading advisors are compensated in part by receiving a quarterly incentive fee for any net new profits which Grant Park generates. This may present a conflict of interest in that the trading advisors may have an incentive to trade more aggressively (including using more leverage) or entering riskier trades in an attempt to produce greater profits.
128
Grant Park has no directors or officers. Its affairs are managed by the general partner, which receives compensation for its services as described under “FEES AND EXPENSES — Brokerage Charge” and “FEES AND EXPENSES — Organization and Offering Expenses.”
Fees and Expenses Paid by Grant Park
Grant Park pays the following fees and expenses in connection with the offering of units, trading activities and operation of Grant Park:
Recipient | Nature of | Amount of Payment | ||
General Partner | Brokerage Charge | Class A: 7.50%* Class B: 7.95%* Legacy 1 Class: 5.00%* Legacy 2 Class: 5.25%* Global 1 Class: 4.45%* Global 2 Class: 4.70%* Global 3 Class: 6.45%* * Annualized basis. | ||
Counterparties | Dealer Spreads | Grant Park pays its counterparties bid-ask spreads on Grant Park’s non-exchange traded commodity interests. | ||
Trading Advisors | Incentive Fees | Grant Park pays each trading advisor a quarterly incentive fee ranging from 20% to 26% of the new trading profits, if any, achieved on the trading advisor’s allocated net assets as of the end of each calendar quarter. | ||
General Partner | Organization and Offering Expense Reimbursement | Grant Park reimburses the general partner on a monthly basis for its advancement of Grant Park’s organization and offering expenses, up to an amount not to exceed 1.0% per annum of the average month-end net assets of Grant Park. | ||
Third Parties | Operating Expenses; Extraordinary Expenses | Grant Park pays its ongoing operating expenses up to a maximum of 0.25% of Grant Park’s average net assets per year. This includes expenses associated with Grant Park’s SEC reporting obligations, which for 2010 are estimated to be approximately $350,000. Grant Park also pays any extraordinary expenses it incurs. | ||
A more complete description of these fees and expenses follows below. Net asset value as of a specified time with respect to any class of units or of
Grant Park as a whole equals the value of the net assets attributable to such class or of Grant Park, as applicable, as of that time. Net assets is defined as the total assets attributable to any class of units or of Grant Park, as applicable, including all cash, plus Treasury securities at accrued interest and the market value of all open commodity interest positions attributable to such class or of Grant Park, less all liabilities attributable to such class or of Grant Park, determined in accordance with generally accepted accounting principles (GAAP).
Brokerage Charge
As of the date of this prospectus, Class A units pay the general partner a monthly brokerage charge equal to a rate of 0.625%, a rate of 7.50% annually, of Class A’s month-end net assets; Class B units pay the general partner a monthly charge equal to a rate of 0.6625%, a rate of 7.95% annually, of Class B’s month-end net assets. Legacy 1 Class units pay the general partner a monthly brokerage charge equal to a rate of 0.4167%, a rate of 5.00% annually; Legacy 2 Class units pay the general partner a monthly brokerage charge equal to a rate of 0.4375%, a rate of 5.25% annually; Global 1 Class units pay the general partner a monthly brokerage charge equal to a rate of 0.3708%, a rate of 4.45% annually; Global 2 Class units pay the general partner a monthly brokerage charge equal to a rate of 0.3917%, a rate of 4.70% annually; and Global 3 Class units pay the general partner a monthly brokerage charge equal to a rate of 0.5375%, a rate of 6.45% annually. The general partner pays from the brokerage charge all clearing, execution and give-up, floor brokerage, exchange and NFA fees, any other transaction costs, selling agent compensation and consulting fees to the trading advisors. The payments to the clearing brokers are based upon a specified amount per round-turn for each commodity interest transaction executed on behalf of Grant Park. The amounts paid to selling agents, trading advisors or others may be based upon a specified percentage of Grant Park’s net asset value or round-turn transactions. A round-turn is both the purchase and sale of a futures contract. The balance of the brokerage charge not paid out to other parties is retained by the general partner as payment for its services to Grant Park. The amount retained by the general partner varies based on allocations to the trading advisors and has ranged from approximately 1.68% to 2.30% in the past.
Grant Park pays the general partner the brokerage charge, which is based on a fixed percentage of net assets, regardless of whether actual transaction costs were less than or exceeded this fixed percentage or
129
whether the number of trades significantly increases. For the Legacy 1 Class units, assuming Grant Park’s brokerage charge was expressed on a per-transaction basis, the brokerage charge equates to round-turn commissions of approximately $30.56 based on the average trading activity of the Legacy 1 Class units’ trading advisors for the last three calendar years and assuming current allocations to the trading advisors.
For the Legacy 2 Class units, assuming Grant Park’s brokerage charge was expressed on a per-transaction basis, the brokerage charge equates to round-turn commissions of approximately $32.09 based on the average trading activity of the Legacy 2 Class units’ trading advisors for the last three calendar years and assuming current allocations to the trading advisors.
For the Global 1 Class units, assuming Grant Park’s brokerage charge was expressed on a per-transaction basis, the brokerage charge equates to round-turn commissions of approximately $25.61 based on the average trading activity of the Global 1 Class units’ trading advisors for the last three calendar years and assuming current allocations.
For the Global 2 Class units, assuming Grant Park’s brokerage charge was expressed on a per-transaction basis, the brokerage charge equates to round-turn commissions of approximately $27.01 based on the average trading activity of the Global 2 Class units’ trading advisors for the last three calendar years and assuming current allocations.
For the Global 3 Class units, assuming Grant Park’s brokerage charge was expressed on a per-transaction basis, the brokerage charge equates to round-turn commissions of approximately $37.11 based on the average trading activity of the Global 3 Class units’ trading advisors for the last three calendar years and assuming current allocations of net assets to the trading advisors.
The clearing brokers are also paid by the general partner, out of its brokerage charge, an average of between approximately $5.00 and $10.00 per round turn transaction entered into by Grant Park. This round turn commission includes all clearing, exchange and NFA fees.
The Guidelines for the Registration of Commodity Pool Programs developed by the North American Securities Administrators Association, Inc., or NASAA Guidelines, require that the brokerage charge payable by Grant Park will not be greater than (1) 80% of the published retail commission rate plus
pit brokerage fees, or (2) 14% annually of Grant Park’s average net assets, including pit brokerage fees. Net assets for purposes of this limitation exclude assets not directly related to trading activity, if any. The general partner intends to operate Grant Park so as to comply with these limitations.
Dealer Spreads
Grant Park trades OTC derivatives, including foreign currency forward contracts. These contracts are traded among dealers that act as principals or counterparties to each trade. The execution costs are included in the price of the contract purchased or sold, and accordingly, these costs to Grant Park cannot necessarily be determined. However, the general partner believes the bid-ask spreads (i.e., compensation) paid by Grant Park are competitive with the spreads paid by other institutional customers that are comparable in size and trading activity to Grant Park. Any commissions or other transaction fees that may be incurred by Grant Park in trading, other than the associated bid-ask spreads, are paid by the general partner out of the brokerage charge.
Incentive Fees
Grant Park pays each trading advisor a quarterly incentive fee based on any new trading profits achieved on that trading advisor’s allocated net assets as of the end of each calendar quarter. Generally, new trading profits means the net increase in trading profits, realized and unrealized, experienced by the trading advisor on its allocated net assets from the most recent prior quarter in which an incentive fee was paid to the trading advisor, or if an incentive fee has yet to be paid to that trading advisor, the trading advisor’s initial allocation of net assets. Currently, the incentive fees payable to each of Grant Park’s trading advisors that are allocated 10% or more of the fund’s assets are as follows: 22.5% to EMC, 24% to ETC, 20% to Winton and 20% to Welton.
Grant Park pays incentive fees ranging between 20% and 26% to each of Rabar, Global Advisors, Transtrend, QIM, Sunrise, Amplitude and, effective February 1, 2011, Alder and Denali.
Calculation of New Trading Profits. New trading profits are calculated with respect to each trading advisor’s allocated net assets. Allocated net assets means that portion of the net assets of each class of Grant Park allocated to the trading advisor by the general partner through the trading company and subject to the trading advisor’s discretion (including any notional funds), together with any appreciation or
130
depreciation in such allocated net assets. New trading profits are calculated on a high water mark basis, as described in the paragraph below. For a definition of net assets, please see “LIMITED PARTNERSHIP AGREEMENT — Nature of Classes and Determination of Net Asset Value.”
New trading profits on the allocated net assets of each trading advisor are calculated as the sum of (1) the net of any profits (excluding interest income) and losses realized on all trades closed out during the period of such allocated net assets, plus (2) the net of any unrealized profits and losses on open positions as of the end of such period on such allocated net assets, minus (3)(A) the net of any unrealized profits or losses on open positions as of the end of the preceding period on such allocated net assets, (B) all expenses (except the incentive fee payable to the trading advisor, if any, for the current period and applicable state taxes) attributable to such allocated net assets incurred or accrued during such period, including, without limitation, the brokerage charge and Grant Park’s ongoing expenses, and (C) cumulative net realized or unrealized trading losses on such allocated net assets (reduced by a proportionate share of realized and unrealized trading losses on such allocated net assets attributable to redeemed units or reallocated amounts as of any redemption or reallocation date), if any, carried forward from all preceding periods since the last period for which an incentive fee was payable to the trading advisor. The general partner may, however, in its sole discretion, adjust the computation of new trading profits on the allocated net assets of any trading advisor to exclude or include all or a portion of particular expenses for purposes of calculating that trading advisor’s incentive fee. In the case of ETC, Winton, Welton, Global Advisors, Transtrend, QIM, Sunrise, Amplitude, and, effective February 1, 2011, Alder and Denali, only certain allocated expenses of Grant Park are included for the purpose of calculating such trading advisor’s incentive fee, while for EMC and Rabar, all allocated expenses of Grant Park are included.
Incentive fees paid at the end of a quarter will be retained by each trading advisor and will not be repaid to Grant Park if the net assets of Grant Park or of any class subsequently decline. This could result in substantial incentive fees being paid to a trading advisor despite the fact that an overall decline in the net assets of Grant Park or of any class has occurred. Because each trading advisor’s incentive fee will be determined independently based on new trading profits experienced on the net assets allocated to the trading
advisor, it also is possible that one of the trading advisors could be paid incentive fees for a quarter even though, because of losses suffered by another trading advisor, the net asset value per unit of a limited partner’s units declined during the quarter. Incentive fees will be payable on realized and unrealized profits and, therefore, without regard to cash available for distribution.
The general partner generally reallocates assets to or from a trading advisor as of the first trading day of a calendar month. However, the advisory contracts authorize the general partner to reallocate assets among the trading advisors monthly as it determines in its sole discretion upon 10 days’ prior written notice to the affected trading advisors. If a trading advisor’s advisory contract with Grant Park is terminated other than as of the end of a calendar quarter or assets are allocated away from the trading advisor on other than a quarter-end, the trading advisor will receive an incentive fee, if due, as though the termination date or reallocation date were the end of a calendar quarter. With respect to any allocated assets, in determining the trading advisor’s quarterly incentive fee, reallocated assets are transferred at the net asset value they had on the last trading day immediately prior to the date they are allocated away from the trading advisor, and the trading advisor is paid its quarterly incentive fee on the new trading profits on the reallocated assets. Below is a sample calculation of the incentive fee:
Assume one of Grant Park’s trading advisors, referred to as trading advisor A, is entitled to a 20% incentive fee. Assume Grant Park paid an incentive fee to trading advisor A at the end of the fourth quarter of 2008 and assume that trading advisor A’s allocated net assets recognized trading profits, net of all applicable fees and expenses, of $100,000 during the first quarter of 2009. The new trading profits, excluding interest income, for the quarter would be $100,000 and trading advisor A’s incentive fee would be $20,000 (0.2 ÷ $100,000). Alternatively, assume that Grant Park paid an incentive fee to trading advisor A at the end of the fourth quarter of 2008 but did not pay an incentive fee to trading advisor A at the end of the first quarter of 2009, because trading advisor A had trading losses of $50,000. If trading advisor A’s allocated net assets recognized trading profits of $100,000 at the end of the second quarter of 2009, the net trading profits, excluding interest income, for the quarter would be $50,000 ($100,000 – $50,000 loss carryforward) and trading advisor A’s incentive fee would be $10,000 (0.2 ÷ $50,000). You should note that this simplified example assumes that no additional assets have been
131
allocated to, nor have any assets been allocated away from, trading advisor A during these sample time frames.
New trading profits are calculated on the performance of each trading advisor’s allocated net assets of Grant Park as a whole, and not on a capital account-by-capital account basis. In particular, because incentive fees are calculated on the basis of any new trading profits attributable to a trading advisor’s allocated net assets, the incentive fees are subject to equal allocation among all limited partners, even though these persons may have purchased their units at different times. Furthermore, because incentive fees are calculated on the trading advisor’s allocated net assets and not on the new trading profits experienced by a class of units, and each class of units bears differing proportions of Grant Park’s organization and offering expenses, for purposes of calculating new trading profits these expenses are deemed to be shared proportionately among each unit.
The distortions described above are the product of calculating and allocating incentive compensation among multi-advisor, multi-class, open-end funds among persons investing at different times while still maintaining a uniform net asset value per unit of each class. This method is the most common method used in publicly-offered managed futures funds in which the large number of investors makes it impracticable to individually track capital accounts for each investor, but can result in incentive fees that disproportionately benefit or disadvantage particular limited partners in comparison to funds that can assess fees solely based upon the individual investment experience of each limited partner.
Miscellaneous
The NASAA Guidelines impose the following restrictions on the amount of advisory fees paid by Grant Park: any management fees, any advisory fees, and all other fees paid by Grant Park, excluding incentive fees and brokerage commissions, when added to the customary and routine administrative expenses of Grant Park may not exceed 1/2 of 1% of net assets per month, or 6% annually. Aggregate incentive fees may not exceed 15% of new trading profits. An additional 2% incentive fee, however, may be paid for each 1% by which the fees and expenses described above are reduced below 6% annually. The general partner intends to operate Grant Park so as to comply with these limitations.
Organization and Offering Expenses
All expenses incurred in connection with the organization and the ongoing offering of the units are paid by the general partner and then reimbursed to the general partner by Grant Park. The limited partnership agreement provides that Grant Park shall be entitled to reimbursement for organization and offering expenses at a rate of up to 1.0% per annum, computed monthly, of which up to 10% of such amount is reimbursable by Class A and 90% is reimbursable by Class B. Effective April 1, 2004, Class A units bear organization and offering expenses at an annual rate of 20 basis points (0.20%) of the adjusted net assets of the Class A units calculated and payable monthly on the basis of month-end adjusted net assets. Effective September 1, 2005, Class B units bear these expenses at an annual rate of 60 basis points (0.60%) of the adjusted net assets of the Class B units, calculated and payable monthly on the basis of month-end adjusted net assets. Effective April 1, 2009, Class A units bear organization and offering expenses at an annual rate of 10 basis points (0.10%) of the adjusted net assets of the Class A units, calculated and payable monthly on the basis of month-end adjusted net assets, and Class B, Legacy 1 Class, Legacy 2 Class, Global 1 Class, Global 2 Class and Global 3 Class units bear organization and offering expenses at an annual rate of 30 basis points (0.30%) of the adjusted net assets of each respective Class of units, calculated and payable monthly on the basis of month-end adjusted net assets. In no event, however, will the reimbursement from Grant Park to the general partner exceed 1.0% per annum of the average month-end net assets of Grant Park. The general partner has the discretion to change the amounts assessed to each class for organization and offering expenses, provided the amounts do not exceed the limits set forth in the limited partnership agreement. In its discretion, the general partner may require Grant Park to reimburse the general partner in any subsequent calendar year for amounts that exceed these limits in any calendar year, provided that the maximum amount reimbursed by Grant Park in any calendar year will not exceed the overall limits set forth above.
The NASAA Guidelines require that the organization and offering expenses of Grant Park do not exceed 15% of the total subscriptions accepted. The general partner, and not Grant Park, is responsible for any expenses in excess of that limitation. Since the general partner has agreed to limit Grant Park’s responsibility for these expenses to a total of 1% per annum of Grant Park’s average month-end net assets
132
per year, the general partner does not expect the NASAA Guidelines limit of 15% of total subscriptions to be reached.
Operating Expenses
Grant Park has borne, and will continue to bear, all ongoing operating expenses subject to a maximum charge for such expenses of 0.25% of the average net assets of Grant Park per year, including legal, audit, internal control attestation, administration, transfer agent, printing and postage expenses and the costs and expenses of preparing and filing required periodic reports with the SEC. To the extent operating expenses are less than 0.25% of Grant Park’s average net assets during the year, the difference may be reimbursed pro rata to recordholders as of December 31 of each year. If actual operating expenses are higher than 0.25% of Grant Park’s average net assets during any year, the general partner, not Grant Park, will bear the excess amount. The general partner estimates that the legal and audit fee portion of the operating expense chargeable to Grant Park during 2010 will be approximately $500,000. The general partner does not anticipate that Grant Park will be liable for any income or other business taxes. The portion of the operating expense borne by Grant Park relating to the fees and expenses associated with Grant Park’s transfer agent will be paid to the general partner, which acts as Grant Park’s transfer agent.
The general partner will not cause Grant Park to pay any of the general partner’s indirect expenses, other than organization and offering expenses as described above, incurred in connection with its administration of Grant Park, including salaries, rent, travel expenses or other items generally considered overhead.
Extraordinary Expenses
Grant Park is required to pay all of its extraordinary expenses, if any. These expenses include any litigation expenses and IRS audit expenses, among others.
Early Redemption Fee
Investors in the offered units are prohibited from redeeming such units for three months following the subscription for units. Global 3 Class units that are redeemed after the three-month lock-up, but before the one-year anniversary of the subscription for the units will pay the general partner an early redemption fee. The early redemption fee is based on the net asset
value of the redeemed units as of the close of business on the date of the redemption and will differ depending on when the units are redeemed during the first year of investment as follows:
| • | units redeemed after the third month-end and on or before the sixth month-end after the subscription are subject to a fee of 1.50% of the net asset value of the redeemed units; |
| • | units redeemed after the sixth month-end and on or before the ninth month-end after the subscription are subject to a fee of 1.0% of the net asset value of the redeemed units; and |
| • | units redeemed after the ninth month-end and before the one-year anniversary of the subscription are subject to a fee of 0.5% of the net asset value of the redeemed units. |
For purposes of determining the existence and the amount of an early redemption fee with respect to the Global 3 Class units, redemptions are made on a first-in, first-out basis such that the redeemed units will be deemed to have been acquired on the redeeming limited partner’s earliest subscription date for which units have not yet been redeemed. Global 3 Class limited partners who redeem units on or after the one year anniversary of their subscription for the redeemed units do not pay any redemption fees for such redemption.
Fees and Expenses Paid by the General Partner
The general partner pays the following fees and expenses in connection with the offering of units, trading activities and operation of Grant Park.
Transaction Costs
As described above under “FEES AND EXPENSES — Fees and Expenses Paid by Grant Park — Brokerage Charge,” the general partner pays all clearing, execution and give-up, floor brokerage, exchange and NFA fees, and other transaction costs incurred in connection with Grant Park’s trading activities.
Selling Agent Compensation
The general partner pays all upfront sales commissions and other ongoing compensation to the selling agents for the sales of any units. You will not directly pay sales compensation to the selling agents.
133
Legacy 1 Class Units. Selling agents who sell Legacy 1 Class units do not receive any upfront sales compensation and will not receive an administrative fee. However, such selling agents may be reimbursed for bona fide due diligence expenses. In no event will the total underwriting compensation per Legacy 1 Class unit exceed 10% of the subscription proceeds of the unit (plus bona fide due diligence expenses).
Legacy 2 Class Units. Beginning with the first month after the subscription proceeds of a Legacy 2 Class unit have been invested in Grant Park, selling agents who sell Legacy 2 Class units will receive an administrative fee calculated and payable monthly at an annual rate of 25 basis points (0.25%) of the month-end net asset value of the unit, paid on a monthly basis, in order to compensate them for ongoing administrative and other support services provided to the unit holder. However, in no event will the total underwriting compensation per Legacy 2 Class unit exceed 10% of the subscription proceeds of the unit (plus bona fide due diligence expenses). This ongoing compensation will continue as long as the unit remains outstanding.
Global 1 Class Units. Selling agents who sell Global 1 Class units do not receive any upfront sales compensation and will not receive an administrative fee. However, such selling agents may be reimbursed for bona fide due diligence expenses. In no event will the total underwriting compensation per Global 1 Class unit exceed 10% of the subscription proceeds of the unit (plus bona fide due diligence expenses).
Global 2 Class Units. Beginning with the first month after the subscription proceeds of a Global 2 Class unit have been invested in Grant Park, selling agents who sell Global 2 Class units will receive an administrative fee calculated and payable monthly at an annual rate of 25 basis points (0.25%) of the month-end net asset value of the unit, paid on a monthly basis, in order to compensate them for ongoing administrative and other support services provided to the unit holder. However, in no event will the total underwriting compensation per Global 2 Class unit exceed 10% of the subscription proceeds of the unit (plus bona fide due diligence expenses). This ongoing compensation will continue as long as the unit remains outstanding.
Global 3 Class Units. Selling agents who sell Global 3 Class units receive for each unit sold sales compensation as follows: The general partner pays that selling agent an upfront sales commission of up to 2.0% of the purchase price per Global 3 Class unit at
the time that each Global 3 Class unit is sold. Then, beginning with the thirteenth month after the subscription proceeds of a Global 3 Class unit are invested in Grant Park, in return for ongoing services provided to the limited partners, the selling agent who sold the unit will receive ongoing compensation, calculated and payable monthly at an annual rate of up to 2.0% of the month-end net asset value of the unit, provided that the total underwriting compensation per Global 3 Class unit does not exceed 10% of the subscription proceeds of the unit (plus bona fide due diligence expenses). Once begun, this ongoing compensation will continue as long as the unit remains outstanding. In the event that the total underwriting compensation paid to the selling agent per a Global 3 Class unit meets this limit, such Global 3 Class unit will be automatically exchanged for an equal net asset amount of Global 1 Class units at no additional cost. The Global 1 Class units, which are initially offered only to investors through wrap-accounts, are identical to the Global 3 Class units, except for a different (lower) fee structure and not subject to the payment of trailing commissions or any other ongoing compensation.
Ongoing Compensation Paid to Selling Agents Who Previously Sold Class A and Class B Units. Although we are no longer offering Class A or Class B units, selling agents who previously sold Class A units continue to receive ongoing compensation for continuing services provided to Class A unit holders calculated and payable monthly at an annual rate ranging between 2.0% and 2.25% of the month-end net asset value of the unit, provided that the total underwriting compensation per Class A unit does not exceed 10% of the subscription proceeds of the unit unless the selling agent is registered with the CFTC and is a member of the NFA as a futures commission merchant or introducing broker and the registered representative of the selling agent responsible for the sale is registered with the CFTC, is a member of the NFA and has either passed the Series 3 or Series 31 examination or was “grandfathered” as an associated person of the selling agent and agrees to perform certain ongoing services with respect to the holder of the unit. Once begun, this ongoing compensation will continue as long as the unit remains outstanding.
Selling agents who previously sold Class B units continue to receive ongoing compensation, calculated and payable monthly at an annual rate of up to 3.5% of the month-end net asset value of the unit, provided that the total underwriting compensation per Class B unit
134
does not exceed 10% of the subscription proceeds of the unit unless the selling agent is registered with the CFTC and is a member of the NFA as a futures commission merchant or introducing broker and the registered representative of the selling agent responsible for the sale is registered with the CFTC, is a member of the NFA and has either passed the Series 3 or Series 31 examination or was “grandfathered” as an associated person of the selling agent and agrees to perform certain ongoing services with respect to the holder of the unit. Once begun, this ongoing compensation will continue as long as the unit remains outstanding.
Grant Park also engages certain employees of the general partner to perform wholesaling activities with respect to the fund. Any compensation of employees of the general partner for their wholesaling services is either considered part of Grant Park’s organization and offering expenses, and is payable by Grant Park in accordance with the procedure described above under “FEES AND EXPENSES — Fees and Expenses Paid by Grant Park — Organization and Offering Expenses,” or is paid by the general partner out of its own assets, in the general partner’s sole discretion.
The general partner may engage third-parties, including affiliates of the selling agents, to provide administrative services to certain investors in Grant Park. The general partner will be responsible for the payment of any fees or expenses incurred in connection with such arrangements.
Trading Advisor Consulting Fees
Each trading advisor receives a consulting fee, payable by the general partner not Grant Park, ranging from 0% to 2% per year, computed and accrued monthly on the basis of the trading advisor’s allocated net assets either at the beginning of the month or at month-end and paid monthly or quarterly. The consulting fees payable to each of Grant Park’s trading advisors that are allocated 10% or more of the fund’s assets are as follows: 1.5% to EMC, 1.0% to ETC, 1% to Winton and 1% to Welton for the GDP program and 0% to Welton for both the AES and GNP programs. Grant Park pays consulting fees ranging between 0.25% and 3% to each of Rabar, Global Advisors, Transtrend, QIM, Sunrise, Amplitude, and, effective February 1, 2011, Alder and Denali. No advisor fees are payable with respect to certain advisors.
The proceeds of the offering will be deposited in Grant Park’s bank and allocated to the trading advisors for the purpose of engaging in trading activities in accordance with Grant Park’s trading policies and the trading advisors’ respective trading strategies. The trading advisors will be accessed through trading companies or such trading advisors’ funds.
Approximately 5% to 35% of Grant Park’s assets will be committed as margin for futures, options on futures or security futures contracts and held by the clearing brokers, although the amount committed may vary significantly. These assets are maintained in segregated accounts with the clearing brokers pursuant to the Commodity Exchange Act and CFTC regulations and are generally held in U.S. government securities. Approximately 1% to 5% of Grant Park’s assets are deposited with the clearing brokers, their affiliates or other dealers to initiate and maintain forward, OTC options, swap or spot contracts. These assets are not held in segregation or otherwise regulated under the Commodity Exchange Act and generally are held either in U.S. government securities or short-term time deposits with U.S.-regulated banks, which may or may not be affiliated with the clearing brokers, their affiliates or other dealers. The general partner anticipates investing through GP Cash Management, LLC the remaining 65% to 95% of Grant Park’s assets in U.S. Treasury securities, including Treasury bills and repurchase agreements utilizing investment grade securities, securities issued by U.S. government agencies and other investment grade money market securities. Investors should note that maintenance of Grant Park’s assets in U.S. government securities and banks does not reduce the risk of loss from trading commodity interest contracts. Grant Park receives all interest earned on its assets.
The trading advisors will not, directly or indirectly, commingle Grant Park’s assets with the property of any other person nor loan Grant Park’s assets to the trading advisors or any affiliate of the trading advisors.
The following is a summary of Grant Park’s Third Amended and Restated Limited Partnership Agreement, a form of which is attached as Appendix A.
135
Nature of Grant Park
Grant Park is organized under the Revised Uniform Limited Partnership Act of the State of Illinois. The purpose of Grant Park is to seek to profit from investing in, trading, buying, selling or otherwise acquiring, holding or disposing of commodity interests and all rights or interests in or pertaining to such activities and engaging in any other related activities.
Nature of Classes and Determination of Net Asset Value
Grant Park is organized into seven separate classes of limited partnership units, Class A units, Class B units, Legacy 1 Class units, Legacy 2 Class units, Global 1 Class units, Global 2 Class units and Global 3 Class units, each having the rights and preferences described in this prospectus and in the limited partnership agreement. The general partner has the authority to establish one or more additional classes of units in its discretion.
The terms “net asset value” or “net assets” as of any date with respect to any class of units refer to (1) the total assets of Grant Park constituting such class as of such date including all cash and cash equivalents, plus the market value of all open commodity interest positions and U.S. Treasury bills; minus (2) any brokerage commission attributable to that class that are or would be payable directly by Grant Park if all open commodity interest positions were closed as of the date the calculation is made; and minus (3) all accrued liabilities of Grant Park as of that date attributable to that class determined in accordance with generally accepted accounting principles. The terms “net asset value” or “net assets” as of any date with respect to Grant Park as a whole refer to the sum of the net asset values or net assets of all classes as of that date. Net assets include any unrealized profits or losses attributable to the net assets and any accrued fees or expenses, including fees and expenses based on a percentage of net assets, attributable to the net assets.
The market value of a commodity interest is the price quoted on the exchange on which that commodity interest is traded as of the close of each trading day, or if the commodity interest is not traded on an exchange, the fair market value of the commodity interest, as determined by the general partner.
Each class shall share in the assets, expenses and liabilities of Grant Park on a proportional basis with each other class, except to the extent otherwise
specifically provided in the limited partnership agreement or to the extent that the general partner determines, in good faith, that any expense or liability of Grant Park, or any portion of any expense or liability of Grant Park, should be attributable only to a particular class or classes including, without limitation, expenses incurred in connection with the organization and offering of units. This allocation will be final and binding on all limited partners.
The term “net asset value per unit” with respect to units of any class refers to the net asset value of that class divided by the number of units outstanding in that class. Thus, each unit within a class shall have the same net asset value as all other units within that same class.
The general partner will calculate the approximate net asset value per unit of each class on a daily basis and furnish this information upon request to a limited partner.
Liability of Limited Partners
When purchased in this offering, units will be fully paid and nonassessable. A limited partner will be liable for the losses and obligations of Grant Park only to the extent of its capital contribution and any share of undistributed profits. Once a limited partner has caused Grant Park to redeem its units, Grant Park may have a claim against that limited partner for liabilities of Grant Park that arose before the date of redemption, but the claim will not exceed the limited partner’s capital contribution and share of undistributed profits together with interest. Grant Park will make a claim against a limited partner only in the event that assets of Grant Park are insufficient to discharge Grant Park’s liabilities to its creditors. The general partner will be liable for all obligations of Grant Park to the extent that Grant Park’s assets are insufficient to discharge those obligations. Although the limited partnership units are separated into distinct classes, the assets and liabilities of Grant Park will not be segregated between the classes for legal purposes.
Management of Grant Park’s Affairs
The general partner is solely responsible for the management of Grant Park. With few exceptions, limited partners will take no part in the management and will have no voice in the operations of Grant Park. The general partner will delegate to the trading advisors the authority to make commodity interest trading decisions for Grant Park. The limited partners, by executing the subscription agreement and a power
136
of attorney in favor of the general partner, will appoint the general partner their attorney-in-fact for purposes of executing various documents on behalf of Grant Park. In general, the general partner will not be liable, responsible or accountable in damages or otherwise to Grant Park or any of the limited partners for any act or omission performed by it in good faith pursuant to the authority granted to it by the limited partnership agreement.
The general partner is accountable to Grant Park and its participants as a fiduciary and consequently must exercise good faith and integrity in handling Grant Park’s affairs. This is a rapidly developing and changing area of the law, and if you have questions concerning the general partner’s duties you should consult with your counsel.
Redemptions, Distributions and Transfers
Redemption of Units
A limited partner may cause any of its units to be redeemed by Grant Park for an amount equal to the net asset value per applicable unit as of the last business day of each month by delivering a written request for redemption to the general partner, a form of which is attached as Appendix D, indicating the number or dollar amount worth of units that the limited partner wishes to redeem and the requested redemption date. Such written notice must be delivered to the general partner at least 10 days in advance of the requested redemption date, or at an earlier date if required by your selling agent. The general partner, in its sole discretion, may permit limited partners to cause their units to be redeemed under other conditions, at other times or upon shorter notice as it determines. The general partner will notify a redeeming limited partner in writing within ten days after the proposed redemption date regarding whether redemption has been, or will be, effected on the requested redemption date. Except as described below, the redemption amount will be paid by the fifteenth business day of the month following the redemption date, as applicable. The general partner will redeem units at the net asset value per unit on the requested redemption date unless the number of redemptions would be detrimental to the tax status of Grant Park. In such a case, the general partner will select by lot that number of redemptions as will not impair Grant Park’s tax status. The right to obtain redemption also is contingent upon Grant Park’s having property sufficient to discharge its liabilities on the redemption date and may be delayed if the general partner determines that earlier liquidation of commodity
interest positions to meet redemption payments would be detrimental to Grant Park or nonredeeming limited partners.
The terms of the redemption request, which shall be irrevocable, must include (1) the number or dollar amount worth of units and the date for which redemption is requested, (2) an acknowledgment of the basis upon which valuation of the units being redeemed will be made, and (3) a representation by the limited partner that the limited partner is the lawful owner of the units being redeemed and that the units have not been encumbered in any fashion. Redemptions of the offered units are prohibited during the first three months following an initial and each subsequent investment. There will be no redemption charge for redemption of Legacy 1 Class and Legacy 2 Class units or Global 1 Class and Global 2 Class units. Holders of Global 3 Class units who desire to redeem any or all of their units after the three-month lock-up period, but before the one year anniversary of their subscription for the redeemed units, will pay the applicable early redemption fee to the general partner as described elsewhere in this prospectus. All redemptions shall be made on a first-in, first-out basis, such that the redeemed units will be deemed to have been acquired on the redeeming limited partner’s earliest subscription date for which units have not yet been redeemed.
The net asset value per applicable unit as of the date of redemption may differ substantially from the net asset value per unit as of the date by which the irrevocable notice of redemption must be submitted.
Required Redemption
The general partner may, at any time in its sole discretion, require any limited partner to withdraw entirely from Grant Park, or to withdraw a portion of the limited partner’s units, on not less than 15 days’ advance notice in writing to the limited partner. In addition, the general partner without notice may require at any time, or retroactively, withdrawal of any limited partner (1) that it determines is an employee benefit plan in order for the assets of Grant Park not to be treated as plan assets of the investing plan under ERISA, (2) that made a misrepresentation to the general partner in connection with its purchase of units, or (3) if the limited partner’s ownership of units would result in the violation of applicable laws or regulations by Grant Park or a partner. A mandatorily redeemed limited partner is treated as withdrawn from Grant Park or as having made a partial withdrawal
137
from his capital account, as the case may be, without further action on the part of the limited partner.
Special Redemption Date
The general partner will declare a special redemption date whenever Grant Park experiences a decline in the net asset value of a unit at the close of business on any business day to less than 50% of the net asset value per unit on the last valuation date. Grant Park will suspend trading during any special redemption period.
Distributions
The general partner is not required to make distributions of Grant Park assets to any limited partner. While the general partner has the authority to make distributions of Grant Park assets, it does not intend to do so. The general partner believes that it is not necessary to make distributions, because you may cause Grant Park to redeem any or all of your units on a periodic basis. You should note, however, that, if Grant Park realizes profits during any fiscal year, your allocable share of those profits will constitute taxable income to you for federal income tax purposes whether or not the general partner makes distributions to you.
Transfers and Assignments
A limited partner may transfer or assign his or her units in Grant Park upon 30 days’ prior written notice to the general partner and subject to approval by the general partner of the assignee. The general partner will provide approval when it is satisfied that the transfer complies with applicable laws and/or does not endanger Grant Park’s tax status as a partnership. An assignee not admitted to Grant Park as a limited partner will have only limited rights to share in the profits and capital of Grant Park and a limited redemption right.
Termination of Grant Park
The affairs of Grant Park will be wound up and Grant Park will be liquidated upon the happening of any of the following events (1) expiration of Grant Park’s term on December 31, 2027, (2) a decision by the limited partners to liquidate Grant Park, (3) withdrawal or dissolution of the general partner and the failure of the limited partners to elect a substitute general partner to continue Grant Park, or (4) assignment for the benefit of creditors or adjudication of bankruptcy of the general partner or appointment of a receiver for or seizure by a judgment creditor of the general partner’s interest in Grant Park.
Amendments and Meetings
In general, the limited partnership agreement may be amended if limited partners owning more than 50% of the outstanding units agree. The general partner may amend the limited partnership agreement without the approval of the limited partners in order to clarify inaccuracies or ambiguities, make changes required by any regulatory or self-regulatory authority, or by law or to make other changes the general partner deems advisable so long as they are not adverse to limited partners.
Limited partners owning at least 10% of the outstanding units can require the general partner to call a meeting of Grant Park. In general, at the meeting, the limited partners owning more than 50% of the outstanding units may vote to (1) amend the limited partnership agreement as provided in the limited partnership agreement, (2) remove the general partner, (3) elect a substitute general partner or general partners upon the removal or withdrawal of the existing general partner, provided that the substitute general partner shall continue the business of Grant Park without dissolution, (4) terminate any contract between Grant Park and the general partner or any trading advisor, or (5) liquidate Grant Park.
In the event that the matter to be voted on affects only one class of units, then only limited partners holding units of the affected class will be entitled to vote, with such matter being approved by a vote of limited partners owning more than 50% of the outstanding units of the affected class.
Any material changes to Grant Park’s fundamental investment objectives or policies, as determined by the general partner in good faith, shall require the prior written approval of limited partners holding more than 50% of Grant Park’s outstanding units.
Indemnity
Grant Park will indemnify and hold harmless the general partner and its members, directors, officers, employees and agents from and against any loss, expense or other liability (including reasonable attorneys’ fees and expenses) incurred by them by reason of any act performed or omission by them on behalf of Grant Park, provided that (1) the general partner has determined, in good faith, that the course of conduct that caused the loss or liability was in the best interests of Grant Park, (2) the general partner or such related person was acting on behalf of, or
138
performing services for, Grant Park, and (3) the loss or liability was not the result of negligence or misconduct by the general partner or such related person. Grant Park may only advance funds to the general partner and/or its members, directors, officers, employees and agents under this indemnity if (a) the legal action relates to acts or omissions relating to the performance of duties on behalf of Grant Park, (b) the legal action is initiated by someone other than a limited partner, or if initiated by a limited partner, the court approves the advance, and (c) the general partner and/or its members, directors, officers, employees and agents, as the case may be, agree to reimburse Grant Park for the amount of the advance plus interest if the legal action is subsequently deemed not to give rise to indemnification. Any indemnification of the general partner or any related person is recoverable only from the assets of Grant Park and not from the limited partners. Nevertheless, Grant Park shall not indemnify the general partner or any related person for any loss, expense or other liability arising from an alleged violation of federal or state securities laws unless the indemnification complies with the requirements for indemnification set forth in the NASAA Guidelines.
The limited partnership agreement further provides that the general partner is authorized to cause Grant Park to indemnify and hold harmless the trading advisors, the clearing brokers, the selling agents and other third parties to the extent permitted by applicable law. In no event, however, will any undertaking to indemnify any selling agent or other person be contrary to the limitations on indemnification set forth in the NASAA Guidelines.
No indemnity by Grant Park will increase the liability of any limited partner beyond the amount of the limited partner’s capital contribution and profits, if any, in Grant Park.
Reports and Notices to Limited Partners
Limited partners will receive monthly statements within 30 days after the last day of the prior month setting forth the value of their units and other information relating to Grant Park as may be required by CFTC rules. No later than March 15th of each year, a certified annual report of financial condition of Grant Park will be distributed to limited partners, together with tax information necessary for limited partners to prepare their annual income tax returns. This certified annual report will contain financial statements that have been audited by Grant Park’s independent accountants. If a certified annual report is due to be
distributed within 45 days after the end of a calendar year, a monthly statement of account for December may not be distributed.
Limited partners will have the right to inspect Grant Park’s books and records at the general partner’s offices during reasonable business hours upon reasonable notice to the general partner.
In addition, notice will be mailed to each limited partner, together with a description of limited partners’ redemption and voting rights and a description of any material effect that the applicable following event may have on limited partners, within seven business days of any of the following events:
| (1) | a decrease in the net asset value per applicable unit to 50% or less of the net asset value per unit most recently reported; |
| (2) | any material change in any contract with a trading advisor, including any change to trading advisors or any modification in connection with the method of calculating the incentive fee, as determined by the general partner in good faith; and |
| (3) | any material change in the amount of the brokerage charge or any other material change affecting the compensation of any party, as determined by the general partner in good faith. |
Miscellaneous
In compliance with the NASAA Guidelines, the limited partnership agreement provides that (1) no loans may be made by Grant Park to the general partner or any other person, (2) Grant Park’s assets will not be commingled with the assets of any other person — assets used to satisfy margin requirements will not be considered commingled for this purpose, (3) no rebates or give ups may be received by the general partner nor may the general partner participate in any reciprocal business arrangements that could circumvent the NASAA Guidelines, (4) no trading advisor will receive a fee from Grant Park based on Grant Park net assets if the trading advisor shares, directly or indirectly, in any brokerage commissions generated by Grant Park, (5) the duration of any contract between Grant Park and the general partner or any trading advisor shall not exceed one year (although these contracts may be automatically renewable for successive one-year periods until terminated) and must
139
be terminable without penalty upon no less than 60 days’ prior written notice, (6) any other proposed or contemplated agreement, arrangement or transaction may be restricted in the discretion of a state securities administrator if it would be considered unfair to the limited partners, (7) Grant Park will not engage in pyramiding, and (8) at no time will a trading advisor be an affiliate of Grant Park’s clearing broker nor at any time will a trading advisor be an affiliate of the general partner.
In the event of the general partner’s removal or withdrawal from Grant Park, the general partner will be entitled to redeem any units it owns at the applicable net asset value on the next valuation date following such removal or withdrawal.
MATERIAL U.S. FEDERAL INCOME TAX CONSEQUENCES
Except as otherwise noted herein, the following summarizes the material U.S. federal income tax consequences to U.S. citizen or resident individual investors in Grant Park. Grant Park has obtained an opinion of Vedder Price P.C., counsel to Grant Park, that the summary below correctly describes the material U.S. federal income tax consequences as of the date hereof to Grant Park and to a U.S. resident individual who invests in Grant Park. The summary is based on current U.S. federal income tax law, which is subject to change prospectively or retroactively. Vedder Price P.C.’s opinion is based on the facts described in the registration statement of which this prospectus is a part and on the accuracy of factual representations made by the general partner. Vedder Price P.C.’s opinion represents only its legal judgment and does not bind the Internal Revenue Service or the courts. No ruling has been or will be sought from the Internal Revenue Service as to any matters discussed below. Certain tax consequences discussed below may vary in their application to each limited partner depending on that limited partner’s particular circumstances, and the summary below therefore is not intended to be a substitute for professional tax advice.You should consult with your own professional tax advisor concerning the U.S. federal, state, local and foreign tax consequences of investing in Grant Park.
The Partnership Tax Status of Grant Park
The general partner has received an opinion of counsel from Vedder Price P.C. to the effect that, under current U.S. federal income tax law, Grant Park will be treated as a partnership for U.S. federal income
tax purposes, provided that (1) at least 90% of Grant Park’s annual gross income has previously consisted of and currently consists of “qualifying income” as defined in the Internal Revenue Code of 1986, as amended (the “Code”), and (2) Grant Park is organized and operated in accordance with its governing agreements and applicable law. As a partnership for U.S. federal income tax purposes, Grant Park will not pay any U.S. federal corporate income tax. However, Grant Park may constitute a publicly traded partnership if less than 90% of Grant Park’s annual gross income consists of “qualified income” as defined in the Code. In that case, Grant Park generally would be subject to U.S. federal income tax as a corporation, and distributions to limited partners could be taxable as dividends. The general partner believes that Grant Park has previously satisfied and currently satisfies the 90% test and that it is likely, but not certain, that Grant Park will continue to do so.
Taxation of Limited Partners on Profits and Losses of Grant Park
Assuming that Grant Park will be treated as a partnership for U.S. federal income tax purposes, each limited partner will be subject to federal income tax on that limited partner’s share of any of Grant Park’s net income and gains, losses, deductions, etc. as determined for federal income tax purposes, even though Grant Park does not intend to make current cash distributions. Accordingly, investors may be required to fund any tax liability arising from their investments in Grant Park through other sources. The profits and losses of Grant Park will be allocated to the limited partners in a manner set forth in the limited partnership agreement. The general partner believes that the allocations provided for in the limited partnership agreement reflect each limited partner’s economic interest in Grant Park and therefore should be respected for federal income tax purposes. However, it is possible that the allocations may be challenged by the relevant taxing authorities and such challenge may result in profits and losses being allocated for federal income tax purposes in a manner different from that set forth in the limited partnership agreement. In such event, limited partners may be required to amend their tax returns to take into account such different allocations and could potentially pay additional taxes plus interest and possible penalties.
Limited partners will be allocated their proportionate share of the taxable income and losses recognized by Grant Park during the period that units are owned by them. Taxable income will be allocated
140
to correspond as closely as possible to economic income allocations. However, because some limited partners may redeem units before all other limited partners do so, the allocation of taxable income may differ from the way the economic benefits of the income have been allocated among the limited partners.
Losses Allocated to Limited Partners
You may deduct any of Grant Park’s tax losses only to the extent of your adjusted tax basis in your interest in Grant Park. Generally, your tax basis is the total amount invested by you in Grant Park, reduced (but not below zero) by your share of any Grant Park distributions, losses and expenses and increased by your share of Grant Park’s income and gains and liabilities, if any. However, if you are an individual or other limited partner who is subject to at-risk limitations (generally, non-corporate taxpayers and closely-held corporations), you can deduct losses only to the extent you are at-risk. Generally, the amount at-risk is a limited partner’s allocable share of capital invested and such partner’s share of recourse debt for which the limited partner is liable. Amounts representing nonrecourse financing (other than certain nonrecourse financing to hold real estate) are generally not considered to be at-risk. Losses that cannot be claimed under the “at-risk” rules may be carried forward and deducted in subsequent tax years, subject to the “at-risk” and other applicable limitations on deductibility. You should consult your own professional tax advisor concerning the application of the “at-risk” rules to your investment in Grant Park.
Passive-Activity Loss Rules and Their Effect on the Treatment of Income and Loss
Because Grant Park’s allocable items of income, gain, loss, deductions, etc. will generally be derived from trading activities or consist of items of “portfolio income” and related losses, such items of income and loss generally will not be treated as derived from a “passive activity,” and therefore the passive activity loss rules will not result in the deductibility of any tax losses of Grant Park being limited by reason of the passive activity loss rules (but such losses may be subject to other deductibility limitations described in this summary). Because Grant Park’s income and gains generally will not be treated as passive activity income, such income cannot offset any of your passive activity losses from other investments.
Cash Distributions and Redemptions
When you receive cash from Grant Park, either through a distribution or a partial redemption, you will not pay federal income tax on that cash until the distribution exceeds your adjusted tax basis in your interest in Grant Park.
If you receive a cash payment in complete redemption of all of your units, you will recognize gain or loss for federal income tax purposes equal to the difference between the amount of cash you receive and your adjusted tax basis in your units. The gain or loss generally will be characterized as long-term or short-term capital gain or loss depending on whether you held the units for more than one year.
Gain Or Loss on “Section 1256 Contracts” (As Defined in Section 1256 of the Code) and Non-Section 1256 Contracts
Section 1256 Contracts include regulated futures contracts (other than security futures contracts) traded on U.S. and certain non-U.S. futures exchanges, most options traded on U.S. futures exchanges and certain foreign currency contracts. For federal income tax purposes, Section 1256 Contracts that remain open at the close of the taxable year are treated as if they were sold at year-end. The gain or loss on Section 1256 Contracts is characterized as 60% long-term capital gain or loss and 40% short-term capital gain or loss (60/40 gain or loss), regardless of how long the contracts are held. Any gain or loss arising from actual sales of Section 1256 Contracts are also treated as 60/40 gain or loss.
Contracts which are not Section 1256 Contracts include, among other things, most futures contracts traded on foreign exchanges, security futures contracts and certain foreign currency transactions. The gain and loss from these non-Section 1256 Contracts generally will be short-term capital gain or loss, but certain of these transactions may generate ordinary income.
Capital Gains and Losses
For non-corporate taxpayers, net long-term capital gains, such as net gain on capital assets held more than one year and 60% of the gain on Section 1256 Contracts, are taxed at a current maximum U.S. federal capital gains tax rate of 15% for taxable years beginning on or before December 31, 2012, and net short-term capital gains, such as most net gain on non-Section 1256 Contracts held one year or less and 40% of the gain on Section 1256 Contracts,
141
are subject to federal income tax at the same rates as ordinary income, with a current maximum U.S. federal income tax rate of 35%. Non-corporate taxpayers can deduct capital losses to the extent of their capital gains, and any capital losses in excess of capital gains may be used to offset up to $3,000 ($1,500 for a married individual filing separately) of ordinary income. Any unused capital losses can be carried over to future years. Accordingly, Grant Park could suffer significant capital losses, and you could still be required to pay federal income tax on, for example, your share of Grant Park’s interest income.
Unlike net capital losses derived from the sale or exchange of a capital asset, a non-corporate taxpayer (other than estates, trusts or partnerships) may elect to carry back net losses on Section 1256 Contracts three years to offset earlier gains on Section 1256 Contracts. To the extent the taxpayer cannot offset past Section 1256 Contract gains, the taxpayer can carry forward such losses indefinitely.
Limited Deduction for Certain Expenses
The general partner intends to report the trading advisors’ consulting and incentive fees incurred by Grant Park and reported on Grant Park’s federal income tax returns as trade or business expenses that are not subject to the limitations on deductibility for investment expenses and other “miscellaneous itemized deductions.” The Internal Revenue Service or a state or local taxing authority could contend otherwise. For example, in a recent revenue ruling, the Internal Revenue Service ruled that where an upper-tier partnership held interests in several lower-tier partnerships that were engaged in the trade or business of trading in securities, the fees charged by the upper-tier partnership were not trade or business expenses, but rather were expenses incurred in connection with investment activities.
If Grant Park expenses are recharacterized as investment expenses, the ability of limited partners who are non-corporate taxpayers to deduct their proportionate share of such expenses may be limited and such expenses would not be deductible at all for federal alternative minimum tax purposes. The consequences of the limitations on the deductibility of investment expenses will vary depending on the particular tax situation of each taxpayer. Non-corporate taxpayers should consult their own professional tax advisors with respect to the application of these limitations to their situation.
In any event, Grant Park’s expenses of offering interests are not deductible or amortizable for federal income tax purposes.
Interest Income
Interest earned by Grant Park will be taxed as ordinary income and generally cannot be offset by capital losses. See the section above entitled “Capital Gains And Losses.”
Investment Interest Deductibility Limitations
Non-corporate limited partners can deduct investment interest, such as interest on indebtedness allocable to property held for investment, only to the extent that it does not exceed their net investment income. Net investment income does not include “net capital gain” (within the meaning of Code Section 163(d)) and qualified dividend income (as defined in Section 1(h)(11)(B) of the Code) absent an election by the limited partner to treat such gain and such dividends as ordinary income. The limitation on investment interest relates to property held for investment, which for this purpose would generally include the units of Grant Park. Thus, interest expense incurred by a limited partner to purchase such units and the limited partner’s allocable share of Grant Park’s interest expense, if any, generally will be subject to this limitation.
Unrelated Business Taxable Income
The general partner anticipates that tax-exempt limited partners will not be required to pay federal income tax on their share of income or gains of Grant Park, provided that tax-exempt limited partners do not purchase their units with borrowed funds. Grant Park has not generated unrelated business taxable income in the past and the general partner does not anticipate the generation of unrelated business taxable income in the future. However, if Grant Park were to purchase interests in commodities with borrowed funds (although the general partner does not currently intend to do so), unrelated business taxable income may arise and be taxable for federal income tax purposes to tax-exempt limited partners. You should consult with your tax advisors as to whether an investment in Grant Park will result in any unrelated business taxable income to you.
142
Foreign Individual Limited Partners
A foreign individual limited partner generally is not subject to United States taxation on capital gains from commodity or derivatives trading, provided such foreign individual limited partner is not otherwise a U.S. citizen, a “resident alien” (within the meaning of Code Section 7701) or present for more than 182 days in the United States during the taxable year, and provided further, that such foreign individual limited partner is not otherwise engaged in a trade or business within the United States during the taxable year to which the income, gain or loss is treated as “effectively connected.” An investment in Grant Park should not, by itself, cause a foreign individual limited partner to be engaged in a trade or business within the United States for the foregoing purposes, based on the manner of Grant Park’s trading activities as described herein. Pursuant to certain “safe harbors” under the Code, an investment fund whose United States business activities consist solely of trading commodities and derivatives for its own account should not be treated as engaged in a trade or business within the United States provided that such investment fund is not a dealer in commodities or derivatives and that the commodities traded are of a kind customarily dealt in on an organized commodity exchange. If the contracts traded by Grant Park in the future are not covered by these safe harbors, there is a risk that Grant Park would be treated as engaged in a trade or business within the United States and foreign individual limited partners would, in such case, be required to file United States federal income tax returns, be subject to United States federal income tax withholding and be required to pay United States federal income tax.
Certain interest income (such as interest associated with original issue discount on Treasury Bills having a maturity of 183 days or less or commercial bank deposits) earned by Grant Park and allocable to foreign individual limited partners should not be subject to United States federal income tax or withholding, but may be subject to tax in other jurisdictions to which the foreign individual limited partner is connected. Likewise, portfolio interest income allocable to a foreign individual limited partner should not be subject to United States federal income tax withholding provided such partner is not otherwise engaged in a trade or business within the United States and provides Grant Park with a correct and complete Form W-8BEN or other applicable form.
Internal Revenue Service Audits of Grant Park and its Limited Partners
Audits of tax items relating to Grant Park are conducted at the Grant Park level rather than at the limited partner level. The general partner will act as tax matters partner with the authority to determine Grant Park’s responses to an audit. If an audit results in an adjustment, limited partners may be required to pay additional taxes including state and local income taxes, interest and penalties. Interest on tax deficiencies generally is not deductible by non-corporate limited partners.
Foreign, State, Local and Other Taxes
In addition to the material U.S. federal income tax consequences described above, Grant Park and the limited partners may be subject to various foreign, state, local and other taxes. Prospective investors should consult their tax advisors as to the foreign, state and local tax consequences of investing in Grant Park.
Backup Withholding Applicable to U.S. Persons
In order to avoid backup withholding and possible penalties, each limited partner which is a U.S. person must furnish Grant Park its true, correct and complete “taxpayer identification number” or social security number, certify that it is correct and certify that the limited partner is not subject to backup withholding. If a taxpayer identification number or social security number is not furnished, if the proper certifications are not provided, or if the Internal Revenue Service otherwise notifies Grant Park that backup withholding is required, Grant Park may be required to withhold, as backup withholding, (under current law) up to 28% of the payments made to such limited partner.
Importance of Obtaining Professional Advice
The foregoing analysis is not intended as a substitute for careful tax planning, particularly because the income tax consequences of an investment in Grant Park and of Grant Park’s transactions are complex, and some of these consequences would vary significantly with the particular situation of a limited partner. Accordingly, you are strongly urged to consult your own tax advisors regarding the possible federal, state, local and foreign tax consequences of this investment, including, for example, the potential impact on your liability for federal alternative minimum tax from earning long-term capital gain realized from this investment.
143
INVESTMENT BY ERISA AND OTHER PLAN ACCOUNTS
General
Most employee benefit plans and individual retirement accounts (“IRAs”) are subject to the Employee Retirement Income Security Act of 1974, as amended (“ERISA”) or the Code, or both. This section discusses certain considerations that arise under ERISA and the Code that a fiduciary of an employee benefit plan as defined in ERISA or a plan as defined in Section 4975 of the Code who has investment discretion should take into account before deciding to invest the plan’s assets in Grant Park. Employee benefit plans and plans are collectively referred to below as plans, and fiduciaries with investment discretion are referred to below as plan fiduciaries.
This summary is based on the provisions of ERISA and the Code as of the date hereof. This summary is not intended to be complete, but only to address certain questions under ERISA and the Code likely to be raised by your advisors. The summary does not include state or local law.
Potential plan investors are urged to consult with their own professional advisors concerning the appropriateness of an investment in Grant Park and the manner in which units should be purchased.
Special Investment Considerations
Each plan fiduciary must consider the facts and circumstances that are relevant to an investment in Grant Park, including the role that an investment in Grant Park would play in the plan’s overall investment portfolio. Each plan fiduciary, before deciding to invest in Grant Park, must be satisfied that the investment is prudent for the plan, that the investments of the plan are diversified so as to minimize the risk of large losses and that an investment in Grant Park complies with the terms of the plan.
Grant Park and Plan Assets
A regulation issued under ERISA contains rules for determining when an investment by a plan in an equity interest of a limited partnership will result in the underlying assets of the partnership being deemed plan assets for purposes of ERISA and Section 4975 of the Code. Those rules provide that assets of a limited partnership will not be plan assets of a plan that purchases an equity interest in the partnership if the equity interest purchased is a publicly-offered security.
If the underlying assets of a partnership are considered to be assets of any plan for purposes of ERISA or Section 4975 of the Code, the operations of that partnership would be subject to and, in some cases, limited by, the provisions of ERISA and Section 4975 of the Code.
The publicly-offered security exception described above applies if the equity interest is a security that is:
| (1) | freely transferable (determined based on the relevant facts and circumstances); |
| (2) | part of a class of securities that is widely held (meaning that the class of securities is owned by 100 or more investors independent of the issuer and of each other); and |
| (3) | either (a) part of a class of securities registered under Section 12(b) or 12(g) of the Securities Exchange Act of 1934 or (b) sold to the plan as part of a public offering pursuant to an effective registration statement under the Securities Act of 1933 and the class of which such security is a part is registered under the Securities Exchange Act of 1934 within 120 days (or such later time as may be allowed by the SEC) after the end of the fiscal year of the issuer in which the offering of such security occurred. |
The plan asset regulation under ERISA states that the determination of whether a security is freely transferable is to be made based on all the relevant facts and circumstances. In the case of a security that is part of an offering in which the minimum investment is $10,000 or less, the following requirements, alone or in combination, ordinarily will not affect a finding that the security is freely transferable: (1) a requirement that no transfer or assignment of the security or rights relating to the security be made that would violate any federal or state law, (2) a requirement that not less than a minimum number of shares or units of such security be transferred or assigned, (3) a requirement that no transfer or assignment be made (a) to an ineligible or unsuitable investor, or (b) which would result in a termination or reclassification of the entity for federal or state tax purposes, or (c) without advance written notice given to the entity that issued the security, and (4) any restriction on the substitution of assignee as a limited partner of a partnership, including a general partner consent requirement, provided that the economic benefits of ownership of the assignor may be transferred or assigned without regard to such restriction or consent (other than compliance with any of the foregoing restrictions).
144
The general partner believes that the units are freely transferable within the meaning of the regulation. For ERISA accounts, the minimum investment in the offered units is $1,000. Limited partners may assign their economic interests in the partnership by providing written notice to the general partner, provided such assignment would not violate any applicable laws, adversely affect the tax status of the partnership, or have any other adverse legal consequences.
The general partner believes that the conditions described above will be satisfied with respect to the units. The general partner believes that the units should therefore constitute publicly-offered securities, and the underlying assets of Grant Park should not be considered to constitute plan assets of any plan that purchases units.
Prohibited Transactions
ERISA and the Code generally prohibit certain transactions involving the plan and persons who have certain specified relationships to the plan.
In general, units may not be purchased with the assets of a plan if the general partner, the clearing brokers, the trading advisors, or any of their affiliates, agents or employees:
| • | exercise any discretionary authority or discretionary control with respect to management of the plan; |
| • | exercise any authority or control with respect to management or disposition of the assets of the plan; |
| • | render investment advice for a fee or other compensation, direct or indirect, with respect to any moneys or other property of the plan; |
| • | have any authority or responsibility to render investment advice with respect to any monies or other property of the plan; or |
| • | have any discretionary authority or discretionary responsibility in the administration of the plan. |
Also, a prohibited transaction may occur under ERISA or the Code when circumstances indicate that (1) the investment in a unit is made or retained for the purpose of avoiding application of the fiduciary standards of ERISA, (2) the investment in a unit constitutes an arrangement under which Grant Park is
expected to engage in transactions that would otherwise be prohibited if entered into directly by the plan purchasing the unit, (3) the investing plan, by itself, has the authority or influence to cause Grant Park to engage in such transactions, or (4) a person who is prohibited from transacting with the investing plan may, but only with the aid of certain of its affiliates and the investing plan, cause Grant Park to engage in such transactions with such person.
Special IRA Rules
IRAs are not subject to ERISA’s fiduciary standards, but are subject to their own rules, including the prohibited transaction rules of Section 4975 of the Code, which generally mirror ERISA’s prohibited transaction rules. For example, IRAs are subject to special custody rules and must maintain a qualifying IRA custodial arrangement separate and distinct from Grant Park and its custodial arrangement. Otherwise, if a separate qualifying custodial arrangement is not maintained, an investment in the units will be treated as a distribution from the IRA. Second, IRAs are prohibited from investing in certain commingled investments, and the general partner makes no representation regarding whether an investment in units is an inappropriate commingled investment for an IRA. Third, in applying the prohibited transaction provisions of Section 4975 of the Code, in addition to the rules summarized above, the individual for whose benefit the IRA is maintained is also treated as the creator of the IRA. For example, if the owner or beneficiary of an IRA enters into any transaction, arrangement, or agreement involving the assets of his or her IRA to benefit the IRA owner or beneficiary (or his or her relatives or business affiliates) personally, or with the understanding that such benefit will occur, directly or indirectly, such transaction could give rise to a prohibited transaction that is not exempted by any available exemption. Moreover, in the case of an IRA, the consequences of a non-exempt prohibited transaction are that the IRA’s assets will be treated as if they were distributed, causing immediate taxation of the assets (including any early distribution penalty tax applicable under Section 72 of the Code), in addition to any other fines or penalties that may apply.
Exempt Plans
Certain employee benefit plans may be governmental plans or church plans. Governmental plans and church plans are generally not subject to ERISA, nor do the above-described prohibited transaction provisions apply to them. These plans are, however, subject to prohibitions against certain
145
related-party transactions under Section 503 of the Code, which operate similar to the prohibited transaction rules described above. In addition, the fiduciary of any governmental or church plan must consider any applicable state or local laws and any restrictions and duties of common law imposed upon the plan.
No view is expressed as to whether an investment in Grant Park (and any continued investment in Grant Park), or the operation and administration of Grant Park, is appropriate or permissible for any governmental plan or church plan under Code Section 503, or under any state, county, local or other law relating to that type of plan.
Acceptance of subscriptions on behalf of plans is not to be construed as a representation by Grant Park, its general partner, any trading advisor, any clearing broker, the selling agents or legal counsel or other advisors to such parties or any other party that this investment meets some or all of the relevant legal requirements with respect to investments by any particular plan or that this investment is appropriate for any such particular plan. The person with investment discretion should consult with the plan’s attorney and financial advisors as to the propriety of an investment in Grant Park in light of the circumstances of the particular plan, current tax law and ERISA.
The Selling Agents
The selling agents, the broker-dealers who are offering the units, are offering the units on a best efforts basis without any firm underwriting commitment. The lead selling agent for Grant Park with respect to the offered units is DCM Brokers, LLC. The general partner may retain additional selling agents or may replace Grant Park’s existing selling agents in its sole discretion.
Grant Park has entered into a selling agreement with each of the selling agents. In the selling agreements, the general partner has agreed to indemnify the selling agents against certain liabilities that the selling agents may incur in connection with the offering and sale of the units, including liabilities under the Securities Act of 1933, as amended. However, in accordance with the NASAA Guidelines, Grant Park is not permitted to indemnify the selling agents for any loss, expense or other liability arising
from or out of an alleged violation of federal or state securities laws unless the following conditions have been met:
| • | there has been a successful adjudication on the merits of each count involving alleged securities law violations as to a particular indemnitee; or |
| • | such claims have been dismissed with prejudice on the merits by a court of competent jurisdiction as to the particular indemnitee; or |
| • | a court of competent jurisdiction approves a settlement of claims against a particular indemnitee and finds that indemnification of the settlement amount and any related costs should be made; provided that the court considering the request for indemnification has been advised of the position of the SEC and any state securities regulatory authority where Grant Park’s units were offered and sold with respect to such indemnification. |
Selling Agent Compensation
The general partner, not Grant Park, pays all upfront sales commissions, any trailing commissions and other ongoing compensation to the selling agents for the sales of any units, as described below. You will not directly pay sales compensation to the selling agents.
Legacy 1 Class
Legacy 1 Class units are being offered only to investors who purchase such units through wrap accounts. Selling agents who sell Legacy 1 Class units do not receive any upfront sales compensation and will not receive an administrative fee. However, such selling agents may be reimbursed for bona fide due diligence expenses. In no event will the total underwriting compensation per Legacy 1 Class unit exceed 10% of the subscription proceeds of the unit (plus bona fide due diligence expenses).
Legacy 2 Class
Legacy 2 Class units are being offered only to investors purchasing such units through wrap accounts. Selling agents who sell Legacy 2 Class units do not receive any upfront sales compensation. Each selling agent does, however, receive, beginning with the first month after the subscription proceeds of the Legacy 2
146
Class units sold have been invested in Grant Park, ongoing compensation for continuing administrative services it provides to the limited partners, calculated and payable monthly at an annual rate of 25 basis points (0.25%) of the month-end net asset value of the unit, provided that the total underwriting compensation per Legacy 2 Class unit does not exceed 10% of the subscription proceeds of the unit (plus bona fide due diligence expenses).
Global 1 Class
Global 1 Class units are being offered only to investors who purchase such units through wrap accounts. Selling agents who sell Global 1 Class units do not receive any upfront sales compensation and will not receive an administrative fee. However, such selling agents may be reimbursed for bona fide due diligence expenses. In no event will the total underwriting compensation per Global 1 Class unit exceed 10% of the subscription proceeds of the unit (plus bona fide due diligence expenses).
Global 2 Class
Global 2 Class units are being offered only to investors purchasing such units through wrap accounts. Selling agents who sell Global 2 Class units do not receive any upfront sales compensation. Each selling agent does, however, receive, beginning with the first month after the subscription proceeds of the Global 2 Class units sold have been invested in Grant Park, ongoing compensation for continuing administrative services it provides to the limited partners, calculated and payable monthly at an annual rate of 25 basis points (0.25%) of the month-end net asset value of the unit, provided that the total underwriting compensation per Global 2 Class unit does not exceed 10% of the subscription proceeds of the unit (plus bona fide due diligence expenses).
Global 3 Class
Grant Park’s selling agents who sell Global 3 Class units receive from the general partner an upfront sales commission of up to 2.0% of the purchase price per Global 3 Class unit at the time that each such unit is sold. The general partner’s registered representatives who sell Global 3 Class units receive a portion of this commission. The general partner finances the payment of these upfront sales commissions through a line of credit obtained by the general partner. Beginning with the thirteenth month after the subscription proceeds of a Global 3 Class unit are invested in Grant Park, in return for ongoing services provided to the limited
partners, the selling agent who sold the unit receives ongoing compensation, calculated and payable monthly at an annual rate of up to 2.0% of the month-end net asset value of the unit, provided that the total underwriting compensation per Global 3 Class unit does not exceed 10% of the subscription proceeds of the unit (plus bona fide due diligence expenses). Once begun, this ongoing compensation will continue as long as the units remain outstanding. In the event that the total underwriting compensation paid to the selling agent per a Global 3 Class unit meets this limit, such Global 3 Class unit will be automatically exchanged for Global 1 Class units at no additional cost. The Global 1 Class units, which are initially offered only to investors through wrap-accounts, are identical to the Global 3 Class units, except for a different (lower) fee structure and not subject to the payment of trailing commissions or any other ongoing compensation.
Ongoing Compensation Paid to Selling Agents Who Previously Sold Class A and Class B Units
Although we are no longer offering Class A and Class B units, selling agents who previously sold Class A units continue to receive ongoing compensation for continuing services provided to Class A unit holders calculated and payable monthly at an annual rate ranging between 2.0% and 2.25% of the month-end net asset value of the unit, provided that the total underwriting compensation per Class A unit does not exceed 10% of the subscription proceeds of the unit unless the selling agent is registered with the CFTC and is a member of the NFA as a futures commission merchant or introducing broker and the registered representative of the selling agent responsible for the sale is registered with the CFTC, is a member of the NFA and has either passed the Series 3 or Series 31 examination or was “grandfathered” as an associated person of the selling agent and agrees to perform certain ongoing services with respect to the holder of the unit. Once begun, this ongoing compensation will continue as long as the unit remains outstanding.
Selling agents who previously sold Class B units continue to receive ongoing compensation, calculated and payable monthly at an annual rate of up to 3.5% of the month-end net asset value of the unit, provided that the total underwriting compensation per Class B unit does not exceed 10% of the subscription proceeds of the unit unless the selling agent is registered with the CFTC and is a member of the NFA as a futures commission merchant or introducing broker and the
147
registered representative of the selling agent responsible for the sale is registered with the CFTC, is a member of the NFA and has either passed the Series 3 or Series 31 examination or was “grandfathered” as an associated person of the selling agent and agrees to perform certain ongoing services with respect to the holder of the unit. Once begun, this ongoing compensation will continue as long as the unit remains outstanding.
In the case of the offered units and Classes A and B, the ongoing compensation referenced above, once begun, will continue for as long as the unit remains outstanding. Selling agents pay a portion of this compensation to their eligible registered representatives after deduction of due diligence and administrative expenses incurred in connection with this offering, in accordance with the selling agent’s standard compensation arrangements. No selling agent will receive upfront sales commissions or ongoing compensation that exceed the amounts described above.
Other Important Information
Grant Park also engages certain employees of the general partner to provide wholesaling services with respect to the fund. Any compensation paid to employees of the general partner for their wholesaling services either is considered part of Grant Park’s organization and offering expenses, and is payable by Grant Park in accordance with the procedure described above under “FEES AND EXPENSES — Fees and Expenses Paid by Grant Park — Organization and Offering Expenses,” or is paid by the general partner out of its own assets, in the general partner’s sole discretion.
This offering is being made in compliance with FINRA Rule 2310. Underwriting compensation to participating FINRA members will not exceed 10% of the initial sale price of the offered units, plus bona fide due diligence reimbursements, including the ongoing trailing commissions to be paid to each selling agent as detailed above. The selling agents have advised Grant Park that they will not make any sales to any accounts over which they exercise discretionary authority without the prior specific written approval of the customer.
Investor Suitability
The general partner cannot assure you that Grant Park will achieve its objectives or avoid substantial losses. An investment in Grant Park is suitable only for a limited segment of the risk portion of an investor’s
portfolio, and no one should invest more in Grant Park than he or she could afford to lose.
To invest in Grant Park, you must meet certain regulatory requirements. Generally, you must have:
| • | a net worth of at least $250,000, exclusive of home, furnishings and automobiles; or |
| • | an annual gross income of at least $70,000 and a net worth of at least $70,000, exclusive of home, furnishings and automobiles. |
Certain jurisdictions in which the units are offered impose more stringent minimum suitability requirements on their residents, which are described in Appendix C to this prospectus. Please see Appendix C for a detailed description of the minimum suitability requirements in the state in which you reside. You will be required to represent that you meet the requirements set forth in your state of residence before your subscription to purchase units will be accepted. You should review the subscription requirements described in Appendix C carefully before deciding whether to invest. An investment in Grant Park may not be suitable for you even if you meet the regulatory requirements described above and in Appendix C.These suitability requirements are, in each case, regulatory minimums only, and merely because you meet the requirements does not mean that an investment in the units is suitable for you. In no event may you invest more than 10% of your net worth, exclusive of home, furnishings and automobiles, in Grant Park. Employee benefit plans and investment retirement accounts are subject to special suitability requirements.In addition, individual selling agents may impose even higher minimum suitability requirements on their clients investing in Grant Park than those described above or required by an individual state. You should consult with your financial advisor to confirm that you meet these requirements before deciding to invest in Grant Park. If an investment in Grant Park is suitable for you, it is suitable only as a limited portion of your portfolio and you should not invest more than you can afford to lose. You should consult with your selling agent and financial advisor and consider the highly speculative and illiquid nature of an investment in Grant Park in determining whether an investment in Grant Park is consistent with your overall portfolio objectives.
148
Minimum Investment
The minimum investment required to invest in the Legacy 1 Class and the Legacy 2 Class units is $10,000, except that in the case of investors that are employee benefit plans and/or individual retirement accounts, the minimum investment is $1,000. The selling agents offer the Legacy 1 Class and the Legacy 2 Class units at a price equal to the net asset value per unit of each of the units at the close of business on each closing date, which is the last business day of each month (or if such calendar day is not a business day, the immediately preceding business day). Only investors who purchase units through wrap-accounts may purchase Legacy 1 Class and Legacy 2 Class units.
The minimum investment in the Global 1 Class, Global 2 Class and Global 3 Class units is $5,000, except that in the case of investors that are employee benefit plans and/or individual retirement accounts, the minimum investment is $1,000. The selling agents offer the Global 1 Class, Global 2 Class and Global 3 Class units at a price equal to the net asset value per unit of each of the units at the close of business on each closing date, which is the last calendar day of each month (or if such calendar day is not a business day, the immediately preceding business day). Only investors who purchase units through wrap-accounts may purchase Global 1 Class and Global 2 Class units.
Any of these minimum investment requirements, including the requirement to invest in certain classes of units through wrap-accounts, may be waived by the general partner in its sole discretion. Units are sold in fractions calculated to three decimal places.
Subscription Procedures
The selling agents offer the units at a price equal to the net asset value per unit of each of the units at the close of business on each closing date, which is the last business day of each month.
You may buy units as of any closing date, which is the last business day of each month, by submitting your subscription at least five business days before such closing date or at an earlier date if required by your selling agent. The number of units that you receive will be based on the net asset value per unit for that particular class as of the closing date. Units are sold in fractions calculated to three decimal places. There is no minimum aggregate subscription amount that must be received before new investors’ funds may be invested.
The general partner will accept or reject your subscription, in whole or in part, in its sole discretion. The general partner will deposit your subscription funds in Grant Park’s non-interest bearing subscription account until invested. If the general partner accepts your subscription, your subscription funds will be invested in Grant Park on the applicable closing date. If the general partner does not accept your subscription, your subscription funds will be returned to you without interest.
The selling agents will use their best efforts to sell the units offered, without any firm underwriting commitment. You will not directly pay any sales commissions to the selling agents. All sales commissions and other compensation to the selling agents will be paid by the general partner out of its own assets. Investors will be required to make representations and warranties relating to their suitability to purchase the units in the subscription agreement and power of attorney.
The general partner and the selling agents will make every reasonable effort to determine that the purchase of units is suitable and appropriate for each investor, based on the information provided by the investor regarding the investor’s financial condition and investment objectives. No selling agent may complete a sale of units until at least five business days after the date the investor receives a final prospectus.
Read this prospectus as well as the subscription agreement carefully and discuss with your financial advisor any questions you have about Grant Park. If you decide to invest, please complete and sign the subscription agreement and power of attorney and deliver to your selling agent a check made payable to “Grant Park Futures Fund Limited Partnership — Subscription Account,” or authorize a wire transfer in the amount of your subscription in accordance with the instructions set forth in the subscription agreement and power of attorney. Alternatively, if available, you may authorize your selling agent to debit your customer securities account in the amount of your subscription.
Additional investments in units may be made by completing, executing and delivering an additional subscription agreement and power of attorney, along with payment at least five business days prior to the applicable closing date.
Compliance with Anti-Money Laundering Laws
To satisfy Grant Park’s, the general partner’s and the selling agents’ obligations under applicable anti-
149
money laundering laws and regulations, subscribers will be required to make representations and warranties in the subscription agreement concerning the nature of the subscriber, its source of investment funds and other related matters. The general partner or the selling agents reserve the right to request additional information from subscribers as the general partner or the selling agents in their sole discretion require in order to satisfy applicable anti-money laundering obligations. By subscribing for units in Grant Park, each subscriber agrees to provide this information upon request.
Representations and Warranties of Investors in the Subscription Agreement and Power of Attorney
To invest in Grant Park, you must make representations and warranties in the subscription agreement and power of attorney. The representations and warranties enable the general partner to determine whether you are qualified to invest in Grant Park. The representations and warranties relate to:
| • | your eligibility to invest in Grant Park, including legal age, net worth, annual income, investment objectives and investment experience; |
| • | your representative capacity; |
| • | information provided by you; |
| • | information received by you; |
| • | investments made on behalf of employee benefit plans; and |
| • | your compliance with applicable anti-money laundering laws. |
Selling Restrictions
The distribution of this prospectus and the offering of the units in Grant Park may be restricted in certain jurisdictions. The information contained herein is for general guidance only and it is the responsibility of any person or persons in possession of this prospectus, and wishing to make an application for units to inform themselves of, and to observe, all applicable laws and regulations of any relevant jurisdiction. Prospective applicants for units should inform themselves as to legal requirements also applying and any applicable exchange control regulations and applicable taxes in the countries of their respective citizenship, residence or domicile. This prospectus does not constitute an offer or solicitation
to any person in any jurisdiction in which such offer or solicitation is not authorized or to any person to whom it would be unlawful to make such offer or solicitation.
Argentina
This prospectus includes a private invitation to invest in units in Grant Park. It is addressed only to you on an individual, exclusive, and confidential basis, and its unauthorized copy, disclosure, or transfer by any means whatsoever is absolutely and strictly forbidden. The selling agents will not provide copies of this prospectus, or provide any kind of advice or clarification, or accept any offer or commitment to purchase the units herein referred to from persons other than the intended recipient. The offer herein contained is not a public offering, and as such it is not and will not be registered with, or authorized by, the Comisión Nacional de Valores. The information contained herein has been compiled by the general partner, who assumes the sole responsibility for the accuracy of the data herein disclosed.
Brazil
The units in Grant Park may not be offered or sold to the public in Brazil. Accordingly, the units have not been, nor will they be, registered with the Brazilian Securities Commission (the “CVM”) and nor has this prospectus been submitted to the foregoing agency for approval. Documents relating to the units, as well as the information contained therein, may not be supplied to the public in Brazil, as the offering of the units is not a public offering of securities in Brazil, nor used in connection with any offer for subscription or sale of securities to the public in Brazil.
China
This prospectus does not constitute a public offer of the units in Grant Park, whether by sale or subscription, in the People’s Republic of China (the “PRC”). The units are not being offered or sold directly or indirectly in the PRC to, or for the benefit of, legal or natural persons of the PRC.
Further, no legal or natural persons of the PRC may directly or indirectly purchase any of the units or any beneficial interest therein without obtaining all prior PRC’s governmental approvals that are required, whether statutorily or otherwise. Persons who come into possession of this document are required by the issuer and its representatives to observe these restrictions.
150
El Salvador
This prospectus has been produced for the purpose of providing information about Grant Park. This prospectus is made available on the condition that it is for the use only of the recipient and may not be passed on to any other person or be reproduced in any part. The units in Grant Park have not been, and will not be, offered in the course of a public offering or of equivalent marketing in El Salvador and therefore, the provisions of the Stock Market Law of 1994 (Ley del Mercado de Valores) as amended, relating to registration requirements and to prospectus requirements do not apply. The units have thus neither been registered for public distribution in El Salvador with the Stock Superintendency nor have they been the subject matter of a prospectus compliant with the Stock Market Law. Any subscription application by any person other than the initial recipient of the prospectus will be rejected.
Mexico
The units in Grant Park have not been, and will not be, registered with the National Registry of Securities maintained by the Mexican National Banking Commission and, as a result, may not be offered or sold publicly in Mexico. Grant Park and any underwriter or purchaser may offer and sell the units in Mexico, to Institutional and Accredited Investors, on a private placement basis, pursuant to Article 8 of the Mexican Securities Market Law.
Panama
The distribution of this prospectus and the offering of the units in Grant Park may be restricted in certain jurisdictions. The information contained herein is for general guidance only and it is the responsibility of any person or persons in possession of this prospectus, and wishing to make an application for units to inform themselves of, and to observe, all applicable laws and regulations of any relevant jurisdiction. Prospective applicants for units should inform themselves as to legal requirements also applying and any applicable exchange control regulations and applicable taxes in the countries of their respective citizenship, residence or domicile. This prospectus does not constitute an offer or solicitation to any person in any jurisdiction in which such offer or solicitation is not authorized or to any person to whom it would be unlawful to make such offer or solicitation.
Taiwan
The units in Grant Park are not registered in Taiwan and may not be sold, issued or offered in Taiwan. No person or entity in Taiwan has been authorized to offer, sell, give advice regarding or otherwise intermediate the offering and sale of the units in Taiwan.
Uruguay
The sale of the units in Grant Park qualifies as a private placement pursuant to section 2 of Uruguayan law 18,627. The units must not be offered or sold to the public in Uruguay, except in circumstances which do not constitute a public offering or distribution under Uruguayan laws and regulations. The units are not, and will not be, registered with the Financial Services Superintendency of the Central Bank of Uruguay.
The units correspond to an investment fund that is not an investment fund regulated by Uruguayan law 16,774 dated September 27, 1996, as amended.
Venezuela
Under the laws of the República Bolivariana de Venezuela (“Venezuela”), no offer of the units in Grant Park described in this Prospectus may take place in Venezuela. This prospectus may not be publicly distributed within the territory of Venezuela.
Grant Park and the general partner collect certain nonpublic personal information about investors from the information provided by them in their subscription agreement, power of attorney and related subscription documents, as well as in the course of processing transaction requests. None of this information is disclosed except as necessary in the course of processing subscriptions and redemptions and otherwise administering Grant Park — and then only subject to customary undertakings of confidentiality. Grant Park and its general partner do not disclose nonpublic personal information about investors to anyone, except as permitted by law. Grant Park and the general partner restrict access to the nonpublic personal information they collect from investors to those employees who need access to this information to provide products and services to investors. Grant Park and the general partner each maintain physical, electronic and procedural controls to safeguard this information. These standards are reasonably designed to (1) ensure the security and confidentiality of
151
investors’ records and information, (2) protect against any anticipated threats or hazards to the security or integrity of investors’ records and information, and (3) protect against unauthorized access to or use of investors’ records or information that could result in substantial harm or inconvenience to any investor.
The legality of the units has been passed upon by Vedder Price P.C., Chicago, Illinois. The statements under “MATERIAL U.S. FEDERAL INCOME TAX CONSEQUENCES” have been reviewed by Vedder Price P.C.
The consolidated financial statements of Grant Park, the financial statements of Dearborn Select Master Fund, SPC — Winton Segregated Portfolio, and the consolidated statement of financial condition of Dearborn Capital Management, L.L.C. appearing in this Prospectus and Registration Statement have been audited by McGladrey & Pullen, LLP, an independent registered public accounting firm, as stated in their reports appearing elsewhere herein, and are included in reliance upon such report and upon the authority of such firm as experts in accounting and auditing.
WHERE YOU CAN FIND MORE INFORMATION
This prospectus is part of a registration statement on Form S-1 Grant Park has filed with the SEC. This prospectus does not contain all of the information contained in the registration statement and the exhibits to the registration statement. Summaries of agreements or other documents in this prospectus are not necessarily complete. Please see the registration statement for more information about Grant Park and the exhibits to the registration statement for complete copies of the agreements and other documents summarized in this prospectus.
Grant Park files annual, quarterly and current reports, and other information with the SEC. You may read and copy the registration statement and the exhibits to the registration statement, and any other materials Grant Park files with the SEC at the SEC public reference room located at 100 F Street, N.E, Washington, D.C. 20549. You may obtain information on the operation of the public reference room by calling the SEC at 1-800-SEC-0330. The registration statement is also available on the SEC’s website athttp://www.sec.gov, which contains reports, proxy and information statements and other information regarding companies that file electronically with the SEC.
152
Grant Park Futures Fund Limited Partnership | ||||
| 154 | ||||
Consolidated Statements of Financial Condition December 31, 2010 and 2009 | 155 | |||
Consolidated Condensed Schedule of Investments December 31, 2010 | 156 | |||
Consolidated Condensed Schedule of Investments December 31, 2009 | 158 | |||
Consolidated Statements Of Operations Years Ended December 31, 2010, 2009 and 2008 | 160 | |||
| 161 | ||||
| 165 | ||||
Dearborn Select Master Fund, SPC — Winton Segregated Portfolio | ||||
| 178 | ||||
Statements of Financial Condition as of December 31, 2008 and 2007 | 179 | |||
| 180 | ||||
| 183 | ||||
Statements of Operations for the Years ended December 31, 2008 and 2007 | 185 | |||
Statements of Cash Flows for the Years ended December 31, 2008 and 2007 | 186 | |||
Statements of Changes in Shareholders’ Equity for the Years ended December 31, 2008 and 2007 | 187 | |||
| 188 | ||||
Dearborn Capital Management, L.L.C. | ||||
| 194 | ||||
Consolidated Statement of Financial Condition December 31, 2010 | 195 | |||
| 196 | ||||
153
REPORT OF INDEPENDENT REGISTERED PUBLIC ACCOUNTING FIRM
To the Partners
Grant Park Futures Fund Limited Partnership
We have audited the accompanying consolidated statements of financial condition, including the consolidated condensed schedules of investments, of Grant Park Futures Fund Limited Partnership (the Partnership) as of December 31, 2010 and 2009, and the related consolidated statements of operations and changes in partners’ capital for each of the three years in the period ended December 31, 2010. These financial statements are the responsibility of the Partnership’s management. Our responsibility is to express an opinion on these financial statements based on our audits.
We conducted our audits in accordance with the standards of the Public Company Accounting Oversight Board (United States). Those standards require that we plan and perform the audit to obtain reasonable assurance about whether the financial statements are free of material misstatement. The Partnership is not required to have, nor were we engaged to perform an audit of its internal control over financial reporting. Our audit included consideration of internal control over financial reporting as a basis for designing audit procedures that are appropriate in the circumstances, but not for the purpose of expressing an opinion on the effectiveness of the Partnership’s internal control over financial reporting. Accordingly, we express no such opinion. An audit also includes examining, on a test basis, evidence supporting the amounts and disclosures in the financial statements, assessing the accounting principles used and significant estimates made by management, as well as evaluating the overall financial statement presentation. We believe that our audits provide a reasonable basis for our opinion.
In our opinion, the consolidated financial statements referred to above present fairly, in all material respects, the financial position of Grant Park Futures Fund Limited Partnership as of December 31, 2010 and 2009, and the results of its operations for each of the three years in the period ended December 31, 2010, in conformity with U.S. generally accepted accounting principles.
/s/ McGladrey & Pullen, LLP
Chicago, Illinois
February 24, 2011
154
GRANT PARK FUTURES FUND LIMITED PARTNERSHIP
CONSOLIDATED STATEMENTS OF FINANCIAL CONDITION
December 31, 2010 and 2009
| 2010 | 2009 | |||||||
Assets | ||||||||
Equity in brokers’ trading accounts: | ||||||||
U.S. Government securities, at fair value | $ | 98,441,357 | $ | 89,970,252 | ||||
Cash | 6,757,371 | 24,103,516 | ||||||
Unrealized gain on open contracts, net | 35,956,214 | 14,009,391 | ||||||
Deposits with brokers | 141,154,942 | 128,083,159 | ||||||
Cash and cash equivalents | 338,154,495 | 42,335,885 | ||||||
Certificates of deposit, at fair value | 20,009,468 | 15,755,711 | ||||||
Commercial paper, at fair value | 14,996,133 | — | ||||||
U.S. Government-sponsored enterprises, at fair value | 292,555,595 | 596,671,609 | ||||||
U.S. Government securities, at fair value | 119,865,174 | 74,755,744 | ||||||
Interest receivable | 82,357 | — | ||||||
Total assets | $ | 926,818,164 | $ | 857,602,108 | ||||
Liabilities and Partners’ Capital | ||||||||
Liabilities | ||||||||
Brokerage commission payable | $ | 5,622,480 | $ | 5,153,201 | ||||
Accrued incentive fees | 9,372,262 | 203,427 | ||||||
Organization and offering costs payable | 217,123 | 197,909 | ||||||
Accrued operating expenses | 140,163 | 175,169 | ||||||
Pending partner additions | 12,218,587 | 15,517,679 | ||||||
Redemptions payable | 7,334,779 | 5,084,225 | ||||||
Total liabilities | 34,905,394 | 26,331,610 | ||||||
Partners’ Capital | ||||||||
General Partner | ||||||||
Class A (3,008.66 units outstanding at both December 31, 2010 and December 31, 2009) | 4,478,872 | 4,287,922 | ||||||
Class B (427.01 units outstanding at both December 31, 2010 and December 31, 2009) | 542,672 | 522,813 | ||||||
Legacy 1 Class (1,025.00 units outstanding at both December 31, 2010 and December 31, 2009) | 1,050,542 | 990,276 | ||||||
Legacy 2 Class (1,000.00 units outstanding at both December 31, 2010 and December 31, 2009) | 1,019,793 | 964,540 | ||||||
Global 1 Class (1,044.66 units outstanding at both December 31, 2010 and December 31, 2009) | 1,028,338 | 999,554 | ||||||
Global 2 Class (1,181.06 and 708.97 units outstanding at December 31, 2010 and December 31, 2009, respectively) | 1,155,098 | 676,076 | ||||||
Global 3 Class (500.00 units outstanding at both December 31, 2010 and December 31, 2009) | 473,009 | 469,821 | ||||||
Limited Partners | ||||||||
Class A (40,362.54 and 48,356.59 units outstanding at December 31, 2010 and December 31, 2009, respectively) | 60,086,201 | 68,917,549 | ||||||
Class B (498,484.71 and 570,593.04 units outstanding at December 31, 2010 and December 31, 2009, respectively) | 633,504,348 | 698,607,417 | ||||||
Legacy 1 Class (5,908.00 and 3,851.25 units outstanding at December 31, 2010 and December 31, 2009, respectively) | 6,055,220 | 3,720,780 | ||||||
Legacy 2 Class (6,361.06 and 3,122.95 units outstanding at December 31, 2010 and December 31, 2009, respectively) | 6,486,967 | 3,012,215 | ||||||
Global 1 Class (10,133.38 and 3,358.60 units outstanding at December 31, 2010 and December 31, 2009, respectively) | 9,975,048 | 3,213,581 | ||||||
Global 2 Class (18,631.40 and 7,333.83 units outstanding at December 31, 2010 and December 31, 2009, respectively) | 18,221,772 | 6,993,517 | ||||||
Global 3 Class (156,270.73 and 40,328.60 units outstanding at December 31, 2010 and December 31, 2009, respectively) | 147,834,890 | 37,894,437 | ||||||
Total partners’ capital | 891,912,770 | 831,270,498 | ||||||
Total liabilities and partners’ capital | $ | 926,818,164 | $ | 857,602,108 | ||||
The accompanying notes are an integral part of these consolidated financial statements.
155
GRANT PARK FUTURES FUND LIMITED PARTNERSHIP
CONSOLIDATED CONDENSED SCHEDULE OF INVESTMENTS
December 31, 2010
| Expiration Dates | No. of contracts | Unrealized gain/(loss) on open long contracts | Percent of Partners’ Capital | Unrealized gain/(loss) on open short contracts | Percent of Partners’ Capital | Net unrealized gain/(loss) on open contracts | Percent of Partners’ Capital | |||||||||||||||||||||||||||||
| Long | Short | |||||||||||||||||||||||||||||||||||
Futures Contracts* | ||||||||||||||||||||||||||||||||||||
U.S. Futures Positions: | ||||||||||||||||||||||||||||||||||||
Agriculturals | $ | 6,663,696 | 0.7 | % | $ | (377,927 | ) | ** | $ | 6,285,769 | 0.7 | % | ||||||||||||||||||||||||
Currencies | 9,558,662 | 1.1 | % | 2,283,505 | 0.2 | % | 11,842,167 | 1.3 | % | |||||||||||||||||||||||||||
Energy | 2,655,082 | 0.3 | % | (1,303,695 | ) | (0.1 | )% | 1,351,387 | 0.2 | % | ||||||||||||||||||||||||||
Interest rates | 277,176 | ** | (418,671 | ) | ** | (141,495 | ) | ** | ||||||||||||||||||||||||||||
Meats | 787,250 | 0.1 | % | (20,500 | ) | ** | 766,750 | 0.1 | % | |||||||||||||||||||||||||||
Metals | 4,039,143 | 0.5 | % | (616,704 | ) | (0.1 | )% | 3,422,439 | 0.4 | % | ||||||||||||||||||||||||||
Soft commodities | 2,720,770 | 0.3 | % | (216,592 | ) | ** | 2,504,178 | 0.3 | % | |||||||||||||||||||||||||||
Stock indices and single stock futures | 928,568 | 0.1 | % | 71,857 | ** | 1,000,425 | 0.1 | % | ||||||||||||||||||||||||||||
Total U.S. Futures Positions | 27,630,347 | (598,727 | ) | 27,031,620 | ||||||||||||||||||||||||||||||||
Foreign Futures Positions: | ||||||||||||||||||||||||||||||||||||
Agriculturals | 24,719 | ** | — | ** | 24,719 | ** | ||||||||||||||||||||||||||||||
Energy | 509,737 | 0.1 | % | (17,165 | ) | ** | 492,572 | 0.1 | % | |||||||||||||||||||||||||||
Interest rates | 2,243,690 | 0.2 | % | (983,344 | ) | (0.1 | )% | 1,260,346 | 0.1 | % | ||||||||||||||||||||||||||
Metals | ||||||||||||||||||||||||||||||||||||
Copper | | 1/19/2011 - 6/15/2011 | | 386 | 208 | 8,937,572 | 1.0 | % | (4,285,970 | ) | (0.5 | )% | 4,651,602 | 0.5 | % | |||||||||||||||||||||
Other metals | 7,077,265 | 0.8 | % | (7,672,518 | ) | (0.9 | )% | (595,253 | ) | (0.1 | )% | |||||||||||||||||||||||||
Soft commodities | 27,959 | ** | — | ** | 27,959 | ** | ||||||||||||||||||||||||||||||
Stock indices | (120,097 | ) | ** | 148,949 | ** | 28,852 | ** | |||||||||||||||||||||||||||||
Total Foreign Futures Positions | 18,700,845 | (12,810,048 | ) | 5,890,797 | ||||||||||||||||||||||||||||||||
Total Futures Contracts | $ | 46,331,192 | 5.2 | % | $ | (13,408,775 | ) | (1.5 | )% | $ | 32,922,417 | 3.7 | % | |||||||||||||||||||||||
Forward Contracts* | ||||||||||||||||||||||||||||||||||||
Currencies | $ | 3,078,051 | 0.3 | % | $ | (39,629 | ) | ** | $ | 3,038,422 | 0.3 | % | ||||||||||||||||||||||||
Options on Futures Contracts* | ||||||||||||||||||||||||||||||||||||
U.S. Stock indices | $ | 4,840 | ** | $ | (9,465 | ) | ** | $ | (4,625 | ) | ** | |||||||||||||||||||||||||
Total Futures, Forward and Options on Futures Contracts | $ | 49,414,083 | 5.5 | % | $ | (13,457,869 | ) | (1.5 | )% | $ | 35,956,214 | 4.0 | % | |||||||||||||||||||||||
| * | No individual futures, forward, or options on futures contract position, other than those presented, constituted greater than 1 percent of partners’ capital. Accordingly, the number of contracts and expiration dates are not presented. |
| ** | Represents less than 0.1% of partners’ capital. |
U.S. Government securities in brokers’ trading accounts***
Face Value | Maturity Dates | Description | Fair Value | Percent of Partners’ Capital | ||||||||||
$98,450,000 | | 1/6/2011 – 3/31/2011 | | U.S. Treasury Bills, 0.1% – 0.3% (cost $98,314,299) | $ | 98,441,357 | 11.0 | % | ||||||
| *** | Pledged as collateral for the trading of futures, forward and option on futures contracts. |
The accompanying notes are an integral part of these consolidated financial statements.
156
GRANT PARK FUTURES FUND LIMITED PARTNERSHIP
CONSOLIDATED CONDENSED SCHEDULE OF INVESTMENTS – (continued)
December 31, 2010
U.S. Certificates of deposit
| Face Value | Maturity Date | Description | Fair Value | Percent of Partners’ Capital | ||||||
| $20,000,000 | 4/29/2011 | Bank of Nova Scotia, 0.3 % (cost $20,000,000) | $20,009,468 | 2.2% | ||||||
U.S. Commercial paper
| Face Value | Maturity Date | Description | Fair Value | Percent of Partners’ Capital | ||||||
| $15,000,000 | 2/2/2011 | Citigroup Funding, 0.3% (cost $14,988,158) | $14,996,133 | 1.7% | ||||||
U.S. Government-sponsored enterprises
| Face Value | Maturity Dates | Description | Fair Value | Percent of Partners’ Capital | ||||||||
| $130,500,000 | 9/9/2013 – 12/30/2013 | Federal Home Loan Bank, 1.0 –1.6% | $ | 130,677,841 | 14.6% | |||||||
| 61,575,000 | 2/14/2011 – 12/16/2013 | Federal Farm Credit Bank, 0.2 –1.4% | 61,636,684 | 6.9% | ||||||||
| 45,000,000 | 4/27/2012 – 5/25/2012 | Federal National Mortgage Association, 1.3 – 1.4% | 45,087,111 | 5.1% | ||||||||
| 30,075,000 | 2/1/2011 – 1/25/2012 | Federal Home Loan Mortgage Corp., 0.1 –1.3% | 30,109,748 | 3.4% | ||||||||
| 15,000,000 | 8/23/2013 | Federal Agricultural Mortgage Corp., 1.3% | 15,066,667 | 1.7% | ||||||||
| 10,000,000 | 7/8/2011 | Federal Home Loan Discount Note, 0.4% | 9,977,544 | 1.1% | ||||||||
Total U.S. Government-sponsored enterprises (cost $292,091,597) | $ | 292,555,595 | 32.8% | |||||||||
U.S. Government securities
| Face Value | Maturity Dates | Description | Fair Value | Percent of Partners’ Capital | ||||||||||
| $120,000,000 | 3/31/2011 – 11/17/2011 | U.S. Treasury Bills, 0.1% – 0.3% (cost $119,853,362) | $ | 119,865,174 | 13.3% | |||||||||
The accompanying notes are an integral part of these consolidated financial statements.
157
GRANT PARK FUTURES FUND LIMITED PARTNERSHIP
CONSOLIDATED CONDENSED SCHEDULE OF INVESTMENTS
December 31, 2009
| Unrealized gain/(loss) on open long contracts | Percent of Partners’ Capital | Unrealized gain/(loss) on open short contracts | Percent of Partners’ Capital | Net unrealized gain/(loss) on open contracts | Percent of Partners’ Capital | |||||||||||||||||||
Futures Contracts* | ||||||||||||||||||||||||
U.S. Futures Positions: | ||||||||||||||||||||||||
Agriculturals | $ | 655,296 | 0.1 | % | $ | (704,834 | ) | (0.1 | )% | $ | (49,538 | ) | ** | |||||||||||
Currencies | (1,345,719 | ) | (0.2 | )% | 1,691,679 | 0.2 | % | 345,960 | ** | |||||||||||||||
Energy | 1,459,685 | 0.2 | % | (1,100,365 | ) | (0.1 | )% | 359,320 | ** | |||||||||||||||
Interest rates | (462,911 | ) | (0.1 | )% | 1,076,800 | 0.1 | % | 613,889 | 0.1 | % | ||||||||||||||
Meats | 397,832 | ** | (215,832 | ) | ** | 182,000 | ** | |||||||||||||||||
Metals | (1,273,379 | ) | (0.2 | )% | (35,959 | ) | ** | (1,309,338 | ) | (0.2 | )% | |||||||||||||
Soft commodities | 6,528,998 | 0.8 | % | (4,543,342 | ) | (0.5 | )% | 1,985,656 | 0.2 | % | ||||||||||||||
Stock indices and single stock futures | 656,609 | 0.1 | % | 54,186 | ** | 710,795 | 0.1 | % | ||||||||||||||||
Total U.S. Futures Positions | 6,616,411 | (3,777,667 | ) | 2,838,744 | ||||||||||||||||||||
Foreign Futures Positions: | ||||||||||||||||||||||||
Agriculturals | (9,180 | ) | ** | 5,150 | ** | (4,030 | ) | ** | ||||||||||||||||
Energy | 469,717 | 0.1 | % | 24,716 | ** | 494,433 | 0.1 | % | ||||||||||||||||
Interest rates | (2,198,937 | ) | (0.3 | )% | 630,585 | 0.1 | % | (1,568,352 | ) | (0.2 | )% | |||||||||||||
Metals | 23,381,126 | 2.8 | % | (16,423,105 | ) | (2.0 | )% | 6,958,021 | 0.8 | % | ||||||||||||||
Soft commodities | 362,063 | ** | (27,893 | ) | ** | 334,170 | ** | |||||||||||||||||
Stock indices | 4,719,890 | 0.6 | % | (300,409 | ) | ** | 4,419,481 | 0.5 | % | |||||||||||||||
Total Foreign Futures Positions | 26,724,679 | (16,090,956 | ) | 10,633,723 | ||||||||||||||||||||
Total Futures Contracts | $ | 33,341,090 | 4.0 | % | $ | (19,868,623 | ) | (2.4 | )% | $ | 13,472,467 | 1.6 | % | |||||||||||
Forward Contracts* | ||||||||||||||||||||||||
Currencies | $ | (804,012 | ) | (0.1 | )% | $ | 1,346,066 | 0.2 | % | $ | 542,054 | 0.1 | % | |||||||||||
Options on Futures Contracts* | ||||||||||||||||||||||||
U.S. Stock indices | $ | 3,955 | ** | $ | (9,085 | ) | ** | $ | (5,130 | ) | ** | |||||||||||||
Total Futures, Forward and Options on Futures Contracts | $ | 32,541,033 | 3.9 | % | $ | (18,531,642 | ) | (2.2 | )% | $ | 14,009,391 | 1.7 | % | |||||||||||
| * | No individual futures, forward and options on futures contract position constituted greater than 1 percent of partners’ capital. Accordingly, the number of contracts and expiration dates are not presented. |
| ** | Represents less than 0.1% of partners’ capital. |
U.S. Government securities in brokers’ trading accounts***
| Face Value | Maturity Date | Description | Fair Value | Percent of Partners’ Capital | ||||||||
| $90,000,000 | 1/14/2010 – 12/16/2010 | U.S. Treasury Bills, 0.0% – 0.4% (cost $89,943,831) | $ | 89,970,252 | 10.8 | % | ||||||
| *** | Pledged as collateral for the trading of futures, forward and option on futures contracts. |
The accompanying notes are an integral part of these consolidated financial statements.
158
GRANT PARK FUTURES FUND LIMITED PARTNERSHIP
CONSOLIDATED CONDENSED SCHEDULE OF INVESTMENTS – (continued)
December 31, 2009
U.S. Certificates of deposit
| Face Value | Maturity Date | Description | Fair Value | Percent of Partners’ Capital | ||||||||
| $15,485,000 | 2/2/2010 – 11/24/2010 | U.S. Certificates of Deposit, 1.3 – 2.0% (cost $15,485,000) | $ | 15,755,711 | 1.8 | % | ||||||
U.S. Government-sponsored enterprises
| Face Value | Maturity Dates | Description | Fair Value | Percent of Partners’ Capital | ||||||||||
| $84,300,000 | 8/5/2010 – 12/30/2011 | Federal National Mortgage Association, 0.2 – 1.4% | $ | 84,339,694 | 10.2 | % | ||||||||
| 249,000,000 | 8/24/2010 – 12/21/2011 | Federal Home Loan Mortgage Corp., 0.1 – 1.8% | 249,417,475 | 30.0 | % | |||||||||
| 242,375,000 | 2/5/2010 – 12/15/2011 | Federal Home Loan Bank, 0.1 – 1.4% | 242,919,190 | 29.2 | % | |||||||||
| 20,000,000 | 2/14/2011 | Federal Farm Credit Bank, 0.2% | 19,995,250 | 2.4 | % | |||||||||
| Total U.S. Government-sponsored enterprises (cost $595,614,295) | $ | 596,671,609 | 71.8 | % | ||||||||||
U.S. Government securities
| Face Value | Maturity Dates | Description | Fair Value | Percent of Partners’ Capital | ||||||||
| $75,000,000 | 9/23/2010 – 12/16/2010 | U.S. Treasury Bills, 0.4% (cost $74,703,247) | $ | 74,755,744 | 9.0 | % | ||||||
The accompanying notes are an integral part of these consolidated financial statements.
159
GRANT PARK FUTURES FUND LIMITED PARTNERSHIP
CONSOLIDATED STATEMENTS OF OPERATIONS
Years Ended December 31, 2010, 2009 and 2008
| 2010 | 2009 | 2008 | ||||||||||
Net trading gains (losses) | ||||||||||||
Net gain (loss) from trading | ||||||||||||
Realized | $ | 86,593,970 | $ | (26,368,046 | ) | $ | 135,271,602 | |||||
Change in unrealized | 21,946,823 | 9,175,197 | (926,609 | ) | ||||||||
Commissions | (12,554,218 | ) | (11,878,814 | ) | (6,824,118 | ) | ||||||
Net gains (losses) from trading | 95,986,575 | (29,071,663 | ) | 127,520,875 | ||||||||
Income allocated from Dearborn Select Master Fund, SPC – Winton Segregated Portfolio | — | — | 16,714,939 | |||||||||
Loss allocated from GP 1, LLC | — | (2,740,621 | ) | — | ||||||||
Total trading gains (losses) | 95,986,575 | (31,812,284 | ) | 144,235,814 | ||||||||
Net investment income | ||||||||||||
Income | ||||||||||||
Interest income | 4,324,858 | 6,395,208 | 12,681,834 | |||||||||
Expenses | ||||||||||||
Brokerage commission | 51,091,552 | 51,808,133 | 34,156,316 | |||||||||
Incentive fees | 14,273,739 | 4,545,390 | 25,332,013 | |||||||||
Organizational and offering costs | 2,381,437 | 2,839,077 | — | |||||||||
Operating expense | 2,042,370 | 2,060,934 | 1,412,552 | |||||||||
Total expenses | 69,789,098 | 61,253,534 | 60,900,881 | |||||||||
Net investment loss | $ | (65,464,240 | ) | $ | (54,858,326 | ) | $ | (48,219,047 | ) | |||
Net income (loss) | $ | 30,522,335 | $ | (86,670,610 | ) | $ | 96,016,767 | |||||
Net income (loss) per unit from operations (based on weighted average number of units outstanding during the period): | ||||||||||||
General Partner & Limited Partner Class A Units | $ | 63.46 | $ | (145.00 | ) | $ | 263.77 | |||||
General Partner & Limited Partner Class B Units | $ | 46.51 | $ | (134.12 | ) | $ | 223.70 | |||||
General Partner & Limited Partner Legacy 1 Class Units | $ | 58.80 | $ | (33.88 | ) | $ | N/A | |||||
General Partner & Limited Partner Legacy 2 Class Units | $ | 55.25 | $ | (35.46 | ) | $ | N/A | |||||
General Partner & Limited Partner Global 1 Class Units | $ | 27.56 | $ | (43.18 | ) | $ | N/A | |||||
General Partner & Limited Partner Global 2 Class Units | $ | 24.41 | $ | (46.40 | ) | $ | N/A | |||||
General Partner & Limited Partner Global 3 Class Units | $ | 6.38 | $ | (60.36 | ) | $ | N/A | |||||
Increase (decrease) in net asset value per unit for the period: | ||||||||||||
General Partner & Limited Partner Class A Units | $ | 63.46 | $ | (145.00 | ) | $ | 260.73 | |||||
General Partner & Limited Partner Class B Units | $ | 46.51 | $ | (134.12 | ) | $ | 215.79 | |||||
General Partner & Limited Partner Legacy 1 Class Units | $ | 58.80 | $ | (33.88 | ) | $ | N/A | |||||
General Partner & Limited Partner Legacy 2 Class Units | $ | 55.25 | $ | (35.46 | ) | $ | N/A | |||||
General Partner & Limited Partner Global 1 Class Units | $ | 27.56 | $ | (43.18 | ) | $ | N/A | |||||
General Partner & Limited Partner Global 2 Class Units | $ | 24.41 | $ | (46.40 | ) | $ | N/A | |||||
General Partner & Limited Partner Global 3 Class Units | $ | 6.38 | $ | (60.36 | ) | $ | N/A | |||||
The accompanying notes are an integral part of these consolidated financial statements.
160
GRANT PARK FUTURES FUND LIMITED PARTNERSHIP
CONSOLIDATED STATEMENTS OF CHANGES IN PARTNERS’ CAPITAL (NET ASSET VALUE)
Years Ended December 31, 2010, 2009 and 2008
| Class A | Class B | |||||||||||||||||||||||||||||||
| General Partner | Limited Partners | General Partner | Limited Partners | |||||||||||||||||||||||||||||
| Number of Units | Amount | Number of Units | Amount | Number of Units | Amount | Number of Units | Amount | |||||||||||||||||||||||||
Partners’ capital, | ||||||||||||||||||||||||||||||||
December 31, 2007 | 3,671.69 | $ | 4,807,965 | 51,371.93 | $ | 67,269,942 | — | $ | — | 335,708.69 | $ | 383,607,889 | ||||||||||||||||||||
Contributions | 676.49 | 1,000,000 | 14,070.43 | 20,802,983 | — | — | 105,026.40 | 134,317,181 | ||||||||||||||||||||||||
Redemptions | — | — | (13,033.66 | ) | (19,201,221 | ) | — | — | (32,574.35 | ) | (41,963,683 | ) | ||||||||||||||||||||
Offering costs | — | — | — | (163,756 | ) | — | — | — | (2,898,858 | ) | ||||||||||||||||||||||
Net income (loss) | — | 1,019,544 | — | 13,584,192 | — | — | — | 81,413,031 | ||||||||||||||||||||||||
Partners’ capital, | ||||||||||||||||||||||||||||||||
December 31, 2008 | 4,348.18 | 6,827,509 | 52,408.70 | �� | 82,292,140 | — | — | 408,160.74 | 554,475,560 | |||||||||||||||||||||||
Contributions | — | — | 1,656.55 | 2,601,110 | 2,001.08 | 2,677,822 | 199,443.69 | 267,164,784 | ||||||||||||||||||||||||
Redemptions | (1,339.52 | ) | (2,000,000 | ) | (5,708.66 | ) | (8,424,365 | ) | (1,574.07 | ) | (2,028,133 | ) | (37,011.39 | ) | (46,695,477 | ) | ||||||||||||||||
Net income (loss) | — | (539,587 | ) | — | (7,551,336 | ) | — | (126,876 | ) | — | (76,337,450 | ) | ||||||||||||||||||||
Partners’ capital, | ||||||||||||||||||||||||||||||||
December 31, 2009 | 3,008.66 | 4,287,922 | 48,356.59 | 68,917,549 | 427.01 | 522,813 | 570,593.04 | 698,607,417 | ||||||||||||||||||||||||
Contributions | — | — | — | — | — | — | — | — | ||||||||||||||||||||||||
Redemptions | — | — | (7,994.05 | ) | (10,932,503 | ) | — | — | (72,108.33 | ) | (84,911,592 | ) | ||||||||||||||||||||
Net income (loss) | — | 190,950 | — | 2,101,155 | — | 19,859 | — | 19,808,523 | ||||||||||||||||||||||||
Partners’ capital, | ||||||||||||||||||||||||||||||||
December 31, 2010 | 3,008.66 | $ | 4,478,872 | 40,362.54 | $ | 60,086,201 | 427.01 | $ | 542,672 | 498,484,71 | $ | 633,504,348 | ||||||||||||||||||||
Net asset value per unit at | ||||||||||||||||||||||||||||||||
December 31, 2007 | $1,309.47 | $1,142.68 | ||||||||||||||||||||||||||||||
Net asset value per unit at | ||||||||||||||||||||||||||||||||
December 31, 2008 | $1,570.20 | $1,358.47 | ||||||||||||||||||||||||||||||
Net asset value per unit at | ||||||||||||||||||||||||||||||||
December 31, 2009 | $1,425.20 | $1,224.35 | ||||||||||||||||||||||||||||||
Net asset value per unit at | ||||||||||||||||||||||||||||||||
December 31, 2010 | $1,488.66 | $1,270.86 | ||||||||||||||||||||||||||||||
The accompanying notes are an integral part of these consolidated financial statements.
161
GRANT PARK FUTURES FUND LIMITED PARTNERSHIP
CONSOLIDATED STATEMENTS OF CHANGES IN PARTNERS’ CAPITAL (NET ASSET VALUE)
Years Ended December 31, 2010, 2009 and 2008 – (continued)
| Legacy 1 Class | Legacy 2 Class | |||||||||||||||||||||||||||||||
| General Partner | Limited Partners | General Partner | Limited Partners | |||||||||||||||||||||||||||||
| Number of Units | Amount | Number of Units | Amount | Number of Units | Amount | Number of Units | Amount | |||||||||||||||||||||||||
Partners’ capital, December 31, 2007 | — | $ | — | — | $ | — | — | $ | — | — | $ | — | ||||||||||||||||||||
Contributions | — | — | — | — | — | — | — | — | ||||||||||||||||||||||||
Redemptions | — | — | — | — | — | — | — | — | ||||||||||||||||||||||||
Offering costs | — | — | — | — | — | — | — | — | ||||||||||||||||||||||||
Net income (loss) | — | — | — | — | — | — | — | — | ||||||||||||||||||||||||
Partners’ capital, December 31, 2008 | — | — | — | — | — | — | — | — | ||||||||||||||||||||||||
Contributions | 1,025.00 | 1,025,000 | 3,861.68 | 3,768,594 | 1,000.00 | 1,000,000 | 3,295.20 | 3,228,114 | ||||||||||||||||||||||||
Redemptions | (10.43 | ) | (10,000 | ) | (172.25 | ) | (167,161 | ) | ||||||||||||||||||||||||
Net income (loss) | — | (34,724 | ) | — | (37,814 | ) | — | (35,460 | ) | — | (48,738 | ) | ||||||||||||||||||||
Partners’ capital, December 31, 2009 | 1,025.00 | 990,276 | 3,851.25 | 3,720,780 | 1,000.00 | 964,540 | 3,122.95 | 3,012,215 | ||||||||||||||||||||||||
Contributions | — | — | 2,638.44 | 2,474,508 | — | — | 3,507.78 | 3,296,617 | ||||||||||||||||||||||||
Redemptions | — | — | (581.69 | ) | (561,445 | ) | — | — | (269.67 | ) | (266,846 | ) | ||||||||||||||||||||
Net income (loss) | — | 60,266 | — | 421,377 | — | 55,253 | — | 444,981 | ||||||||||||||||||||||||
Partners’ capital, December 31, 2010 | 1,025.00 | $ | 1,050,542 | 5,908.00 | $ | 6,055,220 | 1,000.00 | $ | 1,019,793 | 6,361.06 | $ | 6,486,967 | ||||||||||||||||||||
Net asset value per unit at December 31, 2007 | $ | — | $ | — | ||||||||||||||||||||||||||||
Net asset value per unit at December 31, 2008 | $ | — | $ | — | ||||||||||||||||||||||||||||
Net asset value per unit at December 31, 2009 | $ | 966.12 | $ | 964.54 | ||||||||||||||||||||||||||||
Net asset value per unit at December 31, 2010 | $ | 1,024.92 | $ | 1,019.79 | ||||||||||||||||||||||||||||
The accompanying notes are an integral part of these consolidated financial statements.
162
GRANT PARK FUTURES FUND LIMITED PARTNERSHIP
CONSOLIDATED STATEMENTS OF CHANGES IN PARTNERS’ CAPITAL (NET ASSET VALUE)
Years Ended December 31, 2010, 2009 and 2008 – (continued)
| Global 1 Class | Global 2 Class | |||||||||||||||||||||||||||||||
| General Partner | Limited Partners | General Partner | Limited Partners | |||||||||||||||||||||||||||||
| Number of Units | Amount | Number of Units | Amount | Number of Units | Amount | Number of Units | Amount | |||||||||||||||||||||||||
Partners’ capital, | ||||||||||||||||||||||||||||||||
December 31, 2007 | — | $ | — | — | $ | — | — | $ | — | — | $ | — | ||||||||||||||||||||
Contributions | — | �� | — | — | — | — | — | — | — | |||||||||||||||||||||||
Redemptions | — | — | — | — | — | — | — | — | ||||||||||||||||||||||||
Offering costs | — | — | — | — | — | — | — | — | ||||||||||||||||||||||||
Net income (loss) | — | — | — | — | — | — | — | — | ||||||||||||||||||||||||
Partners’ capital, | ||||||||||||||||||||||||||||||||
December 31, 2008 | — | — | — | — | — | — | — | — | ||||||||||||||||||||||||
Contributions | 1,044.66 | 1,045,000 | 3,517.12 | 3,464,764 | 708.97 | 705,000 | 7,373.24 | 7,242,488 | ||||||||||||||||||||||||
Redemptions | — | — | (158.52 | ) | (154,906 | ) | — | — | (39.41 | ) | (37,588 | ) | ||||||||||||||||||||
Net income (loss) | — | (45,446 | ) | — | (96,277 | ) | — | (28,924 | ) | — | (211,383 | ) | ||||||||||||||||||||
Partners’ capital, | ||||||||||||||||||||||||||||||||
December 31, 2009 | 1,044.66 | 999,554 | 3,358.60 | 3,213,581 | 708.97 | 676,076 | 7,333.83 | 6,993,517 | ||||||||||||||||||||||||
Contributions | — | — | 7,451.07 | 6,873,217 | 472.09 | 435,000 | 12,167.82 | 11,189,495 | ||||||||||||||||||||||||
Redemptions | — | — | (676.29 | ) | (626,330 | ) | — | — | (870.25 | ) | (808,314 | ) | ||||||||||||||||||||
Net income (loss) | — | 28,784 | — | 514,580 | — | 44,022 | — | 847,074 | ||||||||||||||||||||||||
Partners’ capital, | ||||||||||||||||||||||||||||||||
December 31, 2010 | 1,044.66 | $ | 1,028,338 | 10,133.38 | $ | 9,975,048 | 1,181.06 | $ | 1,155,098 | 18,631.40 | $ | 18,221,772 | ||||||||||||||||||||
Net asset value per unit at December 31, 2007 | $ — | $ — | ||||||||||||||||||||||||||||||
Net asset value per unit at December 31, 2008 | $ — | $ — | ||||||||||||||||||||||||||||||
Net asset value per unit at December 31, 2009 | $956.82 | $953.60 | ||||||||||||||||||||||||||||||
Net asset value per unit at December 31, 2010 | $984.38 | $978.01 | ||||||||||||||||||||||||||||||
The accompanying notes are an integral part of these consolidated financial statements.
163
GRANT PARK FUTURES FUND LIMITED PARTNERSHIP
CONSOLIDATED STATEMENTS OF CHANGES IN PARTNERS’ CAPITAL (NET ASSET VALUE)
Years Ended December 31, 2010, 2009 and 2008 – (continued)
| Global 3 Class | ||||||||||||||||||||
| General Partner | Limited Partners | |||||||||||||||||||
| Number of Units | Amount | Number of Units | Amount | Total Amount | ||||||||||||||||
Partners’ capital, | ||||||||||||||||||||
December 31, 2007 | — | $ | — | — | $ | — | $ | 455,685,796 | ||||||||||||
Contributions | — | — | — | — | 156,120,164 | |||||||||||||||
Redemptions | — | — | — | — | (61,164,904 | ) | ||||||||||||||
Offering costs | — | — | — | (3,062,614 | ) | |||||||||||||||
Net income (loss) | — | — | — | — | 96,016,767 | |||||||||||||||
Partners’ capital, | ||||||||||||||||||||
December 31, 2008 | — | — | — | — | 643,595,209 | |||||||||||||||
Contributions | 500.00 | 500,000 | 40,377.44 | 39,486,889 | 333,909,565 | |||||||||||||||
Redemptions | — | — | (48.84 | ) | (46,036 | ) | (59,563,666 | ) | ||||||||||||
Net income (loss) | — | (30,179 | ) | — | (1,546,416 | ) | (86,670,610 | ) | ||||||||||||
Partners’ capital, | ||||||||||||||||||||
December 31, 2009 | 500.00 | 469,821 | 40,328.60 | 37,894,437 | 831,270,498 | |||||||||||||||
Contributions | — | — | 120,956.30 | 108,514,458 | 132,783,295 | |||||||||||||||
Redemptions | — | — | (5,014,17 | ) | (4,556,328 | ) | (102,663,358 | ) | ||||||||||||
Net income (loss) | — | 3,188 | — | 5,982,323 | 30,522,335 | |||||||||||||||
Partners’ capital, | ||||||||||||||||||||
December 31, 2010 | 500.00 | $ | 473,009 | 156,270.73 | $ | 147,834,890 | $ | 891,912,770 | ||||||||||||
Net asset value per unit at December 31, 2007 | $ — | |||||||||||||||||||
Net asset value per unit at December 31, 2008 | $ — | |||||||||||||||||||
Net asset value per unit at December 31, 2009 | $939.64 | |||||||||||||||||||
Net asset value per unit at December 31, 2010 | $946.02 | |||||||||||||||||||
The accompanying notes are an integral part of these consolidated financial statements.
164
GRANT PARK FUTURES FUND LIMITED PARTNERSHIP
NOTES TO CONSOLIDATED FINANCIAL STATEMENTS
NOTE 1. NATURE OF BUSINESS AND SIGNIFICANT ACCOUNTING POLICIES
Nature of business: Grant Park Futures Fund Limited Partnership (the “Partnership”) was organized as a limited partnership under Illinois law in August 1988 and will continue until December 31, 2027, unless sooner terminated as provided for in its Limited Partnership Agreement. As a commodity investment pool, the Partnership is subject to the regulations of the Commodity Futures Trading Commission (“CFTC”), an agency of the United States (U.S.) government which regulates most aspects of the commodity futures industry; rules of the National Futures Association, an industry self-regulatory organization; and the requirements of the various commodity exchanges where the Partnership executes transactions. Additionally, the Partnership is subject to the requirements of futures commission merchants (“FCMs”) and interbank and other market makers through which the Partnership trades. The Partnership is a registrant with the Securities and Exchange Commission (“SEC”), and, accordingly is subject to the regulatory requirements under the Securities Act of 1933, as amended, and the Securities Exchange Act of 1934, as amended.
The Partnership’s business is to trade, buy, sell, margin or otherwise acquire, hold or dispose of futures and forward contracts for commodities, financial instruments or currencies, any rights pertaining thereto and any options thereon, or on physical commodities. The Partnership may also engage in hedge, arbitrage and cash trading of commodities and futures.
The Partnership is a multi-advisor pool that carries out its purpose through trading by independent professional commodity trading advisors retained by Dearborn Capital Management, L.L.C. (the “General Partner”), the Partnership and, effective April 1, 2009, the Partnership’s subsidiary limited liability trading companies (each a “Trading Company” and collectively, the “Trading Companies”). The Trading Companies were set up to, among other things, segregate risk by commodity trading advisor. Effectively, this structure isolates one trading advisor from another and any losses from one Trading Company will not carry over to the other Trading Companies. The following is a list of the Trading Companies, for which the Partnership is the sole member and all of which were organized as Delaware limited liability companies:
GP 1, LLC (“GP 1”) | GP 7, LLC (“GP 7”) | GP 12, LLC (“GP 12”) | ||
GP 3, LLC (“GP 3”) | GP 8, LLC (“GP 8”) | GP 14, LLC (“GP 14”) | ||
GP 4, LLC (“GP 4”) | GP 9, LLC (“GP 9”) | GP 15, LLC (“GP 15”) | ||
GP 5, LLC (“GP 5”) | GP 10, LLC (“GP 10”) | GP 16, LLC (“GP 16”) | ||
GP 6, LLC (“GP 6”) | GP 11, LLC (“GP 11”) |
Assets of the Partnership will not be invested in GP 15 and GP 16 until the first quarter of 2011.
Additionally, GP Cash Management, LLC was created as a Delaware limited liability company to collectively manage and invest excess cash not required to be held at clearing brokers. The members of GP Cash Management, LLC are the Trading Companies.
Through December 31, 2008 a portion of Grant Park’s net assets was previously allocated to the Dearborn Select Master Fund, SPC — Winton Segregated Portfolio — Class GP (the “GP Class”). Dearborn Select Master Fund, SPC (“Dearborn Select”) was incorporated under the laws of the Cayman Islands on April 7, 2006 and was a private investment fund organized as a segregated portfolio company with limited liability. The GP Class allocated the assets invested by Grant Park to Winton Capital Management Limited (“Winton”) through one or more managed accounts, traded pursuant to Winton’s Diversified Program. Grant Park owned all of the outstanding Class GP units of the GP Class. The general partner of Grant Park was also the Investment Manager of Dearborn Select. As of December 31, 2008, the investment in the GP Class was redeemed and was shown on the statement of financial condition as a redemption receivable. Effective January 1, 2009, the portion of Grant Park’s net assets allocated to the GP Class was reallocated to one of Grant Park’s trading companies, GP 1, LLC (“GP 1”), a Delaware limited liability company. GP 1 allocated assets to Winton to be traded pursuant to Winton’s Diversified Program.
165
GRANT PARK FUTURES FUND LIMITED PARTNERSHIP
NOTES TO CONSOLIDATED FINANCIAL STATEMENTS
NOTE 1. NATURE OF BUSINESS AND SIGNIFICANT ACCOUNTING POLICIES – (continued)
Classes of interests: The Partnership has seven classes of limited partner interests (each a “Class” and collectively, the “Interests”), Class A, Class B, Legacy 1 Class, Legacy 2 Class, Global Alternative Markets 1 (“Global 1”) Class, Global Alternative Markets 2 (“Global 2”) Class and Global Alternative Markets 3 (“Global 3”) Class units.
The Class A and Class B units are outstanding but are no longer offered by the Partnership. Both Class A and Class B units are traded pursuant to identical trading programs and differ only in respect to the brokerage commission payable to the General Partner.
The Legacy 1 Class and Legacy 2 Class units are traded pursuant to trading programs pursuing a technical trend trading philosophy, which is the same trading philosophy used for the Class A and Class B units. The Legacy 1 Class and Legacy 2 Class units differ in respect to the General Partner’s brokerage commission and organization and offering and costs. The Legacy 1 Class and Legacy 2 Class units are offered only to investors who are represented by approved selling agents who are directly compensated by the investor for services rendered in connection with an investment in the Partnership (such arrangements commonly referred to as “wrap-accounts”).
The Global 1 Class, Global 2 Class and Global 3 Class units are traded pursuant to trading programs pursuing technical trend trading philosophies, as well as pattern recognition philosophies, focused on relatively shorter timeframes than the Legacy 1 Class and Legacy 2 Class units. The Global 1 Class, Global 2 Class and Global 3 Class units differ in respect to the General Partner’s brokerage commission. The Global 1 Class and Global 2 Class units are offered only to investors in wrap-accounts.
The Partnership’s significant accounting policies are as follows:
Consolidation: The Partnership is the sole member of each of the Trading Companies. The Trading Companies, in turn, are the only members of GP Cash Management, LLC. The Partnership presents consolidated financial statements for the Partnership which include the accounts of the Trading Companies and GP Cash Management, LLC. All material inter-company accounts and transactions are eliminated in consolidation. Recent Financial Accounting Standards Board (“FASB”) guidance under FASB ASC 810 establishes accounting and reporting requirements for noncontrolling interests, which the Partnership previously referred to as minority interests. This guidance requires noncontrolling interests to be reported as a component of partners’ capital on the consolidated statement of financial condition and the amount of net income (loss) attributable to noncontrolling interests to be identified on the consolidated statement of operations.
Use of estimates: The preparation of financial statements in conformity with generally accepted accounting principles (“GAAP”) requires management to make estimates and assumptions that affect the reported amounts of assets and liabilities and disclosure of contingent assets and liabilities at the date of the financial statements and the reported amounts of revenue and expenses during the reporting period. Actual results could differ from those estimates.
Cash and cash equivalents: Cash and cash equivalents may include cash, overnight investments, commercial paper, U.S. treasury bills and short-term investments in interest-bearing demand deposits with banks and cash managers with maturities of three months or less at the date of acquisition. The Partnership maintains deposits with high quality financial institutions in amounts that are in excess of federally insured limits; however, the Partnership does not believe it is exposed to any significant credit risk.
Revenue recognition: Futures, options on futures, and forward contracts are recorded on a trade date basis and realized gains or losses are recognized when contracts are liquidated. Unrealized gains or losses on open contracts (the difference between contract trade price and market price) are reported in the consolidated statement of financial condition as a net unrealized gain or loss, as there exists a right of offset of unrealized
166
GRANT PARK FUTURES FUND LIMITED PARTNERSHIP
NOTES TO CONSOLIDATED FINANCIAL STATEMENTS
NOTE 1. NATURE OF BUSINESS AND SIGNIFICANT ACCOUNTING POLICIES – (continued)
gains or losses in accordance with FASB ASC 210-20,Balance Sheet, Offsetting. Any change in net unrealized gain or loss from the preceding period is reported in the consolidated statement of operations.
Redemptions payable: Pursuant to the provisions of FASB ASC 480,Distinguishing Liabilities from Equity, redemptions approved by the General Partner prior to month end with a fixed effective date and fixed amount are recorded as redemptions payable as of month end.
Income taxes: No provision for income taxes has been made in these consolidated financial statements as each partner is individually responsible for reporting income or loss based on its respective share of the Partnership’s income and expenses as reported for income tax purposes.
The Partnership follows the provisions of ASC 740,Income Taxes. The Partnership is not generally subject to examination by U.S. federal or state taxing authorities for tax years before 2007. As of December 31, 2010, the Partnership has no material uncertain income tax positions, and accordingly, has not recorded a liability for the payment of interest or penalties.
Organization and offering costs: All expenses incurred in connection with the organization and the ongoing public offering of partnership interests are paid by the General Partner and are reimbursed to the General Partner by the Partnership. This reimbursement is made monthly. Effective April 1, 2009, Class A units bear organization and offering expenses at an annual rate of 10 basis points (0.10 percent) of the adjusted net assets of the Class A units, calculated and payable monthly on the basis of month-end adjusted net assets. Legacy 1 Class, Legacy 2 Class, Global 1 Class, Global 2 Class, Global 3 Class and, effective April 1, 2009, Class B units bear these expenses at an annual rate of 30 basis points (0.30 percent) of the adjusted net assets of the Legacy 1 Class, Legacy 2 Class, Global 1 Class, Global 2 Class, Global 3 Class and Class B units, respectively, calculated and payable monthly on the basis of month-end adjusted net assets. Prior to April 1, 2009, Class A units and Class B units bore these expenses at an annual rate of 20 basis points (0.20 percent) and 60 basis points (0.60 percent), respectively, of the adjusted net assets of the Class A and Class B units, respectively, calculated and payable monthly on the basis of month-end adjusted net assets. “Adjusted net assets” is defined as the month-end net assets of the particular class before accruals for fees and expenses and redemptions. In its discretion, the General Partner may require the Partnership to reimburse the General Partner in any subsequent calendar year for amounts that exceed these limits in any calendar year, provided that the maximum amount reimbursed by the Partnership will not exceed the overall limit. Amounts reimbursed by the Partnership with respect to ongoing public offering expenses are charged to expense from operations at the time of reimbursement or accrual. Any amounts reimbursed by the Partnership with respect to organization expenses are expensed at the time the reimbursement is incurred or accrued. If the Partnership terminates prior to completion of payment of the calculated amounts to the General Partner, the General Partner will not be entitled to any additional payments, and the Partnership will have no further obligation to the General Partner. At December 31, 2010, all organization and offering costs incurred by the General Partner have been reimbursed.
Foreign currency transactions: The Partnership’s functional currency is the U.S. dollar, however, it transacts business in currencies other than the U.S. dollar. Assets and liabilities denominated in currencies other than the U.S. dollar are translated into U.S. dollars at the rates in effect at the date of the consolidated statement of financial condition. Income and expense items denominated in currencies other than the U.S. dollar are translated into U.S. dollars at the rates in effect during the period. Gains and losses resulting from the translation to U.S. dollars are reported in income currently.
The Partnership does not isolate that portion of the results of operations resulting from changes in foreign exchange rates on investments from fluctuations arising from changes in market prices of securities held. Such fluctuations are included with the net realized or unrealized gain or loss from investments.
167
GRANT PARK FUTURES FUND LIMITED PARTNERSHIP
NOTES TO CONSOLIDATED FINANCIAL STATEMENTS
NOTE 1. NATURE OF BUSINESS AND SIGNIFICANT ACCOUNTING POLICIES – (continued)
Reclassification: Certain amounts in the 2009 financial statements have been reclassified to conform with the 2010 presentation.
Statement of Cash Flows: The Partnership has elected not to provide statements of cash flows as permitted by FASB ASC 230,Statement of Cash Flows.
Subsequent Events: The Partnership follows the provisions of FASB ASC 855,Subsequent Events, which establishes general standards of accounting for and disclosure of events that occur after the balance sheet date but before financial statements are issued. See Note 12.
Recent accounting pronouncements: In January 2010, FASB issued Accounting Standards update No. 2010-06 (“ASU 2010-06”) for improving disclosure about fair value measurements. ASU 2010-06 adds new disclosure requirements about transfers into and out of Levels 1 and 2 and separate disclosures about purchases, sales, issuances and settlements in the reconciliation for fair value measurements using significant unobservable inputs (Level 3). It also clarifies existing disclosure requirements relating to the levels of disaggregation for fair value measurement and inputs and valuation techniques used to measure fair value. The amended guidance is effective for financial statements for fiscal years and interim periods beginning after December 15, 2009 except for disclosures about purchases, sales, issuances and settlements in the rollforward of activity in Level 3 fair value measurements, which are effective for fiscal years beginning after December 15, 2010 and for interim periods within those fiscal years. As this update is disclosure related, adoption did not have an impact on the Partnership’s financial condition or results of operations.
NOTE 2. FAIR VALUE MEASUREMENTS
The Partnership follows the provisions of FASB ASC 820,Fair Value Measurements and Disclosures. FASB ASC 820 defines fair value, establishes a framework for measuring fair value and expands disclosures about fair value measurement and also emphasizes that fair value is a market-based measurement, not an entity-specific measurement. FASB ASC 820 defines fair value as the price that would be received to sell an asset or paid to transfer a liability in an orderly transaction between market participants at the measurement date and sets out a fair value hierarchy. The fair value hierarchy gives the highest priority to quoted prices in active markets for identical assets or liabilities (Level 1) and the lowest priority to unobservable inputs (Level 3). Inputs are broadly defined under FASB ASC 820 as assumptions market participants would use in pricing an asset or liability. The three levels of the fair value hierarchy under FASB ASC 820 are described below:
Level 1. Unadjusted quoted prices in active markets for identical assets or liabilities that the reporting entity has the ability to access at the measurement date.
Level 2. Inputs other than quoted prices within Level 1 that are observable for the asset or liability, either directly or indirectly. A significant adjustment to a Level 2 input could result in the Level 2 measurement becoming a Level 3 measurement.
Level 3. Inputs are unobservable for the asset or liability.
The following section describes the valuation techniques used by the Partnership to measure different financial instruments at fair value and includes the level within the fair value hierarchy in which the financial instrument is categorized.
Fair value of exchange-traded contracts is based upon exchange settlement prices. Fair value of non-exchange-traded contracts is based on third party quoted dealer values on the Interbank market. U.S. Government securities, U.S. Government-sponsored enterprises and commercial paper are stated at cost plus accrued interest, which approximates fair value based on quoted market prices in an active market. These financial instruments are classified in Level 1 of the fair value hierarchy.
168
GRANT PARK FUTURES FUND LIMITED PARTNERSHIP
NOTES TO CONSOLIDATED FINANCIAL STATEMENTS
NOTE 2. FAIR VALUE MEASUREMENTS – (continued)
The Partnership values certificates of deposit at face value plus accrued interest, which approximates fair value, and these financial instruments are classified in Level 2 of the fair value hierarchy. The Partnership values forward contracts based on third-party quoted dealer values on the Interbank market and forward contracts are classified in Level 2.
The following table presents the Partnership’s fair value hierarchy for those assets and liabilities measured at fair value on a recurring basis as of December 31, 2010:
Assets | Level 1 | Level 2 | Level 3 | Total | ||||||||||||
Equity in brokers’ trading accounts | ||||||||||||||||
U.S. Government securities | $ | 98,441,357 | $ | — | $ | — | $ | 98,441,357 | ||||||||
Futures contracts* | 32,922,417 | — | — | 32,922,417 | ||||||||||||
Forward contracts* | — | 3,038,422 | — | 3,038,422 | ||||||||||||
Options on futures contracts* | (4,625 | ) | — | — | (4,625 | ) | ||||||||||
Cash and cash equivalents | ||||||||||||||||
Certificates of deposit | 28,202,983 | 28,202,983 | ||||||||||||||
Commercial paper | 297,810,795 | — | — | 297,810,795 | ||||||||||||
Certificates of deposit | — | 20,009,468 | — | 20,009,468 | ||||||||||||
Commercial paper | 14,996,133 | — | — | 14,996,133 | ||||||||||||
U.S. Government-sponsored enterprises | 292,555,595 | — | — | 292,555,595 | ||||||||||||
U.S. Government securities | 119,865,174 | — | — | 119,865,174 | ||||||||||||
| * | See the consolidated condensed schedule of investments for further description. |
The following table presents the Partnership’s fair value hierarchy for those assets and liabilities measured at fair value on a recurring basis as of December 31, 2009:
Assets | Level 1 | Level 2 | Level 3 | Total | ||||||||||||
Equity in brokers’ trading accounts | ||||||||||||||||
U.S. Government securities | $ | 89,970,252 | $ | — | $ | — | $ | 89,970,252 | ||||||||
Futures contracts* | 13,472,467 | — | — | 13,472,467 | ||||||||||||
Forward contracts* | 542,054 | — | — | 542,054 | ||||||||||||
Options on futures contracts* | (5,130 | ) | — | — | (5,130 | ) | ||||||||||
Cash and cash equivalents | ||||||||||||||||
Certificates of deposit | — | 20,042,688 | — | 20,042,688 | ||||||||||||
Commercial paper | 6,761,718 | — | — | 6,761,718 | ||||||||||||
Certificates of deposit | — | 15,755,711 | — | 15,755,711 | ||||||||||||
U.S. Government-sponsored enterprises | 596,671,609 | — | — | 596,671,609 | ||||||||||||
U.S. Government securities | 74,755,744 | — | — | 74,755,744 | ||||||||||||
| * | See the consolidated condensed schedule of investments for further description. |
NOTE 3. DEPOSITS WITH BROKERS
The Partnership, through the Trading Companies, deposits assets with brokers subject to CFTC regulations and various exchange and broker requirements. Margin requirements are satisfied by the deposit of U.S. Treasury bills, Government-sponsored enterprises and cash with such brokers. The Partnership earns interest income on its assets deposited with the brokers.
169
GRANT PARK FUTURES FUND LIMITED PARTNERSHIP
NOTES TO CONSOLIDATED FINANCIAL STATEMENTS
NOTE 4. COMMODITY TRADING ADVISORS
The Partnership, through the Trading Companies, allocates assets to the commodity trading advisors. Each Trading Company has entered into an advisory contract with its own Advisor. The commodity trading advisors are Rabar Market Research, Inc., EMC Capital Management, Inc., Eckhardt Trading Co., Graham Capital Management, L.P., Winton Capital Management, Welton Investment Corporation, Global Advisors Jersey Limited, Transtrend B.V., Quantitative Investment Management LLC, Revolution Capital Management, LLC, Sunrise Capital Partners, LLC and Amplitude Capital International Limited (the “Advisors”). The Advisors are paid a quarterly management fee ranging from 0 percent to 3 percent per annum of the Partnership’s month-end allocated net assets and a quarterly incentive fee ranging from 20 percent to 26 percent of the new trading profits on the allocated net assets of the Advisor.
NOTE 5. GENERAL PARTNER AND RELATED PARTY TRANSACTIONS
The General Partner shall at all times, so long as it remains a general partner of the Partnership, own Units in the Partnership: (i) in an amount sufficient, in the opinion of counsel for the Partnership, for the Partnership to be taxed as a partnership rather than as an association taxable as a corporation; and (ii) during such time as the Units are registered for sale to the public, in an amount at least equal to the greater of: (a) 1 percent of all capital contributions of all Partners to the Partnership; or (b) $25,000; or such other amount satisfying the requirements then imposed by the North American Securities Administrators Association, Inc.(NASAA) Guidelines. Further, during such time as the Units are registered for sale to the public, the General Partner shall, so long as it remains a general partner of the Partnership, maintain a net worth (as such term may be defined in the NASAA Guidelines) at least equal to the greater of: (i) 5 percent of the total capital contributions of all partners and all limited partnerships to which it is a general partner (including the Partnership) plus 5 percent of the Units being offered for sale in the Partnership; or (ii) $50,000; or such other amount satisfying the requirements then imposed by the NASAA Guidelines. In no event, however, shall the General Partner be required to maintain a net worth in excess of $1,000,000 or such other maximum amount satisfying the requirements then imposed by the NASAA Guidelines.
Ten percent of the General Partner limited partnership interest in the Grant Park Futures Fund Limited Partnership is characterized as a general partnership interest. Notwithstanding, the general partnership interest will continue to pay all fees associated with a limited partnership interest.
Through March 31, 2009, the Partnership paid the General Partner a monthly brokerage commission equal to one twelfth of 7.55 percent (7.55 percent annualized) of month-end net assets for Class A units and one twelfth of 8.00 percent (8.00 percent annualized) of month-end net assets for Class B units. Effective April 1, 2009, the Partnership pays the General Partner a monthly brokerage commission equal to one twelfth of 7.50 percent (7.50 percent annualized) of month-end net assets for Class A units, one twelfth of 7.95 percent (7.95 percent annualized) of month-end net assets for Class B units, one twelfth of 5.00 percent (5.00 percent annualized) of month-end net assets for Legacy 1 Class units, one twelfth of 5.25 (5.25 percent annualized) of month-end net assets for Legacy 2 Class units, one twelfth of 4.45 percent (4.45 percent annualized) of month-end net assets for Global 1 Class units, one twelfth of 4.70 percent (4.70 percent annualized) of month-end net assets for Global 2 Class units, one twelfth of 6.45 percent (6.45 percent annualized) of month-end net assets for Global 3 Class units. Included in the total brokerage commission are amounts paid to the clearing brokers for execution and clearing costs which are reflected in the commissions line of the consolidated statements of operations, and the remaining amounts are management fees paid to the Advisors, compensation to the selling agents and an amount to the General Partner for management services rendered which are reflected in the brokerage commission line on the consolidated statements of operations.
170
GRANT PARK FUTURES FUND LIMITED PARTNERSHIP
NOTES TO CONSOLIDATED FINANCIAL STATEMENTS
NOTE 6. OPERATING EXPENSES
Operating expenses of the Partnership are paid for by the General Partner and reimbursed by the Partnership. Operating expenses of the Partnership are limited to 0.25 percent per year of the average month-end net assets of the Partnership. To the extent operating expenses are less than 0.25 percent of the Partnership’s average month-end net assets during the year, the difference may be reimbursed pro rata to record-holders as of December 31 of each year. For the year ended December 31, 2010, the operating expenses incurred by the Partnership were less than the percentages outlined above. Accordingly, at December 31, 2010, 2009 and 2008 the General Partner reimbursed $50,000, $0 and $0, respectively, of operating expenses to the Partnership.
NOTE 7. REDEMPTIONS
Class A and Class B Limited Partners have the right to redeem units as of any month-end upon ten (10) days’ prior written notice to the Partnership. The General Partner, however, may permit earlier redemptions in its discretion. There are no redemption fees applicable to Class A Limited Partners or to Class B Limited Partners who redeem their units on or after the one-year anniversary of their subscription. Legacy 1 Class, Legacy 2 Class, Global 1 Class, Global 2 Class and Global 3 Class Limited Partners are prohibited from redeeming such units for the three months following the subscription for units. There are no redemption fees applicable to Legacy 1 Class, Legacy 2 Class, Global 1 Class, Global 2 Class Limited Partners or to Global 3 Class Limited Partners who redeem their units on or after the one-year anniversary of their subscription. Global 3 Class Limited Partners who redeem their units after the three-month lock-up, but prior to the one-year anniversary of their subscriptions for the redeemed units will pay the applicable early redemption fee. Redemptions will be made on the last day of the month for an amount equal to the net asset value per unit, as defined, represented by the units to be redeemed. The right to obtain redemption is also contingent upon the Partnership’s having property sufficient to discharge its liabilities on the redemption date and may be delayed if the General Partner determines that earlier liquidation of commodity interest positions to meet redemption payments would be detrimental to the Partnership or nonredeeming Limited Partners.
In addition, the General Partner may at any time cause the redemption of all or a portion of any Limited Partner’s units upon fifteen (15) days written notice. The General Partner may also immediately redeem any Limited Partner’s units without notice if the General Partner believes that (i) the redemption is necessary to avoid having the assets of the Partnership deemed Plan Assets under the Employee Retirement Income Security Act of 1974, as amended (“ERISA”), (ii) the Limited Partner made a misrepresentation in connection with its subscription for the units, or (iii) the redemption is necessary to avoid a violation of law by the Partnership or any Partner.
171
GRANT PARK FUTURES FUND LIMITED PARTNERSHIP
NOTES TO CONSOLIDATED FINANCIAL STATEMENTS
NOTE 8. FINANCIAL HIGHLIGHTS
The following financial highlights reflect activity related to the Partnership. Total return is based on the change in value during the period of a theoretical investment made at the beginning of each calendar month during the period and is not annualized. Individual partner’s ratios may vary from these ratios based on various factors, including but not limited to, the timing of capital transactions.
| 2010 | 2009 | 2008 | ||||||||||
Total return – Class A Units | 4.45 | % | (9.23 | )% | 19.91 | % | ||||||
Total return – Class B Units | 3.80 | % | (9.87 | )% | 18.88 | % | ||||||
Total return – Legacy 1 Class Units | 6.09 | % | (3.39 | )% | — | |||||||
Total return – Legacy 2 Class Units | 5.73 | % | (3.55 | )% | — | |||||||
Total return – Global 1 Class Units | 2.88 | % | (4.32 | )% | — | |||||||
Total return – Global 2 Class Units | 2.56 | % | (4.64 | )% | — | |||||||
Total return – Global 3 Class Units | 0.68 | % | (6.04 | )% | — | |||||||
Ratios as a percentage of average net assets:* | ||||||||||||
Interest income | 0.53 | % | 0.80 | % | 2.32 | % | ||||||
Expenses prior to incentive fees | 6.75 | % | 7.08 | % | 6.52 | % | ||||||
Incentive fees | 1.73 | % | 0.57 | % | 4.64 | % | ||||||
Total expenses | 8.48 | % | 7.65 | % | 11.16 | % | ||||||
Net investment loss** | (6.22 | )% | (6.28 | )% | (4.20 | )% | ||||||
| * | Legacy 1 Class, Legacy 2 Class, Global 1 Class, Global 2 Class and Global 3 Class Units began trading April 1, 2009 and, accordingly, the total return represents the return from April 1, 2009 through December 31, 2009. These units exclude the classes of the Partnership’s proportionate share of expenses and net investment income (loss) from GP 1, LLC from January 1, 2009 to March 31, 2009, and Dearborn Select Master Fund, SPC — Winton Segregated Portfolio for 2008. |
| ** | Excludes incentive fee. |
The interest income and expense ratios above are computed based upon the weighted average net assets of the limited partners for the years ended December 31, 2010, 2009 and 2008.
172
GRANT PARK FUTURES FUND LIMITED PARTNERSHIP
NOTES TO CONSOLIDATED FINANCIAL STATEMENTS
NOTE 8. FINANCIAL HIGHLIGHTS – (continued)
The following per unit performance calculations reflect activity related to the Partnership.
| Class A Units | Class B Units | Legacy 1 Class Units | Legacy 2 Class Units | Global 1 Class Units | Global 2 Class Units | Global 3 Class Units | ||||||||||||||||||||||
Per Unit Performance | ||||||||||||||||||||||||||||
(for unit outstanding throughout the entire period): | ||||||||||||||||||||||||||||
Net asset value per unit at December 31, 2007 | $ | 1,309.47 | $ | 1,142.68 | N/A | N/A | N/A | N/A | N/A | |||||||||||||||||||
Income (loss) from operations | ||||||||||||||||||||||||||||
Net realized and change in unrealized gain from trading | 389.13 | 336.88 | N/A | N/A | N/A | N/A | N/A | |||||||||||||||||||||
Expenses net of interest income* | (125.36 | ) | (113.18 | ) | N/A | N/A | N/A | N/A | N/A | |||||||||||||||||||
Total income (loss) from operations | 263.77 | 223.70 | N/A | N/A | N/A | N/A | N/A | |||||||||||||||||||||
Organization and offering costs* | (3.04 | ) | (7.91 | ) | N/A | N/A | N/A | N/A | N/A | |||||||||||||||||||
Net asset value per unit at December 31, 2008** | 1,570.20 | 1,358.47 | 1,000.00 | 1,000.00 | 1,000.00 | 1,000.00 | 1,000.00 | |||||||||||||||||||||
Income (loss) from operations | ||||||||||||||||||||||||||||
Net realized and change in unrealized gain (loss) from trading | (54.61 | ) | (45.74 | ) | 2.72 | 1.58 | (10.96 | ) | (13.73 | ) | (14.17 | ) | ||||||||||||||||
Expenses net of interest income* | (90.39 | ) | (88.38 | ) | (36.60 | ) | (37.04 | ) | (32.22 | ) | (32.67 | ) | (46.19 | ) | ||||||||||||||
Total income (loss) from operations | (145.00 | ) | (134.12 | ) | (33.88 | ) | (35.46 | ) | (43.18 | ) | (46.40 | ) | (60.36 | ) | ||||||||||||||
Net asset value per unit at December 31, 2009 | 1,425.20 | 1,224.35 | 966.12 | 964.54 | 956.82 | 953.60 | 939.64 | |||||||||||||||||||||
Income (loss) from operations | ||||||||||||||||||||||||||||
Net realized and change in unrealized gain (loss) from trading | 166.28 | 142.15 | 118.37 | 119.78 | 79.95 | 78.92 | 79.73 | |||||||||||||||||||||
Expenses net of interest income* | (102.82 | ) | (95.64 | ) | (59.57 | ) | (64.53 | ) | (52.39 | ) | (54.51 | ) | (73.35 | ) | ||||||||||||||
Total income (loss) from operations | 63.46 | 46.51 | 58.80 | 55.25 | 27.56 | 24.41 | 6.38 | |||||||||||||||||||||
Net asset value per unit at December 31, 2010 | $ | 1,488.66 | $ | 1,270.86 | $ | 1,024.92 | $ | 1,019.79 | $ | 984.38 | $ | 978.01 | $ | 946.02 | ||||||||||||||
| * | Expenses net of interest income per unit and organization and offering costs per unit are calculated by dividing the expenses net of interest income and organization and offering costs by the average number of units outstanding during the period. The net realized and change in unrealized gain from trading is a balancing amount necessary to reconcile the change in net asset value per unit with the other per unit information. |
| ** | Legacy 1 Class, Legacy 2 Class, Global 1 Class, Global 2 Class and Global 3 Class units began trading April 1, 2009. |
173
GRANT PARK FUTURES FUND LIMITED PARTNERSHIP
NOTES TO CONSOLIDATED FINANCIAL STATEMENTS
NOTE 9. TRADING ACTIVITIES AND RELATED RISKS
The Partnership, through its Advisors, engages in the speculative trading of U.S. and foreign futures contracts, options on U.S. and foreign futures contracts, and forward contracts (collectively, derivatives; see Note 11). These derivatives include both financial and nonfinancial contracts held as part of a diversified trading strategy. The Partnership is exposed to both market risk, the risk arising from changes in the market value of the contracts; and credit risk, the risk of failure by another party to perform according to the terms of a contract.
The purchase and sale of futures and options on futures contracts require margin deposits with FCMs. Additional deposits may be necessary for any loss on contract value. The Commodity Exchange Act requires an FCM to segregate all customer transactions and assets from the FCM’s proprietary activities. A customer’s cash and other property (for example, U.S. Treasury bills) deposited with an FCM are considered commingled with all other customer funds subject to the FCM’s segregation requirements. In the event of an FCM’s insolvency, recovery may be limited to a pro rata share of segregated funds available. It is possible that the recovered amount could be less than the total of cash and other property deposited.
Net trading results from derivatives for the years ended December 31, 2010, 2009, and 2008 are reflected in the consolidated statements of operations. Such trading results reflect the net gain arising from the Partnership’s speculative trading of futures contracts, options on futures contract, and forward contracts.
For derivatives, risks arise from changes in the fair value of the contracts. Theoretically, the Partnership is exposed to a market risk equal to the value of futures and forward contracts purchased and unlimited liability on such contracts sold short. As both a buyer and seller of options, the Partnership pays or receives a premium at the outset and then bears the risk of unfavorable changes in the price of the contract underlying the option. Written options expose the Partnership to potentially unlimited liability; for purchased options the risk of loss is limited to the premiums paid.
In addition to market risk, in entering into commodity interest contracts there is a credit risk that a counterparty will not be able to meet its obligations to the Partnership. The counterparty for futures and options on futures contracts traded in the United States and on most non-U.S. futures exchanges is the clearinghouse associated with such exchange. In general, clearinghouses are backed by the corporate members of the clearinghouse who are required to share any financial burden resulting from the nonperformance by one of their members and, as such, should significantly reduce this credit risk. In cases where the clearinghouse is not backed by the clearing members, like some non-U.S. exchanges, it is normally backed by a consortium of banks or other financial institutions.
In the case of forward contracts, over-the-counter options contracts or swap contracts, which are traded on the interbank or other institutional market rather than on exchanges, the counterparty is generally a single bank or other financial institution, rather than a clearinghouse backed by a group of financial institutions; thus, there likely will be greater counterparty credit risk. The Partnership trades only with those counterparties that it believes to be creditworthy. All positions of the Partnership are valued each day on a mark-to-market basis. There can be no assurance that any clearing member, clearinghouse or other counterparty will be able to meet its obligations to the Partnership.
174
GRANT PARK FUTURES FUND LIMITED PARTNERSHIP
NOTES TO CONSOLIDATED FINANCIAL STATEMENTS
NOTE 9. TRADING ACTIVITIES AND RELATED RISKS – (continued)
The unrealized gain (loss) on open futures, forward and option contracts is comprised of the following:
| Futures Contracts (exchange-traded) | Forward Contracts (non-exchange-traded) | Option Contracts (exchange-traded) | Total | |||||||||||||||||||||||||||||
| December 31, 2010 | December 31, 2009 | December 31, 2010 | December 31, 2009 | December 31, 2010 | December 31, 2009 | December 31, 2010 | December 31, 2009 | |||||||||||||||||||||||||
Gross unrealized gains | $ | 53,353,561 | $ | 51,128,960 | $ | 7,237,275 | $ | 6,513,328 | $ | 4,840 | $ | 3,955 | $ | 60,595,676 | $ | 57,646,243 | ||||||||||||||||
Gross unrealized (losses) | (20,431,144 | ) | (37,656,493 | ) | (4,198,853 | ) | (5,971,274 | ) | (9,465 | ) | (9,085 | ) | (24,639,462 | ) | (43,636,852 | ) | ||||||||||||||||
Net unrealized gain (loss) | $ | 32,922,417 | $ | 13,472,467 | $ | 3,038,422 | $ | 542,054 | $ | (4,625 | ) | $ | (5,130 | ) | $ | 35,956,214 | $ | 14,009,391 | ||||||||||||||
The General Partner has established procedures to actively monitor and minimize market and credit risks. The limited partners bear the risk of loss only to the extent of the fair value of their respective investments and, in certain specific circumstances, distributions and redemptions received.
NOTE 10. INDEMNIFICATIONS
In the normal course of business, the Partnership enters into contracts and agreements that contain a variety of representations and warranties and which provide general indemnifications. The Partnership’s maximum exposure under these arrangements is unknown, as this would involve future claims that may be made against the Partnership that have not yet occurred. The Partnership expects the risk of any future obligation under these indemnifications to be remote.
NOTE 11. DERIVATIVE INSTRUMENTS AND HEDGING ACTIVITIES
The Partnership follows the provisions of FASB ASC 815,Derivatives and Hedging. FASB ASC 815 is intended to improve transparency in financial reporting by requiring enhanced disclosures of an entity’s derivative instruments and hedging activities and their effects on the entity’s financial position, financial performance, and cash flows. FASB ASC 815 applies to all derivative instruments within the scope of FASB ASC 815-10-05. It also applies to non-derivative hedging instruments and all hedged items designated and qualifying as hedges under FASB ASC 815-10-05. FASB ASC 815 amends the current qualitative and quantitative disclosure requirements for derivative instruments and hedging activities set forth in FASB ASC 815-10-05 and generally increases the level of disaggregation that will be required in an entity’s financial statements. FASB ASC 815 requires qualitative disclosures about objectives and strategies for using derivatives, quantitative disclosures about fair value amounts of gains and losses on derivative instruments, and disclosures about credit-risk related contingent features in derivative agreements.
The Partnership’s business is speculative trading. The Partnership intends to close out all futures, option on futures and forward contracts prior to their expiration. The Partnership trades in futures and other commodity interest contracts and is therefore a party to financial instruments with elements of off-balance sheet market and credit risk. In entering into these contracts, the Partnership faces the market risk that these contracts may be significantly influenced by market conditions, such as interest rate volatility, resulting in such contracts being less valuable. The Partnership minimizes market risk through real-time monitoring of open positions, diversification of the portfolio and maintenance of a margin-to-equity ratio that rarely exceeds 25%.
In addition to market risk, in entering into commodity interest contracts there is a credit risk that a counterparty will not be able to meet its obligations to the Partnership. In general, clearing organizations are backed by the corporate members of the clearing organization who are required to share any financial burden resulting from the non-performance by one of their members and, as such, should significantly reduce this credit risk. In cases where the clearing organization is not backed by the clearing members, like some non-U.S. exchanges, it is normally backed by a consortium of banks or other financial institutions.
175
GRANT PARK FUTURES FUND LIMITED PARTNERSHIP
NOTES TO CONSOLIDATED FINANCIAL STATEMENTS
NOTE 11. DERIVATIVE INSTRUMENTS AND HEDGING ACTIVITIES – (continued)
In the case of forward contracts, over-the-counter options contracts or swap contracts, which are traded on the interbank or other institutional market rather than on exchanges, the counterparty is generally a single bank or other financial institution, rather than a central clearing organization backed by a group of financial institutions. As a result, there will likely be greater counterparty credit risk in these transactions. The Partnership trades only with those counterparties that it believes to be creditworthy. Nonetheless, the clearing member, clearing organization or other counterparty to these transactions may not be able to meet its obligations to the Partnership, in which case the Partnership could suffer significant losses on these contracts.
The Partnership does not designate any derivative instruments as hedging instruments under FASB ASC 815-10-05. The monthly average futures contracts, forward contracts and option contracts bought and sold was 8,356 and 5,996 for the years ended December 31, 2010 and 2009, respectively. The following tables summarize the quantitative information required by FASB ASC 815:
Fair Values of Derivative Instruments at December 21, 2010 and 2009
| Asset Derivatives* 12/31/2010 | Liability Derivatives* 12/31/2010 | Fair Value | ||||||||||
Agriculturals contracts | $ | 6,741,951 | $ | (431,469 | ) | $ | 6,310,488 | |||||
Currencies contracts | 20,057,183 | (5,176,594 | ) | 14,880,589 | ||||||||
Energy contracts | 3,684,943 | (1,840,984 | ) | 1,843,959 | ||||||||
Interest rates contracts | 2,945,795 | (1,826,944 | ) | 1,118,851 | ||||||||
Meats contracts | 846,430 | (79,680 | ) | 766,750 | ||||||||
Metals contracts | 20,402,750 | (12,923,962 | ) | 7,478,788 | ||||||||
Soft commodities contracts | 3,241,903 | (709,766 | ) | 2,532,137 | ||||||||
Stock indices contracts | 2,674,715 | (1,650,063 | ) | 1,024,652 | ||||||||
| $ | 60,595,676 | $ | (24,639,462 | ) | $ | 35,956,214 | ||||||
| * | The fair values of all asset and liability derivatives, including currencies, energy, agriculturals, interest rates, meats, metals, soft commodities and stock indices contracts, are included in equity in broker trading accounts in the consolidated statement of financial condition. |
| Asset Derivatives* 12/31/2009 | Liability Derivatives* 12/31/2009 | Fair Value | ||||||||||
Agriculturals contracts | $ | 1,318,059 | $ | (1,371,627 | ) | $ | (53,568 | ) | ||||
Currencies contracts | 9,791,450 | (8,903,436 | ) | 888,014 | ||||||||
Energy contracts | 3,238,790 | (2,385,037 | ) | 853,753 | ||||||||
Interest rates contracts | 3,716,428 | (4,670,891 | ) | (954,463 | ) | |||||||
Meats contracts | 465,512 | (283,512 | ) | 182,000 | ||||||||
Metals contracts | 25,182,087 | (19,533,404 | ) | 5,648,683 | ||||||||
Soft commodities contracts | 7,672,469 | (5,352,643 | ) | 2,319,826 | ||||||||
Stock indices contracts | 6,261,448 | (1,136,302 | ) | 5,125,146 | ||||||||
| $ | 57,646,243 | $ | (43,636,852 | ) | $ | 14,009,391 | ||||||
| * | The fair values of all asset and liability derivatives, including currencies, energy, agriculturals, interest rates, meats, metals, soft commodities and stock indices contracts, are included in equity in broker trading accounts in the consolidated statement of financial condition. |
176
GRANT PARK FUTURES FUND LIMITED PARTNERSHIP
NOTES TO CONSOLIDATED FINANCIAL STATEMENTS
NOTE 11. DERIVATIVE INSTRUMENTS AND HEDGING ACTIVITIES – (continued)
The Effect of Derivative Instruments on the Consolidated Statement of Operations for the Years Ended December 31, 2010 and 2009
| Year Ended December 31, | ||||||||
Type of Contract | 2010* | 2009* | ||||||
Agriculturals contracts | $ | 17,978,928 | $ | (4,428,202 | ) | |||
Currencies contracts | 25,579,604 | (3,908,974 | ) | |||||
Energy contracts | (21,311,972 | ) | (27,770,298 | ) | ||||
Interest rates contracts | 63,389,648 | (33,040,510 | ) | |||||
Meats contracts | 161,046 | (729,433 | ) | |||||
Metals contracts | 20,714,739 | 21,225,706 | ||||||
Soft commodities contracts | 17,611,921 | 3,968,216 | ||||||
Stock indices contracts | (15,583,121 | ) | 27,490,646 | |||||
| $ | 108,540,793 | $ | (17,192,849 | ) | ||||
| * | The gains or losses on derivatives, including currencies, energy, agriculturals, interest rates, meats, metals, soft commodities and stock indices contracts, are included in realized and change in unrealized gain (loss) from trading in the consolidated statement of operations. |
| Year Ended December 31, | ||||||||
Line Item in Consolidated Statement of Operations | 2010 | 2009 | ||||||
Realized | $ | 86,593,970 | $ | (26,368,046 | ) | |||
Change in unrealized | 21,946,823 | 9,175,197 | ||||||
| $ | 108,540,793 | $ | (17,192,849 | ) | ||||
NOTE 12. SUBSEQUENT EVENTS
Subsequent to December 31, 2010, there were contributions and redemptions totaling approximately $23,150,000 and $6,702,000 respectively.
Effective February 1, 2011, Alder Capital Limited (“Alder”) and Denali Asset Management LLLP (“Denali”) began trading on behalf of the Partnership and will serve as a commodity trading advisor with respect to all outstanding classes of the Partnership’s units. Alder and Denali will each be allocated less than 10 percent of the Partnership’s net assets to manage.
177

To the Directors and Shareholders Dearborn Select Master Fund, SPC — Winton Segregated Portfolio Grand Cayman, Cayman Islands
We have audited the accompanying statements of financial condition, including the condensed schedules of investments of Dearborn Select Master Fund, SPC — Winton Segregated Portfolio (the “Company”), as of December 31, 2008 and 2007, and the related statements of operations, changes in shareholders’ equity and cash flows for the year ended December 31, 2008 and the period from June 1, 2007 (commencement of operations) through December 31, 2007. These financial statements are the responsibility of the Company’s management. Our responsibility is to express an opinion on these financial statements based on our audit.
We conducted our audit in accordance with auditing standards generally accepted in the United States of America. Those standards require that we plan and perform the audit to obtain reasonable assurance about whether the financial statements are free of material misstatement. An audit includes examining, on a test basis, evidence supporting the amounts and disclosures in the financial statements. An audit also includes assessing the accounting principles used and significant estimates made by management, as well as evaluating the overall financial statement presentation. We believe that our audit provides a reasonable basis for our opinion.
In our opinion, the financial statements referred to above present fairly, in all material respects, the financial position of Dearborn Select Master Fund, SPC — Winton Segregated Portfolio as of December 31, 2008 and 2007, and the results of its operations and its cash flows for the year ended December 31, 2008 and the period from June 1, 2007 (commencement of operations) through December 31, 2007 in conformity with accounting principles generally accepted in the United States of America.
/s/ McGladrey & Pullen, LLP
Chicago, Illinois March 4, 2009
McGladrey & Pullen, LLP is a member firm of RSM International – an affiliation of separate and independent legal entities.
178
DEARBORN SELECT MASTER FUND, SPC – WINTON SEGREGATED PORTFOLIO
STATEMENTS OF FINANCIAL CONDITION
December 31, 2008 and 2007
| 2008 | 2007 | |||||||
Assets | ||||||||
Equity in broker trading account: | ||||||||
Cash | $ | 6,632,155 | $ | 7,377,530 | ||||
U.S. Government securities, at fair value | 2,998,799 | 12,469,108 | ||||||
Unrealized gain on open futures contracts, net | 1,958,960 | 1,250,392 | ||||||
Deposits with broker | 11,589,914 | 21,097,030 | ||||||
Cash and cash equivalents | 26,404,426 | 27,614,107 | ||||||
Certificates of deposit, at fair value | 3,728,731 | 20,270,349 | ||||||
Commercial paper, at fair value | 2,573,970 | 8,458,676 | ||||||
Government-sponsored enterprises, at fair value | 71,749,054 | 22,731,032 | ||||||
Interest receivable | 34,484 | 81,634 | ||||||
Total assets | $ | 116,080,579 | $ | 100,252,828 | ||||
Liabilities and Shareholders’ Equity | ||||||||
Liabilities | ||||||||
Brokerage commission payable | $ | 327,555 | $ | 258,428 | ||||
Accrued incentive fee | 396,993 | 1,175,356 | ||||||
Management fee payable | — | 1,948 | ||||||
Redemption payable | 115,343,975 | — | ||||||
Other payables | 12,056 | 28,100 | ||||||
Total liabilities | 116,080,579 | 1,463,832 | ||||||
Shareholders’ equity | ||||||||
Class GP | — | 98,629,036 | ||||||
Class A | — | 159,960 | ||||||
Total shareholders’ equity | — | 98,788,996 | ||||||
Total liabilities and shareholders’ equity | $ | 116,080,579 | $ | 100,252,828 | ||||
The accompanying notes are an integral part of these financial statements.
179
DEARBORN SELECT MASTER FUND, SPC – WINTON SEGREGATED PORTFOLIO
CONDENSED SCHEDULE OF INVESTMENTS
December 31, 2008
(Expressed in U.S. dollars)
| Unrealized gain/(loss) on open long contracts | Percent of Shareholders’ Equity* | Unrealized gain/(loss) on open short contracts | Percent of Shareholders’ Equity* | Net unrealized gain/(loss) on open contracts | Percent of Shareholders’ Equity* | |||||||||||||||||||
Futures Contacts** | ||||||||||||||||||||||||
U.S. Futures Positions: | ||||||||||||||||||||||||
Currencies | $ | 198,481 | 0.2 | % | $ | (611,431 | ) | (0.5 | )% | $ | (412,950 | ) | (0.3 | )% | ||||||||||
Energy | *** | 40,428 | *** | 40,428 | *** | |||||||||||||||||||
Grains | — | *** | (539,362 | ) | (0.5 | )% | (539,362 | ) | (0.5 | )% | ||||||||||||||
Interest rates | 1,037,902 | 0.9 | % | — | *** | 1,037,902 | 0.9 | % | ||||||||||||||||
Meats | 5,160 | *** | 25,800 | *** | 30,960 | *** | ||||||||||||||||||
Metals | — | *** | (60,808 | ) | (0.1 | )% | (60,808 | ) | (0.1 | )% | ||||||||||||||
Soft commodities | 2,290 | *** | 15,225 | *** | 17,515 | *** | ||||||||||||||||||
Stock indices | (3,540 | ) | *** | (20,075 | ) | *** | (23,615 | ) | *** | |||||||||||||||
Total U.S. Futures Positions | 1,240,293 | (1,150,223 | ) | 90,070 | ||||||||||||||||||||
Foreign Futures Positions: | ||||||||||||||||||||||||
Energy | $ | 12,585 | *** | $ | 17,810 | *** | $ | 30,395 | *** | |||||||||||||||
Grains | — | *** | (1,188 | ) | *** | (1,188 | ) | *** | ||||||||||||||||
Interest rates | 1,363,347 | 1.2 | % | (2,633 | ) | *** | 1,360,714 | 1.2 | % | |||||||||||||||
Metals | (71,206 | ) | (0.1 | )% | 528,609 | 0.5 | % | 457,403 | 0.4 | % | ||||||||||||||
Soft commodities | 45,705 | *** | 2,430 | *** | 48,135 | *** | ||||||||||||||||||
Stock indices | — | *** | (26,569 | ) | *** | (26,569 | ) | *** | ||||||||||||||||
Total Foreign Futures Positions | 1,350,431 | 518,459 | 1,868,890 | |||||||||||||||||||||
Total Futures Contracts | $ | 2,590,724 | 2.2 | % | $ | (631,764 | ) | (0.5 | )% | $ | 1,958,960 | 1.7 | % | |||||||||||
| * | Represents the percent of shareholders’ equity on December 31, 2008 before redemption. |
| ** | No individual futures and option contract position constituted greater than 5 percent of shareholders’ equity. Accordingly, the number of contracts and expiration dates are not presented. |
| *** | Represents less than 0.1% of shareholders’ equity. |
Certificates of deposit
| Face Value | Maturity Date | Description | Fair Value | Percent of Shareholders’ Equity* | ||||||||||
| $3,000,000 | 5/1/2009 | Comerica Bank, 1 month LIBOR plus 15 basis points | $ | 3,005,296 | 2.6 | % | ||||||||
| 240,000 | 8/14/2009 | Amcore Bank, 3.5% | 241,120 | 0.2 | % | |||||||||
| 240,000 | 11/12/2009 | Huntington National Bank, 4.0% | 241,250 | 0.2 | % | |||||||||
| 240,000 | 11/17/2009 | Mercantile Bank of Michigan, 3.6% | 241,065 | 0.2 | % | |||||||||
| Total Certificates of deposit | $ | 3,728,731 | 3.2 | % | ||||||||||
| * | Represents the percent of shareholders’ equity on December 31, 2008 before redemption. |
The accompanying notes are an integral part of these financial statements.
180
DEARBORN SELECT MASTER FUND, SPC – WINTON SEGREGATED PORTFOLIO
CONDENSED SCHEDULE OF INVESTMENTS – (continued)
December 31, 2008
(Expressed in U.S. dollars)
Commercial paper
| Face Value | Maturity Date | Description | Fair Value | Percent of Shareholders’ Equity* | ||||||||||
| $2,575,000 | 1/9/2009 | Conoco Phillips Co., 1.8% | $ | 2,573,970 | 2.2 | % | ||||||||
| Total Commercial paper | $ | 2,573,970 | ||||||||||||
| * | Represents the percent of shareholders’ equity on December 31, 2008 before redemption. |
Government-sponsored enterprises
| Face Value | Maturity Date | Description | Fair Value | Percent of Shareholders’ Equity* | ||||||||||||
| $2,500,000 | 1/2/2009 | Federal Home Loan Bank, 3.8% | $ | 2,523,486 | 2.2 | % | ||||||||||
| 2,500,000 | 1/2/2009 | Federal Farm Credit Bank, 3 month U.S. Treasury bill plus 82 basis points weekly reset | 2,507,651 | 2.2 | % | |||||||||||
| 2,000,000 | 1/14/2009 | Federal Home Loan Bank, 3 month LIBOR minus 20 basis points quarterly reset | 2,020,272 | 1.8 | % | |||||||||||
| 2,500,000 | 1/29/2009 | Fannie Mae Discount Note, 2.3% | 2,495,625 | 2.2 | % | |||||||||||
| 2,000,000 | 2/24/2009 | Freddie Mac Discount Note, 2.6% | 1,992,230 | 1.7 | % | |||||||||||
| 2,500,000 | 3/20/2009 | Federal Home Loan Bank Discount Note, 2.9% | 2,484,833 | 2.2 | % | |||||||||||
| 2,000,000 | 4/1/2009 | Farmer Mac, 2.3% | 2,010,930 | 1.7 | % | |||||||||||
| 2,000,000 | 4/7/2009 | Freddie Mac, 2.4% | 2,011,228 | 1.7 | % | |||||||||||
| 2,500,000 | 4/15/2009 | Federal Home Loan Bank Discount Note, 3.0% | 2,479,345 | 2.2 | % | |||||||||||
| 2,000,000 | 4/17/2009 | Federal Home Loan Discount Note, 3.2% | 1,981,744 | 1.7 | % | |||||||||||
| 2,500,000 | 4/24/2009 | Federal Home Loan Bank, 1 month LIBOR minus 8 basis points monthly reset | 2,499,586 | 2.2 | % | |||||||||||
| 2,000,000 | 4/24/2009 | Farmer Mac, 2.3% | 2,008,561 | 1.7 | % | |||||||||||
| 2,500,000 | 4/30/2009 | Federal Home Loan Bank 2.6% | 2,511,120 | 2.2 | % | |||||||||||
| 2,500,000 | 4/27/2009 | Federal Home Loan Bank Discount Note, 2.8% | 2,477,445 | 2.2 | % | |||||||||||
| 2,000,000 | 5/13/2009 | Fannie Mae Discount Note, 1.2% | 1,991,200 | 1.7 | % | |||||||||||
| 2,500,000 | 5/11/2009 | Federal Home Loan Bank Discount Note, 3.0% | 2,473,819 | 2.1 | % | |||||||||||
| 1,000,000 | 5/18/2009 | Federal Home Loan Bank, 1.7% | 993,531 | 0.9 | % | |||||||||||
| 3,000,000 | 5/20/2009 | Federal Home Loan Bank, 3 month LIBOR minus 18 basis points quarterly reset | 3,006,806 | 2.6 | % | |||||||||||
| 2,000,000 | 5/20/2009 | Federal Home Loan Bank Discount Note, 1.4% | 1,989,575 | 1.7 | % | |||||||||||
| 2,000,000 | 6/30/2009 | Federal Home Loan Bank, 3.0% | 2,000,167 | 1.7 | % | |||||||||||
| 2,500,000 | 8/20/2009 | Federal Home Loan Bank, 3.1% | 2,527,292 | 2.2 | % | |||||||||||
| 2,000,000 | 7/14/2009 | Federal Home Loan Bank, 3.2% | 2,029,189 | 1.8 | % | |||||||||||
| 1,500,000 | 10/5/2009 | Federal Home Loan Bank, 3 month LIBOR minus 4 basis points quarterly reset | 1,518,666 | 1.3 | % | |||||||||||
| 2,500,000 | 10/19/2009 | Freddie Mac, 1 month LIBOR minus 6 basis points monthly reset | 2,500,315 | 2.2 | % | |||||||||||
| 2,000,000 | 11/25/2009 | Freddie Mac, 2.1% | 2,004,083 | 1.7 | % | |||||||||||
| 2,000,000 | 12/1/2009 | Federal Home Loan Bank, 2.0% | 2,003,333 | 1.7 | % | |||||||||||
| 3,500,000 | 12/15/2009 | Federal Home Loan Bank, 1.8% | 3,502,862 | 3.0 | % | |||||||||||
| 3,500,000 | 12/16/2009 | Freddie Mac, 1.9% | 3,502,771 | 3.0 | % | |||||||||||
| 5,000,000 | 12/30/2009 | Farmer Mac, 1.0% | 5,000,138 | 4.3 | % | |||||||||||
| 2,700,000 | 2/19/2010 | Federal Home Loan Bank, 3 month LIBOR minus 3.5 basis points | 2,701,251 | 2.4 | % | |||||||||||
| Total Government-sponsored enterprises | $ | 71,749,054 | 62.2 | % | ||||||||||||
| * | Represents the percent of shareholders’ equity on December 31, 2008 before redemption. |
The accompanying notes are an integral part of these financial statements.
181
DEARBORN SELECT MASTER FUND, SPC – WINTON SEGREGATED PORTFOLIO
CONDENSED SCHEDULE OF INVESTMENTS – (continued)
December 31, 2008
(Expressed in U.S. dollars)
U.S. Government Securities**
| Face Value | Maturity Date | Description | Fair Value | Percent of Shareholders’ Equity* | ||||||||
| $3,000,000 | 6/4/2009 | U.S. Treasury bills, 0.2% (cost $2,996,562) | $ | 2,998,799 | 2.6 | % | ||||||
| Total U.S. Government Securities | $ | 2,998,799 | ||||||||||
| * | Represents the percent of shareholders’ equity on December 31, 2008 before redemption. |
| ** | Pledged as collateral for the trading of futures, forward and option contracts. |
The accompanying notes are an integral part of these financial statements.
182
DEARBORN SELECT MASTER FUND, SPC – WINTON SEGREGATED PORTFOLIO
CONDENSED SCHEDULE OF INVESTMENTS
December 31, 2007
(Expressed in U.S. dollars)
| Unrealized gain/(loss) on open long contracts | Percent of Shareholders’ Equity | Unrealized gain/(loss) on open short contracts | Percent of Shareholders’ Equity | Net unrealized gain/(loss) on open contracts | Percent of Shareholders’ Equity | |||||||||||||||||||
Futures Contacts* | ||||||||||||||||||||||||
U.S. Futures Positions: | ||||||||||||||||||||||||
Currencies | $ | 77,274 | 0.1 | % | $ | (34,803 | ) | ** | $ | 42,471 | ** | |||||||||||||
Energy | 339,275 | 0.3 | % | (72,290 | ) | (0.1 | )% | 266,985 | 0.3 | % | ||||||||||||||
Grains | 1,015,644 | 1.0 | % | — | ** | 1,015,644 | 1.0 | % | ||||||||||||||||
Interest rates | (102,891 | ) | (0.1 | )% | — | ** | (102,891 | ) | (0.1 | )% | ||||||||||||||
Meats | (13,028 | ) | ** | 32,560 | ** | 19,532 | ** | |||||||||||||||||
Metals | 390,270 | 0.4 | % | — | ** | 390,270 | 0.4 | % | ||||||||||||||||
Soft commodities | 3,065 | ** | (170,296 | ) | (0.2 | )% | (167,231 | ) | (0.2 | )% | ||||||||||||||
Stock indices | (123,104 | ) | (0.1 | )% | — | ** | (123,104 | ) | (0.1 | )% | ||||||||||||||
Total U.S. Futures Positions | 1,586,505 | (244,829 | ) | 1,341,676 | ||||||||||||||||||||
Foreign Futures Positions: | ||||||||||||||||||||||||
Energy | $ | 170,530 | 0.2 | % | — | ** | 170,530 | 0.2 | % | |||||||||||||||
Interest rates | (132,569 | ) | (0.1 | )% | (39,128 | ) | ** | (171,697 | ) | (0.2 | )% | |||||||||||||
Metals | (620,144 | ) | (0.6 | )% | 316,710 | 0.3 | % | (303,434 | ) | (0.3 | )% | |||||||||||||
Soft commodities | 3,420 | ** | (11,605 | ) | ** | (8,185 | ) | ** | ||||||||||||||||
Stock indices | 203,780 | 0.2 | % | 17,722 | ** | 221,502 | 0.2 | % | ||||||||||||||||
Total Foreign Futures Positions | (374,983 | ) | 283,699 | (91,284 | ) | |||||||||||||||||||
Total Futures Contracts | $ | 1,211,522 | 1.2 | % | $ | 38,870 | ** | $ | 1,250,392 | 1.3 | % | |||||||||||||
| * | No individual futures and option contract position constituted greater than 5 percent of shareholders’ equity. Accordingly, the number of contracts and expiration dates are not presented. |
| ** | Represents less than 0.1% of shareholders’ equity. |
Certificates of deposit
| Face Value | Maturity Date | Description | Fair Value | Percent of Shareholders’ Equity | ||||||||||||
| $3,000,000 | 1/7/2008 | Abbey National Bank, 5.3% | $ | 3,079,506 | 3.1 | % | ||||||||||
| 3,000,000 | 2/7/2008 | Wilmington Trust, 5.3% | 3,064,435 | 3.1 | % | |||||||||||
| 2,500,000 | 4/28/2008 | Comerica Bank, 4.7% | 2,521,868 | 2.5 | % | |||||||||||
| 5,000,000 | 6/5/2008 | Associated Bank, 3 month LIBOR less 4 basis points | 5,019,162 | 5.1 | % | |||||||||||
| 1,500,000 | 6/20/2008 | Washington Mutual Bank, 5.4% | 1,543,631 | 1.6 | % | |||||||||||
| 3,000,000 | 7/28/2008 | Regions Bank, 4.7% | 3,026,158 | 3.1 | % | |||||||||||
| 2,000,000 | 11/3/2008 | Marshall & Ilsley Bank, 4.6% | 2,015,589 | 2.0 | % | |||||||||||
| Total Certificates of deposit | $ | 20,270,349 | 20.5 | % | ||||||||||||
The accompanying notes are an integral part of these financial statements.
183
DEARBORN SELECT MASTER FUND, SPC – WINTON SEGREGATED PORTFOLIO
CONDENSED SCHEDULE OF INVESTMENTS – (Continued)
December 31, 2007
(Expressed in U.S. dollars)
Commercial paper
| Face Value | Maturity Date | Description | Fair Value | Percent of Shareholders’ Equity | ||||||||||||
| $2,000,000 | 1/10/2008 | Progress Energy Co., 5.5% | $ | 1,997,335 | 2.0 | % | ||||||||||
| 3,500,000 | 2/8/2008 | Zions Banc Corp., 5.2% | 3,481,491 | 3.5 | % | |||||||||||
| 3,000,000 | 2/22/2008 | GE Capital, 4.8% | 2,979,850 | 3.0 | % | |||||||||||
| Total Commercial paper | $ | 8,458,676 | 8.5 | % | ||||||||||||
Government-sponsored enterprises
| Face Value | Maturity Date | Description | Fair Value | Percent of Shareholders’ Equity | ||||||||||||
| $2,000,000 | 6/15/2008 | Fannie Mae, 5.3% | $ | 2,004,289 | 2.0 | % | ||||||||||
| 3,500,000 | 7/16/2008 | Federal Home Loan Bank, 5.3% | 3,585,502 | 3.6 | % | |||||||||||
| 3,000,000 | 8/1/2008 | Farmer Mac, 5.3% | 3,066,692 | 3.1 | % | |||||||||||
| 3,000,000 | 10/8/2008 | Farmer Mac, 4.7% | 3,031,333 | 3.1 | % | |||||||||||
| 1,000,000 | 10/30/2008 | Federal Home Loan Bank, 4.5% | 1,007,500 | 1.0 | % | |||||||||||
| 3,000,000 | 11/19/2008 | Federal Home Loan Bank, 4.6% | 3,016,188 | 3.1 | % | |||||||||||
| 3,000,000 | 11/24/2008 | Federal Home Loan Bank, 1 year constant maturity plus 65 basis points | 3,002,328 | 3.1 | % | |||||||||||
| 2,000,000 | 11/28/2008 | Federal Home Loan Bank, 4.6% | 2,008,342 | 2.0 | % | |||||||||||
| 2,000,000 | 12/1/2008 | Federal Home Loan Bank, 3 month LIBOR minus 23 basis points quarterly reset | 2,008,858 | 2.0 | % | |||||||||||
| Total Government-sponsored enterprises | $ | 22,731,032 | 23.0 | % | ||||||||||||
U.S. Government Securities***
| Face Value | Maturity Date | Description | Fair Value | Percent of Shareholders’ Equity | ||||||||
| $12,500,000 | 1/31/2008 | U.S. Treasury bills, 2.7% (cost $12,466,751) | $ | 12,469,108 | 12.6 | % | ||||||
| Total U.S. Government Securities | $ | 12,469,108 | ||||||||||
| *** | Pledged as collateral for the trading of futures, forward and option contracts. |
The accompanying notes are an integral part of these financial statements.
184
DEARBORN SELECT MASTER FUND, SPC – WINTON SEGREGATED PORTFOLIO
STATEMENTS OF OPERATIONS
Year ended December 31, 2008 and the Period from June 1, 2007
(commencement of operations) through December 31, 2007
(Expressed in U.S. dollars)
| 2008 | 2007 | |||||||
Investment Income | ||||||||
Interest | $ | 3,041,789 | $ | 2,547,579 | ||||
Expenses | ||||||||
Brokerage commissions | 3,694,647 | 1,767,930 | ||||||
Management fees | 3,992 | 1,948 | ||||||
Incentive fees | 4,834,298 | 2,662,490 | ||||||
Total Expenses | 8,532,937 | 4,432,368 | ||||||
Net investment loss | (5,491,148 | ) | (1,884,789 | ) | ||||
Trading gains | ||||||||
Realized gains from trading | 23,467,613 | 10,066,605 | ||||||
Change in unrealized gains from trading | (1,250,392 | ) | 1,250,392 | |||||
Total trading gains | 22,217,221 | 11,316,997 | ||||||
Increase in net assets arising from operations | $ | 16,726,073 | $ | 9,432,208 | ||||
The accompanying notes are an integral part of these financial statements.
185
DEARBORN SELECT MASTER FUND, SPC – WINTON SEGREGATED PORTFOLIO
STATEMENTS OF CASH FLOWS
Year ended December 31, 2008 and the Period from June 1, 2007
(commencement of operations) through December 31, 2007
(Expressed in U.S. dollars)
| 2008 | 2007 | |||||||
Cash Flows Used In Operating Activities | ||||||||
Increase in net assets arising from operations | $ | 16,726,073 | $ | 9,432,208 | ||||
Adjustments to reconcile net increase in net assets arising from operations to cash used in operating activities | ||||||||
Net purchases of investments in U.S. Government securities | 9,470,309 | (12,469,108 | ) | |||||
Net change in unrealized gain on open futures contracts, net | (708,568 | ) | (1,250,392 | ) | ||||
Net sales (purchases) of investments in Certificates of deposit | 16,541,618 | (20,270,349 | ) | |||||
Net sales (purchases) of investments in Commercial paper | 5,884,706 | (8,458,676 | ) | |||||
Net purchases of investments in Government-sponsored enterprises | (49,018,022 | ) | (22,731,032 | ) | ||||
Decrease (Increase) in interest receivable | 47,150 | (81,634 | ) | |||||
Increase in brokerage commission payable | 69,127 | 258,428 | ||||||
(Decrease) Increase in accrued incentive fees | (778,363 | ) | 1,175,356 | |||||
(Decrease) Increase in management fee payable | (1,948 | ) | 1,948 | |||||
Increase in redemption payable | 115,343,975 | — | ||||||
(Decrease) Increase in other payables | (16,044 | ) | 28,100 | |||||
Net cash used in operating activities | 113,560,013 | (54,365,151 | ) | |||||
Cash Flows Provided by Financing Activities | ||||||||
Proceeds from issuance of shares | — | 89,356,788 | ||||||
Payments for redemptions of shares | (115,515,069 | ) | — | |||||
Net cash provided by financing activities | (115,515,069 | ) | 89,356,788 | |||||
Net increase (decrease) in cash and cash equivalents | (1,955,056 | ) | 34,991,637 | |||||
Cash and cash equivalents | ||||||||
Beginning of year | 34,991,637 | — | ||||||
End of year | $ | 33,036,581 | $ | 34,991,637 | ||||
End of year cash and cash equivalents consists of: | ||||||||
Cash in broker trading accounts | $ | 6,632,155 | $ | 7,377,530 | ||||
Cash and cash equivalents | 26,404,426 | 27,614,107 | ||||||
Total end of year cash and cash equivalents | $ | 33,036,581 | $ | 34,991,637 | ||||
The accompanying notes are an integral part of these financial statements.
186
DEARBORN SELECT MASTER FUND, SPC – WINTON SEGREGATED PORTFOLIO
STATEMENTS OF CHANGES IN SHAREHOLDERS’ EQUITY
Year ended December 31, 2008 and the Period from June 1, 2007
(commencement of operations) through December 31, 2007
(Expressed in U.S. dollars)
| Class GP | Class A | |||||||||||||||||||||||||||||||||||||||||||
| Number of Shares | Share Capital | Share Premium | Accumulated Surplus/ (Deficit) | Class GP Total | Number of Shares | Share Capital | Share Premium | Accumulated Surplus/ (Deficit) | Class A Total | Total | ||||||||||||||||||||||||||||||||||
Balance – beginning* | — | $ | — | $ | — | $ | — | $ | — | — | $ | — | $ | — | $ | — | $ | — | $ | — | ||||||||||||||||||||||||
Proceeds on subscription of shares | 89,211.59 | 892 | 89,210,696 | — | 89,211,588 | 145.20 | 1 | 145,199 | — | 145,200 | 89,356,788 | |||||||||||||||||||||||||||||||||
Payments on redemption of shares | — | — | — | — | — | — | — | — | — | — | ||||||||||||||||||||||||||||||||||
Net gain | — | — | — | 9,417,448 | 9,417,448 | — | — | — | 14,760 | 14,760 | 9,432,208 | |||||||||||||||||||||||||||||||||
Balance – December 31, 2007 | 89,211.59 | 892 | 89,210,696 | 9,417,448 | 98,629,036 | 145.20 | 1 | 145,199 | 14,760 | 159,960 | $ | 98,788,996 | ||||||||||||||||||||||||||||||||
Proceeds on subscription of shares | — | — | ||||||||||||||||||||||||||||||||||||||||||
Payments on redemption of shares | (89,211.59 | ) | (892 | ) | (89,210,696 | ) | (26,132,387 | ) | (115,343,975 | ) | (145.20 | ) | (1 | ) | (145,199 | ) | (25,894 | ) | (171,094 | ) | (115,515,069 | ) | ||||||||||||||||||||||
Net gain | — | — | — | 16,714,939 | 16,714,939 | — | — | — | 11,134 | 11,134 | 16,726,073 | |||||||||||||||||||||||||||||||||
Balance – December 31, 2008 | — | $ | — | $ | — | $ | — | $ | — | — | $ | — | $ | — | $ | — | $ | — | $ | — | ||||||||||||||||||||||||
Net asset value per share at December 31, 2007 | $ | 1,105.56 | $ | 1,101.65 | ||||||||||||||||||||||||||||||||||||||||
Net asset value per share at December 31, 2008 | $ | — | $ | — | ||||||||||||||||||||||||||||||||||||||||
| * | Commencement of operations of Class GP was June 1, 2007 and Class A was August 1, 2007. |
187
DEARBORN SELECT MASTER FUND, SPC – WINTON SEGREGATED PORTFOLIO
NOTES TO FINANCIAL STATEMENTS
NOTE 1. ORGANIZATION AND SIGNIFICANT ACCOUNTING POLICIES
Organization: Dearborn Select Master Fund, SPC (the “Master Fund”) was formed in April 2006 and is an exempt segregated portfolio company with limited liability incorporated under the Companies Law (2004 Revision) of the Cayman Islands. The Master Fund commenced operations on June 16, 2006. The Master Fund’s strategy is to achieve capital appreciation of its assets through the investment and speculative trading of futures contracts, options on futures contracts, foreign currency and forward contracts, swaps and derivative contracts by independent trading advisors.
The Master Fund offers shares of various segregated portfolios, each of which may use different investment trading methods and strategies as well as different products. Dearborn Capital Management, L.L.C. (the “Investment Manager”) serves as investment manager and manages the Master Fund’s assets pursuant to its trading methods and strategies.
Winton Segregated Portfolio is a segregated portfolio of the Master Fund and commenced operations on June 1, 2007. At December 31, 2008 the Master Fund had no shareholders. At December 31, 2007, Winton Segregated Portfolio had two shareholders, Dearborn Select Fund, Limited Partnership (“Dearborn Select”) and Grant Park Futures Fund Limited Partnership (“Grant Park”).
The Investment Manager allocated to the Winton Segregated Portfolio which traded in accordance with Winton’s Diversified Program. The investment technique of Winton’s Diversified Program consists of trading a portfolio of more than 100 futures and forward contracts on major commodity exchanges and forward markets worldwide, employing a computerized, technical, trend-following trading system developed by its principals.
Significant accounting policies are as follows:
Use of estimates: The preparation of financial statements in conformity with generally accepted accounting principles requires management to make estimates and assumptions that affect the amounts of assets and liabilities and disclosure of contingent assets and liabilities at the date of the financial statements and the reported amounts of revenue and expenses during the reporting period. Actual results could differ from those estimates.
Cash and cash equivalents: Cash and cash equivalents include cash and short-term investments in interest-bearing demand deposits with banks with maturities of three months or less. Winton Segregated Portfolio maintains deposits with high quality financial institutions in amounts that are in excess of federally insured limits; however, Winton Segregated Portfolio does not believe it is exposed to any significant credit risk.
Revenue recognition: Futures, options on futures, and forward contracts are recorded on a trade date basis and realized gains or losses are recognized when contracts are liquidated. Unrealized gains or losses on open contracts (the difference between contract trade price and market price) are reported in the statement of financial condition as a net unrealized gain or loss, as there exists a right of offset of unrealized gains or losses in accordance with Financial Accounting Standards Board (“FASB”) Interpretation No. 39,Offsetting of Amounts Related to Certain Contracts. Any change in net unrealized gain or loss from the preceding period is reported in the statement of operations.
Recently adopted accounting pronouncements: In September 2006, the FASB issued Statement of Financial Accounting Standards No. 157, Fair Value Measurements (“SFAS No. 157”). SFAS No. 157 defines fair value, establishes a framework for measuring fair value and expands disclosures about fair value measurement and also emphasizes that fair value is a market-based measurement, not an entity-specific measurement. SFAS No. 157 is effective for fiscal years beginning after November 15, 2007, except for nonfinancial assets and nonfinancial liabilities that are recognized or disclosed at fair value in the financial statements on a nonrecurring basis for which delayed application is permitted until fiscal years beginning after November 15, 2008. The adoption of SFAS No. 157 was effective for Winton Segregated Portfolio on January 1, 2008, and did not impact Winton Segregated Portfolio’s financial position, results of operations or cash flows.
188
DEARBORN SELECT MASTER FUND, SPC – WINTON SEGREGATED PORTFOLIO
NOTES TO FINANCIAL STATEMENTS
NOTE 1. ORGANIZATION AND SIGNIFICANT ACCOUNTING POLICIES – (continued)
SFAS No. 157 defines fair value as the price that would be received to sell an asset or paid to transfer a liability in an orderly transaction between market participants at the measurement date and sets out a fair value hierarchy. The fair value hierarchy gives the highest priority to quoted prices in active markets for identical assets or liabilities (Level 1) and the lowest priority to unobservable inputs (Level 3). Inputs are broadly defined under SFAS 157 as assumptions market participants would use in pricing an asset or liability. The three levels of the fair value hierarchy under SFAS 157 are described below:
Level 1. Unadjusted quoted prices in active markets for identical assets or liabilities that the reporting entity has the ability to access at the measurement date.
Level 2. Inputs other than quoted prices within Level 1 that are observable for the asset or liability, either directly or indirectly. A significant adjustment to a Level 2 input could result in the Level 2 measurement becoming a Level 3 measurement.
Level 3. Inputs are unobservable for the asset or liability.
The following section describes the valuation techniques used by Winton Segregated Portfolio to measure different financial instruments at fair value and includes the level within the fair value hierarchy in which the financial instrument is categorized.
Fair value of exchange-traded contracts is based upon exchange settlement prices. U.S. Government securities, Government-sponsored enterprises and commercial paper are stated at cost plus accrued interest, which approximates fair value. These financial instruments are classified in Level 1 of the fair value hierarchy.
Certificates of deposit are stated at cost plus accrued interest, which approximates fair value. These financial instruments are classified in Level 2 of the fair value hierarchy.
The following table presents Winton Segregated Portfolio’s fair value hierarchy for those assets and liabilities measured at fair value on a recurring basis as of December 31, 2008:
Assets | Level 1 | Level 2 | Level 3 | Total | ||||||||||||
Equity in brokers’ trading accounts | ||||||||||||||||
U.S. Government securities | $ | 2,998,799 | $ | — | $ | — | $ | 2,998,799 | ||||||||
Futures contracts | 1,958,960 | — | — | 1,958,960 | ||||||||||||
Cash and cash equivalents | ||||||||||||||||
Certificates of deposit | — | 12,456,183 | — | 12,456,183 | ||||||||||||
Commercial paper | 12,450,226 | — | — | 12,450,226 | ||||||||||||
Government-sponsored enterprises | 1,498,017 | — | — | 1,498,017 | ||||||||||||
Certificates of deposit | — | 3,728,731 | — | 3,728,731 | ||||||||||||
Commercial paper | 2,573,970 | — | — | 2,573,970 | ||||||||||||
Government-sponsored enterprises | 71,749,054 | — | — | 71,749,054 | ||||||||||||
In April 2007 the FASB issued Interpretation No. 39-1, Amendment of FASB Interpretation No. 39 (“FIN 39-1”). FIN 39-1 defines “right of setoff” and specifies what conditions must be met for a derivative contract to qualify for this right of setoff. It also addresses the applicability of a right of setoff to derivative instruments and clarifies the circumstances in which it is appropriate to offset amounts recognized for multiple derivative instruments executed with the same counterparty under a master netting arrangement and fair value amounts recognized for the right to reclaim cash collateral (a receivable) or the obligation to return cash collateral (a payable) arising from the same master netting arrangement as the derivative instruments. This interpretation is effective for fiscal years beginning after November 15, 2007. The adoption of FIN 39-1 did not have a material impact on Winton Segregated Portfolio’s financial statements.
189
DEARBORN SELECT MASTER FUND, SPC – WINTON SEGREGATED PORTFOLIO
NOTES TO FINANCIAL STATEMENTS
NOTE 2. COMMODITY TRADING ADVISOR
The Master Fund has entered into an advisory contract for itself and on behalf of the Winton Segregated Portfolio with Winton Capital Management (the “Advisor”) to act as the Winton Segregated Portfolio’s commodity trading advisor. The Investment Manager will pay the Advisor out of the brokerage commission a management fee for the Advisor’s services to the Winton Segregated Portfolio in accordance with the Offering Memorandum. The brokerage commission fee is earned at a rate of 3.5% and is included on the statement of operations.
Additionally, the Advisor receives a quarterly incentive fee based upon a percentage of new trading profits on the allocated net assets of the Advisor and such incentive fee is included on the statement of operations.
NOTE 3. INCOME TAXES
Under the current law of the Cayman Islands, there are no income, withholding, capital, corporation, inheritance or estate taxes. The Winton Segregated Portfolio may not be exempt from withholding tax on dividend and interest income received from its investments in other jurisdictions.
NOTE 4. DEPOSITS WITH BROKER
Winton Segregated Portfolio deposits assets with a broker subject to Commodity Futures Trading Commission (“CFTC”) regulations and various exchange and broker requirements. Margin requirements are satisfied by the deposit of U.S. treasury bills and cash with such broker. Winton Segregated Portfolio earns interest income on its assets deposited with the broker.
NOTE 5. SHAREHOLDER’S EQUITY
The Master Fund has authorized share capital of $50,000, divided into 10 shares of voting, non-participating shares (the “Management Shares”) having a par value of $1 per share and 49,990 redeemable, non-voting participating shares (the “Shares”) having a par value of $0.01 per share, which are divided into multiple separate and distinct segregated portfolios. Each portfolio may have differing investment or trading methods and strategies, and may be subject to differing rights and obligations.
A shareholder may redeem part of or all of his shares in the Master Fund on any day on one business day’s notice. No redemption fees or penalties will be assessed on redemptions. The Master Fund has the right to temporarily suspend the right of redemption if it suspends the determination of its net asset value (NAV) per share.
NOTE 6. REDEMPTIONS
The Winton Segregated Portfolio Class A ceased operations on September 30, 2008 and the final redemption payment of $171,093 was made on November 13, 2008. The Winton Segregated Portfolio Class GP ceased operations on December 31, 2008, and the redemption payable on the statement of financial condition represents the net assets as of such date. Effective January 1, 2010, the net assets were reallocated to GP 1, LLC, an affiliated trading company of Grant Park.
190
DEARBORN SELECT MASTER FUND, SPC – WINTON SEGREGATED PORTFOLIO
NOTES TO FINANCIAL STATEMENTS
NOTE 7. FINANCIAL HIGHLIGHTS
Per share operating performance, total return and selected ratios for Class GP for the year ended December 31, 2008 and the period from June 1, 2007 through December 31, 2007, and for Class A for the period from January 1, 2008 through September 30, 2008 and the period from August 1, 2007 through December 31, 2007, are provided in the tables below. The ratios to average net assets have not been annualized for the periods presented.
| Winton Segregated Portfolio | ||||||||
| Class GP | Class A | |||||||
2007 | ||||||||
Total return | 10.56 | % | 10.17 | % | ||||
Ratios to average net assets: | ||||||||
Interest income | 2.73 | % | 1.93 | % | ||||
Expenses prior to incentive fees | 1.90 | % | 1.27 | % | ||||
Incentive fees | 2.85 | % | 2.57 | % | ||||
Total expenses | 4.75 | % | 3.84 | % | ||||
Net investment income* | 0.83 | % | 0.66 | % | ||||
2008 | ||||||||
Total return | 16.95 | % | 6.96 | % | ||||
Ratios to average net assets: | ||||||||
Interest income | 2.80 | % | 2.21 | % | ||||
Expenses prior to incentive fees | 3.40 | % | 2.28 | % | ||||
Incentive fees | 4.45 | % | 4.07 | % | ||||
Total expenses | 7.85 | % | 6.35 | % | ||||
Net investment (loss)* | (0.60 | )% | (0.07 | )% | ||||
| * | Excludes incentive fee. |
The total return is based on the change in value during the period of a theoretical investment made at the beginning of each calendar month during the year. An individual investor’s return may vary from these returns based on participation in different management fee and incentive allocation arrangements (as applicable) and the timing of capital transactions.
| Winton Segregated Portfolio | ||||||||
| Class GP | Class A | |||||||
Net asset value per share – initial subscription* | $ | 1,000.00 | $ | 1,000.00 | ||||
Net investment loss* | (21.09 | ) | (20.17 | ) | ||||
Net realized and change in unrealized gain from trading* | 126.65 | 121.82 | ||||||
Total increase in net assets arising from operations | 105.56 | 101.65 | ||||||
Net asset value per share – December 31, 2007 | $ | 1,105.56 | $ | 1,101.65 | ||||
Net investment loss* | (61.47 | ) | (49.84 | ) | ||||
Net realized and change in unrealized gain from trading* | (1,044.09 | ) | (1,051.81 | ) | ||||
Total increase in net assets arising from operations | (1,105.56 | ) | (1,101.65 | ) | ||||
Net asset value per share – December 31, 2007 | $ | — | $ | — | ||||
| * | Commencement of operations for Winton Segregated Portfolio Class GP was June 1, 2007 and Class A was August 1, 2007. |
The net investment loss per share above is computed based on the average number of shares outstanding during the period.
191
DEARBORN SELECT MASTER FUND, SPC – WINTON SEGREGATED PORTFOLIO
NOTES TO FINANCIAL STATEMENTS
NOTE 7. FINANCIAL HIGHLIGHTS – (continued)
The interest income, expenses prior to incentive fees, and net investment income ratios are computed based upon the shareholders’ weighted average net assets for the period from January 1, 2008 through December 31, 2008 and June 1, 2007 (commencement of operations) through December, 31, 2007 for Winton Segregated Portfolio Class GP and for the period from January 1, 2008 through September 30, 2008 and August 1, 2007 (commencement of operations) through December 31, 2007 for Winton Segregated Portfolio Class A.
NOTE 8. TRADING ACTIVITIES AND RELATED RISKS
The Winton Segregated Portfolio, through the Advisor, engages in the speculative trading of futures contracts, options on futures contracts, and forward contracts, swaps, derivatives and synthetics. These derivatives include both financial and nonfinancial contracts held as part of a diversified trading strategy. The Winton Segregated Portfolio is exposed to both market risk, the risk arising from changes in the market value of the contracts; and credit risk, the risk of failure by another party to perform according to the terms of a contract.
The purchase and sale of futures and options on futures contracts require margin deposits with futures commission merchants (FCMs). Additional deposits may be necessary for any loss on contract value. The Commodity Exchange Act requires an FCM to segregate all customer transactions and assets from the FCM’s proprietary activities. A customer’s cash and other property (for example, U.S. Treasury bills) deposited with an FCM are considered commingled with all other customer funds subject to the FCM’s segregation requirements. In the event of an FCM’s insolvency, recovery may be limited to a pro rata share of segregated funds available. It is possible that the recovered amount could be less than the total of cash and other property deposited.
Net trading results from derivatives for the period from January 1, 2008 through December 31, 2008 and June 1, 2007 (commencement of operations) through December 31, 2007 for the Winton Segregated Portfolio Class GP and for the period from January 1, 2008 through September 20, 2008 and June 1, 2007 (commencement of operations) through December 31, 2007 for the Winton Segregated Portfolio Class A are reflected in the statement of operations. Such trading results reflect the net gain arising from the Winton Segregated Portfolio’s speculative trading of futures contracts and options on futures contracts.
For derivatives, risks arise from changes in the market value of the contracts. Theoretically, the Winton Segregated Portfolio is exposed to a market risk equal to the value of futures and forward contracts purchased and unlimited liability on such contracts sold short. As both a buyer and seller of options, the Winton Segregated Portfolio pays or receives a premium at the outset and then bears the risk of unfavorable changes in the price of the contract underlying the option. Written options expose the Winton Segregated Portfolio to potentially unlimited liability; for purchased options the risk of loss is limited to the premiums paid.
In addition to market risk, in entering into commodity interest contracts there is a credit risk that a counterparty will not be able to meet its obligations to the Winton Segregated Portfolio. The counterparty for futures and options on futures contracts traded in the United States and on most non-U.S. futures exchanges is the clearinghouse associated with such exchange. In general, clearinghouses are backed by the corporate members of the clearinghouse who are required to share any financial burden resulting from the nonperformance by one of their members and, as such, should significantly reduce this credit risk. In cases where the clearinghouse is not backed by the clearing members, like some non-U.S. exchanges, it is normally backed by a consortium of banks or other financial institutions. In the case of forward contracts, over-the-counter options contracts or swap contracts, which are traded on the interbank or other institutional market rather than on exchanges, the counterparty is generally a single bank or other financial institution, rather than a clearinghouse backed by a group of financial institutions; thus, there likely will be greater counterparty credit risk. The Winton Segregated Portfolio trades only with those counterparties that it believes to be creditworthy. All positions of the Winton Segregated Portfolio are valued each day on a mark-to-market basis. There can be no assurance that any clearing member, clearinghouse or other counterparty will be able to meet its obligations to the Winton Segregated Portfolio.
192
DEARBORN SELECT MASTER FUND, SPC – WINTON SEGREGATED PORTFOLIO
NOTES TO FINANCIAL STATEMENTS
NOTE 8. TRADING ACTIVITIES AND RELATED RISKS – (continued)
The unrealized gain (loss) on open futures and option contracts is comprised of the following:
| Futures Contracts | Futures Contracts | |||||||||||||||
| (exchange-traded) | (exchange-traded) | Total | Total | |||||||||||||
| December 31, 2008 | December 31, 2007 | December 31, 2008 | December 31, 2007 | |||||||||||||
Gross unrealized gains | $ | 3,676,858 | $ | 3,499,330 | $ | 3,676,858 | $ | 3,499,330 | ||||||||
Gross unrealized (losses) | (1,717,898 | ) | (2,248,938 | ) | (1,717,898 | ) | (2,248,938 | ) | ||||||||
Net unrealized gain | $ | 1,958,960 | $ | 1,250,392 | $ | 1,958,960 | $ | 1,250,392 | ||||||||
The Investment Manager has established procedures to actively monitor and minimize market and credit risks. The shareholder bears the risk of loss only to the extent of the market value of his investments and, in certain specific circumstances, distributions and redemptions received.
NOTE 9. INDEMNIFICATIONS
In the normal course of business, the Master Fund and the Winton Segregated Portfolio enter into contracts and agreements that contain a variety of representations and warranties and which provide general indemnifications. The Master Fund and the Winton Segregated Portfolio’s maximum exposure under these arrangements is unknown, as this would involve future claims that may be made against the Master Fund and the Winton Segregated Portfolio that have not yet occurred. The Master Fund and the Winton Segregated Portfolio expect the risk of any future obligation under these indemnifications to be remote.
193
To the Managing Member
Dearborn Capital Management, L.L.C.
Chicago, Illinois
We have audited the accompanying consolidated statement of financial condition of Dearborn Capital Management, L.L.C. and Subsidiaries (“the Company”) as of December 31, 2010. This financial statement is the responsibility of the Company’s management. Our responsibility is to express an opinion on this financial statement based on our audit.
We conducted our audit in accordance with auditing standards generally accepted in the United States of America. Those standards require that we plan and perform the audit to obtain reasonable assurance about whether the statement of financial condition is free of material misstatement. An audit includes examining, on a test basis, evidence supporting the amounts and disclosures in the statement of financial condition. An audit also includes assessing the accounting principles used and significant estimates made by management, as well as evaluating the overall statement of financial condition presentation. We believe that our audit provides a reasonable basis for our opinion.
In our opinion, the consolidated statement of financial condition referred to above presents fairly, in all material respects, the financial position of Dearborn Capital Management, L.L.C. and Subsidiaries as of December 31, 2010, in conformity with accounting principles generally accepted in the United States of America.
/s/ McGladrey & Pullen, LLP
Chicago, Illinois
February 24, 2011
194
Dearborn Capital Management, L.L.C.
Consolidated Statement of Financial Condition
December 31, 2010
Assets | ||||
Cash and cash equivalents | $ | 338,518,810 | ||
Certificates of deposit, at fair value | 20,084,436 | |||
Commercial paper, at fair value | 14,996,133 | |||
U.S. Government-sponsored enterprises, at fair value | 296,812,266 | |||
U.S. Government securities, at fair value | 119,865,174 | |||
Securities purchased under agreements to resell | 5,604,690 | |||
Deposits with brokers | 142,351,138 | |||
Interest and other receivables | 83,812 | |||
Property and equipment at cost, net of accumulated depreciation of $754,827 | 2,848,212 | |||
Other assets | 254,080 | |||
Total assets | $ | 941,418,751 | ||
Liabilities and Members’ Equity | ||||
Liabilities | ||||
Bank borrowings | $ | 1,636,058 | ||
Pending partner additions | 12,168,587 | |||
Redemptions payable | 7,334,779 | |||
Accounts payable, accrued expenses and other liabilities | 13,422,267 | |||
Total liabilities | 34,561,691 | |||
Members’ equity | ||||
Non-controlling interest in consolidated subsidiaries | 882,042,894 | |||
Members’ equity of Dearborn Capital Management, L.L.C. | 24,814,166 | |||
Total members’ equity | 906,857,060 | |||
Total liabilities and members’ equity | $ | 941,418,751 | ||
The accompanying notes are an integral part of this consolidated statement of financial condition.
195
DEARBORN CAPITAL MANAGEMENT, L.L.C.
NOTES TO CONSOLIDATED STATEMENT OF FINANCIAL CONDITION
NOTE 1. NATURE OF THE BUSINESS AND SIGNIFICANT ACCOUNTING POLICIES
Dearborn Capital Management, L.L.C. (“Dearborn”) was organized as a limited liability company in Illinois in January 1996 and will continue until December 31, 2045, unless sooner terminated as provided for in the Operating Agreement. Dearborn is registered as a Commodity Pool Operator (“CPO”) and a Commodity Trading Advisor (“CTA”) with the Commodity Futures Trading Commission (“CFTC”) and is a member of the National Futures Association (“NFA”). Dearborn conducts an investment management business and acts as the General Partner for Grant Park Futures Fund Limited Partnership (“Grant Park”). Grant Park is a multi-advisor pool that carries out its purpose through trading by independent professional commodity trading advisors retained by Dearborn, Grant Park and Grant Park’s subsidiary trading companies (each a “Trading Company” and collectively, the “Trading Companies”). The Trading Companies were set up to, among other things, segregate risk by commodity trading advisor. The following is a list of the trading companies, for which Grant Park is the sole member and all of which were organized as Delaware limited liability companies:
GP 1, LLC (“GP 1”) | GP 7, LLC (“GP 7”) | GP 12, LLC (“GP 12”) | ||
GP 3, LLC (“GP 3”) | GP 8, LLC (“GP 8”) | GP 14, LLC (“GP 14”) | ||
GP 4, LLC (“GP 4”) | GP 9, LLC (“GP 9”) | GP 15, LLC (“GP 15”) | ||
GP 5, LLC (“GP 5”) | GP 10, LLC (“GP 10”) | GP 16, LLC (“GP 16”) | ||
GP 6, LLC (“GP 6”) | GP 11, LLC (“GP 11”) |
Assets of Grant Park will not be invested in GP 15 and GP 16 until the first quarter of 2011.
GP Cash Management, LLC was created as a Delaware limited liability company to collectively manage and invest excess cash not required to be held at clearing brokers. The members of GP Cash Management, LLC are the Trading Companies.
DCM Brokers, LLC (“DCM”), a wholly owned subsidiary of Dearborn, is an investment banking firm that seeks to act as a wholesaler of primarily U.S.-based public and private companies and limited partnerships who may benefit from financing through the private placement via direct participation programs of equity and/or debt capital.
Significant accounting policies are as follows:
Accounting policies: The Company follows accounting standards established by the Financial Accounting Standards Board (the “FASB”) to ensure consistent reporting of financial condition, results of operations, and cash flows. References to Generally Accepted Accounting Principles (“GAAP”) in these footnotes are to the FASB Accounting Standards Codification, sometimes referred to as the Codification or ASC.
Basis of presentation: The consolidated statement of financial condition includes the accounts of Dearborn, Grant Park, and its subsidiaries, DCM, 555-6, LLC (“555-6”) and 555-6’s majority owned subsidiary, 888 Development, LLC (“888”), (collectively, the “Company”). All significant intercompany accounts, balances and transactions have been eliminated in consolidation.
Dearborn consolidates entities which are variable interest entities as defined by FASB ASC 810-10,Consolidation of Variable Interest Entities. In addition, Dearborn consolidates entities, regardless of ownership percentage, in which Dearborn serves as the general partner and the limited partners do not have substantive kick-out rights or substantive participation rights as required under ASC 810-20,Consolidation, Control of Partnerships and Similar Entities. As of December 31, 2010, 555-6 is consolidated under ASC 810-10 and Grant Park is consolidated under ASC 810-20.
In February 2010, the FASB issued Accounting Standard Update (ASU) No. 2010-10,Consolidation, Amendments for Certain Investment Funds, that defers the application of revised consolidation standards for certain investment funds. The Company analyzed this update and concluded that it had no impact as consolidation of Grant Park is still required.
196
DEARBORN CAPITAL MANAGEMENT, L.L.C.
NOTES TO CONSOLIDATED STATEMENT OF FINANCIAL CONDITION
NOTE 1. NATURE OF THE BUSINESS AND SIGNIFICANT ACCOUNTING POLICIES – (continued)
555-6 is an affiliate under common ownership that leases office space to Dearborn. 888 also leases office space to Dearborn and is consolidated with 555-6 under ASC 810-10. Financial information of 555-6, including its majority owned subsidiary, 888, at December 31, 2010 consisted of assets (principally property), liabilities and members’ equity of approximately $2,877,000, $2,822,000 and $55,000 respectively.
The consolidation of Grant Park and its subsidiary Trading Companies, net of intercompany eliminations, in the consolidated statement of financial condition of the Company as of December 31, 2010, consists of the following:
Cash and cash equivalents | $ | 338,079,527 | ||
Certificates of deposit | 20,084,437 | |||
Commercial paper | 14,996,133 | |||
U.S. Government-sponsored enterprises | 292,555,595 | |||
U.S. Government securities | 119,865,174 | |||
Deposits with brokers | 141,154,942 | |||
Interest and other receivables | 82,357 | |||
Pending partner additions | 12,168,587 | |||
Redemptions payable | 7,334,779 | |||
Accounts payable, accrued expenses, and other liabilities | 9,545,296 | |||
Non-controlling interest in consolidated subsidiaries | 882,164,446 |
Use of estimates: The preparation of financial statements in conformity with generally accepted accounting principles requires management to make estimates and assumptions that affect the reported amounts of assets and liabilities and disclosure of contingent assets and liabilities at the date of the financial statements and the reported amounts of revenue and expenses during the reporting period. Actual results could differ from those estimates.
Cash and cash equivalents: Cash and cash equivalents may include cash, overnight investments, commercial paper, U.S. treasury bills and short-term investments in interest-bearing demand deposits with banks and cash managers with original maturities of three months or less at the date of acquisition. The Company maintains deposits with high quality financial institutions in amounts that are in excess of federally insured limits; however, the Company does not believe it is exposed to any significant credit risk.
Property and equipment: Property and equipment, which includes furniture, fixtures, computer equipment and buildings, are recorded at cost. Depreciation is provided on the straight-line method over the estimated useful lives of the assets, ranging from 3 to 39 years.
Securities purchased under agreements to resell: Securities purchased under agreements to resell are accounted for as collateralized financing transactions and are recorded at the amount at which the securities were acquired plus accrued interest, which approximates fair value. It is the policy of Dearborn to obtain possession of collateral with a market value equal to or in excess of the principal amount loaned.
Revenue recognition: Advisory and management fees accrue monthly based upon a percentage of assets under management.
Futures, options on futures, and forward contracts are recorded on a trade date basis and realized gains or losses are recognized when contracts are liquidated. Unrealized gains or losses on open contracts (the difference between contract trade price and market price) are reported in deposits with brokers balance in the consolidated statement of financial condition as a net unrealized gain or loss, as there exists a right of offset of unrealized gains or losses in accordance with the FASB ASC 210-20,Balance Sheet, Offsetting. Any change in net unrealized gain or loss from the preceding period is reported in the period the gain or loss occurs.
197
DEARBORN CAPITAL MANAGEMENT, L.L.C.
NOTES TO CONSOLIDATED STATEMENT OF FINANCIAL CONDITION
NOTE 1. NATURE OF THE BUSINESS AND SIGNIFICANT ACCOUNTING POLICIES – (continued)
Income taxes: No provision for income taxes has been made in these financial statements as each member is individually responsible for reporting income or loss based on its respective share of the Company’s income and expenses as reported for income tax purposes.
The Company follows the provisions of ASC 740,Income Taxes. The Company is not generally subject to examination by U.S. federal or state taxing authorities for tax years before 2007. As of December 31, 2010, the Company has no material uncertain income tax positions, and accordingly, has not recorded a liability for the payment of interest or penalties.
Foreign currency transactions: Grant Park’s functional currency is the U.S. dollar, however, it transacts business in currencies other than the U.S. dollar. Assets and liabilities denominated in currencies other than the U.S. dollar are translated into U.S. dollars at the rates in effect at the date of the consolidated statement of financial condition.
Subsequent Events: The Company follows the provisions of FASB ASC 855,Subsequent Events, which establishes general standards of accounting for and disclosure of events that occur after the balance sheet date but before financial statements are issued. See Note 15.
Recent accounting pronouncements: In January 2010, FASB issued Accounting Standards update No. 2010-06 (“ASU 2010-06”) for improving disclosure about fair value measurements. ASU 2010-06 adds new disclosure requirements about transfers into and out of Levels 1 and 2 and separate disclosures about purchases, sales, issuances and settlements in the reconciliation for fair value measurements using significant unobservable inputs (Level 3). It also clarifies existing disclosure requirements relating to the levels of disaggregation for fair value measurement and inputs and valuation techniques used to measure fair value. The amended guidance is effective for financial statements for fiscal years and interim periods beginning after December 15, 2009 except for disclosures about purchases, sales, issuances and settlements in the rollforward of activity in Level 3 fair value measurements, which are effective for fiscal years beginning after December 15, 2010 and for interim periods within those fiscal years. As this update is disclosure related, adoption did not have an impact on the Company’s financial condition.
NOTE 2. FAIR VALUE MEASUREMENTS
The Company follows the provisions of FASB ASC 820,Fair Value Measurements and Disclosures. FASB ASC 820 defines fair value, establishes a framework for measuring fair value and expands disclosures about fair value measurement and also emphasizes that fair value is a market-based measurement, not an entity-specific measurement. FASB ASC 820 defines fair value as the price that would be received to sell an asset or paid to transfer a liability in an orderly transaction between market participants at the measurement date and sets out a fair value hierarchy. The fair value hierarchy gives the highest priority to quoted prices in active markets for identical assets or liabilities (Level 1) and the lowest priority to unobservable inputs (Level 3). Inputs are broadly defined under FASB ASC 820 as assumptions market participants would use in pricing an asset or liability. The three levels of the fair value hierarchy under FASB ASC 820 are described below:
Level 1. Unadjusted quoted prices in active markets for identical assets or liabilities that the reporting entity has the ability to access at the measurement date.
Level 2. Inputs other than quoted prices within Level 1 that are observable for the asset or liability, either directly or indirectly. A significant adjustment to a Level 2 input could result in the Level 2 measurement becoming a Level 3 measurement.
Level 3. Inputs are unobservable for the asset or liability.
198
DEARBORN CAPITAL MANAGEMENT, L.L.C.
NOTES TO CONSOLIDATED STATEMENT OF FINANCIAL CONDITION
NOTE 2. FAIR VALUE MEASUREMENTS – (continued)
The following section describes the valuation techniques used by the Company to measure different financial instruments at fair value and includes the level within the fair value hierarchy in which the financial instrument is categorized.
Fair value of exchange-traded contracts is based upon exchange settlement prices. Fair value of non-exchange-traded contracts is based on third party quoted dealer values on the Interbank market. Equity securities are recorded at fair value based on quoted market prices. U.S. Government securities, U.S. Government-sponsored enterprises and commercial paper are stated at cost plus accrued interest, which approximates fair value based on quoted prices in an active market. Securities purchased under agreements to resell are accounted for as collateralized financing transactions and are recorded at the amount at which the securities were acquired plus accrued interest, which approximates fair value. These financial instruments are classified in Level 1 of the fair value hierarchy.
The Company values certificates of deposit at face value plus accrued interest, which approximates fair value, and these financial instruments are classified in Level 2 of the fair value hierarchy. Forward contracts are valued based on third-party quoted dealer values on the Interbank market and forward contracts are classified in Level 2.
The following table presents the Company’s fair value hierarchy for those assets and liabilities measured at fair value on a recurring basis as of December 31, 2010:
Assets | Level 1 | Level 2 | Level 3 | Total | ||||||||||||
Cash and cash equivalents | ||||||||||||||||
Certificates of deposit | $ | — | $ | 28,202,983 | — | $ | 28,202,983 | |||||||||
Commercial paper | 297,810,795 | — | — | 297,810,795 | ||||||||||||
Certificates of deposit | — | 20,084,436 | — | 20,084,436 | ||||||||||||
Commercial paper | 14,996,133 | — | — | 14,996,133 | ||||||||||||
U.S. Government-sponsored enterprises | 296,812,266 | — | — | 296,812,266 | ||||||||||||
U.S. Government securities | 119,865,174 | — | — | 119,865,174 | ||||||||||||
Securities purchased under agreements to resell | 5,604,690 | — | — | 5,604,690 | ||||||||||||
Deposits with brokers | ||||||||||||||||
U.S. Government securities | 98,441,357 | — | — | 98,441,357 | ||||||||||||
Futures contracts | 32,852,139 | — | — | 32,852,139 | ||||||||||||
Forward contracts | — | 3,038,422 | — | 3,038,422 | ||||||||||||
Options on futures contracts | 18,481 | — | — | 18,481 | ||||||||||||
NOTE 3. INVESTMENTS
As General Partner of Grant Park, Dearborn has committed to maintaining an investment in Grant Park equal to at least the greater of (1) 1 percent of all capital contributions of all limited partners in Grant Park or (2) $25,000, during any time that units in Grant Park are publicly offered for sale. Further, during such time as the units of Grant Park are registered for sale to the public, Dearborn shall, so long as it remains a General Partner of Grant Park, maintain a net worth at least equal to the greater of 5 percent of the total capital contributions of all partners and all limited partnerships to which it is a General Partner (including Grant Park) plus 5 percent of the units being offered for sale in Grant Park or $50,000. In no event shall Dearborn be required to maintain a net worth in excess of $1,000,000.
199
DEARBORN CAPITAL MANAGEMENT, L.L.C.
NOTES TO CONSOLIDATED STATEMENT OF FINANCIAL CONDITION
NOTE 4. DEPOSITS WITH BROKERS
Dearborn, and Grant Park through the Trading Companies, deposit assets with brokers subject to Commodity Futures Trading Commission regulations and various exchange and broker requirements. Margin requirements are satisfied by the deposit of U.S. Treasury bills and cash with such brokers. Dearborn and Grant Park earn interest income on assets deposited with the brokers. Included in deposits with brokers are U.S. Treasury bills, reported at fair value, totaling $98,441,357 that are pledged as collateral to the brokers at December 31, 2010.
NOTE 5. COMMODITY TRADING ADVISORS
Grant Park, through the Trading Companies, allocates assets to the commodity trading advisors. Each Trading Company has entered into an advisory contract with its own Advisor. The commodity trading advisors are Rabar Market Research, Inc., EMC Capital Management, Inc., Eckhardt Trading Co., Graham Capital Management, L.P., Winton Capital Management, Welton Investment Corporation, Global Advisors Jersey Limited, Transtrend B.V., Quantitative Investment Management LLC, Revolution Capital Management, LLC, Sunrise Capital Partners, LLC and Amplitude Capital International Limited (the “Advisors”). The Advisors are paid a quarterly management fee ranging from 0 percent to 3 percent per annum of Grant Park’s month-end allocated net assets and a quarterly incentive fee ranging from 20 percent to 26 percent of the new trading profits on the allocated net assets of the Advisor.
Dearborn has entered into an advisory contract with Frontera Management, LLC and Liberty Funds Group to act as advisors in the trading of other commodity interests on behalf of Dearborn.
NOTE 6. BROKERAGE COMMISSION, ORGANIZATION AND OFFERING COSTS AND OPERATING EXPENSES
As the General Partner and Commodity Trading Advisor of Grant Park, Dearborn is entitled to a brokerage commission. Grant Park pays the General Partner a monthly brokerage commission equal to 7.50 percent per annum of month-end net assets for Class A units, 7.95 percent per annum of month-end net assets for Class B units, 5.00 percent per annum of month-end net assets for Legacy 1 Class units, 5.25 per annum of month-end net assets for Legacy 2 Class units, 4.45 percent per annum of month-end net assets for Global 1 Class units, 4.70 percent per annum of month-end net assets for Global 2 Class units, 6.45 percent per annum of month-end net assets for Global 3 Class units. Included in the brokerage commission are amounts paid to the clearing brokers for execution and clearance costs. If such commissions and fees exceed the brokerage commission limit in any one year, Dearborn will bear the excess amount. In its discretion, Dearborn may require that Grant Park reimburse Dearborn. The remaining amount is for commissions to certain selling agents as compensation for selling interests of Grant Park, management fees to Grant Park’s commodity trading advisors, and a management fee retained by Dearborn.
Organization and offering costs: All expenses incurred in connection with the organization and the initial and ongoing public offering of Grant Park’s partnership interests will be paid by Dearborn on behalf of Grant Park, and reimbursed to Dearborn by Grant Park. This reimbursement is made monthly. Class A units bear organization and offering expenses at an annual rate of 10 basis points (0.10 percent) of the adjusted net assets of the Class A units, calculated and payable monthly on the basis of month-end adjusted net assets. Class B, Legacy 1 Class, Legacy 2 Class, Global 1 Class, Global 2 Class and Global 3 Class units bear these expenses at an annual rate of 30 basis points (0.30 percent) of the adjusted net assets of the Class B, Legacy 1 Class, Legacy 2 Class, Global 1 Class, Global 2 Class and Global 3 Class units, respectively, calculated and payable monthly on the basis of month-end adjusted net assets. “Adjusted net assets” is defined as the month-end net assets of the particular class before accruals for fees, expenses and redemptions. In its discretion, Dearborn may require Grant Park to reimburse Dearborn in any subsequent calendar year for amounts that exceed these limits in any calendar year, provided that the maximum amount reimbursed by Grant Park will not exceed the overall limit.
200
DEARBORN CAPITAL MANAGEMENT, L.L.C.
NOTES TO CONSOLIDATED STATEMENT OF FINANCIAL CONDITION
NOTE 6. BROKERAGE COMMISSION, ORGANIZATION AND OFFERING COSTS AND OPERATING EXPENSES – (continued)
The reimbursement for organization and offering cost is made on a monthly basis. At December 31, 2010, all organization and offering costs have been reimbursed by Grant Park.
Operating expenses: All ongoing operating expenses, such as legal, audit, administrative costs, expense of preparing and filing required periodic reports with the Securities and Exchange Commission (“SEC”), transfer agent fees, printing and postage will be paid by Dearborn on behalf of Grant Park and reimbursed to Dearborn by Grant Park. This reimbursement is made monthly at a rate 0.021 percent, or 0.25 percent annually of the net asset value of Grant Park. Dearborn bears any of the excess amount. In its discretion, Dearborn may require Grant Park to reimburse Dearborn in any subsequent calendar year for amounts that exceed these limits in any calendar year, provided that the maximum amount reimbursed by Grant Park will not exceed the overall limit set forth above. Dearborn has agreed to remit back to Grant Park $50,000 of Grant Park’s operating expenses to the extent actual expenses incurred were less than the actual amount Grant Park paid to Dearborn at December 31, 2010.
NOTE 7. PENDING PARTNER ADDITIONS AND REDEMPTIONS PAYABLE
At December 31, 2010, redemptions payable and pending partner additions represent capital transactions at Grant Park. Pursuant to the provisions of FASB ASC 480,Distinguishing Liabilities from Equity, redemptions approved by the General Partner of Grant Park prior to month-end with a fixed effective date and fixed amount are recorded as redemptions payable as of month-end.
NOTE 8. BANK BORROWINGS
Dearborn has entered into an agreement with a bank for a credit facility for up to a maximum amount of $5 million. Amounts can be borrowed in multiple advances; however, the aggregate amount of such advances cannot exceed the maximum amount. Loan amounts are due on demand, no later than May 15, 2011, and bear interest at the prime rate (3.25 percent at December 31, 2010) with a floor of 4.50 percent. Loans are collateralized by certain property of Dearborn, including receivables, investments and equipment. At December 31, 2010, Dearborn has an outstanding balance of $1,097,400, which is included in bank borrowings on the consolidated statement of financial condition. This agreement contains financial covenants requiring the maintenance of an amount of tangible net worth and certain financial ratios. The agreement also contains certain non-financial covenants. As of December 31, 2010 Dearborn is in compliance with its financial covenants, and has obtained a waiver of a certain non-financial covenant. At December 31, 2010, the carrying values of the term loan and credit facility approximate fair value.
Additionally, Dearborn has a note payable with a bank that matures on January 15, 2013 and bears interest at the rate of 6.25 percent. The original principal amount of the note was $650,000, of which $538,659 remains payable at December 31, 2010 and is included in bank borrowings in the consolidated statement of financial condition. The note is payable in monthly installments, including principal and interest, of $4,750 and is collateralized by certain assets of 555-6 and guaranteed by Dearborn. At December 31, 2010, the carrying value of the note payable approximates fair value. Scheduled repayments of notes payable, exclusive of interest, at December 31, 2010 are set forth as follows:
Fiscal year ending December 31: | ||||
2011 | $ | 23,669 | ||
2012 | $ | 24,995 | ||
2013 | $ | 489,995 | ||
| $ | 538,659 | |||
201
DEARBORN CAPITAL MANAGEMENT, L.L.C.
NOTES TO CONSOLIDATED STATEMENT OF FINANCIAL CONDITION
NOTE 9. RELATED PARTY TRANSACTIONS
Dearborn entered into an agreement with 888 for a promissory note. 888 promises to pay Dearborn the principal and interest at a rate of 3 percent. The note is payable in monthly installments and matures on September 30, 2024. At December 31, 2010 Dearborn has a note receivable in the amount of $2,227,634.
Dearborn entered into an agreement with 555-6 for a promissory note. 555-6 promises to pay Dearborn the principal and interest at a rate of 3 percent. The note is payable in monthly installments and matures on September 30, 2024. At December 31, 2010 Dearborn has a note receivable in the amount of $230,792.
NOTE 10. EMPLOYEE BENEFIT PLAN
The Company has established a salary deferral plan under section 401(k) of the Internal Revenue Code. The plan allows eligible employees to defer a portion of their compensation to the plan. The Company matches employees’ contributions, up to 50 percent of 6 percent of eligible compensation. The plan also provides a component whereby the Company can make a discretionary contribution to the plan.
NOTE 11. TRADING ACTIVITIES AND RELATED RISKS
Dearborn and Grant Park, through its subsidiary Trading Companies, engage in the speculative trading of U.S. and foreign futures contracts, options on U.S. and foreign futures contracts, and forward contracts (collectively, derivatives). These derivatives include both financial and nonfinancial contracts held as part of a diversified trading strategy. Dearborn and Grant Park are exposed to both market risk, the risk arising from changes in the market value of the contracts; and credit risk, the risk of failure by another party to perform according to the terms of a contract.
The purchase and sale of futures and options on futures contracts require margin deposits with Futures Commission Merchants (“FCMs”). Additional deposits may be necessary for any loss on contract value. The Commodity Exchange Act requires an FCM to segregate all customer transactions and assets from the FCM’s proprietary activities. A customer’s cash and other property (for example, U.S. Treasury bills) deposited with an FCM are considered commingled with all other customer funds subject to the FCM’s segregation requirements. In the event of an FCM’s insolvency, recovery may be limited to a pro rata share of segregated funds available. It is possible that the recovered amount could be less than the total of cash and other property deposited.
For derivatives, risks arise from changes in the market value of the contracts. Theoretically, Dearborn and Grant Park are exposed to a market risk equal to the value of futures and forward contracts purchased and unlimited liability on such contracts sold short. As both a buyer and seller of options, Dearborn and Grant Park pay or receive a premium at the outset and then bear the risk of unfavorable changes in the price of the contract underlying the option. Written options expose Dearborn and Grant Park to potentially unlimited liability; for purchased options the risk of loss is limited to the premiums paid.
In addition to market risk, in entering into commodity interest contracts there is a credit risk that a counterparty will not be able to meet its obligations to Dearborn and Grant Park. The counterparty for futures and options on futures contracts traded in the United States and on most non-U.S. futures exchanges is the clearinghouse associated with such exchange. In general, clearinghouses are backed by the corporate members of the clearinghouse who are required to share any financial burden resulting from the nonperformance by one of their members and, as such, should significantly reduce this credit risk. In cases where the clearinghouse is not backed by the clearing members, like some non-U.S. exchanges, it is normally backed by a consortium of banks or other financial institutions.
In the case of forward contracts, over-the-counter options contracts or swap contracts, which are traded on the interbank or other institutional market rather than on exchanges, the counterparty is generally a single bank or other financial institution, rather than a clearing house backed by a group of financial institutions; thus, there
202
DEARBORN CAPITAL MANAGEMENT, L.L.C.
NOTES TO CONSOLIDATED STATEMENT OF FINANCIAL CONDITION
NOTE 11. TRADING ACTIVITIES AND RELATED RISKS – (continued)
likely will be greater counterparty credit risk. Dearborn and Grant Park trade only with those counterparties that Dearborn and Grant Park believe to be creditworthy. All positions of Dearborn and Grant Park are valued each day on a mark-to-market basis. There can be no assurance that any clearing member, clearinghouse or other counterparty will be able to meet its obligations to Dearborn and Grant Park.
NOTE 12. DERIVATIVE INSTRUMENTS AND HEDGING ACTIVITIES
Dearborn and Grant Park follow the provisions of FASB ASC 815,Derivatives and Hedging. FASB ASC 815 is intended to improve transparency in financial reporting by requiring enhanced disclosures of an entity’s derivative instruments and hedging activities and their effects on the entity’s financial position, financial performance, and cash flows. FASB ASC 815 applies to all derivative instruments within the scope of FASB ASC 815-10-05. It also applies to non-derivative hedging instruments and all hedged items designated and qualifying as hedges under FASB ASC 815-10-05. FASB ASC 815 amends the current qualitative and quantitative disclosure requirements for derivative instruments and hedging activities set forth in FASB ASC 815-10-05 and generally increases the level of disaggregation that will be required in an entity’s financial statements. FASB ASC 815 requires qualitative disclosures about objectives and strategies for using derivatives, quantitative disclosures about fair value amounts of gains and losses on derivative instruments, and disclosures about credit-risk related contingent features in derivative agreements.
The business of Dearborn and Grant Park is speculative trading. Dearborn and Grant Park intend to close out all futures, option on futures and forward contracts prior to their expiration. Dearborn and Grant Park trade in futures and other commodity interest contracts and is therefore a party to financial instruments with elements of off-balance sheet market and credit risk. In entering into these contracts, Dearborn and Grant Park face the market risk that these contracts may be significantly influenced by market conditions, such as interest rate volatility, resulting in such contracts being less valuable. Dearborn and Grant Park minimize market risk through real-time monitoring of open positions, diversification of the portfolio and maintenance of a margin-to-equity ratio that rarely exceeds 25%.
In addition to market risk, in entering into commodity interest contracts there is a credit risk that a counterparty will not be able to meet its obligations to Dearborn or Grant Park. In general, clearing organizations are backed by the corporate members of the clearing organization who are required to share any financial burden resulting from the non-performance by one of their members and, as such, should significantly reduce this credit risk. In cases where the clearing organization is not backed by the clearing members, like some non-U.S. exchanges, it is normally backed by a consortium of banks or other financial institutions.
In the case of forward contracts, over-the-counter options contracts or swap contracts, which are traded on the interbank or other institutional market rather than on exchanges, the counterparty is generally a single bank or other financial institution, rather than a central clearing organization backed by a group of financial institutions. As a result, there will likely be greater counterparty credit risk in these transactions. Dearborn and Grant Park trade only with those counterparties that they believe to be creditworthy. Nonetheless, the clearing member, clearing organization or other counterparty to these transactions may not be able to meet their obligations to Dearborn or Grant Park, in which case Dearborn or Grant Park could suffer significant losses on these contracts.
203
DEARBORN CAPITAL MANAGEMENT, L.L.C.
NOTES TO CONSOLIDATED STATEMENT OF FINANCIAL CONDITION
NOTE 12. DERIVATIVE INSTRUMENTS AND HEDGING ACTIVITIES – (continued)
Dearborn and Grant Park do not designate any derivative instruments as hedging instruments under FASB ASC 815-10-05. The monthly average futures contracts, forward contracts and option contracts bought and sold was 8,356 for the twelve months ended December 31, 2010. The following tables summarize the quantitative information required by FASB ASC 815:
Fair Values of Derivative Instruments at December 31, 2010
| Asset Derivatives* 12/31/2010 | Liability Derivatives* 12/31/2010 | Fair Value | ||||||||||
Agriculturals contracts | $ | 6,741,957 | $ | (431,469 | ) | $ | 6,310,488 | |||||
Currencies contracts | 20,057,183 | (5,176,594 | ) | 14,880,589 | ||||||||
Energy contracts | 3,684,943 | (1,855,684 | ) | 1,829,259 | ||||||||
Interest rates contracts | 2,945,795 | (1,836,431 | ) | 1,109,364 | ||||||||
Meats contracts | 846,430 | (79,680 | ) | 766,750 | ||||||||
Metals contracts | 20,402,750 | (12,948,182 | ) | 7,454,568 | ||||||||
Soft commodities contracts | 3,253,715 | (731,636 | ) | 2,522,079 | ||||||||
Stock indices contracts | 2,689,934 | (1,653,989 | ) | 1,035,945 | ||||||||
| $ | 60,622,707 | $ | (24,713,665 | ) | $ | 35,909,042 | ||||||
| * | The fair values of all asset and liability derivatives, including currencies, energy, agriculturals, interest rates, meats, metals, soft commodities and stock indices contracts, are included in deposits with brokers in the consolidated statement of financial condition. |
NOTE 13. INDEMNIFICATIONS
In the normal course of business, the Company enters into contracts and agreements that contain a variety of representations and warranties and which provide general indemnifications. The Company’s maximum exposure under these arrangements is unknown, as this would involve future claims that may be made against the Company that have not yet occurred. The Company expects the risk of any future obligation under these indemnifications to be remote.
NOTE 14. NET CAPITAL REQUIREMENTS
DCM is a broker-dealer subject to the Securities and Exchange Commission Uniform Net Capital Rule (SEC Rule 15c3-1), which requires the maintenance of minimum net capital and requires that the ratio of aggregate indebtedness to net capital, both as defined, shall not exceed 15 to 1. Rule 15c3-1 also provides that equity capital may not be withdrawn or cash dividends paid if the resulting net capital would exceed 10 to 1. At December 31, 2010 DCM has net capital of $52,109 which was $47,109 in excess of its required net capital of $5,000. At December 31, 2010, DCM’s net capital ratio was 0 to 1.
DCM operates under the provisions of Paragraph (k)(1) of rule 15c3-3 of the Securities Exchange Act of 1934 and, accordingly, is exempt from the remaining provisions of that rule. Essentially, the requirements of Paragraph (k)(1) provide that the Company does not hold customer funds or securities or owe money or securities to customers.
204
DEARBORN CAPITAL MANAGEMENT, L.L.C.
NOTES TO CONSOLIDATED STATEMENT OF FINANCIAL CONDITION
NOTE 15. SUBSEQUENT EVENTS
Management of the Company evaluated subsequent events through February 24, 2011, the date these financial statements were issued. Subsequent to December 31, 2010, Grant Park had contributions and redemptions totaling approximately $23,150,000 and $6,702,000 respectively.
Effective February 1, 2011, Alder Capital Limited (“Alder”) and Denali Asset Management LLLP (“Denali”) began trading on behalf of Grant Park and will serve as a commodity trading advisor with respect to all outstanding classes of Grant Park’s units. Alder and Denali will each be allocated less than 10 percent of Grant Park’s net assets to manage.
205
PART TWO: STATEMENT OF ADDITIONAL INFORMATION
GRANT PARK FUTURES FUND
LIMITED PARTNERSHIP
$200,000,000 Legacy 1 Class Units
$200,000,000 Legacy 2 Class Units
$200,000,000 Global Alternative Markets 1 Class Units
$200,000,000 Global Alternative Markets 2 Class Units
$350,000,000 Global Alternative Markets 3 Class Units
An investment in the units is speculative. Before you decide whether to invest, you should read this entire prospectus carefully and consider the risk factors beginning on page 19.
This prospectus is in two parts: a disclosure document and a statement of additional information. These parts are bound together, and both parts contain important information.
This statement of additional information and accompanying
disclosure document are both dated April 29, 2011.
206
PART TWO: STATEMENT OF ADDITIONAL INFORMATION
TABLE OF CONTENTS
| 208 | ||||||
| 217 | ||||||
| 218 | ||||||
| SAI-E-1 | ||||||
| SAI-E-22 | ||||||
| APPENDICES | ||||||
Appendices | ||||||
Limited Partnership Agreement | A-1 | |||||
Subscription Agreement and Power of Attorney | B-1 | |||||
Subscription Requirements | C-1 | |||||
Request for Redemption Form | D-1 | |||||
Glossary | E-1 | |||||
207
INTEREST MARKETS
As a public commodity fund, Grant Park actively trades commodity interests in various derivatives markets. This section provides an overview of the concepts, key terms, purposes, players and regulation of commodity interests, both from the perspective of exchange-traded derivatives and OTC derivatives.
Definition of a Derivative
Generally, a derivative is a contract whose value is based upon (or derived from) the value of something else. The “something else,” which is often referred to as the “underlier” or the “commodity,” can be a security (e.g., a share of IBM stock or a U.S. Treasury bond), a commodity (e.g., gold, wheat or cattle), an index (e.g., the Dow Jones Industrial Average), a reference rate (e.g., LIBOR), or virtually anything else.
Types of Derivatives
Conceptually, derivatives take many different forms. At the highest and broadest level, there are two types of derivatives: exchange-traded derivatives and OTC derivatives.
Exchange-traded Derivatives
Exchange-traded derivatives include futures, options on futures, security futures and listed equity options. Exchange-traded derivatives are characterized by standardized contractual terms (except for price and quantity), multilateral execution on an exchange, centralized clearing, and the presence of a statutory regulatory regime.
Futures. A futures contract is a standardized contract to buy or sell a commodity for a specified price in the future. Futures contracts are classified based upon the nature of their underlier. Thus, futures contracts consist of interest rate futures, equity futures, foreign exchange futures, commodity futures (e.g., energy, agriculture and meats), weather futures, carbon futures and real estate futures, among many others.
Options on Futures. An option on a futures contract, or a “futures option,” is a standardized contract that conveys to its holder the right, but not the obligation, to purchase (call) or sell (put) the underlying futures contract at a specified price in the future. Options on futures contracts are classified by the type of futures contract upon which the option is
based, such as interest rate futures options, equity futures options, foreign exchange futures options, commodity futures options, among many others.
Option terminology is an important part of understanding options. A call option gives the holder (buyer) the right to buy (go long) a futures contract at a specific price on or before an expiration date. An “option writer,” or “option seller,” underwrites the option and is obligated, if and when assigned an exercise, to fulfill the terms of the option contract. Exercise refers to the process whereby the option buyer asserts his right and goes long the underlying futures (in the case of exercising a call) or short the underlying futures (in the case of exercising a put). The “strike price,” also known as the “exercise price,” refers to, in the case of a physical delivery option, the price at which the option holder has the right to purchase or sell the underlying. The “expiration date” refers to the date on which the option expires. The “premium” is the non-refundable amount that the option holder pays and the option writer receives for the rights conveyed by the option.
Security Futures. A security futures contract is a standardized contract to buy or sell shares of the underlying security or the component securities of a narrow-based security index (or the cash value thereof) at a specified price in the future. Security futures possess the economic characteristics of futures, but are legally distinct from futures and securities.
Listed Options. A listed, or exchange-traded, equity option is a standardized contract that conveys to its holder the right, but not the obligation, to purchase (call) or sell (put) shares of the underlying security or the component securities of a security index at a specified price on or before a given date.
OTC Derivatives
OTC derivatives are privately negotiated contracts conducted almost entirely between institutions on a principal-to-principal basis and designed to permit customers to adjust individual risk positions with greater precision. OTC derivatives include forwards, swaps, non-listed options, structured notes, and hybrids of these instruments. OTC derivatives are characterized by customized terms, bilateral execution between two parties, and the lack of a statutory regulatory regime (although disparate regulatory regimes often touch upon certain derivatives’ products and users).
208
Forwards. A forward contract is a bilaterally-negotiated contract to buy or sell something (i.e., the underlier) at a specified price in the future. Forwards, for reference purposes, often take the character of their underlier, such as forward interest rate agreements, forward bond and note agreements, forward foreign exchange agreements, forward equity agreements, commodity forwards, and forward bullion agreements.
Swaps. A swap is a bilaterally-negotiated agreement between two parties to exchange cash flows based upon an asset, rate or something else. Swaps are characterized by the nature of their underlier, such as interest rate swaps, credit default swaps, foreign currency swaps, commodity swaps and equity swaps; and/or the nature of their features, such as accreting swaps, amortizing swaps, arrears swaps, constant maturity swaps, extendable swaps, forward swaps, overnight average swaps, reversible swaps, seasonal swaps, total return swaps, variance swaps, and zero-coupon swaps.
OTC Options
An OTC option is a bilaterally-negotiated contract that conveys to its holder the right, but not the obligation, to purchase (call) or sell (put) the underlying for a specified price in the future. Like swaps, OTC options are characterized by: 1) the nature of their underlier, such as interest rate options, foreign currency options and (OTC) equity options; and/or 2) the nature of their features, such as whether they are: a) vanilla options (where the price of the option is based upon the price of the underlier on the day of exercise or expiration), such as calls, puts, caps, floors and collars; or b) path dependent, or “exotic” options (where the price of the option is based upon the price pattern of the underlier prior to the day of exercise or expiration).
Derivatives’ Pricing
Commodity interest contracts are typically quoted in terms of a “bid” and an “ask.” A “bid” is offer to buy a specific quantity of a commodity at a stated price. The bid price represents the highest price a buyer is willing to pay for the commodity. In contrast, an “ask” is an offer to sell a specific quantity of a commodity at a stated price. The ask price represents the lowest price any seller is willing to sell the commodity or underlier. The “spread” is the difference between the bid and ask for a particular contract and represents the difference between the price that must be paid for immediate purchase and the price that can be received for immediate sale of the contract.
Moreover, while the pricing of forward contracts adhere to the bid/ask convention, the price agreed upon with respect to a forward contract is called the delivery price, which is equal to the forward price at the time the contract is entered into. The delivery price is generally fixed over a period of time. The forward price of new contracts change as the spot price changes. The forward price of such a contract is commonly contrasted with the spot price, which is the price at which the asset changes hands on the spot date.
Concept of Notional Value
A central feature of all derivatives contracts—both exchange-traded and OTC—is the concept of “notional value,” which is sometimes referred to as the “notional principal amount” if the underlier is a reference rate, such as LIBOR. The notional value represents the hypothetical value of the underlier. The purpose of using notional value is to have a reference, or benchmark, to determine the amount of payments one party owes to another party. The notional amount is generally not exchanged between the parties.
Spot Contracts and EFPs
Spot contracts are cash market transactions where the buyer and the seller agree to the immediate purchase and sale of a commodity, usually with a two-day settlement. Spot contracts are not uniform and not traded on an exchange. An exchange for physical, or EFP, transaction is one type of common transaction involving spot contracts. An EFP is the spot purchase or sale of a commodity in conjunction with an offsetting sale or purchase of a corresponding futures contract involving the same or equivalent commodity, without making an open and competitive trade for the futures contract on the exchange. Exchange rules govern the manner in which EFPs involving futures contracts that are listed on the exchange may be transacted.
Types of Commodity Interest Users
There are two broad classes of persons who trade commodity interests: hedgers and speculators. A hedger is a person who enters into a position in a commodity interest contract opposite to a position held in the cash market to minimize the risk of financial loss from an adverse price change; or who purchases or sells a commodity interest contract as a temporary substitute for a cash transaction that will occur later. One can hedge either a long cash market position (e.g.,
209
one owns the cash commodity) or a short cash market position (e.g., one plans on buying the cash commodity in the future). Hedgers include financial institutions that manage or deal in interest rate-sensitive instruments, foreign currencies or stock portfolios (among other things), and commercial end-users, such as farmers and manufacturers, that seek to manage price risk or market risk.
By contrast, a speculator generally expects neither to make nor take delivery of the underlying commodity. Rather, the speculator risks his capital with the hope of making profits from price fluctuations in the prices of commodity interests. All trades made by Grant Park are for speculative purposes, not hedging purposes.
Market Participants in the Futures Markets
Futures Markets
Role. Futures markets provide centralized market facilities in which multiple persons have the ability to execute or trade contracts by accepting bids and offers from multiple participants. Futures markets may provide for execution of trades at a physical location utilizing trading pits and/or may provide for trading to be done electronically through computerized matching of bids and offers pursuant to various algorithms. Members of a particular exchange and the trades executed on such exchanges are subject to the rules of that exchange.
The Commodity Exchange Act, or CEA, provides for two tiers of markets: regulated and exempt. The regulated markets include designated contract markets and designated execution transaction facilities; while the exempt markets include exempt commercial markets and exempt boards of trade.
Designated Contract Markets. Designated Contract Markets (“DCMs”) represent the traditional futures exchanges, such as CME, CBOT and NYMEX. DCMs may list for trading futures contracts (or options thereon) on any underlying commodity, index, or instrument and may allow access to their facilities by all types of participants, including retail customers. Applicants for initial designation must satisfy certain “designation criteria,” such as the prevention of market manipulation, fair and equitable trading, enforcement of rules, financial integrity of transactions, disciplinary procedures, public access to information, and the ability to obtain information. They also must demonstrate the ability to comply with, and once
designated, must comply with, 18 “core principles” set forth in the CEA.
Designated Transaction Execution Facilities. Designated Transaction Execution Facilities (“DTEFs”) are trading facilities that limit access to institutional or otherwise eligible traders and restrict the types of products that may be traded. DTEFs operate under a reduced level of regulation from that applicable to a DCM. Boards of trade registered as DTEFs may list for trading futures or option contracts on commodities that have a nearly inexhaustible deliverable supply, have a deliverable supply sufficiently large that the contract is highly unlikely to be susceptible to the threat of manipulation, have no cash market, are security futures products, or have been determined (on a case-by-case basis) by the CFTC to be highly unlikely to be susceptible to the threat of manipulation. Applicants for DTEF registration must satisfy certain designation criteria and comply with nine core principles.
Exempt Commercial Markets. Exempt Commercial Markets (“ECMs”) are electronic trading facilities that restrict trading to principal-to-principal transactions in “exempt commodities” between “eligible commercial entities.” ECMs are not entirely unregulated, in that they are subject to certain recordkeeping and reporting requirements, as well as to the anti-fraud and anti-manipulation provisions of the CEA. Moreover, if these markets list futures contracts that serve as significant price discovery function, they are subject to regulation comparable to that of a DCM.
Exempt Boards of Trade. Exempt Boards of Trade (“XBOTs”) are not registered with, or designated by, the CFTC. XBOTs are exempt from most provisions of the CEA (other than its anti-fraud and anti-manipulation prohibitions), but are subject to certain commodity and participant restrictions. The commodities that can be traded on an XBOT are those defined as excluded commodities, such as an interest rate, exchange rate, credit risk or measure, debt, measure of inflation or other macroeconomic index or measure. XBOTs must limit access to certain institutional and sophisticated persons defined as “eligible contract participants.” If the CFTC determines that the XBOT represents a significant source of price discovery for the commodity underlying any contract, the XBOT will be required to disseminate publicly, on a daily basis, trading volume, price data and other data as appropriate to the market.
210
The trading advisors intend to monitor the development of and opportunities and risks presented by the less-regulated DTEFs, ECMs and XBOTS and may, allocate a percentage of Grant Park’s assets to trading in products on these exchanges, provided Grant Park maintains assets exceeding $5 million, in which case Grant Park would qualify as an eligible contract participant and thus would be able to trade on such exchanges.
Non-U.S. Futures Exchanges. Non-U.S. futures exchanges differ in certain respects from their U.S. counterparts. The CFTC is prohibited by statute from regulating trading on non-U.S. futures exchanges and markets. The CFTC, however, has adopted regulations relating to the marketing of non-U.S. futures contracts in the U.S. These regulations permit certain contracts traded on non-U.S. exchanges to be offered and sold in the U.S. In contrast to U.S. designated contract markets, some non-U.S. exchanges are principals’ markets, where trades remain the liability of the traders involved, and the exchange or an affiliated clearing organization, if any, does not become substituted for any party. Due to the absence of a clearing system, such exchanges are significantly more susceptible to disruptions. Further, participants in such markets must often satisfy themselves as to the individual creditworthiness of each entity with which they enter into a trade.
Clearing Houses
Role.Once a futures trade has been executed, the trade is submitted for “clearing.” Clearing is the process of matching, reconciling and resolving obligations between counterparties. With centralized, or multilateral clearing, the original contract between the two counterparties is replaced by two contracts (via novation), each of which arises between one of the original counterparties and the clearinghouse. A clearinghouse thus interposes itself as a legal counterparty to both sides of a transaction. Thereafter, each clearing member party to the trade looks only to the clearing house for performance. A central function of the clearing organization is to ensure the integrity of trades, and members effecting transactions on an exchange need not concern themselves with the solvency of the party on the opposite side of the trade; their only remaining concerns are the respective solvencies of their clearing broker and the clearing organization.
Margin.Initial margin (which is often referred to as the “performance bond”) is the minimum amount of funds that must be deposited by a futures trader with the trader’s futures commission merchant to initiate and maintain an open position in futures contracts. Maintenance margin is the amount to which a trader’s account may decline before he must deliver additional margin. A margin deposit operates as a cash performance bond, helping to ensure the trader’s performance of the futures contracts that he or she purchases or sells. Futures contracts are customarily bought and sold on margin that represents a very small percentage (ranging upward from less than 2%) of the notional value of the contract. The amount of margin is inversely related to the degree of leverage. Thus, a margin deposit of 2% represents a 50-to-1 leverage ratio, while a margin deposit of 100% would represent no leverage. The relationship between margin and leverage also determines capital efficiency, in that borrowed funds generally result in greater capital efficiency.
As a result of such low margin requirements, price fluctuations occurring in the futures markets may create profits and losses that, in relation to the amount invested, are greater than are customary in other forms of investment or speculation. The amount of margin required in connection with a particular futures contract is established from time to time by the exchange on which the contract is traded and may be modified from time to time by the exchange during the term of the contract.
The concept of “mark-to-market” is a critical component of futures-style margin. Simply stated, “mark-to-market” refers to the current value of a futures position. The mark-to-market system is part of the daily cash flow system used by U.S. futures exchanges to maintain a minimum level of equity for a given futures or option contract position by calculating the gain or loss in each contract position resulting from changes in the price of the futures or option contracts at the end of each trading session. Typically, with respect to exchange-traded derivatives, the “mark-to-market” represents the fair market value of the position.
Brokerage firms, such as Grant Park’s clearing brokers, may not accept lower—and generally require higher—amounts of margin as a matter of policy. The clearing brokers require Grant Park to make margin deposits equal to exchange minimum levels for all exchange-traded derivatives. This requirement may be adjusted from time to time in the clearing brokers’ discretion.
211
Trading in the OTC markets where no clearing facility is provided generally does not require margin but generally does require the extension of credit between counterparties.
When a trader purchases an option, there is no margin requirement, however, the option premium must be paid in full. When a trader sells an option, on the other hand, he or she is required to deposit margin in an amount determined by the margin requirements established for the underlying interest and, in addition, an amount substantially equal to the current premium for the option. The margin requirements imposed on the selling of options, although adjusted to reflect the probability that out-of-the-money options will not be exercised, can in fact be higher than those imposed in dealing in the futures markets directly. Complicated margin requirements apply to spreads and conversions, which are complex trading strategies in which a trader acquires a mixture of options positions and positions in the underlying interest.
Margin requirements are computed each day by a trader’s clearing broker. When the market value of a particular open commodity interest position changes to a point where the margin on deposit does not satisfy maintenance margin requirements, a margin call is made by the broker. If the margin call is not met within a reasonable time, the broker may close out the trader’s position. With respect to Grant Park’s trading, Grant Park (and not its investors personally) is subject to margin calls.
Many major U.S. exchanges have passed certain cross margining arrangements involving procedures pursuant to which the futures and options positions held in an account would, in the case of some accounts, be aggregated and margin requirements would be assessed on a portfolio basis, measuring the total risk of the combined positions.
Futures Commission Merchants
Futures commission merchants are the brokers of the futures industry. They solicit or accept orders from customers for the purchase or sale of futures contracts (or options thereon), and accept and hold customer funds relating to such transactions. Thus, two elements characterize futures commission merchants: taking orders to buy or sell futures or options thereon; and accepting money or other assets from customers for such orders.
Clearing Firms
Clearing firms, which are a subset of futures commission merchants, serve as intermediaries in the provision of clearing services to clients, which may include non-clearing exchange members such as introducing brokers, other futures commission merchants and proprietary trading firms, among others. Clearing firms are generally responsible for the day-to-day settlement of all customer accounts at futures exchanges. They act as a third party to all trades, serving as buyer to every seller and seller to every buyer, and guarantor of all futures contracts.
Introducing Brokers
In contrast to futures commission merchants, introducing brokers solicit and accept orders to purchase or sell futures (or options thereon), but they may not accept or hold customer funds.
Commodity Pool Operators
Commodity pool operators operate collective investment vehicles (i.e., commodity pools) that solicit or accept funds for the purchase of interests in the collective investment vehicle, which therein may invest in futures and options on futures.
Commodity Trading Advisors
Commodity trading advisors engage in the business of advising others, either directly or through publications, writings, or electronic media, on the value of or the advisability of trading in futures or options on futures, or as part of a regular business, issue analyses or reports regarding futures or options on futures.
Associated Persons
Associated persons (“APs”) are salespersons – or supervisors of salespersons—for futures commission merchants, introducing brokers, commodity pool operators and commodity trading advisors.
Principals
Principals are generally the persons that control or have management responsibility over registrants. Generally, they include officers, directors and 10% shareholders or membership interest holders of registrants.
212
Floor Brokers
A floor broker is a member of the exchange that operates in the pit by buying and selling contracts on behalf of customers—not on behalf of his account.
The floor broker, as an intermediary like an futures commission merchant, serves in an agency capacity in which the principal is the customer.
Floor Traders
Floor traders, or “locals,” buy and sell futures contracts for their own account on the floor of the exchange. Floor traders often seek to profit by “scalping” trades—i.e., they seek to buy (or sell) contracts at the bid (or ask) price and then quickly sell (or buy) them a tick higher (or lower) for a profit.
Overview of Futures Regulation
In 1974, Congress established the CFTC as an independent federal regulatory agency and granted the agency exclusive jurisdiction over the regulation of futures and options on futures contracts. The CFTC’s function is to implement the CEA’s objectives of preventing price manipulation and excessive speculation and promoting orderly and efficient futures markets. In addition, the various exchanges and clearing houses exercise regulatory and supervisory authority over their member firms.
The CFTC has adopted regulations with respect to the activities of commodity pool operators and commodity trading advisors. Under the CEA, a registered commodity pool operator, such as the general partner, is required to make annual filings with the CFTC describing its organization, capital structure, management and controlling persons. In addition, the CEA authorizes the CFTC to require and review books and records of, and documents prepared by, registered commodity pool operators. The CEA gives the CFTC similar authority with respect to the activities of commodity trading advisors, such as Grant Park’s trading advisors.
The CEA requires all futures commission merchants, such as Grant Park’s clearing brokers, to meet and maintain specified fitness and financial requirements, to segregate customer funds from proprietary funds and account separately for all customers’ funds and positions, and to maintain specified books and records open to inspection by the staff of the CFTC. The CFTC has similar authority
over introducing brokers, or persons who solicit or accept orders for commodity interest trades but who do not accept margin deposits for the execution of trades.
Grant Park’s investors are afforded prescribed rights for reparations under the CEA. Investors may also be able to maintain a private right of action for violations of the CEA. The CFTC has adopted rules implementing the reparation provisions of the CEA, which provide that any person may file a reparations complaint with the CFTC for violation of the CEA against a floor broker or a futures commission merchant, introducing broker, commodity trading advisor, commodity pool operator, and their respective associated persons.
Under the CEA, the NFA operates as a registered futures association, which is a form of self-regulatory organization. The CFTC has delegated to NFA responsibility for the registration of commodity trading advisors, commodity pool operators, futures commission merchants, introducing brokers, and their respective associated persons and floor brokers. The general partner, each trading advisor, the selling agents and the clearing brokers are members of NFA. As such, they are subject to NFA standards relating to fair trade practices, financial condition and consumer protection. Grant Park itself is not required to be registered in any capacity with the CFTC or to become a member of the NFA. As the self-regulatory organization of the futures industry, NFA issues rules and interpretations governing the conduct of futures industry professionals and disciplines those professionals that do not comply with NFA’s rules. The NFA also arbitrates disputes between members and their customers and conducts registration and fitness screening of applicants for membership.
The regulations of the CFTC and the NFA prohibit any representation by a person registered with the CFTC or by any member of the NFA, that registration with the CFTC, or membership in the NFA, in any respect indicates that the CFTC or the NFA, as the case may be, has approved or endorsed that person or that person’s trading program or objectives. The registrations and memberships of the parties described in this summary must not be considered as constituting any such approval or endorsement. Similarly, no futures exchange is permitted to provide any similar approval or endorsement.
The regulation of futures trading in the United States and other countries is an evolving area of the
213
law. As discussed in the “RISK FACTORS,” numerous proposals regarding the regulation of commodity interests have been made by members Congress, the Treasury Department, the CFTC and the SEC. The various statements made in this summary are subject to modification by legislative action and changes in the rules and regulations of the CFTC, the SEC, the NFA, the futures exchanges, clearing houses and other regulatory bodies.
Overview of Speculative Position Limits
The CFTC and U.S. designated contract markets have established limits or position accountability rules, referred to as speculative position limits or position limits, on the maximum net long or net short speculative position that any person or group of persons under common trading control (other than a hedger, which Grant Park is not) may hold, own or control in commodity interests. Among the purposes of speculative position limits is to prevent a corner or squeeze on a market or undue influence on prices by any single trader or group of traders.
The position limits established by the CFTC apply to certain exchange-traded derivatives, such as gold, crude oil, wheat, soybeans and cotton. In addition, U.S. exchanges are required to establish position limits (or accountability positions) for all contracts traded on the exchange. Certain exchanges or clearing houses also establish limits on the total net positions that may be held by a clearing broker.
Position limits do not apply to OTC derivatives or with respect to trading on non-U.S. futures exchanges, although the principals with which Grant Park and the clearing brokers may trade in such markets may impose such limits as a matter of credit policy. For purposes of determining position limits, Grant Park’s commodity interest positions will not be attributable to investors in their own commodity interest trading.
Market Participants in the OTC Derivatives Markets
Unlike the many and diverse players involved in the futures markets, the number of players involved in forward transactions typically is smaller in number, and primarily include OTC dealers, prime brokers, credit support providers, custodians and end-users, several of which are discussed below.
Dealers
The OTC markets are organized as “dealer markets” in which the dealers “make markets” (i.e., offer to take either side of a trade) in forwards, swaps and OTC options (among other products) by maintaining and continuously updating bid and offer quotes to market participants and potential end-users. Ultimately, dealers seek to find other sides to their transaction and earn a “spread” by closing out the positions in subsequent trades with other parties. Often times, however, they may hold positions and establish a hedge position in the futures market or through other OTC derivatives, or simply take a calculated view (i.e., speculate) on the outcome of the position. Most OTC derivatives dealers in the U.S. are banks or affiliates of banks, or affiliates of broker-dealers or futures commission merchants. Recently, among many other proposals, the Obama Administration has proposed to require banks to separate their traditional banking functions from their proprietary trading operations.
Prime Brokers
Prime brokers play a pivotal role in the OTC derivatives market. Generally, prime brokerage arrangements in the OTC derivatives markets involve a prime broker, a prime brokerage client and an executing dealer. Prime brokerage allows clients to trade in the name of the prime broker with executing dealers approved by the prime broker. Prime brokers also provide a number of administrative functions relating to, among other things, bookkeeping, custody, and transaction reporting.
Credit Support Providers
An important feature of OTC derivatives transactions is that each party must take on the creditworthiness of the other party. Counterparties thus are exposed to “credit risk,” which is the prospect that a counterparty may default on a payment or become insolvent. One way to reduce credit risk is to make arrangements for “credit support,” which may take the forms of guarantees, pledges, letters of credit or credit default swaps. Credit support providers are the parties that provide, for a fee, the credit support. Ultimately, credit support does not eliminate counterparty risk, but may provide substantial recourse in the event of a counterparty failure.
214
Clearing in the OTC Derivatives Markets
Most OTC derivatives, such as forwards, are settled bilaterally by the counterparties to the contract. Futures contracts, by contrast, and a growing amount of OTC derivatives, are cleared and settled through a centralized clearing house. In an OTC market with a central counterparty (i.e., a “CCP”), trading itself continues to take place on a bilateral basis. However, after a trade agreement is executed, it is transferred, or “novated,” to the CCP. Thus, the single contract between the two initial counterparties is replaced by two new contracts between the CCPs and each of the two parties.
Numerous proposals in Congress—including legislation proposed by the Obama Administration—would require that “standardized” OTC derivatives be cleared by a clearinghouse registered with the CFTC. A number of complex issues surround these proposals, including the definition of “standardized,” the regulation of swap dealers, and the imposition of regulatory requirements on end-users that rely upon the capital efficiency of derivatives to hedge various risks.
Enforcement OTC Derivatives Transactions
Governance
OTC derivatives transactions are generally documented by using template agreements published by the International Swap Dealers Association, or “ISDA”. The ISDA master agreement is the standard governing document used throughout the industry that serves as a framework for all swaps transactions, including forwards and OTC options transactions, between counterparties. OTC documentation can be negotiated for individual transactions or can be negotiated once, prior to the first transaction, and used for multiple transactions. The negotiated agreement serves as the basis for enforcing an OTC derivatives contract—no statutory private right of action exists.
Standard ISDA documentation for swaps usually consists of five parts: 1) the master agreement, which is a preprinted and standardized form; 2) the schedule, which supplements and consists of negotiated amendments to the terms of the master agreement; 3) the credit support annex, which addresses the complexities of the pledge and transfer of collateral or some other form of credit support; and 4) the confirmation, which sets forth the economic and legal essentials of particular transactions or “trades,” drawing from standard sets of defined terms. The
confirmation typically sets for standard definitions that will govern the trade(s).
Regulation
Historically, OTC derivatives have been subjected to substantial legal uncertainty. In 2000, issues relating to legal uncertainty and the disparate regulation of OTC derivatives and exchange-traded derivatives culminated in the enactment of the Commodity Futures Modernization Act (the “CFMA”), which amended the CEA. Notably, Section 2(g) of the CEA excludes from regulation all agreements, contracts, and transactions “in a commodity other than an agricultural commodity” between “eligible contract participants” that are individually negotiated by the parties and that are “not executed or traded on a trading facility.” The CFMA also amended the Securities Act of 1933, as amended, and the Securities Exchange Act of 1934, as amended, to provide that swap agreements, including security-based swap agreements, are not “securities” under those acts and may not be regulated as such except with respect to those provisions that prohibit fraud, manipulation and insider trading.
Moreover, in 2008, Congress passed the Food, Conservation, and Energy Act of 2008, which includes, in Title VIII, the CFTC Reauthorization Act of 2008 (the “Reauthorization Act”). The Reauthorization Act reauthorized the CFTC for five years and amends the CEA in an effort to address changes that have occurred in the derivatives markets since the last CFTC’s reauthorization in 2000. Most significantly for OTC derivatives, the Reauthorization Act creates a new regulatory regime for certain OTC energy derivatives markets, subjecting them to a host of DCM-like regulations. Specifically, Section 2(h)(7) of the CEA increases the CFTC’s regulatory authority over trading in “significant price discovery contracts” (i.e., contracts in exempt commodities that would be exempt from CFTC oversight under Section 2(h)(3), but that perform significant price discovery functions). Under the Reauthorization Act, the CFTC is given the discretion to determine whether a contract is a significant price discovery contract. If the CFTC issues an order determining that a contract on an electronic trading facility constitutes a significant price discovery contract, the electronic trading facility must comply with nine statutory core principles.
Recently, as confidence in the financial markets began to melt in August 2007—and virtually evaporate in 2008—OTC derivatives generally, and credit default
215
swaps (“CDS”) in particular, became the du jure culprit and a leading candidate for exasperating, if not causing, the turmoil that rifled through the financial markets. The harshness of the recent financial crisis, coupled with the perceived role that OTC derivatives played in the crisis, has lead to urgent calls to regulate the OTC market and, in some cases, abolish certain financial products. As a result, several governmental agencies, members of Congress and the Obama Administration have sought to regulate OTC derivatives. The various proposals range from limiting
excessive speculation with respect to certain products to requiring “standardized” OTC derivatives to be exchange-traded or cleared through a registered clearing house to mandating the registration of OTC derivatives dealers—among many other proposals. While the nature of the outcome of these proposals remains uncertain, the notion of some type of outcome seems secure. Given the significance of the proposals, the ultimate impact on the trading of commodity interests is likely to be substantial.
216
HISTORICAL PERSPECTIVE OF THE MANAGED FUTURES INDUSTRY
Since 1980, the world’s futures markets have expanded from consisting primarily of agricultural contracts to include worldwide financial markets such as stock indices, currencies and global interest rates. The pie chart below demonstrates this growth of diversity within the futures industry. In 1980, the agricultural sector dominated the trading volume of the industry. By December 2010, the agricultural sector represented approximately only 7% of trading while interest rates, currencies and stock indices represented approximately 82%.
Futures Industry Sectors
| 1980 | 2010 | |
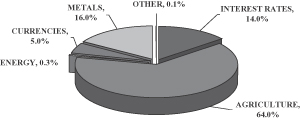 | 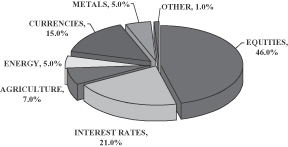 | |
Source: Futures Industry Association, Washington, D.C., Futures and Options Global Trading Volume
The above charts were prepared by Dearborn Capital Management, L.L.C.
The managed futures industry is comprised of professional money managers known as commodity trading advisors. Commodity trading advisors manage client assets on a discretionary basis using derivatives as an investment medium. As the chart below illustrates, assets dedicated to managed futures have grown from approximately $300 million in 1980 to $266 billion in December 2010.
Growth in the Managed Futures Industry
January 1980 – December 2010
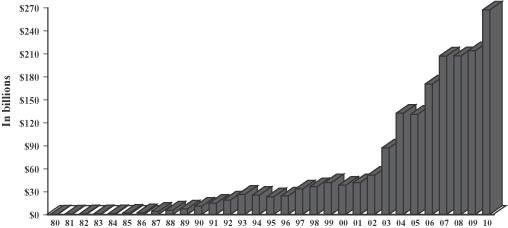
This chart was prepared by Dearborn Capital Management, L.L.C. using data obtained from Barclay Trading Group, Ltd.
217
POTENTIAL ADVANTAGES OF INVESTMENT
The following section provides a description of the potential advantages of investing in Grant Park.
Value of Diversifying Into Managed Futures
The inclusion of managed futures into a portfolio is based upon the most fundamental of all investment principles: diversification. Dr. Harry Markowitz’s groundbreaking work in portfolio construction concluded that a more efficient portfolio can be created by investing across non-correlated asset classes. This hypothesis became known as Modern Portfolio Theory and earned Dr. Markowitz a Nobel Prize in economics.
In 1980 John Lintner of Harvard University applied this theory to the developing asset class of managed futures. His study determined that “the combined portfolios of stocks (or stocks and bonds) after including judicious investments…in leveraged managed futures accounts show substantially less risk at every possible level of expected return than portfolios of stocks and bonds alone.” While managed futures were intuitively understood to have a low correlation to traditional asset classes, this landmark study confirmed the diversification benefits derived from allocating a portion of a portfolio into this asset class.
True diversification is derived from investing across asset classes that move independently, or are non-correlated, to each other. Managed futures have long been recognized as having a low correlation to traditional asset classes.
Historical Correlation and Comparative Performance
The chart below shows the historical correlation of the monthly returns of the NASDAQ Composite Index, HFRI Fund Weighted Composite Index, Morgan Stanley Capital International Europe, Australasia, Far East (MSCI EAFE) Index, Barclays Capital U.S. Long Government Index and the Barclay CTA Index with the Standard & Poor’s 500 Total Return Index (S&P 500 Index). The NASDAQ Composite Index, HFRI Fund Weighted Composite Index, MSCI EAFE Index, Barclays Capital U.S. Long Government Index and S&P 500 Index are passive, unmanaged indices of equity or debt securities, as applicable, generally purchased by investors for investment purposes. The Barclay CTA Index is an unweighted index which attempts, to measure performance of the CTA industry. All of the above indices are used by the marketplace in varying degrees as performance benchmarks of the various asset classes they represent.
A correlation of 1.0 indicates a perfect positive and direct correlation between the particular index and the S&P 500 Index; a correlation of -1.0 indicates a perfectly negative or inverse correlation between the particular index and the S&P 500 Index. Note that stocks associated with the NASDAQ, HFRI Fund Weighted Composite and MSCI EAFE indices, as well as bonds, have historically had a higher correlation with the S&P 500 Index than managed futures investments, as represented by the Barclay CTA Index. This low correlation shows that managed futures have a tendency to behave somewhat independently from stocks.
218
Historical Correlation of Monthly Returns with S&P 500 Stock Index
January 1980 – December 2010
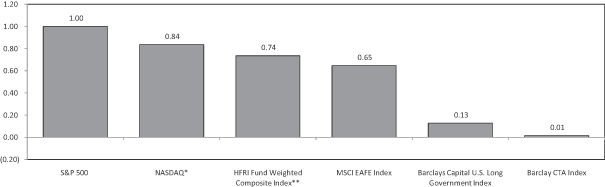
| * | Performance data for the NASDAQ Composite Index available only from December 1984 through December 2010. |
| ** | Performance data for the HFRI Fund Weighted Composite Index available only from January 1990 through December 2010. |
This chart was prepared by Dearborn Capital Management, L.L.C.
See the glossary in Appendix E for descriptions of the indices in this chart.
PAST PERFORMANCE IS NOT NECESSARILY INDICATIVE OF FUTURE RESULTS
ALL PERFORMANCE REPORTED FOR GRANT PARK IS FOR CLASS A UNITS AND IS NET OF FEES AND EXPENSES
The Advantages of Non-Correlation
Given that historically, managed futures investments have had very little correlation to the stock and bond markets, Dearborn Capital Management, L.L.C., Grant Park’s sponsor and general partner, believes that the performance of Grant Park should also exhibit a substantial degree of non-correlation with the performance of traditional equity and debt portfolio components, in part because of the ease of selling commodity interests short. This feature of many commodity interest contracts—being able to be long or short a commodity interest position with similar ease—means that profit and loss from commodity interest trading is not dependent upon economic prosperity or stability.
However, non-correlation will not provide any diversification advantages unless the non-correlated assets are outperforming other portfolio assets, and it is entirely possible that Grant Park may not outperform other sectors of an investor’s portfolio, or may produce losses. Additionally, although adding managed futures funds to a portfolio may provide diversification, managed futures funds are not a hedging mechanism and you should not assume that managed futures funds will appreciate during periods of inflation or stock and bond market declines.
Non-correlated performance should not be confused with negatively correlated performance. Negative correlation occurs when the performance of two asset classes are in opposite direction to each other. Non-correlation means only that Grant Park’s performance will likely have no relation to the performance of equity and debt instruments, reflecting the general partner’s belief that certain factors that affect equity and debt prices may affect Grant Park differently and that certain factors that affect equity and debt prices may not affect Grant Park at all. Grant Park’s net asset value per unit may decline or increase more or less than equity and debt instruments during both rising and falling cash markets. The general partner does not expect that Grant Park’s performance will be negatively correlated to general debt and equity markets.
219
The chart below shows the historical correlation of the monthly returns of the Barclay CTA Index, Barclays Capital U.S. Long Government Index, the HFRI Fund Weighted Composite Index, the MSCI EAFE Index, S&P 500 Index and the NASDAQ Composite Index with Grant Park.
Historical Correlation of Monthly Returns with Grant Park Futures Fund
January 1989 – December 2010
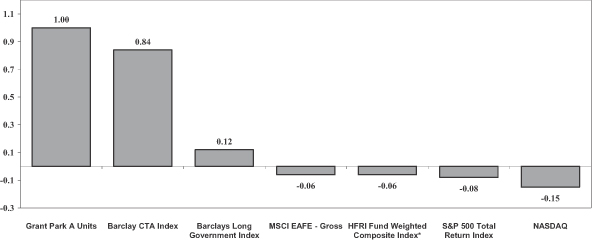
| * | Performance data for the HFRI Fund Weighted Composite Index available only from January 1990 through December 2010. |
This chart was prepared by Dearborn Capital Management, L.L.C.
See the glossary in Appendix E for descriptions of the indices in this chart.
PAST PERFORMANCE IS NOT NECESSARILY INDICATIVE OF FUTURE RESULTS
ALL PERFORMANCE REPORTED FOR GRANT PARK IS FOR CLASS A UNITS
AND IS NET OF FEES AND EXPENSES
Advantages of Commodity Pool Investments
Both the commodity interest markets and funds investing in those markets offer many structural advantages that make managed futures an efficient way to participate in global markets. For example, each investor in Grant Park should be able to participate in a greater number of commodity interest markets (both U.S. and non-U.S.) and to a greater extent than would be possible if Grant Park’s minimum investment were traded on an individual investor basis.
Profit Potential
Commodity interest contracts can easily be leveraged, which magnifies the potential profit and the potential loss. As a result of this leveraging, even a small movement in the price of a contract can cause major losses.
Interest Income
Unlike some alternative investment funds, Grant Park does not borrow money in order to obtain leverage, so Grant Park does not incur any interest expense. Rather, Grant Park’s margin deposits are maintained in cash equivalents, such as U.S. Treasury bills, and interest is earned on 100% of Grant Park’s available assets, which include unrealized profits credited to Grant Park’s accounts.
220
Diversification within a Single Investment
Commodity interest contracts allow an investor to diversify risk across market sectors, as well as geographically. For example, an investor can trade interest rates, stock indices, currencies, energy products and metals in numerous countries around the world. This market diversification may reduce the risk of loss. While Grant Park itself trades across a diverse selection of global markets, an investment in Grant Park is not a substitute for overall portfolio diversification.
The pie chart below demonstrates Grant Park’s collective market sectors exposure of all of its trading advisors as of December 31, 2010. This is not a reflection of actual positions held on this date, but rather a reflection of the potential estimated exposure to any one market sector on this date.
Grant Park Futures Fund Sector Exposure
As of December 31, 2010
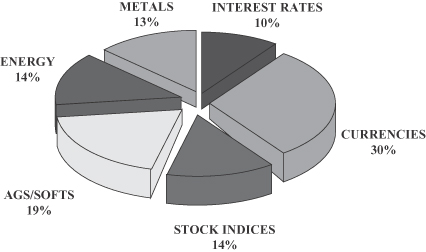
This chart was prepared by Dearborn Capital Management, L.L.C.
See “Overview of the Commodity Interest Markets” above for information related to this chart.
Ability to Profit or Lose in a Rising or Falling Market Environment
Grant Park can establish short positions and thereby profit from declining markets as easily as it can establish long positions. This potential to make money, whether markets are rising or falling around the world, makes managed futures particularly attractive to sophisticated investors. Of course, if markets go higher while an investor has a short position, the investor will lose money until the short position is exited.
Professional Trading
Grant Park’s trading decisions are made by Rabar Market Research, Inc., EMC Capital Management, Inc., Eckhardt Trading Company, Winton Capital Management Limited, Welton Investment Corporation, Global Advisors Jersey Limited, Transtrend B.V., Quantitative Investment Management LLC, Sunrise Capital Partners LLC, Amplitude Capital International Limited and, effective February 1, 2011, Alder Capital Limited and Denali Asset Management, LLLP. Each trading advisor uses its own proprietary trading program.
Each of the trading advisors is a full-time commodity trading advisor with an established performance record and a dedicated staff of experienced alternative investment professionals. The general partner may terminate or replace the trading advisors or retain additional trading advisors in its sole discretion.
Convenience
Through Grant Park, investors can participate in global markets and opportunities without needing to master complex trading strategies and monitor multiple international markets. In addition, Grant Park provides to or
221
obtains for its investors many services designed to alleviate the administrative details involved in trading commodity interests directly, including maintaining books and records of trading activities, preparing unaudited monthly and audited annual account statements to investors and supplying investors with information necessary for preparing their federal income tax returns.
Liquidity
In most cases, the commodity interest markets on which Grant Park trades have sufficient liquidity. Some markets trade 24 hours on business days. While there can be cases where there may be no buyer or seller for a particular market, Grant Park attempts to select markets for investment based upon, among other things, their perceived liquidity. Most exchanges impose limits on the amount that prices in certain futures or options contracts can move in one day. Situations in which markets have moved the limit for several consecutive days have not been common, but do occur.
Investors also may cause Grant Park to redeem all or a portion of their units on a monthly basis.
Limited Liability
Investors’ liability is limited to the amount of their investment in Grant Park. Investors cannot individually be subjected to margin calls and will not be required to contribute additional capital to Grant Park.
Sponsor Experience
Grant Park’s sponsor and general partner, Dearborn Capital Management, L.L.C., and its principals have extensive experience managing and operating Grant Park. Grant Park has been in continuous existence since January 1989. However, past performance is not necessarily indicative of future results.
Low Investment Requirements
The minimum investment required to invest in the Legacy 1 Class and Legacy 2 Class units is $10,000, except in the case of investors that are employee benefit plans and/or individual retirement accounts for which the minimum investment is $1,000; subsequent investment in the Legacy 1 Class and Legacy 2 Class units must be at least $1,000. The minimum investment in the Global 1 Class, Global 2 Class and Global 3 Class units is $5,000, except in the case of investors that are employee benefit plans and/or individual retirement accounts for which the minimum investment is $1,000; subsequent investment in the Global 1 Class, Global 2 Class and Global 3 Class units must be at least $1,000. Typically, the minimum investment in an individually managed futures account would be substantially greater. In fact, some of Grant Park’s current trading advisors have a general account size minimum of at least $1,000,000.
222
SUPPLEMENTAL PERFORMANCE INFORMATION OF GRANT PARK
The tables and accompanying information on the remaining pages that follow present certain supplemental historical performance and statistical information of the Class A and Class B units of Grant Park. Class B units are assessed an annual rate of 30 basis points (0.30%) of the adjusted net assets of the Class B units in organization and offering expenses, calculated and payable monthly on the basis of month-end adjusted net assets. Class A units are assessed an annual rate of 10 basis points (0.10%) of the adjusted net assets of the Class A units, calculated and payable monthly on the basis of month-end adjusted net assets. In addition, Class A units pay the general partner a monthly brokerage charge equal to 0.6250%, a rate of 7.50% annually, of the month-end adjusted net assets of the Class A units, whereas Class B unit holders pay a monthly brokerage charge equal to 0.6625%, a rate of 7.95% annually, of the month-end adjusted net assets of the Class B units. Had these additional expenses been reflected, the performance of the Class A units would have been lower. Although the following information has not been audited, the general partner believes this information to be reliable.All performance information for Grant Park is shown net of fees and expenses. You should consult Part One of this prospectus regarding the material terms applicable to an investment in Grant Park, including the associated fees and expenses.Past performance is not necessarily indicative of future results.
SAI-E-1
SUPPLEMENTAL PERFORMANCE INFORMATION
GRANT PARK FUTURES FUND CLASS A UNITS PERFORMANCE — INCEPTION THROUGH DECEMBER 2010
(UNAUDITED)
The past performance record of Grant Park’s Class A units is presented below. While the performance record set forth in the table below has not been independently audited, the general partner believes that the information presented is accurate.All performance information is shown net of fees and expenses.
Name of the Fund | Grant Park Futures Fund Limited Partnership (Class A units) |
Type of Fund | Privately offered (through February 2003); Publicly offered beginning June 30, 2003; Multi-advisor |
Inception of Trading | January 1989 |
Aggregate Gross Subscriptions at December 2010 | $147,153,661 |
Net Asset Value at December 2010 | $64,565,072 |
Worst Monthly Percentage Draw-Down * (Since inception) | -21.72% 08/89 |
Worst Peak-to-Valley Draw-Down** (Since inception) | -38.87% 05/89 – 10/89 |
| Rate of Return*** | ||||||||||||||||||||||||||||||||||||||||||||||||||||||||||||||||||||||||||||||||||||||||
Month | 2010 | 2009 | 2008 | 2007 | 2006 | 2005 | 2004 | 2003† | 2002 | 2001 | 2000 | 1999 | 1998 | 1997 | 1996 | 1995 | 1994 | 1993 | 1992 | 1991 | 1990 | 1989 | ||||||||||||||||||||||||||||||||||||||||||||||||||||||||||||||||||
Jan | (7.95 | )% | (0.91 | )% | 2.49 | % | 1.25 | % | 3.49 | % | (5.96 | )% | 0.38 | % | 2.72 | % | (0.87 | )% | 1.86 | % | (1.12 | )% | (2.02 | )% | 1.96 | % | 6.82 | % | (1.09 | )% | (10.69 | )% | (13.74 | )% | 2.38 | % | (15.23 | )% | (12.36 | )% | 5.20 | % | 0.97 | % | ||||||||||||||||||||||||||||||||||||||||||||
Feb | 0.63 | % | (0.80 | )% | 9.66 | % | (4.18 | )% | (3.28 | )% | 3.42 | % | 7.33 | % | 5.77 | % | (5.95 | )% | 0.53 | % | 0.69 | % | 7.95 | % | 2.62 | % | 7.61 | % | (13.59 | )% | 16.37 | % | (9.39 | )% | 18.13 | % | (5.32 | )% | (13.31 | )% | 6.32 | % | (3.29 | )% | ||||||||||||||||||||||||||||||||||||||||||||
Mar | 4.08 | % | (3.26 | )% | (0.63 | )% | (4.55 | )% | 4.06 | % | (0.51 | )% | (1.40 | )% | (7.47 | )% | 2.26 | % | 6.63 | % | (1.70 | )% | (5.18 | )% | (1.08 | )% | 1.06 | % | (1.34 | )% | 20.67 | % | 23.25 | % | 1.57 | % | (2.32 | )% | 1.75 | % | 22.20 | % | 17.34 | % | ||||||||||||||||||||||||||||||||||||||||||||
Apr | 1.80 | % | (1.73 | )% | (0.13 | )% | 5.23 | % | 9.46 | % | (5.05 | )% | (11.66 | )% | 2.57 | % | (3.07 | )% | (4.51 | )% | (3.84 | )% | 2.92 | % | (7.46 | )% | (8.45 | )% | 4.97 | % | 10.88 | % | 2.31 | % | 15.69 | % | (4.13 | )% | (6.52 | )% | 31.10 | % | (9.51 | )% | ||||||||||||||||||||||||||||||||||||||||||||
May | (3.83 | )% | 1.64 | % | 2.11 | % | 4.60 | % | (0.81 | )% | 3.98 | % | (4.75 | )% | 9.68 | % | 5.17 | % | (0.47 | )% | 1.80 | % | (5.51 | )% | 3.13 | % | (0.91 | )% | (4.35 | )% | 14.93 | % | 14.29 | % | 2.30 | % | (2.34 | )% | (1.90 | )% | (15.80 | )% | 26.07 | % | ||||||||||||||||||||||||||||||||||||||||||||
Jun | (0.21 | )% | (3.41 | )% | 3.06 | % | 4.16 | % | (2.85 | )% | 1.89 | % | (4.47 | )% | (1.26 | )% | 10.07 | % | (2.66 | )% | (3.51 | )% | 0.22 | % | (0.37 | )% | 0.34 | % | 2.32 | % | (1.82 | )% | 14.25 | % | (2.34 | )% | 8.33 | % | 3.93 | % | 14.00 | % | (3.31 | )% | ||||||||||||||||||||||||||||||||||||||||||||
Jul | (1.66 | )% | (1.26 | )% | (5.06 | )% | (3.72 | )% | (3.66 | )% | (1.96 | )% | (3.36 | )% | (0.49 | )% | 6.63 | % | 0.12 | % | (1.60 | )% | (2.68 | )% | (0.30 | )% | 15.73 | % | (1.48 | )% | (14.36 | )% | (5.96 | )% | 20.56 | % | 16.34 | % | (10.99 | )% | 16.03 | % | 0.70 | % | ||||||||||||||||||||||||||||||||||||||||||||
Aug | 2.77 | % | 1.15 | % | (2.41 | )% | (3.71 | )% | 2.20 | % | 1.97 | % | (0.32 | )% | 0.19 | % | 1.57 | % | 2.88 | % | 4.36 | % | (1.16 | )% | 24.62 | % | (8.17 | )% | (2.53 | )% | (11.29 | )% | (6.26 | )% | 0.16 | % | 7.34 | % | (1.85 | )% | 22.83 | % | (21.72 | )% | ||||||||||||||||||||||||||||||||||||||||||||
Sep | 3.24 | % | 1.17 | % | 1.31 | % | 8.78 | % | (1.10 | )% | (0.04 | )% | 1.07 | % | 0.13 | % | 2.87 | % | 3.69 | % | (2.30 | )% | 1.54 | % | 6.23 | % | 2.92 | % | 3.81 | % | (10.54 | )% | 2.76 | % | (3.99 | )% | (11.40 | )% | 6.76 | % | 14.76 | % | (1.68 | )% | ||||||||||||||||||||||||||||||||||||||||||||
Oct | 4.33 | % | (2.59 | )% | 4.76 | % | 5.23 | % | (0.64 | )% | (3.38 | )% | 3.43 | % | 2.52 | % | (6.04 | )% | 5.30 | % | 0.80 | % | (8.65 | )% | (4.64 | )% | (5.18 | )% | 14.82 | % | (5.40 | )% | (7.54 | )% | (5.39 | )% | (0.72 | )% | 0.12 | % | 5.49 | % | (18.43 | )% | ||||||||||||||||||||||||||||||||||||||||||||
Nov | (2.58 | )% | 4.24 | % | 2.76 | % | (0.66 | )% | 3.59 | % | 4.16 | % | 8.45 | % | (0.91 | )% | (2.53 | )% | (7.80 | )% | 8.91 | % | 2.10 | % | (3.21 | )% | 0.81 | % | 7.80 | % | 2.77 | % | 15.50 | % | 4.57 | % | 2.41 | % | (0.21 | )% | 2.83 | % | 5.37 | % | ||||||||||||||||||||||||||||||||||||||||||||
Dec | 4.57 | % | (3.57 | )% | 1.08 | % | 0.63 | % | (0.92 | )% | (1.36 | )% | (0.89 | )% | 6.00 | % | 5.58 | % | 2.14 | % | 9.00 | % | 3.05 | % | 2.09 | % | 6.10 | % | (6.99 | )% | 18.69 | % | (0.17 | )% | 13.15 | % | (5.55 | )% | 35.80 | % | (2.65 | )% | 29.00 | % | ||||||||||||||||||||||||||||||||||||||||||||
Year | 4.45 | % | (9.23 | )% | 19.91 | % | 12.63 | % | 9.11 | % | (3.44 | )% | (7.58 | )% | 20.03 | % | 15.25 | % | 7.00 | % | 10.97 | % | (8.24 | )% | 22.40 | % | 17.31 | % | (0.59 | )% | 23.04 | % | 24.30 | % | 84.25 | % | (15.50 | )% | (6.77 | )% | 197.04 | % | 8.61 | % | ||||||||||||||||||||||||||||||||||||||||||||
| * | Worst Monthly Percentage Draw-Down is the largest monthly loss experienced by Grant Park in any calendar month expressed as a percentage of total equity in Grant Park and includes the month and year of such draw-down. |
| ** | Worst Peak-to-Valley Draw-Down is greatest cumulative percentage decline in month-end net asset value of Grant Park due to losses sustained by Grant Park during a period in which the initial month-end net asset value of Grant Park is not equaled or exceeded by a subsequent month-end net asset value of Grant Park and includes the time period in which such draw-down occurred. |
| *** | The monthly rate of return is computed by dividing monthly performance by beginning monthly equity plus additions less redemptions. The monthly rates are then compounded to arrive at the annual rate of return. |
| † | During the period presented through March 31, 2003, Grant Park’s net profits and losses were allocated on a capital account-by-capital account basis. As of April 1, 2003, net profits and losses are allocated on a per-unit basis within each class of units. Investors should note that these two methods of allocation may result in slight differences in how Grant Park’s performance is calculated. |
PAST PERFORMANCE IS NOT NECESSARILY INDICATIVE OF FUTURE RESULTS
ALL PERFORMANCE REPORTED IS NET OF FEES AND EXPENSES
SAI-E-2
SUPPLEMENTAL PERFORMANCE INFORMATION
GRANT PARK FUTURES FUND CLASS B UNITS PERFORMANCE —
INCEPTION THROUGH DECEMBER 2010
(UNAUDITED)
The past performance record of Grant Park’s Class B units is presented below. While the performance record set forth in the table below has not been independently audited, the general partner believes that the information presented is accurate.All performance information is shown net of fees and expenses.
Name | Grant Park Futures Fund Limited Partnership (Class B units) |
Type | Public; Multi-advisor |
Inception of trading | August 2003 |
Aggregate gross subscriptions at December 2010 | $872,734,726 |
Net asset value at December 2010 | $634,047,022 |
Worst monthly percentage draw-down (Since August 2003)* | (11.72)% 04/04 |
Worst peak-to-valley draw-down (Since August 2003)** | (23.99)% 02/04 – 08/04 |
| Rate of Return*** (Through the Month Ended December 31, 2009) | ||||||||||||||||||||||||||||||||
Month | 2010 | 2009 | 2008 | 2007 | 2006 | 2005 | 2004 | 2003 | ||||||||||||||||||||||||
January | (8.00 | )% | (0.98 | )% | 2.42 | % | 1.18 | % | 3.41 | % | (6.04 | )% | 0.31 | % | — | |||||||||||||||||
February | 0.57 | % | (0.88 | )% | 9.58 | % | (4.25 | )% | (3.35 | )% | 3.34 | % | 7.25 | % | — | |||||||||||||||||
March | 4.03 | % | (3.33 | )% | (0.70 | )% | (4.62 | )% | 3.98 | % | (0.59 | )% | (1.47 | )% | — | |||||||||||||||||
April | 1.74 | % | (1.78 | )% | (0.20 | )% | 5.15 | % | 9.38 | % | (5.12 | )% | (11.72 | )% | — | |||||||||||||||||
May | (3.88 | )% | 1.58 | % | 2.03 | % | 4.52 | % | (0.88 | )% | 3.90 | % | (4.82 | )% | — | |||||||||||||||||
June | (0.27 | )% | (3.46 | )% | 2.99 | % | 4.09 | % | (2.92 | )% | 1.81 | % | (4.55 | )% | — | |||||||||||||||||
July | (1.71 | )% | (1.32 | )% | (5.12 | )% | (3.79 | )% | (3.73 | )% | (2.03 | )% | (3.44 | )% | — | |||||||||||||||||
August | 2.71 | % | 1.09 | % | (2.48 | )% | (3.78 | )% | 2.12 | % | 1.89 | % | (0.40 | )% | 0.12 | % | ||||||||||||||||
September | 3.21 | % | 1.12 | % | 1.24 | % | 8.70 | % | (1.17 | )% | (0.11 | )% | 0.99 | % | 0.06 | % | ||||||||||||||||
October | 4.27 | % | (2.64 | )% | 4.69 | % | 5.16 | % | (0.71 | )% | (3.45 | )% | 3.35 | % | 2.45 | % | ||||||||||||||||
November | (2.63 | )% | 4.19 | % | 2.69 | % | (0.73 | )% | 3.51 | % | 4.08 | % | 8.37 | % | (0.98 | )% | ||||||||||||||||
December | 4.52 | % | (3.63 | )% | 1.01 | % | 0.64 | % | (0.90 | )% | (1.35 | )% | (0.96 | )% | 5.93 | % | ||||||||||||||||
Year | 3.80 | % | (9.87 | )% | 18.88 | % | 11.76 | % | 8.28 | % | (4.25 | )% | (8.40 | )% | 7.66 | % | ||||||||||||||||
| * | Worst monthly percentage draw-down is the largest monthly loss experienced by Grant Park in any calendar month expressed as a percentage of total equity in Grant Park and includes the month and year of that draw-down. |
| ** | Worst peak-to-valley draw-down is the greatest cumulative percentage decline in month-end net asset value of Grant Park due to losses sustained by Grant Park during a period in which the initial month-end net asset value of Grant Park is not equaled or exceeded by a subsequent month-end net asset value of Grant Park and includes the time period in which the draw-down occurred. |
| *** | The monthly rate of return is computed by dividing monthly performance by beginning monthly equity plus additions less redemptions. The monthly rates are then compounded to arrive at the annual rate of return. |
PAST PERFORMANCE IS NOT NECESSARILY INDICATIVE OF FUTURE RESULTS
ALL PERFORMANCE REPORTED FOR GRANT PARK IS NET OF FEES AND EXPENSES
SAI-E-3
SUPPLEMENTAL PERFORMANCE INFORMATION
Performance by Sector
The following table presents combined trading gains by sector for Grant Park from January 1, 2000 through December 31, 2010.
Performance by Sector January 2000 – December 2010
| % Gains/(Losses) by Sector | ||||||||||||||||||||||||||||||||||||||||||||
Sector | 2000 | 2001 | 2002 | 2003 | 2004 | 2005 | 2006 | 2007 | 2008 | 2009 | 2010 | |||||||||||||||||||||||||||||||||
Currencies | 3.1 | % | 1.2 | % | 14.6 | % | 17.9 | % | 1.3 | % | (4.6 | )% | 0.8 | % | 5.7 | % | 0.1 | % | (0.7 | )% | 3.0 | % | ||||||||||||||||||||||
Interest rates | 18.5 | % | 10.2 | % | 10.1 | % | 6.3 | % | (1.0 | )% | (1.0 | )% | (1.0 | )% | 7.2 | % | 8.6 | % | (4.1 | )% | 8.0 | % | ||||||||||||||||||||||
Metals | (4.8 | )% | 0.5 | % | (2.0 | )% | 4.3 | % | (1.0 | )% | 1.2 | % | 10.8 | % | 0.7 | % | 3.0 | % | 2.5 | % | 2.5 | % | ||||||||||||||||||||||
Softs/Agriculturals/Meats | (1.5 | )% | (0.9 | )% | 2.8 | % | 1.0 | % | 1.4 | % | 0.6 | % | (2.1 | )% | 1.7 | % | 4.8 | % | (0.1 | )% | 4.3 | % | ||||||||||||||||||||||
Stock Indices | (8.3 | )% | 4.7 | % | (0.1 | )% | 3.6 | % | (1.2 | )% | 5.1 | % | 6.9 | % | (2.3 | )% | 5.6 | % | 3.6 | % | (1.9 | )% | ||||||||||||||||||||||
Energy | 7.8 | % | (2.3 | )% | 1.6 | % | (0.2 | )% | 3.2 | % | 1.0 | % | (1.7 | )% | 5.0 | % | 8.4 | % | (3.2 | )% | (2.5 | )% | ||||||||||||||||||||||
Miscellaneous | (0.5 | )% | (0.1 | )% | (1.8 | )% | 1.5 | % | (0.7 | )% | (0.1 | )% | 0.0 | % | 0.0 | % | 0.0 | % | 0.0 | % | 0.0 | % | ||||||||||||||||||||||
Total Trading Gains | 14.3 | % | 13.3 | % | 25.2 | % | 34.4 | % | 2.0 | % | 2.2 | % | 13.7 | % | 18.0 | % | 30.5 | % | (2.0 | )% | 13.4 | % | ||||||||||||||||||||||
Class A Unit Return | 11.0 | % | 7.0 | % | 15.3 | % | 20.0 | % | (7.6 | )% | (3.4 | )% | 9.1 | % | 12.6 | % | 19.9 | % | (9.2 | )% | 4.5 | % | ||||||||||||||||||||||
This table was prepared by Dearborn Capital Management, L.L.C.
PAST PERFORMANCE IS NOT NECESSARILY INDICATIVE OF FUTURE RESULTS
ALL PERFORMANCE REPORTED FOR GRANT PARK IS FOR CLASS A UNITS AND IS NET
OF FEES AND EXPENSES
SAI-E-4
SUPPLEMENTAL PERFORMANCE INFORMATION
Comparative Performance Statistics
The table below compares various performance statistics for Grant Park, the S&P 500 Index, the MSCI EAFE Index, the NASDAQ Composite Index, and the Barclays Capital U.S. Long Government Index from January 1989, the date of Grant Park’s inception, through December 2010.
Comparative Performance Statistics
January 1989 – December 2010
| Grant Park Futures Fund A Units | Grant Park Futures Fund B Units* | S&P 500 Index | MSCI EAFE Index | Nasdaq Index | Barclays Capital U.S. Long Government Index | |||||||||||
Rate of Return: | December 2010 | 4.57% | 4.52% | 6.68% | 8.11% | 6.19% | -3.69% | |||||||||
| Year to date | 4.45% | 3.80% | 15.07% | 8.21% | 16.91% | 9.44% | ||||||||||
Compound Annualized Rate of Return | Last 12 Months | 4.45% | 3.80% | 15.07% | 8.21% | 16.91% | 9.44% | |||||||||
| Last 3 Years | 4.37% | 3.61% | -2.86% | -6.55% | 0.01% | 5.64% | ||||||||||
| Last 5 Years | 6.92% | 6.12% | 2.29% | 2.94% | 3.76% | 5.71% | ||||||||||
| Since Jan. 1989* | 14.38% | 3.28% | 9.48% | 4.87% | 9.22% | 8.67% | ||||||||||
Cumulative Returns:** | Last 12 Months | 4.45% | 3.80% | 15.07% | 8.21% | 16.91% | 9.44% | |||||||||
| Last 3 Years | 13.68% | 11.22% | -8.32% | -18.38% | 0.02% | 17.90% | ||||||||||
| Last 5 Years | 39.71% | 34.59% | 11.99% | 15.58% | 20.29% | 31.97% | ||||||||||
| Since Jan. 1989* | 1821.10% | 27.09% | 633.70% | 184.53% | 596.69% | 522.45% | ||||||||||
Annualized Standard Deviation of Monthly Returns (Risk): | Last 12 Months | 13.34% | 13.34% | 19.26% | 22.92% | 23.19% | 11.39% | |||||||||
| Last 3 Years | 11.84% | 11.83% | 22.16% | 26.65% | 25.52% | 13.61% | ||||||||||
| Last 5 Years | 12.76% | 12.75% | 17.82% | 21.58% | 21.03% | 11.25% | ||||||||||
| Since Jan. 1989* | 28.00% | 13.38% | 15.12% | 17.69% | 23.68% | 9.18% | ||||||||||
Worst Case Decline: | Last 5 Years | -16.45% | -17.08% | -50.95% | -56.40% | -51.81% | -12.27% | |||||||||
| Duration | 12/08 to 01/10 | 12/08 to 01/10 | 10/07 to 02/09 | 10/07 to 02/09 | 10/07 to 02/09 | 12/08 to 05/09 | ||||||||||
| Since Jan. 1989* | -38.87% | -23.99% | -50.95% | -56.40% | -75.04% | -12.27% | ||||||||||
| Duration | 5/89 to 10/89 | 2/04 to 8/04 | 10/07 to 02/09 | 10/07 to 02/09 | 2/00 to 9/02 | 12/08 to 05/09 | ||||||||||
Correlation with S&P Index: | Last 5 Years | 0.06 | 0.06 | 1.00 | 0.91 | 0.95 | (0.16) | |||||||||
Correlation During S&P 500 Index Positive Months: | Last 5 Years | 0.08 | 0.09 | 1.00 | 0.78 | 0.84 | (0.14) | |||||||||
Correlation During S&P 500 Index Negative Months: | Last 5 Years | (0.27) | (0.27) | 1.00 | 0.91 | 0.85 | 0.21 | |||||||||
| * | Performance statistics for Grant Park Class B Units are limited as the units began trading on August 1, 2003. |
| ** | Cumulative returns show the overall gain or loss in the value of an investment over the given time period. |
This table was prepared by Dearborn Capital Management, L.L.C.
See the glossary in Appendix E for descriptions of the indices in this chart.
PAST PERFORMANCE IS NOT NECESSARILY INDICATIVE OF FUTURE RESULTS
ALL PERFORMANCE REPORTED FOR GRANT PARK IS NET OF FEES AND EXPENSES
SAI-E-5
SUPPLEMENTAL PERFORMANCE INFORMATION
The chart below shows the worst peak-to-valley draw-down for Grant Park and several other indices. Worst peak-to-valley draw-down generally refers to the greatest loss in value of Grant Park or index during consecutive months for the period presented.
Worst Peak-to-Valley Draw-Down
January 1989 – December 2010
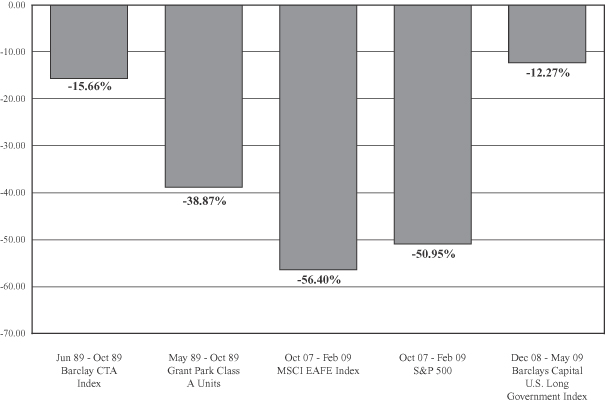
This chart was prepared by Dearborn Capital Management, L.L.C.
See the glossary in Appendix E for descriptions of the indices in this chart.
PAST PERFORMANCE IS NOT NECESSARILY INDICATIVE OF FUTURE RESULTS
ALL PERFORMANCE REPORTED FOR GRANT PARK IS FOR CLASS A UNITS AND IS NET
OF FEES AND EXPENSES
SAI-E-6
SUPPLEMENTAL PERFORMANCE INFORMATION
Benchmark Comparison
The chart below shows the actual performance of Grant Park compared with the following market benchmarks: the MSCI EAFE Index, Bloomberg U.S. Generic Government 3-month Yield Index, MSCI U.S. REIT Index, Barclay BTOP50 Index, Dow Jones-UBS Commodity Index Total Return, Barclays Capital U.S. Long Government Index, S&P 500 Total Return Index, HFRI Equity Hedge Index, Barclays Capital U.S. Aggregate Bond Index, Barclays Capital Diversified Trader Index and the Barclay CTA Index.
Compound Annualized Rate of Return
Benchmark Comparison
January 1989 – December 2010
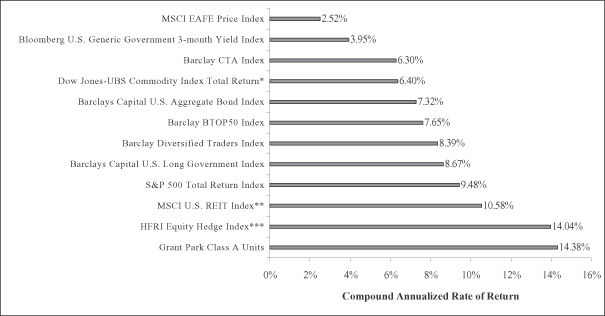
| * | Performance data for the Dow Jones-UBS Commodity Index Total Return is for the period February 1991 through December 2010 |
| ** | Performance data for the MSCI U.S. REIT Index is for the period July 2005 through December 2010 |
| *** | Performance data for the HFRI Equity Hedge Index is for the period January 1990 through December 2010 |
This chart was prepared by Dearborn Capital Management, L.L.C.
See the glossary in Appendix E for descriptions of the indices in this chart.
PAST PERFORMANCE IS NOT NECESSARILY INDICATIVE OF FUTURE RESULTS
ALL PERFORMANCE REPORTED FOR GRANT PARK IS FOR CLASS A UNITS AND IS NET
OF FEES AND EXPENSES
SAI-E-7
SUPPLEMENTAL PERFORMANCE INFORMATION
Benchmark Comparison
The chart below shows the actual performance of Grant Park compared with the following market benchmarks: the S&P 500 Total Return Index, the NASDAQ Composite Index, the Barclays Capital U.S. Long Government Index and the Barclay CTA Index.
Growth of $10,000 Initial Investment
Benchmark Comparison
January 1989 – December 2010
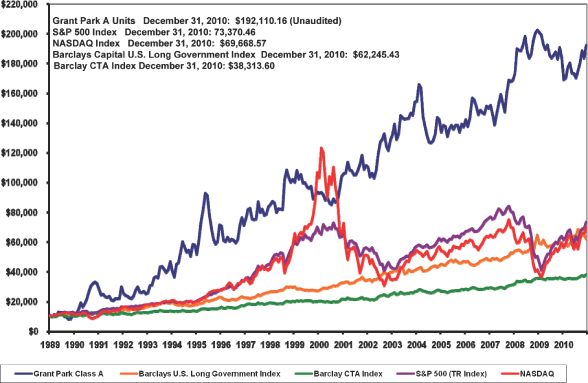
This chart was prepared by Dearborn Capital Management, L.L.C.
See the glossary in Appendix E for descriptions of the indices in this chart.
PAST PERFORMANCE IS NOT NECESSARILY INDICATIVE OF FUTURE RESULTS
ALL PERFORMANCE REPORTED FOR GRANT PARK IS FOR CLASS A UNITS AND IS NET
OF FEES AND EXPENSES
SAI-E-8
SUPPLEMENTAL PERFORMANCE INFORMATION
Performance History
The following chart illustrates the growth of a $10,000 initial investment in Grant Park on January 1, 1989 at the end of each year through December 2010. As of December 31, 2010, that investment would have grown to $192,110.16, assuming there were no additions or redemptions made over the course of the investment.
Performance History of a $10,000 Investment
January 1989 – December 2010
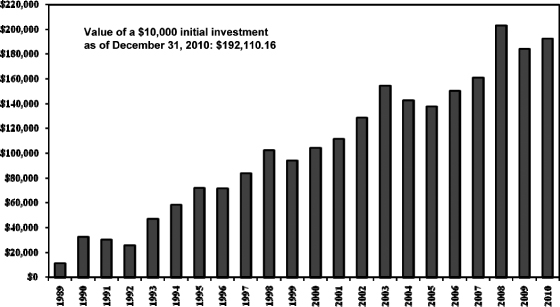
This chart was prepared by Dearborn Capital Management, L.L.C.
PAST PERFORMANCE IS NOT NECESSARILY INDICATIVE OF FUTURE RESULTS
ALL PERFORMANCE REPORTED FOR GRANT PARK IS FOR CLASS A UNITS AND IS NET
OF FEES AND EXPENSES
SAI-E-9
SUPPLEMENTAL PERFORMANCE INFORMATION
Performance Statistics
The following tables present historical performance information and other related information for Grant Park from January 1, 1989 through December 31, 2010.
Performance Statistics
January 1989 – December 2010
Compounded Annual Rates of Return
12-Month | 4.45% | |||
36-Month | 4.37% | |||
60-Month | 6.92% | |||
120-Month | 6.32% | |||
Since Inception (January 1989) | 14.38% |
Other Performance Statistics
| 1 Month | 12 Month | |||||||
Average Rate of Return | 1.43 | % | 18.63 | % | ||||
Average Gain | 6.59 | % | 30.54 | % | ||||
Average Loss | -4.47 | % | -9.65 | % | ||||
Best Period | 35.80 | % | 303.33 | % | ||||
Worst Period | -21.72 | % | -34.81 | % | ||||
Number of Profitable Months |
| 141 | ||||||
Number of Unprofitable Months |
| 123 | ||||||
Standard Deviation of Monthly Returns |
| 8.08 | % | |||||
Annualized Standard Deviation |
| 28.00 | % | |||||
Annualized Sharpe Ratio (0.00%) |
| 0.61 | ||||||
These tables were prepared by Dearborn Capital Management, L.L.C.
See the glossary in Appendix E for definitions relevant to these tables.
PAST PERFORMANCE IS NOT NECESSARILY INDICATIVE OF FUTURE RESULTS
ALL PERFORMANCE REPORTED FOR GRANT PARK IS FOR CLASS A UNITS AND IS NET OF FEES AND EXPENSES
SAI-E-10
SUPPLEMENTAL PERFORMANCE INFORMATION
The following table shows the five worst peak-to-valley draw-downs for Grant Park from January 1, 1989 through December 31, 2010. The table also reflects the length of the decline and the time to recover to new highs.
Worst Peak-to-Valley Draw-Downs
January 1989 – December 2010
Period | Decline | Length | Recovery | |||||||||
May 1989 – Oct 1989 | (38.87 | )% | 5 Months | 5 Months | ||||||||
Nov 1990 – Aug 1991 | (37.34 | )% | 9 Months | 20 Months | ||||||||
May 1995 – Oct 1995 | (36.88 | )% | 5 Months | 34 Months | ||||||||
Feb 2004 – Aug 2004 | (23.65 | )% | 6 Months | 38 Months | ||||||||
Dec 1993 – Feb 1994 | (21.84 | )% | 2 Months | 3 Months | ||||||||
This table was prepared by Dearborn Capital Management, L.L.C.
PAST PERFORMANCE IS NOT NECESSARILY INDICATIVE OF FUTURE RESULTS
ALL PERFORMANCE REPORTED FOR GRANT PARK IS FOR CLASS A UNITS AND IS NET OF FEES AND EXPENSES
SAI-E-11
SUPPLEMENTAL PERFORMANCE INFORMATION
The tables below demonstrate that historically, Grant Park’s returns are not negatively correlated with stocks, but rather non-correlated and therefore perform independently from stocks. These tables compare the performance of Grant Park during the ten best performing quarters of the S&P 500 Index since Grant Park’s inception in January 1989 through December 2010 and simultaneously during the ten worst performing quarters of the S&P 500 Index during the same time period.
S&P 500 Index vs. Grant Park Class A Units
January 1989 – December 2010
During 10 Best Quarters | During 10 Worst Quarters | |||||||||||||||||
(Jan 1989 – December 2010) | (Jan 1989 – December 2010) | |||||||||||||||||
# | Qtr Ended | S&P 500 Index | Grant Park | # | Qtr Ended | S&P 500 Index | Grant Park | |||||||||||
| (Unaudited) | (Unaudited) | |||||||||||||||||
1 | Dec-98 | 21.29% | (5.77)% | 1 | Dec-08 | (21.96)% | 8.82 | % | ||||||||||
2 | Jun-97 | 17.46% | (8.97)% | 2 | Sep-02 | (17.28)% | 11.41 | % | ||||||||||
3 | Jun-09 | 15.93% | (3.52)% | 3 | Sep-01 | (14.68)% | 6.80 | % | ||||||||||
4 | Sep-09 | 15.60% | 1.04% | 4 | Sep-90 | (13.75)% | 63.55 | % | ||||||||||
5 | Jun-03 | 15.40% | 11.08% | 5 | Jun-02 | (13.39)% | 12.20 | % | ||||||||||
6 | Dec-99 | 14.88% | (3.89)% | 6 | Mar-01 | (11.85)% | 9.20 | % | ||||||||||
7 | Mar-91 | 14.52% | (22.70)% | 7 | Jun-10 | (11.42)% | (2.31 | )% | ||||||||||
8 | Mar-98 | 13.95% | 3.51% | 8 | Mar-09 | (11.01)% | (4.91 | )% | ||||||||||
9 | Dec-03 | 12.18% | 7.68% | 9 | Sep-98 | (9.95)% | 31.98 | % | ||||||||||
10 | Sep-10 | 11.30% | 4.34% | 10 | Mar-08 | (9.45)% | (11.69 | )% | ||||||||||
Average: | 15.25% | (1.72)% | Average: | (13.47)% | 14.84 | % | ||||||||||||
These tables were prepared by Dearborn Capital Management, L.L.C.
See the glossary in Appendix E for a description of the S&P 500 Index.
PAST PERFORMANCE IS NOT NECESSARILY INDICATIVE OF FUTURE RESULTS
ALL PERFORMANCE REPORTED FOR GRANT PARK IS FOR CLASS A UNITS AND IS NET OF FEES AND EXPENSES
SAI-E-12
SUPPLEMENTAL PERFORMANCE INFORMATION
The table below further demonstrates that, historically, Grant Park’s returns are not negatively correlated with stocks, but rather perform independently from stocks. As shown below, between January 1989 and December 2010, Grant Park and the S&P 500 Index have experienced positive returns simultaneously 35% of the time; losses simultaneously 17% of the time; and in 48% of the 264 months represented, the performance of Grant Park and the S&P 500 Index has moved in opposite directions.
Correlation Analysis Grant Park and S&P 500 Index
January 1989 – December 2010
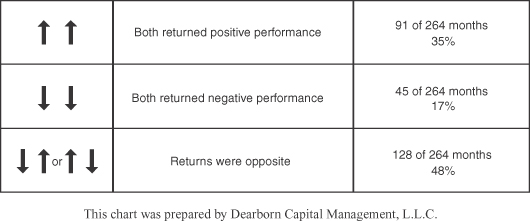
PAST PERFORMANCE IS NOT NECESSARILY INDICATIVE OF FUTURE RESULTS
ALL PERFORMANCE REPORTED FOR GRANT PARK IS FOR CLASS A UNITS AND IS NET OF FEES AND EXPENSES
The Effect of Adding Grant Park to an Investment Portfolio
Any discussion of return must also be weighed against the risk factors involved. Historically, the non-correlating aspect of managed futures has allowed investors to lower their overall portfolio risk while enhancing return. The charts on the pages that follow demonstrate the effect of allocating increasing percentages of an investment in Grant Park to a hypothetical portfolio of stocks and bonds. The first chart begins with a portfolio consisting of 60% stocks and 40% bonds. An investment in Grant Park is added in increments of 5% while the bond portion is reduced by a like amount. The allocations to stocks remain the same. As the allocation to Grant Park is increased to 10%, returns increased while standard deviation, one measure of risk, decreased. An allocation greater than 10% to Grant Park resulted in increased return but risk increased as well.
Prospective investors must be aware that the hypothetical analysis that follows below is dependent on periods in which Grant Park outperforms other asset classes used in the portfolio. Grant Park may not, however, outperform the other asset classes during any particular time period. The charts below do not constitute a recommendation that anyone invest more than 10% of his or her net worth, exclusive of home, furnishings and automobiles, which is the maximum investment permitted, in Grant Park.
SAI-E-13
SUPPLEMENTAL PERFORMANCE INFORMATION
The Effect of Adding Grant Park to a Hypothetical Portfolio of Stocks and Bonds
January 1989 – December 2010
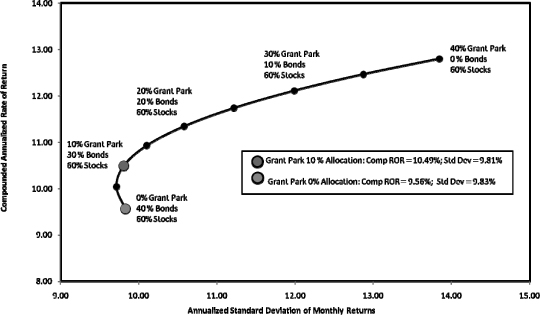
This chart, prepared by Dearborn Capital Management, L.L.C., contains historical trading results hypothetically blended assuming a quarterly rebalancing. The stocks are represented by the S&P 500 Index and the bonds are represented by the Barclays Capital U.S. Long Government Index.
Grant Park returns are net of all fees. See the glossary in Appendix E for descriptions of those indices.
PAST PERFORMANCE IS NOT NECESSARILY INDICATIVE OF FUTURE RESULTS
ALL PERFORMANCE REPORTED FOR GRANT PARK IS FOR CLASS A UNITS AND IS NET
OF FEES AND EXPENSES
HYPOTHETICAL PERFORMANCE RESULTS MAY HAVE MANY INHERENT LIMITATIONS, SOME OF WHICH ARE DESCRIBED BELOW. NO REPRESENTATION IS BEING MADE THAT ANY ACCOUNT WILL OR IS LIKELY TO ACHIEVE PROFITS OR LOSSES SIMILAR TO THOSE SHOWN. IN FACT, THERE ARE FREQUENTLY SHARP DIFFERENCES BETWEEN HYPOTHETICAL PERFORMANCE RESULTS AND THE ACTUAL RESULTS SUBSEQUENTLY ACHIEVED BY ANY PARTICULAR TRADING PROGRAM.
ONE OF THE LIMITATIONS OF HYPOTHETICAL PERFORMANCE RESULTS IS THAT THEY ARE GENERALLY PREPARED WITH THE BENEFIT OF HINDSIGHT. IN ADDITION, HYPOTHETICAL TRADING DOES NOT INVOLVE FINANCIAL RISK, AND NO HYPOTHETICAL TRADING RECORD CAN COMPLETELY ACCOUNT FOR THE IMPACT OF FINANCIAL RISK IN ACTUAL TRADING. FOR EXAMPLE, THE ABILITY TO WITHSTAND LOSSES OR TO ADHERE TO A PARTICULAR TRADING PROGRAM IN SPITE OF TRADING LOSSES ARE MATERIAL POINTS WHICH CAN ALSO ADVERSELY AFFECT ACTUAL TRADING RESULTS. THERE ARE NUMEROUS OTHER FACTORS RELATED TO THE MARKETS IN GENERAL OR TO THE IMPLEMENTATION OF ANY SPECIFIC TRADING PROGRAM WHICH CANNOT BE FULLY ACCOUNTED FOR IN THE PREPARATION OF HYPOTHETICAL PERFORMANCE RESULTS AND ALL OF WHICH CAN ADVERSELY AFFECT ACTUAL TRADING RESULTS.
SAI-E-14
SUPPLEMENTAL PERFORMANCE INFORMATION
The chart below shows the effect of allocating increasing percentages to Grant Park to a hypothetical portfolio of stocks and bonds. In this example, allocations to Grant Park are added in increments of 5% while the allocation to stocks is reduced by a like amount. The allocations to bonds remain the same.
The Effect of Adding Grant Park to a Hypothetical Portfolio of Stocks and Bonds
January 1989 – December 2010
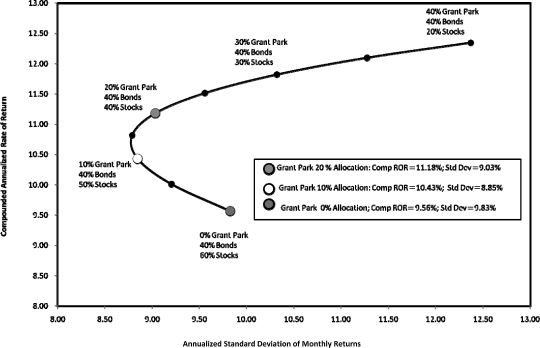
This chart, prepared by Dearborn Capital Management, L.L.C., contains historical trading results hypothetically blended assuming a quarterly rebalancing. The stocks are represented by the S&P 500 Index and the bonds are represented by the Barclays Capital U.S. Long Government Index.
Grant Park returns are net of all fees. See the glossary in Appendix E for descriptions of those indices.
PAST PERFORMANCE IS NOT NECESSARILY INDICATIVE OF FUTURE RESULTS
ALL PERFORMANCE REPORTED FOR GRANT PARK IS FOR CLASS A UNITS AND IS NET OF FEES AND EXPENSES
HYPOTHETICAL PERFORMANCE RESULTS MAY HAVE MANY INHERENT LIMITATIONS, SOME OF WHICH ARE DESCRIBED BELOW. NO REPRESENTATION IS BEING MADE THAT ANY ACCOUNT WILL OR IS LIKELY TO ACHIEVE PROFITS OR LOSSES SIMILAR TO THOSE SHOWN. IN FACT, THERE ARE FREQUENTLY SHARP DIFFERENCES BETWEEN HYPOTHETICAL PERFORMANCE RESULTS AND THE ACTUAL RESULTS SUBSEQUENTLY ACHIEVED BY ANY PARTICULAR TRADING PROGRAM.
ONE OF THE LIMITATIONS OF HYPOTHETICAL PERFORMANCE RESULTS IS THAT THEY ARE GENERALLY PREPARED WITH THE BENEFIT OF HINDSIGHT. IN ADDITION, HYPOTHETICAL TRADING DOES NOT INVOLVE FINANCIAL RISK, AND NO HYPOTHETICAL TRADING RECORD CAN COMPLETELY ACCOUNT FOR THE IMPACT OF FINANCIAL RISK IN ACTUAL TRADING. FOR EXAMPLE, THE ABILITY TO WITHSTAND LOSSES OR TO ADHERE TO A PARTICULAR TRADING PROGRAM IN SPITE OF TRADING LOSSES ARE MATERIAL POINTS WHICH CAN ALSO ADVERSELY AFFECT ACTUAL TRADING RESULTS. THERE ARE NUMEROUS OTHER FACTORS RELATED TO THE MARKETS IN GENERAL OR TO THE IMPLEMENTATION OF ANY SPECIFIC TRADING PROGRAM WHICH CANNOT BE FULLY ACCOUNTED FOR IN THE PREPARATION OF HYPOTHETICAL PERFORMANCE RESULTS AND ALL OF WHICH CAN ADVERSELY AFFECT ACTUAL TRADING RESULTS.
SAI-E-15
SUPPLEMENTAL PERFORMANCE INFORMATION
The chart below shows the effect of allocating increasing percentages to Grant Park to a hypothetical portfolio of stocks and bonds. In this example, allocations to Grant Park are added in increments of 10% while the allocation to stocks and bonds are equally reduced by 5% increments. As the allocation to Grant Park is increased to 10%, returns increased while standard deviation, one measure of risk, decreased. An allocation greater than 10% to Grant Park resulted in increased return but risk increased as well.
The Effect of Adding Grant Park to a Hypothetical Portfolio of Stocks and Bonds
January 1989 – December 2010
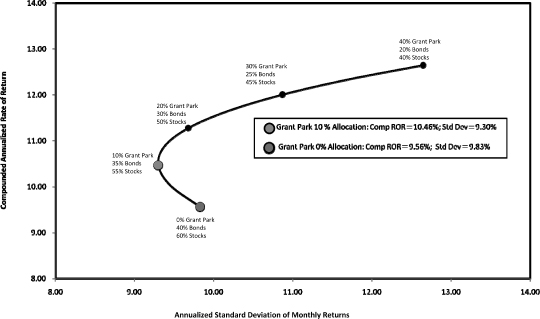
This chart, prepared by Dearborn Capital Management, L.L.C., contains historical trading results hypothetically blended assuming a quarterly rebalancing. The stocks are represented by the S&P 500 Index and the bonds are represented by the Barclays Capital U.S. Long Government Index.
Grant Park returns are net of all fees. See the glossary in Appendix E for descriptions of those indices.
PAST PERFORMANCE IS NOT NECESSARILY INDICATIVE OF FUTURE RESULTS
ALL PERFORMANCE REPORTED FOR GRANT PARK IS FOR CLASS A UNITS AND IS NET
OF FEES AND EXPENSES
HYPOTHETICAL PERFORMANCE RESULTS MAY HAVE MANY INHERENT LIMITATIONS, SOME OF WHICH ARE DESCRIBED BELOW. NO REPRESENTATION IS BEING MADE THAT ANY ACCOUNT WILL OR IS LIKELY TO ACHIEVE PROFITS OR LOSSES SIMILAR TO THOSE SHOWN. IN FACT, THERE ARE FREQUENTLY SHARP DIFFERENCES BETWEEN HYPOTHETICAL PERFORMANCE RESULTS AND THE ACTUAL RESULTS SUBSEQUENTLY ACHIEVED BY ANY PARTICULAR TRADING PROGRAM.
ONE OF THE LIMITATIONS OF HYPOTHETICAL PERFORMANCE RESULTS IS THAT THEY ARE GENERALLY PREPARED WITH THE BENEFIT OF HINDSIGHT. IN ADDITION, HYPOTHETICAL TRADING DOES NOT INVOLVE FINANCIAL RISK, AND NO HYPOTHETICAL TRADING RECORD CAN COMPLETELY ACCOUNT FOR THE IMPACT OF FINANCIAL RISK IN ACTUAL TRADING. FOR EXAMPLE, THE ABILITY TO WITHSTAND LOSSES OR TO ADHERE TO A PARTICULAR TRADING PROGRAM IN SPITE OF TRADING LOSSES ARE MATERIAL POINTS WHICH CAN ALSO ADVERSELY AFFECT ACTUAL TRADING RESULTS. THERE ARE NUMEROUS OTHER FACTORS RELATED TO THE MARKETS IN GENERAL OR TO THE IMPLEMENTATION OF ANY SPECIFIC TRADING PROGRAM WHICH CANNOT BE FULLY ACCOUNTED FOR IN THE PREPARATION OF HYPOTHETICAL PERFORMANCE RESULTS AND ALL OF WHICH CAN ADVERSELY AFFECT ACTUAL TRADING RESULTS.
SAI-E-16
SUPPLEMENTAL PERFORMANCE INFORMATION
The chart below shows the effect of allocating increasing percentages of Grant Park to a hypothetical portfolio of stocks and bonds. These results are compared to a portfolio of only stocks and bonds. In the upper curve of this example, the allocation to Grant Park remains steady, while the allocation to stocks is increased by 5% and the allocation to bonds is decreased by 5%. In the lower curve of this example, the allocation to stocks is increased by 5%, while the allocation to bonds is decreased by 5%.
The Effect of Adding Grant Park to a Hypothetical Portfolio of Stocks and Bonds
January 1989 – December 2010
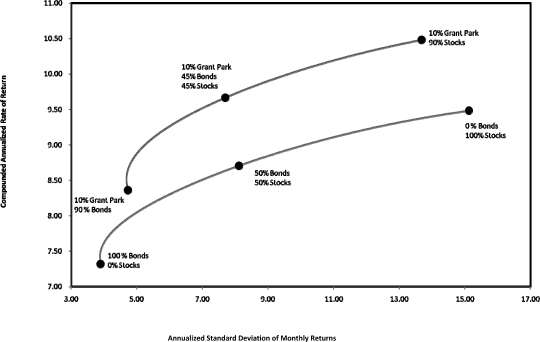
This chart, prepared by Dearborn Capital Management, L.L.C., contains historical trading results hypothetically blended and rebalanced quarterly. The stock allocation is represented by the S&P 500 Index and the bonds are represented by the Barclays Capital U.S. Aggregate Government Index.
Grant Park returns are net of all fees. See the glossary in Appendix E for a description of those indices.
PAST PERFORMANCE IS NOT NECESSARILY INDICATIVE OF FUTURE RESULTS
ALL PERFORMANCE REPORTED FOR GRANT PARK IS FOR CLASS A UNITS AND IS NET OF FEES AND EXPENSES
HYPOTHETICAL PERFORMANCE RESULTS MAY HAVE MANY INHERENT LIMITATIONS, SOME OF WHICH ARE DESCRIBED BELOW. NO REPRESENTATION IS BEING MADE THAT ANY ACCOUNT WILL OR IS LIKELY TO ACHIEVE PROFITS OR LOSSES SIMILAR TO THOSE SHOWN. IN FACT, THERE ARE FREQUENTLY SHARP DIFFERENCES BETWEEN HYPOTHETICAL PERFORMANCE RESULTS AND THE ACTUAL RESULTS SUBSEQUENTLY ACHIEVED BY ANY PARTICULAR TRADING PROGRAM.
ONE OF THE LIMITATIONS OF HYPOTHETICAL PERFORMANCE RESULTS IS THAT THEY ARE GENERALLY PREPARED WITH THE BENEFIT OF HINDSIGHT. IN ADDITION, HYPOTHETICAL TRADING DOES NOT INVOLVE FINANCIAL RISK, AND NO HYPOTHETICAL TRADING RECORD CAN COMPLETELY ACCOUNT FOR THE IMPACT OF FINANCIAL RISK IN ACTUAL TRADING. FOR EXAMPLE, THE ABILITY TO WITHSTAND LOSSES OR TO ADHERE TO A PARTICULAR TRADING PROGRAM IN SPITE OF TRADING LOSSES ARE MATERIAL POINTS WHICH CAN ALSO ADVERSELY AFFECT ACTUAL TRADING RESULTS. THERE ARE NUMEROUS OTHER FACTORS RELATED TO THE MARKETS IN GENERAL OR TO THE IMPLEMENTATION OF ANY SPECIFIC TRADING PROGRAM WHICH CANNOT BE FULLY ACCOUNTED FOR IN THE PREPARATION OF HYPOTHETICAL PERFORMANCE RESULTS AND ALL OF WHICH CAN ADVERSELY AFFECT ACTUAL TRADING RESULTS.
SAI-E-17
SUPPLEMENTAL PERFORMANCE INFORMATION
The chart below demonstrates the effect on a hypothetical portfolio both with and without an allocation to Grant Park. The first gray shaded line in the chart below represents performance of a portfolio consisting of 60% stocks and 40% bonds compared to a portfolio of 50% stocks and 40% bonds and 10% allocated to Grant Park, which is represented by the black shaded line in the chart below. The portfolio with a 10% allocation to Grant Park resulted in an 20% better return than the portfolio consisting of stocks and bonds alone.
Value of Hypothetical $100,000 Portfolio with a 10% Allocation to the
Grant Park Futures Fund A Units vs. a 60% Equity and 40% Bond Portfolio
January 1989 – December 2010
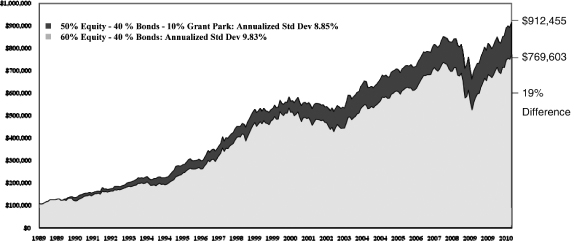
This chart, prepared by Dearborn Capital Management, L.L.C., contains historical trading results hypothetically blended and rebalanced quarterly. The stock allocation is represented by the S&P 500 Index and the bonds are represented by the Barclays Capital U.S. Long Government Index.
Grant Park returns are net of all fees. See the glossary in Appendix E for a description of those indices.
PAST PERFORMANCE IS NOT NECESSARILY INDICATIVE OF FUTURE RESULTS
ALL PERFORMANCE REPORTED FOR GRANT PARK IS FOR CLASS A UNITS AND IS NET
OF FEES AND EXPENSES
HYPOTHETICAL PERFORMANCE RESULTS MAY HAVE MANY INHERENT LIMITATIONS, SOME OF WHICH ARE DESCRIBED BELOW. NO REPRESENTATION IS BEING MADE THAT ANY ACCOUNT WILL OR IS LIKELY TO ACHIEVE PROFITS OR LOSSES SIMILAR TO THOSE SHOWN. IN FACT, THERE ARE FREQUENTLY SHARP DIFFERENCES BETWEEN HYPOTHETICAL PERFORMANCE RESULTS AND THE ACTUAL RESULTS SUBSEQUENTLY ACHIEVED BY ANY PARTICULAR TRADING PROGRAM.
ONE OF THE LIMITATIONS OF HYPOTHETICAL PERFORMANCE RESULTS IS THAT THEY ARE GENERALLY PREPARED WITH THE BENEFIT OF HINDSIGHT. IN ADDITION, HYPOTHETICAL TRADING DOES NOT INVOLVE FINANCIAL RISK, AND NO HYPOTHETICAL TRADING RECORD CAN COMPLETELY ACCOUNT FOR THE IMPACT OF FINANCIAL RISK IN ACTUAL TRADING. FOR EXAMPLE, THE ABILITY TO WITHSTAND LOSSES OR TO ADHERE TO A PARTICULAR TRADING PROGRAM IN SPITE OF TRADING LOSSES ARE MATERIAL POINTS WHICH CAN ALSO ADVERSELY AFFECT ACTUAL TRADING RESULTS. THERE ARE NUMEROUS OTHER FACTORS RELATED TO THE MARKETS IN GENERAL OR TO THE IMPLEMENTATION OF ANY SPECIFIC TRADING PROGRAM WHICH CANNOT BE FULLY ACCOUNTED FOR IN THE PREPARATION OF HYPOTHETICAL PERFORMANCE RESULTS AND ALL OF WHICH CAN ADVERSELY AFFECT ACTUAL TRADING RESULTS.
SAI-E-18
SUPPLEMENTAL PERFORMANCE INFORMATION
The chart below shows the long and short position exposure by sector for the Legacy 1 Class and Legacy 2 Class units for 2010.
Grant Park Legacy Class Exposure by Sector
January 2010 — December 2010
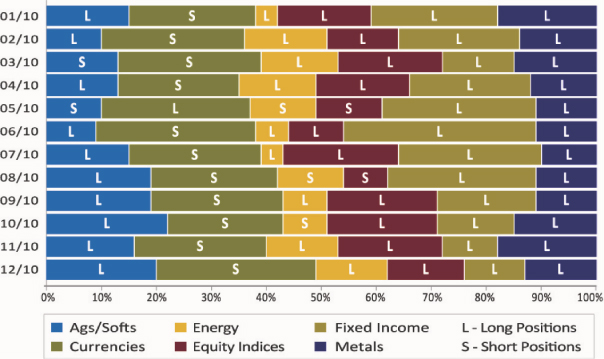
This table was prepared by Dearborn Capital Management, L.L.C.
See the glossary in Appendix E for descriptions of the indices in this chart.
PAST PERFORMANCE IS NOT NECESSARILY INDICATIVE OF FUTURE RESULTS
ALL PERFORMANCE REPORTED FOR GRANT PARK IS NET OF FEES AND EXPENSES
SAI-E-19
SUPPLEMENTAL PERFORMANCE INFORMATION
The chart below shows the long and short position exposure by sector for the Global 1 Class, Global 2 Class and Global 3 Class units for 2010.
Grant Park Global Class Exposure by Sector
January 2010 — December 2010
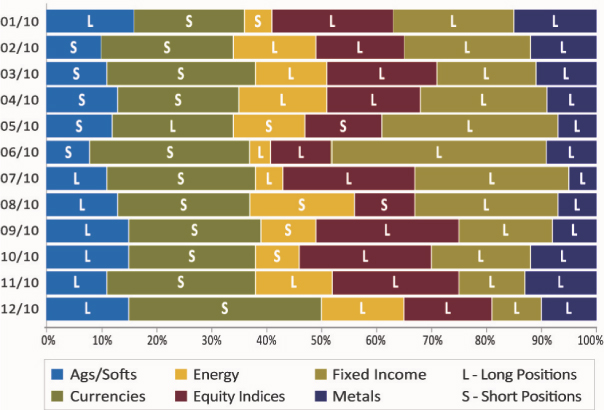
This table was prepared by Dearborn Capital Management, L.L.C.
See the glossary in Appendix E for descriptions of the indices in this chart.
PAST PERFORMANCE IS NOT NECESSARILY INDICATIVE OF FUTURE RESULTS
ALL PERFORMANCE REPORTED FOR GRANT PARK IS NET OF FEES AND EXPENSES
SAI-E-20
SUPPLEMENTAL PERFORMANCE INFORMATION
The information included in the following table reflects the composite performance of the trading programs used by the current trading advisors to manage the assets of Grant Park. Grant Park’s allocation to trading advisors has changed and evolved over time, and is subject to further change in the discretion of Grant Park’s general partner. The performance figures that follow are from the trading advisor’s composite performance tables representing the composite performance of all accounts traded under these trading programs. Although the general partner believes the information provided is reliable, it has not independently verified such information and cannot guarantee its accuracy or completeness. Fees, expenses and performance of individual accounts making up the composite track records will differ from that of Grant Park. No representation is made that an investor in Grant Park will or is likely to achieve results comparable to those shown, or will make any profit or will not suffer any loss. For a more complete discussion of the trading advisors and a more complete discussion of Grant Park’s performance and its fee structure, please refer to pages 39 through 67 and the information set forth under the heading “FEES AND EXPENSES” of this prospectus.
SAI-E-21
SUPPLEMENTAL PERFORMANCE INFORMATION
Trading Advisor Overview
December 31, 2010
| Alder Capital Limited | Amplitude Capital Inter- national Ltd. | Denali- Asset Manage- ment, LLLP | Eckhardt Trading Company | EMC Capital Management, LLC | Global Advisors (Jersey) Limited | Quantitative Investment Manage- ment, LLC | Rabar Market Research, Inc. | Sunrise Capital Partners, LLC | Transtrend, B.V. | Welton Investment Corporation | Welton Investment Corporation | Welton Investment Corporation | Winton Capital Manage- ment Ltd | |||||||||||||||
Firm Assets Under Management | $571.0M | $958.8M | $285.0M | $673.7M | $180.2M | $306.0M | $4.8B | $191.3M | 736.0M | $9.3B | $585.0M | $585.0M | $585.0M | $17.2B | ||||||||||||||
Program | Global 20 | Sinfonie | Global Macro Discretionary | Standard Plus | Classic | Global Commodity Systematic | Global | Diversified | Expanded Diversified | Diversified Trend Program – Enhanced Risk (USD) | GDP | GNP | AES | Diversified | ||||||||||||||
Program Assets Under Management | $533.0M | $69.4M | $285.0M | $256.0M | $180.2M | $306.0M | $4.3B | $179.3M | $662.0M | $5.9B | $551.0M | $0.0M | $34.0M | $17.0B | ||||||||||||||
Program Inception | Feb – 2001 | Sep – 2009 | Jun – 2000 | Oct – 1991 | Jan – 1985 | Jul – 2005 | Dec – 2001 | Jan – 1989 | Jan – 1989 | Jan – 1995 | Jun – 2004 | Feb – 2011 | Jan – 2009 | Oct – 1997 | ||||||||||||||
Began Trading for Grant Park | Feb – 2011 | Apr – 2010 | Feb – 2011 | Jun – 2007 | Jan – 1989 | Jul – 2008 | Oct – 2008 | Jan – 1989 | Jan – 2010 | Jul – 2008 | Mar – 2006 | Feb – 2011 | Feb – 2011 | Aug – 2004 | ||||||||||||||
Margin/Equity Average | 9.00% | 15.71% | 9.00% | 9.23% | 13.00% | 4.02% | 8.00% | 7.96% | 8.70% | 15.00% | 16.00% | N/A | 24.80% | 6.20% | ||||||||||||||
Roundturns per Million | 125 | 6000 | 4500 | 1384 | 2000 | 900 | 1200 | 930 | 350 | 135 | 1300 | N/A | N/A | 661 | ||||||||||||||
Approximate Number of Markets Traded | 28 | 68 | 60 | 62 | 80 | 35 | 38 | 94 | 55 | 250+ | 100 | 100 | 600 | 100+ | ||||||||||||||
Number of Trading Systems | 1 | Multiple | 2 | Multiple | Multiple | Multiple | Multiple | Multiple | Multiple | Multiple | Multiple | Multiple | Multiple | Multiple | ||||||||||||||
Time Horizon (holding period) | 5 days | 6 days | 3 – 7 days | 7 – 60+ days | 11 – 60 days | 3 – 4 weeks | 7.5 days | 8 – 52 days | 60 days | 1 month | Ranges from short to long term | Ranges from short – to intermediate – term | Short – term | Ranges from short – to long – term | ||||||||||||||
Compounded Annual ROR Since Inception | 8.60% | – 2.28% | 18.15% | 23.27% | 23.20% | 12.99% | 14.41% | 14.03% | 12.60% | 16.65% | 13.28% | N/A | 7.62% | 17.00% | ||||||||||||||
Compounded Annual ROR Last 5 Years * | 8.00% | – 2.28% | 8.92% | 13.70% | 13.09% | 12.99% | 10.17% | 14.60% | 7.30% | 12.58% | 12.43% | N/A | 7.62% | 12.92% | ||||||||||||||
Worst Drawdown Period Since Inception | Jun – 2003 to Aug – 2004 | Oct – 2009 to Dec – 2010 | 4 months | Dec – 1991 to May – 1992 | Jun – 1995 to May – 1996 | Jan – 2010 to Dec – 2010 | Sep – 2009 to Dec – 2010 | May – 1995 to Aug – 1998 | Aug – 1993 to Apr – 1994 | Feb – 2009 to Jan – 2010 | Jan – 2009 to Jan – 2010 | N/A | Jul – 2009 to Oct – 2009 | Nov – 2001 to Feb – 2002 | ||||||||||||||
Worst Drawdown Percentage Since Inception | 28.60% | – 11.63% | – 10.71% | – 40.39% | – 45.16% | – 10.19% | – 11.15% | – 29.81% | – 29.80% | – 15.15% | – 11.95% | N/A | – 8.26% | – 25.60% | ||||||||||||||
Worst Drawdown Period Last 5 Years * | May – 2008 to Aug – 2008 | Oct – 2009 to Dec – 2010 | Jun – 2007 to Jul – 2007 | Jun – 2008 to Feb – 2010 | Jan – 2009 to Feb – 2010 | Jan – 2010 to Dec – 2010 | Sep – 2009 to Dec – 2010 | Jun – 2008 to Nov – 2009 | Dec – 2009 to Jul – 2010 | Feb – 2009 to Jan – 2010 | Jan – 2009 to Jan – 2010 | N/A | Jul – 2009 to Oct – 2009 | Feb – 2007 to Mar – 2007 | ||||||||||||||
Worst Drawdown Percentage Last 5 Years * | 15.80% | – 11.63% | – 5.51% | – 18.54% | 24.56% | – 10.19% | – 11.15% | – 12.97% | 20.67% | – 15.15% | – 11.95% | N/A | – 8.26% | – 9.64% | ||||||||||||||
Annualized Standard Deviation Since Inception | 15.10% | 12.11% | 11.86% | 30.18% | 49.68% | 10.80% | 11.23% | 22.36% | 22.20% | 14.45% | 14.26% | N/A | 8.31% | 18.54% | ||||||||||||||
Annualized Standard Deviation Last 5 Years * | 12.90% | 12.11% | 7.69% | 15.25% | 17.57% | 10.80% | 9.87% | 15.55% | 15.40% | 12.02% | 14.88% | N/A | 8.31% | 11.03% |
| * | 5 year period = 1/2006 to 12/2010 or since inception for shorter track records. |
| Notes: |
| (1) | The range and average of margin to equity ratio for Rabar is computed without giving effect to certain foreign currency contracts which are traded in the OTC foreign exchange markets. Depending upon the margin requirements imposed by the particular clearing firm, inclusion of these markets would likely increase the range and average of the margin to equity ratio, in some cases significantly. |
This table and chart was prepared by Dearborn Capital Management, L.L.C.
based on unaudited information provided to Dearborn by each trading advisor.
See the glossary in Appendix E for definitions relevant to this table.
ALL PERFORMANCE REPORTED IS NET OF FEES AND EXPENSES.
PAST PERFORMANCE IS NOT INDICATIVE OF FUTURE RESULTS.
SAI-E-22
THIRD AMENDED AND RESTATED
LIMITED PARTNERSHIP AGREEMENT
OF
GRANT PARK FUTURES FUND LIMITED PARTNERSHIP
This THIRD AMENDED AND RESTATED LIMITED PARTNERSHIP AGREEMENT, effective as of June 30, 2003, by and among Dearborn Capital Management, L.L.C., an Illinois limited liability company, as the General Partner, the Limited Partners of the Partnership as of the date hereof and those other parties who agree to be bound hereby as Limited Partners in the future, amends and restates in its entirety the Second Amended and Restated Limited Partnership Agreement of the Partnership dated as of April 1, 2003.
The above parties formed the Partnership on August 26, 1988 and now desire to continue the business of the Partnership described in Article IV hereof upon the terms and conditions hereinafter set forth.
It is, therefore, agreed as follows:
ARTICLE I
DEFINITIONS.
1.1 Act. The term “Act” shall refer to the Revised Uniform Limited Partnership Act of the State of Illinois.
1.2 Administrator. The term “Administrator” shall refer to an official or agency administering the securities laws of a state.
1.3 Affiliate. The term “Affiliate” with respect to any Person shall refer to: (i) any Person directly or indirectly owning, controlling or holding with power to vote 10% or more of the outstanding voting securities of such Person; (ii) any Person 10% or more of whose outstanding voting securities are directly or indirectly owned, controlled or held with power to vote, by such Person; (iii) any Person, directly or indirectly, controlling, controlled by or under common control of such Person; (iv) any officer, director or partner of such Person; or (v) if such Person is an officer, director or partner, any Person for which such Person acts in such capacity.
1.4 Agreement. The term “Agreement” shall refer to this Third Amended and Restated Limited Partnership Agreement, as amended, modified or supplemented from time to time.
1.5 Allocated Net Assets. The term “Allocated Net Assets” shall refer to that portion of the Net Assets of the Partnership allocated to a Trading Advisor by the General Partner and subject to the Trading Advisor’s trading discretion (including any notional funds), together with any appreciation or depreciation in such Allocated Net Assets.
1.6 Capital Contributions. The term “Capital Contributions” shall refer to the total cash investment in the Partnership by a Partner or by all Partners, as the case may be, unless the context requires otherwise.
1.7 Class. The term “Class” shall refer to a separate class of the Partnership, the Units of which shall be beneficial interests in the Partnership separately identified with and belonging to such Class.
1.8 Clearing Broker. The term “Clearing Broker” shall refer to any Person who engages in the business of effecting transactions in Commodity Interests for the accounts of others or for its own accounts and who has been appointed by the General Partner to so act on behalf of the Partnership from time to time. As of the date of this Agreement, the Partnership’s Clearing Brokers are Refco, Inc. and UBS Financial Services Inc.
A-1
1.9 Commodity Interests. The term “Commodity Interests” shall refer to U.S. and foreign futures contracts, forward contracts and all other interests in commodities whether traded on an exchange or over-the-counter (including, without limitation, security futures contracts, foreign currencies, swap contracts, spot contracts, and options contracts on futures contracts, forward contracts and physical commodities).
1.10 General Partner. The term “General Partner” shall refer to Dearborn Capital Management, L.L.C., but in the event it is no longer acting as General Partner, the term shall mean the party or parties then acting in such capacity.
1.11 Limited Partners. The term “Limited Partners” shall refer to the Limited Partners of the Partnership as of the effective date hereof and all parties who agree to be bound by this Agreement as Limited Partners following the effective date hereof, including parties admitted as additional or substituted Limited Partners.
1.12 NASAA Guidelines. The term “NASAA Guidelines” shall refer to the Guidelines for the Registration of Commodity Pool Programs promulgated by the North American Securities Administrators Association, Inc., as amended, modified or supplemented from time to time.
1.13 Net Asset Value. The terms “Net Asset Value” or “Net Assets” as of any date with respect to any Class shall refer to: (i) the total assets of the Partnership constituting such Class as of such date including all cash and cash equivalents, plus the market value of all open Commodity Interest positions and U.S. Treasury bills; minus (ii) any brokerage commissions attributable to such Class that are payable directly by the Partnership (or which would be payable directly by the Partnership) if all open Commodity Interest positions were closed as of the date the calculation is being made; and minus (iii) all other accrued liabilities of the Partnership as of such date attributable to such Class determined in accordance with generally accepted accounting principles. The market value of a Commodity Interest shall be that price quoted on the exchange on which each such Commodity Interest is traded as of the close of each trading day, or if any such Commodity Interest is not so traded, the fair market value of each Commodity Interest, as determined by the General Partner. Each Class shall share in the assets, expenses and liabilities of the Partnership on a pro rata basis with all other Classes, except to the extent otherwise specifically provided in this Agreement or to the extent that the General Partner determines, in good faith, that any expense or liability of the Partnership (or a portion thereof) should be attributable only to a particular Class or Classes (including, without limitation, expenses incurred in connection with the organization and offering of Units of a Class or Classes). Any such determination shall be final and binding as to all Limited Partners. The terms “Net Asset Value” or “Net Assets” as of any date with respect to the Partnership as a whole shall refer to the sum of the Net Asset Values or Net Assets of all Classes as of such date. Without limitation to the foregoing, Net Assets shall include any unrealized profits or losses on open positions attributable to such Net Assets and any accrued fees or expenses (including fees based on a percentage of Net Assets) attributable to such Net Assets.
1.14 Net Asset Value per Unit. The term “Net Asset Value per Unit” with respect to Units of any Class shall refer to the Net Asset Value of such Class divided by the number of Units in such Class outstanding.
1.15 New Trading Profits on the Allocated Net Assets of each Trading Advisor. The term “New Trading Profits on the Allocated Net Assets of each Trading Advisor” shall mean the sum of (A) the net of any profits (excluding interest income) and losses realized on all trades closed out during the period on such Allocated Net Assets, plus (B) the net of any unrealized profits and losses on open positions as of the end of such period (after deduction for any accrued brokerage commissions payable directly by the Partnership) on such Allocated Net Assets, minus (C) (i) the net of any unrealized profits or losses on open positions as of the end of the preceding period (after deduction for any accrued brokerage commissions payable directly by the Partnership) on such Allocated Net Assets, (ii) all expenses (except the incentive fee payable to such Trading Advisor for the current period and applicable state taxes) attributable to such Allocated Net Assets, incurred or accrued during such period, including without limitation, any management fees paid to the General Partner and such Trading Advisor, any brokerage fee expressed as a percentage of Net Assets, and the Partnership’s other ongoing expenses, and
A-2
(iii) cumulative net realized or unrealized trading losses on such Allocated Net Assets (reduced by a proportionate share of realized and unrealized trading losses on such Allocated Net Assets attributable to redeemed Units or reallocated amounts as of any redemption or reallocation date), if any, carried forward from all preceding periods since the last period for which an incentive fee was payable to the Trading Advisor. Notwithstanding the foregoing, the General Partner may, in its sole discretion, adjust the computation of New Trading Profits on the Allocated Net Assets with respect to any Trading Advisor to exclude or include certain expenses (or a portion thereof) for purposes of calculating such Trading Advisor’s incentive fee. The terms of such adjusted computation shall be set forth in the Advisory Contract by and among the Partnership, the General Partner and such Trading Advisor.
1.16 Net Worth. The term “Net Worth” shall refer to the excess of total assets over total liabilities as determined by generally accepted accounting principles. Net Worth shall be determined exclusive of home, home furnishings and automobiles.
1.17 Organization and Offering Expenses. The term “Organization and Offering Expenses” shall refer to all expenses incurred by the Partnership in connection with and in preparing any Class of Units for registration and subsequently offering and distributing such Units to the public, including but not limited to, total Selling Agent, underwriting and brokerage discounts and commissions, expenses for printing, engraving, mailing, salaries of the General Partner’s employees while engaged in sales activity, charges of transfer agents, registrars, trustees, escrow holders, depositories, experts, expenses of qualification of the sale of such Units under federal and state law, including taxes and fees, accountants’ and attorneys’ fees, to the extent applicable.
1.18 Partners. The term “Partners” shall refer to the General Partner and all Limited Partners, as constituted from time to time, where no distinction is required by the context in which the term is used.
1.19 Partnership. The term “Partnership” shall refer to the limited partnership continued pursuant to this Agreement by the parties hereto, as said partnership may from time to time be constituted.
1.20 Person. The term “Person” shall refer to any natural person, partnership, corporation, association or other legal entity.
1.21 Pit Brokerage Fees. The term “Pit Brokerage Fees” shall include floor brokerage, clearing fees, National Futures Association fees and exchange fees.
1.22 Prospectus. The term “Prospectus” shall refer to either the Confidential Private Offering Circular adopted by the General Partner in connection with the private offering of Units, or in the event of a public offering of Units, the final prospectus and disclosure document of the Partnership, contained in any Registration Statement that is filed with the Securities and Exchange Commission (“SEC”) and declared effective thereby, as the same at any time and from time to time may be amended or supplemented after the effective date(s) of such Registration Statement(s).
1.23 Pyramiding. The term “Pyramiding” shall refer to a method of using all or a part of an unrealized profit in a Commodity Interest contract position to provide margin for any additional Commodity Interest contracts of the same or related commodities.
1.24 Registration Statement. “Registration Statement” shall refer to a registration statement on Form S-1, as amended, that the General Partner may file for the Partnership with the SEC for the registration and public offering of the Units, as the same may at any time and from time to time be further amended or supplemented.
1.25 Selling Agent. The term “Selling Agent” shall refer to any broker-dealer that is engaged by the General Partner from time to time to offer and sell the Units to prospective Limited Partners. As of the date of this Agreement, the Partnership’s primary Selling Agents are UBS Financial Services Inc., A.G. Edwards &
A-3
Sons, Inc. and Fahnestock & Co. Inc. The General Partner may replace the above named primary Selling Agents or engage additional Selling Agents in its sole discretion.
1.26 Sponsor. The term “Sponsor” shall refer to any Person directly or indirectly instrumental in organizing the Partnership or any Person who will manage or participate in the management of the Partnership, including any Clearing Broker who pays any portion of the Organization and Offering Expenses of the Partnership, and the General Partner and any other Person who regularly performs or selects the Persons who performs service for the Partnership. The term “Sponsor” does not include wholly independent third parties such as any attorneys, accountants, Selling Agents and underwriters whose only compensation is for professional services rendered in connection with the offering of the Units. The term “Sponsor” shall be deemed to include its Affiliates. As of the date of this Agreement, the Partnership’s sole Sponsor is Dearborn Capital Management, L.L.C.
1.27 Trading Advisor. The term “Trading Advisor” shall refer to any Person who for consideration engages in the business of advising others, either directly or indirectly, as to the value, purchase or sale of Commodity Interests and who has been appointed by the General Partner to so act on behalf of the Partnership from time to time. As of the date of this Agreement, the Partnership’s Trading Advisors are EMC Capital Management, Inc., Rabar Market Research, Inc., Eckhardt Trading Company and Graham Capital Management, L.P., Winton Capital Management Limited, Welton Investment Corporation, Transtrend B.V., Global Advisors L.P., Quantitative Investment Management LLC.
1.28 Units. The term “Units” shall refer to the ownership interests in the Partnership acquired upon the making of a Capital Contribution by the General Partner or a Limited Partner. Ownership of Units by a Partner constitutes an ownership interest of such Partner in the Partnership, including the right of such Partner to any and all benefits to which a Partner may be entitled under this Agreement and the Act, together with the obligations of such Partner to comply with all the terms and provisions of this Agreement with which such Partner is required to comply. The General Partner’s ownership of the Partnership shall be represented by “General Partnership Units,” and a Limited Partner’s ownership of the Partnership shall be represented by “Limited Partnership Units,” which Limited Partnership Units shall comprise one or more Classes as provided for herein. From time to time, the General Partner also may subscribe for Limited Partnership Units of a Class or Classes upon such terms as are applicable to such Class(es) generally. When used in this Agreement, the term “Unit” shall include both Limited Partnership Units and General Partnership Units, pari passu, unless the context requires otherwise. The Units may, but need not, be evidenced by certificates.
1.29 Unit Ownership Percentage. The term “Unit Ownership Percentage” with respect to each Partner holding Units of a Class as of any date, shall refer to the number of Units owned by such Partner of such Class, divided by the number of Units of such Class outstanding as of such date. The sum of the Unit Ownership Percentages as to each Class shall equal 100%.
1.30 Valuation Date. The term “Valuation Date” shall refer to the close of business on the last business day of each calendar month (or portion thereof) of Partnership operations or such other day as determined by the General Partner in its sole discretion and on which day the Net Asset Value of each Class is determined. The time on any such day when the close of business shall occur shall be determined in the sole discretion of the General Partner.
ARTICLE II
CONTINUATION AND OFFERING.
2.1 Continuation of Partnership. The parties hereby agree to continue a limited partnership under the provisions of the Act and the rights and liabilities of the Partners shall be as provided in that Act except as herein otherwise expressly provided.
A-4
2.2 Offering of Units. There is no maximum on the amount of Units being offered, but the General Partner reserves the right to institute a maximum in the future. The minimum Capital Contribution required to subscribe for Limited Partnership Units of any Class together with other related terms of offering shall be determined by the General Partner in its sole and absolute discretion, and shall be set forth in the Prospectus.
ARTICLE III
NAME AND PRINCIPAL PLACE OF BUSINESS.
3.1 Name. The business of the Partnership shall be conducted under the name of Grant Park Futures Fund Limited Partnership, or such other name as the General Partner may determine.
3.2 Principal Place of Business. The principal place of business of the Partnership shall be 550 West Jackson Boulevard, Suite 1300, Chicago, Illinois 60661, or such other place as the General Partner may determine.
ARTICLE IV
PURPOSE.
The purpose of the Partnership shall be to seek profit from investing in, trading, buying, selling or otherwise acquiring, holding or disposing of: (i) Commodity Interests and all rights or interests in or pertaining thereto, and engaging in any other activities relating thereto; and (ii) any other investment products or opportunities, investments, strategies, ventures or transactions deemed appropriate in the sole determination of the General Partner including, without limitation, derivatives, currencies, short sales and all rights or interests in or pertaining thereto, and engaging in any other activities relating thereto.
ARTICLE V
TERM.
The term of the Partnership commenced on August 26, 1988 and shall end on December 31, 2027, unless sooner dissolved as hereinafter provided.
ARTICLE VI
CAPITAL CONTRIBUTIONS AND CAPITAL ACCOUNTS.
6.1 General Partner Capital Contribution; Net Worth of General Partner. The General Partner shall at all times, so long as it remains a general partner of the Partnership, own Units in the Partnership: (i) in an amount sufficient, in the opinion of counsel for the Partnership, for the Partnership to be taxed as a partnership rather than as an association taxable as a corporation; and (ii) during such time as the Units are registered for sale to the public, in an amount at least equal to the greater of: (a) 1% of all Capital Contributions of all Partners to the Partnership; or (b) $25,000; or such other amount satisfying the requirements then imposed by the NASAA Guidelines. Further, during such time as the Units are registered for sale to the public, the General Partner shall, so long as it remains a general partner of the Partnership, maintain a Net Worth at least equal to the greater of: (i) 5% of the total Capital Contributions of all partners and all limited partnerships to which it is a general partner (including the Partnership) plus 5% of the Units being offered for sale in the Partnership; or (ii) $50,000; or such other amount satisfying the requirements then imposed by the NASAA Guidelines. In no event, however, shall the General Partner be required to maintain a Net Worth in excess of $1,000,000, or such other maximum amount satisfying the requirements then imposed by the NASAA Guidelines.
6.2 Establishment of Initial Classes; Nature of Classes. The General Partner shall have the power and authority, without Limited Partner approval, to issue Units in one or more Classes from time to time as it deems necessary or desirable. The General Partner shall have exclusive power without the requirement of Limited Partner approval to establish and designate such separate and distinct Classes, as provided in Section 6.3, and to
A-5
fix and determine the relative rights and preferences as between the Units of the separate Classes relative to any matter including, without limitation, fees, minimum Capital Contributions, payment of expenses and rights of redemption. Without limiting the authority of the General Partner set forth in this Section 6.2 to establish and designate any further Classes, the General Partner hereby establishes and designates two (2) initial Classes of Limited Partnership Units, Class A Limited Partnership Units and Class B Limited Partnership Units, having the relative rights and preferences set forth in the Prospectus and this Agreement. For the avoidance of doubt, the creation of separate Classes of Units shall be for accounting purposes only, and is not intended to separate or segregate the assets and liabilities of one Class from all other Classes for legal or any other purposes. Further, for the avoidance of doubt, the General Partnership Units shall be accounted for separately from all other Units and shall be considered the functional equivalent of a separate “class” of Units for all purposes hereunder. Such General Partnership Units shall share in the profits, losses and expenses of the Partnership on a pro rata basis, excluding any management fees, incentive fees and certain other expenses (or a portion thereof) as determined by the General Partner in its sole discretion.
6.3 Establishment of Additional Classes. The establishment and designation of any Classes of Units other than those specifically named in Section 6.2 above shall be effective upon the execution by the General Partner of an instrument setting forth such establishment and designation and the relative rights and preferences of such Class, or as otherwise provided in such instrument. At any time that there are no Units outstanding of any particular Class previously established and designated, the General Partner may by an instrument executed by it abolish that Class and the establishment and designation thereof. Each instrument referred to in this Section 6.3 shall have the status of an amendment to this Agreement.
6.4 Division or Combination of Units. From time to time, the General Partner may divide or combine the Units of any Class into a greater or lesser number without thereby changing the proportionate beneficial interests in the Class. The General Partner may issue Units of any Class for such consideration and on such terms as it may determine (or for no consideration if pursuant to a Unit distribution or split-up), all without action or approval of the Limited Partners. The General Partner may classify or reclassify any unissued Units or any Units previously issued and reacquired of any Class into one or more Classes that may be established and designated from time to time. The General Partner may hold as treasury Units, reissue for such consideration and on such terms as it may determine, or cancel, at its discretion from time to time, any Units of any Class reacquired by the Partnership. The Units may be divided into fractional Units. Notwithstanding the foregoing, the Units of any Class will be offered at such times as are set forth in the Prospectus at the then applicable Net Asset Value per Unit of such Class.
6.5 Procedures for Becoming Limited Partner. A party shall become a Limited Partner at such time as:
(a) It has made a Capital Contribution of the Partnership for deposit in the Partnership’s account established for that purpose, and such Capital Contribution has been accepted by the General Partner;
(b) It has executed and delivered to the General Partner a Subscription Agreement in form and substance acceptable to the General Partner and designating the Class of Units to be subscribed therefor; and
(c) The General Partner has designated such Person as a Limited Partner holding Units of the applicable Class on the books and records of the Partnership.
6.6 Capital Accounts. A capital account shall be established for each Partner. The initial balance of each Partner’s capital account shall be the amount of his initial Capital Contribution to the Partnership. Thereafter, each Partner’s capital account shall be: (i) increased by all net profits allocated to the Partner pursuant to Section 7.1 below and all subsequent Capital Contributions to the Partnership by such Partner; and (ii) decreased by (a) all net losses and items of expense allocated to the Partner pursuant to Section 7.1 below, (b) all distributions made to the Partner pursuant to Article VIII below and (c) all redemptions or withdrawals made by such Partner.
A-6
6.7 Units Fully Paid and Nonassessable. Once a Capital Contribution is made and accepted by the General Partner, a Partner’s Units shall be fully paid and nonassessable.
6.8 Investment by General Partner and Affiliates. The General Partner, its principals, certain employees of the General Partner and its Affiliates may make contributions for Units of such Class or Classes as the General Partner may in its sole discretion determine.
6.9 Admission of Additional Limited Partners. The General Partner shall have complete discretionary authority regarding the admission of additional Limited Partners and the number which may be admitted, provided that no offer to additional investors shall be made if it would violate federal or state securities laws, the Commodity Exchange Act, as amended, or any other applicable laws.
6.10 No Right to Demand Return of Contribution. Except as specifically provided in Article XIII of this Agreement, no Limited Partner shall have the right to demand the return of his contribution at any time or to reduce his contribution to the Partnership.
ARTICLE VII
ALLOCATION OF NET PROFITS AND NET LOSSES.
7.1 Determination of Net Asset Value. The Net Asset Value of any Class shall be determined for each Valuation Date before any management fees and incentive fees payable with respect to Units of such Class as of such date. All net profits, net losses and items of expense attributable to a Class, before payment of any management or incentive fees as of the end of such period shall then be credited or charged to the capital accounts of the Partners holding Units in such Class in proportion to their respective Unit Ownership Percentages. Any management fees and incentive fees with respect to each Partner holding Units of a Class for such period shall then be charged to the capital account of such Partner in proportion to his Unit Ownership Percentage. The amount of any distribution to a Partner and any amount paid to a Partner in redemption shall be charged to that Partner’s capital account. The General Partner shall calculate the approximate Net Asset Value per Unit of each Class on a daily basis and furnish such information upon request to a Limited Partner.
7.2 Allocations of Profit and Loss. As of the end of each fiscal year, the Partnership’s profit or loss attributable to a Class shall be allocated among the Partners holding Units of such Class pursuant to the following subparagraphs for federal income tax purposes. Such allocation of profits and losses shall be in proportion to such Partners’ respective Unit Ownership Percentages from net short-term capital gain or loss, net long-term capital gain or loss and net ordinary income or loss realized by the Partnership and attributable to such Class as follows:
(a) First, the General Partner may, in its sole and absolute discretion, make special allocations of income and gain or expense and loss to any Partner or former Partner who received one or more payments in withdrawal from its capital account pursuant to Article XIII hereof during the fiscal year to reflect equitably amounts credited or debited to its capital account pursuant to Sections 6.6 and 7.1 hereof for each fiscal year and all prior fiscal years as compared to the aggregate taxable income or loss allocated to the Partner or former Partner in all prior fiscal years.
(b) Second, the remainder of the taxable income or loss of the Partnership attributable to such Class for the fiscal year, if any, and each item of Partnership income, gain, loss, expense, or credit attributable to such Class included therein, shall be allocated among the Partners holding Units of such Class, and former Partners who held Units at any time during such fiscal year of such Class, in such amounts and in such proportions as will, as determined in the sole and absolute discretion of the General Partner, reflect equitably amounts credited or debited to each such Partner’s and former Partner’s capital account for the fiscal year and all prior fiscal years as compared to the aggregate taxable income or loss that has been allocated to such Partner and former Partner during the fiscal year (including allocations for the fiscal year under subsection (a) hereof) and all prior fiscal years.
A-7
(c) The character of any item of income, gain, expense or loss allocated pursuant to this Section 7.2 shall be made solely in the discretion of the General Partner.
(d) All amounts withheld from Partnership revenues or distributions by the Partnership pursuant to the Internal Revenue Code (“Code”) or any provision of any state or local tax law shall be treated for all purposes as distributions to those Partners who receive tax credits with respect to withheld amounts or for whose account such amounts are withheld. In any case where a tax, fee or other assessment is levied upon the Partnership, the amount of which is determined in whole or in part by the status or identity of the Partners, the General Partner may allocate the expense and deduct from such Partners’ capital accounts their distributable share of such taxes, fees and assessments.
(e) Notwithstanding the foregoing, the General Partner, in its sole discretion, may allocate the Partnership’s items of income, gain, expense, or loss attributable to a Class in a manner other than that provided in this Section 7.2, provided such allocation is made in accordance with Section 704(b) of the Code. Any allocation made pursuant to this subsection (e) will replace any allocation of profit or loss otherwise provided for herein and neither the amendment of this Agreement nor the consent of the Limited Partners shall be required to effect any allocation made pursuant hereto.
ARTICLE VIII
DISTRIBUTIONS.
8.1 Distributions Generally. The Partnership shall have the right to make distributions of Partnership profits at any time to the Limited Partners, but such distributions shall be in the sole and absolute discretion of the General Partner. It is not anticipated that the General Partner will make any such distributions unless the profits of the Partnership are substantial. Any such distributions shall be made pro rata among each Class of Limited Partnership Units and in proportion to the Unit Ownership Percentages of Limited Partners holding Limited Partnership Units of each such Class.
8.2 Timing of Distributions. Distributions pursuant to this Article VIII shall be charged against the respective capital accounts of the Limited Partners as of the date of the distribution.
8.3 Return of Distributions. If any amounts have been distributed to the Limited Partners (whether pursuant to this Article VIII or in accordance with redemptions by the Limited Partners pursuant to Section 13.1 below), attributable to repayment, in whole or in part, of Capital Contributions to the Partnership, whether prior to or subsequent to the dissolution of the Partnership, and subsequent to any such distributions there shall be unpaid debts or obligations of the Partnership that arose before such distribution, then each of the Limited Partners shall be obligated to repay to the Partnership such distributed amounts, with interest, as may be required to discharge any such unpaid debts or obligations upon demand by the General Partner.
8.4 No Guarantee of Return of Capital Contribution. No provision in the Agreement shall be construed as guaranteeing the return, either by the General Partner personally or by the Partnership, of part or all of the Capital Contributions made to the Partnership by any of the Limited Partners.
8.5 Tax Withholding. All amounts withheld from Partnership revenue or distributions by or for the Partnership pursuant to the Internal Revenue Code, of 1986, as the same shall be amended from time to time (the “Code”), or any provision of any state or local tax law shall be treated for all purposes of this Agreement as distributions to those Partners who receive tax credits with respect to such withheld amounts. In any case where a tax, fee or other assessment is levied upon the Partnership, the amount of which is levied in whole or in part by the status or identity of the Partners, the General Partner shall allocate the expense and withhold from the distributions to each Partner their respective attributable share of such taxes, fees and assessments.
A-8
ARTICLE IX
THE GENERAL PARTNER.
9.1 Authority of General Partner. The General Partner shall have the exclusive right and power to manage and operate the business of the Partnership and to do all things necessary to carry on the business of the Partnership for the purpose described in Article IV of this Agreement. Except as otherwise specifically provided in this Agreement, the General Partner shall have all of the rights, powers and authority of a general partner of a limited partnership under the Act. Without limiting the foregoing or any other provision of this Agreement, the General Partner, in its sole and absolute discretion, shall have the power on behalf of the Partnership to:
(a) Employ agents, attorneys, accountants, custodians, consultants or such other Persons, firms or corporations from time to time on such terms as the General Partner deems appropriate and to delegate to them any powers of the General Partner;
(b) Retain itself, Affiliates, the Trading Advisors, the Clearing Brokers or others as commodity pool operator, commodity trading advisor, clearing and executing broker and/or investment manager;
(c) Invest Partnership property in interest-bearing accounts or depositories or in U.S. government debt securities;
(d) Effect private or public offerings of Units now or in the future, cause the Partnership to file a Registration Statement and such amendments as the General Partner deems advisable with the SEC for the registration and public offering of Units, and seek to qualify the Units for sale in various jurisdictions as the General Partner deems advisable; and
(e) Cause the Partnership to enter into selling agreements with one or more Selling Agents on such terms as the General Partner deems appropriate.
9.2 General Partner Obligations. The General Partner shall be liable for all obligations of the Partnership in excess of the Partnership’s total assets, except to the extent that the Partnership obtains financing where the creditor has recourse only against the property that secures such financing or other property of the Partnership.
9.3 Devotion of Time. The General Partner and its principals shall devote so much of their time to the business of the Partnership as they determine is reasonably required to operate and manage the Partnership in an efficient manner, but shall not be required to devote their entire time to Partnership business.
9.4 Standard of Care. In carrying out its duties and exercising its powers hereunder, the General Partner shall exercise good faith and shall act at all times in the best interests of the Limited Partners. Neither the General Partner nor its directors, officers, employees or its agents shall be liable to the Partnership or the Limited Partners for any act or omission performed or omitted in good faith pursuant to the authority granted to them by this Agreement.
9.5 Third Party Dealings. Persons dealing with the Partnership are entitled to rely conclusively upon the certificate furnished by the General Partner that it is acting according to powers, rights and authority granted by this Agreement.
9.6 Retention of Clearing Brokers. The General Partner, on behalf of the Partnership, shall retain the Clearing Brokers and hereby is authorized to enter into a Clearing Agreement on behalf of the Partnership with each such Clearing Broker. The General Partner is further authorized to retain different or additional Clearing Brokers in the future and to engage (or cause or permit the Trading Advisors to engage) floor brokers, executing brokers or dealers to assist in the execution of the Partnership’s Commodity Interest transactions. The General Partner further is authorized to cause the Partnership to pay to the Clearing Brokers brokerage commissions at
A-9
the rates and on the terms provided for in the Clearing Agreements, it being understood that a portion of such commissions may be paid to the Selling Agents or, in some cases, the General Partner, as may be described in the Prospectus. In addition, the General Partner is authorized to assess against the Net Assets of the Partnership (or any Class therein) a brokerage fee or other fee, either expressed as a percentage of the Net Asset Value of the Partnership (or any Class therein), as a specified dollar amount per transaction undertaken on behalf of the Partnership, or in any other manner as determined by the General Partner in its sole discretion, as may be described in the Prospectus. The General Partner is authorized to pay all or a portion of any such fees collected from the Partnership to the Clearing Brokers, the Trading Advisors, the Selling Agents, custodians, consultants or such other Persons, firms or corporations as compensation for services performed (or to be performed) on behalf of the Partnership, and the General Partner is authorized to retain the balance of any such fees as remuneration for its services undertaken on behalf of the Partnership, as may be described in the Prospectus. The foregoing brokerage commissions and fees may be increased in the future, provided, however, that during such time as the Units are registered for sale to the public, written notice thereof is given to the Limited Partners pursuant to Section 15.8.
9.7 Retention of Trading Advisors. The General Partner shall retain Trading Advisors to make all trading decisions regarding the Partnership and shall delegate complete trading discretion with respect to the Partnership to such Trading Advisors; provided, however, the General Partner shall have the right to reverse any trading decisions of the Trading Advisors which, in the opinion of the General Partner, are in violation of the trading policies of the Partnership as described in the Prospectus. The Trading Advisors shall initially be granted trading discretion over their respective Allocated Net Assets of the Partnership. The General Partner may from time to time, in its sole discretion, appoint additional or substitute Trading Advisors, dismiss the Trading Advisors (or any of them), and in each case reallocate Partnership assets among the remaining Trading Advisors. There is no assurance that new or additional advisors may be engaged on the same terms as are currently in place and such engagement may occur without prior notice to the Limited Partners. The General Partner also may allocate notional funds (as such may be described in the Advisory Contracts) to the Trading Advisors. For the avoidance of doubt, each Trading Advisor shall be granted trading discretion over a portion of the Partnership’s Net Assets as a whole.
9.8 Advisory Contracts. The General Partner hereby is authorized to enter into the Advisory Contracts, described in the Prospectus, by and among the Partnership, the General Partner and each Trading Advisor. The General Partner further is authorized to either cause the Partnership to pay each Trading Advisor, in connection with the trading advice rendered to the Partnership, a management or consulting fee or the General Partner may compensate the Trading Advisors out of the fees collected by the General Partner from the Partnership as described in Section 9.6 hereof, as may be described in the Prospectus. Moreover, the General Partner is authorized to cause the Partnership to pay each Trading Advisor an incentive fee calculated as a percentage of New Trading Profits on the Allocated Net Assets allocated to such Trading Advisor, as may be described in the Prospectus. The method of calculating the applicable fees or other compensation payable to any Trading Advisor shall be set forth in the Advisory Contract and further described in the Prospectus.
9.9 General Partner Management Fee. In consideration for its services hereunder, the General Partner is authorized to cause the Partnership to pay to it a management fee equal to a percentage of the Net Assets of each Class of Limited Partnership Units, as may be described in the Prospectus. In addition, the General Partner is authorized to retain the balance of the fees collected from the Partnership, as described in Section 9.6 hereof, that are not paid out to the Clearing Brokers, Trading Advisors, Selling Agents or the Partnership’s other service providers, as remuneration for its services hereunder, as may be described in the Prospectus.
9.10 Organization and Offering Expenses; Operating Expenses; Restrictions on Loans.
(a) The General Partner shall advance the Organization and Offering Expenses incurred in any initial and continuous public offerings of the Class A Units and the Class B Units, and no such expenses shall be deducted from the proceeds of such offerings. Subject to the limitation described below, at the General Partner’s
A-10
discretion and upon presentation by the General Partner of invoices to the Partnership, the Partnership shall reimburse such amounts advanced by the General Partner after the closing of the initial offering and monthly during the continuous offering up to the total amount of the Organization and Offering Expenses incurred, and such reimbursed amounts shall be borne 10% by the Class A Units and 90% by the Class B Units. The General Partner shall have discretion to adopt reasonable procedures to implement the amortization of such expenses, including grouping expenses related to the same offering period and expensing de minimis amounts as they are incurred. In no event, however, shall the General Partner be entitled to invoice the Partnership, and to receive reimbursement therefrom, in any calendar year in an amount greater than 0.0833% (1.0% per annum) of the Net Asset Value of the Partnership per month in such year (the “maximum annual reimbursement amount”), with the Class A Units and the Class B Units bearing such proportional amounts of such maximum annual reimbursement amount as are set forth above. The General Partner may, in its sole discretion, in any subsequent calendar year invoice the Partnership for amounts advanced that exceeded the maximum annual reimbursement amount in any prior year and cause the Partnership to reimburse it for such amounts, subject always to total reimbursement by the Partnership in any calendar year of no more than the maximum annual reimbursement amount. In the event the Partnership terminates prior to completion of the reimbursement, the General Partner will not be entitled to receive additional reimbursement and the Partnership will have no obligation to make further reimbursement payments to the General Partner. In no event shall the Organization and Offering Expenses paid by the Partnership exceed limits set by the NASAA Guidelines during such time as the Units are registered for sale to the public.
(b) The Partnership shall pay its ongoing operating expenses and any extraordinary expenses, as described in the Prospectus. The General Partner will not cause the Partnership to pay any of the General Partner’s indirect expenses (other than Organization and Offering Expenses) incurred in connection with its administration of the Partnership, including but not limited to, salaries, rent, travel expenses or other items generally considered “overhead.”
(c) With respect to loans made to the Partnership by the General Partner, if any, the General Partner may not receive interest in excess of its interest costs, nor may the General Partner receive interest in excess of amounts that would be charged the Partnership (without reference to the General Partner’s financial abilities or guarantees, if any) by unrelated banks on comparable loans for the same purpose and the General Partner shall not receive points or other financing charges regardless of the amount.
9.11 NASAA Guidelines.
(a) Notwithstanding the foregoing, during such time as the Units are registered for sale to the public, compensation payable by the Fund to any party, including without limitation the General Partner, any Trading Advisor or any Clearing Broker, shall not exceed the limitations imposed by the NASAA Guidelines, as such are interpreted and applied by the General Partner in its good faith determination. In the event the compensation exceeds the NASAA Guidelines during such period, the General Partner shall promptly reimburse the Partnership for such excess. As of the date hereof, the NASAA Guidelines impose the following limitations on fees: (i) management fees, advisory fees and all other fees, except for incentive fees and commodity brokerage commissions, when added to the customary and routine administrative expenses, shall not exceed 6% annually of the commodity pool’s net asset value; (ii) the aggregate incentive fees shall not exceed 15% of new trading profits experienced by the commodity pool; (iii) the sponsor or advisor to the commodity pool will be entitled to an additional 2% incentive fee for each 1% by which the fees and expenses set forth in (i) above is reduced below 6%; and (iv) commodity brokerage rates will be presumptively reasonable if they satisfy either 80% of the published retail rate plus Pit Brokerage Fees or 14% annually of average net assets (excluding assets not directly related to trading activity, if any), including Pit Brokerage Fees.
(b) During such time as the Units are registered for sale to the public and to the extent required by the NASAA Guidelines: (i) no loans may be made by the Partnership to the General Partner or any other Person; (ii) the Partnership’s assets shall not be commingled with the assets of any other Person (assets used to satisfy
A-11
margin requirements will not be considered commingled for this purpose); (iii) no rebates or give ups may be received by the General Partner nor may the General Partner participate in any reciprocal business arrangements which could circumvent the NASAA Guidelines; (iv) no Trading Advisor shall receive a fee from the Partnership based on Partnership Net Assets if the Trading Advisor shares, directly or indirectly, in any brokerage commissions incurred by the Partnership; (v) the duration of any contract between the Partnership and the General Partner or any Trading Advisor shall not exceed one (1) year (although such contracts may be automatically renewable for successive one (1) year periods until terminated) and must be terminable without penalty upon no less than sixty (60) days’ prior written notice; (vi) any other proposed or contemplated agreement, arrangement or transaction may be restricted in the discretion of an Administrator if it would be considered unfair to the Limited Partners; (vii) the Partnership shall not engage in Pyramiding; and (viii) at no time will a Trading Advisor be an Affiliate of a Clearing Broker nor at any time will a Trading Advisor be an Affiliate of the General Partner.
9.12 Advisory Fees Upon Redemption. In the event Limited Partnership Units of a Class are redeemed at any date other than the end of a month, any management fees payable to the General Partner and the incentive fees payable to the Trading Advisor with respect to the Limited Partnership Units of such Class will be prorated and adjusted accordingly. If any fee is paid to the Trading Advisors in connection with investment advice rendered to the Partnership and the Partnership thereafter suffers trading losses, the Trading Advisors shall not forfeit the amount previously held.
9.13 Tax Matters Partner. The General Partner shall be the “tax matters partner” as described in Sections 6221-6233 of the Code. The General Partner may enter into any settlement agreement pursuant to the Code. All costs and expenses incurred in connection with or as a result of an audit of the Partnership shall be borne by the Partnership.
9.14 General Partner Withdrawal. The General Partner shall not withdraw from the Partnership without giving Limited Partners no less than one hundred twenty (120) days’ prior written notice. In the event the General Partner withdraws as general partner and the Limited Partners elect to continue the Partnership, the withdrawing General Partner shall pay all expenses incurred as a result of its withdrawal. In the event of removal or withdrawal of the General Partner, the General Partner shall be entitled to redemption of its Units at the applicable Net Asset Value per Unit on the next Valuation Date following such removal or withdrawal.
ARTICLE X
INDEMNIFICATION.
10.1 Indemnification of General Partner. The Partnership will indemnify and hold harmless the General Partner and its members, directors, officers, employees and agents (each, a “General Partner Party”) from and against any loss, expense or other liability (including reasonable attorneys’ fees and expenses) incurred by them by reason of any act performed or omission by them on behalf of the Partnership, provided that: (i) the General Partner has determined, in good faith, that the course of conduct which caused the loss or liability was in the best interests of the Partnership; (ii) the General Partner Party was acting on behalf of or performing services for the Partnership; and (iii) such loss or liability was not the result of negligence or misconduct by the General Partner Party. Any indemnification of a General Partner Party is recoverable only from the assets of the Partnership and not from the Limited Partners. Notwithstanding the foregoing, the Partnership shall not indemnify a General Partner Party for any loss, expense or other liability arising from an alleged violation of federal or state securities laws unless one of the following conditions have been met: (i) there has been a successful adjudication on the merits of each count involving alleged securities law violations as to such General Partner Party; or (ii) such claims have been dismissed with prejudice on the merits by a court of competent jurisdiction as to such General Partner Party; or (iii) a court of competent jurisdiction approves a settlement of claims against such General Partner Party and finds that indemnification to such General Partner Party of the settlement amount and any related costs should be made, provided that the court considering the request for indemnification has been advised of the position of the SEC and any relevant Administrator with respect to such indemnification. The
A-12
Partnership shall not incur the cost of that portion of any insurance which insures the General Partner against any liability the indemnification of which is herein prohibited. The advancement of Partnership funds to the General Partner or its Affiliates for legal expenses and other costs incurred as a result of any legal action shall be permissible, but only if: (i) the legal action relates to acts or omissions with respect to the performance of duties or services on behalf of the Partnership; (ii) the legal action is initiated by a third party who is not a Limited Partner, or the legal action is initiated by a Limited Partner and a court of competent jurisdiction specifically approves such advancement; and (iii) the General Partner or its Affiliates undertake to repay the advanced funds of the Partnership, together with the applicable legal rate of interest thereon, in cases in which such Person is not entitled to indemnification in this Section 10.1.
10.2 Indemnification of Third Parties. In its discretion, the General Partner is authorized to cause the Partnership to indemnify and hold harmless the Trading Advisors, the Clearing Brokers, the Selling Agents and other third parties against losses, expenses or liabilities (including without limitation, reasonable attorneys’ fees and expenses) incurred in connection with such Persons’ performance of services for or on behalf of the Partnership, to the extent permitted by applicable law, on such commercially reasonable terms as may be agreed upon by the General Partner and such Persons. In no event, however, shall any undertaking by the Partnership to indemnify any Selling Agent or other third party be contrary to the limitations on indemnification set forth in the NASAA Guidelines.
10.3 Effect on Limited Partners. No indemnity by the Partnership will increase the liability of any Limited Partner beyond the amount of his Capital Contribution and profits, if any, in the Partnership.
ARTICLE XI
LIMITED PARTNERS.
11.1 No Role in Partnership Business. No Limited Partner, as such, shall take any part in the conduct or control of the Partnership’s business nor have any right or authority to act for or on behalf of the Partnership.
11.2 Limitation of Liability. No Limited Partner, as such, shall be liable for any debts or obligations of the Partnership in excess of his Capital Contributions to the Partnership, plus his share of accumulated and undistributed net profits of the Partnership and interest thereon. No Limited Partner shall be permitted or required to contract away the fiduciary obligation owed to the Limited Partners by the General Partner.
11.3 Voting Rights.
(a) Limited Partners shall have no voting rights except as set forth in this Agreement.
(b) Upon receipt of a written request, signed by Limited Partners owning at least 10% of the Units then outstanding that are entitled to vote on the matter to be presented, delivered in person or by certified mail that a meeting of the Partnership be called to vote upon any matter which the Limited Partners may vote upon pursuant to this Agreement, the General Partner shall, by written notice, either in person or by certified mail, to each eligible Limited Partner of record mailed within fifteen (15) days after receipt of such request, call a meeting of the Partnership. Such meeting shall be held at least thirty (30) but not more than sixty (60) days after the mailing of such notice and such notice shall specify the date, a reasonable place and time and the purpose of such meeting.
(c) At any meeting called pursuant to Section 11.3(b), upon the affirmative vote (which may be in person or proxy or otherwise deemed received pursuant to Section 17.4) of the Limited Partners owning more than 50% of the Units then outstanding that are entitled to vote on the matter to be presented (excluding Units owned by the General Partner and its Affiliates), the following actions may be taken without the consent of the General Partner: (i) the amendment of this Agreement to the extent permitted by Article XVII; (ii) the removal of the General Partner; (iii) the election of a substitute General Partner or General Partners upon the removal or
A-13
withdrawal of the existing General Partner, provided that the substitute General Partner or General Partners shall continue the business of the Partnership without dissolution; and (iv) the termination of any contracts between the Partnership and the General Partner (excluding, for the avoidance of doubt, this Agreement) or any Trading Advisor upon no less than sixty (60) days’ notice without penalty; and (v) the liquidation of the Partnership.
(d) In the event that the matter to be voted on affects only one Class of Units, then only Limited Partners holding Units of such Class shall be entitled to vote on such matter, with such matter being approved by a vote of Limited Partners owning more than 50% of the outstanding Units of such Class (excluding Units owned by the General Partner and its Affiliates).
(e) Any material changes to the Partnership’s fundamental investment objectives or policies, as determined by the General Partner in good faith, shall require the prior written approval of Limited Partners holding more than 50% of the Partnership’s outstanding Units (excluding Units owned by the General Partner and its Affiliates).
(f) Without the consent of the Limited Partners owning more than 50% of the Units then outstanding that are entitled to vote on the matter to be presented (excluding Units owned by the General Partner and its Affiliates), the General Partner may not: (i) amend this Agreement except as provided for in Section 17.3; (ii) appoint a new General Partner or General Partners; or (iii) liquidate the Partnership. Notwithstanding anything else in this Agreement to the contrary, any amendment to this Agreement which modifies the compensation or distributions to which the General Partner is entitled or which affects the duties of the General Partner shall be conditioned upon the consent of the General Partner.
11.4 Dissolution. The Partnership shall not be dissolved by the incompetency, bankruptcy or death of any Limited Partner or by a change in any Limited Partner’s relative capital interest in the Partnership, whether by assignment or otherwise. If any such event effects a dissolution of the Partnership by operation of law, then upon its occurrence a new Partnership automatically shall be in effect among the remaining Limited Partners, and such successor Partnership shall succeed to all the property, assets and business, subject to all liabilities and contracts, of the prior Partnership and shall be controlled by the terms of this Agreement.
11.5 Consent to Further Action. Each Limited Partner (or any permitted assignee thereof) hereby agrees that the General Partner is authorized to execute, deliver and perform the agreements, acts, transactions and matters contemplated hereby or described in or contemplated by the Registration Statements on behalf of the Partnership without any further act, approval or vote of the Limited Partners, notwithstanding any other provision of this Agreement, the Act or any applicable law, rule or regulation.
ARTICLE XII
SUBSTITUTE OR ADDITIONAL LIMITED PARTNERS.
12.1 Admission, Transfer and Assignment.
(a) Each Limited Partner expressly agrees that he will not voluntarily assign, transfer or dispose of, by gift or otherwise, any of his Units or any part or all of his right, title and interest in the capital or profits of the Partnership in violation of any applicable federal or state securities laws or without given written notice to the General Partner at least thirty (30) days prior to the date of such assignment, transfer or disposition. No assignment, transfer or disposition by a Limited Partner of Units or of any part of his right, title and interest in the capital or profits of the Partnership shall be effective against the Partnership or the General Partner until; (i) the General Partner receives the written notice of the assignment, unless such notice is waived by the General Partner in its sole discretion; (ii) the proposed assignee completes any required subscription documentation or other documentation; and (iii) the General Partner consents to such proposed assignments, transfer or disposition. No such assignee, except with the consent of the General Partner, which consent may be withheld under the circumstances provided below, may become a substituted Limited Partner, nor will the estate or any beneficiary
A-14
of a deceased Limited Partner or assignee have any right to redeem Units from the Partnership except by redemption as provided in Article XIII hereof. The General Partner may withhold consent only to prevent or minimize potential adverse legal or tax consequences to the Partnership or in the event the proposed assignee does not independently satisfy the standards for admission as a Limited Partner set forth in the subscription documentation, as determined by the General Partner in its reasonable discretion. Upon advice of legal counsel, the General Partner shall eliminate or modify any restrictions on substitution or assignment at such time as the restriction is no longer necessary. If the General Partner withholds consent, an assignee shall not become a substituted Limited Partner, and shall not have any of the rights of a Limited Partner, except that the assignee shall be entitled to receive that share of capital and profits and shall have that right of redemption to which his assignor would otherwise have been entitled. No assignment, transfer or disposition of Units shall be effective against the Partnership or the General Partner until the first day of the month succeeding the month in which the General Partner consents to such assignment, transfer or disposition, or as otherwise provided by the General Partner. No Units may be transferred where, after the transfer, either the transferee or the transferor would hold less than the minimum number of Units equivalent to an initial minimum purchase, except for transfers by gift, inheritance, intrafamily transfers, family dissolutions, and transfers to Affiliates.
(b) Any assignee or proposed assignee of a Limited Partner shall pay or obligate itself to pay all reasonable legal fees and other expenses incurred by the Partnership or General Partner in connection with such assignment as the General Partner may determine.
12.2 Withdrawal from Partnership. No Limited Partner at any time shall be entitled to elect to withdraw from the Partnership except to the extent provided in Article XIII below. If a Limited Partner shall die, be adjudicated insane or incompetent, or be dissolved, prior to dissolution of the Partnership, the Limited Partner’s legal representative shall be deemed to be an assignee of, and with the prior written consent of the General Partner may be substituted for, such Limited Partner. The legal representative of any such Limited Partner shall have no right to elect to receive the value of such Limited Partner’s interest in the Partnership as a creditor of the Partnership in lieu of the rights of the Limited Partner to profits, losses and distributions provided by this Agreement.
ARTICLE XIII
REDEMPTION OF UNITS.
13.1 Monthly Redemptions. Limited Partners may require the Partnership to redeem Units for an amount equal to all or a portion of the Net Assets represented by such Units, as of the close of business on the last business day of any calendar month if the Partnership has received written notice of such desired redemption at least ten (10) days prior to the last business day of the month-end as of which the redemption is to occur, or as may otherwise be provided for in the Prospectus. The General Partner will notify a redeeming Limited Partner in writing within ten (10) days after the proposed redemption date regarding whether the redemption has been, or will be, effected on the requested redemption date. Except as described below, the redemption amount will be paid by the fifteenth business day of the month following the redemption date. The General Partner will redeem Units at the Net Asset Value per Unit on the requested redemption date unless the number of redemptions would be detrimental to the tax status of the Partnership, in which case, the General Partner shall select by lot that number of redemptions as will, in its judgment, not impair the Partnership’s tax status. The right to obtain redemption is also contingent upon the Partnership’s having property sufficient to discharge its liabilities on the redemption date and may be delayed if the General Partner determines that earlier liquidation of Commodity Interest positions to meet redemption payments would be detrimental to the Partnership or nonredeeming Limited Partners. Redemption charges for redemption of Units of any Class, if any, shall be as set forth in the Prospectus; provided, however, that: (i) no redemption charge shall be assessed against holders of the Class A Units; and (ii) during such time as the Units are registered for sale to the public, all redemption charges shall comply with any restrictions on redemption charges imposed by the NASAA Guidelines. Redemptions from investors purchasing Units will be made on a first-in-first-out basis. The General Partner may cause the Partnership to redeem its capital at any time.
A-15
13.2 Redemption Requests. In order to effect a redemption, a Limited Partner must furnish the General Partner with a written request for redemption. The terms of the request for redemption must include: (i) the Units and the date for which redemption is requested; (ii) an acknowledgment of the basis upon which valuation of Units being redeemed will be made; and (iii) a representation by the Limited Partner that he is the lawful owner of the Units being redeemed and that the Units have not been encumbered in any fashion.
13.3 Required Redemption. The General Partner may, at any time, in its sole discretion, require any Unit holder to withdraw entirely from the Partnership, or to withdraw a portion of his Partner capital account, by giving not less than fifteen (15) days’ advance written notice to the Unit holder thus designated. In addition, the General Partner without notice may require at any time, or retroactively, withdrawal of all or any portion of the capital account of any Limited Partner: (i) that the General Partner determines is a benefit plan investor (within the meaning of Department of Labor Regulations §2510.3-101(f)(2)) in order for the assets of the Partnership not to be treated as plan assets under ERISA; (ii) which made a misrepresentation to the General Partner in connection with its purchase of Units; or (iii) if such Limited Partner’s ownership of Units would result in the violation of any law or regulation applicable to the Partnership or a Partner. The Unit holder thus designated shall withdraw from the Partnership or withdraw that portion of his Partner capital account specified in such notice, as the case may be, as of the close of business on such date as determined by the General Partner. The Unit holder thus designated shall be deemed to have withdrawn from the Partnership or to have made a partial withdrawal from his Partner capital account, as the case may be, without further action on the part of said Unit holder and the provisions of Section 13.1 shall apply. The Unit holder thus designated shall withdraw from the Partnership or withdraw that portion of his Partner capital account specified in such notice, as the case may be, as of the close of business on such date as determined by the General Partner. The Unit holder thus designated shall be deemed to have withdrawn from the Partnership or to have made a partial withdrawal from his Partner capital account, as the case may be, without further action on the part of said Unit holder and the provisions of Section 13.1 shall apply.
13.4 Special Redemption. The General Partner may, in its sole discretion and upon notice to the Limited Partners, declare a special redemption date on which Limited Partners may redeem their Units at the Net Asset Value per Unit, provided that the Limited Partner submits a request for redemption in a form acceptable to the General Partner. During such time as the Units are registered for sale to the public, the General Partner shall declare such a special redemption date whenever the Partnership experiences a decline in Net Asset Value per Unit as of the close of business on any business day to less than 50% of the Net Asset Value per Unit on the last valuation date. The Partnership shall suspend trading during such special redemption period.
ARTICLE XIV
COMPETING OR RELATED BUSINESSES.
14.1 Other Activities of General Partner and Limited Partners. Except as provided in Section 14.2, the General Partner (and its principals and Affiliates) and the Limited Partners may acquire Commodity Interests and other investments for their own account or engage in the business of investing, trading, buying and selling Commodity Interests or other investments on behalf of other partnerships, joint ventures, corporations or other business ventures formed by them or in which they may have an interest, including, without limitation, business ventures similar to, related to or in direct or indirect competition with any business of the Partnership. Neither the Partnership nor any other Partner shall have any right by virtue of this Agreement in or to such other business ventures or income, profits or fees derived from any of the foregoing.
14.2 Compliance with Position Limits. Each Partner herein represents, covenants and agrees with the Partnership that he shall not hold positions in commodity futures contracts in excess of any applicable position limits imposed from time to time by the Commodity Futures Trading Commission (“CFTC”), any other regulatory body or any commodity exchange on which the Partnership may trade in commodity futures contracts. Such limitation shall apply to the Partner individually and to any other Person controlled by or trading pursuant to a common pattern with any of the Partners or any other Person whose holdings may be attributed to any
A-16
Partner by the CFTC, any other regulatory body or any such exchange. If position limits are exceeded by reason of trading by or attributed to any Partner, in the opinion of the CFTC, any other regulatory body, any exchange or the General Partner, such Partner (and not the Partnership) shall immediately reduce positions attributed to him (other than positions held by the Partnership) to comply with such position limit.
ARTICLE XV
FISCAL YEAR, BOOKS OF ACCOUNT, ACCOUNTING AND
OTHER REPORTS, TAX RETURNS AND BANKING.
15.1 Fiscal Year. The fiscal year of the Partnership shall be the calendar year.
15.2 Books and Records. The General Partner shall maintain, or cause to be maintained, for a period of no less than five (5) years from the date each such record is generated and in accordance with CFTC Reg. §1.31 and §4.23, full and accurate books for the Partnership at the Partnership’s principal place of business reflecting all receipts and expenditures, assets and liabilities, income and losses and all other records necessary for recording the Partnership’s business and transactions, including those sufficient to record the allocations and distributions provided for in Articles VII and VIII. Notwithstanding the foregoing, records relating to the suitability of a Limited Partner purchasing Units through the General Partner directly (as opposed to through a Selling Agent) shall be maintained by the General Partner for no less than six (6) years from the date such records are generated. Each Limited Partner shall have the right to inspect such books and records during reasonable business hours upon reasonable written notice to the General Partner. A Limited Partner may inspect or (at such Limited Partner’s expense) obtain a list of the names and addresses of all Limited Partners, provided that such Limited Partner first provides to the General Partner adequate written assurances that such information is reasonably related to such Limited Partner’s interest as a Limited Partner and will not be used for commercial purposes.
15.3 Independent Auditor. The records and books of account of the Partnership may be audited by independent certified public accountants selected by the General Partner at any time that the General Partner may deem it necessary or desirable.
15.4 Partnership Tax Returns. The General Partner shall prepare or cause to be prepared all tax returns required of the Partnership and may make any available or necessary elections.
15.5 Annual Report. As soon as reasonably practicable after the end of each fiscal year, but in no event later than ninety (90) days after such period, the General Partner shall furnish each Limited Partner with an “Annual Report,” as required by CFTC Reg. §4.22(c), and a tax statement showing the amounts of any income, gains and losses allocated to the Limited Partner and the amount of any distributions made to the Limited Partner pursuant to this Agreement.
15.6 Monthly Account Statement. The General Partner also shall furnish each Limited Partner with a monthly “Account Statement,” as required by CFTC Reg. §4.22(a), within thirty (30) calendar days following the last day of the prior monthly period; provided, however, that such statement for the last month of the Partnership’s fiscal year need not be distributed in the event an annual report required by Section 15.5 is to be distributed to each Limited Partner within forty-five (45) calendar days after the end of the Partnership’s fiscal year. The General Partner will comply with the reporting requirements of CFTC Reg. §4.22 with respect to the Partnership.
15.7 Fund Depositories. All funds of the Partnership shall be deposited in a separate customer account or accounts or such other appropriate depositories as shall be determined by the General Partner.
15.8 Notice to Limited Partners. During such time as the Units are registered for sale to the public, notice will be mailed to each Limited Partner, together with a description of Limited Partners’ redemption and voting
A-17
rights and a description of any material effect the applicable following event may have on Limited Partners, within seven (7) business days of any of the following events:
(a) a decrease in the Net Asset Value per Unit of such Limited Partners’ Units to 50% or less of the Net Asset Value per Unit most recently reported;
(b) any material change in any Advisory Contract with a Trading Advisor, including any change to Trading Advisors or any modification in connection with the method of calculating the incentive fee, as determined by the General Partner in good faith; and
(c) any material change in the amount of any brokerage commissions or brokerage fees paid by the Partnership, or any other material change affecting the compensation of any party, as determined by the General Partner in good faith.
ARTICLE XVI
DISSOLUTION AND LIQUIDATION.
16.1 Dissolution.
(a) The Partnership shall be dissolved prior to the expiration of the term provided in Article V upon the happening of any of the following events;
(b) A decision of Limited Partners holding more than 50% of the Partnership’s outstanding Units (excluding Units owned by the General Partner and its Affiliates) to liquidate the Partnership;
(c) The withdrawal or dissolution of the General Partner, and the failure of the Limited Partners to elect a substitute General Partner to continue the Partnership; or
(d) The assignment for the benefit of creditors or adjudication of bankruptcy of the General Partner or appointment of a receiver for or seizure by a judgment creditor of the General Partner’s interest in the Partnership.
16.2 Liquidation. There shall be no liquidation and termination of the Partnership unless dissolution has occurred pursuant to Section 16.1 or unless dissolution has occurred at the end of the term provided in Article V. In the event of any such dissolution, the General Partner first shall contribute to the Partnership an amount equal to the debit balance, if any, in the capital account for the General Partner and then shall proceed to wind up the affairs of the Partnership and liquidate its investments. The General Partner shall have full right and unlimited discretion to determine the time, manner, and terms of any sale of Partnership property pursuant to such liquidation having due regard to the activity and condition of the relevant market and general financial and economic conditions. The proceeds of such liquidation shall be applied and distributed in the following order of priority:
(a) To the payment of debts and liabilities of the Partnership (other than any loans or advances that may have been made by any of the Limited Partners to the Partnership) and the expenses of the liquidation;
(b) To the creation of any reserves that the General Partner may consider reasonably necessary for any contingent or unforeseen liabilities or obligations of the Partnership; provided, however, that if and when a contingency ceases to exist, the monies, if any, then in reserve attributable to such contingency shall be distributed in the manner hereinafter provided;
(c) To the repayment of any loans or advances that may have been made by any of the Partners to the Partnership, or pro rata among them if the amount available for repayment is insufficient; and
A-18
(d) Amongst the Classes pro rata and to all Partners of a Class in accordance with their respective Unit Ownership Percentages with respect to such Class. Solely for purposes of this Section 16.2, in the event that the General Partner is unable to wind up the affairs of the Partnership and liquidate its assets, such Person as may be designated by the Limited Partners holding more than 50% of all Limited Partnership Units of the Partnership then issued and outstanding (excluding Units owned by the General Partner and its Affiliates) shall carry out such duties in accordance with the provisions of this Article XVI.
16.3 Sale of Assets. The Limited Partners shall have no right to demand property other than cash in return for their contributions to the capital of the Partnership. Upon dissolution, any physical assets of the Partnership shall be sold at public or private sale at such price and upon such terms as the General Partner may consider advisable. Any Partner may purchase the assets of the Partnership at any such sale.
16.4 Return of Capital Contributions. The General Partner shall not be personally responsible or liable for the return of all or any part of the Capital Contributions of the Limited Partners, and any such return shall be made solely from Partnership assets.
16.5 Liquidation Statement. Each of the Limited Partners shall be furnished with a statement, prepared or caused to be prepared by the General Partner, reflecting the assets and liabilities of the Partnership as of the date of complete liquidation. Upon the completion of distributions pursuant to the preceding subsections of this Article XVI, the Limited Partners shall cease to be such; and the General Partner shall cause any Certificate of Limited Partnership to be cancelled.
ARTICLE XVII
AMENDMENTS.
17.1 Procedure for Amendments Generally. Except as otherwise provided in this Article XVII, amendments to this Agreement may only be made with the consent of holders of more than 50% of the Limited Partnership Units of the Partnership then outstanding (excluding Units owned by the General Partner and its Affiliates) except that (a) without the consent of all Partners, no amendment shall amend this Article XVII, and (b) no amendment may change the requisite percentage of Units held by Limited Partners which are needed to give any consent or approval under this Agreement without the consent of at least such requisite percentage.
17.2 Amendments Requiring Limited Partner Consent. No amendment shall: (i) reduce the participation of a Limited Partner in net profits and losses or distributions of the Partnership; (ii) change the Partnership to a general partnership; (iii) reduce the liabilities, obligations or responsibilities of the General Partner; or (iv) increase the obligations or liabilities of a Limited Partner without the written consent of such Partner. Any Limited Partner that does not consent to such a proposed amendment affecting such Limited Partner may withdraw from the Partnership prior to the effectiveness of the amendment.
17.3 Amendments Without Limited Partner Consent. The General Partner may, in its discretion, without the consent of the Limited Partners, modify or amend any provision of this Agreement for any of the following purposes: (i) for the purpose of adding to this Agreement any further covenants, restrictions, undertakings or other provisions for the protection of the Limited Partners; (ii) to cure any ambiguity, to correct or supplement any provision contained herein which may be defective or inconsistent with any other provisions contained herein or otherwise to more accurately reflect the intent of the General Partner in connection with the operations of the Partnership or the computation and determination of allocations hereunder; (iii) to cause the allocations contained herein to comply with Section 704 of the Code or any other statutory provisions or regulations relating to such allocations; (iv) to ensure that the Partnership is not taxed as an association taxable as a corporation for federal income tax purposes; (v) to ensure that the Partnership is not required to register as an “investment company” under the Investment Company Act of 1940; (vi) to ensure that the Partnership is not treated as a “publicly-traded partnership” under Section 7704 of the Code; (vii) to ensure that the Partnership is not
A-19
considered to hold “plan assets” within the meaning of the Employee Retirement Income Security Act of 1974; (viii) to ensure that the Partnership is not in violation of any applicable law or regulation, including to bring the Partnership into compliance with the securities or Blue Sky laws of the SEC or any other federal agency or any state in which Units have been or will be sold; (ix) to make any other change not materially adverse to the interests of the Limited Partners; or (x) if the General Partner is expressly authorized to amend this Agreement as provided herein.
17.4 Methods of Limited Partner Consent. In any matter regarding any Partnership action in which the consent of a Limited Partner is required, such consent shall be deemed given if either: (i) such Limited Partner affirmatively grants such consent in writing; or (ii) the Limited Partner has been furnished with a written notice of the matter(s) for which consent is requested and the Limited Partner shall have failed to respond to such notice within the time period designated for such in the notice.
ARTICLE XVIII
POWER OF ATTORNEY.
18.1 Power of Attorney Generally. Each Limited Partner, by becoming a Limited Partner, constitutes and appoints the General Partner its true and lawful attorney-in-fact and agent in his name, place and stead to make, execute, sign, acknowledge, file and record from time to time with respect to the Partnership:
(a) Any documents and instruments that the General Partner deems appropriate to reflect any amendment, change or modification of the Partnership, in accordance with the terms of this Agreement;
(b) Any certificates, documents or instruments that the General Partner deems necessary or appropriate to effect the dissolution of the Partnership; and
(c) All such other certificates, documents and instruments that may be required by the laws of the State of Illinois, the United States of America, or any other jurisdiction in which the Partnership may do business to effectuate, implement, continue and defend the valid and subsisting existence of the Partnership.
18.2 General Partner Action. The General Partner shall take no action as such attorney that would in any way increase the liability of any Limited Partner beyond the liability expressly set forth in this Agreement.
18.3 Survival of Power of Attorney. The power of attorney granted by each Limited Partner to the General Partner shall be a power coupled with an interest, shall be irrevocable and shall survive the death, incompetence or dissolution of such Limited Partner and the delivery of an assignment by a Limited Partner of his Units, except that where the assignee thereof has been approved by the General Partner for admission to the Partnership as a substituted Limited Partner, the power of attorney shall survive the delivery of such assignment for the sole purpose of enabling the General Partner to execute, acknowledge and file any certificate, instrument or document necessary to effect such substitution.
18.4 Exercise of Power of Attorney. The power of attorney granted herein shall be exercisable by the General Partner for each Limited Partner by a facsimile signature or by listing all the Limited Partners executing any instrument with a single signature of the General Partner.
ARTICLE XIX
NOTICES.
Any notice given pursuant to this Agreement may be served personally on the Partner to be notified or may be mailed, postage prepaid, registered with return receipt requested, addressed as follows, or at such other address as a Partner may from time to time designate in writing:
To the General Partner: At the address set forth in Section 3.2 hereof.
To any Limited Partner: At the address as last provided to the General Partner in writing.
A-20
ARTICLE XX
PARTITION.
The Partner agrees that the Partnership properties are not suitable for partition. Accordingly, each of the Partners irrevocably waives any and all rights that he may have to maintain any action for partition of any of the Partnership’s property.
ARTICLE XXI
ENTIRE AGREEMENT.
This Agreement constitutes the entire agreement among the parties.
ARTICLE XXII
GOVERNING LAW.
This Agreement and the rights of the parties hereunder shall be governed by and interpreted in accordance with the laws of the State of Illinois, without regard to principles of conflicts of law, except for matters arising under federal or state securities laws (exclusive of Illinois securities laws). Any and all litigation arising out of this Agreement shall be conducted only in courts located in the State of Illinois.
ARTICLE XXIII
BINDING EFFECT.
All the terms and conditions of this Agreement shall be binding upon the Partners and their legal representatives, heirs, successors and assigns of the Partners except as otherwise expressly provided in this Agreement.
ARTICLE XXIV
PRONOUNS.
Wherever from the context it appears appropriate, each term stated in either the singular or the plural shall include both the singular and the plural, and pronouns stated in either the masculine, the feminine or the neuter gender shall include the masculine, feminine and neuter genders.
ARTICLE XXV
CAPTIONS.
Captions and section headings contained in this Agreement are inserted for convenience only and in no way define, limit or extend the scope or intent of any provision of this Agreement.
ARTICLE XXVI
COUNTERPARTS.
This Agreement, and any amendment thereto, may be executed simultaneously in one or more counterparts, each of which shall be deemed an original, but all of which together shall constitute one and the same instrument. In addition, this Agreement, and any amendment thereto, may contain more than one counterpart of the signature page, and all such counterpart signature pages shall have the same force and effect as though all parties had signed a single signature page.
A-21
ARTICLE XXVII
COPY ON FILE.
Each Partner agrees that one original of this Agreement, or set of original counterparts, shall be held at the principal place of business of the Partnership and that there shall be distributed to each Partner a composite conformed copy of this Agreement.
[Signature Page to Follow]
A-22
IN WITNESS WHEREOF, the parties hereto have executed this Agreement effective as of the date first above written.
GENERAL PARTNER:
DEARBORN CAPITAL MANAGEMENT, L.L.C.
By: Dearborn Capital Management, Ltd., its Managing Member | ||
| By: | ||
David M. Kavanagh, its President | ||
| LIMITED PARTNERS: | ||
A-23
APPENDIX B
NOTICE:
| • | This Subscription Agreement MUST be used in conjunction with the current Grant Park Futures Fund Limited Partnership prospectus. |
Grant Park Fund
Instructions to Subscription Agreement and Power of Attorney
Any person considering subscribing for the units should carefully read and review a current prospectus. The prospectus should be accompanied by the most recent monthly report of the Fund.
| 1. | (a) Check box indicating Legacy or Global Class UnitsANDenter the investment amount. |
| (b) Check the box if this is an addition to an existing account and provide the existing Investor ID Number (Investor ID Number is located in the upper right corner of your most recent Investor Statement). |
| 2. | Enter the Investor’s Selling Firm Account Number. |
| 3. | Enter the Social Security NumberOR Taxpayer ID Number of the investor, as applicable. For IRA accounts, the Taxpayer ID Number of the Custodian should be provided in addition to the Social Security Number of the investor. If the investor qualifies as a non-US citizen this form must be accompanied by Form W-8BEN. |
| 4. | (a) Indicate the type of account |
| (b) For all account types in bold and marked with an “*”, read paragraph and initial. When required, Section 4(b) must be initialed by each investor listed in Section 6 or Section 7. |
| 5. | Based on the definition included below, please indicate the most appropriate choice applicable to the investor if investing as account type: LLC, LTD, Partnership, Foreign Corporation, or Other. |
A Commodity Pool Operator (“CPO”) is an individual or organization which operates or solicits, accepts or receives funds from others for a commodity pool; that is, an enterprise in which funds contributed by a number of persons are combined for the purpose of trading futures contracts or commodity options or to invest in another commodity pool. (Note that futures trading does not need to be the primary purpose of the enterprise for it to be considered a commodity pool.)
Registration is required unless the CPO qualifies for one of the exemptions from registration outlined in Commodity Futures Trading Commission (“CFTC”) Regulations 4.5 or 4.13. If a CPO is qualified for an exemption from registration, the pool operator must electronically file a notice of exemption from CPO registration through National Futures Association (“NFA”) Electronic Exemption Filing System. This system can be accessed at http://www.nfa.futures.org/compliance/ExemptLoginSelection.asp
| 6. | Enter the Investor name or account title. The Account Title should be exactly the same as the account held with the Selling Firm . |
| • | For Trust, Corporation, Partnership, Estate, Profit Sharing, Pension, Defined Benefit and Other, enter the entity name. |
| • | For UGMA/UTMA (Minor), enter the Minor name, followed by “Minor.” |
| 7. | Enter the name of individual(s) authorized to act on behalf of the account; anyone listed must sign the Subscription Agreement. |
| • | For Trust, Corporation, Partnership, Estate, Profit Sharing, Pension, Defined Benefit and Other, enter the name(s) of the authorized individual(s) or trustee(s). |
| • | For UGMA/UTMA (Minor), enter the name(s) of the trustee(s). |
B-1
| 8. | Enter the legal address, which is the residence or domicile address used for tax purposes, of the investor named online 6(no post office boxes).Line 8 must be completed. |
| 9. | Enter the mailing address if it is different from the legal address in line 8. |
| 10. | Enter the Investor Email address. Grant Park Fund Investor Statements are available online; please check the box only if you do not wish to access the statement online and wish to receive a mailed paper statement. |
| 11. | Each investor must sign and date.If the account has multiple owners, all owners must sign. In the case of an IRA, the Custodian’s signature, as well as the investor’s signature, is required. |
| 12. | For account type IRA, IRA Rollover, Roth or SEP, enter Custodian’s name and Custodian must sign. |
| 13. | Enter the legal address associated with the Custodian for the account. |
| 14. | The Financial Advisor must sign and date.Some broker/dealers may also require the signature of an office manager. |
| 15. | Sections 15 through 21 must be completed as follows: 15. Enter the name of the Selling Firm, 16. Selling Firm’s Branch Code, 17. Selling Firm’s Financial Advisor Code, 18. Financial Advisor or Group Name, 19. Financial Advisor Phone Number, 20. Financial Advisor’s Email address, 21. Selling Firm’s Branch address. |
Investor should return this Subscription Agreement and payment to their Financial Advisor’s office address.
Subscription agreements, payment, and any other required documents should be sent by the Financial Advisor to either:
| 1. | The Fund Administration Office of the named Selling Firm, if firm procedures require, or |
| 2. | The custodial firm, if one is required, or |
| 3. | Grant Park Fund, c/o Dearborn Capital Management, 626 W Jackson Blvd, Suite 600, Chicago, IL, 60661. Please check with Selling Firm’s Fund Administration Office before sending paperwork directly to Grant Park Fund. |
If payment is being made by wire transfer, the Financial Advisor should contact either his or her firm’s Fund Administration Department or Grant Park Fund Client Services for instructions.Payments and Subscription documents must be received by the general partner at least five business days prior to the end of the month.However, the Selling Firm’s Fund Administration Department may have an earlier cut-off for subscriptions.
If Financial Advisors have specific questions about the subscription process, please call the Financial Advisor Support Team at 866-242-4055 or your Fund Administration Department.
| Class 1 | ||||||||||||
B-2
GRANT PARK FUTURES FUND LIMITED PARTNERSHIP
LIMITED PARTNERSHIP UNITS
SUBSCRIPTION AGREEMENT AND POWER OF ATTORNEY
GRANT PARK FUND
c/o Dearborn Capital Management, L.L.C.
626 West Jackson Boulevard, Suite 600
Chicago, Illinois 60661
Dear Sir or Madam:
1.Subscription for Units. I hereby subscribe for the dollar amount of Limited Partnership Units (“units”) in Grant Park Futures Fund Limited Partnership (“Grant Park”) as set forth in this Subscription Agreement and Power of Attorney, at the net asset value per unit as set forth in the current prospectus of Grant Park (the “prospectus”). I have (i) enclosed a check payable to “Grant Park Futures Fund Limited Partnership — Subscription Account,” in the full amount of my subscription, (ii) authorized a wire transfer to Grant Park’s account (as set forth in this Subscription Agreement and Power of Attorney) in the full amount of my subscription, or (iii) authorized my selling agent to debit my customer securities account in the full amount of my subscription. Dearborn Capital Management, L.L.C. (the “General Partner”), in its sole and absolute discretion, may accept or reject this subscription in whole or in part. Once submitted, all subscriptions are irrevocable.
2.Representations and Warranties of Subscriber. I have received the prospectus, the Third Amended and Restated Limited Partnership Agreement (each as supplemented by sticker supplements, if any) and the most recent monthly report of Grant Park for the class of units in which I am investing.I acknowledge that I am making the representations and warranties set forth in Appendix C to the prospectus, including the applicable requirements relating to net worth and annual income. If subscriber is not an individual, the person signing the Subscription Agreement and Power of Attorney on behalf of the subscriber is duly authorized to execute such signature page. By signing the Subscription Agreement and Power of Attorney, I am not waiving any rights under the federal or state securities laws.
3.Power of Attorney. In connection with my purchase of units, I do hereby irrevocably constitute and appoint the General Partner, and its successors and assigns, as my true and lawful attorney-in-fact, with full power of substitution, in my name, place and stead, (i) to file, prosecute, defend, settle or compromise litigation, claims or arbitrations on behalf of Grant Park, and (ii) to make, execute, sign, acknowledge, swear to, deliver, record and file any documents or instruments that may be considered necessary or desirable by the General Partner to carry out fully the provisions of Grant Park’s Third Amended and Restated Limited Partnership Agreement, including, without limitation, the execution of said Agreement itself, and the execution of all amendments permitted by the terms thereof. The Power of Attorney granted hereby shall be deemed to be coupled with an interest, shall be irrevocable and shall survive, and shall not be affected by, my subsequent death, incapacity, disability, insolvency or dissolution or any delivery by me of an assignment of the whole or any portion of my units.
4.Irrevocability; Governing Law. I hereby acknowledge and agree that I am not entitled to cancel, terminate or revoke this subscription or any of my agreements hereunder after this Subscription Agreement and Power of Attorney has been submitted and that this subscription and such agreements shall survive my death or disability, but shall terminate with the full redemption of all my units in Grant Park. I hereby acknowledge and agree that this Subscription Agreement and Power of Attorney shall be governed by and shall be interpreted in accordance with the laws of the State of Illinois, without regard to principles of conflicts of laws, except for matters arising under federal or state securities laws (exclusive of Illinois securities laws).
PLEASE CAREFULLY READ AND COMPLETE THE REVERSE SIDE.
B-3
| Class 1 | GRANT PARK FUND SUBSCRIPTION AGREEMENT AND POWER OF ATTORNEY IMPORTANT: READ INSTRUCTIONS AND REVERSE SIDE BEFORE SIGNING |
The investor named below, by execution and delivery of this Subscription Agreement and Power of Attorney and by either (i) enclosing a check payable to “Grant Park Futures Fund- Subscription Account,” (ii) authorizing a wire transfer in the investor’s name to “Grant Park Futures Fund- Subscription Account” at Lake Forest Bank & Trust Company (727 North Bank Lane, Lake Forest, Illinois 60045), Account No. 0000379735, ABA #071925334 or (iii) authorizing the Selling Agent to debit investor’s securities brokerage account in the amount set forth below, hereby subscribes for the purchase of units in Grant Park Futures Fund Limited Partnership (the “Fund” or “Grant Park”) at the net asset value per unit. The named investor further acknowledges receipt of the current Grant Park Fund prospectus (and any sticker supplements), including Grant Park’s Third Amended and Restated Limited Partnership Agreement, the Subscription Agreement and Power of Attorney, the terms of which govern the investment in the units being subscribed for hereby. By signature on this document, (i) I acknowledge the Representations and Warranties set forth in Appendix C of the prospectus, including the suitability requirements therein, and (ii) I authorize the named Financial Advisor to make changes, or correct any clerical errors, on this document with regards to the Series and/ or Class of the fund specified in Section 1(a), the Selling Firm Account Number in Section 2, or the Account Type in Section 4(a) below. Notwithstanding this authorization, the Financial Advisor is not being provided investment discretion over the account.
| 1) | (a) Indicate Investment(s): |
| ¨Global 1- Grant Park Global Alternative Markets Class 1 |
| ($5,000 minimum investment; $1,000 minimum investment for ERISA. Subsequent investments: $1,000.) Investment Amount:$ |
| ¨Legacy 1- Grant Park Legacy Class 1 |
| ($10,000 minimum investment; $1,000 minimum investment for ERISA. Subsequent investments: $1,000.) Investment Amount: $ |
| (b)¨ Addition to an existing account? Investor ID Number: (ID# appears on your monthly statement) |
| 2) | Selling Firm Account Number: 3) Social Security Number or Tax ID: |
¨ I am subject to backup withholding under Sections 3406(a)(1)(c) of the Internal Revenue Code.
| 4) | (a) Account Type (Choose One): |
¨ Individual Ownership ¨ Joint Tenants With Rights of Survivorship ¨ Tenants In Common ¨ Community Property ¨ UGMA/UTM (Minor) | ¨ IRA ¨ IRA Rollover ¨ Roth IRA ¨ SEP | ¨ Trust * ¨ Corporation *¨ Partnership * ¨ Estate * | ¨ Profit Sharing * ¨ Pension * ¨ Defined Benefit * ¨ Other* | |||
¨ Foreign *The investor is a not a United States citizen, corporation, partnership, estate or trust and has included Form W-8 BEN with this Subscription Agreement. | ||||||
| (b) | For each account type indicated with “*” above,each account owner should read and initial the following paragraph |
____ ____ Initial(s) | The undersigned investor(s) hereby certifies by signing below that the investor(s) subscribing to purchase units in the Fund has the power, under its applicable charter or organizational documents, to enter into transactions in each of the following types of securities: (1) units of beneficial interest in a limited partnership; (2) U.S. government securities; and (3) managed futures (i.e., futures, forward, option, spot, swap and security futures contracts). Additionally, the undersigned investor(s) acknowledges that the Fund’s general partner, Dearborn Capital Management, L.L.C., has not been provided the investor’s charter or organizational documents as part of the Subscription documents, and that, accordingly, neither the Fund nor the general partner will make a review or interpretation of such documents. | |||||||||||||||||
| 5) | For Account Type LLC, LTD, Partnership, Foreign and Other read and complete the following: |
The undersigned investor(s) hereby certifies by signing below that the investor(s) subscribing to purchase units in the Fund has read the definition of a Commodity Pool Operator as stated in the Subscription Instructions and attests to the following (Choose One):
| ¨ | Is a registered Commodity Pool Operator with the CFTC and is a member of the NFA |
| ¨ | Has an exemption from registration as a Commodity Pool Operator with CFTC (Exemption Type: ) |
| ¨ | Does not fall within the definition of Commodity Pool Operator as defined by the CFTC and membership in the NFA is not required. |
| 6) | Account Title: |
| 7) | Authorized Individuals: |
(List individual(s) authorized to act on behalf of the account for UGMA, Trust, Corporation, Partnership, Estate,
Profit Sharing, Pension, Defined Benefit and Other.)
| 8) | Legal Address: |
Street (No PO Boxes) City State Zip Code
| 9) | Mailing Address: |
(If Different) Street City State Zip Code
| 10) | Investor Email Address: |
| ¨ | Check box to opt out of accessing your monthly statement online. |
INVESTOR(S) INFORMATION AND SIGNATURE REQUIRED
Under Penalties of perjury, I attest by signature, that the Social Security Number or Taxpayer ID, and all information in this document is true, correct and complete.
11) | X | X | ||||||||||
| Signature of Investor Date | Date | Signature of Joint Investor (if applicable) | Date |
CUSTODIAN INFORMATION AND SIGNATURE REQUIRED
12) | Custodian Name: | X | ||||
| (For Account Types: IRA, IRA Rollover, Roth, SEP) | Signature of Custodian or Authorized Agent (if applicable) | Date |
13) | Custodian Legal Address: | |||||||
| Street (No PO Boxes) | City | State | Zip Code |
FINANCIAL ADVISOR INFORMATION AND SIGNATURE REQUIRED
The undersigned Financial Advisor (“F.A.”) hereby certifies that: (1) he/she holds the appropriate securities licenses required by his/her Firm in order to offer and sell units in the Fund; (2) the F.A. has informed the person(s) named above of all pertinent facts relating to the liquidity and marketability of the units as set forth in the prospectus; (3) the F.A. has delivered to the person(s) named above a copy of the current prospectus on or before the date of this certification; and (4) the F.A. has reasonable grounds to believe (on the basis of information obtained from the person(s) named above concerning such person’s(s’) age, investment objectives, investment experience, income, net worth, financial situation and needs, other investments and any other information known by the F.A.) that: (a) the purchase of units of the Fund is a suitable and appropriate investment for such person(s); (b) such person(s) meet(s) the applicable minimum income and net worth requirements; (c) such person(s) can reasonably benefit from an investment in the Fund based on such person’s(s’) overall investment objectives and portfolio structure; (d) such person(s) can bear the economic risks of the investment in the Fund; and, (e) such person(s) appears(s) to have an understanding of the fundamental risks of investment in the Fund (including that an investor may lose its entire investment), the restrictions on the liquidity and transferability of the units, and the general background and qualifications of the general partner and the trading advisors.The Financial Advisor must sign below in order to substantiate compliance with NASD Conduct Rule 2810 (please visit www.finra.org for more information regarding Rule 2810).
14) | X | X | ||||||||||
| Financial Advisor Signature | Date | Office Manager (if required by Selling Firm procedures) | Date |
| 15) | Selling Firm Name: 16) Branch Code: 17) F.A. Code: |
18) | F.A./ Group Name: | 19) F.A. Phone: |
| 20) | F.A. Email: Additional Email: |
21) | Branch Address: | |||||||
| Street (No PO Boxes) | City | State Zip Code | ||||||
B-4
Special Form for residents ofAlabama, Arkansas, and Tennessee
This form must accompany the subscription agreement.
Your Account Information
Please print clearly.
| Grant Park Account Title | Social Security/Taxpayer ID # | Selling Firm Account Number |
Representations and Warranties
As an inducement to the general partner to accept your subscription, you, by executing and delivering your subscription agreement and power of attorney, represent and warrant to Grant Park, the general partner, the clearing brokers and the selling agent who solicited your subscription as follows, as applicable:
| ARKANSAS AND TENNESSEE RESIDENTS ONLY | INITIALS | |||
| 1. You are of legal age to execute the subscription agreement and power of attorney and are legally competent to do so. You acknowledge that you have received a copy of the prospectus including the limited partnership agreement contained therein (as supplemented by sticker supplements if any). | 1. | |||
| 2. All information that you have furnished to the general partner or that is set forth in the subscription agreement and power of attorney submitted by you is correct and complete as of the date of the subscription agreement and power of attorney, and if there should be any change in such information acceptance of your subscription, you will immediately furnish the revised or corrected information to the general partner. | 2. | |||
| 3. Unless paragraph 4 or 5 below is applicable, your subscription is made with your funds for your own account and not as trustee, custodian or nominee for another. | 3. | |||
| 4. The subscription, if made as custodian for a minor, is a gift that you have made to such minor and is not made with such minor’s funds or, if not a gift, the representations as to net worth and annual income set forth below apply only to such minor. | 4. | |||
| 5. If you are subscribing in a representative capacity, you have full power and authority to purchase the units and enter into and be bound by the subscription agreement and power of attorney on behalf of the entity for which you are purchasing the units, and such entity has full right and power to purchase such units and enter into and be bound by the subscription agreement and power of attorney and become a limited partner pursuant to the limited partnership agreement. | 5. | |||
| 6. You either are not required to be registered with the Commodity Futures Trading Commission (“CFTC”) or to be a member of the National Futures Association (“NFA”) or, if you are required to be so registered and to have such membership, are duly registered with the CFTC and are a member in good standing of the NFA. | 6. | |||
7. If you are acting on behalf of an “employee benefit plan,” as defined in and subject to the Employee Retirement Income Security Act of 1974, as amended (“ERISA”), or a “plan” as defined in and subject to Section 4975 of the Internal Revenue Code of 1986, as amended (the “Code”), the individual signing the subscription agreement and power of attorney on your behalf hereby further represents and warrants as, or on behalf of, the plan responsible for purchasing units (the “Plan Fiduciary”) that: (a) the Plan Fiduciary has considered an investment in Grant Park for such plan in light of the risks relating thereto; (b) the Plan Fiduciary has determined that, in view of such considerations, the investment in Grant Park is consistent with the Plan Fiduciary’s responsibilities under ERISA; (c) the plan’s investment in Grant Park does not violate and is not otherwise inconsistent with the terms of any legal document constituting the plan or any agreement thereunder; (d) the plan’s investment in Grant Park has been duly authorized and approved by all necessary parties; (e) none of the general partner, any trading advisor, any clearing brokers, any selling agent, or any of their respective affiliates, agents or employees (1) has investment discretion with respect to the investment of assets of the plan used to purchase units, (2) has authority or responsibility to or regularly gives investment advice with respect to the assets of the plan used to purchase units for a fee and pursuant to an agreement or understanding that such advice will serve as a primary basis for investment decisions with respect to the plan and that such advice will be based on the particular investment needs of the plan, or (3) is an employer maintaining or contributing to the plan; and (f) the Plan Fiduciary (1) is authorized to make, and is responsible for, the decision to invest in Grant Park, including the determination that such investment is consistent with the requirement imposed by Section 404 of ERISA that plan investments be diversified so as to minimize the risks of large losses, (2) is independent of the general partner, the trading advisors, the clearing brokers, any selling agent and each of their respective affiliates, and (3) is qualified to make such investment decision. You will, at the request of the general partner, furnish the general partner with such information as the general partner may reasonably require to establish that the purchase of the units by the plan does not violate any provision of ERISA or the Code, including without limitation, those provisions relating to “prohibited transactions” by “parties in interest” or “disqualified persons” as defined therein. | 7. | |||
| 8. If you are acting on behalf of a trust (the “Subscriber Trust”), the individual signing the subscription agreement and power of attorney on behalf of the Subscriber Trust hereby further represents and warrants that an investment in the trust is permitted under the trust agreement of the Subscriber Trust, and that the undersigned is authorized to act on behalf of the Subscriber Trust under the trust agreement thereof. | 8. | |||
| 9. You understand that the investment is not liquid, except in accordance with the redemption provisions of the limited partnership agreement, as amended from time to time. | 9. | |||
| 10. You acknowledge that due to anti-money laundering requirements operating in the United States, as well as Grant Park’s own internal anti-money laundering policies, Grant Park, the general partner and/or your selling agent may require further identification of you and the source of your subscription funds before your subscription agreement and power of attorney can be processed, subscription monies accepted, or request for redemption processed. Grant Park, the general partner, your selling agent and each of their respective principals, members, shareholders, | 10. | |||
B-5
directors, officers, and employees shall be held harmless and indemnified against any losses, expenses or liabilities arising as a result of a failure to process your subscription agreement and power of attorney or any request for redemption if you have not satisfactorily provided any information that has been required by an indemnified party. You further acknowledge that all subscription payments delivered to Grant Park must originate directly from a bank or brokerage account in your name. You represent and warrant that you are not involved in any anti-money laundering scheme and that acceptance by the general partner of your subscription agreement and power of attorney to subscribe for units in Grant Park, together with acceptance of the appropriate remittance, will not breach any applicable laws, rules and regulations designed to avoid money laundering, including the provisions of the Bank Secrecy Act of 1970, as amended. Specifically, you represent and warrant that all evidence of identity provided is genuine and all related information furnished, and to be furnished in the future, is accurate. (a) You represent and warrant that you are subscribing for units for your own account and own risk, and, unless you advise the general partner and your selling agent to the contrary in writings and identify with specificity supplementally each beneficial owner on whose behalf you are acting, you represent that you are not acting as a nominee for any other person or entity, and no other person or entity will have a beneficial or economic interest in your units. You also represent that you do not have the present intention or obligation to sell, distribute or transfer the units, directly or indirectly, to any other person or entity or to any nominee account. (b) If you are (i) acting as trustee, agent, representative or disclosed nominee for another person or entity, or (ii) an entity investing on behalf of underlying investors, other than a publicly traded company listed on an organized exchange (or a subsidiary or a pension fund of such a company) based in a Financial Action Task Force (“FATF”) Compliant Jurisdiction (the persons, entities and underlying investors referred to in (i) and (ii) being referred to collectively as the “Beneficial Owners”), you represent and warrant that: (A) You understand and acknowledge the representations, warranties and agreements made in this paragraph 11 are made by you (i) with respect to you, and (ii) with respect to the Beneficial Owners; (B) You have all requisite power and authority from the Beneficial Owners to execute and perform the obligations under the subscription agreement and power of attorney; (C) You have adopted and implemented anti-money laundering policies, procedures and controls that comply with, and will continue to comply in all respects with, the requirements of applicable anti-money laundering laws and regulations; and (D) You have established the identity of or have access to all Beneficial Owners, hold evidence of or have access to such identities, and (i) will make such information available to the general partner and /or your selling agent upon request, or (ii) will provide a certificate signed by you or by a senior officer of you with respect to your compliance with the anti-money laundering policies, procedures and controls, and, in either case, have procedures in place to ensure that no Beneficial Owner is a Prohibited Investor. (c) You represent and warrant that, to the best of your knowledge and belief, neither you, any Beneficial Owners nor any person controlling, controlled by, or under common control with any such Beneficial Owners, nor any person having a beneficial or economic interest in any such Beneficial Owners, is a Prohibited Investor or, unless disclosed to the general partner and your selling agent in writing, a Senior Foreign Political Figure or a member of the Immediate Family or a Close Associate of a Senior Foreign Political Figure, and you are not investing and will not invest in Grant Park on behalf or for the benefit of any Prohibited Investor. You agree promptly to notify the general partner and your selling agent of any change in information affecting the representations and warranties in this paragraph II. (d) You represent and warrant that the funds being used to make this investment are not derived from any unlawful or criminal activities. (e) For purposes of this paragraph II, the following terms shall have the following meanings: •Close Associate of a Senior Foreign Political Figure is a person who is widely and publicly known internationally to maintain an unusually close relationship with the Senior Foreign Political Figure, and includes a person who is in a position to conduct substantial domestic and international financial transactions on behalf of the Senior Foreign Political Figure. •FATF-Compliant Jurisdiction is a jurisdiction that (i) is a member in good standing of FATF and (ii) has undergone two rounds of FATF mutual evaluations. • FATF means the Financial Action Task Force on Money Laundering. •Foreign Bank means an organization that (i) is organized under the laws of a non-U.S. country, (ii) engages in the business of banking, (iii) is recognized as a bank by the bank supervisory or monetary authority of the country of its organization or principal banking operations, (iv) receives deposits to a substantial extent in the regular course of its business, and (v) has the power to accept demand deposits, but does not include the U.S. branches or agencies of a non-U.S. bank. •Foreign Shell Bank means a Foreign Bank without a Physical Presence in any country, but does not include a Regulated Affiliate. Regulated Affiliate means a Foreign Shell Bank that (i) is an affiliate of a depository institution, credit union, or Foreign Bank that maintains a Physical Presence in the United States or a non-U.S. country, as applicable, and (ii) is subject to supervision by a banking authority in the country regulating such affiliated depository institution, credit union, or Foreign Bank. •Immediate Family of a Senior Foreign Political Figure typically includes such person’s parents, siblings, spouse, children and in-laws. •Non-Cooperative Jurisdiction means any non-U.S. country that has been designated as noncooperative with international anti-money laundering principles or procedures by an intergovernmental group or organization, such as the FATF, of which the United States is a member and with which designation the United States representative to the group or organization continues to concur.2 •Physical Presence means a place of business that is maintained by a Foreign Bank and is located at a fixed address, other than solely a post office box or an electronic address, in a country in which the Foreign Bank is authorized to conduct banking activities, at which location the Foreign Bank (i) employs one or more individuals on a full-time basis, (ii) maintains operating records related to its banking activities, and (iii) is subject to inspection by the banking authority that licensed the Foreign Bank to conduct banking activities. •Prohibited Investor means (i) a person or entity whose name appears on the various lists issued and maintained by the U.S. Office of Foreign Assets Control (“OFAC”), including the List of Specially Designated Nationals and Blocked Persons, the Specially Designated Terrorists List and the Specially Designated Narcotics Traffickers List;3 (ii) a Foreign Shell Bank; or (iii) a person or entity who is a citizen or resident of, or which is located in, or whose subscription funds are transferred from or through, a Foreign Bank in a Non-Cooperative Jurisdiction or Sanctioned Regime. •Regulated Affiliate means a Foreign Shell Bank that (i) is an affiliate of a depository institution, credit union, or Foreign Bank that maintains a Physical Presence in the United States or a non-U.S. country, as applicable, and (ii) is subject to supervision by a banking authority in the country regulating such affiliated depository institution, credit union, or Foreign Bank. |
B-6
•Sanctioned Regimes means targeted foreign countries, terrorism sponsoring organizations and international narcotics traffickers in respect of which OFAC administers and enforces economic and trade sanctions based on U.S. foreign policy and national security goals.4 •Senior Foreign Political Figure means a senior official in the executive, legislative, administrative, military or judicial branch of a foreign government (whether elected or not), a senior official of a major foreign political party, or a senior executive of a foreign government-owned corporation. In addition, a Senior Foreign Political Figure includes any corporation, business or other entity that has been formed by, or for the benefit of, a Senior Foreign Political Figure. 1For a current list of FATF-compliant jurisdictions refer to the Financial Action Task Force website, http://www1.oecd.org/fatf/NCCT_en.htm2The list of Non-Cooperative Countries and Territories is amended periodically. For a current list of Non-Cooperative Countries and Territories, refer to the Financial Action Task Force website, http://www1.oecd.org/fatf/NCCT_en.htm3 The OFAC lists may be found at the OFAC website: http://www.treas.gov/ofac4As of the date of the prospectus, OFAC has imposed sanctions upon the following regimes: the Balkans, Belarus, Burma (Myanmar), Cote d’Ivoire (Ivory Coast), Cuba, Democratic Republic of the Congo, Iran, Iraq, Former Liberian Regime of Charles Taylor, North Korea, Persons Undermining the Sovereignty of Lebanon or Its Democratic Processes and Institutions, Sierra Leone, Sudan, Syria and Zimbabwe. | ||||
| 11. Neither Grant Park nor any selling agent may complete a sale of units until at least five business days after the date the investor receives a final prospectus. | 11. | |||
| ARKANSAS RESIDENTS ONLY | INITIALS | |||
| You have a net worth of at least $250,000, exclusive of home, furnishings and automobiles, or an annual gross income of at least $70,000 and a net worth, similarly calculated, of at least $70,000. Furthermore, in no event may you invest more than 10% of your liquid net worth, exclusive of home, furnishings and automobiles, in Grant Park. | ||||
| TENNESSEE RESIDENTS ONLY | INITIALS | |||
| You have a net worth of at least $500,000, exclusive of home, furnishings and automobiles, or an annual gross income of at least $100,000 and a net worth, similarly calculated, of at least $100,000. Furthermore, in no event may you invest more than 10% of your liquid net worth, exclusive of home, furnishings and automobiles, in Grant Park. | ||||
| ARKANSAS AND TENNESSEE RESIDENTS ONLY | ||||
POWER OF ATTORNEY In connection with my purchase of Limited Partnership Units (“units”) in Grant Park Futures Fund Limited Partnership (“Grant Park”) as set forth in this
I hereby acknowledge and agree that I am not entitled to cancel, terminate or revoke this power of attorney after this Power of Attorney and the Subscription
Neither Grant Park nor any selling agent may complete a sale of units until at least five business days after the date the investor receives a final
Signature of Investor Signature of Joint Investor (if applicable) Date: Date: | ||||
| ALABAMA RESIDENTS ONLY | INITIALS | |||
| 1. You are of legal age to execute the subscription agreement and are legally competent to do so. You acknowledge that you have received a copy of the final prospectus including the limited partnership agreement contained therein (as supplemented by sticker supplements if any). | 1. | |||
| 2. All information that you have furnished to the general partner or that is set forth in the subscription agreement submitted by you is correct and complete as of the date of the subscription agreement, and if there should be any change in such information acceptance of your subscription, you will immediately furnish the revised or corrected information to the general partner. | 2. | |||
| 3. Unless paragraph 4 or 5 below is applicable, your subscription is made with your funds for your own account and not as trustee, custodian or nominee for another. | 3. | |||
B-7
| 4. The subscription, if made as custodian for a minor, is a gift that you have made to such minor and is not made with such minor’s funds or, if not a gift, the representations as to net worth and annual income set forth below apply only to such minor. | 4. | |
| 5. If you are subscribing in a representative capacity, you have full power and authority to purchase the units and enter into and be bound by the subscription agreement on behalf of the entity for which you are purchasing the units, and such entity has full right and power to purchase such units and enter into and be bound by the subscription agreement and become a limited partner pursuant to the limited partnership agreement. | 5. | |
| 6. You either are not required to be registered with the Commodity Futures Trading Commission (“CFTC”) or to be a member of the National Futures Association (“NFA”) or, if you are required to be so registered and to have such membership, are duly registered with the CFTC and are a member in good standing of the NFA. | 6. | |
7. If you are acting on behalf of an “employee benefit plan,” as defined in and subject to the Employee Retirement Income Security Act of 1974, as amended (“ERISA”), or a “plan” as defined in and subject to Section 4975 of the Internal Revenue Code of 1986, as amended (the “Code”), the individual signing the subscription agreement on your behalf hereby further represents and warrants as, or on behalf of, the plan responsible for purchasing units (the “Plan Fiduciary”) that: (a) the Plan Fiduciary has considered an investment in Grant Park for such plan in light of the risks relating thereto; (b) the Plan Fiduciary has determined that, in view of such considerations, the investment in Grant Park is consistent with the Plan Fiduciary’s responsibilities under ERISA; (c) the plan’s investment in Grant Park does not violate and is not otherwise inconsistent with the terms of any legal document constituting the plan or any agreement thereunder; (d) the plan’s investment in Grant Park has been duly authorized and approved by all necessary parties; (e) none of the general partner, any trading advisor, any clearing brokers, any selling agent, or any of their respective affiliates, agents or employees (1) has investment discretion with respect to the investment of assets of the plan used to purchase units, (2) has authority or responsibility to or regularly gives investment advice with respect to the assets of the plan used to purchase units for a fee and pursuant to an agreement or understanding that such advice will serve as a primary basis for investment decisions with respect to the plan and that such advice will be based on the particular investment needs of the plan, or (3) is an employer maintaining or contributing to the plan; and (f) the Plan Fiduciary (1) is authorized to make, and is responsible for, the decision to invest in Grant Park, including the determination that such investment is consistent with the requirement imposed by Section 404 of ERISA that plan investments be diversified so as to minimize the risks of large losses, (2) is independent of the general partner, the trading advisors, the clearing brokers, any selling agent and each of their respective affiliates, and (3) is qualified to make such investment decision. You will, at the request of the general partner, furnish the general partner with such information as the general partner may reasonably require to establish that the purchase of the units by the plan does not violate any provision of ERISA or the Code, including without limitation, those provisions relating to “prohibited transactions” by “parties in interest” or “disqualified persons” as defined therein. | 7. | |
| 8. If you are acting on behalf of a trust (the “Subscriber Trust”), the individual signing the subscription agreement on behalf of the Subscriber Trust hereby further represents and warrants that an investment in the trust is permitted under the trust agreement of the Subscriber Trust, and that the undersigned is authorized to act on behalf of the Subscriber Trust under the trust agreement thereof. | 8. | |
| 9. You acknowledge that the investment is not liquid, except in accordance with the redemption provisions of the limited partnership agreement, as amended from time to time. | 9. | |
10. You acknowledge that due to anti-money laundering requirements operating in the United States, as well as Grant Park’s own internal anti-money laundering policies, Grant Park, the general partner and/or your selling agent may require further identification of you and the source of your subscription funds before your subscription agreement can be processed, subscription monies accepted, or request for redemption processed. Grant Park, the general partner, your selling agent and each of their respective principals, members, shareholders, directors, officers, and employees shall be held harmless and indemnified against any losses, expenses or liabilities arising as a result of a failure to process your subscription agreement or any request for redemption if you have not satisfactorily provided any information that has been required by an indemnified party. You further acknowledge that all subscription payments delivered to Grant Park must originate directly from a bank or brokerage account in your name. You represent and warrant that you are not involved in any anti-money laundering scheme and that acceptance by the general partner of your subscription agreement to subscribe for units in Grant Park, together with acceptance of the appropriate remittance, will not breach any applicable laws, rules and regulations designed to avoid money laundering, including the provisions of the Bank Secrecy Act of 1970, as amended. Specifically, you represent and warrant that all evidence of identity provided is genuine and all related information furnished, and to be furnished in the future, is accurate. (a) You represent and warrant that you are subscribing for units for your own account and own risk, and, unless you advise the general partner and your selling agent to the contrary in writings and identify with specificity supplementally each beneficial owner on whose behalf you are acting, you represent that you are not acting as a nominee for any other person or entity, and no other person or entity will have a beneficial or economic interest in your units. You also represent that you do not have the present intention or obligation to sell, distribute or transfer the units, directly or indirectly, to any other person or entity or to any nominee account. (b) If you are (i) acting as trustee, agent, representative or disclosed nominee for another person or entity, or (ii) an entity investing on behalf of underlying investors, other than a publicly traded company listed on an organized exchange (or a subsidiary or a pension fund of such a company) based in a Financial Action Task Force (“FATF”) Compliant Jurisdiction (the persons, entities and underlying investors referred to in (i) and (ii) being referred to collectively as the “Beneficial Owners”), you represent and warrant that: (A) You acknowledge the representations, warranties and agreements made in this paragraph 11 are made by you (i) with respect to you, and (ii) with respect to the Beneficial Owners; (B) You have all requisite power and authority from the Beneficial Owners to execute and perform the obligations under the subscription agreement; (C) You have adopted and implemented anti-money laundering policies, procedures and controls that comply with, and will continue to comply in all respects with, the requirements of applicable anti-money laundering laws and regulations; and (D) You have established the identity of or have access to all Beneficial Owners, hold evidence of or have access to such identities, and (i) will make such information available to the general partner and /or your selling agent upon request, or (ii) will provide a certificate | 10. |
B-8
signed by you or by a senior officer of you with respect to your compliance with the anti-money laundering policies, procedures and controls, and, in either case, have procedures in place to ensure that no Beneficial Owner is a Prohibited Investor. (c) You represent and warrant that, to the best of your knowledge and belief, neither you, any Beneficial Owners nor any person controlling, controlled by, or under common control with any such Beneficial Owners, nor any person having a beneficial or economic interest in any such Beneficial Owners, is a Prohibited Investor or, unless disclosed to the general partner and your selling agent in writing, a Senior Foreign Political Figure or a member of the Immediate Family or a Close Associate of a Senior Foreign Political Figure, and you are not investing and will not invest in Grant Park on behalf or for the benefit of any Prohibited Investor. You agree promptly to notify the general partner and your selling agent of any change in information affecting the representations and warranties in this paragraph II. (d) You represent and warrant that the funds being used to make this investment are not derived from any unlawful or criminal activities. (e) For purposes of this paragraph II, the following terms shall have the following meanings: •Close Associate of a Senior Foreign Political Figure is a person who is widely and publicly known internationally to maintain an unusually close relationship with the Senior Foreign Political Figure, and includes a person who is in a position to conduct substantial domestic and international financial transactions on behalf of the Senior Foreign Political Figure. •FATF-Compliant Jurisdiction is a jurisdiction that (i) is a member in good standing of FATF and (ii) has undergone two rounds of FATF mutual evaluations. •FATF means the Financial Action Task Force on Money Laundering. •Foreign Bank means an organization that (i) is organized under the laws of a non-U.S. country, (ii) engages in the business of banking, (iii) is recognized as a bank by the bank supervisory or monetary authority of the country of its organization or principal banking operations, (iv) receives deposits to a substantial extent in the regular course of its business, and (v) has the power to accept demand deposits, but does not include the U.S. branches or agencies of a non-U.S. bank. •Foreign Shell Bank means a Foreign Bank without a Physical Presence in any country, but does not include a Regulated Affiliate. Regulated Affiliate means a Foreign Shell Bank that (i) is an affiliate of a depository institution, credit union, or Foreign Bank that maintains a Physical Presence in the United States or a non-U.S. country, as applicable, and (ii) is subject to supervision by a banking authority in the country regulating such affiliated depository institution, credit union, or Foreign Bank. •Immediate Family of a Senior Foreign Political Figure typically includes such person’s parents, siblings, spouse, children and in-laws. •Non-Cooperative Jurisdiction means any non-U.S. country that has been designated as noncooperative with international anti-money laundering principles or procedures by an intergovernmental group or organization, such as the FATF, of which the United States is a member and with which designation the United States representative to the group or organization continues to concur.2 •Physical Presence means a place of business that is maintained by a Foreign Bank and is located at a fixed address, other than solely a post office box or an electronic address, in a country in which the Foreign Bank is authorized to conduct banking activities, at which location the Foreign Bank (i) employs one or more individuals on a full-time basis, (ii) maintains operating records related to its banking activities, and (iii) is subject to inspection by the banking authority that licensed the Foreign Bank to conduct banking activities. •Prohibited Investor means (i) a person or entity whose name appears on the various lists issued and maintained by the U.S. Office of Foreign Assets Control (“OFAC”), including the List of Specially Designated Nationals and Blocked Persons, the Specially Designated Terrorists List and the Specially Designated Narcotics Traffickers List;3 (ii) a Foreign Shell Bank; or (iii) a person or entity who is a citizen or resident of, or which is located in, or whose subscription funds are transferred from or through, a Foreign Bank in a Non-Cooperative Jurisdiction or Sanctioned Regime. •Regulated Affiliate means a Foreign Shell Bank that (i) is an affiliate of a depository institution, credit union, or Foreign Bank that maintains a Physical Presence in the United States or a non-U.S. country, as applicable, and (ii) is subject to supervision by a banking authority in the country regulating such affiliated depository institution, credit union, or Foreign Bank. •Sanctioned Regimes means targeted foreign countries, terrorism sponsoring organizations and international narcotics traffickers in respect of which OFAC administers and enforces economic and trade sanctions based on U.S. foreign policy and national security goals.4 •Senior Foreign Political Figure means a senior official in the executive, legislative, administrative, military or judicial branch of a foreign government (whether elected or not), a senior official of a major foreign political party, or a senior executive of a foreign government-owned corporation. In addition, a Senior Foreign Political Figure includes any corporation, business or other entity that has been formed by, or for the benefit of, a Senior Foreign Political Figure. 1For a current list of FATF-compliant jurisdictions refer to the Financial Action Task Force website, http://www1.oecd.org/fatf/NCCT_en.htm 2The list of Non-Cooperative Countries and Territories is amended periodically. For a current list of Non-Cooperative Countries and Territories, refer to the Financial Action Task Force website, http://www1.oecd.org/fatf/NCCT_en.htm3 The OFAC lists may be found at the OFAC website: http://www.treas.gov/ofac4As of the date of the prospectus, OFAC has imposed sanctions upon the following regimes: the Balkans, Belarus, Burma (Myanmar), Cote d’Ivoire (Ivory Coast), Cuba, Democratic Republic of the Congo, Iran, Iraq, Former Liberian Regime of Charles Taylor, North Korea, Persons Undermining the Sovereignty of Lebanon or Its Democratic Processes and Institutions, Sierra Leone, Sudan, Syria and Zimbabwe. | ||||
| 11. Neither Grant Park nor any selling agent may complete a sale of units until at least five business days after the date the investor receives a final prospectus. | 11. | |||
| 12. You have a net worth of at least $250,000, exclusive of home, furnishings and automobiles, or an annual gross income of at least $70,000 and a net worth, similarly calculated, of at least $70,000. Furthermore, in no event may you invest more than 10% of your liquid net worth, exclusive of home, furnishings and automobiles, in Grant Park and other similar programs. | 12. | |||
B-9
| ALABAMA RESIDENTS ONLY | ||
POWER OF ATTORNEY In connection with my purchase of Limited Partnership Units (“units”) in Grant Park Futures Fund Limited Partnership (“Grant Park”) as set forth in this Subscription Agreement and Power of Attorney enclosed herewith, I do hereby irrevocably constitute and appoint Dearborn Capital Management, L.L.C. (the “General Partner”), and its successors and assigns, as my true and lawful attorney-in-fact, with full power of substitution, in my name, place and stead, (i) to file, prosecute, defend, settle or compromise litigation, claims or arbitrations on behalf of Grant Park, and (ii) to make, execute, sign, acknowledge, swear to, deliver, record and file any documents or instruments that may be considered necessary or desirable by the General Partner to carry out fully the provisions of Grant Park’s Third Amended and Restated Limited Partnership Agreement, including, without limitation, the execution of said Agreement itself, and the execution of all amendments permitted by the terms thereof. The Power of Attorney granted hereby shall be deemed to be coupled with an interest, shall be irrevocable and shall survive, and shall not be affected by, my subsequent death, incapacity, disability, insolvency or dissolution or any delivery by me of an assignment of the whole or any portion of my units.
I hereby acknowledge and agree that I am not entitled to cancel, terminate or revoke this power of attorney after this Power of Attorney and the Subscription Agreement and Power of Attorney have been submitted and that this subscription and such agreements shall survive my death or disability, but shall terminate with the full redemption of all my units in Grant Park. I hereby acknowledge and agree that this Power of Attorney shall be governed by and shall be interpreted in accordance with the laws of the State of Illinois, without regard to principles of conflicts of laws, except for matters arising under federal or state securities laws (exclusive of Illinois securities laws).
By executing this Power of Attorney, you represent and warrant that:
1. You are of legal age to execute the power of attorney and are legally competent to do so. You acknowledge that you have received a copy of the prospectus including the limited partnership agreement contained therein (as supplemented by sticker supplements if any). 2. All information that you have furnished to the general partner or that is set forth in the power of attorney submitted by you is correct and complete as of the date of the power of attorney, and if there should be any change, you will immediately furnish the revised or corrected information to the general partner. 3. If you are subscribing in a representative capacity, you have full power and authority to purchase the units and enter into and be bound by the power of attorney on behalf of the entity for which you are purchasing the units, and such entity has full right and power to purchase such units and enter into and be bound by the power of attorney and become a limited partner pursuant to the limited partnership agreement. 4. If you are (i) acting as trustee, agent, representative or disclosed nominee for another person or entity, or (ii) an entity investing on behalf of underlying investors, other than a publicly traded company listed on an organized exchange (or a subsidiary or a pension fund of such a company) based in a Financial Action Task Force (“FATF”) Compliant Jurisdiction (the persons, entities and underlying investors referred to in (i) and (ii) being referred to collectively as the “Beneficial Owners”), you represent and warrant that you have all requisite power and authority from the Beneficial Owners to execute and perform the obligations under the power of attorney.
Neither Grant Park nor any selling agent may complete a sale of units until at least five business days after the date the investor receives a final prospectus. This Power of Attorney will be accepted only with a completed Subscription Agreement and Power of Attorney of Grant Park Futures Fund Limited Partnership.
Signature of Investor Signature of Joint Investor (if applicable) Date: Date: | ||
B-10
Grant Park Fund Subsequent Subscription Agreement Addition to Existing Account |
Use this form only if:
| (i) | You are making an addition to an existing Grant Park Fund account, and |
| (ii) | Your registration information is the same as in your original Subscription Agreement and Power of Attorney. |
If any of your original Subscription information has changed
please complete a new Subscription Agreement in its entirety.
The investor named below, by execution and delivery of this Subscription Addition and by either (i) enclosing a check payable to “Grant Park Futures Fund- Subscription Account,” (ii) authorizing a wire transfer in the investor’s name to “Grant Park Futures Fund- Subscription Account” at Lake Forest Bank & Trust Company (727 North Bank Lane, Lake Forest, Illinois 60045), Account No. 0000379735, ABA #071925334 or (iii) authorizing the Selling Agent to debit investor’s securities brokerage account in the amount set forth below, hereby subscribes for the additional purchase of units in Grant Park Futures Fund Limited Partnership (the “Fund” or “Grant Park”) at the net asset value per unit. The named investor further acknowledges receipt of the current Grant Park Fund prospectus (and any sticker supplements).
By signature on this document, I acknowledge (i) there have been no changes to the terms of my original Subscription Agreement and all statements made in my original Subscription Agreement remain true and accurate.
1 Indicate Investment(s): The minimum subsequent investment is $1,000
¨ Global 1 - Grant Park Global Alternative Markets Class 1: Investment Amount:$
¨ Legacy 1 - Grant Park Legacy Class 1 Investment Amount:$
| 2. Investor ID Number: | 2. Selling Firm Account Number: | |||
| (ID# appears on your monthly statement) |
3. Investor Name:
4. Investor Address:
(If Different) Street City State Zip
INVESTOR(S) SIGNATURE REQUIRED
| 5. X | X | |
Signature of Investor Date | Signature of Joint Investor Date |
CUSTODIAN INFORMATION AND SIGNATURE REQUIRED
| 6. Custodian Name: | X | |
| Signature of Custodian or Authorized Agent Date | ||
FINANCIAL ADVISOR INFORMATION AND SIGNATURE REQUIRED
| 7. Selling Firm Name: | 8. F.A. Name: | |
| 8. F.A. Code: | 8. F.A. Phone: | |
| 8. F.A. Email(s): | 8. Branch Code: | |
(If Different) | (If Different) | |
8. Branch Address:
(If Different) Street City State Zip
5. X | X | |
Financial Advisor Signature Date | Office Manager Signature (if required by Selling Firm) Date |
Please retain a copy of this form for your records
B-11
SUBSCRIPTION REQUIREMENTS
Notice: An investment in Grant Park is speculative and involves a high degree of risk. Please refer to the section of the prospectus entitled “Risk Factors” for a complete description of the material risks of an investment in Grant Park.
| I. | Subscription Procedures |
To subscribe for limited partnership units in the Grant Park Futures Fund Limited Partnership (“Grant Park”), you must:
| • | execute and deliver to the selling agent who solicited your subscription the subscription agreement and power of attorney, and any other documents needed (for example, fund, pension, corporate authorizations, as applicable); and |
| • | unless you intend to make payment by debiting your brokerage account with your selling agent, deliver to your selling agent a check in the full amount of the subscription payable to “Grant Park Futures Fund Limited Partnership, Subscription Account,” or authorize a wire transfer in the amount of your subscription in accordance with the instructions set forth in the subscription agreement and power of attorney. |
The minimum investment required to invest in the Legacy 1 Class units and Legacy 2 Class units is $10,000, except in the case of investors that are employee benefit plans and/or individual retirement accounts for which the minimum investment is $1,000; subsequent investment in the Legacy 1 Class units and Legacy 2 Class units must be at least $1,000. The selling agents will offer the Legacy 1 Class units and Legacy 2 Class units at a price of $1,000 per unit as of the initial closing date. Only investors who are represented by approved selling agents who are directly compensated by the investor for services rendered in connection with an investment in Grant Park (such arrangements commonly referred to as “wrap-accounts”) may purchase Legacy 1 Class units and Legacy 2 Class units.
The minimum investment in the Global 1 Class units, Global 2 Class units and Global 3 Class units is $5,000, except that in the case of investors in such units that are employee benefit plans and/or individual retirement accounts, the minimum investment is $1,000; subsequent investment in the Global 1 Class units, Global 2 Class units and Global 3 Class units must be at least $1,000. The selling agents will offer the Global 1 Class units, Global 2 Class units and Global 3 Class Units at a price of $1,000 per unit as of the initial closing date.
Any of these minimums may be waived by the general partner in its sole discretion. You will be required to reimburse Grant Park and Dearborn Capital Management, L.L.C., the general partner of Grant Park, for any expense or loss incurred as a result of the cancellation of your subscription for units due to your failure to deliver good funds in the amount of the subscription price.
By executing and delivering the subscription agreement and power of attorney, you irrevocably subscribe for Legacy 1 Class units, Legacy 2 Class units, Global 1 Class units, Global 2 Class units or Global 3 Class units, as specified, at a price equal to the net asset value per unit of the class subscribed for as of the close of business on the last business day of the month in which your subscription is accepted, provided your subscription is received at least five business days prior to the month end. The
C-1
general partner may accept or reject your subscription, in whole or in part, in its sole discretion. If your subscription is accepted, you agree to contribute your subscription to Grant Park and to be bound by the terms of the limited partnership agreement (a form of which is attached as Appendix A to Grant Park’s prospectus). By executing and delivering the subscription agreement and power of attorney, you will be deemed to have executed the limited partnership agreement.
| II. | Representations and Warranties |
As an inducement to the general partner to accept your subscription, you, by executing and delivering your subscription agreement and power of attorney, represent and warrant to Grant Park, the general partner, the clearing brokers and the selling agent who solicited your subscription as follows, as applicable:
1. You are of legal age to execute the subscription agreement and power of attorney and are legally competent to do so. You acknowledge that you have received a copy of the prospectus, including the limited partnership agreement contained therein (as supplemented by sticker supplements, if any).
2. All information that you have furnished to the general partner or that is set forth in the subscription agreement and power of attorney submitted by you is correct and complete as of the date of the subscription agreement and power of attorney, and if there should be any change in such information acceptance of your subscription, you will immediately furnish the revised or corrected information to the general partner.
3. Unless paragraph 4 or 5 below is applicable, your subscription is made with your funds for your own account and not as trustee, custodian or nominee for another.
4. The subscription, if made as custodian for a minor, is a gift that you have made to such minor and is not made with such minor’s funds or, if not a gift, the representations as to net worth and annual income set forth below apply only to such minor.
5. If you are subscribing in a representative capacity, you have full power and authority to purchase the units and enter into and be bound by the subscription agreement and power of attorney on behalf of the entity for which you are purchasing the units, and such entity has full right and power to purchase such units and enter into and be bound by the subscription agreement and power of attorney and become a limited partner pursuant to the limited partnership agreement.
6. You either are not required to be registered with the Commodity Futures Trading Commission (“CFTC”) or to be a member of the National Futures Association (“NFA”) or, if you are required to be so registered and to have such membership, are duly registered with the CFTC and are a member in good standing of the NFA.
7. If you are acting on behalf of an “employee benefit plan,” as defined in and subject to the Employee Retirement Income Security Act of 1974, as amended (“ERISA”), or a “plan” as defined in and subject to Section 4975 of the Internal Revenue Code of 1986, as amended (the “Code”), the individual signing the subscription agreement and power of attorney on your behalf hereby further represents and warrants as, or on behalf of, the plan responsible for purchasing units (the “Plan Fiduciary”) that:
(a) the Plan Fiduciary has considered an investment in Grant Park for such plan in light of the risks relating thereto;
C-2
(b) the Plan Fiduciary has determined that, in view of such considerations, the investment in Grant Park is consistent with the Plan Fiduciary’s responsibilities under ERISA;
(c) the plan’s investment in Grant Park does not violate and is not otherwise inconsistent with the terms of any legal document constituting the plan or any agreement thereunder;
(d) the plan’s investment in Grant Park has been duly authorized and approved by all necessary parties;
(e) none of the general partner, any trading advisor, any clearing brokers, any selling agent, or any of their respective affiliates, agents or employees (1) has investment discretion with respect to the investment of assets of the plan used to purchase units, (2) has authority or responsibility to or regularly gives investment advice with respect to the assets of the plan used to purchase units for a fee and pursuant to an agreement or understanding that such advice will serve as a primary basis for investment decisions with respect to the plan and that such advice will be based on the particular investment needs of the plan, or (3) is an employer maintaining or contributing to the plan; and
(f) the Plan Fiduciary (1) is authorized to make, and is responsible for, the decision to invest in Grant Park, including the determination that such investment is consistent with the requirement imposed by Section 404 of ERISA that plan investments be diversified so as to minimize the risks of large losses, (2) is independent of the general partner, the trading advisors, the clearing brokers, any selling agent and each of their respective affiliates, and (3) is qualified to make such investment decision.
You will, at the request of the general partner, furnish the general partner with such information as the general partner may reasonably require to establish that the purchase of the units by the plan does not violate any provision of ERISA or the Code, including without limitation, those provisions relating to “prohibited transactions” by “parties in interest” or “disqualified persons” as defined therein.
8. If you are acting on behalf of a trust (the “Subscriber Trust”), the individual signing the subscription agreement and power of attorney on behalf of the Subscriber Trust hereby further represents and warrants that an investment in the trust is permitted under the trust agreement of the Subscriber Trust, and that the undersigned is authorized to act on behalf of the Subscriber Trust under the trust agreement thereof.
9. You have a net worth of at least $250,000, exclusive of home, furnishings and automobiles, or an annual gross income of at least $70,000 and a net worth, similarly calculated, of at least $70,000. If you are a resident of any of the following states, you must also meet the requirements set forth below for that state. Furthermore, in no event may you invest more than 10% of your net worth, exclusive of home, furnishings and automobiles, in Grant Park. Net worth in all cases is exclusive of home, furnishings and automobiles.
C-3
Alabama | Net worth of at least $250,000, or an annual gross income of at least $70,000 and a net worth of at least $70,000. This investment will only be sold to Alabama residents that represent that they have a liquid net worth of at least 10 times their investment in Grant Park and other similar programs. | |
Arizona | Net worth of at least $250,000 or a net worth of at least $70,000 and an annual gross income of at least $70,000. | |
California | Net worth of at least $250,000 (exclusive of home, home furnishings and automobiles) or an annual gross income of at least $75,000 and a net worth of $100,000 (exclusive of home, home furnishings and automobiles). In no event may a resident of California invest more than 10% of their total net worth, exclusive of home, furnishings and automobiles in units of Grant Park. | |
Iowa | A net worth of $250,000 (exclusive of home, auto and furnishings) and an annual taxable income of $100,000, or, in the alternative, a net worth of $500,000 (exclusive of home, auto and furnishings). In no event may a resident of Iowa invest more than 10% of such resident’s net worth in units of Grant Park and similar managed futures programs. | |
Kansas | Kansas investors should limit their aggregate investment in units of Grant Park and other similar investments to not more than 10% of their liquid net worth. Liquid net worth is that portion of an investor’s total net worth (total assets minus total liabilities) which is comprised of cash, cash equivalents and readily marketable securities. | |
Kentucky | Net worth of at least $300,000 exclusive of home, home furnishings, and automobiles or a minimum annual gross income of $85,000 and a minimum net worth of $85,000. Total investment in Grant Park and similar managed futures programs may not exceed 10% of investor’s total net worth excluding home, home furnishing, and automobiles. | |
Michigan | Net worth of at least $250,000, or an annual gross income of at least $70,000 and a net worth of at least $70,000. In no event may a resident of Michigan invest more than 10% of their net worth in units of Grant Park and securities of any affiliate of Grant Park. | |
Missouri | Net worth of at least $250,000, or an annual gross income of at least $70,000 and a net worth of at least $70,000. In no event may a resident of Missouri invest more than 10% of their liquid net worth in units of Grant Park. | |
Nebraska | Net worth of at least $150,000, or an annual gross income of at least $45,000 and a net worth of at least $45,000. A purchaser of limited partnership interests may not invest more than 10% of his/her net worth, exclusive of home, furnishing, and automobiles, in any one limited partnership. | |
C-4
Ohio | Net worth of at least $250,000 or a net worth of at least $70,000 and an annual income of at least $70,000; Ohio investors should limit their investment in units of Grant Park and securities of other managed futures programs to not more than 10% of their liquid net worth (cash, cash equivalents and readily marketable securities). | |
Oregon | Net worth of at least $250,000 or a net worth of at least $70,000 and an annual gross income of at least $70,000. Oregon residents may not invest more than 10% of their net worth in units of Grant Park and securities of any affiliate of Grant Park. | |
Tennessee | A net worth of $500,000 or an annual gross income of at least $100,000 and a net worth of at least $100,000. Tennessee residents’ investment must not exceed ten percent (10%) of their liquid net worth. | |
10. You understand that the investment is not liquid, except in accordance with the redemption provisions of the limited partnership agreement, as amended from time to time.
11. You acknowledge that due to anti-money laundering requirements operating in the United States, as well as Grant Park’s own internal anti-money laundering policies, Grant Park, the general partner and/or your selling agent may require further identification of you and the source of your subscription funds before your subscription agreement and power of attorney can be processed, subscription monies accepted, or request for redemption processed. Grant Park, the general partner, your selling agent and each of their respective principals, members, shareholders, directors, officers, and employees shall be held harmless and indemnified against any losses, expenses or liabilities arising as a result of a failure to process your subscription agreement and power of attorney or any request for redemption if you have not satisfactorily provided any information that has been required by an indemnified party. You further acknowledge that all subscription payments delivered to Grant Park must originate directly from a bank or brokerage account in your name. You represent and warrant that you are not involved in any anti-money laundering scheme and that acceptance by the general partner of your subscription agreement and power of attorney to subscribe for units in Grant Park, together with acceptance of the appropriate remittance, will not breach any applicable laws, rules and regulations designed to avoid money laundering, including the provisions of the Bank Secrecy Act of 1970, as amended. Specifically, you represent and warrant that all evidence of identity provided is genuine and all related information furnished, and to be furnished in the future, is accurate.
(a) You represent and warrant that you are subscribing for units for your own account and own risk, and, unless you advise the general partner and your selling agent to the contrary in writings and identify with specificity supplementally each beneficial owner on whose behalf you are acting, you represent that you are not acting as a nominee for any other person or entity, and no other person or entity will have a beneficial or economic interest in your units. You also represent that you do not have the present intention or obligation to sell, distribute or transfer the units, directly or indirectly, to any other person or entity or to any nominee account.
(b) If you are (i) acting as trustee, agent, representative or disclosed nominee for another person or entity, or (ii) an entity investing on behalf of underlying investors, other than a publicly traded company listed on an organized exchange (or a subsidiary or a pension fund of such a company) based in a Financial Action Task Force (“FATF”) Compliant Jurisdiction (the persons,
C-5
entities and underlying investors referred to in (i) and (ii) being referred to collectively as the “Beneficial Owners”), you represent and warrant that:
(A) You understand and acknowledge the representations, warranties and agreements made in this paragraph 11 are made by you (i) with respect to you, and (ii) with respect to the Beneficial Owners;
(B) You have all requisite power and authority from the Beneficial Owners to execute and perform the obligations under the subscription agreement and power of attorney;
(C) You have adopted and implemented anti-money laundering policies, procedures and controls that comply with, and will continue to comply in all respects with, the requirements of applicable anti-money laundering laws and regulations; and
(D) You have established the identity of or have access to all Beneficial Owners, hold evidence of or have access to such identities, and (i) will make such information available to the general partner and /or your selling agent upon request, or (ii) will provide a certificate signed by you or by a senior officer of you with respect to your compliance with the anti-money laundering policies, procedures and controls, and, in either case, have procedures in place to ensure that no Beneficial Owner is a Prohibited Investor.
(c) You represent and warrant that, to the best of your knowledge and belief, neither you, any Beneficial Owners nor any person controlling, controlled by, or under common control with any such Beneficial Owners, nor any person having a beneficial or economic interest in any such Beneficial Owners, is a Prohibited Investor or, unless disclosed to the general partner and your selling agent in writing, a Senior Foreign Political Figure or a member of the Immediate Family or a Close Associate of a Senior Foreign Political Figure, and you are not investing and will not invest in Grant Park on behalf or for the benefit of any Prohibited Investor. You agree promptly to notify the general partner and your selling agent of any change in information affecting the representations and warranties in this paragraph II.
(d) You represent and warrant that the funds being used to make this investment are not derived from any unlawful or criminal activities.
(e) For purposes of this paragraph II, the following terms shall have the following meanings:
| • | Close Associate of a Senior Foreign Political Figure is a person who is widely and publicly known internationally to maintain an unusually close relationship with the Senior Foreign Political Figure, and includes a person who is in a position to conduct substantial domestic and international financial transactions on behalf of the Senior Foreign Political Figure. |
| • | FATF-Compliant Jurisdiction is a jurisdiction that (i) is a member in good standing of FATF and (ii) has undergone two rounds of FATF mutual evaluations.* |
| • | FATF means the Financial Action Task Force on Money Laundering. |
C-6
| • | Foreign Bank means an organization that (i) is organized under the laws of a non-U.S. country, (ii) engages in the business of banking, (iii) is recognized as a bank by the bank supervisory or monetary authority of the country of its organization or principal banking operations, (iv) receives deposits to a substantial extent in the regular course of its business, and (v) has the power to accept demand deposits, but does not include the U.S. branches or agencies of a non-U.S. bank. |
| • | Foreign Shell Bank means a Foreign Bank without a Physical Presence in any country, but does not include a Regulated Affiliate. Regulated Affiliate means a Foreign Shell Bank that (i) is an affiliate of a depository institution, credit union, or Foreign Bank that maintains a Physical Presence in the United States or a non-U.S. country, as applicable, and (ii) is subject to supervision by a banking authority in the country regulating such affiliated depository institution, credit union, or Foreign Bank. |
| • | Immediate Family of a Senior Foreign Political Figure typically includes such person’s parents, siblings, spouse, children and in-laws. |
| • | Non-Cooperative Jurisdiction means any non-U.S. country that has been designated as non-cooperative with international anti-money laundering principles or procedures by an intergovernmental group or organization, such as the FATF, of which the United States is a member and with which designation the United States representative to the group or organization continues to concur.** |
| • | Physical Presence means a place of business that is maintained by a Foreign Bank and is located at a fixed address, other than solely a post office box or an electronic address, in a country in which the Foreign Bank is authorized to conduct banking activities, at which location the Foreign Bank (i) employs one or more individuals on a full-time basis, (ii) maintains operating records related to its banking activities, and (iii) is subject to inspection by the banking authority that licensed the Foreign Bank to conduct banking activities. |
| • | Prohibited Investor means (i) a person or entity whose name appears on the various lists issued and maintained by the U.S. Office of Foreign Assets Control (“OFAC”), including the List of Specially Designated Nationals and Blocked Persons, the Specially Designated Terrorists List and the Specially Designated Narcotics Traffickers List; *** (ii) a Foreign Shell Bank; or (iii) a person or entity who is a citizen or resident of, or which is located in, or whose subscription funds are transferred from or through, a Foreign Bank in a Non-Cooperative Jurisdiction or Sanctioned Regime. |
| • | Regulated Affiliate means a Foreign Shell Bank that (i) is an affiliate of a depository institution, credit union, or Foreign Bank that maintains a Physical Presence in the United States or a non-U.S. country, as applicable, and (ii) is subject to supervision by a banking authority in the country regulating such affiliated depository institution, credit union, or Foreign Bank. |
| • | Sanctioned Regimes means targeted foreign countries, terrorism sponsoring organizations and international narcotics traffickers in respect of which OFAC administers and enforces economic and trade sanctions based on U.S. foreign policy and national security goals.**** |
C-7
| • | Senior Foreign Political Figure means a senior official in the executive, legislative, administrative, military or judicial branch of a foreign government (whether elected or not), a senior official of a major foreign political party, or a senior executive of a foreign government-owned corporation. In addition, a Senior Foreign Political Figure includes any corporation, business or other entity that has been formed by, or for the benefit of, a Senior Foreign Political Figure. |
| III. | Additional Representations and Warranties By Non-U.S. Investors |
1. You acknowledge that any marketing, promotion or offering of the units in Grant Park, your execution and delivery of the Subscription Agreement, your acquisition and holding of any units in Grant Park and the performance of your obligations under this Subscription Agreement and the Limited Partnership Agreement do not violate, and will not be in violation of, or conflict with any applicable laws or regulations in any relevant jurisdiction, any instruments governing your operation or any agreement or other instrument to which you are a party or by which you or any of your assets are bound to comply. As such, you undertake that your investment is lawful and is being made in or from a jurisdiction in which you are permitted to invest in accordance with all applicable laws and regulations.
| 2. | For investors in certain jurisdictions: |
Brazil | I acknowledge that I have requested information about Grant Park without any solicitation and that this subscription is being made in the context of a privately negotiated transaction. I further acknowledge that the units in Grant Park have not been, nor will they be, registered with, or submitted for approval by, the Brazilian Securities Commission (Comissão de Valores Mobilários). | |
Mexico | I hereby certify by signature that I am, and understand that I am, an Accredited Investor or an Institutional Investor for the purposes of the private placement provisions of Article 8 of the Mexican Securities Market Law. I further acknowledge that the units in Grant Park have not been, nor will they be, registered with the National Registry of Securities, maintained by the Mexican National Banking Commission. | |
Panama | I hereby certify by signature that I am an institutional investor for the purposes of Article 83(3) of Panama Decree Law N°1 of 1999 (the Securities Law). | |
Taiwan | I hereby acknowledge that this Subscription Agreement will not be deemed executed until it is signed by the Custodian on behalf of Grant Park outside of the territory of Taiwan. | |
| * | For a current list of FATF-compliant jurisdictions refer to the Financial Action Task Force website, http://www1.oecd.org/fatf/NCCT_en.htm |
| ** | The list of Non-Cooperative Countries and Territories is amended periodically. For a current list of Non-Cooperative Countries and Territories, refer to the Financial Action Task Force website, http://www1.oecd.org/fatf/NCCT_en.htm |
| *** | The OFAC lists may be found at the OFAC website: http://www.treas.gov/ofac |
| **** | As of the date of the prospectus, OFAC has imposed sanctions upon the following regimes: the Balkans, Belarus, Burma (Myanmar), Cote d’Ivoire (Ivory Coast), Cuba, Democratic Republic of the Congo, Iran, Iraq, Former Liberian Regime of Charles Taylor, North Korea, Persons Undermining the Sovereignty of Lebanon or Its Democratic Processes and Institutions, Sierra Leone, Sudan, Syria and Zimbabwe. |
C-8
Uruguay | I hereby certify by signature that I am an institutional investor for the purposes of the private placement provisions under section 2 of Uruguayan law 18,627. I further acknowledge that the units in the Fund have not been, nor will they be, registered with the Financial Services Superintendency of the Central Bank of Uruguay and correspond to an investment fund that is not an investment fund regulated by Uruguayan law 16,774 dated September 27, 1996, as amended. | |
C-9
Grant Park Fund
Request for Redemption
| 1) | Investor ID | 2) | Selling Firm Brokerage Account Number: | |||||||||
| (Located on Monthly Investor Statement) | ||||||||||||
| 3) | Social Security Number or Tax ID Number: | |||||||||||
| 4) | Redemption Month: | |||||||||||
| (Grant Park Fund offers redemptions dates are outlined in the table below. If no date is specified, the redemption will occur on the next available redemption date. Redemption Forms must be received 10 days prior to the redemption date; if your form is not received prior to the cutoff date, it will be processed on the next available redemption date.) | ||||||||||||
| 5) | Indicate the Class of Units you wish to Redeem(Choose One): A separate Redemption Form must be completed for each Class of Units of Grant Park Futures Fund Limited Partnership (“Grant Park”) being redeemed. | |||||||||||
¨ Grant Park Class A | ¨ Legacy 1 | ¨ Global 1 | ¨ Global 3 | |||||||
¨ Grant Park Class B | ¨ Legacy 2 | ¨ Global 2 | ||||||||
| 6) | Redemption Type(Choose One): | |||||||||
| ¨ Full RedemptionOR ¨ Partial Redemption: | Specify “$” or “Units”) | |||||||||
| 7) | Account Title: | 8) | Contact Phone: | |||||||||
| 9) | FA Name: | 10) | FA Phone: | |||||||||
ALL REDEMPTION PROCEEDS WILL BE WIRED, IN THE NAME OF THE INVESTOR, TO THE FIRM ACCOUNT ON RECORD.
| Non-custody account holders may request to receive a check, made out in the investor’s name and sent to the legal address on record. To request a check, please mark the box below and confirm the investor’s legal address. | ||||||
| ¨Please send check to (address must be the investor’s legal address): | ||||||
Street (No PO Boxes) | City | State | Zip Code |
I understand that a limited partner may cause any of its units to be redeemed by Grant Park for an amount equal to the net asset value per applicable unit as of the valuation date of any calendar month (the “Redemption Date”) if at least 10 days prior to the Redemption Date, or at an earlier date if required by its selling agent, Dearborn Capital Management, L.L.C. (the “General Partner”) receives a written request for redemption indicating the number or dollar amount of units the limited partner wishes to redeem. I understand that by redeeming Units of the Fund I may be subject to redemption fees or penalties as detailed below. Furthermore, I have read the prospectus, understand and agree to the terms outlined therein.
| Redemption Fee Table for Grant Park Fund | ||||||||||
| Unit Class | Redemption Cycle | On or Before 3rd Month-End | On or Before 6th Month-End | On or Before 9th Month-End | On or Before 12th Month-End | |||||
| A | Monthly - Last Day of the Month | N/A | N/A | N/A | N/A | |||||
| B | Monthly - Last Day of the Month | N/A | N/A | N/A | N/A | |||||
| Global 1 | Monthly - Last Day of the Month | NO REDEMPTIONS ALLOWED | N/A | N/A | N/A | |||||
| Global 2 | Monthly - Last Day of the Month | NO REDEMPTIONS ALLOWED | N/A | N/A | N/A | |||||
| Global 3 | Monthly - Last Day of the Month | NO REDEMPTIONS ALLOWED | 1.50% | 1.00% | 0.50% | |||||
| Legacy 1 | Monthly - Last Day of the Month | NO REDEMPTIONS ALLOWED | N/A | N/A | N/A | |||||
| Legacy 2 | Monthly - Last Day of the Month | NO REDEMPTIONS ALLOWED | N/A | N/A | N/A | |||||
I understand that the units will be redeemed on a “first-in, first-out” basis, such that the redeemed units will be deemed to have been acquired on the redeeming limited partner’s earliest subscription date for which units have not yet been redeemed. I (either in my individual capacity or as an authorized representative of an entity, if applicable) hereby represent and warrant that I am the true, lawful, and beneficial owner of the units to which this Request for Redemption relates, with full power and authority to request redemption of such units. Such units are not subject to any pledge or otherwise encumbered in any fashion.
United States Taxable Limited Partners Only
Under penalties of perjury, by signature below, I hereby certify that the Social Security Number or Taxpayer ID Number indicated on this Request for Redemption is my true, correct and complete Social Security Number or Taxpayer ID Number and that the undersigned is not subject to backup withholding under the provisions of Section 3406(a)(1)(c) of the Internal Revenue Code.
Non-United States Limited Partners Only
Under penalties of perjury, by signature below, I hereby certify that (a) I am not a citizen or resident of the United States or (b) (in the case of an investor that is not an individual), the investor is not a United States corporation, partnership, estate or trust.
| 11) | INVESTOR(S) MUST SIGN SIGNATURE(S) MUST BE IDENTICAL TO NAME(S) IN WHICH UNITS ARE REGISTERED. | |||||||||||
| X |
| X |
| |||||||||
| Signature of Investor | Date | Additional Signature (if applicable) | Date | |||||||||
| X |
| X |
| |||||||||
| Additional Signatures (if applicable) | Date | Signature of Custodian (if applicable) | Date | |||||||||
Please return completed original no later than 10 days prior to the redemption date (or at an earlier date if required by your Selling Agent) to:
Grant Park Fund
c/o Dearborn Capital Management, LLC
626 West Jackson Blvd, Suite 600
Chicago, IL 60661
D-1
GLOSSARY
The following glossary may assist prospective investors in understanding certain terms used in this prospectus:
Administrator. An official or agency administering the securities laws of a state.
Affiliate. An affiliate of a person is (a) any person directly or indirectly owning, controlling or holding with power to vote 10% or more of the outstanding voting securities of such person, (b) any person 10% or more of whose outstanding voting securities are directly or indirectly owned, controlled or held with power to vote, by such person, (c) any person, directly or indirectly, controlling, controlled by or under common control of such person, (d) any officer, director or partner of such person, or (e) if such person is an officer, director or partner, any person for which such person acts in such capacity.
Allocated Net Assets. The portion of Grant Park’s net assets allocated to a trading advisor and subject to that trading advisor’s investment discretion (including any notional funds), together with any appreciation or depreciation in such assets adjusted proportionally for new capital contributions, redemptions or capital distributions, if any.
Barclay BTOP50 Index. The Barclay BTOP50 Index is an investable index that seeks to replicate the overall composition of the managed futures industry with regard to trading style and overall market exposure. The BTOP50 employs a top-down approach in selecting its constituents. The largest investable trading advisor programs, as measured by assets under management, are selected for inclusion in the BTOP50. In each calendar year the selected trading advisor programs represent, in aggregate, no less than 50% of the investable assets of the Barclay CTA Universe.
Barclay CTA Index. An unweighted index which attempts to measure the performance of the CTA industry. The index measures the combined performance of all CTAs who have more than 4 years past performance. For purposes of calculating the index, the first 4 years of a CTA’s performance history is ignored. The Barclay CTA Index is not the same as an investment in Grant Park as it is more broadly diversified across a much greater number of trading programs. Furthermore, Grant Park may perform quite differently from the Barclay CTA Index, just as, for example, an individual stock may perform quite differently from the S&P 500 Index.
Barclays Capital U.S. Aggregate Bond Index. An index that covers the USD-denominated, investment-grade, fixed-rate, taxable bond market of SEC-registered securities. The index includes bonds from the Treasury, government-related, corporate, MBS (agency fixed-rate and hybrid ARM passthroughs), ABS and CMBS sectors. The U.S. Aggregate Index is a component of the U.S. Universal Index in its entirety. The index was created in 1986, with index history backfilled to January 1, 1976.
Barclays Capital U.S. Long Government Index (formerly Lehman Brothers U.S. Government Index (long Subset)). A benchmark comprised of The Barclays Capital U.S. Treasury and U.S. Agency indices. The U.S. Government Index includes Treasuries (public obligations of the U.S. Treasury that have remaining maturities of more than ten years) and U.S. agency debentures (publicly issued debt of U.S. Government agencies, quasi-federal corporations, and corporate or foreign debt guaranteed by the U.S. Government). The U.S. Government Index is a component of the Barclays Capital U.S. Government Index.
Barclays Capital Diversified Traders Index. A non-investable index designed to represent the performance of the Diversified Trader Sector of the managed futures industry. The index is equally-weighted and is comprised of managed futures programs (CTAs) that trade a diversified portfolio. The index is rebalanced annually at the start of each calendar year. In 2009, there were 339 diversified programs included in the index.
E-1
Bloomberg U.S. Generic Government 3-month Yield Index. This index, compiled by Bloomberg, is intended to serve as a benchmark for the changes in yields on a generic 3-month Treasury Bill. Each index value is shown as the annual yield for a treasury bill at that current time. For purposes of the demonstration of monthly performance below, the closing value for each month is divided by 12. (i.e. a 5.00% annual yield shown at the end of a month will show a monthly performance of 0.60%, 5.00% / 12 = 0.60%)
CEA. Commodity Exchange Act, as amended.
CFMA. Commodity Futures Modernization Act of 2000.
CFTC. Commodity Futures Trading Commission. An independent regulatory commission of the U.S. government empowered to regulate futures transactions and other commodity interest transactions under the CEA.
Clearing Broker. Any person who engages in the business of effecting commodity interest transactions for the accounts of others or for its own account and who has been appointed by the general partner to act as a clearing broker on behalf of Grant Park. Currently, Grant Park’s clearing brokers are MF Global Inc., Newedge USA, LLC and UBS Financial Services Inc.
Commodity. Refers to goods, wares, merchandise, produce and in general everything that is bought and sold in commerce, including financial instruments that have been selected as appropriate vehicles for trading on various national and international exchanges or markets located in principal marketing and commercial areas.
Commodity Interest. A contract or option thereon providing for the delivery or receipt at a future date of a specified amount and grade of a traded commodity at a specified price and delivery point, or other contract or transaction described in this prospectus the value of which is tied to an underlying commodity.
Correlation. This is the tendency for the returns of two assets, such as a portfolio and an index, to move together relative to their average. The measurement of this statistic (the correlation coefficient) can range from -1 (perfect negative correlation, one goes up the other down) to 1 (perfect positive correlation, both moving in the same direction). A correlation of 0 means no relationship can be found between the movement in the index and the movement in the portfolio’s performance.
Daily Price Fluctuation Limit. The maximum permitted fluctuation (imposed by an exchange and approved by the CFTC) in the price of a futures contract or options on futures contract that can occur on an exchange on a given day in relation to the previous day’s settlement price. Such maximum permitted fluctuation is subject to change from time to time by the exchange. These limits generally are not imposed outside the U.S.
Delivery. The process of satisfying a futures contract, option on a commodity or a forward contract by transferring ownership of a specified quantity and grade of a cash commodity to the purchaser thereof. Certain financial instrument contracts are not settled by delivery of the financial instrument, but rather are settled in cash.
Dow Jones-UBS Commodity Index Total Return. The DJ-UBSCI is a total return index composed of futures contracts on physical commodities. Unlike equities, which typically entitle the holder to a continuing stake in a corporation, commodity futures contracts normally specify a certain date for the delivery of the underlying physical commodity. In order to avoid the delivery process and maintain a long futures position, nearby contracts must be sold and contracts that have not yet reached the delivery period must be purchased. This process is known as “rolling” a futures position. The DJ-UBSCI is a “rolling index.” The index is rebalanced annually.
Draw-down. A measure of losses experienced by the composite performance record from peak (high to valley (low). Draw-downs are measured on the basis of month-end net asset values only.
E-2
EFP. Exchange for physical. An EFP transaction involves the spot purchase or sale of a commodity in conjunction with the offsetting sale or purchase of a corresponding futures contract involving the same or equivalent commodity, without making an open competitive trade on an exchange as permitted by exchange rules.
ERISA. Employee Retirement Income Security Act of 1974, as amended.
ERISA Plan. Employee benefit plan governed by ERISA.
FCM. Futures commission merchant.
FINRA. Financial Industry Regulatory Authority.
Forward Contract. A contract relating to the purchase and sale of a commodity for delivery at a future date. It is distinguished from a futures contract in that it is not traded on an exchange, and in that it is not uniform and contains terms and conditions specifically negotiated by the parties.
Futures Contract. A contract providing for the delivery or receipt at a future date of a specified amount and grade of a traded commodity at a specified price and delivery point, or for cash settlement. Such contracts are uniform for each commodity on each exchange and vary only with respect to price and delivery time. It is important to note that trading in futures contracts involves trading in contracts for future delivery of commodities and not the buying and selling of particular lots of commodities. A contract to buy or sell may be satisfied either by making or taking delivery of the commodity and payment or acceptance of the entire purchase price, or by offsetting the contractual obligation with a countervailing contract on the same or a linked exchange prior to delivery.
Hedge Fund Research, Inc. Equity Hedge Index (HFRI Equity Hedge Index). The index is comprised of Investment Managers who maintain positions both long and short in primarily equity and equity derivative securities. A wide variety of investment processes can be employed to arrive at an investment decision, including both quantitative and fundamental techniques; strategies can be broadly diversified or narrowly focused on specific sectors and can range broadly in terms of levels of net exposure, leverage employed, holding period, concentrations of market capitalizations and valuation ranges of typical portfolios. Hedge Equity managers would typically maintain at least 50%, and may in some cases be substantially or entirely invested in equities, both long and short.
Hedge Fund Research, Inc. Fund Weighted Composite Index (HFRI Fund Weighted Composite Index). The Hedge Fund Research Institute’s Hedge Fund Weighed Composite Index is an internationally-recognized benchmark comprised of over 2,000 funds from the internal HFR Database. HFRI Fund Weighted Composite Index is an equal-weighted return of all funds in the HFR Monthly Indices, excluding HFRI Fund of Funds Index. This is a broad-based index comprising a wide variety of hedge fund strategies. Any specific hedge fund may perform quite differently than the index.
IRA. Individual Retirement Account.
Long Contract. A contract to accept delivery of (i.e., to buy) a specified amount of a commodity at a future date at a specified price.
Margin. Good faith deposits with a clearing broker to assure fulfillment of a purchase or sale of a futures contract or, in certain cases, forward or option contract. Commodity interest margins do not usually involve the payment of interest. Original or initial margin is the minimum amount of funds that must be deposited by a commodity interest trader with the trader’s broker to initiate and maintain an open position in futures contracts. Maintenance margin is the amount (generally less than the original margin) to which a trader’s account may decline before the trader must deliver additional margin.
E-3
Margin Call. A demand for additional funds after the initial good faith deposit required to maintain a customer’s account in compliance with the requirements of a particular exchange or a clearing broker.
Morgan Stanley Capital International Europe, Australasia, Far East Index (MSCI EAFE Index). A capitalization-weighted index that is designed to measure the investment returns of developed economies outside of North America. The index includes publicly traded stocks from 21 countries that are divided into industry groups, with representative stocks selected from each industry group. Cross-ownership is tracked to ensure that the market weight given each company is accurate.
MSCI U.S. REIT Index. The MSCI US REIT Index broadly and fairly represents the equity REIT opportunity set with proper investability screens to ensure that the index is investable and replicable. The index represents approximately 85% of the US REIT universe. The MSCI US REIT Index will reflect the evolving equity REIT market on a timely basis through quarterly index reviews.
NASAA. North American Securities Administrators Association, Inc.
NASAA Guidelines. The Guidelines for the Registration of Commodity Pool Programs imposed by NASAA.
NASDAQ Composite Index. An index that measures all NASDAQ domestic and non-U.S. based common stocks listed on the NASDAQ Stock Market (currently over 3,000 companies). The index is market-value weighted. This means that each company’s stock affects the index in proportion to its market value. The market value, the last sale price multiplied by total shares outstanding, is calculated throughout the trading day, and is related to the total value of the index.
Net Asset Value or NAV. Net asset value as of a specified time with respect to any class of units or of Grant Park as a whole equals the value of the net assets attributable to such class or of Grant Park, as applicable, as of that time.
NFA. National Futures Association. A self-regulatory organization for commodity interest professionals.
Net Assets. The total assets attributable to any class of units or of Grant Park, as applicable, including all cash, plus Treasury securities at accrued interest and the market value of all open commodity interest positions attributable to such class or of Grant Park, less all liabilities attributable to such class or of Grant Park, determined in accordance with generally accepted accounting principles (GAAP).
Net Asset Value per Unit. Net asset value of a class of units divided by the aggregate number of units of such class outstanding.
Net Worth. The excess of total assets over total liabilities as determined in accordance with GAAP. Net worth is determined exclusive of home, home furnishings and automobiles.
New Trading Profits. The excess, if any, of the value of the trading advisor’s allocated net assets as of the end of a quarter over the value of the trading advisor’s allocated net assets as of the end of the most recent prior quarter in which an incentive fee was paid to the trading advisor.
Notional Funds. The difference between the nominal size of an account as agreed between a trading advisor and the client and the actual amount of cash funds held in the client’s account at the clearing broker. Notional funds has the same meaning as notional equity.
Open Position. A contractual commitment arising under a commodity interest contract that has not been extinguished by an offsetting trade or by delivery.
E-4
Option. A contract giving the purchaser the right, as opposed to the obligation, to acquire or to dispose of the commodity, futures contract or forward contract underlying the option.
Organization and Offering Expenses. All expenses incurred by Grant Park in connection with and in preparing any class of units for registration and subsequently offering and distributing the units to the public, including, but not limited to, total selling agent, underwriting and brokerage discounts and commissions (including fees of the selling agent’s or underwriter’s attorneys), expenses for printing, engraving, mailing, salaries of the general partner’s employees while engaged in sales activity, charges of transfer agents, registrars, trustees, escrow holders, depositories, experts, expenses of qualification of the sale of the units under federal and state law, including taxes and fees, accountants’ and attorneys’ fees, to the extent applicable.
Person. Any natural person, partnership, corporation, association or other legal entity.
Pit Brokerage Fees. Includes floor brokerage, clearing fees, NFA fees and exchange fees.
Pyramiding. A method of using all or a part of an unrealized profit in a commodity interest contract position to provide margin for any additional commodity interest contracts of the same or related commodities.
Round-turn Transaction. The process of opening an investment in a commodity interest by taking a position together with the process of closing out that investment by undertaking an offsetting transaction.
Round-Turns per Million. Measures the frequency with which a trading advisor initiates and subsequently closes out a market position on an average million-dollar account.
SEC. Securities and Exchange Commission.
Selling Agent. Any broker-dealer that is engaged by the general partner to offer and sell the units to prospective investors. Currently, Grant Park’s lead selling agents are UBS Financial Services Inc., A.G. Edwards & Sons, Inc., and Oppenheimer & Co. Inc. The general partner may engage additional selling agents.
Settlement Price. The closing price for futures contracts in a particular commodity established by the clearing organization or exchange after the close of each day’s trading.
Short Contract. A contract to make delivery of (i.e., to sell) a specified amount of a commodity at a future date at a specified price.
Speculative Position Limit. The maximum number of speculative futures or option contracts in any one commodity (on one contract market), imposed by the CFTC or a U.S. futures exchange, that can be held or controlled at one time by one person or a group of persons acting together. These limits generally are not imposed for trading on markets or exchanges outside the U.S.
Sponsor. Any person directly or indirectly instrumental in organizing Grant Park or any person who will manage or participate in the management of Grant Park, including any clearing broker who pays any portion of the organization and offering expenses of Grant Park, and the general partner and any other person who regularly performs or selects the persons who performs service for Grant Park. The term “sponsor” does not include wholly independent third parties such as any attorneys, accountants, selling agents and underwriters whose only compensation is for professional services rendered in connection with the offering of the units. The term “sponsor” shall be deemed to include its affiliates. Grant Park’s sole sponsor is Dearborn Capital Management, L.L.C.
Spot Contract. A cash market transaction in which the buyer and seller agree to the immediate purchase and sale of a specific commodity, usually with a two-day settlement. Spot contracts are not uniform and are not exchange traded.
E-5
Spread or Straddle. A trading strategy involving the simultaneous buying and selling of contracts on the same commodity interest but involving different delivery dates or markets and in which the trader expects to earn a profit from a widening or narrowing of the difference between the prices of the two contracts.
Standard & Poor’s 500 Total Return Index (S&P 500 Index). A weighted index consisting of the 500 stocks in the S&P 500 Index, which are chosen by Standard and Poor’s based on industry representation, liquidity and stability. The stocks in the S&P 500 Index are not the 500 largest companies, rather the index is designed to capture the returns of many different sectors of the U.S. economy. The Total Return calculation includes the price-plus-gross cash dividend return.
Standard Deviation. Standard deviation measures the dispersal or uncertainty in a random variable (in this case, investment returns). It measures the degree of variation of returns around the mean, or average, return. The higher the volatility of the investment returns, the higher the standard deviation will be. For this reason, standard deviation is often used as a measure of investment risk.
Sharpe Ratio. A return/risk measure developed by William Sharpe. Return (numerator) is defined as the incremental average return of an investment over the risk free rate. Risk (denominator) is defined as the standard deviation of the investment returns.
Swap Contract. A transaction that generally involves contracts with a counterparty to exchange a stream of payments computed by reference to a notional amount and the price of the asset that is the subject of the swap. Swap contracts generally are not uniform and not exchange traded.
Time Horizon. Refers to the average trading length of a market position held in the trading advisor’s system.
Trading Advisor. Any person who for consideration engages in the business of advising others, either directly or indirectly, as to the value, purchase or sale of commodity interests and who has been appointed to act as a trading advisor for Grant Park. Currently, Grant Park’s trading advisors are Rabar Market Research, Inc., EMC Capital Management, Inc., Eckhardt Trading Company, Graham Capital Management, L.P., Winton Capital Management Limited, and Welton Investment Corporation.
Unrealized Profit or Loss. The profit or loss that would be realized on an open position if it were closed out at the current settlement price.
Valuation Date. The date as of which the net assets of any class of units or of Grant Park are determined.
E-6