Filed pursuant to Rule 424(b)(3)
File No. 333-179641
GRANT PARK FUTURES FUND
LIMITED PARTNERSHIP
________________________________________________
Supplement dated January 1, 2013
to
Prospectus and Disclosure Document
dated April 30, 2012
and Supplement dated December 1, 2012
________________________________________________
THIS SUPPLEMENT CONTAINS INFORMATION WHICH AMENDS, SUPPLEMENTS OR MODIFIES CERTAIN INFORMATION CONTAINED IN THE PROSPECTUS AND DISCLOSURE DOCUMENT OF THE GRANT PARK FUTURES FUND LIMITED PARTNERSHIP DATED APRIL 30, 2012 AND THE SUPPLEMENT DATED DECEMBER 1, 2012, AND SHOULD BE READ TOGETHER THEREWITH.
YOU SHOULD CAREFULLY CONSIDER THE “RISK FACTORS” BEGINNING ON PAGE 20 OF THE PROSPECTUS BEFORE YOU DECIDE TO INVEST.
NEITHER THE SECURITIES AND EXCHANGE COMMISSION NOR ANY STATE SECURITIES COMMISSION HAS APPROVED OR DISAPPROVED OF THESE SECURITIES OR PASSED UPON THE ACCURACY OR ADEQUACY OF THIS PROSPECTUS SUPPLEMENT. ANY REPRESENTATION TO THE CONTRARY IS A CRIMINAL OFFENSE.
THE COMMODITY FUTURES TRADING COMMISSION HAS NOT PASSED UPON THE MERITS OF PARTICIPATING IN THIS POOL NOR HAS THE COMMISSION PASSED ON THE ADEQUACY OR ACCURACY OF THIS DISCLOSURE DOCUMENT SUPPLEMENT.
SUMMARY
This supplement revises and replaces the second paragraph on page 2 of the Prospectus under the heading “SUMMARY—Legacy 1 Class and Legacy 2 Class Units” in its entirety as follows:
As of January 1, 2013, through their respective trading companies, each of Rabar Market Research, Inc., EMC Capital Management, Inc., Eckhardt Trading Company, or ETC, Winton Capital Management Limited, Transtrend B.V., Sunrise Partners, LLC, Amplitude Capital International Limited, Quantitative Investment Management, LLC, or QIM, Alder Capital Limited, Denali Asset Management, LLLP, and Lynx Asset Management AB, or Lynx serve as Grant Park’s commodity trading advisors with respect to the Legacy 1 Class and Legacy 2 Class units. The trading advisors and their respective asset allocations with respect to the Legacy 1 Class and Legacy 2 Class units are the same as with respect to the fund’s Class A and Class B units. As of January 1, 2013, with respect to the Class A and Class B units and the Legacy 1 Class and Legacy 2 Class, each of Amplitude, Transtrend, Winton, Rabar, EMC, ETC, QIM, Sunrise, Alder, Denali, and Lynx manage between 5% to 20% of Grant Park’s net assets.
This supplement revises and replaces the fourth paragraph on page 2 of the Prospectus under the heading “SUMMARY—Global 1 Class, Global 2 Class and Global 3 Class” in its entirety as follows:
As of January 1, 2013, through their respective trading companies, each of Rabar, EMC, ETC, Winton, Transtrend, QIM, Sunrise, Amplitude, Alder, Denali, Lynx, and effective February 1, 2013, Quantica Capital AG serve as Grant Park’s commodity trading advisors with respect to the Global 1 Class, Global 2 Class and Global 3 Class units. As of January 1, 2013, with respect to the Global 1 Class, Global 2 Class and Global 3 Class units, each of Rabar, EMC, ETC, Winton, Transtrend, QIM, Sunrise, Amplitude, Alder, Denali, Lynx and effective February 1, 2013, Quantica manage between 5% to 20% of Grant Park’s net assets.
This supplement revises and replaces the second paragraph on page 5 of the Prospectus under the heading “SUMMARY—Plan of Distribution—What is the difference between Legacy 1 Class, the Legacy 2 Class, the Global 1 Class, the Global 2 Class and the Global 3 Class Units” in its entirety as follows:
As of January 1, 2013, the trading advisors for the Legacy 1 Class and Legacy 2 Class units are Rabar, EMC, ETC, Winton, Transtrend, QIM, Sunrise, Amplitude, Alder, Denali, and Lynx. The trading advisors, asset allocations and trading philosophy with respect to the Legacy 1 Class and Legacy 2 Class units are the same as those utilized for Grant Park’s Class A and Class B units. As of January 1, 2013, the trading advisors for the Global 1 Class, Global 2 Class and Global 3 Class units are Rabar, EMC, ETC, Winton, Transtrend, QIM, Sunrise, Amplitude, Alder, Denali, Lynx, and effective February 1, 2013, Quantica. The investment process is uniquely managed for each class of units.
This supplement revises and replaces the text on page 3 of the Prospectus under the heading “SUMMARY—Breakeven Amounts for Each Class of Units” in its entirety as follows:
The following summarizes the approximate dollar returns and percentage returns required for the redemption value of a hypothetical $1,000 initial investment in offered units to equal the amount invested 12 months after the investment was made. The breakeven summary for the Global 3 Class units shows the amount required to “break-even” both with and without an early redemption fee which, for purposes of this summary, has been averaged to approximate the effect that payment of an early redemption fee will have on a redemption of such units during the first year of investment.
| · | Legacy 1 Class: 5.60% (or $55.98). |
| · | Legacy 2 Class: 5.91% (or $59.14). |
| · | Global 1 Class: 4.92% (or $49.20). |
| · | Global 2 Class: 5.23% (or $52.30). |
| · | Global 3 Class: 7.44% (or $74.39) without average early redemption fee, or 8.94% (or $89.39) with average early redemption fee. |
See “Summary – Breakeven Analysis” beginning on page 12 for detailed breakeven analysis of the offered units.
This supplement revises and replaces the Breakeven Analysis tables on page 13-18 of the Prospectus under the heading “SUMMARY—Breakeven Analysis” in its entirety as follows:
Legacy 1 Class Breakeven Analysis
| | | Legacy 1 Class Units | |
Assumed initial selling price per unit(1) | | $ | 1,000.00 | |
Trading advisors’ incentive fees(2) | | $ | 5.48 | |
Brokerage charge(3) (5.00%) | | $ | 50.00 | |
Operating expenses(4) (0.25%) | | $ | 2.50 | |
Offering expenses(5) (0.30%) | | $ | 3.00 | |
Interest income(6) (0. 50%) | | $ | (5.00 | ) |
| Amount of trading income required for the redemption value at the end of one year to equal the initial selling price of the unit | | $ | 55.98 | |
| Percentage of initial selling price per Legacy 1 Class unit | | | 5.60 | % |
(1) The minimum investment required to invest in the Legacy 1 Class units is $10,000. For ease of comparability, $1,000 will be deemed to be the assumed selling price per unit of a Legacy 1 Class unit, and, as described below, a Legacy 2 Class unit, a Global 1 Class unit, a Global 2 Class unit and a Global 3 Class unit, for purposes of the breakeven analysis.
(2) Reflects incentive fees payable to Amplitude, EMC, ETC, Rabar, Winton, Transtrend, QIM, Sunrise, Alder, Denali, and Lynx assuming they manage between 5% and 20% of invested assets and assuming each of the advisors have equivalent performance returns for the 12-month period. Actual incentive fees are calculated quarterly or semi-annually on the basis of each trading advisor’s individual
performance, not the overall performance of Grant Park or the Legacy 1 Class units. Because incentive fees payable to certain of these trading advisors are calculated on the basis of trading profits realized on the assets they manage after deduction for the allocable portion of only certain expenses charged to Grant Park, these advisors would receive an incentive fee before Grant Park has recouped all expenses and reaches the “break-even” level. Incentive fees payable to certain other of these trading advisors are calculated after deduction for the allocable portion of expenses charged to Grant Park. These advisors would not receive an incentive fee before Grant Park has recouped all expenses.
(3) The brokerage charge is paid to the general partner on a monthly basis. Effective the initial closing date, the brokerage charge for the Legacy 1 Class units equals 0.4167 % per month, a rate of 5.00% annually, of such units’ month-end adjusted net assets. Out of this amount, the general partner pays all clearing, execution and give-up, floor brokerage, exchange and NFA fees, any other transaction costs, selling agent compensation, selling agent service fees and consulting fees to the trading advisors. The general partner retains the balance as payment for its services to Grant Park. Bid-ask spreads on Grant Park’s forward and other non-exchange traded contracts are not included in this breakeven table due to the difficulty of determining those spreads.
(4) Grant Park is responsible for ongoing operating expenses, up to an amount not to exceed 0.25% of Grant Park’s average net assets per year. This amount is used for purposes of this breakeven analysis.
(5) Grant Park’s organization and offering expenses are paid by the general partner and then reimbursed to the general partner by Grant Park. To pay this reimbursement, effective the initial closing date, Legacy 1 Class units are assessed at an annual rate of 30 basis points (0.30%) of adjusted net assets, calculated and payable monthly on the basis of month-end adjusted net assets of the applicable class.
(6) Grant Park earns interest on free cash balances held in its futures trading accounts. Interest is estimated for these purposes at a rate of 0.50% per year.
Legacy 2 Class Breakeven Analysis
| | | Legacy 2 Class Units | |
Assumed initial selling price per unit(1) | | $ | 1,000.00 | |
Trading advisors’ incentive fees(2) | | $ | 6.14 | |
Brokerage charge(3) (5.25%) | | $ | 52.50 | |
Operating expenses(4) (0.25%) | | $ | 2.50 | |
Offering expenses(5) (0.30%) | | $ | 3.00 | |
Interest income(6) (0.50%) | | $ | (5.00 | ) |
| Amount of trading income required for the redemption value at the end of one year to equal the initial selling price of the unit | | $ | 59.14 | |
| Percentage of initial selling price per Legacy 2 Class unit | | | 5.91 | % |
(1) The minimum investment required to invest in the Legacy 2 Class units is $10,000. For ease of comparability, $1,000 will be deemed to be the assumed selling price per unit of a Legacy 2 Class unit, and, as described above, a Legacy 1 Class unit, and, as described below, a Global 1 Class unit, a Global 2 Class unit and a Global 3 Class unit, for purposes of the breakeven analysis.
(2) Reflects incentive fees payable to Amplitude, EMC, ETC, Rabar, Winton, Transtrend, QIM, Sunrise, Alder, Denali, and Lynx assuming they manage between 5% and 20% of invested assets and assuming each of the advisors have equivalent performance returns for the 12-month period. Actual incentive fees are calculated quarterly or semi-annually on the basis of each trading advisor’s individual performance, not the overall performance of Grant Park or the Legacy 1 Class units. Because incentive fees payable to certain of these trading advisors are calculated on the basis of trading profits realized on the assets they manage after deduction for the allocable portion of only certain expenses charged to Grant Park, these advisors would receive an incentive fee before Grant Park has recouped all expenses and reaches the “break-even” level. Incentive fees payable to certain other of these trading advisors are calculated after deduction for the allocable portion of expenses charged to Grant Park. These advisors
would not receive an incentive fee before Grant Park has recouped all expenses.
(3) The brokerage charge is paid to the general partner on a monthly basis. Effective the initial closing date, the brokerage charge for the Legacy 2 Class units equals 0.4375% per month, a rate of 5.25% annually, of such units’ month-end adjusted net assets. Out of this amount, the general partner pays all clearing, execution and give-up, floor brokerage, exchange and NFA fees, any other transaction costs, selling agent compensation, selling agent service fees and consulting fees to the trading advisors. The general partner retains the balance as payment for its services to Grant Park. Bid-ask spreads on Grant Park’s forward and other non-exchange traded contracts are not included in this breakeven table due to the difficulty of determining those spreads.
(4) Grant Park is responsible for ongoing operating expenses, up to an amount not to exceed 0.25% of Grant Park’s average net assets per year. This amount is used for purposes of this breakeven analysis.
(5) Grant Park’s organization and offering expenses are paid by the general partner and then reimbursed to the general partner by Grant Park. To pay this reimbursement, effective the initial closing date, Legacy 2 Class units are assessed at an annual rate of 30 basis points (0.30%) of adjusted net assets, calculated and payable monthly on the basis of month-end adjusted net assets of the applicable class.
(6) Grant Park earns interest on free cash balances held in its futures trading accounts. Interest is estimated for these purposes at a rate of 0. 50% per year.
Global 1 Class Breakeven Analysis
| | | Global 1 Class Units | |
Assumed initial selling price per unit(1) | | $ | 1,000.00 | |
Trading advisors’ incentive fees(2) | | $ | 4.20 | |
Brokerage charge(3) (4.45%) | | $ | 44.50 | |
Operating expenses(4) (0.25%) | | $ | 2.50 | |
Offering expenses(5) (0.30%) | | $ | 3.00 | |
Interest income(6) (0. 50%) | | $ | (5.00 | ) |
| Amount of trading income required for the redemption value at the end of one year to equal the initial selling price of the unit | | $ | 49.20 | |
| Percentage of initial selling price per Global 1 Class unit | | | 4.92 | % |
(1) The minimum investment required to invest in the Global 1 Class units is $5,000. For ease of comparability, $1,000 will be deemed to be the assumed selling price per unit of a Global 1 Class unit, and, as described above, a Legacy 1 Class unit and a Legacy 2 Class unit, and, as described below, a Global 2 Class unit and a Global 3 Class unit, for purposes of the breakeven analysis.
(2) Reflects incentive fees payable to Amplitude, EMC, ETC, Rabar, Winton, Transtrend, QIM, Sunrise, Alder, Denali, Lynx, and Quantica assuming they manage between 5% and 20% of invested assets and assuming each of the advisors have equivalent performance returns for the 12-month period. Actual incentive fees are calculated quarterly on the basis of each trading advisor’s individual performance, not the overall performance of Grant Park or the Global 1 Class units. Because incentive fees payable to certain of these trading advisors are calculated on the basis of trading profits realized on the assets they manage after deduction for the allocable portion of only certain expenses charged to Grant Park, these advisors would receive an incentive fee before Grant Park has recouped all expenses and reaches the “break-even” level. Incentive fees payable to certain other of these trading advisors are calculated after deduction for the allocable portion of expenses charged to Grant Park. These advisors would not receive an incentive fee before Grant Park has recouped all expenses.
(3) The brokerage charge is paid to the general partner on a monthly basis. Effective the initial closing date, the brokerage charge for the Global 1 Class units equals 0.3708% per month, a rate of
4.45% annually, of such units’ month-end adjusted net assets. Out of this amount, the general partner pays all clearing, execution and give-up, floor brokerage, exchange and NFA fees, any other transaction costs, selling agent compensation, selling agent service fees and consulting fees to the trading advisors. The general partner retains the balance as payment for its services to Grant Park. Bid-ask spreads on Grant Park’s forward and other non-exchange traded contracts are not included in this breakeven table due to the difficulty of determining those spreads.
(4) Grant Park is responsible for ongoing operating expenses, up to an amount not to exceed 0.25% of Grant Park’s average net assets per year. This amount is used for purposes of this breakeven analysis.
(5) Grant Park’s organization and offering expenses are paid by the general partner and then reimbursed to the general partner by Grant Park. To pay this reimbursement, effective the initial closing date, Global 1 Class units are assessed at an annual rate of 30 basis points (0.30%) of adjusted net assets, calculated and payable monthly on the basis of month-end adjusted net assets of the applicable class.
(6) Grant Park earns interest on free cash balances held in its futures trading accounts. Interest is estimated for these purposes at a rate of 0.50% per year.
Global 2 Class Breakeven Analysis
| | | Global 2 Class Units | |
Assumed initial selling price per unit(1) | | $ | 1,000.00 | |
Trading advisors’ incentive fees(2) | | $ | 4.80 | |
Brokerage charge(3) (4.70%) | | $ | 47.00 | |
Operating expenses(4) (0.25%) | | $ | 2.50 | |
Offering expenses(5) (0.30%) | | $ | 3.00 | |
Interest income(6) (0. 50%) | | $ | (5.00 | ) |
| Amount of trading income required for the redemption value at the end of one year to equal the initial selling price of the unit | | $ | 52.30 | |
| Percentage of initial selling price per Global 2 Class unit | | | 5.23 | % |
(1) The minimum investment required to invest in the Global 2 Class units is $5,000. For ease of comparability, $1,000 will be deemed to be the assumed selling price per unit of a Global 2 Class unit, and, as described above, a Legacy 1 Class unit, a Legacy 2 Class unit and a Global 1 Class unit, and, as described below, a Global 3 Class unit, for purposes of the breakeven analysis.
(2) Reflects incentive fees payable to Amplitude, EMC, ETC, Winton, Transtrend, QIM, Sunrise, Alder, Denali, Lynx, and Quantica assuming they manage between 5% and 20% of invested assets and assuming each of the advisors have equivalent performance returns for the 12-month period. Actual incentive fees are calculated quarterly or semi-annually on the basis of each trading advisor’s individual performance, not the overall performance of Grant Park or the Global 2 Class units. Because incentive fees payable to certain of these trading advisors are calculated on the basis of trading profits realized on the assets they manage after deduction for the allocable portion of only certain expenses charged to Grant Park, these advisors would receive an incentive fee before Grant Park has recouped all expenses and reaches the “break-even” level. Incentive fees payable to certain other of these trading advisors are calculated after deduction for the allocable portion of expenses charged to Grant Park. These advisors would not receive an incentive fee before Grant Park has recouped all expenses.
(3) The brokerage charge is paid to the general partner on a monthly basis. Effective the initial closing date, the brokerage charge for the Global 2 Class units equals 0.3917% per month, a rate of 4.70% annually, of such units’ month-end adjusted net assets. Out of this amount, the general partner pays all
clearing, execution and give-up, floor brokerage, exchange and NFA fees, any other transaction costs, selling agent compensation, selling agent service fees and consulting fees to the trading advisors. The general partner retains the balance as payment for its services to Grant Park. Bid-ask spreads on Grant Park’s forward and other non-exchange traded contracts are not included in this breakeven table due to the difficulty of determining those spreads.
(4) Grant Park is responsible for ongoing operating expenses, up to an amount not to exceed 0.25% of Grant Park’s average net assets per year. This amount is used for purposes of this breakeven analysis.
(5) Grant Park’s organization and offering expenses are paid by the general partner and then reimbursed to the general partner by Grant Park. To pay this reimbursement, effective the initial closing date, Global 2 Class units are assessed at an annual rate of 30 basis points (0.30%) of adjusted net assets, calculated and payable monthly on the basis of month-end adjusted net assets of the applicable class.
(6) Grant Park earns interest on free cash balances held in its futures trading accounts. Interest is estimated for these purposes at a rate of 0. 50% per year.
Global 3 Class Breakeven Analysis
| | | Global 3 Class Units | |
Assumed initial selling price per unit(1) | | $ | 1,000.00 | |
Trading advisors’ incentive fees(2) | | $ | 9.39 | |
Brokerage charge(3) (6.45%) | | $ | 64.50 | |
Operating expenses(4) (0.25%) | | $ | 2.50 | |
Offering expenses(5) (0.30%) | | $ | 3.00 | |
Interest income(6) (0. 50%) | | $ | (5.00 | ) |
| | | | | |
| Amount of trading income required for the redemption value at the end of one year to | | | | |
| equal the initial selling price of the unit, without early redemption fee | | $ | 74.39 | |
| | | | | |
| Percentage of initial selling price per unit, without early redemption fee | | | 7.44 | % |
| Early redemption fee(7) (1.00%) | | $ | 15.00 | |
| | | | | |
| Amount of trading income required for the redemption value at the end of one year to | | | | |
| equal the initial selling price per Global 3 Class unit, with average early redemption fee | | $ | 89.39 | |
| | | | | |
| Percentage of initial selling price per Global 3 Class unit, with average early redemption fee | | | 8.94 | % |
(1) The minimum investment required to invest in the Global 3 Class units is $5,000. For ease of comparability, $1,000 will be deemed to be the assumed selling price per unit of a Global 3 Class unit, and, as described above, a Legacy 1 Class unit, a Legacy 2 Class unit and a Global 1 Class unit, and a Global 2 Class unit, for purposes of the breakeven analysis.
(2) Reflects incentive fees payable to Amplitude, EMC, ETC, Winton, Transtrend, QIM, Sunrise, Alder, Denali, Lynx, and Quantica assuming they manage between 5% and 20% of invested assets and assuming each of the advisors have equivalent performance returns for the 12-month period. Actual incentive fees are calculated quarterly or semi-annually on the basis of each trading advisor’s individual performance, not the overall performance of Grant Park or the Global 3 Class units. Because incentive fees payable to certain of these trading
advisors are calculated on the basis of trading profits realized on the assets they manage after deduction for the allocable portion of only certain expenses charged to Grant Park, these advisors would receive an incentive fee before Grant Park has recouped all expenses and reaches the “break-even” level. Incentive fees payable to certain other of these trading advisors are calculated after deduction for the allocable portion of expenses charged to Grant Park. These advisors would not receive an incentive fee before Grant Park has recouped all expenses.
(3) The brokerage charge is paid to the general partner on a monthly basis. Effective the initial closing date, the brokerage charge for the Global 3 Class units equals 0.5375% per month, a rate of 6.45% annually, of such units’ month-end adjusted net assets. Out of this amount, the general partner pays all clearing, execution and give-up, floor brokerage, exchange and NFA fees, any other transaction costs, selling agent compensation, selling agent service fees and consulting fees to the trading advisors. The general partner retains the balance as payment for its services to Grant Park. Bid-ask spreads on Grant Park’s forward and other non-exchange traded contracts are not included in this breakeven table due to the difficulty of determining those spreads.
(4) Grant Park is responsible for ongoing operating expenses, up to an amount not to exceed 0.25% of Grant Park’s average net assets per year. This amount is used for purposes of this breakeven analysis.
(5) Grant Park’s organization and offering expenses are paid by the general partner and then reimbursed to the general partner by Grant Park. To pay this reimbursement, effective the initial closing date, Global 3 Class units are assessed at an annual rate of 30 basis points (0.30%) of adjusted net assets, calculated and payable monthly on the basis of month-end adjusted net assets of the applicable class.
(6) Grant Park earns interest on free cash balances held in its futures trading accounts. Interest is estimated for these purposes at a rate of 0. 50% per year.
(7) Global 3 Class limited partners are prohibited from redeeming such units for three months following the subscription for units. Thereafter, Global 3 Class limited partners causing redemption of their units on or before the one-year anniversary of their subscription for the redeemed units will pay an early redemption fee of 1.5%, 1.0% or 0.5% of the net asset value of the redeemed units, depending on when the units are redeemed during the first year. For purposes of this breakeven analysis, the early redemption fee has been presented as an average of the three different early redemption fees to approximate the effect a payment of an early redemption fee would have on a redemption of Global 3 Class units at an undetermined point during the first year of investment. Because the early redemption fee has been averaged and the other fees and expenses shown assume an investment in Grant Park for one year, the breakeven analysis does not reflect the actual amount required to “break-even” for Global 3 Class units that are redeemed prior to the one-year anniversary of the investment, which will vary depending on the date of redemption.
This supplement revises and replaces the first and second paragraphs on page 8-9 of the Prospectus under the heading “SUMMARY—The Trading Advisors” in its entirety as follows:
As of January 1, 2013, Grant Park trades through its eleven independent professional commodity trading advisors: Rabar Market Research, Inc., EMC Capital Management, Inc., Eckhardt Trading Company (or ETC), Winton Capital Management Limited, Transtrend B.V., Quantitative Investment Management LLC (or QIM), Sunrise Capital Partners, LLC, Amplitude Capital International Limited, Alder Capital Limited, Denali Asset Management, LLLP, and Lynx Asset Management AB. Effective February 1, 2013, Quantica Capital AG will begin trading for Grant Park. Each of the trading advisors is registered as a commodity trading advisor under the Commodity Exchange Act and is a member of the NFA. The general partner may terminate or replace any or all of the trading advisors, or add additional trading advisors, at any time in its sole discretion.
Rabar Market Research, Inc. is located at 10 Bank Street, Suite 830, White Plains, New York 10606, and its telephone number is (914) 682-8363. EMC Capital Management, Inc. is located at 2201 Waukegan Road, Suite 240 West, Bannockburn, Illinois 60015, and its telephone number is (847) 267-8700. ETC is located at 1314 North Dearborn Parkway, Carriage House, Chicago, Illinois 60610, and its telephone number is (312) 787-1107. Winton Capital Management Limited is located at 1-5 St. Mary Abbott’s Place, London, W8 6LS, United Kingdom, and its
telephone number is +44-20-7610-5350. The business office of Transtrend B.V. is located at Weena 723, Unit C5.070, 3013 AM Rotterdam, The Netherlands and its telephone number is +31-10-453-6500. QIM is located at 401 East Market Street, Suite 104, Charlottesville, Virginia 22902, and its telephone number is (434) 817-4800. Sunrise Capital Partners, LLC is located at 12544 High Bluff Drive, Suite 400, San Diego, California 92130, and its telephone number is (858) 259-8911. Amplitude Capital International Limited is located at Grand Pavilion Commercial Centre, 1st Floor, 802 West Bay Road, P.O. Box 31855, KY1 1207 Cayman Islands, and its telephone number is (345) 943-2295. Alder Capital Limited is located at 61 Merrion Square, Dublin 2, Ireland, and its telephone number is +353-1-614-7232. Denali Asset Management, LLLP is located at 5020 Anchor Way, 2nd Floor, Christiansted, Virgin Islands 00826-4633, and its telephone number is (340) 778-7744. Lynx Asset Management AB is located at Norrmalmstorg 12, Box 7060, Stockholm, Sweden, SE-103 86 and its telephone number is +46-8-663-3360. Quantica Capital AG is located at Freier Platz 10, Schaffhausen, CH-8200, Switzerland, and its telephone number is +41-52-630-00-70.
This supplement revises and replaces the paragraph titled, “Incentive Fees,” on page 11 of the Prospectus under the heading “SUMMARY—Fees and Expenses—Incentive Fees” in its entirety as follows:
Incentive Fees—Grant Park currently pays each trading advisor a quarterly or semi-annual incentive fee based on any new trading profits achieved on the trading advisor’s allocated net assets at the end of each calendar quarter or semi-annual period. Generally, new trading profits means the net increase in trading profits, realized and unrealized, experienced by the trading advisor on its allocated net assets from the most recent prior period in which an incentive fee was paid to the trading advisor, or if an incentive fee has yet to be paid to that trading advisor, the trading advisor’s initial allocation of net assets. Currently, the incentive fees payable to each of Grant Park’s trading advisors are as follows: 20.0% to Rabar, 22.5% to EMC, 24.0% to ETC, 20.0% to Winton, 22.5% to Transtrend, 26.0% to QIM, 23.5% to Amplitude, 22.0% to Alder, 24.0% to Denali, 20.0% to Sunrise, 23.0% to Lynx, and effective February 1, 2013, the incentive fees payable to Quantica are 20.0%. The method of calculating new trading profits on the allocated net assets of each trading advisor is described in “FEES AND EXPENSES—Fees and Expenses Paid by Grant Park—Incentive Fees.”
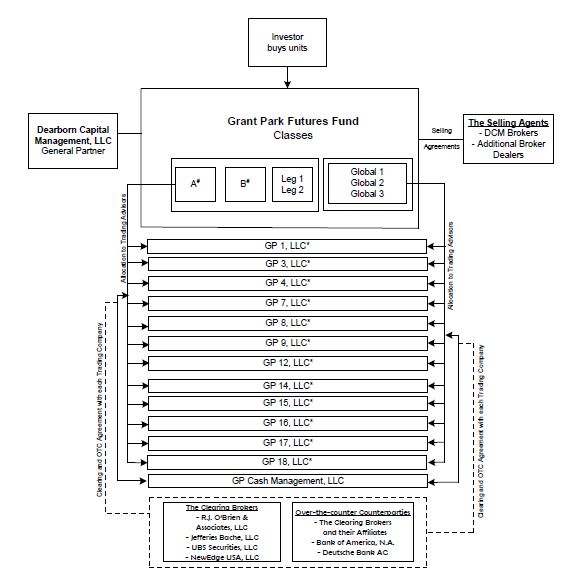
This supplement revises and replaces the chart included on page 19 of the Prospectus under the heading “SUMMARY—Organizational Chart” in its entirety as follows:
Notes:
# Classes A and B are closed to new investment. These classes are no longer offered by the Selling Agents.
* Grant Park invests through an individual trading company for each trading advisor. An Advisory Agreement is entered by each trading advisor, its corresponding trading company, Dearborn Capital Management, L.L.C., as general partner, and, in the case of some trading advisors, Grant Park.
RISK FACTORS
This supplement revises and replaces the first paragraph on page 30 of the Prospectus under the heading “RISK FACTORS—Operating Risks—The general partner places significant reliance on the trading advisors and their key personnel.” in its entirety as follows:
The general partner relies on the trading advisors to achieve trading gains for Grant Park, allocating to each of them responsibility for, and discretion over, trading of their allocated portions of Grant Park’s assets. The trading advisors, in turn, are dependent on the services of a limited number of persons to develop and refine their trading approaches and strategies and execute Grant Park’s transactions. The loss of the services of any trading advisor’s principals or key employees, or the failure of those principals or key employees to function effectively as a team, may have an adverse effect on that trading advisor’s ability to manage its trading activities successfully or may cause the trading advisor to cease operations entirely, either of which, in turn, could negatively impact Grant Park’s performance. Each of Grant Park’s trading advisors is controlled, directly or indirectly, by one or more individuals, or, in the case of Transtrend, of which 100% of the voting interest is owned by Robeco Netherlands BV, by its managing directors. These individuals are: Paul Rabar at Rabar, Elizabeth Cheval at EMC, William Eckhardt at ETC, David Winton Harding at Winton, Johannes P.A. van den Broek and Harold M. De Boer at Transtrend, Jaffrey Woodriff, Michael Geismar and Ryan Vaughan at QIM, Dr. Gary B. Davis at Sunrise, Karsten Schroeder at Amplitude, Mark Caslin at Alder, Scott T. Ramsey at Denali, Jonas Bengtsson, Svante Bergstrom, and Martin Sandquist at Lynx, and Dr. Bruno Gmuer at Quantica. The death, incapacity or other prolonged unavailability of such individuals likely would greatly hinder these trading advisors’ operations, and could result in their ceasing operations entirely, which could adversely affect the value of your investment in Grant Park.
THE TRADING ADVISORS
This supplement revises and replaces the first five paragraphs and the chart on pages 40-41 of the Prospectus under the heading “THE TRADING ADVISORS” in its entirety as follows:
As of January 1, 2013, the general partner has retained Rabar Market Research, Inc., EMC Capital Management, Inc., Eckhardt Trading Company, or ETC, Transtrend B.V., Quantitative Investment Management LLC, or QIM, Winton Capital Management Limited, Sunrise Capital Partners, LLC, Amplitude Capital International Limited, Alder Capital Limited, Denali Asset Management, LLLP, Lynx Asset Management AB, and effective February 1, 2013, Quantica Capital AG as Grant Park’s trading advisors. The table below illustrates the trading advisors for each class of Grant Park’s outstanding limited partnership units:
| | | | | | | | | | | | | |
| Class A | X | X | X | X | X | X | X | | X | X | X | X |
| Class B | X | X | X | X | X | X | X | | X | X | X | X |
| Legacy 1 | X | X | X | X | X | X | X | | X | X | X | X |
| Legacy 2 | X | X | X | X | X | X | X | | X | X | X | X |
| Global 1 | X | X | X | X | X | X | X | X | X | X | X | X |
| Global 2 | X | X | X | X | X | X | X | X | X | X | X | X |
| Global 3 | X | X | X | X | X | X | X | X | X | X | X | X |
The trading advisors and their respective asset allocations with respect to the Legacy 1 Class and the Legacy 2 Class units are the same as with respect to the Class A and Class B units. As of January 1, 2013, with respect to the Class A and Class B units and the Legacy 1 Class and Legacy 2 Class, each of Amplitude, Transtrend, Winton, Rabar, EMC, ETC, QIM, Sunrise, Alder, Denali, and Lynx manage between 5% to 20% of Grant Park’s net assets.
As of January 1, 2013, for the Global 1 Class, Global 2 Class and Global 3 Class units, between 5% to 20% of Grant Park’s assets are allocated to each of Rabar, EMC, ETC, Winton, Transtrend, QIM, Sunrise, Amplitude, Alder, Denali, Lynx, and effective February 1, 2013, Quantica.
The general partner may, in its sole discretion, reallocate assets among the trading advisors upon termination of a trading advisor or retention of any new trading advisors, or at the commencement of any month. Consequently, the allocation for all classes of units is subject to change.
Rabar and EMC have been trading on behalf of Grant Park since January 1989 and ETC has been trading on behalf of Grant Park since April 1998. Winton began trading for Grant Park on August 1, 2004. Transtrend began trading on July 1, 2008, QIM began trading for Grant Park on October 1, 2008. As of January 1, 2010, Sunrise began trading for Grant Park and as of February 1, 2010, Amplitude began trading on behalf of Grant Park. Alder and Denali each began trading for Grant Park on February 1, 2011. As of November 1, 2012, Lynx began trading on behalf of Grant Park. Effective February 1, 2013, Quantica will begin trading for Grant Park. The general partner may, in its sole discretion, reallocate assets among the trading advisors upon termination of a trading advisor or retention of any new trading advisors, or at the commencement of any month. Consequently, the current apportionment is subject to change.
This supplement revises and replaces the ten paragraphs on pages 47 and 48 of the Prospectus under the heading “THE TRADING ADVISORS-Winton Capital Management Limited-Management” in its entirety as follows:
Management
The listed principals for Winton are David Winton Harding, Amal Osman Ali Murgian, Martin John Hunt, Anthony Daniell, Matthew D. Beddall, Rajeev Patel, Tony Fenner-Leitao, Jeremy Dawson, and Nicola Malhotra.
David Winton Harding founded Winton Capital Management Limited in February 1997, and is the firm’s managing director. Mr. Harding ultimately oversees all critical functions performed at Winton. Mr. Harding graduated from Cambridge University with a first class honors degree in 1982. Mr. Harding became a listed principal and associated person of Winton in January 1998.
Amal Osman Ali Murgian was appointed a non-executive director of Winton Capital Management in July 2011. Ms. Amal Murgian does not take part in any trading or operational activities of Winton. Ms. Amal Murgian has a beneficial interest of more than 10% of Winton’s share capital. This interest is held by Samur Jersey Ltd. and Amur Jersey., both of which are investment holding companies ultimately owned by Ms. Amal Murgian’s family foundation. Ms. Amal Murgian has an MBA from the University of San Francisco in international finance and a B.S. in business administration and economics from Pepperdine University. Ms. Amal Murgian became a listed principal of Winton in August 2011.
Martin John Hunt is a founding director of the firm. Mr. Hunt supervises the trading operations and has responsibility for the firm’s regulatory compliance and finance. Mr. Hunt became a listed principal and associated person of Winton in January 1998.
Anthony Hamilton Daniell joined Winton in October 2004 and became a director in October 2006. Mr. Daniell is responsible for supervising Winton’s sales and marketing team. Mr. Daniell became an associated person and listed principal of Winton in April 2005 and October 2006, respectively.
Matthew Beddall was appointed to the main Board of Directors at Winton in December 2008. He was appointed Chief Investment Officer in December 2008. Mr. Beddall joined Winton as a researcher in July 2001. As CIO, Mr. Beddall’s responsibilities are principally focused on managing the investment process behind the Winton Futures Fund and overseeing a large section of the research department. Mr. Beddall is extensively involved in all aspects of Winton’s research process and has led the development of much of the software that underlies the design and running of Winton’s trading strategy. Mr. Beddall received a first class honors degree in mathematics and computer science from Southampton University. Mr. Beddall also has an M.Sc. in applied statistics from Birkbeck College, University of London. Mr. Beddall became a listed principal of Winton in January 2009. He became registered as an associated person of Winton in February 2009.
Rajeev Patel joined Winton in April 1997 as a trader and became Director of Trading and Operations in June 2009 and Winton’s Chief Operating Officer in November 2010. Mr. Patel is responsible for overseeing all aspects of trading and is responsible for operations software development, fund accounting and settlements. Mr. Patel holds a degree in economics and business administration from Trinity and All Saints College, Leeds. Mr. Patel became registered as an associated person and listed principal of Winton effective May 1998 and June 2009, respectively.
Tony Fenner-Leitao is the deputy Chief Executive Officer of Winton. He was appointed to this position in October 2012, after joining Winton in June 2008 and working in business development. Between March 2008 and May 2008, Mr. Fenner-Leitao was on sabbatical. Prior to joining Winton, Mr. Fenner-Leitao served as the Chief Financial Officer at TIMWE, a telecom company based in Portugal, between February 2007 and February 2008. Mr. Fenner-Leitao became a listed principal of Winton effective November 2012 and registered as an associated person of Winton in July 2008.
Jeremy Dawson is the Chief Financial Officer of Winton. He was appointed to this position when he joined Winton in January 2011. Prior to joining Winton, Mr. Dawson was employed by PricewaterhouseCoopers, serving as an Assurance Director between July 2003 and January 2011. Mr. Dawson became a listed principal of Winton effective December 2012.
Nicola Malhotra is the Chief Risk and Compliance Officer of Winton. She was appointed to this position in July 2011, after joining the firm in June 2007 as Risk Manager. Ms. Malhotra is responsible for the oversight of Winton’s Risk Management and Compliance department. Ms. Malhotra became a listed principal of Winton effective December 2012.
This supplement inserts the following paragraphs on page 62 in the Prospectus under the heading “The Trading Advisors” immediately following the last paragraph under the heading “Denali Asset Management, LLLP—Denali’s Trading Program”:
Quantica Capital AG
Quantica Capital AG, a Swiss stock company, provides systematic and quantitative investment advisory and management services to institutional and other qualified investors since its inception in May 2003. Quantica became registered as a commodity trading advisor in November 2012 and has been a member of the NFA since November 2012. Quantica’s offices are located at Freier Platz 10, Schaffhausen, CH-8200, Switzerland. The firm’s telephone number is +41-52-630-0070.
The listed principal of Quantica is Thomas Looser. Dr. Bruno Gmuer, Isak Ahlbom and Patrick Wirth are principals of Quantica who are currently pending CFTC listing and NFA registration.
Thomas Looser serves as the Head of Operations at Quantica Capital and was appointed to this position when he joined the firm in February 2009. Prior to joining Quantica, Mr. Looser served as a math teacher at Kantonsschule Schaffhausen, a public secondary school, between August 2008 and January 2009. Between June 2005 and August 2008, Mr. Looser served as the Deputy Head of Product Development at the Bank Vontobel. He has been listed as a principal of Quantica and a registered member of the NFA since November 2012.
Dr. Bruno Gmuer serves as the Chief Executive Officer and Chief Investment Officer at Quantica, and has maintained these positions since he founded Quantica in May 2003. Dr. Gmuer’s registration as a listed principal of Quantica is currently pending.
Isak Ahlbom serves as the Head of Business Development at Quantica and was appointed to this position when he joined the firm in November 2012. Prior to joining Quantica, Mr. Ahlbom was a Portfolio Manager at Harcourt Investment Consulting, a consulting firm specializing in alternative investments for institutional investors, between April 2010 and November 2012. He took a sabbatical during the month of March 2010. Between July 2007 and February 2010, Mr. Ahlbom served as a Portfolio Manager at UBS Global Asset Management, a large-scale asset management division of UBS. Mr. Ahlbom’s registration as a listed principal of Quantica is currently pending.
Patrick Wirth serves as the Head of Portfolio Management at Quantica Capital and was appointed to this position when he joined the firm in January 2009. Prior to joining Quantica, Mr. Wirth served as a Senior Quantitative Analyst at VP Bank Switzerland between December 2008 and September 2012. Between September 2008 and November 2008, Mr. Wirth took a sabbatical after serving as a Senior Quantitative Analyst at Julius Baer Private Bank from June 2006 until August 2008. Mr. Wirth’s registration as a listed principal of Quantica is currently pending.
Quantica’s Trading Program
Quantica will use its trading program, the Managed Futures Program, in managing assets for Grant Park.
The Quantica Managed Futures (QMF) program is a systematic investment strategy that aims to detect and take advantage of trend-following market inefficiencies in a diversified, liquid investment universe including more than 60+ Futures and FX Forward instruments. The investment universe is globally diversified and includes exchange traded Futures contracts within the Equity Index, Bonds, Interest Rates, Commodities, and FX markets, as well as OTC Currency Forwards. The QMF program’s objective is to generate long-term capital growth while maintaining strict risk controls and to produce investment returns that are largely independent of traditional asset classes such as stocks and bonds. Investment and Risk management processes are systematic and purely price driven. Neither fundamental nor other external data that price movements are used as inputs for the program. Quantica’s proprietary real-time risk management systems are value-at-risk based and an integral part of the investment process. Leverage may be utilized in connection with trading the investment program and the use of such is not restricted. The QMF program generates a rule based, fully systematic model portfolio. Portfolio managers are responsible to keep the actual traded portfolio in any account in line with the model portfolio by executing necessary trades. The trade identification process is fully rule based with respect to tracking error (portfolio level) and significance of a gap trade (risk of a gap trade relative to the overall portfolio risk, marginal tracking error reduction and risk of gape trades per asset class). Tracking error between the different accounts is being considered and kept on a minimal level.
Execution of trades is performed electronically or via trading desks. The execution methodology is founded on the basis of highest possible liquidity and lowest possible slippage. Quantica does not trade any illiquid or difficult to price or trade instruments including: options, single name stocks, or exchange traded futures contracts with limited liquidity. In order to achieve this, the best execution method is applied. When best execution is not possible should a sudden drought in liquidity occur, methods (similar to but not exclusively) like TWAP (Time-Weighted-Average-Price) or VWAP (Volume-Weighted-Average-Price) are targeted. The responsible portfolio manager is continuously monitoring open orders through direct market access. Under normal market
conditions, no open orders are kept in the market overnight, and Futures contracts are executed through Bloomberg Tradebook. Should this system not be functioning, a back-up electronic trading system is with the Deutsche Bank Autobahn trading platform. Should this system not be functioning, then there is direct access to the execution desk at the clearing broker of the accounts. OTC Currency Forwards are electronically executed with Deutsche Bank Autobahn trading platform. Should this system not be functioning, then there is direct access to the execution desk at the clearing broker of the accounts. An audit trail of orders and fills is maintained.
This supplement revises and replaces the table on page 64 of the Prospectus captioned “PERFORMANCE OF GRANT PARK—CLASS A UNITS” in its entirety as follows:
PERFORMANCE OF GRANT PARK - CLASS A UNITS
(Unaudited)
As required by CFTC regulations, the past performance record of Grant Park’s Class A units for the last five full calendar years and the first ten months of 2012 is presented below. While the performance record set forth in the table below has not been independently audited, the General Partner believes that the information presented is accurate. All performance information is shown net of fees and expenses.
| Name | Grant Park Futures Fund Limited Partnership (Class A units) |
| Type | Privately offered (through February 2003); Publicly offered beginning June 30, 2003; Multi-advisor |
| Inception of Trading | January 1989 |
| Aggregate Gross Subscriptions at 10/31/2012 | $147,153,661 |
| Net Asset Value at 10/31/2012 | $ 35,838,416 |
Worst Monthly Percentage Draw-Down (Since 1/07)(1) | -7.95% 01/10 |
Worst Peak-to-Valley Draw-Down (Since 1/07)(2) | -22.44% (Start of 01/09 - End of 10/12 ) |
| | | Rate of Return(3) | |
| | | 2012 | | | 2011 | | | 2010 | | | 2009 | | | 2008 | | | 2007 | |
| | | | | | | | | | | | | | | | | | | |
January | | | 0.00 | % | | | -0.52 | % | | | -7.95 | % | | | -0.91 | % | | | 2.49 | % | | | 1.25 | % |
| February | | | 0.80 | % | | | 2.26 | % | | | 0.63 | % | | | -0.80 | % | | | 9.66 | % | | | -4.18 | % |
March | | | -2.21 | % | | | -2.48 | % | | | 4.08 | % | | | -3.26 | % | | | -0.63 | % | | | -4.55 | % |
April | | | 0.00 | % | | | 3.79 | % | | | 1.80 | % | | | -1.73 | % | | | -0.13 | % | | | 5.23 | % |
May | | | 6.19 | % | | | -6.93 | % | | | -3.83 | % | | | 1.64 | % | | | 2.11 | % | | | 4.60 | % |
June | | | -4.88 | % | | | -3.79 | % | | | -0.21 | % | | | -3.41 | % | | | 3.06 | % | | | 4.16 | % |
| July . | | | 3.56 | % | | | 3.02 | % | | | -1.66 | % | | | -1.26 | % | | | -5.06 | % | | | -3.72 | % |
August | | | -1.30 | % | | | -1.81 | % | | | 2.77 | % | | | 1.15 | % | | | -2.41 | % | | | -3.71 | % |
September | | | -2.13 | % | | | -1.64 | % | | | 3.24 | % | | | 1.17 | % | | | 1.31 | % | | | 8.78 | % |
October | | | -5.64 | % | | | -4.51 | % | | | 4.33 | % | | | -2.59 | % | | | 4.76 | % | | | 5.23 | % |
November | | | --- | | | | -0.57 | % | | | -2.58 | % | | | 4.24 | % | | | 2.76 | % | | | -0.66 | % |
December | | | --- | | | | -0.05 | % | | | 4.57 | % | | | -3.57 | % | | | 1.08 | % | | | 0.63 | % |
Year | | | -6.02 | % | | | -12.95 | % | | | 4.45 | % | | | -9.23 | % | | | 19.91 | % | | | 12.63 | % |
______________________________
(1) Worst Monthly Percentage Draw-Down is the largest monthly loss experienced by Grant Park in any calendar month expressed as a percentage of total equity in Grant Park and includes the month and year of that draw-down.
(2) Worst Peak-to-Valley Draw-Down is the greatest cumulative percentage decline in month-end net asset value of Grant Park due to losses sustained by Grant Park during a period in which the initial month-end net asset value of Grant Park is not equaled or exceeded by a subsequent month-end net asset value of Grant Park and includes the time period in which the draw-down occurred.
(3) The monthly rate of return is computed by dividing monthly performance by beginning monthly equity plus additions less redemptions. The monthly rates are then compounded to arrive at the annual rate of return.
PAST PERFORMANCE IS NOT NECESSARILY INDICATIVE OF FUTURE RESULTS
This supplement revises and replaces the table on page 65 of the Prospectus captioned “PERFORMANCE OF GRANT PARK—CLASS B UNITS” in its entirety as follows:
PERFORMANCE OF GRANT PARK - CLASS B UNITS
(Unaudited)
As required by CFTC regulations, the past performance record of Grant Park’s Class B units for the last five full calendar years and the first ten months of 2012 is presented below. While the performance record set forth in the table below has not been independently audited, the General Partner believes that the information presented is accurate. All performance information is shown net of fees and expenses.
| Name | Grant Park Futures Fund Limited Partnership (Class B units) |
| Type | Public; Multi-advisor |
| Inception of Trading | August 2003 |
| Aggregate Gross Subscriptions at 10/31/2012 | $ 872,734,726 |
| Net Asset Value at 10/31/2012 | $ 347,586,155 |
Worst Monthly Percentage Draw-Down(1) (Since 1/07) | -8.00% 01/10 |
Worst Peak-to-Valley Draw-Down(2) (Since 1/07) | -24.38% (Start of 01/09 - End of 10/12 ) |
| | | Rate of Return(3) | |
| | | 2012 | | | 2011 | | | 2010 | | | 2009 | | | 2008 | | | 2007 | |
| | | | | | | | | | | | | | | | | | | |
January | | | -0.06 | % | | | -0.58 | % | | | -8.00 | % | | | -0.98 | % | | | 2.42 | % | | | 1.18 | % |
| February | | | 0.75 | % | | | 2.20 | % | | | 0.57 | % | | | -0.88 | % | | | 9.58 | % | | | -4.25 | % |
March | | | -2.27 | % | | | -2.53 | % | | | 4.03 | % | | | -3.33 | % | | | -0.70 | % | | | -4.62 | % |
April | | | -0.05 | % | | | 3.74 | % | | | 1.74 | % | | | -1.78 | % | | | -0.20 | % | | | 5.15 | % |
May | | | 6.13 | % | | | -6.98 | % | | | -3.88 | % | | | 1.58 | % | | | 2.03 | % | | | 4.52 | % |
June | | | -4.93 | % | | | -3.84 | % | | | -0.27 | % | | | -3.46 | % | | | 2.99 | % | | | 4.09 | % |
| July | | | 3.51 | % | | | 2.96 | % | | | -1.71 | % | | | -1.32 | % | | | -5.12 | % | | | -3.79 | % |
August | | | -1.36 | % | | | -1.86 | % | | | 2.71 | % | | | 1.09 | % | | | -2.48 | % | | | -3.78 | % |
September | | | -2.19 | % | | | -1.69 | % | | | 3.21 | % | | | 1.12 | % | | | 1.24 | % | | | 8.70 | % |
October | | | -5.69 | % | | | -4.57 | % | | | 4.27 | % | | | -2.64 | % | | | 4.69 | % | | | 5.16 | % |
November | | | --- | | | | -0.62 | % | | | -2.63 | % | | | 4.19 | % | | | 2.69 | % | | | -0.73 | % |
December | | | --- | | | | -0.11 | % | | | 4.52 | % | | | -3.63 | % | | | 1.01 | % | | | 0.64 | % |
Year | | | -6.53 | % | | | -13.52 | % | | | 3.80 | % | | | -9.87 | % | | | 18.88 | % | | | 11.76 | % |
______________________________
(1) Worst Monthly Percentage Draw-Down is the largest monthly loss experienced by Grant Park in any calendar month expressed as a percentage of total equity in Grant Park and includes the month and year of that draw-down.
(2) Worst Peak-to-Valley Draw-Down is the greatest cumulative percentage decline in month-end net asset value of Grant Park due to losses sustained by Grant Park during a period in which the initial month-end net asset value of Grant Park is not equaled or exceeded by a subsequent month-end net asset value of Grant Park and includes the time period in which the draw-down occurred.
(3) The monthly rate of return is computed by dividing monthly performance by beginning monthly equity plus additions less redemptions. The monthly rates are then compounded to arrive at the annual rate of return.
PAST PERFORMANCE IS NOT NECESSARILY INDICATIVE OF FUTURE RESULTS
This supplement revises and replaces the table on page 66 of the Prospectus captioned “PERFORMANCE OF GRANT PARK—LEGACY 1 UNITS” in its entirety as follows:
PERFORMANCE OF GRANT PARK - Legacy 1 Units
(Unaudited)
As required by CFTC regulations, the past performance record of Grant Park’s Legacy 1 Class units from April 1, 2009 through October 31, 2012, is presented below. While the performance record set forth in the table below has not been independently audited, the general partner believes that the information presented is accurate. All performance information is shown net of fees and expenses.
| Name | Grant Park Futures Fund Limited Partnership (Legacy 1 Class) |
| Type | Public |
| Inception of Trading | April 2009 |
| Aggregate Gross Subscriptions at 10/31/2012 | $ 8,338,177 |
| Net Asset Value at 10/31/2012 | $ 5,204,604 |
Worst Monthly Percentage Draw-Down (Since April 2009)(1) | -7.77% 01/10 |
Worst Peak-to-Valley Draw-Down (Since April 2009)(2) | -17.71% (Start of 05/11 - End of 10/12 ) |
| | | Rate of Return(3) | |
| | | 2012 | | | 2011 | | | 2010 | | | 2009 | |
| | | | | | | | | | | | | |
| | | | | | | | | | | | | | | | | |
| January | | | 0.18 | % | | | -0.35 | % | | | -7.77 | % | | | --- | |
| February | | | 1.00 | % | | | 2.37 | % | | | 0.82 | % | | | --- | |
| March | | | -2.03 | % | | | -2.21 | % | | | 4.15 | % | | | --- | |
| April | | | 0.18 | % | | | 3.84 | % | | | 1.77 | % | | | -1.59 | % |
| May | | | 6.24 | % | | | -6.63 | % | | | -3.53 | % | | | 1.66 | % |
| June | | | -4.57 | % | | | -3.62 | % | | | -0.03 | % | | | -3.10 | % |
| July | | | 3.73 | % | | | 3.23 | % | | | -1.50 | % | | | -1.08 | % |
| August | | | -1.10 | % | | | -1.62 | % | | | 2.86 | % | | | 1.27 | % |
| September | | | -1.93 | % | | | -1.47 | % | | | 3.24 | % | | | 1.21 | % |
| October | | | -5.45 | % | | | -4.34 | % | | | 4.35 | % | | | -2.42 | % |
| November | | | --- | | | | -0.40 | % | | | -2.32 | % | | | 4.04 | % |
| December | | | --- | | | | 0.14 | % | | | 4.67 | % | | | -3.19 | % |
| Year | | | -4.22 | % | | | -11.00 | % | | | 6.09 | % | | | -3.39 | % |
______________________________
(1) Worst Monthly Percentage Draw-Down is the largest monthly loss experienced by Grant Park in any calendar month expressed as a percentage of total equity in Grant Park and includes the month and year of that draw-down.
(2) Worst Peak-to-Valley Draw-Down is the greatest cumulative percentage decline in month-end net asset value of Grant Park due to losses sustained by Grant Park during a period in which the initial month-end net asset value of Grant Park is not equaled or exceeded by a subsequent month-end net asset value of Grant Park and includes the time period in which the draw-down occurred.
(3) The monthly rate of return is computed by dividing monthly performance by beginning monthly equity plus additions less redemptions. The monthly rates are then compounded to arrive at the annual rate of return.
PAST PERFORMANCE IS NOT NECESSARILY INDICATIVE OF FUTURE RESULTS
This supplement revises and replaces the table on page 67 of the Prospectus captioned “PERFORMANCE OF GRANT PARK—LEGACY 2 UNITS” in its entirety as follows:
PERFORMANCE OF GRANT PARK - Legacy 2 Units
(Unaudited)
As required by CFTC regulations, the past performance record of Grant Park’s Legacy 2 Class units from April 1, 2009 through October 31, 2012, is presented below. While the performance record set forth in the table below has not been independently audited, the general partner believes that the information presented is accurate. All performance information is shown net of fees and expenses.
| Name | Grant Park Futures Fund Limited Partnership (Legacy 2 Class) |
| Type | Public |
| Inception of Trading | April 2009 |
| Aggregate Gross Subscriptions at 10/31/2012 | $ 20,110,845 |
| Net Asset Value at 10/31/2012 | $ 12,398,546 |
Worst Monthly Percentage Draw-Down (Since April 2009)(1) | -7.79% 01/10 |
Worst Peak-to-Valley Draw-Down (Since April 2009)(2) | -18.22% (Start of 05/11 - End of 10/12) |
| | | Rate of Return(3) | |
| | | 2012 | | | 2011 | | | 2010 | | | 2009 | |
| | | | | | | | | | | | | |
| January | | | 0.17 | % | | | -0.37 | % | | | -7.79 | % | | | --- | |
| February | | | 0.98 | % | | | 2.33 | % | | | 0.80 | % | | | --- | |
| March | | | -2.04 | % | | | -2.22 | % | | | 4.13 | % | | | --- | |
| April | | | 0.16 | % | | | 3.77 | % | | | 1.72 | % | | | -1.61 | % |
| May | | | 6.16 | % | | | -6.63 | % | | | -3.53 | % | | | 1.62 | % |
| June | | | -4.60 | % | | | -3.66 | % | | | -0.05 | % | | | -3.12 | % |
| July | | | 3.71 | % | | | 3.18 | % | | | -1.52 | % | | | -1.09 | % |
| August | | | -1.12 | % | | | -1.69 | % | | | 2.82 | % | | | 1.26 | % |
| September | | | -1.94 | % | | | -1.57 | % | | | 3.20 | % | | | 1.21 | % |
| October | | | -5.47 | % | | | -4.40 | % | | | 4.31 | % | | | -2.44 | % |
| November | | | --- | | | | -0.42 | % | | | -2.34 | % | | | 4.04 | % |
| December | | | --- | | | | 0.12 | % | | | 4.62 | % | | | -3.22 | % |
| Year | | | -4.48 | % | | | -11.45 | % | | | 5.73 | % | | | -3.55 | % |
______________________________
(1) Worst Monthly Percentage Draw-Down is the largest monthly loss experienced by Grant Park in any calendar month expressed as a percentage of total equity in Grant Park and includes the month and year of that draw-down.
(2) Worst Peak-to-Valley Draw-Down is the greatest cumulative percentage decline in month-end net asset value of Grant Park due to losses sustained by Grant Park during a period in which the initial month-end net asset value of Grant Park is not equaled or exceeded by a subsequent month-end net asset value of Grant Park and includes the time period in which the draw-down occurred.
(3) The monthly rate of return is computed by dividing monthly performance by beginning monthly equity plus additions less redemptions. The monthly rates are then compounded to arrive at the annual rate of return.
PAST PERFORMANCE IS NOT NECESSARILY INDICATIVE OF FUTURE RESULTS
This supplement revises and replaces the table on page 68 of the Prospectus captioned “PERFORMANCE OF GRANT PARK—GLOBAL 1 UNITS” in its entirety as follows:
PERFORMANCE OF GRANT PARK - Global 1 Units
(Unaudited)
As required by CFTC regulations, the past performance record of Grant Park’s Global 1 Class units from April 1, 2009 through October 31, 2012 is presented below. While the performance record set forth in the table
below has not been independently audited, the general partner believes that the information presented is accurate. All performance information is shown net of fees and expenses.
| Name | Grant Park Futures Fund Limited Partnership (Global 1 Class) |
| Type | Public |
| Inception of Trading | April 2009 |
| Aggregate Gross Subscriptions at 10/31/2012 | $ 21,012,424 |
| Net Asset Value at 10/31/2012 | $ 12,083,450 |
Worst Monthly Percentage Draw-Down (Since April 2009)(1) | -7.80% 01/10 |
Worst Peak-to-Valley Draw-Down (Since April 2009)(2) | -17.17% (Start of 06/09 - End of 10/12 ) |
| | | Rate of Return(3) | |
| | | 2012 | | | 2011 | | | 2010 | | | 2009 | |
| | | | | | | | | | | | | |
| January | | | 0.39 | % | | | -0.74 | % | | | -7.80 | % | | | --- | |
| February | | | 0.96 | % | | | 2.00 | % | | | 0.71 | % | | | --- | |
| March | | | -1.97 | % | | | -1.85 | % | | | 3.65 | % | | | --- | |
| April | | | 0.27 | % | | | 2.92 | % | | | 1.52 | % | | | -0.28 | % |
| May | | | 6.32 | % | | | -6.49 | % | | | -2.21 | % | | | 2.02 | % |
| June | | | -4.59 | % | | | -3.33 | % | | | 0.29 | % | | | -3.21 | % |
| July | | | 3.85 | % | | | 3.09 | % | | | -2.51 | % | | | -1.26 | % |
| August | | | -1.15 | % | | | -1.25 | % | | | 2.71 | % | | | 1.11 | % |
| September | | | -1.85 | % | | | -1.34 | % | | | 1.97 | % | | | 1.18 | % |
| October | | | -5.36 | % | | | -4.01 | % | | | 3.70 | % | | | -3.22 | % |
| November | | | --- | | | | -0.39 | % | | | -2.13 | % | | | 3.75 | % |
| December | | | --- | | | | 0.06 | % | | | 3.59 | % | | | -4.21 | % |
| Year | | | -3.62 | % | | | -11.18 | % | | | 2.88 | % | | | -4.32 | % |
______________________________
(1) Worst Monthly Percentage Draw-Down is the largest monthly loss experienced by Grant Park in any calendar month expressed as a percentage of total equity in Grant Park and includes the month and year of that draw-down.
(2) Worst Peak-to-Valley Draw-Down is the greatest cumulative percentage decline in month-end net asset value of Grant Park due to losses sustained by Grant Park during a period in which the initial month-end net asset value of Grant Park is not equaled or exceeded by a subsequent month-end net asset value of Grant Park and includes the time period in which the draw-down occurred.
(3) The monthly rate of return is computed by dividing monthly performance by beginning monthly equity plus additions less redemptions. The monthly rates are then compounded to arrive at the annual rate of return.
PAST PERFORMANCE IS NOT NECESSARILY INDICATIVE OF FUTURE RESULTS
This supplement revises and replaces the table on page 69 of the Prospectus captioned “PERFORMANCE OF GRANT PARK—GLOBAL 2 UNITS” in its entirety as follows:
PERFORMANCE OF GRANT PARK - Global 2 Units
(Unaudited)
As required by CFTC regulations, the past performance record of Grant Park’s Global 2 Class units from April 1, 2009 through October 31, 2012, is presented below. While the performance record set forth in the table below has not been independently audited, the general partner believes that the information presented is accurate. All performance information is shown net of fees and expenses.
| Name | Grant Park Futures Fund Limited Partnership (Global 2 Class) |
| Type | Public |
| Inception of Trading | April 2009 |
| Aggregate Gross Subscriptions at 10/31/2012 | $ 38,996,269 |
| Net Asset Value at 10/31/2012 | $ 26,357,253 |
Worst Monthly Percentage Draw-Down (Since April 2009)(1) | -7.82% 01/10 |
Worst Peak-to-Valley Draw-Down (Since April 2009)(2) | -18.06% (Start of 06/09 - End of 10/12) |
| | | Rate of Return(3) | |
| | | 2012 | | | 2011 | | | 2010 | | | 2009 | |
| | | | | | | | | | | | | |
| January | | | 0.37 | % | | | -0.76 | % | | | -7.82 | % | | | --- | |
| February | | | 0.94 | % | | | 1.99 | % | | | 0.69 | % | | | --- | |
| March | | | -1.99 | % | | | -1.89 | % | | | 3.56 | % | | | --- | |
| April | | | 0.25 | % | | | 2.91 | % | | | 1.50 | % | | | -0.30 | % |
| May | | | 6.27 | % | | | -6.53 | % | | | -2.24 | % | | | 1.97 | % |
| June | | | -4.59 | % | | | -3.36 | % | | | 0.29 | % | | | -3.24 | % |
| July | | | 3.80 | % | | | 3.07 | % | | | -2.53 | % | | | -1.28 | % |
| August | | | -1.16 | % | | | -1.28 | % | | | 2.70 | % | | | 1.09 | % |
| September | | | -1.85 | % | | | -1.36 | % | | | 1.94 | % | | | 1.10 | % |
| October | | | -5.38 | % | | | -4.03 | % | | | 3.68 | % | | | -3.24 | % |
| November | | | --- | | | | -0.41 | % | | | -2.15 | % | | | 3.61 | % |
| December | | | --- | | | | 0.04 | % | | | 3.56 | % | | | -4.17 | % |
| Year | | | -3.83 | % | | | -11.43 | % | | | 2.56 | % | | | -4.64 | % |
(1) Worst Monthly Percentage Draw-Down is the largest monthly loss experienced by Grant Park in any calendar month expressed as a percentage of total equity in Grant Park and includes the month and year of that draw-down.
(2) Worst Peak-to-Valley Draw-Down is the greatest cumulative percentage decline in month-end net asset value of Grant Park due to losses sustained by Grant Park during a period in which the initial month-end net asset value of Grant Park is not equaled or exceeded by a subsequent month-end net asset value of Grant Park and includes the time period in which the draw-down occurred.
(3) The monthly rate of return is computed by dividing monthly performance by beginning monthly equity plus additions less redemptions. The monthly rates are then compounded to arrive at the annual rate of return.
PAST PERFORMANCE IS NOT NECESSARILY INDICATIVE OF FUTURE RESULT
This supplement revises and replaces the table on page 70 of the Prospectus captioned “PERFORMANCE OF GRANT PARK—GLOBAL 3 UNITS” in its entirety as follows:
PERFORMANCE OF GRANT PARK - Global 3 Units
(Unaudited)
As required by CFTC regulations, the past performance record of Grant Park’s Global 3 Class units from April 1, 2009 through October 31, 2012 is presented below. While the performance record set forth in the table below has not been independently audited, the general partner believes that the information presented is accurate. All performance information is shown net of fees and expenses.
| Name | Grant Park Futures Fund Limited Partnership (Global 3 Class) |
| Type | Public |
| Inception of Trading | April 2009 |
| Aggregate Gross Subscriptions at 10/31/2012 | $ 313,471,492 |
| Net Asset Value at 10/31/2012 | $ 217,511,634 |
Worst Monthly Percentage Draw-Down (Since April 2009)(1) | -7.95% 01/10 |
Worst Peak-to-Valley Draw-Down (Since April 2009)(2) | -23.02% (Start of 06/09 - End of 10/12) |
| | | Rate of Return(3) | |
| | | 2012 | | | 2011 | | | 2010 | | | 2009 | |
| | | | | | | | | | | | | |
| January | | | 0.22 | % | | | -0.91 | % | | | -7.95 | % | | | --- | |
| February | | | 0.79 | % | | | 1.76 | % | | | 0.54 | % | | | --- | |
| March | | | -2.13 | % | | | -2.01 | % | | | 3.40 | % | | | --- | |
| April | | | 0.10 | % | | | 2.75 | % | | | 1.33 | % | | | -0.44 | % |
| May | | | 6.16 | % | | | -6.67 | % | | | -2.38 | % | | | 1.77 | % |
| June | | | -4.73 | % | | | -3.50 | % | | | 0.10 | % | | | -3.49 | % |
| July | | | 3.66 | % | | | 2.92 | % | | | -2.67 | % | | | -1.43 | % |
| August | | | -1.31 | % | | | -1.43 | % | | | 2.54 | % | | | 0.94 | % |
| September | | | -2.00 | % | | | -1.52 | % | | | 1.79 | % | | | 0.96 | % |
| October | | | -5.52 | % | | | -4.17 | % | | | 3.51 | % | | | -3.38 | % |
| November | | | --- | | | | -0.56 | % | | | -2.28 | % | | | 3.52 | % |
| December | | | --- | | | | -0.11 | % | | | 3.40 | % | | | -4.36 | % |
| Year | | | -5.19 | % | | | -13.05 | % | | | 0.68 | % | | | -6.04 | % |
| (1) | Worst Monthly Percentage Draw-Down is the largest monthly loss experienced by Grant Park in any calendar month expressed as a percentage of total equity in Grant Park and includes the month and year of that draw-down. |
| (2) | Worst Peak-to-Valley Draw-Down is the greatest cumulative percentage decline in month-end net asset value of Grant Park due to losses sustained by Grant Park during a period in which the initial month-end net asset value of Grant Park is not equaled or exceeded by a subsequent month-end net asset value of Grant Park and includes the time period in which the draw-down occurred. |
| (3) | The monthly rate of return is computed by dividing monthly performance by beginning monthly equity plus additions less redemptions. The monthly rates are then compounded to arrive at the annual rate of return. |
PAST PERFORMANCE IS NOT NECESSARILY INDICATIVE OF FUTURE RESULTS
MANAGEMENT’S DISCUSSION AND ANALYSIS OF FINANCIAL CONDITION AND RESULTS OF OPERATIONS
This supplement revises and replaces the third paragraph on page 71 of the Prospectus under the heading “MANAGEMENT’S DISCUSSION AND ANALYSIS OF FINANCIAL CONDITION AND RESULTS OF OPERATIONS—Organization of Grant Park” in its entirety as follows:
Grant Park invests through the trading companies with independent professional commodity trading advisors retained by the general partner. As of January 1, 2013, Rabar, EMC, ETC, Winton, Transtrend, QIM, Sunrise, Amplitude, Alder, Denali, and Lynx serve as Grant Park’s commodity trading advisors. Each of the trading advisors is registered as a commodity trading advisor under the Commodity Exchange Act and is a member of the NFA. As of January 1, 2013, the general partner allocated Grant Park’s net assets through the respective trading companies among Rabar, EMC, ETC, Winton, Transtrend, QIM, Sunrise, Amplitude, Alder, Denali, Lynx, and effective February 1, 2013, Quantica. No more than 20% of Grant Park’s assets are allocated to any one trading company and in turn, any one trading advisor. The general partner may terminate or replace the trading advisors or retain additional trading advisors in its sole discretion.
FEES AND EXPENSES
This supplement revises and replaces the first three paragraphs on pages 92-94 of the Prospectus under the heading “FEES AND EXPENSES—Fees and Expenses Paid by Grant Park—Incentive Fees” in its entirety as follows:
Grant Park pays each trading advisor a quarterly or semi-annual incentive fee based on any new trading profits achieved on the trading advisor’s allocated net assets at the end of each calendar period. Generally, new trading profits means the net increase in trading profits, realized and unrealized, experienced by the trading advisor on its allocated net assets from the most recent prior period in which an incentive fee was paid to the trading advisor, or if an incentive fee has yet to be paid to that trading advisor, the trading advisor’s initial allocation of net assets. Currently, the incentive fees payable to each of Grant Park’s trading advisors are as follows: 20.0% to Rabar, 22.5% to EMC, 24.0% to ETC, 20.0% to Winton, 22.5% to Transtrend, 26.0% to QIM, 23.5% to Amplitude, 22.0% to Alder, 24.0% to Denali, 20.0% to Sunrise, 23.0% to Lynx, and effective February 1, 2013, the incentive fees payable to Quantica are 20.0%.
Calculation of New Trading Profits. New trading profits are calculated with respect to each trading advisor’s allocated net assets. Allocated net assets means that portion of the net assets of each class of Grant Park allocated to the trading advisor by the general partner through the trading company and subject to the trading advisor’s discretion (including any notional funds), together with any appreciation or depreciation in such allocated net assets. New trading profits are calculated on a high water mark basis, as described in the paragraph below. For a definition of net assets, please see “LIMITED PARTNERSHIP AGREEMENT — Nature of Classes and Determination of Net Asset Value.”
New trading profits on the allocated net assets of each trading advisor are calculated as the sum of (1) the net of any profits (excluding interest income) and losses realized on all trades closed out during the period of such allocated net assets, plus (2) the net of any unrealized profits and losses on open positions as of the end of such period on such allocated net assets, minus (3)(A) the net of any unrealized profits or losses on open positions as of the end of the preceding period on such allocated net assets, (B) all expenses (except the incentive fee payable to the trading advisor, if any, for the current period and applicable state taxes) attributable to such allocated net assets incurred or accrued during such period, including, without limitation, the brokerage charge and Grant Park’s ongoing expenses, and (C) cumulative net realized or unrealized trading losses on such allocated net assets (reduced by a proportionate share of realized and unrealized trading losses on such allocated net assets attributable to redeemed units or reallocated amounts as of any redemption or reallocation date), if any, carried forward from all preceding periods since the last period for which an incentive fee was payable to the trading advisor. The general partner may, however, in its sole discretion, adjust the computation of new trading profits on the allocated net assets of any trading advisor to exclude or include all or a portion of particular expenses for purposes of calculating that trading advisor’s incentive fee. In the case of ETC, Winton, Transtrend, QIM, Sunrise, Amplitude, Alder, Denali, Lynx, and effective February 1, 2013, Quantica, only certain allocated expenses of Grant Park are included for the purpose of calculating such trading advisor’s incentive fee, while for EMC and Rabar, all allocated expenses of Grant Park are included.
This supplement revises and replaces the first paragraph on pages 97 of the Prospectus under the heading “FEES AND EXPENSES—Fees and Expenses Paid by the General Partner—Trading Advisor Consulting Fees” in its entirety as follows:
Each trading advisor receives a consulting fee, payable by the general partner not Grant Park, ranging from 0% to 2% per year, computed and accrued monthly on the basis of the trading advisors allocated net assets either at the beginning of the month or at month-end and paid, depending on the trading advisor, either monthly or quarterly. As of January 1, 2013, the consulting fees payable to each of Grant Park’s trading advisors are as follows: Between 0.0% and 2.0% to Rabar, 1.5% to EMC, 1.0% to ETC, 1.0% to Winton, 1.5% to Transtrend, 0.25% to QIM, 1.0% to Sunrise, 1.5% to Amplitude, 1.0% to Alder, 1.0% to Denali, 0.5% to Lynx, and effective February 1, 2013, 1.0% to Quantica. No advisor fees are payable with respect to certain advisors.
GRANT PARK FUTURES FUND LIMITED PARTNERSHIP NOTES TO CONSOLIDATED FINANCIAL STATEMENTS
This supplement revises and replaces the first paragraph on pages 131-132 of the Prospectus under the heading “GRANT PARK FUTURES FUND LIMITED PARTNERSHIP NOTES TO CONSOLIDATED FINANCIAL STATEMENTS—NOTE 4. COMMODITY TRADING ADVISORS” in its entirety as follows:
The Partnership, through the Trading Companies, allocates assets to the commodity trading advisors. Each Trading Company has entered into an advisory contract with its own Advisor. As of January 1, 2013, the commodity trading advisors are Rabar Market Research, Inc., EMC Capital Management, Inc., Eckhardt Trading Co., Winton Capital Management Limited, Transtrend B.V., Quantitative Investment Management LLC, Sunrise Capital Partners, LLC, Amplitude Capital International Limited, Alder Capital Limited, Denali Asset Management, LLLP, Lynx Asset Management AB, and effective February 1, 2013, Quantica Capital AG (collectively, the ‘‘Advisors’’). The Advisors are paid a consulting fee, either monthly or quarterly, ranging from 0 percent to 2 percent per annum of the Partnership’s month-end allocated net assets and a quarterly or semi-annual incentive fee ranging from 20 percent to 26 percent of the new trading profits on the allocated net assets of the Advisor.
GRANT PARK FUTURES FUND LIMITED PARTNERSHIP NOTES TO CONSOLIDATED FINANCIAL CONDITION
This supplement revises and replaces the first paragraph on pages 148 of the Prospectus under the heading “GRANT PARK FUTURES FUND LIMITED PARTNERSHIP NOTES TO CONSOLIDATED FINANCIAL CONDITION—NOTE 5. COMMODITY TRADING ADVISORS” in its entirety as follows:
Grant Park, through the Trading Companies, allocates assets to the commodity trading advisors. Each Trading Company has entered into an advisory contract with its own Advisor. As of January 1, 2013, the commodity trading advisors are Rabar Market Research, Inc., EMC Capital Management, Inc., Eckhardt Trading Co., Winton Capital Management, Transtrend B.V., Quantitative Investment Management LLC, Sunrise Capital Partners, LLC, Amplitude Capital International Limited, Alder Capital Limited, Denali Asset Management, LLLP, Lynx Asset Management AB, and effective February 1, 2013, Quantica Capital AG (collectively, the ‘‘Advisors’’). The Advisors are paid a quarterly management fee ranging from 0 percent to 2 percent per annum of Grant Park’s month-end allocated net assets and a quarterly or semi-annual incentive fee ranging from 20 percent to 26 percent of the new trading profits on the allocated net assets of the Advisor.
POTENTIAL ADVANTAGES OF INVESTMENT
This supplement revises and replaces the first paragraph on page 170 of the Prospectus under the heading “POTENTIAL ADVANTAGES OF INVESTMENT—Professional Trading” in its entirety as follows:
As of January 1, 2013, Grant Park’s trading decisions are made by Rabar Market Research, Inc., EMC Capital, Management, Inc., Eckhardt Trading Company, Winton Capital Management Limited, Transtrend B.V., Quantitative Investment Management LLC, Sunrise Capital Partners LLC, Amplitude Capital International Limited, Alder Capital Limited, Denali Asset Management, LLLP, Lynx Asset Management AB, and effective February 1, 2013, Quantica Capital AG. Each trading advisor uses its own proprietary trading program.
SUPPLEMENTAL PERFORMANCE INFORMATION
This supplement revises and replaces the chart on page 193 of the Prospectus titled, “SUPPLEMENTAL PERFORMANCE INFORMATION – Trading Advisor Overview” as follows:
SUPPLEMENTAL PERFORMANCE INFORMATION
Trading Advisor Overview
December 31, 2011
| | | Amplitude Capital International Ltd. | Denali Asset Management, LLLP | | | | | Quantitative Investment Management, LLC | | Sunrise Capital Partners, LLC | | Winton Capital Management Ltd |
| Firm Assets Under Management | $561.9M | $1,055.8M | $1,100.0M | $709.8M | $142.2M | $5,644.0M | $202.0M | $4,560.3M | $294.8M | $706.0M | $9,500.0M | $29,000.0M |
Program | Global 20 | Sinfonie | Global Macro Discretionary | Standard Plus | Classic | Lynx | Managed Futures | Global | Diversified | Expanded Diversified | Diversified Trend Program—Enhanced Risk (USD) | Diversified |
| Program Assets Under Management | $548.7M | $90.5M | $1,100.0M | $211.4M | $142.2M | $5,644.0M | $197.0M | $3,854.0M | $240.0M | $700.0M | $7,200.0M | $28,760.0M |
Program Inception | Feb-2001 | Sep-2009 | Jun-2000 | Oct-1991 | Jan-1985 | May-2000 | Jan-2005 | Dec-2001 | Jan-1989 | Jan-1989 | Jan-1995 | Oct-1997 |
| Began Trading for Grant Park | Feb-2011 | Apr-2010 | Feb-2011 | Jun-2007 | Jan-1989 | Nov-2012 | Jan-2013 | Oct-2008 | Jan-1989 | Jan-2010 | Jul-2008 | Aug-2004 |
| Margin/Equity Average | 9.10% | 15.19% | 2.16% | 8.32% | 13.00% | 14.10% | 7.20% | 8.00% | 9.18% | 8.70% | 15.00% | 6.20% |
| Roundturns per Million | 125 | 6000 | 1527 | 1382 | 2000 | 2000 | 450 | 1200 | 881 | 350 | 1350 | 661 |
| Approximate Number of Markets Traded | Pairs and Crosses using 7 currencies | 72 | 100 | 62 | 80 | 60 | 50 | 57 | 109 | 75 | 400 | 100+ |
| Number of Trading Systems | 1 | 2 | 0 | Multiple | 6 | 34 | Multiple | 1 | Multiple | Multiple | Multiple | Multiple |
| Time Horizon (average holding period) | 5 days | 2 Days | 1 – 5 days | 7 – 60+ days | 24 days | 5-6 weeks | Short to long term | 5 – 6 days | 38 days | 60 days | 1 month | Ranges from short- to long-term |
| Compounded Annual ROR Since Inception | 7.50% | −4.78% | 16.63% | 20.79% | 21.73% | 13.04% | 11.36% | 13.10% | 12.92% | 12.10% | 14.99% | 16.21% |
| Compounded Annual ROR Last 5 Years * | 5.20% | −4.78% | 9.07% | 8.90% | 6.95% | 9.50% | 8.52% | 9.91% | 10.50% | 5.70% | 8.07% | 10.62% |
| Worst Drawdown Period Since Inception | May-2003 to Aug-2004 | Oct-2009 to Aug-2011 | Sep-2003 to Nov-2003 | Dec-1991 to May-1992 | June-1995 to Ma-1996 | Jan- 2009 to Jan-2010 | June-2007 to Aug-2007 | Sep-2009 to Jun-2011 | Jun-1995 to Aug-1998 | Aug-1993 to Apr-1994 | Feb-2009 to Jan-2010 | Oct-2001 to Feb-2002 |
| Worst Drawdown Percentage Since Inception | −28.60% | −11.63% | −10.70% | −40.39% | −45.16% | −12.20% | −9.82% | −12.48% | −29.81% | −29.80% | −15.15% | −25.59% |
| Worst Drawdown Period Last 5 Years * | Apr-2008 to Aug-2008 | Oct-2009 to Aug-2011 | Jun-2007 to Aug-2007 | Apr-2011 to Dec-2011 | Jan-2009 to Feb-2010 | Jan- 2009 to Jan-2010 | June-2007 to Aug-2007 | Sep-2009 to Jun-2011 | May-2011 to Dec-2011 | Dec-2009 to Jul-2010 | Feb-2009 to Jan-2010 | Jan-2007 to Mar-2007 |
| Worst Drawdown Percentage Last 5 Years * | −15.84% | −11.63% | −5.50% | −24.81% | −24.56% | −12.20% | −9.82% | −12.48% | −19.33% | −20.67% | −15.15% | −9.65% |
| Annualized Standard Deviation Since Inception | 15.50% | 12.62% | 10.37% | 29.80% | 48.93% | 14.55% | 10.77% | 11.00% | 22.21% | 21.90% | 14.25% | 17.99% |
| Annualized Standard Deviation Last 5 Years * | 13.20% | 12.62% | 8.03% | 16.61% | 17.47% | 16.01% | 9.74% | 10.04% | 16.45% | 16.00% | 11.82% | 10.61% |
* 5 year period=1/2006 to 12/2011 or since inception for shorter track records.
Notes:
(1) The range and average of margin to equity ratio for Rabar is computed without giving effect to certain foreign currency contracts which are traded in the OTC foreign exchange markets. Depending upon the margin requirements imposed by the particular clearing firm, inclusion of these markets would likely increase the range and average of the margin to equity ratio, in some cases significantly.
This table and chart was prepared by Dearborn Capital Management, L.L.C.
based on unaudited information provided to Dearborn by each trading advisor.
See the glossary in Appendix E for definitions relevant to this table.
ALL PERFORMANCE REPORTED IS NET OF FEES AND EXPENSES.
PAST PERFORMANCE IS NOT INDICATIVE OF FUTURE RESULTS.