UNITED STATES
SECURITIES AND EXCHANGE COMMISSION
Washington, D.C. 20549
FORM N-CSR
CERTIFIED SHAREHOLDER REPORT OF REGISTERED MANAGEMENT INVESTMENT COMPANIES
| Investment Company Act file number: | 811-05770 |
| | |
| Exact name of registrant as specified in charter: | abrdn Emerging Markets Equity Income Fund, Inc. |
| | |
| Address of principal executive offices: | 1900 Market Street, Suite 200 |
| | Philadelphia, PA 19103 |
| | |
| Name and address of agent for service: | Ms. Andrea Melia |
| | abrdn Inc. |
| | 1900 Market Street, Suite 200 |
| | Philadelphia, PA 19103 |
| | |
| Registrant’s telephone number, including area code: | 800-522-5465 |
| | |
| Date of fiscal year end: | December 31 |
| | |
| Date of reporting period: | June 30, 2022 |
Item 1 - Reports to Stockholders.
(a) A copy of the report transmitted to shareholders pursuant to Rule 30e-1 under the Investment Company Act of 1940 (the “1940 Act”) is filed herewith.

Letter to Shareholders (unaudited)
Dear Shareholder,
We present this Semi-Annual Report which covers the activities of abrdn Emerging Markets Equity Income Fund, Inc. (the "Fund") for the six-month period ended June 30, 2022. The Fund's principal investment objective is to seek both current income and long-term capital appreciation.
Total Investment Return1
For the six-month period ended June 30, 2022, the total return to shareholders of the Fund based on the net asset value ("NAV") and market price of the Fund, respectively, compared to the Fund's benchmark are as follows:
| NAV2,3 | | | -25.8 | % |
| Market Price2 | | | -27.5 | % |
| MSCI Emerging Markets Index (Net)4 | | | -17.6 | % |
For more information about Fund performance, please visit the Fund on the web at www.abrdnaef.com. Here, you can view quarterly commentary on the Fund's performance, monthly fact sheets, distribution and performance information, and other Fund literature.
NAV, Market Price and Premium/Discount
The table below represents comparison from current six-month period end to prior fiscal year end of market price to NAV and associated premium(+)/discount(-).
| | | | NAV | | Closing
Market
Price | | Premium(+)/
Discount(-) |
| 6/30/2022 | | | $6.20 | | $5.52 | | -11.0% |
| 12/31/2021 | | | $8.70 | | $7.92 | | -9.0% |
Throughout the six-month period ended June 30, 2022, the Fund's NAV was within a range of $6.10 to $8.98 and the Fund's market price was within a range of $5.35 to $8.18 for the same time period. Throughout the six-month period ended June 30, 2022, the Fund's shares traded within a range of a premium(+)/discount(-) of -7.0% to -14.1%.
Distribution Policy
The Fund has a managed distribution policy of paying quarterly distributions at an annual rate, set once a year, as a percentage of the rolling average of the Fund's net asset values over the preceding three month period ending on the last day of the month immediately preceding the distribution's declaration date. In June 2022, the Board of Directors of the Fund (the "Board") determined the rolling distribution rate to be 6.5% for the 12-month period commencing with the distribution payable in June 2022. This policy will be subject to regular review by the Board.
The policy is expected to provide a steady and sustainable quarterly cash distribution to Fund shareholders that may help reduce any discount to NAV at which the Fund's shares trade. There is no assurance that the Fund will achieve these results.
The distributions will be made from net investment income generated by dividends paid from the Fund's underlying securities and return of capital. As net assets of the Fund may vary from quarter to quarter, the quarterly distribution may represent more or less than one quarter of 6.5% of the Fund's net assets at the time of distribution. Shareholders should not draw any conclusions about the Fund's investment performance from the amount of the distributions or the terms of the Fund's policy.
Credit Facility
On June 21, 2022, the Fund renewed its revolving credit facility for a 1-year period with The Bank of Nova Scotia with a committed facility
| 1 | Past performance is no guarantee of future results. Investment returns and principal value will fluctuate and shares, when sold, may be worth more or less than original cost. Current performance may be lower or higher than the performance quoted. Net asset value return data include investment management fees, custodial charges and administrative fees (such as Director and legal fees) and assumes the reinvestment of all distributions. |
| 2 | Assuming the reinvestment of all dividends and distributions. |
| 3 | The Fund's total return is based on the reported net asset value ("NAV") for each financial reporting period end and may differ from what is reported on the Financial Highlights due to financial statement rounding or adjustments. |
| 4 | The MSCI Emerging Markets Index (Net) captures large and mid-cap representation across 24 Emerging Markets (EM) countries. With 1,380 constituents, the index covers approximately 85% of the free float-adjusted market capitalization in each country. EM countries in the Index are: Brazil, Chile, China, Colombia, Czech Republic, Egypt, Greece, Hungary, India, Indonesia, Korea, Kuwait, Malaysia, Mexico, Peru, Philippines, Poland, Qatar, Saudi Arabia, South Africa, Taiwan, Thailand, Turkey and United Arab Emirates. The MSCI Emerging Markets Index (Net) is calculated net of withholding taxes to which the Fund is generally subject. The Index is unmanaged and has been provided for comparison purposes only. No fees or expenses are reflected. You cannot invest directly in an index. Index performance is not an indication of the performance of the Fund itself. For complete Fund performance, please visit http://www.abrdnaef.com. |
| abrdn Emerging Markets Equity Income Fund, Inc. | 1 |
Letter to Shareholders (unaudited) (continued)
of $65,000,000. The outstanding balance on the loan as of June 30, 2022 was $55,000,000. Under the terms of the loan facility and applicable regulations, the Fund is required to maintain certain asset coverage ratios for the amount of its outstanding borrowings. The Board regularly reviews the use of leverage by the Fund.
Open Market Repurchase Program
The Fund's policy is to consider buying back Fund shares on the open market when the Fund trades at a discount to the NAV that is above an established threshold and management believes such repurchases may enhance shareholder value. During the six-month period ended June 30, 2022 and fiscal year ended December 31, 2021, the Fund did not repurchase any shares.
Unclaimed Share Accounts
Please be advised that abandoned or unclaimed property laws for certain states require financial organizations to transfer (escheat) unclaimed property (including Fund shares) to the state. Each state has its own definition of unclaimed property, and Fund shares could be considered "unclaimed property" due to account inactivity (e.g., no owner-generated activity for a certain period), returned mail (e.g., when mail sent to a shareholder is returned to the Fund's transfer agent as undeliverable), or a combination of both. If your Fund shares are categorized as unclaimed, your financial advisor or the Fund's transfer agent will follow the applicable state's statutory requirements to contact you, but if unsuccessful, laws may require that the shares be escheated to the appropriate state. If this happens, you will have to contact the state to recover your property, which may involve time and expense. For more information on unclaimed property and how to maintain an active account, please contact your financial adviser or the Fund's transfer agent.
Portfolio Holdings Disclosure
The Fund's complete schedule of portfolio holdings for the second and fourth quarters of each fiscal year are included in the Fund's semi-annual and annual reports to shareholders. The Fund files its complete schedule of portfolio holdings with the Securities and Exchange Commission (the "SEC") for the first and third quarters of each fiscal year as an exhibit to its reports on Form N-PORT. These reports are available on the SEC's website at http://www.sec.gov. The Fund makes the information available to shareholders upon request and without charge by calling Investor Relations toll-free at 1-800-522-5465.
Proxy Voting
A description of the policies and procedures that the Fund uses to determine how to vote proxies relating to portfolio securities, and information regarding how the Fund voted proxies relating to portfolio securities during the most recent twelve months ended June 30 is
available by August 31 of the relevant year: (i) upon request and without charge by calling Investor Relations toll-free at 1-800-522-5465; and (ii) on the SEC's website at http://www.sec.gov.
COVID-19
The COVID-19 pandemic has caused major disruption to economies and markets around the world, including the United States. Financial markets have experienced losses and some sectors of the economy and individual issuers have experienced particularly large losses. Although many financial markets have generally recovered from such losses, market volatility has continued. These circumstances may continue for an extended period of time, and as a result may affect adversely the value and liquidity of the Fund's investments. The rapid development and fluidity of this situation precludes any prediction as to the ultimate adverse impact of COVID-19 on economic and market conditions, and, as a result, present uncertainty and risk with respect to the Fund and the performance of its investments and ability to pay distributions. The full extent of the impact and effects of COVID-19 will depend on future developments, including, among other factors, the duration and spread of the outbreak, along with related travel advisories, quarantines and restrictions, the recovery time of the disrupted supply chains and industries, the impact of labor market interruptions, the impact of government interventions, and uncertainty with respect to the duration of the global economic slowdown.
LIBOR
In July 2017, the head of the United Kingdom's Financial Conduct Authority ("FCA"), which regulates LIBOR, announced a desire to phase out the use of LIBOR by the end of 2021. However, subsequent announcements by the FCA, the LIBOR administrator and other regulators indicate that it is possible that the most widely used LIBOR rates may continue until mid-2023. It is anticipated that LIBOR ultimately will be discontinued or the regulator will announce that it is no longer sufficiently robust to be representative of its underlying market around that time. In connection with supervisory guidance from regulators, certain regulated entities will cease to enter into certain new LIBOR contracts after January 1, 2022. Although financial regulators and industry working groups have suggested alternative reference rates, such as European Interbank Offered Rate ("EURIBOR"), Sterling Overnight Interbank Average Rate ("SONIA") and Secured Overnight Financing Rate ("SOFR"), global consensus on alternative rates is lacking and the process for amending existing contracts or instruments to transition away from LIBOR remains unclear. The elimination of LIBOR or changes to other reference rates or any other changes or reforms to the determination or supervision
| 2 | abrdn Emerging Markets Equity Income Fund, Inc. | |
Letter to Shareholders (unaudited) (concluded)
of reference rates could have an adverse impact on the market for, or value of, any securities or payments linked to those reference rates, which may adversely affect the Fund's performance and/or net asset value. Uncertainty and risk also remain regarding the willingness and ability of issuers and lenders to include revised provisions in new and existing contracts or instruments. Consequently, the transition away from LIBOR to other reference rates may lead to increased volatility and illiquidity in markets that are tied to LIBOR, fluctuations in values of LIBOR-related investments or investments in issuers that utilize LIBOR, increased difficulty in borrowing or refinancing and diminished effectiveness of hedging strategies, adversely affecting the Fund's performance. Furthermore, the risks associated with the expected discontinuation of LIBOR and transition may be exacerbated if the work necessary to effect an orderly transition to an alternative reference rate is not completed in a timely manner.
abrdn Rebrand
abrdn plc, formerly known as Standard Life Aberdeen plc, was renamed on September 27, 2021. In connection with this re-branding, the entities within abrdn plc group, including investment advisory entities, have been or will be renamed in the near future. The Fund's Board approved a change in the name of the Fund from "Aberdeen Emerging Markets Equity Income Fund, Inc." to "abrdn Emerging Markets Equity Income Fund, Inc." effective June 30, 2022. The internet address for the Fund's website has also changed from www.aberdeenaef.com to www.abrdnaef.com, effective as of June 30, 2022. The old address will continue to redirect to the new address for at least a year.
Investor Relations Information
As part of abrdn's commitment to shareholders, we invite you to visit the Fund on the web at www.aberdeenaef.com. Here, you can view monthly fact sheets, quarterly commentary, distribution and performance information, and other Fund literature.
Enroll in abrdn's email services and be among the first to receive the latest closed-end fund news, announcements, videos and other information. In addition, you can receive electronic versions of important Fund documents including annual reports, semi-annual reports, prospectuses, and proxy statements. Sign up today at https://www.abrdn.com/en-us/cefinvestorcenter/contact-us/preferences.
Contact Us:
| • | Visit: https://www.abrdn.com/en-us/cefinvestorcenter; |
| • | Email: Investor.Relations@abrdn.com; or |
| • | Call: 1-800-522-5465 (toll-free in the U.S.). |
Yours sincerely,
/s/ Christian Pittard
Christian Pittard
President
All amounts are U.S. Dollars unless otherwise stated.
| abrdn Emerging Markets Equity Income Fund, Inc. | 3 |
Total Investment Return (unaudited)
The following table summarizes the average annual Fund total investment return compared to the Fund's primary benchmark and Custom Index (as defined below) for the 6-month (not annualized), 1-year, 3-year, 5-year and 10-year periods as of June 30, 2022.
| | | 6 Months | | 1 Year | | 3 Years | | 5 Years | | 10 Years |
| Net Asset Value (NAV) | | -25.8% | | -33.6% | | -4.4% | | 0.1% | | -0.5% |
| Market Price | | -27.5% | | -34.1% | | -4.2% | | 0.0% | | -0.8% |
| MSCI Emerging Markets Index (Net) | | -17.6% | | -25.3% | | 0.6% | | 2.2% | | 3.1% |
| Custom AEF Emerging Markets Index1 | | -17.6% | | -25.3% | | 0.6% | | 3.0% | | -0.5% |
Performance of a $10,000 Investment (as of June 30, 2022)
This graph shows the change in value of a hypothetical investment of $10,000 in the Fund for the period indicated. For comparison, the same investment is shown in the indicated index.
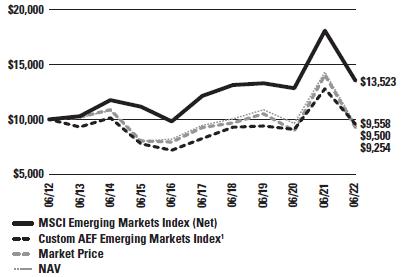
All performance information for the periods prior to April 30, 2018 are for the Aberdeen Latin American Equity Fund, Inc. ("LAQ"), the performance and accounting survivor of the reorganizations of seven closed-end funds into the Fund. Performance information for periods prior to April 30, 2018 do not reflect the Fund's current investment strategy. Returns prior to April 30, 2018 reflect the impact of any contractual waivers in effect for LAQ, without which performance would be lower. Effective April 30, 2018, Aberdeen Asset Managers Limited ("AAML" or the "Adviser"), the Fund's adviser, entered into an expense limitation agreement with the Fund that is effective through June 30, 2023. Without such waivers and limitation agreements, performance would be lower. abrdn Inc. has entered into an agreement with the Fund to limit investor relations services fees, without which performance would be lower if the Fund's investor services fees exceeded such limit during the relevant period. This agreement aligns with the term of the advisory agreement and may not be terminated prior to the end of the current term of the advisory agreement. See Note 3 in the Notes to Financial Statements. Returns represent past performance. Total investment return at NAV is based on changes in the NAV of Fund shares and assumes reinvestment of dividends and distributions, if any, at market prices pursuant to the dividend reinvestment program sponsored by the Fund's transfer agent. All return data at NAV includes fees charged to the Fund, which are listed in the Fund's Statement of Operations under "Expenses." Total investment return at market value is based on changes in the market price at which the Fund's shares traded on the NYSE American during the period and assumes reinvestment of dividends and distributions, if any, at market prices pursuant to the dividend reinvestment program sponsored by the Fund's transfer agent. The Fund's total investment return is based on the reported NAV on the financial reporting period ended June 30, 2022. Because the Fund's shares trade in the stock market based on investor demand, the Fund may trade at a price higher or lower than its NAV. Therefore, returns are calculated based on both market price and NAV. Performance information for periods prior to April 30, 2018 does not reflect the Fund's current strategy. Past performance is no guarantee of future results. The performance information provided does not reflect the deduction of taxes that a shareholder would pay on distributions received from the Fund. The current performance of the Fund may be lower or higher than the figures shown. The Fund's yield, return, market price and NAV will fluctuate. Performance information current to the most recent month-end is available at www.abrdnaef.com or by calling 800-522-5465.
The annualized total operating expense ratio, excluding fee waivers/recoupment, based on the six-month period ended June 30, 2022, was 1.38%. The annualized total operating expense ratio, net of fee waivers/recoupment, based on the six-month period ended June 30, 2022, was 1.38%. The annualized total operating expenses, excluding taxes and interest and revolving credit facility expenses, net of fee waivers/recoupment based on the six-month period ended June 30, 2022, was 1.20%.
| 1 | The Custom Index reflects the returns of the MSCI Emerging Markets Latin America Index (Net) for periods prior to April 27, 2018 and the returns of the MSCI Emerging Markets Index (Net) for periods subsequent to April 30, 2018. The indices and time periods for the Custom Index align with the strategies utilized and benchmark for the Fund during the same time periods. |
| 4 | abrdn Emerging Markets Equity Income Fund, Inc. | |
Portfolio Summary (as a percentage of net assets) (unaudited)
The following table summarizes the sector composition of the Fund's portfolio, in S&P Global Inc.'s Global Industry Classification Standard ("GICS") Sectors.
| Sectors | | |
| Information Technology | | 29.7% |
| Financials | | 24.3% |
| Consumer Discretionary | | 16.6% |
| Materials | | 12.2% |
| Industrials | | 10.0% |
| Communication Services | | 9.3% |
| Consumer Staples | | 7.2% |
| Real Estate | | 2.1% |
| Utilities | | 2.0% |
| Energy | | 1.7% |
| Health Care | | 1.6% |
| Private Equity | | 0.1% |
| Short-Term Investment | | 0.6% |
| Liabilities in Excess of Other Assets | | (17.4)% |
| | | 100.0% |
| * | The sectors, as classified by GICS, are comprised of several industries. As of June 30, 2022, the Fund did not have more than 25% of its assets invested in any industry. As of June 30, 2022, the Fund's holdings in the Information Technology sector were allocated to five industries: Semiconductors & Semiconductor Equipment (12.6%), Technology Hardware, Storage Peripherals (7.3%), Information Technology Services (5.4%), Electronic Equipment Instruments & Components (3.2%) and Software (1.2%). |
The following chart summarizes the composition of the Fund's portfolio by geographic classification.
| Geographic Region | | |
| China | | 38.8% |
| India | | 16.2% |
| Taiwan | | 12.6% |
| South Korea | | 10.4% |
| Mexico | | 6.5% |
| Brazil | | 6.3% |
| Hong Kong | | 5.2% |
| South Africa | | 3.6% |
| Indonesia | | 3.3% |
| Thailand | | 3.0% |
| Vietnam | | 2.4% |
| Other, less than 2% each | | 9.1% |
| Liabilities in Excess of Other Assets | | (17.4)% |
| | | 100.0% |
| abrdn Emerging Markets Equity Income Fund, Inc. | 5 |
Portfolio Summary (as a percentage of net assets) (unaudited) (concluded)
| Currency Composition | | |
| Hong Kong Dollar | | 29.0%* |
| Indian Rupee | | 16.2% |
| Chinese Yuan Renminbi | | 15.0% |
| New Taiwan Dollar | | 12.1% |
| South Korean Won | | 10.4% |
| United States Dollar | | 6.5% |
| South African Rand | | 6.7% |
| Brazilian Real | | 5.6% |
| Mexican Peso | | 4.4% |
| Indonesian Rupiah | | 3.3% |
| Thai Baht | | 3.0% |
| Viet Nam Dong | | 2.5% |
| Euro Currency | | 1.6% |
| Polish Zloty | | 0.5% |
| Short-Term Investments | | 0.6% |
| Other Liabilities | | (17.4)% |
| | | 100.0% |
| * | Includes 2.2% H Shares which are Chinese issued securities that trade in Hong Kong dollar |
| Top Ten Holdings | | |
| Taiwan Semiconductor Manufacturing Co. Ltd. | | 8.3% |
| Tencent Holdings Ltd. | | 7.6% |
| Samsung Electronics Co. Ltd., Pref | | 7.4% |
| Alibaba Group Holding Ltd. | | 5.5% |
| Housing Development Finance Corp. Ltd. | | 2.9% |
| JD.com, Inc. | | 2.6% |
| Grupo Mexico SAB de CV, Class B | | 2.4% |
| China Merchants Bank Co. Ltd., H Shares | | 2.2% |
| LONGi Green Energy Technology Co. Ltd., A Shares | | 2.2% |
| Bank Rakyat Indonesia Persero Tbk PT | | 2.1% |
| 6 | abrdn Emerging Markets Equity Income Fund, Inc. | |
Portfolio of Investments (unaudited)
As of June 30, 2022
| Shares | | Description | | Industry and Percentage
of Net Assets | | Value
(US$) | |
| LONG-TERM INVESTMENTS—116.8% | |
| COMMON STOCKS—107.4% | |
| ARGENTINA—0.8% | |
| 13,993 | | Globant SA(a) | | Information Technology Services—0.8% | | $ | 2,434,782 | |
| AUSTRALIA—1.5% | |
| 167,316 | | BHP Group Ltd. | | Metals & Mining—1.5% | | | 4,637,541 | |
| AUSTRIA—1.7% | |
| 298,130 | | Mondi PLC | | Paper & Forest Products—1.7% | | | 5,297,686 | |
| BRAZIL—6.3% | |
| 1,549,575 | | B3 SA—Brasil Bolsa Balcao | | Capital Markets—1.1% | | | 3,245,152 | |
| 1,621,559 | | Banco Bradesco SA | | Banks—1.4% | | | 4,455,573 | |
| 3,493 | | MercadoLibre, Inc.(a) | | Internet & Direct Marketing Retail—0.7% | | | 2,224,587 | |
| 909,270 | | Raia Drogasil SA | | Food & Staples Retailing—1.1% | | | 3,335,846 | |
| 853,550 | | Rumo SA | | Road & Rail—0.8% | | | 2,604,629 | |
| 445,100 | | TOTVS SA | | Software—0.6% | | | 1,978,241 | |
| 367,500 | | WEG SA | | Electrical Equipment—0.6% | | | 1,857,355 | |
| | | | 19,701,383 | |
| CHILE—1.0% | |
| 202,528 | | Banco Santander Chile, ADR | | Banks—1.0% | | | 3,299,181 | |
| CHINA—38.8% | |
| 1,207,600 | | Alibaba Group Holding Ltd.(a) | | Internet & Direct Marketing Retail—5.5% | | | 17,226,875 | |
| 545,000 | | Centre Testing International Group Co. Ltd., A Shares (Stock Connect)(b) | |
Professional Services—0.6% | | | 1,893,470 | |
| 1,034,500 | | China Merchants Bank Co. Ltd., H Shares | | Banks—2.2% | | | 6,987,448 | |
| 1,015,500 | | China Resources Land Ltd. | | Real Estate Management & Development—1.5% | | | 4,761,969 | |
| 155,000 | | China Tourism Group Duty Free Corp. Ltd., A Shares (Stock Connect)(b) | | Specialty Retail—1.7% | | | 5,403,719 | |
| 816,799 | | Estun Automation Co. Ltd., A Shares(b) | | Machinery—1.0% | | | 2,999,124 | |
| 298,168 | | Foshan Haitian Flavouring & Food Co Ltd., A Shares(b) | | Food Products—1.3% | | | 4,035,698 | |
| 258,411 | | JD.com, Inc. | | Internet & Direct Marketing Retail—2.6% | | | 8,326,781 | |
| 14,497 | | Kweichow Moutai Co. Ltd., A Shares (Stock Connect)(b) | | Beverages—1.4% | | | 4,433,939 | |
| 683,564 | | LONGi Green Energy Technology Co. Ltd., A Shares(b) | | Semiconductors & Semiconductor Equipment—2.2% | | | 6,836,779 | |
| 555,486 | | Midea Group Co. Ltd., A Shares (Stock Connect)(b) | | Household Durables—1.6% | | | 5,027,736 | |
| 1,626,043 | | NARI Technology Co. Ltd., A Shares (Stock Connect)(b) | | Electrical Equipment—2.1% | | | 6,579,690 | |
| 287,600 | | Shenzhou International Group Holdings Ltd. | | Textiles, Apparel & Luxury Goods—1.1% | | | 3,510,332 | |
| 253,300 | | Sungrow Power Supply Co. Ltd., A Shares | | | | | | |
| | | (Stock Connect)(b) | | Electrical Equipment—1.2% | | | 3,729,510 | |
| 529,600 | | Tencent Holdings Ltd. | | Interactive Media & Services—7.6% | | | 23,972,412 | |
| 547,500 | | Wuxi Biologics Cayman, Inc.(a)(c) | | Life Sciences Tools & Services—1.6% | | | 5,072,817 | |
| 620,328 | | Yonyou Network Technology Co. Ltd., A Shares(b) | | Software—0.6% | | | 2,018,801 | |
| 113,868 | | Yunnan Energy New Material Co. Ltd., A Shares | | | | | | |
| | | (Stock Connect)(b) | | Chemicals—1.4% | | | 4,268,969 | |
| 716,000 | | Zhongsheng Group Holdings Ltd. | | Specialty Retail—1.6% | | | 5,058,942 | |
| | | | 122,145,011 | |
| HONG KONG—5.2% | |
| 513,800 | | AIA Group Ltd. | | Insurance—1.8% | | | 5,614,069 | |
| 112,232 | | Hong Kong Exchanges & Clearing Ltd. | | Capital Markets—1.7% | | | 5,550,572 | |
| 13,748,000 | | Pacific Basin Shipping Ltd. | | Marine—1.7% | | | 5,285,495 | |
| | | | 16,450,136 | |
| abrdn Emerging Markets Equity Income Fund, Inc. | 7 |
Portfolio of Investments (unaudited) (continued)
As of June 30, 2022
| Shares | | Description | | Industry and Percentage
of Net Assets | | Value
(US$) | |
| LONG-TERM INVESTMENTS (continued) | |
| COMMON STOCKS (continued) | |
| INDIA—16.2% | |
| 117,600 | | Godrej Properties Ltd.(a) | | Real Estate Management & Development—0.6% | | $ | 1,763,765 | |
| 178,290 | | Hindustan Unilever Ltd. | | Personal Products—1.6% | | | 5,031,125 | |
| 335,758 | | Housing Development Finance Corp. Ltd. | | Thrifts & Mortgage Finance—2.9% | | | 9,217,641 | |
| 43,000 | | Info Edge India Ltd. | | Interactive Media & Services—0.7% | | | 2,070,813 | |
| 276,000 | | Infosys Ltd. | | Information Technology Services—1.6% | | | 5,121,457 | |
| 200,206 | | Kotak Mahindra Bank Ltd. | | Banks—1.3% | | | 4,226,402 | |
| 42,467 | | Maruti Suzuki India Ltd. | | Automobiles—1.4% | | | 4,559,787 | |
| 2,286,303 | | Power Grid Corp. of India Ltd. | | Electric Utilities—2.0% | | | 6,137,088 | |
| 430,283 | | SBI Life Insurance Co. Ltd.(c) | | Insurance—1.9% | | | 5,871,727 | |
| 87,141 | | Tata Consultancy Services Ltd. | | Information Technology Services—1.1% | | | 3,615,815 | |
| 48,369 | | UltraTech Cement Ltd. | | Construction Materials—1.1% | | | 3,412,260 | |
| | | | 51,027,880 | |
| INDONESIA—3.3% | |
| 4,925,300 | | Bank Central Asia Tbk PT | | Banks—0.8% | | | 2,398,324 | |
| 23,671,586 | | Bank Rakyat Indonesia Persero Tbk PT | | Banks—2.1% | | | 6,610,658 | |
| 37,027,200 | | Sepatu Bata Tbk PT(a)(f) | | Textiles, Apparel & Luxury Goods—0.4% | | | 1,280,014 | |
| | | | 10,288,996 | |
| KAZAKHSTAN—0.7% | |
| 45,057 | | Kaspi.KZ JSC., GDR(c) | | Consumer Finance—0.7% | | | 2,050,093 | |
| MEXICO—6.5% | |
| 59,990 | | Fomento Economico Mexicano SAB de CV, ADR | | Beverages—1.3% | | | 4,048,725 | |
| 55,318 | | Grupo Aeroportuario del Centro Norte SAB de CV | | Transportation Infrastructure—0.9% | | | 2,833,388 | |
| 1,086,804 | | Grupo Financiero Banorte SAB de CV, Class O | | Banks—1.9% | | | 6,074,580 | |
| 1,832,644 | | Grupo Mexico SAB de CV, Class B | | Metals & Mining—2.4% | | | 7,637,878 | |
| | | | 20,594,571 | |
| NETHERLANDS—1.6% | |
| 8,821 | | ASM International NV | | Semiconductors & Semiconductor Equipment—0.7% | | | 2,194,728 | |
| 6,170 | | ASML Holding NV | | Semiconductors & Semiconductor Equipment—0.9% | | | 2,914,942 | |
| | | | 5,109,670 | |
| PERU—0.6% | |
| 15,157 | | Credicorp Ltd. | | Banks—0.6% | | | 1,817,476 | |
| POLAND—0.5% | |
| 20,949 | | Dino Polska SA(a)(c) | | Food & Staples Retailing—0.5% | | | 1,494,224 | |
| RUSSIA—0.0% | |
| 106,851 | | LUKOIL PJSC, ADR(d)(f)(j) | | Oil, Gas & Consumable Fuels—0.0% | | | – | |
| 314,849 | | Novatek PJSC(d)(f)(j) | | Oil, Gas & Consumable Fuels—0.0% | | | – | |
| 730,234 | | Sberbank of Russia PJSC(d)(f)(j) | | Banks—0.0% | | | – | |
| | | | – | |
| SOUTH AFRICA—3.6% | |
| 74,332 | | Anglo American Platinum Ltd. | | Metals & Mining—2.1% | | | 6,510,832 | |
| 978,785 | | Sanlam Ltd. | | Insurance—1.0% | | | 3,181,274 | |
| 198,344 | | Vodacom Group Ltd. | | Wireless Telecommunication Services—0.5% | | | 1,606,190 | |
| | | | 11,298,296 | |
| 8 | abrdn Emerging Markets Equity Income Fund, Inc. | |
Portfolio of Investments (unaudited) (continued)
As of June 30, 2022
| Shares | | Description | | Industry and Percentage
of Net Assets | | Value
(US$) | |
| LONG-TERM INVESTMENTS (continued) | |
| COMMON STOCKS (continued) | |
| SOUTH KOREA—1.1% | |
| 207,040 | | Samsung Engineering Co. Ltd.(a) | | Construction & Engineering—1.1% | | $ | 3,441,161 | |
| TAIWAN—12.6% | |
| 397,000 | | Chroma ATE, Inc. | | Electronic Equipment Instruments & Components—0.7% | | | 2,044,475 | |
| 279,000 | | Delta Electronics, Inc. | | Electronic Equipment Instruments & Components—0.7% | | | 2,080,294 | |
| 121,000 | | Globalwafers Co. Ltd. | | Semiconductors & Semiconductor Equipment—0.6% | | | 1,848,843 | |
| 1,670,000 | | Hon Hai Precision Industry Co. Ltd. | | Electronic Equipment Instruments & Components—1.9% | | | 6,130,805 | |
| 22,972 | | Sea Ltd., ADR(a) | | Entertainment—0.5% | | | 1,535,908 | |
| 1,619,000 | | Taiwan Semiconductor Manufacturing Co. Ltd. | | Semiconductors & Semiconductor Equipment—8.2% | | | 25,946,652 | |
| | | | 39,586,977 | |
| THAILAND—3.0% | |
| 926,900 | | Kasikornbank PCL, Foreign Shares | | Banks—1.3% | | | 3,955,368 | |
| 1,215,000 | | PTT Exploration & Production PCL | | Oil, Gas & Consumable Fuels—1.7% | | | 5,477,172 | |
| | | | 9,432,540 | |
| VIETNAM—2.4% | |
| 1,572,000 | | FPT Corp. | | Information Technology Services—1.8% | | | 5,831,307 | |
| 1,225,000 | | Vietnam Technological & Commercial Joint Stock Bank(a) | |
Banks—0.6% | | | 1,873,562 | |
| | | | 7,704,869 | |
| | | Total Common Stocks | | | | | 337,812,473 | |
| PREFERRED STOCKS—9.3% | |
| SOUTH KOREA—9.3% | |
| 33,356 | | LG Chem Ltd., Pref | | Chemicals—2.0% | | | 6,177,062 | |
| 576,109 | | Samsung Electronics Co. Ltd., Pref | | Technology Hardware, Storage & Peripherals—7.3% | | | 23,156,926 | |
| | | | 29,333,988 | |
| | | Total Preferred Stocks | | | | | 29,333,988 | |
| PRIVATE EQUITY—0.1% | | | | | | |
| GLOBAL—0.0%* | | | | | | |
| 11,723,413 | (e) | Emerging Markets Ventures I, L.P.(a)(f)(g)(h)(i)(j) | | Private Equity— –% | | | 9,965 | |
| ISRAEL—0.1% | |
| 3,349,175 | (e) | BPA Israel Ventures, LLC(a)(f)(g)(h)(i)(j)(k) | | Private Equity— –% | | | 41,597 | |
| 1,522,368 | (e) | Neurone Ventures II, L.P.(a)(f)(g)(i)(j)(k) | | Private Equity—0.1% | | | 155,799 | |
| 2,400,000 | | Telesoft Partners II QP, L.P.(a)(f)(i)(j)(k)(l) | | Private Equity— –% | | | 121,896 | |
| | | | 319,292 | |
| | | Total Private Equity | | | | | 329,257 | |
| | | Total Long-Term Investments—116.8% (cost $412,095,525) | | | 367,475,718 | |
| abrdn Emerging Markets Equity Income Fund, Inc. | 9 |
Portfolio of Investments (unaudited) (concluded)
As of June 30, 2022
| Shares | | Description | | Value
(US$) | |
| SHORT-TERM INVESTMENT—0.6% | |
| UNITED STATES—0.6% | |
| 1,852,795 | | State Street Institutional U.S. Government Money Market Fund, Premier Class, 1.43%(m) | | $ | 1,852,795 | |
| | | Total Short-Term Investment—0.6% (cost $1,852,795) | | | 1,852,795 | |
| | | Total Investments—117.4% (cost $413,948,320)(n) | | | 369,328,513 | |
| | | Liabilities in Excess of Other Assets—(17.4)% | | | (54,758,329 | ) |
| | | Net Assets—100.0% | | $ | 314,570,184 | |
| (a) | Non-income producing security. |
| (b) | China A Shares. These shares are issued in local currency, traded in the local stock markets and are held through either a Qualified Foreign Institutional Investor (QFII) license or the Shanghai or Shenzhen Hong-Kong Stock Connect program. |
| (c) | Denotes a security issued under Regulation S or Rule 144A. |
| (d) | Level 3 security. See Note 2(a) of the accompanying Notes to Financial Statements. |
| (e) | Represents contributed capital. |
| (g) | Considered in liquidation by the Fund's Adviser. |
| (h) | As of June 30, 2022, the aggregate amount of open commitments for the Fund is $2,806,782. |
| (i) | Fair Valued Security. Fair Values are determined pursuant to procedures approved by the Fund's Board of Directors. Unless otherwise noted, securities are valued by applying valuation factors to the exchange traded price. See Note 2(a) of the accompanying Notes to Financial Statements. |
| (j) | Restricted security, not readily marketable. See Note 2(b) of the accompanying Notes to Financial Statements. |
| (k) | Fund of Fund investment. |
| (l) | Considered active investments by the Fund's Adviser. |
| (m) | Registered investment company advised by State Street Global Advisors. The rate shown is the 7 day yield as of June 30, 2022. |
| (n) | See accompanying Notes to Financial Statements for tax unrealized appreciation/(depreciation) of securities. |
| * | "Global" is the percentage attributable to the Fund's holdings in a private equity fund which invests globally and is not categorized under a particular country. |
ADR—American Depositary Receipt
GDR—Global Depositary Receipt
PLC—Public Limited Company
See Notes to Financial Statements.
| 10 | abrdn Emerging Markets Equity Income Fund, Inc. | |
Statement of Assets and Liabilities (unaudited)
As of June 30, 2022
| Assets |
| | | | | |
| Investments, at value (cost $413,948,320) | | $ | 369,328,513 | |
| Foreign currency, at value (cost $1,317,661) | | | 1,187,457 | |
| Cash | | | 619,935 | |
| Interest and dividends receivable | | | 623,281 | |
| Tax reclaim receivable | | | 48,601 | |
| Prepaid expenses | | | 122,706 | |
| Prepaid expenses in connection with revolving credit facility (Note 7) | | | 6,902 | |
| Total assets | | | 371,937,395 | |
| | | | | |
| Liabilities | | | | |
| Revolving credit facility payable (Note 7) | | | 55,000,000 | |
| Deferred foreign capital gains tax (Note 2h) | | | 1,089,747 | |
| Investment advisory fees payable (Note 3) | | | 716,706 | |
| Administration fees payable (Note 3) | | | 67,729 | |
| Interest payable on revolving credit facility | | | 49,807 | |
| Director fees payable | | | 43,424 | |
| Investor relations fees payable (Note 3) | | | 33,078 | |
| Other accrued expenses | | | 366,720 | |
| Total liabilities | | | 57,367,211 | |
| | | | | |
| Net Assets | | $ | 314,570,184 | |
| | | | | |
| Composition of Net Assets | | | | |
| Common stock (par value $.001 per share) (Note 5) | | $ | 50,752 | |
| Paid-in capital in excess of par | | | 434,393,511 | |
| Distributable accumulated loss | | | (119,874,079 | ) |
| Net Assets | | $ | 314,570,184 | |
| Net asset value per share based on 50,751,778 shares issued and outstanding | | $ | 6.20 | |
See Notes to Financial Statements.
| | abrdn Emerging Markets Equity Income Fund, Inc. | 11 |
Statement of Operations (unaudited)
For the Six-Month Period Ended June 30, 2022
| Net Investment Income: | | | | |
| | | | | |
| Income | | | | |
| Dividends and other income (net of foreign withholding taxes of $679,976) | | $ | 7,117,212 | |
| Total Investment Income | | | 7,117,212 | |
| | | | | |
| Expenses: | | | | |
| Investment advisory fee (Note 3) | | | 1,617,422 | |
| Administration fee (Note 3) | | | 149,345 | |
| Custodian's fees and expenses | | | 141,660 | |
| Directors' fees and expenses | | | 99,674 | |
| Investor relations fees and expenses (Note 3) | | | 54,355 | |
| Independent auditors' fees and expenses | | | 36,832 | |
| Reports to shareholders and proxy solicitation | | | 34,442 | |
| Legal fees and expenses | | | 32,124 | |
| Transfer agent's fees and expenses | | | 18,417 | |
| Insurance expense | | | 12,626 | |
| Miscellaneous | | | 11,916 | |
| Total expenses before reimbursed/waived expenses | | | 2,208,813 | |
| Interest and revolving credit facility expenses (Note 7) | | | 375,359 | |
| Total expenses | | | 2,584,172 | |
| | | | | |
| Net Investment Income | | | 4,533,040 | |
| | | | | |
| Net Realized/Unrealized Gain/(Loss) from Investments and Foreign Currency Related Transactions: | | | | |
| | | | | |
| Net realized gain/(loss) from: | | | | |
| Investment transactions | | | (12,170,006 | ) |
| Foreign currency transactions | | | 67,119 | |
| | | | (12,102,887 | ) |
| Net change in unrealized appreciation/(depreciation) on: | | | | |
| Investments (including $895,904 change in deferred capital gains tax) | | | (106,608,749 | ) |
| Foreign currency translation | | | (139,530 | ) |
| | | | (106,748,279 | ) |
| Net realized and unrealized (loss) from investments and foreign currency translations | | | (118,851,166 | ) |
| Net Decrease in Net Assets Resulting from Operations | | $ | (114,318,126 | ) |
See Notes to Financial Statements.
| 12 | abrdn Emerging Markets Equity Income Fund, Inc. |
Statements of Changes in Net Assets
| | For the
Six-Month
Period Ended
June 30, 2022
(unaudited) | | | For the
Year Ended
December 31, 2021 | |
| | | | | | |
| Increase/(Decrease) in Net Assets: | | | | | | | |
| | | | | | | | |
| Operations: | | | | | | | |
| Net investment income | $ | 4,533,040 | | | $ | 7,934,683 | |
| Net realized gain/(loss) from investment and foreign currency related transactions | | (12,102,887 | ) | | | 2,117,757 | |
| Net change in unrealized appreciation on investments and foreign currency translation | | (106,748,279 | ) | | | (18,898,367 | ) |
| Net decrease in net assets resulting from operations | | (114,318,126 | ) | | | (8,845,927 | ) |
| | | | | | | | |
| Distributions to Shareholders From: | | | | | | | |
| Distributable earnings | | (12,687,945 | ) | | | (11,561,960 | ) |
| Tax return of capital | | – | | | | (15,488,739 | ) |
| Net decrease in net assets from distributions | | (12,687,945 | ) | | | (27,050,699 | ) |
| Change in net assets resulting from operations | | (127,006,071 | ) | | | (35,896,626 | ) |
| | | | | | | | |
| Net Assets: | | | | | | | |
| Beginning of period | | 441,576,255 | | | | 477,472,881 | |
| End of period | $ | 314,570,184 | | | $ | 441,576,255 | |
Amounts listed as "–" are $0 or round to $0.
See Notes to Financial Statements.
| abrdn Emerging Markets Equity Income Fund, Inc. | 13 |
Statement of Cash Flows (unaudited)
For the Six Months Ended June 30, 2022
| Cash Flows from Operating Activities | | | |
| | | | |
| Net decrease in net assets resulting from operations | $ | (114,318,126 | ) |
| Adjustments to reconcile net decrease in net assets resulting from operations to net cash provided by operating activities: | | | |
| Investments purchased | | (74,689,612 | ) |
| Investments sold and principal repayments | | 91,120,788 | |
| Decrease in short-term investments, excluding foreign government securities | | 1,442,420 | |
| Decrease in interest and dividends receivable | | 165,905 | |
| Decrease in prepaid expenses | | (56,561 | ) |
| Increase in interest payable on bank loan | | 13,966 | |
| Decrease in accrued investment management fees payable | | (506,684 | ) |
| Decrease in other accrued expenses | | (81,234 | ) |
| Decrease in deferred foreign capital gains tax | | (7,061 | ) |
| Net change in unrealized depreciation from investments | | 106,608,749 | |
| Net change in unrealized depreciation from foreign currency translations | | 139,530 | |
| Net realized loss on investment transactions | | 12,170,006 | |
| Net cash provided by operating activities | | 22,002,086 | |
| | | | |
| Cash Flows from Financing Activities | | | |
| Distributions paid to shareholders | | (20,300,712 | ) |
| Net cash used in financing activities | | (20,300,712 | ) |
| Effect of exchange rate on cash | | (130,549 | ) |
| Net change in cash | | 1,570,825 | |
| Unrestricted and restricted cash and foreign currency, beginning of year | | 236,567 | |
| Unrestricted and restricted cash and foreign currency, end of year | $ | 1,807,392 | |
| | | | |
| Supplemental disclosure of cash flow information: | | | |
| | | | |
| Cash paid for interest and fees on credit facility: | $ | 361,393 | |
See Notes to Financial Statements.
| 14 | abrdn Emerging Markets Equity Income Fund, Inc. |
Financial Highlights
| | For the
Six-Month
Period Ended
June 30, 2022 | | For the Fiscal Years Ended December 31, | |
| | (unaudited) | | 2021 | | 2020 | | 2019 | | 2018(a)(b) | | 2017 | |
| PER SHARE OPERATING PERFORMANCE(c): | | | | | | | | | | | | |
| Net asset value per common share, beginning of period | $8.70 | | $9.41 | | $8.66 | | $7.37 | | $9.99 | | $7.80 | |
| Net investment income | 0.09 | | 0.16 | | 0.23 | | 0.23 | | 0.19 | | 0.10 | |
| Net realized and unrealized gains/(losses) on investments and foreign currency transactions | (2.34 | ) | (0.34 | ) | 0.79 | | 1.21 | | (1.36 | ) | 2.23 | |
| Total from investment operations applicable to common shareholders | (2.25 | ) | (0.18 | ) | 1.02 | | 1.44 | | (1.17 | ) | 2.33 | |
| Dividends and distributions to common shareholders from: | | | | | | | | | | | | |
| Net investment income | (0.25 | ) | (0.22 | ) | (0.27 | ) | (0.17 | ) | (0.13 | ) | (0.14 | ) |
| Net realized gains | – | | – | | – | | – | | (1.36 | ) | – | |
| Tax return of capital | – | | (0.31 | ) | – | | – | | – | | – | |
| Total distributions | (0.25 | ) | (0.53 | ) | (0.27 | ) | (0.17 | ) | (1.49 | ) | (0.14 | ) |
| Capital Share Transactions: | | | | | | | | | | | | |
| Impact of open market repurchase program (Note 6) | – | | – | | – | | – | | 0.01 | | – | |
| Impact due to tender offer | – | | – | | – | | 0.02 | | 0.03 | | – | |
| Total capital share transactions | – | | – | | – | | 0.02 | | 0.04 | | – | |
| Net asset value per common share, end of period | $6.20 | | $8.70 | | $9.41 | | $8.66 | | $7.37 | | $9.99 | |
| Market value, end of period | $5.52 | | $7.92 | | $8.16 | | $7.62 | | $6.35 | | $9.15 | |
| | | | | | | | | | | | | |
| Total Investment Return Based on(d): | | | | | | | | | | | | |
| Market value | (27.47% | ) | 3.27% | | 11.42% | | 22.80% | | (16.72% | ) | 37.05% | |
| Net asset value | (25.84% | ) | (1.63% | ) | 13.06% | | 20.25% | | (10.38% | ) | 30.05% | |
| | | | | | | | | | | | | |
| Ratio to Average Net Assets/Supplementary Data: | | | | | | | | | | | | |
| Net assets, end of period (000 omitted) | $314,570 | | $441,576 | | $477,473 | | $439,330 | | $440,819 | | $217,187 | |
| Average net assets (000 omitted) | $376,456 | | $492,593 | | $390,881 | | $442,354 | | $445,001 | | $203,477 | |
| Total expenses, net of fee waivers(d) | 1.38% | (e) | 1.31% | | 1.44% | | 1.54% | | 1.55% | (f)(g) | 1.68% | (f)(g) |
| Total expenses, excluding fee waivers(d) | 1.38% | (e) | 1.27% | | 1.44% | | 1.57% | | 1.56% | (f)(g) | 1.70% | (f)(g) |
| Total expenses, excluding taxes net of fee waivers | 1.38% | (e) | 1.31% | | 1.44% | | 1.54% | | 1.45% | (g) | 1.32% | |
| Total expenses, excluding taxes and interest and revolving credit facility expenses, net of fee waivers | 1.20% | (e) | 1.21% | | 1.27% | | 1.19% | | 1.25% | (g) | – | (h) |
| Net investment income(d) | 2.43% | (e) | 1.61% | | 2.96% | | 2.92% | | 2.24% | (f) | 1.03% | (f) |
| Portfolio turnover | 16.96% | (i) | 49.88% | | 21.03% | | 13.26% | | 145.10% | (j) | 14.53% | |
| Senior securities (loan facility) outstanding (000 omitted) | $55,000 | | $55,000 | | $40,900 | | $40,900 | | $49,000 | | $– | (h) |
| Asset coverage ratio on revolving credit facility at period end | 672% | | 903% | | 1,267% | | 1,174% | | 1,000% | | – | (h) |
| Asset coverage per $1,000 on revolving credit facility at period end(k) | $6,719 | | $9,029 | | $12,674 | | $11,742 | | $9,996 | | $– | (h) |
| (a) | Seven closed-end funds advised by the Adviser or its affiliates reorganized with and into the Fund on April 27, 2018. |
| (b) | Historical net asset value and per share amounts for the accounting survivor of the reorganizations have been recasted to reflect the conversion ratio of 2.9187 in effect on the date of reorganization of April 27, 2018. Ratios to Average Net Assets were not impacted. |
| (c) | Based on average shares outstanding. |
| abrdn Emerging Markets Equity Income Fund, Inc. | 15 |
Financial Highlights (concluded)
| (d) | Total investment return based on market value is calculated assuming that shares of the Fund's common stock were purchased at the closing market price as of the beginning of the period, dividends, capital gains, and other distributions were reinvested as provided for in the Fund's dividend reinvestment plan and then sold at the closing market price per share on the last day of the period. The computation does not reflect any sales commission investors may incur in purchasing or selling shares of the Fund. The total investment return based on the net asset value is similarly computed except that the Fund's net asset value is substituted for the closing market value. |
| (e) | Annualized. |
| (f) | Ratios include the effect of Chilean taxes. |
| (g) | Effective April 30, 2018, the Fund entered into an expense limitation agreement to limit total ordinary operating expenses of the Fund (excluding any interest, taxes, brokerage fees, short sale dividend and interest expenses and non-routine expenses) from exceeding 1.20% of the average daily Net Assets of the Fund on an annualized basis. (See Note 3) Prior to this, there was no expense limitation agreement in place. |
| (h) | Effective June 26, 2018, the Fund began utilizing the revolving credit facility. |
| (i) | Not annualized. |
| (j) | The variation in the Fund's turnover rate from 2017 to 2018 was primarily due to the reorganization of the Fund and change in investment strategy. |
| (k) | Asset coverage ratio is calculated by dividing net assets plus the amount of any borrowings, for investment purposes by the amount of the revolving credit facility. |
Amounts listed as "–" are $0 or round to $0.
See Notes to Financial Statements.
| 16 | abrdn Emerging Markets Equity Income Fund, Inc. |
Notes to Financial Statements (unaudited)
June 30, 2022
1. Organization
abrdn Emerging Markets Equity Income Fund, Inc. (the "Fund") was incorporated in Maryland on January 30, 1989 and commenced investment operations on September 27, 1989. The Fund is registered under the Investment Company Act of 1940, as amended (the "1940 Act"), as a non-diversified closed-end, management investment company. The Fund trades on the NYSE American under the ticker symbol "AEF".
2. Summary of Significant Accounting Policies
The Fund is an investment company and accordingly follows the investment company accounting and reporting guidance of the Financial Accounting Standards Board ("FASB") Accounting Standard Codification Topic 946 Financial Services-Investment Companies. The following is a summary of significant accounting policies followed by the Fund in the preparation of its financial statements. The policies conform to generally accepted accounting principles ("GAAP") in the United States of America. The preparation of financial statements requires management to make estimates and assumptions that affect the reported amounts of assets and liabilities, disclosure of contingent assets and liabilities at the date of the financial statements, and the reported amounts of income and expenses for the period. Actual results could differ from those estimates. The accounting records of the Fund are maintained in U.S. Dollars.
a. Security Valuation:
The Fund values its securities at current market value or fair value, consistent with regulatory requirements. "Fair value" is defined in the Fund's Valuation and Liquidity Procedures as the price that could be received to sell an asset or paid to transfer a liability in an orderly transaction between willing market participants without a compulsion to transact at the measurement date.
Equity securities that are traded on an exchange are valued at the last quoted sale price on the principal exchange on which the security is traded at the "Valuation Time" subject to application, when appropriate, of the valuation factors described in the paragraph below. Under normal circumstances, the Valuation Time is as of the close of regular trading on the New York Stock Exchange ("NYSE") (usually 4:00 p.m. Eastern Time). In the absence of a sale price, the security is valued at the mean of the bid/ask price quoted at the close on the principal exchange on which the security is traded. Securities traded on NASDAQ are valued at the NASDAQ official closing price.
Foreign equity securities that are traded on foreign exchanges that close prior to Valuation Time are valued by applying valuation factors to the last sale price or the mean price as noted above. Valuation factors are provided by an independent pricing service provider approved by the Board. These valuation factors are used when pricing the Fund's
portfolio holdings to estimate market movements between the time foreign markets close and the time the Fund values such foreign securities. These valuation factors are based on inputs such as depositary receipts, indices, futures, sector indices/ETFs, exchange rates, and local exchange opening and closing prices of each security. When prices with the application of valuation factors are utilized, the value assigned to the foreign securities may not be the same as quoted or published prices of the securities on their primary markets. A security that applies a valuation factor is determined to be a Level 2 investment because the exchange-traded price has been adjusted. Valuation factors are not utilized if the independent pricing service provider is unable to provide a valuation factor or if the valuation factor falls below a predetermined threshold; in such case, the security is determined to be a Level 1 investment. Closed-end funds and exchange-traded funds ("ETFs") are valued at the market price of the security at the Valuation Time. A security using any of these pricing methodologies is determined to be a Level 1 investment.
Short-term investments are comprised of cash and cash equivalents invested in short-term investment funds which are redeemable daily. The Fund sweeps available cash into the State Street Institutional U.S. Government Money Market Fund, which has elected to qualify as a "government money market fund" pursuant to Rule 2a-7 under the 1940 Act, and has an objective, which is not guaranteed, to maintain a $1.00 per share NAV. Generally, these investment types are categorized as Level 1 investments.
In the event that a security's market quotations are not readily available or are deemed unreliable (for reasons other than because the foreign exchange on which it trades closes before the Valuation Time), the security is valued at fair value as determined by the Fund's Pricing Committee, taking into account the relevant factors and surrounding circumstances using valuation policies and procedures approved by the Board. A security that has been fair valued by the Fund's Pricing Committee may be classified as Level 2 or Level 3 depending on the nature of the inputs.
In accordance with the authoritative guidance on fair value measurements and disclosures under GAAP, the Fund discloses the fair value of its investments using a three-level hierarchy that classifies the inputs to valuation techniques used to measure the fair value. The hierarchy assigns Level 1, the highest level, measurements to valuations based upon unadjusted quoted prices in active markets for identical assets, Level 2 measurements to valuations based upon other significant observable inputs, including adjusted quoted prices in active markets for similar assets, and Level 3, the lowest level, measurements to valuations based upon unobservable inputs that are significant to the valuation. Inputs refer broadly to the assumptions that market participants would use in pricing the asset or liability, including
| abrdn Emerging Markets Equity Income Fund, Inc. | 17 |
Notes to Financial Statements (unaudited) (continued)
June 30, 2022
assumptions about risk, for example, the risk inherent in a particular valuation technique used to measure fair value including a pricing model and/or the risk inherent in the inputs to the valuation technique. Inputs may be observable or unobservable. Observable inputs are inputs that reflect the assumptions market participants would use in pricing the asset or liability, which are based on market data obtained from sources independent of the reporting entity. Unobservable inputs are inputs that reflect the reporting entity's own assumptions about the assumptions market participants would use in pricing the asset or liability developed based on the best information available in the circumstances. A financial instrument's level within the fair value hierarchy is based upon the lowest level of any input that is significant to the fair value measurement. The three-level hierarchy of inputs is summarized below.
Level 1 – quoted prices in active markets for identical investments;
Level 2 – other significant observable inputs (including quoted prices for similar securities, interest rates, prepayment speeds, and credit risk); or
Level 3 – significant unobservable inputs (including the Fund's own assumptions in determining the fair value of investments).
The Fund may also invest in private equity private placement securities, which represented 0.1% of the net assets of the Fund as of June 30, 2022.
The private equity private placement securities in which the Fund is invested are deemed to be restricted securities. In the absence of readily ascertainable market values, these securities are valued at fair value as determined in good faith by, or under the direction of the Board, pursuant to valuation policies and procedures established by the Board. The Fund's estimate of fair value assumes a willing buyer and a willing seller neither of whom are acting under the compulsion to buy or sell. Although these securities may be resold in privately negotiated transactions, the prices realized on such sales could differ from the prices originally paid by the Fund or the current carrying values, and the difference could be material. These securities are stated at fair value as determined by the Fund's Pricing Committee by utilizing the net asset valuations provided by the underlying funds as a practical expedient. In determining the fair value of these investments, management uses the market approach which includes as the primary input the capital balance reported; however, adjustments to the reported capital balance may be made based on various factors, including, but not limited to, the attributes of the interest held, including the rights and obligations, and any restrictions or illiquidity of such interests, and the fair value of these private equity investments. No such adjustments were made to the NAVs provided by the underlying funds.
A summary of standard inputs is listed below:
| Security Type | | Standard Inputs |
| Foreign equities utilizing a fair value factor | | Depositary receipts, indices, futures, sector indices/ETFs, exchange rates, and local exchange opening and closing prices of each security. |
The following is a summary of the inputs used as of June 30, 2022 in valuing the Fund's investments and other financial instruments at fair value. The inputs or methodology used for valuing securities are not necessarily an indication of the risk associated with investing in those securities. Please refer to the Portfolio of Investments for a detailed breakout of the security types:
| Investments, at Value | Level 1 – Quoted
Prices ($) | Level 2 – Other Significant
Observable Inputs ($) | Level 3 – Significant
Unobservable Inputs ($) | Total ($) |
| Investments in Securities | | | | |
| Common Stocks | $59,224,240 | $278,588,233 | $– | $337,812,473 |
| Preferred Stocks | – | 29,333,988 | – | 29,333,988 |
| Short-Term Investment | 1,852,795 | – | – | 1,852,795 |
| Total | $61,077,035 | $307,922,221 | $– | $368,999,256 |
| Private Equity(a) | | | | 329,257 |
| Total Investments | | | | $369,328,513 |
Amounts listed as "–" are $0 or round to $0.
| (a) | Private Equity investments are measured at the net asset valuations provided by the underlying funds as a practical expedient and have not been classified in the fair value levels. The fair value amounts presented are intended to permit reconciliation to the total investment amount presented in the Portfolio of Investments. |
| 18 | abrdn Emerging Markets Equity Income Fund, Inc. |
Notes to Financial Statements (unaudited) (concluded)
June 30, 2022
A reconciliation of the Level 3 investments held during and at the end of the six-month period ended June 30, 2022 is presented below. The valuation technique used at June 30, 2022 was fair valuation at zero pursuant to procedures approved by the Fund's Board of Directors.
Investments
in Securities | Balance
as of
December 31,
2021 | Accrued
Discounts
(Premiums) | Realized
Gain
(Loss) | Change in
Unrealized
Appreciation
(Depreciation) | | Net
Purchases | Net
Sales | Net
Transfers
In to
Level 3 | Net
Transfers
Out of
Level 3 | Balance
as of
June 30,
2022 | Change in
Unrealized
Appreciation
(Depreciation)
from
Investments
Held at
June 30,
2022 | |
| Common Stocks |
| Russia | $– | $– | $– | $(21,189,113 | ) | $– | $– | $21,189,113 | $– | $– | $(21,189,113 | ) |
| Total | $– | $– | $– | $(21,189,113 | ) | $– | $– | $21,189,113 | $– | $– | $(21,189,113 | ) |
b. Restricted Securities:
Restricted securities are privately-placed securities whose resale is restricted under U.S. securities laws. The Fund may invest in restricted securities, including unregistered securities eligible for resale without registration pursuant to Rule 144A and privately-placed securities of U.S. and non-U.S. issuers offered outside the U.S. without registration pursuant to Regulation S under the Securities Act of 1933, as amended. Rule 144A securities may be freely traded among certain qualified institutional investors, such as the Fund, but resale of such securities in the U.S. is permitted only in limited circumstances.
c. Foreign Currency Translation:
Foreign securities, currencies, and other assets and liabilities denominated in foreign currencies are translated into U.S. Dollars at the exchange rate of said currencies against the U.S. Dollar, as of the Valuation Time, as provided by an independent pricing service approved by the Board.
Foreign currency amounts are translated into U.S. Dollars on the following basis:
| (i) | market value of investment securities, other assets and liabilities – at the current daily rates of exchange at the Valuation Time; and |
| (ii) | purchases and sales of investment securities, income and expenses – at the relevant rate of exchange prevailing on the respective dates of such transactions. |
The Fund does not isolate that portion of gains and losses on investments in equity securities due to changes in the foreign exchange rates from the portion due to changes in market prices of equity securities. Accordingly, realized and unrealized foreign currency gains and losses with respect to such securities are included in the reported net realized and unrealized gains and losses on investment transactions balances.
The Fund reports certain foreign currency related transactions and foreign taxes withheld on security transactions as components of realized gains for financial reporting purposes, whereas such foreign currency related transactions are treated as ordinary income for U.S. federal income tax purposes.
Net unrealized currency gains or losses from valuing foreign currency denominated assets and liabilities at period end exchange rates are reflected as a component of net unrealized appreciation/depreciation in value of investments, and translation of other assets and liabilities denominated in foreign currencies.
Net realized foreign exchange gains or losses represent foreign exchange gains and losses from transactions in foreign currencies and forward foreign currency contracts, exchange gains or losses realized between the trade date and settlement date on security transactions, and the difference between the amounts of interest and dividends recorded on the Fund's books and the U.S. Dollar equivalent of the amounts actually received.
Foreign security and currency transactions may involve certain considerations and risks not typically associated with those of domestic origin, including unanticipated movements in the value of the foreign currency relative to the U.S. Dollar. Generally, when the U.S. Dollar rises in value against foreign currency, the Fund's investments denominated in that foreign currency will lose value because the foreign currency is worth fewer U.S. Dollars; the opposite effect occurs if the U.S. Dollar falls in relative value.
d. Rights Issues and Warrants:
Rights issues give the right, normally to existing shareholders, to buy a proportional number of additional securities at a given price (generally at a discount) within a fixed period (generally a short-term period) and are offered at the company's discretion. Warrants are securities that
| abrdn Emerging Markets Equity Income Fund, Inc. | 19 |
Notes to Financial Statements (unaudited) (continued)
June 30, 2022
give the holder the right to buy common stock at a specified price for a specified period of time. Rights issues and warrants are speculative and have no value if they are not exercised before the expiration date. Rights issues and warrants are valued at the last sale price on the exchange on which they are traded. e. Security Transactions, Investment Income and Expenses: Security transactions are recorded on the trade date. Realized and unrealized gains/(losses) from security and currency transactions are calculated on the identified cost basis. Dividend income is recorded on the ex-dividend date except for certain dividends on foreign securities, which are recorded as soon as the Fund is informed after the ex-dividend date. Interest income and expenses are recorded on an accrual basis. Certain distributions received by the Fund could represent a return of capital or capital gain. The Fund determines the components of these distributions subsequent to the ex-dividend date, based upon receipt of tax filings or other correspondence relating to the underlying investment. These distributions are recorded as a reduction of cost of investments and/or as a realized gain. f. Distributions: The Fund records dividends and distributions payable to its shareholders on the ex-dividend date. The amount of dividends and distributions from net investment income and net realized capital gains are determined in accordance with federal income tax regulations, which may differ from GAAP. These book basis/tax basis differences are either considered temporary or permanent in nature. To the extent these differences are permanent in nature, such amounts are reclassified within the capital accounts based on their federal tax basis treatment; temporary differences do not require reclassification. Dividends and distributions which exceed net investment income and net realized capital gains for tax purposes are reported as return of capital. g. Federal Income Taxes: The Fund intends to continue to qualify as a "regulated investment company" by complying with the provisions available to certain investment companies, as defined in Subchapter M of the Internal Revenue Code of 1986, as amended, and to make distributions of net investment income and net realized capital gains sufficient to relieve the Fund from all federal income taxes. Therefore, no federal income tax provision is required. The Fund recognizes the tax benefits of uncertain tax positions only where the position is "more likely than not" to be sustained assuming examination by tax authorities. Management of the Fund has concluded that there are no significant uncertain tax positions that | | would require recognition in the financial statements. Since tax authorities can examine previously filed tax returns, the Fund's U.S. federal and state tax returns for each of the most recent four fiscal years up to the most recent fiscal year ended December 31, 2021 are subject to such review. h. Foreign Withholding Tax: Dividend and interest income from non-U.S. sources received by the Fund are generally subject to non-U.S. withholding taxes and are recorded on the Statement of Operations. The Fund files for tax reclaims for the refund of such withholdings taxes according to tax treaties. Tax reclaims that are deemed collectible are booked as tax reclaim receivable on the Statement of Assets and Liabilities. In addition, the Fund may be subject to capital gains tax in certain countries in which it invests. The above taxes may be reduced or eliminated under the terms of applicable U.S. income tax treaties with some of these countries. The Fund accrues such taxes when the related income is earned. In addition, when the Fund sells securities within certain countries in which it invests, the capital gains realized may be subject to tax. Based on these market requirements and as required under GAAP, the Fund accrues deferred capital gains tax on securities currently held that have unrealized appreciation within these countries. The amount of deferred capital gains tax accrued is reported on the Statement of Assets and Liabilities. i. Partnership Accounting Policy: The Fund records its pro-rata share of the income/(loss) and capital gains/(losses) allocated from the private equity investments, which are classified as partnerships, and adjusts the cost of the underlying partnerships accordingly. These amounts are included in the Fund's Statement of Operations. 3. Agreements and Transactions with Affiliates a. Investment Adviser: Aberdeen Asset Managers Limited ("AAML", the "Investment Adviser" or the "Adviser") serves as the Fund's investment adviser with respect to all investments. AAML is an indirect wholly-owned subsidiary of abrdn plc. AAML receives, an annual fee, calculated weekly and paid quarterly, equal to 0.90% of the first $250 million, 0.80% of amounts $250-$500 million and 0.75% of amounts over $500 million. For the six-month period ended June 30, 2022, AAML earned $1,617,422 for advisory services. AAML entered into a written contract (the "Expense Limitation Agreement") with the Fund that is effective through June 30, 2022. |
| 20 | abrdn Emerging Markets Equity Income Fund, Inc. | | |
| | | |
Notes to Financial Statements (unaudited) (continued)
June 30, 2022
The Expense Limitation Agreement limits the total ordinary operating expenses of the Fund (excluding any interest, taxes, brokerage fees, short sale dividend and interest expenses and non-routine expenses) from exceeding 1.20% of the average daily Net Assets of the Fund on an annualized basis. AAML did not waive any advisory fees pursuant to the Expense Limitation Agreement during the six-month period ended June 30, 2022. AAML may request and receive reimbursement of the advisory fees waived and other expenses reimbursed pursuant to the Expense Limitation Agreement as of a date not more than three years after the date when AAML limited the fees or reimbursed the expenses; provided that the following requirements are met: the reimbursements do not cause the Fund to exceed the lesser of the applicable expense limitation in the contract at the time the fees were limited or expenses are paid or the applicable expense limitation in effect at the time the expenses are being recouped by AAML (the "Reimbursement Requirements"). As of June 30, 2022, there is no reimbursement due to AAML. b. Fund Administration: abrdn Inc. (formerly, Aberdeen Standard Investments Inc.), an affiliate of the Adviser, is the Fund's Administrator, pursuant to an agreement under which abrdn Inc. receives a fee paid by the Fund, at an annual fee rate of 0.08% of the Fund's average monthly net assets. For the six-month period ended June 30, 2022, abrdn Inc. earned $149,345 from the Fund for administration services. c. Investor Relations: Under the terms of the Investor Relations Services Agreement, abrdn Inc. provides, and/or engages third parties to provide, investor relations services to the Fund and certain other funds advised by AAML or its affiliates as part of an Investor Relations Program. Under the Investor Relations Services Agreement, the Fund owes a portion of the fees related to the Investor Relations Program (the "Fund's Portion"). However, investor relations services fees are limited by abrdn Inc. so that the Fund will only pay up to an annual rate of 0.05% of the Fund's average weekly net assets. Any difference between the capped rate of 0.05% of the Fund's average weekly net assets and the Fund's Portion is paid for by abrdn Inc. Pursuant to the terms of the Investor Relations Services Agreement, abrdn Inc. (or third parties engaged by abrdn Inc.), among other things, provides objective and timely information to shareholders based on publicly-available information; provides information efficiently through the use of technology while offering shareholders immediate access to knowledgeable investor relations representatives; develops and maintains effective communications with investment professionals from a wide variety of firms; creates and maintains investor relations | | communication materials such as fund manager interviews, films and webcasts, publishes white papers, magazine articles and other relevant materials discussing the Fund's investment results, portfolio positioning and outlook; develops and maintains effective communications with large institutional shareholders; responds to specific shareholder questions; and reports activities and results to the Board and management detailing insight into general shareholder sentiment. During the six-month period ended June 30, 2022, the Fund incurred investor relations fees of approximately $54,355. For the six-month period ended June 30, 2022, abrdn Inc. did not contribute to the investor relations fees for the Fund because the Fund's contribution was below 0.05% of the Fund's average weekly net assets on an annual basis. 4. Investment Transactions Purchases and sales of investment securities (excluding short-term securities) for the six-month period ended June 30, 2022, were $73,265,048 and $90,333,791, respectively. 5. Capital The authorized capital of the Fund is 100 million shares of $0.001 par value per share of common stock. As of June 30, 2022, there were 50,751,778 shares of common stock issued and outstanding. 6. Open Market Repurchase Program The Board has authorized, but does not require, Fund management to make open market purchases from time to time in an amount up to 10% of the Fund's outstanding shares in a given year, in accordance with Rule 10b-18 under the Securities Exchange Act of 1934, as amended (the "Exchange Act"), and other applicable federal securities laws. Such purchases may be made when, in the reasonable judgment of Fund management, such repurchases may enhance shareholder value. The Fund reports repurchase activity on the Fund's website on a monthly basis. For the six-month period ended June 30, 2022, the Fund did not repurchase any shares pursuant to its repurchase agreement. 7. Credit Facility On June 21, 2022, the Fund renewed its revolving credit facility for a 1-year period with The Bank of Nova Scotia with a committed facility of $65,000,000. The outstanding balance on the loan as of June 30, 2022 was $55,000,000. During the current fiscal period the average daily balance outstanding and the average interest rate on the loan facility was $55,000,000 and 1.36%, respectively. The interest expense is accrued on a daily basis and is payable to The Bank of Nova Scotia on a monthly basis. The Fund uses leverage for investment purposes. In the event of a general market decrease in the value of assets in which |
| abrdn Emerging Markets Equity Income Fund, Inc. | 21 |
Notes to Financial Statements (unaudited) (continued)
June 30, 2022
the Fund invests, the effect of that decline will be magnified in the Fund because of the additional assets purchased with the proceeds of the leverage. Non-recurring expenses in connection with the implementation of the loan facility will reduce the Fund's performance. The Fund's leveraged capital structure creates special risks not associated with unleveraged funds having similar investment objectives and policies. The funds borrowed pursuant to the loan facility may constitute a substantial lien and burden by reason of their prior claim against the income of the Fund and against the net assets of the Fund in liquidation. The Fund is not permitted to declare dividends or other distributions in the event of default under the loan facility. In the event of a default under the loan facility, the lenders have the right to cause a liquidation of the collateral (i.e., sell portfolio securities and other assets of the Fund) and, if any such default is not cured, the lenders may be able to control the liquidation as well. A liquidation of the Fund's collateral assets in an event of default, or a voluntary paydown of the loan facility in order to avoid an event of default, would typically involve administrative expenses and sometimes penalties. Additionally, such liquidations often involve selling off of portions of the Fund's | | assets at inopportune times which can result in losses when markets are unfavorable. The loan facility has a one year term and is not a perpetual form of leverage; there can be no assurance that the loan facility will be available for renewal on acceptable terms, if at all. Bank loan fees and expenses included in the Statement of Operations include fees for the loan facility as well as commitment fees for any portion of the loan facility not drawn upon at any time during the period. During the six-month period ended June 30, 2022, the Fund incurred fees of approximately $8,079. The credit agreement governing the loan facility includes usual and customary covenants for this type of transaction. These covenants impose on the Fund asset coverage requirements, Fund composition requirements and limits on certain investments, such as illiquid investments, which are more stringent than those imposed on the Fund by the 1940 Act. The covenants or guidelines could impede the Investment Adviser from fully managing the Fund's portfolio in accordance with the Fund's investment objective and policies. Furthermore, non-compliance with such covenants or the occurrence of other events could lead to the cancellation of the loan facility. |
8. Private Equity Investments
Certain of the Fund's investments, listed in the chart below, are restricted as to resale and are valued at net asset value as determined in good faith by, or under the direction of, the Board under procedures established by the Board in the absence of readily ascertainable market values.
| Security (1) | | Acquisition Date(s) | | Total
Commitments | Cost | | Fair
Value at
6/30/22 | | Percent
of Net
Assets | Cumulative
Distributions
Received (2) | |
| BPA Israel Ventures, LLC (3) | | 10/05/00 – 12/09/05 | | | $4,600,000 | | $1,696,650 | | | $41,597 | | 0.01 | | $818,946 | |
| Emerging Markets Ventures I, L.P. (3) | | 01/22/98 – 01/10/06 | | | 13,100,000 | | 3,935,953 | | | 9,965 | | – | | 12,787,187 | |
| Neurone Ventures II, L.P. | | 11/24/00 – 12/21/10 | | | 1,500,000 | | 5,407 | | | 155,799 | | 0.05 | | 1,453,620 | |
| Telesoft Partners II QP, L.P. | | 07/14/00 – 03/01/10 | | | 2,400,000 | | 892,115 | | | 121,896 | | 0.04 | | 1,674,183 | |
| Total | | | | | $21,600,000 | | $6,530,125 | | | $329,257 | | 0.10 | | $16,733,906 | |
Amounts listed as "–" are $0 or round to $0.
| (1) | Telesoft Partners II QP, L.P. is still considered an active investment by the Fund's Adviser. Neurone Ventures II, L.P., BPA Israel Ventures, LLC, and Emerging Markets Ventures I, L.P. are in liquidation. |
| (2) | Cumulative Distributions include distributions received from Income, realized gains or return of capital. Distributions from return of capital will reduce the cost basis of the security. |
| (3) | BPA Israel Ventures LLC has open commitments of $1,250,825. Emerging Markets Ventures I, L.P. has open commitments of $1,555,957. |
The Fund may incur certain costs in connection with the disposition of the above securities.
| 22 | abrdn Emerging Markets Equity Income Fund, Inc. |
Notes to Financial Statements (unaudited) (continued)
June 30, 2022
9. Portfolio Investment Risks a. Risks Associated with Foreign Securities and Currencies: Investments in securities of foreign issuers carry certain risks not ordinarily associated with investments in securities of U.S. issuers. These risks include future political and economic developments, and the possible imposition of exchange controls or other foreign governmental laws and restrictions. In addition, with respect to certain countries, there is the possibility of expropriation of assets, confiscatory taxation, and political or social instability or diplomatic developments, which could adversely affect investments in those countries. Certain countries also may impose substantial restrictions on investments in their capital markets by foreign entities, including restrictions on investments in issuers of industries deemed sensitive to relevant national interests. These factors may limit the investment opportunities available and result in a lack of liquidity and high price volatility with respect to securities of issuers from developing countries. Foreign securities may also be harder to price than U.S. securities. The value of foreign currencies relative to the U.S. Dollar fluctuates in response to market, economic, political, regulatory, geopolitical or other conditions. A decline in the value of a foreign currency versus the U.S. Dollar reduces the value in U.S. Dollars of investments denominated in that foreign currency. This risk may impact the Fund more greatly to the extent the Fund does not hedge its currency risk, or hedging techniques used by the Adviser are unsuccessful. b. Risks Associated with Emerging Markets: The emerging countries' securities markets are substantially smaller, less liquid and more volatile than the major securities markets in the United States. A high proportion of the securities of many companies in emerging countries may be held by a limited number of persons, which may limit the number of securities available for investment by the Fund. The limited liquidity of emerging country securities markets may also affect the Fund's ability to acquire or dispose of securities at the price and time it wishes to do so. c. Risks Associated with Restricted Securities: The Fund, subject to local investment limitations, may invest up to 30% of its assets (at the time of commitment) in illiquid equity securities, including securities of private equity funds (whether in corporate or partnership form) that invest primarily in emerging markets. When investing through another investment fund, the Fund will bear its proportionate share of the expenses incurred by that underlying fund, including management fees. Such securities are expected to be illiquid and may involve a high degree of business and financial risk and may result in substantial losses. Because of the current absence of any liquid trading market for these investments, the private equity funds may take longer to liquidate than would be the case for | | publicly traded securities. Although these securities may be resold in privately negotiated transactions, the prices realized on such sales could be substantially less than those originally paid by the Fund or the current carrying values and these differences could be material. Further, companies whose securities are not publicly traded may not be subject to the disclosures and other investor protection requirements applicable to companies whose securities are publicly traded. d. China Risk: The economy of China differs from the U.S. and other more established economies in such respects as structure, general development, government involvement, wealth distribution, rate of inflation, growth rate, allocation of resources and capital reinvestment, and some of these differences are unfavorable to investors. Therefore, investing in China involves a high degree of risk and special considerations not typically associated with investing in other more established economies or securities markets. The Fund invests in China A shares. China A shares are shares in mainland China-based companies that trade on Chinese stock exchanges and are usually only available to foreign investors through a quota license or by purchasing Shanghai and Shenzhen Stock Exchange-listed securities via brokers in Hong Kong through the Shanghai-Hong Kong Stock Connect and Shenzhen-Hong Kong Stock Connect programs (collectively, "Stock Connect"). Investing in China A shares may involve special risk considerations such as volatility in the China A share market and uncertainty regarding taxation. The Fund's ability to freely trade in China A shares as a foreign investor through the quota license or Stock Connect may be limited by quota and repatriation restrictions, and utilizing Stock Connect is subject to trading, clearance and settlement procedures in China that are relatively new and untested. e. Illiquid Securities Risk: Illiquid securities are assets that the Fund reasonably expects cannot be sold or disposed of in current market conditions in seven calendar days or less without the sale or disposition significantly changing the market value of the asset. An inability to sell a portfolio position can adversely affect the Fund's value or prevent the Fund from being able to take advantage of other investment opportunities. Illiquid securities are relatively less liquid securities may also be difficult to value. f. Sector Risk: To the extent that the Fund has a significant portion of its assets invested in securities of companies conducting business in a broadly related group of industries within an economic sector, the Fund may be more vulnerable to unfavorable developments in that economic sector than funds that invest more broadly. Financial Sector Risk. To the extent that the financial sector represents a significant portion of the Fund's investments, the Fund will be |
| abrdn Emerging Markets Equity Income Fund, Inc. | 23 |
Notes to Financial Statements (unaudited) (continued)
June 30, 2022
sensitive to changes in, and its performance may depend to a greater extent on, factors impacting this sector. Performance of companies in the financials sector may be adversely impacted by many factors, including, among others, government regulations, economic conditions, credit rating downgrades, changes in interest rates, and decreased liquidity in credit markets. The impact of more stringent capital requirements, recent or future regulation of any individual financial company, or recent or future regulation of the financials sector as a whole cannot be predicted. In recent years, cyber attacks and technology malfunctions and failures have become increasingly frequent in this sector and have caused significant losses. Information Technology Sector Risk. To the extent that the information technology sector represents a significant portion of the Fund, the Fund will be sensitive to changes in, and its performance may depend to a greater extent on, factors impacting this sector. Information technology companies face intense competition, both domestically and internationally, which may have an adverse effect on their profit margins. Like other technology companies, information technology companies may have limited product lines, markets, financial resources or personnel. The products of information technology companies may face obsolescence due to rapid technological developments, frequent new product introduction, unpredictable changes in growth rates and competition for the services of qualified personnel. Companies in the information technology sector are heavily dependent on patent and intellectual property rights. The loss or impairment of these rights may adversely affect the profitability of these companies. g. Valuation Risk: The price that the Fund could receive upon the sale of any particular portfolio investment may differ from the Fund's valuation of the investment, particularly for securities that trade in thin or volatile markets or that are valued using a fair valuation methodology or a price provided by an independent pricing service. As a result, the price received upon the sale of an investment may be less than the value ascribed by the Fund, and the Fund could realize a greater than expected loss or lower than expected gain upon the sale of the investment. The Fund's ability to value its investments may also be impacted by technological issues and/or errors by pricing services or other third-party service providers. h. Market Events Risk: Markets are affected by numerous factors, including interest rates, the outlook for corporate profits, the health of the national and world economies, the fluctuation of other stock markets around the world, and financial, economic and other global market developments and disruptions, such as those arising from war, terrorism, market manipulation, government interventions, defaults and shutdowns, political changes or diplomatic developments, public health | | emergencies and natural/environmental disasters. Such events can negatively impact the securities markets and cause the Fund to lose value. One such event is the COVID-19 pandemic, which has caused major disruptions to economies and markets around the world, including the markets in which the Fund invests, and which has and may continue to negatively impact the value of certain of the Fund's investments. Although vaccines for COVID-19 and variants thereof are becoming more widely available, the COVID-19 pandemic and impacts thereof may continue for an extended period of time and may vary from market to market. To the extent the impacts of COVID-19 continue, the Fund may experience negative impacts to its business that could exacerbate other risks to which the Fund is subject. Policy and legislative changes in countries around the world are affecting many aspects of financial regulation, and governmental and quasi-governmental authorities and regulators throughout the world have previously responded to serious economic disruptions with a variety of significant fiscal and monetary policy changes. In addition, economies and financial markets throughout the world are becoming increasingly interconnected. As a result, whether or not a Fund invests in securities of issuers located in or with significant exposure to countries experiencing economic and financial difficulties, the value and liquidity of the Fund's investments may be negatively affected by such events. For example, whether or not the Fund invests in securities of issuers located in Europe (whether the EU, Eurozone or UK) or with significant exposure to European, EU, Eurozone or UK issuers or countries, the unavoidable uncertainties and events related to the UK's departure from the EU ("Brexit") could negatively affect the value and liquidity of the Fund's investments, increase taxes and costs of business and cause volatility in currency exchange rates and interest rates. European, UK or worldwide political, regulatory, economic or market conditions and could contribute to instability in political institutions, regulatory agencies and financial markets. Brexit could also lead to legal uncertainty and politically divergent national laws and regulations as a new relationship between the UK and EU is defined and as the UK determines which EU laws to replace or replicate. Any of these effects of Brexit, and others that cannot be anticipated, could adversely affect the Fund's business, results of operations and financial condition. In addition, investment in Hong Kong issuers may subject the Fund to legal, regulatory, and political risks, specific to Hong Kong. Hong Kong is closely tied to China, economically and politically, following the UK's 1997 handover of the former colony to China to be governed as a Special Administrative Region. Changes to Hong Kong's legal, financial, and monetary system could negatively impact its economic prospects. Hong Kong's evolving relationship with the central government in Beijing has been a source of political unrest and may result in economic disruption. By treaty, China has committed to preserve Hong Kong's |
| 24 | abrdn Emerging Markets Equity Income Fund, Inc. |
Notes to Financial Statements (unaudited) (concluded)
June 30, 2022
high degree of autonomy in certain matters until 2047. However, as demonstrated by Hong Kong protests in recent years over political, economic, and legal freedoms, and the Chinese government's response to them, there continues to exist political uncertainty within Hong Kong. For example, in June 2020 China adopted a new security law that severely limits freedom of speech in Hong Kong and expands police powers to seize electronic devices and intercept communications of suspects. Widespread protests were held in Hong Kong in response to the new law, and the United States imposed sanctions on certain Hong Kong officials for cracking down on pro-democracy protests. There is no guarantee that additional protests will not arise in the future or whether the United States will respond to such protests with additional | | sanctions. Further, any changes in the Chinese economy, trade regulations, or control over Hong Kong may have an adverse impact on Hong Kong's economy and thereby impact the Fund. 10. Contingencies In the normal course of business, the Fund may provide general indemnifications pursuant to certain contracts and organizational documents. The Fund's maximum exposure under these arrangements is dependent on future claims that may be made against the Fund, and therefore, cannot be estimated; however, the Fund expects the risk of loss from such claims to be remote. |
11. Tax Information
The U.S. federal income tax basis of the Fund's investments (including derivatives, if applicable) and the net unrealized depreciation as of June 30, 2022, were as follows:
| Tax Basis of Investments | Appreciation | Depreciation | | Net Unrealized
Depreciation | | |
| $408,453,831 | $41,659,240 | $(80,784,558 | ) | $(39,125,318 | ) | |
| | | | | | | |
12. Recent Rulemaking In December 2020, the Securities and Exchange Commission ("SEC") adopted Rule 2a-5 under the 1940 Act, which establishes requirements for determining fair value in good faith for purposes of the 1940 Act, including related oversight and reporting requirements. The rule also defines when market quotations are "readily available" for purposes of the 1940 Act, the threshold for determining whether a fund must fair value a security. The SEC also adopted new Rule 31a-4 under the 1940 Act, which sets forth the recordkeeping requirements associated with fair value determinations. The new regulations also rescinded and withdrew the guidance of the SEC and its staff on related issues, including the role of a board in determining fair value and the | | accounting and auditing of fund investments. Rule 2a-5 and Rule 31a-4 became effective on March 8, 2021, with a compliance date of September 8, 2022 (after the period covered by this report). The Funds are currently complying with the new regulations that are now in effect. 13. Subsequent Events Management has evaluated the need for disclosures and/or adjustments resulting from subsequent events through the date the financial statements were issued. Based on this evaluation, no disclosures and/or adjustments were required to the financial statements as of June 30, 2022. |
| abrdn Emerging Markets Equity Income Fund, Inc. | 25 |
Supplemental Information (unaudited)
Results of Annual Meeting of Shareholders
The Annual Meeting of Shareholders was held on March 31, 2022. The description of each proposal and number of shares voted at the meeting are as follows:
To elect one Class II Director to the Board of Directors to serve until the 2025 Annual Meeting of Shareholders:
| | Votes For | Votes Against | Abstained | |
| C. William Maher | 25,757,317 | 16,446,457 | 126,951 | |
To approve the continuation of term of one Director under the Fund's Corporate Governance Policies until the 2023 Annual Meeting of Shareholders:
| | Votes For | Votes Against | Abstained | |
| Steven N. Rappaport (Class III) | 41,075,759 | 1,130,104 | 124,862 | |
Board Approval of Investment Advisory Agreement
The Investment Company Act of 1940 (the "1940 Act") and the terms of the investment advisory agreement (the "Advisory Agreement") between the abrdn Emerging Markets Equity Income Fund, Inc. (the "Fund") and abrdn Asset Managers Limited (the "Adviser" or "AAML") require that the Advisory Agreement be approved annually at an in-person meeting by the Board of Directors (the "Board"), including a majority of the Directors who have no direct or indirect interest in the Advisory Agreement and are not "interested persons" of the Fund, as defined in the 1940 Act (the "Independent Directors").
At a regularly scheduled quarterly meeting held on June 14, 2022 (the "Quarterly Meeting"), the Board voted unanimously to renew the Advisory Agreement between the Fund and the Adviser. In considering whether to approve the continuation of the Fund's Advisory Agreement, the Board members received and considered a variety of information provided by the Adviser relating to the Fund, the Advisory Agreement and the Adviser, including information regarding the nature, extent and quality of services provided by the Adviser under the Advisory Agreement, comparative investment performance, fee and expense information of a peer group of funds (the "Peer Group") selected by Institutional Shareholder Services Inc. ("ISS"), an independent third-party provider of investment company data and other performance information for relevant benchmark indices. In addition, the Independent Directors of the Fund held a separate telephonic meeting on June 8, 2022 (together with the Quarterly Meeting held on June 14, 2022, the "Meetings") to review the materials provided and the relevant legal considerations.
In connection with their consideration of whether to approve the continuation of the Fund's Advisory Agreement, the Board members received and reviewed a variety of information provided by the Advisor relating to the Fund, the Advisory Agreement and the Adviser, including comparative performance, fee and expense information and other information regarding the nature and quality of services provided by the Adviser under the Advisory Agreement. The materials provided to the Board generally included, among other items: (i) information on the investment performance of the Fund and the performance of the Peer Group and the Fund's performance benchmark, including, with respect to the Fund's performance and accounting predecessor (the "Predecessor Fund"), information for the Predecessor Fund for periods prior to the reorganization of seven closed-end funds with and into the Fund (the "Reorganization") and the renaming of the Fund that took effect on April 30, 2018; (ii) a report prepared by the Adviser in response to a request submitted by the Independent Directors' independent legal counsel on behalf of the Independent Directors; (iii) information regarding the Fund's expenses and advisory fees, including information comparing the Fund's expenses to the Peer Group and information about applicable fee "breakpoints" and expense limitations; (iv) information regarding the profitability of the Advisory Agreement to the Adviser; and (v) a memorandum from the Independent Directors' independent legal counsel on the responsibilities of the Board in considering the approval of the investment advisory arrangement under the 1940 Act and Maryland law.
The Board also noted that in addition to the materials provided by the Adviser in connection with the Board's consideration of the renewal of the Advisory Agreement at the Meetings, the Board received and reviewed materials in advance of each regular quarterly meeting that contained information about the Fund's investment performance and information relating to the services provided by the Adviser.
| 26 | abrdn Emerging Markets Equity Income Fund, Inc. |
Supplemental Information (unaudited) (continued)
The Independent Directors were advised by separate independent legal counsel throughout the process and also consulted in executive sessions with their counsel regarding consideration of the renewal of the Advisory Agreement. In determining whether to approve the continuation of the Advisory Agreement, the Board, including the Independent Directors, did not identify any single factor as determinative. Individual Directors may have evaluated the information presented differently from one another and given different weights to various factors. Matters considered by the Board, including the Independent Directors, in connection with its approval of the continuation of the Advisory Agreement include the factors listed below.
In addition, the Board considered other matters such as: (i) the Fund's investment objective and strategy, (ii) the Adviser's investment personnel and operations, (iii) the resources devoted by the Adviser to the Fund, (iv) the Adviser's financial condition and stability, (v) the Adviser's record of compliance with the Fund's investment policies and restrictions, policies on personal securities transactions and other compliance policies, (vi) the allocation of the Fund's brokerage, and the use, if any, of "soft" commission dollars to pay the Fund's expenses and to pay for research and other similar services, and (vii) possible conflicts of interest. Throughout the process, the Board members had the opportunity to ask questions of and request additional information from management.
As part of their deliberations, the Board members considered the following:
Investment performance of the Fund and the Adviser. The Board received and reviewed with the Fund's management, among other performance data, information that compared the Fund's return to comparable investment companies. The Board also received and considered performance information compiled by ISS as compared with the funds in the Fund's Morningstar category (the "Morningstar Group").
In addition, the Board received and reviewed information regarding the Fund's total return on a net and gross basis and relative to the Fund's benchmark and the Fund's and Predecessor Fund's share performance and premium/discount information. The Board also received and considered information about the Fund's and Predecessor Fund's total return against the respective Morningstar Group average and against other comparable abrdn-managed funds. The Directors considered management's discussion of the factors contributing to differences in performance, including differences in the investment strategies, restrictions and risks of each of these other funds. Additionally, the Board took into account information about the Fund's discount/premium ranking relative to its Morningstar Group and management's discussion of the Fund's performance. The Board also considered the Adviser's performance and reputation generally, the responsiveness of the Adviser to Director concerns about performance and the willingness of the Adviser to take steps intended to improve performance. The Board concluded that overall Fund performance supported continuation of the Advisory Agreement.
Economies of Scale. The Board considered management's discussion of the Fund's management fee structure and determined that the management fee structure was reasonable and reflected economies of scale being shared between each of the Fund and the Adviser. The Board based its determination on various factors, including how the Fund's management fees compared relative to the Peer Group at higher asset levels and that the Fund's management fee schedule provided breakpoints at higher asset levels to adjust for anticipated economies in the event of asset increases. The Board also considered that the Adviser had agreed to extend its expense limitation agreement with the Fund, pursuant to which the Adviser agreed to waive a portion of its advisory fee and/or reimburse certain expenses as a means of limiting the Fund's total annual operating expenses for a period of time.
The nature, extent and quality of the services provided to the Fund under the Advisory Agreement. The Directors also considered the nature, extent and quality of the services provided by the Adviser to the Fund and the resources dedicated to the Fund by the Adviser and its affiliates. Among other things, The Board reviewed the background and experience of the Adviser's senior management personnel and the qualifications, background and responsibilities of the portfolio managers primarily responsible for the day-to-day portfolio management services for the Fund. The Directors also considered the financial condition of the Adviser and the Adviser's ability to provide quality service to the Fund. Management reported to the Board on, among other things, its business plans and organizational changes. The Board considered the Adviser's risk management processes. The Board noted that they received information on a regular basis from the Fund's Chief Compliance Officer regarding the Adviser's compliance policies and procedures and considered the Adviser's brokerage policies and practices. The Directors also took into account the Adviser's investment experience and considered information regarding the Adviser's compliance with applicable laws and Securities and Exchange Commission and other regulatory inquiries or audits of the Fund and/or the Adviser. The Directors took into account their knowledge of management and the quality of the performance of management's duties through Board meetings, discussion and reports during the preceding year.
| abrdn Emerging Markets Equity Income Fund, Inc. | 27 |
Supplemental Information (unaudited) (continued)
The costs of the services provided and profits realized by the Adviser and its affiliates from their relationships with the Fund. The Board reviewed with management the effective annual management fee rate paid by the Fund to the Adviser for investment management services. The Board considered the management fee structure, including that management fees for the Fund were based on the Fund's average weekly net assets rather than total managed assets. The Board received and took into account information compiled at the request of the Fund by ISS that compared the Fund's effective annual management fee rate with the fees paid by its Peer Group. Management noted that due to the unique strategy and structure of the Fund, abrdn did not have any closed-end funds that were directly comparable to the Fund. Although there were no other substantially similar AAML-advised investment vehicles against which to compare the Fund's advisory fees, the Adviser provided information for other abrdn products with similar investment strategies to those of the Fund where available. In evaluating the Fund's advisory fees, the Board took into account the demands, complexity and quality of the investment management of the Fund.
In addition to the foregoing, the Board considered the Fund's fees and expenses as compared to its Peer Group, consisting of closed-end funds in the Fund's Morningstar expense category as compiled by ISS.
The Board also considered other factors, which included but were not limited to the following:
| • | the nature, quality, cost and extent of administrative services performed by abrdn Inc. ("AI"), an affiliate of the Adviser, under a separate agreement covering administrative services. |
| • | whether the Fund has operated in accordance with its investment objective, the Fund's record of compliance with its investment restrictions, and the compliance programs of the Adviser. |
| • | the effect of any market and economic volatility on the performance, asset levels and expense ratios of the Fund. |
| • | so-called "fallout benefits" to the Adviser or AI, such as the benefits of research made available to AI by reason of brokerage commissions generated by the Fund's securities transactions or reputational and other indirect benefits. The Board considered any possible conflicts of interest associated with these fallout and other benefits, and the reporting, disclosure and other processes in place to disclose and monitor such possible conflicts of interest. |
Based on their evaluation of all factors that they deemed to be material, including those factors described above, and assisted by the advice of independent counsel, the Directors, including the Independent Directors, voting separately, approved the Fund's Advisory Agreement for an additional one-year period.
| 28 | abrdn Emerging Markets Equity Income Fund, Inc. |
Dividend Reinvestment and Optional Cash Purchase Plan (unaudited)
The Fund intends to distribute to stockholders substantially all of its net investment income and to distribute any net realized capital gains at least annually. Net investment income for this purpose is income other than net realized long-term and short-term capital gains net of expenses. Pursuant to the Dividend Reinvestment and Optional Cash Purchase Plan (the "Plan"), stockholders whose shares of common stock are registered in their own names will be deemed to have elected to have all distributions automatically reinvested by Computershare Trust Company N.A. (the "Plan Agent") in the Fund shares pursuant to the Plan, unless such stockholders elect to receive distributions in cash. Stockholders who elect to receive distributions in cash will receive such distributions paid by check in U.S. Dollars mailed directly to the stockholder by the Plan Agent, as dividend paying agent. In the case of stockholders such as banks, brokers or nominees that hold shares for others who are beneficial owners, the Plan Agent will administer the Plan on the basis of the number of shares certified from time to time by the stockholders as representing the total amount registered in such stockholders' names and held for the account of beneficial owners that have not elected to receive distributions in cash. Investors that own shares registered in the name of a bank, broker or other nominee should consult with such nominee as to participation in the Plan through such nominee and may be required to have their shares registered in their own names in order to participate in the Plan. Please note that the Fund does not issue certificates so all shares will be registered in book entry form. The Plan Agent serves as agent for the stockholders in administering the Plan. If the Directors of the Fund declare an income dividend or a capital gains distribution payable either in the Fund's common stock or in cash, nonparticipants in the Plan will receive cash and participants in the Plan will receive common stock, to be issued by the Fund or purchased by the Plan Agent in the open market, as provided below. If the market price per share (plus expected per share fees) on the valuation date equals or exceeds NAV per share on that date, the Fund will issue new shares to participants at NAV; provided, however, that if the NAV is less than 95% of the market price on the valuation date, then such shares will be issued at 95% of the market price. The valuation date will be the payable date for such distribution or dividend or, if that date is not a trading day on the New York Stock Exchange, the immediately preceding trading date. If NAV exceeds the market price of Fund shares at such time, or if the Fund should declare an income dividend or capital gains distribution payable only in cash, the Plan Agent will, as agent for the participants, buy Fund shares in the open market, on the New York Stock Exchange or elsewhere, for the participants' accounts on, or shortly after, the payment date. If, before the Plan Agent has completed its purchases, the market price exceeds the NAV of a Fund share, the average per share purchase price paid by the Plan Agent may exceed the NAV of the Fund's shares, resulting in the acquisition of fewer shares than if the distribution had been paid in shares issued by the Fund on the dividend payment date.
Because of the foregoing difficulty with respect to open-market purchases, the Plan provides that if the Plan Agent is unable to invest the full dividend amount in open-market purchases during the purchase period or if the market discount shifts to a market premium during the purchase period, the Plan Agent will cease making open-market purchases and will receive the uninvested portion of the dividend amount in newly issued shares at the close of business on the last purchase date.
Participants have the option of making additional cash payments of a minimum of $50 per investment (by check, one-time online bank debit or recurring automatic monthly ACH debit) to the Plan Agent for investment in the Fund's common stock, with an annual maximum contribution of $250,000. The Plan Agent will use all such funds received from participants to purchase Fund shares in the open market on the 25th day of each month or the next trading day if the 25th is not a trading day.
If the participant sets up recurring automatic monthly ACH debits, funds will be withdrawn from his or her U.S. bank account on the 20th of each month or the next business day if the 20th is not a banking business day and invested on the next investment date. The Plan Agent maintains all stockholder accounts in the Plan and furnishes written confirmations of all transactions in an account, including information needed by stockholders for personal and tax records. Shares in the account of each Plan participant will be held by the Plan Agent in the name of the participant, and each stockholder's proxy will include those shares purchased pursuant to the Plan. There will be no brokerage charges with respect to common shares issued directly by the Fund. However, each participant will pay a per share fee of $0.02 incurred with respect to the Plan Agent's open market purchases in connection with the reinvestment of dividends, capital gains distributions and voluntary cash payments made by the participant. Per share fees include any applicable brokerage commissions the Plan Agent is required to pay.
Participants also have the option of selling their shares through the Plan. The Plan supports two types of sales orders. Batch order sales are submitted on each market day and will be grouped with other sale requests to be sold. The price will be the average sale price obtained by Computershare's broker, net of fees, for each batch order and will be sold generally within 2 business days of the request during regular open market hours. Please note that all written sales requests are always processed by Batch Order. ($10 and $0.12 per share). Market Order sales will sell at the next available trade. The shares are sold real time when they hit the market, however an available trade must be presented to complete this transaction. Market Order sales may only be requested by phone at 1-800-647-0584 or using Investor Center through www.computershare.com/buyaberdeen. ($25 and $0.12 per share).
| abrdn Emerging Markets Equity Income Fund, Inc. | 29 |
Dividend Reinvestment and Optional Cash Purchase Plan (unaudited) (concluded)
The receipt of dividends and distributions under the Plan will not relieve participants of any income tax that may be payable on such dividends or distributions. The Fund or the Plan Agent may terminate the Plan as applied to any voluntary cash payments made and any dividend or distribution paid subsequent to notice of the termination sent to members of the Plan at least 30 days prior to the record date for such dividend or distribution. The Plan also may be amended by the Fund or the Plan Agent, but (except when necessary or appropriate to comply
with applicable law or the rules or policies of the Securities and Exchange Commission or any other regulatory authority) only by mailing a written notice at least 30 days prior to the effective date to the participants in the Plan. All correspondence concerning the Plan should be directed to the Plan Agent by phone at 1-800-647-0584, using Investor Center through www.computershare.com/buyaberdeen or in writing to Computershare Trust Company N.A., P.O. Box 505000, Louisville, KY 40233-5000.
| 30 | abrdn Emerging Markets Equity Income Fund, Inc. |
Corporate Information
Directors
Stephen Bird
Nancy Yao Maasbach
C. William Maher
Rahn Porter
Steven N. Rappaport, Chairman
Investment Adviser
Aberdeen Asset Managers Limited
Bow Bells House
1 Bread Street
London, United Kingdom
EC4M 9HH
Custodian
State Street Bank and Trust Company
1 Heritage Drive, 3rd Floor
North Quincy, MA 02171
Administrator
abrdn Inc.
1900 Market Street
Suite 200
Philadelphia, PA 19103
Transfer Agent
Computershare Trust Company, N.A.
P.O. Box 505000
Louisville, KY 40233
Independent Registered Public Accounting Firm
KPMG LLP
1601 Market Street
Philadelphia, PA 19103
Legal Counsel
Dechert LLP
1900 K Street N.W.
Washington, DC 20006
Investor Relations
abrdn Inc.
1900 Market Street, Suite 200
Philadelphia, PA 19103
1-800-522-5465
Investor.Relations@abrdn.com

The Financial Statements as of June 30, 2022, included in this report, were not audited and accordingly, no opinion is expressed thereon.
Notice is hereby given in accordance with Section 23(c) of the Investment Company Act of 1940, as amended, that the Fund may purchase, from time to time, shares of its common stock in the open market.
Shares of abrdn Emerging Markets Equity Income Fund, Inc. are traded on the NYSE American under the symbol "AEF". Information about the Fund's net asset value and market price is available at www.abrdnaef.com.
This report, including the financial information herein, is transmitted to the shareholders of abrdn Emerging Markets Equity Income Fund, Inc. for their general information only. It does not have regard to the specific investment objectives, financial situation and the particular needs of any specific person. Past performance is no guarantee of future returns.
AEF SEMI-ANNUAL
(b) Not applicable.
Item 2 - Code of Ethics.
This item is inapplicable to semi-annual report on Form N-CSR.
Item 3 - Audit Committee Financial Expert.
This item is inapplicable to semi-annual report on Form N-CSR.
Item 4 - Principal Accountant Fees and Services.
This item is inapplicable to semi-annual report on Form N-CSR.
Item 5 - Audit Committee of Listed Registrants.
This item is inapplicable to semi-annual report on Form N-CSR.
Item 6 - Schedule of Investments.
(a) Schedule of Investments in securities of unaffiliated issuers as of close of the reporting period are included as part of the Report to Shareholders filed under Item 1 of this Form N-CSR.
(b) Not applicable.
Item 7 - Disclosure of Proxy Voting Policies and Procedures for Closed-End Management Investment Companies.
This item is inapplicable to semi-annual report on Form N-CSR.
Item 8 - Portfolio Managers of Closed-End Management Investment Companies.
(a) Not applicable to semi-annual report on Form N-CSR.
(b) There has been no change, as of the date of this filing, in any of the portfolio managers identified in response to paragraph (a)(1)of this Item in the registrant’s most recently filed annual report on Form N-CSR.
Item 9 - Purchases of Equity Securities by Closed-End Management Investment Company and Affiliated Purchasers.
No such purchases were made by or on behalf of the Registrant during the period covered by the report.
Item 10 - Submission of Matters to a Vote of Security Holders.
During the period ended June 30, 2022, there were no material changes to the procedures by which shareholders may recommend nominees to the Registrant’s Board of Directors.
Item 11 - Controls and Procedures.
| (a) | The Registrant’s principal executive and principal financial officers, or persons performing similar functions, have concluded that the Registrant’s disclosure controls and procedures (as defined in Rule 30a-3(c) under the Investment Company Act of 1940 (the “Act”) (17 CFR 270.30a-3(c))) are effective, as of a date within 90 days of the filing date of the report that includes the disclosure required by this paragraph, based on the evaluation of these controls and procedures required by Rule 30a-3(b) under the Act (17 CFR 270.30a3(b)) and Rule 13a-15(b) or 15d-15(b) under the Securities Exchange Act of 1934, as amended (17 CFR 240.13a-15(b) or 240.15d15(b)). |
| (b) | There were no changes in the Registrant’s internal control over financial reporting (as defined in Rule 30a-3(d) under the Act (17 CFR 270.30a-3(d))) that occurred during the Registrant’s second fiscal half-year covered buy this report that has materially affected, or is reasonably likely to materially affect, the Registrant’s internal control over financial reporting. |
Item 12. Disclosure of Securities Lending Activities for Closed-End Management Investment Companies
Not applicable.
Item 13. Exhibits.
SIGNATURES
Pursuant to the requirements of the Securities Exchange Act of 1934 and the Investment Company Act of 1940, the Registrant has duly caused this report to be signed on its behalf by the undersigned, thereunto duly authorized.
| abrdn Emerging Markets Equity Income Fund, Inc. | |
| | | |
| By: | /s/ Christian Pittard | |
| | Christian Pittard, | |
| | Principal Executive Officer of
abrdn Emerging Markets Equity Income Fund, Inc. | |
| | | |
| Date: | September 6, 2022 | |
Pursuant to the requirements of the Securities Exchange Act of 1934 and the Investment Company Act of 1940, this report has been signed below by the following persons on behalf of the Registrant and in the capacities and on the dates indicated.
| | | |
| By: | /s/ Christian Pittard | |
| | Christian Pittard, | |
| | Principal Executive Officer of
abrdn Emerging Markets Equity Income Fund, Inc. | |
| | | |
| Date: | September 6, 2022 | |
| | | |
| By: | /s/ Andrea Melia | |
| | Andrea Melia, | |
| | Principal Financial Officer of
abrdn Emerging Markets Equity Income Fund, Inc. | |
| | | |
| Date: | September 6, 2022 | |