UNITED STATES
SECURITIES AND EXCHANGE COMMISSION
Washington, D.C. 20549
FORM N-CSR
CERTIFIED SHAREHOLDER REPORT OF REGISTERED MANAGEMENT INVESTMENT
COMPANIES
Investment Company Act file number: 811-05723
Name of Fund: BlackRock Emerging Markets Fund, Inc.
Fund Address: 100 Bellevue Parkway, Wilmington, DE 19809
Name and address of agent for service: John M. Perlowski, Chief Executive Officer, BlackRock Emerging Markets
Fund, Inc., 55 East 52nd Street, New York, NY 10055
Registrant’s telephone number, including area code: (800) 441-7762
Date of fiscal year end: 10/31/2017
Date of reporting period: 04/30/2017
Item 1 – Report to Stockholders
APRIL 30, 2017
| | | | |
SEMI-ANNUAL REPORT (UNAUDITED) | | | |  |
BlackRock Emerging Markets Fund, Inc.
BlackRock Latin America Fund, Inc.
|
| Not FDIC Insured • May Lose Value • No Bank Guarantee |
Dear Shareholder,
In the 12 months ended April 30, 2017, risk assets, such as stocks and high-yield bonds, delivered strong performance. These markets showed great resilience during a period with big surprises, including the United Kingdom’s vote to leave the European Union and the outcome of the U.S. presidential election, which brought only brief spikes in equity market volatility. However, high-quality assets with more interest rate sensitivity struggled. U.S. Treasuries posted negative returns as rising energy prices, modest wage increases and steady job growth led to expectations of higher inflation and anticipation of interest rate increases by the U.S. Federal Reserve (the “Fed”).
The global reflationary theme — rising nominal growth, wages and inflation — was the dominant driver of asset returns during the period, outweighing significant political upheavals and uncertainty. Reflationary expectations accelerated after the U.S. election and continued into the beginning of 2017, stoked by expectations that the new presidential administration’s policies would provide an extra boost to U.S. growth. More recently, however, growing skepticism about the likelihood of significant near-term U.S. tax reform and infrastructure spending has tempered enthusiasm around the reflation trade. Nonetheless, markets have remained generally positive thus far in 2017 and continue to exhibit low levels of volatility by historical standards. Although political uncertainty persisted, benign credit conditions and expectations for economic growth have kept markets fairly tranquil. The period ended with a global risk asset rally following centrist Emmanuel Macron’s win in the first round of the French presidential election and better-than-expected U.S. and European corporate earnings.
Although economic momentum is gaining traction, the capacity for rapid global growth is restrained by structural factors, including an aging population, low productivity growth and excess savings, as well as cyclical factors, like the Fed moving toward the normalization of monetary policy and the length of the current expansion. Tempered economic growth and high valuations across most assets have set the stage for muted returns going forward.
Equity markets still present opportunities, although the disparity between winners and losers is widening — a dynamic that increases both the risk and return potential of active investing. Fixed income investors are also facing challenges as many sectors are exhibiting higher valuations while rates remain at historically low levels.
In this environment, investors need to think globally, extend their scope across a broad array of asset classes, and be nimble as market conditions change. We encourage you to talk with your financial advisor and visit blackrock.com for further insight about investing in today’s markets.
Sincerely,

Rob Kapito
President, BlackRock Advisors, LLC

Rob Kapito
President, BlackRock Advisors, LLC
| | | | | | | | |
| Total Returns as of April 30, 2017 | |
| | | 6-month | | | 12-month | |
U.S. large cap equities
(S&P 500® Index) | | | 13.32 | % | | | 17.92 | % |
U.S. small cap equities
(Russell 2000® Index) | | | 18.37 | | | | 25.63 | |
International equities
(MSCI Europe, Australasia,
Far East Index) | | | 11.47 | | | | 11.29 | |
Emerging market equities
(MSCI Emerging Markets Index) | | | 8.88 | | | | 19.13 | |
3-month Treasury bills
(BofA Merrill Lynch 3-Month
U.S. Treasury Bill Index) | | | 0.23 | | | | 0.40 | |
U.S. Treasury securities
(BofA Merrill Lynch
10-Year U.S. Treasury
Index) | | | (3.13 | ) | | | (2.68 | ) |
U.S. investment grade bonds
(Bloomberg Barclays U.S.
Aggregate Bond Index) | | | (0.67 | ) | | | 0.83 | |
Tax-exempt municipal
bonds (S&P Municipal
Bond Index) | | | (0.41 | ) | | | 0.57 | |
U.S. high yield bonds
(Bloomberg Barclays U.S. Corporate High Yield 2% Issuer
Capped Index) | | | 5.30 | | | | 13.29 | |
| Past performance is no guarantee of future results. Index performance is shown for illustrative purposes only. You cannot invest directly in an index. | |
| | | | | | |
| | | | | | | |
| 2 | | THIS PAGE NOT PART OF YOUR FUND REPORT | | | | |

| | | | | | |
| | | | | | | |
| | SEMI-ANNUAL REPORT | | APRIL 30, 2017 | | 3 |
| | |
| Fund Summary as of April 30, 2017 | | BlackRock Emerging Markets Fund, Inc. |
BlackRock Emerging Markets Fund, Inc.’s (the “Fund”) investment objective is to seek long-term capital appreciation by investing in securities, principally equity securities, of issuers in countries having smaller capital markets.
| | |
| Portfolio Management Commentary | | |
How did the Fund perform?
| • | | For the six-month period ended April 30, 2017, the Fund underperformed the benchmark, the MSCI Emerging Markets Index. |
What factors influenced performance?
| • | | During the period, the Fund’s exposure to South Korea weighed on performance. In particular, the decision not to hold Samsung Electronics Co. Ltd. for much of the period detracted from returns as the stock performed well based on strong demand for its memory products and OLED display panels, as well as positive fourth quarter earnings. Similarly, an underweight to Taiwanese information technology (“IT”) stocks also detracted as component manufacturers there have benefited from the new mobile phone product cycle. In addition, a position in BRF SA was among the largest detractors, as the Brazilian consumer staples company was negatively affected by weak earnings and the resignation of its chief financial officer during the first quarter of 2017. |
| • | | Conversely, security selection within India was the largest contributor to returns, as holdings there benefited from the global markets’ “risk-on” sentiment, supported by a weaker U.S. dollar and a pickup in global growth. Within India, holdings in the IT services firm Vakrangee Ltd., the private lender Yes Bank Ltd. and the financial firm Indiabulls Housing Finance Ltd. performed well. Additionally, the Fund’s out-of-benchmark allocation to Argentina was among the top performers, as equities there benefited from reform momentum and an acceleration in GDP growth that pointed toward a recovery from the country’s recent recessionary woes. In |
| | | particular, the integrated energy company YPF SA performed well, supported by positive negotiations between President Macri and the oil workers’ union during the first quarter of 2017. More recently, YPF benefited from the government’s April announcement to increase gas prices in the Greater Buenos Aires area. An overweight to Russia also was additive, with positions in Sberbank of Russia PJSC and Novatek OJSC among the top individual contributors for the period. |
Describe recent portfolio activity.
| • | | Most recently the Fund’s IT position was notably decreased, reducing momentum exposure within the Fund. Specifically, the Fund’s allocation to Alibaba Group Holdings Ltd. was trimmed, and holdings in MercadoLibre, Inc. were sold, locking in profits. The Fund also rotated some of its semiconductor exposure from Taiwan Semiconductor Manufacturing Co. Ltd. to Samsung in light of more favorable fundamentals in the latter company. Lastly, exposure to emerging European stocks was increased, with new positions in Turkish Airlines Inc. and a pair of banks, one in Greece and the other in pan-emerging Europe. |
Describe portfolio positioning at period end.
| • | | Relative to the MSCI Emerging Markets Index, the Fund ended the period overweight in Russia and Indonesia, and underweight in Taiwan and South Africa. The Fund also maintained out-of-benchmark holdings in Argentina. In terms of sectors, the Fund ended the period with its most significant overweight to financials, while underweighting telecommunication services. |
The views expressed reflect the opinions of BlackRock as of the date of this report and are subject to change based on changes in market, economic or other conditions. These views are not intended to be a forecast of future events and are no guarantee of future results.
| | | | | | |
| | | | | | | |
| 4 | | SEMI-ANNUAL REPORT | | APRIL 30, 2017 | | |
| | |
| | | BlackRock Emerging Markets Fund, Inc. |
| | |
| Total Return Based on a $10,000 Investment | | |
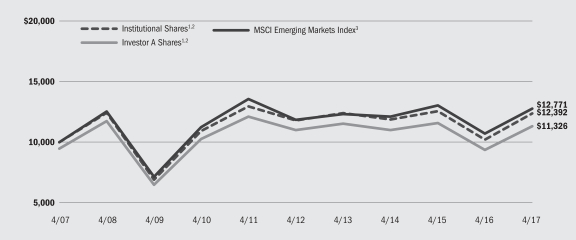
| | 1 | | Assuming maximum sales charges, if any, transaction costs and other operating expenses, including investment advisory fees. Institutional Shares do not have a sales charge. |
| | 2 | | Under normal conditions, the Fund invests at least 80% of its net assets plus any borrowings for investment purposes in equity securities of issuers located in countries with developing capital markets. |
| | 3 | | A free float-adjusted market capitalization index that is designed to measure equity market performance of emerging markets. The MSCI Emerging Markets Index consists of the following 23 emerging market country indexes: Brazil, Chile, China, Colombia, Czech Republic, Egypt, Greece, Hungary, India, Indonesia, Korea, Malaysia, Mexico, Peru, Philippines, Poland, Qatar, Russia, South Africa, Taiwan, Thailand, Turkey and United Arab Emirates. |
| | |
| Performance Summary for the Period Ended April 30, 2017 | | |
| | | | | | | | | | | | | | | | | | | | | | | | | | | | |
| | | | | | Average Annual Total Returns4 | |
| | | | | | 1 Year | | | 5 Years | | | 10 Years | |
| | | 6-Month
Total Returns | | | w/o sales
charge | | | w/sales
charge | | | w/o sales
charge | | | w/sales
charge | | | w/o sales
charge | | | w/sales
charge | |
Institutional | | | 8.62 | % | | | 21.42 | % | | | N/A | | | | 0.98 | % | | | N/A | | | | 2.17 | % | | | N/A | |
Investor A | | | 8.45 | | | | 20.95 | | | | 14.60 | % | | | 0.57 | | | | (0.50 | )% | | | 1.80 | | | | 1.25 | % |
Investor C | | | 7.97 | | | | 19.94 | | | | 18.94 | | | | (0.27 | ) | | | (0.27 | ) | | | 0.96 | | | | 0.96 | |
MSCI Emerging Markets Index | | | 8.88 | | | | 19.13 | | | | N/A | | | | 1.49 | | | | N/A | | | | 2.48 | | | | N/A | |
| | 4 | | Assuming maximum sales charges, if any. Average annual total returns with and without sales charges reflect reductions for distribution and service fees. See “About Fund Performance” on page 10 for a detailed description of share classes, including any related sales charges and fees. |
| | | | N/A — Not applicable as share class and index do not have a sales charge. |
| | | | Past performance is not indicative of future results. |
| | | | Performance results may include adjustments made for financial reporting purposes in accordance with U.S. generally accepted accounting principles. |
| | | | | | | | | | | | | | | | | | | | | | | | | | | | |
| | | Actual | | | Hypothetical6 | | | | |
| | | Beginning
Account Value
November 1, 2016 | | | Ending
Account Value
April 30, 2017 | | | Expenses Paid
During the
Period5 | | | Beginning
Account Value
November 1, 2016 | | | Ending
Account Value
April 30, 2017 | | | Expenses Paid
During the
Period5 | | | Annualized
Expense Ratio | |
Institutional | | $ | 1,000.00 | | | $ | 1,086.20 | | | $ | 6.78 | | | $ | 1,000.00 | | | $ | 1,018.30 | | | $ | 6.56 | | | | 1.31 | % |
Investor A | | $ | 1,000.00 | | | $ | 1,084.50 | | | $ | 8.63 | | | $ | 1,000.00 | | | $ | 1,016.51 | | | $ | 8.35 | | | | 1.67 | % |
Investor C | | $ | 1,000.00 | | | $ | 1,079.70 | | | $ | 12.99 | | | $ | 1,000.00 | | | $ | 1,012.30 | | | $ | 12.57 | | | | 2.52 | % |
| | 5 | | For each class of the Fund, expenses are equal to the annualized net expense ratio for the class, multiplied by the average account value over the period, multiplied by 181/365 (to reflect the one-half year period shown). |
| | 6 | | Hypothetical 5% return before expenses is calculated by prorating the number of days in the most recent fiscal half year divided by 365. |
| | | | See “Disclosure of Expenses” on page 10 for further information on how expenses were calculated. |
| | | | | | |
| | | | | | | |
| | SEMI-ANNUAL REPORT | | APRIL 30, 2017 | | 5 |
| | |
| Fund Summary as of April 30, 2017 | | BlackRock Latin America Fund, Inc. |
BlackRock Latin America Fund Inc.’s (the “Fund”) investment objective is to seek long-term capital appreciation by investing primarily in Latin American equity and debt securities.
| | |
| Portfolio Management Commentary | | |
How did the Fund perform?
| • | | For the six-month period ended April 30, 2017, the Fund’s Institutional Shares outperformed its benchmark, the MSCI Emerging Markets Latin America Index, Investor A Shares performed in line and the Fund’s Investor B and Investor C Shares underperformed. |
What factors influenced performance?
| • | | During the period, the Fund’s out-of-benchmark allocation to Argentina was the top contributor, largely driven by positive macroeconomic data there, as declining unemployment and acceleration in GDP growth pointed toward a recovery from the country’s recent recessionary woes. As a result, positions in the online retailer Mercadolibre, Inc. and the utility company Pampa Energia SA performed well. Also in Argentina, the integrated energy company YPF SA was the top individual contributor for the six-month period, supported by positive negotiations between President Macri and the oil workers’ union during the first quarter of 2017. More recently, YPF benefited from the government’s April announcement to increase gas prices in the Greater Buenos Aires area between 20% and 37%. Stock selection within Brazil also was additive. |
| • | | An underweight to Chile was the largest detractor from returns as the country has continued to be an outperformer in the region, attributable mainly to improving investor sentiment regarding the upcoming presidential election. Stock selection in Mexico also weighed on relative performance, as the Fund’s underweight to the telecommunication services company America Movil SAB de CV detracted in light of the company’s |
| | strong first quarter results. Individual overweights to Petrobras (Petróleo Brasileiro S.A.) and the Brazilian consumer staples company BRF SA were the largest detractors. In particular, BRF was negatively affected by weak earnings and the resignation of the company’s chief financial officer during the first quarter. |
Describe recent portfolio activity.
| • | | During the period, overall portfolio positioning was largely unchanged. Within Mexico, the Fund’s allocation to domestic Mexican firms was reduced in favor of non-Mexican companies with exposure to the country. In the process, America Movil was reintroduced to the portfolio, while exposure to Walmex de Mexico SAB de CV and Grupo Financiero Banorte SAB de CV was reduced; the Fund also exited Fibra Uno Administracion SA de CV. In addition, the Fund sold its position in the Peruvian mining company Compania de Minas Buenaventura SA. Lastly, the Fund utilized cash to increase its exposure to Brazil. Specifically, the Fund participated in a successful initial public offering by the Brazilian airline Azul Linhas Aéreas Brasileiras S/A, while also increasing its Banco Bradesco SA position. |
Describe portfolio positioning at period end.
| • | | At period end, the Fund was overweight in Brazil and Peru, and underweight in Chile, Mexico and Colombia. The Fund also maintained an out-of-benchmark allocation to Argentina. At the sector level, the Fund was overweight in energy and select consumer staples names, and underweight in consumer discretionary and utilities. |
The views expressed reflect the opinions of BlackRock as of the date of this report and are subject to change based on changes in market, economic or other conditions. These views are not intended to be a forecast of future events and are no guarantee of future results.
| | | | | | |
| | | | | | | |
| 6 | | SEMI-ANNUAL REPORT | | APRIL 30, 2017 | | |
| | | | |
| | | BlackRock Latin America Fund, Inc. |
| | |
| Total Return Based on a $10,000 Investment | | |
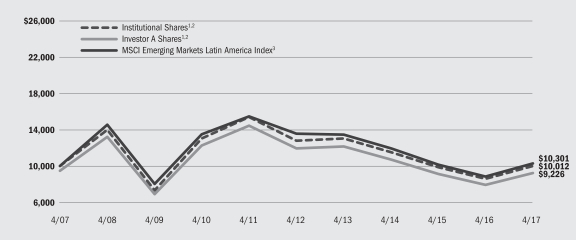
| | 1 | | Assuming maximum sales charge, if any, transaction costs and other operating expenses, including investment advisory fees. Institutional Shares do not have a sales charge. |
| | 2 | | Under normal market conditions, the Fund will invest at least 80% of its net assets plus any borrowings for investment purposes in Latin American securities. |
| | 3 | | A free float-adjusted market capitalization weighted index that is designed to measure the equity market performance of emerging markets in Latin America. |
| | |
| Performance Summary for the Period Ended April 30, 2017 | | |
| | | | | | | | | | | | | | | | | | | | | | | | | | | | |
| | | | | | Average Annual Total Returns4 | |
| | | | | | 1 Year | | | 5 Years | | | 10 Years | |
| | | 6-Month
Total Returns | | | w/o sales
charge | | | w/sales
charge | | | w/o sales
charge | | | w/sales
charge | | | w/o sales
charge | | | w/sales
charge | |
Institutional | | | 1.22 | % | | | 16.61 | % | | | N/A | | | | (4.80 | )% | | | N/A | | | | 0.01 | % | | | N/A | |
Investor A | | | 1.07 | | | | 16.24 | | | | 10.14 | % | | | (5.06 | ) | | | (6.08 | )% | | | (0.27 | ) | | | (0.80 | )% |
Investor B | | | 0.36 | | | | 14.72 | | | | 10.22 | | | | (6.10 | ) | | | (6.47 | ) | | | (0.98 | ) | | | (0.98 | ) |
Investor C | | | 0.63 | | | | 15.28 | | | | 14.28 | | | | (5.86 | ) | | | (5.86 | ) | | | (1.09 | ) | | | (1.09 | ) |
MSCI Emerging Markets Latin America Index | | | 1.04 | | | | 16.31 | | | | N/A | | | | (5.39 | ) | | | N/A | | | | 0.30 | | | | N/A | |
| | 4 | | Assuming maximum sales charges, if any. Average annual total returns with and without sales charges reflect reductions for distribution and service fees. See “About Fund Performance” on page 10 for a detailed description of share classes, including any related sales charges and fees. |
| | | | N/A — Not applicable as share class and index do not have a sales charge. |
| | | | Past performance is not indicative of future results. |
| | | Performance results may include adjustments made for financial reporting purposes in accordance with U.S. generally accepted accounting principles. |
| | | | | | | | | | | | | | | | | | | | | | | | | | | | |
| | | Actual | | | Hypothetical6 | | | | |
| | | Beginning
Account Value
November 1, 2016 | | | Ending
Account Value
April 30, 2017 | | | Expenses Paid
During the
Period5 | | | Beginning
Account Value
November 1, 2016 | | | Ending
Account Value
April 30, 2017 | | | Expenses Paid
During the
Period5 | | | Annualized
Expense Ratio | |
Institutional | | $ | 1,000.00 | | | $ | 1,012.20 | | | $ | 6.64 | | | $ | 1,000.00 | | | $ | 1,018.20 | | | $ | 6.66 | | | | 1.33 | % |
Investor A | | $ | 1,000.00 | | | $ | 1,010.70 | | | $ | 8.23 | | | $ | 1,000.00 | | | $ | 1,016.61 | | | $ | 8.25 | | | | 1.65 | % |
Investor B | | $ | 1,000.00 | | | $ | 1,003.60 | | | $ | 15.65 | | | $ | 1,000.00 | | | $ | 1,009.17 | | | $ | 15.69 | | | | 3.15 | % |
Investor C | | $ | 1,000.00 | | | $ | 1,006.30 | | | $ | 12.44 | | | $ | 1,000.00 | | | $ | 1,012.40 | | | $ | 12.47 | | | | 2.50 | % |
| | 5 | | For each class of the Fund, expenses are equal to the annualized net expense ratio for the class, multiplied by the average account value over the period, multiplied by 181/365 (to reflect the one-half year period shown). |
| | 6 | | Hypothetical 5% annual return before expenses is calculated by prorating the number of days in the most recent fiscal half year divided by 365. |
| | | | See “Disclosure of Expenses” on page 10 for further information on how expenses were calculated. |
| | | | | | |
| | | | | | | |
| | SEMI-ANNUAL REPORT | | APRIL 30, 2017 | | 7 |
| | | | |
| Portfolio Information as of April 30, 2017 | | |
| | |
| BlackRock Emerging Markets Fund, Inc. | | |
| | |
Ten Largest Holdings | | Percent of
Net Assets |
| | | | |
Alibaba Group Holding Ltd. — ADR | | | 5 | % |
Tencent Holdings Ltd. | | | 5 | |
Samsung Electronics Co. Ltd. | | | 4 | |
Sberbank of Russia PJSC — ADR | | | 4 | |
Bank of China Ltd. | | | 3 | |
Itau Unibanco Holding SA, Preference Shares — ADR | | | 3 | |
Naspers Ltd. | | | 3 | |
Housing Development Finance Corp. | | | 2 | |
Erste Group Bank AG | | | 2 | |
Taiwan Semiconductor Manufacturing Co. Ltd. | | | 2 | |
| | |
| Geographic Allocation | | Percent of
Net Assets |
| | | | |
China | | | 27 | % |
South Korea | | | 13 | |
India | | | 10 | |
Brazil | | | 10 | |
Russia | | | 8 | |
Indonesia | | | 5 | |
Mexico | | | 5 | |
Thailand | | | 3 | |
South Africa | | | 3 | |
Taiwan | | | 3 | |
Austria | | | 2 | |
Argentina | | | 2 | |
Turkey | | | 2 | |
Greece | | | 1 | |
Peru | | | 1 | |
Philippines | | | 1 | |
United Arab Emirates | | | 1 | |
Other | | | 2 | 1 |
Other Assets Less Liabilities | | | 1 | |
| | 1 | | Other includes a 1% or less investment in each of the following countries: |
Ukraine and the United States.
| | |
| BlackRock Latin America Fund, Inc. | | |
| | |
| Ten Largest Holdings | | Percent of
Net Assets |
| | | | |
Banco Bradesco SA — ADR | | | 9 | % |
Itau Unibanco Holding SA, Preference Shares — ADR | | | 7 | |
Petroleo Brasileiro SA — ADR | | | 7 | |
AMBEV SA — ADR | | | 4 | |
BM&FBovespa SA | | | 4 | |
Fomento Economico Mexicano SAB de CV — ADR | | | 4 | |
Grupo Financiero Banorte SAB de CV, Series O | | | 3 | |
Vale SA | | | 3 | |
Cemex SAB de CV — ADR | | | 3 | |
Vale SA — ADR | | | 3 | |
| | |
| Geographic Allocation | | Percent of
Net Assets |
| | | | |
Brazil | | | 65 | % |
Mexico | | | 25 | |
Peru | | | 4 | |
Argentina | | | 4 | |
Chile | | | 1 | |
Other | | | 1 | 1 |
| | 1 | | Other includes a 1% or less investment in each of the following countries: |
Colombia and the United States.
| | | | | | |
| | | | | | | |
| 8 | | SEMI-ANNUAL REPORT | | APRIL 30, 2017 | | |
| • | | Institutional Shares are not subject to any sales charge. These shares bear no ongoing distribution or service fees and are available only to certain eligible investors. |
| • | | Investor A Shares are subject to a maximum initial sales charge (front-end load) of 5.25% and a service fee of 0.25% per year (but no distribution fee). Certain redemptions of these shares may be subject to a contingent deferred sales charge (“CDSC”) where no initial sales charge was paid at the time of purchase. These shares are generally available through financial intermediaries. |
| • | | Investor B Shares (available only in BlackRock Latin America Fund, Inc.) are subject to a maximum CDSC of 4.50% declining to 0% after six years. In addition, these shares are subject to a distribution fee of 0.75% per year and a service fee of 0.25% per year. These shares automatically convert to Investor A Shares after approximately eight years. (There is no initial sales charge for automatic share conversions.) All returns for periods greater than eight years reflect this conversion. These shares are only available through exchanges and distribution reinvestments by current holders and for purchase by certain employer-sponsored retirement plans. |
| • | | Investor C Shares are subject to a 1.00% CDSC if redeemed within one year of purchase. In addition, these shares are subject to a distribution |
| | | fee of 0.75% per year and a service fee of 0.25% per year. These shares are generally available through financial intermediaries. |
Performance information reflects past performance and does not guarantee future results. Current performance may be lower or higher than the performance data quoted. Refer to www.blackrock.com/funds to obtain performance data current to the most recent month end. Performance results do not reflect the deduction of taxes that a shareholder would pay on fund distributions or the redemption of fund shares. Figures shown in the performance tables on the previous pages assume reinvestment of all distributions, if any, at net asset value (“NAV”) on the ex-dividend date. Investment return and principal value of shares will fluctuate so that shares, when redeemed, may be worth more or less than their original cost. Distributions paid to each class of shares will vary because of the different levels of service, distribution and transfer agency fees applicable to each class, which are deducted from the income available to be paid to shareholders.
BlackRock Advisors, LLC (the “Manager”), each Fund’s investment adviser, waived a portion of the Funds’ expenses. Without such waiver, the Funds’ performance would have been lower. The Manager is under no obligation to waive or to continue waiving its fees and such voluntary waiver may be reduced or discontinued at any time. See Note 5 of the Notes to Financial Statements for additional information on waivers.
Shareholders of these Funds may incur the following charges: (a) transactional expenses, such as sales charges; and (b) operating expenses, including investment advisory fees, service and distribution fees, including 12b-1 fees, acquired fund fees and expenses, and other fund expenses. The expense examples on previous pages (which are based on a hypothetical investment of $1,000 invested on November 1, 2016 and held through April 30, 2017) are intended to assist shareholders both in calculating expenses based on an investment in each Fund and in comparing these expenses with similar costs of investing in other mutual funds.
The expense examples provide information about actual account values and actual expenses. In order to estimate the expenses a shareholder paid during the period covered by this report, shareholders can divide their account value by $1,000 and then multiply the result by the number corresponding to their Fund and share class under the heading entitled “Expenses Paid During the Period.”
The expense examples also provide information about hypothetical account values and hypothetical expenses based on a Fund’s actual expense ratio and an assumed rate of return of 5% per year before expenses. In order to assist shareholders in comparing the ongoing expenses of investing in these Funds and other funds, compare the 5% hypothetical examples with the 5% hypothetical examples that appear in shareholder reports of other funds.
The expenses shown in the expense examples are intended to highlight shareholders’ ongoing costs only and do not reflect any transactional expenses, such as sales charges, if any. Therefore, the hypothetical examples are useful in comparing ongoing expenses only, and will not help shareholders determine the relative total expenses of owning different funds. If these transactional expenses were included, shareholder expenses would have been higher.
| | | | | | |
| | | | | | | |
| | SEMI-ANNUAL REPORT | | APRIL 30, 2017 | | 9 |
| | |
Schedule of Investments April 30, 2017 (Unaudited) | | BlackRock Emerging Markets Fund, Inc. (Percentages shown are based on Net Assets) |
| | | | | | | | |
| Common Stocks | | Shares | | | Value | |
| Argentina — 2.1% | |
Grupo Financiero Galicia SA — ADR | | | 57,721 | | | $ | 2,255,159 | |
YPF SA — ADR | | | 180,729 | | | | 4,668,230 | |
| | | | | | | | |
| | | | | | | | 6,923,389 | |
| Austria — 2.2% | |
Erste Group Bank AG | | | 204,460 | | | | 7,320,445 | |
| Brazil — 8.5% | |
Banco Nacional SA, Preference Shares (a) | | | 42,567,626 | | | | 134 | |
EcoRodovias Infraestrutura e Logistica SA | | | 1,236,047 | | | | 3,676,150 | |
Itau Unibanco Holding SA, Preference Shares — ADR | | | 877,063 | | | | 10,787,875 | |
Kroton Educacional SA | | | 1,426,612 | | | | 6,719,443 | |
Linx SA | | | 555,041 | | | | 3,096,919 | |
Rumo SA (a) | | | 1,392,263 | | | | 3,829,321 | |
| | | | | | | | |
| | | | | | | | 28,109,842 | |
| China — 24.8% | |
Alibaba Group Holding Ltd. — ADR (a) | | | 141,950 | | | | 16,395,225 | |
Anhui Conch Cement Co. Ltd., Class H | | | 1,149,000 | | | | 4,018,114 | |
Bank of China Ltd., Class H | | | 23,793,200 | | | | 11,509,071 | |
Brilliance China Automotive Holdings Ltd. | | | 2,266,000 | | | | 3,796,005 | |
China Overseas Land & Investment Ltd. | | | 1,990,000 | | | | 5,772,168 | |
China Petroleum & Chemical Corp., Class H | | | 4,954,000 | | | | 4,022,913 | |
Jiangsu Expressway Co. Ltd., Class H | | | 2,460,000 | | | | 3,629,974 | |
NetEase, Inc. — ADR | | | 5,861 | | | | 1,555,451 | |
New Oriental Education & Technology Group, Inc. — ADR (a) | | | 63,774 | | | | 4,115,974 | |
Silergy Corp. | | | 285,000 | | | | 5,153,662 | |
Sino Biopharmaceutical Ltd. | | | 7,825,000 | | | | 6,430,464 | |
Tencent Holdings Ltd. | | | 498,510 | | | | 15,619,973 | |
| | | | | | | | |
| | | | | | | | 82,018,994 | |
| Greece — 1.4% | |
Alpha Bank AE (a) | | | 2,249,003 | | | | 4,791,080 | |
| India — 9.8% | |
Bharat Petroleum Corp. Ltd. | | | 359,161 | | | | 4,015,896 | |
Housing Development Finance Corp. | | | 337,118 | | | | 8,048,685 | |
Indiabulls Housing Finance Ltd. | | | 257,533 | | | | 4,067,226 | |
ITC Ltd. | | | 1,469,620 | | | | 6,345,561 | |
Larsen & Toubro Ltd. | | | 54,432 | | | | 1,479,999 | |
Vakrangee Ltd. | | | 763,180 | | | | 4,056,025 | |
Yes Bank Ltd. | | | 167,734 | | | | 4,251,763 | |
| | | | | | | | |
| | | | | | | | 32,265,155 | |
| Indonesia — 5.4% | |
Astra International Tbk PT | | | 2,296,500 | | | | 1,539,095 | |
Bank Central Asia Tbk PT | | | 3,101,724 | | | | 4,125,110 | |
Bumi Serpong Damai Tbk PT | | | 14,057,700 | | | | 1,883,231 | |
Semen Indonesia Persero Tbk PT | | | 4,682,300 | | | | 3,094,357 | |
Summarecon Agung Tbk PT | | | 15,243,300 | | | | 1,551,522 | |
Telekomunikasi Indonesia Persero Tbk PT | | | 17,681,100 | | | | 5,832,753 | |
| | | | | | | | |
| | | | | | | | 18,026,068 | |
| Mexico — 5.0% | |
Arca Continental SAB de CV | | | 665,807 | | | | 4,911,521 | |
Fresnillo PLC | | | 84,368 | | | | 1,586,300 | |
Grupo Financiero Banorte SAB de CV, Series O | | | 842,803 | | | | 4,877,672 | |
Wal-Mart de Mexico SAB de CV | | | 2,254,378 | | | | 5,089,498 | |
| | | | | | | | |
| | | | | | | | 16,464,991 | |
| | | | | | | | |
| Common Stocks | | Shares | | | Value | |
| Peru — 1.2% | |
Credicorp Ltd. | | | 25,805 | | | $ | 3,965,196 | |
| Philippines — 1.2% | |
Metropolitan Bank & Trust Co. | | | 2,312,300 | | | | 3,906,465 | |
| Russia — 7.8% | |
Gazprom PJSC — ADR | | | 793,998 | | | | 3,769,545 | |
Inter Rao UES PJSC | | | 53,444,534 | | | | 3,809,951 | |
Lukoil PJSC — ADR | | | 73,151 | | | | 3,630,970 | |
Mail.ru Group Ltd. — GDR (a) | | | 59,666 | | | | 1,572,199 | |
Sberbank of Russia PJSC — ADR | | | 1,090,202 | | | | 12,997,189 | |
| | | | | | | | |
| | | | | | | | 25,779,854 | |
| South Africa — 3.0% | |
Naspers Ltd., Class N | | | 52,535 | | | | 9,989,608 | |
| South Korea — 13.4% | |
Korea Aerospace Industries Ltd. | | | 69,462 | | | | 3,893,297 | |
LG Chem Ltd. | | | 19,244 | | | | 4,628,723 | |
Pan Ocean Co. Ltd. (a) | | | 1,067,475 | | | | 4,880,777 | |
POSCO | | | 19,931 | | | | 4,705,369 | |
Samsung Electronics Co. Ltd. | | | 7,206 | | | | 14,126,839 | |
Samsung Electronics Co. Ltd., Preference Shares | | | 2,666 | | | | 4,105,437 | |
SK Hynix, Inc. | | | 74,055 | | | | 3,508,234 | |
WONIK IPS Co., Ltd. (a) | | | 190,686 | | | | 4,337,001 | |
| | | | | | | | |
| | | | | | | | 44,185,677 | |
| Taiwan — 2.6% | |
Powertech Technology, Inc. | | | 529,000 | | | | 1,659,592 | |
Taiwan Semiconductor Manufacturing Co. Ltd., ADR | | | 211,715 | | | | 7,001,415 | |
| | | | | | | | |
| | | | | | | | 8,661,007 | |
| Thailand — 3.0% | |
Kasikornbank PCL — NVDR | | | 537,400 | | | | 2,871,746 | |
PTT PCL | | | 620,400 | | | | 6,977,034 | |
| | | | | | | | |
| | | | | | | | 9,848,780 | |
| Turkey — 1.9% | |
Koza Altin Isletmeleri AS (a)(b) | | | 312,987 | | | | 1,700,915 | |
Turk Hava Yollari (a) | | | 2,720,528 | | | | 4,639,877 | |
| | | | | | | | |
| | | | | | | | 6,340,792 | |
| Ukraine — 0.4% | |
Ferrexpo PLC | | | 702,811 | | | | 1,438,387 | |
| United Arab Emirates — 1.1% | |
DP World Ltd. | | | 77,310 | | | | 1,580,217 | |
NMC Health PLC | | | 75,726 | | | | 1,952,183 | |
| | | | | | | | |
| | | | | | | | 3,532,400 | |
| Total Common Stocks — 94.8% | | | | | | | 313,568,130 | |
| | | | | | | | |
| | | | | | | | | |
|
| Participation Notes | |
| Brazil — 1.2% | |
Morgan Stanley (Multiplan Empreendimentos Imobiliarios SA), due 04/12/19 | | | 180,550 | | | | 3,906,813 | |
| Thailand — 0.1% | |
Deutsche Bank (Kasikornbank PCL), due 3/10/25 (a) | | | 40,272 | | | | 215,390 | |
| Total Participation Notes — 1.3% | | | | | | | 4,122,203 | |
| | | | | | | | |
| | |
| ADR | | American Depositary Receipts |
| BRL | | Brazilian Real |
| GDR | | Global Depositary Receipt |
| NVDR | | Non-voting Depository Receipts |
| PCL | | Public Company Limited |
See Notes to Financial Statements.
| | | | | | |
| | | | | | | |
| 10 | | SEMI-ANNUAL REPORT | | APRIL 30, 2017 | | |
| | |
Schedule of Investments (continued) | | BlackRock Emerging Markets Fund, Inc. |
| | | | | | | | |
| Warrants | | Shares | | | Value | |
| China — 2.6% | |
Deutsche Bank AG, (Expires 06/08/26) (a) | | | 82,327 | | | $ | 4,935,275 | |
Weifu High-Technology Group Co. Ltd., (Expires 12/22/17) (a) | | | 1,045,293 | | | | 3,740,226 | |
| Total Warrants — 2.6% | | | | | | | 8,675,501 | |
Total Long-Term Investments
(Cost — $275,758,942) — 98.7% | | | | | | | 326,365,834 | |
| | | | | | | | |
| Short-Term Securities | | Shares | | | Value | |
BlackRock Liquidity Funds, T-Fund, Institutional Class, 0.64% (c)(d) | | | 453,561 | | | $ | 453,561 | |
SL Liquidity Series, LLC, Money Market Series, 1.09% (c)(d)(e) | | | 123,182 | | | | 123,207 | |
Total Short-Term Securities
(Cost — $576,768) — 0.2% | | | | 576,768 | |
Total Investments (Cost — $276,335,710) — 98.9% | | | | 326,942,602 | |
Other Assets Less Liabilities — 1.1% | | | | 3,796,812 | |
| | | | | | | | |
Net Assets — 100.0% | | | $ | 330,739,414 | |
| | | | | | | | |
|
| Notes to Schedule of Investments |
| (a) | | Non-income producing security. |
| (b) | | Security, or a portion of the security, is on loan. |
| (c) | | During the six months ended April 30, 2017, investments in issuers considered to be affiliates of the Fund for purposes of Section 2(a)(3) of the Investment Company Act of 1940, as amended, were as follows: |
| | | | | | | | | | | | | | | | | | | | | | | | | | | | |
| Affiliate | | Shares Held
at October 31,
2016 | | | Net
Activity | | | Shares Held
at April 30,
2017 | | | Value at
April 30,
2017 | | | Income | | | Net Realized
Gain1 | | | Change in
Unrealized
Appreciation
(Depreciation) | |
BlackRock Liquidity Funds, T-Fund, Institutional Class | | | 3,774,950 | | | | (3,321,389 | ) | | | 453,561 | | | $ | 453,561 | | | $ | 5,571 | | | $ | 16 | | | | — | |
SL Liquidity Series, LLC, Money Market Series | | | — | | | | 123,182 | | | | 123,182 | | | | 123,207 | | | | 238 | 2 | | | — | | | | — | |
Total | | | $ | 576,768 | | | $ | 5,809 | | | $ | 16 | | | | — | |
| | | | | | | | | | | | | | | | | |
1 Includes net capital gain distributions. | |
2 Represents securities lending income earned from the reinvestment of cash collateral from loaned securities, net of fees and collateral investment expenses, and other payments to and from borrowers of securities. | |
| (d) | | Current yield as of period end. |
| (e) | | Security was purchased with the cash collateral from loaned securities. |
|
| Fair Value Hierarchy as of Period End |
Various inputs are used in determining the fair value of investments. For information about the Fund’s policy regarding valuation of investments, refer to the Notes to Financial Statements.
See Notes to Financial Statements.
| | | | | | |
| | | | | | | |
| | SEMI-ANNUAL REPORT | | APRIL 30, 2017 | | 11 |
| | |
Schedule of Investments (concluded) | | BlackRock Emerging Markets Fund, Inc. |
The following tables summarize the Fund’s investments categorized in the disclosure hierarchy:
| | | | | | | | | | | | | | | | |
| | | Level 1 | | | Level 2 | | | Level 3 | | | Total | |
Assets: | |
| Investments: | | | | | | | | | | | | | | | | |
| Common Stocks: | | | | | | | | | | | | | | | | |
Argentina | | $ | 6,923,389 | | | | — | | | | — | | | $ | 6,923,389 | |
Austria | | | — | | | $ | 7,320,445 | | | | — | | | | 7,320,445 | |
Brazil | | | 28,109,708 | | | | — | | | $ | 134 | | | | 28,109,842 | |
China | | | 22,066,650 | | | | 59,952,344 | | | | — | | | | 82,018,994 | |
Greece | | | — | | | | 4,791,080 | | | | — | | | | 4,791,080 | |
India | | | — | | | | 32,265,155 | | | | — | | | | 32,265,155 | |
Indonesia | | | — | | | | 18,026,068 | | | | — | | | | 18,026,068 | |
Mexico | | | 14,878,691 | | | | 1,586,300 | | | | — | | | | 16,464,991 | |
Peru | | | 3,965,196 | | | | — | | | | — | | | | 3,965,196 | |
Philippines | | | — | | | | 3,906,465 | | | | — | | | | 3,906,465 | |
Russia | | | 1,572,199 | | | | 24,207,655 | | | | — | | | | 25,779,854 | |
South Africa | | | — | | | | 9,989,608 | | | | — | | | | 9,989,608 | |
South Korea | | | — | | | | 44,185,677 | | | | — | | | | 44,185,677 | |
Taiwan | | | 7,001,415 | | | | 1,659,592 | | | | — | | | | 8,661,007 | |
Thailand | | | 6,977,034 | | | | 2,871,746 | | | | — | | | | 9,848,780 | |
Turkey | | | — | | | | 6,340,792 | | | | — | | | | 6,340,792 | |
Ukraine | | | — | | | | 1,438,387 | | | | — | | | | 1,438,387 | |
United Arab Emirates | | | 1,580,217 | | | | 1,952,183 | | | | — | | | | 3,532,400 | |
Participation Notes | | | — | | | | 215,390 | | | | 3,906,813 | | | | 4,122,203 | |
Warrants | | | — | | | | 8,675,501 | | | | — | | | | 8,675,501 | |
Short-Term Securities | | | 453,561 | | | | — | | | | — | | | | 453,561 | |
| | | | |
Subtotal | | $ | 93,528,060 | | | $ | 229,384,388 | | | $ | 3,906,947 | | | $ | 326,819,395 | |
| | | | |
Investments Valued at NAV1 | | | | 123,207 | |
| | | | | | | | | | | | | | | | |
Total Investments | | | | | | | | | | | | | | $ | 326,942,602 | |
| | | | | | | | | | | | | | | | |
1 As of April 30, 2017, certain investments of the Fund were fair valued using NAV per share as no quoted market value is available and therefore have been excluded from the fair value hierarchy. | |
During the six months ended April 30, 2017, there were no transfers between Level 1 and Level 2.
A reconciliation of Level 3 investments is presented when the Fund had a significant amount of Level 3 investments at the beginning and/or end of the period in relation to net assets. The following table is a reconciliation of Level 3 investments for which significant unobservable inputs were used in determining fair value:
| | | | | | | | | | | | |
| | | Common Stocks | | | Participation
Notes | | | Total | |
| Assets: | | | | | | | | | |
Opening Balance, as of October 31, 2016 | | $ | 133 | | | $ | 3,653,808 | | | $ | 3,653,941 | |
Transfers into Level 3 | | | — | | | | — | | | | — | |
Transfers out of Level 3 | | | — | | | | — | | | | — | |
Accrued discounts/premiums | | | — | | | | — | | | | — | |
Net realized gain (loss) | | | — | | | | 43,722 | | | | 43,722 | |
Net change in unrealized appreciation (depreciation)1,2 | | | 1 | | | | 233,404 | | | | 233,405 | |
Purchases | | | — | | | | 186,423 | | | | 186,423 | |
Sales | | | — | | | | (210,544 | ) | | | (210,544 | ) |
| | | | | | | | | | | | |
Closing Balance, as of April 30 2017 | | $ | 134 | | | $ | 3,906,813 | | | $ | 3,906,947 | |
| | | | | | | | | | | | |
Net change in unrealized appreciation (depreciation) on investments still held at April 30, 20172 | | $ | 1 | | | $ | 233,404 | | | $ | 233,405 | |
| | | | | | | | | | | | |
1 Included in the related net change in unrealized appreciation (depreciation) in the Statements of Operations. | |
2 Any difference between net change in unrealized appreciation (depreciation) and net change in unrealized appreciation (depreciation) on investments still held at April 30, 2017 is generally due to investments no longer held or categorized as Level 3 at period end. | |
The Fund’s investments that are categorized as Level 3 were valued utilizing third party pricing information without adjustment. Such valuations are based on unobservable inputs. A significant change in third party information inputs could result in a significantly lower or higher value of such Level 3 investments.
See Notes to Financial Statements.
| | | | | | |
| | | | | | | |
| 12 | | SEMI-ANNUAL REPORT | | APRIL 30, 2017 | | |
| | |
Schedule of Investments April 30, 2017 (Unaudited) | | BlackRock Latin America Fund, Inc. (Percentages shown are based on Net Assets) |
| | | | | | | | | | | | |
| Common Stocks | | Shares | | | Value | |
| Argentina — 3.9% | |
Adecoagro SA (a) | | | | | | | 105,000 | | | $ | 1,164,450 | |
MercadoLibre, Inc. | | | | | | | 5,000 | | | | 1,144,550 | |
Pampa Energia SA, ADR (a) | | | | | | | 35,000 | | | | 1,908,900 | |
YPF SA — ADR | | | | | | | 105,000 | | | | 2,712,150 | |
| | | | | | | | | | | | |
| | | | | | | | | | | | 6,930,050 | |
| Brazil — 64.6% | |
AMBEV SA — ADR | | | | | | | 1,275,000 | | | | 7,305,750 | |
Arezzo Industria e Comercio SA | | | | | | | 125,000 | | | | 1,327,168 | |
Azul SA — ADR (a) | | | | | | | 27,718 | | | | 629,476 | |
Banco Bradesco SA — ADR | | | | | | | 1,450,000 | | | | 15,297,500 | |
Banco do Brasil SA | | | | | | | 295,000 | | | | 3,053,118 | |
BM&FBovespa SA | | | | | �� | | 1,194,781 | | | | 7,155,775 | |
BR Malls Participacoes SA (a) | | | | | | | 380,000 | | | | 1,682,078 | |
Bradespar SA, Preference Shares | | | | | | | 265,000 | | | | 1,657,268 | |
BRF SA — ADR | | | | | | | 204,784 | | | | 2,547,513 | |
CCR SA | | | | | | | 625,000 | | | | 3,485,295 | |
Cia Energetica de Sao Paulo, Preference ‘B’ Shares | | | | | | | 215,000 | | | | 1,226,036 | |
Hypermarcas SA | | | | | | | 210,000 | | | | 1,988,816 | |
Iguatemi Empresa de Shopping Centers SA | | | | | | | 215,000 | | | | 2,246,830 | |
Iochpe-Maxion SA | | | | | | | 294,781 | | | | 1,551,894 | |
Itau Unibanco Holding SA, Preference Shares — ADR | | | | | | | 1,050,000 | | | | 12,915,000 | |
Kroton Educacional SA | | | | | | | 1,050,000 | | | | 4,945,574 | |
Linx SA | | | | | | | 180,000 | | | | 1,004,332 | |
Petroleo Brasileiro SA — ADR (a) | | | | | | | 1,775,000 | | | | 15,621,750 | |
Qualicorp SA | | | | | | | 4,014 | | | | 28,581 | |
Raia Drogasil SA | | | | | | | 120,000 | | | | 2,550,054 | |
Rumo SA (a) | | | | | | | 1,500,000 | | | | 4,125,644 | |
Sao Martinho SA | | | | | | | 170,000 | | | | 953,356 | |
Telefonica Brasil SA — ADR | | | | | | | 100,000 | | | | 1,479,000 | |
Telefonica Brasil SA, Preference Shares | | | | | | | 285,000 | | | | 4,246,200 | |
Transmissora Alianca de Energia Eletrica SA | | | | | | | 165,000 | | | | 1,196,153 | |
Ultrapar Participacoes SA | | | | | | | 200,000 | | | | 4,437,233 | |
Vale SA, Preference Shares — ADR | | | | | | | 625,000 | | | | 5,131,250 | |
Vale SA — ADR | | | | | | | 585,000 | | | | 5,019,300 | |
| | | | | | | | | | | | |
| | | | | | | | | | | | 114,807,944 | |
| Chile — 1.1% | |
Empresa Nacional de Electricidad SA | | | | | | | 565,000 | | | | 432,466 | |
Empresa Nacional de Electricidad SA — ADR | | | | | | | 22,000 | | | | 505,560 | |
Itau CorpBanca | | | | | | | 120,000,000 | | | | 1,093,909 | |
| | | | | | | | | | | | |
| | | | | | | | | | | | 2,031,935 | |
| Colombia — 0.4% | |
Cemex Latam Holdings SA (a) | | | | | | | 205,000 | | | | 748,369 | |
| Mexico — 24.6% | |
Alsea SAB de CV | | | | | | | 300,000 | | | | 1,065,962 | |
America Movil SAB de CV, Series L — ADR | | | | | | | 228,476 | | | | 3,516,246 | |
Arca Continental SAB de CV | | | | | | | 549,382 | | | | 4,052,678 | |
Becle SAB de CV (a) | | | | | | | 550,000 | | | | 920,307 | |
Cemex SAB de CV — ADR (a) | | | | | | | 555,000 | | | | 5,117,100 | |
Controladora Vuela Cia de Aviacion SAB de CV, ADR (a) | | | | | | | 65,000 | | | | 819,650 | |
| | | | | | | | | | | | |
| Common Stocks | | Shares | | | Value | |
| Mexico (continued) | |
Corp. Inmobiliaria Vesta SAB de CV | | | | | | | 975,000 | | | $ | 1,374,045 | |
Fomento Economico Mexicano SAB de CV — ADR | | | | | | | 75,000 | | | | 6,753,000 | |
Grupo Aeroportuario del Centro Norte SAB de CV | | | | | | | 300,000 | | | | 1,664,838 | |
Grupo Bimbo SAB de CV, Series A | | | | | | | 950,000 | | | | 2,325,387 | |
Grupo Financiero Banorte SAB de CV, Series O | | | | | | | 960,000 | | | | 5,555,942 | |
Grupo Mexico SAB de CV, Series B | | | | | | | 1,675,000 | | | | 4,926,615 | |
Infraestructura Energetica Nova SAB de CV | | | | | | | 335,000 | | | | 1,564,914 | |
Wal-Mart de Mexico SAB de CV | | | | | | | 1,800,000 | | | | 4,063,691 | |
| | | | | | | | | | | | |
| | | | | | | | | | | | 43,720,375 | |
| Peru — 3.9% | |
Credicorp Ltd. | | | | | | | 29,000 | | | | 4,456,140 | |
Southern Copper Corp. | | | | | | | 70,000 | | | | 2,475,900 | |
| | | | | | | | | | | | |
| | | | | | | | | | | | 6,932,040 | |
| Total Common Stocks — 98.5% | | | | | | | | | | | 175,170,713 | |
| | | | | | | | | | | | |
| | | | | | | | | | | | | |
| Corporate Bonds | | Par (000) | | | | |
| Brazil — 0.4% | |
Hypermarcas SA, 11.30%, 10/15/18 | | | BRL | | | | 412 | | | | 32,192 | |
Klabin SA: | | | | | | | | | | | | |
12.24%, 1/08/19 (b)(c) | | | | | | | 24 | | | | 404,495 | |
7.25%, 6/15/20 | | | | | | | 22 | | | | 110,917 | |
1.00%, 6/15/22 | | | | | | | 19 | | | | 93,852 | |
Lupatech SA, Series 1,
6.50%, 4/15/18 (a)(c)(d) | | | | | | | 2,128 | | | | 33,522 | |
| Total Corporate Bonds — 0.4% | | | | | | | | 674,978 | |
| | | | | | | | | | | | |
| | | | | | | | | | | | | |
| Warrants | | Shares | | | | |
| Brazil — 0.1% | |
Iochpe-Maxion SA (Expires 06/03/20) (a) | | | | | | | 9,478 | | | | 13,135 | |
Klabin SA (Expires 06/15/20) | | | | | | | 22,282 | | | | — | |
| Total Warrants — 0.1% | | | | | | | | | | | 13,135 | |
Total Long-Term Investments
(Cost — $134,011,019) — 99.0% | | | | | | | | 175,858,826 | |
| | | | | | | | | | | | |
| | | | | | | | | | | | | |
| | | |
| Short-Term Securities | | | | | | | | | |
BlackRock Liquidity Funds, T-Fund, Institutional Class, 0.64% (e)(f) | | | | | | | 979,321 | | | | 979,321 | |
Total Short-Term Securities
(Cost — $979,321) — 0.6% | | | | | | | | 979,321 | |
Total Investments (Cost — $134,990,340) — 99.6% | | | | | | | | 176,838,147 | |
Other Assets Less Liabilities — 0.4% | | | | | | | | 765,282 | |
| | | | | | | | | | | | |
Net Assets — 100.0% | | | | | | | | | | $ | 177,603,429 | |
| | | | | | | | | | | | |
|
| Notes to Schedule of Investments |
| (a) | | Non-income producing security. |
| (b) | | Step-up bond that pays an initial coupon rate for the first period and then a higher coupon rate for the following periods. Rate as of period end. |
| (c) | | Convertible security. |
| (d) | | Issuer filed for bankruptcy and/or is in default. |
See Notes to Financial Statements.
| | | | | | |
| | | | | | | |
| | SEMI-ANNUAL REPORT | | APRIL 30, 2017 | | 13 |
| | |
Schedule of Investments (concluded) | | BlackRock Latin America Fund, Inc. |
| (e) | | During the six months ended April 30, 2017, investments in issuers considered to be an affiliate of the Fund for purposes of Section 2(a)(3) of the Investment Company Act of 1940, as amended, were as follows: |
| | | | | | | | | | | | | | | | | | | | | | | | | | | | |
| Affiliate | | Shares Held
at October 31,
2016 | | | Net
Activity | | | Shares Held
at April 30,
2017 | | | Value at
April 30,
2017 | | | Income | | | Net Realized
Gain1 | | | Change in
Unrealized
Appreciation
(Depreciation) | |
BlackRock Liquidity Funds, T-Fund, Institutional Class | | | 639,493 | | | | 339,828 | | | | 979,321 | | | $ | 979,321 | | | $ | 4,170 | | | $ | 1 | | | | — | |
1 Includes net capital gain distributions. | |
| (f) | | Current yield as of period end. |
|
| Fair Value Hierarchy as of Period End |
Various inputs are used in determining the fair value of investments. For information about the Fund’s policy regarding valuation of investments, refer to the Notes to Financial Statements.
The following tables summarize the Fund’s investments categorized in the disclosure hierarchy:
| | | | | | | | | | | | | | | | |
| | | Level 1 | | | Level 2 | | | Level 3 | | | Total | |
Assets: | | | | | | | | | | | | | | | | |
| Investments: | | | | | | | | | | | | | | | | |
| Common Stocks: | | | | | | | | | | | | | | | | |
Argentina | | $ | 6,930,050 | | | | — | | | | — | | | $ | 6,930,050 | |
Brazil | | | 114,807,944 | | | | — | | | | — | | | | 114,807,944 | |
Chile | | | 2,031,935 | | | | — | | | | — | | | | 2,031,935 | |
Colombia | | | 748,369 | | | | — | | | | — | | | | 748,369 | |
Mexico | | | 43,720,375 | | | | — | | | | — | | | | 43,720,375 | |
Peru | | | 6,932,040 | | | | — | | | | — | | | | 6,932,040 | |
Corporate Bonds | | | — | | | $ | 642,786 | | | $ | 32,192 | | | | 674,978 | |
Warrants | | | 13,135 | | | | — | | | | — | | | | 13,135 | |
Short-Term Securities | | | 979,321 | | | | — | | | | — | | | | 979,321 | |
| | | | |
Total | | $ | 176,163,169 | | | $ | 642,786 | | | $ | 32,192 | | | $ | 176,838,147 | |
| | | | |
During the ended April 30, 2017, there were no transfers between Level 1 and Level 2.
A reconciliation of Level 3 investments is presented when the Fund had a significant amount of Level 3 investments at the beginning and/or end of the period in relation to net assets. The following table is a reconciliation of Level 3 investments for which significant unobservable inputs were used in determining fair value:
| | | | | | | | | | | | |
| | | Corporate
Bonds | | | Participation
Notes | | | Total | |
Assets: | | | | | | | | | | | | |
Opening Balance, as of October 31, 2016 | | $ | 57,023 | | | $ | 1,861,766 | | | $ | 1,918,789 | |
Transfers into Level 3 | | | — | | | | — | | | | — | |
Transfers out of Level 3 | | | — | | | | — | | | | — | |
Accrued discounts/premiums | | | — | | | | — | | | | — | |
Net realized gain (loss) | | | (37,397 | ) | | | 733,107 | | | | 695,710 | |
Net change in unrealized appreciation (depreciation)1,2 | | | 56,809 | | | | (1,081,887 | ) | | | (1,025,078 | ) |
Purchases | | | — | | | | — | | | | — | |
Sales | | | (44,243 | ) | | | (1,512,986 | ) | | | (1,557,229 | ) |
| | | | |
Closing Balance, as of April 30 2017 | | $ | 32,192 | | | | — | | | $ | 32,192 | |
| | | | |
Net change in unrealized appreciation (depreciation) on investments still held at April 30, 20172 | | $ | 56,809 | | | | — | | | $ | 56,809 | |
| | | | |
1 Included in the related net change in unrealized appreciation (depreciation) in the Statements of Operations. | |
2 Any difference between net change in unrealized appreciation (depreciation) and net change in unrealized appreciation (depreciation) on investments still held at April 30, 2017 is generally due to investments no longer held or categorized as Level 3 at period end. | |
The Fund’s investments that are categorized as Level 3 were valued utilizing third party pricing information without adjustment. Such valuations are based on unobservable inputs. A significant change in third party information inputs could result in a significantly lower or higher value of such Level 3 investments.
See Notes to Financial Statements.
| | | | | | |
| | | | | | | |
| 14 | | SEMI-ANNUAL REPORT | | APRIL 30, 2017 | | |
| | |
| Statements of Assets and Liabilities | | |
| | | | | | | | |
| April 30, 2017 (Unaudited) | | BlackRock
Emerging
Markets Fund,
Inc.
| | | BlackRock
Latin America
Fund, Inc.
| |
| | | | | | | | |
| Assets | |
Investments at value — unaffiliated1,2 | | $ | 326,365,834 | | | $ | 175,858,826 | |
Investments at value — affiliated3 | | | 576,768 | | | | 979,321 | |
Foreign currency at value4 | | | 840,786 | | | | 259,624 | |
| Receivables: | |
Investments sold | | | 16,698,919 | | | | 331,335 | |
Capital shares sold | | | 911,010 | | | | 144,219 | |
Dividends — unaffiliated | | | 616,479 | | | | 886,105 | |
Dividends — affiliated | | | 980 | | | | 1,106 | |
Securities lending income — affiliated | | | 178 | | | | — | |
Interest — unaffiliated | | | — | | | | 13,484 | |
Prepaid expenses | | | 23,377 | | | | 34,486 | |
| | | | | | | | |
Total assets | | | 346,034,331 | | | | 178,508,506 | |
| | | | | | | | |
| | | | | | | | |
| Liabilities | |
Cash collateral on securities loaned at value | | | 123,207 | | | | — | |
| Payables: | |
Investments purchased | | | 12,502,932 | | | | 405 | |
Capital shares redeemed | | | 1,269,953 | | | | 356,259 | |
Deferred foreign capital gain tax | | | 507,065 | | | | 103,883 | |
Other accrued expenses | | | 503,827 | | | | 257,210 | |
Investment advisory fees | | | 271,647 | | | | 145,619 | |
Service and distribution fees | | | 108,160 | | | | 37,585 | |
Officer’s and Directors’ fees | | | 4,967 | | | | 3,245 | |
Other affiliates | | | 3,159 | | | | 871 | |
| | | | | | | | |
Total liabilities | | | 15,294,917 | | | | 905,077 | |
| | | | | | | | |
Net Assets | | $ | 330,739,414 | | | $ | 177,603,429 | |
| | | | | | | | |
| | | | | | | | |
| Net Assets Consist of | |
Paid-in capital | | $ | 377,428,592 | | | $ | 224,228,015 | |
Undistributed net investment income (loss) (distributions in excess of net investment income) | | | (2,663,765 | ) | | | 1,029,255 | |
Accumulated net realized loss | | | (94,129,774 | ) | | | (89,401,018 | ) |
Net unrealized appreciation (depreciation) | | | 50,104,361 | | | | 41,747,177 | |
| | | | | | | | |
Net Assets | | $ | 330,739,414 | | | $ | 177,603,429 | |
| | | | | | | | |
1 Investments at cost — unaffiliated | | $ | 275,758,942 | | | $ | 134,011,019 | |
2 Securities loaned at value | | $ | 109,945 | | | | — | |
3 Investments at cost — affiliated | | $ | 576,768 | | | $ | 979,321 | |
4 Foreign currency at cost | | $ | 840,571 | | | $ | 262,120 | |
| | | | | | | | |
| | | | | | |
| See Notes to Financial Statements. | | | | |
| | | | | | | |
| | SEMI-ANNUAL REPORT | | APRIL 30, 2017 | | 15 |
| | |
| Statements of Assets and Liabilities (concluded) | | |
| | | | | | | | |
| April 30, 2017 (Unaudited) | | BlackRock
Emerging
Markets Fund,
Inc.
| | | BlackRock
Latin America
Fund, Inc.
| |
| | | | | | | | |
| Net Asset Value | |
| Institutional: | |
Net assets | | $ | 58,944,663 | | | $ | 58,086,824 | |
| | | | | | | | |
Shares outstanding, 100 million shares authorized | | | 3,014,472 | | | | 1,287,303 | |
| | | | | | | | |
Net asset value | | $ | 19.55 | | | $ | 45.12 | |
| | | | | | | | |
Par value | | $ | 0.100 | | | $ | 0.100 | |
| | | | | | | | |
| Investor A: | |
Net assets | | $ | 187,721,856 | | | $ | 98,517,088 | |
| | | | | | | | |
Shares outstanding, 100 million shares authorized | | | 9,961,737 | | | | 2,211,910 | |
| | | | | | | | |
Net asset value | | $ | 18.84 | | | $ | 44.54 | |
| | | | | | | | |
Par value | | $ | 0.100 | | | $ | 0.100 | |
| | | | | | | | |
| Investor B: | |
Net assets | | | — | | | $ | 104,354 | |
| | | | | | | | |
Shares outstanding, 100 million shares authorized | | | — | | | | 2,521 | |
| | | | | | | | |
Net asset value | | | — | | | $ | 41.40 | |
| | | | | | | | |
Par value | | | — | | | $ | 0.100 | |
| | | | | | | | |
| Investor C: | |
Net assets | | $ | 84,072,895 | | | $ | 20,895,163 | |
| | | | | | | | |
Shares outstanding, 100 million shares authorized | | | 5,254,280 | | | | 515,125 | |
| | | | | | | | |
Net asset value | | $ | 16.00 | | | $ | 40.56 | |
| | | | | | | | |
Par value | | $ | 0.100 | | | $ | 0.100 | |
| | | | | | | | |
| | | | | | |
| See Notes to Financial Statements. | | | | |
| | | | | | | |
| 16 | | SEMI-ANNUAL REPORT | | APRIL 30, 2017 | | |
| | | | | | | | |
| Six Months Ended April 30, 2017 (Unaudited) | | BlackRock
Emerging
Markets Fund,
Inc. | | | BlackRock Latin
America Fund,
Inc. | |
| | | | | | | | |
| Investment Income | |
Dividends — unaffiliated | | $ | 2,754,717 | | | $ | 2,731,977 | |
Dividends — affiliated | | | 5,571 | | | | 4,170 | |
Interest — unaffiliated | | | — | | | | 31,123 | |
Securities lending income — affiliated — net | | | 238 | | | | — | |
Foreign taxes withheld | | | (300,720 | ) | | | (300,740 | ) |
| | | | |
Total investment income | | | 2,459,806 | | | | 2,466,530 | |
| | | | |
| | | | | | | | |
| Expenses | |
Investment advisory | | | 1,629,079 | | | | 861,187 | |
Service and distribution — class specific | | | 663,488 | | | | 229,300 | |
Transfer agent — class specific | | | 463,676 | | | | 161,473 | |
Custodian | | | 80,727 | | | | 54,379 | |
Professional | | | 45,562 | | | | 38,501 | |
Accounting services | | | 34,206 | | | | 17,614 | |
Registration | | | 30,339 | | | | 33,645 | |
Printing | | | 19,433 | | | | 15,206 | |
Officer and Directors | | | 9,355 | | | | 6,997 | |
Miscellaneous | | | 14,088 | | | | 11,944 | |
| | | | |
Total expenses | | | 2,989,953 | | | | 1,430,246 | |
| Less: | | | | | | | | |
Fees waived by the Manager | | | (929 | ) | | | (600 | ) |
Fees paid indirectly | | | (3,949 | ) | | | (439 | ) |
| | | | |
Total expenses after fees waived and paid indirectly | | | 2,985,075 | | | | 1,429,207 | |
| | | | |
Net investment income (loss) | | | (525,269 | ) | | | 1,037,323 | |
| | | | |
| | | | | | | | |
| Realized and Unrealized Gain (Loss) | |
| Net realized gain (loss) from: | |
Investments | | | 43,690,716 | | | | 8,232,183 | 1 |
Foreign currency transactions | | | 54,056 | | | | (45,436 | ) |
Capital gain distributions from investment companies — affiliated | | | 16 | | | | 1 | |
| | | | |
| | | 43,744,788 | | | | 8,186,748 | |
| | | | |
| Net change in unrealized appreciation (depreciation) on: | | | | | | | | |
Investments | | | (22,590,358 | )2 | | | (8,312,127 | )3 |
Foreign currency translations | | | 10,304 | | | | (14,342 | ) |
| | | | |
| | | (22,580,054 | ) | | | (8,326,469 | ) |
| | | | |
Net realized and unrealized gain (loss) | | | 21,164,734 | | | | (139,721 | ) |
| | | | |
Net Increase in Net Assets Resulting from Operations | | $ | 20,639,465 | | | $ | 897,602 | |
| | | | |
1 Including $3,512 realized foreign capital gain tax. | |
2 Including $(507,065) unrealized foreign capital gain tax. | |
3 Including $(103,883) unrealized foreign capital gain tax. | |
| | | | | | |
| See Notes to Financial Statements. | | | | |
| | | | | | | |
| | SEMI-ANNUAL REPORT | | APRIL 30, 2017 | | 17 |
| | |
| Statements of Changes in Net Assets | | |
| | | | | | | | | | | | | | | | | | | | |
| | | BlackRock Emerging Markets
Fund, Inc. | | | BlackRock Latin America
Fund, Inc. | |
| Increase (Decrease) in Net Assets: | | Six Months Ended
April 30,
2017
(Unaudited) | | | Year Ended
October 31,
2016 | | | Six Months Ended
April 30,
2017
(Unaudited) | | | Year Ended
October 31,
2016 | | | | |
| | | | | | | | | | | | | | | | | | | | |
| Operations | | | | | | | | | | | | | |
Net investment income (loss) | | $ | (525,269 | ) | | $ | 1,950,723 | | | $ | 1,037,323 | | | $ | 1,919,601 | | | | | |
Net realized gain (loss) | | | 43,744,788 | | | | (6,775,370 | ) | | | 8,186,748 | | | | (14,393,611 | ) | | | | |
Net change in unrealized appreciation (depreciation) | | | (22,580,054 | ) | | | 53,534,997 | | | | (8,326,469 | ) | | | 55,778,211 | | | | | |
| | | | | | | | |
Net increase in net assets resulting from operations | | | 20,639,465 | | | | 48,710,350 | | | | 897,602 | | | | 43,304,201 | | | | | |
| | | | | | | | |
| | | | | | | | | | | | | | | | | | | | |
| Distributions to Shareholders1 | | | | | | | | | | | | | |
| From net investment income: | | | | | | | | | | | | | |
Institutional | | | (836,175 | ) | | | (1,981,110 | ) | | | (679,329 | ) | | | (342,238 | ) | | | | |
Investor A | | | (2,476,565 | ) | | | (1,730,786 | ) | | | (1,077,921 | ) | | | (365,980 | ) | | | | |
Investor C | | | (659,003 | ) | | | (298,064 | ) | | | (73,597 | ) | | | — | | | | | |
| | | | | | | | |
Decrease in net assets resulting from distributions to shareholders | | | (3,971,743 | ) | | | (4,009,960 | ) | | | (1,830,847 | ) | | | (708,218 | ) | | | | |
| | | | | | | | |
| | | | | | | | | | | | | | | | | | | | |
| Capital Share Transactions | | | | | | | | | | | | | |
Net decrease in net assets derived from capital share transactions | | | (97,241,417 | ) | | | (106,972,143 | ) | | | (8,097,280 | ) | | | (18,647,180 | ) | | | | |
| | | | | | | | |
| | | | | | | | | | | | | | | | | | | | |
| Net Assets | | | | | | | | | | | | | |
Total increase (decrease) in net assets | | | (80,573,695 | ) | | | (62,271,753 | ) | | | (9,030,525 | ) | | | 23,948,803 | | | | | |
Beginning of period | | | 411,313,109 | | | | 473,584,862 | | | | 186,633,954 | | | | 162,685,151 | | | | | |
| | | | | | | | |
End of period | | $ | 330,739,414 | | | $ | 411,313,109 | | | $ | 177,603,429 | | | $ | 186,633,954 | | | | | |
| | | | | | | | |
Undistributed net investment income (loss), end of period | | $ | (2,663,765 | ) | | $ | 1,833,247 | | | $ | 1,029,255 | | | $ | 1,822,779 | | | | | |
| | | | | | | | |
1 Distributions for annual periods determined in accordance with U.S. federal income tax regulations. | | | | | | | | | |
| | | | | | |
| See Notes to Financial Statements. | | | | |
| | | | | | | |
| 18 | | SEMI-ANNUAL REPORT | | APRIL 30, 2017 | | |
| | |
| Financial Highlights | | BlackRock Emerging Markets Fund, Inc. |
| | | | | | | | | | | | | | | | | | | | | | | | |
| | | Institutional | |
| | | Six Months Ended
April 30, 2017
(Unaudited) | | | Year Ended October 31, | |
| | | | 2016 | | | 2015 | | | 2014 | | | 2013 | | | 2012 | |
| | | | | | | | | | | | | | | | | | | | | | | | |
| Per Share Operating Performance | |
Net asset value, beginning of period | | $ | 18.32 | | | $ | 16.51 | | | $ | 20.56 | | | $ | 20.10 | | | $ | 19.28 | | | $ | 18.23 | |
| | | | |
Net investment income1 | | | 0.02 | | | | 0.16 | | | | 0.19 | | | | 0.18 | | | | 0.19 | | | | 0.29 | |
Net realized and unrealized gain (loss) | | | 1.51 | | | | 1.86 | | | | (4.13 | ) | | | 0.39 | | | | 0.90 | | | | 0.85 | |
| | | | |
Net increase (decrease) from investment operations | | | 1.53 | | | | 2.02 | | | | (3.94 | ) | | | 0.57 | | | | 1.09 | | | | 1.14 | |
| | | | |
Distributions from net investment income2 | | | (0.30 | ) | | | (0.21 | ) | | | (0.11 | ) | | | (0.11 | ) | | | (0.27 | ) | | | (0.09 | ) |
| | | | |
Net asset value, end of period | | $ | 19.55 | | | $ | 18.32 | | | $ | 16.51 | | | $ | 20.56 | | | $ | 20.10 | | | $ | 19.28 | |
| | | | |
| | | | | | | | | | | | | | | | | | | | | | | | |
| Total Return3 | |
Based on net asset value | | | 8.62% | 4 | | | 12.47% | | | | (19.24)% | | | | 2.86% | | | | 5.67% | 5 | | | 6.37% | |
| | | | |
| | | | | | | | | | | | | | | | | | | | | | | | |
| Ratios to Average Net Assets | |
Total expenses | | | 1.31% | 6 | | | 1.20% | | | | 1.17% | 7 | | | 1.17% | | | | 1.29% | | | | 1.33% | |
| | | | |
Total expenses after fees waived and paid indirectly | | | 1.31% | 6 | | | 1.20% | | | | 1.17% | 7 | | | 1.16% | | | | 1.29% | | | | 1.33% | |
| | | | |
Net investment income | | | 0.22% | 6 | | | 0.97% | | | | 0.98% | 7 | | | 0.88% | | | | 0.95% | | | | 1.53% | |
| | | | |
| | | | | | | | | | | | | | | | | | | | | | | | |
| Supplemental Data | |
Net assets, end of period (000) | | $ | 58,945 | | | $ | 120,939 | | | $ | 169,509 | | | $ | 467,132 | | | $ | 186,724 | | | $ | 116,883 | |
| | | | |
Portfolio turnover rate | | | 56% | | | | 92% | | | | 103% | | | | 94% | | | | 71% | | | | 155% | |
| | | | |
| | 1 | | Based on average shares outstanding. |
| | 2 | | Distributions for annual periods determined in accordance with U.S. federal income tax regulations. |
| | 3 | | Where applicable, assumes the reinvestment of distributions. |
| | 4 | | Aggregate total return. |
| | 5 | | Includes a payment from an affiliate to compensate for forgone securities lending revenue which impacted the Fund’s total return. Not including this payment, the Fund’s total return would have been 5.51%. |
| | 7 | | Ratios do not include expenses incurred indirectly as a result of investments in underlying funds of approximately 0.01% for the year ended October 31, 2015. |
| | | | | | |
| See Notes to Financial Statements. | | | | |
| | | | | | | |
| | SEMI-ANNUAL REPORT | | APRIL 30, 2017 | | 19 |
| | |
| Financial Highlights (continued) | | BlackRock Emerging Markets Fund, Inc. |
| | | | | | | | | | | | | | | | | | | | | | | | |
| | | Investor A | |
| | | Six Months Ended
April 30, 2017
(Unaudited) | | | Year Ended October 31, | |
| | | | 2016 | | | 2015 | | | 2014 | | | 2013 | | | 2012 | |
| | | | | | | | | | | | | | | | | | | | | | | | |
| Per Share Operating Performance | |
Net asset value, beginning of period | | $ | 17.62 | | | $ | 15.89 | | | $ | 19.81 | | | $ | 19.38 | | | $ | 18.61 | | | $ | 17.60 | |
| | | | |
Net investment income (loss)1 | | | (0.01 | ) | | | 0.08 | | | | 0.10 | | | | 0.06 | | | | 0.13 | | | | 0.22 | |
Net realized and unrealized gain (loss) | | | 1.46 | | | | 1.79 | | | | (3.99 | ) | | | 0.42 | | | | 0.86 | | | | 0.83 | |
| | | | |
Net increase (decrease) from investment operations | | | 1.45 | | | | 1.87 | | | | (3.89 | ) | | | 0.48 | | | | 0.99 | | | | 1.05 | |
| | | | |
Distributions from net investment income2 | | | (0.23 | ) | | | (0.14 | ) | | | (0.03 | ) | | | (0.05 | ) | | | (0.22 | ) | | | (0.04 | ) |
| | | | |
Net asset value, end of period | | $ | 18.84 | | | $ | 17.62 | | | $ | 15.89 | | | $ | 19.81 | | | $ | 19.38 | | | $ | 18.61 | |
| | | | |
| | | | | | | | | | | | | | | | | | | | | | | | |
| Total Return3 | |
Based on net asset value | | | 8.45% | 4 | | | 11.95% | | | | (19.67)% | | | | 2.46% | | | | 5.30% | 5 | | | 6.02% | |
| | | | |
| | | | | | | | | | | | | | | | | | | | | | | | |
| Ratios to Average Net Assets | |
Total expenses | | | 1.67% | 6 | | | 1.68% | | | | 1.62% | 7 | | | 1.58% | | | | 1.60% | | | | 1.67% | |
| | | | |
Total expenses after fees waived and paid indirectly | | | 1.67% | 6 | | | 1.68% | | | | 1.62% | 7 | | | 1.58% | | | | 1.60% | | | | 1.67% | |
| | | | |
Net investment income (loss) | | | (0.16)% | 6 | | | 0.51% | | | | 0.56% | 7 | | | 0.32% | | | | 0.69% | | | | 1.24% | |
| | | | |
| | | | | | | | | | | | | | | | | | | | | | | | |
| Supplemental Data | |
Net assets, end of period (000) | | $ | 187,722 | | | $ | 191,205 | | | $ | 193,165 | | | $ | 231,467 | | | $ | 215,490 | | | $ | 174,637 | |
| | | | |
Portfolio turnover rate | | | 56% | | | | 92% | | | | 103% | | | | 94% | | | | 71% | | | | 155% | |
| | | | |
| | 1 | | Based on average shares outstanding. |
| | 2 | | Distributions for annual periods determined in accordance with U.S. federal income tax regulations. |
| | 3 | | Where applicable, excludes the effects of any sales charges and assumes the reinvestment of distributions. |
| | 4 | | Aggregate total return. |
| | 5 | | Includes a payment from an affiliate to compensate for forgone securities lending revenue which impacted the Fund’s total return. Not including this payment, the Fund’s total return would have been 5.13%. |
| | 7 | | Ratios do not include expenses incurred indirectly as a result of investments in underlying funds of approximately 0.01% for the year ended October 31, 2015. |
| | | | | | |
| See Notes to Financial Statements. | | | | |
| | | | | | | |
| 20 | | SEMI-ANNUAL REPORT | | APRIL 30, 2017 | | |
| | |
| Financial Highlights (concluded) | | BlackRock Emerging Markets Fund, Inc. |
| | | | | | | | | | | | | | | | | | | | | | | | |
| | | Investor C | |
| | | Six Months Ended
April 30, 2017
(Unaudited) | | | Year Ended October 31, | |
| | | | 2016 | | | 2015 | | | 2014 | | | 2013 | | | 2012 | |
| | | | | | | | | | | | | | | | | | | | | | | | |
| Per Share Operating Performance | |
Net asset value, beginning of period | | $ | 14.93 | | | $ | 13.48 | | | $ | 16.91 | | | $ | 16.65 | | | $ | 16.02 | | | $ | 15.26 | |
| | | | |
Net investment income (loss)1 | | | (0.07 | ) | | | (0.04 | ) | | | (0.04 | ) | | | (0.08 | ) | | | (0.03 | ) | | | 0.06 | |
Net realized and unrealized gain (loss) | | | 1.24 | | | | 1.53 | | | | (3.39 | ) | | | 0.34 | | | | 0.74 | | | | 0.71 | |
| | | | |
Net increase (decrease) from investment operations | | | 1.17 | | | | 1.49 | | | | (3.43 | ) | | | 0.26 | | | | 0.71 | | | | 0.77 | |
| | | | |
Distributions from net investment income2 | | | (0.10 | ) | | | (0.04 | ) | | | — | | | | — | | | | (0.08 | ) | | | (0.01 | ) |
| | | | |
Net asset value, end of period | | $ | 16.00 | | | $ | 14.93 | | | $ | 13.48 | | | $ | 16.91 | | | $ | 16.65 | | | $ | 16.02 | |
| | | | |
| | | | | | | | | | | | | | | | | | | | | | | | |
| Total Return3 | |
Based on net asset value | | | 7.97% | 4 | | | 11.07% | | | | (20.28)% | | | | 1.56% | | | | 4.45% | 5 | | | 5.07% | |
| | | | |
| | | | | | | | | | | | | | | | | | | | | | | | |
| Ratios to Average Net Assets | |
Total expenses | | | 2.52% | 6 | | | 2.52% | | | | 2.44% | 7 | | | 2.41% | | | | 2.46% | | | | 2.56% | |
| | | | |
Total expenses after fees waived and paid indirectly | | | 2.52% | 6 | | | 2.52% | | | | 2.44% | 7 | | | 2.41% | | | | 2.46% | | | | 2.56% | |
| | | | |
Net investment income (loss) | | | (1.02)% | 6 | | | (0.33)% | | | | (0.26)% | 7 | | | (0.49)% | | | | (0.18)% | | | | 0.38% | |
| | | | |
| | | | | | | | | | | | | | | | | | | | | | | | |
| Supplemental Data | |
Net assets, end of period (000) | | $ | 84,073 | | | $ | 99,170 | | | $ | 110,911 | | | $ | 128,684 | | | $ | 119,015 | | | $ | 102,559 | |
| | | | |
Portfolio turnover rate | | | 56% | | | | 92% | | | | 103% | | | | 94% | | | | 71% | | | | 155% | |
| | | | |
| | 1 | | Based on average shares outstanding. |
| | 2 | | Distributions for annual periods determined in accordance with U.S. federal income tax regulations. |
| | 3 | | Where applicable, excludes the effects of any sales charges and assumes the reinvestment of distributions. |
| | 4 | | Aggregate total return. |
| | 5 | | Includes a payment from an affiliate to compensate for forgone securities lending revenue which impacted the Fund’s total return. Not including this payment, the Fund’s total return would have been 4.27%. |
| | 7 | | Ratios do not include expenses incurred indirectly as a result of investments in underlying funds of approximately 0.01% for the year ended October 31, 2015. |
| | | | | | |
| See Notes to Financial Statements. | | | | |
| | | | | | | |
| | SEMI-ANNUAL REPORT | | APRIL 30, 2017 | | 21 |
| | |
| Financial Highlights | | BlackRock Latin America Fund, Inc. |
| | | | | | | | | | | | | | | | | | | | | | | | |
| | | Institutional | |
| | | Six Months Ended
April 30, 2017
(Unaudited) | | | Year Ended October 31, | |
| | | | 2016 | | | 2015 | | | 2014 | | | 2013 | | | 2012 | |
| | | | | | | | | | | | | | | | | | | | | | | | |
| Per Share Operating Performance | |
Net asset value, beginning of period | | $ | 45.22 | | | $ | 34.98 | | | $ | 54.16 | | | $ | 56.13 | | | $ | 58.82 | | | $ | 62.80 | |
| | | | |
Net investment income1 | | | 0.33 | | | | 0.56 | | | | 0.49 | | | | 1.08 | | | | 0.79 | | | | 0.94 | |
Net realized and unrealized gain (loss) | | | 0.14 | | | | 9.95 | | | | (18.53 | ) | | | (2.52 | ) | | | (2.48 | ) | | | (4.38 | ) |
| | | | |
Net increase (decrease) from investment operations | | | 0.47 | | | | 10.51 | | | | (18.04 | ) | | | (1.44 | ) | | | (1.69 | ) | | | (3.44 | ) |
| | | | |
Distributions from net investment income2 | | | (0.57 | ) | | | (0.27 | ) | | | (1.14 | ) | | | (0.53 | ) | | | (1.00 | ) | | | (0.54 | ) |
| | | | |
Net asset value, end of period | | $ | 45.12 | | | $ | 45.22 | | | $ | 34.98 | | | $ | 54.16 | | | $ | 56.13 | | | $ | 58.82 | |
| | | | |
| | | | | | | | | | | | | | | | | | | | | | | | |
| Total Return3 | |
Based on net asset value | | | 1.22% | 4 | | | 30.32% | | | | (33.77)% | | | | (2.51)% | | | | (3.01)% | | | | (5.43)% | |
| | | | |
| | | | | | | | | | | | | | | | | | | | | | | | |
| Ratios to Average Net Assets | |
Total expenses | | | 1.33% | 5 | | | 1.33% | | | | 1.32% | | | | 1.25% | | | | 1.27% | | | | 1.32% | |
| | | | |
Total expenses after fees waived and paid indirectly | | | 1.33% | 5 | | | 1.33% | | | | 1.32% | | | | 1.25% | | | | 1.27% | | | | 1.32% | |
| | | | |
Net investment income | | | 1.56% | 5 | | | 1.52% | | | | 1.14% | | | | 1.99% | | | | 1.36% | | | | 1.55% | |
| | | | |
| | | | | | | | | | | | | | | | | | | | | | | | |
| Supplemental Data | |
Net assets, end of period (000) | | $ | 58,087 | | | $ | 56,867 | | | $ | 45,472 | | | $ | 87,941 | | | $ | 110,295 | | | $ | 125,473 | |
| | | | |
Portfolio turnover rate | | | 22% | | | | 58% | | | | 35% | | | | 42% | | | | 66% | | | | 50% | |
| | | | |
| | 1 | | Based on average shares outstanding. |
| | 2 | | Distributions for annual periods determined in accordance with U.S. federal income tax regulations. |
| | 3 | | Where applicable, assumes the reinvestment of distributions. |
| | 4 | | Aggregate total return. |
| | | | | | |
| See Notes to Financial Statements. | | | | |
| | | | | | | |
| 22 | | SEMI-ANNUAL REPORT | | APRIL 30, 2017 | | |
| | |
| Financial Highlights (continued) | | BlackRock Latin America Fund, Inc. |
| | | | | | | | | | | | | | | | | | | | | | | | |
| | | Investor A | |
| | | Six Months Ended
April 30, 2017
(Unaudited) | | | Year Ended October 31, | |
| | | | 2016 | | | 2015 | | | 2014 | | | 2013 | | | 2012 | |
| | | | | | | | | | | | | | | | | | | | | | | | |
| Per Share Operating Performance | |
Net asset value, beginning of period | | $ | 44.57 | | | $ | 34.45 | | | $ | 53.31 | | | $ | 55.21 | | | $ | 57.90 | | | $ | 61.67 | |
| | | | |
Net investment income1 | | | 0.25 | | | | 0.42 | | | | 0.35 | | | | 0.92 | | | | 0.61 | | | | 0.78 | |
Net realized and unrealized gain (loss) | | | 0.16 | | | | 9.83 | | | | (18.24 | ) | | | (2.47 | ) | | | (2.43 | ) | | | (4.25 | ) |
| | | | |
Net increase (decrease) from investment operations | | | 0.41 | | | | 10.25 | | | | (17.89 | ) | | | (1.55 | ) | | | (1.82 | ) | | | (3.47 | ) |
| | | | |
Distributions from net investment income2 | | | (0.44 | ) | | | (0.13 | ) | | | (0.97 | ) | | | (0.35 | ) | | | (0.87 | ) | | | (0.30 | ) |
| | | | |
Net asset value, end of period | | $ | 44.54 | | | $ | 44.57 | | | $ | 34.45 | | | $ | 53.31 | | | $ | 55.21 | | | $ | 57.90 | |
| | | | |
| | | | | | | | | | | | | | | | | | | | | | | | |
| Total Return3 | |
Based on net asset value | | | 1.07% | 4 | | | 29.91% | | | | (33.96)% | | | | (2.78)% | | | | (3.27)% | | | | (5.60)% | |
| | | | |
| | | | | | | | | | | | | | | | | | | | | | | | |
| Ratios to Average Net Assets | |
Total expenses | | | 1.66% | 5 | | | 1.65% | | | | 1.61% | | | | 1.53% | | | | 1.53% | | | | 1.53% | |
| | | | |
Total expenses after fees waived and paid indirectly | | | 1.65% | 5 | | | 1.65% | | | | 1.61% | | | | 1.53% | | | | 1.53% | | | | 1.53% | |
| | | | |
Net investment income | | | 1.20% | 5 | | | 1.17% | | | | 0.83% | | | | 1.72% | | | | 1.06% | | | | 1.32% | |
| | | | |
| | | | | | | | | | | | | | | | | | | | | | | | |
| Supplemental Data | |
Net assets, end of period (000) | | $ | 98,517 | | | $ | 105,414 | | | $ | 93,494 | | | $ | 178,571 | | | $ | 236,205 | | | $ | 315,531 | |
| | | | |
Portfolio turnover rate | | | 22% | | | | 58% | | | | 35% | | | | 42% | | | | 66% | | | | 50% | |
| | | | |
| | 1 | | Based on average shares outstanding. |
| | 2 | | Distributions for annual periods determined in accordance with U.S. federal income tax regulations. |
| | 3 | | Where applicable, excludes the effects of any sales charges and assumes the reinvestment of distributions. |
| | 4 | | Aggregate total return. |
| | | | | | |
| See Notes to Financial Statements. | | | | |
| | | | | | | |
| | SEMI-ANNUAL REPORT | | APRIL 30, 2017 | | 23 |
| | |
| Financial Highlights (continued) | | BlackRock Latin America Fund, Inc. |
| | | | | | | | | | | | | | | | | | | | | | | | |
| | | Investor B | |
| | | Six Months Ended
April 30, 2017
(Unaudited) | | | Year Ended October 31, | |
| | | | 2016 | | | 2015 | | | 2014 | | | 2013 | | | 2012 | |
| | | | | | | | | | | | | | | | | | | | | | | | |
| Per Share Operating Performance | |
Net asset value, beginning of period | | $ | 41.25 | | | $ | 32.18 | | | $ | 49.60 | | | $ | 51.51 | | | $ | 53.96 | | | $ | 57.68 | |
| | | | |
Net investment income (loss)1 | | | (0.10 | ) | | | 0.07 | | | | (0.11 | ) | | | 0.35 | | | | 0.08 | | | | 0.24 | |
Net realized and unrealized gain (loss) | | | 0.25 | | | | 9.00 | | | | (17.04 | ) | | | (2.26 | ) | | | (2.28 | ) | | | (3.96 | ) |
| | | | |
Net increase (decrease) from investment operations | | | 0.15 | | | | 9.07 | | | | (17.15 | ) | | | (1.91 | ) | | | (2.20 | ) | | | (3.72 | ) |
| | | | |
Distributions from net investment income2 | | | — | | | | — | | | | (0.27 | ) | | | — | | | | (0.25 | ) | | | — | |
| | | | |
Net asset value, end of period | | $ | 41.40 | | | $ | 41.25 | | | $ | 32.18 | | | $ | 49.60 | | | $ | 51.51 | | | $ | 53.96 | |
| | | | |
| | | | | | | | | | | | | | | | | | | | | | | | |
| Total Return3 | |
Based on net asset value | | | 0.36% | 4 | | | 28.18% | | | | (34.71)% | | | | (3.71)% | | | | (4.12)% | | | | (6.45)% | |
| | | | |
| | | | | | | | | | | | | | | | | | | | | | | | |
| Ratios to Average Net Assets | |
Total expenses | | | 3.15% | 5 | | | 3.01% | | | | 2.69% | | | | 2.51% | | | | 2.44% | | | | 2.41% | |
| | | | |
Total expenses after fees waived and paid indirectly | | | 3.15% | 5 | | | 3.00% | | | | 2.69% | | | | 2.51% | | | | 2.44% | | | | 2.41% | |
| | | | |
Net investment income (loss) | | | (0.51)% | 5 | | | 0.23% | | | | (0.27)% | | | | 0.71% | | | | 0.15% | | | | 0.43% | |
| | | | |
| | | | | | | | | | | | | | | | | | | | | | | | |
| Supplemental Data | |
Net assets, end of period (000) | | $ | 104 | | | $ | 236 | | | $ | 932 | | | $ | 2,820 | | | $ | 5,009 | | | $ | 7,989 | |
| | | | |
Portfolio turnover rate | | | 22% | | | | 58% | | | | 35% | | | | 42% | | | | 66% | | | | 50% | |
| | | | |
| | 1 | | Based on average shares outstanding. |
| | 2 | | Distributions for annual periods determined in accordance with U.S. federal income tax regulations. |
| | 3 | | Where applicable, excludes the effects of any sales charges and assumes the reinvestment of distributions. |
| | 4 | | Aggregate total return. |
| | | | | | |
| See Notes to Financial Statements. | | | | |
| | | | | | | |
| 24 | | SEMI-ANNUAL REPORT | | APRIL 30, 2017 | | |
| | |
| Financial Highlights (concluded) | | BlackRock Latin America Fund, Inc. |
| | | | | | | | | | | | | | | | | | | | | | | | |
| | | Investor C | |
| | | Six Months Ended
April 30, 2017
(Unaudited) | | | Year Ended October 31, | |
| | | | 2016 | | | 2015 | | | 2014 | | | 2013 | | | 2012 | |
| | | | | | | | | | | | | | | | | | | | | | | | |
| Per Share Operating Performance | |
Net asset value, beginning of period | | $ | 40.45 | | | $ | 31.41 | | | $ | 48.57 | | | $ | 50.37 | | | $ | 52.79 | | | $ | 56.39 | |
| | | | |
Net investment income (loss)1 | | | 0.07 | | | | 0.12 | | | | (0.02 | ) | | | 0.43 | | | | 0.13 | | | | 0.27 | |
Net realized and unrealized gain (loss) | | | 0.17 | | | | 8.92 | | | | (16.64 | ) | | | (2.23 | ) | | | (2.24 | ) | | | (3.87 | ) |
| | | | |
Net increase (decrease) from investment operations | | | 0.24 | | | | 9.04 | | | | (16.66 | ) | | | (1.80 | ) | | | (2.11 | ) | | | (3.60 | ) |
| | | | |
Distributions from net investment income2 | | | (0.13 | ) | | | — | | | | (0.50 | ) | | | — | | | | (0.31 | ) | | | — | |
| | | | |
Net asset value, end of period | | $ | 40.56 | | | $ | 40.45 | | | $ | 31.41 | | | $ | 48.57 | | | $ | 50.37 | | | $ | 52.79 | |
| | | | |
| | | | | | | | | | | | | | | | | | | | | | | | |
| Total Return3 | |
Based on net asset value | | | 0.63% | 4 | | | 28.78% | | | | (34.53)% | | | | (3.57)% | | | | (4.05)% | | | | (6.38)% | |
| | | | |
| | | | | | | | | | | | | | | | | | | | | | | | |
| Ratios to Average Net Assets | |
Total expenses | | | 2.50% | 5 | | | 2.51% | | | | 2.48% | | | | 2.36% | | | | 2.35% | | | | 2.35% | |
| | | | |
Total expenses after fees waived and paid indirectly | | | 2.50% | 5 | | | 2.51% | | | | 2.47% | | | | 2.36% | | | | 2.35% | | | | 2.35% | |
| | | | |
Net investment income (loss) | | | 0.36% | 5 | | | 0.37% | | | | (0.04)% | | | | 0.88% | | | | 0.25% | | | | 0.49% | |
| | | | |
| | | | | | | | | | | | | | | | | | | | | | | | |
| Supplemental Data | |
Net assets, end of period (000) | | $ | 20,895 | | | $ | 24,117 | | | $ | 22,787 | | | $ | 49,724 | | | $ | 72,047 | | | $ | 111,344 | |
| | | | |
Portfolio turnover rate | | | 22% | | | | 58% | | | | 35% | | | | 42% | | | | 66% | | | | 50% | |
| | | | |
| | 1 | | Based on average shares outstanding. |
| | 2 | | Distributions for annual periods determined in accordance with U.S. federal income tax regulations. |
| | 3 | | Where applicable, excludes the effects of any sales charges and assumes the reinvestment of distributions. |
| | 4 | | Aggregate total return. |
| | | | | | |
| See Notes to Financial Statements. | | | | |
| | | | | | | |
| | SEMI-ANNUAL REPORT | | APRIL 30, 2017 | | 25 |
| | | | |
| Notes to Financial Statements (Unaudited) | | |
1. Organization:
BlackRock Emerging Markets Fund, Inc. and BlackRock Latin America Fund, Inc. are each registered under the Investment Company Act of 1940, as amended (the “1940 Act”), as open-end management investment companies. Each Fund is organized as a Maryland corporation. The following are referred to herein collectively as the “Funds” or individually, a “Fund”:
| | | | |
| Fund Name | | Herein Referred To As | | Diversification Classification |
BlackRock Emerging Markets Fund, Inc | | Emerging Markets | | Non-diversified |
BlackRock Latin America Fund, Inc | | Latin America | | Non-diversified |
Each Fund offers multiple classes of shares. All classes of shares have identical voting, dividend, liquidation and other rights and are subject to the same terms and conditions, except that certain classes bear expenses related to the shareholder servicing and distribution of such shares. Institutional Shares are sold only to certain eligible investors. Investor A and Investor C Shares are generally available through financial intermediaries. Investor B Shares are available only through exchanges and dividend and capital gain reinvestments by existing shareholders, and for purchase by certain employer-sponsored retirement plans. Each class has exclusive voting rights with respect to matters relating to its shareholder servicing and distribution expenditures (except that Investor B shareholders may vote on material changes to the Investor A distribution and service plan).
| | | | | | |
| Share Class | | Initial Sales
Charge | | CDSC | | Conversion Privilege |
Institutional Shares | | No | | No | | None |
Investor A Shares | | Yes | | No1 | | None |
Investor B Shares | | No | | Yes | | To Investor A Shares after approximately 8 years |
Investor C Shares | | No | | Yes | | None |
| | 1 | | Investor A Shares may be subject to a contingent deferred sales charge (“CDSC”) for certain redemptions where no initial sales charge was paid at the time of purchase. |
The Funds, together with certain other registered investment companies advised by BlackRock Advisors, LLC (the “Manager”) or its affiliates, are included in a complex of open-end funds referred to as the Equity-Liquidity Complex.
2. Significant Accounting Policies:
The financial statements are prepared in conformity with accounting principles generally accepted in the United States of America (“U.S. GAAP”), which may require management to make estimates and assumptions that affect the reported amounts of assets and liabilities in the financial statements, disclosure of contingent assets and liabilities at the date of the financial statements and the reported amounts of increases and decreases in net assets from operations during the reporting period. Actual results could differ from those estimates. Each Fund is considered an investment company under U.S. GAAP and follows the accounting and reporting guidance applicable to investment companies. Below is a summary of significant accounting policies:
Investment Transactions and Investment Income: For financial reporting purposes, investment transactions are recorded on the dates the transactions are entered into (the trade dates). Realized gains and losses on investment transactions are determined on the identified cost basis. Dividend income is recorded on the ex-dividend date. Dividends from foreign securities where the ex-dividend date may have passed are subsequently recorded when the Funds are informed of the ex-dividend date. Under the applicable foreign tax laws, a withholding tax at various rates may be imposed on capital gains, dividends and interest. Interest income, including amortization and accretion of premiums and discounts on debt securities, is recognized on the accrual basis. Income, expenses and realized and unrealized gains and losses are allocated daily to each class based on its relative net assets.
Foreign Currency: Each Fund’s books and records are maintained in U.S. dollars. Purchases and sales of investments are recorded at the rates of exchange prevailing on the respective dates of such transactions. Generally, when the U.S. dollar rises in value against a foreign currency, the investments denominated in that currency will lose value; the opposite effect occurs if the U.S. dollar falls in relative value.
Each Fund does not isolate the portion of the results of operations arising as a result of changes in the exchange rates from the changes in the market prices of investments held or sold for financial reporting purposes. Accordingly, the effects of changes in exchange rates on investments are not segregated in the Statements of Operations from the effects of changes in market prices of those investments, but are included as a component of net realized and unrealized gain (loss) from investments. Each Fund reports realized currency gains (losses) on foreign currency related transactions as components of net realized gain (loss) for financial reporting purposes, whereas such components are generally treated as ordinary income for federal income tax purposes.
Segregation and Collateralization: In cases where a Fund enters into certain investments (e.g., forward foreign currency exchange contracts) that would be treated as “senior securities” for 1940 Act purposes, a Fund may segregate or designate on its books and records cash or liquid assets having a market value at least equal to the amount of its future obligations under such investments. Doing so allows the investment to be excluded from treatment as a “senior security.” Furthermore, if required by an exchange or counterparty agreement, the Funds may be required to deliver/deposit cash and/or securities to/with an exchange, or broker-dealer or custodian as collateral for certain investments or obligations.
Distributions: Distributions paid by the Funds are recorded on the ex-dividend date. The character and timing of distributions are determined in accordance with U.S. federal income tax regulations, which may differ from U.S. GAAP.
| | | | | | |
| | | | | | | |
| 26 | | SEMI-ANNUAL REPORT | | APRIL 30, 2017 | | |
| | | | |
| Notes to Financial Statements (continued) | | |
Recent Accounting Standard: In March 2017, the Financial Accounting Standards Board issued Accounting Standards Update “Premium Amortization of Purchased Callable Debt Securities” which amends the amortization period for certain purchased callable debt securities. Under the new guidance, premium amortization of purchased callable debt securities that have explicit, non-contingent call features and are callable at fixed prices will be amortized to the earliest call date. The guidance will be applied on a modified retrospective basis and is effective for fiscal years, and their interim periods, beginning after December 15, 2018. Management is currently evaluating the impact of this guidance to the Funds.
SEC Reporting Modernization: The Securities and Exchange Commission (“SEC”) adopted new rules and forms and amended other rules to enhance the reporting and disclosure of information by registered investment companies. As part of these changes, the SEC amended Regulation S-X to standardize and enhance disclosures in investment company financial statements. The compliance date for implementing the new or amended rules is August 1, 2017.
Indemnifications: In the normal course of business, a Fund enters into contracts that contain a variety of representations that provide general indemnification. A Fund’s maximum exposure under these arrangements is unknown because it involves future potential claims against a Fund, which cannot be predicted with any certainty.
Other: Expenses directly related to a Fund or its classes are charged to that Fund or the applicable class. Other operating expenses shared by several funds, including other funds managed by the Manager, are prorated among those funds on the basis of relative net assets or other appropriate methods. Expenses directly related to the Funds and other shared expenses prorated to the Funds are allocated daily to each class based on its relative net assets or other appropriate methods.
The Funds have an arrangement with their custodian whereby credits are earned on uninvested cash balances, which could be used to reduce custody fees and/or overdraft charges. The Funds may incur charges on certain uninvested cash balances and overdrafts, subject to certain conditions.
3. Investment Valuation and Fair Value Measurements:
Investment Valuation Policies: The Funds’ investments are valued at fair value (also referred to as “market value” within the financial statements) as of the close of trading on the New York Stock Exchange (“NYSE”) (generally 4:00 p.m., Eastern time) (or if the reporting date falls on a day the NYSE is closed, investments are valued at fair value as of the period end). U.S. GAAP defines fair value as the price the Funds would receive to sell an asset or pay to transfer a liability in an orderly transaction between market participants at the measurement date. The Funds determine the fair values of their financial instruments using various independent dealers or pricing services under policies approved by the Board of Directors of each Fund (the “Board”). The BlackRock Global Valuation Methodologies Committee (the “Global Valuation Committee”) is the committee formed by management to develop global pricing policies and procedures and to oversee the pricing function for all financial instruments.
Fair Value Inputs and Methodologies: The following methods and inputs are used to establish the fair value of each Fund’s assets and liabilities:
| • | | Equity investments traded on a recognized securities exchange are valued at the official closing price each day, if available. For equity investments traded on more than one exchange, the official closing price on the exchange where the stock is primarily traded is used. Equity investments traded on a recognized exchange for which there were no sales on that day may be valued at the last available bid (long positions) or ask (short positions) price. |
| • | | Fixed-income securities for which market quotations are readily available are generally valued using the last available bid prices or current market quotations provided by independent dealers or third party pricing services. Floating rate loan interests are valued at the mean of the bid prices from one or more independent brokers or dealers as obtained from a third party pricing service. Pricing services generally value fixed-income securities assuming orderly transactions of an institutional round lot size, but the Funds may hold or transact in such securities in smaller, odd lot sizes. Odd lots often trade at lower prices than institutional round lots. The pricing services may use matrix pricing or valuation models that utilize certain inputs and assumptions to derive values, including transaction data (e.g., recent representative bids and offers), credit quality information, perceived market movements, news, and other relevant information. Certain fixed-income securities, including asset-backed and mortgage related securities may be valued based on valuation models that consider the estimated cash flows of each tranche of the entity, establish a benchmark yield and develop an estimated tranche specific spread to the benchmark yield based on the unique attributes of the tranche. The amortized cost method of valuation may be used with respect to debt obligations with sixty days or less remaining to maturity unless the Manager determines such method does not represent fair value. |
| • | | Generally, trading in foreign instruments is substantially completed each day at various times prior to the close of trading on the NYSE. Occasionally, events affecting the values of such instruments may occur between the foreign market close and the close of trading on the NYSE that may not be reflected in the computation of the Funds’ net assets. Each business day, the Funds use a pricing service to assist with the valuation of certain foreign exchange-traded equity securities and foreign exchange-traded over-the-counter (“OTC”) options (the “Systematic Fair Value Price”). Using current market factors, the Systematic Fair Value Price is designed to value such foreign securities and foreign options at fair value as of the close of trading on the NYSE, which follows the close of the local markets. |
| | | | | | |
| | | | | | | |
| | SEMI-ANNUAL REPORT | | APRIL 30, 2017 | | 27 |
| | |
| Notes to Financial Statements (continued) | | |
| • | | The Funds value their investment in SL Liquidity Series, LLC, Money Market Series (the “Money Market Series”) at fair value, which is ordinarily based upon their pro rata ownership in the underlying fund’s net assets. The Money Market Series seeks current income consistent with maintaining liquidity and preserving capital. Although the Money Market Series is not registered under the 1940 Act, its investments may follow the parameters of investments by a money market fund that is subject to Rule 2a-7 under the 1940 Act. |
| • | | Securities and other assets and liabilities denominated in foreign currencies are translated into U.S. dollars using exchange rates determined as of the close of trading on the NYSE. Forward foreign currency exchange contracts are valued at the mean between the bid and ask prices and are determined as of the close of trading on the NYSE. Interpolated values are derived when the settlement date of the contract is an interim date for which quotations are not available |
| • | | Participation notes are valued on the basis of last available bid prices or current market quotations provided by dealers or pricing services. |
If events (e.g., a company announcement, market volatility or a natural disaster) occur that are expected to materially affect the value of such investments, or in the event that the application of these methods of valuation results in a price for an investment that is deemed not to be representative of the market value of such investment, or if a price is not available, the investment will be valued by the Global Valuation Committee, or its delegate, in accordance with a policy approved by the Board as reflecting fair value (“Fair Valued Investments”). The fair valuation approaches that may be used by the Global Valuation Committee will include Market approach, Income approach and Cost approach. Valuation techniques such as discounted cash flow, use of market comparables and matrix pricing are types of valuation approaches and typically used in determining fair value. When determining the price for Fair Valued Investments, the Global Valuation Committee, or its delegate, seeks to determine the price that each Fund might reasonably expect to receive or pay from the current sale or purchase of that asset or liability in an arm’s-length transaction. Fair value determinations shall be based upon all available factors that the Global Valuation Committee, or its delegate, deems relevant and consistent with the principles of fair value measurement.
The Global Valuation Committee, or its delegate, employs various methods for calibrating valuation approaches for investments where an active market does not exist, including regular due diligence of each Fund’s pricing vendors, regular reviews of key inputs and assumptions, transactional back-testing or disposition analysis to compare unrealized gains and losses to realized gains and losses, reviews of missing or stale prices and large movements in market values and reviews of any market related activity. The pricing of all Fair Valued Investments is subsequently reported to the Board or a committee thereof on a quarterly basis. As a result of the inherent uncertainty in valuation of these investments, the fair values may differ from the values that would have been used had an active market existed.
For investments in equity or debt issued by privately-held companies or funds (“Private Company” or collectively, the “Private Companies”) and other Fair Valued Investments, the fair valuation approaches that are used by third party pricing services utilize one or a combination of, but not limited to, the following inputs.
| | |
| Standard Inputs Generally Considered By Third Party Pricing Services |
Market approach | | (i) recent market transactions, including subsequent rounds of financing, in the underlying investment or comparable issuers; (ii) recapitalizations and other transactions across the capital structure; and (iii) market multiples of comparable issuers. |
Income approach | | (i) future cash flows discounted to present and adjusted as appropriate for liquidity, credit, and/or market risks; (ii) quoted prices for similar investments or assets in active markets; and (iii) other risk factors, such as interest rates, yield curves, volatilities, prepayment speeds, loss severities, credit risks, recovery rates, liquidation amounts and/or default rates. |
Cost approach | | (i) audited or unaudited financial statements, investor communications and financial or operational metrics issued by the Private Company; (ii) changes in the valuation of relevant indices or publicly traded companies comparable to the Private Company; (iii) relevant news and other public sources; and (iv) known secondary market transactions in the Private Company’s interests and merger or acquisition activity in companies comparable to the Private Company. |
Investments in series of preferred stock issued by Private Companies are typically valued utilizing Market approach in determining the enterprise value of the company. Such investments often contain rights and preferences that differ from other series of preferred and common stock of the same issuer. Valuation techniques such as an option pricing model (“OPM”), a probability weighted expected return model (“PWERM”) or a hybrid of those techniques are used in allocating enterprise value of the company, as deemed appropriate under the circumstances. The use of OPM and PWERM techniques involve a determination of the exit scenarios of the investment in order to appropriately allocate the enterprise value of the company among the various parts of its capital structure.
The Private Companies are not subject to the public company disclosure, timing, and reporting standards as other investments held by a Fund. Typically, the most recently available information by a Private Company is as of a date that is earlier than the date a Fund is calculating its net asset value (“NAV”). This factor may result in a difference between the value of the investment and the price a Fund could receive upon the sale of the investment.
| | | | | | |
| | | | | | | |
| 28 | | SEMI-ANNUAL REPORT | | APRIL 30, 2017 | | |
| | | | |
| Notes to Financial Statements (continued) | | |
Fair Value Hierarchy: Various inputs are used in determining the fair value of investments. These inputs to valuation techniques are categorized into a fair value hierarchy consisting of three broad levels for financial statement purposes as follows:
| • | | Level 1 — unadjusted price quotations in active markets/exchanges for identical assets or liabilities that each Fund has the ability to access |
| • | | Level 2 — other observable inputs (including, but not limited to, quoted prices for similar assets or liabilities in markets that are active, quoted prices for identical or similar assets or liabilities in markets that are not active, inputs other than quoted prices that are observable for the assets or liabilities (such as interest rates, yield curves, volatilities, prepayment speeds, loss severities, credit risks and default rates) or other market–corroborated inputs) |
| • | | Level 3 — unobservable inputs based on the best information available in the circumstances, to the extent observable inputs are not available (including each Fund’s own assumptions used in determining the fair value of investments) |
The hierarchy gives the highest priority to unadjusted quoted prices in active markets for identical assets or liabilities (Level 1 measurements) and the lowest priority to unobservable inputs (Level 3 measurements). Accordingly, the degree of judgment exercised in determining fair value is greatest for instruments categorized in Level 3. The inputs used to measure fair value may fall into different levels of the fair value hierarchy. In such cases, for disclosure purposes, the fair value hierarchy classification is determined based on the lowest level input that is significant to the fair value measurement in its entirety. Investments classified within Level 3 have significant unobservable inputs used by the Global Valuation Committee in determining the price for Fair Valued Investments. Level 3 investments include equity or debt issued by privately held companies or funds. There may not be a secondary market, and/or there are a limited number of investors. Level 3 investments may also be adjusted to reflect illiquidity and/or non-transferability, with the amount of such discount estimated by the Global Valuation Committee in the absence of market information.
Changes in valuation techniques may result in transfers into or out of an assigned level within the hierarchy. In accordance with each Fund’s policy, transfers between different levels of the fair value hierarchy are deemed to have occurred as of the beginning of the reporting period. The categorization of a value determined for investments is based on the pricing transparency of the investments and is not necessarily an indication of the risks associated with investing in those securities.
As of April 30, 2017, certain investments of the Funds were valued using NAV per share or its equivalent as no quoted market value is available and therefore have been excluded from the fair value hierarchy.
4. Securities and Other Investments:
Participation Notes: Participation notes (“P-Notes”) are promissory notes issued by banks or broker-dealers that are designed to offer a return measured by the change in the value of the underlying security or basket of securities (the “underlying security”) while not holding the actual shares of the underlying security. These investments are typically used to gain exposure to securities traded in foreign markets that may be restricted due to country-specific regulations. When the P-Note matures, the issuer will pay or receive the difference between the value of the underlying security at the time of the purchase and the underlying security’s value at maturity of the P-Notes. Income received on P-Notes is recorded by a Fund as dividend income in the Statements of Operations. An investment in a P-Note involves additional risks beyond the risks normally associated with a direct investment in the underlying security. While the holder of a P-Note is entitled to receive from the bank or broker-dealer any dividends paid by the underlying security, the holder is not entitled to the same rights (e.g., voting rights) as a direct owner of the underlying security. P-Notes are considered general unsecured contractual obligations of the bank or broker-dealer. The holder of a P-Note must rely on the creditworthiness of the issuer for its investment returns on the P-Notes and has no rights against the issuer of the underlying security. A P-Note may be more volatile and less liquid than other investments held by a Fund since the P-Note generally is dependent on the liquidity in the local trading market for the underlying security.
Warrants: Warrants entitle a Fund to purchase a specified number of shares of common stock and are non-income producing. The purchase price and number of shares are subject to adjustment under certain conditions until the expiration date of the warrants, if any. If the price of the underlying stock does not rise above the strike price before the warrant expires, the warrant generally expires without any value and a Fund will lose any amount it paid for the warrant. Thus, investments in warrants may involve more risk than investments in common stock. Warrants may trade in the same markets as their underlying stock; however, the price of the warrant does not necessarily move with the price of the underlying stock.
Securities Lending: The Fund may lend their securities to approved borrowers, such as brokers, dealers and other financial institutions. The borrower pledges and maintains with the Funds collateral consisting of cash, an irrevocable letter of credit issued by a bank, or securities issued or guaranteed by the U.S. Government. The initial collateral received by each Fund is required to have a value of at least 102% of the current value of the loaned securities for securities traded on U.S. exchanges and a value of at least 105% for all other securities. The collateral is maintained thereafter at a value equal to at least 100% of the current market value of the securities on loan. The market value of the loaned securities is determined at the close of each business day of the Fund and any additional required collateral is delivered to the Fund, or excess collateral returned by the Fund, on the next business day. During the term of the loan, the Funds are entitled to all distributions made on or in respect of the loaned securities but does not receive interest income on securities received as collateral. Loans of securities are terminable at any time and the borrower, after notice, is required to return borrowed securities within the standard time period for settlement of securities transactions.
| | | | | | |
| | | | | | | |
| | SEMI-ANNUAL REPORT | | APRIL 30, 2017 | | 29 |
| | |
| Notes to Financial Statements (continued) | | |
The market value of any securities on loan, all of which were classified as common stocks in the Funds’ Schedules of Investments, and the value of any related collateral are shown separately in the Statements of Assets and Liabilities as a component of investments at value-unaffiliated, and collateral on securities loaned at value, respectively. As of period end, any securities on loan were collateralized by cash and/or U.S. Government obligations. Cash collateral invested by the securities lending agent, BlackRock Investment Management, LLC (“BIM”), if any, is disclosed in the Schedules of Investments.
Securities lending transactions are entered into by the Funds under Master Securities Lending Agreements (each, an “MSLA”), which provide the right, in the event of default (including bankruptcy or insolvency), for the non-defaulting party to liquidate the collateral and calculate a net exposure to the defaulting party or request additional collateral. In the event that a borrower defaults, the Funds, as lender, would offset the market value of the collateral received against the market value of the securities loaned. When the value of the collateral is greater than that of the market value of the securities loaned, the lender is left with a net amount payable to the defaulting party. However, bankruptcy or insolvency laws of a particular jurisdiction may impose restrictions on or prohibitions against such a right of offset in the event of an MSLA counterparty’s bankruptcy or insolvency. Under the MSLA, absent an event of default, the borrower can resell or re-pledge the loaned securities, and a Fund can reinvest cash collateral received in connection with loaned securities. Upon an event of default, the parties’ obligations to return the securities or collateral to the other party are extinguished, and the parties can resell or re-pledge the loaned securities or the collateral received in connection with the loaned securities in order to satisfy the defaulting party’s net payment obligation for all transactions under the MSLA. The defaulting party remains liable for any deficiency.
As of period end, the following table is a summary of the Funds’ securities lending agreements by counterparty which are subject to offset under an MSLA:
| | | | | | | | | | | | |
| Emerging Markets | |
| Counterparty | | Securities
Loaned
at Value | | | Cash
Collateral
Received1 | | | Net Amount | |
Merrill Lynch, Pierce, Fenner & Smith Inc. | | $ | 109,945 | | | $ | (109,945 | ) | | | — | |
| | 1 | | Collateral with a value of $ 123,207 has been received in connection with securities lending agreements. Collateral received in excess of the value of securities loaned from the individual counterparty is not shown for financial reporting purposes in the table above. |
The risks of securities lending include the risk that the borrower may not provide additional collateral when required or may not return the securities when due. To mitigate these risks, the Funds benefit from a borrower default indemnity provided by BIM. BIM’s indemnity allows for full replacement of the securities loaned if the collateral received does not cover the value on the securities loaned in the event of borrower default. Each Fund could incur a loss if the value of an investment purchased with cash collateral falls below the market value of loaned securities or if the value of an investment purchased with cash collateral falls below the value of the original cash collateral received.
5. Investment Advisory Agreement and Other Transactions with Affiliates:
The PNC Financial Services Group, Inc. is the largest stockholder and an affiliate of BlackRock, Inc. (“BlackRock”) for 1940 Act purposes.
Investment Advisory: Each Fund entered into an Investment Advisory Agreement with the Manager, the Funds’ investment adviser, an indirect, wholly-owned subsidiary of BlackRock, to provide investment advisory and administration services. The Manager is responsible for the management of each Fund’s portfolio and provides the personnel, facilities, equipment and certain other services necessary to the operations of each Fund.
For such services, each Fund pays the Manager a monthly fee at an annual rate equal to the following percentages of the average daily value of each Fund’s net assets:
| | | | |
| Average Daily Net Assets | | Investment Advisory Fees | |
First $1 Billion | | | 1.00% | |
$1 Billion — $3 Billion | | | 0.94% | |
$3 Billion — $5 Billion | | | 0.90% | |
$5 Billion — $10 Billion | | | 0.87% | |
Greater than $10 Billion | | | 0.85% | |
With respect to each Fund, the Manager entered into separate sub-advisory agreements with BlackRock International Limited (“BIL”), an affiliate of the Manager. The Manager pays BIL, for services it provides, a monthly fee that is a percentage of the investment advisory fees paid by each Fund to the Manager.
With respect to Emerging Markets, the Manager entered into a separate sub-advisory agreement with BlackRock Asset Management North Asia Limited (“BAMNAL”). The Manager pays BAMNAL, for services it provides, a monthly fee that is a percentage of the investment advisory fees paid by the Fund to the Manager.
| | | | | | |
| | | | | | | |
| 30 | | SEMI-ANNUAL REPORT | | APRIL 30, 2017 | | |
| | | | |
| Notes to Financial Statements (continued) | | |
Service and Distribution Fees: The Funds entered into a Distribution Agreement and Distribution Plans with BlackRock Investments, LLC (“BRIL”), an affiliate of the Manager. Pursuant to the Distribution Plans and in accordance with Rule 12b-1 under the 1940 Act, each Fund pays BRIL ongoing service and distribution fees. The fees are accrued daily and paid monthly at annual rates based upon the average daily net assets of the relevant share class of each Fund as follows:
| | | | | | | | |
| | | Service Fee | | | Distribution Fee | |
Investor A | | | 0.25 | % | | | — | |
Investor B | | | 0.25 | % | | | 0.75 | % |
Investor C | | | 0.25 | % | | | 0.75 | % |
BRIL and broker-dealers, pursuant to sub-agreements with BRIL, provide shareholder servicing and distribution services to the Funds. The ongoing service and/or distribution fee compensates BRIL and each broker-dealer for providing shareholder servicing and/or distribution related services to shareholders.
For the six months ended April 30, 2017, the following table shows the class specific service and distribution fees borne directly by each share class of each Fund:
| | | | | | | | | | | | | | | | |
| | | Investor A | | | Investor B | | | Investor C | | | Total | |
Emerging Markets | | $ | 226,859 | | | | — | | | $ | 436,629 | | | $ | 663,488 | |
Latin America | | $ | 123,600 | | | $ | 878 | | | $ | 104,822 | | | $ | 229,300 | |
Transfer Agent: Pursuant to written agreements, certain financial intermediaries, some of which may be affiliates, provide the Funds with sub-accounting, recordkeeping, sub-transfer agency and other administrative services with respect to sub-accounts they service. For these services, these entities receive an asset-based fee or an annual fee per shareholder account, which will vary depending on share class and/or net assets.
The Manager maintains a call center that is responsible for providing certain shareholder services to the Funds. Shareholder services include responding to inquiries and processing subscriptions and redemptions based upon instructions from shareholders. For the six months ended April 30, 2017, each Fund reimbursed the Manager the following amounts for costs incurred in running the call center, which are included in transfer agent — class specific in the Statements of Operations:
| | | | | | | | | | | | | | | | | | | | |
| | | Institutional | | | Investor A | | | Investor B | | | Investor C | | | Total | |
Emerging Markets | | $ | 677 | | | $ | 3,540 | | | | — | | | $ | 1,158 | | | $ | 5,375 | |
Latin America | | $ | 367 | | | $ | 4,406 | | | $ | 44 | | | $ | 496 | | | $ | 5,313 | |
For the six months ended April 30, 2017, the following table shows the class specific transfer agent fees borne directly by each class of each Fund:
| | | | | | | | | | | | | | | | | | | | |
| | | Institutional | | | Investor A | | | Investor B | | | Investor C | | | Total | |
Emerging Markets | | $ | 50,984 | | | $ | 250,444 | | | | — | | | $ | 162,248 | | | $ | 463,676 | |
Latin America | | $ | 32,023 | | | $ | 97,956 | | | $ | 835 | | | $ | 30,659 | | | $ | 161,473 | |
Other Fees: For the six months ended April 30, 2017, affiliates earned underwriting discounts, direct commissions and dealer concessions on sales of each Fund’s Investor A Shares as follows:
| | | | | | | | |
| | | Emerging Markets | | | Latin America | |
Investor A | | $ | 8,304 | | | $ | 4,571 | |
For the six months ended April 30, 2017, affiliates received CDSCs as follows:
| | | | | | | | |
| | | Emerging Markets | | | Latin America | |
Investor A | | $ | 1,222 | | | | — | |
Investor C | | $ | 6,074 | | | $ | 2,915 | |
Expense Waivers and Reimbursements: With respect to each Fund, the Manager voluntarily agreed to waive its investment advisory fees by the amount of investment advisory fees each Fund pays to the Manager indirectly through its investment in affiliated money market funds (the “affiliated money market fund waiver”). This amount is included in fees waived by the Manager in the Statements of Operations. The amount of waivers and/or reimbursements of fees and expenses made pursuant to the expense limitation caps, as applicable, will be reduced by the amount of the affiliated money market fund waiver. For the six months ended April 30, 2017, the amounts waived were as follows:
| | | | | | | | |
| | | Emerging Markets | | | Latin America | |
Amounts waived | | $ | 929 | | | $ | 600 | |
The Manager has voluntarily agreed to waive its investment advisory fee with respect to any portion of the Funds’ assets invested in affiliated equity and fixed-income mutual funds and affiliated exchange-traded funds that have a contractual management fee. Effective February 28, 2017, the waiver became contractual through February 28, 2018. The contractual agreement may be terminated upon 90 days’ notice by a majority of the non-interested directors
| | | | | | |
| | | | | | | |
| | SEMI-ANNUAL REPORT | | APRIL 30, 2017 | | 31 |
| | |
| Notes to Financial Statements (continued) | | |
or by a vote of a majority of the outstanding voting securities of the applicable Fund. For the six months ended April 30, 2017, there were no fees waived by the manager.
For the six months ended April 30, 2017, the Funds reimbursed the Manager for certain accounting services, which is included in accounting services in the Statements of Operations. The reimbursements were as follows:
| | | | | | | | |
| | | Emerging Markets | | | Latin America | |
Amounts reimbursed | | $ | 2,288 | | | $ | 977 | |
Securities Lending: The U.S. Securities and Exchange Commission has issued an exemptive order which permits BIM, an affiliate of the Manager, to serve as securities lending agent for the Funds, subject to applicable conditions. As securities lending agent, BIM bears all operational costs directly related to securities lending. The Funds are responsible for expenses in connection with the investment of cash collateral received for securities on loan (the “collateral investment expenses”). The cash collateral is invested in a private investment company managed by the Manager or its affiliates. However, BIM has agreed to cap the collateral investment expenses of the private investment company to an annual rate of 0.04%. The investment adviser to the private investment company will not charge any advisory fees with respect to shares purchased by the Funds. If the private investment company’s weekly liquid assets fall below 30% of its total assets, BIM, as managing member of the private investment company, is permitted at any time, if it determines it to be in the best interests of the private investment company, to impose a liquidity fee of up to 2% of the value of units withdrawn or impose a redemption gate that temporarily suspends the right of withdrawal out of the private investment company. In addition, if the private investment company’s weekly liquid assets fall below 10% of its total assets at the end of any business day, the private investment company will impose a liquidity fee in the default amount of 1% of the amount withdrawn, generally effective as of the next business day, unless BIM determines that a higher (not to exceed 2%) or lower fee level or not imposing a liquidity fee is in the best interests of the private investment company. The shares of the private investment company purchased by the Funds would be subject to any such liquidity fee or redemption gate imposed.
Securities lending income is equal to the total of income earned from the reinvestment of cash collateral, net of fees and other payments to and from borrowers of securities, and less the collateral investment expenses. Each Fund retains a portion of securities lending income and remits a remaining portion to BIM as compensation for its services as securities lending agent. Pursuant to a securities lending agreement, BIM may lend securities only when the difference between the borrower rebate rate and the risk free rate exceeds a certain level (such securities, the “specials only securities”).
Pursuant to such agreement, each Fund retains 80% of securities lending income. In addition, commencing the business day following the date that the aggregate securities lending income earned across certain funds in the Equity-Liquidity Complex in a calendar year exceeds a specified threshold, each Fund, pursuant to the securities lending agreement, will retain for the remainder of the calendar year securities lending income in an amount equal to 85% of securities lending income.
The share of securities lending income earned by each Fund is shown as securities lending — affiliated — net in the Statements of Operations. For the six months ended April 30, 2017, each Fund paid BIM the following amounts for securities lending agent services:
| | | | | | | | |
| | | Emerging Markets | | | Latin America | |
Securities lending services | | $ | 59 | | | | — | |
Interfund Lending: In accordance with an exemptive order (the “Order”) from the U.S. Securities and Exchange Commission, Emerging Markets may participate in a joint lending and borrowing facility for temporary purposes (the “Interfund Lending Program”), subject to compliance with the terms and conditions of the Order, and to the extent permitted by Emerging Market’s investment policies and restrictions. Emerging Markets is currently permitted to borrow under the Interfund Lending Program.
A lending BlackRock fund may lend in aggregate up to 15% of its net assets, but may not lend more than 5% of its net assets to any one borrowing fund through the Interfund Lending Program. A borrowing BlackRock fund may not borrow through the Interfund Lending Program or from any other source more than 33 1/3% of its total assets (or any lower threshold provided for by the fund’s investment restrictions). If a borrowing BlackRock fund’s total outstanding borrowings exceed 10% of its total assets, each of its outstanding interfund loans will be subject to collateralization of at least 102% of the outstanding principal value of the loan. All interfund loans are for temporary or emergency purposes and the interest rate to be charged will be the average of the highest current overnight repurchase agreement rate available to a lending fund and the bank loan rate, as calculated according to a formula established by the Board.
During the six months ended April 30, 2017, Emerging Markets did not participate in the Interfund Lending Program.
Officers and Directors: Certain officers and/or directors of the Funds are officers and/or directors of BlackRock or its affiliates. The Funds reimburse the Manager for a portion of the compensation paid to the Funds’ Chief Compliance Officer, which is included in Officer and Directors in the Statements of Operations.
| | | | | | |
| | | | | | | |
| 32 | | SEMI-ANNUAL REPORT | | APRIL 30, 2017 | | |
| | | | |
| Notes to Financial Statements (continued) | | |
6. Purchases and Sales:
For the six months ended April 30, 2017, purchases and sales of investments excluding short-term securities were as follows:
| | | | | | | | |
| | | Emerging Markets | | | Latin America | |
Purchases | | $ | 187,271,861 | | | $ | 37,508,764 | |
Sales | | $ | 291,998,305 | | | $ | 47,964,612 | |
7. Income Tax Information:
It is the Funds’ policy to comply with the requirements of the Internal Revenue Code of 1986, as amended, applicable to regulated investment companies, and to distribute substantially all of their taxable income to their shareholders. Therefore, no U.S. federal income tax provision is required.
Each Fund files U.S. federal and various state and local tax returns. No income tax returns are currently under examination. The statute of limitations on each Fund’s U.S. federal tax returns generally remains open for each of the four years ended October 31, 2016. The statutes of limitations on each Fund’s state and local tax returns may remain open for an additional year depending upon the jurisdiction.
Management has analyzed tax laws and regulations and their application to the Funds as of April 30, 2017, inclusive of the open tax return years, and does not believe that there are any uncertain tax positions that require recognition of a tax liability in the Funds’ financial statements.
As of October 31, 2016, the Funds had capital loss carryforwards available to offset future realized capital gains through the indicated expiration dates as follows:
| | | | | | | | |
| Expires October 31, | | Emerging Markets | | | Latin America | |
No expiration date1 | | $ | 120,350,166 | | | $ | 46,116,386 | |
2017 | | | 11,598,286 | | | | 43,968,643 | |
| | | | |
Total | | $ | 131,948,452 | | | $ | 90,085,029 | |
| | | | |
| | 1 | | Must be utilized prior to losses subject to expiration. |
As of April 30, 2017, gross unrealized appreciation and depreciation based on cost for U.S. federal income tax purposes were as follows:
| | | | | | | | |
| | | Emerging Markets | | | Latin America | |
Tax cost | | $ | 284,400,351 | | | $ | 142,501,960 | |
| | | | | | | | |
Gross unrealized appreciation | | | 55,137,618 | | | | 47,443,019 | |
Gross unrealized depreciation | | | (12,595,367 | ) | | | (13,106,832 | ) |
| | | | | | | | |
Net unrealized appreciation | | $ | 42,542,251 | | | $ | 34,336,187 | |
| | | | |
8. Bank Borrowings:
The Fund, along with certain other funds managed by the Manager and its affiliates (“Participating Funds”), is a party to a 364-day, $2.1 billion credit agreement with a group of lenders. Under this agreement, the Funds may borrow to fund shareholder redemptions. Excluding commitments designated for certain individual funds, the Participating Funds, including the Funds, can borrow up to an aggregate commitment amount of $1.6 billion at any time outstanding, subject to asset coverage and other limitations as specified in the agreement. The credit agreement has the following terms: a fee of 0.12% per annum on unused commitment amounts and interest at a rate equal to the higher of (a) one-month LIBOR (but, in any event, not less than 0.00%) on the date the loan is made plus 0.80% per annum or (b) the Fed Funds rate (but, in any event, not less than 0.00%) in effect from time to time plus 0.80% per annum on amounts borrowed. The agreement expires in April 2018 unless extended or renewed. Participating Funds paid administration, legal and arrangement fees, which, if applicable, are included in miscellaneous expenses in the Statements of Operations. These fees were allocated among such funds based upon portions of the aggregate commitment available to them and relative net assets of Participating Funds. During the six months ended April 30, 2017, the Funds did not borrow under the credit agreement.
9. Principal Risks:
In the normal course of business, certain Funds invest in securities and enter into transactions where risks exist due to fluctuations in the market (market risk) or failure of the issuer to meet all its obligations, including the ability to pay principal and interest when due (issuer credit risk). The value of securities held by the Funds may decline in response to certain events, including those directly involving the issuers of securities owned by the Funds. Investments in the securities of issuers domiciled in countries with emerging capital markets involve certain additional risks that do not generally apply to investments in securities of issuers in more developed capital markets, such as (i) low or nonexistent trading volume, resulting in a lack of liquidity and increased volatility in prices for such securities; (ii) uncertain national policies and social, political and economic instability, increasing the potential for expropriation of assets, confiscatory taxation, high rates of inflation or unfavorable diplomatic developments; and (iii) possible fluctuations in exchange rates, differing legal systems and the existence or possible imposition of exchange controls, custodial restrictions or other foreign or U.S. governmental laws or restrictions applicable to such investments. Changes arising from the general economy, the overall market and local, regional or global political and/or social instability, as well as currency, interest rate and price fluctuations, may also affect the securities’ value.
| | | | | | |
| | | | | | | |
| | SEMI-ANNUAL REPORT | | APRIL 30, 2017 | | 33 |
| | |
| Notes to Financial Statements (continued) | | |
On October 11, 2016, BlackRock implemented certain changes required by amendments to Rule 2a-7 under the 1940 Act, which governs the operations of U.S. money market funds. The Funds may be exposed to additional risks when reinvesting cash collateral in money market funds that do not seek to maintain a stable NAV per share of $1.00 and which may be subject to redemption gates or liquidity fees under certain circumstances.
Counterparty Credit Risk: Similar to issuer credit risk, the Funds may be exposed to counterparty credit risk, or the risk that an entity may fail to or be unable to perform on its commitments related to unsettled or open transactions. The Funds manage counterparty credit risk by entering into transactions only with counterparties that the Manager believes have the financial resources to honor their obligations and by monitoring the financial stability of those counterparties. Financial assets, which potentially expose the Funds to market, issuer and counterparty credit risks, consist principally of financial instruments and receivables due from counterparties. The extent of the Funds’ exposure to market, issuer and counterparty credit risks with respect to these financial assets is approximately their value recorded in the Statements of Assets and Liabilities, less any collateral held by the Funds.
Valuation Risk: The market values of equities, such as common stocks and preferred securities or equity related investments, such as futures and options, may decline due to general market conditions which are not specifically related to a particular company. They may also decline due to factors which affect a particular industry or industries. A Fund may invest in illiquid investments and may experience difficulty in selling those investments in a timely manner at the price that they believe the investments are worth. Prices may fluctuate widely over short or extended periods in response to company, market or economic news. Markets also tend to move in cycles, with periods of rising and falling prices. This volatility may cause each Fund’s NAV to experience significant increases or decreases over short periods of time. If there is a general decline in the securities and other markets, the NAV of a Fund may lose value, regardless of the individual results of the securities and other instruments in which a Fund invests.
Concentration Risk: Latin America invests a substantial amount of its assets in issuers located in a single country or a limited number of countries. When the Fund concentrates its investments in this manner, it assumes the risk that economic, political and social conditions in those countries may have a significant impact on their investment performance. Foreign issuers may not be subject to the same uniform accounting, auditing and financial reporting standards and practices as used in the United States. Foreign securities markets may also be less liquid, more volatile and less subject to governmental supervision not typically associated with investing in U.S. securities. Investment percentages in specific countries are presented in the Schedule of Investments.
As of period end, Latin America’s investments had the following industry classifications:
| | | | |
| Industry | | Percent of
Net Assets | |
Bank | | | 24 | % |
Oil, Gas & Consumable Fuels | | | 13 | |
Beverages | | | 11 | |
Metal & Mining | | | 11 | |
Other1 | | | 41 | |
| | 1 | | All other industries held were less than 5% of net assets. |
10. Capital Share Transactions:
Transactions in capital shares for each class were as follows:
| | | | | | | | | | | | | | | | | | | | |
| | | Six Months Ended
April 30, 2017 | | | | | | Year Ended
October 31, 2016 | |
| Emerging Markets | | Shares | | | Amount | | | | | | Shares | | | Amount | |
| Institutional | | | | | | | | | | | | | | | | | | | | |
Shares sold | | | 894,539 | | | $ | 15,846,783 | | | | | | | | 1,277,003 | | | $ | 20,250,856 | |
Shares issued in reinvestment of distributions | | | 39,799 | | | | 675,417 | | | | | | | | 120,690 | | | | 1,861,033 | |
Shares redeemed | | | (4,519,613 | ) | | | (77,308,596 | ) | | | | | | | (5,065,591 | ) | | | (84,653,192 | ) |
| | | | | | | | | | | | |
Net decrease | | | (3,585,275 | ) | | $ | (60,786,396 | ) | | | | | | | (3,667,898 | ) | | $ | (62,541,303 | ) |
| | | | | | | | | | | | |
| | | | | | | | | | | | | | | | | | | | |
| Investor A | | | | | | | | | | | | | | | | | | | | |
Shares sold | | | 1,200,998 | | | $ | 20,763,918 | | | | | | | | 2,880,670 | | | $ | 45,551,784 | |
Shares issued in reinvestment of distributions | | | 140,259 | | | | 2,296,161 | | | | | | | | 108,713 | | | | 1,619,830 | |
Shares redeemed | | | (2,228,107 | ) | | | (38,888,930 | ) | | | | | | | (4,294,309 | ) | | | (69,108,610 | ) |
| | | | | | | | | | | | |
Net decrease | | | (886,850 | ) | | $ | (15,828,851 | ) | | | | | | | (1,304,926 | ) | | $ | (21,936,996 | ) |
| | | | | | | | | | | | |
| | | | | | | | | | | | | | | | | | | | |
| Investor C | | | | | | | | | | | | | | | | | | | | |
Shares sold | | | 326,143 | | | $ | 4,699,734 | | | | | | | | 1,360,604 | | | $ | 17,544,192 | |
Shares issued in reinvestment of distributions | | | 43,365 | | | | 604,948 | | | | | | | | 21,912 | | | | 278,503 | |
Shares redeemed | | | (1,758,702 | ) | | | (25,930,852 | ) | | | | | | | (2,964,944 | ) | | | (40,316,539 | ) |
| | | | | | | | | | | | |
Net decrease | | | (1,389,194 | ) | | $ | (20,626,170 | ) | | | | | | | (1,582,428 | ) | | $ | (22,493,844 | ) |
| | | | | | | | | | | | |
Total Net Decrease | | | (5,861,319 | ) | | $ | (97,241,417 | ) | | | | | | | (6,555,252 | ) | | $ | (106,972,143 | ) |
| | | | | | | | | | | | |
| | | | | | |
| | | | | | | |
| 34 | | SEMI-ANNUAL REPORT | | APRIL 30, 2017 | | |
| | | | |
| Notes to Financial Statements (concluded) | | |
| | | | | | | | | | | | | | | | | | | | |
| | | Six Months Ended
April 30, 2017 | | | | | | Year Ended
October 31, 2016 | |
| Latin America | | Shares | | | Amount | | | | | | Shares | | | Amount | |
| Institutional | | | | | | | | | | | | | | | | | | | | |
Shares sold | | | 313,816 | | | $ | 13,623,017 | | | | | | | | 591,555 | | | $ | 20,946,101 | |
Shares issued in reinvestment of distributions | | | 15,890 | | | | 625,263 | | | | | | | | 9,396 | | | | 309,433 | |
Shares redeemed | | | (300,023 | ) | | | (12,537,309 | ) | | | | | | | (643,196 | ) | | | (22,358,941 | ) |
| | | | | | | | | | | | |
Net increase (decrease) | | | 29,683 | | | $ | 1,710,971 | | | | | | | | (42,245 | ) | | $ | (1,103,407 | ) |
| | | | | | | | | | | | |
| | | | | | | | | | | | | | | | | | | | |
| Investor A | | | | | | | | | | | | | | | | | | | | |
Shares sold | | | 343,701 | | | $ | 14,483,530 | | | | | | | | 1,063,826 | | | $ | 39,117,103 | |
Shares issued in reinvestment of distributions | | | 24,413 | | | | 949,511 | | | | | | | | 9,973 | | | | 324,519 | |
Shares redeemed | | | (521,469 | ) | | | (22,047,520 | ) | | | | | | | (1,422,316 | ) | | | (52,041,960 | ) |
| | | | | | | | | | | | |
Net decrease | | | (153,355 | ) | | $ | (6,614,479 | ) | | | | | | | (348,517 | ) | | $ | (12,600,338 | ) |
| | | | | | | | | | | | |
| | | | | | | | | | | | | | | | | | | | |
| Investor B | | | | | | | | | | | | | | | | | | | | |
Shares sold | | | — | | | | — | | | | | | | | — | | | $ | 17 | |
Shares issued in reinvestment of distributions | | | — | | | | — | | | | | | | | — | | | | — | |
Shares redeemed | | | (3,209 | ) | | $ | (131,133 | ) | | | | | | | (23,242 | ) | | | (766,561 | ) |
| | | | | | | | | | | | |
Net decrease | | | (3,209 | ) | | $ | (131,133 | ) | | | | | | | (23,242 | ) | | $ | (766,544 | ) |
| | | | | | | | | | | | |
| | | | | | | | | | | | | | | | | | | | |
| Investor C | | | | | | | | | | | | | | | | | | | | |
Shares sold | | | 30,025 | | | $ | 1,165,396 | | | | | | | | 63,884 | | | $ | 2,038,804 | |
Shares issued in reinvestment of distributions | | | 1,865 | | | | 66,256 | | | | | | | | — | | | | — | |
Shares redeemed | | | (112,993 | ) | | | (4,294,291 | ) | | | | | | | (193,111 | ) | | | (6,215,695 | ) |
| | | | | | | | | | | | |
Net decrease | | | (81,103 | ) | | $ | (3,062,639 | ) | | | | | | | (129,227 | ) | | $ | (4,176,891 | ) |
| | | | | | | | | | | | |
Total Net Decrease | | | (207,984 | ) | | $ | (8,097,280 | ) | | | | | | | (543,231 | ) | | $ | (18,647,180 | ) |
| | | | | | | | | | | | |
11. Subsequent Events:
Management has evaluated the impact of all subsequent events on the Funds through the date the financial statements were issued and has determined that there were no subsequent events requiring adjustment or additional disclosure in the financial statements.
| | | | | | |
| | | | | | | |
| | SEMI-ANNUAL REPORT | | APRIL 30, 2017 | | 35 |
| | |
| Disclosure of Sub-Advisory Agreement | | |
The Board of Directors (the “Board,” and the members of which are referred to as “Board Members”) of BlackRock Emerging Markets Fund, Inc. (the “Fund”) met in person on February 24, 2017 (the “February 2017 Meeting”) to consider the initial approval of the proposed sub-advisory agreement (the “Sub-Advisory Agreement”) between BlackRock Advisors, LLC (the “Manager”), the Fund’s investment advisor, and BlackRock Asset Management North Asia Limited (the “Sub-Advisor”) with respect to the Fund. The Board was informed that the Sub-Advisory Agreement was substantially the same as sub-advisory agreements previously approved with respect to certain other funds advised by the Manager.
On the date of the February 2017 Meeting, the Board consisted of thirteen individuals, eleven of whom were not “interested persons” of the Trust or the Fund as defined in the Investment Company Act of 1940, as amended (the “1940 Act”) (the “Independent Board Members”). Pursuant to the 1940 Act, the Board is required to consider the initial approval of the Sub-Advisory Agreement.
The Board previously met in person on April 21, 2016 (the “April 2016 Meeting”) and on May 18-20, 2016 (the “May 2016 Meeting”) to consider the approval of (i) the investment advisory agreement between the Fund and the Manager (the “Advisory Agreement”) and (ii) the sub-advisory agreement between the Manager and BlackRock International Limited (“BIL”) with respect to the Fund (the “BIL Sub-Advisory Agreement”). At the May 2016 Meeting, the Board, including the independent board members, approved the continuation of the Advisory Agreement and the BIL Sub-Advisory Agreement, each for a one-year term ending June 30, 2017. A discussion of the basis for the Board’s approval of the Advisory Agreement and the BIL Sub-Advisory Agreement at the May 2016 Meeting is included in the annual shareholder report of the Fund for the period ended October 31, 2016.
At the February 2017 Meeting, the Board reviewed materials relating to its consideration of the Sub-Advisory Agreement. The factors considered by the Board at the February 2017 Meeting in connection with approval of the proposed Sub-Advisory Agreement were substantially the same as the factors considered at the April 2016 Meeting and the May 2016 Meeting with respect to approval of the Advisory Agreement and the BIL Sub-Advisory Agreement.
Following discussion, the Board, including a majority of the Independent Board Members, approved the Sub-Advisory Agreement between the Manager and the Sub-Advisor with respect to the Fund for a two-year term beginning on the effective date of the Sub-Advisory Agreement. Based upon its evaluation of all of the aforementioned factors in their totality, the Board, including a majority of the Independent Board Members, was satisfied that the terms of the Sub-Advisory Agreement were fair and reasonable and in the best interest of the Fund and its shareholders. In arriving at its decision to approve the Sub-Advisory Agreement, the Board did not identify any single factor or group of factors as all-important or controlling, but considered all factors together, and different Board Members may have attributed different weights to the various factors considered. The Independent Board Members were also assisted by the advice of independent legal counsel in making this determination.
| | | | | | |
| | | | | | | |
| 36 | | SEMI-ANNUAL REPORT | | APRIL 30, 2017 | | |
Rodney D. Johnson, Chair of the Board and Director
Susan J. Carter, Director
Collette Chilton, Director
Neil A. Cotty, Director
Cynthia A. Montgomery, Director
Joseph P. Platt, Director
Robert C. Robb, Jr., Director
Mark Stalnecker, Director
Kenneth L. Urish, Director
Claire A. Walton, Director
Frederick W. Winter, Director
Barbara G. Novick, Director
John M. Perlowski, Director, President and Chief Executive Officer
Thomas Callahan, Vice President
Jennifer McGovern, Vice President
Neal J. Andrews, Chief Financial Officer
Jay M. Fife, Treasurer
Charles Park, Chief Compliance Officer
Fernanda Piedra, Anti-Money Laundering Compliance Officer
Benjamin Archibald, Secretary
Effective December 31, 2016, David O. Beim and Dr. Matina S. Horner retired as Directors of the Funds.
| | | | | | | | |
Investment Adviser BlackRock Advisors, LLC Wilmington, DE 19809 | | Sub-Advisers BlackRock International Limited Edinburgh, EH3 8BL United Kingdom BlackRock Asset Management North Asia Limited1 Hong Kong | | Custodian Brown Brothers Harriman & Co. Boston, MA 02109 | | Transfer Agent BNY Mellon Investment
Servicing (US) Inc. Wilmington, DE 19809 | | Address of the Funds 100 Bellevue Parkway Wilmington, DE 19809 |
| | | | |
Distributor BlackRock Investments, LLC New York, NY 10022 | | Independent Registered
Public Accounting Firm Deloitte & Touche LLP Boston, MA 02116 | | Legal Counsel Sidley Austin LLP New York, NY 10019 | | Accounting Agent State Street Bank and
Trust Company Boston, MA 02110 | | |
| | 1 | | For Emerging Markets only. |
| | | | | | |
| | | | | | | |
| | SEMI-ANNUAL REPORT | | APRIL 30, 2017 | | 37 |
Electronic Delivery
Shareholders can sign up for e-mail notifications of quarterly statements, annual and semi-annual shareholder reports and prospectuses by enrolling in the electronic delivery program. Electronic copies of shareholder reports and prospectuses are available on BlackRock’s website.
To enroll in electronic delivery:
Shareholders Who Hold Accounts with Investment Advisers, Banks or Brokerages:
Please contact your financial advisor. Please note that not all investment advisers, banks or brokerages may offer this service.
Householding
The Funds will mail only one copy of shareholder documents, including prospectuses, annual and semi-annual reports and proxy statements, to shareholders with multiple accounts at the same address. This practice is commonly called “householding” and is intended to reduce expenses and eliminate duplicate mailings of shareholder documents. Mailings of your shareholder documents may be householded indefinitely unless you instruct us otherwise. If you do not want the mailing of these documents to be combined with those for other members of your household, please call the Funds at (800) 441-7762.
Availability of Quarterly Schedule of Investments
The Funds file their complete schedule of portfolio holdings with the SEC for the first and third quarters of each fiscal year on Form N-Q. The Funds’ Forms N-Q are available on the SEC’s website at http://www.sec.gov and may also be reviewed and copied at the SEC’s Public Reference Room in Washington, D.C. Information on the operation of the Public Reference Room or how to access documents on the SEC’s website without charge may be obtained by calling (800) SEC-0330. The Funds’ Forms N-Q may also be obtained upon request and without charge by calling (800) 441-7762.
Availability of Proxy Voting Policies and Procedures
A description of the policies and procedures that the Funds use to determine how to vote proxies relating to portfolio securities is available upon request and without charge (1) by calling (800) 441-7762; (2) at http://www.blackrock.com; and (3) on the SEC’s website at http://www.sec.gov.
Availability of Proxy Voting Record
Information about how the Funds voted proxies relating to securities held in the Funds’ portfolios during the most recent 12-month period ended June 30 is available upon request and without charge (1) at http://www.blackrock.com; or by calling (800) 441-7762 and (2) on the SEC’s website at http://www.sec.gov.
BlackRock’s Mutual Fund Family
BlackRock offers a diverse lineup of open-end mutual funds crossing all investment styles and managed by experts in equity, fixed income and tax-exempt investing. Visit http://www.blackrock.com for more information.
| | | | | | |
| | | | | | | |
| 38 | | SEMI-ANNUAL REPORT | | APRIL 30, 2017 | | |
| | | | |
| Additional Information (concluded) | | |
Account Information
Call us at (800) 441-7762 from 8:00 AM to 6:00 PM ET on any business day to get information about your account balances, recent transactions and share prices. You can also reach us on the Web at http://www.blackrock.com/funds.
Automatic Investment Plans
Investor Class shareholders who want to invest regularly can arrange to have $50 or more automatically deducted from their checking or savings account and invested in any of the BlackRock funds.
Systematic Withdrawal Plans
Investor Class shareholders can establish a systematic withdrawal plan and receive periodic payments of $50 or more from their BlackRock funds, as long as their account balance is at least $10,000.
Retirement Plans
Shareholders may make investments in conjunction with Traditional, Rollover, Roth, Coverdell, Simple IRAs, SEP IRAs and 403(b) Plans.
|
| BlackRock Privacy Principles |
BlackRock is committed to maintaining the privacy of its current and former fund investors and individual clients (collectively, “Clients”) and to safeguarding their non-public personal information. The following information is provided to help you understand what personal information BlackRock collects, how we protect that information and why in certain cases we share such information with select parties.
If you are located in a jurisdiction where specific laws, rules or regulations require BlackRock to provide you with additional or different privacy-related rights beyond what is set forth below, then BlackRock will comply with those specific laws, rules or regulations.
BlackRock obtains or verifies personal non-public information from and about you from different sources, including the following: (i) information we receive from you or, if applicable, your financial intermediary, on applications, forms or other documents; (ii) information about your transactions with us, our affiliates, or others; (iii) information we receive from a consumer reporting agency; and (iv) from visits to our websites.
BlackRock does not sell or disclose to non-affiliated third parties any non-public personal information about its Clients, except as permitted by law or as is necessary to respond to regulatory requests or to service Client accounts. These non-affiliated third parties are required to protect the confidentiality and security of this information and to use it only for its intended purpose.
We may share information with our affiliates to service your account or to provide you with information about other BlackRock products or services that may be of interest to you. In addition, BlackRock restricts access to non-public personal information about its Clients to those BlackRock employees with a legitimate business need for the information. BlackRock maintains physical, electronic and procedural safeguards that are designed to protect the non-public personal information of its Clients, including procedures relating to the proper storage and disposal of such information.
| | | | | | |
| | | | | | | |
| | SEMI-ANNUAL REPORT | | APRIL 30, 2017 | | 39 |
This report is intended for current holders. It is not authorized for use as an offer of sale or a solicitation of an offer to buy shares of the Funds unless preceded or accompanied by the Funds’ current prospectus. Past performance results shown in this report should not be considered a representation of future performance. Investment returns and principal value of shares will fluctuate so that shares, when redeemed, may be worth more or less than their original cost. Statements and other information herein are as dated and are subject to change.

| | |
| EMLA-4/17-SAR | |  |
| Item 2 – | Code of Ethics – Not Applicable to this semi-annual report |
| Item 3 – | Audit Committee Financial Expert – Not Applicable to this semi-annual report |
| Item 4 – | Principal Accountant Fees and Services – Not Applicable to this semi-annual report |
| Item 5 – | Audit Committee of Listed Registrants – Not Applicable |
(a) The registrant’s Schedule of Investments is included as part of the Report to Stockholders filed under Item 1 of this Form.
(b) Not Applicable due to no such divestments during the semi-annual period covered since the previous Form N-CSR filing.
| Item 7 – | Disclosure of Proxy Voting Policies and Procedures for Closed-End Management Investment Companies – Not Applicable |
| Item 8 – | Portfolio Managers of Closed-End Management Investment Companies – Not Applicable |
| Item 9 – | Purchases of Equity Securities by Closed-End Management Investment Company and Affiliated Purchasers – Not Applicable |
| Item 10 – | Submission of Matters to a Vote of Security Holders –There have been no material changes to these procedures. |
| Item 11 – | Controls and Procedures |
(a) – The registrant’s principal executive and principal financial officers, or persons performing similar functions, have concluded that the registrant’s disclosure controls and procedures (as defined in Rule 30a-3(c) under the Investment Company Act of 1940, as amended (the “1940 Act”)) are effective as of a date within 90 days of the filing of this report based on the evaluation of these controls and procedures required by Rule 30a-3(b) under the 1940 Act and Rule 15d-15(b) under the Securities Exchange Act of 1934, as amended.
(b) – There were no changes in the registrant’s internal control over financial reporting (as defined in Rule 30a-3(d) under the 1940 Act) that occurred during the second fiscal quarter of the period covered by this report that have materially affected, or are reasonably likely to materially affect, the registrant’s internal control over financial reporting.
| Item 12 – | Exhibits attached hereto |
(a)(1) – Code of Ethics – Not Applicable to this semi-annual report
(a)(2) – Certifications – Attached hereto
(a)(3) – Not Applicable
(b) – Certifications – Attached hereto
2
Pursuant to the requirements of the Securities Exchange Act of 1934 and the Investment Company Act of 1940, the registrant has duly caused this report to be signed on its behalf by the undersigned, thereunto duly authorized.
BlackRock Emerging Markets Fund, Inc.
| | | | | | |
| By: | | /s/ John M. Perlowski | | | | |
| | John M. Perlowski | | | | |
| | Chief Executive Officer (principal executive officer) of | | |
| | BlackRock Emerging Markets Fund, Inc. | | |
Date: July 5, 2017
Pursuant to the requirements of the Securities Exchange Act of 1934 and the Investment Company Act of 1940, this report has been signed below by the following persons on behalf of the registrant and in the capacities and on the dates indicated.
| | | | | | |
| By: | | /s/ John M. Perlowski | | | | |
| | John M. Perlowski | | | | |
| | Chief Executive Officer (principal executive officer) of | | |
| | BlackRock Emerging Markets Fund, Inc. | | |
Date: July 5, 2017
| | | | | | |
| By: | | /s/ Neal J. Andrews | | | | |
| | Neal J. Andrews | | | | |
| | Chief Financial Officer (principal financial officer) of | | |
| | BlackRock Emerging Markets Fund, Inc. | | |
Date: July 5, 2017
3