UNITED STATES
SECURITIES AND EXCHANGE COMMISSION
Washington, D.C. 20549
FORM N-CSR
CERTIFIED SHAREHOLDER REPORT OF REGISTERED MANAGEMENT INVESTMENT COMPANIES
Investment Company Act file number: 811-05723
Name of Fund: BlackRock Emerging Markets Fund, Inc.
Fund Address: 100 Bellevue Parkway, Wilmington, DE 19809
Name and address of agent for service: John M. Perlowski, Chief Executive Officer, BlackRock Emerging Markets
Fund, Inc., 55 East 52nd Street, New York, NY 10055
Registrant’s telephone number, including area code: (800) 441-7762
Date of fiscal year end: 10/31/2016
Date of reporting period: 04/30/2016
| Item 1 – | Report to Stockholders |
APRIL 30, 2016
| | | | | | |
SEMI-ANNUAL REPORT (UNAUDITED) | | | | | |  |
BlackRock Emerging Markets Fund, Inc.
BlackRock Latin America Fund, Inc.
|
| Not FDIC Insured • May Lose Value • No Bank Guarantee |

| | | | | | |
| | | | | | | |
| 2 | | SEMI-ANNUAL REPORT | | APRIL 30, 2016 | | |
Dear Shareholder,
Diverging monetary policies and shifting economic outlooks across regions have been the overarching themes driving financial markets over the past couple of years. Investors spent most of 2015 anticipating the end of the Federal Reserve’s (the “Fed”) near-zero interest rate policy as U.S. growth outpaced other developed markets. The Fed ultimately hiked rates in December, whereas the European Central Bank and the Bank of Japan took additional steps to stimulate growth, even introducing negative interest rates. The U.S. dollar had strengthened considerably ahead of these developments, causing profit challenges for U.S. companies that generate revenues overseas, and pressuring emerging market currencies and commodities prices.
Global market volatility increased in the latter part of 2015 and spilled over into early 2016. Oil prices were a key factor behind the instability after collapsing in mid-2015 due to excess global supply. China, one of the world’s largest consumers of oil, was another notable source of stress for financial markets. Signs of slowing economic growth, a depreciating yuan and declining confidence in the country’s policymakers stoked investors’ worries about the potential impact of China’s weakness on the global economy. Risk assets (such as equities and high yield bonds) suffered in this environment.
After a painful start to the new year, fears of a global recession began to fade as the first quarter wore on, allowing markets to calm and risk assets to rebound. Central bank stimulus in Europe and Japan, combined with a more tempered outlook for rate hikes in the United States, helped bolster financial markets. A softening in U.S. dollar strength offered some relief to U.S. exporters and emerging market economies. Oil prices found firmer footing as global supply showed signs of leveling off.
The selloff in risk assets at the turn of the year brought valuations to more reasonable levels, creating some appealing entry points for investors in 2016. Nonetheless, slow but relatively stable growth in the United States is countered by a less optimistic global economic outlook and uncertainties around the efficacy of China’s policy response, the potential consequences of negative interest rates in Europe and Japan, and a host of geopolitical risks.
For the 12 months ended April 30, 2016, higher-quality assets such as municipal bonds, U.S. Treasuries and investment grade corporate bonds generated positive returns, while riskier assets such as non-U.S. and small cap equities broadly declined.
At BlackRock, we believe investors need to think globally, extend their scope across a broad array of asset classes and be prepared to adjust accordingly as market conditions change over time. We encourage you to talk with your financial advisor and visit blackrock.com for further insight about investing in today’s markets.
Sincerely,

Rob Kapito
President, BlackRock Advisors, LLC

Rob Kapito
President, BlackRock Advisors, LLC
| | | | | | | | |
| Total Returns as of April 30, 2016 | |
| | | 6-month | | | 12-month | |
U.S. large cap equities
(S&P 500® Index) | | | 0.43 | % | | | 1.21 | % |
U.S. small cap equities
(Russell 2000® Index) | | | (1.90 | ) | | | (5.94 | ) |
International equities
(MSCI Europe, Australasia,
Far East Index) | | | (3.07 | ) | | | (9.32 | ) |
Emerging market equities
(MSCI Emerging
Markets Index) | | | (0.13 | ) | | | (17.87 | ) |
3-month Treasury bills
(BofA Merrill Lynch 3-Month
U.S. Treasury Bill Index) | | | 0.14 | | | | 0.15 | |
U.S. Treasury securities
(BofA Merrill Lynch 10-Year
U.S. Treasury Index) | | | 3.76 | | | | 3.74 | |
U.S. investment grade
bonds (Barclays
U.S. Aggregate Bond Index) | | | 2.82 | | | | 2.72 | |
Tax-exempt municipal
bonds (S&P Municipal
Bond Index) | | | 3.52 | | | | 5.16 | |
U.S. high yield bonds
(Barclays U.S.
Corporate High Yield 2%
Issuer Capped Index) | | | 2.38 | | | | (1.08 | ) |
| Past performance is no guarantee of future results. Index performance is shown for illustrative purposes only. You cannot invest directly in an index. | |
| | | | | | |
| | | | | | | |
| | THIS PAGE NOT PART OF YOUR FUND REPORT | | | | 3 |
| | |
| Fund Summary as of April 30, 2016 | | BlackRock Emerging Markets Fund, Inc. |
BlackRock Emerging Markets Fund, Inc.’s (the “Fund”) investment objective is to seek long-term capital appreciation by investing in securities, principally equity securities, of issuers in countries having smaller capital markets.
| | |
| Portfolio Management Commentary | | |
How did the Fund perform?
| • | | For the six-month period ended April 30, 2016, the Fund outperformed its benchmark, the MSCI Emerging Markets Index. |
What factors influenced performance?
| • | | Stock selection within the information technology (“IT”) sector, and selection in China, were the main contributors to performance for the period. Exposure to out-of-benchmark IT hardware manufacturers such as Himax Technologies, Inc. and Wonik IPS Co. Ltd., as well as an overweight position in TSMC, benefited performance as the industry appeared to be coming out of a prolonged slump. Talk of an earlier-than-expected launch date for the iPhone 6c in 2016 helped to spur growth within the Apple supply chain throughout the period and boosted these companies. Stock selection in China benefited from being underweight in macroeconomically sensitive financial companies negatively impacted by the January 2016 correction in China’s A-share market. |
| • | | Stock selection within India and the consumer discretionary sector represented the largest detractors from performance. Weak earnings as well as concerns regarding non-performing loan levels in India’s state banks weighed on the Fund’s broad positioning in the country early in the period. In addition, holdings in the Chinese consumer discretionary |
| | | names Haier Electronics Group Co. Ltd. and Vipshop Holdings Ltd. — ADR were among the largest detractors. |
Describe recent portfolio activity.
| • | | During the period, the investment advisor began to reduce the Fund’s long-term IT overweight, scaling back positions in component manufacturers amid a slowdown in global end-user demand. Similarly, the Fund’s positioning in financials was lowered through a combination of profit taking in Latin American names that had rallied in early 2016 and a reduction in the Fund’s exposure to Chinese banks due to a lack of clarity concerning non-performing loans there. Conversely, the Fund has added to its Brazilian position amid positive politically driven momentum in that country’s equity market. Most notably, the Fund purchased infrastructure-related firms that should benefit from improving economic conditions in Brazil. |
Describe portfolio positioning at period end.
| • | | Relative to the MSCI Emerging Markets Index, the Fund remained overweight in what the investment advisor believes are reasonably-valued financial stocks, and in issues that stand to benefit from the domestic emerging market consumer. Conversely, the Fund continues to be underweight in telecommunication services, South Korea and Taiwan. |
| | |
| Ten Largest Holdings | | Percent of
Net Assets |
| | | | |
Taiwan Semiconductor Manufacturing Co. Ltd. — ADR | | | 5 | % |
Tencent Holdings Ltd. | | | 5 | |
Itau Unibanco Holding SA, Preference Shares — ADR | | | 3 | |
China Overseas Land & Investment Ltd. | | | 3 | |
Naspers Ltd., Class N | | | 3 | |
CNOOC Ltd. | | | 3 | |
PTT PCL | | | 3 | |
Sberbank of Russia — ADR | | | 2 | |
Grupo Financiero Banorte SAB de CV, Series O | | | 2 | |
Erste Group Bank AG | | | 2 | |
| | |
| Geographic Allocation | | Percent of
Net Assets |
| | | | |
China | | | 22 | % |
South Korea | | | 9 | |
Taiwan | | | 9 | |
Brazil | | | 9 | |
India | | | 8 | |
Hong Kong | | | 7 | |
South Africa | | | 6 | |
Mexico | | | 6 | |
Thailand | | | 5 | |
Russia | | | 4 | |
Indonesia | | | 2 | |
Argentina | | | 2 | |
Turkey | | | 2 | |
Austria | | | 2 | |
United States | | | 2 | |
Peru | | | 2 | |
Switzerland | | | 1 | |
Philippines | | | 1 | |
Luxembourg | | | 1 | |
| | | | | | |
| | | | | | | |
| 4 | | SEMI-ANNUAL REPORT | | APRIL 30, 2016 | | |
| | |
| | | BlackRock Emerging Markets Fund, Inc. |
| | |
| Total Return Based on a $10,000 Investment | | |
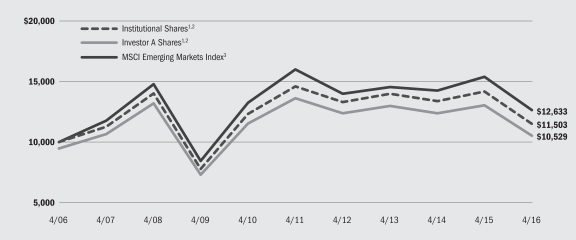
| | 1 | | Assuming maximum sales charges, if any, transaction costs and other operating expenses, including investment advisory fees. Institutional Shares do not have a sales charge. |
| | 2 | | Under normal conditions, the Fund invests at least 80% of its net assets plus any borrowings for investment purposes in equity securities of issuers located in countries with developing capital markets. |
| | 3 | | A free float-adjusted market capitalization index that is designed to measure equity market performance of emerging markets. The MSCI Emerging Markets Index consists of the following 23 emerging market country indexes: Brazil, Chile, China, Colombia, Czech Republic, Egypt, Greece, Hungary, India, Indonesia, Korea, Malaysia, Mexico, Peru, Philippines, Poland, Qatar, Russia, South Africa, Taiwan, Thailand, Turkey and United Arab Emirates. |
| | |
| Performance Summary for the Period Ended April 30, 2016 | | |
| | | | | | | | | | | | | | | | | | | | | | | | | | | | |
| | | | | | Average Annual Total Returns4 | |
| | | | | | 1 Year | | | 5 Years | | | 10 Years | |
| | | 6-Month
Total Returns | | | w/o sales
charge | | | w/sales
charge | | | w/o sales
charge | | | w/sales
charge | | | w/o sales
charge | | | w/sales
charge | |
Institutional | | | 0.86 | %5 | | | (18.81 | )% | | | N/A | | | | (4.65 | )% | | | N/A | | | | 1.41 | % | | | N/A | |
Investor A | | | 0.52 | 5 | | | (19.23 | ) | | | (23.47 | )% | | | (5.02 | ) | | | (6.04 | )% | | | 1.06 | | | | 0.52 | % |
Investor C | | | 0.14 | 5 | | | (19.91 | ) | | | (20.71 | ) | | | (5.81 | ) | | | (5.81 | ) | | | 0.23 | | | | 0.23 | |
MSCI Emerging Markets Index | | | (0.13 | ) | | | (17.87 | ) | | | N/A | | | | (4.61 | ) | | | N/A | | | | 2.36 | | | | N/A | |
| | 4 | | Assuming maximum sales charges, if any. Average annual total returns with and without sales charges reflect reductions for distribution and service fees. See “About Fund Performance” on page 9 for a detailed description of share classes, including any related sales charges and fees. |
| | 5 | | Performance results do not reflect adjustments to valuation for financial reporting purposes in accordance with U.S. generally accepted accounting principles and therefore differ from returns reported in the Financial Highlights. |
| | | | N/A — Not applicable as share class and index do not have a sales charge. |
| | | | Past performance is not indicative of future results. |
| | | | | | | | | | | | | | | | | | | | | | | | | | | | |
| | | Actual | | | Hypothetical7 | | | | |
| | | Beginning
Account Value
November 1, 2015 | | | Ending
Account Value
April 30, 2016 | | | Expenses Paid
During the
Period6 | | | Beginning
Account Value
November 1, 2015 | | | Ending
Account Value
April 30, 2016 | | | Expenses Paid
During the
Period6 | | | Annualized
Expense Ratio | |
Institutional | | $ | 1,000.00 | | | $ | 1,008.60 | | | $ | 6.39 | | | $ | 1,000.00 | | | $ | 1,018.50 | | | $ | 6.42 | | | | 1.28 | % |
Investor A | | $ | 1,000.00 | | | $ | 1,005.20 | | | $ | 8.67 | | | $ | 1,000.00 | | | $ | 1,016.21 | | | $ | 8.72 | | | | 1.74 | % |
Investor C | | $ | 1,000.00 | | | $ | 1,001.40 | | | $ | 12.79 | | | $ | 1,000.00 | | | $ | 1,012.08 | | | $ | 12.86 | | | | 2.57 | % |
| | 6 | | For each class of the Fund, expenses are equal to the annualized net expense ratio for the class, multiplied by the average account value over the period, multiplied by 182/366 (to reflect the one-half year period shown). |
| | 7 | | Hypothetical 5% return before expenses is calculated by prorating the number of days in the most recent fiscal half year divided by 366. |
| | | | See “Disclosure of Expenses” on page 9 for further information on how expenses were calculated. |
| | | | | | |
| | | | | | | |
| | SEMI-ANNUAL REPORT | | APRIL 30, 2016 | | 5 |
| | |
| Fund Summary as of April 30, 2016 | | BlackRock Latin America Fund, Inc. |
BlackRock Latin America Fund Inc.’s (the “Fund”) investment objective is to seek long-term capital appreciation by investing primarily in Latin American equity and debt securities.
| | |
| Portfolio Management Commentary | | |
How did the Fund perform?
| • | | For the six-month period ended April 30, 2016, the Fund underperformed its benchmark, the MSCI Emerging Markets Latin America Index. |
What factors influenced performance?
| • | | Stock selection in Brazil was the largest detractor from performance during the period, and an out-of-benchmark position in Argentina also weighed on returns. In addition, an overweight in Mexico somewhat offset strong stock selection within that country. The largest individual detractor came from an overweight to the Brazilian pulp producer Fibria Celulose SA, which saw its exports suffer from the negative impact of the Brazilian real’s appreciation. An underweight to the metals & mining company Vale SA also weighed on returns as the stock benefited from the recovery in iron ore prices and continued strength in materials stocks. Lastly, an underweight to the state-owned Brazilian oil company Petrobras (Petróleo Brasileiro S.A.) hindered performance as the stock benefited from resurgent oil prices and the potential for political change in Brazil. |
| • | | Stock selection in Mexico was the largest contributor to returns, mostly notably from an underweight to the telecommunications firm America Movil SAB de CV. Underweights to Chile and Colombia contributed positively as both markets were relative underperformers. Stock selection in Peru also added to returns via an overweight to the mining company Compania de Minas Buenaventura SA. Recent strength in commodity prices, especially gold, benefited Buenaventura. An underweight to America Movil was the largest individual contributor as the company’s results were negatively impacted by stiff competition in most markets and ongoing regulatory headwinds. Holdings in the Brazilian rail operator Rumo Logistica SA also supported returns, as |
| | | Rumo benefited from an improvement in its debt profile after restructuring debt and raising capital. |
Describe recent portfolio activity.
| • | | During the period, the Fund increased exposure to Brazil while reducing its positions in Mexico and Peru. In Brazil, exposure to energy, banking and beverage companies was increased as a way to boost the portfolio’s market sensitivity given the dramatic changes in the country’s political landscape late in the period. In particular, the Fund added to positions in Banco Itaú, Banco Bradesco SA, brewing company AMBEV SA, ADR, and Petrobras. In addition, the Fund’s underweight to Vale was reduced late in the period based on unexpectedly resilient iron ore prices and a positive outlook for materials stocks generally. In Mexico, the Fund took some profits, reducing exposure to names viewed as potentially vulnerable to a general market rotation away from Mexico, such as the banking firms Gentera SAB de CV and Grupo Financiero Banorte SAB de CV. In addition, the Fund increased its underweight to America Movil and reduced its overweight in the consumer firm FEMSA, which remains a top holding in the portfolio. In Peru, exposure to the financial holding company Credicorp Ltd. was reduced ahead of the expected negative impact on economic activity from the recent El Niño and April’s first round of presidential elections, as a non-market-friendly candidate gained momentum. |
Describe portfolio positioning at period end.
| • | | The Fund continued to be overweight in Mexico, Peru and Brazil, and underweight Chile and Colombia relative to the benchmark. The Fund also had an out-of-benchmark position in Argentina. At the sector level, the Fund remained overweight in pulp, cement, banks and non-bank financials, and underweight utilities. |
| | | | | | |
| | | | | | | |
| 6 | | SEMI-ANNUAL REPORT | | APRIL 30, 2016 | | |
| | |
| | | BlackRock Latin America Fund, Inc. |
| | |
| Ten Largest Holdings | | Percent of
Net Assets |
| | | | |
Itau Unibanco Holding SA, Preference Shares — ADR | | | 8 | % |
AMBEV SA | | | 7 | |
Banco Bradesco SA — ADR | | | 6 | |
Fomento Economico Mexicano SAB de CV — ADR | | | 5 | |
Cemex SAB de CV — ADR | | | 4 | |
Petroleo Brasileiro SA — ADR | | | 4 | |
Grupo Financiero Banorte SAB de CV, Series O | | | 4 | |
Cielo SA | | | 4 | |
Wal-Mart de Mexico SAB de CV | | | 3 | |
Grupo Mexico SAB de CV, Series B | | | 3 | |
| | |
| Geographic Allocation | | Percent of
Net Assets |
| | | | |
Brazil | | | 54 | % |
Mexico | | | 35 | |
Peru | | | 6 | |
Chile | | | 3 | |
United States | | | 2 | |
Argentina | | | 1 | |
Colombia | | | 1 | |
Liabilities in excess of other assets | | | (2 | ) |
| | |
| Total Return Based on a $10,000 Investment | | |
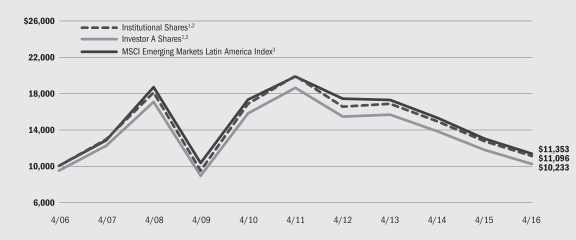
| | 1 | | Assuming maximum sales charge, if any, transaction costs and other operating expenses, including investment advisory fees. Institutional Shares do not have a sales charge. |
| | 2 | | Under normal market conditions, the Fund will invest at least 80% of its net assets plus any borrowings for investment purposes in Latin American securities. |
| | 3 | | A free float-adjusted market capitalization weighted index that is designed to measure the equity market performance of emerging markets in Latin America. |
| | |
| Performance Summary for the Period Ended April 30, 2016 | | |
| | | | | | | | | | | | | | | | | | | | | | | | | | | | |
| | | | | | Average Annual Total Returns4 | |
| | | | | | 1 Year | | | 5 Years | | | 10 Years | |
| | | 6-Month
Total Returns | | | w/o sales
charge | | | w/sales
charge | | | w/o sales
charge | | | w/sales
charge | | | w/o sales
charge | | | w/sales
charge | |
Institutional | | | 13.12 | % | | | (12.90 | )% | | | N/A | | | | (11.05 | )% | | | N/A | | | | 1.05 | % | | | N/A | |
Investor A | | | 12.95 | | | | (13.17 | ) | | | (17.73 | )% | | | (11.29 | ) | | | (12.24 | )% | | | 0.77 | | | | 0.23 | % |
Investor B | | | 12.15 | | | | (14.34 | ) | | | (18.19 | ) | | | (12.17 | ) | | | (12.52 | ) | | | 0.07 | | | | 0.07 | |
Investor C | | | 12.42 | | | | (13.96 | ) | | | (14.82 | ) | | | (12.02 | ) | | | (12.02 | ) | | | (0.05 | ) | | | (0.05 | ) |
MSCI Emerging Markets Latin America Index | | | 15.78 | | | | (12.71 | ) | | | N/A | | | | (10.57 | ) | | | N/A | | | | 1.28 | | | | N/A | |
| | 4 | | Assuming maximum sales charges, if any. Average annual total returns with and without sales charges reflect reductions for distribution and service fees. See “About Fund Performance” on page 9 for a detailed description of share classes, including any related sales charges and fees. |
| | | | N/A — Not applicable as share class and index do not have a sales charge. |
| | | | Past performance is not indicative of future results. |
| | | | | | |
| | | | | | | |
| | SEMI-ANNUAL REPORT | | APRIL 30, 2016 | | 7 |
| | | | |
| | | BlackRock Latin America Fund, Inc. |
| | | | | | | | | | | | | | | | | | | | | | | | | | | | |
| | | Actual | | | Hypothetical6 | | | | |
| | | Beginning
Account Value
November 1, 2015 | | | Ending
Account Value
April 30, 2016 | | | Expenses Paid
During the
Period5 | | | Beginning
Account Value
November 1, 2015 | | | Ending
Account Value
April 30, 2016 | | | Expenses Paid
During the
Period5 | | | Annualized
Expense Ratio | |
Institutional | | $ | 1,000.00 | | | $ | 1,131.20 | | | $ | 7.42 | | | $ | 1,000.00 | | | $ | 1,017.90 | | | $ | 7.02 | | | | 1.40 | % |
Investor A | | $ | 1,000.00 | | | $ | 1,129.50 | | | $ | 9.00 | | | $ | 1,000.00 | | | $ | 1,016.41 | | | $ | 8.52 | | | | 1.70 | % |
Investor B | | $ | 1,000.00 | | | $ | 1,121.50 | | | $ | 16.25 | | | $ | 1,000.00 | | | $ | 1,009.55 | | | $ | 15.39 | | | | 3.08 | % |
Investor C | | $ | 1,000.00 | | | $ | 1,124.20 | | | $ | 13.89 | | | $ | 1,000.00 | | | $ | 1,011.79 | | | $ | 13.16 | | | | 2.63 | % |
| | 5 | | For each class of the Fund, expenses are equal to the annualized net expense ratio for the class, multiplied by the average account value over the period, multiplied by 182/366 (to reflect the one-half year period shown). |
| | 6 | | Hypothetical 5% annual return before expenses is calculated by prorating the number of days in the most recent fiscal half year divided by 366. |
| | | | See “Disclosure of Expenses” on page 9 for further information on how expenses were calculated. |
| | | | | | |
| | | | | | | |
| 8 | | SEMI-ANNUAL REPORT | | APRIL 30, 2016 | | |
| • | | Institutional Shares are not subject to any sales charge. These shares bear no ongoing distribution or service fees and are available only to certain eligible investors. |
| • | | Investor A Shares are subject to a maximum initial sales charge (front-end load) of 5.25% and a service fee of 0.25% per year (but no distribution fee). Certain redemptions of these shares may be subject to a contingent deferred sales charge (“CDSC”) where no initial sales charge was paid at the time of purchase. These shares are generally available through financial intermediaries. |
| • | | Investor B Shares (available only in BlackRock Latin America Fund, Inc.) are subject to a maximum CDSC of 4.50% declining to 0% after six years. In addition, these shares are subject to a distribution fee of 0.75% per year and a service fee of 0.25% per year. These shares automatically convert to Investor A Shares after approximately eight years. (There is no initial sales charge for automatic share conversions.) All returns for periods greater than eight years reflect this conversion. These shares are only available through exchanges and distribution reinvestments by current holders and for purchase by certain employer-sponsored retirement plans. |
| • | | Investor C Shares are subject to a 1.00% CDSC if redeemed within one year of purchase. In addition, these shares are subject to a distribution |
| | | fee of 0.75% per year and a service fee of 0.25% per year. These shares are generally available through financial intermediaries. |
Performance information reflects past performance and does not guarantee future results. Current performance may be lower or higher than the performance data quoted. Refer to www.blackrock.com/funds to obtain performance data current to the most recent month end. Performance results do not reflect the deduction of taxes that a shareholder would pay on fund distributions or the redemption of fund shares. Figures shown in the performance tables on the previous pages assume reinvestment of all distributions, if any, at NAV on the ex-dividend date. Investment return and principal value of shares will fluctuate so that shares, when redeemed, may be worth more or less than their original cost. Distributions paid to each class of shares will vary because of the different levels of service, distribution and transfer agency fees applicable to each class, which are deducted from the income available to be paid to shareholders.
BlackRock Advisors, LLC (the “Manager”), each Fund’s investment advisor, waived a portion of the Funds’ expenses. Without such waiver, the Funds’ performance would have been lower. The Manager is under no obligation to waive or to continue waiving its fees and such voluntary waiver may be reduced or discontinued at any time. See Note 6 of the Notes to Financial Statements for additional information on waivers.
Shareholders of these Funds may incur the following charges: (a) transactional expenses, such as sales charges; and (b) operating expenses, including investment advisory fees, service and distribution fees, including 12b-1 fees, acquired fund fees and expenses, and other fund expenses. The expense examples on previous pages (which are based on a hypothetical investment of $1,000 invested on November 1, 2015 and held through April 30, 2016) are intended to assist shareholders both in calculating expenses based on an investment in each Fund and in comparing these expenses with similar costs of investing in other mutual funds.
The expense examples provide information about actual account values and actual expenses. In order to estimate the expenses a shareholder paid during the period covered by this report, shareholders can divide their account value by $1,000 and then multiply the result by the number corresponding to their Fund and share class under the heading entitled “Expenses Paid During the Period.”
The expense examples also provide information about hypothetical account values and hypothetical expenses based on a Fund’s actual expense ratio and an assumed rate of return of 5% per year before expenses. In order to assist shareholders in comparing the ongoing expenses of investing in these Funds and other funds, compare the 5% hypothetical examples with the 5% hypothetical examples that appear in shareholder reports of other funds.
The expenses shown in the expense examples are intended to highlight shareholders’ ongoing costs only and do not reflect any transactional expenses, such as sales charges, if any. Therefore, the hypothetical examples are useful in comparing ongoing expenses only, and will not help shareholders determine the relative total expenses of owning different funds. If these transactional expenses were included, shareholder expenses would have been higher.
| | | | | | |
| | | | | | | |
| | SEMI-ANNUAL REPORT | | APRIL 30, 2016 | | 9 |
| | |
Schedule of Investments April 30, 2016 (Unaudited) | | BlackRock Emerging Markets Fund, Inc. (Percentages shown are based on Net Assets) |
| | | | | | | | | | |
| | |
| Common Stocks | | Shares | | | Value | |
Argentina — 2.2% | | | | | | | | | | |
Grupo Financiero Galicia SA, ADR | | | | | 178,751 | | | $ | 5,089,041 | |
MercadoLibre, Inc. | | | | | 35,272 | | | | 4,405,120 | |
| | | | | | | | | | |
| | | | | | | | | | 9,494,161 | |
Austria — 2.0% | | | | | | | | | | |
Erste Group Bank AG (a) | | | | | 309,733 | | | | 8,916,041 | |
Brazil — 7.8% | | | | | | | | | | |
Banco Nacional SA, Preference Shares (a) | | | | | 42,567,626 | | | | 124 | |
BB Seguridade Participacoes SA | | | | | 393,771 | | | | 3,434,798 | |
BRF SA | | | | | 189,360 | | | | 2,708,879 | |
EcoRodovias Infraestrutura e Logistica SA | | | | | 1,524,033 | | | | 3,323,471 | |
Hypermarcas SA | | | | | 467,312 | | | | 4,122,482 | |
Itau Unibanco Holding SA, Preference Shares — ADR | | | | | 1,453,665 | | | | 13,853,427 | |
Multiplan Empreendimentos Imobiliarios SA | | | | | 45,137 | | | | 773,665 | |
Rumo Logistica Operadora Multimodal SA (a) | | | | | 4,557,035 | | | | 5,671,036 | |
| | | | | | | | | | |
| | | | | | | | | | 33,887,882 | |
China — 19.5% | | | | | | | | | | |
3SBio, Inc. (a)(b) | | | | | 2,022,000 | | | | 2,440,902 | |
Alibaba Group Holding Ltd. — SP ADR (a) | | | | | 86,662 | | | | 6,667,774 | |
Anhui Conch Cement Co., Ltd., Class H | | | | | 2,937,500 | | | | 7,740,510 | |
Bank of China Ltd., Class H | | | | | 20,485,200 | | | | 8,294,342 | |
CITIC Securities Co. Ltd., Class H | | | | | 1,605,000 | | | | 3,527,437 | |
CNOOC Ltd. | | | | | 9,526,000 | | | | 11,767,661 | |
Ctrip.com International Ltd. — ADR (a) | | | | | 134,435 | | | | 5,862,710 | |
Hengan International Group Co. Ltd. | | | | | 632,000 | | | | 5,662,600 | |
Hollysys Automation Technologies, Ltd. (a) | | | | | 199,295 | | | | 3,820,485 | |
JD.com, Inc., ADR (a) | | | | | 43,029 | | | | 1,099,821 | |
Jiangsu Expressway Co. Ltd., Class H | | | | | 3,750,000 | | | | 4,928,164 | |
Sunny Optical Technology Group Co., Ltd. | | | | | 1,191,000 | | | | 3,673,348 | |
Tencent Holdings Ltd. | | | | | 962,910 | | | | 19,593,593 | |
| | | | | | | | | | |
| | | | | | | | | | 85,079,347 | |
Hong Kong — 7.2% | | | | | | | | | | |
AIA Group Ltd. | | | | | 1,006,000 | | | | 6,020,508 | |
Brilliance China Automotive Holdings Ltd. | | | | | 5,146,000 | | | | 5,075,732 | |
China Overseas Land & Investment Ltd. | | | | | 4,348,000 | | | | 13,801,708 | |
Melco Crown Entertainment Ltd. — ADR | | | | | 113,916 | | | | 1,685,957 | |
Wynn Macau Ltd. | | | | | 3,363,800 | | | | 4,782,843 | |
| | | | | | | | | | |
| | | | | | | | | | 31,366,748 | |
India — 8.4% | | | | | | | | | | |
Axis Bank, Ltd. | | | | | 503,381 | | | | 3,577,197 | |
Dr. Reddy’s Laboratories Ltd. — ADR | | | | | 66,378 | | | | 3,026,837 | |
GAIL India Ltd. | | | | | 409,390 | | | | 2,220,146 | |
Housing Development Finance Corp. | | | | | 257,777 | | | | 4,224,244 | |
ITC Ltd. | | | | | 1,624,307 | | | | 7,952,108 | |
Lupin Ltd. | | | | | 180,660 | | | | 4,367,499 | |
| | | | | | | | | | |
| | |
| Common Stocks | | Shares | | | Value | |
India (continued) | | | | | | | | | | |
NTPC Ltd. | | | | | 3,246,695 | | | $ | 6,803,292 | |
Tata Motors Ltd. — ADR (a) | | | | | 149,092 | | | | 4,529,415 | |
| | | | | | | | | | |
| | | | | | | | | | 36,700,738 | |
Indonesia — 2.2% | | | | | | | | | | |
Bank Central Asia Tbk PT | | | | | 3,375,124 | | | | 3,330,909 | |
Telekomunikasi Indonesia Persero Tbk PT (a) | | | | | 23,750,700 | | | | 6,372,143 | |
| | | | | | | | | | |
| | | | | | | | | | 9,703,052 | |
Luxembourg — 0.6% | | | | | | | | | | |
Globant SA (a) | | | | | 69,929 | | | | 2,481,780 | |
Mexico — 6.1% | | | | | | | | | | |
Arca Continental SAB de CV | | | | | 872,386 | | | | 6,021,893 | |
Grupo Aeroportuario del Pacifico SAB de CV, Class B | | | | | 606,756 | | | | 5,716,777 | |
Grupo Financiero Banorte SAB de CV, Series O | | | | | 1,673,889 | | | | 9,502,590 | |
Kimberly-Clark de Mexico SAB de CV, Class A | | | | | 2,207,110 | | | | 5,223,793 | |
| | | | | | | | | | |
| | | | | | | | | | 26,465,053 | |
Peru — 1.5% | | | | | | | | | | |
Credicorp Ltd. | | | | | 45,958 | | | | 6,683,212 | |
Philippines — 0.9% | | | | | | | | | | |
BDO Unibank, Inc. | | | | | 1,924,490 | | | | 4,099,838 | |
Russia — 4.4% | | | | | | | | | | |
MMC Norilsk Nickel PJSC, ADR | | | | | 155,137 | | | | 2,292,502 | |
NovaTek OAO — GDR | | | | | 73,167 | | | | 7,060,971 | |
Sberbank of Russia — ADR | | | | | 1,249,274 | | | | 10,044,323 | |
| | | | | | | | | | |
| | | | | | | | | | 19,397,796 | |
South Africa — 6.2% | | | | | | | | | | |
AngloGold Ashanti Ltd. (a) | | | | | 407,536 | | | | 6,625,021 | |
Mr Price Group Ltd. | | | | | 304,265 | | | | 3,868,031 | |
Naspers Ltd., Class N | | | | | 95,635 | | | | 13,160,456 | |
Sanlam Ltd. | | | | | 696,699 | | | | 3,383,425 | |
| | | | | | | | | | |
| | | | | | | | | | 27,036,933 | |
South Korea — 9.4% | | | | | | | | | | |
KT&G Corp. | | | | | 79,957 | | | | 8,614,176 | |
NAVER Corp. | | | | | 12,021 | | | | 7,124,211 | |
POSCO | | | | | 38,482 | | | | 8,062,560 | |
Samsung Electronics Co. Ltd. | | | | | 423 | | | | 460,999 | |
Samsung Electronics Co. Ltd., Preference Shares | | | | | 3,718 | | | | 3,395,607 | |
Samsung Life Insurance Co., Ltd. | | | | | 32,311 | | | | 3,099,661 | |
SK Hynix, Inc. | | | | | 163,759 | | | | 4,016,649 | |
SK Telecom Co. Ltd. | | | | | 34,146 | | | | 6,200,883 | |
| | | | | | | | | | |
| | | | | | | | | | 40,974,746 | |
Switzerland — 1.0% | | | | | | | | | | |
Luxoft Holding, Inc. (a) | | | | | 76,550 | | | | 4,425,355 | |
| | |
| ADR | | American Depositary Receipts |
| BRL | | Brazilian Real |
| GDR | | Global Depositary Receipts |
| NVDR | | Non-voting Depository Receipts |
| PCL | | Public Company Limited |
| USD | | United States Dollar |
See Notes to Financial Statements.
| | | | | | |
| | | | | | | |
| 10 | | SEMI-ANNUAL REPORT | | APRIL 30, 2016 | | |
| | |
Schedule of Investments (continued) | | BlackRock Emerging Markets Fund, Inc. |
| | | | | | | | | | |
| | |
| Common Stocks | | Shares | | | Value | |
Taiwan — 9.0% | | | | | | | | | | |
Cathay Financial Holding Co. Ltd. | | | | | 5,773,650 | | | $ | 6,465,265 | |
CTBC Financial Holding Co. Ltd. | | | | | 13,312,522 | | | | 6,746,459 | |
Himax Technologies, Inc., ADR | | | | | 320,340 | | | | 3,328,332 | |
Pixart Imaging, Inc. | | | | | 1,233,000 | | | | 2,673,491 | |
Taiwan Semiconductor Manufacturing Co. Ltd. — ADR | | | | | 857,057 | | | | 20,217,975 | |
| | | | | | | | | | |
| | | | | | | | | | 39,431,522 | |
Thailand — 4.7% | | | | | | | | | | |
Kasikornbank PCL — NVDR | | | | | 779,100 | | | | 3,693,949 | |
PTT PCL | | | | | 1,278,800 | | | | 11,129,551 | |
Siam Cement PCL — NVDR | | | | | 413,978 | | | | 5,773,453 | |
| | | | | | | | | | |
| | | | | | | | | | 20,596,953 | |
Turkey — 2.1% | | | | | | | | | | |
Coca-Cola Icecek AS | | | | | 212,905 | | | | 3,121,061 | |
Turkiye Halk Bankasi | | | | | 1,528,837 | | | | 5,871,311 | |
| | | | | | | | | | |
| | | | | | | | | | 8,992,372 | |
United States — 1.7% | | | | | | | | | | |
Cognizant Technology Solutions Corp., Class A (a) | | | | | 95,174 | | | | 5,555,307 | |
Samsonite International SA | | | | | 564,500 | | | | 1,815,461 | |
| | | | | | | | | | |
| | | | | | | | | | 7,370,768 | |
| Total Common Stocks — 96.9% | | | | 423,104,297 | |
| | | | | | | | | | |
| | | | | | | | | | | |
| | | |
| Participation Notes | | | | | | | | |
Brazil — 0.7% | | | | | | | | | | |
Morgan Stanley BV (Multiplan Empreendimentos Imobiliarios SA), due 04/12/19 | | | | | 180,550 | | | | 3,119,001 | |
| | | | | | | | | | |
| | | |
| Participation Notes | | | | Shares | | | Value | |
China — 1.9% | | | | | | | | | | |
Deutsche Bank AG (Shanghai International Airport Co.), due 01/19/17 | | | | | 491,700 | | | $ | 2,063,252 | |
Deutsche Bank AG (Shanghai International Airport Co.), due 12/03/24 | | | | | 1,511,607 | | | | 6,342,945 | |
| | | | | | | | | | |
| | | | | | | | | | 8,406,197 | |
Thailand — 0.1% | | | | | | | | | | |
Deutsche Bank (Kasikornbank PCL), due 3/10/25 (a) | | | | | 54,731 | | | | 260,101 | |
| Total Participation Notes — 2.7% | | | | | | | | | 11,785,299 | |
Total Long-Term Investments
(Cost — $384,868,914) — 99.6% | | | | 434,889,596 | |
| | | | | | | | | | |
| | | | | | | | | | | |
| | | |
| Short-Term Securities | | | | | | | | |
BlackRock Liquidity Funds, TempFund, Institutional Class, 0.40% (c)(d) | | | | | 1,305,838 | | | | 1,305,838 | |
Total Short-Term Securities
(Cost — $1,305,838) — 0.3% | | | | 1,305,838 | |
| Total Investments (Cost — $386,174,752) — 99.9% | | | | 436,195,434 | |
| Other Assets Less Liabilities — 0.1% | | | | 302,373 | |
| | | | | | | | | | |
Net Assets — 100.0% | | | $ | 436,497,807 | |
| | | | | | | | | | |
|
| Notes to Schedule of Investments |
| (a) | | Non-income producing security. |
| (b) | | Security exempt from registration pursuant to Rule 144A under the Securities Act of 1933, as amended. These securities may be resold in transactions exempt from registration to qualified institutional investors. |
| (c) | | During the six months ended April 30, 2016, investments in issuers considered to be affiliates of the Fund for purposes of Section 2(a)(3) of the Investment Company Act of 1940, as amended, were as follows: |
| | | | | | | | | | | | | | | | | | |
| Affiliate | | Shares/Beneficial
Interest Held at
October 31,
2015 | | | Net
Activity | | | Shares/Beneficial
Interest Held at
April 30,
2016 | | | Income | | | |
BlackRock Liquidity Funds, TempFund, Institutional Class | | | 193,162,427 | | | | (191,856,589 | ) | | | 1,305,838 | | | $ | 14,819 | | | |
BlackRock Liquidity Series, LLC, Money Market Series | | $ | 3,917,695 | | | $ | (3,917,695 | ) | | | — | | | $ | 8,567 | 1 | | |
Total | | | | | | | | | | | 1,305,838 | | | $ | 23,386 | | | |
| | | | | | | | | | | |
1 Represents securities lending income earned from the reinvestment of cash collateral from loaned securities, net of fees and collateral investment expenses, and other payments to and from borrowers of securities. | | | |
| (d) | | Current yield as of period end. |
|
| Fair Value Hierarchy as of Period End |
Various inputs are used in determining the fair value of investments. For information about the Fund’s policy regarding valuation of investments, refer to the Notes to Financial Statements.
See Notes to Financial Statements.
| | | | | | |
| | | | | | | |
| | SEMI-ANNUAL REPORT | | APRIL 30, 2016 | | 11 |
| | |
Schedule of Investments (concluded) | | BlackRock Emerging Markets Fund, Inc. |
The following tables summarize the Fund’s investments categorized in the disclosure hierarchy:
| | | | | | | | | | | | | | | | |
| | | Level 1 | | | Level 2 | | | Level 3 | | | Total | |
Assets: | | | | | | | | | | | | | | | | |
| Investments: | | | | | | | | | | | | | | | | |
Common Stocks: | | | | | | | | | | | | | | | | |
Argentina | | $ | 9,494,161 | | | | — | | | | — | | | $ | 9,494,161 | |
Austria | | | — | | | $ | 8,916,041 | | | | — | | | | 8,916,041 | |
Brazil | | | 33,887,758 | | | | — | | | $ | 124 | | | | 33,887,882 | |
China | | | 17,450,790 | | | | 67,628,557 | | | | — | | | | 85,079,347 | |
Hong Kong | | | 1,685,957 | | | | 29,680,791 | | | | — | | | | 31,366,748 | |
India | | | 7,556,252 | | | | 29,144,486 | | | | — | | | | 36,700,738 | |
Indonesia | | | — | | | | 9,703,052 | | | | — | | | | 9,703,052 | |
Luxembourg | | | 2,481,780 | | | | — | | | | — | | | | 2,481,780 | |
Mexico | | | 26,465,053 | | | | — | | | | — | | | | 26,465,053 | |
Peru | | | 6,683,212 | | | | — | | | | — | | | | 6,683,212 | |
Philippines | | | — | | | | 4,099,838 | | | | — | | | | 4,099,838 | |
Russia | | | — | | | | 19,397,796 | | | | — | | | | 19,397,796 | |
South Africa | | | — | | | | 27,036,933 | | | | — | | | | 27,036,933 | |
South Korea | | | — | | | | 40,974,746 | | | | — | | | | 40,974,746 | |
Switzerland | | | 4,425,355 | | | | — | | | | — | | | | 4,425,355 | |
Taiwan | | | 23,546,307 | | | | 15,885,215 | | | | — | | | | 39,431,522 | |
Thailand | | | 11,129,551 | | | | 9,467,402 | | | | — | | | | 20,596,953 | |
Turkey | | | — | | | | 8,992,372 | | | | — | | | | 8,992,372 | |
United States | | | 5,555,307 | | | | 1,815,461 | | | | — | | | | 7,370,768 | |
Participation Notes | | | — | | | | 8,666,298 | | | | 3,119,001 | | | | 11,785,299 | |
Short-Term Securities | | | 1,305,838 | | | | — | | | | — | | | | 1,305,838 | |
| | | | |
Total | | $ | 151,667,321 | | | $ | 281,408,988 | | | $ | 3,119,125 | | | $ | 436,195,434 | |
| | | | |
The Fund may hold assets and/or liabilities in which the fair value approximates the carrying amount for financial statement purposes. As of period end, foreign currency at value of $1,261,099 is categorized as Level 1 within the disclosure hierarchy. Transfers between Level 1 and Level 2 were as follows: | |
| | | Transfers Into
Level 1 | | | Transfers Out of Level 11 | | | Transfers Into
Level 21 | | | Transfers Out of Level 2 | |
Assets: | | | | | | | | | | | | | | | | |
| Investments: | | | | | | | | | | | | | | | | |
Common Stocks: | | | | | | | | | | | | | | | | |
United States | | | — | | | $ | (5,481,516 | ) | | $ | 5,481,516 | | | | — | |
South Africa | | | — | | | | (6,192,888 | ) | | | 6,192,888 | | | | — | |
| | | | |
Total | | | — | | | $ | (11,674,404 | ) | | $ | 11,674,404 | | | | — | |
| | | | |
1 External pricing service used to reflect any significant market movements between the time the Fund valued such foreign securities and the earlier closing of foreign markets. | |
See Notes to Financial Statements.
| | | | | | |
| | | | | | | |
| 12 | | SEMI-ANNUAL REPORT | | APRIL 30, 2016 | | |
| | |
Schedule of Investments April 30, 2016 (Unaudited) | | BlackRock Latin America Fund, Inc. (Percentages shown are based on Net Assets) |
| | | | | | | | | | |
| Common Stocks | | | | Shares | | | Value | |
Argentina — 1.5% | | | | | | | | | | |
Pampa Energia SA, ADR (a) | | | | | 45,000 | | | $ | 920,700 | |
YPF SA | | | | | 2,780 | | | | 56,206 | |
YPF SA, ADR | | | | | 90,000 | | | | 1,813,500 | |
| | | | | | | | | | |
| | | | | | | | | | 2,790,406 | |
Brazil — 52.8% | | | | | | | | | | |
Adecoagro SA (a) | | | | | 140,000 | | | | 1,492,400 | |
AMBEV SA, ADR | | | | | 2,175,000 | | | | 12,158,250 | |
Arezzo Industria e Comercio SA | | | | | 145,000 | | | | 1,022,389 | |
Banco Bradesco SA — ADR | | | | | 1,450,000 | | | | 10,831,500 | |
Banco do Brasil SA | | | | | 325,000 | | | | 2,089,336 | |
BB Seguridade Participacoes SA | | | | | 450,000 | | | | 3,925,275 | |
BM&FBovespa SA | | | | | 790,000 | | | | 3,946,267 | |
BRF SA — ADR | | | | | 233,000 | | | | 3,313,260 | |
CCR SA | | | | | 230,000 | | | | 1,082,038 | |
Cielo SA | | | | | 696,000 | | | | 6,779,385 | |
Fibria Celulose SA | | | | | 212,000 | | | | 1,872,664 | |
Fibria Celulose SA — Sponsored ADR | | | | | 150,000 | | | | 1,329,000 | |
Hypermarcas SA | | | | | 45,000 | | | | 396,976 | |
Iguatemi Empresa de Shopping Centers SA | | | | | 175,000 | | | | 1,358,581 | |
Iochpe-Maxion SA | | | | | 150,000 | | | | 634,586 | |
Itau Unibanco Holding SA, Preference Shares — ADR | | | | | 1,525,000 | | | | 14,533,250 | |
Klabin SA, Preference Shares | | | | | 400,000 | | | | 2,027,186 | |
Odontoprev SA | | | | | 250,000 | | | | 760,340 | |
Petroleo Brasileiro SA — ADR (a) | | | | | 1,200,000 | | | | 7,985,000 | |
Raia Drogasil SA | | | | | 150,000 | | | | 2,400,523 | |
Rumo Logistica Operadora Multimodal SA (a) | | | | | 1,652,513 | | | | 2,056,482 | |
Sao Martinho SA | | | | | 68,000 | | | | 884,391 | |
Telefonica Brasil SA — ADR | | | | | 90,040 | | | | 1,109,293 | |
Telefonica Brasil SA, Preference Shares | | | | | 300,000 | | | | 3,694,992 | |
Transmissora Alianca de Energia Eletrica SA | | | | | 188,000 | | | | 1,069,210 | |
Ultrapar Participacoes SA | | | | | 155,000 | | | | 3,263,822 | |
Vale SA, Preference Shares — ADR | | | | | 520,000 | | | | 2,360,800 | |
Valid Solucoes e Servicos de Seguranca em Meios de Pagamento e Identificacao SA | | | | | 85,000 | | | | 865,014 | |
WEG SA | | | | | 220,000 | | | | 971,026 | |
| | | | | | | | | | |
| | | | | | | | | | 96,213,236 | |
Chile — 2.6% | | | | | | | | | | |
Empresa Nacional de Electricidad SA | | | | | 668,000 | | | | 614,822 | |
Empresa Nacional de Electricidad SA, ADR | | | | | 25,000 | | | | 696,250 | |
Endesa SA (a) | | | | | 668,000 | | | | 313,093 | |
Endesa SA, ADR (a) | | | | | 25,000 | | | | 353,250 | |
Itau CorpBanca | | | | | 145,000,000 | | | | 1,317,932 | |
SACI Falabella | | | | | 180,000 | | | | 1,393,057 | |
| | | | | | | | | | |
| | | | | | | | | | 4,688,404 | |
Colombia — 0.6% | | | | | | | | | | |
Cemex Latam Holdings SA (a) | | | | | 250,000 | | | | 1,146,141 | |
Mexico — 34.6% | | | | | | | | | | |
Alfa SAB de CV, Series A | | | | | 1,475,000 | | | | 2,772,593 | |
Alsea SAB de CV | | | | | 350,000 | | | | 1,340,422 | |
America Movil SAB de CV, Series L — SP ADR | | | | | 287,000 | | | | 4,063,920 | |
Arca Continental SAB de CV | | | | | 365,000 | | | | 2,519,517 | |
Cemex SAB de CV — ADR (a) | | | | | 1,040,000 | | | | 7,748,000 | |
Concentradora Fibra Hotelera Mexicana SA de CV | | | | | 385,525 | | | | 350,464 | |
Controladora Vuela Cia de Aviacion SAB de C.V., ADR (a) | | | | | 80,000 | | | | 1,670,400 | |
Corp. Inmobiliaria Vesta SAB de CV | | | | | 1,000,000 | | | | 1,629,792 | |
| | | | | | | | | | | | |
| Common Stocks | | | | | Shares | | | Value | |
Mexico (continued) | | | | | | | | | | | | |
Fibra Uno Administracion SA de CV | | | | | | | 880,000 | | | $ | 2,095,062 | |
Fomento Economico Mexicano SAB de CV — ADR | | | | | | | 102,000 | | | | 9,507,420 | |
Gentera SAB de CV | | | | | | | 605,000 | | | | 1,203,343 | |
Grupo Aeroportuario del Pacifico SAB de CV, Class B | | | | | | | 135,000 | | | | 1,271,953 | |
Grupo Financiero Banorte SAB de CV, Series O | | | | | | | 1,325,000 | | | | 7,521,964 | |
Grupo Mexico SAB de CV, Series B | | | | | | | 2,218,940 | | | | 5,643,870 | |
Grupo Sanborns SA de CV | | | | | | | 975,000 | | | | 1,348,763 | |
Grupo Televisa SAB — ADR | | | | | | | 130,000 | | | | 3,799,900 | |
Mexico Real Estate Management SA de CV (a) | | | | | | | 610,000 | | | | 839,587 | |
PLA Administradora Industrial S de RL de CV (a) | | | | | | | 880,000 | | | | 1,625,514 | |
Wal-Mart de Mexico SAB de CV | | | | | | | 2,450,000 | | | | 6,059,263 | |
| | | | | | | | | | | | |
| | | | | | | | | | | | 63,011,747 | |
Peru — 5.5% | | | | | | | | | | | | |
Compania de Minas Buenaventura SA — ADR (a) | | | | | | | 175,000 | | | | 1,776,250 | |
Credicorp Ltd. | | | | | | | 36,000 | | | | 5,235,120 | |
Grana y Montero SA — ADR | | | | | | | 104,000 | | | | 716,560 | |
Southern Copper Corp. (b) | | | | | | | 80,000 | | | | 2,373,600 | |
| | | | | | | | | | | | |
| | | | | | | | | | | | 10,101,530 | |
| Total Common Stocks — 97.6% | | | | 177,951,464 | |
| | | | | | | | | | | | |
| | |
| | | |
| Corporate Bonds | | | | | Par
(000) | | | | |
Brazil — 0.4% | | | | | | | | | | | | |
Hypermarcas SA, 11.30%, 10/15/18 | | | BRL | | | | 687 | | | | 82,976 | |
Klabin SA: | | | | | | | | | | | | |
8.00%, 1/08/19 (c)(d) | | | | | | | 1,528 | | | | 386,637 | |
7.25%, 6/15/20 | | | | | | | 22 | | | | 112,925 | |
2.50%, 6/15/22 | | | | | | | 22 | | | | 112,924 | |
Lupatech SA, Series 1,
6.50%, 4/15/18 (a)(c)(e) | | | | | | | 2,128 | | | | 30,937 | |
| Total Corporate Bonds — 0.4% | | | | | | | | | | | 726,399 | |
| | | | | | | | | | | | |
| | | | | | | | | | | | | |
| | |
| Participation Notes | | Shares | | | | |
Brazil — 0.7% | | | | | | | | | | | | |
Morgan Stanley BV, (Lojas Renner SA), due 2/27/17 | | | | | | | 185 | | | | 1,355,218 | |
Netherlands — 0.1% | | | | | | | | | | | | |
Morgan Stanley BV, (Odontoprev SA), due 2/10/17 | | | | | | | 50,000 | | | | 165,000 | |
| Total Participation Notes — 0.8% | | | | | | | | | | | 1,520,218 | |
| | | | | | | | | | | | |
| | | | | | | | | | | | | |
| | | |
| Warrants | | | | | | | | | |
Brazil — 0.5% | | | | | | | | | | | | |
CCR SA (Expires 06/07/16) | | | | | | | 105,000 | | | | 493,974 | |
CCR SA (Expires 02/17/17) | | | | | | | 105,000 | | | | 493,974 | |
Klabin SA (Expires 06/15/20) | | | | | | | 22 | | | | — | |
| Total Warrants — 0.5% | | | | | | | | | | | 987,948 | |
Total Long-Term Investments
(Cost — $156,808,103) — 99.3% | | | | 181,186,029 | |
See Notes to Financial Statements.
| | | | | | |
| | | | | | | |
| | SEMI-ANNUAL REPORT | | APRIL 30, 2016 | | 13 |
| | |
Schedule of Investments (continued) | | BlackRock Latin America Fund, Inc. |
| | | | | | | | | | |
| Short-Term Securities | | | | Shares | | | Value | |
BlackRock Liquidity Funds, TempFund, Institutional Class, 0.40% (f)(g) | | | | | 3,339,393 | | | $ | 3,339,393 | |
| | | | | | | | | | |
| | | | | | | | | | | |
| | | |
| | | | | Beneficial
Interest
(000) | | | | |
BlackRock Liquidity Series, LLC, Money Market Series, 0.55% (f)(g)(h) | | USD | | | 1,308 | | | | 1,308,450 | |
Total Short-Term Securities
(Cost — $4,647,843) — 2.6% | | | | 4,647,843 | |
| Total Investments (Cost — $161,455,946) — 101.9% | | | | 185,833,872 | |
| Liabilities in Excess of Other Assets — (1.9)% | | | | (3,427,102 | ) |
| | | | | | | | | | |
| Net Assets — 100.0% | | | $ | 182,406,770 | |
| | | | | | | | | | |
| | |
| Notes to Schedule of Investments | | |
| (a) | | Non-income producing security. |
| (b) | | Security, or a portion of security, is on loan. |
| (c) | | Convertible security. |
| (d) | | Step-up bond that pays an initial coupon rate for the first period and then a higher coupon rate for the following periods. Rate as of period end. |
| (e) | | Issuer filed for bankruptcy and/or is in default of interest payments. |
| (f) | | Current yield as of period end. |
| (g) | | During the six months ended April 30, 2016, investments in issuers considered to be affiliates of the Fund for purposes of Section 2(a)(3) of the Investment Company Act of 1940, as amended, were as follows: |
| | | | | | | | | | | | | | | | |
| Affiliate | | Shares/Beneficial
Interest Held at
October 31,
2015 | | | Net
Activity | | | Shares/Beneficial
Interest Held at
April 30,
2016 | | | Income | |
BlackRock Liquidity Funds, TempFund, Institutional Class | | | 1,410,505 | | | | 1,928,888 | | | | 3,339,393 | | | $ | 6,656 | |
BlackRock Liquidity Series, LLC, Money Market Series | | $ | 1,070,034 | | | $ | 238,416 | | | $ | 1,308,450 | | | $ | 5,599 | 1 |
Total | | | | | | | | | | | 4,647,843 | | | $ | 12,255 | |
| | | | | | | | | | | | |
1 Represents securities lending income earned from the reinvestment of cash collateral from loaned securities, net of fees and collateral investment expenses, and other payments to and from borrowers of securities. | |
| (h) | | Security was purchased with the cash collateral from loaned securities. The Fund may withdraw up to 25% of its investment daily, although the manager of the BlackRock Liquidity Series, LLC, Money Market Series, in its sole discretion, may permit an investor to withdraw more than 25% on any one day. |
|
| Fair Value Hierarchy as of Period End |
Various inputs are used in determining the fair value of investments. For information about the Fund’s policy regarding valuation of investments, refer to the Notes to Financial Statements.
The following tables summarize the Fund’s investments categorized in the disclosure hierarchy:
| | | | | | | | | | | | | | | | |
| | | Level 1 | | | Level 2 | | | Level 3 | | | Total | |
Assets: | | | | | | | | | | | | | | | | |
| Investments: | | | | | | | | | | | | | | | | |
Common Stocks: | | | | | | | | | | | | | | | | |
Argentina | | $ | 2,790,406 | | | | — | | | | — | | | $ | 2,790,406 | |
Brazil | | | 96,213,236 | | | | — | | | | — | | | | 96,213,236 | |
Chile | | | 4,688,404 | | | | — | | | | — | | | | 4,688,404 | |
Colombia | | | 1,146,141 | | | | — | | | | — | | | | 1,146,141 | |
Mexico | | | 63,011,747 | | | | — | | | | — | | | | 63,011,747 | |
Peru | | | 10,101,530 | | | | — | | | | — | | | | 10,101,530 | |
See Notes to Financial Statements.
| | | | | | |
| | | | | | | |
| 14 | | SEMI-ANNUAL REPORT | | APRIL 30, 2016 | | |
| | |
Schedule of Investments (concluded) | | BlackRock Latin America Fund, Inc. |
| | | | | | | | | | | | | | | | |
| | | Level 1 | | | Level 2 | | | Level 3 | | | Total | |
Assets (concluded): | | | | | | | | | | | | | | | | |
| Investments (concluded): | | | | | | | | | | | | | | | | |
Corporate Bonds | | | — | | | $ | 256,786 | | | $ | 469,613 | | | $ | 726,399 | |
Participation Notes | | | — | | | | — | | | | 1,520,218 | | | | 1,520,218 | |
Warrants | | | — | | | | 987,948 | | | | — | | | | 987,948 | |
Short-Term Securities | | $ | 3,339,393 | | | | 1,308,450 | | | | — | | | | 4,647,843 | |
| | | | |
Total | | $ | 181,290,857 | | | $ | 2,553,184 | | | $ | 1,989,831 | | | $ | 185,833,872 | |
| | | | |
The Fund may hold assets and/or liabilities in which the fair value approximates the carrying amount for financial statement purposes. As of period end, such assets and/or liabilities are categorized within the disclosure hierarchy as follows: | |
| | | Level 1 | | | Level 2 | | | Level 3 | | | Total | |
Assets: | | | | | | | | | | | | | | | | |
Foreign currency at value | | $ | 145,240 | | | | — | | | | — | | | $ | 145,240 | |
Liabilities: | | | | | | | | | | | | | | | | |
Collateral on securities loaned at value | | | — | | | $ | (1,308,450 | ) | | | — | | | | (1,308,450 | ) |
| | | | |
Total | | $ | 145,240 | | | $ | (1,308,450 | ) | | | — | | | $ | (1,163,210 | ) |
| | | | |
During the six months ended April 30, 2016, there were no transfers between Level 1 and Level 2.
A reconciliation of Level 3 investments is presented when the Fund had a significant amount of Level 3 investments at the beginning and/or end of the period in relation to net assets. The following table is a reconciliation of Level 3 investments for which significant unobservable inputs were used in determining fair value:
| | | | | | | | | | | | |
| | | Corporate
Bonds | | | Participation
Notes | | | Total | |
Assets: | |
Opening Balance, as of October 31, 2015 | | $ | 538,607 | | | $ | 1,407,084 | | | $ | 1,945,691 | |
Transfers into Level 3 | | | — | | | | — | | | | — | |
Transfers out of Level 3 | | | — | | | | — | | | | — | |
Accrued discounts/premiums | | | — | | | | — | | | | — | |
Net realized gain (loss) | | | (42,508 | ) | | | | | | | (42,508 | ) |
Net change in unrealized appreciation (depreciation)1,2 | | | 11,693 | | | | 113,134 | | | | 124,827 | |
Purchases | | | — | | | | — | | | | — | |
Sales | | | (38,179 | ) | | | — | | | | (38,179 | ) |
Closing Balance, as of April 30, 2016 | | $ | 469,613 | | | $ | 1,520,218 | | | $ | 1,989,831 | |
| | | | |
Net change in unrealized appreciation (depreciation) on investments still held at April 30, 20162 | | $ | 11,693 | | | $ | 113,134 | | | $ | 124,827 | |
| | | | |
1 Included in the related net change in unrealized appreciation (depreciation) in the Statements of Operations. 2 Any difference between net change in unrealized appreciation (depreciation) and net change in unrealized appreciation (depreciation) on investments still held at April 30, 2016, is generally due to investments no longer held or categorized as Level 3 at period end. | |
The Fund’s investments that are categorized as Level 3 were valued utilizing third party pricing information without adjustment. Such valuations are based on unobservable inputs. A significant change in third party information inputs could result in a significantly lower or higher value of such Level 3 investments.
See Notes to Financial Statements.
| | | | | | |
| | | | | | | |
| | SEMI-ANNUAL REPORT | | APRIL 30, 2016 | | 15 |
| | |
| Statements of Assets and Liabilities | | |
| | | | | | | | |
| April 30, 2016 (Unaudited) | | BlackRock
Emerging
Markets Fund,
Inc. | | | BlackRock Latin
America Fund,
Inc. | |
| | | | | | | | |
| Assets | | | | | | | | |
Investments at value — unaffiliated1,2 | | $ | 434,889,596 | | | $ | 181,186,029 | |
Investments at value — affiliated3 | | | 1,305,838 | | | | 4,647,843 | |
Foreign currency at value4 | | | 1,261,099 | | | | 145,240 | |
| Receivables: | | | | | | | | |
Capital shares sold | | | 286,268 | | | | 134,143 | |
Dividends receivable — unaffiliated | | | 175,415 | | | | 484,487 | |
Dividends — affiliated | | | 1,972 | | | | 1,010 | |
Interest | | | — | | | | 8,140 | |
Investments sold | | | 6,456,587 | | | | 1,640,815 | |
Securities lending income — affiliated | | | 437 | | | | 1,110 | |
Prepaid expenses | | | 30,173 | | | | 29,337 | |
| | | | |
Total assets | | | 444,407,385 | | | | 188,278,154 | |
| | | | |
| | | | | | | | |
| Liabilities | | | | | | | | |
Collateral on securities loaned at value | | | — | | | | 1,308,450 | |
| Payables: | | | | | | | | |
Capital shares redeemed | | | 2,018,775 | | | | 263,255 | |
Deferred foreign capital gain tax | | | 50,765 | | | | 8,064 | |
Investment advisory fees | | | 358,629 | | | | 141,943 | |
Investments purchased | | | 4,673,761 | | | | 3,830,917 | |
Officer’s and Directors’ fees | | | 3,149 | | | | 635 | |
Other affiliates | | | 2,274 | | | | 808 | |
Other accrued expenses | | | 674,619 | | | | 277,695 | |
Service and distribution fees | | | 127,606 | | | | 39,617 | |
| | | | |
Total liabilities | | | 7,909,578 | | | | 5,871,384 | |
| | | | |
Net Assets | | $ | 436,497,807 | | | $ | 182,406,770 | |
| | | | |
| | | | | | | | |
| Net Assets Consist of | | | | | | | | |
Paid-in capital | | $ | 547,765,268 | | | $ | 251,751,764 | |
Undistributed (distributions in excess of) net investment income (loss) | | | (489,999 | ) | | | 1,541,081 | |
Accumulated net realized loss | | | (160,747,232 | ) | | | (95,260,444 | ) |
Net unrealized appreciation (depreciation) | | | 49,969,770 | | | | 24,374,369 | |
| | | | |
Net Assets | | $ | 436,497,807 | | | $ | 182,406,770 | |
| | | | |
1 Investments at cost — unaffiliated | | $ | 384,868,914 | | | $ | 156,808,103 | |
2 Securities loaned at value | | | — | | | $ | 1,272,843 | |
3 Investments at cost — affiliated | | $ | 1,305,838 | | | $ | 4,647,843 | |
4 Foreign currency at cost | | $ | 1,261,102 | | | $ | 141,688 | |
| | | | | | |
| See Notes to Financial Statements. | | | | |
| | | | | | | |
| 16 | | SEMI-ANNUAL REPORT | | APRIL 30, 2016 | | |
| | |
| Statements of Assets and Liabilities (concluded) | | |
| | | | | | | | |
| April 30, 2016 (Unaudited) | | BlackRock
Emerging
Markets Fund,
Inc. | | | BlackRock Latin
America Fund,
Inc. | |
| | | | | | | | |
| Net Asset Value | | | | | | | | |
| Institutional: | | | | | | | | |
Net assets | | $ | 134,460,282 | | | $ | 49,606,050 | |
| | | | |
Shares outstanding, 100 million shares authorized | | | 8,206,149 | | | | 1,263,947 | |
| | | | |
Net asset value | | $ | 16.39 | | | $ | 39.25 | |
| | | | |
Par value | | $ | 0.100 | | | $ | 0.100 | |
| | | | |
| Investor A: | | | | | | | | |
Net assets | | $ | 195,892,240 | | | $ | 109,383,295 | |
| | | | |
Shares outstanding, 100 million shares authorized | | | 12,398,381 | | | | 2,823,141 | |
| | | | |
Net asset value | | $ | 15.80 | | | $ | 38.75 | |
| | | | |
Par value | | $ | 0.100 | | | $ | 0.100 | |
| | | | |
| Investor B: | | | | | | | | |
Net assets | | | — | | | $ | 586,028 | |
| | | | |
Shares outstanding, 100 million shares authorized | | | — | | | | 16,237 | |
| | | | |
Net asset value | | | — | | | $ | 36.09 | |
| | | | |
Par value | | | — | | | $ | 0.100 | |
| | | | |
| Investor C: | | | | | | | | |
Net assets | | $ | 106,145,285 | | | $ | 22,831,397 | |
| | | | |
Shares outstanding, 100 million shares authorized | | | 7,899,025 | | | | 646,649 | |
| | | | |
Net asset value | | $ | 13.44 | | | $ | 35.31 | |
| | | | |
Par value | | $ | 0.100 | | | $ | 0.100 | |
| | | | |
| | | | | | |
| See Notes to Financial Statements. | | | | |
| | | | | | | |
| | SEMI-ANNUAL REPORT | | APRIL 30, 2016 | | 17 |
| | | | | | | | |
| Six Months Ended April 30, 2016 (Unaudited) | | BlackRock
Emerging
Markets Fund,
Inc.
| | | BlackRock Latin
America Fund,
Inc.
| |
| | | | | | | | |
| Investment Income | | | | | | | | |
Dividends — unaffiliated | | $ | 3,466,228 | | | $ | 3,020,118 | |
Interest | | | 19,386 | | | | 46,067 | |
Dividends — affiliated | | | 14,819 | | | | 6,656 | |
Securities lending — affiliated — net | | | 8,567 | | | | 5,599 | |
Foreign taxes withheld | | | (301,520 | ) | | | (198,748 | ) |
| | | | |
Total income | | | 3,207,480 | | | | 2,879,692 | |
| | | | |
| | | | | | | | |
| Expenses | | | | | | | | |
Investment advisory | | | 2,110,882 | | | | 762,010 | |
Service and distribution — class specific | | | 743,407 | | | | 216,988 | |
Transfer agent — class specific | | | 525,905 | | | | 194,024 | |
Custodian | | | 168,233 | | | | 42,902 | |
Accounting services | | | 99,419 | | | | 26,790 | |
Professional | | | 46,160 | | | | 37,557 | |
Registration | | | 50,802 | | | | 29,828 | |
Printing | | | 22,305 | | | | 9,307 | |
Officer and Directors | | | 8,687 | | | | 4,365 | |
Miscellaneous | | | 15,443 | | | | 13,415 | |
| | | | |
Total expenses | | | 3,791,243 | | | | 1,337,186 | |
Less fees waived by the Manager | | | (3,476 | ) | | | (1,410 | ) |
| | | | |
Total expenses after fees waived | | | 3,787,767 | | | | 1,335,776 | |
| | | | |
Net investment income (loss) | | | (580,287 | ) | | | 1,543,916 | |
| | | | |
| | | | | | | | |
| Realized and Unrealized Gain (Loss) | | | | | | | | |
| Net realized gain (loss) from: | | | | | | | | |
Investments | | | (29,008,427 | ) | | | (11,802,391 | )1 |
Foreign currency transactions | | | (431,849 | ) | | | (169,911 | ) |
| | | | |
| | | (29,440,276 | ) | | | (11,972,302 | ) |
| | | | |
| Net change in unrealized appreciation (depreciation) on: | | | | | | | | |
Investments | | | 30,473,308 | 2 | | | 29,907,013 | 3 |
Foreign currency translations | | | 347,044 | | | | 171,921 | |
| | | | |
| | | 30,820,352 | | | | 30,078,934 | |
| | | | |
Net realized and unrealized gain | | | 1,380,076 | | | | 18,106,632 | |
| | | | |
Net Increase in Net Assets Resulting from Operations | | $ | 799,789 | | | $ | 19,650,548 | |
| | | | |
1 Including $984 realized foreign capital gain tax. | | | | | | | | |
2 Including $(50,765) unrealized foreign capital gain tax. | | | | | | | | |
3 Including $(8,064) unrealized foreign capital gain tax. | | | | | | | | |
| | | | | | |
| See Notes to Financial Statements. | | | | |
| | | | | | | |
| 18 | | SEMI-ANNUAL REPORT | | APRIL 30, 2016 | | |
| | |
| Statements of Changes in Net Assets | | BlackRock Emerging Markets Fund, Inc. |
| | | | | | | | |
| Increase (Decrease) in Net Assets: | | Six Months Ended
April 30,
2016
(Unaudited) | | | Year Ended October 31,
2015 | |
| | | | | | | | |
| Operations | | | | | | | | |
Net investment income (loss) | | $ | (580,287 | ) | | $ | 5,561,859 | |
Net realized loss | | | (29,440,276 | ) | | | (67,254,918 | ) |
Net change in unrealized appreciation (depreciation) | | | 30,820,352 | | | | (100,398,173 | ) |
| | | | |
Net increase (decrease) in net assets resulting from operations | | | 799,789 | | | | (162,091,232 | ) |
| | | | |
| | | | | | | | |
| Distributions to Shareholders1 | | | | | | | | |
| From net investment income: | | | | | | | | |
Institutional | | | (1,981,110 | ) | | | (2,841,195 | ) |
Investor A | | | (1,730,786 | ) | | | (328,181 | ) |
Investor C | | | (298,064 | ) | | | — | |
| | | | |
Decrease in net assets resulting from distributions to shareholders | | | (4,009,960 | ) | | | (3,169,376 | ) |
| | | | |
| | | | | | | | |
| Capital Share Transactions | | | | | | | | |
Net decrease in net assets derived from capital share transactions | | | (33,876,884 | ) | | | (189,154,921 | ) |
| | | | |
| | | | | | | | |
| Net Assets | | | | | | | | |
Total decrease in net assets | | | (37,087,055 | ) | | | (354,415,529 | ) |
Beginning of period | | | 473,584,862 | | | | 828,000,391 | |
| | | | |
End of period | | $ | 436,497,807 | | | $ | 473,584,862 | |
| | | | |
Undistributed (distributions in excess of) net investment income (loss), end of period | | $ | (489,999 | ) | | $ | 4,100,248 | |
| | | | |
1 Distributions for annual periods determined in accordance with federal income tax regulations. | | | | | | | | |
| | | | | | |
| See Notes to Financial Statements. | | | | |
| | | | | | | |
| | SEMI-ANNUAL REPORT | | APRIL 30, 2016 | | 19 |
| | |
| Statements of Changes in Net Assets | | BlackRock Latin America Fund, Inc. |
| | | | | | | | |
| Increase (Decrease) in Net Assets: | | Six Months Ended
April 30,
2016
(Unaudited) | | | Year Ended
October 31,
2015 | |
| | | | | | | | |
| Operations | | | | | | | | |
Net investment income | | $ | 1,543,916 | | | $ | 1,739,213 | |
Net realized loss | | | (11,972,302 | ) | | | (22,840,827 | ) |
Net change in unrealized appreciation (depreciation) | | | 30,078,934 | | | | (75,271,244 | ) |
| | | | |
Net increase (decrease) in net assets resulting from operations | | | 19,650,548 | | | | (96,372,858 | ) |
| | | | |
| | | | | | | | |
| Distributions to Shareholders1 | | | | | | | | |
| From net investment income: | | | | | | | | |
Institutional | | | (342,238 | ) | | | (1,688,848 | ) |
Investor A | | | (365,980 | ) | | | (3,149,648 | ) |
Investor B | | | — | | | | (14,311 | ) |
Investor C | | | — | | | | (488,390 | ) |
| | | | |
Decrease in net assets resulting from distributions to shareholders | | | (708,218 | ) | | | (5,341,197 | ) |
| | | | |
| | | | | | | | |
| Capital Share Transactions | | | | | | | | |
Net increase (decrease) in net assets derived from capital share transactions | | | 779,289 | | | | (54,655,555 | ) |
| | | | |
| | | | | | | | |
| Net Assets | | | | | | | | |
Total increase (decrease) in net assets | | | 19,721,619 | | | | (156,369,610 | ) |
Beginning of period | | | 162,685,151 | | | | 319,054,761 | |
| | | | |
End of period | | $ | 182,406,770 | | | $ | 162,685,151 | |
| | | | |
Undistributed net investment income, end of period | | $ | 1,541,081 | | | $ | 705,383 | |
| | | | |
1 Distributions for annual periods determined in accordance with federal income tax regulations. | | | | | | | | |
| | | | | | |
| See Notes to Financial Statements. | | | | |
| | | | | | | |
| 20 | | SEMI-ANNUAL REPORT | | APRIL 30, 2016 | | |
| | |
| Financial Highlights | | BlackRock Emerging Markets Fund, Inc. |
| | | | | | | | | | | | | | | | | | | | | | | | |
| | | Institutional | |
| | | Six Months Ended
April 30,
2016
(Unaudited) | | | Year Ended October 31, | |
| | | | 2015 | | | 2014 | | | 2013 | | | 2012 | | | 2011 | |
| | | | | | | | | | | | | | | | | | | | | | | | |
| Per Share Operating Performance | | | | | | | | | | | | | | | | | | | | | | | | |
Net asset value, beginning of period | | $ | 16.51 | | | $ | 20.56 | | | $ | 20.10 | | | $ | 19.28 | | | $ | 18.23 | | | $ | 20.50 | |
| | | | |
Net investment income1 | | | 0.02 | | | | 0.19 | | | | 0.18 | | | | 0.19 | | | | 0.29 | | | | 0.27 | |
Net realized and unrealized gain (loss) | | | 0.07 | | | | (4.13 | ) | | | 0.39 | | | | 0.90 | | | | 0.85 | | | | (2.34 | )2 |
| | | | |
Net increase (decrease) from investment operations | | | 0.09 | | | | (3.94 | ) | | | 0.57 | | | | 1.09 | | | | 1.14 | | | | (2.07 | ) |
| | | | |
Distributions from net investment income3 | | | (0.21 | ) | | | (0.11 | ) | | | (0.11 | ) | | | (0.27 | ) | | | (0.09 | ) | | | (0.20 | ) |
| | | | |
Net asset value, end of period | | $ | 16.39 | | | $ | 16.51 | | | $ | 20.56 | | | $ | 20.10 | | | $ | 19.28 | | | $ | 18.23 | |
| | | | |
| | | | | | | | | | | | | | | | | | | | | | | | |
| Total Return4 | | | | | | | | | | | | | | | | | | | | | | | | |
Based on net asset value | | | 0.62% | 5 | | | (19.24)% | | | | 2.86% | | | | 5.67% | 6 | | | 6.37% | | | | (10.21)% | |
| | | | |
| | | | | | | | | | | | | | | | | | | | | | | | |
| Ratios to Average Net Assets | | | | | | | | | | | | | | | | | | | | | | | | |
Total expenses | | | 1.28% | 7 | | | 1.17% | 8 | | | 1.17% | | | | 1.29% | | | | 1.33% | | | | 1.28% | |
| | | | |
Total expenses after fees waived | | | 1.28% | 7 | | | 1.17% | 8 | | | 1.16% | | | | 1.29% | | | | 1.33% | | | | 1.28% | |
| | | | |
Net investment income | | | 0.21% | 7 | | | 0.98% | 8 | | | 0.88% | | | | 0.95% | | | | 1.53% | | | | 1.39% | |
| | | | |
| | | | | | | | | | | | | | | | | | | | | | | | |
| Supplemental Data | | | | | | | | | | | | | | | | | | | | | | | | |
Net assets, end of period (000) | | $ | 134,460 | | | $ | 169,509 | | | $ | 467,132 | | | $ | 186,724 | | | $ | 116,883 | | | $ | 127,181 | |
| | | | |
Portfolio turnover rate | | | 47% | | | | 103% | | | | 94% | | | | 71% | | | | 155% | | | | 138% | |
| | | | |
| | 1 | | Based on average shares outstanding. |
| | 2 | | Includes a redemption fee, which is less than $0.005 per share. |
| | 3 | | Distributions for annual periods determined in accordance with federal income tax regulations. |
| | 4 | | Where applicable, assumes the reinvestment of distributions. |
| | 5 | | Aggregate total return. |
| | 6 | | Includes a payment from an affiliate to compensate for forgone securities lending revenue which impacted the Fund’s total return. Not including this payment, the Fund’s total return would have been 5.51%. |
| | 8 | | Ratios do not include expenses incurred indirectly as a result of investments in underlying funds of approximately 0.01% for the year ended October 31, 2015. |
| | | | | | |
| See Notes to Financial Statements. | | | | |
| | | | | | | |
| | SEMI-ANNUAL REPORT | | APRIL 30, 2016 | | 21 |
| | |
| Financial Highlights (continued) | | BlackRock Emerging Markets Fund, Inc. |
| | | | | | | | | | | | | | | | | | | | | | | | |
| | | Investor A | |
| | | Six Months Ended
April 30,
2016
(Unaudited) | | | Year Ended October 31, | |
| | | | 2015 | | | 2014 | | | 2013 | | | 2012 | | | 2011 | |
| | | | | | | | | | | | | | | | | | | | | | | | |
| Per Share Operating Performance | | | | | | | | | | | | | | | | | | | | | | | | |
Net asset value, beginning of period | | $ | 15.89 | | | $ | 19.81 | | | $ | 19.38 | | | $ | 18.61 | | | $ | 17.60 | | | $ | 19.81 | |
| | | | |
Net investment income1 | | | (0.02 | ) | | | 0.10 | | | | 0.06 | | | | 0.13 | | | | 0.22 | | | | 0.18 | |
Net realized and unrealized gain (loss) | | | 0.07 | | | | (3.99 | ) | | | 0.42 | | | | 0.86 | | | | 0.83 | | | | (2.24 | )2 |
| | | | |
Net increase (decrease) from investment operations | | | 0.05 | | | | (3.89 | ) | | | 0.48 | | | | 0.99 | | | | 1.05 | | | | (2.06 | ) |
| | | | |
Distributions from net investment income3 | | | (0.14 | ) | | | (0.03 | ) | | | (0.05 | ) | | | (0.22 | ) | | | (0.04 | ) | | | (0.15 | ) |
| | | | |
Net asset value, end of period | | $ | 15.80 | | | $ | 15.89 | | | $ | 19.81 | | | $ | 19.38 | | | $ | 18.61 | | | $ | 17.60 | |
| | | | |
| | | | | | | | | | | | | | | | | | | | | | | | |
| Total Return4 | | | | | | | | | | | | | | | | | | | | | | | | |
Based on net asset value | | | 0.39% | 5 | | | (19.67)% | | | | 2.46% | | | | 5.30% | 6 | | | 6.02% | | | | (10.48)% | |
| | | | |
| | | | | | | | | | | | | | | | | | | | | | | | |
| Ratios to Average Net Assets | | | | | | | | | | | | | | | | | | | | | | | | |
Total expenses | | | 1.74% | 7 | | | 1.62% | 8 | | | 1.58% | | | | 1.60% | | | | 1.67% | | | | 1.59% | |
| | | | |
Total expenses after fees waived | | | 1.74% | 7 | | | 1.62% | 8 | | | 1.58% | | | | 1.60% | | | | 1.67% | | | | 1.59% | |
| | | | |
Net investment income (loss) | | | (0.21)% | 7 | | | 0.56% | 8 | | | 0.32% | | | | 0.69% | | | | 1.24% | | | | 0.93% | |
| | | | |
| | | | | | | | | | | | | | | | | | | | | | | | |
| Supplemental Data | | | | | | | | | | | | | | | | | | | | | | | | |
Net assets, end of period (000) | | $ | 195,892 | | | $ | 193,165 | | | $ | 231,467 | | | $ | 215,490 | | | $ | 174,637 | | | $ | 155,017 | |
| | | | |
Portfolio turnover rate | | | 47% | | | | 103% | | | | 94% | | | | 71% | | | | 155% | | | | 138% | |
| | | | |
| | 1 | | Based on average shares outstanding. |
| | 2 | | Includes a redemption fee, which is less than $0.005 per share. |
| | 3 | | Distributions for annual periods determined in accordance with federal income tax regulations. |
| | 4 | | Where applicable, excludes the effects of any sales charges and assumes the reinvestment of distributions. |
| | 5 | | Aggregate total return. |
| | 6 | | Includes a payment from an affiliate to compensate for forgone securities lending revenue which impacted the Fund’s total return. Not including this payment, the Fund’s total return would have been 5.13%. |
| | 8 | | Ratios do not include expenses incurred indirectly as a result of investments in underlying funds of approximately 0.01% for the year ended October 31, 2015. |
| | | | | | |
| See Notes to Financial Statements. | | | | |
| | | | | | | |
| 22 | | SEMI-ANNUAL REPORT | | APRIL 30, 2016 | | |
| | |
| Financial Highlights (concluded) | | BlackRock Emerging Markets Fund, Inc. |
| | | | | | | | | | | | | | | | | | | | | | | | |
| | | Investor C | |
| | | Six Months Ended
April 30,
2016
(Unaudited) | | | Year Ended October 31, | |
| | | | 2015 | | | 2014 | | | 2013 | | | 2012 | | | 2011 | |
| | | | | | | | | | | | | | | | | | | | | | | | |
| Per Share Operating Performance | | | | | | | | | | | | | | | | | | | | | | | | |
Net asset value, beginning of period | | $ | 13.48 | | | $ | 16.91 | | | $ | 16.65 | | | $ | 16.02 | | | $ | 15.26 | | | $ | 17.23 | |
| | | | |
Net investment income (loss)1 | | | (0.07 | ) | | | (0.04 | ) | | | (0.08 | ) | | | (0.03 | ) | | | 0.06 | | | | 0.05 | |
Net realized and unrealized gain (loss) | | | 0.07 | | | | (3.39 | ) | | | 0.34 | | | | 0.74 | | | | 0.71 | | | | (1.98 | )2 |
| | | | |
Net increase (decrease) from investment operations | | | — | | | | (3.43 | ) | | | 0.26 | | | | 0.71 | | | | 0.77 | | | | (1.93 | ) |
| | | | |
Distributions from net investment income3 | | | (0.04 | ) | | | — | | | | — | | | | (0.08 | ) | | | (0.01 | ) | | | (0.04 | ) |
| | | | |
Net asset value, end of period | | $ | 13.44 | | | $ | 13.48 | | | $ | 16.91 | | | $ | 16.65 | | | $ | 16.02 | | | $ | 15.26 | |
| | | | |
| | | | | | | | | | | | | | | | | | | | | | | | |
| Total Return4 | | | | | | | | | | | | | | | | | | | | | | | | |
Based on net asset value | | | (0.01)% | 5 | | | (20.28)% | | | | 1.56% | | | | 4.45% | 6 | | | 5.07% | | | | (11.21)% | |
| | | | |
| | | | | | | | | | | | | | | | | | | | | | | | |
| Ratios to Average Net Assets | | | | | | | | | | | | | | | | | | | | | | | | |
Total expenses | | | 2.58% | 7 | | | 2.44% | 8 | | | 2.41% | | | | 2.46% | | | | 2.56% | | | | 2.37% | |
| | | | |
Total expenses after fees waived | | | 2.57% | 7 | | | 2.44% | 8 | | | 2.41% | | | | 2.46% | | | | 2.56% | | | | 2.37% | |
| | | | |
Net investment income (loss) | | | (1.05)% | 7 | | | (0.26)% | 8 | | | (0.49)% | | | | (0.18)% | | | | 0.38% | | | | 0.30% | |
| | | | |
| | | | | | | | | | | | | | | | | | | | | | | | |
| Supplemental Data | | | | | | | | | | | | | | | | | | | | | | | | |
Net assets, end of period (000) | | $ | 106,145 | | | $ | 110,911 | | | $ | 128,684 | | | $ | 119,015 | | | $ | 102,559 | | | $ | 87,455 | |
| | | | |
Portfolio turnover rate | | | 47% | | | | 103% | | | | 94% | | | | 71% | | | | 155% | | | | 138% | |
| | | | |
| | 1 | | Based on average shares outstanding. |
| | 2 | | Includes a redemption fee, which is less than $0.005 per share. |
| | 3 | | Distributions for annual periods determined in accordance with federal income tax regulations. |
| | 4 | | Where applicable, excludes the effects of any sales charges and assumes the reinvestment of distributions. |
| | 5 | | Aggregate total return. |
| | 6 | | Includes a payment from an affiliate to compensate for forgone securities lending revenue which impacted the Fund’s total return. Not including this payment, the Fund’s total return would have been 4.27%. |
| | 8 | | Ratios do not include expenses incurred indirectly as a result of investments in underlying funds of approximately 0.01% for the year ended October 31, 2015. |
| | | | | | |
| See Notes to Financial Statements. | | | | |
| | | | | | | |
| | SEMI-ANNUAL REPORT | | APRIL 30, 2016 | | 23 |
| | |
| Financial Highlights | | BlackRock Latin America Fund, Inc. |
| | | | | | | | | | | | | | | | | | | | | | | | |
| | | Institutional | |
| | | Six Months Ended April 30,
2016
(Unaudited) | | | Year Ended October 31, | |
| | | | 2015 | | | 2014 | | | 2013 | | | 2012 | | | 2011 | |
| | | | | | | | | | | | | | | | | | | | | | | | |
| Per Share Operating Performance | | | | | | | | | | | | | | | | | | | | | | | | |
Net asset value, beginning of period | | $ | 34.98 | | | $ | 54.16 | | | $ | 56.13 | | | $ | 58.82 | | | $ | 62.80 | | | $ | 75.35 | |
| | | | |
Net investment income1 | | | 0.40 | | | | 0.49 | | | | 1.08 | | | | 0.79 | | | | 0.94 | | | | 1.31 | |
Net realized and unrealized gain (loss) | | | 4.14 | | | | (18.53 | ) | | | (2.52 | ) | | | (2.48 | ) | | | (4.38 | ) | | | (12.58 | ) |
| | | | |
Net increase (decrease) from investment operations | | | 4.54 | | | | (18.04 | ) | | | (1.44 | ) | | | (1.69 | ) | | | (3.44 | ) | | | (11.27 | ) |
| | | | |
Distributions from net investment income2 | | | (0.27 | ) | | | (1.14 | ) | | | (0.53 | ) | | | (1.00 | ) | | | (0.54 | ) | | | (1.28 | ) |
| | | | |
Net asset value, end of period | | $ | 39.25 | | | $ | 34.98 | | | $ | 54.16 | | | $ | 56.13 | | | $ | 58.82 | | | $ | 62.80 | |
| | | | |
| | | | | | | | | | | | | | | | | | | | | | | | |
| Total Return3 | | | | | | | | | | | | | | | | | | | | | | | | |
Based on net asset value | | | 13.12% | 4 | | | (33.77)% | | | | (2.51)% | | | | (3.01)% | | | | (5.43)% | | | | (15.18)% | |
| | | | |
| | | | | | | | | | | | | | | | | | | | | | | | |
| Ratios to Average Net Assets | | | | | | | | | | | | | | | | | | | | | | | | |
Total expenses | | | 1.40% | 5 | | | 1.32% | | | | 1.25% | | | | 1.27% | | | | 1.32% | | | | 1.26% | |
| | | | |
Total expenses after fees waived | | | 1.40% | 5 | | | 1.32% | | | | 1.25% | | | | 1.27% | | | | 1.32% | | | | 1.26% | |
| | | | |
Net investment income | | | 2.40% | 5 | | | 1.14% | | | | 1.99% | | | | 1.36% | | | | 1.55% | | | | 1.89% | |
| | | | |
| | | | | | | | | | | | | | | | | | | | | | | | |
| Supplemental Data | | | | | | | | | | | | | | | | | | | | | | | | |
Net assets, end of period (000) | | $ | 49,606 | | | $ | 45,472 | | | $ | 87,941 | | | $ | 110,295 | | | $ | 125,473 | | | $ | 175,554 | |
| | | | |
Portfolio turnover rate | | | 25% | | | | 35% | | | | 42% | | | | 66% | | | | 50% | | | | 33% | |
| | | | |
| | 1 | | Based on average shares outstanding. |
| | 2 | | Distributions for annual periods determined in accordance with federal income tax regulations. |
| | 3 | | Where applicable, assumes the reinvestment of distributions. |
| | 4 | | Aggregate total return. |
| | | | | | |
| See Notes to Financial Statements. | | | | |
| | | | | | | |
| 24 | | SEMI-ANNUAL REPORT | | APRIL 30, 2016 | | |
| | |
| Financial Highlights (continued) | | BlackRock Latin America Fund, Inc. |
| | | | | | | | | | | | | | | | | | | | | | | | |
| | | Investor A | |
| | | Six Months Ended
April 30,
2016
(Unaudited) | | | Year Ended October 31, | |
| | | | 2015 | | | 2014 | | | 2013 | | | 2012 | | | 2011 | |
| | | | | | | | | | | | | | | | | | | | | | | | |
| Per Share Operating Performance | | | | | | | | | | | | | | | | | | | | | | | | |
Net asset value, beginning of period | | $ | 34.45 | | | $ | 53.31 | | | $ | 55.21 | | | $ | 57.90 | | | $ | 61.67 | | | $ | 74.07 | |
| | | | |
Net investment income1 | | | 0.34 | | | | 0.35 | | | | 0.92 | | | | 0.61 | | | | 0.78 | | | | 1.08 | |
Net realized and unrealized gain (loss) | | | 4.09 | | | | (18.24 | ) | | | (2.47 | ) | | | (2.43 | ) | | | (4.25 | ) | | | (12.37 | ) |
| | | | |
Net increase (decrease) from investment operations | | | 4.43 | | | | (17.89 | ) | | | (1.55 | ) | | | (1.82 | ) | | | (3.47 | ) | | | (11.29 | ) |
| | | | |
Distributions from net investment income2 | | | (0.13 | ) | | | (0.97 | ) | | | (0.35 | ) | | | (0.87 | ) | | | (0.30 | ) | | | (1.11 | ) |
| | | | |
Net asset value, end of period | | $ | 38.75 | | | $ | 34.45 | | | $ | 53.31 | | | $ | 55.21 | | | $ | 57.90 | | | $ | 61.67 | |
| | | | |
| | | | | | | | | | | | | | | | | | | | | | | | |
| Total Return3 | | | | | | | | | | | | | | | | | | | | | | | | |
Based on net asset value | | | 12.95% | 4 | | | (33.96)% | | | | (2.78)% | | | | (3.27)% | | | | (5.60)% | | | | (15.44)% | |
| | | | |
| | | | | | | | | | | | | | | | | | | | | | | | |
| Ratios to Average Net Assets | | | | | | | | | | | | | | | | | | | | | | | | |
Total expenses | | | 1.71% | 5 | | | 1.61% | | | | 1.53% | | | | 1.53% | | | | 1.53% | | | | 1.55% | |
| | | | |
Total expenses after fees waived | | | 1.70% | 5 | | | 1.61% | | | | 1.53% | | | | 1.53% | | | | 1.53% | | | | 1.55% | |
| | | | |
Net investment income | | | 2.06% | 5 | | | 0.83% | | | | 1.72% | | | | 1.06% | | | | 1.32% | | | | 1.57% | |
| | | | |
| | | | | | | | | | | | | | | | | | | | | | | | |
| Supplemental Data | | | | | | | | | | | | | | | | | | | | | | | | |
Net assets, end of period (000) | | $ | 109,383 | | | $ | 93,494 | | | $ | 178,571 | | | $ | 236,205 | | | $ | 315,531 | | | $ | 405,903 | |
| | | | |
Portfolio turnover rate | | | 25% | | | | 35% | | | | 42% | | | | 66% | | | | 50% | | | | 33% | |
| | | | |
| | 1 | | Based on average shares outstanding. |
| | 2 | | Distributions for annual periods determined in accordance with federal income tax regulations. |
| | 3 | | Where applicable, excludes the effects of any sales charges and assumes the reinvestment of distributions. |
| | 4 | | Aggregate total return. |
| | | | | | |
| See Notes to Financial Statements. | | | | |
| | | | | | | |
| | SEMI-ANNUAL REPORT | | APRIL 30, 2016 | | 25 |
| | |
| Financial Highlights (continued) | | BlackRock Latin America Fund, Inc. |
| | | | | | | | | | | | | | | | | | | | | | | | |
| | | Investor B | |
| | | Six Months Ended
April 30,
2016
(Unaudited) | | | Year Ended October 31, | |
| | | | 2015 | | | 2014 | | | 2013 | | | 2012 | | | 2011 | |
| | | | | | | | | | | | | | | | | | | | | | | | |
| Per Share Operating Performance | | | | | | | | | | | | | | | | | | | | | | | | |
Net asset value, beginning of period | | $ | 32.18 | | | $ | 49.60 | | | $ | 51.51 | | | $ | 53.96 | | | $ | 57.68 | | | $ | 69.31 | |
| | | | |
Net investment income (loss)1 | | | 0.12 | | | | (0.11 | ) | | | 0.35 | | | | 0.08 | | | | 0.24 | | | | 0.46 | |
Net realized and unrealized gain (loss) | | | 3.79 | | | | (17.04 | ) | | | (2.26 | ) | | | (2.28 | ) | | | (3.96 | ) | | | (11.59 | ) |
| | | | |
Net increase (decrease) from investment operations | | | 3.91 | | | | (17.15 | ) | | | (1.91 | ) | | | (2.20 | ) | | | (3.72 | ) | | | (11.13 | ) |
| | | | |
Distributions from net investment income2 | | | — | | | | (0.27 | ) | | | — | | | | (0.25 | ) | | | — | | | | (0.50 | ) |
| | | | |
Net asset value, end of Period | | $ | 36.09 | | | $ | 32.18 | | | $ | 49.60 | | | $ | 51.51 | | | $ | 53.96 | | | $ | 57.68 | |
| | | | |
| | | | | | | | | | | | | | | | | | | | | | | | |
| Total Return3 | | | | | | | | | | | | | | | | | | | | | | | | |
Based on net asset value | | | 12.15% | 4 | | | (34.71)% | | | | (3.71)% | | | | (4.12)% | | | | (6.45)% | | | | (16.16)% | |
| | | | |
| | | | | | | | | | | | | | | | | | | | | | | | |
| Ratios to Average Net Assets | | | | | | | | | | | | | | | | | | | | | | | | |
Total expenses | | | 3.09% | 5 | | | 2.69% | | | | 2.51% | | | | 2.44% | | | | 2.41% | | | | 2.40% | |
| | | | |
Total expenses after fees waived | | | 3.08% | 5 | | | 2.69% | | | | 2.51% | | | | 2.44% | | | | 2.41% | | | | 2.40% | |
| | | | |
Net investment income (loss) | | | 0.76% | 5 | | | (0.27)% | | | | 0.71% | | | | 0.15% | | | | 0.43% | | | | 0.71% | |
| | | | |
| | | | | | | | | | | | | | | | | | | | | | | | |
| Supplemental Data | | | | | | | | | | | | | | | | | | | | | | | | |
Net assets, end of period (000) | | $ | 586 | | | $ | 932 | | | $ | 2,820 | | | $ | 5,009 | | | $ | 7,989 | | | $ | 11,866 | |
| | | | |
Portfolio turnover rate | | | 25% | | | | 35% | | | | 42% | | | | 66% | | | | 50% | | | | 33% | |
| | | | |
| | 1 | | Based on average shares outstanding. |
| | 2 | | Distributions for annual periods determined in accordance with federal income tax regulations. |
| | 3 | | Where applicable, excludes the effects of any sales charges and assumes the reinvestment of distributions. |
| | 4 | | Aggregate total return. |
| | | | | | |
| See Notes to Financial Statements. | | | | |
| | | | | | | |
| 26 | | SEMI-ANNUAL REPORT | | APRIL 30, 2016 | | |
| | |
| Financial Highlights (concluded) | | BlackRock Latin America Fund, Inc. |
| | | | | | | | | | | | | | | | | | | | | | | | |
| | | Investor C | |
| | | Six Months Ended
April 30,
2016
(Unaudited) | | | Year Ended October 31, | |
| | | | 2015 | | | 2014 | | | 2013 | | | 2012 | | | 2011 | |
| | | | | | | | | | | | | | | | | | | | | | | | |
| Per Share Operating Performance | | | | | | | | | | | | | | | | | | | | | | | | |
Net asset value, beginning of period | | $ | 31.41 | | | $ | 48.57 | | | $ | 50.37 | | | $ | 52.79 | | | $ | 56.39 | | | $ | 67.92 | |
| | | | |
Net investment income (loss)1 | | | 0.17 | | | | (0.02 | ) | | | 0.43 | | | | 0.13 | | | | 0.27 | | | | 0.51 | |
Net realized and unrealized gain (loss) | | | 3.73 | | | | (16.64 | ) | | | (2.23 | ) | | | (2.24 | ) | | | (3.87 | ) | | | (11.35 | ) |
| | | | |
Net increase (decrease) from investment operations | | | 3.90 | | | | (16.66 | ) | | | (1.80 | ) | | | (2.11 | ) | | | (3.60 | ) | | | (10.84 | ) |
| | | | |
Distributions from net investment income2 | | | — | | | | (0.50 | ) | | | — | | | | (0.31 | ) | | | — | | | | (0.69 | ) |
| | | | |
Net asset value, end of period | | $ | 35.31 | | | $ | 31.41 | | | $ | 48.57 | | | $ | 50.37 | | | $ | 52.79 | | | $ | 56.39 | |
| | | | |
| | | | | | | | | | | | | | | | | | | | | | | | |
| Total Return3 | | | | | | | | | | | | | | | | | | | | | | | | |
Based on net asset value | | | 12.42% | 4 | | | (34.53)% | | | | (3.57)% | | | | (4.05)% | | | | (6.38)% | | | | (16.10)% | |
| | | | |
| | | | | | | | | | | | | | | | | | | | | | | | |
| Ratios to Average Net Assets | | | | | | | | | | | | | | | | | | | | | | | | |
Total expenses | | | 2.64% | 5 | | | 2.48% | | | | 2.36% | | | | 2.35% | | | | 2.35% | | | | 2.33% | |
| | | | |
Total expenses after fees waived | | | 2.63% | 5 | | | 2.47% | | | | 2.36% | | | | 2.35% | | | | 2.35% | | | | 2.33% | |
| | | | |
Net investment income (loss) | | | 1.16% | 5 | | | (0.04)% | | | | 0.88% | | | | 0.25% | | | | 0.49% | | | | 0.80% | |
| | | | |
| | | | | | | | | | | | | | | | | | | | | | | | |
| Supplemental Data | | | | | | | | | | | | | | | | | | | | | | | | |
Net assets, end of period (000) | | $ | 22,831 | | | $ | 22,787 | | | $ | 49,724 | | | $ | 72,047 | | | $ | 111,344 | | | $ | 160,612 | |
| | | | |
Portfolio turnover rate | | | 25% | | | | 35% | | | | 42% | | | | 66% | | | | 50% | | | | 33% | |
| | | | |
| | 1 | | Based on average shares outstanding. |
| | 2 | | Distributions for annual periods determined in accordance with federal income tax regulations. |
| | 3 | | Where applicable, excludes the effects of any sales charges and assumes the reinvestment of distributions. |
| | 4 | | Aggregate total return. |
| | | | | | |
| See Notes to Financial Statements. | | | | |
| | | | | | | |
| | SEMI-ANNUAL REPORT | | APRIL 30, 2016 | | 27 |
| | | | |
| Notes to Financial Statements (Unaudited) | | |
1. Organization:
BlackRock Emerging Markets Fund, Inc. and BlackRock Latin America Fund, Inc. are each registered under the Investment Company Act of 1940, as amended (the “1940 Act”), as open-end management investment companies. Each Fund is organized as a Maryland corporation. The following are referred to herein collectively as the “Funds” or individually, a “Fund”:
| | | | | | |
| Fund Name | | Herein Referred To As | | Diversification Classification | |
BlackRock Emerging Markets Fund, Inc | | Emerging Markets | | | Non-diversified | |
BlackRock Latin America Fund, Inc | | Latin America | | | Non-diversified | |
Each Fund offers multiple classes of shares. All classes of shares have identical voting, dividend, liquidation and other rights and are subject to the same terms and conditions, except that certain classes bear expenses related to the shareholder servicing and distribution of such shares. Institutional Shares are sold only to certain eligible investors. Investor B Shares are only available through exchanges and distribution reinvestments by current holders and for purchase by certain employer-sponsored retirement plans. Investor A and Investor C Shares are generally available through financial intermediaries. Each class has exclusive voting rights with respect to matters relating to its shareholder servicing and distribution expenditures (except that Investor B shareholders may vote on material changes to the Investor A distribution and service plan).
| | | | | | |
| Share Class | | Initial Sales
Charge | | CDSC | | Conversion Privilege |
Institutional | | No | | No | | None |
Investor A Shares | | Yes | | No1 | | None |
Investor B Shares | | No | | Yes | | To Investor A Shares after approximately 8 years |
Investor C Shares | | No | | Yes | | None |
| | 1 | | Investor A Shares may be subject to a and may be subject to a contingent deferred sales charge (“CDSC”) for certain redemptions where no initial sales charge was paid at the time of purchase. |
The Funds, together with certain other registered investment companies advised by BlackRock Advisors, LLC (the “Manager”) or its affiliates, are included in a complex of open-end funds referred to as the Equity-Liquidity Complex.
2. Significant Accounting Policies:
The financial statements are prepared in conformity with accounting principles generally accepted in the United States of America (“U.S. GAAP”), which may require management to make estimates and assumptions that affect the reported amounts of assets and liabilities in the financial statements, disclosure of contingent assets and liabilities at the date of the financial statements and the reported amounts of increases and decreases in net assets from operations during the reporting period. Actual results could differ from those estimates. Each Fund is considered an investment company under U.S. GAAP and follows the accounting and reporting guidance applicable to investment companies. Below is a summary of significant accounting policies:
Foreign Currency: Each Fund’s books and records are maintained in U.S. dollars. Purchases and sales of investments are recorded at the rates of exchange prevailing on the respective dates of such transactions. Generally, when the U.S. dollar rises in value against a foreign currency, the investments denominated in that currency will lose value; the opposite effect occurs if the U.S. dollar falls in relative value.
Each Fund does not isolate changes in the exchange rates from the changes in the market prices of investments held or sold for financial reporting purposes. Accordingly, the effects of changes in exchange rates on investments are not segregated in the Statements of Operations from the effects of changes in market prices of those investments, but are included as a component of net realized and unrealized gain (loss) from investments. Each Fund reports realized currency gains (losses) on foreign currency related transactions as components of net realized gain (loss) for financial reporting purposes, whereas such components are generally treated as ordinary income for federal income tax purposes.
Segregation and Collateralization: In cases where a Fund enters into certain investments (e.g., forward foreign currency exchange contracts) that would be treated as “senior securities” for 1940 Act purposes, a Fund may segregate or designate on its books and records cash or liquid assets having a market value at least equal to the amount of its future obligations under such investments. Doing so allows the investment to be excluded from treatment as a “senior security.” Furthermore, if required by an exchange or counterparty agreement, the Funds may be required to deliver/deposit cash and/or securities to/with an exchange, or broker-dealer or custodian as collateral for certain investments or obligations.
Investment Transactions and Investment Income: For financial reporting purposes, investment transactions are recorded on the dates the transactions are entered into (the trade dates). Realized gains and losses on investment transactions are determined on the identified cost basis. Dividend income
| | | | | | |
| | | | | | | |
| 28 | | SEMI-ANNUAL REPORT | | APRIL 30, 2016 | | |
| | |
| Notes to Financial Statements (continued) | | |
is recorded on the ex-dividend date. Dividends from foreign securities where the ex-dividend date may have passed are subsequently recorded when the Funds are informed of the ex-dividend date. Under the applicable foreign tax laws, a withholding tax at various rates may be imposed on capital gains, dividends and interest. Interest income, including amortization and accretion of premiums and discounts on debt securities, is recognized on the accrual basis. Income, expenses and realized and unrealized gains and losses are allocated daily to each class based on its relative net assets.
Distributions: Distributions paid by the Funds are recorded on the ex-dividend date. The character and timing of distributions are determined in accordance with federal income tax regulations, which may differ from U.S. GAAP.
Indemnifications: In the normal course of business, a Fund enters into contracts that contain a variety of representations that provide general indemnification. A Fund’s maximum exposure under these arrangements is unknown because it involves future potential claims against a Fund, which cannot be predicted with any certainty.
Other: Expenses directly related to a Fund or its classes are charged to that Fund or the applicable class. Other operating expenses shared by several funds, including other funds managed by the Manager, are prorated among those funds on the basis of relative net assets or other appropriate methods. Expenses directly related to the Funds and other shared expenses prorated to the Funds are allocated daily to each class based on its relative net assets or other appropriate methods.
The Funds have an arrangement with their custodian whereby fees may be reduced by credits earned on uninvested cash balances, which, if applicable, are shown as fees paid indirectly in the Statements of Operations. The custodian imposes fees on overdrawn cash balances, which can be offset by accumulated credits earned or may result in additional custody charges. Effective October 2015, the custodian is imposing fees on certain uninvested cash balances.
3. Investment Valuation and Fair Value Measurements:
Investment Valuation Policies: The Funds’ investments are valued at fair value (also referred to as “market value” within the financial statements) as of the close of trading on the New York Stock Exchange (“NYSE”) (generally 4:00 p.m., Eastern time) (or if the reporting date falls on a day the NYSE is closed, investments are valued at fair value as of the report date). U.S. GAAP defines fair value as the price the Funds would receive to sell an asset or pay to transfer a liability in an orderly transaction between market participants at the measurement date. The Funds determine the fair values of their financial instruments using various independent dealers or pricing services under policies approved by the Board of Directors of each Fund (the “Board”). The BlackRock Global Valuation Methodologies Committee (the “Global Valuation Committee”) is the committee formed by management to develop global pricing policies and procedures and to oversee the pricing function for all financial instruments.
Fair Value Inputs and Methodologies: The following methods (or “techniques”) and inputs are used to establish the fair value of each Fund’s assets and liabilities:
| • | | Equity investments traded on a recognized securities exchange are valued at the official closing price each day, if available. For equity investments traded on more than one exchange, the official close price on the exchange where the stock is primarily traded is used. Equity investments traded on a recognized exchange for which there were no sales on that day may be valued at the last available bid (long positions) or ask (short positions) price. Generally, trading in foreign instruments is substantially completed each day at various times prior to the close of business on the NYSE. Occasionally, events affecting the values of such instruments may occur between the foreign market close and the close of business on the NYSE that may not be reflected in the computation of the Funds’ net assets. Each business day, the Funds use a pricing service to assist with the valuation of certain foreign exchange-traded equity securities and foreign exchange-traded and over-the-counter (“OTC”) options (the “Systematic Fair Value Price”). Using current market factors, the Systematic Fair Value Price is designed to value such foreign securities and foreign options at fair value as of the close of business on the NYSE, which follows the close of the local markets. |
| • | | Bond investments are valued on the basis of last available bid prices or current market quotations provided by dealers or pricing services. Floating rate loan interests are valued at the mean of the bid prices from one or more brokers or dealers as obtained from a pricing service. In determining the value of a particular investment, pricing services may use certain information with respect to transactions in such investments, quotations from dealers, pricing matrixes, market transactions in comparable investments, various relationships observed in the market between investments and calculated yield measures. Asset-backed and mortgage-backed securities are valued by independent pricing services using models that consider estimated cash flows of each tranche of the security, establish a benchmark yield and develop an estimated tranche-specific spread to the benchmark yield based on the unique attributes of the tranche. Generally, trading in foreign instruments is substantially completed each day at various times prior to the close of business on the NYSE. Occasionally, events affecting the values of such instruments may occur between the foreign market close and the close of business on the NYSE that may not be reflected in the computation of the Funds’ net assets. |
| | | | | | |
| | | | | | | |
| | SEMI-ANNUAL REPORT | | APRIL 30, 2016 | | 29 |
| | | | |
| Notes to Financial Statements (continued) | | |
| • | | Participation notes are valued on the basis of last available bid prices or current market quotations provided by dealers or pricing services. |
| • | | The Funds value their investment in BlackRock Liquidity Series, LLC, Money Market Series (the “Money Market Series”) at fair value, which is ordinarily based upon its pro rata ownership in the underlying fund’s net assets. The Money Market Series seeks current income consistent with maintaining liquidity and preserving capital. Although the Money Market Series is not registered under the 1940 Act, its investments may follow the parameters of investments by a money market fund that is subject to Rule 2a-7 under the 1940 Act. The Funds may withdraw up to 25% of their investment daily, although the manager of the Money Market Series, in its sole discretion, may permit an investor to withdraw more than 25% on any one day. |
| • | | Securities and other assets and liabilities denominated in foreign currencies are translated into U.S. dollars using exchange rates determined as of the close of business on the NYSE. Forward foreign currency exchange contracts are valued at the mean between the bid and ask prices and are determined as of the close of business on the NYSE. Interpolated values are derived when the settlement date of the contract is an interim date for which quotations are not available. |
If events (e.g., a company announcement, market volatility or a natural disaster) occur that are expected to materially affect the value of such instruments, or in the event that the application of these methods of valuation results in a price for an investment that is deemed not to be representative of the market value of such investment, or if a price is not available, the investment will be valued by the Global Valuation Committee, or its delegate, in accordance with a policy approved by the Board as reflecting fair value (“Fair Valued Investments”). When determining the price for Fair Valued Investments, the Global Valuation Committee, or its delegate, seeks to determine the price that each Fund might reasonably expect to receive or pay from the current sale or purchase of that asset or liability in an arm’s-length transaction. Fair value determinations shall be based upon all available factors that the Global Valuation Committee, or its delegate, deems relevant consistent with the principles of fair value measurement, which include the market approach, income approach and/or in the case of recent investments, the cost approach, as appropriate. The market approach generally consists of using comparable market transactions. The income approach generally is used to discount future cash flows to present value and is adjusted for liquidity as appropriate. These factors include but are not limited to: (i) attributes specific to the investment or asset; (ii) the principal market for the investment or asset; (iii) the customary participants in the principal market for the investment or asset; (iv) data assumptions by market participants for the investment or asset, if reasonably available; (v) quoted prices for similar investments or assets in active markets; and (vi) other factors, such as future cash flows, interest rates, yield curves, volatilities, prepayment speeds, loss severities, credit risks, recovery rates, liquidation amounts and/or default rates. Due to the inherent uncertainty of valuations of such investments, the fair values may differ from the values that would have been used had an active market existed.
The Global Valuation Committee, or its delegate, employs various methods for calibrating valuation approaches for investments where an active market does not exist, including regular due diligence of each Fund’s pricing vendors, regular reviews of key inputs and assumptions, transactional back-testing or disposition analysis to compare unrealized gains and losses to realized gains and losses, reviews of missing or stale prices and large movements in market values and reviews of any market related activity. The pricing of all Fair Valued Investments is subsequently reported to the Board or a committee thereof on a quarterly basis.
Fair Value Hierarchy: Various inputs are used in determining the fair value of investments. These inputs to valuation techniques are categorized into a fair value hierarchy consisting of three broad levels for financial statement:
| • | | Level 1 — unadjusted price quotations in active markets/exchanges for identical assets or liabilities that each Fund has the ability to access |
| • | | Level 2 — other observable inputs (including, but not limited to, quoted prices for similar assets or liabilities in markets that are active, quoted prices for identical or similar assets or liabilities in markets that are not active, inputs other than quoted prices that are observable for the assets or liabilities (such as interest rates, yield curves, volatilities, prepayment speeds, loss severities, credit risks and default rates) or other market–corroborated inputs) |
| • | | Level 3 — unobservable inputs based on the best information available in the circumstances, to the extent observable inputs are not available (including each Fund’s own assumptions used in determining the fair value of investments) |
The hierarchy gives the highest priority to unadjusted quoted prices in active markets for identical assets or liabilities (Level 1 measurements) and the lowest priority to unobservable inputs (Level 3 measurements). Accordingly, the degree of judgment exercised in determining fair value is greatest for instruments categorized in Level 3. The inputs used to measure fair value may fall into different levels of the fair value hierarchy. In such cases, for disclosure purposes, the fair value hierarchy classification is determined based on the lowest level input that is significant to the fair value measurement
| | | | | | |
| | | | | | | |
| 30 | | SEMI-ANNUAL REPORT | | APRIL 30, 2016 | | |
| | |
| Notes to Financial Statements (continued) | | |
in its entirety. The significant unobservable inputs used by the Global Valuation Committee in determining the price for Fair Valued Investments are typically categorized as Level 3. The fair value hierarchy for each Fund’s investments has been included in the Schedules of Investments.
Changes in valuation techniques may result in transfers into or out of an assigned level within the hierarchy. In accordance with Fund’s policy, transfers between different levels of the fair value hierarchy are deemed to have occurred as of the beginning of the reporting period. The categorization of a value determined for investments is based on the pricing transparency of the investments and is not necessarily an indication of the risks associated with investing in those securities.
4. Securities and Other Investments:
Participation Notes: Participation notes (“P-Notes”) are promissory notes issued by banks or broker-dealers that are designed to offer a return measured by the change in the value of the underlying security or basket of securities (the “underlying security”) while not holding the actual shares of the underlying security. These investments are typically used to gain exposure to securities traded in foreign markets that may be restricted due to country-specific regulations. When the P-Note matures, the issuer will pay or receive the difference between the value of the underlying security at the time of the purchase and the underlying security’s value at maturity of the P-Notes. Income received on P-Notes is recorded by a Fund as dividend income in the Statements of Operations. An investment in a P-Note involves additional risks beyond the risks normally associated with a direct investment in the underlying security. While the holder of a P-Note is entitled to receive from the bank or broker-dealer any dividends paid by the underlying security, the holder is not entitled to the same rights (e.g., voting rights) as a direct owner of the underlying security. P-Notes are considered general unsecured contractual obligations of the bank or broker-dealer. The holder of a P-Note must rely on the creditworthiness of the issuer for its investment returns on the P-Notes and has no rights against the issuer of the underlying security. A P-Note may be more volatile and less liquid than other investments held by a Fund since the P-Note generally is dependent on the liquidity in the local trading market for the underlying security.
Warrants: Warrants entitle a Fund to purchase a specified number of shares of common stock and are non-income producing. The purchase price and number of shares are subject to adjustment under certain conditions until the expiration date of the warrants, if any. If the price of the underlying stock does not rise above the strike price before the warrant expires, the warrant generally expires without any value and a Fund will lose any amount it paid for the warrant. Thus, investments in warrants may involve more risk than investments in common stock. Warrants may trade in the same markets as their underlying stock; however, the price of the warrant does not necessarily move with the price of the underlying stock.
Securities Lending: Certain Funds may lend their securities to approved borrowers, such as brokers, dealers and other financial institutions. The borrower pledges and maintains with the Funds collateral consisting of cash, an irrevocable letter of credit issued by a bank, or securities issued or guaranteed by the U.S. Government. The initial collateral received by each Fund is required to have a value of at least 102% of the current value of the loaned securities for securities traded on U.S. exchanges and a value of at least 105% for all other securities. The collateral is maintained thereafter at a value equal to at least 100% of the current market value of the securities on loan. The market value of the loaned securities is determined at the close of each business day of the Fund and any additional required collateral is delivered to the Fund, or excess collateral returned by the Fund, on the next business day. During the term of the loan, the Funds are entitled to all distributions made on or in respect of the loaned securities. Loans of securities are terminable at any time and the borrower, after notice, is required to return borrowed securities within the standard time period for settlement of securities transactions.
The market value of any securities on loan, all of which were classified as common stocks in the Funds’ Schedules of Investments, and the value of any related collateral are shown separately in the Statements of Assets and Liabilities as a component of investments at value-unaffiliated, and collateral on securities loaned at value, respectively. As of period end, any securities on loan were collateralized by cash. The cash collateral invested by the securities lending agent, BlackRock Investment Management, LLC (“BIM”), if any, is disclosed in the Schedules of Investments.
Securities lending transactions are entered into by the Funds under Master Securities Lending Agreements (each, an “MSLA”), which provide the right, in the event of default (including bankruptcy or insolvency), for the non-defaulting party to liquidate the collateral and calculate a net exposure to the defaulting party or request additional collateral. In the event that a borrower defaults, the Funds, as lender, would offset the market value of the collateral received against the market value of the securities loaned. When the value of the collateral is greater than that of the market value of the securities loaned, the lender is left with a net amount payable to the defaulting party. However, bankruptcy or insolvency laws of a particular jurisdiction may impose restrictions on or prohibitions against such a right of offset in the event of an MSLA counterparty’s bankruptcy or insolvency. Under the MSLA, absent an event of default the borrower can resell or re-pledge the loaned securities, and a Fund can reinvest cash collateral received in connection with loaned securities. Upon an event of default, the parties’ obligations to return the securities or collateral to the other party
| | | | | | |
| | | | | | | |
| | SEMI-ANNUAL REPORT | | APRIL 30, 2016 | | 31 |
| | | | |
| Notes to Financial Statements (continued) | | |
are extinguished, and the parties can resell or re-pledge the loaned securities or the collateral received in connection with the loaned securities in order to satisfy the defaulting party’s net payment obligation for all transactions under the MSLA. The defaulting party remains liable for any deficiency.
As of period end, the following table is a summary of the Funds’ securities lending agreements by counterparty which are subject to offset under an MSLA:
| | | | | | | | | | | | |
| Latin America | |
| Counterparty | | Securities
Loaned
at Value | | | Cash
Collateral
Received1 | | | Net
Amount | |
Credit Suisse Securities (USA) LLC | | $ | 1,047,351 | | | $ | (1,047,351 | ) | | | — | |
Goldman Sachs & Co. | | | 225,492 | | | | (225,492 | ) | | | — | |
| | | | | | | | | | | | |
Total | | $ | 1,272,843 | | | $ | (1,272,843 | ) | | | — | |
| | | | | | | | | | | | |
| | 1 | | Collateral with a value of $ 1,308,450 has been received in connection with securities lending agreements. Collateral received in excess of the value of securities loaned from the individual counterparty is not shown for financial reporting purposes in the table above. |
The risks of securities lending include the risk that the borrower may not provide additional collateral when required or may not return the securities when due. To mitigate these risks, the Funds benefit from a borrower default indemnity provided by BIM. BIM’s indemnity allows for full replacement of the securities loaned if the collateral received does not cover the value on the securities loaned in the event of borrower default. Each Fund could suffer a loss if the value of an investment purchased with cash collateral falls below the market value of loaned securities or if the value of an investment purchased with cash collateral falls below the value of the original cash collateral received.
5. Investment Advisory Agreement and Other Transactions with Affiliates:
The PNC Financial Services Group, Inc. is the largest stockholder and an affiliate of BlackRock, Inc. (“BlackRock”) for 1940 Act purposes.
Investment Advisory
Each Fund entered into an Investment Advisory Agreement with the Manager, the Funds’ investment advisor, an indirect, wholly owned subsidiary of BlackRock, to provide investment advisory and administration services. The Manager is responsible for the management of each Fund’s portfolio and provides the personnel, facilities, equipment and certain other services necessary to the operations of each Fund. For such services, each Fund pays the Manager a monthly fee, which is determined by calculating a percentage of each Fund’s average daily net assets based on the following annual rates:
| | | | |
| Average Daily Net Assets | | Investment Advisory Fee | |
First $1 Billion | | | 1.00% | |
$1 Billion — $3 Billion | | | 0.94% | |
$3 Billion — $5 Billion | | | 0.90% | |
$5 Billion — $10 Billion | | | 0.87% | |
Greater than $10 Billion | | | 0.85% | |
The Manager entered into separate sub-advisory agreements with BlackRock International Limited (“BIL”), an affiliate of the Manager. The Manager pays BIL, for services it provides, a monthly fee that is a percentage of the investment advisory fees paid by each Fund to the Manager.
Service and Distribution Fees
The Funds entered into a Distribution Agreement and Distribution Plans with BlackRock Investments, LLC (“BRIL”), an affiliate of the Manager. Pursuant to the Distribution Plan and in accordance with Rule 12b-1 under the 1940 Act, each Fund pays BRIL ongoing service and distribution fees. The fees are accrued daily and paid monthly at annual rates based upon the average daily net assets of the relevant share class of each Fund as follows:
| | | | | | | | |
| | | Service Fee | | | Distribution Fee | |
Investor A | | | 0.25% | | | | — | |
Investor B | | | 0.25% | | | | 0.75% | |
Investor C | | | 0.25% | | | | 0.75% | |
BRIL and broker-dealers, pursuant to sub-agreements with BRIL, provide shareholder servicing and distribution services to the Funds. The ongoing service and/or distribution fee compensates BRIL and each broker-dealer for providing shareholder servicing and/or distribution related services to the shareholders.
| | | | | | |
| | | | | | | |
| 32 | | SEMI-ANNUAL REPORT | | APRIL 30, 2016 | | |
| | |
| Notes to Financial Statements (continued) | | |
For the six months ended April 30, 2016, the following table shows the class specific service and distribution fees borne directly by each share class of each Fund:
| | | | | | | | | | | | | | | | |
| Service and Distribution Fees | | | | | | | | | | | | |
| | | Investor A | | | Investor B | | | Investor C | | | Total | |
Emerging Markets | | $ | 227,930 | | | | — | | | $ | 515,477 | | | $ | 743,407 | |
Latin America | | $ | 112,037 | | | $ | 3,237 | | | $ | 101,714 | | | $ | 216,988 | |
Transfer Agent
The Manager maintains a call center that is responsible for providing certain shareholder services to the Funds. Shareholder services include responding to inquiries and processing subscriptions and redemptions transactions based upon instructions from shareholders. For the six months ended April 30, 2016, each Fund reimbursed the Manager the following amounts for costs incurred in running the call center, which are included in transfer agent — class specific in the Statements of Operations:
| | | | | | | | | | | | | | | | | | | | |
| | | Institutional | | | Investor A | | | Investor B | | | Investor C | | | Total | |
Emerging Markets | | $ | 1,193 | | | $ | 4,815 | | | | — | | | $ | 1,714 | | | $ | 7,722 | |
Latin America | | $ | 498 | | | $ | 5,994 | | | $ | 152 | | | $ | 601 | | | $ | 7,245 | |
For the six months ended April 30, 2016, the following table shows the class specific transfer agent fees borne directly by each class of each Fund:
| | | | | | | | | | | | | | | | | | | | |
| | | Institutional | | | Investor A | | | Investor B | | | Investor C | | | Total | |
Emerging Markets | | $ | 60,158 | | | $ | 270,680 | | | | — | | | $ | 195,067 | | | $ | 525,905 | |
Latin America | | $ | 39,750 | | | $ | 108,791 | | | $ | 2,810 | | | $ | 42,673 | | | $ | 194,024 | |
Other Fees
For the six months ended April 30, 2016, affiliates earned underwriting discounts, direct commissions and dealer concessions on sales of the Fund’s Investor A Shares as follows:
| | | | | | | | |
| | | Emerging Markets | | | Latin America | |
Investor A | | $ | 10,894 | | | $ | 1,374 | |
For the six months ended April 30, 2016, affiliates received CDSCs as follows:
| | | | | | | | |
| | | Emerging Markets | | | Latin America | |
Investor A | | $ | 468 | | | | — | |
Investor C | | $ | 6,967 | | | $ | 1,046 | |
Expense Waivers and Reimbursements
The Manager voluntarily agreed to waive its investment advisory fees by the amount of investment advisory fees each Fund pays to the Manager indirectly through its investment in affiliated money market funds. These amounts are included in fees waived by the Manager in the Statements of Operations. However, the Manager does not waive its investment advisory fees by the amount of investment advisory fees paid in connection with each Fund’s investments in other affiliated investment companies, if any. For the six months ended April 30, 2016, the amounts waived were as follows:
| | | | | | | | |
| | | Emerging Markets | | | Latin America | |
Amounts waived | | $ | 3,476 | | | $ | 1,410 | |
For the six months ended April 30, 2016, the Funds reimbursed the Manager for certain accounting services, which is included in accounting services in the Statements of Operations. The reimbursements were as follows:
| | | | | | | | |
| | | Emerging Markets | | | Latin America | |
Amounts reimbursed | | $ | 3,568 | | | $ | 635 | |
| | | | | | |
| | | | | | | |
| | SEMI-ANNUAL REPORT | | APRIL 30, 2016 | | 33 |
| | | | |
| Notes to Financial Statements (continued) | | |
Securities Lending
The U.S. Securities and Exchange Commission has issued an exemptive order which permits BIM, an affiliate of the Manager, to serve as securities lending agent for the Funds, subject to applicable conditions. As securities lending agent, BIM bears all operational costs directly related to securities lending. The Funds are responsible for expenses in connection with the investment of cash collateral received for securities on loan (the “collateral investment expenses”). The cash collateral is invested in a private investment company managed by the Manager or its affiliates. However, BIM has agreed to cap the collateral investment expenses of the private investment company to an annual rate of 0.04%. The investment advisor to the private investment company will not charge any advisory fees with respect to shares purchased by the Funds.
Securities lending income is equal to the total of income earned from the reinvestment of cash collateral, net of fees and other payments to and from borrowers of securities, and less the collateral investment expenses. Each Fund retains a portion of securities lending income and remits a remaining portion to BIM as compensation for its services as securities lending agent. Pursuant to a securities lending agreement, BIM may lend securities only when the difference between the borrower rebate rate and the risk free rate exceeds a certain level (such securities, the “specials only securities”).
Pursuant to such agreement, each Fund retains 80% of securities lending income. In addition, commencing the business day following the date that the aggregate securities lending income earned across certain funds in the Equity-Liquidity Complex in a calendar year exceeds a specified threshold, each Fund, pursuant to the securities lending agreement, will retain for the remainder of the calendar year securities lending income in an amount equal to 85% of securities lending income.
The share of securities lending income earned by each Fund is shown as securities lending — affiliated — net in the Statements of Operations. For the six months ended April 30, 2016, each Fund paid BIM the following amounts for securities lending agent services:
| | | | | | | | |
| | | Emerging Markets | | | Latin America | |
Securities lending services | | $ | 1,965 | | | $ | 1,309 | |
Officers and Directors
Certain officers and/or directors of the Funds are officers and/or directors of BlackRock or its affiliates. The Funds reimburse the Manager for a portion of the compensation paid to the Funds’ Chief Compliance Officer, which is included in Officer and Directors in the Statements of Operations.
Other Transactions
The Funds may purchase securities from, or sell securities to, an affiliated fund provided the affiliation is due solely to having a common investment advisor, common officers, or common directors. For the six months ended April 30, 2016, the purchase and sale transactions with an affiliated fund in compliance with Rule 17a-7 under the 1940 Act were as follows:
| | | | | | | | |
| | | Purchases | | | Sales | |
Emerging Markets | | | — | | | $ | 185,133 | |
Latin America | | $ | 659,400 | | | | — | |
6. Purchases and Sales:
For the six months ended April 30, 2016, purchases and sales of investments excluding short-term securities and equity-linked notes, were as follows:
| | | | | | | | |
| | | Emerging Markets | | | Latin America | |
Purchases | | $ | 199,948,065 | | | $ | 41,880,246 | |
Sales | | $ | 225,697,318 | | | $ | 37,952,921 | |
7. Income Tax Information:
It is the Funds’ policy to comply with the requirements of the Internal Revenue Code of 1986, as amended, applicable to regulated investment companies, and to distribute substantially all of their taxable income to their shareholders. Therefore, no federal income tax provision is required.
Each Fund files U.S. federal and various state and local tax returns. No income tax returns are currently under examination. The statute of limitations on each Fund’s U.S. federal tax returns remains open for each of the four years ended October 31, 2015. The statutes of limitations on each Fund’s state and local tax returns may remain open for an additional year depending upon the jurisdiction.
| | | | | | |
| | | | | | | |
| 34 | | SEMI-ANNUAL REPORT | | APRIL 30, 2016 | | |
| | |
| Notes to Financial Statements (continued) | | |
Management has analyzed tax laws and regulations and their application to the Funds as of April 30, 2016, inclusive of the open tax return years, and does not believe there are any uncertain tax positions that require recognition of a tax liability in the Funds’ financial statements.
As of October 31, 2015, the Funds had capital loss carryforwards available to offset future realized capital gains through the indicated expiration dates as follows:
| | | | | | | | |
| Expires October 31, | | Emerging Markets | | | Latin America | |
No expiration date1 | | $ | 102,831,598 | | | $ | 26,611,231 | |
2017 | | | 11,598,286 | | | | 43,968,643 | |
| | | | | | | | |
Total | | $ | 114,429,884 | | | $ | 70,579,874 | |
| | | | | | | | |
| | 1 | | Must be utilized prior to losses subject to expiration. |
As of April 30, 2016, gross unrealized appreciation and depreciation based on cost for federal income tax purposes were as follows:
| | | | | | | | |
| | | Emerging Markets | | | Latin America | |
Tax cost | | $ | 403,051,824 | | | $ | 174,164,986 | |
| | | | |
Gross unrealized appreciation | | | 61,145,784 | | | | 37,854,982 | |
Gross unrealized depreciation | | | (28,002,174 | ) | | | (26,186,096 | ) |
| | | | |
Net unrealized appreciation | | $ | 33,143,610 | | | $ | 11,668,886 | |
| | | | |
8. Bank Borrowings:
The Funds, along with certain other funds managed by the Manager and its affiliates (“Participating Funds”), is a party to a 364-day, $2.1 billion credit agreement with a group of lenders. Under this agreement, the Funds may borrow to fund shareholder redemptions. Excluding commitments designated for certain individual funds, the Participating Funds, including the Funds, can borrow up to an aggregate commitment amount of $1.6 billion at any time outstanding, subject to asset coverage and other limitations as specified in the agreement. The credit agreement has the following terms: a fee of 0.12% per annum on unused commitment amounts and interest at a rate equal to the higher of (a) one-month LIBOR (but, in any event, not less than 0.00%) on the date the loan is made plus 0.80% per annum or (b) the Fed Funds rate (but, in any event, not less than 0.00%) in effect from time to time plus 0.80% per annum on amounts borrowed. The agreement expires in April 2017 unless extended or renewed. Prior to April 21, 2016, a fee per annum was 0.06% on unused commitment amounts and interest at a rate equal to the higher of (a) one-month LIBOR (but, in any event, not less than 0.00%) on the date the loan is made plus 0.80% per annum or (b) the Fed Funds rate (but, in any event, not less than 0.00%) in effect from time to time plus 0.80% per annum on amounts borrowed. Participating Funds paid administration, legal and arrangement fees, which, if applicable, are included in miscellaneous expenses in the Statements of Operations. These fees were allocated among such funds based upon portions of the aggregate commitment available to them and relative net assets of Participating Funds. During the six months ended April 30, 2016, the Funds did not borrow under the credit agreement.
9. Principal Risks:
In the normal course of business, certain Funds invest in securities and enter into transactions where risks exist due to fluctuations in the market (market risk) or failure of the issuer to meet all its obligations, including the ability to pay principal and interest when due (issuer credit risk). The value of securities held by the Funds may decline in response to certain events, including those directly involving the issuers of securities owned by the Funds. Investments in the securities of issuers domiciled in countries with emerging capital markets involve certain additional risks that do not generally apply to investments in securities of issuers in more developed capital markets, such as (i) low or nonexistent trading volume, resulting in a lack of liquidity and increased volatility in prices for such securities; (ii) uncertain national policies and social, political and economic instability, increasing the potential for expropriation of assets, confiscatory taxation, high rates of inflation or unfavorable diplomatic developments; and (iii) possible fluctuations in exchange rates, differing legal systems and the existence or possible imposition of exchange controls, custodial restrictions or other foreign or U.S. governmental laws or restrictions applicable to such investments. Changes arising from the general economy, the overall market and local, regional or global political and/or social instability, as well as currency, interest rate and price fluctuations, may also affect the securities’ value.
Counterparty Credit Risk: Similar to issuer credit risk, the Funds may be exposed to counterparty credit risk, or the risk that an entity may fail to or be unable to perform on its commitments related to unsettled or open transactions. The Funds manage counterparty credit risk by entering into transactions only with counterparties that the Manager believes have the financial resources to honor their obligations and by monitoring the financial stability of those counterparties. Financial assets, which potentially expose the Funds to market, issuer and counterparty credit risks, consist principally
| | | | | | |
| | | | | | | |
| | SEMI-ANNUAL REPORT | | APRIL 30, 2016 | | 35 |
| | | | |
| Notes to Financial Statements (continued) | | |
of financial instruments and receivables due from counterparties. The extent of the Funds’ exposure to market, issuer and counterparty credit risks with respect to these financial assets is approximately their value recorded in the Statements of Assets and Liabilities, less any collateral held by the Funds.
Concentration Risk: Certain Funds invest a substantial amount of their assets in issuers located in a single country or a limited number of countries. When the Funds concentrate their investments in this manner, they assume the risk that economic, political and social conditions in those countries may have a significant impact on their investment performance. Foreign issuers may not be subject to the same uniform accounting, auditing and financial reporting standards and practices as used in the United States. Foreign securities markets may also be less liquid, more volatile and less subject to governmental supervision not typically associated with investing in U.S. securities. Investment percentages in specific countries are presented in the Schedules of Investments.
As of period end, the Funds’ investments had the following industry classifications:
| | | | |
| Industry | | Percent of Net Assets | |
Bank | | | 23 | % |
Internet Software & Services | | | 9 | |
Semiconductors & Semiconductor Equipment | | | 7 | |
Oil, Gas & Consumable Fuels | | | 7 | |
Insurance | | | 5 | |
Other1 | | | 49 | |
| | | | |
| Industry | | Percent of Net Assets | |
Bank | | | 24 | % |
Beverages | | | 13 | |
Oil, Gas & Consumable Fuels | | | 7 | |
Metals & Mining | | | 7 | |
Construction Materials | | | 5 | |
Food & Staples Retailing | | | 5 | |
Other1 | | | 39 | |
| | 1 | | All other industries held was less than 5% of net assets. |
10. Capital Share Transactions:
Transactions in capital shares for each class were as follows:
| | | | | | | | | | | | | | | | | | |
| | | Six Months Ended
April 30, 2016 | | | | | Year Ended
October 31, 2015 | |
| Emerging Markets | | Shares | | | Amount | | | | | Shares | | | Amount | |
| Institutional | | | | | | | | | | | | | | | | | | |
Shares sold | | | 848,422 | | | $ | 12,744,373 | | | | | | 11,688,582 | | | $ | 220,323,424 | |
Shares issued in reinvestment of distributions | | | 120,690 | | | | 1,861,033 | | | | | | 144,097 | | | | 2,760,865 | |
Shares redeemed | | | (3,030,608 | ) | | | (47,730,466 | ) | | | | | (24,288,826 | ) | | | (428,109,488 | ) |
| | | | | | | | | | | | | | |
Net decrease | | | (2,061,496 | ) | | $ | (33,125,060 | ) | | | | | (12,456,147 | ) | | $ | (205,025,199 | ) |
| | | | | | | | | | |
| | | | | | | | | | | | | | | | | | |
| Investor A | | | | | | | | | | | | | | | | | | |
Shares sold | | | 1,824,055 | | | $ | 27,257,816 | | | | | | 3,447,061 | | | $ | 61,932,631 | |
Shares issued in reinvestment of distributions | | | 108,713 | | | | 1,619,830 | | | | | | 16,435 | | | | 304,346 | |
Shares redeemed | | | (1,687,900 | ) | | | (25,297,744 | ) | | | | | (2,996,802 | ) | | | (54,683,654 | ) |
| | | | | | | | | | | | | | |
Net increase | | | 244,868 | | | $ | 3,579,902 | | | | | | 466,694 | | | $ | 7,553,323 | |
| | | | | | | | | | |
| | | | | | | | | | | | | | | | | | |
| Investor B | | | | | | | | | | | | | | | | | | |
Shares sold | | | _ | | | | _ | | | | | | 855 | | | $ | 14,384 | |
Shares redeemed and automatic conversion of shares | | | _ | | | | _ | | | | | | (42,007 | ) | | | (706,053 | ) |
| | | | | | | | | | | | | | |
Net decrease | | | _ | | | | _ | | | | | | (41,152 | ) | | $ | (691,669 | ) |
| | | | | | | | | | |
| | | | | | |
| | | | | | | |
| 36 | | SEMI-ANNUAL REPORT | | APRIL 30, 2016 | | |
| | |
| Notes to Financial Statements (concluded) | | |
| | | | | | | | | | | | | | | | | | |
| | | Six Months Ended
April 30, 2016 | | | | | Year Ended
October 31, 2015 | |
| Emerging Markets (concluded) | | Shares | | | Amount | | | | | Shares | | | Amount | |
| Investor C | | | | | | | | | | | | | | | | | | |
Shares sold | | | 1,012,827 | | | $ | 12,626,687 | | | | | | 2,421,392 | | | $ | 36,931,920 | |
Shares issued in reinvestment of distributions | | | 21,912 | | | | 278,503 | | | | | | — | | | | — | |
Shares redeemed | | | (1,361,616 | ) | | | (17,236,916 | ) | | | | | (1,803,292 | ) | | | (27,923,296 | ) |
| | | | | | | | | | |
Net increase (decrease) | | | (326,877 | ) | | $ | (4,331,726 | ) | | | | | 618,100 | | | $ | 9,008,624 | |
| | | | | | | | | | |
Total Net Decrease | | | (2,143,505 | ) | | $ | (33,876,884 | ) | | | | | (11,412,505 | ) | | $ | (189,154,921 | ) |
| | | | | | | | | | |
| | | |
| | | Six Months Ended
April 30, 2016 | | | | | Year Ended
October 31, 2015 | |
| Latin America Fund | | Shares | | | Amount | | | | | Shares | | | Amount | |
| Institutional | | | | | | | | | | | | | | | | | | |
Shares sold | | | 383,073 | | | $ | 12,271,567 | | | | | | 550,715 | | | $ | 23,578,567 | |
Shares issued to shareholders in reinvestment of distributions | | | 9,396 | | | | 309,433 | | | | | | 32,763 | | | | 1,470,584 | |
Shares redeemed | | | (428,387 | ) | | | (13,752,685 | ) | | | | | (907,295 | ) | | | (39,274,640 | ) |
| | | | | | | | | | |
Net decrease | | | (35,918 | ) | | $ | (1,171,685 | ) | | | | | (323,817 | ) | | $ | (14,225,489 | ) |
| | | | | | | | | | |
| | | | | | | | | | | | | | | | | | |
| Investor A | | | | | | | | | | | | | | | | | | |
Shares sold and automatic conversion of shares | | | 494,865 | | | $ | 17,365,857 | | | | | | 309,560 | | | $ | 13,091,135 | |
Shares issued to shareholders in reinvestment of distributions | | | 9,973 | | | | 324,519 | | | | | | 63,004 | | | | 2,792,237 | |
Shares redeemed | | | (395,479 | ) | | | (13,017,467 | ) | | | | | (1,008,316 | ) | | | (43,501,756 | ) |
| | | | | | | | | | |
Net increase (decrease) | | | 109,359 | | | $ | 4,672,909 | | | | | | (635,752 | ) | | $ | (27,618,384 | ) |
| | | | | | | | | | |
| | | | | | | | | | | | | | | | | | |
| Investor B | | | | | | | | | | | | | | | | | | |
Shares sold | | | — | | | | — | | | | | | 2 | | | $ | 129 | |
Shares issued to shareholders in reinvestment of distributions | | | — | | | | — | | | | | | 322 | | | | 13,492 | |
Shares redeemed and automatic conversion of shares | | | (12,735 | ) | | $ | (391,170 | ) | | | | | (28,207 | ) | | | (1,124,722 | ) |
| | | | | | | | | | |
Net decrease | | | (12,735 | ) | | $ | (391,170 | ) | | | | | (27,883 | ) | | $ | (1,111,101 | ) |
| | | | | | | | | | |
| | | | | | | | | | | | | | | | | | |
| Investor C | | | | | | | | | | | | | | | | | | |
Shares sold | | | 41,597 | | | $ | 1,240,483 | | | | | | 52,311 | | | $ | 2,058,716 | |
Shares issued to shareholders in reinvestment of distributions | | | — | | | | — | | | | | | 10,994 | | | | 447,651 | |
Shares redeemed | | | (120,403 | ) | | | (3,571,248 | ) | | | | | (361,650 | ) | | | (14,206,948 | ) |
| | | | | | | | | | |
Net decrease | | | (78,806 | ) | | $ | (2,330,765 | ) | | | | | (298,345 | ) | | $ | (11,700,581 | ) |
| | | | | | | | | | |
Total Net Increase (Decrease) | | | (18,100 | ) | | $ | 779,289 | | | | | | (1,285,797 | ) | | $ | (54,655,555 | ) |
| | | | | | | | | | |
11. Subsequent Events:
Management has evaluated the impact of all subsequent events on the Funds through the date the financial statements were issued and has determined that there were no subsequent events requiring adjustment or additional disclosure in the financial statements.
| | | | | | |
| | | | | | | |
| | SEMI-ANNUAL REPORT | | APRIL 30, 2016 | | 37 |
Rodney D. Johnson, Chair of the Board and Director
David O. Beim, Director
Susan J. Carter, Director
Collette Chilton, Director
Neil A. Cotty, Director
Barbara G. Novick, Director
Dr. Matina S. Horner, Director
Cynthia A. Montgomery, Director
Joseph P. Platt, Director
Robert C. Robb, Jr., Director
Mark Stalnecker, Director
Kenneth L. Urish, Director
Claire A. Walton, Director
Frederick W. Winter, Director
John M. Perlowski, Director, President and Chief Executive Officer
Jennifer McGovern, Vice President
Neil J. Andrews, Chief Financial Officer
Jay M. Fife, Treasurer
Charles Park, Chief Compliance Officer
Fernanda Piedra, Anti-Money Laundering Compliance Officer
Benjamin Archibald, Secretary
Effective December 31, 2015, Herbert I. London and Toby Rosenblatt retired as Directors of the Funds.
Effective February 5, 2016, Frank J. Fabozzi resigned as a Director of the Fund.
Effective February 8, 2016, Susan J. Carter, Neil A. Cotty and Claire A. Walton were appointed to serve as Directors of the Funds.
| | | | | | | | |
| | | | | |
Investment Advisor BlackRock Advisors, LLC Wilmington, DE 19809 | | Sub-Advisor BlackRock International Limited Edinburgh, EH3 8BL United Kingdom | | Custodian Brown Brothers Harriman & Co. Boston, MA 02109 | | Transfer Agent BNY Mellon Investment
Servicing (US) Inc. Wilmington, DE 19809 | | Address of the Funds 100 Bellevue Parkway Wilmington, DE 19809 |
| | | | |
Distributor BlackRock Investments, LLC New York, NY 10022 | | Independent Registered
Public Accounting Firm Deloitte & Touche LLP Boston, MA 02116 | | Legal Counsel Sidley Austin LLP New York, NY 10019 | | Accounting Agent State Street Bank and
Trust Company Boston, MA 02110 | | |
| | | | | | |
| | | | | | | |
| 38 | | SEMI-ANNUAL REPORT | | APRIL 30, 2016 | | |
A Special Meeting of Shareholders was held on February 8, 2016 for shareholders of record on December 11, 2015, to elect a Board of Directors of each Fund.
Approved the Directors as follows:
| | | | | | | | | | | | | | | | | | | | | | | | |
| | | David O. Beim | | | Susan J. Carter | | | Collette Chilton | |
| | | Votes For | | | Votes
Withheld | | | Votes For | | | Votes
Withheld | | | Votes For | | | Votes
Withheld | |
BlackRock Emerging Markets Fund | | | 27,037,213 | | | | 1,101,189 | | | | 27,160,152 | | | | 978,250 | | | | 27,182,961 | | | | 955,441 | |
BlackRock Latin America Fund | | | 4,115,827 | | | | 206,407 | | | | 4,126,019 | | | | 196,215 | | | | 4,134,535 | | | | 187,698 | |
| | | Neil A. Cotty | | | Matina S. Horner | | | Rodney D. Johnson | |
| | | Votes For | | | Votes
Withheld | | | Votes For | | | Votes
Withheld | | | Votes For | | | Votes
Withheld | |
BlackRock Emerging Markets Fund | | | 27,130,315 | | | | 1,008,087 | | | | 27,073,487 | | | | 1,064,915 | | | | 27,137,349 | | | | 1,001,053 | |
BlackRock Latin America Fund | | | 4,121,050 | | | | 201,183 | | | | 4,121,836 | | | | 200,398 | | | | 4,120,461 | | | | 201,773 | |
| | | Cynthia A. Montgomery | | | Joseph P. Platt | | | Robert C. Robb, Jr. | |
| | | Votes For | | | Votes
Withheld | | | Votes For | | | Votes
Withheld | | | Votes For | | | Votes
Withheld | |
BlackRock Emerging Markets Fund | | | 27,173,839 | | | | 964,563 | | | | 27,120,879 | | | | 1,017,523 | | | | 27,127,315 | | | | 1,011,087 | |
BlackRock Latin America Fund | | | 4,129,438 | | | | 192,796 | | | | 4,123,928 | | | | 198,306 | | | | 4,126,731 | | | | 195,503 | |
| | | Mark Stalnecker | | | Kenneth L. Urish | | | Claire A. Walton | |
| | | Votes For | | | Votes
Withheld | | | Votes For | | | Votes
Withheld | | | Votes For | | | Votes
Withheld | |
BlackRock Emerging Markets Fund | | | 27,119,737 | | | | 1,018,665 | | | | 27,098,888 | | | | 1,039,514 | | | | 27,160,152 | | | | 978,250 | |
BlackRock Latin America Fund | | | 4,130,106 | | | | 192,128 | | | | 4,129,222 | | | | 193,012 | | | | 4,120,028 | | | | 202,205 | |
| | | Frederick W. Winter | | | Barbara G. Novick | | | John M. Perlowski | |
| | | Votes For | | | Votes
Withheld | | | Votes For | | | Votes
Withheld | | | Votes For | | | Votes
Withheld | |
BlackRock Emerging Markets Fund | | | 27,120,107 | | | | 1,018,295 | | | | 27,158,229 | | | | 980,173 | | | | 27,125,900 | | | | 1,012,502 | |
BlackRock Latin America Fund | | | 4,122,133 | | | | 200,101 | | | | 4,129,725 | | | | 192,509 | | | | 4,132,536 | | | | 189,697 | |
| | | | | | |
| | | | | | | |
| | SEMI-ANNUAL REPORT | | APRIL 30, 2016 | | 39 |
| | |
| Additional Information (continued) | | |
Householding
The Funds will mail only one copy of shareholder documents, including prospectuses, annual and semi-annual reports and proxy statements, to shareholders with multiple accounts at the same address. This practice is commonly called “householding” and is intended to reduce expenses and eliminate duplicate mailings of shareholder documents. Mailings of your shareholder documents may be householded indefinitely unless you instruct us otherwise. If you do not want the mailing of these documents to be combined with those for other members of your household, please call the Funds at (800) 441-7762.
Availability of Quarterly Schedule of Investments
The Funds file their complete schedule of portfolio holdings with the SEC for the first and third quarters of each fiscal year on Form N-Q. The Funds’ Forms N-Q are available on the SEC’s website at http://www.sec.gov and may also be reviewed and copied at the SEC’s Public Reference Room in Washington, D.C. Information on how to access documents on the SEC’s website without charge may be obtained by calling (800) SEC-0330. The Funds’ Forms N-Q may also be obtained upon request and without charge by calling (800) 441-7762.
Availability of Proxy Voting Policies and Procedures
A description of the policies and procedures that the Funds use to determine how to vote proxies relating to portfolio securities is available upon request and without charge (1) by calling (800) 441-7762; (2) at http://www.blackrock.com; and (3) on the SEC’s website at http://www.sec.gov.
Availability of Proxy Voting Record
Information about how the Funds voted proxies relating to securities held in the Funds’ portfolios during the most recent 12-month period ended June 30 is available upon request and without charge (1) at http://www.blackrock.com; or by calling (800) 441-7762 and (2) on the SEC’s website at http://www.sec.gov.
BlackRock’s Mutual Fund Family
BlackRock offers a diverse lineup of open-end mutual funds crossing all investment styles and managed by experts in equity, fixed income and tax-exempt investing. Visit http://www.blackrock.com for more information.
Account Information
Call us at (800) 441-7762 from 8:00 AM to 6:00 PM EST on any business day to get information about your account balances, recent transactions and share prices. You can also reach us on the Web at http://www.blackrock.com/funds.
Automatic Investment Plans
Investor Class shareholders who want to invest regularly can arrange to have $50 or more automatically deducted from their checking or savings account and invested in any of the BlackRock funds.
Systematic Withdrawal Plans
Investor Class shareholders can establish a systematic withdrawal plan and receive periodic payments of $50 or more from their BlackRock funds, as long as their account balance is at least $10,000.
Retirement Plans
Shareholders may make investments in conjunction with Traditional, Rollover, Roth, Coverdell, Simple IRAs, SEP IRAs and 403(b) Plans.
| | | | | | |
| | | | | | | |
| 40 | | SEMI-ANNUAL REPORT | | APRIL 30, 2016 | | |
| | | | |
| Additional Information (concluded) | | |
|
| BlackRock Privacy Principles |
BlackRock is committed to maintaining the privacy of its current and former fund investors and individual clients (collectively, “Clients”) and to safeguarding their non-public personal information. The following information is provided to help you understand what personal information BlackRock collects, how we protect that information and why in certain cases we share such information with select parties.
If you are located in a jurisdiction where specific laws, rules or regulations require BlackRock to provide you with additional or different privacy-related rights beyond what is set forth below, then BlackRock will comply with those specific laws, rules or regulations.
BlackRock obtains or verifies personal non-public information from and about you from different sources, including the following: (i) information we receive from you or, if applicable, your financial intermediary, on applications, forms or other documents; (ii) information about your transactions with us, our affiliates, or others; (iii) information we receive from a consumer reporting agency; and (iv) from visits to our websites.
BlackRock does not sell or disclose to non-affiliated third parties any non-public personal information about its Clients, except as permitted by law or as is necessary to respond to regulatory requests or to service Client accounts. These non-affiliated third parties are required to protect the confidentiality and security of this information and to use it only for its intended purpose.
We may share information with our affiliates to service your account or to provide you with information about other BlackRock products or services that may be of interest to you. In addition, BlackRock restricts access to non-public personal information about its Clients to those BlackRock employees with a legitimate business need for the information. BlackRock maintains physical, electronic and procedural safeguards that are designed to protect the non-public personal information of its Clients, including procedures relating to the proper storage and disposal of such information.
| | | | | | |
| | | | | | | |
| | SEMI-ANNUAL REPORT | | APRIL 30, 2016 | | 41 |
This report is intended for current holders. It is not authorized for use as an offer of sale or a solicitation of an offer to buy shares of the Funds unless preceded or accompanied by the Funds’ current prospectus. Past performance results shown in this report should not be considered a representation of future performance. Investment returns and principal value of shares will fluctuate so that shares, when redeemed, may be worth more or less than their original cost. Statements and other information herein are as dated and are subject to change.

| | |
| EMLA-4/16-SAR | | |
| |
| |  |
| Item 2 – | Code of Ethics – Not Applicable to this semi-annual report |
| Item 3 – | Audit Committee Financial Expert – Not Applicable to this semi-annual report |
| Item 4 – | Principal Accountant Fees and Services – Not Applicable to this semi-annual report |
| Item 5 – | Audit Committee of Listed Registrants – Not Applicable |
(a) The registrant’s Schedule of Investments is included as part of the Report to Stockholders filed under Item 1 of this Form.
(b) Not Applicable due to no such divestments during the semi-annual period covered since the previous Form N-CSR filing.
| Item 7 – | Disclosure of Proxy Voting Policies and Procedures for Closed-End Management Investment Companies – Not Applicable |
| Item 8 – | Portfolio Managers of Closed-End Management Investment Companies – Not Applicable |
| Item 9 – | Purchases of Equity Securities by Closed-End Management Investment Company and Affiliated Purchasers – Not Applicable |
| Item 10 – | Submission of Matters to a Vote of Security Holders –There have been no material changes to these procedures. |
| Item 11 – | Controls and Procedures |
(a) – The registrant’s principal executive and principal financial officers, or persons performing similar functions, have concluded that the registrant’s disclosure controls and procedures (as defined in Rule 30a-3(c) under the Investment Company Act of 1940, as amended (the “1940 Act”)) are effective as of a date within 90 days of the filing of this report based on the evaluation of these controls and procedures required by
Rule 30a-3(b) under the 1940 Act and Rule 15d-15(b) under the Securities Exchange Act of 1934, as amended.
(b) – There were no changes in the registrant’s internal control over financial reporting (as defined in
Rule 30a-3(d) under the 1940 Act) that occurred during the second fiscal quarter of the period covered by this report that have materially affected, or are reasonably likely to materially affect, the registrant’s internal control over financial reporting.
| Item 12 – | Exhibits attached hereto |
(a)(1) – Code of Ethics – Not Applicable to this semi-annual report
(a)(2) – Certifications – Attached hereto
(a)(3) – Not Applicable
(b) – Certifications – Attached hereto
2
Pursuant to the requirements of the Securities Exchange Act of 1934 and the Investment Company Act of 1940, the registrant has duly caused this report to be signed on its behalf by the undersigned, thereunto duly authorized.
BlackRock Emerging Markets Fund, Inc.
| | | | | | |
| By: | | /s/ John M. Perlowski | | | | |
| | John M. Perlowski | | | | |
| | Chief Executive Officer (principal executive officer) of | | |
| | BlackRock Emerging Markets Fund, Inc. | | |
Date: July 1, 2016
Pursuant to the requirements of the Securities Exchange Act of 1934 and the Investment Company Act of 1940, this report has been signed below by the following persons on behalf of the registrant and in the capacities and on the dates indicated.
| | | | | | |
| By: | | /s/ John M. Perlowski | | | | |
| | John M. Perlowski | | | | |
| | Chief Executive Officer (principal executive officer) of | | |
| | BlackRock Emerging Markets Fund, Inc. | | |
Date: July 1, 2016
| | | | | | |
| By: | | /s/ Neal J. Andrews | | | | |
| | Neal J. Andrews | | | | |
| | Chief Financial Officer (principal financial officer) of | | |
| | BlackRock Emerging Markets Fund, Inc. | | |
Date: July 1, 2016
3