UNITED STATES
SECURITIES AND EXCHANGE COMMISSION
Washington, D.C. 20549
FORM N-CSR
CERTIFIED SHAREHOLDER REPORT OF REGISTERED MANAGEMENT INVESTMENT
COMPANIES
Investment Company Act file number 811-05723
Name of Fund: BlackRock Emerging Markets Fund, Inc.
Fund Address: 100 Bellevue Parkway, Wilmington, DE 19809
Name and address of agent for service: John M. Perlowski, Chief Executive Officer, BlackRock Emerging Markets Fund, Inc.,
55 East 52nd Street, New York, NY 10055
Registrant’s telephone number, including area code: (800) 441-7762
Date of fiscal year end: 10/31/2013
Date of reporting period: 04/30/2013
Item 1 – Report to Stockholders
APRIL 30, 2013
| | | | | | |
SEMI-ANNUAL REPORT (UNAUDITED) | | | | | |  |
BlackRock Emerging Markets Fund, Inc.
BlackRock Latin America Fund, Inc.
|
| Not FDIC Insured • May Lose Value • No Bank Guarantee |
| | | | | | |
| | | | | | | |
| 2 | | SEMI-ANNUAL REPORT | | APRIL 30, 2013 | | |
About this time one year ago, financial market activity was dominated by concerns about Europe’s debt crisis. Investors were also discouraged by gloomy economic reports from various parts of the world, particularly in China. As the outlook for the global economy worsened, however, investors grew increasingly optimistic that the world’s largest central banks would intervene to stimulate growth. This theme, along with the European Central Bank’s (“ECB’s”) firm commitment to preserve the euro currency bloc, drove most asset classes higher through the summer of 2012. In early September, the ECB announced its sovereign bond-buying program designed to support the region’s debt-laden countries. Days later, the US Federal Reserve announced its own much-anticipated stimulus package.
Although financial markets world-wide were buoyed by these aggressive policy actions, risk assets weakened in the fall of 2012. Global trade slowed as many European countries fell into recession and growth continued to decelerate in China. In the United States, stocks slid on lackluster corporate earnings and volatility rose in advance of the US Presidential election. In the post-election environment, investors became more concerned about the “fiscal cliff,” the automatic tax increases and spending cuts that had been scheduled to take effect at the beginning of 2013. High levels of global market volatility persisted through year-end due to fears that bipartisan gridlock would preclude a timely resolution, putting the US economy at high risk for recession. Ultimately, the worst of the fiscal cliff was averted with a last-minute tax deal, although decisions relating to spending cuts and the debt ceiling were postponed, leaving lingering uncertainty.
Investors shook off the nerve-wracking finale to 2012 and the New Year began with a powerful relief rally. Money that had been pulled to the sidelines amid year-end tax-rate uncertainty poured back into the markets in January. Key indicators signaling modest but broad-based improvements in the world’s major economies underpinned the rally. Underlying this aura of comfort was the absence of negative headlines out of Europe. Against this backdrop, global equities surged through January while rising US Treasury yields pressured high quality fixed income assets (as prices move in the opposite direction of yields).
However, bond markets regained strength in February (as yields once again dropped) when global economic momentum slowed and investors toned down their risk appetite. International stock markets weakened amid a resurgence of macro risk out of Europe. A stalemate presidential election in Italy was a reminder that political instability continued to plague the eurozone and a severe banking crisis in Cyprus underscored the fragility of the broader European banking system. In the United States, stocks continued to rise, but at a more moderate pace. Investors grew more cautious given uncertainty as to how long the central bank would continue its stimulus programs. How government spending cuts would impact the already slow economic recovery was another concern. But improving labor market data and rising home prices boosted sentiment in March, pushing major US stock indices to all-time highs. Investors scaled back their enthusiasm in April due to a series of disappointing economic reports. On the whole, US stocks have performed well thus far in 2013 as the US economy demonstrated enough resilience to allay fears of recession, but growth has remained slow enough to dissuade the US Federal Reserve from changing its stance.
Despite continued headwinds for global growth, risk assets have rallied, driven largely by investors seeking meaningful yields in the ongoing low-interest-rate environment. For the 6- and 12-month periods ended April 30, 2013, US and international stocks and high yield bonds posted strong gains. Emerging market equities lagged the rally as the uneven pace of global growth raised doubts that developing economies could thrive in the near term. US Treasury yields were highly volatile over the past 12 months, although they continue to remain low from a historical perspective. US Treasury and investment-grade bonds generated modest returns in this environment, while tax-exempt municipal bonds benefited from favorable supply-and-demand dynamics. Near-zero short term interest rates continued to keep yields on money market securities near their all-time lows.
Market conditions have improved over the past couple of years, but investors still remain highly uncertain and many of the old ways of investing no longer work. That’s why the new world of investing calls for a new approach. One that seeks out more opportunities in more places across a broader array of investments in a portfolio designed to move freely as the markets move up and down. Visit www.blackrockplan.com to learn more about how to take action.
Sincerely,

Rob Kapito
President, BlackRock Advisors, LLC

“Despite continued headwinds for global growth, risk assets have rallied, driven largely by investors seeking meaningful yields in the ongoing low-interest-rate environment.”
Rob Kapito
President, BlackRock Advisors, LLC
| | | | | | | | |
| Total Returns as of April 30, 2013 | |
| | | 6-month | | | 12-month | |
US large cap equities
(S&P 500® Index) | | | 14.42 | % | | | 16.89 | % |
US small cap equities
(Russell 2000® Index) | | | 16.58 | | | | 17.69 | |
International equities
(MSCI Europe, Australasia, Far East Index) | | | 16.90 | | | | 19.39 | |
Emerging market equities (MSCI Emerging Markets Index) | | | 5.29 | | | | 3.97 | |
3-month Treasury bill
(BofA Merrill Lynch
3-Month US Treasury Bill Index) | | | 0.06 | | | | 0.12 | |
US Treasury securities
(BofA Merrill Lynch
10-Year US Treasury Index) | | | 1.52 | | | | 5.07 | |
US investment grade
bonds (Barclays US Aggregate Bond Index) | | | 0.90 | | | | 3.68 | |
Tax-exempt municipal
bonds (S&P Municipal Bond Index) | | | 2.01 | | | | 5.74 | |
US high yield bonds
(Barclays US Corporate High Yield 2% Issuer Capped Index) | | | 7.26 | | | | 13.95 | |
| Past performance is no guarantee of future results. Index performance is shown for illustrative purposes only. You cannot invest directly in an index. | |
| | | | | | |
| | | | | | | |
| | THIS PAGE NOT PART OF YOUR FUND REPORT | | | | 3 |
| | |
| Fund Summary as of April 30, 2013 | | BlackRock Emerging Markets Fund, Inc. |
BlackRock Emerging Markets Fund, Inc.’s (the “Fund”) investment objective is to seek long-term capital appreciation by investing in securities, principally equity securities, of issuers in countries having smaller capital markets.
| | |
| Portfolio Management Commentary | | |
How did the Fund perform?
| Ÿ | | For the six-month period ended April 30, 2013, the Fund outperformed its benchmark, the MSCI Emerging Markets Index. |
What factors influenced performance?
| Ÿ | | Stock selection drove the Fund’s outperformance relative to the benchmark index. The Fund’s position in Macau casino operator Sands China Ltd. was the largest individual contributor to performance during the period. Other holdings that delivered exceptional returns included Taiwanese information technology (“IT”) company Hermes Microvision, Inc. and Panamanian airline operator Copa Holdings SA. |
| Ÿ | | Conversely, holdings that detracted from relative performance included Chinese mining company Jiangxi Copper Co. Ltd. and two Korean stocks, car manufacturer Kia Motors Corp. and pharmaceutical firm Celltrion, Inc., which were both sold during the period. |
Describe recent portfolio activity.
| Ÿ | | During the six-month period, the Fund increased its overweight relative to the benchmark index in Brazilian equities. Within Brazil, the Fund increased exposure to its bank holding Itau Unibanco Holdings SA and added a new position in insurer BB Seguridade. Also during the period, the Fund reduced its holdings of exporters in South Korea due to exchange rate movements in the Korean won versus the Japanese yen. |
Describe portfolio positioning at period end.
| Ÿ | | Relative to the MSCI Emerging Markets Index, the Fund ended the period with an overweight to the IT sector, with a focus on select IT companies with strong competitive positions. The Fund was also overweight in consumer staples and consumer discretionary stocks, particularly those with significant market share and attractive valuations. The Fund held an underweight to the energy sector given the impact of increasing supply from new sources, such as US shale development. The Fund also maintained sector underweights in telecommunication services and materials. |
| Ÿ | | From a geographic perspective, the Fund was overweight in Brazil, which appears to be benefiting from increased infrastructure expenditure as the nation prepares to host the World Cup tournaments in 2014 and the Olympics in 2016. Indonesia was another country overweight given strong growth in domestic consumption and infrastructure investment. The Fund also continued to maintain an overweight to Thailand. The most significant country underweights included South Africa, where social unrest continues to be a headwind and economic activity has been slowing, and South Korea, where management has found more attractive domestic opportunities elsewhere. The Fund also remained underweight in Taiwan given concerns about weakening demand for the nation’s exports. |
| Ÿ | | As of period end, emerging market equities broadly were trading at a discount to their historical valuations and were also priced attractively relative to global developed markets. Emerging markets offer a range of attractive opportunities in companies with potential for strong earnings growth at relatively low prices. |
The views expressed reflect the opinions of BlackRock as of the date of this report and are subject to change based on changes in market, economic or other conditions. These views are not intended to be a forecast of future events and are no guarantee of future results.
| | |
| Ten Largest Holdings | | Percent of
Long-Term Investments |
| | | | |
Samsung Electronics Co. Ltd | | | 6 | % |
Taiwan Semiconductor Manufacturing Co. Ltd. — ADR | | | 4 | |
Itau Unibanco Holdings SA — ADR | | | 4 | |
Bank of China Ltd., Class H | | | 3 | |
Sberbank — ADR | | | 2 | |
Vale SA | | | 2 | |
AIA Group Ltd | | | 2 | |
Kasikornbank Public Co. Ltd. — NVDR | | | 2 | |
Cia de Concessoes Rodoviarias | | | 2 | |
Turkiye Garanti Bankasi AS | | | 2 | |
| | |
| Geographic Allocation | | Percent of
Long-Term Investments |
| | | | |
Brazil | | | 19 | % |
China | | | 12 | |
South Korea | | | 8 | |
Taiwan | | | 8 | |
Hong Kong | | | 8 | |
India | | | 7 | |
Russia | | | 6 | |
Mexico | | | 5 | |
Indonesia | | | 5 | |
Thailand | | | 4 | |
South Africa | | | 3 | |
United States | | | 2 | |
Turkey | | | 2 | |
Other1 | | | 11 | |
| | 1 | | Other includes a 1% holding or less in each of the following countries: Chile, Colombia, Hungary, Ireland, Italy, Malaysia, Netherlands, Panama, Peru, Philippines and Switzerland. |
| | | | | | |
| | | | | | | |
| 4 | | SEMI-ANNUAL REPORT | | APRIL 30, 2013 | | |
| | |
| | | BlackRock Emerging Markets Fund, Inc. |
| | |
| Total Return Based on a $10,000 Investment | | |
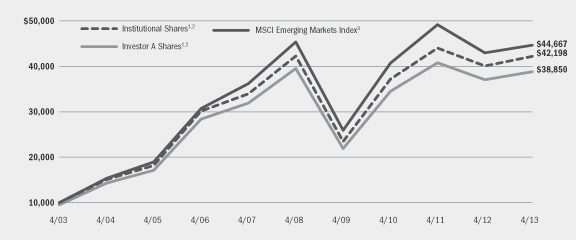
| | 1 | | Assuming maximum sales charges, if any, transaction costs and other operating expenses, including investment advisory fees. Institutional Shares do not have a sales charge. |
| | 2 | | The Fund invests in equity securities of issuers located in countries with developing capital markets. |
| | 3 | | This free float-adjusted market capitalization weighted index is designed to measure equity market performance of emerging markets. |
|
| Performance Summary for the Period Ended April 30, 2013 |
| | | | | | | | | | | | | | | | | | | | | | | | | | | | |
| | | | | | Average Annual Total Returns4 | |
| | | | | | 1 Year | | | 5 Years | | | 10 Years | |
| | | 6-Month
Total Returns | | | w/o sales
charge | | | w/sales
charge | | | w/o sales
charge | | | w/sales
charge | | | w/o sales
charge | | | w/sales
charge | |
Institutional | | | 7.46 | % | | | 5.22 | % | | | N/A | | | | (0.02 | )% | | | N/A | | | | 15.49 | % | | | N/A | |
Investor A | | | 7.25 | | | | 4.88 | | | | (0.62 | )% | | | (0.34 | ) | | | (1.41 | )% | | | 15.15 | | | | 14.54 | % |
Investor B | | | 6.67 | | | | 3.71 | | | | (0.79 | ) | | | (1.24 | ) | | | (1.58 | ) | | | 14.42 | | | | 14.42 | |
Investor C | | | 6.84 | | | | 3.92 | | | | 2.92 | | | | (1.17 | ) | | | (1.17 | ) | | | 14.22 | | | | 14.22 | |
MSCI Emerging Markets Index | | | 5.29 | | | | 3.97 | | | | N/A | | | | (0.33 | ) | | | N/A | | | | 16.14 | | | | N/A | |
| | 4 | | Assuming maximum sales charges, if any. Average annual total returns with and without sales charges reflect reductions for distribution and service fees. See “About Fund Performance” on page 8 for a detailed description of share classes, including any related sales charges and fees. |
| | | | N/A — Not applicable as share class and index do not have a sales charge. |
| | | | Past performance is not indicative of future results. |
| | | | | | | | | | | | | | | | | | | | | | | | | | | | |
| | | Actual | | | Hypothetical6 | | | | |
| | | Beginning
Account Value
November 1, 2012 | | | Ending
Account Value
April 30, 2013 | | | Expenses Paid
During the Period5 | | | Beginning
Account Value
November 1, 2012 | | | Ending
Account Value
April 30, 2013 | | | Expenses Paid
During the Period5 | | | Annualized
Expense Ratio | |
Institutional | | $ | 1,000.00 | | | $ | 1,074.60 | | | $ | 6.53 | | | $ | 1,000.00 | | | $ | 1,018.50 | | | $ | 6.36 | | | | 1.27 | % |
Investor A | | $ | 1,000.00 | | | $ | 1,072.50 | | | $ | 8.17 | | | $ | 1,000.00 | | | $ | 1,016.91 | | | $ | 7.95 | | | | 1.59 | % |
Investor B | | $ | 1,000.00 | | | $ | 1,066.70 | | | $ | 13.63 | | | $ | 1,000.00 | | | $ | 1,011.60 | | | $ | 13.27 | | | | 2.66 | % |
Investor C | | $ | 1,000.00 | | | $ | 1,068.40 | | | $ | 12.56 | | | $ | 1,000.00 | | | $ | 1,012.65 | | | $ | 12.23 | | | | 2.45 | % |
| | 5 | | For each class of the Fund, expenses are equal to the annualized expense ratio for the class, multiplied by the average account value over the period, multiplied by 181/365 (to reflect the one-half year period shown). |
| | 6 | | Hypothetical 5% annual return before expenses is calculated by pro rating the number of days in the most recent fiscal half year divided by 365. |
| | | | See “Disclosure of Expenses” on page 8 for further information on how expenses were calculated. |
| | | | | | |
| | | | | | | |
| | SEMI-ANNUAL REPORT | | APRIL 30, 2013 | | 5 |
| | |
| Fund Summary as of April 30, 2013 | | BlackRock Latin America Fund, Inc. |
BlackRock Latin America Fund Inc.’s (the “Fund”) investment objective is to seek long-term capital appreciation by investing primarily in Latin American equity and debt securities.
| | |
| Portfolio Management Commentary | | |
How did the Fund perform?
| Ÿ | | For the six-month period ended April 30, 2013, the Fund outperformed its benchmark, the MSCI Emerging Markets Latin America Index. |
What factors influenced performance?
| Ÿ | | Relative to the benchmark index, stock selection in Brazil contributed to the Fund’s outperformance, as did an underweight to Colombian stocks. In Peru, both stock selection and an underweight to the country had a positive impact on returns. The Fund’s overweight to Panama boosted results, as did an underweight to Chile, although selection within Chilean stocks was a detractor. |
| Ÿ | | Detracting from relative performance during the period was the Fund’s position in Canadian-listed Colombian oil company, Pacific Rubiales Energy Corp., which is not represented in the benchmark index. As mentioned above, stock selection in Chile had a negative impact, although this was more than offset by the benefits of maintaining underweight exposure to the country. |
Describe recent portfolio activity.
| Ÿ | | During the six-month period, the Fund increased exposure to Brazil, especially within industries that rely more on the local economy such as retailers, fuel distributors and education companies. The Fund also increased its iron ore exposure in Brazil by adding to its position in Vale SA. The Fund’s weighting in Mexico decreased during the period. Portfolio activity in Mexico included reducing exposure to banks and telecommunications, while adding exposure to real estate investment trusts (“REITs”). In addition, the Fund reduced exposure to utilities in both Chile and Brazil. |
Describe portfolio positioning at period end.
| Ÿ | | As of period end, the Fund continued to maintain its largest overweight in Brazil, with the most significant industry exposures in retailers, toll road operators, fuel distributors and iron ore. The Fund also maintained a preference for Brazilian banks versus banks in the rest of the region due to improving asset quality, reduced government pressure on credit spreads and the potential for a short-term pick up in corporate earnings resulting from the current monetary policy tightening cycle. The Fund continued to be underweight in Mexican equities given recent high valuations, although the reform agenda continues to elicit optimism. In Mexico, the Fund held a bias toward REITs, beverages and media names. The Fund continued to be underweight in countries in the Andean region given ongoing liquidity concerns and rich valuations. |
The views expressed reflect the opinions of BlackRock as of the date of this report and are subject to change based on changes in market, economic or other conditions. These views are not intended to be a forecast of future events and are no guarantee of future results.
| | |
| Ten Largest Holdings | | Percent of
Long-Term Investments |
| | | | |
Vale SA, Preference ‘A’ Shares — ADR | | | 7 | % |
Banco Bradesco SA — ADR | | | 6 | |
Fomento Economico Mexicano SAB de CV — ADR | | | 5 | |
Itau Unibanco Holdings SA Preference Shares — ADR | | | 5 | |
Cia de Concessoes Rodoviarias | | | 5 | |
Grupo Televisa SA — ADR | | | 4 | |
BRF — Brasil Foods SA — ADR | | | 4 | |
Petroleo Brasileiro SA | | | 3 | |
BM&F Bovespa SA | | | 3 | |
America Movil, SAB de CV | | | 3 | |
| | |
| Geographic Allocation | | Percent of
Long-Term Investments |
| | | | |
Brazil | | | 69 | % |
Mexico | | | 22 | |
Chile | | | 4 | |
Colombia | | | 2 | |
Panama | | | 2 | |
Peru | | | 1 | |
| | | | | | |
| | | | | | | |
| 6 | | SEMI-ANNUAL REPORT | | APRIL 30, 2013 | | |
| | |
| | | BlackRock Latin America Fund, Inc. |
| | |
| Total Return Based on a $10,000 Investment | | |
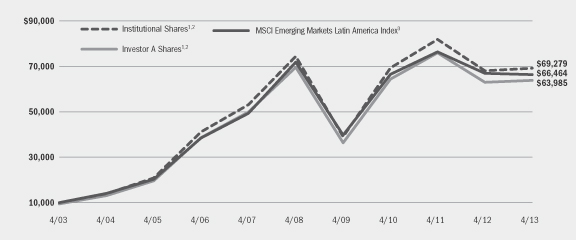
| | 1 | | Assuming maximum sales charge, if any, transaction costs and other operating expenses, including Investment advisory fees. Institutional Shares do not have a sales charge. |
| | 2 | | The Fund invests primarily in Latin American securities. |
| | 3 | | This free float-adjusted market capitalization weighted index is designed to measure the equity market performance of emerging markets in Latin America. |
|
| Performance Summary for the Period Ended April 30, 2013 |
| | | | | | | | | | | | | | | | | | | | | | | | | | | | |
| | | | | | Average Annual Total Returns4 | |
| | | | | | 1 Year | | | 5 Years | | | 10 Years | |
| | | 6-Month
Total Returns | | | w/o sales
charge | | | w/sales
charge | | | w/o sales
charge | | | w/sales
charge | | | w/o sales
charge | | | w/sales
charge | |
Institutional | | | 7.48 | % | | | 1.76 | % | | | N/A | | | | (1.43 | )% | | | N/A | | | | 21.36 | % | | | N/A | |
Investor A | | | 7.35 | | | | 1.54 | | | | (3.79 | )% | | | (1.69 | ) | | | (2.75 | )% | | | 21.05 | | | | 20.39 | % |
Investor B | | | 6.86 | | | | 0.59 | | | | (3.91 | ) | | | (2.57 | ) | | | (2.96 | ) | | | 20.25 | | | | 20.25 | |
Investor C | | | 6.91 | | | | 0.69 | | | | (0.31 | ) | | | (2.49 | ) | | | (2.49 | ) | | | 20.09 | | | | 20.09 | |
MSCI Emerging Markets Latin America Index | | | 5.31 | | | | (0.92 | ) | | | N/A | | | | (1.57 | ) | | | N/A | | | | 20.85 | | | | N/A | |
| | 4 | | Assuming maximum sales charges, if any. Average annual total returns with and without sales charges reflect reductions for distribution and service fees. See “About Fund Performance” on page 8 for a detailed description of share classes, including any related sales charges and fees. |
| | | | N/A — Not applicable as share class and index do not have a sales charge. |
| | | | Past performance is not indicative of future results. |
| | | | | | | | | | | | | | | | | | | | | | | | | | | | |
| | | Actual | | | Hypothetical6 | | | | |
| | | Beginning
Account Value
November 1, 2012 | | | Ending
Account Value
April 30, 2013 | | | Expenses Paid
During the Period5 | | | Beginning
Account Value
November 1, 2012 | | | Ending
Account Value
April 30, 2013 | | | Expenses Paid
During the Period5 | | | Annualized
Expense Ratio | |
Institutional | | $ | 1,000.00 | | | $ | 1,074.80 | | | $ | 6.74 | | | $ | 1,000.00 | | | $ | 1,018.30 | | | $ | 6.56 | | | | 1.31 | % |
Investor A | | $ | 1,000.00 | | | $ | 1,073.50 | | | $ | 8.02 | | | $ | 1,000.00 | | | $ | 1,017.06 | | | $ | 7.80 | | | | 1.56 | % |
Investor B | | $ | 1,000.00 | | | $ | 1,068.60 | | | $ | 12.82 | | | $ | 1,000.00 | | | $ | 1,012.40 | | | $ | 12.47 | | | | 2.50 | % |
Investor C | | $ | 1,000.00 | | | $ | 1,069.10 | | | $ | 12.26 | | | $ | 1,000.00 | | | $ | 1,012.94 | | | $ | 11.93 | | | | 2.39 | % |
| | 5 | | For each class of the Fund, expenses are equal to the annualized net expense ratio for the class, multiplied by the average account value over the period, multiplied by 181/365 (to reflect the one-half year period shown). |
| | 6 | | Hypothetical 5% annual return before expenses is calculated by pro rating the number of days in the most recent fiscal half year divided by 365. |
| | | | See “Disclosure of Expenses” on page 8 for further information on how expenses were calculated. |
| | | | | | |
| | | | | | | |
| | SEMI-ANNUAL REPORT | | APRIL 30, 2013 | | 7 |
| Ÿ | | Institutional Shares are not subject to any sales charge. These shares bear no ongoing distribution or service fees and are available only to eligible investors. |
| Ÿ | | Investor A Shares are subject to a maximum initial sales charge (front-end load) of 5.25% and a service fee of 0.25% per year (but no distribution fee). |
| Ÿ | | Investor B Shares are subject to a maximum contingent deferred sales charge (“CDSC”) of 4.50% declining to 0% after six years. In addition, these shares are subject to a distribution fee of 0.75% per year and a service fee of 0.25% per year. These shares automatically convert to Investor A Shares after approximately eight years. (There is no initial sales charge for automatic share conversions.) All returns for periods greater than eight years reflect this conversion. These shares are only available through exchanges and dividend reinvestments by existing shareholders or for purchase by certain employer-sponsored retirement plans. |
| Ÿ | | Investor C Shares are subject to a distribution fee of 0.75% and a service fee of 0.25%. In addition, these shares are subject to a 1.00% CDSC if redeemed within one year of purchase. |
Performance information reflects past performance and does not guarantee future results. Current performance may be lower or higher than the performance data quoted. Refer to www.blackrock.com/funds to obtain performance data current to the most recent month end. Performance results do not reflect the deduction of taxes that a shareholder would pay on fund distributions or the redemption of fund shares. Figures shown in the performance tables on pages 5 and 7 assume reinvestment of all dividends and capital gain distributions, if any, at net asset value on the ex-dividend date. Investment return and principal value of shares will fluctuate so that shares, when redeemed, may be worth more or less than their original cost. Dividends paid to each class of shares will vary because of the different levels of service, distribution and transfer agency fees applicable to each class, which are deducted from the income available to be paid to shareholders. In certain periods, the Funds’ investment advisor waived a portion of its fees. Without such waiver, the Funds’ performance would have been lower.
Shareholders of these Funds may incur the following charges: (a) transactional expenses, such as sales charges; and (b) operating expenses, including investment advisory fees, service and distribution fees, including 12b-1 fees, and other Fund expenses. The expense examples on the previous pages (which are based on a hypothetical investment of $1,000 invested on November 1, 2012 and held through April 30, 2013) are intended to assist shareholders both in calculating expenses based on an investment in the Funds and in comparing these expenses with similar costs of investing in other mutual funds.
The expense examples provide information about actual account values and actual expenses. In order to estimate the expenses a shareholder paid during the period covered by this report, shareholders can divide their account value by $1,000 and then multiply the result by the number corresponding to their Fund and share class under the heading entitled “Expenses Paid During the Period.”
The expense examples also provide information about hypothetical account values and hypothetical expenses based on a Fund’s actual expense ratio and an assumed rate of return of 5% per year before expenses. In order to assist shareholders in comparing the ongoing expenses of investing in these Funds and other funds, compare the 5% hypothetical examples with the 5% hypothetical examples that appear in other funds’ shareholder reports.
The expenses shown in the expense examples are intended to highlight shareholders’ ongoing costs only and do not reflect any transactional expenses, such as sales charges, if any. Therefore, the hypothetical examples are useful in comparing ongoing expenses only, and will not help shareholders determine the relative total expenses of owning different funds. If these transactional expenses were included, shareholder expenses would have been higher.
| | | | | | |
| | | | | | | |
| 8 | | SEMI-ANNUAL REPORT | | APRIL 30, 2013 | | |
| | |
| Derivative Financial Instruments | | |
The Funds may invest in various derivative financial instruments, including foreign currency exchange contracts and options, as specified in Note 2 of the Notes to Financial Statements, which may constitute forms of economic leverage. Such derivative financial instruments are used to obtain exposure to a market without owning or taking physical custody of securities or to hedge market, equity and/or foreign currency exchange rate risks. Derivative financial instruments involve risks, including the imperfect correlation between the value of a derivative financial instrument and the underlying asset, possible default of the counterparty to the transaction or illiquidity of the derivative financial instrument. The Funds’ ability to use a derivative financial instrument successfully depends on the investment advisor’s ability to predict pertinent market movements accurately, which cannot be assured. The use of derivative financial instruments may result in losses greater than if they had not been used, may require a Fund to sell or purchase portfolio investments at inopportune times or for distressed values, may limit the amount of appreciation a Fund can realize on an investment, may result in lower dividends paid to shareholders or may cause a Fund to hold an investment that it might otherwise sell. The Funds’ investments in these instruments are discussed in detail in the Notes to Financial Statements.
| | | | | | |
| | | | | | | |
| | SEMI-ANNUAL REPORT | | APRIL 30, 2013 | | 9 |
| | |
Schedule of Investments April 30, 2013 (Unaudited) | | BlackRock Emerging Markets Fund, Inc. (Percentages shown are based on Net Assets) |
| | | | | | | | |
| Common Stocks | |
Shares | | | Value | |
Brazil — 18.4% | | | | | | | | |
BB Seguridade Participacoes SA (a) | | | 595,000 | | | $ | 5,070,474 | |
BM&FBovespa SA | | | 1,032,805 | | | | 7,170,142 | |
BR Malls Participacoes SA | | | 433,972 | | | | 5,151,486 | |
BRF - Brasil Foods SA | | | 234,375 | | | | 5,798,607 | |
Cia de Concessoes Rodoviarias | | | 801,897 | | | | 7,927,788 | |
Cyrela Brazil Realty SA | | | 355,795 | | | | 3,232,964 | |
Embraer SA | | | 445,981 | | | | 3,903,100 | |
Itau Unibanco Holdings SA — ADR | | | 978,324 | | | | 16,465,193 | |
Localiza Rent a Car SA | | | 242,215 | | | | 4,297,705 | |
Mills Estruturas e Servicos de Engenharia SA | | | 374,210 | | | | 6,144,095 | |
Natura Cosmeticos SA | | | 194,881 | | | | 4,935,459 | |
Tim Participacoes SA — ADR | | | 169,973 | | | | 3,545,637 | |
Vale SA | | | 602,540 | | | | 10,314,629 | |
| | | | | | | | |
| | | | | | | | 83,957,279 | |
Chile — 1.4% | | | | | | | | |
Empresa Nacional de Telecomunicaciones SA | | | 111,276 | | | | 2,145,303 | |
SACI Falabella | | | 362,267 | | | | 4,133,744 | |
| | | | | | | | |
| | | | | | | | 6,279,047 | |
China — 11.9% | | | | | | | | |
Anhui Conch Cement Co. Ltd. Class H | | | 1,328,500 | | | | 4,823,192 | |
Bank of China Ltd., Class H | | | 29,567,200 | | | | 13,853,242 | |
China Mobile Ltd. | | | 206,666 | | | | 2,273,039 | |
China Shenhua Energy Co. Ltd., Class H | | | 1,001,954 | | | | 3,552,792 | |
CNOOC Ltd. | | | 2,838,000 | | | | 5,315,771 | |
CNOOC Ltd. — ADR | | | 20,335 | | | | 3,809,559 | |
Jiangxi Copper Co. Ltd., Class H | | | 2,065,455 | | | | 4,031,606 | |
PetroChina Co. Ltd. | | | 5,106,000 | | | | 6,508,253 | |
Tencent Holdings Ltd. | | | 139,062 | | | | 4,797,394 | |
Want Want China Holdings Ltd. | | | 3,417,000 | | | | 5,428,267 | |
| | | | | | | | |
| | | | | | | | 54,393,115 | |
Colombia — 0.7% | | | | | | | | |
Pacific Rubiales Energy Corp. | | | 145,531 | | | | 3,076,888 | |
Hong Kong — 7.5% | | | | | | | | |
AIA Group Ltd. | | | 1,964,400 | | | | 8,738,548 | |
China Overseas Land & Investment Ltd. | | | 2,546,000 | | | | 7,773,603 | |
Haier Electronics Group Co. Ltd. (a) | | | 2,865,000 | | | | 5,122,405 | |
Kunlun Energy Co. Ltd. | | | 2,500,000 | | | | 4,899,426 | |
Sands China Ltd. | | | 1,470,400 | | | | 7,731,306 | |
| | | | | | | | |
| | | | | | | | 34,265,288 | |
Hungary — 0.7% | | | | | | | | |
Mol Hungarian Oil & Gas Plc | | | 45,366 | | | | 3,224,671 | |
India — 6.7% | | | | | | | | |
Dr Reddy’s Laboratories Ltd. — ADR | | | 118,596 | | | $ | 4,492,417 | |
Financial Technologies India Ltd. | | | 201,464 | | | | 3,022,240 | |
ITC Ltd. | | | 1,243,066 | | | | 7,595,717 | |
Tata Motors Ltd. — ADR | | | 230,622 | | | | 6,351,330 | |
Titan Industries Ltd. | | | 427,884 | | | | 2,152,089 | |
Yes Bank Ltd. | | | 734,474 | | | | 7,018,826 | |
| | | | | | | | |
| | | | | | | | 30,632,619 | |
Indonesia — 4.6% | | | | | | | | |
Bank Mandiri Persero Tbk PT | | | 6,842,500 | | | | 7,402,414 | |
Indocement Tunggal Prakarsa Tbk PT | | | 2,716,000 | | | | 7,390,351 | |
Telekomunikasi Indonesia Tbk PT | | | 5,205,084 | | | | 6,270,996 | |
| | | | | | | | |
| | | | | | | | 21,063,761 | |
Ireland — 1.0% | | | | | | | | |
Dragon Oil Plc | | | 462,342 | | | | 4,555,350 | |
Italy — 1.1% | | | | | | | | |
Prada SpA | | | 559,400 | | | | 5,051,166 | |
Malaysia — 0.6% | | | | | | | | |
Malayan Banking Bhd | | | 866,100 | | | | 2,739,961 | |
Mexico — 5.5% | | | | | | | | |
Alpek SA de CV | | | 1,909,113 | | | | 4,556,476 | |
Fomento Economico Mexicano SAB de CV — ADR | | | 56,432 | | | | 6,398,825 | |
Grupo Financiero Banorte SA de CV ‘O’ | | | 574,865 | | | | 4,334,816 | |
Grupo Televisa SA — ADR | | | 199,807 | | | | 5,059,113 | |
Wal-Mart de Mexico SA de CV, Series V | | | 1,416,169 | | | | 4,506,623 | |
| | | | | | | | |
| | | | | | | | 24,855,853 | |
Netherlands — 0.8% | | | | | | | | |
Yandex NV (a) | | | 142,819 | | | | 3,676,161 | |
Panama — 1.0% | | | | | | | | |
Copa Holdings SA, Class A | | | 37,729 | | | | 4,738,008 | |
Peru — 1.1% | | | | | | | | |
Credicorp Ltd. | | | 31,753 | | | | 4,781,684 | |
Philippines — 0.7% | | | | | | | | |
Philippine Long Distance Telephone Co. | | | 43,910 | | | | 3,245,325 | |
Russia — 6.2% | | | | | | | | |
Lukoil OAO — ADR | | | 88,008 | | | | 5,601,709 | |
Magnit OJSC — GDR | | | 107,439 | | | | 5,490,167 | |
Mail.ru Group Ltd. — GDR | | | 161,541 | | | | 4,361,607 | |
Sberbank — ADR | | | 800,611 | | | | 10,333,262 | |
Sistema JSFC — GDR | | | 119,617 | | | | 2,287,479 | |
| | | | | | | | |
| | | | | | | | 28,074,224 | |
| | | | | | | | |
| To simplify the listings of portfolio holdings in the Schedules of Investments, the names and descriptions of many of the securities have been abbreviated according to the following list: | | ADR | | American Depositary Receipts | | MXN | | Mexican New Peso |
| | BRL | | Brazilian Real | | NVDR | | Non-voting Depository Receipts |
| | CLP | | Chilean Peso | | PCL | | Public Company Limited |
| | GDR | | Global Depositary Receipts | | THB | | Thai Baht |
| | HKD | | Hong Kong Dollar | | USD | | US Dollar |
| | HUF | | Hungarian Forint | | ZAR | | South African Rand |
| | INR | | Indian Rupee | | | | |
See Notes to Financial Statements.
| | | | | | |
| | | | | | | |
| 10 | | SEMI-ANNUAL REPORT | | APRIL 30, 2013 | | |
| | |
Schedule of Investments (continued) | | BlackRock Emerging Markets Fund, Inc. (Percentages shown are based on Net Assets) |
| | | | | | | | |
| Common Stocks | |
Shares | | | Value | |
South Africa — 3.0% | | | | | | | | |
The Foschini Group Ltd. | | | 317,412 | | | $ | 4,073,155 | |
Shoprite Holdings Ltd. | | | 339,853 | | | | 6,453,710 | |
Standard Bank Group Ltd. | | | 267,642 | | | | 3,346,724 | |
| | | | | | | | |
| | | | | | | | 13,873,589 | |
South Korea — 7.8% | | | | | | | | |
Hyundai Motor Co. | | | 21,833 | | | | 3,964,502 | |
LG Household & Health Care Ltd. | | | 11,599 | | | | 6,522,361 | |
Samsung Electronics Co. Ltd. | | | 17,950 | | | | 24,825,195 | |
| | | | | | | | |
| | | | | | | | 35,312,058 | |
Taiwan — 7.5% | | | | | | | | |
Delta Electronics, Inc. | | | 1,249,000 | | | | 5,992,471 | |
Hermes Microvision, Inc. | | | 141,903 | | | | 4,311,761 | |
HON HAI Precision Industry Co. Ltd. | | | 2,173,363 | | | | 5,617,657 | |
Taiwan Semiconductor Manufacturing Co. Ltd. — ADR | | | 964,129 | | | | 18,395,581 | |
| | | | | | | | |
| | | | | | | | 34,317,470 | |
Thailand — 4.2% | | | | | | | | |
Advanced Info Service PCL | | | 483,900 | | | | 4,451,550 | |
CP ALL Public Co. Ltd. — NVDR | | | 300,700 | | | | 451,161 | |
Kasikornbank Public Co. Ltd. — NVDR | | | 1,129,800 | | | | 8,176,013 | |
Siam Cement PCL — NVDR | | | 364,800 | | | | 5,948,419 | |
| | | | | | | | |
| | | | | | | | 19,027,143 | |
Turkey — 2.2% | | | | | | | | |
Koza Altin Isletmeleri AS | | | 116,315 | | | | 2,333,045 | |
Turkiye Garanti Bankasi AS | | | 1,424,216 | | | | 7,880,068 | |
| | | | | | | | |
| | | | | | | | 10,213,113 | |
United States — 2.4% | | | | | | | | |
Cognizant Technology Solutions Corp., Class A (a) | | | 99,879 | | | | 6,472,159 | |
United States (concluded) | | | | | | | | |
First Cash Financial Services, Inc. (a) | | | 82,458 | | | $ | 4,244,113 | |
| | | | | | | | |
| | | | | | | | 10,716,272 | |
| Total Common Stocks — 97.0% | | | | | | | 442,070,045 | |
| | | | | | | | |
| | | | | | | | | |
| | |
| Participation Notes | | Par (000) | | | | |
Switzerland — 1.4% | | | | | | | | |
UBS AG (Shinhan Financial Group Co., Ltd., due 2/22/16) | | $ | 189,414 | | | | 6,550,921 | |
| Total Long-Term Investments (Cost — $376,613,935) — 98.4% | | | | 448,620,966 | |
| | | | | | | | |
| | | | | | | | | |
| | |
| Short-Term Securities | | Shares | | | | |
Money Market Funds — 1.6% | | | | | | | | |
BlackRock Liquidity Funds, TempFund, Institutional Class, 0.08% (b)(c) | | | 7,177,076 | | | | 7,177,076 | |
| | | | | | | | |
| | | | | | | | | | | | |
| | | | | | Par (000) | | | | |
Time Deposits — 0.0% | | | | | | | | | | | | |
Brown Brothers Harriman & Co., 3.90%, 5/02/13 | | | ZAR | | | | 553 | | | | 61,605 | |
| Total Short-Term Securities (Cost — $7,238,681) — 1.6% | | | | 7,238,681 | |
| Total Investments (Cost — $383,852,616) — 100.0% | | | | 455,859,647 | |
| Other Assets Less Liabilities — 0.0% | | | | 12,668 | |
| | | | | | | | | | | | |
Net Assets — 100.0% | | | | | | | | | | $ | 455,872,315 | |
| | | | | | | | | | | | |
|
| Notes to Schedule of Investments |
| (a) | | Non-income producing security. |
| (b) | | Investments in issuers considered to be an affiliate of the Fund during the six months ended April 30, 2013, for purposes of Section 2(a)(3) of the Investment Company Act of 1940, as amended, were as follows: |
| | | | | | | | | | | | | | | | |
| Affiliate | | Shares Held
at October 31, 2012 | | | Net
Activity | | | Shares Held
at April 30,
2013 | | | Income | |
BlackRock Liquidity Funds, TempFund, Institutional Class | | | 12,893,760 | | | | (5,716,684 | ) | | | 7,177,076 | | | $ | 9,402 | |
| (c) | | Represents the current yield as of report date. |
| Ÿ | | Foreign currency exchange contracts as of April 30, 2013 were as follows: |
| | | | | | | | | | | | | | | | | | | | |
Currency Purchased | | | Currency Sold | | | Counterparty | | Settlement
Date | | | Unrealized
Appreciation
(Depreciation) | |
| BRL | | | 10,115,000 | | | USD | | | 5,066,366 | | | Brown Brothers Harriman & Co. | | | 5/02/13 | | | $ | (10,762 | ) |
| INR | | | 3,382,725 | | | USD | | | 63,044 | | | Brown Brothers Harriman & Co. | | | 5/02/13 | | | | (256 | ) |
| INR | | | 429,434 | | | USD | | | 8,003 | | | Brown Brothers Harriman & Co. | | | 5/02/13 | | | | (33 | ) |
| USD | | | 755,343 | | | HKD | | | 5,862,460 | | | UBS AG | | | 5/02/13 | | | | (114 | ) |
| USD | | | 249,270 | | | HUF | | | 57,842,644 | | | Deutsche Bank AG | | | 5/02/13 | | | | (5,248 | ) |
| CLP | | | 363,268,513 | | | USD | | | 769,311 | | | Brown Brothers Harriman & Co. | | | 5/03/13 | | | | 2,042 | |
| USD | | | 574,106 | | | BRL | | | 1,152,231 | | | Brown Brothers Harriman & Co. | | | 5/03/13 | | | | (1,793 | ) |
| USD | | | 20,367 | | | BRL | | | 40,847 | | | Brown Brothers Harriman & Co. | | | 5/03/13 | | | | (48 | ) |
See Notes to Financial Statements.
| | | | | | |
| | | | | | | |
| | SEMI-ANNUAL REPORT | | APRIL 30, 2013 | | 11 |
| | |
Schedule of Investments (continued) | | BlackRock Emerging Markets Fund, Inc. |
Foreign currency exchange contracts as of April 30, 2013 were as follows (concluded):
| | | | | | | | | | | | | | | | | | | | |
Currency Purchased | | | Currency Sold | | | Counterparty | | Settlement
Date | | | Unrealized
Appreciation
(Depreciation) | |
| USD | | | 5,755 | | | BRL | | | 11,507 | | | Brown Brothers Harriman & Co. | | | 5/03/13 | | | $ | 4 | |
| USD | | | 22,891 | | | BRL | | | 45,770 | | | Brown Brothers Harriman & Co. | | | 5/03/13 | | | | 14 | |
| USD | | | 46,289 | | | BRL | | | 92,555 | | | Brown Brothers Harriman & Co. | | | 5/03/13 | | | | 29 | |
| USD | | | 46,289 | | | BRL | | | 92,555 | | | Brown Brothers Harriman & Co. | | | 5/03/13 | | | | 29 | |
| USD | | | 103,945 | | | BRL | | | 207,838 | | | Brown Brothers Harriman & Co. | | | 5/03/13 | | | | 65 | |
| USD | | | 181,974 | | | BRL | | | 363,857 | | | Brown Brothers Harriman & Co. | | | 5/03/13 | | | | 114 | |
| USD | | | 181,974 | | | BRL | | | 363,857 | | | Brown Brothers Harriman & Co. | | | 5/03/13 | | | | 114 | |
| USD | | | 698,311 | | | HKD | | | 5,419,588 | | | Goldman Sachs Group, Inc. | | | 5/03/13 | | | | (77 | ) |
| USD | | | 137,548 | | | HUF | | | 31,347,261 | | | Citigroup, Inc. | | | 5/03/13 | | | | (385 | ) |
| USD | | | 232,874 | | | HUF | | | 53,185,721 | | | Goldman Sachs Group, Inc. | | | 5/03/13 | | | | (1,152 | ) |
| USD | | | 72,813 | | | THB | | | 2,134,080 | | | Brown Brothers Harriman & Co. | | | 5/03/13 | | | | 102 | |
| USD | | | 851,239 | | | THB | | | 24,948,951 | | | Brown Brothers Harriman & Co. | | | 5/03/13 | | | | 1,189 | |
| BRL | | | 1,855,492 | | | USD | | | 927,746 | | | Brown Brothers Harriman & Co. | | | 5/06/13 | | | | (348 | ) |
| USD | | | 725,663 | | | THB | | | 21,330,152 | | | Brown Brothers Harriman & Co. | | | 5/07/13 | | | | (1,088 | ) |
| Total | | | | | | | | | | | | | | | | | | $ | (17,602 | ) |
| | | | | | | | | | | | | | | | | | | | |
| Ÿ | | Fair Value Measurements — Various inputs are used in determining the fair value of investments and derivative financial instruments. These inputs to valuation techniques are categorized into a disclosure hierarchy consisting of three broad levels for financial statement purposes as follows: |
| Ÿ | | Level 1 — unadjusted price quotations in active markets/exchanges for identical assets and liabilities that the Fund has the ability to access |
| Ÿ | | Level 2 — other observable inputs (including, but not limited to, quoted prices for similar assets or liabilities in markets that are active, quoted prices for identical or similar assets or liabilities in markets that are not active, inputs other than quoted prices that are observable for the assets or liabilities (such as interest rates, yield curves, volatilities, prepayment speeds, loss severities, credit risks and default rates) or other market-corroborated inputs) |
| Ÿ | | Level 3 — unobservable inputs based on the best information available in the circumstances, to the extent observable inputs are not available (including the Fund’s own assumptions used in determining the fair value of investments and derivative financial instruments) |
The hierarchy gives the highest priority to unadjusted quoted prices in active markets for identical assets or liabilities (Level 1 measurements) and the lowest priority to unobservable inputs (Level 3 measurements). Accordingly, the degree of judgment exercised in determining fair value is greatest for instruments categorized in Level 3. The inputs used to measure fair value may fall into different levels of the fair value hierarchy. In such cases, for disclosure purposes, the level in the fair value hierarchy within which the fair value measurement falls in its entirety is determined based on the lowest level input that is significant to the fair value measurement in its entirety.
Changes in valuation techniques may result in transfers into or out of an assigned level within the disclosure hierarchy. In accordance with the Fund’s policy, transfers between different levels of the fair value disclosure hierarchy are deemed to have occurred as of the beginning of the reporting period. The categorization of a value determined for investments and derivative financial instruments is based on the pricing transparency of the investment and derivative financial instrument and is not necessarily an indication of the risks associated with investing in those securities. For information about the Fund’s policy regarding valuation of investments and derivative financial instruments and other significant accounting policies, please refer to Note 1 of the Notes to Financial Statements.
The following tables summarize the Fund’s investments and derivative financial instruments categorized in the disclosure hierarchy as of April 30, 2013:
| | | | | | | | | | | | | | | | |
| | | Level 1 | | | Level 2 | | | Level 3 | | | Total | |
Assets: | | | | | | | | | | | | | | | | |
| Investments: | | | | | | | | | | | | | | | | |
Long-Term Investments: | | | | | | | | | | | | | | | | |
Common Stocks: | | | | | | | | | | | | | | | | |
Brazil | | $ | 83,957,279 | | | | — | | | | — | | | $ | 83,957,279 | |
Chile | | | 6,279,047 | | | | — | | | | — | | | | 6,279,047 | |
China | | | 3,809,559 | | | $ | 50,583,556 | | | | — | | | | 54,393,115 | |
Colombia | | | 3,076,888 | | | | — | | | | — | | | | 3,076,888 | |
Hong Kong | | | — | | | | 34,265,288 | | | | — | | | | 34,265,288 | |
Hungary | | | — | | | | 3,224,671 | | | | — | | | | 3,224,671 | |
India | | | 13,865,987 | | | | 16,766,632 | | | | — | | | | 30,632,619 | |
Indonesia | | | — | | | | 21,063,761 | | | | — | | | | 21,063,761 | |
Ireland | | | — | | | | 4,555,350 | | | | — | | | | 4,555,350 | |
Italy | | | — | | | | 5,051,166 | | | | — | | | | 5,051,166 | |
Malaysia | | | — | | | | 2,739,961 | | | | — | | | | 2,739,961 | |
Mexico | | | 24,855,853 | | | | — | | | | — | | | | 24,855,853 | |
Netherlands | | | 3,676,161 | | | | — | | | | — | | | | 3,676,161 | |
Panama | | | 4,738,008 | | | | — | | | | — | | | | 4,738,008 | |
Peru | | | 4,781,684 | | | | — | | | | — | | | | 4,781,684 | |
See Notes to Financial Statements.
| | | | | | |
| | | | | | | |
| 12 | | SEMI-ANNUAL REPORT | | APRIL 30, 2013 | | |
| | |
Schedule of Investments (concluded) | | BlackRock Emerging Markets Fund, Inc. |
| | | | | | | | | | | | | | | | |
| | | Level 1 | | | Level 2 | | | Level 3 | | | Total | |
Assets (concluded): | | | | | | | | | | | | | | | | |
| Investments (concluded): | | | | | | | | | | | | | | | | |
Long-Term Investments (concluded): | | | | | | | | | | | | | | | | |
Common Stocks (concluded): | | | | | | | | | | | | | | | | |
Philippines | | | — | | | $ | 3,245,325 | | | | — | | | $ | 3,245,325 | |
Russia | | $ | 9,963,316 | | | | 18,110,908 | | | | — | | | | 28,074,224 | |
South Africa | | | — | | | | 13,873,589 | | | | — | | | | 13,873,589 | |
South Korea | | | — | | | | 35,312,058 | | | | — | | | | 35,312,058 | |
Taiwan | | | 18,395,581 | | | | 15,921,889 | | | | — | | | | 34,317,470 | |
Thailand | | | 4,451,550 | | | | 14,575,593 | | | | — | | | | 19,027,143 | |
Turkey | | | — | | | | 10,213,113 | | | | — | | | | 10,213,113 | |
United States | | | 10,716,272 | | | | — | | | | — | | | | 10,716,272 | |
Participation Notes | | | — | | | | — | | | $ | 6,550,921 | | | | 6,550,921 | |
Short-Term Securities | | | 7,177,076 | | | | 61,605 | | | | — | | | | 7,238,681 | |
| | | | |
Total | | $ | 199,744,261 | | | $ | 249,564,465 | | | $ | 6,550,921 | | | $ | 455,859,647 | |
| | | | |
| | | | | | | | | | | | | | | | |
| | | Level 1 | | | Level 2 | | | Level 3 | | | Total | |
| Derivative Financial Instruments1 | | | | | | | | | | | | | | | | |
Assets: | | | | | | | | | | | | | | | | |
Foreign currency exchange contracts | | | — | | | $ | 3,702 | | | | — | | | $ | 3,702 | |
Liabilities: | | | | | | | | | | | | | | | | |
Foreign currency exchange contracts | | | — | | | | (21,304 | ) | | | — | | | | (21,304 | ) |
| | | | |
Total | | | — | | | $ | (17,602 | ) | | | — | | | $ | (17,602 | ) |
| | | | |
1 Derivative financial instruments are foreign currency exchange contracts, which are valued at the unrealized appreciation/depreciation on the instrument. | |
Certain of the Fund’s assets are held at carrying amount, which approximates fair value for financial statement purposes. As of April 30, 2013, foreign currency at value of $1,594,731 is categorized as Level 1 within the disclosure hierarchy.
There were no transfers between Level 1 and Level 2 during the six months ended April 30, 2013.
A reconciliation of Level 3 investments is presented when the Fund had a significant amount of Level 3 investments at the beginning and/or end of the period in relation to net assets. The following table is a reconciliation of Level 3 investments for which significant unobservable inputs were used in determining fair value:
| | | | | | | | |
| | | Participation Notes | | | Total | |
Assets: | | | | | | | | |
Opening Balance, as of October 31, 2012 | | | — | | | | — | |
Transfers into Level 32 | | | — | | | | — | |
Transfers out of Level 32 | | | — | | | | — | |
Accrued discounts/premiums | | | — | | | | — | |
Net realized gain (loss) | | $ | (21,015 | ) | | $ | (21,015 | ) |
Net change in unrealized appreciation/depreciation3 | | | (682,062 | ) | | | (682,062 | ) |
Purchases | | | 7,475,544 | | | | 7,475,544 | |
Sales | | | (221,546 | ) | | | (221,546 | ) |
| | | | | | | | |
Closing Balance, as of April 30, 2013 | | $ | 6,550,921 | | | $ | 6,550,921 | |
| | | | | | | | |
2 Transfers into and transfers out of Level 3 represent the values as of the beginning of the reporting period. | |
3 Included in the related net change in unrealized appreciation/depreciation in the Statements of Operations. The change in unrealized appreciation/depreciation on securities still held as of April 30, 2013 was $(682,062). | |
Certain of the Fund’s investments that are categorized as Level 3 were valued utilizing transaction prices or third party pricing information without adjustment. Such valuations are based on unobservable inputs. A significant change in third party information inputs could result in a significantly lower or higher value of such Level 3 investments.
See Notes to Financial Statements.
| | | | | | |
| | | | | | | |
| | SEMI-ANNUAL REPORT | | APRIL 30, 2013 | | 13 |
| | |
Schedule of Investments April 30, 2013 (Unaudited) | | BlackRock Latin America Fund, Inc. (Percentages shown are based on Net Assets) |
| | | | | | | | | | |
| | | |
| Common Stocks | | | |
Shares | | | Value | |
Brazil — 64.4% | | | | | | | | | | |
Arezzo Industria e Comercio SA | | | | | 12,000 | | | $ | 269,899 | |
Autometal SA | | | | | 325,000 | | | | 3,411,221 | |
Banco Bradesco SA — ADR | | | | | 1,850,000 | | | | 30,691,500 | |
Banco do Brasil SA | | | | | 575,000 | | | | 7,222,167 | |
BB Seguridade Participacoes SA (a) | | | | | 1,300,000 | | | | 11,078,346 | |
BM&FBovespa SA | | | | | 2,507,000 | | | | 17,404,588 | |
BR Malls Participacoes SA | | | | | 668,000 | | | | 7,929,526 | |
BR Properties SA | | | | | 564,000 | | | | 6,286,243 | |
BRF - Brasil Foods SA — ADR | | | | | 834,000 | | | | 20,708,220 | |
BTG Pactual Participations Ltd. | | | | | 164,000 | | | | 2,723,838 | |
Cia Brasileira de Distribuicao Grupo Pao de Acucar, Preference Shares | | | | | 239,000 | | | | 13,235,637 | |
Cia de Bebidas das Americas, Preference Shares — ADR | | | | | 330,000 | | | | 13,866,600 | |
Cia de Concessoes Rodoviarias | | | | | 2,530,000 | | | | 25,012,320 | |
Cia de Saneamento Basico do Estado de Sao Paulo (a) | | | | | 138,000 | | | | 1,941,622 | |
Cia de Saneamento Basico do Estado de Sao Paulo — ADR (a) | | | | | 289,500 | | | | 4,139,850 | |
Cosan Ltd., Class A | | | | | 92,000 | | | | 1,909,000 | |
Cosan SA Industria e Comercio | | | | | 330,000 | | | | 7,834,562 | |
Cyrela Brazil Realty SA Empreendimentos e Participacoes | | | | | 338,000 | | | | 3,071,268 | |
EDP - Energias do Brasil SA | | | | | 579,000 | | | | 3,550,833 | |
Embraer SA — ADR (a) | | | | | 201,000 | | | | 7,020,930 | |
Estacio Participacoes SA | | | | | 85,000 | | | | 2,026,490 | |
Even Construtora e Incorporadora SA | | | | | 404,000 | | | | 1,908,184 | |
Gol Linhas Aereas Inteligentes SA — ADR (a) | | | | | 253,000 | | | | 1,563,540 | |
Itau Unibanco Holdings SA, Preference Shares — ADR | | | | | 1,527,000 | | | | 25,699,410 | |
Klabin SA, Preference Shares | | | | | 505,000 | | | | 3,437,761 | |
Kroton Educacional SA | | | | | 400,000 | | | | 5,597,901 | |
Localiza Rent a Car SA | | | | | 158,000 | | | | 2,803,449 | |
Lojas Renner SA | | | | | 14,000 | | | | 533,550 | |
LPS Brasil Consultoria de Imoveis SA | | | | | 530,000 | | | | 5,396,026 | |
Marcopolo SA, Preference Shares | | | | | 710,000 | | | | 4,776,509 | |
Natura Cosmeticos SA | | | | | 307,000 | | | | 7,774,929 | |
Petroleo Brasileiro SA — ADR (a) | | | | | 652,000 | | | | 12,485,800 | |
Petroleo Brasileiro SA — Sponsored ADR (a) | | | | | 933,000 | | | | 18,632,010 | |
QGEP Participacoes SA | | | | | 471,000 | | | | 2,686,048 | |
Qualicorp SA (a) | | | | | 304,000 | | | | 2,962,889 | |
T4F Entretenimento SA (a) | | | | | 426,000 | | | | 1,809,821 | |
Transmissora Alianca de Energia Eletrica SA | | | | | 248,000 | | | | 2,853,410 | |
Ultrapar Participacoes SA | | | | | 347,000 | | | | 9,245,818 | |
Ultrapar Participacoes SA — ADR | | | | | 38,000 | | | | 1,013,460 | |
Vale SA — ADR (b) | | | | | 579,000 | | | | 9,895,110 | |
Vale SA, Preference ‘A’ Shares — ADR | | | | | 2,456,000 | | | | 39,934,560 | |
| | | | | | | | | | |
| | | | | | | | | | 352,344,845 | |
Chile — 3.9% | | | | | | | | | | |
Banco Santander Chile SA - ADR | | | | | 182,000 | | | | 4,848,480 | |
Empresa Nacional de Telecomunicaciones SA | | | | | 112,000 | | | | 2,159,261 | |
SACI Falabella | | | | | 777,000 | | | | 8,866,165 | |
Sociedad Quimica y Minera de Chile SA — ADR | | | | | 113,000 | | | | 5,592,370 | |
| | | | | | | | | | |
| | | | | | | | | | 21,466,276 | |
Colombia — 1.9% | | | | | | | | | | |
Pacific Rubiales Energy Corp. | | | | | 479,000 | | | | 10,127,252 | |
| | | | | | | | | | | | |
| | | |
| Common Stocks | | | | |
Shares | | | Value | |
Mexico — 21.9% | | | | | | | | | | | | |
Alfa SAB de CV, Class A | | | | | | | 3,364,000 | | | $ | 7,812,754 | |
Alpek SA de CV | | | | | | | 981,000 | | | | 2,341,350 | |
America Movil SAB de CV, Series L — ADR | | | | | | | 800,000 | | | | 17,104,000 | |
Fibra Uno Administracion SA de CV | | | | | | | 1,890,000 | | | | 7,269,051 | |
Fomento Economico Mexicano SAB de CV — ADR | | | | | | | 249,000 | | | | 28,234,110 | |
Grupo Financiero Banorte SA de CV, Series O | | | | | | | 1,388,000 | | | | 10,466,327 | |
Grupo Sanborns SA de CV (a)(b) | | | | | | | 1,328,000 | | | | 3,095,163 | |
Grupo Televisa SA — ADR | | | | | | | 920,000 | | | | 23,294,400 | |
Macquarie Mexico Real Estate Management SA de CV (a) | | | | | | | 1,296,000 | | | | 3,129,450 | |
Mexichem SAB de CV | | | | | | | 570,000 | | | | 2,905,323 | |
Wal-Mart de Mexico SA de CV, Series V | | | | | | | 4,476,000 | | | | 14,243,812 | |
| | | | | | | | | | | | |
| | | | | | | | | | | | 119,895,740 | |
Panama — 1.4% | | | | | | | | | | | | |
Copa Holdings SA, Class A | | | | | | | 62,000 | | | | 7,785,960 | |
Peru — 1.0% | | | | | | | | | | | | |
Credicorp Ltd. | | | | | | | 38,000 | | | | 5,722,420 | |
Spain — 0.4% | | | | | | | | | | | | |
Cemex Latam Holdings SA (a) | | | | | | | 344,000 | | | | 2,412,600 | |
| Total Common Stocks – 94.9% | | | | 519,755,093 | |
| | | | | | | | | | | | |
| | |
| | | |
| Corporate Bonds | | | | | Par (000) | | | | |
Brazil — 0.5% | | | | | | | | | | | | |
Hypermarcas SA: | | | | | | | | | | | | |
3.00%, 10/15/15 | | | BRL | | | | 1,648 | | | | 976,079 | |
11.30%, 10/15/18 | | | | | | | 1,510 | | | | 693,689 | |
Lupatech SA, 6.50%, 4/15/18 (c) | | | | | | | 2,128 | | | | 1,143,323 | |
| Total Corporate Bonds — 0.5% | | | | 2,813,091 | |
| | | | | | | | | | | | |
| | |
| | | |
| Participation Notes | | | | | | | | | |
Brazil — 4.0% | | | | | | | | | | | | |
Merrill Lynch International: | | | | | | | | | | | | |
(Arezzo Industria e Comercio SA), due 4/30/14 | | | USD | | | | 50 | | | | 1,065,266 | |
(Lojas Renner SA), due 4/04/14 | | | | | | | 40 | | | | 1,518,180 | |
Morgan Stanley BV: | | | | | | | | | | | | |
(Arezzo Industria e Comercio SA), due 3/02/15 | | | | | | | 100 | | | | 2,149,510 | |
(BTG Pactual Participations Ltd.), due 6/06/14 | | | | | | | 75 | | | | 1,280,858 | |
(Consan SA Industria e Comercio), due 2/05/15 | | | | | | | 153 | | | | 3,632,449 | |
(Lojas Renner SA), due 7/22/13 | | | | | | | 33 | | | | 1,333,748 | |
(Lojas Renner SA), due 12/05/13 | | | | | | | 100 | | | | 4,083,600 | |
(Lojas Renner SA), due 2/25/14 | | | | | | | 50 | | | | 2,049,155 | |
(Natura Cosmetico SA), due 7/22/13 | | | | | | | 148 | | | | 3,879,539 | |
(Natura Cosmetico SA), due 10/29/14 | | | | | | | 27 | | | | 699,567 | |
| Total Participation Notes – 4.0% | | | | 21,691,872 | |
See Notes to Financial Statements.
| | | | | | |
| | | | | | | |
| 14 | | SEMI-ANNUAL REPORT | | APRIL 30, 2013 | | |
| | |
Schedule of Investments (continued) | | BlackRock Latin America Fund, Inc. (Percentages shown are based on Net Assets) |
| | | | | | | | | | |
| | | |
| Rights | | | |
Shares | | | Value | |
Brazil — 0.0% | | | | | | | | | | |
Cia Brasileira de Distribuicao Grupo Pao de Acucar (Expires 5/17/13) (a) | | | | | 272 | | | $ | 817 | |
| | | | | | | | | | |
| | |
| | | |
| Warrants (d) | | | | | | | | |
Brazil — 0.0% | | | | | | | | | | |
Hypermarcas SA (Expires 10/15/15) | | | | | 1,644 | | | | — | |
Total Long-Term Investments
(Cost — $398,227,065) — 99.4% | | | | 544,260,873 | |
| | | | | | | | | | |
| | |
| | | |
| Short-Term Securities | | | | | | | | |
BlackRock Liquidity Funds, TempFund,
Institutional Class, 0.08% (e)(f) | | | | | 13,531,946 | | | | 13,531,946 | |
| Short-Term Securities | | | | | Beneficial
Interest
(000) | | | Value | |
BlackRock Liquidity Series LLC, Money Market Series, 0.22% (e)(f)(g) | | | USD | | | | 12,000 | | | $ | 12,000,000 | |
Total Short-Term Securities
(Cost — $25,531,946) — 4.7% | | | | 25,531,946 | |
| Total Investments (Cost — $423,759,011) — 104.1% | | | | 569,792,819 | |
| Liabilities in Excess of Other Assets — (4.1)% | | | | (22,392,078 | ) |
| | | | | | | | | | | | |
Net Assets — 100.0% | | | $ | 547,400,741 | |
| | | | | | | | | | | | |
|
| Notes to Schedule of Investments |
| (a) | | Non-income producing security. |
| (b) | | Security, or a portion of security, is on loan. |
| (c) | | Convertible security. |
| (d) | | Warrants entitle the Fund to purchase a predetermined number of shares of common stock and are non-income producing. The purchase price and number of shares are subject to adjustment under certain conditions until the expiration date of the warrants, if any. |
| (e) | | Investments in issuers considered to be an affiliate of the Fund during the six months ended April 30, 2013, for purposes of Section 2(a)(3) of the Investment Company Act of 1940, as amended, were as follows: |
| | | | | | | | | | | | | | | | |
| Affiliate | | Shares/Beneficial
Interest Held at
October 31,
2012 | | | Net
Activity | | | Shares/Beneficial
Interest Held at
April 30, 2013 | | | Income | |
BlackRock Liquidity Funds, TempFund, Institutional Class | | | 4,263,188 | | | | 9,268,758 | | | | 13,531,946 | | | $ | 2,323 | |
BlackRock Liquidity Series, LLC, Money Market Series | | $ | 11,970,000 | | | $ | 30,000 | | | $ | 12,000,000 | | | | $23,332 | |
| (f) | | Represents the current yield as of report date. |
| (g) | | Security was purchased with the cash collateral from loaned securities. The Fund may withdraw up to 25% of its investment daily, although the manager of the BlackRock Liquidity Series LLC, Money Market Series, in its sole discretion, may permit an investor to withdraw more than 25% on any one day. |
| Ÿ | | Foreign currency exchange contracts as of April 30, 2013 were as follows: |
| | | | | | | | | | | | | | | | | | | | |
Currency Purchased | | | Currency
Sold | | | Counterparty | | Settlement
Date | | | Unrealized
Appreciation
(Depreciation) | |
| BRL | | | 15,965,550 | | | USD | | | 7,978,786 | | | Brown Brothers Harriman & Co. | | | 5/02/13 | | | $ | 997 | |
| USD | | | 5,596 | | | MXN | | | 68,000 | | | Citigroup, Inc. | | | 5/02/13 | | | | (4 | ) |
| BRL | | | 3,305,020 | | | USD | | | 1,652,923 | | | Brown Brothers Harriman & Co. | | | 5/03/13 | | | | (1,033 | ) |
| USD | | | 658,145 | | | BRL | | | 1,315,962 | | | Brown Brothers Harriman & Co. | | | 5/03/13 | | | | 411 | |
| Total | | | | | | | | | | | | | | | | | | $ | 371 | |
| | | | | | | | | | | | | | | | | | | | |
| Ÿ | | Fair Value Measurements — Various inputs are used in determining the fair value of investments and derivative financial instruments. These inputs to valuation techniques are categorized into a disclosure hierarchy consisting of three broad levels for financial statement purposes as follows: |
| Ÿ | | Level 1 — unadjusted price quotations in active markets/exchanges for identical assets and liabilities that the Fund has the ability to access |
| Ÿ | | Level 2 — other observable inputs (including, but not limited to, quoted prices for similar assets or liabilities in markets that are active, quoted prices for identical or similar assets or liabilities in markets that are not active, inputs other than quoted prices that are observable for the assets or liabilities (such as interest rates, yield curves, volatilities, prepayment speeds, loss severities, credit risks and default rates) or other market-corroborated inputs) |
| Ÿ | | Level 3 — unobservable inputs based on the best information available in the circumstances, to the extent observable inputs are not available (including the Fund’s own assumptions used in determining the fair value of investments and derivative financial instruments) |
See Notes to Financial Statements.
| | | | | | |
| | | | | | | |
| | SEMI-ANNUAL REPORT | | APRIL 30, 2013 | | 15 |
| | |
Schedule of Investments (continued) | | BlackRock Latin America Fund, Inc. |
The hierarchy gives the highest priority to unadjusted quoted prices in active markets for identical assets or liabilities (Level 1 measurements) and the lowest priority to unobservable inputs (Level 3 measurements). Accordingly, the degree of judgment exercised in determining fair value is greatest for instruments categorized in Level 3. The inputs used to measure fair value may fall into different levels of the fair value hierarchy. In such cases, for disclosure purposes, the level in the fair value hierarchy within which the fair value measurement falls in its entirety is determined based on the lowest level input that is significant to the fair value measurement in its entirety.
Changes in valuation techniques may result in transfers into or out of an assigned level within the disclosure hierarchy. In accordance with the Fund’s policy, transfers between different levels of the fair value disclosure hierarchy are deemed to have occurred as of the beginning of the reporting period. The categorization of a value determined for investments and derivative financial instruments is based on the pricing transparency of the investment and derivative financial instrument and is not necessarily an indication of the risks associated with investing in those securities. For information about the Fund’s policy regarding valuation of investments and derivative financial instruments and other significant accounting policies, please refer to Note 1 of the Notes to Financial Statements.
The following tables summarize the Fund’s investments and derivative financial instruments categorized in the disclosure hierarchy as of April 30, 2013:
| | | | | | | | | | | | | | | | |
| | | Level 1 | | | Level 2 | | | Level 3 | | | Total | |
Assets: | | | | | | | | | | | | | | | | |
| Investments: | | | | | | | | | | | | | | | | |
Long-Term Investments: | | | | | | | | | | | | | | | | |
Common Stocks: | | | | | | | | | | | | | | | | |
Brazil | | $ | 352,344,845 | | | | — | | | | — | | | $ | 352,344,845 | |
Chile | | | 21,466,276 | | | | — | | | | — | | | | 21,466,276 | |
Colombia | | | 10,127,252 | | | | — | | | | — | | | | 10,127,252 | |
Mexico | | | 119,895,740 | | | | — | | | | — | | | | 119,895,740 | |
Panama | | | 7,785,960 | | | | — | | | | — | | | | 7,785,960 | |
Peru | | | 5,722,420 | | | | — | | | | — | | | | 5,722,420 | |
Spain | | | 2,412,600 | | | | — | | | | — | | | | 2,412,600 | |
Corporate Bonds | | | — | | | | — | | | $ | 2,813,091 | | | | 2,813,091 | |
Participation Notes | | | — | | | $ | 2,583,446 | | | | 19,108,426 | | | | 21,691,872 | |
Rights | | | 817 | | | | — | | | | — | | | | 817 | |
Short-Term Securities | | | 13,531,946 | | | | 12,000,000 | | | | — | | | | 25,531,946 | |
| | | | |
Total | | $ | 533,287,856 | | | $ | 14,583,446 | | | $ | 21,921,517 | | | $ | 569,792,819 | |
| | | | |
| | | | | | | | | | | | |
| | | Level 1 | | Level 2 | | | Level 3 | | Total | |
| Derivative Financial Instruments1 | | | | | | | | | | | | |
Assets: | | | | | | | | | | | | |
Foreign currency exchange contracts | | — | | $ | 1,408 | | | — | | $ | 1,408 | |
Liabilities: | | | | | | | | | | | | |
Foreign currency exchange contracts | | — | | | (1,037 | ) | | — | | | (1,037 | ) |
| | | |
Total | | — | | $ | 371 | | | — | | $ | 371 | |
| | | |
| | 1 | | Derivative financial instruments are foreign currency exchange contracts, which are valued at the unrealized appreciation/depreciation on the instrument. |
Certain of the Fund’s assets and liabilities are held at carrying amount, which approximates fair value for financial statement purposes. As of April 30, 2013, such assets and liabilities are categorized within the disclosure hierarchy as follows:
| | | | | | | | | | | | | | |
| | | Level 1 | | | Level 2 | | | Level 3 | | Total | |
Assets: | | | | | | | | | | | | | | |
Foreign currency at value | | $ | 586,358 | | | | — | | | — | | $ | 586,358 | |
Liabilities: | | | | | | | | | | | | | | |
Collateral on securities loaned at value | | | — | | | $ | (12,000,000 | ) | | — | | | (12,000,000 | ) |
| | | | |
Total | | $ | 586,358 | | | $ | (12,000,000 | ) | | — | | $ | (11,413,642 | ) |
| | | | |
There were no transfers between Level 1 and Level 2 during the six months ended April 30, 2013.
See Notes to Financial Statements.
| | | | | | |
| | | | | | | |
| 16 | | SEMI-ANNUAL REPORT | | APRIL 30, 2013 | | |
| | |
Schedule of Investments (concluded) | | BlackRock Latin America Fund, Inc. |
A reconciliation of Level 3 investments is presented when the Fund had a significant amount of Level 3 investments at the beginning and/or end of the period in relation to net assets. The following table is a reconciliation of Level 3 investments for which significant unobservable inputs were used in determining fair value:
| | | | | | | | | | | | |
| | | Corporate
Bonds | | | Participation
Notes | | | Total | |
Assets: | | | | | | | | | | | | |
Opening Balance, as of October 31, 2012 | | $ | 2,809,770 | | | $ | 13,139,589 | | | $ | 15,949,359 | |
Transfers into Level 31 | | | — | | | | — | | | | — | |
Transfers out of Level 31 | | | — | | | | — | | | | — | |
Accrued discounts/premiums | | | 1,060 | | | | — | | | | 1,060 | |
Net realized gain (loss) | | | (13,761 | ) | | | — | | | | (13,761 | ) |
Net change in unrealized appreciation/depreciation2 | | | 87,612 | | | | 350,505 | | | | 438,117 | |
Purchases | | | — | | | | 5,618,332 | | | | 5,618,332 | |
Sales | | | (71,590 | ) | | | — | | | | (71,590 | ) |
| | | | | | | | | | | | |
Closing Balance, as of April 30, 2013 | | $ | 2,813,091 | | | $ | 19,108,426 | | | $ | 21,921,517 | |
| | | | | | | | | | | | |
| | 1 | | Transfers into and transfers out of Level 3 represent the values as of the beginning of the reporting period. |
| | 2 | | Included in the related net change in unrealized appreciation/depreciation in the Statements of Operations. The change in unrealized appreciation/depreciation on securities still held as of April 30, 2013 was $438,117. |
Certain of the Fund’s investments that are categorized as Level 3 were valued utilizing transaction prices or third party pricing information without adjustment. Such valuations are based on unobservable inputs. A significant change in third party information inputs could result in a significantly lower or higher value of such Level 3 investments.
See Notes to Financial Statements.
| | | | | | |
| | | | | | | |
| | SEMI-ANNUAL REPORT | | APRIL 30, 2013 | | 17 |
| | |
| Statements of Assets and Liabilities | | |
| | | | | | | | |
| April 30, 2013 (Unaudited) | | BlackRock
Emerging Markets Fund, Inc. | | | BlackRock Latin America Fund, Inc. | |
| | | | | | | | |
| Assets | | | | | | | | |
Investments at value — unaffiliated1,2 | | $ | 448,682,571 | | | $ | 544,260,873 | |
Investments at value — affiliated3 | | | 7,177,076 | | | | 25,531,946 | |
Investments sold receivable | | | 9,806,445 | | | | 3,910,964 | |
Dividends receivable | | | 494,260 | | | | 3,662,846 | |
Foreign currency at value4 | | | 1,594,731 | | | | 586,358 | |
Capital shares sold receivable | | | 1,242,299 | | | | 367,405 | |
Interest receivable | | | — | | | | 36,944 | |
Unrealized appreciation on foreign currency exchange contracts | | | 3,702 | | | | 1,408 | |
Securities lending income receivable — affiliated | | | — | | | | 3,712 | |
Prepaid expenses | | | 2,620 | | | | 4,853 | |
| | | | | | | | |
Total assets | | | 469,003,704 | | | | 578,367,309 | |
| | | | | | | | |
| | | | | | | | |
| Liabilities | | | | | | | | |
Collateral on securities loaned at value | | | — | | | | 12,000,000 | |
Investments purchased payable | | | 11,293,625 | | | | 16,349,342 | |
Capital shares redeemed payable | | | 978,792 | | | | 1,362,461 | |
Investment advisory fees payable | | | 364,822 | | | | 448,128 | |
Service and distribution fees payable | | | 128,036 | | | | 146,967 | |
Foreign capital gain tax payable | | | 36,579 | | | | 57,447 | |
Unrealized depreciation on foreign currency exchange contracts | | | 21,304 | | | | 1,037 | |
Other affiliates payable | | | 1,938 | | | | 4,342 | |
Other accrued expenses payable | | | 306,293 | | | | 596,844 | |
| | | | | | | | |
Total liabilities | | | 13,131,389 | | | | 30,966,568 | |
| | | | | | | | |
Net Assets | | $ | 455,872,315 | | | $ | 547,400,741 | |
| | | | | | | | |
| | | | | | | | |
| Net Assets Consist of | | | | | | | | |
Paid-in capital | | $ | 418,602,881 | | | $ | 461,144,567 | |
Undistributed net investment income (loss) | | | (960,767 | ) | | | 724,036 | |
Accumulated net realized loss | | | (33,766,921 | ) | | | (60,395,386 | ) |
Net unrealized appreciation/depreciation | | | 71,997,122 | | | | 145,927,524 | |
| | | | | | | | |
Net Assets | | $ | 455,872,315 | | | $ | 547,400,741 | |
| | | | | | | | |
1 Investments at cost — unaffiliated | | $ | 376,675,540 | | | $ | 398,227,065 | |
2 Securities on loan at value | | | — | | | $ | 11,574,904 | |
3 Investments at cost — affiliated | | $ | 7,177,076 | | | $ | 25,531,946 | |
4 Foreign currency at cost | | $ | 1,591,339 | | | $ | 682,853 | |
| | | | | | | | |
| | | | | | |
| See Notes to Financial Statements. | | | | |
| | | | | | | |
| 18 | | SEMI-ANNUAL REPORT | | APRIL 30, 2013 | | |
| | |
| Statements of Assets and Liabilities (concluded) | | |
| | | | | | | | |
| April 30, 2013 (Unaudited) | | BlackRock
Emerging Markets Fund, Inc. | | | BlackRock Latin America Fund, Inc. | |
| | | | | | | | |
| Net Asset Value | | | | | | | | |
| Institutional: | | | | | | | | |
Net assets | | $ | 141,296,469 | | | $ | 138,217,186 | |
| | | | | | | | |
Shares outstanding, 100 million shares authorized | | | 6,913,861 | | | | 2,222,279 | |
| | | | | | | | |
Net asset value | | $ | 20.44 | | | $ | 62.20 | |
| | | | | | | | |
Par value | | $ | 0.10 | | | $ | 0.10 | |
| | | | | | | | |
| Investor A: | | | | | | | | |
Net assets | | $ | 202,204,072 | | | $ | 300,801,825 | |
| | | | | | | | |
Shares outstanding, 100 million shares authorized | | | 10,243,313 | | | | 4,909,721 | |
| | | | | | | | |
Net asset value | | $ | 19.74 | | | $ | 61.27 | |
| | | | | | | | |
Par value | | $ | 0.10 | | | $ | 0.10 | |
| | | | | | | | |
| Investor B: | | | | | | | | |
Net assets | | $ | 1,837,003 | | | $ | 7,095,517 | |
| | | | | | | | |
Shares outstanding, 100 million shares authorized | | | 104,416 | | | | 123,602 | |
| | | | | | | | |
Net asset value | | $ | 17.59 | | | $ | 57.41 | |
| | | | | | | | |
Par value | | $ | 0.10 | | | $ | 0.10 | |
| | | | | | | | |
| Investor C: | | | | | | | | |
Net assets | | $ | 110,534,771 | | | $ | 101,286,213 | |
| | | | | | | | |
Shares outstanding, 100 million shares authorized | | | 6,490,441 | | | | 1,804,889 | |
| | | | | | | | |
Net asset value | | $ | 17.03 | | | $ | 56.12 | |
| | | | | | | | |
Par value | | $ | 0.10 | | | $ | 0.10 | |
| | | | | | | | |
| | | | | | |
| See Notes to Financial Statements. | | | | |
| | | | | | | |
| | SEMI-ANNUAL REPORT | | APRIL 30, 2013 | | 19 |
| | | | | | | | |
| Six Months Ended April 30, 2013 (Unaudited) | | BlackRock
Emerging
Markets Fund, Inc. | | | BlackRock Latin America Fund, Inc. | |
| | | | | | | | |
| Investment Income | | | | | |
Dividends — unaffiliated | | $ | 3,580,050 | | | $ | 9,111,860 | |
Dividends — affiliated | | | 9,402 | | | | 2,323 | |
Securities lending — affiliated | | | — | | | | 23,332 | |
Foreign taxes withheld | | | (332,807 | ) | | | (932,840 | ) |
| | | | | | | | |
Total income | | | 3,256,645 | | | | 8,204,675 | |
| | | | | | | | |
| | | | | | | | |
| Expenses | | | | | | | | |
Investment advisory | | | 2,207,421 | | | | 2,779,506 | |
Service — Investor A | | | 235,845 | | | | 392,275 | |
Service and distribution — Investor B | | | 10,535 | | | | 38,649 | |
Service and distribution — Investor C | | | 531,084 | | | | 536,996 | |
Transfer agent — Institutional | | | 90,779 | | | | 119,238 | |
Transfer agent — Investor A | | | 179,875 | | | | 288,122 | |
Transfer agent — Investor B | | | 5,408 | | | | 14,416 | |
Transfer agent — Investor C | | | 160,993 | | | | 143,527 | |
Custodian | | | 170,543 | | | | 159,603 | |
Accounting services | | | 47,261 | | | | 77,297 | |
Professional | | | 45,254 | | | | 39,582 | |
Registration | | | 23,141 | | | | 21,634 | |
Printing | | | 23,653 | | | | 20,000 | |
Officer and Directors | | | 6,157 | | | | 10,618 | |
Miscellaneous | | | 11,491 | | | | 12,516 | |
| | | | | | | | |
Total expenses | | | 3,749,440 | | | | 4,653,979 | |
Less fees waived by Manager | | | (5,599 | ) | | | (1,484 | ) |
| | | | | | | | |
Total expenses after fees waived | | | 3,743,841 | | | | 4,652,495 | |
| | | | | | | | |
Net investment income (loss) | | | (487,196 | ) | | | 3,552,180 | |
| | | | | | | | |
| | | | | | | | |
| Realized and Unrealized Gain (Loss) | | | | | | | | |
| Net realized gain (loss) from: | | | | | | | | |
Investments | | | 156,646 | | | | 25,144,372 | |
Foreign currency transactions | | | (136,445 | ) | | | (171,000 | ) |
| | | | | | | | |
| | | 20,201 | | | | 24,973,372 | |
| | | | | | | | |
| Net change in unrealized appreciation/depreciation on: | | | | | | | | |
Investments | | | 29,591,165 | | | | 10,218,632 | |
Foreign currency translations | | | (10,707 | ) | | | 17,657 | |
| | | | | | | | |
| | | 29,580,458 | | | | 10,236,289 | |
| | | | | | | | |
Total realized and unrealized gain | | | 29,600,659 | | | | 35,209,661 | |
| | | | | | | | |
Net Increase in Net Assets Resulting from Operations | | $ | 29,113,463 | | | $ | 38,761,841 | |
| | | | | | | | |
| | | | | | |
| See Notes to Financial Statements. | | | | |
| | | | | | | |
| 20 | | SEMI-ANNUAL REPORT | | APRIL 30, 2013 | | |
| | |
| Statements of Changes in Net Assets | | |
| | | | | | | | | | | | | | | | | | |
| | | BlackRock Emerging Markets Fund, Inc. | | | | | BlackRock Latin America Fund, Inc. | |
| Increase (Decrease) in Net Assets: | | Six Months Ended
April 30,
2013 (Unaudited) | | | Year Ended
October 31,
2012 | | | | | Six Months Ended
April 30,
2013
(Unaudited) | | | Year Ended
October 31,
2012 | |
| | | | | | | | | | | | | | | | | | |
| Operations | | | | | | | | | | | | | | | | | | |
Net investment income (loss) | | $ | (487,196 | ) | | $ | 4,339,687 | | | | | $ | 3,552,180 | | | $ | 7,879,333 | |
Net realized gain (loss) | | | 20,201 | | | | (15,383,056 | ) | | | | | 24,973,372 | | | | 17,773,200 | |
Net change in unrealized appreciation/depreciation | | | 29,580,458 | | | | 40,830,513 | | | | | | 10,236,289 | | | | (68,159,086 | ) |
| | | | | | | | | | |
Net increase (decrease) in net assets resulting from operations | | | 29,113,463 | | | | 29,787,144 | | | | | | 38,761,841 | | | | (42,506,553 | ) |
| | | | | | | | | | |
| | | | | | | | | | | | | | | | | | |
| Dividends to Shareholders From | | | | | | | | | | | | | | | | | | |
Net investment income: | | | | | | | | | | | | | | | | | | |
Institutional | | | (1,775,605 | ) | | | (655,387 | )1 | | | | | (2,038,175 | ) | | | (1,452,355 | )1 |
Investor A | | | (2,033,704 | ) | | | (376,139 | )1 | | | | | (4,509,297 | ) | | | (1,922,455 | )1 |
Investor B | | | — | | | | — | | | | | | (34,979 | ) | | | — | |
Investor C | | | (531,671 | ) | | | (70,513 | )1 | | | | | (626,313 | ) | | | — | |
| | | | | | | | | | |
Decrease in net assets resulting from dividends and distributions to shareholders | | | (4,340,980 | ) | | | (1,102,039 | ) | | | | | (7,208,764 | ) | | | (3,374,810 | ) |
| | | | | | | | | | |
| | | | | | | | | | | | | | | | | | |
| Capital Share Transactions | | | | | | | | | | | | | | | | | | |
Net increase (decrease) in net assets derived from capital share transactions | | | 34,769,376 | | | | (5,393,607 | ) | | | | | (44,489,491 | ) | | | (147,736,209 | ) |
| | | | | | | | | | |
| | | | | | | | | | | | | | | | | | |
| Net Assets | | | | | | | | | | | | | | | | | | |
Total increase (decrease) in net assets | | | 59,541,859 | | | | 23,291,498 | | | | | | (12,936,414 | ) | | | (193,617,572 | ) |
Beginning of period | | | 396,330,456 | | | | 373,038,958 | | | | | | 560,337,155 | | | | 753,954,727 | |
| | | | | | | | | | |
End of period | | $ | 455,872,315 | | | $ | 396,330,456 | | | | | $ | 547,400,741 | | | $ | 560,337,155 | |
| | | | | | | | | | |
Undistributed (distributions in excess of) net investment income | | $ | (960,767 | ) | | $ | 3,867,409 | | | | | $ | 724,036 | | | $ | 4,380,620 | |
| | | | | | | | | | |
| | 1 | | Dividends are determined in accordance with federal income tax regulations. |
| | | | | | |
| See Notes to Financial Statements. | | | | |
| | | | | | | |
| | SEMI-ANNUAL REPORT | | APRIL 30, 2013 | | 21 |
| | |
| Financial Highlights | | BlackRock Emerging Markets Fund, Inc. |
| | | | | | | | | | | | | | | | | | | | | | | | | | | | |
| | | Institutional | |
| | | Six Months Ended
April 30,
2013 (Unaudited) | | | Year Ended October 31, | | | Period July 1, 2008 to October 31, 2008 | | | Year Ended
June 30, 2008 | |
| | | | 2012 | | | 2011 | | | 2010 | | | 2009 | | | |
| | | | | | | | | | | | | | | | | | | | | | | | | | | | |
| Per Share Operating Performance | | | | | | | | | | | | | | | | | | | | | | | | | | | | |
Net asset value, beginning of period | | $ | 19.28 | | | $ | 18.23 | | | $ | 20.50 | | | $ | 17.01 | | | $ | 10.17 | | | $ | 22.45 | | | $ | 27.91 | |
| | | | |
Net investment income1 | | | 0.02 | | | | 0.29 | | | | 0.27 | | | | 0.13 | | | | 0.14 | | | | 0.07 | | | | 0.12 | |
Net realized and unrealized gain (loss) | | | 1.41 | | | | 0.85 | | | | (2.34 | )2 | | | 3.47 | 2 | | | 6.75 | 2 | | | (10.34 | )2 | | | 1.28 | 2 |
| | | | |
Net increase (decrease) from investment operations | | | 1.43 | | | | 1.14 | | | | (2.07 | ) | | | 3.60 | | | | 6.89 | | | | (10.27 | ) | | | 1.40 | |
| | | | |
| Dividends and distributions from: | | | | | | | | | | | | | | | | | | | | | | | | | |
Net investment income | | | (0.27 | ) | | | (0.09 | )3 | | | (0.20 | )3 | | | (0.11 | )3 | | | (0.05 | )3 | | | (0.01 | )3 | | | — | |
Net realized gain | | | — | | | | — | | | | — | | | | — | | | | — | | | | (2.00 | ) | | | (6.86 | ) |
| | | | |
Total dividends and distributions | | | (0.27 | ) | | | (0.09 | ) | | | (0.20 | ) | | | (0.11 | ) | | | (0.05 | ) | | | (2.01 | ) | | | (6.86 | ) |
| | | | |
Net asset value, end of period | | $ | 20.44 | | | $ | 19.28 | | | $ | 18.23 | | | $ | 20.50 | | | $ | 17.01 | | | $ | 10.17 | | | $ | 22.45 | |
| | | | |
| | | | | | | | | | | | | | | | | | | | | | | | | | | | |
| Total Investment Return4 | | | | | | | | | | | | | | | | | | | | | | | | | | | | |
Based on net asset value | | | 7.46% | 5 | | | 6.37% | | | | (10.21)% | | | | 21.28% | | | | 68.14% | | | | (48.15)% | 5 | | | 3.84% | |
| | | | |
| | | | | | | | | | | | | | | | | | | | | | | | | | | | |
| Ratios to Average Net Assets | | | | | | | | | | | | | | | | | | | | | | | | | | | | |
Total expenses | | | 1.27% | 6 | | | 1.33% | | | | 1.28% | | | | 1.33% | | | | 1.48% | | | | 1.56% | 6 | | | 1.40% | |
| | | | |
Total expenses after fees waived | | | 1.27% | 6 | | | 1.33% | | | | 1.28% | | | | 1.33% | | | | 1.48% | | | | 1.54% | 6 | | | 1.37% | |
| | | | |
Net investment income | | | 0.20% | 6 | | | 1.53% | | | | 1.39% | | | | 0.71% | | | | 1.10% | | | | 1.31% | 6 | | | 0.45% | |
| | | | |
| | | | | | | | | | | | | | | | | | | | | | | | | | | | |
| Supplemental Data | | | | | | | | | | | | | | | | | | | | | | | | | | | | |
Net assets, end of period (000) | | $ | 141,296 | | | $ | 116,883 | | | $ | 127,181 | | | $ | 123,007 | | | $ | 86,173 | | | $ | 42,803 | | | $ | 80,399 | |
| | | | |
Portfolio turnover | | | 35% | | | | 155% | | | | 138% | | | | 135% | | | | 191% | | | | 76% | | | | 163% | |
| | | | |
| | 1 | | Based on average shares outstanding. |
| | 2 | | Includes a redemption fee, which is less than $0.01 per share. |
| | 3 | | Dividends and distributions are determined in accordance with federal income tax regulations. |
| | 4 | | Where applicable, total investment returns include the reinvestment of dividends and distributions. |
| | 5 | | Aggregate total investment return. |
| | | | | | |
| See Notes to Financial Statements. | | | | |
| | | | | | | |
| 22 | | SEMI-ANNUAL REPORT | | APRIL 30, 2013 | | |
| | |
| Financial Highlights (continued) | | BlackRock Emerging Markets Fund, Inc. |
| | | | | | | | | | | | | | | | | | | | | | | | | | | | |
| | | Investor A | |
| | | Six Months
Ended April 30, 2013 (Unaudited) | | | Year Ended October 31, | | | Period
July 1, 2008
to October 31, 2008 | | | Year Ended June 30, 2008 | |
| | | | 2012 | | | 2011 | | | 2010 | | | 2009 | | | |
| | | | | | | | | | | | | | | | | | | | | | | | | | | | |
| Per Share Operating Performance | | | | | | | | | | | | | | | | | | | | | | | | | | | | |
Net asset value, beginning of period | | $ | 18.61 | | | $ | 17.60 | | | $ | 19.81 | | | $ | 16.45 | | | $ | 9.85 | | | $ | 21.80 | | | $ | 27.27 | |
| | | | |
Net investment income1 | | | 0.01 | | | | 0.22 | | | | 0.18 | | | | 0.07 | | | | 0.10 | | | | 0.05 | | | | 0.04 | |
Net realized and unrealized gain (loss) | | | 1.34 | | | | 0.83 | | | | (2.24 | )2 | | | 3.36 | 2 | | | 6.53 | 2 | | | (10.02 | )2 | | | 1.25 | 2 |
| | | | |
Net increase (decrease) from investment operations | | | 1.35 | | | | 1.05 | | | | (2.06 | ) | | | 3.43 | | | | 6.63 | | | | (9.97 | ) | | | 1.29 | |
| | | | |
| Dividends and distributions from: | | | | | | | | | | | | | | | | | | | | | | | | | | | | |
Net investment income | | | (0.22 | ) | | | (0.04 | )3 | | | (0.15 | )3 | | | (0.07 | )3 | | | (0.03 | )3 | | | — | | | | — | |
Net realized gain | | | — | | | | — | | | | — | | | | — | | | | — | | | | (1.98 | ) | | | (6.76 | ) |
| | | | |
Total dividends and distributions | | | (0.22 | ) | | | (0.04 | ) | | | (0.15 | ) | | | (0.07 | ) | | | (0.03 | ) | | | (1.98 | ) | | | (6.76 | ) |
| | | | |
Net asset value, end of period | | $ | 19.74 | | | $ | 18.61 | | | $ | 17.60 | | | $ | 19.81 | | | $ | 16.45 | | | $ | 9.85 | | | $ | 21.80 | |
| | | | | | | | | | | | | | | | | | | | | | | | | | | | |
| | | | | | | | | | | | | | | | | | | | | | | | | | | | |
| Total Investment Return4 | | | | | | | | | | | | | | | | | | | | | | | | | | | | |
Based on net asset value | | | 7.25% | 5 | | | 6.02% | | | | (10.48)% | | | | 20.93% | | | | 67.59% | | | | (48.18)% | 5 | | | 3.49% | |
| | | | |
| | | | | | | | | | | | | | | | | | | | | | | | | | | | |
| Ratios to Average Net Assets | | | | | | | | | | | | | | | | | | | | | | | | | | | | |
Total expenses | | | 1.59% | 6 | | | 1.67% | | | | 1.59% | | | | 1.65% | | | | 1.83% | | | | 1.87% | 6 | | | 1.68% | |
| | | | |
Total expenses after fees waived | | | 1.59% | 6 | | | 1.67% | | | | 1.59% | | | | 1.65% | | | | 1.83% | | | | 1.85% | 6 | | | 1.65% | |
| | | | |
Net investment income (loss) | | | (0.10)% | 6 | | | 1.24% | | | | 0.93% | | | | 0.43% | | | | 0.80% | | | | 0.98% | 6 | | | 0.16% | |
| | | | |
| | | | | | | | | | | | | | | | | | | | | | | | | | | | |
| Supplemental Data | | | | | | | | | | | | | | | | | | | | | | | | | | | | |
Net assets, end of period (000) | | $ | 202,204 | | | $ | 174,637 | | | $ | 155,017 | | | $ | 144,976 | | | $ | 111,850 | | | $ | 67,614 | | | $ | 145,781 | |
| | | | |
Portfolio turnover | | | 35% | | | | 155% | | | | 138% | | | | 135% | | | | 191% | | | | 76% | | | | 163% | |
| | | | |
| | 1 | | Based on average shares outstanding. |
| | 2 | | Includes a redemption fee, which is less than $0.01 per share. |
| | 3 | | Dividends and distributions are determined in accordance with federal income tax regulations. |
| | 4 | | Where applicable, total investment returns exclude the effects of any sales charges and include the reinvestment of dividends and distributions. |
| | 5 | | Aggregate total investment return. |
| | | | | | |
| See Notes to Financial Statements. | | | | |
| | | | | | | |
| | SEMI-ANNUAL REPORT | | APRIL 30, 2013 | | 23 |
| | |
| Financial Highlights (continued) | | BlackRock Emerging Markets Fund, Inc. |
| | | | | | | | | | | | | | | | | | | | | | | | | | | | |
| | | Investor B | |
| | | Six Months
Ended April 30, 2013 (Unaudited) | | | Year Ended October 31, | | | Period
July 1, 2008 to October 31, 2008 | | | Year Ended
June 30, 2008 | |
| | | | 2012 | | | 2011 | | | 2010 | | | 2009 | | | |
| | | | | | | | | | | | | | | | | | | | | | | | | | | | |
| Per Share Operating Performance | | | | | | | | | | | | | | | | | | | | | | | | | | | | |
Net asset value, beginning of period | | $ | 16.49 | | | $ | 15.71 | | | $ | 17.70 | | | $ | 14.76 | | | $ | 8.89 | | | $ | 19.86 | | | $ | 25.20 | |
| | | | |
Net investment income (loss)1 | | | (0.11 | ) | | | 0.04 | | | | (0.00 | )2 | | | (0.07 | ) | | | (0.01 | ) | | | 0.01 | | | | (0.14 | ) |
Net realized and unrealized gain (loss) | | | 1.21 | | | | 0.74 | | | | (1.99 | )3 | | | 3.01 | | | | 5.88 | 3 | | | (8.98 | )3 | | | 1.18 | 3 |
| | | | |
Net increase (decrease) from investment operations | | | 1.10 | | | | 0.78 | | | | (1.99 | ) | | | 2.94 | | | | 5.87 | | | | (8.97 | ) | | | 1.04 | |
| | | | |
Distributions from net realized gain | | | — | | | | — | | | | — | | | | — | | | | — | | | | (2.00 | )4 | | | (6.38 | )4 |
| | | | |
Total dividends and distributions | | | — | | | | — | | | | — | | | | — | | | | — | | | | (2.00 | ) | | | (6.38 | ) |
| | | | |
Net asset value, end of period | | $ | 17.59 | | | $ | 16.49 | | | $ | 15.71 | | | $ | 17.70 | | | $ | 14.76 | | | $ | 8.89 | | | $ | 19.86 | |
| | | | |
| | | | | | | | | | | | | | | | | | | | | | | | | | | | |
| Total Investment Return5 | | | | | | | | | | | | | | | | | | | | | | | | | | | | |
Based on net asset value | | | 6.67% | 6 | | | 4.96% | | | | (11.24)% | | | | 19.92% | | | | 66.03% | | | | (48.33)% | 6 | | | 2.70% | |
| | | | |
| | | | | | | | | | | | | | | | | | | | | | | | | | | | |
| Ratios to Average Net Assets | | | | | | | | | | | | | | | | | | | | | | | | | | | | |
Total expenses | | | 2.66% | 7 | | | 2.66% | | | | 2.45% | | | | 2.49% | | | | 2.71% | | | | 2.71% | 7 | | | 2.47% | |
| | | | |
Total expenses after fees waived | | | 2.66% | 7 | | | 2.66% | | | | 2.45% | | | | 2.49% | | | | 2.71% | | | | 2.69% | 7 | | | 2.44% | |
| | | | |
Net investment income (loss) | | | (1.27)% | 7 | | | 0.25% | | | | (0.02)% | | | | (0.45)% | | | | (0.08)% | | | | 0.13% | 7 | | | (0.60)% | |
| | | | |
| | | | | | | | | | | | | | | | | | | | | | | | | | | | |
| Supplemental Data | | | | | | | | | | | | | | | | | | | | | | | | | | | | |
Net assets, end of period (000) | | $ | 1,837 | | | $ | 2,251 | | | $ | 3,386 | | | $ | 4,677 | | | $ | 4,809 | | | $ | 3,487 | | | $ | 7,955 | |
| | | | |
Portfolio turnover | | | 35% | | | | 155% | | | | 138% | | | | 135% | | | | 191% | | | | 76% | | | | 163% | |
| | | | |
| | 1 | | Based on average shares outstanding. |
| | 2 | | Amount is less than $(0.01) per shares. |
| | 3 | | Includes a redemption fee, which is less than $0.01 per share. |
| | 4 | | Dividends and distributions are determined in accordance with federal income tax regulations. |
| | 5 | | Where applicable, total investment returns exclude the effects of any sales charges and include the reinvestment of dividends and distributions. |
| | 6 | | Aggregate total investment return. |
| | | | | | |
| See Notes to Financial Statements. | | | | |
| | | | | | | |
| 24 | | SEMI-ANNUAL REPORT | | APRIL 30, 2013 | | |
| | |
| Financial Highlights (concluded) | | BlackRock Emerging Markets Fund, Inc. |
| | | | | | | | | | | | | | | | | | | | | | | | | | | | |
| | | Investor C | |
| | | Six Months
Ended April 30, 2013 (Unaudited) | | | Year Ended October 31, | | | Period July 1, 2008 to October 31, 2008 | | | Year Ended
June 30, 2008 | |
| | | | 2012 | | | 2011 | | | 2010 | | | 2009 | | | |
| | | | | | | | | | | | | | | | | | | | | | | | | | | | |
| Per Share Operating Performance | | | | | | | | | | | | | | | | | | | | | | | | | | | | |
Net asset value, beginning of period | | $ | 16.02 | | | $ | 15.26 | | | $ | 17.23 | | | $ | 14.38 | | | $ | 8.65 | | | $ | 19.42 | | | $ | 24.91 | |
| | | | |
Net investment income (loss)1 | | | (0.08 | ) | | | 0.06 | | | | 0.05 | | | | (0.06 | ) | | | (0.01 | ) | | | 0.01 | | | | (0.14 | ) |
Net realized and unrealized gain (loss) | | | 1.17 | | | | 0.71 | | | | (1.98 | )2 | | | 2.92 | 2 | | | 5.74 | 2 | | | (8.89 | )2 | | | 1.18 | 2 |
| | | | |
Net increase (decrease) from investment operations | | | 1.09 | | | | 0.77 | | | | (1.93 | ) | | | 2.86 | | | | 5.73 | | | | (8.88 | ) | | | 1.04 | |
| | | | |
| Dividends and distributions from: | | | | | | | | | | | | | | | | | | | | | | | | | | | | |
Net investment income | | | (0.08 | ) | | | (0.01 | )3 | | | (0.04 | )3 | | | (0.01 | )3 | | | — | | | | — | | | | — | |
Net realized gain | | | — | | | | — | | | | — | | | | — | | | | — | | | | (1.89 | )3 | | | (6.53 | )3 |
| | | | |
Total dividends and distributions | | | (0.08 | ) | | | (0.01 | ) | | | (0.04 | ) | | | (0.01 | ) | | | — | | | | (1.89 | ) | | | (6.53 | ) |
| | | | |
Net asset value, end of period | | $ | 17.03 | | | $ | 16.02 | | | $ | 15.26 | | | $ | 17.23 | | | $ | 14.38 | | | $ | 8.65 | | | $ | 19.42 | |
| | | | |
| | | | | | | | | | | | | | | | | | | | | | | | | | | | |
| Total Investment Return4 | | | | | | | | | | | | | | | | | | | | | | | | | | | | |
Based on net asset value | | | 6.84% | 5 | | | 5.07% | | | | (11.21)% | | | | 19.90% | | | | 66.24% | | | | (48.35)% | 5 | | | 2.70% | |
| | | | |
| | | | | | | | | | | | | | | | | | | | | | | | | | | | |
| Ratios to Average Net Assets | | | | | | | | | | | | | | | | | | | | | | | | | | | | |
Total expenses | | | 2.45% | 6 | | | 2.56% | | | | 2.37% | | | | 2.49% | | | | 2.66% | | | | 2.69% | 6 | | | 2.45% | |
| | | | |
Total expenses after fees waived | | | 2.45% | 6 | | | 2.56% | | | | 2.37% | | | | 2.49% | | | | 2.66% | | | | 2.67% | 6 | | | 2.42% | |
| | | | |
Net investment income (loss) | | | (0.98)% | 6 | | | 0.38% | | | | 0.30% | | | | (0.38)% | | | | (0.08)% | | | | 0.15% | 6 | | | (0.61)% | |
| | | | |
| | | | | | | | | | | | | | | | | | | | | | | | | | | | |
| Supplemental Data | | | | | | | | | | | | | | | | | | | | | | | | | | | | |
Net assets, end of period (000) | | $ | 110,535 | | | $ | 102,559 | | | $ | 87,455 | | | $ | 38,711 | | | $ | 26,347 | | | $ | 13,572 | | | $ | 31,948 | |
| | | | |
Portfolio turnover | | | 35% | | | | 155% | | | | 138% | | | | 135% | | | | 191% | | | | 76% | | | | 163% | |
| | | | |
| | 1 | | Based on average shares outstanding. |
| | 2 | | Includes a redemption fee, which is less than $0.01 per share. |
| | 3 | | Dividends and distributions are determined in accordance with federal income tax regulations. |
| | 4 | | Where applicable, total investment returns exclude the effects of any sales charges and include the reinvestment of dividends and distributions. |
| | 5 | | Aggregate total investment return. |
| | | | | | |
| See Notes to Financial Statements. | | | | |
| | | | | | | |
| | SEMI-ANNUAL REPORT | | APRIL 30, 2013 | | 25 |
| | |
| Financial Highlights | | BlackRock Latin America Fund, Inc. |
| | | | | | | | | | | | | | | | | | | | | | | | | | | | |
| | | Institutional | |
| | | Six Months
Ended
April 30,
2013
(Unaudited) | | | Year Ended October 31, | | | Period
December 1, 2007
to October 31,
20081 | | | Year Ended
November 30,
20071 | |
| | | | 2012 | | | 2011 | | | 2010 | | | 20091 | | | |
| | | | | | | | | | | | | | | | | | | | | | | | | | | | |
| Per Share Operating Performance | | | | | | | | | | | | | | | | | | | | | | | | | |
Net asset value, beginning of period | | $ | 58.82 | | | $ | 62.80 | | | $ | 75.35 | | | $ | 58.63 | | | $ | 30.53 | | | $ | 78.57 | | | $ | 50.67 | |
| | | | |
Net investment income2 | | | 0.53 | | | | 0.94 | | | | 1.31 | | | | 0.85 | | | | 0.64 | | | | 0.61 | | | | 0.50 | |
Net realized and unrealized gain (loss) | | | 3.85 | | | | (4.38 | ) | | | (12.58 | ) | | | 16.82 | | | | 27.45 | | | | (36.41 | ) | | | 28.10 | |
| | | | |
Net increase (decrease) from investment operations | | | 4.38 | | | | (3.44 | ) | | | (11.27 | ) | | | 17.67 | | | | 28.09 | | | | (35.80 | ) | | | 28.60 | |
| | | | |
| Dividends and distributions from: | | | | | | | | | | | | | | | | | | | | | | | | | | | | |
Net investment income | | | (1.00 | ) | | | (0.54 | )3 | | | (1.28 | )3 | | | (0.97 | )3 | | | — | | | | (0.80 | )3 | | | (0.72 | )3 |
Net realized gain | | | — | | | | — | | | | — | | | | — | | | | — | | | | (11.47 | )3 | | | — | |
| | | | |
Total dividends and distributions | | | (1.00 | ) | | | (0.54 | ) | | | (1.28 | ) | | | (0.97 | ) | | | — | | | | (12.27 | ) | | | (0.72 | ) |
| | | | |
Redemption fee | | | — | | | | — | | | | — | | | | 0.02 | | | | 0.01 | | | | 0.03 | | | | 0.02 | |
| | | | |
Net asset value, end of period | | $ | 62.20 | | | $ | 58.82 | | | $ | 62.80 | | | $ | 75.35 | | | $ | 58.63 | | | $ | 30.53 | | | $ | 78.57 | |
| | | | |
| | | | | | | | | | | | | | | | | | | | | | | | | | | | |
| Total Investment Return4 | | | | | | | | | | | | | | | | | | | | | | | | | |
Based on net asset value | | | 7.48% | 5 | | | (5.43)% | | | | (15.18)% | | | | 30.52% | | | | 92.04% | | | | (53.70)% | 5 | | | 57.20% | 6 |
| | | | |
| | | | | | | | | | | | | | | | | | | | | | | | | | | | |
| Ratios to Average Net Assets | | | | | | | | | | | | | | | | | | | | | | | | | |
Total expenses | | | 1.31% | 7 | | | 1.32% | | | | 1.26% | | | | 1.25% | | | | 1.35% | | | | 1.30% | 7 | | | 1.26% | |
| | | | |
Total expenses after fees waived | | | 1.31% | 7 | | | 1.32% | | | | 1.26% | | | | 1.25% | | | | 1.35% | | | | 1.30% | 7 | | | 1.26% | |
| | | | |
Net investment income | | | 1.74% | 7 | | | 1.55% | | | | 1.89% | | | | 1.31% | | | | 1.60% | | | | 1.04% | 7 | | | 0.87% | |
| | | | |
| | | | | | | | | | | | | | | | | | | | | | | | | | | | |
| Supplemental Data | | | | | | | | | | | | | | | | | | | | | | | | | |
Net assets, end of period (000) | | $ | 138,217 | | | $ | 125,473 | | | $ | 175,554 | | | $ | 200,980 | | | $ | 114,101 | | | $ | 58,877 | | | $ | 128,094 | |
| | | | |
Portfolio turnover | | | 29% | | | | 50% | | | | 33% | | | | 64% | | | | 50% | | | | 61% | | | | 72% | |
| | | | |
| | 1 | | Consolidated Financial Highlights. See Note 1 to the Notes to Financial Statements. |
| | 2 | | Based on average shares outstanding. |
| | 3 | | Dividends and distributions are determined in accordance with federal income tax regulations. |
| | 4 | | Where applicable, total investment returns include the reinvestment of dividends and distributions. |
| | 5 | | Aggregate total investment return. |
| | 6 | | The investment advisor reimbursed the Fund in order to resolve a regulatory issue relating to an investment, which increased the return by 0.02%. |
| | | | | | |
| See Notes to Financial Statements. | | | | |
| | | | | | | |
| 26 | | SEMI-ANNUAL REPORT | | APRIL 30, 2013 | | |
| | |
| Financial Highlights (continued) | | BlackRock Latin America Fund, Inc. |
| | | | | | | | | | | | | | | | | | | | | | | | | | | | |
| | | Investor A | |
| | | Six Months
Ended
April 30,
2013
(Unaudited) | | | Year Ended October 31, | | | Period
December 1, 2007
to October 31,
20081 | | | Year Ended
November 30,
20071 | |
| | | | 2012 | | | 2011 | | | 2010 | | | 20091 | | | |
| | | | | | | | | | | | | | | | | | | | | | | | | | | | |
| Per Share Operating Performance | | | | | | | | | | | | | | | | | | | | | | | | | |
Net asset value, beginning of period | | $ | 57.90 | | | $ | 61.67 | | | $ | 74.07 | | | $ | 57.73 | | | $ | 30.15 | | | $ | 77.78 | | | $ | 50.17 | |
| | | | |
Net investment income2 | | | 0.41 | | | | 0.78 | | | | 1.08 | | | | 0.65 | | | | 0.51 | | | | 0.44 | | | | 0.60 | |
Net realized and unrealized gain (loss) | | | 3.83 | | | | (4.25 | ) | | | (12.37 | ) | | | 16.54 | | | | 27.06 | | | | (35.97 | ) | | | 27.60 | |
| | | | |
Net increase (decrease) from investment operations | | | 4.24 | | | | (3.47 | ) | | | (11.29 | ) | | | 17.19 | | | | 27.57 | | | | (35.53 | ) | | | 28.20 | |
| | | | |
| Dividends and distributions from: | | | | | | | | | | | | | | | | | | | | | | | | | | | | |
Net investment income | | | (0.87 | ) | | | (0.30 | )3 | | | (1.11 | )3 | | | (0.88 | )3 | | | — | | | | (0.66 | )3 | | | (0.61 | )3 |
Net realized gain | | | — | | | | — | | | | — | | | | — | | | | — | | | | (11.47 | )3 | | | — | |
| | | | |
Total dividends and distributions | | | (0.87 | ) | | | (0.30 | ) | | | (1.11 | ) | | | (0.88 | ) | | | — | | | | (12.13 | ) | | | (0.61 | ) |
| | | | |
Redemption fee | | | — | | | | — | | | | — | | | | 0.03 | | | | 0.01 | | | | 0.03 | | | | 0.02 | |
| | | | |
Net asset value, end of period | | $ | 61.27 | | | $ | 57.90 | | | $ | 61.67 | | | $ | 74.07 | | | $ | 57.73 | | | $ | 30.15 | | | $ | 77.78 | |
| | | | |
| | | | | | | | | | | | | | | | | | | | | | | | | | | | |
| Total Investment Return4 | | | | | | | | | | | | | | | | | | | | | | | | | |
Based on net asset value | | | 7.35% | 5 | | | (5.60)% | | | | (15.44)% | | | | 30.15% | | | | 91.48% | | | | (53.82)% | 5 | | | 56.85% | 6 |
| | | | |
| | | | | | | | | | | | | | | | | | | | | | | | | | | | |
| Ratios to Average Net Assets | | | | | | | | | | | | | | | | | | | | | | | | | |
Total expenses | | | 1.56% | 7 | | | 1.53% | | | | 1.55% | | | | 1.53% | | | | 1.63% | | | | 1.55% | 7 | | | 1.51% | |
| | | | |
Total expenses after fees waived | | | 1.56% | 7 | | | 1.53% | | | | 1.55% | | | | 1.53% | | | | 1.63% | | | | 1.55% | 7 | | | 1.51% | |
| | | | |
Net investment income | | | 1.37% | 7 | | | 1.32% | | | | 1.57% | | | | 1.00% | | | | 1.26% | | | | 0.76% | 7 | | | 0.92% | |
| | | | |
| | | | | | | | | | | | | | | | | | | | | | | | | | | | |
| Supplemental Data | | | | | | | | | | | | | | | | | | | | | | | | | |
Net assets, end of period (000) | | $ | 300,802 | | | $ | 315,531 | | | $ | 405,903 | | | $ | 616,664 | | | $ | 475,611 | | | $ | 176,711 | | | $ | 433,844 | |
| | | | |
Portfolio turnover | | | 29% | | | | 50% | | | | 33% | | | | 64% | | | | 50% | | | | 61% | | | | 72% | |
| | | | |
| | 1 | | Consolidated Financial Highlights. See Note 1 to the Notes to Financial Statements. |
| | 2 | | Based on average shares outstanding. |
| | 3 | | Dividends and distributions are determined in accordance with federal income tax regulations. |
| | 4 | | Where applicable, total investment returns exclude the effects of any sales charges and include the reinvestment of dividends and distributions. |
| | 5 | | Aggregate total investment return. |
| | 6 | | The investment advisor reimbursed the Fund in order to resolve a regulatory issue relating to an investment, which increased the return by 0.02%. |
| | | | | | |
| See Notes to Financial Statements. | | | | |
| | | | | | | |
| | SEMI-ANNUAL REPORT | | APRIL 30, 2013 | | 27 |
| | |
| Financial Highlights (continued) | | BlackRock Latin America Fund, Inc. |
| | | | | | | | | | | | | | | | | | | | | | | | | | | | |
| | | Investor B | |
| | | Six Months
Ended
April 30,
2013
(Unaudited) | | | Year Ended October 31, | | | Period
December 1, 2007
to October 31,
20081 | | | Year Ended
November 30,
20071 | |
| | | | 2012 | | | 2011 | | | 2010 | | | 20091 | | | |
| | | | | | | | | | | | | | | | | | | | | | | | | | | | |
| Per Share Operating Performance | | | | | | | | | | | | | | | | | | | | | | | | | |
Net asset value, beginning of period | | $ | 53.96 | | | $ | 57.68 | | | $ | 69.31 | | | $ | 54.12 | | | $ | 28.54 | | | $ | 74.38 | | | $ | 48.00 | |
| | | | |
Net investment income (loss)2 | | | 0.11 | | | | 0.24 | | | | 0.46 | | | | 0.12 | | | | 0.15 | | | | (0.04 | ) | | | 0.05 | |
Net realized and unrealized gain (loss) | | | 3.59 | | | | (3.96 | ) | | | (11.59 | ) | | | 15.50 | | | | 25.42 | | | | (34.09 | ) | | | 26.52 | |
| | | | |
Net increase (decrease) from investment operations | | | 3.70 | | | | (3.72 | ) | | | (11.13 | ) | | | 15.62 | | | | 25.57 | | | | (34.13 | ) | | | 26.57 | |
| | | | |
| Dividends and distributions from: | | | | | | | | | | | | | | | | | | | | | | | | | | | | |
Net investment income | | | (0.25 | ) | | | — | | | | (0.50 | )3 | | | (0.45 | )3 | | | — | | | | (0.27 | )3 | | | (0.21 | )3 |
Net realized gain | | | — | | | | — | | | | — | | | | — | | | | — | | | | (11.47 | )3 | | | — | |
| | | | |
Total dividends and distributions | | | (0.25 | ) | | | — | | | | (0.50 | ) | | | (0.45 | ) | | | — | | | | (11.74 | ) | | | (0.21 | ) |
| | | | |
Redemption fee | | | — | | | | — | | | | — | | | | 0.02 | | | | 0.01 | | | | 0.03 | | | | 0.02 | |
| | | | |
Net asset value, end of period | | $ | 57.41 | | | $ | 53.96 | | | $ | 57.68 | | | $ | 69.31 | | | $ | 54.12 | | | $ | 28.54 | | | $ | 74.38 | |
| | | | |
| | | | | | | | | | | | | | | | | | | | | | | | | | | | |
| Total Investment Return4 | | | | | | | | | | | | | | | | | | | | | | | | | |
Based on net asset value | | | 6.86% | 5 | | | (6.45)% | | | | (16.16)% | | | | 29.06% | | | | 89.63% | | | | (54.18)% | 5 | | | 55.61% | 6 |
| | | | |
| | | | | | | | | | | | | | | | | | | | | | | | | | | | |
| Ratios to Average Net Assets | | | | | | | | | | | | | | | | | | | | | | | | | |
Total expenses | | | 2.50% | 7 | | | 2.41% | | | | 2.40% | | | | 2.37% | | | | 2.62% | | | | 2.39% | 7 | | | 2.32% | |
| | | | |
Total expenses after fees waived | | | 2.50% | 7 | | | 2.41% | | | | 2.40% | | | | 2.37% | | | | 2.62% | | | | 2.39% | 7 | | | 2.32% | |
| | | | |
Net investment income (loss) | | | 0.40% | 7 | | | 0.43% | | | | 0.71% | | | | 0.21% | | | | 0.40% | | | | (0.08)% | 7 | | | 0.09% | |
| | | | |
| | | | | | | | | | | | | | | | | | | | | | | | | | | | |
| Supplemental Data | | | | | | | | | | | | | | | | | | | | | | | | | |
Net assets, end of period (000) | | $ | 7,096 | | | $ | 7,989 | | | $ | 11,886 | | | $ | 18,660 | | | $ | 18,695 | | | $ | 11,794 | | | $ | 31,268 | |
| | | | |
Portfolio turnover | | | 29% | | | | 50% | | | | 33% | | | | 64% | | | | 50% | | | | 61% | | | | 72% | |
| | | | |
| | 1 | | Consolidated Financial Highlights. See Note 1 to the Notes to Financial Statements. |
| | 2 | | Based on average shares outstanding. |
| | 3 | | Dividends and distributions are determined in accordance with federal income tax regulations. |
| | 4 | | Where applicable, total investment returns exclude the effects of any sales charges and include the reinvestment of dividends and distributions. |
| | 5 | | Aggregate total investment return. |
| | 6 | | The investment advisor reimbursed the Fund in order to resolve a regulatory issue relating to an investment, which increased the return by 0.02%. |
| | | | | | |
| See Notes to Financial Statements. | | | | |
| | | | | | | |
| 28 | | SEMI-ANNUAL REPORT | | APRIL 30, 2013 | | |
| | |
| Financial Highlights (concluded) | | BlackRock Latin America Fund, Inc. |
| | | | | | | | | | | | | | | | | | | | | | | | | | | | |
| | | Investor C | |
| | | Six Months
Ended April 30,
2013 (Unaudited) | | | Year Ended October 31, | | | Period December 1, 2007
to October 31, 20081 | | | Year Ended November 30, 20071 | |
| | | | 2012 | | | 2011 | | | 2010 | | | 20091 | | | |
| | | | | | | | | | | | | | | | | | | | | | | | | | | | |
| Per Share Operating Performance | | | | | | | | | | | | | | | | | | | | | | | | | |
Net asset value, beginning of period | | $ | 52.79 | | | $ | 56.39 | | | $ | 67.92 | | | $ | 53.17 | | | $ | 28.01 | | | $ | 73.28 | | | $ | 47.40 | |
| | | | |
Net investment income (loss)2 | | | 0.15 | | | | 0.27 | | | | 0.51 | | | | 0.14 | | | | 0.17 | | | | (0.01 | ) | | | 0.11 | |
Net realized and unrealized gain (loss) | | | 3.49 | | | | (3.87 | ) | | | (11.35 | ) | | | 15.21 | | | | 24.98 | | | | (33.46 | ) | | | 26.08 | |
| | | | |
Net increase (decrease) from investment operations | | | 3.64 | | | | (3.60 | ) | | | (10.84 | ) | | | 15.35 | | | | 25.15 | | | | (33.47 | ) | | | 26.19 | |
| | | | |
| Dividends and distributions from: | | | | | | | | | | | | | | | | | | | | | | | | | | | | |
Net investment income | | | (0.31 | ) | | | — | | | | (0.69 | )3 | | | (0.62 | )3 | | | — | | | | (0.36 | )3 | | | (0.33 | )3 |
Net realized gain | | | — | | | | — | | | | — | | | | — | | | | — | | | | (11.47 | )3 | | | — | |
| | | | |
Total dividends and distributions | | | (0.31 | ) | | | — | | | | (0.69 | ) | | | (0.62 | ) | | | — | | | | (11.83 | ) | | | (0.33 | ) |
| | | | |
Redemption fee | | | — | | | | — | | | | — | | | | 0.02 | | | | 0.01 | | | | 0.03 | | | | 0.02 | |
| | | | |
Net asset value, end of period | | $ | 56.12 | | | $ | 52.79 | | | $ | 56.39 | | | $ | 67.92 | | | $ | 53.17 | | | $ | 28.01 | | | $ | 73.28 | |
| | | | |
| | | | | | | | | | | | | | | | | | | | | | | | | | | | |
| Total Investment Return4 | | | | | | | | | | | | | | | | | | | | | | | | | |
Based on net asset value | | | 6.91% | 5 | | | (6.38)% | | | | (16.10)% | | | | 29.15% | | | | 89.82% | | | | (54.16)% | 5 | | | 55.62% | 6 |
| | | | |
| | | | | | | | | | | | | | | | | | | | | | | | | | | | |
| Ratios to Average Net Assets | | | | | | | | | | | | | | | | | | | | | | | | | |
Total expenses | | | 2.39% | 7 | | | 2.35% | | | | 2.33% | | | | 2.32% | | | | 2.49% | | | | 2.35% | 7 | | | 2.29% | |
| | | | |
Total expenses after fees waived | | | 2.39% | 7 | | | 2.35% | | | | 2.33% | | | | 2.32% | | | | 2.49% | | | | 2.35% | 7 | | | 2.29% | |
| | | | |
Net investment income (loss) | | | 0.53% | 7 | | | 0.49% | | | | 0.80% | | | | 0.24% | | | | 0.46% | | | | (0.02)% | 7 | | | 0.17% | |
| | | | |
| | | | | | | | | | | | | | | | | | | | | | | | | | | | |
| Supplemental Data | | | | | | | | | | | | | | | | | | | | | | | | | |
Net assets, end of period (000) | | $ | 101,286 | | | $ | 111,344 | | | $ | 160,612 | | | $ | 217,750 | | | $ | 151,046 | | | $ | 72,714 | | | $ | 164,742 | |
| | | | |
Portfolio turnover | | | 29% | | | | 50% | | | | 33% | | | | 64% | | | | 50% | | | | 61% | | | | 72% | |
| | | | |
| | 1 | | Consolidated Financial Highlights. See Note 1 to the Notes to Financial Statements. |
| | 2 | | Based on average shares outstanding. |
| | 3 | | Dividends and distributions are determined in accordance with federal income tax regulations. |
| | 4 | | Where applicable, total investment returns exclude the effects of any sales charges and include the reinvestment of dividends and distributions. |
| | 5 | | Aggregate total investment return. |
| | 6 | | The investment advisor reimbursed the Fund in order to resolve a regulatory issue relating to an investment, which increased the return by 0.02%. |
| | | | | | |
| See Notes to Financial Statements. | | | | |
| | | | | | | |
| | SEMI-ANNUAL REPORT | | APRIL 30, 2013 | | 29 |
| | |
| Notes to Financial Statements (unaudited) | | |
1. Organization and Significant Accounting Policies:
BlackRock Emerging Markets Fund, Inc. (formerly known as BlackRock Global Emerging Markets Fund, Inc.), (“Emerging Markets”) and BlackRock Latin America Fund, Inc. (“Latin America”) (collectively the “Funds” or individually a “Fund”), are registered under the Investment Company Act of 1940, as amended (the “1940 Act”), as open-end management investment companies. The Funds are classified as non-diversified. Each Fund is organized as a Maryland corporation. The Funds’ financial statements are prepared in conformity with accounting principles generally accepted in the United States of America (“US GAAP”), which may require management to make estimates and assumptions that affect the reported amounts of assets and liabilities in the financial statements and the reported amount of increases and decreases in net assets from operations during the reporting period. Actual results could differ from those estimates. Each Fund offers multiple classes of shares. Institutional Shares are sold without a sales charge and only to certain eligible investors. Investor A Shares are generally sold with a front-end sales charge. Investor B and Investor C Shares may be subject to a CDSC. All classes of shares have identical voting, dividend, liquidation and other rights and the same terms and conditions, except that Investor A, Investor B and Investor C Shares bear certain expenses related to the shareholder servicing of such shares, and Investor B and Investor C Shares also bear certain expenses related to the distribution of such shares. Investor B Shares automatically convert to Investor A Shares after approximately eight years. Investor B Shares are only available through exchanges and dividend reinvestments by existing shareholders or for purchase by certain employer-sponsored retirement plans. Each class has exclusive voting rights with respect to matters relating to its shareholder servicing and distribution expenditures (except that Investor B shareholders may vote on material changes to the Investor A distribution and service plan).
The following is a summary of significant accounting policies followed by the Funds:
Valuation: US GAAP defines fair value as the price the Funds would receive to sell an asset or pay to transfer a liability in an orderly transaction between market participants at the measurement date. The Funds determine the fair value of their financial instruments at market value using independent dealers or pricing services under policies approved by the Board of Directors of each Fund (each, a “Board”). The BlackRock Global Valuation Methodologies Committee (the “Global Valuation Committee”) is the committee formed by management to develop global pricing policies and procedures and to provide oversight of the pricing function for the Funds for all financial instruments.
Equity investments traded on a recognized securities exchange or the NASDAQ Global Market System (“NASDAQ”) are valued at the last reported sale price that day or the NASDAQ official closing price, if applicable. For equity investments traded on more than one exchange, the last reported sale price on the exchange where the stock is primarily traded is used. Equity investments traded on a recognized exchange for which there were no sales on that day are valued at the last available bid (long positions) or ask (short positions) price. If no bid or ask price is available, the prior day’s price will be used, unless it is determined that such prior day’s price no longer reflects the fair value of the security.
The Funds value their investments in BlackRock Liquidity Series, LLC Money Market Series (the “Money Market Series”) at fair value, which is ordinarily based upon their pro rata ownership in the underlying fund’s net assets. The Money Market Series seeks current income consistent with maintaining liquidity and preserving capital. Although the Money Market Series is not registered under the 1940 Act, its investments will follow the parameters of investments by a money market fund that is subject to Rule 2a-7 under the 1940 Act. Each Fund may withdraw up to 25% of its investment daily, although the manager of the Money Market Series, in its sole discretion, may permit an investor to withdraw more than 25% on any one day.
Securities and other assets and liabilities denominated in foreign currencies are translated into US dollars using exchange rates determined as of the close of business on the New York Stock Exchange (“NYSE”). Foreign currency exchange contracts are valued at the mean between the bid and ask prices and are determined as of the close of business on the NYSE. Interpolated values are derived when the settlement date of the contract is an interim date for which quotations are not available.
In the event that application of these methods of valuation results in a price for an investment which is deemed not to be representative of the market value of such investment or if a price is not available, the investment will be valued by the Global Valuation Committee, or its delegate, in accordance with a policy approved by the Board as reflecting fair value (“Fair Value Assets”). When determining the price for Fair Value Assets, the Global Valuation Committee, or its delegate, seeks to determine the price that the Fund might reasonably expect to receive from the current sale of that asset in an arm’s-length transaction. Fair value determinations shall be based upon all available factors that the Global Valuation Committee, or its delegate, deem relevant consistent with the principles of fair value measurement which include the market approach, income approach and/or in the case of recent investments, cost approach, as appropriate. A market approach generally consists of using comparable market transactions. The income approach generally is used to discount future cash flows to present value and adjusted for liquidity as appropriate. These factors include but are not limited to: (i) attributes specific to the investment or asset; (ii) the principal market for the investment or asset; (iii) the customary participants in the principal market for the investment or asset; (iv) data assumptions by market participants for the investment or asset,
| | | | | | |
| | | | | | | |
| 30 | | SEMI-ANNUAL REPORT | | APRIL 30, 2013 | | |
| | |
| Notes to Financial Statements (continued) | | |
if reasonably available; (v) quoted prices for similar investments or assets in active markets; and (vi) other factors, such as future cash flows, interest rates, yield curves, volatilities, prepayment speeds, loss severities, credit risks, recovery rates, liquidation amounts and/or default rates. Due to the inherent uncertainty of valuations of such investments, the fair values may differ from the values that would have been used had an active market existed. The Global Valuation Committee, or its delegate, employs various methods for calibrating valuation approaches for investments where an active market does not exist including regular due diligence of the Funds’ pricing vendors, a regular review of key inputs and assumptions, transactional back-testing or disposition analysis to compare unrealized gains and losses to realized gains and losses, reviews of missing or stale prices and large movements in market values and reviews of any market related activity. The pricing of all Fair Value Assets is subsequently reported to the Board or a committee thereof on a quarterly basis.
Generally, trading in foreign instruments is substantially completed each day at various times prior to the close of business on the NYSE. Occasionally, events affecting the values of such instruments may occur between the foreign market close and the close of business on the NYSE that may not be reflected in the computation of the Funds’ net assets. If events (for example, a company announcement, market volatility or a natural disaster) occur during such periods that are expected to affect the value of such instruments materially, those instruments may be Fair Value Assets and be valued at their fair value, as determined in good faith by the Global Valuation Committee using a pricing service and/or policies approved by the Board. Each business day, the Funds use a pricing service to assist with the valuation of certain foreign exchange-traded equity securities and foreign exchange-traded and over-the-counter (“OTC”) options (the “Systematic Fair Value Price”). Using current market factors, the Systematic Fair Value Price is designed to value such foreign securities and foreign options at fair value as of the close of business on the NYSE, which follows the close of the local markets.
Foreign Currency: The Funds’ books and records are maintained in US dollars. Purchases and sales of investment securities are recorded at the rates of exchange prevailing on the respective date of such transactions. Generally, when the US dollar rises in value against a foreign currency, the Funds’ investments denominated in that currency will lose value because that currency is worth fewer US dollars; the opposite effect occurs if the US dollar falls in relative value.
The Funds do not isolate the portion of the results of operations arising as a result of changes in the foreign exchange rates from the changes in the market prices of investments held or sold for financial reporting purposes. Accordingly, the effects of changes in foreign currency exchange rates on investments are not segregated on the Statements of Operations from the effects of changes in market prices of those investments but are included as a component of net realized and unrealized gain (loss) from investments. The Funds report realized currency gains (losses) on foreign currency related transactions as components of net realized gain (loss) for financial reporting purposes, whereas such components are treated as ordinary income for federal income tax purposes.
Participation Notes: The Funds may invest in participation notes (“P-Notes”). P-Notes are promissory notes issued by banks or broker-dealers that are designed to offer the Funds a return measured by the change in the value of the underlying security or basket of securities (the “underlying security”) while not holding the actual shares of the underlying security. P-Notes are typically used to allow the Funds to gain exposure to securities traded in foreign markets that may be restricted due to country-specific regulations. When the P-Note matures, the issuer will pay to, or receive from, the Funds the difference between the value of the underlying security at the time of the purchase and the underlying security’s value at maturity of the P-Notes. Income received on P-Notes is recorded by the Funds as dividend income in the Statements of Operations. An investment in a P-Note involves additional risks beyond the risks normally associated with a direct investment in the underlying security. While the holder of a P-Note is entitled to receive from the bank or broker-dealer any dividends paid by the underlying security, the holder is not entitled to the same rights (e.g., voting rights) as a direct owner of the underlying security. P-Notes are considered general unsecured contractual obligations of the bank or broker-dealer. The Funds must rely on the creditworthiness of the issuer for their investment returns on the P-Notes and have no rights against the issuer of the underlying security. A P-Note may be more volatile and less liquid than other investments held by the Funds since the P-Note generally is dependent on the liquidity in the local trading market for the underlying security.
Segregation and Collateralization: In cases in which the 1940 Act and the interpretive positions of the Securities and Exchange Commission (“SEC”) require that a Fund either deliver collateral or segregate assets in connection with certain investments (e.g., foreign currency exchange contracts), each Fund will, consistent with SEC rules and/or certain interpretive letters issued by the SEC, segregate collateral or designate on its books and records cash or liquid securities having a market value at least equal to the amount that would otherwise be required to be physically segregated. Furthermore, based on requirements and agreements with certain exchanges and third party broker-dealers, a Fund engaging in such transactions may have requirements to deliver/deposit securities to/with an exchange or broker-dealer as collateral for certain investments.
Investment Transactions and Investment Income: For financial reporting purposes, investment transactions are recorded on the dates the transactions are entered into (the trade dates). Realized gains and losses on
| | | | | | |
| | | | | | | |
| | SEMI-ANNUAL REPORT | | APRIL 30, 2013 | | 31 |
| | |
| Notes to Financial Statements (continued) | | |
investment transactions are determined on the identified cost basis. Dividend income is recorded on the ex-dividend dates. Dividends from foreign securities where the ex-dividend date may have passed are subsequently recorded when the Funds are informed of the ex-dividend date. Under the applicable foreign tax laws, a withholding tax at various rates may be imposed on capital gains, dividends and interest. Upon notification from issuers, some of the dividend income received from a real estate investment trust may be redesignated as a reduction of cost of the related investment and/or realized gain. Interest income, including amortization and accretion of premiums and discounts on debt securities, is recognized on the accrual basis. Income and realized and unrealized gains and losses are allocated daily to each class based on its relative net assets.
Dividends and Distributions: Dividends and distributions paid by the Funds are recorded on the ex-dividend dates. The portion of distributions that exceeds a Fund’s current and accumulated earnings and profits, which are measured on a tax basis, will constitute a nontaxable return of capital. Distributions in excess of a Fund’s taxable income and net capital gains, but not in excess of a Fund’s earnings and profits, will be taxable to shareholders as ordinary income and will not constitute a nontaxable return of capital. Capital losses carried forward from years beginning before 2011 do not reduce earnings and profits, even if such carried forward losses offset current year realized gains. The character and timing of dividends and distributions are determined in accordance with federal income tax regulations, which may differ from US GAAP.
Securities Lending: The Funds may lend securities to approved borrowers, such as banks, brokers and other financial institutions. The borrower pledges cash, securities issued or guaranteed by the US government or irrevocable letters of credit issued by a bank as collateral, which will be maintained at all times in an amount equal to at least 100% of the current market value of the loaned securities. The market value of the loaned securities is determined at the close of business of the Funds and any additional required collateral is delivered to the Funds on the next business day. Securities lending income, as disclosed in the Statements of Operations, represents the income earned from the investment of the cash collateral, net of rebates paid to, or fees paid by, borrowers and less the fees paid to the securities lending agent. During the term of the loan, the Funds earn dividend or interest income on the securities loaned but do not receive interest income on the securities received as collateral. Loans of securities are terminable at any time and the borrower, after notice, is required to return borrowed securities within the standard time period for settlement of securities transactions. In the event that the borrower defaults on its obligation to return borrowed securities because of insolvency or for any other reason, the Funds could experience delays and costs in gaining access to the collateral. The Funds also could suffer a loss if the value of an investment purchased with cash collateral falls below the market value of loaned securities or if the value of an investment purchased with cash collateral falls below the value of the original cash collateral received. During the six months ended April 30, 2013, any securities on loan were collateralized by cash.
Income Taxes: It is the Funds’ policy to comply with the requirements of the Internal Revenue Code of 1986, as amended, applicable to regulated investment companies and to distribute substantially all of their taxable income to their shareholders. Therefore, no federal income tax provision is required.
Each Fund files US federal and various state and local tax returns. No income tax returns are currently under examination. The statute of limitations for each Fund’s US federal tax returns remains open for each of the four years ended October 31, 2012. The statutes of limitations on each Fund’s state and local tax returns may remain open for an additional year depending upon the jurisdiction. Management does not believe there are any uncertain tax positions that require recognition of a tax liability.
Basis of Consolidation:
Latin America
The Fund’s accompanying consolidated Financial Highlights for the year ended November 30, 2007 and for the two periods ended October 31, 2009 include the accounts of Merrill Lynch Latin America Fund Chile Ltd., a wholly owned subsidiary of the Fund. The subsidiary was created for regulatory purposes to invest in Chilean securities. Intercompany accounts and transactions have been eliminated. During the year ended October 31, 2009, Merrill Lynch Latin America Fund Chile Ltd. was dissolved.
Recent Accounting Standards: In December 2011, the Financial Accounting Standards Board (the “FASB”) issued guidance that will expand current disclosure requirements on the offsetting of certain assets and liabilities. The new disclosures will be required for investments and derivative financial instruments subject to master netting or similar agreements which are eligible for offset in the Statements of Assets and Liabilities and will require an entity to disclose both gross and net information about such investments and transactions in the financial statements. In January 2013, the FASB issued guidance that clarifies which investments and transactions are subject to the offsetting disclosure requirements. The scope of the disclosure requirements for offsetting will be limited to derivative instruments, repurchase agreements and reverse repurchase agreements, and securities borrowing and securities lending transactions. The guidance is effective for financial statements with fiscal years beginning on or after January 1, 2013, and interim periods within those fiscal years. Management is evaluating the impact of this guidance on the Funds’ financial statement disclosures.
Other: Expenses directly related to a Fund or its classes are charged to that Fund or class. Other operating expenses shared by several funds are pro rated among those funds on the basis of relative net assets or other appropriate methods. Expenses directly related to a Fund and other shared expenses prorated to a Fund are allocated daily to each class based on its relative net assets or other appropriate methods.
| | | | | | |
| | | | | | | |
| 32 | | SEMI-ANNUAL REPORT | | APRIL 30. 2013 | | |
| | |
| Notes to Financial Statements (continued) | | |
The Funds have an arrangement with the custodian whereby fees may be reduced by credits earned on uninvested cash balances, which, if applicable, are shown as fees paid indirectly in the Statements of Operations. The custodian imposes fees on overdrawn cash balances, which can be offset by accumulated credits earned or may result in additional custody charges.
2. Derivative Financial Instruments:
The Funds engage in various portfolio investment strategies using derivative contracts both to increase the returns of the Funds and/or economically hedge their exposure to certain risks such as foreign currency exchange rate risk. These contracts may be transacted on an exchange or OTC.
Foreign Currency Exchange Contracts: The Funds enter into foreign currency exchange contracts as an economic hedge against either specific transactions or portfolio instruments or to obtain exposure to foreign currencies (foreign currency exchange rate risk). A foreign currency exchange contract is an agreement between two parties to buy and sell a currency at a set exchange rate on a future date. Foreign currency exchange contracts, when used by the Fund, help to manage the overall exposure to the currencies in which some of the investments held by the Fund are denominated. The contract is marked-to-market daily and the change in market value is recorded by the Fund as an unrealized gain or loss. When the contract is closed, the Funds record a realized gain or loss equal to the difference between the value at the time it was opened and the value at the time it was closed. The use of foreign currency exchange contracts involves the risk that the value of a foreign currency exchange contract changes unfavorably due to movements in the value of the referenced foreign currencies and the risk that a counterparty to the contract does not perform its obligations under the agreement.
| | | | | | | | | | | | |
| Derivative Financial Instruments Categorized by Risk Exposure: | |
| Fair Values of Derivative Financial Instruments as of April 30, 2013 | |
| | | Asset Derivatives | |
| | | | | | | Emerging Markets | | | Latin America | |
| | | Statements of
Assets and Liabilities
Location | | | | Value | |
Foreign currency exchange contracts | | Unrealized appreciation on foreign currency exchange contracts | | | | $ | 3,702 | | | $ | 1,408 | |
| | | | | | | | | | | |
| | | Liability Derivatives | |
| | | | | | | Emerging Markets | | | Latin
America | |
| | | Statements of
Assets And Liabilities
Location | | | | Value | |
Foreign currency exchange contracts | | Unrealized depreciation on foreign currency exchange contracts | | | | $ | 21,304 | | | $ | 1,037 | |
The Effect of Derivative Financial Instruments In the Statements of Operations Six Months Ended April 30, 2013 | |
| | | Net Realized Gain (Loss) From | |
| | | Emerging Markets | | | | Latin
America | |
| Foreign currency exchange contracts: | | | | | | | | |
Foreign currency transactions | | $(136,439) | | | | $ | (171,000 | ) |
| |
| | | Net Change in Unrealized
Appreciation/Depreciation on | |
| | | Emerging Markets | | | | Latin
America | |
| Foreign currency exchange contracts: | | | | | | | | |
Foreign currency translations | | $(10,713) | | | | $ | 17,657 | |
For the six months ended April 30, 2013, the average quarterly balances of outstanding derivative financial instruments were as follows:
| | | | | | | | |
| | | Emerging Markets | | | Latin
America | |
| Foreign currency exchange contracts: | | | | | | | | |
Average number of contracts — US dollars purchased | | | 13 | | | | 6 | |
Average number of contracts — US dollars sold | | | 9 | | | | 4 | |
Average US dollar amounts purchased | | $ | 5,014,678 | | | $ | 335,991 | |
Average US dollar amounts sold | | $ | 4,872,328 | | | $ | 8,913,665 | |
3. Investment Advisory Agreement and Other Transactions with Affiliates:
The PNC Financial Services Group, Inc. (“PNC”) is the largest stockholder and an affiliate, for 1940 Act purposes, of BlackRock, Inc. (“BlackRock”).
Each Fund entered into an Investment Advisory Agreement with BlackRock Advisors, LLC (the “Manager”), the Funds’ investment advisor, an indirect, wholly owned subsidiary of BlackRock, to provide investment advisory and administration services. The Manager is responsible for the management of each Fund’s portfolio and provides the necessary personnel, facilities, equipment and certain other services necessary to the operations of each Fund. For such services, each Fund pays the Manager a monthly fee based on a percentage of each Fund’s average daily net assets at the following annual rates:
| | | | |
| Average Daily Net Assets | | Investment Advisory Fee | |
First $1 Billion | | | 1.00 | % |
$1 Billion — $3 Billion | | | 0.94 | % |
$3 Billion — $5 Billion | | | 0.90 | % |
$5 Billion — $10 Billion | | | 0.87 | % |
Greater than $10 Billion | | | 0.85 | % |
The Manager voluntarily agreed to waive its investment advisory fees by the amount of investment advisory fees each Fund pays to the Manager indirectly through its investment in affiliated money market funds.
| | | | | | |
| | | | | | | |
| | SEMI-ANNUAL REPORT | | APRIL 30, 2013 | | 33 |
| | |
| Notes to Financial Statements (continued) | | |
However, the Manager does not waive its investment advisory fees by the amount of investment advisory fees paid through each Fund’s investment in other affiliated investment companies, if any. These amounts are included in, fees waived by Manager in the Statements of Operations. For the six months ended April 30, 2013, the amounts waived were as follows:
| | | | |
Emerging Markets | | $ | 5,599 | |
Latin America | | $ | 1,484 | |
With respect to each Fund, the Manager entered into separate sub-advisory agreements with BlackRock Investment Management, LLC (“BIM”) and BlackRock International Limited (“BIL”). BIM and BIL are both affiliates of the Manager. The Manager pays each sub-advisor for services it provides, a monthly fee that is a percentage of the investment advisory fees paid by the Funds to the Manager.
For the six months ended April 30, 2013, each Fund reimbursed the Manager for certain accounting services, which are included in accounting services in the Statements of Operations. The reimbursements were as follows:
| | | | |
Emerging Markets | | $ | 2,089 | |
Latin America | | $ | 3,639 | |
The Funds entered into a Distribution Agreement and Distribution Plans with BlackRock Investments, LLC (“BRIL”), an affiliate of the Manager. Pursuant to the Distribution Plans and in accordance with Rule 12b-1 under the 1940 Act, each Fund pays BRIL ongoing service and distribution fees. The fees are accrued daily and paid monthly at annual rates based upon the average daily net assets of the shares of each Fund as follows:
| | | | | | | | |
| | | Service Fee | | | Distribution Fee | |
Investor A | | | 0.25 | % | | | — | |
Investor B | | | 0.25 | % | | | 0.75 | % |
Investor C | | | 0.25 | % | | | 0.75 | % |
Pursuant to sub-agreements with BRIL, broker-dealers and BRIL provide shareholder servicing and distribution services to each Fund. The ongoing service and/or distribution fee compensates BRIL and each broker-dealer for providing shareholder servicing and/or distribution related services to Investor A, Investor B and Investor C shareholders.
The Manager maintains a call center, which is responsible for providing certain shareholder services to the Funds, such as responding to shareholder inquiries and processing transactions based upon instructions from shareholders with respect to the subscription and redemption of Fund shares. For the six months ended April 30, 2013, each Fund reimbursed the Manager the following amounts for costs incurred in running the call center, which are included in transfer agent — class specific in the Statements of Operations:
| | | | | | | | |
| | | Emerging Markets | | | Latin America | |
Institutional | | $ | 647 | | | $ | 1,785 | |
Investor A | | $ | 3,002 | | | $ | 9,753 | |
Investor B | | $ | 181 | | | $ | 595 | |
Investor C | | $ | 906 | | | $ | 3,492 | |
For the six months ended April 30, 2013, affiliates earned underwriting discounts, direct commissions and dealer concessions on sales of the Funds’ Investor A Shares as follows:
| | | | |
| | | Investor A | |
Emerging Markets | | $ | 27,414 | |
Latin America | | $ | 13,689 | |
For the six months ended April 30, 2013, affiliates received CDSCs as follows:
| | | | | | | | | | | | |
| | | Investor A | | | Investor B | | | Investor C | |
Emerging Markets | | $ | 9,362 | | | $ | 636 | | | $ | 5,188 | |
Latin America | | $ | 1,804 | | | $ | 7,057 | | | $ | 4,588 | |
The Funds received an exemptive order from the SEC permitting them, among other things, to pay an affiliated securities lending agent a fee based on a share of the income derived from the securities lending activities and have retained BIM as the securities lending agent. BIM may, on behalf of the Funds, invests cash collateral received by the Funds for such loans, among other things, in a private investment company managed by the Manager or in registered money market funds advised by the Manager or its affiliates. As securities lending agent, BIM is responsible for all transaction fees and all other operational costs relating to securities lending activities, other than extraordinary expenses. BIM does not receive any fees for managing the cash collateral. The market value of securities on loan and the value of the related collateral, if applicable, are shown in the Statements of Assets and Liabilities as securities on loan at value and collateral on securities loaned at value, respectively. The cash collateral invested by BIM is disclosed in the Schedules of Investments, if any. Securities lending income is equal to the total of income earned from the reinvestment of cash collateral, net of rebates paid to, or fees paid by, borrowers of securities. The Funds retain 65% of securities lending income and pay a fee to BIM equal to 35% of such income. The share of income earned by the Funds on the reinvestment of cash collateral is shown as securities lending — affiliated in the Statements of Operations. For the six months ended April 30, 2013, BIM received $12,564 in securities lending agent fees related to securities lending activities for the Funds.
Certain officers and/or directors of the Funds are officers and/or directors of BlackRock or its affiliates. The Funds reimburse the Manager for compensation paid to the Funds’ Chief Compliance Officer which is included in officer and directors in the Statements of Operations.
| | | | | | |
| | | | | | | |
| 34 | | SEMI-ANNUAL REPORT | | APRIL 30, 2013 | | |
| | |
| Notes to Financial Statements (continued) | | |
4. Investments:
Purchases and sales of investments, excluding short-term securities, for the six months ended April 30, 2013 were as follows:
| | | | | | | | |
| | | Purchases | | | Sales | |
Emerging Markets | | $ | 194,179,251 | | | $ | 151,887,664 | |
Latin America | | $ | 162,150,750 | | | $ | 210,986,856 | |
During the year ended October 31, 2012, Latin America utilized $6,995,844 of its capital loss carryforward.
5. Income Tax Information:
As of April 30, 2013, gross unrealized appreciation and gross unrealized depreciation based on cost for federal income tax purposes were as follows:
| | | | | | | | |
| | | Emerging Markets | | | Latin America | |
Tax cost | | $ | 391,636,355 | | | $ | 451,665,530 | |
| | | | | | | | |
Gross unrealized appreciation | | | 81,723,085 | | | | 156,435,418 | |
Gross unrealized depreciation | | | (17,499,793 | ) | | | (38,308,129 | ) |
| | | | | | | | |
Net unrealized appreciation | | $ | 64,223,292 | | | $ | 118,127,289 | |
| | | | | | | | |
As of October 31, 2012, the Funds had capital loss carryforwards available to offset future realized capital gains through the indicated expiration dates as follows:
| | | | | | | | |
| Expires October 31, | | Emerging Markets | | | Latin America | |
2017 | | $ | 11,598,286 | | | $ | 60,291,123 | |
No expiration date1 | | | 14,880,122 | | | | — | |
| | | | | | | | |
| Total | | $ | 26,478,408 | | | $ | 60,291,123 | |
| | | | | | | | |
| 1 | | Must be utilized prior to losses subject to expiration. |
6. Borrowings:
The Funds, along with certain other funds managed by the Manager and its affiliates (“Participating Funds”), is a party to a 364-day, $800 million credit agreement with a group of lenders, under which the Fund may borrow to fund shareholder redemptions. The agreement expires in April 2014. Excluding commitments designated for a certain individual fund, other Participating Funds, including the Funds, can borrow up to an aggregate commitment amount of $500 million, subject to asset coverage and other limitations as specified in the agreement. The credit agreement has the following terms: a fee of 0.065% per annum on unused commitment amounts and interest at a rate equal to the higher of (a) the one-month LIBOR plus 0.80% per annum or (b) the Fed Funds rate plus 0.80% per annum on amounts borrowed. Participating Funds paid administration and arrangement fees, which, along with commitment fees, were allocated among such funds based upon portions of the aggregate commitment available to them and relative net assets of Participating Funds. The Funds did not borrow under the credit agreement during the six months ended April 30, 2013.
7. Concentration, Market and Credit Risk:
In the normal course of business, Emerging Markets and Latin America invest in securities and enter into transactions where risks exist due to fluctuations in the market (market risk) or failure of the issuer of a security to meet all its obligations (issuer credit risk). The value of securities held by the Funds may decline in response to certain events, including those directly involving the issuers whose securities are owned by the Funds; conditions affecting the general economy; overall market changes; local, regional or global political, social or economic instability; and currency and interest rate and price fluctuations. Similar to issuer credit risk, the Funds may be exposed to counterparty credit risk, or the risk that an entity with which the Funds have unsettled or open transactions may fail to or be unable to perform on its commitments. The Funds manage counterparty credit risk by entering into transactions only with counterparties that they believe have the financial resources to honor their obligations and by monitoring the financial stability of those counterparties. Financial assets, which potentially expose the Funds to market, issuer and counterparty credit risks, consist principally of financial instruments and receivables due from counterparties. The extent of the Funds’ exposure to market, issuer and counterparty credit risks with respect to these financial assets is generally approximated by their value recorded in the Statements of Assets and Liabilities, less any collateral held by the Funds.
The Funds invest a substantial amount of their assets in issuers located in a single country or a limited number of countries. When the Funds concentrate their investments in this manner, they assume the risk that economic, political and social conditions in those countries may have a significant impact on their investment performance. Foreign issuers may not be subject to the same uniform accounting, auditing and financial reporting standards and practices as used in the United States. Foreign securities markets may also be less liquid, more volatile, and less subject to governmental supervision not typically associated with investing in US securities. Please see the Schedules of Investments for concentrations in specific countries.
| | | | | | |
| | | | | | | |
| | SEMI-ANNUAL REPORT | | APRIL 30, 2013 | | 35 |
| | |
| Notes to Financial Statements (continued) | | �� |
As of April 30, 2013, the Funds had the following industry classifications:
| | | | |
| Emerging Markets | | | |
| Industry | | Percent of
Long-Term
Investments | |
Commercial Banks | | | 19 | % |
Semiconductors & Semiconductor Equipment | | | 11 | |
Oil, Gas & Consumable Fuels | | | 9 | |
Other1 | | | 61 | |
| | | | |
| Latin America | | | |
| Industry | | Percent of
Long-Term
Investments | |
Commercial Banks | | | 16 | % |
Oil, Gas & Consumable Fuels | | | 10 | |
Metals & Mining | | | 9 | |
Beverages | | | 8 | |
Food Products | | | 6 | |
Food & Staples Retailing | | | 5 | |
Media | | | 5 | |
Transportation Infrastructure | | | 5 | |
Other1 | | | 36 | |
| 1 | | All other industries held were each less than 5% of long-term investments. |
8. Capital Share Transactions:
Transactions in capital shares for each class were as follows:
| | | | | | | | | | | | | | | | | | |
| | | Six Months Ended
April 30, 2013 | | | | | Year Ended
October 31, 2012 | |
| Emerging Markets | | Shares | | | Amount | | | | | Shares | | | Amount | |
| Institutional | | | | | | | | | | | | | | |
Shares sold | | | 2,639,792 | | | $ | 53,078,743 | | | | | | 7,072,715 | | | $ | 132,053,424 | |
Shares issued to shareholders in reinvestment of dividends and distributions | | | 77,220 | | | | 1,556,768 | | | | | | 22,113 | | | | 364,406 | |
Shares redeemed | | | (1,865,460 | ) | | | (37,820,394 | ) | | | | | (8,009,137 | ) | | | (156,758,283 | ) |
| | | | | | | | | | | | | | |
Net increase (decrease) | | | 851,552 | | | $ | 16,815,117 | | | | | | (914,309 | ) | | $ | (24,340,453 | ) |
| | | | | | | | | | | | | | |
| | | | | | | | | | | | | | | | | | |
| Investor A | | | | | | | | | | | | | | | | | | |
Shares sold and automatic conversion of shares | | | 1,813,598 | | | $ | 35,568,779 | | | | | | 2,780,465 | | | $ | 50,377,456 | |
Shares issued to shareholders in reinvestment of dividends and distributions | | | 94,238 | | | | 1,837,678 | | | | | | 21,269 | | | | 339,176 | |
Shares redeemed | | | (1,050,337 | ) | | | (20,479,791 | ) | | | | | (2,226,121 | ) | | | (40,490,696 | ) |
| | | | | | | | | | | | | | |
Net increase | | | 857,499 | | | $ | 16,926,666 | | | | | | 575,613 | | | $ | 10,225,936 | |
| | | | | | | | | | | | | | |
| | | | | | | | | | | | | | | | | | |
| Investor B | | | | | | | | | | | | | | | | | | |
Shares sold | | | 6,717 | | | $ | 117,631 | | | | | | 25,273 | | | $ | 408,330 | |
Shares redeemed and automatic conversion of shares | | | (38,852 | ) | | | (678,025 | ) | | | | | (104,256 | ) | | | (1,672,103 | ) |
| | | | | | | | | | | | | | |
Net decrease | | | (32,135 | ) | | $ | (560,394 | ) | | | | | (78,983 | ) | | $ | (1,263,773 | ) |
| | | | | | | | | | | | | | |
| | | | | | | | | | | | | | | | | | |
| Investor C | | | | | | | | | | | | | | | | | | |
Shares sold | | | 825,463 | | | $ | 13,926,080 | | | | | | 2,529,536 | | | $ | 39,102,370 | |
Shares issued to shareholders in reinvestment of dividends and distributions | | | 29,470 | | | | 497,463 | | | | | | 4,758 | | | | 65,842 | |
Shares redeemed | | | (764,871 | ) | | | (12,835,556 | ) | | | | | (1,864,861 | ) | | | (29,183,529 | ) |
| | | | | | | | | | | | | | |
Net increase | | | 90,062 | | | $ | 1,587,987 | | | | | | 669,433 | | | $ | 9,984,683 | |
| | | | | | | | | | | | | | |
Total Net Increase (Decrease) | | | 1,766,978 | | | $ | 34,769,376 | | | | | | 251,754 | | | $ | (5,393,607 | ) |
| | | | | | | | | | | | | | |
| | | | | | |
| | | | | | | |
| 36 | | SEMI-ANNUAL REPORT | | APRIL 30, 2013 | | |
| | |
| Notes to Financial Statements (concluded) | | |
| | | | | | | | | | | | | | | | | | |
| | | Six Months Ended
April 30, 2013 | | | | | Year Ended
October 31, 2012 | |
| Latin America | | Shares | | | Amount | | | | | Shares | | | Amount | |
| Institutional | | | | | | | | | | | | | | |
Shares sold | | | 570,525 | | | $ | 35,322,229 | | | | | | 923,394 | | | $ | 57,836,919 | |
Shares issued to shareholders in reinvestment of dividends and distributions | | | 28,731 | | | | 1,750,616 | | | | | | 22,927 | | | | 1,275,571 | |
Shares redeemed | | | (510,143 | ) | | | (31,108,160 | ) | | | | | (1,608,780 | ) | | | (98,060,968 | ) |
| | | | | | | | | | | | | | | | | | |
Net increase (decrease) | | | 89,113 | | | $ | 5,964,685 | | | | | | (662,459 | ) | | $ | (38,948,478 | ) |
| | | | | | | | | | | | | | | | | | |
| | | | | | | | | | | | | | | | | | |
| Investor A | | | | | | | | | | | | | | | | | | |
Shares sold and automatic conversion of shares | | | 427,866 | | | $ | 26,000,711 | | | | | | 1,039,359 | | | $ | 63,673,220 | |
Shares issued to shareholders in reinvestment of dividends and distributions | | | 67,626 | | | | 4,062,402 | | | | | | 31,367 | | | | 1,721,015 | |
Shares redeemed | | | (1,035,456 | ) | | | (62,382,136 | ) | | | | | (2,202,430 | ) | | | (131,281,751 | ) |
| | | | | | | | | | | | | | | | | | |
Net decrease | | | (539,964 | ) | | $ | (32,319,023 | ) | | | | | (1,131,704 | ) | | $ | (65,887,516 | ) |
| | | | | | | | | | | | | | | | | | |
| | | | | | | | | | | | | | | | | | |
| Investor B | | | | | | | | | | | | | | | | | | |
Shares sold | | | 108 | | | $ | 6,299 | | | | | | 2,141 | | | $ | 118,286 | |
Shares issued to shareholders in reinvestment of dividends and distributions | | | 590 | | | | 33,355 | | | | | | — | | | | — | |
Shares redeemed and automatic conversion of shares | | | (25,150 | ) | | | (1,425,272 | ) | | | | | (60,135 | ) | | | (3,370,740 | ) |
| | | | | | | | | | | | | | | | | | |
Net decrease | | | (24,452 | ) | | $ | (1,385,618 | ) | | | | | (57,994 | ) | | $ | (3,252,454 | ) |
| | | | | | | | | | | | | | | | | | |
| | | | | | | | | | | | | | | | | | |
| Investor C | | | | | | | | | | | | | | | | | | |
Shares sold | | | 69,161 | | | $ | 3,850,021 | | | | | | 187,954 | | | $ | 10,524,845 | |
Shares issued to shareholders in reinvestment of dividends and distributions | | | 10,510 | | | | 580,064 | | | | | | — | | | | — | |
Shares redeemed | | | (383,913 | ) | | | (21,179,620 | ) | | | | | (926,885 | ) | | | (50,172,606 | ) |
| | | | | | | | | | | | | | | | | | |
Net decrease | | | (304,242 | ) | | $ | (16,749,535 | ) | | | | | (738,931 | ) | | $ | (39,647,761 | ) |
| | | | | | | | | | | | | | | | | | |
Total Net Decrease | | | (779,545 | ) | | $ | (44,489,491 | ) | | | | | (2,591,088 | ) | | $ | (147,736,209 | ) |
| | | | | | | | | | | | | | | | | | |
9. Subsequent Events:
Management has evaluated the impact of all subsequent events on each Fund through the date the financial statements were issued and has determined that there were no subsequent events requiring adjustment or additional disclosure in the financial statements.
| | | | | | |
| | | | | | | |
| | SEMI-ANNUAL REPORT | | APRIL 30, 2013 | | 37 |
Ronald W. Forbes, Co-Chairman of the Board and Director
Rodney D. Johnson, Co-Chairman of the Board and Director
Paul L. Audet, Director
David O. Beim, Director
Henry Gabbay, Director
Dr. Matina S. Horner, Director
Herbert I. London, Director
Ian A. MacKinnon, Director
Cynthia A. Montgomery, Director
Joseph P. Platt, Director
Robert C. Robb, Jr., Director
Toby Rosenblatt, Director
Kenneth L. Urish, Director
Frederick W. Winter, Director
John M. Perlowski, President and Chief Executive Officer
Brendan Kyne, Vice President
Neal Andrews, Chief Financial Officer
Jay Fife, Treasurer
Brian Kindelan, Chief Compliance Officer and Anti-Money Laundering Officer
Benjamin Archibald, Secretary
Investment Advisor
BlackRock Advisors, LLC
Wilmington, DE 19809
Sub-Advisors
BlackRock Investment Management, LLC
Princeton, NJ 08540
BlackRock International Limited
Edinburgh, Scotland
United Kingdom EH3 8JB
Custodian
Brown Brothers Harriman & Co.
Boston, MA 02109
Transfer Agent
BNY Mellon Investment Servicing (US) Inc.
Wilmington, DE 19809
Accounting Agent
State Street Bank and Trust Company
Boston, MA 02110
Distributor
BlackRock Investments, LLC
New York, NY 10022
Independent Registered Public Accounting Firm
Deloitte & Touche LLP
Boston, MA 02116
Legal Counsel
Sidley Austin LLP
New York, NY 10019
Address of the Funds
100 Bellevue Parkway
Wilmington, DE 19809
| | | | | | |
| | | | | | | |
| 38 | | SEMI-ANNUAL REPORT | | APRIL 30, 2013 | | |
Electronic Delivery
Electronic copies of most financial reports and prospectuses are available on the Funds’ website or shareholders can sign up for e-mail notifications of quarterly statements, annual and semi-annual reports and prospectuses by enrolling in the Funds’ electronic delivery program.
To enroll:
Shareholders Who Hold Accounts with Investment Advisors, Banks or Brokerages:
Please contact your financial advisor. Please note that not all investment advisors, banks or brokerages may offer this service.
Shareholders Who Hold Accounts Directly with BlackRock:
| 1) | Access the BlackRock Web site at http://www.blackrock.com/edelivery |
| 2) | Select “eDelivery” under the “More Information” section |
Householding
The Funds will mail only one copy of shareholder documents, including prospectuses, annual and semi-annual reports and proxy statements, to shareholders with multiple accounts at the same address. This practice is commonly called “householding” and is intended to reduce expenses and eliminate duplicate mailings of shareholder documents. Mailings of your shareholder documents may be householded indefinitely unless you instruct us otherwise. If you do not want the mailing of these documents to be combined with those for other members of your household, please call the Funds at (800) 441-7762.
Availability of Quarterly Schedule of Investments
The Funds file their complete schedule of portfolio holdings with the SEC for the first and third quarters of each fiscal year on Form N-Q. The Funds’ Forms N-Q are available on the SEC’s website at http://www.sec.gov and may also be reviewed and copied at the SEC’s Public Reference Room in Washington, DC. Information on how to access documents on the SEC’s website without charge may be obtained by calling (800) SEC-0330. The Funds’ Forms N-Q may also be obtained upon request and without charge by calling (800) 441-7762.
Availability of Proxy Voting Policies and Procedures
A description of the policies and procedures that the Funds use to determine how to vote proxies relating to portfolio securities is available (1) without charge, upon request, by calling (800) 441-7762; (2) at http://www.blackrock.com; and (3) on the SEC’s website at http://www.sec.gov.
Availability of Proxy Voting Record
Information about how the Funds voted proxies relating to securities held in the Funds’ portfolios during the most recent 12-month period ended June 30 is available upon request and without charge (1) at http://www.blackrock.com or by calling (800) 441-7762 and (2) on the SEC’s website at http://www.sec.gov.
| | | | | | |
| | | | | | | |
| | SEMI-ANNUAL REPORT | | APRIL 30, 2013 | | 39 |
| | |
| Additional Information (continued) | | |
Account Information
Call us at (800) 441-7762 from 8:00 AM to 6:00 PM EST on any business day to get information about your account balances, recent transactions and share prices. You can also reach us on the Web at http://www.blackrock.com/funds.
Automatic Investment Plans
Investor Class shareholders who want to invest regularly can arrange to have $50 or more automatically deducted from their checking or savings account and invested in any of the BlackRock funds.
Systematic Withdrawal Plans
Investor Class shareholders can establish a systematic withdrawal plan and receive periodic payments of $50 or more from their BlackRock funds, as long as their account balance is at least $10,000.
Retirement Plans
Shareholders may make investments in conjunction with Traditional, Rollover, Roth, Coverdell, Simple IRAs, SEP IRAs and 403(b) Plans.
| | | | | | |
| | | | | | | |
| 40 | | SEMI-ANNUAL REPORT | | APRIL 30, 2013 | | |
| | |
| Additional Information (concluded) | | |
|
| BlackRock Privacy Principles |
BlackRock is committed to maintaining the privacy of its current and former fund investors and individual clients (collectively, “Clients”) and to safeguarding their non-public personal information. The following information is provided to help you understand what personal information BlackRock collects, how we protect that information and why in certain cases we share such information with select parties.
If you are located in a jurisdiction where specific laws, rules or regulations require BlackRock to provide you with additional or different privacy-related rights beyond what is set forth below, then BlackRock will comply with those specific laws, rules or regulations.
BlackRock obtains or verifies personal non-public information from and about you from different sources, including the following: (i) information we receive from you or, if applicable, your financial intermediary, on applications, forms or other documents; (ii) information about your transactions with us, our affiliates, or others; (iii) information we receive from a consumer reporting agency; and (iv) from visits to our websites.
BlackRock does not sell or disclose to non-affiliated third parties any non-public personal information about its Clients, except as permitted by law or as is necessary to respond to regulatory requests or to service Client accounts. These non-affiliated third parties are required to protect the confidentiality and security of this information and to use it only for its intended purpose.
We may share information with our affiliates to service your account or to provide you with information about other BlackRock products or services that may be of interest to you. In addition, BlackRock restricts access to non-public personal information about its Clients to those BlackRock employees with a legitimate business need for the information. BlackRock maintains physical, electronic and procedural safeguards that are designed to protect the non-public personal information of its Clients, including procedures relating to the proper storage and disposal of such information.
| | | | | | |
| | | | | | | |
| | SEMI-ANNUAL REPORT | | APRIL 30, 2013 | | 41 |
| | |
| A World-Class Mutual Fund Family | | |
BlackRock offers a diverse lineup of open-end mutual funds crossing all investment styles and managed by experts in equity, fixed income and tax-exempt investing.
BlackRock ACWI ex-US Index Fund
BlackRock All-Cap Energy & Resources Portfolio
BlackRock Basic Value Fund
BlackRock Capital Appreciation Fund
BlackRock China Fund
BlackRock Commodity Strategies Fund
BlackRock Disciplined Small Cap Core Fund
BlackRock Emerging Markets Fund
BlackRock Emerging Markets Long/Short Equity Fund
BlackRock Energy & Resources Portfolio
BlackRock Equity Dividend Fund
BlackRock EuroFund
BlackRock Flexible Equity Fund
BlackRock Focus Growth Fund
BlackRock Global Dividend Income Portfolio
BlackRock Global Long/Short Equity Fund
BlackRock Global Opportunities Portfolio
BlackRock Global SmallCap Fund
BlackRock Health Sciences Opportunities Portfolio
BlackRock India Fund
BlackRock International Fund
BlackRock International Index Fund
BlackRock International Opportunities Portfolio
BlackRock Large Cap Core Fund
BlackRock Large Cap Core Plus Fund
BlackRock Large Cap Growth Fund
BlackRock Large Cap Value Fund
BlackRock Latin America Fund
BlackRock Long-Horizon Equity Fund
BlackRock Mid-Cap Growth Equity Portfolio
BlackRock Mid Cap Value Opportunities Fund
BlackRock Natural Resources Trust
BlackRock Pacific Fund
BlackRock Real Estate Securities Fund
BlackRock Russell 1000 Index Fund
BlackRock Science & Technology Opportunities Portfolio
BlackRock Small Cap Growth Equity Portfolio
BlackRock Small Cap Growth Fund II
BlackRock Small Cap Index Fund
BlackRock S&P 500 Stock Fund
BlackRock U.S. Opportunities Portfolio
BlackRock Value Opportunities Fund
BlackRock World Gold Fund
| | |
| Taxable Fixed Income Funds | | |
BlackRock Bond Index Fund
BlackRock Core Bond Portfolio
BlackRock CoreAlpha Bond Fund
BlackRock Emerging Market Local Debt Portfolio
BlackRock Floating Rate Income Portfolio
BlackRock Global Long/Short Credit Fund
BlackRock GNMA Portfolio
BlackRock High Yield Bond Portfolio
BlackRock Inflation Protected Bond Portfolio
BlackRock International Bond Portfolio
BlackRock Long Duration Bond Portfolio
BlackRock Low Duration Bond Portfolio
BlackRock Secured Credit Portfolio
BlackRock Short Obligations Fund
BlackRock Short-Term Treasury Fund
BlackRock Strategic Income Opportunities Portfolio
BlackRock Total Return Fund
BlackRock U.S. Government Bond Portfolio
BlackRock U.S. Mortgage Portfolio
BlackRock Ultra-Short Obligations Fund
BlackRock World Income Fund
| | |
| Municipal Fixed Income Funds | | |
BlackRock California Municipal Bond Fund
BlackRock High Yield Municipal Fund
BlackRock Intermediate Municipal Fund
BlackRock National Municipal Fund
BlackRock New Jersey Municipal Bond Fund
BlackRock New York Municipal Bond Fund
BlackRock Pennsylvania Municipal Bond Fund
BlackRock Short-Term Municipal Fund
| | | | | | | | | | | | | | | | |
| BlackRock Balanced Capital Fund | | LifePath Active Portfolios | | | | LifePath Index Portfolios |
BlackRock Emerging Market Allocation Portfolio | | | | 2015 | | 2040 | | | | | | | | Retirement | | 2040 |
BlackRock Global Allocation Fund | | | | 2020 | | 2045 | | | | | | | | 2020 | | 2045 |
BlackRock Managed Volatility Portfolio | | | | 2025 | | 2050 | | | | | | | | 2025 | | 2050 |
BlackRock Multi-Asset Income Portfolio | | | | 2030 | | 2055 | | | | | | | | 2030 | | 2055 |
BlackRock Multi-Asset Real Return Fund | | | | 2035 | | | | | | | | | | 2035 | | |
BlackRock Strategic Risk Allocation Fund | | | | | | | | | | | | | | | | |
| | | | | | | | | | | | | | | | |
| BlackRock Prepared Portfolios | | LifePath Portfolios | | | | | | | | |
Conservative Prepared Portfolio | | | | Retirement | | 2040 | | | | | | | | | | |
Moderate Prepared Portfolio | | | | 2020 | | 2045 | | | | | | | | | | |
Growth Prepared Portfolio | | | | 2025 | | 2050 | | | | | | | | | | |
Aggressive Growth Prepared Portfolio | | | | 2030 | | 2055 | | | | | | | | | | |
| | | | 2035 | | | | | | | | | | | | |
BlackRock mutual funds are currently distributed by BlackRock Investments, LLC. You should consider the investment objectives, risks, charges and expenses of the funds under consideration carefully before investing. Each fund’s prospectus contains this and other information and is available at www.blackrock.com or by calling (800) 441-7762 or from your financial advisor. The prospectus should be read carefully before investing.
| | | | | | |
| | | | | | | |
| 42 | | SEMI-ANNUAL REPORT | | APRIL 30. 2013 | | |
This report is not authorized for use as an offer of sale or a solicitation of an offer to buy shares of a Fund unless accompanied or preceded by the Fund’s current prospectus. Past performance results shown in this report should not be considered a representation of future performance. Investment returns and principal value of shares will fluctuate so that shares, when redeemed, may be worth more or less than their original cost. Statements and other information herein are as dated and are subject to change. Please see each Fund’s prospectus for a description of risks associated with global investments.

| | |
| EMLA-4/13-SAR | | |
| |
| |  |
| Item 2 – | Code of Ethics – Not Applicable to this semi-annual report |
| Item 3 – | Audit Committee Financial Expert – Not Applicable to this semi-annual report |
| Item 4 – | Principal Accountant Fees and Services – Not Applicable to this semi-annual report |
| Item 5 – | Audit Committee of Listed Registrants – Not Applicable |
(a) The registrant’s Schedule of Investments is included as part of the Report to Stockholders filed under Item 1 of this Form.
(b) Not Applicable due to no such divestments during the semi-annual period covered since the previous Form N-CSR filing.
| Item 7 – | Disclosure of Proxy Voting Policies and Procedures for Closed-End Management Investment Companies – Not Applicable |
| Item 8 – | Portfolio Managers of Closed-End Management Investment Companies – Not Applicable |
| Item 9 – | Purchases of Equity Securities by Closed-End Management Investment Company and Affiliated Purchasers – Not Applicable |
Item 10 – Submission of Matters to a Vote of Security Holders –There have been no material changes to these procedures.
Item 11 – Controls and Procedures
(a) – The registrant’s principal executive and principal financial officers, or persons performing similar functions, have concluded that the registrant’s disclosure controls and procedures (as defined in Rule 30a-3(c) under the Investment Company Act of 1940, as amended (the “1940 Act”)) are effective as of a date within 90 days of the filing of this report based on the evaluation of these controls and procedures required by Rule 30a-3(b) under the 1940 Act and Rule 15d-15(b) under the Securities Exchange Act of 1934, as amended.
(b) – There were no changes in the registrant’s internal control over financial reporting (as defined in Rule 30a-3(d) under the 1940 Act) that occurred during the second fiscal quarter of the period covered by this report that have materially affected, or are reasonably likely to materially affect, the registrant’s internal control over financial reporting.
Item 12 – Exhibits attached hereto
(a)(1) – Code of Ethics – Not Applicable to this semi-annual report
(a)(2) – Certifications – Attached hereto
(a)(3) – Not Applicable
(b) – Certifications – Attached hereto
2
Pursuant to the requirements of the Securities Exchange Act of 1934 and the Investment Company Act of 1940, the registrant has duly caused this report to be signed on its behalf by the undersigned, thereunto duly authorized.
BlackRock Emerging Markets Fund, Inc.
| | |
| By: | | /s/ John M. Perlowski |
| | John M. Perlowski |
| | Chief Executive Officer (principal executive officer) of |
| | BlackRock Emerging Markets Fund, Inc. |
Date: July 2, 2013
Pursuant to the requirements of the Securities Exchange Act of 1934 and the Investment Company Act of 1940, this report has been signed below by the following persons on behalf of the registrant and in the capacities and on the dates indicated.
| | |
| By: | | /s/ John M. Perlowski |
| | John M. Perlowski |
| | Chief Executive Officer (principal executive officer) of |
| | BlackRock Emerging Markets Fund, Inc. |
Date: July 2, 2013
| | |
By: | | /s/ Neal J. Andrews |
| | Neal J. Andrews |
| | Chief Financial Officer (principal financial officer) of |
| | BlackRock Emerging Markets Fund, Inc. |
Date: July 2, 2013
3