UNITEDSTATES
SECURITIESANDEXCHANGECOMMISSION
Washington,D.C.20549
FORM N-CSRS
CERTIFIED SHAREHOLDER REPORT OF REGISTERED MANAGEMENT
INVESTMENT COMPANIES
Investment Company Act file number 811-05723
Name of Fund: BlackRock Global Emerging Markets Fund, Inc.
Fund Address: 100 Bellevue Parkway, Wilmington, DE 19809
Name and address of agent for service: Anne F. Ackerley, Chief Executive Officer, BlackRock
Global Emerging Markets Fund, Inc., 55 East 52nd Street, New York, NY 10055.
Registrant’s telephone number, including area code: (800) 441-7762
Date of fiscal year end: 10/31/2010
Date of reporting period: 04/30/2010
Item 1 – Report to Stockholders

Semi-Annual Report
APRIL 30, 2010 I (UNAUDITED)
BlackRock Global Emerging Markets Fund, Inc.
BlackRock Latin America Fund, Inc.
BlackRock International Fund of BlackRock Series, Inc.
NOT FDIC INSURED
MAY LOSE VALUE
NO BANK GUARANTEE
| |
| Table of Contents | |
| | Page |
| Dear Shareholder | 3 |
| Semi-Annual Report: | |
| Fund Summaries | 4 |
| About Fund Performance | 10 |
| Disclosure of Expenses | 10 |
| Derivative Financial Instruments | 10 |
| Financial Statements: | |
| Schedules of Investments | 11 |
| Statements of Assets and Liabilities | 16 |
| Statements of Operations | 17 |
| Statements of Changes in Net Assets | 18 |
| Financial Highlights | 19 |
| Notes to Financial Statements | 25 |
| Master Portfolio Information | 33 |
| Master Portfolio Financial Statements: | |
| Schedule of Investments | 34 |
| Statement of Assets and Liabilities | 36 |
| Statement of Operations | 37 |
| Statements of Changes in Net Assets | 38 |
| Master Portfolio Financial Highlights | 38 |
| Master Portfolio Notes to Financial Statements | 39 |
| Officers and Directors | 43 |
| Additional Information | 44 |
| Mutual Fund Family | 46 |
2 SEMI-ANNUAL REPORT
APRIL 30, 2010
Dear Shareholder
Although overall global economic and financial conditions have generally improved over the past year, the period ended with high levels of market volatility
and diminishing investor confidence sparked by the sovereign debt crisis in Europe, concerns over the strength of the economic recovery and uncertainty
surrounding the future of interest rate policies. Additionally, as the period drew to a close, the increasing likelihood of more stringent financial market regula-
tions added to the overall sense of investment uncertainty. Despite the uneven nature of recent market conditions, we continue to believe that the “Great
Recession” likely ended at some point last summer, thanks primarily to massive fiscal and monetary stimulus, and that the global economy remains in
recovery mode.
Global equity markets bottomed in early 2009 and since that time have moved unevenly higher as investors were lured back into the markets by depressed
valuations, desire for higher yields and improvements in corporate earnings prospects. There have been several corrections along the way and volatility levels
have remained elevated — reflections of mixed economic data, lingering deflation issues (especially in Europe) and uncertainty surrounding financial regula-
tions. On balance, however, improving corporate revenues and profits and a positive macro backdrop helped push stock prices higher over the last twelve
and six months. From a geographic perspective, US equities have outpaced their international counterparts in recent months, as the domestic economic
recovery has been more pronounced and as credit-related issues have held European markets down.
Within fixed income markets, yields have been moving unevenly as improving economic conditions have been acting to push Treasury yields higher (and
prices correspondingly lower), while concerns over ongoing deflation threats have acted as a counterweight. As the period drew to a close, Treasury yields
were falling as investors flocked to the “safe haven” asset class in the face of escalating uncertainty. Over the course of the last twelve and six months,
however, Treasuries underperformed other areas of the bond market, particularly the high yield sector, which has been benefiting from increased investor
demand. Meanwhile, municipal bonds slightly outperformed taxable sectors over both the six- and twelve-month periods thanks to continued high demand
levels, but have continued to face the headwinds of ongoing state and local budget problems. As in the taxable arena, high yield municipals have been out-
performing the rest of the market.
Regarding cash investments, yields on money market securities remain near all-time lows (producing returns only marginally above zero percent), with
the Federal Open Market Committee reiterating that economic circumstances are likely to necessitate an accommodative interest rate stance for an
“extended period.”
| | |
| Against this backdrop, the major market averages posted the following returns: | | |
| Total Returns as of April 30, 2010 | 6-month | 12-month |
| US equities (S&P 500 Index) | 15.66% | 38.84% |
| Small cap US equities (Russell 2000 Index) | 28.17 | 48.95 |
| International equities (MSCI Europe, Australasia, Far East Index) | 2.48 | 34.43 |
| 3-month Treasury bill (BofA Merrill Lynch 3-Month Treasury Bill Index) | 0.04 | 0.15 |
| US Treasury securities (BofA Merrill Lynch 10-Year US Treasury Index) | (0.54) | (1.32) |
| Taxable fixed income (Barclays Capital US Aggregate Bond Index) | 2.54 | 8.30 |
| Tax-exempt fixed income (Barclays Capital Municipal Bond Index) | 3.68 | 8.85 |
| High yield bonds (Barclays Capital US Corporate High Yield 2% Issuer Capped Index) | 11.60 | 42.53 |
Past performance is no guarantee of future results. Index performance shown for illustrative purposes only. You cannot invest directly in an index.
Global financial markets continue to show signs of improvement, but questions about the strength and sustainability of the recovery abound. Through
periods of uncertainty, as ever, BlackRock’s full resources are dedicated to the management of our clients’ assets. For additional market perspective and
investment insight, visit www.blackrock.com/shareholdermagazine, where you’ll find the most recent issue of our award-winning Shareholder® magazine,
as well as its quarterly companion newsletter, Shareholder Perspectives. As always, we thank you for entrusting BlackRock with your investments, and we
look forward to your continued partnership in the months and years ahead.

THIS PAGE NOT PART OF YOUR FUND REPORT
3
Fund Summary as of April 30, 2010
BlackRock Global Emerging Markets Fund, Inc.
Portfolio Management Commentary
How did the Fund perform?
• The Fund generated positive results for the six-month period ended
April 30, 2010, but underperformed the benchmark MSCI Emerging
Markets Index.
What factors influenced performance?
• Strong stock selection in Russia and Brazil contributed positively to relative
performance during the period. Brazilian retailers Hypermarcas SA and
Lojas Renner SA also added value. The Fund’s exposure to Saudi Arabia,
which is not included in the benchmark, contributed positively, as did the
position in Panama-based airline Copa Holdings SA, Class A.
• The largest detractor from relative performance was South Korea. Although
the overweight exposure was beneficial, it could not offset very weak stock
selection. Meanwhile, the Chinese government’s increased tightening meas-
ures had a negative effect on shares in the financial sector, particularly
property companies. This significantly affected the Fund’s holding in
Guangzhou R&F Properties Co., Ltd., which closed the period down
almost 25%.
Describe recent portfolio activity.
• During the six months, we significantly reduced the Fund’s exposure to
China, moving to a large underweight position as headwinds such as
monetary tightening and an overheating property market have made the
country less attractive in a global context. We built positions in South
Korea, India and Saudi Arabia.
Describe Fund positioning at period end.
• At period end, the Fund was overweight in South Korea, which was also
the largest absolute weight. Other large overweight country exposures
include India, Qatar, Saudi Arabia and Russia. The Fund has a very large
underweight in China, as well as in the materials sector, which we believe
to be overvalued.
The views expressed reflect the opinions of BlackRock as of the date of this report and are subject to change based on changes in market, economic or other conditions.
These views are not intended to be a forecast of future events and are no guarantee of future results.
| | | |
| Portfolio Information | | | |
| | Percent of | | Percent of |
| | Long-Term | | Long-Term |
| Ten Largest Holdings | Investments | Geographic Allocation | Investments |
| America Movil, SA de CV — ADR | 4% | South Korea | 17% |
| OAO Gazprom — ADR | 4 | Brazil | 17 |
| Samsung Electronics Co., Ltd. | 4 | India | 11 |
| Vale SA — ADR | 4 | China | 10 |
| Itau Unibanco Holdings SA — ADR | 3 | Russia | 8 |
| Morgan Stanley Asia Products Ltd. (ITC Ltd.), due 7/03/14 | 3 | South Africa | 8 |
| Teva Pharmaceutical Industries Ltd. — ADR | 3 | Taiwan | 7 |
| Deutsche Bank AG (Axis Bank), due 8/17/17 | 3 | Mexico | 6 |
| Bank of China Ltd. | 2 | Israel | 3 |
| Shinhan Financial Group Co., Ltd. | 2 | Qatar | 3 |
| | | Saudi Arabia | 2 |
| | | Peru | 2 |
| | | Hungary | 2 |
| | | Czech Republic | 1 |
| | | Panama | 1 |
| | | Thailand | 1 |
| | | Poland | 1 |
4 SEMI-ANNUAL REPORT
APRIL 30, 2010
BlackRock Global Emerging Markets Fund, Inc.
Total Return Based on a $10,000 Investment
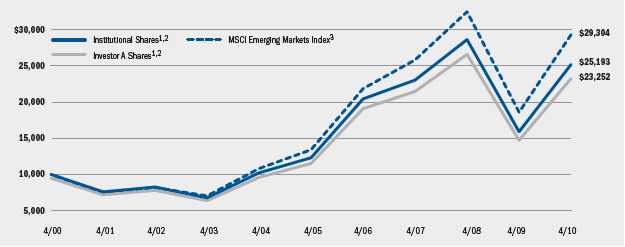
1 Assuming maximum sales charges, transaction costs and other operating expenses, including advisory fees. Institutional Shares do not have
a sales charge.
2 The Fund invests in securities, principally equities, of issuers in countries having smaller capital markets.
3 This unmanaged index measures the total returns of emerging foreign stock markets in Europe, Asia and the Far East.
| | | | | | | |
| Performance Summary for the Period Ended April 30, 2010 | | | | | | |
| | | | | Average Annual Total Returns4 | | |
| | | 1 Year | | 5 Years | | 10 Years |
| | 6-Month | w/o sales | w/sales | w/o sales | w/sales | w/o sales | w/sales |
| | Total Returns | charge | charge | charge | charge | charge | charge |
| Institutional | 9.63% | 58.43% | N/A | 15.40% | N/A | 9.68% | N/A |
| Investor A | 9.45 | 57.94 | 49.65% | 15.08 | 13.85% | 9.39 | 8.80% |
| Investor B | 9.01 | 56.67 | 52.17 | 14.15 | 13.91 | 8.69 | 8.69 |
| Investor C | 8.98 | 56.71 | 55.71 | 14.15 | 14.15 | 8.51 | 8.51 |
| MSCI Emerging Markets Index | 12.46 | 57.55 | N/A | 16.92 | N/A | 11.35 | N/A |
4 Assuming maximum sales charges, if any. Average annual total returns with and without sales charges reflect reductions for distribution and service fees. See “About Fund
Performance” on page 10 for a detailed description of share classes, including any related sales charges and fees.
N/A — Not applicable as share class and index do not have a sales charge.
| | | | | | |
| Expense Example | | | | | | |
| | | Actual | | | Hypothetical6 | |
| | Beginning | Ending | | Beginning | Ending | |
| | Account Value | Account Value | Expenses Paid | Account Value | Account Value | Expenses Paid |
| | November 1, 2009 | April 30, 2010 | During the Period5 | November 1, 2009 | April 30, 2010 | During the Period5 |
| Institutional | $1,000 | $1,096.30 | $ 6.96 | $1,000 | $1,018.16 | $ 6.71 |
| Investor A | $1,000 | $1,094.50 | $ 8.57 | $1,000 | $1,016.62 | $ 8.25 |
| Investor B | $1,000 | $1,090.10 | $12.96 | $1,000 | $1,012.40 | $12.47 |
| Investor C | $1,000 | $1,089.80 | $12.69 | $1,000 | $1,012.65 | $12.23 |
5 For each share class of the Fund, expenses are equal to the annualized expense ratio for the class (1.34% for Institutional, 1.65% for Investor A, 2.50% for Investor B and 2.45%
for Investor C), multiplied by the average account value over the period, multiplied by 181/365 (to reflect the one-half year period shown).
6 Hypothetical 5% annual return before expenses is calculated by pro rating the number of days in the most recent fiscal half year divided by 365.
See “Disclosure of Expenses” on page 10 for further information on how expenses were calculated.
Past performance is not indicative of future results.
SEMI-ANNUAL REPORT
APRIL 30, 2010
5
Fund Summary as of April 30, 2010
BlackRock Latin America Fund, Inc.
Portfolio Management Commentary
How did the Fund perform?
• The Fund’s Institutional and Investor A Shares outperformed the benchmark
MSCI Emerging Markets Latin America Index for the six-month period ended
April 30, 2010, while Investor B and Investor C Shares modestly underper-
formed the index.
What factors influenced performance?
• Stock selection within Brazil was the primary contributor to performance
during the period. In particular, allocations to oil giant Petroleo Brasileiro
SA and banks Itau Unibanco Holdings SA and Banco Bradesco SA helped
relative performance. Also benefiting results were our allocations to several
non-benchmark holdings, including Canadian-listed Colombian oil company
Pacific Rubiales Energy Corp., Mexican over-the-counter pharmaceutical and
personal care products company Genomma Lab Internacional SA de CV and
Argentinean steel production company Ternium SA.
• On the negative side, underweight positions in Mexico, Chile and Colombia
detracted from Fund performance. An underweight allocation in the materi-
als sector and an overweight position in Brazilian homebuilders also hurt rel-
ative results. On an individual-stock basis, Fund holdings Vale SA, Cyrela
Brazil Realty SA and Centrais Eletricas Brasileiras SA were the largest
detractors from performance.
Describe recent portfolio activity.
• Within Brazil, we increased exposure to the oil and telecommunications
industries, as well as to private banks and consumer-related stocks. We
reduced the Fund’s exposure to Brazilian steel companies, but began
increasing our weighting in this sector as the period drew to a close. We
closed our positions in Brazilian credit card acquirers due to our expecta-
tions of a tougher competitive landscape, and we reduced exposure to
Brazilian agribusiness and consumer staples companies.
• In other markets, we exited the Mexican housing industry as we believed
that sector of the market became unattractive. We also reduced exposure to
Mexican retail and financial companies in favor of beverages and telecom-
munications companies. We rotated out of Brazilian airlines into Chilean and
Panamanian airlines given better-than-expected performance prospects for
the coming year. We added exposure to Colombia through a Canadian-listed
Colombian oil stock due to attractive valuation levels and growth prospects.
We increased mining exposure in Peru.
Describe Fund positioning at period end.
• Our outlook for Latin American equities (especially Brazil) continues to be
positive. The Brazilian economy is growing rapidly, the Brazilian Central Bank
remains committed to keeping a lid on inflation and domestic demand lev-
els continue to be strong. One relatively weak area of the region is Mexico,
whose economic outlook is less certain given that its economy remains
highly dependent on economic growth in the United States. From a valua-
tion perspective, for the region as a whole, we believe that Latin American
equity valuations compare favorably to other regions.
• Regarding country weights at period end, we have maintained an under-
weight position in Chile, believing that valuations are relatively high, and
we have moved to an overweight in Peru through increased exposure to
mining companies.
The views expressed reflect the opinions of BlackRock as of the date of this report and are subject to change based on changes in market, economic or other conditions.
These views are not intended to be a forecast of future events and are no guarantee of future results.
| | | |
| Portfolio Information | | | |
| | Percent of | | Percent of |
| | Long-Term | | Long-Term |
| Ten Largest Holdings | Investments | Geographic Allocation | Investments |
| Petroleo Brasileiro SA — ADR | 13% | Brazil | 74% |
| Itau Unibanco Holdings SA — ADR | 10 | Mexico | 17 |
| Vale SA — ADR | 9 | Chile | 3 |
| America Movil, SA de CV — ADR | 9 | Peru | 3 |
| Banco Bradesco SA — ADR | 5 | Panama | 1 |
| Fomento Economico Mexicano, SA de CV — ADR | 3 | Colombia | 1 |
| Usinas Siderurgicas de Minas Gerais SA (Preference 'A' Shares) | 3 | Argentina | 1 |
| OGX Petroleo e Gas Participacoes SA | 3 | | |
| Bradespar SA (Preference Shares) | 2 | | |
| Cyrela Brazil Realty SA | 2 | | |
6 SEMI-ANNUAL REPORT
APRIL 30, 2010
BlackRock Latin America Fund, Inc.
Total Return Based on a $10,000 Investment
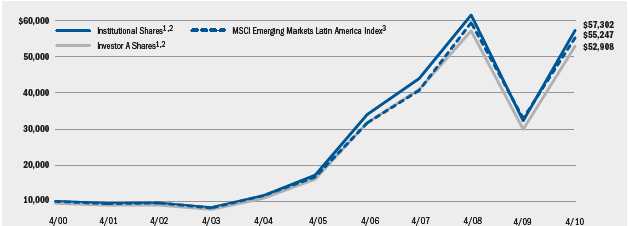
1 Assuming maximum sales charges, if any, transaction costs and other operating expenses, including advisory fees. Institutional Shares do not have
a sales charge.
2 The Fund invests primarily in Latin America equity and debt securities.
3 This unmanaged market-capitalization-weighted index by Morgan Stanley Capital International is comprised of a representative sampling of stocks of
large-, medium-, and small-capitalization companies in Argentina, Brazil, Chile and Mexico, which are freely purchasable by foreign investors.
| | | | | | | |
| Performance Summary for the Period Ended April 30, 2010 | | | | | | |
| | | | | Average Annual Total Returns4 | | |
| | | 1 Year | | 5 Years | | 10 Years |
| | 6-Month | w/o sales | w/sales | w/o sales | w/sales | w/o sales | w/sales |
| | Total Returns | charge | charge | charge | charge | charge | charge |
| Institutional | 12.66% | 77.52% | N/A | 27.14% | N/A | 19.07% | N/A |
| Investor A | 12.49 | 76.95 | 67.66% | 26.81 | 25.45% | 18.77 | 18.13% |
| Investor B | 12.00 | 75.39 | 70.89 | 25.75 | 25.59 | 18.02 | 18.02 |
| Investor C | 12.07 | 75.57 | 74.57 | 25.81 | 25.81 | 17.83 | 17.83 |
| MSCI Emerging Markets Latin America Index | 12.15 | 67.88 | N/A | 27.00 | N/A | 18.64 | N/A |
4 Assuming maximum sales charges, if any. Average annual total returns with and without sales charges reflect reductions for distribution and service fees. See “About Fund
Performance” on page 10 for a detailed description of share classes, including any related sales charges and fees.
N/A — Not applicable as share class and index do not have a sales charge.
| | | | | | |
| Expense Example | | | | | | |
| | | Actual | | | Hypothetical6 | |
| | Beginning | Ending | | Beginning | Ending | |
| | Account Value | Account Value | Expenses Paid | Account Value | Account Value | Expenses Paid |
| | November 1, 2009 | April 30, 2010 | During the Period5 | November 1, 2009 | April 30, 2010 | During the Period5 |
| Institutional | $1,000 | $1,126.60 | $ 6.43 | $1,000 | $1,018.75 | $ 6.11 |
| Investor A | $1,000 | $1,125.10 | $ 8.01 | $1,000 | $1,017.26 | $ 7.60 |
| Investor B | $1,000 | $1,120.00 | $12.56 | $1,000 | $1,012.95 | $11.93 |
| Investor C | $1,000 | $1,120.70 | $12.04 | $1,000 | $1,013.44 | $11.43 |
5 For each share class of the Fund, expenses are equal to the expense ratio for the class (1.22% for Institutional, 1.52% for Investor A, 2.39% for Investor B and 2.29% for
Investor C), multiplied by the average account value over the period, multiplied by 181/365 (to reflect the one-half year period shown).
6 Hypothetical 5% annual return before expenses is calculated by pro rating the number of days in the most recent fiscal half year divided by 365.
See “Disclosure of Expenses” on page 10 for further information on how expenses were calculated.
Past performance is not indicative of future results.
SEMI-ANNUAL REPORT
APRIL 30, 2010
7
Fund Summary as of April 30, 2010
BlackRock International Fund of BlackRock Series, Inc.
Portfolio Management Commentary
How did the Fund perform?
• Effective March 1, 2010, the Fund changed its primary benchmark from the
MSCI EAFE Index to the MSCI All Country World Index ex-US. The MSCI All
Country World Index ex-US provides a closer representation of the Fund’s
investable universe than the MSCI EAFE Index and more accurately reflects
the investment strategy of the Fund. The Fund invests all of its assets in
BlackRock Master International Portfolio (the “Portfolio”).
• Fund returns for the six-month period ended April 30, 2010 underperformed
that of the MSCI All Country World Index ex-US, but outpaced its former
benchmark, the MSCI EAFE Index. The following discussion of relative per-
formance pertains to the MSCI All Country World Index ex-US.
What factors influenced performance?
• Overall, stock selection during the period detracted from relative perform-
ance, particularly within the information technology and utilities sectors.
Sector allocation, however, was positive for the period, as the Portfolio
benefited from an overweight in the consumer discretionary sector and an
underweight in financials.
• On an individual-stock basis, the Portfolio’s holding in Societe Generale
SA, France’s second-largest bank, detracted from performance during the
six months. The company issued a profit warning for the fourth quarter of
2009 after having to write down €1.4 billion from real-estate-linked assets.
Greek retail bank EFG Eurobank Ergasias SA also hampered results as the
firm continued to weaken sharply in the face of the country’s sovereign
debt crisis.
• On the positive side, Portfolio holding Lloyds TSB Group Plc rose strongly
after announcing that it expected to return to profitability this year amid
expectations that UK and US interest rates will stay near current lows for
some time. In the consumer discretionary sector, Liberty Global, Inc. was
the strongest contributor to performance. The market reacted well to the
company’s fourth quarter 2009 results, which beat consensus estimates.
Macau-based Sands China Ltd. also rose after it was reported that casino
revenue in the world’s biggest gambling hub had jumped 48% in December
2009 over December 2008. In the telecommunication services sector, NII
Holdings, Inc., which has significant exposure to Latin America, was also
strong over the period.
Describe recent portfolio activity.
• With our growing conviction that there are good prospects for a return to
growth in most markets, we increased the Portfolio’s emphasis on stocks
that we believe have an attractive growth profile and are reasonably valued.
As such, we added Nissan Motor Co., Ltd. and Russia’s Sberbank during
the period. Sberbank was later sold out of the Fund.
• We continued to reduce exposure to some of the cyclical value names in
the portfolio following strong performance, with sales including Sandvik
and ArcelorMittal.
Describe portfolio positioning at period end.
• We continue to believe that the global economic recovery will gather pace
over the course of 2010 and that monetary policy will be accommodative
for the foreseeable future.
• We are seeing evidence of investors once again moving from high cash
levels into riskier assets. In this environment, we continue to be positive on
global equities as an asset class. While the rally that began in March 2009
has reduced many of the outright value characteristics of equities, their
valuations continue to be attractive relative to bonds.
• In an environment where equities have moved away from extremes in terms
of sentiment, valuation and earnings expectations, we continue to favor
stocks that offer growth at a reasonable price.
The views expressed reflect the opinions of BlackRock as of the date of this report and are subject to change based on changes in market, economic or other conditions.
These views are not intended to be a forecast of future events and are no guarantee of future results.
8 SEMI-ANNUAL REPORT
APRIL 30, 2010
BlackRock International Fund of BlackRock Series, Inc.
Total Return Based on a $10,000 Investment
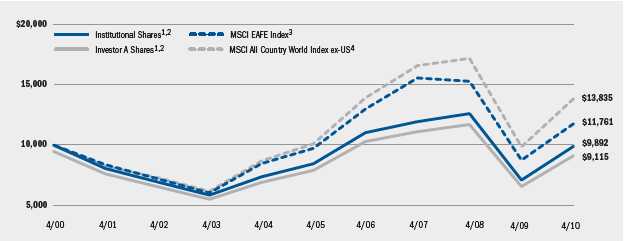
1 Assuming maximum sales charges, transaction costs and other operating expenses, including administration fees, if any. Institutional Shares do not have a
sales charge.
2 The Fund invests all of its assets in BlackRock Master International Portfolio of BlackRock Master LLC. The Portfolio invests primarily in stocks of companies
located outside of the United States that its management believes are undervalued or have good prospects for earnings growth.
3 This unmanaged broad-based index measures the total returns of developed foreign stock markets in Europe, Australasia and the Far East.
4 This market capitalization weighted index is designed to provide a broad measure of stock performance throughout the world, with the exception of
US-based companies. The index includes both developed and emerging markets. The Fund now uses this index as its benchmark rather than the
MSCI EAFE Index because Fund management believes it is more representative of the industry standard benchmark for funds with similar strategies.
| | | | | | | |
| Performance Summary for the Period Ended April 30, 2010 | | | | | | |
| | | | | Average Annual Total Returns5 | | |
| | | 1 Year | | 5 Years | | 10 Years |
| | 6-Month | w/o sales | w/sales | w/o sales | w/sales | w/o sales | w/sales |
| | Total Returns | charge | charge | charge | charge | charge | charge |
| Institutional | 4.03% | 39.43% | N/A | 3.20% | N/A | (0.11)% | N/A |
| Investor A | 3.90 | 38.88 | 31.59% | 2.89 | 1.79% | (0.39) | (0.92)% |
| Investor B | 3.34 | 37.52 | 33.02 | 1.87 | 1.50 | (1.04) | (1.04) |
| Investor C | 3.50 | 37.82 | 36.82 | 2.12 | 2.12 | (1.14) | (1.14) |
| MSCI EAFE Index | 2.48 | 34.43 | N/A | 3.86 | N/A | 1.64 | N/A |
| MSCI All Country World Index ex-US | 5.76 | 40.38 | N/A | 6.48 | N/A | 3.30 | N/A |
5 Assuming maximum sales charges, if any. Average annual total returns with and without sales charges reflect reductions for distribution and service fees. See “About Fund
Performance” on page 10 for a detailed description of share classes, including any related sales charges and fees.
N/A — Not applicable as share class and index do not have a sales charge.
| | | | | | |
| Expense Example | | | | | | |
| | | Actual | | | Hypothetical7 | |
| | Beginning | Ending | | Beginning | Ending | |
| | Account Value | Account Value | Expenses Paid | Account Value | Account Value | Expenses Paid |
| | November 1, 2009 | April 30, 2010 | During the Period6 | November 1, 2009 | April 30, 2010 | During the Period6 |
| Institutional | $1,000 | $1,040.30 | $ 9.00 | $1,000 | $1,015.97 | $ 8.90 |
| Investor A | $1,000 | $1,039.00 | $10.52 | $1,000 | $1,014.49 | $10.39 |
| Investor B | $1,000 | $1,033.40 | $16.39 | $1,000 | $1,008.68 | $16.19 |
| Investor C | $1,000 | $1,035.00 | $14.23 | $1,000 | $1,010.82 | $14.06 |
6 For each share class of the Fund, expenses are equal to the expense ratio for the class (1.78% for Institutional, 2.08% for Investor A, 3.25% for Investor B and 2.82% for
Investor C), multiplied by the average account value over the period, multiplied by 181/365 (to reflect the one-half year period shown). Because the Fund is a feeder fund, the
expense example reflects the expenses of both the fund and the Portfolio in which it invests.
7 Hypothetical 5% annual return before expenses are calculated by pro rating the number of days in the most recent fiscal half year divided by 365.
See “Disclosure of Expenses” on page 10 for further information on how expenses were calculated.
Past performance is not indicative of future results.
SEMI-ANNUAL REPORT
APRIL 30, 2010
9
About Fund Performance
• Institutional Shares are not subject to any sales charge. Institutional
Shares bear no ongoing distribution or service fees and are available only
to eligible investors.
• Investor A Shares incur a maximum initial sales charge (front-end load) of
5.25% and a service fee of 0.25% per year (but no distribution fee).
• Investor B Shares are subject to a maximum contingent deferred sales
charge of 4.50% declining to 0% after six years. In addition, Investor B
Shares are subject to a distribution fee of 0.75% per year and a service
fee of 0.25% per year. These shares automatically convert to Investor A
Shares after approximately eight years. (There is no initial sales charge for
automatic share conversions.) All returns for periods greater than eight
years reflect this conversion. Investor B Shares of the Funds are only avail-
able through exchanges, dividend reinvestments by existing shareholders or
for purchase by certain qualified employee benefit plans.
• Investor C Shares are subject to a distribution fee of 0.75% and a service
fee of 0.25%. In addition, Investor C Shares are subject to a 1% contingent
deferred sales charge if redeemed within one year of purchase.
Performance information reflects past performance and does not guarantee
future results. Current performance may be lower or higher than the per-
formance data quoted. Refer to www.blackrock.com/funds to obtain per-
formance data current to the most recent month-end. Performance results
do not reflect the deduction of taxes that a shareholder would pay on fund
distributions or the redemption of fund shares. The Funds may charge a 2%
redemption fee for sales or exchanges of shares within 30 days of pur-
chase or exchange. Performance data does not reflect this potential fee.
Figures shown in the performance tables on pages 5, 7 and 9 assume
reinvestment of all dividends and capital gain distributions, if any, at net
asset value on the ex-dividend date. Investment return and principal value
of shares will fluctuate so that shares, when redeemed, may be worth more
or less than their original cost. Dividends paid to each class of shares will
vary because of the different levels of service, distribution and transfer
agency fees applicable to each class, which are deducted from the income
available to be paid to shareholders.
Disclosure of Expenses
Shareholders of these Funds may incur the following charges: (a) expenses
related to transactions, including sales charges, redemption fees and
exchange fees; and (b) operating expenses including advisory fees, dis-
tribution fees including 12b-1 fees and other Fund expenses. The expense
examples on pages 5, 7 and 9 (which are based on a hypothetical invest-
ment of $1,000 invested on November 1, 2009 and held through April 30,
2010) are intended to assist shareholders both in calculating expenses
based on an investment in the Funds and in comparing these expenses
with similar costs of investing in other mutual funds.
The tables provide information about actual account values and actual
expenses. In order to estimate the expenses a shareholder paid during the
period covered by this report, shareholders can divide their account value
by $1,000 and then multiply the result by the number corresponding to
their share class under the heading “Expenses Paid During the Period.”
The tables also provide information about hypothetical account values and
hypothetical expenses based on each Fund’s actual expense ratio and an
assumed rate of return of 5% per year before expenses. In order to assist
shareholders in comparing the ongoing expenses of investing in these
Funds and other funds, compare the 5% hypothetical examples with the
5% hypothetical examples that appear in other funds’ shareholder reports.
The expenses shown in the tables are intended to highlight shareholders’
ongoing costs only and do not reflect any transactional expenses, such as
sales charges, redemption fees or exchange fees. Therefore, the hypotheti-
cal examples are useful in comparing ongoing expenses only, and will not
help shareholders determine the relative total expenses of owning different
funds. If these transactional expenses were included, shareholder expenses
would have been higher.
Derivative Financial Instruments
The Funds and Portfolio may invest in various derivative instruments,
including foreign currency exchange contracts and options, as specified
in Note 2 of the Notes to Financial Statements, which constitute forms
of economic leverage. Such instruments are used to obtain exposure to a
market without owning or taking physical custody of securities or to hedge
market, equity and/or foreign currency exchange rate risks. Such derivative
instruments involve risks, including the imperfect correlation between the
value of a derivative instrument and the underlying asset, possible default
of the counterparty to the transaction and illiquidity of the derivative instru-
ment. The Funds’ and Portfolio’s ability to successfully use a derivative
instrument depends on the investment advisor’s ability to accurately
predict pertinent market movements, which cannot be assured. The use
of derivative instruments may result in losses greater than if they had
not been used, may require the Funds and Portfolio to sell or purchase
portfolio securities at inopportune times or at distressed values, may limit
the amount of appreciation the Funds and Portfolio can realize on an
investment or may cause the Funds and Portfolio to hold a security that
they might otherwise sell. The Funds’ and Portfolio’s investments in these
instruments are discussed in detail in the Notes to Financial Statements.
10 SEMI-ANNUAL REPORT
APRIL 30, 2010
Schedule of Investments April 30, 2010 (Unaudited)
BlackRock Global Emerging Markets Fund, Inc.
(Percentages shown are based on Net Assets)
| | |
| Common Stocks | Shares | Value |
| Brazil — 16.6% | | |
| Cia Energetica de Minas Gerais — ADR | 219,432 | $ 3,543,833 |
| Cyrela Brazil Realty SA | 244,832 | 2,936,716 |
| Hypermarcas SA (a) | 204,188 | 2,796,902 |
| Itau Unibanco Holdings SA — ADR | 383,158 | 8,306,866 |
| Lojas Renner SA | 118,502 | 2,938,263 |
| OGX Petroleo e Gas Participacoes SA (a) | 511,000 | 5,109,265 |
| Petroleo Brasileiro SA — ADR | 84,875 | 3,220,158 |
| Tele Norte Leste Participacoes SA — ADR | 162,500 | 2,414,750 |
| Tractebel Energia SA | 178,006 | 2,272,373 |
| Vale SA — ADR | 354,020 | 9,526,678 |
| | | 43,065,804 |
| China — 9.8% | | |
| Bank of China Ltd. | 12,264,000 | 6,313,325 |
| China Coal Energy Co. | 1,758,000 | 2,652,831 |
| China Life Insurance Co. Ltd. | 1,111,000 | 5,115,595 |
| China Petroleum & Chemical Corp. | 4,350,000 | 3,487,826 |
| Focus Media Holding Ltd. — ADR (a) | 160,740 | 2,697,217 |
| Melco Crown Entertainment Ltd. — ADR (a) | 554,721 | 2,640,472 |
| Zhejiang Expressway Co. Ltd. | 2,714,000 | 2,531,630 |
| | | 25,438,896 |
| Czech Republic — 1.4% | | |
| CEZ AS | 73,758 | 3,536,736 |
| Hungary — 1.8% | | |
| OTP Bank Rt. | 133,907 | 4,707,028 |
| India — 1.0% | | |
| ICICI Bank Ltd. — ADR | 62,300 | 2,648,996 |
| Israel — 2.7% | | |
| Teva Pharmaceutical Industries Ltd. — ADR | 117,576 | 6,905,238 |
| Mexico — 5.9% | | |
| America Movil, SA de CV — ADR | 216,925 | 11,167,299 |
| Fomento Economico Mexicano, SA de CV — ADR | 84,086 | 3,979,790 |
| | | 15,147,089 |
| Panama — 1.2% | | |
| Copa Holdings SA, Class A | 56,639 | 3,210,298 |
| Peru — 2.1% | | |
| Credicorp Ltd. | 27,119 | 2,355,557 |
| Southern Copper Corp. | 99,640 | 3,046,991 |
| | | 5,402,548 |
| Poland — 1.0% | | |
| Central European Distribution Corp. (a) | 74,609 | 2,585,202 |
| Russia — 8.0% | | |
| OAO Gazprom — ADR | 450,123 | 10,483,365 |
| OAO Rosnft Oil Co. — ADR | 502,064 | 4,071,739 |
| VTB Bank OJSC — GDR | 493,857 | 2,469,285 |
| VimpelCom Ltd. — ADR (a) | 212,481 | 3,701,419 |
| | | 20,725,808 |
| South Africa — 7.4% | | |
| African Bank Investments Ltd. | 622,753 | 2,981,996 |
| Aveng Ltd. | 441,867 | 2,213,736 |
| FirstRand Ltd. | 1,047,481 | 2,876,893 |
| Gold Fields Ltd. | 117,135 | 1,564,659 |
| Gold Fields Ltd. — ADR | 111,775 | 1,502,256 |
| MTN Group Ltd. | 372,282 | 5,476,662 |
| Tiger Brands Ltd. | 102,527 | 2,610,657 |
| | | 19,226,859 |
| | | | |
| Common Stocks | | | Shares | Value |
| South Korea — 17.0% | | | | |
| GS Engineering & Construction Corp. | | | 42,043 | $ 3,178,003 |
| Hana Financial Group, Inc. | | | 105,620 | 3,285,180 |
| Hyundai Mobis | | | 29,565 | 4,907,086 |
| LG Electronics, Inc. | | | 38,172 | 4,162,179 |
| NHN Corp. (a) | | | 22,943 | 3,825,103 |
| Samsung Electronics Co., Ltd. | | | 12,811 | 9,740,701 |
| Samsung Fire & Marine Insurance Co. Ltd. | | | 15,600 | 2,883,885 |
| SK Telecom Co., Ltd. | | | 3,843 | 599,739 |
| SK Telecom Co., Ltd. — ADR | | | 113,650 | 2,103,661 |
| Shinhan Financial Group Co., Ltd. | | | 132,393 | 5,631,685 |
| Shinsegae Co. Ltd. | | | 7,968 | 3,653,181 |
| | | | | 43,970,403 |
| Taiwan — 6.9% | | | | |
| Delta Electronics, Inc. | | 1,585,000 | 5,253,883 |
| Far Eastern New Century Corp. | | 2,501,060 | 2,713,726 |
| MediaTek, Inc. | | | 224,000 | 3,792,777 |
| Taiwan Semiconductor Manufacturing Co., Ltd. | | 2,070,000 | 4,051,198 |
| Taiwan Semiconductor Manufacturing Co., Ltd. — ADR | | 194,057 | 2,055,064 |
| | | | | 17,866,648 |
| Thailand — 1.1% | | | | |
| Kasikornbank Pcl | | 1,011,700 | 2,796,910 |
| Turkey — 0.2% | | | | |
| Koza Altin Isletmeleri AS | | | 24,931 | 623,861 |
| Total Common Stocks — 84.1% | | | | 217,858,324 |
| | | | Par | |
| Structured Notes | | | (000) | |
| India — 9.6% | | | | |
| Citigroup Global Markets Holdings, Inc. (Sterlite | | | | |
| Industries (India) Ltd.), due 10/24/12 (a) | USD | 183 | 3,418,321 |
| Deutsche Bank AG (a): | | | | |
| (Axis Bank), due 8/17/17 | | | 229 | 6,513,166 |
| (Lanco Infratech Ltd.), due 11/23/16 | | | 1,117 | 1,607,117 |
| Morgan Stanley Asia Products Ltd. (ITC Ltd.), | | | | |
| due 7/03/14 (a) | | | 1,313 | 7,870,832 |
| Morgan Stanley BV (Rolta India Ltd.), due 5/26/14 | | 478 | 2,042,084 |
| UBS AG (Glenmark Pharmaceuticals Ltd.), | | | | |
| due 12/18/12 (a) | | | 548 | 3,336,013 |
| | | | | 24,787,533 |
| Qatar — 2.4% | | | | |
| Deutsche Bank AG (Commercial Bank of | | | | |
| Qatar Inc.), due 5/26/17 | | | 125 | 2,652,519 |
| Morgan Stanley BV (Industries Qatar), | | | | |
| due 11/30/10 (a) | | | 109 | 3,567,723 |
| | | | | 6,220,242 |
| Saudi Arabia — 2.2% | | | | |
| HSBC Bank Plc (a): | | | | |
| (Abdullah Al Othaim Markets), due 9/05/11 | | | 85 | 1,626,200 |
| (Co. for Cooperative Insurance), due 9/24/11 | | | 22 | 525,467 |
| (Saudi Arabian Mining), due 9/05/11 | | | 655 | 3,528,475 |
| | | | | 5,680,142 |
| | | | |
| Portfolio Abbreviations | | | | |
| To simplify the listings of portfolio holdings in | ADR | American Depositary Receipts | KRW | South Korean Won |
| the Schedules of Investments, the names and | BRL | Brazilian Real | TRY | Turkish Lira |
| descriptions of many of the securities have been | CLP | Chilean Peso | USD | US Dollar |
| abbreviated according to the following list: | GDR | Global Depositary Receipts | ZAR | South African Rand |
| See Notes to Financial Statements. | | | | |
SEMI-ANNUAL REPORT
APRIL 30, 2010
11
Schedule of Investments (continued)
BlackRock Global Emerging Markets Fund, Inc.
(Percentages shown are based on Net Assets)
| | |
| | Par | |
| Structured Notes | (000) | Value |
| South Africa — 0.2% | | |
| Deutsche Bank AG (Naspers Ltd./Tencent | | |
| Holdings Ltd.), due 8/21/11 (a) | USD 68 | $ 533,803 |
| Total Structured Notes — 14.4% | | 37,221,720 |
| Total Long-Term Investments | | |
| (Cost — $214,567,663) — 98.5% | | 255,080,044 |
| Short-Term Securities | Shares | |
| BlackRock Liquidity Funds, TempFund, | | |
| Institutional Class, 0.13% (b)(c) | 7,771,573 | 7,771,573 |
| Total Short-Term Securities | | |
| (Cost — $7,771,573) — 3.0% | | 7,771,573 |
| Total Investments (Cost — $222,339,236*) — 101.5% | 262,851,617 |
| Liabilities in Excess of Other Assets — (1.5)% | | (3,828,042) |
| Net Assets — 100.0% | | $ 259,023,575 |
* The cost and unrealized appreciation (depreciation) of investments as of April 30,
2010, as computed for federal income tax purposes, were as follows:
| |
| Aggregate cost | $ 232,295,127 |
| Gross unrealized appreciation | $ 33,026,496 |
| Gross unrealized depreciation | (2,470,006) |
| Net unrealized appreciation | $ 30,556,490 |
(a) Non-income producing security.
(b) Investments in companies considered to be an affiliate of the Fund during the
period, for purposes of Section 2(a)(3) of the Investment Company Act of 1940,
were as follows:
| | | | |
| | Shares Held at | | Shares Held at | |
| | October 31, | Net | April 30, | |
| Affiliate | 2009 | Activity | 2010 | Income |
| BlackRock Liquidity | | | | |
| Funds, TempFund, | | | | |
| Institutional Class | 6,661,505 | 1,110,068 | 7,771,573 $ | 2,655 |
| (c) Represents the current yield as of report date. | | |
• Foreign currency exchange contracts as of April 30, 2010 were as follows:
| | | | | | |
| | | | | | | Unrealized |
| Currency | Currency | | Settlement Appreciation |
| Purchased | | Sold | Counterparty | Date | (Depreciation) |
| BRL | 2,120,427 | USD | 1,208,220 | Brown Brothers | | |
| | | | | Harriman & Co. | 5/03/2010 | $ 10,906 |
| KRW 677,555,766 | USD | 611,789 | Brown Brothers | | |
| | | | | Harriman & Co. | 5/03/2010 | (469) |
| TRY | 111,137 | USD | 74,887 | Goldman | | |
| | | | | Sachs & Co. | 5/03/2010 | (229) |
| ZAR | 2,281 | USD | 309 | Brown Brothers | | |
| | | | | Harriman & Co. | 5/03/2010 | — |
| ZAR | 4,574,872 | USD | 615,605 | Goldman | | |
| | | | | Sachs & Co. | 5/03/2010 | 3,427 |
| TRY | 758,848 | USD | 511,119 | Goldman | | |
| | | | | Sachs & Co. | 5/04/2010 | (1,346) |
| USD | 78,529 | BRL | 135,973 | Brown Brothers | | |
| | | | | Harriman & Co. | 5/04/2010 | 305 |
| ZAR | 5,415,867 | USD | 723,031 | Goldman | | |
| | | | | Sachs & Co. | 5/05/2010 | 9,543 |
| Total | | | | | | $ 22,137 |
• For Fund compliance purposes, the Fund's industry classifications refer to any one
or more of the industry sub-classifications used by one or more widely recognized
market indexes or rating group indexes, and/or as defined by Fund management.
This definition may not apply for purposes of this report, which may combine such
industry sub-classifications for reporting ease.
See Notes to Financial Statements.
12 SEMI-ANNUAL REPORT
APRIL 30, 2010
Schedule of Investments (concluded)
BlackRock Global Emerging Markets Fund, Inc.
• Fair Value Measurements — Various inputs are used in determining the fair value of
investments, which are as follows:
• Level 1 — price quotations in active markets/exchanges for identical assets and
liabilities
• Level 2 — other observable inputs (including, but not limited to: quoted prices
for similar assets or liabilities in markets that are active, quoted prices for iden-
tical or similar assets or liabilities in markets that are not active, inputs other
than quoted prices that are observable for the assets or liabilities (such as
interest rates, yield curves, volatilities, prepayment speeds, loss severities, credit
risks and default rates) or other market-corroborated inputs)
• Level 3 — unobservable inputs based on the best information available in the
circumstances, to the extent observable inputs are not available (including the
Fund's own assumptions used in determining the fair value of investments)
The inputs or methodologies used for valuing securities are not necessarily an
indication of the risk associated with investing in those securities. For information
about the Fund's policy regarding valuation of investments and other significant
accounting policies, please refer to Note 1 of the Notes to Financial Statements.
The following tables summarize the inputs used as of April 30, 2010 in determining
the fair valuation of the Fund's investments:
| | | | | |
| Investments in Securities |
|
| Valuation Inputs | Level 1 | Level 2 | | Level 3 | Total |
| Assets: | | | | | |
| Common Stocks: | | | | | |
| Brazil | $ 43,065,804 | — | | — | $ 43,065,804 |
| China | 10,453,284 | $ 14,985,612 | | — | 25,438,896 |
| Czech | | | | | |
| Republic | — | 3,536,736 | | — | 3,536,736 |
| Hungary | — | 4,707,028 | | — | 4,707,028 |
| India | 2,648,996 | — | | — | 2,648,996 |
| �� Israel | 6,905,238 | — | | — | 6,905,238 |
| Mexico | 15,147,089 | — | | — | 15,147,089 |
| Panama | 3,210,298 | — | | — | 3,210,298 |
| Peru | 5,402,548 | — | | — | 5,402,548 |
| Poland | 2,585,202 | — | | — | 2,585,202 |
| Russia | 18,256,523 | 2,469,285 | | — | 20,725,808 |
| South Africa | 1,502,256 | 17,724,603 | | — | 19,226,859 |
| South Korea . | 2,103,661 | 41,866,742 | | — | 43,970,403 |
| Taiwan | 2,055,064 | 15,811,584 | | — | 17,866,648 |
| Thailand | — | 2,796,910 | | — | 2,796,910 |
| Turkey | 623,861 | — | | — | 623,861 |
| Structured Notes: | | | | | |
| India | — | 24,787,533 | | — | 24,787,533 |
| Qatar | — | 6,220,242 | | — | 6,220,242 |
| Saudi Arabia | — | 5,680,142 | | — | 5,680,142 |
| South Africa | — | — | $ 533,803 | 533,803 |
| Short-Term | | | | | |
| Securities | 7,771,573 | — | | — | 7,771,573 |
| Total | $121,731,397 | $140,586,417 | $ 533,803 | $262,851,617 |
| Other Financial Instruments1 |
|
| Valuation Inputs | Level 1 | Level 2 | | Level 3 | Total |
| Assets | — | $ 24,181 | | — | $ 24,181 |
| Liabilities | — | (2,044) | | — | (2,044) |
| Total | — | $ 22,137 | | — | $ 22,137 |
1 Other financial instruments are foreign currency exchange contracts, which are
shown at the unrealized appreciation/depreciation on the instrument.
The following table is a reconciliation of Level 3 investments for which significant
unobservable inputs were used in determining fair value:
| |
| | Investments in |
| Valuation Inputs | Securities |
| | Structured |
| | Notes |
| Balance, as of October 31, 2009 | $ 18,760,194 |
| Accrued discounts/premiums | — |
| Net realized gain (loss) | (149,624) |
| Net change in unrealized appreciation/depreciation2 | 356,382 |
| Net purchases (sales) | (5,574,163) |
| Net transfers in/out of Level 3 | (12,858,986) |
| Balance, as of April 30, 2010 | $ 533,803 |
2 Included in the related net change in unrealized appreciation/depreciation
on the Statement of Operations. The change in unrealized appreciation/
depreciation on securities still held at April 30, 2010 was $(5,216).
See Notes to Financial Statements.
SEMI-ANNUAL REPORT
APRIL 30, 2010
13
Schedule of Investments April 30, 2010 (Unaudited)
BlackRock Latin America Fund, Inc.
(Percentages shown are based on Net Assets)
| | |
| Common Stocks | Shares | Value |
| Argentina — 0.7% | | |
| Ternium SA — ADR | 169,000 | $ 6,242,860 |
| Brazil — 70.7% | | |
| Amil Partcipacoes SA | 139,200 | 1,141,148 |
| Anhanguera Educaional Participacoes SA | 525,000 | 8,027,902 |
| BM&F Bovespa SA | 1,835,000 | 12,087,300 |
| BR Malls Participacoes SA | 152,000 | 1,927,272 |
| BR Properties SA | 607,000 | 4,347,562 |
| Banco ABC Brasil SA (Preference Shares) | 258,000 | 1,856,799 |
| Banco Bradesco SA — ADR (a) | 2,250,000 | 41,895,000 |
| Banco Industrial e Comercial SA (Preference Shares) | 350,000 | 2,756,508 |
| Bradespar SA (Preference Shares) | 823,000 | 18,877,037 |
| CPFL Energia SA | 272,000 | 5,583,179 |
| Centrais Eletricas Basileiras SA | 7,800 | 110,611 |
| Centrais Eletricas Brasileiras SA — ADR | 29,300 | 418,697 |
| Cia Brasileira de Distribuicao Grupo Pao | | |
| de Acucar — ADR (a) | 140,895 | 9,652,716 |
| Cia de Bebidas das Americas | | |
| (Preference Shares) — ADR | 159,000 | 15,550,200 |
| Cia de Concessoes Rodoviarias | 219,000 | 5,039,551 |
| Cia Energetica de Minas Gerais — ADR (a) | 603,780 | 9,751,047 |
| Cia Energetica de Minas Gerais (Preference Shares) | 51,700 | 820,895 |
| Cia Energetica de Sao Paulo (Preference 'B' Shares) | 460,200 | 6,698,150 |
| Cia Siderurgica Nacional SA | 212,000 | 3,963,757 |
| Companhia Paranaense de Energia-Copel — ADR (a) | 151,000 | 3,122,680 |
| Cyrela Brazil Realty SA | 1,385,000 | 16,612,829 |
| Diagnosticos da America SA | 665,000 | 5,746,182 |
| Duratex SA | 400,000 | 3,645,045 |
| EDP — Energias do Brasil SA | 111,000 | 2,123,256 |
| Eletropaulo Metropolitana Eletricidade de Sao | | |
| Paulo SA (Preference 'B' Shares) | 166,000 | 3,683,371 |
| Fibria Celulose SA — ADR (a)(b) | 195,000 | 3,870,750 |
| Hypermarcas SA (b) | 870,000 | 11,916,986 |
| Iguatemi Empresa de Shopping Centers SA | 109,000 | 1,822,885 |
| Iochpe-Maxion SA | 550,000 | 5,078,383 |
| Itau Unibanco Holdings SA — ADR | 3,675,000 | 79,674,000 |
| Itausa-Investimentos Itau SA (Preference Shares) | 1,773,600 | 12,254,242 |
| Light SA | 181,000 | 2,447,001 |
| Lojas Renner SA | 110,000 | 2,727,456 |
| Lupatech SA (b) | 98,000 | 1,344,628 |
| Marcopolo SA (Preference Shares) | 340,000 | 1,607,824 |
| Metalfrio Solutions SA | 169,000 | 962,520 |
| Multiplus SA (b) | 595,000 | 6,982,885 |
| OGX Petroleo e Gas Participacoes SA (b) | 2,200,000 | 21,996,836 |
| PDG Realty SA Empreendimentos e Participacoes | 1,365,000 | 12,407,306 |
| Petroleo Brasileiro SA — ADR | 2,875,000 | 109,077,500 |
| Profarma Distribuidora de Produtos Farmaceuticos SA | 373,000 | 3,755,214 |
| Rossi Residencial SA | 467,000 | 3,438,861 |
| Suzano Papel e Celulose SA (Preference Shares) | 318,000 | 4,055,838 |
| Tele Norte Leste Participacoes SA — ADR | 695,000 | 10,327,700 |
| Totvs SA | 59,000 | 4,056,091 |
| Tractebel Energia SA | 347,000 | 4,429,702 |
| Transmissora Alianca de Energia Eletrica SA | 85,000 | 1,887,531 |
| Ultrapar Participacoes SA (Preference Shares) | 57,784 | 2,724,233 |
| Usinas Siderurgicas de Minas Gerais SA | | |
| (Preference 'A' Shares) | 695,000 | 22,714,195 |
| Vale SA — ADR (a) | 2,825,000 | 76,020,750 |
| Weg SA | 210,000 | 2,144,398 |
| | | 595,164,409 |
| Chile — 3.0% | | |
| Banco Santander Chile SA — ADR (a) | 130,000 | 8,565,700 |
| Empresa Nacional de Electricidad SA — ADR | 112,000 | 5,202,400 |
| Lan Airlines SA | 350,000 | 6,676,944 |
| SACI Falabella | 699,000 | 4,423,385 |
| | | 24,868,429 |
| | | | |
| Common Stocks | | | Shares | Value |
| Colombia — 1.1% | | | | |
| Pacific Rubiales Energy Corp. (b) | | 422,000 | $ 9,513,487 |
| Mexico — 16.9% | | | | |
| America Movil, SA de CV — ADR | | 1,440,000 | 74,131,200 |
| Empresas ICA Sociedad Controladora, SA de CV (b) | 900,000 | 2,372,759 |
| Fomento Economico Mexicano, SA de CV — ADR (a) | 490,000 | 23,191,700 |
| Genomma Lab Internacional SA de CV (b) | | 1,948,000 | 6,390,361 |
| Grupo Mexico, SA de CV | | 4,225,000 | 11,149,079 |
| Grupo Televisa, SA — ADR | | 770,000 | 16,000,600 |
| Wal-Mart de Mexico, SA de CV | | 4,000,000 | 9,356,535 |
| | | | | 142,592,234 |
| Panama — 1.2% | | | | |
| Copa Holdings SA, Class A | | 174,000 | 9,862,320 |
| Peru — 2.5% | | | | |
| Cia de Minas Buenaventura SA — ADR | | 145,000 | 4,769,050 |
| Credicorp Ltd. | | | 99,000 | 8,599,140 |
| Southern Copper Corp. | | 250,000 | 7,645,000 |
| | | | | 21,013,190 |
| Total Common Stocks — 96.1% | | | | 809,256,929 |
| | | | Par | |
| Corporate Bonds | | | (000) | |
| Brazil — 0.2% | | | | |
| Lupatech SA, 6.50%, 4/15/18 (c) | | BRL | 2,128 | 1,226,860 |
| Total Corporate Bonds — 0.2% | | | | 1,226,860 |
| Structured Notes | | | | |
| Brazil — 3.0% | | | | |
| Deutsche Bank AG (Cyrela Brazil Realty SA), | | | | |
| due 11/03/10 (b) | | USD | 325 | 3,895,450 |
| Morgan Stanley BV (b): | | | | |
| (BR Malls Participacoes SA), due 8/19/10 | | | 125 | 1,639,838 |
| (Cyrela Brazil Realty SA), due 4/05/12 | | | 225 | 2,699,302 |
| (Itausa — Investimentos Itau SA), due 4/05/12 | | 868 | 5,996,527 |
| (Lojas Renner SA), due 11/17/10 | | | 400 | 10,058,080 |
| (Lojas Renner SA), due 3/04/11 | | | 50 | 1,250,266 |
| Total Structured Notes — 3.0% | | | | 25,539,463 |
| Total Long-Term Investments | | | | |
| (Cost — $570,232,666) — 99.3% | | | | 836,023,252 |
| Short-Term Securities | | | Shares | |
| BlackRock Liquidity Funds, TempFund, | | | | |
| Institutional Class, 0.13% (d)(e) | | 8,441,552 | 8,441,552 |
| | | Beneficial | |
| | | | Interest | |
| | | | (000) | |
| BlackRock Liquidity Series, LLC Money | | | | |
| Market Series, 0.22% (d)(e)(f) | USD 140,367 | 140,367,430 |
| Total Short-Term Securities | | | | |
| (Cost — $148,808,982) — 17.6% | | | | 148,808,982 |
| Total Investments (Cost — $719,041,648*) — 116.9% | | 984,832,234 |
| Liabilities in Excess of Other Assets — (16.9)% | | | (142,600,382) |
| Net Assets — 100.0% | | | | $ 842,231,852 |
See Notes to Financial Statements.
14 SEMI-ANNUAL REPORT
APRIL 30, 2010
Schedule of Investments (concluded)
BlackRock Latin America Fund, Inc.
* The cost and unrealized appreciation (depreciation) of investments as of April 30,
2010, as computed for federal income tax purposes, were as follows:
| |
| Aggregate cost | $ 758,874,803 |
| Gross unrealized appreciation | $ 234,918,406 |
| Gross unrealized depreciation | (8,960,975) |
| Net unrealized appreciation | $ 225,957,431 |
(a) Security, or a portion of security, is on loan.
(b) Non-income producing security.
(c) Convertible security.
(d) Investments in companies considered to be an affiliate of the Fund during the
period, for purposes of Section 2(a)(3) of the Investment Company Act of 1940,
were as follows:
| | | | | | | | |
| | Shares/Beneficial | | Shares/Beneficial | | |
| | | Interest Held at | Net | Interest Held at | | |
| Affiliate | October 31, 2009 | Activity | April 30, 2010 | Income |
| BlackRock Liquidity | | | | | | | |
| Funds, TempFund, | | | | | | | |
| Institutional Class | 9,596,587 | (1,155,035) | 8,441,552 | $ 4,192 |
| BlackRock | | | | | | | | |
| Liquidity Series, | | | | | | | |
| LLC Money | | | | | | | | |
| Market Series | $156,541,250 | $ (16,173,820) $140,367,430 | $ 87,174 |
| (e) Represents the current yield as of report date. | | | | | |
| (f) Security was purchased with the cash collateral from loaned securities. | |
| • Foreign currency exchange contracts as of April 30, 2010 were as follows: | |
| Currency | | Currency | | | Settlement | Unrealized |
| Purchased | | Sold | Counterparty | Date | Appreciation |
| CLP 216,308,417 USD 416,699 | Brown Brothers | | | | |
| | | | Harriman & Co. | 5/03/10 | $ 120 |
• Fair Value Measurements — Various inputs are used in determining the fair value of
investments, which are as follows:
• Level 1 — price quotations in active markets/exchanges for identical assets and
liabilities
• Level 2 — other observable inputs (including, but not limited to: quoted prices
for similar assets or liabilities in markets that are active, quoted prices for iden-
tical or similar assets or liabilities in markets that are not active, inputs other
than quoted prices that are observable for the assets or liabilities (such as
interest rates, yield curves, volatilities, prepayment speeds, loss severities, credit
risks and default rates) or other market-corroborated inputs)
• Level 3 — unobservable inputs based on the best information available in the
circumstances, to the extent observable inputs are not available (including the
Fund's own assumptions used in determining the fair value of investments)
The inputs or methodologies used for valuing securities are not necessarily an
indication of the risk associated with investing in those securities. For information
about the Fund's policy regarding valuation of investments and other significant
accounting policies, please refer to Note 1 of the Notes to Financial Statements.
The following tables summarize the inputs used as of April 30, 2010 in determining
the fair valuation of the Fund’s investments:
| | | | |
| Investments in Securities |
|
| Valuation Inputs | Level 1 | Level 2 | Level 3 | Total |
| Assets: | | | | |
| Long-Term Investments: | | | |
| Common | | | | |
| Stocks1 | $809,256,929 | — | — $809,256,929 |
| Corporate | | | | |
| Bonds | — | — | $ 1,226,860 | 1,226,860 |
| Structured | | | | |
| Notes | — | — | 25,539,463 | 25,539,463 |
| Short-Term | | | | |
| Securities | 8,441,552 | $140,367,430 | — 148,808,982 |
| Total | $817,698,481 | $140,367,430 | $ 26,766,323 $984,832,234 |
| 1 See above Schedule of Investments for values in each country. | |
| Other Financial Instruments1 |
|
| Valuation Inputs | Level 1 | Level 2 | Level 3 | Total |
| Assets | — | $ 120 | — $ | 120 |
1 Other financial instruments are foreign currency exchange contracts, which are
shown at the unrealized appreciation/depreciation on the instrument.
The following is a reconciliation of investments for unobservable inputs (Level 3)
used to determine fair value:
| | | |
| Investments In Securities |
|
| | Corporate | Structured | |
| | Bonds | Notes | Total |
| Balance, as of October 31, 2009 | $ 1,753,383 | $ 20,909,528 | $ 22,662,911 |
| Accrued discounts/premiums | — | — | — |
| Realized gain | — | 6,032,642 | 6,032,642 |
| Change in unrealized appreciation/ | | | |
| depreciation2 | (248,971) | (4,819,505) | (5,068,476) |
| Net purchases (sales) | (277,552) | (16,587,377) | (16,864,929) |
| Net transfers in/out of Level 3 | — | 20,004,175 | 20,004,175 |
| Balance, as of April 30, 2010 | $ 1,226,860 | $ 25,539,463 | $ 26,766,323 |
2 Included in the related net change in unrealized appreciation/depreciation
in the Statements of Operations. The change in unrealized appreciation/
depreciation on securities still held at April 30, 2010 was $3,695.
See Notes to Financial Statements.
SEMI-ANNUAL REPORT
APRIL 30, 2010
15
| | | |
| Statements of Assets and Liabilities | | | |
| | BlackRock | BlackRock | |
| | Global Emerging | Latin | BlackRock |
| | Markets | America | International |
| April 30, 2010 (Unaudited) | Fund, Inc. | Fund, Inc. | Fund |
| Assets | | | |
| Investments at value — unaffiliated1,2 | $ 255,080,044 | $ 836,023,252 | — |
| Investments at value — Master International Portfolio of BlackRock Master LLC (the “Portfolio”) (cost — $61,695,995) | — | — | $ 66,024,601 |
| Investments at value — affiliated3 | 7,771,573 | 148,808,982 | — |
| Foreign currency at value4 | 2,029,787 | 3,004,334 | — |
| Unrealized appreciation on foreign currency exchange contracts | 24,181 | 120 | — |
| Investments sold receivable | 2,577,821 | 6,223,461 | — |
| Dividends receivable | 1,068,851 | 6,017,212 | — |
| Capital shares sold receivable | 979,308 | 3,960,103 | 64,362 |
| Withdrawals receivable from the Portfolio | — | — | 79,037 |
| Securities lending income receivable — affiliated | — | 30,088 | — |
| Interest receivable | — | 3,488 | — |
| Prepaid expenses | 55,940 | 73,197 | 36,645 |
| Other assets | 107 | — | — |
| Total assets | 269,587,612 | 1,004,144,237 | 66,204,645 |
| Liabilities | | | |
| Collateral on securities loaned at value | — | 140,367,430 | — |
| Unrealized depreciation on foreign currency exchange contracts | 2,044 | — | — |
| Investments purchased payable | 9,054,431 | 16,221,327 | — |
| Capital shares redeemed payable | 1,069,870 | 4,032,240 | 143,399 |
| Investment advisory fees payable | 213,931 | 700,137 | — |
| Distribution fees payable | 60,383 | 281,560 | 31,728 |
| Other affiliates payable | 18,844 | 93,998 | 2,708 |
| Administration fees payable | — | — | 14,291 |
| Officer’s and Directors’ fees payable | 1,247 | 1,699 | 11 |
| Other accrued expenses payable | 143,287 | 206,070 | 100,304 |
| Other liabilities payable | — | 7,924 | — |
| Total liabilities | 10,564,037 | 161,912,385 | 292,441 |
| Net Assets | $ 259,023,575 | $ 842,231,852 | $ 65,912,204 |
| Net Assets Consist of | | | |
| Paid-in capital | $ 269,135,503 | $ 693,201,914 | $ 129,793,615 |
| Undistributed (accumulated) net investment income (loss) | 155,196 | 1,062,054 | (350,461) |
| Accumulated net realized loss | (50,781,971) | (117,862,756) | — |
| Net unrealized appreciation/depreciation | 40,514,847 | 265,830,640 | — |
| Accumulated net realized loss allocated from the Portfolio | — | — | (67,859,556) |
| Net unrealized appreciation/depreciation allocated from the Portfolio | — | — | 4,328,606 |
| Net Assets | $ 259,023,575 | $ 842,231,852 | $ 65,912,204 |
| 1 Investments at cost — unaffiliated | $ 214,567,663 | $ 570,232,666 | — |
| 2 Securities loaned at value | — | $ 133,530,472 | — |
| 3 Investments at cost — affiliated | $ 7,771,573 | $ 148,808,982 | — |
| 4 Foreign currency at cost | $ 2,021,442 | $ 3,037,433 | — |
| Net Asset Value | | | |
| Institutional: | | | |
| Net assets | $ 86,939,645 | $ 160,490,346 | $ 5,194,095 |
| Shares outstanding, 100 million shares authorized | 4,692,239 | 2,467,567 | 457,577 |
| Par value per share | $ 0.10 | $ 0.10 | $ 0.0001 |
| Net asset value | $ 18.53 | $ 65.04 | $ 11.35 |
| Investor A: | | | |
| Net assets | $ 132,679,580 | $ 470,492,280 | $ 32,111,633 |
| Shares outstanding, 100 million shares authorized | 7,401,379 | 7,348,573 | 2,871,113 |
| Par value per share | $ 0.10 | $ 0.10 | $ 0.0001 |
| Net asset value | $ 17.93 | $ 64.02 | $ 11.18 |
| Investor B: | | | |
| Net assets | $ 4,774,158 | $ 18,585,077 | $ 16,172,713 |
| Shares outstanding, 100 million shares authorized | 296,743 | 308,976 | 1,537,988 |
| Par value per share | $ 0.10 | $ 0.10 | $ 0.0001 |
| Net asset value | $ 16.09 | $ 60.15 | $ 10.52 |
| Investor C: | | | |
| Net assets | $ 34,630,192 | $ 192,664,149 | $ 12,433,763 |
| Shares outstanding, 100 million shares authorized | 2,211,121 | 3,268,918 | 1,168,291 |
| Par value per share | $ 0.10 | $ 0.10 | $ 0.0001 |
| Net asset value | $ 15.66 | $ 58.94 | $ 10.64 |
| See Notes to Financial Statements. | | | |
16 SEMI-ANNUAL REPORT
APRIL 30, 2010
| | | |
| Statements of Operations | | | |
| | BlackRock | | |
| | Global | BlackRock | |
| | Emerging | Latin | BlackRock |
| | Markets | America | International |
| Six Months Ended April 30, 2010 (Unaudited) | Fund, Inc. | Fund, Inc. | Fund |
| Investment Income | | | |
| Dividends | $ 2,325,918 | $ 13,712,089 | — |
| Foreign taxes withheld | (144,397) | (899,914) | — |
| Interest | — | 72,973 | — |
| Income — affiliated | 2,655 | 4,192 | — |
| Securities lending — affiliated | — | 87,174 | — |
| Investment income allocated from the Portfolio: | | | |
| Dividends | — | — | $ 498,581 |
| Foreign taxes withheld | — | — | (43,199) |
| Income — affiliated | — | — | 1,174 |
| Expenses | — | — | (365,301) |
| Total income | 2,184,176 | 12,976,514 | 91,255 |
| Expenses | | | |
| Investment advisory | 1,226,255 | 4,220,315 | — |
| Service — Investor A | 153,733 | 629,260 | 40,389 |
| Service and distribution — Investor B | 24,443 | 96,934 | 93,485 |
| Service and distribution — Investor C | 152,993 | 898,301 | 64,437 |
| Transfer agent — Institutional | 51,248 | 68,055 | 6,268 |
| Transfer agent — Investor A | 105,635 | 363,616 | 46,735 |
| Transfer agent — Investor B | 6,654 | 26,012 | 66,025 |
| Transfer agent — Investor C | 34,762 | 148,599 | 17,819 |
| Administration | — | — | 86,441 |
| Custodian | 85,640 | 208,812 | — |
| Accounting services | 63,764 | 135,948 | — |
| Professional | 46,029 | 41,689 | 36,290 |
| Registration | 33,941 | 41,954 | 25,618 |
| Printing | 22,967 | 60,788 | 11,312 |
| Officer and Directors | 5,474 | 11,203 | 18 |
| Miscellaneous | 17,234 | 20,116 | 7,540 |
| Total expenses | 2,030,772 | 6,971,602 | 502,377 |
| Less fees waived by advisor | (1,406) | (2,303) | — |
| Total expenses after fees waived | 2,029,366 | 6,969,299 | 502,377 |
| Net investment income (loss) | 154,810 | 6,007,215 | (411,122) |
| Realized and Unrealized Gain (Loss) | | | |
| Net realized gain (loss) from: | | | |
| Investments | 23,663,507 | 39,845,791 | — |
| Foreign currency transactions | (212,241) | (1,297,894) | — |
| Investments and foreign currency transactions allocated from the Portfolio | — | — | 5,898,716 |
| | 23,451,266 | 38,547,897 | 5,898,716 |
| Net change in unrealized appreciation/depreciation on: | | | |
| Investments | (2,306,416) | 39,255,373 | — |
| Foreign currency transactions | 3,523 | 77,726 | — |
| Investments and foreign currency transactions allocated from the Portfolio | — | — | (3,168,562) |
| | (2,302,893) | 39,333,099 | (3,168,562) |
| Total realized and unrealized gain | 21,148,373 | 77,880,996 | 2,730,154 |
| Net Increase in Net Assets Resulting from Operations | $ 21,303,183 | $ 83,888,211 | $ 2,319,032 |
See Notes to Financial Statements.
SEMI-ANNUAL REPORT
APRIL 30, 2010
17
| | | | | | | |
| Statements of Changes in Net Assets | | | | | | |
| | BlackRock Global Emerging | BlackRock Latin | BlackRock | |
| | Markets Fund, Inc. | America Fund, Inc. | International Fund |
| | Six Months | | Six Months | | Six Months | | |
| | Ended | | Ended | | Ended | | |
| | April 30, | Year Ended | April 30, | Year Ended | April 30, | Year Ended |
| | 2010 | October 31, | 2010 | October 31, | 2010 | October 31, |
| Increase (Decrease) in Net Assets: | (Unaudited) | 2009 | (Unaudited) | 20091 | (Unaudited) | | 2009 |
| Operations | | | | | | | |
| Net investment income (loss) | $ 154,810 | $ 1,267,163 | $ 6,007,215 | $ 5,021,003 | $ (411,122) | $ 64,482 |
| Net realized gain (loss) | 23,451,266 | (23,216,908) | 38,547,897 | (72,628,541) | 5,898,716 | | (15,605,920) |
| Net change in unrealized appreciation/depreciation | (2,302,893) | 106,105,709 | 39,333,099 | 364,608,806 | (3,168,562) | | 31,035,081 |
| Net increase in net assets resulting from operations | 21,303,183 | 84,155,964 | 83,888,211 | 297,001,268 | 2,319,032 | | 15,493,643 |
| Dividends to Shareholders From | | | | | | | |
| Net investment income: | | | | | | | |
| Institutional | (571,284) | (252,551) | (2,062,764) | — | — | | — |
| Investor A | (495,119) | (232,391) | (7,759,663) | — | — | | — |
| Investor B | — | — | (151,277) | — | — | | — |
| Investor C | (20,175) | — | (1,878,791) | — | — | | — |
| Decrease in net assets resulting from | | | | | | | |
| dividends to shareholders | (1,086,578) | (484,942) | (11,852,495) | — | — | | — |
| Capital Share Transactions | | | | | | | |
| Net increase (decrease) in net assets derived | | | | | | | |
| from capital share transactions | 9,615,063 | 18,024,424 | 10,578,209 | 142,193,743 | (3,317,130) | | (7,735,440) |
| Redemption Fee | | | | | | | |
| Redemption fee | 13,191 | 7,513 | 164,077 | 162,049 | 17,441 | | 15,098 |
| Net Assets | | | | | | | |
| Total increase (decrease) in net assets | 29,844,859 | 101,702,959 | 82,778,002 | 439,357,060 | (980,657) | | 7,773,301 |
| Beginning of period | 229,178,716 | 127,475,757 | 759,453,850 | 320,096,790 | 66,892,861 | | 59,119,560 |
| End of period | $ 259,023,575 | $ 229,178,716 | $ 842,231,852 | $ 759,453,850 | $ 65,912,204 | $ 66,892,861 |
| Undistributed (accumulated) net investment | | | | | | | |
| income (loss) | $ 155,196 | $ 1,086,964 | $ 1,062,054 | $ 6,907,334 | $ (350,461) | $ 60,661 |
| 1 Consolidated Statement of Changes in Net Assets. See Note 1 of the Notes to Financial Statements. | | | | | |
See Notes to Financial Statements.
18 SEMI-ANNUAL REPORT
APRIL 30, 2010
| | | | | | | |
| Financial Highlights | | | | BlackRock Global Emerging Markets Fund, Inc. |
| | Six Months | | Period | | | | |
| | Ended | Year Ended | July 1, 2008 | | | | |
| | April 30, 2010 | October 31, | to October 31, | | Year Ended June 30, | |
| | (Unaudited) | 2009 | 2008 | 2008 | 20071 | 20061 | 20051 |
| | | | | Institutional | | | |
| Per Share Operating Performance | | | | | | | |
| Net asset value, beginning of period | $ 17.01 | $ 10.17 | $ 22.45 | $ 27.91 | $ 24.14 | $ 17.74 | $ 13.37 |
| Net investment income2 | 0.04 | 0.14 | 0.07 | 0.12 | 0.09 | 0.22 | 0.18 |
| Net realized and unrealized gain (loss)3 | 1.59 | 6.75 | (10.34) | 1.28 | 8.37 | 6.28 | 4.19 |
| Net increase (decrease) from investment operations | 1.63 | 6.89 | (10.27) | 1.40 | 8.46 | 6.50 | 4.37 |
| Dividends and distributions from: | | | | | | | |
| Net investment income | (0.11) | (0.05) | (0.01) | - | (0.28) | (0.10) | — |
| Net realized gain | — | — | (2.00) | (6.86) | (4.41) | — | — |
| Total dividends and distributions | (0.11) | (0.05) | (2.01) | (6.86) | (4.69) | (0.10) | — |
| Net asset value, end of period | $ 18.53 | $ 17.01 | $ 10.17 | $ 22.45 | $ 27.91 | $ 24.14 | $ 17.74 |
| Total Investment Return4 | | | | | | | |
| Based on net asset value | 9.63%5 | 68.14% | (48.15)%5 | 3.84% | 41.99% | 36.80% | 32.69% |
| Ratios to Average Net Assets | | | | | | | |
| Total expenses | 1.34%6 | 1.48% | 1.56%6 | 1.40% | 1.44% | 1.50% | 1.63% |
| Total expenses after fees waived | 1.34%6 | 1.48% | 1.54%6 | 1.37% | 1.40% | 1.50% | 1.60% |
| Net investment income | 0.39%6 | 1.10% | 1.31%6 | 0.45% | 0.36% | 0.99% | 1.18% |
| Supplemental Data | | | | | | | |
| Net assets, end of period (000) | $ 86,940 | $ 86,713 | $ 42,803 | $ 80,399 | $ 86,385 | $ 73,914 | $ 63,018 |
| Portfolio turnover | 69% | 191% | 76% | 163% | 140% | 121% | 110% |
| | | | | Investor A | | | |
| Per Share Operating Performance | | | | | | | |
| Net asset value, beginning of period | $ 16.45 | $ 9.85 | $ 21.80 | $ 27.27 | $ 23.68 | $ 17.41 | $ 13.16 |
| Net investment income2 | 0.01 | 0.10 | 0.05 | 0.04 | 0.02 | 0.17 | 0.15 |
| Net realized and unrealized gain (loss)3 | 1.54 | 6.53 | (10.02) | 1.25 | 8.21 | 6.16 | 4.10 |
| Net increase (decrease) from investment operations | 1.55 | 6.63 | (9.97) | 1.29 | 8.23 | 6.33 | 4.25 |
| Dividends and distributions from: | | | | | | | |
| Net investment income | (0.07) | (0.03) | — | — | (0.23) | (0.06) | — |
| Net realized gain | — | — | (1.98) | (6.76) | (4.41) | — | — |
| Total dividends and distributions | (0.07) | (0.03) | (1.98) | (6.76) | (4.64) | (0.06) | — |
| Net asset value, end of period | $ 17.93 | $ 16.45 | $ 9.85 | $ 21.80 | $ 27.27 | $ 23.68 | $ 17.41 |
| Total Investment Return4 | | | | | | | |
| Based on net asset value | 9.45%5 | 67.59% | (48.18)%5 | 3.49% | 41.66% | 36.46% | 32.29% |
| Ratios to Average Net Assets | | | | | | | |
| Total expenses | 1.65%6 | 1.83% | 1.87%6 | 1.68% | 1.71% | 1.75% | 1.88% |
| Total expenses after fees waived | 1.65%6 | 1.83% | 1.85%6 | 1.65% | 1.66% | 1.75% | 1.85% |
| Net investment income | 0.16%6 | 0.80% | 0.98%6 | 0.16% | 0.10% | 0.74% | 0.94% |
| Supplemental Data | | | | | | | |
| Net assets, end of period (000) | $ 132,680 | $ 111,850 | $ 67,614 | $ 145,781 | $ 151,309 | $ 122,331 | $ 91,292 |
| Portfolio turnover. | 69% | 191% | 76% | 163% | 140% | 121% | 110% |
1 Consolidated Financial Highlights. See Note 1 of the Notes to Financial Statements.
2 Based on average shares outstanding.
3 Includes a redemption fee, which is less than $0.01 per share.
4 Where applicable, total investment returns exclude the effect of any sales charges
and include the reinvestment of dividends and distributions.
5 Aggregate total investment return.
6 Annualized.
See Notes to Financial Statements.
SEMI-ANNUAL REPORT
APRIL 30, 2010
19
| | | | | | | |
| Financial Highlights (concluded) | | | | BlackRock Global Emerging Markets Fund, Inc. |
| | Six Months | | Period | | | | |
| | Ended | Year Ended | July 1, 2008 | | | | |
| | April 30, 2010 | October 31, | to October 31, | | Year Ended June 30, | |
| | (Unaudited) | 2009 | 2008 | 2008 | 20071 | 20061 | 20051 |
| | | | | Investor B | | | |
| Per Share Operating Performance | | | | | | | |
| Net asset value, beginning of period | $ 14.76 | $ 8.89 | $ 19.86 | $ 25.20 | $ 22.10 | $ 16.32 | $ 12.44 |
| Net investment income (loss)2 | (0.06) | (0.01) | 0.01 | (0.14) | (0.15) | (0.00)3 | 0.02 |
| Net realized and unrealized gain (loss)4 | 1.39 | 5.88 | (8.98) | 1.18 | 7.62 | 5.78 | 3.86 |
| Net increase (decrease) from investment operations | 1.33 | 5.87 | (8.97) | 1.04 | 7.47 | 5.78 | 3.88 |
| Dividends and distributions from: | | | | | | | |
| Net investment income | — | — | — | — | (0.13) | — | — |
| Net realized gain | — | — | (2.00) | (6.38) | (4.24) | — | — |
| Total dividends and distributions | — | — | (2.00) | (6.38) | (4.37) | — | — |
| Net asset value, end of period | $ 16.09 | $ 14.76 | $ 8.89 | $ 19.86 | $ 25.20 | $ 22.10 | $ 16.32 |
| Total Investment Return5 | | | | | | | |
| Based on net asset value | 9.01%6 | 66.03% | (48.33)%6 | 2.70% | 40.59% | 35.42% | 31.19% |
| Ratios to Average Net Assets | | | | | | | |
| Total expenses | 2.50%7 | 2.71% | 2.71%7 | 2.47% | 2.48% | 2.53% | 2.68% |
| Total expenses after fees waived | 2.50%7 | 2.71% | 2.69%7 | 2.44% | 2.45% | 2.53% | 2.65% |
| Net investment income (loss) | (0.76)%7 | (0.08)% | 0.13%7 | (0.60)% | (0.68)% | (0.02)% | 0.11% |
| Supplemental Data | | | | | | | |
| Net assets, end of period (000) | $ 4,774 | $ 4,809 | $ 3,487 | $ 7,955 | $ 13,280 | $ 17,238 | $ 24,333 |
| Portfolio turnover | 69% | 191% | 76% | 163% | 140% | 121% | 110% |
| | | | | Investor C | | | |
| Per Share Operating Performance | | | | | | | |
| Net asset value, beginning of period | $ 14.38 | $ 8.65 | $ 19.42 | $ 24.91 | $ 22.01 | $ 16.25 | $ 12.38 |
| Net investment income (loss)2 | (0.05) | (0.01) | 0.01 | (0.14) | (0.14) | (0.01) | 0.02 |
| Net realized and unrealized gain (loss)4 | 1.34 | 5.74 | (8.89) | 1.18 | 7.53 | 5.77 | 3.85 |
| Net increase (decrease) from investment operations | 1.29 | 5.73 | (8.88) | 1.04 | 7.39 | 5.76 | 3.87 |
| Dividends and distributions from: | | | | | | | |
| Net investment income | (0.01) | — | — | — | (0.13) | — | — |
| Net realized gain | — | — | (1.89) | (6.53) | (4.36) | — | — |
| Total dividends and distributions | (0.01) | — | (1.89) | (6.53) | (4.49) | — | — |
| Net asset value, end of period | $ 15.66 | $ 14.38 | $ 8.65 | $ 19.42 | $ 24.91 | $ 22.01 | $ 16.25 |
| Total Investment Return5 | | | | | | | |
| Based on net asset value | 8.98%6 | 66.24% | (48.35)%6 | 2.70% | 40.58% | 35.45% | 31.26% |
| Ratios to Average Net Assets | | | | | | | |
| Total expenses | 2.45%7 | 2.66% | 2.69%7 | 2.45% | 2.47% | 2.52% | 2.68% |
| Total expenses after fees waived | 2.45%7 | 2.66% | 2.67%7 | 2.42% | 2.43% | 2.52% | 2.65% |
| Net investment income (loss) | (0.60)%7 | (0.08)% | 0.15%7 | (0.61)% | (0.66)% | (0.05)% | 0.16% |
| Supplemental Data | | | | | | | |
| Net assets, end of period (000) | $ 34,630 | $ 26,347 | $ 13,572 | $ 31,948 | $ 32,208 | $ 24,674 | $ 15,956 |
| Portfolio turnover. | 69% | 191% | 76% | 163% | 140% | 121% | 110% |
1 Consolidated Financial Highlights. See Note 1 of the Notes to Financial Statements.
2 Based on average shares outstanding.
3 Amount is less than $(0.01) per share.
4 Includes a redemption fee, which is less than $0.01 per share.
5 Where applicable, total investment returns exclude the effect of any sales charges
and include the reinvestment of dividends and distributions.
6 Aggregate total investment return.
7 Annualized.
See Notes to Financial Statements.
20 SEMI-ANNUAL REPORT
APRIL 30, 2010
| | | | | | | | | |
| Financial Highlights | | | | | | | BlackRock Latin America Fund, Inc. |
| | Six Months | | | Period | | | | | |
| | Ended | | Year Ended December 1, 2007 | | | | |
| | April 30, 2010 | October 31, | to October 31, | | | Year Ended November 30, | |
| | (Unaudited) | | 20091 | 20081 | | 20071 | 20061 | 20051 | 20041 |
| | | | | | | Institutional | | | |
| Per Share Operating Performance | | | | | | | | | |
| Net asset value, beginning of period | $ 58.63 | $ 30.53 | $ 78.57 | $ 50.67 | $ 37.27 | $ 22.64 | $ 15.83 |
| Net investment income2 | 0.61 | | 0.64 | 0.61 | | 0.50 | 0.65 | 0.57 | 0.33 |
| Net realized and unrealized gain (loss) | 6.76 | | 27.45 | (36.41) | | 28.10 | 13.32 | 14.42 | 6.79 |
| Net increase (decrease) from investment operations | 7.37 | | 28.09 | (35.80) | | 28.60 | 13.97 | 14.99 | 7.12 |
| Dividends and distributions from: | | | | | | | | | |
| Net investment income | (0.97) | | — | (0.80) | | (0.72) | (0.58) | (0.41) | (0.31) |
| Net realized gain | — | | — | (11.47) | | — | — | — | — |
| Total dividends and distributions | (0.97) | | — | (12.27) | | (0.72) | (0.58) | (0.41) | (0.31) |
| Redemption fee | 0.01 | | 0.01 | 0.03 | | 0.02 | 0.01 | 0.05 | 0.003 |
| Net asset value, end of period | $ 65.04 | $ 58.63 | $ 30.53 | $ 78.57 | $ 50.67 | $ 37.27 | $ 22.64 |
| Total Investment Return4 | | | | | | | | | |
| Based on net asset value | 12.66%5 | | 92.04% | (53.70)%5 | | 57.20%6 | 38.12% | 67.55% | 45.73% |
| Ratios to Average Net Assets | | | | | | | | | |
| Total expenses | 1.22%7 | | 1.35% | 1.30%7 | | 1.26% | 1.31% | 1.43% | 1.60% |
| Total expenses after fees waived | 1.22%7 | | 1.35% | 1.30%7 | | 1.26% | 1.31% | 1.43% | 1.60% |
| Net investment income | 1.92%7 | | 1.60% | 1.04%7 | | 0.87% | 1.49% | 1.98% | 1.81% |
| Supplemental Data | | | | | | | | | |
| Net assets, end of period (000) | $ 160,490 | $ 114,101 | $ 58,877 | $ 128,094 | $ 191,085 | $ 135,279 | $ 47,921 |
| Portfolio turnover. | 41% | | 50% | 61% | | 72% | 48% | 47% | 57% |
| | | | | | | Investor A | | | |
| Per Share Operating Performance | | | | | | | | | |
| Net asset value, beginning of period | $ 57.73 | $ 30.15 | $ 77.78 | $ 50.17 | $ 36.93 | $ 22.45 | $ 15.71 |
| Net investment income2 | 0.48 | | 0.51 | 0.44 | | 0.60 | 0.53 | 0.51 | 0.29 |
| Net realized and unrealized gain (loss) | 6.68 | | 27.06 | (35.97) | | 27.60 | 13.21 | 14.29 | 6.72 |
| Net increase (decrease) from investment operations | 7.16 | | 27.57 | (35.53) | | 28.20 | 13.74 | 14.80 | 7.01 |
| Dividends and distributions from: | | | | | | | | | |
| Net investment income | (0.88) | | — | (0.66) | | (0.61) | (0.51) | (0.37) | (0.27) |
| Net realized gain | — | | — | (11.47) | | — | — | — | — |
| Total dividends and distributions | (0.88) | | — | (12.13) | | (0.61) | (0.51) | (0.37) | (0.27) |
| Redemption fee | 0.01 | | 0.01 | 0.03 | | 0.02 | 0.01 | 0.05 | 0.003 |
| Net asset value, end of period | $ 64.02 | $ 57.73 | $ 30.15 | $ 77.78 | $ 50.17 | $ 36.93 | $ 22.45 |
| Total Investment Return4 | | | | | | | | | |
| Based on net asset value | 12.49%5 | | 91.48% | (53.82)%5 | | 56.85%6 | 37.77% | 67.10% | 45.35% |
| Ratios to Average Net Assets | | | | | | | | | |
| Total expenses | 1.52%7 | | 1.63% | 1.55%7 | | 1.51% | 1.57% | 1.68% | 1.85% |
| Total expenses after fees waived | 1.52%7 | | 1.63% | 1.55%7 | | 1.51% | 1.57% | 1.68% | 1.85% |
| Net investment income | 1.52%7 | | 1.26% | 0.76%7 | | 0.92% | 1.23% | 1.81% | 1.60% |
| Supplemental Data | | | | | | | | | |
| Net assets, end of period (000) | $ 470,492 | $ 475,611 | $ 176,711 | $ 433,844 | $ 191,187 | $ 139,062 | $ 81,969 |
| Portfolio turnover. | 41% | | 50% | 61% | | 72% | 48% | 47% | 57% |
1 Consolidated Financial Highlights. See Note 1 to the Notes to Financial Statements.
2 Based on average shares outstanding.
3 Amount is less than $0.01 per share.
4 Where applicable, total investment returns exclude the effect of any sales charges
and include the reinvestment of dividends and distributions.
5 Aggregate total investment return.
6 The investment advisor reimbursed the Fund in order to resolve a regulatory issue
relating to an investment, which increased the return by 0.02%.
7 Annualized.
See Notes to Financial Statements.
SEMI-ANNUAL REPORT
APRIL 30, 2010
21
| | | | | | | | | |
| Financial Highlights (concluded) | | | | | | | BlackRock Latin America Fund, Inc. |
| | Six Months | | | Period | | | | | |
| | Ended | | Year Ended December 1, 2007 | | | | |
| | April 30, 2010 | October 31, | to October 31, | | | Year Ended November 30, | |
| | (Unaudited) | | 20091 | 20081 | | 20071 | 20061 | 20051 | 20041 |
| | | | | | | Investor B | | | |
| Per Share Operating Performance | | | | | | | | | |
| Net asset value, beginning of period | $ 54.12 | $ 28.54 | $ 74.38 | $ 48.00 | $ 35.33 | $ 21.45 | $ 15.01 |
| Net investment income (loss)2 | 0.19 | | 0.15 | (0.04) | | 0.05 | 0.20 | 0.29 | 0.15 |
| Net realized and unrealized gain (loss) | 6.28 | | 25.42 | (34.09) | | 26.52 | 12.68 | 13.70 | 6.43 |
| Net increase (decrease) from investment operations | 6.47 | | 25.57 | (34.13) | | 26.57 | 12.88 | 13.99 | 6.58 |
| Dividends and distributions from: | | | | | | | | | |
| Net investment income | (0.45) | | — | (0.27) | | (0.21) | (0.22) | (0.16) | (0.14) |
| Net realized gain | — | | — | (11.47) | | — | — | — | — |
| Total dividends and distributions | (0.45) | | — | (11.74) | | (0.21) | (0.22) | (0.16) | (0.14) |
| Redemption fee | 0.01 | | 0.01 | 0.03 | | 0.02 | 0.01 | 0.05 | 0.003 |
| Net asset value, end of period | $ 60.15 | $ 54.12 | $ 28.54 | $ 74.38 | $ 48.00 | $ 35.33 | $ 21.45 |
| Total Investment Return4 | | | | | | | | | |
| Based on net asset value | 12.00%5 | | 89.63% | (54.18)%5 | | 55.61%6 | 36.72% | 65.91% | 44.16% |
| Ratios to Average Net Assets | | | | | | | | | |
| Total expenses | 2.39%7 | | 2.62% | 2.39%7 | | 2.32% | 2.34% | 2.46% | 2.64% |
| Total expenses after fees waived | 2.39%7 | | 2.62% | 2.39%7 | | 2.32% | 2.34% | 2.46% | 2.64% |
| Net investment income (loss) | 0.66%7 | | 0.40% | (0.08)%7 | | 0.09% | 0.48% | 1.10% | 0.86% |
| Supplemental Data | | | | | | | | | |
| Net assets, end of period (000) | $ 18,585 | $ 18,695 | $ 11,794 | $ 31,268 | $ 13,911 | $ 12,144 | $ 11,497 |
| Portfolio turnover. | 41% | | 50% | 61% | | 72% | 48% | 47% | 57% |
| | | | | | | Investor C | | | |
| Per Share Operating Performance | | | | | | | | | |
| Net asset value, beginning of period | $ 53.17 | $ 28.01 | $ 73.28 | $ 47.40 | $ 35.07 | $ 21.38 | $ 15.00 |
| Net investment income (loss)2 | 0.24 | | 0.17 | (0.01) | | 0.11 | 0.17 | 0.25 | 0.14 |
| Net realized and unrealized gain (loss) | 6.14 | | 24.98 | (33.46) | | 26.08 | 12.56 | 13.64 | 6.41 |
| Net increase (decrease) from investment operations | 6.38 | | 25.15 | (33.47) | | 26.19 | 12.73 | 13.89 | 6.55 |
| Dividends and distributions from: | | | | | | | | | |
| Net investment income | (0.62) | | — | (0.36) | | (0.33) | (0.41) | (0.25) | (0.17) |
| Net realized gain | — | | — | (11.47) | | — | — | — | — |
| Total dividends and distributions | (0.62) | | — | (11.83) | | (0.33) | (0.41) | (0.25) | (0.17) |
| Redemption fee | 0.01 | | 0.01 | 0.03 | | 0.02 | 0.01 | 0.05 | 0.003 |
| Net asset value, end of period | $ 58.94 | $ 53.17 | $ 28.01 | $ 73.28 | $ 47.40 | $ 35.07 | $ 21.38 |
| Total Investment Return4 | | | | | | | | | |
| Based on net asset value | 12.07%5 | | 89.82% | (54.16)%5 | | 55.62%6 | 36.75% | 65.90% | 44.15% |
| Ratios to Average Net Assets | | | | | | | | | |
| Total expenses | 2.29%7 | | 2.49% | 2.35%7 | | 2.29% | 2.34% | 2.45% | 2.63% |
| Total expenses after fees waived | 2.29%7 | | 2.49% | 2.35%7 | | 2.29% | 2.34% | 2.45% | 2.63% |
| Net investment income (loss) | 0.83%7 | | 0.46% | (0.02)%7 | | 0.17% | 0.42% | 0.94% | 0.80% |
| Supplemental Data | | | | | | | | | |
| Net assets, end of period (000) | $ 192,664 | $ 151,046 | $ 72,714 | $ 164,742 | $ 50,609 | $ 25,071 | $ 6,655 |
| Portfolio turnover. | 41% | | 50% | 61% | | 72% | 48% | 47% | 57% |
1 Consolidated Financial Highlights. See Note 1 to the Notes to Financial Statements.
2 Based on average shares outstanding.
3 Amount is less than $0.01 per share.
4 Where applicable, total investment returns exclude the effect of any sales charges
and include the reinvestment of dividends and distributions.
5 Aggregate total investment return.
6 The investment advisor reimbursed the Fund in order to resolve a regulatory issue
relating to an investment, which increased the return by 0.02%.
7 Annualized.
See Notes to Financial Statements.
22 SEMI-ANNUAL REPORT
APRIL 30, 2010
| | | | | | | | | |
| Financial Highlights | | | | | | | | BlackRock International Fund |
| | Six Months | | | Period | | | | | |
| | Ended | | Year Ended | June 1, 2008 | | | | | |
| | April 30, 2010 | October 31, | to October 31, | | Year Ended May 31, | |
| | (Unaudited) | | 2009 | 2008 | | 2008 | 2007 | 2006 | 2005 |
| | | | | | | Institutional | | | |
| Per Share Operating Performance | | | | | | | | | |
| Net asset value, beginning of period | $ 10.91 | $ 8.20 | $ 15.01 | $ 14.18 | $ 12.38 | $ 10.05 | $ 8.90 |
| Net investment income (loss)1 | (0.02) | | 0.09 | 0.04 | | 0.19 | 0.12 | 0.08 | 0.07 |
| Net realized and unrealized gain (loss)2 | 0.46 | | 2.62 | (6.68) | | 0.73 | 1.87 | 2.39 | 1.11 |
| Net increase (decrease) from investment operations | 0.44 | | 2.71 | (6.64) | | 0.92 | 1.99 | 2.47 | 1.18 |
| Dividends from net investment income | — | | — | (0.17) | | (0.09) | (0.19) | (0.14) | (0.03) |
| Net asset value, end of period | $ 11.35 | $ 10.91 | $ 8.20 | $ 15.01 | $ 14.18 | $ 12.38 | $ 10.05 |
| Total Investment Return3 | | | | | | | | | |
| Based on net asset value | 4.03%4 | | 33.05% | (44.63)%4 | | 6.58% | 16.29% | 24.80% | 13.31% |
| Ratios to Average Net Assets5 | | | | | | | | | |
| Total expenses | 1.78%6 | | 2.03% | 1.70%6 | | 1.54% | 1.65% | 1.74% | 1.72% |
| Net investment income (loss) | (0.44)%6 | | 0.99% | 0.75%6 | | 1.32% | 0.97% | 0.72% | 0.76% |
| Supplemental Data | | | | | | | | | |
| Net assets, end of period (000) | $ 5,194 | $ 5,133 | $ 5,161 | $ 10,904 | $ 12,133 | $ 12,453 | $ 11,946 |
| Portfolio turnover of the Portfolio | 69% | | 178% | 78% | | 153% | 151% | 96% | 49% |
| | | | | | | Investor A | | | |
| Per Share Operating Performance | | | | | | | | | |
| Net asset value, beginning of period | $ 10.76 | $ 8.12 | $ 14.85 | $ 14.04 | $ 12.26 | $ 9.94 | $ 8.80 |
| Net investment income (loss)1 | (0.04) | | 0.05 | 0.02 | | 0.17 | 0.10 | 0.06 | 0.03 |
| Net realized and unrealized gain (loss)2 | 0.46 | | 2.59 | (6.62) | | 0.70 | 1.84 | 2.36 | 1.12 |
| Net increase (decrease) from investment operations | 0.42 | | 2.64 | (6.60) | | 0.87 | 1.94 | 2.42 | 1.15 |
| Dividends from net investment income | — | | — | (0.13) | | (0.06) | (0.16) | (0.10) | (0.01) |
| Net asset value, end of period | $ 11.18 | $ 10.76 | $ 8.12 | $ 14.85 | $ 14.04 | $ 12.26 | $ 9.94 |
| Total Investment Return3 | | | | | | | | | |
| Based on net asset value | 3.90%4 | | 32.51% | (44.72)%4 | | 6.25% | 16.02% | 24.51% | 13.04% |
| Ratios to Average Net Assets5 | | | | | | | | | |
| Total expenses | 2.08%6 | | 2.40% | 2.02%6 | | 1.84% | 1.91% | 1.98% | 1.97% |
| Net investment income (loss) | (0.76)%6 | | 0.54% | 0.50%6 | | 1.18% | 0.77% | 0.53% | 0.30% |
| Supplemental Data | | | | | | | | | |
| Net assets, end of period (000) | $ 32,112 | $ 28,949 | $ 22,537 | $ 42,052 | $ 35,750 | $ 21,807 | $ 18,058 |
| Portfolio turnover of the Portfolio | 69% | | 178% | 78% | | 153% | 151% | 96% | 49% |
1 Based on average shares outstanding.
2 Includes a redemption fee, which is less than $0.01 per share.
3 Where applicable, total investment returns exclude the effect of any sales charges
and include the reinvestment of dividends and distributions.
4 Aggregate total investment return.
5 Includes the Fund’s share of the Portfolio’s allocated expenses and/or net invest-
ment income.
6 Annualized.
See Notes to Financial Statements.
SEMI-ANNUAL REPORT
APRIL 30, 2010
23
| | | | | | | | |
| Financial Highlights (concluded) | | | | | | | BlackRock International Fund |
| | Six Months | | | Period | | | | |
| | Ended | | Year Ended | June 1, 2008 | | | | |
| | April 30, 2010 | October 31, | to October 31, | | Year Ended May 31, | |
| | (Unaudited) | | 2009 | 2008 | 2008 | 2007 | 2006 | 2005 |
| | | | | | Investor B | | | |
| Per Share Operating Performance | | | | | | | | |
| Net asset value, beginning of period | $ 10.18 | $ 7.77 | $ 14.13 | $ 13.44 | $ 11.75 | $ 9.54 | $ 8.51 |
| Net investment loss1 | (0.10) | | (0.04) | (0.03) | (0.01) | (0.02) | (0.03) | (0.02) |
| Net realized and unrealized gain (loss)2 | 0.44 | | 2.45 | (6.33) | 0.70 | 1.78 | 2.27 | 1.05 |
| Net increase (decrease) from investment operations | 0.34 | | 2.41 | (6.36) | 0.69 | 1.76 | 2.24 | 1.03 |
| Dividends from net investment income | — | | — | — | — | (0.07) | (0.03) | — |
| Net asset value, end of period | $ 10.52 | $ 10.18 | $ 7.77 | $ 14.13 | $ 13.44 | $ 11.75 | $ 9.54 |
| Total Investment Return3 | | | | | | | | |
| Based on net asset value | 3.34%4 | | 31.02% | (45.01)%4 | 5.13% | 15.02% | 23.52% | 12.10% |
| Ratios to Average Net Assets5 | | | | | | | | |
| Total expenses | 3.25%6 | | 3.61% | 3.17%6 | 2.90% | 2.76% | 2.76% | 2.75% |
| Net investment loss | (1.93)%6 | | (0.54)% | (0.70)%6 | (0.11)% | (0.20)% | (0.31)% | (0.24)% |
| Supplemental Data | | | | | | | | |
| Net assets, end of period (000) | $ 16,173 | $ 20,342 | $ 20,878 | $ 44,254 | $ 56,428 | $ 71,575 | $ 69,342 |
| Portfolio turnover of the Portfolio | 69% | | 178% | 78% | 153% | 151% | 96% | 49% |
| | | | | | Investor C | | | |
| Per Share Operating Performance | | | | | | | | |
| Net asset value, beginning of period | $ 10.28 | $ 7.81 | $ 14.19 | $ 13.45 | $ 11.75 | $ 9.54 | $ 8.51 |
| Net investment income (loss)1 | (0.08) | | (0.01) | (0.01) | 0.04 | (0.01) | (0.03) | (0.02) |
| Net realized and unrealized gain (loss)2 | 0.44 | | 2.48 | (6.35) | 0.70 | 1.78 | 2.27 | 1.05 |
| Net increase (decrease) from investment operations | 0.36 | | 2.47 | (6.36) | 0.74 | 1.77 | 2.24 | 1.03 |
| Dividends from net investment income | — | | — | (0.02) | — | (0.07) | (0.03) | — |
| Net asset value, end of period | $ 10.64 | $ 10.28 | $ 7.81 | $ 14.19 | $ 13.45 | $ 11.75 | $ 9.54 |
| Total Investment Return3 | | | | | | | | |
| Based on net asset value | 3.50%4 | | 31.63% | (44.87)%4 | 5.50% | 15.09% | 23.47% | 12.10% |
| Ratios to Average Net Assets5 | | | | | | | | |
| Total expenses | 2.82%6 | | 3.09% | 2.74%6 | 2.57% | 2.68% | 2.77% | 2.76% |
| Net investment income (loss) | (1.50)%6 | | (0.07)% | (0.25)%6 | 0.32% | (0.09)% | (0.32)% | (0.27)% |
| Supplemental Data | | | | | | | | |
| Net assets, end of period (000) | $ 12,434 | $ 124,710 | $ 10,543 | $ 20,892 | $ 22,133 | $ 23,463 | $ 22,879 |
| Portfolio turnover of the Portfolio | 69% | | 178% | 78% | 153% | 151% | 96% | 49% |
1 Based on average shares outstanding.
2 Includes a redemption fee, which is less than $0.01 per share.
3 Where applicable, total investment returns exclude the effect of any sales charges
and include the reinvestment of dividends and distributions.
4 Aggregate total investment return.
5 Includes the Fund’s share of the Portfolio’s allocated expenses and/or net invest-
ment income (loss).
6 Annualized.
See Notes to Financial Statements.
24 SEMI-ANNUAL REPORT
APRIL 30, 2010
Notes to Financial Statements (Unaudited)
1. Organization and Significant Accounting Policies:
BlackRock Global Emerging Markets Fund, Inc. (“Global Emerging
Markets”), BlackRock Latin America Fund, Inc. (“Latin America”) and
BlackRock International Fund (“International”) of BlackRock Series, Inc.
(the “Corporation”) (collectively the “Funds” or individually the “Fund”),
are registered under the Investment Company Act of 1940, as amended
(the “1940 Act”). Each Fund is organized as a Maryland corporation.
International is registered as a diversified, open-end management invest-
ment company. Global Emerging Markets and Latin America are registered
as non-diversified, open-end management investment companies. The
Funds’ financial statements are prepared in conformity with accounting
principles generally accepted in the United States of America ("US GAAP"),
which may require the use of management accruals and estimates. Actual
results may differ from these estimates. Each Fund offers multiple classes
of shares. Institutional Shares are sold without a sales charge and only to
certain eligible investors. Investor A Shares are generally sold with a front-
end sales charge. Investor B and Investor C Shares may be subject to a
contingent deferred sales charge. All classes of shares have identical vot-
ing, dividend, liquidation and other rights and the same terms and condi-
tions, except that Investor A, Investor B and Investor C Shares bear certain
expenses related to the shareholder servicing of such shares, and Investor
B and Investor C Shares also bear certain expenses related to the distribu-
tion of such shares. Investor B Shares automatically convert to Investor A
Shares after approximately 8 years. Investor B Shares are only available
through exchanges, dividend reinvestments or for purchase by certain quali-
fied employee benefit plans. Each class has exclusive voting rights with
respect to matters relating to its shareholder servicing and distribution
expenditures (except that Investor B shareholders may vote on material
changes to the Investor A distribution plan).
International seeks to achieve its investment objective by investing all of
its assets in BlackRock Master International Portfolio (the “Portfolio”) of
BlackRock Master LLC (the “Master LLC”), which has the same investment
objective and strategies as the Fund. The value of the Fund’s investment in
the Portfolio reflects the Fund’s proportionate interest in the net assets of
the Portfolio. The performance of the Fund is directly affected by the per-
formance of the Portfolio. The financial statements of the Portfolio, includ-
ing the Schedule of Investments, are included elsewhere in this report
and should be read in conjunction with the Fund’s financial statements.
The percentage of the Portfolio owned by the Fund at April 30, 2010
was 100%.
The following is a summary of significant accounting policies followed by
the Funds:
Valuation: The Funds’ policy is to fair value their financial instruments at
market value using independent dealers or pricing services selected under
the supervision of the Board of Directors (“the Board”). Equity investments
traded on a recognized securities exchange or the NASDAQ Global Market
System are valued at the last reported sale price that day or the NASDAQ
official closing price, if applicable. For equity investments traded on more
than one exchange, the last reported sale price on the exchange where the
stock is primarily traded is used. Equity investments traded on a recognized
exchange for which there were no sales on that day are valued at the last
available bid (long positions) or ask (short positions) price. If no bid or ask
price is available, the prior day’s price will be used, unless it is determined
that such prior day’s price no longer reflects the fair value of the security.
Investments in open-end investment companies are valued at net asset
value each business day. Short-term securities with remaining maturities of
60 days or less may be value at amortized cost, which approximates fair
value.
The Funds’ value their investments in BlackRock Liquidity Series, LLC
Money Market Series (the “Money Market Series”) at fair value, which is
ordinarily based upon their pro rata ownership in the net assets of the
underlying fund. The Money Market Series seeks current income consistent
with maintaining liquidity and preserving capital. Although the Money
Market Series is not registered under the 1940 Act, its investments will
follow the parameters of investments by a money market fund that is
subject to Rule 2a-7 promulgated by the Securities and Exchange
Commission (“SEC”) under the 1940 Act. The Funds may withdraw up
to 25% of their investment daily, although the manager of the Money
Market Series, in its sole discretion, may permit an investor to withdraw
more than 25% on any one day.
Securities and other assets and liabilities denominated in foreign curren-
cies are translated into US dollars using exchange rates determined as of
the close of business on the New York Stock Exchange (“NYSE”). Foreign
currency exchange contracts are valued at the mean between the bid and
ask prices and are determined as of the close of business on the NYSE.
Interpolated values are derived when the settlement date of the contract is
an interim date for which quotations are not available.
In the event that application of these methods of valuation results in a
price for an investment which is deemed not to be representative of the
market value of such investment or is not available, the investment will be
valued by a method approved by each Fund’s Board as reflecting fair value
(“Fair Value Assets”). When determining the price for Fair Value Assets, the
investment advisor and/or the sub-advisor seeks to determine the price
that each Fund might reasonably expect to receive from the current sale of
that asset in an arm’s-length transaction. Fair value determinations shall be
based upon all available factors that the investment advisor and/or sub-
advisor deems relevant. The pricing of all Fair Value Assets is subsequently
reported to the Board or a committee thereof.
Generally, trading in foreign instruments is substantially completed
each day at various times prior to the close of business on the NYSE.
Occasionally, events affecting the values of such instruments may occur
between the foreign market close and the close of business on the NYSE
that may not be reflected in the computation of the Fund’s net assets. If
events (for example, a company announcement, market volatility or a natu-
ral disaster) occur during such periods that are expected to materially
affect the value of such instruments, those instruments may be Fair Value
Assets and be valued at their fair values, as determined in good faith by
the Board or by the investment advisor using a pricing service and/or pro-
cedures approved by the Board. Each business day, the Funds use a pric-
ing service selected under the supervision of that Fund’s Board to assist
SEMI-ANNUAL REPORT
APRIL 30, 2010
25
Notes to Financial Statements (continued)
with the valuation of certain foreign exchange-traded equity securities and
foreign exchange-traded and OTC options (the “Systematic Fair Value
Price”). Using current market factors, the Systematic Fair Value Price is
designed to value such foreign securities and foreign options at fair value
as of the close of business on the NYSE, which follows the close of the
local markets.
International records its investments in the Portfolio at fair value. Valuation
of securities held by the Portfolio is discussed in Note 1 of the Portfolio’s
Notes to Financial Statements, which are included elsewhere in this report.
Fair Value Measurements: Various inputs are used in determining the fair
value of investments, which are as follows:
• Level 1 — price quotations in active markets/exchanges for identical
assets and liabilities
• Level 2 — other observable inputs (including, but not limited to: quoted
prices for similar assets or liabilities in markets that are active, quoted
prices for identical or similar assets or liabilities in markets that are not
active, inputs other than quoted prices that are observable for the
assets or liabilities (such as interest rates, yield curves, volatilities,
prepayment speeds, loss severities, credit risks and default rates) or
other market-corroborated inputs)
• Level 3 — unobservable inputs based on the best information available
in the circumstances, to the extent observable inputs are not available
(including the Funds’ own assumptions used in determining the fair
value of investments)
The inputs or methodologies used for valuing securities are not necessarily
an indication of the risk associated with investing in those securities.
As of April 30, 2010, International’s investment in the Portfolio was
classified as Level 2. The Fund believes more relevant disclosure regarding
fair value measurements relates to the Portfolio, which is disclosed in
Note 1 of the Portfolio’s Notes to Financial Statements included elsewhere
in this report.
Foreign Currency Transactions: Each Fund’s books and records are main-
tained in US dollars. Foreign currency amounts are translated into US
dollars as follows: (i) market value of investment securities, assets and
liabilities at the current rate of exchange; and (ii) purchases and sales of
investment securities, income and expenses at the rates of exchange pre-
vailing on the respective dates of such transactions. Generally, when the
US dollar rises in value against foreign currency, the Fund’s investments
denominated in that currency will lose value because its currency is worth
fewer US dollars; the opposite effect occurs if the US dollar falls in
relative value.
The Funds report foreign currency related transactions as components of
realized gain (loss) for financial reporting purposes, whereas such compo-
nents are treated as ordinary income for federal income tax purposes.
Segregation and Collateralization: In cases in which the 1940 Act and
the interpretive positions of the SEC require that a Fund either delivers
collateral or segregates assets in connection with certain investments
(e.g., foreign currency exchange contracts), each Fund will, consistent with
SEC rules and/or certain interpretive letters issued by the SEC, segregate
collateral or designate on its books and records cash or other liquid
securities having a market value at least equal to the amount that would
otherwise be required to be physically segregated. Furthermore, based
on requirements and agreements with certain exchanges and third party
broker-dealers, each party has requirements to deliver/deposit securities
as collateral for certain investments.
Investment Transactions and Investment Income: For financial reporting
purposes, investment transactions are recorded on the dates the transac-
tions are entered into (the trade dates). Realized gains and losses on
investment transactions are determined on the identified cost basis.
Dividend income is recorded on the ex-dividend dates. Dividends from for-
eign securities where the ex-dividend date may have passed are subse-
quently recorded when the Funds have determined the ex-dividend date.
Under the applicable foreign tax laws, a withholding tax at various rates
may be imposed on capital gains, dividends and interest. Upon notification
from issuers, some of the dividend income received from a real estate
investment trust may be redesignated as a reduction of cost of the related
investment and/or realized gain. Interest income, including amortization of
premium and accretion of discount on debt securities, is recognized on the
accrual basis. Income and realized and unrealized gains and losses are
allocated daily to each class based on its relative net assets.
Dividends and Distributions: Dividends and distributions paid by the Funds
are recorded on the ex-dividend dates. The amount and timing of dividends
and distributions are determined in accordance with federal income tax
regulations, which may differ from US GAAP.
Securities Lending: Global Emerging Markets and Latin America may lend
securities to financial institutions that provide cash as collateral, which will
be maintained at all times in an amount equal to at least 100% of the
current market value of the loaned securities. The market value of the
loaned securities is determined at the close of business of the Funds
and any additional required collateral is delivered to the Funds on the next
business day. Securities lending income, as disclosed in the Statement of
Operations, represents the income earned from the investment of the cash
collateral, net of rebates paid to, or fees paid by, borrowers and less the
fees paid to the securities lending agent. Loans of securities are terminable
at any time and the borrower, after notice, is required to return borrowed
securities within the standard time period for settlement of securities trans-
actions. In the event that the borrower defaults on its obligation to return
borrowed securities because of insolvency or for any other reason, the
Funds could experience delays and costs in gaining access to the collat-
eral. The Funds also could suffer a loss if the value of an investment pur-
chased with cash collateral falls below the market value of loaned
securities or if the value of an investment purchased with cash collateral
falls below the value of the original cash collateral received.
26 SEMI-ANNUAL REPORT
APRIL 30, 2010
Notes to Financial Statements (continued)
Income Taxes: It is each Fund’s policy to comply with the requirements of
the Internal Revenue Code of 1986, as amended, applicable to regulated
investment companies and to distribute substantially all of its taxable
income to its shareholders. Therefore, no federal income tax provision
is required.
Each Fund files US federal and various state and local tax returns.
No income tax returns are currently under examination. The statute of
limitations on Global Emerging Market’s US federal tax returns remains
open for the year ended October 31, 2009, the period ended October 31,
2008 and the two years ended June 30, 2008. The statute of limitations
on Latin America’s US federal tax returns remains open for the year ended
October 31, 2009, the period ended October 31, 2008 and the two years
ended November 30, 2007. The statute of limitations on International’s US
federal tax returns remains open for the year ended October 31, 2009, the
period ended October 31, 2008 and the two years ended May 31, 2008.
The statutes of limitations on each Fund’s state and local tax returns may
remain open for an additional year depending upon the jurisdiction. There
are no uncertain tax positions that require recognition of a tax liability.
Recent Accounting Standard: In January 2010, the Financial Accounting
Standards Board issued amended guidance to improve disclosure about
fair value measurements which will require additional disclosures about
transfers into and out of Levels 1 and 2 and separate disclosures about
purchases, sales, issuances and settlements in the reconciliation for fair
value measurements using significant unobservable inputs (Level 3). It also
clarifies existing disclosure requirements relating to the levels of disaggre-
gation for fair value measurement and inputs and valuation techniques
used to measure fair value. The amended guidance is effective for financial
statements for fiscal years beginning after December 15, 2009, and the
interim periods within those fiscal years, except for disclosures about pur-
chases, sales, issuances and settlements in the rollforward of activity in
Level 3 fair value measurements, which are effective for fiscal years begin-
ning after December 15, 2010 and for interim periods within those fiscal
years. The impact of this guidance on the Funds’ financial statements and
disclosures is currently being assessed.
Basis of Consolidation:
Global Emerging Markets
The Fund’s accompanying consolidated Financial Highlights for each of the
years in the three-year period ended June 30, 2007 include the accounts
of Inversiones en Marcado Accionario de Valores Chile Limitada, a wholly
owned subsidiary of the Fund. The subsidiary was created for regulatory
purposes to invest in Chilean securities. Intercompany accounts and
transactions have been eliminated. During the year ended June 30,
2007, Inversiones en Marcado Accionario de Valores Chile Limitada
was dissolved.
Latin America
The Fund’s accompanying consolidated financial statements include the
accounts of Merrill Lynch Latin America Fund Chile Ltd., a wholly owned
subsidiary of the Fund. The subsidiary was created for regulatory purposes
to invest in Chilean securities. Intercompany accounts and transactions
have been eliminated. During the year ended October 31, 2009, Merrill
Lynch Latin America Fund Chile Ltd. was dissolved.
Other: Expenses directly related to each Fund or its classes are charged to
that Fund or class. Other operating expenses shared by several funds are
pro rated among those funds on the basis of relative net assets or other
appropriate methods. Other expenses of the Fund are allocated to each
class based on its relative net assets. Each Fund has an arrangement with
the custodian whereby fees may be reduced by credits earned on unin-
vested cash balances, which if applicable are shown as fees paid indirectly
in the Statement of Operations. The custodian imposes fees on overdrawn
cash balances, which can be offset by accumulated credits earned or may
result in additional custody charges.
2. Derivative Financial Instruments:
The Funds may engage in various portfolio investment strategies both to
increase the returns of the Funds and to economically hedge, or protect,
their exposure to certain risks such as foreign currency exchange rate risk.
Losses may arise if the value of the contract decreases due to an unfavor-
able change in the price of the underlying instrument or if the counterparty
does not perform under the contract. The Funds may mitigate counterparty
risk through master netting agreements included within an International
Swap and Derivatives Association, Inc. (“ISDA”) Master Agreement between
a Fund and separately each of its counterparties. The ISDA Master
Agreement allows each Fund to offset with its counterparty certain deriva-
tive financial instrument’s payables and/or receivables with collateral held
with each separate counterparty. The amount of collateral moved to/from
applicable counterparties is based upon minimum transfer amounts of up
to $500,000. To the extent amounts due to the Funds from their counter-
parties are not fully collateralized contractually or otherwise, the Funds
bear the risk of loss from counterparty non-performance. See Note 1
“Segregation and Collateralization” for information with respect to collateral
practices. In addition, each Fund manages counterparty risk by entering
into agreements only with counterparties that it believes have the financial
resources to honor their obligations and by monitoring the financial stability
of those counterparties.
The Funds’ maximum risk of loss from counterparty credit risk on OTC
derivatives is generally the aggregate unrealized gain in excess of any
collateral pledged by the counterparty to the Funds. Certain ISDA Master
Agreements allow counterparties to OTC derivatives to terminate derivative
contracts prior to maturity in the event a Fund’s net assets decline by a
stated percentage or a Fund fails to meet the terms of its ISDA Master
Agreements, which would cause the Fund to accelerate payment of any
net liability owed to the counterparty. Counterparty risk related to exchange-
traded financial futures contracts and options is minimal because of the
protection against defaults provided by the exchange on which they trade.
Foreign Currency Exchange Contracts: The Funds may enter into foreign
currency exchange contracts as an economic hedge against either specific
transactions or portfolio instruments (foreign currency exchange rate risk).
A foreign currency exchange contract is an agreement between two parties
SEMI-ANNUAL REPORT
APRIL 30, 2010
27
Notes to Financial Statements (continued)
to buy and sell a currency at a set exchange rate on a future date. Foreign
currency exchange contracts, when used by the Funds, help to manage the
overall exposure to the currency backing some of the investments held by
the Funds. The contract is marked-to-market daily and the change in mar-
ket value is recorded by the Funds as an unrealized gain or loss. When the
contract is closed, the Funds record a realized gain or loss equal to the dif-
ference between the value at the time it was opened and the value at the
time it was closed. The use of foreign currency exchange contracts involves
the risk that counterparties may not meet the terms of the agreement or
unfavorable movements in the value of a foreign currency relative to the
US dollar.
| | | | | | |
| Derivatives Categorized by Risk Exposure: | | | | |
| Fair Values of Derivative Instruments as of April 30, 2010 |
|
| Asset Derivatives |
|
| | | | Global | | | |
| | | | Emerging | | | |
| | | | Markets | | Latin America |
| | Statement of Assets | | | |
| | and Liabilities | | | | |
| | Location | | | Value | |
| | Unrealized appreciation | | | |
| Foreign currency | on foreign currency | | | | |
| exchange contracts | exchange contracts | $24,181 | | $120 |
| Liability Derivatives |
|
| | | | Global | | | |
| | | | Emerging | | | |
| | | | Markets | | Latin America |
| | Statement of Assets | | | |
| | and Liabilities | | | | |
| | Location | | | Value | |
| | Unrealized depreciation | | | |
| Foreign currency | on foreign currency | | | | |
| exchange contracts | exchange contracts | $2,044 | | | — |
| The Effect of Derivative Instruments on the Statements of Operations |
| Six Months Ended April 30, 2010 |
|
| Net Realized Gain From |
|
| | | | Global | | | |
| | | Emerging Markets | Latin America |
| Foreign currency exchange contracts: | | | | | |
| Foreign currency transactions | $ (32,170) | $ (591,565) |
| Net Change in Unrealized Appreciation/Depreciation on |
|
| | | | Global | | | |
| | | Emerging Markets | Latin America |
| Foreign currency exchange contracts: | | | | | |
| Foreign currency transactions | $ 23,910 | $ 120 |
| For the six months ended April 30, 2010, the average quarterly balance of |
| outstanding derivative financial instruments was as follows: | | |
| | | | Global | | | |
| | | Emerging Markets | Latin America |
| Foreign currency exchange contracts: | | | | | |
| Average number of contracts-US | | | | | |
| dollars purchased | | | 12 | | | 6 |
| Average number of contracts-US | | | | | |
| dollars sold | | | 5 | | | 1 |
| Average US dollar amounts purchased | $ 2,324,384 | | $ 923,557 |
| Average US dollar amounts sold | $ 2,386,399 | | $ 208,350 |
3. Investment Advisory Agreement and Other Transactions
with Affiliates:
The PNC Financial Services Group, Inc. ("PNC"), Bank of America
Corporation ("BAC") and Barclays Bank PLC ("Barclays") are the largest
stockholders of BlackRock, Inc. ("BlackRock"). Due to the ownership struc-
ture, PNC is an affiliate of the Funds for 1940 Act purposes, but BAC and
Barclays are not.
Global Emerging Markets and Latin America each entered into an Invest-
ment Advisory Agreement with BlackRock Advisors, LLC (the “Manager”),
each Fund's investment advisor, an indirect, wholly owned subsidiary of
BlackRock, to provide investment advisory and administration services. The
Manager is responsible for the management of each Fund’s portfolio and
provides the necessary personnel, facilities, equipment and certain other
services necessary to the operations of each Fund’s. For such services,
Global Emerging Markets and Latin America pay the Manager a monthly
fee at an annual rate 1.0% of each Fund’s average daily net assets.
The Manager voluntarily agreed to waive its advisory fees by the amount of
investment advisory fees the Funds pay to the Manager indirectly through
its investment in affiliated money market funds, however the Manager
does not waive its advisory fees by the amount of investment advisory
fees through its investment in other affiliated investment companies.
These amounts are shown as fees waived by advisor in the Statement
of Operations.
The Manager entered into a separate sub-advisory agreement with
BlackRock Investment Management, LLC (“BIM”) with respect to each
Fund and BlackRock International Limited, with respect to Global Emerging
Markets and Latin America, both affiliates of the Manager. The Manager
pays each sub-advisor, for services it provides, a monthly fee that is a per-
centage of the investment advisory fees paid by the Funds to the Manager.
The Corporation, on behalf of International, entered into an Administration
Agreement with the Manager to provide administrative services (other than
investment advice and related portfolio activities). For such services, the
Fund pays the Manager a monthly fee at an annual rate of 0.25% of the
average daily value of the Fund’s net assets.
For the six months ended April 30, 2010, Global Emerging Markets and
Latin America reimbursed the Manager for certain accounting services,
which are included in accounting services in the Statements of Operations
The reimbursements were as follows:
| |
| | Reimbursement |
| Global Emerging Markets | $2,440 |
| Latin America | $7,831 |
The Funds have received an exemptive order from the SEC permitting,
among other things, to pay an affiliated securities lending agent a fee
based on a share of the income derived from the securities lending activi-
ties and has retained BIM as the securities lending agent. BIM may, on
behalf of the Funds, invest cash collateral received by the Funds for such
loans, among other things, in a private investment company managed by
the Manager or in registered money market funds advised by the Manager
28 SEMI-ANNUAL REPORT
APRIL 30, 2010
Notes to Financial Statements (continued)
or its affiliates. The market value of securities on loan and the value of the
related collateral are shown in the Statements of Assets and Liabilities as
securities loaned and collateral at value — securities loaned, respectively.
The cash collateral invested by BIM is disclosed in the Schedules of
Investments. The share of income earned by the Funds on such invest-
ments is shown as securities lending — affiliated in the Statements of
Operations. For the six months ended April 30, 2010, BIM received
$21,526 in securities lending agent fees from Latin America.
Global Emerging Markets, Latin America and the Corporation (on behalf of
International) have entered into a Distribution Agreement and Distribution
Plans with BlackRock Investments, LLC (”BRIL“), an affiliate of BlackRock.
Pursuant to the Distribution Plans and in accordance with Rule 12b-1
under the 1940 Act, the Funds pay BRIL ongoing service and distribution
fees. The fees are accrued daily and paid monthly at annual rates based
upon the average daily net assets of the shares of the Funds, as follows:
| | |
| | Service | Distribution |
| | Fee | Fee |
| Investor A | 0.25% | — |
| Investor B | 0.25% | 0.75% |
| Investor C | 0.25% | 0.75% |
Pursuant to sub-agreements with BRIL, broker-dealers and BRIL provide
shareholder servicing and distribution services to each Fund. The ongoing
service and/or distribution fee compensates BRIL and each broker-dealer
for providing shareholder servicing and/or distribution related services to
Investor A, Investor B and Investor C shareholders.
For the six months ended April 30, 2010, affiliates earned underwriting dis-
counts, direct commissions and dealer concessions on sales of the Fund’s
Investor A Shares as follows:
| |
| | Investor A |
| Global Emerging Markets | $ 15,924 |
| Latin America | $ 107,846 |
| International | $ 902 |
For the six months ended April 30, 2010, affiliates received contingent
deferred sales charges relating to transactions in Investor B and Investor C
Shares as follows.
| | |
| | Investor B | Investor C |
| Global Emerging Markets | $ 1,882 | $ 4,150 |
| Latin America | $ 33,922 | $ 54,466 |
| International | $ 1,079 | $ 461 |
Furthermore, affiliates received contingent deferred sales charges relating
to transactions subject to front-end sales charge waivers on Investor A
Shares as follows.
| |
| | Investor A |
| Global Emerging Markets | $ 312 |
| Latin America | $ 1,888 |
| International | $ 88 |
PNC Global Investment Servicing (U.S.) Inc., an indirect, wholly owned
subsidiary of PNC and an affiliate of the Manager, serves as transfer agent
and dividend disbursing agent. Transfer agency fees borne by each Fund
are comprised of those fees charged for all shareholder communications
including mailing of shareholder reports, dividend and distribution notices,
and proxy materials for shareholder meetings, as well as per account and
per transaction fees related to servicing and maintenance of shareholder
accounts, including the issuing, redeeming and transferring of shares of
each class of the Funds, check writing, anti-money laundering services, and
customer identification services.
Pursuant to written agreements, certain affiliates provide the Funds with
sub-accounting, recordkeeping, sub-transfer agency and other administra-
tive services with respect to sub-accounts they service. For these services,
these affiliates receive an annual fee per shareholder account which will
vary depending on share class. For the six months ended April 30, 2010,
the following Fund paid the following in return for these services which is
included in transfer agent in the Statements of Operations:
Latin America $ 688
The Manager maintains a call center, which is responsible for providing
certain shareholder services to the Funds, such as responding to share-
holder inquiries and processing transactions based upon instructions
from shareholders with respect to the subscription and redemption of Fund
shares. For the six months ended April 30, 2010, the Funds reimbursed the
Manager the following amounts for costs incurred in running the call cen-
ter, which are included in transfer agent — class specific in the Statements
of Operations.
| | | |
| Global |
| | Emerging | Latin | |
| Call Center Fees | Markets | America | International |
| Institutional | $ 348 | $ 535 | $ 23 |
| Investor A | $1,236 | $8,946 | $199 |
| Investor B | $ 89 | $ 623 | $ 55 |
| Investor C | $ 323 | $2,701 | $133 |
Certain officers and/or directors of Global Emerging Markets, Latin America
and the Corporation are officers and/or directors of BlackRock or its
affiliates. The Funds reimburse the Manager for compensation paid to the
Chief Compliance Officer of Global Emerging Markets, Latin America and
the Corporation.
4. Investments:
Purchases and sales of investments excluding short-term securities for the
six months ended April 30, 2010, were as follows:
| | |
| | Purchases | Sales |
| Global Emerging Markets | $181,061,014 | $164,107,355 |
| Latin America | $333,546,724 | $331,837,226 |
SEMI-ANNUAL REPORT
APRIL 30, 2010
29
Notes to Financial Statements (continued)
5. Borrowings:
Global Emerging Markets and Latin America, along with certain other
funds managed by the Manager and its affiliates, is a party to a $500
million credit agreement with a group of lenders, which was renewed until
November 2010. The Funds may borrow under the credit agreement to
fund shareholder redemptions. Prior to its renewal, the credit agreement
had the following terms: 0.02% upfront fee on the aggregate commitment
amount which was allocated to each Fund based on its net assets as of
October 31, 2008; a commitment fee of 0.08% per annum based on each
Funds’ pro rata share of the unused portion of the credit agreement, which
is included in miscellaneous in the Statements of Operations, and interest
at a rate equal to the higher of the (a) federal funds effective rate and
(b) reserve adjusted one-month LIBOR, plus, in each case, the higher of
(i) 1.50% and (ii) 50% of the CDX Index (as defined in the credit agree-
ment) on amounts borrowed. Effective November 2009, the credit agree-
ment was renewed with the following terms: 0.02% upfront fee on the
aggregate commitment amount which was allocated to each Fund based
on its net assets as of October 31, 2009, a commitment fee of 0.10% per
annum based on each Fund’s pro rata share of the unused portion of the
credit agreement and interest at a rate equal to the higher of (a) the one-
month LIBOR plus 1.25% per annum and (b) the Fed Funds rate plus
1.25% per annum on amounts borrowed. Global Emerging Markets and
Latin America did not borrow under the credit agreement during the six
months ended April 30, 2010.
6. Capital Loss Carry Forward:
As of April 30, 2010, the Funds had capital loss carryforwards available to
offset future realized capital gains through the indicated expiration dates:
| | | |
| Global |
| Expires | Emerging | Latin | |
| October 31, | Markets | America | International |
| 2010 | $ 3,618,280 | — | $ 38,696,952 |
| 2016 | 37,949,987 | $ 57,163,692 | 19,370,107 |
| 2017 | 22,709,079 | 64,351,106 | 15,346,411 |
| Total | $ 64,277,346 | $121,514,798 | $ 73,413,470 |
| 7. Concentration, Market and Credit Risk: | |
In the normal course of business, Global Emerging Markets and Latin
America invest in securities and enter into transactions where risks exist
due to fluctuations in the market (market risk) or failure of the issuer of a
security to meet all its obligations (credit risk). The value of securities held
by the Funds may decline in response to certain events, including those
directly involving the issuers whose securities are owned by the Funds;
conditions affecting the general economy; overall market changes; local,
regional or global political, social or economic instability; and currency and
interest rate and price fluctuations. Similar to credit risk, the Funds may be
exposed to counterparty risk, or the risk that an entity with which the Funds
have unsettled or open transactions may default. The Funds manage coun-
terparty risk by entering into transactions only with counterparties that it
believes have the financial resources to honor their obligations and by
monitoring the financial stability of those counterparties. Financial assets,
which potentially expose the Funds to credit and counterparty risks, consist
principally of investments and cash due from counterparties. The extent of
the Funds’ exposure to credit and counterparty risks with respect to these
financial assets is generally approximated by their value recorded in the
Funds’ Statements of Assets and Liabilities, less any collateral held by
the Funds.
Global Emerging Markets and Latin America invest from time to time a sub-
stantial amount of their assets in issuers located in a single country or a
limited number of countries. At April 30, 2010, Latin America invested 74%
of its net assets in Brazil. When the Funds concentrate their investments in
this manner, they assume the risk that economic, political and social con-
ditions in those countries may have a significant impact on their investment
performance. Please see the Schedules of Investments for concentrations
in specific countries.
As of April 30, 2010, Global Emerging Markets and Latin America had the
following industry classifications:
| |
| Global Emerging Markets | |
| | Percent of |
| | Long-Term |
| Industry | Investments |
| Commercial Banks | 18% |
| Oil, Gas & Consumable Fuels | 13 |
| Semiconductors & Semiconductor Equipment | 9 |
| Wireless Telecommunication Services | 9 |
| Metals & Mining | 8 |
| Other* | 43 |
| Latin America | |
| | Percent of |
| | Long-Term |
| Industry | Investments |
| Commercial Banks | 19% |
| Metals & Mining | 19 |
| Oil, Gas & Consumable Fuels | 18 |
| Wireless Telecommunication Services | 9 |
| Beverages | 5 |
| Household Products | 5 |
| Other* | 25 |
* All other industries held were each less than 5% of long-term investments.
30 SEMI-ANNUAL REPORT
APRIL 30, 2010
| | | | |
| Notes to Financial Statements (continued) | | | | |
| 8. Capital Share Transactions: | | | | |
| Transactions in capital shares for each class were as follows: | | | | |
| | Six Months Ended | | Year Ended |
| | April 30, 2010 | October 31, 2009 |
| Global Emerging Markets | Shares | Amount | Shares | Amount |
| Institutional | | | | |
| Shares sold | 1,085,862 | $ 19,574,911 | 2,427,202 | $ 31,998,241 |
| Shares issued to shareholders in reinvestment of dividends | 23,865 | 415,421 | 22,603 | 228,222 |
| Total issued | 1,109,727 | 19,990,332 | 2,449,805 | 32,226,463 |
| Shares redeemed | (1,483,498) | (26,176,665) | (1,593,248) | (20,139,564) |
| Net increase (decrease) | (373,771) | $ (6,186,333) | 856,557 | $ 12,086,899 |
| Investor A | | | | |
| Shares sold and automatic conversion of shares | 1,127,570 | $ 19,587,955 | 1,279,420 | $ 18,123,676 |
| Shares issued to shareholders in reinvestment of dividends | 25,718 | 433,582 | 320,613 | 201,779 |
| Total issued | 1,153,288 | 20,021,537 | 1,300,033 | 18,325,455 |
| Shares redeemed | (552,458) | (9,537,523) | (1,364,931) | (16,128,173) |
| Net increase (decrease) | 600,830 | $ 10,484,014 | (64,898) | $ 2,197,282 |
| Investor B | | | | |
| Shares sold | 23,030 | $ 362,399 | 75,705 | $ 876,794 |
| Shares redeemed and automatic conversion of shares | (52,051) | (816,552) | (142,339) | (1,419,591) |
| Net decrease | (29,021) | $ (454,153) | (66,634) | $ (542,797) |
| Investor C | | | | |
| Shares sold | 663,816 | $ 10,096,019 | 778,580 | $ 9,627,317 |
| Shares issued to shareholders in reinvestment of dividends | 1,203 | 17,773 | — | — |
| Total issued | 665,019 | 10,113,792 | 778,580 | 9,627,317 |
| Shares redeemed | (286,459) | (4,342,257) | (514,884) | (5,344,277) |
| Net increase | 378,560 | $ 5,771,535 | 263,696 | $ 4,283,040 |
| Latin America | | | | |
| Institutional | | | | |
| Shares sold | 934,961 | $ 60,158,410 | 1,056,535 | $ 48,081,433 |
| Shares issued to shareholders in reinvestment of dividends | 28,822 | 1,796,412 | — | — |
| Total issued | 963,783 | 61,954,822 | 1,056,535 | 48,081,433 |
| Shares redeemed | (442,354) | (27,591,247) | (1,038,791) | (36,964,049) |
| Net increase | 521,429 | $ 34,363,575 | 17,744 | $ 11,117,384 |
| Investor A | | | | |
| Shares sold and automatic conversion of shares | 2,352,337 | $ 148,973,328 | 4,344,050 | $ 191,578,027 |
| Shares issued to shareholders in reinvestment of dividends | 111,798 | 6,869,768 | — | — |
| Total issued | 2,464,135 | 155,843,096 | 4,344,050 | 191,578,027 |
| Shares redeemed | (3,353,671) | (202,940,781) | (1,966,080) | (76,595,525) |
| Net increase (decrease) | (889,536) | $ (47,097,685) | 2,377,970 | $ 114,982,502 |
| Investor B | | | | |
| Shares sold | 9,694 | $ 581,620 | 68,592 | $ 2,737,186 |
| Shares issued to shareholders in reinvestment of dividends | 2,352 | 136,208 | — | — |
| Total issued | 12,046 | 717,828 | 68,592 | 2,737,186 |
| Shares redeemed and automatic conversion of shares | (48,523) | (2,851,275) | (136,323) | (4,829,849) |
| Net decrease | (36,477) | $ (2,133,447) | (67,731) | $ (2,092,663) |
| Investor C | | | | |
| Shares sold | 855,837 | $ 49,933,639 | 1,124,791 | $ 48,207,477 |
| Shares issued to shareholders in reinvestment of dividends | 30,235 | 1,714,777 | — | — |
| Total issued | 886,072 | 51,648,416 | 1,124,791 | 48,207,477 |
| Shares redeemed | (457,856) | (26,202,650) | (879,816) | (30,020,957) |
| Net increase | 428,216 | $ 25,445,766 | 244,975 | $ 18,186,520 |
SEMI-ANNUAL REPORT
APRIL 30, 2010
31
| | | | |
| Notes to Financial Statements (concluded) | | | | |
| | Six Months Ended | | Year Ended |
| | April 30, 2010 | October 31, 2009 |
| International | Shares | Amount | Shares | Amount |
| Institutional | | | | |
| Shares sold | 44,697 | $ 511,947 | 72,049 | $ 573,143 |
| Shares redeemed | (57,683) | (667,053) | (231,246) | (1,934,401) |
| Net decrease | (12,986) | $ (155,106) | (159,197) | $ (1,361,258) |
| Investor A | | | | |
| Shares sold and automatic conversion of shares | 894,501 | $ 10,099,505 | 1,149,898 | $ 10,086,404 |
| Shares redeemed | (712,928) | (7,889,276) | (1,236,681) | (10,173,305) |
| Net increase (decrease) | 181,573 | $ 2,210,229 | (86,783) | $ (86,901) |
| Investor B | | | | |
| Shares sold | 223,201 | $ 2,367,473 | 718,550 | $ 5,916,834 |
| Shares redeemed and automatic conversion of shares | (683,715) | (7,262,089) | (1,406,707) | (11,208,094) |
| Net decrease | (460,514) | $ (4,894,616) | (688,157) | $ (5,291,260) |
| Investor C | | | | |
| Shares sold | 104,541 | $ 1,128,917 | 199,307 | $ 1,688,311 |
| Shares redeemed | (149,280) | (1,606,554) | (336,919) | (2,684,332) |
| Net decrease | (44,739) | $ (477,637) | (137,612) | $ (996,021) |
| 9. Subsequent Events: | | | | |
Management has evaluated the impact of all subsequent events on the Funds through the date the financial statements were issued and has determined
that there were no subsequent events requiring adjustment or additional disclosure in the financial statements.
32 SEMI-ANNUAL REPORT
APRIL 30, 2010
| | | |
| Portfolio Information as of April 30, 2010 (Unaudited) | | BlackRock Master International Portfolio |
| BlackRock Master International Portfolio | | | |
| | Percent of | | Percent of |
| | Long-Term | | Long-Term |
| Ten Largest Holdings | Investments | Geographic Allocation | Investments |
| Nestle SA Registered Shares | 4% | Japan | 18% |
| Sanofi-Aventis | 4 | United Kingdom | 16 |
| British American Tobacco Plc | 3 | Switzerland | 13 |
| Bridgestone Corp. | 3 | Germany | 8 |
| DaimlerChrysler AG | 3 | France | 8 |
| BG Group Plc | 3 | Taiwan | 6 |
| Taiwan Semiconductor Manufacturing Co., Ltd. — ADR | 3 | China | 5 |
| Nitto Denko Corp. | 3 | United States | 4 |
| UBS AG | 3 | Netherlands | 4 |
| Heineken NV | 3 | South Korea | 4 |
| | | Brazil | 3 |
| | | South Africa | 2 |
| | | Hong Kong | 2 |
| | | India | 2 |
| | | Italy | 2 |
| | | Thailand | 1 |
| | | Austria | 1 |
| | | Hungary | 1 |
SEMI-ANNUAL REPORT
APRIL 30, 2010
33
Schedule of Investments April 30, 2010 (Unaudited)
BlackRock Master International Portfolio
(Percentages shown are based on Net Assets)
| | |
| Common Stocks | Shares | Value |
| Austria — 1.1% | | |
| Erste Bank der Oesterreichischen Sparkassen AG | 16,681 | $ 740,613 |
| Brazil — 2.9% | | |
| NET Servicos de Comunicacao SA — ADR (a) | 50,834 | 597,300 |
| Rossi Residencial SA | 180,564 | 1,329,624 |
| | | 1,926,924 |
| China — 4.8% | | |
| Focus Media Holding Ltd. — ADR (a) | 59,436 | 997,336 |
| Sands China Ltd. (a) | 885,600 | 1,437,654 |
| VanceInfo Technologies, Inc. — ADR (a) | 31,220 | 744,597 |
| | | 3,179,587 |
| France — 7.5% | | |
| Eutelsat Communications | 32,222 | 1,147,071 |
| Sanofi-Aventis | 34,304 | 2,340,171 |
| Societe Generale SA | 27,733 | 1,480,923 |
| | | 4,968,165 |
| Germany — 7.8% | | |
| DaimlerChrysler AG | 36,646 | 1,885,569 |
| Deutsche Lufthansa AG (a) | 63,613 | 1,057,848 |
| E.ON AG | 36,361 | 1,340,914 |
| HeidelbergCement AG | 14,473 | 896,189 |
| | | 5,180,520 |
| Hong Kong — 2.0% | | |
| Shun Tak Holdings Ltd. | 2,214,000 | 1,292,943 |
| Hungary — 1.1% | | |
| OTP Bank Rt. | 19,938 | 700,850 |
| India — 1.5% | | |
| Sterlite Industries India Ltd. — ADR | 54,282 | 984,675 |
| Italy — 1.5% | | |
| Unicredit SpA | 369,622 | 968,670 |
| Japan — 16.7% | | |
| Bridgestone Corp. | 114,600 | 1,909,926 |
| Kurita Water Industries Ltd. | 54,900 | 1,587,519 |
| Makita Corp. | 50,900 | 1,577,733 |
| Mitsui & Co., Ltd. | 64,800 | 973,886 |
| Nissan Motor Co., Ltd. | 178,200 | 1,550,546 |
| Nitto Denko Corp. | 46,400 | 1,813,034 |
| Nomura Holdings, Inc. | 230,000 | 1,589,786 |
| | | 11,002,430 |
| Netherlands — 4.2% | | |
| Heineken NV | 36,211 | 1,688,440 |
| ING Groep NV CVA | 123,616 | 1,091,076 |
| | | 2,779,516 |
| South Africa — 2.3% | | |
| MTN Group Ltd. | 102,310 | 1,505,088 |
| South Korea — 3.7% | | |
| LG Electronics, Inc. | 11,945 | 1,302,453 |
| Samsung Electronics Co., Ltd. | 1,500 | 1,140,508 |
| | | 2,442,961 |
| Switzerland — 12.0% | | |
| Credit Suisse Group AG | 22,463 | 1,031,002 |
| Nestle SA Registered Shares | 52,287 | 2,558,451 |
| The Swatch Group Ltd., Bearer Shares | 2,564 | 751,159 |
| Transocean Ltd. (a) | 15,800 | 1,144,710 |
| | | |
| Common Stocks | | Shares | Value |
| Switzerland (concluded) | | | |
| UBS AG | | 110,517 | $ 1,712,149 |
| Weatherford International Ltd. (a) | | 41,406 | 749,862 |
| | | | 7,947,333 |
| Taiwan — 5.2% | | | |
| HTC Corp. | | 117,000 | 1,567,762 |
| Taiwan Semiconductor Manufacturing | | | |
| Co., Ltd. — ADR | | 175,151 | 1,854,849 |
| | | | 3,422,611 |
| Thailand — 1.2% | | | |
| Kasikornbank Pcl | | 275,300 | 761,085 |
| United Kingdom — 14.8% | | | |
| 3i Group Plc | | 293,482 | 1,210,687 |
| BG Group Plc | | 110,578 | 1,869,067 |
| British Airways Plc | | 252,047 | 873,874 |
| British American Tobacco Plc | | 60,842 | 1,913,163 |
| Group 4 Securicor Plc | | 331,506 | 1,349,401 |
| Lloyds TSB Group Plc | | 1,018,524 | 1,019,031 |
| Tullow Oil Plc | | 88,256 | 1,537,110 |
| | | | 9,772,333 |
| United States — 4.2% | | | |
| Intel Corp. | | 50,333 | 1,149,102 |
| Liberty Global, Inc. (a) | | 33,711 | 924,019 |
| NII Holdings, Inc. (a) | | 17,054 | 723,431 |
| | | | 2,796,552 |
| Total Long-Term Investments | | | |
| (Cost — $58,090,407) — 94.5% | | | 62,372,856 |
| Short-Term Securities | | | |
| Money Market Fund — 4.0% | | | |
| BlackRock Liquidity Funds, TempFund, Institutional | | |
| Class, 0.14% (b)(c) | | 2,620,151 | 2,620,151 |
| | | Par | |
| | | (000) | |
| Time Deposits — 0.0% | | | |
| Europe — 0.0% | | | |
| Brown Brothers Harriman & Co., | | | |
| 0.05%, 5/03/10 | EUR | 12 | 16,249 |
| Total Short-Term Securities | | | |
| (Cost — $2,636,400) — 4.0% | | | 2,636,400 |
| Total Investments (Cost — $60,726,807*) — 98.5% | | 65,009,256 |
| Other Assets Less Liabilities — 1.5% | | | 1,015,345 |
| Net Assets – 100.0% | | | $ 66,024,601 |
* The cost and unrealized appreciation (depreciation) of investments as of April 30,
2010, as computed for federal income tax purposes, were as follows:
| |
| Aggregate cost | $ 61,121,552 |
| Gross unrealized appreciation | $ 6,305,082 |
| Gross unrealized depreciation | (2,417,378) |
| Net unrealized appreciation | $ 3,887,704 |
| | | | |
| Portfolio Abbreviations | | | | |
| To simplify the listing of portfolio holdings in the Schedule | ADR | American Depositary Receipts | JPY | Japanese Yen |
| of Investments, the names and descriptions of many of the | EUR | Euro | THB | Thai Baht |
| securities have been abbreviated according to the following | GBP | British Pound | USD | US Dollar |
| list: | | | | |
| See Notes to Financial Statements. | | | | |
34 SEMI-ANNUAL REPORT
APRIL 30, 2010
Schedule of Investments (concluded)
BlackRock Master International Portfolio
(a) Non-income producing security.
(b) Represents the current yield as of report date.
(c) Investments in companies considered to be an affiliate of the Portfolio during the
period, for purposes of Section 2(a)(3) of the Investment Company Act of 1940,
were as follows:
| | | | | | | | |
| | | | Shares Held at | Shares Held at | |
| | | | October 31, | Net | April 30, | | |
| | Affiliate | 2009 | | Activity | 2010 | | Income |
| | BlackRock Liquidity | | | | | | |
| | Funds, TempFund, | | | | | | |
| | Institutional Class | 1,466,787 | 1,153,364 | 2,620,151 | | $1,174 |
| • | Foreign currency exchange contracts as of April 30, 2010 were as follows: |
| | | | | | | | Unrealized |
| | Currency | Currency | | | Settlement Appreciation |
| | Purchased | Sold | Counterparty | Date | (Depreciation) |
| | USD | 512,612 EUR | 386,207 | Citibank NA | 5/05/10 | $ (1,609) |
| | GBP | 193,443 USD | 295,833 JPMorgan Chase NA 5/06/10 | | 139 |
| | THB 15,155,133 USD | 468,619 | Brown Brothers | | | |
| | | | | Harriman & Co. | 5/06/10 | | (236) |
| | USD | 1,099,960 JPY 102,967,292 | Brown Brothers | | | |
| | | | | Harriman & Co. | 5/07/10 | | 3,742 |
| | EUR | 1,202,747 JPY 145,376,000 | State Street Bank | | |
| | | | | | & Trust Co. | 5/20/10 | | 53,595 |
| | JPY 145,376,000 EUR 1,188,251 | Citibank NA | 5/20/10 | | (34,294) |
| | USD | 19,686 EUR | 14,496 | Brown Brothers | | | |
| | | | | Harriman & Co. | 5/20/10 | | 385 |
| | Total | | | | | | $ 21,722 |
• Fair Value Measurements — Various inputs are used in determining the fair value of
investments, which are as follows:
• Level 1 — price quotations in active markets/exchanges for identical assets and
liabilities
• Level 2 — other observable inputs (including, but not limited to: quoted prices for
similar assets or liabilities in markets that are active, quoted prices for identical
or similar assets or liabilities in markets that are not active, inputs other than
quoted prices that are observable for the assets or liabilities (such as interest
rates, yield curves, volatilities, prepayment speeds, loss severities, credit risks and
default rates) or other market-corroborated inputs)
• Level 3 — unobservable inputs based on the best information available in the cir-
cumstances, to the extent observable inputs are not available (including the
Portfolio's own assumptions used in determining the fair value of investments)
The inputs or methodologies used for valuing securities are not necessarily an indi-
cation of the risk associated with investing in those securities. For information about
the Portfolio’s policy regarding valuation of investments and other significant
accounting policies, please refer to Note 1 of the Notes to Financial Statements.
The following tables summarize the inputs used as of April 30, 2010 in determining
the fair valuation of the Portfolio's investments:
| | | | |
| | Investments in Securities | | |
| Valuation Inputs | Level 1 | Level 2 | Level 3 | Total |
| Assets: | | | | |
| Common Stocks: | | | | |
| Austria | — | $ 740,613 | — | $ 740,613 |
| Brazil | $ 1,926,924 | — | — | 1,926,924 |
| China. | 1,741,933 | 1,437,654 | — | 3,179,587 |
| France | — | 4,968,165 | — | 4,968,165 |
| Germany | — | 5,180,520 | — | 5,180,520 |
| Hong Kong | — | 1,292,943 | — | 1,292,943 |
| Hungary | — | 700,850 | — | 700,850 |
| India | 984,675 | — | — | 984,675 |
| Italy | — | 968,670 | — | 968,670 |
| Japan | — | 11,002,430 | — | 11,002,430 |
| Netherlands | — | 2,779,516 | — | 2,779,516 |
| South Africa | — | 1,505,088 | — | 1,505,088 |
| South Korea. | — | 2,442,961 | — | 2,442,961 |
| Switzerland | 1,894,572 | 6,052,761 | — | 7,947,333 |
| Taiwan | 1,854,849 | 1,567,762 | — | 3,422,611 |
| Thailand. | — | 761,085 | — | 761,085 |
| United Kingdom | — | 9,772,333 | — | 9,772,333 |
| United States | 2,796,552 | — | — | 2,796,552 |
| Short-Term Securities | 2,620,151 | 16,249 | — | 2,636,400 |
| Total | $ 13,819,656 | $ 51,189,600 | — | $ 65,009,256 |
| | Other Financial Instruments1 | | |
| Valuation Inputs | Level 1 | Level 2 | Level 3 | Total |
| Assets | — | $ 57,861 | — | $ 57,861 |
| Liabilities | — | (36,139) | — | (36,139) |
| Total | — | $ 21,722 | — | $ 21,722 |
1 Other financial instruments are foreign currency exchange contracts which are shown
at the unrealized appreciation/depreciation on the instrument.
See Notes to Financial Statements.
SEMI-ANNUAL REPORT
APRIL 30, 2010
35
| |
| Statement of Assets and Liabilities | BlackRock Master International Portfolio |
| April 30, 2010 (Unaudited) | |
| Assets | |
| Investments at value — unaffiliated (cost — $58,106,656) | $ 62,389,105 |
| Investments at value — affiliated (cost — $2,620,151) | 2,620,151 |
| Unrealized appreciation on foreign currency exchange contracts | 57,861 |
| Foreign currency at value (cost — $171) | 258 |
| Investments sold receivable | 1,610,371 |
| Dividends receivable | 596,244 |
| Prepaid expenses | 29,433 |
| Other assets | 834 |
| Total assets | 67,304,257 |
| Liabilities | |
| Unrealized depreciation on foreign currency exchange contracts | 36,139 |
| Investments purchased payable | 1,062,569 |
| Withdrawals payable to investor | 79,037 |
| Investment advisory fees payable | 42,865 |
| Other affiliates payable | 436 |
| Officer's and Directors' fees payable | 111 |
| Other accrued expenses payable | 58,499 |
| Total liabilities | 1,279,656 |
| Net Assets | $ 66,024,601 |
| Net Assets Consist of | |
| Investor's capital | $ 61,695,995 |
| Net unrealized appreciation/depreciation | 4,328,606 |
| Net Assets | $ 66,024,601 |
See Notes to Financial Statements.
36 SEMI-ANNUAL REPORT
APRIL 30, 2010
| |
| Statement of Operations | BlackRock Master International Portfolio |
| Six Months Ended April 30, 2010 (Unaudited) | |
| Investment Income | |
| Dividends | $ 498,581 |
| Foreign taxes withheld | (43,199) |
| Income — affiliated | 1,174 |
| Total income | 456,556 |
| Expenses | |
| Investment advisory | 259,662 |
| Accounting services | 41,863 |
| Professional | 29,628 |
| Custodian | 23,648 |
| Officer and Directors | 3,732 |
| Printing | 411 |
| Miscellaneous | 7,030 |
| Total expenses | 365,974 |
| Less fees waived by advisor | (673) |
| Total expenses after fees waived | 365,301 |
| Net investment income | 91,255 |
| Realized and Unrealized Gain (Loss) | |
| Net realized gain (loss) from: | |
| Investments | 6,116,067 |
| Foreign currency transactions | (217,351) |
| | 5,898,716 |
| Net change in unrealized appreciation/depreciation on: | |
| Investments | (3,240,653) |
| Foreign currency transactions | 72,091 |
| | (3,168,562) |
| Total realized and unrealized gain | 2,730,154 |
| Net Increase in Net Assets Resulting from Operations | $ 2,821,409 |
See Notes to Financial Statements.
SEMI-ANNUAL REPORT
APRIL 30, 2010
37
| | | | | | | | |
| Statements of Changes in Net Assets | | | | BlackRock Master International Portfolio |
| | | | | | | Six Months | | |
| | | | | | | Ended | | Year Ended |
| | | | | | | April 30, 2010 | October 31, |
| Increase (Decrease) in Net Assets: | | | | | | (Unaudited) | | 2009 |
| Operations | | | | | | | | |
| Net investment income | | | | | $ 91,255 | $ 1,084,347 |
| Net realized gain (loss) | | | | | | 5,898,716 | | (15,605,920) |
| Net change in unrealized appreciation/depreciation | | | | | | (3,168,562) | | 31,035,081 |
| Net increase in net assets resulting from operations | | | | | | 2,821,409 | | 16,513,508 |
| Capital Transactions | | | | | | | | |
| Proceeds from contributions | | | | | | 14,107,842 | | 18,264,692 |
| Value of withdrawals | | | | | (17,879,790) | | (27,020,407) |
| Net decrease in net assets derived from capital transactions | | | | | | (3,771,948) | | (8,755,715) |
| Net Assets | | | | | | | | |
| Total increase (decrease) in net assets | | | | | | (950,539) | | 7,757,793 |
| Beginning of period | | | | | | 66,975,140 | | 59,217,347 |
| End of period | | | | | $ 66,024,601 | $ 66,975,140 |
| Financial Highlights | | | | | BlackRock Master International Portfolio |
| | | | Period | | | | | |
| | Six Months | | June 1, | | | | | |
| | Ended | Year Ended | 2008 to | | | | | |
| | April 30, 2010 | October 31, | October 31, | | Year Ended May 31, | | |
| | (Unaudited) | 2009 | 2008 | 2008 | 2007 | 2006 | | 2005 |
| Total Investment Return | | | | | | | | |
| Total investment return | 4.39%1 | 33.94% | (44.29)%1 | 7.12% | 16.99% | 25.58% | | 14.08% |
| Average Net Ratios to Assets | | | | | | | | |
| Total expenses | 1.06%2 | 1.11% | 1.04%2 | 0.99% | 0.96% | 0.98% | | 0.95% |
| Total expenses after fees waived | 1.06%2 | 1.11% | 1.04%2 | 0.99% | 0.96% | 0.98% | | 0.95% |
| Net investment income | 0.26%2 | 1.89% | 1.44%2 | 1.90% | 1.64% | 1.48% | | 1.51% |
| Supplemental Data | | | | | | | | |
| Net assets, end of period (000) | $ 60,025 $ | 66,975 $ | 59,217 $ | 118,236 | $ 126,594 $ | 129,475 | $ 122,401 |
| Portfolio turnover | 69% | 178% | 78% | 153% | 151% | 96% | | 49% |
1 Aggregate total investment return.
2 Annualized.
See Notes to Financial Statements.
38 SEMI-ANNUAL REPORT
APRIL 30, 2010
Notes to Financial Statements (Unaudited) BlackRock Master International Portfolio
1. Organization and Significant Accounting Policies:
BlackRock Master International Portfolio (the “Portfolio”) of BlackRock
Master LLC (the “Master LLC”) is registered under the Investment Comp-
any Act of 1940, as amended (the “1940 Act”), and is organized as a
Delaware limited liability company. The Limited Liability Company Agree-
ment permits the Directors to issue non-transferable interests in the Master
LLC, subject to certain limitations. The Portfolio’s financial statements are
prepared in conformity with accounting principles generally accepted in
the United States of America ("US GAAP"), which may require the use
of management accruals and estimates. Actual results may differ from
these estimates.
The following is a summary of significant accounting policies followed by
the Portfolio:
Valuation: The Master LLC’s policy is to fair value its financial instruments
at market value, using independent dealers and pricing services selected
under the supervision of the Board of Directors (“the Board”). Equity invest-
ments traded on a recognized securities exchange or the NASDAQ Global
Market System are valued at the last reported sale price that day or the
NASDAQ official closing price, if applicable. For equity investments traded
on more than one exchange, the last reported sale price on the exchange
where the stock is primarily traded is used. Equity investments traded on a
recognized exchange for which there were no sales on that day are valued
at the last available bid (long positions) or ask (short positions) price. If no
bid or ask price is available, the prior day’s price will be used, unless it is
determined that such prior day’s price no longer reflects the fair value of
the security. Investments in open-end investment companies are valued at
net asset value each business day. Short-term securities with remaining
maturities of 60 days or less may be valued at amortized cost, which
approximates fair value.
Securities and other assets and liabilities denominated in foreign curren-
cies are translated into US dollars using exchange rates determined as of
the close of business on the New York Stock Exchange (“NYSE”). Foreign
currency exchange contracts are valued at the mean between the bid and
ask prices and are determined as of the close of business on the NYSE.
Interpolated values are derived when the settlement date of the contract is
an interim date for which quotations are not available.
In the event that application of these methods of valuation results in a
price for an investment which is deemed not to be representative of the
market value of such investment or is not available, the investment will be
valued by a method approved by the Board as reflecting fair value (“Fair
Value Assets”). When determining the price for Fair Value Assets, the invest-
ment advisor and/or the sub-advisor seeks to determine the price that the
Portfolio might reasonably expect to receive from the current sale of that
asset in an arm’s-length transaction. Fair value determinations shall be
based upon all available factors that the investment advisor and/or sub-
advisor deems relevant. The pricing of all Fair Value Assets is subsequently
reported to the Board or a committee thereof.
Generally, trading in foreign instruments is substantially completed
each day at various times prior to the close of business on the NYSE.
Occasionally, events affecting the values of such instruments may occur
between the foreign market close and the close of business on the NYSE
that may not be reflected in the computation of the Portfolio’s net assets.
If events (for example, a company announcement, market volatility or a
natural disaster) occur during such periods that are expected to materially
affect the value of such instruments, those instruments may be Fair Value
Assets and be valued at their fair values, as determined in good faith by
the Board or by the investment advisor using a pricing service and/or pro-
cedures approved by the Board. Each business day, the Portfolio uses a
pricing service selected under the supervision of the Portfolio’s Board to
assist with the valuation of certain foreign exchange-traded equity securi-
ties and foreign exchange-traded and OTC options (the “Systematic Fair
Value Price”). Using current market factors, the Systematic Fair Value Price
is designed to value such foreign securities and foreign options at fair
value as of the close of business on the NYSE, which follows the close of
the local markets.
Foreign Currency Transactions: The Master LLC’s books and records are
maintained in US dollars. Foreign currency amounts are translated into
US dollars as follows: (i) market value of investment securities, assets and
liabilities at the current rate of exchange; and (ii) purchases and sales of
investment securities, income and expenses at the rates of exchange pre-
vailing on the respective dates of such transactions. Generally, when the
US dollar rises in value against foreign currency, the Portfolio’s investments
denominated in that currency will lose value because its currency is worth
fewer US dollars; the opposite effect occurs if the US dollar falls in
relative value.
The Portfolio reports foreign currency related transactions as components
of realized gain (loss) for financial reporting purposes, whereas such com-
ponents are treated as ordinary income for federal income tax purposes.
Segregation and Collateralization: In cases in which the 1940 Act and the
interpretive positions of the SEC require that the Portfolio either delivers
collateral or segregates assets in connection with certain investments (e.g.,
foreign currency exchange contracts), the Portfolio will, consistent with SEC
rules and/or certain interpretive letters issued by the SEC, segregate collat-
eral or designate on its books and records cash or other liquid securities
having a market value at least equal to the amount that would otherwise
be required to be physically segregated. Furthermore, based on require-
ments and agreements with certain exchanges and third party broker-deal-
ers, each party has requirements to deliver/deposit securities as collateral
for certain investments.
Investment Transactions and Investment Income: For financial reporting
purposes, investment transactions are recorded on the dates the trans-
actions are entered into (the trade dates). Realized gains and losses
on investment transactions are determined on the identified cost basis.
Dividend income is recorded on the ex-dividend dates. Dividends from
foreign securities where the ex-dividend date may have passed are subse-
quently recorded when the Portfolio has determined the ex-dividend date.
Under the applicable foreign tax laws, a withholding tax at various rates
may be imposed on capital gains, dividends and interest. Upon notification
from issuers, some of the dividend income received from a real estate
SEMI-ANNUAL REPORT
APRIL 30, 2010
39
Notes to Financial Statements (continued) BlackRock Master International Portfolio
investment trust may be redesignated as a reduction of cost of the related
investment and/or realized gain. Interest income, including amortization of
premium and accretion of discount on debt securities, is recognized on the
accrual basis.
Income Taxes: The Master LLC is classified as a “pass-through entity” for
federal income tax purposes. As such, the owner of the Master LLC is
treated as the owner of the net assets, income, expenses and realized and
unrealized gains and losses of the Master LLC. Therefore, no federal tax
provision is required. It is intended that the Master LLC’s assets will be
managed so the owner of the Master LLC can satisfy the requirements of
Subchapter M of the Internal Revenue Code of 1986, as amended. Under
the applicable foreign tax laws, a withholding tax may be imposed on inter-
est, dividends and capital gains at various rates.
The Master LLC is disregarded for tax purposes, therefore it is not required
to file income tax returns.
Recent Accounting Standard: In January 2010, the Financial Accounting
Standards Board issued amended guidance to improve disclosure about
fair value measurements which will require additional disclosures about
transfers into and out of Levels 1 and 2 and separate disclosures about
purchases, sales, issuances and settlements in the reconciliation for fair
value measurements using significant unobservable inputs (Level 3). It also
clarifies existing disclosure requirements relating to the levels of disaggre-
gation for fair value measurement and inputs and valuation techniques
used to measure fair value. The amended guidance is effective for financial
statements for fiscal years beginning after December 15, 2009, and the
interim periods within those fiscal years, except for disclosures about pur-
chases, sales, issuances and settlements in the rollforward of activity in
Level 3 fair value measurements, which are effective for fiscal years begin-
ning after December 15, 2010 and for interim periods within those fiscal
years. The impact of this guidance on the Portfolio’s financial statements
and disclosures is currently being assessed.
Other: Expenses directly related to the Portfolio are charged to the
Portfolio. Other operating expenses shared by several funds are pro rated
among those funds on the basis of relative net assets or other appropriate
methods. The Portfolio has an arrangement with the custodian whereby
fees may be reduced by credits earned on uninvested cash balances,
which if applicable are shown as fees paid indirectly in the Statement of
Operations. The custodian imposes fees on overdrawn cash balances,
which can be offset by accumulated credits earned or may result in addi-
tional custody charges.
2. Derivative Financial Instruments:
The Portfolio may engage in various portfolio investment strategies both to
increase the returns of the Portfolio and to economically hedge, or protect,
its exposure to certain risks such as credit risk, equity risk, interest rate risk
and foreign currency exchange rate risk. Losses may arise if the value of
the contract decreases due to an unfavorable change in the price of the
underlying instrument or if the counterparty does not perform under the
contract. The Portfolio may mitigate counterparty risk through master net-
ting agreements included within an International Swap and Derivatives
Association, Inc. (“ISDA”) Master Agreement between the Portfolio and sep-
arately each of its counterparties. The ISDA Master Agreement allows the
Portfolio to offset with its counterparty certain derivative financial instru-
ment’s payables and/or receivables with collateral held with each separate
counterparty. The amount of collateral moved to/from applicable counter-
parties is based upon minimum transfer amounts of up to $500,000. To
the extent amounts due to the Portfolio from its counterparties are not
fully collateralized contractually or otherwise, the Portfolio bears the risk of
loss from counterparty non-performance. See Note 1 “Segregation and
Collateralization” for information with respect to collateral practices. In
addition, the Portfolio manages counterparty risk by entering into agree-
ments only with counterparties that it believes have the financial resources
to honor their obligations and by monitoring the financial stability of
those counterparties.
The Portfolio is subject to foreign currency exchange rate risk in the normal
course of pursuing its investment objectives by investing in various deriva-
tive investments, as described below.
Foreign Currency Exchange Contracts: The Portfolio may enter into foreign
currency exchange contracts as an economic hedge against either specific
transactions or portfolio instruments (foreign currency exchange rate risk).
A foreign currency exchange contract is an agreement between two parties
to buy and sell a currency at a set exchange rate on a future date. Foreign
currency exchange contracts, when used by the Portfolio, help to manage
the overall exposure to the currency backing some of the investments held
by the Portfolio. The contract is marked-to-market daily and the change in
market value is recorded by the Portfolio as an unrealized gain or loss.
When the contract is closed, the Portfolio records a realized gain or loss
equal to the difference between the value at the time it was opened and
the value at the time it was closed. The use of foreign currency exchange
contracts involves the risk that counterparties may not meet the terms of
the agreement or unfavorable movements in the value of a foreign currency
relative to the US dollar.
| | | |
| Derivatives Categorized by Risk Exposure: | | |
| Fair Values of Derivative Instruments as of April 30, 2010 | |
| | Asset Derivatives | | |
| | Statement of Assets and | | |
| | Liabilities Location | | Value |
| Foreign currency | Unrealized appreciation on | | |
| exchange contracts | foreign currency exchange contracts | $ 57,861 |
| | Liability Derivatives | | |
| | Statement of Assets and | | |
| | Liabilities Location | | Value |
| Foreign currency | Unrealized depreciation on | | |
| exchange contracts | foreign currency exchange contracts | $ 36,139 |
The Effect of Derivative Instruments on the Statement of Operations
Year Ended April 30, 2010
| | |
| Net Realized Gain (loss) From |
|
| Foreign currency exchange transactions | $ (176,469) |
| Net Change in Unrealized Appreciation/Depreciation on |
|
| Foreign currency exchange transactions | $ 132,327 |
40 SEMI-ANNUAL REPORT
APRIL 30, 2010
Notes to Financial Statements (continued) BlackRock Master International Portfolio
For the year ended April 30, 2010, the average quarterly balance of out-
standing derivative financial instruments was as follows:
| |
| Foreign currency exchange contracts: | |
| Average number of contracts-US | |
| dollars purchased | 5 |
| Average number of contracts-US | |
| dollars sold | 7 |
| Average US dollar amounts purchased | $ 4,509,431 |
| Average US dollar amounts sold | $ 7,418,799 |
3. Investment Advisory Agreement and Other Transactions
with Affiliates:
The PNC Financial Services Group, Inc. ("PNC"), Bank of America
Corporation ("BAC") and Barclays Bank PLC ("Barclays") are the largest
stockholders of BlackRock, Inc. ("BlackRock"). Due to the ownership struc-
ture, PNC is an affiliate of the Portfolio for 1940 Act purposes, but BAC and
Barclays are not.
The Master LLC, on behalf of the Portfolio, entered into an Investment
Advisory Agreement with BlackRock Advisors, LLC (the “Manager”), the
Master LLC's investment advisor, an indirect, wholly owned subsidiary of
BlackRock, to provide investment advisory and administration services. The
Manager is responsible for the management of the Portfolio’s portfolio and
provides the necessary personnel, facilities, equipment and certain other
services necessary to the operations of the Portfolio. For such services, the
Portfolio pays the Manager a monthly fee at the following annual rates as a
percentage of the Portfolio’s average daily net assets:
| |
| Portfolio average daily value of net assets | Rate |
| Not exceeding $500 million | 0.75% |
| In excess of $500 million | 0.70% |
The Manager has voluntarily agreed to waive its advisory fees by the
amount of investment advisory fees the Portfolio pays to the Manager indi-
rectly through its investment in affiliated money market funds, however the
manager does not waive its advisory fees by the amount of investment
advisory fees through its investment in other affiliated investment compa-
nies. This amount is included in fees waived by advisor in the Statement
of Operations.
The Manager has entered into a separate sub-advisory agreement with
BlackRock International Limited, an affiliate of the Manager. The Manager
pays the sub-advisor for services it provides, a monthly fee that is a
percentage of the investment advisory fees paid by the Portfolio to
the Manager.
For the six months ended April 30, 2010, the Portfolio reimbursed the
Manager $1,339 for certain accounting services, which is included in
accounting services in the Statements of Operations.
Certain officers and/or directors of the Master LLC are officers and/or
directors of BlackRock or its affiliates.
4. Investments:
Purchases and sales of investments, excluding short-term securities
for the six months ended April 30, 2010, were $45,663,420 and
$52,067,761, respectively.
5. Borrowings:
The Portfolio, along with certain other funds managed by the Manager and
its affiliates, is a party to a $500 million credit agreement with a group of
lenders, which was renewed until November 2010. The Portfolio may borrow
under the credit agreement to fund shareholder redemptions. Prior to its
renewal, the credit agreement had the following terms: 0.02% upfront fee
on the aggregate commitment amount which was allocated to the Portfolio
based on its net assets as of October 31, 2008; a commitment fee of
0.08% per annum based on the Portfolio's pro rata share of the unused
portion of the credit agreement, which is included in miscellaneous in the
Statement of Operations, and interest at a rate equal to the higher of the
(a) federal funds effective rate and (b) reserve adjusted one-month LIBOR,
plus, in each case, the higher of (i) 1.50% and (ii) 50% of the CDX Index
(as defined in the credit agreement) on amounts borrowed. Effective
November 2009, the credit agreement was renewed with the following
terms: 0.02% upfront fee on the aggregate commitment amount which was
allocated to the Portfolio based on its net assets as of October 31, 2009,
a commitment fee of 0.10% per annum based on the Portfolio's pro rata
share of the unused portion of the credit agreement and interest at a rate
equal to the higher of (a) the one-month LIBOR plus 1.25% per annum
and (b) the Fed Funds rate plus 1.25% per annum on amounts borrowed.
The Portfolio did not borrow under the credit agreement during the six
months ended April 30, 2010.
6. Geographic, Market and Credit Risk:
In the normal course of business, the Portfolio invests in securities and
enters into transactions where risks exist due to fluctuations in the market
(market risk) or failure of the issuer of a security to meet all its obligations
(credit risk). The value of securities held by the Portfolio may decline in
response to certain events, including those directly involving the issuers
whose securities are owned by the Portfolio; conditions affecting the gen-
eral economy; overall market changes; local, regional or global political,
social or economic instability; and currency and interest rate and price
fluctuations. Similar to credit risk, the Portfolio may be exposed to counter-
party risk, or the risk that an entity with which the Portfolio has unsettled or
open transactions may default. The Portfolio manages counterparty risk by
entering into transactions only with counterparties that it believes have the
financial resources to honor their obligations and by monitoring the finan-
cial stability of those counterparties. Financial assets, which potentially
expose the Portfolio to credit and counterparty risks, consist principally of
investments and cash due from counterparties. The extent of the Portfolio's
exposure to credit and counterparty risks with respect to these financial
assets is generally approximated by their value recorded in the Portfolio's
Statement of Assets and Liabilities, less any collateral held by the Portfolio.
SEMI-ANNUAL REPORT
APRIL 30, 2010
41
| | |
| Notes to Financial Statements (concluded) | BlackRock Master International Portfolio |
| As of April 30, 2010, the Portfolio had the following industry classifications: | |
| | Percent of | |
| | Long-Term | |
| Industry | Investments | |
| Commercial Banks | 9% | |
| Capital Markets | 9 | |
| Household Durables | 7 | |
| Semiconductors & Semiconductor Equipment | 7 | |
| Media | 6 | |
| Automobiles | 6 | |
| Other* | 56 | |
* All other industries held were less than 5% of long term investments.
7. Subsequent Events:
Management has evaluated the impact of all subsequent events on the
Portfolio through the date the financial statements were issued and has
determined that there were no subsequent events requiring adjustment or
additional disclosure in the financial statements.
42 SEMI-ANNUAL REPORT
APRIL 30, 2010
Officers and Directors
Ronald W. Forbes, Co-Chairman of the Board and Director
Rodney D. Johnson, Co-Chairman of the Board and Director
David O. Beim, Director
Richard S. Davis, Director
Henry Gabbay, Director
Dr. Matina Horner, Director
Herbert I. London, Director and Member of the Audit Committee
Cynthia A. Montgomery, Director
Joseph P. Platt, Jr., Director
Robert C. Robb, Jr., Director
Toby Rosenblatt, Director
Kenneth L. Urish, Chairman of the Audit Committee and Director
Frederick W. Winter, Director and Member of the Audit Committee
Anne Ackerley, President and Chief Executive Officer
Jeffrey Holland, Vice President
Brendan Kyne, Vice President
Brian Schmidt, Vice President
Neal Andrews, Chief Financial Officer
Jay Fife, Treasurer
Brian Kindelan, Chief Compliance Officer
Howard Surloff, Secretary
Investment Advisor
BlackRock Advisors, LLC
Wilmington, DE 19809
Sub-Advisors
BlackRock Investment Management, LLC1
Plainsboro, NJ 08536
BlackRock International Limited2
Edinburgh, Scotland
United Kingdom EH3 8JB
Custodian
Brown Brothers Harriman & Co.
Boston, MA 02109
Transfer Agent
PNC Global Investment Servicing (U.S.) Inc.
Providence, RI 02940
Accounting Agent
State Street Bank and Trust Company
Princeton, NJ 08540
Distributor
BlackRock Investments, LLC
New York, NY 10022
Independent Registered Public Accounting Firm
Deloitte & Touche LLP
Princeton, NJ 08540
Legal Counsel
Sidley Austin LLP
New York, NY 10019
Address of the Funds
100 Bellevue Parkway
Wilmington, DE 19809
1 For Global Emerging Markets Fund, Latin America Fund.
2 For all Funds.
SEMI-ANNUAL REPORT
APRIL 30, 2010
43
Additional Information
General Information
Electronic Delivery
Electronic copies of most financial reports and prospectuses are available
on the Funds’ website or shareholders can sign up for e-mail notifications of
quarterly statements, annual and semi-annual reports and prospectuses by
enrolling in the Funds’ electronic delivery program.
To enroll:
Shareholders Who Hold Accounts with Investment Advisors, Banks or
Brokerages:
Please contact your financial advisor. Please note that not all investment
advisers, banks or brokerages may offer this service.
Shareholders Who Hold Accounts Directly with BlackRock:
1) Access the BlackRock Web site at
http://www.blackrock.com/edelivery
2) Select “eDelivery” under the “More Information” section
3) Log into your account
Householding
The Funds will mail only one copy of shareholder documents, including
prospectuses, annual and semi-annual reports and proxy statements, to
shareholders with multiple accounts at the same address. This practice is
commonly called “householding” and is intended to reduce expenses and
eliminate duplicate mailings of shareholder documents. Mailings of your
shareholder documents may be householded indefinitely unless you instruct
us otherwise. If you do not want the mailing of these documents to be
combined with those for other members of your household, please
call (800) 441-7762.
Availability of Quarterly Portfolio Schedule of Investments
The Funds file their complete schedule of portfolio holdings with the
Securities and Exchange Commission (the “SEC”) for the first and third
quarters of each fiscal year on Form N-Q. The Funds’ Forms N-Q are avail-
able on the SEC’s website at http://www.sec.gov and may also be
reviewed and copied at the SEC’s Public Reference Room in Washington,
D.C. Information on the operation of the Public Reference Room may be
obtained by calling (800) SEC-0330. The Funds’ Forms N-Q may also be
obtained upon request and without charge by calling (800) 441-7762.
Availability of Proxy Voting Policies and Procedures
A description of the policies and procedures that the Funds use to
determine how to vote proxies relating to portfolio securities is available
(1) without charge, upon request, by calling (800) 441-7762; (2) at
www.blackrock.com; and (3) on the SEC’s website at http://www.sec.gov.
Availability of Proxy Voting Record
Information about how the Funds voted proxies relating to securities held
in the Funds’ portfolio during the most recent 12-month period ended
June 30 is available upon request and without charge (1) at www.black-
rock.com or by calling (800) 441-7762 and (2) on the SEC’s website
at http://www.sec.gov.
44 SEMI-ANNUAL REPORT
APRIL 30, 2010
Additional Information (concluded)
Shareholder Privileges
Account Information
Call us at (800) 441-7762 from 8:00 AM to 6:00 PM EST on any
business day to get information about your account balances, recent
transactions and share prices. You can also reach us on the Web at
www.blackrock.com/funds.
Automatic Investment Plans
Investor Class shareholders who want to invest regularly can arrange to have
$50 or more automatically deducted from their checking or savings account
and invested in any of the BlackRock funds.
Systematic Withdrawal Plans
Investor Class shareholders can establish a systematic withdrawal plan and
receive periodic payments of $50 or more from their BlackRock funds, as
long as their account balance is at least $10,000.
Retirement Plans
Shareholders may make investments in conjunction with Traditional, Rollover,
Roth, Coverdell, Simple IRAs, SEP IRAs and 403(b) Plans.
BlackRock Privacy Principles
BlackRock is committed to maintaining the privacy of its current and
former fund investors and individual clients (collectively, “Clients”) and to
safeguarding their non-public personal information. The following information
is provided to help you understand what personal information BlackRock col-
lects, how we protect that information and why in certain cases we share
such information with select parties.
If you are located in a jurisdiction where specific laws, rules or regulations
require BlackRock to provide you with additional or different privacy-related
rights beyond what is set forth below, then BlackRock will comply with
those specific laws, rules or regulations.
BlackRock obtains or verifies personal non-public information from and
about you from different sources, including the following: (i) information we
receive from you or, if applicable, your financial intermediary, on applica-
tions, forms or other documents; (ii) information about your transactions
with us, our affiliates, or others; (iii) information we receive from a consumer
reporting agency; and (iv) from visits to our websites.
BlackRock does not sell or disclose to non-affiliated third parties any non-
public personal information about its Clients, except as permitted by law
or as is necessary to respond to regulatory requests or to service Client
accounts. These non-affiliated third parties are required to protect the
confidentiality and security of this information and to use it only for its
intended purpose.
We may share information with our affiliates to service your account
or to provide you with information about other BlackRock products or serv-
ices that may be of interest to you. In addition, BlackRock restricts access
to non-public personal information about its Clients to those BlackRock
employees with a legitimate business need for the information. BlackRock
maintains physical, electronic and procedural safeguards that are designed
to protect the non-public personal information of its Clients, including pro-
cedures relating to the proper storage and disposal of such information.
SEMI-ANNUAL REPORT
APRIL 30, 2010
45
| | | |
| A World-Class Mutual Fund Family | | |
| BlackRock offers a diverse lineup of open-end mutual funds crossing all investment styles and managed by experts in equity, fixed income and |
| tax-exempt investing. | | | |
| Equity Funds | | | |
| BlackRock All-Cap Energy & Resources Portfolio | BlackRock Global Growth Fund | BlackRock Mid-Cap Value Equity Portfolio |
| BlackRock Asset Allocation Portfolio† | BlackRock Global Opportunities Portfolio | BlackRock Mid Cap Value Opportunities Fund |
| BlackRock Aurora Portfolio | BlackRock Global SmallCap Fund | BlackRock Natural Resources Trust |
| BlackRock Balanced Capital Fund† | BlackRock Health Sciences Opportunities Portfolio | BlackRock Pacific Fund |
| BlackRock Basic Value Fund | BlackRock Healthcare Fund | BlackRock Science & Technology |
| BlackRock Capital Appreciation Portfolio | BlackRock Index Equity Portfolio* | Opportunities Portfolio |
| BlackRock Energy & Resources Portfolio | BlackRock International Fund | BlackRock Small Cap Core Equity Portfolio |
| BlackRock Equity Dividend Fund | BlackRock International Index Fund | BlackRock Small Cap Growth Equity Portfolio |
| BlackRock EuroFund | BlackRock International Opportunities Portfolio | BlackRock Small Cap Growth Fund II |
| BlackRock Focus Growth Fund | BlackRock International Value Fund | BlackRock Small Cap Index Fund |
| BlackRock Focus Value Fund | BlackRock Large Cap Core Fund | BlackRock Small/Mid-Cap Growth Portfolio |
| BlackRock Fundamental Growth Fund | BlackRock Large Cap Core Plus Fund | BlackRock S&P 500 Index Fund |
| BlackRock Global Allocation Fund† | BlackRock Large Cap Growth Fund | BlackRock U.S. Opportunities Portfolio |
| BlackRock Global Dynamic Equity Fund | BlackRock Large Cap Value Fund | BlackRock Utilities and Telecommunications Fund |
| BlackRock Global Emerging Markets Fund | BlackRock Latin America Fund | BlackRock Value Opportunities Fund |
| BlackRock Global Financial Services Fund | BlackRock Mid-Cap Growth Equity Portfolio | BlackRock World Gold Fund |
| Fixed Income Funds | | | |
| BlackRock Bond Portfolio | BlackRock Income Builder Portfolio† | BlackRock Managed Income Portfolio |
| BlackRock Emerging Market Debt Portfolio | BlackRock Inflation Protected Bond Portfolio | BlackRock Multi-Sector Bond Portfolio |
| BlackRock GNMA Portfolio | BlackRock Intermediate Government | BlackRock Short-Term Bond Fund |
| BlackRock Government Income Portfolio | Bond Portfolio | | BlackRock Strategic Income |
| BlackRock High Income Fund | BlackRock International Bond Portfolio | Opportunities Portfolio |
| BlackRock High Yield Bond Portfolio | BlackRock Long Duration Bond Portfolio | BlackRock Total Return Fund |
| BlackRock Income Portfolio† | BlackRock Low Duration Bond Portfolio | BlackRock Total Return Portfolio II |
| | | | BlackRock World Income Fund |
| Municipal Bond Funds | | | |
| BlackRock AMT-Free Municipal Bond Portfolio | BlackRock Kentucky Municipal Bond Portfolio | BlackRock New York Municipal Bond Fund |
| BlackRock California Municipal Bond Fund | BlackRock Municipal Insured Fund | BlackRock Ohio Municipal Bond Portfolio |
| BlackRock High Yield Municipal Fund | BlackRock National Municipal Fund | BlackRock Pennsylvania Municipal Bond Fund |
| BlackRock Intermediate Municipal Fund | BlackRock New Jersey Municipal Bond Fund | BlackRock Short-Term Municipal Fund |
| Target Risk & Target Date Funds† | | | |
| BlackRock Prepared Portfolios | BlackRock Lifecycle Prepared Portfolios | BlackRock LifePath Portfolios |
| Conservative Prepared Portfolio | 2010 | 2035 | Retirement |
| Moderate Prepared Portfolio | 2015 | 2040 | 2020 |
| Growth Prepared Portfolio | 2020 | 2045 | 2030 |
| Aggressive Growth Prepared Portfolio | 2025 | 2050 | 2040 |
| | 2030 | | 2050 |
* See the prospectus for information on specific limitations on investments in the fund.
† Mixed asset fund.
BlackRock mutual funds are currently distributed by BlackRock Investments, LLC. You should consider the investment objectives, risks, charges and
expenses of the funds under consideration carefully before investing. Each fund’s prospectus contains this and other information and is available at
www.blackrock.com or by calling (800) 441-7762 or from your financial advisor. The prospectus should be read carefully before investing.
46
SEMI-ANNUAL REPORT
APRIL 30, 2010
This report is not authorized for use as an offer of sale or a solicitation of an offer to buy shares of the Funds unless accompanied or preceded by the
Funds’ current prospectus. Past performance results shown in this report should not be considered a representation of future performance. Investment
return and principal value of shares will fluctuate so that shares, when redeemed, may be worth more or less than their original cost. Statements and other
information herein are as dated and are subject to change. Please see each Fund’s prospectus for a description of risks associated with global investments.

Item 2 – Code of Ethics – Not Applicable to this semi-annual report
Item 3 – Audit Committee Financial Expert – Not Applicable to this semi-annual report
Item 4 – Principal Accountant Fees and Services – Not Applicable to this semi-annual report
Item 5 – Audit Committee of Listed Registrants – Not Applicable
Item 6 – Investments
(a) The registrant’s Schedule of Investments is included as part of the Report to
Stockholders filed under Item 1 of this form.
(b) Not Applicable due to no such divestments during the semi-annual period covered since
the previous Form N-CSR filing.
Item 7 – Disclosure of Proxy Voting Policies and Procedures for Closed-End Management
Investment Companies – Not Applicable
Item 8 – Portfolio Managers of Closed-End Management Investment Companies – Not Applicable
Item 9 – Purchases of Equity Securities by Closed-End Management Investment Company and
Affiliated Purchasers – Not Applicable
Item 10 – Submission of Matters to a Vote of Security Holders – The registrant’s Nominating and
Governance Committee will consider nominees to the board of directors recommended by
shareholders when a vacancy becomes available. Shareholders who wish to recommend a
nominee should send nominations that include biographical information and set forth the
qualifications of the proposed nominee to the registrant’s Secretary. There have been no
material changes to these procedures.
Item 11 – Controls and Procedures
11(a) – The registrant’s principal executive and principal financial officers or persons performing
similar functions have concluded that the registrant’s disclosure controls and procedures (as
defined in Rule 30a-3(c) under the Investment Company Act of 1940, as amended (the
“1940 Act”)) are effective as of a date within 90 days of the filing of this report based on the
evaluation of these controls and procedures required by Rule 30a-3(b) under the 1940 Act
and Rule 15(d)-15(b) under the Securities Exchange Act of 1934, as amended.
11(b) – There were no changes in the registrant’s internal control over financial reporting (as
defined in Rule 30a-3(d) under the 1940 Act) that occurred during the second fiscal quarter
of the period covered by this report that have materially affected, or are reasonably likely to
materially affect, the registrant’s internal control over financial reporting.
Item 12 – Exhibits attached hereto
12(a)(1) – Code of Ethics – Not Applicable to this semi-annual report
12(a)(2) – Certifications – Attached hereto
12(a)(3) – Not Applicable
12(b) – Certifications – Attached hereto
Pursuant to the requirements of the Securities Exchange Act of 1934 and the Investment
Company Act of 1940, the registrant has duly caused this report to be signed on its behalf by
the undersigned, thereunto duly authorized.
BlackRock Global Emerging Markets Fund, Inc.
By: /s/ Anne F. Ackerley
Anne F. Ackerley
Chief Executive Officer of
BlackRock Global Emerging Markets Fund, Inc.
Date: June 28, 2010
Pursuant to the requirements of the Securities Exchange Act of 1934 and the Investment
Company Act of 1940, this report has been signed below by the following persons on behalf
of the registrant and in the capacities and on the dates indicated.
By: /s/ Anne F. Ackerley
Anne F. Ackerley
Chief Executive Officer (principal executive officer) of
BlackRock Global Emerging Markets Fund, Inc.
Date: June 28, 2010
By: /s/ Neal J. Andrews
Neal J. Andrews
Chief Financial Officer (principal financial officer) of
BlackRock Global Emerging Markets Fund, Inc.
Date: June 28, 2010