UNITEDSTATES
SECURITIESANDEXCHANGECOMMISSION
Washington,D.C.20549
FORM N-CSR
CERTIFIED SHAREHOLDER REPORT OF REGISTERED MANAGEMENT
INVESTMENT COMPANIES
Investment Company Act file number 811-05723
Name of Fund: BlackRock Global Emerging Markets Fund, Inc.
Fund Address: 100 Bellevue Parkway, Wilmington, DE 19809
Name and address of agent for service: John M. Perlowski, Chief Executive Officer, BlackRock
Global Emerging Markets Fund, Inc., 55 East 52nd Street, New York, NY 10055
Registrant’s telephone number, including area code: (800) 441-7762
Date of fiscal year end: 10/31/2011
Date of reporting period: 04/30/2011
Item 1 – Report to Stockholders

April 30, 2011
Semi-Annual Report (Unaudited)
BlackRock Global Emerging Markets Fund, Inc.
BlackRock Latin America Fund, Inc.
BlackRock International Fund of BlackRock Series, Inc.
Not FDIC Insured • No Bank Guarantee • May Lose Value
| |
| Table of Contents | |
| | Page |
| Dear Shareholder | 3 |
| Semi-Annual Report: | |
| Fund Summaries | 4 |
| About Fund Performance | 10 |
| Disclosure of Expenses | 10 |
| Derivative Financial Instruments | 10 |
| Financial Statements: | |
| Schedules of Investments | 11 |
| Statements of Assets and Liabilities | 16 |
| Statements of Operations | 17 |
| Statements of Changes in Net Assets | 18 |
| Financial Highlights | 19 |
| Notes to Financial Statements | 25 |
| Master Portfolio Information | 32 |
| Master Portfolio Financial Statements: | |
| Schedule of Investments | 33 |
| Statement of Assets and Liabilities | 35 |
| Statement of Operations | 36 |
| Statements of Changes in Net Assets | 37 |
| Master Portfolio Financial Highlights | 37 |
| Master Portfolio Notes to Financial Statements | 38 |
| Officers and Directors | 41 |
| Additional Information | 42 |
| Mutual Fund Family | 43 |
2 SEMI-ANNUAL REPORT APRIL 30, 2011
Dear Shareholder
Time and again, we have seen how various global events and developing trends can have significant influence on financial markets. I hope you find
that the following review of recent market conditions provides additional perspective on the performance of your investments as you read this
shareholder report.
Over the past 12 months, we have seen a sluggish, stimulus-driven economic recovery at long last gain real traction, accelerate, and transition into a
consumption-driven expansion. For the most part, 2010 was plagued with widely fluctuating economic data, but as the year drew to a close, it became
clear that cyclical stimulus had beaten out structural problems as economic data releases generally became more positive and financial markets showed
signs of continuing improvement. Although the sovereign debt crisis in Europe and high inflation in developing markets that troubled the global economy
in 2010 remain challenges today, overall investor confidence has improved considerably. During the first four months of 2011, that confidence was shaken
by political turmoil in the Middle East/North Africa region, soaring prices of oil and other commodities, tremendous natural disasters in Japan and a
change in the ratings outlook for US debt. However, strong corporate earnings prevailed and financial markets resumed their course while the global
economy continued to garner strength.
Equity markets experienced uneven growth and high volatility in 2010, but ended the year with gains. Following a strong start to 2011, the series of confi-
dence-shaking events brought spurts of heightened volatility to markets worldwide, but was not enough to derail the bull market. Overall, global equities
posted strong returns over the past 12 months. Emerging market equities, which had outperformed developed markets earlier in the period, fell prey to
heightened inflationary pressures and underperformed developed markets later in the period. In the United States, strong corporate earnings and positive
signals from the labor market were sources of encouragement for equity investors, although the housing market did not budge from its slump. Early in
2011, the US Federal Reserve announced that it would continue its Treasury purchase program (“QE2”) through to completion and keep interest rates low
for an extended period. This compelled investors to continue buying riskier assets, furthering the trend of small cap stocks outperforming large caps.
While fixed income markets saw yields trend lower (pushing bond prices higher) through most of 2010, the abrupt reversal in investor sentiment and risk
tolerance in the fourth quarter drove yields sharply upward. Global credit markets were surprisingly resilient in the face of recent headwinds and yields
regained relative stability as the period came to a close. Yield curves globally remained steep by historical standards and higher-risk sectors continued
to outperform higher-quality assets. The tax-exempt municipal market enjoyed a powerful rally during the period of low yields in 2010, but when that
trend reversed, the market was dealt an additional blow as it became evident that the Build America Bond program would not be extended. Meanwhile,
municipal finance troubles raised credit concerns among investors and tax-exempt mutual funds experienced heavy outflows, resulting in wider spreads
and falling prices. The new year brought relief from these headwinds and a steady rebound in the tax-exempt municipal market.
Cash investments, as represented by the 3-month Treasury bill, returned only a fraction over 0% for the 12-month period as short-term interest rates
remained low. Yields on money market securities remain near all-time lows.
| | |
| Risk Assets Rallied on Growing Investor Confidence: Total Returns as of April 30, 2011 | 6-month | 12-month |
| US large cap equities (S&P 500® Index) | 16.36% | 17.22% |
| US small cap equities (Russell2000®Index) | 23.73 | 22.20 |
| International equities (MSCI Europe, Australasia, Far East Index) | 12.71 | 19.18 |
| Emerging market equities (MSCI Emerging Markets Index) | 9.74 | 20.67 |
| 3-month Treasury bill (BofA Merrill Lynch 3-Month Treasury Bill Index) | 0.09 | 0.17 |
| US Treasury securities (BofA Merrill Lynch 10-Year US Treasury Index) | (3.85) | 6.37 |
| US investment grade bonds (Barclays Capital US Aggregate Bond Index) | 0.02 | 5.36 |
| Tax-exempt municipal bonds (Barclays Capital Municipal Bond Index) | (1.68) | 2.20 |
| US high yield bonds (Barclays Capital US Corporate High Yield 2% Issuer Capped Index) | 6.18 | 13.32 |
| Past performance is no guarantee of future results. Index performance shown for illustrative purposes only. You cannot invest directly in an index. | |
While no one can peer into a crystal ball and eliminate the uncertainties presented by the economic landscape and financial markets, BlackRock can
offer investors the next best thing: partnership with the world’s largest asset management firm that delivers consistent long-term investment results with
fewer surprises. For additional market perspective and investment insight, visit www.blackrock.com/shareholdermagazine, where you’ll find the most
recent issue of our award-winning Shareholder® magazine, as well as its quarterly companion newsletter, Shareholder Perspectives. As always, we thank
you for entrusting BlackRock with your investments, and we look forward to your continued partnership in the months and years ahead.

THIS PAGE NOT PART OF YOUR FUND REPORT 3
Fund Summary as of April 30, 2011 BlackRock Global Emerging Markets Fund, Inc.
Investment Objective
BlackRock Global Emerging Markets Fund, Inc.’s (the “Fund”) investment objective is to seek long-term capital appreciation by investing in securities, prin-
cipally equity securities, of issuers in countries having smaller capital markets.
Portfolio Management Commentary
How did the Fund perform?
• The Fund generated positive results for the six-month period ended April
30, 2011, but underperformed its benchmark, the MSCI Emerging
Markets Index.
What factors influenced performance?
• The most notable detractors from the Fund’s performance relative to its
benchmark included its investment in Indian engineering company, Larsen &
Toubro, which performed poorly due to delays on its strategically important
projects. Shares of Indian real estate developer Unitech Ltd. also fell on con-
cerns regarding a federal investigation into the process for granting telecom
licenses. Stock selection in Brazil also detracted from performance. In par-
ticular, shares of real estate company Cyrela Brazil Realty SA fell after man-
agement reported that cost pressures were affecting the company’s margins.
Shares of Brazilian bank Itau Unibanco Holdings SA also suffered as
investors reacted to interest rate hikes.
• Driving the Fund’s positive performance were holdings in Korean petrochem-
ical and rechargeable battery manufacturer LG Chem Ltd., which appreci-
ated as the market recognized the strength of its underlying businesses.
Russian energy company OAO Gazprom delivered strong returns after spot
European gas prices converged with long-term contracts, increasing the
probability that Gazprom’s pricing model would be preserved. Chinese
advertising company Focus Media Holding Ltd. performed well after the
company announced revenue growth and Macau-based casino operator
Melco Crown Entertainment Ltd. posted gains on optimistic revenue growth
estimates for the company’s gaming operations in Macau.
Describe recent portfolio activity.
• During the six-month period, we made a new investment in Russian bank
Sberbank, which we expect to benefit from a decline in non-performing
loans and stronger loan growth in 2011. Against this purchase, we took
profits on Peruvian bank Credicorp Ltd., Indonesian bank Bank Rakyat
Indonesia Tbk PT and Turkish bank Yapi Ve Kredi Bankasi and sold Korean
bank Shinhan Financial Group Co., Ltd., which resulted in a reduction in
the Fund’s overall banking exposure.
• We also made a new investment in Korean petrochemical and rechargeable
battery manufacturer LG Chem Ltd. after its stock price fell. We found the
stock’s valuation attractive as we believe there is further upside to its
battery business.
• We added to existing positions in Brazil, particularly the miner Vale SA and
toll road operator Cia de Concessoes Rodoviarias. Subsequently, the team
took some profits on Cia de Consessoes Rodoviarias after the stock per-
formed strongly. The management team added to Thai coal miner Banpu
PCL and Mexican bank Grupo Financiero Banorte, SA de CV, which is
well-placed for the economic recovery and credit growth in Mexico.
• Sales during the period included holdings in Chinese telecommunications
operator China Mobile Ltd. due to concerns over its position in the 3G tele-
coms technology market versus its competitors. We reduced the Fund’s posi-
tions in Taiwanese electronics manufacturer HON HAI Precision Industry Co.,
Ltd. and Mexican brewer Fomento Economico Mexicano, SA de CV. We also
sold the Fund’s shares of Russian steel producer Evraz Group SA on
price strength.
Describe Fund positioning at period end.
• At period end, the Fund was overweight relative to the MSCI Emerging
Markets Index in the industrials and consumer-related sectors and under-
weight in financials and materials. From a geographic perspective, the Fund
was overweight in Mexico and underweight in China and Malaysia. As of
period end, the Fund’s largest deviation from the benchmark is the under-
weight in China, where we are concerned about slowing economic growth.
The views expressed reflect the opinions of BlackRock as of the date of this report and are subject to change based on changes in market, economic or other conditions.
These views are not intended to be a forecast of future events and are no guarantee of future results.
| |
| Portfolio Information | |
| | Percent of |
| | Long-Term |
| Ten Largest Holdings | Investments |
| Itau Unibanco Holdings SA — ADR | 5% |
| Vale SA, Preference 'A' Shares — ADR | 5 |
| Samsung Electronics Co., Ltd. | 4 |
| Sberbank | 3 |
| OAO Gazprom — ADR | 3 |
| America Movil, SA de CV — ADR | 3 |
| CNOOC Ltd. | 3 |
| MTN Group Ltd. | 2 |
| Bank Pekao SA | 2 |
| Cia de Bebidas das Americas, Preference Shares — ADR | 2 |
| |
| | Percent of |
| | Long-Term |
| Geographic Allocation | Investments |
| Brazil | 17% |
| South Korea | 13 |
| India | 10 |
| China | 10 |
| South Africa | 8 |
| Russia | 8 |
| Taiwan | 7 |
| Mexico | 7 |
| Thailand | 3 |
| Poland | 2 |
| Chile | 2 |
| Hong Kong | 2 |
| Panama | 2 |
| Other1 | 9 |
1 Other includes 1% holding or less in each of the following countries: Qatar, Turkey,
Singapore, Indonesia, Saudi Arabia, Norway, Peru, Hungary and Kazakhstan.
4 SEMI-ANNUAL REPORT APRIL 30, 2011
BlackRock Global Emerging Markets Fund, Inc.
Total Return Based on a $10,000 Investment
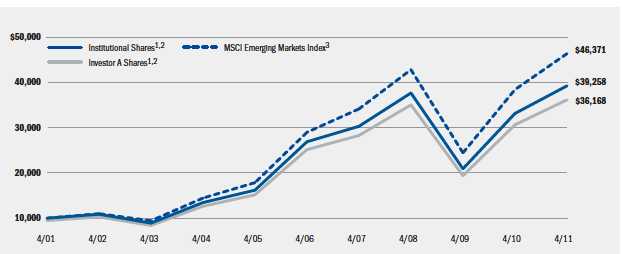
1 Assuming maximum sales charges, transaction costs and other operating expenses, including advisory fees. Institutional Shares do not have
a sales charge.
2 The Fund invests in equity securities of issuers in countries with developing capital markets.
3 This free float-adjusted market capitalization weighted index is designed to measure equity market performance of emerging markets.
Performance Summary for the Period Ended April 30, 2011
| | | | | | | |
| | | | | Average Annual Total Returns4 | | |
| | | 1 Year | | 5 Years | | 10 Years |
| | 6-Month | w/o sales | w/sales | w/o sales | w/sales | w/o sales | w/sales |
| | Total Returns | charge | charge | charge | charge | charge | charge |
| Institutional | 7.03% | 18.41% | N/A | 7.86% | N/A | 14.65% | N/A |
| Investor A | 6.81 | 18.01 | 11.81% | 7.53 | 6.37% | 14.33 | 13.72% |
| Investor B | 6.44 | 17.09 | 12.59 | 6.65 | 6.42 | 13.60 | 13.60 |
| Investor C | 6.42 | 17.09 | 16.09 | 6.67 | 6.67 | 13.42 | 13.42 |
| MSCI Emerging Markets Index | 9.74 | 20.67 | N/A | 9.85 | N/A | 16.58 | N/A |
4 Assuming maximum sales charges, if any. Average annual total returns with and without sales charges reflect reductions for distribution and service fees. See “About Fund
Performance” on page 10 for a detailed description of share classes, including any related sales charges and fees.
N/A — Not applicable as share class and index do not have a sales charge.
Expense Example
| | | | | | | |
| | | Actual | | | Hypothetical6 | | |
| | Beginning | Ending | | Beginning | Ending | | |
| | Account Value | Account Value | Expenses Paid | Account Value | Account Value | Expenses Paid | Annualized |
| | November 1, 2010 | April 30, 2011 | During the Period5 | November 1, 2010 | April 30, 2011 | During the Period5 | Expense Ratio |
| Institutional | $1,000.00 | $1,070.30 | $ 6.57 | $1,000.00 | $1,018.45 | $ 6.41 | 1.28% |
| Investor A | $1,000.00 | $1,068.10 | $ 8.15 | $1,000.00 | $1,016.92 | $ 7.95 | 1.59% |
| Investor B | $1,000.00 | $1,064.40 | $12.52 | $1,000.00 | $1,012.70 | $12.18 | 2.44% |
| Investor C | $1,000.00 | $1,064.20 | $12.33 | $1,000.00 | $1,012.85 | $12.03 | 2.41% |
5 For each class of the Fund, expenses are equal to the expense ratio for the class, multiplied by the average account value over the period, multiplied by 181/365 (to reflect the
one-half year period shown).
6 Hypothetical 5% annual return before expenses is calculated by pro rating the number of days in the most recent fiscal half year divided by 365.
See “Disclosure of Expenses” on page 10 for further information on how expenses were calculated.
Past performance is not indicative of future results.
SEMI-ANNUAL REPORT APRIL 30, 2011 5
Fund Summary as of April 30, 2011 BlackRock Latin America Fund, Inc.
Investment Objective
BlackRock Latin America Fund Inc.’s (the “Fund”) investment objective is to provide long-term capital appreciation by investing primarily in equity and debt
securities of issuers in Latin American countries.
Portfolio Management Commentary
How did the Fund perform?
• The Fund underperformed its benchmark, the MSCI Emerging Markets Latin
America Index, for the six-month period ended April 30, 2011.
What factors influenced performance?
• Underperformance relative to the benchmark stemmed primarily from
stock selection in Brazil and Mexico as well as an overweight position
and stock selection in Peru. The largest individual detractors from perform-
ance for the period were Brazilian homebuilder Cyrela Brazil Realty SA and
oil and gas names OGX Petroleo e Gas Participacoes SA and Petroleo
Brasilerro SA.
• Contributing to performance was an underweight in Colombia and an over-
weight in Panama. The largest individual contributors were stocks including
Brazilian beverage company Cia de Bebidas das Americas, automobile parts
manufacturer Autometal SA and education institution Anhanguera
Educacional Participacoes SA.
Describe recent portfolio activity.
• During the six-month period, we increased the Fund’s exposure to Brazil by
adding to existing holdings and participating in two initial public offerings in
the consumer discretionary sector. We also increased exposure to Brazilian
utilities and industrials stocks and added to the Fund’s position in Vale SA
following completion of its CEO transition. We increased exposure to oil and
gas via Petroleo de Brasileiro SA and QGEP Participacoes SA and reduced
exposure to the nation’s homebuilders. Due to concerns about the competi-
tive environment, we exited the Fund’s positions in Brazilian wireless
telecommunication services names.
• Elsewhere, we reduced exposure to Peru given the results of the nation’s first
round of presidential elections and we continue to monitor that situation as
the second round approaches in early June 2011. In Chile, we rotated out
of consumer-related holdings, exited airlines and added to utilities, telecom-
munication services and banks. In Mexico, we added to existing holdings in
financials, consumer-related stocks and industrials with proceeds from sales
in the metals & mining and beverages space.
Describe Fund positioning at period end.
• At period end, the Fund continues to be positioned with a large overweight
in Brazil and underweight in almost every other market in the region. In
Brazil, we remain focused on sectors that tend to be more domestic, partic-
ularly banks, retailers, homebuilders and industrials. Mexico remains an
underweight given our concerns regarding the sustainability of the recovery
in the United States and the impact of softening US macroeconomic data
on Mexico. Chile remains expensive from a valuation perspective and there-
fore an underweight. We are keeping a close eye on Peru as the second
round of presidential elections nears in early June.
The views expressed reflect the opinions of BlackRock as of the date of this report and are subject to change based on changes in market, economic or other conditions.
These views are not intended to be a forecast of future events and are no guarantee of future results.
| |
| Portfolio Information | |
| | Percent of |
| | Long-Term |
| Ten Largest Holdings | Investments |
| Vale SA, Preference 'A' Shares — ADR | 11% |
| Petroleo Brasileiro SA — ADR | 10 |
| Itau Unibanco Holdings SA — ADR | 10 |
| America Movil, SA de CV — ADR | 8 |
| Cia de Bebidas das Americas, Preference Shares — ADR | 5 |
| Banco Bradesco SA — ADR | 4 |
| OGX Petroleo e Gas Participacoes SA | 3 |
| Fomento Economico Mexicano, SA de CV — ADR | 2 |
| Grupo Televisa, SA — ADR | 2 |
| PDG Realty SA Empreendimentos e Participacoes | 2 |
| |
| | Percent of |
| | Long-Term |
| Geographic Allocation | Investments |
| Brazil | 74% |
| Mexico | 17 |
| Chile | 3 |
| Peru | 3 |
| Colombia | 1 |
| Panama | 1 |
| Argentina | 1 |
6 SEMI-ANNUAL REPORT APRIL 30, 2011
BlackRock Latin America Fund, Inc.
Total Return Based on a $10,000 Investment
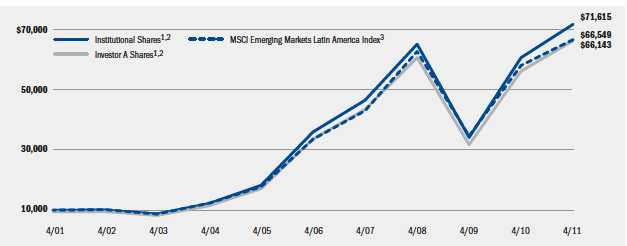
1 Assuming maximum sales charges, if any, transaction costs and other operating expenses, including advisory fees. Institutional Shares do not have
a sales charge.
2 The Fund invests primarily in Latin America equity and debt securities.
3 This unmanaged broad based market capitalization-weighted index by MSCI, Inc. is comprised of a representative sampling of stocks of large-, medium-,
and small-capitalization companies in Argentina, Brazil, Chile and Mexico, that are freely purchasable by foreign investors.
Performance Summary for the Period Ended April 30, 2011
| | | | | | | |
| | | | | Average Annual Total Returns4 | | |
| | | 1 Year | | 5 Years | | 10 Years |
| | 6-Month | w/o sales | w/sales | w/o sales | w/sales | w/o sales | w/sales |
| | Total Returns | charge | charge | charge | charge | charge | charge |
| Institutional | 2.04% | 18.22% | N/A | 14.78% | N/A | 21.76% | N/A |
| Investor A | 1.89 | 17.89 | 11.70% | 14.47 | 13.24% | 21.45 | 20.79% |
| Investor B | 1.47 | 16.92 | 12.42 | 13.51 | 13.26 | 20.66 | 20.66 |
| Investor C | 1.48 | 16.94 | 15.94 | 13.56 | 13.56 | 20.48 | 20.48 |
| MSCI Emerging Markets Latin America Index | 4.10 | 14.77 | N/A | 14.70 | N/A | 20.87 | N/A |
4 Assuming maximum sales charges, if any. Average annual total returns with and without sales charges reflect reductions for distribution and service fees. See “About Fund
Performance” on page 10 for a detailed description of share classes, including any related sales charges and fees.
N/A — Not applicable as share class and index do not have a sales charge.
Expense Example
| | | | | | | |
| | | Actual | | | Hypothetical6 | | |
| | Beginning | Ending | | Beginning | Ending | | |
| | Account Value | Account Value | Expenses Paid | Account Value | Account Value | Expenses Paid | Annualized |
| | November 1, 2010 | April 30, 2011 | During the Period5 | November 1, 2010 | April 30, 2011 | During the Period5 | Expense Ratio |
| Institutional | $1,000.00 | $1,020.40 | $ 6.01 | $1,000.00 | $1,018.85 | $ 6.01 | 1.20% |
| Investor A | $1,000.00 | $1,018.90 | $ 7.46 | $1,000.00 | $1,017.41 | $ 7.45 | 1.49% |
| Investor B | $1,000.00 | $1,014.70 | $11.64 | $1,000.00 | $1,013.25 | $11.63 | 2.33% |
| Investor C | $1,000.00 | $1,014.80 | $11.34 | $1,000.00 | $1,013.54 | $11.33 | 2.27% |
5 For each class of the Fund, expenses are equal to the expense ratio for the class, multiplied by the average account value over the period, multiplied by 181/365 (to reflect the
one-half year period shown).
6 Hypothetical 5% annual return before expenses is calculated by pro rating the number of days in the most recent fiscal half year divided by 365.
See “Disclosure of Expenses” on page 10 for further information on how expenses were calculated.
Past performance is not indicative of future results.
SEMI-ANNUAL REPORT APRIL 30, 2011 7
Fund Summary as of April 30, 2011 BlackRock International Fund of BlackRock Series, Inc.
Investment Objective
BlackRock International Fund’s (the “Fund”) of BlackRock Series, Inc. (the “Corporation”) investment objective is to seek long-term capital growth through
investments primarily in a diversified portfolio of equity securities of companies located outside the US.
Portfolio Management Commentary
How did the Fund perform?
• For the six-month period ended April 30, 2011, the Fund, through its
investment in BlackRock Master International Portfolio (the “Portfolio”),
outperformed its benchmark, the MSCI All Country World Index ex-US.
What factors influenced performance?
• Positive stock selection across various sectors was the primary driver of the
Portfolio’s outperformance for the period. Early in 2011, the Portfolio’s hold-
ings in Focus Media Holding Ltd. rose on analyst upgrades citing its unap-
preciated operating leverage. Shares in the world’s third-largest brewer
Heineken NV rose after increasing the third phase of its existing share buy-
back program. Two cyclical Japanese stocks enjoyed strong performance
during the period as the economic recovery gathered pace. Nitto Denko
Corp., the maker of optical film for LCD panels, issued a double-digit
increase in its net income estimate for 2011. Power tools manufacturer
Makita Corp. performed well in advance of its quarterly results, as the com-
pany expected limited impact from the earthquake in Japan. The Portfolio
also benefited from an overweight in information technology (IT) and an
underweight in financials.
• In IT, Activision Blizzard, Inc. detracted from performance, as the stock price
fell on heightened concerns that console-based games would lose gaming
market share in the future. Elsewhere, stocks exposed to Brazil, including
energy company OGX Petroleo e Gas Participacoes SA and telecommunica-
tion services company NII Holdings, Inc., suffered during the rotation away
from the country and other emerging markets near the beginning of 2011.
Describe recent portfolio activity.
• Given our favorable view on the emerging market consumer, we purchased
the Chinese personal products manufacturer Hengan International Group
Co. Ltd. In addition, we participated in the initial public offering of Changsha
Zoomlion Heavy Industry Science and Technology Development Co., Ltd., the
largest machinery company in China, which enjoys strong market share and
attractive sales growth. We bought electrical equipment company Schneider
Electric SA in March on our belief that the company would be able to grow
its margins through the cyclical recovery. We also purchased UK-listed
tobacco stock Imperial Tobacco Group Plc due to its attractive valuation
and growth prospects.
• We sold Taiwan Semiconductor Manufacturing Co., Ltd., the Indian bank
ICICI Bank Ltd., Lam Research Corp., UK-listed tobacco stock British
American Tobacco Plc and semiconductor company ASML Holding NV
following strong performance in those names.
Describe Portfolio positioning at period end.
• As of period end, global equities remained in a bull market due to a gener-
ally positive outlook for economic growth across the world. However, it is our
view that high growth rates in emerging markets may be counteracted by
slower growth in the highly indebted developed markets. With the long-run
risk to inflation increasing as commodity prices have surged, the value of
inflation protection is likely to rise. We continue to see money flowing from
low-yielding fixed income to higher-yielding equities, while valuations of the
latter continue to be reasonable. Our focus remains on the resilient and
growing emerging market consumer, especially in Asia and Latin America,
and corporate capital expenditure, as companies are catching up on
business investment following the recession.
• On March 14, 2011, the Board of Directors of the Fund approved a plan
of reorganization whereby the Fund will acquire substantially all of the
assets and assume certain stated liabilities of the BlackRock International
Value Fund (“International Value”) in exchange for newly issued shares of
the Fund. The reorganization is subject to shareholder approval by
International Value Fund shareholders and certain other conditions.
The views expressed reflect the opinions of BlackRock as of the date of this report and are subject to change based on changes in market, economic or other conditions.
These views are not intended to be a forecast of future events and are no guarantee of future results.
8 SEMI-ANNUAL REPORT APRIL 30, 2011
BlackRock International Fund of BlackRock Series, Inc.
Total Return Based on a $10,000 Investment
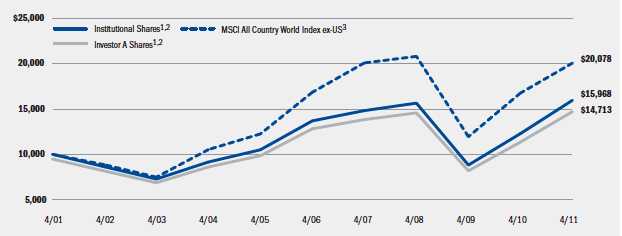
1 Assuming maximum sales charges, transaction costs and other operating expenses, including administration fees, if any. Institutional Shares do not have a
sales charge.
2 The Fund invests all of its assets in the Portfolio, a series of BlackRock Master LLC. The Portfolio invests primarily in a diversified portfolio of equity securi-
ties of companies located outside of the United States.
3 This market capitalization weighted index is designed to provide a broad measure of stock performance throughout the world, with the exception of
US-based companies. The index includes both developed and emerging markets.
Performance Summary for the Period Ended April 30, 2011
| | | | | | | |
| | | | | Average Annual Total Returns4 | | |
| | | 1 Year | | 5 Years | | 10 Years |
| | 6-Month | w/o sales | w/sales | w/o sales | w/sales | w/o sales | w/sales |
| | Total Returns | charge | charge | charge | charge | charge | charge |
| Institutional | 14.70% | 29.96% | N/A | 3.11% | N/A | 4.79% | N/A |
| Investor A | 14.45 | 29.61 | 22.80% | 2.79 | 1.69% | 4.50 | 3.94% |
| Investor B | 13.77 | 28.04 | 23.54 | 1.70 | 1.32 | 3.76 | 3.76 |
| Investor C | 14.08 | 28.67 | 27.67 | 2.06 | 2.06 | 3.71 | 3.71 |
| MSCI All Country World Index ex-US | 12.44 | 19.73 | N/A | 3.55 | N/A | 7.22 | N/A |
4 Assuming maximum sales charges, if any. Average annual total returns with and without sales charges reflect reductions for distribution and service fees. See “About Fund
Performance” on page 10 for a detailed description of share classes, including any related sales charges and fees.
N/A — Not applicable as share class and index do not have a sales charge.
Expense Example
| | | | | | | |
| | | Actual | | | Hypothetical6 | | |
| | Beginning | Ending | | Beginning | Ending | | |
| | Account Value | Account Value | Expenses Paid | Account Value | Account Value | Expenses Paid | Annualized |
| | November 1, 2010 | April 30, 2011 | During the Period5 | November 1, 2010 | April 30, 2011 | During the Period5 | Expense Ratio |
| Institutional | $1,000.00 | $1,147.00 | $ 9.26 | $1,000.00 | $1,016.17 | $ 8.70 | 1.74% |
| Investor A | $1,000.00 | $1,144.50 | $11.01 | $1,000.00 | $1,014.54 | $10.34 | 2.07% |
| Investor B | $1,000.00 | $1,137.70 | $17.39 | $1,000.00 | $1,008.53 | $16.33 | 3.28% |
| Investor C | $1,000.00 | $1,140.80 | $14.76 | $1,000.00 | $1,011.01 | $13.86 | 2.78% |
5 For each class of the Fund, expenses are equal to the expense ratio for the class, multiplied by the average account value over the period, multiplied by 181/365 (to reflect the
one-half year period shown).
6 Hypothetical 5% annual return before expenses is calculated by pro rating the number of days in the most recent fiscal half year divided by 365.
See “Disclosure of Expenses” on page 10 for further information on how expenses were calculated.
Past performance is not indicative of future results.
SEMI-ANNUAL REPORT APRIL 30, 2011 9
About Fund Performance
• Institutional Shares are not subject to any sales charge. Institutional
Shares bear no ongoing distribution or service fees and are available only
to eligible investors.
• Investor A Shares incur a maximum initial sales charge (front-end load) of
5.25% and a service fee of 0.25% per year (but no distribution fee).
• Investor B Shares are subject to a maximum contingent deferred sales
charge of 4.50% declining to 0% after six years. In addition, Investor B
Shares are subject to a distribution fee of 0.75% per year and a service
fee of 0.25% per year. These shares automatically convert to Investor A
Shares after approximately eight years. (There is no initial sales charge
for automatic share conversions.) All returns for periods greater than
eight years reflect this conversion. Investor B Shares of the Funds are
only available through exchanges and dividend reinvestment by existing
shareholders or for purchase by certain qualified employee benefit plans.
• Investor C Shares are subject to a distribution fee of 0.75% and a service
fee of 0.25%. In addition, Investor C Shares are subject to a 1% contingent
deferred sales charge if redeemed within one year of purchase.
Performance information reflects past performance and does not guarantee
future results. Current performance may be lower or higher than the per-
formance data quoted. Refer to www.blackrock.com/funds to obtain per-
formance data current to the most recent month-end. Performance results
do not reflect the deduction of taxes that a shareholder would pay on fund
distributions or the redemption of fund shares. Performance data does not
reflect this potential fee. Figures shown in the performance tables on pages
5, 7 and 9 assume reinvestment of all dividends and capital gain distribu-
tions, if any, at net asset value on the ex-dividend date. Investment return
and principal value of shares will fluctuate so that shares, when redeemed,
may be worth more or less than their original cost. Dividends paid to each
class of shares will vary because of the different levels of service, distribu-
tion and transfer agency fees applicable to each class, which are deducted
from the income available to be paid to shareholders.
Disclosure of Expenses
Shareholders of these Funds may incur the following charges: (a) expenses
related to transactions, including sales charges and exchange fees; and
(b) operating expenses including advisory fees, distribution fees including
12b-1 fees and other Fund expenses. The expense examples on pages 5,
7 and 9 (which are based on a hypothetical investment of $1,000 invested
on November 1, 2010 and held through April 30, 2011) are intended to
assist shareholders both in calculating expenses based on an investment
in the Funds and in comparing these expenses with similar costs of invest-
ing in other mutual funds.
The tables provide information about actual account values and actual
expenses. In order to estimate the expenses a shareholder paid during the
period covered by this report, shareholders can divide their account value
by $1,000 and then multiply the result by the number corresponding to
their share class under the heading “Expenses Paid During the Period.”
The tables also provide information about hypothetical account values and
hypothetical expenses based on each Fund’s actual expense ratio and an
assumed rate of return of 5% per year before expenses. In order to assist
shareholders in comparing the ongoing expenses of investing in these
Funds and other funds, compare the 5% hypothetical examples with the
5% hypothetical examples that appear in other funds’ shareholder reports.
The expenses shown in the tables are intended to highlight shareholders’
ongoing costs only and do not reflect any transactional expenses, such as
sales charges or exchange fees. Therefore, the hypothetical examples are
useful in comparing ongoing expenses only, and will not help shareholders
determine the relative total expenses of owning different funds. If these
transactional expenses were included, shareholder expenses would have
been higher.
Derivative Financial Instruments
The Funds and Portfolio may invest in various derivative financial instru-
ments, including foreign currency exchange contracts and options, as spec-
ified in Note 2 of the Notes to Financial Statements, which constitute forms
of economic leverage. Such instruments are used to obtain exposure to a
market without owning or taking physical custody of securities or to hedge
market, equity and/or foreign currency exchange rate risks. Such derivative
financial instruments involve risks, including the imperfect correlation
between the value of a derivative instrument and the underlying asset, pos-
sible default of the counterparty to the transaction and illiquidity of the
derivative instrument. The Funds’ and Portfolio’s ability to use a derivative
instrument successfully depends on the investment advisor’s ability to pre-
dict pertinent market movements accurately, which cannot be assured. The
use of derivative financial instruments may result in losses greater than if
they had not been used, may require the Funds and Portfolio to sell or pur-
chase portfolio investments at inopportune times or at distressed values,
may limit the amount of appreciation the Funds and Portfolio can realize
on an investment or may cause the Funds and Portfolio to hold an invest-
ment that they might otherwise sell. The Funds’ and Portfolio’s investments
in these instruments are discussed in detail in the Notes to Financial
Statements.
10 SEMI-ANNUAL REPORT APRIL 30, 2011
BlackRock Global Emerging Markets Fund, Inc.
Schedule of Investments April 30, 2011 (Unaudited)
(Percentages shown are based on Net Assets)
| | |
| Common Stocks | Shares | Value |
| Brazil — 16.6% | | |
| Cia de Bebidas das Americas, Preference | | |
| Shares — ADR | 187,390 | $ 6,105,166 |
| Cia de Concessoes Rodoviarias | 157,075 | 4,877,392 |
| Itau Unibanco Holdings SA — ADR | 581,769 | 13,817,014 |
| Natura Cosmeticos SA | 132,035 | 3,705,406 |
| OGX Petroleo e Gas Participacoes SA (a) | 346,500 | 3,660,584 |
| Petroleo Brasileiro SA — ADR | 114,739 | 3,828,841 |
| Vale SA, Preference ‘A’ Shares — ADR | 434,699 | 12,997,500 |
| | | 48,991,903 |
| Chile — 2.2% | | |
| E.CL SA | 1,086,000 | 2,935,938 |
| Empresa Nacional de Telecomunicaciones SA | 167,312 | 3,397,475 |
| | | 6,333,413 |
| China — 9.7% | | |
| Bank of China Ltd. | 9,332,200 | 5,165,216 |
| CNOOC Ltd. | 3,056,000 | 7,595,920 |
| China Rongsheng Heavy Industry Group Co., Ltd. | 4,768,500 | 4,032,497 |
| Focus Media Holding Ltd. — ADR (a) | 99,643 | 3,502,452 |
| Melco Crown Entertainment Ltd. — ADR (a) | 504,422 | 5,417,492 |
| PetroChina Co. Ltd. | 2,080,000 | 3,019,327 |
| | | 28,732,904 |
| Hong Kong — 1.9% | | |
| China Merchants Holdings International Co., Ltd. | 1,222,000 | 5,634,601 |
| Hungary — 0.5% | | |
| Mol Magyar Olaj- es Gazipari Rt. (a) | 11,298 | 1,579,020 |
| India — 2.0% | | |
| Infosys Technologies Ltd. — ADR | 89,400 | 5,827,092 |
| Indonesia — 1.0% | | |
| Perusahaan Gas Negara Tbk PT | 6,116,500 | 2,864,525 |
| Kazakhstan — 0.5% | | |
| KazMunaiGas Exploration Production (a) | 68,615 | 1,557,908 |
| Mexico — 6.6% | | |
| America Movil, SA de CV — ADR | 151,581 | 8,670,433 |
| Fomento Economico Mexicano, SA de CV — ADR | 49,353 | 3,104,304 |
| Genomma Lab Internacional SA de CV (a) | 1,329,868 | 3,327,067 |
| Grupo Financiero Banorte, SA de CV ‘O’ | 708,891 | 3,540,853 |
| Urbi Desarollos Urbanos SAB, SA de CV (a) | 335,155 | 800,643 |
| | | 19,443,300 |
| Norway — 0.9% | | |
| DNO International ASA (a) | 1,759,598 | 2,640,806 |
| Panama — 1.6% | | |
| Copa Holdings SA, Class A | 83,228 | 4,839,708 |
| Peru — 0.6% | | |
| Cia de Minas Buenaventura SA — ADR | 45,473 | 1,894,860 |
| Poland — 2.2% | | |
| Bank Pekao SA | 100,822 | 6,608,363 |
| Russia — 7.4% | | |
| OAO Gazprom — ADR | 523,642 | 8,933,333 |
| Sberbank | 2,725,011 | 9,959,915 |
| VimpelCom Ltd. — ADR | 201,600 | 2,937,312 |
| | | 21,830,560 |
| Singapore — 1.3% | | |
| Straits Asia Resources Ltd. | 1,523,000 | 3,684,129 |
| | |
| Common Stocks | Shares | Value |
| South Africa — 7.5% | | |
| African Bank Investments Ltd. | 929,445 | $ 5,425,882 |
| Anglo American Platinum Ltd. | 52,174 | 5,309,725 |
| Aveng Ltd. | 200,619 | 1,066,038 |
| The Foschini Group Ltd. | 240,244 | 3,316,104 |
| MTN Group Ltd. | 314,088 | 6,986,051 |
| | | 22,103,800 |
| South Korea — 12.9% | | |
| Celltrion, Inc. | 90,044 | 3,089,270 |
| Daewoo Shipbuilding & Marine Engineering Co., Ltd. | 47,200 | 2,022,902 |
| Doosan Infracore Co. Ltd. (a) | 195,650 | 5,424,781 |
| Green Cross Corp. | 6,212 | 806,924 |
| Hyundai Mobis | 17,896 | 6,002,464 |
| Kangwon Land, Inc. | 119,390 | 2,714,344 |
| Korea Electric Power Corp. (a) | 136,910 | 3,280,254 |
| LG Chem Ltd. | 5,752 | 2,857,695 |
| Samsung Electronics Co., Ltd. | 14,252 | 11,904,413 |
| | | 38,103,047 |
| Taiwan — 6.8% | | |
| Delta Electronics, Inc. | 855,000 | 3,827,265 |
| King Yuan Electronics Co., Ltd. (a) | 3,778,000 | 2,126,090 |
| Mega Financial Holding Co. Ltd. | 4,330,000 | 3,783,063 |
| Taiwan Semiconductor Manufacturing Co., Ltd. | 2,047,000 | 5,294,535 |
| Taiwan Semiconductor Manufacturing | | |
| Co., Ltd. — ADR | 366,255 | 4,944,442 |
| | | 19,975,395 |
| Thailand — 2.6% | | |
| Banpu Pcl | 123,400 | 3,083,967 |
| Kasikornbank Pcl | 1,086,100 | 4,602,735 |
| | | 7,686,702 |
| Turkey — 1.4% | | |
| Koza Altin Isletmeleri AS | 254,291 | 3,990,186 |
| Total Common Stocks — 86.2% | | 254,322,222 |
| | Par | |
| Participation Notes | (000) | |
| India — 8.0% | | |
| Citigroup Global Markets Holdings, Inc.: | | |
| (United Phosphorus), due 4/05/12 | USD 983 | 3,344,809 |
| (Yes Bank Ltd.), due 10/24/12 | 483 | 3,316,466 |
| Deutsche Bank AG: | | |
| (Axis Bank), due 8/17/17 | 139 | 3,990,795 |
| (Lanco Infratech Ltd.), due 11/23/16 | 2,311 | 2,053,092 |
| JPM (Aurobino Pharma), due 12/15/15 | 215 | 937,587 |
| Morgan Stanley Asia Products Ltd.: | | |
| (ITC Ltd.), due 7/03/14 | 628 | 2,725,404 |
| (Reliance Industries Ltd.), due 8/01/2014 | 130 | 2,890,406 |
| Morgan Stanley BV (Rolta India Ltd.), due 5/26/14 | 439 | 1,373,839 |
| UBS AG (Glenmark Pharmaceuticals Ltd.), | | |
| due 12/18/12 | 432 | 2,898,327 |
| | | 23,530,725 |
| Qatar — 1.5% | | |
| Deutsche Bank AG (Commercial Bank of Qatar Inc.), | | |
| due 5/26/17 | 220 | 4,416,405 |
| | | | |
| Portfolio Abbreviations | | | | |
| To simplify the listings of portfolio holdings in | ADR | American Depositary Receipts | MXN | Mexican Peso |
| the Schedules of Investments, the names and | BRL | Brazilian Real | USD | US Dollar |
| descriptions of many of the securities have been | | | | |
| abbreviated according to the following list: | | | | |
| See Notes to Financial Statements. | | | | |
SEMI-ANNUAL REPORT APRIL 30, 2011 11
BlackRock Global Emerging Markets Fund, Inc.
Schedule of Investments (continued)
(Percentages shown are based on Net Assets)
| | |
| | Par | |
| Participation Notes | (000) | Value |
| Saudi Arabia — 0.9% | | |
| HSBC Bank Plc (Abdullah Al Othaim Markets), | | |
| due 9/05/11 | USD 108 | $ 2,827,798 |
| Total Participation Notes — 10.4% | | 30,774,928 |
| Total Long-Term Investments | | |
| (Cost — $229,801,554) — 96.6% | | 285,097,150 |
| Short-Term Securities | Shares | |
| BlackRock Liquidity Funds, TempFund, | | |
| Institutional Class, 0.10% (b)(c) | 9,873,847 | 9,873,847 |
| Total Short-Term Securities | | |
| (Cost — $9,873,847) — 3.4% | | 9,873,847 |
| Total Investments (Cost — $239,675,401*) — 100.0% | 294,970,997 |
| Liabilities in Excess of Other Assets — 0.0% | | (23,238) |
| Net Assets — 100.0% | | $294,947,759 |
* The cost and unrealized appreciation (depreciation) of investments as of
April 30, 2011, as computed for federal income tax purposes, were as follows:
| |
| Aggregate cost | $ 245,433,033 |
| Gross unrealized appreciation | $ 52,621,273 |
| Gross unrealized depreciation | (3,083,309) |
| Net unrealized appreciation | $ 49,537,964 |
(a) Non-income producing security.
(b) Investments in companies considered to be an affiliate of the Fund during the
period, for purposes of Section 2(a)(3) of the Investment Company Act of 1940, as
amended, were as follows:
| | | | |
| | Shares Held at | | Shares Held at | |
| | October 31, | Net | April 30, | |
| Affiliate | 2010 | Activity | 2011 | Income |
| BlackRock Liquidity | | | | |
| Funds, TempFund, | | | | |
| Institutional Class | 2,579,161 | 7,294,686 | 9,873,847 | $ 4,097 |
(c) Represents the current yield as of report date.
• Foreign currency exchange contracts as of April 30, 2011 were as follows:
| | | | | | | |
| Currency | Currency | | Settlement Unrealized |
| Purchased | Sold | | Counterparty | Date | Appreciation |
| USD | 22,842 | BRL | 35,862 | Brown | | | |
| | | | | Brothers | | | |
| | | | | Harriman & Co. | 5/03/2011 | $ 46 |
• Fair Value Measurements — Various inputs are used in determining the fair value of
investments and derivative financial instruments. These inputs are summarized in
three broad levels for financial statement purposes as follows:
• Level 1 — price quotations in active markets/exchanges for identical assets
and liabilities
• Level 2 — other observable inputs (including, but not limited to: quoted prices
for similar assets or liabilities in markets that are active, quoted prices for iden-
tical or similar assets or liabilities in markets that are not active, inputs other
than quoted prices that are observable for the assets or liabilities (such as
interest rates, yield curves, volatilities, prepayment speeds, loss severities, credit
risks and default rates) or other market-corroborated inputs)
• Level 3 — unobservable inputs based on the best information available in the
circumstances, to the extent observable inputs are not available (including the
Fund’s own assumptions used in determining the fair value of investments and
derivative financial instruments)
The inputs or methodologies used for valuing securities are not necessarily an
indication of the risk associated with investing in those securities. For information
about the Fund’s policy regarding valuation of investments and derivative financial
instruments and other significant accounting policies, please refer to Note 1 of the
Notes to Financial Statements.
The following tables summarize the inputs used as of April 30, 2011 in determining
the fair valuation of the Fund’s investments and derivative financial instruments:
| | | | |
| Valuation Inputs | Level 1 | Level 2 | Level 3 | Total |
| Assets: | | | | |
| Investments: | | | | |
| Long-Term Investments: | | | |
| Common Stocks: | | | | |
| Brazil | $ 48,991,903 | — | — | $ 48,991,903 |
| Chile | 6,333,413 | — | — | 6,333,413 |
| China | 8,919,944 | $ 19,812,960 | — | 28,732,904 |
| Hong Kong | — | 5,634,601 | — | 5,634,601 |
| Hungary | — | 1,579,020 | — | 1,579,020 |
| India | 5,827,092 | — | — | 5,827,092 |
| Indonesia | — | 2,864,525 | — | 2,864,525 |
| Kazakhstan | 1,557,908 | — | — | 1,557,908 |
| Mexico | 19,443,300 | — | — | 19,443,300 |
| Norway | — | 2,640,806 | — | 2,640,806 |
| Panama | 4,839,708 | — | — | 4,839,708 |
| Peru | 1,894,860 | — | — | 1,894,860 |
| Poland | — | 6,608,363 | — | 6,608,363 |
| Russia | 21,830,560 | — | — | 21,830,560 |
| Singapore | — | 3,684,129 | — | 3,684,129 |
| South Africa | — | 22,103,800 | — | 22,103,800 |
| South Korea . | — | 38,103,047 | — | 38,103,047 |
| Taiwan | 4,944,442 | 15,030,953 | — | 19,975,395 |
| Thailand | 7,686,702 | — | — | 7,686,702 |
| Turkey | — | 3,990,186 | — | 3,990,186 |
| Participation Notes: | | | |
| India | — | — | $ 23,530,725 | 23,530,725 |
| Qatar | — | — | 4,416,405 | 4,416,405 |
| Saudi Arabia . | — | — | 2,827,798 | 2,827,798 |
| Short-Term | | | | |
| Securities: | 9,873,847 | — | — | 9,873,847 |
| Total | $142,143,679 | $122,052,390 | $ 30,774,928 | $294,970,997 |
See Notes to Financial Statements.
12 SEMI-ANNUAL REPORT APRIL 30, 2011
BlackRock Global Emerging Markets Fund, Inc.
Schedule of Investments (concluded)
| | | | | | |
| Derivative Financial Instruments1 |
|
| Valuation Inputs | Level 1 | Level 2 | Level 3 | | Total | |
| Assets: | | | | | | |
| Foreign | | | | | | |
| currency | | | | | | |
| exchange | | | | | | |
| contracts | — | $ 46 | | — | $ 46 |
| Total | — | $ 46 | | — | $ 46 |
1 Derivative financial instruments are foreign currency exchange contracts.
Foreign currency exchange contracts are valued at the unrealized appreciation/
depreciation on the instrument.
The following table is a reconciliation of Level 3 investments for which significant
unobservable inputs were used in determining fair value:
| |
| | Participation |
| | Notes |
| Assets: | |
| Balance, as of October 31, 2010 | $ 46,101,686 |
| Accrued discounts/premium | — |
| Net realized gain (loss) | 1,316,782 |
| Net change in unrealized appreciation/depreciation2 | (5,759,718) |
| Purchases | 17,416,242 |
| Sales | (28,300,064) |
| Transfers in3 | — |
| Transfers out3 | — |
| Balance, as of April 30, 2011 | $ 30,774,928 |
2 Included in the related net change in unrealized appreciation/depreciation
in the Statement of Operations. The change in unrealized appreciation/
depreciation on investments still held at April 30, 2011 was $(4,982,014).
3 The Fund’s policy is to recognize transfers in and transfers out as of the
beginning of the period of the event or the change in circumstances that
caused the transfer.
See Notes to Financial Statements.
SEMI-ANNUAL REPORT APRIL 30, 2011 13
BlackRock Latin America Fund, Inc.
Schedule of Investments April 30, 2011 (Unaudited)
(Percentages shown are based on Net Assets)
| | |
| Common Stocks | Shares | Value |
| Argentina — 0.5% | | |
| Ternium SA — ADR | 162,000 | $ 5,446,440 |
| Brazil — 70.4% | | |
| AES Tiete SA | 179,000 | 2,670,436 |
| AES Tiete SA, Preference Shares | 114,000 | 1,880,435 |
| Anhanguera Educacional Participacoes SA | 315,000 | 7,034,039 |
| Autometal SA | 631,000 | 7,119,406 |
| BM&FBOVESPA SA | 2,680,000 | 20,118,739 |
| BR Malls Participacoes SA | 495,000 | 5,229,405 |
| BR Properties SA | 550,000 | 6,502,670 |
| Banco Bradesco SA — ADR | 2,050,000 | 41,471,500 |
| Banco do Brasil SA | 850,000 | 15,614,671 |
| Bradespar SA, Preference Shares | 790,000 | 20,463,069 |
| Braskem SA, Preference 'A' Shares (a) | 440,000 | 6,362,827 |
| Cia de Bebidas das Americas, Preference | | |
| Shares — ADR | 1,575,000 | 51,313,500 |
| Cia de Concessoes Rodoviarias | 655,000 | 20,338,641 |
| Cia Energetica de Minas Gerais — ADR | 580,000 | 12,104,600 |
| Cia Energetica de Minas Gerais, Preference Shares | 49,500 | 1,007,494 |
| Cyrela Brazil Realty SA | 840,000 | 8,900,839 |
| Diagnosticos da America SA | 367,000 | 4,926,926 |
| Hypermarcas SA | 1,000,000 | 13,405,797 |
| Iguatemi Empresa de Shopping Centers SA | 99,000 | 2,565,618 |
| Iochpe-Maxion SA | 527,000 | 7,369,692 |
| Itau Unibanco Holdings SA — ADR | 4,300,000 | 102,125,000 |
| Itau Unibanco Holdings SA — ADR (b) | 500,000 | 11,875,000 |
| Itausa-Investimentos Itau SA, Preference Shares | 2,620,000 | 20,084,668 |
| LPS Brasil Consultoria de Imoveis SA (a) | 200,000 | 5,451,309 |
| Localiza Rent A Car SA | 617,700 | 10,620,891 |
| Lojas Renner SA | 26,000 | 963,514 |
| Magazine Luiza SA (a) | 595,400 | 6,055,429 |
| Marcopolo SA, Preference Shares | 625,000 | 2,773,010 |
| Metalfrio Solutions SA | 149,000 | 1,108,124 |
| Multiplus SA | 440,000 | 8,980,676 |
| Natura Cosmeticos SA | 475,000 | 13,330,314 |
| OGX Petroleo e Gas Participacoes SA (a) | 3,000,000 | 31,693,364 |
| PDG Realty SA Empreendimentos e Participacoes | 3,500,000 | 20,601,322 |
| Petroleo Brasileiro SA — ADR | 3,100,000 | 103,447,000 |
| Profarma Distribuidora de Produtos | | |
| Farmaceuticos SA | 342,000 | 3,402,174 |
| QGEP Participacoes SA (a) | 769,500 | 10,418,478 |
| Rossi Residencial SA | 258,000 | 2,399,275 |
| T4F Entretenimento SA (a) | 525,000 | 5,005,721 |
| Totvs SA | 270,000 | 5,167,620 |
| Tractebel Energia SA | 338,000 | 5,983,537 |
| Vale SA, Preference 'A' Shares — ADR | 3,800,000 | 113,620,000 |
| Weg SA | 82,100 | 1,020,249 |
| | | 742,526,979 |
| Chile — 3.0% | | |
| Banco Santander Chile SA — ADR (c) | 157,000 | 14,379,630 |
| E.CL SA | 2,000,000 | 5,406,885 |
| Empresa Nacional de Electricidad SA — ADR | 107,000 | 6,032,660 |
| Empresa Nacional de Telecomunicaciones SA | 283,000 | 5,746,661 |
| | | 31,565,836 |
| Colombia — 1.4% | | |
| Pacific Rubiales Energy Corp. | 470,000 | 14,281,562 |
| Mexico — 16.9% | | |
| America Movil, SA de CV — ADR | 1,490,000 | 85,228,000 |
| Compartamos SAB de CV (a) | 2,575,000 | 4,798,053 |
| Corporacion GEO, SA de CV Series B (a) | 800,000 | 2,360,729 |
| Empresas ICA Sociedad Controladora, SA de CV (a) | 865,000 | 2,134,003 |
| Fomento Economico Mexicano, SA de CV — ADR | 400,000 | 25,160,000 |
| Genomma Lab Internacional SA de CV (a) | 3,340,000 | 8,356,020 |
| Grupo Financiero Banorte, SA de CV 'O' | 1,701,900 | 8,500,851 |
| Grupo Mexico, SA de CV | 2,400,000 | 8,310,154 |
| | | |
| Common Stocks | | Shares | Value |
| Mexico (concluded) | | | |
| Grupo Televisa, SA — ADR (a) | | 900,000 | $ 21,348,000 |
| Wal-Mart de Mexico, SA de CV | 3,870,000 | 12,102,470 |
| | | | 178,298,280 |
| Panama — 1.1% | | | |
| Copa Holdings SA, Class A | | 198,000 | 11,513,700 |
| Peru — 2.5% | | | |
| Cia de Minas Buenaventura SA — ADR | | 300,000 | 12,501,000 |
| Credicorp Ltd. | | 52,000 | 5,019,040 |
| Southern Copper Corp. | | 238,000 | 8,915,480 |
| | | | 26,435,520 |
| Total Common Stocks — 95.8% | | | 1,010,068,317 |
| | | Par | |
| Corporate Bonds | | (000) | |
| Brazil — 0.3% | | | |
| Hypermarcas SA: | | | |
| 3.00%, 10/15/15 | BRL | 1,648 | 1,140,359 |
| 11.30%, 10/15/18 | | 1,648 | 1,011,958 |
| Lupatech SA, 6.50%, 4/15/18 (d) | | 2,128 | 1,356,305 |
| Total Corporate Bonds — 0.3% | | | 3,508,622 |
| Participation Notes | | | |
| Brazil — 3.2% | | | |
| Deutsche Bank AG (Cyrela Brazil Realty SA), | | | |
| due 6/09/15 | USD 325,000 | 3,443,115 |
| Morgan Stanley BV: | | | |
| (AES Tiete SA), due 12/20/12 | | 55 | 912,934 |
| (Cyrela Brazil Realty SA Empreendimentos e | | | |
| Participacoes), due 4/15/12 | | 400 | 4,345,560 |
| (Hypermarcas SA), due 6/12/11 | | 15 | 210,818 |
| (Itausa — Investimentos Itau SA), due 4/05/12 | 6 | 45,612 |
| (Lojas Renner SA), due 11/17/10) | | 400 | 15,351,480 |
| (Lojas Renner SA), due 3/04/11 | | 50 | 1,926,305 |
| (Lojas Renner SA), due 7/29/11 | | 33 | 1,253,370 |
| (Natura Cosmetico SA), due 7/29/11 | | 95 | 2,718,976 |
| (Natura Cosmeticos SA), due 10/29/12 | | 27 | 764,632 |
| (OGX Petroleo e Gas Participacoes SA), | | | |
| due 4/05/12 | | 1 | 6,404 |
| (Rossi Residencial SA), due 4/05/12 | | 200 | 1,920,800 |
| (Weg SA), due 1/21/13 | | 89 | 1,120,510 |
| Total Participation Notes — 3.2% | | | 34,020,516 |
| Rights | | Shares | |
| Brazil — 0.0% | | | |
| Hypermarcas SA (Expires 10/15/15) | | 1,644 | — |
| Total Rights — 0.0% | | | — |
| Total Long-Term Investments | | | |
| (Cost — $677,191,306) — 99.3% | | | 1,047,597,455 |
| Short-Term Securities | | Shares | |
| BlackRock Liquidity Funds, TempFund, | | | |
| Institutional Class, 0.10% (e)(f) | 12,938,764 | 12,938,764 |
See Notes to Financial Statements.
14 SEMI-ANNUAL REPORT APRIL 30, 2011
BlackRock Latin America Fund, Inc.
Schedule of Investments (concluded)
(Percentages shown are based on Net Assets)
| | |
| | Beneficial | |
| | Interest | |
| Short-Term Securities | (000) | Value |
| BlackRock Liquidity Series, LLC | | |
| Money Market Series, 0.23% (e)(f)(g) | USD 9,579 | $ 9,579,000 |
| Total Short-Term Securities | | |
| (Cost — $22,517,764) — 2.2% | | 22,517,764 |
| Total Investments (Cost — $699,709,070*) — 101.5% | 1,070,115,219 |
| Liabilities in Excess of Other Assets — (1.5)% | | (15,713,582) |
| Net Assets — 100.0% | | $1,054,401,637 |
* The cost and unrealized appreciation (depreciation) of investments as of April 30,
2011, as computed for federal income tax purposes, were as follows:
| |
| Aggregate cost | $ 746,706,940 |
| Gross unrealized appreciation | $ 327,440,014 |
| Gross unrealized depreciation | (4,031,735) |
| Net unrealized appreciation | $ 323,408,279 |
(a) Non-income producing security.
(b) Security exempt from registration under Rule 144A of the Securities Act of 1933.
These securities may be resold in transactions exempt from registration to qualified
institutional investors.
(c) Security, or a portion of security, is on loan.
(d) Convertible security.
(e) Investments in companies considered to be an affiliate of the Fund during the
period, for purposes of Section 2(a)(3) of the Investment Company Act of 1940, as
amended, were as follows:
| | | | | | |
| | Shares/Beneficial | | Shares/Beneficial | |
| | Interest Held at | Net | Interest Held at | |
| Affiliate | October 31, 2010 | Activity | April 30, 2011 | Income |
| BlackRock Liquidity | | | | | |
| Funds, TempFund, | | | | | |
| Institutional Class | 5,978,803 | 6,959,961 | 12,938,764 | $ 5,486 |
| BlackRock | | | | | | |
| Liquidity Series, | | | | | |
| LLC Money | | | | | | |
| Market Series | $ 62,121,755 | $(52,542,755) | $ 9,579,000 | $ 47,056 |
(f) Represents the current yield as of report date.
(g) Security was purchased with the cash collateral from loaned securities.
• Foreign currency exchange contracts as of April 30, 2011 were as follows:
| | | | |
| Currency | Currency | | Settlement | Unrealized |
| Purchased | Sold | Counterparty | Date | Appreciation |
| USD 184,899 | MXN 2,128,500 | Brown | | |
| | | Brothers | | |
| | | Harriman & Co. | 5/03/11 | $ 59 |
• Fair Value Measurements — Various inputs are used in determining the fair value of
investments and derivative financial instruments. These inputs are summarized in
three broad levels for financial statement purposes as follows:
• Level 1 — price quotations in active markets/exchanges for identical assets
and liabilities
• Level 2 — other observable inputs (including, but not limited to: quoted prices
for similar assets or liabilities in markets that are active, quoted prices for
identical or similar assets or liabilities in markets that are not active, inputs
other than quoted prices that are observable for the assets or liabilities (such
as interest rates, yield curves, volatilities, prepayment speeds, loss severities,
credit risks and default rates) or other market-corroborated inputs)
• Level 3 — unobservable inputs based on the best information available in the
circumstances, to the extent observable inputs are not available (including
the Fund's own assumptions used in determining the fair value of investments
and derivative financial instruments)
The inputs or methodologies used for valuing securities are not necessarily an
indication of the risk associated with investing in those securities. For information
about the Fund’s policy regarding valuation of investments and derivative financial
instruments and other significant accounting policies, please refer to Note 1 of the
Notes to Financial Statements.
The following tables summarize the inputs used as of April 30, 2011 in determining
the fair valuation of the Fund’s investments and derivative financial instruments:
| | | | |
| Valuation Inputs | Level 1 | Level 2 | Level 3 | Total |
| Assets: | | | | |
| Investments: | | | | |
| Long-Term Investments: | | | |
| Common Stocks: | | | | |
| Argentina | $ 5,446,440 | — | — | $ 5,446,440 |
| Brazil | 742,526,979 | — | — | 742,526,979 |
| Chile | 31,565,836 | — | — | 31,565,836 |
| Colombia | 14,281,562 | — | — | 14,281,562 |
| Mexico | 178,298,280 | — | — | 178,298,280 |
| Panama | 11,513,700 | — | — | 11,513,700 |
| Peru | 26,435,520 | — | — | 26,435,520 |
| Corporate | | | | |
| Bonds | — | — $ 3,508,622 | 3,508,622 |
| Participation | | | | |
| Notes | — | — | 34,020,516 | 34,020,516 |
| Short-Term | | | | |
| Securities | 12,938,764 $ 9,579,000 | — | 22,517,764 |
| Total | $1,023,007,081 $ 9,579,000 $37,529,138 $1,070,115,219 |
| | | | | |
| Valuation Inputs | Level 1 | Level 2 | Level 3 | Total | |
| Derivative Financial Instruments1 | | | | |
| Assets: | | | | | |
| Foreign currency | | | | | |
| exchange contracts — | $ 59 | — | $ 59 |
1 Derivative financial instruments are foreign currency exchange contracts.
Foreign currency exchange contracts are valued at the unrealized appreciation/
depreciation on the instrument.
The following table is a reconciliation of Level 3 investments for which significant unobservable inputs were used in determining fair value:
| | | |
| | Corporate | Participation | |
| | Bonds | Notes | Total |
| Assets: | | | |
| Balance, as of October 31, 2010 | $ 1,266,510 | $43,996,618 | $45,263,128 |
| Accrued discounts/premium | (1,164) | — | (1,164) |
| Net realized gain (loss) | — | 623,754 | 623,754 |
| Net change in unrealized appreciation/depreciation2 | 270,810 | (4,819,061) | (4,548,251) |
| Purchases | 1,972,466 | 2,943,402 | 4,915,868 |
| Sales | — | (8,724,197) | (8,724,197) |
| Transfers in3 | — | — | — |
| Transfers out3 | — | — | — |
| Balance, as of April 30, 2011 | $ 3,508,622 | $34,020,516 | $37,529,138 |
2 Included in the related net change in unrealized appreciation/depreciation in the Statement of Operations. The change in unrealized appreciation/depreciation on investments
still held at April 30, 2011 was $(3,739,765).
3 The Fund’s policy is to recognize transfers in and transfers out as of the beginning of the period of the event or the change in circumstances that caused the transfer.
See Notes to Financial Statements.
SEMI-ANNUAL REPORT APRIL 30, 2011 15
| | | |
| Statements of Assets and Liabilities | | | |
| | BlackRock | BlackRock | |
| | Global Emerging | Latin | BlackRock |
| | Markets | America | International |
| April 30, 2011 (Unaudited) | Fund, Inc. | Fund, Inc. | Fund |
| Assets | | | |
| Investments at value — unaffiliated1,2 | $ 285,097,150 | $1,047,597,455 | — |
| Investments at value — Master International Portfolio of BlackRock Master LLC (the "Portfolio") (cost $62,648,580) | — | — | $ 76,976,799 |
| Investments at value — affiliated3 | 9,873,847 | 22,517,764 | — |
| Unrealized appreciation on foreign currency exchange contracts | 46 | 59 | — |
| Foreign currency at value4 | 2,234,494 | 468,583 | — |
| Investments sold receivable | 1,774,199 | 228,701 | — |
| Capital shares sold receivable | 829,743 | 4,417,276 | 168,723 |
| Dividends receivable | 334,637 | 4,859,756 | — |
| Interest receivable | — | 18,439 | — |
| Securities lending income receivable — affiliated | — | 2,610 | — |
| Prepaid expenses | 26,668 | 33,375 | 29,681 |
| Total assets | 300,170,784 | 1,080,144,018 | 77,175,203 |
| Liabilities | | | |
| Collateral on securities loaned at value | — | 9,579,000 | — |
| Investments purchased payable | 3,772,767 | 9,107,758 | — |
| Capital shares redeemed payable | 858,328 | 4,846,920 | 131,494 |
| Investment advisory fees payable | 229,828 | 836,621 | — |
| Service and distribution fees payable | 64,367 | 308,217 | 28,477 |
| Deferred foreign capital gain tax payable | 38,450 | 389,189 | — |
| Other affiliates payable | 3,596 | 15,375 | 301 |
| Officer's and Directors' fees payable | 113 | 385 | 16 |
| Administration fees payable | — | — | 14,640 |
| Contributions payable to the Portfolio | — | — | 37,229 |
| Other accrued expenses payable | 254,089 | 625,257 | 160,814 |
| Other liabilities | 1,487 | 33,659 | — |
| Total liabilities | 5,223,025 | 25,742,381 | 372,971 |
| Net Assets | $ 294,947,759 | $1,054,401,637 | $ 76,802,232 |
| Net Assets Consist of | | | |
| Paid-in capital | $ 258,516,122 | $ 773,758,923 | $ 92,211,163 |
| Distributions in excess of net investment income | (1,303,223) | (9,681,568) | (202,748) |
| Accumulated net realized loss | (17,588,893) | (79,804,656) | — |
| Net unrealized appreciation/depreciation | 55,323,753 | 370,128,938 | — |
| Accumulated net realized loss allocated from the Portfolio | — | — | (29,534,402) |
| Net unrealized appreciation/depreciation allocated from the Portfolio | — | — | 14,328,219 |
| Net Assets | $ 294,947,759 | $1,054,401,637 | $ 76,802,232 |
| 1 Investments at cost — unaffiliated | $ 229,801,554 | $ 677,191,306 | — |
| 2 Securities loaned at value | — | $ 9,433,770 | — |
| 3 Investments at cost — affiliated | $ 9,873,847 | $ 22,517,764 | — |
| 4 Foreign currency at cost | $ 2,168,942 | $ 526,555 | — |
| Net Asset Value | | | |
| Institutional: | | | |
| Net assets | $ 100,022,970 | $ 233,427,727 | $ 5,942,908 |
| Shares outstanding, 100 million shares authorized | 4,603,503 | 3,089,899 | 402,798 |
| Net asset value | $ 21.73 | $ 75.55 | $ 14.75 |
| Par value per share | $ 0.10 | $ 0.10 | $ 0.0001 |
| Investor A: | | | |
| Net assets | $ 150,325,729 | $ 578,515,250 | $ 44,805,574 |
| Shares outstanding, 100 million shares authorized | 7,157,225 | 7,785,255 | 3,091,894 |
| Net asset value | $ 21.00 | $ 74.31 | $ 14.49 |
| Par value per share | $ 0.10 | $ 0.10 | $ 0.0001 |
| Investor B: | | | |
| Net assets | $ 4,055,472 | $ 16,819,552 | $ 10,400,912 |
| Shares outstanding, 100 million shares authorized | 215,314 | 240,943 | 772,021 |
| Net asset value | $ 18.84 | $ 69.81 | $ 13.47 |
| Par value per share | $ 0.10 | $ 0.10 | $ 0.0001 |
| Investor C: | | | |
| Net assets | $ 40,543,588 | $ 225,639,108 | $ 15,652,838 |
| Shares outstanding, 100 million shares authorized | 2,217,097 | 3,307,791 | 1,143,134 |
| Net asset value | $ 18.29 | $ 68.21 | $ 13.69 |
| Par value per share | $ 0.10 | $ 0.10 | $ 0.0001 |
See Notes to Financial Statements.
16 SEMI-ANNUAL REPORT APRIL 30, 2011
| | | |
| Statements of Operations | | | |
| | BlackRock | BlackRock | |
| | Global Emerging | Latin | BlackRock |
| | Markets | America | International |
| Six Months Ended April 30, 2011 (Unaudited) | Fund, Inc. | Fund, Inc. | Fund |
| Investment Income | | | |
| Dividends | $ 2,428,772 | $ 14,881,239 | — |
| Foreign taxes withheld | (198,640) | (1,731,556) | — |
| Interest | — | 169,416 | — |
| Dividends — affiliated | 4,097 | 5,486 | — |
| Securities lending — affiliated | — | 47,056 | — |
| Investment income allocated from the Portfolio: | | | |
| Dividends | — | — | $ 898,293 |
| Foreign taxes withheld | — | — | (88,670) |
| Dividends — affiliated | — | — | 1,189 |
| Total Expenses | — | — | (336,728) |
| Fees waived | — | — | 589 |
| Total income | 2,234,229 | 13,371,641 | 474,673 |
| Expenses | | | |
| Investment advisory | 1,402,493 | 5,191,876 | — |
| Service — Investor A | 181,016 | 727,758 | 50,404 |
| Service and distribution — Investor B | 21,557 | 88,048 | 55,307 |
| Service and distribution — Investor C | 195,876 | 1,104,047 | 72,236 |
| Transfer agent — Institutional | 47,042 | 104,462 | 2,770 |
| Transfer agent — Investor A | 112,486 | 386,465 | 53,422 |
| Transfer agent — Investor B | 5,496 | 19,691 | 40,831 |
| Transfer agent — Investor C | 43,910 | 179,510 | 16,612 |
| Custodian | 95,743 | 241,239 | — |
| Professional | 45,397 | 37,488 | 34,589 |
| Registration | 38,076 | 48,470 | 26,790 |
| Accounting services | 37,844 | 142,151 | — |
| Printing | 20,855 | 48,561 | 5,502 |
| Officer and Directors | 4,872 | 12,838 | 17 |
| Administration | — | — | 86,883 |
| Reorganization | — | — | 43,976 |
| Miscellaneous | 15,003 | 15,531 | 6,614 |
| Total expenses | 2,267,666 | 8,348,135 | 495,953 |
| Less fees waived by advisor | (1,829) | (2,298) | — |
| Total expenses after fees waived | 2,265,837 | 8,345,837 | 495,953 |
| Net investment income (loss) | (31,608) | 5,025,804 | (21,280) |
| Realized and Unrealized Gain (Loss) | | | |
| Net realized gain (loss) from: | | | |
| Investments | 26,793,3151 | 24,048,5442 | — |
| Foreign currency transactions | (132,416) | (285,473) | — |
| Investments and foreign currency transactions allocated from the Portfolio | — | — | 5,397,962 |
| | 26,660,899 | 23,763,071 | 5,397,962 |
| Net change in unrealized appreciation/depreciation on: | | | |
| Investments | (7,969,691)3 | (11,798,519)4 | — |
| Foreign currency transactions | 94,491 | 53,294 | — |
| Investments and foreign currency transactions allocated from the Portfolio | — | — | 4,081,351 |
| | (7,875,200) | (11,745,225) | 4,081,351 |
| Total realized and unrealized gain | 18,785,699 | 12,017,846 | 9,479,313 |
| Net Increase in Net Assets Resulting from Operations | $ 18,754,091 | $ 17,043,650 | $ 9,458,033 |
1 Including $171,743 foreign capital gains tax.
2 Including $330,792 foreign capital gains tax.
3 Including $29,456 deferred foreign capital gain tax.
4 Including $49,172 deferred foreign capital gains tax.
See Notes to Financial Statements.
SEMI-ANNUAL REPORT APRIL 30, 2011 17
| | | | | | | |
| Statements of Changes in Net Assets | | | | | | |
| | BlackRock Global Emerging | BlackRock Latin | BlackRock |
| | Markets Fund, Inc. | America Fund, Inc. | International Fund |
| | Six Months | | Six Months | | | Six Months | |
| | Ended | | Ended | | | Ended | |
| | April 30, | Year Ended | April 30, | | Year Ended | April 30, | Year Ended |
| | 2011 | October 31, | 2011 | | October 31, | 2011 | October 31, |
| Increase (Decrease) in Net Assets: | (Unaudited) | 2010 | (Unaudited) | | 2010 | (Unaudited) | 2010 |
| Operations | | | | | | | |
| Net investment income (loss) | $ (31,608) | $ 1,044,952 | $ 5,025,804 | $ 7,373,532 | $ (21,280) | $ (580,078) |
| Net realized gain | 26,660,899 | 29,666,926 | 23,763,071 | | 51,273,531 | 5,397,962 | 6,856,088 |
| Net change in unrealized appreciation/depreciation | (7,875,200) | 20,381,213 | (11,745,225) | | 155,376,622 | 4,081,351 | 2,749,700 |
| Net increase in net assets resulting from operations | 18,754,091 | 51,093,091 | 17,043,650 | | 214,023,685 | 9,458,033 | 9,025,710 |
| Dividends to Shareholders From | | | | | | | |
| Net investment income: | | | | | | | |
| Institutional | (812,320) | (571,284) | (3,667,145) | | (2,062,764) | — | — |
| Investor A | (1,088,882) | (495,119) | (9,501,007) | | (7,759,663) | — | — |
| Investor B | — | — | (131,790) | | (151,277) | — | — |
| Investor C | (99,233) | (20,174) | (2,266,406) | | (1,878,791) | — | — |
| Decrease in net assets resulting from dividends | | | | | | | |
| to shareholders | (2,000,435) | (1,086,577) | (15,566,348) | | (11,852,495) | — | — |
| Capital Share Transactions | | | | | | | |
| Net increase (decrease) in net assets derived | | | | | | | |
| from capital share transactions | (33,193,594) | 32,159,861 | (1,167,237) | | 92,196,491 | 2,126,561 | (10,726,181) |
| Redemption Fee | | | | | | | |
| Redemption fee | 18,007 | 24,599 | 37,221 | | 232,820 | 3,608 | 21,640 |
| Net Assets | | | | | | | |
| Total increase (decrease) in net assets | (16,421,931) | 82,190,974 | 347,286 | | 294,600,501 | 11,588,202 | (1,678,831) |
| Beginning of period | 311,369,690 | 229,178,716 | 1,054,054,351 | | 759,453,850 | 65,214,030 | 66,892,861 |
| End of period | $ 294,947,759 | $ 311,369,690 | $1,054,401,637 | $1,054,054,351 | $ 76,802,232 | $ 65,214,030 |
| Undistributed (distributions in excess of) net | | | | | | | |
| investment income | $ (1,303,223) | $ 728,820 | $ (9,681,568) $ | 858,976 | $ (202,748) | $ (181,468) |
See Notes to Financial Statements.
18 SEMI-ANNUAL REPORT APRIL 30, 2011
| | | | | | | | |
| Financial Highlights | | | | BlackRock Global Emerging Markets Fund, Inc. |
| | | | | | | | | |
| | Six Months | | | | | | | |
| | Ended | | | Period | | | | |
| | April 30, | | July 1, 2008 | | | |
| | 2011 | Year Ended October 31, | to October 31, | Year Ended June 30, |
| | (Unaudited) | 2010 | 2009 | 2008 | 2008 | 20071 | | 20061 |
| | | | | | | | |
| | | | | Institutional | | | | |
| Per Share Operating Performance | | | | | | | | |
| Net asset value, beginning of period | $ 20.50 | $ 17.01 | $ 10.17 | $ 22.45 | $ 27.91 | $ 24.14 | $ 17.74 |
| Net investment income2 | 0.03 | 0.13 | 0.14 | 0.07 | 0.12 | 0.09 | | 0.22 |
| Net realized and unrealized gain (loss)3 | 1.40 | 3.47 | 6.75 | (10.34) | 1.28 | 8.37 | | 6.28 |
| Net increase (decrease) from investment operations | 1.43 | 3.60 | 6.89 | (10.27) | 1.40 | 8.46 | | 6.50 |
| Dividends and distributions from: | | | | | | | | |
| Net investment income | (0.20) | (0.11) | (0.05) | (0.01) | - | (0.28) | | (0.10) |
| Net realized gain | — | — | — | (2.00) | (6.86) | (4.41) | | — |
| Total dividends and distributions | (0.20) | (0.11) | (0.05) | (2.01) | (6.86) | (4.69) | | (0.10) |
| Net asset value, end of period | $ 21.73 | $ 20.50 | $ 17.01 | $ 10.17 | $ 22.45 | $ 27.91 | $ 24.14 |
| Total Investment Return4 | | | | | | | | |
| Based on net asset value | 7.03%5 | 21.28% | 68.14% | (48.15)%5 | 3.84% | 41.99% | | 36.80% |
| Ratios to Average Net Assets | | | | | | | | |
| Total expenses | 1.28%6 | 1.33% | 1.48% | 1.56%6 | 1.40% | 1.44% | | 1.50% |
| Total expenses after fees waived | 1.28%6 | 1.33% | 1.48% | 1.54%6 | 1.37% | 1.40% | | 1.50% |
| Net investment income | 0.29%6 | 0.71% | 1.10% | 1.31%6 | 0.45% | 0.36% | | 0.99% |
| Supplemental Data | | | | | | | | |
| Net assets, end of period (000) | $ 100,023 | $ 123,007 | $ 86,173 | $ 42,803 | $ 80,399 | $ 86,385 | $ 73,914 |
| Portfolio turnover | 67% | 135% | 191% | 76% | 163% | 140% | | 121% |
| | | | | | | | |
| | | | | Investor A | | | | |
| Per Share Operating Performance | | | | | | | | |
| Net asset value, beginning of period | $ 19.81 | $ 16.45 | $ 9.85 | $ 21.80 | $ 27.27 | $ 23.68 | $ 17.41 |
| Net investment income2 | —7 | 0.07 | 0.10 | 0.05 | 0.04 | 0.02 | | 0.17 |
| Net realized and unrealized gain (loss)3 | 1.34 | 3.36 | 6.53 | (10.02) | 1.25 | 8.21 | | 6.16 |
| Net increase (decrease) from investment operations | 1.34 | 3.43 | 6.63 | (9.97) | 1.29 | 8.23 | | 6.33 |
| Dividends and distributions from: | | | | | | | | |
| Net investment income | (0.15) | (0.07) | (0.03) | — | — | (0.23) | | (0.06) |
| Net realized gain | — | — | — | (1.98) | (6.76) | (4.41) | | — |
| Total dividends and distributions | (0.15) | (0.07) | (0.03) | (1.98) | (6.76) | (4.64) | | (0.06) |
| Net asset value, end of period | $ 21.00 | $ 19.81 | $ 16.45 | $ 9.85 | $ 21.80 | $ 27.27 | $ 23.68 |
| Total Investment Return4 | | | | | | | | |
| Based on net asset value | 6.81%5 | 20.93% | 67.59% | (48.18)%5 | 3.49% | 41.66% | | 36.46% |
| Ratios to Average Net Assets | | | | | | | | |
| Total expenses | 1.59%6 | 1.65% | 1.83% | 1.87%6 | 1.68% | 1.71% | | 1.75% |
| Total expenses after fees waived | 1.59%6 | 1.65% | 1.83% | 1.85%6 | 1.65% | 1.66% | | 1.75% |
| Net investment income | 0.01%6 | 0.43% | 0.80% | 0.98%6 | 0.16% | 0.10% | | 0.74% |
| Supplemental Data | | | | | | | | |
| Net assets, end of period (000) | $ 150,326 | $ 144,976 | $ 111,850 | $ 67,614 | $ 145,781 | $ 151,309 | $ 122,331 |
| Portfolio turnover. | 67% | 135% | 191% | 76% | 163% | 140% | | 121% |
| 1 Consolidated Financial Highlights. See Note 1 of the Notes to Financial Statements. | 4 Where applicable, total investment returns exclude the effects of any sales charges |
| 2 Based on average shares outstanding. | and include the reinvestment of dividends and distributions. |
| 3 Includes a redemption fee, which is less than $0.01 per share. | 5 Aggregate total investment return. |
| | 6 Annualized. |
| | 7 Amount is less than $0.01 per share. |
| See Notes to Financial Statements. | |
SEMI-ANNUAL REPORT APRIL 30, 2011 19
| | | | | | | | |
| Financial Highlights (concluded) | | | | BlackRock Global Emerging Markets Fund, Inc. |
| | | | | | | | | |
| | Six Months | | | | | | | |
| | Ended | | | Period | | | | |
| | April 30, | | July 1, 2008 | | | |
| | 2011 | Year Ended October 31, | to October 31, | Year Ended June 30, |
| | (Unaudited) | 2010 | 2009 | 2008 | 2008 | 20071 | | 20061 |
| | | | | | | | |
| | | | | Investor B | | | | |
| Per Share Operating Performance | | | | | | | | |
| Net asset value, beginning of period | $ 17.70 | $ 14.76 | $ 8.89 | $ 19.86 | $ 25.20 | $ 22.10 | $ 16.32 |
| Net investment income (loss)2 | (0.08) | (0.07) | (0.01) | 0.01 | (0.14) | (0.15) | | (0.00)3 |
| Net realized and unrealized gain (loss)4 | 1.22 | 3.01 | 5.88 | (8.98) | 1.18 | 7.62 | | 5.78 |
| Net increase (decrease) from investment operations | 1.14 | 2.94 | 5.87 | (8.97) | 1.04 | 7.47 | | 5.78 |
| Dividends and distributions from: | | | | | | | | |
| Net investment income | — | — | — | — | — | (0.13) | | — |
| Net realized gain | — | — | — | (2.00) | (6.38) | (4.24) | | — |
| Total dividends and distributions | — | — | — | (2.00) | (6.38) | (4.37) | | — |
| Net asset value, end of period | $ 18.84 | $ 17.70 | $ 14.76 | $ 8.89 | $ 19.86 | $ 25.20 | $ 22.10 |
| Total Investment Return5 | | | | | | | | |
| Based on net asset value | 6.44%6 | 19.92% | 66.03% | (48.33)%6 | 2.70% | 40.59% | | 35.42% |
| Ratios to Average Net Assets | | | | | | | | |
| Total expenses | 2.44%7 | 2.49% | 2.71% | 2.71%7 | 2.47% | 2.48% | | 2.53% |
| Total expenses after fees waived | 2.44%7 | 2.49% | 2.71% | 2.69%7 | 2.44% | 2.45% | | 2.53% |
| Net investment income (loss) | (0.86)%7 | (0.45)% | (0.08)% | 0.13%7 | (0.60)% | (0.68)% | | (0.02)% |
| Supplemental Data | | | | | | | | |
| Net assets, end of period (000) | $ 4,055 | $ 4,677 | $ 4,809 | $ 3,487 | $ 7,955 | $ 13,280 | $ 17,238 |
| Portfolio turnover | 67% | 135% | 191% | 76% | 163% | 140% | | 121% |
| | | | | | | | |
| | | | | Investor C | | | | |
| Per Share Operating Performance | | | | | | | | |
| Net asset value, beginning of period | $ 17.23 | $ 14.38 | $ 8.65 | $ 19.42 | $ 24.91 | $ 22.01 | $ 16.25 |
| Net investment income (loss)2 | (0.07) | (0.06) | (0.01) | 0.01 | (0.14) | (0.14) | | (0.01) |
| Net realized and unrealized gain (loss)4 | 1.17 | 2.92 | 5.74 | (8.89) | 1.18 | 7.53 | | 5.77 |
| Net increase (decrease) from investment operations | 1.10 | 2.86 | 5.73 | (8.88) | 1.04 | 7.39 | | 5.76 |
| Dividends and distributions from: | | | | | | | | |
| Net investment income | (0.04) | (0.01) | — | — | — | (0.13) | | — |
| Net realized gain | — | — | — | (1.89) | (6.53) | (4.36) | | — |
| Total dividends and distributions | (0.04) | (0.01) | — | (1.89) | (6.53) | (4.49) | | — |
| Net asset value, end of period | $ 18.29 | $ 17.23 | $ 14.38 | $ 8.65 | $ 19.42 | $ 24.91 | $ 22.01 |
| Total Investment Return5 | | | | | | | | |
| Based on net asset value | 6.42%6 | 19.90% | 66.24% | (48.35)%6 | 2.70% | 40.58% | | 35.45% |
| Ratios to Average Net Assets | | | | | | | | |
| Total expenses | 2.41%7 | 2.49% | 2.66% | 2.69%7 | 2.45% | 2.47% | | 2.52% |
| Total expenses after fees waived | 2.41%7 | 2.49% | 2.66% | 2.67%7 | 2.42% | 2.43% | | 2.52% |
| Net investment income (loss) | (0.81)%7 | (0.38)% | (0.08)% | 0.15%7 | (0.61)% | (0.66)% | | (0.05)% |
| Supplemental Data | | | | | | | | |
| Net assets, end of period (000) | $ 40,544 | $ 38,711 | $ 26,347 | $ 13,572 | $ 31,948 | $ 32,208 | $ 24,674 |
| Portfolio turnover. | 67% | 135% | 191% | 76% | 163% | 140% | | 121% |
| 1 Consolidated Financial Highlights. See Note 1 of the Notes to Financial Statements. | 4 Includes a redemption fee, which is less than $0.01 per share. |
| 2 Based on average shares outstanding. | 5 Where applicable, total investment returns exclude the effects of any sales charges |
| 3 Amount is less than $(0.01) per share. | and include the reinvestment of dividends and distributions. |
| | 6 Aggregate total investment return. |
| See Notes to Financial Statements. | 7 Annualized. |
20 SEMI-ANNUAL REPORT APRIL 30, 2011
| | | | | | | | |
| Financial Highlights | | | | | | BlackRock Latin America Fund, Inc. |
| | | | | | | | | |
| | Six Months | | | | | | | |
| | Ended | | | Period | | | |
| | April 30, | | December 1, 2007 | | |
| | 2011 | Year Ended October 31, | to October 31, | | Year Ended November 30, |
| | (Unaudited) | 2010 | 20091 | 20081 | | 20071 | 20061 | 20051 |
| | | | | | | | |
| | | | | Institutional | | | | |
| Per Share Operating Performance | | | | | | | | |
| Net asset value, beginning of period | $ 75.35 | $ 58.63 | $ 30.53 | $ 78.57 | $ 50.67 | $ 37.27 | $ 22.64 |
| Net investment income2 | 0.51 | 0.85 | 0.64 | 0.61 | | 0.50 | 0.65 | 0.57 |
| Net realized and unrealized gain (loss) | 0.97 | 16.82 | 27.45 | (36.41) | | 28.10 | 13.32 | 14.42 |
| Net increase (decrease) from investment operations | 1.48 | 17.67 | 28.09 | (35.80) | | 28.60 | 13.97 | 14.99 |
| Dividends and distributions from: | | | | | | | | |
| Net investment income | (1.28) | (0.97) | — | (0.80) | | (0.72) | (0.58) | (0.41) |
| Net realized gain | — | — | — | (11.47) | | — | — | — |
| Total dividends and distributions | (1.28) | (0.97) | — | (12.27) | | (0.72) | (0.58) | (0.41) |
| Redemption fee | —3 | 0.02 | 0.01 | 0.03 | | 0.02 | 0.01 | 0.05 |
| Net asset value, end of period | $ 75.55 | $ 75.35 | $ 58.63 | $ 30.53 | $ 78.57 | $ 50.67 | $ 37.27 |
| Total Investment Return4 | | | | | | | | |
| Based on net asset value | 2.04%5 | 30.52% | 92.04% | (53.70)%5 | | 57.20%6 | 38.12% | 67.55% |
| Ratios to Average Net Assets | | | | | | | | |
| Total expenses | 1.20%7 | 1.25% | 1.35% | 1.30%7 | | 1.26% | 1.31% | 1.43% |
| Total expenses after fees waived | 1.20%7 | 1.25% | 1.35% | 1.30%7 | | 1.26% | 1.31% | 1.43% |
| Net investment income | 1.38%7 | 1.31% | 1.60% | 1.04%7 | | 0.87% | 1.49% | 1.98% |
| Supplemental Data | | | | | | | | |
| Net assets, end of period (000) | $ 233,428 | $ 200,980 | $ 114,101 | $ 58,877 | $ 128,094 | $ 191,085 | $ 135,279 |
| Portfolio turnover. | 18% | 64% | 50% | 61% | | 72% | 48% | 47% |
| | | | | | | | |
| | | | | Investor A | | | | |
| Per Share Operating Performance | | | | | | | | |
| Net asset value, beginning of period | $ 74.07 | $ 57.73 | $ 30.15 | $ 77.78 | $ 50.17 | $ 36.93 | $ 22.45 |
| Net investment income2 | 0.40 | 0.65 | 0.51 | 0.44 | | 0.60 | 0.53 | 0.51 |
| Net realized and unrealized gain (loss) | 0.94 | 16.54 | 27.06 | (35.97) | | 27.60 | 13.21 | 14.29 |
| Net increase (decrease) from investment operations | 1.34 | 17.19 | 27.57 | (35.53) | | 28.20 | 13.74 | 14.80 |
| Dividends and distributions from: | | | | | | | | |
| Net investment income | (1.11) | (0.88) | — | (0.66) | | (0.61) | (0.51) | (0.37) |
| Net realized gain | — | — | — | (11.47) | | — | — | — |
| Total dividends and distributions | (1.11) | (0.88) | — | (12.13) | | (0.61) | (0.51) | (0.37) |
| Redemption fee | 0.01 | 0.03 | 0.01 | 0.03 | | 0.02 | 0.01 | 0.05 |
| Net asset value, end of period | $ 74.31 | $ 74.07 | $ 57.73 | $ 30.15 | $ 77.78 | $ 50.17 | $ 36.93 |
| Total Investment Return4 | | | | | | | | |
| Based on net asset value | 1.89%5 | 30.15% | 91.48% | (53.82)%5 | | 56.85%6 | 37.77% | 67.10% |
| Ratios to Average Net Assets | | | | | | | | |
| Total expenses | 1.49%7 | 1.53% | 1.63% | 1.55%7 | | 1.51% | 1.57% | 1.68% |
| Total expenses after fees waived | 1.49%7 | 1.53% | 1.63% | 1.55%7 | | 1.51% | 1.57% | 1.68% |
| Net investment income | 1.09%7 | 1.00% | 1.26% | 0.76%7 | | 0.92% | 1.23% | 1.81% |
| Supplemental Data | | | | | | | | |
| Net assets, end of period (000) | $ 578,515 | $ 616,664 | $ 475,611 | $ 176,711 | $ 433,844 | $ 191,187 | $ 139,062 |
| Portfolio turnover. | 18% | 64% | 50% | 61% | | 72% | 48% | 47% |
| 1 Consolidated Financial Highlights. See Note 1 to the Notes to Financial Statements. | 5 Aggregate total investment return. |
| 2 Based on average shares outstanding. | 6 The investment advisor reimbursed the Fund in order to resolve a regulatory issue |
| 3 Amount is less than $0.01 per share. | relating to an investment, which increased the return by 0.02%. |
| 4 Where applicable, total investment returns exclude the effects of any sales charges | 7 Annualized. |
| and include the reinvestment of dividends and distributions. | |
| See Notes to Financial Statements. | |
SEMI-ANNUAL REPORT APRIL 30, 2011 21
| | | | | | | | |
| Financial Highlights (concluded) | | | | | | BlackRock Latin America Fund, Inc. |
| | | | | | | | | |
| | Six Months | | | | | | | |
| | Ended | | | Period | | | |
| | April 30, | | December 1, 2007 | | |
| | 2011 | Year Ended October 31, | to October 31, | | Year Ended November 30, |
| | (Unaudited) | 2010 | 20091 | 20081 | | 20071 | 20061 | 20051 |
| | | | | | | | |
| | | | | Investor B | | | | |
| Per Share Operating Performance | | | | | | | | |
| Net asset value, beginning of period | $ 69.31 | $ 54.12 | $ 28.54 | $ 74.38 | $ 48.00 | $ 35.33 | $ 21.45 |
| Net investment income (loss)2 | 0.08 | 0.12 | 0.15 | (0.04) | | 0.05 | 0.20 | 0.29 |
| Net realized and unrealized gain (loss) | 0.92 | 15.50 | 25.42 | (34.09) | | 26.52 | 12.68 | 13.70 |
| Net increase (decrease) from investment operations | 1.00 | 15.62 | 25.57 | (34.13) | | 26.57 | 12.88 | 13.99 |
| Dividends and distributions from: | | | | | | | | |
| Net investment income | (0.50) | (0.45) | — | (0.27) | | (0.21) | (0.22) | (0.16) |
| Net realized gain | — | — | — | (11.47) | | — | — | — |
| Total dividends and distributions | (0.50) | (0.45) | — | (11.74) | | (0.21) | (0.22) | (0.16) |
| Redemption fee | —3 | 0.02 | 0.01 | 0.03 | | 0.02 | 0.01 | 0.05 |
| Net asset value, end of period | $ 69.81 | $ 69.31 | $ 54.12 | $ 28.54 | $ 74.38 | $ 48.00 | $ 35.33 |
| Total Investment Return4 | | | | | | | | |
| Based on net asset value | 1.47%5 | 29.06% | 89.63% | (54.18)%5 | | 55.61%6 | 36.72% | 65.91% |
| Ratios to Average Net Assets | | | | | | | | |
| Total expenses | 2.33%7 | 2.37% | 2.62% | 2.39%7 | | 2.32% | 2.34% | 2.46% |
| Total expenses after fees waived | 2.33%7 | 2.37% | 2.62% | 2.39%7 | | 2.32% | 2.34% | 2.46% |
| Net investment income (loss) | 0.23%7 | 0.21% | 0.40% | (0.08)%7 | | 0.09% | 0.48% | 1.10% |
| Supplemental Data | | | | | | | | |
| Net assets, end of period (000) | $ 16,820 | $ 18,660 | $ 18,695 | $ 11,794 | $ 31,268 | $ 13,911 | $ 12,144 |
| Portfolio turnover. | 18% | 64% | 50% | 61% | | 72% | 48% | 47% |
| | | | | | | | |
| | | | | Investor C | | | | |
| Per Share Operating Performance | | | | | | | | |
| Net asset value, beginning of period | $ 67.92 | $ 53.17 | $ 28.01 | $ 73.28 | $ 47.40 | $ 35.07 | $ 21.38 |
| Net investment income (loss)2 | 0.10 | 0.14 | 0.17 | (0.01) | | 0.11 | 0.17 | 0.25 |
| Net realized and unrealized gain (loss) | 0.88 | 15.21 | 24.98 | (33.46) | | 26.08 | 12.56 | 13.64 |
| Net increase (decrease) from investment operations | 0.98 | 15.35 | 25.15 | (33.47) | | 26.19 | 12.73 | 13.89 |
| Dividends and distributions from: | | | | | | | | |
| Net investment income | (0.69) | (0.62) | — | (0.36) | | (0.33) | (0.41) | (0.25) |
| Net realized gain | — | — | — | (11.47) | | — | — | — |
| Total dividends and distributions | (0.69) | (0.62) | — | (11.83) | | (0.33) | (0.41) | (0.25) |
| Redemption fee | —3 | 0.02 | 0.01 | 0.03 | | 0.02 | 0.01 | 0.05 |
| Net asset value, end of period | $ 68.21 | $ 67.92 | $ 53.17 | $ 28.01 | $ 73.28 | $ 47.40 | $ 35.07 |
| Total Investment Return4 | | | | | | | | |
| Based on net asset value | 1.48%5 | 29.15% | 89.82% | (54.16)%5 | | 55.62%6 | 36.75% | 65.90% |
| Ratios to Average Net Assets | | | | | | | | |
| Total expenses | 2.27%7 | 2.32% | 2.49% | 2.35%7 | | 2.29% | 2.34% | 2.45% |
| Total expenses after fees waived | 2.27%7 | 2.32% | 2.49% | 2.35%7 | | 2.29% | 2.34% | 2.45% |
| Net investment income (loss) | 0.30%7 | 0.24% | 0.46% | (0.02)%7 | | 0.17% | 0.42% | 0.94% |
| Supplemental Data | | | | | | | | |
| Net assets, end of period (000) | $ 225,639 | $ 217,750 | $ 151,046 | $ 72,714 | $ 164,742 | $ 50,609 | $ 25,071 |
| Portfolio turnover. | 18% | 64% | 50% | 61% | | 72% | 48% | 47% |
| 1 Consolidated Financial Highlights. See Note 1 to the Notes to Financial Statements. | 5 Aggregate total investment return. |
| 2 Based on average shares outstanding. | 6 The investment advisor reimbursed the Fund in order to resolve a regulatory issue |
| 3 Amount is less than $0.01 per share. | relating to an investment, which increased the return by 0.02%. |
| 4 Where applicable, total investment returns exclude the effects of any sales charges | 7 Annualized. |
| and include the reinvestment of dividends and distributions. | |
| See Notes to Financial Statements. | |
22 SEMI-ANNUAL REPORT APRIL 30, 2011
| | | | | | | | | |
| Financial Highlights | | | | | | | BlackRock International Fund |
| | | | | | | | | | |
| | Six Months | | | | | | | | |
| | Ended | | | Period | | | | | |
| | April 30, | | June 1, 2008 | | | | |
| | 2011 | Year Ended October 31, | to October 31, | Year Ended May 31, |
| | (Unaudited) | 2010 | 2009 | 2008 | | 2008 | 2007 | | 2006 |
| | | | | | | | | |
| | | | | Institutional | | | | | |
| Per Share Operating Performance | | | | | | | | | |
| Net asset value, beginning of period | $ 12.86 | $ 10.91 | $ 8.20 | $ 15.01 | $ 14.18 | $ 12.38 | $ 10.05 |
| Net investment income (loss)1 | 0.07 | (0.01) | 0.09 | 0.04 | | 0.19 | 0.12 | | 0.08 |
| Net realized and unrealized gain (loss)2 | 1.82 | 1.96 | 2.62 | (6.68) | | 0.73 | 1.87 | | 2.39 |
| Net increase (decrease) from investment operations | 1.89 | 1.95 | 2.71 | (6.64) | | 0.92 | 1.99 | | 2.47 |
| Dividends from net investment income | — | — | — | (0.17) | | (0.09) | (0.19) | | (0.14) |
| Net asset value, end of period | $ 14.75 | $ 12.86 | $ 10.91 | $ 8.20 | $ 15.01 | $ 14.18 | $ 12.38 |
| Total Investment Return3 | | | | | | | | | |
| Based on net asset value | 14.70%4 | 17.87% | 33.05% | (44.63)%4 | | 6.58% | 16.29% | | 24.80% |
| Ratios to Average Net Assets5 | | | | | | | | | |
| Total expenses | 1.74%6 | 1.77% | 2.03% | 1.70%6 | | 1.54% | 1.65% | | 1.74% |
| Net investment income (loss) | 0.97%6 | (0.13)% | 0.99% | 0.75%6 | | 1.32% | 0.97% | | 0.72% |
| Supplemental Data | | | | | | | | | |
| Net assets, end of period (000) | $ 5,943 | $ 2,645 | $ 5,133 | $ 5,161 | $ 10,904 | $ 12,133 | $ 12,453 |
| Portfolio turnover of the Portfolio | 56% | 154% | 178% | 78% | | 153% | 151% | | 96% |
| | | | | | | | | |
| | | | | Investor A | | | | | |
| Per Share Operating Performance | | | | | | | | | |
| Net asset value, beginning of period | $ 12.66 | $ 10.76 | $ 8.12 | $ 14.85 | $ 14.04 | $ 12.26 | $ 9.94 |
| Net investment income (loss)1 | 0.02 | (0.06) | 0.05 | 0.02 | | 0.17 | 0.10 | | 0.06 |
| Net realized and unrealized gain (loss)2 | 1.81 | 1.96 | 2.59 | (6.62) | | 0.70 | 1.84 | | 2.36 |
| Net increase (decrease) from investment operations | 1.83 | 1.90 | 2.64 | (6.60) | | 0.87 | 1.94 | | 2.42 |
| Dividends from net investment income | — | — | — | (0.13) | | (0.06) | (0.16) | | (0.10) |
| Net asset value, end of period | $ 14.49 | $ 12.66 | $ 10.76 | $ 8.12 | $ 14.85 | $ 14.04 | $ 12.26 |
| Total Investment Return3 | | | | | | | | | |
| Based on net asset value | 14.45%4 | 17.66% | 32.51% | (44.72)%4 | | 6.25% | 16.02% | | 24.51% |
| Ratios to Average Net Assets5 | | | | | | | | | |
| Total expenses | 2.07%6 | 2.08% | 2.40% | 2.02%6 | | 1.84% | 1.91% | | 1.98% |
| Net investment income (loss) | 0.27%6 | (0.51)% | 0.54% | 0.50%6 | | 1.18% | 0.77% | | 0.53% |
| Supplemental Data | | | | | | | | | |
| Net assets, end of period (000) | $ 44,806 | $ 37,035 | $ 28,949 | $ 22,537 | $ 42,052 | $ 35,750 | $ 21,807 |
| Portfolio turnover of the Portfolio | 56% | 154% | 178% | 78% | | 153% | 151% | | 96% |
| 1 Based on average shares outstanding. | 4 Aggregate total investment return. |
| 2 Includes a redemption fee, which is less than $0.01 per share. | 5 Includes the Fund’s share of the Portfolio’s allocated expenses and/or net invest- |
| 3 Where applicable, total investment returns exclude the effects of any sales charges | ment income (loss). |
| and include the reinvestment of dividends and distributions. | 6 Annualized. |
See Notes to Financial Statements.
SEMI-ANNUAL REPORT APRIL 30, 2011 23
| | | | | | | | | |
| Financial Highlights (concluded) | | | | | | | BlackRock International Fund |
| | | | | | | | | | |
| | Six Months | | | | | | | | |
| | Ended | | | Period | | | | | |
| | April 30, | | June 1, 2008 | | | | |
| | 2011 | Year Ended October 31, | to October 31, | Year Ended May 31, |
| | (Unaudited) | 2010 | 2009 | 2008 | | 2008 | 2007 | | 2006 |
| | | | | Investor B | | | | | |
| Per Share Operating Performance | | | | | | | | | |
| Net asset value, beginning of period | $ 11.84 | $ 10.18 | $ 7.77 | $ 14.13 | $ 13.44 | $ 11.75 | $ 9.54 |
| Net investment loss1 | (0.07) | (0.17) | (0.04) | (0.03) | | (0.01) | (0.02) | | (0.03) |
| Net realized and unrealized gain (loss)2 | 1.70 | 1.83 | 2.45 | (6.33) | | 0.70 | 1.78 | | 2.27 |
| Net increase (decrease) from investment operations | 1.63 | 1.66 | 2.41 | (6.36) | | 0.69 | 1.76 | | 2.24 |
| Dividends from net investment income | — | — | — | — | | — | (0.07) | | (0.03) |
| Net asset value, end of period | $ 13.47 | $ 11.84 | $ 10.18 | $ 7.77 | $ 14.13 | $ 13.44 | $ 11.75 |
| Total Investment Return3 | | | | | | | | | |
| Based on net asset value | 13.77%4 | 16.31% | 31.02% | (45.01)%4 | | 5.13% | 15.02% | | 23.52% |
| Ratios to Average Net Assets5 | | | | | | | | | |
| Total expenses | 3.28%6 | 3.21% | 3.61% | 3.17%6 | | 2.90% | 2.76% | | 2.76% |
| Net investment loss | (1.09)%6 | (1.65)% | (0.54)% | (0.70)%6 | | (0.11)% | (0.20)% | | (0.31)% |
| Supplemental Data | | | | | | | | | |
| Net assets, end of period (000) | $ 10,401 | $ 11,898 | $ 20,342 | $ 20,878 | $ 44,254 | $ 56,428 | $ 71,575 |
| Portfolio turnover of the Portfolio | 56% | 154% | 178% | 78% | | 153% | 151% | | 96% |
| | | | | | | | | |
| | | | | Investor C | | | | | |
| Per Share Operating Performance | | | | | | | | | |
| Net asset value, beginning of period | $ 12.00 | $ 10.28 | $ 7.81 | $ 14.19 | $ 13.45 | $ 11.75 | $ 9.54 |
| Net investment income (loss)1 | (0.03) | (0.13) | (0.01) | (0.01) | | 0.04 | (0.01) | | (0.03) |
| Net realized and unrealized gain (loss)2 | 1.72 | 1.85 | 2.48 | (6.35) | | 0.70 | 1.78 | | 2.27 |
| Net increase (decrease) from investment operations | 1.69 | 1.72 | 2.47 | (6.36) | | 0.74 | 1.77 | | 2.24 |
| Dividends from net investment income | — | — | — | (0.02) | | — | (0.07) | | (0.03) |
| Net asset value, end of period | $ 13.69 | $ 12.00 | $ 10.28 | $ 7.81 | $ 14.19 | $ 13.45 | $ 11.75 |
| Total Investment Return3 | | | | | | | | | |
| Based on net asset value | 14.08%4 | 16.73% | 31.63% | (44.87)%4 | | 5.50% | 15.09% | | 23.47% |
| Ratios to Average Net Assets5 | | | | | | | | | |
| Total expenses | 2.78%6 | 2.80% | 3.09% | 2.74%6 | | 2.57% | 2.68% | | 2.77% |
| Net investment income (loss) | (0.46)%6 | (1.23)% | (0.07)% | (0.25)%6 | | 0.32% | (0.09)% | | (0.32)% |
| Supplemental Data | | | | | | | | | |
| Net assets, end of period (000) | $ 15,653 | $ 13,636 | $ 12,470 | $ 10,543 | $ 20,892 | $ 22,133 | $ 23,463 |
| Portfolio turnover of the Portfolio | 56% | 154% | 178% | 78% | | 153% | 151% | | 96% |
| 1 Based on average shares outstanding. | 4 Aggregate total investment return. |
| 2 Includes a redemption fee, which is less than $0.01 per share. | 5 Includes the Fund’s share of the Portfolio’s allocated expenses and/or net |
| 3 Where applicable, total investment returns exclude the effects of any sales charges | investment income (loss). |
| and include the reinvestment of dividends and distributions. | 6 Annualized. |
See Notes to Financial Statements.
24 SEMI-ANNUAL REPORT APRIL 30, 2011
Notes to Financial Statements (Unaudited)
1. Organization and Significant Accounting Policies:
BlackRock Global Emerging Markets Fund, Inc. (“Global Emerging
Markets”), BlackRock Latin America Fund, Inc. (“Latin America”) and
BlackRock International Fund (“International”), a series of BlackRock
Series, Inc. (the “Corporation”) (collectively the “Funds” or individually the
“Fund”), are registered under the Investment Company Act of 1940, as
amended (the “1940 Act”). Each Fund is organized as a Maryland corp-
oration. International is registered as a diversified, open-end management
investment company. Global Emerging Markets and Latin America are regis-
tered as non-diversified, open-end management investment companies. The
Funds' financial statements are prepared in conformity with accounting
principles generally accepted in the United States of America ("US GAAP"),
which may require management to make estimates and assumptions that
affect the reported amounts and disclosures in the financial statements.
Actual results could differ from those estimates. Each Fund offers multiple
classes of shares. Institutional Shares are sold without a sales charge and
only to certain eligible investors. Investor A Shares are generally sold with
a front-end sales charge. Investor B and Investor C Shares may be subject
to a contingent deferred sales charge. All classes of shares have identical
voting, dividend, liquidation and other rights and the same terms and
conditions, except that Investor A, Investor B and Investor C bear certain
expenses related to the shareholder servicing of such shares, and Investor
B and Investor C also bear certain expenses related to the distribution of
such shares. Investor B Shares automatically convert to Investor A Shares
after approximately eight years. Investor B Shares are only available
through exchanges, dividend reinvestment by existing shareholders or for
purchase by certain qualified employee benefit plans. Each class has
exclusive voting rights with respect to matters relating to its shareholder
servicing and distribution expenditures (except that Investor B shareholders
may vote on material changes to the Investor A distribution plan).
International seeks to achieve its investment objective by investing all
of its assets in BlackRock Master International Portfolio (the “Portfolio”), a
series of BlackRock Master LLC (the “Master LLC”), which has the same
investment objective and strategies as International. The value of the Fund’s
investment in the Portfolio reflects International’s proportionate interest in
the net assets of the Portfolio. The performance of International is directly
affected by the performance of the Portfolio. The financial statements of the
Portfolio, including the Schedule of Investments, are included elsewhere in
this report and should be read in conjunction with the Fund’s financial
statements. The percentage of the Portfolio owned by the Fund at April 30,
2011 was 100%.
Reorganization: On March 14, 2011, the Board of Directors of the Fund
approved a plan or reorganization, subject to shareholder approval and
certain other conditions, whereby International will acquire substantially
all of the assets and assume certain stated liabilities of the BlackRock
International Value Fund in exchange for newly issued shares
of International.
The following is a summary of significant accounting policies followed by
the Funds:
Valuation: US GAAP defines fair value as the price the Funds' would
receive to sell an asset or pay to transfer a liability in an orderly transaction
between market participants at the measurement date. The Funds fair value
their financial instruments at market value using independent dealers or
pricing services under policies approved by the Board of Directors (the
"Board"). Equity investments traded on a recognized securities exchange
or the NASDAQ Global Market System ("NASDAQ") are valued at the last
reported sale price that day or the NASDAQ official closing price, if applica-
ble. For equity investments traded on more than one exchange, the last
reported sale price on the exchange where the stock is primarily traded is
used. Equity investments traded on a recognized exchange for which there
were no sales on that day are valued at the last available bid price. If no
bid price is available, the prior day’s price will be used, unless it is deter-
mined that such prior day’s price no longer reflects the fair value of the
security. Investments in open-end investment companies are valued at
net asset value each business day. Short-term securities with remaining
maturities of 60 days or less may be valued at amortized cost, which
approximates fair value.
The Funds value their investments in BlackRock Liquidity Series, LLC
Money Market Series (the “Money Market Series”) at fair value, which is
ordinarily based upon their pro rata ownership in the net assets of the
underlying fund. The Money Market Series seeks current income consistent
with maintaining liquidity and preserving capital. Although the Money
Market Series is not registered under the 1940 Act, its investments will
follow the parameters of investments by a money market fund that is sub-
ject to Rule 2a-7 under the 1940 Act. The Funds may withdraw up to 25%
of their investment daily, although the manager of the Money Market Series,
in its sole discretion, may permit an investor to withdraw more than 25%
on any one day.
Securities and other assets and liabilities denominated in foreign curren-
cies are translated into US dollars using exchange rates determined as of
the close of business on the New York Stock Exchange (“NYSE”). Foreign
currency exchange contracts are valued at the mean between the bid and
ask prices and are determined as of the close of business on the NYSE.
Interpolated values are derived when the settlement date of the contract is
an interim date for which quotations are not available.
In the event that application of these methods of valuation results in a
price for an investment which is deemed not to be representative of the
market value of such investment or is not available, the investment will
be valued in accordance with a policy approved by the Board as reflecting
fair value (“Fair Value Assets”). When determining the price for Fair Value
Assets, the investment advisor and/or the sub-advisor seeks to determine
the price that each Fund might reasonably expect to receive from the cur-
rent sale of that asset in an arm’s-length transaction. Fair value determina-
tions shall be based upon all available factors that the investment advisor
and/or sub-advisor deems relevant. The pricing of all Fair Value Assets is
subsequently reported to the Board or a committee thereof.
Generally, trading in foreign instruments is substantially completed
each day at various times prior to the close of business on the NYSE.
Occasionally, events affecting the values of such instruments may occur
between the foreign market close and the close of business on the NYSE
that may not be reflected in the computation of each Fund's net assets.
If events (for example, a company announcement, market volatility or a
natural disaster) occur during such periods that are expected to materially
affect the value of such instruments, those instruments may be Fair Value
Assets and be valued at their fair value, as determined in good faith by the
investment advisor using a pricing service and/or policies approved by the
SEMI-ANNUAL REPORT APRIL 30, 2011 25
Notes to Financial Statements (continued)
Board. Each business day, the Funds use a pricing service to assist with
the valuation of certain foreign exchange-traded equity securities and
foreign exchange-traded and over-the-counter (“OTC”) options (the
“Systematic Fair Value Price”). Using current market factors, the Systematic
Fair Value Price is designed to value such foreign securities and foreign
options at fair value as of the close of business on the NYSE, which follows
the close of the local markets.
International records its investment in the Portfolio at fair value based on
the Fund’s proportionate interest in the net assets of the Portfolio. Valuation
of securities held by the Portfolio, including categorization of fair value
measurements, is discussed in Note 1 of the Portfolio’s Notes to Financial
Statements, which are included elsewhere in this report.
Foreign Currency Transactions: The Funds' books and records are main-
tained in US dollars. Purchases and sales of investment securities are
recorded at the rates of exchange prevailing on the date the transactions
are entered into. Generally, when the US dollar rises in value against a for-
eign currency, the Funds' investments denominated in that currency will
lose value because its currency is worth fewer US dollars; the opposite
effect occurs if the US dollar falls in relative value.
The Funds report realized currency gains (losses) on foreign currency
related transactions as components of net realized gain (loss) for financial
reporting purposes, whereas such components are treated as ordinary
income for federal income tax purposes.
Participation Notes: Global Emerging Markets and Latin America may invest
in participation notes (“P-Notes”). P-Notes are promissory notes issued by
banks or broker-dealers that are designed to offer the Fund a return meas-
ured by the change in the value of the underlying security or basket of
securities (the “underlying security”) while not holding the actual shares of
the underlying security. P-Notes are typically used to allow the Fund to gain
exposure to securities traded in foreign markets that may be restricted due
to country-specific regulations. When the P-Note matures, the issuer will
pay to, or receive from, the Fund the difference between the value of the
underlying security at the time of the purchase and the underlying secu-
rity’s value at maturity of the P-Notes. Income received on P-Notes is
recorded by the Fund as dividend income in the Statement of Operations.
An investment in a P-Note involves additional risks beyond the risks nor-
mally associated with a direct investment in the underlying security. While
the holder of a P-Note is entitled to receive from the bank or broker-dealer
any dividends paid by the underlying security, the holder is not entitled to
the same rights (e.g., voting rights) as a direct owner of the underlying
security. P-Notes are considered general unsecured contractual obligations
of the bank or broker-dealer. The Fund must rely on the creditworthiness of
the issuer for its investment returns on the P-Notes and has no rights
against the issuer of the underlying security. A P-Note may be more volatile
and less liquid than other investments held by the Fund since the P-Note
generally is dependent on the liquidity in the local trading market for the
underlying security.
Segregation and Collateralization: In cases in which the 1940 Act and the
interpretive positions of the Securities and Exchange Commission (“SEC”)
require that the Funds either deliver collateral or segregate assets in con-
nection with certain investments (e.g., foreign currency exchange contracts)
the Funds will, consistent with SEC rules and/or certain interpretive letters
issued by the SEC, segregate collateral or designate on their books and
records cash or other liquid securities having a market value at least equal
to the amount that would otherwise be required to be physically
segregated. Furthermore, based on requirements and agreements with
certain exchanges and third party broker-dealers, each party to such
transactions has requirements to deliver/deposit securities as collateral
for certain investments.
Investment Transactions and Investment Income: For financial reporting
purposes, investment transactions are recorded on the dates the transac-
tions are entered into (the trade dates). For financial reporting purposes,
contributions to and withdrawals from the Portfolio are accounted on a
trade date basis. Realized gains and losses on investment transactions are
determined on the identified cost basis. Dividend income is recorded on
the ex-dividend dates. Dividends from foreign securities where the ex-divi-
dend date may have passed are subsequently recorded when the Fund is
informed of the ex-dividend date. Under the applicable foreign tax laws, a
withholding tax at various rates may be imposed on capital gains, divi-
dends and interest. Upon notification from issuers, some of the dividend
income received from a real estate investment trust may be redesignated
as a reduction of cost of the related investment and/or realized gain.
Interest income, including amortization and accretion of premiums and
discounts on debt securities, is recognized on the accrual basis. Income
and realized and unrealized gains and losses are allocated daily to each
class based on its relative net assets. Consent fees are compensation for
agreeing to changes in the terms of debt instruments and are included in
interest income in the Statements of Operations. The International Fund
records daily its proportionate share of the Master Portfolio’s income,
expenses and realized and unrealized gains and losses.
Dividends and Distributions: Dividends and distributions paid by the
Funds are recorded on the ex-dividend dates. The amount and timing of
dividends and distributions are determined in accordance with federal
income tax regulations, which may differ from US GAAP.
Securities Lending: Latin America may lend securities to approved borrow-
ers, such as banks, brokers and other financial institutions. The borrower
pledges cash, securities issued or guaranteed by the US government or
irrevocable letters of credit issued by a bank as collateral, which will be
maintained at all times in an amount equal to at least 100% of the
current market value of the loaned securities. The market value of the
loaned securities is determined at the close of business of Latin America
and any additional required collateral is delivered to Latin America on
the next business day. Securities lending income, as disclosed in the
Statements of Operations, represents the income earned from the invest-
ment of the cash collateral, net of rebates paid to, or fees paid by, borrow-
ers and less the fees paid to the securities lending agent. During the term
of the loan, Latin America earns dividends and interest on the securities
loaned but does not receive dividend or interest income on the securities
received as collateral. Loans of securities are terminable at any time and
the borrower, after notice, is required to return borrowed securities within
the standard time period for settlement of securities transactions. In the
event that the borrower defaults on its obligation to return borrowed secur-
ities because of insolvency or for any other reason, Latin America could
experience delays and costs in gaining access to the collateral. Latin
America also could suffer a loss if the value of an investment purchased
with cash collateral falls below the market value of loaned securities or if
26 SEMI-ANNUAL REPORT APRIL 30, 2011
Notes to Financial Statements (continued)
the value of an investment purchased with cash collateral falls below the
value of the original cash collateral received. During the period, Latin
America accepted only cash collateral in connection with securities loaned.
Income Taxes: It is each Fund's policy to comply with the requirements
of the Internal Revenue Code of 1986, as amended, applicable to regu-
lated investment companies and to distribute substantially all of its
taxable income to its shareholders. Therefore, no federal income tax provi-
sion is required.
Each Fund files US federal and various state and local tax returns. No
income tax returns are currently under examination. The statute of limita-
tions on Global Emerging Market’s US federal tax returns remains open
for the two years ended October 31, 2010, the period ended October 31,
2008 and the year ended June 30, 2008. The statute of limitations on
Latin America’s US federal tax returns remains open for the two years
ended October 31, 2010, the period ended October 31, 2008 and
the year ended November 30, 2007. The statute of limitations on
International’s US federal tax returns remains open for the two years
ended October 31, 2010, the period ended October 31, 2008 and the
year ended May 31, 2008. The statutes of limitations on each Fund’s state
and local tax returns may remain open for an additional year depending
upon the jurisdiction. Management does not believe there are any uncer-
tain tax positions that require recognition of a tax liability.
Basis of Consolidation:
Global Emerging Markets
The Fund’s accompanying consolidated Financial Highlights for each
of the years in the two-year period ended June 30, 2007 include the
accounts of Inversiones en Marcado Accionario de Valores Chile Limitada,
a wholly owned subsidiary of the Fund. The subsidiary was created for
regulatory purposes to invest in Chilean securities. Intercompany accounts
and transactions have been eliminated. During the year ended June 30,
2007, Inversiones en Marcado Accionario de Valores Chile Limitada
was dissolved.
Latin America
The Fund’s accompanying consolidated Financial Highlights for each of
the three years ended November 30, 2007 and for the two periods ended
October 31, 2009 include the accounts of Merrill Lynch Latin America
Fund Chile Ltd., a wholly owned subsidiary of the Fund. The subsidiary
was created for regulatory purposes to invest in Chilean securities.
Intercompany accounts and transactions have been eliminated. During
the year ended October 31, 2009, Merrill Lynch Latin America Fund
Chile Ltd. was dissolved.
Other: Expenses directly related to a Fund or its classes are charged to
that Fund or class. Other operating expenses shared by several funds are
pro rated among those funds on the basis of relative net assets or other
appropriate methods. Other expenses of the Fund are allocated daily to
each class based on its relative net assets. Each Fund has an arrangement
with the custodian whereby fees may be reduced by credits earned on
uninvested cash balances, which if applicable are shown as fees paid indi-
rectly in the Statements of Operations. The custodian imposes fees on
overdrawn cash balances, which can be offset by accumulated credits
earned or may result in additional custody charges.
2. Derivative Financial Instruments:
The Funds engage in various portfolio investment strategies using derivative
contracts both to increase the returns of the Funds and to economically
hedge, or protect, their exposure to certain risks such as foreign currency
exchange rate risk.
Losses may arise if the value of the contract decreases due to an unfavor-
able change in the market rates or values of the underlying instrument or
if the counterparty does not perform under the contract. The Funds' maxi-
mum risk of loss from counterparty credit risk on OTC derivatives is gener-
ally the aggregate unrealized gain netted against any collateral pledged
by/posted to the counterparty. Counterparty risk related to exchange-traded
financial futures contracts and options is deemed to be minimal due to
the protection against defaults provided by the exchange on which these
contracts trade.
The Funds may mitigate counterparty risk by procuring collateral and
through netting provisions included within an International Swaps and
Derivatives Association, Inc. master agreement (“ISDA Master Agreement”)
implemented between a Fund and each of its respective counterparties.
The ISDA Master Agreement allows each Fund to offset with each separate
counterparty certain derivative financial instrument’s payables and/or
receivables with collateral held. The amount of collateral moved to/from
applicable counterparties is generally based upon minimum transfer
amounts of up to $500,000. To the extent amounts due to a Fund from its
counterparties are not fully collateralized contractually or otherwise, the
Fund bears the risk of loss from counterparty non-performance. See Note 1
“Segregation and Collateralization” for information with respect to collateral
practices. In addition, each Fund manages counterparty risk by entering
into agreements only with counterparties that it believes have the financial
resources to honor their obligations and by monitoring the financial stability
of those counterparties.
Certain ISDA Master Agreements allow counterparties to OTC derivatives to
terminate derivative contracts prior to maturity in the event a Fund’s net
assets decline by a stated percentage or the Fund fails to meet the terms
of its ISDA Master Agreements, which would cause the Fund to accelerate
payment of any net liability owed to the counterparty.
Foreign Currency Exchange Contracts: The Funds enter into foreign cur-
rency exchange contracts as an economic hedge against either specific
transactions or portfolio instruments or to obtain exposure to foreign cur-
rencies (foreign currency exchange rate risk). A foreign currency exchange
contract is an agreement between two parties to buy and sell a currency at
a set exchange rate on a future date. Foreign currency exchange contracts,
when used by the Funds, help to manage the overall exposure to the cur-
rencies in which some of the investments held by the Funds are denomi-
nated. The contract is marked-to-market daily and the change in market
value is recorded by the Funds as an unrealized gain or loss. When the
contract is closed, the Funds record a realized gain or loss equal to the dif-
ference between the value at the time it was opened and the value at the
time it was closed. The use of foreign currency exchange contracts involves
the risk that the value of a foreign currency exchange contract changes
unfavorably due to movements in the value of the referenced foreign cur-
rencies and the risk that a counterparty to the contract does not perform
its obligations under the agreement.
SEMI-ANNUAL REPORT APRIL 30, 2011 27
Notes to Financial Statements (continued)
| | | | |
| Derivative Financial Instruments Categorized by Risk Exposure: | |
| Fair Values of Derivative Financial Instruments as of April 30, 2011 |
|
| Asset Derivatives |
|
| | | Global | | |
| | | Emerging | | |
| | | Markets | Latin America |
| | Statement of Assets | | | |
| | and Liabilities | | | |
| | Location | | Value | |
| | Unrealized appreciation | | | |
| Foreign currency | on foreign currency | | | |
| exchange contracts | exchange contracts | $ 46 | $ 59 |
| | |
| The Effect of Derivative Financial Instruments |
| in the Statements of Operations |
| Six Months Ended April 30, 2011 |
|
| Net Realized Loss From |
|
| | Global | |
| | Emerging Markets | Latin America |
| Foreign currency exchange contracts: | | |
| Foreign currency exchange contracts | $ (143,864) | $ (313,828) |
| Net Change in Unrealized Appreciation/Depreciation on |
|
| | Global | |
| | Emerging Markets | Latin America |
| Foreign currency exchange contracts: | | |
| Foreign currency exchange contracts | $ 16,656 | $ 4,172 |
For the six months ended April 30, 2011, the average quarterly balances of
outstanding derivative financial instruments were as follows:
| | |
| | Global | |
| | Emerging Markets | Latin America |
| Foreign currency exchange contracts: | | |
| Average number of contracts-US | | |
| dollars purchased | 1 | 4 |
| Average number of contracts-US | | |
| dollars sold | 1 | 1 |
| Average US dollar amounts purchased | $ 11,421 | $ 819,649 |
| Average US dollar amounts sold | $ 114,201 | $ 2,083,038 |
3. Investment Advisory Agreement and Other Transactions
with Affiliates:
As of April 30, 2011, The PNC Financial Services Group, Inc. ("PNC"), Bank
of America Corporation ("BAC") and Barclays Bank PLC ("Barclays") were
the largest stockholders of BlackRock, Inc. ("BlackRock"). Due to the own-
ership structure, PNC is an affiliate of the Funds for 1940 Act purposes, but
BAC and Barclays are not.
Global Emerging Markets and Latin America each entered into an
Investment Advisory Agreement with BlackRock Advisors, LLC (the
“Manager”), each Fund’s investment advisor, an indirect, wholly owned
subsidiary of BlackRock, to provide investment advisory and administra-
tion services. The Manager is responsible for the management of each
Fund's portfolio and provides the necessary personnel, facilities, equip-
ment and certain other services necessary to the operations of each
Fund. For such services, Global Emerging Markets and Latin America each
pay the Manager a monthly fee at an annual rate of 1.00% of the Fund's
average daily net assets.
The Manager voluntarily agreed to waive its investment advisory fees by the
amount of investment advisory fees each Fund pays to the Manager indi-
rectly through its investment in affiliated money market funds. This amount
is shown as, or included in, fees waived by advisor in the Statements of
Operations. However the Manager does not waive its investment advisory
fees by the amount of investment advisory fees paid as a result of each
Fund's investment in other affiliated investment companies, if any.
The Manager entered into a sub-advisory agreement with BlackRock
Investment Management, LLC (“BIM”) with respect to each Fund and
BlackRock International Limited (“BIL”), with respect to Global Emerging
Markets and Latin America. Each of BIM and BIL is an affiliate of the
Manager. The Manager pays each sub-advisor for services it provides, a
monthly fee that is a percentage of the investment advisory fees paid by
the Funds to the Manager.
The Corporation, on behalf of International, entered into an Administration
Agreement with BlackRock Advisors, LLC (in such capacity, the
“Administrator”) to provide administrative services (other than investment
advice and related portfolio activities). For such services, the Fund pays the
Manager a monthly fee at an annual rate of 0.25% of the average daily
value of the Fund’s net assets. The Fund does not pay an investment advi-
sory fee or investment management fee.
For the six months ended April 30, 2011, Global Emerging Markets and
Latin America reimbursed the Manager for certain accounting services,
which are included in accounting services in the Statements of Operations.
The reimbursements were as follows:
| |
| Global Emerging Markets | $2,733 |
| Latin America. | $9,749 |
The Funds received an exemptive order from the SEC permitting them,
among other things, to pay an affiliated securities lending agent a fee
based on a share of the income derived from the securities lending activi-
ties and has retained BIM as the securities lending agent. BIM may, on
behalf of the Funds, invest cash collateral received by the Funds for such
loans, among other things, in a private investment company managed by
the Manager or in registered money market funds advised by the Manager
or its affiliates. The market value of securities on loan and the value of the
related collateral, if applicable, are shown in the Statements of Assets
and Liabilities as securities loaned at value and collateral on securities
loaned at value, respectively. The cash collateral invested by BIM is dis-
closed in the Schedules of Investments. The share of income earned by
the Funds on such investments is shown as securities lending — affiliated
in the Statements of Operations. For the six months ended April 30, 2011,
BIM received $13,757 in securities lending agent fees related to securities
lending activities from Latin America.
Global Emerging Markets, Latin America and the Corporation (on behalf of
International) entered into a Distribution Agreement and Distribution and
Service Plan with BlackRock Investments, LLC (”BRIL“), an affiliate of the
Manager. Pursuant to the Distribution and Service Plan and in accordance
with Rule 12b-1 under the 1940 Act, each Fund pays BRIL ongoing service
and distribution fees. The fees are accrued daily and paid monthly at
annual rates based upon the average daily net assets of the shares of
the Funds, as follows:
| | |
| | Service | Distribution |
| | Fee | Fee |
| Investor A | 0.25% | — |
| Investor B | 0.25% | 0.75% |
| Investor C | 0.25% | 0.75% |
28 SEMI-ANNUAL REPORT APRIL 30, 2011
Notes to Financial Statements (continued)
Pursuant to sub-agreements with BRIL, broker-dealers and BRIL provide
shareholder servicing and distribution services to each Fund. The ongoing
service and/or distribution fee compensates BRIL and each broker-dealer
for providing shareholder servicing and/or distribution related services to
Investor A, Investor B and Investor C shareholders.
For the six months ended April 30, 2011, affiliates earned underwriting dis-
counts, direct commissions and dealer concessions on sales of the Funds'
Investor A Shares as follows:
| |
| | Investor A |
| Global Emerging Markets | $ 16,113 |
| Latin America | $ 69,164 |
| International | $ 2,319 |
For the six months ended April 30, 2011, affiliates received the following
contingent deferred sales charges relating to transactions in Investor B and
Investor C Shares:
| | |
| | Investor B | Investor C |
| Global Emerging Markets | $ 2,739 | $ 4,380 |
| Latin America | $ 27,315 | $ 33,052 |
| International | $ 305 | $ 894 |
Furthermore, affiliates received contingent deferred sales charges relating
to transactions subject to front-end sales charge waivers on Investor A
Shares as follows:
| |
| | Investor A |
| Global Emerging Markets | $ 181 |
| Latin America | $ 8,652 |
The Manager maintains a call center, which is responsible for providing
certain shareholder services to the Funds, such as responding to share-
holder inquiries and processing transactions based upon instructions
from shareholders with respect to the subscription and redemption of Fund
shares. For the six months ended April 30, 2011, the Funds reimbursed the
Manager the following amounts for costs incurred in running the call cen-
ter, which are included in transfer agent — class specific in the Statements
of Operations:
| | | |
| Global |
| | Emerging | Latin | |
| | Markets | America | International |
| Institutional | $ 306 | $ 692 | $ 18 |
| Investor A | $1,122 | $5,325 | $ 150 |
| Investor B | $ 66 | $ 391 | $ 31 |
| Investor C | $ 306 | $2,319 | $ 102 |
Certain officers and/or directors of Global Emerging Markets, Latin America
and the Corporation are officers and/or directors of BlackRock or its affili-
ates. The Funds reimburse the Manager for compensation paid to the Chief
Compliance Officer of Global Emerging Markets, Latin America and
the Corporation.
4. Investments:
Purchases and sales of investments excluding short-term securities, for the
six months ended April 30, 2011, were as follows:
| | |
| | Purchases | Sales |
| Global Emerging Markets | $184,483,422 | $223,742,032 |
| Latin America | $188,010,177 | $189,528,524 |
5. Capital Loss Carryforwards:
As of October 31, 2010, the Funds had capital loss carryforwards
available to offset future realized capital gains through the indicated
expiration dates:
| | | |
| Global |
| | Emerging | Latin | |
| Expires October 31, | Markets | America | International |
| 2016 | $ 17,062,380 | $ 6,626,092 | $ 19,370,107 |
| 2017 | $ 22,709,079 | $ 64,351,106 | $ 15,346,411 |
| Total | $ 39,771,459 | $ 70,977,198 | $ 34,716,518 |
Under the recently enacted Regulated Investment Company Modernization
Act of 2010, capital losses incurred by the Fund after October 31, 2011
will not be subject to expiration. In addition, these losses must be utilized
prior to the losses incurred in pre-enactment taxable years.
6. Borrowings:
Global Emerging Markets are Latin America, along with certain other funds
managed by the Manager and its affiliates, are parties to a $500 million
credit agreement with a group of lenders, which expired in November 2010.
The Funds may borrow under the credit agreement to fund shareholder
redemptions. Effective November 2009, the credit agreement had the fol-
lowing terms: 0.02% upfront fee on the aggregate commitment amount
which was allocated to each Fund based on its net assets as of October
31, 2009, a commitment fee of 0.10% per annum based on each Fund's
pro rata share of the unused portion of the credit agreement and interest
at a rate equal to the higher of (a) the one-month LIBOR plus 1.25% per
annum and (b) the Fed Funds rate plus 1.25% per annum on amounts
borrowed. In addition, the Funds paid administration and arrangement fees
which were allocated to the Funds based on their net assets as of October
31, 2009. Effective November 2010, the credit agreement was renewed
until November 2011 with the following terms: a commitment fee of 0.08%
per annum based on the Funds' pro rata share of the unused portion of
the credit agreement and interest at a rate equal to the higher of (a) the
one-month LIBOR plus 1.00% per annum and (b) the Fed Funds rate plus
1.00% per annum on amounts borrowed. In addition, the Funds paid
administration and arrangement fees which were allocated to the Funds
based on their net assets as of October 31, 2010. The Funds did not
borrow under the credit agreement during the six months ended
April 30, 2011.
7. Concentration, Market and Credit Risk:
In the normal course of business, Global Emerging Markets and Latin
America invest in securities and enter into transactions where risks exist
due to fluctuations in the market (market risk) or failure of the issuer of a
security to meet all its obligations (issuer credit risk). The value of securities
held by the Funds may decline in response to certain events, including
those directly involving the issuers whose securities are owned by the
Funds; conditions affecting the general economy; overall market changes;
local, regional or global political, social or economic instability; and cur-
rency and interest rate and price fluctuations. Similar to issuer credit risk,
the Funds may be exposed to counterparty credit risk, or the risk that an
entity with which the Funds have unsettled or open transactions may fail
to or be unable to perform on its commitments. The Funds manage coun-
terparty credit risk by entering into transactions only with counterparties
that they believe have the financial resources to honor their obligations
SEMI-ANNUAL REPORT APRIL 30, 2011 29
Notes to Financial Statements (continued)
and by monitoring the financial stability of those counterparties. Financial
assets, which potentially expose the Funds to market, issuer and counter-
party credit risks, consist principally of financial instruments and receiv-
ables due from counterparties. The extent of the Funds' exposure to market,
issuer and counterparty credit risks with respect to these financial assets
is generally approximated by their value recorded in the Funds' Statements
of Assets and Liabilities, less any collateral held by the Funds.
Global Emerging Markets and Latin America invest a substantial amount
of their assets in issuers located in a single country or a limited number
of countries. At April 30, 2011, Latin America invested 74% of its net
assets in Brazil. When the Funds concentrate their investments in this
manner, it assumes the risk that economic, political and social conditions
in those countries may have a significant impact on their investment per-
formance. Please see the Schedules of Investments for concentrations in
specific countries.
As of April 30, 2011, Global Emerging Markets and Latin America had the
following industry classifications:
| |
| Global Emerging Markets | |
| | Percent of |
| | Long-Term |
| Industry | Investments |
| Commercial Banks | 19% |
| Oil, Gas & Consumable Fuels | 15 |
| Semiconductors & Semiconductor Equipment | 10 |
| Metals & Mining | 10 |
| Wireless Telecommunication Services | 9 |
| Machinery | 4 |
| Other* | 33 |
| |
| Latin America | |
| | Percent of |
| | Long-Term |
| Industry | Investments |
| Commercial Banks | 21% |
| Metals & Mining | 17 |
| Oil, Gas & Consumable Fuels | 16 |
| Wireless Telecommunication Services | 9 |
| Beverages | 7 |
| Other* | 30 |
*All other industries held were each less than 5% of long-term investments.
| | | | |
| 8. Capital Share Transactions: | | | | |
| | Six Months Ended | Year Ended |
| | April 30, 2011 | October 31, 2010 |
| Global Emerging Markets | Shares | Amount | Shares | Amount |
| Institutional | | | | |
| Shares sold | 928,199 | $ 18,911,526 | 3,841,676 | $ 68,294,096 |
| Shares issued to shareholders in reinvestment of dividends and distributions | 23,825 | 480,296 | 23,866 | 415,421 |
| Total issued | 952,024 | 19,391,822 | 3,865,542 | 68,709,517 |
| Shares redeemed | (2,348,002) | (48,265,179) | (2,932,071) | (51,255,137) |
| Net increase (decrease) | (1,395,978) | $ (28,873,357) | 933,471 | $ 17,454,380 |
| Investor A | | | | |
| Shares sold and automatic conversion of shares | 705,476 | $ 14,026,840 | 2,040,890 | $ 35,939,082 |
| Shares issued to shareholders in reinvestment of dividends and distributions | 49,417 | 964,052 | 25,718 | 433,581 |
| Total issued | 754,893 | 14,990,892 | 2,066,608 | 36,372,663 |
| Shares redeemed | (917,673) | (18,009,936) | (1,547,152) | (27,299,341) |
| Net increase (decrease) | (162,780) | $ (3,019,044) | 519,456 | $ 9,073,322 |
| Investor B | | | | |
| Shares sold | 10,415 | $ 186,300 | 38,154 | $ 608,042 |
| Shares issued to shareholders in reinvestment of dividends and distributions | — | — | — | — |
| Total issued | 10,415 | 186,300 | 38,154 | 608,042 |
| Shares redeemed and automatic conversion of shares | (59,269) | (1,051,964) | (99,750) | (1,587,503) |
| Net decrease | (48,854) | $ (865,664) | (61,596) | $ (979,461) |
| Investor C | | | | |
| Shares sold | 364,137 | $ 6,307,862 | 1,010,363 | $ 15,533,210 |
| Shares issued to shareholders in reinvestment of dividends and distributions | 5,197 | 88,497 | 1,202 | 17,774 |
| Total issued | 369,334 | 6,396,359 | 1,011,565 | 15,550,984 |
| Shares redeemed | (399,147) | (6,831,888) | (597,216) | (8,939,364) |
| Net increase (decrease) | (29,813) | $ (435,529) | 414,349 | $ 6,611,620 |
30 SEMI-ANNUAL REPORT APRIL 30, 2011
Notes to Financial Statements (concluded)
| | | | |
| | Six Months Ended | Year Ended |
| | April 30, 2011 | October 31, 2010 |
| Latin America | Shares | Amount | Shares | Amount |
| Institutional | | | | |
| Shares sold | 1,006,393 | $ 74,549,286 | 1,682,887 | $ 110,636,374 |
| Shares issued to shareholders in reinvestment of dividends and distributions | 44,877 | 3,253,058 | 28,822 | 1,796,411 |
| Total issued | 1,051,270 | 77,802,344 | 1,711,709 | 112,432,785 |
| Shares redeemed | (628,535) | (46,292,634) | (990,683) | (61,114,645) |
| Net increase | 422,735 | $ 31,509,710 | 721,026 | $ 51,318,140 |
| Investor A | | | | |
| Shares sold and automatic conversion of shares | 1,516,561 | $ 110,837,912 | 4,685,471 | $ 303,041,998 |
| Shares issued to shareholders in reinvestment of dividends and distributions | 120,575 | 8,606,521 | 111,800 | 6,869,769 |
| Total issued | 1,637,136 | 119,444,433 | 4,797,271 | 309,911,767 |
| Shares redeemed | (2,176,927) | (157,361,287) | (4,710,334) | (288,779,539) |
| Net increase (decrease) | (539,791) | $ (37,916,854) | 86,937 | $ 21,132,228 |
| Investor B | | | | |
| Shares sold | 4,357 | $ 299,569 | 17,319 | $ 1,070,001 |
| Shares issued to shareholders in reinvestment of dividends and distributions | 1,807 | 121,495 | 2,352 | 136,208 |
| Total issued | 6,164 | 421,064 | 19,671 | 1,206,209 |
| Shares redeemed and automatic conversion of shares | (34,439) | (2,325,002) | (95,906) | (5,586,278) |
| Net decrease | (28,275) | $ (1,903,938) | (76,235) | $ (4,380,069) |
| Investor C | | | | |
| Shares sold | 570,632 | $ 38,279,556 | 1,336,936 | $ 79,199,064 |
| Shares issued to shareholders in reinvestment of dividends and distributions | 31,842 | 2,092,221 | 30,234 | 1,714,776 |
| Total issued | 602,474 | 40,371,777 | 1,367,170 | 80,913,840 |
| Shares redeemed | (500,722) | (33,227,932) | (1,001,833) | (56,787,648) |
| Net increase | 101,752 | $ 7,143,845 | 365,337 | $ 24,126,192 |
| International | | | | |
| Institutional | | | | |
| Shares sold | 222,804 | $ 3,097,221 | 63,958 | $ 754,224 |
| Shares redeemed | (25,662) | (346,508) | (328,865) | (3,388,448) |
| Net increase (decrease) | 197,142 | $ 2,750,713 | (264,907) | $ (2,634,224) |
| Investor A | | | | |
| Shares sold | 681,159 | $ 9,050,714 | 1,547,376 | $ 17,444,412 |
| Shares redeemed | (515,382) | (6,864,462) | (1,310,799) | (14,329,639) |
| Net increase | 165,777 | $ 2,186,252 | 236,577 | $ 3,114,773 |
| Investor B | | | | |
| Shares sold | 96,006 | $ 1,192,127 | 356,832 | $ 3,766,604 |
| Shares redeemed | (329,054) | (4,084,528) | (1,350,265) | (14,158,071) |
| Net decrease | (233,048) | $ (2,892,401) | (993,433) | $ (10,391,467) |
| Investor C | | | | |
| Shares sold | 111,865 | $ 1,408,851 | 181,265 | $ 1,939,156 |
| Shares redeemed | (104,873) | (1,326,854) | (258,153) | (2,754,419) |
| Net increase (decrease) | 6,992 | $ 81,997 | (76,888) | $ (815,263) |
There is a 2% redemption fee on shares redeemed or exchanged that have been held for 30 days or less. The redemption fees are collected and retained
by the Funds for the benefit of the remaining shareholders. The redemption fees are recorded as a credit to paid-in capital. Effective April 1, 2011, the
redemption fee was terminated and is no longer charged by the Funds.
9. Subsequent Events:
Management has evaluated the impact of all subsequent events on the Funds through the date the financial statements were issued and has determined
that there were no subsequent events requiring adjustment or additional disclosure in the financial statements.
SEMI-ANNUAL REPORT APRIL 30, 2011 31
Portfolio Information BlackRock Master International Portfolio
As of April 30, 2011
| |
| | Percent of |
| | Long-Term |
| Ten Largest Holdings | Investments |
| Sanofi | 7% |
| Novartis AG, Registered Shares | 4 |
| Heineken NV | 4 |
| Reckitt Benckiser Plc | 4 |
| Imperial Tobacco Group Plc | 3 |
| Telefonica SA | 3 |
| Activision Blizzard, Inc. | 3 |
| Rogers Communications, Inc., Class B | 3 |
| Julius Baer Group Ltd. | 3 |
| NII Holdings, Inc. | 3 |
| |
| | Percent of |
| | Long-Term |
| Geographic Allocation | Investments |
| United Kingdom | 21% |
| Switzerland | 13 |
| United States | 11 |
| Japan | 10 |
| France | 8 |
| China | 6 |
| Spain | 5 |
| Canada | 5 |
| Sweden | 4 |
| Netherlands | 4 |
| Hong Kong | 3 |
| South Africa | 2 |
| Germany | 2 |
| Brazil | 2 |
| Russia | 2 |
| Singapore | 1 |
| Taiwan | 1 |
32 SEMI-ANNUAL REPORT APRIL 30, 2011
BlackRock Master International Portfolio
Schedule of Investments April 30, 2011 (Unaudited)
(Percentages shown are based on Net Assets)
| | |
| Common Stocks | Shares | Value |
| Brazil — 1.6% | | |
| OGX Petroleo e Gas Participacoes SA (a) | 115,000 | $ 1,214,912 |
| Canada — 4.3% | | |
| Rogers Communications, Inc., Class B | 55,628 | 2,105,415 |
| Teck Resources Ltd., Class B | 21,519 | 1,169,711 |
| | | 3,275,126 |
| China — 5.6% | | |
| Changsha Zoomlion Heavy Industry Science and | | |
| Technology Development Co., Ltd. (a) | 254,400 | 674,797 |
| Focus Media Holding Ltd. — ADR (a) | 29,996 | 1,054,359 |
| Hengan International Group Co. Ltd. | 95,000 | 742,558 |
| Lenovo Group Ltd. | 1,278,000 | 745,849 |
| VanceInfo Technologies, Inc. — ADR (a) | 34,288 | 1,102,702 |
| | | 4,320,265 |
| France — 7.9% | | |
| Sanofi | 60,642 | 4,797,812 |
| Schneider Electric SA | 7,418 | 1,310,559 |
| | | 6,108,371 |
| Germany — 1.7% | | |
| Daimler AG | 16,635 | 1,285,658 |
| Hong Kong — 2.5% | | |
| China Overseas Land & Investment Ltd. | 438,000 | 845,472 |
| Sands China Ltd. (a) | 376,000 | 1,055,822 |
| | | 1,901,294 |
| Japan — 9.7% | | |
| Makita Corp. | 29,500 | 1,356,434 |
| Mitsubishi Estate Co., Ltd. | 43,000 | 752,491 |
| Nissan Motor Co., Ltd. | 187,800 | 1,806,920 |
| Nitto Denko Corp. | 18,800 | 1,006,859 |
| OKUMA Corp. | 120,000 | 1,130,360 |
| Sumitomo Heavy Industries Ltd. | 220,000 | 1,450,781 |
| | | 7,503,845 |
| Netherlands — 3.4% | | |
| Heineken NV | 44,187 | 2,643,892 |
| Russia — 1.5% | | |
| Sberbank | 323,720 | 1,183,197 |
| Singapore — 1.3% | | |
| Genting Singapore Plc (a) | 584,000 | 1,039,356 |
| South Africa — 2.3% | | |
| MTN Group Ltd. | 80,015 | 1,779,393 |
| Spain — 4.6% | | |
| Banco Bilbao Vizcaya Argentaria SA | 99,657 | 1,276,558 |
| Telefonica SA | 84,517 | 2,270,563 |
| | | 3,547,121 |
| Sweden — 4.1% | | |
| Hennes & Mauritz AB, B Shares | 46,874 | 1,656,630 |
| Skandinaviska Enskilda Banken AB, Class A | 154,194 | 1,482,253 |
| | | 3,138,883 |
| | |
| Common Stocks | Shares | Value |
| Switzerland — 12.5% | | |
| Credit Suisse Group AG | 25,315 | $ 1,152,254 |
| Julius Baer Group Ltd. | 43,132 | 2,018,481 |
| Novartis AG, Registered Shares | 47,176 | 2,797,545 |
| The Swatch Group Ltd., Bearer Shares | 3,645 | 1,794,927 |
| UBS AG (a) | 91,156 | 1,824,265 |
| | | 9,587,472 |
| Taiwan — 1.3% | | |
| HTC Corp. | 21,300 | 968,999 |
| United Kingdom — 20.1% | | |
| BG Group Plc | 42,363 | 1,090,915 |
| Imperial Tobacco Group Plc | 66,161 | 2,333,657 |
| Lloyds TSB Group Plc (a) | 1,594,165 | 1,582,776 |
| Man Group Plc | 341,971 | 1,431,101 |
| Reckitt Benckiser Plc | 47,270 | 2,630,437 |
| Rio Tinto Plc, Registered Shares | 26,004 | 1,897,389 |
| Tullow Oil Plc | 60,133 | 1,442,783 |
| William Morrison Supermarkets Plc | 242,071 | 1,194,266 |
| Xstrata Plc | 72,113 | 1,849,635 |
| | | 15,452,959 |
| United States — 10.5% | | |
| Activision Blizzard, Inc. | 196,358 | 2,236,518 |
| The Goldman Sachs Group, Inc. | 12,821 | 1,936,099 |
| Liberty Global, Inc. (a) | 24,899 | 1,157,804 |
| NII Holdings, Inc. (a) | 47,223 | 1,963,532 |
| Veeco Instruments, Inc. (a) | 16,196 | 828,101 |
| | | 8,122,054 |
| Total Long-Term Investments | | |
| (Cost — $58,859,557) — 94.9% | | 73,072,797 |
| Short-Term Securities | | |
| BlackRock Liquidity Funds, TempFund, | | |
| Institutional Class, 0.10% (b)(c) | 2,974,583 | 2,974,583 |
| Total Short-Term Securities | | |
| (Cost — $2,974,583) — 3.9% | | 2,974,583 |
| Total Investments (Cost — $61,834,140*) — 98.8% | | 76,047,380 |
| Other Assets Less Liabilities — 1.2% | | 929,419 |
| Net Assets – 100.0% | | $ 76,976,799 |
* The cost and unrealized appreciation (depreciation) of investments as of April 30,
2011, as computed for federal income tax purposes, were as follows:
| |
| Aggregate cost | $ 62,232,780 |
| Gross unrealized appreciation | $ 14,220,414 |
| Gross unrealized depreciation | (405,814) |
| Net unrealized appreciation | $ 13,814,600 |
| | |
| Portfolio Abbreviations | | |
| To simplify the listing of portfolio holdings in the Schedule | ADR | American Depositary Receipts |
| of Investments, the names and descriptions of many of the | | |
| securities have been abbreviated according to the following | | |
| list: | | |
| See Notes to Financial Statements. | | |
SEMI-ANNUAL REPORT APRIL 30, 2011 33
BlackRock Master International Portfolio
Schedule of Investments (concluded)
(a) Non-income producing security.
(b) Investments in companies considered to be an affiliate of the Portfolio during the
period, for purposes of Section 2(a)(3) of the Investment Company Act of 1940, as
amended, were as follows:
| | | | |
| | Shares Held at | | Shares Held at | |
| | October 31, | Net | April 30, | |
| Affiliate | 2010 | Activity | 2011 | Income |
| BlackRock Liquidity | | | | |
| Funds, TempFund, | | | | |
| Institutional Class | 3,168,986 | (194,403) | 2,974,583 | $ 1,189 |
(c) Represents the current yield as of report date.
• Fair Value Measurements — Various inputs are used in determining the fair value of
investments. These inputs are summarized in three broad levels for financial state-
ment purposes as follows:
• Level 1 — price quotations in active markets/exchanges for identical assets
and liabilities
• Level 2 — other observable inputs (including, but not limited to: quoted prices for
similar assets or liabilities in markets that are active, quoted prices for identical
or similar assets or liabilities in markets that are not active, inputs other than
quoted prices that are observable for the assets or liabilities (such as interest
rates, yield curves, volatilities, prepayment speeds, loss severities, credit risks and
default rates) or other market-corroborated inputs)
• Level 3 — unobservable inputs based on the best information available in the
circumstances, to the extent observable inputs are not available (including the
Portfolio‘s own assumptions used in determining the fair value of investments)
The inputs or methodologies used for valuing securities are not necessarily an
indication of the risk associated with investing in those securities. For information
about the Portfolio’s policy regarding valuation of investments and derivative
financial instruments and other significant accounting policies, please refer to
Note 1 of the Notes to Financial Statements.
The following table summarizes the inputs used as of April 30, 2011 in determining
the fair valuation of the Portfolio’s investments:
| | | | |
| Valuation Inputs | Level 1 | Level 2 | Level 3 | Total |
| Assets: | | | | |
| Investments: | | | | |
| Long-Term Investments: | | | |
| Common Stocks: | | | | |
| Brazil | $ 1,214,912 | — | — | $ 1,214,912 |
| Canada | 3,275,126 | — | — | 3,275,126 |
| China | 4,320,265 | — | — | 4,320,265 |
| France. | — | $ 6,108,371 | — | 6,108,371 |
| Germany | — | 1,285,658 | — | 1,285,658 |
| Hong Kong | 845,472 | 1,055,822 | — | 1,901,294 |
| Japan | — | 7,503,845 | — | 7,503,845 |
| Netherlands . | — | 2,643,892 | — | 2,643,892 |
| Russia. | 1,183,197 | — | — | 1,183,197 |
| Singapore | — | 1,039,356 | — | 1,039,356 |
| South Africa . | — | 1,779,393 | — | 1,779,393 |
| Spain | — | 3,547,121 | — | 3,547,121 |
| Sweden. | — | 3,138,883 | — | 3,138,883 |
| Switzerland | — | 9,587,472 | — | 9,587,472 |
| Taiwan. | — | 968,999 | — | 968,999 |
| United | | | | |
| Kingdom | — | 15,452,959 | — | 15,452,959 |
| United | | | | |
| States | 8,122,054 | — | — | 8,122,054 |
| Short-Term | | | | |
| Securities | 2,974,583 | — | — | 2,974,583 |
| Total | $ 21,935,609 | $54,111,771 | — | $ 76,047,380 |
See Notes to Financial Statements.
34 SEMI-ANNUAL REPORT APRIL 30, 2011
| |
| Statement of Assets and Liabilities | BlackRock Master International Portfolio |
| April 30, 2011 (Unaudited) | |
| Assets | |
| Investments at value — unaffiliated (cost — $58,859,557) | $ 73,072,797 |
| Investments at value — affiliated (cost — $2,974,583) | 2,974,583 |
| Foreign currency at value (cost — $5,078) | 5,246 |
| Dividends receivable | 987,788 |
| Contributions receivable from investors | 37,229 |
| Investments sold receivable | 21,993 |
| Interest receivable | 1,325 |
| Prepaid expenses | 1,652 |
| Total assets | 77,102,613 |
| Liabilities | |
| Investment advisory fees payable | 43,873 |
| Investments purchased payable | 21,993 |
| Other affiliates payable | 412 |
| Other accrued expenses payable | 59,536 |
| Total liabilities | 125,814 |
| Net Assets | $ 76,976,799 |
| Net Assets Consist of | |
| Investor’s capital | $ 62,648,580 |
| Net unrealized appreciation/depreciation | 14,328,219 |
| Net Assets | $ 76,976,799 |
See Notes to Financial Statements.
SEMI-ANNUAL REPORT APRIL 30, 2011 35
| |
| Statement of Operations | BlackRock Master International Portfolio |
| Six Months Ended April 30, 2011 | |
| Investment Income | |
| Dividends | $ 898,293 |
| Foreign taxes withheld | (88,670) |
| Dividends — affiliated | 1,189 |
| Total income | 810,812 |
| Expenses | |
| Investment advisory | 261,135 |
| Professional | 29,998 |
| Custodian | 23,684 |
| Accounting services | 11,706 |
| Directors | 2,395 |
| Printing | 530 |
| Miscellaneous | 7,280 |
| Total expenses | 336,728 |
| Less fees waived by advisor | (589) |
| Total expenses after fees waived | 336,139 |
| Net investment income | 474,673 |
| Realized and Unrealized Gain (Loss) | |
| Net realized gain (loss) from: | |
| Investments | 5,432,456 |
| Foreign currency transactions | (34,494) |
| | 5,397,962 |
| Net change in unrealized appreciation/depreciation on: | |
| Investments | 4,020,641 |
| Foreign currency transactions | 60,710 |
| | 4,081,351 |
| Total realized and unrealized gain | 9,479,313 |
| Net Increase in Net Assets Resulting from Operations | $ 9,953,986 |
See Notes to Financial Statements.
36 SEMI-ANNUAL REPORT APRIL 30, 2011
| | |
| Statements of Changes in Net Assets | BlackRock Master International Portfolio |
| | Six Months | |
| | Ended | |
| | April 30, | Year Ended |
| | 2011 | October 31, |
| Increase (Decrease) in Net Assets: | (Unaudited) | 2010 |
| Operations | | |
| Net investment income | $ 474,673 | $ 345,397 |
| Net realized gain | 5,397,962 | 6,856,088 |
| Net change in unrealized appreciation/depreciation | 4,081,351 | 2,749,700 |
| Net increase in net assets resulting from operations | 9,953,986 | 9,951,185 |
| Capital Transactions | | |
| Proceeds from contributions | 14,752,521 | 23,926,035 |
| Value of withdrawals | (13,047,571) | (35,534,497) |
| Net increase (decrease) in net assets derived from capital transactions | 1,704,950 | (11,608,462) |
| Net Assets | | |
| Total increase (decrease) in net assets | 11,658,936 | (1,657,277) |
| Beginning of period | 65,317,863 | 66,975,140 |
| End of period | $ 76,976,799 | $ 65,317,863 |
| | | | | | | |
| Financial Highlights | | | | | BlackRock Master International Portfolio |
| | | | | | | | |
| | Six Months | | | | | | |
| | Ended | | | Period | | | |
| | April 30, | | June 1, 2008 | | | |
| | 2011 | Year Ended October 31, | to October 31, | Year Ended May 31, |
| | (Unaudited) | 2010 | 2009 | 2008 | 2008 | 2007 | 2006 |
| Total Investment Return | | | | | | | |
| Total investment return | 15.09%1 | 18.59% | 33.94% | (44.29)%1 | 7.12% | 16.99% | 25.58% |
| Ratios to Average Net Assets | | | | | | | |
| Total expenses | 0.97%2 | 1.03% | 1.11% | 1.04%2 | 0.99% | 0.96% | 0.98% |
| Total expenses after fees waived | 0.97%2 | 1.03% | 1.11% | 1.04%2 | 0.99% | 0.96% | 0.98% |
| Net investment income | 1.36%2 | 0.54% | 1.89% | 1.44%2 | 1.90% | 1.64% | 1.48% |
| Supplemental Data | | | | | | | |
| Net assets, end of period (000) | $ 76,977 | $ 65,318 | $ 66,975 | $ 59,217 | $ 118,236 | $ 126,594 | $ 129,475 |
| Portfolio turnover | 56% | 154% | 178% | 78% | 153% | 151% | 96% |
| 1 Aggregate total investment return. | | | | | | | |
| 2 Annualized. | | | | | | | |
See Notes to Financial Statements.
SEMI-ANNUAL REPORT APRIL 30, 2011 37
Notes to Financial Statements (Unaudited) BlackRock Master International Portfolio
1. Organization and Significant Accounting Policies:
BlackRock Master International Portfolio (the “Portfolio”) of BlackRock
Master LLC (the “Master LLC”) is registered under the Investment
Company Act of 1940, as amended (the “1940 Act”), and is organized
as a Delaware limited liability company. The Limited Liability Company
Agreement of the Master LLC permits the Board of Directors of the Master
LLC (the “Board”) to issue non-transferable interests in the Master LLC,
subject to certain limitations. The Portfolio’s financial statements are pre-
pared in conformity with accounting principles generally accepted in the
United States of America (“US GAAP”), which may require management to
make estimates and assumptions that affect the reported amounts and
disclosures in the financial statements. Actual results could differ from
those estimates.
The following is a summary of significant accounting policies followed by
the Portfolio:
Valuation: US GAAP defines fair value as the price the Portfolio would
receive to sell an asset or pay to transfer a liability in an orderly transaction
between market participants at the measurement date. The Portfolio fair
values its financial instruments at market value using independent dealers
or pricing services under policies approved by the Board. Equity invest-
ments traded on a recognized securities exchange or the NASDAQ Global
Market System (“NASDAQ”) are valued at the last reported sale price
that day or the NASDAQ official closing price, if applicable. For equity
investments traded on more than one exchange, the last reported sale
price on the exchange where the stock is primarily traded is used. Equity
investments traded on a recognized exchange for which there were no
sales on that day are valued at the last available bid (long positions) or
ask (short positions) price. If no bid or ask price is available, the prior
day’s price will be used, unless it is determined that such prior day’s
price no longer reflects the fair value of the security. Investments in open-
end registered investment companies are valued at net asset value each
business day. Short-term securities with remaining maturities of 60 days
or less may be valued at amortized cost, which approximates fair value.
Securities and other assets and liabilities denominated in foreign curren-
cies are translated into US dollars using exchange rates determined as of
the close of business on the New York Stock Exchange (“NYSE”). Foreign
currency exchange contracts are valued at the mean between the bid and
ask prices and are determined as of the close of business on the NYSE.
Interpolated values are derived when the settlement date of the contract is
an interim date for which quotations are not available.
In the event that application of these methods of valuation results in a
price for an investment which is deemed not to be representative of the
market value of such investment or is not available, the investment will
be valued in accordance with a policy approved by the Board as reflecting
fair value (“Fair Value Assets”). When determining the price for Fair Value
Assets, the investment advisor and/or the sub-advisor seeks to determine
the price that the Portfolio might reasonably expect to receive from the
current sale of that asset in an arm’s-length transaction. Fair value
determinations shall be based upon all available factors that the invest-
ment advisor and/or sub-advisor deems relevant. The pricing of all Fair
Value Assets is subsequently reported to the Board or a committee thereof.
Generally, trading in foreign instruments is substantially completed
each day at various times prior to the close of business on the NYSE.
Occasionally, events affecting the values of such instruments may occur
between the foreign market close and the close of business on the NYSE
that may not be reflected in the computation of the Portfolio’s net assets.
If events (for example, a company announcement, market volatility or a
natural disaster) occur during such periods that are expected to materially
affect the value of such instruments, those instruments may be Fair Value
Assets and be valued at their fair value, as determined in good faith by
the investment advisor using a pricing service and/or policies approved by
the Board. Each business day, the Portfolio uses a pricing service to assist
with the valuation of certain foreign exchange-traded equity securities
and foreign exchange-traded and OTC options (the “Systematic Fair Value
Price”). Using current market factors, the Systematic Fair Value Price is
designed to value such foreign securities and foreign options at fair value
as of the close of business on the NYSE, which follows the close of the
local markets.
Foreign Currency Transactions: The Portfolio’s books and records are
maintained in US dollars. Purchases and sales of investment securities are
recorded at the rates of exchange prevailing on the date the transactions
are entered into. Generally, when the US dollar rises in value against a
foreign currency, the Portfolio’s investments denominated in that currency
will lose value because its currency is worth fewer US dollars; the opposite
effect occurs if the US dollar falls in relative value.
The Portfolio reports realized currency gains (losses) on foreign currency
related transactions as components of net realized gain (loss) for financial
reporting purposes, whereas such components are treated as ordinary
income for federal income tax purposes.
Segregation and Collateralization: In cases in which the 1940 Act and the
interpretive positions of the SEC require that the Portfolio either delivers
collateral or segregates assets in connection with certain investments (e.g.,
foreign currency exchange contracts), the Portfolio will, consistent with SEC
rules and/or certain interpretive letters issued by the SEC, segregate collat-
eral or designate on its books and records cash or liquid securities having
a market value at least equal to the amount that would otherwise be
required to be physically segregated. Furthermore, based on requirements
and agreements with certain exchanges and third party broker-dealers,
each party to such transactions has requirements to deliver/deposit
securities as collateral for certain investments.
Investment Transactions and Investment Income: For financial reporting
purposes, investment transactions are recorded on the dates the trans-
actions are entered into (the trade dates). Realized gains and losses
on investment transactions are determined on the identified cost basis.
Dividend income is recorded on the ex-dividend dates. Dividends from
foreign securities where the ex-dividend date may have passed are subse-
quently recorded when the Portfolio is informed of the ex-dividend date.
Under the applicable foreign tax laws, a withholding tax at various rates
may be imposed on capital gains, dividends and interest. Upon notification
from issuers, some of the dividend income received from a real estate
investment trust may be redesignated as a reduction of cost of the related
investment and/or realized gain. Interest income, including amortization
38 SEMI-ANNUAL REPORT APRIL 30, 2011
Notes to Financial Statements (continued) BlackRock Master International Portfolio
and accretion of premiums and discounts on debt securities, is recognized
on the accrual basis. Income and realized and unrealized gains and losses
are allocated daily to each class based on its relative net assets. Consent
fees are compensation for agreeing to changes in the terms of debt instru-
ments and are included in interest income in the Statement of Operations.
Income Taxes: The Portfolio is disregarded as an entity separate from its
owner for tax purposes. As such, the owner of the Portfolio is treated as
the owner of the net assets, income, expenses and realized and unrealized
gains and losses of the Portfolio. Therefore, no federal income tax provision
is required. It is intended that the Portfolio’s assets will be managed so the
owner of the Portfolio can satisfy the requirements of Subchapter M of the
Internal Revenue Code of 1986, as amended.
Other: Expenses directly related to the Portfolio are charged to the
Portfolio. Other operating expenses shared by several funds are pro rated
among those funds on the basis of relative net assets or other appropriate
methods. The Portfolio has an arrangement with the custodian whereby
fees may be reduced by credits earned on uninvested cash balances,
which, if applicable, are shown as fees paid indirectly in the Statement
of Operations. The custodian imposes fees on overdrawn cash balances,
which can be offset by accumulated credits earned or may result in
additional custody charges.
2. Derivative Financial Instruments:
The Portfolio engages in various portfolio investment strategies using
derivative contracts both to increase the returns of the Portfolio and to
economically hedge, or protect, its exposure to certain risks such as credit
risk, equity risk, interest rate risk, foreign currency exchange rate risk or
other risk (commodity price risk and inflation risk). These contracts may be
transacted on an exchange or OTC.
Losses may arise if the value of the contract decreases due to an unfavor-
able change in the market rates or values of the underlying instrument or
if the counterparty does not perform under the contract. For OTC options
purchased, the Portfolio bears the risk of loss in the amount of the premi-
ums paid plus the positive change in market values net of any collateral
received on the options should the counterparty fail to perform under the
contracts. Options written by the Portfolio do not give rise to counterparty
credit risk, as options written obligate the Portfolio to perform and not the
counterparty. Counterparty risk related to exchange-traded financial futures
contracts and options is deemed to be minimal due to the protection
against defaults provided by the exchange on which these contracts trade.
The Portfolio may mitigate counterparty risk by procuring collateral and
through netting provisions included within an International Swaps and
Derivatives Association, Inc. master agreement (“ISDA Master Agreement”)
implemented between the Portfolio and each of its respective counterpar-
ties. The ISDA Master Agreement allows the Portfolio to offset with each
separate counterparty certain derivative financial instrument’s payables
and/or receivables with collateral held. The amount of collateral moved
to/from applicable counterparties is generally based upon minimum
transfer amounts of up to $500,000. To the extent amounts due to the
Portfolio from its counterparties are not fully collateralized contractually
or otherwise, the Portfolio bears the risk of loss from counterparty
non-performance. See Note 1 “Segregation and Collateralization” for
information with respect to collateral practices. In addition, the Portfolio
manages counterparty risk by entering into agreements only with counter-
parties that it believes have the financial resources to honor its obligations
and by monitoring the financial stability of those counterparties.
Certain ISDA Master Agreements allow counterparties to OTC derivatives to
terminate derivative contracts prior to maturity in the event the Portfolio’s
net assets decline by a stated percentage or the Portfolio fails to meet the
terms of its ISDA Master Agreements, which would cause the Portfolio to
accelerate payment of any net liability owed to the counterparty.
Foreign Currency Exchange Contracts: The Portfolio enters into foreign
currency exchange contracts as an economic hedge against either specific
transactions or portfolio instruments or to obtain exposure to foreign cur-
rencies (foreign currency exchange rate risk). A foreign currency exchange
contract is an agreement between two parties to buy and sell a currency at
a set exchange rate on a future date. Foreign currency exchange contracts,
when used by the Portfolio, help to manage the overall exposure to the
currencies in which some of the investments held by the Portfolio are
denominated. The contract is marked-to-market daily and the change in
market value is recorded by the Portfolio as an unrealized gain or loss.
When the contract is closed, the Portfolio records a realized gain or loss
equal to the difference between the value at the time it was opened and
the value at the time it was closed. The use of foreign currency exchange
contracts involves the risk that the value of a foreign currency exchange
contract changes unfavorably due to movements in the value of the
referenced foreign currencies and the risk that a counterparty to the
contract does not perform its obligations under the agreement.
| | |
| The Effect of Derivative Financial Instruments in the Statement of Operations |
| Six Months Ended April 30, 2011 |
|
| Net Realized Loss From |
|
| Foreign currency exchange contracts | $ (37,164) |
| Net Change in Unrealized Appreciation/Depreciation on |
|
| Foreign currency exchange contracts | $ 1,326 |
For the six months ended April 30, 2011, the average quarterly balance of
outstanding derivative financial instruments were as follows:
| |
| Foreign currency exchange contracts: | |
| Average number of contracts-US dollars purchased | 1 |
| Average US dollar amounts purchased | $ 237,631 |
3. Investment Advisory Agreement and Other Transactions
with Affiliates:
As of April 30, 2011, The PNC Financial Services Group, Inc. (“PNC”),
Bank of America Corporation (“BAC”) and Barclays Bank PLC (“Barclays”)
were the largest stockholders of BlackRock, Inc. (“BlackRock”). Due to the
ownership structure, PNC is an affiliate of the Master LLC for 1940 Act
purposes, but BAC and Barclays are not.
The Master LLC, on behalf of the Portfolio, entered into an Investment
Advisory Agreement with BlackRock Advisors, LLC (the “Manager”), the
Portfolio’s investment advisor, an indirect, wholly owned subsidiary of
BlackRock, to provide investment advisory and administration services. The
SEMI-ANNUAL REPORT APRIL 30, 2011 39
Notes to Financial Statements (concluded) BlackRock Master International Portfolio
Manager is responsible for the management of the Portfolio’s portfolio and
provides the necessary personnel, facilities, equipment and certain other
services necessary to the operations of the Portfolio. For such services, the
Portfolio pays the Manager a monthly fee at the following annual rates of
the Portfolio’s average daily net assets:
| |
| Portion of Average Daily Value of Net Assets | Rate |
| Not exceeding $500 million | 0.75% |
| In excess of $500 million | 0.70% |
The Manager voluntarily agreed to waive its investment advisory fees by
the amount of investment advisory fees the Portfolio pays to the Manager
indirectly through its investment in affiliated money market funds, however,
the Manager does not waive its investment advisory fees by the amount
of investment advisory fees paid as a result of the Portfolio’s investment in
other affiliated investment companies, if any. This amount is shown as,
or included in, fees waived by advisor in the Statement of Operations.
The Manager entered into a sub-advisory agreement with BlackRock
International Limited, an affiliate of the Manager. The Manager pays the
subadvisor for services it provides, a monthly fee that is a percentage
of the investment advisory fees paid by the Portfolio to the Manager.
For the six months ended April 30, 2011, the Master LLC reimbursed
the Manager $640 for certain accounting services, which are included in
accounting services in the Statement of Operations.
Certain officers and/or directors of the Master LLC are officers and/or
directors of BlackRock or its affiliates.
4. Investments:
Purchases and sales of investments, excluding short-term securities for the
six months ended April 30, 2011, were $37,556,688 and $36,560,556,
respectively.
5. Borrowings:
The Portfolio, along with certain other funds managed by the Manager and
its affiliates, is a party to a $500 million credit agreement with a group of
lenders, which expired in November 2010. The Portfolio may borrow under
the credit agreement to fund shareholder redemptions. Effective November
2009, the credit agreement had the following terms: 0.02% upfront fee
on the aggregate commitment amount which was allocated to the Portfolio
based on its net assets as of October 31, 2009, a commitment fee of
0.10% per annum based on the Portfolio’s pro rata share of the unused
portion of the credit agreement and interest at a rate equal to the higher
of (a) the one-month LIBOR plus 1.25% per annum and (b) the Fed
Funds rate plus 1.25% per annum on amounts borrowed. In addition, the
Portfolio paid administration and arrangement fees which were allocated
to the Portfolio based on its net assets as of October 31, 2009. Effective
November 2010, the credit agreement was renewed until November 2011
with the following terms: a commitment fee of 0.08% per annum based on
the Portfolio’s pro rata share of the unused portion of the credit agreement
and interest at a rate equal to the higher of (a) the one-month LIBOR plus
1.00% per annum and (b) the Fed Funds rate plus 1.00% per annum
on amounts borrowed. In addition, the Portfolio paid administration and
arrangement fees which were allocated to the Portfolio based on its net
assets as of October 31, 2010. The Portfolio did not borrow under the
credit agreement during the six months ended April 30, 2011.
6. Geographic, Market and Credit Risk:
In the normal course of business, the Portfolio invests in securities and
enters into transactions where risks exist due to fluctuations in the market
(market risk) or failure of the issuer of a security to meet all its obligations
(issuer credit risk). The value of securities held by the Portfolio may decline
in response to certain events, including those directly involving the issuers
whose securities are owned by the Portfolio; conditions affecting the gen-
eral economy; overall market changes; local, regional or global political,
social or economic instability; and currency and interest rate and price
fluctuations. Similar to issuer credit risk, the Portfolio may be exposed to
counterparty credit risk, or the risk that an entity with which the Portfolio
has unsettled or open transactions may fail to or be unable to perform on
its commitments. The Portfolio manages counterparty credit risk by entering
into transactions only with counterparties that it believes have the financial
resources to honor their obligations and by monitoring the financial stability
of those counterparties. Financial assets, which potentially expose the
Portfolio to market, issuer and counterparty credit risks, consist principally
of financial instruments and receivables due from counterparties. The
extent of the Portfolio’s exposure to market, issuer and counterparty credit
risks with respect to these financial assets is generally approximated by
their value recorded in the Portfolio’s Statement of Assets and Liabilities,
less any collateral held by the Portfolio.
As of April 30, 2011, the Portfolio had the following industry classifications:
| |
| | Percent of |
| | Long-Term |
| Industry | Investments |
| Capital Markets | 11% |
| Pharmaceuticals | 10 |
| Wireless Telecommunication Services | 8 |
| Commercial Banks. | 8 |
| Metals & Mining | 7 |
| Machinery | 7 |
| Semiconductors & Semiconductor Equipment | 6 |
| Oil, Gas & Consumable Fuels | 5 |
| Software | 5 |
| Other* | 33 |
| *All other industries held were each less than 5% of long-term investments. |
7. Subsequent Events:
Management has evaluated the impact of all subsequent events on the
Portfolio through the date the financial statements were issued and has
determined that there were no subsequent events requiring adjustment or
additional disclosure in the financial statements.
40 SEMI-ANNUAL REPORT APRIL 30, 2011
Officers and Directors
Ronald W. Forbes, Co-Chair of the Board and Director
Rodney D. Johnson, Co-Chair of the Board and Director
David O. Beim, Director
Richard S. Davis, Director
Henry Gabbay, Director
Dr. Matina S. Horner, Director
Herbert I. London, Director
Cynthia A. Montgomery, Director
Joseph P. Platt, Director
Robert C. Robb, Jr., Director
Toby Rosenblatt, Director
Kenneth L. Urish, Director
Frederick W. Winter, Director
John M. Perlowski, President and Chief Executive Officer
Brendan Kyne, Vice President
Brian Schmidt, Vice President
Neal Andrews, Chief Financial Officer
Jay Fife, Treasurer
Brian Kindelan, Chief Compliance Officer
Ira P. Shapiro, Secretary
Investment Advisor
BlackRock Advisors, LLC
Wilmington, DE 19809
Sub-Advisors
BlackRock Investment Management, LLC1
Plainsboro, NJ 08536
BlackRock International Limited2
Edinburgh, Scotland
United Kingdom EH3 8JB
Custodian
Brown Brothers Harriman & Co.
Boston, MA 02109
Transfer Agent
BNY Mellon Investment Servicing (US) Inc.
Providence, RI 02940
Accounting Agent
State Street Bank and Trust Company
Princeton, NJ 08540
Distributor
BlackRock Investments, LLC
New York, NY 10022
Independent Registered Public Accounting Firm
Deloitte & Touche LLP
Princeton, NJ 08540
Legal Counsel
Sidley Austin LLP
New York, NY 10019
Address of the Funds
100 Bellevue Parkway
Wilmington, DE 19809
1 For Global Emerging Markets Fund and Latin America Fund.
2 For all Funds.
Effective November 16, 2010, Ira P. Shapiro became Secretary of the Funds and Master LLC.
SEMI-ANNUAL REPORT APRIL 30, 2011 41
Additional Information
General Information
Electronic Delivery
Electronic copies of most financial reports and prospectuses are available
on the Funds’ website or shareholders can sign up for e-mail notifications of
quarterly statements, annual and semi-annual reports and prospectuses by
enrolling in the Funds’ electronic delivery program.
To enroll:
Shareholders Who Hold Accounts with Investment Advisors, Banks or
Brokerages:
Please contact your financial advisor. Please note that not all investment
advisers, banks or brokerages may offer this service.
Shareholders Who Hold Accounts Directly with BlackRock:
1) Access the BlackRock Web site at
http://www.blackrock.com/edelivery
2) Select “eDelivery” under the “More Information” section
3) Log into your account
Householding
The Funds will mail only one copy of shareholder documents, including
prospectuses, annual and semi-annual reports and proxy statements, to
shareholders with multiple accounts at the same address. This practice is
commonly called “householding” and is intended to reduce expenses and
eliminate duplicate mailings of shareholder documents. Mailings of your
shareholder documents may be householded indefinitely unless you instruct
us otherwise. If you do not want the mailing of these documents to be
combined with those for other members of your household, please
call (800) 441-7762.
Availability of Quarterly Schedule of Investments
Each Fund files its complete schedule of portfolio holdings with the SEC
for the first and third quarters of each fiscal year on Form N-Q. The Funds’
Forms N-Q are available on the SEC’s website at http://www.sec.gov and
may also be reviewed and copied at the SEC’s Public Reference Room in
Washington, D.C. Information on how to access documents on the SEC’s
website without charge may be obtained by calling (800) SEC-0330. Each
Fund’s Forms N-Q may also be obtained upon request and without charge
by calling (800) 441-7762.
Availability of Proxy Voting Policies and Procedures
A description of the policies and procedures that the Funds use to
determine how to vote proxies relating to portfolio securities is available
(1) without charge, upon request, by calling (800) 441-7762; (2) at
http://www.blackrock.com; and (3) on the SEC’s website at
http://www.sec.gov.
Availability of Proxy Voting Record
Information about how the Funds voted proxies relating to securities
held in the Funds’ portfolio during the most recent 12-month period
ended June 30 is available upon request and without charge (1) at
http://www.blackrock.com or by calling (800) 441-7762 and (2) on
the SEC’s website at http://www.sec.gov.
Shareholder Privileges
Account Information
Call us at (800) 441-7762 from 8:00 AM to 6:00 PM EST on any
business day to get information about your account balances, recent
transactions and share prices. You can also reach us on the Web at
www.blackrock.com/funds.
Automatic Investment Plans
Investor Class shareholders who want to invest regularly can arrange to have
$50 or more automatically deducted from their checking or savings account
and invested in any of the BlackRock funds.
Systematic Withdrawal Plans
Investor Class shareholders can establish a systematic withdrawal plan and
receive periodic payments of $50 or more from their BlackRock funds, as
long as their account balance is at least $10,000.
Retirement Plans
Shareholders may make investments in conjunction with Traditional, Rollover,
Roth, Coverdell, Simple IRAs, SEP IRAs and 403(b) Plans.
BlackRock Privacy Principles
BlackRock is committed to maintaining the privacy of its current and
former fund investors and individual clients (collectively, “Clients”) and to
safeguarding their non-public personal information. The following information
is provided to help you understand what personal information BlackRock col-
lects, how we protect that information and why in certain cases we share
such information with select parties.
If you are located in a jurisdiction where specific laws, rules or regulations
require BlackRock to provide you with additional or different privacy-related
rights beyond what is set forth below, then BlackRock will comply with
those specific laws, rules or regulations.
BlackRock obtains or verifies personal non-public information from and
about you from different sources, including the following: (i) information we
receive from you or, if applicable, your financial intermediary, on applica-
tions, forms or other documents; (ii) information about your transactions
with us, our affiliates, or others; (iii) information we receive from a consumer
reporting agency; and (iv) from visits to our websites.
BlackRock does not sell or disclose to non-affiliated third parties any non-
public personal information about its Clients, except as permitted by law
or as is necessary to respond to regulatory requests or to service Client
accounts. These non-affiliated third parties are required to protect the
confidentiality and security of this information and to use it only for its
intended purpose.
We may share information with our affiliates to service your account
or to provide you with information about other BlackRock products or serv-
ices that may be of interest to you. In addition, BlackRock restricts access
to non-public personal information about its Clients to those BlackRock
employees with a legitimate business need for the information. BlackRock
maintains physical, electronic and procedural safeguards that are designed
to protect the non-public personal information of its Clients, including pro-
cedures relating to the proper storage and disposal of such information.
42 SEMI-ANNUAL REPORT APRIL 30, 2011
| | | | |
| A World-Class Mutual Fund Family | | | |
| BlackRock offers a diverse lineup of open-end mutual funds crossing all investment styles and managed by experts in equity, fixed income and |
| tax-exempt investing. | | | | |
| Equity Funds | | | | |
| BlackRock All-Cap Energy & Resources Portfolio | BlackRock Global SmallCap Fund | BlackRock Mid Cap Value Opportunities Fund |
| BlackRock Asset Allocation Portfolio† | BlackRock Health Sciences Opportunities Portfolio | BlackRock Natural Resources Trust |
| BlackRock Balanced Capital Fund† | BlackRock Healthcare Fund | BlackRock Pacific Fund |
| BlackRock Basic Value Fund | BlackRock Index Equity Portfolio | BlackRock Russell 1000 Index Fund |
| BlackRock Capital Appreciation Fund | BlackRock India Fund | | BlackRock Science & Technology |
| BlackRock China Fund | BlackRock International Fund | Opportunities Portfolio |
| BlackRock Energy & Resources Portfolio | BlackRock International Index Fund | BlackRock Small Cap Growth Equity Portfolio |
| BlackRock Equity Dividend Fund | BlackRock International Opportunities Portfolio | BlackRock Small Cap Growth Fund II |
| BlackRock EuroFund | BlackRock International Value Fund | BlackRock Small Cap Index Fund |
| BlackRock Focus Growth Fund | BlackRock Large Cap Core Fund | BlackRock Small/Mid-Cap Growth Portfolio |
| BlackRock Focus Value Fund | BlackRock Large Cap Core Plus Fund | BlackRock S&P 500 Index Fund |
| BlackRock Global Allocation Fund† | BlackRock Large Cap Growth Fund | BlackRock S&P 500 Stock Fund |
| BlackRock Global Dividend Income Portfolio | BlackRock Large Cap Value Fund | BlackRock U.S. Opportunities Portfolio |
| BlackRock Global Dynamic Equity Fund | BlackRock Latin America Fund | BlackRock Utilities and Telecommunications Fund |
| BlackRock Global Emerging Markets Fund | BlackRock Mid-Cap Growth Equity Portfolio | BlackRock Value Opportunities Fund |
| BlackRock Global Growth Fund | BlackRock Mid-Cap Value Equity Portfolio | BlackRock World Gold Fund |
| BlackRock Global Opportunities Portfolio | | | | |
| Fixed Income Funds | | | | |
| BlackRock Bond Index Fund | BlackRock Income Portfolio† | BlackRock Short-Term Bond Fund |
| BlackRock Bond Portfolio | BlackRock Inflation Protected Bond Portfolio | BlackRock Strategic Income |
| BlackRock Emerging Market Debt Portfolio | BlackRock Intermediate Government | Opportunities Portfolio |
| BlackRock Floating Rate Income Portfolio | Bond Portfolio | | BlackRock Total Return Fund |
| BlackRock GNMA Portfolio | BlackRock International Bond Portfolio | BlackRock Total Return Portfolio II |
| BlackRock Government Income Portfolio | BlackRock Long Duration Bond Portfolio | BlackRock World Income Fund |
| BlackRock High Income Fund | BlackRock Low Duration Bond Portfolio | | |
| BlackRock High Yield Bond Portfolio | BlackRock Managed Income Portfolio | | |
| | BlackRock Multi-Sector Bond Portfolio | | |
| Municipal Bond Funds | | | | |
| BlackRock AMT-Free Municipal Bond Portfolio | BlackRock Municipal Fund | BlackRock New York Municipal Bond Fund |
| BlackRock California Municipal Bond Fund | BlackRock National Municipal Fund | BlackRock Pennsylvania Municipal Bond Fund |
| BlackRock High Yield Municipal Fund | BlackRock New Jersey Municipal Bond Fund | BlackRock Short-Term Municipal Fund |
| BlackRock Intermediate Municipal Fund | | | | |
| Target Risk & Target Date Funds† | | | | |
| BlackRock Prepared Portfolios | BlackRock Lifecycle Prepared Portfolios | BlackRock LifePath Portfolios |
| Conservative Prepared Portfolio | 2015 | 2035 | Retirement | 2040 |
| Moderate Prepared Portfolio | 2020 | 2040 | 2020 | 2045 |
| Growth Prepared Portfolio | 2025 | 2045 | 2025 | 2050 |
| Aggressive Growth Prepared Portfolio | 2030 | 2050 | 2030 | 2055 |
| | | | 2035 | |
† Mixed asset fund.
BlackRock mutual funds are currently distributed by BlackRock Investments, LLC. You should consider the investment objectives, risks, charges and
expenses of the funds under consideration carefully before investing. Each fund’s prospectus contains this and other information and is available at
www.blackrock.com or by calling (800) 441-7762 or from your financial advisor. The prospectus should be read carefully before investing.
SEMI-ANNUAL REPORT APRIL 30, 2011 43
This report is not authorized for use as an offer of sale or a solicitation of an offer to buy shares of a Fund unless accompanied or
preceded by a Fund’s current prospectus. Past performance results shown in this report should not be considered a representation
of future performance. Investment return and principal value of shares will fluctuate so that shares, when redeemed, may be worth
more or less than their original cost. Statements and other information herein are as dated and are subject to change. Please see
each Fund’s prospectus for a description of risks associated with global investments.

Item 2 – Code of Ethics – Not Applicable to this semi-annual report
Item 3 – Audit Committee Financial Expert – Not Applicable to this semi-annual report
Item 4 – Principal Accountant Fees and Services – Not Applicable to this semi-annual report
Item 5 – Audit Committee of Listed Registrants – Not Applicable
Item 6 – Investments
(a) The registrant’s Schedule of Investments is included as part of the Report to
Stockholders filed under Item 1 of this Form.
(b) Not Applicable due to no such divestments during the semi-annual period covered since
the previous Form N-CSR filing.
Item 7 – Disclosure of Proxy Voting Policies and Procedures for Closed-End Management
Investment Companies – Not Applicable
Item 8 – Portfolio Managers of Closed-End Management Investment Companies – Not Applicable
Item 9 – Purchases of Equity Securities by Closed-End Management Investment Company and
Affiliated Purchasers – Not Applicable
Item 10 – Submission of Matters to a Vote of Security Holders – There have been no material
changes to these procedures.
Item 11 – Controls and Procedures
(a) – The registrant’s principal executive and principal financial officers, or persons
performing similar functions, have concluded that the registrant’s disclosure controls and
procedures (as defined in Rule 30a-3(c) under the Investment Company Act of 1940, as
amended (the “1940 Act”)) are effective as of a date within 90 days of the filing of this
report based on the evaluation of these controls and procedures required by Rule 30a-3(b)
under the 1940 Act and Rule 15d-15(b) under the Securities Exchange Act of 1934, as
amended.
(b) – There were no changes in the registrant’s internal control over financial reporting (as
defined in Rule 30a-3(d) under the 1940 Act) that occurred during the second fiscal quarter
of the period covered by this report that have materially affected, or are reasonably likely to
materially affect, the registrant’s internal control over financial reporting.
Item 12 – Exhibits attached hereto
(a)(1) – Code of Ethics – Not Applicable to this semi-annual report
(a)(2) – Certifications – Attached hereto
(a)(3) – Not Applicable
(b) – Certifications – Attached hereto
Pursuant to the requirements of the Securities Exchange Act of 1934 and the Investment
Company Act of 1940, the registrant has duly caused this report to be signed on its behalf by
the undersigned, thereunto duly authorized.
BlackRock Global Emerging Markets Fund, Inc.
By: /S/ John M. Perlowski
John M. Perlowski
Chief Executive Officer (principal executive officer) of
BlackRock Global Emerging Markets Fund, Inc.
Date: July 5, 2011
Pursuant to the requirements of the Securities Exchange Act of 1934 and the Investment
Company Act of 1940, this report has been signed below by the following persons on behalf
of the registrant and in the capacities and on the dates indicated.
By: /S/ John M. Perlowski
John M. Perlowski
Chief Executive Officer (principal executive officer) of
BlackRock Global Emerging Markets Fund, Inc.
Date: July 5, 2011
By: /S/ Neal J. Andrews
Neal J. Andrews
Chief Financial Officer (principal financial officer) of
BlackRock Global Emerging Markets Fund, Inc.
Date: July 5, 2011