UNITEDSTATES
SECURITIESANDEXCHANGECOMMISSION
Washington,D.C.20549
FORM N-CSRS
CERTIFIED SHAREHOLDER REPORT OF REGISTERED MANAGEMENT
INVESTMENT COMPANIES
Investment Company Act file number 811-05723
Name of Fund: BlackRock Global Emerging Markets Fund, Inc.
Fund Address: 100 Bellevue Parkway, Wilmington, DE 19809
Name and address of agent for service: Donald C. Burke, Chief Executive Officer, BlackRock
Global Emerging Markets Fund, Inc., 800 Scudders Mill Road, Plainsboro, NJ, 08536.
Mailing address: P.O. Box 9011, Princeton, NJ, 08543-9011
Registrant’s telephone number, including area code: (800) 441-7762
Date of fiscal year end: 10/31/2009
Date of reporting period: 04/30/2009
Item 1 – Report to Stockholders
EQUITIES FIXED INCOME REAL ESTATE LIQUIDITY ALTERNATIVES BLACKROCK SOLUTIONS
Semi-Annual Report
APRIL 30, 2009 | (UNAUDITED)
BlackRock Global Emerging Markets Fund, Inc.
BlackRock Latin America Fund, Inc.
BlackRock International Fund of BlackRock Series, Inc.

NOT FDIC INSURED
MAY LOSE VALUE
NO BANK GUARANTEE
| |
| Table of Contents | |
| |
| | Page |
| |
| Dear Shareholder | 3 |
| Semi-Annual Report: | |
| Fund Summaries | 4 |
| About Fund Performance | 10 |
| Disclosure of Expenses | 10 |
| Portfolio Information | 11 |
| Financial Statements: | |
| Schedules of Investments | 12 |
| Statements of Assets and Liabilities | 16 |
| Statements of Operations | 18 |
| Statements of Changes in Net Assets | 20 |
| Financial Highlights | 23 |
| Notes to Financial Statements | 29 |
| Master Portfolio Information | 38 |
| Master Portfolio Financial Statements: | |
| Schedule of Investments | 39 |
| Statement of Assets and Liabilities | 41 |
| Statement of Operations | 42 |
| Statements of Changes in Net Assets | 43 |
| Master Portfolio Financial Highlights | 43 |
| Master Portfolio Notes to Financial Statements | 44 |
| Officers and Directors | 47 |
| Additional Information | 48 |
| Mutual Fund Family | 50 |
2 SEMI-ANNUAL REPORT
APRIL 30, 2009
Dear Shareholder
The past 12 months reveal a tale of two markets — one of investor pessimism and decided weakness, and another of optimism and some early signs of
recovery. The majority of the past year was characterized by the former as the global financial crisis erupted into the worst recession in decades. Economic
data were uniformly poor and daily headlines recounted the downfalls of storied financial firms, volatile swings in global financial markets, and monumental
government actions that included widespread (and globally coordinated) monetary and quantitative easing by central banks and large-scale fiscal stimuli.
Sentiment improved noticeably in March 2009, however, on the back of new program announcements by the Treasury and Federal Reserve Board, as well
as signs of improved economic performance, such as in retail sales, consumer confidence and select areas of the housing market.
Against this backdrop, US equities contended with unprecedented levels of volatility, posting steep declines early, and then pared some of those losses in
March and April. The experience in international markets was similar to that in the United States, though there was a marked divergence in regional perform-
ance. Notably, emerging economies, which lagged most developed regions through the downturn, were among the market leaders during the late-period rally.
In fixed income markets, while risk aversion remained a dominant theme overall, relatively attractive yields and distressed valuations, alongside a more
favorable macro environment, eventually captured investor attention, leading to a modest recovery in non-Treasury assets. A notable example from the
opposite end of the credit spectrum was the high yield sector, which generally outperformed in the first four months of 2009 after extraordinary challenges
and severe underperformance last year. At the same time, the new year ushered in a return to normalcy for the tax-exempt market, which had registered one
of its worst years on record in 2008.
| | | | |
| All told, the major benchmark indexes posted mixed results for the current reporting period, reflective of a bifurcated market. | | | |
| Total Returns as of April 30, 2009 | 6-month | | 12-month | |
| US equities (S&P 500 Index) | (8.53 | )% | (35.31 | )% |
| Small cap US equities (Russell 2000 Index) | (8.40 | ) | (30.74 | ) |
| International equities (MSCI Europe, Australasia, Far East Index) | (2.64 | ) | (42.76 | ) |
| US Treasury securities (Merrill Lynch 10-Year US Treasury Index) | 8.98 | | 9.30 | |
| Taxable fixed income (Barclays Capital US Aggregate Bond Index) | 7.74 | | 3.84 | |
| Tax-exempt fixed income (Barclays Capital Municipal Bond Index) | 8.20 | | 3.11 | |
| High yield bonds (Barclays Capital US Corporate High Yield 2% Issuer Capped Index) | 16.39 | | (12.55 | ) |
Past performance is no guarantee of future results. Index performance shown for illustrative purposes only. You cannot invest directly in an index.
On June 16, 2009, BlackRock, Inc. announced that it received written notice from Barclays PLC (“Barclays”) in which Barclays’ Board of Directors had
accepted BlackRock’s offer to acquire Barclays Global Investors (“BGI”). Barclays also notified BlackRock that its Board will recommend the transaction to
Barclays’ shareholders for approval at a special meeting to be held in early August 2009. The combination of BlackRock and BGI will bring together market
leaders in active and index strategies to create the preeminent asset management firm. The transaction is expected to close in the fourth quarter 2009
following approval by Barclays’ shareholders, the receipt of client consents and regulatory approvals, and satisfaction of customary closing conditions.
Through periods of market turbulence, as ever, BlackRock’s full resources are dedicated to the management of our clients’ assets. We thank you for entrusting
BlackRock with your investments and look forward to continuing to serve you in the months and years ahead.
Sincerely,

THIS PAGE NOT PART OF YOUR FUND REPORT
3
Fund Summary as of April 30, 2009 BlackRock Global Emerging Markets Fund, Inc.
Portfolio Management Commentary
How did the Fund perform?
•The Fund underperformed the benchmark Morgan Stanley Capital
International (MSCI) Emerging Markets Index for the six-month period.
What factors influenced performance?
•At a country level, poor stock selection in Korea, South Africa and China
was one of the largest detractors from relative Fund performance for the
period. At a sector level, strong stock selection in materials could not offset
the negative impact of the Fund’s underweight position. Holdings in energy
and consumer discretionary also weighed on performance. On an individ-
ual stock basis, the Fund’s overweight position in shipping company China
COSCO Holdings Company Ltd. was the biggest drag on relative perform-
ance. South African mining firm Anglo American Plc and an underweight
position in Teva Pharmaceutical Industries Ltd. also detracted from results.
•Conversely, overweight allocations and strong stock selection in Taiwan,
Brazil and India drove positive performance over the period. From a sector
perspective, financials, telecommunication services and information tech-
nology (IT) all performed well. Stock selection was the source of both the
financials and telecommunication services sectors’ outperformance, while
the Fund’s underweight position aided returns in IT. Hungary’s OTP Bank Plc.,
and property companies China Overseas Land & Investment Ltd. and Cyrela
Brazil Realty SA, Empreendimentos e Participacoes were the largest individual
contributors over the six months.
Describe recent portfolio activity.
•During the period, we reduced the Fund’s underweight position in Asia,
adding to its Taiwan and Korea exposure, while also trimming its China
weighting. Additionally, we reduced the Fund’s weightings in Mexico and
Peru, while exiting Chile entirely. In turn, we opened a position in Hungary
and increased the Fund’s overweight position in Russia.
•On a sector level, we reduced the Fund’s overweight exposure to tele-
communication services and moved to underweight positions in consumer
staples and healthcare. We also moved from an underweight to an over-
weight in both the industrials and financials sectors.
Describe Fund positioning at period end.
•Increased exposure to Russia and Hungary moved the Fund from a slight
underweight position in emerging Europe to it being our largest overweight
regional position. We reduced the Fund’s Latin America overweight, while
increasing the underweight positions in the Middle East and Africa. In gen-
eral, we have focused on purchasing cheap beta stocks, which we believe
are best placed to outperform as the markets rally.
•From a longer-term perspective, the investment case for the asset class
remains intact. While most markets are undergoing a cyclical downturn,
emerging markets are not experiencing the more structural problems seen
in the developed world. With their higher rates of growth, we believe emerg-
ing markets will adapt and recover more quickly than their developed peers.
The views expressed reflect the opinions of BlackRock as of the date of this report and are subject to change based on changes in market, economic or other conditions.
These views are not intended to be a forecast of future events and are no guarantee of future results.
| | | | | | | | | | | | |
| Expense Example | | | | | | | | | | | | |
| |
| | | | | Actual | | | | | | Hypothetical2 | | |
| | | Beginning | | Ending | | | | Beginning | | Ending | | |
| | | Account Value | | Account Value | | Expenses Paid | | Account Value | | Account Value | | Expenses Paid |
| | | November 1, 2008 | | April 30, 2009 | | During the Period1 | | November 1, 2008 | | April 30, 2009 | | During the Period1 |
| Institutional | $ | 1,000 | $ | 1,163.50 | $ | 8.88 | $ | 1,000 | $ | 1,016.70 | $ | 8.27 |
| Investor A | $ | 1,000 | $ | 1,161.40 | $ | 10.91 | $ | 1,000 | $ | 1,014.81 | $ | 10.17 |
| Investor B | $ | 1,000 | $ | 1,155.20 | $ | 15.81 | $ | 1,000 | $ | 1,010.23 | $ | 14.74 |
| Investor C | $ | 1,000 | $ | 1,156.10 | $ | 15.65 | $ | 1,000 | $ | 1,010.38 | $ | 14.60 |
1 For each class of the Fund, expenses are equal to the annualized expense ratio for the class (1.65% for Institutional, 2.03% for Investor A, 2.95% for Investor B, and 2.92% for
Investor C), multiplied by the average account value over the period, multiplied by 181/364 (to reflect the one-half year period shown).
2 Hypothetical 5% annual return before expenses is calculated by pro-rating the number of days in the most recent fiscal half year divided by 364.
See “Disclosure of Expenses” on page 10 for further information on how expenses were calculated.
4 SEMI-ANNUAL REPORT APRIL 30, 2009
BlackRock Global Emerging Markets Fund, Inc.
Total Return Based on a $10,000 Investment
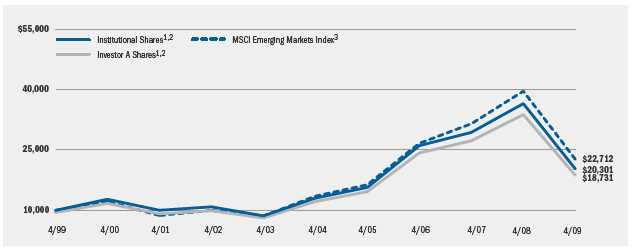
1 Assuming maximum sales charge, if any, transaction costs and other operating expenses, including advisory fees. Institutional Shares do not have
a sales charge.
2 The Fund invests in securities, principally equities, of issuers in countries having smaller capital markets.
3 This unmanaged index measures the total returns of emerging foreign stock markets in Europe, Asia and the Far East.
| | | | | | | | | | | | | | |
| Performance Summary for the Period Ended April 30, 2009 | | | | | | | | | | | | | |
| |
| | | | | | | | Average Annual Total Returns4 | | | | | |
| | | | 1 | Year | | | 5 Years | | | | 10 Years | |
| | 6-Month | | w/o sales | | w/sales | | w/o sales | | w/sales | | w/o sales | | w/sales | |
| | Total Returns | | charge | | charge | | charge | | charge | | charge | | charge | |
| Institutional | 16.35 | % | (44.47 | )% | N/A | | 9.24 | % | N/A | | 7.34 | % | N/A | |
| Investor A | 16.14 | | (44.64 | ) | (47.55 | )% | 8.94 | | 7.77 | % | 7.05 | | 6.48 | % |
| Investor B | 15.52 | | (45.14 | ) | (47.28 | ) | 8.06 | | 7.82 | | 6.38 | | 6.38 | |
| Investor C | 15.61 | | (45.15 | ) | (45.62 | ) | 8.07 | | 8.07 | | 6.19 | | 6.19 | |
| MSCI Emerging Markets Index | 17.52 | | (42.71 | ) | N/A | | 11.46 | | N/A | | 8.55 | | N/A | |
4 Assuming maximum sales charges. Average annual total returns with and without sales charges reflect reductions for distribution and service fees. See “About Fund Performance”
on page 10 for a detailed description of share classes, including any related sales charges and fees.
N/A — Not applicable as share class and index do not have a sales charge.
Past performance is not indicative of future results.
SEMI-ANNUAL REPORT APRIL 30, 2009 5
Fund Summary as of April 30, 2009 BlackRock Latin America Fund, Inc.
Portfolio Management Commentary
How did the Fund perform?
•The Fund outperformed the benchmark Morgan Stanley Capital International
(MSCI) Emerging Markets Latin America Index for the six-month period.
What factors influenced performance?
•An overweight position and security selection in Brazil and an under-
weight position in Mexico were the main contributors to Fund performance
at the country level. Individual names that helped returns for the period
included Brazilian banks Unibanco Holdings SA and Itau Unibanco Multiplo
SA, Chilean copper name Antofagasta Plc, Mexican consumer staples name
FEMSA Cerveza and Cyrela Brazil Realty SA Empreendimentos e
Participacoes, a Brazilian homebuilder. From a sector perspective, security
selection in consumer staples, an overweight position and security selec-
tion in financials and security selection and an underweight position in
telecommunication services aided results.
•By contrast, security selection in Chile, which was somewhat offset by the
Fund’s underweight position in the country, and an underweight position
in Peru weighed on performance during the period. Individual names that
detracted included large cap cyclical oil giant Petrobras SA; Mexican home-
builder Corporacion Geo SAB de CV, which lagged due to concerns regard-
ing credit availability in a credit crunch scenario; and Mexican bank Grupo
Financiero Banorte SAB de CV, which suffered due to concerns about its
exposure to some of the Mexican companies that went bankrupt or suffered
huge losses from foreign exchange market positions late in 2008. From a
sector perspective, an underweight in energy hindered results. A small cash
position, which averaged 1% during the period, also was a detractor.
Describe recent portfolio activity.
•During the period, we reduced exposure to Mexico, especially consumer
names, given the continued challenging environment and their dependency
on the US economy. We also reduced exposure to Chilean consumer names.
Chilean GDP growth was at its lowest levels in almost a decade and, as
a result, consumer confidence was low, which was a concern with respect
to our outlook for Chilean equities. The Fund’s exposure to Argentina was
reduced as well because Tenaris SA, one of the largest names in the
Argentine benchmark, was removed from the index in November. Meanwhile,
we reintroduced Panama into the Fund via Copa Holdings SA and we
increased exposure to Brazil, primarily in the more domestically-oriented
sectors, including financials, consumers and industrials.
Describe Fund positioning at period end.
•At period end, Brazil remains the Fund’s largest overweight. We continue
to favor stocks that are exposed to the domestic economy, given strong
resilience on the employment front, record low Selic interest rates (with
expectations of further cuts) and the potential upside on the commodity
front from an improvement in global economic activity. The Fund still holds
an underweight position in Mexico on account of its challenging growth
profile (not helped by the swine flu scare), but we have reduced the under-
weight given some stock-specific, attractive valuation levels. Peru remains
our favorite market in the Andean region, while Chile remains a large under-
weight due to low economic growth and relatively high valuation.
The views expressed reflect the opinions of BlackRock as of the date of this report and are subject to change based on changes in market, economic or other conditions.
These views are not intended to be a forecast of future events and are no guarantee of future results.
| | | | | | | | | | | | |
| Expense Example | | | | | | | | | | | | |
| |
| | | | | Actual | | | | | | Hypothetical2 | | |
| | | Beginning | | Ending | | | | Beginning | | Ending | | |
| | | Account Value | | Account Value | | Expenses Paid | | Account Value | | Account Value | | Expenses Paid |
| | | November 1, 2008 | | April 30, 2009 | | During the Period1 | | November 1, 2008 | | April 30, 2009 | | During the Period1 |
| Institutional | $ | 1,000 | $ | 1,218.80 | $ | 8.66 | $ | 1,000 | $ | 1,017.09 | $ | 7.87 |
| Investor A | $ | 1,000 | $ | 1,217.20 | $ | 10.09 | $ | 1,000 | $ | 1,015.80 | $ | 9.17 |
| Investor B | $ | 1,000 | $ | 1,210.90 | $ | 15.89 | $ | 1,000 | $ | 1,010.53 | $ | 14.45 |
| Investor C | $ | 1,000 | $ | 1,211.70 | $ | 15.18 | $ | 1,000 | $ | 1,011.18 | $ | 13.80 |
1 For each class of the Fund, expenses are equal to the annualized expense ratio for the class (1.57% for Institutional, 1.83% for Investor A, 2.89% for Investor B, and 2.76% for
Investor C), multiplied by the average account value over the period, multiplied by 181/364 (to reflect the one-half year period shown).
2 Hypothetical 5% annual return before expenses is calculated by pro-rating the number of days in the most recent fiscal half year divided by 364.
See “Disclosure of Expenses” on page 10 for further information on how expenses were calculated.
6 SEMI-ANNUAL REPORT APRIL 30, 2009
BlackRock Latin America Fund, Inc.
Total Return Based on a $10,000 Investment
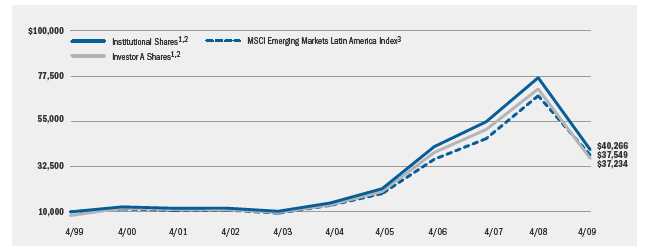
1 Assuming maximum sales charge, if any, transaction costs and other operating expenses, including advisory fees. Institutional Shares do not have
a sales charge.
2 The Fund invests primarily in Latin America equity and debt securities.
3 This unmanaged market-capitalization-weighted index by Morgan Stanley Capital International is comprised of a representative sampling of stocks of
large-, medium-, and small-capitalization companies in Argentina, Brazil, Chile and Mexico, which are freely purchasable by foreign investors.
| | | | | | | | | | | | | | |
| Performance Summary for the Period Ended April 30, 2009 | | | | | | | | | | | | | |
| |
| | | | | | | | Average Annual Total Returns4 | | | | | |
| | | | 1 | Year | | | 5 Years | | | | 10 Years | |
| | 6-Month | | w/o sales | | w/sales | | w/o sales | | w/sales | | w/o sales | | w/sales | |
| | Total Returns | | charge | | charge | | charge | | charge | | charge | | charge | |
| Institutional | 21.88 | % | (47.52 | )% | N/A | | 22.83 | % | N/A | | 14.95 | % | N/A | |
| Investor A | 21.72 | | (47.66 | ) | (50.41 | )% | 22.53 | | 21.21 | % | 14.67 | | 14.05 | % |
| Investor B | 21.09 | | (48.17 | ) | (50.50 | ) | 21.54 | | 21.36 | | 13.95 | | 13.95 | |
| Investor C | 21.17 | | (48.11 | ) | (48.63 | ) | 21.57 | | 21.57 | | 13.75 | | 13.75 | |
| MSCI Emerging Markets Latin America Index | 18.98 | | (44.57 | ) | N/A | | 23.25 | | N/A | | 14.15 | | N/A | |
4 Assuming maximum sales charges. Average annual total returns with and without sales charges reflect reductions for distribution and service fees. See “About Fund Performance”
on page 10 for a detailed description of share classes, including any related sales charges and fees.
N/A — Not applicable as share class and index do not have a sales charge.
Past performance is not indicative of future results.
SEMI-ANNUAL REPORT APRIL 30, 2009 7
Fund Summary as of April 30, 2009 BlackRock International Fund of BlackRock Series, Inc.
Portfolio Management Commentary
How did the Fund perform?
•Through its investment in BlackRock Master International Portfolio, the Fund
outperformed the benchmark Morgan Stanley Capital International (MSCI)
EAFE Index for the six-month period.
What factors influenced performance?
•During the period, the Fund realized strong returns from stock selection, but
sector allocation generally detracted from overall performance.
•Positive stock selection was led by the Fund’s holdings within the energy
sector, as UK-listed Tullow Oil Plc and Brazil’s Petrobras S.A. were stand-out
performers. Stock-specific alpha was also generated in the financials sec-
tor, with strong rises in Credit Suisse Group AG, The Toronto-Dominion Bank
and UBS AG.
•Given the deteriorating global economic environment for much of the
period, we remained underweight in financials and materials. This, however,
resulted in negative sector allocation, as both sectors rallied toward the
end of the period. On the other hand, the Fund’s overweight positioning in
consumer discretionary and telecommunication services was beneficial to
performance.
•From a regional standpoint, the Fund’s overweight position in the
United Kingdom was positive due to holdings including Rio Tinto plc and
Prudential plc. By contrast, the Fund’s underweight in Japan detracted
from performance.
Describe recent portfolio activity.
•At the start of the period, the Fund’s exposure to global growth industries
was reduced and switched aggressively into more defensive stocks.
•Over the first three months of the period, we continued to reduce cyclical
risk by removing names such as Fiat S.p.A., ArcelorMittal and China South
Locomotive & Rolling Stock Industry (Group) Corp. We increased the size
bias in the Fund, investing in large-cap names such as Vodafone Group Plc.
The overall effect was to increase stock-specific risk in the Fund, while
reducing country risk.
•In the last three months of the period, we maintained the high-quality tilt of
the Fund, investing in companies with strong balance sheets and attractive
cash flow characteristics. At the same time, we reduced the size of many of
the Fund’s sector positions, including its underweight in financials.
Describe Fund positioning at period end.
•At period end, the Fund continued to have an overweight position in the
United Kingdom, focused primarily on companies with international earnings
and operations, while it remained underweight in Japan. On a sector basis,
the Fund was overweight in consumer staples, consumer discretionary and
materials, while it was underweight in financials and industrials. We con-
tinue to see value within both defensive and more cyclical sectors.
The views expressed reflect the opinions of BlackRock as of the date of this report and are subject to change based on changes in market, economic or other conditions.
These views are not intended to be a forecast of future events and are no guarantee of future results.
| | | | | | | | | | | | |
| Expense Example | | | | | | | | | | | | |
| |
| | | | | Actual | | | | | | Hypothetical2 | | |
| | | Beginning | | Ending | | | | Beginning | | Ending | | |
| | | Account Value | | Account Value | | Expenses Paid | | Account Value | | Account Value | | Expenses Paid |
| | | November 1, 2008 | | April 30, 2009 | | During the Period1 | | November 1, 2008 | | April 30, 2009 | | During the Period1 |
| Institutional | $ | 1,000 | $ | 993.90 | $ | 10.06 | $ | 1,000 | $ | 1,014.81 | $ | 10.17 |
| Investor A | $ | 1,000 | $ | 991.40 | $ | 11.93 | $ | 1,000 | $ | 1,012.92 | $ | 12.06 |
| Investor B | $ | 1,000 | $ | 985.80 | $ | 18.76 | $ | 1,000 | $ | 1,006.00 | $ | 18.95 |
| Investor C | $ | 1,000 | $ | 988.50 | $ | 15.23 | $ | 1,000 | $ | 1,009.58 | $ | 15.39 |
1 For each class of the Fund, expenses are equal to the annualized expense ratio for the class (2.03% for Institutional, 2.41% for Investor A, 3.80% for Investor B, and 3.08% for
Investor C), multiplied by the average account value over the period, multiplied by 181/364 (to reflect the one-half year period shown). Because the Fund is a feeder fund, the
expense example reflects the expenses of both the feeder fund and the master fund in which it invests.
2 Hypothetical 5% annual return before expenses is calculated by pro-rating the number of days in the most recent fiscal half year divided by 364.
See “Disclosure of Expenses” on page 10 for further information on how expenses were calculated.
8 SEMI-ANNUAL REPORT APRIL 30, 2009
BlackRock International Fund of BlackRock Series, Inc.
Total Return Based on a $10,000 Investment
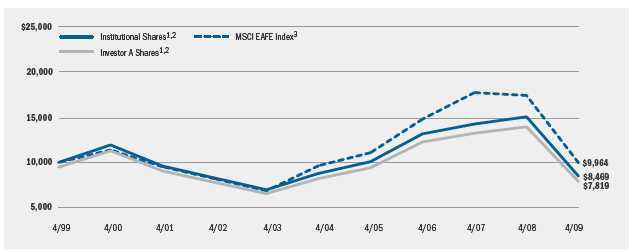
1 Assuming maximum sales charge, if any, transaction costs and other operating expenses, including advisory fees. Institutional Shares do not have
a sales charge.
2 The Fund invests all of its assets in BlackRock Master International Portfolio of BlackRock Master LLC. The Portfolio invests primarily in stocks of companies
located outside of the United States that its management believes are undervalued or have good prospects for earnings growth.
3 This unmanaged broad-based index measures the total returns of developed foreign stock markets in Europe, Australasia and the Far East.
| | | | | | | | | | | | | | |
| Performance Summary for the Period Ended April 30, 2009 | | | | | | | | | | | | | |
| |
| | | | | | | | Average Annual Total Returns4 | | | | | |
| | | | 1 | Year | | | 5 Years | | | | 10 Years | |
| | 6-Month | | w/o sales | | w/sales | | w/o sales | | w/sales | | w/o sales | | w/sales | |
| | Total Returns | | charge | | charge | | charge | | charge | | charge | | charge | |
| Institutional | (0.73 | )% | (43.72 | )% | N/A | | (0.74 | )% | N/A | | (1.65 | )% | N/A | |
| Investor A | (0.86 | ) | (43.91 | ) | (46.86 | )% | (1.00 | ) | (2.06 | )% | (1.90 | ) | (2.43 | )% |
| Investor B | (1.54 | ) | (44.61 | ) | (47.10 | ) | (1.94 | ) | (2.33 | ) | (2.52 | ) | (2.52 | ) |
| Investor C | (1.15 | ) | (44.25 | ) | (44.81 | ) | (1.74 | ) | (1.74 | ) | (2.65 | ) | (2.65 | ) |
| MSCI EAFE Index | (2.64 | ) | (42.76 | ) | N/A | | 0.66 | | N/A | | (0.04 | ) | N/A | |
4 Assuming maximum sales charges. Average annual total returns with and without sales charges reflect reductions for distribution and service fees. See “About Fund Performance”
on page 10 for a detailed description of share classes, including any related sales charges and fees.
N/A — Not applicable as share class and index do not have a sales charge.
Past performance is not indicative of future results.
SEMI-ANNUAL REPORT APRIL 30, 2009 9
About Fund Performance
•Institutional Shares are not subject to any sales charge. Institutional
Shares bear no ongoing distribution or service fees and are available only
to eligible investors.
•Investor A Shares incur a maximum initial sales charge (front-end load) of
5.25% and a service fee of 0.25% per year (but no distribution fee).
•Investor B Shares are subject to a maximum contingent deferred sales
charge of 4.50% declining to 0% after six years. In addition, Investor B
Shares are subject to a distribution fee of 0.75% per year and a service
fee of 0.25% per year. These shares automatically convert to Investor A
Shares after approximately eight years. (There is no initial sales charge for
automatic share conversions.) All returns for periods greater than eight
years reflect this conversion.
•Investor C Shares are subject to a distribution fee of 0.75% and a service
fee of 0.25%. In addition, Investor C Shares are subject to a 1% contin-
gent deferred sales charge if redeemed within one year of purchase.
Performance information reflects past performance and does not guaran-
tee future results. Current performance may be lower or higher than the
performance data quoted. Refer to www.blackrock.com/funds to obtain
performance data current to the most recent month-end. Performance
results do not reflect the deduction of taxes that a shareholder would pay
on fund distributions or the redemption of fund shares. The Funds may
charge a 2% redemption fee for sales or exchanges of shares within 30
days of purchase or exchange. Performance data does not reflect this
potential fee. Figures shown in the performance tables on pages 5, 7 and
9 assume reinvestment of all dividends and capital gain distributions, if
any, at net asset value on the ex-dividend date. Investment return and
principal value of shares will fluctuate so that shares, when redeemed,
may be worth more or less than their original cost. Dividends paid to each
class of shares will vary because of the different levels of service, distribu-
tion and transfer agency fees applicable to each class, which are
deducted from the income available to be paid to shareholders.
Disclosure of Expenses
Shareholders of these Funds may incur the following charges: (a)
expenses related to transactions, including sales charges, redemption fees
and exchange fees; and (b) operating expenses including advisory fees,
distribution fees including 12b-1 fees, and other Fund expenses. The
expense examples on pages 4, 6 and 8 (which are based on a hypothetical
investment of $1,000 invested on November 1, 2008 and held through
April 30, 2009) are intended to assist shareholders both in calculating
expenses based on an investment in the Funds and in comparing
these expenses with similar costs of investing in other mutual funds.
The tables provide information about actual account values and actual
expenses. In order to estimate the expenses a shareholder paid during the
period covered by this report, shareholders can divide their account value
by $1,000 and then multiply the result by the number corresponding to
their share class under the heading “Expenses Paid During the Period.”
The tables also provide information about hypothetical account values and
hypothetical expenses based on each Fund’s actual expense ratio and an
assumed rate of return of 5% per year before expenses. In order to assist
shareholders in comparing the ongoing expenses of investing in these
Funds and other funds, compare the 5% hypothetical examples with the
5% hypothetical examples that appear in other funds’ shareholder reports.
The expenses shown in the tables are intended to highlight shareholders’
ongoing costs only and do not reflect any transactional expenses, such as
sales charges, redemption fees or exchange fees. Therefore, the hypotheti-
cal examples are useful in comparing ongoing expenses only, and will not
help shareholders determine the relative total expenses of owning differ-
ent funds. If these transactional expenses were included, shareholder
expenses would have been higher.
10 SEMI-ANNUAL REPORT APRIL 30, 2009
| | | | | |
| Portfolio Information as of April 30, 2009 | | | | | |
| |
| BlackRock Global Emerging Markets Fund, Inc. | | | | | |
| |
| | Percent of | | | Percent of | |
| | Long-Term | | | Long-Term | |
| Ten Largest Holdings | Investments | | Geographic Allocation | Investments | |
| Samsung Electronics Co., Ltd. | 4 | % | Brazil | 15 | % |
| OAO Gazprom | 4 | | China | 15 | |
| Shinhan Financial Group Co., Ltd. | 3 | | South Korea | 14 | |
| China Mobile Ltd. | 3 | | Taiwan | 14 | |
| Petroleo Brasileiro SA | 3 | | Russia | 11 | |
| Taiwan Semiconductor Manufacturing Co., Ltd. | 2 | | South Africa | 7 | |
| Itau Unibanco Multiplo SA | 2 | | India | 6 | |
| China Life Insurance Co., Ltd. | 2 | | Mexico | 5 | |
| Hyundai Development Co. | 2 | | Argentina | 2 | |
| America Movil, SA de CV | 2 | | Thailand | 2 | |
| | | | Turkey | 2 | |
| | | | Hungary | 2 | |
| | | | Other1 | 5 | |
| | | | 1 Other includes a 1% investment in each country as follows: Indonesia, United Arab | |
| | | | Emirates, Peru, Israel and Malaysia. | | |
| |
| |
| |
| |
| BlackRock Latin America Fund, Inc. | | | | | |
| |
| | Percent of | | | Percent of | |
| | Long-Term | | | Long-Term | |
| Ten Largest Holdings | Investments | | Geographic Allocation | Investments | |
| Petroleo Brasileiro SA | 14 | % | Brazil | 76 | % |
| Itau Unibanco Multiplo SA | 11 | | Mexico | 18 | |
| America Movil, SA de CV | 9 | | Peru | 2 | |
| Companhia Vale do Rio Doce (Preference 'A' Shares) | 9 | | Chile | 2 | |
| Banco Bradesco SA | 5 | | Argentina | 2 | |
| Cia de Bebidas das Americas (Preference Shares) | 5 | | | | |
| Usinas Siderurgicas de Minas Gerais SA (Preference ‘A’ Shares) | 3 | | | | |
| Grupo Televisa, SA | 3 | | | | |
| Bradespar SA (Preference Shares) | 3 | | | | |
| Cyrela Brazil Realty SA Empreendimentos e Participacoes | 2 | | | | |
SEMI-ANNUAL REPORT
APRIL 30, 2009
11
Schedule of Investments April 30, 2009 (Unaudited)
BlackRock Global Emerging Markets Fund, Inc.
(Percentages shown are based on Net Assets)
| | | |
| Common Stocks | Shares | | Value |
| |
| Argentina — 2.1% | | | |
| Tenaris SA (a) | 96,607 | $ | 2,417,107 |
| Ternium SA (a) | 64,470 | | 542,193 |
| | | | 2,959,300 |
| Brazil — 15.0% | | | |
| All America Latina Logistica SA | 283,000 | | 1,453,172 |
| Banco Bradesco SA (a) | 181,421 | | 2,227,850 |
| Companhia Vale do Rio Doce | | | |
| (Preference ‘A’ Shares) (a) | 182,500 | | 2,505,725 |
| Cyrela Brazil Realty SA | 288,000 | | 1,832,769 |
| GVT Holding SA (b) | 115,000 | | 1,519,359 |
| Itau Unibanco Banco Multiplo SA (a) | 228,797 | | 3,141,376 |
| Lojas Renner SA | 163,259 | | 1,481,223 |
| Petroleo Brasileiro SA (a) | 134,600 | | 3,631,508 |
| Rodobens Negocios Imobiliarios SA | 81,583 | | 539,675 |
| Tam SA (Preference Shares) (a)(b) | 190,118 | | 1,268,087 |
| Usinas Siderurgicas de Minas Gerais SA | | | |
| (Preference ‘A’ Shares) | 115,000 | | 1,705,864 |
| | | | 21,306,608 |
| China — 14.5% | | | |
| Bank of China Ltd. | 6,546,000 | | 2,427,096 |
| CNOOC Ltd. | 2,153,000 | | 2,403,435 |
| China Coal Energy Co. | 1,904,000 | | 1,624,972 |
| China Communications Construction Co. Ltd. | 1,402,000 | | 1,662,883 |
| China Life Insurance Co. Ltd. | 836,000 | | 2,935,960 |
| China Mobile Ltd. | 457,990 | | 3,954,850 |
| China Resources Power Holdings Co. | 1,100,000 | | 2,464,951 |
| China Shipping Development Co. Ltd. | 1,308,000 | | 1,489,720 |
| Foxconn International Holdings Ltd. (b) | 2,649,000 | | 1,632,494 |
| | | | 20,596,361 |
| Hungary — 1.5% | | | |
| OTP Bank Plc | 165,570 | | 2,132,500 |
| India — 2.6% | | | |
| Bharti Tele-Ventures Ltd. | 113,023 | | 1,711,906 |
| ICICI Bank Ltd. (a) | 91,742 | | 1,892,638 |
| | | | 3,604,544 |
| Indonesia — 1.3% | | | |
| Bumi Resources Tbk PT | 13,617,000 | | 1,872,722 |
| Israel — 0.9% | | | |
| Teva Pharmaceutical Industries Ltd. (a) | 28,561 | | 1,253,542 |
| Malaysia — 0.7% | | | |
| Tenaga Nasional Bhd | 494,300 | | 1,016,372 |
| Mexico — 4.7% | | | |
| America Movil, SA de CV (a) | 83,500 | | 2,742,975 |
| Desarrolladora Homex SA de CV (a)(b) | 69,373 | | 1,289,644 |
| Grupo Financiero Banorte, SA de CV ‘O’ | 885,000 | | 1,365,385 |
| Grupo Televisa, SA (a) | 86,000 | | 1,331,280 |
| | | | 6,729,284 |
| | | |
| Common Stocks | Shares | | Value |
| |
| Peru — 0.9% | | | |
| Credicorp Ltd. | 25,816 | $ | 1,291,316 |
| Russia — 10.7% | | | |
| AO VimpelCom (a) | 164,913 | | 1,553,480 |
| LUKOIL (a) | 35,871 | | 1,599,847 |
| MMC Norilsk Nickel (a) | 260,283 | | 2,168,157 |
| Mechel OAO (a) | 262,336 | | 1,395,628 |
| Mobile Telesystems (a) | 38,448 | | 1,274,167 |
| OAO Gazprom (a) | 309,646 | | 5,536,471 |
| OAO Rosnft Oil Co. (a)(b) | 323,287 | | 1,697,257 |
| | | | 15,225,007 |
| South Africa — 6.4% | | | |
| Anglo American Plc | 71,735 | | 1,566,075 |
| Anglo Platinum Ltd. | 27,200 | | 1,455,026 |
| Blue Label Telecoms Ltd. (b) | 560,870 | | 276,227 |
| FirstRand Ltd. | 1,200,211 | | 1,833,307 |
| Sasol Ltd. | 41,244 | | 1,241,867 |
| Telkom SA Ltd. | 112,596 | | 1,418,686 |
| Tiger Brands Ltd. | 86,173 | | 1,338,669 |
| | | | 9,129,857 |
| South Korea — 14.1% | | | |
| Hite Brewery Co., Ltd. | 115 | | 16,408 |
| Hyundai Development Co. | 92,727 | | 2,887,686 |
| POSCO | 5,020 | | 1,548,069 |
| SK Telecom Co., Ltd. | 11,854 | | 1,689,865 |
| Samsung Electronics Co., Ltd. | 12,275 | | 5,668,069 |
| Samsung Fire & Marine Insurance Co. Ltd. | 13,594 | | 1,854,828 |
| Shinhan Financial Group Co., Ltd. | 168,803 | | 4,176,182 |
| Shinsegae Co. Ltd. | 5,990 | | 2,136,592 |
| | | | 19,977,699 |
| Taiwan — 13.8% | | | |
| Advanced Semiconductor Engineering Inc. | 3,501,000 | | 1,943,634 |
| Asustek Computer, Inc. | 1,528,000 | | 2,027,801 |
| Chunghwa Telecom Co. Ltd. (a) | 62,719 | | 1,185,390 |
| Chunghwa Telecom Co. Ltd. | 314,919 | | 599,859 |
| Far Eastern Textile Co. Ltd. | 1,998,000 | | 1,864,053 |
| Formosa Plastics Corp. | 1,108,000 | | 1,952,211 |
| HON HAI Precision Industry Co. Ltd. | 898,250 | | 2,593,281 |
| Taiwan Semiconductor Manufacturing Co. Ltd. | 2,136,878 | | 3,616,114 |
| Uni-President Enterprises Corp. | 1,697,000 | | 1,704,062 |
| Yuanta Financial Holding Co. Ltd. | 3,608,000 | | 2,110,076 |
| | | | 19,596,481 |
| Thailand — 1.7% | | | |
| Kasikornbank PCL | 1,024,000 | | 1,512,035 |
| PTT Exploration & Production PCL (a) | 322,090 | | 936,294 |
| | | | 2,448,329 |
| Turkey — 1.7% | | | |
| Turkiye Vakiflar Bankasi T.A.O. Class D | 2,107,000 | | 2,385,608 |
| Total Common Stocks — 92.6% | | | 131,525,530 |
See Notes to Financial Statements.
12 SEMI-ANNUAL REPORT
APRIL 30, 2009
Schedule of Investments (concluded)
BlackRock Global Emerging Markets Fund, Inc.
(Percentages shown are based on Net Assets)
| | | |
| Warrants (c) | Shares | | Value |
| |
| India — 0.6% | | | |
| Unitech Ltd. | 1,062,972 | $ | 935,819 |
| United Arab Emirates — 0.9% | | | |
| Emaar Properties PJSC | 2,010,614 | | 1,286,391 |
| Total Warrants — 1.5% | | | 2,222,210 |
| |
| |
| |
| Structured Notes | | | |
| India — 2.7% | | | |
| Citigroup Global Markets Holdings, Inc. (Jaiprakash | | | |
| Associates Ltd.), 10/24/12 (b) | 523,000 | | 1,448,710 |
| Citigroup Global Markets Holdings, Inc. (Reliance | | | |
| Infrastructure Ltd.), 10/24/12 (b) | 73,655 | | 1,023,068 |
| Deutsche Bank AG London (Sterlite Industries | | | |
| (India) Ltd.), 6/19/09 (b) | 162,991 | | 1,340,715 |
| Total Structured Notes — 2.7% | | | 3,812,493 |
| Total Investments (Cost — $130,048,682*) — 96.8% | | | 137,560,233 |
| Other Assets Less Liabilities — 3.2% | | | 4,524,934 |
| Net Assets — 100.0% | | $ | 142,085,167 |
* The cost and unrealized appreciation (depreciation) of investments as of April 30,
2009, as computed for federal income tax purposes, were as follows:
| | | |
| Aggregate cost | $ | 139,685,408 | |
| Gross unrealized appreciation | $ | 19,293,648 | |
| Gross unrealized depreciation | | (21,418,823 | ) |
| Net unrealized depreciation | $ | (2,125,175 | ) |
(a) Depositary receipts.
(b) Non-income producing security.
(c) Warrants entitle the Fund to purchase a predetermined number of shares of com-
mon stock and are non-income producing. The purchase price and number of
shares are subject to adjustment under certain conditions until the expiration date.
•Investments in companies considered to be an affiliate of the Fund, for purposes of
Section 2(a)(3) of the Investment Company Act of 1940, were as follows:
| | | | | |
| | | Net | | | |
| Affiliate | | Activity | | | Income |
| |
| BlackRock Liquidity Series, LLC | | | | | |
| Cash Sweep Series | $ | (6,128,715 | ) | $ | 14,119 |
•Foreign currency exchange contracts as of April 30, 2009 were as follows:
| | | | | | | | |
| Currency | | Currency | | Settlement | | Unrealized | |
| Purchased | | | Sold | Counterparty | Date | | Depreciation | |
| |
| BRL | 568,107 | USD | 263,013 | Brown Brothers | | | | |
| | | | | Harriman & Co. | 5/04/09 | $ | (3,766 | ) |
| BRL | 673,613 | USD | 308,926 | Brown Brothers | | | | |
| | | | | Harriman & Co. | 5/05/09 | | (1,619 | ) |
| KRW 1,870,720,207 | USD | 1,471,849 | Brown Brothers | | | | |
| | | | | Harriman & Co. | 5/06/09 | | (13,766 | ) |
| Total | | | | | | $ | (19,151 | ) |
•Currency Abbreviations:
| |
BRL KRW USD | Brazilian Real South Korean Won US Dollar |
•Financial Accounting Standards Board Statement of Financial Accounting Standards
No. 157, “Fair Value Measurements,” clarifies the definition of fair value, establishes
a framework for measuring fair values and requires additional disclosures about the
use of fair value measurements. Various inputs are used in determining the fair
value of investments, which are as follows:
•Level 1 — price quotations in active markets/exchanges for identical securities
•Level 2 — other observable inputs (including, but not limited to: quoted prices for
similar assets or liabilities in markets that are active, quoted prices for identical
or similar assets in markets that are not active, inputs other than quoted prices
that are observable for the assets or liabilities (such as interest rates, yield
curves, volatilities, prepayment speeds, loss severities, credit risks and default
rates) or other market-corroborated inputs)
•Level 3 — unobservable inputs based on the best information available in the
circumstance, to the extent observable inputs are not available (including the
Fund’s own assumptions used in determining the fair value of investments)
The inputs or methodology used for valuing securities are not necessarily an indica-
tion of the risk associated with investing in those securities. For information about
the Fund’s policy regarding valuation of investments and other significant accounting
policies, please refer to Note 1 of the Notes to Financial Statements.
The following table summarizes the inputs used as of April 30, 2009 in determining
the fair valuation of the Fund’s investments:
| | | | | |
| Valuation | | Investments in | | Other Financial | |
| Inputs | | Securities | | Instruments* | |
| | | Assets | | Liabilities | |
| Level 1 | $ | 51,843,083 | | — | |
| Level 2 | | 85,717,150 | $ | (19,151 | ) |
| Level 3 | | — | | — | |
| Total | $ | 137,560,233 | $ | (19,151 | ) |
* Other financial instruments are foreign currency exchange contracts which are
valued at the unrealized appreciation/depreciation on the instrument.
See Notes to Financial Statements.
SEMI-ANNUAL REPORT
APRIL 30, 2009
13
Schedule of Investments April 30, 2009 (Unaudited)
BlackRock Latin America Fund, Inc.
(Percentages shown are based on Net Assets)
| | | |
| Common Stocks | Shares | | Value |
| |
| Argentina — 1.4% | | | |
| Tenaris SA (a) | 164,000 | $ | 4,103,280 |
| Ternium SA (a) | 154,000 | | 1,295,140 |
| | | | 5,398,420 |
| Brazil — 73.9% | | | |
| Agra Empreendimentos Imobiliarios SA | 400,000 | | 420,293 |
| All America Latina Logistica SA | 1,175,000 | | 6,033,486 |
| Amil Partcipacoes SA | 532,000 | | 2,005,071 |
| Anhanguera Educaional Participacoes SA | 360,000 | | 2,516,275 |
| B2W Companhia Global Do Varejo | 98,000 | | 1,555,769 |
| BM&F Bovespa SA | 829,000 | | 3,408,484 |
| Banco ABC Brasil SA (Preference Shares) | 300,000 | | 959,364 |
| Banco Bradesco SA (a)(b) | 1,433,000 | | 17,597,240 |
| Banco Industrial e Comercial SA | | | |
| (Preference Shares) | 400,000 | | 1,059,869 |
| Bradespar SA (Preference Shares) | 870,000 | | 10,866,306 |
| Cia Brasileira de Distribuicao Grupo Pao | | | |
| de Acucar (a) | 60,000 | | 1,937,400 |
| Cia Energetica de Minas Gerais (a) | 190,000 | | 2,859,500 |
| Cia Energetica de Minas Gerais | | | |
| (Preference Shares) | 37,500 | | 453,128 |
| Cia Siderurgica Nacional SA (a) | 179,000 | | 3,315,080 |
| Cia de Bebidas das Americas (a)(b) | 25,000 | | 1,136,250 |
| Cia de Bebidas das Americas (Preference | | | |
| Shares) (a) | 308,000 | | 17,365,040 |
| Cia de Concessoes Rodoviarias | 232,600 | | 2,784,038 |
| Companhia Vale do Rio Doce (Preference ‘A’ | | | |
| Shares) (a) | 2,435,000 | | 33,432,550 |
| Companhia de Saneamento de Minas Gerais | 98,000 | | 1,061,504 |
| Cyrela Brazil Realty SA Empreendimentos | | | |
| e Participacoes | 1,024,500 | | 6,519,694 |
| Diagnosticos da America SA (c) | 172,000 | | 2,502,661 |
| EDP — Energias do Brasil SA | 120,000 | | 1,456,041 |
| Eletropaulo Metropolitana Eletricidade de | | | |
| Sao Paulo SA (Preference ‘B’ Shares) | 80,000 | | 1,043,423 |
| Equatorial Energia SA | 98,000 | | 610,220 |
| GVT Holding SA (c) | 207,000 | | 2,734,845 |
| Hypermarcas SA (c) | 360,000 | | 3,070,513 |
| Itau Unibanco Multiplo SA (a) | 3,190,000 | | 43,798,700 |
| Itausa-Investimentos Itau SA (Preference Shares) | 759,000 | | 3,245,501 |
| Lojas Renner SA | 291,000 | | 2,640,197 |
| Lupatech SA (c) | 130,000 | | 1,633,797 |
| Marcopolo SA (Preference Shares) | 400,000 | | 889,924 |
| Metalfrio Solutions SA (c) | 209,000 | | 424,884 |
| Mrv Engenharia e Participacoes SA | 318,000 | | 3,153,923 |
| NET Servicos de Comunicacao SA (Preference | | | |
| Shares) (c) | 655,000 | | 5,362,206 |
| OGX Petroleo e Gas Participacoes SA | 9,000 | | 3,778,483 |
| PDG Realty SA Empreendimentos e Participacoes | 278,000 | | 2,649,252 |
| Petroleo Brasileiro SA (a) | 1,950,000 | | 52,611,000 |
| Porto Seguro SA | 405,000 | | 2,440,417 |
| Profarma Distribuidora de Produtos | | | |
| Farmaceuticos SA | 88,000 | | 295,484 |
| Redecard SA | 171,200 | | 2,154,713 |
| Rodobens Negocios Imobiliarios SA | 105,000 | | 694,580 |
| Suzano Papel e Celulose SA (Preference Shares) (c) | 172,000 | | 1,091,427 |
| | | |
| Common Stocks | Shares | | Value |
| |
| Brazil (concluded) | | | |
| Tam SA (Preference Shares) (a)(c) | 445,000 | $ | 2,968,150 |
| Tele Norte Leste Participacoes SA (a) | 256,000 | | 3,980,800 |
| Terna Participacoes SA | 100,000 | | 1,685,740 |
| Tim Participacoes SA (a) | 81,000 | | 1,349,460 |
| Totvs SA | 81,004 | | 2,190,748 |
| Tractebel Energia SA | 249,000 | | 2,052,107 |
| Ultrapar Participacoes SA (Preference Shares) | 50,000 | | 1,397,245 |
| Usinas Siderurgicas de Minas Gerais SA | 107,000 | | 1,472,811 |
| Usinas Siderurgicas de Minas Gerais SA | | | |
| (Preference ‘A’ Shares) | 860,000 | | 12,756,892 |
| Weg SA | 222,000 | | 1,418,845 |
| | | | 286,841,330 |
| Chile — 2.0% | | | |
| Antofagasta Plc | 240,000 | | 2,059,690 |
| Banco Santander Chile SA (a) | 44,000 | | 1,558,040 |
| Empresa Nacional de Electricidad SA (a) | 113,000 | | 4,333,550 |
| | | | 7,951,280 |
| Mexico — 17.3% | | | |
| America Movil, SA de CV (a)(b) | 1,035,000 | | 33,999,750 |
| Cemex, SA de CV (a)(b)(c) | 552,000 | | 4,128,960 |
| Desarrolladora Homex SAB de CV (a)(c) | 212,200 | | 3,944,798 |
| Fomento Economico Mexicano, SA de CV (a) | 124,000 | | 3,510,440 |
| Grupo Financiero Banorte, SAB de CV Class O | 2,100,000 | | 3,239,896 |
| Grupo Mexico, SA de CV | 5,113,000 | | 3,962,705 |
| Grupo Televisa, SA (a) | 711,000 | | 11,006,280 |
| Wal-Mart de Mexico, SA de CV | 1,330,000 | | 3,612,560 |
| | | | 67,405,389 |
| Panama — 0.4% | | | |
| Copa Holdings SA Class A | 50,000 | | 1,532,500 |
| Peru — 2.1% | | | |
| Cia de Minas Buenaventura SA (a) | 147,000 | | 3,110,520 |
| Credicorp Ltd. (b) | 98,000 | | 4,901,960 |
| | | | 8,012,480 |
| Total Common Stocks — 97.1% | | | 377,141,399 |
| |
| |
| |
| Structured Notes | | | |
| Brazil — 1.2% | | | |
| Deutsche Bank AG (Redecard SA), due 3/24/11 (c) | 90,000 | | 1,131,066 |
| Morgan Stanley BV (Redecard SA), due 2/26/10 (c) | 150,000 | | 1,905,450 |
| Morgan Stanley BV (Redecard SA), due 3/02/10 (c) | 50,000 | | 638,050 |
| Morgan Stanley BV (Redecard SA), due 4/01/10 (c) | 75,000 | | 950,100 |
| Total Structured Notes — 1.2% | | | 4,624,666 |
| Total Long-Term Investments | | | |
| (Cost — $378,178,108) — 98.3% | | | 381,766,065 |
See Notes to Financial Statements.
14 SEMI-ANNUAL REPORT
APRIL 30, 2009
Schedule of Investments (concluded)
BlackRock Latin America Fund, Inc.
(Percentages shown are based on Net Assets)
| | | | | |
| | Par | | | | |
| Short-Term Securities | (000 | ) | | Value | |
| |
| Time Deposit — 0.9% | | | | | |
| Brown Brothers Harriman & Co., 0.03%, 5/01/09 | USD 3,372 | | $ | 3,372,128 | |
| |
| | Beneficial | | | | |
| | Interest (000) | | | | |
| Money Market Fund — 8.8% | | | | | |
| BlackRock Liquidity Series, LLC | | | | | |
| Money Market Series, 0.80% (d)(e)(f) | USD 34,217 | | | 34,216,800 | |
| Total Short-Term Securities | | | | | |
| (Cost — $37,588,928) — 9.7% | | | | 37,588,928 | |
| Total Investments Before Options Written | | | | | |
| (Cost — $415,767,036*) — 108.0% | | | | 419,354,993 | |
| |
| |
| |
| Options Written | Contracts | | | | |
| Exchange-Traded Call Options | | | | | |
| Cia Siderurgica Nacional SA, expiring | | | | | |
| June 2009 at USD 22.5 | 800 | | | (30,000 | ) |
| Cia de Bebidas das Americas (Preference | | | | | |
| Shares), expiring July 2009 at USD 60 | 300 | | | (100,500 | ) |
| Total Options Written | | | | | |
| (Premiums Received — $99,780) — 0.0% | | | | (130,500 | ) |
| Total Investments — 108.0% | | | | 419,224,493 | |
| Liabilities in Excess of Other Assets — (8.0)% | | | | (31,020,303 | ) |
| Net Assets — 100.0% | | | $ | 388,204,190 | |
* The cost and unrealized appreciation (depreciation) of investments as of April 30,
2009, as computed for federal income tax purposes, were as follows:
| | | |
| Aggregate cost | $ | 440,487,728 | |
| Gross unrealized appreciation | $ | 53,593,802 | |
| Gross unrealized depreciation | | (74,726,537 | ) |
| Net unrealized depreciation | $ | (21,132,735 | ) |
(a) Depositary receipts.
(b) Security, or a portion of security, is on loan.
(c) Non-income producing security.
(d) Investments in companies considered to be an affiliate of the Fund, for purposes of
Section 2(a)(3) of the Investment Company Act of 1940, were as follows:
| | | | |
| | | Net | | |
| Affiliate | | Activity | | Income |
| |
| BlackRock Liquidity Series, LLC | | | | |
| Cash Sweep Series | | — | $ | 3,753 |
| BlackRock Liquidity Series, LLC | | | | |
| Money Market Series | $ | 23,396,050 | $ | 48,846 |
| | | | | | | |
| (e) Represents the current yield as of report date. | | | | | |
| (f) Security was purchased with the cash proceeds from securities loans. | | | |
| |
| •Foreign currency exchange contracts as of April 30, 2009 were as follows: | | |
| | | | | | Unrealized | |
| Currency | Currency | | Settlement | Appreciation | |
| Purchased | Sold | Counterparty | Date | (Depreciation) | |
| |
| USD 1,769,126 | BRL 3,857,580 | Brown Brothers | | | | | |
| | | Harriman & Co. | 5/04/09 | $ | 8,783 | |
| BRL 1,046,102 | USD 479,753 | Brown Brothers | | | | | |
| | | Harriman & Co. | 5/05/09 | | (2,514 | ) |
| Total | | | | | $ | 6,269 | |
| |
| •Currency Abbreviations: |
| BRL | Brazilian Real |
| USD | US Dollar |
•Effective November 1, 2008, the Fund adopted Financial Accounting Standards
Board Statement of Financial Accounting Standards No. 157, “Fair Value
Measurements,” clarifies the definition of fair value, establishes a framework for
measuring fair values and requires additional disclosures about the use of fair value
measurements. Various inputs are used in determining the fair value of investments,
which are as follows:
•Level 1 — price quotations in active markets/exchanges for identical securities
•Level 2 — other observable inputs (including, but not limited to: quoted prices for
similar assets or liabilities in markets that are active, quoted prices for identical
or similar assets in markets that are not active, inputs other than quoted prices
that are observable for the assets or liabilities (such as interest rates, yield
curves, volatilities, prepayment speeds, loss severities, credit risks and default
rates) or other market-corroborated inputs)
•Level 3 — unobservable inputs based on the best information available in the
circumstance, to the extent observable inputs are not available (including the
Fund’s own assumptions used in determining the fair value of investments)
The inputs or methodology used for valuing securities are not necessarily an indica-
tion of the risk associated with investing in those securities. For information about
the Fund’s policy regarding valuation of investments and other significant accounting
policies, please refer to Note 1 of the Notes to Financial Statements.
The following table summarizes the inputs used as of April 30, 2009 in determining
the fair valuation of the Fund’s investments:
| | | | | | | |
| Valuation | | Investments in | | Other Financial | |
| Inputs | | Securities | | Instruments* | |
| | | Assets | | Assets | | Liabilities | |
| Level 1 | $ | 375,081,708 | | — | $ | (130,500 | ) |
| Level 2 | | 39,648,619 | $ | 8,783 | | (2,514 | ) |
| Level 3 | | 4,624,666 | | — | | — | |
| Total | $ | 419,354,993 | $ | 8,783 | $ | (133,014 | ) |
* Other financial instruments are options written and foreign currency exchange
contracts. Foreign currency exchange contracts are valued at the unrealized
appreciation/depreciation on the instrument and options written are shown
at market value.
The following is a reconciliation of investments for unobservable inputs (Level 3)
used in determining fair value:
| | |
| | | Investments in |
| | | Securities |
| | | Assets |
| Balance, as of November 1, 2008 | | — |
| Accrued discounts/premiums | | — |
| Realized gain (loss) | | — |
| Change in unrealized appreciation/depreciation | $ | 889,832 |
| Net purchases (sales) | | — |
| Net transfers in/out of Level 3 | | 3,734,834 |
| Balance, as of April 30, 2009 | $ | 4,624,666 |
See Notes to Financial Statements.
SEMI-ANNUAL REPORT
APRIL 30, 2009
15
| | | | | | |
| Statements of Assets and Liabilities | | | | | | |
| |
| | | BlackRock | | | | |
| | | Global | | | BlackRock | |
| | | Emerging | | | Latin | |
| | | Markets | | | America | |
| April 30, 2009 (Unaudited) | | Fund, Inc. | | | Fund, Inc. | |
| |
| Assets | | | | | | |
| Investments at value — unaffiliated1,2 | $ | 137,560,233 | | $ | 385,138,193 | |
| Investments at value — affiliated3 | | — | | | 34,216,800 | |
| Foreign currency at value4 | | 2,391,357 | | | 268,891 | |
| Unrealized appreciation on foreign currency exchange contracts | | — | | | 8,783 | |
| Investments sold receivable | | 2,269,455 | | | 1,833,363 | |
| Dividends receivable | | 461,369 | | | 3,445,182 | |
| Capital shares sold receivable | | 63,126 | | | 1,508,247 | |
| Options written receivable | | — | | | 99,780 | |
| Prepaid expenses | | 21,169 | | | 42,214 | |
| Securities lending income receivable — affiliated | | — | | | 18,922 | |
| Interest receivable | | 1,598 | | | — | |
| Other assets | | 52,662 | | | — | |
| Total assets | | 142,820,969 | | | 426,580,375 | |
| |
| Liabilities | | | | | | |
| Collateral on securities loaned at value | | — | | | 34,216,800 | |
| Unrealized depreciation on foreign currency exchange contracts | | 19,151 | | | 2,514 | |
| Options written at value5 | | — | | | 130,500 | |
| Investments purchased payable | | 293,445 | | | 2,432,259 | |
| Capital shares redeemed payable | | 152,588 | | | 821,768 | |
| Other accrued expenses payable | | 117,294 | | | 301,431 | |
| Investment advisory fees payable | | 111,389 | | | 299,940 | |
| Distribution fees payable | | 29,062 | | | 120,417 | |
| Other affiliates payable | | 12,856 | | | 50,516 | |
| Officer’s and Directors’ fees payable | | 17 | | | 40 | |
| Total liabilities | | 735,802 | | | 38,376,185 | |
| Net Assets | $ | 142,085,167 | | $ | 388,204,190 | |
| |
| Net Assets Consist of | | | | | | |
| Paid-in capital | $ | 244,502,812 | | $ | 545,557,652 | |
| Undistributed net investment income | | 26,559 | | | 3,380,803 | |
| Accumulated net realized loss | | (109,945,457 | ) | | (164,259,193 | ) |
| Net unrealized appreciation/depreciation | | 7,501,253 | | | 3,524,928 | |
| Net Assets | $ | 142,085,167 | | $ | 388,204,190 | |
| |
| Net Asset Value | | | | | | |
| Institutional: | | | | | | |
| Net assets | $ | 51,480,518 | | $ | 58,063,962 | |
| Shares outstanding, 100 million shares authorized, $0.10 par value | | 4,374,763 | | | 1,560,380 | |
| Net asset value | $ | 11.77 | | $ | 37.21 | |
| Investor A: | | | | | | |
| Net assets | $ | 72,719,239 | | $ | 239,139,976 | |
| Shares outstanding, 100 million shares authorized, $0.10 par value | | 6,381,090 | | | 6,516,016 | |
| Net asset value | $ | 11.40 | | $ | 36.70 | |
| Investor B: | | | | | | |
| Net assets | $ | 3,405,111 | | $ | 12,442,267 | |
| Shares outstanding, 100 million shares authorized, $0.10 par value | | 331,524 | | | 360,013 | |
| Net asset value | $ | 10.27 | | $ | 34.56 | |
| Investor C: | | | | | | |
| Net assets | $ | 14,480,299 | | $ | 78,557,985 | |
| Shares outstanding, 100 million shares authorized, $0.10 par value | | 1,447,829 | | | 2,314,665 | |
| Net asset value | $ | 10.00 | | $ | 33.94 | |
| 1 Investments at cost — unaffiliated | $ | 130,048,682 | | $ | 381,550,236 | |
| 2 Securities loaned at value | $ | — | | $ | 32,764,155 | |
| 3 Investments at cost — affiliated | $ | — | | $ | 34,216,800 | |
| 4 Foreign currency at cost | $ | 2,387,416 | | $ | 321,908 | |
| 5 Premiums received | $ | — | | $ | 99,780 | |
| |
| See Notes to Financial Statements. | | | | | | |
16 SEMI-ANNUAL REPORT
APRIL 30, 2009
| | | |
| Statements of Assets and Liabilities (concluded) | | | |
| |
| |
| | | BlackRock | |
| | | International | |
| April 30, 2009 (Unaudited) | | Fund | |
| Assets | | | |
| Investments at value — Master International Portfolio of BlackRock Master LLC (the “Portfolio”), (cost — $56,117,146) | $ | 51,950,418 | |
| Withdrawals receivable from the Portfolio | | 104,305 | |
| Capital shares sold receivable | | 25,962 | |
| Prepaid expenses | | 28,091 | |
| Total assets | | 52,108,776 | |
| |
| Liabilities | | | |
| Capital shares redeemed payable | | 130,267 | |
| Distribution fees payable | | 25,904 | |
| Administration fees payable | | 10,253 | |
| Other affiliates payable | | 2,352 | |
| Officer’s and Directors’ fees payable | | 8 | |
| Other accrued expenses payable | | 24,500 | |
| Total liabilities | | 193,284 | |
| Net Assets | $ | 51,915,492 | |
| |
| Net Assets Consist of | | | |
| Paid-in capital | $ | 135,218,378 | |
| Undistributed net investment income | | 178,034 | |
| Accumulated net realized loss allocated from the Portfolio | | (79,314,192 | ) |
| Net unrealized appreciation/depreciation allocated from the Portfolio | | (4,166,728 | ) |
| Net Assets | $ | 51,915,492 | |
| |
| Net Asset Value | | | |
| Institutional: | | | |
| Net assets | $ | 4,346,483 | |
| Shares outstanding, 100 million shares authorized, $0.0001 par value | | 533,647 | |
| Net asset value | $ | 8.14 | |
| Investor A: | | | |
| Net assets | $ | 20,721,713 | |
| Shares outstanding, 100 million shares authorized, $0.0001 par value | | 2,573,527 | |
| Net asset value | $ | 8.05 | |
| Investor B: | | | |
| Net assets | $ | 17,224,955 | |
| Shares outstanding, 100 million shares authorized, $0.0001 par value | | 2,250,173 | |
| Net asset value | $ | 7.65 | |
| Investor C: | | | |
| Net assets | $ | 9,622,341 | |
| Shares outstanding, 100 million shares authorized, $0.0001 par value | | 1,246,894 | |
| Net asset value | $ | 7.72 | |
See Notes to Financial Statements.
SEMI-ANNUAL REPORT
APRIL 30, 2009
17
| | | | | | |
| Statements of Operations | | | | | | |
| |
| | | BlackRock | | | | |
| | | Global | | | BlackRock | |
| | | Emerging | | | Latin | |
| | | Markets | | | America | |
| Six Months Ended April 30, 2009 (Unaudited) | | Fund, Inc. | | | Fund, Inc. | |
| |
| Investment Income | | | | | | |
| |
| Dividends | $ | 1,218,185 | | $ | 6,667,169 | |
| Foreign withholding tax | | (69,747 | ) | | (573,994 | ) |
| Income — affiliated | | 14,160 | | | 4,491 | |
| Securities lending — affiliated | | — | | | 48,846 | |
| Total income | | 1,162,598 | | | 6,146,512 | |
| |
| |
| Expenses | | | | | | |
| |
| Investment advisory fees | | 608,644 | | | 1,559,820 | |
| Service — Investor A | | 77,881 | | | 228,796 | |
| Service and distribution — Investor B | | 15,466 | | | 53,613 | |
| Service and distribution — Investor C | | 61,995 | | | 329,588 | |
| Transfer agent — Institutional | | 44,147 | | | 68,516 | |
| Transfer agent — Investor A | | 103,215 | | | 262,754 | |
| Transfer agent — Investor B | | 7,723 | | | 31,531 | |
| Transfer agent — Investor C | | 29,355 | | | 150,736 | |
| Custodian | | 64,390 | | | 130,778 | |
| Accounting services | | 49,679 | | | 112,759 | |
| Professional | | 63,080 | | | 53,562 | |
| Printing | | 31,546 | | | 69,093 | |
| Registration | | 39,379 | | | 55,254 | |
| Officer and Directors | | 10,475 | | | 14,741 | |
| Miscellaneous | | 15,122 | | | 21,150 | |
| Total expenses | | 1,222,097 | | | 3,142,691 | |
| Net investment income (loss) | | (59,499 | ) | | 3,003,821 | |
| |
| |
| Realized and Unrealized Gain (Loss)/Realized and Unrealized Gain (Loss) from the Portfolio | | | | | | |
| |
| Net realized gain (loss) from: | | | | | | |
| Investments | | (51,072,221 | ) | | (81,649,678 | ) |
| Foreign currency | | (354,090 | ) | | (336,752 | ) |
| | | (51,426,311 | ) | | (81,986,430 | ) |
| Net change in unrealized appreciation/depreciation on: | | | | | | |
| Investments | | 70,739,913 | | | 141,170,301 | |
| Foreign currency | | 49,309 | | | 496,612 | |
| Options written | | — | | | (30,720 | ) |
| | | 70,789,222 | | | 141,636,193 | |
| Total realized and unrealized gain (loss) | | 19,362,911 | | | 59,649,763 | |
| Net Increase in Net Assets Resulting from Operations | $ | 19,303,412 | | $ | 62,653,584 | |
See Notes to Financial Statements.
18 SEMI-ANNUAL REPORT
APRIL 30, 2009
| | | |
| Statements of Operations (concluded) | | | |
| |
| | | BlackRock | |
| | | International | |
| Six Months Ended April 30, 2009 (Unaudited) | | Fund | |
| |
| Investment Income | | | |
| |
| Net investment income allocated from the Portfolio: | | | |
| Dividends | $ | 1,087,069 | |
| Foreign withholding tax | | (112,555 | ) |
| Income — affiliated | | 8,278 | |
| Expenses | | (292,156 | ) |
| Total income | | 690,636 | |
| |
| |
| Expenses | | | |
| |
| Administration | | 64,582 | |
| Transfer agent — Institutional | | 8,577 | |
| Transfer agent — Investor A | | 51,675 | |
| Transfer agent — Investor B | | 100,781 | |
| Transfer agent — Investor C | | 20,073 | |
| Service — Investor A | | 25,279 | |
| Service and distribution — Investor B | | 87,868 | |
| Service and distribution — Investor C | | 46,848 | |
| Professional | | 35,767 | |
| Printing | | 14,735 | |
| Registration | | 12,860 | |
| Officer and Directors | | 10 | |
| Miscellaneous | | 5,532 | |
| Total expenses | | 474,587 | |
| Net investment income | | 216,049 | |
| |
| |
| Realized and Unrealized Gain (Loss) Allocated from the Portfolio | | | |
| |
| Net realized gain (loss) from: | | | |
| Investments | | (21,221,045 | ) |
| Foreign currency | | 186,905 | |
| | | (21,034,140 | ) |
| Net change in unrealized appreciation/depreciation on: | | | |
| Investments | | 19,850,637 | |
| Foreign currency | | (479,452 | ) |
| | | 19,371,185 | |
| Total realized and unrealized loss | | (1,662,955 | ) |
| Net Decrease in Net Assets Resulting from Operations | $ | (1,446,906 | ) |
See Notes to Financial Statements.
SEMI-ANNUAL REPORT
APRIL 30, 2009
19
| | | | | | | | | | |
| Statements of Changes in Net Assets | | BlackRock Global Emerging Markets Fund, Inc. | |
| |
| | | Six Months Ended | | | | Period | | | Year Ended | |
| | | April 30, 20091 | | | July 1, 2008 to | | | June 30, | |
| Increase (Decrease) in Net Assets: | | (Unaudited) | | | October 31, 2008 | | | 2008 | |
| Operations | | | | | | | | | | |
| Net investment income (loss) | $ | (59,499 | ) | | $ | 651,787 | | $ | 376,391 | |
| Net realized gain (loss) | | (51,426,311 | ) | | | (46,035,385 | ) | | 59,329,681 | |
| Net change in unrealized appreciation/depreciation | | 70,789,222 | | | | (78,769,472 | ) | | (49,229,034 | ) |
| Net increase (decrease) in net assets resulting from operations | | 19,303,412 | | | | (124,153,070 | ) | | 10,477,038 | |
| |
| Dividends and Distributions to Shareholders From | | | | | | | | | | |
| Net investment income: | | | | | | | | | | |
| Institutional | | (252,551 | ) | | | (46,785 | ) | | — | |
| Investor A | | (232,391 | ) | | | — | | | — | |
| Investor B | | — | | | | — | | | — | |
| Investor C | | — | | | | — | | | — | |
| Net realized gain: | | | | | | | | | | |
| Institutional | | — | | | | (6,666,957 | ) | | (21,745,299 | ) |
| Investor A | | — | | | | (12,702,815 | ) | | (39,569,089 | ) |
| Investor B | | — | | | | (704,799 | ) | | (2,962,637 | ) |
| Investor C | | — | | | | (2,856,511 | ) | | (9,120,068 | ) |
| Decrease in net assets resulting from dividends and distributions to shareholders | | (484,942 | ) | | | (22,977,867 | ) | | (73,397,093 | ) |
| |
| Capital Share Transactions | | | | | | | | | | |
| Net increase (decrease) in net assets derived from capital share transactions | | (4,213,353 | ) | | | 8,523,710 | | | 45,811,401 | |
| |
| Redemption Fee | | | | | | | | | | |
| Redemption fee | | 4,293 | | | | 167 | | | 9,593 | |
| |
| Net Assets | | | | | | | | | | |
| Total increase (decrease) in net assets | | 14,609,410 | | | | (138,607,060 | ) | | (17,099,061 | ) |
| Beginning of period | | 127,475,757 | | | | 266,082,817 | | | 283,181,878 | |
| End of period | $ | 142,085,167 | | $ | 127,475,757 | | $ | 266,082,817 | |
| End of period undistributed net investment income | $ | 26,559 | | | $ | 571,000 | | $ | 82,388 | |
| 1 Consolidated Statement of Changes in Net Assets. See Note 1 of the Notes to Financial Statements. | | | | | | | | | | |
See Notes to Financial Statements.
20 SEMI-ANNUAL REPORT
APRIL 30, 2009
| | | | | | | | | | |
| Statements of Changes in Net Assets | | BlackRock Latin America Fund, Inc. | |
| |
| | | Six Months Ended | | | | Period | | | Year Ended | |
| | | April 30, 2009 | | | December 1, 2007 | | | November 30, | |
| Increase (Decrease) in Net Assets: | | (Unaudited) to October 31, 20081 | | | 20071 | |
| Operations | | | | | | | | | | |
| Net investment income | $ | 3,003,821 | | | $ | 4,075,060 | | $ | 4,002,197 | |
| Net realized gain (loss) | | (81,986,430 | ) | | | (83,411,553 | ) | | 138,490,749 | |
| Net change in unrealized appreciation/depreciation | | 141,636,193 | | | | (364,631,306 | ) | | 78,178,634 | |
| Net increase (decrease) in net assets resulting from operations | | 62,653,584 | | | | (443,967,799 | ) | | 220,671,580 | |
| |
| Dividends and Distributions to Shareholders From | | | | | | | | | | |
| Net investment income: | | | | | | | | | | |
| Institutional | | — | | | | (1,310,857 | ) | | (2,731,394 | ) |
| Investor A | | — | | | | (3,704,656 | ) | | (2,328,020 | ) |
| Investor B | | — | | | | (115,826 | ) | | (59,260 | ) |
| Investor C | | — | | | | (814,364 | ) | | (351,727 | ) |
| Net realized gain: | | | | | | | | | | |
| Institutional | | — | | | | (18,913,410 | ) | | — | |
| Investor A | | — | | | | (64,111,958 | ) | | — | |
| Investor B | | — | | | | (4,862,076 | ) | | — | |
| Investor C | | — | | | | (26,310,139 | ) | | — | |
| Decrease in net assets resulting from dividends and distributions to shareholders | | — | | | | (120,143,286 | ) | | (5,470,401 | ) |
| |
| Capital Share Transactions | | | | | | | | | | |
| Net increase in net assets derived from capital share transactions | | 5,403,593 | | | | 126,047,735 | | | 95,810,271 | |
| |
| Redemption Fee | | | | | | | | | | |
| Redemption fee | | 50,223 | | | | 212,007 | | | 144,491 | |
| |
| Net Assets | | | | | | | | | | |
| Total increase (decrease) in net assets | | 68,107,400 | | | | (437,851,343 | ) | | 311,155,941 | |
| Beginning of period | | 320,096,790 | | | | 757,948,133 | | | 446,792,192 | |
| End of period | $ | 388,204,190 | | $ | 320,096,790 | | $ | 757,948,133 | |
| End of period undistributed net investment income | $ | 3,380,803 | | | $ | 376,982 | | $ | 3,698,919 | |
| 1 Consolidated Statement of Changes in Net Assets. See Note 1 of the Notes to Financial Statements. | | | | | | | | | | |
See Notes to Financial Statements.
SEMI-ANNUAL REPORT
APRIL 30, 2009
21
| | | | | | | | | |
| Statements of Changes in Net Assets | | | | | BlackRock International Fund | |
| |
| | | Six Months Ended | | | Period | | | Year Ended | |
| | | April 30, 2009 | | | June 1, 2008 to | | | May 31, | |
| Increase (Decrease) in Net Assets: | | (Unaudited) | | | October 31, 2008 | | | 2008 | |
| Operations | | | | | | | | | |
| Net investment income (loss) | $ | 216,049 | | $ | (17,879 | ) | $ | 606,280 | |
| Net realized gain (loss) | | (21,034,140 | ) | | (19,570,681 | ) | | 10,435,185 | |
| Net change in unrealized appreciation/depreciation | | 19,371,185 | | | (31,339,044 | ) | | (4,715,333 | ) |
| Net increase (decrease) in net assets resulting from operations | | (1,446,906 | ) | | (50,927,604 | ) | | 6,326,132 | |
| |
| Dividends to Shareholders From | | | | | | | | | |
| Net investment income: | | | | | | | | | |
| Institutional | | — | | | (116,723 | ) | | (74,593 | ) |
| Investor A | | — | | | (385,085 | ) | | (150,124 | ) |
| Investor B | | — | | | — | | | — | |
| Investor C | | — | | | (26,788 | ) | | — | |
| Decrease in net assets resulting from dividends to shareholders | | — | | | (528,596 | ) | | (224,717 | ) |
| |
| Capital Share Transactions | | | | | | | | | |
| Net decrease in net assets derived from capital share transactions | | (5,763,484 | ) | | (7,527,283 | ) | | (14,445,370 | ) |
| |
| Redemption Fee | | | | | | | | | |
| Redemption fee | | 6,322 | | | 2,038 | | | 963 | |
| |
| Net Assets | | | | | | | | | |
| Total decrease in net assets | | (7,204,068 | ) | | (58,981,445 | ) | | (8,342,992 | ) |
| Beginning of period | | 59,119,560 | | | 118,101,005 | | | 126,443,997 | |
| End of period | $ | 51,915,492 | | $ | 59,119,560 | | $ | 118,101,005 | |
| End of period undistributed (accumulated) net investment income (loss) | $ | 178,034 | | $ | (38,015 | ) | $ | 514,616 | |
See Notes to Financial Statements.
22 SEMI-ANNUAL REPORT
APRIL 30, 2009
| | | | | | | | | | | | | | | | | | | | | |
| Financial Highlights | | | | | | | | | | | BlackRock Global Emerging Markets Fund, Inc. | |
| |
| | | Six Months | | | Period | | | | | | | | | | | | | | | | |
| | | Ended April 30, | July 1, 2008 | | | | | | | | | | | | | | | | |
| | | 2009 | | to October 31, | | | | | | | | Year Ended June 30, | | | | | |
| | | (Unaudited) | | | 2008 | | | 2008 | | | 20071 | | | 20061 | | | 20051 | | | 20041 | |
| | | | | | | | | | | | Institutional | | | | | | | | | | |
| Per Share Operating Performance | | | | | | | | | | | | | | | | | | | | | |
| Net asset value, beginning of period | $ | 10.17 | | $ | 22.45 | | $ | 27.91 | | $ | 24.14 | | $ | 17.74 | | $ | 13.37 | | $ | 10.42 | |
| Net investment income2 | | 0.01 | | | 0.07 | | | 0.12 | | | 0.09 | | | 0.22 | | | 0.18 | | | 0.06 | |
| Net realized and unrealized gain (loss) | | 1.643 | | | (10.34 | )3 | | 1.283 | | | 8.373 | | | 6.283 | | | 4.193 | | | 2.96 | |
| Net increase (decrease) from investment operations | | 1.65 | | | (10.27 | ) | | 1.40 | | | 8.46 | | | 6.50 | | | 4.37 | | | 3.02 | |
| Dividends and distributions from: | | | | | | | | | | | | | | | | | | | | | |
| Net investment income | | (0.05 | ) | | (0.01 | ) | | — | | | (0.28 | ) | | (0.10 | ) | | — | | | (0.07 | ) |
| Net realized gain | | — | | | (2.00 | ) | | (6.86 | ) | | (4.41 | ) | | — | | | — | | | — | |
| Total dividends and distributions | | (0.05 | ) | | (2.01 | ) | | (6.86 | ) | | (4.69 | ) | | (0.10 | ) | | — | | | (0.07 | ) |
| Net asset value, end of period | $ | 11.77 | | $ | 10.17 | | $ | 22.45 | | $ | 27.91 | | $ | 24.14 | | $ | 17.74 | | $ | 13.37 | |
| |
| Total Investment Return4 | | | | | | | | | | | | | | | | | | | | | |
| Based on net asset value | | 16.35 | %5 | | (48.15)%5 | | | 3.84 | % | | 41.99 | % | | 36.80 | % | | 32.69 | % | | 29.11 | % |
| |
| Ratios to Average Net Assets | | | | | | | | | | | | | | | | | | | | | |
| Total expenses after waiver and excluding reorganization expenses | | 1.65 | %6 | | 1.54 | %6 | | 1.37 | % | | 1.40 | % | | 1.50 | % | | 1.60 | % | | 1.88 | % |
| Total expenses after waiver | | 1.65 | %6 | | 1.54 | %6 | | 1.37 | % | | 1.40 | % | | 1.50 | % | | 1.60 | % | | 2.02 | % |
| Total expenses | | 1.65 | %6 | | 1.56 | %6 | | 1.40 | % | | 1.44 | % | | 1.50 | % | | 1.63 | % | | 2.02 | % |
| Net investment income | | 0.28 | %6 | | 1.31 | %6 | | 0.45 | % | | 0.36 | % | | 0.99 | % | | 1.18 | % | | 0.43 | % |
| |
| Supplemental Data | | | | | | | | | | | | | | | | | | | | | |
| Net assets, end of period (000) | $ | 51,481 | | $ | 42,803 | | $ | 80,399 | | $ | 86,385 | | $ | 73,914 | | $ | 63,018 | | $ | 63,831 | |
| Portfolio turnover | | 110 | % | | 76 | % | | 163 | % | | 140 | % | | 121 | % | | 110 | % | | 183 | % |
| |
| |
| | | | | | | | | | | | Investor A | | | | | | | | | | |
| Per Share Operating Performance | | | | | | | | | | | | | | | | | | | | | |
| Net asset value, beginning of period | $ | 9.85 | | $ | 21.80 | | $ | 27.27 | | $ | 23.68 | | $ | 17.41 | | $ | 13.16 | | $ | 10.27 | |
| Net investment income2 | | (0.01 | ) | | 0.05 | | | 0.04 | | | 0.02 | | | 0.17 | | | 0.15 | | | 0.02 | |
| Net realized and unrealized gain (loss) | | 1.593 | | | (10.02 | )3 | | 1.253 | | | 8.213 | | | 6.163 | | | 4.103 | | | 2.92 | |
| Net increase (decrease) from investment operations | | 1.58 | | | (9.97 | ) | | 1.29 | | | 8.23 | | | 6.33 | | | 4.25 | | | 2.94 | |
| Dividends and distributions from: | | | | | | | | | | | | | | | | | | | | | |
| Net investment income | | (0.03 | ) | | — | | | — | | | (0.23 | ) | | (0.06 | ) | | — | | | (0.05 | ) |
| Net realized gain | | — | | | (1.98 | ) | | (6.76 | ) | | (4.41 | ) | | — | | | — | | | — | |
| Total dividends and distributions | | (0.03 | ) | | (1.98 | ) | | (6.76 | ) | | (4.64 | ) | | (0.06 | ) | | — | | | (0.05 | ) |
| Net asset value, end of period | $ | 11.40 | | $ | 9.85 | | $ | 21.80 | | $ | 27.27 | | $ | 23.68 | | | v17.41 | | $ | 13.16 | |
| |
| Total Investment Return4 | | | | | | | | | | | | | | | | | | | | | |
| Based on net asset value | | 16.14 | %5 | | (48.18)%5 | | | 3.49 | % | | 41.66 | % | | 36.46 | % | | 32.29 | % | | 28.71 | % |
| |
| Ratios to Average Net Assets | | | | | | | | | | | | | | | | | | | | | |
| Total expenses after waiver and excluding reorganization expenses | | 2.03 | %6 | | 1.85 | %6 | | 1.65 | % | | 1.66 | % | | 1.75 | % | | 1.85 | % | | 2.12 | % |
| Total expenses after waiver | | 2.03 | %6 | | 1.85 | %6 | | 1.65 | % | | 1.66 | % | | 1.75 | % | | 1.85 | % | | 2.25 | % |
| Total expenses | | 2.03 | %6 | | 1.87 | %6 | | 1.68 | % | | 1.71 | % | | 1.75 | % | | 1.88 | % | | 2.25 | % |
| Net investment income | | (0.13 | )%6 | | 0.98 | %6 | | 0.16 | % | | 0.10 | % | | 0.74 | % | | 0.94 | % | | 0.17 | % |
| |
| Supplemental Data | | | | | | | | | | | | | | | | | | | | | |
| Net assets, end of period (000) | $ | 72,719 | | $ | 67,614 | | $ | 145,781 | | $ | 151,309 | | $ | 122,331 | | $ | 91,292 | | $ | 79,383 | |
| Portfolio turnover | | 110 | % | | 76 | % | | 163 | % | | 140 | % | | 121 | % | | 110 | % | | 183 | % |
1 Consolidated Financial Highlights. See Note 1 of the Notes to Financial Statements.
2 Based on average shares outstanding.
3 Includes a redemption fee, which is less than $0.01 per share.
4 Total investment returns exclude the effect of any sales charges.
5 Aggregate total investment return.
6 Annualized.
See Notes to Financial Statements.
SEMI-ANNUAL REPORT
APRIL 30, 2009
23
| | | | | | | | | | | | | | | | | | | | | | |
| Financial Highlights (concluded) | | | | | | | | | | | BlackRock Global Emerging Markets Fund, Inc. | |
| |
| | | Six Months | | | Period | | | | | | | | | | | | | | | | | |
| | | Ended April 30, | | | July 1, 2008 | | | | | | | | | | | | | | | | | |
| | | 2009 | | | to October 31, | | | | | | | | Year Ended June 30, | | | | | | |
| | | (Unaudited) | | | 2008 | | | 2008 | | | 20071 | | | 20061 | | | 20051 | | | | 20041 | |
| | | | | | | | | | | | Investor B | | | | | | | | | | | |
| Per Share Operating Performance | | | | | | | | | | | | | | | | | | | | | | |
| Net asset value, beginning of period | $ | 8.89 | | $ | 19.86 | | $ | 25.20 | | $ | 22.10 | | $ | 16.32 | | $ | 12.44 | | $ | | 9.74 | |
| Net investment income (loss)2 | | (0.05 | ) | | 0.01 | | | (0.14 | ) | | (0.15 | ) | | (0.00 | )3 | | 0.02 | | | | (0.08 | ) |
| Net realized and unrealized gain (loss) | | 1.434 | | | (8.98 | )4 | | 1.184 | | | 7.624 | | | 5.784 | | | 3.864 | | | | 2.78 | |
| Net increase (decrease) from investment operations | | 1.38 | | | (8.97 | ) | | 1.04 | | | 7.47 | | | 5.78 | | | 3.88 | | | | 2.70 | |
| Dividends and distributions from: | | | | | | | | | | | | | | | | | | | | | | |
| Net investment income | | — | | | — | | | — | | | (0.13 | ) | | — | | | — | | | | — | |
| Net realized gain | | — | | | (2.00 | ) | | (6.38 | ) | | (4.24 | ) | | — | | | — | | | | — | |
| Total dividends and distributions | | — | | | (2.00 | ) | | (6.38 | ) | | (4.37 | ) | | — | | | — | | | | — | |
| Net asset value, end of period | $ | 10.27 | | $ | 8.89 | | $ | 19.86 | | $ | 25.20 | | $ | 22.10 | | $ | 16.32 | | $ | | 12.44 | |
| |
| Total Investment Return5 | | | | | | | | | | | | | | | | | | | | | | |
| Based on net asset value | | 15.52 | %6 | | (48.33)%6 | | | 2.70 | % | | 40.59 | % | | 35.42 | % | | 31.19 | % | | | 27.72 | % |
| |
| Ratios to Average Net Assets | | | | | | | | | | | | | | | | | | | | | | |
| Total expenses after waiver and excluding reorganization expenses | | 2.95 | %7 | | 2.69 | %7 | | 2.44 | % | | 2.45 | % | | 2.53 | % | | 2.65 | % | | | 2.93 | % |
| Total expenses after waiver | | 2.95 | %7 | | 2.69 | %7 | | 2.44 | % | | 2.45 | % | | 2.53 | % | | 2.65 | % | | | 3.06 | % |
| Total expenses | | 2.95 | %7 | | 2.71 | %7 | | 2.47 | % | | 2.48 | % | | 2.53 | % | | 2.68 | % | | | 3.06 | % |
| Net investment income (loss) | | (1.06 | )%7 | | 0.13 | %7 | | (0.60 | )% | | (0.68 | )% | | (0.02 | )% | | 0.11 | % | | | (0.66 | )% |
| |
| Supplemental Data | | | | | | | | | | | | | | | | | | | | | | |
| Net assets, end of period (000) | $ | 3,405 | | $ | 3,487 | | $ | 7,955 | | $ | 13,280 | | $ | 17,238 | | $ | 24,333 | | | $ | 30,102 | |
| Portfolio turnover | | 110 | % | | 76 | % | | 163 | % | | 140 | % | | 121 | % | | 110 | % | | | 183 | % |
| |
| | | | | | | | | | | | Investor C | | | | | | | | | | | |
| Per Share Operating Performance | | | | | | | | | | | | | | | | | | | | | | |
| Net asset value, beginning of period | $ | 8.65 | | $ | 19.42 | | $ | 24.91 | | $ | 22.01 | | $ | 16.25 | | $ | 12.38 | | $ | | 9.70 | |
| Net investment income (loss)2 | | (0.04 | ) | | 0.01 | | | (0.14 | ) | | (0.14 | ) | | (0.01 | ) | | 0.02 | | | | (0.07 | ) |
| Net realized and unrealized gain (loss) | | 1.394 | | | (8.89 | )4 | | 1.184 | | | 7.534 | | | 5.774 | | | 3.854 | | | | 2.75 | |
| Net increase (decrease) from investment operations | | 1.35 | | | (8.88 | ) | | 1.04 | | | 7.39 | | | 5.76 | | | 3.87 | | | | 2.68 | |
| Dividends and distributions from: | | | | | | | | | | | | | | | | | | | | | | |
| Net investment income | | — | | | — | | | — | | | (0.13 | ) | | — | | | — | | | | — | |
| Net realized gain | | — | | | (1.89 | ) | | (6.53 | ) | | (4.36 | ) | | — | | | — | | | | — | |
| Total dividends and distributions | | — | | | (1.89 | ) | | (6.53 | ) | | (4.49 | ) | | — | | | — | | | | — | |
| Net asset value, end of period | $ | 10.00 | | $ | 8.65 | | $ | 19.42 | | $ | 24.91 | | $ | 22.01 | | $ | 16.25 | | $ | | 12.38 | |
| |
| Total Investment Return5 | | | | | | | | | | | | | | | | | | | | | | |
| Based on net asset value | | 15.61 | %6 | | (48.35)%6 | | | 2.70 | % | | 40.58 | % | | 35.45 | % | | 31.26 | % | | | 27.63 | % |
| |
| Ratios to Average Net Assets | | | | | | | | | | | | | | | | | | | | | | |
| Total expenses after waiver and excluding reorganization expenses | | 2.92 | %7 | | 2.67 | %7 | | 2.42 | % | | 2.43 | % | | 2.52 | % | | 2.65 | % | | | 2.93 | % |
| Total expenses after waiver | | 2.92 | %7 | | 2.67 | %7 | | 2.42 | % | | 2.43 | % | | 2.52 | % | | 2.65 | % | | | 3.07 | % |
| Total expenses | | 2.92 | %7 | | 2.69 | %7 | | 2.45 | % | | 2.47 | % | | 2.52 | % | | 2.68 | % | | | 3.07 | % |
| Net investment income (loss) | | (1.02 | )%7 | | 0.15 | %7 | | (0.61 | )% | | (0.66 | )% | | (0.05 | )% | | 0.16 | % | | | (0.62 | )% |
| |
| Supplemental Data | | | | | | | | | | | | | | | | | | | | | | |
| Net assets, end of period (000) | $ | 14,480 | | $ | 13,572 | | $ | 31,948 | | $ | 32,208 | | $ | 24,674 | | $ | 15,956 | | $ | | 14,903 | |
| Portfolio turnover | | 110 | % | | 76 | % | | 163 | % | | 140 | % | | 121 | % | | 110 | % | | | 183 | % |
1 Consolidated Financial Highlights. See Note 1 of the Notes to Financial Statements.
2 Based on average shares outstanding.
3 Amount is less than $(0.01) per share.
4 Includes a redemption fee, which is less than $0.01 per share.
5 Total investment returns exclude the effect of any sales charges.
6 Aggregate total investment return.
7 Annualized.
See Notes to Financial Statements.
24 SEMI-ANNUAL REPORT
APRIL 30, 2009
| | | | | | | | | | | | | | | | | | | | | |
| Financial Highlights | | | | | | | | | | | | | | BlackRock Latin America Fund | |
| |
| Period |
| | | Six Months | | | December 1, | | | | | | | | | | | | | | | | |
| | | Ended April 30, | 2007 | to | | | | | | | | | | | | | | | |
| | | 2009 | | | October 31, | | | | | | Year Ended November 30, | | | | |
| | | (Unaudited) | | | 2008 | | | 2007 | | | 2006 | | | 2005 | | | 2004 | | | 2003 | |
| | | | | | | | | | | | Institutional1 | | | | | | | | | | |
| Per Share Operating Performance | | | | | | | | | | | | | | | | | | | | | |
| Net asset value, beginning of period | $ | 30.53 | | $ | 78.57 | | $ | 50.67 | | $ | 37.27 | | $ | 22.64 | | $ | 15.83 | | $ | 10.23 | |
| Net investment income2 | | 0.35 | | | 0.61 | | | 0.50 | | | 0.65 | | | 0.57 | | | 0.33 | | | 0.22 | |
| Net realized and unrealized gain (loss) | | 6.33 | | | (36.41 | ) | | 28.10 | | | 13.32 | | | 14.42 | | | 6.79 | | | 5.44 | |
| Net increase (decrease) from investment operations | | 6.68 | | | (35.80 | ) | | 28.60 | | | 13.97 | | | 14.99 | | | 7.12 | | | 5.66 | |
| Dividends and distributions from: | | | | | | | | | | | | | | | | | | | | | |
| Net investment income | | — | | | (0.80 | ) | | (0.72 | ) | | (0.58 | ) | | (0.41 | ) | | (0.31 | ) | | (0.06 | ) |
| Net realized gain | | — | | | (11.47 | ) | | — | | | — | | | — | | | — | | | — | |
| Total dividends and distributions | | — | | | (12.27 | ) | | (0.72 | ) | | (0.58 | ) | | (0.41 | ) | | (0.31 | ) | | (0.06 | ) |
| Redemption fee | | 0.003 | | | 0.03 | | | 0.02 | | | 0.01 | | | 0.05 | | | 0.003 | | | — | |
| Net asset value, end of period | $ | 37.21 | | $ | 30.53 | | $ | 78.57 | | $ | 50.67 | | $ | 37.27 | | $ | 22.64 | | $ | 15.83 | |
| |
| Total Investment Return4 | | | | | | | | | | | | | | | | | | | | | |
| Based on net asset value | | 21.88 | %5 | | (53.70)%5 | | | 57.20 | %6 | | 38.12 | % | | 67.55 | % | | 45.73 | % | | 55.61 | % |
| Ratios to Average Net Assets | | | | | | | | | | | | | | | | | | | | | |
| Total expenses | | 1.57 | %7 | | 1.30 | %7 | | 1.26 | % | | 1.31 | % | | 1.43 | % | | 1.60 | % | | 1.81 | % |
| Net investment income | | 2.35 | %7 | | 1.04 | %7 | | 0.87 | % | | 1.49 | % | | 1.98 | % | | 1.81 | % | | 1.78 | % |
| |
| Supplemental Data | | | | | | | | | | | | | | | | | | | | | |
| Net assets, end of period (000) | $ | 58,064 | | $ | 58,877 | | $ | 128,094 | | $ | 191,085 | | $ | 135,279 | | $ | 47,921 | | $ | 27,811 | |
| Portfolio turnover | | 39 | % | | 61 | % | | 72 | % | | 48 | % | | 47 | % | | 57 | % | | 58 | % |
| |
| | | | | | | | | | | | Investor A1 | | | | | | | | | | |
| Per Share Operating Performance | | | | | | | | | | | | | | | | | | | | | |
| Net asset value, beginning of period | $ | 30.15 | | $ | 77.78 | | $ | 50.17 | | $ | 36.93 | | $ | 22.45 | | $ | 15.71 | | $ | 10.15 | |
| Net investment income2 | | 0.32 | | | 0.44 | | | 0.60 | | | 0.53 | | | 0.51 | | | 0.29 | | | 0.19 | |
| Net realized and unrealized gain (loss) | | 6.23 | | | (35.97 | ) | | 27.60 | | | 13.21 | | | 14.29 | | | 6.72 | | | 5.40 | |
| Net increase (decrease) from investment operations | | 6.55 | | | (35.53 | ) | | 28.20 | | | 13.74 | | | 14.80 | | | 7.01 | | | 5.59 | |
| Dividends and distributions from: | | | | | | | | | | | | | | | | | | | | | |
| Net investment income | | — | | | (0.66 | ) | | (0.61 | ) | | (0.51 | ) | | (0.37 | ) | | (0.27 | ) | | (0.03 | ) |
| Net realized gain | | — | | | (11.47 | ) | | — | | | — | | | — | | | — | | | — | |
| Total dividends and distributions | | — | | | (12.13 | ) | | (0.61 | ) | | (0.51 | ) | | (0.37 | ) | | (0.27 | ) | | (0.03 | ) |
| Redemption fee | | 0.003 | | | 0.03 | | | 0.02 | | | 0.01 | | | 0.05 | | | 0.003 | | | — | |
| Net asset value, end of period | $ | 36.70 | | $ | 30.15 | | $ | 77.78 | | $ | 50.17 | | $ | 36.93 | | $ | 22.45 | | $ | 15.71 | |
| |
| Total Investment Return4 | | | | | | | | | | | | | | | | | | | | | |
| Based on net asset value | | 21.72 | %5 | | (53.82)%5 | | | 56.85 | %6 | | 37.77 | % | | 67.10 | % | | 45.35 | % | | 55.23 | % |
| |
| Ratios to Average Net Assets | | | | | | | | | | | | | | | | | | | | | |
| Total expenses | | 1.83 | %7 | | 1.55 | %7 | | 1.51 | % | | 1.57 | % | | 1.68 | % | | 1.85 | % | | 2.07 | % |
| Net investment income | | 2.11 | %7 | | 0.76 | %7 | | 0.92 | % | | 1.23 | % | | 1.81 | % | | 1.60 | % | | 1.52 | % |
| |
| Supplemental Data | | | | | | | | | | | | | | | | | | | | | |
| Net assets, end of period (000) | $ | 239,140 | | $ | 176,711 | | $ | 433,844 | | $ | 191,187 | | $ | 139,062 | | $ | 81,969 | | $ | 62,145 | |
| Portfolio turnover | | 39 | % | | 61 | % | | 72 | % | | 48 | % | | 47 | % | | 57 | % | | 58 | % |
1 Consolidated Financial Highlights. See Note 1 to the Notes to Financial Statements.
2 Based on average shares outstanding.
3 Amount is less than $0.01 per share.
4 Total investment returns exclude the effects of any sales charges.
5 Aggregate total investment return.
6 Total investment return includes a payment by BlackRock Advisors, LLC in order to
resolve a regulatory compliance issue relating to an investment, which increased
the return by 0.02%.
7 Annualized.
See Notes to Financial Statements.
SEMI-ANNUAL REPORT
APRIL 30, 2009
25
| | | | | | | | | | | | | | | | | | | | | | | |
| Financial Highlights (concluded) | | | | | | | | | | | | | | | BlackRock Latin America Fund | |
| |
| &nb sp; Period |
| | | Six Months | | | December 1, | | | | | | | | | | | | | | | | | | |
| | | Ended April 30, | 2007 | | | | | | | | | | | | | | | | | | |
| | | 2009 | | | to October 31, | | | | | | | Year Ended November 30, | | | | |
| | | (Unaudited) | | | 2008 | | | 2007 | | | | 2006 | | | 2005 | | | | 2004 | | | 2003 | |
| | | | | | | | | | | | | Investor B1 | | | | | | | | | | | |
| Per Share Operating Performance | | | | | | | | | | | | | | | | | | | | | | | |
| Net asset value, beginning of period | $ | 28.54 | | $ | 74.38 | | $ | 48.00 | | $ | | 35.33 | | $ | 21.45 | | $ | | 15.01 | | $ | 9.75 | |
| Net investment income (loss)2 | | 0.15 | | | (0.04 | ) | | 0.05 | | | | 0.20 | | | 0.29 | | | | 0.15 | | | 0.08 | |
| Net realized and unrealized gain (loss) | | 5.87 | | | (34.09 | ) | | 26.52 | | | | 12.68 | | | 13.70 | | | | 6.43 | | | 5.18 | |
| Net increase (decrease) from investment operations | | 6.02 | | | (34.13 | ) | | 26.57 | | | | 12.88 | | | 13.99 | | | | 6.58 | | | 5.26 | |
| Dividends and distributions from: | | | | | | | | | | | | | | | | | | | | | | | |
| Net investment income | | — | | | (0.27 | ) | | (0.21 | ) | | | (0.22 | ) | | (0.16 | ) | | | (0.14 | ) | | — | |
| Net realized gain | | — | | | (11.47 | ) | | — | | | | — | | | — | | | | — | | | — | |
| Total dividends and distributions | | — | | | (11.74 | ) | | (0.21 | ) | | | (0.22 | ) | | (0.16 | ) | | | (0.14 | ) | | — | |
| Redemption fee | | 0.003 | | | 0.03 | | | 0.02 | | | | 0.01 | | | 0.05 | | | | 0.003 | | | — | |
| Net asset value, end of period | $ | 34.56 | | $ | 28.54 | | $ | 74.38 | | $ | | 48.00 | | $ | 35.33 | | $ | | 21.45 | | $ | 15.01 | |
| |
| Total Investment Return4 | | | | | | | | | | | | | | | | | | | | | | | |
| Based on net asset value | | 21.09 | %5 | | (54.18)%5 | | | 55.61 | %6 | | | 36.72 | % | | 65.91 | % | | | 44.16 | % | | 53.95 | % |
| Ratios to Average Net Assets | | | | | | | | | | | | | | | | | | | | | | | |
| Total expenses | | 2.89 | %7 | | 2.39 | %7 | | 2.32 | % | | | 2.34 | % | | 2.46 | % | | | 2.64 | % | | 2.89 | % |
| Net investment income (loss) | | 1.08 | %7 | | (0.08 | %)7 | | 0.09 | % | | | 0.48 | % | | 1.10 | % | | | 0.86 | % | | 0.75 | % |
| |
| Supplemental Data | | | | | | | | | | | | | | | | | | | | | | | |
| Net assets, end of period (000) | $ | 12,442 | | $ | 11,794 | | $ | 31,268 | | | $ | 13,911 | | $ | 12,144 | | | $ | 11,497 | | $ | 15,129 | |
| Portfolio turnover | | 39 | % | | 61 | % | | 72 | % | | | 48 | % | | 47 | % | | | 57 | % | | 58 | % |
| |
| | | | | | | | | | | | | Investor C1 | | | | | | | | | | | |
| Per Share Operating Performance | | | | | | | | | | | | | | | | | | | | | | | |
| Net asset value, beginning of period | $ | 28.01 | | $ | 73.28 | | $ | 47.40 | | $ | | 35.07 | | $ | 21.38 | | $ | | 15.00 | | $ | 9.74 | |
| Net investment income (loss)2 | | 0.17 | | | (0.01 | ) | | 0.11 | | | | 0.17 | | | 0.25 | | | | 0.14 | | | 0.08 | |
| Net realized and unrealized gain (loss) | | 5.76 | | | (33.46 | ) | | 26.08 | | | | 12.56 | | | 13.64 | | | | 6.41 | | | 5.18 | |
| Net increase (decrease) from investment operations | | 5.93 | | | (33.47 | ) | | 26.19 | | | | 12.73 | | | 13.89 | | | | 6.55 | | | 5.26 | |
| Dividends and distributions from: | | | | | | | | | | | | | | | | | | | | | | | |
| Net investment income | | — | | | (0.36 | ) | | (0.33 | ) | | | (0.41 | ) | | (0.25 | ) | | | (0.17 | ) | | — | |
| Net realized gain | | — | | | (11.47 | ) | | — | | | | — | | | — | | | | — | | | — | |
| Total dividends and distributions | | — | | | (11.83 | ) | | (0.33 | ) | | | (0.41 | ) | | (0.25 | ) | | | (0.17 | ) | | — | |
| Redemption fee | | 0.003 | | | 0.03 | | | 0.02 | | | | 0.01 | | | 0.05 | | | | 0.003 | | | — | |
| Net asset value, end of period | $ | 33.94 | | $ | 28.01 | | $ | 73.28 | | $ | | 47.40 | | $ | 35.07 | | $ | | 21.38 | | $ | 15.00 | |
| |
| Total Investment Return4 | | | | | | | | | | | | | | | | | | | | | | | |
| Based on net asset value | | 21.17 | %5 | | (54.16 | )%5 | | 55.62 | %6 | | | 36.75 | % | | 65.90 | % | | | 44.15 | % | | 54.00 | % |
| |
| Ratios to Average Net Assets | | | | | | | | | | | | | | | | | | | | | | | |
| Total expenses | | 2.76 | %7 | | 2.35 | %7 | | 2.29 | % | | | 2.34 | % | | 2.45 | % | | | 2.63 | % | | 2.88 | % |
| Net investment income (loss) | | 1.21 | %7 | | (0.02 | )%7 | | 0.17 | % | | | 0.42 | % | | 0.94 | % | | | 0.80 | % | | 0.71 | % |
| |
| Supplemental Data | | | | | | | | | | | | | | | | | | | | | | | |
| Net assets, end of period (000) | $ | 78,558 | | $ | 72,714 | | $ | 164,742 | | $ | | 50,609 | | $ | 25,071 | | $ | | 6,655 | | $ | 4,074 | |
| Portfolio turnover | | 39 | % | | 61 | % | | 72 | % | | | 48 | % | | 47 | % | | | 57 | % | | 58 | % |
1 Consolidated Financial Highlights. See Note 1 to the Notes to Financial Statements.
2 Based on average shares outstanding.
3 Amount is less than $0.01 per share.
4 Total investment returns exclude the effects of any sales charges.
5 Aggregate total investment return.
6 Total investment return includes a payment by BlackRock Advisors, LLC in order to
resolve a regulatory compliance issue relating to an investment, which increased
the return by 0.02%.
7 Annualized.
See Notes to Financial Statements.
26 SEMI-ANNUAL REPORT
APRIL 30, 2009
| | | | | | | | | | | | | | | | | | | | | |
| Financial Highlights | | | | | | | | | | | | | | BlackRock International Fund | |
| |
| | | Six Months | | | Period | | | | | | | | | | | | | | | | |
| | | Ended April 30, June 1, 2008 | | | | | | | | | | | | | | | | |
| | | 2009 | | to October 31, | | | | | | | | | Year Ended May 31, | | | | | |
| | | (Unaudited) | | | 2008 | | | 2008 | | | 2007 | | | 2006 | | | 2005 | | | 2004 | |
| | | | | | | | | | | | Institutional | | | | | | | | | | |
| Per Share Operating Performance | | | | | | | | | | | | | | | | | | | | | |
| Net asset value, beginning of period | $ | 8.20 | | $ | 15.01 | | $ | 14.18 | | $ | 12.38 | | $ | 10.05 | | $ | 8.90 | | $ | 7.40 | |
| Net investment income1 | | 0.06 | | | 0.04 | | | 0.19 | | | 0.12 | | | 0.08 | | | 0.07 | | | 0.06 | |
| Net realized and unrealized gain (loss) | | (0.12 | )2 | | (6.68 | )2 | | 0.732 | | | 1.872 | | | 2.392 | | | 1.112 | | | 1.44 | |
| Net increase (decrease) from investment operations | | (0.06 | ) | | (6.64 | ) | | 0.92 | | | 1.99 | | | 2.47 | | | 1.18 | | | 1.50 | |
| Dividends from net investment income | | — | | | (0.17 | ) | | (0.09 | ) | | (0.19 | ) | | (0.14 | ) | | (0.03 | ) | | — | |
| Net asset value, end of period | $ | 8.14 | | $ | 8.20 | | $ | 15.01 | | $ | 14.18 | | $ | 12.38 | | $ | 10.05 | | $ | 8.90 | |
| |
| Total Investment Return3 | | | | | | | | | | | | | | | | | | | | | |
| Based on net asset value | | (0.73 | )%4 | | (44.63 | )%4 | | 6.58 | % | | 16.29 | % | | 24.80 | % | | 13.31 | % | | 20.27 | % |
| |
| Ratios to Average Net Assets5 | | | | | | | | | | | | | | | | | | | | | |
| Total expenses | | 2.03 | %6 | | 1.70 | %6 | | 1.54 | % | | 1.65 | % | | 1.74 | % | | 1.72 | % | | 1.77 | % |
| Net investment income | | 1.71 | %6 | | 0.75 | %6 | | 1.32 | % | | 0.97 | % | | 0.72 | % | | 0.76 | % | | 0.75 | % |
| Supplemental Data | | | | | | | | | | | | | | | | | | | | | |
| Net assets, end of period (000) | $ | 4,346 | | $ | 5,161 | | $ | 10,904 | | $ | 12,133 | | $ | 12,453 | | $ | 11,946 | | $ | 13,901 | |
| Portfolio turnover of the Portfolio | | 78 | % | | 78 | % | | 153 | % | | 151 | % | | 96 | % | | 49 | % | | 74 | % |
| |
| |
| | | | | | | | | | | | Investor A | | | | | | | | | | |
| Per Share Operating Performance | | | | | | | | | | | | | | | | | | | | | |
| Net asset value, beginning of period | $ | 8.12 | | $ | 14.85 | | $ | 14.04 | | $ | 12.26 | | $ | 9.94 | | $ | 8.80 | | $ | 7.34 | |
| Net investment income1 | | 0.05 | | | 0.02 | | | 0.17 | | | 0.10 | | | 0.06 | | | 0.03 | | | 0.04 | |
| Net realized and unrealized gain (loss) | | (0.12 | )2 | | (6.62 | )2 | | 0.702 | | | 1.842 | | | 2.362 | | | 1.122 | | | 1.42 | |
| Net increase (decrease) from investment operations | | (0.07 | ) | | (6.60 | ) | | 0.87 | | | 1.94 | | | 2.42 | | | 1.15 | | | 1.46 | |
| Dividends from net investment income | | — | | | (0.13 | ) | | (0.06 | ) | | (0.16 | ) | | (0.10 | ) | | (0.01 | ) | | — | |
| Net asset value, end of period | $ | 8.05 | | $ | 8.12 | | $ | 14.85 | | $ | 14.04 | | $ | 12.26 | | $ | 9.94 | | $ | 8.80 | |
| |
| Total Investment Return3 | | | | | | | | | | | | | | | | | | | | | |
| Based on net asset value | | (0.86 | )%4 | | (44.72 | )%4 | | 6.25 | % | | 16.02 | % | | 24.51 | % | | 13.04 | % | | 19.89 | % |
| |
| Ratios to Average Net Assets5 | | | | | | | | | | | | | | | | | | | | | |
| Total expenses | | 2.41 | %6 | | 2.02 | %6 | | 1.84 | % | | 1.91 | % | | 1.98 | % | | 1.97 | % | | 2.00 | % |
| Net investment income | | 1.40 | %6 | | 0.50 | %6 | | 1.18 | % | | 0.77 | % | | 0.53 | % | | 0.30 | % | | 0.55 | % |
| |
| Supplemental Data | | | | | | | | | | | | | | | | | | | | | |
| Net assets, end of period (000) | $ | 20,722 | | $ | 22,537 | | $ | 42,052 | | $ | 35,750 | | $ | 21,807 | | $ | 18,058 | | $ | 28,428 | |
| Portfolio turnover of the Portfolio | | 78 | % | | 78 | % | | 153 | % | | 151 | % | | 96 | % | | 49 | % | | 74 | % |
1 Based on average shares outstanding.
2 Includes a redemption fee, which is less than $0.01 per share.
3 Total investment returns exclude the effects of any sales charges.
4 Aggregate total investment return.
5 Includes the Fund’s share of the Portfolio’s allocated expenses and/or net invest-
ment income.
6 Annualized.
See Notes to Financial Statements.
SEMI-ANNUAL REPORT
APRIL 30, 2009
27
| | | | | | | | | |
| Financial Highlights (concluded) | | | | | | BlackRock International Fund |
| | Six Months | | Period | | | | | | |
| | Ended April 30, June 1, 2008 | | | | | | |
| | 2009 | to October 31, | | | Year Ended May 31, | | |
| | (Unaudited) | | 2008 | 2008 | 2007 | 2006 | | 2005 | 2004 |
| | | | | | Investor B | | | | |
| Per Share Operating Performance | | | | | | | | | |
| Net asset value, beginning of period | $ 7.77 | $ 14.13 | $ 13.44 | $ 11.75 | $ 9.54 | $ 8.51 | $ 7.14 |
| Net investment loss1 | (0.00)2 | | (0.03) | (0.01) | (0.02) | (0.03) | | (0.02) | (0.02) |
| Net realized and unrealized gain (loss) | (0.12)3 | | (6.33)3 | 0.703 | 1.783 | 2.273 | | 1.053 | 1.39 |
| Net increase (decrease) from investment operations | (0.12) | | (6.36) | 0.69 | 1.76 | 2.24 | | 1.03 | 1.37 |
| Dividends from net investment income | — | | — | — | (0.07) | (0.03) | | — | — |
| Net asset value, end of period | $ 7.65 | $ 7.77 | $ 14.13 | $ 13.44 | $ 11.75 | $ 9.54 | $ 8.51 |
| Total Investment Return4 | | | | | | | | | |
| Based on net asset value | (1.54)%5 | | (45.01)%5 | 5.13% | 15.02% | 23.52% | | 12.10% | 19.19% |
| Ratios to Average Net Assets6 | | | | | | | | | |
| Total expenses | 3.80%7 | | 3.17%7 | 2.90% | 2.76% | 2.76% | | 2.75% | 2.80% |
| Net investment loss | (0.00)%7,8 | (0.70)%7 | (0.11)% | (0.20)% | (0.31)% | | (0.24)% | (0.25)% |
| Supplemental Data | | | | | | | | | |
| Net assets, end of period (000) | $ 17,225 | $ 20,878 | $ 44,254 | $ 56,428 | $ 71,575 | $ 69,342 | $ 76,727 |
| Portfolio turnover of the Portfolio | 78% | | 78% | 153% | 151% | 96% | | 49% | 74% |
| | | | | | Investor C | | | | |
| Per Share Operating Performance | | | | | | | | | |
| Net asset value, beginning of period | $ 7.81 | $ 14.19 | $ 13.45 | $ 11.75 | $ 9.54 | $ 8.51 | $ 7.14 |
| Net investment income (loss)1 | 0.03 | | (0.01) | 0.04 | (0.01) | (0.03) | | (0.02) | (0.02) |
| Net realized and unrealized gain (loss) | (0.12)3 | | (6.35)3 | 0.703 | 1.783 | 2.273 | | 1.053 | 1.39 |
| Net increase (decrease) from investment operations | (0.09) | | (6.36) | 0.74 | 1.77 | 2.24 | | 1.03 | 1.37 |
| Dividends from net investment income | — | | (0.02) | — | (0.07) | (0.03) | | — | — |
| Net asset value, end of period | $ 7.72 | $ 7.81 | $ 14.19 | $ 13.45 | $ 11.75 | $ 9.54 | $ 8.51 |
| Total Investment Return4 | | | | | | | | | |
| Based on net asset value | (1.15)%5 | | (44.87)%5 | 5.50% | 15.09% | 23.47% | | 12.10% | 19.19% |
| Ratios to Average Net Assets6 | | | | | | | | | |
| Total expenses | 3.08%7 | | 2.74%7 | 2.57% | 2.68% | 2.77% | | 2.76% | 2.82% |
| Net investment income (loss) | 0.77%7 | | (0.25)%7 | 0.32% | (0.09)% | (0.32)% | | (0.27)% | (0.29)% |
| Supplemental Data | | | | | | | | | |
| Net assets, end of period (000) | $ 9,622 | $ 10,543 | $ 20,892 | $ 22,133 | $ 23,463 | $ 22,879 | $ 27,485 |
| Portfolio turnover of the Portfolio | 78% | | 78% | 153% | 151% | 96% | | 49% | 74% |
1 Based on average shares outstanding.
2 Amount is less than $(0.01).
3 Includes a redemption fee, which is less than $0.01 per share.
4 Total investment returns exclude the effects of any sales charges.
5 Aggregate total investment return.
6 Includes the Fund’s share of the Portfolio’s allocated expenses and/or net invest-
ment income.
7 Annualized.
8 Amount is less than 0.01%.
See Notes to Financial Statements.
28 SEMI-ANNUAL REPORT
APRIL 30, 2009
Notes to Financial Statements (Unaudited)
1. Organization and Significant Accounting Policies:
BlackRock Global Emerging Markets Fund, Inc. (“Global Emerging
Markets”), BlackRock Latin America Fund, Inc. (“Latin America”) and
BlackRock International Fund (“International”) of BlackRock Series, Inc.
(the “Corporation”) (referred to as the “Funds” or individually as the “Fund”),
are registered under the Investment Company Act of 1940, as amended
(the “1940 Act”). The Funds are organized as Maryland corporations.
International is registered as a diversified, open-end management invest-
ment company. Global Emerging Markets and Latin America are registered
as non-diversified, open-end management investment companies. The
Funds’ financial statements are prepared in conformity with accounting
principles generally accepted in the United States of America, which may
require the use of management accruals and estimates. Actual results may
differ from these estimates. Each Fund offers multiple classes of shares.
Institutional Shares are sold without a sales charge and only to certain
eligible investors. Investor A Shares are generally sold with a front-end sales
charge. Investor B and Investor C Shares may be subject to a contingent
deferred sales charge. All classes of shares have identical voting, dividend,
liquidation and other rights and the same terms and conditions, except that
Investor A, Investor B and Investor C Shares bear certain expenses related
to the shareholder servicing of such shares, and Investor B and Investor C
Shares also bear certain expenses related to the distribution of such
shares. Each class has exclusive voting rights with respect to matters relat-
ing to its shareholder servicing and distribution expenditures (except that
Investor B shareholders may vote on material changes to the Investor A
distribution plan).
International seeks to achieve its investment objective by investing sub-
stantially all of its assets in BlackRock Master International Portfolio (the
“Portfolio”) of BlackRock Master LLC (the “Master LLC”), which has the
same investment objective and strategies as the Fund. The value of the
Fund’s investment in the Portfolio reflects the Fund’s proportionate interest
in the net assets of the Portfolio. The performance of the Fund is directly
affected by the performance of the Portfolio. The financial statements of the
Portfolio, including the Schedule of Investments, are included elsewhere in
this report and should be read in conjunction with the Fund’s financial
statements. The percentage of the Portfolio owned by the Fund at April 30,
2009 was 100%.
The following is a summary of significant accounting policies followed by
the Funds:
Valuation of Investments: Equity investments traded on a recognized
securities exchange or the NASDAQ Global Market System are valued at
the last reported sale price that day or the NASDAQ official closing price,
if applicable. For equity investments traded on more than one exchange,
the last reported sale price on the exchange where the stock is primarily
traded is used. Equity investments traded on a recognized exchange for
which there were no sales on that day are valued at the last available bid
price. If no bid price is available, the prior day’s price will be used, unless
it is determined that such prior day’s price no longer reflects the fair value
of the security. Investments in open-end investment companies are valued
at net asset value each business day. Short-term securities with maturities
less than 60 days may be valued at amortized cost which approximates
fair value. The Funds value their investments in Cash Sweep Series and
Money Market Series, each of BlackRock Liquidity Series, LLC, at fair
value, which is ordinarily based upon their pro-rata ownership in the net
assets of the underlying fund.
Exchange-traded options are valued at the mean between the last bid and
ask prices at the close of the options market in which the options trade. An
exchange-traded option for which there is no mean price is valued at the
last bid (long positions) or ask (short positions) price. If no bid or ask price
is available, the prior day’s price will be used, unless it is determined that
such prior day’s price no longer reflects the fair value of the option. Over-
the-counter options are valued by an independent pricing service using a
mathematical model which incorporates a number of market data factors,
such as the trades and prices of the underlying securities.
In the event that application of these methods of valuation results in a price
for an investment which is deemed not to be representative of the market
value of such investment, the investment will be valued by a method
approved by each Fund’s Board of Directors (the “Board”) as reflecting fair
value (“Fair Value Assets”). When determining the price for Fair Value Assets,
the investment advisor and/or sub-advisor seeks to determine the price
that the Funds might reasonably expect to receive from the current sale of
that asset in an arm’s-length transaction. Fair value determinations shall be
based upon all available factors that the investment advisor and/or sub-
advisor deems relevant. The pricing of all Fair Value Assets is subsequently
reported to the Board or a committee thereof.
Generally, trading in foreign securities is substantially completed each
day at various times prior to the close of business on the New York Stock
Exchange (“NYSE”). The values of such securities used in computing the
net assets of each Fund are determined as of such times. Foreign currency
exchange rates will be determined as of the close of business on the
NYSE. Occasionally, events affecting the values of such securities and such
exchange rates may occur between the times at which they are determined
and the close of business on the NYSE that may not be reflected in the
computation of the each Fund’s net assets. If events (for example, a com-
pany announcement, market volatility or a natural disaster) occur during
such periods that are expected to materially affect the value of such securi-
ties, those securities may be valued at their fair value as determined in
good faith by the Board or by the investment advisor using a pricing service
and/or procedures approved by the Board. Foreign currency exchange con-
tracts and forward foreign currency exchange contracts are valued at the
mean between the bid and ask prices. Interpolated values are derived when
the settlement date of the contract is an interim date for which quotations
are not available.
International records its investment in the Portfolio at fair value. Valuation
of securities held by the Portfolio is discussed in Note 1 of the Portfolio’s
Notes to Financial Statements, which are included elsewhere in this report.
SEMI-ANNUAL REPORT
APRIL 30, 2009
29
Notes to Financial Statements (continued)
International adopted Financial Accounting Standards Board Statement of
Financial Accounting Standards No. 157, “Fair Value Measurements” (“FAS
157”). FAS 157 clarifies the definition of fair value, establishes a framework
for measuring fair values and requires additional disclosures about the use
of fair value measurements. Various inputs are used in determining the fair
value of investments, which are as follows:
•Level 1 — price quotations in active markets/exchanges for identical
securities
•Level 2 — other observable inputs (including, but not limited to: quoted
prices for similar assets or liabilities in markets that are active, quoted
prices for identical or similar assets that are not active, inputs other than
quoted prices that are observable for the assets or liabilities (such as
interest rates, yield curves, volatilities, prepayment speeds, loss severi-
ties, credit risks and default rates) or other market-corroborated inputs)
•Level 3 — unobservable inputs based on the best information available
in the circumstances, to the extent observable inputs are not available
(including the Fund’s own assumptions used in determining the fair
value of investments)
The inputs or methodology used for valuing securities are not necessar-
ily an indication of the risk associated with investing in those securities.
The following table summarizes the inputs used as of April 30, 2009 in
determining the fair valuation of the Fund’s investments:
| | |
| | | Investments in |
| Valuation Inputs | | Securities |
| |
| | | Assets |
| Level 1 | | — |
| Level 2 | $ | 51,950,418 |
| Level 3 | | — |
| Total | $ | 51,950,418 |
Derivative Financial Instruments: The Funds may engage in various portfolio
investment strategies both to increase the returns of the Funds and to
hedge, or protect, their exposure to interest rate movements and move-
ments in the securities markets. Losses may arise if the value of the con-
tract decreases due to an unfavorable change in the price of the underlying
security, or if the counterparty does not perform under the contract.
•Forward currency contracts — A forward currency contract is an agree-
ment between two parties to buy and sell a currency at a set exchange
rate on a future date. Each Fund may enter into forward currency con-
tracts as a hedge against either specific transactions or portfolio posi-
tions. Forward exchange contracts, when used by the Funds, help to
manage the overall exposure to the foreign currency backing some of
the investments held by the Funds. The contract is marked-to-market
daily and the change in market value is recorded by the Funds as an
unrealized gain or loss. When the contract is closed, the Funds record
a realized gain or loss equal to the difference between the value at the
time it was opened and the value at the time it was closed. The use
of forward currency contracts involves the risk that counterparties may
not meet the terms of the agreement and market risk of unanticipated
movements in the value of a foreign currency relative to the US dollar.
•Options — Funds may purchase and write call and put options. A call
option gives the purchaser of the option the right (but not the obligation)
to buy, and obligates the seller to sell (when the option is exercised),
the underlying position at the exercise price at any time or at a specified
time during the option period. A put option gives the holder the right to
sell and obligates the writer to buy the underlying position at the exer-
cise price at any time or at a specified time during the option period.
When a Fund purchases (writes) an option, an amount equal to the
premium paid (received) by a Fund is reflected as an asset and an
equivalent liability. The amount of the asset (liability) is subsequently
marked-to-market to reflect the current market value of the option
written. When a security is purchased or sold through an exercise of an
option, the related premium paid (or received) is added to (or deducted
from) the basis of the security acquired or deducted from (or added to)
the proceeds of the security sold. When an option expires (or a Fund
enters into a closing transaction), a Fund realizes a gain or loss on the
option to the extent of the premiums received or paid (or gain or loss
to the extent the cost of the closing transaction exceeds the premium
received or paid). When a Fund writes a call option, such option is
“covered,” meaning that a Fund holds the underlying security subject to
being called by the option counterparty, or cash in an amount sufficient
to cover the obligation. When a Fund writes a put option, such option is
covered by cash in an amount sufficient to cover the obligation.
In purchasing and writing options, the Funds bear the market risk of an
unfavorable change in the price of the underlying security. Exercise of a
written option could result in the Funds purchasing a security at a price
different from the current market value. The Funds may execute transac-
tions in both listed and over-the-counter options. Transactions in certain
over the-counter options may expose the Funds to the risk of default by
the counterparty to the transaction.
Foreign Currency Transactions: Foreign currency amounts are translated
into United States dollars on the following basis: (i) market value of invest-
ment securities, assets and liabilities at the current rate of exchange; and
(ii) purchases and sales of investment securities, income and expenses at
the rates of exchange prevailing on the respective dates of such transactions.
The Funds report foreign currency related transactions as components of
realized gains for financial reporting purposes, whereas such components
are treated as ordinary income for federal income tax purposes.
Segregation and Collateralization: In cases in which the 1940 Act and the
interpretive positions of the Securities and Exchange Commission (“SEC”)
require that each Fund segregates assets in connection with certain invest-
ments (e.g., options, written options and forward foreign currency contracts)
consistent with certain interpretive letters issued by the SEC, each Fund will
30 SEMI-ANNUAL REPORT
APRIL 30, 2009
Notes to Financial Statements (continued)
designate on their books and records cash or other liquid securities hav-
ing a market value at least equal to the amount that would otherwise be
required to be physically segregated. Furthermore, based on requirements
and agreements with certain exchanges and third party broker-dealers, the
Funds may also be required to deliver or deposit securities as collateral for
certain investments (e.g., written options).
Investment Transactions and Investment Income: Investment transactions
are recorded on the dates the transactions are entered into (the trade
dates). Realized gains and losses on security transactions are determined
on the identified cost basis. Dividend income is recorded on the ex-divi-
dend dates. Dividends from foreign securities where the ex-dividend date
may have passed are subsequently recorded when the Funds have deter-
mined the ex-dividend date. Interest income is recognized on the accrual
basis. The Funds amortize all premiums and discounts on debt securities.
International records daily its proportionate share of the Portfolio’s income,
expenses and realized and unrealized gains and losses. Investment trans-
actions in the Portfolio are accounted for on a trade date basis. In addition,
the Fund accrues its own expenses. Income and realized and unrealized gains
and losses are allocated daily to each class based on its relative net assets.
Dividends and Distributions: Dividends and distributions are recorded on
the ex-dividend dates.
Securities Lending: The Funds may lend securities to financial institutions
that provide cash, which will be maintained at all times in an amount equal
to at least 100% of the current market value of the loaned securities. The
market value of the loaned securities is determined at the close of business
of the Funds and any additional required collateral is delivered to the Funds
on the next business day. The Funds typically receive the income on the
loaned securities but does not receive the income on the collateral. The
Funds may invest the cash collateral and retain the amount earned on such
investment, net of any amount rebated to the borrower. Loans of securities
are terminable at any time and the borrower, after notice, is required to
return borrowed securities within the standard time period for settlement of
securities transactions. The Funds may pay reasonable lending agent,
administrative and custodial fees in connection with its loans. In the event
that the borrower defaults on its obligation to return borrowed securities
because of insolvency or for any other reason, the Funds could experience
delays and costs in gaining access to the collateral. The Funds also could
suffer a loss if the value of an investment purchased with cash collateral
falls below the market value of loaned securities.
Income Taxes: It is the Funds’ policy to comply with the requirements of the
Internal Revenue Code applicable to regulated investment companies and
to distribute substantially all of their taxable income to their shareholders.
Therefore, no federal income tax provision is required. Under the applicable
foreign tax laws, a withholding tax may be imposed on interest, dividends
and capital gains at various rates.
The Funds file US federal and various state and local tax returns. No
income tax returns are currently under examination. The statutes of limita-
tions on Global Emerging Market’s US federal tax returns remains open for
the three years ended June 30, 2008 and the period ended October 31,
2008. The statute of limitations on Latin America’s US federal tax returns
remains open for the three years ended November 30, 2007 and the period
ended October 31, 2008. The statute of limitations on International’s US
federal tax returns remains open for the three years ended May 31, 2007
and the period ended October 31, 2008. The statute of limitations on the
Funds’ state and local tax returns may remain open for an additional year
depending upon the jurisdiction.
Recent Accounting Pronouncement: In March 2008, Statement of Financial
Accounting Standards No. 161, “Disclosures about Derivative Instruments
and Hedging Activities — an amendment of FASB Statement No. 133”
(“FAS 161”), was issued. FAS 161 is intended to improve financial reporting
for derivative instruments by requiring enhanced disclosure that enables
investors to understand how and why an entity uses derivatives, how deriva-
tives are accounted for, and how derivative instruments affect an entity’s
results of operations and financial position. FAS 161 is effective for finan-
cial statements issued for fiscal years and interim periods beginning after
November 15, 2008. The impact on the Funds’ financial statement disclo-
sures, if any, is currently being assessed.
Basis of Consolidation:
Global Emerging Markets
The Fund’s accompanying consolidated Financial Highlights for each of the
years in the four-year period ended June 30, 2007 include the accounts
of Inversiones en Mercado Accionario de Valores Chile Limitada, a wholly
owned subsidiary of the Fund. The subsidiary was created for regulatory
purposes to invest in Chilean securities. Intercompany accounts and trans-
actions have been eliminated. During the year ended June 30, 2007,
Inversiones en Mercado Accionario de Valores Chile Limitada was dissolved.
Latin America
The Fund’s accompanying consolidated financial statements include the
accounts of Merrill Lynch Latin America Fund Chile Ltd., a wholly owned
subsidiary of the Fund. The subsidiary was created for regulatory purposes
to invest in Chilean securities. Intercompany accounts and transactions
have been eliminated.
Other: Expenses directly related to a Fund or its classes are charged to
that Fund or class. Other operating expenses shared by several funds are
pro-rated among those funds on the basis of relative net assets or other
appropriate methods. Other expenses of a Fund are allocated daily to
each class based on its relative net assets.
2. Investment Advisory Agreements and Other Transactions
with Affiliates:
Global Emerging Markets and Latin America entered into an Investment
Advisory Agreement with BlackRock Advisors, LLC, (the “Advisor” or the
“Administrator”) an indirect, wholly owned subsidiary of BlackRock, Inc.
(“BlackRock”). The PNC Financial Services Group, Inc. (“PNC”) and Bank
of America Corporation (“BAC”) are the largest stockholders of BlackRock.
SEMI-ANNUAL REPORT
APRIL 30, 2009
31
Notes to Financial Statements (continued)
BAC became a stockholder of BlackRock following its acquisition of Merrill
Lynch & Co., Inc. (“Merrill Lynch”) on January 1, 2009. Prior to that date,
both PNC and Merrill Lynch were considered affiliates of the Funds under
the 1940 Act. Subsequent to the acquisition, PNC remains an affiliate, but
due to the restructuring of Merrill Lynch’s ownership interest of BlackRock,
BAC is not deemed to be an affiliate under the 1940 Act.
The Advisor is responsible for the management of each Fund’s portfolio and
provides the necessary personnel, facilities, equipment and certain other
services necessary to the operation of the Funds. For such services, Global
Emerging Markets and Latin America pay the Advisor a monthly fee at an
annual rate of 1.0% of the average daily value of each Fund’s average daily
net assets.
The Advisor, on behalf of Global Emerging Markets and Latin America, has
entered into a separate sub-advisory agreements with BlackRock Investment
Management, LLC (“BIM”) and BlackRock International Limited, both affili-
ates of the Advisor with respect to each Fund, under which the Advisor pays
each sub-advisor for services it provides, a monthly fee that is a percentage
of the investment advisory fee paid by the Funds to the Advisor.
Global Emerging Markets and Latin America reimbursed the Advisor for cer-
tain accounting services, which are included in accounting services in the
Statements of Operations as follows:
| | |
| | | Six Months Ended |
| | | April 30, 2009 |
| Global Emerging Markets | $ | 1,207 |
| Latin America | $ | 3,621 |
The Corporation, on behalf of International, has entered into an
Administration Agreement with the Administrator. The administration fee
payable to the Administrator is calculated daily and paid monthly based on
an annual rate of 0.25% of the average daily value of the Fund’s average
daily net assets for the performance of administrative services (other than
investment advice and related portfolio activities) necessary for the opera-
tion of the Fund.
Global Emerging Markets, Latin America, and the Corporation (on behalf
of International), have entered into separate Distribution Agreements and
Distribution Plans with BlackRock Investments, LLC (“BIL”), which is an affiliate
of BlackRock.
Pursuant to the Distribution Plans adopted by each Fund in accordance
with Rule 12b-1 under the 1940 Act, each Fund pays BIL ongoing service
and distribution fees. The fees are accrued daily and paid monthly at
annual rates based upon the average daily value of each Fund’s net
assets as follows:
| | | | |
| | Service | | Distribution | |
| | Fee | | Fee | |
| Investor A | 0.25 | % | — | |
| Investor B | 0.25 | % | 0.75 | % |
| Investor C | 0.25 | % | 0.75 | % |
Pursuant to sub-agreements with BIL, broker-dealers, including Merrill
Lynch, Pierce, Fenner & Smith Incorporated (“MLPF&S”), a wholly owned
subsidiary of Merrill Lynch, and BIL provide shareholder servicing and dis-
tribution services to each of the Funds. The ongoing service and/or distribu-
tion fee compensates BIL and each broker-dealer for providing shareholder
servicing and/or distribution-related services to Investor A, Investor B, and
Investor C shareholders.
For the six months ended April 30, 2009, BIL earned underwriting discounts
and direct commissions and its affiliates, including Merrill Lynch, which was
considered an affiliate for a portion of the period, earned dealer concessions
on sales of the Funds’ Investor A Shares as follows:
| | |
| | | Investor A |
| Global Emerging Markets | $ | 878 |
| Latin America | $ | 8,196 |
| International | $ | 539 |
For the six months ended April 30, 2009, affiliates received contingent
deferred sales charges relating to transactions in Investor B and Investor C
Shares as follows:
| | | | |
| | | Investor B | | Investor C |
| Global Emerging Markets | $ | 3,428 | $ | 576 |
| Latin America | $ | 28,355 | $ | 34,356 |
| International | $ | 739 | $ | 226 |
Furthermore, affiliates received contingent deferred sales charges relating to
transactions subject to front-end sales charge waivers relating to Investor A
Shares as follows:
| | |
| | | Investor A |
| Global Emerging Markets | $ | 399 |
| Latin America | $ | 5,758 |
PNC Global Investment Servicing (U.S.), Inc., an indirect, wholly owned
subsidiary of PNC and an affiliate of the Advisor, is each Fund’s transfer
agent and dividend disbursing agent. Each class of the Funds bears the
costs of transfer agent fees associated with such respective classes.
Transfer agency fees borne by each class of the Funds are comprised of
those fees charged for all shareholder communications including mailing
of shareholder reports, dividend and distribution notices, and proxy materi-
als for shareholders meetings, as well as per account and per transaction
fees related to servicing and maintenance of shareholder accounts, includ-
ing the issuing, redeeming and transferring of shares of each class of the
Funds, 12b-1 fee calculation, check writing, anti-money laundering serv-
ices, and customer identification services.
Pursuant to written agreements, certain affiliates, including Merrill Lynch,
which was considered an affiliate for a portion of the period, provide the
Funds with sub-accounting, recordkeeping, sub-transfer agency and other
administrative services with respect to sub-accounts they service. For these
services, these affiliates receive an annual fee per shareholder account which
will vary depending on share class. For the period November 1, 2008 to
April 30, 2009, the Funds paid the following amounts, which are a compo-
nent of transfer agent fees in the accompanying Statements of Operations:
32 SEMI-ANNUAL REPORT
APRIL 30, 2009
Notes to Financial Statements (continued)
| |
| | Period November 1, 2008 |
| | to December 31, 2008 |
| Global Emerging Markets | $ 46,047 |
| Latin America | $ 68,270 |
| International | $ 53,352 |
The Funds may earn income on positive cash balances in demand deposit
accounts that are maintained by the transfer agent on behalf of the Funds.
The Funds earned the following, which are included in income — affiliated in
the Statements of Operations:
| |
| | Six Months Ended |
| | April 30, 2009 |
| Global Emerging Markets | $ 41 |
| Latin America | $ 738 |
| International | $ 20 |
The Advisor/Administrator maintains a call center, which is responsible for
providing certain shareholder services to the Funds, such as responding to
shareholder inquiries and processing transactions based upon instructions
from shareholders with respect to the subscription and redemption of Fund
shares. During the six months ended April 30, 2009, the following amounts
have been accrued by the Funds to reimburse the Advisor/Administrator for
costs incurred running the call center, which are a component of the trans-
fer agent fees in the accompanying Statements of Operations.
| | | |
| Global |
| | Emerging | Latin | |
| Call Center Fees | Markets | America | International |
| Institutional | $ 960 | $ 1,233 | $ 67 |
| Investor A | $ 2,766 | $15,676 | $ 517 |
| Investor B | $ 272 | $ 2,139 | $ 252 |
| Investor C | $ 542 | $ 6,684 | $ 354 |
The Funds have received an exemptive order from the SEC permitting
them to lend portfolio securities to MLPF&S or its affiliates. Pursuant to that
order, the Funds have retained BIM as the securities lending agent for a fee
based on a share of the returns on investment of cash collateral. BIM may,
on behalf of the Funds, invest cash collateral received by the Funds for
such loans, among other things, in a private investment company managed
by the Advisor or in registered money market funds advised by the Advisor or
its affiliates. The share of income earned by the Funds on such investments
is shown as securities lending — affiliated on the Statements of Operations.
For the six months ended April 30, 2009, BIM received $12,821 in securi-
ties lending agent fees.
In addition, MLPF&S received commissions on the execution of portfolio
transactions as follows for the period November 1, 2008 to December 31,
2008, during which it was considered an affiliate:
Certain officers and/or directors of the Funds are officers and/or directors of
BlackRock or its affiliates. Each Fund reimburses the Advisor/Administrator
for compensation paid to the Funds’ Chief Compliance Officer.
3. Investments:
Purchases and sales of investments excluding short-term securities, for the
six months ended April 30, 2009 were as follows:
| | |
| | Purchases | Sales |
| Global Emerging Markets | $131,925,226 | $139,113,009 |
| Latin America | $124,502,508 | $122,111,562 |
Transactions in call options written for Latin America for the six months
ended April 30, 2009 were as follows:
| | |
| | | Premiums |
| | Contracts | Received |
| Outstanding call options written, beginning | | |
| of period | — | — |
| Options written | 1,100 | $ 99,780 |
| Outstanding call options written, end of period | 1,100 | $ 99,780 |
| 4. Short-Term Borrowings: | | |
Global Emerging Markets and Latin America, along with certain other funds
managed by the Advisor and its affiliates, are party to a $500 million credit
agreement with a group of lenders, which expired November 2008 and was
subsequently renewed until November 2009. Each Fund may borrow under
the credit agreement to fund shareholder redemptions and for other lawful
purposes other than for leverage. The Funds may borrow up to the maximum
amount allowable under each Fund’s current Prospectus and Statement of
Additional Information, subject to various other legal, regulatory or contrac-
tual limits. Global Emerging Markets and Latin America paid their pro rata
share of a 0.02% upfront fee on the aggregate commitment amount
based on their net assets as of October 31, 2008. Each Fund pays a com-
mitment fee of 0.08% per annum based on each Fund’s pro rata share of
the unused portion of the credit agreement, which is included in miscella-
neous on the Statement of Operations. Amounts borrowed under the credit
agreement bear interest at a rate equal to the higher of the (a) Federal
Funds effective rate and (b) reserve adjusted one month LIBOR plus, in each
case, the higher of (i) 1.50% and (ii) 50% of the CDX index (as defined in
the credit agreement) in effect from time to time. Global Emerging Markets
and Latin America did not borrow under the credit agreement during the six
months ended April 30, 2009.
5. Geographic Concentration, Market and Credit Risk:
In the normal course of business, the Funds invest in securities and enter
into transactions where risks exist due to fluctuations in the market (market
risk) or failure of the issuer of a security to meet all its obligations (credit
risk). The value of securities held by the Funds may decline in response to
certain events, including those directly involving the issuers whose securities
are owned by the Funds; conditions affecting the general economy; overall
market changes; local, regional or global political, social or economic
instability; and currency and interest rate and price fluctuations. Similar
to credit risk, the Funds may be exposed to counterparty risk, or the risk
that an entity with which the Funds have unsettled or open transactions
may default. Financial assets, which potentially expose the Funds to credit
SEMI-ANNUAL REPORT
APRIL 30, 2009
33
Notes to Financial Statements (continued)
and counterparty risks, consist principally of investments and cash due from
counterparties. The extent of the Funds’ exposure to credit and counterparty
risks with respect to these financial assets is approximated by their value
recorded in the Funds’ Statements of Assets and Liabilities.
Global Emerging Markets and Latin America invest from time to time a sub-
stantial amount of their assets in issuers located in a single country or a
limited number of countries. When the Funds concentrate their investments
in this manner, they assume the risk that economic, political and social
conditions in those countries may have a significant impact on their invest-
ment performance. Please see the Consolidated Schedule of Investments
for concentrations in specific countries.
As of April 30, 2009, Global Emerging Markets and Latin America had the
following industry classifications:
| | |
| Global Emerging Markets | | |
| |
| | Percent of | |
| | Long-Term | |
| Industry | Investments | |
| Commercial Banks | 18 | % |
| Oil, Gas & Consumable Fuels | 15 | |
| Metals & Mining | 9 | |
| Wireless Telecommunication Services | 9 | |
| Semiconductors & Semiconductor Equipment | 8 | |
| Diversified Financial Services | 4 | |
| Household Durables | 3 | |
| Insurance | 3 | |
| Construction & Engineering | 3 | |
| Diversified Telecommunication Services | 3 | |
| Computers & Peripherals | 2 | |
| Electronic Equipment, Instruments & Components | 2 | |
| Energy Equipment & Services | 2 | |
| Food & Staples Retailing | 2 | |
| Food Products | 2 | |
| Independent Power Producers & Energy Traders | 2 | |
| Industrial Conglomerates | 2 | |
| Marine | 1 | |
| Media | 1 | |
| Multiline Retail | 1 | |
| Airlines | 1 | |
| Capital Markets | 1 | |
| Electric Utilities | 1 | |
| Chemicals | 1 | |
| Communications Equipment | 1 | |
| Pharmaceuticals | 1 | |
| Real Estate Management & Development | 1 | |
| Road & Rail | 1 | |
| | |
| Latin America | | |
| |
| | Percent of | |
| | Long-Term | |
| Industry | Investments | |
| Commercial Banks | 19 | % |
| Metals & Mining | 16 | |
| Oil, Gas & Consumable Fuels | 15 | |
| Wireless Telecommunication Services | 9 | |
| Beverages | 6 | |
| Household Durables | 5 | |
| Media | 4 | |
| Diversified Financial Services | 4 | |
| Diversified Telecommunication Services | 2 | |
| Food & Staples Retailing | 2 | |
| Independent Power Producers & Energy Traders | 2 | |
| Road & Rail | 2 | |
| Insurance | 2 | |
| IT Services | 1 | |
| Capital Markets | 1 | |
| Construction Materials | 1 | |
| Household Products | 1 | |
| Health Care Providers & Services | 1 | |
| Electric Utilities | 1 | |
| Energy Equipment & Services | 1 | |
| Diversified Consumer Services | 1 | |
| Multiline Retail | 1 | |
| Software | 1 | |
| Airlines | 1 | |
| Transportation Infrastructure | 1 | |
6. Capital Loss Carryforwards:
As of October 31, 2008, capital loss carryforwards available to offset future
realized capital gains through the indicated expiration dates:
| | | | | | |
| Global |
| | | Emerging | | Latin | | |
| October 31, | | Markets | | America | | International |
| |
| 2009 | $ | 7,236,560 | | — | | — |
| 2010 | | 3,618,280 | | — | $ | 38,696,952 |
| 2016 | | 37,949,987 | $ | 57,163,692 | | 19,370,107 |
| |
| Total | $ | 48,804,827 | $ | 57,163,692 | $ | 58,067,059 |
34 SEMI-ANNUAL REPORT
APRIL 30, 2009
| | | | | | | | | | | | | | | |
| Notes to Financial Statements (continued) | | | | | | | | | | | |
| |
| 7. Capital Share Transactions: | | | | | | | | | | | | | | | |
| Transactions in shares for each class were as follows: | | | | | | | | | | | | | | |
| | | | | | | | | | Period | | | | | | |
| | Six Months Ended | | July 1, 2008 to | | | | Year Ended | |
| | April 30, 2009 | | October 31, 2008 | | June 30, 2008 | |
| Global Emerging Markets | Shares | | | Amount | | Shares | | | Amount | | Shares | | | Amount | |
| Institutional | | | | | | | | | | | | | | | |
| Shares sold | 849,245 | | $ | 7,878,059 | | 707,993 | | $ | 9,764,256 | | 187,837 | | $ | 4,917,755 | |
| Shares issued to shareholders in reinvestment | | | | | | | | | | | | | | | |
| of dividends and distributions | 22,603 | | | 228,223 | | 424,939 | | | 5,914,332 | | 750,174 | | | 18,866,886 | |
| Total issued | 871,848 | | | 8,106,282 | | 1,132,932 | | | 15,678,588 | | 938,011 | | | 23,784,641 | |
| Shares redeemed | (706,538 | ) | | (6,654,375 | ) | (505,380 | ) | | (7,626,329 | ) | (450,698 | ) | | (11,679,397 | ) |
| Net increase | 165,310 | | $ | 1,451,907 | | 627,552 | | $ | 8,052,259 | | 487,313 | | $ | 12,105,244 | |
| |
| Investor A | | | | | | | | | | | | | | | |
| Shares sold and automatic conversion of shares | 256,218 | | $ | 2,540,480 | | 161,454 | | $ | 2,487,355 | | 782,422 | | $ | 20,102,130 | |
| Shares issued to shareholders in reinvestment | | | | | | | | | | | | | | | |
| of dividends and distributions | 20,613 | | | 201,779 | | 807,945 | | | 10,897,921 | | 1,345,076 | | | 32,946,633 | |
| Total issued | 276,831 | | | 2,742,259 | | 969,399 | | | 13,385,276 | | 2,127,498 | | | 53,048,763 | |
| Shares redeemed | (761,188 | ) | | (7,043,816 | ) | (789,942 | ) | | (11,598,991 | ) | (989,966 | ) | | (24,538,895 | ) |
| Net increase (decrease) | (484,357 | ) | $ | (4,301,557 | ) | 179,457 | | $ | 1,786,285 | | 1,137,532 | | $ | 28,509,868 | |
| |
| Investor B | | | | | | | | | | | | | | | |
| Shares sold | 27,192 | | $ | 231,522 | | 11,089 | | $ | 168,711 | | 67,969 | | $ | 1,630,778 | |
| Shares issued to shareholders in reinvestment | | | | | | | | | | | | | | | |
| of dividends and distributions | — | | | — | | 51,397 | | | 625,988 | | 113,412 | | | 2,552,296 | |
| Total issued | 27,192 | | | 231,522 | | 62,486 | | | 794,699 | | 181,381 | | | 4,183,074 | |
| Shares redeemed and automatic conversion of shares | (88,066 | ) | | (724,250 | ) | (70,702 | ) | | (946,167 | ) | (307,706 | ) | | (7,194,172 | ) |
| Net decrease | (60,874 | ) | $ | (492,728 | ) | (8,216 | ) | $ | (151,468 | ) | (126,325 | ) | $ | (3,011,098 | ) |
| |
| Investor C | | | | | | | | | | | | | | | |
| Shares sold | 172,742 | | $ | 1,514,262 | | 74,437 | | $ | 1,085,047 | | 401,603 | | $ | 9,253,606 | |
| Shares issued to shareholders in reinvestment | | | | | | | | | | | | | | | |
| of dividends and distributions | — | | | — | | 210,547 | | | 2,496,749 | | 360,570 | | | 7,941,682 | |
| Total issued | 172,742 | | | 1,514,262 | | 283,984 | | | 3,581,796 | | 762,173 | | | (17,195,288 | ) |
| Shares redeemed | (293,778 | ) | | (2,385,237 | ) | (360,069 | ) | | (4,745,162 | ) | (410,160 | ) | | (8,987,901 | ) |
| Net increase (decrease) | (121,036 | ) | $ | (870,975 | ) | (76,085 | ) | $ | (1,163,366 | ) | 352,013 | | $ | 8,207,387 | |
SEMI-ANNUAL REPORT
APRIL 30, 2009
35
| | | | | | | | | | | | | | | | | |
| Notes to Financial Statements (continued) | | | | | | | | | | | | | |
| |
| | | | | | | | | Period | | | | | | | |
| | Six Months Ended | | December 1, 2007 to | | | | | Year Ended | |
| | April 30, 2009 | | October 31, 2008 | | November 30, 2007 | |
| Latin America | Shares | | | Amount | | Shares | | | | Amount | | Shares | | | | Amount | |
| Institutional | | | | | | | | | | | | | | | | | |
| Shares sold | 327,401 | | $ | 10,362,199 | | 1,158,098 | | $ | | 71,001,205 | | 1,272,272 | | | $ | 80,829,282 | |
| Shares issued to shareholders in reinvestment | | | | | | | | | | | | | | | | | |
| of dividends and distributions | — | | | — | | 278,558 | | | | 17,462,107 | | 49,381 | | | | 2,575,234 | |
| Total issued | 327,401 | | | 10,362,199 | | 1,436,656 | | | | 88,463,312 | | 1,321,653 | | | | 83,404,516 | |
| Shares redeemed | (695,415 | ) | | (20,201,060 | ) | (1,138,622 | ) | | | (59,478,030 | ) | (3,462,518 | ) | | | (194,175,665 | ) |
| Net increase (decrease) | (368,014 | ) | $ | (9,838,861 | ) | 298,034 | | | $ | 28,985,282 | | (2,140,865 | ) | $ | (110,771,149 | ) |
| |
| Investor A | | | | | | | | | | | | | | | | | |
| Shares sold and automatic conversion of shares | 1,681,792 | | $ | 52,899,584 | | 3,142,527 | | $ | | 209,226,730 | | 2,993,773 | | | $ | 202,297,775 | |
| Shares issued to shareholders in reinvestment | | | | | | | | | | | | | | | | | |
| of dividends and distributions | — | | | — | | 902,406 | | | | 55,922,568 | | 37,370 | | | | 1,933,536 | |
| Total issued | 1,681,792 | | | 52,899,584 | | 4,044,933 | | | | 265,149,298 | | 3,031,143 | | | | 204,231,311 | |
| Shares redeemed | (1,025,915 | ) | | (29,496,697 | ) | (3,762,743 | ) | | | (209,271,388 | ) | (1,263,895 | ) | | | (82,271,703 | ) |
| Net increase | 655,877 | | $ | 23,402,887 | | 282,190 | | | $ | 55,877,910 | | 1,767,248 | | | $ | 121,959,608 | |
| |
| Investor B | | | | | | | | | | | | | | | | | |
| Shares sold | 22,236 | | $ | 649,365 | | 186,611 | | $ | | 11,962,166 | | 293,436 | | | $ | 18,680,821 | |
| Shares issued to shareholders in reinvestment | | | | | | | | | | | | | | | | | |
| of dividends and distributions | — | | | — | | 71,416 | | | | 4,320,594 | | 1,015 | | | | 50,584 | |
| Total issued | 22,236 | | | 649,365 | | 258,027 | | | | 16,282,760 | | 294,451 | | | | 18,731,405 | |
| Shares redeemed and automatic conversion of shares . | (75,407 | ) | | (2,068,059 | ) | (265,203 | ) | | | (14,446,623 | ) | (163,918 | ) | | | (9,848,033 | ) |
| Net increase (decrease) | (53,171 | ) | $ | (1,418,694 | ) | (7,176 | ) | | $ | 1,836,137 | | 130,533 | | | $ | 8,883,372 | |
| |
| Investor C | | | | | | | | | | | | | | | | | |
| Shares sold | 272,529 | | $ | 8,032,071 | | 1,418,638 | | $ | | 87,692,633 | | 1,680,824 | | | $ | 106,157,297 | |
| Shares issued to shareholders in reinvestment | | | | | | | | | | | | | | | | | |
| of dividends and distributions | — | | | — | | 418,035 | | | | 24,730,101 | | 6,346 | | | | 311,628 | |
| Total issued | 272,529 | | | 8,032,071 | | 1,836,673 | | | | 112,422,734 | | 1,687,170 | | | | 106,468,925 | |
| Shares redeemed | (553,591 | ) | | (14,773,810 | ) | (1,489,018 | ) | | | (73,074,328 | ) | (506,882 | ) | | | (30,730,485 | ) |
| Net increase (decrease) | (281,062 | ) | $ | (6,741,739 | ) | 347,655 | | $ | | 39,348,406 | | 1,180,288 | | | $ | 75,738,440 | |
36 SEMI-ANNUAL REPORT
APRIL 30, 2009
| | | | | | | | | | | | | | | |
| Notes to Financial Statements (concluded) | | | | | | | | | | | |
| |
| | | | | | | | | | Period | | | | | | |
| | Six Months Ended | | June 1, 2008 to | | | | Year Ended | |
| | April 30, 2009 | | October 31, 2008 | | May 31, 2008 | |
| International | Shares | | | Amount | | Shares | | | Amount | | Shares | | | Amount | |
| Institutional | | | | | | | | | | | | | | | |
| Shares sold | 64,010 | | $ | 490,379 | | 5,108 | | $ | 64,694 | | 24,171 | | $ | 351,017 | |
| Shares issued to shareholders in reinvestment | | | | | | | | | | | | | | | |
| of dividends and distributions | — | | | — | | 8,524 | | | 104,425 | | 5,110 | | | 67,055 | |
| Total issued | 64,010 | | | 490,379 | | 13,632 | | | 169,119 | | 29,281 | | | 418,072 | |
| Shares redeemed | (160,123 | ) | | (1,211,754 | ) | (110,195 | ) | | (1,259,256 | ) | (158,602 | ) | | (2,237,713 | ) |
| Net decrease | (96,113 | ) | $ | (721,375 | ) | (96,563 | ) | $ | (1,090,137 | ) | (129,321 | ) | $ | (1,819,641 | ) |
| |
| Investor A | | | | | | | | | | | | | | | |
| Shares sold and automatic conversion of shares | 559,382 | | $ | 4,177,660 | | 417,753 | | $ | 4,967,663 | | 1,140,058 | | $ | 16,105,187 | |
| Shares issued to shareholders in reinvestment | | | | | | | | | | | | | | | |
| of dividends and distributions | — | | | — | | 28,066 | | | 341,015 | | 10,055 | | | 130,879 | |
| Total issued | 559,382 | | | 4,177,660 | | 445,819 | | | 5,308,678 | | 1,150,113 | | | 16,236,066 | |
| Shares redeemed | (762,178 | ) | | (5,443,451 | ) | (501,095 | ) | | (5,458,618 | ) | (865,330 | ) | | (12,179,455 | ) |
| Net increase (decrease) | (202,796 | ) | $ | (1,265,791 | ) | (55,276 | ) | $ | (149,940 | ) | 284,783 | | $ | 4,056,611 | |
| |
| Investor B | | | | | | | | | | | | | | | |
| Shares sold | 376,282 | | $ | 2,659,138 | | 299,347 | | $ | 3,319,265 | | 1,081,938 | | $ | 14,597,126 | |
| Shares issued to shareholders in reinvestment | | | | | | | | | | | | | | | |
| of dividends and distributions | — | | | — | | — | | | — | | — | | | — | |
| Total issued | 376,282 | | | 2,659,138 | | 299,347 | | | 3,319,265 | | 1,081,938 | | $ | 14,597,126 | |
| Shares redeemed and automatic conversion of shares . | (812,768 | ) | | (5,705,919 | ) | (744,167 | ) | | (8,320,772 | ) | (2,148,978 | ) | | (28,924,995 | ) |
| Net decrease | (436,486 | ) | $ | (3,046,781 | ) | (444,820 | ) | $ | (5,001,507 | ) | (1,067,040 | ) | $ | (14,327,869 | ) |
| |
| Investor C | | | | | | | | | | | | | | | |
| Shares sold | 113,320 | | $ | 816,725 | | 29,780 | | $ | 324,315 | | 89,447 | | $ | 1,217,816 | |
| Shares issued to shareholders in reinvestment | | | | | | | | | | | | | | | |
| of dividends and distributions | — | | | — | | 1,922 | | | 22,496 | | — | | | — | |
| Total issued | 113,320 | | | 816,725 | | 31,702 | | | 346,811 | | 89,447 | | $ | 1,217,816 | |
| Shares redeemed | (217,068 | ) | | (1,546,262 | ) | (153,110 | ) | | (1,632,510 | ) | (262,730 | ) | | (3,572,287 | ) |
| Net decrease | (103,748 | ) | $ | (729,537 | ) | (121,408 | ) | $ | (1,285,699 | ) | (173,283 | ) | $ | (2,354,471 | ) |
The Funds impose a 2% redemption fee on shares redeemed or exchanged that have been held 30 days or less. The redemption fees are collected and
retained by the Funds for the benefit of the remaining shareholders. The redemption fees are recorded as a credit to paid-in capital.
SEMI-ANNUAL REPORT
APRIL 30, 2009
37
| | | | | |
| Portfolio Information as of April 30, 2009 | | | | BlackRock Master International Portfolio | |
| |
| BlackRock Master International Portfolio | | | | | |
| |
| | Percent of | | | Percent of | |
| | Long-Term | | | Long-Term | |
| Ten Largest Holdings | Investments | | Geographic Allocation | Investments | |
| E.ON AG | 4 | % | United Kingdom | 22 | % |
| Vodafone Group Plc | 3 | | France | 16 | |
| Sanofi-Aventis | 3 | | Switzerland | 12 | |
| Nokia Oyj | 3 | | Germany | 12 | |
| Roche Holding AG | 3 | | Japan | 8 | |
| Total SA | 3 | | United States | 6 | |
| Vivendi SA | 3 | | Finland | 5 | |
| Zurich Financial Services AG | 3 | | Sweden | 4 | |
| Telefonica SA | 3 | | Denmark | 3 | |
| The Swatch Group Ltd. Bearer Shares | 2 | | | | |
| | | | Spain | 3 | |
| | | | Luxembourg | 2 | |
| | | | Netherlands | 2 | |
| | | | Other1 | 5 | |
1 Other includes a 1% investment in each country as follows: Hong Kong, China,
South Africa, Russia and Ireland.
38 SEMI-ANNUAL REPORT
APRIL 30, 2009
Schedule of Investments April 30, 2009 (Unaudited) BlackRock Master International Portfolio
(Percentages shown are based on Net Assets)
| | | |
| Common Stocks | Shares | | Value |
| |
| China — 1.4% | | | |
| Angang New Steel Co. Ltd. | 608,000 | $ | 722,173 |
| Denmark — 3.4% | | | |
| Carlsberg A/S | 21,020 | | 1,010,636 |
| Vestas Wind Systems A/S (a) | 11,841 | | 768,617 |
| | | | 1,779,253 |
| Finland — 4.9% | | | |
| Fortum Oyj | 49,057 | | 989,491 |
| Nokia Oyj | 110,132 | | 1,564,256 |
| | | | 2,553,747 |
| France — 16.1% | | | |
| AXA SA | 59,155 | | 993,905 |
| BNP Paribas SA | 19,162 | | 1,008,762 |
| Bouygues | 21,198 | | 904,304 |
| Eutelsat Communications | 42,365 | | 917,360 |
| Sanofi-Aventis | 27,143 | | 1,571,909 |
| Total SA | 29,964 | | 1,499,273 |
| Vivendi SA | 54,263 | | 1,459,082 |
| | | | 8,354,595 |
| Germany — 12.0% | | | |
| BASF SE | 29,091 | | 1,097,825 |
| DaimlerChrysler AG | 22,462 | | 805,266 |
| E.ON AG | 60,955 | | 2,061,314 |
| Linde AG | 14,128 | | 1,126,677 |
| MAN AG | 18,440 | | 1,142,989 |
| | | | 6,234,071 |
| Hong Kong — 1.4% | | | |
| Cathay Pacific Airways Ltd. | 650,000 | | 751,863 |
| Ireland — 1.2% | | | |
| CRH Plc | 24,861 | | 645,373 |
| Japan — 8.3% | | | |
| Canon, Inc. | 39,100 | | 1,170,095 |
| Mitsubishi UFJ Financial Group, Inc. | 211,700 | | 1,154,796 |
| Nomura Holdings, Inc. | 165,000 | | 995,701 |
| Tokio Marine Holdings, Inc. | 37,300 | | 983,724 |
| | | | 4,304,316 |
| Luxembourg — 1.8% | | | |
| ArcelorMittal | 40,585 | | 950,678 |
| Netherlands — 1.6% | | | |
| Heineken NV | 27,255 | | 809,913 |
| Russia — 1.3% | | | |
| OAO Gazprom (b) | 37,486 | | 670,250 |
| South Africa — 1.4% | | | |
| MTN Group Ltd. | 54,980 | | 713,816 |
| Spain — 2.6% | | | |
| Telefonica SA | 70,877 | | 1,342,845 |
| Sweden — 3.6% | | | |
| Sandvik AB | 138,216 | | 907,734 |
| Swedish Match AB | 68,360 | | 975,507 |
| | | | 1,883,241 |
| | | | | | | | |
| | Common Stocks | Shares | | Value | |
| |
| | Switzerland — 12.1% | | | | | | | |
| | Credit Suisse Group AG | 22,457 | $ | 877,542 | |
| | Roche Holding AG | 12,356 | | 1,558,143 | |
| | Swatch Group Ltd./The Bearer Shares | | | | 9,345 | | 1,300,204 | |
| | UBS AG | 81,936 | | 1,125,513 | |
| | Zurich Financial Services AG | | | | 7,728 | | 1,436,098 | |
| | | | | | | | 6,297,500 | |
| | United Kingdom — 22.0% | | | | | | | |
| | Cairn Energy Plc (a) | 18,715 | | 586,771 | |
| | GlaxoSmithKline Plc | 76,835 | | 1,183,508 | |
| | Imperial Tobacco Group Plc | 46,344 | | 1,057,397 | |
| | Reed Elsevier Plc | 104,322 | | 773,253 | |
| | Rio Tinto Plc Registered Shares | 21,198 | | 861,291 | |
| | Severn Trent Plc | 66,253 | | 1,019,375 | |
| | Tesco Plc | 257,945 | | 1,278,073 | |
| | Tullow Oil Plc | 94,536 | | 1,115,987 | |
| | Unilever Plc | 48,222 | | 938,959 | |
| | United Business Media Ltd. | 138,397 | | 937,260 | |
| | Vodafone Group Plc | 903,717 | | 1,661,006 | |
| | | | | | | | 11,412,880 | |
| | United States — 5.9% | | | | | | | |
| | Avon Products, Inc. | 55,738 | | 1,268,597 | |
| | McDonald’s Corp. | 17,066 | | 909,447 | |
| | Virgin Media, Inc. | 112,085 | | 865,296 | |
| | | | | | | | 3,043,340 | |
| | Total Long-Term Investments | | | | | | | |
| (Cost— $56,177,521) — 101.0% | | | | | | 52,469,854 | |
| |
| |
| | | | Par | | | | | |
| | Short-Term Securities | (000 | ) | | | | |
| | Time Deposits — 0.2% | | | | | | | |
| | Brown Brothers Harriman & Co., | | | | | | | |
| | 0.0547%, 5/01/09 | CAD | 14 | | | | 11,441 | |
| | Brown Brothers Harriman & Co., | | | | | | | |
| | 0.02%, 5/01/09 | CHF | 2 | | | | 1,420 | |
| | Brown Brothers Harriman & Co., | | | | | | | |
| | 0.0555%, 5/01/09 | EUR | 78 | | | | 102,327 | |
| | Brown Brothers Harriman & Co., | | | | | | | |
| | 8.15%, 5/01/09 | ZAR | 122 | | | | 14,191 | |
| | Total Short-Term Securities | | | | | | | |
| (Cost— $129,379) — 0.2% | | | | | | 129,379 | |
| | Total Investments (Cost — $56,306,900*) — 101.2% | | | | | | 52,599,233 | |
| | Liabilities in Excess of Other Assets — (1.2)% | | | | | | (648,815 | ) |
| | Net Assets — 100.0% | | | | $ | | 51,950,418 | |
See Notes to Financial Statements.
SEMI-ANNUAL REPORT
APRIL 30, 2009
39
Schedule of Investments (concluded) BlackRock Master International Portfolio
* The cost and unrealized appreciation (depreciation) of investments as of April 30,
2009, as computed for federal income tax purposes, were as follows:
| | | |
| Aggregate cost | $ | 56,555,908 | |
| Gross unrealized appreciation | $ | 4,053,804 | |
| Gross unrealized depreciation | | (8,010,479 | ) |
| Net unrealized depreciation | $ | (3,956,675 | ) |
(a) Non-income producing security.
(b) Depositary receipts.
•Investments in companies considered to be an affiliate of the Portfolio, for purposes
of Section 2(a)(3) of the Investment Company Act of 1940, were as follows:
| | | | | |
| | | Net | | | |
| Affiliate | | Activity | | | Income |
| |
| BlackRock Liquidity Series, LLC | | | | | |
| Cash Sweep Series | $ | (1,309,207 | ) | $ | 8,258 |
•Foreign currency exchange contracts as of April 30, 2009 were as follows:
| | | | | | | | |
| | | | | | | | Unrealized | |
| Currency | Currency | | Settlement Appreciation | |
| Purchased | | Sold | Counterparty | Date | | (Depreciation) | |
| |
| EUR | 581,514 | USD | 760,504 | Citibank NA | 5/04/09 | $ | 8,892 | |
| EUR | 698,662 | USD | 931,177 | State Street | | | | |
| | | | | Bank & Trust Co. | 5/05/09 | | (6,785 | ) |
| USD | 136,599 | DKK | 768,176 | Brown Brothers | | | | |
| | | | | Harriman & Co. | 5/05/09 | | 174 | |
| USD | 200,582 | ZAR | 1,774,191 | Brown Brothers | | | | |
| | | | | Harriman & Co. | 5/05/09 | | (8,695 | ) |
| USD | 96,506 | CHF | 110,074 | Brown Brothers | | | | |
| | | | | Harriman & Co. | 5/06/09 | | 55 | |
| USD | 253,592 | EUR | 191,448 | Brown Brothers | | | | |
| | | | | Harriman & Co. | 5/06/09 | | 290 | |
| USD | 324,376 | EUR | 245,498 | Brown Brothers | | | | |
| | | | | Harriman & Co. | 5/07/09 | | (438 | ) |
| JPY 98,953,602 USD | 1,009,319 | State Street | | | | |
| | | | | Bank & Trust Co. | 5/08/09 | | (5,936 | ) |
| JPY 110,646,000 | USD | 1,178,716 | JPMorgan | | | | |
| | | | | Chase Bank NA | 5/20/09 | | (56,445 | ) |
| JPY 313,638,000 | USD | 3,354,949 | State Street | | | | |
| | | | | Bank & Trust Co. | 5/20/09 | | (173,751 | ) |
| USD | 3,354,949 | EUR 2,677,417 | State Street | | | | |
| | | | | Bank & Trust Co. | 5/20/09 | | (187,313 | ) |
| USD | 1,178,716 | GBP | 830,664 | JPMorgan | | | | |
| | | | | Chase Bank NA | 5/20/09 | | (50,094 | ) |
| Total | | | | | | $ | (480,046 | ) |
| |
| •Currency Abbreviations: | | | | | | |
| CAD | Canadian Dollar | | | | | |
| CHF | Swiss Franc | | | | | | |
| DKK | Danish Krone | | | | | | |
| EUR | Euro | | | | | | | |
| GBP | British Pound | | | | | | |
| JPY | Japanese Yen | | | | | | |
| USD | US Dollar | | | | | | |
| ZAR | South African Rand | | | | | |
•Financial Accounting Standards Board Statement of Financial Accounting Standards
No. 157, “Fair Value Measurements,” clarifies the definition of fair value, establishes
a framework for measuring fair values and requires additional disclosures about the
use of fair value measurements. Various inputs are used in determining the fair
value of investments, which are as follows:
•Level 1 — price quotations in active markets/exchanges for identical securities
•Level 2 — other observable inputs (including, but not limited to: quoted prices
for similar assets or liabilities in markets that are active, quoted prices for identi-
cal or similar assets in markets that are not active, inputs other than quoted
prices that are observable for the assets or liabilities (such as interest rates,
yield curves, volatilities, prepayment speeds, loss severities, credit risks and
default rates) or other market-corroborated inputs)
•Level 3 — unobservable inputs based on the best information available in the
circumstance, to the extent observable inputs are not available (including the
Portfolio’s own assumptions used in determining the fair value of investments)
The inputs or methodology used for valuing securities are not necessarily an indica-
tion of the risk associated with investing in those securities. For information about
the Portfolio’s policy regarding valuation of investments and other significant
accounting policies, please refer to Note 1 of the Notes to Financial Statements.
The following table summarizes the inputs used as of April 30, 2009 in determining
the fair valuation of the Portfolio’s investments:
| | | | | | | |
| Valuation | | Investments in | | Other Financial | |
| Inputs | | Securities | | Instruments* | |
| | | Assets | | Assets | | Liabilities | |
| Level 1 | $ | 6,163,041 | | — | | — | |
| Level 2 | | 46,436,192 | $ | 9,411 | $ | (489,457 | ) |
| Level 3 | | — | | — | | — | |
| Total | $ | 52,599,233 | $ | 9,411 | $ | (489,457 | ) |
* Other financial instruments are foreign currency exchange contracts which are
valued at the unrealized appreciation/depreciation on the instrument.
See Notes to Financial Statements.
40 SEMI-ANNUAL REPORT
APRIL 30, 2009
| |
| Statement of Assets and Liabilities | BlackRock Master International Portfolio |
| April 30, 2009 (Unaudited) | |
| Assets | |
| Investments at value (cost — $56,306,900) | $ 52,599,233 |
| Unrealized appreciation on foreign currency exchange contracts | 9,411 |
| Foreign currency at value (cost — $104) | 2,212 |
| Investments sold receivable | 1,690,122 |
| Dividends receivable | 933,842 |
| Other assets | 164,624 |
| Prepaid expenses | 1,934 |
| Total assets | 55,401,378 |
| Liabilities | |
| Unrealized depreciation on foreign currency exchange contracts | 489,457 |
| Bank overdraft | 103,310 |
| Investments purchased payable | 2,697,185 |
| Withdrawals payable to investor | 104,305 |
| Investment advisory fees payable | 30,777 |
| Other accrued expenses payable | 25,526 |
| Other affiliates payable | 400 |
| Total liabilities | 3,450,960 |
| Net Assets | $ 51,950,418 |
| Net Assets Consist of | |
| Investors’ capital | $ 56,117,146 |
| Net unrealized appreciation/depreciation | (4,166,728) |
| Net Assets | $ 51,950,418 |
See Notes to Financial Statements.
SEMI-ANNUAL REPORT
APRIL 30, 2009
41
| |
| Statement of Operations | BlackRock Master International Portfolio |
| | Six Months |
| | Ended |
| | April 30, 2009 |
| | (Unaudited) |
| Investment Income | |
| Dividends | $ 1,087,069 |
| Foreign withholding tax | (112,555) |
| Income — affiliated | 8,278 |
| Total income | 982,792 |
| Expenses | |
| Investment advisory | 193,935 |
| Custodian | 10,729 |
| Accounting services | 44,798 |
| Professional | 25,975 |
| Officer and Directors | 9,957 |
| Printing | 564 |
| Miscellaneous | 6,198 |
| Total expenses | 292,156 |
| Net investment income | 690,636 |
| Realized and Unrealized Gain (Loss) | |
| Net realized gain (loss) from: | |
| Investments | (21,221,045) |
| Foreign currency | 186,905 |
| | (21,034,140) |
| Net change in unrealized appreciation/depreciation on: | |
| Investments | 19,850,637 |
| Foreign currency | (479,452) |
| | 19,371,185 |
| Total realized and unrealized loss | (1,662,955) |
| Net Decrease in Net Assets Resulting from Operations | $ (972,319) |
See Notes to Financial Statements.
42 SEMI-ANNUAL REPORT
APRIL 30, 2009
| | | | | | | |
| Statements of Changes in Net Assets | | | | BlackRock Master International Portfolio |
| |
| | | | | | Six Months | | |
| | | | | Ended April 30, | Period | Year Ended |
| | | | | | 2009 | June 1, 2008 to | May 31, |
| Increase (Decrease) in Net Assets: | | | | | (Unaudited) | October 31, 2008 | 2008 |
| Operations | | | | | | | |
| Net investment income | | | | $ 690,636 | $ 561,798 | $ 2,277,358 |
| Net realized gain (loss) | | | | (21,034,140) | (19,570,681) | 10,435,185 |
| Net change in unrealized appreciation/depreciation | | | | | 19,371,185 | (31,339,044) | (4,715,333) |
| Net increase (decrease) in net assets resulting from operations | | | | | (972,319) | (50,347,927) | 7,997,210 |
| |
| Capital Transactions | | | | | | | |
| Proceeds from contributions | | | | | 8,143,902 | 9,100,850 | 32,271,146 |
| Fair value of withdrawals | | | | (14,438,512) | (17,771,416) | (48,626,388) |
| Net decrease in net assets derived from capital transactions | | | | | (6,294,610) | (8,670,566) | (16,355,242) |
| |
| Net Assets | | | | | | | |
| Total decrease in net assets | | | | | (7,266,929) | (59,018,493) | (8,358,032) |
| Beginning of period | | | | | 59,217,347 | 118,235,840 | 126,593,872 |
| End of period | | | | $ 51,950,418 | $ 59,217,347 | $ 118,235,840 |
| |
| |
| |
| |
| Financial Highlights | | | | | BlackRock Master International Portfolio |
| |
| | Six Months | Period | | | | | |
| | Ended April 30, June 1, 2008 | | | | | |
| | 2009 | to October 31, | | | Year Ended May 31, | |
| | (Unaudited) | 2008 | 2008 | 2007 | 2006 | 2005 | 2004 |
| Total Investment Return | | | | | | | |
| Total investment return | (0.31)%1 | (44.29)%1 | 7.12% | 16.99% | 25.58% | 14.08% | 21.12% |
| Ratios to Average Net Assets | | | | | | | |
| Total expenses | 1.13%2 | 1.04%2 | 0.99% | 0.96% | 0.98% | 0.95% | 0.94% |
| Net investment income | 2.67%2 | 1.44%2 | 1.90% | 1.64% | 1.48% | 1.51% | 1.60% |
| Supplemental Data | | | | | | | |
| Net assets, end of period (000) | $ 51,950 | $ 59,217 $ | 118,236 | $ 126,594 | $ 129,475 | $ 122,401 | $ 146,726 |
| Portfolio turnover | 78% | 78% | 153% | 151% | 96% | 49% | 74% |
1 Aggregate total investment return.
2 Annualized.
See Notes to Financial Statements.
SEMI-ANNUAL REPORT
APRIL 30, 2009
43
Notes to Financial Statements (Unaudited) BlackRock Master International Portfolio
1. Significant Accounting Policies:
BlackRock Master International Portfolio (the “Portfolio”) of BlackRock
Master LLC (the “Master LLC”) is registered under the Investment
Company Act of 1940, as amended (the “1940 Act”), and is organized
as a Delaware limited liability company. The Master LLC’s Limited Liability
Company Agreement permits the Board of Directors (the “Board”) to issue
nontransferable interests in the Master LLC, subject to certain limitations.
The Portfolio’s financial statements are prepared in conformity with account-
ing principles generally accepted in the United States of America, which
may require the use of management accruals and estimates. Actual results
may differ from these estimates.
The following is a summary of significant accounting policies followed by
the Portfolio:
Valuation of Investments: Equity investments traded on a recognized secu-
rities exchange or the NASDAQ Global Market System are valued at the
last reported sale price that day or the NASDAQ official closing price, if
applicable. For equity investments traded on more than one exchange,
the last reported sale price on the exchange where the stock is primarily
traded is used. Equity investments traded on a recognized exchange for
which there were no sales on that day are valued at the last available bid
price. If no bid or ask price is available, the prior day’s price will be used
unless it is determined that such prior day’s price no longer reflects the
fair value of the security. Investments in open-end investment companies
are valued at net asset value each business day. Short-term securities
with maturities less than 60 days may by valued at amortized cost, which
approximates fair value. The Portfolio values its investment in the BlackRock
Liquidity Series, LLC Cash Sweep Series at fair value, which is ordinarily
based upon its pro-rata ownership in the net assets of the underlying fund.
In the event that application of these methods of valuation results in a
price for an investment which is deemed not to be representative of the
market value of such investment, the investment will be valued by a
method approved by the Board as reflecting fair value (“Fair Value Assets”).
When determining the price for Fair Value Assets, the investment advisor
and/or sub-advisor seeks to determine the price that the Portfolio might
reasonably expect to receive from the current sale of that asset in an
arm’s length transaction. Fair value determinations shall be based upon
all available factors that the investment advisor and/or sub-advisor deems
relevant. The pricing of all Fair Value Assets is subsequently reported to the
Board or a committee thereof.
Generally, trading in foreign securities is substantially completed each
day at various times prior to the close of business on the New York Stock
Exchange (“NYSE”). The values of such securities used in computing the
net assets of the Portfolio are determined as of such times. Foreign cur-
rency exchange rates will be determined as of the close of business on the
NYSE. Occasionally, events affecting the values of such securities and such
exchange rates may occur between the times at which they are determined
and the close of business on the NYSE that may not be reflected in the
computation of the Portfolio’s net assets. If events (for example, a company
announcement, market volatility or a natural disaster) occur during such
periods that are expected to materially affect the value of such securities,
those securities will be valued at their fair value as determined in good
faith by the Board or by the investment advisor using a pricing service
and/or procedures approved by the Board. Foreign currency exchange con-
tracts and forward foreign currency exchange contracts are valued at the
mean between the bid and the ask prices. Interpolated values are derived
when the settlement date of the contract is an interim date for which quo-
tations are not available.
Derivative Financial Instruments: The Portfolio may engage in various port-
folio investment strategies both to increase the return of the Portfolio and
to hedge, or protect, its exposure to interest rate movements and move-
ments in the securities markets. Losses may arise if the value of the con-
tract decreases due to an unfavorable change in the price of the underlying
security or if the counterparty does not perform under the contract.
•Forward currency contracts — A forward currency contract is an agree-
ment between two parties to buy and sell a currency at a set exchange
rate on a future date. Each Portfolio may enter into forward currency
contracts as a hedge against either specific transactions or portfolio
positions. Forward currency contracts, when used by the Portfolio,
help to manage the overall exposure to the foreign currency backing
some of the investments held by the Portfolio. The contract is marked-
to-market daily and the change in market value is recorded by the
Portfolio as an unrealized gain or loss. When the contract is closed, the
Portfolio records a realized gain or loss equal to the difference between
the value at the time it was opened and the value at the time it was
closed. The use of forward currency contracts involves the risk that
counterparties may not meet the terms of the agreement and market
risk of unanticipated movements in the value of a foreign currency rela-
tive to the US dollar.
Foreign Currency Transactions: Foreign currency amounts are translated
into United States dollars on the following basis: (i) market value of
investment securities, assets and liabilities at the current rate of exchange;
and (ii) purchases and sales of investment securities, income and
expenses at the rates of exchange prevailing on the respective dates of
such transactions.
The Portfolio reports foreign currency related transactions as components
of realized gains for financial reporting purposes, whereas such compo-
nents are treated as ordinary income for federal income tax purposes.
Investment Transactions and Investment Income: Investment trans-
actions are recorded on the dates the transactions are entered into (the
trade dates). Realized gains and losses on security transactions are deter-
mined on the identified cost basis. Dividend income is recorded on the
ex-dividend dates. Dividends from foreign securities where the ex-dividend
date may have passed are subsequently recorded when the Portfolio has
determined the ex-dividend date. Interest income is recognized on the
accrual basis.
44 SEMI-ANNUAL REPORT
APRIL 30, 2009
Notes to Financial Statements (continued) BlackRock Master International Portfolio
Income Taxes: The Master LLC is classified as a “pass-through entity” for
federal income tax purposes. As such, each investor in the Master LLC
is treated as owner of its proportionate share of the net assets, income,
expenses and realized and unrealized gains and losses of the Master LLC.
Therefore, no federal income tax provision is required. It is intended that
the Master LLC’s assets will be managed so an investor in the Master LLC
can satisfy the requirements of Subchapter M of the Internal Revenue
Code. Under the applicable foreign tax laws, a withholding tax may be
imposed on interest, dividend, and capital gains at various rates.
The Master LLC files US federal and various state and local tax returns.
No income tax returns are currently under examination. The statute of
limitations on the Master LLC’s US federal tax returns remain open for
each of the three years ended May 31, 2008 and the period ended
October 31, 2008. The statute of limitations on the Master LLC’s state
and local tax returns may remain open for an additional year depending
upon the jurisdiction.
Recent Accounting Pronouncement: In March 2008, Statement of
Financial Accounting Standards No. 161, “Disclosures about Derivative
Instruments and Hedging Activities — an amendment of FASB Statement
No. 133” (“FAS 161”), was issued. FAS 161 is intended to improve finan-
cial reporting for derivative instruments by requiring enhanced disclosure
that enables investors to understand how and why an entity uses deriva-
tives, how derivatives are accounted for, and how derivative instruments
affect an entity’s results of operations and financial position. FAS 161 is
effective for financial statements issued for fiscal years and interim periods
beginning after November 15, 2008. The impact on the Portfolio’s financial
statement disclosures, if any, is currently being assessed.
Bank Overdraft: The Portfolio recorded a bank overdraft which resulted from
estimates of available cash.
Other: Expenses directly related to the Portfolio are charged to that
Portfolio. Other operating expenses shared by several funds are prorated
among those funds on the basis of relative net assets or other
appropriate methods.
2. Investment Advisory Agreement and Other Transactions
with Affiliates:
The Master LLC, on behalf of the Portfolio, has entered into an Investment
Advisory Agreement with BlackRock Advisors, LLC (the “Advisor”), an indi-
rect, wholly owned subsidiary of BlackRock, Inc. (“BlackRock”), to provide
investment advisory and administration services. The PNC Financial
Services Group, Inc. (“PNC”) and Bank of America Corporation (“BAC”)
are the largest stockholders of BlackRock. BAC became a stockholder of
BlackRock following its acquisition of Merrill Lynch & Co., Inc. (“Merrill
Lynch”) on January 1, 2009. Prior to that date, both PNC and Merrill Lynch
were considered affiliates of the Portfolio under the 1940 Act. Subsequent
to the acquisition, PNC remains an affiliate, but due to the restructuring of
Merrill Lynch’s ownership interest of BlackRock, BAC is not deemed to be
an affiliate under the 1940 Act.
The Advisor is responsible for the management of the Portfolio’s invest-
ments and provides the necessary personnel, facilities, equipment and
certain other services necessary to the operations of the Portfolio. For such
services, the Portfolio pays the Advisor a monthly fee based upon the aver-
age daily value of the Portfolio’s average daily net assets at the following
annual rates: 0.75% of the Portfolio’s average daily net assets not exceed-
ing $500 million and 0.70% of the Portfolio’s average daily net assets in
excess of $500 million.
The Advisor has entered into a sub-advisory agreement with BlackRock
International Limited, an affiliate of the Advisor, under which the Advisor
pays the sub-advisor, for services it provides, a monthly fee that is a per-
centage of the investment advisory fee paid by the Portfolio to the Advisor.
For the six months ended April 30, 2009, the Portfolio reimbursed the
Advisor $603 for certain accounting services, which are included in
accounting services in the Statement of Operations.
The Portfolio may earn income on positive cash balances in demand
deposit accounts. For the six months ended April 30, 2009, the Portfolio
earned $20, which is included in Income — affiliated in the Statements
of Operations.
Certain officers and/or directors of the Master LLC are officers and/or dir-
ectors of BlackRock or its affiliates. The Master LLC reimburses the Advisor
for compensation paid to the Master LLC’s Chief Compliance Officer.
3. Investments:
Purchases and sales of investments, excluding short-term securities,
for the six months ended April 30, 2009 were $40,007,697 and
$42,940,902, respectively.
4. Short-Term Borrowings:
The Portfolio, along with certain other funds managed by the Advisor and
its affiliates, is party to a $500 million credit agreement with a group of
lenders, which expired November 2008 and was renewed until November
2009. The Portfolio may borrow under the credit agreement to fund share-
holder redemptions and for other lawful purposes other than for leverage.
The Portfolio may borrow up to the maximum amount allowable under the
Portfolio’s current Prospectus and Statement of Additional Information, sub-
ject to various other legal, regulatory or contractual limits. The Portfolio paid
its pro rata share of a 0.02% upfront fee on the aggregate commitment
amount based on its net assets as of October 31, 2008. The Portfolio pays
a commitment fee of 0.08% per annum based on the Portfolio’s pro rata
share of the unused portion of the credit agreement, which is included in
miscellaneous in the Statement of Operations. Amounts borrowed under
the credit agreement bear interest at a rate equal to the higher of the
(a) federal funds effective rate and (b) reserve adjusted one month LIBOR,
plus, in each case, the higher of (i) 1.50% and (ii) 50% of the CDX Index
(as defined in the credit agreement) in effect from time to time. The Portfolio
did not borrow under the credit agreement during the six months ended
April 30, 2009.
SEMI-ANNUAL REPORT
APRIL 30, 2009
45
Notes to Financial Statements (concluded) BlackRock Master International Portfolio
5. Geographic Concentration, Market and Credit Risk:
In the normal course of business, the Portfolio invests in securities and
enters into transactions where risks exist due to fluctuations in the market
(market risk) or failure of the issuer of a security to meet all its obligations
(credit risk). The value of securities held by the Portfolio may decline in
response to certain events, including those directly involving the issuers
whose securities are owned by the Portfolio; conditions affecting the general
economy; overall market changes; local, regional or global political, social or
economic instability; and currency and interest rate and price fluctuations.
Similar to credit risk, the Portfolio may be exposed to counterparty risk, or
the risk that an entity with which the Portfolio has unsettled or open trans-
actions may default. Financial assets, which potentially expose the Portfolio
to credit and counterparty risks, consist principally of investments and cash
due from counterparties. The extent of the Portfolio’s exposure to credit and
counterparty risks with respect to these financial assets is approximated by
their value recorded in the Portfolio’s Statements of Assets and Liabilities.
The Portfolio invests from time to time a substantial amount of its assets in
issuers located in a single country or a limited number of countries. When
the Portfolio concentrates its investments in this manner, it assumes the risk
that economic, political and social conditions in those countries may have
a significant impact on its investment performance. Please see the Schedule
of Investments for concentrations in specific countries.
As of April 30, 2009, the Portfolio had the following industry classifications:
| | |
| | Percent of | |
| | Long-Term | |
| Industry | Investments | |
| Media | 10 | % |
| Pharmaceuticals | 8 | |
| Oil, Gas & Consumable Fuels | 7 | |
| Insurance | 7 | |
| Electric Utilities | 6 | |
| Capital Markets | 6 | |
| Metals & Mining | 5 | |
| Wireless Telecommunication Services | 4 | |
| Chemicals | 4 | |
| Commercial Banks | 4 | |
| Machinery | 4 | |
| Tobacco | 4 | |
| Beverages | 4 | |
| Communications Equipment | 3 | |
| Diversified Telecommunication Services | 3 | |
| Textiles, Apparel & Luxury Goods | 2 | |
| Food & Staples Retailing | 2 | |
| Personal Products | 2 | |
| Office Electronics | 2 | |
| Water Utilities | 2 | |
| Food Products | 2 | |
| Hotels, Restaurants & Leisure | 2 | |
| Construction & Engineering | 2 | |
| Automobiles | 2 | |
| Electrical Equipment | 1 | |
| Airlines | 1 | |
| Construction Materials | 1 | |
46 SEMI-ANNUAL REPORT
APRIL 30, 2009
Officers and Directors
Ronald W. Forbes, Co-Chairman of the Board and Director
Rodney D. Johnson, Co-Chairman of the Board and Director
David O. Beim, Director
Richard S. Davis, Director
Henry Gabbay, Director
Dr. Matina Horner, Director
Herbert I. London, Director
Cynthia A. Montgomery, Director
Joseph P. Platt, Jr., Director
Robert C. Robb, Jr., Director
Toby Rosenblatt, Director
Kenneth L. Urish, Chairman of the Audit Committee and Director
Frederick W. Winter, Director
Donald C. Burke, Fund President and Chief Executive Officer
Anne F. Ackerley, Vice President
Neal J. Andrews, Chief Financial Officer
Jay M. Fife, Treasurer
Brian P. Kindelan, Chief Compliance Officer of the Fund
Howard B. Surloff, Secretary
Custodian
Brown Brothers
Harriman & Co.
Boston, MA 02109
Transfer Agent
PNC Global Investment
Servicing (U.S.) Inc.
Wilmington, DE 19809
Accounting Agent
State Street Bank and
Trust Company
Princeton, NJ 08540
Independent Registered Public
Accounting Firm
Deloitte & Touche LLP
Princeton, NJ 08540
Legal Counsel
Sidley Austin LLP
New York, NY 10019
Funds’ Address
BlackRock Global Emerging Markets Fund, Inc.
BlackRock Latin America Fund, Inc.
BlackRock International Fund of BlackRock Series, Inc.
100 Bellevue Parkway
Wilmington, DE 19809
BlackRock Global Emerging Markets Fund, Inc. is managed by a team of financial professionals. Effective April 1, 2009, Daniel Tubbs, CFA, Dhiren
Shah, CFA and Sam Vecht, CFA are the co-portfolio managers and are jointly and primarily responsible for the day-to-day management of the Fund.
Mr. Tubbs is Director of BlackRock, Inc. since 2007 and Member of the Global Emerging Markets equity team thereof since 2007; Portfolio Manager
at West LB Mellon Asset Management from 2001 to 2007.
Mr. Shah is Director of BlackRock, Inc. since 2009 and Vice President thereof from 2006 to 2008; held various positions at MLIM from 2001 to
2006; Member of the Global Emerging Markets equity team at BlackRock, Inc. since 2006 and at MLIM from 2001 to 2006.
Mr. Vecht is Director of BlackRock, Inc. since 2008 and Vice President thereof from 2006 to 2007; held various positions at MLIM from 1999 to
2006; Member of the Global Emerging Markets equity team at BlackRock, Inc. since 2006 and at MLIM from 1999 to 2006.
SEMI-ANNUAL REPORT
APRIL 30, 2009
47
Additional Information
BlackRock Privacy Principles
BlackRock is committed to maintaining the privacy of its current and former
fund investors and individual clients (collectively, “Clients”) and to safeguard-
ing their non-public personal information. The following information is pro-
vided to help you understand what personal information BlackRock collects,
how we protect that information and why in certain cases we share such
information with select parties.
If you are located in a jurisdiction where specific laws, rules or regulations
require BlackRock to provide you with additional or different privacy-related
rights beyond what is set forth below, then BlackRock will comply with those
specific laws, rules or regulations.
BlackRock obtains or verifies personal non-public information from and
about you from different sources, including the following: (i) information we
receive from you or, if applicable, your financial intermediary, on applica-
tions, forms or other documents; (ii) information about your transactions
with us, our affiliates, or others; (iii) information we receive from a consumer
reporting agency; and (iv) from visits to our websites.
BlackRock does not sell or disclose to non-affiliated third parties any non-
public personal information about its Clients, except as permitted by law
or as is necessary to respond to regulatory requests or to service Client
accounts. These non-affiliated third parties are required to protect the confi-
dentiality and security of this information and to use it only for its intended
purpose.
We may share information with our affiliates to service your account or to
provide you with information about other BlackRock products or services
that may be of interest to you. In addition, BlackRock restricts access to
non-public personal information about its Clients to those BlackRock
employees with a legitimate business need for the information. BlackRock
maintains physical, electronic and procedural safeguards that are designed
to protect the non-public personal information of its Clients, including proce-
dures relating to the proper storage and disposal of such information.
General Information
Electronic Delivery
Electronic copies of most financial reports and prospectuses are available
on the Fund’s website or shareholders can sign up for e-mail notifications of
quarterly statements, annual and semi-annual reports and prospectuses by
enrolling in the Fund’s electronic delivery program.
To enroll:
Shareholders Who Hold Accounts with Investment Advisors, Banks or
Brokerages:
Please contact your financial advisor. Please note that not all investment
advisers, banks or brokerages may offer this service.
Shareholders Who Hold Accounts Directly with BlackRock:
1) Access the BlackRock website at
http://www.blackrock.com/edelivery
2) Select “eDelivery” under the “More Information” section
3) Log into your account
Householding
Each Fund will mail only one copy of shareholder documents, including
prospectuses, annual and semi-annual reports and proxy statements, to
shareholders with multiple accounts at the same address. This practice is
commonly called “householding” and it is intended to reduce expenses and
eliminate duplicate mailings of shareholder documents. Mailings of your
shareholder documents may be householded indefinitely unless you instruct
us otherwise. If you do not want the mailing of these documents to be com-
bined with those for other members of your household, please contact the
relevant Fund at (800) 441-7762.
Availability of Proxy Voting Policies and Procedures
A description of the policies and procedures that a Fund uses to
determine how to vote proxies relating to portfolio securities is available
(1) without charge, upon request, by calling toll-free (800) 441-7762;
(2) at www.blackrock.com; and (3) on the Securities and Exchange
Commission’s (the “SEC”) website at http://www.sec.gov.
Availability of Proxy Voting Record
Information about how each Fund votes proxies relating to securities held
in the Fund’s portfolio during the most recent 12-month period ended
June 30 is available upon request and without charge (1) at www.black-
rock.com or by calling (800) 441-7762 and (2) on the SEC’s website at
http://www.sec.gov.
Availability of Quarterly Portfolio Schedule
Each Fund files its complete schedule of portfolio holdings with the SEC for
the first and third quarters of each fiscal year on Form N-Q. Each Fund’s
Forms N-Q are available on the SEC’s website at http://www.sec.gov and
may also be reviewed and copied at the SEC’s Public Reference Room in
Washington, D.C. Information on the operation of the Public Reference
Room may be obtained by calling (800) SEC-0330. Each Fund’s Forms
N-Q may also be obtained upon request and without charge by calling
(800) 441-7762.
48 SEMI-ANNUAL REPORT
APRIL 30, 2009
Additional Information (concluded)
Shareholder Privileges
Account Information
Call us at (800) 441-7762 from 8:00 AM to 6:00 PM EST to get informa-
tion about your account balances, recent transactions and share prices. You
can also reach us on the web at www.blackrock.com/funds.
Automatic Investment Plans
Investor Class shareholders who want to invest regularly can arrange to have
$50 or more automatically deducted from their checking or savings account
and invested in any of the BlackRock funds.
Systematic Withdrawal Plans
Investor Class shareholders can establish a systematic withdrawal plan and
receive periodic payments of $50 or more from their BlackRock funds, as
long as their account is at least $10,000.
Retirement Plans
Shareholders may make investments in conjunction with Traditional, Rollover,
Roth, Coverdell, Simple IRAs, SEP IRAs and 403(b) Plans.
SEMI-ANNUAL REPORT
APRIL 30, 2009
49
| | |
| A World-Class Mutual Fund Family | |
| |
| BlackRock offers a diverse lineup of open-end mutual funds crossing all investment styles and managed by experts in equity, fixed income and |
| tax-exempt investing. | | |
| Equity Funds | | |
| |
| BlackRock All-Cap Energy & Resources Portfolio | BlackRock Global Opportunities Portfolio | BlackRock Mid-Cap Value Equity Portfolio |
| BlackRock Asset Allocation Portfolio† | BlackRock Global SmallCap Fund | BlackRock Mid Cap Value Opportunities Fund |
| BlackRock Aurora Portfolio | BlackRock Health Sciences Opportunities Portfolio | BlackRock Natural Resources Trust |
| BlackRock Balanced Capital Fund† | BlackRock Healthcare Fund | BlackRock Pacific Fund |
| BlackRock Basic Value Fund | BlackRock Index Equity Portfolio* | BlackRock Science & Technology |
| BlackRock Capital Appreciation Portfolio | BlackRock International Fund | Opportunities Portfolio |
| BlackRock Energy & Resources Portfolio | BlackRock International Diversification Fund | BlackRock Small Cap Core Equity Portfolio |
| BlackRock Equity Dividend Fund | BlackRock International Index Fund | BlackRock Small Cap Growth Equity Portfolio |
| BlackRock EuroFund | BlackRock International Opportunities Portfolio | BlackRock Small Cap Growth Fund II |
| BlackRock Focus Growth Fund | BlackRock International Value Fund | BlackRock Small Cap Index Fund |
| BlackRock Focus Value Fund | BlackRock Large Cap Core Fund | BlackRock Small Cap Value Equity Portfolio* |
| BlackRock Fundamental Growth Fund | BlackRock Large Cap Core Plus Fund | BlackRock Small/Mid-Cap Growth Portfolio |
| BlackRock Global Allocation Fund† | BlackRock Large Cap Growth Fund | BlackRock S&P 500 Index Fund |
| BlackRock Global Dynamic Equity Fund | BlackRock Large Cap Value Fund | BlackRock U.S. Opportunities Portfolio |
| BlackRock Global Emerging Markets Fund | BlackRock Latin America Fund | BlackRock Utilities and Telecommunications Fund |
| BlackRock Global Financial Services Fund | BlackRock Mid-Cap Growth Equity Portfolio | BlackRock Value Opportunities Fund |
| BlackRock Global Growth Fund | | |
| |
| |
| Fixed Income Funds | | |
| |
| BlackRock Bond Portfolio | BlackRock Income Builder Portfolio† | BlackRock Short-Term Bond Fund |
| BlackRock Emerging Market Debt Portfolio | BlackRock Inflation Protected Bond Portfolio | BlackRock Strategic Income Portfolio |
| BlackRock Enhanced Income Portfolio | BlackRock Intermediate Government | BlackRock Total Return Fund |
| BlackRock GNMA Portfolio | Bond Portfolio | BlackRock Total Return Portfolio II |
| BlackRock Government Income Portfolio | BlackRock International Bond Portfolio | BlackRock World Income Fund |
| BlackRock High Income Fund | BlackRock Long Duration Bond Portfolio | |
| BlackRock High Yield Bond Portfolio | BlackRock Low Duration Bond Portfolio | |
| BlackRock Income Portfolio† | BlackRock Managed Income Portfolio | |
| |
| |
| Municipal Bond Funds | | |
| BlackRock AMT-Free Municipal Bond Portfolio | BlackRock Kentucky Municipal Bond Portfolio | BlackRock New York Municipal Bond Fund |
| BlackRock California Municipal Bond Fund | BlackRock Municipal Insured Fund | BlackRock Ohio Municipal Bond Portfolio |
| BlackRock Delaware Municipal Bond Portfolio | BlackRock National Municipal Fund | BlackRock Pennsylvania Municipal Bond Fund |
| BlackRock High Yield Municipal Fund | BlackRock New Jersey Municipal Bond Fund | BlackRock Short-Term Municipal Fund |
| BlackRock Intermediate Municipal Fund | | |
| |
| |
| Target Risk & Target Date Funds | | |
| |
| BlackRock Prepared Portfolios | BlackRock Lifecycle Prepared Portfolios | |
| Conservative Prepared Portfolio | Prepared Portfolio 2010 | Prepared Portfolio 2030 |
| Moderate Prepared Portfolio | Prepared Portfolio 2015 | Prepared Portfolio 2035 |
| Growth Prepared Portfolio | Prepared Portfolio 2020 | Prepared Portfolio 2040 |
| Aggressive Growth Prepared Portfolio | Prepared Portfolio 2025 | Prepared Portfolio 2045 |
| | | Prepared Portfolio 2050 |
| |
| * See the prospectus for information on specific limitations on investments in the fund. | |
| † Mixed asset fund. | | |
| BlackRock mutual funds are currently distributed by BlackRock Investments, LLC. You should consider the investment objectives, risks, charges and |
| expenses of the funds under consideration carefully before investing. Each fund’s prospectus contains this and other information and is available at |
| www.blackrock.com or by calling (800) 882-0052 or from your financial advisor. The prospectus should be read carefully before investing. |
50 SEMI-ANNUAL REPORT
APRIL 30, 2009
This report is not authorized for use as an offer of sale or a solicitation of an offer to buy shares of the Funds unless accompanied or preceded by the Funds’ current
prospectus. Past performance results shown in this report should not be considered a representation of future performance. Investment return and principal value of
shares will fluctuate so that shares, when redeemed, may be worth more or less than their original cost. Statements and other information herein are as dated and
are subject to change. Please see the Funds’ prospectus for a description of risks associated with global investments.


#GEMLAIF-4/09
Item 2 – Code of Ethics – Not Applicable to this semi-annual report
Item 3 – Audit Committee Financial Expert – Not Applicable to this semi-annual report
Item 4 – Principal Accountant Fees and Services – Not Applicable to this semi-annual report
Item 5 – Audit Committee of Listed Registrants – Not Applicable
Item 6 – Investments
(a) The registrant’s Schedule of Investments is included as part of the Report to
Stockholders filed under Item 1 of this form.
(b) Not Applicable due to no such divestments during the semi-annual period covered since
the previous Form N-CSR filing.
Item 7 – Disclosure of Proxy Voting Policies and Procedures for Closed-End Management
Investment Companies – Not Applicable
Item 8 – Portfolio Managers of Closed-End Management Investment Companies – Not Applicable
Item 9 – Purchases of Equity Securities by Closed-End Management Investment Company and
Affiliated Purchasers – Not Applicable
Item 10 – Submission of Matters to a Vote of Security Holders – The registrant’s Nominating and
Governance Committee will consider nominees to the board of directors recommended by
shareholders when a vacancy becomes available. Shareholders who wish to recommend a
nominee should send nominations that include biographical information and set forth the
qualifications of the proposed nominee to the registrant’s Secretary. There have been no
material changes to these procedures.
Item 11 – Controls and Procedures
11(a) – The registrant’s principal executive and principal financial officers or persons performing
similar functions have concluded that the registrant’s disclosure controls and procedures (as
defined in Rule 30a-3(c) under the Investment Company Act of 1940, as amended (the
“1940 Act”)) are effective as of a date within 90 days of the filing of this report based on the
evaluation of these controls and procedures required by Rule 30a-3(b) under the 1940 Act
and Rule 15(d)-15(b) under the Securities Exchange Act of 1934, as amended.
11(b) – There were no changes in the registrant’s internal control over financial reporting (as
defined in Rule 30a-3(d) under the 1940 Act) that occurred during the second fiscal quarter
of the period covered by this report that have materially affected, or are reasonably likely to
materially affect, the registrant’s internal control over financial reporting.
Item 12 – Exhibits attached hereto
12(a)(1) – Code of Ethics – Not Applicable to this semi-annual report
12(a)(2) – Certifications – Attached hereto
12(a)(3) – Not Applicable
12(b) – Certifications – Attached hereto
Pursuant to the requirements of the Securities Exchange Act of 1934 and the Investment
Company Act of 1940, the registrant has duly caused this report to be signed on its behalf by
the undersigned, thereunto duly authorized.
BlackRock Global Emerging Markets Fund, Inc.
By: /s/ Donald C. Burke
Donald C. Burke
Chief Executive Officer of
BlackRock Global Emerging Markets Fund, Inc.
Date: June 19, 2009
Pursuant to the requirements of the Securities Exchange Act of 1934 and the Investment
Company Act of 1940, this report has been signed below by the following persons on behalf
of the registrant and in the capacities and on the dates indicated.
By: /s/ Donald C. Burke
Donald C. Burke
Chief Executive Officer (principal executive officer) of
BlackRock Global Emerging Markets Fund, Inc.
Date: June 19, 2009
By: /s/ Neal J. Andrews
Neal J. Andrews
Chief Financial Officer (principal financial officer) of
BlackRock Global Emerging Markets Fund, Inc.
Date: June 19, 2009