UNITED STATES
SECURITIES AND EXCHANGE COMMISSION
Washington, D.C. 20549
FORM N-CSR
CERTIFIED SHAREHOLDER REPORT OF REGISTERED MANAGEMENT INVESTMENT COMPANIES
Investment Company Act file number 811-05723
Name of Fund: BlackRock Emerging Markets Fund, Inc. (Formerly, BlackRock Global Emerging Markets Fund, Inc.)
Fund Address: 100 Bellevue Parkway, Wilmington, DE 19809
Name and address of agent for service: John M. Perlowski, Chief Executive Officer, BlackRock Emerging Markets Fund, Inc., 55 East 52nd Street, New York, NY 10055
Registrant’s telephone number, including area code: (800) 441-7762
Date of fiscal year end: 10/31/2012
Date of reporting period: 04/30/2012
Item 1 – Report to Stockholders
 | April 30, 2012 |
Semi-Annual Report (Unaudited)
BlackRock Emerging Markets Fund, Inc.
BlackRock Latin America Fund, Inc.
BlackRock International Fund | of BlackRock Series, Inc.
Not FDIC Insured • No Bank Guarantee • May Lose Value
Table of Contents
| 2 | SEMI-ANNUAL REPORT | APRIL 30, 2012 |
Dear Shareholder
One year ago at this time, risk assets were in a broad retreat as political strife in Greece ignited fears about sovereign debt problems spreading across Europe and economic indicators signaled that the global recovery had slowed. Confidence was further shaken by the prolonged debt ceiling debate in Washington, DC. Early in August 2011, Standard & Poor’s downgraded the US government’s credit rating and turmoil erupted in financial markets around the world. Extraordinary levels of volatility persisted in the months that followed as the European debt crisis intensified. Macro news flow became the dominant force in financial markets, driving asset prices up and down in lock step, in a risk on/risk off trading pattern. By the end of the third quarter in 2011, equity markets had fallen nearly 20% from their April peak while safe-haven assets such as US Treasuries and gold had rallied to historic highs.
October 2011 brought enough positive economic data to assuage fears of a global double-dip recession. Additionally, European leaders began making concerted efforts to stem the region’s debt crisis. Investors began to reenter the markets, putting risk assets on the road to recovery. Improving sentiment carried over into early 2012 as a number of factors elicited greater optimism. Sovereign debt problems in Europe became less pressing. Greece secured its second bailout package and completed the restructuring of its national debt. The European Central Bank gave financial markets a boost by providing additional liquidity through its long-term refinancing operations. The outlook for the global economy grew less dim as stronger data from the United States, particularly from the labor market, lifted sentiment. Hopes for additional monetary stimulus from the US Federal Reserve and strong corporate earnings pushed risk assets (including stocks, commodities and high yield bonds) higher through the first two months of the year while rising Treasury yields pressured higher-quality fixed income assets. The risk rally softened in late March, however, due to renewed fears about slowing growth in China and Europe’s debt troubles. Equity markets staggered downward in April as Spain’s financial situation became increasingly severe and elections in Greece and France added to uncertainty about the future of the euro zone. In the United States, disappointing jobs reports in April revealed that the recent acceleration in the labor market had been a short-lived surge. Overall, US economic data signaled that the pace of the recovery had slowed, but not to the extent that warranted additional monetary stimulus.
Thanks in large part to an exceptionally strong first quarter of 2012, equities and high yield bonds posted solid returns for the 6-month period ended April 30, 2012. On a 12-month basis, US large-cap stocks and high yield bonds delivered positive results; however, small-cap stocks finished in negative territory. International and emerging equities, which experienced significant downturns in 2011, lagged the broader rebound. Fixed income securities, including corporate, government and municipal bonds, performed well despite recent yield volatility. US Treasury bonds finished strong, with an April rally erasing the effects of their broad sell-off during February and March. Continued low short-term interest rates kept yields on money market securities near their all-time lows.
Financial markets have regained a significant degree of stability since the period of turmoil we endured last year; however, considerable headwinds remain. Political uncertainty in Europe elevates concerns about additional flare ups in the debt crisis. Higher energy prices and slowing growth in China continue to pose risks for the global economy. Potential political leadership changes around the world create additional layers of uncertainty. But, we believe that with these challenges come opportunities. We remain committed to working with you and your financial professional to identify actionable ideas for your portfolio. We encourage you to visit www.blackrock.com/newworld for more information.
Sincerely,

Rob Kapito
President, BlackRock Advisors, LLC

“Financial markets have regained a significant degree of stability since the period of turmoil we endured last year; however, considerable headwinds remain.”
Rob Kapito
President, BlackRock Advisors, LLC
| | | | |
| |
| Total Returns as of April 30, 2012 |
| |
| | 6-month | 12-month |
| |
| US large cap equities | 12.77 | % | 4.76 | % |
| (S&P 500® Index) | | | | |
| |
| US small cap equities | 11.02 | | (4.25 | ) |
| (Russell 2000® Index) | | | | |
| |
| International equities | 2.44 | | (12.82 | ) |
| (MSCI Europe, Australasia, | | | | |
| Far East Index) | | | | |
| |
| Emerging market | 3.93 | | (12.61 | ) |
| equities (MSCI Emerging | | | | |
| Markets Index) | | | | |
| |
| 3-month Treasury | 0.01 | | 0.05 | |
| bill (BofA Merrill Lynch | | | | |
| 3-Month Treasury | | | | |
| Bill Index) | | | | |
| |
| US Treasury securities | 3.83 | | 16.41 | |
| (BofA Merrill Lynch 10- | | | | |
| Year US Treasury Index) | | | | |
| |
| US investment grade | 2.44 | | 7.54 | |
| bonds (Barclays US | | | | |
| Aggregate Bond Index) | | | | |
| |
| Tax-exempt municipal | 5.71 | | 11.90 | |
| bonds (S&P Municipal | | | | |
| Bond Index) | | | | |
| |
| US high yield bonds | 6.91 | | 5.89 | |
| (Barclays US Corporate | | | | |
| High Yield 2% Issuer | | | | |
| Capped Index) | | | | |
| Past performance is no guarantee of future results. Index performance is shown for illustrative purposes only. You cannot invest directly in an index. |
| | THIS PAGE NOT PART OF YOUR FUND REPORT | 3 |
| |
| Fund Summary as of April 30, 2012 | BlackRock Emerging Markets Fund, Inc. |
Investment Objective
BlackRock Emerging Markets Fund, Inc.’s (the “Fund”) (formerly known as BlackRock Global Emerging Markets Fund, Inc.) investment objective is to seek long-term capital appreciation by investing in securities, principally equity securities, of issuers in countries having smaller capital markets.
Portfolio Management Commentary
How did the Fund perform?
| • | | For the six-month period ended April 30, 2012, the Fund outperformed its benchmark, the MSCI Emerging Markets Index. |
What factors influenced performance?
| • | | Relative to the MSCI Emerging Markets Index, the Fund’s underweight to the materials sector was the largest contributor to performance for the period. From an individual security perspective, overweight positions in Brazilian utility stock Cia Energetica de Minas Gerais and Egyptian telecommunication services (“telecom”) company Orascom Telecom Holding had a positive impact on returns. The Fund’s underweight in Brazilian oil producer Petroleo Brasileiro SA proved beneficial, as did an overweight in Turkish gold miner Koza Altin Isletmeleri AS. |
| • | | Detracting from performance during the period were the Fund’s overweight positions in Mexican telecom America Movil SA de CV and Brazilian oil producer OGX Petroleo e Gas Participacoes SA. An overweight to Indian stocks hurt returns, with Indian agrochemical producer United Phosphorus Ltd. as a notable individual detractor. The Fund’s sector overweight to telecom also had a negative impact. |
Describe recent portfolio activity.
| • | | During the six-month period ended April 30, 2012, significant transactions in the Fund included the purchase of Bank of China Ltd., Korean car manufacturer Kia Motors Corp., Brazilian oil producer OGX Petroleo e Gas Participacoes SA and Russian oil producer OAO LUKOIL. Notable sales included Brazilian mining company Vale SA, Mexican telecom America Movil SA de CV and insurance stock China Life Insurance Co. Ltd. Overall, portfolio activity during the period reflected an increased focus on stock-specific risk. From a sector perspective, the Fund moved from an overweight in tele-com to an underweight relative to the benchmark index. Additionally, the Fund moved from an underweight in consumer-related sectors to a neutral position. The Fund reduced its exposure to frontier markets (countries that are less advanced than emerging-market countries) and increased its overweight in the information technology (“IT”) sector. |
Describe portfolio positioning at period end.
| • | | At the end of the period, the Fund was overweight relative to the MSCI Emerging Markets Index in Russia and the IT sector, while it was underweight in Korea and the materials and telecom sectors. Additionally, the Fund maintained exposure to frontier markets, which are not represented in the benchmark index. |
| • | | Emerging market equities have performed well in the first four months of 2012, rising roughly 13% year-to-date. Companies in those markets are continuing to grow their earnings and benefit from an improving domestic economic backdrop. Emerging economies are expected to continue to outpace developed economies, with a projected growth rate of 5.5% for emerging markets in 2012 as compared with a projected growth rate of 1.5% for the developed world. Growth in China is expected to slow to a more moderate, though still strong, pace in 2012. The Fund remains cautious about the outlook for China’s property market and the associated construction industries, as well as the implications for the materials sector, specifically with respect to the rate of growth in demand for certain commodities. Fund management maintains a positive view on emerging-market equities as they offer a range of attractive opportunities given generally lower valuations than developed-market equities, strong earnings growth and high dividend yields. |
The views expressed reflect the opinions of BlackRock as of the date of this report and are subject to change based on changes in market, economic or other conditions. These views are not intended to be a forecast of future events and are no guarantee of future results.
Portfolio Information
| | |
| Ten Largest Holdings | Percent of
Long-Term
Investments |
| Samsung Electronics Co. Ltd. | 5 | % |
| Bank of China Ltd. | 3 | |
| Taiwan Semiconductor Manufacturing Co. Ltd. — ADR | 3 | |
| Kia Motors Corp. | 2 | |
| HON HAI Precision Industry Co. Ltd. | 2 | |
| CNOOC Ltd. | 2 | |
| Quanta Computer, Inc. | 2 | |
| Lukoil OAO — ADR | 2 | |
| Itau Unibanco Holdings SA — ADR | 2 | |
| Siam Commercial Bank Public Co. Ltd. | 2 | |
| | |
| Geographic Allocation | Percent of
Long-Term
Investments |
| China | 14 | % |
| Brazil | 13 | |
| South Korea | 11 | |
| Taiwan | 10 | |
| Russia | 10 | |
| India | 5 | |
| South Africa | 5 | |
| Thailand | 4 | |
| Indonesia | 4 | |
| Mexico | 4 | |
| Hong Kong | 3 | |
| United States | 2 | |
| Chile | 2 | |
| Turkey | 2 | |
| Kazakhstan | 2 | |
| Panama | 2 | |
| Other1 | 7 | |
| 1 | | Other includes a 1% holding or less in each of the following countries: Italy, Argentina, Peru, Ireland, Hungary, Malaysia and Egypt. |
| 4 | SEMI-ANNUAL REPORT | APRIL 30, 2012 |
BlackRock Emerging Markets Fund, Inc.
Total Return Based on a $10,000 Investment
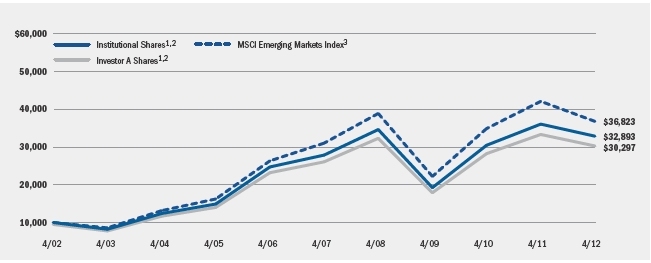
| 1 | | Assuming maximum sales charges, if any, transaction costs and other operating expenses, including investment advisory fees. Institutional Shares do not have a sales charge. |
| 2 | | The Fund invests in equity securities of issuers located in countries with developing capital markets. |
| 3 | | This free float-adjusted market capitalization weighted index is designed to measure equity market performance of emerging markets. |
Performance Summary for the Period Ended April 30, 2012
| | | | | | | | | | | | | | | | |
| | | Average Annual Total Returns4 |
| | 1 Year | | 5 Years | | 10 Years |
| | 6-Month
Total Returns | w/o sales
charge | w/sales
charge | | w/o sales
charge | w/sales
charge | | w/o sales
charge | w/sales
charge |
| Institutional | 8.63 | % | (8.87 | )% | N/A | | | 3.37 | % | N/A | | | 12.64 | % | N/A | |
| Investor A | 8.41 | | (9.14 | ) | (13.91 | )% | | 3.04 | | 1.94 | % | | 12.33 | | 11.72 | % |
| Investor B | 7.96 | | (9.98 | ) | (14.03 | ) | | 2.18 | | 1.90 | | | 11.60 | | 11.60 | |
| Investor C | 8.02 | | (9.88 | ) | (10.78 | ) | | 2.22 | | 2.22 | | | 11.43 | | 11.43 | |
| MSCI Emerging Markets Index | 3.93 | | (12.61 | ) | N/A | | | 3.48 | | N/A | | | 13.92 | | N/A | |
| 4 | | Assuming maximum sales charges, if any. Average annual total returns with and without sales charges reflect reductions for distribution and service fees. See “About Fund Performance” on page 10 for a detailed description of share classes, including any related sales charges and fees. |
N/A — Not applicable as share class and index do not have a sales charge.
Past performance is not indicative of future results.
Expense Example
| | Actual | | Hypothetical6 | | |
| | Beginning
Account Value
November 1, 2011 | Ending
Account Value
April 30, 2012 | Expenses Paid
During the Period5 | | Beginning
Account Value
November 1, 2011 | Ending
Account Value
April 30, 2012 | Expenses Paid
During the Period5 | Annualized
Expense Ratio |
| Institutional | $ | 1,000.00 | $ | 1,086.30 | $ | 6.43 | | $ | 1,000.00 | $ | 1,018.69 | $ | 6.22 | 1.24 | % |
| Investor A | $ | 1,000.00 | $ | 1,084.10 | $ | 8.14 | | $ | 1,000.00 | $ | 1,017.05 | $ | 7.87 | 1.57 | % |
| Investor B | $ | 1,000.00 | $ | 1,079.60 | $ | 12.93 | | $ | 1,000.00 | $ | 1,012.44 | $ | 12.51 | 2.50 | % |
| Investor C | $ | 1,000.00 | $ | 1,080.20 | $ | 12.36 | | $ | 1,000.00 | $ | 1,013.00 | $ | 11.96 | 2.39 | % |
| 5 | | For each class of the Fund, expenses are equal to the annualized expense ratio for the class, multiplied by the average account value over the period, multiplied by 182/366 (to reflect the one-half year period shown). |
| 6 | | Hypothetical 5% annual return before expenses is calculated by pro rating the number of days in the most recent fiscal half year divided by 366. |
See “Disclosure of Expenses” on page 10 for further information on how expenses were calculated.
| SEMI-ANNUAL REPORT | APRIL 30, 2012 | 5 |
| |
| Fund Summary as of April 30, 2012 | BlackRock Latin America Fund, Inc. |
Investment Objective
BlackRock Latin America Fund Inc.’s (the “Fund”) investment objective is to seek long-term capital appreciation by investing primarily in Latin American equity and debt securities.
Portfolio Management Commentary
How did the Fund perform?
| • | | For the six-month period ended April 30, 2012, the Fund underperformed its benchmark, the MSCI Emerging Markets Latin America Index. |
What factors influenced performance?
| • | | Detracting from performance during the period was the Fund’s underweight relative to the benchmark index in Colombian equities. An underweight and stock selection in Mexico also had a negative impact on returns, as did an overweight and stock selection in Brazil. At the individual security level, an overweight position in Brazilian homebuilder PDG Realty SA Empreendimentos e Participacoes hurt relative returns, as did the absence of Colombian stock Ecopetrol SA among the Fund’s holdings. An overweight in Brazilian bank Itau Unibanco Holdings SA also detracted. |
| • | | Positive contributors to performance included holdings in Colombia and Panama that are not represented in the benchmark index. Notable individual performers during the period included Mexican beverage name Formento Economico Mexicano SA de CV, Brazilian utility Companhia Energetica de Minas Gerais and Columbian oil & gas producer Pacific Rubiales Energy Corp. |
Describe recent portfolio activity.
| • | | During the six-month period ended April 30, 2012, the Fund reduced exposure to Brazil, especially in financials. Specifically, the Fund reduced its holdings in Brazilian banks in response to a change in the industry’s competitive landscape as government-owned banks cut spreads on certain financial products. The Fund also exited positions in Brazilian credit card acquirers. However, the Fund added to positions in Brazilian exporters, which stand to benefit from a weaker domestic currency. The Fund also increased exposure to utilities in Brazil. |
| • | | The Fund’s weighting in Mexico increased during the period. Portfolio activity in the country included rotating the Fund’s exposure within consumer-related equities away from consumer goods and retailers and into beverages. The Fund also added to its Mexican industrials exposure. In Chile, the Fund added to its retail sector holdings, which resulted in greater exposure to the Andean region. |
Describe portfolio positioning at period end.
| • | | As of period end, the Fund remains overweight in Brazil with a higher concentration in companies that rely on domestic demand, but with a growing focus on exporters that stand to benefit from a weaker Brazilian Real. Fund management continues to be positive on more domestically oriented sectors in Brazil in light of recent moves by the nation’s central bank and government that have raised expectations for stronger domestic growth. In Mexico, Fund management continues to closely monitor the upcoming Presidential election and the potential for fiscal and energy reform. While valuations for Mexico overall have generally been trading at fair value at best, the Fund has selectively increased exposure to the country as growth has proven to be resilient despite recent uncertainty around economic growth in the United States, the biggest consumer of Mexican exports. Also at period end, the Fund continues to look for opportunities to increase exposure to the Andean region given attractive growth rates, although liquidity and, in many cases, valuation continue to be issues for the region. |
The views expressed reflect the opinions of BlackRock as of the date of this report and are subject to change based on changes in market, economic or other conditions. These views are not intended to be a forecast of future events and are no guarantee of future results.
Portfolio Information
| | |
| Ten Largest Holdings | Percent of
Long-Term
Investments |
| Vale SA, Preference ‘A’ Shares — ADR | 11 | % |
| America Movil, SA de CV — ADR | 9 | |
| Petroleo Brasileiro SA — ADR | 7 | |
| Itau Unibanco Holdings SA — ADR | 6 | |
| Cia de Bebidas das Americas, Preference Shares — ADR | 5 | |
| Fomento Economico Mexicano SA de CV — ADR | 5 | |
| Banco Bradesco SA — ADR | 3 | |
| Cia de Concessoes Rodoviarias | 3 | |
| Banco do Brasil SA | 2 | |
| Grupo Televisa SA — ADR | 2 | |
| | |
| Geographic Allocation | Percent of
Long-Term
Investments |
| Brazil | 69 | % |
| Mexico | 20 | |
| Chile | 4 | |
| Peru | 2 | |
| Colombia | 2 | |
| Panama | 1 | |
| Argentina | 1 | |
| Germany | 1 | |
| 6 | SEMI-ANNUAL REPORT | APRIL 30, 2012 |
BlackRock Latin America Fund, Inc.
Total Return Based on a $10,000 Investment
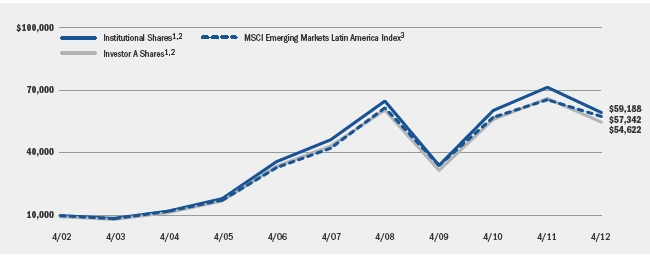
| 1 | | Assuming maximum sales charges, if any, transaction costs and other operating expenses, including investment advisory fees. Institutional Shares do not have a sales charge. |
| 2 | | The Fund invests primarily in Latin American equity and debt securities. |
| 3 | | This unmanaged broad based market capitalization-weighted index by MSCI Inc. is comprised of a representative sampling of stocks of large-, medium-, and small-capitalization companies in Argentina, Brazil, Chile and Mexico that are freely purchasable by foreign investors. |
Performance Summary for the Period Ended April 30, 2012
| | | | | | | | | | | | | | | | |
| | | Average Annual Total Returns4 |
| | | 1 Year | | 5 Years | | 10 Years |
| | 6-Month
Total Returns | w/o sales
charge | w/sales
charge | | w/o sales
charge | w/sales
charge | | w/o sales
charge | w/sales
charge |
| Institutional | (0.10 | )% | (16.96 | )% | N/A | | | 5.06 | % | N/A | | | 19.46 | % | N/A | |
| Investor A | (0.21 | ) | (17.18 | ) | (21.53 | )% | | 4.77 | | 3.65 | % | | 19.15 | | 18.50 | % |
| Investor B | (0.62 | ) | (17.89 | ) | (21.59 | ) | | 3.86 | | 3.52 | | | 18.37 | | 18.37 | |
| Investor C | (0.60 | ) | (17.83 | ) | (18.65 | ) | | 3.93 | | 3.93 | | | 18.21 | | 18.21 | |
| MSCI Emerging Markets Latin America Index | 2.06 | | (12.26 | ) | N/A | | | 6.32 | | N/A | | | 19.08 | | N/A | |
| 4 | | Assuming maximum sales charges, if any. Average annual total returns with and without sales charges reflect reductions for distribution and service fees. See “About Fund Performance” on page 10 for a detailed description of share classes, including any related sales charges and fees. |
N/A — Not applicable as share class and index do not have a sales charge.
Past performance is not indicative of future results.
Expense Example
| | Actual | | Hypothetical6 | | |
| | Beginning
Account Value
November 1, 2011 | Ending
Account Value
April 30, 2012 | Expenses Paid
During the Period5 | | Beginning
Account Value
November 1, 2011 | Ending
Account Value
April 30, 2012 | Expenses Paid
During the Period5 | Annualized
Expense Ratio |
| Institutional | $ | 1,000.00 | $ | 999.00 | $ | 6.36 | | $ | 1,000.00 | $ | 1,018.49 | $ | 6.42 | 1.28 | % |
| Investor A | $ | 1,000.00 | $ | 997.90 | $ | 7.50 | | $ | 1,000.00 | $ | 1,017.34 | $ | 7.57 | 1.51 | % |
| Investor B | $ | 1,000.00 | $ | 993.80 | $ | 11.70 | | $ | 1,000.00 | $ | 1,013.13 | $ | 11.81 | 2.36 | % |
| Investor C | $ | 1,000.00 | $ | 994.00 | $ | 11.50 | | $ | 1,000.00 | $ | 1,013.31 | $ | 11.61 | 2.32 | % |
| 5 | | For each class of the Fund, expenses are equal to the annualized expense ratio for the class, multiplied by the average account value over the period, multiplied by 182/366 (to reflect the one-half year period shown). |
| 6 | | Hypothetical 5% annual return before expenses is calculated by pro rating the number of days in the most recent fiscal half year divided by 366. |
See “Disclosure of Expenses” on page 10 for further information on how expenses were calculated.
| SEMI-ANNUAL REPORT | APRIL 30, 2012 | 7 |
| |
| Fund Summary as of April 30, 2012 | BlackRock International Fund of BlackRock Series, Inc. |
Investment Objective
BlackRock International Fund’s (the “Fund”) investment objective is to seek long-term capital growth through investments primarily in a diversified portfolio of equity securities of companies located outside the US.
Portfolio Management Commentary
How did the Fund perform?
| • | | For the six-month period ended April 30, 2012, through its investment in BlackRock Master International Portfolio (the “Portfolio”) the Fund’s Institutional, Investor A, Investor C and Class R Shares outperformed the benchmark, the MSCI All Country World Index ex-US, while the Fund’s Investor B Shares performed in line with the benchmark. |
What factors influenced performance?
| • | | The Portfolio’s sector positioning contributed positively to performance. Specifically, the Portfolio was overweight relative to the benchmark index in the better performing sectors including consumer staples and consumer discretionary. The Portfolio’s holdings in these sectors such as Imperial Tobacco Group Plc (UK), Reckitt Benckiser group Plc (UK) and Anheuser Busch InBev NV (Belgium) delivered double-digit returns for the period. |
| • | | Conversely, negative performance in the Portfolio came from financials, where sector allocation had the biggest impact. Stock selection also had a negative impact given the Portfolio’s heavy exposure to European financials such as Lloyds TSB Group Plc and ING Groep NV CVA. European financials sold off as investors continued to worry about their exposure to sovereign debt and the potential need for recapitalization. Also detracting from performance was the Portfolio’s positioning in industrials, where stock selection was the primary detractor. |
Describe recent portfolio activity.
| • | | During the six-month period ended April 30, 2012, the Portfolio increased exposure to more defensive names within the consumer discretionary and consumer staples sectors, and reduced exposure to telecom and financials. From time to time, the level of cash increases as the Portfolio reallocates among names and opportunities due to the timing between trade orders and settlement. Cash did not have a material impact on performance for the period. |
Describe portfolio positioning at period end.
| • | | As of period end, the Portfolio continued to focus on generating alpha (i.e., outperformance) through stock selection. The Portfolio sought attractive risk-adjusted opportunities, which have recently occurred mostly in telecom and consumer staples, which remained amongst the Portfolio’s largest sector overweights. The Portfolio remained underweight in the more cyclical sectors such as energy and financials. The Portfolio’s overall positioning reflects management’s belief that the global economy continued to be in a period of deleveraging, resulting in slower growth. |
The views expressed reflect the opinions of BlackRock as of the date of this report and are subject to change based on changes in market, economic or other conditions. These views are not intended to be a forecast of future events and are no guarantee of future results.
| 8 | SEMI-ANNUAL REPORT | APRIL 30, 2012 |
BlackRock International Fund of BlackRock Series, Inc.
Total Return Based on a $10,000 Investment

| 1 | | Assuming maximum sales charges, if any, transaction costs and other operating expenses, including administration fees. Institutional Shares do not have a sales charge. |
| 2 | | The Fund invests all of its assets in the Portfolio, a series of BlackRock Master LLC. The Portfolio invests primarily in a diversified portfolio of equity securities of companies located outside of the United States. |
| 3 | | This market capitalization weighted index is designed to provide a broad measure of stock performance throughout the world, with the exception of US-based companies. The index includes both developed and emerging markets. |
Performance Summary for the Period Ended April 30, 2012
| | | Average Annual Total Returns4 |
| | | 1 Year | | 5 Years | | 10 Years |
| | 6-Month
Total Returns | w/o sales
charge | w/sales
charge | | w/o sales
charge | w/sales
charge | | w/o sales
charge | w/sales
charge |
| Institutional | 3.45 | % | (14.57 | )% | N/A | | | (1.66 | )% | N/A | | | 4.69 | % | N/A | |
| Investor A | 3.32 | | (14.87 | ) | (19.34 | )% | | (1.97 | ) | (3.02 | )% | | 4.38 | | 3.82 | % |
| Investor B | 2.72 | | (15.81 | ) | (19.60 | ) | | (3.08 | ) | (3.47 | ) | | 3.62 | | 3.62 | |
| Investor C | 2.81 | | (15.66 | ) | (16.50 | ) | | (2.71 | ) | (2.71 | ) | | 3.59 | | 3.59 | |
| Class R | 3.18 | | (15.08 | ) | N/A | | | (2.17 | ) | N/A | | | 4.16 | | N/A | |
| MSCI All Country World Index ex-US | 2.73 | | (12.90 | ) | N/A | | | (2.75 | ) | N/A | | | 7.05 | | N/A | |
| 4 | | Assuming maximum sales charges, if any. Average annual total returns with and without sales charges reflect reductions for distribution and service fees. See “About Fund Performance” on page 10 for a detailed description of share classes, including any related sales charges and fees. |
N/A — Not applicable as share class and index do not have a sales charge.
Past performance is not indicative of future results.
Expense Example
| | Actual | | Hypothetical6 | | |
| | Beginning
Account Value
November 1, 2011 | Ending
Account Value
April 30, 2012 | Expenses Paid
During the Period5 | | Beginning
Account Value
November 1, 2011 | Ending
Account Value
April 30, 2012 | Expenses Paid
During the Period5 | Annualized
Expense Ratio |
| Institutional | $ | 1,000.00 | $ | 1,034.50 | $ | 4.96 | | $ | 1,000.00 | $ | 1,019.97 | $ | 4.92 | 0.98 | % |
| Investor A | $ | 1,000.00 | $ | 1,033.20 | $ | 6.88 | | $ | 1,000.00 | $ | 1,018.09 | $ | 6.82 | 1.36 | % |
| Investor B | $ | 1,000.00 | $ | 1,027.20 | $ | 12.20 | | $ | 1,000.00 | $ | 1,012.83 | $ | 12.11 | 2.42 | % |
| Investor C | $ | 1,000.00 | $ | 1,028.10 | $ | 12.05 | | $ | 1,000.00 | $ | 1,012.99 | $ | 11.96 | 2.39 | % |
| Class R | $ | 1,000.00 | $ | 1,031.80 | $ | 8.49 | | $ | 1,000.00 | $ | 1,016.50 | $ | 8.42 | 1.68 | % |
| 5 | | For each class of the Fund, expenses are equal to the annualized expense ratio for the class, multiplied by the average account value over the period, multiplied by 182/366 (to reflect the one-half year period shown). |
| 6 | | Hypothetical 5% annual return before expenses is calculated by pro rating the number of days in the most recent fiscal half year divided by 366. |
See “Disclosure of Expenses” on page 10 for further information on how expenses were calculated.
| SEMI-ANNUAL REPORT | APRIL 30, 2012 | 9 |
About Fund Performance
| • | | Institutional Shares are not subject to any sales charge. These shares bear no ongoing distribution or service fees and are available only to eligible investors. |
| • | | Investor A Shares are subject to a maximum initial sales charge (front-end load) of 5.25% and a service fee of 0.25% per year (but no distribution fee). |
| • | | Investor B Shares are subject to a maximum contingent deferred sales charge (“CDSC”) of 4.50% declining to 0% after six years. In addition, these shares are subject to a distribution fee of 0.75% per year and a service fee of 0.25% per year. These shares automatically convert to Investor A Shares after approximately eight years. (There is no initial sales charge for automatic share conversions.) All returns for periods greater than eight years reflect this conversion. These shares are only available through exchanges, dividend reinvestment by existing shareholders or for purchase by certain qualified employee benefit plans. |
| • | | Investor C Shares are subject to a distribution fee of 0.75% and a service fee of 0.25%. In addition, these shares are subject to a 1.00% CDSC if redeemed within one year of purchase. |
| • | | Class R Shares are not subject to any sales charge. These shares are subject to a distribution fee of 0.25% per year and a service fee of 0.25% per year. These shares are available only to certain retirement plans. Prior to August 15, 2011, BlackRock International Fund’s Class R Shares’ performance results are those of Institutional Shares (which have no distribution or service fees) restated to reflect Class R Share fees. |
Performance information reflects past performance and does not guarantee future results. Current performance may be lower or higher than the performance data quoted. Refer to www.blackrock.com/funds to obtain performance data current to the most recent month end. Performance results do not reflect the deduction of taxes that a shareholder would pay on fund distributions or the redemption of fund shares. Figures shown in the performance tables on pages 5, 7 and 9 assume reinvestment of all dividends and capital gain distributions, if any, at net asset value (“NAV”) on the ex-dividend date. Investment return and principal value of shares will fluctuate so that shares, when redeemed, may be worth more or less than their original cost. Dividends paid to each class of shares will vary because of the different levels of service, distribution and transfer agency fees applicable to each class, which are deducted from the income available to be paid to shareholders. In certain periods, the Funds’ Manager waived a portion of its fees. Without such waiver, the Funds’ performance would have been lower.
Disclosure of Expenses
Shareholders of these Funds may incur the following charges: (a) expenses related to transactions, including sales charges and exchange fees; and (b) operating expenses, including advisory fees, service and distribution fees, including 12b-1 fees and other Fund expenses. The expense examples shown on the previous pages (which are based on a hypothetical investment of $1,000 invested on November 1, 2011 and held through April 30, 2012) are intended to assist shareholders both in calculating expenses based on an investment in the Funds and in comparing these expenses with similar costs of investing in other mutual funds.
The expense examples provide information about actual account values and actual expenses. In order to estimate the expenses a shareholder paid during the period covered by this report, shareholders can divide their account value by $1,000 and then multiply the result by the number corresponding to their share class under the heading entitled “Expenses Paid During the Period.”
The expense examples also provide information about hypothetical account values and hypothetical expenses based on each Fund’s actual expense ratio and an assumed rate of return of 5% per year before expenses. In order to assist shareholders in comparing the ongoing expenses of investing in these Funds and other funds, compare the 5% hypothetical examples with the 5% hypothetical examples that appear in other funds’ shareholder reports.
The expenses shown in the expense examples are intended to highlight shareholders’ ongoing costs only and do not reflect any transactional expenses, such as sales charges or exchange fees, if any. Therefore, the hypothetical examples are useful in comparing ongoing expenses only, and will not help shareholders determine the relative total expenses of owning different funds. If these transactional expenses were included, shareholder expenses would have been higher.
Derivative Financial Instruments
The Funds and Portfolio may invest in various derivative financial instruments, including foreign currency exchange contracts and options as specified in Note 2 of the Notes to Financial Statements, which may constitute forms of economic leverage. Such derivative financial instruments are used to obtain exposure to a market without owning or taking physical custody of securities or to hedge market, equity and/or foreign currency exchange rate risks. Derivative financial instruments involve risks, including the imperfect correlation between the value of a derivative financial instrument and the underlying asset, possible default of the counterparty to the transaction or illiquidity of the derivative financial instrument. The Funds’ and Portfolio’s ability to use a derivative financial instrument successfully depends on the investment advisor’s ability to predict pertinent market movements accurately, which cannot be assured. The use of derivative financial instruments may result in losses greater than if they had not been used, may require the Funds and Portfolio to sell or purchase portfolio investments at inopportune times or for distressed values, may limit the amount of appreciation the Funds and Portfolio can realize on an investment, may result in lower dividends paid to shareholders or may cause the Funds and Portfolio to hold an investment that they might otherwise sell. The Funds’ and Portfolio’s investments in these instruments are discussed in detail in the Notes to Financial Statements.
| 10 | SEMI-ANNUAL REPORT | APRIL 30, 2012 |
| |
| Schedule of Investments April 30, 2012 (Unaudited) | BlackRock Emerging Markets Fund, Inc. |
| | (Percentages shown are based on Net Assets) |
| Common Stocks | Shares | | Value |
| Argentina — 1.3% | | | |
| Tenaris SA — ADR | 129,973 | | $ | 5,093,642 |
| Brazil — 12.8% | | | |
| Banco do Brasil SA | 358,581 | | 4,435,821 |
| BRF — Brasil Foods SA | 191,056 | | 3,493,063 |
| CETIP SA — Mercados Organizado | 272,533 | | 4,199,194 |
| Cia de Bebidas das Americas, Preference | | | |
| Shares — ADR | 93,039 | | 3,905,777 |
| Cia de Concessoes Rodoviarias | 676,441 | | 5,252,119 |
| Cia Energetica de Minas Gerais — ADR | 153,110 | | 3,777,224 |
| Embraer SA | 277,834 | | 2,396,239 |
| Itau Unibanco Holdings SA — ADR | 486,120 | | 7,627,223 |
| Natura Cosmeticos SA | 247,644 | | 5,683,931 |
| OGX Petroleo e Gas Participacoes SA (a) | 850,500 | | 5,903,058 |
| Tim Participacoes SA — ADR | 161,344 | | 4,829,026 |
| | | | 51,502,675 |
| Chile — 2.3% | | | |
| E.CL SA | 1,738,352 | | 4,657,823 |
| Empresa Nacional de Telecomunicaciones SA | 226,152 | | 4,498,378 |
| | | | 9,156,201 |
| China — 13.7% | | | |
| Air China Ltd., Class H (a) | 5,828,000 | | 4,209,556 |
| Anhui Conch Cement Co. Ltd. (a) | 1,451,500 | | 4,828,480 |
| Bank of China Ltd. | 26,783,200 | | 11,153,105 |
| Baidu, Inc. — ADR (a) | 36,451 | | 4,837,047 |
| China Shenhua Energy Co. Ltd., Class H (a) | 1,527,000 | | 6,743,310 |
| China Telecom Corp. Ltd. (a) | 7,788,000 | | 4,173,985 |
| CNOOC Ltd. | 3,945,000 | | 8,336,369 |
| CNOOC Ltd. — ADR | 18,706 | | 3,959,125 |
| Shanghai Electric Group Co. Ltd. (a) | 3,928,000 | | 1,966,579 |
| Tencent Holdings Ltd. | 159,900 | | 5,002,278 |
| | | | 55,209,834 |
| Egypt — 0.5% | | | |
| Orascom Telecom Holding SAE — ADR | 1,734,840 | | 2,023,179 |
| Hong Kong — 2.5% | | | |
| China Overseas Land & Investment Ltd. | 2,500,000 | | 5,402,539 |
| Sands China Ltd. | 1,234,000 | | 4,831,462 |
| | | | 10,234,001 |
| Hungary — 0.8% | | | |
| Mol Magyar Olaj- es Gazipari Rt. (a) | 40,725 | | 3,366,938 |
| India — 5.1% | | | |
| ITC, Ltd. | 1,191,252 | | 5,543,499 |
| Tata Motors Ltd. — ADR | 203,500 | | 6,054,125 |
| United Phosphorus Ltd. | 1,050,422 | | 2,317,112 |
| Yes Bank Ltd. | 993,566 | | 6,578,343 |
| | | | 20,493,079 |
| Indonesia — 3.9% | | | |
| Bank Mandiri Tbk PT | 6,672,000 | | 5,350,609 |
| Indocement Tunggal Prakarsa Tbk PT | 3,152,000 | | 6,172,013 |
| United Tractors Tbk PT | 1,320,000 | | 4,234,426 |
| | | | 15,757,048 |
| Ireland — 0.9% | | | |
| Dragon Oil Plc | 365,469 | | 3,490,491 |
| Italy — 1.4% | | | |
| Prada SpA (a) | 804,400 | | 5,441,961 |
| | | | |
| Common Stocks | Shares | | Value |
| Kazakhstan — 1.7% | | | |
| KazMunaiGas Exploration Production — GDR | 337,697 | | $ | 6,739,054 |
| Malaysia — 0.8% | | | |
| Malayan Banking Bhd | 1,162,100 | | 3,309,451 |
| Mexico — 3.9% | | | |
| Alpek SAB de CV (a) | 1,567,090 | | 3,458,776 |
| Fomento Economico Mexicano SAB de CV — ADR | 82,007 | | 6,663,889 |
| Grupo Financiero Banorte SA de CV ‘O’ | 1,157,652 | | 5,608,759 |
| | | | 15,731,424 |
| Panama — 1.5% | | | |
| Copa Holdings SA, Class A | 76,574 | | 6,226,232 |
| Peru — 1.2% | | | |
| Credicorp Ltd. | 36,100 | | 4,725,851 |
| Russia — 9.6% | | | |
| Lukoil OAO — ADR | 125,622 | | 7,706,910 |
| Magnit OJSC | 126,279 | | 3,700,485 |
| Mail.ru Group Ltd. (a) | 109,287 | | 4,726,450 |
| NovaTek OAO | 38,845 | | 4,959,792 |
| OAO Gazprom — ADR | 320,033 | | 3,670,778 |
| Sberbank | 735,974 | | 1,662,792 |
| Sberbank — ADR | 567,498 | | 7,340,805 |
| Sistema JSFC | 254,083 | | 4,831,289 |
| | | | 38,599,301 |
| South Africa — 4.7% | | | |
| African Bank Investments Ltd. | 909,312 | | 4,546,005 |
| Aveng Ltd. | 760,451 | | 3,886,462 |
| Standard Bank Group Ltd. | 374,884 | | 5,537,896 |
| The Foschini Group Ltd. | 297,405 | | 4,930,127 |
| | | | 18,900,490 |
| South Korea — 10.8% | | | |
| Celltrion, Inc. | 129,506 | | 3,633,652 |
| Kia Motors Corp. | 128,612 | | 9,437,412 |
| LG Chem Ltd. | 10,155 | | 2,538,369 |
| LG Household & Health Care Ltd. | 10,249 | | 5,367,607 |
| Samsung Electronics Co. Ltd. | 16,799 | | 20,561,326 |
| Samsung Engineering Co. Ltd. | 9,719 | | 1,840,050 |
| | | | 43,378,416 |
| Taiwan — 9.3% | | | |
| Delta Electronics, Inc. | 1,530,000 | | 4,519,264 |
| HON HAI Precision Industry Co. Ltd. | 2,759,000 | | 8,674,779 |
| Quanta Computer, Inc. | 3,012,000 | | 7,881,083 |
| Taiwan Semiconductor Manufacturing Co. Ltd. | 1,963,000 | | 5,801,909 |
| Taiwan Semiconductor Manufacturing Co. Ltd. — ADR | 677,377 | | 10,553,534 |
| | | | 37,430,569 |
| Thailand — 4.2% | | | |
| CP ALL Public Co. Ltd. (a) | 1,563,600 | | 3,883,303 |
| Kasikornbank Public Co. Ltd. | 1,111,500 | | 5,890,005 |
| Siam Commercial Bank Public Co. Ltd. | 1,400,400 | | 7,031,439 |
| | | | 16,804,747 |
| Turkey — 2.1% | | | |
| Koza Altin Isletmeleri AS | 220,437 | | 4,776,728 |
| Turkiye Garanti Bankasi AS (a) | 1,046,752 | | 3,853,659 |
| | | | 8,630,387 |
Portfolio Abbreviations
| To simplify the listings of portfolio holdings in | ADR | American Depositary Receipts | HKD | Hong Kong Dollar |
| the Schedules of Investments, the names and | BRL | Brazilian Real | MXN | Mexican New Peso |
| descriptions of many of the securities have been | CLP | Chilean Peso | USD | US Dollar |
| abbreviated according to the following list: | GDR | Global Depositary Receipts | | |
See Notes to Financial Statements.
| SEMI-ANNUAL REPORT | APRIL 30, 2012 | 11 |
| |
| Schedule of Investments (concluded) | BlackRock Emerging Markets Fund, Inc. |
| | (Percentages shown are based on Net Assets) |
| Common Stocks | Shares | | Value |
| United States — 2.4% | | | | |
| Cognizant Technology Solutions Corp. (a) | 72,262 | | $ | 5,298,250 | |
| First Cash Financial Services, Inc. (a) | 110,625 | | 4,531,200 | |
| | | | 9,829,450 | |
| Total Long-Term Investments | | | | |
| (Cost — $353,531,469) — 97.4% | | | 392,074,421 | |
| | | | | |
| | |
| Short-Term Securities | |
| BlackRock Liquidity Funds, TempFund, | | | | |
| Institutional Class, 0.15% (b)(c) | 16,062,470 | | 16,062,470 | |
| Total Short-Term Securities | | | | |
| (Cost — $16,062,470) — 4.0% | | | 16,062,470 | |
| Total Investments (Cost — $369,593,939) — 101.4% | 408,136,891 | |
| Liabilities in Excess of Other Assets — (1.4)% | | | (5,529,992 | ) |
| Net Assets — 100.0% | | | $ | 402,606,899 | |
| | | | | | |
| (a) | | Non-income producing security. |
| (b) | | Investments in companies considered to be an affiliate of the Fund during the period, for purposes of Section 2(a)(3) of the Investment Company Act of 1940, as amended, were as follows: |
| | | | | |
| Affiliate | Shares Held at
October 31,
2011 | Net
Activity | Shares Held at
April 30,
2012 | Income |
| BlackRock Liquidity | | | | |
| Funds, TempFund, | | | | |
| Institutional Class | 13,520,217 | 2,542,253 | 16,062,470 | $ | 9,152 |
| (c) | | Represents the current yield as of report date. |
| • | | Foreign currency exchange contracts as of April 30, 2012 were as follows: |
Currency
Purchased | Currency
Sold | Counter-
party | Settlement
Date | Unrealized
Appreciation |
| HKD | 1,559,731 | USD | 201,017 | State Street
Global
Markets, LLC | 5/02/12 | $ | 14 |
| MXN | 43,094,975 | USD | 3,277,932 | State Street
Global
Markets, LLC | 5/02/12 | 30,462 |
| USD | 20,453 | BRL | 38,609 | Brown
Brothers
Harriman & Co. | 5/02/12 | 198 |
| USD | 27,745 | BRL | 52,614 | Brown
Brothers
Harriman & Co. | 5/03/12 | 143 |
| Total | | | | | | $ | 30,817 |
| • | | Fair Value Measurements — Various inputs are used in determining the fair value of investments and derivative financial instruments. These inputs are categorized into a disclosure hierarchy consisting of three broad levels for financial statement purposes as follows: |
| • | | Level 1 — unadjusted price quotations in active markets/exchanges for identical assets and liabilities |
| • | | Level 2 — other observable inputs (including, but not limited to: quoted prices for similar assets or liabilities in markets that are active, quoted prices for identical or similar assets or liabilities in markets that are not active, inputs other than quoted prices that are observable for the assets or liabilities (such as interest rates, yield curves, volatilities, prepayment speeds, loss severities, credit risks and default rates) or other market-corroborated inputs) |
| • | | Level 3 — unobservable inputs based on the best information available in the circumstances, to the extent observable inputs are not available (including the Fund’s own assumptions used in determining the fair value of investments and derivative financial instruments) |
Changes in valuation techniques may result in transfers into or out of an assigned level within the disclosure hierarchy. The categorization of a value determined for investments and derivative financial instruments is based on the pricing transparency of the investment and derivative financial instrument and is not necessarily an indication of the risks associated with investing in those securities. For information about the Fund’s policy regarding valuation of investments and derivative financial instruments and other significant accounting policies, please refer to Note 1 of the Notes to Financial Statements.
The following tables summarize the inputs used as of April 30, 2012 in determining the fair valuation of the Fund’s investments and derivative financial instruments:
| Valuation Inputs | Level 1 | Level 2 | Level 3 | Total |
| Assets: | | | | |
| Investments: | | | | |
| Long-Term Investments: | | | | | | | | | | | | |
| Common Stocks: | | | | | | | | | | | | |
| Argentina | $ | 5,093,642 | | | — | | | — | | $ | 5,093,642 | |
| Brazil | | 51,502,675 | | | — | | | — | | | 51,502,675 | |
| Chile | | 9,156,201 | | | — | | | — | | | 9,156,201 | |
| China | | 8,796,172 | | $ | 46,413,662 | | | — | | | 55,209,834 | |
| Egypt | | 2,023,179 | | | — | | | — | | | 2,023,179 | |
| Hong Kong | | — | | | 10,234,001 | | | — | | | 10,234,001 | |
| Hungary | | — | | | 3,366,938 | | | — | | | 3,366,938 | |
| India | | 6,054,125 | | | 14,438,954 | | | — | | | 20,493,079 | |
| Indonesia | | — | | | 15,757,048 | | | — | | | 15,757,048 | |
| Ireland | | — | | | 3,490,491 | | | — | | | 3,490,491 | |
| Italy | | — | | | 5,441,961 | | | — | | | 5,441,961 | |
| Kazakhstan | | — | | | 6,739,054 | | | — | | | 6,739,054 | |
| Malaysia | | — | | | 3,309,451 | | | — | | | 3,309,451 | |
| Mexico | | 15,731,424 | | | — | | | — | | | 15,731,424 | |
| Panama | | 6,226,232 | | | — | | | — | | | 6,226,232 | |
| Peru | | 4,725,851 | | | — | | | — | | | 4,725,851 | |
| Russia | | 11,377,688 | | | 27,221,613 | | | — | | | 38,599,301 | |
| South Africa | | — | | | 18,900,490 | | | — | | | 18,900,490 | |
| South Korea | | — | | | 43,378,416 | | | — | | | 43,378,416 | |
| Taiwan | | 10,553,534 | | | 26,877,035 | | | — | | | 37,430,569 | |
| Thailand | | — | | | 16,804,747 | | | — | | | 16,804,747 | |
| Turkey | | — | | | 8,630,387 | | | — | | | 8,630,387 | |
| United States | | 9,829,450 | | | — | | | — | | | 9,829,450 | |
| Short-Term Securities | | 16,062,470 | | | — | | | — | | | 16,062,470 | |
| Total | $ | 157,132,643 | | $ | 251,004,248 | | | — | | $ | 408,136,891 | |
| | | | | | | | | | | | | |
| Valuation Inputs | Level 1 | Level 2 | Level 3 | Total |
| |
| Derivative Financial Instruments1 | | | | | | | | | | | | |
| Assets: | | | | | | | | | | | | |
| Foreign | | | | | | | | | | | | |
| currency | | | | | | | | | | | | |
| exchange | | | | | | | | | | | | |
| contracts | | — | | $ | 30,817 | | | — | | $ | 30,817 | |
| Total | | — | | $ | 30,817 | | | — | | $ | 30,817 | |
| 1 | | Derivative financial instruments are foreign currency exchange contracts, which are valued at the unrealized appreciation/depreciation on the instrument. |
See Notes to Financial Statements.
| 12 | SEMI-ANNUAL REPORT | APRIL 30, 2012 |
| |
| Schedule of Investments April 30, 2012 (Unaudited) | BlackRock Latin America Fund, Inc. |
| | (Percentages shown are based on Net Assets) |
| | | | |
| Common Stocks | Shares | | Value |
| Argentina — 0.9% | | | | |
| Tenaris SA — ADR | 152,000 | | $ | 5,956,880 |
| Brazil — 64.5% | | | | |
| AES Tiete SA | 162,000 | | | 2,052,462 |
| AES Tiete SA, Preference Shares | 89,000 | | | 1,246,649 |
| Arezzo Industria e Comercio SA | 218,000 | | | 3,431,000 |
| Autometal SA | 574,000 | | | 4,598,264 |
| Banco Bradesco SA — ADR | 1,375,000 | | | 22,041,250 |
| Banco do Brasil SA | 1,325,000 | | | 16,390,893 |
| BM&F BOVESPA SA | 2,488,000 | | | 13,992,267 |
| BR Malls Participacoes SA | 793,000 | | | 9,851,397 |
| BR Properties SA (a) | 499,000 | | | 6,191,197 |
| Bradespar SA, Preference Shares | 298,000 | | | 5,456,129 |
| BRF — Brasil Foods SA — ADR | 381,000 | | | 7,021,830 |
| BTG Pactual Participations Ltd. (a) | 225,000 | | | 3,610,812 |
| CETIP SA — Mercados Organizado | 257,000 | | | 3,959,861 |
| Cia de Bebidas das Americas, Preference | | | | |
| Shares — ADR | 823,463 | | | 34,568,977 |
| Cia de Concessoes Rodoviarias | 2,818,000 | | | 21,879,915 |
| Cia de Saneamento Basico do Estado de | | | | |
| Sao Paulo — ADR | 55,000 | | | 4,353,800 |
| Cia Energetica de Minas Gerais — ADR | 600,000 | | | 14,802,000 |
| Cia Energetica de Minas Gerais, Preference Shares | 57,875 | | | 1,147,086 |
| Cia Paranaense de Energia — ADR | 169,000 | | | 4,233,450 |
| Cosan SA Industria e Comercio | 230,340 | | | 3,999,818 |
| Cyrela Brazil Realty SA | 269,000 | | | 2,173,281 |
| Diagnosticos da America SA | 319,000 | | | 2,301,104 |
| EDP — Energias do Brasil SA | 351,000 | | | 2,454,597 |
| Embraer SA — ADR | 303,000 | | | 10,495,920 |
| Even Construtora e Incorporadora SA | 473,000 | | | 1,769,268 |
| Itau Unibanco Holdings SA — ADR | 2,650,000 | | | 41,578,500 |
| Itausa — Investimentos Itau SA, Preference Shares | 1,500,000 | | | 7,129,554 |
| Localiza Rent a Car SA | 400,000 | | | 6,830,522 |
| LPS Brasil Consultoria de Imoveis SA | 312,000 | | | 5,385,096 |
| Marcopolo SA, Preference Shares | 595,000 | | | 3,199,512 |
| Metalfrio Solutions SA (a) | 128,000 | | | 323,668 |
| Natura Cosmeticos SA | 316,000 | | | 7,252,839 |
| OGX Petroleo e Gas Participacoes SA (a) | 1,921,600 | | | 13,337,234 |
| PDG Realty SA Empreendimentos e | | | | |
| Participacoes (a) | 3,376,000 | | | 7,969,992 |
| Petroleo Brasileiro SA — ADR | 2,242,000 | | | 49,682,720 |
| Profarma Distribuidora de Produtos | | | | |
| Farmaceuticos SA | 320,000 | | | 1,599,874 |
| QGEP Participacoes SA | 712,000 | | | 4,788,626 |
| Qualicorp SA (a) | 268,200 | | | 2,335,661 |
| Rossi Residencial SA | 535,000 | | | 2,245,364 |
| T4F Entretenimento SA | 490,000 | | | 4,478,032 |
| Totvs SA | 249,000 | | | 4,852,897 |
| Ultrapar Participacoes SA | 215,000 | | | 4,883,928 |
| Vale SA — ADR | 175,000 | | | 3,885,000 |
| Vale SA, Preference ‘A’ Shares — ADR | 3,325,909 | | | 71,939,412 |
| | | | | 447,721,658 |
| Chile — 4.2% | | | | |
| Banco Santander Chile SA — ADR | 172,100 | | | 14,079,501 |
| E.CL SA | 1,849,000 | | | 4,954,298 |
| Empresa Nacional de Electricidad SA — ADR | 93,000 | | | 5,079,660 |
| Empresa Nacional de Telecomunicaciones SA | 189,000 | | | 3,759,390 |
| SACI Falabella | 105,629 | | | 1,031,271 |
| | | | | 28,904,120 |
| Colombia — 2.1% | | | | |
| BanColombia SA | 2,605 | | | 176,697 |
| Pacific Rubiales Energy Corp. | 505,000 | | | 14,487,726 |
| | | | | 14,664,423 |
| | | | | |
| Common Stocks | | Shares | | | Value |
| |
| Mexico — 19.6% | | | | | |
| Alfa SAB de CV | 255,000 | | $ | 3,640,214 |
| Alpek SAB de CV (a) | 2,600,000 | | | 5,738,545 |
| America Movil, SAB de CV — ADR | 2,204,934 | | | 58,761,491 |
| Fomento Economico Mexicano SAB de CV — ADR | 384,000 | | | 31,203,840 |
| Grupo Financiero Banorte SA de CV ‘O’ | 1,600,000 | | | 7,751,910 |
| Grupo Mexico SA de CV | 1,294,000 | | | 3,992,481 |
| Grupo Televisa SA — ADR | 691,808 | | | 15,199,022 |
| Wal-Mart de Mexico SA de CV | 3,526,633 | | | 10,085,029 |
| | | | | | 136,372,532 |
| Panama — 1.3% | | | | | |
| Copa Holdings SA, Class A | 112,000 | | | 9,106,720 |
| Peru — 2.3% | | | | | |
| Cia de Minas Buenaventura SA — ADR | 210,000 | | | 8,666,700 |
| Credicorp Ltd. | | 45,247 | | | 5,923,285 |
| Southern Copper Corp. | | 39,999 | | | 1,315,167 |
| | | | | | 15,905,152 |
| Total Common Stocks — 94.9% | | | | | 658,631,485 |
| |
| |
| Corporate Bonds | | Par
(000) | | | |
| Brazil — 0.4% | | | | | |
| Hypermarcas SA: | | | | | |
| 3.00%, 10/15/15 | BRL | 1,648 | | | 959,407 |
| 11.30%, 10/15/18 | | 1,648 | | | 865,744 |
| Lupatech SA, 6.50%, 4/15/18 (b) | | 2,128 | | | 1,118,430 |
| | | | | | 2,943,581 |
| Total Corporate Bonds — 0.4% | | | | | 2,943,581 |
| |
| |
| Participation Notes | | | | | |
| Brazil — 2.5% | | | | | |
| Deutsche Bank AG, (Natura Cosmeticos SA), | | | | | |
| due 11/07/19 | USD | 160 | | | 3,615,824 |
| Morgan Stanley BV: | | | | | |
| (AES Tiete SA), due 12/20/12 | | 55 | | | 791,609 |
| (Hypermarcas SA), due 6/21/13 | | 90 | | | 618,643 |
| (Lojas Renner SA), due 12/05/13 | | 100 | | | 3,385,340 |
| (Lojas Renner SA), due 2/25/14 | | 50 | | | 1,700,025 |
| (Lojas Renner SA), due 7/22/13 | | 33 | | | 1,103,322 |
| (Natura Cosmetico SA), 10/29/12 | | 27 | | | 627,043 |
| (Natura Cosmetico SA), due 7/22/13 | | 148 | | | 3,485,578 |
| (Rossi Residential SA), due 6/17/13 | | 371 | | | 1,663,601 |
| Total Participation Notes — 2.5% | | | | | 16,990,985 |
| |
| |
| |
| Rights — 0.0% | | Shares | | | |
| Brazil — 0.0% | | | | | |
| Itausa — Investimentos Itau SA (a) | | 19,181 | | | 5,635 |
See Notes to Financial Statements.
| SEMI-ANNUAL REPORT | APRIL 30, 2012 | 13 |
| |
| Schedule of Investments (continued) | BlackRock Latin America Fund, Inc. |
| | (Percentages shown are based on Net Assets) |
| Warrants (c) — 0.0% | Shares | | Value |
| Brazil — 0.0% | | | | | |
| Hypermarcas SA (Expires 10/15/15) | 1,644 | | | — | |
| Total Long-Term Investments | | | | | |
| (Cost — $499,536,562) — 97.8% | | | $ | 678,571,686 | |
| |
| |
| Short-Term Securities | | | | | |
| BlackRock Liquidity Funds, TempFund, | | | | | |
| Institutional Class, 0.18% (d)(e) | 22,671,591 | | | 22,671,591 | |
| Total Short-Term Securities | | | | | |
| (Cost — $22,671,591) — 3.3% | | | | 22,671,591 | |
| Total Investments (Cost — $522,208,153) — 101.1% | | | 701,243,277 | |
| Liabilities in Excess of Other Assets — (1.1)% | | | | (7,541,287 | ) |
| Net Assets — 100.0% | | | $ | 693,701,990 | |
| | | | | | |
| (a) | | Non-income producing security. |
| (c) | | Warrants entitle the Fund to purchase a predetermined number of shares of common stock and are non-income producing. The purchase price and number of shares are subject to adjustment under certain conditions until the expiration date, if any. |
| (d) | | Investments in companies considered to be an affiliate of the Fund during the period, for purposes of Section 2(a)(3) of the Investment Company Act of 1940, as amended, were as follows: |
| | | | |
| Affiliate | Shares/Beneficial
Interest Held at
October 31, 2011 | Net
Activity | Shares/Beneficial
Interest Held at
April 30, 2012 | Income |
| BlackRock Liquidity | | | | |
| Funds, TempFund, | | | | |
| Institutional Class | 7,334,598 | 15,336,993 | 22,671,591 | $ 4,193 |
| BlackRock | | | | |
| Liquidity Series, | | | | |
| LLC Money | | | | |
| Market Series | $2,210,000 | $ (2,210,000) | — | $ 1,390 |
| (e) | | Represents the current yield as of report date. |
| • | | Foreign currency exchange contracts as of April 30, 2012 were as follows: |
| Currency Purchased | | Currency Sold | | Counterparty | | Settlement
Date | | Unrealized
Appreciation
(Depreciation) |
| BRL | 1,395,322 | | USD | 740,971 | | Brown
Brothers
Harriman & Co. | | 5/02/12 | | $ | (8,960 | ) |
| CLP | 85,441,004 | | USD | 176,418 | | Brown
Brothers
Harriman & Co. | | 5/02/12 | | | (287 | ) |
| CLP | 43,575,686 | | USD | 89,975 | | Brown
Brothers
Harriman & Co. | | 5/02/12 | | | (147 | ) |
| MXN | 71,444,500 | | USD | 5,493,195 | | UBS AG | | 5/02/12 | | | (8,413 | ) |
| USD | 1 | | BRL | 2 | | Brown
Brothers
Harriman & Co. | | 5/02/12 | | | — | |
| USD | 712 | | BRL | 1,344 | | Brown
Brothers | | | | | | |
| | | | | | | Harriman & Co. | | 5/02/12 | | | 7 | |
| USD | 721 | | BRL | 1,362 | | Brown | | | | | | |
| | | | | | | Brothers | | | | | | |
| | | | | | | Harriman & Co. | | 5/02/12 | | | 7 | |
| USD | 1,768 | | BRL | 3,337 | | Brown | | | | | | |
| | | | | | | Brothers | | | | | | |
| | | | | | | Harriman & Co. | | 5/02/12 | | | 17 | |
| USD | 1,808 | | BRL | 3,412 | | Brown | | | | | | |
| | | | | | | Brothers | | | | | | |
| | | | | | | Harriman & Co. | | 5/02/12 | | | 17 | |
| USD | 31,156 | | BRL | 58,813 | | Brown | | | | | | |
| | | | | | | Brothers | | | | | | |
| | | | | | | Harriman & Co. | | 5/02/12 | | | 302 | |
| USD | 85,206 | | BRL | 160,844 | | Brown | | | | | | |
| | | | | | | Brothers | | | | | | |
| | | | | | | Harriman & Co. | | 5/02/12 | | | 825 | |
| CLP | 97,235,716 | | USD | 200,647 | | Brown | | | | |
| | | | | | | Brothers | | | | | | |
| | | | | | | Harriman & Co. | | 5/03/12 | | | (203 | ) |
| USD | 57,419 | | BRL | 108,884 | | Brown | | | | | | |
| | | | | | | Brothers | | | | | | |
| | | | | | | Harriman & Co. | | 5/03/12 | | | 297 | |
| USD | 154,058 | | BRL | 292,140 | | Brown | | | | | | |
| | | | | | | Brothers | | | | | | |
| | | | | | | Harriman & Co. | | 5/03/12 | | | 796 | |
| USD | 1,685,943 | | BRL | 3,197,054 | | Brown | | | | | | |
| | | | | | | Brothers | | | | | | |
| | | | | | | Harriman & Co. | | 5/03/12 | | | 8,712 | |
| Total | | | | | | | | | | $ | (7,030 | ) |
See Notes to Financial Statements.
| 14 | SEMI-ANNUAL REPORT | APRIL 30, 2012 |
| |
| Schedule of Investments (concluded) | BlackRock Latin America Fund, Inc. |
| • | | Fair Value Measurements — Various inputs are used in determining the fair value of investments and derivative financial instruments. These inputs are categorized into a disclosure hierarchy consisting of three broad levels for financial statement purposes as follows: |
| • | | Level 1 — unadjusted price quotations in active markets/exchanges for identical assets and liabilities |
| • | | Level 2 — other observable inputs (including, but not limited to: quoted prices for similar assets or liabilities in markets that are active, quoted prices for identical or similar assets or liabilities in markets that are not active, inputs other than quoted prices that are observable for the assets or liabilities (such as interest rates, yield curves, volatilities, prepayment speeds, loss severities, credit risks and default rates) or other market-corroborated inputs) |
| • | | Level 3 — unobservable inputs based on the best information available in the circumstances, to the extent observable inputs are not available (including the Fund’s own assumptions used in determining the fair value of investments and derivative financial instruments) |
Changes in valuation techniques may result in transfers into or out of an assigned level within the disclosure hierarchy. The categorization of a value determined for investments and derivative financial instruments is based on the pricing transparency of the investment and derivative financial instrument and is not necessarily an indication of the risks associated with investing in those securities. For information about the Fund’s policy regarding valuation of investments and derivative financial instruments and other significant accounting policies, please refer to Note 1 of the Notes to Financial Statements.
The following tables summarize the inputs used as of April 30, 2012 in determining the fair valuation of the Fund’s investments and derivative financial instruments:
| Valuation Inputs | | Level 1 | | Level 2 | | Level 3 | | Total |
| Assets: | | | | | | | | | | | | | | |
| Investments: | | | | | | | | | | | | | | |
| Long-Term Investments: | | | | | | | | | | | | | | |
| Common Stocks: | | | | | | | | | | | | | | |
| Argentina | | $ | 5,956,880 | | | — | | | — | | | $ | 5,956,880 | |
| Brazil | | | 447,721,658 | | | — | | | — | | | | 447,721,658 | |
| Chile | | | 28,904,120 | | | — | | | — | | | | 28,904,120 | |
| Colombia | | | 14,664,423 | | | — | | | — | | | | 14,664,423 | |
| Mexico | | | 136,372,532 | | | — | | | — | | | | 136,372,532 | |
| Panama | | | 9,106,720 | | | — | | | — | | | | 9,106,720 | |
| Peru | | | 15,905,152 | | | — | | | — | | | | 15,905,152 | |
| Corporate Bonds | | | — | | | — | | $ | 2,943,581 | | | | 2,943,581 | |
| Participation Notes: | | | | | | | | | | | | | | |
| Brazil | | | — | | $ | 11,114,011 | | | 5,876,974 | | | | 16,990,985 | |
| Rights | | | — | | | 5,635 | | | — | | | | 5,635 | |
| Short-Term Securities | | | 22,671,591 | | | — | | | — | | | | 22,671,591 | |
| Total | | $ | 681,303,076 | | $ | 11,119,646 | | $ | 8,820,555 | | | $ | 701,243,277 | |
| | | | | | | | | | | | | | | |
| Valuation Inputs | | Level 1 | | Level 2 | | Level 3 | | Total |
| Derivative Financial Instruments1 | | | | | | | | | | | | | | |
| Assets | | | | | | | | | | | | | | |
| Foreign currency | | | | | | | | | | | | | | |
| exchange contracts | | | — | | $ | 10,980 | | | — | | | $ | 10,980 | |
| Liabilities | | | | | | | | | | | | | | |
| Foreign currency | | | | | | | | | | | | | | |
| exchange contracts | | | — | | | (18,010 | ) | | — | | | | (18,010 | ) |
| Total | | | — | | $ | (7,030 | ) | | — | | | $ | (7,030 | ) |
| 1 | | Derivative financial instruments are foreign currency exchange contracts, which are valued at the unrealized appreciation/depreciation on the instrument. |
The following table is a reconciliation of Level 3 investments for which significant unobservable inputs were used to determine fair value:
| | | | | | | | | | | |
| | Corporate | | Participation | | | | |
| | Bonds | | Notes | | Total |
| Assets: | | | | | | | | | | | |
| Balance, as of October 31, 2011 | $ | 3,256,797 | | | | — | | | $ | 3,256,797 | |
| Accrued discounts/premiums | | (2,289 | ) | | | — | | | | (2,289 | ) |
| Net realized gain | | — | | | $ | 4,877,808 | | | | 4,877,808 | |
| Net change in unrealized appreciation/depreciation2 | | (310,927 | ) | | | (2,875,848 | ) | | | (3,186,775 | ) |
| Purchases | | — | | | | — | | | | — | |
| Sales | | — | | | | (11,520,108 | ) | | | (11,520,108 | ) |
| Transfers in3 | | — | | | | 15,395,122 | | | | 15,395,122 | |
| Transfers out3 | | — | | | | — | | | | — | |
| Balance, as of April 30, 2012 | $ | 2,943,581 | | | $ | 5,876,974 | | | $ | 8,820,555 | |
| 2 | | Included in the related net change in unrealized appreciation/depreciation in the Statements of Operations. The change in unrealized appreciation/depreciation on investments still held at April, 30, 2012 was $1,809,618. |
| 3 | | The Fund’s policy is to recognize transfers in and transfers out as of the beginning of the period of the event or the change in circumstances that caused the transfer. |
A reconciliation of level 3 investments is presented when the Fund had a significant amount of Level 3 investments at the beginning and/or end of the period in relation to net assets.
See Notes to Financial Statements.
| SEMI-ANNUAL REPORT | APRIL 30, 2012 | 15 |
Statements of Assets and Liabilities
| | | | | | | | | |
| April 30, 2012 (Unaudited) | BlackRock
Emerging
Markets
Fund, Inc. | BlackRock
Latin
America
Fund, Inc. | BlackRock
International
Fund |
| Assets | | | | | | | | | |
| Investments at value — unaffiliated1 | $ | 392,074,421 | | $ | 678,571,686 | | | — | |
| Investments at value — Master International Portfolio of BlackRock Master LLC (the “Portfolio”) (cost — $699,219,837) | | — | | | — | | $ | 749,201,184 | |
| Investments at value — affiliated2 | | 16,062,470 | | | 22,671,591 | | | — | |
| Foreign currency at value3 | | 365,692 | | | 769,370 | | | — | |
| Unrealized appreciation on foreign currency exchange contracts | | 30,817 | | | 10,980 | | | — | |
| Investments sold receivable | | 3,885,542 | | | 9,626,306 | | | — | |
| Dividends receivable | | 1,196,894 | | | 6,368,902 | | | — | |
| Capital shares sold receivable | | 842,974 | | | 2,944,617 | | | 865,876 | |
| Withdrawals receivable from the Portfolio | | — | | | — | | | 163,537 | |
| Investment advisor receivable | | — | | | — | | | 226,435 | |
| Interest receivable | | — | | | 91,496 | | | — | |
| Securities lending income receivable — affiliated | | — | | | 16 | | | — | |
| Prepaid expenses | | 20,115 | | | 4,442 | | | 32,729 | |
| Total assets | | 414,478,925 | | | 721,059,406 | | | 750,489,761 | |
| | | | | | | | | | |
| Liabilities | | | | | | | | | |
| Bank overdraft | | 5,385,900 | | | 6,957,862 | | | — | |
| Unrealized depreciation on foreign currency exchange contracts | | — | | | 18,010 | | | — | |
| Investments purchased payable | | 5,150,801 | | | 14,420,381 | | | — | |
| Capital shares redeemed payable | | 777,370 | | | 4,248,286 | | | 1,029,413 | |
| Investment advisory fees payable | | 275,811 | | | 591,441 | | | — | |
| Service and distribution fees payable | | 126,255 | | | 210,077 | | | 199,666 | |
| Deferred foreign capital gain tax payable | | 38,249 | | | 363,148 | | | — | |
| Administration fees payable | | — | | | — | | | 44,951 | |
| Other affiliates payable | | 6,874 | | | 27,210 | | | 726 | |
| Officer’s and Directors’ fees payable | | 7,391 | | | 8,287 | | | 453 | |
| Other accrued expenses payable | | 103,375 | | | 512,714 | | | 581,890 | |
| Total liabilities | | 11,872,026 | | | 27,357,416 | | | 1,857,099 | |
| Net Assets | $ | 402,606,899 | | $ | 693,701,990 | | $ | 748,632,662 | |
| | | | | | | | | | |
| Net Assets Consist of | | | | | | | | | |
| Paid-in capital | $ | 380,730,982 | | $ | 599,141,006 | | $ | 1,044,135,758 | |
| Undistributed net investment income (distributions in excess of net investment income) | | 1,735,783 | | | 830,909 | | | (3,217,910 | ) |
| Accumulated net realized loss | | (18,394,824 | ) | | (84,771,888 | ) | | — | |
| Net unrealized appreciation/depreciation | | 38,534,958 | | | 178,501,963 | | | — | |
| Accumulated net realized loss allocated from the Portfolio | | — | | | — | | | (342,266,533 | ) |
| Net unrealized appreciation/depreciation allocated from the Portfolio | | — | | | — | | | 49,981,347 | |
| Net Assets | $ | 402,606,899 | | $ | 693,701,990 | | $ | 748,632,662 | |
| 1 Investments at cost — unaffiliated | $ | 353,531,469 | | $ | 499,536,562 | | | — | |
| 2 Investments at cost — affiliated | $ | 16,062,470 | | $ | 22,671,591 | | | — | |
| 3 Foreign currency at cost | $ | 362,377 | | $ | 840,412 | | | — | |
See Notes to Financial Statements.
| 16 | SEMI-ANNUAL REPORT | APRIL 30, 2012 |
Statements of Assets and Liabilities (concluded)
| April 30, 2012 (Unaudited) | BlackRock
Emerging
Markets
Fund, Inc. | | BlackRock
Latin
America
Fund, Inc. | | BlackRock
International
Fund |
| Net Asset Value | | | | | | | | |
| Institutional: | | | | | | | | |
| Net assets | $ | 117,616,344 | | $ | 165,814,309 | | $ | 336,463,273 |
| Shares outstanding, 100 million shares authorized | | 5,973,993 | | | 2,668,716 | | | 26,866,586 |
| Net asset value | $ | 19.69 | | $ | 62.13 | | $ | 12.52 |
| Par value | $ | 0.10 | | $ | 0.10 | | $ | 0.0001 |
| Investor A: | | | | | | | | |
| Net assets | $ | 174,819,510 | | $ | 375,095,962 | | $ | 217,124,750 |
| Shares outstanding, 100 million shares authorized | | 9,185,686 | | | 6,127,588 | | | 17,683,786 |
| Net asset value | $ | 19.03 | | $ | 61.21 | | $ | 12.28 |
| Par value | $ | 0.10 | | $ | 0.10 | | $ | 0.0001 |
| Investor B: | | | | | | | | |
| Net assets | $ | 3,021,234 | | $ | 10,184,353 | | $ | 18,368,593 |
| Shares outstanding, 100 million shares authorized | | 178,163 | | | 177,666 | | | 1,619,701 |
| Net asset value | $ | 16.96 | | $ | 57.32 | | $ | 11.34 |
| Par value | $ | 0.10 | | $ | 0.10 | | $ | 0.0001 |
| Investor C: | | | | | | | | |
| Net assets | $ | 107,149,811 | | $ | 142,607,366 | | $ | 146,160,611 |
| Shares outstanding, 100 million shares authorized | | 6,506,107 | | | 2,544,259 | | | 12,690,138 |
| Net asset value | $ | 16,47 | | $ | 56.05 | | $ | 11.52 |
| Par value | $ | 0.10 | | $ | 0.10 | | $ | 0.0001 |
| Class R: | | | | | | | | |
| Net assets | | — | | | — | | $ | 30,515,435 |
| Shares outstanding, 100 million shares authorized | | — | | | — | | | 2,491,790 |
| Net asset value | | — | | | — | | $ | 12.25 |
| Par value | | — | | | — | | $ | 0.0001 |
See Notes to Financial Statements.
| SEMI-ANNUAL REPORT | APRIL 30, 2012 | 17 |
Statements of Operations
| | | | | | | | | |
| Six Months Ended April 30, 2012 (Unaudited) | BlackRock
Emerging
Markets
Fund, Inc. | | BlackRock
Latin
America
Fund, Inc. | | BlackRock
International
Fund |
| Investment Income | | | | | | | | | |
| Dividends | $ | 5,607,725 | | $ | 13,502,887 | | | — | |
| Interest | | — | | | 89,480 | | | — | |
| Dividends — affiliated | | 9,152 | | | 4,193 | | | — | |
| Securities lending — affiliated | | — | | | 1,390 | | | — | |
| Other income | | 458 | | | — | | | — | |
| Foreign taxes withheld | | (492,753 | ) | | (1,319,993 | ) | | — | |
| Investment income allocated from the Portfolio: | | | | | | | | | |
| Dividends | | — | | | — | | $ | 7,780,993 | |
| Dividends — affiliated | | — | | | — | | | 21,738 | |
| Foreign taxes withheld | | — | | | — | | | (790,955 | ) |
| Expenses | | — | | | — | | | (3,273,987 | ) |
| Fees waived | | — | | | — | | | 10,999 | |
| Total income | | 5,124,582 | | | 12,277,957 | | | 3,748,788 | |
| | | | | | | | | | |
| Expenses | | | | | | | | | |
| Investment advisory | | 2,017,991 | | | 3,646,281 | | | — | |
| Administration | | — | | | — | | | 1,009,997 | |
| Service — Investor A | | 204,406 | | | 488,659 | | | 261,152 | |
| Service and distribution — Investor B | | 15,744 | | | 55,817 | | | 99,627 | |
| Service and distribution — Investor C | | 492,455 | | | 759,417 | | | 727,723 | |
| Service and distribution — Class R | | — | | | — | | | 78,537 | |
| Transfer agent — Institutional | | 69,743 | | | 138,758 | | | 369,571 | |
| Transfer agent — Investor A | | 142,857 | | | 275,715 | | | 295,333 | |
| Transfer agent — Investor B | | 5,560 | | | 13,093 | | | 76,685 | |
| Transfer agent — Investor C | | 117,161 | | | 151,990 | | | 396,006 | |
| Transfer agent — Class R | | — | | | — | | | 56,933 | |
| Custodian | | 112,804 | | | 194,056 | | | — | |
| Registration | | 48,589 | | | 54,963 | | | 70,899 | |
| Accounting services | | 54,728 | | | 96,689 | | | — | |
| Professional | | 43,403 | | | 53,364 | | | 49,062 | |
| Printing | | 20,356 | | | 29,854 | | | 44,608 | |
| Officer and Directors | | 5,556 | | | 8,081 | | | 306 | |
| Miscellaneous | | 11,941 | | | 14,980 | | | 5,093 | |
| Total expenses | | 3,363,294 | | | 5,981,717 | | | 3,541,532 | |
| Less fees waived by advisor | | (4,748 | ) | | (2,128 | ) | | — | |
| Less fees waived by administrator | | — | | | — | | | (649,707 | ) |
Less transfer agent fees waived and/or reimbursed by advisor — class
specific | | — | | | — | | | (508,385 | ) |
| Total expenses after fees waived | | 3,358,546 | | | 5,979,589 | | | 2,383,440 | |
| Net investment income | | 1,766,036 | | | 6,298,368 | | | 1,365,348 | |
| | | | | | | | | | |
| Realized and Unrealized Gain (Loss) | | | | | | | | | |
| Net realized gain (loss) from: | | | | | | | | | |
| Investments | | 631,1151 | | | 16,473,324 | 2 | | — | |
| Foreign currency transactions | | (179,848 | ) | | (72,000 | ) | | — | |
| Investments and foreign currency transactions allocated from the Portfolio | | — | | | — | | | (45,796,047 | ) |
| | | 451,267 | | | 16,401,324 | | | (45,796,047 | ) |
| Net change in unrealized appreciation/depreciation on: | | | | | | | | | |
| Investments | | 36,962,864 | | | (25,244,363 | )3 | | — | |
| Foreign currency transactions | | (14,057 | ) | | (103,995 | ) | | — | |
| Investments and foreign currency transactions allocated from the Portfolio | | — | | | — | | | 75,281,523 | |
| | | 36,948,807 | | | (25,348,358 | ) | | 75,281,523 | |
| Total realized and unrealized gain (loss) | | 37,400,074 | | | (8,947,034 | ) | | 29,485,476 | |
| Net Increase (Decrease) in Net Assets Resulting from Operations | $ | 39,166,110 | | $ | (2,648,666 | ) | $ | 30,850,824 | |
| 1 | | Including $38,250 foreign capital gain tax. |
| 2 | | Including $1,350 foreign capital gain tax. |
| 3 | | Including $327,322 deferred foreign capital gain tax. |
See Notes to Financial Statements.
| 18 | SEMI-ANNUAL REPORT | APRIL 30, 2012 |
Statements of Changes in Net Assets
| | | | | | | | | | | | | | | | | | | | |
| | BlackRock Emerging
Markets Fund, Inc. | | BlackRock Latin
America Fund, Inc. | | BlackRock
International Fund |
| Increase (Decrease) in Net Assets: | Six Months Ended
April 30,
2012
(Unaudited) | Year Ended
October 31,
2011 | | Six Months Ended
April 30,
2012
(Unaudited) | Year Ended
October 31,
2011 | | Six Months Ended
April 30,
2012
(Unaudited) | Year Ended
October 31,
2011 |
| Operations | |
| Net investment income (loss) | $ | 1,766,036 | | $ | 2,951,006 | | | $ | 6,298,368 | | $ | 13,911,676 | | | $ | 1,365,348 | | $ | (451,327 | ) |
| Net realized gain (loss) | | 451,267 | | | 24,796,096 | | | | 16,401,324 | | | 1,097,562 | | | | (45,796,047 | ) | | (54,806,188 | ) |
| Net change in unrealized appreciation/depreciation | | 36,948,807 | | | (61,612,802 | ) | | | (25,348,358 | ) | | (178,023,842 | ) | | | 75,281,523 | | | 34,396,421 | |
| Net increase (decrease) in net assets resulting from operations | | 39,166,110 | | | (33,865,700 | ) | | | (2,648,666 | ) | | (163,014,604 | ) | | | 30,850,824 | | | (20,861,094 | ) |
| | | | | | | | | | | | | | | | | | | | | |
| Dividends to Shareholders From | | | | | | | | | | | | | | | | | | | | |
| Net investment income: | | | | | | | | | | | | | | | | | | | | |
| Institutional | | (655,387 | ) | | (812,320 | ) | | | (1,452,356 | ) | | (3,667,145 | ) | | | (2,249,032 | ) | | — | |
| Investor A | | (376,139 | ) | | (1,088,882 | ) | | | (1,922,454 | ) | | (9,501,007 | ) | | | (841,498 | ) | | — | |
| Investor B | | — | | | — | | | | — | | | (131,790 | ) | | | (300,200 | ) | | — | |
| Investor C | | (70,513 | ) | | (99,233 | ) | | | — | | | (2,266,406 | ) | | | (140,910 | ) | | — | |
| Decrease in net assets resulting from dividends to shareholders | | (1,102,039 | ) | | (2,000,435 | ) | | | (3,374,810 | ) | | (15,566,348 | ) | | | (3,531,640 | ) | | — | |
| | | | | | | | | | | | | | | | | | | | | |
| Capital Share Transactions | | | | | | | | | | | | | | | | | | | | |
| Net increase (decrease) in net assets derived from capital share transactions | | (8,496,130 | ) | | 97,517,396 | | | | (54,229,261 | ) | | (121,555,893 | ) | | | (110,455,231 | ) | | 787,412,165 | |
| | | | | | | | | | | | | | | | | | | | | |
| Redemption Fee | | | | | | | | | | | | | | | | | | | | |
| Redemption fee | | — | | | 18,007 | | | | — | | | 37,221 | | | | — | | | 3,608 | |
| | | | | | | | | | | | | | | | | | | | | |
| Net Assets | | | | | | | | | | | | | | | | | | | | |
| Total increase (decrease) in net assets | | 29,567,941 | | | 61,669,268 | | | | (60,252,737 | ) | | (300,099,624 | ) | | | (83,136,047 | ) | | 766,554,679 | |
| Beginning of period | | 373,038,958 | | | 311,369,690 | | | | 753,954,727 | | | 1,054,054,351 | | | | 831,768,709 | | | 65,214,030 | |
| End of period | $ | 402,606,899 | | $ | 373,038,958 | | | $ | 693,701,990 | | $ | 753,954,727 | | | $ | 748,632,662 | | $ | 831,768,709 | |
| Undistributed (distributions in excess of) net investment income | $ | 1,735,783 | | $ | 1,071,786 | | | $ | 830,909 | | $ | (2,092,649 | ) | | $ | (3,217,910 | ) | $ | (1,051,618 | ) |
See Notes to Financial Statements.
| SEMI-ANNUAL REPORT | APRIL 30, 2012 | 19 |
| |
| Financial Highlights | BlackRock Emerging Markets Fund, Inc. |
| | | | | | | | | | | | | | | | | | | | | |
| | Institutional |
| | Six Months
Ended
April 30,
2012
| Year Ended October 31, | Period
July 1, 2008
to October 31,
| Year Ended June 30, |
| | (Unaudited) | 2011 | | 2010 | | 2009 | | 2008 | 2008 | | 20071 | |
| Per Share Operating Performance | | | | | | | | | | | | | | | | | | | | | |
| Net asset value, beginning of period | $ | 18.23 | | $ | 20.50 | | $ | 17.01 | | $ | 10.17 | | $ | 22.45 | | $ | 27.91 | | $ | 24.14 | |
| Net investment income2 | | 0.12 | | | 0.27 | | | 0.13 | | | 0.14 | | | 0.07 | | | 0.12 | | | 0.09 | |
| Net realized and unrealized gain (loss)3 | | 1.43 | | | (2.34 | ) | | 3.47 | | | 6.75 | | | (10.34 | ) | | 1.28 | | | 8.37 | |
| Net increase (decrease) from investment operations | | 1.55 | | | (2.07 | ) | | 3.60 | | | 6.89 | | | (10.27 | ) | | 1.40 | | | 8.46 | |
| Dividends and distributions from: | | | | | | | | | | | | | | | | | | | | | |
| Net investment income | | (0.09 | ) | | (0.20 | ) | | (0.11 | ) | | (0.05 | ) | | (0.01 | ) | | — | | | (0.28 | ) |
| Net realized gain | | — | | | — | | | — | | | — | | | (2.00 | ) | | (6.86 | ) | | (4.41 | ) |
| Total dividends and distributions | | (0.09 | ) | | (0.20 | ) | | (0.11 | ) | | (0.05 | ) | | (2.01 | ) | | (6.86 | ) | | (4.69 | ) |
| Net asset value, end of period | $ | 19.69 | | $ | 18.23 | | $ | 20.50 | | $ | 17.01 | | $ | 10.17 | | $ | 22.45 | | $ | 27.91 | |
| | | | | | | | | | | | | | | | | | | | | | |
| Total Investment Return4 | | | | | | | | | | | | | | | | | | | | | |
| Based on net asset value | | 8.63 | %5 | | (10.21 | )% | | 21.28 | % | | 68.14 | % | | (48.15 | )%5 | | 3.84 | % | | 41.99 | % |
| | | | | | | | | | | | | | | | | | | | | | |
| Ratios to Average Net Assets | | | | | | | | | | | | | | | | | | | | | |
| Total expenses | | 1.24 | %6 | | 1.28 | % | | 1.33 | % | | 1.48 | % | | 1.56 | %6 | | 1.40 | % | | 1.44 | % |
| Total expenses after fees waived | | 1.24 | %6 | | 1.28 | % | | 1.33 | % | | 1.48 | % | | 1.54 | %6 | | 1.37 | % | | 1.40 | % |
| Net investment income | | 1.27 | %6 | | 1.39 | % | | 0.71 | % | | 1.10 | % | | 1.31 | %6 | | 0.45 | % | | 0.36 | % |
| | | | | | | | | | | | | | | | | | | | | | |
| Supplemental Data | | | | | | | | | | | | | | | | | | | | | |
| Net assets, end of period (000) | $ | 117,616 | | $ | 127,181 | | $ | 123,007 | | $ | 86,173 | | $ | 42,803 | | $ | 80,399 | | $ | 86,385 | |
| Portfolio turnover | | 112 | % | | 138 | % | | 135 | % | | 191 | % | | 76 | % | | 163 | % | | 140 | % |
| |
| | Investor A |
| Per Share Operating Performance | | | | | | | | | | | | | | | | | | | | | |
| Net asset value, beginning of period | $ | 17.60 | | $ | 19.81 | | $ | 16.45 | | $ | 9.85 | | $ | 21.80 | | $ | 27.27 | | $ | 23.68 | |
| Net investment income2 | | 0.09 | | | 0.18 | | | 0.07 | | | 0.10 | | | 0.05 | | | 0.04 | | | 0.02 | |
| Net realized and unrealized gain (loss)3 | | 1.38 | | | (2.24 | ) | | 3.36 | | | 6.53 | | | (10.02 | ) | | 1.25 | | | 8.21 | |
| Net increase (decrease) from investment operations | | 1.47 | | | (2.06 | ) | | 3.43 | | | 6.63 | | | (9.97 | ) | | 1.29 | | | 8.23 | |
| Dividends and distributions from: | | | | | | | | | | | | | | | | | | | | | |
| Net investment income | | (0.04 | ) | | (0.15 | ) | | (0.07 | ) | | (0.03 | ) | | — | | | — | | | (0.23 | ) |
| Net realized gain | | — | | | — | | | — | | | — | | | (1.98 | ) | | (6.76 | ) | | (4.41 | ) |
| Total dividends and distributions | | (0.04 | ) | | (0.15 | ) | | (0.07 | ) | | (0.03 | ) | | (1.98 | ) | | (6.76 | ) | | (4.64 | ) |
| Net asset value, end of period | $ | 19.03 | | $ | 17.60 | | $ | 19.81 | | $ | 16.45 | | $ | 9.85 | | $ | 21.80 | | $ | 27.27 | |
| | | | | | | | | | | | | | | | | | | | | | |
| Total Investment Return4 | | | | | | | | | | | | | | | | | | | | | |
| Based on net asset value | | 8.41 | %5 | | (10.48 | )% | | 20.93 | % | | 67.59 | % | | (48.18 | )%5 | | 3.49 | % | | 41.66 | % |
| | | | | | | | | | | | | | | | | | | | | | |
| Ratios to Average Net Assets | | | | | | | | | | | | | | | | | | | | | |
| Total expenses | | 1.57 | %6 | | 1.59 | % | | 1.65 | % | | 1.83 | % | | 1.87 | %6 | | 1.68 | % | | 1.71 | % |
| Total expenses after fees waived | | 1.57 | %6 | | 1.59 | % | | 1.65 | % | | 1.83 | % | | 1.85 | %6 | | 1.65 | % | | 1.66 | % |
| Net investment income | | 0.98 | %6 | | 0.93 | % | | 0.43 | % | | 0.80 | % | | 0.98 | %6 | | 0.16 | % | | 0.10 | % |
| | | | | | | | | | | | | | | | | | | | | | |
| Supplemental Data | | | | | | | | | | | | | | | | | | | | | |
| Net assets, end of period (000) | $ | 174,820 | | $ | 155,017 | | $ | 144,976 | | $ | 111,850 | | $ | 67,614 | | $ | 145,781 | | $ | 151,309 | |
| Portfolio turnover. | | 112 | % | | 138 | % | | 135 | % | | 191 | % | | 76 | % | | 163 | % | | 140 | % |
| 1 | | Consolidated Financial Highlights. See Note 1 of the Notes to Financial Statements. |
| 2 | | Based on average shares outstanding. |
| 3 | | Includes a redemption fee, which is less than $0.01 per share. |
| 4 | | Where applicable, total investment returns exclude the effects of any sales charges and include the reinvestment of dividends and distributions. |
| 5 | | Aggregate total investment return. |
See Notes to Financial Statements.
| 20 | SEMI-ANNUAL REPORT | APRIL 30, 2012 |
| |
| Financial Highlights (concluded) | BlackRock Emerging Markets Fund, Inc. |
| | | | | | | | | | | | | | | | | | | | | |
| | Investor B |
| | Six Months
Ended
April 30,
2012
| Year Ended October 31, | | Period
July 1, 2008 to October 31, | Year Ended June 30, |
| | (Unaudited) | 2011 | | 2010 | | 2009 | | | 2008 | 2008 | | 20071 | |
| Per Share Operating Performance | | | | | | | | | | | | | | | | | | | | | |
| Net asset value, beginning of period | $ | 15.71 | | $ | 17.70 | | $ | 14.76 | | $ | 8.89 | | $ | 19.86 | | $ | 25.20 | | $ | 22.10 | |
| Net investment income (loss)2 | | 0.00 | 3 | | 0.00 | 3 | | (0.07 | ) | | (0.01 | ) | | 0.01 | | | (0.14 | ) | | (0.15 | ) |
| Net realized and unrealized gain (loss)4 | | 1.25 | | | (1.99 | ) | | 3.01 | | | 5.88 | | | (8.98 | ) | | 1.18 | | | 7.62 | |
| Net increase (decrease) from investment operations | | 1.25 | | | (1.99 | ) | | 2.94 | | | 5.87 | | | (8.97 | ) | | 1.04 | | | 7.47 | |
| Dividends and distributions from: | | | | | | | | | | | | | | | | | | | | | |
| Net investment income | | — | | | — | | | — | | | — | | | — | | | — | | | (0.13 | ) |
| Net realized gain | | — | | | — | | | — | | | — | | | (2.00 | ) | | (6.38 | ) | | (4.24 | ) |
| Total dividends and distributions | | — | | | — | | | — | | | — | | | (2.00 | ) | | (6.38 | ) | | (4.37 | ) |
| Net asset value, end of period | $ | 16.96 | | $ | 15.71 | | $ | 17.70 | | $ | 14.76 | | $ | 8.89 | | $ | 19.86 | | $ | 25.20 | |
| | | | | | | | | | | | | | | | | | | | | | |
| Total Investment Return5 | | | | | | | | | | | | | | | | | | | | | |
| Based on net asset value | | 7.96 | %6 | | (11.24 | )% | | 19.92 | % | | 66.03 | % | | (48.33 | )%6 | | 2.70 | % | | 40.59 | % |
| | | | | | | | | | | | | | | | | | | | | | |
| Ratios to Average Net Assets | | | | | | | | | | | | | | | | | | | | | |
| Total expenses | | 2.50 | %7 | | 2.45 | % | | 2.49 | % | | 2.71 | % | | 2.71 | %7 | | 2.47 | % | | 2.48 | % |
| Total expenses after fees waived | | 2.50 | %7 | | 2.45 | % | | 2.49 | % | | 2.71 | % | | 2.69 | %7 | | 2.44 | % | | 2.45 | % |
| Net investment income (loss) | | 0.01 | %7 | | (0.02 | )% | | (0.45 | )% | | (0.08 | )% | | 0.13 | %7 | | (0.60 | )% | | (0.68 | )% |
| | | | | | | | | | | | | | | | | | | | | | |
| Supplemental Data | | | | | | | | | | | | | | | | | | | | | |
| Net assets, end of period (000) | $ | 3,021 | | $ | 3,386 | | $ | 4,677 | | $ | 4,809 | | $ | 3,487 | | $ | 7,955 | | $ | 13,280 | |
| Portfolio turnover | | 112 | % | | 138 | % | | 135 | % | | 191 | % | | 76 | % | | 163 | % | | 140 | % |
| |
| | Investor C |
| Per Share Operating Performance | | | | | | | | | | | | | | | | | | | | | |
| Net asset value, beginning of period | $ | 15.26 | | $ | 17.23 | | $ | 14.38 | | $ | 8.65 | | $ | 19.42 | | $ | 24.91 | | $ | 22.01 | |
| Net investment income (loss)2 | | 0.01 | | | 0.05 | | | (0.06 | ) | | (0.01 | ) | | 0.01 | | | (0.14 | ) | | (0.14 | ) |
| Net realized and unrealized gain (loss)4 | | 1.21 | | | (1.98 | ) | | 2.92 | | | 5.74 | | | (8.89 | ) | | 1.18 | | | 7.53 | |
| Net increase (decrease) from investment operations | | 1.22 | | | (1.93 | ) | | 2.86 | | | 5.73 | | | (8.88 | ) | | 1.04 | | | 7.39 | |
| Dividends and distributions from: | | | | | | | | | | | | | | | | | | | | | |
| Net investment income | | (0.01 | ) | | (0.04 | ) | | (0.01 | ) | | — | | | — | | | — | | | (0.13 | ) |
| Net realized gain | | — | | | — | | | — | | | — | | | (1.89 | ) | | (6.53 | ) | | (4.36 | ) |
| Total dividends and distributions | | (0.01 | ) | | (0.04 | ) | | (0.01 | ) | | — | | | (1.89 | ) | | (6.53 | ) | | (4.49 | ) |
| Net asset value, end of period | $ | 16.47 | | $ | 15.26 | | $ | 17.23 | | $ | 14.38 | | $ | 8.65 | | $ | 19.42 | | $ | 24.91 | |
| | | | | | | | | | | | | | | | | | | | | | |
| Total Investment Return5 | | | | | | | | | | | | | | | | | | | | | |
| Based on net asset value | | 8.02 | %6 | | (11.21 | )% | | 19.90 | % | | 66.24 | % | | (48.35 | )%6 | | 2.70 | % | | 40.58 | % |
| | | | | | | | | | | | | | | | | | | | | | |
| Ratios to Average Net Assets | | | | | | | | | | | | | | | | | | | | | |
| Total expenses | | 2.39 | %7 | | 2.37 | % | | 2.49 | % | | 2.66 | % | | 2.69 | %7 | | 2.45 | % | | 2.47 | % |
| Total expenses after fees waived | | 2.39 | %7 | | 2.37 | % | | 2.49 | % | | 2.66 | % | | 2.67 | %7 | | 2.42 | % | | 2.43 | % |
| Net investment income (loss) | | 0.18 | %7 | | 0.30 | % | | (0.38 | )% | | (0.08 | )% | | 0.15 | %7 | | (0.61 | )% | | (0.66 | )% |
| | | | | | | | | | | | | | | | | | | | | | |
| Supplemental Data | | | | | | | | | | | | | | | | | | | | | |
| Net assets, end of period (000) | $ | 107,150 | | $ | 87,455 | | $ | 38,711 | | $ | 26,347 | | $ | 13,572 | | $ | 31,948 | | $ | 32,208 | |
| Portfolio turnover. | | 112 | % | | 138 | % | | 135 | % | | 191 | % | | 76 | % | | 163 | % | | 140 | % |
| 1 | | Consolidated Financial Highlights. See Note 1 of the Notes to Financial Statements. |
| 2 | | Based on average shares outstanding. |
| 3 | | Amount is less than $(0.01) per share. |
| 4 | | Includes a redemption fee, which is less than $0.01 per share. |
| 5 | | Where applicable, total investment returns exclude the effects of any sales charges and include the reinvestment of dividends and distributions. |
| 6 | | Aggregate total investment return. |
See Notes to Financial Statements.
| SEMI-ANNUAL REPORT | APRIL 30, 2012 | 21 |
| |
| Financial Highlights | BlackRock Latin America Fund, Inc. |
| | | | | | | | | | | | | | | | | | | | | |
| | Institutional |
Six Months
Ended
April 30,
2012
| Year Ended October 31, | Period
December 1,
2007
to October 31,
| Year Ended November 30, |
| (Unaudited) | 2011 | | 2010 | | 20091 | | 20081 | 20071 | | 20061 | |
| Per Share Operating Performance | | | | | | | | | | | | | | | | | | | | | |
| Net asset value, beginning of period | $ | 62.80 | | $ | 75.35 | | $ | 58.63 | | $ | 30.53 | | $ | 78.57 | | $ | 50.67 | | $ | 37.27 | |
| Net investment income2 | | 0.65 | | | 1.31 | | | 0.85 | | | 0.64 | | | 0.61 | | | 0.50 | | | 0.65 | |
| Net realized and unrealized gain (loss) | | (1.02 | ) | | (12.58 | ) | | 16.82 | | | 27.45 | | | (36.41 | ) | | 28.10 | | | 13.32 | |
| Net increase (decrease) from investment operations | | (0.37 | ) | | (11.27 | ) | | 17.67 | | | 28.09 | | | (35.80 | ) | | 28.60 | | | 13.97 | |
| Dividends and distributions from: | | | | | | | | | | | | | | | | | | | | | |
| Net investment income | | (0.30 | ) | | (1.28 | ) | | (0.97 | ) | | — | | | (0.80 | ) | | (0.72 | ) | | (0.58 | ) |
| Net realized gain | | — | | | — | | | — | | | — | | | (11.47 | ) | | — | | | — | |
| Total dividends and distributions | | (0.30 | ) | | (1.28 | ) | | (0.97 | ) | | — | | | (12.27 | ) | | (0.72 | ) | | (0.58 | ) |
| Redemption fee | | — | | | — | | | 0.02 | | | 0.01 | | | 0.03 | | | 0.02 | | | 0.01 | |
| Net asset value, end of period | $ | 62.13 | | $ | 62.80 | | $ | 75.35 | | $ | 58.63 | | $ | 30.53 | | $ | 78.57 | | $ | 50.67 | |
| | | | | | | | | | | | | | | | | | | | | | |
| Total Investment Return3 | | | | | | | | | | | | | | | | | | | | | |
| Based on net asset value | | (0.10 | )%4 | | (15.18 | )% | | 30.52 | % | | 92.04 | % | | (53.70 | )%4 | | 57.20 | %5 | | 38.12 | % |
| | | | | | | | | | | | | | | | | | | | | | |
| Ratios to Average Net Assets | | | | | | | | | | | | | | | | | | | | | |
| Total expenses | | 1.28 | %6 | | 1.26 | % | | 1.25 | % | | 1.35 | % | | 1.30 | %6 | | 1.26 | % | | 1.31 | % |
| Total expenses after fees waived | | 1.28 | %6 | | 1.26 | % | | 1.25 | % | | 1.35 | % | | 1.30 | %6 | | 1.26 | % | | 1.31 | % |
| Net investment income | | 2.09 | %6 | | 1.89 | % | | 1.31 | % | | 1.60 | % | | 1.04 | %6 | | 0.87 | % | | 1.49 | % |
| | | | | | | | | | | | | | | | | | | | | | |
| Supplemental Data | | | | | | | | | | | | | | | | | | | | | |
| Net assets, end of period (000) | $ | 165,814 | | $ | 175,554 | | $ | 200,980 | | $ | 114,101 | | $ | 58,877 | | $ | 128,094 | | $ | 191,085 | |
| Portfolio turnover | | 23 | % | | 33 | % | | 64 | % | | 50 | % | | 61 | % | | 72 | % | | 48 | % |
| |
| | Investor A |
| Per Share Operating Performance | | | | | | | | | | | | | | | | | | | | | |
| Net asset value, beginning of period | $ | 61.67 | | $ | 74.07 | | $ | 57.73 | | $ | 30.15 | | $ | 77.78 | | $ | 50.17 | | $ | 36.93 | |
| Net investment income2 | | 0.58 | | | 1.08 | | | 0.65 | | | 0.51 | | | 0.44 | | | 0.60 | | | 0.53 | |
| Net realized and unrealized gain (loss) | | (0.50 | ) | | (12.37 | ) | | 16.54 | | | 27.06 | | | (35.97 | ) | | 27.60 | | | 13.21 | |
| Net increase (decrease) from investment operations | | 0.08 | | | (11.29 | ) | | 17.19 | | | 27.57 | | | (35.53 | ) | | 28.20 | | | 13.74 | |
| Dividends and distributions from: | | | | | | | | | | | | | | | | | | | | | |
| Net investment income | | (0.54 | ) | | (1.11 | ) | | (0.88 | ) | | — | | | (0.66 | ) | | (0.61 | ) | | (0.51 | ) |
| Net realized gain | | — | | | — | | | — | | | — | | | (11.47 | ) | | — | | | — | |
| Total dividends and distributions | | (0.54 | ) | | (1.11 | ) | | (0.88 | ) | | — | | | (12.13 | ) | | (0.61 | ) | | (0.51 | ) |
| Redemption fee | | — | | | — | | | 0.03 | | | 0.01 | | | 0.03 | | | 0.02 | | | 0.01 | |
| Net asset value, end of period | $ | 61.21 | | $ | 61.67 | | $ | 74.07 | | $ | 57.73 | | $ | 30.15 | | $ | 77.78 | | $ | 50.17 | |
| | | | | | | | | | | | | | | | | | | | | | |
| Total Investment Return3 | | | | | | | | | | | | | | | | | | | | | |
| Based on net asset value | | (0.21 | )%4 | | (15.44 | )% | | 30.15 | % | | 91.48 | % | | (53.82 | )%4 | | 56.85 | %5 | | 37.77 | % |
| | | | | | | | | | | | | | | | | | | | | | |
| Ratios to Average Net Assets | | | | | | | | | | | | | | | | | | | | | |
| Total expenses | | 1.51 | %6 | | 1.55 | % | | 1.53 | % | | 1.63 | % | | 1.55 | %6 | | 1.51 | % | | 1.57 | % |
| Total expenses after fees waived | | 1.51 | %6 | | 1.55 | % | | 1.53 | % | | 1.63 | % | | 1.55 | %6 | | 1.51 | % | | 1.57 | % |
| Net investment income | | 1.86 | %6 | | 1.57 | % | | 1.00 | % | | 1.26 | % | | 0.76 | %6 | | 0.92 | % | | 1.23 | % |
| | | | | | | | | | | | | | | | | | | | | | |
| Supplemental Data | | | | | | | | | | | | | | | | | | | | | |
| Net assets, end of period (000) | $ | 375,096 | | $ | 405,903 | | $ | 616,664 | | $ | 475,611 | | $ | 176,711 | | $ | 433,844 | | $ | 191,187 | |
| Portfolio turnover. | | 23 | % | | 33 | % | | 64 | % | | 50 | % | | 61 | % | | 72 | % | | 48 | % |
| 1 | | Consolidated Financial Highlights. See Note 1 to the Notes to Financial Statements. |
| 2 | | Based on average shares outstanding. |
| 3 | | Where applicable, total investment returns exclude the effects of any sales charges and include the reinvestment of dividends and distributions. |
| 4 | | Aggregate total investment return. |
| 5 | | The investment advisor reimbursed the Fund in order to resolve a regulatory issue relating to an investment, which increased the return by 0.02%. |
See Notes to Financial Statements.
| 22 | SEMI-ANNUAL REPORT | APRIL 30, 2012 |
| |
| Financial Highlights (concluded) | BlackRock Latin America Fund, Inc. |
| | | | | | | | | | | | | | | | | | | | | |
| | Investor B |
| | Six Months
Ended
April 30,
2012
| Year Ended October 31, | Period
December 1,
2007
to October 31,
| Year Ended November 30, |
| | (Unaudited) | 2011 | | 2010 | | 20091 | | 20081 | 20071 | | 20061 | |
| Per Share Operating Performance | | | | | | | | | | | | | | | | | | | | | |
| Net asset value, beginning of period | $ | 57.68 | | $ | 69.31 | | $ | 54.12 | | $ | 28.54 | | $ | 74.38 | | $ | 48.00 | | $ | 35.33 | |
| Net investment income (loss)2 | | 0.29 | | | 0.46 | | | 0.12 | | | 0.15 | | | (0.04 | ) | | 0.05 | | | 0.20 | |
| Net realized and unrealized gain (loss) | | (0.65 | ) | | (11.59 | ) | | 15.50 | | | 25.42 | | | (34.09 | ) | | 26.52 | | | 12.68 | |
| Net increase (decrease) from investment operations | | (0.36 | ) | | (11.13 | ) | | 15.62 | | | 25.57 | | | (34.13 | ) | | 26.57 | | | 12.88 | |
| Dividends and distributions from: | | | | | | | | | | | | | | | | | | | | | |
| Net investment income | | — | | | (0.50 | ) | | (0.45 | ) | | — | | | (0.27 | ) | | (0.21 | ) | | (0.22 | ) |
| Net realized gain | | — | | | — | | | — | | | — | | | (11.47 | ) | | — | | | — | |
| Total dividends and distributions | | — | | | (0.50 | ) | | (0.45 | ) | | — | | | (11.74 | ) | | (0.21 | ) | | (0.22 | ) |
| Redemption fee | | — | | | — | | | 0.02 | | | 0.01 | | | 0.03 | | | 0.02 | | | 0.01 | |
| Net asset value, end of period | $ | 57.32 | | $ | 57.68 | | $ | 69.31 | | $ | 54.12 | | $ | 28.54 | | $ | 74.38 | | $ | 48.00 | |
| | | | | | | | | | | | | | | | | | | | | | |
| Total Investment Return3 | | | | | | | | | | | | | | | | | | | | | |
| Based on net asset value | | (0.62 | )%4 | | (16.16 | )% | | 29.06 | % | | 89.63 | % | | (54.18 | )%4 | | 55.61 | %5 | | 36.72 | % |
| | | | | | | | | | | | | | | | | | | | | | |
| Ratios to Average Net Assets | | | | | | | | | | | | | | | | | | | | | |
| Total expenses | | 2.36 | %6 | | 2.40 | % | | 2.37 | % | | 2.62 | % | | 2.39 | %6 | | 2.32 | % | | 2.34 | % |
| Total expenses after fees waived | | 2.36 | %6 | | 2.40 | % | | 2.37 | % | | 2.62 | % | | 2.39 | %6 | | 2.32 | % | | 2.34 | % |
| Net investment income (loss) | | 0.98 | %6 | | 0.71 | % | | 0.21 | % | | 0.40 | % | | (0.08 | )%6 | | 0.09 | % | | 0.48 | % |
| | | | | | | | | | | | | | | | | | | | | | |
| Supplemental Data | | | | | | | | | | | | | | | | | | | | | |
| Net assets, end of period (000) | $ | 10,184 | | $ | 11,886 | | $ | 18,660 | | $ | 18,695 | | $ | 11,794 | | $ | 31,268 | | $ | 13,911 | |
| Portfolio turnover. | | 23 | % | | 33 | % | | 64 | % | | 50 | % | | 61 | % | | 72 | % | | 48 | % |
| |
| | Investor C |
| Per Share Operating Performance | | | | | | | | | | | | | | | | | | | | | |
| Net asset value, beginning of period | $ | 56.39 | | $ | 67.92 | | $ | 53.17 | | $ | 28.01 | | $ | 73.28 | | $ | 47.40 | | $ | 35.07 | |
| Net investment income (loss)2 | | 0.29 | | | 0.51 | | | 0.14 | | | 0.17 | | | (0.01 | ) | | 0.11 | | | 0.17 | |
| Net realized and unrealized gain (loss) | | (0.63 | ) | | (11.35 | ) | | 15.21 | | | 24.98 | | | (33.46 | ) | | 26.08 | | | 12.56 | |
| Net increase (decrease) from investment operations | | (0.34 | ) | | (10.84 | ) | | 15.35 | | | 25.15 | | | (33.47 | ) | | 26.19 | | | 12.73 | |
| Dividends and distributions from: | | | | | | | | | | | | | | | | | | | | | |
| Net investment income | | — | | | (0.69 | ) | | (0.62 | ) | | — | | | (0.36 | ) | | (0.33 | ) | | (0.41 | ) |
| Net realized gain | | — | | | — | | | — | | | — | | | (11.47 | ) | | — | | | — | |
| Total dividends and distributions | | — | | | (0.69 | ) | | (0.62 | ) | | — | | | (11.83 | ) | | (0.33 | ) | | (0.41 | ) |
| Redemption fee | | — | | | — | | | 0.02 | | | 0.01 | | | 0.03 | | | 0.02 | | | 0.01 | |
| Net asset value, end of period | $ | 56.05 | | $ | 56.39 | | $ | 67.92 | | $ | 53.17 | | $ | 28.01 | | $ | 73.28 | | $ | 47.40 | |
| | | | | | | | | | | | | | | | | | | | | | |
| Total Investment Return3 | | | | | | | | | | | | | | | | | | | | | |
| Based on net asset value | | (0.60 | )%4 | | (16.10 | )% | | 29.15 | % | | 89.82 | % | | (54.16 | )%4 | | 55.62 | %5 | | 36.75 | % |
| | | | | | | | | | | | | | | | | | | | | | |
| Ratios to Average Net Assets | | | | | | | | | | | | | | | | | | | | | |
| Total expenses | | 2.32 | %6 | | 2.33 | % | | 2.32 | % | | 2.49 | % | | 2.35 | %6 | | 2.29 | % | | 2.34 | % |
| Total expenses after fees waived | | 2.32 | %6 | | 2.33 | % | | 2.32 | % | | 2.49 | % | | 2.35 | %6 | | 2.29 | % | | 2.34 | % |
| Net investment income (loss) | | 1.03 | %6 | | 0.80 | % | | 0.24 | % | | 0.46 | % | | (0.02 | )%6 | | 0.17 | % | | 0.42 | % |
| | | | | | | | | | | | | | | | | | | | | | |
| Supplemental Data | | | | | | | | | | | | | | | | | | | | | |
| Net assets, end of period (000) | $ | 142,607 | | $ | 160,612 | | $ | 217,750 | | $ | 151,046 | | $ | 72,714 | | $ | 164,742 | | $ | 50,609 | |
| Portfolio turnover. | | 23 | % | | 33 | % | | 64 | % | | 50 | % | | 61 | % | | 72 | % | | 48 | % |
| 1 | | Consolidated Financial Highlights. See Note 1 to the Notes to Financial Statements. |
| 2 | | Based on average shares outstanding. |
| 3 | | Where applicable, total investment returns exclude the effects of any sales charges and include the reinvestment of dividends and distributions. |
| 4 | | Aggregate total investment return. |
| 5 | | The investment advisor reimbursed the Fund in order to resolve a regulatory issue relating to an investment, which increased the return by 0.02%. |
See Notes to Financial Statements.
| SEMI-ANNUAL REPORT | APRIL 30, 2012 | 23 |
| |
| Financial Highlights | BlackRock International Fund |
| | | | | | | | | | | | | | | | | | | | | |
| | Institutional |
| | Six Months
Ended
April 30,
2012
| Year Ended October 31, | Period
June 1, 2008
to October 31,
| Year Ended May 31, |
| | (Unaudited) | 2011 | 2010 | 2009 | 2008 | 2008 | 2007 |
| Per Share Operating Performance | | | | | | | | | | | | | | | | | | | | | |
| Net asset value, beginning of period | $ | 12.18 | | $ | 12.86 | | $ | 10.91 | | $ | 8.20 | | $ | 15.01 | | $ | 14.18 | | $ | 12.38 | |
| Net investment income (loss)1 | | 0.05 | | | 0.02 | | | (0.01 | ) | | 0.09 | | | 0.04 | | | 0.19 | | | 0.12 | |
| Net realized and unrealized gain (loss)3 | | 0.36 | | | (0.70 | ) | | 1.96 | | | 2.62 | | | (6.68 | ) | | 0.73 | | | 1.87 | |
| Net increase (decrease) from investment operations | | 0.41 | | | (0.68 | ) | | 1.95 | | | 2.71 | | | (6.64 | ) | | 0.92 | | | 1.99 | |
| Dividends from net investment income | | (0.07 | ) | | — | | | — | | | — | | | (0.17 | ) | | (0.09 | ) | | (0.19 | ) |
| Net asset value, end of period | $ | 12.52 | | $ | 12.18 | | $ | 12.86 | | $ | 10.91 | | $ | 8.20 | | $ | 15.01 | | $ | 14.18 | |
| | | | | | | | | | | | | | | | | | | | | | |
| Total Investment Return4 | | | | | | | | | | | | | | | | | | | | | |
| Based on net asset value | | 3.45 | %5 | | (5.29 | )% | | 17.87 | % | | 33.05 | % | | (44.63 | )%5 | | 6.58 | % | | 16.29 | % |
| | | | | | | | | | | | | | | | | | | | | | |
| Ratios to Average Net Assets6 | | | | | | | | | | | | | | | | | | | | | |
| Total expenses | | 1.28%7,8 | 1.30 | %7 | | 1.77 | % | | 2.03 | % | | 1.70 | %8 | | 1.54 | % | | 1.65 | % |
| Total expenses after fees waived | | 0.98%7,8 | 1.06 | %7 | | 1.77 | % | | 2.03 | % | | 1.70 | %8 | | 1.54 | % | | 1.65 | % |
| Net investment income (loss) | | 0.77%7,8 | 0.19 | %7 | | (0.13 | )% | | 0.99 | % | | 0.75 | %8 | | 1.32 | % | | 0.97 | % |
| | | | | | | | | | | | | | | | | | | | |
| Supplemental Data | | | | | | | | | | | | | | | | | | | | | |
| Net assets, end of period (000) | $ | 336,463 | | $ | 416,002 | | $ | 2,645 | | $ | 5,133 | | $ | 5,161 | | $ | 10,904 | | $ | 12,133 | |
| Portfolio turnover of the Portfolio | | 57 | % | | 156 | % | | 154 | % | | 178 | % | | 78 | % | | 153 | % | | 151 | % |
| |
| | Investor A |
| Per Share Operating Performance | | | | | | | | | | | | | | | | | | | | | |
| Net asset value, beginning of period | $ | 11.94 | | $ | 12.66 | | $ | 10.76 | | $ | 8.12 | | $ | 14.85 | | $ | 14.04 | | $ | 12.26 | |
| Net investment income (loss)1 | | 0.02 | | | 0.002 | | | (0.06 | ) | | 0.05 | | | 0.02 | | | 0.17 | | | 0.10 | |
| Net realized and unrealized gain (loss)3 | | 0.37 | | | (0.72 | ) | | 1.96 | | | 2.59 | | | (6.62 | ) | | 0.70 | | | 1.84 | |
| Net increase (decrease) from investment operations | | 0.39 | | | (0.72 | ) | | 1.90 | | | 2.64 | | | (6.60 | ) | | 0.87 | | | 1.94 | |
| Dividends from net investment income | | (0.05 | ) | | — | | | — | | | — | | | (0.13 | ) | | (0.06 | ) | | (0.16 | ) |
| Net asset value, end of period | $ | 12.28 | | $ | 11.94 | | $ | 12.66 | | $ | 10.76 | | $ | 8.12 | | $ | 14.85 | | $ | 14.04 | |
| | | | | | | | | | | | | | | | | | | | | | |
| Total Investment Return4 | | | | | | | | | | | | | | | | | | | | | |
| Based on net asset value | | 3.32 | %5 | | (5.69 | )% | | 17.66 | % | | 32.51 | % | | (44.72 | )%5 | | 6.25 | % | | 16.02 | % |
| | | | | | | | | | | | | | | | | | | | | | |
| Ratios to Average Net Assets6 | | | | | | | | | | | | | | | | | | | | | |
| Total expenses | | 1.64%7,8 | 1.80 | %7 | | 2.08 | % | | 2.40 | % | | 2.02 | %8 | | 1.84 | % | | 1.91 | % |
| Total expenses after fees waived | | 1.36%7,8 | 1.67 | %7 | | 1.67 | % | | 2.40 | % | | 2.02 | %8 | | 1.84 | % | | 1.91 | % |
| Net investment income (loss) | | 0.38%7,8 | 0.01 | %7 | | (0.51 | )% | | 0.54 | % | | 0.50 | %8 | | 1.18 | % | | 0.77 | % |
| | | | | | | | | | | | | | | | | | | | |
| Supplemental Data | | | | | | | | | | | | | | | | | | | | | |
| Net assets, end of period (000) | $ | 217,125 | | $ | 208,885 | | $ | 37,035 | | $ | 28,949 | | $ | 22,537 | | $ | 42,052 | | $ | 35,750 | |
| Portfolio turnover of the Portfolio | | 57 | % | | 156 | % | | 154 | % | | 178 | % | | 78 | % | | 153 | % | | 151 | % |
| 1 | | Based on average shares outstanding. |
| 2 | | Amount is less than $0.01 per share. |
| 3 | | Includes a redemption fee, which is less than $0.01 per share. |
| 4 | | Where applicable, total investment returns exclude the effects of any sales charges and include the reinvestment of dividends and distributions. |
| 5 | | Aggregate total investment return. |
| 6 | | Includes the Fund’s share of the Portfolio’s allocated expenses and/or net investment income. |
| 7 | | Includes the Fund’s share of the Portfolio’s allocated fees waived of less than 0.01%. |
See Notes to Financial Statements.
| 24 | SEMI-ANNUAL REPORT | APRIL 30, 2012 |
| |
| Financial Highlights (continued) | BlackRock International Fund |
| | | | | | | | | | | | | | | | | | | | | | |
| | Investor B |
| | Six Months
Ended
April 30,
2012
| Year Ended October 31, | Period
June 1, 2008
to October 31,
| Year Ended May 31, |
| | (Unaudited) | 2011 | 2010 | 2009 | 2008 | 2008 | 2007 |
| Per Share Operating Performance | | | | | | | | | | | | | | | | | | | | | | |
| Net asset value, beginning of period | $ | 11.04 | | $ | | 11.84 | | $ | 10.18 | | $ | 7.77 | | $ | 14.13 | | $ | 13.44 | | $ | 11.75 | |
| Net investment loss1 | | (0.05 | ) | | | (0.12 | ) | | (0.17 | ) | | (0.04 | ) | | (0.03 | ) | | (0.01 | ) | | (0.02 | ) |
| Net realized and unrealized gain (loss)2 | | 0.35 | | | | (0.68 | ) | | 1.83 | | | 2.45 | | | (6.33 | ) | | 0.70 | | | 1.78 | |
| Net increase (decrease) from investment operations | | 0.30 | | | | (0.80 | ) | | 1.66 | | | 2.41 | | | (6.36 | ) | | 0.69 | | | 1.76 | |
| Dividends from net investment income | | — | | | | — | | | — | | | — | | | — | | | — | | | (0.07 | ) |
| Net asset value, end of period | $ | 11.34 | | $ | | 11.04 | | $ | 11.84 | | $ | 10.18 | | $ | 7.77 | | $ | 14.13 | | $ | 13.44 | |
| | | | | | | | | | | | | | | | | | | | | | | |
| Total Investment Return3 | | | | | | | | | | | | | | | | | | | | | | |
| Based on net asset value | | 2.72 | %4 | | | (6.76 | )% | | 16.31 | % | | 31.02 | % | | (45.01 | )%4 | | 5.13 | % | | 15.02 | % |
| | | | | | | | | | | | | | | | | | | | | | | |
| Ratios to Average Net Assets5 | | | | | | | | | | | | | | | | | | | | | | |
| Total expenses | | 2.87 | %6,7 | | | 3.08 | %6 | | 3.21 | % | | 3.61 | % | | 3.17 | %7 | | 2.90 | % | | 2.76 | % |
| Total expenses after fees waived | | 2.42 | %6,7 | | | 2.99 | %6 | | 3.21 | % | | 3.61 | % | | 3.17 | %7 | | 2.90 | % | | 2.76 | % |
| Net investment loss | | (0.79 | )%6,7 | | | (1.01 | )%6 | | (1.65 | )% | | (0.54 | )% | | (0.70 | )%7 | | (0.11 | )% | | (0.20 | )% |
| | | | | | | | | | | | | | | | | | | | | |
| Supplemental Data | | | | | | | | | | | | | | | | | | | | | | |
| Net assets, end of period (000) | $ | 18,369 | | $ | | 22,320 | | $ | 11,898 | | $ | 20,342 | | $ | 20,878 | | $ | 44,254 | | $ | 56,428 | |
| Portfolio turnover of the Portfolio | | 57 | % | | | 156 | % | | 154 | % | | 178 | % | | 78 | % | | 153 | % | | 151 | % |
| |
| | Investor C |
| Per Share Operating Performance | | | | | | | | | | | | | | | | | | | | | | |
| Net asset value, beginning of period | $ | 11.23 | | $ | | 12.00 | | $ | 10.28 | | $ | 7.81 | | $ | 14.19 | | $ | 13.45 | | $ | 11.75 | |
| Net investment income (loss)1 | | (0.04 | ) | | | (0.11 | ) | | (0.13 | ) | | (0.01 | ) | | (0.01 | ) | | 0.04 | | | (0.01 | ) |
| Net realized and unrealized gain (loss)2 | | 0.35 | | | | (0.66 | ) | | 1.85 | | | 2.48 | | | (6.35 | ) | | 0.70 | | | 1.78 | |
| Net increase (decrease) from investment operations | | 0.31 | | | | (0.77 | ) | | 1.72 | | | 2.47 | | | (6.36 | ) | | 0.74 | | | 1.77 | |
| Dividends from net investment income | | (0.02 | ) | | | — | | | — | | | — | | | (0.02 | ) | | — | | | (0.07 | ) |
| Net asset value, end of period | $ | 11.52 | | $ | | 11.23 | | $ | 12.00 | | $ | 10.28 | | $ | 7.81 | | $ | 14.19 | | $ | 13.45 | |
| | | | | | | | | | | | | | | | | | | | | | | |
| Total Investment Return3 | | | | | | | | | | | | | | | | | | | | | | |
| Based on net asset value | | 2.81 | %4 | | | (6.42 | )% | | 16.73 | % | | 31.63 | % | | (44.87 | )%4 | | 5.50 | % | | 15.09 | % |
| | | | | | | | | | | | | | | | | | | | | | | |
| Ratios to Average Net Assets5 | | | | | | | | | | | | | | | | | | | | | | |
| Total expenses | | 2.65 | %6,7 | | | 2.58 | %6 | | 2.80 | % | | 3.09 | % | | 2.74 | %7 | | 2.57 | % | | 2.68 | % |
| Total expenses after fees waived | | 2.39 | %6,7 | | | 2.53 | %6 | | 2.80 | % | | 3.09 | % | | 2.74 | %7 | | 2.57 | % | | 2.68 | % |
| Net investment income (loss) | | (0.68 | )%6,7 | | | (0.99 | )%6 | | (1.23 | )% | | (0.07 | )% | | (0.25 | )%7 | | 0.32 | % | | (0.09 | )% |
| | | | | | | | | | | | | | | | | | | | | |
| Supplemental Data | | | | | | | | | | | | | | | | | | | | | | |
| Net assets, end of period (000) | $ | 146,161 | | $ | | 151,594 | | $ | 13,636 | | $ | 12,470 | | $ | 10,543 | | $ | 20,892 | | $ | 22,133 | |
| Portfolio turnover of the Portfolio | | 57 | % | | | 156 | % | | 154 | % | | 178 | % | | 78 | % | | 153 | % | | 151 | % |
| 1 | | Based on average shares outstanding. |
| 2 | | Includes a redemption fee, which is less than $0.01 per share. |
| 3 | | Where applicable, total investment returns exclude the effects of any sales charges and include the reinvestment of dividends and distributions. |
| 4 | | Aggregate total investment return. |
| 5 | | Includes the Fund’s share of the Portfolio’s allocated expenses and/or net investment income. |
| 6 | | Includes the Fund’s share of the Portfolio’s allocated fees waived of less than 0.01%. |
See Notes to Financial Statements.
| SEMI-ANNUAL REPORT | APRIL 30, 2012 | 25 |
| |
| Financial Highlights (concluded) | BlackRock International Fund |
| | | | | | |
| | Class R |
| | Six Months
Ended
April 30,
2012
(Unaudited) | Period
August 15, 20111
to October 31,
2011 |
| Per Share Operating Performance | | | | | | |
| Net asset value, beginning of period | $ | 11.93 | | $ | 12.11 | |
| Net investment loss2 | | (0.01 | ) | | (0.01 | ) |
| Net realized and unrealized | | 0.38 | | | (0.17 | ) |
| Net increase (decrease) from investment operations | | 0.37 | | | (0.18 | ) |
| Dividends from net investment income | | (0.05 | ) | | — | |
| Net asset value, end of period | $ | 12.25 | | $ | 11.93 | |
| |
| Total Investment Return3 | | | | | | |
| Based on net asset value | | 3.18 | %4 | | (1.49 | )%4 |
| |
| Ratios to Average Net Assets5 | | | | | | |
| Total expenses | | 1.97 | %6,7 | | 1.91 | %6,7 |
| Total expenses after fees waived | | 1.69 | %6,7 | | 1.71 | %6,7 |
| Net investment loss | | (0.02 | )%6,7 | | (0.57 | )%6,7 |
| |
| Supplemental Data | | | | | | |
| Net assets, end of period (000) | $ | 30,515 | | $ | 32,968 | |
| Portfolio turnover of the Portfolio | | 57 | % | | 156 | % |
| 1 | | Commencement of operations. |
| 2 | | Based on average shares outstanding. |
| 3 | | Where applicable, total investment returns exclude the effects of any sales charges and include the reinvestment of dividends and distributions. |
| 4 | | Aggregate total investment return. |
| 5 | | Includes the Fund’s share of the Portfolio’s allocated expenses and/or net investment income. |
| 6 | | Includes the Fund’s share of the Portfolio’s allocated fees waived of less than 0.01%. |
See Notes to Financial Statements.
| 26 | SEMI-ANNUAL REPORT | APRIL 30, 2012 |
Notes to Financial Statements (Unaudited)
1. Organization and Significant Accounting Policies:
BlackRock Emerging Markets Fund, Inc. (formerly known as BlackRock Global Emerging Markets Fund, Inc.) (“Emerging Markets”), BlackRock Latin America Fund, Inc. (“Latin America”) and BlackRock International Fund (“International”), a series of BlackRock Series, Inc. (the “Corporation”) (collectively the “Funds” or individually the “Fund”), are registered under the Investment Company Act of 1940, as amended (the “1940 Act”), as open-end management investment companies. International is classified as a diversified. Emerging Markets and Latin America are classified as non-diversified. Emerging Markets, Latin America and the Corporation are each organized as a Maryland corporation. The Funds’ financial statements are prepared in conformity with accounting principles generally accepted in the United States of America (“US GAAP”), which may require management to make estimates and assumptions that affect the reported amounts and disclosures in the financial statements. Actual results could differ from those estimates. Each Fund offers multiple classes of shares. Institutional Shares are sold without a sales charge and only to certain eligible investors. Investor A Shares are generally sold with a front-end sales charge. Investor B and Investor C Shares may be subject to a CDSC. Class R Shares are sold without a sales charge and only to certain retirement and other similar plans. All classes of shares have identical voting, dividend, liquidation and other rights and the same terms and conditions, except that Investor A, Investor B, Investor C and Class R Shares bear certain expenses related to the shareholder servicing of such shares, and Investor B, Investor C, and Class R Shares also bear certain expenses related to the distribution of such shares. Investor B Shares automatically convert to Investor A Shares after approximately eight years. Investor B Shares are only available through exchanges, dividend reinvestment by existing shareholders or for purchase by certain qualified employee benefit plans. Each class has exclusive voting rights with respect to matters relating to its shareholder servicing and distribution expenditures (except that Investor B shareholders may vote on material changes to the Investor A distribution plan).
International seeks to achieve its investment objective by investing all of its assets in BlackRock Master International Portfolio (the “Portfolio”), a series of BlackRock Master LLC (the “Master LLC”), which has the same investment objective and strategies as International. The value of the Fund’s investment in the Portfolio reflects International’s proportionate interest in the net assets of the Portfolio. The performance of International is directly affected by the performance of the Portfolio. The financial statements of the Portfolio, including the Schedule of Investments, are included elsewhere in this report and should be read in conjunction with the Fund’s financial statements. The percentage of the Portfolio owned by the Fund at April 30, 2012 was 100%.
The Company’s Board of Directors approved a change in the name of Emerging Markets from “BlackRock Global Emerging Markets Fund, Inc.” to BlackRock Emerging Markets Fund, Inc”. This change was effective February 28, 2012.
The following is a summary of significant accounting policies followed by the Funds:
Valuation: US GAAP defines fair value as the price the Funds would receive to sell an asset or pay to transfer a liability in an orderly transaction between market participants at the measurement date. The Funds fair value their financial instruments at market value using independent dealers or pricing services under policies approved by the Board. Equity investments traded on a recognized securities exchange or the NASDAQ Global Market System (“NASDAQ”) are valued at the last reported sale price that day or the NASDAQ official closing price, if applicable. For equity investments traded on more than one exchange, the last reported sale price on the exchange where the stock is primarily traded is used. Equity investments traded on a recognized exchange for which there were no sales on that day are valued at the last available bid (long positions) or ask (short positions) price. If no bid or ask price is available, the prior day’s price will be used, unless it is determined that such prior day’s price no longer reflects the fair value of the security.
The Funds value their investments in BlackRock Liquidity Series, LLC Money Market Series (the “Money Market Series”) at fair value, which is ordinarily based upon their pro rata ownership in the underlying fund’s net assets. The Money Market Series seeks current income consistent with maintaining liquidity and preserving capital. Although the Money Market Series is not registered under the 1940 Act, its investments will follow the parameters of investments by a money market fund that is subject to Rule 2a-7 under the 1940 Act. Each Fund may withdraw up to 25% of its investment daily, although the manager of the Money Market Series, in its sole discretion, may permit an investor to withdraw more than 25% on any one day.
Securities and other assets and liabilities denominated in foreign currencies are translated into US dollars using exchange rates determined as of the close of business on the New York Stock Exchange (“NYSE”). Foreign currency exchange contracts are valued at the mean between the bid and ask prices and are determined as of the close of business on the NYSE. Interpolated values are derived when the settlement date of the contract is an interim date for which quotations are not available.
In the event that application of these methods of valuation results in a price for an investment, which is deemed not to be representative of the market value of such investment or if a price is not available, the investment will be valued in accordance with a policy approved by the Board as reflecting fair value (“Fair Value Assets”). When determining the price for Fair Value Assets, the investment advisor and/or the sub-advisor seeks to determine the price that each Fund might reasonably expect to receive from the current sale of that asset in an arm’s-length transaction. Fair value determinations shall be based upon all available factors that the investment advisor and/or sub-advisor deems relevant. The pricing of all Fair Value Assets is subsequently reported to the Board or a committee thereof.
| SEMI-ANNUAL REPORT | APRIL 30, 2012 | 27 |
Notes to Financial Statements (continued)
Generally, trading in foreign instruments is substantially completed each day at various times prior to the close of business on the NYSE. Occasionally, events affecting the values of such instruments may occur between the foreign market close and the close of business on the NYSE that may not be reflected in the computation of each Fund’s net assets. If events (for example, a company announcement, market volatility or a natural disaster) occur during such periods that are expected to materially affect the value of such instruments, those instruments may be Fair Value Assets and be valued at their fair value, as determined in good faith by the investment advisor using a pricing service and/or policies approved by the Board. Each business day, the Funds use a pricing service to assist with the valuation of certain foreign exchange-traded equity securities and foreign exchange-traded and OTC options (the “Systematic Fair Value Price”). Using current market factors, the Systematic Fair Value Price is designed to value such foreign securities and foreign options at fair value as of the close of business on the NYSE, which follows the close of the local markets.
International records its investment in the Portfolio at fair value based on the Fund’s proportionate interest in the net assets of the Portfolio. Valuation of securities held by the Portfolio, including categorization of fair value measurements, is discussed in Note 1 of the Portfolio’s Notes to Financial Statements, which are included elsewhere in this report.
Foreign Currency Transactions: The Funds’ books and records are maintained in US dollars. Purchases and sales of investment securities are recorded at the rates of exchange prevailing on the respective date of such transactions. Generally, when the US dollar rises in value against a foreign currency, the Fund’s investments denominated in that currency will lose value because that currency is worth fewer US dollars; the opposite effect occurs if the US dollar falls in relative value.
The Funds do not isolate their portion of the results of operations arising as a result of changes in the foreign exchange rates from the changes in the market prices of investments held or sold for financial reporting purposes. Accordingly, the effects of changes in foreign currency exchange rates on investments are not segregated on the Statements of Operations from the effects of changes in market prices of those investments but are included as a component of net realized and unrealized gain (loss) from investments. The Funds report realized currency gains (losses) on foreign currency related transactions as components of net realized gain (loss) for financial reporting purposes, whereas such components are treated as ordinary income for federal income tax purposes.
Participation Notes: Emerging Markets and Latin America may invest in participation notes (“P-Notes”). P-Notes are promissory notes issued by banks or broker-dealers that are designed to offer the Funds a return measured by the change in the value of the underlying security or basket of securities (the “underlying security”) while not holding the actual shares of the underlying security. P-Notes are typically used to allow the Funds to gain exposure to securities traded in foreign markets that may be restricted due to country-specific regulations. When the P-Note matures, the issuer will pay to, or receive from, the Funds the difference between the value of the underlying security at the time of the purchase and the underlying security’s value at maturity of the P-Notes. Income received on P-Notes is recorded by the Funds as dividend income in the Statements of Operations. An investment in a P-Note involves additional risks beyond the risks normally associated with a direct investment in the underlying security. While the holder of a P-Note is entitled to receive from the bank or broker-dealer any dividends paid by the underlying security, the holder is not entitled to the same rights (e.g., voting rights) as a direct owner of the underlying security. P-Notes are considered general unsecured contractual obligations of the bank or broker-dealer. The Funds must rely on the credit-worthiness of the issuer for their investment returns on the P-Notes and have no rights against the issuer of the underlying security. A P-Note may be more volatile and less liquid than other investments held by the Funds since the P-Note generally is dependent on the liquidity in the local trading market for the underlying security.
Segregation and Collateralization: In cases in which the 1940 Act and the interpretive positions of the Securities and Exchange Commission (“SEC”) require that the Funds either deliver collateral or segregate assets in connection with certain investments (e.g., foreign currency exchange contracts), the Funds will, consistent with SEC rules and/or certain interpretive letters issued by the SEC, segregate collateral or designate on their books and records cash or liquid securities having a market value at least equal to the amount that would otherwise be required to be physically segregated. Furthermore, based on requirements and agreements with certain exchanges and third party broker-dealers, each party to such transactions has requirements to deliver/deposit securities as collateral for certain investments.
Investment Transactions and Investment Income: For financial reporting purposes, investment transactions are recorded on the dates the transactions are entered into (the trade dates). For financial reporting purposes, contributions to and withdrawals from the Portfolio are accounted on a trade date basis. International records daily its proportionate share of the Portfolio’s income, expenses and realized and unrealized gains and losses. Realized gains and losses on investment transactions are determined on the identified cost basis. Dividend income is recorded on the ex-dividend dates. Dividends from foreign securities where the ex-dividend date may have passed are subsequently recorded when the Fund is informed of the ex-dividend date. Under the applicable foreign tax laws, a withholding tax at various rates may be imposed on capital gains, dividends and interest. Upon notification from issuers, some of the dividend income received from a real estate investment trust may be redesignated as a reduction of cost of the related investment and/or realized gain. Interest income, including amortization and accretion of premiums and discounts on debt securities, is recognized on the accrual basis. Income and realized and unrealized gains and losses are allocated daily to each class based on its relative net assets. Consent fees are compensation for agreeing to changes in the terms of debt instruments and are included in interest income in the Statements of Operations.
| 28 | SEMI-ANNUAL REPORT | APRIL 30, 2012 |
Notes to Financial Statements (continued)
Dividends and Distributions: Dividends and distributions paid by the Funds are recorded on the ex-dividend dates. The amount and timing of dividends and distributions are determined in accordance with federal income tax regulations, which may differ from US GAAP.
Securities Lending: Latin America may lend securities to approved borrowers, such as banks, brokers and other financial institutions. The borrower pledges cash, securities issued or guaranteed by the US government or irrevocable letters of credit issued by a bank as collateral, which will be maintained at all times in an amount equal to at least 100% of the current market value of the loaned securities. The market value of the loaned securities is determined at the close of business of Latin America and any additional required collateral is delivered to Latin America on the next business day. Securities lending income, as disclosed in the Statements of Operations, represents the income earned from the investment of the cash collateral, net of rebates paid to, or fees paid by, borrowers and less the fees paid to the securities lending agent. During the term of the loan, Latin America earns dividend or interest income on the securities loaned but does not receive interest income on the securities received as collateral. Loans of securities are terminable at any time and the borrower, after notice, is required to return borrowed securities within the standard time period for settlement of securities transactions. In the event that the borrower defaults on its obligation to return borrowed securities because of insolvency or for any other reason, Latin America could experience delays and costs in gaining access to the collateral. Latin America also could suffer a loss if the value of an investment purchased with cash collateral falls below the market value of loaned securities or if the value of an investment purchased with cash collateral falls below the value of the original cash collateral received. During the six months ended April 30, 2012, Latin America accepted only cash collateral in connection with securities loaned.
Income Taxes: It is each Fund’s policy to comply with the requirements of the Internal Revenue Code of 1986, as amended, applicable to regulated investment companies and to distribute substantially all of its taxable income to its shareholders. Therefore, no federal income tax provision is required.
Each Fund files US federal and various state and local tax returns. No income tax returns are currently under examination. The statute of limitations on each Fund’s US federal tax returns remains open for the three years ended October 31, 2011 and the period ended October 31, 2008. The statutes of limitations on each Fund’s state and local tax returns may remain open for an additional year depending upon the jurisdiction. Management does not believe there are any uncertain tax positions that require recognition of a tax liability.
Basis of Consolidation:
Emerging Markets
The Fund’s accompanying consolidated Financial Highlights for the year ended June 30, 2007 include the accounts of Inversiones en Marcado Accionario de Valores Chile Limitada, a wholly owned subsidiary of the Fund. The subsidiary was created for regulatory purposes to invest in Chilean securities. Intercompany accounts and transactions have been eliminated. During the year ended June 30, 2007, Inversiones en Marcado Accionario de Valores Chile Limitada was dissolved.
Latin America
The Fund’s accompanying consolidated Financial Highlights for each of the two years ended November 30, 2007 and for the two periods ended October 31, 2009 includes the accounts of Merrill Lynch Latin America Fund Chile Ltd., a wholly owned subsidiary of the Fund. The subsidiary was created for regulatory purposes to invest in Chilean securities. Intercompany accounts and transactions have been eliminated. During the year ended October 31, 2009, Merrill Lynch Latin America Fund Chile Ltd. was dissolved.
Recent Accounting Standards: In May 2011, the Financial Accounting Standards Board (the “FASB”) issued amended guidance to improve disclosure about fair value measurements, which will require the following disclosures for fair value measurements categorized as Level 3: quantitative information about the unobservable inputs and assumptions used in the fair value measurement, a description of the valuation policies and procedures and a narrative description of the sensitivity of the fair value measurement to changes in unobservable inputs and the interrelationships between those unobservable inputs. In addition, the amounts and reasons for all transfers in and out of Level 1 and Level 2 will be required to be disclosed as well as disclosure of the level in the fair value hierarchy of assets and liabilities not recorded at fair value but where fair value is disclosed. The amended guidance is effective for financial statements for fiscal years beginning after December 15, 2011, and interim periods within those fiscal years. Management is evaluating the impact of this guidance on the Fund’s financial statement disclosures.
In December 2011, the FASB issued guidance that will expand current disclosure requirements on the offsetting of certain assets and liabilities. The new disclosures will be required for investments and derivative financial instruments subject to master netting or similar agreements, which are eligible for offset in the Statements of Assets and Liabilities and will require an entity to disclose both gross and net information about such investments and transactions in the financial statements. The guidance is effective for financial statements with fiscal years beginning on or after January 1, 2013, and interim periods within those fiscal years. Management is evaluating the impact of this guidance on each Fund’s financial statement disclosures.
| SEMI-ANNUAL REPORT | APRIL 30, 2012 | 29 |
Notes to Financial Statements (continued)
Other: Expenses directly related to a Fund or its classes are charged to that Fund or class. Other operating expenses shared by several funds are pro rated among those funds on the basis of relative net assets or other appropriate methods. Expenses directly related to the Funds and other shared expenses prorated to the Funds are allocated daily to each class based on its relative net assets or other appropriate methods.
The Funds have an arrangement with the custodian whereby fees may be reduced by credits earned on uninvested cash balances, which, if applicable, are shown as fees paid indirectly in the Statements of Operations. The custodian imposes fees on overdrawn cash balances, which can be offset by accumulated credits earned or may result in additional custody charges.
2. Derivative Financial Instruments:
The Funds engage in various portfolio investment strategies using derivative contracts both to increase the returns of the Funds and/or economically hedge, or protect their exposure to certain risks such as foreign currency exchange rate risk.
Losses may arise if the value of the contract decreases due to an unfavorable change in the market rates or values of the underlying instrument or if the counterparty does not perform under the contract.
The Funds’ maximum risk of loss from counterparty credit risk on OTC derivatives is generally the aggregate unrealized gain netted against any collateral pledged by/posted to the counterparty. Counterparty risk related to exchange-traded financial futures contracts and options is deemed to be minimal due to the protection against defaults provided by the exchange on which these contracts trade.
The Funds may mitigate counterparty risk by procuring collateral and through netting provisions included within an International Swaps and Derivatives Association, Inc. master agreement (“ISDA Master Agreement”) implemented between a Fund and each of its respective counterparties. An ISDA Master Agreement allows each Fund to offset with each separate counterparty certain derivative financial instrument’s payables and/or receivables with collateral held. The amount of collateral moved to/from applicable counterparties is generally based upon minimum transfer amounts of up to $500,000. To the extent amounts due to the Funds from their counterparties are not fully collateralized contractually or otherwise, the Funds bear the risk of loss from counterparty non-performance. See Note 1 “Segregation and Collateralization” for information with respect to collateral practices. In addition, each Fund manages counterparty risk by entering into agreements only with counterparties that it believes have the financial resources to honor their obligations and by monitoring the financial stability of those counterparties.
Certain ISDA Master Agreements allow counterparties to OTC derivatives to terminate derivative contracts prior to maturity in the event a Fund’s net assets decline by a stated percentage or the Fund fails to meet the terms of its ISDA Master Agreements, which would cause the Funds to accelerate payment of any net liability owed to the counterparty.
Foreign Currency Exchange Contracts: The Funds enter into foreign currency exchange contracts as an economic hedge against either specific transactions or portfolio instruments or to obtain exposure to foreign currencies (foreign currency exchange rate risk). A foreign currency exchange contract is an agreement between two parties to buy and sell a currency at a set exchange rate on a future date. Foreign currency exchange contracts, when used by the Fund, help to manage the overall exposure to the currencies in which some of the investments held by the Fund are denominated. The contract is marked-to-market daily and the change in market value is recorded by the Fund as an unrealized gain or loss. When the contract is closed, the Funds record a realized gain or loss equal to the difference between the value at the time it was opened and the value at the time it was closed. The use of foreign currency exchange contracts involves the risk that the value of a foreign currency exchange contract changes unfavorably due to movements in the value of the referenced foreign currencies and the risk that a counterparty to the contract does not perform its obligations under the agreement.
Derivative Financial Instruments Categorized by Risk Exposure:
| | | | | | | | | | | |
| Fair Values of Derivative Financial Instruments as of April 30, 2012 |
| Asset Derivatives | | | | | | |
| | | Emerging
Markets | | Latin America |
| | Statements of Assets
and Liabilities
Location | Value |
Foreign currency
exchange contracts | Unrealized appreciation
on foreign currency
exchange contracts | $ | 30,817 | | $ | 10,980 | |
| | Liability Derivatives | |
|
| | | Emerging
Markets | | Latin America |
| | Statements of Assets
and Liabilities
Location | Value |
Foreign currency
exchange contracts | Unrealized depreciation
on foreign currency
exchange contracts | | — | | $ | 18,010 | |
The Effect of Derivative Financial Instruments
in the Statements of Operations
Six Months Ended April 30, 2012 |
|
|
| | | Net Realized Gain (Loss) From |
| | | Emerging Markets | Latin America |
Foreign currency exchange contracts:
Foreign currency exchange contracts | $ | (882,129 | ) | | $ | (241,343 | ) |
| |
| | | Net Change in Unrealized
Appreciation/Depreciation on |
| | | Emerging Markets | Latin America |
Foreign currency exchange contracts:
Foreign currency exchange contracts | $ | 124,567 | | | $ | 28,495 | |
| 30 | SEMI-ANNUAL REPORT | APRIL 30, 2012 |
Notes to Financial Statements (continued)
For the six months ended April 30, 2012, the average quarterly balances of outstanding derivative financial instruments were as follows:
| | | | | |
| | Emerging Markets | | Latin America |
| Foreign currency exchange contracts: | | | | | |
| Average number of contracts — US | | | | | |
| dollars purchased | | 4 | | | 6 |
| Average number of contracts — US | | | | | |
| dollars sold | | 1 | | | 5 |
| Average US dollar amounts purchased | $ | 2,830,859 | | $ | 1,551,815 |
| Average US dollar amounts sold | $ | 1,739,475 | | $ | 5,098,912 |
3. Investment Advisory Agreement and Other Transactions with Affiliates:
As of April 30, 2012, the PNC Financial Services Group, Inc. (“PNC”) and Barclays Bank PLC (“Barclays”) are the largest stockholders of BlackRock, Inc. (“BlackRock”). Due to the ownership structure, PNC is an affiliate for 1940 Act purposes, but Barclays is not.
Emerging Markets and Latin America each entered into an Investment Advisory Agreement with BlackRock Advisors, LLC (the “Manager”), the Funds’ investment advisor, an indirect, wholly owned subsidiary of BlackRock, to provide investment advisory and administration services. The Manager is responsible for the management of each Fund’s portfolio and provides the necessary personnel, facilities, equipment and certain other services necessary to the operations of each Fund. For such services, Emerging Markets and Latin America each pay the Manager a monthly fee based on a percentage of each Funds average daily net assets at the following annual rates:
| | |
| Average Daily Net Assets | Investment
Advisory Fee |
| First $1 billion | 1.00 | % |
| $1 billion — $3 billion | 0.94 | % |
| $3 billion — $5 billion | 0.90 | % |
| $5 billion — $10 billion | 0.87 | % |
| Greater than $10 billion | 0.85 | % |
The Corporation, on behalf of International, entered into an Administration Agreement with BlackRock Advisors, LLC (the “Administrator”), an indirect, wholly owned subsidiary of BlackRock, to provide administrative services (other than investment advice and related portfolio activities). For such services, the Fund pays the Administrator a monthly fee at an annual rate of 0.25% of the average daily value of the Fund’s net assets. The Fund does not pay an investment advisory fee or investment management fee.
The Manager voluntarily agreed to waive its investment advisory fees by the amount of investment advisory fees Emerging Markets and Latin America pay to the Manager indirectly through their investment in affiliated money market funds. However, the Manager does not waive its investment advisory fees by the amount of investment advisory fees paid through each Fund’s investment in other affiliated investment companies, if any. This amount is shown as, or included in, fees waived by advisor in the Statements of Operations. For the six months ended April 30, 2012, the amounts waived were as follows:
| | |
| Emerging Markets | $ | 4,748 |
| Latin America | $ | 2,128 |
The Administrator contractually agreed to waive and/or reimburse fees or expenses, excluding interest expense, dividend expense, acquired fund fees and expenses and certain other fund expenses, in order to limit expenses of International. The Administrator has agreed not to reduce or discontinue this contractual waiver or reimbursement prior to March 1, 2014 unless approved by the Board, including a majority of the Independent Trustees. These amounts are included in fees waived by advisor, and shown as administration fees in the Statements of Operations. For the six months ended April 30, 2012, the Administrator waived $649,707 of administration fees for International, which is shown as fees waived by administrator. In addition, the Administrator waived the following amounts for International, which are included in transfer agent fees waived and/or reimbursed — class specific in the Statement of Operations:
| | |
| | International |
| |
| Institutional | $ | 282,897 |
| Investor A | $ | 111,340 |
| Investor B | $ | 27,986 |
| Investor C | $ | 67,784 |
| Class R | $ | 18,378 |
The expense limitations as a percentage of average daily net assets are as follows:
| | |
| | International |
| |
| Institutional | 1.00 | % |
| Investor A | 1.38 | % |
| Investor B | 2.44 | % |
| Investor C | 2.42 | % |
| Class R | 1.70 | % |
The Manager entered into a sub-advisory agreement with BlackRock Investment Management, LLC (“BIM”) and BlackRock International Limited (“BIL”), with respect to Emerging Markets and Latin America. BIM and BIL are both affiliates of the Manager. The Manager pays each sub-advisor for services they provide, a monthly fee that is a percentage of the investment advisory fees paid by the Funds to the Manager.
For the six months ended April 30, 2012, Emerging Markets and Latin America reimbursed the Manager for certain accounting services, which is included in accounting services in the Statements of Operations. The reimbursements were as follows:
| | |
| Emerging Markets | $ | 4,363 |
| Latin America | $ | 7,086 |
The Funds received an exemptive order from the SEC permitting them, among other things, to pay an affiliated securities lending agent a fee based on a share of the income derived from the securities lending activities and have retained BIM as the securities lending agent. BIM may, on behalf of the Funds, invest cash collateral received by the Funds for such loans, among other things, in a private investment company managed by the Manager or in registered money market funds advised by the Manager or its affiliates. As securities lending agent, BIM is responsible for all transaction fees and all other operational costs relating to securities lending activities, other than extraordinary expenses. BIM does not receive any fees for managing the cash collateral. The market value of securities on loan and the value of the related collateral, if applicable, are shown in the
| SEMI-ANNUAL REPORT | APRIL 30, 2012 | 31 |
Notes to Financial Statements (continued)
Statements of Assets and Liabilities as securities loaned at value and collateral on securities loaned at value, respectively. The cash collateral invested by BIM is disclosed in the Schedules of Investments, if any. Securities lending income is equal to the total of income earned from the reinvestment of cash collateral, net of rebates paid to, or fees paid by, borrowers of securities. The Funds retain 65% of securities lending income and pay a fee to BIM equal to 35% of such income. The share of income earned by the Funds on the reinvestment of cash collateral is shown as securities lending — affiliated in the Statements of Operations. For the six months ended April 30, 2012, BIM received $739 in securities lending agent fees related to securities lending activities for the Funds.
Emerging Markets, Latin America and the Corporation (on behalf of International) entered into a Distribution Agreement and Distribution Plan with BlackRock Investments, LLC (“BRIL”), an affiliate of the Manager. Pursuant to the Distribution Plan and in accordance with Rule 12b-1 under the 1940 Act, each Fund pays BRIL ongoing service and distribution fees. The fees are accrued daily and paid monthly at annual rates based upon the average daily net assets of the shares of each Fund as follows:
| | | | |
| | Service
Fee | Distribution
Fee |
| Investor A | 0.25 | % | — | |
| Investor B | 0.25 | % | 0.75 | % |
| Investor C | 0.25 | % | 0.75 | % |
| Class R | 0.25 | % | 0.25 | % |
Pursuant to sub-agreements with BRIL, broker-dealers and BRIL provide shareholder servicing and distribution services to each Fund. The ongoing service and/or distribution fee compensates BRIL and each broker-dealer for providing shareholder servicing and/or distribution related services to Investor A, Investor B, Investor C and Class R shareholders.
For the six months ended April 30, 2012, affiliates earned underwriting discounts, direct commissions and dealer concessions on sales of the Funds’ Investor A Shares as follows:
| | |
| | Investor A |
| Emerging Markets | $ | 18,987 |
| Latin America | $ | 27,287 |
| International | $ | 14,402 |
For the six months ended April 30, 2012, affiliates received CDSCs as follows:
| | Investor A | | Investor B | | Investor C |
| Emerging Markets | $ | 1,799 | | $ | 871 | | $ | 17,073 |
| Latin America | $ | 3,173 | | $ | 16,990 | | $ | 14,837 |
| International | $ | 230 | | $ | 1,124 | | $ | 6,175 |
The Manager maintains a call center, which is responsible for providing certain shareholder services to the Funds, such as responding to shareholder inquiries and processing transactions based upon instructions from shareholders with respect to the subscription and redemption of Fund shares. For the six months ended April 30, 2012, each Fund reimbursed the Manager the following amounts for costs incurred in running the call center, which are included in transfer agent — class specific in the Statements of Operations:
| | Emerging
Markets | | Latin
America | | International |
| Institutional | $ | 894 | | $ | 2,442 | | $ | 42 |
| Investor A | $ | 3,396 | | $ | 15,948 | | $ | 402 |
| Investor B | $ | 186 | | $ | 792 | | $ | 60 |
| Investor C | $ | 1,050 | | $ | 5,376 | | $ | 222 |
Certain officers and/or directors of Emerging Markets and Latin America and the Corporation are officers and/or directors of BlackRock or its affiliates. The Funds reimburse the Manager for compensation paid to the Chief Compliance Officer of Emerging Markets, Latin America and the Corporation.
4. Investments:
Purchases and sales of investments, excluding short-term securities, for the six months ended April 30, 2012, were as follows:
| | | | |
| | Purchases | Sales |
| Emerging Markets | $ | 435,614,843 | $ | 438,619,368 |
| Latin America | $ | 163,060,778 | $ | 216,238,570 |
5. Income Tax Information:
As of October 31, 2011, the Funds had capital loss carryforwards available to offset future realized capital gains through the indicated expiration dates as follows:
| Expires October 31, | Emerging
Markets | | Latin
America | | International |
| 2015 | | — | | | — | | $ | 82,929,238 |
| 2016 | | — | | $ | 2,935,861 | | | 138,870,260 |
| 2017 | $ | 11,598,286 | | | 64,351,106 | | | 15,346,411 |
| 2019 | | — | | | — | | | 42,091,334 |
| Total | $ | 11,598,286 | | $ | 67,286,967 | | $ | 279,237,243 |
Under the Regulated Investment Company Modernization Act of 2010, capital losses incurred by the Funds after October 31, 2011 will not be subject to expiration. In addition, any such losses must be utilized prior to the losses incurred in pre-enactment taxable years.
As of April 30, 2012, gross unrealized appreciation and gross unrealized depreciation based on cost for federal income tax purposes were as follows:
| | | | | | |
| | Emerging
Markets | Latin
America |
| Tax cost | $ | 376,954,905 | | $ | 561,597,369 | |
| Gross unrealized appreciation | $ | 48,657,484 | | $ | 202,857,344 | |
| Gross unrealized depreciation | | (17,475,498 | ) | | (63,211,436 | ) |
| Net unrealized appreciation | $ | 31,181,986 | | $ | 139,645,908 | |
| 32 | SEMI-ANNUAL REPORT | APRIL 30, 2012 |
Notes to Financial Statements (continued)
6. Borrowings:
Emerging Markets and Latin America, along with certain other funds managed by the Manager and its affiliates, is a party to a $500 million credit agreement with a group of lenders. The Funds may borrow under the credit agreement to fund shareholder redemptions. Effective November 2010 to November 2011, the credit agreement had the following terms: a commitment fee of 0.08% per annum based on the Fund’s pro rata share of the unused portion of the credit agreement and interest at a rate equal to the higher of (a) the one-month LIBOR plus 1.00% per annum or (b) the Fed Funds rate plus 1.00% per annum on amounts borrowed. In addition, the Funds paid administration and arrangement fees which were allocated to the Funds based on its net assets as of October 31, 2010. The credit agreement, which expired in November 2011, was renewed until November 2012. Effective November 2011 to November 2012, the credit agreement has the following terms: a commitment fee of 0.065% per annum based on the Fund’s pro rata share of the unused portion of the credit agreement and interest at a rate equal to the higher of (a) the one-month LIBOR plus 0.80% per annum or (b) the Fed Funds rate plus 0.80% per annum on amounts borrowed. In addition, the Funds paid administration and arrangement fees which were allocated to the Funds based on its net assets as of October 31, 2011. The Funds did not borrow under the credit agreement during the period ended April 30, 2012.
7. Concentration, Market and Credit Risk:
In the normal course of business, Emerging Markets and Latin America invest in securities and enter into transactions where risks exist due to fluctuations in the market (market risk) or failure of the issuer of a security to meet all its obligations (issuer credit risk). The value of securities held by the Funds may decline in response to certain events, including those directly involving the issuers whose securities are owned by the Funds; conditions affecting the general economy; overall market changes; local, regional or global political, social or economic instability; and currency and interest rate and price fluctuations. Similar to issuer credit risk, the Funds may be exposed to counterparty credit risk, or the risk that an entity with which the Funds have unsettled or open transactions may fail to or be unable to perform on its commitments. The Funds manage counterparty credit risk by entering into transactions only with counterparties that they believe have the financial resources to honor their obligations and by monitoring the financial stability of those counterparties. Financial assets, which potentially expose the Funds to market, issuer and counterparty credit risks, consist principally of financial instruments and receivables due from counterparties. The extent of the Funds’ exposure to market, issuer and counterparty credit risks with respect to these financial assets is generally approximated by their value recorded in the Funds’ Statements of Assets and Liabilities, less any collateral held by the Funds.
Emerging Markets and Latin America invest a substantial amount of their assets in issuers located in a single country or a limited number of countries. When the Funds concentrate their investments in this manner, it assumes the risk that economic, political and social conditions in those countries may have a significant impact on their investment performance. Foreign issuers may not be subject to the same uniform accounting, auditing and financial reporting standards and practices as used in the US. Foreign securities markets may also be less liquid, more volatile, and less subject to governmental supervision not typically associated with investing in US securities. Please see the Schedules of Investments for concentrations in specific countries.
As of April 30, 2012, Emerging Markets and Latin America had the following industry classifications:
| | |
| Emerging Markets | | |
| Industry | Percent of
Long-Term
Investments |
| Commercial Banks | 12 | % |
| Oil, Gas & Consumable Fuels | 14 | |
| Semiconductors & Semiconductor Equipment | 9 | |
| Wireless Communication Services | 5 | |
| Other* | 51 | |
| |
| Latin America | | |
| | Percent of
Long-Term
Investments |
| |
| Industry |
| Commercial Banks | 17 | % |
| Metals & Mining | 14 | |
| Oil, Gas & Consumable Fuels | 13 | |
| Wireless Telecommunication Services | 10 | |
| Beverages | 10 | |
| Other1 | 36 | |
| 1 | All other industries held were each less than 5% of long-term investments. |
| SEMI-ANNUAL REPORT | APRIL 30, 2012 | 33 |
Notes to Financial Statements (continued)
8. Capital Share Transactions:
Transactions in capital shares for each class were as follows:
| | | | | | | | | | | |
| | Six Months Ended April 30, 2012 | | Year Ended October 31, 2011 |
| Emerging Markets | Shares | | Amount | | Shares | | Amount |
| Institutional | | | | | | | | | | | |
| Shares sold | 6,235,345 | | $ | 116,130,826 | | | 5,497,082 | | $ | 102,063,289 | |
| Shares issued to shareholders in reinvestment of dividends and distributions | 22,113 | | | 364,405 | | | 23,825 | | | 480,297 | |
| Shares redeemed | (7,260,083 | ) | | (142,837,965 | ) | | (4,543,770 | ) | | (88,682,170 | ) |
| Net increase (decrease) | (1,002,625 | ) | $ | (26,342,734 | ) | | 977,137 | | $ | 13,861,416 | |
| | | | | | | | | | | | |
| Investor A | | | | | | | | | | | |
| Shares sold and automatic conversion of shares | 1,534,710 | | $ | 28,099,687 | | | 3,156,813 | | $ | 59,847,429 | |
| Shares issued to shareholders in reinvestment of dividends and distributions | 21,269 | | | 339,176 | | | 49,417 | | | 964,052 | |
| Shares redeemed | (1,180,494 | ) | | (21,655,299 | ) | | (1,716,034 | ) | | (32,633,778 | ) |
| Net increase | 375,485 | | $ | 6,783,564 | | | 1,490,196 | | $ | 28,177,703 | |
| | | | | | | | | | | | |
| Investor B | | | | | | | | | | | |
| Shares sold | 17,960 | | $ | 291,493 | | | 60,572 | | $ | 1,024,275 | |
| Shares issued to shareholders in reinvestment of dividends and distributions | — | | | — | | | — | | | — | |
| Shares redeemed and automatic conversion of shares | (55,331 | ) | | (891,838 | ) | | (109,206 | ) | | (1,862,304 | ) |
| Net decrease | (37,371 | ) | $ | (600,345 | ) | | (48,634 | ) | $ | (838,029 | ) |
| | | | | | | | | | | | |
| Investor C | | | | | | | | | | | |
| Shares sold | 1,700,008 | | $ | 26,278,411 | | | 4,402,492 | | $ | 71,319,189 | |
| Shares issued to shareholders in reinvestment of dividends and distributions | 4,758 | | | 65,842 | | | 5,197 | | | 88,496 | |
| Shares redeemed | (929,605 | ) | | (14,680,868 | ) | | (923,653 | ) | | (15,073,372 | ) |
| Net increase | 775,161 | | $ | 11,663,385 | | | 3,484,036 | | $ | 56,334,313 | |
| Total Net Increase (Decrease) | 110,650 | | $ | (8,496,130 | ) | | 5,902,735 | | $ | 97,535,403 | |
| |
| | Six Months Ended April 30, 2012 | | Year Ended October 31, 2011 |
| Latin America | Shares | | Amount | | Shares | | Amount |
| Institutional | | | | | | | | | | | |
| Shares sold | 708,469 | | $ | 45,474,284 | | | 1,670,457 | | $ | 117,802,736 | |
| Shares issued to shareholders in reinvestment of dividends and distributions | 22,927 | | | 1,275,571 | | | 44,878 | | | 3,253,058 | |
| Shares redeemed | (858,305 | ) | | (54,965,274 | ) | | (1,586,874 | ) | | (107,250,014 | ) |
| Net increase (decrease) | (126,909 | ) | $ | (8,215,419 | ) | | 128,461 | | $ | 13,805,780 | |
| | | | | | | | | | | | |
| Investor A | | | | | | | | | | | |
| Shares sold and automatic conversion of shares | 713,820 | | $ | 45,006,510 | | | 2,177,418 | | $ | 154,252,124 | |
| Shares issued to shareholders in reinvestment of dividends and distributions | 31,367 | | | 1,721,015 | | | 120,575 | | | 8,606,522 | |
| Shares redeemed | (1,198,988 | ) | | (74,067,160 | ) | | (4,041,650 | ) | | (274,668,646 | ) |
| Net decrease | (453,801 | ) | $ | (27,339,635 | ) | | (1,743,657 | ) | $ | (111,810,000 | ) |
| | | | | | | | | | | | |
| Investor B | | | | | | | | | | | |
| Shares sold | 1,442 | | $ | 82,592 | | | 5,364 | | $ | 363,466 | |
| Shares issued to shareholders in reinvestment of dividends and distributions | — | | | — | | | 1,807 | | | 121,495 | |
| Shares redeemed and automatic conversion of shares | (29,823 | ) | | (1,738,054 | ) | | (70,342 | ) | | (4,455,658 | ) |
| Net decrease | (28,381 | ) | $ | (1,655,462 | ) | | (63,171 | ) | $ | (3,970,697 | ) |
| | | | | | | | | | | | |
| Investor C | | | | | | | | | | | |
| Shares sold | 131,752 | | $ | 7,609,959 | | | 760,525 | | $ | 49,713,690 | |
| Shares issued to shareholders in reinvestment of dividends and distributions | — | | | — | | | 31,842 | | | 2,092,221 | |
| Shares redeemed | (435,556 | ) | | (24,628,704 | ) | | (1,150,343 | ) | | (71,349,666 | ) |
| Net decrease | (303,804 | ) | $ | (17,018,745 | ) | | (357,976 | ) | $ | (19,543,755 | ) |
| Total Net Decrease | (912,895 | ) | $ | (54,229,261 | ) | | (2,036,343 | ) | $ | (121,518,672 | ) |
| 34 | SEMI-ANNUAL REPORT | APRIL 30, 2012 |
Notes to Financial Statements (concluded)
| | | | | | | | | | | |
| | Six Months Ended April 30, 2012 | | Year Ended October 31, 2011 |
| International | Shares | | Amount | | Shares | | Amount |
| Institutional | | | | | | | | | | | |
| Shares sold | 11,717,663 | | $ | 142,063,505 | | | 5,228,089 | | $ | 66,016,412 | |
| Shares issued to shareholders in reinvestment of dividends and distributions | 197,135 | | | 2,138,075 | | | — | | | — | |
| Shares issued resulting from reorganization | — | | | — | | | 30,557,228 | | | 400,973,426 | |
| Shares redeemed | (19,196,584 | ) | | (240,061,739 | ) | | (1,842,601 | ) | | (22,082,697 | ) |
| Net increase (decrease) | (7,281,786 | ) | $ | (95,860,159 | ) | | 33,942,716 | | $ | 444,907,141 | |
| | | | | | | | | | | | |
| Investor A | | | | | | | | | | | |
| Shares sold | 2,490,498 | | $ | 29,410,622 | | | 13,049,751 | | $ | 155,947,579 | |
| Shares issued to shareholders in reinvestment of dividends and distributions | 70,047 | | | 746,663 | | | — | | | — | |
| Shares issued resulting from reorganization | — | | | — | | | 7,682,699 | | | 110,164,043 | |
| Shares redeemed | (2,366,982 | ) | | (27,910,854 | ) | | (6,168,344 | ) | | (70,902,006 | ) |
| Net increase | 193,563 | | $ | 2,246,431 | | | 14,564,106 | | $ | 195,209,616 | |
| | | | | | | | | | | | |
| Investor B | | | | | | | | | | | |
| Shares sold | 154,788 | | $ | 1,693,393 | | | 266,854 | | $ | 3,201,168 | |
| Shares issued resulting from reorganization | — | | | — | | | 1,498,587 | | | 10,047,654 | |
| Shares redeemed | (557,021 | ) | | (6,167,444 | ) | | (748,576 | ) | | (8,854,797 | ) |
| Net increase (decrease) | (402,233 | ) | $ | (4,474,051 | ) | | 1,016,865 | | $ | 4,394,025 | |
| | | | | | | | | | | | |
| Investor C | | | | | | | | | | | |
| Shares sold | 1,591,297 | | $ | 17,690,513 | | | 3,160,740 | | $ | 38,639,458 | |
| Shares issued to shareholders in reinvestment of dividends and distributions | 25,809 | | | 258,854 | | | — | | | — | |
| Shares issued resulting from reorganization | — | | | — | | | 10,552,529 | | | 97,256,083 | |
| Shares redeemed | (2,420,483 | ) | | (27,057,950 | ) | | (1,355,896 | ) | | (15,266,144 | ) |
| Net increase (decrease) | (803,377 | ) | $ | (9,108,583 | ) | | 12,357,373 | | $ | 120,629,397 | |
| | | | | | | | | | | | |
| Class R | | | | | | | | | | | |
| Shares sold | 530,163 | | $ | 6,221,301 | | | 168,897 | | $ | 1,984,962 | |
| Shares issued to shareholders in reinvestment of dividends and distributions | 13,244 | | | 140,910 | | | — | | | — | |
| Shares issued resulting from reorganization | — | | | — | | | 2,819,735 | | | 22,960,775 | |
| Shares redeemed | (814,068 | ) | | (9,621,080 | ) | | (226,181 | ) | | (2,670,143 | ) |
| Net increase | (270,661 | ) | $ | (3,258,869 | ) | | 2,762,451 | | $ | 22,275,594 | |
| Total Net Increase (Decrease) | (8,564,494 | ) | $ | (110,455,231 | ) | | 5,902,735 | | $ | 97,535,403 | |
9. Subsequent Events:
Management has evaluated the impact of all subsequent events on each Fund through the date the financial statements were issued and has determined that there were no subsequent events requiring adjustment or additional disclosure in the financial statements.
| SEMI-ANNUAL REPORT | APRIL 30, 2012 | 35 |
| |
| Portfolio Information | BlackRock Master International Portfolio |
As of April 30, 2012
| | |
| Ten Largest Holdings | Percent of
Long-Term
Investments |
| Imperial Tobacco Group Plc | 5 | % |
| Sanofi — Aventis | 5 | |
| Novartis AG, Registered Shares | 4 | |
| Reckitt Benckiser Group Plc | 4 | |
| Vodaphone Group Plc | 4 | |
| BG Group Plc | 4 | |
| Anheuser-Busch InBev NV | 3 | |
| Activision Blizzard, Inc. | 3 | |
| Rogers Communications, Inc., Class B | 3 | |
| HSBC Holdings Plc | 3 | |
| | |
| Geographic Allocation | Percent of
Long-Term
Investments |
| United Kingdom | 24 | % |
| Japan | 13 | |
| United States | 12 | |
| Switzerland | 11 | |
| France | 10 | |
| Germany | 6 | |
| China | 5 | |
| Belgium | 3 | |
| Canada | 3 | |
| Sweden | 2 | |
| India | 2 | |
| Brazil | 2 | |
| Israel | 1 | |
| South Korea | 1 | |
| Netherlands | 1 | |
| Thailand | 1 | |
| Czech Republic | 1 | |
| Singapore | 1 | |
| Russia | 1 | |
| 36 | SEMI-ANNUAL REPORT | APRIL 30, 2012 |
| Schedule of Investments April 30, 2012 (Unaudited) | BlackRock Master International Portfolio |
| | (Percentages shown are based on Net Assets) |
| | | | |
| Common Stocks | Shares | | | Value |
| Belgium — 3.3% | | | | |
| Anheuser-Busch InBev NV | 338,357 | | $ | 24,387,244 |
| Brazil — 1.4% | | | | |
| OGX Petroleo e Gas Participacoes SA (a) | 1,523,800 | | | 10,576,226 |
| Canada — 3.0% | | | | |
| Rogers Communications, Inc., Class B | 595,926 | | | 22,242,032 |
| China — 5.2% | | | | |
| China Construction Bank, Class H | 13,528,000 | | | 10,498,320 |
| China Life Insurance Co. Ltd., Class H (a) | 3,886,000 | | | 10,346,654 |
| Dongfeng Motor Group Co. Ltd., Class H | 4,918,079 | | | 9,619,101 |
| Zoomlion Heavy Industry Science | | | | |
| and Technology Co. Ltd., Class H | 5,533,660 | | | 8,209,859 |
| | | | | 38,673,934 |
| Czech Republic — 1.0% | | | | |
| Komercni Banka AS | 42,390 | | | 7,787,817 |
| France — 9.1% | | | | |
| BNP Paribas SA | 215,087 | | | 8,680,788 |
| Sanofi-Aventis | 439,597 | | | 33,577,212 |
| Schneider Electric SA (a) | 270,476 | | | 16,660,199 |
| Vallourec SA | 159,409 | | | 9,599,881 |
| | | | | 68,518,080 |
| Germany — 5.8% | | | | |
| Daimler AG, Registered Shares | 208,094 | | | 11,514,165 |
| Infineon Technologies AG | 1,262,445 | | | 12,580,940 |
| Linde AG | 113,802 | | | 19,478,712 |
| | | | | 43,573,817 |
| India — 1.6% | | | | |
| ICICI Bank Ltd. — ADR | 351,500 | | | 11,912,335 |
| Israel — 1.2% | | | | |
| Teva Pharmaceutical Industries Ltd. — ADR | 202,842 | | | 9,277,993 |
| Japan — 12.8% | | | | |
| Makita Corp. | 281,200 | | | 10,763,957 |
| NIDEC Corp. | 172,800 | | | 15,528,999 |
| Nissan Motor Co. Ltd. | 1,807,100 | | | 18,788,469 |
| Nitto Denko Corp. | 330,400 | | | 13,559,623 |
| NTT DOCOMO, Inc. | 12,006 | | | 20,500,245 |
| Tokyo Electron Ltd. | 300,500 | | | 16,652,519 |
| | | | | 95,793,812 |
| Netherlands — 1.1% | | | | |
| ING Groep NV CVA (a) | 1,164,522 | | | 8,215,559 |
| Russia — 0.7% | | | | |
| Sberbank | 2,353,383 | | | 5,317,017 |
| Singapore — 1.0% | | | | |
| Noble Group Ltd. | 7,722,000 | | | 7,329,055 |
| South Korea — 1.2% | | | | |
| LG Chem Ltd. | 36,735 | | | 9,182,372 |
| Sweden — 2.3% | | | | |
| Hennes & Mauritz AB, B Shares (a) | 498,041 | | | 17,077,136 |
| | | | | |
| Common Stocks | Shares | | | Value |
| Switzerland — 10.0% | | | | | |
| Novartis AG, Registered Shares | 537,184 | | $ | 29,661,278 | |
| Roche Holding AG | 103,945 | | | 18,997,040 | |
| The Swatch Group Ltd., Bearer Shares | 28,945 | | | 13,372,815 | |
| UBS AG, Registered Shares (a) | 1,054,789 | | | 13,172,405 | |
| | | | | 75,203,538 | |
| Thailand — 1.1% | | | | | |
| Kasikornbank Public Co. Ltd. | 1,481,100 | | | 7,848,570 | |
| United Kingdom — 22.7% | | | | | |
| BG Group Plc | 1,067,140 | | | 25,179,354 | |
| HSBC Holdings Plc | 2,382,999 | | | 21,511,746 | |
| Imperial Tobacco Group Plc | 874,410 | | | 34,968,013 | |
| Reckitt Benckiser Group Plc | 477,854 | | | 27,817,485 | |
| Rio Tinto Plc | 300,179 | | | 16,826,460 | |
| Tullow Oil Plc | 710,316 | | | 17,721,307 | |
| Vodafone Group Plc | 9,461,257 | | | 26,188,375 | |
| | | | | 170,212,740 | |
| United States — 11.0% | | | | | |
| Activision Blizzard, Inc. | 1,856,201 | | | 23,889,307 | |
| Agilent Technologies, Inc. | 53,064 | | | 2,238,240 | |
| Google, Inc., Class A (a) | 19,622 | | | 11,875,823 | |
| Lam Research Corp. (a) | 367,494 | | | 15,306,125 | |
| Liberty Global, Inc. (a) | 209,798 | | | 10,450,038 | |
| Universal Display Corp. (a) | 151,384 | | | 6,807,738 | |
| Veeco Instruments, Inc. (a) | 387,537 | | | 11,699,742 | |
| | | | | 82,267,013 | |
| Total Long-Term Investments | | | | | |
| (Cost — $665,653,429) — 95.5% | | | | 715,396,290 | |
| |
| |
| |
| Short-Term Securities | | | | | |
| BlackRock Liquidity Funds, TempFund, | | | | | |
| Institutional Class, 0.15% (b)(c) | 35,827,071 | | | 35,827,071 | |
| Total Short-Term Securities | | | | | |
| (Cost — $35,827,071) — 4.8% | | | | 35,827,071 | |
| Total Investments (Cost — $701,480,500*) — 100.3% | | | 751,223,361 | |
| Liabilities in Excess of Other Assets — (0.3)% | | | | (2,022,177 | ) |
| Net Assets — 100.0% | | | $ | 749,201,184 | |
| * | | As of April 30, 2012, gross unrealized appreciation and unrealized depreciation based on cost for federal income tax purposes were as follows: |
| | | | | | |
| | | Tax cost | $ | 720,811,313 | |
| | | Gross unrealized appreciation | $ | 59,941,017 | |
| | | Gross unrealized depreciation | | (29,528,969 | ) |
| | | Net unrealized appreciation | $ | 30,412,048 | |
Portfolio Abbreviations
| | | | |
| To simplify the listing of portfolio holdings in the Schedule | ADR | American Depositary Receipts | HKD | Hong Kong Dollar |
| of Investments, the names and descriptions of many of the | AUD | Australian Dollar | USD | US Dollar |
| securities have been abbreviated according to the following | EUR | Euro | | |
| list: | GBP | British Pound | | |
See Notes to Financial Statements.
| SEMI-ANNUAL REPORT | APRIL 30, 2012 | 37 |
| |
| Schedule of Investments (concluded) | BlackRock Master International Portfolio |
| (a) | | Non-income producing security. |
| (b) | | Investments in companies considered to be an affiliate of the Portfolio during the period, for purposes of Section 2(a)(3) of the Investment Company Act of 1940, as amended, were as follows: |
| | Affiliate | Shares Held at
October 31,
2011 | Net
Activity | Shares Held at
April 30,
2012 | Income |
| | BlackRock Liquidity | | | | |
| | Funds, TempFund, | | | | |
| | Institutional Class | 24,233,486 | 11,593,585 | 35,827,071 | $21,738 |
| (c) | | Represents the current yield as of report date. |
| • | | Foreign currency exchange contracts as of April 30, 2012 were as follows: |
| | Currency
Purchased | | Currency
Sold | Counterparty | Settlement
Date | Unrealized
Appreciation
(Depreciation) |
| | HKD 9,986,269 | USD | 1,287,040 | JPMorgan | | | |
| | | | | Securities, Inc. | 5/02/12 | $ | 75 |
| | USD 4,470,206 | GBP | 2,746,316 | JPMorgan | | | |
| | | | | Securities, Inc. | 5/02/12 | | 13,210 |
| | HKD 338,482 | USD | 43,626 | State Street | | | |
| | | | | Global | | | |
| | | | | Markets, LLC | 5/03/12 | | 1 |
| | USD 4,492,409 | EUR | 3,394,314 | JPMorgan | | | |
| | | | | Securities, Inc. | 5/03/12 | | (646) |
| | AUD 13,265,000 | USD | 13,615,859 | State Street | | | |
| | | | | Global | | | |
| | | | | Markets, LLC | 7/19/12 | | 95,245 |
| | Total | | | | | $ | 107,885 |
| • | | Fair Value Measurements — Various inputs are used in determining the fair value of investments and derivative financial instruments. These inputs are categorized into a disclosure hierarchy consisting of three broad levels for financial statement purposes as follows: |
| • | | Level 1 — unadjusted price quotations in active markets/exchanges for identical assets and liabilities |
| • | | Level 2 — other observable inputs (including, but not limited to: quoted prices for similar assets or liabilities in markets that are active, quoted prices for identical or similar assets or liabilities in markets that are not active, inputs other than quoted prices that are observable for the assets or liabilities (such as interest rates, yield curves, volatilities, prepayment speeds, loss severities, credit risks and default rates) or other market-corroborated inputs) |
| • | | Level 3 — unobservable inputs based on the best information available in the circumstances, to the extent observable inputs are not available (including the Portfolio’s own assumptions used in determining the fair value of investments and derivative financial instruments) |
Changes in valuation techniques may result in transfers into or out of an assigned level within the disclosure hierarchy. The categorization of a value determined for investments and derivative financial instruments is based on the pricing transparency of the investment and derivative financial instrument and is not necessarily an indication of the risks associated with investing in those securities. For information about the Portfolio’s policy regarding valuation of investments and derivative financial instruments and other significant accounting policies, please refer to Note 1 of the Notes to Financial Statements.
The following tables summarize the inputs used as of April 30, 2012 in determining the fair valuation of the Portfolio’s investments and derivative financial instruments:
| | | | | | |
| Valuation Inputs | Level 1 | Level 2 | | Level 3 | Total | |
| Assets: | | | | | | |
| Investments: | | | | | | |
| Long-Term Investments: | | | | | |
| Common Stocks: | | | | | | |
| Belgium | $ 24,387,244 | — | | — | $ 24,387,244 | |
| Brazil | 10,576,226 | — | | — | 10,576,226 | |
| Canada | 22,242,032 | — | | — | 22,242,032 | |
| China | — | $ 38,673,934 | | — | 38,673,934 | |
| Czech Republic | — | 7,787,817 | | — | 7,787,817 | |
| France. | — | 68,518,080 | | — | 68,518,080 | |
| Germany | — | 43,573,817 | | — | 43,573,817 | |
| India | 11,912,335 | — | | — | 11,912,335 | |
| Israel | 9,277,993 | — | | — | 9,277,993 | |
| Japan | — | 95,793,812 | | — | 95,793,812 | |
| Netherlands | — | 8,215,559 | | — | 8,215,559 | |
| Russia | — | 5,317,017 | | — | 5,317,017 | |
| Singapore | — | 7,329,055 | | — | 7,329,055 | |
| South Korea | — | 9,182,372 | | — | 9,182,372 | |
| Sweden | — | 17,077,136 | | — | 17,077,136 | |
| Switzerland | — | 75,203,538 | | — | 75,203,538 | |
| Thailand | — | 7,848,570 | | — | 7,848,570 | |
| United Kingdom | — | 170,212,740 | | — | 170,212,740 | |
| United States | 82,267,013 | — | | — | 82,267,013 | |
| Short-Term Securities | 35,827,071 | — | | — | 35,827,071 | |
| Total | $196,489,914 | $554,733,447 | | — | $751,223,361 | |
| | |
| Valuation Inputs | Level 1 | Level 2 | | Level 3 | Total | |
| Derivative Financial Instruments1 | | | | | |
| Assets: | | | | | | |
| Foreign currency | | | | | | |
| exchange contracts | — | $ 108,531 | | — | $ 108,531 | |
| Liabilities: | | | | | | |
| Foreign currency | | | | | | |
| exchange contracts | — | (646 | ) | — | (646 | ) |
| | |
| Total | — | $ 107,885 | | — | $ 107,885 | |
| 1 | Derivative financial instruments are foreign currency exchange contracts, which are valued at the unrealized appreciation/depreciation on the instrument. |
See Notes to Financial Statements.
| 38 | SEMI-ANNUAL REPORT | APRIL 30, 2012 |
| |
| Statement of Assets and Liabilities | BlackRock Master International Portfolio |
April 30, 2012 (Unaudited)
| | |
| Assets |
| Investments at value — unaffiliated (cost — $665,653,429) | $ | 715,396,290 |
| Investments at value — affiliated (cost — $35,827,071) | | 35,827,071 |
| Foreign currency at value (cost — $7,248,688) | | 7,248,688 |
| Unrealized appreciation on foreign currency exchange contracts | | 108,531 |
| Investments sold receivable | | 12,473,398 |
| Dividends receivable | | 5,957,240 |
| Total assets | | 777,011,218 |
| |
| Liabilities |
| Bank overdraft | | 2,001,519 |
| Unrealized depreciation on foreign currency exchange contracts | | 646 |
| Investments purchased payable | | 25,056,544 |
| Investment advisory fees payable | | 584,043 |
| Withdrawals payable to investor | | 163,537 |
| Other accrued expenses payable | | 3,745 |
| Total liabilities | | 27,810,034 |
| Net Assets | $ | 749,201,184 |
| |
| Net Assets Consist of |
| Investor’s capital | $ | 699,219,837 |
| Net unrealized appreciation/depreciation | | 49,981,347 |
| Net Assets | $ | 749,201,184 |
See Notes to Financial Statements.
| SEMI-ANNUAL REPORT | APRIL 30, 2012 | 39 |
| |
| Statement of Operations | BlackRock Master International Portfolio |
Six Months Ended April 30, 2012 (Unaudited)
| | | |
| Investment Income |
| Dividends | $ | 7,780,993 | |
| Dividends — affiliated | | 21,738 | |
| Foreign taxes withheld | | (790,955 | ) |
| Total income | | 7,011,776 | |
| | | | |
| Expenses |
| Investment advisory | | 2,955,485 | |
| Custodian | | 153,423 | |
| Professional | | 29,516 | |
| Directors | | 9,179 | |
| Printing | | 6,014 | |
| Accounting services | | 109,688 | |
| Miscellaneous | | 10,682 | |
| Total expenses | | 3,273,987 | |
| Less fees waived by advisor | | (10,999 | ) |
| Total expenses after fees waived | | 3,262,988 | |
| Net investment income | | 3,748,788 | |
| | | | |
| Realized and Unrealized Gain (Loss) |
| Net realized gain (loss) from: | | | |
| Investments | | (48,617,619 | ) |
| Foreign currency transactions | | 2,821,572 | |
| | | (45,796,047 | ) |
| Net change in unrealized appreciation/depreciation on: | | | |
| Investments | | 78,473,301 | |
| Foreign currency transactions | | (3,191,778 | ) |
| | | 75,281,523 | |
| Total realized and unrealized gain | | 29,485,476 | |
| Net Increase in Net Assets Resulting from Operations | $ | 33,234,264 | |
See Notes to Financial Statements.
| 40 | SEMI-ANNUAL REPORT | APRIL 30, 2012 |
| |
| Statements of Changes in Net Assets | BlackRock Master International Portfolio |
| | | | | | |
| Increase (Decrease) in Net Assets: | Six Months Ended
April 30,
2012
(Unaudited) | Year Ended
October 31,
2011 |
| Operations |
| Net investment income | $ | 3,748,788 | | $ | 1,584,011 | |
| Net realized loss | | (45,796,047 | ) | | (54,806,188 | ) |
| Net change in unrealized appreciation/depreciation | | 75,281,523 | | | 34,396,421 | |
| Net increase (decrease) in net assets resulting from operations | | 33,234,264 | | | (18,825,756 | ) |
| |
| Capital Transactions |
| Proceeds from contributions | | 199,413,559 | | | 907,191,561 | |
| Value of withdrawals | | (316,410,968 | ) | | (120,719,339 | ) |
| Net increase (decrease) in net assets derived from capital transactions | | (116,997,409 | ) | | 786,472,222 | |
| |
| Net Assets |
| Total increase (decrease) in net assets | | (83,763,145 | ) | | 767,646,466 | |
| Beginning of period | | 832,964,329 | | | 65,317,863 | |
| End of period | $ | 749,201,184 | | $ | 832,964,329 | |
| |
| Financial Highlights | BlackRock Master International Portfolio |
| | | | | | | | | | | | | | | | | | | | | |
| | Six Months
Ended
April 30,
2012
| Year Ended October 31, | Period
June 1, 2008
to October 31,
| Year Ended May 31, |
| | (Unaudited) | 2011 | 2010 | 2009 | 2008 | 2008 | 2007 |
| Total Investment Return |
| Total investment return | | 3.53 | %1 | | (5.10 | )% | | 18.59 | % | | 33.94 | % | | (44.29 | )%1 | | 7.12 | % | | 16.99 | % |
| | | | | | | | | | | | | | | | | | | | | | |
| Ratios to Average Net Assets |
| Total expenses | | 0.81 | %2 | | 0.85 | % | | 1.03 | % | | 1.11 | % | | 1.04 | %2 | | 0.99 | % | | 0.96 | % |
| Total expenses after fees waived | | 0.81 | %2 | | 0.85 | % | | 1.03 | % | | 1.11 | % | | 1.04 | %2 | | 0.99 | % | | 0.96 | % |
| Net investment income | | 0.93 | %2 | | 0.64 | % | | 0.54 | % | | 1.89 | % | | 1.44 | %2 | | 1.90 | % | | 1.64 | % |
| | | | | | | | | | | | | | | | | | | | | | |
| Supplemental Data |
| Net assets, end of period (000) | $ | 749,201 | | $ | 832,964 | | $ | 65,318 | | $ | 66,975 | | $ | 59,217 | | $ | 118,236 | | $ | 126,594 | |
| Portfolio turnover | | 57 | % | | 156 | % | | 154 | % | | 178 | % | | 78 | % | | 153 | % | | 151 | % |
| 1 | | Aggregate total investment return. |
See Notes to Financial Statements.
| SEMI-ANNUAL REPORT | APRIL 30, 2012 | 41 |
| Notes to Financial Statements (Unaudited) | BlackRock Master International Portfolio |
1. Organization and Significant Accounting Policies:
BlackRock Master International Portfolio (the “Portfolio”), a series of BlackRock Master LLC (the “Master LLC”), is registered as an investment company under the Investment Company Act of 1940, as amended (the “1940 Act”), and is organized as a Delaware limited liability company. The Master LLC’s Limited Liability Company Agreement permits the Board of Directors of the Master LLC (the “Board”) to issue non-transferable interests, subject to certain limitations. The Portfolio’s financial statements are prepared in conformity with accounting principles generally accepted in the United States of America (“US GAAP”), which may require management to make estimates and assumptions that affect the reported amounts and disclosures in the financial statements. Actual results could differ from those estimates.
The following is a summary of significant accounting policies followed by the Portfolio:
Valuation: US GAAP defines fair value as the price the Portfolio would receive to sell an asset or pay to transfer a liability in an orderly transaction between market participants at the measurement date. The Portfolio fair values its financial instruments at market value using independent dealers or pricing services under policies approved by the Board. Equity investments traded on a recognized securities exchange or the NASDAQ Global Market System (“NASDAQ”) are valued at the last reported sale price that day or the NASDAQ official closing price, if applicable. For equity investments traded on more than one exchange, the last reported sale price on the exchange where the stock is primarily traded is used. Equity investments traded on a recognized exchange for which there were no sales on that day are valued at the last available bid (long positions) or ask (short positions) price. If no bid or ask price is available, the prior day’s price will be used, unless it is determined that such prior day’s price no longer reflects the fair value of the security. Investments in open-end registered investment companies are valued at NAV each business day. Short-term securities with remaining maturities of 60 days or less may be valued at amortized cost, which approximates fair value.
Securities and other assets and liabilities denominated in foreign currencies are translated into US dollars using exchange rates determined as of the close of business on the New York Stock Exchange (“NYSE”). Foreign currency exchange contracts are valued at the mean between the bid and ask prices and are determined as of the close of business on the NYSE. Interpolated values are derived when the settlement date of the contract is an interim date for which quotations are not available.
In the event that application of these methods of valuation results in a price for an investment, which is deemed not to be representative of the market value of such investment or if a price is not available, the investment will be valued in accordance with a policy approved by the Board as reflecting fair value (“Fair Value Assets”). When determining the price for Fair Value Assets, the investment advisor and/or the sub-advisor seeks to determine the price that the Portfolio might reasonably expect to receive from the current sale of that asset in an arm’s-length transaction. Fair value determinations shall be based upon all available factors that the investment advisor and/or sub-advisor deems relevant. The pricing of all Fair Value Assets is subsequently reported to the Board or a committee thereof.
Generally, trading in foreign instruments is substantially completed each day at various times prior to the close of business on the NYSE. Occasionally, events affecting the values of such instruments may occur between the foreign market close and the close of business on the NYSE that may not be reflected in the computation of the Portfolio’s net assets. If events (for example, a company announcement, market volatility or a natural disaster) occur during such periods that are expected to materially affect the value of such instruments, those instruments may be Fair Value Assets and be valued at their fair value, as determined in good faith by the investment advisor using a pricing service and/or policies approved by the Board. Each business day, the Portfolio uses a pricing service to assist with the valuation of certain foreign exchange-traded equity securities and foreign exchange-traded and over-the-counter (“OTC”) options (the “Systematic Fair Value Price”). Using current market factors, the Systematic Fair Value Price is designed to value such foreign securities and foreign options at fair value as of the close of business on the NYSE, which follows the close of the local markets.
Foreign Currency Transactions: The Portfolio’s books and records are maintained in US dollars. Purchases and sales of investment securities are recorded at the rates of exchange prevailing on the respective date of such transactions. Generally, when the US dollar rises in value against a foreign currency, the Portfolio’s investments denominated in that currency will lose value because that currency is worth fewer US dollars; the opposite effect occurs if the US dollar falls in relative value.
The Portfolio does not isolate the portion of the results of operations arising as a result of changes in the foreign exchange rates from the changes in the market prices of investments held or sold for financial reporting purposes. Accordingly, the effects of changes in foreign currency exchange rates on investments are segregated on the Statement of Operations from the effects of changes in market prices of those investments but are included as a component of net realized and unrealized gain (loss) from investments. The Portfolio reports realized currency gains (losses) on foreign currency related transactions as components of net realized gain (loss) for financial reporting purposes, whereas such components are treated as ordinary income for federal income tax purposes.
Segregation and Collateralization: In cases in which the 1940 Act and the interpretive positions of the Securities and Exchange Commission (“SEC”) require that the Portfolio either deliver collateral or segregate assets in connection with certain investments (e.g., foreign currency exchange contracts), the Portfolio will, consistent with SEC rules and/or certain interpretive letters issued by the SEC, segregate collateral or designate on its books and records cash or liquid securities having a market value at least equal to the amount that would otherwise be required to be physically segregated. Furthermore, based on requirements and agreements with certain exchanges and third party broker-dealers, each party to such transactions has requirements to deliver/deposit securities as collateral for certain investments.
| 42 | SEMI-ANNUAL REPORT | APRIL 30, 2012 |
| Notes to Financial Statements (continued) | BlackRock Master International Portfolio |
Investment Transactions and Investment Income: For financial reporting purposes, investment transactions are recorded on the dates the transactions are entered into (the trade dates). Realized gains and losses on investment transactions are determined on the identified cost basis. Dividend income is recorded on the ex-dividend dates. Dividends from foreign securities where the ex-dividend date may have passed are subsequently recorded when the Portfolio is informed of the ex-dividend date. Under the applicable foreign tax laws, a withholding tax at various rates may be imposed on capital gains, dividends and interest. Upon notification from issuers, some of the dividend income received from a real estate investment trust may be redesignated as a reduction of cost of the related investment and/or realized gain. Interest income, including amortization and accretion of premiums and discounts on debt securities, is recognized on the accrual basis. Income and realized and unrealized gains and losses are allocated daily to each class based on its relative net assets. Consent fees are compensation for agreeing to changes in the terms of debt instruments and are included in interest income in the Statement of Operations.
Income Taxes: The Portfolio is disregarded as an entity separate from its owner for tax purposes. As such, the owner of the Portfolio is treated as the owner of the net assets, income, expenses and realized and unrealized gains and losses of the Portfolio. Therefore, no federal tax provision is required. It is intended that the Portfolio’s assets will be managed so the owner of the Portfolio can satisfy the requirements of Subchapter M of the Internal Revenue Code of 1986, as amended.
Recent Accounting Standards: In May 2011, the Financial Accounting Standards Board (the “FASB”) issued amended guidance to improve disclosure about fair value measurements, which will require the following disclosures for fair value measurements categorized as Level 3: quantitative information about the unobservable inputs and assumptions used in the fair value measurement, a description of the valuation policies and procedures and a narrative description of the sensitivity of the fair value measurement to changes in unobservable inputs and the interrelationships between those unobservable inputs. In addition, the amounts and reasons for all transfers in and out of Level 1 and Level 2 will be required to be disclosed as well as disclosure of the level in the fair value hierarchy of assets and liabilities not recorded at fair value but where fair value is disclosed. The amended guidance is effective for financial statements for fiscal years beginning after December 15, 2011, and interim periods within those fiscal years. Management is evaluating the impact of this guidance on the Fund’s financial statements and disclosures.
In December 2011, the FASB issued guidance that will expand current disclosure requirements on the offsetting of certain assets and liabilities. The new disclosures will be required for investments and derivative financial instruments subject to master netting or similar agreements, which are eligible for offset in the Statement of Assets and Liabilities and will require an entity to disclose both gross and net information about such investments and transactions in the financial statements. The guidance is effective for financial statements with fiscal years beginning on or after January 1, 2013, and interim periods within those fiscal years. Management is evaluating the impact of this guidance on the Portfolio’s financial statement disclosures.
Other: Expenses directly related to the Portfolio are charged to the Portfolio. Other operating expenses shared by several funds are pro rated among those funds on the basis of relative net assets or other appropriate methods.
The Portfolio has an arrangement with the custodian whereby fees may be reduced by credits earned on uninvested cash balances, which, if applicable, are shown as fees paid indirectly in the Statement of Operations. The custodian imposes fees on overdrawn cash balances, which can be offset by accumulated credits earned or may result in additional custody charges.
2. Derivative Financial Instruments:
The Portfolio engages in various portfolio investment strategies using derivative contracts both to increase the returns of the Portfolio and to economically hedge, or protect, its exposure to certain risks such as credit risk, equity risk, interest rate risk, foreign currency exchange rate risk or other risk (commodity price risk and inflation risk). These contracts may be transacted on an exchange or OTC.
Losses may arise if the value of the contract decreases due to an unfavorable change in the market rates or values of the underlying instrument or if the counterparty does not perform under the contract. For OTC options purchased, the Portfolio bears the risk of loss in the amount of the premiums paid plus the positive change in market values net of any collateral received on the options should the counterparty fail to perform under the contracts. Options written by the Portfolio do not give rise to counterparty credit risk, as options written obligate the Portfolio to perform and not the counterparty. Counterparty risk related to exchange-traded financial futures contracts and options is deemed to be minimal due to the protection against defaults provided by the exchange on which these contracts trade.
The Portfolio may mitigate counterparty risk by procuring collateral and through netting provisions included within an International Swaps and Derivatives Association, Inc. master agreement (“ISDA Master Agreement”) implemented between the Portfolio and each of its respective counterpar-ties. An ISDA Master Agreement allows the Portfolio to offset with each separate counterparty certain derivative financial instrument’s payables and/or receivables with collateral held. The amount of collateral moved to/from applicable counterparties is generally based upon minimum transfer amounts of up to $500,000. To the extent amounts due to the Portfolio from its counterparties are not fully collateralized contractually or otherwise, the Portfolio bears the risk of loss from counterparty non-performance. See Note 1 “Segregation and Collateralization” for information with respect to collateral practices. In addition, the Portfolio manages counterparty risk by entering into agreements only with counterparties that it believes have the financial resources to honor its obligations and by monitoring the financial stability of those counterparties.
Certain ISDA Master Agreements allow counterparties to OTC derivatives to terminate derivative contracts prior to maturity in the event the Portfolio’s net assets decline by a stated percentage or the Portfolio fails to meet the terms of its ISDA Master Agreements, which would cause the Portfolio to accelerate payment of any net liability owed to the counterparty.
| SEMI-ANNUAL REPORT | APRIL 30, 2012 | 43 |
| Notes to Financial Statements (continued) | BlackRock Master International Portfolio |
Foreign Currency Exchange Contracts: The Portfolio enters into foreign currency exchange contracts as an economic hedge against either specific transactions or portfolio instruments or to obtain exposure to foreign currencies (foreign currency exchange rate risk). A foreign currency exchange contract is an agreement between two parties to buy and sell a currency at a set exchange rate on a future date. Foreign currency exchange contracts, when used by the Portfolio, help to manage the overall exposure to the currencies in which some of the investments held by the Portfolio are denominated. The contract is marked-to-market daily and the change in market value is recorded by the Portfolio as an unrealized gain or loss. When the contract is closed, the Portfolio records a realized gain or loss equal to the difference between the value at the time it was opened and the value at the time it was closed. The use of foreign currency exchange contracts involves the risk that the value of a foreign currency exchange contract changes unfavorably due to movements in the value of the referenced foreign currencies and the risk that a counterparty to the contract does not perform its obligations under the agreement.
Derivative Financial Instruments Categorized by Risk Exposure:
Fair Values of Derivative Financial Instruments as of April 30, 2012
| | | | | |
| | Asset Derivatives | | | | |
|
| | Statement of Assets
and Liabilities
Location | | Value |
Foreign currency
exchange contracts | Unrealized appreciation
on foreign currency
exchange contracts | | $ | 108,531 | |
| | Liability Derivatives | | | | |
|
| | Statement of Assets
and Liabilities
Location | | Value |
Foreign currency
exchange contracts | Unrealized depreciation
on foreign currency
exchange contracts | | $ | 646 | |
The Effect of Derivative Financial Instruments
in the Statement of Operations
Six Months Ended April 30, 2012 |
|
|
| Net Realized Gain (Loss) From |
| Foreign currency exchange contracts | | $ | 1,445,007 | |
| Net Change in Unrealized Appreciation/Depreciation on |
|
| Foreign currency exchange contracts | | $ | (2,377,749 | ) |
| |
| For the six months ended April 30, 2012, the average quarterly balances of outstanding derivative financial instruments were as follows: |
|
| |
Foreign currency exchange contracts:
Average number of contracts — US
dollars purchased | | | 2 | |
Average number of contracts — US
dollars sold | | | 3 | |
| Average US dollar amounts purchased | | $ | 249,065,772 | |
| Average US dollar amounts sold | | $ | 30,241,233 | |
3. Investment Advisory Agreement and Other Transactions with Affiliates:
As of April 30, 2012, the PNC Financial Services Group, Inc. (“PNC”) and Barclays Bank PLC (“Barclays”) are the largest stockholders of BlackRock, Inc. (“BlackRock”). Due to the ownership structure, PNC is an affiliate for 1940 Act purposes, but Barclays is not.
The Master LLC, on behalf of the Portfolio entered into an Investment Advisory Agreement with BlackRock Advisors, LLC (the “Manager”), the Portfolio’s investment advisor, an indirect, wholly owned subsidiary of BlackRock, to provide investment advisory and administration services. The Manager is responsible for the management of the Portfolio’s portfolio and provides the necessary personnel, facilities, equipment and certain other services necessary to the operations of the Portfolio. For such services, the Portfolio pays the Manager a monthly fee at an annual rate of the Portfolio’s average daily net assets.
| | |
| Average Daily Net Assets | Investment
Advisory Fee |
| Not exceeding $500 million | 0.75 | % |
| In excess of $500 million | 0.70 | % |
The Manager voluntarily agreed to waive its investment advisory fees by the amount of investment advisory fees the Portfolio pays to the Manager indirectly through its investment in affiliated money market funds, however the Manager does not waive its investment advisory fees by the amount of investment advisory fees paid in connection with the Portfolio’s investment in other affiliated investment companies, if any. This amount is shown as, or included in, fees waived by advisor in the Statement of Operations.
The Manager entered into a sub-advisory agreement with BlackRock International Limited (“BIL”), an affiliate of the Manager. The Manager pays the subadvisor for services it provides, a monthly fee that is a percentage of the investment advisory fees paid by the Portfolio to the Manager.
For the six months ended April 30, 2012, the Master LLC reimbursed the Manager $5,113 for certain accounting services, which are included in accounting services in the Statement of Operations.
Certain officers and/or directors of the Master LLC are officers and/or directors of BlackRock or its affiliates.
4. Investments:
Purchases and sales of investments, excluding short-term securities, for the six months ended April 30, 2012, were $442,016,192 and $539,374,413, respectively.
5. Borrowings:
The Portfolio, along with certain other funds managed by the Manager and its affiliates, is a party to a $500 million credit agreement with a group of lenders. The Portfolio may borrow under the credit agreement to fund shareholder redemptions. Effective November 2010 to November 2011, the credit agreement had the following terms: a commitment fee of 0.08% per annum based on the Portfolio’s pro rata share of the unused portion of the credit agreement and interest at a rate equal to the higher of (a) the one-month LIBOR plus 1.00% per annum or (b) the Fed Funds rate plus 1.00% per annum on amounts borrowed. In addition, the Portfolio paid administration and arrangement fees which were allocated to the Portfolio based on its net assets as of October 31, 2010. The credit agreement, which expired in November 2011, was renewed until November 2012. Effective November 2011 to November 2012, the credit agreement has the following terms: a commitment fee of 0.065% per annum based on
| 44 | SEMI-ANNUAL REPORT | APRIL 30, 2012 |
| Notes to Financial Statements (concluded) | BlackRock Master International Portfolio |
the Portfolio’s pro rata share of the unused portion of the credit agreement and interest at a rate equal to the higher of (a) the one-month LIBOR plus 0.80% per annum or (b) the Fed Funds rate plus 0.80% per annum on amounts borrowed. In addition, the Portfolio paid administration and arrangement fees which were allocated to the Portfolio based on its net assets as of October 31, 2011. The Portfolio did not borrow under the credit agreement during the six months ended April 30, 2012.
6. Concentration, Market and Credit Risk:
In the normal course of business, the Portfolio invests in securities and enters into transactions where risks exist due to fluctuations in the market (market risk) or failure of the issuer of a security to meet all its obligations (issuer credit risk). The value of securities held by the Portfolio may decline in response to certain events, including those directly involving the issuers whose securities are owned by the Portfolio; conditions affecting the general economy; overall market changes; local, regional or global political, social or economic instability; and currency and interest rate and price fluctuations. Similar to issuer credit risk, the Portfolio may be exposed to counterparty credit risk, or the risk that an entity with which the Portfolio has unsettled or open transactions may fail to or be unable to perform on its commitments. The Portfolio manages counterparty credit risk by entering into transactions only with counterparties that it believes have the financial resources to honor their obligations and by monitoring the financial stability of those counterparties. Financial assets, which potentially expose the Portfolio to market, issuer and counterparty credit risks, consist principally of financial instruments and receivables due from counterparties. The extent of the Portfolio’s exposure to market, issuer and counterparty credit risks with respect to these financial assets is generally approximated by their value recorded in the Portfolio’s Statement of Assets and Liabilities, less any collateral held by the Portfolio.
As of April 30, 2012, the Portfolio had the following industry classifications:
| | |
| Industry | Percent of
Long-Term
Investments |
| Pharmaceuticals | 13 | % |
| Commercial Banks | 10 | |
| Wireless Telecommunications Services | 10 | |
| Semiconductors & Semiconductor Equipment | 8 | |
| Oil, Gas & Consumable Fuels | 7 | |
| Chemicals | 6 | |
| Automobiles | 6 | |
| Electrical Equipment, Instruments & Components | 5 | |
| Other1 | 35 | |
| 1 | | All other industries held were each less than 5% of long-term investments. |
7. Subsequent Events:
Management has evaluated the impact of all subsequent events on the Portfolio through the date the financial statements were issued and has determined that there were no subsequent events requiring adjustment or additional disclosure in the financial statements.
| SEMI-ANNUAL REPORT | APRIL 30, 2012 | 45 |
Officers and Directors
Ronald W. Forbes, Co-Chairman of the Board and Director
Rodney D. Johnson, Co-Chairman of the Board and Director
Paul L. Audet, Director
David O. Beim, Director
Henry Gabbay, Director
Dr. Matina S. Horner, Director
Herbert I. London, Director
Cynthia A. Montgomery, Director
Joseph P. Platt, Director
Robert C. Robb, Jr., Director
Toby Rosenblatt, Director
Kenneth L. Urish, Director
Frederick W. Winter, Director
John M. Perlowski, President and Chief Executive Officer
Brendan Kyne, Vice President
Neal Andrews, Chief Financial Officer
Jay Fife, Treasurer
Brian Kindelan, Chief Compliance Officer and
Anti-Money Laundering Officer
Ira P. Shapiro, Secretary
Investment Advisor
BlackRock Advisors, LLC
Wilmington, DE 19809
Sub-Advisors
BlackRock Investment Management, LLC1
Princeton, NJ 08540
BlackRock International Limited2
Edinburgh, Scotland
United Kingdom EH3 8JB
Custodian
Brown Brothers Harriman & Co.
Boston, MA 02109
Transfer Agent
BNY Mellon Investment Servicing (US) Inc.
Wilmington, DE 19809
Accounting Agent
State Street Bank and Trust Company
Boston, MA 02110
Distributor
BlackRock Investments, LLC
New York, NY 10022
Independent Registered Public Accounting Firm
Deloitte & Touche LLP
Boston, MA 02116
Legal Counsel
Sidley Austin LLP
New York, NY 10019
Address of the Funds
100 Bellevue Parkway
Wilmington, DE 19809
1 For Emerging Markets and Latin America.
2 For all Funds.
| 46 | SEMI-ANNUAL REPORT | APRIL 30, 2012 |
Additional Information
General Information
Electronic Delivery
Electronic copies of most financial reports and prospectuses are available on the Funds’ website or shareholders can sign up for e-mail notifications of quarterly statements, annual and semi-annual reports and prospectuses by enrolling in the Funds’ electronic delivery program.
To enroll:
Shareholders Who Hold Accounts with Investment Advisors, Banks or Brokerages:
Please contact your financial advisor. Please note that not all investment advisors, banks or brokerages may offer this service.
Shareholders Who Hold Accounts Directly with BlackRock:
| 1) | | Access the BlackRock Web site at http://www.blackrock.com/edelivery |
| 2) | | Select “eDelivery” under the “More Information” section |
Householding
The Funds will mail only one copy of shareholder documents, including prospectuses, annual and semi-annual reports and proxy statements, to shareholders with multiple accounts at the same address. This practice is commonly called “householding” and is intended to reduce expenses and eliminate duplicate mailings of shareholder documents. Mailings of your shareholder documents may be householded indefinitely unless you instruct us otherwise. If you do not want the mailing of these documents to be combined with those for other members of your household, please call the Funds at (800) 441-7762.
Availability of Quarterly Schedule of Investments
The Funds/Portfolio file their complete schedule of portfolio holdings with the SEC for the first and third quarters of each fiscal year on Form N-Q. The Funds’/Portfolio’s Forms N-Q are available on the SEC’s website at http://www.sec.gov and may also be reviewed and copied at the SEC’s Public Reference Room in Washington, D.C. Information on how to access documents on the SEC’s website without charge may be obtained by calling (800) SEC-0330. The Funds’/Portfolio’s Forms N-Q may also be obtained upon request and without charge by calling (800) 441-7762.
Availability of Proxy Voting Policies and Procedures
A description of the policies and procedures that the Funds/Portfolio use to determine how to vote proxies relating to portfolio securities is available (1) without charge, upon request, by calling (800) 441-7762; (2) at http://www.blackrock.com; and (3) on the SEC’s website at http://www.sec.gov.
Availability of Proxy Voting Record
Information about how the Funds/Portfolio voted proxies relating to securities held in the Funds’/Portfolio’s portfolios during the most recent 12-month period ended June 30 is available upon request and without charge (1) at http://www.blackrock.com or by calling (800) 441-7762 and (2) on the SEC’s website at http://www.sec.gov.
| SEMI-ANNUAL REPORT | APRIL 30, 2012 | 47 |
Additional Information (continued)
Shareholder Privileges
Account Information
Call us at (800) 441-7762 from 8:00 AM to 6:00 PM EST on any business day to get information about your account balances, recent transactions and share prices. You can also reach us on the Web at http://www.blackrock.com/funds.
Automatic Investment Plans
Investor Class shareholders who want to invest regularly can arrange to have $50 or more automatically deducted from their checking or savings account and invested in any of the BlackRock funds.
Systematic Withdrawal Plans
Investor Class shareholders can establish a systematic withdrawal plan and receive periodic payments of $50 or more from their BlackRock funds, as long as their account balance is at least $10,000.
Retirement Plans
Shareholders may make investments in conjunction with Traditional, Rollover, Roth, Coverdell, Simple IRAs, SEP IRAs and 403(b) Plans.
| 48 | SEMI-ANNUAL REPORT | APRIL 30, 2012 |
Additional Information (concluded)
BlackRock Privacy Principles
BlackRock is committed to maintaining the privacy of its current and former fund investors and individual clients (collectively, “Clients”) and to safeguarding their non-public personal information. The following information is provided to help you understand what personal information BlackRock collects, how we protect that information and why in certain cases we share such information with select parties.
If you are located in a jurisdiction where specific laws, rules or regulations require BlackRock to provide you with additional or different privacy-related rights beyond what is set forth below, then BlackRock will comply with those specific laws, rules or regulations.
BlackRock obtains or verifies personal non-public information from and about you from different sources, including the following: (i) information we receive from you or, if applicable, your financial intermediary, on applications, forms or other documents; (ii) information about your transactions with us, our affiliates, or others; (iii) information we receive from a consumer reporting agency; and (iv) from visits to our websites.
BlackRock does not sell or disclose to non-affiliated third parties any non-public personal information about its Clients, except as permitted by law or as is necessary to respond to regulatory requests or to service Client accounts. These non-affiliated third parties are required to protect the confidentiality and security of this information and to use it only for its intended purpose.
We may share information with our affiliates to service your account or to provide you with information about other BlackRock products or services that may be of interest to you. In addition, BlackRock restricts access to non-public personal information about its Clients to those BlackRock employees with a legitimate business need for the information. BlackRock maintains physical, electronic and procedural safeguards that are designed to protect the non-public personal information of its Clients, including procedures relating to the proper storage and disposal of such information.
| SEMI-ANNUAL REPORT | APRIL 30, 2012 | 49 |
A World-Class Mutual Fund Family
BlackRock offers a diverse lineup of open-end mutual funds crossing all investment styles and managed by experts in equity, fixed income and tax-exempt investing.
| | | | | | |
| Equity Funds |
| BlackRock ACWI ex-US Index Fund | | BlackRock Global Dynamic Equity Fund | BlackRock Mid-Cap Value Equity Portfolio |
| BlackRock All-Cap Energy & Resources Portfolio | BlackRock Global Opportunities Portfolio | BlackRock Mid Cap Value Opportunities Fund |
| BlackRock Balanced Capital Fund† | | BlackRock Global SmallCap Fund | BlackRock Natural Resources Trust | |
| BlackRock Basic Value Fund | | BlackRock Health Sciences Opportunities Portfolio | BlackRock Pacific Fund | |
| BlackRock Capital Appreciation Fund | | BlackRock Index Equity Portfolio | | BlackRock Russell 1000 Index Fund |
| BlackRock China Fund | | BlackRock India Fund | | BlackRock Science & Technology | |
| BlackRock Commodity Strategies Fund | | BlackRock International Fund | | Opportunities Portfolio | |
| BlackRock Emerging Markets Fund | | BlackRock International Index Fund | BlackRock Small Cap Growth Equity Portfolio |
| BlackRock Emerging Markets Long/Short | | BlackRock International Opportunities Portfolio | BlackRock Small Cap Growth Fund II |
| Equity Fund | | BlackRock Large Cap Core Fund | | BlackRock Small Cap Index Fund | |
| BlackRock Energy & Resources Portfolio | | BlackRock Large Cap Core Plus Fund | BlackRock S&P 500 Index Fund | |
| BlackRock Equity Dividend Fund | | BlackRock Large Cap Growth Fund | BlackRock S&P 500 Stock Fund | |
| BlackRock EuroFund | | BlackRock Large Cap Value Fund | BlackRock U.S. Opportunities Portfolio |
| BlackRock Focus Growth Fund | | BlackRock Latin America Fund | | BlackRock Value Opportunities Fund |
| BlackRock Global Allocation Fund† | | BlackRock Managed Volatility Portfolio† | BlackRock World Gold Fund | |
| BlackRock Global Dividend Income | | BlackRock Mid-Cap Growth Equity Portfolio | | | |
| Portfolio | | | | | |
| | | | | | |
| Fixed Income Funds |
| BlackRock Bond Index Fund | | BlackRock High Yield Bond Portfolio | BlackRock Strategic Income | |
| BlackRock Core Bond Portfolio | | BlackRock Inflation Protected Bond Portfolio | Opportunities Portfolio | |
| BlackRock CoreAlpha Bond Fund | | BlackRock International Bond Portfolio | BlackRock Total Return Fund | |
| BlackRock Emerging Market Debt Portfolio | | BlackRock Long Duration Bond Portfolio | BlackRock US Government Bond Portfolio |
| BlackRock Floating Rate Income Portfolio | | BlackRock Low Duration Bond Portfolio | BlackRock US Mortgage Portfolio | |
| BlackRock Global Long/Short Credit Fund | | BlackRock Multi-Asset Income Portfolio† | BlackRock World Income Fund | |
| BlackRock GNMA Portfolio | | BlackRock Secured Credit Portfolio | | | |
| | | | | | |
| Municipal Bond Funds |
| BlackRock California Municipal Bond Fund | | BlackRock National Municipal Fund | BlackRock Pennsylvania Municipal Bond Fund |
| BlackRock High Yield Municipal Fund | | BlackRock New Jersey Municipal Bond Fund | BlackRock Short-Term Municipal Fund |
| BlackRock Intermediate Municipal Fund | | BlackRock New York Municipal Bond Fund | | | |
| | | | | | |
| Target Risk & Target Date Funds† |
| BlackRock Prepared Portfolios | BlackRock Lifecycle Prepared Portfolios | LifePath Portfolios | LifePath Index Portfolios |
| Conservative Prepared Portfolio | 2015 | 2035 | Retirement | 2040 | Retirement | 2040 |
| Moderate Prepared Portfolio | 2020 | 2040 | 2020 | 2045 | 2020 | 2045 |
| Growth Prepared Portfolio | 2025 | 2045 | 2025 | 2050 | 2025 | 2050 |
| Aggressive Growth Prepared Portfolio | 2030 | 2050 | 2030 | 2055 | 2030 | 2055 |
| | | | 2035 | | 2035 | |
† Mixed asset fund.
BlackRock mutual funds are currently distributed by BlackRock Investments, LLC. You should consider the investment objectives, risks, charges and expenses of the funds under consideration carefully before investing. Each fund’s prospectus contains this and other information and is available at www.blackrock.com or by calling (800) 441-7762 or from your financial advisor. The prospectus should be read carefully before investing.
| 50 | SEMI-ANNUAL REPORT | APRIL 30, 2012 |
This report is not authorized for use as an offer of sale or a solicitation of an offer to buy shares of a Fund unless accompanied or preceded by a Fund’s current prospectus. Past performance results shown in this report should not be considered a representation of future performance. Investment returns and principal value of shares will fluctuate so that shares, when redeemed, may be worth more or less than their original cost. Statements and other information herein are as dated and are subject to change. Please see each Fund’s prospectus for a description of risks associated with global investments.

| #GEMLAIF -4/12-SAR | |
Item 2 – Code of Ethics – Not Applicable to this semi-annual report
Item 3 – Audit Committee Financial Expert – Not Applicable to this semi-annual report
Item 4 – Principal Accountant Fees and Services – Not Applicable to this semi-annual report
Item 5 – Audit Committee of Listed Registrants – Not Applicable
Item 6 – Investments
(a) The registrant’s Schedule of Investments is included as part of the Report to Stockholders filed under Item 1 of this Form.
(b) Not Applicable due to no such divestments during the semi-annual period covered since the previous Form N-CSR filing.
Item 7 – Disclosure of Proxy Voting Policies and Procedures for Closed-End Management Investment Companies – Not Applicable
Item 8 – Portfolio Managers of Closed-End Management Investment Companies – Not Applicable
Item 9 – Purchases of Equity Securities by Closed-End Management Investment Company and Affiliated Purchasers – Not Applicable
Item 10 – Submission of Matters to a Vote of Security Holders –There have been no material changes to these procedures.
Item 11 – Controls and Procedures
| (a) – | The registrant’s principal executive and principal financial officers, or persons performing similar functions, have concluded that the registrant’s disclosure controls and procedures (as defined in Rule 30a-3(c) under the Investment Company Act of 1940, as amended (the “1940 Act”)) are effective as of a date within 90 days of the filing of this report based on the evaluation of these controls and procedures required by Rule 30a-3(b) under the 1940 Act and Rule 15d-15(b) under the Securities Exchange Act of 1934, as amended. |
| (b) – | There were no changes in the registrant’s internal control over financial reporting (as defined in Rule 30a-3(d) under the 1940 Act) that occurred during the second fiscal quarter of the period covered by this report that have materially affected, or are reasonably likely to materially affect, the registrant’s internal control over financial reporting. |
Item 12 – Exhibits attached hereto
(a)(1) – Code of Ethics – Not Applicable to this semi-annual report
(a)(2) – Certifications – Attached hereto
(a)(3) – Not Applicable
| (b) – | Certifications – Attached hereto |
Pursuant to the requirements of the Securities Exchange Act of 1934 and the Investment Company Act of 1940, the registrant has duly caused this report to be signed on its behalf by the undersigned, thereunto duly authorized.
BlackRock Emerging Markets Fund, Inc.
By: /s/ John M. Perlowski
John M. Perlowski
Chief Executive Officer (principal executive officer) of
BlackRock Emerging Markets Fund, Inc.
Date: July 2, 2012
Pursuant to the requirements of the Securities Exchange Act of 1934 and the Investment Company Act of 1940, this report has been signed below by the following persons on behalf of the registrant and in the capacities and on the dates indicated.
By: /s/ John M. Perlowski
John M. Perlowski
Chief Executive Officer (principal executive officer) of
BlackRock Emerging Markets Fund, Inc.
Date: July 2, 2012
By: /s/ Neal J. Andrews
Neal J. Andrews
Chief Financial Officer (principal financial officer) of
BlackRock Emerging Markets Fund, Inc.
Date: July 2, 2012