UNITED STATES
SECURITIES AND EXCHANGE COMMISSION
Washington, D.C. 20549
FORM N-CSRS
CERTIFIED SHAREHOLDER REPORT OF REGISTERED MANAGEMENT
INVESTMENT COMPANIES
Investment Company Act file number 811-05723
Name of Fund: BlackRock Developing Capital Markets Fund, Inc.
Fund Address: 100 Bellevue Parkway, Wilmington, DE 19809
Name and address of agent for service: Donald C. Burke, Chief Executive Officer, BlackRock
Developing Capital Markets Fund, Inc., 800 Scudders Mill Road, Plainsboro, NJ, 08536.
Mailing address: P.O. Box 9011, Princeton, NJ, 08543-9011
Registrant’s telephone number, including area code: (800) 441-7762
Date of fiscal year end: 06/30/2008
Date of reporting period: 07/01/2007 – 12/31/2007
Item 1 – Report to Stockholders |
EQUITIES FIXED INCOME REAL ESTATE LIQUIDITY ALTERNATIVES BLACKROCK SOLUTIONS

| | BlackRock Developing Capital
Markets Fund, Inc. |
| | SEMI-ANNUAL REPORT
DECEMBER 31, 2007 | (UNAUDITED) |
NOT FDIC INSURED
MAY LOSE VALUE
NO BANK GUARANTEE
| Table of Contents | | |
| |
|
| |
| | | Page |
| |
|
| |
| A Letter to Shareholders | | 3 |
| Semi-Annual Report: | | |
| Fund Summary | | 4 |
| About Fund Performance | | 6 |
| Disclosure of Expenses | | 6 |
| Portfolio Summary | | 7 |
| Financial Statements: | | |
| Schedule of Investments | | 8 |
| Statement of Assets and Liabilities | | 11 |
| Statement of Operations | | 12 |
| Statements of Changes in Net Assets | | 13 |
| Financial Highlights | | 14 |
| Notes to Financial Statements | | 18 |
| Officers and Directors | | 24 |
| Proxy Results | | 24 |
| BlackRock Fund Information | | 25 |
| Mutual Fund Family | | 27 |
2
BLACKROCK DEVELOPING CAPITAL MARKETS FUND, INC.
Dear Shareholder
Financial markets endured heightened volatility during 2007, culminating in mixed results for some of the major benchmark indexes:
| Total Returns as of December 31, 2007 | | 6-month | | 12-month |
| |
| |
|
| U.S. equities (S&P 500 Index) | | –1.37% | | + 5.49% |
| |
| |
|
|
| Small cap U.S. equities (Russell 2000 Index) | | –7.53 | | – 1.57 |
| |
| |
|
|
| International equities (MSCI Europe, Australasia, Far East Index) | | +0.39 | | +11.17 |
| |
| |
|
| Fixed income (Lehman Brothers U.S. Aggregate Bond Index) | | +5.93 | | + 6.97 |
| |
| |
|
|
| Tax-exempt fixed income (Lehman Brothers Municipal Bond Index) | | +3.22 | | + 3.36 |
| |
| |
|
|
| High yield bonds (Lehman Brothers U.S. Corporate High Yield 2% Issuer Cap Index) | | –0.67 | | + 2.27 |
| |
| |
|
|
Past performance is no guarantee of future results. Index performance shown for illustrative purposes only. You cannot invest directly in an index.
Subprime mortgage woes dominated headlines for much of 2007, spawning a widespread liquidity and credit crisis with ramifications across global markets. The Federal Reserve Board (the “Fed”) stepped in to inject liquidity into the markets and bolster investor confidence, cutting the federal funds rate by 0.50% in September, 0.25% in October and 0.25% in December, which brought the target short-term interest rate to 4.25% . In taking action, the central bankers, who had long deemed themselves inflation fighters, were seeking to stem the fallout from the credit crunch and forestall a wider economic unraveling.
Amid the volatility, equity markets displayed surprising resilience. Market fundamentals generally held firm, dividend payouts and share buybacks continued, and valuations remained attractive. To some extent, the credit turmoil dampened corporate merger-and-acquisition (M&A) activity, a key source of strength for equity markets, but 2007 remained a record year for global M&A nonetheless. As the returns indicate, the most recent six months were more trying, reflecting the slowing U.S. economy, a troubled housing market and a more difficult corporate earnings backdrop. Overall, large cap stocks outperformed small caps as investors grew increasingly risk averse. International markets fared better than their U.S. counterparts, benefiting from generally stronger economies.
In fixed income markets, mixed economic signals and subprime fallout resulted in a flight to quality. Investors shunned bonds associated with the housing and credit markets in favor of higher-quality Treasury issues. The yield on 10-year Treasury issues, which touched 5.30% in June (its highest level in five years), fell to 4.04% by year-end, while prices correspondingly rose. The tax-exempt bond market waffled amid the economic uncertainty and concerns around the credit worthiness of bond insurers, but set a new-issuance record in 2007. A drop in municipal bond prices created buying opportunities, and the heightened supply was generally well absorbed.
As you navigate the uncertainties inherent in the financial markets, we encourage you to start the year by reviewing your investment goals with your financial professional and making portfolio changes, as needed. For more reflection on 2007 and our 10 predictions for 2008, please ask your financial professional for a copy of “What’s Ahead in 2008: An Investment Perspective,” or view it online at www.blackrock.com/funds. As always, we thank you for entrusting BlackRock with your investment assets, and we look forward to continuing to serve you in the new year and beyond.
Sincerely,
THIS PAGE NOT PART OF YOUR FUND REPORT
3
Fund Summary
Portfolio Management Commentary
How did the Fund perform?- The Fund provided strong absolute returns, but modestly underperformed its benchmark for the six-month period ended December 31, 2007.
What factors influenced performance?
- The Fund’s underweight position in China, which was Asia’s best-perform- ing market during the period, dragged on relative performance. Elsewhere in Asia, holdings in Thailand and Taiwan also detracted. While an over- weight allocation to Brazil proved helpful, this was offset by weak stock selection, particularly the decision to underweight energy giant Petrobras, whose share price surged following the surprise discovery of a huge off- shore oil reserve. Poor stock selection in the consumer discretionary sector, particularly Latin American homebuilders such as Corporacion Geo, SA de CV in Mexico, also hindered the Fund’s relative results.
- South Korea was the largest positive contributor to performance, thanks primarily to strong stock selection. Holdings in the Middle East also proved beneficial, particularly in the non-benchmarked United Arab Emirates, where low-cost carrier Air Arabia appreciated more than 75% during this period. An underweight exposure to the weak Mexican market also contributed to the Fund’s relative performance. At the sector level, our holdings in materials were very strong, led by Brazilian iron ore miner Companhia Vale do Rio Doce and Indian steel producer JSW. Industrial companies also contributed positively, particularly those with exposure to the Indian construction theme.
Describe recent portfolio activity.- During the period, we significantly reduced the Fund’s exposure to Latin America. We took profits in Brazil, particularly in domestic-oriented names that had enjoyed a strong run. We also trimmed the Fund’s exposure to Mexico, as the market slowed on fears of a U.S. economic slowdown.
- In the Emerging Europe, Middle East and Africa (EEMEA) region, increased political clarity and attractive valuations led us to build on the Fund’s Russian holdings, particularly OAO Gazprom, which appears set to benefit from the ongoing liberalization of domestic gas prices starting in 2008. We also increased the Fund’s positions in the United Arab Emirates, while reducing exposure to South Africa, where the econo- my showed signs of a slowdown. Weights in Asia remained relatively unchanged. The Fund remained underweight the North Asian economies, while overweight Thailand and the Philippines.
Describe Fund positioning at period-end.
- Heading into 2008, the Fund remains overweight Latin America and EEMEA, and underweight Asia. Brazil continues to represent the largest weighting, given its combination of an improving macro-economic environment and compelling valuations. We increased exposure to the energy and materials sectors there. In Russia, our focus is on energy names, primarily Gazprom, but also oil producer OAO Rosnft Oil Co.
Elsewhere in the EEMEA region, we continue to like the United ArabEmirates, while being underweight South Africa and Central Europe. InAsia, the Fund is underweight the North Asian markets, as well as India,while overweight South East Asia.
| Total Return Based on a $10,000 Investment |
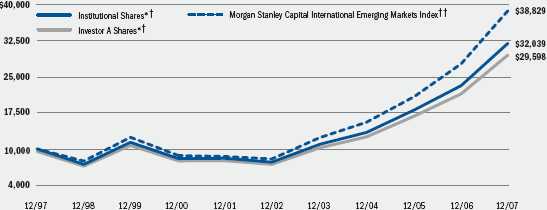
* Assuming maximum sales charge, if any, transaction costs and other operating expenses, including advisory fees.
† The Fund invests in securities, principally equities, of issuers in countries having smaller capital markets.
† † This unmanaged Index measures the total returns of emerging foreign stock markets in Europe, Asia and the Far East.
Past performance is not indicative of future results.
4
BLACKROCK DEVELOPING CAPITAL MARKETS FUND, INC.
| Performance Summary for the Period Ended December 31, 2007 | | | | | | | | | | | | |
| |
| |
| |
| |
| |
| |
|
| |
| | | | | | | | | Average Annual Total Returns* | | | | |
| | | | |
| |
| |
| |
| |
|
| | | | | 1 Year | | 5 Years | | 10 Years |
| | | | |
| |
| |
|
| | | 6-Month | | w/o sales | | w/sales | | w/o sales | | w/sales | | w/o sales | | w/sales |
| | | Total Returns | | charge | | charge | | charge | | charge | | charge | | charge |
| |
| |
| |
| |
| |
| |
| |
|
| Institutional | | +17.62% | | +38.05% | | — | | +34.66% | | — | | +12.35% | | — |
| Investor A | | +17.44 | | +37.69 | | +30.46% | | +34.32 | | +32.88% | | +12.06 | | +11.46% |
| Investor B | | +16.98 | | +36.60 | | +32.10 | | +33.29 | | +33.16 | | +11.35 | | +11.35 |
| Investor C | | +16.98 | | +36.61 | | +35.61 | | +33.27 | | +33.27 | | +11.17 | | +11.17 |
| Morgan Stanley Capital International | | | | | | | | | | | | | | |
| Emerging Markets Index | | +18.71 | | +39.78 | | — | | +37.46 | | — | | +14.53 | | — |
| |
| |
| |
| |
| |
| |
| |
|
| * | Assuming maximum sales charges. See “About Fund Performance” on page 6 for a detailed description of share classes, including any related sales charges and fees. Past performance is not indicative of future results. |
| |
| Expense Example | | | | | | | | | | | | |
| |
| | | | | Actual | | | | | | Hypothetical** | | |
| | | Beginning | | Ending | | | | Beginning | | Ending | | |
| | | Account Value | | Account Value | | Expenses Paid | | Account Value | | Account Value | | Expenses Paid |
| | | July 1, 2007 | | Dec. 31, 2007 | | During the Period* | | July 1, 2007 | | Dec. 31, 2007 | | During the Period* |
| |
| |
| |
| |
| |
| |
|
| Institutional | | $1,000 | | $1,176.20 | | $ 7.17 | | $1,000 | | $1,018.71 | | $ 6.65 |
| Investor A | | $1,000 | | $1,174.40 | | $ 8.71 | | $1,000 | | $1,017.29 | | $ 8.08 |
| Investor B | | $1,000 | | $1,169.80 | | $13.09 | | $1,000 | | $1,013.24 | | $12.14 |
| Investor C | | $1,000 | | $1,169.80 | | $12.81 | | $1,000 | | $1,013.49 | | $11.89 |
| |
| |
| |
| |
| |
| |
|
| * | For each class of the Fund, expenses are equal to the annualized expense ratio for the class (1.30% for Institutional, 1.58% for Investor A, 2.38% for Investor B, and 2.33% for Investor C), multiplied by the average account value over the period, multiplied by 185/365 (to reflect the one-half year period shown). |
| |
| ** | Hypothetical 5% annual return before expenses is calculated by pro-rating the number of days in the most recent fiscal half year divided by 365. See “Disclosure of Expenses” on page 6 for further information on how expenses were calculated. |
| |
| Fund Profile as of December 31, 2007 | | |
| |
|
| |
| Ten Largest Holdings | | Percent of |
| (Equity Investments) | | Net Assets |
| |
|
| OAO Gazprom | | 5.8% |
| Petroleo Brasileiro SA | | 4.3 |
| Companhia Vale do Rio Doce | | |
| (Preference ‘A’ Shares) | | 3.2 |
| China Mobile Ltd. | | 2.8 |
| Kookmin Bank | | 2.8 |
| America Movil, SA de CV | | 2.7 |
| Banco Bradesco SA | | 2.3 |
| Tenaris SA | | 2.2 |
| Samsung Electronics Co., Ltd. | | 2.2 |
| Sasol Ltd. | | 2.0 |
| |
|
| Five Largest Industries | | Percent of |
| (Equity Investments) | | Net Assets |
| |
|
| Commercial Banks | | 18.2% |
| Oil, Gas & Consumable Fuels | | 15.6 |
| Metals & Mining | | 12.1 |
| Industrial Conglomerates | | 6.5 |
| Wireless Telecommunication Services | | 6.0 |
| |
|
| |
| For Fund compliance purposes, the Fund's industry classifications refer to any |
| one or more of the industry sub-classifications used by one or more widely rec- |
| ognized market indexes or ratings group indexes, and/or as defined by Fund |
| management. This definition may not apply for purposes of this report, which |
| may combine such industry sub-classifications for reporting ease. | | |
| BLACKROCK DEVELOPING CAPITAL MARKETS FUND, INC. |
- Institutional Shares are not subject to any sales charge. Institutional Shares bear no ongoing distribution or service fees and are available only to eligible investors.
- Investor A Shares incur a maximum initial sales charge (front-end load) of 5.25% and a service fee of 0.25% per year (but no distribution fee).
- Investor B Shares are subject to a maximum contingent deferred sales charge of 4.50% declining to 0% after six years. In addition, Investor B
Shares are subject to a distribution fee of 0.75% per year and a service fee of 0.25% per year. These shares automatically convert to Investor AShares after approximately eight years. (There is no initial sales charge for automatic share conversions.) All returns for periods greater than eight years reflect this conversion. - Investor C Shares are subject to a distribution fee of 0.75% and a service fee of 0.25%. In addition, Investor C Shares are subject to a 1% contingent deferred sales charge if redeemed within one year of purchase.
Performance information reflects past performance and does not guar-
antee future results. Current performance may be lower or higher than
the performance data quoted. Refer to www.blackrock.com/funds to
obtain performance data current to the most recent month-end.
Performance results do not reflect the deduction of taxes that a share-
holder would pay on fund distributions or the redemption of fund shares.
The Fund may charge a 2% redemption fee for sales or exchanges of
shares within 30 days of purchase or exchange. Performance data does
not reflect this potential fee. Figures shown in the performance tables
on page 5 assume reinvestment of all dividends and capital gain
distributions, if any, at net asset value on the ex-dividend date.
Investment return and principal value of shares will fluctuate so that
shares, when redeemed, may be worth more or less than their original
cost. Dividends paid to each class of shares will vary because of the
different levels of service, distribution and transfer agency fees applica-
ble to each class, which are deducted from the income available to be
paid to shareholders. |
| | Disclosure of Expenses
Shareholders of this Fund may incur the following charges: (a) expenses
related to transactions, including sales charges, redemption fees and
exchange fees; and (b) operating expenses including advisory fees,
distribution fees including 12b-1 fees, and other Fund expenses. The
expense example on page 5 (which is based on a hypothetical invest-
ment of $1,000 invested on July 1, 2007 and held through December 31,
2007) is intended to assist shareholders both in calculating expenses
based on an investment in the Fund and in comparing these expenses
with similar costs of investing in other mutual funds.
The table provides information about actual account values and actual
expenses. In order to estimate the expenses a shareholder paid during
the period covered by this report, shareholders can divide their account
value by $1,000 and then multiply the result by the number correspon-
ding to their share class under the heading “Expenses Paid During
the Period.” |
| | The table also provides information about hypothetical account values
and hypothetical expenses based on the Fund’s actual expense ratio
and an assumed rate of return of 5% per year before expenses. In
order to assist shareholders in comparing the ongoing expenses of
investing in this Fund and other funds, compare the 5% hypothetical
example with the 5% hypothetical examples that appear in other funds’
shareholder reports.
The expenses shown in the table are intended to highlight shareholders’
ongoing costs only and do not reflect any transactional expenses, such
as sales charges, redemption fees or exchange fees. Therefore, the hypo-
thetical table is useful in comparing ongoing expenses only, and will
not help shareholders determine the relative total expenses of owning
different funds. If these transactional expenses were included, shareholder
expenses would have been higher. |
6
BLACKROCK DEVELOPING CAPITAL MARKETS FUND, INC.
| Portfolio Summary | | |
| |
|
| |
| As of December 31, 2007 | | |
| |
|
| |
| | | Percent of |
| | | Long-Term |
| Geographic Allocation | | Investments |
| |
|
| Brazil | | 16.8% |
| South Korea | | 13.0 |
| Russia | | 12.7 |
| China | | 11.8 |
| Taiwan | | 8.3 |
| India | | 6.3 |
| South Africa | | 6.1 |
| Mexico | | 3.9 |
| Malaysia | | 3.5 |
| United Arab Emirates | | 3.5 |
| Turkey | | 3.5 |
| Thailand | | 2.2 |
| Argentina | | 2.2 |
| Philippines | | 1.8 |
| Kazakhstan | | 1.4 |
| Egypt | | 1.0 |
| Indonesia | | 1.0 |
| Israel | | 1.0 |
| |
|
| BLACKROCK DEVELOPING CAPITAL MARKETS FUND, INC. |
Schedule of Investments as of December 31, 2007 (Unaudited)
| | | Shares | | |
| Common Stocks | | Held | | Value |
| |
| |
|
| |
| Africa | | | | |
| |
| |
|
| |
| South Africa — 6.0% | | | | |
| Commercial Banks — 1.0% | | | | |
| Nedbank Group Ltd. | | 160,836 | | $ 3,217,700 |
| |
| |
|
| Commercial Services & Supplies — 0.5% | | | | |
| Blue Label Telecoms Ltd. (b) | | 1,331,553 | | 1,714,525 |
| |
| |
|
| Diversified Financial Services — 0.9% | | | | |
| FirstRand Ltd. | | 940,180 | | 2,711,894 |
| |
| |
|
| Metals & Mining — 1.1% | | | | |
| Anglo Platinum Ltd. | | 22,720 | | 3,351,531 |
| |
| |
|
| Oil, Gas & Consumable Fuels — 1.9% | | | | |
| Sasol Ltd. | | 124,265 | | 6,157,765 |
| |
| |
|
| Pharmaceuticals — 0.6% | | | | |
| Enaleni Pharmaceuticals Ltd. (b) | | 3,145,065 | | 1,846,746 |
| |
| |
|
| Total Common Stocks in Africa — 6.0% | | | | 19,000,161 |
| |
| |
|
| |
| |
| Europe | | | | |
| |
| |
|
| |
| Russia — 12.6% | | | | |
| Commercial Banks — 1.0% | | | | |
| VTB Bank OJSC (a)(b) | | 312,530 | | 3,156,553 |
| |
| |
|
| Metals & Mining — 2.7% | | | | |
| Cherepovets MK Severstal (a) | | 141,227 | | 3,205,853 |
| MMC Norilsk Nickel (a) | | 10,870 | | 2,940,335 |
| Novolipetsk Steel (a) | | 58,134 | | 2,366,054 |
| | | | |
|
| | | | | 8,512,242 |
| |
| |
|
| Oil, Gas & Consumable Fuels — 8.4% | | | | |
| LUKOIL (a) | | 55,746 | | 4,710,537 |
| OAO Gazprom (a) | | 322,695 | | 18,264,537 |
| OAO Rosnft Oil Co. (a)(b) | | 349,200 | | 3,341,146 |
| | | | |
|
| | | | | 26,316,220 |
| |
| |
|
| Wireless Telecommunication Services — 0.5% | | | | |
| Mobile Telesystems (a) | | 17,100 | | 1,740,609 |
| |
| |
|
| Total Common Stocks in Russia | | | | 39,725,624 |
| |
| |
|
| Turkey — 3.5% | | | | |
| Commercial Banks — 2.5% | | | | |
| Akbank T.A.S. | | 116,336 | | 859,230 |
| Turkiye Garanti Bankasi AS | | 360,640 | | 3,218,148 |
| Turkiye Vakiflar Bankasi T.A.O. Class D | | 1,042,000 | | 3,666,177 |
| | | | |
|
| | | | | 7,743,555 |
| |
| |
|
| Metals & Mining — 1.0% | | | | |
| Eldorado Gold Corp. (b) | | 529,560 | | 3,128,157 |
| |
| |
|
| Total Common Stocks in Turkey | | | | 10,871,712 |
| |
| |
|
| Total Common Stocks in Europe — 16.1% | | | | 50,597,336 |
| |
| |
|
| |
| |
| Latin America | | | | |
| |
| |
|
| |
| Argentina — 2.2% | | | | |
| Energy Equipment & Services — 2.2% | | | | |
| Tenaris SA (a) | | 154,530 | | 6,912,127 |
| |
| |
|
| Total Common Stocks in Argentina | | | | 6,912,127 |
| |
| |
|
| | | Shares | | |
| Common Stocks | | Held | | Value |
| |
| |
|
| |
| Latin America (concluded) | | | | |
| |
| |
|
| |
| Brazil — 16.7% | | | | |
| Airlines — 0.3% | | | | |
| Tam SA (Preference Shares) (a) | | 45,099 | | $ 1,087,788 |
| |
| |
|
| Building Products — 0.7% | | | | |
| Duratex SA (Preference Shares) | | 85,343 | | 2,085,629 |
| |
| |
|
| Commercial Banks — 2.7% | | | | |
| Banco Bradesco SA (a) | | 221,658 | | 7,093,056 |
| Banco Industrial e Comercial SA | | | | |
| (Preference Shares) | | 243,825 | | 1,488,976 |
| | | | |
|
| | | | | 8,582,032 |
| |
| |
|
| Diversified Telecommunication Services — 1.0% | | | | |
| Tele Norte Leste Participacoes SA (a) | | 109,000 | | 2,101,520 |
| Tele Norte Leste Participacoes SA | | 28,000 | | 921,011 |
| | | | |
|
| | | | | 3,022,531 |
| |
| |
|
| Household Durables — 0.9% | | | | |
| Cyrela Brazil Realty SA | | 208,500 | | 2,834,663 |
| |
| |
|
| Independent Power Producers & | | | | |
| Energy Traders — 1.2% | | | | |
| Cia Energetica de Sao Paulo | | | | |
| (Preference Shares) | | 158,657 | | 3,871,053 |
| |
| |
|
| Metals & Mining — 4.1% | | | | |
| Companhia Vale do Rio Doce | | | | |
| (Preference ‘A’ Shares) (a) | | 356,402 | | 9,972,128 |
| Usinas Siderurgicas de Minas Gerais SA | | | | |
| (Preference ‘A’ Shares) | | 65,257 | | 2,987,891 |
| | | | |
|
| | | | | 12,960,019 |
| |
| |
|
| Multiline Retail — 0.5% | | | | |
| Lojas Renner SA | | 70,892 | | 1,433,771 |
| |
| |
|
| Oil, Gas & Consumable Fuels — 4.3% | | | | |
| Petroleo Brasileiro SA (a) | | 142,178 | | 13,680,367 |
| |
| |
|
| Real Estate Management & Development — 1.0% | | | | |
| Agra Empreendimentos Imobiliarios SA (b) | | 222,390 | | 1,461,777 |
| Rodobens Negocios Imobiliarios SA | | 135,455 | | 1,609,479 |
| | | | |
|
| | | | | 3,071,256 |
| |
| |
|
| Total Common Stocks in Brazil | | | | 52,629,109 |
| |
| |
|
| Mexico — 3.9% | | | | |
| Construction & Engineering — 0.8% | | | | |
| Empresas ICA Sociedad Controladora, SA de CV (b) | | 370,688 | | 2,445,034 |
| |
| |
|
| Household Durables — 0.4% | | | | |
| Corporacion GEO, SA de CV Series B (b) | | 454,298 | | 1,306,997 |
| |
| |
|
| Wireless Telecommunication Services — 2.7% | | | | |
| America Movil, SA de CV (a) | | 136,713 | | 8,392,811 |
| |
| |
|
| Total Common Stocks in Mexico | | | | 12,144,842 |
| |
| |
|
| Total Common Stocks in Latin America — 22.8% | | | | 71,686,078 |
| |
| |
|
8
BLACKROCK DEVELOPING CAPITAL MARKETS FUND, INC.
Schedule of Investments (continued)
| | | Shares | | |
| Common Stocks | | Held | | Value |
| |
| |
|
| Middle East | | | | |
| |
| |
|
| Egypt — 1.0% | | | | |
| Capital Markets — 1.0% | | | | |
| Egyptian Financial Group-Hermes Holding | | 276,800 | | $ 3,296,368 |
| |
| |
|
| Total Common Stocks in Egypt | | | | 3,296,368 |
| |
| |
|
| Israel — 1.0% | | | | |
| Software — 1.0% | | | | |
| AFI Development Plc (a)(b) | | 320,987 | | 3,046,167 |
| |
| |
|
| Total Common Stocks in Israel | | | | 3,046,167 |
| |
| |
|
| Total Common Stocks in the Middle East — 2.0% | | | | 6,342,535 |
| |
| |
|
| |
| Pacific Basin/Asia | | | | |
| |
| |
|
| China — 11.6% | | | | |
| Commercial Banks — 1.9% | | | | |
| China Construction Bank Class H | | 3,404,000 | | 2,850,628 |
| Industrial & Commercial Bank of China | | 4,344,000 | | 3,083,801 |
| | | | |
|
| | | | | 5,934,429 |
| |
| |
|
| Electronic Equipment & Instruments — 1.2% | | | | |
| AAC Acoustic Technology Holdings, Inc. (b) | | 2,730,000 | | 3,635,167 |
| |
| |
|
| Independent Power Producers & | | | | |
| Energy Traders — 0.6% | | | | |
| Datang International Power Generation Co. Ltd. | | 2,178,000 | | 1,914,618 |
| |
| |
|
| Industrial Conglomerates — 1.3% | | | | |
| Beijing Enterprises Holdings Ltd. | | 896,000 | | 4,202,381 |
| |
| |
|
| Insurance — 1.2% | | | | |
| China Life Insurance Co. Ltd. | | 768,000 | | 3,925,606 |
| |
| |
|
| Metals & Mining — 0.8% | | | | |
| Angang New Steel Co. Ltd. | | 963,800 | | 2,583,799 |
| |
| |
|
| Oil, Gas & Consumable Fuels — 0.9% | | | | |
| PetroChina Co. Ltd. | | 1,601,000 | | 2,819,909 |
| |
| |
|
| Real Estate Management & Development — 0.9% | | | | |
| Shimao Property Holdings Ltd. | | 1,130,000 | | 2,833,918 |
| |
| |
|
| Wireless Telecommunication Services — 2.8% | | | | |
| China Mobile Ltd. | | 509,990 | | 8,881,222 |
| |
| |
|
| Total Common Stocks in China | | | | 36,731,049 |
| |
| |
|
| India — 2.7% | | | | |
| Commercial Banks — 1.0% | | | | |
| Bank of India | | 343,220 | | 3,148,698 |
| |
| |
|
| Construction & Engineering — 0.8% | | | | |
| IVRCL Infrastructures & Projects Ltd. | | 33,753 | | 475,959 |
| Prajay Engineers Syndicate Ltd. | | 208,852 | | 2,108,398 |
| | | | |
|
| | | | | 2,584,357 |
| |
| |
|
| Electric Utilities — 0.3% | | | | |
| Tata Power Co. Ltd. | | 28,240 | | 1,040,545 |
| |
| |
|
| Household Durables — 0.6% | | | | |
| DS Kulkarni Developers Ltd. | | 196,700 | | 1,833,852 |
| |
| |
|
| Total Common Stocks in India | | | | 8,607,452 |
| |
| |
|
| | | | | (in U.S. dollars) |
| |
| | | Shares | | |
| Common Stocks | | Held | | Value |
| |
| |
|
| |
| Pacific Basin/Asia | | | | |
| |
| |
|
| |
| Indonesia — 1.0% | | | | |
| Commercial Banks — 1.0% | | | | |
| Bank Mandiri Persero Tbk PT | | 8,369,000 | | $ 3,067,298 |
| |
| |
|
| Total Common Stocks in Indonesia | | | | 3,067,298 |
| |
| |
|
| Kazakhstan — 1.4% | | | | |
| Metals & Mining — 1.4% | | | | |
| Eurasian Natural Resources Corp. (b) | | 103,084 | | 1,313,277 |
| Kazakhmys Plc | | 116,640 | | 3,155,772 |
| |
| |
|
| Total Common Stocks in Kazakhstan | | | | 4,469,049 |
| |
| |
|
| Malaysia — 3.5% | | | | |
| Commercial Banks — 0.7% | | | | |
| Bumiputra-Commerce Holdings Bhd | | 719,800 | | 2,369,869 |
| |
| |
|
| Energy Equipment & Services — 0.4% | | | | |
| KNM Group Bhd | | 543,900 | | 1,251,766 |
| |
| |
|
| Industrial Conglomerates — 2.4% | | | | |
| Malaysian Resources Corp. Bhd (b) | | 3,529,000 | | 2,684,431 |
| Sime Darby BhD (b) | | 1,314,148 | | 4,728,866 |
| | | | |
|
| | | | | 7,413,297 |
| |
| |
|
| Total Common Stocks in Malaysia | | | | 11,034,932 |
| |
| |
|
| Philippines — 1.8% | | | | |
| Diversified Financial Services — 1.0% | | | | |
| Ayala Corp. | | 234,020 | | 3,161,378 |
| |
| |
|
| Real Estate Management & | | | | |
| Development — 0.8% | | | | |
| Robinsons Land Corp. | | 6,315,000 | | 2,499,057 |
| |
| |
|
| Total Common Stocks in the Philippines | | | | 5,660,435 |
| |
| |
|
| South Korea — 13.0% | | | | |
| Commercial Banks — 3.7% | | | | |
| Industrial Bank of Korea | | 146,960 | | 2,741,826 |
| Kookmin Bank | | 119,570 | | 8,813,984 |
| | | | |
|
| | | | | 11,555,810 |
| |
| |
|
| Construction & Engineering — 3.0% | | | | |
| Daelim Industrial Co. | | 16,800 | | 3,176,618 |
| GS Engineering & Construction Corp. | | 11,510 | | 1,892,702 |
| Keangnam Enterprises Ltd. | | 104,300 | | 4,406,932 |
| | | | |
|
| | | | | 9,476,252 |
| |
| |
|
| Industrial Conglomerates — 1.6% | | | | |
| CJ Corp. | | 58,454 | | 5,087,327 |
| |
| |
|
| Insurance — 1.2% | | | | |
| Dongbu Insurance Co., Ltd. | | 65,880 | | 3,792,221 |
| |
| |
|
| Multiline Retail — 1.3% | | | | |
| Lotte Shopping Co. Ltd. | | 9,170 | | 4,018,111 |
| |
| |
|
| Semiconductors & Semiconductor | | | | |
| Equipment — 2.2% | | | | |
| Samsung Electronics Co., Ltd. | | 11,611 | | 6,833,048 |
| |
| |
|
| Total Common Stocks in South Korea | | | | 40,762,769 |
| |
| |
|
| BLACKROCK DEVELOPING CAPITAL MARKETS FUND, INC. |
Schedule of Investments (concluded)
| | | Shares | | |
| Common Stocks | | Held | | Value |
| |
| |
|
| |
| Pacific Basin/Asia (concluded) | | | | |
| |
| |
|
| |
| Taiwan — 8.3% | | | | |
| Electronic Equipment & Instruments — 2.0% | | | | |
| HON HAI Precision Industry Co., Ltd. | | 999,000 | | $ 6,157,317 |
| |
| |
|
| Industrial Conglomerates — 1.2% | | | | |
| Far Eastern Textile Co. Ltd. | | 3,337,800 | | 3,879,740 |
| |
| |
|
| Insurance — 1.9% | | | | |
| Cathay Financial Holding Co., Ltd. | | 2,800,000 | | 5,785,480 |
| |
| |
|
| Metals & Mining — 1.0% | | | | |
| China Steel Corp. | | 2,403,000 | | 3,196,638 |
| |
| |
|
| Semiconductors & Semiconductor | | | | |
| Equipment — 2.2% | | | | |
| Advanced Semiconductor Engineering Inc. | | 2,657,787 | | 2,647,726 |
| Taiwan Semiconductor Manufacturing Co., Ltd. (a) | | 282,100 | | 2,809,716 |
| Taiwan Semiconductor Manufacturing Co., Ltd. | | 834,000 | | 1,581,254 |
| | | | |
|
| | | | | 7,038,696 |
| |
| |
|
| Total Common Stocks in Taiwan | | | | 26,057,871 |
| |
| |
|
| Thailand — 2.2% | | | | |
| Commercial Banks — 1.5% | | | | |
| Kasikornbank PCL | | 1,827,000 | | 4,677,824 |
| |
| |
|
| Diversified Telecommunication | | | | |
| Services — 0.7% | | | | |
| True Corp. PCL — Foreign (b) | | 13,062,600 | | 2,249,164 |
| |
| |
|
| Total Common Stocks in Thailand | | | | 6,926,988 |
| |
| |
|
| Total Common Stocks in the Pacific Basin/Asia — 45.5% | | 143,317,843 |
| |
|
| Total Common Stocks (Cost — $237,966,611) — 92.4% | | 290,943,953 |
| |
|
| | | | | (in U.S. dollars) |
| |
| | | Shares | | |
| Structured Notes | | Held | | Value |
| |
| |
|
| Middle East | | | | |
| |
| |
|
| United Arab Emirates — 3.5% | | | | |
| Commercial Banks — 1.2% | | | | |
| HSBC Bank Plc (Air Arabia), due 7/24/2008 (b) | | 7,278,571 | | $ 3,904,298 |
| |
| |
|
| Diversified Financial Services — 2.3% | | | | |
| Citigroup Global Markets Holdings, Inc. (b) | | | | |
| (Emaar Properties PJSC), due 3/19/2008 | | 1,748,546 | | 7,094,078 |
| |
| |
|
| Total Structured Notes in the Middle East — 3.5% | | | | 10,998,376 |
| |
| |
|
| |
| Pacific Basin/Asia | | | | |
| |
| |
|
| India — 3.5% | | | | |
| Capital Markets — 1.8% | | | | |
| Morgan Stanley Asia Products Ltd. | | | | |
| (Bharti Airtel Ltd.), due 8/01/2010 (b) | | 233,528 | | 5,894,504 |
| |
| |
|
| Diversified Financial Services — 1.7% | | | | |
| Citigroup Global Markets Holdings, Inc. | | | | |
| (JSW Steel Ltd.), due 1/20/2010 (b) | | 160,363 | | 5,368,488 |
| |
| |
|
| Total Structured Notes in the Pacific Basin/Asia — 3.5% | | 11,262,992 |
| |
|
| Total Structured Notes (Cost — $16,899,752) — 7.1% | | 22,261,368 |
| |
|
| Total Investments (Cost — $254,866,363*) — 99.5% | | 313,205,321 |
| Other Assets Less Liabilities — 0.5% | | | | 1,465,974 |
| | | | |
|
| Net Assets — 100.0% | | | | $314,671,295 |
| | | | |
|
| * The cost and unrealized appreciation (depreciation) of investments as of December |
| 31, 2007, as computed for federal income tax purposes, were as follows: |
| Aggregate cost | | $ 254,948,255 |
| | |
|
| Gross unrealized appreciation | | $ 65,587,870 |
| Gross unrealized depreciation | | (7,330,804) |
| | |
|
| Net unrealized appreciation | | $ 58,257,066 |
| | |
|
(a) Depositary receipts.
(b) Non-income producing security. |
• For Fund compliance purposes,the Fund's industry classifications refer to any one or
more of the industry sub-classifications used by one or more widely recognized market
indexes or ratings group indexes, and/or as defined by Fund management. This defini-
tion may not apply for purposes of this report, which may combine such industry sub-
classifications for reporting ease. Industries are shown as a percent of net assets.
• Investments in companies considered to be an affiliate of the Fund,for purposes of
Section 2(a)(3) of the Investment Company Act of 1940, were as follows: |
| | | Net | | | | Interest |
| Affiliate | | Activity | | | | Income |
| |
| |
| |
|
| |
| BlackRock Liquidity Series, LLC | | | | | | |
| Cash Sweep Series | | | | — | | $57,273 |
| |
| |
| |
|
| | See Notes to Financial Statements. |
10
BLACKROCK DEVELOPING CAPITAL MARKETS FUND, INC.
| Statement of Assets and Liabilities | | | | |
| |
| As of December 31, 2007 (Unaudited) | | | | |
| |
| |
|
| |
| Assets | | | | |
| |
| |
|
| |
| Investments in unaffiliated securities, at value (identified cost — $254,866,363) | | | | $ 313,205,321 |
| Foreign cash (cost — $5,715,505) | | | | 5,730,310 |
| Receivables: | | | | |
| Securities sold | | $ 881,689 | | |
| Dividends | | 376,885 | | |
| Capital shares sold | | 101,246 | | |
| Interest from affiliates | | 2,549 | | 1,362,369 |
| | |
| | |
| Prepaid expenses and other assets | | | | 25,871 |
| | | | |
|
| Total assets | | | | 320,323,871 |
| |
| |
|
| |
| Liabilities | | | | |
| |
| |
|
| |
| Deferred foreign capital gain tax | | | | 146,531 |
| Bank overdraft | | | | 2,737,043 |
| Payables: | | | | |
| Securities purchased | | 1,993,721 | | |
| Investment adviser | | 267,799 | | |
| Capital shares redeemed | | 223,279 | | |
| Distributor | | 77,195 | | |
| Other affiliates | | 70,054 | | |
| Distributions to shareholders | | 854 | | 2,632,902 |
| | |
| | |
| Accrued expenses and other liabilities | | | | 136,100 |
| | | | |
|
| Total liabilities | | | | 5,652,576 |
| |
| |
|
| |
| Net Assets | | | | |
| |
| |
|
| |
| Net assets | | | | $ 314,671,295 |
| |
| |
|
| |
| Net Assets Consist of | | | | |
| |
| |
|
| |
| Institutional Shares of Common Stock, $.10 par value, 100,000,000 shares authorized | | | | $ 369,454 |
| Investor A Shares of Common Stock, $.10 par value, 100,000,000 shares authorized | | | | 691,114 |
| Investor B Shares of Common Stock, $.10 par value, 100,000,000 shares authorized | | | | 51,662 |
| Investor C Shares of Common Stock, $.10 par value, 100,000,000 shares authorized | | | | 172,173 |
| Paid-in capital in excess of par | | | | 250,423,052 |
| Undistributed investment income — net | | | | 401,728 |
| Undistributed realized capital gains — net | | | | 4,356,359 |
| Unrealized appreciation — net | | | | 58,205,753 |
| | | | |
|
| Net Assets | | | | $ 314,671,295 |
| |
| |
|
| |
| Net Asset Value | | | | |
| |
| |
|
| |
| Insitutional — Based on net assets of $93,945,402 and 3,694,537 shares outstanding | | | | $ 25.43 |
| | | | |
|
| Investor A — Based on net assets of $170,956,193 and 6,911,144 shares outstanding | | | | $ 24.74 |
| | | | |
|
| Investor B — Based on net assets of $11,684,406 and 516,618 shares outstanding | | | | $ 22.62 |
| | | | |
|
| Investor C — Based on net assets of $38,085,294 and 1,721,725 shares outstanding | | | | $ 22.12 |
| | | | |
|
| See Notes to Financial Statements. | | | | |
| BLACKROCK DEVELOPING CAPITAL MARKETS FUND, INC. |
| Statement of Operations | | | | |
| |
| For the Six Months Ended December 31, 2007 (Unaudited) | | | | |
| |
| |
|
| |
| Investment Income | | | | |
| |
| |
|
| |
| Dividends (net of $247,719 foreign withholding tax) | | | | $ 2,839,635 |
| Interest from affiliates | | | | 57,273 |
| | | | |
|
| Total income | | | | 2,896,908 |
| |
| |
|
| |
| |
| Expenses | | | | |
| |
| |
|
| |
| Investment advisory fees | | $ 1,538,924 | | |
| Service fees — Investor A | | 207,782 | | |
| Custodian fees | | 205,173 | | |
| Service and distribution fees — Investor C | | 179,786 | | |
| Transfer agent fees — Investor A | | 109,281 | | |
| Accounting services | | 65,101 | | |
| Service and distribution fees — Investor B | | 63,663 | | |
| Transfer agent fees — Institutional | | 47,648 | | |
| Printing and shareholder reports | | 31,747 | | |
| Professional fees | | 30,130 | | |
| Registration fees | | 27,509 | | |
| Transfer agent fees — Investor C | | 24,126 | | |
| Directors’ fees and expenses | | 11,828 | | |
| Transfer agent fees — Investor B | | 11,603 | | |
| Pricing fees | | 3,424 | | |
| Other | | 14,537 | | |
| | |
| | |
| Total expenses before waiver | | 2,572,262 | | |
| Waiver of expenses | | (77,082) | | |
| | |
| | |
| Total expenses after waiver | | | | 2,495,180 |
| | | | |
|
| Investment income — net | | | | 401,728 |
| |
| |
|
| |
| |
| Realized & Unrealized Gain (Loss) — Net | | | | |
| |
| |
|
| |
| Realized gain (loss) on: | | | | |
| Investments — net (including $136,169 foreign capital gain tax) | | 53,719,872 | | |
| Foreign currency transactions — net | | (70,760) | | 53,649,112 |
| | |
| | |
| Change in unrealized appreciation/depreciation on: | | | | |
| Investments — net (including $146,531 deferred foreign capital gain tax) | | (6,503,638) | | |
| Foreign currency transactions — net | | (1,146) | | (6,504,784) |
| | |
| |
|
| Total realized and unrealized gain — net | | | | 47,144,328 |
| | | | |
|
| Net Increase in Net Assets Resulting from Operations | | | | $ 47,546,056 |
| | | | |
|
| See Notes to Financial Statements. | | | | |
12
BLACKROCK DEVELOPING CAPITAL MARKETS FUND, INC.
| Statements of Changes in Net Assets | | | | |
| |
| | | For the | | For the |
| | | Six Months Ended | | Year Ended |
| | | December 31, 2007 | | June 30, |
| Increase (Decrease) in Net Assets: | | (Unaudited) | | 2007† |
| |
| |
|
| |
| Operations | | | | |
| |
| |
|
| |
| Investment income — net | | $ 401,728 | | $ 125,781 |
| Realized gain — net | | 53,649,112 | | 46,929,278 |
| Change in unrealized appreciation/depreciation — net | | (6,504,784) | | 40,985,034 |
| | |
| |
|
| Net increase in net assets resulting from operations | | 47,546,056 | | 88,040,093 |
| |
| |
|
| |
| Dividends & Distributions to Shareholders | | | | |
| |
| |
|
| |
| Investment income — net: | | | | |
| Institutional | | — | | (895,352) |
| Investor A | | — | | (1,243,863) |
| Investor B | | — | | (89,432) |
| Investor C | | — | | (167,642) |
| Realized gain — net: | | | | |
| Institutional | | (21,745,299) | | (13,057,383) |
| Investor A | | (39,569,089) | | (22,224,912) |
| Investor B | | (2,962,637) | | (2,979,300) |
| Investor C | | (9,120,068) | | (4,763,109) |
| | |
| |
|
| Net decrease in net assets resulting from dividends and distributions to shareholders | | (73,397,093) | | (45,420,993) |
| |
| |
|
| |
| Capital Share Transactions | | | | |
| |
| |
|
| |
| Net increase in net assets derived from capital share transactions | | 57,333,853 | | 2,399,521 |
| |
| |
|
| |
| Redemption Fee | | | | |
| |
| |
|
| |
| Redemption fee | | 6,601 | | 7,377 |
| |
| |
|
| |
| Net Assets | | | | |
| |
| |
|
| |
| Total increase in net assets | | 31,489,417 | | 45,025,998 |
| Beginning of period | | 283,181,878 | | 238,155,880 |
| | |
| |
|
| End of period* | | $ 314,671,295 | | $ 283,181,878 |
| | |
| |
|
| * Undistributed investment income — net | | $ 401,728 | | — |
| | |
| |
|
†Consolidated Statement of Changes in Net Assets. See Note 1(h) of Notes to Financial Statements. See Notes to Financial Statements.
| BLACKROCK DEVELOPING CAPITAL MARKETS FUND, INC. |
| Financial Highlights | | | | | | | | | | | | | | |
| |
| | | | | | | | | Institutional | | | | |
| For the Six |
| Months Ended |
| The following per share data and ratios have been derived | | December 31, 2007 | | | | For the Year Ended June 30, | | |
| from information provided in the financial statements. | | (Unaudited) | | | | 2007†† | | 2006†† | | 2005†† | | 2004†† | | 2003†† |
| |
| |
| |
| |
| |
| |
| |
|
| Per Share Operating Performance | | | | | | | | | | | | | | |
| |
| |
| |
| |
| |
| |
| |
|
| |
| Net asset value, beginning of period | | $ 27.91 | | $ 24.14 | | $ 17.74 | | $ 13.37 | | $ 10.42 | | $ 10.33 |
| | |
| |
| |
| |
| |
| |
|
| Investment income — net*** | | .08 | | | | .09 | | .22 | | .18 | | .06 | | .02 |
| Realized and unrealized gain — net | | 4.30† | | | | 8.37† | | 6.28† | | 4.19† | | 2.96 | | .07 |
| | |
| |
| |
| |
| |
| |
| |
|
| Total from investment operations | | 4.38 | | | | 8.46 | | 6.50 | | 4.37 | | 3.02 | | .09 |
| | |
| |
| |
| |
| |
| |
| |
|
| Less dividends and distributions: | | | | | | | | | | | | | | |
| Investment income — net | | — | | | | (.28) | | (.10) | | — | | (.07) | | — |
| Realized gain — net | | (6.86) | | | | (4.41) | | — | | — | | — | | — |
| | |
| |
| |
| |
| |
| |
| |
|
| Total dividends and distributions | | (6.86) | | | | (4.69) | | (.10) | | — | | (.07) | | — |
| | |
| |
| |
| |
| |
| |
| |
|
| Net asset value, end of period | | $ 25.43 | | $ 27.91 | | $ 24.14 | | $ 17.74 | | $ 13.37 | | $ 10.42 |
| |
| |
| |
| |
| |
| |
|
| |
| Total Investment Return** | | | | | | | | | | | | | | |
| |
| |
| |
| |
| |
| |
| |
|
| |
| Based on net asset value per share | | 17.62%‡ | | | | 41.99% | | 36.80% | | 32.69% | | 29.11% | | .87% |
| |
| |
| |
| |
| |
| |
| |
|
| |
| Ratios to Average Net Assets | | | | | | | | | | | | | | |
| |
| |
| |
| |
| |
| |
| |
|
| |
| Expenses, net of waiver and excluding reorganization expenses | | 1.30%* | | | | 1.40% | | 1.50% | | 1.60% | | 1.88% | | 2.15% |
| | |
| |
| |
| |
| |
| |
| |
|
| Expenses, net of waiver | | 1.30%* | | | | 1.40% | | 1.50% | | 1.60% | | 2.02% | | 2.15% |
| | |
| |
| |
| |
| |
| |
| |
|
| Expenses | | 1.35%* | | | | 1.44% | | 1.50% | | 1.63% | | 2.02% | | 2.15% |
| | |
| |
| |
| |
| |
| |
| |
|
| Investment income — net | | .58%* | | | | .36% | | .99% | | 1.18% | | .43% | | .24% |
| |
| |
| |
| |
| |
| |
| |
|
| |
| Supplemental Data | | | | | | | | | | | | | | |
| |
| |
| |
| |
| |
| |
| |
|
| |
| Net assets, end of period (in thousands) | | $ 93,945 | | $ 86,385 | | $ 73,914 | | $ 63,018 | | $ 63,831 | | $ 28,786 |
| | |
| |
| |
| |
| |
| |
|
| Portfolio turnover | | 75% | | | | 140% | | 121% | | 110% | | 183% | | 78% |
| | |
| |
| |
| |
| |
| |
| |
|
| * | Annualized. |
| |
| ** | Total investment returns exclude the effect of any sales charges. |
| |
| *** | Based on average shares outstanding. |
| |
| | † Includes a redemption fee, which is less than $.01 per share. |
††Consolidated Financial Highlights. See Note 1(h) of Notes to Financial Statements.
‡ Aggregate total investment return.
See Notes to Financial Statements.
14
BLACKROCK DEVELOPING CAPITAL MARKETS FUND, INC.
| Financial Highlights (continued) | | | | | | | | | | | | | | |
| |
| | | | | | | | | Investor A | | | | |
For the Six |
| Months Ended |
| The following per share data and ratios have been derived | | December 31, 2007 | | | | For the Year Ended June 30, | | |
| from information provided in the financial statements. | | (Unaudited) | | | | 2007†† | | 2006†† | | 2005†† | | 2004†† | | 2003†† |
| |
| |
| |
| |
| |
| |
| |
|
| Per Share Operating Performance | | | | | | | | | | | | | | |
| |
| Net asset value, beginning of period | | $ 27.27 | | $ 23.68 | | $ 17.41 | | $ 13.16 | | $ 10.27 | | $ 10.19 |
| | |
| |
| |
| |
| |
| |
|
| Investment income — net*** | | .04 | | | | .02 | | .17 | | .15 | | .02 | | .01 |
| Realized and unrealized gain — net | | 4.19† | | | | 8.21† | | 6.16† | | 4.10† | | 2.92 | | .07 |
| | |
| |
| |
| |
| |
| |
| |
|
| Total from investment operations | | 4.23 | | | | 8.23 | | 6.33 | | 4.25 | | 2.94 | | .08 |
| | |
| |
| |
| |
| |
| |
| |
|
| Less dividends and distributions: | | | | | | | | | | | | | | |
| Investment income — net | | — | | | | (.23) | | (.06) | | — | | (.05) | | — |
| Realized gain — net | | (6.76) | | | | (4.41) | | — | | — | | — | | — |
| | |
| |
| |
| |
| |
| |
| |
|
| Total dividends and distributions | | (6.76) | | | | (4.64) | | (.06) | | — | | (.05) | | — |
| | |
| |
| |
| |
| |
| |
| |
|
| Net asset value, end of period | | $ 24.74 | | $ 27.27 | | $ 23.68 | | $ 17.41 | | $ 13.16 | | $ 10.27 |
| |
| |
| |
| |
| |
| |
|
| |
| Total Investment Return** | | | | | | | | | | | | | | |
| |
| |
| |
| |
| |
| |
| |
|
| |
| Based on net asset value per share | | 17.44%‡ | | | | 41.66% | | 36.46% | | 32.29% | | 28.71% | | .79% |
| |
| |
| |
| |
| |
| |
| |
|
| |
| Ratios to Average Net Assets | | | | | | | | | | | | | | |
| |
| |
| |
| |
| |
| |
| |
|
| |
| Expenses, net of waiver and excluding reorganization expenses | | 1.58%* | | | | 1.66% | | 1.75% | | 1.85% | | 2.12% | | 2.40% |
| | |
| |
| |
| |
| |
| |
| |
|
| Expenses, net of waiver | | 1.58%* | | | | 1.66% | | 1.75% | | 1.85% | | 2.25% | | 2.40% |
| | |
| |
| |
| |
| |
| |
| |
|
| Expenses | | 1.63%* | | | | 1.71% | | 1.75% | | 1.88% | | 2.25% | | 2.40% |
| | |
| |
| |
| |
| |
| |
| |
|
| Investment income — net | | .29%* | | | | .10% | | .74% | | .94% | | .17% | | .07% |
| |
| |
| |
| |
| |
| |
| |
|
| |
| Supplemental Data | | | | | | | | | | | | | | |
| |
| |
| |
| |
| |
| |
| |
|
| |
| Net assets, end of period (in thousands) | | $ 170,956 | | $ 151,309 | | $ 122,331 | | $ 91,292 | | $ 79,383 | | $ 12,353 |
| | |
| |
| |
| |
| |
| |
|
| Portfolio turnover | | 75% | | | | 140% | | 121% | | 110% | | 183% | | 78% |
| | |
| |
| |
| |
| |
| |
| |
|
| * | Annualized. |
| |
| ** | Total investment returns exclude the effect of sales charges. |
| |
| *** | Based on average shares outstanding. |
| |
| | † Includes a redemption fee, which is less than $.01 per share. |
† † Consolidated Financial Highlights. See Note 1(h) of Notes to Financial Statements.
‡ Aggregate total investment return.
See Notes to Financial Statements.
| BLACKROCK DEVELOPING CAPITAL MARKETS FUND, INC. |
| Financial Highlights (continued) | | | | | | | | | | | | | | | | |
| |
| | | | | | | | | Investor B | | | | |
| | | For the Six | | | | | | | | | | | | | | |
| | | Months Ended | | | | | | | | | | | | | | |
| The following per share data and ratios have been derived | | December 31, 2007 | | | | For the Year Ended June 30, | | |
| from information provided in the financial statements. | | (Unaudited) | | | | 2007††† | | 2006††† | | | | 2005††† | | 2004††† | | 2003††† |
| |
| |
| |
| |
| |
| |
| |
| |
|
| Per Share Operating Performance | | | | | | | | | | | | | | | | |
| |
| |
| |
| |
| |
| |
| |
| |
|
| |
| Net asset value, beginning of period | | $ 25.20 | | $ 22.10 | | $ 16.32 | | $ 12.44 | | $ 9.74 | | $ 9.75 |
| | |
| |
| |
| |
| |
| |
|
| Investment income (loss) — net*** | | (.06) | | | | (.15) | | —†† | | .02 | | (.08) | | (.09) |
| Realized and unrealized gain — net | | 3.86† | | | | 7.62† | | 5.78† | | | | 3.86† | | 2.78 | | .08 |
| | |
| |
| |
| |
| |
| |
| |
| |
|
| Total from investment operations | | 3.80 | | | | 7.47 | | 5.78 | | | | 3.88 | | 2.70 | | (.01) |
| | |
| |
| |
| |
| |
| |
| |
| |
|
| Less dividends and distributions: | | | | | | | | | | | | | | | | |
| Investment income — net | | — | | | | (.13) | | — | | | | — | | — | | — |
| Realized gain — net | | (6.38) | | | | (4.24) | | — | | | | — | | — | | — |
| | |
| |
| |
| |
| |
| |
| |
| |
|
| Total dividends and distributions | | (6.38) | | | | (4.37) | | — | | | | — | | — | | — |
| | |
| |
| |
| |
| |
| |
| |
| |
|
| Net asset value, end of period | | $ 22.62 | | $ 25.20 | | $ 22.10 | | $ 16.32 | | $ 12.44 | | $ 9.74 |
| |
| |
| |
| |
| |
| |
|
| |
| Total Investment Return** | | | | | | | | | | | | | | | | |
| |
| |
| |
| |
| |
| |
| |
| |
|
| |
| Based on net asset value per share | | 16.98%‡ | | | | 40.59% | | 35.42% | | | | 31.19% | | 27.72% | | (.10%) |
| |
| |
| |
| |
| |
| |
| |
| |
|
| |
| Ratios to Average Net Assets | | | | | | | | | | | | | | | | |
| |
| |
| |
| |
| |
| |
| |
| |
|
| |
| Expenses, net of waiver and excluding reorganization expenses | | 2.38%* | | | | 2.45% | | 2.53% | | | | 2.65% | | 2.93% | | 3.25% |
| | |
| |
| |
| |
| |
| |
| |
| |
|
| Expenses, net of waiver | | 2.38%* | | | | 2.45% | | 2.53% | | | | 2.65% | | 3.06% | | 3.25% |
| | |
| |
| |
| |
| |
| |
| |
| |
|
| Expenses | | 2.43%* | | | | 2.48% | | 2.53% | | | | 2.68% | | 3.06% | | 3.25% |
| | |
| |
| |
| |
| |
| |
| |
| |
|
| Investment income (loss) — net | | (.45%)* | | | | (.68%) | | (.02%) | | | | .11% | | (.66%) | | (.98%) |
| |
| |
| |
| |
| |
| |
| |
| |
|
| |
| Supplemental Data | | | | | | | | | | | | | | | | |
| |
| |
| |
| |
| |
| |
| |
| |
|
| |
| Net assets, end of period (in thousands) | | $ 11,684 | | $ 13,280 | | $ 17,238 | | $ 24,333 | | $ 30,102 | | $ 15,106 |
| | |
| |
| |
| |
| |
| |
|
| Portfolio turnover | | 75% | | | | 140% | | 121% | | | | 110% | | 183% | | 78% |
| | |
| |
| |
| |
| |
| |
| |
| |
|
| * | Annualized. |
| |
| ** | Total investment returns exclude the effect of sales charges. |
| |
| *** | Based on average shares outstanding. |
| |
† Includes a redemption fee, which is less than $.01 per share.
††Amount is less than $(.01) per share.
†††Consolidated Financial Highlights. See Note 1(h) of Notes to Financial Statements.
‡Aggregate total investment return. See Notes to Financial Statements.
16
BLACKROCK DEVELOPING CAPITAL MARKETS FUND, INC.
| Financial Highlights (concluded) | | | | | | | | | | | | | | |
| |
| | | | | | | | | Investor C | | | | |
| For the Six |
| Months Ended |
| The following per share data and ratios have been derived | | December 31, 2007 | | | | For the Year Ended June 30, | | |
| from information provided in the financial statements. | | (Unaudited) | | | | 2007†† | | 2006†† | | 2005†† | | 2004†† | | 2003†† |
| Per Share Operating Performance | | | | | | | | | | | | | | |
| |
| Net asset value, beginning of period | | $ 24.91 | | $ 22.01 | | $ 16.25 | | $ 12.38 | | $ 9.70 | | $ 9.71 |
| | |
| |
| |
| |
| |
| |
|
| Investment income (loss) — net*** | | (.06) | | | | (.14) | | (.01) | | .02 | | (.07) | | (.07) |
| Realized and unrealized gain — net | | 3.80† | | | | 7.53† | | 5.77† | | 3.85† | | 2.75 | | .06 |
| | |
| |
| |
| |
| |
| |
| |
|
| Total from investment operations | | 3.74 | | | | 7.39 | | 5.76 | | 3.87 | | 2.68 | | (.01) |
| | |
| |
| |
| |
| |
| |
| |
|
| Less dividends and distributions: | | | | | | | | | | | | | | |
| Investment income — net | | — | | | | (.13) | | — | | — | | — | | — |
| Realized gain — net | | (6.53) | | | | (4.36) | | — | | — | | — | | — |
| | |
| |
| |
| |
| |
| |
| |
|
| Total dividends and distributions | | (6.53) | | | | (4.49) | | — | | — | | — | | — |
| | |
| |
| |
| |
| |
| |
| |
|
| Net asset value, end of period | | $ 22.12 | | $ 24.91 | | $ 22.01 | | $ 16.25 | | $ 12.38 | | $ 9.70 |
| |
| |
| |
| |
| |
| |
|
| |
| Total Investment Return** | | | | | | | | | | | | | | |
| |
| |
| |
| |
| |
| |
| |
|
| |
| Based on net asset value per share | | 16.98%‡ | | | | 40.58% | | 35.45% | | 31.26% | | 27.63% | | (.10%) |
| |
| |
| |
| |
| |
| |
| |
|
| |
| Ratios to Average Net Assets | | | | | | | | | | | | | | |
| |
| |
| |
| |
| |
| |
| |
|
| |
| Expenses, net of waiver and excluding reorganization expenses | | 2.33%* | | | | 2.43% | | 2.52% | | 2.65% | | 2.93% | | 3.24% |
| | |
| |
| |
| |
| |
| |
| |
|
| Expenses, net of waiver | | 2.33%* | | | | 2.43% | | 2.52% | | 2.65% | | 3.07% | | 3.24% |
| | |
| |
| |
| |
| |
| |
| |
|
| Expenses | | 2.38%* | | | | 2.47% | | 2.52% | | 2.68% | | 3.07% | | 3.24% |
| | |
| |
| |
| |
| |
| |
| |
|
| Investment income (loss) — net | | (.47%)* | | | | (.66%) | | (.05%) | | .16% | | (.62%) | | (.84%) |
| |
| |
| |
| |
| |
| |
| |
|
| |
| Supplemental Data | | | | | | | | | | | | | | |
| |
| |
| |
| |
| |
| |
| |
|
| |
| Net assets, end of period (in thousands) | | $ 38,085 | | $ 32,208 | | $ 24,674 | | $ 15,956 | | $ 14,903 | | $ 4,946 |
| | |
| |
| |
| |
| |
| |
|
| Portfolio turnover | | 75% | | | | 140% | | 121% | | 110% | | 183% | | 78% |
| | |
| |
| |
| |
| |
| |
| |
|
| * | Annualized. |
| |
| ** | Total investment returns exclude the effect of sales charges. |
| |
| *** | Based on average shares outstanding. |
| |
| | † Includes a redemption fee, which is less than $.01 per share. |
††Consolidated Financial Highlights. See Note 1(h) of Notes to Financial Statements.
‡ Aggregate total investment return.
See Notes to Financial Statements.
| BLACKROCK DEVELOPING CAPITAL MARKETS FUND, INC. |
Notes to Financial Statements (Unaudited)
1. Significant Accounting Policies:
BlackRock Developing Capital Markets Fund, Inc. (the “Fund”) is registered under the Investment Company Act of 1940, as amended, as a non-diversified, open-end management investment company. The Fund’s financial statements are prepared in conformity with U.S. generally accepted accounting principles, which may require the use of management accruals and estimates. Actual results may differ from these estimates. These unaudited financial statements reflect all adjustments, which are, in the opinion of management, necessary to present a fair statement of the results for the interim period. All such adjustments are of a normal, recurring nature. The Fund offers multiple classes of shares. Institutional Shares are sold only to certain eligible investors. Investor A Shares are generally sold with a front-end sales charge. Shares of Investor B and Investor C may be subject to a contingent deferred sales charge. All clas ses of shares have identical voting, dividend, liquidation and other rights and the same terms and conditions, except that Investor A, Investor B and Investor C Shares bear certain expenses related to the shareholder servicing of such shares, and Investor B and Investor C Shares also bear certain expenses related to the distribution of such shares. Each class has exclusive voting rights with respect to matters relating to its shareholder servicing and distribution expenditures (except that Investor B shareholders may vote on certain changes to the Investor A distribution plan). Income, expenses (other than expenses attributable to a specific class) and realized and unrealized gains and losses are allocated daily to each class based on its relative net assets. The following is a summary of significant accounting policies followed by the Fund.
(a) Valuation of investments — Equity securities held by the Fund that are traded on stock exchanges or the NASDAQ Global Market are valued at the last sale price or official close price on the exchange, as of the close of business on the day the securities are being valued or, lacking any sales, at the last available bid price for long positions, and at the last available asked price for short positions. In cases where equity securities are traded on more than one exchange, the securities are valued on the exchange designated as the primary market by or under the authority of the Board of Directors of the Fund. Long positions traded in over-the-counter (“OTC”) markets, NASDAQ Capital Market or Bulletin Board are valued at the last available bid price or yield equivalent obtained from one or more dealers or pricing services approved by the Board of Directors of the Fund. Short positions traded in the OTC markets are valued at the last available asked price.
Portfolio securities that are traded both in the OTC markets and on a stock exchange are valued according to the broadest and most representative market.
Effective September 4, 2007, exchange-traded options are valued at the mean between the last bid and ask prices at the close of the options market in which the options trade and previously were valued at the last sales price as of the close of options trading on applicable exchanges. Options traded in the OTC market are valued at the last asked price (options written) or the last bid price (options purchased). Swap agreements are valued based upon quoted fair valuations received daily by the Fund from a pricing service or counterparty. Financial futures contracts and options thereon, which are traded on exchanges, are valued at their last sale price as of the close of such exchanges. Valuation of short-term investment vehicles is generally based on the net asset value of the underlying investment vehicle or amortized cost.
Repurchase agreements are valued at cost plus accrued interest. The Fund employs pricing services to provide certain securities prices for the Fund. Securities and assets for which market quotations are not readily available are valued at fair value as determined in good faith by or under the direction of the Board of Directors of the Fund, including valuations furnished by the pricing services retained by the Fund, which may use a matrix system for valuations. The procedures of a pricing service and its valuations are reviewed by the officers of the Fund under the general supervision of the Fund’s Board of Directors. Such valuations and procedures will be reviewed periodically by the Board of Directors of the Fund.
Generally, trading in foreign securities, as well as U.S. government securities, money market instruments and certain fixed income securities, is substantially completed each day at various times prior to the close of business on the New York Stock Exchange (“NYSE”). The values of such securities used in computing the net asset value of the Fund’s shares are determined as of such times. Foreign currency exchange rates will generally be determined as of the close of business on the NYSE. Occasionally, events affecting the values of such securities and such exchange rates may occur between the times at which they are determined and the close of business on the NYSE that may not be reflected in the computation of the Fund’s net asset value. If events (for example, a company announcement, market volatility or a natural disaster) occur during such periods that are expected to materially affect the value of such s ecurities, those securities will be valued at their fair value as determined in good faith by the Fund’s Board of Directors or by BlackRock Advisors, LLC (the “Manager”), an indirect, wholly owned subsidiary of BlackRock, Inc., using a pricing service and/or procedures approved by the Fund’s Board of Directors.
(b) Derivative financial instruments — The Fund may engage in various portfolio investment strategies both to increase the return of the Fund and to hedge, or protect, its exposure to interest rate movements and movements in the securities markets. Losses may arise due to changes
18
BLACKROCK DEVELOPING CAPITAL MARKETS FUND, INC.
Notes to Financial Statements (continued)
in the value of the contract due to an unfavorable change in the price of the underlying security, or index, or if the counterparty does not perform under the contract. The counterparty, for certain instruments, may pledge cash or securities as collateral.
•Forward foreign exchange contracts — The Fund may enter into for- ward foreign exchange contracts as a hedge against either specific transactions or portfolio positions. The contract is marked-to-market daily and the change in market value is recorded by the Fund as an unrealized gain or loss. When the contract is closed, the Fund records a realized gain or loss equal to the difference between the value at the time it was opened and the value at the time it was closed.
•Foreign currency options and futures — The Fund may also purchase or sell listed or OTC foreign currency options, foreign currency futures and related options on foreign currency futures as a short or long hedge against possible variations in foreign exchange rates. Such transactions may be effected with respect to hedges on non-U. S. dollar-denominated securities owned by the Fund, sold by the Fund but not yet delivered, or committed or anticipated to be purchased by the Fund.
•Options — The Fund may write put and covered call options and purchase call and put options. When the Fund writes an option, an amount equal to the premium received by the Fund is reflected as an asset and an equivalent liability. The amount of the liability is subsequently marked-to-market to reflect the current market value of the option written. When a security is purchased or sold through an exercise of an option, the related premium paid (or received) is added to (or deducted from) the basis of the security acquired or deducted from (or added to) the proceeds of the security sold. When an option expires (or the Fund enters into a closing transaction), the Fund realizes a gain or loss on the option to the extent of the premi- ums received or paid (or gain or loss to the extent th e cost of the closing transaction exceeds the premium paid or received).
Written and purchased options are non-income producing investments.
•Financial futures contracts — The Fund may purchase or sell financial futures contracts and options on such financial futures contracts. Financial futures contracts are contracts for delayed delivery of securities at a specific future date and at a specific price or yield. Upon entering into a contract, the Fund deposits and maintains as collateral such initial margin as required by the exchange on which the transaction is effected. Pursuant to the contract, the Fund agrees to receive from or pay to the broker an amount of cash equal to the daily fluctuation in value of the contract. Such receipts or payments are known as variation marg in and are recorded by the Fund as unrealized gains or losses. When the contract is closed, the Fund records a realized gain or loss equal to the difference between the value of the contract at the time it was opened and the value at the time it was closed.
(c) Foreign currency transactions — Transactions denominated in foreign currencies are recorded at the exchange rate prevailing when recognized. Assets and liabilities denominated in foreign currencies are valued at the exchange rate at the end of the period. Foreign currency transactions are the result of settling (realized) or valuing (unrealized) assets or liabilities expressed in foreign currencies into U.S. dollars. Realized and unrealized gains or losses from investments include the effects of foreign exchange rates on investments. The Fund invests in foreign securities, which may involve a number of risk factors and special considerations not present with investments in securities of U.S. corporations.
(d) Income taxes — It is the Fund’s policy to comply with the requirements of the Internal Revenue Code applicable to regulated investment companies and to distribute substantially all of its taxable income to its shareholders. Therefore, no federal income tax provision is required. Under the applicable foreign tax law, a withholding tax may be imposed on interest, dividends and capital gains at various rates.
(e) Security transactions and investment income — Security transactions are recorded on the dates the transactions are entered into (the trade dates). Realized gains and losses on security transactions are determined on the identified cost basis. Dividend income is recorded on the ex-dividend dates. Dividends from foreign securities where the ex-dividend date may have passed are subsequently recorded when the Fund has determined the ex-dividend date. Interest income is recognized on the accrual basis.
(f) Prepaid registration fees — Prepaid registration fees are charged to expense as the related shares are issued.
(g) Dividends and distributions — Dividends and distributions paid by the Fund are recorded on the ex-dividend dates.
(h) Basis of consolidation — The accompanying consolidated Financial Highlights for each of the years in the four-year period ended June 30, 2006 includes the accounts of Inversiones en Marcado Accionario de Valores Chile Limitada, a wholly owned subsidiary of the Fund. The subsidiary was created for regulatory purposes to invest in Chilean securities. Intercompany accounts and transactions have been eliminated. During the year ended June 30, 2007, Inversiones en Marcado Accionario de Valores Chile Limitada was dissolved.
| BLACKROCK DEVELOPING CAPITAL MARKETS FUND, INC. |
Notes to Financial Statements (continued)
(i) Securities lending — The Fund may lend securities to financial institutions that provide cash or securities issued or guaranteed by the U.S. government as collateral, which will be maintained at all times in an amount equal to at least 100% of the current market value of the loaned securities. The market value of the loaned securities is determined at the close of business of the Fund and any additional required collateral is delivered to the Fund on the next business day. Where the Fund receives securities as collateral for the loaned securities, it collects a fee from the borrower. The Fund typically receives the income on the loaned securities but does not receive the income on the collateral. Where the Fund receives cash as collateral, it may invest such collateral and retain the amount earned on such investment, net of any amount reba ted to the borrower. Loans of securities are terminable at any time and the borrower, after notice, is required to return borrowed securities within five business days. The Fund may pay reasonable lending agent, administrative and custodial fees in connection with its loans. In the event that the borrower defaults on its obligation to return borrowed securities because of insolvency or for any other reason, the Fund could experience delays and costs in gaining access to the collateral. The Fund also could suffer a loss where the value of the collateral falls below the market value of the borrowed securities, in the event of borrower default or in the event of losses on investments made with cash collateral.
(j) Bank overdraft — The Fund recorded a bank overdraft resulting from management estimates of available cash.
(k) Recent accounting pronouncements — Effective June 29, 2007, the Fund implemented Financial Accounting Standards Board (“FASB”) Interpretation No. 48, “Accounting for Uncertainty in Income Taxes — an interpretation of FASB Statement No. 109” (“FIN 48”). FIN 48 prescribes the minimum recognition threshold a tax position must meet in connection with accounting for uncertainties in income tax positions taken or expected to be taken by an entity, including investment companies, before being measured and recognized in the financial statements. Management has evaluated the application of FIN 48 to the Fund, and has determined that the adoption of FIN 48 does not have a material impact on the Fund’s financial statements. The Fund files U.S. federal and various state and local tax returns. No income tax retur ns are currently under examination. The statute of limitations on the Fund’s U.S. federal tax returns remains open for the years ended June 30, 2004 through June 30, 2007. The statute of limitations on the Fund’s state and local tax returns may remain open for an additional year depending upon the jurisdiction.
In September 2006, Statement of Financial Accounting Standards No. 157, “Fair Value Measurements” (“FAS 157”), was issued and is effective for fiscal years beginning after November 15, 2007. FAS 157 defines fair value, establishes a framework for measuring fair value and expands disclosures about fair value measurements. At this time, management is evaluating the implications of FAS 157 and its impact on the Fund’s financial statements, if any, has not been determined.
In addition, in February 2007, Statement of Financial Accounting Standards No. 159, “The Fair Value Option for Financial Assets and Financial Liabilities” (“FAS 159”), was issued and is effective for fiscal years beginning after November 15, 2007. Early adoption is permitted as of the beginning of a fiscal year that begins on or before November 15, 2007, provided the entity also elects to apply the provisions of FAS 157. FAS 159 permits entities to choose to measure many financial instruments and certain other items at fair value that are not currently required to be measured at fair value. FAS 159 also establishes presentation and disclosure requirements designed to facilitate comparisons between entities that choose different measurement attributes for similar types of assets and liabilities. At this time, management is evaluating the implications of FAS 159 and its impact on the Fund’s financial stat ements, if any, has not been determined.
2. Investment Advisory Agreement and Transactions with Affiliates:
The Fund has entered into an Investment Advisory Agreement with the Manager. The Fund has also entered into separate Distribution Agreements and Distribution Plans with FAM Distributors, Inc. (“FAMD”) and BlackRock Distributors, Inc. and its affiliates (“BDI”) (collectively, the “Distributor”). FAMD is a wholly owned subsidiary of Merrill Lynch Group, Inc., and BDI is an affiliate of BlackRock. Inc. Merrill Lynch & Co., Inc. (“Merrill Lynch”) and The PNC Financial Services Group, Inc., (“PNC”) are the principal owners of BlackRock, Inc.
The Manager is responsible for the management of the Fund’s portfolio and provides the necessary personnel, facilities, equipment and certain other services necessary to the operations of the Fund. For such services, the Fund pays a monthly fee of 1.0%, on an annual basis, of the average daily value of the Fund’s net assets. The Manager voluntarily agreed to waive .10% of its fee, for the period July 1, 2007 to August 31, 2007. For the six months ended December 31, 2007, the Manager earned fees of $1,538,924, of which $77,082 was waived. In addition, the Manager has entered into sub-advisory agreements with BlackRock Investment Management, LLC (“BIM”) and BlackRock Asset Management U.K. Limited, both affiliates of the Manager, under which the Manager pays each sub-adviser for services it provides a monthly fee at an annual rate that is a percentage of the management fee paid by the Fund to the Manager.
Pursuant to the Distribution Plans adopted by the Fund in accordance with Rule 12b-1 under the Investment Company Act of 1940, the Fund pays the Distributor ongoing service and distribution fees. The fees are
20
BLACKROCK DEVELOPING CAPITAL MARKETS FUND, INC.
Notes to Financial Statements (continued)
accrued daily and paid monthly at annual rates based upon the average daily net assets of the shares as follows:
| | | Service | | Distribution |
| | | Fee | | Fee |
| |
| |
|
| Investor A | | .25% | | — |
| Investor B | | .25% | | .75% |
| Investor C | | .25% | | .75% |
| |
| |
|
Pursuant to sub-agreements with each Distributor, broker-dealers, including Merrill Lynch, Pierce, Fenner & Smith Incorporated (“MLPF&S”), a wholly owned subsidiary of Merrill Lynch, and the Distributor provide shareholder and distribution services to the Fund. The ongoing service fee compensates the Distributor and each broker-dealer (including MLPF&S) for providing shareholder servicing to Investor A, Investor B and Investor C shareholders. The ongoing distribution fee compensates the Distributor and the broker-dealers for providing distribution-related services to Investor B and Investor C shareholders.
For the six months ended December 31, 2007, FAMD and BDI earned underwriting discounts and direct commissions. MLPF&S and BDI earned dealer concessions on sales of the Fund’s Investor A Shares, which totaled $35,110.
For the six months ended December 31, 2007, affiliates received contingent deferred sales charges of $5,952 and $1,707 relating to transactions in Investor B and Investor C Shares, respectively. Furthermore, MLPF&S received contingent deferred sales charges of $660 relating to transactions subject to front-end sales charge waivers in Investor A Shares.
The Manager maintains a call center, which is responsible for providing certain shareholder services to the Fund, such as responding to shareholder inquiries and processing transactions based upon instructions from shareholders with respect to the subscription and redemption of Fund shares. During the six months ended December 31, 2007, the following amounts have been accrued by the Fund to reimburse the Manager for costs incurred running the call center, which are a component of the transfer agent fees in the accompanying Statement of Operations.
| | | Call Center |
| | | Fees |
| |
|
| Institutional | | $3,090 |
| Investor A | | $8,924 |
| Investor B | | $ 811 |
| Investor C | | $1,328 |
| |
|
The Fund has received an exemptive order from the Securities and Exchange Commission permitting it to lend portfolio securities to MLPF&S or its affiliates. Pursuant to that order, the Fund has retained BIM as securities lending agent for a fee based on a share of the returns on investment of cash collateral. BIM may, on behalf of the Fund, invest cash collateral received by the Fund for such loans, among other things, in a private investment company managed by the Manager or in registered money market funds advised by the Manager or its affiliates. For the six months ended December 31, 2007, there were no securities lending agent fees paid to BIM.
In addition, MLPF&S received $1,267 in commissions on the execution of portfolio security transactions for the Fund for the six months ended December 31, 2007.
PFPC Inc., an indirect, wholly owned subsidiary of PNC and an affiliate of the Manager, is the Fund’s transfer agent.
For the six months ended December 31, 2007, the Fund reimbursed the Manager $2,420, for certain accounting services.
Certain officers and/or directors of the Fund are officers and/or directors of BlackRock, Inc. or its affiliates.
3. Investments:
Purchases and sales of investments, excluding short-term securities, for the six months ended December 31, 2007 were $228,999,568 and $245,710,998, respectively.
| BLACKROCK DEVELOPING CAPITAL MARKETS FUND, INC. |
Notes to Financial Statements (continued)
4. Capital Share Transactions:
Net increase in net assets derived from capital share transactions was $57,333,853 and $2,399,521 for the six months ended December 31, 2007 and for the year ended June 30, 2007, respectively.
| Transactions in capital shares for each class were as follows: | | | | | | | | | | |
| For the | | For the | | | | |
| | | Six Months Ended | | Year Ended | | | | |
| | | December 31, 2007 | | June 30, 2007 | | |
| |
| |
| |
|
| | | Shares | | Dollar Amount | | Shares | | Dollar Amount |
| |
| |
| |
| |
|
| Institutional Shares | | | | | | | | | | |
| |
| |
| |
| |
| |
|
| Shares sold | | 97,420 | | $ 2,744,177 | | 103,900 | | $ 2,445,868 |
| Shares issued to shareholders in reinvestment | | | | | | | | | | |
| of dividends and distributions | | 750,174 | | 18,866,887 | | 560,278 | | | | 11,600,782 |
| | |
| |
| |
| |
| |
|
| Total issued | | 847,594 | | 21,611,064 | | 664,178 | | | | 14,046,650 |
| Shares redeemed | | (247,645) | | (6,884,696) | | (631,519) | | (15,126,694) |
| | |
| |
| |
| |
|
| Net increase (decrease) | | 599,949 | | $14,726,368 | | 32,659 | | $ (1,080,044) |
| |
| |
| |
| |
|
| |
| Investor A | | | | | | | | | | |
| |
| |
| |
| |
| |
|
| Shares sold and automatic conversion of shares | | 436,624 | | $12,067,969 | | 619,093 | | $14,461,982 |
| Shares issued to shareholders in reinvestment | | | | | | | | | | |
| of dividends and distributions | | 1,345,071 | | 32,946,496 | | 909,100 | | | | 18,434,053 |
| | |
| |
| |
| |
| |
|
| Total issued | | 1,781,695 | | 45,014,465 | | 1,528,193 | | | | 32,896,035 |
| Shares redeemed | | (419,009) | | (11,481,993) | | (1,145,067) | | (26,610,025) |
| | |
| |
| |
| |
|
| Net increase | | 1,362,686 | | $33,532,472 | | 383,126 | | $ 6,286,010 |
| |
| |
| |
| |
|
| |
| Investor B | | | | | | | | | | |
| |
| |
| |
| |
| |
|
| Shares sold | | 46,634 | | $ 1,179,235 | | 94,447 | | $ 2,022,074 |
| Shares issued to shareholders in reinvestment | | | | | | | | | | |
| of dividends and distributions | | 113,417 | | 2,552,429 | | 134,036 | | | | 2,527,381 |
| | |
| |
| |
| |
| |
|
| Total issued | | 160,051 | | 3,731,664 | | 228,483 | | | | 4,549,455 |
| Shares redemed and automatic conversion of shares | | (170,372) | | (4,341,950) | | (481,390) | | (10,403,861) |
| | |
| |
| |
| |
|
| Net decrease | | (10,321) | | $ (610,286) | | (252,907) | | $ (5,854,406) |
| |
| |
| |
| |
|
| |
| Investor C | | | | | | | | | | |
| |
| |
| |
| |
| |
|
| Shares sold | | 217,327 | | $ 5,450,877 | | 236,875 | | $ 5,127,554 |
| Shares issued to shareholders in reinvestment | | | | | | | | | | |
| of dividends and distributions | | 360,575 | | 7,941,811 | | 237,166 | | | | 4,421,388 |
| | |
| |
| |
| |
| |
|
| Total issued | | 577,902 | | 13,392,688 | | 474,041 | | | | 9,548,942 |
| Shares redeemed | | (149,114) | | (3,707,389) | | (302,033) | | | | (6,500,981) |
| | |
| |
| |
| |
| |
|
| Net increase | | 428,788 | | $ 9,685,299 | | 172,008 | | $ 3,047,961 |
| | |
| |
| |
| |
|
The Fund charges a 2% redemption fee on the proceeds (calculated at market value) of a redemption (either by sale or exchange) of Fund shares made within 30 days of purchase or exchange. The redemption fee is paid to the Fund and is intended to offset the trading costs, market impact and other costs associated with short-term trading into and out of the Fund.
22
BLACKROCK DEVELOPING CAPITAL MARKETS FUND, INC.
Notes to Financial Statements (concluded)
5. Short-Term Borrowings:
The Fund, along with certain other funds managed by the Manager and its affiliates, is party to a $500,000,000 credit agreement with a group of lenders. The Fund may borrow under the credit agreement to fund shareholder redemptions and for other lawful purposes other than for leverage. The Fund may borrow up to the maximum amount allowable under the Fund’s current prospectus and statement of additional information, subject to various other legal, regulatory or contractual limits. The Fund pays a commitment fee of .06% per annum based on the Fund’s pro rata share of the unused portion of the credit agreement. Amounts borrowed under the credit agreement bear interest at a rate equal to, at each fund’s election, the federal funds rate plus .35% or a base rate as defined in the credit agreement. The Fund did not borrow under the credit agreement during the six months ended December 31, 2007. On November 21, 2007, the credit agreement was renewed for one year under substantially the same terms.
6. Commitments:
At December 31, 2007, the Fund had entered into foreign exchange contracts, under which it had agreed to sell a foreign currency with an approximate value of $522,000.
7. Capital Loss Carryforward:
On June 30, 2007, the Fund had a net capital loss carryforward of $14,473,120, of which $10,854,840 expires in 2010 and $3,618,280 expires in 2011. This amount will be available to offset like amounts of any future taxable gains.
| BLACKROCK DEVELOPING CAPITAL MARKETS FUND, INC. |
Officers and Directors
David O. Beim, Director
Richard S. Davis, Director
Ronald W. Forbes, Director
Henry Gabbay, Director
Dr. Matina Horner, Director
Rodney D. Johnson, Director
Herbert I. London, Director
Cynthia A. Montgomery, Director
Joseph . Platt, Jr., Director
Robert C. Robb, Jr., Director
Toby Rosenblatt, Director
Kenneth L. Urish, Director
Frederick W. Winter, Director
David R. Wilmerding, Jr., Advisory Board Member*
Donald C. Burke, Fund President and Chief Executive Officer
Anne F. Ackerley, Vice President
Neal J. Andrews, Chief Financial Officer
Jay M. Fife, Treasurer
Brian . Kindelan, Chief Compliance Officer
Howard Surloff, Secretary
* David R. Wilmerding, Jr. resigned from the Advisory Board of the Master LLC,
effective December 31, 2007. |
Custodian
Brown Brothers Harriman & Co.
Boston, MA 02109-3661
Transfer Agent
PFPC Inc.
Wilmington, DE 19809
Accounting Agent
State Street Bank and
Trust Company
Princeton, NJ 08540
Independent Registered Public
Accounting Firm
Deloitte & Touche LLP
Princeton, NJ 08540
Legal Counsel
Sidley Austin LLP
New York, NY 10019 |
Proxy Results
During the six-month period ended December 31, 2007, the shareholders of BlackRock Developing Capital Markets Fund, Inc. voted on the following proposal, which was approved at a special shareholders’ meeting on September 7, 2007. This proposal was a part of the reorganization of the Fund’s Board of Directors that took effect on November 1, 2007. A description of the proposal and number of shares voted are as follows:
| | | | | Shares Voted | | Shares Withheld |
| | | | | For | | From Voting |
| |
| |
| |
|
| To elect the Fund’s Board of Directors: | | David O. Beim | | 8,777,626 | | 233,182 |
| | | Richard S. Davis | | 8,779,769 | | 231,039 |
| | | Ronald W. Forbes | | 8,778,958 | | 231,850 |
| | | Henry Gabbay | | 8,778,937 | | 231,871 |
| | | Dr. Matina Horner | | 8,779,248 | | 231,560 |
| | | Rodney D. Johnson | | 8,779,163 | | 231,645 |
| | | Herbert I. London | | 8,778,152 | | 232,656 |
| | | Cynthia A. Montgomery | | 8,777,992 | | 232,816 |
| | | Joseph . Platt, Jr. | | 8,777,867 | | 232,941 |
| | | Robert C. Robb, Jr. | | 8,778,729 | | 232,079 |
| | | Toby Rosenblatt | | 8,779,695 | | 231,113 |
| | | Kenneth L. Urish | | 8,777,308 | | 233,500 |
| | | Frederick W. Winter | | 8,779,023 | | 231,785 |
| |
| |
| |
|
24
BLACKROCK DEVELOPING CAPITAL MARKETS FUND, INC.
BlackRock Fund Information
BlackRock Privacy Principles
BlackRock is committed to maintaining the privacy of its current and
former fund investors and individual clients (collectively, “Clients”) and
to safeguarding their nonpublic personal information. The following infor-
mation is provided to help you understand what personal information
BlackRock collects, how we protect that information and why in certain
cases we share such information with select parties.
If you are located in a jurisdiction where specific laws, rules or regulations
require BlackRock to provide you with additional or different privacy-related
rights beyond what is set forth below, then BlackRock will comply with
those specific laws, rules or regulations.
BlackRock obtains or verifies personal nonpublic information from and
about you from different sources, including the following: (i) information
we receive from you or, if applicable, your financial intermediary, on appli-
cations, forms or other documents; (ii) information about your trans-
actions with us, our affiliates, or others; (iii) information we receive from
a consumer reporting agency; and (iv) from visits to our websites. |
BlackRock does not sell or disclose to nonaffiliated third parties any non-
public personal information about its Clients, except as permitted by law
or as is necessary to respond to regulatory requests or to service Client
accounts. These nonaffiliated third parties are required to protect the
confidentiality and security of this information and to use it only for its
intended purpose.
We may share information with our affiliates to service your account or to
provide you with information about other BlackRock products or services
that may be of interest to you. In addition, BlackRock restricts access
to nonpublic personal information about its Clients to those BlackRock
employees with a legitimate business need for the information. BlackRock
maintains physical, electronic and procedural safeguards that are designed
to protect the nonpublic personal information of its Clients, including proce-
dures relating to the proper storage and disposal of such information. |
Availability of Additional Information
Electronic copies of most financial reports and prospectuses are available
on the Fund’s website or shareholders can sign up for e-mail notifications of
quarterly statements, annual and semi-annual reports and prospectuses by
enrolling in the Fund’s electronic delivery program.
To enroll:
Shareholders Who Hold Accounts with Investment Advisers, Banks or
Brokerages:
Please contact your financial advisor. Please note that not all investment
advisers, banks or brokerages may offer this service. |
The Fund will mail only one copy of shareholder documents, including
prospectuses, annual and semi-annual reports and proxy statements, to
shareholders with multiple accounts at the same address. This practice is
commonly called “householding” and it is intended to reduce expenses
and eliminate duplicate mailings of shareholder documents. Mailings of
your shareholder documents may be householded indefinitely unless you
instruct us otherwise. If you do not want the mailing of these documents
to be combined with those for other members of your household, please
contact the Fund at (800) 441-7762. |
| Shareholders Who Hold Accounts Directly with BlackRock: |
| 1) | Access the BlackRock website at http://www.blackrock.com/edelivery |
| |
| 2) | Select “eDelivery” under the “More Information” section |
| |
| 3) | Log into your account |
| |
| BLACKROCK DEVELOPING CAPITAL MARKETS FUND, INC. |
BlackRock Fund Information (concluded)
Availability of Additional Information (concluded)
Availability of Proxy Voting Policies and Procedures
The Fund has delegated proxy voting responsibilities to BlackRock and
its affiliates, subject to the general oversight of the Fund’s Board of
Directors. A description of the policies and procedures that BlackRock and
its affiliates use to determine how to vote proxies relating to portfolio
securities is available without charge, upon request, on our website at
www.blackrock.com, by calling (800) 441-7762, or on the website of
the Securities and Exchange Commission (the “Commission”) at
http://www.sec.gov.
Availability of Proxy Voting Record
Information on how proxies relating to the Fund’s voting securities were
voted (if any) by BlackRock during the most recent 12-month period ended
June 30 is available, upon request and without charge, on our website at
www.blackrock.com, by calling (800) 441-7762 or on the website of the
Commission at http://www.sec.gov. |
Availability of Quarterly Portfolio Schedule
The Fund files its complete schedule of portfolio holdings for the first
and third quarters of its fiscal year with the Commission on Form N-Q.
The Fund’s Forms N-Q are available on the Commission’s website at
http://www.sec.gov and may be reviewed and copied at the Commission’s
Public Reference Room in Washington, D.C. Information regarding the
operation of the Public Reference Room may be obtained by calling
(800) SEC-0330. The Fund’s Forms N-Q may also be obtained upon
request, without charge, by calling (800) 441-7762. |
Shareholder Privileges
Account Information
Call us at (800) 441-7762 8:00 AM – 6:00 PM EST to get information
about your account balances, recent transactions and share prices. You
can also reach us on the Web at www.blackrock.com/funds.
Automatic Investment Plans
Investor Class shareholders who want to invest regularly can arrange to
have $50 or more automatically deducted from their checking or savings
account and invested in any of the BlackRock funds. |
Systematic Withdrawal Plans
Investor Class shareholders can establish a systematic withdrawal plan
and receive periodic payments of $50 or more from their BlackRock
funds, as long as their account is at least $10,000.
Retirement Plans
Shareholders may make investments in conjunction with Traditional,
Rollover, Roth, Coverdell, Simple IRAs, SEP IRAs and 403(b) Plans. |
26
BLACKROCK DEVELOPING CAPITAL MARKETS FUND, INC.
A World-Class Mutual Fund Family
BlackRock offers a diverse lineup of open-end mutual funds crossing all investment styles and managed by experts in equity, fixed income and tax-exempt investing.
| Equity Funds | | | | |
| |
| |
|
| |
| BlackRock All-Cap Global Resources Portfolio | | BlackRock Global Opportunities Portfolio | | BlackRock Mid-Cap Growth Equity Portfolio |
| BlackRock Aurora Portfolio | | BlackRock Global Resources Portfolio | | BlackRock Mid-Cap Value Equity Portfolio |
| BlackRock Asset Allocation Portfolio† | | BlackRock Global Science & Technology | | BlackRock Mid Cap Value Opportunities Fund |
| BlackRock Balanced Capital Fund† | | Opportunities Portfolio | | BlackRock Natural Resources Trust |
| BlackRock Basic Value Fund | | BlackRock Global SmallCap Fund | | BlackRock Pacific Fund |
| BlackRock Capital Appreciation Portfolio | | BlackRock Healthcare Fund | | BlackRock Small Cap Core Equity Portfolio |
| BlackRock Developing Capital Markets Fund | | BlackRock Health Sciences Opportunities Portfolio* | | BlackRock Small Cap Growth Equity Portfolio |
| BlackRock Equity Dividend Fund | | BlackRock Index Equity Portfolio* | | BlackRock Small Cap Growth Fund II |
| BlackRock EuroFund | | BlackRock International Fund | | BlackRock Small Cap Index Fund |
| BlackRock Focus Growth Fund | | BlackRock International Index Fund | | BlackRock Small Cap Value Equity Portfolio* |
| BlackRock Focus Value Fund | | BlackRock International Opportunities Portfolio* | | BlackRock Small/Mid-Cap Growth Portfolio |
| BlackRock Fundamental Growth Fund | | BlackRock International Value Fund | | BlackRock S&P 500 Index Fund |
| BlackRock Global Allocation Fund† | | BlackRock Large Cap Core Fund | | BlackRock Technology Fund |
| BlackRock Global Dynamic Equity Fund | | BlackRock Large Cap Growth Fund | | BlackRock U.S. Opportunities Portfolio |
| BlackRock Global Financial Services Fund | | BlackRock Large Cap Value Fund | | BlackRock Utilities and Telecommunications Fund |
| BlackRock Global Growth Fund | | BlackRock Latin America Fund | | BlackRock Value Opportunities Fund |
| |
| |
|
| |
| Fixed Income Funds | | | | |
| |
| |
|
| |
| BlackRock Commodity Strategies Fund | | BlackRock Inflation Protected Bond Portfolio | | BlackRock Managed Income Portfolio |
| BlackRock Enhanced Income Portfolio | | BlackRock Intermediate Bond Portfolio II | | BlackRock Short-Term Bond Fund |
| BlackRock GNMA Portfolio | | BlackRock Intermediate Government | | BlackRock Total Return Fund |
| BlackRock Government Income Portfolio | | Bond Portfolio | | BlackRock Total Return Portfolio II |
| BlackRock High Income Fund | | BlackRock International Bond Portfolio | | BlackRock World Income Fund |
| BlackRock High Yield Bond Portfolio | | BlackRock Low Duration Bond Portfolio | | |
| |
| |
|
| |
| Municipal Bond Funds | | | | |
| |
| |
|
| |
| BlackRock AMT-Free Municipal Bond Portfolio | | BlackRock Intermediate Municipal Fund | | BlackRock New York Municipal Bond Fund |
| BlackRock California Insured Municipal Bond Fund | | BlackRock Kentucky Municipal Bond Portfolio | | BlackRock Ohio Municipal Bond Portfolio |
| BlackRock Delaware Municipal Bond Portfolio | | BlackRock Municipal Insured Fund | | BlackRock Pennsylvania Municipal Bond Fund |
| BlackRock Florida Municipal Bond Fund | | BlackRock National Municipal Fund | | BlackRock Short-Term Municipal Fund |
| BlackRock High Yield Municipal Fund | | BlackRock New Jersey Municipal Bond Fund | | |
| |
| |
|
| |
| Target Risk & Target Date Funds | | | | |
| |
| |
|
| |
| BlackRock Prepared Portfolios | | BlackRock Lifecycle Prepared Portfolios | | |
| Conservative Prepared Portfolio | | Prepared Portfolio 2010 | | Prepared Portfolio 2030 |
| Moderate Prepared Portfolio | | Prepared Portfolio 2015 | | Prepared Portfolio 2035 |
| Growth Prepared Portfolio | | Prepared Portfolio 2020 | | Prepared Portfolio 2040 |
| Aggressive Growth Prepared Portfolio | | Prepared Portfolio 2025 | | Prepared Portfolio 2045 |
| | | | | Prepared Portfolio 2050 |
| * See the prospectus for information on specific limitations on investments in the fund. | | |
| † Mixed asset fund. | | | | |
BlackRock mutual funds are distributed by BlackRock Distributors, Inc. and certain funds are also distributed by FAM Distributors, Inc. You should consider the investment objectives, risks, charges and expenses of the funds under consideration carefully before investing. Each fund’s prospectus contains this and other information and is available at www.blackrock.com or by calling 800-882-0052 or from your financial advisor. The prospectus should be read carefully before investing.
| BLACKROCK DEVELOPING CAPITAL MARKETS FUND, INC. |

This report is transmitted to shareholders only. It is not authorized for use
as an offer of sale or a solicitation of an offer to buy shares of the Fund
unless accompanied or preceded by the Fund’s current prospectus. Past
performance results shown in this report should not be considered a
representation of future performance. Investment return and principal
value of shares will fluctuate so that shares, when redeemed, may
be worth more or less than their original cost. Statements and other
information herein are as dated and are subject to change.
Investing in emerging market securities involves a number of risk
factors and special considerations, including restrictions on foreign
investments and on repatriation of capital invested in emerging
markets, currency fluctuations, and potential price volatility and less
liquidity of securities traded in emerging markets. In addition, there may
be less publicly available information about the issuers of securities, and
such issuers may not be subject to accounting, auditing and financial
reporting standards and requirements comparable to those to which
U.S. companies are subject.Therefore, the Fund is designed as a long-
term investment for investors capable of assuming the risks of investing
in emerging markets. Please refer to the prospectus for details.
BlackRock Developing Capital Markets Fund, Inc.
100 Bellevue Parkway
Wilmington, DE 19809 |

#10997-12/07
Item 2 – Code of Ethics – Not Applicable to this semi-annual report
Item 3 – Audit Committee Financial Expert – Not Applicable to this semi-annual report Item 4 – Principal Accountant Fees and Services – Not Applicable to this semi-annual report Item 5 – Audit Committee of Listed Registrants – Not Applicable
Item 6 – Schedule of Investments – The registrant’s Schedule of Investments is included as part of the Report to Stockholders filed under Item 1 of this form.
Item 7 – Disclosure of Proxy Voting Policies and Procedures for Closed-End Management Investment Companies – Not Applicable
Item 8 – Portfolio Managers of Closed-End Management Investment Companies – Not Applicable
Item 9 – Purchases of Equity Securities by Closed-End Management Investment Company and Affiliated Purchasers – Not Applicable
Item 10 – Submission of Matters to a Vote of Security Holders – The registrant’s Nominating and Governance Committee will consider nominees to the Board recommended by shareholders when a vacancy becomes available. Shareholders who wish to recommend a nominee should send nominations which include biographical information and set forth the qualifications of the proposed nominee to the registrant’s Secretary. There have been no material changes to these procedures.
Item 11 – Controls and Procedures
| 11(a) – | | The registrant’s principal executive and principal financial officers or persons performing |
| | | similar functions have concluded that the registrant’s disclosure controls and procedures (as |
| | | defined in Rule 30a-3(c) under the Investment Company Act of 1940, as amended (the |
| | | “1940 Act”)) are effective as of a date within 90 days of the filing of this report based on the |
| | | evaluation of these controls and procedures required by Rule 30a-3(b) under the 1940 Act |
| | | and Rule 15d-15(b) under the Securities Exchange Act of 1934, as amended. |
11(b) – There were no changes in the registrant’s internal control over financial reporting (as defined in Rule 30a-3(d) under the 1940 Act) that occurred during the second fiscal quarter of the period covered by this report that have materially affected, or are reasonably likely to materially affect, the registrant’s internal control over financial reporting.
Item 12 – Exhibits attached hereto
12(a)(1) – Code of Ethics – Not Applicable to this semi-annual report 12(a)(2) – Certifications – Attached hereto 12(a)(3) – Not Applicable 12(b) – Certifications – Attached hereto
Pursuant to the requirements of the Securities Exchange Act of 1934 and the Investment Company Act of 1940, the registrant has duly caused this report to be signed on its behalf by the undersigned, thereunto duly authorized.
BlackRock Developing Capital Markets Fund, Inc.
| By: | | /s/ Donald C. Burke |
| | | Donald C. Burke |
| | | Chief Executive Officer of |
| | | BlackRock Developing Capital Markets Fund, Inc. |
Date: February 21, 2008
Pursuant to the requirements of the Securities Exchange Act of 1934 and the Investment Company Act of 1940, this report has been signed below by the following persons on behalf of the registrant and in the capacities and on the dates indicated.
By: /s/ Donald C. Burke
Donald C. Burke
Chief Executive Officer (principal executive officer) of BlackRock Developing Capital Markets Fund, Inc.
Date: February 21, 2008
By: /s/ Neal J. Andrews |
Neal J. Andrews
Chief Financial Officer (principal financial officer) of BlackRock Developing Capital Markets Fund, Inc.